National water summary 1983: Hydrologic events and issues
254
National Water Summary 1983 Hydrologic Events and Issues '>" *f*W ( %*w- <-/-' * >*k *4fr**t u- * V» * IV*. .; " < i jg^ /«« fi*J:H* c4^ ttf. H^B^-^Li" >> *t<J- :f'-il&'. ^ ISrr- .&tf ;->>,>, ,> .; ' i - »:%!'M-> I : -'.' M f.f'Lln, I, 7' ' ' J ""l »rf ^- ^ -h ,hf ,J V J»^* i.; { - if: ff : ^ u 'pr^; . it?-|f-\ MV t H '' 'J ' t v ti ! , »-'. , r , ; *. 1,. .. brt..--*v,r>'^,- -^ >^, **>' ^» '*! ' &- ^rf ns*v United States Geological Survey Water-Supply Paper 2250 W5psrt""4r fav j f' *- j - i^ j wmtiteiK; ^-,-.._ -*~£^»*:,
-
Upload
khangminh22 -
Category
Documents
-
view
2 -
download
0
Transcript of National water summary 1983: Hydrologic events and issues

National Water Summary 1983 Hydrologic Events and Issues
'>"
*f*W
( %*w-
<-/-' *>*k*4fr**t
u- * V» * IV*. .; "
< ijg^/««
fi*J:H* c4^
ttf.H^B^-^Li"
>>
*t<J-:f'-il&'. ^
ISrr-.&tf
;->>,>,
,> .; ' i - »:%!'M->I : -'.' M f.f'Lln,I, 7' ' ' J ""l»rf -
^ -h ,hf ,J
V J»^*
i.;{ - if:
ff: ^ u 'pr^; . it?-|f-\ MV tH '' 'J ' t vti ! , »-'. , r , ; *. 1,. ..
brt..--*v,r>'^,- -^ >^,
**>'
^» '*! '
&-^rf
ns*v
United States Geological Survey Water-Supply Paper 2250
W5psrt""4r fav j f' *- j - i^ jwmtiteiK;
^-,-.._-*~£^»*:,

Cover: Watercolor by Jim Caldwell, U.S. Geological Survey
National Water Summary 1983 Hydrologic Events and Issues
By U.S. Geological Survey
United States Geological Survey Water-Supply Paper 2250

UNITED STATES DEPARTMENT OF THE INTERIOR WILLIAM P. CLARK, Secretary
GEOLOGICAL SURVEY
Dallas L. Peck, Director
UNITED STATES GOVERNMENT PRINTING OFFICE: 1984
For sale by the Superintendent of Documents U.S. Government Printing Office Washington, D.C. 20402

Foreword iii
FOREWORDEvents of the past few years have placed the Nation's
water resources in the forefront of the news. Nearly every day there are reports of one water-related issue or another: A hazardous-waste site feared to be polluting a local water supply, declining ground-water levels, floods taking their toll of life and property, acid rain affecting lakes and streams, or drought conditions affecting crops. Warnings of "the coming water crisis" frequently appear in the media. These reports bring into focus the degree to which society depends upon and is influenced by water.
What is not as prominent in the news are the success stories. For example, 380 billion gallons per day of fresh surface and ground water is being delivered to the Na tion's homes, farms, industries, and thermoelectric powerplants. Of this amount, about 280 billion gallons per day is returned to the Nation's rivers and streams, carrying with it large amounts of wastes. Yet, through pollution-control efforts, the water quality of rivers and streams generally is adequate for most uses. In many respects, the water quality is better than it was 20 to 30 years ago, despite the doubling of freshwater withdrawals between 1950 and 1980. There are of course many re maining concerns about water quality for example, those relating to contamination by synthetic organic chemicals and toxic metals. These concerns presently are being addressed through the technical resources of government, industry, and the academic community.
Although many important water issues must be ad dressed in the coming decades, the outlook is optimistic. Effective institutional arrangements, water-management techniques, and engineering practices, all based on hydrologic knowledge, will enable the Nation to continue to meet its water demands and to maintain a healthful environment.
For more thart 100 years, the U.S. Geological Survey has collected, disseminated, and evaluated information on water availability, quantity, and quality to help guide the development, management, and use of the Nation's water resources. Many of the hydrologic investigations by the Geological Survey have been concerned with water conditions at the State and local levels or with specific research topics. However, in the past decade, the Geolog ical Survey has gained an increased national perspective of water-resources conditions through several nationwide investigative programs.
For example, the National Stream-Quality Accounting Network (NASQAN) was begun in 1972 to evaluate the water quality of the Nation's major rivers. Now, with 10 years of data available, water-quality trends can be evaluated statistically. In 1977, moreover, the Geological Survey began the Regional Aquifer-Systems Analysis Program to examine the Nation's major ground-water systems. Also in 1977, the Congress directed the Geolog ical Survey to formalize its water-use-data activities by establishing a National Water-Use Information Program. In 1981, the Hazardous-Waste Hydrology Program was organized to coordinate hydrologic research and investi gations of the disposal of toxic chemical and radioactive wastes. These national investigative programs, coupled with hydrologic investigations conducted by the Geolog ical Survey in cooperation with more than 800 State and local agencies, provide much information upon which to base a summary of national water conditions.
In March 1983, the Secretary of the Interior directed the Geological Survey to prepare a National Water Sum mary. The Secretary also directed the Department of the Interior's Office of Water Policy to analyze in a separate report issues documented in the Geological Survey's National Water Summary from the viewpoint of public policy and to outline water-policy options.
Water-Supply Paper 2250, "National Water Summary 1983 Hydrologic Events and Issues," presents an over view of the hydrologic events and water conditions from January 1982 through August 1983. It describes major water issues that presently are of concern to the States as well as to the Nation and provides a hydrologic perspec tive on these issues. The report does not incorporate cer tain mission-oriented water concerns of other Federal agencies, whose published reports present their perspec tives on water issues.
Comments regarding the content of this report are welcome and may be addressed to the Chief Hydrologist, U.S. Geological Survey, 409 National Center, Reston, VA 22092.
Director
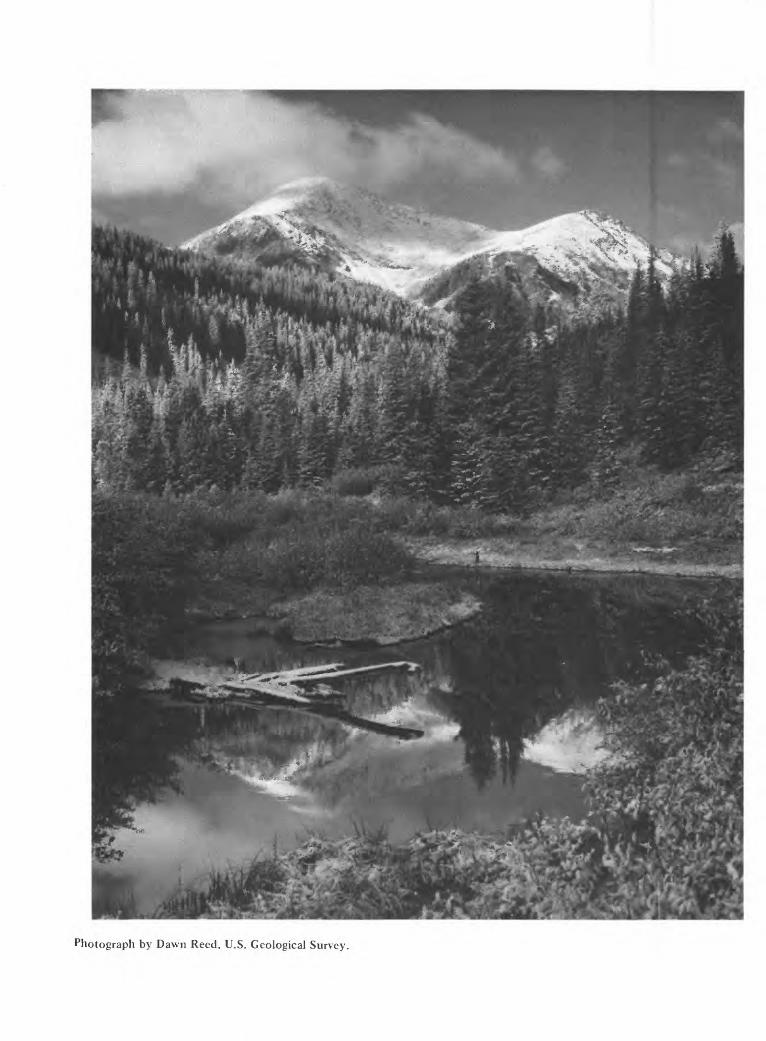
Photograph by Dawn Reed, U.S. Geological Survey.

Contents v
CONTENTS
Foreword Summary Introduction Acknowledgments Man and the hydrologic cycle -----
Selected hydrologic events lor January 1982 through August 1983
Precipitation conditions Streamllow conditions Floods
Winter and spring Hoods in the Mississip pi River basin
Record late-spring inflow in the Colorado River basin
Flooding in the Great Basin and the rise of the Great Salt Lake
Hydrologic perspectives on water issues Water-availability issues
Surface-water development - Ground-water development
Water-quality issues
Point and nonpoint sources of pollution Futrophication
Bottom-sediment contamination Saline-water intrusion Hazardous wastes Radioactive wastes Acidic precipitation
Hydrologic hazards and land-use issues -- Flooding Land subsidence Sinkholes Frosion and sedimentation - -Volcanoes Wetlands Resource development
Institutional and management issues - State water issues
Overview of issues -- Water-availability issues Water-quality issues
Hydrologic hazards and land-use issues Institutional and management issues
State water-issue summaries - Alabama Alaska Arizona Arkansas
Page
iii1
458
10141416
19
19
202323303645515556575860616363656768696970717474747575777980828589
California Colorado Connecticut Delaware Florida Georgia
Hawaii and other Pacific areas Idaho Illinois Indiana Iowa Kansas Kentucky Louisiana Maine
Maryland and District of Columbia Massachusetts Michigan Minnesota Mississippi Missouri Montana Nebraska Nevada New Hampshire New Jersey New Mexico New York - North Carolina North Dakota Ohio - Oklahoma Oregon Pennsylvania
Puerto Rico and the U.S. Virgin Islands - Rhode Island - South Carolina South Dakota Tennessee Texas Utah Vermont Virginia Washington West Virginia Wisconsin Wyoming
Glossary
Factors for converting inch-pound units to Interna tional System of Units (SI)
Page
9296
100104106110113117120123126129132135138141144148151154157160163166169172175178182185188191194197200203206209212215218221224227230233236240
243
vi National Water Summary 1983
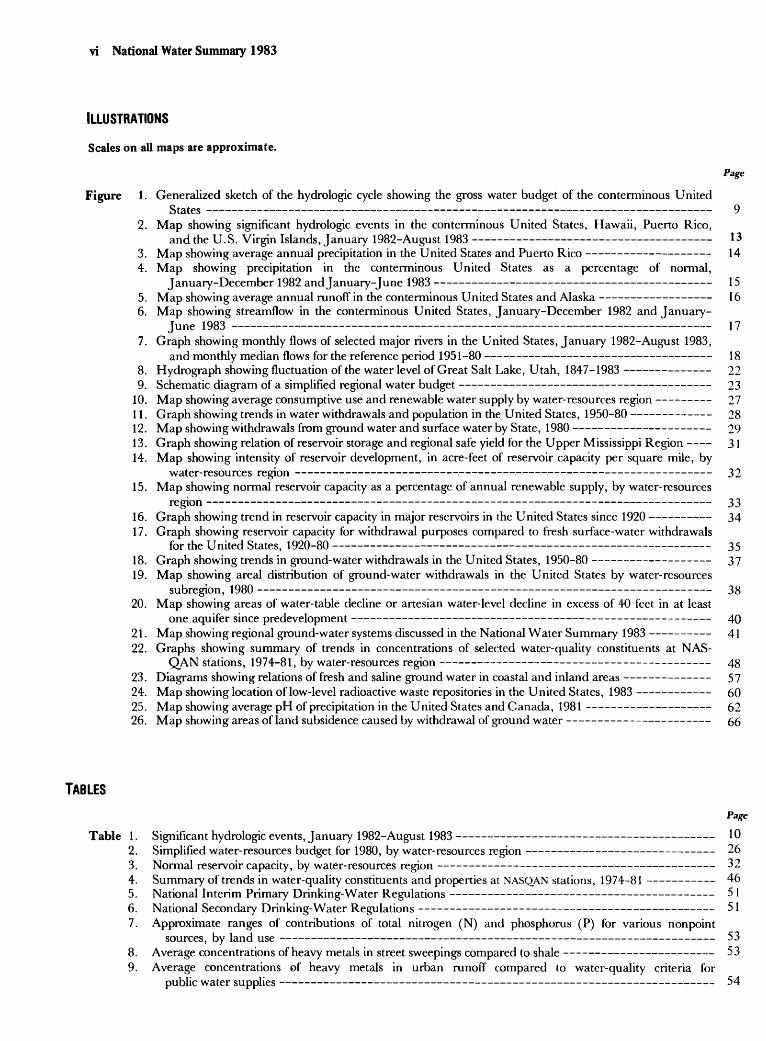
ILLUSTRATIONSScales on all maps are approximate.
Page
Figure 1. Generalized sketch of the hydrologic cycle showing the gross water budget of the conterminous UnitedStates 9
2. Map showing significant hydrologic events in the conterminous United States, Hawaii, Puerto Rico,and the U. S. Virgin Islands, January 1982-August 1983 1 3
3. Map showing average annual precipitation in the United States and Puerto Rico 144. Map showing precipitation in the conterminous United States as a percentage of normal,
January-December 1982 and January-June 1983 155. Map showing average annual runoff in the conterminous United States and Alaska 1 66. Map showing streamflow in the conterminous United States, January-December 1982 and January-
June 1983 177. Graph showing monthly flows of selected major rivers in the United States, January 1982-August 1983,
and monthly median flows for the reference period 1951-80 188. Hydrograph showing fluctuation of the water level of Great Salt Lake, Utah, 1847-1983 229. Schematic diagram of a simplified regional water budget 23
10. Map showing average consumptive use and renewable water supply by water-resources region 2711. Graph showing trends in water withdrawals and population in the United States, 1950-80 2812. Map showing withdrawals from ground water and surface water by State, 1980 2913. Graph showing relation of reservoir storage and regional safe yield for the Upper Mississippi Region 3 114. Map showing intensity of reservoir development, in acre-feet of reservoir capacity per square mile, by
water-resources region 3215. Map showing normal reservoir capacity as a percentage of annual renewable supply, by water-resources
region 3316. Graph showing trend in reservoir capacity in major reservoirs in the United States since 1920 3417. Graph showing reservoir capacity for withdrawal purposes compared to fresh surface-water withdrawals
for the United States, 1920-80 3518. Graph showing trends in ground-water withdrawals in the United States, 1950-80 3719. Map showing areal distribution of ground-water withdrawals in the United States by water-resources
subregion, 1980 3820. Map showing areas of water-table decline or artesian water-level decline in excess of 40 feet in at least
one aquifer since predevelopment 4021. Map showing regional ground-water systems discussed in the National Water Summary 1983 4122. Graphs showing summary of trends in concentrations of selected water-quality constituents at NAS-
QAN stations, 1974-81, by water-resources region 4823. Diagrams showing relations of fresh and saline ground water in coastal and inland areas 5724. Map showing location of low-level radioactive waste repositories in the United States, 1983 6025. Map showing average pH of precipitation in the United States and Canada, 1981 6226. Map showing areas of land subsidence caused by withdrawal of ground water 66
TABLES
Table 1.2.3.4.5.6.7.
Page
Significant hydrologic events, January 1982-August 1983 10 Simplified water-resources budget for 1980, by water-resources region 26 Normal reservoir capacity, by water-resources region 32 Summary of trends in water-quality constituents and properties at NASQAN stations, 1974-81 46 National Interim Primary Drinking-Water Regulations 5 1 National Secondary Drinking-Water Regulations 51 Approximate ranges of contributions of total nitrogen (N) and phosphorus (P) for various nonpoint
sources, by land use 53 Average concentrations of heavy metals in street sweepings compared to shale 53 Average concentrations of heavy metals in urban runoff compared to water-quality criteria for
public water supplies 54

Summary 1
NATIONAL WATER SUMMARY 1983-HYDROLOGIC EVENTS AND ISSUESBY U.S. GEOLOGICAL SURVEY
SUMMARYThe United States as a Nation possesses abundant
water resources and has developed and used those resources extensively. The national renewable supply of water is about 1,400 billion gallons per day (for the con terminous 48 States). Approximately 380 billion gallons per day of freshwater is withdrawn for use by the Nation's homes, farms, and industries, and about 280 billion gallons per day is returned to streams. Although a large percentage of the Nation's waste is carried in this return flow, the quality of water in streams has improved in many respects as a result of the pollution-control pro grams of recent years. However, much remains to be learned about water quality particularly the extent of contamination by synthetic organic chemicals and heavy metals, and the effects of these contaminants on human health.
Hydrologic conditions change abruptly in space and in time, and this variability tends to complicate the develop ment and management of water resources and the re sponse to hydrologic problems. What works well in one area may work poorly elsewhere because of geologic, climatic, or institutional differences. What seems impor tant today (the flood or drought or toxic spill) may seem relatively unimportant tomorrow. The period from Janu ary 1982 through August 1983 provides examples of the extreme areal and temporal variability of water condi tions. Through much of this period, normal and above- normal precipitation patterns that prevailed over most of the United States filled reservoirs, recharged aquifers, and caused severe flooding in at least 14 States. Heavy precipitation and runoff in the Rocky Mountains and Great Basin caused the Great Salt Lake to experience its greatest seasonal rise in history and caused reservoirs of the Colorado River Storage Project to fill completely for the first time. In contrast, drought prevailed in Florida and in the New York City area early in 1982; in the sum mer of 1983, deficient rainfall caused crop losses over a large portion of the Nation.
The 1983 National Water Summary reviews current hydrologic conditions and recent events in the United States and provides a broad overview of the hydrologic issues facing the Nation. The summary also includes a description of water issues for each State, the District of Columbia, Puerto Rico, the U.S. Virgin Islands, and the western Pacific Islands under the jurisdiction of the United States. States were chosen as the basis for describ ing water issues because the country's water resources are managed and controlled, for the most part, by State gov ernments. The State water-issue summaries were pre pared by U.S. Geological Survey personnel in each of the States and are based on discussions with more than 130 State and local organizations, reviews of recently pub lished information, and knowledge of water conditions ac quired in the course of U.S. Geological Survey studies. The State water-issue summaries identify concerns ex pressed by State and local water-management officials. In
some cases, they also illustrate the variety of actions that are being taken to resolve these issues.
Because most water problems are local in nature, the State water-issue summaries cannot describe every water situation of concern; some issues may be missing from the descriptions. Taken together, however, these State sum maries indicate the major similarities and differences in water issues facing different parts of the country.
Major issues described in this report include (1) the short-term vulnerability of surface-water supplies and shallow ground-water supplies to drought; (2) concerns about the reliability of water supplies as competition for water increases; (3) declining ground-water levels; (4) control of surface-water pollution, especially nonpoint sources of pollution; (5) contamination of ground-water supplies and the mitigation of existing sources of pollu tion, such as hazardous-waste sites; (6) the potential effects of acidic precipitation; (7) chronic problems of flooding; (8) the impacts of resource development, such as coal mining and low-head hydropower, on water re sources; and (9) the development of water allocation and reallocation procedures. Hydrologic perspectives on these issues are discussed in the following paragraphs. Items 1-3 are discussed under the heading "Water availability"; items 4-6 under "Water quality"; items 7-8 under "Hydrologic hazards and land use"; and item 9 under "Institutional and management".
Water availability
The United States has an abundance of fresh surface and ground water. The renewable (long-term) supply of water in streams and aquifers is approximately 1,400 billion gallons per day (for the conterminous United States). That is more than three times the present rate of freshwater withdrawal in the Nation, and about 14 times the national consumptive use of water. Thus, considering only the overall supply of water without regard to devel opment, distribution, or quality, there is no crisis facing the Nation; the resource far exceeds the present level of use. However, this in itself does not guarantee that ade quate water supplies of an acceptable quality will be avail able where and when they are needed in the years to come.
The actual availability and quality of water are deter mined, to a large degree, by the way in which the resource is developed and managed in the face of chang ing demands. These matters are governed by human decisions regarding the engineering works required to develop new supplies, the management strategies and operating policies governing the use of existing supplies, the allocation or reallocation of supplies among users or among States, and the policies or actions employed to en sure the quality of water supplies.
In order to understand water-availability issues, it is necessary to make a distinction between the raw resource (the total flow of water through streams and aquifers) and

2 National Water Summary 1983
the developed resource (the part of the total flow that is reliably available for use). The characteristics of the developed resource are a function of the raw resource and of the existing structures and institutions that control its use.
The limits imposed by the availability of the raw re source are important in the Colorado River basin, the Rio Grande basin, the Great Basin, parts of the High Plains, and parts of California. In these areas, the ratio of present consumptive use to the renewable supply of water is high, and water available for additional development is limited. In most other areas of the country, the availabil ity of the raw resource does not now constitute a signifi cant limit. The availability of the developed resource, however, imposes limits almost everywhere. Typically, the rates of withdrawal and use in an area increase gradually over time, but the storage and distribution facilities that provide the developed supply may fail to keep pace with these increases. The result is a decline in the reliability of supply that is, supplies become more vulnerable to drought. This vulnerability can be dimin ished by building surface-water reservoirs, using ground water, improving water-supply forecasting and improv ing overall management of the existing facilities.
In recent years, the rate of reservoir construction has slowed considerably, whereas ground-water use has ac celerated. There is a growing recognition that the best reservoir sites have already been put to use, and that new reservoir development is likely to be less cost-effective than that which has occurred in the past. Nevertheless, the potential for creating a larger developed supply through the construction of new reservoirs appears to be good in most regions of the country, except for the arid Southwest.
In three areas where the raw resource is limiting the lower Colorado River basin, the High Plains, and California sustained withdrawals of ground water from storage have occurred in recent decades. Although these withdrawals have maintained high levels of supply to these areas, they cannot continue indefinitely. As ground- water levels fall, increasing pumping costs and decreasing well yields will force gradual reductions in pumping. This has already begun to happen in the southern High Plains and in some parts of Arizona. In contrast, ground-water development in humid areas such as Florida and the Atlantic Coastal Plain has been characterized by diver sion of water from streamflow or from evapotranspira- tion, rather than by extended withdrawals from storage. In these areas, ground-water development is a substitute for the construction of surface-water storage and con veyance facilities.
All of the State water-issue summaries refer to water- availability issues or to related management issues. Con cern is expressed over the future of certain instream uses (navigation, fish habitat, and waste assimilation) as diver sions continue to grow. Many of the State water-issue summaries point to ground-water development as the primary means of increasing developed supplies or in creasing the reliability of existing supplies.
Water quality
The quality of the Nation's ground- and surface-water supplies generally is adequate, although numerous prob
lems exist. Contamination of ground and surface waters is mentioned frequently in the State water-issue sum maries. The sources of contamination noted most fre quently include sewage-treatment plants, industrial plants, coal mines, spills, urban runoff, agricultural runoff, feedlots, landfills, and naturally saline waters. The hazardous wastes most often mentioned are synthetic- organic compounds and toxic metals.
Data collected from major streams during the period 1974-81 by the U.S. Geological Survey indicate improve ment in some aspects of water quality and deterioration in others. In particular, lead concentrations and bacterial counts show widespread declines, whereas some other metals, nutrients, and inorganic compounds show in creases. Insufficient data were available to permit a similar evaluation of trends in synthetic organic com pounds in major streams; however, the presence of these compounds in streams, and particularly in stream-bottom sediments, has been demonstrated in a number of studies. State water-issue summaries indicate that considerable progress has been made in the control of point-source pollution of surface water, especially industrial point sources. The serious surface-water-quality problems of the past, depressed levels of dissolved oxygen and high bacterial counts, appear to be much less extensive today. However, further improvements in surface-water quality will require increasing attention to the difficult task of controlling nonpoint sources of pollution.
Ground-water quality is influenced by point and non- point sources of contamination. The State water-issue summaries focus predominantly on point-source pollution from landfills, lagoons, and disposal pits. This concern apparently results from several recent, interrelated developments: (1) increased Federal and State efforts to identify and cope with hazardous wastes; (2) discoveries of pollution that have been widely reported by the media; (3) advances in chemical-detection equipment and tech niques; and (4) growing lists of substances judged to be carcinogenic and mutagenic. As the State summaries indicate, neither the full extent nor the full impact of ground-water pollution by hazardous waste has been determined. Efforts to delineate and monitor the known occurrences of ground-water pollution and studies of known disposal sites to determine possible pollution of water resources are increasing and now involve every State. These efforts are hampered, however, by the lack of knowledge about local ground-water flow near waste sites, by lack of funding for comprehensive water analyses, and by a shortage of qualified investigators.
Point-source ground-water pollution tends to be con centrated in urban areas, where adverse effects include contamination of water supplies and the seepage of con taminated ground water into streams, drains, or ditches. By contrast, nonpoint sources may affect broad regions, including urban and rural settings. However, little quan titative data are available on the influence of nonpoint sources of contamination on ground-water quality.
Acidic precipitation is mentioned as an issue of concern in about half of the State water-issue summaries. Long- term observation of streams by the U.S. Geological Survey in remote locations suggests that the effects of acidic precipitation are decreasing in the Northeast, but increasing in other areas of the Nation.
Summary 3
Hydrologic hazards and land use
Flooding remains a major issue nationwide despite more than 40 years of major Federal flood-control effort and the recent application of flood-zoning and flood- insurance programs. Average annual flood damages have been increasing during this century at an annual rate of about 4 percent in real dollars, and there is some indica tion that this rate has increased during the last decade to about 6 or 7 percent per year. There is widespread con cern over the safety of dams. The problem of increased flooding brought about by urbanization has received con siderable attention, and is being addressed by laws and regulations in many parts of the Nation.
Land subsidence and sinkhole development are two hazards that are caused or exacerbated by the develop ment of ground water in certain types of geologic en vironments. Subsidence is well understood scientifically, and some jurisdictions have taken actions to manage the problem.
Erosion and sedimentation present problems related to loss of topsoil, filling of reservoirs and navigation chan nels, and transport of contaminants that attach to the sediments. Methods to control erosion are effective in many situations, but the associated sedimentation prob lems may persist for decades or centuries.
The extraction of minerals can have substantial im pacts on water resources through contamination of sur face and ground water, disruption of aquifers by mining, or competition for water with other users. This competi tion is of particular concern in regard to coal development as a result of water use for powerplant cooling or coal- slurry pipelines. The development or rehabilitation of many small hydroelectric plants may affect streamttow and sedimentation on small streams.
Institutional and management
Water moves through the hydrologic cycle without regard to individual property lines and political bound aries. Thus, the quantity and quality of water available lor use at one location may be affected by water use,
waste disposal, or weather-modification practices at another location. Similarly, the cost of increasing the available water supply in one area may be affected by water-resources development somewhere else. It is this in terdependence of water users that gives rise to many water issues and complicates the "rules of the game" by which water is managed.
Water-management rules, laws, and conventions in the United States have evolved in response to water- management problems. There has been a continual evolution of institutions designed to allocate water among competing users, resolve disputes, and promote public health, safety, and the general welfare. Because these in stitutions have evolved in different historical settings and because they reflect the customs, ethics, and physical environment of the people involved, they form a complex mosaic that is always undergoing change.
These changes occur as the resource becomes increas ingly scarce. State water-right systems, for example, originally were designed primarily to protect a static pat tern of water use, once that pattern had been achieved. Increasingly, these same institutions are faced with the problem of facilitating transfers of water rights from ex isting uses to new uses, while simultaneously protecting other water-right holders. The problem of reallocating scarce waters differs from the problem of providing and supporting new allocations from a relatively abundant supply. It appears that water-right markets are evolving as a mechanism for reallocation in those areas of the West where the demand for water is great relative to the avail able supply. In the East, where competition for water is growing, there is some movement in the direction of requiring permits for surface- and ground-water withdrawals.
Water-management institutions and systems change as the knowledge of water resources changes. As it becomes possible to predict the effects of one water user's actions on another, laws and regulations will change in order to manage these effects. Similarly, recognition of the bene fits of adopting new, more integrated water-management approaches will lead to the changes in laws, treaties, com pacts, or agreements necessary to achieve these benefits.

4 National Water Summary 1983
INTRODUCTIONThe public has come to expect abundant, clean, safe,
and inexpensive water at the turn of the tap. Most people recognize that water, although abundant, is unevenly distributed across, the United States. The Western United States, with the exception of the coastal and mountainous areas, is arid or semiarid, whereas the Eastern United States is humid. Daily we read or hear of a variety of water conditions and issues that cause widespread con cern in every part of the country. Droughts diminish water supplies in the humid East, whereas floods inundate parts of the arid West. Ground-water supplies in some places are contaminated. Declining ground-water levels are said to be affecting broad regions of the country. As a result of these and other water-related events, various writers warn of "the coming water crisis."
The hydrologic events and concerns mentioned above have raised numerous questions about the status of the Nation's water resources. What is the quality of the water? What changes are taking place? What has caused various conditions to develop? What can be done about those matters? Is there a water crisis? To answer such questions, it is necessary to analyze and evaluate existing hydrologic information. Some questions can be answered quickly because there is sufficient hydrologic information. Other questions related to more recent concerns, such as "What is the regional or national extent of ground-water contamination by synthetic organic substances?," cannot be answered immediately because sufficient information has not been accumulated. Years may be needed to con duct the necessary research and obtain the needed hydro- logic information.
Periodic analysis of national water conditions and iden tification of water issues can help to identify deficiencies in water-related information and can serve as the first step in developing water-policy options. Consequently, the purpose of this report and subsequent National Water Summary reports is to describe and analyze the condition of the Nation's water. The Geological Survey's National Water Summary reports will not propose or recommend water policies. However, these reports will summarize the results of recent analyses of water-related information for use by those groups that do formulate policies.
This report is organized in four parts, each of which is independent but related to the other parts. The four parts are:Man and the hydrologic cycle, which provides an over
view of hydrologic processes and man's interaction with those processes, particularly in such areas as water supply, agriculture, and urbanization.
Selected hydrologic events for January 1982 through August 1983, which provides a synopsis of the hydrologic events that occurred during that period. This part covers rapidly changing water-resources conditions, as distinct from long-term or gradually evolving conditions and issues. It provides background for many of the water-availability and hydrologic hazard issues discussed in subsequent parts.
Hydrologic perspectives on water issues, which pro vides background information and a hydrologic perspective for most of the issues described in the in
dividual State summaries of water issues. Extensive references to current studies and additional informa tion sources also are included.
State water issues, which summarizes the water issues of concern for each State, the District of Columbia, Puer to Rico, the U.S. Virgin Islands, and western Pacific Islands under United States jurisdiction. These issues are grouped in four categories: water availability, water quality, hydrologic hazards and land use, and institutional and management. Each State summary includes a map that shows the location of areas affected by or involved in specific issues, a summary table of water-use data, and a list of selected references.
The State water issues described in this report are the result of consultations between U.S. Geological Survey personnel in each State and more than 130 State and local organizations concerned with water, from May through July 1983. Many of these organizations cooperate with the U.S. Geological Survey in water-resources investiga tions. The U.S. Department of the Interior's Office of Water Policy also cooperated in this activity by arranging for representatives of the Governors to review the issues relating to their States.
Various aspects of the Nation's water resources have been assessed in a number of important studies. The U.S. Water Resources Council's (1978) Second National Assessment reviewed in considerable detail water condi tions and issues for the base year of 1975. An earlier study by the .National Water Commission (1973) provided one of the most comprehensive reviews of water-resources policies to date. The Commission's report made more than 200 specific recommendations to improve future water policies.
Other Federal studies of interest include the annual report of the U.S. Council on Environmental Quality (1982); the National Waterways Study, in preparation by the U.S. Army Corps of Engineers; and the 1982 Na tional Water Quality Inventory, in preparation by the U.S. Environmental Protection Agency. The Soil Con servation Service (U.S. Department of Agriculture, 1982) and the U.S. Forest Service (1981) have produced assess ments of soil, water, and forest and range lands as related to their agricultural and forestry policies and programs.
National associations and private groups also have been active in examining water issues. The National Conference of State Legislatures (Morandi and Lazarus, 1982) reviewed water-resources-management issues and options as part of a broader study that considers the inter active, long-range nature of water, land, and renewable- resource issues. The Council of State Governments (1981, 1982) reported on water-resources-management and water-quality-planning issues in the context of State programs. The Conservation Foundation (1982) assessed the state of the environment and also reviewed a number of the water-issue and water-policy studies referred to above (Metzger, 1983). Many other groups, such as the Interstate Conference on Water Problems (1983), Na tional Society of Professional Engineers (1981), and the American Institute of Professional Geologists (1983), have prepared position papers on water issues and policies.

Acknowledgements 5
Selected References
American Institute of Professional Geologists, 1983, Ground water issues and answers: Arvada, Colo., 25 p.
Conservation Foundation, 1982, State of the environment 1982: Washington, D.C., The Conservation Foundation, 439 p.
Council of State Governments, 1981, Water resource manage ment, new responsibilities for state governments: Lexington, Ky., The Council of State Governments, 32 p.
____1982, State water quality planning issues: Lexington, Ky., The Council of State Governments, 53 p.
Interstate Conference on Water Problems, 1983, Statement of policy 1982-1983: Washington, D.C., Interstate Conference on Water Problems, 32 p.
Metzger, P. C., 1983, National significant studies of water policy: Washington, D.C, The Conservation Foundation, 92 p.
Morandi, L. B., and Lazarus, G. H., 1982, Water resources management, issues and policy options: Denver, Colo., Na tional Conference of State Legislatures, 219 p.
National Society of Professional Engineers, 1981, Water policy statement Executive summary of the report of the National Society of Professional Engineers Water Policy Task Force: Washington, D.C., 6 p.
National Water Commission, 1973, Water policies for the future: Washington, D.C., U.S. Government Printing Of fice, 579 p.
U.S. Council on Environmental Quality, 1982, Environmental quality, 1982, 13th annual report of the Council on Environ mental Quality: Washington, D.C., U.S. Government Print ing Office, 330 p.
U.S. Department of Agriculture, 1982, Soil, water, and related resources in the United States status, conditions, and trends, 1980 Appraisal: Washington, D.C., (2 vols.)
U.S. Forest Service, 1981, An assessment of the forest and rangeland situation in the United States: U.S. Forest Service, Forest Resource Report no. 22, 352 p.
U.S. Water Resources Council, 1978, The Nation's water resources 1975-2000: Washington, D.C., U.S. Govern ment Printing Office (4 vols.)
ACKNOWLEDGMENTSThe National Water Summary 1983 was conceived and
prepared within a period of 6 months under the administrative supervision of Dallas L. Peck, Director, and Philip Cohen, Chief Hydrologist, of the U.S. Geological Survey. The U.S. Geological Survey's District and Regional offices compiled and reviewed the summaries of State water issues in consultation with State officials.
U.S. Geological Survey contributors to this report include the following:
B. L. Foxworthy G. D. Glysson P. E. Greeson H. F. Grubb E. R. Hampton C. A. Haupt R. C. Heath
R. B. AlexanderW. M. AlleyD. F. AltD. A. AronsonR. C. AverettG. D. BennettG. L. BertoldiW. L. BradfordJ. D. BredehoeftT. H. ChancyE. B. ChaseAlberto Condes de la TorreJ. S. Cragwall, Jr.E. S. DavidsonG. W. Edelen, Jr.H. R. FeltzJ. N. Fischer
R. M. Hirsch I. C. James II R. H. Johnston D. G. Jorgensen J. C. Kammerer F. A. Kilpatrick J. W. LaBaugh L. B. Laird R. L. Laney S. M. Lang
G. F. Lindholm H. C. Riggs H. F. Lins J. S. Rosenshein R. R. Luckey C. W. Saboe S. N. Luoma J. E. Schefter G. E. Mallard Robert Schoen W. B. Mann IV R. A. Smith H. C. McWreath III W. B. Solley R. H. Meade A. M. Spieker Harold Meisler J. T. Turk Gerald Meyer John Vecchioli D. W. Moody R. L. Wait J. E. Moore J. B. Weeks J. G. Newton Martin Weiss R. P. Novitze P. W. Woll A. L. Putnam H. L. Young T. E. ReillyAlthough individual credit is not feasible for all the reviewers, graphic specialists, and typists who made this report possible, their helpful cooperation is gratefully acknowledged. Donald E. Hillier, Office of the Regional Hydrologist, Denver, Colo., is specifically acknowledged for his outstanding effort in coor dinating and reviewing the State summaries. The preparation of this report was coordinated by David W. Moody and Edith B. Chase.
From May through July 1983, U.S. Geological Survey District personnel contacted the following organizations for ad vice in assembling the issue descriptions. The cooperation of those agencies is gratefully acknowledged.
Alabama
Alabama Department of EnvironmentalManagement
Alabama Geological Survey
Alaska
Department of Natural ResourcesDivision of Geological and Geophysical
Surveys
Arizona
Arizona Department of Health Services Arizona Department of Water Resources Municipal Water Users Association Salt River Valley Water Users Association University of Arizona, Water Resources
Research Center
Arkansas
Arkansas Geological Commission Arkansas Department of Pollution Control
and Ecology Arkansas Soil and Water Conservation
Commission
California
Agricultural Water Quality Management Group,AQM The Tulare Lake Basin
California Department of Water Resources Division of Planning Flood Operations BranchGeology and Ground Water, Northern District
California Regional Water Quality ControlBoard, Central Valley Region
California State Office of Emergency Services

6 National Water Summary 1983
Colorado
Department of Natural Resources Colorado Water Conservation Board Office of the State Engineer
Connecticut
Connecticut Department of EnvironmentalProtection
Connecticut Department of Health Services
Delaware
Delaware Department of Natural Resourcesand Environmental Control
Water Supply Section Delaware Geological Survey
Florida
Florida Department of EnvironmentalRegulation
Northwest Florida Water ManagementDistrict
South Florida Water ManagementDistrict
Southwest Florida Water ManagementDistrict
St. Johns River Water ManagementDistrict
Suwannee River Water ManagementDistrict
Georgia
Department of Natural Resources Environmental Protection Division
Georgia Geologic Survey Water Protection Branch Water Resources Management Branch
Hawaii and other Pacific Areas
Hawaii Department of Land and NaturalResources
Commonwealth of the Northern Marianas Government of American Samoa Government of Guam Federated States of Micronesia Republic of Palau
Idaho
Idaho Department of Water Resources
Illinois
Illinois Department of Conservation Illinois Department of Transportation Illinois Environmental Protection Agency
Indiana
Indiana Department of Natural ResourcesDivision of ReclamationDivision of Water
Indiana State Board of Health
Kansas Department of Health and Environment Kansas Water Office
Kentucky
Iowa
Iowa Geological Survey University Hygienic Laboratory,
University of Iowa
Kentucky Geological Survey Kentucky Natural Resources and Environmental
Protection
Louisiana
Kansas
State Board of Agriculture, Division of Water Resources
Louisiana Department of Transportation andDevelopment
Office of Public Works
Maine
Maine Department of Environmental Protection Maine Department of Conservation
Geological Survey
Maryland and the District of Columbia
Maryland Geological Survey
Massachusetts
Massachusetts Executive Office of Environmental Affairs Department of Environmental Quality Engineering
Division of Water Pollution ControlDivision of Water Supply
Department of Environmental ManagementDivision of Water Resources
Michigan
Michigan Department of Natural Resources
Minnesota
Minnesota Department of Natural Resources Minnesota Pollution Control Agency
Mississippi
Mississippi Department of Natural Resources Bureau of Land and Water Resources Bureau of Pollution Control Bureau of Geology
Missouri
Missouri Department of Natural Resources
Montana
Montana Bureau of Mines and Geology Montana Department of Natural Resources
and Conservation
Nebraska
Nebraska Department of Water Resources Nebraska Natural Resources Commission University of Nebraska, Conservation
and Survey Division
Nevada
Nevada Department of Conservation and Natural ResourcesDivision of Environmental ProtectionDivision of Water Resources
Nevada Bureau of Mines and Geology, University of Nevada
New Hampshire
New Hampshire Water Resources Board

Acknowledgements 7
New Jersey
New Jersey Department of EnvironmentalProtection
Division of Water ResourcesBureau of Water Supply Planning Bureau of Groundwater Management
Resources Evaluation Section
New Mexico
Office of State Engineer
New York
Long Island Regional Planning Board Monroc County Water Authority Nassau County Department of Public Works New York City Department of Environmental
ProtectionAir and Water Resources/Energy
New York State Department of EnvironmentalConservation, Division of Water
New York State Department of Health,Division of Environmental Health
Suffolk County Department of Health Services Suffolk County Water Authority
North Carolina
North Carolina Department of HumanResources
Division of Health ServicesWater Supply BranchSolid and Hazard Waste Branch
North Carolina Department of NaturalResources and Community Development
Division of Environmental ManagementWater Quality SectionG round water Section
Division of Land Resources Division of Marine Eisheries Office of Water Policy
North Dakota
North Dakota State Health DepartmentEnvironmental Health SectionWater Supply and Pollution Control Division
North Dakota State Water Commission Hydrology Division
Puerto Rico and the U.S. Virgin Islands
Puerto Rico Department of NaturalResources
Puerto Rico Environmental QualityBoard
Virgin Islands Department of Public Works
Rhode Island
Rhode Island Statewide Planning Program Rhode Island Water Resources Board
South Carolina
State Department of Health and EnvironmentalControl
State Water Resources Commission
South Dakota
South Dakota Department of Water and Natural Resources
Tennessee
Memphis Light, Gas and Water DivisionWater Operations and Shops
Tennessee Department of Public HealthDivision of Water Management
Engineering Section Tennessee Department of Transportation
Texas
Texas Department of Water and Natural Resources
Utah
Ohio
Ohio Department of Natural Resources, Division of Water
Oklahoma
Oklahoma Geological Survey Oklahoma Water Resources Board
Oregon
Oregon Department of Environmental Quality Oregon Water Resources Department
Pennsylvania
Pennsylvania Department of Environmental Resources Bureau of Dams and Waterway Management Bureau of Solid Wastes and Management Bureau of Water Quality Management Office of Resource Management
Department of Natural Resources Division of Water Rights Division of Water Resources
Vermont
Agency of Environmental Conservation Vermont Department of Water Resources
and Environmental Engineering
Virginia
Virginia Water Control Board
Washington
Washington Department of Ecology Washington Department of Fisheries Puyallup Indian Nation
West Virginia
West Virginia Department of NaturalResources
Division of Water Resources West Virginia Geological and Economic
Survey
Wisconsin
Wisconsin Department of Natural ResourcesBureau of Research
Wisconsin Geological and Natural History Survey
Wyoming
Wyoming State Engineer

8 National Water Summary 1983
MAN AND THE HYDROLOGIC CYCLE
Understanding the interactions between man's activ ities and the processes involved in the hydrologic cycle is one of the goals of hydrologic research. This understand ing provides the foundation upon which to design water policies and water-management practices. As will be shown in this part, man's activities are an integral and an inseparable part of the hydrologic cycle (Matalas and others, 1982).
Water constantly circulates from the sea, to and through the atmosphere, to the land, and eventually returns to the sea by streamflow and to the atmosphere (by way of transpiration and evaporation) from the sea and land surfaces. This circulation pattern is termed the "hydrologic cycle" and is often described as a gigantic distillation machine. This movement of water and moisture is driven by energy from the sun and involves a number of interrelated processes, such as precipitation, evaporation, transpiration by plants, soil infiltration, sur face runoff, and ground-water flow; it also involves a variety of geochemical and biological processes.
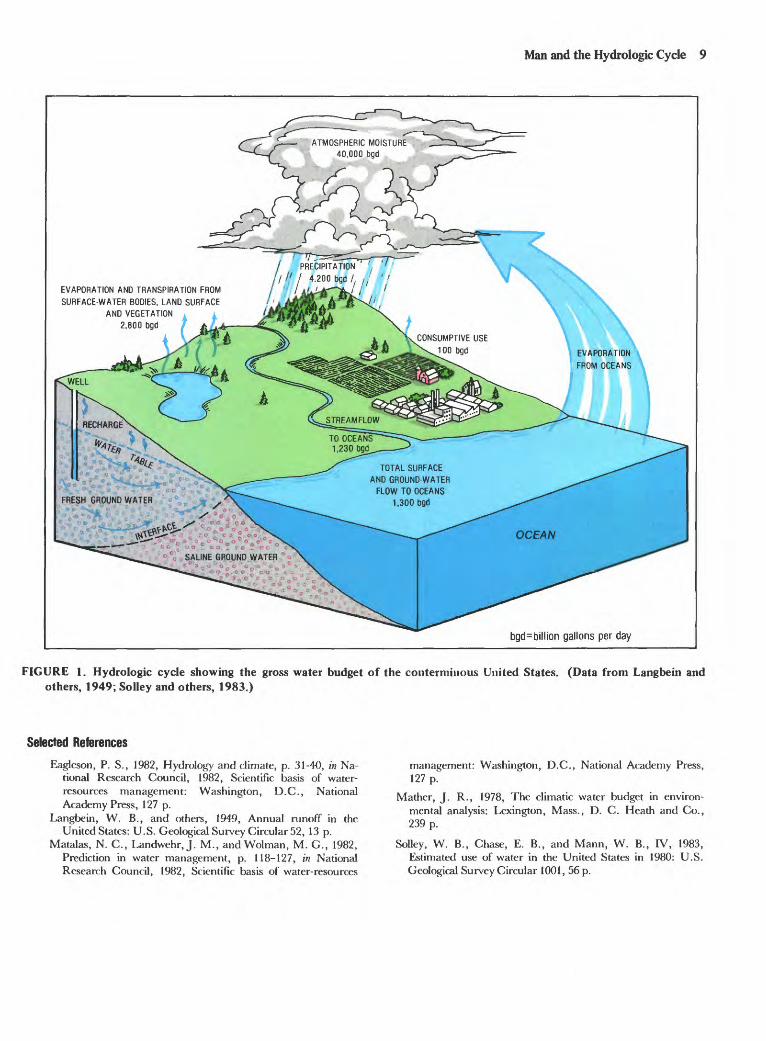
The magnitude of the quantity of water transported by the hydrologic cycle is illustrated by the gross water budget of the conterminous United States, as shown in figure 1. Of the approximately 40,000 billion gallons per day (bgd) of water vapor that pass over the conterminous United States, about 4,200 bgd falls as precipitation. About two-thirds of this precipitation (2,800 bgd) is returned to the atmosphere through evapotranspiration loss of water from a land area through transpiration of plants and evaporation from the soil and water surfaces. The remaining 1,400 bgd, depending upon the properties of the land surface, soils, and vegetation, discharges directly to streams, lakes, or to the ocean, or seeps into the ground, where it goes into storage and subsequently discharges to surface-water bodies. During its journey to the ocean, some of this water is withdrawn from aquifers and streams for various uses by man, returned to its source (usually to streams), and withdrawn again several times. These uses and reuses of water involve the total withdrawal of approximately 380 bgd of freshwater, of which about 100 bgd is consumptively used (Solley and others, 1983). The total amount of water that returns to the ocean is about 1,300 bgd.
The renewable water supply of the conterminous United States is about 1,400 bgd. Consumptive use of water is only a small part (about 7 percent) of the renewable supply. In addition, there is a very large volume of ground water in storage. Thus, in the ag gregate, there is no overall shortage of water. There are, however, many problems of local and regional supply because the desired amount of water is not always available at the right place, at the right time, and of the right quality for the intended use.
Many of man's activities affect the distribution of water on the Earth and in the atmosphere by directly con suming or evaporating water, by altering the land and vegetation, or by affecting the climate. These activities also alter the quality of water. An example of the effects of one of man's activities is the pumping of water from a well drilled in an alluvial aquifer near a stream. The with drawal of ground water adjacent to the stream may reduce the seepage of ground water into the stream or cause water from the stream to move toward the well, thereby reducing the streamflow available for use down stream. If the water is used to irrigate crops, it may dissolve salts from the soil. During irrigation, about 50 to 80 percent of the water will return to the atmosphere through evapotranspiration; the remaining amount car ries the dissolved salts and returns to the water table or to a stream where it increases the dissolved-solids content.
Alteration of the land surface by different land uses may significantly affect the hydrologic response of a drainage basin to precipitation. In an urban setting, for example, buildings, streets, parking lots, and other im pervious surfaces prevent precipitation from infiltrating into the ground where it could be available for pumping or for base flow to streams. Conversely, impervious sur faces and storm sewers can increase the volume and rate of runoff as a result of decreased infiltration and de creased roughness of the drainage basin. The result may be increased discharge of small streams, which can cause channel erosion and flooding.
The chemical and physical quality of the runoff also is altered by different land uses. Construction without ade quate erosion control allows soils to erode rapidly, which adds a large quantity of sediment to local streams. Urban runoff may flush heavy metals, oil, grease, and other natural and synthetic organic matter from streets and parking lots into the stream system. Agricultural runoff may contain sediment, fertilizers, and pesticides. In short, the land-use practices of an area influence the quality of both surface and ground water.
Some of the more subtle effects of land modification in clude changes in surface roughness, surface reflectance, vegetation, moisture-holding capacity of the soil, and thermal characteristics of the surface, all of which alter the transfer of moisture and heat between land and air. Draining a wetland or deforesting an area, for example, decreases local evaporation and transpiration and in creases runoff (Mather, 1978). Concentrations of dust particles and aerosols and thermal convection over urban areas increase precipitation and increase the frequency of fog, cloudiness, and thunderstorms (Eagleson, 1982).
Changes in the quality and quantity of water trans ported in the hydrologic cycle and the associated climatic changes may range widely over space and time. Some changes affect only a few square miles; others may affect the global climate. Some changes may be observed in very short periods of time; others may take years or centuries.
Man and the Hydrologic Cycle 9
EVAPORATION AND TRANSPIRATION FROM SURFACE-WATER BODIES, LAND SURFACE
AND VEGETATION ,2,800 bgd / £ ,^
ATMOSPHERIC MOISTURE 40,000 bgd
bgd=billion gallons per day
FIGURE 1. Hydrologic cycle showing the gross water budget of the conterminous United States. (Data from Langbein and others, 1949; Solley and others, 1983.)
Selected ReferencesEagleson, P. S., 1982, Hydrology and climate, p. 31-40, in Na
tional Research Council, 1982, Scientific basis of water- resources management: Washington, D.C., National Academy Press, 127 p.
Langbein, W. B., and others, 1949, Annual runoff in the United States: U.S. Geological Survey Circular 52, 13 p.
Matalas, N. C., Landwehr,J. M., and Wolman, M. G., 1982, Prediction in water management, p. 118-127, in National Research Council, 1982, Scientific basis of water-resources
management: Washington, D.C., National Academy Press, 127 p.
Mather, J. R., 1978, The climatic water budget in environ mental analysis: Lexington, Mass., D. C. Heath and Co., 239 p.
Solley, W. B., Chase, E. B., and Mann, W. B., IV, 1983, Estimated use of water in the United States in 1980: U.S. Geological Survey Circular 1001, 56 p.

10 National Water Summary 1983
SELECTED HYDROLOGIC EVENTS FOR JANUARY 1982 THROUGH AUGUST 1983A series of significant and diverse hydrologic events
that occurred during 1982 and the first 8 months of 1983 kept water resources in the news almost constantly. These events highlight the degree to which our economy, health, and welfare are dependent upon water. Often, these hydrologic events are soon forgotten, but it is important to learn from them and to understand the factors that con tribute to their occurrence. Some of the more significant hydrologic events that occurred from January 1982 through August 1983 are listed in table 1. The geographic locations of the events are shown in figure 2.
Many of the extreme hydrologic events of 1982 and early 1983 are manifestations of a single, unified, global- scale atmospheric phenomenon known as an El Nino- Southern Oscillation (ENSO) event (Philander, 1983). An ENSO event is characterized by a shift in the atmospheric and oceanic flows of the equatoral Pacific from an easterly to a westerly direction and a resulting increase in water temperature in the Pacific Ocean. These oceanic and at mospheric changes lead to variations in the distribution
and intensity of pressure fields and shifts in storm tracks worldwide (Namias, 1976; Barnett, 1981; Horel and Wallace, 1981). The time interval between successive ENSO events varies from 2 to 10 years.
The ENSO event of 1982-83 was atypical in that it developed earlier (late summer of 1982 rather than the usual late autumn), intensified more rapidly, persisted longer (into the spring of 1983), and was more intense than normal. Storm tracks that ordinarily would pass over Western Canada were displaced to the Western United States. This storm activity resulted in extensive damage all along the West Coast. These storms produced record snow accumulations in the Sierra Nevada and Rocky Mountains, giving rise to severe floods in the spring of 1983 throughout much of the West. Increased storm activity along the Gulf Coast, which also tends to occur during ENSO activity, produced excessive rain and severe flooding and erosion in Louisiana, Mississippi, and Florida (Rasmusson and Hall, 1983).
TABLE 1.-Significant hydrologic events, January 1982-August 1983
Location (See fig. 2) Date Event
1982January
do
February
do
March
do
do
April
June
Rains of January 3-5 in the San Francisco Bay area, California, triggered disastrous mudslides. A rainfall of 13.5 inches was reported at Kentheld in Marin County. Hundreds of homes were destroyed or damaged. Peak flows on streams were the highest since 1955, although their recurrence intervals were only in the 20- to 30-year range.
Torrential rains on January 3-4 in Alabama contributed to the development of sinkholes near Sylacauga and Calera. The recurrence intervals of the floods caused by the rains equaled or exceeded 50 years.
Moderately severe flooding occurred in the State of Washington on February 20-21. Peak discharge on the Klickitat River had a recurrence interval be tween 25 and 50 years.
Heavy rainfall west and north of Atlanta, Ga., produced floods on several small streams. These floods had recurrence intervals of 50 to 60 years.
A prolonged drought in south Florida ended as a result of near normal rainfall in February and the first 2 weeks of March. Mandatory water-use restrictions were eased.
An eruption of Mount St. Helens on March 19 caused a snowmelt and debris flood on the Toutle River system in Washington.
Extensive flooding, caused by runoff from a warm rain falling on a dense snowpack, occurred throughout northern Indiana, southern Michigan, and northwestern Ohio during the last half of the month. Recurrence intervals of maximum flows on many streams equaled or exceeded those of a 100-year flood. Extensive flood damage was experienced in much of northern Indiana. Among the river systems affected were the St. Joseph, Raisin, St. Marys, Maumee, Illinois, and Kankakee.
Intense thunderstorms on April 1 in the San Jose area, California, caused near- record flooding in the Coyote Creek basin.
Runoff from rains of from 3 to 14 inches during June 4-7 caused widespread damage and severe flooding in Connecticut, Massachusetts, and Rhode IslancT Recurrence intervals of these floods were greater than 100 years, and many dam failures resulted. Ground-water levels in some Connecticut wells were highest in many years.

Selected Hydrologic Events 11
TABU 1. Significant hydrologic events, January 1982-August 1983 Continued
Location (See fig. 2)
Date Event
10
11
12
13
14
15
do
July
do
do
do
do
16
17
18
19
20
21
22
23
24
do
August
September
do
October
do
December
do
do
Heavy rainfall at mid-month caused flooding on several tributaries of the Iowa River downstream from Marshalltown, Iowa, resulting in peak discharges with recurrence intervals of 100 years.
Heavy rainfall in northeastern Illinois on July 22 caused severe flooding in several suburbs north of Chicago.
Runoff from intense rains of up to 9 inches in a 12-hour period on July 28 caused flooding in Pennsylvania in northern Chester County, southern Montgomery and Bucks Counties, and in northeast Philadelphia. Highest discharges of record occurred on Tacony, Poquessing, Biberr, and Pen ny back Creeks.
A fishkill due to high biochemical-oxygen demand levels in Pat's Creek near Belmont, Wis., occurred during runoff following a storm on July 6.
Lawn Lake Dam on the Roaring River in Rocky Mountain National Park, Colo., failed on July 15, and caused severe flooding along Roaring River, Fall River, and Big Thompson River and severe damage to the town of Estes Park, Colo.
Extensive flooding occured on tributaries to the Des Moines River downstream from Des Moines, Iowa, during July 3-16 from rains totaling almost 2 feet. Cedar Creek near Bussey (drainage area, 374 square miles) had estimated peak flows of 100,000 and 80,000 cubic feet per second on July 3 and 16, respectively. The storm of the 16th also caused flooding in central and east- central Iowa.
Several thousand rainbow trout were killed when 5,000 gallons of No. 2 diesel fuel leaked into Spring River at Mammoth Spring, Ark., following a train derailment on July 9.
Small streams in northwest Georgia experienced floods that exceeded a 50-year recurrence interval.
Intense thunderstorms that produced 13 to 15 inches of rain struck north-central Tennessee on September 2 and west Tennessee on September 13. Runoff from these storms caused peak flows that exceeded previous maximums at Wolf River near Byrdstown, Cain Creek near Fruitland, and Beaver Creek at Huntingdon.
Record high rainfall along the Wasatch Front in northern Utah, on September 25-26, caused serious flooding along Big and Little Cottonwood Creeks. Estimated recurrence intervals of the storm and floods was 100 years.
A sinkhole which developed in Lake Jackson near Tallahassee, Fla., during Oc tober 23-25, drained about two-thirds of the 4,000-acre lake.
Ground water was contaminated when about 7,500 gallons of carbon tetrachloride were spilled in the town of Barcelonata, in northern Puerto Rico.
Floods that began in December and continued into early January 1983 affected an area about 250 miles wide and 1,000 miles long extending from the Great Lakes to the Gulf of Mexico.
Forty counties in Arkansas and 15 counties in Missouri were declared disaster areas because of flood and tornado damage. Damages in the two-State area exceeded $500 million. Record high stages occurred in many streams in Arkansas, Missouri, Louisiana, Mississippi, and Illinois, and peak discharges exceeded the 100-year flood at several locations in each State.
New York City's Delaware River reservoirs dropped to 33 percent of capacity. As a result, the Delaware River Basin Commission restricted New York City's allocation of water from the Delaware to 560 million gallons per day about 70 percent of the city's normal allocation. Restrictions were not removed until May 1983 when the reservoir system was replenished to 100 percent of normal maximum capacity.

12 National Water Summary 1983
TABLE 1. Significant hydrologic events, January 1982-August 1983 Continued
Location (See fig. 2) Date Event
1983
25
26
27
28
29
30
31
January
February-March
do
do
April
do
do
32
33
34
35
36
do
May
do
do
June
37
38
39
40
41
do
do
do
do
July
Severe flooding occurred in north-central Louisiana as a result of heavy rains in late December.
Drought conditions continued in Hawaii and in the western Pacific.
California was plagued with severe storms from the Pacific, which caused record flows on some streams and local floods, mostly in urban areas. Wave damage was extensive in shoreline areas, especially in southern California. Levee failures along the Sacramento and San Joaquin Rivers caused extensive flooding in rural areas.
Warm air temperatures during early March, combined with rain on a record snowpack, caused major flooding along the Humboldt River in northern Nevada and most small streams in eastern Nevada.
Drought conditions continued in Hawaii and in many parts of the western Pacific. On Oahu, the first 3 months of 1983 were the driest in 105 years, with less than 1 inch of rain recorded at the airport.
Heavy rains in the Delaware and Susquehanna River basins on April 16-17 caused flooding on many streams in eastern Pennsylvania.
Record-breaking floods in southeastern Louisiana and adjacent parts of Mississippi occurred from the Amite River basin to the Pearl River basin. In Louisiana, the Pearl River at Pearl River reached the highest flood level since 1874. More than 1,500 homes were flooded in St. Tammany Parish (Pearl River basin) and more than 3,000 homes were flooded in East Baton Rouge and Livingston Parishes (lower Amite River basin). Recurrence intervals of flood peaks exceeded 100 years at many locations.
Severe flooding in St. Thomas and St. John in the U.S. Virgin Islands on April 19 occurred as a result of as much as 18 inches of rain in 24 hours. Extensive areas in Charlotte Amalie were flooded and the airport was closed for 2 days by water as much as 2 feet deep. Throughout the islands, floods exceeded previously known maximums.
Record high streamflows and many mudslides caused extensive damage in northern Utah.
A large mudslide occurred in the Ophir Creek basin in Washoe County in western Nevada.
The Pearl River at Jackson, Miss., reached its third highest level in history on May 25.
Warm air temperatures triggered a rapid snowmelt in the Rocky Mountains and caused extensive flooding in the Colorado River basin. The snowpack was reported to be the greatest in history at many locations. The peak discharge of 65,700 cubic feet per second on June 26 on the Colorado River near the Colorado-Utah State line was highest of record and had a recurrence interval of about 100 years.
Extensive flooding occured in Arizona, California, and Nevada downstream from Glen Canyon, Hoover, Parker, Davis, and Imperial Dams on the Colo rado River because of reservoir releases that were the largest since the reser voirs were constructed.
Floods on the Platte River in Nebraska downstream from North Platte were the highest in over 40 years.
Floods on Plum Creek, Lincoln Creek, and the Big Nebraska caused by heavy rains inundated 86,00<
Blue River in southeastern 1 acres of farmland.
In a few key observation wells in New England, ground-water levels were highest for end of June during the entire 25- to 35-year period of record.
Water stored in reservoirs in the Colorado River basin reached the highest level since dams were constructed. Flow over the spillways of Hoover Dam, Nev., began on July 3 for the first time in its history, except for a test of the structure in 1941.

Selected Hydrologic Events 13
TABLE 1. Significant hydrologic events, January 1982-August 1983 Continued
Location (See fig. 2) Date Event
42
43
44
45
Not shown
do
do
do
August
do -
Great Salt Lake, rose to its highest level since 1924 and was 4,205.00 feet above sea level on July 1, 1983. The seasonal rise of 5.2 feet since September 15, 1982, was the largest continuous rise ever recorded, surpassing the previous high of 3.4 feet in 1906-07.
The three major rivers in western Nevada the Truckee, Carson, and Walker had the largest flows ever recorded.
Floods on several streams in Utah exceeded all previously known maximum floods. A peak flow of 5,500 cubic feet per second on the Sevier River near Lynndyl, Utah, was more than twice that of the 100-year flood.
Severe drought plagued a 27-county area in West Texas.
Stream flows were lowest of record in parts of Kansas, New Mexico, and South Dakota as the result of a lingering neat wave and below-normal precipitation over large areas from the Rocky Mountains to the East Coast.
27
36[18)
o
HAWAII >^Lc>PUERTO RICO
f]gf> (32>-VIRGIN L^fiF-S ISLANDS
EXPLANATION
(Numbers correspond to those in table 1)
Q Pollution
/34\, Mudslide
^ Drought
[40] High ground-water levels
Q Sinkhole
@ Flood
| 22 [ Large area affected by flood
FIGURE 2. Significant hydrologic events in the conterminous United States, Hawaii, Puerto Rico, and the U.S. Virgin Islands, January 1982-August 1983.

14 National Water Summary 1983
PRECIPITATION CONDITIONSPrecipitation is the source of nearly all water that oc
curs on and beneath the land surface. Average annual precipitation in the United States ranges from a few tenths of an inch per year in the desert areas of the South west to 400 inches per year at some locations in Hawaii (fig- 3).
During 1982, precipitation in most of the conterminous United States generally was above normal (fig. 4A). However, less than normal precipitation in 1982 occurred in a large area covering parts of Kansas, Oklahoma, New Mexico, and Texas; in an area covering eastern North Carolina, eastern South Carolina, and northeastern Georgia; and in an area covering most of New Jersey, eastern New York, and central New England.
During the first 6 months of 1983, precipitation was above normal in most of the country (fig. 4B). Again, there were several areas that had less than normal precipitation. A broad area of lower than normal precipitation extended across the northern part of the Na tion from Washington eastward through the Great Lakes States, and southward into Kentucky, Tennessee, and northern Georgia. Lower than normal precipitation also occurred in much of Texas, Arkansas, and southeastern New Mexico.
STREAMFLOW CONDITIONSThat part of precipitation that appears in surface-water
bodies is called runoff. The distribution and pattern of runoff is determined by precipitation patterns, air temperature, geologic and topographic conditions, vegetation, land use, and other factors.
Average annual runoff in the United States varies widely, as shown in figure 5. Yearly runoff of less than 1 inch is common in parts of the Great Plains, in the Great Basin of Nevada and Utah, and in southern California, Arizona, and New Mexico. In areas of low rainfall, run off is typically a very small percentage of precipitation; in humid areas, on the other hand, runoff commonly is more than one-half of rainfall. Streamflow was above average in 1982 (fig. 6A) and the first half of 1983 (fig. 6B) in all of the United States except the Pacific North west, southern Texas, and scattered small areas in the central and eastern parts of the country. Small percentage departures from normal rainfall can lead to very large percentage departures from normal streamflow. For ex ample, in the first 6 months of 1983, rainfall in the Southwest did not exceed 150 percent of normal in much of the area; however, streamflow was 200-400 percent of normal. In the Gulf States, precipitation of 150 percent of normal yielded streamflows of about 200 percent of normal.
EXPLANATION
Precipitation, in inches
1 10-10 | 110-20 | I 20-30
30-40
f ] 40-60
60-100
>100
Precipitation varies from 16 to 400 inches
Precipitation varies from 30 to 210 inches
FIGURE 3. Average annual precipitation in the United States and Puerto Rico. (Adapted from U.S. Department of Commerce, 1968.)

A. January December 1982
200
B. January June 1983
WC
Streamflow Conditions 15
wo
wo
o
EXPLANATION Precipitation as a percentage of normal
< 75
75 100
100 150
J50f
150 200
> 200
FIGURE 4. Precipitation in the conterminous United States, as a percentage of normal, January December 1982 (A) and January June 1983 (B). (Data from National Oceanic and Atmospheric Administration and U.S. Department of Agri culture.)

16 National Water Summary 1983
Most streams exhibit seasonal variations in flow, with high-flow periods corresponding to seasons of high precipitation and low evapotranspiration, or to seasons of snowmelt. Lakes, wetlands, and aquifers tend to smooth out the responses of streamfiow to precipitation by storing water and releasing it slowly to streams. Figure 7 shows the typical pattern of seasonal variation for 10 major rivers in the Nation. Actual streamflows for January 1982 through August 1983 are superimposed on the long-term monthly median flow for the period 1951-80.
During January 1982 through August 1983, the flow of most major rivers ranged from normal to well above normal. The Sacramento River at Verona, Calif., flowed at rates above the monthly median flows for each month; flow in many of these months was about twice the monthly median flow. On the opposite side of the coun try, the St. Lawrence River also flowed at rates above the monthly median flow for each month of this period, although the relative differences were much smaller than for the Sacramento River. In the north-central part of the country, the stream gage on the Mississippi River at Keo- kuk, Iowa, also recorded flow above the monthly median values.
Other rivers that exhibited above-median flows during this 20-month period, and the number of months in which they exhibited this condition include the Missouri River at Herman, Mo. (19 months); Mississippi River at Vicksburg, Miss. (17 months); Columbia River at The Dalles, Oreg. (15 months); and the Willamette River at Salem, Oreg. (14 months).
In the eastern part of the Nation, streamflow in major rivers generally was in the normal range. The Apalachi- cola River at Chattahoochee, Fla., exhibited flows gener ally near monthly median values except during the period from December 1982 through April 1983, when flows were well above median. The Susquehanna River at Har- risburg, Pa., was below monthly median flows from August 1982 through January 1983, followed by above- median flows for March through July 1983. Periods of above normal and below normal flow were about equal for the Ohio River at Louisville, Ky.
Except for the Sacramento River, which flowed well above its August median, the other major rivers discussed above were flowing at or near normal rates in August 1983. Although this may seem incongruous with the reports of heat waves in the Midwest and drought in a number of areas of the Nation, it demonstrates that streamflow is related to antecedent meteorological condi tions as well as to present conditions. Water that was stored in aquifers, lakes, and reservoirs in the drainage basins of these rivers during the generally wet winter and spring of 1983 maintained relatively high river flows through the dry summer of 1983.
FLOODSSnowmelt, hurricane rainfall, thunderstorms, and ma
jor frontal weather systems can cause runoff sufficient to cause stream flooding. In addition, ice damming of streams can cause backwater conditions that may cause
EXPLANATION Runoff, in inchesI I 0-1
1-5
5-20
____ 20-40
I I >40
0 200 400 600 KILOMETER
FIGURE 5. Average annual runoff in the conterminous United States and Alaska. (From Walker, 1979.)

A. January December 1982
B. January June 1983
-400-
EXPLANATION
Streamflow as a percentage of normal
>400
TOO- 75-
r400 -200
,200
-too
O
FIGURE 6. Streamflow in the conterminous United States, January December 1982 (A) and January June 1983 (B). (Data based on U.S. Geological Survey index stream-gaging stations.)

18 National Water Summary 1983
800,000
600,000
400,000
200,000£
Co
1
um
I
Dia F ver a
1
t The Dalles, Oregon
TitimililiJFMAMJJASOND
1982
1 f 1JFMAMJJA
1983
80,000
60,000
40,000
20,000
Willamette River at Salem, Oregon (adjusted)
JFMAMJJASONDJFMAMJJA 1982 1983
400,000
300,000
200,000
O 100,000
St Lawrence River at Cornwall, Ontario near Massena, New York
JFMAMJJASONDJFMAMJJA 1982 1983
80,000
60,000
40,000
20,000
Sacramento River at Verona, California
J FMAMJJASONDJFMAMJJA 1982 1983
200,000
100,000
II
Mis
f
sou
Y
n R
[\
ive
1
rat
1
He
1
rm£
1
in, Mis
Tr
SOL
JFMAMJJASOND
ri
ill 1 1 1 1 ITJFMAMJJA
300,000
200,000
100,000
Mississippi River at Keokuk, lo
iffJFMAMJ JASOND
ilJFMAMJJA
300,000
200,000
100,000
Ohio River at Louisville, Kentucky
IITWTJFMAMJ JASONDJ FMAMJJA
1982 1983
EXPLANATION
Monthly discharge
Median of monthly discharges based on 1951-80 reference period
80,000
60,000
40,000
20,000
Apalachicola River at Chattahoochee, Florida
111JFMAMJJASOND
1982
III
I
1,600,000
1,400,000
1,200,000
1,000,000
800,000
600,000
400,000
200,000
0
120,000
100,000 -
80,000 - , .
40,000 -
20,000
Mississippi River at Vicksburg, Mississippi
JFMAMJJASOND J F M A M J J A
J F M A M J J A 1983
JFMAMJJASONDJFMAMJJA 1982 1983
FIGURE 7. Monthly flows of selected major rivers in the United States, January 1982-August 1983 and monthly median flows for the reference period 1951 80.
Floods 19
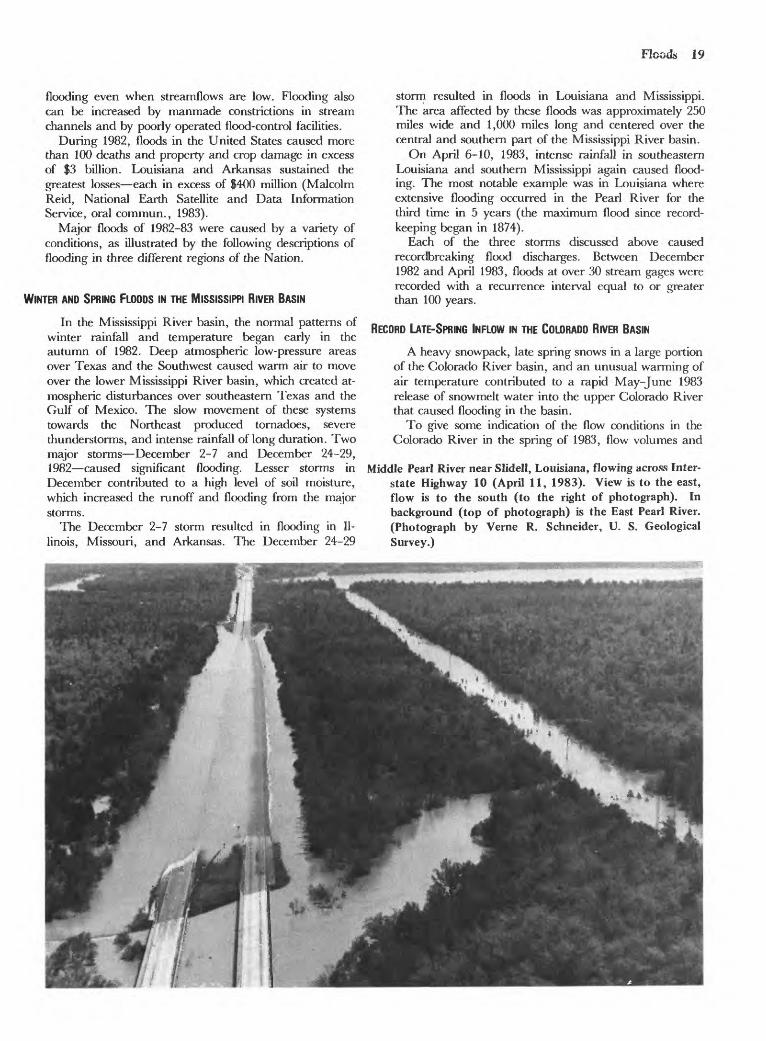
flooding even when streamflows are low. Flooding also can be increased by manmade constrictions in stream channels and by poorly operated flood-control facilities.
During 1982, floods in the United States caused more than 100 deaths and property and crop damage in excess of $3 billion. Louisiana and Arkansas sustained the greatest losses each in excess of $400 million (Malcolm Reid, National Earth Satellite and Data Information Service, oral commun., 1983).
Major floods of 1982-83 were caused by a variety of conditions, as illustrated by the following descriptions of flooding in three different regions of the Nation.
WINTER AND SPRING FLOODS IN THE MISSISSIPPI RIVER BASIN
In the Mississippi River basin, the normal patterns of winter rainfall and temperature began early in the autumn of 1982. Deep atmospheric low-pressure areas over Texas and the Southwest caused warm air to move over the lower Mississippi River basin, which created at mospheric disturbances over southeastern Texas and the Gulf of Mexico. The slow movement of these systems towards the Northeast produced tornadoes, severe thunderstorms, and intense rainfall of long duration. Two major storms December 2-7 and December 24-29, 1982 caused significant flooding. Lesser storms in December contributed to a high level of soil moisture, which increased the runoff and flooding from the major storms.
The December 2-7 storm resulted in flooding in Il linois, Missouri, and Arkansas. The December 24-29
storm resulted in floods in Louisiana and Mississippi. The area affected by these floods was approximately 250 miles wide and 1,000 miles long and centered over the central and southern part of the Mississippi River basin.
On April 6-10, 1983, intense rainfall in southeastern Louisiana and southern Mississippi again caused flood ing. The most notable example was in Louisiana where extensive flooding occurred in the Pearl River for the third time in 5 years (the maximum flood since record- keeping began in 1874).
Each of the three storms discussed above caused recordbreaking flood discharges. Between December 1982 and April 1983, floods at over 30 stream gages were recorded with a recurrence interval equal to or greater than 100 years.
RECORD LATE-SPRING INFLOW IN THE COLORADO RIVER BASIN
A heavy snowpack, late spring snows in a large portion of the Colorado River basin, and an unusual warming of air temperature contributed to a rapid May-June 1983 release of snowmelt water into the upper Colorado River that caused flooding in the basin.
To give some indication of the flow conditions in the Colorado River in the spring of 1983, flow volumes and
Middle Pearl River near Slidell, Louisiana, flowing across Inter state Highway 10 (April 11, 1983). View is to the east, flow is to the south (to the right of photograph). In background (top of photograph) is the East Pearl River. (Photograph by Verne R. Schneider, U. S. Geological Survey.)

20 National Water Summary 1983
Flow over the Arizona Spillway of Hoover Dam on July 22, 1983. Rate of flow was 13,944 cubic feet per second. (Photograph by U. S. Bureau of Reclamation.)
their recurrence intervals were computed for the com bined flow at the three gaging stations that measure the major inflows to Lake Powell: Colorado River near Cisco, Utah; Green River at Green River, Utah; and San Juan River near Bluff, Utah.
The combined flow volume for June 1 through July 31, 1983, was 8.7 million acre-feet and was the largest June to July volume since 1957. The estimated recurrence inter val for this flow volume is 50 years. The projected com bined flow volume for the 1983 water year is 21.5 million acre-feet; this would be the largest annual volume since at least 1922, having an estimated recurrence interval of 100 years. The peak inflow to Lake Powell was 120,000 cubic feet per second. This flow was regulated by Glen Canyon Dam so that the maximum outflow from Lake Powell was about 92,000 cubic feet per second. Downstream at the Hoover Dam outlet, the maximum flow peaked at about 45,000 cubic feet per second.
For the past 48 years, flooding in the lower reaches of the Colorado River has been controlled by Hoover Dam, and this has encouraged development close to the river's edge in some instances, even inside the levees. This en croachment contributed significantly to flood damages suffered during the spring of 1983. The unusual floods of 1983 are a consequence of the fact that reservoirs in the Colorado River Storage Project entered this water year
nearly full of water for the first time since the completion of the Glen Canyon Dam in 1963, and then received these very high, but not unprecedented, spring flows.
FLOODING IN THE GREAT BASIN AND THE RISE OF THE GREAT SALT LAKE
In the Great Basin of Utah and Nevada, the winter of 1982-83 was one of the most severe since the collection of climatic data began in the late 1880's. Snowpacks at many sites set new records for depth and water content, and air temperatures for most of the winter and spring re mained well below normal. In early March 1983, warm days and nights, combined with rain at elevations below 6,000 feet, caused major flooding along the Humboldt River in northern Nevada and on most small streams in eastern Nevada. The peak discharge of the Humboldt River at Elko, Nev., exceeded 7,000 cubic feet per second the estimated magnitude of the 50-year flood.
In western Nevada, winter-like conditions with heavy snowfall continued through mid-May. Then, a dramatic change occurred and daytime temperatures suddenly rose into the 80's (°F). Melting snow saturated the steep slopes of the eastern Sierra Nevada mountain range, causing a number of landslides. On May 29, 1983, a 400-foot seg ment of the major road connecting Lake Tahoe with Carson City and Reno, Nev., slid to the bottom of a

Floods 21
250-foot-deep ravine, causing damming but no major flooding. A day later, a massive landslide on Slide Moun tain displaced two small lakes and resulted in a mud-and- debris flow in Ophir Creek and into Washoe Valley, be tween Carson City and Reno.
Streamflow in the Truckee, Carson, and Walker Rivers of Nevada exceeded long-term records. The yearly average discharge of the Truckee River at Reno, Nev., is 657 cubic feet per second for the past 55 years of record. The projected average flow for the 1983 water year is estimated at 2,000 cubic feet per second. Pyramid Lake, the closed-basin terminus of the Truckee River, is ex pected to rise a total of 13 feet by the end of the 1983 water year, exceeding the previous maximum rise of April 1950. The Carson River is projected to have a record average discharge of approximately 1,000 cubic feet per second for the 1983 water year, which will exceed the previous 42-year average of 390 cubic feet per second. Walker Lake, the closed-basin terminus of the Walker River, rose 7.5 feet between October 1, 1982, and Tune
' * * *j
30, 1983. Only two other similar rises in Walker Lake have been recorded since 1928 6 feet in 1938 and 7 feet in 1969. Pyramid Lake and Walker Lake have experi enced declines of 80 and 120 feet, respectively, during this century.
September 1982 was the beginning of recordbreaking rains in the Salt Lake City, Utah, area, with the rainfall accumulation for the month exceeding previous records. The Jordan River rose to its highest flow in 40 years; runoff from October through December 1982 was 3.8
Flooding in Salt Lake City, Utah, May 28, 1983. View is of State Street and South Temple, looking south through the Eagle Gate, site of Brigham Young's farm. (Photograph by Paul Blanchard, U.S. Geological Survey.)
times greater than average. Low air temperatures and above normal precipitation continued through the spring of 1983. A late but rapid snowmelt caused by a warm weekend (May 29-30, 1983) released record-breaking quantities of water onto already wet soil. Peak flows set new records on the Bear River and on the Jordan River. The Sevier River near Lynndyl, Utah, peaked at more than double the estimated magnitude of the 100-year flood. Underground conduits designed to convey water through Salt Lake City became clogged with silt, gravel, and debris, and were unable to convey the flow, which then had to be diverted to the street.
Landslides and mudflows, some of which caused damage, also occurred in several areas of Utah. The largest slide was on April 14, 1983, when an estimated 15 million cubic yards of debris slid into Spanish Fork Can yon and dammed the stream. Rising water subsequently inundated the town of Thistle, Utah.
High runoff in the spring of 1983 also affected the Great Salt Lake. Inputs to the lake are from streams such as the Bear River, Weber River, Jordan River, and from direct precipitation on the lake. The only significant loss of water from the lake is through evaporation from the lake surface.
Over short periods, evaporation from the Great Salt Lake may be considerably different than inflow, and the difference is made up by a change in water stored in the lake. The result is a rise or fall in the elevation of the lake surface and a corresponding increase or decrease in the area covered by the lake. This increases or decreases the loss of water from the lake by evaporation which, in turn, moderates the increase or decrease of lake level. The within-year variation in lake stage typically is about 2 feet (fig. 8).
Over longer periods, the lake's surface may rise and fall as climatic variations cause long-term changes in precipi tation and runoff or changes in evaporation. These effects commonly work together in contributing to changes in lake stage, in that climatic conditions that contribute to increased precipitation also tend to reduce evaporation. The converse also is usually true. The long-term level of the lake also is affected by man-induced changes in inflow through diversion of water for consumptive uses.
In the early 1870's, the Great Salt Lake reached its highest level since records began in 1847 4,211.50 feet above sea level. At that time, the lake surface covered about 2,500 square miles. The lowest levels were reached in the early 1960's when the lake fell to 4,191.35 feet above sea level and the lake surface covered about 1,000 square miles (Arnow, 1983).
From September 18, 1982, to July 1, 1983, the Great Salt Lake rose 5.2 feet the greatest seasonal rise ever recorded (Arnow, 1983). The previous largest recorded seasonal rise was 3.4 feet in 1906-07. The level of the Great Salt Lake on July 1, 1983, was 4,205 feet above sea level, the highest level the lake had reached since 1924. From September 1982 to July 1983, the lake increased in area by about 267 square miles to 1,950 square miles. This increase in area resulted in damage to roads, railroads, wildlife-management areas, recreational facilities, and industrial installations that had been established on the exposed lakebed.

22 National Water Summary 1983
4212
4210
4205
4200
4195
4190
4188
Dashed line is apf roximate
O i i O if>CO COO) O5
FIGURE 8. Fluctuation of the water level of Great Salt Lake, Utah, 1847-1983.
Selected ReferencesArnow, Ted, 1983, Water-level and water-quality
changes Great Salt Lake, Utah 1847-1983: U.S. Geolog ical Survey Circular 913. [in press]
Barnett, T. P., 1981, Statistical prediction of North American air temperatures from Pacific predictors: Monthly Weather Review, v. 109, p. 1021-1041.
Horel, J. D., and Wallace, J. M., 1981, Planetary-scale at mospheric phenomena associated with the southern oscilla tion: Monthly Weather Review, v. 109, p. 813-829.
Namias, Jerome, 1976, Some statistical and synoptic characteristics associated with El Nino: Journal of Physical Oceanography, v. 6, p. 130-138.
Philander, S. G. H., 1983, El Nino southern oscillation phenomena: Nature, v. 302, p. 295-301.
Rasmusson, E. M., and Hall, J. M., 1983, El Nino, the great equatorial Pacific Ocean warming event of 1982-1983: Weatherwise, v. 36, p. 166-175.
U.S. Department of Commerce, 1968, Climatic atlas of the United States: Environmental Science Services Administra tion Atlas, p. 43.
Walker, P. N., 1979, How are the Nation's surface-water resources distributed?, in Rickert, D. A., and others, Syn thetic fuels development, earth-science considerations: U.S. Geological Survey Professional Paper 1240-A, 45 p.

Hydrologic Perspectives on Water Issues 23
HYDROLOGIC PERSPECTIVES ON WATER ISSUESThe "Hydrologic Perspectives on Water Issues"
describe significant national water issues and is intended to provide background information for the material dis cussed in the "State Water Issues Summaries". This part of the report is divided into four sections, as follows: Water-availability issues discusses the distribution
and development of surface- and ground-water supplies. Water-quality issues examines the issues related to
the quality of the Nation's water and includes discus sions on drinking water, polluting substances, and mechanisms of contamination.
Hydrologic hazards and land-use issues discusses flooding, land subsidence, sinkholes, wetlands, erosion and sedimentation, volcanoes, and the hydrologic ef fects of mineral-resource development.
Institutional and management issues discusses treaties, water law, financing the infrastructure, and water management.
WATER-AVAILABILITY ISSUESAs stated in "Man and the Hydrologic Cycle," the
renewable supply of water for the Nation is vastly larger than the rate of consumptive use. This suggests that con sumptive use could grow to several times its present rate on a sustained basis. However, in every State water-issue summary, water-availability or related management issues are mentioned; this indicates that the relationship between overall national supply and use does not govern regional or local water availability. In order to under stand the nature of water-availability issues around the Nation, it is first necessary to examine the vast differences between the regions of the Nation in both the abundance
SOURCE:
other atmosphere regions
ground water in storage in the region
and the use of water, and then to examine the other con straints that influence water availability.
To examine these regional differences, water-budget analyses were made on the basis of the 21 water-resources regions (U.S. Geological Survey, 1982). (See fig. 10.) Even at a regional scale, however, there may be very large differences in hydrologic conditions within a region that are masked by averaging.
Four of the water-resources regions the Lower Colo rado, Lower Mississippi, Ohio, and Upper Mississippi receive appreciable surface-water inflows from other regions. Numbers used for the Upper Mississippi exclude the effects of the Missouri, and numbers for the Ohio ex clude the effects of the Tennessee. In contrast, conditions of the Lower Colorado and Lower Mississippi are largely an integration of conditions in their upstream regions. Therefore, numbers were developed for the entire Col orado and entire Mississippi basins, and not for the Lower Colorado and Lower Mississippi Regions. The re maining regions were treated as defined by the U.S. Geological Survey (1982). Flow of ground water across regional boundaries or to the ocean was not considered in the analysis.
In this simplified water-budget approach, flows or deliveries of water, in volumes per unit time (billions of gallons per day) are represented by arrows in figure 9. The horizontal arrows represent the accumulated supply of the region. Arrows pointing inward toward the central arrow represent contributions to that supply, whereas ar rows leading away from it represent distributions of the supply to various uses or destinations. The water entering the region is of two categories precipitation and im ports. Imports are manmade transfers of water into the region from some other region. Water leaving the region falls into four categories: (1) natural evapotranspiration,
DESTINATION: atmosphere other regions
atmosphere downstream region, closed basin, or oceans
FIGURE 9. Schematic diagram of a simplified regional water budget.

24 National Water Summary 1983
which is defined as the evaporation from natural fresh water bodies and the evapotranspiration that would occur in the absence of irrigation; (2) exports (manmade transfers) of water out of the region; (3) the consumptive use of water, which includes the additional evapotranspi ration brought about by irrigation, the evaporation of water in industrial and cooling uses, and the net evaporative losses from reservoirs (actual reservoir evaporation minus the evapotranspiration that would have occurred on the land flooded by the reservoir); and (4) natural surface-water outflow into a downstream region, into closed basins within the region, or into the
ocean. Natural evapotranspiration, as defined here, is not totally "natural," because it is a function of the kind of vegetation present, and this is, in large part, controlled by man.
In any water-budget analysis, the difference between the sum of the inflows and the sum of the outflows must equal the rate of change in storage. Applied to the present analysis of water-resources regions, the difference be tween the total inflow (precipitation plus imports) and the four outflows must equal the rate of change in storage in surface- and ground-water bodies within the region. Over a period of several years, accumulations and depletions of
Canyon Ferry Dam, 17 miles northeast of Helena, Montana. Canyon Ferry Lake has a total capacity of 2,051,000 acre-feet and a surface area of 35,200 acres providing a large body of water for recreation and fish and wildlife. Water for irrigation and municipal use, under a head from the reservoir, is boosted by pumps and lifted 163 feet to a 2.7-mile-long tunnel of the Helena Valley Canal. (Photograph by U.S. Bureau of Reclamation.)
Water-Availability Issues 25
storage due to climatic variation usually average to zero. Thus, in terms of surface-water (reservoir) storage, and in terms of naturally induced changes in ground-water stor age, the regions should be at equilibrium over the long term. In some regions, however, sustained withdrawals of ground water from storage have been maintained over very long periods of time, and must be considered even in a long-term budget. Depletion of ground-water storage is, therefore, shown as a contribution to the supply in figure 9.
Gross supply is defined as the flow potentially or theoretically available for use within the region under cur rent conditions. It may be thought of as the supply that sustains the current consumptive use, plus the outflow from the region. As indicated in figure 9, it can be con sidered the sum of the available water sources (imports, precipitation, and depletion of ground-water storage) minus the water not available for use (natural evapotrans- piration and exports). Renewable supply on the other hand, represents the flow potentially or theoretically available for use in the region on an essentially permanent basis. Thus, it includes only those contributions precipitation and imports that presumably will remain constant, on the average, through time. Depletion of ground-water storage, which eventually must cease as water levels con tinue to fall, is not included. Renewable supply is the sum of precipitation and imports, minus the water not avail able for use (natural evapotranspiration and exports). It differs from gross supply only in that it does not include depletion of ground-water storage.
Renewable supply is actually a simplified upper limit to the amount of water consumption that could occur in a region on a sustained basis. It is simplified in the sense that the terms involved precipitation, imports, natural evapotranspiration, and exports are subject to change due to natural causes and human intervention, whether intentional or inadvertent. Where there are legal and in stitutional requirements to maintain minimum flows in streams leaving the region for instream uses such as navigation, hydroelectric power generation, fish propaga tion, or downstream withdrawal uses, it may not be possi ble to consume the entire renewable supply. Total devel opment of a surface-water supply is never possible because of increasing evaporative losses as more reser voirs are used. Thus, beneficial consumption that is, consumption other than evaporation from reservoirs can never equal total consumption; therefore, beneficial consumption is always less than the renewable supply. Nevertheless, renewable supply provides a rough meas ure of the abundance of the water resource, and when compared to the existing rate of consumptive use, it pro vides an index of the degree to which the resource has already been developed. Consumption in any region can increase by no more than the difference between renew able supply and existing consumption unless imports are increased, exports are decreased, or some sort of supply enhancement is achieved for example, by managing vegetation or lowering ground-water levels to control or reduce evapotranspiration.
As figure 9 indicates, renewable supply could be calculated by adding precipitation and imports and sub tracting natural evapotranspiration and exports. Alter
natively, it can be calculated by summing outflow and consumptive use and subtracting depletion of ground- water storage from this total. The latter approach was adopted in this analysis, simply because estimates of the terms involved are more easily obtained.
Long-term average outflow rates for each region were estimated from streamflow records through 1975. Esti mates of present consumption were calculated by adding published data on offstream consumption (Solley and others, 1983) and calculated estimates of net reservoir evaporation. Net reservoir evaporation was calculated with information developed by Hardison (1972), which gives the net evaporation rate as a function of reservoir capacity for each water-re sources region. The reservoir volumes used in this calculation were taken from the U.S. Army Corps of Engineers inventory of dams (1981).
Depletion of ground-water storage was estimated only where water-table decline or land subsidence has been in progress over wide areas for a number of decades. Storage withdrawals associated with declines in artesian level or with small areas of water-table decline were neglected because of the limited effect they would have on regional water-budget calculations. Storage-depletion estimates, based on long-term water-level declines, ad justed to 1980 conditions where possible, are estimates from ongoing U.S. Geological Survey studies and are subject to revision as the investigations continue.
Regionally significant depletion of ground-water storage has occurred in three major areas southern Arizona, the High Plains, and California. Depletion in southern Arizona, which falls completely within the Lower Colorado Region, was estimated at approximately 2.1 bgd for 1980. Depletion in the High Plains for 1980 was estimated at 8.9 bgd; approximately 25 percent oc curred in the Missouri Region, 40 percent in the Arkansas-White-Red Region, and 35 percent in the Texas-Gulf Region. Depletion in the California Region for 1980 was difficult to estimate, in part because data on ground-water levels since 1978 are limited, and in part because the region was in a period of transition from very dry conditions in 1976-77 to very wet conditions during the past 3 years. However, long-term data for the period 1961-78 indicate an average storage-depletion rate of 1.4 bgd during that period. In the absence of more complete information, this figure was used as the 1980 storage depletion for the California Region.
The values for consumption were based largely on data for 1980, the outflows were estimated from long-term stream-gaging records, and the ground-water-storage changes were derived from long-term data adjusted, in some cases, for 1980 conditions. Complete consistency would require all of the estimated quantities to be evaluated for 1980, but the necessary information to do this was not available. For the purposes of this analysis, the estimates as developed were considered adequate.
The estimates of average outflow, depletion of ground- water storage, consumption, and renewable supply for the 19 water-resources regions analyzed, and for the en tire Colorado and Mississippi basins are given in table 2.
A useful index for comparing the regions is consump tive use as a percentage of renewable supply. (See table 2 and figure 10.) In 13 of the 21 regions, consumptive use is

26 National Water Summary 1983
TABLE 2. Simplified water-resources budget for 1980, by water-resources region[Units are in billion gallons per day except where indicated]
Water-resources region
New England Mid-Atlantic South Atlantic-Gulf Great Lakes Ohio (exclusive of Tennessee
Region) Tennessee
Upper Mississippi (exclusive ofMissouri Region)
Mississippi (entire basin) Souris-Red- Rainy Missouri Arkansas-White-Red Texas-Gulf
Rio Grande Upper Colorado Colorado (entire basin) Great Basin Pacific Northwest California
Alaska Hawaii Caribbean
Stream outflow
77.878.9
227.972.7
137.540.8
75.1428.3
6.045.861.327.9
2.29.91.65.9
263.650.5
975.56.74.8
Depletionof
ground-waterstorage
0.0.0.0.0
.0
.0
.05.8
.02.23.63.1
.0
.02.1
.0
.01.4
.0
.0
.0
Consumptive use
0.61.85.61.6
2.1.4
2.142.3
.519.311.08.3
3.24.0
10.84.1
12.625.5
.04
.7
.3
Renewable supply
78.480.7
233.574.3
139.641.2
77.2464.8
6.562.968.733.1
5.413.910.310.0
276.274.6
975.57.45.1
Consumptiveuse as a
percentage of renewable
supply
1222
21
398
311625
5929
10541
534
096
less than 10 percent of renewable supply; in five it is be tween 10 and 40 percent; in two, the Great Basin and the Rio Grande, it is between 40 and 60 percent; and in one, the Colorado, it is 105 percent. A percentage greater than 100 can occur only where there is depletion of ground water in storage. These depletions cannot continue in definitely. As ground water in storage is progressively depleted, becoming increasingly costly to obtain, one or more of the following will have to happen: a decrease in consumption, exports, or stream outflow, or an increase in supply by precipitation, by vegetation management, or by imports.
Even in regions where consumptive use is a small percentage of renewable supply, there may be local areas in that region where the percentage is high. The three regions draining the High Plains (the Missouri, Arkansas-White-Red, and Texas-Gulf) have percentages between 16 and 31; yet consumptive use now exceeds renewable supply in some of the western parts of these regions. Conversely, within basins where consumptive use is a high percentage of renewable supply, there may be subbasins for which the percentage is low. For exam ple, tributary basins in the Colorado basin, such as the Green, White, and Yampa, have low percentages of con sumptive use even though, for the entire Colorado basin, the percentage is 105.
The purpose of considering these percentages is to compare current development with upper limits to water development on a broad regional scale. The results show that, for a very large part of the Nation, consumption is a very low percentage of supply, and considerable increases in consumptive use could be sustained. The factors con
trolling water availability, however, are often unrelated to the constraints imposed by these upper limits; rather, they are related to the limitations of the existing local or regional supply system the reservoirs, wells, pipelines, canals, and their operating policies, as well as the suitabil ity of the water for its intended use.
Although the Nation's natural endowment of water may, in total, be more than adequate to meet everyone's needs, the real issue is that the water is not always available when and where needed. The State water-issue summaries in this report show that water availability is an issue in every State those where the consumption is less than 10 percent of renewable supply, as well as those where it is a high percentage. In many States, it is not the raw resource (water in streams and aquifers) that is scarce, rather it is the developed resource. The developed resource is the water that can be supplied for either withdrawal or instream uses on a reliable basis. Thus, the developed resource is not only a function of the character istics of the raw resource, but also of the facilities and the institutional arrangements laws, agreements and oper ating rules for withdrawing the water from the stream or aquifer.
The scarcity of water in an area may arise for either of two generic reasons. The first, which largely pertains to the more arid parts of the Nation, is the absolute decline in the size of the raw resource due to continued depletions from ground-water storage. The second, which is ubiqui tous, is the increased competition for the developed resource that is, increasing competition for the supply with a fixed set of facilities. In either case, the scarcity of water can almost always be alleviated by engineering or

Water-Availability Issues 27
LOWER I <> \COLORADO M %
^ ^h \
* Represents entire Colorado River basin** Represents entire Mississippi River basin
EXPLANATION Billion gallons per day
11.0 Consumptive use 68.7 Renewable water supply
Consumptive use as a percentage of renewable supply
I 10-10
| 110 40
| | 40 100
FIGURE 10. Average consumptive use and renewable water supply, by water-resources region.
management actions. However, these actions usually re quire the use of still other resources for example, labor, energy, land, and capital for which there also may be competing uses; these actions also may decrease the avail able water supply in another area.
Competition among the alternative uses of resources is a fundamental characteristic of human existence. The allocation of scarce resources to one use over another en tails a cost the loss of the resource to the competing use. In those instances where the benefits derived from in creasing the available water supply are greater than the costs of the increase, decisions typically are made (by in dividuals, corporations, or public bodies) to increase the supply. Where the costs are greater than the benefits, the individual or group may choose to adjust its water use and put its resources (such as labor, energy, land, and capital) to other uses.
Actions that have been used to resolve problems of scarcity include (1) development of surface-water supplies
(by building reservoirs, diversions, and conveyance struc tures); (2) development of ground-water supplies (by drilling wells and building conveyance structures); (3) changes in the nature and efficiency of water uses by us ing water of impaired quality (by employing new treat ment methods); (4) prevention or lessening of certain water losses considered to be nonbeneflcial; and (5) at tempts to increase the amount of precipitation falling on the land.
Competition for water increases with population and economic growth, and is further influenced by technolog ical change, by preferences of water users, and by govern mental policies. Examples of technological innovations that have influenced water use include center-pivot irriga tion systems, trickle irrigation, dishwashers, water-saving shower heads, and cooling towers. Some of these technol ogies lead to increased water use, whereas others lead to decreased water use. Examples of governmental policies affecting competition include instream-flow require-

£ f I I Cfl g U)
O=
e
e r
R- H
WA
TE
R W
ITH
DR
AW
ALS
, IN
BIL
LIO
N G
ALLO
NS
PE
R D
AY
^-fr
^^S
l^- |3
cSe.
noS
2^n|a
^»3-l.S
:'1
r3
-or
P ff
3 cq
|
5' ^
S-
H D
^
<.
2 sT
G-
o c.
zt
<-l
ft
i i->
, D
" O
3
S.
00
£P
-
^ I
f 7
5"
o ^
s i
to -n
S.
o a .
3o
c
CD 01 01 CD
_en o
PO
PU
LAT
ION
, IN
MIL
LIO
NS

Water-Avaflabflity Issues 29
r\a
a
n-10
i-o
[] Surface-water withdrawals
Ground-water withdrawals
FIGURE 12. Withdrawals from ground water and surface water, by State, 1980. (From Solley and others, 1983.)
A number of options are available for eliminating or limiting water losses that generally are considered nonbeneficial. One is the prevention of leakage of water from municipal- or irrigation-distribution systems. This commonly is a means for saving large sums of money because the leaked water has been stored, treated, and pumped at some expense and yet is unavailable to those who must pay for it. Analyses of leak detection and prevention programs have shown that the benefits exceed the costs (see Moyer and others, 1983; and Pilzer, 1981). In most situations, leak protection is not a way of making more water available to the region, because the leakage simply returns to aquifers and eventually to streams. In all cases, it is a way of increasing the usable supply without adding new facilities.
Changing the type of vegetation on the land can result in increases in the amount of water available in the streams. Recent reviews of this topic include Ponce (1983) and Dunne and Leopold (1978, p. 150-156). The princi ple of this approach to supply enhancement is to eliminate deep-rooted plants that draw water from deeper soil zones or from ground water, and to replace them with more shallow-rooted plants. Gains in water yields on the order of 5 percent have been observed, but these gains tend to decline over time as the new vegetation matures. These changes generally are not without cost and may produce impacts on water quality, wildlife habitat, and esthetics.
Use of water of impaired quality is another approach to enhancing supplies. For example, Bethlehem Steel in Baltimore, Md., has been using over 100 million gallons per day of Baltimore's secondary-sewage effluent since 1942. This is water that would have been discharged directly to Chesapeake Bay and become unavailable for future use (Wolman, 1948). The use of saline water has increased about sevenfold from 1950 to 1980 (Solley and others, 1983); much of this is for industrial cooling pur poses, and it represents an enhancement of the supply of water. The use of saline water is not without special prob lems and costs, but in some instances, it has been found to be less costly than acquiring additional supplies of freshwater.
Weather modification is another approach to enhanc ing water supplies. Serious scientific attention to tech niques of artifically increasing precipitation began around 1946. There have been more than a dozen major research projects dealing with this subject in the United States. Findings from these studies are still the subject of contro versy in the scientific literature (see Hess, 1974; Tukey and others, 1978; Braham, 1979).
The development of the existing surface- and ground- water resources remains the predominant approach to resolving issues of water availability, and is discussed in the following two sections.

30 National Water Summary 1983
Selected ReferencesBabin, F. G., Willis, C. E., Alien, P. G., and Vlachov, A. S.,
1980, Substitution possibilities for water inputs in selected in dustries: Water Resources Research Center, University of Massachusetts at Amherst, publication no. 121, 114 p.
Baumol, W. J., and Gates, W. E., 1979, Economics, en vironmental policy, and the quality of life: Prentice Hall, Englewood Cliffs, N.J., 377 p.
Beattie, B. R., 1981, Irrigated agriculture and the Great Plains: problems and policy alternatives: Western Journal of Agricultural Economics, v. 6, p. 289-299.
Braham, R. R., 1979, Field experimentation in weather modification: American Statistical Association Journal, v. 74, p. 57-68.
Dunne, T., and Leopold, L. B., 1978, Water in environmental planning: San Francisco, Calif., W. H. Freeman and Com pany, 818 p.
Foster, H. S., and Beattie, B. R., 1979, Urban residential de mand for water in the United States: Land Economics, v. 55, no. 1 p. 43-58.
Hardison, C. H., 1972, Potential United States water-supply development: American Society of Civil Engineers, Irrigation and Drainage Division Journal (IR), v. 98, p. 479-492.
Hess, W. N., ed., 1974, Weather climate modification: New York, J. Wiley and Sons, 842 p.
Hirsch, R. M., 1978, Risk analysis for a water-supply system Occoquan Reservoir, Fairfax and Prince William Counties, Virginia: Hydrological Sciences, v. 23, no. 4, p. 475-505.
Hirshleifer, J., DeHaven, J. C., and Milliman, J. W., 1969, Water supply; economics, technology, and policy: Chicago, 111., University of Chicago Press, 378 p.
Kelso, M. M., Martin, W. E., and Mack, L. E., 1973, Water supplies and economic growth in an arid environment, an Arizona case study: Tucson, Ariz., The University of Arizona Press, 327 p.
Moyer, E. E., Male,]. W., Moore, C., and Hock, J. G., 1983, The economics of leak detection and repair a case study: American Water Works Association Journal, v. 75, p. 29-34.
Office of Technology Assessment, 1982, Use of models for water resources management, planning, and policy: Washington, D.C., U.S. Government Printing Office, 242 p.
Pilzer, J. E., 1981, Leak detection case histories: American Water Works Association Journal, v. 73, p. 565-567.
Ponce, S. L., ed., 1983, The potential for water yield augmenta tion through forest and range management: Bethesda, Md., American Water Resources Association, 70 p., reprinted from Water Resources Bulletin, v. 19, no. 3, p. 351-420.
Solley, W. B., Chase, E. B., and Mann, W. B., IV, 1983, Estimated use of water in the United States in 1980: U.S. Geological Survey Circular 1001, 56 p.
Strudler, Michael, and Strand, I. E., Jr., 1983, Pricing or a policy to reduce sewage costs: Water Resources Research, v. 19, no. l,p. 53-56.
Tukey, J. W., Brillinger, D. R., and Jones, L. V., 1978, The role of statistics in weather resources management, Vol. 2, Final report of Weather Modification Advisory Board: U.S. Department of Commerce, Washington, D.C., U.S. Gov ernment Printing Office.
U.S. Army Corps of Engineers, 1981, National inventory of dams (computerized data base).
U.S. Geological Survey, 1982, Codes for the identification of hydrologic units in the United States and the Caribbean out lying areas: U.S. Geological Survey Circular 878-A, 115 p.
Wolman, A., 1948, Reclamation of sewage effluents: Water Pollution Control Federation Journal, v. 20, p. 15-21.
Young, C. E., Kinsley, K. R., and Sharpe, W. E., 1983, Im pact oh residential water consumption of an increasing rate structure: Water Resources Bulletin, v. 19 no. 1, p. 81-86.
SURFACE-WATER DEVELOPMENT
The unregulated flow of many of the Nation's rivers is highly variable. For example, the rate of flow may be thousands of times greater during floods than during droughts, and some streams cease flowing during drought. Even where the rate at which water withdrawn from a river is small in comparison to the average flow rate of the river (say one tenth the average flow), there typically would be many days during which the desired amount of water was unavailable. Thus, reliance on sur face water as a source of supply usually requires a dam, creating a reservoir to store water from wet periods for use during dry periods. If the reservoir is located upstream from the location where the water is to be used, the water stored during the wet periods may be released to the river channel during dry periods to flow downstream to the point of use. In other cases, the stored water is withdrawn directly from the reservoir and carried by pipe or canal to the point of use. In either situation, there usually are requirements concerning the minimum flow that must remain in the river either below the dam or below the point of diversion. These minimum flows are established to provide sufficient water for instream uses such as navigation, waste dilution, or fish and wildlife habitat.
Reservoirs are often described as having a "safe yield," which is the amount of water that can be with drawn or released on an ongoing basis with an acceptably small risk of supply interruption. The "job" of the reser voir is to make up the difference between the demand for water and the available streamflow during the dry periods, when the available streamflow is less than the de mand. If the desired safe yield is small in comparison to the average flow rate for the river, then the dry period for which the reservoir stores the water may be a few weeks or months during the driest part of the year. For a safe yield approaching the annual average flow of the river (safe yield between 50 and 90 percent of the average flow), the dry period for which the reservoir stores water may span several years. The required size of a reservoir to satisfy a given demand is determined by the volume of water that must be stored to carry the users through severe dry periods. This volume is the product of the flow deficiency (demand minus flow) and the duration of the dry period.
As is the case with the extraction of any natural resource, "water control by storage follows a law of diminishing returns. Each successive increment of control (safe yield) requires a larger amount of reservoir storage space than the preceeding increment" (Langbein, 1959, p. 4). In other words, a doubling of safe yield would re quire more than a doubling of reservoir capacity, and this, in turn, is likely to lead to more than a doubling of costs.
The relationship between reservoir storage and re gional safe yield (a regulated flow that could be delivered to the mouth of the basin continuously in 49 out of 50

Water-Availability Issues 31
years) for the Upper Mississippi Region (Lof and Har- dison, 1966) is shown in figure 13. The line labeled gross yield is a safe yield computed without regard to reservoir evaporation. This curve continues to rise as storage in creases, but beyond a storage of about 100 million acre- feet, the incremental increases in yield are very small. However, when evaporation is considered, there is a point at which increases in storage volume actually lead to decreases in safe yield because the evaporative losses from the incremental storage are greater than the gains in safe yield.
Hardison (1972) found that, for all of the water- resources regions in the conterminous United States, the point at which safe yield reaches its maximum is when storage is in the range of 160 to 460 percent of the average annual renewable supply of the region. This computation involves many simplifying assumptions, and, in many in dividual river basins, substantially different results might be found.
Reservoirs generally are used to regulate streamflows to provide a reliable diverted supply for domestic, in dustrial, or agricultural purposes, or to maintain reliable downstream flows to satisfy instream use or downstream commitment. However, some reservoirs also are used for flood control, hydropower, and recreation. Where this is so, it is necessary for a part of the total storage capacity to be reserved for those uses. Thus, in these reservoirs, the capacity used to regulate the river (deliver the safe yield) is less than the gross capacity. The distribution of reser voir capacity in each of the 21 water-resources regions of
RESERVOIR STORAGE, IN PERCENTAGE OF AVERAGE ANNUAL RENEWABLE SUPPLY
50 100 150 200 250 300 350 40070
> 20
RENEWABLE SUPPLY
50 100 150 200 250
RESERVOIR STORAGE, IN MILLION ACRE-FEET
FIGURE 13. Relation of reservoir storage and regional safe yield for the Upper Mississippi Region. (Data from Lof and Hardison, 1966.)
the Nation, expressed as the sum of the normal capacities of all reservoirs larger than 5,000 acre-feet (U.S. Army Corps of Engineers, 1981) is shown in table 3. Normal capacity the capacity exceeded only during floods represents a desired storage level for the reservoir and, on average, is about two-thirds of the maximum capacity.
One index to the intensity of reservoir development is the normal reservoir capacity in the region per unit area in the entire region (table 3 and figure 14). Even if Alaska and Hawaii are excluded, the range of intensity of development between regions is considerable, ranging from about 24 acre-feet of reservoir capacity per square mile of land area in the Great Basin to 366 acre-feet per square mile in the Upper Colorado. Factors that influence the intensity of development include the availability of precipitation or of ground water, as opposed to surface water, to satisfy water demands, the magnitude of the renewable supply available for development, the existence of suitable reservoir sites, and political and institutional factors such as the establishment of the Tennessee Valley Authority. The upper limits to development of suitable sites among the regions appear to range from about 250 to about 500 acre-feet per square mile (Langbein, 1982).
Another way to view the distribution of reservoirs is to compare capacity to average renewable supply for each of the water-resources regions. The normal capacity of all of the reservoirs in the region can be expressed as a percent age of the average renewable supply of the region for a year. These percentages are given in table 3 and shown in figure 15. As mentioned above, the maximum safe yield of a region usually is obtained where capacity is from about 160 to 460 percent of average annual renewable supply. However, even where capacity is much lower than 160 percent of annual supply the gains in yield from building additional reservoir capacity can be quite low. Water transferred between regions is generally stored within the region from which it is exported. Therefore, the renewable supplies used in table 3 and figure 15 are adjusted by adding exports from each region and sub tracting imports to each region. These percentages in dicate that, with the exceptions of the Colorado and perhaps the Rio Grande basins, there is likely to be con siderable potential for increasing the regional safe yields by increasing reservoir capacity. Even in the Colorado and Rio Grande basins, it may be possible to provide for local increases in safe yield by increasing reservoir capaci ty on those tributaries where capacity is a low percentage of annual supply.
The following material on the historic trends and pros pects for reservoir development is largely from Langbein (1982). The growth in capacity of major reservoirs in the United States is shown in figure 16. The growth rate for total capacity averaged about 80 percent per decade from 1920 until the early 1960's. Since then, reservoir capacity has increased at a markedly slower rate.
Much of the growth in reservoir capacity, especially after 1930, took place in multipurpose reservoirs that pro vided economies of scale. This trend was made possible by a change in technology that increased the number of practical damsites. Early dam builders sought a stream that cut through a narrow or "box" canyon in hard rocks, or a broad lake with a narrow stream outlet, so that
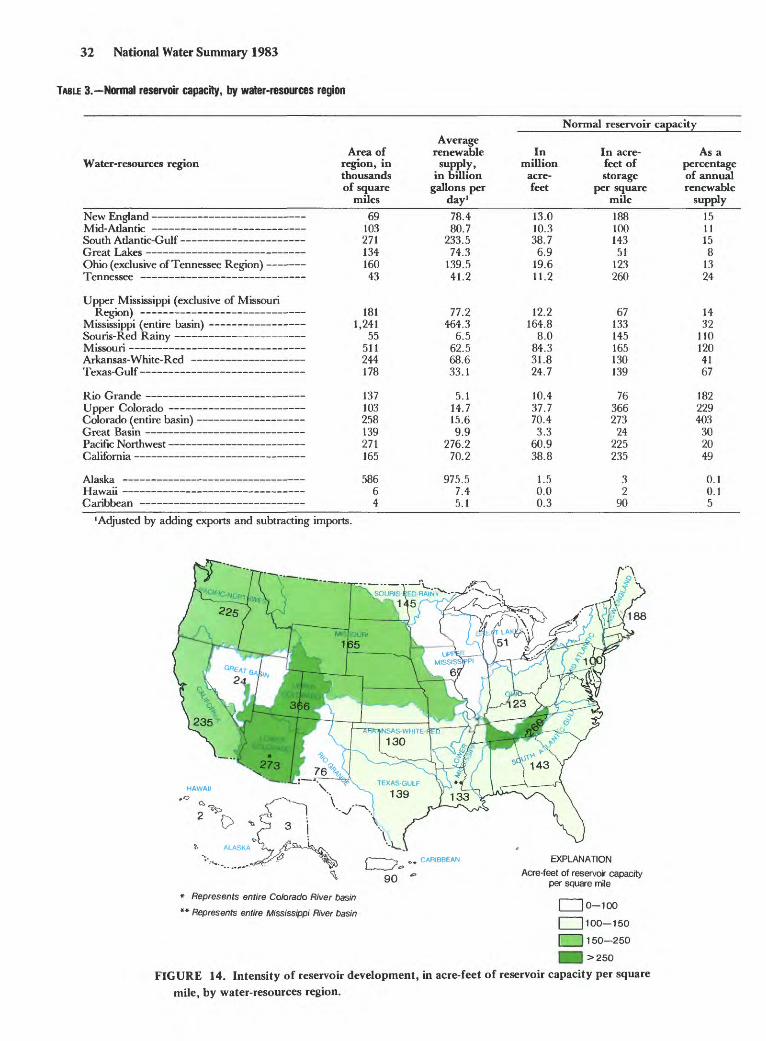
32 National Water Summary 1983
TABLE 3. Normal reservoir capacity, by water-resources region
Normal reservoir capacity
Water-resources region
M 17 1 A
South Atlantic-Gulf
Area of region, in thousands of square
miles
69
271
M.\J\J
d^
Average renewable
supply, in billion
gallons per day1
78.4 80.7
233.5 74.3
139.5dl 9
In million
acre- feet
13.0 10.3 38.7
6.9 19.61 1 9
In acre- feet of storage
per square mile
188 100 143
51 123 9sn
As a percentage of annual renewable
supply
15 11 15 8
1394.
Upper Mississippi (exclusive of MissouriRegion)
Mississippi (entire basin) Souris-Red Rainy -Missouri Arkansas- White- Red -Texas-Gulf -
Rio Grande -Upper Colorado Colorado (entire basin) -Great Basin -Pacific Northwest -California -
Alaska -Hawaii -Caribbean -
i- 181- 1,241- 55- 511- 244- 178
- 137- 103- 258- 139- 271- 165
- 586- 6. 4
77.2464.3
6.562.568.633.1
5.114.715.69.9
276.270.2
975.57.45.1
12.2164.8
8.084.331.824.7
10.437.770.43.3
60.938.8
1.50.00.3
67133145165130139
76366273
24225235
32
90
1432
1101204167
182229403
302049
0.10.15
'Adjusted by adding exports and subtracting imports.
EXPLANATION
Acre-feet of reservoir capacity per square mile
* Represents entire Colorado River basin
** Represents entire Mississippi River basinI [0 100
| [100 150
| | 150 250
j^l >250
FIGURE 14. Intensity of reservoir development, in acre-feet of reservoir capacity per square mile, by water-resources region.

Water-Availability Issues 33
EXPLANATIONReservoir capacity as a percentage
of annual renewable supplyI I 0-15
| | 15 50
| | 50 200
BH> 200
FIGURE 15. Normal reservoir capacity as a percentage of annual renewable supply, by water-resources region.
* Represents entire Colorado River basin** Represents entire Mississippi River basin
a small dam could impound a large volume of water. Over the years, however, less favorable sites (those hav ing a smaller capacity per unit volume of dam) have been developed, as indicated by the following data for the 100 largest reservoirs in the United States, listed by Mermel (1958).
Period
Reservoir capacity per unit volume of dam, in acre-feet per cubic yard
1920's and earlier 1930's 1940's - 1950's 1960's
10.4 2.1
.52
.45
.29
The above data show a steady and marked decline in the storage capacity (acre-feet) per unit of dam volume (cubic yards). This change in capacity-volume ratio for major reservoirs has been associated with a shift in kinds of dams. The narrow valley sites were suited to masonry
dams (gravity, arch, buttress, and so forth), whereas many of the the newer sites require broad-based earth-fill dams. The percentage of masonry dams decreased from over 90 percent before 1930 to about 10 percent since 1960.
Based on a number of intensive surveys, it is possible to estimate that an upper limit on reservoir capacity for the 48 conterminous States is about 1,200 million acre-feet, of which about 450 million acre-feet has already been devel oped. The remaining or potential 750 million acre-feet is likely to be high in cost, because the more cost-effective sites already have been developed. If so, the Nation's reservoir capacity may be gradually approaching a limit lower than the one suggested above.
Figure 17 compares the development of reservoir capacity for withdrawal purposes with the actual with drawals from surface-water supplies. Withdrawals and capacity are clearly related through 1970. But, in the decade 1970-80, capacity did not keep up with the con tinued increase in withdrawals. The historic relation in figure 17 appears to be shifting to one with a greater rate of withdrawal per unit of capacity. This suggests a

34 National Water Summary 1983
2000
1000
LLJ LLJ LLLLJ CCo
500
O <Q_ <Occ O ccLLJ CO LLJ CC
100
20
10
POTENTIAL LIMIT UNITED STATES RESERVOIR CAPACITY
1900 1920 1940 1960 1980 2000
FIGURE 16. Trend in reservoir capacity in major reservoirs in the conterminous United States since 1920. (From Langbein, 1982.)
decrease in reliability from less than a 2-percent chance of deficiency to greater than a 2-percent chance.
The rate of construction of surface reservoirs for the purpose of assuring water supplies (for municipalities, in dustries, and irrigation) has decreased, even though withdrawals of fresh surface water have continued to in crease at a steady rate during the past decade. In 1960, storage equaled 204 days of withdrawal (119 million acre- feet at 190 billion gallons per day); by 1970, storage was 216 days of withdrawal; but by 1980, it had fallen to 201 days. This is the first decline in the six decades for which records are available. A basic principle in reservoir plan ning is that the risk of deficiency will rise if the storage period is not increased as withdrawals increase. Thus, the
decreasing period of storage suggests a less-assured supply of water during critical periods when intensive conserva tion of use must be practiced. There are, however, other means for coping with less storage. There are a large number of multipurpose reservoirs where withdrawal is not now the primary purpose, and where a shift in the allocation could, of course, make additional capacity available to meet water-supply shortages in time of drought. Better management of existing capacity has potential for increasing reliable yields without increasing storage up to some limit (Toebes, 1981).
One example where better management of existing reservoir capacity has been found to be beneficial is the Washington, D.C., metropolitan area (American Society

Water-Availability Issues 35
200
I ILI I- CC
LESS THAN 2 PERCENT
1980
7950
1940
GREA TER THAN 2 PERCENT
0 100 200 300
FRESH SURFACE-WATER WITHDRAWALS, IN BILLION GALLONS PER DAY
FIGURE 17. Reservoir capacity for withdrawal purposes compared to fresh surface-water withdrawals for the conterminous United States, 1920 80. (Two-percent chance of deficiency line from Hardison, 1972.)
of Civil Engineers, 1983; Sheer, 1983). The area's water supply comes from three rivers the Potomac (with one reservoir 200 miles upstream), the Patuxent (Md.) with two reservoirs, and the Occoquan (Va.) with one reser voir. The sum of the safe yields of these three sources is estimated to be 513 million gallons per day, but require ments for water are expected to reach 750 million gallons per day by the year 2000. Through analysis of the com plete system intentionally ignoring certain of the exist ing institutional constraints of three separate supply agencies it was found that the existing engineering works could reliably supply water until the year 2030. Upon recognition of the large gains that could be achieved through flexible and integrated operations, the parties involved forged the necessary legal and financial agreements to make this possible. The savings are in ex cess of $200 million. The achievement of these savings relied heavily on techniques of water-resources engineering-systems analysis, such as linear programing, synthetic hydrology, statistical analysis, hydrologic modeling, long-range probabilistic forecasting, and com puter simulation.
In summary, figure 17 indicates a lessening role of reservoirs in the development of water resources in the near future. The trend toward nonstructural measures places greater dependence on management skill and on understanding the nature of river behavior, including better river forecasting. At some point in the future, the potentials of conservation and better management may become less cost effective than reservoirs. If so, the flat tening of the curves in figure 16 would be seen as merely an inflection along a generally upward trend in reservoir capacity, although at a rate slower.
Aerial view of Glen Canyon Dam and Lake Powell (looking up stream) at full elevation of 3,700 feet. Both spillways are operating. (Photograph by Bureau of Reclamation.)

36 National Water Summary 1983
Selected ReferencesAmerican Society of Civil Engineers, 1983, Water supply: Civil
Engineering, v. 53, p. 50-53. Hardison, C. H., 1972, Potential United States water-supply
development: American Society of Civil Engineers, Irrigationand Drainage Division Journal (IR), v. 98, p. 479-492.
Langbein, W. B., 1959, Water yield and reservoir storage in theUnited States: U.S. Geological Survey Circular 409, 5 p.
____1982, Dams, reservoirs, and withdrawals for watersupply historic trends: U.S. Geological Survey Open-FileReport 82-256, 9 p.
Lof, G. O., and Hardison, C. H., 1966, Storage requirementsfor water in the United States: Water Resources Research, v.2, p.323-354.
Mermel, T. W., 1958, Register of dams in the United States:New York, McGraw-Hill Book Company, 429 p.
Sheer, D. P., 1983, Assured water supply for the WashingtonMetropolitan area: Rockville, Maryland, Interstate Commis sion on the Potomac River Basin, 45 p.
Toebes, G. H., ed., 1981, Proceedings of the national workshopon reservoir systems operations, August 1979: New York,American Society of Civil Engineers, 595 p.
U.S. Army Corps of Engineers, 1981, National inventory ofdams (computerized data base).
GROUND-WATER DEVELOPMENT
Under natural conditions, the ground water in the saturated zone, below the water table, generally is in mo tion from areas of recharge to points of discharge at the surface (see fig. 1). The movement normally occurs as slow seepage or percolation through the intergranular pore space of water-bearing units, or through networks of fractures or solution openings. Normally, recharge to the ground-water system is widely dispersed; discharge is usually to streams, although it also may occur as evapotranspiration by plants or as direct seepage to the sea in coastal areas. Under natural conditions, an equilibrium generally prevails in which the long-term recharge to the ground-water system is balanced by the long-term discharge from it. The ground-water flow regime is characterized by superimposed patterns of cir culation, ranging from shallow, local flow into small upland streams, to deep regional circulation toward major drainage features.
In addition to its capacity to transmit water, the earth provides a capacity to accumulate water in storage, and to release it as water levels fall. Three major mechanisms are involved. The most obvious of these is the change in volume of water in an unconfined aquifer as the water table rises and falls. A less familiar mechanism is that of artesian storage, which occurs in confined aquifers through elastic expansion and contraction of the porous framework, and of the water itself, in response to pressure changes (Jacob, 1940). The volumes of water stored or released in artesian aquifers are much smaller than those in unconfined aquifers, for equal changes in water level; however, the mechanism is fundamental in determining the response of ground-water systems to development. Finally, water can be withdrawn from storage in conjunc tion with the irreversible compaction of certain fine grained sediments as pressure is reduced. This process is always accompanied by subsidence of the land surface.
When pumpage of ground water is initiated, the im mediate response is a withdrawal of ground water from storage that is, a disruption of the natural equilibrium in the aquifer (Theis, 1940). As water is withdrawn from storage, ground-water levels decline; this in turn causes a reduction in the natural discharge to streams, to the sea, or to evapotranspiration, and may sometimes also bring about increases in recharge. As natural discharge dimin ishes and as recharge increases, the amount of water that must be withdrawn from storage to supply the pumpage decreases. In effect, water that was formerly directed toward natural avenues of discharge is now diverted to the pumping centers, and increases in recharge may pro vide an additional source to sustain the pumpage. Ultimately, withdrawal from storage may cease, and a new equilibrium may be established in which the new rate of recharge balances the pumpage and the remaining natural discharge. On the other hand, if the pumping rate exceeds the reductions in natural discharge and the in creases in recharge that can be effected in the system, withdrawal from storage will continue until falling water levels force a reduction in pumping rates. An equilibrium is then established in which the remaining natural discharge and this reduced pumping rate are balanced by the recharge. In many applications, of course, a part of the pumpage is returned to the aquifer or to streams after a cycle of use. To the extent that this occurs, the impact of the pumpage on water supply is reduced; however, it fre quently is replaced by an impact on water quality.
In coastal areas, and in some inland areas, the avail ability of ground water is influenced by the possibility of saline-water intrusion. This phenomenon is discussed fur ther in the section on water-quality issues. In certain en vironments, moreover, the development of ground water is limited by the potential for land subsidence or the development of sinkholes. These processes are discussed in the section on hydrologic hazards and land use.
A great deal of use has been made of the terms "over development" and "safe yield" with regard to ground- water development. As it is often used, "safe yield" seems to refer to the pumpage that can be sustained at equilibrium, without continued withdrawal from storage. However, sustained withdrawal from storage or, as it is often termed, "ground-water mining," is no more "un safe" than the mining of any other mineral resource, pro vided it is recognized and planned. Neither should pump- age at equilibrium necessarily be considered "safe," unless the attendant impacts, such as reduced streamflow or degradation of water quality, are deemed acceptable. The expression "safe yield" can, in fact, only be defined in terms of specific impacts of pumpage. The conse quences of pumpage must be assessed for each level of development, and "safe yield" must be taken as the max imum pumpage for which the consequences are consid ered acceptable. The term "overdevelopment" then im plies pumpage beyond that maximum.
Where the goal is pumpage at equilibrium, economic or environmental constraints may actually preclude the attainment of that goal. For example, in order to achieve a given reduction in natural outflow, it may be necessary to create extensive drawdowns within the ground-water system; the well distribution and pumping lifts required

Water-Availability Issues 37
to generate these drawdowns may be economically in- feasible. Again, in creating the required drawdowns, it may be necessary to remove so much water from storage as to generate unacceptable side effects, such as excessive land subsidence.
Ground-water development usually is uneven, both in space and in time. Locally, pumpage can exceed the reduction in natural outflow, but a regional equilibrium can still exist provided the reduction over the full region or basin balances the withdrawal. Viewing the system through time, a long-term equilibrium may involve fre quent temporary withdrawals from storage, balanced by intervening additions to storage. In this connection, it is worth noting that the high ratio of total storage to either withdrawal or natural discharge is one of the beneficial characteristics of the ground-water system, enabling sup plies to be maintained through long periods of drought.
The volume of ground water in storage in the upper one-half mile of the Earth's crust within the conterminous United States has been estimated to be on the order of 50,000 cubic miles. The recharge or in effect, the rate of flow through the ground-water system has been esti mated to be on the order of 1 trillion gallons per day (Nace, 1960). The estimated volume of water in storage must be qualified by noting that some of the water is highly saline and unfit for most uses. Moreover, the esti mated recharge or flow rate includes a large percentage of very shallow circulation, which presently discharges to streams without reaching major aquifers; only a part of this shallow circulation could be recovered by wells.
The pumpage of fresh ground water in the United States in 1980 is estimated as approximately 88 billion gallons per day (Solley and others, 1983), which is on the order of 10 percent of the estimated natural flow through the Nation's ground-water systems. From the national perspective, therefore, the resource is not overdeveloped; locally, however, the situation can vary widely, and a number of problems exist.
Pumpage has increased steadily over the last three decades, as shown in figure 18. (Figure 18 was developed using data collected at 5-year intervals and does not in dicate yearly variations occurring within those intervals.) The total pumpage of ground water in 1980 represented about 20 percent of the total withdrawal of fresh and saline water in the United States. The largest single use of ground water is for irrigation, which accounted for slight ly more than 60 bgd in 1980. It is important to note, however, that although irrigation represents the largest withdrawal, roughly half of the population of the country relies on ground water for domestic supply. Some of the factors responsible for the continued increase in ground- water use include significant expansion of irrigation in the humid East as well as in the West, particularly through the increased use of center-pivot systems; water-supply requirements of growing urban areas, particularly in the South and Southwest; water demands associated with energy production; a desire to establish drought-resistant supplies; objections to the construction of surface reser voirs; and objections to export of water from one area to another.
Figure 19 shows the areal distribution of ground-water pumpage in the United States in 1980 by water-resources
subregion (U.S. Geological Survey, 1982). About two- thirds of the 1980 pumpage, or approximately 60 bgd, was concentrated in eight States, as follows: California (21 bgd); Texas (8 bgd); Nebraska (7.2 bgd); Idaho (6.3 bgd); Kansas (5.6 bgd); Arizona (4.2 bgd); Arkansas (4 bgd); and Florida (3.8 bgd). For the most part, these figures reflect the extensive use of ground water for irriga tion in those States.
Areas of the United States where ground-water levels have declined 40 feet or more in at least one aquifer since development began are shown in figure 20. Many of the areas are underlain by more than one aquifer, and declines of this magnitude have not necessarily occurred in all aquifers present. In most of the areas, the decline has occurred in an interval substantially deeper than the water table that is, the declines represent artesian or semiconfined water-level changes. As such, they indicate an increase in depth to water, which has implications in terms of pumping lift; however, because artesian proc esses were involved, they do not indicate the loss of large amounts of water from storage. It should also be noted that, in many areas, the indicated change in water level took place many years ago, during the initial stages of development, and that today water levels in those areas are virtually stable. For example, in South Dakota, the indicated widespread change in water level represents drawdown that occurred in the Dakota aquifer in the early part of the century, as the aquifer was developed by flowing wells. The declines shown in Iowa and in the Chicago-Milwaukee area represent drawdowns that have been developing in deep artesian aquifers over a period of
1950 1955 1960 1965 1970 1975 1980
FIGURE 18. Trends in ground-water withdrawals in the United States, 1950-80. (Data from Solley and others, 1983.)
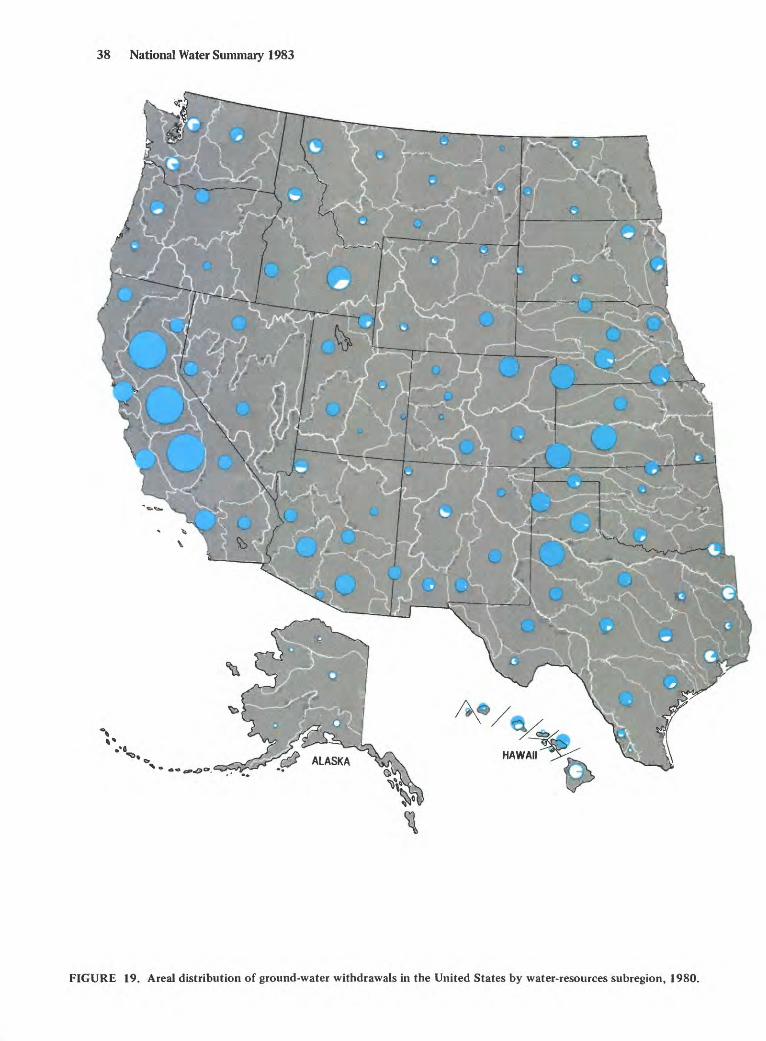
38 National Water Summary 1983
FIGURE 19. Areal distribution of ground-water withdrawals in the United States by water-resources subregion, 1980.

Water-Availability Issues 39
EXPLANATION
Ground-water withdrawals, by water-resources subregion, in million gallons per day
10-100 101-1000
1001-2000
2001-4000
>4000
9 Water used for irrigation
O Water used for all other purposes
PUERTO RICO
VIRGIN ISLANDS

40 National Water Summary 1983
FIGURE 20. Areas of water-table decline or artesian water-level decline in excess of 40 feet in at least one aquifer since predevelopment.
decades; these drawdowns extend outward into forma tions which underlie Lake Michigan.
For the High Plains region of Kansas, New Mexico, Oklahoma, and Texas, and for the alluvial basins of southern Arizona, on the other hand, the water-level changes shown on figure 20 represent drawdown of the water table. In these areas, very large volumes of water have been and continue to be withdrawn from storage. For California, some of the water-level changes represent water-table declines, whereas some represent drawdown in compacting horizons, with associated land subsidence. Substantial volumes of water have been removed from storage in some parts of California, but these volumes represent a relatively small percentage of the total quan tity of water that has been pumped in the State.
The effects of development in a few selected regional ground-water systems (see fig. 21) are discussed below. The data given for pumpage, recharge, depletion from storage, and other hydrologic quantities are current work ing estimates from ongoing U.S. Geological Survey stud ies and are subject to revision as investigations continue.
The High Plains (fig. 21) is a 174,000-square-mile area of flat to gently rolling terrain east of the Rocky Moun tains. It includes parts of Colorado, Kansas, Nebraska, New Mexico, Oklahoma, South Dakota, Texas, and Wyoming. For purposes of discussion, the area has been subdivided into the southern, central, and northern High Plains regions, indicated on figure 21 as Al, A2, and A3, respectively.
The area is characterized by moderate precipitation, but by generally sparse recharge to the ground-water system. The region is underlain by unconsolidated alluvial deposits that form a water-table aquifer capable of sustaining well yields of 100 to more than 1,000 gallons per minute. Irrigation has made the High Plains one of the Nation's leading agricultural areas.
Around 1940, a rapid expansion in the use of ground water for irrigation began in the southern High Plains, spreading to the central High Plains in the 1950's and to the northern High Plains in the 1960's. In 1949, about 2 million acres in the High Plains was irrigated by 4 million acre-feet of ground water. By 1980, about 170,000 wells pumped 18 million acre-feet of water to irrigate 13 million acres (Heimes and Luckey, 1983).
In the southern High Plains, approximately 210 mil lion acre-feet of water was pumped from 1940 to 1980. Of this amount, it is estimated that roughly 43 percent was supplied by withdrawal of ground water from storage and 45 percent by field seepage that is, local recirculation of part of the applied irrigation water back to the water table. The remaining 12 percent was supplied by diver sion of natural ground-water discharge as the water table declined and by increases in recharge (other than that from field seepage). In the latter category, the most important factor appears to have been recharge associated with flooding in the early 1970's.
In the central High Plains, about 96 million acre-feet of water was pumped between 1950 and 1980. Withdrawal

Water-Availability Issues 41
EXPLANATION
A High Plains
A 1 Southern High Plains
A2 Central High Plains
A3 Northern High Plains
B Central Valley
C Southeastern Carbonate Aquifers
D Atlantic Coastal Plain
E Basin and Range Lowlands, Arizona
FIGURE 21. Regional ground-water systems discussed in the National Water Summary 1983.
from storage accounted for about 57 percent of this amount, field seepage for about 39 percent, and de creased natural discharge or increases in recharge for 4 percent. The differences in source of water between the central and southern High Plains appear to be associated primarily with the flooding event mentioned above.
In the northern High Plains, approximately 105 million acre-feet of water was pumped from 1960 to 1980. About 14 percent of this volume was provided by withdrawal from storage; about 36 percent by field seepage from ground-water irrigation; approximately 9 percent by field seepage, reservoir seepage, and con veyance losses in surface-water irrigation systems; arid 41 percent by other recharge increases or by decreased natural discharge. Several factors contribute to the dif ferences between the northern High Plains and the southern and central High Plains. For example, much more surface-water irrigation occurs in the north than in
the central or southern regions. In the north, moreover, the recharge and natural ground-water discharge were higher prior to irrigation than in the central or southern High Plains, providing a greater potential for diversion of natural discharge to wells. Throughout the High Plains there appear to have been increases in recharge due to changing land-use practices for example, increased in filtration as more land is brought under cultivation and there is some evidence to indicate that these processes have had a greater impact in the north. Finally, irrigation in the north began substantially later than in the southern or central High Plains, and the intensity of pumpage per square mile is still much lower in the north.
The withdrawals from storage in the southern and cen tral High Plains have been accompanied by widespread declines in water level, to the point that the aquifer has been dewatered by more than 50 percent in over 3,500 square miles in Kansas, New Mexico, and Texas (Luckey

42 National Water Summary 1983
and others, 1981). These declines have acted in two ways to increase the cost of water to irrigators: Increased pumping lifts have generated higher energy costs and, as the saturated thickness of the aquifer has decreased, the yields of individual wells have diminished, and additional wells have had to be drilled to maintain the supply. These increases in costs of water may be thought of as economic pressures that (barring artificial recharge with imported water) will gradually force reductions in ground-water withdrawals. Because economic pressures tend to build gradually, the pumpage can be expected to decline gradu ally, rather than to cease abruptly as supplies are ex hausted. This process is, in fact, already occurring; pumpage has decreased by 11 percent since 1964 in the southern High Plains. In a continuing effort to adjust to the condition of decreasing pumpage, growers have sought ways to reduce their needs for water for exam ple, by installing more efficient irrigation systems, or by shifting to crops having lower water demands.
The subjects of water importation and artificial recharge are often brought up in discussions of the southern High Plains. Although an analysis of these sub jects is beyond the scope of this report, the use of such methods would clearly be governed by economic factors. The importation of water involves certain costs, as do the processes of storing it in the aquifer and retrieving it by pumpage. The fundamental question is whether these costs would permit irrigation water to be delivered at economically realistic prices.
The Central Valley of California (fig. 21, area B) presently is the most heavily pumped contiguous area in the country. The valley is a structural basin 20,000 square miles in extent, filled with sediments that form a heterogeneous but unified aquifer system, in which ground water occurs under both water table and semicon- fmed conditions. Many of the sediments are susceptible to compaction in response to the withdrawal of water, and land-subsidence problems have characterized ground- water development in a large part of the valley. The area is devoted to irrigated agriculture and accounts for a large fraction of the Nation's production of fruits, nuts, and vegetables.
Prior to development, the ground-water-flow patterns in the valley involved recharge from precipitation and from stream seepage in the higher areas, and discharge to streams and to evapotranspiration in the central part of the valley. Total circulation through the ground-water system was on the order of 2 million acre-feet of water per year.
The growth of irrigation from surface- and ground- water sources profoundly altered the original ground- water flow system in the valley. Pumpage gradually be came the major mechanism of discharge, whereas field seepage and conveyance losses from the irrigation system became the major sources of recharge. In the present- day flow regime, the circulation of water through the ground-water system is several times its value prior to development.
During the period from 1961 to 1978, approximately 22 million acre-feet of water per year was supplied for ir rigation in the Central Valley. On the average, roughly half of this amount was diverted from surface-water
sources, and half was pumped from wells, although the ratio varied with the availability of surface supplies. The recharge to the ground-water system during this period averaged approximately 11 million acre-feet per day, of which 82 percent was return flow from irrigation (in cluding conveyance losses from the surface-water distribution system and field seepage), 14 percent was in filtration of precipitation, and 4 percent was seepage from streams. Discharge from the system in this period was slightly greater than total recharge, averaging 11.8 million acre-feet per year; of this amount, 94 percent represented irrigation pumping, 3 percent was municipal and industrial pumpage, and 3 percent was seepage into streams. Over the period from 1961 to 1978, therefore, an average of 800,000 acre-feet of water per year was withdrawn from ground-water storage in the valley. Roughly half of this amount was supplied by drawdown of the water table, and half by drainage from compacting sediments, accompanied by land subsidence. Clearly, most of the pumpage during this period was supplied by increases in recharge (chiefly through irrigation return flow) or by the diversion of natural discharge; only about 7 percent of the total pumpage was withdrawn from storage.
Since 1978, generally wet conditions in California have increased recharge to the ground-water system, reduced irrigation requirements, and increased surface-water sup plies, thus reducing the need for irrigation pumpage. In dications are that these factors have at least produced a condition of hydraulic equilibrium in the ground-water system, and may actually be causing a temporary accre tion of ground water in storage.
The mechanism of the compaction and land-subsidence process is discussed in a later section of this report. From the perspective of using ground water without inducing further subsidence, the significant point is that ap preciable subsidence results only if water levels are drawn down below any previously experienced level in the locali ty (Poland and Davis, 1969). This characteristic of the subsidence mechanism, coupled with the fact that the ground-water system in the Central Valley has been at or close to equilibrium through much of its recent history, indicates that, with proper management, ground water can be used extensively even in subsidence-prone areas of the valley. During dry periods, when irrigation re quirements increase and surface-water supplies are limited, pumpage of ground water from storage can be in creased to maintain a stable supply. In subsequent wet periods, pumpage can be reduced and recharge allowed to replenish the ground-water system. In subsidence- prone areas, pumpage from semiconfined zones must be carried out under the constraint of not exceeding the previously recorded maximum drawdown, if further sub sidence is to be avoided.
Florida, southern and eastern Georgia, and small adja cent areas in South Carolina and Alabama are underlain by a regional aquifer (fig. 21, area C) that has been developed extensively for agricultural, industrial, and municipal supply (Cederstrom and others, 1979). The aquifer consists of a composite of carbonate (limestone and dolomite) formations, within which are zones with excellent water-bearing characteristics. The humid

Water-Availability Issues 43
climate and generally flat topography combine to provide abundant recharge to the system.
The aquifer is found at shallow depths over a broad area in southwestern Georgia and in the northwestern quarter of the Floridan peninsula, but dips away from this area to the east, south, and west, and is found at depths of several hundred feet in southern Florida and coastal Georgia. Where the aquifer is near land surface, it func tions essentially as an unconfined water-table system; its characteristics change to those of a semiconfined artesian system as depth below land surface increases. Where it is unconfined, the aquifer is characterized by shallow flow patterns in which most of the recharge entering the system is discharged locally to springs, streams, swampy areas, near-shore submarine seepage, or (in the modern flow regime) to wells. In upland areas, however, a part of the recharge to the unconfined system moves downward into artesian zones of the aquifer, where it joins regional flow patterns toward more distant coastal and offshore discharge areas. Further accretion of recharge to the arte sian system occurs by downward seepage through the semiconfining materials, particularly where those materials are breached by fractures or solution openings, and are overlain by shallow water-bearing zones. Natural discharge from the artesian system is provided by upward leakage through the semiconfining materials, particularly in coastal areas, where the flow eventually reaches estuaries, bays, coastal swamps, or the ocean; as in the unconfined system, discharge by wells is a major factor in the present-day artesian regime.
Throughout much of the region, the effective lower boundary of the aquifer is actually a transition from cir culating freshwater to underlying saline water. The con figuration of this transition zone agrees in general with the principles outlined by Hubbert (1940) for the case of an interface between moving freshwater and static saline water. That is, the transition is deepest beneath recharge areas in central Florida and southeastern Georgia; it rises toward the coastlines in the general direction of ground- water flow. Brackish or saline water extends to the top of the aquifer along the western and southeastern coasts of Florida, and throughout the area south of Lake Okee- chobee. On the other hand, the transition zone extends more than 50 miles off the coast of northeastern Florida, and freshwater under artesian conditions is found in the aquifer to these distances offshore (Johnston and others, 1982).
The limestone has been widely developed for water supply, to the extent that about three billion gallons of water per day are presently withdrawn from the system. A number of cities, including Brunswick and Savannah in Georgia and Daytona Beach, Jacksonville, Orlando, and St. Petersburg in Florida, depend on the aquifer for public supply. Moreover, pumpage from the aquifer for industrial and agricultural uses exceeds that for municipal supply. As a result of pumpage, water levels have been lowered in three broad areas centered in coastal Georgia, west-central Florida, and the Florida panhandle. (John ston and others, 1980, 1981) Despite these drawdowns, most of the water pumped from the aquifer during the course of development has been supplied by the diversion of natural outflow or by increased recharge not by with
drawal of water from storage and the present system ap pears to be approximately at equilibrium.
It is estimated that prior to development, about 13.5 bgd circulated through the carbonate aquifer system (Bush, 1982). The bulk of this amount was discharged directly from the limestones to springs, streams, and swamps in areas where the aquifer is near land surface. In response to the pumpage, inflow to the aquifer has been increased above predevelopment levels by about 1.6 bgd; this increase in recharge represents seepage from surface- water bodies, or water diverted into the artesian system from overlying shallow ground-water bodies. Direct natural discharge from the limestone aquifer by springs and streams has decreased by about 0.7 bgd, whereas seepage from the limestones to coastal or offshore discharge has decreased by an equal amount. Figures in dicate that the original flow system has not been changed extensively by the pumpage, which actually represents only about 20 percent of the present flow through the aquifer. Morever, the response to further development will involve new increases in recharge or diversions of natural discharge, rather than sustained storage withdrawals. In some areas, the possibility of local saline- water encroachment must be considered in planning ad ditional development.
Because the artesian system contains saline water in southern Florida, it is not used for water supply in that area. Rather, extensive pumpage has been developed from shallow aquifers, particularly in the Miami-Ft. Lauderdale-Palm Beach area.
The Atlantic Coastal Plain (fig. 21, area D) is a gently rolling to flat region of approximately 70,000 square miles that extends along the Atlantic Coast from Long Island to eastern Georgia. Ground water is an important source of water supply throughout the region for municipal, indus trial, and rural domestic uses, and increasingly for crop irrigation. Present withdrawals appear to be only a small fraction of fresh ground-water supplies available from the region under managed programs of development.
The Coastal Plain is underlain by a wedge of forma tions composed mostly of unconsolidated deposits of clay, silt, sand and gravel. The formations dip and thicken seaward, and extend outward on the continental shelf beneath the ocean. Total thickness of the formations along the coast of Delaware is about 8,000 feet and at Capt Hatteras, N.C., about 10,000 feet; in southeastern South Carolina, the sands and clays interfinger with and grade into the carbonate formations discussed above. The sands, gravels, and some of the more permeable silts function as aquifers, whereas the clays and finer silts act as semiconfining beds. The aquifers are essentially un confined in their outcrop areas, but take on an increasing ly semiconfined character downdip as the thicknesses of clay increase. Despite the occurrence of semiconfined conditions, the entire sequence of sediments comprises an integrated aquifer system, characterized by both local and regional flow patterns.
Precipitation along the Coastal Plain is on the order of 40-55 inches per year; infiltration to the ground-water system is largely in the range from 10 to 25 inches per year. Under natural conditions, most of this water moves in shallow patterns of circulation through the uppermost

44 National Water Summary 1983
deposits, and discharges to the streams that dissect the Coastal Plain; however, a small percentage of the infiltra tion recharges the deeper semiconfined aquifers. Dis charge from the deeper aquifers is primarily by upward leakage across the semiconfining clays into the sea or into coastal estuaries and bays. The circulating freshwater grades into saline water through a complex sequence of transition zones; freshwater can be found many miles off shore in some zones, whereas saline water can be found at depth beneath many inland areas.
Pumpage from coastal-plain aquifers in 1900 is esti mated to have been about 100 million gallons per day. Pumpage has grown steadily since that time, and total pumpage in 1980 is estimated to have been slightly less than 1.5 billion gallons per day. The greatest pumpage is in the more densely populated States in the northern part of the region; pumpage from Long Island and from New Jersey accounted for 450 and 360 million gallons per day, respectively, in 1980. Areas of major water-level decline resulting from pumpage are found in every Coastal Plain State.
The response to pumpage from deeper aquifers has followed a generally similar pattern throughout the area from New Jersey south to the Carolinas. Following each increase in pumping rate in any locality, water has been released from storage in the aquifers, and water levels have declined. These declines have spread updip toward the aquifer outcrop areas; as this has occurred, some of the recharge that formerly discharged to streams has been diverted toward the points of withdrawal. Also, but gen erally to a lesser extent, water that formerly discharged upward through the semiconfining beds in coastal areas has been diverted to sustain the pumpage. These reduc tions in natural discharge have acted to move the system toward a new equilibrium. Frequently, however, before such an equilibrium could become fully established, new increases in pumpage triggered new withdrawals from storage and new cycles of water-level decline. As a result, in some areas there has been a relatively steady decline of water levels in the semiconfined aquifers since 1900. De spite these declines, a very small percentage of the water pumped to date has been supplied by withdrawal of ground water from storage there has been very little ground- water mining. Most of the water that has been pumped has been derived from reduced natural discharge particularly from reduction in ground-water seepage into streams in updip areas.
The ground-water regime, in effect, has been utilized as a transmission system to bring water from updip areas to the point of use, and also has been used to provide tem porary storage during periods of low surface supply. While withdrawals of ground water from storage have not been significant volumetrically, there is evidence of minor land subsidence in some areas in association with those withdrawals. In many areas, some movement of the freshwater-saltwater transition zone has accompanied ground-water development.
The situation on Long Island differs somewhat from that in other areas of the coastal plain. The semiconfined aquifers that have been most heavily pumped on Long Island are in better hydraulic connection with the surface, and the development of ground water has been more in
tense than in other parts of the coastal plain. The changes in the flow system due to pumping have tended to be more uniform and have involved a higher proportion of reduced outflow to coastal areas. In Nassau and Suffolk Counties, much of the water pumped during the course of development was returned to the ground-water system through cesspools and septic systems; the completion of sewer systems during recent years in these areas has, in effect, increased net withdrawals of ground water, and can be expected to cause further reductions in natural ground-water discharge to streams and coastal areas.
Further development of ground water in the coastal plain can be expected to follow patterns similar to those that have occurred in the past. Sustained withdrawals from storage will not represent a major part of any new pumpage. On the other hand, increased drawdown of water levels will be required to divert additional water to the pumping centers. The possibility of saline-water encroachment may also place constraints on further development.
The semiarid basin and range lowlands of Arizona (fig. 21, area E) cover an area of about 50,000 square miles and constitute the most heavily pumped region in the State (Davidson, 1979). Irrigated agriculture accounts for most of the water use in the region; ground water and surface water are used, with ground water accounting for nearly two thirds of irrigation applications. In recent years, competition for water has developed between irri- gators and rapidly growing municipalities. Metropolitan Tucson is dependent entirely on ground water for its sup ply; more than half of the supply of the Phoenix Metro politan Area is derived from ground water.
The region is characterized by rugged mountain ranges separated by more than 30 broad sediment-filled basins. Vast quantities of ground water are stored in the sedi ments, under both unconfined and semiconfined condi tions. Potential evapotranspiration greatly exceeds rain fall over most of the area, and only limited amounts of water are available as natural recharge to the ground- water system. Thus, extensive withdrawal of ground water from storage has accompanied development in the region.
In 1981, about 5.2 million acre-feet of ground water were pumped in this region, of which slightly more than 4.4 million acre-feet were used for the irrigation of crops. The current annual rate of depletion of ground-water storage in the region is estimated to be slightly more than 2 million acre-feet per year, or roughly 40 percent of the pumpage. As an average for the entire region, decreases in natural ground-water discharge and increases in recharge (seepage from streams) are estimated to account for about 20 percent of the pumpage. Thus, on the order of 40 percent of the pumpage is supplied by irrigation return flow, including conveyance losses from the surface- water distribution system and field seepage. Within in dividual basins, the percentages of pumpage derived from storage depletion, irrigation return flow, increases in recharge, and decreases in natural discharge may vary substantially from these regional averages.
A number of hydrologic changes have resulted from withdrawals of ground water in the region. Ground-water levels have declined as much as 400 feet in some places

Water-Quality Issues 45
since the 1940's, and rates of water-level decline have been as great as 8 feet per year. In many areas, water- level declines have altered the natural flow patterns that existed prior to development, creating a series of individ ual flow systems, each one located near a pumping center. In some areas of extensive water-level decline, the land surface has subsided as much as 12 feet, and earth fissures have caused damage to public and private property.
The basin and range lowlands of Arizona have de pended upon withdrawal of ground water from storage to sustain irrigation and municipal supplies for many decades. Concerns over land subsidence, together with the self-limiting factors inherent in ground-water storage depletion declining well yields and rising energy costs for pumping lift are already acting to bring about reductions in the rate of withdrawal.
In summary, patterns of ground-water development in the Nation have varied between two general conditions. In water deficient areas, such as southern Arizona and the southern High Plains, long-term withdrawal of ground water from storage (ground-water mining) has supplied agricultural and municipal needs for many decades. These withdrawals cannot be sustained indefinitely. Decreases in pumpage are already taking place as falling water levels cause well yields to decrease and pumping costs to rise. On the other hand, in humid areas such as Florida and the Atlantic Coastal Plain, ground-water development lias redistributed the natural flow pattern, so that water which originally discharged to streams, to the sea, or by evapotranspiration is now diverted to well fields. In these areas, the ground-water system conveys water from source areas to points of use, and provides short-term storage during drought; however, the net depletion of ground water in storage has been small, from predevelopment to the present. In the Central Valley of California, ground-water development has followed a course somewhere between these two conditions. Sub stantial withdrawals of ground water from storage have occurred in the past in the Central Valley, but the system appears to be near equilibrium at present. Conjunctive use of surface and ground water, in which short-term withdrawals from ground-water storage are used to make up deficiencies during dry periods, should be possible on a sustained basis in the future.
Selected ReferencesBush, P. W., 1982, Predevelopment flow in the Tertiary
limestone aquifer, southeastern United States; a regional analysis from digital modeling: U.S. Geological Survey Water-Resources Investigations 82-905, 41 p.
Bear, Jacob, 1979, Hydraulics of groundwater: New York, McGraw-Hill Book Company, 569 p.
Cederstrom, D. J., Boswell, E. H., and Tarver, G. R., 1979, Summary appraisal of the Nation's ground water resources South Atlantic-Gulf Region: U.S. Geological Survey Professional Paper 813-0, 35 p.
Davidson, E. S., 1979, Summary appraisals of the Nation's ground-water resources Lower Colorado Region, U.S. Geological Survey Professional Paper 813-R, 23 p.
Freeze, R. A., and Cherry, J. A., 1979, Groundwater: Englewood Cliffs, New Jersey, Prentice-Hall, Inc., 604 p.
Heimes, F. J., and Luckey, R. R., 1983, Estimating 1980 ground water pumpage for irrigation on the High Plains in
parts of Colorado, Kansas, Nebraska, New Mexico, Okla homa, South Dakota, Texas, Wyoming: U.S. Geological Survey Water-Resources Investigations 83-4123, 36 p.
Hubbert, M. K., 1940, The theory of ground water motion: Journal of Geology, Volume XLVIII, No. 8, Part 1, p. 785-944.
Jacob, C. E., 1940, On the flow of water in an elastic artesian aquifer: American Geophysical Union Transactions, v. 21, part 2, p. 574-586.
Johnston, R. H., Bush, P. W., Krause, R. E., Miller, J. A., and Sprinkle, C. L., 1982, Summary of hydrologic testing in Tertiary limestone aquifer, Tenneco offshore exploratory well Atlantic OCS, Lease-Block 427, U.S. Geological Survey Water-Supply Paper 2180, 15 p.
Johnston, R. H., Healy, H. G., and Hayes, L. R., 1981, Potentiometric surface of the Tertiary limestone aquifer system, southeastern United States, May 1980: U.S. Geolog ical Survey Open-File Report 80-486, 1 map.
Johnston, R. H., Krause, R. E., Meyer, F. W., Ryder, P. D., Tibbals, C. H., and Hunn, J. D., 1980, Estimated poten- tiometric surface for the Tertiary limestone aquifer system, southeastern United States, prior to development: U.S. Geo logical Survey Open-File Report 80-406, 1 map.
Luckey, R. R., Gutentag, E. D., and Weeks, J. B., 1981, Water-level and saturated thickness changes, predevelopment to 1980 in the High Plains aquifer in parts of Colorado, Kansas, Nebraska, New Mexico, Oklahoma, South Dakota, Texas, and Wyoming: U.S. Geological Survey Hydrologic Investigations Adas 652, 2 sheets.
McGuinness, C. L., 1963, The role of ground water in the na tional situation: U.S. Geological Survey Water-Supply Paper 1800,1121 p.
Nace, R. L., 1960, Water management, agriculture, and ground-water supplies: U.S. Geological Survey Circular 415, 12 D.
Poland, J. ! '., and Davis, G. H., 1969, Land subsidence due to the withdrawal of fluids, in Varnes, D. J., and Kiersch, G., eds., Reviews in Engineering Geology, v. 2: Boulder, Colo., Geo logical Society of America, p. 187-269.
Solley, W. B., Chase, E. B., and Mann, W. B., IV, 1983, Estimated use of water in the United States in 1980: U.S. Geological Survey Circular 1001, 56 p.
Theis, C. V., 1940, The source of water derived from wells; essential factors controlling the response of an aquifer to development: Civil Engineering, v. 10, no. 5, p. 277-280.
U.S. Geological Survey, 1982, Codes for the identification of hydrologic units in the United States and the Caribbean out lying areas: U.S. Geological Survey Circular 878-A, 115 p.
Walton, W. C., 1970, Groundwater resource evaluation: New York, McGraw-Hill, Inc., 664p.
WATER-QUALITY ISSUESWater quality is intimately associated with water
availability because quality ultimately determines the usability of the water for a specific purpose. The quality of surface and ground water also is closely linked because a large part of the Nation's streamflow is supplied by ground water that discharges directly into streams (McGuinness, 1952). Thus, the quality of ground water has an especially pronounced effect on surface-water quality during periods of low flow. Conversely, the qual ity of surface water affects ground water in areas where streams recharge aquifers.
Natural water, as it moves through the hydrologic cy cle, carries with it dissolved materials, such as salts,

46 National Water Summary 1983
metals, organic substances, naturally occurring radioac tive substances, and suspended materials, such as bacteria, viruses, and sediment, that may render the water unsuitable for many purposes. Man's activities also may degrade the quality of water when dissolved and suspended substances are added and natural properties such as temperature are altered.
Many water-quality issues identified in the State water- issue summaries relate to whether the Nation's surface and ground waters are safe to drink. In many parts of the country, some drinking-water sources have been seriously degraded by manmade pollutants. For this reason, the sources of pollution of the Nation's ground and surface water, and some of the factors that can affect water qual ity, such as eutrophication, contamination of bottom sedi ments, saline-water intrusion, hazardous and radioactive wastes, and acidic precipitation, are described in this sec tion. These discussions are preceded by a brief examina tion of trends in surface-water quality.
A commonly recurring question is whether the quality of the Nation's water is improving or deteriorating. To help answer this question, the National Stream-Quality Accounting Network (NASQAN) was established by the U.S. Geological Survey in 1972 to (1) account for the quantity and quality of streamflow within the United States, (2) develop a large-scale indication of how stream
quality varies from place to place, and (3) detect changes in stream quality with time. The NASQAN network presently consists of 504 stations at which the quality of outflow from the Nation's major river basins is measured. Data collected include the quantity of streamflow, con centration of major inorganic and trace constituents (including trace metals), two bacterial indicators of pollu tion, and concentrations of selected pesticides and radio- chemicals. Presently, there are insufficient measurements of the concentrations of synthetic organic substances from the NASQAN network to develop a clear picture of their oc currence, distribution, and effects on the aquatic environ ment. The data from the NASQAN stations do not necessarily characterize water-quality conditions either upstream or downstream because many of the reported constituents undergo changes in concentration as the water moves downstream.
Recently, data were analyzed for the 8-year period 1974 through 1981 to detect trends in selected water- quality constituents and properties in the major rivers in the United States (Smith and Alexander, 1983). Some preliminary results for selected constituents are shown in table 4. Reasons for the trends are presently under in vestigation by U.S. Geological Survey scientists and will be presented in a separate report. The data in table 4 were adjusted for the effects of streamflow on constituent con-
TABLE 4. Summary of trends in selected water-quality constituents and properties at NASQAN stations, 1974-81[Data from Smith and Alexander, 1983]
Constituents and properties
Number of stations with
Increasing trends
No change
Decreasing trends
Total stations
Temperature pH -___ -Alkalinity Sulfate Nitrate-nitrite Ammonia Total organic carbon Phosphorus Calcium Magnesium Sodium Potassium Chloride Silica Dissolved solids Suspended sediment Conductivity Turbidity Fecal coliform bacteria Fecal streptococcus bacteria Phytoplankton Dissolved trace metals:
Arsenic Barium Boron Cadmium Chromium Copper Iron Lead Manganese Mercury Selenium Silver Zinc
3974188276313639235010369
1044868446942192
22
42
32126
285
30821
19
218174207182203221230232198208173193164213183204193199216190234
2288115
26415283
25823225019420132
251
465679402530133083462842364151414318347844
1113726
2176192
210
32
303304304304304282279301304304304304304302302289305259269270300
3078620
3031669530731329920422433
302

Water-Quality Issues 47
centrations, and all data were screened for possible trends brought about by changes in field sampling techniques or laboratory procedures. Only those stations for which suf ficient data were available to draw statistically defensible trends are included in the table.
A graphical presentation of 13 water-quality constitu ents for 21 water-resources regions is shown in figure 22. These consitutents were selected for graphical portrayal because they are important in defining a particular water- quality problem. Although these trends are statistically significant, it is possible only to speculate at present on the causes.
In order to place the significance and extent of water- quality issues in the proper perspective, their discussion will be preceded by pertinent information on the sources, quality standards, and treatment of drinking water.
Each individual in the United States consumes about 2 quarts per day of water or water-based fluids (National Research Council, Safe Drinking Water Committee, 1977). Ideally, this water "should be clear, colorless, tasteless, and odorless. It should contain no pathogenic organisms * * *" anc| "should not contain concentra tions of chemicals that may be physiologically harmful, esthetically objectionable, or economically damaging" (Francis and others, 1983, p. V-3).
Drinking water obtained from surface- or ground- water sources may contain chemical and biological im
purities that must be removed before the water can meet the ideal standards stated above. Undesirable constituents can be natural or synthetic; they enter water by natural processes such as the movement of water over and through rocks and soil, and by activities of man such as disposal of waste or application of agricultural chemicals. Depending on their chemical or biological nature, con taminants can affect the quality of drinking water in dif ferent ways. If contaminants impart a disagreeable taste or odor, the problem is quickly perceived and action can be taken to identify the offending contaminant and remove it from the water. A more serious situation may develop when the contaminant cannot be detected by human senses. For example, the effects on human health of a carcinogen present in drinking water may go unde tected, particularly if it produces only a small increase in the incidence of a commonly occurring cancer.
The kind and degree of treatment necessary to produce safe and esthetically acceptable drinking water depends on the kinds of substances that must be removed and their concentration in the source water. Most larger communi ty water systems use surface water and subject it to full treatment before distribution. Typically, this treatment consists of the addition of chemicals to precipitate dis solved and suspended substances. Before distribution, the water is disinfected (usually with chlorine compounds) to destroy microorganisms. In contrast, ground water gen-
Hydrologists collecting water samples for chemical analysis at the NASQAN station on the Iowa River at Wapello, Iowa. (Photo graph by Robert Schoen, U.S. Geological Survey.)
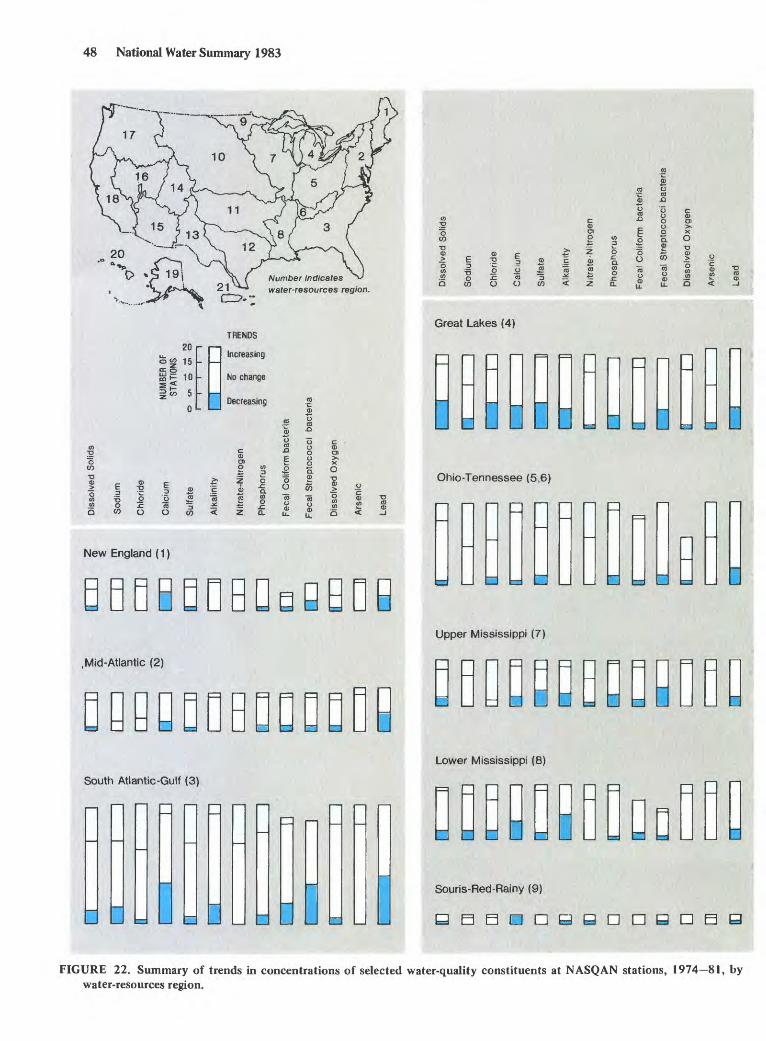
48 National Water Summary 1983
> E
Number Indicates water-resources region.
o o ,2.c ffl -JO O CO
o
- T5 O
ff £ I
TRENDS
Increasing
No change
Decreasing
Great Lakes (4)
O "5 .£ = r= V) O
New England (1)
> z£ S. O
Ohio-Tennessee (5,6)
£ 5
BQBBDBBoBBOBUpper Mississippi (7)
.Mid-Atlantic (2)
DLower Mississippi (8)
South Atlantic-Gulf (3)
Souris-Red-Rainy (9)
B B B 0 Q n p e n B s
FIGURE 22. Summary of trends in concentrations of selected water-quality constituents at NASQAN stations, 1974 81, by water-resources region.

Water-Quality Issues 49
TRENDS
Increasing
No change
Decreasing
I so 5
-fc 3 ^
0) Q.
73 « "5 "« 2
S .eLower Colorado (15)
-500^O .c « 3«> O O co
Missouri (10}
Great Basin (16)
Pacific Northwest (17)
Arkansas-White-Red (11)
UuUUlddUDaCalifornia (18)
Texas-Gulf (12) OQQAlaska (19)
Rio Grande (13)
BBBBB
Upper Colorado {14)
DDDDBDDn
BOB
BDnaPDD
Hawaii (20)
BBBBBBPBQB
Caribbean (21)
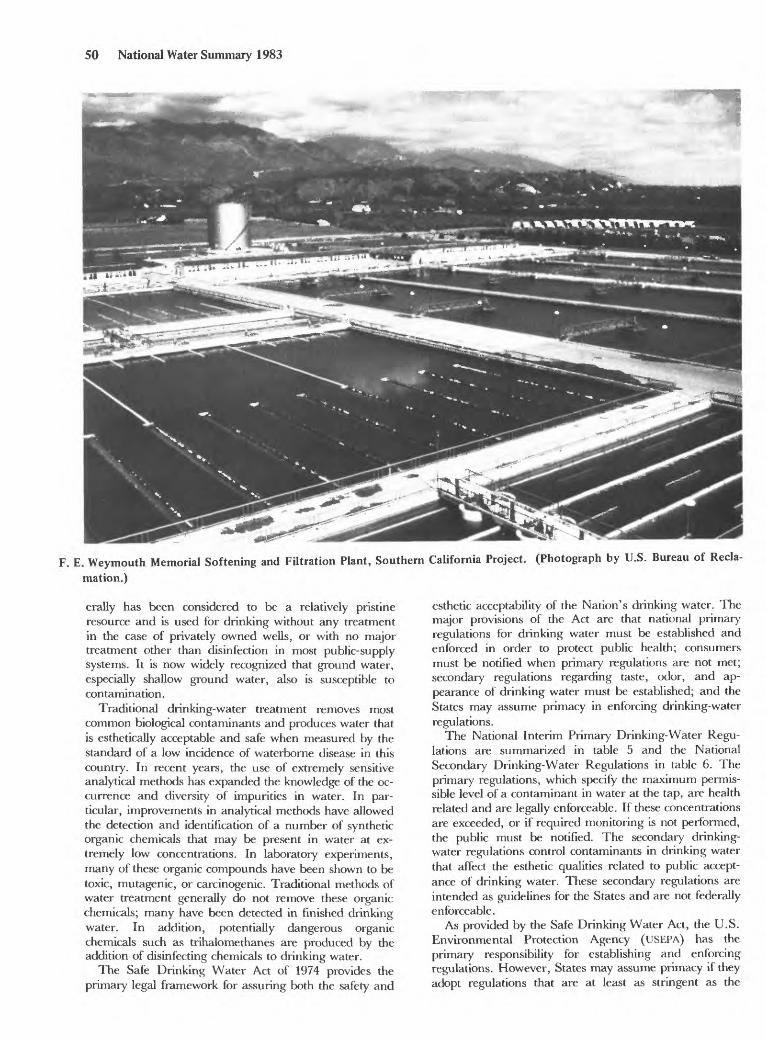
50 National Water Summary 1983
F. E. Weymouth Memorial Softening and Filtration Plant, Southern California Project. (Photograph by U.S. Bureau of Recla
mation.)
erally has been considered to be a relatively pristine resource and is used for drinking without any treatment in the case of privately owned wells, or with no major treatment other than disinfection in most public-supply systems. It is now widely recognized that ground water, especially shallow ground water, also is susceptible to contamination.
Traditional drinking-water treatment removes most common biological contaminants and produces water that is esthetically acceptable and safe when measured by the standard of a low incidence of waterborne disease in this country. In recent years, the use of extremely sensitive analytical methods has expanded the knowledge of the oc currence and diversity of impurities in water. In par ticular, improvements in analytical methods have allowed the detection and identification of a number of synthetic organic chemicals that may be present in water at ex tremely low concentrations. In laboratory experiments, many of these organic compounds have been shown to be toxic, mutagenic, or carcinogenic. Traditional methods of water treatment generally do not remove these organic chemicals; many have been detected in finished drinking water. In addition, potentially dangerous organic chemicals such as trihalomethanes are produced by the addition of disinfecting chemicals to drinking water.
The Safe Drinking Water Act of 1974 provides the primary legal framework for assuring both the safety and
esthetic acceptability of the Nation's drinking water. The major provisions of the Act are that national primary regulations for drinking water must be established and enforced in order to protect public health; consumers must be notified when primary regulations are not met; secondary regulations regarding taste, odor, and ap pearance of drinking water must be established; and the States may assume primacy in enforcing drinking-water regulations.
The National Interim Primary Drinking-Water Regu lations are summarized in table 5 and the National Secondary Drinking-Water Regulations in table 6. The primary regulations, which specify the maximum permis sible level of a contaminant in water at the tap, are health related and are legally enforceable. If these concentrations are exceeded, or if required monitoring is not performed, the public must be notified. The secondary drinking- water regulations control contaminants in drinking water that affect the esthetic qualities related to public accept ance of drinking water. These secondary regulations are intended as guidelines for the States and are not federally enforceable.
As provided by the Safe Drinking Water Act, the U.S. Environmental Protection Agency (USEPA) has the primary responsibility for establishing and enforcing regulations. However, States may assume primacy if they adopt regulations that are at least as stringent as the

Water-Quality Issues 51
TABLE 5. National Interim Primary Drinking-Water Regulations
[Data in milligrams per liter unless otherwise specified, tu = turbidity; pCi/L = picocurie per liter; mrem = millirem (one thousandths of a rem). Data from U.S. Environmental Pro tection Agency, 1982a]
Constituent Maximum concentration
those water-supply systems that have at least 15 service connections and regularly serve at least 25 individuals are regulated. Until recently, little information about drinking-water quality in rural areas, where many people rely on individual water-supply systems, has been avail able. Within the past year, however, results of analyses of 43 constituents in water samples from 2,654 rural
Arsenic ~~JJ~~J~JJJJJ~~J~J~JJJJ~~~^^ households were compiled in the National Assessment of Cadmium ________________________ 0 010 Rural Water Conditions, under sponsorship of the U.S. Chromium 0.05 Environmental Protection Agency (Francis and others, Lead 0.05 1983). Each of four constituents (total coliform bacteria,
Mercury - 0.002 lead, cadmium, and mercury) were found to exceed theSe"enium-~----------------~--------~------~001 Interim Primary Drinking-Water Regulations (U.S. En- Silver ________________-_______-___ 0.05 vironmental Protection Agency, 1982a) in at least 15 per- Fluoride 1.4-2.4 cent of the sampled households.Turbidity ; 1-5 tu The water-quality issues listed in the State water-issue
Coliform^a^ter^--------------^^ summaries were reported and grouped in various ways:Lindane __________________________ 6 004 ^e category of point and nonpoint sources of pollution Methoxychlor 0.1 refers to the manner in which contaminants are intro- Toxaphene 0.005 duced. The category of hazardous waste refers to the£>t~P~"" -0.1 nature and origin of the contaminant, as does the cate-2,4,5-TP Silvex 0.01 r ,- , t - c ^Total trihalomethanes [the sum of the concentrations SOI7 of radioactive waste, and the categones of bottom-
of bromodichloromethane, dibromochloromethane, sediment contamination and eutrophication refer to thetribromomethane (bromoform) and trichlorometh- effects of the contaminant in the hydrologic system.ane (chloroform)] 0.10 Because of this, there is a certain amount of overlap in the
Kadionuclides way that individual issues are classified in the summaries;Radium 226 and 228 (combined) 5 pCi/L _ 7 , . , ._ , ,Gross alpha particle activity 15 pCi/L for example, what is classified under point or nonpoint Gross beta particle activity 4 mrem/year sources of pollution in one State summary may be classi
fied as hazardous waste in another, and conversely. ToTABLE 6.-National Secondary Drinking-Water Regulations reduce repetition in the following discussions of hydro-
_ , T o T, , ^ . o, , lomc perspectives on these issues, the discussion of point[Data from U.S. Environmental Protection Agency, 1982b] and nonpoint sources of poUution emphasizes surface-
Constituent Maximum level water aspects, whereas the discussion of hazardous wasteChloride _________ 250 m /Lfocuses primarily on ground-water contamination.Color 15 color unitsCopper i mg/L Selected ReferencesCorrosivity noncorrosiveDissolved solids 500 mg/L Francis, J. D., Brower, B. L., Graham, W. F., Larson, O. W.,Foaming agents 0.5 mg/L III, McCaull, J. L., and Vigorita, H. M., 1983, NationalIron 0.3 mg/L statistical assessment of rural water conditions, v. 1-4: Ithaca,Manganese 0.05 mg/L N.Y., Cornell University.Odor 3 (threshold odor number) McGuinness, C. L., 1952, The water situation in the UnitedP ... v.5-0.5 units States with special reference to ground water: U.S. GeologicalSulfate 250 mg/L c ,-.- i n/t im7 - __________________ t^ /j Survey Circular 114, 127 p. - National Research Council, Safe Drinking Water Committee,
1977, Drinking water and health: Washington, D.C., Na-
Federal regulations in levels specified for protection of _ tional Academy Press, 939 p. ,- , , i , r .,1 i r Smith, R. A., and Alexander, R. B., 1983, A statistical sum-
public health and in provision of surveillance and enforce- mary of rfata from ^ y s Geologica, Survey> s Nationalment. The States may adopt more stringent regulations, Water Qua, ity Netvvorks: TJ.S. Geological Survey Open-Fileand may establish regulations for other constituents. As of Report 83-533 700 p1983, all States and territories have assumed primacy ex- U.S. Environmental Protection Agency, 1982a, Maximum con cept Indiana, Oregon, Pennsylvania, South Dakota, taminant levels (subpart B of part 141, National interim Wyoming, and the District of Columbia. primary drinking water regulations): U.S. Code of Federal
Although the Safe Drinking Water Act and the attend- Regulations, Tide 40, Parts 100 to 149, revised as of July 1, ant Federal and State regulations provide a strong legal 1982, p. 315-318. basis for protecting public health, several significant 1982b, Secondary maximum contaminant levels (section
i . IT- j 143.3 of part 143, National secondary drinking water regula-dnnking-water issues remain, first, most manmade con- . . TTF0 _ .' , , . . - , , n n tru~0 .... ... .... ., tions): U.S. Code of Federal Regulations, Title 40, Parts 100
tammants, including volatile organic chemicals, generally . </in A n i i moo Q-?/L ' ,o i r IP to 149, revised as of July 1, 1982, p. 374. are unregulated. Second, inlrequent outbreaks ol water- borne disease do occur in this country; the majority of p()|NT AND NONPO|NT SOURCES OF POLLUTION these outbreaks are caused by pathogenic microorgan isms. Finally some drinking-water supplies are excluded Polluting substances may enter surface and ground from the provisions of the Safe Drinking Water Act. Only water either at readily identifiable discrete points, or over

52 National Water Summary 1983
large areas. Legislation pertaining to water-polluting substances and their control refer to these two categories of pollution as point and nonpoint sources, respectively.
Point sources of pollution are those that can be associ ated with a particular and highly localized activity or process. In surface-water systems, the majority of point sources are discharges of liquid industrial or municipal wastes, such as effluent from sewage-treatment plants; point sources of ground-water pollution are discussed in the section "Hazardous Wastes".
The most severe impacts on surface-water quality from point sources occur where the largest waste loads are generated, in the heavily populated and industrialized parts of the Nation. Although less densely populated areas of the country do not escape point-source-pollution prob lems, rivers in the Northeast and Mid-Atlantic areas, where over one-half the national population lives and works, have been most adversely affected (U.S. Council on Environmental Quality, 1981). These two regions also contain 6 of the 10 leading chemical-producing States and account for 41 percent of the Nation's chemical produc tion (Chemical and Engineering News, 1983). As popula tion and industrial activity shift regionally with time, pollution loads may be expected to be redistributed ac cordingly. California, for instance, now has the fastest growing chemical industry in the country, presenting the
State with expanding problems of waste management and water-quality protection.
The most common pollutants in municipal wastewater include disease-causing organisms, oxygen-demanding materials, and the plant nutrients nitrogen and phos phorus. Municipal wastewater also contains heavy metals and numerous organic substances, which are contributed largely by industrial discharges to municipal treatment systems. One consequence of the presence of these substances is that the sludge generated in the treatment process often contains these materials in high concentra tions and is, therefore, difficult to dispose of safely. In ad dition, disinfection of wastewater by chlorination prior to discharge generates chlorinated organic compounds reported to be carcinogenic or mutagenic (Hileman, 1982). Wastewaters from certain industries contain con centrations of heavy metals and organic substances higher than those found in municipal wastewaters.
Federal legislation directed at point-source pollution of surface waters was initiated as part of the Federal Water Pollution Control Act Amendments of 1972 (Public Law 92-500). This legislation has been modified several times in recent years, including a change of name in 1977 to the Clean Water Act (Public Law 95-217). The Act of 1972 specifies that, as an interim national goal "wherever at tainable," the Nation's surface waters be of adequate
Water being discharged into stream through a pipe-
U.S. Geological Survey.)
-an example of point-source pollution. (Photograph by Douglas Glysson,

Water-Quality Issues 53
quality for water recreation and fish propagation by July 1, 1983. The Act also establishes a goal of zero discharge of pollution into "navigable waters" by 1985 (U.S. Con gress, 1980). Control of industrial effluents was to be achieved by implementation of the best practicable waste- management technology by 1977 and the best available technology by July 1, 1983. Federal financial and technical assistance in upgrading and constructing sewage-treatment plants has been the principal stimulus for controlling municipal waste discharges to streams and water bodies.
The quality of the Nation's surface waters has im proved substantially in several respects compared to the quality measured 10 to 20 years ago, even though both in dustrial activity and the population have increased during that period, with attendant increases in use of water and disposal of wastes. Low dissolved-oxygen levels caused by the inflow of high concentrations of oxygen-demanding material to streams are rarely encountered today, but they were a major problem 20 years ago. According to the U.S. Council on Environmental Quality (1981), this can be attributed to measures for the control of point-source discharges and particularly to the construction of im proved waste-treatment facilities. Nevertheless, the U.S. Environmental Protection Agency reports that substantial improvements remain to be made (U.S. Environmental Protection Agency, 1983).
Nonpoint sources of pollution are activities or processes that introduce contaminants to ground water or surface water over a broad area, rather than in a specific locality. Examples include drainage of contaminated runoff from agricultural land or from urban areas into streams, leak age from urban sewer pipes or septic systems into shallow aquifers, and downward transport of agricultural pesti cides to the water table.
Drainage from forest and agricultural land (including fertilized cropland, pastureland, and animal feedlots) commonly contains high concentrations of nitrogen and phosphorus, and may contain high concentrations of her bicides and insecticides. Drainage from urban areas com monly contains, in addition to the above, heavy metals, petroleum products, and oxygen-demanding materials. Pollution of a receiving water by runoff from an urban area commonly equals or exceeds that from the point sources of wastewater in the same area. Precipitation, too, may be viewed as an extensive nonpoint source where it deposits nitrate and sulfate ions, a phenomenon known as "acid rain" and discussed further in the section on acidic precipitation.
When the Water Pollution Control Act Amendments of 1972 were adopted, there was general awareness that pollution of water by nonpoint sources might be a sig nificant problem. However, knowledge about nonpoint- pollution processes was deficient, and no specific regula tions governing nonpoint pollution were included in the legislation. Rather, State water-quality-management agencies were directed to deal with the issue in their areawide planning process, supported by Federal grants under Section 208 of the Act. Studies conducted with grant support, together with investigations by the U.S. Environmental Protection Agency, other Federal agen cies, and the academic community have improved under
standing of the extent of nonpoint pollution and the proc esses involved in conveying pollutants to receiving waters. Nevertheless, levels of understanding remain inadequate and much investigative work remains to be done.
The effects of nonpoint sources of pollution are often expressed in terms of loading rates that is, the amount of contaminant supplied per unit time from a unit area of contributing land surface. For example, table 7 gives estimated ranges in loading rates (expressed in pounds per acre per year) for phosphorous and nitrogen, from a variety of nonpoint sources. Loading rates for both nitrogen and phosphorus from animal feedlot runoff are as much as 100 times greater than those from any other source. During the 1970's, the U.S. Environmental Pro tection Agency placed strict controls on feedlot runoff.
Urban runoff is a major source of heavy metals enter ing surface waters. Concentrations of some heavy metals can be higher in street sweepings than in naturally occur ring soils, rocks, and sediments. As shown in table 8, higher average concentrations of cadmium, chromium, copper, lead, and zinc can occur in street sweepings than in shale (a sedimentary rock used here to represent the composition of sediments deposited in the absence of man's influences). All of the listed metals are used in common industrial processes or in domestic materials.
Average concentrations of cadmium and lead in urban runoff exceed criteria for public water supplies, as shown in table 9. Concentrations of all heavy metals listed far ex ceed criteria for protection of marine and freshwater
TABLE 7. Approximate ranges of contribution of total nitrogen (N) and phosphorous (P) from variable nonpoint sources, by land use[Data in pounds per acre per feet. Data from Loehr, 1974]
Source Areal loading ratesNitrogen
Land receiving
Irrigation return flows:out iace
Urban land drainage Animal feedlot runoff
5.0 2.7
.10
3.6
3.0 4.0 6.4
90
9.8 - 12
I 12
- 12
271 Q
8.9 - 1,400
Phosphorous0.04
.03
.07
.05
0.7
1.0 2.9 1.1 8.9
: - 0.05
i- .8 - .08
. - 2.7
- 2.7
4.110
- 5.4 -630
TABLE 8. Average concentrations of heavy motals in street sweepings compared to shale[Data in milligrams per kilogram]
Heavy metal
Iron (Fe) -Lead (Pb) -
Nickel (Ni)
From Bradford, 1977.
Street sweepings'
2111O4.
99 non1,810
41835
<J7A
2 From Krauskopf,
Average composition
of shale2
0.3 100 57
47,000 20
850 95 80
1967.

54 National Water Summary 1983
aquatic life (U.S. Environmental Protection Agency, 1976).
TABU 9. Average concentrations of heavy metals in urban runoff com pared to water-quality criteria for public water supplies[Data in micrograms per liter]
Heavy metal
J-jCctCl ^.T UJ
Urban runoff1
1 Q
33
C)Q C
24C)Q/~
Criteria for public water
supplies2 10 2 50
3 1,000 2 50
3 5,000'U.S. Environmental Protection Agency, 1982a. 2U.S. Environmental Protection Agency, 1976. 3U.S. Environmental Proection Agency, 1982b.
Pesticides, which include insecticides and herbicides, are applied extensively to crop, pasture, and forest land throughout the Nation. In urban areas, they are used on lawns, gardens, and for extermination of pests in build ings and homes. Pesticides in runoff from crop land have been investigated, but little work has been done on pesti cide residues and other organic substances in urban run off, although significant concentrations of many of these substances have been measured in urban runoff.
Because of the wide variety of pesticides in use, the diversity of application from place to place, and the com plexity of the processes which control the amounts of these substances washing from agricultural land, studies at tempting to quantify areal loading rates of pesticides have proven fruitless. However, some broad patterns have been recognized in the relationships between application, chemical properties, and losses from the soil of certain pesticides in common use (Wauchope, 1978).
Organochlorine insecticides, such as DDT, chlordane, and dieldrin, strongly sorb to soil and enter surface waters as a result of soil erosion. The use of these compounds in agriculture has been largely banned as of 1975 but, because of their resistance to decay, they continue to be found in sediments. Water-soluble pesticides, represented largely by carbamates, are able to dissolve readily and move off the land surface or downward into the soil; high concentrations of these pesticides are possible in runoff that occurs shortly after application.
Although nonpoint-source pollution continues to receive much attention, improved understanding of the magnitude of the problem and of the processes involved is developing only gradually. It is clear that this understand ing must be advanced, and that much effort must be devoted to education of the many contributors to non- point source pollution, before signifant progress in deal ing with the problem will be possible.
Salinity of surface waters, originating from point and nonpoint sources, is an issue of concern for many rivers, particularly those where there is extensive irrigation or where naturally occurring saltwater sources exist. Both of these circumstances occur in the Colorado River basin, and they create an issue of significant economic propor tions. Average dissolved-solids concentrations range from
about 50 mg/L in the headwater areas of the Colorado Rockies to about 800 mg/L at Imperial Dam near the Mexican border. The contributions of salinity to the river are estimated as 47 percent due to natural sources, 37 per cent due to irrigation, and 16 percent due to loss of low- salinity water by reservoir evaporation, exports, and municipal and industrial consumption. Economic losses due to salinity were about $113 million in 1982. These in clude increased treatment cost for industrial use, and crop losses. The Colorado River Basin Salinity Control Act of 1974 (Public Law 93-320) provides for the construction, operation, and maintenance of certain works in the basin to control the salinity of water delivered to users in the United States and Mexico. Six projects have been planned to control natural sources and manmade sources, including irrigation return flow. The goal of these projects is to reduce salinity at Imperial Dam by 120 mg/L; total construction costs are estimated at about $700 million (U.S. Bureau of Reclamation, 1983).
Selected ReferencesBradford, W. L., 1977, Urban stormwater pollutant
loadings a statistical summary through 1972: Water Pollu tion Control Federation Journal, v. 49, no. 4, p. 613-622.
Chemical and Engineering News, 1983, Texas' pre-eminence in chemicals is slipping: March 12, 1983, p. 18.
Haith, D. A., and Tubbs, L. J., 1981, Watershed loading func tions for nonpoint sources: American Society of Civil Engi neers, Environmental Engineering Division Journal (EEI), v. 107, p. 121-137.
Hileman, Bette, 1982, The chlorination question: Environ mental Science and Technology, v. 16, no. 1, p. 15A-18A.
Krauskopf, K. B., 1967, Introduction to geochemistry: New York, McGraw-Hill Book Co., 721 p.
Loehr, R. C., 1974, Characteristics and comparative magnitude of nonpoint sources: Water Pollution Control Federation Journal, v. 46, no. 8, p. 1849-1872.
National Wetlands Newsletter, 1982, Kepone in the James River dredging is safe but commerical fishing still restricted: National Wetlands Newsletter, v. 4, no. 1, p. 8.
U.S. Bureau of Reclamation, 1983, Colorado River Improve ment Program, Status Report, January 1983: Denver, Colo rado, U.S. Bureau of Reclamation, Colorado River Water Quality Office, 126 p.
U.S. Congress, 1980, Implementation of the Federal Water Pollution Control Act: 96th Congress, House Subcommittee on Oversight and Review, Committee on Public Works and Transportation, Committee Print 96-71.
U.S. Council on Environmental Quality, 1981, Environmental quality 1981, 12th annual report of the Council on Environ mental Quality: Washington, D.C., U.S. Government Print ing Office, 291 p.
U.S. Environmental Protection Agency, 1976, Quality criteria for water: Washington, D.C., U.S. Governmental Printing Office.
____1979, Chemical substances inventory, Initial inventory: Washington, D.C.,v. I-III.
_1982a, Preliminary results of the Nationwide UrbanRunoff Program, volume 1, final draft: Washington, D.C., U.S. Environmental Protection Agency, Water Planning Division.
.1982b, Secondary maximum contaminant levels (section143.3 of part 143, National secondary drinking-water regula tions): U.S. Code of Federal Regulations, Title 40, Parts 100 to 149, revised as of July 1, 1982, p. 374.

Water-Quality Issues 55
___1982c, Amendment to National Oil and Hazardous Substances Contingency Plan; the National Priorities List: Federal Register, v. 47, no. 251, December 30, 1982, p. 58476-58485.
.1983, The 1982 needs survey-conveyance, treatment,and control of municipal wastewater, combined sewer over flows, and stormwater runoff: Washington, D.C., U.S. Envi ronmental Protection Agency, Office of Water Program Operations.
Wauchope, R. D., 1978, The pesticide content of surface-water draining agricultural fields a review: Environmental Qual- ityjournal, v. 7, no. 4, p. 459-472.
Weber, J. B., Shea, P., Jr., and Strek, H. J., 1980, An evalua tion of nonpoint sources of pesticide pollution in runoff, in Overcash, M. R., and Davidson, J. M., eds., Environmental impact of nonpoint source pollution: Ann Arbor, Mich., Ann Arbor Science Publication, Inc., p. 69-98.
Wilbur, W. G., and Hunter, J. V., 1979, Distribution of metals in street sweepings, stormwater solids, and urban aquatic sediments: Water Pollution Control Federation Journal, v. 51, no. 12, p. 2810-2822.
'TROPHICATION
Eutrophication is the process by which surface waters become enriched with plant nutrients, especially phos phorus and nitrogen. These nutrients may be derived from natural or manmade sources, such as animal waste, industrial waste, sewage, and fertilizers. Their presence can adversely affect lakes, reservoirs, streams, and estuaries.
Nutrient enrichment increases the abundance of aquatic plants, especially phytoplankton (microscopic plants suspended in water). Increased phytoplankton pro duction often results in increases in the populations of fish and other aquatic organisms, creating increased demand on the available oxygen supply. When the phytoplankton die, they are decomposed by bacteria; this process tends to reduce oxygen in the water. A reduction in oxygen below a critical level can cause the death of all fish, shellfish, and other higher aquatic organisms. Eutrophic waters usually have a pea-green color, have an undesir able odor, and are unusable for public water supplies or recreation.
As of 1981, nearly 10,000 publicly owned lakes in the United States required treatment for the eutrophication effects of nutrient enrichment. At that time, programs to reduce these effects in approximately 100 of the lakes, located in 29 States, were in effect or scheduled (U.S. Environmental Protection Agency, 1981).
Eutrophication also occurs in some estuaries receiving drainage from large metropolitan areas. Examples are the Potomac River estuary (Rasin and Brooks, 1982) and the Hudson River estuary (Simpson and others, 1972), and Chesapeake Bay (Heinle and others, 1980). Estuaries dif fer from lakes and reservoirs because of the interaction of tidal currents and streamflow that control the distribution of salinity and movement of sediments and bottom mate rial (Milliman and Meade, 1983; Schoen, 1983). In addi tion, the configuration of the mouth of the estuary con trols flushing to the sea and hence the residence time of nutrients in the system. The effects of nutrient enrich ment can be modified greatly by the residence time (Pomeroy and others, 1972). Eutrophication of estuaries
in the United States presently is confined to those having large human populations on their borders. However, even estuaries receiving drainage from large metropolitan areas such as the Delaware River (Sharp and others, 1982) and the San Francisco Bay estuaries (Luoma and Cloern, 1982) do not always show the effects of eutrophi cation due to nutrient enrichment.
An example of an enriched estuary is Chesapeake Bay (Heinle and others, 1980; Walton, 1982). These authors reported that increased nutrients, especially phosphorus, have resulted in eutrophication of Chesapeake Bay. Algae biomass has increased recently in the upper and middle bay and in several tributaries. In the Patuxent River, in creased algae production has led to reduced concentra tions of dissolved oxygen. As a result, the effects of eutrophication on the biota in Chesapeake Bay presently is of concern (Heinle and others, 1980).
The amount of aquatic plants in surface water in most parts of the United States is directly related to the amount of phosphorus in the water (Nicholls and Dillon, 1978). Thus, many communities throughout the Nation are at tempting to control the input of phosphorus by restricting the use or disposal of phosphate fertilizers, detergents, and other sources of phosphorus. Phosphorus loading from wastes generated by the dense population along the shores of Lake Erie was the chief cause of serious eutrophic conditions in the lake a decade ago (Flynn, 1982). Control of the amount of phosphorus entering the lake has resulted in a lessening of these conditions.
Eutrophication of lakes and estuaries is mentioned in 18 State water-issue summaries.
Selected ReferencesBritton, L. J., Averett, R. C., and Ferreira, R. F., 1974, An in
troduction to the processes, problems, and management of urban lakes: U.S. Geological Survey Circular 601-K, 22 p.
Cooke, G. D., 1981, Phosphorus inactivation a summary of knowledge and research needs, in Restoration of lakes and inland waters: U.S. Environmental Protection Agency 440/5-81-010, p. 395-399.
Edmondson, W. T., and Lehman, J. T., 1981, The effect of changes in the nutrient income on the condition of Lake Washington: Limnology and Oceanography, v. 26, no. 1, p. 1-29.
Flynn, K. C., 1982, New challenges in the Great Lakes states to banning phosphorus in detergents: Water Pollution Control Federationjournal, v. 54, no. 10, p. 1342-1345.
Heinle, D. R., D'Elia, C. F., Taft, J. L., Wilson, J. S., Cole- Jones, M., Caplins, A. B., and Cronin, L. E., 1980, Historical review of water quality and climatic data from Chesapeake Bay with emphasis on effect of enrichment: U.S. Environmental Protection Agency, Chesapeake Bay Program Report, 635 p.
Luoma, S. N., and Cloern, J. E., 1982, The impact of waste- water discharge on biological communities in San Francisco Bay, in Kockelman and others, eds., San Francisco Bay use and protection: San Francisco, Pacific Division of the Amer ican Association for the Advancement of Science, p. 137-160.
McKnight, D. M., 1981, Chemical and biological processes controlling the response of a freshwater ecosystem to copper stress a field study of CuSO* treatment of Mill Pond Reser voir, Burlington, Massachusetts: Limnology and Oceanog raphy, v. 26, no. 3, p. 518-531.

56 National Water Summary 1983
Milliman, J. D., and Meade, R. H., 1983, World-wide delivery of river sediment to the oceans: Journal of Geology, v. 91, no. 1, p. 1-21.
Nicholls, K. H., and Dillon, P. J., 1978, An evaluation of phosphorus-chlorophyll-phytoplankton relationships for lakes: International Revue der gesamten Hydrobiologie, v. 63, no. 2, p. 141-154.
Pomeroy, L. R., Shenton, L. R. , Jones, R. D. H., and Reinhold, R. J., 1972, Nutrient flux in estuaries, in Likens, G. E., ed., Nutrients and eutrophication: American Society of Limnology and Oceanography, Special Symposium, v. 1, p. 274-291.
Rasin, J. R., Jr., and Brooks, K. M., 1982, Potomac River basin quality, 1980-1981: Washington, D.C., Interstate Commission on the Potomac River Basin Technical Publica tion 82-1, 74 p.
Reckhow, K. H., 1978, Quantitative techniques for the assess ment of lake quality: Lansing, Midi., Michigan Department of Natural Resources, 138 p.
Schindler, D. W., 1982, Studies of eutrophication in lakes and their relevance to the estuarine environments, in Nielson, B. J., and Cronin, L. E., eds., Estuaries and Nutrients: Clif ton, N.J., Humana Press, p. 71-82.
Schindler, D. W., and Fee, E. J., 1974, Experimental lakes area whole-lake experiments in eutrophication: Journal of the Fisheries Research Board of Canada, v. 31, no. 5, p. 937- 953.
Schoen, Robert, 1983, Estuarine hydrology, in Halasi-Kun, G. J., ed., Pollution and water resources: Pergamon Press, v. XV, parti, p. 95-109.
Shapiro, J., 1979, The need for more biology in lake restoration, in Lake Restoration: U.S. Environmental Protection Agency 440/5-79-001, p. 161-167.
Sharp, J. H., Culberson, C. H., and Church, T. M., 1982, The chemistry of the Delaware estuary, general considerations: Limnology and Oceanography, v. 27, no. 6, p. 1015-1028.
Simpson, H. J., Williams, S. C., Olsen, C. R., and Hammond, D. E., 1972, Nutrient and particulate matter budgets in urban estuaries, in Estuaries, geophysics and the environ ment: Washington, D.C., National Academy of Sciences, p. 94-103.
Stefan, H. G., ed., 1981, Proceedings of the Symposium on Surface Water Impoundments: New York, N.Y., American Society of Civil Engineers, 1682 p.
U.S. Environmental Protection Agency, 1975, National eutrophication survey methods, 1973-1976: Corvallis, Oreg., Working paper 175, 91 p.
____1981, Restoration of lakes and inland waters: Washington, D.C., U.S. Environmental Protection Agency 440/5-81-010, 552 p.
Vallentyne, J. R., 1974, The algal bowl-lakes and man: Fisheries Research Board of Canada Miscellaneous Special Publication 22, 186 p.
Walton, Susan, 1982, Chesapeake Bay threats to ecological stability: BioScience v. 32, v. 11, p. 843-844.
BOTTOM-SEDIMENT CONTAMINATION
Contamination of bottom sediments in lakes, streams, estuaries, and bays by inorganic and organic trace substances may adversely affect human health and ecological systems. Outbreaks in Japan of Minamata disease (mercury poisoning) and itai-itai (cadmium poisoning) have been conclusively linked to chemical pollution of water and bottom sediments that introduced heavy metals into the aquatic food chain. Because most potentially toxic trace materials adhere strongly to sedi
ment particles, concentrations of contaminants and trace materials in bottom sediments may range from 10 to more than 1,000 times higher than concentrations of the same substances in the overlying water.
Most instances of bottom-sediment contamination tend to be localized around point sources of the contaminant. However, major contamination events, such as those caused by discharge of polychlorinated biphenyls (PCB's) in the Hudson River, N.Y. (Schroeder and Barnes, 1983), Kepone in the James River, Va. (Lunsford and others, 1982), and DDT in the Southern California Bight, have contaminated sediments in detectable quan tities for distances measured in tens to hundreds of miles downcurrent from the point of discharge.
Contamination of bottom sediment can cause death or disruption of reproductive cycles in aquatic life. This can occur, for example, where contaminated sediment and benthic plants are ingested by fish and shellfish, or where mixing and turbulence create high concentrations of con taminants in the water immediately above affected sedi ments. In some parts of the Nation, it has been necessary to place restrictions on the harvesting of contaminated fish and shellfish.
Contaminants may remain in bottom sediments long after discharge of the source materials ceases. Although certain contaminants (such as cadmium) have been known to disperse in a short period of time, others, such as mercury, may remain available for organism uptake for years. Ultimately, contaminated sediments are pre sumably cleansed or carried out to sea, but such processes may take hundreds or thousands of years.
Attempts to mitigate bottom-sediment contamination by covering the sediments with uncontaminated materials or by dredging have met with only limited success. Most measures are either prohibitively expensive or fail to ade quately take into account the biological, chemical, and physical complexities of aquatic environments. Once sediments are contaminated, there are few quick solu tions. Contaminated sediments interfere with normal activities such as maintenance dredging because of the possibility of spreading the contaminants.
Bottom-sediment contamination is mentioned in six State water-issue summaries.
Selected ReferencesCrump-Wiesner, H. J., Feltz, H., and Yates, M. L., 1973, A
study of the distribution of polychlorinated biphenyls in the aquatic environment: U.S. Geological Survey Journal of Re search, v. 1, p. 603.
Fowler, S. W., Polikarpov, G. G., Elder, D. L., Parsi, P. and Villeneue, J-P., 1978, Polychlorinated biphenyls: Accumula tion from contaminated sediments and water by the poly- chaete Nereis diversicolor: Marine Biology, v. 48, p. 303-309.
Lunsford, C. A., Todd, B. G., and Soldano, C. E., 1982, Sum mary of kepone study results 1979-1981: Virginia State Water Control Board Basic-Data Bulletin no. 49, 80 p.
Luoma, S. N., 1983, Biological availability of trace metals to aquatic organisms a review: The Science of the Total En vironment, Elsevier Science Publishing, Amsterdam, v. 28, p. 1-22.
Luoma, S. N., and Bryan, G. W., 1978, Factors controlling the availability of sediment-bound lead to the estuarine bivalve

Water-Quality Issues 57
Scrobicularia plana: Journal of Maine Biology Association, United Kingdom, v. 58, p. 793-802.
Luoma, S. N., and Cloern, J. E., 1982, Impacts of waste-water discharge on biological communities in San Francisco Bay, in Kockelmen and others, eds., San Francisco Bay; use and pro tection: San Francisco, Pacific Division of American Associa tion of Advanced Science, p. 137-160
Luoma, S. N., and Davis, J. A., 1983, Requirements for modeling trace metal partitioning in oxidized estuarine sediments: Marine Chemistry, v. 12, p. 159-181.
Schroeder, R. A., and Barnes, C. R., 1983, Polychlorinated biphenyl concentrations in Hudson River water and treated drinking water at Waterford, New York: U.S. Geological Survey Water-Resources Investigations 83-4188. [in press]
U.S. Environmental Protection Agency, 1982, Chesapeake Bay Program technical studies a synthesis: Annapolis, Md., 635 p.
SALINE-WATER INTRUSION
Saline-water intrusion usually refers to the movement of salty ground water into aquifers or to the encroachment of saline water into freshwater reaches of estuaries.
Hubbert (1940) discusses the relationship between fresh and saline ground waters. Under natural conditions an "interface" that is, a narrow transition zone commonly separates circulating freshwater from seawater in coastal aquifers (see fig. 23A). Any pumpage from a coastal aquifer reduces the seaward discharge of fresh ground water and decreases fluid pressure along the inter face, causing it to shift landward and upward. However, if a net flow of fresh ground water toward the sea is main tained, the movement of the interface represents only an adjustment toward a new equilibrium, in which the saline water again becomes stationary, and a part of the original freshwater flow is diverted to well fields. In this process of adjustment toward a new equilibrium position, individual wells which are either too deep or too close to the shoreline may begin to draw saline water; regionally, however, the situation is one in which most of the wells in the area are simply intercepting freshwater that formerly discharged to the sea.
On the other hand, if pumpage exceeds the regional flow to the sea which existed naturally, the saline water cannot become stationary in a new equilibrium position. Rather, saltwater will continue to move inland until it reaches the major pumping centers; in this case a general seawater-intrusion problem exists. In such situations, various strategies (such as the injection of treated wastewater near the coastline) may be employed to retard saltwater movement while freshwater is taken from storage in the aquifer. Ultimately, however, pumpage must be reduced to match the seaward flow of freshwater, which can be intercepted by well fields.
Saline ground water occurs naturally in inland aquifers as well as in coastal areas, and has similar implications for ground-water use. As in coastal situations, it is possible to develop ground water in such a way that the saline inter face, though displaced from its initial position, has ceased to move. However, such a stable interface configuration can be achieved only under equilibrium conditions that is, only when the pumpage is balanced by reductions in natural discharge and increases in recharge. If freshwater is being taken from storage, pressures along the interface
ff.::-Fresrj\gr'p'ur^d_'\^^
< >- o " i o n - o "ground water o*" 00 O- « 0 0- 0 r.3
ooo
Idealized diagram showing relation of fresh ground water to saline ground water in a coastal area
Pumped well
'/Fresh ground [water'-.
,. x-% § o o uu on .00 «^"O
' Salme ground water ° °c « «" « « ^« « « u"_oo.oo;
o oo o
o o o o
o o " o o ' o o o o
00 00 - 00 " 00o.oo.oo.oo.o
000.0
B. Saline ground water upconing caused by a pumping well
FIGURE 23. Relation of fresh and saline ground water in coastal and inland areas.
will continue to change, and the saline water will continue to move toward the discharging wells.
In either coastal or inland environments, saline water commonly enters individual wells through the process of vertical "upconing" of the interface (fig. 23B). This can occur whether or not an equilibrium in the regional flow regime has been achieved; however, if a regional equilib rium exists, the local upconing problem can often be con trolled by limiting the discharge of the affected well.

58 National Water Summary 1983
Saline-water intrusion in estuaries occurs where the freshwater flow into an estuary is reduced either by upstream diversions of water, or by drought conditions in the areas drained by inflowing streams. Intrusion may also be caused by engineering activities in the estuary itself, such as channel dredging. Saline-water intrusion into the freshwater reaches of estuaries can be controlled by dams that prevent the inland (upstream) movement of saline water.
Salinity of water also may be of concern to water users as a result of point and nonpoint sources of dissolved solids where there is extensive irrigation or where natural sources of saline water exist. This is discussed in the sec tion "Point and Nonpoint Sources of Pollution."
Saline-water intrusion issues are mentioned in 34 State water-issue summaries.
Selected ReferencesCalifornia Department of Water Resources, 1975, Sea-water in
trusion in California inventory of coastal ground-water basins: California Department of Water Resources Bulletin 63-5, 349 p.
____1982, Watermaster science in the West Coast Basin, Los Angeles County, July 1, 1981-June 30, 1982: California Department of Water Resources District Report, 85 p.
Feth, J. H., and others, 1965, Preliminary map of the conter minous United States showing depth to and quality of shal lowest ground water containing more than 1,000 parts per million dissolved solids: U.S. Geological Survey Hydrologic Investigations Adas 199.
Hubbert, M. K., 1940, The theory of ground water motion: Journal of Geology, v. 48, no. 8, part 1, p. 785-944.
Hughes, J. L., 1979, Saltwater barrier line in Florida concepts, considerations, and site examples: U.S. Geological Survey Water-Resources Investigations 79-75, 29 p.
Klein, Howard, and Causaras, C. R., 1982, Biscayne aquifer, southeast Florida, and the contiguous surficial aquifer to the north, in Franks, B. J., ed., Principal aquifers in Florida: U.S. Geological Survey Open-File Report 82-255, 4 sheets.
Mathews, W. E., Hester, W. G., and McFadden, K. W., 1982, Ground-water data for Georgia, 1981: U.S. Geological Survey Open-File Report 82-904, 110 p.
McGuinness, C. L., 1952, The water situation in the United States with special reference to ground water: U.S. Geological Survey Circular 114, 127 p.
HAZARDOUS WASTES
Any substance that is toxic or otherwise a threat to life is considered hazardous waste when discharged through human activity to the land, water, or atmosphere. The category of hazardous waste, as used in this report, is intended to focus primarily on nonradioactive contamina tion by toxic metals and toxic manmade organic chemicals, particularly where these are introduced through waste-disposal operations or leakage from sub surface storage and transmission systems. As noted previously, there is some overlap between this category and that of point and nonpoint sources of pollution in the accompanying summaries of State water issues that is, an activity considered under hazardous waste in one sum mary may be considered under the category of point and nonpoint sources of pollution in another. The discussion
presented here focuses primarily on the effects of hazard ous waste on ground-water systems. Radioactive wastes are treated as a separate category in this report.
A large part of the hazardous-waste issue is associated with some of the new organic chemicals and attendant wastes produced by industry in the past 50 years, and with metals such as chromium, lead, and mercury. These constituents can be harmful even in low concentrations.
Contaminants may be added to ground water from wastes in solid or liquid form. Solid wastes emplaced in the unsaturated zone or on the land surface in landfills and dumps that are not properly designed are leached by water from precipitation or by other liquids that percolate through the landfill or dump. The resulting leachate then moves downward to the water table and disperses into slowly moving ground water. Some landfills extend below the water table, allowing ground water to interact directly with the waste materials. In either case, a plume of con taminated ground water develops as a result of the transport of dissolved constituents away from the site. Constituents of liquid wastes can enter ground water by direct injection through waste-disposal wells, as well as by percolation through the unsaturated zone.
Once in ground water, the contaminants move slowly in the direction of flow toward areas of discharge into streams, lakes, wetlands, springs, or pumped wells. Various attenuation processes, including dilution, disper sion, sorption, ion exchange, and chemical precipitation, may decrease contaminant concentrations as the water moves through the earth. Thus, ground-water contami nation from hazardous-waste disposal sites tends to be localized. Generally, serious contamination is limited to distances of less than a few miles from the disposal site; however, many sites are in densely populated areas where ground water is used for drinking water, and the disposal sites tend to be closely spaced. In these densely populated areas, supply wells may be threatened even though the contaminated area is small.
Some common mechanisms by which hazardous con taminants have been introduced into ground water in clude: (1) disposal of municipal and industrial wastewater into percolation ponds or wells and, to a lesser extent, by spray irrigation; (2) disposal of domestic wastewater into cesspools or drainfields; (3) spreading on land of sludge from municipal and industrial wastewater-treatment systems; (4) disposal of toxic chemicals and substances in municipal and industrial dumps and landfills; (5) disposal of solid and liquid wastes from mining operations in tail ings piles, settling-pond lagoons, or streams; (6) seepage of liquid wastes from holding ponds and tanks; (7) leakage of fuels, chemicals, and solvents from storage tanks and transmission lines; and (8) leakage from sewer pipes.
The Comprehensive Environmental Response, Com pensation, and Liability Act of 1980, also referred to as the "Superfund" legislation, established procedures for the U.S. Environmental Protection Agency (USEPA) to identify abandoned hazardous-waste sites in need of remedial cleanup action. In 1982, USEPA selected more than 400 sites for action and initiated cleanup measures (U.S. Environmental Protection Agency, 1982). This list of priority sites is updated regularly with sites added or deleted as appropriate. The Resource Conservation and

Water-Quality Issues 59
Aerial photo of Bruin Lagoon, Bruin Borough, Pennsylvania, an abandoned hazardous waste site listed in the U.S. Environmental Protection Agency's National Priorities List of 400+ "Superfund" sites. The wastes on site are primarily from the white-oil manufacturing industry. Contamination of ground water, surface water, and air has been documented. (Photograph by Stephen C. Delaney, U.S. Environmental Protection Agency.)
Recovery Act of 1976 gives USEPA authority to regulate the disposal of newly generated hazardous materials. As part of this process, USEPA has identified 14,000 hazardous-waste disposal sites in the United States.
Various remedial measures can be used in areas where ground water has been contaminated by substances mi grating from hazardous-waste disposal sites. Interceptor wells can be installed to withdraw the contaminated ground water, which can then be treated at the surface before being discharged back to the ground or to a stream. Barriers to ground-water flow, intended to retard or redirect the movement of contaminated water, can be emplaced by driving sheet piling, by constructing slurry walls, or by injecting grout curtains. For some con taminants, injection of nutrients to stimulate bacterial growth in the contaminated part of the aquifer theoreti
cally can provide in situ treatment by digestion of the wastes. Lastly, public-supply wells can be relocated or pumpage regulated to avoid drawing contaminated ground water toward the wells. These remedial actions tend to be expensive and have met with only limited success.
Hazardous waste in ground water is mentioned in 39 State water-issue summaries; hazardous waste in surface water is mentioned in 16 State water-issue summaries.
Selected References
Glover, E. W.,Jr., 1982, Containment of contaminated ground water an overview, in Nielsen, D. N., ed., Second national symposium on aquifer restoration and ground water monitor ing proceedings: Worthington, Ohio, Water Well Journal Publishing Co., p. 17-22.

60 National Water Summary 1983
Gray, G. G., and Hoffman, J. L., 1983, A numerical model study of ground-water contamination from Price's Landfill, New Jersey I. Data base and flow simulation: Ground Water, v. 21, no. 1, p. 7-14.
Handman, E. H., 1983, Hydrologic and geologic aspects of waste management and disposal a bibliography of publica tions by U.S. Geological Survey authors, 1950-81: U.S. Geo logical Survey Circular 907, 40 p.
Mattraw, H. C., Jr., Hull, J. E., and Klein, Howard, 1978, Ground-water quality near the Northwest 58th Street solid- waste disposal facility, Dade County, Florida: U.S. Geolog ical Survey Water-Resources Investigations 78-45, 61 p.
Miller, D. W., ed., 1980, Waste disposal effects on ground water: Berkeley, Calif., Premier Press, 512 p.
Pqjasek, R. B., ed., 1977, Drinking water quality enhancement through source protection: Ann Arbor, Mich., Ann Arbor Science, 614 p.
U.S. Environmental Protection Agency, 1982, Amendment to National Oil and Hazardous Substances Contingency Plan; the National Priorities List: Federal Register, v. 47, no. 251, December 30, 1982, p. 58476-58485.
RADIOACTIVE WASTESRadiation somewhat above natural average back
ground levels generally is considered a threat to health. Consequently, the disposal of low- and high-level radioac tive wastes poses a threat to the quality of ground and sur face water, because of the possibility of migration of radionuclides from disposal sites into active parts of the hydrologic cycle.
Low-level radioactive waste is generated, for the most part, at hospital and research facilities and by nuclear power production in other than the fuel-related processes.
It consists of a wide variety of materials including con taminated clothing, tools, valves and pipes, animal car casses, liquids, and sludges. The annual volume in this country is approximately 210,000 cubic yards. Low-level radioactive waste does not generate large amounts of heat in its decay.
High-level radioactive waste includes spent nuclear- reactor fuel and waste derived from the reprocessing of nuclear fuel and the production of nuclear weapons. The waste is characterized by high radioactivity, nuclides with relatively long half-lives, and a considerable amount of heat generated during its decay.
Low-level radioactive waste is disposed of by means of shallow land-burial techniques at commercial and Federal sites (fig. 24). Of the six commercial sites, three have been closed (Maxey Flats, Sheffield, and West Valley) and a potential fourth closure is under consideration in the courts. Several of the problems that have resulted in site closure have been geohydrologic in nature. At West Valley, N.Y., the very low permeability of glacial tills in which the site is located resulted in the filling of some disposal trenches with water and overflow of contami nated water onto the land surface. The host rock for the Maxey Flats, Ky., disposal site is fractured shale; the complexities of detecting and predicting radionuclide transport by ground water in fractured rock combined with water accumulation problems in the waste-filled trenches led to closure of this site. Other geohydrologic processes and conditions such as erosion, flooding, and depth to the water table can affect the suitability of dis posal sites for storing radionuclides.
EXPLANATION ^-
U.S. Department of Energy site *
* Commercial site
FIGURE 24. Location of low-level radioactive waste repositories in the United States, 1983.

Water-Quality Issues 61
Provisions of the Low-Level Radioactive Waste Policy Act (Public Law 96-573) of 1980 may result in the establishment of as many as eight new commercial dis posal sites by 1990. Geologic and hydrologic investiga tions and research at current sites by the U.S. Geological Survey and others have provided information for the establishment of effective Federal regulations that will help to ensure that future low-level radioactive waste will be disposed of in such a way as to minimize contamina tion of the Nation's freshwater resources.
After more than 30 years of nuclear power develop ment, a suitable permanent repository has yet to be developed for high-level radioactive waste. A disposal concept under consideration consists of emplacing the waste in a deep mined repository in which the geohydro- logic environment effectively isolates the waste from the biosphere for tens of thousands of years. Nearly all high- level wastes are currently stored in facilities near their places of origin (reactors or processing plants).
The comprehensive Nuclear Waste Policy Act of 1982 defines the timetable and responsibility of the U.S. Department of Energy in selecting the first and second repositories. The first repository site is to be selected in 1987 and emplacement of wastes is to begin by 1998. The current earth-science approach stresses the concept of isolating nuclear wastes by means of relatively independ ent multiple natural barriers to radionuclide migration (U.S. Department of Energy, 1979; Winograd, 1981). A major requirement is to identify environments where such multiple natural barriers are believed to exist. A sec ond major requirement is to identify and understand the critical hydrogeologic properties and processes that are in volved in radionuclide migration from a repository to the biosphere. Nine locations presently are being considered by the U.S. Department of Energy as potential sites for the first repository.
Selected ReferencesBredehoeft, J. D. ( England, A. W., Steward, D. B., Trask,
N. J., and Winograd, I. J., 1978, Geologic disposal of high- level radioactive-wastes earth-science perspectives: U.S. Geological Survey Circular 779, 15 p.
Cahill, J. M., 1982, Hydrology of the low-level radioactive solid-waste burial site and vicinity near Barnwell, South Carolina: U.S. Geological Survey Open-File Report 82-863, 101 p.
Fischer, J. N., and Robertson, J. B., 1983, Geohydrologic problems at low-level radioactive waste disposal sites in the United States of America: International Atomic Energy Agency Conference on Radioactive Waste Management Pro ceedings, May 15-20, 1983, Seattle, Wash., 16 p.
National Academy of Sciences, 1983, A study of the isolation system for geological disposal of radioactive wastes: Washing ton, D.C., National Academy Press, 345 p.
Prudic, D. E., and Randall, A. D., 1979, Ground-water hydrology and subsurface migration of radioisotopes at a low- level solid radioactive waste disposal site, West Valley, New York, in Carter, M., ed., Management of Low-Level Radioactive Waste: Pergammon Press, v. 2, 29 p.
U.S. Department of Energy, 1979, Report to the President by the Interagency Review Group on Nuclear Waste Manage ment: Washington, B.C., March 1979, 239 p.
____1983, General guidelines for recommendation of sites for nuclear waste repositories proposed final draft: Washing ton, B.C., September 23, 1983, 39 p.
U.S. Geological Survey and U.S. Bepartment of Energy, 1980, Earth-science technical plan for disposal of radioactive waste in a mined repository: U.S. Bepartment of Energy Report/ U.S. Geological Survey Open-File Report, BOE/TIC- 11033, 207 p.
U.S. Nuclear Regulatory Commission, 1982, Licensing re quirements for land disposal of low-level radioactive waste (10 CFR61), Washington, B.C., 26 p.
Winograd, I. J., 1981, Radioactive waste disposal in thick un- saturated zones: Science, June 26, 1981, v. 212, no. 4502, p. 1457-1464.
Zehner, H. H., 1979, Preliminary hydrogeologic investigation at the Maxey Flats radioactive waste burial site, Fleming County, Kentucky: U.S. Geological Survey Open-File Report 79-1329, 66 p.
____1983 Hydrologic investigation of the Maxey Flats radioactive waste burial site, Fleming County Kentucky: U.S. Geological Survey Open-File Report 83-133, 148 p.
ACIDIC PRECIPITATION
The foremost issue concerning the quality of precipita tion is its acidity and the effect which that acidity may have on aquatic animals, plants, and manmade struc tures, and indirectly on human health. Acidic gases in the atmosphere are derived from natural sources such as volcanoes and forest fires, but especially from man's activities such as the burning of fossil fuels in powerplants and motor vehicles. These gases, through interaction with sunlight, water, and dust particles, can be changed chemically into strong acids, including sulfuric and nitric acids. If a sufficient quantity of alkaline material, such as soil or dust, is present in the atmosphere, the acids and alkaline materials may react to neutralize one another. However, an excess of acids relative to alkaline materials yields acidic precipitation. Measurements of acidic pre cipitation in areas relatively unaffected by industrial emis sions indicate that natural precipitation generally has a minimum (most acidic) pH of about 5.0. The pH of pre cipitation in much of the Eastern United States, especially in the Northeast, averages less than 5.0, and some areas receive precipitation with an average pH of 4.2, which is nearly 10 times more acidic than most natural precipita tion. (A decrease of one pH unit is equivalent to a tenfold increase in acidity.) Acidic precipitation also occurs in the Western United States, as shown in figure 25, but prob lem areas are more isolated and less well-defined than in the Northeast (Interagency Task Force on Acid Precipita tion, 1983).
The U.S. Geological Survey maintains a network of hydrologic bench-mark stations on 52 streams that are virtually unaffected by the activities of man. Data from these stations are useful in determining changes in water- quality constituents brought about by changes in the com position of precipitation. At the hydrologic bench-mark stations, sulfate levels have tended to increase during the past 10 years over a broad area of the conterminous United States extending from the Southeast to the moun tain States and into the Pacific Northwest. In contrast, stations in the northeastern quarter of the Nation have tended to show either no trend or declines in sulfate con-

62 National Water Summary 1983
EXPLANATION
5.4 pH at sample site
'5.0-- Line of equal pH value
5-V-'.5.4
Kt5.4/ ""t**
5.4 V* 58* \ -5'8i
5.6 \\ ^6.s * ^
1 531^.3x e t
5.55,9*
' " ^
3
<
\ri
? -v-^ 5.1
"*'"* * , rtf°V^t= % l
T 5.5£ 1.
1'"^-"^
> * T»~
5.0
» "" "" '5.4
^"r**.,^,/ 5,0
4.7
-».{ "-! »
f
,«^
W.- "I
*'N
l~I
_5,0' " "*,"« '- 5.0
4.7 :t 5 - 0
~>.1
5.7
5.2
*-' - i--*-^._
V5.2
5.8^ n 4' 5 * J-o (V.4.8 i
t*>
FIGURE 25. Average pH of precipitation in the United States and Canada, 1981. (From Interagency Task Force on Acid Precipitation, 1983.)
centrations. These changes in sulfate levels tend to coin cide with the historical pattern of trends in atmospheric sulfur dioxide emissions in the United States from 1965 through 1980 and lend support to the hypothesis that stream sulfate concentrations in surface water tend to follow regional trends in deposition rates of acidic precipitation (Smith and Alexander, 1983).
When acidic precipitation falls on the land surface in areas of alkaline terrane, the acidity generally is neutral ized by reaction with alkaline constituents of the soil, rock, and vegetation; thus, in areas of alkaline terrane, the acidity of the precipitation has little effect on surface or ground water. In areas of less alkaline terrane, the water remains acidic as it moves through the hydrologic system by overland runoff and ground-water flow. Acidic water can dissolve naturally occurring elements in the rocks and soils, such as aluminum, which can attain con centrations that are toxic to aquatic life or vegetation.
Acidic precipitation can corrode and weaken the sur face of metal and stone structures and monuments, and can have an adverse effect on vegetation. Acidic water can dissolve copper and lead pipes and, if used for public water supplies, requires special treatment to protect the public from the toxic effects of these metals. There is some uncertainty at present as to the direct effects of acidic dust or fog on human health.
Acidity in lakes can be reduced by the addition of alkaline materials (U.S. Fish and Wildlife Service, 1982), although this requires a long-term and costly commit ment and may be effective only in certain types of lakes.
The Acid Precipitation Act of 1980, Title VII of Public Law 96-264 (the Energy Security Act of 1980), estab lished an Interagency Task Force on Acid Precipitation to examine scientific and policy issues associated with acidic precipitation. Most present management options center around the reduction of sulfur dioxide and nitrogen oxide

Hydrologic Hazards and Land-Use Issues 63
emissions from specific utility and industrial sources thought to be contributing to acidic emissions.
Acidic precipitation is mentioned in 25 State water- issue summaries.
Selected References
Charlson, R. J., and Rodhe, H., 1982, Factors controlling the acidity of natural rainwater: Nature, v. 295, p. 368-685.
Cogbill, C. V., and Likens, G. E., 1974, Acid precipitation in the Northeastern United States: Water Resources Research, v. 10, p. 1133-1137.
Cowling, E. B., and Linthurst, R. A., 1981, The acid precipita tion phenomenon and its ecological consequences: Bioscience, v. 31, p. 649-654.
Galloway, J. N., Likens, G. E., Keene, W. C., and Miller, J. M., 1982, The composition of precipitation in remote areas of the world: Journal of Geophysical Research, v. 87, p. 8771-8786.
Huebert, J. M., Norton, R. B., Bollinger, M. J., Parrish, D. D., Hahn, C., Bush, Y. A., Murphy, P. C., Fehsenfeld, F. C., and Albritton, D. L., 1983, Gas phase and precipita tion acidities in the Colorado mountains, in Hermann, R., and Johnson, A. I., eds., Acid rain a water resource issue for the 80's: Denver, Colo., 1982, Proceedings, International Symposium on Hydrometeorology, p. 17-23.
Interagency Task Force on Acid Precipitation, 1983, Annual Report, 1982, to the President and Congress: Washington, D.C., National Acid Precipitation Assessment Program, 55 p.
Lewis, W. M., Jr., and Grant, M. C., 1980, Acid precipitation in the western United States: Science, v. 107, p. 176-177.
Likens, G. E., and Butler, T. J., 1981, Recent acidification of precipitation in North America: Atmospheric Environment, v. 15, no. 7, p. 1102-1109.
Liljestrand, H. M., and Morgan, J. J., 1979, Error analysis ap plied to indirect methods for precipitation acidity: Tellus, v. 31, no. 5, p. 421-431.
National Research Council, 1983, Acid deposition atmospheric processes in Eastern North America: Washing ton, D.C., National Academy Press, 375 p.
Peters, N. E., Schroeder, R. A., and Troutman, D. E., 1982, Temporal trends in the acidity of precipitation and surface waters of New York: U.S. Geological Survey Water-Supply Paper 2188, 35 p.
Ritter, J. R., and Brown, A. E., 1981, An evaluation of the ef fects of acid rain on low conductivity headwater streams in Pennsylvania: U.S. Geological Survey Open-File Report 81-1025, 53 p.
Smith, R. A., and Alexander, R. B., 1983, Evidence for acid- precipitation-induced trends in stream chemistry at hydro- logic bench-mark stations: U.S. Geological Survey Circular 910, 12 p.
Stensland, G. J., and Semonion, R. G., 1982, Another inter pretation of the pH trend in the United States: American Meteorological Society Bulletin, v. 63, p. 1277-1284.
Turk, J. T., 1983, An evaluation of trends in the acidity of pre cipitation and the related acidification of surface water in North America: U.S. Geological Survey Water-Supply Paper 2249. [in press]
Turk, J. T., and Peters, N. E., 1977, Acid-rain weathering of a metasedimentary rock basin, Herkimer County, New York, in Proceedings of the Second International Symposium on Water-Rock Interaction, Strasbourg, France: Strasbourg, France, p. 1346-1354. (Also released as U.S. Geological Survey Open-File Report 77-538, 14 p.)
U.S. Fish and Wildlife Service, 1982, International Liming Workshop, Friday Harbor, Wash.: Biological Services Pro gram, Eastern Energy and Land Use Team, FWS-OBS-80/ 40.14, 36 p.
HYDROLOGIC HAZARDS AND LAND-USE ISSUESLand-use and water-use decisions are closely in
terdependent. The availability of water attracts develop ment, but the type of development and use of the land may significantly alter water quantity and quality by im posing new patterns of water withdrawals and wastewater discharges on the region. Development also may create hazards to safety and property. Flooding, land sub sidence, sinkholes, erosion and sedimentation, volcanic eruptions, wetlands, and resources development are hydrologic-hazard or land-use issues of concern in various States. They are discussed below.
FLOODINGFloods are natural and recurring hydrologic events.
They become a hazard when man makes use of flood plains. The natural function of a flood plain is to convey excess water during floods. Man's encroachment onto flood plains has led to an increase in flood damage. Flood- plain occupancy and use is based on the economic advan tages of level ground, fertile soils, ease of access, and availability of water supplies in some cases without full consideration of flood risk. Floods are one of the most destructive natural hazards in the United States. They cause 10 times as many deaths annually as any other geologic hazard (Robinson and Spieker, 1978).
About 6 percent of the land area of the conterminous United States is prone to flooding by streams. Low-lying areas along the Nation's coastline also are subject to flooding by high tides associated with coastal storms and hurricanes. More than 20,800 communities have flood problems, and about 6,100 of these communities have populations greater than 2,500 (U.S. Water Resources Council, 1977). Since 1936, the Federal Government has spent more than $13 billion on flood-protection works (U.S. Water Resources Council, 1978). Average annual flood damages have been increasing during this century at an annual rate of about 4 percent in real dollars, and there is some indication that this rate has increased during the last decade to about 6-7 percent (National Science Foundation, 1980). In 1979, average annual flood damages were estimated to be approaching $3 billion (U.S. Water Resources Council, 1979).
Many approaches are used to reduce losses from flood ing (White, 1964). Some of these are used to protect the occupants of flood-prone areas others are intended to keep development off the flood plains. There are tradeoffs between upstream and downstream interests involved in virtually all flood-control activities. For example, levees may be built along river banks to keep floodwaters in the channels, but this will limit flood-plain storage of water and thus may exacerbate flooding downstream.
Many reservoirs are built for the single purpose of con trolling floods. Water levels in these reservoirs usually are kept low. Their effectiveness for flood control is largely a function of their capacity and the water-release policy.

64 National Water Summary 1983
Releases from these reservoirs may be regulated by an operator, or they may be controlled by the outlet struc ture. On the other hand, many multipurpose storage reservoirs impound water for water supply, recreation, and hydropower, as well as for flood control. The man agement of these reservoirs for flood control is very com plicated. If little storage capacity is available during a flood, the reservoirs will be ineffective in reducing the size of the flood wave. In addition, the dam could be over topped and breached if the capacity of its spillway is ex ceeded. On the other hand, if storage in the reservoir is kept low and a flood does not occur, valuable water for other uses may be lost.
Complete protection from flooding is never achieved. Flood-control reservoirs and levees may create a sense of security, encouraging development in partially protected areas. Flood protection in these areas may be achieved for most floods, but there is the potential for even greater losses during a very large flood when levees are over topped or reservoir flood storage is exhausted. This may provide a partial explanation of the observed long-term rise in flood damages.
Historically, much controversy has surrounded the question of whether to build many small upstream dams as opposed to a few (or one) large downstream dams. Leopold and Maddock (1954) demonstrated that small upstream reservoirs and large downstream impound ments cannot be substituted for one another in a basin- wide flood control scheme. To be effective, a reservoir typically should be a fairly short distance upstream from the protected site.
In addition to levees and reservoirs, other flood- damage mitigation strategies include "flood proofing" of buildings in flood-prone areas, zoning to keep people and property out of the most hazardous areas, and develop ment of flood-warning systems. Timely forecasts and warnings can aid disaster preparedness, and thus save lives and reduce property damage. The National Weather Service maintains regional River Forecast Centers that use rapidly collected hydrologic and weather data in hydrologic models to predict the timing and magnitude of floods.
The U.S. Flood Insurance Administration of the Federal Emergency Management Agency directs a pro gram to make flood insurance available to property owners on a nationwide basis through cooperative efforts of the Federal Government and the private sector. This program also encourages State and local governments to adopt programs of flood-plain management. Flood- insurance studies, for use by the Flood Insurance Admin istration in determining insurance rates, have been pre pared for more than 10,000 of the 20,800 communities with known flood problems.
In 1982, Congress passed the Coastal Barrier Resources Act (Public Law 97-348), which established a Coastal Barrier Resources System for 186 undeveloped units of land along the Atlantic Ocean and the Gulf of Mexico. These areas are ineligible for Federal flood in surance and for most kinds of Federal assistance that would encourage development of coastal areas prone to flooding.
Changes in land use generally affect the magnitude of floods occurring downstream. Changes due to urbaniza tion are the best documented of these. Urbanization results in the covering of parts of a drainage basin with impervious surfaces such as roads, parking lots, and roofs. This typically results in a greater volume of runoff from a given rainstorm than would have occurred prior to development. In addition, gutters and storm sewers are used in urbanized areas to convey runoff rapidly into streams. Natural channels commonly are straightened, deepened, or lined with concrete to make them carry water away more efficiently. Storm waters can, therefore, accumulate downstream more quickly than in natural drainage systems. Increased volume and rate of runoff commonly result in increased flood discharges, flood levels, and flood damages downstream.
For many years, the general practice in designing urban-drainage systems was to remove the water from the area as quickly as possible. This practice has been re placed in recent years by more comprehensive storm- water management, which utilizes innovative approaches such as detention ponds, restricted outlets from rooftops and parking lots, porous pavement, and diversion of drainage from impervious areas to pervious areas.
Many other land-use changes related to agriculture, forestry, and mining have some effect on flooding. However, in many cases, the effects are subtle and dif ficult to quantify, and it is not clear whether flood magnitudes will be increased or decreased by a given land-use change. For example, surface mining may in crease infiltration rates of soils in some areas of disturbed land and decrease the infiltration rates elsewhere due to compaction of soils by heavy equipment.
Virtually all of the State water-issue summaries cite flooding as a significant water issue. In addition to flooding of rivers, the summaries report concern about rising lake levels, increased urban runoff associated with upstream development, coastal flooding, especially flooding of barrier islands, and flash flooding in small streams.
Selected ReferencesDunne, Thomas, and Leopold, L. B., 1978, Water in en
vironmental planning: San Francisco, Calif., W. H. Free man and Company, p. 392-440.
Leopold, L. B., and Maddock, T. M., 1954, The flood control controversy: New York, Ronald Press, 278 p.
National Science Foundation, 1980, A report on flood hazard mitigation: Washington, D.C., National Science Founda tion, 253 p.
Robinson, G. D., and Spieker, A. M., 1978, Nature to be com manded: U.S. Geological Survey Professional Paper 950, 97 p.
U.S. Water Resources Council, 1977, Estimated flood damages nationwide analysis report: Washington, D.C., Appendix B, 27 p.
____1978, The Nation's water resources 1975-2000, Second National Water Assessment, volume 2, water quan tity, quality, and related land considerations: Washington, D.C.,531p.
.1979, A unified national program for flood plainmanagement: Washington, D.C., p. II-3.

Hydrologic Hazards and Land-Use Issues 65
White, G. F., 1964, Choice of adjustment to floods: University of Chicago, Department of Geography, Research Paper no. 93, 150 p.
LAND SUBSIDENCE
In some areas, the development of ground-water sup plies is accompanied by land subsidence (Poland and Davis, 1969). Subsidence generally is associated with pumpage from confined or semiconfined aquifers con taining fine-grained sediments susceptible to compaction. As noted in the section on ground-water development, the process of storage release through compaction is irreversi ble; the structure of the sediments is altered permanently during the compaction, and the water released cannot be returned to storage. The volumes of water released from compacting sediments are much greater than those avail able from artesian storage, but because of this characteris tic of irreversibility, they are available only the first time water levels are lowered to a given depth. For example, the first time water levels in a compacting interval are
lowered to a depth of 100 feet below land surface, a large volume of ground water will be released from storage, with associated compaction of the sediments and subsi dence of the land surface. If pumpage ceases, water levels will recover quickly; however, the system will function essentially as a normal (noncompacting) artesian aquifer during any future withdrawal, as long as the water level does not again fall below the 100-foot depth. This means that when pumping is resumed, water will be provided from the mechanisms of artesian storage, not from the compaction of sediments. Thus, much smaller volumes of water will be available from storage, but on the other hand, no new subsidence will occur.
The implications of these principles for ground-water use in subsidence-prone areas are that short-term with drawals are indeed possible without generating appreci able new land subsidence, provided the drawdown is not allowed to exceed the previously recorded maximum drawdown in the area. In general, this means that the use will be restricted to some son of cyclic pumpage for ex ample, conjunctive use of surface and ground water in
Sfcfc
^y^^^^ss--.^?lt|spK. -i^S^C s. *^"'J^SS
.'^f>- -^
-^.-u^. ^ y<f'~. **&
An earth fissure about 9 miles east of Mesa, Arizona. This, and other similar cracks, are believed to be caused by a subsidence of the Earth's surface due to removal of large quantities of underground water. This view shows the southeasternmost portion of the earth fissure. Perpendicular gullies occur by piping and erosion. (Photograph by U.S. Bureau of Reclamation.)

66 National Water Summary 1983
which pumpage is limited to periods of low surface supply.
Some of the damaging effects of land subsidence in clude: (1) damage to well casings; (2) structural damage to buildings, levees, roads, and bridges; (3) damage to buried cables, pipes, and drains; (4) an increase in the acreage of coastal areas that have sunk below sea level, and are submerged or exposed to increased flooding threat; (5) changes in grade of canal systems and loss of conveyance capacity; and (6) changes in grade and drain age efficiency of irrigated land.
Areas in the conterminous United States where land subsidence has occurred because of ground-water withdrawals are shown in figure 26. Problems caused by subsidence are of major concern in the Santa Clara Valley of California because of the permanent lowering of land surface below sea level during past episodes of subsidence. Costs attributed to subsidence in the Santa Clara Valley are estimated at $30 million. In the Brown wood subdivi sion in Baytown, Tex. (part of the Houston-Galveston area), a waterfront community has subsided more than 8 feet since 1915. Most of the 450 homes in the subdivision have become permanently inundated by water (Neigh bors, 1981).
The Central Valley of California (discussed under water-availability issue, "Ground-Water Development") provides perhaps the best-known historical example of land subsidence. Subsidence began in the mid-1920's as ground water was developed for irrigation. By 1964, ground-water withdrawals had increased to over 10
million acre-feet per year, and subsidence was widespread in the valley. About 5,200 square miles of land had been affected. By 1970, the maximum subsidence exceeded 28 feet at one point in the valley. Increasing use of surface water for irrigation since 1950 has reduced pumping re quirements and increased recharge; thus, the withdrawal of ground water from storage in compacting sediments has been reduced and this has brought about a leveling of subsidence trends (Poland and others, 1975).
Generally, the use of ground water in subsidence-prone areas requires some sort of regulatory program to control the amounts of pumpage, and alternative sources of water usually must be available. For example, in 1979, the Texas Legislature established the Harris-Galveston Coastal Subsidence District to regulate the amount of ground water withdrawn through the use of well permits. This legislation and the increased use of surface-water resources has sharply reduced subsidence in that area.
Land subsidence is mentioned in four State water-issue summaries.
Selected References
Fowler, L. C., 1981, Economic consequences of land-surface subsidence: American Society of Civil Engineers, Proceed ings, Irrigation and Drainage Division Journal, v. 107, no. IR2, p. 151-160.
Neighbors, R. J., 1981, Subsidence in Harris and Galveston Counties, Texas: American Society of Civil Engineers, Pro ceedings, Irrigation and Drainage Division Journal, v. 107, no. IR2, p. 161-174.
BATON ROUGE^p
HOUSTON-GALVESTON
SAN JQAQUIN
(I 'V T
'LANCASTER
'SAN JACINTO- ^LUKE% J QUEEN CREEK
STANFIELD'IELOY
^~ JLJ-**£
FIGURE 26. Areas of land subsidence caused by withdrawal of ground water. (From Poland, 1981.)

Hydrologic Hazards and Land-Use Issues 67
Poland, J. F., 1981, Subsidence in the United States due to ground-water withdrawal: American Society of Civil Engi neers, Proceedings, Irrigation and Drainage Division Jour nal, v. 107, no. IR2, p. 115-135.
Poland, J. F., and Davis, G. H., 1969, Land subsidence due to the withdrawal of fluids, in Varnes, D. J., and Kiersch, G., eds., Reviews in Engineering Geology, v. 2: Boulder, Colo., Geological Society of America, p. 187-269.
Poland, J. F., Lofgren, B. E., Ireland, R. L., and Pugh, R. G., 1975, Land subsidence in the San Joaquin Valley, California: U.S. Geological Survey Professional Paper 437-H, 77 p.
SINKHOLESSinkholes are depressions in the land surface in
carbonate-rock terrane, usually created by sudden col lapse after the underlying rock has been dissolved and weakened by circulating ground water. Sinkhole develop ment is a natural process and occurs whether or not human activities are present. However, there is substan
tial evidence that human activities, particularly ground- water pumpage, can accelerate sinkhole development in those areas where the natural processes are active. The mechanisms involved are not fully understood; a prevalent opinion in the past was that the lowering of pressure during pumpage caused a loss of hydrostatic sup port to overlying rock units. More recently, attention has focused on geochemical reactions that occur at the water table in carbonate aquifers, and result in weakening of the rock at that level (White, 1977); fluctuation of the water table due to pumping presumably allows these reactions to attack a much greater thickness of the subsurface, resulting in more extensive weakening and more rapid collapse. In any case, it is probable that more than one mechanism is involved, and that the relative importance of different mechanisms varies from one locality to another.
In the Central and Eastern United States, where rain fall provides an abundance of water for subsurface solu tion and erosion, carbonate terranes are especially prone
Sinkhole resulting from collapse at Winter Park, Florida, 1981. (Photograph by J. L. Smoot, U.S. Geological Survey.)

68 National Water Summary 1983
to development of sinkholes. Many sinkholes have ap peared in these regions during the past several decades and, in some cases, human activities may have contrib uted to their development. Injuries, fatalities, and costly property damage have resulted from sudden development of sinkholes beneath highways, railroad tracks, buildings, pipelines and sewers, and reservoirs and dams.
Sinkholes that may be due at least in part to human ac tivity are found in Alabama, Florida, Georgia, and Ten nessee in the Southeast, in Pennsylvania in the Northeast, and in Missouri in the Midwest. The high incidence of sinkholes in areas of extensive pumpage in Florida ap pears to be related to fluctuations in ground-water level, but again the relationship is not yet fully explained.
Sinkholes are mentioned in eight State water-issue summaries; five States report fatalities or injuries due to sinkholes.
Selected References
Aley, T. J., Williams, J. H., and Massello, J. W., 1972, Ground water contamination and sinkhole collapse induced by leaky impoundments in soluble rock terrain: Missouri Geological Survey and Water Resources, Engineering Geology series no. 5, 32 p.
Brucker, E. E., 1970, Geology and treatment of sinkholes in land development, St. Louis area, Missouri and Illinois: Mis souri Mineral Industry News, v. 10, no. 7, p. 125-135.
Foose, R. M., 1968, Surface subsidence and collapse caused by ground-water withdrawal in carbonate rock areas: Interna tional Geological Congress, 23d, Prague, 1968, Proceedings, p. 155-166.
Harris, L. D., 1973, Areas with abundant sinkholes in Knox County, Tenn.: U.S. Geological Survey Miscellaneous Geo logic Investigations Map I-762-F.
Newton, J. G., 1976, Early detection and correction of sinkhole problems in Alabama, with a preliminary evolution of remote sensing applications: Alabama Highway Department, HPR Report No. 76, 83 p.
Newton, J. G., and Hyde, L. W., 1971, Sinkhole problem in and near Roberts industrial subdivision, Birmingham, Alabama a reconnaissance: Geological Survey of Alabama Circular 68, 42 p.
Sinclair, W. C., 1982, Sinkhole development resulting from ground-water withdrawal in the Tampa area, Florida: U.S. Geological Survey Water-Resources Investigations 81-50, 24 p.
White, W. B., 1977, Role of solution kinetics in the develop ment of karst aquifers, in Tolson, J. S., and Doyle, F. L., eds., Karst hydrogeology: International Association of Hydrogeologists Memoirs, v. 12, p. 503-517.
EROSION AND SEDIMENTATION
Erosion is the wearing away of earth materials and sedimentation is the deposition of these materials. Both these processes are natural and both may be accelerated by the activities of man. Although wind and ice may erode and move materials, water is the primary trans porting mechanism and it moves much of the sand, silt, and clay and their associated chemical and biological materials.
Erosion and sedimentation can be increased by man's activities such as surface mining, timber harvest, farm ing, including livestock grazing, and construction. Vegetation holds soil in place and also is important in
controlling water velocity and promoting infiltration. When vegetation is removed, soil is easily transported by water. Structural changes in streambeds or shoreline features also may increase erosion and sedimentation by altering water velocities and the availability of sediment.
Increased rates of erosion and sedimentation are signif icant to man's economy and health. Removal of soil from agricultural lands decreases their productive capacity. Sedimentation in rivers and harbors can restrict shipping and require costly dredging. Sediment deposited in stream channels and culverts reduces their water-carrying capacity and raises the potential for flooding. Similarly, reservoir capacities are reduced by the deposition of sedi ment so that periodic dredging is required to maintain their usefulness. Sediments act as sites of attachment for substances in water and, therefore, are an important transport mechanism for organic compounds, metals, radionuclides, bacteria, and viruses. These substances may attach to sediments in concentrations of 10-1,000 times (or greater) than those found in the surrounding water (a more detailed discussion of this phenomenon is presented under the water-quality issue "Bottom- Sediment Contamination").
The rate of sediment transport downstream is highly variable in time. It is not uncommon for 50 percent of the annual sediment load to be transported in 3 or 4 days and for 90 percent to be transported in about a month. This implies that any given sediment particle (and the con taminants adsorbed onto it) is likely to spend very little time in actual transport and a great deal of time in storage somewhere in the stream system. The greatest annual sediment load for a river may be 15 times larger than the smallest annual load. The reason for these year-to-year differences is related to the occurrence of large floods that carry very large sediment loads. As a consequence of this great variability, it may take many years to identify man- induced changes in sediment loads.
The most easily discernible effect of man's activities on the sediment load of streams has been that caused by the construction of dams and reservoirs. The most spec tacular example in the United States is provided by the Colorado River, which discharged about 135 million tons of sediment a year to the sea. Since the construction of Hoover, Glen Canyon, and other dams, the river now discharges only 100,000 tons per year. Similarly, the Mississippi, which discharged about 400-500 million tons per year to the Gulf of Mexico, now averages about 210 million tons per year because of many dams on the Mis souri and other tributaries of the Mississippi (Milliman and Meade, 1983).
Many well-documented case studies have shown that sediment in streams is increased by surface mining, by conversion of forests to crop lands, by conversion of rural areas to suburbs, and by other human activities. Recogni tion of these increases led to the passage of laws and regulations to control the entry of sediment into rivers, and led to the establishment of agencies (most notably, the U.S. Soil Conservation Service 50 years ago) to deal with erosion and sedimentation.
However, the reversal of this increase that is, the reduction of the sediment loads of streams when sediment-producing human activities have decreased or

Hydrologic Hazards and Land Use Issues 69
even stopped has been much more difficult to docu ment. Although widespread conservation measures (such as crop rotation and contour plowing) have been taken, and land uses with high erosion rates have ceased in many areas, sediment discharges in many United States streams remain high.
For example, in the Atlantic Coastal States, upland soil erosion has decreased in recent decades, but a large quan tity of previously eroded soil is stored on hillslopes and in stream valleys where it continues to augment the sedi ment loads of rivers. Trimble (1975) has estimated that more than 90 percent of the 6 cubic miles of soil that were eroded since 1700 from the uplands of the southern Pied mont of Alabama, Georgia, the Carolinas, and Virginia is still stored on the hillslopes and in the valleys of the Piedmont.
Looking at the same question on a national scale, the sediment loads of streams are much less than one might expect from knowledge of the rates of soil erosion. The gross soil erosion in the conterminous United States, ac cording to the Soil Conservation Service, is more than 5 billion tons per year (U.S. Department of Agriculture, 1981). However, the discharge of sediment to the oceans from the same area is only one-tenth that amount (Curds and others, 1973). This indicates that some 90 percent of the soil eroded in the country is being stored somewhere between erosion sites and the sea much of it in stream valleys. Thus, there is a time lag of decades or centuries between reductions in soil erosion and reductions in sedimentation downstream. The implications of this time lag on the fate of pollutants in streams are highly signifi cant. Once a pollutant or contaminant enters a stream and attaches itself to sediment particles, it can be expected to remain in the stream system for decades or centuries.
Erosion and sedimentation is mentioned in 17 State water-issue summaries.
Selected ReferencesBarnard, W. D., 1976, Predicting and controlling turbidity
around dredging and disposal operations: American Society of Civil Engineers, Specialty Conference on Dredging and Its Environmental Effects, Proceedings, p. 930-935.
Curtis, W. F., Culbertson, J. K., and Chase, E. B., 1973, Fluvial sediment discharge to the oceans from the contermi nous United States: U.S. Geological Survey Circular 670, 17 p.
Duffy, McFadden, 1983, Crisis on the coast a task force reacts: Louisiana Conservationist, v. 35, no. 2, p. 4-11.
Easter, K. W., and Cotner, M. L., 1982, Evaluation of current soil conservation strategies, in Halcrow, H. G., and others, eds., Soil conservation policies, institutions, and incentives: Soil Conservation Society of America, p. 283-301.
Holman, J. N., 1968, Sediment yield of major rivers of the world: Water Resources Research, v. 4, p. 737-747.
Meade, R. H., 1982, Sources, sinks, and storage of river sedi ment in the Atlantic drainage of the United States: Journal of Geology, v. 90, no. 3, p. 235-252.
Milliman, J. D., and Meade, R. H., 1983, World-wide delivery of river sediment to the oceans: Journal of Geology, v. 91, no. l,p. 1-21.
Stevens, J. C., 1936, The silt problem: American Society of Civil Engineers Transactions, v. 101, paper 1927, p. 207-250.
Swader, F. N., 1980, Soil productivity and the future of agriculture, in Batie, S. S., and Healy, R. G., eds., The future of American agriculture as a strategic resource: Wash ington, D.C., The Conservation Foundation, 291 p.
Trimble, S. W., 1975, Denudation studies can we assure stream steady state?: Science, v. 188, p. 1207-1208.
____1977, The fallacy of stream equilibrium in contemporary denudation studies: American Journal of Science, v. 277, p. 876-887.
U.S. Army Corps of Engineers, 1981, Final report to Congress The Streambank Erosion Control Evaluation and Demonstration Act of 1974: Public Law 93-251, Section 32, Main report, p. IV-2.
U.S. Department of Agriculture, 1981, Soil, water, and related resources in the United States status, conditions, and trends, 1980 appraisal: Washington, D.C., (2 vols.).
U.S. Soil Conservation Service, 1971, Sedimentation: U.S. Department of Agriculture, National Engineering Hand book, sec. 3, p. 1-19.
Vanoni, V. A., 1975, Sedimentation engineering: American Society of Civil Engineers, Manuals and Reports on Engi neering Practice, no. 54, 745 p.
VOLCANOES
Recent eruptions in Hawaii and Alaska have been relatively nonviolent and have affected comparatively few citizens. However, the eruption of Mount St. Helens in southwestern Washington on May 18, 1980, caused many land and atmospheric effects, including massive mudflows, floods, debris blockage and filling of stream channels, and changes in water quality (Foxworthy and Hill, 1982). These events clearly showed that volcanic eruptions may affect water resources within tens to hun dreds of miles of the volcano. Other volcanoes in the Cascade Range of Washington, Oregon, and California, have been active in recent centuries, indicating that erup tions and damages could occur throughout the Range.
Although nothing can be done to prevent volcanic eruptions, the potential for hydrologic hazards associated with eruptions can be evaluated in advance, permitting public officials to develop adequate emergency-response plans.
Volcanoes are mentioned in three State water-issue summaries.
Selected ReferencesFoxworthy, B. L., and Hill, Mary, 1982, Volcanic eruptions of
1980 at Mount St. Helens the first 100 days: U.S. Geolog ical Survey Professional Paper 1249, 125 p.
Lipman, P. W., and Mullineaux, D. R., eds., 1981, The 1981 eruptions of Mount St. Helens, Washington: U.S. Geological Survey Professional Paper 1250, 844 p.
WETLANDS
Wetlands are important environments in the United States because they are areas of transition from terrestrial to aquatic habitats and serve as nurseries for many valuable species of fish and wildlife. Broadly defined, a wetland is an area where saturation with water (either permanent or intermittent) is the dominant factor deter mining the nature of soil development and the types of plant and animal communities living in the soil, on its surface, and in the overlying water.

70 National Water Summary 1983
Merchants Millpond, North Carolina. Forested wetland do minated by cypress (Taxodinum distichum) and aquatic bed dominated by water lily (Nympaca odorata) and submerged aquatic plants. (Photograph by Virginia Carter, U.S. Geological Survey.)
In the mid-1970's, there were an estimated 99 million acres of tidal and inland wetlands in the conterminous United States a reduction of over 9 million acres from the 1950's (Prayer and others, 1983). There are wetlands in every State; they compose less than 4 percent of the total area of the Nation. The most extensive wetland areas are located in Alaska, Florida, the lower Mississippi River bottom lands, the lowlands of the Atlantic and Gulf coasts, and the forested areas of Minnesota, Wisconsin, and Michigan. Most of the wetlands in California and Missouri, half of the wetlands in Arkansas, and more than one-fourth of the wetlands in Florida have been eliminated through conversion to agricultural or urban uses, mining, or natural causes (U.S. Council on En vironmental Quality, 1981). In addition to a decrease in wetland area, there has, in recent decades, been a deterioration of water quality in many wetlands. Canals and inlets are avenues for saline-water encroachment, and urban growth increases sedimentation.
During the past decade, a number of studies have been conducted on the plants and animals, water chemistry, types of soils, and use of wetlands as a habitat for fish and wildlife. Research suggests that wetlands regulate streamflows by reducing flood peaks and improve water quality by removing nutrients and sediments from surface waters flowing through them. Because wetlands act as
biological filters and remove some pollutants from water, they are sometimes used in conjunction with municipal sewage-treatment systems.
Wetlands are mentioned in 10 State water-issue summaries.
Selected References
Cowardin, L. M., Carter, Virginia, Golet, F. C., and LaRoe, E. T., 1979, Classification of wetlands and deep-water habitats of the United States: U.S. Fish and Wildlife Publica tion FWS/OBS-79/31, 103 p.
Frayer, W. E., Monahan, T. J., Bowden, D. C., and Graybill, F. A., 1983, Status and trends of wetlands and deepwater habitats in the conterminous United States, 1950's to 1970's: Department of Forest and Wood Sciences, Colorado State University, Fort Collins, Colo., 32 p.
Greeson, P. E., Clark, J. R., and Clark, J. E., eds., 1979, Wedand functions and values the state of our understand ing: Minneapolis, Minn., American Water Resources Asso ciation, 700 p.
Heeley, R. W., 1973, Hydrogeology of wetlands in Mas sachusetts: Amherst, University of Massachusetts, M.S. thesis, 129 p.
Horwitz, E. L., 1978, Our Nation's wetlands: Washington, D.C., U.S. Council on Environmental Quality, 70 p.
Klingebiel, A. A., and Montgomery, P. H., 1961, Land capability classification: Washington, D.C., U.S. Depart ment of Agriculture Handbook no. 210, 21 p.
National Wetlands Technical Council, 1978, Workshop report on research priorities for wetland ecosystem analysis: Wash ington, D.C., National Wetlands Technical Council, 68 p.
Richardson, Brandt, ed., 1981, Midwest conference on wetlands values and management, St. Paul, Minn., June 17-19, 1981, Selected proceedings: Navarre, Minn., Fresh Water Society, 660 p.
Shaw, S. P., and Fredine, C. G., 1956, Wetlands of the United States: U.S. Fish and Wildlife Service Circular 39, 67 p.
U.S. Council on Environmental Quality, 1981, Environmental trends: Washington, D.C., U.S. Government Printing Of fice, 346 p.
U.S. Department of Agriculture, 1981, Soil, water, and related resources in the United States status, conditions, and trends, 1980 appraisal: Washington, D.C., (2 vols.), v. 1, 328 p. ,v. 2, 296 p.
____1977, Basic Statistics 1977 National Resource In ventory: Washington, D.C., U.S. Department of Agricul ture, 267 p.
U.S. Water Resources Council, 1978, The Nation's water resources 1975-2000: Washington, D.C., U.S. Government Printing Office (4 vols.).
RESOURCE DEVELOPMENT
The United States is the world's largest producer and consumer of metallic and nonmetallic minerals and mineral fuels. Mineral development occurs in every State. The major metallic minerals produced include iron, lead, zinc, manganese, gold, silver, copper, and molybdenum. The major nonmetallic minerals include lime, clay, barite, phosphate, potash, sulfur, pumice, sand, gravel, and stone. The major fuel minerals include peat, lignite, coal, oil shale, petroleum, natural gas, and uranium.
Water is required to mine and process minerals. The quantity of water needed for this use is not large when

Institutional and Management Issues 71
compared to most other industrial uses or to water use for agriculture, but it is significant and competes with other uses where water is limited. In addition, disruptive effects to the environment may result from mineral development and related waste management. Liquid and solid wastes resulting from mineral processing can contaminate surface- and ground-water resources, and mining opera tions can disrupt aquifers. Examples of hazards associated with mineral extraction include erosion and sedimenta tion, mine dewatering, acid mine drainage, landslides and tail ings-pile collapse, land subsidence, and develop ment of sinkholes.
The hydrologic and environmental hazards that ac company mineral-resource development are widely recognized and have been addressed by State and Federal legislation. Principal among these is the Federal Surface Mining Control and Reclamation Act (U.S. Congress, 1977), which prescribes management and reclamation practices designed to make surface mining less disruptive to the environment.
In addition to mineral resources, the resource- development category has been defined to include the development of hydroelectric power. The construction or rehabilitation of small hydroelectric units on minor streams has been increasing in recent years. This type of development influences both streamflow and sediment transport.
Resource development is mentioned in 31 State water- issue summaries.
Selected ReferencesAveritt, Paul, 1975, Coal resources of the United States,
January 1, 1974: U.S. Geological Survey Bulletin 1412, 131 p.
Davis, G. H., and Wood, L. A., 1974, Water demands for ex panding energy development: U.S. Geological Survey Cir cular 703, 14 p.
Erikson, Kai T., 1976, Everything in its path destruction of community in the Buffalo Creek flood: New York, Simon & Schuster, 180 p.
Martinez, J. D., and others, 1981, Catastrophic drawdown shapes floors: Geotimes, v. 26, no. 3, p. 14-16.
National Academy of Sciences, Committee on Surface Mining and Reclamation, 1979, Surface mining of non-coal minerals a study of mineral mining from the perspective of the Surface Mining Control and Reclamation Act of 1979: Washington, D.C., National Academy Press, 400 p., 2 appendices.
Nugent, Tom, 1973, Death at Buffalo Creek: New York, Norton, 120 p.
Rickert, D. A., Ulman, W. J., and Hampton, E. R., eds., 1979, Synthetic fuels development earth-science consid erations: U.S. Geological Survey Professional Paper 1240-A, 45 p.
U.S. Congress, 1977, Surface Mining Control and Reclamation Act: U.S. Congress, 95th, Public Law 95-87.
U.S. Department of the Interior, 1972, Preliminary analysis of the coal refuse dam failure at Saunders, West Virginia: Washington, D.C , U.S. Department of the Interior, Task Force to Study Coal Waste Hazards, 42 p.
U.S. Geological Survey, 1970, National atlas of the United States: Washington, D.C., U.S. Geological Survey, 415 p.
INSTITUTIONAL AND MANAGEMENT ISSUES
A continuing issue in water management is: Who gets to use how much water for what purposes and at what cost to whom? Rivalry over water is an enduring problem. The word rival stems from the Latin word rivalis, mean ing "one using the same brook as another." Water- management problems differ from many other resource- management problems because we all "share the same brook" in that we all are linked by and are part of the hydrologic cycle.
Water moves through the hydrologic cycle without re gard to individual property lines and political boundaries. Thus, the quantity and quality of water available for use at one location may be affected by water use, waste disposal, or weather-modification practices at another location. Similarly, the cost of increasing the available water supply in one area may be affected by water- resources development somewhere else. It is this interde pendence of water users that gives rise to many water issues and complicates the "rules of the game" by which water is managed.
Water-management rules, laws, and conventions in the United States have evolved in response to water- management problems. There has been a continual evolution of institutions designed to allocate water among competing users, resolve disputes, and promote public health, safety, and the general welfare. Because these institutions have evolved in different historical settings and because they reflect the customs, ethics, and physical environment of the people involved, they form a complex mosaic. There is, however, a hierarchy of these institu tions. All are subject to the provisions of the Constitution of the United States.
The constitutionally based responsibilities of the Federal Government encompass treaties with foreign na tions, interstate commerce and navigation, interstate compacts and litigation, and the management of public lands. The Federal Government's early activities in water management were primarily concerned with navigation; in more recent years, especially since about 1960, the Government has taken a much more active role (Holmes 1972, 1979).
The Federal Government has entered into treaties con cerning water management with Canada and Mexico. Congress has consented to many interstate water com pacts and the Supreme Court has adjudicated numerous cases involving interstate disputes over water. Witmer (1968) provided a compendium of water treaties, com pacts, and adjudications. A more recent bibliography of interstate water compacts was provided by Maloney (1975).
The Federal Government holds "reserved water rights" to water for use in conjunction with certain public lands, such as national parks and forests. In addition, the Federal Government has water-related fiduciary duties and responsibilities under treaties and other agreements with Native Americans.
Those powers not delegated to the Federal Govern ment by the Constitution, nor prohibited by it to the States, are reserved to the States and the people. Thus,

72 National Water Summary 1983
the States have primacy over many aspects of water management within their respective boundaries.
Each State has a unique set of institutions for the management of water allocation and water quality, in ad dition to environmental and other natural-resource- management institutions, that also influence water management. However, the principal body of water laws are those that relate to water rights governing the alloca tion of water among competing users. The subject of water rights is complex, and there are considerable and substantive differences in these rights among the States (Meyers and Tarlock, 1971; Trelease, 1974; Weatherford and others, 1982; Cox, 1982).
Farther down the hierarchy of water-management in stitutions are the rules and regulations promulgated by local administrative agencies, municipalities, irrigation districts, and so forth. These operating rules regulate such things as waste-disposal practices, ground-water pump ing, and allocation and exchange of irrigation-district waters. These rules and regulations are subject to the con stitutions of the respective States and to that of the United States, and cannot be changed without consideration of the provisions of these superior institutions.
Water-management institutions do change, however. The U.S. Constitution is open to different interpreta tions, and can support different ideologies as to the respective roles of the States and the Federal Government in water-resources management.
Water-management institutions and systems change as the knowledge of water resources changes. Increased understanding of ground-water movement and of the interrelationship of ground and surface waters has made
Tl
Between rows of pecan trees, a field of lettuce is being irrigated, Rio Grande Project near San Miguel, New Mexico. (Photo graph by U.S. Bureau of Reclamation.)
possible some recent innovations in Western water law (Schaab, 1983). As it becomes possible to predict the ef fects of one water user's actions on another, laws and regulations may change in order to manage these effects. Similarly, recognition of the benefits of adopting new, more integrated water-management approaches may lead to the changes in laws, treaties, compacts, or agreements necessary to achieve these benefits.
Institutions also change as the problems they are designed to deal with change. State water-right systems, for example, were originally designed primarily to protect a static pattern of water use once the original pattern was achieved (Brown and others, 1980). Increasingly, these same institutions are faced with the problem of facilitating transfers of water rights from existing uses to new ones while simultaneously protecting other water-right holders. The problem of reallocating scarce waters differs from the problem of providing and supporting new allocations from a relatively abundant supply. Brown and others (1980) conclude, however, that more proficient water-right markets are evolving in those areas where the increasing demand for water is greater relative to the available supply.
The costs of construction, repair, and rehabilitation of the physical facilities used for water supply and treatment have been a topic of much recent concern (Viessman and DeMoncada, 1980; Business Week, 1981; Choate and Walter, 1981; Newsweek, 1982; U.S. News and World Report, 1982, General Accounting Office, 1982; Kovalic, 1982). For example, the Congressional Budget Office (1983) estimated that the capital costs for needed new construction, repair, rehabilitation, and replacement of the Nation's water infrastructure would average $18.4 billion annually over the period 1983-1990. More than 75 percent of these costs are for wastewater treatment and municipal water supply. The Federal Government has shared in the cost of some of these facilities in the past particuarly waste-treatment plants. In recent years, the apportionment of these costs has become an issue, as have cost-sharing arrangements for irrigation and other water-resource-development projects. The institutional arrangements for cost sharing have equity implications and affect the magnitude and economic efficiency of water-resource investments.
Selected ReferencesBrown, L., McDonald, B., Tysseling, J., and Dumars, C.,
1980, Water allocation, market proficiency, and conflicting social values: Albuquerque, New Mexico, Bureau of Business and Economic Research, The University of New Mexico for John Muir Inc, 126 p.
Business Week, 1981, State and local governments in trouble: October 26, 1981, p. 135-181.
Choate, P., and Walter, S., 1981, America in ruins beyond the public works pork barrel: Washington, D.C., The Coun cil of State Planning Agencies, 97 p.
Condes de la Tarre, Alberto, 1982, Support by the U.S. Geological Survey for adjucation, compacts, and treaties: U.S. Geological Survey Open-File Report 82-680, 24 p.
Congressional Budget Office, 1983, Public works infrastruc ture policy considerations for the 1980's: Congress of the United States, a CBO Study, April 1983, 137 p.

Institutional and Management Issues 73
Cox, William E., 1982, Water law primer: Journal of the Water Resources Planning and Management Division, American Society of Civil Engineers, vol. 108, No. WR1 (March), p. 107-121.
General Accounting Office, 1982, Water issues facing the nation an overview: CED-82-83, May 6, 1982, 30 p.
Holmes, B. H., 1972, A history of federal water resources pro grams, 1800-1960: Washington, D.C., U.S. Department of Agriculture, Miscellaneous Publication No. 1233, 51 p.
____1979, History of federal water resources programs and policies, 1961-1970: Washington, D.C., U.S. Department of Agriculture, Miscellaneous Publication No. 1379, 331 p.
Kovalic, J. M., 1982, Funding to meet America's water needs: National Society of Professional Engineers, Professional Engineer, winter 1982, p. 28-35.
Maloney, F. E., ed., 1975, Interstate water compacts, a bibliography: Washington, D.C., U.S. Department of the Interior, Office of Water Research and Technology, OWRT7 WRSIC 75-205, 488 p.
Meyers, C. J., and Tarlock, A. D., 1971, Water resources management, a casebook in law and public policy: Mineola, N.Y., The Foundation Press, Inc, 984 p.
Newsweek, 1982, The decaying of America: August 2, 1982, p. 12-16.
Schaab, W. C., 1983, Prior appropriation, impairment, replace ment, models and markets: Natural Resources Journal, v. 23, no. 1, p. 25-51.
Trelease, F., 1974, Cases and materials on water law, resource use and environmental protection: St. Paul, Minn., West Publishing Co., 863 p.
U.S. News and World Report, 1982, To rebuild America $2.5 trillion job: September 27, 1982, p. 57-62.
Viessman, W., Jr., and DeMoncada, C., 1980, Water re sources issues of the 1980's: Library of Congress, Congres sional Research Service, rept. no. 8-210S, 41 p.
Weatherford, G., Nardi, K., Osterhoudt, F., and Roach, F., eds., 1982, Acquiring water for energy institutional aspects: Littleton, Colo., Water Resources Publications, 259 p.
Witmer, T. R., 1968, Documents of the use and control of the waters of interstate and international streams: Washington, D.C., U.S. Government Printing Office, 815 p.

74 National Water Summary 1983
STATE WATER ISSUESThe final part of the National Water Summary con
tains descriptions of water issues for each State, the District of Columbia (combined with Maryland), Puerto Rico and the U.S. Virgin Islands (combined), and the western Pacific Islands under the jurisdiction of the United States (combined with Hawaii). These reports are collectively referred to in the text as the State water-issue summaries.
These State water-issue summaries, which were pre pared by U.S. Geological Survey personnel in consulta tion with State and local officials, also draw upon reviews of recent published information and knowledge of water conditions acquired in the course of U.S. Geological Survey studies. They represent the collective judgment and perceptions of U.S. Geological Survey personnel and officials of more than 130 State and local organizations.
The State water-issue summaries do not inventory all of the water issues and concerns present in a given State. Some important water issues may not be mentioned. Nevertheless, the State water-issue summaries, taken as a whole, provide insight into the variety of water issues of concern to water-resources managers in various parts of the country.
Each State summary consists of five components: (1) introductory remarks highlighting general water condi tions in the State; (2) brief descriptions of major water issues in the State; (3) a list of references pertaining to State water issues; (4) a map showing the location of selected issues; and (5) a table showing the amount of water used in the State during 1980.
The State maps show the location of specific features such as hazardous-waste sites or the polluted segments of streams. Where a large area is affected by a condition, such as declining ground-water levels, or where there are too many points to show on the map, part of the map has been shaded by a colored pattern. Because the maps are generalized, the shading does not necessarily imply that a particular condition is present at every point within the shaded area. Similarly, the boundaries of shaded areas are imprecise. Issues that occur at many locations throughout the State are identified with an asterisk in the text and are not shown on the maps.
Water issues are grouped in four main categories and are coded on the map by letter and color: Water- Availability Issues (A); Water-Quality Issues (B); Hydrologic Hazards and Land-Use Issues (C); and Insti tutional and Management Issues (D). Each major category is further subdivided for the discussion of specific issues.
OVERVIEW OF ISSUESThe following discussion of the State water-issue sum
maries is arranged according to the water-issue categories.
WATER-AVAILABILITY ISSUES
The discussions of water conditions for most States gen erally include a statement to the effect that water is abun dant in most areas or that the available water supplies
generally are adequate to meet foreseeable needs. Yet, water-availability issues are ubiquitous (occurring in arid and humid States alike). In virtually all of the State water- issue summaries, the availability of water is seen as a major issue, primarily because water resources may not be readily available when and where they are needed, or may not be of adequate quality for the intended use. Many State sum maries also mention institutional and management issues which are related to water availability.
Surface-water-availability issues are characterized by short-term inadequacies of supply during drought (men tioned in 29 State water-issue summaries), and may be a consequence of long-term increases in the competition for the developed supplies (mentioned in 17 State water-issue summaries). There is widespread concern that, if devel oped supplies are not supplemented through investment in new reservoirs or conveyance structures, reliable sup plies for existing uses will be hampered. Instream uses, such as waste-load assimilation, fish and wildlife habitat, and navigation, are perceived as being vulnerable to reductions in flow due to increased withdrawals.
About one-third of the State water-issue summaries mention the desirability of constructing additional surface-water storage and improving water distribution systems. Several of those mention constraints on the development of additional storage because few good reservoir sites remain unused and the unit costs of in creasing storage are high. A key question here is how will these improvements be financed through user charges or through Federal, State, or local taxes.
Ground-water-availability issues are cited in 47 State water-issue summaries. Many States are looking to ground water to meet most of their future growth in water use. Ground-water-availability issues are described most frequently in terms of water-level decline in response to intensive pumping (35 States), or in terms of increasing competition for available ground-water supplies (26 States). Both of these perceptions reflect the general in crease in ground-water pumping that has occurred na tionwide over the last several decades. Drawdown of ground-water levels in the vicinity of a well that is being pumped is an inevitable result of pumping and does not necessarily mean that significant depletion of ground- water supplies is occurring. The issues of water-level decline that are cited in the State water-issue summaries are only those declines that are of major concern because (1) they are progressive or areally extensive, (2) they cause significant decreases in streamflow, or (3) they are in conflict with State regulations. Some of the water-level declines have interstate ramifications because pumpage in one State may cause water-level declines in an adjacent State.
A number of State water-issue summaries mention in tensive pumping for irrigation as a cause of declining ground-water levels. Many new irrigation systems have been installed in response to drought conditions in recent years. Once installed, they continue to be used to produce higher yields of traditional crops and to grow higher- profit crops that cannot be produced on naturally moisture alone. Use of ground water for irrigation has been increasing dramatically in some Eastern and South eastern States during the past several years. Such use has

Overview of Issues 75
decreased ground-water levels and increased competition for available supplies, and is mentioned repeatedly as an issue of concern. Total withdrawals of water for irrigation in the Eastern States increased 54 percent between 1975 and 1980; much of that increase was supplied by ground water. In southwestern Georgia, for example, ground- water pumpage for irrigation reportedly increased about 127 percent from 1977 to 1981. The increased withdrawal of ground water for irrigation in Eastern States has not been large enough to change the nationwide pattern of ir rigation withdrawal significantly (about 90 percent of ground water is still withdrawn in 19 Western States). Nevertheless, the increase in pumping for irrigation in the East has a significant impact on water resources, because much of the water withdrawn for that purpose is evaporated or transpired rather than returned to the ground or to streams.
In contrast to the numerous reports of ground-water decline, a few State water-issue summaries cite rising ground-water levels that have caused water-logging or flooding of basements, tunnels, and other subsurface in stallations. In some cases, new or increased application of irrigation water has resulted in rapid buildup of ground- water levels to the land surface in some places. Flooding of subsurface installations has occurred mainly where ground-water levels were depressed by pumping during the years in which the installations were constructed. When ground-water pumping was later decreased for some reason, the installations were flooded as water levels recovered.
One way of increasing the reliable supply of water is through the conjunctive use of surface water and ground water. Several State water-issue summaries mention the desirability of revising water laws to better accommodate conjunctive use.
WATER-QUALITY ISSUESThe State water-issue summaries reflect great concern
about water quality. Although a high percentage of the water-quality discussions relate to water pollution, the vast majority of public water supplies apparently meet Federal and State standards for drinking water. Only a few State water-issue summaries mention substandard public supplies, although the number of ground-water supplies that have been abandoned because of pollution is increasing.
Issues of surface-water quality are mentioned in all but six of the State water-issue summaries. Point sources of greatest concern are sewage-treatment plants and in dustrial waste discharges. Other point sources mentioned include coal mines, spoil piles, and feedlots. Nonpoint sources of pollution most frequently cited are urban runoff and agricultural runoff (including pesticide residue and sediment). The most commonly mentioned pollut ants in hazardous wastes are synthetic organic com pounds and toxic metal compounds. Other frequently mentioned surface-water-quality issues include excessive dissolved solids and troublesome amounts of naturally occurring dissolved metals, fluoride, and radioactivity.
The State water-issue summaries indicate that con siderable progress has been made in the control of point sources of surface-water pollution especially industrial
point sources. The serious surface-water-quality problems of the past depressed levels of dissolved oxygen and high bacterial counts appear to be much less extensive today. Further improvements in surface-water quality probably will require increasing attention to nonpoint sources.
In the area of ground-water quality, hazardous-waste sites are described in 39 State summaries, other point sources of pollution in 34, and nonpoint sources in 29. The types of point sources most commonly mentioned are landfills and wastewater disposal sites, including settling ponds. Leakage of refined petroleum products is men tioned in several summaries, mostly in the Eastern States. The most commonly mentioned nonpoint sources of ground-water pollution include runoff and irrigation return flows carrying pesticide residue from agricultural land, seepage from household septic systems, and storm runoff from urban areas. The types of hazardous waste most frequently listed are synthetic organic compounds, metallic compounds, and radioactive wastes. Because many States are looking to ground water as an alternative to surface-water supplies during drought and as the source of water with which to meet future growth in water use, the protection of ground water from pollution is of great importance.
These concerns regarding ground-water pollution and hazardous wastes apparently result from several recent, interrelated developments: (1) increased Federal and State efforts to identify and cope with hazardous wastes; (2) discoveries of pollution that have been widely reported by the media; (3) advances in chemical-detection equip ment and techniques; and (4) growing lists of substances judged to be carcinogenic and mutagenic. As the State water-issue summaries indicate, neither the full extent nor the full impact of ground-water pollution by hazard ous waste has been determined. Efforts to delineate and monitor the reported occurrences of ground-water pollu tion, and studies of known disposal sites to detect pollu tion, are increasing and now involve every State. These efforts are greatly hampered, however, by lack of knowl edge about local ground-water flow near waste sites, by lack of funding required for comprehensive water analy ses, and by a shortage of qualified investigators.
Eutrophication of lakes, reservoirs, estuaries, and bays is mentioned as an issue in 18 State water-issue sum maries. Bottom-sediment contamination especially pollution by toxic chemicals and metallic compounds is mentioned in six State water-issue summaries.
Saline-water intrusion into freshwater aquifers is identified in 22 of the State water-issue summaries. Fif teen of these are in coastal areas where the landward migration of saline water occurs in response to ground- water pumping.
Acidic precipitation is listed as an important issue in 25 State water-issue summaries. Several States have begun intensive studies of the quality (acidity) of their precipita tion and of the ability of their surface water and soils to buffer atmospheric acid.
HYDROLOGIC HAZARDS AND LAND-USE ISSUES
The category "Hydrologic Hazards and Land-Use Issues" includes a variety of water-related hazards and

76 National Water Summary 1983
hydrologic effects related to certain land uses. The specific issues discussed in the State water-issue summaries in clude flooding; land subsidence caused by withdrawal of ground water; the development of sinkholes; erosion and sedimentation; mudflows and floods associated with vol canic activity; wet soils, land drainage, and wetlands; and hydrologic consequences of the development of natural resources.
Nearly all of the State water-issue summaries (41) described flooding as a cause of major property and crop damage. Although flooding on rivers is experienced in all parts of the country, catastrophic flash flooding due to in tense thunderstorms is of particular concern to Western States. Residential and industrial development near the mouths of canyons is particularly vulnerable to flash floods. Similar concerns exist in mountainous Eastern States where the only flat land available for development tends to be in flood plains. Another concern mentioned in the summaries is the effects of urbanization on floods downstream. Other reports described changes from rising lake levels, coastal flooding, and concerns about dam safety.
Land subsidence is reported as an issue of concern in Arizona, California, Nevada, and Texas, where long-
term pumping of ground water has resulted in the com pression of thick sequences of interbedded sand and clay.
Sinkhole formation, like subsidence, is a phenomenon that requires special geologic conditions namely, soluble rock such as limestone in the subsurface. Sinkhole forma tion is a natural process that can, however, be accelerated by the effects of pumping on water levels. Sinkholes are reported as an important issue mainly in Southeastern States underlain by extensive limestone formations, and in Puerto Rico.
Erosion and sedimentation is mentioned in 17 State water-issue summaries. This issue includes coastal ero sion, stream erosion, erosion from cropland, sediment in runoff from irrigated and logged areas, and sediment deposition in lakes, reservoirs, and stream channels.
Volcano-related flood hazards are mentioned in water- issue summaries of three States that have active volcanoes Alaska, Oregon, and Washington.
Concerns about wet soils, drainage, and wetlands relate mainly to increased waterlogging, usually associ ated with increased irrigation, and threats to natural wet land habitats. These concerns are mentioned in 15 State water-issue summaries.
Sediment deposition from a roadcut after a moderate rain storm in recently urbanized area, Santa Cruz County, California. (Photograph by Douglas Glysson, U.S. Geological Survey.)

Overview of Issues 77
The category of resource development (mentioned in 31 State summaries) includes hydrologic concerns related to mining activities, but has been defined broadly to include also hydropower and other structural develop ments affecting the hydrologic environment. The mining- related concerns described in the State water-issue summaries represent a complex set of hydrologic prob lems affecting surface- and ground-water regimes as well as water quality. The problems include, for example, acid drainage and heavy-metal contamination from aban doned mines, brine disposal from oil and gas production, increased sediment and dissolved-solid levels in streams from placer mining, and aquifer contamination from lead-zinc mines. A related issue is the supply of water for development of energy resources.
An emerging issue is the use of water for small-scale hydropower development. The enactment of recent Fed eral legislation providing tax credits and other incentives to independent developers of hydroelectric power has resulted in proposals for hundreds of dams or diversions on small streams. Some of the proposed facilities may compete with fisheries and other instream uses, as well as with stream diversions.
INSTITUTIONAL AND MANAGEMENT ISSUES
Some aspects of institutional and water-management issues are discussed in all but six of the State water-issue summaries. Although it is not the purpose of this report to examine these issues in detail, they are reviewed briefly here.
Increasing competition for water has drawn attention to the means by which water resources are allocated among competing uses. Concerns about allocation methods are cited in 22 State water-issue summaries. In the West, where there has been a long history of allocating water based on the appropriation doctrine ol water rights, new mechanisms appear to be developing to handle the reallocation of water rights to new users without adversely affecting existing water rights.
Eastern States have had little need to allocate water because in most areas the size of the water resource vastly exceeded water use. In recent years, competition for available supplies has intensified in some areas. A
number of eastern States are considering a permit system for surface-water and ground-water withdrawals. Com missions and State legislatures are currently considering revisions of State water codes in several States to strengthen water-allocation procedures.
Interbasin transfers are of concern in six States because of the effects of the proposed diversions on downstream users in the exporting basin. As local supplies are fully allocated, increasing attention will be given to interbasin transfers as a way of increasing water supplies in many States.
Fourteen State water-issue summaries describe treaties and compacts which allocate water in various river basins. A number of States are having difficulty meeting the terms of the compacts. In the past, interstate compacts and court decisions regarding water allocation have fo cused primarily on surface water. The State water-issue summaries indicate that there are a number of potential conflicts concerning the effects of ground-water with drawal in one State on the water supplies of an adjacent State.
Improved water management is a topic mentioned in about half of the State water-issue summaries. The management concepts mentioned include artificial ground-water recharge, flood-plain management, con junctive use of surface and ground water, and integrated management of multiple water sources for multiple uses. In order for the benefits of improved management to be realized, however, some centralization of authority over the water resources of a basin or area may be needed. This may require the modification of laws and regulations and the development of agreements among many govern ment and private entities.
Finally, the State water-issue summaries for five States mention the issue of financing the refurbishment and expansion of water-supply systems. Several States have recently passed bond issues to assist in the funding of local programs for this purpose.
The diversity and number of topics covered under Institutional and Management Issues in the State water- issue summaries suggests that State and local agencies are taking many actions to meet the challenges imposed by the increasing competition for water.
Photograph by Dawn Reed, U.S. Geological Survey.

STATEWATER-ISSUE
SUMMARIES

80 National Water Summary 1983
ALABAMA WATER ISSUESAs identified by the Alabama District Office of the U.S.
Geological Survey in consultation with State officials
Alabama is a State with plentiful water; precipitation averages about 55 inches per year. Large quantities of water are contained in sand and gravel aquifers in the southern and western parts of the State; these aquifers are a major source of supply. Elsewhere, limestone and other carbonate rocks, which have extensive cavernous systems, store large quantities of water. Large springs, principally in Madison, Morgan, and Colbert Counties, issue from these carbonate rocks.
Major water issues are summarized by category below. The letters and numerical subscripts identify issues shown on the map.
WATER-AVAILABILITY ISSUESGround water Ai
Southeastern Alabama relies almost entirely on ground water for its supply. Water levels in parts of this area have declined as much as 100 feet during the past 10 years. Two factors have contributed to the magnitude of the decline: The increasing competition between municipal, industrial, and irri gation use and the small areal extent of the aquifer system.
WATER-QUALITY ISSUESSurface water Point and nonpoint sources of pollution BI
The development of the Tennessee-Tombigbee Waterway may affect the water quality of the Mobile River, its tributaries, and Mobile Bay. Concerns have been expressed that increased sedimentation resulting from the development activities may adversely affect fish and game habitats and transportation industries. State agencies, such as the Game and Fish Division of Alabama's Department of Conservation and Natural Resources, have addressed these concerns as authorized under provisions of the Fish and Wildlife Coordina tion Act, as amended (PL 85-624; 16U.S.C. 661 etseq.).
Surface water Hazardous-waste site B2
The sediment, water, and fish in Indian Creek have been polluted by DOT residues. Indian Creek was the water supply for some people near the town of Triana, and studies con ducted by the Center for Disease Control, U.S. Department of Health and Human Services, have shown that the people who ate the fish from Indian Creek have large concentrations of DOT in their bodies. The DOT originated from a leased produc tion facility located on the Redstone Arsenal property. The Triana (Redstone Arsenal) site has been included in the U.S. Environmental Protection Agency's National Priorities List (1982) of hazardous-waste sites.
Ground water Saline-water intrusion 83
The coastal zones of Baldwin and Mobile Counties include major population centers that rely almost exclusively on ground water for supply. Water from wells in the Dauphin Island and Mobile Bay regions of Mobile County and the Gulf Shores region in Baldwin County has increased in salinity due to saline water intrusion resulting from large withdrawals of ground water. There is concern that salinity will increase with the continued and increased use of ground water.
Ground water Hazardous wastes B+
A relatively impermeable chalk formation in west-central Alabama is being used as a repository for hazardous wastes and is being considered for additional waste storage. In places where the chalk is fractured, the water resources of the area may become polluted and be a threat to public health.
Small concentrations of benzene, phenols, and other organic compounds have been detected in several major ground-water supplies in Alabama. The causes of the pollution are under in vestigation. The community of Perdido in Baldwin County has been included in the U.S. Environmental Protection Agency's National Priorities List (1982) because benzene was detected in its ground-water supply.
HYDROLOGIC HAZARDS AND LAND-USE ISSUESSinkholes Ci
Sinkholes have developed and are developing at numerous sites underlain by carbonate rocks. It is estimated that more than 4,000 sinkholes, sites of subsidence, or related features have formed since 1900, with most occurring since 1950 (New ton, 1976). Some sinkholes are the result of natural causes, whereas others have resulted from the dewatering of limestone, dolomite, and marble mines; ground-water withdrawals; or impoundment of surface water. In addition to possible loss of life and property caused by sudden collapse, sinkholes have been and are potential conduits for pollutants to move from the land surface to ground and surface waters.
REFERENCESNewton, J. G., 1976, Early detection and correction of sinkhole prob
lems in Alabama, with preliminary evaluation of remote sensing applications: Alabama Highway Research HPR Report No. 76, 85 p.
Solley, W. B., Chase, E. B., and Mann, W. B., IV, 1983, Estimated use of water in the United States in 1980: U.S. Geological Survey Circular 1001, 56 p.
U.S. Environmental Protection Agency, 1982, Amendment to National Oil and Hazardous Substance Contingency Plan; the Na tional Priorities List: Federal Register, v. 47, no. 251, December 30, 1982, p. 58476-58485.
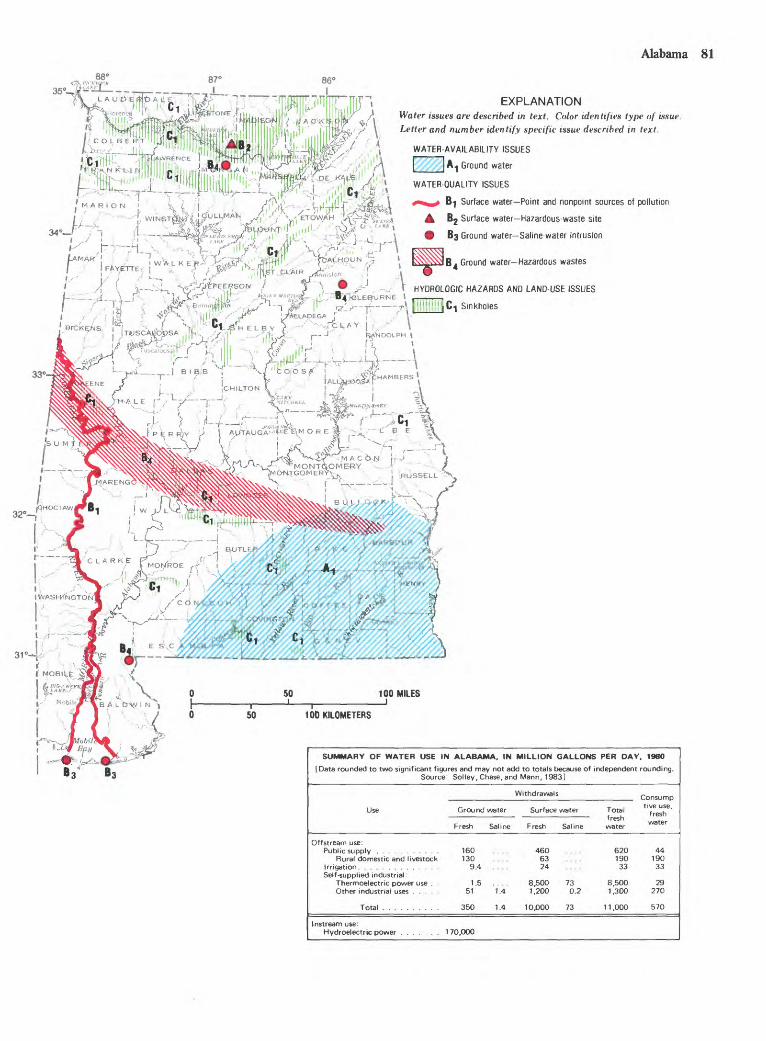
Alabama 81
35°^
EXPLANATIONWater issues are described in text. Color identifies type of issue. Letter and number identify specific issue described in text.
WATER-AVAILABILITY ISSUES
[ ]A 1 Ground water
WATER-QUALITY ISSUES
B-| Surface water Point and nonpomt sources of pollution
A 82 Surface water Hazardous-waste site
83 Ground water-Saline-water intrusion
Ground water Hazardous wastes
HYDROLOGIC HAZARDS AND LAND-USE ISSUES
Sinkholes
3.4 Jj , \Jfl
SUMMARY OF WATER USE IN ALABAMA. IN MILLION GALLONS PER DAY. 1980
[Data rounded to two significant figures and may not add to totals because of independent rounding. Source Solley. Chase, and Mann, 1983]
Use
Offstream use:
Rural domestic and livestock
Self-supplied industrial: Thermoelectric power use . Other industrial uses .....
Total ..........
Instream use:
Ground water
Fresh Saline
160 . 130
9.4
1 .5 .... 51 1.4
350 1 .4
170,000
Withdrawals
Surface water
Fresh Saline
460 63 24
8,500 73 1.200 0.2
10,000 73
Total fresh water
620 190 33
8,500 1.300
1 1 .000
Consump live use.
fresh water
44 190 33
29 270
570

82 National Water Summary 1983
ALASKA WATER ISSUESAs identified by the Alaska District Office of the U.S.
Geological Survey in consultation with State officials
Alaska has abundant water resources, most of which are undeveloped. Certain natural phenomena hinder develop ment: Glacial silt and seasonal freezing affect the availability of surface water, and permafrost affects the availability of ground water. Climatic zones range from arctic through continental to maritime. Precipitation ranges from about 10 inches on the Arctic Slope to about 300 inches in parts of southeastern Alaska. Glaciers and perennial snowfields cover about 30,000 square miles, or about 5 percent of the State. Alaska's popula tion has nearly doubled during the last decade and is expected to continue to increase rapidly. The concentration of this population in the Anchorage-Kenai Peninsula, Fairbanks, and Juneau areas has resulted in increased demands on their water- supply facilities. Continued development of Alaska's abundant metallic and nonmetallic mineral resources and energy resources (oil, gas, geothermal, and coal) will affect water resources. The preservation and protection of fish habitat is essential for the State's anadromous fish industry.
Major water issues are summarized by category below. The letters and numerical subscripts identify issues shown on the map; an asterisk instead of a numerical subscript indicates that the issue is not shown on the map.
WATER-AVAILABILITY ISSUESSurface water A.
Existing water-supply facilities for Anchorage and Juneau do not have sufficient capacity to meet projected demand for water in the next few years. Anchorage is currently meeting demands with surface water from Ship Creek and with ground water. Anchorage proposes to construct a pipeline from Lake Eklutna to increase supply. Juneau is meeting demands with surface water but is investigating the possibility of using ground water from the Mendenhall Valley.
In most of the State, streamflow is decreased significantly by freezing during the winter months (October through April), and most of the flow occurs during the relatively short summer. Many small streams freeze completely. Lakes are used for water supply by several Arctic Slope communities. Water volume decreases and water quality concurrently deteriorates as ice cover thickens through the winter. Expansion of seafood- processing operations has placed increased demands on the local water-supply systems. At Kodiak, current storage is in adequate to guarantee supplies during low streamflow (Alaska Water Study Committee, 1981).
Ground water A,
In most of the State, permafrost decreases the quantity of ground water that would otherwise be available. Ground water below the permafrost usually is saline (Cederstrom and others, 1953; Hopkins and others. 1955; Williams, 1970). In the Cop per River basin, a number of the small unincorporated com munities along the State highway have potential water-supply shortages because of frozen ground, shallow or small aquifers, saline ground water, or malfunctioning distribution systems (Alaska Water Study Committee, 1981). Many small coastal communities are located on bars, spits, small benches, or alluvial fans. Only small quantities of ground water are available, and surface water is not a dependable source. In ad dition, underdeveloped or poorly developed supply systems make it difficult to meet current demands. In some coastal communities where pipes are insufficiently insulated to prevent freezing, faucets are left running to keep pipes open, which results in excessive water use during the winter months.
WATER-QUALITY ISSUESSurface water Point and nonpoint sources of pollution B t
Streams draining commercial and densely populated residential areas in the Anchorage area contain slightly greater
concentrations of dissolved solids and suspended sediments than do streams draining only undeveloped lands. Similar water-quality effects might be expected, but so far have not been documented, in parts of Fairbanks and Juneau. There is concern that effluent from sewage treatment plants and possibly leachate from waste-disposal sites in areas around An chorage, Fairbanks, and Juneau may adversely affect the quality of local water resources.
Ground water Landfills and septic systems B2
Leachate from some landfills and effluent from septic systems may pose a threat to the quality of local ground water because of the combination of permafrost, intense springtime recharge, proximity of surface-water bodies, and permeable surficial material. Leachates from landfills are of particular concern in the Anchorage and Fairbanks areas. In the Big Lake and Wasilla areas, a shallow aquifer underlain by relatively impermeable material also makes ground-water pollution from septic systems a concern (Alaska Water Study Committee, 1981).
Ground water Chemical constituents 83
Many residential ground-water supply wells in the bedrock hills near Fairbanks produce water containing large concentra tions of iron, arsenic, and (or) nitrate (Cederstrom, 1963). Iron and arsenic in the well water at Fairbanks may be of natural origins, although the exact sources are unknown. Some of the nitrate in the well water may be from septic-system effluent. Large iron concentrations are a common problem in ground water throughout Alaska.
Eutrophication 64
Eutrophication of lakes in the Palmer-Wasilla area is the result of recreational use and the concentration of nutrients in runoff from adjacent developing areas.
Acidic precipitation B5
Acid precipitation may be a problem on the Arctic Slope. A recent survey found that water from snow samples at 15 sites on the Arctic Slope had pH values of less than 4.9. Many arctic lakes are susceptible to acidification because the waters have little capacity to neutralize acid.
HYDROLOGIC HAZARDS AND LAND-USE ISSUESVolcanoes Ci
Flooding, mudflows, and ash falls could result from volcanic activity at any of Alaska's 40 active volcanoes. Mount Spurr, 70 miles west of Anchorage, poses a threat to water-supply sources, power-transmission lines, an electric-generating plant, and oil-production facilities. Flooding and mudflows could result from thermal activity at Mount Wrangell in the Copper River basin.
Ice-jam flooding C.
Streams in interior Alaska, particularly the Yukon and Kuskokwim Rivers and their tributaries, are subject to ice-jam floods during the spring. Many villages in Alaska have been damaged extensively by such floods. Peak flood stage may per sist for several days or more until the ice jam dissipates.
Glacial-outburst flooding C,
There are nearly 750 glacier-dammed lakes existing in Alaska. Although many of these lakes are in remote areas, con tinued development of roads, mines, and power grids will in crease the chances for loss of life and property damage from glacial-outburst flooding. Development is occurring on the flood plain of the Knik River. This area has been periodically inundated by floods when the glacier damming Lake George melts during the spring. This has occurred annually prior to 1966 but has not occurred since then.

Alaska S3
0 100 200 MILESI i T i i0 100 200 KILOMETERS
EXPLANATIONWater issues an- described in text. Color identifies type of issue. Letter and number identify specific issue described in text.
WATER-QUALITY ISSUES
A BI Surface Water Point and nonpomt sources of pollution
0 82 Ground water Landfills and septic systems
83 Ground water Chemical constituents
A 84 Eutrophication
|\$^§j 85 Acidic precipitation
HYDROLDGIC HAZARDS LAND-USE ISSUES
O C-j Volcanoes
SUMMARY OF WATER USE IN ALASKA, IN MILLION GALLONS
[Data rounded to two significant figures and may not add to totals because of Source: Solley, Chase, and Mann, 1983]
PER DAY. 1980
ndependent rounding.
Withdrawals
Use
Off stream use:
Rural domestic and livestock . .
Self-supplied industrial: Thermoelectric power use . . Other industrial uses ....
Total ..........
Instream use: Hydroelectric power
Ground water
Fresh Saline
23 .... 11 .... 0 ....
8.4 6.1 0
49 0
770
Surface water
Fresh Saline
30 0.3 ... 0 ....
22 0 120 0
170 0
Total fresh water
53 11 0
30 130
220
Consump tive use,
fresh water
33 0.3 0
.3 1.2
35

84 National Water Summary 1983
Erosion and sedimentation G*
Stream-bank erosion is prevalent in Alaska and causes prop erty damage to Native villages. Accelerated erosion in the Kenai River may be partly caused by man's activities. Erosion adjacent to roads, culverts, and bridges is prevalent along the pipeline haul road.
Resource development Hydroelectric power C.
The effects of hydroelectric-power development are of con cern to the State. Major hydroelectric-power development along the Susitna River is of immediate concern because of potential effects on stream hydraulics and sedimentation, which may then adversely affect fisheries.
Resource development Mineral extraction C.
Improper disposal of wastes and waste water associated with development of the State's mineral resources can adversely af fect water quality. In northern Alaska, permafrost retards the movement of pollutants through the ground; thus, waste water at or near the land surface has the potential to enter nearby lakes and streams. Placer mining, in particular, causes large increases in sediment and dissolved-solids concentrations in streams. Changes in the sediment regime of streams may adversely affect the migration and spawning of anadromous fish.
INSTITUTIONAL AND MANAGEMENT ISSUESWater laws D.
A concern to the State is the claim by some Native groups that the State has no claim to ground water under Native lands.
Water allocation D.
At present, one of the more important issues in Alaska is the implementation of the Alaska National Interest Lands Conser vation Act of 1980 (Public Law 96-487). Clarification of land ownership will result in new resource development and associ ated water-allocation issues. Also of importance are water- allocation issues concerning instream use, such as navigability.
REFERENCESAlaska Water Study Committee, 1981, Anticipating water and related
land resource needs The final report of the South Central Alaskaresources study: Anchorage, 134 p.
Cederstrom, D. J., 1963, Ground-water resources of the Fairbanksarea, Alaska: U.S. Geological Survey Water-Supply Paper 1590,83 p.
Cederstrom, D. J., Johnson, P. M., and Subitzky, Seymour, 1953,Occurrence and development of ground water in permafrostregions: U.S. Geological Survey Circular 275, 30 p.
Cederstrom, D. J., Trainer, F. W., and Waller, R. M., 1964,Geology and ground-water resources of the Anchorage area,Alaska: U.S. Geological Survey Water-Supply Paper 1773, 108 p.
Hopkins, D. M., Karlstrom, T. N. V., and others, 1955, Permafrostand ground water in Alaska: U.S. Geological Survey ProfessionalPaper 264-F, p. F113-F146.
Solley, W. B., Chase, E. B., and Mann, W. B., IV, 1983, Estimateduse of water in the United States in 1980: U.S. Geological SurveyCircular 1001,56 p.
Williams, J. R., 1970, Ground water in the permafrost regions ofAlaska: U.S. Geological Survey Professional Paper 696, 83 p.
Zenone, Chester, and Anderson, G. S., 1978, Summary appraisals ofthe Nation's ground-water resources Alaska: U.S. GeologicalSurvey Professional Paper 813-P, 28 p.

Arizona 85
ARIZONA WATER ISSUESAs identified by the Arizona District Office of the U.S.
Geological Survey in consultation with State officials
Arizona is one of the major agricultural areas of the United States because of extensive irrigation. Average annual runoff is 0.4 inch, the least in the Nation (Ligner and others, 1969).
In the Basin and Range lowlands, where the largest cities and agricultural lands are located, annual precipitation generally ranges from about 4 to 12 inches, but may exceed 25 inches at higher altitudes. Little surface water originates there because of the low precipitation and high evaporation and transpiration. Ground water occurs in very thick alluvial deposits in the basins. Water levels range from above land sur face to more than 800 feet below land surface. Wells that penetrate a significant thickness of aquifer within a basin have yields from a few hundred to several thousand gallons per minute.
In the Central highlands, annual precipitation ranges from about 15 to 30 inches, and most perennial streams in the State originate there. Ground water occurs in consolidated rocks of limited areal extent and in unconsolidated sedimentary deposits beneath the flood plains of major streams. Water levels range from at land surface to more than 500 feet below land surface. Well yields range from about 10 to 1,000 gallons per minute.
In the northern Plateau uplands, annual precipitation ranges from about 10 to 25 inches, and only a few streams are perennial. Ground water occurs in the eastern two-thirds of the uplands in consolidated sedimentary rocks. Elsewhere, sup plies are few. A few wells flow at the land surface; in other places, water levels are more than 1,000 feet below the land surface. Well yields range from about 10 to several hundred gallons per minute.
The major stream in Arizona is the Colorado River. The Colorado and Gila Rivers originate outside the State, but im portant tributaries to the Gila the Salt and Aqua Fria Rivers and the Verde River originate in the Central highlands.
Major water issues are summarized by category below. The letters and numerical subscripts identify issues shown on the map; an asterisk instead of a numerical subscript indicates that the issue is not shown on the map.
WATER-AVAILABILITY ISSUESGround water AI
More than 400 feet of water-level decline has occurred southeast of Phoenix and west of Casa Grande as a result of ground-water withdrawals during the last 50 years. Water- level declines of more than 100 feet have occurred in extensive areas during the same time. During 1980-81, the average water-level decline in 14 irrigation wells scattered throughout the developed part of the Harquahala Plains was about 8 feet (U.S. Geological Survey, 1982b). Declining water levels cause decreasing well yields and increasing pumping costs. Increased withdrawals of ground water from the Coconino aquifer near Holbrook in southern Navajo County and at St. Johns and Springerville in southern Apache County resulted in a lawsuit that seeks major damages because of the decrease in water levels associated with pumping for the powerplant near St. Johns. Withdrawals associated with coal mining on Black Mesa in the Navajo and Hopi Indian Reservations in northern Navajo County have resulted in more than 100 feet of water- level decline (G. W. Hill, U.S. Geological Survey, written commun., 1983). Local Indian community supplies may be adversely affected if water levels in the confined aquifer con tinue to decline. Potential increases in ground-water withdraw als near Sierra Vista (Cochise County) for municipal uses could result in a large expansion of the area of water-level declines and could decrease surface-water flow in the San Pedro River.
Surface water A.
Most of Arizona's streams flow only in response to rainfall; therefore, surface-water supplies are small. Perennial streams that drain the Central highlands are regulated by reservoirs designed primarily to store water for irrigation. The Salt- Verde system can store 2.06 million acre-feet and, in 1983, is near capacity. Storage for flood control currently is not available on the Salt-Verde system. Flood-control structures have been built on local streams near major agricultural areas for protection from overland runoff.
WATER-QUALITY ISSUESSurface water Colorado River salinity Bi
The water to be imported from the Colorado River as part of the Central Arizona Project for the Phoenix and Tucson areas is more mineralized than that from most surface- and ground- water sources in the State. For example, at Parker Dam on the Colorado River, surface water contains 700 to 800 milligrams per liter of dissolved solids, whereas surface water from the Salt-Verde system contains 250 to 350 milligrams per liter of dissolved solids (U.S. Geological Survey, 1982a). The effects of the addition of thousands of tons of salt annually on the local water quality is a major concern to the State. Local municipali ties are concerned that some water-treatment plants are not designed to treat the more saline water and that costly modifi cation may be required.
Surface and ground water Bacteria B2
There is concern that recreation and recreation-based development periodically results in local bacterial pollution of surface and ground water in places throughout the Central highlands. For example, at a popular swimming and water- sports area along Oak Creek south of Flagstaff near Sedona, numbers of fecal coliform bacteria are encountered that com monly exceed State standards for such activities during the summer. Since 1971, fecal coliform bacteria have been detected in water from public-supply and private wells near Pinetop and Lakeside in southern Navajo County during the summer (Mann, 1976).
Ground water Nonpoint sources of pollution 83
The pesticide dibromochloropropane was detected in water from wells in the Phoenix and Yuma areas in 1980. This pesti cide was commonly used to control nematodes in citrus-growing areas. Because this pesticide is a suspected carcinogen, its use was banned in 1979.
Ground water Hazardous-waste sites and landfills B4
Four sites two hazardous-waste in the Phoenix metro politan area and one in the Tucson metropolitan area and one landfill in the Phoenix area have been included in the U.S. Environmental Protection Agency's National Priorities List (1982). The occurrence of organic pollutants in ground water near industrial waste sites is a major concern. For instance, trichloroethylene, an industrial degreaser, has been detected in ground water at sites in Tucson, Phoenix, Scottsdale, and Goodyear. A sample from a well in Tucson contained 4,600 micrograms per liter of trichloroethylene (Arizona Department of Health Services, 1983), and a sample from a well east of Phoenix contained 992 micrograms per liter (Smith and others, 1982). Landfills, which have been used for the disposal of solid waste for several decades under minimal restriction, also are of concern because landfills generally are located near nonperen- nial streams at sites initially used for mining sand and gravel. Infiltrating surface water and fluctuating ground-water levels present a potential for pollution of local ground water by leachate from the landfills. A study of potential pollution sources along the Santa Cruz River northwest of Tucson found lead and other organic compounds such as trichlorofluoro- methane and toluene, were in the ground water (Wilson and

86 National Water Summary 1983
others, 1983). In the future, hazardous wastes will be disposed of in a special facility that is being planned in Rainbow Valley about 30 miles southwest of Phoenix.
Ground water Natural constituents B,
Ground water obtained from volcanic rocks generally con tains natural fluoride concentrations in excess of drinking- water standards established by the State (Arizona Bureau of Water Quality Control, 1978). Such concentrations of fluoride are found in an area north of the Little Colorado River (Kister, 1973), in the Willcox basin in Cochise County (Kister and others, 1966), and in the lower Santa Cruz basin in western Final County (Kister and Hardt, 1966). In several areas, ground water also contains naturally occurring arsenic in ex cess of 50 micrograms per liter, which exceeds quality of water standards for arsenic in public-water supplies (Arizona Bureau of Water Quality Control, 1978). In the upper Verde River area in eastern Yavapai County, water from the Verde aquifer contains arsenic concentrations ranging from 1 to 240 micro- grams per liter (Owen-Joyce and Bell, 1983). Arsenic concen trations range from a trace to almost 100 micrograms per liter in ground water in parts of Papago Indian Reservation in south-central Pima County (Hollett and Garrett, 1983). Con centrations of other naturally occurring constituents in ground water such as nitrate, chromium, and mercury exceed State drinking-water standards in three areas in Maricopa County and in the Kingman area in Mohave County.
HYDROLOGIC HAZARDS AND LAND-USE ISSUESSubsidence C i
Ground-water withdrawal has resulted in the dewatering and compaction of aquifer materials in several intensively developed areas. Near Eloy in south-central Pinal County, land subsidence of about 12 feet has been measured, and many earth fissures attendant have been mapped (Laney and others, 1978). Natural drainage and engineering structures may be severely affected by subsidence. In northeastern Phoenix, sub sidence of about 3 feet resulted in decreased velocity of flow in sewer lines, which decreased the capacity of the sewers. Main tenance problems now occur because the sewer lines no longer are self cleaning, and excessive sewage gases have been de tected (Harmon, 1982).
Storm-water management C2
Urbanization results in increased runoff because extensively paved or roofed areas prevent infiltration of rainfall into the ground. In Arizona, local ordinances require developers to control the runoff, and temporary onsite storage is one alter native. Another alternative is to dispose of runoff in dry wells. Ground-water pollution may result from this practice.
Resource development Metal mining Cs
Metal-laden tailings resulting from historic mining activities in many areas are potential sources of pollution because of the release of acid and heavy metals to a number of small streams. Some adverse effects on surface-water quality caused by min ing wastes have occurred in the upper San Pedro River, Boulder Creek near Bagdad, Verde River near Clarkdale, and Pinal Creek near Miami. Pollution of local ground water also has occurred in the Pinal Creek basin near Miami (Arizona Department of Health Services, 1983).
Safety of dams C*
Recent changes in hydrologic analyses and assessment of adequacy of spillway capacity resulted in several dams being classified as unsafe. The largest dams are federally owned and locally operated. The extent to which the local operators will be required to share repair costs is a key issue as is the funding for the Federal share of the repairs. The national program of dam inspection identified several problems that require additional studies at non-Federal dams. Some of these studies have been made. Funding for repair of non-Federal dams that are found to be unsafe also is an important issue.
Flooding C.
Unusually excessive runoff from the Upper Colorado River Basin in spring 1983 necessitated record releases from Lakes Powell and Mead. Along the downstream reach of the Colo rado River from Bullhead City to Yuma, flood damage oc curred to residences and businesses. LaPaz, Mohave, and Yuma Counties in Arizona were designated as Federal disaster areas.
INSTITUTIONAL AND MANAGEMENT ISSUESWater allocation D»
The legal right to the control and use of sewage effluent has been an issue in recent years. Rights to effluent was an issue in allocations of water from the Central Arizona Project because the effluent is considered part of a city's dependable supply. The Arizona Department of Health Services is developing regulations to control the reuse of sewage effluent. In the Phoenix area, the Palo Verde Nuclear Generating Station has contracted with the Municipal Water Users' Association for the purchase of about 140,000 acre-feet of effluent per year for use as cooling water. That action is the subject of lawsuits filed by the Salt River-Pima-Maricopa Indian communities and by several other entities.
Water-resources management Surface and ground water Da
A significant potential for recharge of ground water by surplus surface water exists in the coarse alluvium that underlies most streams, particularly in the Phoenix, Safford, and Tucson areas, but the opportunity for recharge is limited by the quantity of surface water available. An example of this type of recharge occurred from 1978 to 1980 when greater- than-normal precipitation in the Salt and Verde River basins necessitated the release of surplus surface water to the normally dry bed of the Salt River, which flows through the Phoenix metropolitan area. Infiltration of nearly 500,000 acre-feet of flood water caused ground-water levels in 169 wells that tap the alluvial deposits in the Salt River Valley to rise an average of about 35 feet from February 1978 to May 1980 (Mann and Rohne, 1983).
Water laws D.
In 1980, the Arizona Legislature passed the Groundwater Management Act, which created four Active Management Areas and two Irrigation Non-Expansion Areas. Subsequent ly, another Irrigation Non-Expansion Area has been desig nated in the Harquahala Plains area. In these areas, the use of ground water will be controlled. Management goals have been established on the basis of the safe-yield concept. Safe yield is defined as a long-term balance between the annual quantity of ground water withdrawn and the annual quantity of natural and artificial ground-water recharge. The law establishes plans for a series of management periods, which culminate in the year 2025 when safe yield is to be achieved. This goal will be reached through mandated conservation plans for all water users and eventually by purchase and retirement of farmlands. The costs of this water-management program will be recov ered, in part, from ground-water withdrawal fees.
Treaties and compacts D.
Arizona's use of Colorado River water is governed by the Rio Grande, Colorado, and Tijuana Treaty of 1944 with Mex ico, the Colorado River Compact of 1922 (Arizona, California, Colorado, Nevada, New Mexico, Utah, and Wyoming), and the Upper Colorado River Basin Compact of 1948 (Arizona, Colorado, New Mexico, Utah, and Wyoming). Arizona's ef forts to obtain water allocated, but not used, from the Colorado River for the Central Arizona Project was challenged by California, which was using the water. In a U.S. Supreme Court decree (Arizona v. California, March 9, 1964), Arizona obtained the right to 2.8 million acre-feet of water per year from the Colorado River. Much of the water will be used in

Arizona 87
114 110° 109°
EXPLANATION Water issues are described in text. Color identifies type of issue. Letter and number identify specific issue described in text.
WATER AVAILABILITY ISSUES
I | A-| Ground water
WATER-QUALITY ISSUES
|^j^| 61 Surface water-Colorado River salinity (see small map)
M=^~l ^2 Surface and ground water Bacteria
A R, Ground water Nonpoint sources w J of pollution
P Ground water Hazardous-waste D4 sites and landfills
|§j^§^3 65 Ground water Natural constituents
HYDRDLOGIC HAZARDS AND LAND-USE ISSUES
[l||||l"| Ci Subsidence (see small map)
Storm-water management1^ J °2 (See sma|| map)
9> £3 Resource development- Metal mining
(£ 04 Safety of dams
INSTITUTIONALAND MANAGEMENT ISSUES
DI Water allocation
| | g_ Water resources management I I Surface and ground water
100 KILOMETERS. v-~ w. r A -c* JL,, .-x*ena vista A ^ U2 l^=Er '<- *
*"*
SUMMARY OF WATER USE IN ARIZONA, IN MILLION GALLONS PER DAY, 1980
[Data rounded to two significant figures and may not add to totals because of independent rounding. Source: Sollev. Chase, and Mann. 1983]
Withdrawals
Use
Offstream use:
Rural domestic and livestock
Self-supplied industrial: Thermoelectric power use . Other industrial uses . .
Total ..........
Instream use: Hydroelectric power
Ground water
Fresh Saline
300 .... 42
3,700 ....
40 .... 140 0
4,200 0
41,000
Surface water
Fresh Saline
260 .... 1 .8
3,400 ....
49 0 20 0
3,700 0
Total fresh water
560 43
7,100
89 160
8,000
Consump tive use,
fresh water
340 32
4,000
51 120
4,500

88 National Water Summary 1983
place of ground water in the central part of the State. The Cen tral Arizona Project diversion system is being constructed and is expected to deliver water to the Phoenix area by 1985 and to the Tucson area by 1990.
Indian water rights D.
Arizona has 22 Indian reservations that occupy more than 25 percent of the State's area. The water rights of each reserva tion have not been determined. Several lawsuits are pending as a result of non-Indian diversions of surface water and pumping of ground water. The outcome of these court cases, which could significantly affect the future types of water-resources development within the State, is of vital concern to all residents.
Water-rights adjudication D.
There has been no statewide adjudication of water rights. In 1980, Arizona began efforts toward comprehensive basinwide water-rights adjudication in the Gila River basin. These ad judications were to include all water-rights claimants, which include Federal agencies and Indian tribes. In February 1982, a ruling by the 9th U.S. Circuit Court of Appeals negated the right of Arizona to adjudicate Indian water rights.
Water-quality regulation D.
Standards and regulations for surface-water quality were adopted in the 1970's. A fixed-station network was established at that time to monitor long-term quality trends and to detect serious degradations in surface-water quality. Standards and regulations for ground-water quality are being developed.
REFERENCESAldridge, B. N., and Hales, T. A., 1983, Floods of November 1978 to
March 1979 in Arizona and west-central New Mexico: U.S. Geo logical Survey Open-File Report 83-201, 168 p.
Arizona Bureau of Water Quality Control, 1978, Drinking water regulations for the State of Arizona: Arizona Department of Health Services, 39 p.
Arizona Department of Health Services, 1983, Water quality assess ment report for the State of Arizona, water years 1980 and 1981: Arizona Department of Health Services, 85 p.
Harmon, D. B., 1982, Subsidence in northeast Phoenix: Arizona Bureau of Geology and Mineral Technology Field Notes, v. 12, no. 3, p. 10-11.
Hollett, K. J., and Garrett, J. M., 1983, Geohydrology of the Papago, San Xavier, and Gila Bend Indian Reservations,
Arizona 1978-81: U.S. Geological Survey Hydrologic Investiga tions Atlas HA-660. [in press]
Kister, L. R., 1973, Quality of ground water in the lower Colorado River region, Arizona, Nevada, New Mexico, and Utah: U.S. Geological Survey Hydrologic Investigations Atlas HA-478, 2 sheets.
Kister, L. R., and Hardt, W. F., 1966, Salinity of the ground water in western Pinal County, Arizona: U.S. Geological Survey Water- Supply Paper 1819-E, 21 p.
Kister, L. R., Brown, S. G., Schumann, H. H., and Johnson, P. W., 1966, Maps showing fluoride content and salinity of ground water in the Willcox basin, Graham and Cochise Counties, Arizona: U.S. Geological Survey Hydrologic Investigations Atlas HA-214, 6 p., 2 sheets.
Laney, R. L., Raymond, R. H., and Winika, C. C., 1978, Maps showing water-level declines, land subsidence, and earth fissures in south-central Arizona: U.S. Geological Survey Water-Resources Investigations 78-83, 2 sheets.
Ligner, J. J., White, N. D., Kister, L. R., and Moss, M. E., 1969, Water resources of Arizona: Senate Committee on Interior and In sular Affairs, 90th Congress, 2d session, committee print, p. 459-569.
Mann, L. J., 1976, Ground-water resources and water use in South ern Navajo County, Arizona: Arizona Water Commission Bulletin 10, 106 p.
Mann L. J., and Rohne, P. B., Jr., 1983, Streamflow losses and changes in ground-water level along the Salt and Gila Rivers near Phoenix, Arizona February 1978 to June 1980: U.S. Geological Survey Water-Resources Investigations Report 83-4043, lip.
Owen-Joyce, S. J., and Bell, C. K., 1983, Appraisal of water resources in the upper Verde River area, Yavapai and Coconino counties, Arizona: Arizona Department of Water Resources Bulle tin 2, 219 p. [in press]
Smith, S. A., Small, G. G., Phillips, T. S., and Clester, Michael, 1982, Water quality in the Salt River Project, a preliminary report: Salt River Project, Water Resources Operations Report, 343 p.
Solley, W. B., Chase, E. B., and Mann, W. B., IV, 1983, Estimated use of water in the United States in 1980: U.S. Geological Survey Circular 1001,56 p.
U.S. Environmental Protection Agency, 1982, Amendment to National Oil and Hazardous Substance Contingency Plan; the Na tional Priorities List: Federal Register, v. 47, no. 251, December 30, 1982, p. 58476-58485.
U.S. Geological Survey, 1982a, Water resources data for Arizona: U.S. Geological Survey Water-Data Report AZ-80-1, 568 p.
____1982b, Annual summary of ground-water conditions in Arizona, Spring 1980 to Spring 1981: U.S. Geological Survey Open-File Report 82-368, 2 sheets.
Wilson, L. G., Keith S. J., and Fitch, H. R., 1983, Cortaro Area Pollution Source Assessment Final report, Pima Association of Governments: Tucson, University of Arizona, Water Resources Research Center, 425 p.

Arkansas 89
ARKANSAS WATER ISSUESAs identified by the Arkansas District Office of the U.S.
Geological Survey in consultation with State officials
Arkansas is a water-rich State; its average annual precipita tion ranges from about 42 to 55 inches. Physiographically, the State has been divided into two provinces; the northwestern one-half is part of the Interior Highlands, and the southeastern one-half is part of the Gulf Coastal Plain (Baker, 1955). The Highlands area generally is not suited for large-scale growing of crops because of topography; however, large numbers of poultry and some cattle are raised, and there is some small- scale crop farming. In the Highlands, domestic water supplies generally are obtained from shallow wells, and some smaller cities obtain water from deeply buried sandstone aquifers. The larger cities in the Highlands obtain water from surface-water reservoirs. The Gulf Coastal Plain is an area of intensive agriculture using large quantities of ground water; ground water also is used extensively for municipal and domestic supplies.
Major water issues are summarized by category below. The letters and numerical subscripts identify issues shown on the map; an asterisk instead of a numerical subscript indicates that the issue is not shown on the map.
WATER-AVAILABILITY ISSUESSurface water Ai
Although some surface water is now used for irrigation in eastern Arkansas, withdrawals of additional large quantities of water from the Arkansas, White, and Little Red Rivers for irrigation have been proposed as an alternative to the predomi nant use of ground water because of decreasing ground-water supplies. Additional withdrawals of surface water may gener ate concerns about maintaining adequate streamflow for navigation, power production, waste dilution and assimilation, and preservation of wildlife.
Ground water A2
Irrigation pumpage since the early 1930's has caused water- level declines of more than 60 feet in the Mississippi River alluvial aquifer in the Grand Prairie area of eastern Arkansas. Water levels in the alluvial aquifer are declining by as much as 1 foot per year. In southern Arkansas, declines of 225 feet in the Magnolia area (Columbia County) and of 300 feet in the El Dorado area (Union County) of the Sparta aquifer have re sulted from municipal and industrial pumpage.
WATER-QUALITY ISSUESSurface water Point and nonpoint sources of pollution Bi
Several streams and surface-water bodies receive municipal and industrial waste-water discharges that adversely affect the suitability of the water for drinking, recreation, and aquatic life. Depletion of dissolved oxygen in the White River and eutrophication of Beaver Reservoir in northwest Arkansas caused by nutrient enrichment are two widely publicized ex amples. Also contributing to concerns about the White River are nonpoint discharges of nutrients and sediments from agricultural and municipal sources (Terry and others, 1983). The Arkansas River is being considered as a source of water for public supply and irrigation. Seepage from naturally occur ring salt deposits in Kansas and Oklahoma, which increases the salinity of the river, may make the river unsuitable for most uses during low flows. Municipal and industrial discharges to the Arkansas River may contribute wastes and chemicals that affect its potability although storage effects of the Arkansas River Navigation System and tributary dams may have mod erated the effects of any inflowing pollutants.
Surface water Pesticides 82
Potential pollution of water and accumulation of pesticides in bottom sediments of streams, lakes, and ponds is a concern
in agricultural areas of the State. Although there are many potentially adverse effects on fish, wildlife, and human health, the extent of these effects in Arkansas has not been quantified. In order to decrease the erosion of soil particles to which pesticides adhere, land-treatment practices, including planting of cover crops, no-till farming, and crop rotation, are being implemented. These practices may decrease the quantity of sediment and attached pesticides deposited in streams, ponds, and lakes.
Ground water Saline-water intrusion 83
Saline water from underlying rocks is intruding into the fresh water aquifers in several areas due to ground-water withdrawals. Areas of concern are the alluvial aquifer in eastern Arkansas and the Sparta aquifer in southern Arkansas.
Ground water Hazardous-waste sites and landfills B4
Of the 247 hazardous-waste sites in Arkansas, 7 have been included in the U.S. Environmental Protection Agency's Na tional Priorities List (1982). Wastes at these sites include pesticides, dioxin, pentachlorophenol, creosote, arsenic, chromium, copper, lead, and oil. Because of their geohydro- logic settings, all hazardous-waste sites are considered poten tial sources of ground-water pollution. There also are several hundred solid-waste landfills and active open-dump sites that have not been assessed adequately as to their contents, and potential for pollution of local ground water.
HYDROLOGIC HAZARDS AND UNO-USE ISSUESResource development Coal mining Ci
Semianthracite and bituminous coals have been mined in the Arkansas Valley Coal Region of west-central Arkansas since 1870 (Bush and Gilbreath, 1978). Large deposits of lignite in south-central Arkansas are scheduled to be strip mined beginning about 1990. A study describing premining hydro- logic conditions has been completed for the lignite area (Terry and others, 1979). However, little work has been done to deter mine environmental effects of coal mining in Arkansas.
Flooding C.
Twenty-four-hour rains of 5 to 10 inches are frequent in the State, and, occasionally, rains greater than 10 inches occur (National Oceanic and Atmospheric Administration, 1976). As a result, localized flooding is common throughout the State. Widespread flooding in low-lying areas of the Gulf Coastal Plain is a continuing concern.
Wetlands C.
Decrease of wetlands by drainage, stream channelization, or clearing is a concern in the State. The percentage of the Missis sippi River alluvial plain in Arkansas that contains hardwood bottomland decreased from 41 percent in 1937 to 13 percent in 1977 (MacDonald and others, 1979). The alluvial plain con tained approximately 1.0 million acres of bottomland forests in 1978; projections estimate additional decreases to 0.88 million acres by 1985 and to 0.80 million acres by 1990 (MacDonald and others, 1979).
INSTITUTIONAL AND MANAGEMENT ISSUESWater laws D.
Proposals to adopt a State water code were introduced during the 1983 legislative session.
REFERENCESBaker, R. C., 1955, Arkansas' ground-water resources: Arkansas
Geological Commission Water Resources Circular 1,16 p.Bush, W. V., and Gilbreath, L. B., 1978, Inventory of surface and
underground coal mines in the Arkansas Valley coal field: Arkan sas Geological Commission Information Circular 20-L, 15 p.
Holland, T. W., and Ludwig, A. H., 1982, Use of water in Arkansas, 1980: Arkansas Geological Commission Water Resources Sum mary 14, 30 p.

90 National Water Summary 1983
Jackson, J. L., and Mack, L. E., 1982, Arkansas water Why wait for the crisis?: Little Rock, The Winthrop Rockefeller Foundation, 47 p.
MacDonald, P. O., Prayer, W. E., and Clauser, J. K., 1979, Documentation, chronology, and future projections of bottomland hardwood habitat loss in the lower Mississippi Alluvial Plain, in Basic report, v. 1: Vicksburg, Miss., U.S. Fish and Wildlife Serv ice, 133 p.
National Oceanic and Atmospheric Administration, 1976, Climatography of United States No. 60, Climate of Arkansas: Asheville, N.G., Environmental Data Services, 14 p.
Solley, W. B., Chase, E. B., and Mann, W. B., IV, 1983, Estimated water use in the United States in 1980: U.S. Geological Survey Cir cular 1001, 56 p.
Terry, J. E., Bryant, C. T., Ludwig, A. H., and Reed, J. E., 1979, Water-resources appraisal of the south-Arkansas lignite area: U.S. Geological Survey Open-File Report 79-924,162 p.
Terry, J. E., Morris, E. E., and Bryant, C. T., 1983, Water-quality assessment of White River between Lake Sequoyah and Beaver Reservoir, Washington County, Arkansas: U.S. Geological Survey Water-Resources Investigations 82-4063, 84 p.
U.S. Environmental Protection Agency, 1982, Amendment to National Oil and Hazardous Substance Contingency Plan; the Na tional Priorities List: Federal Register, v. 47, no. 251, December 30, 1982, p. 58476-58485.

Arkansas 91
94°I
93°I
92° 91°'">.
I"" ";*WiP * } 4»-.*4'-*'-.S«^' V'M!Si'»* ^-- "' - vl I RANDdLPH,.'] - / /. Y *?
, B E N T O.I^F^C-A-| ^L L I:; BJONE ! MARION\BAXT^fer" _ A __ J^' _i ' . ,-? ^i-i-.___,'_ , J
EXPLANATIONFRANCIS
i/xg^-'i .. u»i."' f^ 1*^j^T _, \___cf^ A^
1| T~~ v, 7 'ifJiP Water issues are described in text.\ ] .-- L ft £\
u-, H
'j .'Mw^r^ f-JINGTO -I - , / .-'
S ./',!. ;N>%TO;
NE }_r_vr-i\!-A*^9 !
4 ? t~**i r~ ~' r '-^Sf , _ jC" ^-i S -' -i i " - -.. s~f~~ mf- y - i...--'' /
MUlUCEtS'_JC... j-v- ,-lv"'
" JvTlH^T: SP
. _ _ _ijiJ ;A -"oc
100 KILOMETERS
Co/or identifies type of issue. Letter and number identify specific issue
r~~~V~ "^C- described in text.
WATER-AVAILABILITY ISSUES
At Surface water
> I _| A 2 Ground water
WATER-QUALITY ISSUES
1 Surface water Point and nonpoint sources
of pollution
82 Surface water-Pesticides (see small map)
63 Ground water-Saline-water intrusion
0 84 Ground water-Hazardous waste sites
and landfills
HYDROLOGIC HAZARDS AND LAND-USE ISSUES
jiljjljljl C-j Resource development-Coal mining (see
small map)-
SUMMARY OF WATER USE IN ARKANSAS. IN MILLION GALLONS PER DAY. 1980
[Data rounded to two significant figures and may not add to totals because of independent rounding. Source: Solley, Chase, and Mann, 1983]
Withdrawals
Use
Offstream use:
Rural domestic and livestock . . Irrigation. . . ...Self-supplied industrial:
Thermoelectric power use . . Other industrial uses .....
Total ..........
Instream use: Hydroelectric power ....
Ground water
Fresh Saline
110 ... 78 ...
3,500 ...
3.1 ... '380 0
'4.100 0
26,000
Surface water
Fresh Saline
1 5039 , ..
1 600
9,700 0 '410 0
1 1 1 ,000 0
Total fresh water
260 120
'4,100
9,700 '790
'15,000
Consump tive use,
fresh water
64 110
3,100
100 200
3,600
1 Revised. See Holland and Ludwig, 1982.

92 National Water Summary 1983
CALIFORNIA WATER ISSUESAs identified by the California District Office of the U.S.
Geological Survey in consultation with State officials
Average annual precipitation in California ranges from about 4 inches in the Mojave-Colorado desert to 60 inches in the north and along the higher elevations of the Sierra Nevada. Before intensive development of the State's water resources, most of the southern part of the State depended on ground water for its principal supply. As a result, ground water is more extensively developed in the coastal valleys, desert areas, and the Central Valley. Plateau areas depend mainly on surface-water supplies. Prolonged use of ground water has caused large water-level declines in the Los Angeles basin, southern Central Valley, and some coastal valleys, with attendant land subsidence, increased cost of pumping, degradation of water quality, and saline-water intrusion along the coast. Since about 1950, the major water projects of the California Department of Water Resources and the U.S. Bureau of Reclamation have diverted surface water from northern California through large aqueducts to the southern Central Valley and southern coastal areas. Although this prac tice has decreased pumping in both areas and has halted sub sidence, it has increased many environmental concerns in the San Francisco Bay and the delta of the San Joaquin and Sacra mento Rivers area. A court-decreed transfer of 2.8 million acre-feet of Colorado River water from southern California to Arizona beginning in 1985 may result in more interbasin transfer of water from northern to southern California, further decreasing outflow to the San Francisco Bay-San Joaquin- Sacramento delta areas. The quality of water in California generally meets water-quality standards for most uses; however, some local pollution of ground and surface water has occurred in or near major metropolitan areas. The potential for pollution from pesticides and saline agricultural waste water exists in many areas of the State, but especially in the southern one-third of the Central Valley where there are no agricultural drainage systems that can remove irrigation return water.
Major water issues are summarized by category below. The letters and numerical subscripts identify issues shown on the map; an asterisk instead of a numerical subscript indicates that the issue is not shown on the map.
WATER-AVAILABILITY ISSUESSurface water Ai
Since 1941, water levels in Mono Lake (Inyo County) have declined about 45 feet because of increased evapotranspiration and increased diversion of water from perennial streams flow ing into the lake. In the Mono Lake basin, Los Angeles has diversion rights of 147,000 acre-feet of water per year, which is one-sixth of the city's annual supply. Some environmental concerns of lowered lake levels are the effects on gull nesting and on native vegetation, and increased lake salinity. Since 1930, the dissolved-solids concentration in the lake has in creased from about 45,000 to 100,000 milligrams per liter. As water levels in the lake decline, recharge from the lake to the ground-water system decreases, causing ground-water levels to decline.
Ground water A?
California, the Nation's largest user of ground water, pumps about 19 million acre-feet during an average year, or 28 per cent of the total ground water pumped in the United States. About 48 percent of the State's water supply during an average year comes from ground water. As population and agriculture increase, continual water-level declines are occurring in a number of areas. The California Department of Water Re sources (1980a) determined that large ground-water declines are occurring in 11 basins, of which 8 are in the San Joaquin Valley where agricultural development is extensive. The an nual maximum water-level declines in these basins are as much as 6 feet and average about 2.5 feet per year (California
Department of Water Resources, 1982). Three other basins where ground-water declines are occurring, are the coastal basins of Santa Cruz-Pajaro, Cuyama Valley, and Ventura County; water levels have declined as much as 200 feet since 1950 and saline-water intrusion is occurring. In parts of Im perial, Los Angeles, Riverside, and San Bernardino Counties, annual pumpage is more than twice the recharge to the ground-water system.
WATER-QUALITY ISSUESSurface and ground water Irrigation return water BI
Surface water imported for irrigation of 5.4 million acres in the San Joaquin Valley part of the Central Valley adds nearly 2 million tons of salt to the soil and water in this area each year. Losses of tillable land from increasing soil and water salinity are expected to increase from about 400,000 acres to about 700,000 acres by the year 2020. This represents crop losses ranging from $32 million to about $320 million annually (U.S. Bureau of Reclamation and others, 1979). There is no valley- wide drainage system in the Central Valley to remove saline ir rigation return water. Although several individual drainage systems are operated, they drain only small areas and locally remove irrigation return water from the valley. Therefore, pollution of ground water by agricultural return water con tinues. Although the San Joaquin Valley represents a major area where irrigation return water is an issue, it also is an issue in many of the southern coastal basins. Examples are the Ven tura basin, where shallow or perched ground water, mainly recharge of irrigation return water, contains as much as 2,500 milligrams per liter of dissolved solids, and the Salinas basin, where dissolved-solids concentrations in irrigation return water ranges from 400 to 1,000 milligrams per liter.
Ground water Saline-water intrusion 82
The intrusion of saline water occurs to some extent along most of the central and southern coastal areas. The most serious intrusion occurs in the Los Angeles, Orange, and Ven tura Counties coastal plain where ground-water withdrawals generally are twice the recharge. Los Angeles and Orange Counties operate artificial-recharge programs to control saline- water intrusion. Ventura County, where about 22 square miles of the Oxnard aquifer have been affected by saline-water intru sion, is implementing plans to import water for artificial recharge. Saline-water intrusion also occurs in the Santa Cruz-Salinas and Niles Cone (south San Francisco Bay) areas. In the Central Valley, an extensive body of saline water con taining as much as 60,000 milligrams per liter of dissolved solids Ties below the fresh-water aquifers. The possible upward movement of this saline water into the fresh-water aquifers is a concern.
Ground water Hazardous-waste sites B3
The U.S. Environmental Protection Agency has identified and included in the National Priorities List (1982) 11 hazardous-waste sites in California. With the exception of the Iron Mountain Mine Complex in northern California, all of these sites are in urban areas where pollutants may affect municipal ground-water supplies. Pollutants at these sites in clude heavy metals, such as chromium, copper, lead, and zinc; arsenic; polychlorinated biphenyls; trichloroethylene; petro leum sludge; and pentachlorophenols.
Ground water Pesticides B.
Pollution of ground water by pesticides from nonpoint sources is widespread in California (California State Water Resources Control Board, 1979). Dibromochloropropane, a pesticide used to control nematodes and a suspected car cinogen, is found in ground water in every county in the San Joaquin Valley and in the municipal and industrial water sup plies of the city of Fresno (metropolitan population about 350,000). Agricultural use of pesticides (more than 120 million pounds of active ingredients during 1980) increases the poten tial for pollution of aquifers and streams. The California Water

California 93
123
EXPLANATIONissues are described in text. Color identifies type of issue.
Letter and number identify specific issue described in text.
WATER-AVAILABILITY ISSUES
IV1 Surface water
[ |A2 Ground water
WATER-QUALITY ISSUES
{%%%^B-| Surface and ground water Irrigation return water (see small map)
IHIB2 Ground water-Saline-water intrusion
63 Ground water-Hazardous-waste sites
HYDRDLDGIC HAZARDS AND LAND-USE ISSUES
C-) Flooding (see small map)
Subsidence
63 Wetlands and estuaries
^5
V <h ^p^f m
Poio! r-ieoras eiai
o o**
~?-2-
\*&- { >, r i ' ->>J\ L A R '4 S\
N v °^ N
\ar^ \ 'V360
\^'t \\- "' / ' '* N _ 1 - - -\.-f \ \----s sr~r^i^r'~7"^' "i "**&**.
^^ ^f '..JLU* -'. ^
<f
2 R N
"^- _ ~<4r--,,
:~R«-T-A BAR B*^R A T
ric^MM<?^__^
JU«M «,lffB.4R,
5*»r i^
i
50
Se" Ml8!""M*Me,Santa Rcsci Ifilan;
100 MILES
50 100 KILOMETERS

94 National Water Summary 1983
Resources Control Board is implementing basin-monitoring programs designed to fully assess the issue.
HYDROLOGIC HAZARDS AND LAND-USE ISSUESFlooding Ci
During 1982 and the first 6 months of 1983, flooding prob ably was the single most costly water-related hazard in Califor nia. A 50-year flood at Clear Lake caused the lake to rise 17 feet to its highest recorded level and to inundate the town of Lakeport (California Department of Water Resources, 1983). Combined record runoff and high tides caused breaks in levees surrounding several delta islands in the San Francisco Bay area. About 30,000 acres of delta-island farmland was flooded during the first 6 months of 1983. In Tulare Lake, normally a dry lake bed in the south San Joaquin Valley, 85,000 acres of farmland were inundated.
Subsidence Ci
The largest volume of land subsidence in the world (15.6 million acre-feet in about 5,000 square miles) due to the withdrawal of ground water has occurred in the San Joaquin Valley of California (Poland and others, 1975). In the Santa Clara Valley, the volume of land subsidence as of 1971 was about 0.5 million acre-feet. Land subsidence ranging from 1 to 4 feet in an area of undetermined extent has been reported in the Sacramento Valley about 20 miles north of Sacramento. Since 1971, the rate of subsidence in the San Joaquin and Santa Clara Valleys has slowed significantly as a result of de creased ground-water withdrawals (Poland and others, 1975). Subsidence may recur if ground-water pumping causes water levels to decline below their previous lows. Such declines did occur during the 1976-77 drought when ground-water pump- age increased and measured subsidence was as much as 0.5 foot in the San Joaquin Valley (Ireland and others, 1982). Al though there was no significant subsidence during 1982 and 1983, it still remains a major issue in California.
Wetlands and estuaries Cs
San Francisco Bay and the Sacramento-San Joaquin River delta area of central California have been affected oy water- development projects (State Water Plan and U.S. Bureau of Reclamation's Central Valley Project) that have decreased streamflow from 30 million to about 15 million acre-feet per year. During dry years, streamflow through the delta to the bay may be as low as 8 million acre-feet. This decrease in streamflow is a potential threat to one of the Nation's largest wetlands and wildlife areas by decreasing the opportunity for the system-to flush toxic materials and by decreasing the food sources for both fish and waterfowl. Most of the delta is at or near sea level, and diversion of water increases tidal intrusion of saline water during dry years. In San Francisco Bay, pollu tion by local waste discharge has decreased greatly during the last 10 to 15 years; however, heavy metals continue to be a localized concern, especially in the southern part of the bay.
INSTITUTIONAL AND MANAGEMENT ISSUESWater laws D.
In all but a few southern California basins, landowners may pump as much water as they wish. The State Legislature is
considering legislation to designate ground-water- management areas and to implement management plans (California Department of Water Resources, 1980b).
Interbasin transfers D.
The Colorado River provides a significant proportion of the water used in southern California. When the Central Arizona Project begins diverting water in 1985, California's share of the Colorado River will decrease. This decrease has led the State to plan increased interbasin transfers from northern California. A critical link in water transfers from northern California basins is the San Francisco Bay-Sacramento River delta area. There are many concerns about the potential effects of increased interbasin diversions from northern California on the bay and delta areas.
Treaties and compacts D.
California's use of Colorado River water is governed by the Rio Grande, Colorado, and Tijuana Treaty of 1944 with Mex ico; the Colorado River Compact of 1922 (Arizona, California, Colorado, New Mexico, Nevada, Utah, and Wyoming); and the Upper Colorado River Basin Compact of 1948 (Arizona, Colorado, New Mexico, Utah, and Wyoming). In 1964, the U.S. Supreme Court decreed that Arizona should receive 2.8 million acre-feet of water from California's present use of Col orado River water. Delivery of that water to Arizona is sched uled to begin in 1985 and will affect water use in southern California.
REFERENCESCalifornia Department of Water Resources, 1980a, California's
ground water: California Department of Water Resources Bulletin 118, 135 p.
____1980b, Ground-water basins in California A report to the Legislature in response to Water Code Section 12924: California Department of Water Resources Bulletin 118-80, 73 p.
.1982, The hydrologic-economic model of the San JoaquinValley: California Department of Water Resources Bulletin 214, 177 p.
.1983, Water conditions in California, Report 4, May 1, 1983:California Cooperative Snow Surveys Bulletin 120-83, 19 p.
California State Water Resources Control Board, 1979, Pesticides and toxic chemicals in irrigated agriculture: California State Water Resources Control Board Publications No. 62, 152 p.
Ireland, R. L., Poland, J. F., and Riley, F. S., 1982, Land sub sidence in the San Joaquin Valley, California, as of 1980: U.S. Geological Survey Open-File Report 82-370, 129 p.
Poland, J. F., Lotgren, B. E., and Riley, F. S., 1975, Land sub sidence in the San Joaquin Valley, California, as of 1972: U.S. Geological Survey Professional Paper 437-11, 78 p.
Solley, W. B., Chase, E. B., and Mann, W. B., IV, 1983, Estimated use of water in the United States in 1980: U.S. Geological Survey Circular 1001, 56 p.
U.S. Bureau of Reclamation, California Department of Water Resources, and California State Water Resources Control Board, 1979, Agricultural drainage and salt management in the San Joaquin Valley (Recommended Plan and Environmental Impact Report): Interagency Drainage Program Special Report, 180 p.
U.S. Environmental Protection Agency, 1982, Amendment to National Oil and Hazardous Substance Contingency Plan; the Na tional Priorities List: Federal Register, v. 47, no. 251, December 30, 1982, p. 58476-58485.

California 95
SUMMARY OF WATER USE IN CALIFORNIA, IN MILLION GALLONS PER DAY, 1980
[Data rounded to two significant figures and may not add to totals because of independent rounding. Source: Solley, Chase, and Mann, 1983]
Withdrawals
Use
Off stream use:
Rural domestic and livestock . .
Self -supplied industrial: Thermoelectric power use . Other industrial uses . . . .
Total ..........
Instream use: Hydroelectric power .......
Ground water
Fresh Saline
1 ,900 .... 160 .
18,000 ....
890 .... 420 250
21 ,000 250
81 ,000
Surface water
Fresh Saline
2,200 ... 60 ...
19,000 ....
1,100 9,200 45 560
23,000 9,800
Total fresh water
4,100 220
37,000
2,000 470
44,000
Consump tive use,
fresh water
1,700 130
23,000
41 190
25,000
EXPLANATIONWater issues are described in text. Color identifies type of issue. Letter and number identify specific issue described in text.
WATER-QUALITY ISSUES
[^ ^ /l BI Surface and ground water Irrigation return water
HYDROLOGIC HAZARDS AND LAND-USE ISSUES
\/%\ C -, Flooding

96 National Water Summary 1983
COLORADO WATER ISSUESAs identified by the Colorado District Office of the U.S.
Geological Survey in consultation with State officials
Variations in air-mass movement over Colorado, coupled with orographic effects of the mountains, produce a climate in which precipitation ranges from about 8 to 50 inches per year. Much of the streamflow in the western and central United States results from snowfall accumulation in Colorado's moun tains. Snowmelt supplies streams in the Platte River, Arkansas River, Colorado River, and Rio Grande basins. From water years 1972 to 1981, annual runoff has been about 120 percent of the long-term average, except in the eastern Arkansas River basin where streamflow has been about 75 percent of the long- term average. Reservoirs are used throughout the State to at tenuate runoff and to store water to meet agricultural and municipal demands. In general, water demands west of the Continental Divide are met by appropriation of surface water, and water demands east of the Continental Divide are met by conjunctive use of ground water and surface water, augmented by transmountain diversions. Ground water provides nearly 33 percent of the irrigation water in eastern Colorado and about 1 percent in western Colorado. The primary sources of ground water in eastern Colorado are alluvial aquifers along the South Platte and Arkansas Rivers and in the San Luis Valley, as well as sand and gravel of the High Plains (Ogallala) aquifer. All waters within Colorado are controlled by State water laws administered by the State Engineer, and are based on the doc trine of prior appropriation. In addition to State water laws, several rivers in Colorado also are subject to interstate compacts.
Major water issues are summarized by category below. The letters and numerical subscripts identify issues shown on the map; an asterisk instead of a numerical subscript indicates that the issue is not shown on the map.
WATER-AVAILABILITY ISSUESGround water Ai
Annual variations in ground-water levels occur statewide; however, the only widespread, downward trends are in the High Plains (Ogallala) aquifer in eastern Colorado. Agricul tural demands in the area are met primarily with ground water. Recharge to the Ogallala aquifer is small, and, since 1965, water-level declines nave affected well production and increased irrigation costs. The saturated thickness of the Ogallala has decreased as much as 25 percent in some areas as the result of water-level declines of 40 to 50 feet (Borman and others, 1983). In approximately 110 square miles of northeast ern Rio Grande County, water levels have declined 5 feet or more, and, in 50 square miles of this area, declines of 20 feet resulting from ground-water withdrawals have been measured. Small areas of decline have been mapped in alluvial aquifers tributary to the South Platte River. In southwestern Morgan County, water levels have declined as much as 30 to 40 feet since the late 1940's (Hurr and others, 1975).
WATER-QUALITY ISSUESSurface water Colorado River salinity Bi
The Colorado River Basin Salinity Control Act of 1974 (Public Law 93-320) established a maximum allowable con centration of dissolved solids in the Colorado River as it enters Mexico. Control of salinity in the river is a basinwide concern. Irrigation return flows commonly are responsible for large dissolved-solids concentrations, but, in Colorado, natural dis charges of saline water also are partly responsible. Saline ground water discharging to streams, such as Salt Creek and Dolores River, causes increases in stream salinity. Additional ly, dewatering of coal mines and leachate from coal spoil piles can contribute to stream salinity. Reservoir storage in Colo rado contributes to increased dissolved-solids concentrations by leaching of soluble minerals from the reservoir banks and by
evaporative concentration of dissolved solids in the stored water. The U.S. Bureau of Reclamation has primary responsi bility for resolving the basin salinity issue (U.S. Bureau of Reclamation, 1983).
Surface and ground water Hazardous-waste sites B2
Commerce City, a suburb of Denver, in Adams County, has two hazardous-waste sites included in the U.S. Environmental Protection Agency's National Priorities List (1982). At one site, pesticides were produced at a chemical plant until it was destroyed by fire in 1965. After the fire, such organic pesticide compounds such as aldrin, endrin, heptachlor, and toxaphene were disposed in an adjacent vacant lot. Potential ground- water pollution is of particular concern because supply wells of the city of Thornton are within about 3 miles of the Commerce City site. The U.S. Environmental Protection Agency and Colorado Department of Health are conducting a study of the site. The second site, Sand Creek, an industrial site of about 300 acres, has been used for petroleum- and chemical-product production. Pollutants that are of concern at the site include methane, sulfuric acid, petroleum derivatives, and pesticides. Reconnaissance surveys by the Colorado Department of Health and the Tri-County District Health Department in dicate that pollution of soil, surface water, and ground water has occurred. The U.S. Environmental Protection Agency also is studying the site.
Ground water Landfills B3
The Lowry and Marshall landfills in the Denver metropol itan area are of particular environmental concern. Between 1967 and 1980, the Lowry landfill in Arapahoe County re ceived between 10 million and 15 million gallons of liquid industrial wastes. These wastes, together with solid wastes, were placed in unlined trenches. Organic compounds have been detected in the alluvial aquifer under and adjacent to the landfill. The primary concern involves the potential for pollu tion of the Dawson aquifer that provides most of the water for domestic and agricultural uses within a 3-mile radius of the landfill (U.S. Environmental Protection Agency, written com- mun., 1983). The Marshall landfill, which occupies about 160 acres in Boulder County, has been used as a municipal waste and sewage-sludge landfill since 1965. The inactive northern part of the landfill (80 acres), which was closed in 1973, also accepted liquid wastes of unknown composition. Samples col lected from wells and seeps at the site as part of a water-quality reconnaissance indicate that ground water beneath the landfill and seepage from the base of the landfill contain phenols, methylene chloride, trichloroethylene, and diethylphthalate. The U.S. Environmental Protection Agency, which has in cluded this site in its National Priorities List (1982), is studying the extent of ground-water pollution as well as surface-water pollution in Community Ditch and Louisville Lateral, which provide municipal and agricultural supplies.
Ground water National defense facilities B4
The Rocky Mountain Arsenal and Rocky Flats Nuclear Processing Plant are federally supported facilities that have created a potential for environmental pollution. Chemical and incendiary munitions were produced at the arsenal during World War II. Subsequent activities have included the devel opment and production of defoliants and the removal of chem icals from munitions. These activities have resulted in the pollution of ground water in the vicinity of the arsenal. Rocky Flats is a plutonium recovery plant operated for the U.S. Department of Energy. The facility also has been used as a temporary storage site for low-level radioactive waste. Envi ronmental and hydrologic concerns pertain to the potential for accidental spills or releases of radiochemical compounds. A study by Hurr (1976) indicates that pollutants resulting from an accidental surface spill could move into the alluvial ground- water system within 2 to 12 hours during wet periods. Max imum time to reach a point of discharge in a stream would be about 3 years.

Colorado 97
106° 105103°
§&«!& ' -> , .- . 7^. v r- .,>"'V.^«'' '* "* " "\ v O^Ac'lttfl.Kdrj- -^ - , - '-. -,'
. \ . rL A R'i'w eS«£tiJi . '.JA/CK-90>J \) !, ' KoVtro^h^-'l^d./-'"^ .
*' v~ "i. ' '- p-'*»^»*-"' '
. .«.-.:',4) '-"N -;< "" %. _ '"^ , ; 1
*S"S N^^vT* '\^ 1r&^VV| K ,,VV;j|V ' |TELLE^ v - ...:__ -Jx,. % , ...Vy^
-.]_._ v-Koio'rado ^pH*gs ~| ^ t > N C O L-N-, ' ' "-
' " ! E\t P Aj S O
-<P^>I
. x . . ^ ^ H '/llls^ 1 'BENT. [pRO'WERS' 1i $--;v~' ^ -^^'4 "P^-'RO ! ! ;, , i I
P_iL^/_.'r .^..H-^^,' /- -v-{/ ' HUERFAt^e f / ' I _J:'' ,'-- --' X / "';/' x1
' _ -V__ -
'.^.JK^rJ^- /Gffeesfefc... -> * r- -i '' (' ' H U E R F A t*& "('
MINERAL !"/ ,' '" - 'J ; " , '''Rlp-'GRAN ^fr^MosA x'^
~-r!-- ~ : " ' '' 'C <$? ' &, ',,,__-J,iii^/ - l. ,-> & °' - /' . J
- --.._ H\-Z>^/,.-^"" " \ __/--J, ^ s , A Njf I JM -A , S , :'V' - / COST1U-A ht - ' ' '' " ,-' -, **'- ' , " ' 1
C-XO^N 'E j o.£> \ -£n\ tm \ -.. i,,nv±*/ ''-"" '. : ,\' t ' \N-x --'; ; "" _'':"" C. "
EXPLANATIONWafer issues are described in text. Color iden tifies type of issue. Letter and number identify specific issue described in text.
WATER-AVAILABILITY ISSUES
|/%%| A-| Ground water
WATER-QUALITY ISSUES
E^x$J>l Bi Surface water-Colorado River salinity
62 Surface and ground water Hazardous-waste sites
83 Ground water Landfills
H 64 Ground water-National defense facilities
A 65 Eutrophication
HYDROLOGIC HAZARDS AND LAND-USE ISSUER
Q n . Resource development-Mineral extraction 1 and processing
Illllllllll C 2 Resource development-Oil shale
50I
B "A C A-
100 MILES
.__J
50I
100 KILOMETERS
SUMMARY OF WATER USE IN COLORADO, IN MILLION GALLONS PER DAY, 1980
[Data rounded to two significant figures and may not add to totals because of independent founding. Source. Solley, Chase, and Mann, 1983]
Withdrawals
Use
Off stream use:
Rural domestic and livestock .
Self -supplied industrial: Thermoelectric power use . Other industrial uses .
Instream use:
Ground water
Fresh Saline
48 .... 54
2,700 ....
9.4 .... 7.1 0
2,800 0
5,500
Surface water
Fresh Saline
540 .... 150
1 1 ,000 ....
160 0 730 0
13,000 0
Total fresh water
590 200
14,000
170 730
16,000
Consump tive use,
fresh water
160 59
3,600
97 73
4,000

98 National Water Summary 1983
Eutrophication B5
Rapid urbanization in the Denver metropolitan area has contributed to eutrophication of urban lakes and reservoirs and has increased concentrations of chemical constituents in the South Platte River. Nutrients in runoff from urban areas entering urban lakes and reservoirs have contributed to in creased algal production and accelerated eutrophication (Denver Regional Council of Governments, 1982).
HYDROLOGIC HAZARDS AND LAND-USE ISSUESResource development Mineral extraction and proc essing Ci
Metal mining and processing of gold, silver, lead, copper, zinc, and uranium have increased potential for surface- and ground-water pollution near cities such as Leadville, Central City, Idaho Springs, Denver, and Canon City. California Gulch, located in the Leadville Mining District, contains numerous abandoned mines and tailing piles. Drainage from the mines has a pH of 3.2 to 5.4 and contains large concentra tions of iron, lead, zinc, manganese, and cadmium (Moran and Wentz, 1974). A second area where mine drainage has caused surface- and ground-water pollution is the Central City-Idaho Springs-Clear Creek Mining District. About seven mines in Central City and the Argo Tunnel in Idaho Springs discharge acidic water containing large concentrations of copper and cadmium into Clear Creek. The primary con cern of State health agencies and local water users is pollution of local surface- and ground-water domestic supplies of small communities along Clear Creek west of Denver. Radium was processed, refined, or fabricated at 35 sites in Colorado during the early 1900's, of which 31 are in the Denver metropolitan area. The effects on water resources of the radioactive wastes at these sites are unknown.
In the Canon City area, possible sources of pollution include tailings from an active uranium mill; tailings from old lead-, zinc-, and other metal-ore-processing facilities; drainage from abandoned coal mines underlying the area; and brines from oil wells. Water from the tailings and abandoned coal mines seeps into the terrace deposits and alluvium along the Arkansas River where numerous wells produce water for livestock, domestic supply, and irrigation. Water from these wells contains large concentrations of uranium, molybdenum, selenium, alpha-emitting substances, sulfate, and dissolved solids (Hershey-Wooderson Associates, 1977). Some of the uranium-mill tailings have been reprocessed, and the re mainder have been placed in lined tailings ponds. Tailings from the lead- and zinc-ore-processing remain largely undis turbed. The Leadville, Central City-Idaho Springs, and Denver sites have been included in the U.S. Environmental Protection Agency's National Priorities List (1982) of hazardous-waste sites.
Resource development Oil shale C2
The Piceance structural basin in western Colorado contains some of the largest undeveloped oil shale reserves in the world. Known oil shale deposits with a minimum grade of 15 gallons per ton of rock are estimated to contain 1.2 trillion barrels of recoverable oil (Federal Energy Administration, 1974). Although commercial development of this resource has been suspended because of current economic conditions, prototype development is continuing. Large-scale commercial develop ment of the resource will result in various hydrologic, environ mental, and institutional issues. Hydrologic concerns include effects of mine dewatering on tributary aquifers, pollution of aquifers, transport of pollutants in the ground-water system from mined areas, and increased sediment and water-quality changes in streams. In addition to the hydrologic concerns, air quality will be a major issue. There is concern that additional dust and stack emissions could contribute to air pollution and increase acidic precipitation in wilderness areas and park lands east of the Piceance basin. Also of concern is the question of water rights, both intrastate and interstate, and the oil-shale
industry's impact on quantity and quality requirements that are set by international treaties, river compacts, and State water law.
Flooding C.
Many communities in Colorado are located near foothills at the base of mountain ranges. Streams originating in the moun tains flow through scenic canyons, and, because of the esthetic setting, urban development is progressing rapidly in and im mediately downstream from these canyons. Unfortunately, foothill streams are subject to catastrophic flash floods that often cause tragic deaths and costly property damage, as in the flood along the Big Thompson River in 1976.
INSTITUTIONAL AND MANAGEMENT ISSUESWater allocation D.
As urbanization and industrialization increase along the eastern slopes of the Continential Divide, institutional con straints involving water rights as regulated by State water law will become increasingly important in water-allocation issues relating to water demands of eastern Colorado. Currently, al ternative approaches including transmountain water diver sions and conjunctive surface- and ground-water development, such as occur in the South Platte and Arkansas River basins, create special concerns among various water users. These are being considered in an areawide study of water requirements in metropolitan Denver being conducted by the U.S. Army Corps of Engineers. Critical factors to be considered include Federal water rights, instream-flow requirements, traditional offstream appropriated rights, and treaty and compact requirements.
Treaties and compacts D*
Treaties and compacts affect the quantity of water that can be appropriated by Colorado from several rivers flowing into other States and Mexico. Use of water in the Rio Grande and Colorado River is affected by provisions of the Rio Grande Convention of 1906, the Rio Grande Rectification Convention of 1933, and the Rio Grande, Colorado, and Tijuana Treaty of 1944 with Mexico. Colorado currently underutilizes its rights granted in the South Platte Compact of 1926 (Colorado and Nebraska), in the Colorado River Compact of 1922 (Arizona, California, Colorado, Nevada, New Mexico Utah, and Wyo ming), and in the Upper Colorado River Basin Compact of 1948 (Arizona, Colorado, New Mexico, Utah, and Wyoming), thereby allowing more water to flow to adjacent States than is legally permitted. The Rio Grande Compact of 1938 (Colo rado, New Mexico, and Texas) was based on streamflow records that were intended to represent average conditions but subsequently were alleged to represent a period of greater than normal precipitation. Based on that compact, Colorado is now in arrears with respect to New Mexico; studies are being made to determine how deficits can be ameliorated for example, by developing additional supplies through salvage of water cur rently lost to evapotranspiration. In the Arkansas River basin, there is concern in Kansas as to whether the quantity of water it is authorized to receive under the Arkansas River Compact of 1948 (Colorado and Kansas) is being met.
REFERENCESBorman, R. G., Lindner, J. B., Bryne, S. M., and Rutledge, John,
1983, The Ogallala aquifer in the northern High Plains of Colorado Saturated thickness in 1980; saturated-thickness changes, predevelopment to 1980; hydraulic conductivity; specific yield; and predevelopment and 1980 probable well yields: U.S. Geological Survey Hydrologic Atlas HA-671. [in press]
Denver Regional Council of Governments, 1982, Sloan Lake-Clean Lake study: Denver, May 1982 report, 117 p.
Federal Energy Administration, 1974, Potential future role of oil shale Prospects and constraints: Final task force report of Project Independence Blueprint, under direction of U.S. Department of the Interior, 495 p.
Hershey-Wooderson Associates, 1977, Geohydrology of the Cotter Mill environment: Canyon City, 62 p.

Colorado 99
Hurr, R. T., 1976, Hydrology of a nuclear-processing plant site, Rocky Flats, Jefferson County, Colorado: U.S. Geological Survey Open-File Report 76-268, 68 p.
Hurr, R. T., Schneider, P. A., Jr., and Minges, D. R., 1975, Hydrology of the South Platte River valley, northeastern Colorado: Colorado Water Conservation Board, Water Resources Circular No. 28, 24 p.
Kircher, J. E., and Von Guerard, Paul 1982, Evaluation of sediment yield and sediment data-collection network in the Piceance basin, northwestern Colorado: U.S. Geological Survey Water-Resources Investigations 82-4046, 25 p.
Moran, R. E., and Wentz, D. A., 1974, Effects of metal-mine drainage on water quality in selected areas of Colorado, 1972-1973: Colorado Water Resources Circular No. 25, 250 p.
Solley, W. B., Chase, E. B., and Mann, W. B., IV, 1983, Estimated use of water in the United States in 1980: U.S. Geological Survey Circular 1001, 56 p.
Taylor, O. J., 1982, Three-dimensional mathematical model for simulating the hydrologic system in the Piceance basin: U.S. Geological Survey Water-Resources Investigations Report 82-037, 35 p.
U.S. Bureau of Reclamation, 1983, Colorado River water-quality im provement program Status report: Denver, 154 p.
U.S. Environmental Protection Agency, 1982, Amendment to National Oil and Hazardous Substance Contingency Plan; the Na tional Priorities List: Federal Register, v. 47, no. 251, December 30, 1982, p. 58476-58485.
Warner, J. W., 1979, Digital transport model study of dissopropylmethylphosphate (DIMP) ground-water contamination at the Rocky Mountain Arsenal, Colorado: U.S. Geological Survey Open-File Report 79-676, 39 p.
Weeks, J. B., Leavesley, G. H., Welder, F. A., and Saulnier, G. J., Jr., 1974, Simulated effects of oil-shale development on the hydrol ogy of Piceance basin, Colorado: U.S. Geological Survey Profes sional Paper 908, 84 p.

100 National Water Summary 1983
CONNECTICUT WATER ISSUESAs identified by the Connecticut Office, New England
District, of the U.S. Geological Survey in consultation with State officials
The average annual precipitation in Connecticut ranges from about 42 to 53 inches. Although the current supplies of water are adequate to meet demands under normal conditions, deficiencies occur during droughts. The quality of water throughout the State generally meets established State stand ards, but locally may not be suitable for some uses. Most pres ent demand is met by surface-water sources. The uneven distribution of water resources and the concentration of popu lation and industry are causes of supply deficiencies and con flicts between competing uses during droughts. Water quality has improved since 1967 as a result of water pollution control programs. The State's policy for surface and ground water, adopted in 1980 (Connecticut Department of Environmental Protection, 1980), and basin-strategy reports scheduled for completion in 1983 will guide future water-quality management.
Major water issues are summarized by category below. The letters and numerical subscripts identify issues shown on the map; an asterisk instead of a numerical subscript indicates that the issue is not shown on the map.
WATER-AVAILABILITY ISSUESSurface and ground water AI
In the southwestern part of the State, four water companies serving all or part of five towns will not be able to meet demands by the year 2000 without new sources of supply (New England River Basins Commission, 1981). Several other areas within Connecticut will need additional sources of drinking water during the next 20 years to meet increased demands or to replace surface-water sources that cannot meet the re quirements of the Safe Drinking Water Act of 1974 (Public Law 93-523). Areas where supply problems will be most critical include Fairfield County, the Quinnipiac Valley in New Haven County, and parts of New London County. State policy is to meet most future needs by developing ground- water sources.
WATER-QUALITY ISSUESSurface water Point and nonpoint sources of pollution Bi
Despite significant progress toward meeting the State's goal of water quality that is suitable for fishing and swimming, about 30 percent (288 miles) of the major streams and major harbors, including New Haven, Bridgeport, Norwalk, and New London, do not meet established water-quality standards (Connecticut Department of Environmental Protection, 1982b). Major factors preventing attainment of surface-water quality goals include overflows of combined storm and sanitary sewers, waste discharges from municipal and industrial sources, and nonpoint sources of pollution such as runoff from urban areas. In the upper Housatonic River in Litchfield, New Haven, and Fairfield Counties surface water-quality goals are not being met because sediments are polluted by polychlori- nated biphenyls (Frink and others, 1982).
Surface and ground water Public and domestic supplies B.
Of about 600 public-water supplies, 28 do not meet the State's drinking-water standards, and water from domestic wells in many communities also has failed tp meet these stand ards (Connecticut General Assembly 1975). Supplies that do not meet drinking-water standards are located throughout the State. Principal sources of the pollution are waste-disposal and waste-storage sites; unregulated discharges or spills of various chemicals, including gasoline, oil, and volatile organic solvents; salt storage and highway application; fertilizers; and septic systems. In addition, drinking water at several well sites has been adversely affected by induced recharge of degraded
surface water and by saline-water intrusion (Handman and others, 1979). To preserve and protect present and future potable water supplies, the State considers the quality of drink ing water to be the highest water-quality management priority (Connecticut Department of Environmental Protection, 1982a).
Ground water-Land disposal of wastes B.
Municipal and industrial waste disposal into landfills and lagoons has resulted in widespread ground-water pollution. In 1982, the Connecticut Department of Environmental Protec tion estimated that 227 active and inactive landfills had polluted 87 private and 3 public-supply wells, and 35 landfills are threatening supply wells (Paul Marin, oral commun., 1982). Pollution occurs at landfills in Beacon Falls (New Haven County), Canterbury (Windham County), and Nauga- tuck (New Haven County), which are included in the U.S. En vironmental Protection Agency's National Priorities List (1982). Many existing hazardous-waste sites are being closed because they have reached capacity or cannot comply with regulatory requirements. The State is encouraging resource conservation and recovery of municipal and industrial wastes, while recognizing the continued need for land disposal of residual material. Also under consideration are provisions for future disposal of low-level radioactive wastes, dredged material from harbors and rivers, and fly ash from powerplants being converted to coal. Land-disposal facilities that will not have an adverse effect on water quality are important to the State, local municipalities, and industry, but suitable disposal sites are few.
Eutrophication-B.
Eutrophication resulting from phosphorus enrichment is occurring in some lakes in the State (Connecticut Department of Environmental Protection, 1982b). A recent survey of 70 lakes found 12 to be eutrophic and 7 to be highly eutrophic (Connecticut Department of Environmental Protection, 1982c). Sources of phosphorus include fertilizers in runoff from agricultural lands and detergents from septic systems of lakeside homeowners.
Acidic precipitation B.
Precipitation in Connecticut, as in much of the Northeast, is more acidic than in other areas of the United States. There is public concern about the effects of acidic precipitation on soil, water, fish, vegetation, structures, and human health. A recent report commissioned by the Connecticut General Assembly recommended further studies, including expanded water-qual ity monitoring (Connecticut Agricultural Experiment Station, 1983, p. 13).
HYDROLOGIC HAZARDS AND UNO-USE ISSUESFlooding C.
Riverine and coastal flooding is a major hydrologic hazard in Connecticut and occurs statewide. Record flooding in southern Connecticut (New Haven, Middlesex, and New Lon don Counties) in June 1982 caused 12 deaths and an estimated $277 million in damage (National Weather Service, 1983). As a consequence, the State is focusing attention on development of improved flood-warning systems and other measures to miti gate damage and loss of life.
INSTITUTIONAL AND MANAGEMENT ISSUESInterbasin transfers D.
The Connecticut Department of Environmental Protection estimates that there are several thousand surface-water diver sions of varying size, and the impacts of which on water sup plies and other uses of water are largely unknown. Major decreases in streamflow or changes in the time-distribution of streamflow are of concern, particularly where water is needed downstream for fish and wildlife, recreation, water supply, and waste assimilation. Large diversions from the Connecticut

Connecticut 101
41
42
ISLAND
D
I 3 10
10I
I 20
20 I
I30 KILOMETERS
30 MILES
_J
SOUND
EXPLANATIONWater issues arc descibed in text. Color identifies type of issue. Letter and number identify specific issue described in text.
WATER AVAILABILITY ISSUES
/ A i Surface and ground water
SUMMARY OF WATER USE IN CONNECTICUT, IN MILLION GALLONS PER DAY, 1980
[Data rounded to two significant figures and may not add to totals because of independent rounding. Source: Solley, Chase. and Mann, 1983]
Withdrawals
Use
Off stream use:
Rural domestic and livestock .
Self -supplied industrial: Thermoelectric power use .
Total .........
Instream use:
Ground water
Fresh Saline
55 .... 54 .... 1£ ....
.2 .... 26 1.0
140 1.0
4,000
Surface water
Fresh Saline
300 ... IS
19 ...
610 2.400 250 1.0
1.200 2,400
Total fresh water
360 56 21
610 270
1,300
Consump tive use,
fresh water
89 34 21
1.9 19
160
WATER QUALITY ISSUES
"^^^ Bj Surface water Point and nonpoint sources of pollution

102 National Water Summary 1983
River to meet water demands in eastern Massachusetts, and from the Farmington River in Hartford County to meet water demands in the Hartford metropolitan area recently have been proposed. In 1982, the State enacted the Connecticut Water Diversion Policy Act to ensure that the impacts of diversions and competing demands for surface and ground water are con sidered in the future.
Improved coordination in water-resources planning and management D.
Responsibilities for various aspects of water-resources plan ning and management are distributed among a number of State agencies. Efforts are being made to integrate water- supply and water-quality planning and management at the State level (State of Connecticut, 1982).
REFERENCESConnecticut Agricultural Experiment Station, 1983, Acid
rain Sources and effects in Connecticut, Report of the Acid Rain Task Force: Connecticut Agricultural Experiment Station Bulletin 809, 17 p.
Connecticut Department of Environmental Protection, 1980, Con necticut water-quality standards and criteria: Water Compliance Unit, 28 p., 4appendices.
____1982a, Water quality management priorities: Water Com pliance Unit, 22 p.
_1982b, State of Connecticut 1982 water-quality report to Congress: Water Compliance Unit, 46 p., 2 appendices.
_1982c, The trophic classifications of seventy Connecticut lakes:Connecticut Department of Environmental Protection Bulletin 3, 364 p.
Connecticut General Assembly, 1975, Standards for quality of public drinking water: Public Act No. 75-513, Section 19-13-13102.
Frink, C. R., Sawhney, B. L., Kulp, K. P., and Fredette, C. G., 1982, Polychlorinated biphenyls in Housatonic River sediments in Massachusetts and Connecticut Determination, distribution, and transport: Connecticut Agricultural Experiment Station Bulletin 800, 20 p., 1 appendix.
Handman, E. H., Grossman, I. G., Bingham, J. W., and Rolston, J. L., 1979, Major sources of ground-water contamination in Con necticut: U.S. Geological Survey Water-Resources Investigations Open-File Report 79-1069, 59 p.
National Weather Service, 1983, Disaster survey report June 5-7, 1982, southern New England flood: Garden City, N.Y., Eastern Region Headquarters Report, 36 p., 34attachments.
New England River Basins Commission, 1981, Connecticut coastal river basin overview: Boston, Mass., 145 p., 2 appendices.
Solley, W. B., Chase, E. B., and Mann, W. B., IV, 1983, Estimated water use in the United States in 1980: U.S. Geological Survey Cir cular 1001, 56 p.
State of Connecticut, 1982, Memorandum of agreement for ground- water management between the Department of Environmental Protection and the Department of Health Services: Hartford, Conn., unpublished memorandum, 7 p.
U.S. Environmental Protection Agency, 1982, Amendment to National Oil and Hazardous Substance Contingency Plan; the Na tional Priorities List: Federal Register, v. 47, no. 251, December 30, 1982, p.58476-58485.

Connecticut 103
Flooding associated with extremely heavy rain in June 1982 resulted in flood peaks with 200- to 1,000-year recurrence inter vals on many streams in Connecticut. This flood marker is on Salmon River at Leesville (East Haddam, Conn.) where recurrence interval was computed at 200 years.
Measuring the flow of the Connecticut River at Hartford, Conn. Large diversions from the Connecticut River to meet water demands in eastern Massachusetts recently have been proposed.
One of three recently installed precipitation samplers to collect information on acidity and quality of precipita tion in Connecticut as part of U.S. Geological Survey and Connecticut Department of Environmental Protec tion Cooperative Program.
Photographs by David McCartney, U.S. Geological Survey.

104 National Water Summary 1983
DELAWARE WATER ISSUESAs identified by the Delaware Office, Mid-Atlantic
District, of the U.S. Geological Survey in consultation with State officials.
Average annual precipitation in Delaware is 43 inches. Most of Delaware is located in the flat Coastal Plain, which is underlain by unconsolidated sediments; only 6 percent of northernmost Delaware lies within the Piedmont physio graphic province, which is composed of crystalline rocks of the Appalachian Mountain system. Yields from wells completed in the crystalline rocks and in the thin layer of overlying uncon solidated sediments in northern Delaware generally are small (less than 10 gallons per minute) to moderate (10 to 50 gallons per minute). Most of the State's population lives in New Castle County in northern Delaware. Some municipal and industrial water supplies in New Castle County are only marginally ade quate to meet demand. Rural Sussex County in southern Delaware, however, is underlain by thick deposits of perme able unconsolidated sediments that generally contain more than adequate water to meet all demands.
Major water issues are summarized by category below. The letters and numerical subscripts identify issues shown on the map; an asterisk instead of a numerical subscript indicates that the issue is not shown on the map.
WATER-AVAILABILITY ISSUESGround water AI
Ground-water levels in the Potomac aquifer have declined by as much as 150 feet below sea level in eastern New Castle County as a result of municipal and industrial pumpage (Mar tin and Denver, 1982). A decline in ground-water levels also has occurred in central Kent County where levels dropped by as much as 110 feet in the Piney Point aquifer between 1952 and 1977 (Leahy, 1982). The Piney Point is one of the main sources of water for the city of Dover.
WATER-QUALITY ISSUESGround water Hazardous-waste sites and landfills Bi
Delaware has eight hazardous-waste sites included in the U.S. Environmental Protection Agency's National Priorities List (1982). Ground-water pollution from chemicals, including industrial solvents, has been detected or is suspected at all of the sites. Seven of the eight sites are located above the Potomac aquifer, which is the major source of water for New Castle County. In addition, there are approximately 30 operating or abandoned landfills in the State that have the potential to pollute local ground water. There is concern that Kent and Sussex Counties are particularly vulnerable to ground-water pollution from existing landfills because of very permeable sur- ficial materials and high water levels.
Ground water Saline-water intrusion B2
Pumpage from the Potomac aquifer averaged approximately 20 million gallons per day during 1979, almost 70 percent of which came from wells within 10,000 feet of the Delaware River Estuary (Martin and Denver, 1982). This pumpage has resulted in water levels declining to substantially below sea level in the aquifer adjacent to the estuary. Chloride concentra tions in water from four large-capacity wells adjacent to the river have exceeded 250 milligrams per liter, the recommended limit for drinking water (U.S. Environmental Protection Agency, 1979). Intrusion of saline water from the Delaware River and its bordering tidal marshes is the suspected source for much of the high chloride concentrations. Mean annual chloride concentrations in the Delaware River at the Delaware Memorial Bridge sampling station have ranged from 230 to 1,230 milligrams per liter. At the present time (1983), there ap pears to be little need for concern about the quality of recharge to the aquifer under wet-year conditions, but there is cause for concern under normal-year and drought-year conditions. Ad ditional saline-water intrusion into parts of the Potomac
aquifer could result from the upward movement of saline water from the deeper aquifers.
Ground water Nitrate B.
There is concern about the large concentrations of nitrate in ground water in the unconfined aquifers. In some parts of Kent and Sussex Counties. Water analyses from coastal Sussex County showed that 32 percent of wells sampled contained more than 10 milligrams per liter of nitrate as nitrogen, which is the primary standard for drinking water (U.S. Environmen tal Protection Agency, 1976). Twenty-one percent of the samples from noncoastal Sussex County and 8 percent of the samples from Kent County contained more than 10 milligrams per liter of nitrate as nitrogen. Nitrogen-isotope analyses in dicated fertilizers, poultry manure, and septic-system effluent as sources of this nitrate (Ritter and Chirnside, 1982).
Eutrophication B.
Nitrate concentrations in storm runoff from fertilized agricultural areas (Gushing and others, 1973), in conjunction with nitrate and other nutrients from septic tanks (Miller, 1972), is contributing to eutrophication of 52 manmade lakes throughout Delaware.
HYDROLOGIC HAZARDS AND UNO-USE ISSUESFlooding Ci
Urban areas of New Castle County are flooded during many storms because of a combination of high tides and increased runoff resulting from urbanization. Resort communities along the Atlantic coast of Delaware and the primary coastal highway (Delaware Route 1) continue to sustain damage from flooding and wave action during major coastal storms.
INSTITUTIONAL AND MANAGEMENT ISSUESWater laws D,
The Delaware Department of Natural Resources and En vironmental Control established a Comprehensive Water Resources Management Committee in February 1981. This Committee was directed to prepare findings and recommenda tions for a Comprehensive Water Resources Management Program for the State. The report of the Committee was presented at a public hearing in March 1983. Topics addressed in the report included recommendations for improving water allocation, water conservation, ground-water-quality manage ment, and water-data management.
REFERENCESGushing, E. M., Kantrowitz, I. H., and Taylor, K. R., 1973, Water
resources of the Delmarva Peninsula: U.S. Geological Survey Pro fessional Paper822, 58 p.
Leahy, P. P., 1982, Ground-water resources of the Piney Point and Cheswold aquifers in central Delaware as determined by a flow model: Delaware Geological Survey Bulletin 16, 68 p.
Martin, M. M., and Denver, J. M., 1982, Hydrologic data for the Potomac Formation in New Castle County, Delaware: U.S. Geo logical Survey Open-File Report 81-916, 148 p.
Miller, J. C., 1972, Nitrate contamination of the water-table aquifer in Delaware: Delaware Geological Survey Report of Investigations No. 20, 36 p.
Ritter, W. F., and Chirnside, A. E. M., 1982, Ground-water quality in selected areas of Kent and Sussex Counties, Delaware: Newark, University of Delaware, Agricultural Engineering Department, 229 p.
Solley, W. B., Chase, E. B., and Mann, W. B., IV, 1983, Estimated use of water in the United States in 1980: U.S. Geological Survey Circular 1001, 56 p.
U.S. Environmental Protection Agency, 1976, National interim primary drinking water regulations: Office of Water Supply, EPA-570/9-76-003, 159 p.
____1979, National secondary drinking water regulations' Federal Register, v. 44, no. 140, July 19, 1979, p. 42195-42202.
.1982, Amendment to National Oil and Hazardous SubstanceContingency Plan; the National Priorities List: Federal Register, v. 47, no. 251, December 30, 1982, p. 58476-58485.

Delaware 105
75°30'
S U S S \E X
Georgetown
SUMMARY OF WATER USE IN DELAWARE, IN MILLION GALLONS PER DAY, 1980
[Data rounded to two significant figures and may not add to totals because of independent rounding. Source: Solley , Chase, and Mann, 1983]
Withdrawals
Use
Off stream use:
Rural domestic and livestock
Self -supplied industrial: Thermoelectric power use . -
Total ..........
Instream use:
Ground water
Fresh Saline
30 ... 27 ....
4.1 ....
5.4 .... 15 0.3
82 0.3
0
Surface water
Fresh Saline
48 ... 0 .... 2.4 ...
0 670 6.2 390
57 1,100
Total fresh water
78 27 6.5
5.4 22
140
Consump tive use,
fresh water
0 2.0 6.5
.5 2.1
11
EXPLANATIONWater issues are described in text. Color identifies type of issue. Letter and number identify specific issue described in text.
WATER AVAILABILITY ISSUES
yyfly^ AI Ground water
WATER QUALITY ISSUES
% 61 Ground water-Hazardous waste sites and landfills
HH B2 Ground water-Saline water intrusion (see small map)
HYDROLOGIC HAZARDS AND LAND USE ISSUES
Ulllllllli GI Flooding
O
O
Ola
1 10 15
5 10 15 20 25 KILOMETERS
25 MILES

106 National Water Summary 1983
FLORIDA WATER ISSUESAs identified by the Florida District Office of the U.S.
Geological Survey in consultation with State officials
Florida is a water-rich State with an average annual rainfall of about 53 inches and some of the most productive aquifers in the Nation. Florida's population and freshwater use almost doubled between 1960 and 1980 (Leach, 1980). Increased mu nicipal, agricultural, and industrial water demands and prob lems of waste disposal have increased concern for the State's land and water resources. Because of these concerns, the State Legislature has made efforts to protect and manage the State's water resources through the Florida Department of Environ mental Regulation and five regional water-management districts.
Major water issues are summarized by category below. The letters and numerical subscripts identify issues shown on the map; an asterisk instead of a numerical subscript indicates that the issue is not shown on the map.
WATER-AVAILABILITY ISSUESGround water Ai
Water-level declines of more than 150 feet have occurred in the Floridan aquifer in the northeast and northwest coastal areas because of municipal and industrial pumpage. Large water-level declines also have occurred in the Floridan aquifer as the result of large-scale agricultural and industrial pumpage in northeastern Florida and in the Tampa Bay area. Municipal pumpage from surficial aquifers at numerous other coastal locations has resulted in water-use restrictions because of the potential of saline-water intrusion, especially in densely urban ized areas of the southeastern and southwestern coasts where water in the Floridan aquifer is too saline for public supplies.
Surface water A.
Increased urbanization and water use have lowered the level of many lakes located near areas of major ground-water development in central Florida. As an example, more than 90 lakes in central Florida were augmented with water from wells during 1982. As well fields are developed to meet water needs of an increasing population, additional stresses will be placed on lakes (Stewart and Hughes, 1974; Gant, 1982).
WATER-QUALITY ISSUESSurface water Point and nonpoint sources of pollution-Bi
Major point sources of surface-water pollution in Florida are (1) municipal sewage-treatment plants (2) pulp and paper mills, and (3) citrus-processing plants (Florida Department of Environmental Regulation, 1980). Other industrial discharges that cause surface-water pollution include chemical processing and production plants, electroplating operations, and power- plants. Agricultural runoff also results in surface-water pollu tion; the Everglades agricultural area is a prime example of surface-water pollution caused by fertilizers and irrigation practices. The Taylor Creek-Nubbin Slough area of the Kis- simmee River basin is an example of surface-water pollution by dairy and feedlot operations. Numerous river basins in the Panhandle of Florida are affected periodically by erosion and nutrient enrichment resulting from crop-production activities. Within the upper St. Johns River basin, agricultural develop ment has adversely affected water quality. Direct effects on water quality are related to the pollutant content of discharges. Indirect effects on water quality result from changes in the flow regime. Increases in dissolved-solids concentrations and decreases in dissolved-oxygen concentrations also have been associated with modifications of the flow regime (Florida Department of Environmental Regulation, 1980).
Surface water Saline-water intrusion B2
Coastal reaches of most Florida streams experience some upstream saline-water intrusion during periods of low flow,
high tides, or a combination of these. For example, the water supply for the urban parts of Lee County is from both the Caloosahatchee River and shallow aquifers that yield only small quantities of water to wells. Demands during the dry season are increasingly dependent on the Caloosahatchee River, but the water quality at the water-supply intakes is af fected periodically by upstream movement of saline water and by organic substances. Recharge and storage of freshwater in deep saline aquifers for later withdrawal and use has been studied; however, development of new freshwater supplies from a permeable limestone aquifer recently delineated in southwestern Lee County may be a more effective solution (Boggess and others, 1981).
Ground-water Saline-water intrusion B3
The intrusion of saline water into aquifers occurs along the coastlines and is a concern in urbanized coastal areas. It is most serious in the Jacksonville, Tampa, and Miami areas where pumping has lowered water levels below sea level (Wilson, 1982; Franks, 1982). Saline-water intrusion into the shallow Biscayne aquifer in the Miami area is being reduced by adjusting freshwater levels in canals (Hughes, 1979).
Ground water Bacteria 84
Fecal coliform bacteria have been found in water pumped from the Floridan aquifer. The Florida Department of En vironmental Regulation has identified bacteria in water from public-supply and private wells in Lake County. Fecal coliform bacteria also have been found in water from shallow observa tion wells that tap the Biscayne aquifer in the Miami area. Leakage from septic systems and infiltration of storm water are likely causes of the pollution (Pitt and others, 1975).
Ground water Hazardous-waste sites B5
Florida has more than 200 unregulated hazardous-waste sites. Of these, 25 are included in the National Priorities List (U.S. Environmental Protection Agency, 1982). Because of the shallow depth to water, the permeability of the aquifers, and the almost total reliance on ground water as a source of drink ing water, pollution of ground water by hazardous wastes is a major concern. Pollution of local ground water by leachates from hazardous wastes has been documented at sites through out the State (Florida House of Representatives, 1983).
Ground water Wastewater B,
Large quantities of wastewater including treated sewage, in dustrial liquids, and storm-water runoff are injected into the subsurface, are applied to the land surface by spray irrigation, or disposed in percolation ponds. Deep-well injection of treated sewage into saline-water aquifers is practiced in the southeastern coastal area and the Pinellas Peninsula on the western coast. Industrial wastewater also is injected at sites in the Lake Okeechobee and Tampa Bay areas and in the western panhandle (Vecchioli, 1981). In Orlando, Ocala, and other places in northern peninsular Florida, excess storm water is gravity drained through wells into the Floridan aquifer, which is the major public water-supply source for the area. Percola tion ponds have long been a common means for disposing of treated sewage in many parts of Florida. Spray irrigation, a more recent and increasingly common means of treated- sewage disposal, is used in the Tallahassee area, and, on a smaller scale, at numerous other sites from the western pan handle to the Tampa Bay area.
Ground water Landfills B.
Florida has about 700 landfills and open dumps. Ground water in most of the State is susceptible to pollution by landfill leachate because of the permeable surficial materials underly ing the landfills, the abundant precipitation, and the shallow depth to water near the landfills. There is concern regarding the effect of this disposal practice on the quality of ground water, which supplies about 90 percent of the State's drinking water. Leachate studies have been conducted at many major landfills, and State and local agencies are intensifying efforts to

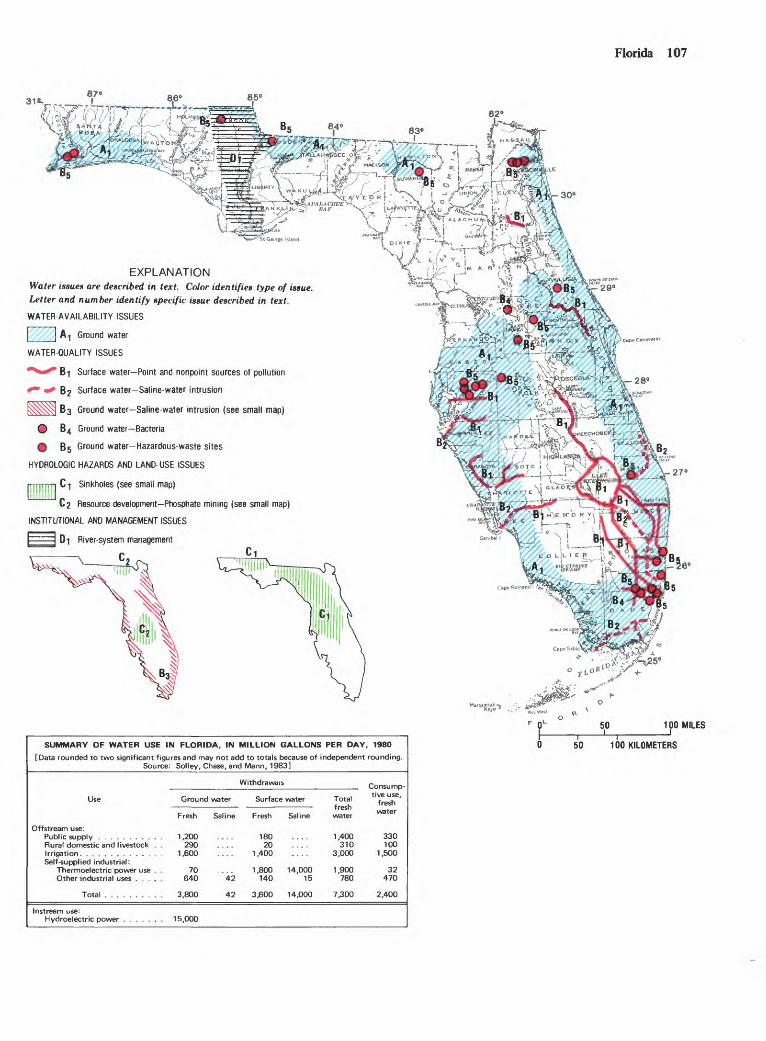
Florida 107
85
82«
30°
EXPLANATIONissues are described in text. Color identifies type of issue.
Letter and number identify specific issue described in text.
WATER-AVAILABILITY ISSUES
I___I A-) Ground water
WATER-QUALITY ISSUES
^^^ B-) Surface water Point and nonpoint sources of pollution
< <* 62 Surface water-Saline-water intrusion
fc^$$] 83 Ground water Saline-water intrusion (see small map)
% B 4 Ground water Bacteria
£ 65 Ground water Hazardous-waste sites
HYDROLOGIC HAZARDS AND LAND-USE ISSUES
|jll)ijli] C-| Sinkholes (see small map)
Cz Resource development-Phosphate mining (see small map)
INSTITUTIONAL AND MANAGEMENT ISSUES
| | D-| River-system management
C,
Marquesas **K*«v *
100 MILES
SUMMARY OF WATER USE IN FLORIDA. IN MILLION GALLONS
[Data rounded to two significant figures and may not add to totals because of i Source: Solley, Chase, and Mann, 1983]
PER DAY. 1980
ndependent rounding.
Withdrawals
Use
Offstream use:
Rural domestic and livestock .
Self-supplied industrial: Thermoelectric power use , Other industrial uses ...
Instream use:
Ground water
Fresh Saline
1 ,200 .... 290 ....
1 ,600 ....
70 ... 640 42
3,800 42
15,000
Surface water
Fresh Saline
180 .... 20 ....
1 ,400 ....
1,800 14,000 140 15
3,600 14,000
Total fresh water
1,400 310
3,000
1,900 780
7,300
Consump tive use,
fresh water
330 100
1,500
32 470
2,400
50 100 KILOMETERS
108 National Water Summary 1983
determine leachate characteristics at all landfills beginning with those upgradient from ground-water supplies (Florida Senate Committee on Natural Resources, 1982).
Ground water Pesticide B.
Aldicarb (Temik), a pesticide used for controlling nematodes in citrus-growing areas, has been detected in water from some wells used for drinking-water supplies in central Florida. Although documentation about the magnitude, occurrence, and distribution of aldicarb pollution is limited, its presence in public supplies caused Florida's Agriculture Commissioner to temporarily ban its commercial use on January 28, 1983. However, because the citrus crop is very important to Florida's economy, there is opposition to the aldicarb ban.
Acidic precipitation B.
The acidity of precipitation in Florida may have increased during the last 25 years. Precipitation in the northern and cen tral parts of the State has pH values of less than 4.7. Studies indicate that the acidity of some of Florida's lakes and streams may have increased. The increased acidity adversely affects the survival and reproduction of some aquatic organisms (Brez- onik and others, 1980; Crisman and others, 1980).
IYDROLOGIC HAZARDS AND UNO-USE ISSUESSinkholes C,
Sinkholes occur throughout Florida, although the north- central panhandle, gulf coastal, and central parts of the State are the areas most prone to sudden development of sinkholes. Sinkhole formation may be caused by a decrease in ground- water levels in a limestone aquifer as a result of ground-water withdrawal, or by a rise in the water table resulting from in tense rains, particularly after a drought. Sinkhole formation resulting from ground-water withdrawals has been docu mented in the Tampa area (Sinclair, 1982) and in central Florida (Rutledge, 1982). In addition to the possible loss of life and property caused by their sudden development, sinkholes and other solution features provide an avenue for pollutants on the land surface to move rapidly into aquifers.
Resource development Phosphate mining C2
Phosphate-bearing strata in Florida typically are enriched in uranium. Natural radioactive decay produces a series of radio active products including thorium, radium, radon, and polonium. The Florida Departments of Environmental Regu lation and Health and Rehabilitative Services, the Florida In stitute of Phosphate Research, private companies, and several Federal agencies, are investigating the distribution, origin, source, and changes in these radionuclides in the natural envi ronments of Florida. Many wells in the phosphate-ore areas produce water containing large concentrations of radium-226, radium-228, and other radioactive materials (Miller and others, 1978; Miller and Sutcliffe, 1982).
Wetlands and estuaries C.
Wetlands and estuaries in Florida are subject to physical changes as a result of, dredging of ship channels, filling of marshes, and construction of islands and causeways. These activities may change the natural tide-induced circulation and flushing characteristics of some Florida estuaries. These changes may have long-term ecological implication, such as the pollution of shellfish waters and important marine nursery habitats, and a decrease in freshwater fish and wildlife popula tions. Studies indicate that Everglades National Park, Big Cypress National Monument, and Biscayne Bay National Park are dependent on managed freshwater flows to maintain their ecological integrity (McPherson and others, 1973, 1976, and 1982).
INSTITUTIONAL AND MANAGEMENT ISSUESRiver-system management Di
There is a tristate concern regarding the management plans for the Chattahoochee-Flint-Apalachicola Rivers system. Georgia and Alabama generally favor river development for navigation, and Florida generally favors restricted river devel opment. Florida is concerned especially about the potential effects on the shellfish resources in Apalachicola Bay caused by increased dredging activities and structural navigation controls.
REFERENCESBernstein, 1983, Temik traces found in Floridan aquifer: Miami,
Fla., Miami Tribune, February 19.gess, D. H., Missimer, T. M., and O'Donnell, T. H., 1981,
Hydrogeologic sections through Lee County and adjacent areas of Hendry and Collier Counties, Florida: U.S. Geological Survey Water-Resources Investigations Open-File Report 81-638, 1 sheet.
Brezonik, P. L., Edgerton, E. S., and Henry, C. D., 1980, Acid precipitation and sulfate deposits in Florida: Science, v. 208, p. 1027-1029.
Churchville, Victoria, 1983, Traces of Temik found in one out of seven drinking wells: Orlando, Fla., Orlando Sentinel, Febru ary 17.
Crisman, T. L., Schulz, P. L., and Bloom, S. A., 1980, Acid precipitation The biotic response in Florida lakes: Proceedings of the International Conference on the Ecological Impact of Acid Precipitation, Norway, SNSK Project, p. 296-299.
Florida Department of Environmental Regulation, 1980, 1980 Water- Quality Inventory: Tallahassee, 294 p.
Florida House of Representatives, 1983, Summary and recommenda tion: Tallahassee, Report of the Speaker's Task Force on Water Issues, March, 81 p.
Florida Senate Committee on Natural Resources, 1982, Review of Florida's drinking water problems: Tallahassee, 66 p.
Franks, B. J. 1982, Principal aquifers in Florida: U.S. Geological Survey Water-Resources Investigations Open-File Report 82-255, 4 sheets.
Gant, R. D., 1982, Directory of lakes within the Southwest Florida Water Management District: Brooksville, Southwest Florida Water Management District, 39 p.
Hughes, J. L., 1979, Saltwater barrier lines in Florida: Concepts, considerations, and site examples: U.S. Geological Survey Water Resources Investigations 79-75, 29 p.
Leach, S. D., 1980, Source, use and disposition of water in Florida, 1980: U.S. Geological Survey Water-Resources Investigations 82-4090, 337 p.
McPherson, B. F., Hendrix, G. Y., Klein, Howard, and Tyus, H. M., 1976, The environment of south Florida: U.S. Geological Survey Professional Paper 1011, 81 p.
McPherson, B. F., Mattraw, H. C., Freiberger, H. J., Altschuler, Z. S., and Zen, C. S., 1973, Environmental quality in resource and land information, south Dade County, Florida: U.S. Geological Survey Miscellaneous Investigations 1-850, p. 20-37.
McPherson, B. F., Sabanskas, Maryann, and Long, W. A., 1982, Physical, hydrological, and biological characteristics of the Loxa- hatchee River Estuary, Florida: U.S. Geological Survey Water- Resources Investigations Open-File Report 82-350, 1 sheet.
Miller, J. A., Hughes, G. H., Hull, R. W., Vecchioli, John, and Seaber, P. R., 1978, Impact of potential phosphate mining on (he hydrology of Osceola National Forest, Florida: U.S. Geological Water-Resources Investigations 78-6, 159 p.
Miller, R. L., and Sutcliffe, Horace, Jr., 1982, Water-quality and hydrologic data for three phosphate-industry waste-disposal sites in central Florida, 1979-80: U.S. Geological Survey Water- Resources Investigations 81-84, 77 p.
Pitt, W. A. J., Jr., Mattraw, H. C., and Klein, Howard, 1975, Ground-water quality in selected areas serviced by septic tanks, Dade County, Florida: U.S. Geological Survey Open-File Report 75-607, 82 p.
Rutledge, A. T., 1982, Hydrology of the Floridan aquifer in northwest Volusia County, Florida: U.S. Geological Survey Water-Resources Investigations Open-File Report 82-108, 116 p.

Florida 109
Sinclair, W. C., 1982, Sinkhole development resulting from ground- water withdrawal in the Tampa area, Florida: U.S. Geological Survey Water-Resources Investigations 81-50, 19 p.
Solley, W. B., Chase, E. B., and Mann, W. B., IV, 1983, Estimated use of water in the United States in 1980: U.S. Geological Survey Circular 1001, 56 p.
Stewart, J. W., and Hughes, G. H., 1974, Hydrologic consequences of using ground-water to maintain lake levels affected by water wells near Tampa, Florida: Florida Bureau of Geology Report of Investigations 74, 41 p.
U.S. Environmental Protection Agency, 1982, Amendment to National Oil and Hazardous Substance Contingency Plan; the Na tional Priorities List: Federal Register, v. 47, no. 251, December 30, 1982, p.58476-58485.
Vecchioli, John, 1981, Subsurface injection of liquid waste in Florida, United States of America, in Proceedings of the International Sym posium on Ground-Water Quality, Amsterdam, March 23-27, 1981: Amsterdam, The Netherlands, Elsevier Press, p. 385-394.
Wilson, W. E., 1982, Estimated effects of projected ground-water withdrawals on movement of saltwater in the Floridan aquifer, 1976-2008, west-central Florida: U.S. Geological Survey Water- Supply Paper 2139, 24 p.

110 National Water Summary 1983
GEORGIA WATER ISSUESAs identified by the Georgia District Office of the U.S.
Geological Survey in consultation with State Officials
Georgia has a plentiful supply of water; precipitation averages about 50 inches per year. The State is divided into the Coastal Plain, Piedmont, Valley and Ridge, Blue Ridge, and Cumberland Plateau physiographic provinces. The Coastal Plain has large rivers and productive aquifers. The Piedmont is drained by small streams and is underlain by crystalline rocks that generally do not yield large quantities of water. Except for the Valley and Ridge, the remaining provinces resemble the Piedmont in that they are drained by small streams and under lain by aquifers that are not regionally significant sources of water. The Valley and Ridge also is drained by small streams, but the valleys are underlain by limestone and dolomite that may yield significant quantities of water.
Major water issues are summarized by category below. The letters and numerical subscripts identify issues shown on the map; an asterisk instead of a numerical subscript indicates that the issue is not shown on the map.
WATER-AVAILABILITY ISSUESSurface water AI
The largest population centers in the State are in the Pied mont, where streams are relatively small and ground-water supplies are not readily available. Areas that may be affected by shortages of surface water include all of metropolitan Atlan ta and Athens in the Piedmont and Dalton in the Valley and Ridge provinces. Industrial development in the northwestern part of the State also may be affected by shortages of surface water.
Ground water Aa
There is competition for ground water in south Georgia for irrigation, industrial, and municipal uses. Along the coast, in dustrial and municipal pumping has caused large cones of depression in Savannah, Brunswick, and Jesup. Data indicate that the cones of depression may be merging. The water level at the center of the cone of depression in Savannah is about 115 feet below sea level (Matthews and others, 1982); the predevel- opment water level was about 35 feet above sea level. In Savannah, water levels tapping the principal confined aquifer have declined as much as 10 feet during the past 15 years. In southwestern Georgia, pumpage of ground water for irrigation from the Clayton, Providence, Tallahatta, and Ocala aquifers has increased from about 130 million gallons per day in 1977 to about 290 million gallons per day in 1981.
WATER-QUALITY ISSUESSurface water Point and nonpoint sources of pollution Bi
As a result of various waste discharges, several stream reaches have some dissolved-oxygen deficiencies, such as the Chattahoochee River downstream from Atlanta and the Oc- mulgee River downstream from Macon. Impacts of waste discharges also have been observed in the Coosa River basin downstream from Dalton and Rome. Discharges from carpet manufacturing plants in northwestern Georgia contain nearly 300 different petrochemicals and other organic compounds. Nutrients in nonpoint runoff from agricultural lands also have been identified by the State.
Ground water Saline-water intrusion 82
Degradation of ground water in coastal Georgia is caused by saline-water intrusion. In water from an observation well on the north end of Hilton Head Island (at the north end of the aquifer system that supplies water to the Savannah area), chloride concentrations increased from 80 to 500 milligrams per liter between 1972 and 1982. In the vicinity of Brunswick, chloride concentrations in water from one test well have in
creased from 4,400 to 7,000 milligrams per liter during the past 10 years. One municipal-supply well has been abandoned because of high chloride concentrations. Saline-water intrusion at Brunswick is caused by the upward migration of brines from the formation below the fresh-water aquifer. A decline in water levels resulting from the withdrawal of about 105 million gallons per day by industry and municipalities has caused the brines to move upward through faults and fractures. A major decrease in ground-water withdrawal on the Brunswick penin sula occurred in mid-1982 when a large industry installed evaporative cooling towers. The decrease in pumpage has caused a rise in water levels in some wells.
Ground water Pesticides 83
Recent reconnaissance sampling of ground water in the agricultural area of southwestern Georgia indicated that low levels of several commonly used pesticides were present in water from some wells (Hayes and others, 1983).
Ground water Natural substances B4
Ground water in several parts of Georgia is unsuitable for some uses because of naturally occurring substances. Naturally occurring radioactivity in excess of State and Federal standards has been found in municipal supplies for Mount Vernon, Alamo, and Tarrytown. Barium in excess of State and Federal standards has been found in the municipal water supply for Fitzgerald. Each of the towns has had to modify its wells to ex clude water from the aquifers that contain the undesirable substances. Naturally occurring organic substances, color, and turbidity have been a cause of concern to the city of Valdosta for many years, although limited ground-water pumpage is possible without causing water-quality degradation (Krause, 1979).
Eutrophication-Bs
Jackson Lake on the Ocmulgee River and High Falls Lake in Monroe County have been designated by the State as need ing restoration because of eutrophication caused by inflow of excessive nutrients.
Bottom sediments Be
For a number of years, direct discharges and runoff from several industrial areas draining into the Coosa River down stream from Rome contained large concentrations of poly- chlorinated biphenyls, the presence of which was discovered in 1975. Eight years after these discharges and runoff were con trolled, concentrations of the pollutant ranging from 200 to 400 micrograms per kilogram are still found in the bottom sediments. Commercial fishing on the river has been banned for several years.
HYDROLOGIC HAZARDS AND LAND-USE ISSUESSinkholes Ci
Sinkholes commonly develop in the southwestern and south- central parts of the Coastal Plain and in the Valley and Ridge area of northwest Georgia. In the Coastal Plain, sinkholes have formed in response to naturally occurring fluctuations in ground-water levels. Many sinkholes formed in the southwest ern part of the State during the 1980-81 drought when water levels in the Ocala aquifer declined rapidly as the combined result of the drought and rapidly increasing pumpage for ir rigation. In northwestern Georgia near Rossville, sinkhole for mation in local areas may have been caused by declining water levels resulting from industrial pumpage.
Coastal-zone utilization Ca
The U.S. Navy is constructing a large submarine base at Kings Bay in southeastern Georgia. Part of the construction ef fort will include the dredging of a deep and wide navigation channel from St. Marys Entrance to Kings Bay. A deep, ship- turning basin also will be dredged. Because the dredged depth of the facilities will be 20 or more feet deeper than the natural

Georgia 111
84'
!% S >A^i 3U. * X \ P
EXPLANATIONWater issues are described in text. Color identifies type of issue. Letter and number identify specific issue described in text.
WATER-AVAILABILITY ISSUES
Surface water
__ \ A 2 Ground water
WATER-QUALITY ISSUES
Surface water Point and nonpoint sources of pollutkxi
Bj Ground water Saline-water intrusion
Ground water Pesticides
64 Ground water Natural substances
65 Euthrophication
Bg Bottom sediments
HYDROLOGIC HAZARDS AND LAND-USE ISSUES
Sinkhole areas (see small map)
/© &2 Coastal zone utilization (see small map)
INSTITUTIONAL AND MANAGEMENT ISSUES (D)
D-) Interbasin transfers
Interstate ground-water issues
River-system management
SUMMARY OF WATER USE IN GEORGIA. IN MILLION GALLONS
[Data rounded to two significant figures and may not add to totals becauia of Source: Solley, Chase, and Mann. 19831
PER DAY, 19SO
'(dependent founding
Withdrawali
Use
Olfitream uie:
Rural domaitic and livaitock .
Self-iupplied induitrial: Thermoelectric power uie . Other induitrial uiet ...
Total . ......
Instream use.
Ground water
Freih Saline
230 160 .... 380
4.1 400 0
1 .200 0
52.000
Surface water
Fieih Saline
640 11 ....
200
4.400 160 380 42
5.500 200
Total fresh water
770 160 580
4,400 780
6,700
Consump tive use,
fresh water
180 110 580
120 59
1.000

112 National Water Summary 1983
channel in most areas, movement of sediment in the estuary will be altered.
Flooding C.
In the rapidly developing urban areas, especially in the Pied mont, increased flooding caused by urbanization is an impor tant issue in the State. Flooding in the Atlanta area can be expected to increase as land use in stream basins changes from undeveloped to developed (E. J. Inman, U.S. Geological Survey, written commun., 1983).
INSTITUTIONAL AND MANAGEMENT ISSUESInterbasin transfers Di
Most water for the metropolitan Atlanta area is supplied from the Chattahoochee River basin; some water also is sup plied from the Coosa River basin. Because the Atlanta metropolitan area encompasses several river basins, some of the water withdrawn from the Chattahoochee River basin is discharged into the Altamaha River basin. Hence, the net flow of the Chattahoochee River is decreased by interbasin transfer. Some of the treated-waste water currently being discharged in to the South and Flint Rivers soon will be diverted back into the Chattahoochee River basin. The water quality of all three rivers will be improved by the diversion.
Interstate ground-water issues D2
Ground-water pumpage in the Savannah area has interstate ramifications with South Carolina. Savannah obtains much of its water from the aquifer system that extends into South Carolina. There is a potential for considerable controversy about this issue; however, a management plan is being developed by the U.S. Army Corps of Engineers in coopera tion with the States of Georgia and South Carolina, the U.S. Environmental Protection Agency, and several local govern ment agencies.
River-system management Ds
The Chattahoochee River basin provides water for a signifi cant part of Georgia's population. Flow of the river is regulated upstream from Atlanta by releases of water from Lake Sidney Lanier. Releases primarily are for the production of peak- demand electric power. Withdrawal of water for municipal use is complicated by the cyclic nature of the releases. A recent
study of the water-supply needs of the metropolitan Atlanta area (U.S. Army Corps of Engineers, 1981) developed a set of alternatives for meeting the area's water-supply needs until the year 2000. The selected alternative requires the construction of a dam downstream from Lake Sidney Lanier to regulate re leases. The purpose of the new dam would be to store water re leased during peak power production and then release the stored water at a relatively even flow rate.
Water laws and water allocation D.
Georgia has a comprehensive set of laws governing the allocation of surface and ground water for industrial and municipal users of more than 100,000 gallons per day. Enforce ment of all surface-water, ground-water, and water-quality laws is centered in one State agency-the Environmental Pro tection Division. Although the laws provide for the necessary management of industrial and municipal water users, they ex plicitly exempt pumpage for agricultural irrigation from the permitting process. Irrigation is now one of the largest water users and is the largest water consumer in the State. Com prehensive management of the total water resources is hampered because this major use is exempted from the permit ting process. Amendments, which were passed in 1982, to the Georgia Ground Water Use Act of 1972 and the Georgia Water-Quality Control Act require that irrigation water use be reported to the State, but permits for that use still are not required.
REFERENCESHayes, L. R., Maslia, M. L., Meeks, W. C., 1983, Hydrology and
model evaluation of the principal artesian aquifer, Dougherty Plain, southwest Georgia: Georgia Geologic Survey Bulletin 97. [in press]
Krause, R. E., 1979, Geohydrology of Brooks, Lowndes, and western Echols Counties, Georgia: U.S. Geological Survey Water- Resources Investigations 78- 117, 48 p.
Matthews, S. E., Hester, W. G., and McFadden, K. W., 1982, Ground-water data for Georgia, 1981: U.S. Geological Survey Open-File Report 82-904, 110 p.
Solley, W. B., Chase, E. B., and Mann, W. B., IV, 1983, Estimated use of water in the United States in 1980: U.S. Geological Survey Circular 1001, 56 p.
U.S. Army Corps of Engineers, 1981, Final report and final en vironmental impact statement, metropolitan Atlanta area water resources management study: Savannah, Ga., Savannah District, variously paged.
Hawaii and Other Pacific Areas 113
HAWAII AND OTHER PACIFIC AREAS WATER ISSUES
As identified by the Hawaii District Office of the U.S. Geological Survey in consultation with State and other Pacific area officials
HAWAIIThe Hawaiian Archipelago consists of a 1,600-mile-long,
northwest-trending chain of 132 islands, shoals, and reefs in the central Pacific Ocean. The eight major islands at the southeastern end of the chain, which are the tops of large shield volcanoes, have an area of 6,450 square miles. The principal water-supply issues in Hawaii result from the variable spatial distribution of precipitation. Although the average annual precipitation is about 73 inches, precipitation on individual islands ranges from 6.5 to 450 inches. Each of the major islands also is independent regarding the occurrence and availability of water for public supply. The population of Hawaii has doubled since 1950, and there has been a corresponding increase in the demand for water for agricultural, industrial, and domestic use. The greatest use of water in Hawaii is for agriculture primarily for sugar-cane irrigation. Water for agricultural use is supplied equally from ground and surface water. Ninety per cent of Hawaii's domestic water is supplied by ground water. The island of Oahu, which supports 80 percent of the State's population, has the most water issues. If present consumptive trends continue, the islandwide water demand could equal the total recoverable supply by the year 2000 (Hawaii Water Resources Regional Study Committee, 1979). Smaller areas on several other islands will need additional water supplies by the year 2020.
Major water issues are summarized by category below. The letters and numerical subscripts identify issues shown on the map; an asterisk instead of a numerical subscript indicates that the issue is not shown on the map.
WATER-AVAILABILITY ISSUESGround water Ai
On Oahu, supplies of ground water are adequate to meet present demands. However, aquifers in two areas are regu lated by the State because they are at or near their sustained yield, and withdrawal of additional ground water may induce saline-water intrusion or other adverse effects. Most of the easily obtained ground water already has been developed; development of smaller sources on the island is a continuing endeavor. Because of the likelihood of saline-water intrusion, all coastal aquifers need to be developed and managed with care. In general, ground water is abundant on each of the other islands except for Lanai, Niihau, and Kahoolawe. Supplies on these islands appear to be adequate for the present populations (Hawaii Water Resources Regional Study Committee, 1979).
Surface and ground water A,
Hawaii's water resources are very susceptible to prolonged droughts. A statewide drought during 1976-77 caused signifi cant decreases in streamflow and ground-water-level declines to historic lows on Oahu and other islands in the State, which resulted in severe crop damage, livestock losses, and water-use restrictions. During the first 3 months of 1983, a total of 0.91 inch of precipitation was recorded at the Honolulu Airport on Oahu the driest first quarter in 105 years of record. This lack of rainfall, and subsequent increase in ground-water pumpage, caused water levels to decline significantly in some aquifers. On the island of Hawaii, only 7 percent of normal precipitation was recorded for January and February 1983. Water-use restrictions were imposed, and the Governor declared the com munities of Puna and Kamuela disaster areas.
Surface water A.
The major source of dependable surface water on most of the Hawaiian Islands is the base flow of streams. Most of this water is transported to areas of use by ditches and tunnels. Constraints on future development of surface-water supplies include water rights, environmental and esthetic considera tions, water-treatment costs, lack of reservoir and storage sites, and potential adverse effects on ground-water resources.
WATER-QUALITY ISSUESSurface water Point and nonpoint sources of pollution Bi
The adverse effects of sediment derived from agricultural and over-grazed pasture lands on stream quality is a major issue of concern in the State. Storm runoff from urban areas, which also introduces additional sediment, oil, grease, chem icals, and urban litter into surface waters, also is of concern. Most sediment and pollutants eventually are transported to the near-shore coastal waters, where they may affect near-shore ecosystems. Although pollution resulting from point-source discharges has been identified and effectively controlled by the State Department of Health, the more difficult task of control ling pollution from nonpoint sources remains.
Ground water Point and nonpoint sources of pollution B2
The Pearl Harbor aquifer the State's most productive and economically important aquifer underlies large fields of sugar cane and pineapple. Irrigation-return water contains dissolved fertilizer salts, residues of organic pesticides, and increased chloride concentrations. Probably, the two most potentially hazardous organic pesticides are dibromochloropropane (DBCP) and ethylene dibromide (EDB). Routine water sampling by the State's Department of Health in June 1983 discovered traces (0.020-0.100 part per billion) of EDB in four of Honolulu's water-supply wells. A few days later, a well on the island of Maui was found to have 0.140 parts per billion of DBCP in its water. Although Hawaii does not have any stand ards for these pesticides in drinking water, the wells were shut down as a precautionary measure. The Governor has organ ized a special task force to study the pesticide-contamination problem on a statewide basis.
Ground water Saline-water intrusion B3
A major issue of concern is that the State's coastal fresh water aquifers are subject to saline-water intrusion because of large ground-water pumpage. The three aquifers most suscep tible to saline-water intrusion Pearl Harbor, Honolulu, and Waialua underlie Oahu. In the Pearl Harbor aquifer, exten sive development and long-term pumping have resulted in a gradual landward and upward movement of saline water, and some wells have been abandoned as a result. Large increases in chloride concentration also have occurred in water pumped from older irrigation wells completed in the Pearl Harbor aquifer. Saline-water intrusion also is occurring in the Honolulu and Waialua aquifers because of intensive ground- water pumpage.
Ground water Waste-water injection B,
The practice of disposing of waste water by subsurface injec tion has increased in Hawaii (Takasaki, 1974). This type of waste disposal has the potential to pollute local ground-water supplies and near-shore coastal waters.
HYDROLOGIC HAZARDS AND LAND-USE ISSUESFlooding Ci
In Hawaii, storm runoff, high surf, and tsunamis cause flooding that results in loss of life and extensive damage to public and private property. Although substantial measures for protection against flooding from storm runoff have been pro-

114 National Water Summary 1983
vided in many areas of the State, other areas are still vulner able. High surf generally affects the northern and western coasts of each island, causing damage to highways, homes, and resort complexes. Damage has been greatest on Oahu because of extensive development on the coasts. Flooding by tsunamis has caused the most deaths and property damage. The city of Hilo on the island of Hawaii is perhaps the most vulnerable to this type of flooding because of its location near sea level along Hilo Bay.
INSTITUTIONAL AND MANAGEMENT ISSUESWater laws D,
In 1979, the Pearl Harbor aquifer was designated by the State Department of Land and Natural Resources as a ground- water-control area. The Pearl Harbor aquifer has had declin ing water levels, storage depletion, and saline-water intrusion since about 1910 (Soroos and Ewart, 1979). Since 1979, sever al other aquifers have been designated as ground-water control areas. In 1983, the State Legislature appointed an advisory study commission on water resources and charged it with de veloping a State Water Code.
OTHER PACIFIC AREASPopulation increases on the islands of Guam, American
Samoa, the Northern Marianas (Saipan), the Federated States of Micronesia (Yap, Truk, Ponape, and Kosrae), and the Republic of Palau, have increased the demand for water. This is a major concern because surface waters commonly are polluted by pathogenic organisms. During periods of deficient rainfall, water shortages are a common occurrence on all the islands. Only the islands of Guam, Saipan in the Northern Mariana Islands, Moen in Truk, and Tutuila in American Samoa have developed ground-water supplies. Annual rainfall ranges from 80 inches on Saipan to about 350 inches in the mountains on Ponape. A drought that has persisted in the western Pacific since October 1982 has caused water shortages. Water-use restrictions have been imposed on all main islands with centralized distribution systems.
WATER-AVAILABILITY ISSUESSurface and ground water Guam A.
Guam has an area of 212 square miles. Annual rainfall averages about 94 inches and falls mostly from July to December. Although supplies of ground water in northern Guam are adequate to meet water demands in the forseeable future, additional distribution lines and storage facilities are needed to meet current demands (R. J. Bordallo, Territory of Guam, written commun., 1983). An extended drought, which has persisted since late 1982, has caused significant depletion of reservoir storage in southern Guam. Water conservation measures have been imposed.
Surface and ground water American Samoa A.
American Samoa includes the volcanic islands of Tutuila, Aunuu, Ofu, Olosega, and Tau. The islands annually receive more than 100 inches of rainfall, but, during droughts, water supplies from surface-water sources become critically deficient. Increasing population, expansion of the tuna-canning in dustry, and increasing tourism are creating greater demands for water. The scarcity of sites for reservoirs hinder additional surface-water development. Development of ground-water re sources is being considered (Bentley, 1975).
Surface and ground water Northern Mariana Islands A.
The Northern Mariana Islands include the 15 islands of the Marianas chain north of Guam. Saipan is the largest island
and has an area of 48 square miles. An increasing population and a thriving tourist industry has increased the demand for fresh water in Saipan. Although an average annual rainfall of 81 inches falls on the island, surface-water sources are not ade quate because much of the rainfall percolates through the island's permeable limestone surface. The demand for water is being met by production from wells and springs, but these sup plies are not sufficient to meet future demands.
Surface and ground water Federated States of Micronesia and Republic of Palau A.
Except for the island of Moen (Truk) where ground water is the principal source of supply, the islands of Yap, Ponape, Kosrae, and Koror (Republic of Palau) depend on surface water, springs, and shallow dug wells for their water. The primary source of surface-water supply for Koror is a reservoir located on the nearby island of Babelthuap. Yearly rainfall averages are more than 150 inches and as much as 350 inches in the mountains on Ponape. Streamflow is abundant on the main islands but is dependent on the quantity and a real distribution of rainfall. A drought in the western Pacific, which has persisted since October 1982, has caused many streams and dug wells at higher altitudes to go dry. The drought has decreased drinking-water supplies and has caused extensive tree and root-crop damage on many inhabited atolls. People on these atolls are now faced with water and food shortages. The municipalities on the islands of Moen, Yap, Ponape, and Koror have centralized distribution systems, but these are inefficient because of large water losses due to leakage.
WATER-QUALITY ISSUESGround water Saline-water intrusion Northern Mariana Islands B.
Saline-water intrusion is a continuing concern in all parts of Saipan where limestone aquifers extend below sea level. In many localities, natural intrusion is sufficient to make the ground water too saline for human consumption. In other areas, numerous wells that once produced fresh water are now abandoned because of saline-water intrusion caused by pump ing. A widespread limestone aquifer in southern Saipan has been a principal source for the island's water system since its development by the military during the early 1940's. A rapid increase in salinity, which began shortly after pumping began, was followed by a slower but persistent increase in salinity as pumping continued. Since 1980, the average concentration of chloride in water from the wells in southern Saipan generally has been greater than 1,000 milligrams per liter.
Ground water Saline-water intrusion Truk B.
Two drilled wells producing from thin shallow aquifers on the island of Moen have become brackish because of increased pumpage since the current drought began in October 1982. Chloride concentrations from a well located near Pou Bay have increased from an average of 50 milligrams per liter in 1980 to 1,250 milligrams per liter by April 20, 1983. Villages that are not being supplied with water by the government have been advised to boil water obtained from local sources because of the threat of cholera.
Ground water Point and nonpoint sources of pollution American Samoa B.
Because of the high permeability of the surface rocks, pollu tion by leakage from shallow cesspools and contaminated sur face water is appearing in the water pumped from wells in the Tafuna-Leone area-and is an issue of concern.
HYDROLOGIC HAZARDS AND UNO-USE ISSUESErosion and sedimentation Guam G.
Soil erosion is a major concern on Guam. A study made in 1982 shows that sediment yields for the Talofofo, Ugum, and

Hawaii and Other Pacific Areas 115
/B,
HO!*e*s*««^^B3 /' ^ is?"* 1 "'"">>
50 100 MILES
50 100 KILOMETERS
SUMMARY OF WATER USE IN HAWAII. IN MILLION GALLONS PER DAY. 1980
[Data rounded to two significant figures and may not add to totals because of independent rounding. Source: Solley, Chase, and Mann, 1983]
Withdrawals
Use
Off stream use:
Rural domestic and livestock . .
Self-supplied industrial: Thermoelectric power use . . Other industrial uses .....
Total ..........
Instream use: Hydroelectric power . .
Ground water
Fresh Saline
180 .... 8.8 ...
460 ....
130 .... 9.1 0
800 0
180
Surface water
Fresh Saline
15 .... 0.6 ...
450
9.0 1 ,200 36 7.0
510 1,200
Total fresh water
200 9.4
910
140 45
1,300
Consump tive use,
fresh water
60 8.2
610
0 0
680
19°
EXPLANATIONWafer issues are described in text. Color identifies type of issue. Letter and number identify specific issue described in text.
WATER-AVAILABILITY ISSUES
|___[ A.J Ground water
WATER-QUALITY ISSUES
j^^H BI Surface water Point and nonpoint sources of pollution
I B2 Ground water-Point and nonpoint sources of pollution
(see small map)
183 Ground water-Saline water intrusion
HYDROLOGIC HAZARDS AND LAND-USE ISSUES
| Illlll j C 1 Flooding
INSTITUTIONAL AND MANAGEMENT ISSUES
I | D-j Water laws Critical ground-water areas

116 National Water Summary 1983
Ylig River basins in southern Guam were 1,200, 1,210, and 1,385 tons per year per square mile, respectively (P. J. Shade, U.S. Geological Survey, written commun., 1983).
INSTITUTIONAL AND MANAGEMENT ISSUESWater supply planning and management Ponape D*
Ponape is concerned about providing new water supplies for settlements that are not served by Kolonia Central Water District System because the surface water in most of these set- dements is polluted. Ponape plans to install new water systems that include ground-water supplies.
REFERENCESBentley, C. B., 1975, Ground-water resources of American Samoa
with emphasis on the Tafuna-Leone plain, Tutuila Island: U.S. Geological Survey Water-Resources Investigations 29-75, 33 p.
Hawaii Water Resources Regional Study Committee, 1979, Hawaii water resources plan, 1979: Honolulu, 207 p.
Solley, W. B., Chase, E. B., and Mann, W. B., IV, 1983, Estimated water use in the United States in 1980: U.S. Geological Survey Cir cular 1001, 56 p.
Soroos, R. L., and Ewart, C. J., 1979, Ground-water status report, Pearl Harbor area, Hawaii: U.S. Geological Survey Water- Resources Investigations 79-1542, 3 sheets.
Takasaki, K. J., 1974, Hydrologic conditions related to subsurface and surface disposal of waters in Hawaii: U.S. Geological Survey Water-Resources Investigations 1-74, 5 sheets.

Idaho 117
IDAHO WATER ISSUESAs identified by the Idaho Office, Idaho-Nevada
District, of the U.S. Geological Survey in consultation with State officials
Idaho receives about 10 to 60 inches of precipitation annual ly, most of which accumulates as snowpack in the mountains during the winter. Reservoirs provide water for irrigation of semiarid agricultural areas, mostly on the Snake River Plain. The reservoirs also provide water for electric-power genera tion. All large commercial powerplants in Idaho are hydroelec tric. The basalt aquifers of the eastern Snake River Plain and other principal aquifers in the State store and transmit large quantities of water. Ground water is used for domestic, indus trial, and municipal supplies and is extensively used for irriga tion. The quality of surface and ground water generally is suit able for all uses. However, some streams, lakes, and aquifers have been affected by farming, grazing, logging, mining, and urbanization. Because of rapid infiltration of precipitation and surface runoff, the basalt aquifers are susceptible to pollution. Concentrations of naturally occurring iron, manganese, and fluoride in water from wells locally exceed drinking-water standards. In spite of the abundance of water in Idaho, perhaps the most important issue is the allocation of water rights among power companies, irrigators, and future develop ment. To manage the water resources in the State, the Idaho Department of Water Resources and the Idaho Water Resource Board (1982) publish and periodically revise the State Water Plan.
Major water issues are summarized by category below. The letters and numerical subscripts identify issues shown on the map; an asterisk instead of a numerical subscript indicates that the issue is not shown on the map.
WATER-AVAILABILITY ISSUESSurface water A.
Drought conditions in 1977 seriously depleted storage in reservoirs, although subsequent rains alleviated these short ages. However, a prolonged drought could be economically disastrous, particularly in areas of the State where there is little or no reservoir storage. A recent State Supreme Court decision has allocated a significant part of the water upstream from Swan Falls Dam on the Snake River to the Idaho Power Com pany for hydroelectric-power generation. Future development in the area may require water allocations from other reservoirs. Dozens of applications for construction of small hydroelectric plants have been filed in Idaho. These applications usually are for construction of hydroelectric plants on small, steep- gradient streams, although some are for construction on canals and larger streams. These installations may have some adverse effects on streamflow and fisheries. The Pacific Northwest Power Planning Council has prepared a plan to mitigate the effects of powerplants on streamflow and fisheries and to enhance fisheries in the Columbia River basin. This plan pro vides for the establishment of criteria for instream flows and for the identification of available stored water to maintain the flows.
Ground water A.
From 1971 to 1982, water levels in about 75 percent of 366 observation wells in Idaho declined from 1 to 50 feet, principal ly because of pumpage for irrigation (Young, 1983). General ly, the greatest declines (more than 10 feet) were in wells along the southern part of the Snake River Plain and in Butte and Camas Counties where irrigation is extensive. Considerable tracts of additional land could be irrigated with ground water.
WATER-QUALITY ISSUESGround water Point and nonpoint sources of pollution BI
Petroleum products have polluted shallow aquifers near Boise, Nampa, and other urban areas (Parliman, 1983a). Con centrations of nutrients, probably from septic systems or fertil izers, exceed limits for drinking water (U.S. Environmental Protection Agency, 1976) in several areas (Yee and Souza, 1983). Some water from shallow aquifers near Boise (Parliman, 1982a, 1983a), in the Rathdrum Prairie area (Parliman and others, 1980) and in several areas in eastern and south-central Idaho (Parliman, 1982b, 1983b) contains bacteria and a variety of naturally dissolved minerals, such as fluoride, sulfate, chloride, or iron, that exceed limits for drink ing water (U.S. Environmental Protection Agency, 1976, 1979). A shallow aquifer underlying phosphate-processing plants near Pocatello contains high concentrations of arsenic and heavy metals (Jacobson, 1982). Radioactive waste water from a nuclear chemical-processing plant at the Idaho National Engineering Laboratory (Butte County) is being injected into the Snake Plain aquifer (Robertson and others, 1974). More than 1,000 drainage wells allow excess irrigation water, street runoff, and septic-tank effluent to enter aquifers in south- central and eastern Idaho (Seitz and others, 1977).
Ground water Hazardous-waste sites B2
Four hazardous-waste sites in Idaho are included in the U.S. Environmental Protection Agency's National Priorities List (1982). Ground water at these sites has been polluted by smelting wastes, solvents, lumber preservatives, and poly- chlorinated biphenyls.
Surface water Point and nonpoint sources of pollution B.
Although the quality of most of Idaho's water generally is suitable for all uses, the water in some reaches of major rivers has been polluted. Concentrations of heavy metals have in creased in some reaches of the Spokane and Coeur d'Alene Rivers as a result of metal-mining activities, and heavy metals from unknown sources have degraded water in the down stream reaches of the Salmon and Clearwater Rivers (Parli man and others, 1980; Parliman, 1982b). Water quality in the downstream reach of the Portneuf River and in Rock Creek has been degraded by irrigation return flows (Idaho Depart ment of Health and Welfare, Division of Environment, 1980). Large concentrations of suspended sediment have been meas ured in the Bruneau and Bear Rivers. Runoff from urban and agricultural areas has degraded water quality in the down stream reach of the Boise River and in the Payette and Weiser Rivers. Pathogenic protozoa are reported to be present in some mountain streams (Craun, 1980).
HYDROLOGIC HAZARDS AND LAND-USE ISSUESFlooding C.
Intense storms and warm rain on snow pack have caused catastrophic flooding and associated mud and debris flows near Boise (Harper and Hubbard, 1980). Dam breaks, such as the Teton Dam disaster (Ray and Kjelstrom, 1978), have pro duced some of the highest flood flows ever recorded in Idaho. Because many dams were built about 1900 and may have deteriorated, the threat of dam-failure flooding is a serious and persistent concern.
Landslides C.
Landslides caused by intense rains, snowmelt, and steep road cuts periodically block streets and highways and endanger subdivisions near Boise and at other locations in the State.
118 National Water Summary 1983
Wet soils and drainage C.
Irrigation has caused waterlogging of poorly drained areas. Resulting perched water bodies discharge as springs along the Snake River, and erosion caused by the springs has endan gered the Hagerman Fossil Beds, which contain fossil skeletal remains of Pliocene horses, fish, and other animal life. Fish fossils in these beds are some of the best examples of fresh water Pliocene fauna found in North America.
INSTITUTIONAL AND MANAGEMENT ISSUESWater laws Di
The Idaho Department of Water Resources has declared eight areas as Critical Ground-Water Areas to prevent ground- water mining. State regulations prohibit withdrawals that would cause water levels to decline below a specified altitude established for each area.
Water-resources management Ground water D2
The Idaho Department of Water Resources has designated three areas as Ground-Water Management Areas to control and decrease potential declines of ground-water levels. Permits for new ground-water withdrawals in these areas may be de nied to protect existing water supplies from further depletion.
REFERENCESCraun, G. F., 1980, Disease outbreaks caused by drinking water:
Water Pollution Control Federation Journal, v. 52, no. 6, p. 1833-1838.
Harper, R. W., and Hubbard, E. F., 1980, Winter water The flooding at Boise, Idaho, January 11-12, 1979: U.S. Geological Survey Water-Resources Investigations 80-201, 1 sheet.
Idaho Department of Health and Welfare, Division of Environment, 1980, Water quality status report, Rock Creek (Power County), 1977-79: Idaho Department of Health and Welfare, Division of Environment Report No. WQ-44, 77 p.
Idaho Water Resource Board, 1982, Idaho State Water Plan: Boise, 56 p.
Jacobson, N. D., 1982, Ground-water conditions in the eastern part of Michand Flats, Fort Hall Indian Reservation, Idaho: U.S. Geological Survey Open-File Report 82-570, 35 p.
Parliman, D. J., 1982a, Compilation of ground-water quality data for selected wells in Elmore, Owyhee, Ada, and Canyon Counties, Idaho, 1945 through 1982: U.S. Geological Survey Open-File Report 83-39, 152 p.
____1982b, Ground-water quality in east-central Idaho valleys: U.S. Geological Survey Open-File Report 81-1011, 55 p.
_1983a, Ground-water quality in the western Snake Riverbasin, Idaho: U.S. Geological Survey Water-Resources Investiga tions 82-4062. {in press]
_1983b, Reconnaissance of ground-water quality, eastern SnakeRiver basin, Idaho: U.S. Geological Survey Water-Resources In vestigations 82-4004, 100 p.
Parliman, D. J., Seitz, H. R., and Jones, M. L., 1980, Ground-waterquality in north Idaho: U.S. Geological Survey Water-ResourcesInvestigations 80-596, 34 p.
Ray, H. A., and Kjelstrom, L. C., 1978, The flood in southeasternIdaho from the Teton Dam failure of June 5, 1976: U.S. GeologicalSurvey Open-File Report 77-765, 48 p.
Robertson, J. B., Schoen, Robert, and Barraclough, J. T., 1974, Theinfluence of liquid-waste disposal on the geochemistry of water atthe National Reactor Testing Station, Idaho, 1952-70: U.S.Geological Survey Open-File Report, 231 p.
Seitz, H. R., La Sala, A. M., and Moreland, J. A., 1977, Effects ofdrain wells on the ground-water quality of the western Snake Plainaquifer, Idaho: U.S. Geological Survey Open-File Report 76-673,34 p.
Solley, W. B., Chase, E. B., and Mann, W. B., IV, 1983, Estimateduse of water in the United States in 1980. U.S. Geological SurveyCircular 1001, 56 p.
U.S. Environmental Protection Agency, 1976, National interimprimary drinking water regulations: Office of Water Supply,EPA-570/9-76-003, 159 p.
____1979, National secondary drinking water regulations: FederalRegister, v. 44, no. 140, July 19, 1979, p. 42195-42202.
.1982, Amendment to National Oil and Hazardous SubstanceContingency Plan; the National Priorities List: Federal Register, v.47, no. 251, December 30, 1982, p. 58476-58485.
Yee, J. J. S., and Souza, W. R., 1983, Quality of ground water inIdaho: U.S. Geological Survey Open-File Report 83-50. [in press]
Young, H. W., 1983, Hydrographs of water levels in observationwells in Idaho, 1971-82: U.S. Geological Survey Open-File Report83-225, 282 p.

Idaho 119
>_.._ 's
! »^ i ' i iBOUNIbARY,,! A [ ^-*-*""v
\
SUMMARY OF WATER USE IN IDAHO. IN MILLION GALLONS
[Data rounded to two significant figures and may not add to totals because of Source: Solley. Chase, and Mann. 1983]
PER DAY. 1980
independent rounding.
Withdrawals
Use
Offstream use:
Rural domestic and livestock
Self-supplied industrial: Thermoelectric power use . Other industrial uses .
Total .........
Instream use:
Ground water
Fresh Saline
1 50 .... 53 ....
4.100 ....
5.3 .... 2,100 0
6.300 0
76,000
Surface water
Fresh Saline
16 .... 15 ....
12,000
0 0 120 0
12,000 0
Total fresh water
160 68
16,000
5.3 2,200
18,000
Consump tive use,
fresh water
51 30
5,600
1.3 170
5,900
EXPLANATIONWa/«T I'.S.SUCK art' described in text. Color identifies type of issue. Letter and number identify specific issue described in text.
WATER-QUALITY ISSUES
Ground water Point and nonpoint sources of pollution
62 Ground water-Hazardous waste sites
INSTITUTIONAL AND MANAGEMENT ISSUES
Water laws
Water-resources management Ground-water
501 '
100 MILES
50 100 KILOMETERS
120 National Water Summary 1983
ILLINOIS WATER ISSUESAs identified by Illinois District Office of the U.S. Geo
logical Survey in consultation with State officials
Annual average precipitation in Illinois ranges from 32 inches near Lake Michigan in the north to 46 inches in the Shawnee Hills in the south. The State virtually is bounded by water the Mississippi River on the west, the Ohio and Wabash Rivers on the south and southeast, and Lake Mich igan on the northeast. Water suitable for most uses is available from several major rivers within the State, including the Il linois, Rock, Kaskaskia, Sangamon, and Big Muddy Rivers. In the northern one-third of Illinois, most municipal water sup plies are obtained from ground-water sources, whereas, in the remainder of the State, municipal supplies generally are ob tained from surface-water sources. In the southern two-thirds of the State, potable ground water generally is obtained from alluvium-filled shallow valleys that were eroded into the bedrock by ancestral streams. Drought-related water shortages occur in areas where surface-water storage facilities are relatively small and the ground-water sources are few, especially in the southern part of the State. A State Water Plan Task Force is developing a plan to address emerging water issues and to establish goals for better utilization of the resource.
Major water issues are summarized by category below. The letters and numerical subscripts identify issues shown on the map; an asterisk instead of a numerical subscript indicates that the issue is not shown on the map.
WATER-AVAILABILITY ISSUESGround water Ai
Ground water is the source for most municipal supplies in the northern one-third of Illinois. Recent studies (Sasman and others, 1982) of public and industrial water supplies in the Chicago metropolitan area indicate that ground-water with drawals from deep sandstone aquifers are about three times the recharge rate. Withdrawals from deep wells in 20 counties in northern Illinois have increased from about 200,000 gallons per day during 1864 to about 239 million gallons per day dur ing 1971 (Sasman and others, 1982). About 63 percent of this increase occurred in the Chicago area, and, as a result, water levels there have declined more than 850 feet from 1864 to 1980 (Sasman and others, 1982). Most rural supplies throughout the State are obtained from shallow aquifers that are susceptible to drought and pollution.
Surface water A.
During droughts, some surface-water supplies are inade quate, particularly in the southern two-thirds of Illinois. Local ly, storage may be inadequate to meet municipal and industrial demands. Minimum instream flow requirements for water quality, navigation, and fish and wildlife place additional stress on available surface-water resources.
WATER-QUALITY ISSUESSurface water Point and nonpoint sources of pollution Bi
Most pollution from industrial and municipal point discharges has been lessened by conventional regulatory pro grams; however, pollution from hazardous-waste disposal sites and from overflows of combined storm and sanitary sewers needs attention. Nonpoint pollution resulting from runoff from agricultural lands and modifications of stream channels are statewide issues. Streams west of the Illinois River, and in west-central Illinois, and tributaries to the Wabash River are very turbid as a result of large suspended-sediment concentra tions, generally attributable to agricultural practices. Stream channelization is a significant issue on streams tributary to and south of the Illinois River and in northeastern and southeast ern Illinois. The stream-channel modifications may affect stream reaeration capacity, stream temperature, and aquatic life, and may increase stream-bank erosion. Four additional
nonpoint sources are contributors to surface-water pollution: Runoff from eight major urban areas (shown on map), surface mining in southern Illinois, salt brine from oil fields in south ern Illinois, and construction-related erosion in major develop ing areas adjacent to urban centers.
Ground water Hazardous-waste sites 82
The Illinois Environmental Protection Agency has identified more than 500 potential hazardous-waste sites in the State. Thirty-two of these sites'have been identified by the U.S. Envi ronmental Protection Agency as candidates for remedial action. Eleven of these sites (shown on the map) have been in cluded in the U.S. Environmental Protection Agency's Na tional Priorities List (1982), and authorization for remedial actions has been approved (Illinois Environmental Protection Agency, 1983). During recent years, hazardous wastes have been transported to six licensed shallow-burial sites. One of these at Wilsonville (Macoupin County) was found to be leak ing and is being exhumed under court order.
Surface water Lakes B,
There are approximately 2,700 lakes in Illinois that have a surface area of 6 acres or more; about 95 percent of these are artificial impoundments. Statewide, lakes are affected by sedimentation and turbidity, aquatic weeds, fluctuating water levels, algal blooms, and oxygen depletion. Other concerns are taste and odor, bacterial content, hazardous constituents, and inflow of heated water.
Ground water Point and nonpoint sources of pollution B.
Ground-water pollution in Illinois has numerous sources, including landfills, farmland, animal feedlots, septic systems, highway deicing salts, and accidental spills and leakage of agricultural and industrial chemicals. Ground-water pollution also may result from abandoned oil and gas wells in central and southern Illinois, mine wastes in southern and western Illinois, and saline-water intrusion in northeastern Illinois.
Ground water Public supplies B.
Ground water in some areas contains constituents that ex ceed maximum allowable concentrations for drinking water (U.S. Environmental Protection Agency, 1976). Chemical constituents reported in public supplies include volatile organic compounds in about 10 supplies, generally in northern Illinois; fluoride in supplies in northwestern and north-central Illinois; and barium sulfate in supplies in northwestern and north eastern Illinois (Gilkeson and others, 1981).
KYDROLOGIC HAZARDS AND UNO-USE ISSUESFlooding Ci
Flood damages in urban areas more than tripled from the mid-1960's to the mid-1970's and tripled again from 1974 to 1980 (Illinois State Water Plan Task Force, 1982a). In 1981, many municipalities in northeastern Illinois were flooded; flood damages in part of the Little Calumet River basin in Cook County were $64 million, and, in the Hickory Creek basin in Will County, they were $20 million (Illinois State Water Plan Task Force, 1982a). In 1982, numerous munic ipalities and rural areas again were flooded; the most serious flooding occurred in the North Branch Chicago River basin (Cook and Lake Counties), in river basins between Rock Island (Rock Island County) and Gulfport (Henderson Coun ty) along the Mississippi River, and in the lower Illinois River basin.
Rising ground-water levels C2
The American Bottoms part of the Mississippi flood plain near East St. Louis is densely populated and industrialized. During recent years, water levels in the sand and gravel aquifer underlying the flood plain have risen considerably because industrial plants have changed from ground-water to

Illinois 121
90° I
89° 88°
<v'' ; 'm"' ri''''uMJiiiir'ji *._ Jo ^i T l* -iliMlJI :i' »
INNE|g3pDS ||W*^HKNF|Y[ . yfj X^P 2
p %d ;9i> 1 lAtjUlF
EXPLANATIONWater issues are described in text. Color identifies type of issue. Letter and number identify specific issue described in text.
WATER-AVAILABILITY ISSUES
I___[A-] Ground water
WATER-QUALITY ISSUES
A BI Surface water-Point and nonpoint sources of pollution
9 62 Ground water-Hazardous-waste sites
HYDROLOGIC HAZARDS AND LAND-USE ISSUES
/vI iimM Ci Flooding
|___|C2 Rising ground-water levels
Jr _/ ^-^r^X -^' ~ "" T7 I KENDALl;
i-fTCN&^^vr,. -H-E-W H V , ( j a" " :tcr^Rv-»cL /^sLj , Pi > ;i^^rjRJEjif^^^^^"^^^^ '' ;
n r«eii<1eS£-^C rJ^/^E!-J^H1TNAj}^ V--- i ' IKANKAK^ECi _x/cdnT xTSTLi M^ALT^ rV«-^^r~r ; 0-^'A«"-jfa&*£±L :r^^ brfa--*
-,;CHMSffrStsHELB
'- . ,/ U JV"\ p '-1 * **- r^-_J /C-l * I ^ ~' :'l j CHBISTIAKF4-- orlc ' ST ,T -.CREENE jlMACOWINJ- [___^ _j ^
\( O{ . . / ^j / i '. \ I MONTdoMERYl ^ ""- ' ' / AE P 71.1^^
SUMMARY OF WATER USE IN ILLINOIS. IN MILLION GALLONS PER DAY, 1980
[Data rounded to two significant figures and may not add to totals because of independent founding. Source: Solley, Chase, and Mann, 1983]
Use
Off stream u?e:
Rural domestic and livestock .
Self -supplied industrial: Thermoelectric power use . Other industrial uses ....
Total .........
Instream use:
Ground water
Fresh Saline
480 .... 130 .... 100 ....
8.4 .... 1 1 70 38
1 890 38
26,000
Withdrawals
Surface water
Fresh Saline
1 ,300 .... 20 ....53 ....
14,000 0 '410 0
1 16,000 0
Total fresh water
1,800 150 110
14,000 '580
'17,000
Consump tive use,
fresh water
18 120 110
260 88
590
50 100 MILES
50 100 KILO METERS
1 Revised. See Illinois State Water Survey Circular 152.
122 National Water Summary 1983
surface-water supplies. Flooded basements and structural damage to buildings have resulted from the rising water levels (U.S. Army Corps of Engineers, 1979).
Erosion and sedimentation C.
Some degree of erosion occurs statewide and affects croplands, streams, lakes, and reservoirs. More than one-third of the topsoil in many parts of Illinois is estimated to have been eroded during the past 100 years (Illinois State Water Plan Task Force, 1982b). Of the estimated 181 million tons of soil eroded annually, about 138 million tons (76 percent) is from croplands (Illinois State Water Plan Task Force, 1982a). Sedimentation has affected aquatic organisms and their habitats, navigation channels, and water supplies. Reservoir storage throughout the State decreases about 8,000 acre-feet annually due to sedimentation (Illinois State Water Plan Task Force, 1982a).
Wetlands C,
Many wetland areas in the State have been drained to allow for agricultural, urban, and industrial land uses during the past 160 years. Less than 50,000 acres of wetlands remain (Il linois State Water Plan Task Force, 1982a). Of the remaining wetlands, less than 25 percent are protected by either the State or Federal government.
INSTITUTIONAL AND MANAGEMENT ISSUESDevelopment of policy and management structure D,
Water issues in Illinois range from localized downstream ef fects of point-source discharges to interstate issues such as uses and plans for the Kankakee River, where Indiana favors drainage and channeling of the river and Illinois desires to maintain natural conditions (Kankakee River Basin Task Force, 1978). Thus, an integrated water-assessment policy and management structure that responds to water-quality and water-availability issues is needed.
Flood-plain management D,
The State is reevaluating Federal and State programs to determine whether they are significantly decreasing flood damages. The State is stressing that land-use management
should be an integral part of planning for flood-control projects and developments adjacent to or within flood-prone areas (Il linois State Water Plan Task Force, 1982b).
Water-quality standards D.
The State is revising its water-quality standards. A segment- specific approach within a river basin will restructure water- quality standards based on designated beneficial uses of the water. Consideration is being given to treatment of storm water or separation of combined storm and sanitary sewer systems in the State. Various State agencies are concerned about the existing combined systems and their effect on the quality of the receiving waters.
REFERENCESGilkeson, R. H., Perry, E. C., Jr., and Cartwright, Keros, 1981,
Isotopic and geologic studies to identify the sources of sulfate in groundwater containing high barium concentrations: Illinois State Geological Survey Contract Grant Report 1981-84, 39 p.
Illinois Environmental Protection Agency, 1983, Water quality management plan, Progress, May-June: Champaign, v. VIII, no. 3, 8 p.
Illinois State Water Plan Task Force, I982a, Illinois State water plan,1981. progress report: Champaign, 197 p.
____1982b, Illinois State water plan, 1982 progress report: Cham paign, 117 p.
Kankakee River Basin Task Force, 1978, Final report to the Gov ernor: Champaign, 359 p.
Kirk, J. R., Jarboe, J., Sanderson, E. W., Sasman, R. T., Lonn- quist, C., 1982, Water withdrawals in Illinois: Illinois State Water Survey Circular 152, 47 p.
Sasman, R. T., Benson, C. R., Ludwigs, R. S., and Williams, T. L.,1982. Water-level trends, pumpage, and chemical quality in the Cambrian-Ordovician Aquifer in Illinois, 1971-1980: Illinois State Water Survey Circular 154/82, 64 p.
Solley, W. B., Chase, E. B., and Mann, W. B., IV, 1983, Estimated use of water in the United States in 1980: U.S. Geological Survey Circular 1001, 56 p.
U.S. Army Corps of Engineers, 1979, American Bottoms ground- water study Reconnaissance report: St. Louis, 81 p.
U.S. Environmental Protection Agency, 1976, National interim primary drinking water regulations: Office of Water Supply, EPA-570/9-76-003, 159 p.
____1982, Amendment to National Oil and Hazardous Substance Contingency Plan; the National Priorities List: Federal Register, v. 47, no. 251, December 30, 1982, p. 58476-58485.

Indiana 123
INDIANA WATER ISSUESAs identified by the Indiana District Office of the U.S.
Geological Survey in consultation with State officials
Indiana has abundant surface and ground water; average annual precipitation is 38 inches and ranges from 36 inches in the north to 44 inches in the south. Streamflow generally is sus tained throughout the year, and quantities are sufficient for most current uses. Although the State has used surface water for most of its supply, ground-water withdrawals, especially for irrigation, are increasing. The principal surficial aquifers are composed of sand and gravel; the principal bedrock aquifers are composed of limestone. Increased management of Indiana's water resources is becoming an important issue as a result of increased irrigation and competition for water in ma jor urban areas. In addition, the State is concerned about the extent of pollution of aquifers and streams by hazardous wastes.
Major water issues are summarized by category below. The letters and numerical subscripts identify issues shown on the map; an asterisk instead of a numerical subscript indicates that the issue is not shown on the map.
WATER-AVAILABILITY ISSUESSurface and Ground Water AI
During the past 5 years, increases in irrigation in northern Indiana have caused localized competition for water among ir- rigators and other users. In Newton and Jasper Counties, water withdrawals for irrigation from a confined bedrock aquifer have caused water-level declines of more than 20 feet throughout a 175-square-mile area (Indiana Department of Natural Resources, 1982). Concern about the water demands for irrigation contributed to passage of a new water law requir ing the State to develop a water-resource management pro gram that will assist in decisions regarding the use and protec tion of Indiana's water resources. However, water withdrawal for irrigation is not a serious concern in all areas. For instance, in LaGrange County (northeastern Indiana), pumping from sand and gravel aquifers and from streams, which are sus tained by discharge from these aquifers, has not caused in- stream water shortages. During 1980, only 10 percent of the irrigable agricultural land was irrigated (Governor's Water Resources Study Commission, 1980).
WATER-QUALITY ISSUESSurface water Point sources of pollution B,
Untreated or partly treated municipal and industrial waste discharges are the most common point sources of surface-water pollution. These waste discharges occur because of obsolete, overloaded, or improperly operated treatment plants and over flow of sewers. Substances in the incoming wastes that are tox ic to bacteria also have decreased biological digestion of sewage at treatment plants resulting in incomplete waste treatment. Approximately 30 of the 130 municipalities and industries monitored by the Indiana State Board of Health are violating stipulations in their discharge permits (Indiana State Board of Health, written commun., 1983). Discharges of inadequately treated municipal sewage cause greater concentrations of fecal coliform bacteria, biochemical oxygen demand, ammonia, and settleable solids in receiving waters. Although nearly all in dustrial discharges are in compliance with State and Federal standards, some industrial-waste discharges commonly contain large concentrations of sulfide; cyanide; ammonia; heavy metals such as cadmium, chromium, lead, and zinc; and organic compounds such as oil and polychlorinated biphenyls. The amount of polychlorinated biphenyls in fish from selected reaches of four streams has been large enough that warnings about consumption of the fish have been issued by the Indiana State Board of Health.
Ground water Hazardous-waste sites 82
Indiana has 13 facilities that are included in the U.S. Envi ronmental Protection Agency's National Priorities List (1982) of hazardous-waste sites. A majority of these sites may pose a threat to the underlying shallow aquifers and to the deeper fractured limestone aquifers. In Elkhart (Elkhart County), the municipal water supply is threatened with pollution by trichloroethylene. Three sites in Gary (Lake County) overlying lacustrine dune-sand aquifers contain volatile organic com pounds and toxic inorganic compounds. Landfills near Bloom- ington (Monroe County) contain polychlorinated biphenyls and are in areas underlain by limestone aquifers.
Eutrophication 83
Increased nutrient concentrations may have been the partial cause of accelerated growth of aquatic vegetation in some lakes and reservoirs throughout the State. Approximately 10 percent of the 413 lakes studied are considered to be eutropnic (Indiana Stream Pollution Control Board, 1978). Effluent from municipal waste-water treatment plants and agricultural fertil izers in surface runoff probably are sources of nutrients to some of these lakes and reservoirs.
Acidic precipitation B4
The median pH of precipitation in Indiana is 4.2 (Hileman, 1982). Few data are available on potential effects of acid precipitation. During a rainfall on April 11, 1980, the pH of water in a tributary to Friday Branch near St. Meinrad (Spencer County) decreased from 7.2 to 6.3.
HYDROLOGIC HAZARDS AND LAND-USE ISSUESFlooding Streams C i
The Maumee River basin, especially in Fort Wayne (Alien County), is prone to major urban flood damage (Governor's Water Resource Study Commission, 1980). The floods in 1978 (Hoggatt, 1981) and 1982, which resulted from snowmelt, were the second highest and highest floods of record, respec tively, at Fort Wayne since the devastating flood of 1913.
Flooding Lakes 2
Floods in June 1981 and March 1982 caused considerable damage along lakeshores in northeastern Indiana. Water levels in June 1981 at most of the approximately 200 lakes in north eastern Indiana were considerably above mean lake level and, in some lakes, were the highest ever recorded. The most severe lake flooding occurred in March 1982 in the St. Joseph River basin (Steuben and Lagrange Counties). Water levels on the Pigeon Creek chain of lakes in March 1982 were 1 to 2 feet higher than the previously recorded maximum which was in April 1950.
Resource development Coal mining Cs
Approximately 9,100 acres of coal-mined land have been declared derelict (abandoned and with no legally responsible party) by the Indiana Department of Natural Resources. These derelict lands are responsible for pollution of the water resources in southwestern Indiana (Alien and others, 1978). The Department also has identified 79 underground mines that are discharging mineralized water. Approximately 421 miles of streams and 974 acres of lakes have been affected by acid-mine drainage from derelict lands. The Blackfoot region in southern Pike County is the largest single area of concern in the State. The South Fork Patoka River in this area has pH values ranging from about 3.0 to 6.0. Water from reaches of the river and some of its tributaries is unusable for fish habitats, livestock and wildlife watering, irrigation, and domestic uses. The acidic water also is corrosive to bridges, culverts, and other structures (Alien and others, 1978).

124 National Water Summary 1983
INSTITUTIONAL AND MANAGEMENT ISSUESWater laws D,
The Water Management Act was enacted by the 1983 In diana General Assembly to foster developement of a water- resource management program for the State. The law directs the Indiana Natural Resources Commission to conduct a con tinuing assessment of the State's water resources; provide an inventory of significant uses of water; and plan for the develop ment, conservation, and utilization of the water resource for beneficial uses. The Natural Resources Commission may establish minimum flows in streams and minimum ground- water levels in aquifers to protect the area's water resources. The law also provides for the registration of facilities capable of withdrawing more than 100,000 gallons per day of ground water, surface water, or combined ground and surface water.
REFERENCESAlien, J. R., Thomas, T. C., and Kelley, R. R., 1978, Derelict lands
of Indiana: Indiana Department of Natural Resources, 46 p. Governor's Water Resource Study Commission (Clark, G. D., ed.),
1980, The Indiana water resource Availability, uses, and needs:Indiana Department of Natural Resources, 508 p.
Hileman, Bette, 1982, Acid deposition: Environmental Science andTechnology, v. 16, no. 6, p. 323A-372A.
Hoggatt, R. E., 1981, Floods of March 1978 in the Maumee Riverbasin, northeastern Indiana: U.S. Geological Survey Open-FileReport 81-695, 18 p.
Indiana Department of Natural Resources, 1982, Preliminary reporton water levels in Jasper and Newton Counties, 1982: Division ofWater Report of Investigation 18, 19 p.
Indiana Stream Pollution Control Board, 1978, Indiana lakeclassification and management plan: Indianapolis, 178 p.
Solley, W. B., Chase, E. B., and Mann, W. B., IV, 1983, Estimateduse of water in the United State in 1980: U.S. Geological SurveyCircular 1001, 56 p.
U.S. Environmental Protection Agency, 1982, Amendment toNational Oil and Hazardous Substance Contingency Plan; the Na tional Priorities List: Federal Register, v. 47, no. 251, December30, 1982, p. 58476-58485.

Indiana 125
85°
iSorfr^v *p£*\ x* , * ' * ., \mvf-v.-w.vrtiM i to
, - .,- -^AB'X B9 .^_ L._ ---.
CARROL! I
' 81 ,._!_, 'HOWARD]-
*_lf___J^ELusf^
r-__~i^jvs. i
EXPLANATIONWafer issues are described in text. Color Identifies type of issue. Letter and number identify specific issue described in text.
WATER-AVAILABILITY ISSUES
Yflfi\ A-i Surface and ground water
WATER-QUALITY ISSUES
A Bj Surface water-Point sources of pollution
© 82 Ground water-Hazardous-waste sites
^ 63 Eutrophication (see small map)
[ ^^ | 84 Acidic precipitation
HYDRDLOGIC HAZARDS AND LAND-USE ISSUES
| Hl!'l'[ C-| Flooding-Streams (see small map)
Iliillll C 2 Flooding-Lakes
!| C 3 Resource development-Coal mining (see small map)
40
)I
0 50
50I
I 100 KILOMETERS
100 MILESI
SUMMARY OF WATER USE IN INDIANA, IN MILLION GALLONS PER DAY, 1980
(Data rounded to two significant figures and may not add to totals because of independent rounding Source: Solley, Chase, and Mann, 1983]
Withdrawals
Use
Off stream use:
Rural domestic and livestock .
Self-supplied industrial: Thermoelectric power use . Other industrial uses ....
Instream use:
Ground water
Fresh Saline
300 .... 130 .... 210 ...
5.0 .... 640 0
1,300 0
9,500
Surface water
Fresh Saline
280 .... 24 .... 21 ....
9.700 0 2,500 0
13,000 0
Total fresh water
580 160 230
9,700 3,100
14,000
Consump tive use,
fresh water
79 160 230
65 160
690

126 National Water Summary 1983
IOWA WATER ISSUESAs identified by the Iowa District Office of the U.S.
Geological Survey in consultation with State officials
Iowa generally receives sufficient precipitation to maintain streamflow, soil moisture necessary for agriculture, and long- term recharge to aquifers. Annual precipitation normally ranges from 25 inches in the northwest to 35 inches in the southeast. Periodic droughts of 1 to 5 years duration have caused increased irrigation, especially in northwest Iowa. Throughout the State, irrigation is used primarily to augment precipitation at critical times during the growing season. Ex cessive precipitation is as much a concern as too little and generally causes flooding and soil erosion. Three general types of topography characterize the State. The relatively flat north west has little developed drainage and is dissected only near rivers. The southern one-half of the State is dissected exten sively by narrow valleys. The northeast has many sinkholes and other features associated with solution of the rocks by water (Prior, 1976). The aquifers in Iowa are composed of alluvial sand and gravel at the surface, principally along rivers, and carbonate rocks and sandstones at greater depths. The car bonate rock aquifers yield large quantities of water where they immediately underlie glacial drift but yield only small quan- titites of water elsewhere. The sandstone aquifers yield large quantities of water throughout the State. Many soils have little permeability and manmade soil drains are common.
Major water issues are summarized by category below. The letters and numerical subscripts identify issues shown on the map; an asterisk instead of a numerical subscript indicates that the issue is not shown on the map.
WATER-AVAILABILITY ISSUESSurface water Ai
During normal years, the total flow in the streams in Iowa, excluding the Missouri and Mississippi Rivers, is about 18 million acre-feet. Most of this flow occurs during late spring and early summer; low flows usually occur during late summer and winter. Total stream runoff ranges from 2 inches in the western part of the State to 8 inches in the east. Only a small fraction of the total flow is available for use on a continuous basis because of the large variability in flow. During years with less than average precipitation, surface-water supplies become critically deficient, particularly in western and south-central counties. Reservoir storage is one alternative by which more water can be made available for use. Most of the major reser voirs in the State are designed only for flood control. As population and water use increase, additional surface-water storage for water supply may be needed.
Ground water A2
Ground-water supplies are relatively small, are not defined completely, and commonly are not potable in south-central and southwestern parts of the State. Withdrawals from alluvial aquifers for irrigation may be depleting streamflow.
Surface and ground water A3
The Missouri River flood plain in Iowa and Nebraska is a large integrated stream-aquifer system. Physical changes in the river for navigation and flood control have deepened the chan nel in some places, and ground-water levels may have been lowered. This, in turn, may have lowered the water levels in wetlands, lakes, and ponds.
WATER-QUALITY ISSUESSurface and ground water Hazardous-waste sites Bt
Three hazardous-waste sites in Iowa a dump site in Charles City (Floyd County) and chemical plants in Council Bluffs and Des Moines have been included in the U.S. Envi ronmental Protection Agency's National Priorities List (1982). At Charles City, 6.4 million cubic feet of wastes was disposed
of at an 8.5-acre site on the Cedar River flood plain. Ground water, which has been polluted by leachate containing 36 organic compounds and metals, and discharges into the Cedar River. Legal actions have resulted in remedial efforts, which are being monitored. At Council Bluffs, water used to fight a fire at a chemical plant caused pesticides to infiltrate into the ground. At Des Moines, trichloroethylene was detected in ground water beneath a chemical plant; disposal was stopped voluntarily.
Ground water Point and nonpoint sources of pollution B2
In northeastern Iowa, major sinkholes in carbonate rocks are a common dumping ground for trash, dead livestock, pesticide containers, and other debris and wastes. The sinkholes also receive surface-water runoff and discharge from manmade drains. Fertilizers and pesticides applied to the crops may stay on the land surface only a short time before being transported underground through sinkholes. Ground water in the carbonate aquifers moves rapidly from recharge areas to discharge areas along streams or lakes. The discharge usually occurrs as springs that flow at a rate of more than 10 cubic feet per second and contain dissolved nutrients and pesticides (Hallberg and others, 1983).
Surface water Nonpoint sources of pollution B.
The major surface-water-quality concerns are associated with soil erosion and other nonpoint-source pollution of streams and lakes. Relatively abundant precipitation and easily erodible soils result in large sediment concentrations in streams. A recent trend in farm practices is toward minimal -to no-till methods of soil preparation. This trend, although decreasing the consumption of energy for the farmer and possibly resulting in a decrease in soil erosion of the fields, is accompanied by a greater application of fertilizers and pesticides to maintain and increase crop yields. These applied chemicals may appear in nearby streams and may infiltrate into the shallow alluvial aquifers.
Surface and ground water Nitrate B.
Long-term water-quality studies in Iowa have shown in creases in nitrate concentrations in surface water and shallow aquifers. From 1950 to 1980, the average nitrate concentration in water from municipal wells less than 100 feet deep increased from about 8 to 12 milligrams per liter. The average concentra tion of nitrate in the Iowa River increased from about 6 to 23 milligrams per liter from 1972 to 1980 (McDonald and Splinter, 1982). The application of nitrogen-enriched fertilizers to agricultural land may be the primary source of nitrate in water supplies. The data indicate that, in north-central Iowa during a normal growing season, 20 to 50 pounds of nitrogen per acre moves down through the root zone to the drainage systems or to the water table (Hallberg and others, 1983).
Ground water Radium B.
A 1982 survey conducted by the University of Iowa Hygienic Laboratory of 614 public-water supplies reported that drinking water in 52 towns contained concentrations of radium in excess of the U.S. Environmental Protection Agency (1976) standards compared with 45 towns during 1981 (Haus- ler and others, 1982). Radium-226 is associated with the Jordan aquifer (1,000-3,200 feet deep) in southern Iowa and the Dakota aquifer (100-600 feet deep) in northwestern Iowa (Kriege and Hahne, 1982). Generally, drinking water in com munities in southern Iowa, which depend on water from wells completed in the Jordan aquifer, have high concentrations of radium.
INSTITUTIONAL AND MANAGEMENT ISSUESWater laws D.
Iowa has a number of laws and agencies concerned with management, control, and utilization of its water resources.

Iowa 127
92°
3
1 } 50
50
1 100 KILOMETERS
100 MILES _J
SUMMARY OF WATER USE IN IOWA. IN MILLION GALLONS PER DAY. 1980
[Data rounded to two significant figures and may not add to totals because of independent rounding Source: Solley, Chase, and Mann, 1983]
Use
Offstream use.
Rural domestic and livestock .
Self-supplied industrial. Thermoelectric power use . Other industrial uses . .
Instream use: Hydroelectric power . .
Ground water
Fresh Saline
1 250 . . . . 1 260 ....
1 76
4.0 .... 320 0
1 900 0
. '19,000
Withdrawals
Surface water
Fresh Saline
1 59 1 1 .6 ....
'16 ...
'2,100 0 1 130 0
1 2,300 0
Total
water
310 '260 '91
'2,100 '450
1 3,200
Consump tive use,
fresh water
47 '220
'91
1 13 11
'380
EXPLANATIONWc^'r issues are described in text. Color identifies type of issue. Letter and number identify specific issue described in text.
WATER-AVAILABILITY ISSUES
A-j Surface water
A 2 Ground water
A3 Surface and ground water
1 Revised: U.S. Geological Survey unpublished data.
WATER-QUALITY ISSUES
O Bt Surface and ground water Hazardous-waste sites
J 82 Ground water Point and nonpoint sources of pollution

128 National Water Summary 1983
Some 30 agencies at the State, county, municipal, and special- district levels of government are involved with water manage ment. In January 1983, the Iowa Natural Resources Council and Department of Environmental Quality were combined to form the Department of Water, Air, and Waste Management, which will have the primary responsibility for assessing Iowa's water uses and developing a general plan of water allocation. The Iowa Geological Survey has been mandated by the State legislature to coordinate cooperative water programs between State and Federal agencies. The State plans to implement a group of water-management laws that relate to water use and quality control of water-use data, water-quality control, drainage, and streams and related shoreline use (Iowa Natural Resources Council, 1978).
Water allocation D,
The increasing demand for water and the potential conflicts and competition between users in recent years have resulted in more State emphasis on water management.
River-system management D,
Plans for upstream uses of Missouri River water, such as the sale of water from Lake Oahe in South Dakota for use in a coal-slurry pipeline in Wyoming and other proposed uses in upper basin States (Colorado, Montana, North Dakota, South Dakota, and Wyoming), are of concern to some water users in Iowa because of possible impacts on the traditional and poten tial uses of the river.
REFERENCES
Hallberg, G. R., Hoyer, B. E., Bettis, B. A., and Libra, Robert,1983, Hydrogeology water quality, and land management in theBig Springs basin, Clayton County, Iowa: Iowa Geological Survey,Iowa Department of Environmental Quality, Contract No.82-5500-02, 191 p.
Hausler, W. J., Splinter, R. C., Hahne, R. H. A., and Wong,Y." W., 1982, Annual Report, University of Iowa HygienicLabratory, 1982: Iowa City, 132 p.
Iowa Natural Resources Council, 1978, Iowa water plan 1978,framework study main report: Iowa Citv, 207 p.
Kriege, L. B., and Hahne, R. H. A., 1982, 226Radium and228Radium in Iowa drinking water: Health Physics, v. A2, no. 4,p. 543-559.
McDonald, D. B., Splinter, R. C., 1982, Long-term trends in nitrateconcentration in Iowa water supplies: American Water WorksAssociation Journal, v. 74, no. 8, p. 437-440.
Prior, J. C., 1976, A regional guide to Iowa landforms: IowaGeological Survey Educational Series 3, 72 p.
Solley, W. B., Chase, E. B., and Mann, W. B., IV, 1983, Estimateduse of water in the United States in 1980: U.S. Geological SurveyCircular 1001, 56 p.
U.S. Environmental Protection Agency, 1976, National interimprimary drinking water regulations: Office of Water Supply,EPA-570/9-76-003, 159 p.
_____1982, Amendment to National Oil and Hazardous SubstanceContingency Plan; the National Priorities List: Federal Register,v. 47, no. 251, December 30, 1982, p. 58476-58485.

Kansas 129
KANSAS WATER ISSUESAs identified by the Kansas District Office of the U.S.
Geological Survey in consultation with State officials
Because of Kansas' agriculture-based economy, irrigation is the major water use in the State. The western part of the State is characterized by flat to gently rolling plains, with thick soils that are well suited for farming. Because annual precipitation is as little as 16 inches in southwestern Kansas, the surface- water resources (average annual runoff, 0.5 to 1.5 inches) are supplemented by extensive ground-water development, pri marily for irrigation. Eastern Kansas is characterized by valleys and deeply dissected uplands with thin loamy soils and rocky slopes that are better suited for raising livestock than for cultivation. The largest urbanized areas are located in the east ern part of the State. Precipitation is as much as 40 inches per year, and average annual runoff ranges from 2 to 10 inches. Many reservoirs have been constructed in eastern Kansas to store and regulate water supplies for municipal, industrial, agricultural, flood control, ana recreational uses.
Major water issues are summarized by category below. The letters and numerical subscripts identify issues shown on the map; an asterisk instead of a numerical subscript indicates that the issue is not shown on the map.
WATER-AVAILABILITY ISSUESGround water Ai
Water levels in the High Plains (Ogallala) aquifer under lying western Kansas have declined as mucn as 150 feet in parts of several counties during the last 30 years after widespread development of the aquifer as the principal source of irrigation water (Luckey and others, 1981). In several areas, this aquifer is being regulated by local Ground-Water Man agement Districts and the Kansas Board of Agriculture, Divi sion of Water Resources. Additional areas are being con sidered for regulatory control. The Dakota aquifer, which underlies the High Plains (Ogallala) aquifer in western Kan sas, is a source of water to supplement supplies. Because of the potential for localized depletion of the overlying High Plains (Ogallala) aquifer, the hydrologic characteristics and water quality of the Dakota aquifer are being investigated. Concern about the effects of withdrawals of ground water from the alluvial stream-aquifer system along the Arkansas River in western Kansas from the State line to Dodge City has resulted in the implementation of controls by the State to restrict further development of the aquifer. Hydrologic-modeling studies show that this stream-aquifer system is sensitive to the quantity of flow in the Arkansas River (Barker and others, 1981).
Surface water A.
Many municipalities and industries in the eastern one-third of Kansas depend on water stored in major reservoirs to meet current and future needs. A concern to the State is its ability to deliver water released from upstream reservoirs to municipali ties as much as 50 to 100 miles downstream. Many communi ties in the southeast depend upon natural flows of rivers, which are not dependable supplies. The State is concerned about pro viding dependable supplies from small local reservoirs or via pipelines from large reservoirs in the region.
WATER-QUALITY ISSUESSurface water Nonpoint sources of pollution BI
Storm runoff from urban areas may be a source of stream pollution. In the Topeka area, for example, storm runoff from Shunganunga Creek basin transports large concentrations of suspended sediment and heavy metals, with the largest concen trations generally occurring during the initial part of the runoff.
Surface water Saline-water intrusion 82
Aquifers underlying central Kansas discharge saline water to streams. During low flows, the discharge of brine (chloride concentration about 60,000 milligrams per liter) from the Wellington aquifer upward through the alluvium to the Smoky Hill River near Salina causes a fourfold increase (from 250 to 1,100 milligrams per liter) in chloride concentration, which restricts the use of the river during low flows (Gillespie and Hargadine, 1981). Other major rivers affected by saline ground-water discharge include the Arkansas, Ninnescah, Saline, and Solomon.
Surface and ground water Hazardous-waste sites 83
Three hazardous-waste sites in Kansas a 10-acre industrial waste-disposal site in Johnson County, a dump at Arkansas City (Cowley County), and an unlined pond at an abandoned oil-recycling site in Wichita have been included in the U.S. Environmental Protection Agency's National Priorities List (1982). At the site in Johnson County, samples of leachate flowing through a culvert into the Kansas River contained phenols, cyanide, and heavy metals. At Arkansas City, a preliminary study detected trace concentrations of polynuclear aromatics in ground water. The site is being investigated by the Kansas Department of Health and Environment. In Wichita, lead and organic compounds have been detected in ground water beneath and adjacent to the unlined pond used for disposal of sludge from recycled oil.
Ground water Saline-water intrusion 84
The "Equus beds", the principal alluvial aquifer in central Kansas, supplies much of the municipal water for the city of Wichita, and is used increasingly for irrigation (Leonard and Kleinschmitt, 1976). Increased pumpage may cause deteriora tion of ground-water quality by influx of saline ground water or movement of more mineralized water from the Arkansas River into the alluvial aquifer.
Surface water Trihalomethane 8,
Many public water-supply lakes in eastern Kansas are used for several purposes, including recreational boating and fishing. Water in these lakes may contain undesirable concen trations of organic compounds resulting from the decay of vegetation. Subsequent water treatment with chlorine can form trihalomethane and other byproducts that are undesirable in drinking water.
HYDROLOGIC HAZARDS AND LAND-USE ISSUESResource development Lead-zinc mining Ci
Lead and zinc deposits in southeastern Kansas were mined in the past by underground methods, and discharge from abandoned workings, mine tailings, and smelter sites has polluted some streams in the area including Short Creek, Spring River, and Tar Creek. In Short Creek, concentrations of as much as 28,000 micrograms per liter of dissolved zinc and as much as 300 micrograms per liter of dissolved cadmium have been detected. Unaffected streams in the area typically have concentrations of less than 200 micrograms per liter of dissolved zinc and less than 1 microgram per liter of dissolved cadmium. There also is concern about possible pollution of an underlying aquifer that annually provides about 3 billion gallons to municipal- and rural-water users. The Tar Creek area has been included in the U.S. Environmental Protection Agency's National Priorities List (1982) of hazardous-waste sites.
Resource development Coal mining C2
Coal has been mined in southeastern Kansas since about 1860. Originally the coal was mined by underground methods; however, because surface mining is less expensive, the deposits

130 National Water Summary 1983
have been strip mined since about 1940. The underground mines and associated spoil piles as well as some strip-mined areas have been abandoned. Seepage from abandoned under ground and strip mines has polluted nearby streams. For ex ample, water in Brush and Little Cherry Creeks sometimes has pH values of less than 4.0 as a result of dishcarges from under ground mines (Bevans and Diaz, 1980). The average concen tration of sulfate in area streams is related to the percentage of the basin that has been strip mined (Bevans, 1982). There also is the potential for localized pollution of aquifers by seepage of water from the abandoned mines. The Kansas Mined-Land Conservation and Reclamation Board has prepared a plan to address these problems.
Flooding C,
Flood-plain areas adjacent to the principal streams and rivers in Kansas are subject to occasional flooding that results in property damage and occasional loss of life. About 52 percent of the communities and 62 percent of the counties in Kansas have been designated as having flood-prone areas, as defined by the Federal Flood Insurance Program.
Erosion and sedimentation G.
Streambank erosion is a concern along reaches of several rivers, especially the Kansas and Nemaha. Sediment yields of streams generally increase from west to east across the State. Investigations have determined that annual sediment yields range from less than 100 tons per square mile in semiarid southwestern Kansas to more than 5,000 tons per square mile in humid northeastern Kansas (Holland, 1971; Osterkamp, 1977; Bevans, 1982). Streambank erosion is a concern along the Kansas and Nemaha Rivers, especially downstream from large reservoirs, in reaches where the channels have been straightened, and where sand is mined from the river channel.
INSTITUTIONAL AND MANAGEMENT ISSUESTreaties and compacts Di
Alleged violations of provisions in the Arkansas River Com pact of 1948 (Colorado and Kansas) have caused a dispute between the two States regarding the quantity of river flow to be delivered to Kansas. The Kansas Legislature has provided funds for a legal and technical evaluation of hydrologic and water-management factors that may affect the flow of the river at the State line.
Water allocation D,
The State has undertaken a major planning effort to for mulate a policy-oriented State Water Plan. Among key issues to be addressed by the planning effort are water supply, water quality, minimum streamflows, management of reservoirs and ground water, flood prevention, conservation, and financing future water-development projects.
Financing the infrastructure D,
The State has approved a pricing schedule for the sale of State-owned water that is stored in federally built reservoirs. Part of the funds received from the sale of this water will accumulate in a fund to be used for future water-supply development.
River-system management D,
Plans for upstream uses of Missouri River water, such as the sale of water from Lake Ohae in South Dakota for use in a coal-slurry pipeline in Wyoming, as well as other proposed uses in upper basin States (Colorado, Montana, North Dakota, South Dakota, and Wyoming), are of concern to some water users in Kansas because of possible impacts on the tradi tional and potential uses of the river.
REFERENCESBarker, R. A., Dunlap, L. E., and Sauer, C. A., 1981, Analysis and
computer simulation of stream-aquifer hydrology, Arkansas River valley, southwestern Kansas: U.S. Geological Survey Open-File Report 81-686, 130 p.
Bevans, H. E., 1982, A procedure for predicting concentrations of dissolved solids and sulfate ion in streams draining areas strip mined for coal: U.S. Geological Survey Water-Resources Investi gations Open-File Report 80-764, 22 p.
____1982, Water-quality and fluvial-sediment characteristics of selected streams in northeast Kansas: U.S. Geological Survey Water-Resources Investigations 82-4005, 53 p.
Bevans, H. E., and Diaz, A. M., 1980, Statistical summaries of water-quality data for streams draining coal-mined areas, southeastern Kansas: U.S. Geological Survey Open-File Report 80-350, 42 p.
Gillespie, J. B., and Hargadine, G. D., 1981, Saline ground-water discharge to the Smoky Hill River between Salina and Abilene, central Kansas: U.S. Geological Survey Water-Resources Investi gations 81-43, 71 p.
Holland, D. D., 1971, Sediment yields from small drainage areas in Kansas: Kansas Water Resources Board Bulletin 16, 26 p.
Leonard, R. B., and Kleinschmidt, M. K., 1976, Saline water in the Little Arkansas River basin area, south-central Kansas: Kansas Geological Survey Chemical Quality Series 3, 24 p.
Luckey, R. R., Gutentag, E. D., and Weeks, J. B., 1981, Water-level and saturated-thickness changes, predevelopment to 1980, in the High Plains aquifer in parts of Colorado, Kansas, Nebraska, New Mexico, Oklahoma, South Dakota, Texas, and Wyoming: U.S. Geological Survey Hydrologic Investigations Atlas HA-652.
Osterkamp, W. R., 1977, Fluvial sediment in the Arkansas River basin, Kansas: Kansas Water Resources Board Bulletin 19, 91 p.
Solley, W. B., Chase, E. B., and Mann, W. B., IV, 1983, Estimated use of water in the United States in 1980: U.S. Geological Survey Circular 1001, 56 p.
U.S. Environmental Protection Agency, Amendment to National Oil and Hazardous Substance Contingency Plan; the National Priori ties List: Federal Register, v. 47, no. 251, December 30, 1982, p. 58476-58485.

Kansas 131
40°'
50 100 MILES_J
50 100 KILOMETERS
EXPLANATIONWater issues are descibed in text. Color identifies type of issue. Letter and number identify specific issue described in text.
WATER AVAILABILITY ISSUES
!%/%! AI Ground water
WATER-QUALITY ISSUES
A B-| Surtace water Nonpoint sources of pollution
62 Surface water-Saline-water intrusion
B 3 Surface and ground water Hazardous-waste sites
B4 Ground water-Saline-water intrusion
HYDRDLOGIC HAZARDS AND LAND-USE ISSUES
|gb^ C 1 Resource development Lead-zinc mining
I' " !"'| C2 Resource development Coal mining
INSTITUTIONAL AND MANAGEMENT ISSUES
A D 1 Treaties and compacts
SUMMARY OF WATER USE IN KANSAS, IN MILLION GALLONS
[Data rounded to two significant figures and may not add to totals because of Source: Solley, Chase, and Mann, 1983]
PER DAY, 1980
ndependem rounding.
Withdrawals
Use
Off stream use:
Rural domestic and livestock .
Self-supplied industrial: Thermoelectric power use . Other industrial uses . .
Total ..........
Instream use:
Ground water
Fresh Saline
140 .... 93 ....
5,200 ....
46 .... 140 0
5,600 0
570
Surface water
Fresh Saline
1 50 .... 50 ....
440 ....
300 0 41 0
980 0
Total fresh water
290 140
5,600
350 180
6,600
Consump tive use,
fresh water
83 140
4,300
39 66
4.700
132 National Water Summary 1983
KENTUCKY WATER ISSUESAs identified by the Kentucky District Office of the U.S.
Geological Survey in consultation with State officials
Precipitation in Kentucky ranges from about 40 inches per year at the northern tip of the State to about 52 inches in the south-central and southeastern parts. This precipitation, although abundant, is unevenly distributed during the year, and generally is deficient during late summer and fall when de mand for water is highest. Large areas of the State depend on surface-water supplies because of small yields from aquifers. In some of the more densely populated drainage basins, the dis charge of streams is not sufficient to meet water requirements under low-flow and drought conditions. Compounding this shortage are the degradation of water quality by coal mining, extraction of industrial minerals, and point and nonpoint pollution. In other drainage basins where surface water vir tually is the only source of supply, people face water shortages during periods of deficient precipitation.
Major water issues are summarized by category below. The letters and numerical subscripts identify issues shown on the map; an asterisk instead of a numerical subscript indicates that the issue is not shown on the map.
WATER-AVAILABILITY ISSUESSurface water Ai
In some drainage basins, people depend on surface-water supplies because ground-water supplies are small. During droughts, however, surface-water supplies also may be in adequate. For example, the cities of Lexington and Frankfort, as well as 14 other cities, use the Kentucky River as their main source of supply; Lexington and Frankfort alone, use about 33.4 and 6.4 million gallons of water per day, respectively. During droughts, such as in 1930, this total of 39.8 million gallons of water per day is about equal to the entire flow of the Kentucky River at Frankfort. The U.S. Army Corps of En gineers (1978, p. 61) estimated that if the drought of 1930 were repeated, the level of the Kentucky River would fall below the primary water intake for Lexington.
WATER-QUALITY ISSUESGround water Radioactive-waste site Bi
Low-level radioactive wastes were buried at Maxey Flats from 1963 to 1977 (Zehner, 1983). Hydrogeologic studies of the site indicate radioactive isotopes may be in ground water beneath the site. Wells will be constructed on the perimeter of the site to monitor possible off-site movement of the radioactive isotopes in the ground-water system.
Surface water Point and nonpoint sources of pollution B.
Kentucky's 305 (b) report to Congress (Kentucky Depart ment of Natural Resources and Environmental Protection, 1982) identified four major activities as adversely affecting water quality. The four are surface coal mining, oil and gas operations, agriculture, and domestic-waste discharges. This reinforces the conclusions from the 1980 305 (b) report (Ken tucky Department of Natural Resources and Environmental Protection, 1980) which identified several statewide water- quality issues that need action, including agricultural practices that result in excessive erosion and sedimentation in streams and lakes, the largely unknown extent of urban runoff and its effects on stream quality and point-source discharges that con tinue to add suspended and dissolved solids and bacterial pollutants to streams.
Ground water Viruses B.
Public health is threatened by use of polluted water from some springs and wells throughout the State. For example, in Georgetown in June 1980, spring water became polluted with gastroenteritis and hepatitis viruses (Hejkel and others, 1982).
In 1982, Buttermilk Falls Spring, a local source of drinking water in Meade County, was found to contain hepatitis virus. Ground water in karst areas, which represent approximately one-third of the State, may become polluted by onsite waste disposal systems, agricultural and industrial operations, and improper disposal of wastes in sinkholes and other openings. Also, some towns in these karst areas discharge effluents from sewage-treatment plants through wells into the ground-water system.
Ground water Landfills B.
Local ground-water pollution by leachate from landfills is a statewide concern, but is especially so in urban areas such as Louisville. In the 1980 305 (b) report, Kentucky reported to Congress, "Sources of data to determine the quality of Ken tucky's ground water remain sparse. Other problem areas, such as the monitoring of leachate from old landfills, remain unaddressed." The importance of ground water is demon strated by the fact that one-third of all Kentuckians depend on ground water as their only source of drinking water.
Ground water Hazardous-waste sites B,
There is statewide concern about hazardous-waste sites because many are believed to have been developed and oper ated without enforcement of design, placement, and operation standards. Some of these, such as the Valley of the Drums and Distlers Farm in the Louisville area, have received national at tention and have been included along with five other sites in the State in the U.S. Environmental Protection Agency's Na tional Priorities List (1982) of hazardous-waste sites.
Acidic precipitation B.
Kentucky is concerned about acid precipitation. Sparse data indicate that precipitation with pH values ranging from 4.0 to 5.0 falls in Kentucky. Much more information is needed to determine the extent of acid precipitation, its sources, and the effect on Kentucky's numerous lakes, reservoirs, and streams. A monitoring network is being implemented by the State to operate in conjunction with the network being planned by the National Atmospheric Deposition Program.
HYDROLOGIC HAZARDS AND LAND-USE ISSUESSinkholes C,
Sinkholes are present in the Mississippian Plateau and Bluegrass Region. Sinkhole formation occurs naturally but can be accelerated by ground-water withdrawals or by other man- induced changes in the position of the water table.
Rising ground-water levels C2
Rising ground-water levels in the Louisville area were a ma jor concern because of possible structural damage to buildings and utilities and flooding of basements especially during the 1970's (Kernodle and Whitesides, 1977). Water levels appear to have stabilized from 1979 to 1982 when precipitation was less than normal, but there is concern about a resumption of the rising water levels if precipitation should be greater than average for an extended period.
Resource development Mineral production Cs
Water pollution has occurred as a result of mineral produc tion (Collier and others, 1964; 1970; Dyer, 1983; Grubb and Ryder, 1972; Hopkins, 1963; Kiesler and others, 1983; Krieger, 1983; Krieger and Hendrickson, 1960; Leist and others, 1982; Musser, 1963; Quinones and others, 1981, 1983). Coal mining and oil and gas production occur in both the Eastern and Western Coal Fields of Kentucky, and oil and gas production occurs in the Mississippian Plateau region. Coal mining generally increases concentrations of sulfate, iron, sediment, and other constituents, and decreases the pH in streams. Unplugged oil test holes and waste water from enhanced oil production generally increase the sodium and

Kentucky 133
50-l ' I
50 100 KILOMETERS
100 MILESI
£»7 F?\. ><, r-71*^'6~w.e-r ~ !V»'. y^a^%X%£ ^Ho^nW ; J^S^^ft^ ^HEN| ^ ^y' ^^^^
T^lvl^^^o^K^k'/^^:S^f -/"""^^^fe^-OwAvVrr-^j__ I f \J -. ; f,-M\,n i StoftAii&.Y' 1MO*J*iC!E:__^\r i /CLINTO*/
LZjS8" T ^"""~"^^"~jr"-
Bluegrass Region
Misslsaipplan Plateau
Western Coal Field
Mississippian Plateau (Oil and Gas)
Eastern Coal Field
EXPLANATIONWater issues are described in text. Color identifies type of issue. Letter and number identify specific issue described in text.
WATER AVAILABILITY ISSUES
|^/^ A 1 Surface water
WATER QUALITY ISSUES
B 1 Ground water-Radloactlve-waste site
HYDROLOGIC HAZARDS AND LAND USE ISSUES
(! ' j C 1 Sinkholes (see small map)
[!'" j C2 Rising ground-water levels
I ; | 63 Resource development-Mineral production (see small map)
SUMMARY OF WATER USE IN KENTUCKY, IN MILLION GALLONS PER DAY, 1980
[Data rounded to two significant figures and may not add to totals because of independent rounding. Source: Solley. Chaie, and Mann, 1983]
Withdrawals
Use
Offitream uie:
Rural domeitic and livestock .
Self-supplied industrial: Thermoelectric power use . Other industrial uses ....
Total .........
Instream use: Hydroelectric power .
Ground water
Freih Saline
47 ... 56 ... 0.2
15 .... 130 0
250 0
98,000
Surface water
Freeh Saline
310 43
4.7
4,000 0 190 0
4,600 0
Total
water
350 99
4.9
4,100 320
4,800
Coniump- tive use,
fresh water
23 87
4.9
140 33
290

134 National Water Summary 1983
chloride concentrations in streams, and, if not controlled, these concentrations can destroy most stream life, as has happened in Blaine Creek in eastern Kentucky.
Flooding C.
Flooding is a recurring problem along many streams in Ken tucky. Major floods occur more frequently from November to May; however, flash floods can occur at any time. People tend to live along flood plains, especially in the coal fields, because that is the only level or nearly level land available. Population centers also are located along the flood plains of the Ohio River and its tributaries because of the level fertile land. As a result, many people are forced to abandon their homes during floods. In addition to mainstem flooding, flash floods occur in stream headwaters, in karst areas due to ponding of sinkholes, and in urban areas, due to inadequate storm sewers.
Landslides C *
Landslides can occur throughout the State. Road cuts in unstable material (mainly shale and clay) and the undercutting of unconsolidated material by streamflow can cause landslides when the overlying material becomes saturated. Mine-tailings piles also can move down steep slopes (as mudflows) when the material becomes saturated, and these flows have damaged or destroyed homes and communities in valleys.
REFERENCESCollier, C. R., and others, 1964, Influences of strip mining on the
hydrologic environment of parts of Beaver Creek basin, Kentucky, 1955-59: U.S. Geological Survey Professional Paper 427-B, 85 p.
Collier, C. R., Pickering, R. J., and Musser, J. J., 1970, Influences of strip mining on the hydrologic environment of parts of Beaver Creek basin, Kentucky, 1955-66: U.S. Geological Survey Profes sional Paper 427-C, 80 p.
Dyer, K. L., 1983, Effects on water quality of coal mining in the basin of the North Fork Kentucky River, eastern Kentucky: U.S. Geo logical Survey Water-Resources Investigations Open-File Report 81-215, 55 p.
Grubb, H. F., and Ryder, P. D., 1972, Effects of coal mining on the water resources of the Tradewater River basin, Kentucky: U.S. Geological Survey Water-Supply Paper 1940, 83 p.
Hejkal, T. W., and others, 1982, Viruses in a community water sup ply associated with an outbreak of gastroenteritis and infectious hepatitis: Journal of the American Water Works Association, v. 74, no. 6, p. 310-321.
Hopkins, H. T., 1963, The effect of oilfield brines on the potable ground water in the upper Big Pitman Creek basin, Kentucky:
Kentucky Geological Survey, Series 10, Report of Investigations 4, 36 p.
Kentucky Department for Natural Resources and Environmental Protection, Division of Water (Quality), 1980, Kentucky report to Congress on water quality: Frankfort, Ky., 91 p.
Kentucky Department of Natural Resources and Environmental Pro tection, Division of Water (Quality), 1982, Kentucky report to Congress on water quality: Frankfort, Ky., 189 p.
Kernodle, J. M., and Whitesides, D. V., 1977, Rising ground-water level in downtown Louisville, Kentucky, 1972-1977: U.S. Geological Survey Water-Resources Investigations 77-92, 24 p.
Kiesler, J. L., and others, 1983, Hydrology of Area 13, Eastern Coal Province, Kentucky, Virginia and West Virginia: U.S. Geological Survey Water-Resources Investigations Open-File Report 82-505,72 P-
Krieger, R. A., ed., 1983, Influences of strip mining on thehydrologic environment of parts of Beaver Creek basin, Kentucky 1973-74: U.S. Geological Survey Professional Paper 427-D, 60 p.
Krieger, R. A., and Hendrickson, G. E., 1960, Effects of Greensburg oilfield brines on the streams, wells, and springs of the upper Green River basin, Kentucky: Kentucky Geological Survey, Series 10, Report of Investigation 2, 36 p.
Leist, D. W., Quinones, Ferdinand, Mull, D. S., and Young, M., 1982, Hydrology of Area 15, Eastern Coal Province, Kentucky and Tennessee: U.S. Geological Survey Water-Resources Investiga tions Open-File Report 81-809, 81 p.
Musser, J. J., 1963, Description of physical environment and of strip mining operations in parts of Beaver Creek basin, Kentucky: U.S. Geological Survey Professional Paper 427-A, 78 p.
Quinones, Ferdinand; Mull, D. S.; York, K.; andKendall, V.; 1981, Hydrology of Area 14, Eastern Coal Province, Kentucky: U.S. Geological Survey Water-Resources Investigations Open-File Report 81-137, 82 p.
Quinones, Ferdinand; York, K. L.; and Plebuch, R. O.; 1983, Hydrology of Area 34, Interior Coal Province, Eastern Region, Kentucky and Indiana: U.S. Geological Survey Water-Resources Investigations Open-File Report 82-638, 73 p.
Solley, W. B., Chase, E. B., and Mann, W. B., IV, 1983, Estimated use of water in the United States in 1980: U.S. Geological Survey Circular 1001, 56 p.
Sullavan, J. N., Ouinones, Ferdinand, and Flint, R. F., 1979, Flood of December 19/8 in Kentucky: U.S. Geological Survey Open-File Report 79-977, 53 p. >>
U.S. Army Corps of Engineers, 1978, Special report on water supply alternatives to Red River Lake: v. 1, 135 p.
U.S. Environmental Protection Agency, 1982, Amendment to National Oil and Hazardous Substance Contingency Plan; the Na tional Priorities List: Federal Register, v. 47, no. 251, December 30, 1982, p. 58476-58485.
Zehner, H. H., 1983, Hydrogeologic investigations of the Maxey Flats radioactive waste burial site, Fleming County, Kentucky: U.S. Geological Survey Open-File Report 83-133, 148 p.
Louisiana 135
LOUISIANA WATER ISSUESAs identified by the Louisiana District Office of the U.S.
Geological Survey in consultation with State officials
Louisiana is located along the terminal reach of the Mississippi River. The southern one-third of the State contains many coastal marshes, streams, and lakes. The State has a humid subtropical climate with an annual average precipita tion of 57 inches; extended droughts are unusual. The surface- water resources of the State, coupled with the ground-water resources in a number of productive aquifer systems, result in a generally abundant water supply. Abundant water and other natural resources have brought many industries and businesses to the State, with accompanying increases in population. Notable among the industrializing and urbanizing areas are the Mississippi River corridor from Baton Rouge to the Gulf of Mexico, the Calcasieu River near Lake Charles, and the Ouachita River near Monroe. Nonindustrial activities also are dependent on the water resources. For example, irrigation for the rice crop in southwestern Louisiana uses about 2.5 times as much water as is used for public supplies throughout the State (Walter, 1982).
Major water issues are summarized by category below. The letters and numerical subscripts identify issues shown on the map; an asterisk instead of of a numerical subscript indicates that the issue is not shown on the map.
WATER-AVAILABILITY ISSUESGround water AI
Pumpage from several of the major aquifers in the State has caused declines in water levels ranging from 180 feet in wells completed in the Chicot aquifer to 430 feet in wells completed in the "2,000-foot" sand at Baton Rouge. The Chicot aquifer in southwestern Louisiana is a major source of water for irriga tion in the rice-growing area and for the the municipal- industrial complex in the Lake Charles area. The aquifers of Miocene and Pliocene age in central Louisiana are a major source of water for municipal and industrial use in the Alex andria area (Rogers, 1981). The Sparta aquifer in northern Louisiana, is a major source of water for municipal and in dustrial use in Ruston, Bastrop, Jonesboro-Hodge, and the Monroe area and in adjacent areas in Arkansas. The water levels in aquifers of Miocene-Pleistocene age in the Baton Rouge area continue to decline (Torak and Whiteman, 1982). Water levels in individual aquifers have stabilized because of changes in water management in recent years, but local and regional declines continue in several major aquifers.
Surface water A.
Low flows in several major streams, including the Red and Ouachita Rivers, and in numerous tributary streams, are inadequate to meet instream uses such as waste assimilation and navigation. Deficient low flows in streams near Monroe and Shreveport restrict surface-water availability for irrigation, industry, and public supply.
WATER-QUALITY ISSUESSurface water Point and nonpoint sources of pollution Bi
Point sources of surface-water pollution in Louisiana are sewage-treatment plants in and near major urban centers, such as New Orleans and Lafayette, industrial plants, such as pulp and paper mills and petrochemical manufacturers, and ac cidental spills of oil and industrial organic compounds in the Mississippi River. Runoff from agricultural land causes diffuse pollution by pesticides and sediment, especially in northeastern Louisiana. Lake Pontchartrain and oxbow lakes adjacent to the Mississippi River are polluted by runoff from agricultural and urban areas, and rates of eutrophication in these lakes are accelerating. The Red (Martien, 1978), Ouachita, Calcasieu,
and Pearl Rivers occasionally have deficient dissolved-oxygen concentrations because of organic material discharged into them.
Surface water Saline-water intrusion 82
During low streamflow, saline water from the Gulf of Mex ico intrudes into coastal streams. The Mississippi River, the principal source of drinking water along its downstream reach, especially is affected (Wells, 1980).
Ground water Hazardous-waste sites and landfills B3
Pollution of local ground water by leachates from hazardous- waste sites and landfills is of great concern in Louisiana. Even though most aquifers are generally thought to be protected by clay layers, there is evidence of waste movement and possible pollution of some aquifers. Four hazardous-waste sites in Loui siana have been included in the U.S. Environmental Protec tion Agency's National Priorities List (1982). An area of par ticular concern is the industrial corridor along the Mississippi River where hazardous wastes stored in open pits may pollute the local ground water.
Ground water -Radioactive wastes (potential) B 4
The U.S. Department of Energy is studying the feasibility of a mined repository in the Vacnerie salt dome in Bienville Parish for the storage of high-level radioactive wastes (Office of Nuclear Waste Isolation, 1982). Local citizens are opposed because of a possible accident or oversight that could pollute the ground-water system, especially the Sparta aquifer, a major source of drinking water. Planned onsite storage of low- level radioactive wastes at nuclear powerplants in West Feli- ciana and St. Charles Parishes also is opposed.
Ground water Saline-water intrusion B.
Saline-water intrusion induced by ground-water withdrawals may adversely affect local ground-water quality in southern Louisiana. Saline water is moving landward or up ward in the Chicot aquifer of southwestern Louisiana, and, in the Baton Rouge area, saline water is moving across geologic barriers (faults) toward municipal wells (Whiteman, 1979). Use of the Gonzales-New Orleans aquifer at New Orleans is limited because of the potential for saline-water intrusion; the aquifer, however, is considered an emergency source of water (using industrial wells) when the Mississippi River is too polluted to be used for municipal supplies (Dial, 1983).
HYDROLOGIC HAZARDS AND UNO-USE ISSUESResource development Lignite mining Ci
Lignite resources in DeSoto and Red River Parishes are be ing considered for surface mining (Snider, 1982). Mining will alter drainage patterns, will affect the ground-water flow systems in the Red River and Wilcox aquifers, and may cause sedimentation and water pollution.
Flooding C.
Flooding is a serious threat in Louisiana because of the large annual precipitation and extensive lowlands (Neely, 1976). Nearly all parishes are affected by floods caused by local heavy rains, and many lowland areas are subject to backwater (flooding). In recent years, floods have occurred along all major streams and many tributaries. Flood damage has been extensive in urban areas, including New Orleans, Baton Rouge, Slidell, Monroe, and Alexandria.
Erosion and sedimentation Coastal zone C.
Louisiana is losing land along the coastal zone because of uneven sediment distribution, land subsidence, and an in creased rate of erosion. The construction of levees, canals, and other structures that control surface-water flows have significantly changed sedimentation patterns along the coast. Longshore currents and major storms are eroding the coast

136 National Water Summary 1983
and transporting sediment into the Gulf of Mexico. The coastline of Louisiana is eroding at a rate of 40 square miles per year (Duffey, 1983). The changes in shoreline affect the determination of oil and gas revenues, alter marshes and other habitats, and affect commercial and sport fisheres. Each year, the Mississippi River conveys large quantities of runoff and an average of 210 million tons of sediment from the mid- continent area through Louisiana to the Gulf of Mexico. Deposition of some of this sediment in the Mississippi River Delta creates hazards for navigation and necessitates repeated dredging by the U.S. Army Corps of Engineers.
INSTITUTIONAL AND MANAGEMENT ISSUESRiver-system management Di
Much of southern Louisiana consists of wetlands. Land use in the Atchafalaya River basin, one of the key wetlands of the United States, has resulted in controversy. Among the issues of concern are preservation of the wetlands, converting the wetlands to farm land, public versus private use of lands, and diverting flood flows from the Mississippi River through the basin to the Gulf of Mexico. The hydrology of the basin is com plex and is compounded by increases in sediment deposition (Wells and Demas, 1977). In Atchafalaya Bay, at the mouth of the basin, delta formation has progressed at a rapid rate and is transforming an open bay into an area of low islands and mudflats.
Locks and dams Da
The U.S. Army Corps of Engineers is constructing locks and dams along the Red River to provide navigation from the mouth upstream to Shreveport. Operation of this system will raise ground-water levels in parts of the Red River Valley (Ludwig and Terry, 1980). Locally, agricultural and urban areas may experience some rise in ground-water levels.
Treaties and compacts D*
The Sabine River Compact of 1953 (Louisiana and Texas) provides for the equitable apportionment of surface water along the Sabine River, which is the boundary between Loui siana and Texas. Of special concern is the problem of main taining high water levels in Toledo Bend Reservoir for recrea tion while providing water for hydroelectric power and flood control in downstream areas. The Red River Compact of 1980 (Arkansas, Louisiana, Oklahoma, and Texas) provides for the equitable distribution of water in the Red River basin. During low flows, irrigation and waste-assimilation requirements are critical, and chloride concentrations are of concern.
REFERENCESDial, D. C., 1983, Ground-water data for the Mississippi River
parishes in the greater New Orleans area, Louisiana: Louisiana Department of Transportation and Development, Office of Public Works Basic Records Report 11, 47 p.
Duffey, McFadden, 1983, Crisis on the coast A task force reacts: Louisiana Conservationist, v. 35, no. 2, p. 4-11.
Ludwig, A. H., and Terry, J. E., 1980, Methods and applications of digital-model simulation of the Red River alluvial aquifer, Shreveport to the mouth of the Black River, Louisiana: U.S. Geological Survey Water-Resources Investigations 79-114, 103 p.
Martien, R. F., 1978, Water-quality characteristics of the Red River in Louisiana: Louisiana Department of Transportation and Development, Office of Public Works Water Resources Technical Report 16, 32 p.
Neely, B. L., Jr., [1976], Floods in Louisiana, magnitude and fre quency (3d ed.): Louisiana Department Highways, 340 p.
Office of Nuclear Waste Isolation, 1982, Introduction, in Gulf coast salt domes geologic area characterization report: Marietta, Ga., Law Engineering Testing Company, Technical Report, July 1982, OWNI-117, v. 1,256 p.
Rogers, J. E., 1981, Water resources of the Kisatchie well-field area near Alexandria, Louisiana: Louisiana Department of Transporta tion and Development, Office of Public Works Water Resources Technical Report 26, 57 p.
Snider, J. L., 1982, Premining hydrology of the lignite area in southeastern De Soto Parish, Louisiana: Louisiana Department of Transportation and Development, Office of Public Works Water Resources Technical Report 29, 40 p.
Solley, W. B., Chase, E. B., and Mann, W. B., IV, 1983, Estimated use of water in the United States in 1980: U.S. Geological Survey Circular 1001, 56 p.
Torak, L. J., and Whiteman, C. D., Jr., 1982, Applications of digital modeling for evaluating the ground-water resources of the "2,000-ft" sand of the Baton Rouge area, Louisiana: Louisiana Department of Transportation and Development, Office of Public Works Water Resources Technical Report 27, 87 p.
U. S. Environmental Protection Agency, 1982, Amendment to Na tional Oil and Hazardous Substance Contingency Plan; the Na tional Priorities List: Federal Register, v. 47, no. 251, December 30, 1982, p. 58476-58485.
Walter, W. H., 1982, Pumpage of water in Louisiana, 1980: Loui siana Department of Transportation and Development, Office of Public Works Special Report 3, 15 p.
Wells, F. C., 1980, Hydrology and water quality of the lower Mississippi River: Louisiana Department of Transportation and Development, Office of Public Works Water Resources Technical Report 21,83 p.
Wells, F. C., and Demas, C. R., 1977, Hydrology and water quality of the Atchafalaya River basin: Louisiana Department of Trans portation and Development, Office of Public Works Water Resources Technical Report 14, 53 p.
Whiteman, C. D., Jr., 1979, Saltwater encroachment in the "600-foot" and "1,500-foot" sands of the Baton Rouge area, Louisiana, 1966-78, including a discussion of saltwater in other sands: Louisiana Department of Transportation and Development, Office of Public Works Water Resources Technical Report 19, 49 p.

Louisiana 137
33e- EXPLANATIONWater issues are described in text. Color identifies type of issue Letter and number identify specific issue described in text.
WATER-AVAILABILITY ISSUES
Kftft\ A! Ground water
WATER-QUALITY ISSUES
Surface water Point and nonpoint sources of pollution
82 Surface water Saline water intrusion
83 Ground water Hazardous-waste sites and landfills
B 84 Ground water-Radioactive wastes (potential)
HYDROLOGIC HAZARDS AND LAND-USE ISSUES
C i Resources development Lignite mining
INSTITUTIONAL AND MANAGEMENT ISSUES
DI River-system management
02 Locks and dams
SUMMARY OF WATER USE IN LOUISIANA, IN MILLION GALLONS PER DAY, 1980
[Data rounded to two significant figures and may not add to totals because of independent rounding. Source: Solley, Chase, and Mann, 1983]
Withdrawals
Use
Off stream use:
Rural domestic and livestock . .
Self-supplied industrial: Thermoelectric power use . .
Total ..........
Instream use:
Ground water
Fresh Saline
270 .... 67 ....
990 ....
46 .... 390 19
1,800 19
1,400
Surface water
Fresh Saline
340 .... 5.2 ....
1 ,300 ....
5,800 180 3,100 210
1 1 .000 390
Total fresh water
610 72
2,200
5,900 3,500
1 2,000
Consump tive use,
fresh water
350 57
1,600
320 550
1 2,900
1 Corrected.
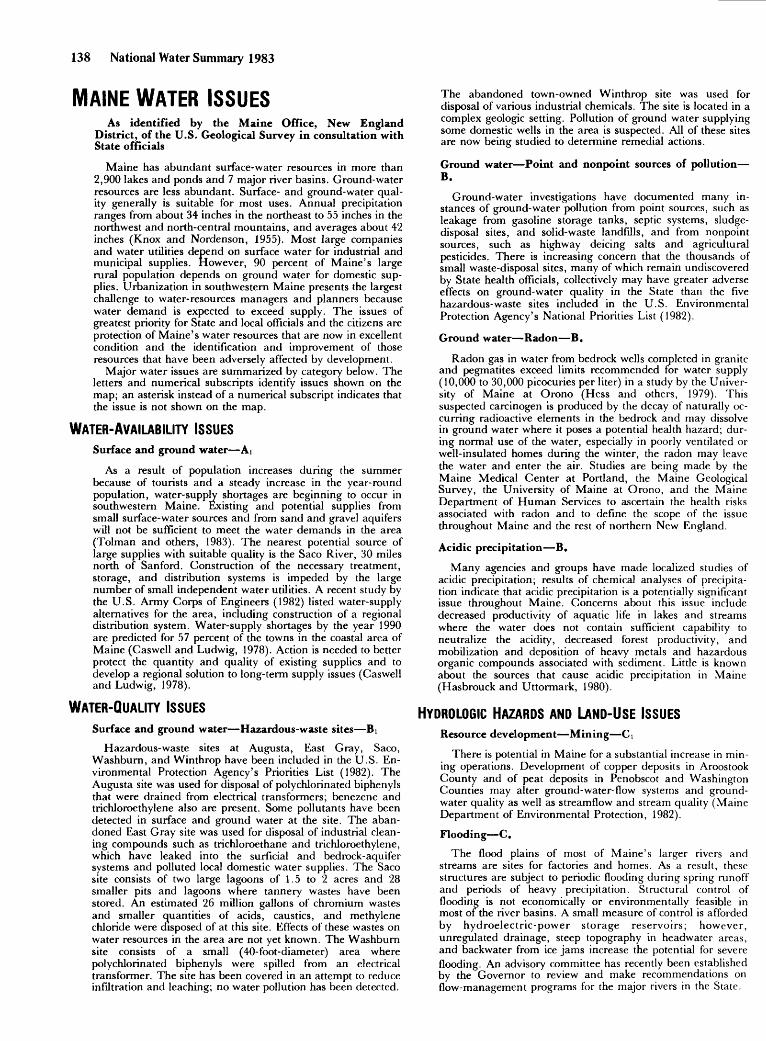
138 National Water Summary 1983
MAINE WATER ISSUESAs identified by the Maine Office, New England
District, of the U.S. Geological Survey in consultation with State officials
Maine has abundant surface-water resources in more than 2,900 lakes and ponds and 7 major river basins. Ground-water resources are less abundant. Surface- and ground-water qual ity generally is suitable for most uses. Annual precipitation ranges from about 34 inches in the northeast to 55 inches in the northwest and north-central mountains, and averages about 42 inches (Knox and Nordenson, 1955). Most large companies and water utilities depend on surface water for industrial and municipal supplies. However, 90 percent of Maine's large rural population depends on ground water for domestic sup plies. Urbanization in southwestern Maine presents the largest challenge to water-resources managers and planners because water demand is expected to exceed supply. The issues of greatest priority for State and local officials and the citizens are protection of Maine's water resources that are now in excellent condition and the identification and improvement of those resources that have been adversely affected by development.
Major water issues are summarized by category below. The letters and numerical subscripts identify issues shown on the map; an asterisk instead of a numerical subscript indicates that the issue is not shown on the map.
WATER-AVAILABILITY ISSUESSurface and ground water Ai
As a result of population increases during the summer because of tourists and a steady increase in the year-round population, water-supply shortages are beginning to occur in southwestern Maine. Existing and potential supplies from small surface-water sources and from sand and gravel aquifers will not be sufficient to meet the water demands in the area (Tolman and others, 1983). The nearest potential source of large supplies with suitable quality is the Saco River, 30 miles north of Sanford. Construction of the necessary treatment, storage, and distribution systems is impeded by the large number of small independent water utilities. A recent study by the U.S. Army Corps of Engineers (1982) listed water-supply alternatives for the area, including construction of a regional distribution system. Water-supply shortages by the year 1990 are predicted for 57 percent of the towns in the coastal area of Maine (Caswell and Ludwig, 1978). Action is needed to better protect the quantity and quality of existing supplies and to develop a regional solution to long-term supply issues (Caswell and Ludwig, 1978).
WATER-QUALITY ISSUESSurface and ground water Hazardous-waste sites Bi
Hazardous-waste sites at Augusta, East Gray, Saco, Washburn, and Winthrop have been included in the U.S. En vironmental Protection Agency's Priorities List (1982). The Augusta site was used for disposal of polychlorinated biphenyls that were drained from electrical transformers; benezene and trichloroethylene also are present. Some pollutants have been detected in surface and ground water at the site. The aban doned East Gray site was used for disposal of industrial clean ing compounds such as trichloroethane and trichloroethylene, which have leaked into the surficial and bedrock-aquifer systems and polluted local domestic water supplies. The Saco site consists of two large lagoons of 1.5 to 2 acres and 28 smaller pits and lagoons where tannery wastes have been stored. An estimated 26 million gallons of chromium wastes and smaller quantities of acids, caustics, and methylene chloride were disposed of at this site. Effects of these wastes on water resources in the area are not yet known. The Washburn site consists of a small (40-foot-diameter) area where polychlorinated biphenyls were spilled from an electrical transformer. The site has been covered in an attempt to reduce infiltration and leaching; no water pollution has been detected.
The abandoned town-owned Winthrop site was used for disposal of various industrial chemicals. The site is located in a complex geologic setting. Pollution of ground water supplying some domestic wells in the area is suspected. All of these sites are now being studied to determine remedial actions.
Ground water Point and nonpoint sources of pollution B.
Ground-water investigations have documented many in stances of ground-water pollution from point sources, such as leakage from gasoline storage tanks, septic systems, sludge- disposal sites, and solid-waste landfills, and from nonpoint sources, such as highway deicing salts and agricultural pesticides. There is increasing concern that the thousands of small waste-disposal sites, many of which remain undiscovered by State health officials, collectively may have greater adverse effects on ground-water quality in the State than the five hazardous-waste sites included in the U.S. Environmental Protection Agency's National Priorities List (1982).
Ground water Radon B.
Radon gas in water from bedrock wells completed in granite and pegmatites exceed limits recommended for water supply (10,000 to 30,000 picocuries per liter) in a study by the Univer sity of Maine at Orono (Hess and others, 1979). This suspected carcinogen is produced by the decay of naturally oc curring radioactive elements in the bedrock and may dissolve in ground water where it poses a potential health hazard; dur ing normal use of the water, especially in poorly ventilated or well-insulated homes during the winter, the radon may leave the water and enter the air. Studies are being made by the Maine Medical Center at Portland, the Maine Geological Survey, the University of Maine at Orono, and the Maine Department of Human Services to ascertain the health risks associated with radon and to define the scope of the issue throughout Maine and the rest of northern New England.
Acidic precipitation B.
Many agencies and groups have made localized studies of acidic precipitation; results of chemical analyses of precipita tion indicate that acidic precipitation is a potentially significant issue throughout Maine. Concerns about this issue include decreased productivity of aquatic life in lakes and streams where the water does not contain sufficient capability to neutralize the acidity, decreased forest productivity, and mobilization and deposition of heavy metals and hazardous organic compounds associated with sediment. Little is known about the sources that cause acidic precipitation in Maine (Hasbrouck and Uttormark, 1980).
HYDROLOGIC HAZARDS AND LAND-USE ISSUESResource development Mining d
There is potential in Maine for a substantial increase in min ing operations. Development of copper deposits in Aroostook County and of peat deposits in Penobscot and Washington Counties may alter ground-water-flow systems and ground- water quality as well as streamflow and stream quality (Maine Department of Environmental Protection, 1982).
Flooding C.
The flood plains of most of Maine's larger rivers and streams are sites for factories and homes. As a result, these structures are subject to periodic flooding during spring runoff and periods of heavy precipitation. Structural control of flooding is not economically or environmentally feasible in most of the river basins. A small measure of control is afforded by hydroelectric-power storage reservoirs; however, unregulated drainage, steep topography in headwater areas, and backwater from ice jams increase the potential for severe flooding. An advisory committee has recently been established by the Governor to review and make recommendations on flow-management programs for the major rivers in the State.

Maine 139
Xf \ 7 - ) ^ JJ'O.'LfrA -.
A^^^>^ \4r-> > ) ^-^fUsiCf r% ^1 /W -4>^X V/ 1\i
EXPLANATIONt>s arc described in text. Color identifies type of issue.
Letter and number identify specific issue described in text.
WATER-AVAILABILITY ISSUES
[ [ A-| Surface and ground water
WATER QUALITY ISSUES
0 61 Surface and ground water Hazardous waste sites
HYDROLOGIC HAZARDS AND LAND USE ISSUES
O GI Resource development-Mining
100 MILESI
100 KILOMETERS
SUMMARY OF WATER USE IN MAINE. IN MILLION GALLONS PER DAY, 1980
[Data rounded to two significant figures and may not add to totals because of independent roqnding. Source: Solley, Chase, and Mann, 1983]
Withdrawels
Use
Off stream use:
Rurel domestic and livestock .
Self -supplied industrial: Thermoelectric power use .
Instream use:
Ground water
Fresh Saline
20 .... 27 .... 0.2 ...
1 .0 .... 33 0
80 0
75,000
Surface water
Fresh Saline
85 ... 1 .2 ... 5.9 ...
55 700 620 11
770 710
Total fresh water
100 28
6.1
56 650
850
Consump tive use,
fresh water
10 28
5.8
0 8.9
53

140 National Water Summary 1983
Erosion and sedimentation C*
On the basis of current farming practices, the estimated soil- loss rate from Maine's cropland is about 6 tons per acre per year twice the "tolerable" rate reported by the U.S. Soil Conservation Service (1978). In addition, timber-harvesting operations may result in significant transport and deposition of sediment in lakes and streams. Erosion and sedimentation is a statewide issue because forestry operations affect most of the State and agricultural operations affect the remainder (Maine Department of Environmental Protection, 1982; Hasbrouck and Uttormark, 1980).
Resource development Hydroelectric power C.
Improved water quality in most rivers has resulted in in creased recreational use, reestablishment of Atlantic salmon and other anadromous fish, and renewed interest in commer cial uses of the rivers. There also is considerable interest in developing hydroelectric-power facilities on rivers with dams, with the result that conflicts between recreational use and hydroelectric-power development of rivers are increasing. More than 500 dams have been identified in Ma'ne for poten tial rehabilitation and use in generating hydroelectric power. Another important consideration is that the Federal Energy Regulatory Commission, by means of the Public Utility Regulatory Policies Act of 1978 (Public Law 95-617), makes hydroelectric-power development attractive by providing sub sidies and tax credits to developers, as well as providing the power of eminent domain.
INSTITUTIONAL AND MANAGEMENT SITES
Water laws D.
The Maine Legislature is now developing laws to improve the classification and protection of ground-water resources. This process is extremely difficult because little detailed infor
mation is available about ground-water quality or the location and extent of the State's most significant ground-water reser voirs. Studies are now in progress to provide this data (Maine Groundwater Protection Commission, 1981).
REFERENCESCaswell, W. B., and Ludwig, S., 1978, Maine coastal area water sup
ply and demand: Maine Geological Survey and State Planning Office, 244 p.
Hasbrouck, S., and Uttormark, P. D., 1980, Water resource needs for Maine: University of Maine at Orono, Land and Water Resources Center, 24 p.
Hess, C. T., and others, 1979, Radon-222 in potable water supplies in Maine The geology, hydrology, physics and health effects: University of Maine at Orono, Land and Water Resources Center, 119 p.
Knox, C. E., and Nordenson, T. J., 1955, Average annual runoff and precipitation in the New England-New York area: U.S. Geological Survey Hydrologic Investigations Atlas HA-7, 6 sheets.
Maine Department of Environmental Protection, 1982, State of Maine water quality management plan: Augusta, 116 p.
Maine Groundwater Protection Commission, 1981, Recommenda tions of the Groundwater Protection Commission A report to the Maine Legislature: Augusta, 34 p.
Solley, W. B., Chase, E. B., and Mann, W. B., IV, 1983, Estimated use of water in the United States in 1980: U.S. Geological Survey Circular 1001, 56 p.
Tolman, A. L., Tepper, D. H., Prescott, G. C. Jr., and Gammon, S. O., 1983, Hydrogeology of significant sand and gravel aquifers Northern York and southern Cumberland Counties, Maine: Maine Geological Survey, 4 sheet plates.
U.S. Army Corps of Engineers, 1982, Water supply study Saco and southern Maine coastal river basins: Waltham, Mass., 64 p.
U.S. Environmental Protection Agency, 1982, Amendment to National Oil and Hazardous Substance Contingency Plan; the Na tional Priorities List: Federal Register, v. 47, no. 251, December 30, 1982, p. 58476-58485.
U.S. Soil Conservation Service, 1978, Maine Study of non-point agricultural pollution: Washington, D.C., U.S. Department of Agriculture, 13 maps.

Maryland and District of Columbia 141
MARYLAND AND DISTRICT OF COLUMBIA WATER ISSUES
As identified by the Maryland Office, Mid-Atlantic District, of the U.S. Geological Survey in consultation with State and District of Columbia officials
The hydrogeologic setting of Maryland includes five physiographic provinces the Coastal Plain, the Piedmont, the Blue Ridge, the Valley and Ridge, and the Appalachian Plateau. Maryland's average precipitation is about 42 inches per year. Almost all streams in the State, including the two ma jor rivers the Potomac and Susquehanna drain into the Chesapeake Bay. The major water-supply source in the Coastal Plain is ground water, whereas the major supply source elsewhere is surface water. Maryland has more than 600 public water-supply systems. Of these, 64 are operated by private investor-owned companies; the rest are publically owned (Pieper, 1981). As a result of the severe drought of the 1960's, the Baltimore, Md., and Washington, D.C., metro politan areas have taken action to increase their water supplies. Baltimore has constructed a pipeline to the Susquehanna River upstream from Conowingo Dam for a supplemental water sup ply. The major water suppliers in the Washington, D.C., area negotiated a formal cooperative agreement in 1982 to share available water resources. Completion of Bloomington Reser voir and the pending construction of Little Seneca Reservoir will increase the available water supplies in the Washington, B.C., area.
Major issues are summarized by category below. The letters and numerical subscripts identify issues shown on the map; an asterisk instead of a numerical subscript indicates that the issue is not shown on the map.
WATER-AVAILABILITY ISSUESGround water At
Ground-water levels have declined in parts of Charles and Prince Georges Counties in southern Maryland as a result of increased pumpage from the Magothy aquifer. Water-level declines are as much as 85 feet in the Waldorf area where ground water is being pumped at the rate of 2 million gallons per day. Total pumpage from the aquifer in southern Mary land has increased from 0.45 million gallons per day during 1962 to 3 3 million gallons per day during 1980 (Mack and others, 1982). The projected increased water demand in Charles County may surpass the ability of the Magothy aquifer to supply the necessary water, and this concern has led to a search for supplemental supplies.
WATER-QUALITY ISSUESSurface water Point and nonpoint sources of pollution B,
Nutrients, heavy metals, sediment, and other pollutants from point and nonpoint sources may be entering, and accumulating in, the tidal parts of rivers important to Mary land's shellfish and fishing industries. Of particular concern are the potential adverse effects of these pollutants on shellfish production, nuisance algae blooms, and dissolved-oxygen deficits. The State's Nutrient Control Strategy for the Patux- ent River basin, issued in 1982, sets limits for maximum nitrogen and phosphorus releases by sewage-treatment plants, advocates land treatment of sewage effluent, and establishes work groups for the control of nonpoint (mostly agricultural) sources (Smeyne, 1983). A comprehensive point-source control program has resulted in measurable improvements in water quality in the upper Potomac River Estuary (U.S. General Accounting Office, 1982). A study has found a decrease in chlorophyll a concentrations of as much as 150 micrograms per liter between 1977 and 1981 (Callender and others, 1983). Dissolved-oxygen concentrations in the area downstream of
the major sewage-treatment plant in Washington, D.C., in creased by about 1 milligram per liter between the summers of 1980 and 1981 due to a new nitrification procedure at the plant. Furthermore, the study found that, although the waters of the tidal Potomac River are still nutrient enriched, sub merged aquatic vegetation is beginning to reappear in the tidal tributaries and along the main stem in the transition zone be tween the tidal river and estuary. The incorporation of effec tive treatment technology for municipal point-source discharges now has focused attention on nonpoint sources, benthic recycling, and runoff from upland areas as remaining controllable sources of nutrients to the tidal part of the river and estuary.
There is concern that the Anacostia River is receiving ex cessive numbers of fecal coliform bacteria from overflows of the city's combined storm and sanitary sewers, and excessive con centrations of sediment from nonpoint sources upstream. Rock Creek is a primary contributor of fecal coliform bacteria and storm-sewer discharge to the Potomac River Estuary. Reaches of Rock Creek, like other metropolitan streams, are unfit for wading or swimming (District of Columbia Department of En vironmental Services, 1980).
Surface water Chesapeake Bay B2Nutrient enrichment, the presence of hazardous substances,
and a decrease of submerged aquatic vegetation are the prin cipal water-quality issues in the Chesapeake Bay, the largest estuary in the United States. The upper bay, middle bay, and several major tributaries are severely or moderately nutrient enriched, compared to historic conditions (U.S. Environ mental Protection Agency, 1982a). Agricultural cropland is the predominant source of nutrient enrichment particularly of nitrogen. In general, most of the heavy metals are transported to the bay by the Susquehanna and Potomac Rivers in Mary land and the James River in Virginia, according to data from stations on the Fall Line. Other sources of heavy metals down stream from these stations include industrial and municipal discharges, runoff from urban areas, and sediment eroded from stream banks. These three rivers collectively contribute about 80 percent of the flow to the bay and also contribute 53 percent of the chromium, 59 percent of the copper, 77 percent of the iron, 43 percent of the lead, and 50 percent of the zinc. Industry is the major source of cadmium, accounting for 66 percent of the contribution from all sources (U.S. Environ mental Protection Agency, 1982a). Submerged aquatic vegeta tion is vitally important in the bay because of its value as a food source for waterfowl, habitat and nursery areas for many com mercially important fish, a control for shoreline erosion, and a mechanism for buffering the adverse effects of excessive nutrient concentrations. Major decreases in aquatic vegetation during the 1960's and 1970's were largely the result of in creases in nutrients, turbidity, and chlorophyll a concentra tions in the upper bay and in major tributaries during the same period. The water-quality issues in Chesapeake Bay were the focus of a 5-year study by the U.S. Environmental Protection Agency (1982a). State and Federal agencies are now develop ing a management program for the bay on the basis of the study results.
Ground water Hazardous-waste sites and landfills 83
There is concern that ground water in many parts of the State is being polluted locally by municipal and industrial waste-disposal sites. For example, measured concentrations of chromium have exceeded 0.35 milligram per liter of hexavalent chromium and 1.00 milligram per liter of total chromium in ground water adjacent to the Hawkins Point Landfill in Baltimore the designated State hazardous-waste disposal site. Land disposal of paint sludge and leakage from storage con tainers of liquids containing chromium has produced a 4,000-foot plume of chromium-polluted ground water at Hagerstown in Washington County (Metcalf and Eddy, 1982). In addition, three sites in Maryland at Cumberland (Allegheny County), near Annapolis (Anne Arundel County), and near Elkton (Cecil County) have been included in the U.S.

142 National Water Summary 1983
Environmental Protection Agency's National Priorities List (1982b) of hazardous-waste sites. Chromium wastes have been identified at the Cumberland site, paints and solvents at the Annapolis site, and industrial processing water and sludge at the Eikton site. Although the State has completed remedial actions at some landfills, potential pollution of ground water by landfills and other sources is of concern, especially in the Coastal Plain, where the sediments are very permeable and pollutants can disperse rapidly and widely in ground water.
Ground water Nitrate B4
A shallow aquifer, which underlies parts of the Delmarva Peninsula, is used extensively for domestic drinking-water supply and irrigation and other agricultural uses. Nitrate con centrations in water from parts of this aquifer exceed the drinking-water standard of 10 milligrams per liter as nitrogen (U.S. Environmental Protection Agency, 1976). Suspected sources of nitrate include septic systems, fertilizers, and animal wastes. In some places, health officials have required the aban donment of shallow wells and the drilling of deeper wells, which are sealed off from the nitrate-enriched water. Health of ficials also are requiring treatment of domestic supplies that contain nitrate in excess of the drinking-water standard (Amendment to Regulation 10.17.13 of the Maryland State Code of Regulations). In addition to the potential loss of the shallow aquifer as a drinking-water source in some areas, there is a possibility that nitrate-enriched water in the shallow aquifer may move into deeper aquifers.
Acidic precipitation B5
There is concern that surface- and ground-water resources, aquatic life, forests, and farmland in parts of Maryland may be adversely affected by acid precipitation because rocks and soils in many areas of the State have negligible capacity to neutralize the acidity. Precipitation in Maryland has a pH of about 4.0 (Munger and Eisenreich, 1983). Studies of precipita tion in parts of western Maryland during 1980 and 1981 in dicated pH values in the range of 4.0 to 5.0 (Peters and Bonelli, 1982; Scott and others, 1982); during the same period, pH values as low as 3.8 were measured during a study in Baltimore (S. R. Martin, Director, Baltimore Regional Plan ning Council, oral commun., 1983). During 1982, the pH of precipitation in central Maryland was about 4 (Katz and Bricker, 1983).
HYDROLOGIC HAZARDS AND LAND-USE ISSUESErosion and sedimentation Coastal zone Ci
Seasonal storms cause severe beach erosion on the barrier islands off the coast of Maryland. Restoring beaches after such storms is a costly and persistent issue for the Ocean City resort area. Hundreds of miles of Chesapeake Bay shoreline consists of easily eroded sediments. For example, in Talbot County, more than 42 miles of shoreline have been identified as critical areas because of erosion rates that exceed 4 feet per year (Maryland Department of Natural Resources, 1983).
Resource development Coal mining 2
Runoff from strip mines, which is the predominant type of coal mining in westernmost Maryland, commonly increases acidity and iron, manganese, sulfate, and sediment concentra tions in local streamflow. As a result, more than 140 miles of streams that receive mine runoff are devoid of fish and benthic invertebrates (Staubitz and Sobashinski, 1983).
INSTITUTIONAL AND MANAGEMENT ISSUESWater laws D.
Maryland recently passed legislation requiring that storm- water management practices be implemented for all new
residential, commercial, industrial, and institutional land developments throughout the State. Provisions of the new law encourage new subdivisions to forego concrete curbs, street gutters, and storm drains in favor of vegetation, infiltration sites, and other measures that would enable storm runoff to soak into the ground.
River-system management D,
Developing and implementing a plan to resolve the water- quality issue of Chesapeake Bay will require the cooperation of Maryland, Pennsylvania, and Virginia, whose governors plan to meet and develop a strategy for regional management of the bay.
REFERENCES
Callender, Edward, Carter, Virginia, Hahl, D. C., and Hitt, Kerie, eds., 1983, A water-quality study of the tidal Potomac River Estuary An overview: U.S. Geological Survey Water-Supply Paper 2233. [in press]
District of Columbia Department of Environmental Services, 1980, 1980 water quality and pollution control status report: Washing ton, D.C., 42 p.
Katz, B. G., and Bricker, O. P., 1983, Water-quality effect of acid precipitation on a forested watershed, Catoctin Mountains, central Maryland: American Chemical Society, Environmental Chemistry Division, 186th Annual Meeting, Washington, D.C., August 28-September 2, 1983, Abstracts of Meeting, v. 23, no. 2. [in press]
Mack, F. K., Wheeler, J. C., and Curtin, S. E., 1982, Water-level declines in the Magothy aquifer in southern Maryland related to increases in pumpage: U.S. Geological Survey Open-File Report 82-919, 44 p.
Maryland Department of Natural Resources, 1983, Coast and bay bylines: Coastal Zone Management Publication, March, 5 p.
Metcalf and Eddy, 1982, Closure report for rehabilitation of the Hot Fire Pit Disposal Site at the Hagerstown facility for Fairchild Republic Company, Hagerstown, Maryland: Consultants report to Fairchild Republic Co., 30 p.
Munger, W. J., and Eisenreich, S. J., 1983, Continental-scale varia tions in precipitation chemistry: Environmental Science and Technology, v. 17, no. 1, p. 32A-42A.
Peters, N. E., and Bonelli,}. E., 1982, Chemical composition of bulk precipitation in the north-central and northeastern United States, December 1980 through February 1981: U.S. Geological Survey Circular 874, 63 p.
Pieper, C. B., 1981, Response plan for drought and other water shortage emergencies: Maryland Water Resources Administration planning document, 17 p.
Scott, H., Campbell, S., and Giuliano, M., 1982, An assessment c the chemical composition of rain and surface water samples col lected at Deep Creek Lake, Garrett County, Maryland: Baltimore, Martin Marietta Corp., Environmental Center Document PPSP-MP-39, 74 p.
Smeyne, Linda, ed., 1983, Progress continues on Patuxent strategy: OE Press, Maryland Department of Health and Mental Hygiene, Office of Environmental Programs, v. 1, no. 1, 8 p.
Solley, W. B., Chase, E. B., and Mann, W. B., IV, 1983, Estimated use of water in the United States in 1980: U.S. Geological Survey Circular 1001, 56 p.
Staubitz, W. W., and Sobashinski, J. R., 1983, Hydrology of area 6, eastern coal province, Maryland, West Virginia, and Pennsyl vania: U.S. Geological Survey Water-Resources Investigations Open-File Report 83-0033. [in press]
U.S. Environmental Protection Agency, 1976, National interim primary drinking water regulations: Office of Water Supply EPA-570/9-76-003, 159 p.
1982a, Chesapeake Bay Program technical studies A syn thesis: Washington, D.C., 635 p.
1982b, Amendment to National Oil and Hazardous SubstanceContingency Plan; the National Priorities List: Federal Register v. 47, no. 251, December 30, 1982, p. 58476-58485.
U.S. General Accounting Office, 1982, Environmental, economic, and political issues impede Potomac River clean-up efforts' GGD-82-7, 159 p.

Maryland and District of Columbia 143
EXPLANATIONWater issues are described in text. Color identifies type of issue Letter and number identify specific issue described in text.
WATER AVAILABILITY ISSUES
I | A-j Ground water
WATER QUALITY ISSUES
{$$$$$$] B-j Surface water Point and nonpoint sources of pollution
^^^1 62 Surface water Chesapeake Bay (see small map)
63 Ground water-Hazardous-waste sites and landfills
64 Ground water Nitrate
I 65 Acidic precipitation
HYDROLOGIC HAZARDS AND LAND-USE ISSUES
r~~] C-) Erosion and sedimentation-Coastal zone
|l| .il'i'l Q Resource development Coal miningZ
SUMMARY OF WATER USE IN MARYLAND, IN MILLION GALLONS PER DAY. 1980
1 D;it;i rounded to two significant figures and may not add to totals because of independent roundmg. Source Solley. Chase, and Mann, 19831
Withdrawals
Use
()flstii!am usePuhlic supplyRural domestic jnd livestockIrrigationSelf supplied industrial
Thermoelectric power useOther industrial uses , . .
Total
instream use
Ground water
Fresh Saline
485910
3.034 0
150 0
15.000
Surface water
Fresh Saline
440 ...0.59.4
400 6.1001 20 500
970 6.600
Total
water
4906020
410150
1.100
Consumptive use.
freshwater
244319
2.015
100
SUMMARY OF WATER USE IN WASHINGTON. D.C.. IN MILLION GALLONS PER DAY, 1980
[Data rounded to two significant figures and may not add to totals because of independent founding. Source: Solley, Chase, and Mann, 19831
Use
Offstream use:
Rural domestic and livestock .
Self-supplied industrial: Thermoelectric power use . Other industrial uses ...
Total .........
Instream use:
Withdrawals
Ground water Surface water
Fresh
0 0 0
0 0.8
0.8
8.0
Saline Fresh Saline
210 .... 0 ....
. 0 ....
0 130 0 0 0.6 0
0 340 0
Total
water
210 0 0
130 1.4
340
Consump tive use,
fresh water
210 0
2.0 .3
23

144 National Water Summary 1983
MASSACHUSETTS WATER ISSUESAs identified by the Massachusetts Office, New England
District, of the U.S. Geological Survey in consultation with State officials
Average precipitation in Massachusetts is about 44 inches per year. During 1980, two-thirds of the Massachusetts' residents (total population about 6 million) obtained their water supply from surface-water sources and one-third from ground water. Also in 1980, an estimated 292 billion gallons were provided by 295 public supplies and 68 private water companies. A reservoir and aqueduct system can transfer about 300 million gallons per day from central Massachusetts to serve the eastern urban and industrial areas where demand is greatest (Massachusetts Water Resources Commission, 1983). In response to water shortages caused by pollution of ground-water supplies, the State Legislature enacted legisla tion for ground-water studies and for other projects relating to water conservation, water-pollution control, polluted-aquifer rehabilitation, aquifer and watershed acquisition, and drinking-water treatment.
Major water issues are summarized by category below. The letters and numerical subscripts identify issues shown on the map; an asterisk instead of a numerical subscript indicates that the issue is not shown on the map.
WATER-AVAILABILITY ISSUESGround water AI
Withdrawal of ground water for public supply may lower water levels in the many cranberry-producing bogs and recrea tional ponds in Barnstable County and southern Plymouth County (Frimpter, 1973b). Cranberry growers are concerned that withdrawals might interfere with bog irrigation and flood management. Another concern is the possible adverse effects of lowered water levels in recreational ponds on swimming, boating, esthetic qualities, and ecology.
Surface and ground water A,
During a recent extended dry period during October 1981, 38 towns declared water emergencies, 23 towns voluntarily im posed water-use restrictions, and 11 towns were identified as having potential water-supply problems (Elizabeth Kline, Massachusetts Executive Office of Environmental Affairs, oral commun., 1983). Beyond the Boston Metropolitan District Commission service area, individual towns are responsible for their own water supplies. Within the Commission's service area, member communities purchase water but retain the responsibility for managing their supplies. In the past, com munities that joined the Metropolitan District Commission were required by law to abandon their local sources, but recent changes in legislation encourage and obligate members to maintain their local sources. Water shortages appear to be partly related to the pattern of water distribution and to the design of the supply systems. The water-supply infrastructure serving eastern Massachusetts would be severely stressed by a drought comparable to that of the mid-1960's.
WATER-QUALITY ISSUESSurface water Municipal sewage BI
A municipal sewage-treatment facility at Webster in southern Worcester County does not provide adequate treat ment for discharges into the French River to meet Massachusetts Division of Water Pollution Control (1978) Class B water-quality standards (New England River Basins Commission, 1979). The river does not meet Massachusetts Division of Water Pollution Control (1978) Class C standards for dissolved oxygen, fecal coliform bacteria, suspended solids, nitrogen, and phosphorus. Low-flow augmentation has been proposed to meet dilution needs of the sewage-treatment plant at Webster.
Surface and ground water Hazardous-waste sites 82
Massachusetts has 14 hazardous-waste sites included in the U.S. Environmental Protection Agency's National Priorities List (1982). Efforts to establish a disposal facility for hazardous chemical or low-level radioactive wastes within the State have been halted because of citizen opposition to the proposed loca tions for the facility. In 1981, water from 25 public-supply wells providing 23 million gallons per day was polluted by hazardous substances, primarily the synthetic solvent trichloroethylene (Special Legislative Commission on Water Supply, 1981). Bedford (Middlesex County) was prohibited from using 80 percent of its water supply because of the presence of trichloroethylene and dioxane in water from four wells located near an industrial park (Special Legislative Com mission on Water Supply, 1981). In Westford (Middlesex County) and in other communities, tetrachloroethylene was determined to be entering the water supply from the vinyl lin ing of asbestos-cement pipe used in the distribution systems. The pipes had been lined with vinyl to prevent corrosion of the pipe and release of asbestos. An industrial park included in the National Priorities List is the probable source of a variety of organic chemicals polluting water in wells supplying 40 percent of Acton's water supply (Middlesex County). In Woburn (Middlesex County), two public-supply wells near another hazardous-waste site included in the National Priorities List have been abandoned because of ground-water pollution by chloroform and trichloroethylene. Pollution and loss of 23 million gallons per day of public supply in eastern Massachu setts have resulted in unplanned stresses on community water supplies and on the Boston Metropolitan District Commission's supply system.
Surface and ground water Highway deicing salts 83
Storage and application of highway deicing salts have polluted many surface- and ground-water supplies. The city of Cambridge (near Boston) reported sodium concentrations of as much as 50 milligrams per liter in reservoirs adjoining major highways (Special Legislative Commission on Water Supply, 1981). Public-supply wells in Auburn (Worcester County), Weston (Middlesex County), and Yarmouth (Barnstable County) have been abandoned. Massachusetts is testing special highway-drainage systems designed to minimize pollu tion of ground water by highway deicing salts.
Ground water Point sources of pollution B4
There is considerable concern that the sole-source aquifer on Cape Cod (Ryan, 1980) and the aquifers on the islands of Nan- tucket and Martha's Vineyard may become polluted by the leachate from solid-waste disposal sites (landfills and dumps) and from liquid-waste disposal sites (lagoons and septic systems). Disposal of sewage in lagoons has polluted ground water in Falmouth on Cape Coa (LeBlanc, 1982), and a public-supply well in Falmouth has been taken out of service because of detergents in the water. In other locations, nitrate- nitrogen from domestic septic systems is present in ground water in concentrations exceeding the U.S. Environmental Protection Agency's (1976) standard for drinking water of 10 milligrams per liter as nitrogen (Cape Cod Planning and Economic Development Commission, written commun., 1983.)
Ground water Saline-water intrusion B5
Fresh-water aquifers in four coastal counties (Barnstable, Dukes, Essex, and Plymouth) have been affected by saline- water intrusion. Ground-water withdrawals have caused in land movement or upconing of saline water into public and private water supplies, especially near the tip of Cape Cod where concentrations of sodium in the Provincetown public supply increased from less than 40 to about 80 milligrams per liter during 1982 (Paul Daley, Superintendent, Provincetown Water Department, oral commun., 1983). Saline-water intru sion near Provincetown has been exacerbated by pollution of a

Massachusetts 145
CAPE COD
''Monomoy island
EXPLANATION
WATER-AVAILABILITY ISSUES
p^^^] A1 Ground water
WATER-QUALITY ISSUES
£ Bi Surface water-Municipal sewage
0 62 Surface and ground water Hazardous waste sites
m 63 Surface and ground water Highway deicing salts
64 Ground water Point sources of pollution (see small map)
65 Ground water-Saline-water intrusion
INSTITUTIONAL AND MANAGEMENT ISSUES
Interbasin transfers (see small map)
SUMMARY OF WATER USE IN MASSACHUSETTS, IN MILLION GALLONS PER DAY. 1980
[Data rounded to two significant figures and may not add to totals because of independent roundinySource: Solley, Chase, and Mann. 1983 1
Use
Offstream use
Rural domestic and livestock .Irrigation .... .......Self-supplied industrial
Thermoelectric power useOther industrial uses
Total . . .....
Instream use
Ground watei
Fresh Saline
19032
5.4
093 0
320 0
25.000
Withdrawals
Suiface water
Fresh Saline
6100.5
14
1.300 3.400220 64
2,100 3,500
Total
water
8003319
1,300310
2.500
Consumplive use,
freshwatei
415.1
19
025
90

146 National Water Summary 1983
well field by a leaking gasoline storage tank, which forced increased pumping of other wells and resulted in a gradual in crease of salt in the municipal water supply (Special Legislative Commission on Water Supply, 1981).
Bottom sediments B,
Polychlorinated biphenyls discharged by industry into the harbor, local waterways, and sewage plants in and near the city of New Bedford have resulted in the accumulation of large concentrations of the hazardous chemical in the sediments and bottom-dwelling organisms in the harbor. There is concern that storms may transport these sediments into the adjacent, biologically productive Buzzards Bay (Starr, 1982). The con tent of polychlorinated biphenyls in fish from the Housatonic River has exceeded the limit of 5 parts per million for edible flesh of fish set by the U.S. Food and Drug Administration (1973^, and the chemical has been reported in the sediments of Woods Pond (Berkshire County), about 10 miles downstream from the source of the chemical in Pittsfield (Frink and others, 1982). Analyses indicate that concentrations in streambed sediments are high and vary considerably from place to place. These bottom sediments were suspected to be a potential source of polychlorinated biphenyls in ground water adjacent to the river. However, chemical data indicate that the polychlorinated biphenyls are not entering ground water from Woods Pond even though discharging wells induce infiltration from the pond (F. B. Gay, U.S. Geological Survey, written commun., 1982).
Acidic precipitation B,
Ketde-hole ponds, lakes, and reservoirs in eastern and cen tral Massachusetts are susceptible to die effects of acidic precipitation (Fielding, 1982). Except in Berkshire County in western Massachusetts, rocks and soils contain few carbonate minerals and, dierefore, have litde ability to neutralize acidity (Hendrey and odiers, 1980). Crushed limestone has been added to some acidic ponds to make diem capable of sustaining stocked fish. Acidic ground- and surface-water supplies are treated widi sodium hydroxide to decrease corrosion and dissolution of lead and copper from water pipes (Taylor and Symons, 1983) and to decrease corrosion and release of asbestos from asbestos-cement pipe (Special Legislative Com- mision on Water Supply, 1981). An apparent decrease of alkalinity in die Quabbin Reservoir, which provides much of the water supply for the Boston Metropolitan District Commis sion, may be caused partly by acidic precipitation. Dissolution of lead from pipes in older sections of Boston and Cambridge by water from Quabbin Reservoir has been corrected by treat ment of die water in the system.
HYDROLOGIC HAZARDS AND LAND-USE ISSUESRising ground-water levels G*
Shallow ground-water levels are a major cause of septic- system failure (Frimpter, 1980). Homes built during a drought may later be susceptible to failing septic systems and flooded basements as water levels rise. About 100,000 of the 600,000 septic systems in new and older homes in die State have failed, many because of rising ground-water levels. In East Bridge- water (Plymoudi County) and Norton (Bristol County), base ments have flooded and sewage has backed up into new homes because of rising ground-water levels.
INSTITUTIONAL AND MANAGEMENT ISSUESInterbasin transfers Di
Boston obtains much of its water supply from interbasin transfers dirough a system of reservoirs and aqueducts. In re cent years, the actual quantity of water delivered has exceeded die rated capacity (300 million gallons per day) of die metro politan district system by as much as 20 million gallons per day. In accordance with State water policy, new surface-water diversions for supplemental supply cannot be developed until
all water-management alternatives are evaluated and local resources are fully developed (Massachusetts Executive Office of Environmental Affairs, 1978).
Water laws D.
In 1982, die State Legislature enacted comprehensive legislation for projects related to water conservation, water- pollution control, polluted-aquifer rehabilitation, aquifer and watershed acquisition, and drinking-water treatment; $357.5 million was appropriated to fund these projects. Preemptive land use has been recognized as a cause of the elimination of potential well sites for public supply. The aquifer-acquisition section of the legislation passed in 1982 designated $10 million for the purchase of lands to protect recharge areas for public- supply wells. In 1983, legislation was introduced that addresses die interdependency of ground and surface water, establishes a mechanism for registering withdrawals, and authorizes alloca tion of water resources to achieve a balance between competing water uses.
River-system management D.
There are concerns about water-quantity and water-quality issues in eastern Massachusetts because of increasing ur banization and pollution of some water supplies. For example, in the Charles River basin, more than 25 percent of the flow in die Charles River is diverted outside of the basin, and much of die ground water withdrawn also is discharged out of the basin through sewers. Because of concerns about streamflow deple tion caused by ground-water withdrawals, with attendant loss of the aquatic environment for fish and the degradation of water quality, plans to develop more wells for public supply in the Charles River basin have been suspended (Frimpter, 1973a). All water supplies in the Taunton River basin are dependent on an interconnected network of streams and aquifers. Increased competition for either surface or ground water will affect the water supplies throughout the basin.
REFERENCESFielding, Kevin, 1982, Preserving the quality of our water A critical
crossroad for Cape Cod: Cape Cod Life, p. 83-88. Frimpter, M. H., 1973a, Ground-water management, Charles River
basin: U.S. Geological Survey Open-File Report, 36 p. ____1973b, Ground-water management, south shore coastal
streams: U.S. Geological Survey Open-File Report, 33 p..1980, Probable high ground-water levels in Massachusetts:
U.S. Geological Survey Water-Resources Investigations 80-1205, 19 p.
Frink, C. R., Sawhney, B. L., Kulp, K. P., and Fredette, C. G., 1982, Polychlorinated biphenyls in Housatonic River sediments in Massachusetts and Connecticut Determination, distribution, and transport: Connecticut Agricultural Experiment Station Bulletin 800, 20 p.
Hendrey, G. R., Galloway, J. N., Norton, S. A., and Schofield, C. L., 1980, Geological and hydrochemical sensitivity of the east ern United States to acid precipitation: U.S. Environmental Pro tection Agency report EPA-600/3-80-024, 100 p.
LeBlanc, D. R., 1982, Sewage plume in a sand and gravel aquifer, Cape Cod, Massachusetts: U.S. Geological Survey Open-File Report 82-274, 35 p.
Massachusetts Division of Water Pollution Control, 1978, Massachusetts surface-water quality standards: Boston, Regulation No. 314, CMR 4.00, 89 p.
Massachusetts Executive Office of Environmental Affairs, 1978, Massachusetts water supply policy statement: Boston, 353 p.
Massachusetts Water Resources Commission, 1983, Massachusetts water supply systems Source of supply, safe yield, type of supply, proposed sources: Boston, 47 p.
New England River Basins Commission, 1979, Thames River over view: Boston, 138 p., 2 appendices.
Ryan, B. J., 1980, Cape Cod aquifer, Cape Cod, Massachusetts: U.S. Geological Survey Water-Resources Investigations 80-571, 23 p.
Solley, W. B. Chase, E. B., and Mann, W. B., IV, 1983, Estimated use of water in the United States in 1980: U.S. Geological Survey Circular 1001,56 p.
Special Legislative Commission on Water Supply, 1981, Water qual ity issues in Massachusetts chemical contamination Second work ing paper of the Special Legislative Commission on Water Supply: Boston, 88 p.

Massachusetts 147
Starr, D., 1982, Toxic PCB's taint the future of a struggling NewEngland port: Audubon Magazine, v. 84, no. 5, p. 108-110.
Taylor, F. B., and Symons, G. E., 1983, Acid rain update: NewEngland Water Works Association Journal, v. 97, no. 1,p. 26-42.014.
U.S. Environmental Protection Agency, 1976, National interimprimary drinking water regulations: Office of Water Supply,EPA-570/9-76-003, 159 p.
____1982, Amendment to National Oil and Hazardous SubstanceContingency Plan; the National Priorities List: Federal Register, v.47, no. 251, December 30, 1982, p. 58476-58485.
U.S. Food and Drug Administration, 1973, Limits of PCB's in foods,etc., Aug. 8, Corrections: Federal Register, v. 38, July 6, 1973,p. 18096-18103.

148 National Water Summary 1983
MICHIGAN WATER ISSUESAs identified by the Michigan District Office of the U.S.
Geological Survey in consultation with State officials
Michigan is a land of abundant freshwater. The State has 3,000 miles of shoreline along the Great Lakes and 11,000 in land lakes with a total area of 1,150 square miles. The State is drained by hundreds of perennial streams and is underlain in many places by very productive aquifers. Continued increases in industrial and agricultural uses of water and a significant in crease in tourism are resulting in ever-increasing demands on the State's water resources and concerns about waste disposal and water supply. Polluted ground water, resulting from past disposal practices, has become a prime concern (Michigan Department of Natural Resources, 1982b). In some areas, municipalities, industries, and irrigators with large production wells compete for the available ground water with homeowners with shallow wells.
Major water issues are summarized by category below. The letters and numerical subscripts identify issues shown on the map; an asterisk instead of a numerical subscript indicates that the issue is not shown on the map.
WATER-AVAILABILITY ISSUESGround water Ai
In the western part of the upper peninsula, where ground water is used extensively, many domestic and municipal wells dry up or yield insufficient quantities of water to meet demands during prolonged droughts because relatively impermeable bedrock is near the surface and overlying permeable glacial deposits are thin. During the 1976-77 drought, records com piled by the Michigan Department of Public Health indicated that 2,000 to 3,000 wells became dry or nearly so. Counties with the greatest proportion of such wells were Delta, Mar- quette, Houghton, Menominee, Iron, Gogebic, and Ontona- gon. The Great Lakes could provide water for all the communities, but the cost of transporting this water to serve a sparsely populated region is prohibitive.
Surface and ground water A.
From 1970 to 1977, the total quantity of irrigation water withdrawn from surface- and ground-water sources in Mich igan more than doubled (Bedell and Van Til, 1979). The number of acres irrigated increased from 14,000 in 1951 to 400,000 in 1980 (Vincent Bralts, Professor of Agricultural Engineering, Michigan State University, oral commun., June 1983). In about 70 percent of the State's counties, the increase in irrigation is expected to continue. According to the Mich igan Department of Natural Resources, depletion of water supplies caused by irrigation withdrawals is most serious in 26 counties in Michigan's lower peninsula; an estimated 75 percent of the water problems caused by irrigation involve surface-water withdrawals, and 25 percent involve ground- water withdrawals.
WATER-QUALITY ISSUESSurface water Hazardous waste Bi
Recent hazardous-wastes studies have indicated that some of Michigan's streams and lakes and their associated bottom sediments have been polluted to varying degrees by polychlori- nated biphenyls, polybrominated biphenyls, DDT, dioxin, and mercury. The Michigan Department of Public Health has issued health warnings about fish consumption for Lake Michigan, Lake Superior, Lake Huron, Lake St. Clair, Detroit River, St. Clair River, and the western edge of Lake Erie. Bans on fish consumption are in effect for Deer Lake, Carp River, Carp Creek, Titabawassee River, Saginaw River, Pine River, Chippewa River, River Raisin, Portage Creek, Shiawassee River, and Cass River. Bans on consumption of specific species of fish have been issued for parts of the Grand,
Hersey, St. Joseph, and Kalamazoo Rivers and for Lake Macatawa.
Surface water Point and nonpoint sources of pollution B.
Although point-source controls, the ban of phosphorus in detergents, and the upgrading of municipal waste-water- treatment facilities have significantly decreased nutrient discharges to streams, nonpoint sources of pollution continue to be of concern, particularly in the southern one-half of the lower peninsula. Runoff from agricultural lands may be a ma jor cause of large nutrient concentrations in streams in the Saginaw River basin and in several streams in southwestern Michigan. There is concern that overflows of combined storm and sanitary sewers and runoff from urban areas may cause severe pollution in the southeastern part of the State, par ticularly in the Clinton, Detroit, and St. Clair River basins.
Ground water Point and nonpoint sources of pollution B.
As of May 1982, the State had identified 441 sites and areas where ground water has been polluted, and 456 additional sites and areas where pollution is suspected (Michigan Department of Natural Resources, 1982b). The sources of pollution are storage and handling of petroleum products, heavy industry, surface and subsurface solid wastes, salt storage and road deic- ing, light industry, oil and gas exploration and production brines, agriculture, municipal waste water, transportation spills, and laundromats. Forty-six sites have been included in the U.S. Environmental Protection Agency's National Priori ties List (1982) of hazardous-waste sites. For most of these sites, neither the extent nor impacts of the pollution have been determined.
Ground water Nitrate B.
Ground water in the extensive agricultural area in south western Michigan has concentrations of nitrate considerably in excess of concentrations found in natural ground water in the State. In one county, 23 percent of the wells drilled for domestic supplies in eight southern townships contain nitrate- nitrogen concentrations exceeding the U.S. Environmental Protection Agency's (1976) drinking-water standard of 10 milligrams per liter (Miller and others, 1982).
Eutrophication B.
A recently completed statewide study of 653 public lakes with areas greater than 50 acres indicates that 26 percent are eutrophic (Michigan Department of Natural Resources, 1982a). Sixteen percent of the eutrophic lakes receive phosphorus from one or more point-source discharges; the re mainder receive phosphorus from nonpoint sources.
Bottom sediments B*
The Water Quality Board of the International Joint Com mission has formally declared three areas in Michigan of major concern because of persistent, localized pollution problems (Great Lakes Water Quality Board, 1982). These areas are Saginaw River and Saginaw Bay, River Rouge basin, and River Raisin basin. Sediments polluted by polychlorinated biphenyls and polybrominated biphenyls are a concern at all three locations. Industrial wastes and runoff from agricultural lands are of concern in the Saginaw River basin; overflows of combined storm and sanitary sewers, oil and grease, and heavy metals are concerns in the River Rouge basin.
HYDROLOGIC HAZARDS AND LAND-USE ISSUESFlooding C.
Urbanization and construction on flood plains have resulted in flooding problems in many communities in the State. As storm-water runoff increases due to continued urbanization, the areal extent of flood damage also increases. Although 510 Michigan communities are designated as flood prone, most

Michigan 149
48V
EXPLANATION Water issues are described in text.Color identifies type of issue. Letter and number identify specific issue described in text.
WATER AVAILABILITY ISSUES
\///-_.' ! A1 Ground water
WATER-QUALITY ISSUES
Surface water Hazardous waste
SUMMARY OF WATER USE IN MICHIGAN. IN MILLION GALLONS PER DAY, 1980
(Data rounded to two significant figures and may not add to totals because of independent rounding. Source: Solley, Chase, and Mann. 1983]
Withdrawals
Use
Uttstream use:
Rural domestic and livestock .
Self -supplied industrial: Thermoelectric power use .
Total .........
Instream use: Hydroelectric powei . .
Ground water
Fresh Saline
220 .... 180 ....
77 ....
0 .... 62 420
530 420
65,000
Surface water
Fresh Saline
1 ,000 5.0 ....
110
12,000 0 1,600 0
14,000 0
Total fresh water
1,300 180 210
12,000 1,700
1 5,000
Consump tive use,
fresh water
100 46
210
0 99
460
150 MILES
100 150 KILOMETERS

150 National Water Summary 1983
flood damage occurs in the densely populated southeastern part of the State. Communities in this area need technical assistance to develop effective local storm-water-management programs (Great Lakes Basin Commission, 1975; Michigan Department of Natural Resources and others, 1981).
Erosion and sedimentation Coastal zone C*
Shoreline erosion is a serious threat to private homes, public highways, and recreation facilities along the Great Lakes. From 1972 to 1976, the Coastal Zone Laboratory (1978) documented about $58 million of installed shore-protection structures and $88 million of coastal property loss in the State. The Michigan Department of Natural Resources estimates that there are 300 miles of high-risk shoreline areas susceptible to erosion of more than 1 foot per year, of which 250 miles are mapped. New buildings are required to meet building-setback criteria.
REFERENCESBedell, D. J., and Van Til, R. L., 1979, Irrigation in Michigan,
1977: Michigan Department of Natural Resources, 37 p.Coastal Zone Laboratory, 1978, Michigan shoreland damage assess
ment program: Ann Arbor, University of Michigan, 109 p.
Great Lakes Basin Commission, 1975, Flood plains: Great Lakesbasin framework study, appendix 14, 327 p.
Great Lakes Water Quality Board, 1982, 1982 Great Lakes report onwater quality to IJC: International Joint Commission, 153 p.
Michigan Department of Natural Resources, Clinton River Water shed Council, and Evaluation Associates, 1981, Clinton Riverbasin stormwater management assessment: Lansing, MichiganDepartment of Natural Resources, 137 p.
Michigan Department of Natural Resources, I982a, Michigan inlandlakes project Identification, survey, and classification: Lansing,20 p.
____1982b, Assessment of ground-water contamination Inventory of sites: Lansing, 242 p.
Miller, J. B., Oberg, J. L., and Sieger, Theodore, Jr., 1982, Waterresources data, Michigan, water year 1982: U.S. GeologicalSurvey Water Data Report MI-82-1, 487 p.
Solley, W. B., Chase, E. B., and Mann, W. B, IV, 1983, Estimateduse of water in the United States in 1980: U.S. Geological SurveyCircular 1001, 56 p.
U.S. Environmental Protection Agency, 1976, National interimprimary drinking water regulations: Office of Water Supply,EPA-570/9-76-003, 159 p.
____1982, Amendment to National Oil and Hazardous SubstanceContingency Plan; the National Priorities List: Federal Register, v.47, no. 251, December 30, 1982, p. 58476-58485.
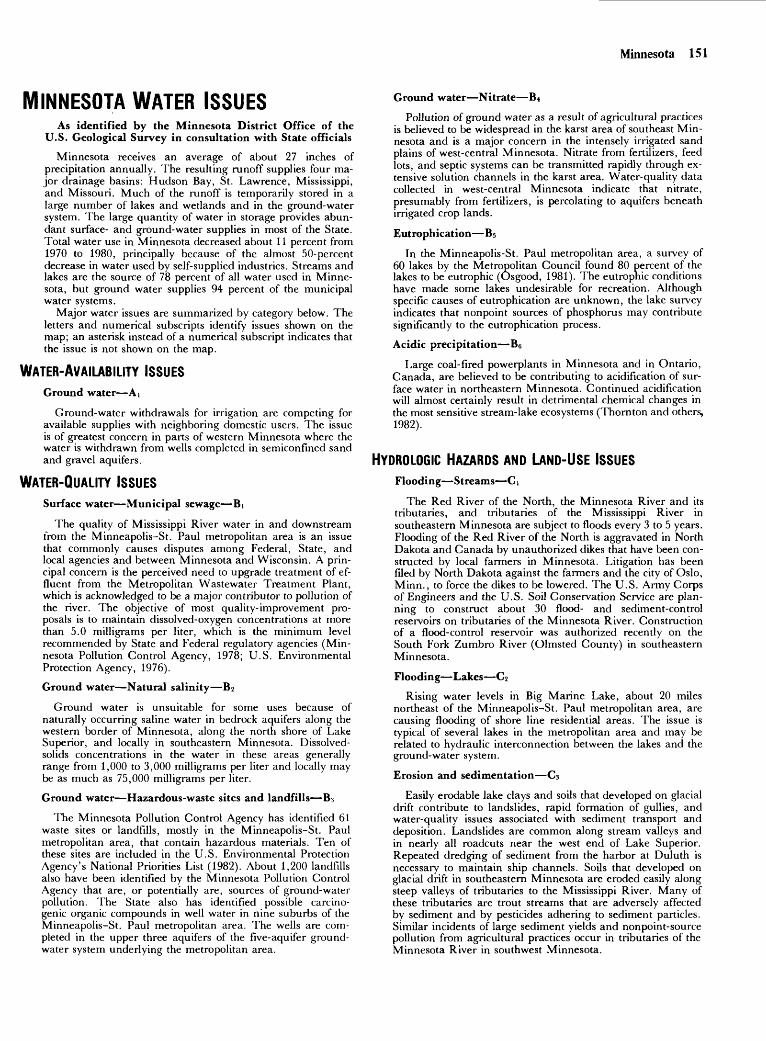
Minnesota 151
MINNESOTA WATER ISSUESAs identified by the Minnesota District Office of the
U.S. Geological Survey in consultation with State officials
Minnesota receives an average of about 27 inches of precipitation annually. The resulting runoff supplies four ma jor drainage basins: Hudson Bay, St. Lawrence, Mississippi, and Missouri. Much of the runoff is temporarily stored in a large number of lakes and wetlands and in the ground-water system. The large quantity of water in storage provides abun dant surface- and ground-water supplies in most of the State. Total water use in Minnesota decreased about 11 percent from 1970 to 1980, principally because of the almost 50-percent decrease in water used by self-supplied industries. Streams and lakes are the source of 78 percent of all water used in Minne sota, but ground water supplies 94 percent of the municipal water systems.
Major water issues are summarized by category below. The letters and numerical subscripts identify issues shown on the map; an asterisk instead of a numerical subscript indicates that the issue is not shown on the map.
WATER-AVAILABILITY ISSUESGround water Ai
Ground-water withdrawals for irrigation are competing for available supplies with neighboring domestic users. The issue is of greatest concern in parts of western Minnesota where the water is withdrawn from wells completed in semiconfmed sand and gravel aquifers.
WATER-QUALITY ISSUESSurface water Municipal sewage Bi
The quality of Mississippi River water in and downstream from the Minneapolis-St. Paul metropolitan area is an issue that commonly causes disputes among Federal, State, and local agencies and between Minnesota and Wisconsin. A prin cipal concern is the perceived need to upgrade treatment of ef fluent from the Metropolitan Wastewater Treatment Plant, which is acknowledged to be a major contributor to pollution of the river. The objective of most quality-improvement pro posals is to maintain dissolved-oxygen concentrations at more than 5.0 milligrams per liter, which is the minimum level recommended by State and Federal regulatory agencies (Min nesota Pollution Control Agency, 1978; U.S. Environmental Protection Agency, 1976).
Ground water Natural salinity B2
Ground water is unsuitable for some uses because of naturally occurring saline water in bedrock aquifers along the western border of Minnesota, along the north shore of Lake Superior, and locally in southeastern Minnesota. Dissolved- solids concentrations in the water in these areas generally range from 1,000 to 3,000 milligrams per liter and locally may be as much as 75,000 milligrams per liter.
Ground water Hazardous-waste sites and landfills B3
The Minnesota Pollution Control Agency has identified 61 waste sites or landfills, mostly in the Minneapolis-St. Paul metropolitan area, that contain hazardous materials. Ten of these sites are included in the U.S. Environmental Protection Agency's National Priorities List (1982). About 1,200 landfills also have been identified by the Minnesota Pollution Control Agency that are, or potentially are, sources of ground-water pollution. The State also has identified possible carcino genic organic compounds in well water in nine suburbs of the Minneapolis-St. Paul metropolitan area. The wells are com pleted in the upper three aquifers of the five-aquifer ground- water system underlying the metropolitan area.
Ground water Nitrate B4
Pollution of ground water as a result of agricultural practices is believed to be widespread in the karst area of southeast Min nesota and is a major concern in the intensely irrigated sand plains of west-central Minnesota. Nitrate from fertilizers, feed lots, and septic systems can be transmitted rapidly through ex tensive solution channels in the karst area. Water-quality data collected in west-central Minnesota indicate that nitrate, presumably from fertilizers, is percolating to aquifers beneath irrigated crop lands.
Eutrophication B5
In the Minneapolis-St. Paul metropolitan area, a survey of 60 lakes by the Metropolitan Council found 80 percent of the lakes to be eutrophic (Osgood, 1981). The eutrophic conditions have made some lakes undesirable for recreation. Although specific causes of eutrophication are unknown, the lake survey indicates that nonpoint sources of phosphorus may contribute significantly to the eutrophication process.
Acidic precipitation B6
Large coal-fired powerplants in Minnesota and in Ontario, Canada, are believed to be contributing to acidification of sur face water in northeastern Minnesota. Continued acidification will almost certainly result in detrimental chemical changes in the most sensitive stream-lake ecosystems (Thornton and others, 1982).
HYDROLOGIC HAZARDS AND LAND-USE ISSUESFlooding Streams C i
The Red River of the North, the Minnesota River and its tributaries, and tributaries of the Mississippi River in southeastern Minnesota are subject to floods every 3 to 5 years. Flooding of the Red River of the North is aggravated in North Dakota and Canada by unauthorized dikes that have been con structed by local farmers in Minnesota. Litigation has been filed by North Dakota against the farmers and the city of Oslo, Minn., to force the dikes to be lowered. The U.S. Army Corps of Engineers and the U.S. Soil Conservation Service are plan ning to construct about 30 flood- and sediment-control reservoirs on tributaries of the Minnesota River. Construction of a flood-control reservoir was authorized recently on the South Fork Zumbro River (Olmsted County) in southeastern Minnesota.
Flooding Lakes C2
Rising water levels in Big Marine Lake, about 20 miles northeast of the Minneapolis-St. Paul metropolitan area, are causing flooding of shore line residential areas. The issue is typical of several lakes in the metropolitan area and may be related to hydraulic interconnection between the lakes and the ground-water system.
Erosion and sedimentation Cs
Easily erodable lake clays and soils that developed on glacial drift contribute to landslides, rapid formation of gullies, and water-quality issues associated with sediment transport and deposition. Landslides are common along stream valleys and in nearly all roadcuts near the west end of Lake Superior. Repeated dredging of sediment from the harbor at Duluth is necessary to maintain ship channels. Soils that developed on glacial drift in southeastern Minnesota are eroded easily along steep valleys of tributaries to the Mississippi River. Many of these tributaries are trout streams that are adversely affected by sediment and by pesticides adhering to sediment particles. Similar incidents of large sediment yields and nonpoint-source pollution from agricultural practices occur in tributaries of the Minnesota River in southwest Minnesota.

152 National Water Summary 1983
Resource development Peat mining 4
Surface mining of about 200,000 acres of peat in northern Minnesota for use as fuel is being considered as a means of decreasing energy imports (Minnesota Department of Natural Resources, 1982). There is concern that large-scale surface mining may disrupt surface- and ground-water flow systems, release acidic bog water and heavy metals to downstream areas, and destroy parts of the "patterned peatlands," which are ecologically unique in the conterminous United States.
INSTITUTIONAL AND MANAGEMENT ISSUESAgency coordination D.
The Minnesota Water Planning Board, established by the State Legislature, developed a State water plan and suggested ways to improve coordination between local. State, and Fed eral water agencies (Minnesota Water Planning Board, 1979). The Board has since been dissolved under a provision of the enabling act. However, coordination and exchange of informa tion between agencies remains a priority issue in Minnesota.
REFERENCESMinnesota Department of Natural Resources, 1982, Big Bog: Energy
garden or wilderness sanctuary: The Minnesota Volunteer, v. 45, no. 261, March-April 1982, p. 2-10.
Minnesota Pollution Control Agency, 1978, Minnesota code of agen cy rules Criteria for classification of intrastate waters of the State and the establishment of standards of quality and purity: Minne sota Pollution Control Agency Regulation WPG 14, 1978 ed., 22 p.
Minnesota Water Planning Board, 1979, Toward efficient allocation and management A strategy to preserve and protect water and related land resources: St. Paul, 93 p.
Osgood, R. A., 1981, A study of the water quality of 60 lakes in the seven county metropolitan area: Metropolitan Council of the Twin Cities, Minnesota, Publication 01-81-047, 83 p.
Solley, W. B., Chase, E. B., and Mann, W. B., IV, 1983, Estimated use of water in the United States in 1980: U.S. Geological Survey Circular 1001, 56 p.
Thornton, J. D., Heiskary, S. A., Payer, R. D., and Malta, John, 1982, Acid precipitation in Minnesota: St. Paul, Report to the Legislative Commission on Minnesota Resources, 328 p.
U.S. Environmental Protection Agency, 1976, Quality criteria for water: Washington, D.C., EPA-440/9-76-023, 501 p.
_____1982, Amendment to National Oil and Hazardous Substance Contingency Plan; the National Priorities List: Federal Register, v. 47, no. 251, December 30, 1982, p. 58476-58485.

Minnesota 153
100 MILESI
SUMMARY OF WATER USE IN MINNESOTA. IN MILLION GALLONS PER DAY, 1980
[Data rounded to two significant figures and may not add to totals because of independent rounding. Source: Solley, Chase, and Mann. 1983]
Withdrawals
Use
Offstream use:
Rural domestic and livestock .
Self-supplied industrial : Thermoelectric power use . Other industrial uses ....
Total .........
Instream use: Hydroelectric power . .
Ground water
Fresh Saline
230 .... 180 .... 140 ....
2.2120 0
670 0
20,000
Surface water
Fresh Saline
210 .... 10 .... 18 ...
1 ,700 0 470 0
2,400 0
Total fresh water
440 190 160
1.700 590
3,100
Consump tive use,
fresh water
44 190 160
7.2 58
450
EXPLANATION Wafer issues are described in text. Color identifies type of issue. Letter and number identify specific issue described in text.
WATER AVAILABILITY ISSUES
A 1 Ground water
WATER QUALITY ISSUES
B-) Surface water Municipal sewage (see small map)
62 Ground water -Natural salinity
63 Ground water -Hazardous waste sites
and landfills
64 Ground water-Nitrate
65 Eutrophication
85 Acidic precipitation
HYDROLOGIC HAZARDS AND LAND-USE ISSUES (see small map)
^^^ | C1 Flooding-Streams
C 2 Flooding-Lakes
''$\ ^3 Erosion an() sedimentation
=q 04 Resource development-Peat mining

154 National Water Summary 1983
MISSISSIPPI WATER ISSUESAs identified by the Mississippi District Office of the
U.S. Geological Survey in consultation with State officials
Mississippi receives an average of about 54 inches of precipitation annually. Large quantities of fresh ground and surface water are readily available in nearly all parts of the State, and there also is an abundant supply of saline water in the estuaries along the Mississippi Gulf Coast. Mississippi is principally an agricultural State. More than 55 percent of the population lives in rural areas, and more than 50 percent of the State is forested (Mississippi Agricultural and Industrial Board, written commun., 1983). Population increases since the 1960's, accompanied by urbanization and industrialization in the Tupelo-Lee County area, in the metropolitan Jackson area, and along the Gulf Coast, have increased and concen trated the demands on the water resources of the State. Part of the increased demands has been due to agricultural irrigation and fish farming; more than 511,000 acres were irrigated and 58,000 acres were inundated for catfish ponds during 1981.
Major water issues are summarized by category below. The letters and numerical subscripts identify issues shown on the map; an asterisk instead of a numerical subscript indicates that the issue is not shown on the map.
WATER-AVAILABILITY ISSUESSurface water Ai
In some parts of the State, competition for ground water has resulted in water-level declines. This has focused new interest and attention on the development and use of surface-water sources as supplemental or alternative supplies. Use of the Tennessee-Tombigbee Waterway for a municipal supply for Tupelo is being studied, diversion of Mississippi River water in the northwest for irrigation has been suggested, and addi tional freshwater reservoirs and increased use of saline water from the estuaries along the Gulf Coast are being discussed.
Ground water A2
Water withdrawals from some of the major aquifers are increasing rapidly throughout the State. Concentrated with drawals have caused significant water-level declines in a number of areas. In the Mississippi River alluvial aquifer in the northwest, large withdrawals, principally for rice irrigation and aquiculture, have caused water-level declines (Darden, 1982). Ground water withdrawn for agricultural uses is ex cluded from State water-control laws.
Water-level declines have been significant in the principal fresh ground-water aquifers along the Gulf Coast during recent years as municipal- and industrial-water use continue to in crease (Callahan, 1983). In addition to lowered pumping levels and increased pumping costs, there is a potential for vertical and lateral migration of saline water into the aquifers (Wasson, 1978). The actual extent of the problem is not defined because the location of the interface between freshwater and saline water is unknown. The four-county (Hinds, Madison, Rankin, and Yazoo) metropolitan Jackson area may soon have significantly lowered ground-water levels (Wasson, 1981a, 198Ib). Although much of Jackson is supplied with treated water from the Pearl River, the city also has large wells to the south and southwest that provide part of the municipal supply. All other residential users (about 100,000) plus all industrial users in the area use ground water. If the population of the Jackson area increases as predicted, competition for ground water in the metropolitan area will accelerate.
The Eutaw-McShan aquifer in northeastern Mississippi has had large water-level declines principally because of municipal and industrial withdrawals. Recent studies indicate that the aquifer in the immediate area cannot meet the predicted de mand on a sustained basis (Kernodle, 1981); the nearby Tennessee-Tombigbee Waterway is being considered as an alternative source. Other cities having similiar concerns are
Laurel, Corinth, Columbus, Natchez, Pascagoula, and Hat- tiesburg and a number of community and rural water-supply associations (Wasson, 1980).
WATER-QUALITY ISSUESGround water Saline-water intrusion Bi
Saline waste water commonly associated with oil production has been reinjected into oil-field production zones in the southern one-half of the State. There are numerous instances of freshwater in wells becoming salty or of saline ground water being encountered where there is no natural reason for its occurrence (Kalkhoff, 1982). Saline-water intrusion may be the result of accidental or intentional injection or increased pressure in a saline-water zone that causes movement of saline water into the freshwater zone.
Ground water Radioactive wastes B2
The U.S. Department of Energy is studying the feasibility of storing high-level radioactive wastes in a salt dome in southern Mississippi. Local public hearings about this issue were held recently by the Department of Energy. The storage of high- level radioactive wastes in Mississippi salt domes is opposed by citizen groups and many State and local officials. The major concern is that the geohydrology at and near individual salt domes is not well defined and that the fate of any wastes that might leak from the repository is speculative (Spiers and Gandl, 1980).
Ground water Point and nonpoint sources of pollution B.
Ground-water pollution from landfills and agricultural prac tices may be a local issue, but supporting data are sprase. Cor rective measures have been taken at the one hazardous-waste site included in the U.S. Environmental Protection Agency's National Priorities List (1982). The Mississippi Bureau of Pollution Control is monitoring the area for ground-water pollution.
Ground water Waste injection into saline aquifers B.
There are only three authorized sites in the State where wastes can be injected into deep saline aquifers. Applications for this type of waste disposal are increasing since the Mississippi Department of Natural Resources-Bureau of Pollution Control assumed primacy in permitting this type of waste injection. There is concern about the movement of the wastes in the ground-water system.
Acidic precipitation B.
The acidity of precipitation in Mississippi has received public attention during the last few years. Historic and recent data indicate that precipitation in the State has a pH of about 4.6, which is about 1 pH unit less than the normal atmospheric equilibrium pH of about 5.6.
HYDROLOGIC HAZARDS AND UNO-USE ISSUESFlooding Ci
Severe flooding along the main stem of the Pearl River downstream from Ross Barnett Reservoir near Jackson, at Columbia, and downstream to the Gulf of Mexico continues to be an issue. Although there is a levee system, a series of ex treme floods beginning with the 1979 flood at Jackson (about a 500-year flood) has caused extensive flooding (Carroon, 1982). The most recent floods in April and May 1983, caused severe flooding in Jackson, in Columbia, and near Picayune in Mis sissippi, as well as in Louisiana where it overtopped Interstate Highway 10 near Slidell. Statewide, periodic inundation of agricultural lands destroys crops and causes millions of dollars in damages. Periodic flooding from intense, short-duration storms also occurs on the Leaf River near Hattiesburg; in reaches of the Yazoo, Big Black, and Tombigbee Rivers; and in many smaller drainages throughout the State.

Mississippi 155
EXPLANATION
Water issues are described in text. Color identifies type of issue. Letter and number identify specific issue described in text.
WATER AVAILABILITY ISSUES
A-) Surface water
A 2 Ground water
WATER QUALITY ISSUES
Ground water Saline water intrusion
62 Ground water-Radioactive wastes
HYDROLOGIC HAZARDS AND LAND USE ISSUES
^^^^ C i Flooding
INSTITUTIONAL AND MANAGEMENT ISSUES
^~ DI River-system management
50 I
I50
I 100 KILOMETERS
100
SUMMARY OF WATER USE IN MISSISSIPPI, IN MILLION GALLONS PER DAY
(Data rounded to two significant figures and may not add to totals because ofSource
Use
Offstream use:
Rural domestic and livestock
Self-supplied industrial:Thermoelectric power use .Other industrial uses 1
Instream use:Hydroelectric power . ....
Solley, Chase, ar
Ground water
Fresh Saline
2 230 ...2 30 ....
2 810 ....
2 33 ....2 430 0
1 .500 0
0
d Mann, 19831
Withdrawals
Surface water
Fresh Saline
2 37 ....12 ....
2 180 ...
2 990 50097 160
1 300 660
independent r
1980
ounding.
Total
water
2 2702 42
2 990
2 1 ,0002 530
2.900
tive use, freshwater
1002 40
500
3336
710
1 Includes fish farming.2 Revised. See Callahan, J.A.. 1983.

156 National Water Summary 1983
INSTITUTIONAL AND MANAGEMENT ISSUESRiver-system management Dt
The effects of the massive Tennessee-Tombigbee Waterway excavation have been a source of controversy and litigation for many years in the State. Among environmental concerns are changes in surface- and ground-water quality, lowered ground-water levels, and changes in the low-flow characteris tics of nearby streams. The waterway is scheduled to be com pleted and operational in 1985.
Water laws D.
The 1983 Mississippi State Legislature authorized establish ment of a Water Management Council to review the water resources and the existing institutional, management, and regulatory arrangements of the State, and to report and make recommendations for action to the State Legislature by January 1985.
Water allocation D,
The city of Baton Rouge, La., has asked the U.S. Environ mental Protection Agency to designate the aquifer system in the Baton Rouge area a sole-source aquifer. This designation would restrict activities in and above the aquifer and its recharge area. The recharge area for this 3,000-foot-thick wedge-shaped aquifer is approximately the southern one-third of Mississippi. Consequently, Mississippi is concerned about the effects that such a designation in Louisiana will have on water development in Mississippi.
REFERENCESCallahan, J. A., 1983, Water use in Mississippi, 1980: U.S.
Geological Survey Open-File Report 83-224, 1 sheet.
Carroon, L. E., 1982, Flood of April 1979 on Pearl River in Jackson, Mississippi and vicinity: U.S. Geological Survey Hydrologic Inves tigations Atlas HA-655, 2 sheets.
Darden, Daphne, 1982, Water-level maps of the alluvial aquifer, northwestern Mississippi, April 1982: U.S. Geological Survey Water-Resources Investigations 82-4061, 1 sheet.
Kalkhoff, S. J., 1982, Specific conductance and dissolved-chloride concentrations of freshwater aquifers and streams in petroleum producing areas in Mississippi: U.S. Geological Survey Open-File Report 82-353, 33 p.
Kernodle, J. M., 1981, Two-dimensional ground-water flow model of the Cretaceous aquifer system of Lee County and vicinity, Mississippi: U.S. Geological Survey Water-Resources Investiga tions 81-70, 53 p.
Solley, W. B., Chase, E. B., and Mann, W. B., IV, 1983, Estimated use of water in the United States in 1980: U.S. Geological Survey Circular 1001, 56 p.
Spiers, C. A., and Gandl, L. A., 1980, A preliminary report of the
feohydrology of the Mississippi salt-dome basin: U.S. Geological urvey Water-Resources Investigations Open-File Report 80-595,
45 p.U.S. Environmental Protection Agency, 1982, Amendment to
National Oil and Hazardous Substance Contingency Plan; the Na tional Priorities List: Federal Register, v. 47, no. 251, December 30, 1982, p. 58476-58485.
Wasson, B. E., 1978, Availability of additional ground-water supplies in the Pascagoula area, Mississippi: Jackson, Mississippi Research and Development Center Bulletin, 32 p.
____1980, Sources for water supplies in Mississippi: Jackson, Mississippi Research and Development Center Bulletin, 112 p.
____1981a, Potentiometric map of the Cockfield aquifer in Mississippi, 1980: U.S. Geological Survey Water-Re sources In vestigations Open-File Report 81-1053, 1 sheet.
_1981b, Potentiometric map of the Sparta aquifer system inMississippi, fall 1980: U.S. Geological Survey Water-Resources Investigations Open-File Report 81-1051, 1 sheet.

Missouri 157
MISSOURI WATER ISSUESAs identified by the Missouri District Office of the U.S.
Geological Survey in consultation with State officials
Sufficient water for present demands is available in many parts of Missouri during most years. Annual precipitation ranges from 34 inches in the northwest to 48 inches in the southeast, but in some years, precipitation has been as much as 15 inches less than normal. More communities depend on ground water than on surface water, but larger quantities of surface water are being withdrawn because most of Missouri's large cities have surface-water supplies. The southeastern two- thirds of the State is underlain by freshwater aquifers (Harris, 1979). Large quantities of saline ground water are available in the northwestern one-third of Missouri, but, without desalina tion, this water is unsuitable for most purposes. Surface-water supplies generally are adequate for most uses. However, varia tion in availability occurs within and among the State's three major physiographic regions: The Plains, the Ozarks, and the Southeastern Lowlands. Low-flow potential of most Plains streams is the least in the State because of the negligible permeability of the underlying clay and shale; storage reser voirs are required for adequate surface-water supplies. Ozarks streams generally have the best-sustained low flows because of flow to the streams from extensive solution cavities in car bonate aquifers; however, some streams lose water to these aquifers. Low flows in the Southeastern Lowlands are second in magnitude to those of the Ozarks and are sustained by ground-water contributions from the extensive alluvial deposits. Missouri's water issues mostly are the result of pollu tion rather than water availability (Missouri Department of Natural Resources, 1983).
Major water issues are summarized by category below. The letters and numerical subscripts identify issues on the map; an asterisk instead of a numerical subscript indicates that the issue is not shown on the map.
WATER-AVAILABILITY ISSUESGround water A t
In local areas, increased use of ground water has lowered water levels. For example, industrial pumpage from a deep aquifer in the Springfield area has caused a water-level decline of several hundred feet (Emmett and others, 1978). Water levels have been lowered slightly in Barton, Vernon, St. Glair, Cedar, Dade, and Audrain Counties because of irrigation of farmlands (Missouri Department of Natural Resources, 1983).
Surface water A,
Streams have minimum instream-flow requirements for preservation of fish and wildlife and the natural environment. Increased demands for irrigation, municipal, and industrial uses could decrease streamflow and adversely affect the aquatic environment of streams and lakes in the State. Some small communities in the Plains region have water-supply shortages during droughts because public-water-supply districts that serve large areas cannot meet the increased demands. Some communities have taken remedial actions to prevent future shortages (Missouri Department of Natural Resources, 1983).
WATER-QUALITY ISSUESSurface and ground water Dioxin B t
The U.S. Environmental Protection Agency has determined that dioxin is present in the soil and streambed sediments in several stream basins and may be moving through the hydro- logic system in association with sediment particles. Dioxin pollution has been confirmed at 31 widely dispersed sites from Newton County in the southwest to Lincoln and St. Louis Counties in the east. Preliminary investigations by the U.S.
Environmental Protection Agency at several locations indicate that the dioxin is moving from the original disposal locations. Dioxin is the pollutant at three of the five hazardous-waste sites in the State that are included in the U.S. Environmental Pro tection Agency's National Priorities List (1982). Of major con cern is the lack of knowledge about the solubility and transport mechanism of the dioxin and the environmental significance of small (parts per trillion) concentrations.
Ground water Saline-water intrusion 82
The interface between saline water and freshwater trends northeast across the State from Vernon County in the south west to Pike County in the northeast. North and west of the interface, water in the deep Cambrian-Ordovician aquifer has a dissolved-solids concentration of more than 1,000 milligrams per liter. With continued pumping of the Cambrian- Ordovician aquifer in southern Missouri, there may be a seasonal, as well as long-term, movement of the saline water into the freshwater zone.
Ground water Natural radioactivity 83
Increased concentrations of radioactivity from natural sources usually occur in ground water adjacent to the interface between saline water and freshwater because of geochemical reactions. Increased concentrations of radioactivity in other areas may result from the dissolution of uranium-enriched rocks in the aquifers. State officials are uncertain about the public-health dangers associated with long-term consumption of the water.
Ground and surface water Septic systems B4
The carbonate rocks of the Ozarks contain solution-enlarged cracks and crevices that allow pollutants to directly enter the shallow ground-water system. At several Ozarks communities, sewage lagoons have abruptly collapsed, allowing the sewage to enter the ground-water system (Aley and others, 1972). Septic-system pollution of ground and surface water is a serious concern in the Ozarks, where eight counties have iden tified septic systems as the principal source of pollution (Missouri Department of Natural Resources, 1983).
Surface watei B.
-Point and nonpoint sources of pollution
The effluent from many obsolete sewage-treatment plants in the State adversely affects water quality (Missouri Department of Natural Resources, 1983). When inadequately treated waste water is discharged into small receiving streams, dissolved oxy gen is depleted, and large concentrations of fecal coliform bacteria, nitrogen, phosphorus, and suspended solids are added; this renders the water unsuitable for most uses and decreases aquatic life. Large quantities of wastes also are added to streams and lakes from storm-sewer outflows (U.S. Army Corps of Engineers, 1979). It is estimated that the total quantity of pollutants contributed yearly by such flows is near ly the same as that released by all secondary sewage-treatment facilities.
Surface water Temperature B,
Temperatures in Missouri streams are impacted to an unknown degree by reservoir releases and inflow from in dustries and thermoelectric powerplants.
Ground water Hazardous-waste sites B,
There are 57 confirmed hazardous-waste dumping locations in Missouri 14 in the St. Louis area many of which pose threats to ground-water quality. Two of these sites, an aban doned dumping area along Caulks Creek near Ellisville in St. Louis County and an abandoned landfill on the flood plain of the Little Sac River near Springfield, are included in the U.S. Environmental Protection Agency's National Priorities List (1982).

158 National Water Summary 1983
HYDROLOGIC HAZARDS AND UNO-USE ISSUESSinkholes Ci
Sinkholes have developed beneath impoundments such as sewage lagoons and recreational lakes and ponds in the karst areas of the Ozarks; 12 such occurrences were reported prior to 1972 (Aley and others, 1972). Sinkholes continue to develop, but the extent of the development has not been documented. In addition to damage to impoundments, other effects include the potential for pollution of the ground water, disruption of waste- water treatment processes, and endangerment of life and property.
Erosion and sedimentation C2
Stream channelization has been a widespread practice in northwestern Missouri. It causes an increase in gully erosion because the main stream erodes a deeper channel and tributary streams then erode to the lower base level. Channelization also affects water quality by causing changes in turbidity, sediment deposition, water temperature, and dissolved-oxygen concen tration. Downstream from channelized reaches, stream bank erosion and sediment deposition increase.
Resource development Coal mining Cs
Coal-mining activities expose sulfide minerals to the air and water, providing favorable conditions for acid formation. If the acid mixes with water and is discharged from the mine or tail ings into streams that have little buffering capacity, the pH of water in receiving streams may be decreased sufficiently to dissolve and mobilize large concentrations of heavy metals particularly iron present in the sediment. Although coal mining is expected to increase in northern and western Missouri, acid mine drainage from new mines is not expected to be a concern because recent laws require coal companies to reclaim all new mines, including those that have been in pro duction since 1972 (Missouri Department of Natural Resources, 1983). Approximately 8,100 acres of abandoned coal-mined land need to be reclaimed because of threats to health and safety (Missouri Department of Natural Resources, 1981).
Resource development Lead-zinc mining C4
Abandoned lead and zinc mines and tailings piles in the Tri- State District (Kansas, Missouri, and Oklahoma) and in the Old and New Lead Belts in southeastern Missoun are sources of heavy metals (lead, copper, and zinc) that pollute streams when storm runoff occurs. In the Tri-State District, mine- water discharges increase zinc concentrations in receiving streams more than 10 times, and tailings deposition increases zinc and lead concentrations in stream-bottom material by a factor of about 25 (Barks, 1977). Acidic runoff from tailings also is a concern in this area. In the Old and New Lead Belts, excessive concentrations of lead and zinc in streams from tail ings, mine shafts, air vents, wells, and drillholes are a concern. Laboratory analysis of fish from Big River (Old Lead Belt) has shown increased contents of lead (Missouri Department of Natural Resources, 1983). In all three lead-zinc mining areas, large quantities of abandoned mill tailings and crushed waste rock are sources for sedimentation, siltation, and heavy metals in streams.
Flooding C.
Flooding causes many problems for Missouri residents. The floods of December 1982 and the localized August 1982 Kansas
City flood caused loss of life, property damage, and personal hardship.
Erosion and sedimentation C.
Missouri's average annual erosion rate of 300 million tons is among the greatest in the United States (U.S. Soil Conserva tion Service, 1981). Agricultural practices and stream chan nelization are major contributors to the sediment load in streams.
Safety of dams C.
Safety of non-Federal dams and their potential hazard to life and property has been inventoried to comply with the National Dam Inspection Program Act of 1972 (Public Law 92-367). Inspection reports were prepared for more than 390 dams, more than 90 percent of which had deficiencies requiring remedial action (Missouri Department of Natural Resources, 1983). Although some action has been taken statewide, many of the dams still are judged to be unsafe.
INSTITUTIONAL AND MANAGEMENT ISSUESRiver-system management DI
As demands for water increase, diversion and use of upstream waters of the Missouri, Osage, and Marmaton Rivers may increase. This may cause water shortages in Missouri communities that depend on surface-water supplies which originate outside of the State.
REFERENCESAley, T. J., Williams, J. H., and Massello, J. W., 1972, Ground-
water contamination and sinkhole collapse induced by leaky impoundments in soluble rock terrain: Missouri Department of Natural Resources, Division of Geology and Land Survey Engineering Geology Series No. 5, 32 p.
Barks, J. H., 1977, Effects of abandoned lead and zinc mines and tail ings piles on water quality in the Joplin area, Missouri: U.S. Geological Survey Water-Resources Investigations 77-75, 49 p.
Emmett, L. F., Skelton, John, Luckey, R. R., and Miller, D. E., 1978, Water resources and geology of the Springfield area, Mis souri: Missouri Department of Natural Resources, Division of Geology and the Land Survey Water Resources Report 34, 150 p.
Harris, Barbara, 1979, Water in Missouri: Missouri Department of Natural Resources, Division of Geology and Land Survey Educa tional Series No. 5, 28 p.
Markos, Mark, and Skelton, John, 1983, Estimated Water use in Missouri, 1980: Missouri Department of Natural Resources, Divi sion of Geology and Land Survey Open-File Map Report, 1 sheet.
Missouri Department of Natural Resources, 1981, Annual report of the Abandoned Mine Land Section: Jefferson City, Land Reclama tion Commission, 20 p.
____1983, Regional watershed assessment plan, rounds 1 and 2: Missouri Abandoned Mine Land Section: Jefferson City, Land Reclamation, Rolla, Mo., unpublished manuscripts on file.
Solley, W. B., Chase, E. B., and Mann, W. B., IV, 1983, Estimated use of water in the United States in 1980: U.S. Geological Survey Circular 1001, 56 p.
U.S. Army Corps of Engineers, 1979, Kansas City urban study sum mary report: Kansas City, 83 p.
U.S. Soil Conservation Service (1981), Losing ground A summary of the report on the soil and water resources of the northern Mis souri River tributaries basin: Columbia, summary pamphlet, 7 p.
U.S. Environmental Protection Agency, 1982, Amendment to National Oil and Hazardous Substance Contingency Plan; the Na tional Priorities List: Federal Register, v. 47, no. 251, December 30, 1982, p. 58476-58485.

Missouri 159
EXPLANATIONWater issues are described in text. Color identifies type of issue. Letter and number identify specific issue described in text.
WATER-AVAILABILITY ISSUES
[___jA-j Ground water
WATER-QUALITY ISSUES
Surface and ground water-Dioxin
62 Ground water-Saline-water intrusion (see small map)
63 Ground water-Natural radioactivity
64 Ground and surface water-Septic systems (see small map)
HYDROLOGIC HAZARDS AND LAND-USE ISSUES
Sinkholes
Erosion and sedimentation (see small map)
jj 63 Resource development-Coal mining
| 64 Resource development Lead-zinc mining
INSTITUTIONAL AND MANAGEMENT ISSUES
*^ DI River-system management
50
SUMMARY OF WATER USE IN MISSOURI, IN MILLION GALLONS PER DAY, 1980
[Data rounded to two significant figures and may not add to totals because of independent rounding. Source: Solley, Chase, and Mann, 1983]
Withdrawals
Use
Offstream use:
Rural domestic and livestock . .
Self -supplied industrial: Thermoelectric power use .
Total ..........
Instream use.
Ground water
Fresh Saline
160 .... 85 98
16 .... 120 0
470 0
13,000
Surface water
Fresh Saline
570 .... 72 .... 30 ....
5,500 0 190 0
6,400 0
Total fresh water
730 160 130
5,500 300
6,900
Consump tive use,
fresh water
150 98
100
300 24
670

160 National Water Summary 1983
MONTANA WATER ISSUESAs identified by the Montana District Office of the U.S.
Geological Survey in consultation with State officials
Montana has two distinct hydrogeologic regimes. Western and south-central Montana receive as much as 100 inches of precipitation annually in the higher mountains and as little as 10 inches in the intermontane valleys. The mountain snow- pack provides an adequate supply of fresh surface water for most purposes, but the water supply for irrigation occasionally is deficient during late summer and early fall. Ground-water supplies in thick alluvium that fills the intermontane valleys generally are underdeveloped. Eastern and north-central Montana receive about 12 to 16 inches of precipitation annu ally. Flow in most major streams in this area is fairly depend able owing to the contribution from mountain snowpack in the west and controlled releases from major reservoirs. Dissolved- solids and sediment concentrations increase with distance downstream. Ground-water supplies are available both from alluvial and glacial deposits and from bedrock aquifers. Ground water is the most reliable source of supply, except along the major streams in eastern and north-central Mon tana. Surface-water supplies primarily are in three major basins. The Clark Fork and Kootenai Rivers, which are tribu tary to the Columbia River, drain about 33,800 square miles and annually discharge about 26 million acre-feet from Mon tana. The Missouri River drains about 92,000 square miles in central and northern Montana and annually discharges about 8 million acre-feet at the State line. The Yellowstone River, which joins the Missouri River just east of the Montana-North Dakota State line, drains about 69,000 square miles in southeastern Montana and adjacent areas in Wyoming and annually discharges about 9.5 million acre-feet at the State line.
Major water issues are summarized by category below. The letters and numerical subscripts identify issues shown on the map; an asterisk instead of a numerical subscript indicates that the issue is not shown on the map.
WATER-AVAILABILITY ISSUESGround water At
Uncontrolled flowing wells are common throughout Mon tana. In the Powder River basin, water levels have declined in the widely used Fox Hills-lower Hell Creek aquifer; these declines have increased pumping lifts and necessitated the in stallation of pumps to be installed in wells that no longer flow. Gravels of the Flaxville Formation and in buried stream- channel deposits form large-yield aquifers of relatively small extent in northeastern Montana. Concerns about potential ground-water mining of these aquifers have stimulated studies to determine their areal extent, capacity, and recharge areas.
Surface water A.
During droughts, irrigators who divert water from the downstream reaches of many rivers sometimes experience severe and unpredictable shortages late in the season. These shortages also make it difficult to maintain minimum instream flows for the State's sports fisheries. Remedies that are being considered by State and local officials in some areas include the construction of additional storage reservoirs; conjunctive use, such as low-flow augmentation with ground water; and the transfer of surface water between river basins. Where short ages can be anticipated, State agencies, on behalf of the public, can use the State's water-reservation process to reserve water for future offstream and instream uses. To date, this procedure has been implemented only in the Yellowstone River basin.
WATER-QUALITY ISSUESGround water Hazardous-waste sites BI
Hazardous-waste sites near Libby (Lincoln County) and in Milltown (Missoula County) have been included in the U.S. Environmental Protection Agency's National Priorities List
(1982). A wood preservative has been detected in ground water at a site near Libby, and large concentrations of arsenic were detected in water from four domestic wells in Milltown.
Ground water Settling ponds B2
Water is used in slurry pipelines to help transport waste products from metal mines and coal powerplants to settling ponds. Water percolating to the water table beneath the set- ding ponds may contain large concentrations of heavy metals, boron, and other dissolved solids (Botz, 1978).
Ground water Landfills B.
There are approximately 200 landfills in the State; slightly less than one-half of these are licensed. None of the licensed sites can accept hazardous wastes. There is concern that leachate from active and abandoned landfills located in aquifer-recharge areas may infiltrate and pollute ground-water supplies.
HYDROLOGIC HAZARDS AND LAND-USE ISSUESErosion and sedimentation C,
Sediment in Muddy Creek, derived from irrigation runoff, is causing serious concern in the Sun River (Cascade County), a tributary to the Missouri River. The Montana Water Quali ty Bureau has classified the situation as Montana's principal water-quality issue.
Resource development Coal mining 2
Montana has one of the largest strippable coal reserves in the Nation. In some places, these coalbeds are the most widely used aquifers in the region. Documented short-term effects of strip mining on ground water near the Decker mine in Big Horn County include water-level declines and increased dissolved-solids concentrations (Van Voast and Hedges, 1975). Because of these effects, potential long-term and cumulative hydrologic effects of coal mining are of increasing concern. Similarly, concern has been expressed for the hydro- logic effects of large surface coal mines being developed or planned in Canadian watersheds that drain into Montana.
Resource development Metal mining Cs
There is concern about acid mine drainage from abandoned metal mines, including the abandoned open-pit mine near Butte. A 25-mile reach of Silver Bow Creek (Silver Bow Coun ty) has been included in the U.S. Environmental Protection Agency's National Priorities List (1982) of hazardous-waste sites because of pollution by heavy metals and phosphorus. Rehabilitation plans include removing abandoned mine tail ings from the creek banks. Another hazardous-waste site associated with metal mining that is included in the National Priorities List is the smelter at Anaconda (Deer Lodge County) where, historically, large concentrations of heavy metals related to smelter operations have been detected.
Resource development Oil-field brines C,
Throughout the eastern part of the State, brine is produced as a byproduct of the crude-oil extraction process. Handling and disposal of brine have polluted some ground-water sup plies and have created salinity hazards for some croplands. Some streams also have been affected by increased salinity from brines.
Resource development Hydroelectric power C.
The enactment of the Public Utility Regulatory Policies Act of 1978 (Public Law 95-617), which provides tax credits and other financial incentives to independent developers of hydroelectric power, has resulted in a significant increase in applications for State water-use permits relating to this poten tial power source. By May 1983, at least 100 new small-scale diversion projects, located mostly in western Montana, had been proposed. Some of these projects will compete with other water uses.

Montana 161
1 ;«° us-;- ___ I
X ^VTlf ,;v 'tf . Y ...«> vt£n
114=4-
112° 111 49°
j 1-^ f>M^ft.»B
; ,5--* e « o - ;-xfe
i »i r- *-*V- V4^7^^ N . -U-^' ' rii-A ^^ r'-'^' ;\ %^w%; < "^Ft-IV-cNi ;>^;^-.A.l
^ SSAND'-' ^^^ft^" /-' *' " ^ T"- ^-'f ^"
.V,--br^ t -.- vL"n^i ^^m^?4£^\ "<\ W^^r u1 ^i\ ,'>^^Xir*'x-^:H?i^»'{t " ^..^-rr^^ a
3
1 3 50
501
1 100
100I
150 MILES I
I150 KILOMETERS
EXPLANATIONWater issues are described in text. Color identifies type of issue. Letter and number identify specific issue described in text.
WATER-AVAILABILITY ISSUES
|^%%] A-j Ground water
WATER-QUALITY ISSUES
9 BI Ground water Hazardous waste sites
B 2 Ground water Settling ponds
HYDRDLDGIC HAZARDS AND LAND-USE ISSUES
--*^" C-j Erosion and sedimentation
O C2 Resource development Coal mining
"^ O £3 Resource development-Metal mining
INSTITUTIONAL AND MANAGEMENT ISSUES
*.»* " DI Water allocation
j] D2 Treaties and compacts
SUMMARY OF WATER USE IN MONTANA. IN MILLION GALLONS PER DAY. 1980
I Data rounded to two significant figures and may not add to totalf because of independent rounding. Source: Solley , Chase, and Mann, 1983]
Withdrawals
Use
Off stream use:
Rural domestic and livestock
Self -supplied industrial: Thermoelectric power use . Other industrial uses ...
Instream use: Hydroelectric power . .
Ground water
Fresh Saline
50 .... 74 ....
110 .
0 .... 32 2.1
260 2.1
76,000
Surface water
Fresh Saline
93 ....14 ....
10,000
180 0 76 0
11,000 0
Total fresh water
140 88
11.000
180 110
11.000
Consump tive use,
fresh water
53 88
2,600
12 15
2,700

162 National Water Summary 1983
Saline seeps C.
The formation and rapid increase of about 10 percent per year of saline seeps on or adjacent to cultivated dry lands has become a significant conservation issue throughout Montana (Montana Department of Natural Resources and Conserva tion and others, 1983). Where precipitation accumulates in alternately fallowed cropland, salts that normally are bound to the soil are dissolved and percolate to shallow aquifers. If these aquifers overlie less permeable shale layers, the water in the shallow system flows to nearby topographically low discharge areas. There, evaporation at the soil surface creates an ac cumulation of salts. The regional deterioration of surface and shallow ground-water resources is considered as serious as the loss of arable land. Several shallow ground-water supplies are becoming increasingly saline. Research underway since 1969 has identified several successful control practices, such as growing deep-rooted perennial crops and switching to flexible intensive cropping systems. In 1979, the Montana Legislature approved funding to provide technical assistance to farmers in nine counties in north-central Montana to implement saline- seep control practices.
INSTITUTIONAL AND MANAGEMENT ISSUESWater allocation Di
The Yellowstone River Compact specifically excluded the Little Bighorn River from apportionment. As a result, there is considerable interest in Wyoming to divert water from the headwaters of the Little Bighorn River. Diversion could affect the Crow Indian Reservation in Montana, which obtains ir rigation water from the river. Montana, Wyoming, and the Crow Tribe are attempting to negotiate apportionment. The Popular River basin is the subject of a separate apportionment issue with Canada.
Treaties and compacts Dz
The 1979 Montana Legislature established the Reserved Water Rights Compact Commission. It gave the Commission the responsibility of concluding compacts by July 1, 1985, for the equitable division of water among State and Federal agen cies and the seven Indian reservations located in Montana that have claims to reserved water rights.
The Yellowstone River Compact of 1950 (Montana, North Dakota, and Wyoming) provides a basis for the apportionment of water in four major tributaries of the Yellowstone River that flow into Montana from Wyoming. Thus far, water quantity has been sufficient to meet the demands of the three States without administering a formal water division under the terms of the Compact. The development of an administrative pro cedure to allocate each State's share is important because of water requirements for present and planned coal development and the increased interest in water development for industrial purposes in the States. The Boundary Waters Treaty of 1909 between the United States and Canada is the basis for the ap portionment of the waters of the St. Mary and Milk Rivers.
Recent water shortages in the United States because of increas ing demand in the downstream reaches of the Milk River and increased use of Canada's share of the water have caused con cern in Montana.
River-system management D.
Lower Missouri River basin States (Iowa, Kansas, Missouri, and Nebraska) are concerned that future water proj ects requiring consumptive use of Missouri River water in the upper basin States (Colorado, Montana, North Dakota, South Dakota, and Wyoming) might decrease streamflow and adversely affect navigation and river quality in the lower basin States. Recent action by upper basin States to develop water projects, and legislation introduced by lower basin States to control upstream water use, have emphasized the need for dialogue leading to resolution of the conflicting needs and uses of Missouri River water (Montana Department of Natural Resources and Conservation and Wright Water Engineers, 1982).
Water-resources management Ground water D.
As surface water becomes increasingly appropriated, greater use will be made of ground water as an alternative source of supply. The Governor has appointed a Ground Water Task Force to develop a strategy to protect and develop the ground- water resources (Montana Department of Natural Resources and Conservation and others, 1983).
Water-use information D.
The continuing collection of water-use data is an important aspect of the water-rights adjudication process mandated by the 1973 Montana Legislature.
REFERENCESBotz, M. K., 1978, Characteristics and potential impact of waste
water from a coal-fired power plant at Colstrip, Montana: Western Technology and Engineering, 67 p.
Montana Department of Natural Resources and Conservation and Wright Water Engineers, 1982, Summary of report on a water pro tection strategy for Montana Missouri River Basin: Helena, Montana Department of Natural Resources and Conservation, 41 p.
Montana Department of Natural Resources and Conservation and others, 1983, Montana ground-water status report to Ground- Water Advisory Council (draft): Helena, Montana Department of Natural Resources and Conservation, 167 p.
Solley, W. R., Chase, E. B., and Mann, W. B., IV, 1983, Estimated use of water in the United States in 1980: U.S. Geological Survey Circular 1001, 56 p.
U.S. Environmental Protection Agency, 1982, Amendment to National Oil and Hazardous Substance Contingency Plan; the Na tional Priorities List: Federal Register, v. 47, no. 251, December 30, 1982, p. 58476-58485.
Van Voast, W. A., and Hedges, R. B., 1975, Hydrogeologic aspects of existing and proposed strip coal mines near Decker, southeastern Montana: Montana Bureau of Mines and Geology Bulletin 97, 31 p.

Nebraska 163
NEBRASKA WATER ISSUESAs identified by the Nebraska District Office of the U.S.
Geological Survey in consultation with State officials
Nebraska is a predominantly agricultural State and has a semiarid to subhumid climate. Annual average precipitation ranges from about 15 inches in the west to about 34 inches in the southeast. Approximately 20 percent of the average flow in the Platte River system and approximately 25 percent of the average flow in the Republican River system originate outside the State. Major streams have been used for irrigation supplies for many years, and an intricate system of storage facilities, diversions, and returns has been developed. Thick aquifer systems capable of yielding large quantities of water underlie much of the State. One such aquifer system, the High Plains aquifer system, underlies about 85 percent of the State and is estimated to contain 2.2 billion acre-feet of recoverable water (Pettijohn and Chen, 1982). The State contains other impor tant but less extensive or less productive aquifers. Throughout the State, aquifers provide much of the water for irrigation and, with a few exceptions, are the exclusive sources for domestic, municipal, and most industrial supplies. Nebraska has about 7.3 million irrigated acres, ranking among the top three States in the Nation. About 85 percent of this land is ir rigated by water pumped from wells (Johnson and Pederson, 1983). Competition for use of water between surface-water and ground-water uses and between instream and offstream uses is a major cause of many of Nebraska's water-related issues. Commonly at issue is how to allocate equitably, under law, a supply which, if not actually dwindling, is subject to ever- increasing demand (University of Nebraska, 1981).
Major water issues are summarized by category below. The letters and numerical subscripts identify issues shown on the map; an asterisk instead of a numerical subscript indicates that the issue is not shown on the map.
WATER-AVAILABILITY ISSUESSurface water AI
Irrigation with surface water began in western Nebraska as early as 1859 to supplement meager rainfall. Currently, sur face water is diverted from nearly every stream of consequence in the State. Numerous reservoirs store water for flood control and for later release to irrigators in accordance with compacts, court decrees, and regulations of the State. Not all flows of the Platte River (A, ) and other rivers have been allocated, and concerns exist about rights to unallocated flows among pro ponents of different irrigation projects and those who would reserve such flows for instream uses. One instream use is maintaining critical habitat for wildlife in a reach of the Platte River between Lexington and Grand Island. There is some evidence that pumping of ground water for irrigation and changing land-use practices are depleting streamflow in some places. The Frenchman Creek basin upstream from Enders Reservoir in Chase County (A, b) is viewed by many as one area where such depletion is occurring (Lappala, 1978).
Ground water A2
Withdrawals of ground water from shallow aquifers for ir rigation have caused significant water-level declines in several areas (A2a ). Progressive water-level declines began during the 1950's in southeastern and central Nebraska as drought condi tions promoted irrigation development. With development of center-pivot irrigation systems during the 1960's, irrigation with ground water accelerated in northern and western Nebraska and also resulted in progressive water-level declines in intensively developed areas. Pumping for irrigation has caused some seasonal depletions of stock and domestic wells and loss of wet meadows in the Sand Hills region of Nebraska. Although the largest water-level declines are about 50 feet, some studies predict declines of as much as 140 feet if irrigation development continues at the present rate (Lappala and
others, 1979; Johnson and Pederson, 1983). In contrast to the declines of water levels, rises of as much as 97 feet have oc curred near storage reservoirs and supply canals, principally along the Platte River (A2b), where surface water has been di verted for irrigation ana power production. The economic value of higher water levels in areas where ground water is pumped for irrigation and the potential problems of waterlog ging and increased streamflow are management issues in the development of Nebraska's water resources.
WATER-QUALITY ISSUESGround water Nonpoint sources of pollution Bi
Concentrations of nitrate-nitrogen may increase gradually in widespread areas as a result of long-term applications of fer tilizers on farm lands. Fertilizer nitrogen is thought to be the principal nonpoint source of nitrate pollution of ground water in the central Platte River basin, especially in Hall County (Spalding, 1975) and possibly also in Holt County. These areas are characterized by sandy soils and shallow water tables a combination that may facilitate rapid leaching of soluble nitrogen to the ground-water reservoir.
Ground water Point sources of pollution B.
Concentrations of nitrate-nitrogen in ground water in excess of the U.S. Environmental Protection Agency's (1976) drinking-water standard of 10 milligrams per liter are present at numerous sites throughout the State and are believed to originate from point sources such as feedlots, barnyards, and septic systems. In recent years, about 40 communities have been required to take remedial measures to decrease undesirable nitrate concentrations in their drinking-water sup plies. Although Nebraska has one hazardous-waste site a fertilizer-manufacturing plant located near Beatrice in Gage County and included in the U.S. Environmental Protection Agency's Priorities List (1982) the site's effect on the quality of local ground water is not a major issue at this time.
HYDROLOGIC HAZARDS AND LAND-USE ISSUESFlooding Ci
Although some flood-prevention and flood-protection struc tures have been constructed, concerns about flooding still remain. Floods occur on the North Platte, South Platte, and Platte Rivers, generally from melting snow in the mountains of Colorado and Wyoming. Flash floods occur on small streams from summer thunderstorms. Flooding can result from ice jams during ice breakup and snowmelt in the spring, par ticularly along the downstream reaches of the Platte and Elkhorn Rivers.
Erosion C?
Wind and water erosion may be accelerated by irrigation development if adequate land-management practices are not used. In the Sand Hills, dunes are stabilized by a cover of native grasses. With the use of center-pivot irrigation systems, the dunes can be cultivated. Abandonment of such irrigation systems after one or two growing seasons, however, may in crease wind and water erosion of the disturbed soil.
Wetlands C3
The wetlands of Nebraska, which include shallow lakes and wet meadows in the Sand Hills region, rainwater basins in the southeast, and marshes along major rivers, are important areas for waterfowl habitat and, when drained, for agricultural pro duction. These uses may conflict.
Erosion and sedimentation C.
There is concern that streambank erosion results in loss of land and damage to roads and bridges, particularly in eastern Nebraska. Some of this erosion may be the result of stream channelization early in this century.

164 National Water Summary 1983
INSTITUTIONAL AND MANAGEMENT ISSUESWater laws D.
Conjunctive or integrated use of surface- and ground-water supplies for irrigation has been practiced in severed areas of the State for many years. A 1983 State statute established legal recognition of ground-water recharge as a benefit of surface- water projects by allowing surface-water irrigation companies to charge ground-water users for recharge to the aquifer by surface water.
Water allocation D.
The major concerns in Nebraska regarding the allocation of water and the setting of priorities for new uses of water include the transbasin diversion of Platte River water, the develop ment of the O'Neill Irrigation Project on the Niobrara River, and the further development of surface-water irrigation in the Platte and other river valleys. These proposed changes in water allocation are being opposed by those wishing to maintain high levels of flow to enhance wildlife habitat (Wolgamott, 1983) and by those wishing to maintain flows needed for induced recharge of municipal well fields.
REFERENCESHarmon, C., and others, 1976, Platte River basin, Nebraska level B
study: Omaha, Missouri River Basin Commission, 252 p.Johnson, M. S., and Pederson, D. T., 1983, Groundwater levels in
Nebraska, 1982: University of Nebraska-Lincoln, Conservation and Survey Division, Nebraska Water Survey Paper No. 56, 65 p.
Lappala, E. G., 1978, Quantitative hydrogeology of the upperRepublican Natural Resources District, southwest Nebraska: U.S.Geological Survey Water Resources Investigations Open-FileReport 78-38, 209 p.
Lappala, E. G., Emery, P. A., and Otradovsky, F. J., 1979,Simulated changes in ground-water levels and streamflow resultingfrom future development (1970-2020) in the Platte River basin,Nebraska: U.S. Geological Survey Water-Resources InvestigationsOpen-File Report 79-26, 89 p.
Omaha World-Herald, 1982a, Little Blue plan stalled by court:March 20, 1982 p. 15.
____1982b, Opponents Petitions a factor in dam vote: December16, 1982 p. 15.
Pettijohn, R. A., and Chen, Hsiu-Hsiung, 1982, Geohydrology of theHigh Plains aquifer system in Nebraska: U.S. Geological SurveyWater-Resources Investigations Open-File Report 82-502, 3 maps,scale 1:750,000.
Solley, W. B., Chase, E. B., and Mann, W. B., IV, 1983, Estimateduse of water in the United States in 1980: U.S. Geological SurveyCircular 1001, 56 p.
Spalding, R. F., 1975, Effects of land use and river seepage ongroundwater quality in Hall County, Nebraska: University ofNebraska-Lincoln, Conservation and Survey Division, NebraskaWater Survey Paper No. 38, 95 p.
University of Nebraska, 1981, Workshop on Nebraska WaterProblems, September 9-10, 1981: University of Nebraska-Lincoln,Institute of Agriculture and Natural Resources, Nebraska WaterResources Center, 21 p.
U.S. Environmental Protection Agency, 1976, National interimprimary drinking water regulations: Office of Water Supply,EPA-5 70/9-76-003, 159 p.
____1982, Amendment to National Oil and Hazardous SubstanceContingency Plan; the National Priorities List: Federal Register, v.47, no. 251, December 30, 1982, p. 58476-58485.
Wolgamott, L. K., 1983, Bird report threatens diversion: LincolnJournal-World, February 16, 1983, p. 1.

Nebraska 165
104*
50I
100 MILES I
50I
100 KILOMETERS
SUMMARY OF WATER USE IN NEBRASKA, IN MILLION GALLONS PER DAY. 1980
[Data rounded to two significant figures and may not add to totals because of independent rounding. Source: Solley. Chase, and Mann, 1983]
Withdrawals
Use
Offstream use:
Rural domestic and livestock . .
Self-supplied industrial: Thermoelectric power use . Other industrial uses
Total ..........
Instream use: Hydroelectric power . . .
Ground water
Fresh Saline
210 .... 140 ....
6,700 ....
31 .... 58 0
7.200 0
5,400
Surface water
Fresh Saline
56 .... 23 ...
2,600
2,200 0 6.3 0
4,900 0
Total fresh water
260 170
9.300
2,200 64
12,000
Consump tive use,
fresh water
53160
7,400
22 3.1
7,600
EXPLANATIONWater issues ore described in text. Co/or identifies type of issue. Letter and number identify specific issue described in text.
WATER-AVAILABILITY ISSUES
*~*i*^s A 1a Surface water-Availability
^ +»^ A 1b Surface water-Depletion
|%%%^ A 2a Ground water-Declining water levels
RA^^J^2b Ground water-Rising water levels
WATER QUALITY ISSUES
I I BI Ground water Monpoint sources of pollution
HYDROLDGIC HAZARDS AND LAND-USE ISSUES
^ *+^ Ci Flooding (see small map)
HJ_JC2 Erosion (see small map)
^Tilc, Wetlands

166 National Water Summary 1983
NEVADA WATER ISSUESAs identified by the Nevada Office, Idaho-Nevada
District, of the U.S. Geological Survey in consultation with State officials
Nevada is a desert State, with an average annual precipita tion of about 9 inches the least in the Nation. Annual average precipitation varies from less than 4 inches in some low- altitude valleys to more than 30 inches in the higher mountains of the State. An average of less than 1 inch of water either recharges aquifers or runs off from the mountains annually (Rush and others, 1971). Water use for irrigation is about 85 percent of total water withdrawn in Nevada; the remainder is apportioned among public supplies and industrial uses, in cluding mining. Population increases in the State since about 1950 have been significant for example, the population in creased by 10 percent from 1980 to 1982. Most of the increase has been concentrated in the Las Vegas and Reno areas. Water demand associated with this relatively recent influx of people has caused some allocation controversies with estab lished water users and has stressed the hydrologic system in some places.
Major water issues are summarized by category below. The letters and numerical subscripts identify issues shown on the map; an asterisk instead of a numerical subscript indicates that the issue is not shown on the map.
WATER-AVAILABILITY ISSUESSurface water Ai
Competition for water from the Truckee and Carson Rivers to meet demands for agricultural, municipal, industrial, and in- stream uses is intense. Water from the Truckee River is ex ported to the Carson River basin by canal for irrigation. This and other withdrawals have affected the level of Pyramid Lake, the terminus of the Truckee River. The lake level has declined more than 80 feet since 1910. Walker Lake, the terminous of the Walker River system, is affected by upstream withdrawals; the lake level has declined about 120 feet during this century. The allocation of water from the Truckee, Carson, and Walker systems is further complicated by the fact that the rivers termi nate in Nevada but originate in California. The Las Vegas area uses about one-half of Nevada's annual allotment of 300,000 acre-feet from the Colorado River. Without some reuse of river water or water from other sources, the allotment limit may hin der development in the near future. Competition for water from the Humboldt River, Nevada's largest intrastate stream, is intense. When snowpacks are meager, demand for irrigation water greatly exceeds the supply.
Ground water A2
Competition is increasing among water users in intermontane basins where ground water is being withdrawn at rates that ex ceed natural replenishment. The competition is principally be tween existing and proposed agricultural uses and proposed mining uses. Water-level declines in such basins have been about several feet per year. Severe water-level declines have oc curred in only a few areas, which have been designated as Criti cal Basins by the Nevada State Engineer. The Critical Basins are near Reno and Carson City and in Eureka and Clark Counties. The approval of existing applications for water rights in many other basins could result in additional water-level declines. Withdrawal of ground water at rates exceeding the natural re charge has occurred in Las Vegas Valley for many years. This situation has been alleviated by using imported water from Lake Mead. However, these imports have caused several prob lems, such as waterlogging and leaching of salts from saline soils that have resulted in aquifer recharge by water of poor quality.
WATER-QUALITY ISSUESSurface water Point and nonpoint sources of pollution B,
An increasing quantity of treated sewage effluent from the Las Vegas metropolitan area flows into Lake Mead by way of Las Vegas Wash. The Wash also is being severely eroded. The treated effluent and eroded sediment are having an adverse ef fect on lake water quality. Sewage effluent and nutrients from nonpoint agricultural sources have adversely affected water quality along the Truckee and Carson Rivers. Adequate sewage treatment and flow control for various types of in- stream use also are issues, especially on the Truckee River. Lake Tahoe is one of the clearest and most beautiful lakes in North America. The esthetic beauty of the lake may be endan gered if its water quality deteriorates and causes an increase in aquatic-plant production. Sediment and nutrients are transported to Lake Tahoe from tributary streams that drain developed areas. Local governments have implemented water- quality and land-use controls to protect the lake quality.
Ground water Radioactive wastes and chemicals B2
The radioactive-waste-disposal site near Beatty is a concern because the solid low-level radioactive wastes, which were first stored there in 1963, could be mobilized and transported to ward the water table by infiltrating precipitation. The Nevada Test Site, a 1,350-square-mile area in Nye County northwest of Las Vegas, has been designated by the U.S. Department of En ergy as a candidate location for a national repository of high- level radioactive wastes. Investigations as to the geologic and hy drologic integrity of the site for waste storage are being made. Above-ground nuclear testing at the site began in January 1951, and the first underground nuclear test was in July 1957 (U.S. Department of Energy, 1983). Leakage of chemicals produced and stored from 1940 to 1970 at an industrial complex near Las Vegas has polluted shallow ground water. At least three distinct chemical plumes have been identified at the complex. The plumes contain benzene, pesticides, nitrate, chloride, and a vari ety of heavy metals.
HYDROLOGIC HAZARDS AND UNO-USE ISSUESSubsidence C i
Land subsidence and earth fissures in Las Vegas Valley are caused chiefly by compaction of dewatered sediments associ ated with ground-water withdrawal. From 1935 to 1980, the central part of the valley subsided about 5 feet (Bell, 1981). In nearby Pahrump Valley, there also is some subsidence related to ground-water pumpage.
Flooding and debris flows C.
Although the State is extremely dry, intense rains produce torrents of water and debris. Residential and industrial developments on alluvial fans in the foothill areas between the mountains and the valley floors are especially prone to flooding and debris flows.
INSTITUTIONAL AND MANAGEMENT ISSUESWater allocation D,
Several electric-power-generation plants in rural Nevada are planned. Much of the power produced may be transmitted to population centers outside the State. Water allocation and con sumption by these plants may cause conflicts with established water uses and water rights. Rapid residential development in areas without community water supplies frequently has con flicted with the concept of safe yield as administered by the State Engineer.

Nevada 167
115°
EXPLANATIONWater issues are described in text. Color identifies type of issue. Letter and number identify specific issue described in text.
WATER-AVAILABILITY ISSUES
A1 Surface water
A 2 Ground water
WATER-QUALITY ISSUES
A^~^^^B 1 Surface water Point and nonpoint sources of pollution
Nevada Test Site
9 62 Ground water Radioactive wastes and chemicals
HYDROLOGIC HAZARDS AND LAND-USE ISSUES
C Subsidence
^v 9 ^ j . _
\ \
\A2 ,C,
SUMMARY OF WATER USE IN NEVADA, IN MILLION GALLONS PER DAY. 1980
[Data rounded to two significant figures and may not add to totals because of independent rounding. Source: Solley, Chase, and Mann, 1983]
Use
Off stream use:
Rural domestic and livestock .
Self-supplied industrial: Thermoelectric power use . Other industrial uses ....
Instream use:
Withdrawals
Ground water Surface water
Fresh
93 14
530
8.1 63
710
1,200
Saline Fresh Saline
.... 140 ....
.... 9.2 2,600 ....
.... 86 0 9.0 74 0
9.0 2,900 0
Total
water
230 24
3,100
94 140
3,600
Consump tive use,
fresh water
69 15
1,500
20 58
1,700
35° -
50 1uO KILOMETERS
100 MILES i
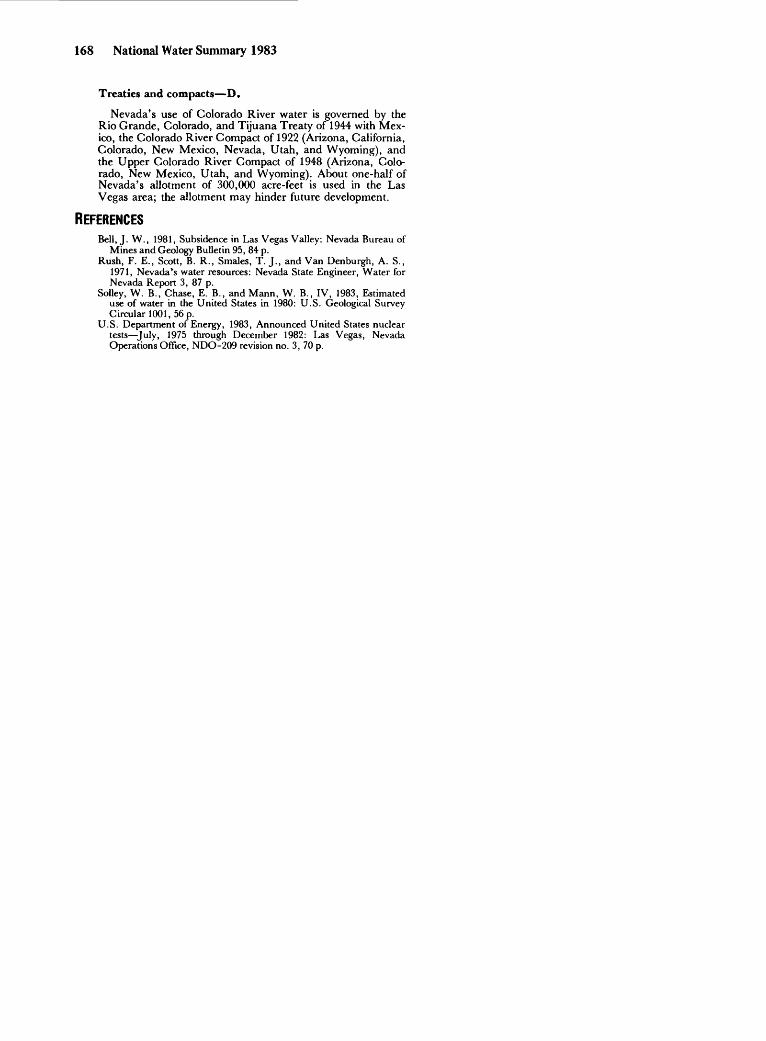
168 National Water Summary 1983
Treaties and compacts D.
Nevada's use of Colorado River water is governed by the Rio Grande, Colorado, and Tijuana Treaty of 1944 with Mex ico, the Colorado River Compact of 1922 (Arizona, California, Colorado, New Mexico, Nevada, Utah, and Wyoming), and the Upper Colorado River Compact of 1948 (Arizona, Colo rado, New Mexico, Utah, and Wyoming). About one-half of Nevada's allotment of 300,000 acre-feet is used in the Las Vegas area; the allotment may hinder future development.
REFERENCESBell, J. W., 1981, Subsidence in Las Vegas Valley: Nevada Bureau of
Mines and Geology Bulletin 95, 84 p. Rush, F. E., Scott, B. R., Smales, T. J., and Van Denburgh, A. S.,
1971, Nevada's water resources: Nevada State Engineer, Water forNevada Report 3, 87 p.
Solley, W. B., Chase, E. B., and Mann, W. B., IV, 1983, Estimateduse of water in the United States in 1980: U.S. Geological SurveyCircular 1001, 56 p.
U.S. Department of Energy, 1983, Announced United States nucleartests July, 1975 through December 1982: Las Vegas, NevadaOperations Office, NDO-209 revision no. 3, 70 p.

New Hampshire 169
NEW HAMPSHIRE WATER ISSUESAs identified by the New Hampshire-Vermont Office of
the New England District, U.S. Geological Survey in con sultation with State officials
New Hampshire is known for its many lakes, ponds, streams, and rivers in a setting of highlands and rolling lowlands. The average annual rainfall is about 43 inches, rang ing from about 40 inches in the lowlands to as much as 70 inches in the White Mountains. Annual runoff averages about 22 inches and ranges from about 18 to 50 inches. With proper development and management, water resources are adequate to meet anticipated water demands. Population is concentrated in the southern one-third of the State. One-third of the popula tion is served by public water-supply systems using surface- water sources, one-third by public systems using ground water, and one-third, by private wells. In general, the quality of surface water is suitable for recreational purposes but needs some treatment for human consumption. Ground-water qual ity generally is suitable for all uses.
Major water issues are summarized by category below. The letters and numerical subscripts identify issues shown on the map; an asterisk instead of a numerical subscript indicates that the issue is not shown on the maps.
WATER-AVAILABILITY ISSUESGround water Ai
Some of the best aquifers for public supplies in New Hamp shire are isolated deposits of glacial sands and gravels. These deposits have been mined for sand and gravel, and commonly serve as waste-disposal sites. Strong local interest in preserving the aquifers for future water supplies conflicts with interests in mining for sand and gravel. For example, a recent proposal to continue mining a large esker in the town of Ossippee has caused considerable controversy (Ferriter, 1983).
Surface and ground water A,
Water-supply shortages occasionally occur in New Hamp shire, largely because of physical limitations of the systems that affect efficient water distribution.
Surface water is used as a source of supply wholly or in part by 59 systems in the State. Of these, 46 do not meet the State's minimum standards for water treatment. There are 19 water systems that are pumping at or in excess of the estimated perennial yield of their supply. At least 15 systems are known to be in need of major repairs to their distribution systems, and at least 31 systems have inadequate storage capacity for fire protection, for meeting peak or emergency demands, or for maintaining sufficient water pressure throughout the system (New Hampshire Office of State Planning, 1982).
Several communities have recently sought additional water supplies some because of inadequate quantity, some for a supply that would require less expensive treatment, and some because of increased water demand.
WATER-QUALITY ISSUESSurface and ground water Hazardous-waste sites Bi
Of the 45 hazardous-waste sites identified in New Hamp shire (New Hampshire Water Supply Pollution Control Com mission, 1982), seven sites have been included in the U.S. Environmental Protection Agency's National Priority List (1982) of hazardous-waste sites, and three have been designated for Comprehensive Environmental Response Com pensation and Liability Act of 1980 funding. The three sites are Keefe Environmental Services hazardous-waste disposal facility in Epping, Kingston Steel Drum/Ottati and Goss bar rel reclamation facility in Kingston, and the Sylvester (Gilson Road) uncontrolled hazardous-waste site in Nashua.
Contaminants found in hazardous-waste sites are generated by industrial and domestic practices within the State, and may be derived from a variety of sources. For example, the Keefe
Environmental Services site in Epping reportedly contains 4,800 barrels of various hazardous-waste materials, approx imately 10,000 gallons of volatile organics, and 600,000 gallons of aqueous inorganic metal-plating wastes (New Hampshire Water Supply Pollution Control Commission, 1982). Most hazardous-waste sites identified in New Hampshire contain mixed hazardous wastes that include a variety of organic chemicals particularly solvents. A lesser number contain heavy-metal wastes from plating and tanning industries. At least two sites are known to contain pesticides and polychlori- nated biphenyls.
Seepage from many of these 45 identified hazardous-waste sites are known to have contaminated ground and surface water. In 1983, the town of Milford shut off 40 percent of its ground-water supply because of chemical contamination by industrial solvents (Covaleski, 1983). Trichloroethylene in concentrations that may be hazardous to health is present in the sand and gravel aquifer underlying much of Peace Air Force Base. Use of one public supply well is severely limited, and there is concern about other downgradient wells (Bradley, 1982). Uncertainties in ground-water flow direction often make it difficult to ascertain the source of contaminants found in wells; however, two private wells within a quarter mile of the hazardous-waste site in Epping were found to contain polynuclear aromatic hydrocarbons well in excess of drinking- water standards (Concord Monitor, 1982).
Surface-water quality Streams 82
The water quality of streams continues to improve as more new treatment plants are brought on line, sewers built, and treatment plants upgraded. From 1980 to 1982, water quality in 97 miles of streams was improved to where it met State water-quality standards. In the 506 miles of streams not meeting water-quality standards, the bacteriological standard is the most frequently violated, followed by the dissolved- oxygen standard. Nineteen miles of streams in the Androscog- gin River basin did not meet bacteriological standards. The 274 miles of streams that do not meet bacteriological standards in the Connecticut River basin include 85 miles of streams that do not meet the dissolved-oxygen standard. The Merrimack River basin contains 133 miles of streams that do not meet bacteriological standards and an additional 19 miles that do not meet dissolved-oxygen standards. The Piscataqua River and coastal drainage basins contain 61 miles of streams that do not meet bacteriological standards; 36 miles also do not meet dissolved-oxygen standards (New Hampshire Water Supply and Pollution Control Commission, 1982). These water- quality problems are believed to be caused by inadequately treated municipal, domestic, and industrial wastes and com bined sewer overflows. Standards other than bacteriological and dissolved-oxygen content are violated in about 5 percent of the stream reaches.
Surface-water quality Lakes B.
Although most of the State's 1,300 lakes are presently in very good condition, eutrophication and acidification threaten many of them. The process of eutrophication occurs as nutrients accumulate in a lake system and stimulate biological productivity. Nutrients from wastes and runoff from vacation homes and residential developments near lakes substantially accelerate the rate of eutrophication. Of 171 lakes studied recently (New Hampshire Water Supply and Pollution Control Commission, 1982), 22 were determined to have a high or very high priority for restoration, and 16 were listed with high or very high rankings for preservation.
Acidic precipitation B.
Acidic precipitation, with a median pH of 4.1 at Concord for samples taken in 1981 and 1982, combined with low capacity for neutralization (low alkalinity) in most New Hampshire lakes indicate a high potential for loss of biological productivity in these lakes from the results of acidification. The median alkalinity for 152 lakes studied was 5 milligrams per liter; 23 of these had alkalinity of 2 milligrams per liter or less. An addi tional 19 lakes are also known to have alkalinity of less than 2

170 National Water Summary 1983
milligrams per liter. The public is concerned about the effects of acidic precipitation on the State's water resources as shown by a 1983 referendum vote in many towns, calling for a reduc tion of sulfur emissions.
Ground water Radon and arsenic B.
Water from many bedrock wells in granite and pegmatites contains radon gas. This suspected carcinogen is absorbed by ground water during the decay of naturally occurring radioac tive elements in the bedrock and poses a potential health hazard, especially in poorly ventilated homes. When the water is used the radon gas is released to the air.
Water from about 15 percent of the wells tested for arsenic in the southern part of the State contains concentrations of arsenic in excess of the State's drinking-water standard of 50 micrograms per liter. Tests for arsenic are expensive, and many privately owned wells have not been tested. The magni tude and area! extent of the problem and the sources of arsenic and causes for its release and transport in ground water are not known.
HYDROLOGIC HAZARDS AND LAND-USE ISSUESResource development Hydroelectric power C.
The Federal Energy Regulatory Ccmmission is receiving many applications for permits for hydroelectric-power develop ment in response to the Public Utility Regulatory Policies Act of 1978 (Public Law 95-617). Many of the applications are for the rehabilitation of dams at old power and mill sites. The ef fects of potential hydroelectric-power development on fish habitat, stream navigability, and recreation are of concern to the public and State officials.
INSTITUTIONAL AND MANAGEMENT ISSUESWater allocation D,
The New Hampshire Legislature recently (1983) passed legislation to license well drillers and to develop a ground- water management program. Program plans include the op tion of establishing withdrawal permits for pumpage in excess of 50,000 gallons per day.
REFERENCESBradley, E., 1982, Trichloroethylene in the ground water supply of
Peace Air Force Base, Portsmouth, New Hampshire: U.S. Geolog ical Survey Water Resources Investigations Open-File Report 80-557, 22 p.
Covaleski, John, 1983, Milford water polluted: Manchester Union Leader, February 17, 1983.
Ferriter, Tom, 1983, Twelve thousand years in the making, twelve years to mine: New Hampshire Times, January 10, 1983.
New Hampshire Office of State Planning, 1982, Water Water Water: New Hampshire Office of State Planning Report, 43 p.
New Hampshire Water Supply and Pollution Control Commission, 1982, New Hampshire Water Quality: State of New Hampshire National Water Quality Inventory Report to Congress, June 1982, Pursuant to Sec. 305 (b) of the Clean Water Act, 53 p.
Solley, W. B., Chase, E. B., and Mann, W. B., IV, 1983, Estimated use of water in the United States in 1980: U.S. Geological Survey Circular 1001, 56 p.
U.S. Environmental Protection Agency, 1982, Amendment to National Oil and Hazardous Substance Contingency Plan; the Na tional Priorities List: Federal Register, v. 47, no. 251, December 30, 1982, p. 58476-58485.

New Hampshire 171
SUMMARY OF WATER USE IN NEW HAMPSHIRE, IN MILLION GALLONS PER DAY, 1980
[Data rounded to two significant figures and may not add to totals because of independent rounding. Source: Solley, Chase, and Mann, 1983)
Withdrawals
Use
Offstream use:
Rural domestic and livestock
Self-supplied industrial: Thermoelectric power use Other industrial uses ....
Total .........
Instream use: Hydroelectric power ......
Ground water
Fresh Saline
43 ... 9.3 ... 0 ...
0 .... 13 0
65 0
26,000
Surface water
Fresh Saline
46 .... 0.8 .... 1 .6 ....
74 620 200 0
320 620
Total fresh water
89 10
1.6
74 210
380
Consump tive use,
fresh water
4.9 1.2 1.3
0 10
17
EXPLANATIONWafer issues are described in text. Color identifies type of issue. Letter and number identify specific issue described in text.
WATER-AVAILABILITY ISSUES
O A1 Ground water
WATER-QUALITY ISSUES
BI Surface and ground water-Hazardous-waste sites
«^» B 2 Surface-water quality-Streams
25 50 MILES44
25 50 KILOMETERS
43° 30
72° 30

172 National Water Summary 1983
NEW JERSEY WATER ISSUESAs identified by the New Jersey District Office of the
U.S. Geological Survey in consultation with State officials
The hydrogeology of New Jersey includes extensive aquifers in unconsolidated Coastal Plain sediments in the south, and smaller aquifers in alluvium-filled valleys and in the underly ing fractured shale, limestone, sandstone, and conglomerate in the north. The principal source of water supply in the Coastal Plain is ground water, whereas a combination of surface and ground water is used in the northern areas. New Jersey receives an average of 44 inches of precipitation annually. This precipitation has allowed the development of a large urban and industrial area along the northeast-trending corridor and large agricultural areas in the south and northwest. More than 600 public and private-water suppliers in the State use reservoirs, rivers, wells, or water purchased from other systems to meet water demands. Approximately 75 percent of the total water supplied is provided by 25 suppliers. In the densely populated northeast, water moves between distribution systems and commonly between river basins by a complex network of inter connections. Most of these interconnections are used continu ously, but some are untested and seldom used. During the drought of the 1960's, it became evident that regional water management was needed to protect and ensure the efficient use of the available water resources. During subsequent years, the State of New Jersey developed the Statewide Water Supply Master Plan that was completed in September 1981 (New Jersey Department of Environmental Protection, 1981) and officially adopted in April 1982.
Major water issues are summarized by category below. The letters and numerical subscripts identify issues shown on the map; an asterisk instead of a numerical subscript indicates that the issue is not shown on the map.
WATER-AVAILABILITY ISSUESSurface water AI
In northern New Jersey, 12 of the 25 largest water suppliers in the State rely almost entirely on surface water, and they are able to meet existing demands only when precipitation is greater than average. Smaller suppliers in the same area, however, have surplus water. Improved interconnections be tween water systems could mitigate the shortages. The New Jersey Department of Environmental Protection (1980) esti mated a supply deficit of more than 55 million gallons per day in northern New Jersey if a drought as severe as the one in the 1960's were to recur. The Wanaque South Water Supply Res ervoir Project in northeastern New Jersey, which is being con structed, will help remedy this situation for two of the major water suppliers.
Ground water A.
In some areas of the State, ground-water resources are plentiful for example, large quantities of fresh water are stored in the Cohansey aquifer underlying the Coastal Plain (Rhodehamel, 1970). However, environmental and institu tional constraints allow only a limited export of water from the New Jersey Pinelands Preservation Area, which overlies much of the Cohansey aquifer. Areas of the Coastal Plain with water- supply shortages include the Atlantic City, Camden, and South River (Middlesex and Monmouth Counties) areas. In tensive ground-water studies of these three areas are planned under funding provided by the Water-Supply Bond Act of 1981. In northern New Jersey, many alluvial and bedrock aquifers have more potential for supply than is being used. The New Jersey Water-Supply Bond Act of 1981 provides the funds needed to define these northern aquifers in greater detail.
WATER-QUALITY ISSUESSurface water Point and nonpoint sources of pollution BI
Downstream reaches of the Raritan, Passaic, and Hacken- sack Rivers of northeastern New Jersey are polluted to varying
degrees by municipal and industrial point sources and by agricultural nonpoint sources. Inorganic and organic chemicals from industrial and agricultural sources have been detected in the rivers. Impoundments on the Raritan River, are subject to eutrophication, and the Passaic River has a large biochemical oxygen demand and large concentrations of fecal coliform bacteria. About 6 percent of the average flow in the Passaic River at Little Falls is treated sewage effluent. During droughts and periods of low streamflow, this may increase to more than 40 percent.
Surface water Estuaries B2
Maintenance of adequate fresh-water inflow is very impor tant in preserving the quality of the Delaware River Estuary. Upstream movement of saline water generally increases in the estuary as river flow decreases. Dissolved-oxygen concentra tions also vary with riverflow, generally being greatest when flow is high and least when flow is low. Hochreiter (1982) determined that the bottom sediments in the estuary are polluted with heavy metals and organic compounds. Because most of the estuary is connected to underlying aquifers, which are important sources of drinking water for southwestern New Jersey, the movement of saline water from the estuary into the underlying ground water is a concern. Along the eastern coastline of southern New Jersey, the estuaries that drain the New Jersey Pinelands and other sparsely populated areas of the Coastal Plain generally are not polluted, although some oyster and clam beds in the bays into which the estuaries flow occasionally cannot be harvested because of bacterial pol lution. In northern New Jersey, the estuaries along the eastern coast are of concern because of oil spills and sewage discharges that contribute to the occurrence of large concentrations of organic compounds and fecal coliform bacteria in these estu aries. Low dissolved-oxygen concentrations also are common.
Ground water Saline-water intrusion 83
Fresh-water aquifers in parts of seven counties (Middlesex, Atlantic, Gloucester, Monmouth, Cape May, Ocean, and Salem) are being affected by saline-water intrusion. Extensive ground-water withdrawals have caused inland movement of saline water in five coastal counties and lateral movement of saline water from the inland part of the Potomac-Raritan- Magothy aquifer system in Cumberland and Salem Counties (Fusillo and Voronin, 1981).
Acidic precipitation B4
The New Jersey Pinelands, most of which is included in the Pinelands Preservation Area, is a unique Coastal Plain ecosystem that may be susceptible to the effects of acid precipitation. The shallow ground water and streams in the region contain little alkalinity and normally are acidic. The sofls are sandy and porous and have little potential to neutralize acidic precipitation. Johnson (1979) detected a decrease in pH from 4.7 in 1963 to 4.2 in 1980 in two Pinelands streams, which may indicate that other streams, and perhaps ground water, in the New Jersey Pinelands may be becoming more acidic.
Surface and ground water Hazardous-waste sites B.
Water pollution has occurred at sites throughout the State from the disposal of municipal and industrial wastes in landfills and waste-water lagoons that have been located without proper site design and placement or that have been operated ineffec tively. Many landfills are situated in gravel pits, tidal wetlands, and quarries located on and in major aquifers or near major water supplies. As a result, New Jersey has 65 hazardous-waste sites included in the U.S. Environmental Protection Agency's National Priorities List (1982) more than any other State. Nearly 300 other abandoned hazardous- waste sites have been identified by the New Jersey Department of Environmental Protection as priority candidates for remedial actions. In 1981, New Jersey voters passed a $100-million bond issue for remedial actions at these sites and for matching funds required for the Federal program ad-

New Jersey 173
74° 30'
74°
39° 30' - 0
EXPLANATIONWater issues are described in text. Color identifies type of issue. Letter and number identify specific issue described in text.
WATER-AVAILABILITY ISSUES
A-| Surface water
Surface water Point and nonpoint
sources of pollution
62 Surface water Estuaries
63 Ground water Saline-water intrusion
Acidic precipitation (see small map)
HYDRDLDGIC HAZARDS AND LAND-USE ISSUES
C-| Flooding (see small map)
39May CH
50 HUES
I 50 KA.OMETERS
SUMMARY OF WATER USE IN NEW JERSEY. IN MILLION GALLONS PER DAY, 1980
(Data rounded to two significant figures and may not add to totals because of independent founding. Source: Solley, Chase, and Mann, 1983]
Withdrawals
Use
Off stream use:
Rural domestic and livestock
Self-supplied industrial: Thermoelectric power use . Other industrial uses ...
Total ..........
Instream use: Hydroelectric power .......
Ground water
Fresh Saline
450 .... 77 .... 40 ....
5.0 .... 150 0
730 0
0
Surface water
Fresh Saline
620 ... 1 .0 ...
15 ....
910 6,500 600 1 .000
2,100 7,500
Total fresh water
1,100 78 55
910 750
2,900
Consump tive use,
fresh water
200 17 45
70 50
380

174 National Water Summary 1983
ministered by the U.S. Environmental Protection Agency. Remedial actions at other New Jersey sites have been started through use of other funding sources.
HYDROLOGIC HAZARDS AND LAND-USE ISSUESFlooding Ci
The State is subject to periodic intense rains from storms and hurricanes. Intense rains in densely populated areas and lack of adequate flood controls result in severe flooding. Dur ing the past 20 years, severe flooding occurred in 1968, 1971, 1973, 1975, 1977, and 1979. In an attempt to decrease flood damage, development of a statewide flood-control master plan was begun in 1981. An important item in the plan will be a priority listing of basins in the State in need of flood-control measures. The U.S. Army Corps of Engineers is working on flood-control studies on the Passaic, Green Brook, Rahway, and Elizabeth Rivers in northeastern New Jersey. The State is identifying and delineating flood-prone areas to guide urban planning and to help decrease future flood damage.
Safety of dams C«
Of the 387 dams in the State inspected in accordance to pro visions in the National Dam Inspection Act of 1972 (Public Law 92-367), 184 dams had deficiencies requiring remedial measures to assure they meet safety standards; 84 of these dams are publicly owned. Typical deficiencies included inade quate spillways, sloughing and cracked masonry, or question able stability. The New Jersey Department of Environmental Protection began a dam-rehabilitation grant program under the New Jersey Natural Resources Bond Act of 1980 that pro vides 50 percent matching funds for publicly owned dams.
INSTITUTIONAL AND MANAGEMENT ISSUESWater laws D.
The New Jersey Solid Waste Management Act of 1970 pro vided the New Jersey Department of Environmental Protec tion with broad authority to regulate all types of waste. The law included the power to control hazardous-waste-facility design and operation and to operate a manifest system to track hazardous-waste shipments from the point of generation to ultimate disposal; the manifest system was implemented in 1978 (New Jersey Department of Environmental Protection, 1983a). In 1979, legislation established the New Jersey Hazardous Waste Strike Force. The functions of the Strike Force include regulation of waste-disposal operators and the oversight of monitoring and closure of selected landfills. The New Jersey Major Hazardous Waste Facilities Siting Act of 1981 provides a mechanism to site and construct major offsite commercial hazardous-waste treatment and disposal facilities. The law established the Hazardous Waste Facilities Siting Commission and the Hazardous Waste Advisory Council that will analyze New Jersey's hazardous-waste-treatment needs and will establish criteria to evaluate sites. The law also provides that the New Jersey Department of Environmental Protection will regulate the construction and monitoring of these disposal facilities (Howell and San Filippo, 1982). The criteria for siting new hazardous-waste-disposal facilities include protection of the population; structural stability; pro tection of surface and ground water, air quality, and environ mentally sensitive areas; and the safe transportation of wastes (New Jersey Department of Environmental Protection, 1983b).
Water allocation D.
As part of a comprehensive statewide water-management plan, the State Legislature enacted the New Jersey Water Sup ply Management Act of 1981, which replaced and consolidated into a single law several allocation statutes affecting surface- and ground-water diversions. The law strengthened the water-
allocation and diversion-permitting programs administered by the New Jersey Department of Environmental Protection. The system requires the submission of engineering, hydrologic, and geologic data on the planned diversion as a basis for granting permits.
Financing the infrastructure D.
In November 1981, the public approved a $350-million Water-Supply Bond Issue. This act, administered by the New Jersey Department of Environmental Protection, provides funding for (1) refurbishing and consolidating existing water- supply systems including all State-owned and operated facili ties, (2) constructing and improving surface-water storage and system interconnections, (3) restoring or replacing polluted ground-water supply systems, and (4) starting water- management feasibility studies and ground-water studies to develop additional surface- and ground-water supplies. The New Jersey Spill Commission and Control Act of 1977 estab lished requirements that all spills or other discharges of hazard ous substances be reported to the New Jersey Department of Environmental Protection. This act includes a mechanism to provide funds for the cleanup and containment of spills and compensation to persons for damages (New Jersey Department of Environmental Protection, 1983a). In November 1981, the public approved the New Jersey Hazardous Discharge Bond Act, which authorized $100 million in State bonds for the iden tification, cleanup, and removal of hazardous discharges.
River-system management D.
Water use in the Delaware River basin affects the water resources of Delaware, New Jersey, New York, and Penn sylvania. The Delaware River Basin Commission (composed of members from these States and the Federal Government) provides interstate water management on issues affecting the water resources in the Delaware River basin. The Delaware River Master is charged with the responsibility of assuring compliance with the terms of the Supreme Court decree that apportions the water resources of the basin.
REFERENCESFusillo, T. V., and Voronin, L. M., 1981, Water-quality data for the
Potomac-Raritan-Magothy aquifer system, Trenton to Pennsville, New Jersey, 1980: U.S. Geological Survey Open-File Report 81-814, 33 p.
Hochreiter, J. J., Jr., 1982, Chemical-quality reconnaissance of the water and surficial bed material in the Delaware River Estuary and adjacent New Jersey tributaries: U.S. Geological Survey Water- Resources Investigations 82-36, 41 p.
Howell, Jennifer, and San Filippo, Anthony, 1982, A citizen's guide to the Major Hazardous Waste Facilities Siting Act: Mendham, N.J., Association of New Jersey Environmental Commission, 36 p.
Johnson, A. H., 1979, Acidification of headwater streams in the New Jersey Pine Barrens: Journal of Environmental Quality, v. 8, p. 383-386.
New Jersey Department of Environmental Protection, 1980, Sum mary of consultants' findings for the New Jersey Statewide Water Supply Plan: Trenton, N.J., 41 p.
____1981, The New Jersey Statewide Water Supply Master Plan: Trenton, N.J., 141 p.
_1983a, Hazardous waste management in New Jersey A guideto rules, programs and officials in New Jersey's Department of Environmental Protection: Trenton, N.J., 17 p.
_1983b, Basis and background document for New Jersey majorcommercial hazardous waste facility siting criteria: Trenton, NJ., 31 p.
Rhodehamel, E. C., 1970, A hydrologic analysis of the New Jersey Pine Barrens region: New Jersey Department of Environmental Protection Water Resources Circular 22, 35 p.
Solley, W. B., Chase, E. B., and Mann, W. E., IV, 1983, Estimated use of water in the United States in 1980: U.S. Geological Survey Circular 1001, 56 p.
U.S. Environmental Protection Agency, 1982, Amendment to National Oil and Hazardous Substance Contingency Plan; the Na tional Priorities List: Federal Register, v. 47, no. 251, December 30, 1982, p. 58476-58485.

New Mexico 175
NEW MEXICO WATER ISSUESAs identified by the New Mexico District Office of the
U.S. Geological Survey in consultation with State officials
Major water issues in New Mexico reflect concern about the availability and quality of the State's limited water resources. Average annual rainfall ranges from about 6 inches in the arid basins to 35 inches in the high mountain areas. At present, water supplies generally are adequate in much of the State, but a number of communities are concerned about the availability of water to meet future demands. Ground water, the principal source of water in the State for domestic and municipal sup plies, is available in thick alluvial deposits (as in the Rio Grande Valley), in consolidated sedimentary rocks in struc tural basins (as in the San Juan Basin), and in semicon- solidated sediments (as in the High Plains in eastern New Mexico). The major perennial streams in New Mexico include the San Juan, North Canadian, South Canadian, Gila, San Francisco, and Pecos Rivers and the Rio Grande. Surface- water supplies are subject to climatological variations. During years of abundant snowfall, the mountainous parts of the State have sufficient supply, but the distribution of adequate quan tities of runoff to the central and southern parts of the State for agricultural, irrigation, and municipal uses is a concern. Dur ing years of deficient snowfall, supplemental water is obtained from ground water. Because of the variability of surface-water supplies, New Mexico water law is based on a system of prior ity water rights. The law recognizes the interconnection of ground and surface water and places the allocation of water resources under the jurisdiction of the State Engineer. Virtu ally all surface waters in New Mexico are appropriated.
Major water issues are summarized by category below. The letters and numerical subscripts identify issues shown on the map; an asterisk instead of a numerical subscript indicates that the issue is not shown on the map.
WATER-AVAILABILITY ISSUESGround water A!
Ground-water levels in the High Plains aquifer in eastern New Mexico are declining because of large withdrawals for ir rigation. Declines of as much as 100 feet have occurred in part of Curry County. In the Gallup-Grants-Acoma-Laguna area of west-central New Mexico, development by municipal, domestic, industrial, and agricultural water users is increasing. The availability of sufficient water supplies to meet the require ments of users is a concern in this area. Other areas where ground-water levels are declining include the Mimbres Basin in the southwest, the San Juan Basin in the northwest, the Estancia Basin in the central part of the State, and the Albuquerque-Belen and Santa Fe Basins in north-central New Mexico.
Surface water A.
Reservoirs store snowmelt runoff for distribution to the cen tral and southern cities and agricultural valleys, but capacities of stream channels to transport reservoir releases are limited. Constant maintenance and improvement of channels are re quired to convey surface water needed during the growing season.
WATER-QUALITY ISSUESGround water Hazardous-waste sites BI
The San Jose well field, which is used for municipal water supplies in the Albuquerque South Valley, has been included in the U.S. Environmental Protection Agency's National Priorities List (1982) because of ground-water pollution by organic chemicals. The extent of the pollution, the hydrology of the area, effects of nearby pumping, direction of ground-
water flow, and interaction with the Rio Grande have not been completely determined. Additional hazardous-waste sites in New Mexico included in the U.S. Environmental Protection Agency's list are a tailings pond at a uranium mine on the Puerco River near Gallup, a railroad refueling site at Clovis, and a uranium-tailings disposal area near Grants.
Ground water Nitrate B2
Increased nitrate concentrations have been detected in well water in localized areas. Current regulations regarding spacing and design of septic systems in New Mexico are based on the assumed capacity of various types of soils to remove nitrogen compounds from septic-system effluent. The ability of soils in the densely populated middle Rio Grande Valley, which in cludes the Albuquerque metropolitan area, to remove nitrogen compounds from septic-system effluent and the effect of septic- system effluent on the quality of ground water are not well known.
Ground water Radioactive wastes B3
The U.S. Department of Energy has begun construction of an underground repository to store low-level radioactive wastes at the Waste Isolation Pilot Project site east of Carlsbad in Eddy County. There are political, legal, and technical con cerns about the repository including the potential for leakage of radioactive wastes into the ground-water system.
INSTITUTIONAL AND MANAGEMENT ISSUESWater-resources management Ground water D,
Ground- and surface-water development in the Rio Grande, lower Rio Grande, Roswell, Mimbres, Tularosa, Tucumcari, Estancia, Hueco, and San Juan ground-water basins and Lea County is being monitored. Interest, however, is not limited to these areas. As of September 1982, 31 Underground-Water Basins have been "declared" by the State Engineer (Rey nolds, 1983) so that water-resources development in the basins can be controlled. New Mexico statutes provide, in Section 72-2-1, that the State Engineer "... has general supervision of waters of the state and of the measurement, appropriation, distribution thereof, and such other duties as required . . . ." Section 72-2-9 empowers the State Engineer to supervise the allocation of the water "... according to licenses issued by him and his predecessors and the adjudications of the courts."
Treaties and compacts D,
The allocation of flow in the principal rivers of New Mexico is affected by three treaties and eight interstate compacts. The treaties are the Rio Grande Convention of 1906, the Rio Grande Rectification Convention of 1933, and the Rio Grande, Colorado, and Tijuana Treaty of 1944 with Mexico. The compacts are the Colorado River Compact of 1922 (Ari zona, California, Colorado, Nevada, New Mexico, Utah, and Wyoming); the Upper Colorado River Basin Compact of 1948 (Arizona, Colorado, New Mexico, Utah, and Wyoming); the Rio Grande Compact of 1938 (Colorado, New Mexico, and Texas); the La Plata River Compact of 1922, the Amended Costilla Creek Compact of 1963, and the Animas-La Plata Compact of 1966 (Colorado and New Mexico); the Canadian River Compact of 1950 (New Mexico, Oklahoma, and Texas); and the Pecos River Compact of 1948 (New Mexico and Texas). The effects of potential ground-water development in the Mesilla ground-water basin in New Mexico by the City of El Paso, Texas, on flow in the Rio Grande (Rio Grande Com pact) and existing water users in New Mexico are of concern to the New Mexico State Engineer. Court action regarding this proposal to transfer ground water from New Mexico to Texas is in progress. In the Pecos River basin, court proceedings are continuing in an effort to resolve a controversy in New Mexico about the effects of current ground- and surface-water use in

176 National Water Summary 1983
New Mexico on intrastate water rights and a controversy be tween New Mexico and Texas about delivery of water under the terms of the Pecos River Compact.
Indian water rights D.
Quantification of Indian water rights is a major concern. Numerous legal briefs addressing the adjudication of these rights either have been filed or are being prepared. Litigation is proceeding in the landmark Aamodt case between Indian in terests and the State.
REFERENCESReynolds, S. E., 1983, Annual report of the State Engineer of New
Mexico for the 70th Fiscal Year, July 1, 1981 to June 30, 1982: Santa Fe, 91 p.
Solley, W. B., Chase, E. B., and Mann, W. B., IV, 1983, Estimated use of water in the United States in 1980: U.S. Geological Survey Circular 1001, 56 p.
U.S. Environmental Protection Agency, 1982, Amendment to National Oil and Hazardous Substance Contingency Plan; the Na tional Priorities List: Federal Register, v. 47, no. 251, December 30, 1982, p. 58476-58485.

New Mexico 177
SAN. M ! G U
I GAUL.UP-GRANTS- -
LINCOLN I
EXPLANATION
Water issues are 'described in text. Color identifies type of issue.
'*\ Letter and number identify specific issue described in text.
WATER-AVAILABILITY ISSUES
| 'J A-j Ground water
WATER-QUALITY ISSUES
tv^^j p Ground water-f x i ' Hazardous-waste sites
I | Ground water- I I B 2 Nitrate
B 3 Ground water- Radioactive wastes
INSTITUTIONAL AND MANAGEMENT ISSUES
[ | n Water-resources I I ' management-
Ground water (see smalt map)
0I
01
50
50 100 MILES
100 KILOMETERS
SUMMARY OF WATER USE IN NEW MEXICO. IN MILLION GALLONS PER DAY, 1980
[Data rounded to two significant figures and may not add to totals because of independent founding. Source: Solley,Chese,and Mann, 1983] ">
Withdrawals
Use
Off stream use:
Rural domestic and livestock . .
Self -supplied industrial: Thermoelectric power use .
Total ..........
Instream use: Hydroelectric power . . ...
Ground water
Fresh Saline
190 42 ....
1 ,600 ....
11 .... 6.6 0.9
1^00 0.9
430
Surface water
Fresh Saline
21 .... 11 ....
2,000
54 0 0.1 0
2,100 0
Totel fresh water
210 52
3,600
65 6.6
3,900
Consump tive use,
fresh water
99 25
1,700
55 4.2
1,900

178 National Water Summary 1983
NEW YORK WATER ISSUESAs identified by the New York District Office of the U.S.
Geological Survey in consultation with State officials.
New York is a water-rich State, but its principal streams and populated areas tend to be concentrated over aquifers suscepti ble to pollution. Precipitation in New York ranges from about 30 inches along the northern lowlands to about 60 inches in the Cat skill Mountains. Large areas of the entire State are underlain by as much as several hundred feet of glacial drift. The drift consists of permeable material that enhances natural recharge to aquifers and pollution of ground water by man- made wastes. Population is concentrated in the southeast (New York City and Long Island) and in the northwest (Rochester and Buffalo). The terrain, which includes mountains, pla teaus, and broad lowlands, has affected development in areas north of New York City; communities and major transporta tion corridors tend to be concentrated along valleys and other low-lying areas. Surface water is the source of freshwater for more than 11 million people; nearly 6 million people use ground water as their source of freshwater. One-half of the ground water used in the State is used on Long Island.
Major water issues are summarized by category below. The letters and numerical subscripts identify issues shown on the map; an asterisk instead of a numerical subscript indicates that the issue is not shown on the map.
WATER-AVAILABILITY ISSUESGround water Ai
Water levels in aquifers may decline as much as 18 feet and low flows in streams may be decreased by 90 percent in south ern Nassau County on Long Island as a result of large ground- water pumpage and an extensive sewer system that decreases ground-water recharge (Sulam, 1979; Reilly and others, 1983). Extensive sewer construction was started to halt pollu tion of ground water by septic systems; however, the sewer systems also result in a net loss of recharge to the aquifer system. Artificial recharge of water, including storm-water runoff, is one means of counteracting these effects (Aronson, 1978). In the northernmost part of the State, aquifers supply ground water to almost a million people. In southern New York, withdrawal of ground water from the Ramapo-Mahwah (Orange County), Jamestown (Chautauqua County), and South Fallsburgh-Woodbourne (Sullivan County) aquifers is causing increased seasonal water-level fluctuations and decreased streamflow during periods of low flow (Waller and Finch, 1982).
Surface water A.
In southeastern New York, the drought of 1980-82 had a large effect on water supplies for New York City and other communities dependent on the city's reservoir system in the Hudson and Delaware River basins. Development of addi tional supplies, more effective water-conservation programs, drought-contingency plans, and other actions are needed to assure adequate water supplies during droughts (New York Department of Environmental Conservation, written com- mun., 1983).
WATER-QUALITY ISSUESSurface water Bacteria BI
Storm-water runoff contributes much of the bacteria enter ing Long Island's tidewaters and has resulted in bans on shellfishing and prohibition of swimming at beaches (Long Island Regional Planning Board, 1978). Water-quality stand ards for bacteria are not always met in several bays on Long Island.
Ground water Saline-water intrusion B2
Naturally occurring saline water is present at relatively shallow depth in central and western New York. Recent data
collected by the U.S. Geological Survey in western New York indicate large barium concentrations have been detected in ground-water supplies in Cattaraugus County, and especially in the water supply of the Cattaraugus Indian Reservation, where brine containing barium moves from bedrock into shallow unconsolidated aquifers. The rate of saline-water in trusion into Long Island's aquifers is slowly increasing. Periods of large pumpage in western Long Island have induced saline-water intrusion and have resulted in the temporary cessation of pumping for public supplies in 1947 and 1974. At the eastern end of Long Island, increasing ground-water use from shallow freshwater lenses has increased chloride concen trations (Suffolk County Water Authority, oral commun., 1983).
Ground water Radioactive-waste sites B3
The West Valley Nuclear Fuels reprocessing plant and associated burial grounds in western New York have been inactive for a decade. Although studies show that no radio- nuclides from low-level wastes have moved from the site into the local water resources, proposed plans to begin solidification of 600,000 gallons of high-level radioactive wastes have in creased concerns about possible movement of radionuclides from the site. Tritium, strontium, and cesium are present in the ground-water supply of the Brookhaven National Labora tory at Upton on Long Island. Possible movement of these radionuclides from the site is a concern.
Eutrophication B+
A recent study concluded that Irondequoit Bay on Lake Ontario in Monroe County has been eutrophic for decades, largely because of nutrients from sewage and combined-sewer overflows from urban areas. Diversion of sewage and a decrease of combined-sewer overflows have not alleviated the eutrophication to the extent expected. Recycling of nutrients in the bay also is a concern (O Brien and Gere, 1983). Other coastal bays along Lakes Ontario and Champlain are moderately eutrophic. Of the 4,000 lakes in New York, 94 per cent have accelerated eutrophication rates caused by increased nutrient concentrations (New York State Department of Envi ronmental Conservation, written commun., 1983).
Acidic precipitation B5
Acid precipitation is affecting the quality of surface-water resources in the eastern part of the State, principally in the Adirondacks and the Catskills. Effects of increased acidity on aquatic systems include fish kills, increased transport of heavy metals, and acidification of lakes (Central Electricity Research Laboratories, 1979).
Surface water Point and nonpoint sources of pollution B.
Issues of concern for the New York Department of Environ mental Conservation are (1) about 12 percent of the 70,000 miles of New York's streams do not meet State water-quality standards, (2) 7 percent of New York's potable surface waters are being affected by nonpoint sources of pollution, (3) runoff from urban areas typically contains petroleum derivatives, heavy metals, lawn fertilizers, and pesticides, (4) runoff from agricultural areas typically contains pesticides and fertilizers, (5) runoff and waste discharges from industrial areas typically contain organic compounds and heavy metals, and (6) the water in about one-third of the major river basins has been polluted locally because of discharge of hazardous wastes (New York State Department of Environmental Conservation, writ ten commun., 1983). For example, industrial discharges of polychlorinated biphenyls have polluted parts of the Hudson River. Discharge of inadequately treated municipal wastes and raw sewage also are causing pollution in some river basins.
Ground water Point and nonpoint sources of pollution B.
There is concern that pollution of water in shallow aquifers is occurring at many places in the State. The most serious con-
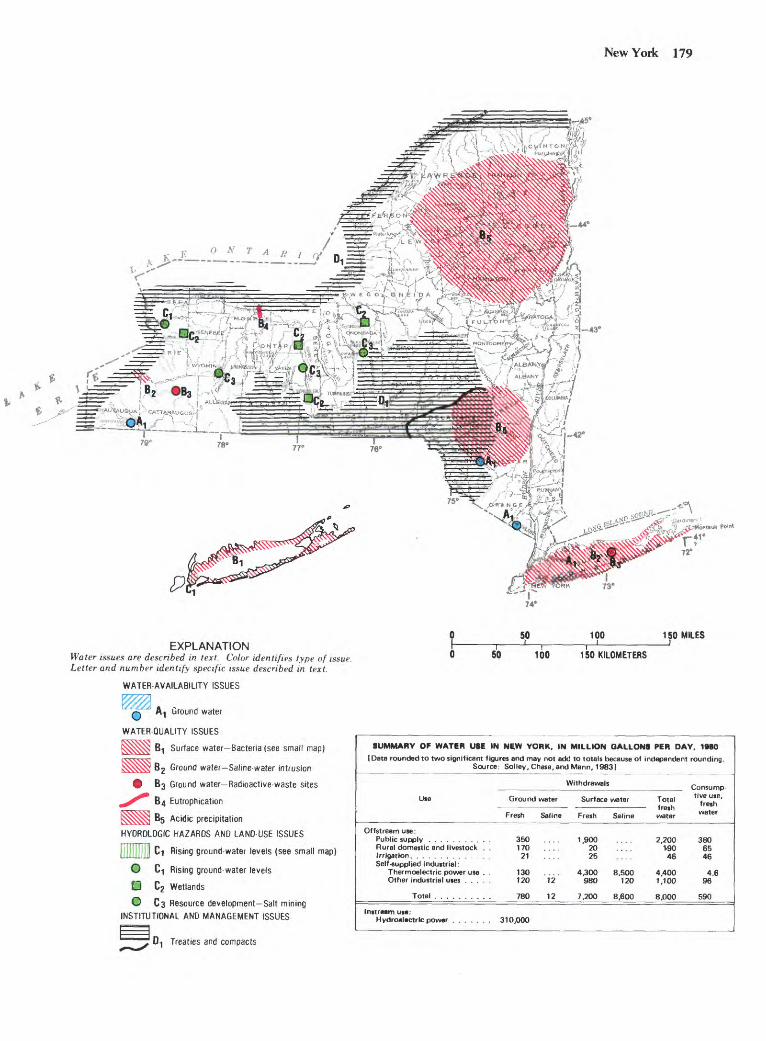
New York 179
t-43"
*^ -i>-mi^eir5" "V p4-*N9G^7^y*~|
73
EXPLANATIONWater issues are described in text. Color identifies type of issue. Letter and number identify specific issue described in text.
WATER-AVAILABILITY ISSUES
Ground water
WATER-QUALITY ISSUES
B1 Surface water -Bacteria (see small map)
B 2 Ground water-Saline-water intrusion
63 Ground water Radioactive-waste sites
64 Eutrophication
65 Acidic precipitation
HYDRDLDGIC HAZARDS AND LAND-USE ISSUES
Illlllllll C-| Rising ground-water levels (see small map)
O C-| Rising ground-water levels
Q C2 Wetlands
O 63 Resource development Salt mining INSTITUTIONAL AND MANAGEMENT ISSUES
Treaties and compacts
0
0
-Ai^*-*^" |^
74'
50 100i i50 100 150 KILOMETERS
150 MILES
SUMMARY OF WATER USE IN NE.W YORK, IN MILLION GALLONS PER DAY, 1980
[Data rounded to two significant figures and may not add to totals because of independent Founding. Source: Solley, Chase, and Mann, 1983]
Withdrawals
Use
Offstream use:
Rural domestic and livestock .
Self -supplied industrial: Thermoelectric power use . Other industrial uses . . .
Total .........
Inttrnm un:
Ground water
Fresh Saline
350 .... 170 ....
21 ....
130 .... 120 12
780 12
310,000
Surface water
Fresh Saline
1 ,900 .... 20 .... 25
4,300 8,500 980 120
7,200 8,600
Total fresh water
2,200 190 46
4,400 1,100
8,000
Consump tive use,
fresh water
380 65 46
4.6 96
590

180 National Water Summary 1983
cern is on Long Island where septic systems and extensive use of agricultural and lawn fertilizers locally have resulted in chloride concentrations of 300 milligrams per liter and nitrate- nitrogen concentrations of 22 milligrams per liter in ground water (Katz and others, 1977). Application of the pesticide aldicarb on potato farms, extensive use of other pesticides, discharge of industrial waste on the land surface, and leachate from landfills (Kimmel and Braids, 1980) all have contributed to pollution in the shallow aquifer on Long Island. Flow of polluted water from the shallow aquifer to the underlying deeper aquifer under Nassau and Suffolk Counties also is a major concern on Long Island. Chloride and nitrate concen trations in ground water have been increasing in central New York (Buller, 1978; Buller and others, 1978). There is concern that chloride from highway deicing salts commonly pollutes the water in local shallow aquifers. Ground-water pollution from improper use of chemicals and from leaks and spills from chemical storage tanks also is a concern throughout the State.
Ground water Petroleum leaks and spills B.
During 1979, gasoline was reported in the water supply of 187 privately owned wells in 49 of 62 counties surveyed by the State. Service stations were the most common sources of gaso line leakage. The New York Department of Environmental Conservation, which has documented oil and gasoline leaks and spills since 1973, concludes that 20 percent of under ground tanks storing petroleum products leak and are a poten tial source of pollution. On Long Island, these leaks pose a potential threat to the quality of parts of the sole-source aquifer in Nassau and Suffolk Counties. In counties in western New York where oil and gas are produced, pollution of ground water by oil and brine is common (Grain, 1969).
Ground water Hazardous-waste sites B.
About 1.4 million tons of hazardous wastes are generated in New York each year (New York Department of Environmental Conservation, 1982). Ground-water pollution by organic com pounds resulted in cessation of pumping of 78 public-supply wells during 1976-81, 65 of which are on Long Island; pump ing of 27 of the 78 wells has resumed (New York State Depart ment of Health, written commun., 1981). Most pumping prohibitions were related to improper storage and use of hazardous materials (New York State Department of En vironmental Conservation, written commun., 1983). New York has identified nearly 700 sites where industrial wastes are known or thought to have been disposed (Pishdadazar and Moghissi, 1980). Of these, 26 sites have been included in the U.S. Environmental Protection Agency's National Priorities List (1982) of hazardous-waste sites.
HYDROLOGIC HAZARDS AND UNO-USE ISSUESRising ground-water levels Ci
Rising ground-water levels after cessation of long-term pumping has flooded basements and subways in parts of Kings County (Brooklyn) on Long Island (Soren, 1976) and base ments in parts of Erie County.
Wetlands C2
A regional landfill in Seneca County produces leachate runoff containing heavy metals (plating wastes) that may adversely effect the ecological integrity of the Montezuma Wildlife Refuge. Urbanization may be altering the hydrologic and biologic systems of Clay Marsh north of Syracuse by changing the magnitude and timing of water flow to the marsh. Rising ground-water levels and increased inflow resulting from lake-level regulation have caused flooding of wetlands at the north and south ends of Seneca Lake. In northeastern Erie County, some wetlands have dried up and subsided for un known reasons.
Resource development Salt mining C3
Salt-mining in three areas in western New York has caused local contamination of aquifers.
Flooding C.
Many urban areas are subject to flooding from intensive precipitation, snowmelt, and ice jams. Flooding especially is severe in the southern and southeastern parts of the State that receive intensive precipitation from coastal storms and in nar row valleys and flood plains in other parts of the State where topography constricts floods to the relatively densely populated valleys and flood plains. Flood-control and shore-protection facilities are required to mitigate flood damages and to provide protection from beach and shore erosion. A proposal to build a dam on the Richelieu River along the New York-Vermont- Canada border to control outflow from Lake Champlain is controversial. Canadian officials believe the dam will be beneficial because it would control flooding along the river in Canada. New York and Vermont officials are concerned that the regulation of levels in Lake Champlain would result in flood damage to lakeshore property and adversely affect wetlands along the shores of the lake.
INSTITUTIONAL AND MANAGEMENT ISSUESTreaties and compacts D,
New York participates in three compact commissions: The Delaware River Basin Commission (Delaware, New Jersey, New York, Pennsylvania, and the Federal Government), the Great Lakes Commission (Illinois, Indiana, Michigan, Min nesota, New York, Ohio, Pennsylvania, and Wisconsin), and the Susquehanna River Basin (Commission (Maryland, New York, and Pennsylvania). The State also is actively involved with the International Joint Commission (United States and Canada). In the Great Lakes area, consumptive water use from basin diversions and regulation of lake levels are continu ing water-management issues. Consumptive use in the Great Lakes basin was predicted to increase from about 5,000 cubic feet per second during 1975 to 16,000 to 37,000 cubic feet per second by the year 2035 (International Great Lakes Diversion and Consumptive Uses Study Board, 1981). There are con flicting interests in higher and lower lake levels on Lake Cham plain that complicate lake-regulation efforts.
Water allocation D.
There are 55 reservoirs in New York in the Black, St. Lawrence, Seneca-Oneida-Oswego, Upper Hudson, Mo hawk, and Allegheny River basins that have the potential for providing water for several uses. Much of the 5 million acre- feet stored in these reservoirs was allocated years ago for single- purpose objectives. Reallocation of water stored in these reser voirs could have a major effect on the water supply of the State (New York State Department of Environmental Conservation, written commun., 1983).
Financing the infrastructure D.
Many water and sewer systems, flood- and shore-protection facilities, and impoundments in the State are obsolete and deteriorating. Statewide water-supply needs are estimated to cost as much as $20 billion, including $6 billion to $9 billion for rehabilitation of water treatment (drinking water) plants and $3 billion to $11 billion for a third New York City water tun nel. The construction and rehabilitation of sewers in the State are estimated to cost $18 billion. Additional expenses for flood walls, levees, jetties, and groins, as well as the refurbishment of 200 hazardous dams, are not yet determined (New York De partment of Environmental Conservation, written commun., 1983).

New York 181
REFERENCESAronson, D. A., 1978, Artificial recharge on Long Island: Long
Island Water Resources Bulletin 9, 25 p.Buller, William, 1978, Hydrologic appraisal of the water resources of
the Homer-Preble valley, New York: U.S. Geological Survey Water-Resources Investigations Open-File Report 78-94, 31 p.
Buller, William, Nichols, W. J., and Harsh, J. F., 1978, Quality and movement of ground water in the Otter Creek-Dry Creek basin, Cortland County, New York: U.S. Geological Survey Water- Resources Investigations Open-File Report 78-3, 63 p.
Central Electricity Research Laboratories, 1979, Ecological effects of acid precipitation: Electric Power Research Institute Publication EA-79-6-LD.
Grain, L. J., 1969, Ground-water pollution from natural gas and oil production in New York: New York State Water Resources Com mission Report of Investigation RI-5, 15 p.
International Great Lakes Diversion and Consumptive Uses Study Board, 1981, Great Lakes diversion and consumptive uses report to the International Joint Commission: Ottawa and Washington, D.C., International Great Lakes Joint Commission, 200 p.
Katz, B. G., Ragone, S. E., and Harr, C. A., 1977, Nitrogen in water in Nassau and Suffolk Counties, Long Island, New York in 1971: U.S. Geological Survey Open-File Report 77-433, 46 p.
Kimmel, G. E., and Braids, O. C., 1980, Leachate plumes in ground water from Babylon and Islip landfills, Long Island, New York: U.S. Geological Survey Professional Paper 1085, 38 p.
Long Island Regional Planning Board, 1978, Long Island compre hensive waste treatment management plan, Volume 1 Summary plan: Hauppauge, N.Y., Nassau-Suffolk Regional Planning Board, 247 p.
New York State Department of Environmental Conservation, 1982, A challenge for the 80's: New York State Department of Environment Conservation annual report, 93 p.
O'Brien and Gere, 1983, Nationwide urban runoff program Irondequoit basin study: Rochester, N.Y., Final report to Monroe County, 164 p. plus appendices.
Pishdadazar, H., and Moghissi, A. A., 1980, Hazardous waste sites in the United States: Nuclear and Chemical Waste Management, v. 1, nos. 3 and 4, [New York], p. 243-256.
Reilly, T. E., Buxton, H. T., and others, 1983, Effects of sanitary sewers on ground-water levels and streams in Nassau and Suffolk Counties, New York: U.S. Geological Survey Water-Resources In vestigations Open-File Report 82-4245, 45 p.
Soren, Julian, 1976, Basement flooding and foundation damage from water-table rise in the east New York section of Brooklyn, Long Island, New York: U.S. Geological Survey Water-Resources In vestigations 76-95, 14 p.
Solley, W. B., Chase, E. B., and Mann, W. B., IV, 1983, Estimated use of water in the United States in 1980: U.S. Geological Survey Circular 1001,56 p.
Sulam, D. J., 1979, Analysis of changes in ground-water levels in a sewered and an unsewered area of Nassau County, Long Island, New York: Ground Water, v. 17, no. 5, p. 446-455.
U.S. Environmental Protection Agency, 1982, Amendment to National Oil and Hazardous Substance Contingency Plan; the Na tional Priorities List: Federal Register, v. 47, no. 251, December 30, 1982, p. 58476-58485.
Waller, R. M., and Finch, A. J., 1982, Atlas of eleven selected aquifers in New York: U.S. Geological Survey Water-Resources Investigations Open-File Report 82-553, 255 p.

182 National Water Summary 1983
NORTH CAROLINA WATER ISSUESAs identified by the North Carolina District Office of the
U.S. Geological Survey in consultation with State officials
North Carolina has a diverse hydrologic setting within its three physiographic provinces Blue Ridge, Piedmont, and Coastal Plain. Annual precipitation is about 50 inches in most of the State except in the southern Blue Ridge where precipita tion reaches as much as 80 inches annually (Eder, and others, 1983). Although water supplies have been adequate in the past, increasing development is beginning to make water availability an issue in many parts of the State. In the Blue Ridge, the water supply for most municipalities is obtained from surface-water sources, but most rural supply is from ground water. In the Piedmont, most communities rely on sur face water for water supply; however, because rapid popula tion growth and industrialization have increased the demand for water and waste discharges to streams, some are now con sidering ground water as a supplementary source. In the Coastal Plain, most communities traditionally have used ground water as a source of water supply.
Major water issues are summarized by category below. The letters and numerical subscripts identify issues shown on the map; an asterisk instead of a numerical subscript indicates that the issue is not shown on the map.
WATER-AVAILABILITY ISSUESSurface water Ai
Some municipalities in the Piedmont, notably Gary, Chapel Hill, and Greensboro, are approaching the limits of their pres ent surface-water supplies. In addition, the city of Asheville in the Blue Ridge has a surface-water shortage. Construction of new surface-water reservoirs, interbasin transfer of water, and development of ground water are some of the options being considered for new or supplemental supplies.
Ground water A?
Ground water is the major source for municipal, rural, and industrial water supply in the Coastal Plain. Withdrawal of water from a major aquifer is causing declining water levels and is increasing the potential for saline-water intrusion. For example, withdrawals at Franklin, Va., from the lower Creta ceous aquifer have caused declining water levels that extend into North Carolina (North Carolina-Virginia Water Re sources Management Committee, 1982). Water-level declines also have occurred in the Castle Hayne aquifer because of dewatering of a phosphate mine in Beaufort County (North Carolina Department of Natural and Economic Resources, 1976), and in the Cretaceous aquifer in response to with drawals by municipalities and industries in the central Coastal Plain.
WATER-QUALITY ISSUESSurface water Point and nonpoint sources of pollution Bi
The North Carolina Department of Natural Resources and Community Development (1982b) listed 259 stream segments in the State as degraded (failed to meet at least one standard of the State classification) as of the end of 1981. Urban stream water in a number of cities is polluted by point sources such as landfills and nonpoint sources such as street runoff. Concen trations of oil and grease, fecal coliform bacteria, heavy metals, and biochemical and chemical oxygen demand have increased in Nasty Branch and Sweeten Creek near the city of Asheville. Animal life, including invertebrates, is virtually absent from these streams (Duda and others, 1982). Pollution also occurs in streams in and near the cities of Asheboro, Brevard, Charlotte, Dunn, Goldsboro, Greenville, Raleigh, Winston-Salem, Morgan ton, and Wilson.
Ground water Saline-water intrusion B2
Large areas of cropland in the Coastal Plain of eastern North Carolina have been damaged by tide-induced movement of saline water from drainage canals on former marsh lands into the ground-water system. Parts of Tyrrell, Dare, Hyde, Beau fort, Pamlico, and Carteret Counties are affected, and some agricultural lands have been abandoned.
Eutrophication Bj
The downstream reach of the Chowan River and adjacent parts of Albemarle Sound have had large surface blooms of blue-green algae at irregular intervals since about 1970. Chlorophyll a concentrations also have been increasing gradually. The river is now classified by the State as nutrient sensitive. Similar eutrophication is developing in the Neuse and Pamlico River Estuaries. Of the 64 other publicly owned lakes, 24 were found to be eutrophic in the North Carolina Clean Lakes Classification Survey (North Carolina Depart ment of Natural Resources and Community Development, 1982a).
Ground water Hazardous-waste sites and landfills B.
The North Carolina Department of Human Resources has identified more than 600 active and abandoned waste sites in the State that are to be checked for hazardous substances; of these sites, three are included in the U.S. Environmental Pro tection Agency's National Priorities List (1982). North Carolina has 26 active hazardous-waste impoundments and approximately 160 municipal landfills. None of the data available to date indicate extensive areal pollution of ground water.
Acidic precipitation B.
Precipitation pH values across the State usually range be tween 4 and 5, but several measurements of less than 4 have been recorded (National Atmospheric Deposition Program, 1980). In a 2-year study at two locations in Winston-Salem, the pH value of precipitation was found to be approximately 3.8 (Forsyth County Environmental Affairs Department, 1982). The effects of acid precipitation on water quality are largely unknown, but decreased pH, decreased biological pro ductivity, mobilization of heavy metals adhering to sediment, and pollution of drinking-water supplies are potential effects.
HYDROLOGIC HAZARDS AND LAND-USE ISSUESResource development Nonmetal mining Ci
Statewide, approximately 1,500 acres were disturbed by mining activities during 1982 (Gardner and Simons, 1983). Sand and gravel operations and industrial minerals mining account for 75 percent of the land disturbed. Open-pit mining for mica, kaolin, and feldspar in the Spruce Pine Mining Dis trict is causing water-quality concerns in a three-county area in the Blue Ridge physiographic province. Mining activities, haul roads, and tailings ponds contribute to greatly increased sedi ment loads in area streams. As a result, populations and diver sity of aquatic invertebrates have decreased, and game fish have been eliminated (Duda and Penrose, 1980).
Coastal-zone utilization C.
Low-lying coastal areas are being developed for agriculture and peat mining, which could change the timing and pathways by which fresh water enters sounds and estuaries. Prior to large-scale farming operations in these areas, fresh-water run off had little effect on the sounds and estuaries (Daniel, 1981). Under present management practices, rapid runoff flushes saline water from near-shore areas of sounds and estuaries. Some concerns include pollution of shellfish areas, decreased productivity in estuarine nursery areas, accelerated rates of eutrophication, and increased turbidity and sedimentation.

North Carolina 183
76°
- M -' ' v "®s~-**F^'<' W **" CVCCfS*0 ' ,iVJ^^i^^^^m^^'' l^^w1 - ^^' :
' "^-N \ , '*, ^"^-'^r^-^y \COLUM ;
^ ^
50I
100 MILES
I 50 100 KILOMETERS
EXPLANATION
Water issues are described in text. Color identifies type of issue. Letter and number identify specific issue described in text.
WATER-AVAILABILITY ISSUES
A A 1 Surface water
[ - A 2 Ground water
WATER-QUALITY ISSUES
B-| Surface water Point and nonpoint
sources of pollution
^^^ 82 Ground water-Saline-water intrusion
A 83 Eutrophication (see small map)
HYDROLOGIC HAZARDS AND LAND- USE ISSUES
SUMMARY OF WATER USE IN NORTH CAROLINA, IN MILLION GALLONS PER DAY. 1980
[Data rounded to two significant figures and may not add to totals because of independent rounding. Source: Solley, Chase, and Mann, 1983]
Use
Offstream use:
Rural domestic and livestock . .
Self-supplied industrial: Thermoelectric power use . . Other industrial uses ....
Total . ........
Instream use.
Ground water
Fresh Saline
70 .... 1 70 .... 39
0 .... '120 0
'400 0
40,000
Withdrawals
Surface water
Fresh Saline
500 .... 5.6
93
4,300 6.4 '390 '1,100
'5,300 '1,100
Total fresh water
570 170 130
4,300 '510
1 5,700
Consump tive use,
fresh water
110 170 130
67'50
'530
Resource development Nonmetal mining 1 Revised, based on North Carolina Department of Natural Resources and Community Develop ment unpublished data.
INSTITUTIONAL AND MANAGEMENT ISSUES
A Dl Interbasin transfers (see small map)

184 National Water Summary 1983
Flooding C.
Historically, cities and towns in inland North Carolina have developed on uplands areas. Because more developments are encroaching on flood plains, flood losses are increasing.
Erosion and sedimentation G.
Erosion and sedimentation is an important water-quality issue in the State (North Carolina Department of Natural Resources and Community Development, 1979). Sediment deposition has impaired aquatic habitats, filled lakes, and de creased the storage capacity of a number of reservoirs. For ex ample, the city of High Point is considering dredging its water- supply reservoir, High Point Lake, because an estimated 46 percent of the lake's original volume consists of sediment.
INSTITUTIONAL AND MANAGEMENT ISSUESInterbasin transfers Dj
Several municipalities are examining the possibility of inter- basin transfers of water. The city of Greensboro may seek to withdraw water from the Dan River and discharge waste ef fluent to the Cape Fear River basin if the proposed Randleman Dam water-supply project is not built. Additional water may be transferred from the Cape Fear River basin to the Neuse River basin if municipalities in the Neuse River basin obtain permits to use Jordan Lake for their water supply. The most controversial proposed interbasin transfer would transfer water from Lake Gaston, in the Roanoke River basin in Virginia, for use in Virginia Beach, Va. The withdrawal may affect water users downstream on the Roanoke River in North Carolina.
REFERENCESDaniel, C. C., Ill, 1981, Hydrology, geology, and soils of
pocosins A comparison of natural and altered systems, in Richardson, C. J., ed., Pocosin wetlands An integrated analysis of Coastal Plain freshwater bogs in North Carolina: Stroudsburg, Pa., Hutchinson Ross, p. 69-108.
Duda, A. M., Lenat, D. R., and Penrose, D. L., 1982, Water quality in urban streams What can we expect?: Journal of the Water Pollution Control Federation, v. 54, no. 7, p. 1139-1147.
Duda, A. M., and Penrose, D. L., 1980, Impact of mining activities on water quality in western North Carolina: Water Resources Bulletin, v. 16, no. 6, p. 1034-1040.
Eder, B. K., Davis, J. M., and Robinson, P. J., 1983, Variations in monthly precipitation over North Carolina: North Carolina Water Resources Research Institute UNC-WRRI-83-185, 50 p.
Forsyth County Environmental Affairs Department, 1982, At mospheric deposition study Winston-Salem/Forsyth County, Urban Runoff Project: Winston-Salem, N.C., 92 p.
Gardner, C. H., and Simons, J. D., 1983, Mining and reclamation in North Carolina, in Hernandez, J., ed., Proceedings of the First Carolina Environmental Affairs Conference, Chapel Hill, N.C., Institute for Environmental Studies, p. 338-349.
National Atmospheric Deposition Program, 1980, NADP data report Precipitation chemistry: Fort Collins, Colorado State University, Natural Resource Ecology Laboratory, v. 3, no. 1, p. 113-136.
North Carolina Department of Natural and Economic Resources, 1976, Interim report on ground-water conditions in capacity use area no. 1 Central Coastal Plain, North Carolina, 1974-75: Divi sion of Environmental Management Report on Groundwater In vestigation No. 13, 55 p.
North Carolina Department of Natural Resources and Community Development, 1979, Water quality management plan Executive summary: Division of Environmental Management, 27 p.
____1982a, North Carolina clean lakes classification survey: Divi sion of Environmental Management Report No. 83-03, 395 p.
_1982b, North Carolina water quality inventory 305b report;calendar years 1980-81: Division of Environmental Management, 309 p.
North Carolina-Virginia Water Resources Management Committee, 1982, The North Carolina-Virginia Tidewater area Developing a process for resolving water resource management issues: Virginia State Water Control Board and North Carolina Department of Natural Resources and Community Development, 77 p.
Solley, W. B., Chase, E. B., and Mann, W. B., IV, 1983, Estimated use of water in the United States in 1980: U.S. Geological Survey Circular 1001, 56 p.
U.S. Environmental Protection Agency, 1982, Amendment to National Oil and Hazardous Substance Contingency Plan; the Na tional Priorities List: Federal Register, v. 47, no. 251, December 30, 1982, p. 58476-58485.
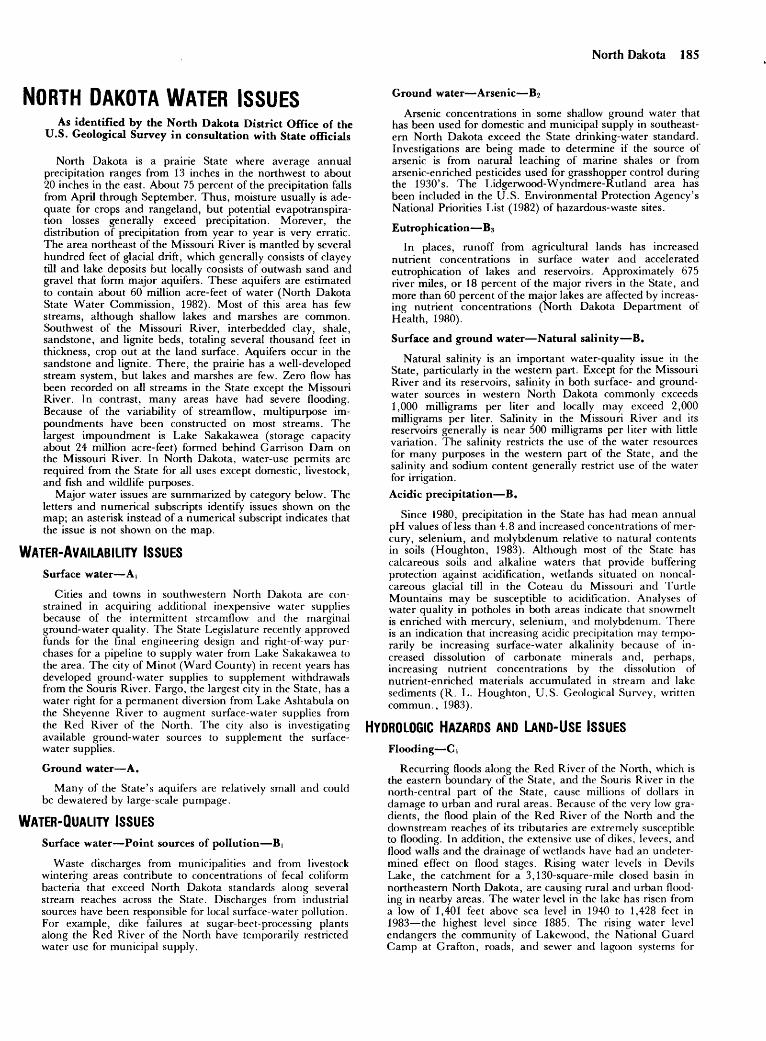
North Dakota 185
NORTH DAKOTA WATER ISSUESAs identified by the North Dakota District Office of the
U.S. Geological Survey in consultation with State officials
North Dakota is a prairie State where average annual precipitation ranges from 13 inches in the northwest to about 20 inches in the east. About 75 percent of the precipitation falls from April through September. Thus, moisture usually is ade quate for crops and rangeland, but potential evapotranspira- tion losses generally exceed precipitation. Morever, the distribution of precipitation from year to year is very erratic. The area northeast of the Missouri River is mantled by several hundred feet of glacial drift, which generally consists of clayey till and lake deposits but locally consists of outwash sand and gravel that form major aquifers. These aquifers are estimated to contain about 60 million acre-feet of water (North Dakota State Water Commission, 1982). Most of this area has few streams, although shallow lakes and marshes are common. Southwest of the Missouri River, interbedded clay, shale, sandstone, and lignite beds, totaling several thousand feet in thickness, crop out at the land surface. Aquifers occur in the sandstone and lignite. There, the prairie has a well-developed stream system, but lakes and marshes are few. Zero flow has been recorded on all streams in the State except the Missouri River. In contrast, many areas have had severe flooding. Because of the variability of streamflow, multipurpose im poundments have been constructed on most streams. The largest impoundment is Lake Sakakawea (storage capacity about 24 million acre-feet) formed behind Garrison Dam on the Missouri River. In North Dakota, water-use permits are required from the State for all uses except domestic, livestock, and fish and wildlife purposes.
Major water issues are summarized by category below. The letters and numerical subscripts identify issues shown on the map; an asterisk instead of a numerical subscript indicates that the issue is not shown on the map.
WATER-AVAILABILITY ISSUESSurface water A,
Cities and towns in southwestern North Dakota are con strained in acquiring additional inexpensive water supplies because of the intermittent streamflow and the marginal ground-water quality. The State Legislature recently approved funds for the final engineering design and right-of-way pur chases for a pipeline to supply water from Lake Sakakawea to the area. The city of Minot (Ward County) in recent years has developed ground-water supplies to supplement withdrawals from the Souris River. Fargo, the largest city in the State, has a water right for a permanent diversion from Lake Ashtabula on the Sheyenne River to augment surface-water supplies from the Red River of the North. The city also is investigating available ground-water sources to supplement the surface- water supplies.
Ground water A.
Many of the State's aquifers are relatively small and could be dewatered by large-scale pumpage.
WATER-QUALITY ISSUESSurface water Point sources of pollution BI
Waste discharges from municipalities and from livestock wintering areas contribute to concentrations of fecal coliform bacteria that exceed North Dakota standards along several stream reaches across the State. Discharges from industrial sources have been responsible for local surface-water pollution. For example, dike failures at sugar-beet-processing plants along the Red River of the North have temporarily restricted water use for municipal supply.
Ground water Arsenic 82
Arsenic concentrations in some shallow ground water that has been used for domestic and municipal supply in southeast ern North Dakota exceed the State drinking-water standard. Investigations are being made to determine if the source of arsenic is from natural leaching of marine shales or from arsenic-enriched pesticides used for grasshopper control during the 1930's. The Lidgerwood-Wyndmere-Rutland area has been included in the U.S. Environmental Protection Agency's National Priorities List (1982) of hazardous-waste sites.
Eutrophication B3
In places, runoff from agricultural lands has increased nutrient concentrations in surface water and accelerated eutrophication of lakes and reservoirs. Approximately 675 river miles, or 18 percent of the major rivers in the State, and more than 60 percent of the major lakes are affected by increas ing nutrient concentrations (North Dakota Department of Health, 1980).
Surface and ground water Natural salinity B.
Natural salinity is an important water-quality issue in the State, particularly in the western part. Except for the Missouri River and its reservoirs, salinity in both surface- and ground- water sources in western North Dakota commonly exceeds 1,000 milligrams per liter and locally may exceed 2,000 milligrams per liter. Salinity in the Missouri River and its reservoirs generally is near 500 milligrams per liter with little variation. The salinity restricts the use of the water resources for many purposes in the western part of the State, and the salinity and sodium content generally restrict use of the water for irrigation.
Acidic precipitation B.
Since 1980, precipitation in the State has had mean annual pH values of less than 4.8 and increased concentrations of mer cury, selenium, and molybdenum relative to natural contents in soils (Houghton, 1983). Although most of the State has calcareous soils and alkaline waters that provide buffering protection against acidification, wetlands situated on noncal- careous glacial till in the Coteau du Missouri and Turtle Mountains may be susceptible to acidification. Analyses of water quality in potholes in both areas indicate that snowmelt is enriched with mercury, selenium, and molybdenum. There is an indication that increasing acidic precipitation may tempo rarily be increasing surface-water alkalinity because of in creased dissolution of carbonate minerals and, perhaps, increasing nutrient concentrations by the dissolution of nutrient-enriched materials accumulated in stream and lake sediments (R. L. Houghton, U.S. Geological Survey, written commun., 1983).
HYDROLOGIC HAZARDS AND LAND-USE ISSUESFlooding Ci
Recurring floods along the Red River of the North, which is the eastern boundary of the State, and the Souris River in the north-central part of the State, cause millions of dollars in damage to urban and rural areas. Because of the very low gra dients, the flood plain of the Red River of the North and the downstream reaches of its tributaries are extremely susceptible to flooding. In addition, the extensive use of dikes, levees, and flood walls and the drainage of wetlands have had an undeter mined effect on flood stages. Rising water levels in Devils Lake, the catchment for a 3,130-square-mile closed basin in northeastern North Dakota, are causing rural and urban flood ing in nearby areas. The water level in the lake has risen from a low of 1,401 feet above sea level in 1940 to 1,428 feet in 1983 the highest level since 1885. The rising water level endangers the community of Lakewood, the National Guard Camp at Grafton, roads, and sewer and lagoon systems for
186 National Water Summary 1983
severed other communities. Rising ground-water levels associ ated with Lake Audubon and the McClusky Canal and greater than normal precipitation in central North Dakota are the causes of flooding in the area. Roads have become water logged, fields inundated, and basements flooded.
Wetlands C2
Except for the bed of glacial Lake Agassiz, the northeastern two-thirds of the State is overlain by glacial sediments contain ing numerous small closed basins or potholes that provide wildlife habitat primarily used by waterfowl. This area has been subjected to extensive drainage, channel improvement, and other land-use changes. There is debate about the effects of this drainage on wildlife habitat, runoff, and ground-water recharge.
Resource development Lignite mining Cs
Leachates from lignite-mine spoils in North Dakota are enriched in sulfate, sodium, and some trace-metal compounds. Dissolved-solids concentrations in mine-affected ground water have increased by two to four times compared to premining waters. Because most of the mined lignite is used by power- plants in the State, disposal of fly ash and flue-gas desulfuriza- tion waste in landfills enriches infiltrating recharge water with sulfate, arsenic, selenium, molybdenum, and other heavy metals, concentrations of which may exceed State drinking- water standards (Groenewold and others, 1980). Potential ground-water pollution from future disposal of complex metal- organic residues from coal-gasification plants under construc tion or planned also is of concern.
Resource development Oil and gas production 4
Leachates from pits used by the oil and gas industry for disposal of brines and drilling fluids commonly are saline and may contain a variety of drilling additives including hazardous heavy-metal compounds. If present near the land surface, such leachates may restrict land use for some agricultural purposes. Although leachate volumes from a single pit may be small, combined leachate from numerous pits in an oil- and gas- production area may have the potential to pollute local surficial aquifers.
Resource development Uranium mining Cs
Leachates from tailings at eight abandoned uranium mines and two uranium processing mills in western North Dakota may be enriched in radioactive constituents, molybdenum, arsenic, and possibly other heavy metals. The extent of the
effect of the leachates on local ground-water quality is being studied.
INSTITUTIONAL AND MANAGEMENT ISSUESWater allocation D,
The State's economic growth depends on agriculture and energy development. Both of these activities depend on the availability of water. Possible actions to restrict development of the Missouri River and Garrison Diversion project are of ma jor concern to State officials. The North Dakota State Water Commission has completed a major update of the State Water Plan. The Commission continues to exercise close manage ment over the State's ground-water resources in an effort to avoid serious ground-water mining.
Treaties and compacts D.
Water in the Souris River continues to be allocated between the United States and Canada under an "Interim Reference." The quality of water returning to Canada has been a major contention of the Canadian Government in the acceptance of the Garrison Diversion project. North Dakota is a signatory State to the Yellowstone River Compact of 1950 (Montana, North Dakota, and Wyoming), which is being challenged by industrial interests because it does not permit diversion of water out of the basin without the unanimous agreement of the signatory States.
REFERENCESGroenewold, G. H., Cherry, J. A., Manz, O. E., Gillicks, H. A.,
Hassett, D. J., and Rehm, B. W., 1980, Potential effects on ground water of fly ash and FGD waste disposal in lignite surface mine pits in North Dakota: Proceedings of the FGD Symposium, Houston, Tex., October 28-31, 1980, 37 p.
Houghton, R. L., 1983, Composition of atmospheric deposition in western North Dakota: Proceedings of the North Dakota Academy of Science, v. 37, p. 59.
North Dakota State Department of Health, 1980, North Dakota 305(b) report: Bismarck, 121 p.
North Dakota State Water Commission, 1982, Map showing glacial- drift aquifers in North Dakota and estimated yields: Bismarck, 1 sheet.
Solley, W. B., Chase, E. B., and Mann, W. B., IV, 1983, Estimated use of water in the United States in 1980. U.S. Geological Survey Circular 1001, 56 p.
U.S. Environmental Protection Agency, 1982, Amendment to National Oil and Hazardous Substance Contingency Plan; the Na tional Priorities List: Federal Register, v. 47, no. 251, December 30, 1982, p. 58476-58485.

North Dakota 187
SUMMARY OF WATER USE IN NORTH DAKOTA. IN MILLION GALLONS PER DAY. 1980
[Data rounded to two significant figures and may not add to totals because of independent rounding. Source: Solley, Chase, and Mann. 1983]
Use
Offstream use; Public supply Rural domestic and livestock
Self-supplied industrial: Thermoelectric power use . Other industrial uses
Instream use. Hydroelectric power . .
Ground water
Fresh Saline
26 24 65 ...
1 .2 .... 2.2 0.2
120 0.2
15000
Withdrawals
Surface water
Fresh Saline
33 .... 8.4 ....
210
920 0 4.7 0
1 .200 0
Total
water
59 32
280
930 7.0
1,300
Consump tive use,
fresh water
34 32
250
14 4.3
330
EXPLANATIONWater issues are described in text. Color identifies type of issue. Letter and number identify specific issue described in text.
WATER-AVAILABILITY ISSUES
I I A-| Surface waterA
WATER-QUALITY ISSUES
Bl Surface water- Point sources of pollution
62 Ground water - Arsenic
63 Eutrophication (see small map for streams)
HYDROLDGIC HAZARDS AND LAND-USE ISSUES
HTJ C-| Flooding
Cy Wetlands (see small map)
Resource development Lignite mining
Resource development Oil and gas production (see small map)
=-j CK Resource development-Uranium mining

188 National Water Summary 1983
OHIO WATER ISSUESAs identified by the Ohio District Office of the U.S.
Geological Survey in consultation with State officials
Throughout its history, Ohio has been characterized by a diverse economy. Agriculture predominates in the west and north, manufacturing in the northeast, and timber and mineral industries in the southeast. Abundant water resources have helped to make this diverse economy possible. Annual precipitation is about 37 inches; in addition, Lake Erie and the Ohio River provide large quantities of water from outside the State. Water management has been a concern of State and local governments in Ohio since the beginning of the 20th cen tury. Extensive drainage projects in northwestern Ohio con verted swamps into productive agricultural land. In response to the disastrous flooding in 1913, water-convervancy districts were established, and flood-control structures were built (Morgan, 1951). Concerns about drinking-water quality led to the development of community water systems; today, more than 90 percent of all water withdrawn for domestic purposes is from public supplies. A five-part plan for future water-supply development has been published by the Ohio Department of Natural Resources (1967, 1972, 1976, 1977, 1978).
Major water issues are summarized by category below. The letters and numerical subscripts identify issues shown on the map; an asterisk instead of a numerical subscript indicates that the issue is not shown on the map.
WATER-AVAILABILITY ISSUESSurface water A.
Water demand is increasing in many municipalities and in dustrial areas of Ohio. Surface-water sources have the poten tial to meet this demand. Several reservoirs have been built during the past decade in northwestern Ohio to store surface water for use during droughts. The trend toward increasing surface-water storage is expected to continue in northwestern Ohio, where surface runoff is about 10 inches per year, or 3 inches less than the statewide average of 13 inches per year (Johnson and Metzker, 1981).
Ground water A,
Ohio has several regional aquifer systems (Bloyd, 1974) that, if more fully utilized, could alleviate many of the water- supply shortages in the State. Two areas in Ohio where water shortages are especially serious are the urbanizing northeast and the rural south. In northeastern Ohio, major sources of ground water for most of the area are local sandstone, shale, and sand and gravel aquifers. Residents and officials are con cerned that increasing ground-water use might cause increased water-level declines, cause wells to become dry, and adversely affect ground-water quality (Nichols, 1980). Except for the narrow strips of land underlain by the alluvial aquifers of the Ohio River and its major tributaries, ground-water yields are barely sufficient for domestic use in most counties in the vicin ity of the Ohio River. The bedrock in this area consists of shale and sandstone that generally yield only 1 or 2 gallons per minute (A. C. Walker, Ohio Department of Natural Re sources, oral commun., 1983).
WATER-QUALITY ISSUESGround water Hazardous-waste sites Bi
Ohio has many operating hazardous-waste sites and many abandoned dumps (Ohio Environmental Protection Agency, 1982). Hazardous-waste sites are most common in the indus trialized northeastern part of the State and along the Miami River in the southwest. Nineteen sites in Ohio have been in cluded in the U.S. Environmental Protection Agency's Na tional Priorities List (1982) as requiring remedial action (Ohio Environmental Protection Agency, 1983). Four of these sites could be inundated by 100-year floods.
Surface water Municipal sewage B.
Some municipal sewage-treatment plants in Ohio are not meeting State standards for discharge quality. In addition, sewer systems in all major urban areas are combined storm and sanitary sewers; therefore, when sewer capacity exceeds treatment-plant capacity, especially during storms, untreated wastes commonly are discharged directly into streams or lakes.
Surface and ground water Public and domestic supplies B.
Numerous areas have local or periodic concerns about drinking-water quality. Some of the local concerns probably can be traced to past or current agricultural and waste-disposal practices and resulting surface- and ground-water pollution. For example, the city of Columbus periodically issues warnings about large nitrate concentrations in the muncipal-water sup plies; diese large concentrations probably result from nonpoint pollution of surface water caused by application of nitrogen- rich fertilizers on agricultural land.
Acidic precipitation B.
The burning of coal in industrial plants and municipal powerplants in the Ohio River valley may be a major source of acids and other pollutants in precipitation in Ohio, other Northeastern States, and Canada. "Pure" precipitation has been defined by the U.S. Environmental Protection Agency (1980) as precipitation having a pH between 5.6 and 5.7. Re cent research indicates that the pH of most precipitation east of the Mississippi River is now between 4.0 and 5.0; precipitation from individual storms may have a pH significantly less than this range (U.S. Environmental Protection Agency, 1980).
HYDROLOGIC HAZARDS AND LAND-USE ISSUESErosion and sedimentation Ci
The glaciated area in the northern and western parts of the State is extensively farmed. Most of this area has large erosion rates ranging from 100 to 500 tons per square mile per year (Anttila and Tobin, 1978). The greatest erosion rates appear to be in areas where row crops are grown on terminal moraines. The average annual sediment load of the Maumee River at Waterville in northwestern Ohio is 1.2 million tons (Anttila and Tobin, 1978). Severe beach erosion along the southern Lake Erie shoreline is a concern when lake levels are high valuable shore property is eroded, and homes are destroyed. Sedimentation also is significant in several major rivers draining into Lake Erie that are used for navigation. Dredging and disposal of dredge spoils continue to be major concerns.
Resource development Coal mining-Cs
Acid mine drainage from abandoned surface and underground coal mines is the primary cause of ground- and surface-water pollution in southeastern Ohio. About 60 per cent of the estimated 10,000 miles of polluted streams in the region is in areas of abandoned underground mines. The Ohio Department of Natural Resources, Division of Reclamation, has made large-scale, expensive efforts to reclaim much of the affected areas. Surface mining, mine reclamation, and abandoned-mine drainage in eastern Ohio directly or indirect ly cause increased stream sedimentation, which results in the decrease of stream-conveyance capacity, flooding, and some water-quality pollution (Engelke and others, 1981).
Resource development Oil and gas production Cs
Pollution of water resources by brine from oil- and gas- producing wells occurs occasionally in eastern Ohio. Approx imately 15 million barrels of brine are produced annually. Of this quantity, 25 percent is pumped back into the ground. Such disposal practices may pollute freshwater aquifers. The remaining 75 percent is spread on roads to melt ice and settle dust, placed in evaporation ponds, and dumped illegally in

Ohio 189
^r iK:X LAKE jASJH'TAt*JLAl
stir"* \ filH1 Dl|l^VvJ^'%f^|S 2^SX; T.kuAih r *f DEFACE "] /x*****!/ x 7]''s^9Vf Y 1 ^^^\^xq7 I [j^UYArtpGA V 4^tf'^JE3) J W^f '
l* ' f i , "! ' "\ ) i ; f- .- ( \|;""'\ <lP ' i - ^1 ; " -''"^ ' ^ :/l Tfn ' ItH^fc 1 I '-I , .. ' W'-i- Ji «_il -..rH r .j x* . "^ VnF *,--.. * ' <^ / := "-^-»*»-iJ _. 1 _ Irl^^B. xia-*. *<
Kl,v
i.
EXPLANATION issues ore described in text. Color -- /ypg 0/ issue. Letter and number
--" issue described in text.
WATER-QUALITY ISSUES
D Ground water-Hazardous-waste 1 sites
HYDROLOGIC HAZARDS AND LAND-USE IRRIIFR
Erosion and sedimentation (see small map)
p Resource development-Coal2 mining
r Resource development-Oil and3 gas production (see small map)
100 MILES J
100 KILOMETERS
SUMMARY OF WATER USE IN OHIO, IN MILLION GALLONS PER DAY, 1980
[Data rounded to two significant figures and may not add to totals because of independent rounding. Source: Solley, Chase, and Mann, 1983]
Withdrawals
Use
Offstream use:
Rural domestic and livestock . .
Self -supplied industrial: Thermoelectric power use Other industrial uses .....
Total ..........
Instream use: Hydroelectric power ......
Ground water
Fresh Saline
380 . 100 ....
1 .9 ....
21 .... 470 0
980 0
380
Surface water
Fresh Saline
1,100 ... 25 ...
3.4 ...
10,000 0 1 .500 0
13,000 0
Total - fresh
water
1,400 130
5.3
10,000 2,000
14,000
Consump tive use,
fresh water
180 98 4.8
93 180
550

190 National Water Summary 1983
streams and on the land (Templeton, 1980). Such disposal practices may pollute local surface- and ground-water resources.
Flooding C.
Ohio has serious flooding nearly every year. Two of the more notable recent floods were in the Maumee River basin in 1978 (Hoggatt, 1981) and in the Blanchard River basin in 1981 (Webber, 1982). Approximately 660 Ohio communities pres ently participate in the National Flood Insurance Program. Accelerated storm-water runoff from urbanized lands causes increased magnitude and frequency of floods in small urban watersheds; erosion at building sites and along streambanks; sediment deposition in culverts, storm sewers, and drainage ditches; and property loss (Goettemoeller and others, 1980).
REFERENCESAnttila, P. W., and Tobin, R. L., 1978, Fluvial sediment in Ohio:
U.S. Geological Survey Water-Supply Paper 2045, 58 p.Bloyd, R. M., Jr., 1974, Summary appraisals of the Nation's ground-
water resources Ohio region: U.S. Geological Survey Profes sional Paper 813-A, 41 p.
Columbus Citizen-Journal, 1982, City water crisis nears end Nitrate level in "safe" range: July 10, p. 12.
Engelke, M. J., Jr., Roth, D. K., and others, 1981, Hydrology of Area 7, Eastern Coal Province, Ohio: U.S. Geological Survey Water-Resources Investigations Open-File Report 81-815, 60 p.
Goettemoeller, R. L., Hanselman, D. P., and James H. Bassett, Inc., 1980, Ohio stormwater control guidebook: Columbus, Ohio Department of Natural Resources, Division of Soil and Water Districts, 49 p.
Hoggatt, R. E., 1981, Floods of March 1978 in the Maumee River basin, northeastern Indiana: U.S. Geological Survey Open-File
Report 81-695, 18 p. Johnson, D. P., and Metzker, K. D., 1981, Low-flow characteristics
of Ohio streams: U.S. Geological Survey Open-File Report81-1195,285 p.
Morgan, A. E., 1951, The Miami Conservancy District: New York,McGraw-Hill, 504 p.
Nichols, V. E., 1980, Ground-water levels and chemical quality inGeauga County, Ohio, 1978: U.S. Geological Survey Water- Resources Investigations 80-28, 17 p.
Ohio Department of Natural Resources, 1967, Northwest Ohio waterdevelopment plan: Columbus, 299 p.
____1972, Northeast Ohio water development plan Main report:Columbus, 396 p.
_1976, Southwest Ohio water development plan: Columbus,744 p.
.1977, Central Ohio water development plan: Columbus 441 p.
.1978, Southeast Ohio water development plan: Columbus517 p.
Ohio Environmental Protection Agency, 1982, Hazardous waste in Ohio; the problem; the solution: Columbus, 13 p.
____1983, Ohio EPA superfund sites, status update: Ohio En vironmental Protection Agency Report 9, 5 p.
Solley, W. B., Chase, E. B., and Mann, W. B., IV, 1983, Estimated use of water in the United States in 1980: U.S. Geological Survey Circular 1001, 56 p.
Templeton, E. E., 1980, Environmentally acceptable disposal of salt brine produced with oil and gas: Columbus, Ohio Water Develop ment Authority, 52 p.
U.S. Environmental Protection Agency, 1980, Acid rain: Washington, D.C., EPA-600/9-79-036, 36 p.
____1982, Amendment to National Oil and Hazardous Substance Contingency Plan; the National Priorities List: Federal Register, v. 47, no. 251, December 30, 1982, p. 58476-58485.
Webber, E. E., 1982, Flood of June 13-15, 1981, in the Blanchard River basin, northwestern Ohio: U.S. Geological Survey Water- Resources Investigations 82-4044, 32 p.

Oklahoma 191
OKLAHOMA WATER ISSUESAs identified by the Oklahoma District Office of the U.S.
Geological Survey in consultation with State officials
Oklahoma extends from the semiarid Western United States to the humid Eastern United States. Average annual precipita tion ranges from 15 inches in the Panhandle in the west to 56 inches in the southeast. Oklahoma has droughts of long dura tion as well as frequent floods. Evapotranspiration returns about 85 percent of the average annual precipitation to the at mosphere. Surface water is a major source of supply in the State. There are more than 2,500 lakes with a surface area of 10 acres or more; 57 of these are considered major lakes. Average annual lake evaporation ranges from 46 inches in the east to 64 inches in the southwest. Oklahoma has 13 major aquifers, some of which are relatively undeveloped. Ground- water levels in parts of western Oklahoma, however, are declining significantly.
Major water issues are summarized by category below. The letters and numerical subscripts identify issues shown on the map; an asterisk instead of a numerical subscript indicates that the issue is not shown on the map.
WATER-AVAILABILITY ISSUESGround water Ai
In northwestern Oklahoma, water is supplied almost ex clusively from the High Plains aquifer. Withdrawals exceed recharge to the High Plains aquifer, and water levels have declined more than 50 feet between 1940 and 1980 (Havens, 1983). Water levels in wells completed in the Rush Springs aquifer in west-central Oklahoma have declined as much as 10 feet during the last 8 years.
Surface water A.
Average annual runoff ranges from 0.2 inch in the extreme western Panhandle to 20 inches in the southeast. Most surface- water impoundment in Oklahoma has been in the eastern part of the State. Many of the major reservoirs have been designed as multipurpose projects that allocate storage for flood control, electric-power generation, and municipal, industrial, irriga tion, and recreational uses. In much of western Oklahoma, streams have been fully allocated, and little water is available for future development.
WATER-QUALITY ISSUESSurface water Point and nonpoint sources of pollution Bi
There is concern that increasing urbanization in Oklahoma has exceeded the capacity of many sewage-treatment plants, and that the North Canadian River is polluted from Oklahoma City to Lake Eufaula. Also, there is evidence that development along the Illinois River, designated a scenic river, has caused pollution because of increased septic-system discharge and in creased recreational use.
Surface water Natural salinity B2
Natural brine seeps and springs along the Salt Fork Arkan sas, the Cimarron, and the Red Rivers and major tributaries increase the chloride concentration so that water from these streams is unusable for many purposes (Stoner, 1981, 1982a).
Surface water Sulfate B3
Large sulfate concentrations resulting from dissolving of gypsum in the Washita River basin affect the suitability of the Washita River as a public supply (Stoner, 1982b). Foss Reser voir on the Washita River is used for a municipal supply, but the water must be treated by a desalination process.
Ground water Hazardous-waste site B4
A hazardous-waste site near Criner, McClain County, has been included in the U.S. Environmental Protection Agency's
National Priorities List (1982). More than 20 million gallons of wastes, including pesticides, solvents, waste oils, and acids, were disposed of in several surface impoundments and a drum burial area (Findings of fact and conclusions of Law filed in U.S.A. versus Rowland Hardage case, U.S. District Court, Oklahoma City; Stanley Hitt, U.S. Environmental Protection Agency, oral commun., 1983). The Oklahoma Department of Health detected ground-water pollution at the site in 1976. Remedial actions at the site have been pursued since then.
HYDROLOGIC HAZARDS AND UNO-USE ISSUESResource development Lead-zinc mining Ci
Acid mine water from the abandoned lead-zinc mines in northeastern Oklahoma contains large concentrations of iron, zinc, and cadmium and is polluting Tar Creek, a tributary of Grand Lake O' The Cherokees. There is concern that the acid mine water also could pollute local ground-water supplies. The mines are separated from the freshwater Roubidoux aquifer by several hundred feet of relatively impermeable shale and dolomite; however, the potential exists for downward migra tion of the acid mine water to the Roubidoux aquifer, which is the major source of public supply in the area. The Tar Creek area of about 40 square miles has been included in the U.S. Environmental Protection Agency's National Priorities List (1982) of hazardous-waste sites.
Resource development Coal mining Cz
Bituminous coal beds underlie 1.5 million acres in 19 eastern Oklahoma counties (Friedman, 1974). About 230 million short tons could be mined by surface methods. The principal hydro- logic issues of concern regarding surface mining of coal in Oklahoma are the possibilities of increased sediment concen trations and degradation of chemical quality of streams.
Resource development Oil and gas production C.
Activities associated with oil and gas exploration and pro duction have caused local pollution of many streams and is an issue of concern throughout the State. Failures of brine- disposal pits and accidental spills of brines and oil have been the likely principal causes of the pollution.
Flooding C.
There is concern that increasing urbanization in the Oklahoma City and Tulsa metropolitan areas is causing an increase in the magnitude of flood peaks, and an increase in erosion and sedimentation because of increased flood-flow velocities. More information about flood runoff from urban areas is necessary for the design of remedial hydraulic struc tures (Huntzinger, 1978). Oklahoma City is using data from a federally funded Flood Insurance Study (Tortorelli and others, 1983) to assist in resolving flood-plain-management issues.
INSTITUTIONAL AND MANAGEMENT ISSUESInterbasin transfers D.
Due to decreasing ground-water reserves in western Oklahoma and increasing urbanization and industrialization in central areas of the State, additional water supplies will be needed to meet increased water demands. Evaluation of local supply potential indicates a water deficit in central and western Oklahoma within the next few decades, and a plan has been developed that proposes conveying excess or surplus waters from eastern Oklahoma to the central and western parts of the State. The costs associated with pumping water render the plan economically infeasible at this time. However, as economic conditions change and new technologies are developed, the statewide water-conveyance system will be given consideration as a means of providing water to water- deficient areas (Oklahoma Water Resources Board, 1980).
192 National Water Summary 1983
Financing the infrastructure D.
The Oklahoma Legislature has created a Financial Assistance Program to promote and assist in the construction of a variety of water-supply and sewage-treatment projects. The Oklahoma Legislature also appropriated $25 million for a revolving fund that could be used as security or collateral when bonds are issued. State officials believe, however, that future water projects will require billions of dollars.
REFERENCESFriedman, S. A., 1974, An investigation of the coal reserve in the
Ozarks section of Oklahoma and their potential uses Final Report to the Ozarks Regional Commission, July 10, 1974: Oklahoma Geological Survey Special Publication 74-2, 117 p.
Havens, J. S., 1983, Water-level changes in the High Plains regional aquifer, northwestern Oklahoma, predevelopment to 1980: U.S. Geological Survey Water-Resources Investigations 83-4073, 1 sheet.
Huntzinger, T. L., 1978, Application of hydraulic and hydrologic data in urban stormwater management: U.S. Geological Survey Open-File Report 78-414, 33 p.
Oklahoma Water Resources Board, 1980, Oklahoma comprehensive water plan: Oklahoma Water Resources Board Publication 94, 248 p.
Solley, W. B., Chase, E. B., and Mann, W. B., IV, 1983, Estimated use of water in the United States in 1980: U.S. Geological Survey Circular 1001, 56 p.
Stoner, J. D., 1981, Salt Fork Arkansas River and Cimarron River basins through 1978, pt. 2 of Water type and suitability of Okla homa surface water for public supply and irrigation: U.S. Geological Survey Water-Resources Investigations 81-39, 150 p.
_____1982a, Red River Mainstem and North Fork Red River basin through 1979, pt. 4 of Water type and suitability of Oklahoma sur face waters for public supply and irrigation: U.S. Geological Survey Water-Resources Investigations 82-9, 235 p.
1982b, Washita River basin through 1979, pt. 5 of Water typeand suitability of Oklahoma surface waters for public supply and ir rigation: U.S. Geological Survey Water-Resources Investigations 82-29, 150 p.
Tortorelli, R. L., Huntzinger, T. L., Bergman, D. L., and Patneaude, A. L., Jr., 1983, Urban flood analysis in Oklahoma City, Oklahoma: U.S. Geological Survey Open-File Report 83-26, 94 p.
U.S. Environmental Protection Agency, 1982, Amendment to National Oil and Hazardous Substance Contingency Plan; the Na tional Priorities List: Federal Register, v. 47, no. 251, December 30, 1982, p. 58476-58485.

Oklahoma 193
r,37*
EXPLANATION Water issues are described in text. Color identifies type of issue. Letter and number identify specific issue described in text.
WATER AVAILABILITY ISSUES
fy///X Aground water
WATER QUALITY ISSUES
^^^ B-j Surface water-Pomt and nonpoint sources of pollution
82 Surface water-Natural salinity
B 3 Surface water-Sulfate
B 4 Ground water-Hazardous waste site
HYDROLOGIC HAZARDS AND LAND USE ISSUES
I___I C-) Resource development-Lead zinc mining
IliiJi" 1 ! C2 Resource development-Coal mining
S%^---f- -f-J -- >., ti-CO C.N.f-x,, "
r* - id .... ,v-.l.._ i*-.rr :-?c:-
- J " 'ott^.!ll|_3S«
-~^-< J
^- ;.
f T(JP^
QT
0I-
0
i, n ~"< "~"''1^ CARTELS
' ' i '".^L, ' -. j at^rrort-s
' ^FERSe*^ -J3JJPJ
X/*H^jv..4
50| |
50 100
;.- ! .JOHNBTON j * ' ° %, * -, V, , ' JkZ&Of^ 'Vl- ----: V% -"-^ji»W
--\- J \ >.J . ;£-i ^ , i C:^H o CT> i
)C^^^s^s" r' ""V^
100 150 MILES|
150 KILOMETERS
SUMMARY OF WATER USE IN OKLAHOMA, IN MILLION GALLONS PER DAY, 1980
[Data rounded to two significant figures and may not add to totals because of independent rounding. Source: Solley, Chase, and Mann, 1983]
Withdrawals
Use
Offstream use:
Rural domestic and livestock . Irrigation. ........ Self-supplied industrial:
Thermoelectric power use Other industrial uses .
Total , .
Instream use: Hydroelectric power .
Ground water
Fresh Saline
8638
730 ....
7.7 .... 95 95
960 95
34,000
Surface water
Fresh Saline
220 ... 55 ....
140 ....
170 0 170 0
760 0
Total fresh water
300 93
870
180 270
1,700
Consump tive use,
fresh water
120 89
610
110 120
1,000

194 National Water Summary 1983
OREGON WATER ISSUESAs identified by the Oregon District Office of the U.S.
Geological Survey in consultation with State officials
Oregon is perceived as a State with a plentiful supply of water, but this is true only in certain areas. Precipitation ranges from about 10 inches in eastern Oregon to about 180 inches in the mountains of western Oregon. About 85 percent of Oregon's population lives in the western one-half of the State. Runoff is variable, and streamflow commonly is depleted by diversions for offstream uses, thus water for in- stream uses is difficult to maintain. Aquifers in much of the State commonly yield small quantities of ground water ade quate only for small domestic or stock supplies. Oregon has one of the most comprehensive statewide land-use laws in the nation. The ocean beaches are State controlled along their entire length. Stringent water-quality measures have succeed ed in restoring the Willamette River to conditions safe for swimming and fishing. The State has acted to improve or pro tect the quality of other waters and has issued regulations on minimum flows for most streams to preserve fish habitat.
Major water issues are summarized by category below. The letters and numerical subscripts identify issues shown on the map; an asterisk instead of a numerical subscript indicates that the issue is not shown on the map.
WATER-AVAILABILITY ISSUESGround water Ai
Declining ground-water levels in the Columbia River Basalt aquifer, a major interstate aquifer underlying parts of Idaho, Oregon, and Washington, affect about 2,500 square miles of Morrow and Umatilla Counties in northeastern Oregon. Aver age rates of decline in the area ranges between 1 and 20 feet per year, and declines exceed 400 feet locally. Other areas in Oregon also have had less extensive but large ground-water- level declines; these declines generally have been stabilized through regulation of ground-water pumpage or denying new withdrawal permits. Additional water-level declines affecting areas of as much as a few square miles have been reported; these areas are being monitored to determine the magnitude of the water-level declines, but no action has been taken to regulate these small areas. In the arid Fort Rock-Christmas Valley area (Lake County) in south-central Oregon, the rapid increase of ground-water withdrawals for irrigation during the last decade is causing concern. The concern is that existing permits allow the withdrawal of ground water significantly in excess of the amount of recharge to the volcanic- and sedimentary-rock aquifer system underlying the 1,500-square- mile area. Water-level declines, however, are small. Pre liminary studies are being made in the area.
Surface water A.
In some streams, diversions for municipal, industrial, and irrigation supplies result in inadequate minimum flow for fish habitats, waste dilution and assimilation, and navigation, and impair the esthetic value of the streams.
WATER-QUALITY ISSUESSurface water Aquatic-habitat degradation Bi
Numerous streams throughout Oregon are affected by a variety of water-quality issues including (1) diversions that may decrease streamflow and affect downstream uses and aquatic habitats; (2) increased water temperatures (which are related to low flows, ambient summer air temperatures, and stream management) that interfere with the rearing and pro duction of salmonoid fishes; (3) streambank erosion, a natural process that results from meandering of streams but which commonly is accelerated by activities of man; (4) excessive debris, usually logs, slash, and other materials, in quantities large enough to hinder fish passage and boating and to damage
culverts and bridges; and (5) nuisance algal or aquatic plant production, commonly associated with low flows, high-water temperatures, and large nutrient concentrations that interfere with water supplies, irrigation, fish rearing, recreation, and esthetic quality of streams, lakes, or reservoirs (Oregon Department of Environmental Quality, 1978).
Surface water Estuaries 82
Designated Oregon estuaries are dredged routinely to main tain navigation channels. This dredging can cause pollution when bottom material is physically transported to and resus- pended in the water at a disposal site. Pollution can be caused by release of ammonia, phenolic compounds, and selected heavy metals from the bottom material into the water in concentrations detrimental to aquatic life. In addition, these released substances, along with certain natural organic substances present in the bottom material, can be oxidized in the water during dredging and disposal operations, creating an immediate oxygen demand. Data indicate that localized pollu tion of this type may occur in the Columbia River and the Yaquina River estuaries during dredging and disposal opera tions (Fuhrer and Rinella, 1983).
Ground water Hazardous-waste sites B3
About 25,000 barrels of herbicide wastes were buried in shallow trenches at a sparsely populated and remote site near Alkali Lake (Lake County). Shallow ground water at the site is saline and contains large concentrations of dissolved solids, but the deeper water is fresh and potable. Leakage from the burial site has been detected, and there is the possibility that this leakage may pollute the fresh ground water in the deeper zone. Two other hazardous-waste sites in Oregon have been in cluded in the U.S. Environmental Protection Agency's Na tional Priorities List (1982). At the site in Portland, hazardous substances of concern include lead-oxide dust in the air and lead in the deep aquifer. At the site near Albany, hazardous substances of concern include low-level radioactive materials, heavy metals, and chlorinated organic solvents.
Ground water Nitrate 84
Ground water in shallow water-table aquifers used for drink ing water has been polluted by a variety of untreated wastes in unsewered urban areas in east Multnomah County, La Pine (Deschutes County), and Florence (Lane County), and in the Clatsop plains (Clatsop County). As a result, in these areas, nitrate concentrations in water from the shallow water-table aquifers exceed State standards for drinking water.
Acidic precipitation 85
The Cascade Range annually receives 80 to 180 inches of precipitation predominately snow. Recent studies show that this precipitation is acidic with pH values ranging from 4.0 to 6.2 (U.S. Geological Survey, 1981). Dissolved-solid concentra tions in numerous lakes near the crest of the Cascades com monly are less than 20 milligrams per liter, which provides little neutralizing capacity, and pH values are as low as 5.1 (Rinella, 1977, 1979). These lakes have negligible buffering capacities and may be susceptible to further acidification (D. L. RamboandC. F. Powers, U.S. Environmental Protec tion Agency, written commun., 1982).
Ground water Landfills and lagoons 8.
Leachates from solid-waste landfills and from liquid-waste treatment lagoons potentially can pollute ground water adja cent to and downgradient from the site. Several landfills and lagoons in Oregon are located in sand and gravel deposits overlying permeable water-table aquifers. Most of these sites, however, are located in sparsely populated areas or are within areas served by public-water supplies, and, as a result, the potentially affected ground water near disposal sites either is slightly used or is unused. Increased use of these water-table aquifers could, however, divert ground water from these sites into supply wells.

Oregon 195
f i Y ' - v i - i 'T_J)-%rm
/.-^> ytoncojf^ T- . j
w -r > t^ r\.-f < " I* I /
EXPLANATIONmuc« are described in text. Color identifies type of issue.
Letter and number identify specific issue described in text.
WATER-AVAILABILITY ISSUES
|/^^/j A 1 Ground water
WATER QUALITY ISSUES
[§v§j$§j B 1 Surface water Aquatic habitat degradation
^^^ B 2 Surface water Estuaries
9 63 Ground water Hazardous-waste sites
50 100 150 MILES
50 100 150 KILOMETERS
^^| B4 Ground water-Nitrate
fc%%%[ B 5 Acidic precipitation
HYDROLOGIC HAZARDS AND LAND-USE ISSUES
imT1TTT Volcanoes
C 2 Volcanoes Mud Hows
SUMMARY OF WATER USE
(Data rounded to Iwo significant I
IN OREGON, IN MILLION GALLONS PER DAY, 1980
guies and may not add to totals because ol independent founding.Source Solley, Chase, at
Use
Offstream usePublic supplyRural domestic anil livestockIrrigation.Self supplied industrial
Thermoelectric power useOther industrial uses
Total . . ...
Instream use:Hydroelectric power
Ground water
Fiesh Saline
66140850
0 . .80 0
1,100 0
490,000
ul Mann, 19831
Withdrawals ^
burlace water 1 otal , .
Fresh Saline water Water
160 230 4738 170 170
5,000 .... 5,900 3,000
22 0 22 0420 0 500 20
5 700 0 6,800 3,200

196 National Water Summary 1983
Ground water Natural salinity B.
Naturally saline ground water occurs in many areas of western Oregon underlain by marine sedimentary and volcanic rocks (McFarland, 1983). The saline ground water is found most commonly at shallow depths in valley sites near principal streams. Salinity can exceed that of sea water (about 35,000 milligrams per liter of dissolved solids) in the deeper parts of many aquifers. Discharge of saline ground water to streams occurs locally.
HYDROLOGIC HAZARDS AND LAND-USE ISSUESVolcanoes Ci
The eruption of Mount St. Helens on May 18, 1980, was a dramatic reminder that volcanoes may become active in the Cascade Range in the Western United States. A study is being made to identify potential hydrologic hazards frcm potential eruptions of Mount Hood near Portland. Eruptions at the Three Sisters area and Mount Jefferson also would create hydrologic hazards.
Volcanoes Mudflows Cz
Mudflows resulting from the eruption of Mount St. Helens in Washington partly blocked the shipping lanes in the Colum bia River. The breeching of the dam at Spirit Lake near Mount St. Helens could cause mudflows in the Columbia River via the Cowlitz River of greater magnitude than those caused by the eruption. There are concerns about the effect such an event would have on the Columbia River and on the electrical-generating operations of the Trojan Nuclear Plant located on the Columbia River 5 miles upstream from the Cowlitz River.
Flooding Debris flows C,
Historically, most major floods in isolated small drainage basins have been considered to be water flows. However, re cent investigation indicates that many of these isolated floods were debris flows (viscous mixtures of water, suspended sedi ment, and other solids). One debris flow occurred in December 1980 in the Polallie Creek Canyon on the east slope of Mount Hood (G. L. Gallino, U.S. Geological Survey, written com- mun., 1983). This debris flow caused one death, destroyed
approximately 5 miles of highway and a U.S. Forest Service campground, and severely damaged a water-supply distribu tion system.
Flooding Streams C *
Statewide, increased urbanization is causing increased fre quency of flooding. Urbanization commonly modifies drainage systems, decreases storm-runoff-carrying capacities of stream channels, and increases the volume and rate of runoff. The in crease in impervious area decreases the area available for infil tration, thus increasing the volume and rate of runoff. A study relating storm runoff to urbanization for the Portland, Oreg., and Vancouver, Wash., area is completed (Laenen, 1980), and studies are being made for the Salem and Roseburg areas.
REFERENCESFuhrer, G. J., and Rinella, F. A., 1983, Analyses of elutriate, native
water, and bottom material in selected rivers and estuaries in Western Oregon and Washington; U.S. Geological Survey Open- File Report 82-922, 147 p.
Laenen, Antonius, 1980, Storm runoff as related to urbanization in the Portland, Oregon-Vancouver, Washington area; U.S. Geological Survey Water-Resources Investigations Open-File Report 80-689, 71 p.
McFarland, W. D., 1983, A description of aquifer units in western Oregon for the U.S. Environmental Protection Agency's underground injection control program: U.S. Geological Survey Open-File Report 82-165. [in press]
Oregon Department of Environmental Quality, 1978, Oregon's statewide assessment of nonpoint source problems: Portland, Oregon Department of Environmental Quality, Water Quality Program, 71 p.
Rinella, J. F., 1977, Lakes of Oregon-Volume 5, Marion County: U.S. Geological Survey Open-File Report, 97 p.
____1979, Lakes of Oregon Volume 6, Douglas County: U.S. Geological Survey Open-File Report, 124 p.
Solley, W. B., Chase, E. B., and Mann, W. B., IV, 1983, Estimated use of water in the United States in 1980: U.S. Geological Survey Circular 1001, 56 p.
U.S. Environmental Protection Agency, 1982, Amendment to National Oil and Hazardous Substance Contingency Plan; the Na tional Priorities List: Federal Register, v. 47, no. 251, December 30, 1982, p. 58476-58485.
U.S. Geological Survey, 1981, Water-resources data for Oregon, Water year 1980 Volumes 1 and 2: U.S. Geological Survey Water-Data Report OR-80-1, 244 p. (v. 1), 491 p. (v. 2).

Pennsylvania 197
PENNSYLVANIA WATER ISSUESAs identified by the Pennsylvania District Office of the
U.S. Geological Survey in consultation with State officials.
Precipitation in Pennsylvania ranges from 39 to 50 inches and averages about 44 inches. There are approximately 50,000 miles of streams and rivers in the State including most of the Susquehanna River basin. The State's population has been stable since 1960 (Pennsylvania Department of Environmental Resources, 1981). Water use for agriculture, industry, and electric-power generation, however, is increasing. The total water available is sufficient to meet current and projected water use during average flow conditions, but water supplies may be critically short during extended droughts. The Penn sylvania Department of Environmental Resources has recom mended a water-use-management program to assess and designate water-use problem areas and, considering supply and demand, to create plans -for equitable management of water resources (Pennsylvania Department of Environmental Resources, 1981).
Major water issues are summarized by category below. The letters and numerical subscripts identify issues shown on the map; an asterisk instead of a numerical subscript indicates that the issue is not shown on the map.
WATER-QUALITY ISSUESSurface and ground water Agricultural runoff Bi
Agricultural lands are a source of nonpoint pollution in parts of the State. The Conestoga River basin, which predominantly drains agricultural land, is an example of this issue. Runoff from agricultural lands has polluted surface and ground water in the basin, particularly in the headwaters. On June 5, 1981, the U.S. Congress enacted the Rural Clean Waters Program that designated the Conestoga Headwaters Watershed in Lan caster County as 1 of 21 projects approved for remedial actions (Agriculture, Rural Development, and Related Agencies Appropriations Act of 1979, Public Law 96-108). The change in pollutants in surface and ground water resulting from the installation of controls and the implementation of land- management practices will be evaluated during the 10-year project.
Ground water Hazardous-waste sites B2
The Pennsylvania Department of Environmental Resources estimates that 8 million of the 26 million tons of industrial wastes generated annually in Pennsylvania are hazardous, and the possible pollution of ground water by these wastes is a major issue. There are numerous abandoned disposal sites, 450 permitted hazardous-waste storage areas, and about 45 hazardous-waste disposal sites in the State. Although all such facilities must be designed and operated to prevent ground- water contamination, about 800 disposal sites have the poten tial for causing ground-water pollution. Thirty disposal sites, most of which are abandoned, have been included in the U.S. Environmental Protection Agency's National Priorities List (1982). Large concentrations of trichlorethylene have been found in water from wells in various parts of the State. In the Kimberton area of West Chester, 10 water wells are polluted with this substance and related compounds, all of which are possible carcinogens.
Ground water Industrial wastes 63
The Philadelphia Water Department is interested in using ground water for an emergency supply of drinking water. There is concern, however, that both the water-table and con fined aquifers underlying Philadelphia have been polluted locally by industrial wastes and spills. Ground water underly ing Philadelphia is moving southeastward under the Delaware River toward New Jersey. Camden and other municipalities in New Jersey downgradient from Philadelphia depend on ground water for municipal supplies.
Acidic precipitation B.
Although the extent and significance of the effects of acidic precipitation are as yet undefined, Pennsylvania is receiving the most acidic precipitation in the Nation (Pennsylvania Department of Environmental Resources, written commun., 1983). Data collected at (he 10-site precipitation-monitoring network operated by the Pennsylvania Department of Envi ronmental Resources indicated a precipitation-weighted pH of about 4.0 during 1982. Some areas have the buffering capacity to neutralize (his acidic precipitation, but other areas may not. Reports of adverse effects on aquatic life from acidic precipita tion have been received by the Pennsylvania Fish Commission and the Pennsylvania Department of Environmental Resources. Some small headwater streams appear to be af fected by the acidic precipitation.
HYDROLOGIC HAZARDS AND LAND-USE ISSUESStorm-water management-Ci
Storm-water management commonly is difficult in areas underlain by limestone formations or "redbed" clay deposits, discharging excessive urban runoff, or containing abandoned surface and underground mines. Accelerated storm-water run off and other drainage issues are addressed in the Pennsylvania Stormwater Management Act of 1978. The act establishes a systematic program for watershed planning by counties, in cluding the development of regulatory standards to manage runoff from future land developments. The watershed plans also include identification of flood damage and drainage issues and proposed solutions and priorities. The storm-water management program gradually is being implemented after the completion of several pilot plans (Pennsylvania Depart ment of Environmental Resources, written commun., 1983). In central and eastern Pennsylvania, storm-water dissolves underlying limestone formations and causes surficial soil to col lapse, thus creating sinkholes (C.V The Pittsburgh area has had severe landslides when "redbed" clay topsoil or subsoil became unstable after being saturated with water (C lb). In Chester County, construction of impervious surfaces is restricted in order to decrease runoff and to facilitate ground- water recharge. Near Philadelphia, sediment-control or dinances have resulted in decreased quantities of runoff and sediment discharged from urban developments (C, c).
Resource development Coal mining Ca
Of the 2,700 miles of major streams in Pennsylvania that do not meet State water-quality standards, pollution in more than 2,000 miles of streams primarily is attributed all or partly to drainage from abandoned coal mines (Pennsylvania Depart ment of Environmental Resources, 1982a). The acid, metals, and smothering effects of iron precipitates associated with mine drainage generally have made affected streams unsuitable for aquatic life. Measures being used to minimize or abate mine- drainage pollution include diversion of surface runoff from mines, use of sedimentation basins, removal or covering of acid-forming refuse piles, sealing entrances to underground mines, and chemical treatment to increase pH. Some pollution of ground water has occurred in a major aquifer downgradient from coal workings in the Southern and Western-Middle Anthracite Fields. About 12 underground mines are scheduled to open within the next 20 years to recover about 5.9 billion tons of coal in Greene County. There is concern about the ef fect of this new mining on the ground-water system.
Resource development Oil and gas production Cs
Oil and gas operations are a potential source of ground- water pollution. Areas polluted by activities associated with oil and gas production range from 1 acre to more than 50 square miles (Pennsylvania Department of Environmental Resources, 1982b). Where such ground-water pollution has occurred, abatement of the pollution in affected aquifers is extremely difficult.

198 National Water Summary 1983
INSTITUTIONAL AND MANAGEMENT ISSUESRiver-system management Di
Several areas in Pennsylvania have severe imbalances in water use and availability during droughts and periods of low flow. Along the Monongahela River, streamflow and reservoir storage are insufficient during droughts to provide adequate water for navigation, supplies for power generation and for in dustrial and municipal uses. In the Delaware River basin, the central issue is that releases of water from New York City reservoirs in the upper Delaware River Basin are insufficient during droughts to supply water for municipal use in south eastern New York and to sustain a minimum flow of 1,750 cubic feet per second at Montague, N.J., as required by the 1954 Supreme Court Decree, which allocated Delaware River basin waters (Pennsylvania Department of Environmental Re sources, 1981). A recent agreement signed by Delaware, New Jersey, New York, Pennsylvania, and New York City provides for a series of actions to alleviate water-use issues. These ac tions include modifying reservoir-operating procedures and developing additional reservoir-storage capacity in the basin (largely through enlargement or replacement of existing reservoirs).
Water-resources management Ground water Dz
Pumpage from the Triassic sandstone aquifer ex ceeds the average annual recharge rate in many areas in
southeastern Pennsylvania and also commonly exceeds the 10-year recharge rate throughout parts of a five-county area. As a result of this excessive pumpage, the Delaware River Basin Commission has designated this area as a protected area and requires a permit for all new ground-water uses exceeding 10,000 gallons per day (Pennsylvania Department of Environ mental Resources, written commun., 1983).
REFERENCESMclntire, M. J., 1982a, Officials identify E. Pikeland contaminants:
West Chester, Daily Local News, March 11. ____1982b, DER checking for TCE in Kimberton area wells: West
Chester, Daily Local News, March 11.Pennsylvania Department of Environmental Resources, 1981, Report
and recommendations on water-use management: Harrisburg, p. 5-12.
____1982a, Commonwealth of Pennsylvania 1982 water quality in ventory: Harrisburg, 302 p.
____1982b, COWAMP/Upper Allegheny Area: Harrisburg, 40 p. Solley, W. B., Chase, E. B., and Mann, W. B., IV, 1983, Estimated
use of water in the United States in 1980: U.S. Geological SurveyCircular 1001, 56 p.
U.S. Environmental Protection Agency, 1982, Amendment to National Oil and Hazardous Substance Contingency Plan; the Na tional Priorities List: Federal Register, v. 47, no. 251, December 30, 1982, p.58476-58485.

Pennsylvania 199
'^ E'RTE
bi-vf^f! 9 R A \/F~b R1!? '
50 100 MILES
50 100 KILOMETERS
EXPLANATIONWater issues are described in text. Color identifies type of issue. Letter and number identify specific issue described in text.
WATER-QUALITY ISSUES
A BI Surface and ground water Agricultural runoff
0 62 Ground water Hazardous-waste sites
(^^| 63 Ground water Industrial wastes
HYDRDLDGIC HAZARDS AND LAND-USE ISSUES
Storm-water management
lllljllll Cia s' nknoles
I'lllllHI C ib Landslide-prone areas
li!,!!'|| Clc Erosion and sedimentation
[I,], lill C 2 Resource development Coal mining (see small map)
[|||[|l|[ 63 Resource development Oil and gas production (see small map)
INSTITUTIONAL AND MANAGEMENT ISSUES
I I DI River-system management
[ | D2 Water-resources management Ground water (see small map)
^ II ' '"' x X° 2 \ ill ?
IF. /=Qi=-y
Illlnii"i
/~
SUMMARY OF WATER USE IN PENNSYLVANIA, IN MILLION GALLONS PER DAY. 1980
[Data rounded to two significant figures and may not add to totals because of independent rounding. Source: Solley, Chase, and Mann, 19831
Withdrawals
Use
Ottstream use:
1
Rural domestic and livestock
Self-supplied industrial: Thermoelectric power use . Other industrial uses ...
Total .........
istream use: Hydroelectric power .
Ground water
Fresh Saline
240 200
22 .
6.8 ... 550 0
1 ,000 0
81 ,000
Surface water
Fresh Saline
1 ,300 7.0
140
10,000 93 3,100 0
15,000 93
Total fresh water
1,500 210 160
to, ooo3,600
16,000
Consump live use.
Iresh wafer
160 56
160
290 260
920

200 National Water Summary 1983
PUERTO Rico AND THE U.S. VIRGINISLANDS WATER ISSUES
As identified by the Caribbean District of the U.S. Geo logical Survey in consultation with Commonwealth of Puerto Rico and Territory of the U.S. Virgin Islands officials
Puerto Rico; its outlying smaller islands of Vieques, Culebra, and Mona; and the U.S. Virgin Islands of St. Thomas, St. Croix, and St. John comprise a land area of 3,606 square miles characterized by diverse topography, geology, and hydrologic environments. Rainfall ranges from 32 to 100 inches per year. On Puerto Rico, the nearly constant trade winds from the eastern Caribbean Sea result in an annual average rainfall of 72 inches. The climate of the U.S. Virgin Islands is dryer than that of Puerto Rico, with average annual precipitation ranging from 40 inches on St. Croix to 45 inches on St. Thomas and St. John. The water issues of the U.S. Virgin Islands are similar to those of Puerto Rico but are more severe due to the limited precipitation and lack of productive aquifers.
Major water issues are summarized by category below. The letters and numerical subscripts identify issues shown on the map; an asterisk instead of a numerical subscript indicates that the issue is not shown on the map.
WATER-AVAILABILITY ISSUESSurface water A,
Surface-water sources in Puerto Rico are able to meet water- use demands only when rainfall is normal. During 1980, water demand exceeded supply in six of seven water-producing regions (Vazquez and others, 1983). The total usable surface- water resources on Puerto Rico have been estimated to be about 1.1 billion gallons per day. Although this quantity is more than ample to supply existing and anticipated future needs, available resources usually are not located near demand areas. On the U.S. Virgin Islands, surface-water supplies are scarce and provide only limited quantities to individual users. There are no perennial streams that can contribute significant supplies.
Ground water A,
The estimated usable ground-water resource of Puerto Rico is about 440 million gallons per day. Current withdrawals total about 240 million gallons per day. Ground water is used most ly along the north-central and southern coasts, where several municipal public water-supply systems depend entirely on ground water. Projected developments of agricultural, indus trial, and domestic facilities in several areas throughout Puerto Rico will require additional withdrawals of about 50 million gallons per day within the next 10 years. Ground-water sup plies on the U.S. Virgin Islands are few due to the small size of the aquifers. Ground water accounts for about 10 percent of the total water supplies. Among the three islands, St. Croix has the most productive aquifer, with maximum yields to wells of about 80 gallons per minute. The importance of ground water is decreasing as the islands become dependent on water sup plied by desalination plants. The potential for development of additional but small supplies exists in several basins, par ticularly on St. John.
WATER-QUALITY ISSUESSurface and ground water Point sources of pollution BI
Outbreaks of dysentery and hepatitis have recendy (1983) occurred in at least five towns on Puerto Rico. Health officials have traced these incidences to the presence of bacteria and viruses in the drinking water. There also is concern that some industrial compounds, principally tri- and tetrachloroethylene, may be endangering the potability of water from some wells.
On the U.S. Virgin Islands, ground-water quality conditions have not been quantified other than for bacterial concentra tions. A recent study (Isquith and Winter, 1981) indicates that most of the drinking water contains bacterial concentrations that exceed the U.S. Environmental Protection Agency's (1976) drinking-water standards. Preliminary data from the U.S. Virgin Islands Department of Conservation and Cultural Affairs indicate that some ground-water pollution is occurring on St. Croix.
Surface water Point and nonpoint sources of pollution B.
The major potential sources of surface-water pollution on Puerto Rico are domestic and industrial point-source discharges. Partly treated and untreated sewage commonly are discharged into many streams and reservoirs. Fecal coliform bacteria commonly exceed 500 colonies per 100 milliliters of sample at most stream-monitoring sites, with common occur rences in excess of 1 million colonies. Nutrients from nonpoint agricultural runoff may cause accelerated eutrophication of reservoirs and coastal streams, with many areas affected by ex cessive growth of water hyacinths. On the U.S. Virgin Islands, surface-water pollution occurs only in a basin on St. Thomas, where sewage effluent is discharged into the only near- perennial stream on the islands.
Surface water Saline-water intrusion B,
Downstream reaches of several streams along the north coast of Puerto Rico are affected by saline-water intrusion, par ticularly during low flow.
Ground water Point sources of pollution B,
There are more than 100 solid-waste disposal sites on Puerto Rico, of which 5 have been included in the U.S. Environmental Protection Agency's National Priorities List (1982) of hazardous-waste sites. Preliminary investigations on the effects of the wastes at these sites on the ground-water resources are now being planned. Recent incidents of ground-water pollution at two industrial sites indicate that the potential for pollution of ground water by industrial facilities could be significant. This concern is complicated by the lack of local water-quality stand ards. A recent islandwide reconnaissance of ground-water quality detected a variety of organic pollutants in ground water in concentrations that exceed water-quality standards estab lished by many States (Gomez-Gomez and Guzman-Rios, 1982). Six water-supply wells have been abandoned, and water from 13 others is being monitored for pollutants. The number of disposal wells in Puerto Rico is unknown. Regulations are now being drafted for the control of underground waste disposal.
Ground-water Saline-water intrusion B.
Several aquifers in the Dorado and Manati valleys along the north coast and in the Coamo, Guayama, and Yauco valleys along the south coast of Puerto Rico are affected by saline- water intrusion (Diaz, 1979). Improper design of wells and large ground-water withdrawals probably account for most of the intrusion.
HYDROLOGIC HAZARDS AND LAND-USE ISSUESFlooding Ci
Most of the coastal valleys of Puerto Rico are subject to ex tensive flooding (Lopez and others, 1979). The towns of Guayanilla, Utuado, Bayamon, and Vega Baja and several parts of metropolitan San Juan are flooded frequently. More than 300,000 acres are subject to flooding, affecting nearly 500,000 people. On the U.S. Virgin Islands, severe floods oc cur on St. Croix and St. Thomas periodically; the most recent having occurred in 1974, 1979, and 1983. The most recent flood (April 18, 1983) inundated most of Charlotte Amalie and caused the airport to be closed for 2 days.

Puerto Rico and the U.S. Virgin Islands 201
ATLANTIC OCEAN
3 P 4.0
EXPLANATIONissues are described in text. Color identifies type of issue.
Letter and number identify specific issue described in text.
WATER QUALITY ISSUES
B-i Surface and ground water Point sources of pollution
HYDROLOGIC HAZARDS AND LAND-USE ISSUES
|___I C-| Flooding (see small map)
I 'I C 2 Sinkholes
|___I 3 Erosion and sedimentation Coastal zone (see small map)
| | C4 Wetlands
SUMMARY OF WATER USE IN PUERTO RICO. IN MILLION GALLONS PER DAY. 1980
[Data rounded to two significant figures and may not add to totals because of independent rounding. Source: Solley, Chase, and Mann, 1983]
Withdrawals
Use
Off stream use:
Rural domestic and livestock
Self -supplied industrial: Thermoelectric power use . . Other industrial uses ...
Total ...........
Instream use: Hydroelectric power ......
Ground water
Fresh Saline
73 18
'100 ...
3.0 .... '50 '0
1 240 '0
'440
Surface water
Fresh Saline
280 . 18 ....
180 ....
'3.0 1,500 1 0 ' 400
1 480 '1 ,900
Total fresh water
350 36
'280
'6.0 '50
'720
Consump tive use,
fresh water
74 8.0
'160
'6.0 '0
'250
1 Revised: U.S. Geological Survey unpublished data.
SUMMARY OF WATER USE IN VIRGIN ISLANDS. IN MILLION GALLONS PER DAY. 1980
[Data rounded to two significant figures and may not add to totals because of independent rounding. Source: Soiley. Chase, and Mann, 1983]
Withdrawals
Use
Offstream use:
Rural domestic and livestock . .
Self-supplied industrial: Thermoelectric power use . Other industrial uses ....
Total ..........
Instream use: Hydroelectric power .......
Ground water
Fresh Saline
2.0 ....2.0 .... 0 ....
0 .... 0 0
4.0 0
0
Surface water
Fresh Saline
2.0 .... .2 ....
0 ....
0 32 0 0
2.2 32
Total fresh water
4.0 2.2 0
0 0
6.3
Consump tive use,
fresh water
0.8 1.1 0
.2 0
2.1
CARIBBEAN SKA
65M5'
50 MILES
0 10 20 30 40 50 KILOMETERS
U.S. VIRGIN ISLANDS
O

202 National Water Summary 1983
Sinkholes Cz
The development of sinkholes along the north-coast limestone area of Puerto Rico has been conspicuous during the last decade. No guidelines or regulations restrict construction in areas with potential for sinkhole development.
Erosion and sedimentation Coastal zone Cs
Severe shore and beach erosion is occurring on Puerto Rico and on the U.S. Virgin Islands. Sand extraction along the coastal zone and the previous removal of sand dunes appear to be causes of coastal erosion.
Wetlands C4
Dredging, filling, and urban expansion have significantly decreased wetland areas on Puerto Rico. Mangrove areas have decreased from 45,000 to about 15,000 acres (Birdsey and Weaver, 1982).
Erosion and sedimentation Reservoirs C.
Preliminary studies of several reservoirs on Puerto Rico indicate capacity losses of about 2 percent per year. Current soil-conservation practices combined with intensive rainfall common to the tropics account for most of the large-sediment yields.
INSTITUTIONAL AND MANAGEMENT ISSUESWater laws D.
Puerto Rico developed a comprehensive water law in 1976. However, rules for implementation of key aspects of the law have not been established.
Water allocation D.
The continual increase in water use on Puerto Rico may cause a potential controversy within the next decade among domestic, industrial, and agricultural water users. Water shortages will be critical during extended droughts, particu larly along the north coast where water demands for a major rice-growing industry may surpass supplies.
Financing the infrastructure D.
The proposed islandwide water-supply plan for Puerto Rico (Vazquez and others, 1983) will require capital investments of nearly $2 billion during the next 15 to 20 years. Construction
of needed sewage-treatment plants will cost another $2 billion. On the U.S. Virgin Islands, particularly on St. Thomas, con tinued dependency on desalinization plants will increase the costs of water supplies.
River-system management D.
The management of river systems on Puerto Rico is the responsibility of a number of agencies. Land uses that are in conflict with water-resources planning or development are common. Most of the needed water planning by the Puerto Rico Department of Natural Resources and the Virgin Islands Department of Conservation and Cultural Affairs is dependent on Federal funds.
REFERENCESAkin, Benetia, 1983, Severe flood damages in U.S. Virgin Islands:
San Juan, El Muevo Din, April 22, 1983.Birdsey, Richard, and Weaver, P., 1982, The forest resources of
Puerto Rico: U.S. Department of Agriculture Resource Bulletin 50-85, 59 p.
Diaz, J. R., 1979, Sea water instrusion, south coast of Puerto Rico: U.S. Geological Survey Open-File Report 79-1334, 28 p.
Gomez-Gomez, Fernando, and Guzman-Rios, Senen, 1982, Recon naissance of ground-water quality throughout Puerto Rico, September-October 1981: U.S. Geological Survey Open-File Report 82-331, 1 sheet.
Gomez-Gomez, Fernando, and Heisel, J. E., 1980, Summary of the Nation's ground-water resources Caribbean Region: U.S. Geological Survey Professional Paper, 813-U, 32 p.
Isquith, I. R., and Winter, H., 1981, Microbial quality of water in old wells and the public-distribution system in the U.S. Virgin Islands and St. Thomas: College of the Virgin Islands, Caribbean Research Institute, Water Resources Research Center Technical Report No. 8, 23 p.
Lopez, M. A., Colon-Dieppa, Eloy, and Cobb, E. D., 1979, Floods in Puerto Rico, magnitude and frequency: U.S. Geological Survey Water Resources Investigations 78-141, 68 p.
Solley, W. B., Chase, E. B., and Mann, W. B., IV, 1983, Estimated use of water in the United States in 1980: U.S. Geological Survey Circular 1001, 56 p.
U.S. Environmental Protection Agency, 1976, National interim primary drinking water regulations: Office of Water Supply, EPA-570/9-76-003, 159 p.
____1982, Amendment to National Oil and Hazardous Substance Contingency Plan; the National Priorities List: Federal Register, v. 47, no. 251, December 30, 1982, p. 58476-58485.
Vazquez, Santiago and others, 1983, Island-wide water supply im plementation plan for Puerto Rico Executive Summary: San Juan, Santiago Vazquez, Flaherty, Giavara, 430 Parque Street, 47 p.
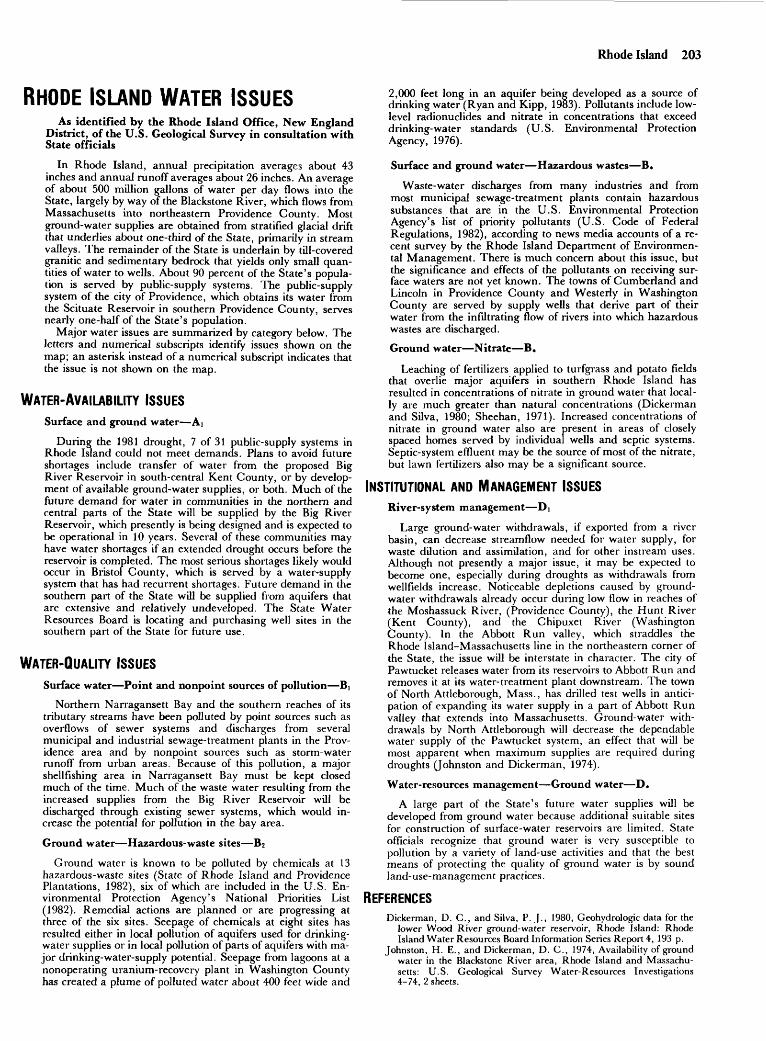
Rhode Island 203
RHODE ISLAND WATER ISSUESAs identified by the Rhode Island Office, New England
District, of the U.S. Geological Survey in consultation with State officials
In Rhode Island, annual precipitation averages about 43 inches and annual runoff averages about 26 inches. An average of about 500 million gallons of water per day flows into the State, largely by way of the Blackstone River, which flows from Massachusetts into northeastern Providence County. Most ground-water supplies are obtained from stratified glacial drift that underlies about one-third of the State, primarily in stream valleys. The remainder of the State is underlain by till-covered granitic and sedimentary bedrock that yields only small quan tities of water to wells. About 90 percent of the State's popula tion is served by public-supply systems. The public-supply system of the city of Providence, which obtains its water from the Scituate Reservoir in southern Providence County, serves nearly one-half of the State's population.
Major water issues are summarized by category below. The letters and numerical subscripts identify issues shown on the map; an asterisk instead of a numerical subscript indicates that the issue is not shown on the map.
WATER-AVAILABILITY ISSUESSurface and ground water Ai
During the 1981 drought, 7 of 31 public-supply systems in Rhode Island could not meet demands. Plans to avoid future shortages include transfer of water from the proposed Big River Reservoir in south-central Kent County, or by develop ment of available ground-water supplies, or both. Much of the future demand for water in communities in the northern and central parts of the State will be supplied by the Big River Reservoir, which presently is being designed and is expected to be operational in 10 years. Several of these communities may have water shortages if an extended drought occurs before the reservoir is completed. The most serious shortages likely would occur in Bristol County, which is served by a water-supply system that has had recurrent shortages. Future demand in the southern part of the State will be supplied from aquifers that are extensive and relatively undeveloped. The State Water Resources Board is locating and purchasing well sites in the southern part of the State for future use.
WATER-QUALITY ISSUESSurface water Point and nonpoint sources of pollution BI
Northern Narragansett Bay and the southern reaches of its tributary streams have been polluted by point sources such as overflows of sewer systems and discharges from several municipal and industrial sewage-treatment plants in the Prov idence area and by nonpoint sources such as storm-water runoff from urban areas. Because of this pollution, a major shellfishing area in Narragansett Bay must be kept closed much of the time. Much of the waste water resulting from the increased supplies from the Big River Reservoir will be discharged through existing sewer systems, which would in crease the potential for pollution in the bay area.
Ground water Hazardous-waste sites B2
Ground water is known to be polluted by chemicals at 13 hazardous-waste sites (State of Rhode Island and Providence Plantations, 1982), six of which are included in the U.S. En vironmental Protection Agency's National Priorities List (1982). Remedial actions are planned or are progressing at three of the six sites. Seepage of chemicals at eight sites has resulted either in local pollution of aquifers used for drinking- water supplies or in local pollution of parts of aquifers with ma jor drinking-water-supply potential. Seepage from lagoons at a nonoperating uranium-recovery plant in Washington County has created a plume of polluted water about 400 feet wide and
2,000 feet long in an aquifer being developed as a source of drinking water (Ryan and Kipp, 1983). Pollutants include low- level radionuclides and nitrate in concentrations that exceed drinking-water standards (U.S. Environmental Protection Agency, 1976).
Surface and ground water Hazardous wastes B.
Waste-water discharges from many industries and from most municipal sewage-treatment plants contain hazardous substances that are in the U.S. Environmental Protection Agency's list of priority pollutants (U.S. Code of Federal Regulations, 1982), according to news media accounts of a re cent survey by the Rhode Island Department of Environmen tal Management. There is much concern about this issue, but the significance and effects of the pollutants on receiving sur face waters are not yet known. The towns of Cumberland and Lincoln in Providence County and Westerly in Washington County are served by supply wells that derive part of their water from the infiltrating flow of rivers into which hazardous wastes are discharged.
Ground water Nitrate B.
Leaching of fertilizers applied to turfgrass and potato fields that overlie major aquifers in southern Rhode Island has resulted in concentrations of nitrate in ground water that local ly are much greater than natural concentrations (Dickerman and Silva, 1980; Sheehan, 1971). Increased concentrations of nitrate in ground water also are present in areas of closely spaced homes served by individual wells and septic systems. Septic-system effluent may be the source of most of the nitrate, but lawn fertilizers also may be a significant source.
INSTITUTIONAL AND MANAGEMENT ISSUESRiver-system management Di
Large ground-water withdrawals, if exported from a river basin, can decrease streamflow needed for water supply, for waste dilution and assimilation, and for other instream uses. Although not presently a major issue, it may be expected to become one, especially during droughts as withdrawals from wellfields increase. Noticeable depletions caused by ground- water withdrawals already occur during low flow in reaches of the Moshassuck River, (Providence County), the Hunt River (Kent County), and the Chipuxet River (Washington County). In the Abbott Run valley, which straddles the Rhode Island-Massachusetts line in the northeastern corner of the State, the issue will be interstate in character. The city of Pawtucket releases water from its reservoirs to Abbott Run and removes it at its water-treatment plant downstream. The town of North Attleborough, Mass., has drilled test wells in antici pation of expanding its water supply in a part of Abbott Run valley that extends into Massachusetts. Ground-water with drawals by North Attleborough will decrease the dependable water supply of the Pawtucket system, an effect that will be most apparent when maximum supplies are required during droughts (Johnston and Dickerman, 1974).
Water-resources management Ground water D,
A large part of the State's future water supplies will be developed from ground water because additional suitable sites for construction of surface-water reservoirs are limited. State officials recognize that ground water is very susceptible to pollution by a variety of land-use activities and that the best means of protecting the quality of ground water is by sound land-use-management practices.
REFERENCESDickerman, D. C., and Silva, P. J., 1980, Geohydrologic data for the
lower Wood River ground-water reservoir, Rhode Island: Rhode Island Water Resources Board Information Series Report 4, 193 p.
Johnston, H. E., and Dickerman, D. C., 1974, Availability of ground water in the Blackstone River area, Rhode Island and Massachu setts: U.S. Geological Survey Water-Resources Investigations 4-74, 2 sheets.
204 National Water Summary 1983
Ryan, B. J., and Kipp, K. L., Jr., 1983, Ground-water contamina tion plume from low-level radioactive wastes, Wood River Junc tion, Rhode Island (abs.): American Geophysical Union Transac tions, v. 64, no. 18, p. 224.
Sheehan, J. E., 1971, Yield of nutrients from agricultural land to water sources: Rhode Island Water Resources Research Center, 7th Annual Report, p. 56-60.
Solley, W. B. ( Chase, E. B., and Mann, W. B., IV, 1983, Estimated use of water in the United States in 1980: U.S. Geological Survey Circular 1001, 56 p.
State of Rhode Island and Providence Plantations, 1982, The state of the State's water Rhode Island: Rhode Island Department of Environmental Management, Division of Water Resources, 100 p.
U.S. Code of Federal Regulations, 1982, Section 401.15, Toxic pollutants, in Subchapter N, Effluent guidelines and standards, of Chapter 1, Environmental Protection Agency: Title 40, Protection of Environment, revised July 1, 1982.
U.S. Environmental Protection Agency, 1976, National interim primary drinking water regulations: Office of Water Supply, EPA-570/9-76-003, 159 p.
____1982, Amendment to National Oil and Hazardous Substance Contingency Plan; the National Priorities List: Federal Register, v. 47, no. 251, December 30, 1982, p. 58476-58485.

Rhode Island 205
71°30'
42°00' T EXPLANATIONWater issues are described in text. Color identifies type of issue. Letter and number identify specific issue described in text.
WATER-AVAILABILITY ISSUES
W/,, . j A-| Surface and ground water
WATER-QUALITY ISSUES
*^^* BI Surface water Point ana nonpoint sources of pollution
62 Ground water-Hazardous-waste sites
INSTITUTIONAL AND MANAGEMENT ISSUES
*+~*~*- DI River-system management
41 "30
15 MILES
15 KILOMETERS
I V) ((NEWPORT CO)
V--- --~._^'
SUMMARY OF WATER USE IN RHODE ISLAND, IN MILLION GALLONS PER DAY, 1980
[Data rounded to two significant figures and may not add to totals because of independent rounding. Source: Solley, Chase, and Mann, 1983]
Withdrawals
Use
Offstream use:
Rural domestic and livestock . .
Self-supplied industrial: Thermoelectric power use . .
Total ..........
Instream use:
Ground water
Fresh Saline
19 .... 5.0 ....
.5
0 .... 13 0
37 0
23
Surface water
Fresh Saline
110 .... 0.1 .... 4.5 ....
.1 330 23 0.6
140 330
Total fresh water
130 5.1 5.0
.1 35
170
Consump tive use,
fresh water
6.3 1.0 4.5
0 2.9
15

206 National Water Summary 1983
SOUTH CAROLINA WATER ISSUESAs identified by the South Carolina District Office of the
U.S. Geological Survey in consultation with State officials
South Carolina is located in three major physiographic prov inces the Coastal Plain, Piedmont, and Blue Ridge. The Coastal Plain occupies the southeastern two-thirds of the State. The Piedmont and Blue Ridge occupy the northwestern one- third of the State, but the Blue Ridge, located in the northwest corner of the State, accounts for only 2 percent of the State's area. Large quantities of freshwater are available in streams, several large and numerous small lakes, and extensive aquifers in the Coastal Plain. In the Piedmont and Blue Ridge, water, which is less abundant than in the Coastal Plain, is available in streams, lakes, fractures in the bedrock, discontinuous sand lenses within weathered bedrock, and alluvial deposits. Precipitation in South Carolina averages slightly more than 48 inches per year and ranges from about 44 inches in the north- central part of the State to about 80 inches in the mountainous northwestern part.
Major water issues are summarized by category below. The letters and numerical subscripts identify issues shown on the map; an asterisk instead of a numerical subscript indicates that the issue is not shown on the map.
WATER-AVAILABILITY ISSUESSurface water Ai
Flow of streams in the Piedmont and in the Coastal Plain near the ocean is quite variable. Flow depends primarily on rainfall and runoff because there is little ground-water discharge to sustain base flow. Storage reservoirs at suitable locations could improve the reliability of streamflow in these areas.
Ground water A.
In contrast to the plentiful supplies of ground water in the Coastal Plain, the igneous- and metamorphic-rock aquifers in the Piedmont and Blue Ridge yield little water except in in tensely fractured areas that generally are more extensive in valleys than in uplands. Many domestic supplies are obtained from large-diameter dug wells completed in weathered bedrock. These relatively shallow wells store considerable quantities of water; however, they generally are dry during droughts. Ground-water use has increased significantly in the agricultural areas of Allendale, Hampton, Bamberg, and Orangeburg Counties, resulting in declining ground-water levels that may have accelerated sinkhole formation in this limestone terrane. Reconnaissance investigations have been made in these counties to determine ground-water availability and quality.
WATER-QUALITY ISSUESSurface water Hazardous-waste sites Bi
Although most surface water has been unaffected by hazard ous wastes, there are isolated areas where pollution has oc curred, such as Lake Hartwell on the Savannah River (Ander- son County). Fish from Lake Hartwell and from a tributary, Twelvemile Creek, contain large concentrations of polychlo- rinated biphenyls. Consumption of fish from these waters has been restricted, and the sources of the polychlorinated biphenyls have been identified. The industrial firms involved have since eliminated the use of the polychlorinated biphenyls, and its concentration in fish is decreasing. Discharge of in dustrial and municipal wastes into the Savannah River and tributaries near Augusta and North Augusta has resulted in increased concentrations of heavy metals, acidic water, and deficient or depleted dissolved-oxygen concentrations (U.S. Environmental Protection Agency, 1972; South Carolina Department of Health and Environmental Control, 1975). Upgraded waste-water treatment facilities in the North
Augusta area have improved water quality significantly, although desired quality conditions have not been achieved.
Ground water Point sources of pollution B2
The Savannah River Plant (U.S. Department of Energy) currently has five facilities designated as "hazardous waste storage and disposal facilities." Contaminants include mer cury, chromium, and liquid wastes outside of the 3- to 12-pH range. Although there was no indication that the hazardous waste has moved from the site, there is considerable evidence of contamination of ground water near these disposal facilities (Marine and others, 1983).
Ground water Saline-water intrusion B3
Saline-water intrusion into freshwater aquifers is significant in the Beaufort-Hilton Head area as a result of pumping near ly 80 million gallons per day in the area near Savannah, Ga. Water levels at the center of pumpage declined from a predevelopment level of 35 feet above sea level in 1880 to a depth of about 150 feet below sea level in Savannah in 1970 (Counts and Krause, 1976, sheet 1) and have induced saline- water intrusion into the limestone aquifer at Port Royal Sound. Water levels in the Savannah area have recovered somewhat to a level of about 115 feet below sea level in 1982 due to reductions in industrial pumpage (Matthews and others, 1982). Increased pumpage on HQton Head Island near the outcrop area also has contributed to the saline-water intru sion. If allowed to continue, water from the limestone aquifer may not meet State and Federal drinking-water standards. Water supplies also may be affected by saline-water intrusion at Myrtle Beach and vicinity. Large municipal withdrawals have lowered water levels in the Black Creek aquifer to more than 100 feet below sea level. A clay confining bed has prevented saline water from entering the aquifer, but lowered water levels have created the potential for lateral and upward intrusion of saline water. Presently, ground water is the sole source of fresh water in the area, and importation of surface water from distant sources would be costly.
Ground water Natural constituents B4
Natural constituents making ground water unsuitable for some uses include chloride concentrations of more than 250 milligrams per liter and fluoride concentrations of 5 to 6 milligrams per liter in coastal areas, hardness of more than 180 milligrams per liter in the limestone aquifer system, iron con centrations ranging from 300 to about 6,000 micrograms per liter in nearly all sedimentary aquifers, and acidic water with pH values ranging from 4.5 to 5.5 in sedimentary aquifers near the Fall Line.
Ground water Radioactive-waste sites B5
More than one-half of the Nation's low-level radioactive wastes are buried at a site in Barnwell County. The concern of the State is that the wastes will pollute nearby ground-water supplies. The State also is concerned about long-term effects on the quality of deeper ground water and possible discharge of radioactive pollutants to surface water. It is the policy of the State of South Carolina, as expressed by the Governor and members of the State General Assembly, that this facility and other facilities of the U.S. Department of Energy, such as the Savannah River Plant, be operated and maintained in a man ner fully consistent with the environmental, health, and safety laws of the State and that any pollution resulting from past or current practices be assessed and corrected to the greatest ex tent possible. At the Savannah River Plant, 15,000 curies of tritium have migrated southwest of the radioactive-waste burial ground beneath a 16-acre tract. Migration of beta and gamma nuclides into the ground water from the buried waste is evident at one well that contains beta and gamma radioactivity 15 times greater than the normal background level. There is low-level plutonium contamination in the ground water over a 12-acre portion of the burial ground. The perched ground water in contact with the waste at the burial ground contains

South Carolina 207
82°
83'
35
EXPLANATIONWater issues are described in text. Color identifies type of issue. Letter and number identify specific issue described in text.
WATER AVAILABILITY ISSUES
[ ] Af Surface water (see small map)
WATER QUALITY ISSUES
Surface water-Hazardous waste sites
J 62 Ground water-PoInt sources of pollution (see small map)
63 Ground water Saline water intrusion
32°-" ~
Ground water-Natural constituents
Ground water-Radioactive waste sites
HYOROLOGIC HAZARDS AND LAND USE ISSUES
ImnJUll C i Coastal-zone utilization
C 2 Sinkholes (see small map)
50 100 MILES
50 100 KILOMETERS
SUMMARY OF WATER USE IN SOUTH CAROLINA, IN MILLION GALLONS PER DAY, 1980
[Data rounded to two significant figures and may not add to totals because of independent rounding. Source: Solley, Chase, and Mann. 1983]
Use
Off stream use:
Rural domestic and livestock .
Self -supplied industrial: Thermoelectric power use . Other industrial uses ....
Total .........
Instream use:
Ground water
Fresh Saline
78 ...77 .... 17 ...
0.5 .... 57 0
230 0
41,000
Withdrawals
Surface water
Fresh Saline
270 10 .... 37 ....
5,200 7.7 400 30
5,900 38
Total fresh water
350 87 54
5,200 460
6.200
Consump tive use,
fresh water
53 87 54
35 47
280

208 National Water Summary 1983
beta and gamma radioactivity 100 times the average natural background for shallow ground water (Liverman, 1977).
Surface water Point and nonpoint sources of pollution B.
The most widespread surface-water quality concern in South Carolina is the presence of fecal coliform bacteria derived from sewage effluent and other sources. This pollution primarily af fects shellfish harvest and recreational water use and typically is caused by municipal waste-water discharge and runoff from urban and agricultural areas. Approximately 72,000 acres (33 percent) of the State's estuarine waters are closed to shellfish harvesting (Luke Hause, South Carolina Department of Health and Environmental Control, written commun., 1982), and 74 percent of the State's water-quality monitoring stations indicate potential pollution because of large concentrations of fecal coliform bacteria (South Carolina Department of Health and Environmental Control, 1979).
Ground water Point and nonpoint sources of pollution B.
Harris (1978) listed 28 areas in the State affected by ground- water pollution resulting from mismanagement and incorrect siting of septic systems, landfills, dumps, stockpiles, and feed lots; application of fertilizers and pesticides; incorrect spray irrigation of sewage effluents; mining operations; poorly de signed test wells; abandoned wells; and leaking storage tanks and sewer lines. Three hazardous-waste sites near Caycee, Columbia, and Fort Lawn have been included in the U.S. Environmental Protection Agency's National Priorities List (1982).
HYDROLOGIC HAZARDS AND LAND-USE ISSUESCoastal-zone utilization Ci
Development of barrier islands, especially Kiawah Island, is a major issue in South Carolina. Additional pollution of coastal waters by development of the islands could increase the poten tial of adverse effects on the fish and wildlife including the valuable shellfish resource. The shellfish industry is affected by pollutants from various shoreline point sources.
Sinkholes Cz
Sinkholes have formed as a result of declining water levels in limestone aquifers in southwestern Georgetown County, the Harleyville area in Dorchester County, the Jamestown area in Berkeley County, and the Lake Marion area in Orangeburg County. Withdrawal of ground water has caused water-level declines of more than 35 feet since 1975. Sinkholes form at and near pumping wells and likely will continue to form as long as pumping continues (Spigner, 1978a, 1978b).
Aquatic weeds C.
Aquatic weed growth in freshwater lakes and streams has severely restricted boating, fishing, and swimming; power generation; and industrial use of surface water in many areas of the State. The weeds spread if just a small piece of stem takes root after being transported from one freshwater body to another. In South Carolina, the weeds grow all year, and the measures to control their growth generally have not been effec tive. The use of chemical herbicides is detrimental to the qual ity of the water, and physical removal of the weeds is expen sive. The importation of weed-eating fish has met with only limited success.
INSTITUTIONAL AND MANAGEMENT ISSUESWater laws D.
Two management issues are not addressed in State policies, statutes, or regulations the diversion of very large quantities of water from surface-water courses, particularly when this water is not returned to its basin or origin, and the absence of State policy regarding maintenance of minimum instream flow. The Governor's State Water Law Review Committee recommends that an agency or agencies be designated to analyze existing withdrawals of this type, to develop criteria by which to define and judge the impacts of future significant withdrawals, and to recommend appropriate legislation to the General Assembly and that the State adopt a policy recogniz ing the beneficial uses of water that are dependent on a minimum instream flow, and acknowledging the need to main tain minimum stream flows.
Ground water constitutes significant portions of the State's water resources. Some programs exist to manage and protect this resource, but critical information about ground water in many areas of the State is inadequate. Therefore, the Gover nor's State Water Law Review Committee (1982) recommends that a comprehensive effort be undertaken to investigate this resource.
REFERENCESCounts, H. B., and Krause, R. E., 1976, Digital model analysis of the
principal artesian aquifer, Savannah, Georgia, area: U.S. Geolog ical Survey Water Resources Investigations 76-133, 4 sheets.
Governor's State Water Law Review Committee, 1982, Report and Recommendations: Columbia, S.C., 32 p.
Harris, C. L., 1978, 208 ground-water statewide management plan: South Carolina Department of Health and Environmental Control, 117p.
Liverman, James L., 1977, Final Environmental Impact Statement Waste management operation, Savannah River Plant: Aiken, S.C., U.S. Energy Research and Development Administra tion, report 1537, 700 p.
Marine, I. W., Gordon, D. E., Phifer, M. A., Peralta, C. S., and Bledsoe, H. W., 1983, Ground Water quality protection at the Savannah River Plant: Aiken, S.C., E. I. du Pont de Nemours and Company, Savannah River Laboratory, 128 p.
Matthews, S. E., Hester, W. G., and McFadden, K. W., 1982, Ground-water data for Georgia, 1981: U.S. Geological Survey Open-File Report 82-904, 110 p.
Solley, W. B., Chase, E. B., and Mann, W. B., IV, 1983, Estimated use of water in the United States in 1980: U.S. Geological Survey Circular 1001, 56 p.
Spigner, B. C., 1978a, Land-surface collapse and ground-water problems in the Jamestown area, Berkeley County, South Carolina: South Carolina Water Resources Commission Open-File Report 78, 47 p.
____1978b, Review of sinkhole-collapse problems in a carbonate terrain: South Carolina Water Resources Commission, 16 p.
South Carolina Department of Health and Environmental Control, 1975, Savannah River basin water-quality management plan: Co lumbia, 164 p.
____1979, Water-quality management planning report Identification of potential water-quality problem areas and classification of stream segments: Columbia, 172 p.
U.S. Environmental Protection Agency, 1972, In the matter of pollu tion of the middle reach of the Savannah River in the States of Georgia and South Carolina: Atlanta, transcript of conference pro ceedings, March 22-23, 1972, 515 p.
____1982, Amendment to National Oil and Hazardous Substance Contingency Plan; the National Priorities List: Federal Register, v. 47, no. 251, December 30, 1982, p. 58476-58485.

South Dakota 209
SOUTH DAKOTA WATER ISSUESAs identified by the South Dakota District Office of the
U.S. Geological Survey in consultation with State officials
South Dakota has an average annual precipitation of about 18 inches, ranging from 14 inches in the northwest to about 25 inches in the southeast. In most years, 75 to 85 percent of the precipitation falls between April and September. Droughts, especially those of the 1930's, 1950's, and 1970's, have been disastrous to agriculture, the State's dominant industry. With the exception of the Missouri River, where 31 million acre-feet of water is stored in four large reservoirs, streamflow during low flows generally is not dependable for continued irrigation or for municipal or industrial withdrawals. The four large Missouri River reservoirs, built under the Pick-Sloan Missouri River Program, provide flood protection and navigation benefits for the basin States downstream from Sioux City, Iowa. Ground water underlies the entire State, but the water in many of the aquifers is of marginal quality. South Dakota's commitment to water development is demonstrated by coor dinated efforts under the State Comprehensive Water Plan (South Dakota Department of Water and Natural Resources, 1983).
Major water issues are summarized by category below. The letters and numerical subscripts identify issues shown on the map; an asterisk instead of a numerical subscript indicates that the issue is not shown on the map.
WATER-AVAILABILITY ISSUESGround water Ai
Adequate quantities of ground-water generally are available for most uses; however, in a few areas of the State, withdrawals almost equal supplies. Rapid development within the Big Sioux River basin in eastern South Dakota has created con cerns about the effects of ground-water recharge, surface storage, and withdrawal of ground and surface water on the basin's water supplies. Increasing population, mining ac tivities, irrigation, and energy-development activities in the Black Hills in western South Dakota and nearby coal fields of Wyoming, Montana, and North Dakota have increased the demands on the water resources of this area. Increased de mand for irrigation water in the east-central part of the State has created a need for water to supplement existing supplies.
Surface water A.
Surface-water supplies, which depend on local runoff, are relatively scarce except near the Missouri River and in a few areas in the eastern and western parts of the State. During years when streamflow is less than average, it is necessary to cease diversions for irrigation. Even with the decrease of major diversions, flows are insufficient to maintain environmental and recreation needs. Major water-development projects to move water long distances are proposed to provide additional water supplies.
WATER-QUALITY ISSUESEutrophication BI
The natural eutrophication of many shallow prairie lakes throughout South Dakota is being accelerated by man's activi ties. Significant sources of nutrients that may be contributing to the accelerated eutrophication are discharges from municipal sewage-treatment plants, effluent from septic systems, and runoff from agricultural land and feedlots. Restoration programs are ongoing at several lakes.
Acidic precipitation B2
Data from two precipitation-monitoring stations operated by South Dakota Department of Water and Natural Resources in western South Dakota (Lemmon and Buffalo Gap) indicate that acidic precipitation (measured pH ranging from 4.2 to 6.3) is occurring in this part of the State.
Surface water Point and nonpoint sources of pollution B.
Municipal sewage-treatment plants constitute the greatest number o^ point sources of pollution in South Dakota, and feedlots rank second in number (South Dakota Department of Water and Natural Resources, 1982). Discharge of inade quately treated sewage and runoff from feedlots have polluted some streams; however, construction of new and upgrading of existing sewage-treatment facilities seem to be resulting in a general improvement of surface-water quality in parts of the State. Runoff from agricultural lands probably is the largest source of nonpoint pollution and contributes sediment and nutrients to streams and lakes.
Ground water Landfills B.
South Dakota has approximately 350 landfills. One-third of these sites potentially could pollute ground water with leachates or by direct disposal of liquid wastes (South Dakota Department of Water and Natural Resoures, written com- mun., 1983).
Ground water Natural constituents and gasoline B.
Much of the State's ground water is naturally hard and has large concentrations of sulfate, iron, and, in some places, nitrate. In parts of the State, ground water is of marginal qual ity as a drinking-water supply. The Fox Hills aquifer in the northwestern part of the State and the Arikaree and Ogallala aquifers in the southwestern part of the State contain water suitable for all present uses. In isolated cases, the water in glacial-drift aquifers either is being intruded by saline water from underlying bedrock aquifers through abandoned and deteriorated well casings, or is being polluted by gasoline spills and leaks from old deteriorated storage tanks. In an effort to obtain supplies of potable drinking water, several rural water systems have been formed, and 22 of these systems are in cluded in the 1983 State Water Plan (South Dakota Depart ment of Water and Natural Resources, 1983).
HYDROLOGIC HAZARDS AND LAND-USE ISSUESResource development Metal mining Ci
There is concern that leachates from gold and silver mill tail ings near the town of Lead may be polluting the surface and ground water of the Whitewood Creek-Belle Fourche River-Cheyenne River stream system. High concentrations of chromium, iron, manganese, and zinc have been detected in surface water in the area, and high concentrations of arsenic have been found in ground water. Of particular concern is the fact that a number of farms and ranches along the rivers obtain domestic and agricultural water from these sources. A reach of Whitewood Creek has been included in the U.S. Environ mental Protection Agency's National Priorities List (1982) of hazardous-waste sites. The Environmental Protection Agency, the State of South Dakota, and the Homestake Mining Co. are jointly investigating possible remedial actions.
Flooding C.
Periodic flooding, resulting from spring snowmelt and in tense summer thunderstorms, can occur in prairie streams such as the Big Sioux and James Rivers in the eastern part of the State. The majority of damage is to lands used for agricultural purposes. Flash floods resulting from intense thunderstorms also can occur in the western part of the State. The Rapid City flood of 1972, which killed 237 people and caused $160 million in damage, is an example of a flash flood resulting from intense rainfall (Schwarz and others, 1975).
Erosion and sedimentation C,
Sedimentation, resulting primarily from erosion of agricultural land, is a concern in South Dakota. It has caused a decrease in the channel capacities in the James River and several other prairie streams.

210 National Water Summary 1983
Wetlands C.
Prairie-pothole wetlands are the primary breeding areas of migratory waterfowl in the United States; however many prairie potholes in eastern South Dakota have been drained for agricultural use. These conflicting uses of the land pose an environmental issue of major concern.
INSTITUTIONAL AND MANAGEMENT ISSUESWater allocation D»
New well permits have been denied by the South Dakota Department of Water and Natural Resources in part of the James River basin, and diversions from the James River have been restricted because of increased irrigation demands resulting from the severe drought of the 1970's.
Water-resources planning and management Dz
Proposed water-development projects include (1) the reha bilitation of the Belle Fourche Irrigation Project delivery sys tem, which provides irrigation water to more than 57,000 acres; (2) the Central Dakota Water Supply System, Inc. (CEN- DAK), Irrigation Project, a multiple-purpose project that would transport Missouri River water to six central South Dakota counties for irrigation of about 400,000 acres; (3) the Garrison Diversion Extension Project, which was developed to obtain benefits from North Dakota's Garrison Division Unit, in cluding flood control, channel improvements, recreation, off- stream storage, water for municipal and industrial purposes, and irrigation of about 100,000 acres along the James River in South Dakota; (4) the Gregory County Hydroelectric Pumped Storage Unit, which would be capable of generating peak-hour electricity and providing water for rural, municipal, and agricultural use; (5) the Lake Andes-Wagner Project, which would irrigate about 30,000 acres in Charles Mix County us ing Missouri River water; (6) the Walworth, Edmunds, Brown Water Development Association, Inc. (WEB) Pipeline Project, a domestic-water pipeline that will supply treated Missouri River water to about 30,000 people in parts of nine counties in north-central South Dakota; and (7) the West River Aqueduct, an industrial- and domestic-water pipeline project that would
obtain water from the Energy Transportation Systems Inc. pipeline from the Missouri River to supply several com munities and rural users in western South Dakota that do not have adequate sources of water (South Dakota Department of Water and Natural Resources, 1983).
Water laws D.
The use of surface water in South Dakota is managed under the doctrine of prior appropriation. Planning and management of the State's ground-water resources is accomplished through a water record and permit system and a State Water Plan. State law does not allow withdrawals from an aquifer to exceed the average annual recharge.
River-system management D.
It is South Dakota's position that the State has every right to use its equitable portion of surface water from interstate streams, as long as downstream States are not harmed. This position was the basis for the sale of water from Lake Oahe on the Missouri River to the Energy Transportation Systems, Inc., for use in a coal-slurry pipeline in Wyoming. The Pick- Sloan Missouri River Basin Program of 1944 (Flood Control Act of 1944) remains the cornerstone for planning and management of the Missouri River basin in South Dakota.
REFERENCESSchwarz, F. K., Hughes, L. A., Hansen, E. M., Petersen, M. S., and
Kelly, D. B., 1975, The Black Hills Rapid City flood of June 9-10, 1972: A description of the storm and flood: U.S. Geological Survey Professional Paper 877, 45 p.
Solley, W. B., Chase, E. B., and Mann, W. B., IV., 1983, Estimated use of water in the United States in 1980: U.S. Geological Survey Circular 1001, 56 p.
South Dakota Department of Water and Natural Resources, 1982, 1982 water quality of South Dakota: Pierre, 134 p.
____1983, 1983 State water plan and 1982 annual report: Pierre, 46 p.
U.S. Environmental Protection Agency, 1982, Amendment to National Oil and Hazardous Substance Contingency Plan; the Na tional Priorities List: Federal Register, v. 47, no. 251, December 30, 1982, p. 58476-58485.

South Dakota 211
43*-
100 MILES
SUMMARY OF WATER USE IN SOUTH DAKOTA, IN MILLION GALLONS PER DAY. 1980
[Data rounded to two significant figures and may not add to totals because of independent rounding. Source: Solley. Chase, and Mann, 1983]
Withdrawals
Use
Off stream use:
Rural domestic and livestock .
Self-supplied industrial: Thermoelectric power use . Other industrial uses ...
Total .........
Instream use: Hydroelectric power .
Ground water
Fresh Saline
52 ... 100 150 ....
2.4 .... 23 3.4
330 3.4
67,000
Surface water
Fresh Saline
24 ... 12 ....
310 ....
2.5 0 19 0
360 0
Total
water
76 110 460
4.9 42
690
Consump tive use,
fresh water
15 100 340
3.2 2.3
460
KILOMETERS
EXPLANATIONWater issues are described in text. Color identifies type of issue. Letter and number identify specific- issue described in text.
WATER-AVAILABILITY ISSUES
|^^v>] A-j Ground water
WATER-QUALITY ISSUES
A B-| Eutrophication
A 62 Acidic precipitation
HYDRDLOGIC HAZARDS AND LAND-RELATED ISSUES
"^^" C-| Resource development-Metal mining
INSTITUTIONAL AND MANAGEMENT ISSUES
Water allocation
D2 Water-resources planning and management (see small map)

212 National Water Summary 1983
TENNESSEE WATER ISSUESAs identified by the Tennessee District Office of the U.S.
Geological Survey in consultation with State officials
The geologic setting of Tennessee includes unconsolidated sediments of the Coastal Plain (Mississippi embayment) in western Tennessee, limestone and dolomite in central Ten nessee, and limestone and granite of the folded Appalachian Mountains in the east. In the Coastal Plain, ground water is the principal source of supply, whereas a combination of sur face and ground water is used in other areas. Tennessee receives an average of about 50 inches of precipitation per year. This plentiful rainfall provides water for many uses in the State. The combination of water use and waste disposal in densely urbanized areas and waste discharge from industries and agricultural areas throughout the State has caused increas ing concern for the land and water resources.
Major water issues are summarized by category below. The letters and numerical subscripts identify issues shown on the map; an asterisk instead of a numerical subscript indicates that the issue is not shown on the map.
WATER-AVAILABILITY ISSUESSurface water Ai
Several counties in the eastern and central parts of Ten nessee depend almost entirely on surface water. Shortages of surface-water supply can occur in some counties with rapidly increasing populations, such as Williamson and Lincoln. Other counties that are known to have similar shortages of surface-water supply are Giles, Monroe, Scott, and Dickson.
WATER-QUALITY ISSUESSurface water Point and nonpoint sources of pollution Bi
The effects of municipal and industrial discharges on surface-water quality are a concern in Tennessee. Foremost among such sources of discharges are municipal sewage- treatment plants in and near major urban centers and chemical processing and production plants. Discharges from pulp and paper mills and powerplants also are important water-quality concerns. Runoff from agricultural land increases sediment transport and potential pollution by agricultural chemicals. Numerous basins in western Tennessee may be adversely af fected by soil erosion and possible nutrient enrichment resulting from crop-production activities.
Surface and ground water Radioactive-waste sites 62
Since the early 1940's, solid, low-level radioactive wastes routinely have been buried in shallow trenches at the Oak Ridge National Laboratory. To date, six burial sites have been used (Webster, 1982). Small, but measurable, concentrations of radionuclides have been detected in the streams in and near the four largest disposal areas. These small concentrations probably occur as a result of radionuclides leaching from the buried wastes, being transported in ground water, and seeping into streams. Cesium-137, for example, has been identified in subsurface rocks at a burial site at a depth of about 130 feet, indicating some subsurface movement in ground water (Web ster, 1982).
Ground water Hazardous-waste sites B3
There are more than 500 waste sites in Tennessee that may contain hazardous materials. Of these, six are included in the U.S. Environmental Protection Agency's National Priorities List (1982) of hazardous-waste sites (shown on accompanying map). Efforts are being made to determine the effects of each site on local water supplies. Several sites previously identified are near Bumpass Cove in eastern Tennessee (Unicoi County), near Toone in western Tennessee (Hardeman Coun ty), and at five locations near Memphis. More than 300,000 barrels of hazardous pesticide wastes were dumped at the
Toone site between 1964 and 1972 (Sprinkle, 1978). Local residents believe that these wastes have induced cancer in humans and caused livestock deaths in the vicinity of the site (Coleman, 1982). Chemical and industrial wastes disposed of at the Hollywood Dump near Memphis have caused public concern about the possibility of ground-water pollution. Tests made by the U.S. Geological Survey reveal that trace concen trations of some constituents in the U.S. Environmental Pro tection Agency's list of priority pollutants (U.S. Code of Federal Regulations, 1982) are present in the shallow water- table aquifer in the immediate vicinity of the Hollywood Dump. Residents of Memphis are concerned about the possi- ble pollution of the Memphis Sand aquifer, the major source of water supply for Memphis. However, no traces of any priority pollutants have been found in water from wells completed in the Memphis Sand aquifer (Graham, 1982).
Surface water Tennessee Valley reservoirs B.
The two most significant water-quality problems associated with the Tennessee Valley Authority (TVA) reservoirs along the Tennessee River and its tributaries are low dissolved-oxygen concentrations in reservoir releases and accelerated lake eutrophication (Tennessee Valley Authority, 1980). Problems associated with reservoir releases also include increased levels of iron and manganese and rapidly fluctuating water tempera tures. Each condition has the potential to affect water uses below all the reservoirs, particularly during severe or extended droughts. Problems of increased iron and manganese in reser voir releases have been observed in the South Holston River below South Holston Dam and the Duck River below Nor mandy Dam. Water releases from Cherokee, Douglas, and Melton Hill Reservoirs have temperatures that are marginal for fish development too warm for cold-water species and too cold for warm-water species. The principal reservoir water- quality concern is that of eutrophication. Sources of nutrients that accelerate eutrophication include municipal and industrial effluents, urban runoff, and runoff from heavily fertilized crop land areas. At present, only Cherokee and Normandy Reser voirs in the Tennessee part of the valley are eutrophic. Reser voir eutrophication has been studied by the TVA, and a draft reservoir quality management plan has been completed for Cherokee Reservoir. Similar plans are being prepared for the Fort Loudon, Pickwick, and Tellico Reservoirs.
HYDROLOGIC HAZARDS AND UNO-USE ISSUESSinkholes Ci
Sinkholes are present throughout central Tennessee and a large part of eastern Tennessee. Sinkholes may provide a route for pollutants introduced at land surface to move downward to the ground-water system.
Resource development Coal mining Cz
In anticipation of future coal mining in Tennessee, the Ten nessee Surface Mining and Water Management Divisions of the Department of Health and Environment are formulating new regulations governing coal mining and mineral-area reclamation. Surface mining can cause increased sedimenta tion and increased mineralization of water in streams common ly resulting in adverse water-quality conditions (Gaydos and others, 1982). These conditions may limit the domestic, municipal, industrial, and recreational use of the water. In ad dition, a decline of ground-water levels that may cause some wells and springs to go dry can occur in and near mining areas when excavation extends below the water table. The quality of ground water also may be adversely affected, although the ef fects may take much longer to determine because of the slow movement of ground water.
Flooding C.
Many urban areas have some flooding caused by storm- water runoff associated with increased urbanization. Concerns related to flooding by surface runoff from urban watersheds are
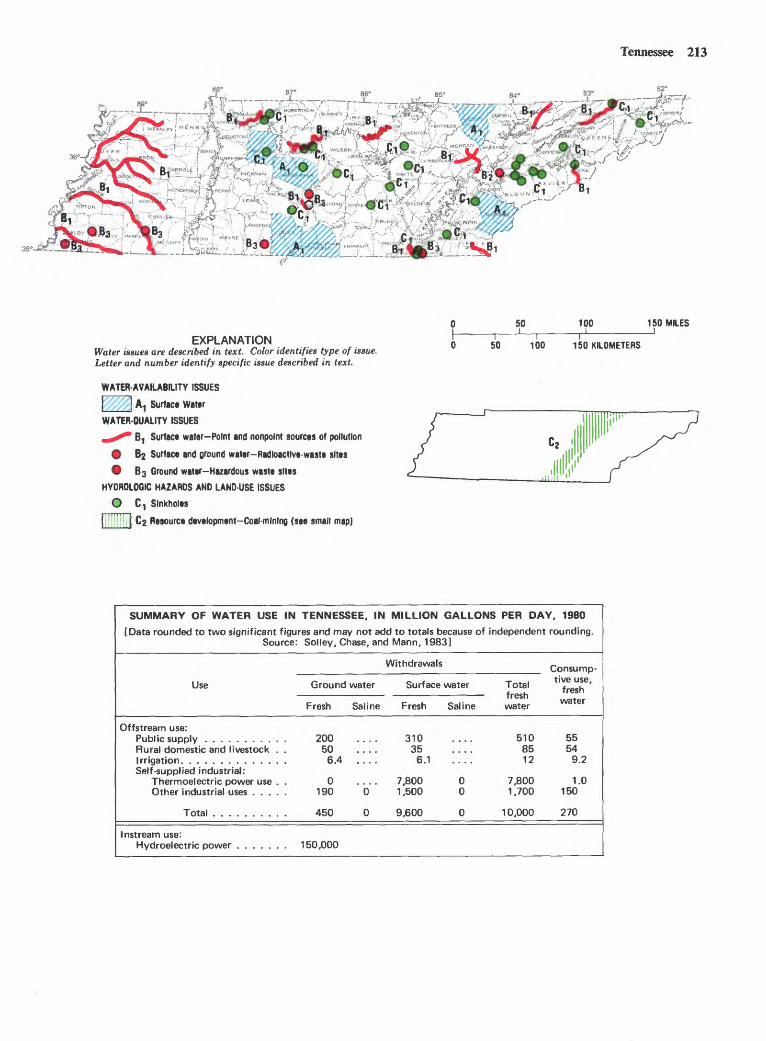
Tennessee 213
t^-^r-r-^^S^Sr^^r^ '<$ ^^~[?:.;: -X-.Bi.iePE>1 . - >. . ' fe*.
i^ **t-ii_ Jj^"^}1 '"--£' H|9,KM*N
EXPLANATIONWater issues are described in text. Co/or identifies type of issue. Letter and number identify specific issue described in text.
WATER-AVAILABILITY ISSUES
I \ A, Surfaw WaterWATER-QUALITY ISSUES
^^" B1 Surface water-Point and nonpolnt sources of pollution
62 Surface and ground water-Radloactlve-waste sites
63 Ground water-Hazardous waste sites
HYDROLOGIC HAZARDS AND LAND-USE ISSUES
9 C, Sinkholes
II' 11 '"1 '] 62 Resource development-Coal-mlnlng (see small map)
SO 100
50 100
150 MILES_I
150 KILOMETERS
SUMMARY OF WATER USE IN TENNESSEE, IN MILLION GALLONS PER DAY, 1980
[Data rounded to two significant figures and may not add to totals because of independent rounding. Source: Solley, Chase, and Mann, 1983]
Use
Offstream use:
Rural domestic and livestock .
Self-supplied industrial: Thermoelectric power use .
Total .........
Instream use:
Ground water
Fresh Saline
200 .... 50 .... 6.4 ....
0 .... 190 0
450 0
150,000
Withdrawals
Surface water
Fresh Saline
310 .... 35 ....
6.1 ....
7.800 0 1 ,500 0
9,600 0
Total fresh water
510 85 12
7.800 1.700
10.000
Consump tive use,
fresh water
55 54
9.2
1.0 150
270

214 National Water Summary 1983
being addressed by the Tennessee Department of Transporta tion and by some communities (Metropolitan Nashville- Davidson County, Shelby County, and the city of Memphis).
REFERENCESColeman, L., 1982, Farmer cites Velsicol Dump for "mystery" cattle
deaths: Memphis, Tennessee, Commercial Appeal, July 7.Gaydos, M. W.,,and others, 1982, Hydrology of area 19, eastern coal
province, Tennessee: U.S. Geological Survey Water-Resources In vestigations Open-File Report 81-901, 75 p.
Graham, D. D., 1982, Effects of urban development on the aquifers in the Memphis area, Tennessee: U.S. Geological Survey Water- Resources Investigations 82-4024, 20 p.
Solley, W. B., Chase, E. B., and Mann, W. B., IV, 1983, Estimated use of water in the United States in 1980: U.S. Geological Survey Circular 1001, 56 p.
Sprinkle, C. L., 1978, Leachate migration from a pesticide waste disposal site in Hardeman County, Tennessee: U.S. Geological Survey Water-Resources Investigations 78-128, 35 p.
Tennessee Valley Authority, 1980, "Is the water getting cleaner?", A survey of water quality in the Tennessee Valley: Knoxville, Ten nessee, Office of Natural Resources, November 1980.
U.S. Code of Federal Regulations, 1982, Section 401.15, Toxic pollutants, in Subchapter N, Effluent guidelines and standards, of Chapter 1, Environmental Protection Agency: Title 40, Protection of Environment, revised July 1, 1982.
U.S. Environmental Protection Agency, 1982, Amendment to National Oil and Hazardous Substance Contingency Plan; the Na tional Priorities List: Federal Register, v. 47, no. 251, December 30, 1982, p.58476-58485.
Webster, D. A., 1982, Oak Ridge National Laboratory, Tennessee, in U.S. Geological Survey research in radioactive waste disposal Fiscal Year 1980: U.S. Geological Survey Open-File Report 82-509, p. 88-90.
Texas 215
TEXAS WATER ISSUESAs identified by the Texas District Office of the U.S. Geological Survey in consultation with State officials
Texas is diverse physiographically and climatically. Average annual precipitation ranges from less than 10 inches in far West Texas to more than 56 inches along the eastern bound ary. Twenty-three major river basins, including eight coastal basins and five interstate basins, trend southwestward across the State. There are currently 179 major surface-water reser voirs with 5,000 acre-feet or more total capacity. In addition, 10 major surface-water reservoirs are under construction. Combined conservation storage totals about 32.3 million acre- feet. Aquifers underlie about 50 percent of the State and include 7 major aquifers and 16 minor aquifers, as defined by the Texas Department of Water Resources (Muller and Price, 1979). Currently, the dependable annual water supply reservoir releases needed to meet demands if the worst drought of record would recur (1950-1956 or 1961-1963 droughts de pending on location) plus recoverable recharge from aquifers is about 16.3 million acre-feet. The Texas Depart ment of Water Resources estimates that the total dependable water supply that can be developed is about 21.6 million acre- feet. By the year 2000, annual water demand is projected to be between 17.3 and 26.4 million acre-feet (Texas Department of Water Resources, 1983). Plans are being developed to address water availability, water-quality protection, and projected water needs; institutional and managerial aspects of water development; conservation; and reuse (Texas Department of Water Resources, 1983).
Major water issues are summarized by category below. The letters and numerical subscripts identify issues shown on the map; an asterisk instead of a numerical subscript indicates that the issue is not shown on the map.
WATER-AVAILABILITY ISSUESGround water Ai
In many areas, ground-water withdrawals exceed recharge. Pumpage from the High Plains aquifer in northwest Texas for agricultural purposes has caused water-level declines of as much as 200 feet since development began in the early 1900's, with most declines ranging from 10 to 50 feet. The total volume of water in the Texas part of the High Plains aquifer has been decreased by approximately 23 percent the greatest decrease in the eight States underlain by the High Plains aquifer (Luckey and others, 1981). Long-term water-level declines in many areas have increased pumping costs and resulted in decreased pumpage, especially in Reeves and Pecos Counties in West Texas. Pumpage also has decreased in the High Plains because of increased irrigation efficiency (Texas Department of Water Resources, 1983). In the El Paso area, alluvium and bolson deposits could be depleted by the year 2000 at the present rate of pumping (Texas Department of Water Resources, 1983). In the San Antonio area, the Ed wards aquifer is recharged readily from precipitation and resulting runoff, but, during droughts, water levels decline rapidly. An extended drought could cause serious water short ages and decreased springflows. Pumpage from the Carrizo- Wilcox aquifer in the Winter Garden area southwest of San Antonio has caused significant water-level declines. Pumping in the Waco-Dallas-Fort Worth area of north-central Texas also has caused substantial water-level declines. In the coastal area, there are limits to the quantity of water that can be obtained from the generally prolific Gulf Coast aquifer. For ex ample, extensive pumping has caused serious water-level declines at Houston and Galveston; further development is restricted because of the risk of subsidence and saline-water intrusion.
Surface water A.
About 64 percent of the dependable yield of the 179 existing major reservoirs with capacity greater than 5,000 acre-feet is
being used to meet current demands; the remainder of the reservoirs is committed to meet expanding municipal and in dustrial demands during the next 20 to 30 years. Most of these supplies, however, will not meet the projected demands in their respective locations and cannot meet future demands in neigh boring and distant water-deficient areas. Texas has identified 65 potential reservoir sites, 32 of which are planned to meet projected water requirements until the year 2000. The remain ing 33 sites are planned to meet projected water requirements after the year 2000. In areas of ground-water mining, importa tion of flood waters is being considered as one alternative to meet projected demands.
WATER-QUALITY ISSUESSurface water Point and nonpoint sources of pollution Bi
Discharges from sewage-treatment and industrial plants, and runoff from urban areas are concerns downstream from major urban and industrial development areas. There also are concerns about eutrophication and turbidity in several water- supply reservoirs, including those that supply Houston and Dallas-Fort Worth, because of runoff from established and developing urban areas and because of inflow of waste water and its associated nutrients. Management strategies include nutrient-source identification and control through improved operations of sewage-treatment plants and sediment controls.
Surface water Natural salinity B2
Natural salinity from saline seeps is present in the upstream reaches of many of the major rivers (Rawson, 1982); this salinity makes the water unsuitable for many uses, especially during low flows. Natural salinity also is present in reservoirs in northern Texas during droughts. For example, dissolved- solids concentrations have been as much as 2,000 milligrams per liter in Possum Kingdom Reservoir and 1,000 milligrams per liter in Lake Meredith during droughts.
Ground water Point and nonpoint sources of pollution B3
The quality of ground water in some areas is of concern because of the potential for pollution by runoff from urban areas, by the disposal of wastes, and by irrigation return flows in some agricultural areas. In the San Antonio and Austin areas, the recharge areas of the Edwards aquifer are extremely susceptible to some types of pollution because of a lack of soil cover and because of rapid infiltration of surface runoff.
Ground water Saline-water intrusion B*
Excessive pumping in coastal areas, that lowers water levels and results in saline-water intrusion, is an issue of concern principally in the Texas City-Galveston area and in the area south of Corpus Christi. Saline water also poses a potential threat to ground-water supplies in the El Paso and San Antonio
Ground water Hazardous-waste sites 85
Eight of the hazardous-waste sites in Texas have been in cluded in the U.S. Environmental Protection Agency's Na tional Priority List (1982). Seven of these sites are located in the Houston-Orange area, and one is located near Dallas-Fort Worth. Two of the sites at Crosby and Grand Prairie are located on flood plains, and the Crosby site has been flooded several times. A third site at Highlands is located in a subsiding area, and parts of the site are now under water.
Eutrophication B5
Eutrophication and turbidity are problems in several water- supply reservoirs, including those that supply Houston and Dallas-Fort Worth, because of runoff from both established and developing urban areas and because of inflow of treated waste waters and associated nutrients.

216 National Water Summary 1983
HYDROLOGIC HAZARDS AND LAND-USE ISSUESSubsidence C i
The land surface in a large part of the Texas Gulf Coast is susceptible to subsidence as a result of ground-water with drawals (Ratzlaff, 1982). The land surface has subsided as much as 9 feet at Houston and Galveston (Gabrysch, 1982). The subsidence has increased the vulnerability of low-lying areas along Galveston Bay to flooding during high tides and has caused fissures in other areas. The potential for new subsi dence is being decreased primarily by die decrease of ground- water pumpage, the relocation of well fields, and an increased use of surface water. Houston has long-range plans to expand its water-treatment facilities for municipal supplies to allow in creased surface-water use, thus decreasing ground-water withdrawals and land-surface subsidence.
Resource development Lignite mining 2
Texas contains large lignite reserves and, during 1980, ranked tenth in the Nation in coal production (Kaiser and others, 1980). Continued development of this resource and the possible impacts on ground-water availability and quality and surface-water quality are major concerns in the State.
Flooding C.
Serious flooding has, at one time or another, occurred along most streams of the State. Flash flooding from intense rainstorms is common and not easily predicted. In the flat Coastal Plain, tropical storms produce high tides and excessive runoff. All of the 254 counties in Texas have some flood-prone areas, as identified by the Federal Emergency Management Agency.
Resource development Oil and gas production C.
There is concern that improper well completion and corro sion of well casings may have resulted in movement of saline water into fresh-water aquifers in some oil- and gas-production areas. Brines produced with oil and gas also may have polluted freshwater supplies by past disposal practices. In some areas, past activities associated with oil and gas exploration may have polluted surface water.
INSTITUTIONAL AND MANAGEMENT ISSUESTreaties and compacts Dt
The three treaties and five compacts that affect surface-water use in Texas are the Rio Grande Convention of 1906, the Rio Grande Rectification Convention of 1933, and the Rio Grande, Colorado, and Tijuana Treaty of 1944 with Mexico; and the Canadian River Compact of 1950 (New Mexico, Okla homa, and Texas), the Pecos River Compact of 1948 (New Mexico and Texas), the Red River Compact of 1980 (Arkan sas, Louisiana, Oklahoma, and Texas), the Rio Grande Com pact of 1938 (Colorado, New Mexico, and Texas), and the Sabine River Compact of 1953 (Louisiana and Texas). Decreased flow of the Pecos River at the New Mexico-Texas State line under terms of the Pecos River Compact is of in creasing concern in the agricultural areas along the Pecos River in Texas. An important issue is El Paso's need for water and the possible impact of legal rulings regarding export of ground water from New Mexico. Current ground-water pumpage in El Paso is causing concern in Mexico. Delivery of water under the terms of the Rio Grande and Canadian River Compacts also is of concern. A concern regarding use of the Sabine River is the problem of maintaining high water levels in
Toledo Bend Reservoir for recreation while decreasing storage in the reservoir for hydroelectric power and flood control. Dur ing low flows when irrigation and waste-dilution needs are critical, the large chloride concentrations in the Red River are a concern.
Water allocation D.
It is anticipated by the Texas Department of Water Resources that about 4,500 new municipal and industrial wells will be withdrawing water from the aquifers in the State within the next 20 years. This additional use will increase water-level declines. Under Texas law, ground water is considered to be the property of the land owner and subject to few regulations. Development of the remaining 65 major surface-water reser voir sites will increase existing dependable yields by about 39 percent. However, parts of sites suitable for reservoirs are be ing converted to other uses that could conflict with future water development. Existing vvater supplies also can be increased by 9 percent by treating waste-water return flows.
Water-quality protection D.
The State's water-quality-protection program contains goals to improve streamflow quality so that the rivers meet State water-quality standards for fishing and swimming, and to ad minister programs governing the discharge of liquid and solid wastes, including hazardous materials, to surface and ground water. The protection of the bays and estuaries along the Texas coasdine also is a concern, and programs are being conducted to study and maintain their biological productivity.
Water conservation D.
Opportunities for water reuse include treatment or recycling by industries, installation of dual-water systems by municipalities, and recovery of irrigation return flows (Texas Department of Water Resources, 1983).
REFERENCESGabrysch, R. K., 1982, Ground-water withdrawals and land-surface
subsidence in the Houston-Galveston region, Texas 1906-80: U.S. Geological Survey Open-File Report 82-571, 68 p.
Kaiser, W. R., Ayers, W. B., Jr., and LaBrie, L. W., 1980, Lignite resources in Texas: University of Texas, Bureau of Economic Geol ogy Report of Investigations 104, 52 p.
Luckey, R. R., Gutentag, E. D., and Weeks, J. B., 1981, Water-level and saturated-thickness changes, predevelopment to 1980, in the High Plains aquifer in parts of Colorado, Kansas, Nebraska, New Mexico, Oklahoma, South Dakota, Texas, and Wyoming: U.S. Geological Survey Hydrologic Investigations Atlas HA-652, 2 sheets.
Muller, D. A., and Price, R. D., 1979, Ground-water availability in Texas Estimates and projections through 2030: Texas Depart ment of Water Resources Report 238, 77 p.
Ratzlaff, K. W., 1982, Land-surface subsidence in the Texas coastal region: U.S. Geological Survey Open-File Report 80-969, 19 p.
Rawson, Jack, 1982, Source areas of salinity and trends of salt loads in streamflow in the upper Colorado River, Texas: U.S. Geological Survey Water-Supply Paper 2084, 36 p.
Solley, W. B., Chase, E. B., and Mann, W. B., IV, 1983, Estimated use ofwater in the United States in 1980: U.S. Geological Survey Circular 1001, 56 p.
Texas Department of Water Resources, 1982, The State of Texas water quality inventory: Texas Department of Water Resources Report LP-59, 549 p.
____1983, Water for Texas, planning for the future: Austin, un numbered draft report.
U.S. Environmental Protection Agency, 1982, Amendment to National Oil and Hazardous Substance Contingency Plan; the Na tional Priorities List: Federal Register, v. 47, no. 251, December 30, 1982, p. 58476-58485.

Texas 217
100 150 MILESI_____i
EXPLANATIONWater issues are described in text. Color identifies type of issue Letter and number identify specific issue described in text.
WATER-AVAILABILITY ISSUES
| ] A1 Ground water
WATER QUALITY ISSUES
i*^^ 61 Surface water-Point and nonpoint sources of pollution
^ B 2 Surface water-Natural salinity
1$^^} 83 Ground water Point and nonpoint sources of pollution
^^| 64 Ground water-Sallne-water intrusion (see small map)0 85 Ground water-Hazardous-waste sites
| I Be Eutrophication
HYDROLOGIC HAZARDS AND LAND-USE ISSUES
I ''"' 1 Ci Subsidence
| I 62 Resource development Lignite mining
INSTITUTIONAL AND MANAGEMENT ISSUES
* ^ D1 Treaties and compacts
SUMMARY OF WATER USE IN TEXAS, IN MILLION GALLONS
[Data rounded to two significant figures and may not add to totals because of Source: Solley, Chase, and Mann, 1983]
PER DAY, 1980
independent founding.
Withdrawals
Use
Off stream use:
Rural domestic and livestock . .
Self-supplied industrial: Thermoelectric power use .
Total ..........
Instream use:
Ground water
Fresh Saline
930 .... 250 ....
6,500 ....
38 .... 320 0
8,000 0
7,000
Surface water
Fresh Saline
2,900 .... 150 ....
1 ,900
960 5,500 410 1,100
6,300 6,600
Total fresh water
3,800 400
8,400
990 730
14,000
Consump tive use,
fresh water
640 400
8,000
500 490
10,000

218 National Water Summary 1983
UTAH WATER ISSUESAs identified by the Utah District Office of the U.S.
Geological Survey in cooperation with State officials
Utah is divided approximately into east and west halves by the drainage divide that separates the Colorado River Basin from the Great Basin. The Colorado River Basin is a region of high plateaus deeply incised by the Colorado River and its tributaries. Much of the Colorado River Basin is arid; average annual precipitation ranges from less than 6 inches in the San Rafael Desert and the Uinta Basin to more than 40 inches in the Uinta Mountains and the Wasatch Plateau. The Colorado, Green, and San Juan Rivers that originate outside the State, and several streams that originate in the State, provide most of the water developed for use. The underlying consolidated rocks contain large quantities of ground water, but, in most places, the water either is yielded slowly to wells and springs or is at great depths. Only about 10 percent of the State's population lives in the Colorado River Basin; however, it contains nearly all of Utah's energy resources. The Great Basin is an area of deep basins separated by north-trending mountain ranges. All drainage is internal and flows to Great Salt Lake, Sevier Lake, or other low-lying areas. Principal sources of surface water are the Bear, Weber, Jordan, and Sevier Rivers. Principal sources of ground water are the saturated unconsolidated alluvial and lacustrine deposits in the deep basins. Most of Utah's popula tion lives along the western slopes of the Wasatch Range the Wasatch Front. Precipitation during 1982 was greater than average in most of Utah, and, in some areas, was considerably greater than average. For example, Salt Lake City had the wet test year of record (46 percent greater than average). This trend continued into 1983 and is reflected in rising ground- water levels in most of the State (Appel and others, 1983).
Major water issues are summarized by category below. The letters and numerical subscripts identify issues shown on the map; an asterisk instead of a numerical subscript indicates that the issue is not shown on the map.
WATER-AVAILABILITY ISSUESSurface water and ground water Ai
Approximately 90 percent of Utah's population lives along the Wasatch Front. The population in this area increased almost 50 percent from 1970 to 1980; the trend is expected to continue, and additional water supplies will be needed. Possi ble water sources are ground water in the area, unused streamflow in the area, and transmountain diversions from tributaries of the Colorado River (Central Utah Project). There are legal and environmental constraints to withdrawal of additional surface water in the area and to some aspects of the Central Utah Project. There also are concerns about additional large-scale ground-water withdrawals because of possible con flicts among water-rights owners and saline-water intrusion into the producing fresh-water aquifers.
Ground water Az
Ground-water levels have declined nearly 60 feet southwest of Ogden from 1953 to 1983. These declines are due chiefly to increased withdrawals of ground water for public supply. Significant declines also have been recorded in several valleys of southwestern Utah during the past several decades because of large withdrawals of ground water for irrigation (Appel and others, 1983). Associated with the declines in southwestern Utah has been some local degradation of the ground-water quality (Handy and others, 1969) and some localized land sub sidence (Cordova and Mower, 1976).
WATER-QUALITY ISSUESSurface water Point and nonpoint sources of pollution Bi
The Jordan River, in the vicinity of Salt Lake City, flows through the most densely populated area of the State. The river receives industrial and municipal wastes as well as runoff from
urban areas. An estimated annual load of 6 million pounds of oxygen-demanding substances is discharged to the river as it passes through Salt Lake County. As a result, summertime dissolved-oxygen concentrations seldom meet the State fishery standard of 5.5 milligrams per liter. Silt and clay-sized par ticles from tributary sources produce excessive turbidity. Storm runoff and discharge from overloaded sewage-treatment plants contribute undesirable concentrations of fecal coliform and streptococcal bacteria to the Jordan River. Concentrations of hazardous substances exceed State standards for example, cadmium exceeds standards in 10 percent of the samples col lected, and ammonia and mercury exceed standards in as many as 75 percent of the samples collected. Bottom sediments in the Jordan River contain variable, but detectable, quantities of pesticides. Urbanization along the Wasatch Range from Brigham City to Nephi has resulted in some overloaded munic ipal sewage-treatment facilities and increased discharges of storm-water runoff to parts of the Jordan River drainage. If projected population increases occur, deterioration of stream quality may continue in this area unless sewage-treatment facilities are upgraded and enlarged.
Surface water Colorado River salinity 82
Several streams that originate in Utah contribute to the salinity of the Colorado River; these include the Duchesne, Price, San Rafael, Dirty Devil, Escalante, Paria, and Virgin Rivers. The principal sources of the salinity are irrigation return water, natural] runoff from soils developed on shale, and saline springs discharging from the shale and other salt-bearing formations. Attempts are being made to decrease or control the salt inflow under the various projects of the Colorado River Salinity Control Program (U.S. Department of the Interior, 1981), which was authorized by the passage of the Colorado River Basin Salinity Control Act of 1974 (Public Law 93-320).
Ground water Hazardous-waste sites 83
A plume of water containing a large concentration of dis solved minerals as well as low-level radioactivity has been iden tified in the shallow unconfined ground water (downgradient from a uranium tailings-storage facility) about 3 miles south of Salt Lake City. The underlying confined aquifer is used exten sively for public supply and industrial purposes in Salt Lake County. An unlined sludge pit located at Rose Park in Salt Lake City, which was used for the disposal of petroleum wastes, is included in the U.S. Environmental Protection Agency's National Priorities List (1982) of hazardous-waste sites. The site has been fenced, and remedial actions are sched uled for completion in 1983.
Acidic precipitation 84
Analysis of the precipitation in the southern part of Salt Lake County indicates that one-half of the storms result in precipitation with a pH of less than 5.6 (Doyle Stephens, U.S. Geological Survey, written commun., 1983). The acidic precipitation is most common in the fall from storms that are widely distributed throughout the valley. Snow samples col lected during spring 1982 in the adjacent Wasatch Range, however, indicated little evidence of acidic precipitation (Messer and others, 1982).
HYDROLOGIC HAZARDS AND LAND-USE ISSUESFlooding Ci
The greater than average precipitation during fall 1982, combined with greater than average reservoir-carryover storage, resulted in excessive discharge of many streams dur ing the following winter and spring. This, in turn, resulted in unusual rises of the levels of Utah Lake and Great Salt Lake. On June 23, 1983, Utah Lake had reached its highest level since 1862, and, on June 30, 1983, Great Salt Lake had reached its highest level since 1924. Considerable farmland around Utah Lake and wildlife habitat around Great Salt Lake


Utah 219
EXPLANATIONWater issues are described in text. Color identifies type of issue. Letter and number identify specific issue described in text.
WATER-AVAILABILITY ISSUES
I lAi Surface and ground water
| A 2 Ground water
WATER-QUALITY ISSUES
Surface water Point andBi
B 2
nonpoint sources of pollution
Surface water Colorado River salinity (see small map)
Ground water Hazardous-waste sites (see small map)
I I 64 Acidic precipitation
HYDROLOGIC HAZARDS AND LAND-USE ISSUES
|llllllll,[Ci Flooding
H C 2 Landslides
I ^^>' I C Resource development Energy L I 3 minerals
INSTITUTIONAL AND MANAGEMENT ISSUES
| [ Q 1 Treaties and compacts (see small I * map)
SUMMARY OF WATER USE IN UTAH. IN MILLION GALLONS PER DAY. 1980
[Data rounded to two significant figures and may not add to totals because of independent rounding. Sourca: Sol ley. Chase, and Mann, 1983]
Withdrawals
Use
Off stream use:
Rural domestic and livestock .
Self -supplied industrial: Thermoelectric power use .
Total .........
Instream use:
Ground water
Fresh Saline
380 57 ....
530 ....
0.2 68 4.0
1,000 4.0
3,400
Surface water
Frash Saline
370 12 ....
2.700 ....
64 5.9 390 50
3.500 56
Total fresh water
750 69
3,200
64 460
4,500
Consump tive use,
frash water
300 21
2,400
9.9 80
2.900

220 National Water Summary 1983
were flooded. Local industries, transportation routes, recrea tion facilities, and residental areas also were flooded or threat ened by the rising water. The high level of Great Salt Lake during the past 8 years has caused serious concerns for in dustries dependent on the lake's mineral content, wildlife refuges, and recreation and transportation facilities. Estimated direct and indirect costs of damage and cost of protecting facilities were $157 million as of June 30, 1983 (Utah Division of State Lands and Forestry, 1983). Rapid melting of the snowpack in the Wasatch Range during May and June also caused flooding in the densely populated Wasatch Front area. Several major streets in Salt Lake City (including nine blocks of U.S. Highway 89-91 in the main business district) were lined with sandbags and used as channels to convey flood waters toward the Jordan River.
Landslides Cj
Soils saturated by the greater-than-normal precipitation have resulted in a number of landslides in the State's moun tainous areas. The largest slide, which occurred on April 14, 1983, consisted of about 15 million cubic yards of debris that formed a dam about 1,000 feet long and more than 200 feet high across Spanish Fork Canyon. The flow of Spanish Fork was impounded by the dam, forming "Lake Thistle". This lake inundated the town of Thistle (22 homes) and posed a flood threat to the town of Spanish Fork (population about 1,000) 11 miles downstream. The landslide also destroyed a major road and a railroad between Utah's Wasatch Front and the energy resources in the eastern part of the State. The damage and ensuing far-reaching economic effects led to Presi dent Reagan's declaration of the area as a national disaster area. By May 16, 1983, a diversion tunnel had been con structed to release water from "Lake Thistle", and the U.S. Army Corps of Engineers had begun pumping water over the slide in an attempt to prevent the lake from spilling over the slide. By July 4, 1983, a 3,100-foot railroad tunnel was con structed through the mountain at the foot of the slide, and railroad traffic throughout Spanish Fork Canyon resumed. Several mudflows occurred along the Wasatch Front between Salt Lake City and Brigham City; the most damaging were associated with flooding in the communities of Farmington and Bountiful.
Resource development Energy minerals C3
Part of the Colorado River Basin in Utah contains large reserves of coal, oil shale, tar sand, and other fossil fuels. Coal reserves are estimated to exceed 25 billion tons, and oil reserves probably exceed 100 billion barrels in the oil shale and 20 billion barrels in the tar sand (Rickert and others, 1979). There are proposals for leasing and mining the oil shale and tar sand and for expanded leasing and mining of the coal. Even assuming the most optimistic schedules for the proposals, addi tional annual water requirements probably would not exceed 100,000 acre-feet by the year 1990 (Utah Division of Water Resources, 1981). Although this was slightly less than 20 per cent of Utah's unused share of Colorado River water in 1980, some existing water rights (chiefly irrigation) might be affected depending on type and location of development.
INSTITUTIONAL AND MANAGEMENT ISSUESTreaties and compacts Di
Allocation of Bear River basin water and control of the level of Bear Lake are within the framework of the Bear River Com pact of 1958, as amended in 1980, under which Idaho, Utah, and Wyoming manage allocation and use of Bear River water. Management decisions regarding the allocation and use of Col orado River Basin water are within the framework of the Colo rado River Compact of 1922 (Arizona, California, Colorado, New Mexico, Nevada, Utah, and Wyoming), the Upper Colo rado River Basin Compact of 1948 (Arizona, Colorado, New Mexico, Utah, and Wyoming), and the Rio Grande, Colo rado, and Tijuana Treaty of 1944 with Mexico.
Water allocation D.
Surface and ground water have been fully allocated in many parts of Utah. Water needed for new development will be ob tained largely by purchase and transfer of existing water rights. Generally, approval of water-right purchases or transfers are based on protection of existing rights and the most beneficial use of the water. It is the policy of the State not to issue a per mit for water to be exported from the State. This has caused some controversy among coal-mine operators and slurry- pipeline developers in regard to using Utah water to slurry coal to an adjacent State.
REFERENCESAppel, C. L. and others, 1983, Ground-water conditions in Utah,
spring of 1983: Utah Division of Water Resources Cooperative Investigations Report 23, 97 p.
Cordova, R. M., and Mower, R. W., 1976, Fracturing and sub sidence of the land surface caused by the withdrawal of ground water in the Milford area, Utah: U.S. Geological Survey Journal of Research, v. 4, no. 5, p. 505-510.
Handy, A. H., Mower, R. W., and Sandberg, G. W., 1969, Changes in chemical quality of ground water in three areas in the Great Basin, Utah: U.S. Geological Survey Professional Paper 650-D, p. D229-D234.
Messer, J. J., Slezak, Lloyd, and Liff, C. I., 1982, Potential for acid snowmelt in the Wasatch Mountains: Utah Water Research Laboratory Water Quality Series Report UNRL/Q-82/06, 37 p.
Parker, Douglas, 1983, Cost of Hood: Salt Lake Tribune, July 7, 1983, p. Bl.
Rickert, D. A., Ulman, W. J., and Hampton, E. R., eds., 1979, Syn thetic fuels development, Earth-science considerations: U.S. Department of the Interior, Geological Survey Professional Paper 1240-A, 45 p.
Solley, W. B., Chase, E. B., and Mann, W. B., IV, 1983, Estimated use of water in the United States in 1980: U.S. Geological Survey Circular 1001, 56 p.
U.S. Department of the Interior, 1981, Quality of Water, Colorado River Basin: U.S. Department of the Interior Progress Report 10, 190 p.
U.S. Environmental Protection Agency, 1982, Amendment to National Oil and Hazardous Substance Contingency Plan; the Na tional Priorities List: Federal Register, v. 47, no. 251, December 30, 1982, p. 58476-58485.
Utah Division of State Lands and Forestry, 1983, Great Salt Lake contingency plan: Utah Division of State Lands and Forestry, 47 p.
Utah Division of Water Resources, 1981, State of Utah Water, 1980: Utah Division of Water Resources Annual Report, 47 p.

Vermont 221
VERMONT WATER ISSUESAs identified by the New Hampshire-Vermont Office,
New England District, of the U.S. Geological Survey in consultation with State officials
Precipitation averages about 41 inches statewide and ranges from about 32 inches in the Champlain Valley to about 60 in ches in the Green Mountains. Annual runoff averages about 23 inches and ranges from about 12 to about 40 inches. About 33 percent of the population is served by publicly owned surface-water facilities; about 38 percent, by publicly owned ground-water wells; and about 29 percent, by privately owned wells. In 1980, 48 million gallons per day were supplied by public water systems, and 29 million gallons per day were withdrawn for rural use (Solley and others, 1983).
The quality of surface water generally is suitable for most recreational purposes. Some "Class C waters" (Vermont Agency of Environmental Conservation, 1982) are unsuitable for swimming, and all the State's surface water requires some treatment before it can be used for human consumption.
Ground water is generally suitable for human consumption use except where local aquifers have been polluted.
Major water issues are summarized by category below. The letters and numerical subscripts identify issues shown on the map; an asterisk instead of a numerical subscript indicates that the issue is not shown on the map.
WATER-QUALITY ISSUESSurface and ground water Hazardous-waste sites and landfills B,
The principal water-quality problems in Vermont are caused by contamination from landfills, percolation from sep tic systems, leaking storage tanks, and spills of chemicals and other wastes (U.S. Water Resources Council, 1981).
In 1981, 199 oil and hazardous-materials spills were reported in the State. Of these, contaminants from 59 directly affected surface waters and 19 affected ground water (Vermont Agency of Environmental Conservation, 1982). Twenty-two known waste-disposal sites are being investigated as possible sources for pollution of surface and ground water. The U.S. Environmental Agency, in its National Priority List (1982), in cluded two of these disposal sites one at Burlington where wastes from a coal-gasification plant were disposed of in a wetland bordering an abandoned shipping canal, and the other at Springfield where leachate containing organic compounds and heavy metals has contaminated Black River, Seavers Brook, and three local domestic wells.
In upland areas of the State where the continuing growth of recreation developments and second homes is focused, leakage from septic systems has locally contaminated ground water and the headwaters of small streams. Similar pollution has affected ground-water quality in the urban areas particularly in Chit- tenden, Rutland, and Washington Counties.
Eutrophication B2
Lake Champlain, located between the States of New York and Vermont, is an important recreational, resource. Two species of aquatic plants have reached nuisance proportions in Lake Champlain. In the southern part of the Lake, water chestnut (Trapa natans L.) has rendered several hundred acres unnavigable. Originally carried by boats through the lock system, water chestnut is progressively spreading northward and threatens to infest additional shallow areas of Lake Champlain and other Vermont lakes. In northern Lake Champlain, Eurasian watermilfoil (Myriophyllum spicatwn L.), another introduced species, has inundated several major bays and is found in virtually all shallow areas of the Lake.
An approved program to mechanically harvest these nuisance growths is intended to prevent the spread of water chestnut into northern Lake Champlain by reducing the pres ent infestations and confining them to south of latitude
43 43'00"N,and to control Eurasian watermilfoil inSt.Albans Bay (Vermont Agency of Environmental Conservation, 1982).
Fourteen lakes, including Lake Champlain and Lake Mem- phremagog, which is partly in Vermont and partly in the Prov ince of Quebec, Canada, were identified as "High-Priority Lakes for Diagnostic Studies or Management Action" (Ver mont Agency of Environmental Conservation, 1982). This classification includes lakes where water-quality problems exist or where trends toward deteriorating water quality are indi cated (New England River Basin Commission, 1982).
Surface water and ground water B.
The assessment of water quality of over 1,100 miles of streams in Vermont shows that 84 percent meet State water- quality standards. Some 90 percent of those streams contain sites where municipal water supplies are now withdrawn (Ver mont Agency of Environmental Conservation, 1982). About 700 miles of river meet "Class B" standards water accept able for public-water supply with filtration and disinfection. The remaining 400-plus miles of rivers are waters of "Class C" standards or are in violation of the standards. These are, in general, streams which contain biological pollutants commonly from combined sewer flows and municipal waste.
Ground water provides about 50 percent of the water used in the State for drinking (U.S. Water Resources Council, 1981). Almost 60 percent of this is from public ground-water systems which, at a minimum, is chlorinated; the remaining 40 percent is untreated ground water from private wells.
Acidic precipitation B.
Vermont is experiencing the effects of acidic precipitation on its aquatic ecosystem. Studies conducted by the State Depart ment of Water Resources and Environmental Engineering confirmed that lakes with a calcite saturation index (Kramer, 1976) greater than 4 were unstable relative to acidic loading. In 12 of 25 lakes in the sample study, the Calcite Saturation Index averaged greater than 4. Future studies are planned but are dependent upon availability of funds (Vermont Agency of Environmental Conservation, 1982).
HYDROLOGIC HAZARDS AND LAND-USE ISSUESFlooding Ci
Major flooding in Vermont is relatively uncommon, but it does occur. The flood of April 18, 1982, along the Browns, Lamoille, and Mississquoi Rivers in northwestern Vermont, for example, was the largest of record on those streams. Homes in Cambridge and roads and farms throughout the area were flooded, and three people were killed.
Controversy surrounds a proposal to build a dam on the Richelieu River, which is the outlet of Lake Champlain, near the Vermont-New York-Canada border. Canadian officials believe the dam will be beneficial because it would control flooding along the river in Canada, but Vermont and New York officials are concerned that the resulting regulation of Lake Champlain would cause flood damage to lakeshore prop erty and would adversely affect wetland areas of the lake. The International Joint Commission has not yet addressed this issue.
Resource development Hydroelectric power C.
Hydroelectric-power development in Vermont has grown in significance as energy costs have increased in recent years. From 1980 to 1982, the Federal Energy Regulatory Commis sion received about 70 applications for permits for major hydroelectric-power development in response to the Public Utility Regulatory Policies Act of 1978 (Public Law 95-617) (Vermont Agency of Environmental Conservation, 1982). This act makes hydroelectric-power development attractive by providing subsidies and tax credits for developers, and the power of eminent domain to allow access to river-front land for facility sites. Many applications are for rehabilitation of old power or mill sites. Potential hydroelectric-power development

222 National Water Summary 1983
involves virtually all of the major rapids and waterfalls of Ver mont's major rivers. The probable effects of development are assessed by appropriate State agencies and include the poten tial impacts on recreation, esthetics, fish and game, and water quality, and the issues of flooding and dam safety.
Resources development Uplands water withdrawals C.
The development of water supplies or supplies for snow- making operations has resulted in the utilization of the total hydrologic capacity of many small upland streams. The effects of such development have not been evaluated, but are believed to have the potential for significant negative impact on water quality (Vermont Agency of Environmental Conservation, 1982).
INSTITUTIONAL AND MANAGEMENT ISSUESWater allocation D.
State governmental agencies have found that ground- and surface-water data needed for making decisions regarding water allocation is not adequate on a statewide basis. The Ver mont Agency of Environmental Conservation, through its Department of Water Resources and Environmental Engi neering, is actively increasing data collection as well as developing strategies for resolving future issues involving water allocation.
There are no statutory provisions governing the allocation of ground water or for establishing priorities of use. The State
Agency of Environmental Conservation is presendy (1983) reviewing ground-water policy and management proposals. Ground-water is afforded some statutory protection through laws governing deep-well injection of industrial waste, land fills, and some surface-land activities (Vermont Agency of Environmental Conservation, 1982).
REFERENCESKramer, James R., 1976, Geochemical and lithological factors in acid
precipitation: U.S. Forest Service Technical Report NE-23, P. 611-168
New England River Basins Commission, 1982, Recommended Priorities for Selected Federal Water and Related Land Resource Programs in the New England/New York Region: Boston, Mass., June 1980, 56 p.
Solley, W. B., Chase, E. B., and Mann, W. B., IV, 1983, Estimated use of water in the United States in 1980: U.S. Geological Survey Circular 1001,56 p.
U.S. Environmental Protection Agency, 1982, Amendment to National Oil and Hazardous Substance Contingency Plan, the Na tional Priorities List: Federal Register, v. 47, no. 251, December 30, 1982, p. 58476-58485.
U.S. Water Resources Council, 1981, State of the States: Water Resources Planning and Management, Ground-Water Supple ment: Washington, D.C., May 1981.
Vermont Agency of Environmental Conservation, 1982, Department of Water Resources and Environmental Engineering, Water Qual ity Division, 1982 Water Quality Assessment, (305 (B) Report): Montpelier, Vt., 164 p.

Vermont 223
73° 72° 30'
45
EXPLANATIONWater issues are described in text. Color identifies type of issue. Letter and number identify specific issue described in text.
WATER-QUALITY ISSUES
B-| Surface and ground water Hazardous-waste sites and landfills
B 2 Eutrophication
HYDROLOGIC HAZARDS AND LAND-USE ISSUES
IIIH | Ci Flooding
SUMMARY OF WATER USE IN VERMONT. IN
(Data rounded to two significantSoi
Use
Offstream usePublic supplyRural domestic and livestockIrrigation.Self-supplied industrial
Thermoelectric power useOther industrial uses
Total
Instream useHydroelectric power
MILLION GALLONS
figures and may not add to totals because of ir
PER DAY
(dependent
, 1980
roundmg.rce Solley. Chase, and Mann. 1983]
Ground water
Fresh Saline
1723
0.3
05.2 0
45 0
14.000
Withdrawals
Surface water
Fresh Saline
316.11.2
2509.6
290
00
0
Total
water
4829
1.4
25015
340
five use, freshwater
5.810
1.0
222.3
41
25 50 MILES
25 50 KILOMETERS

224 National Water Summary 1983
VIRGINIA WATER ISSUESAs identified by the Virginia Office, Mid-Atlantic
District, of the U.S. Geological Survey in consultation with State officials
Virginia is a water-rich State; nine major river basins, numerous streams, ponds and reservoirs, and abundant ground water provide ample supplies of freshwater to most parts of the State. Annual precipitation averages 43 inches, of which about 14 inches leave the State as runoff. Ground water accounts for about 30 percent and surface water for about 70 percent of total water used. Although the average annual replenishment of the water resources by precipitation is large compared to the 1980 water use, ample water supplies are not always available when and where they are needed. Key actions being taken by the State to manage the water resources include the completion of river-basin management plans, documenta tion of water use, promotion of water conservation, and tech nical assistance on water-supply issues.
Major water issues are summarized by category below. The letters and numerical subscripts identify issues shown on the map; an asterisk instead of a numerical subscript indicates that the issue is not shown on the map.
WATER-AVAILABILITY ISSUESSurface and ground water Ai
Water supplies in southeastern Virginia are not sufficient to meet the expected increases in demand. Deficits in supply for the area south of the James River are projected to be as much as 60 million gallons per day by the year 2030 (U.S. Army Corps of Engineers, written commun., 1983). Droughts in 1977 and 1980-81 resulted in strict water-conservation measures in the area and also resulted in a concerted effort by State and local officials to seek additional sources of municipal supplies. Ground-water withdrawals, principally in Isle of Wight County, have caused water-level declines of as much as 200 feet in some areas. The largest of these areas extends into North Carolina, creating concern that ground water discharge to Albemarle Sound in North Carolina may be decreased. Also, the principal surface-water alternatives for providing ad ditional supplies rely on interstate rivers which flow into Albemarle Sound causing additional concerns of biological degradation through decreased freshwater inflows (U.S. Army Corps of Engineers, written commun., 1983; North Carolina- Virginia Water Resources Management Committee, 1982).
WATER-QUALITY ISSUESSurface water Chesapeake Bay Bi
Nutrient enrichment, pollution by heavy metals and organic substances, and decrease of submerged aquatic vegetation in Chesapeake Bay are issues of continuing concern. The Susque- hanna and Potomac Rivers are two of the main sources for nutrients and other pollutants flowing into the Maryland part of Chesapeake Bay. With the exception of several tributaries, the Virginia part of Chesapeake Bay has relatively little nutrient enrichment and decreased submerged aquatic vegeta tion compared to the Maryland part of the bay. In Virginia, the James River is a major source of freshwater to the bay. The James River, however, is moderately to significantly nutrient enriched and has been polluted by organic chemicals. There is concern in Virginia that the pollution in the Maryland part of the bay area will move into the Virginia part of the bay (U.S. Environmental Protection Agency, 1982a).
Surface and ground water Hazardous-waste sites B2
Several areas of local hazardous-waste pollution have been identified. One such area is along the South Fork Shenandoah River near Front Royal (Warren County), where local ground
water is polluted by organic solvents and heavy metals dis charged during the late 1940's by a synthetic fiber plant. An additional 111 hazardous-waste sites have been identified in Virginia. Four of these sites, in Nelson, Roanoke, Smyth, and York Counties, have been included in the U.S. Environmental Protection Agency's National Priorities List (1982b). Runoff and leachate from 80,000 tons of acidic waste material has caused fishkills in the Piney River in Nelson County. Electroplating-process wastes have polluted ground water at a site in Roanoke County. Disposal ponds containing 11 million tons of mercury-enriched wastes in Smyth County have pol luted 81 miles of the North Fork Holston River; consumption of fish caught in this reach has been prohibited since 1970. Fly ash deposited in borrow pits has polluted ground water with vanadium along Chisman Creek in York County.
Ground water Bacteria and chemical constituents 83
A study by the Virginia Department of Health (written com mun., 1983) indicates that water from 73 percent of 200 shallow wells less than 50 feet deep in the Coastal Plain and Piedmont of Virginia either is polluted by bacteria or is unsuit able for some uses because of excess concentrations of naturally occurring chemical constituents such as iron and manganese.
Ground water Radioactivity B4
Natural radioactivity that exceeds State drinking-water standards of 15 picocuries per liter for gross alpha radiation and 5 picocuries per liter for total radium is present in ground water from supply wells at Fort A. P. Hill in Caroline County and at the Defense General Supply Center in Chesterfield County. Water from some public supply wells in the Piedmont also contains radioactivity in excess of State drinking-water standards. Maximum reported concentrations have been 45 picocuries per liter for gross alpha radiation and 15 picocuries per liter for total radium (R. Taylor, Virginia Department of Health, oral commun., 1983).
Eutrophic ation 85
There is concern about extensive algal growth and eutrophication in the downstream reach of the Chowan River, which may be the result of large concentrations of nutrients in the river. The Virginia-North Carolina Water Management Committee is evaluating causes of the algal blooms, the effect of freshwater inflows on the blooms, and management pro cedures for improving water quality.
Bottom sediments B6
Sediment in the reach of the James River downstream from Hopewell (Prince George County) was polluted with the- chemical Kepone from discharges from a small chemical plant. The problem was discovered in 1975, and Kepone discharges stopped at that time. Since 1975, concentrations of Kepone have decreased primarily because of the covering of Kepone- laden sediments with unpolluted sediment. The dredging of 800,000 cubic yards of polluted sediment also is planned (Virginia State Water Control Board, 1982). Although sport fishing is permitted throughout the James River Estuary, seasonal restrictions on commercial fishing are in effect for a 113-mile reach of the estuary (Virginia State Water Controi Board, 1981). In June 1977, the Governor of Virginia pro hibited fishing in the South River and South Fork Shenandoah River downstream, from Waynesboro because of pollution of bottom sediments by mercury that was discharged at Waynes boro in 1950. The ban of fishing was later decreased to a 90-mile reach of the South River and the South Fork Shenan doah River downstream from Waynesboro (Rasin and Brooks, 1982). Large concentrations of heavy metals and organic chemicals have been found in sediments of the Elizabeth River Estuary near Portsmouth (U.S. Environmental Protection Agency, 1982a). There is concern that proposed dredging of a ship channel will release these pollutants into 'the water and food chain.

Virginia 225
37'
83'
100 MILES
50 100 KILOMETERS
EXPLANATIONWater issues are described in text. Color identifies type of issue. Letter and number identify specific issue described in text.
WATER-AVAILABILITY ISSUES
\/// \ A1 Surface and ground water
WATER-QUALITY ISSUES
| B1 Surface water Chesapeake Bay
62 Surface and ground water Hazardous-waste sites
| 63 Ground water Bacteria and chemical constituents
B4 Ground water-Radioactivity
65 Eutrophication (see small map)
65 Bottom sediments
HYDROLOGIC HAZARDS AND LAND-USE ISSUES
| '!!!!'. | C1 Flooding
| '! ' |C? Resource development Coal mining (see small map)
SUMMARY OF WATER USE IN VIRGINIA. IN MILLION GALLONS
(Data rounded to two significant figures and may not add to totals because of
PER DAY
ndependent
. 1980
roundmg.Source: Solley, Chase, and Mann, 1983]
Withdrawals
Use
Offstream usePublic supply ....Rural domestic and livestock
Self -supplied industrial:Thermoelectric power use .Other industrial uses . .
Total ....
Instream useHydroelectric power . .
Ground water Surface water
Fresh Saline Fresh
1 20 ... 480150 26
8.4 19
1 .2 . . 4,300110 0.2 360
390 0.2 5.200
26,000
Saline
4,00081
4,100
Total
water
60018028
4,300470
5,600
freshwater
329117
4347
230

226 National Water Summary 1983
HYDROLOGIC HAZARDS AND LAND-USE ISSUESFlooding Ci
Flooding is the primary natural hazard affecting land-use development throughout the Appalachian Plateaus physio graphic province, which is characterized by steep relief. Periodic flooding of many streams in the area has resulted in concern about the effects of various land-use alterations on the characteristics of storm runoff (Scott, 1980).
Resource development Coal mining Cz
Pollution of streams and ground water from discharges of chemical wastes and debris from strip mines is an issue of con cern in most coal-mining areas of the State. Strip mines also may adversely affect natural drainage patterns and patterns of ground-water flow (Virginia Water Resources Research Center, 1981).
Safety of dams C.
Forty-four nonfederally owned dams in the State, inspected pursuant to the National Dam Inspection Act of 1972 (Public Law 92-367), have deficiencies requiring remedial measures to ensure adequate flood control and safety. Typical deficiencies include instability of upstream slopes, seepage, piping, and in adequate spillways.
INSTITUTIONAL AND MANAGEMENT ISSUESWater allocation D.
Demands for water have changed since the implementation of the present State water policies and laws in some areas current demands exceed local supplies. The State recognizes the need to develop a comprehensive water policy and to recodify water laws, especially the doctrine of riparian rights as applied to water-allocations for water-short areas (State Water Study Commission, 1980)
River-system management D,
Developing and implementing a plan to resolve the water- quality issues in Chesapeake Bay will require the cooperation of Maryland, Pennsylvania, and Virginia to manage the major river systems that flow into the bay. River-system manage ment is needed because the major rivers convey much of the sediment and dissolved constituents that enter the bay.
REFERENCESNorth Carolina-Virginia Water Resources Management Committee,
1982. The North Carolina-Virginia Tidewater area Developing a process for resolving water resources management issues: Virginia State Water Control Board, Richmond, Va, 77 p.
Rasin, V. J., Jr., and Brooks, K. M., 1982, Potomac River basin water quality, 1980-1981: Rockville, Md., Interstate Commission on the Potomac River Basin Technical Publication 82-1, 74 p.
Scott, A. G., 1980, Interim report on the investigations of flooding in the Tug Fork basin of Kentucky, Virginia, and West Virginia: U.S. Geological Survey Water-Resources Investigations Open-File Report 80-1188, 116 p.
Solley, W. B., Chase, E. B., and Mann, W. B., IV, 1983, Estimated use of water in the United States in 1980: U.S. Geological Survey Circular 1001, 56 p.
State Water Study Commission, 1980, Report of the State Water Study Commission to the governor and the general assembly of Virginia: Senate Document No. 14, Richmond, Commonwealth of Virginia, 36 p.
U.S. Environmental Protection Agency, 1982a, Chesapeake Bay Pro gram technical studies A synthesis: Washington, D.C., 635 p.
____1982b, Amendment to National Oil and Hazardous Substance Contingency Plan; the National Priorities List: Federal Register, v. 47, no. 251, December 30, 1982, p. 58476-58485.
Virginia State Water Control Board, 1981, Water pollution control in Virginia, 1946-1980: Virginia State Water Control Board Progress Report 81,20 p.
____1982, Summary of Kepone study results, 1979-1981: Virginia State Water Control Board Basic Data Bulletin 49, 80 p.
Virginia Water Resources Research Center, 1981, Virginia's most important water-related problems: Blacksburg, Va., Water Resources Research Center Special Report No. 13, 19 p.
Washington 227
WASHINGTON WATER ISSUESAs identified by the Washington District Office of the
U.S. Geological Survey in consultation with State officials
Washington is divided climatologically into a wet western part and a dry eastern part. Mean annual precipitation varies from more than 100 inches in parts of the Olympic and Cas cade Mountains to less than 16 inches throughout much of the Columbia Plateau. Water from major streams draining the mountains is used principally for agriculture, electric-power generation, domestic water supply, and fisheries. Areas with deficient surface-water supplies, particularly east of the Cascades, depend mostly on ground water. Because of in creased water use for municipal, industrial, and agricultural purposes, competition among users and potential users of available water resources is intense. Requests by Indian tribes that the flows in some of the major streams be maintained to observe treaty fishery rights could alter the allocation of water and land-use practices in stream basins. Agricultural use of ground water has lowered water levels in many municipal and domestic wells.
Major water issues are summarized by category below. The letters and numerical subscripts identify issues shown on the map; an asterisk instead of a numerical subscript indicates that the issue is not shown on the map.
WATER-AVAILABILITY ISSUESGround water AI
Ground water is used throughout the State for municipal, domestic, agricultural, and industrial purposes. It is the major, and commonly only, source of water for the many islands within Puget Sound. Population increases and increased water demand have decreased the availability of and adversely af fected the quality of ground water in some of the major islands of Island and San Juan Counties (Cline and others, 1982; Whiteman and others, 1983). Agricultural development of the fertile Columbia Plateau relies on water from Lake Roosevelt (behind Grand Coulee Dam on the Columbia River) and on ground water. There is an increasing demand for ground water, but severe water-level declines of as much as 20 feet per year are occurring throughout large areas of the Columbia Plateau (Lincoln, Grant, Franklin, and Adams Counties) and in the Horse Heaven Hills (Yakima, Benton, and Klickitat Counties) 30 to 40 miles southeast of Yakima (Luzier and Burt, 1974; Luzier and Skrivan, 1975; Cline, 1983).
Surface water A.
Surface water is used throughout the State for municipal supply, irrigation, waste dilution and assimilation, hydroelec tric power, recreation, and fish propagation. These competing uses threaten the quantity, quality, and temperature of streamflow needed to protect fishing and other Indian water rights throughout the State. The future development of hydroelectric power on small tributary streams also may adversely affect Indian fishing rights. Expansion of agricultural areas, mainly in eastern Washington, is placing increased demands on available surface- and ground-water resources. Water-management alternatives include increased storage of surface water in reservoirs and more efficient distribution systems.
WATER-QUALITY ISSUESGround water Saline-water intrusion B,
The islands of Island and San Juan Counties are being af fected by saline-water intrusion, which is expected to worsen with continued ground-water use. Increased chloride concen trations, some in excess of 500 milligrams per liter, have been detected in water from 10 to 15 percent of the nearly 300 wells sampled by Whiteman and others (1983). Saline-water intru sion also is occurring at other major islands and along coastal
areas, especially along Puget Sound (Dion and Sumioka, 1983).
Ground water Radioactive wastes B2
The feasibility of storing high-level radioactive wastes in the basalts underlying the Hanford Atomic Energy Reservation (Benton County) is being investigated by the U.S. Department of Energy. Investigations include studies of the hydrogeology of the site and surrounding area, including the rate and direc tion of ground-water flow, and any effects of the presently stored low-level radioactive wastes on ground water at the site (Eddy and others, 1978, 1982).
Ground water Hazardous-waste sites B3
Pollution of ground water by hazardous wastes has occurred at Kent (industrial wastes), Seattle (lead), Spokane (cyanide at one site, solvents at another site), Tacoma (synthetic organic compounds), Vancouver (chromium), and Yakima (pesticides at two sites). These hazardous-waste sites have been included in the U.S. Environmental Protection Agency's National Priorities List (1982).
Ground water Nitrate 84
Large nitrate concentrations that exceed the drinking-water standards of the U.S. Environmental Protection Agency (1976) are present in ground water near Burbank (Benton and Walla Walla Counties) and at several areas along the periphery of the Spokane aquifer, which is a sole-source aquifer that provides much of the water for the Spokane area. At Burbank, nitrate sources include agricultural fertilizers, feed lots, and septic tanks (Carr and Balmer, 1980). In the Spokane area, the large nitrate concentrations in several areas along the periphery of the aquifer probably are related to agricultural practices and septic systems in tributary valleys.
Ground water Natural salinity 85
Ground water used for irrigation in some areas of the Co lumbia Plateau commonly has large concentrations of natu rally occurring sodium. Accumulation of sodium minerals in soils and attendant decreased soil permeability are becoming concerns in some agricultural areas of the Columbia Plateau.
Bottom sediments Be
Industrial discharges have polluted the bottom sediments of numerous streams and bays in the State with heavy metals and organic substances. The condition is especially severe in the vicinity of Commencement Bay and Puyallup Estuary at Tacoma (Pierce County), Elliot Bay and Duwamish Estuary at Seattle (King County), Everett Bay (Snohomish County), and a number of inlets of Pugot Sound at Olympia (Thurston County). In some areas, guidelines have been issued on the number of bottom fish that may be consumed safely during a given period. Commencement Bay near Tacoma was indicated by the U.S. Environmental Protection Agency to be one of the ten worst polluted areas in the Nation. Two sites in the Com mencement Bay area have been included in the U.S. En vironmental Protection Agency's National Priorities List (1982) of hazardous-waste sites.
Acidic precipitation B7
A large percentage of the more than 7,000 lakes in the State are located at altitudes where drainage basins have very thin soils and receive more than 100 inches of precipitation per year. Many lakes located downwind of urban and industrial areas are susceptible to acidic precipitation (Logan and others, 1982; Welch and Chamberlain, 1981). Based on studies in other parts of the Nation, fish propagation in these lakes could decrease.
Ground water Landfills B.
Several hundred landfills in Washington have the potential for polluting ground water. The location and chemical content

228 National Water Summary 1983
of filled and covered landfills have not been adequately documented. Leachates from landfills are polluting ground- water supplies in areas of King, Spokane, and Pierce Counties. At some locations, ground water does not meet the drinking- water standards established by the U.S. Environmental Pro tection Agency (1976).
Eutrophication B»
Many lakes situated near densely populated cities have become eutrophic because of inflow of nutrients from septic systems in near-shore residential areas and parks (Bortleson, 1978). A major effect of eutrophication has been the decrease or loss of recreational fishing. The State is trying to decrease lake eutrophication and to restore the water quality of affected lakes (Sumioka and Dion, 1983).
HYDROLOGIC HAZARDS AND LAND-USE ISSUESFlooding Ci
On the Puyallup River near Tacoma, some flood-protection levees have become ineffective due to sediment deposition in the streambed (Nece and others, 1982). Removal of the ac cumulated sediment would decrease the likelihood and severity of flooding but also might damage fish habitats. The upper valley of the North Fork Toutle River contains several billion cubic yards of unconsolidated material derived from the land slides that resulted from the May 18, 1980, eruption of Mount St. Helens. Erosion of this material and its subsequent deposi tion in the Cowlitz River channel have increased the likelihood of flooding in the lower Cowlitz River valley. Landslide debris also dams three major lakes in the upper North Fork Toutle River valley. Should any of these dams fail, severe flooding would occur in downstream areas (Kresch, 1983; Swift and Kresch, 1983).
Volcanoes 2
Besides Mount St. Helens, there are four other active volcanoes in Washington Mount Rainier, Mount Adams, Mount Baker, and Glacier Peak (Hyde and Crandell, 1978). A large eruption of any of these volcanoes could have devastating consequences. Major flooding from mudflows, resulting from an eruption of Mount Rainer, could be expected at Tacoma and Seattle (Crandell and Mullineaux, 1967).
Resource development Fisheries Cs
Production of salmon and other anadromous fish depends on the ability of these fish to swim upstream from the ocean to spawn. This ability to reach spawning areas is being threaten ed by changes in water quality of streams due to urbanization and industrialization, and by changes in the configuration and gradient of stream channels because of channelization and dredging. Decreased fish harvests could severely affect the economy of the State.
INSTITUTIONAL AND MANAGEMENT ISSUESRiver-system management Di
The Columbia River Basin Fish and Wildlife Program of 1982 is designed to compensate for losses of fish and wildlife caused by the Columbia River hydroelectric system. Imple mentation of the program will affect water-resources planning, management, and allocation by State and Federal agencies.
Treaties and compacts D»
Recent court decisions have confirmed the fishing rights of some Indian tribes within the State. The degree to which the court decisions will affect present water use and allocation is
not known. Major rivers that may be affected by these decisions include the Columbia and Yakima.
REFERENCESBortleson, G. C., 1978, Preliminary water-quality characterization of
lakes in Washington: U.S. Geological Survey Water-Resources In vestigations 77-94, 31 p.
Carr J. R., and Balmer, D. K., 1980, Evaluation of nitrate and fluoride in ground water of the Burbank-Wallula area, Walla Walla County, Washington: Lakewood, Wash., Robinson and Noble, 107 p.
Cline, D. R., 1983, Ground-water levels and pumpage in east-central Washington including the Odessa-Lind area, 1967 to 1981: Washington Department of Ecology Water Supply Bulletin 55. [in press]
Cline, D. R., Jones, M. A., Dion, N. P., Whiteman, K. J., and Sapik, D. B., 1982, Preliminary survey of ground-water resources for Island County, Washington: U.S. Geological Survey Open-File Report 82-561, 46 p.
Crandell, D. R., and Mullineaux, D. R., 1967, Volcanic hazards at Mount Rainier, Washington: U.S. Geological Survey Bulletin 1238, 26 p.
Dion, N. P., and Sumioka, S. S., 1983, Seawater intrusion along coastal Washington, 1978: Washington Department of Ecology Water-Supply Bulletin 56. [in press]
Eddy, P. A., Cline, C. S., and Prater, L. S., 1982, Radiological status of the ground water beneath the Hanford Site: Pacific North west Laboratory Publication PNL-4237, 48 p.
Eddy, P. A., Meyers, D. A., and Raymond, J. R., 1978, Vertical contamination in the unconfined ground water at the Hanford Site, Washington: Pacific Northwest Laboratory Publication PNL-2724, 22 p.
Hyde, J. H., and Crandell, D. R., 1978, Postglacial volcanic deposits at Mount Baker, Washington, and potential hazards from future eruptions: U.S. Geological Survey Professional Paper 1022-G, 17 p.
Kresch, D. L., 1983, Spirit Lake dam-failure flood routing assess ment: U.S. Geological Survey Open-File Report 82-770, 7 p.
Logan, R. M., Derby, J. C., and Duncan, L. C., 1982, Acid precipitation and lake susceptibility in the central Washington Cascades: Journal of Environmental Science and Technology, v. 16, no. 11, p. 771-775.
Luzier, J. E., and Burt, R. J., 1974, Hydrology of basalt aquifers and depletion of ground water in east-central Washington: Washington Department of Ecology Water-Supply Bulletin 33, 53 p.
Luzier, J. E., and Skrivan, J. A., 1975, Digital simulation and projec tion of water-level declines in basalt aquifers of the Odessa-Lind area, east-central Washington: U.S. Geological Survey Water- Supply Paper 2036, 48 p.
Nece, R. E., Lettenmaier, D. P., and Kierman, K. E., 1982, Puyallup River basin flood management study, Phase I report: University of Washington, Department of Civil Engineering, 110 p.
Solley, W. B., Chase, E. B., and Mann, W. B., IV, 1983, Estimated use of water in the United States in 1980: U.S. Geological Survey Circular 1001, 56 p.
Sumioka, S. S., and Dion, N. P., 1983, Trophic classification of Washington lakes using reconnaissance data: Washington Depart ment of Ecology Bulletin 54. [in press]
Swift, C. H., Ill, and Kresch, D. L., 1983, Mudflow hazards along the Toutle and Cowlitz Rivers from a hypothetical failure of Spirit Lake blockage: U.S. Geological Survey Water Resources Investi gations 82-4125, 10 p.
U.S. Environmental Protection Agency, 1976, National interim primary drinking water regulations: Office of Water Supply, EPA-570/9-76-003, 159 p.
____1982, Amendment to National Oil and Hazardous Substance Contingency Plan; the National Priorities List: Federal Register, v. 47, no. 251, December 30, 1982, p. 58476-58485.
Welch, E. B., and Chamberlain, W. H., 1981, Initial detection of acid lakes in Washington State: University of Washington, Depart ment of Civil Engineering, 16 p.
Whiteman, K. J., Molenaar, Dee, Bortleson, G. C., and Jacoby, J. M., 1983, Occurrence, quality, and use of ground water in Orcas, San Juan, Lopez, and Shaw Islands, San Juan County, Washington: U.S. Geological Survey Water-Resources Investiga tions 83-4019, 12 sheets.

Washington 229
119°
""' TT"? T"*"':«« r-; ) V <? v- ' ( y i '
V- -/ \ *^ viV
\ J~-"' i :r/ oJ^W'i ^;r- r y-E F F-'E * ? b -N v.JFu5feu^~:-~
i ~ T ^ ." _ ^/ UJ ^W , / ^S.A.*;. * , *^. -.^w
r^'jr^T1 -^. >^ /-y^i
* ,' i . ix . !, & ' r V 'k^K ^- U;^7r (\\^~-i.,-.>/ // Trv- j\ i,
V,.^*X^T>|S. i-\ | «Pr«^VO _ "" V^ T^L/ V ^. :_ ^ 5-
"Y .,'-"/rc^
50 100 KILOMETERS
EXPLANATIONWa^cr j.s.swcs arc rfc.scri/x'd m ^C'A:/. Co/or identifies type uf issue. Letter and number identify specific issue described in text.
WATER-AVAILABILITY ISSUES
y/y^^\ AI^Ground water
WATER-QUALITY ISSUES
Ground water Saline-water intrusion
62 Ground water Radioactive wastes
63 Ground water-Hazardous-wastes sites
B4 Ground water Nitrate
65 Ground water Natural salinity (see small map)
B 6 Bottom sediments
67 Acidic precipitation
HYDROLOGIC HAZARDS AND LAND-USE ISSUES
* " '* C 1 Flooding
C2 Volcanoes
03 Resource development Fisheries (see small map)
INSTITUTIONAL AND MANAGEMENT ISSUES
| | D-| River-system management (see small map)
SUMMARY OF WATER USE IN WASHINGTON, IN MILLION GALLONS PER DAY. 1980
[Data rounded to two significant figures and may not add to totals because of independent Founding. Source: Solley, Chase, and Mann, 1983]
Use
Off stream use:
Rural domestic and livestock .
Self -supplied industrial: Thermoelectric power use . Other industrial uses ...
Total .........
Instream use: Hydroelectric power .
Ground water
Fresh Saline
300 44
260
0 .... 150 0
770 0
940,000
Withdrawals
Surface water
Fresh Saline
510 13
6.100
1.3 0 830 42
7,500 42
Total
water
810 58
6.400
1.3 990
8.200
Consump tive use,
fresh water
170 21
2,600
1.1 150
2,900

230 National Water Summary 1983
WEST VIRGINIA WATER ISSUESAs identified by the West Virginia District Office of the
U.S. Geological Survey in consultation with State officials
Average annual precipitation in West Virginia is about 30 inches in the western part of the Eastern Panhandle, 40 inches in the western and southern parts of the State, and more than 60 inches in the higher mountainous areas in the east-central part of the State. Surface water is the principal source of water for public supply and industrial uses in West Virginia. Ground water is used by many industries and is the principal source for rural domestic supplies. A series of comprehensive river-basin water-management plans have been developed by the West Virginia Department of Natural Resources to protect and en sure the efficient use of the State's available water resources.
Major water issues are summarized by category below. The letters and numerical subscripts identify issues shown on the map; an asterisk instead of a numerical subscript indicates that the issue is not shown on the map.
WATER-AVAILABILITY ISSUESSurface water Ai
During droughts, many communities that depend on surface water have serious water-supply shortages. A factor con tributing to the shortages is the very low base flows of streams in the Appalachian Plateaus physiographic province.
WATER-QUALITY ISSUESSurface water Point and nonpoint sources of pollution Bi
Reaches of the Kanawha River are polluted by point and nonpoint discharges from manufacturing plants, municipal waste-water treatment plants, mines, farms, construction areas, and silviculture areas. For example, more than 216 facilities with permitted discharges included in the National Pollution Discharge Elimination System are located in the Kanawha River basin (West Virginia Department of Natural Resources, Division of Water Resources, 1975).
Surface and ground water Hazardous-waste sites B2
Manufacturing plants along the alluvial flood plains of the Ohio and Kanawha Rivers are some of the world's leading producers of chemicals and chemical byproducts. Other in dustries, such as steel, aluminum, and coke production, also are common in the two river basins. The wastes from these chemical and other industrial plants have been buried, injected into the ground, stored in ponds, or incinerated, thus creating widespread potential for waste seepage into the local ground and surface water or direct release to the atmosphere. Approx imately 290 disposal sites in West Virginia have been identified as potential hazardous-waste sites by the U.S. Environmental Protection Agency and the West Virginia Department of Natural Resources (Cinguegarnna and Ramey, 1982). Four of these sites have been included in the U.S. Environmental Pro tection Agency's National Priorities List (1982). Data are be ing collected to define the recharge, movement, and quality of ground water at and near some of the 290 sites.
Acidic precipitation B3
Acidic precipitation is of concern in 17 counties in the eastern part of the State. In the affected areas of these counties, the pH of streamflow appears to have decreased gradually from about 7 to less than 5 (Menendez, 1978). The increase in acid ity may have affected, to some degree, the populations of aquatic plants and animals. Fish populations in particular are reported to have decreased in some areas.
Surface water Fecal coliform bacteria B,
The most common statewide water-quality issue is the presence of excessive concentrations of fecal coliform bacteria
in streams. In the Little Kanawha River basin, for example, 78 of 923 sites sampled had concentrations of fecal coliform bacteria exceeding the State standard of 200 colonies per 100 milliliters of water (West Virginia Department of Natural Resources, Division of Water Resources, 1982). Recent sampling in the Tug Fork and Twelvepole basins by the U.S. Geological Survey determined that concentrations of fecal coli form bacteria exceeded the State standard at 149 of 156 sites. Excessive concentrations of fecal coliform bacteria are present in parts of all the State's seven major river basins. Discharges of inadequately treated sewage and runoff from agricultural lands are major sources of this widespread bacterial pollution (West Virginia Department of Natural Resources, Division of Water Resources, 1979).
HYDROLOGIC HAZARDS AND LAND-USE ISSUESSafety of dams Ci
On February 26, 1972, the most destructive flood in the State's history swept through the Buffalo Creek valley in southwestern West Virginia. A coal-waste dam collapsed, releasing 132 million gallons of water. The small settlement of Saunders in Logan County was completely destroyed as were parts of 16 other mining towns farther down the valley. The 10- to 20-foot-high flood wave traveled through the 15-mile- long Buffalo Creek valley at an average speed of 5 miles per hour, reaching the town of Man at the mouth of Buffalo Creek. During the 3-hour flood, at least 118 lives were lost, 500 homes destroyed, 4,000 people left homeless, and property damage exceeded $50 million (Davies and others, 1972). There were an estimated 450 coal-waste dams in the State at the time of the disaster. Many were built with little concern for safety or proper dam design, and many were abandoned. Since then, most abandoned dams have been breached or backfilled to eliminate storage capacity. The U.S. Mine Safety and Health Administration currently inspects the 107 active coal-waste dams in West Virginia.
Resource development Coal mining C2
More than 2,000 miles of streams in the State have been identified as being significantly affected by coal-mine drainage (State of West Virginia and Environmental Protection Agency, Federal Water-Quality Administration, 1970). In many of the affected stream reaches, the water is not suitable for most uses without expensive treatment. The pH of water draining mined areas commonly ranges from 2.1 to 5.0 in the northern part of the State where rocks generally contain few calcareous miner als and coal contains a significant quantity of sulfur. In con trast, the pH of mine drainage generally is neutral or alkaline (pH 7.0 or more) in the southern part of the State where calcareous minerals are common and coal contains little sulfur. In addition to acidic drainage that characterizes most of the northern part of the State, sulfate and dissolved-solid concen trations commonly range from about 250 to 2,500 milligrams per liter in many parts of the State (Dyer, 1982). The water also is hard to very hard, with hardness ranging from 120 to 2,500 milligrams per liter, and commonly contains objection able concentrations of iron, manganese, and aluminum.
Flooding C.
Most homes and businesses in West Virginia are built on the flat, narrow valley floors that are subject to flooding. The April 1977 flood in southern West Virginia displaced 10,000 fami lies, damaged 5,000 homes and hundreds of businesses, and almost destroyed several cities and towns (Citizens Committee on Flood Cause and Prevention to the West Virginia Legisla ture, 1978).
INSTITUTIONAL AND MANAGEMENT ISSUESHydroelectric power D,
There are many potential sites for conventional and pump- storage hydroelectric power-generating dams in the State.

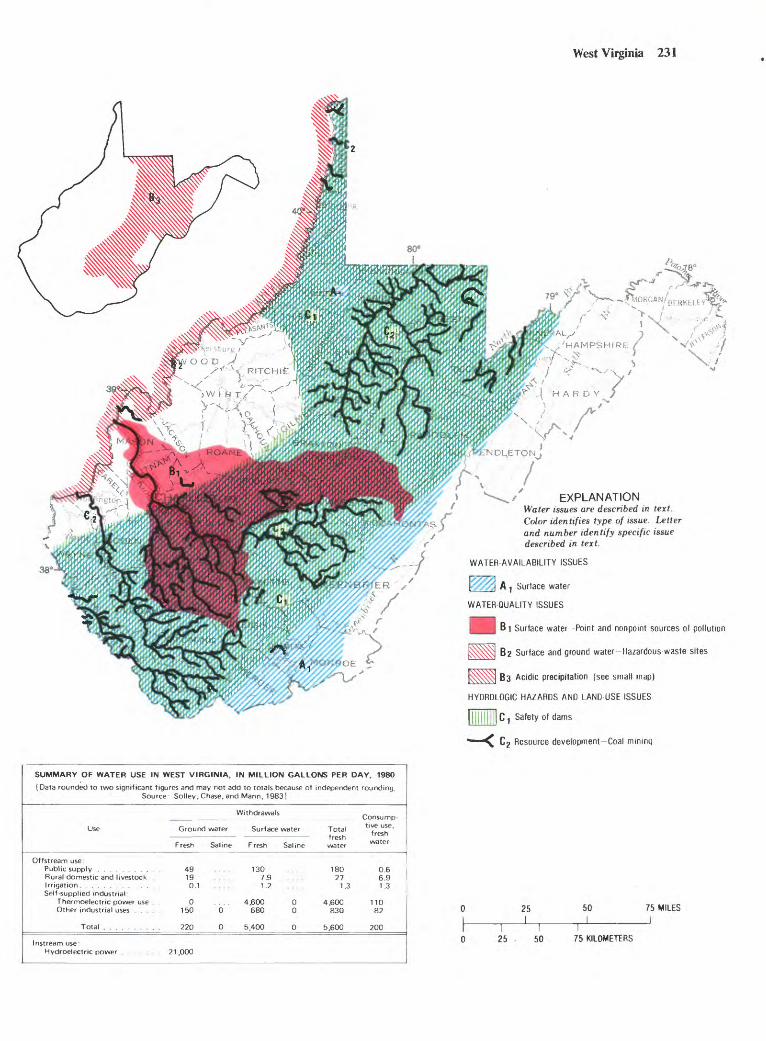
West Virginia 231
/ EXPLANATIONWater issues are described in text. Color identifies type of issue. Letter and number identify specific issue described in text.
WATER AVAILABILITY ISSUES
l-X^i A i Surface water
WATER-QUALITY ISSUES
1 Surface water-Point and nonpoint sources ol pollution
j^§^q 62 Surface and ground water-Hazardous-waste sites
fcj^jyjj 63 Acidic precipitation (see small map)
HYDRDLOGIC HAZARDS AND LAND USE ISSUES
|l||||| |C-| Safety of dams
C 2 Resource development-Coal mimnq
SUMMARY OF WATER USE IN WEST VIRGINIA, IN MILLION GALLONS PER DAY. 1980
[Data rounded to two significant figures and may not add to totals because of independent rounding. Source Solley, Chase, and Mann, 1983]
Withdrawals
Use
Off stream use:
Rural domestic and livestock
Self-supplied industrial Thermoelectric power use . Other industrial uses ....
Total .........
Instream use Hydroelectric power . .
Ground water
Fresh Saline
49 .... 19 ....0.1 . . . .
0 .... 150 0
220 0
21.000
Surface water
Fresh Saline
130 .... 7.9 .... 1.2
4.600 0 680 0
5.400 0
Total fresh water
180 27
1.3
4,600 830
5.600
Consump tive use.
fresh water
0.6 6.9 1.3
110 82
200
25 50I
75 MILES
_J
25 . 50I
75 KILOMETERS

232 National Water Summary 1983
Because of the steep mountainsides and narrow valleys, these dams would have adequate height for efficient operation, but most of the rivers are relatively small and would have in adequate flow volumes to make such dams economical. The State's present economy is dependent primarily on coal, much of which is used to generate electricity. The State has, therefore, two polarized groups: Those who advocate develop ment of hydroelectric power as a clean, nonpolluting source of much-needed energy, and those who view hydroelectric power as economically questionable and harmful to the environment and to State fisheries.
REFERENCESCinguegarnna, Marie, and Ramey, Curt, 1982, West Virginia
hazardous-waste survey: West Virginia Department of Natural Resources, Division of Water Resources, Hazardous Waste Ground Water Branch, 25 p.
Citizens Committee on Flood Cause and Prevention to the West Virginia Legislature, 1978, Report of the Citizens Committee on flood cause and protection to the West Virginia Legislature The flood of 1977: Charleston, West Virginia Legislature, 55 p.
Davies, W. E., Bailey, J. F., and Kelly, D. B., 1972, West Virginia's Buffalo Creek flood A study of the hydrology and engineering geology: U.S. Geological Survey Circular 667, 32 p.
Dyer, K. L., 1982, Stream water quality in the coal regions of West Virginia and Maryland: U.S. Forest Service, Northeast Forestry Experimental Station General Technical Report NE-70, 215 p.
Menendez, R., 1978, Effects of acid water on Shavers Fork A coal history, in Proceedings of Symposium on Surface Mining and Fish/Wildife Needs in the Eastern United States: U.S. Fish and Wildlife Service Biological Service Program, FWS/OBS-78-81, p. 160-169.
Solley, W. B., Chase, E. B., and Mann, W. B., IV, 1983, Estimated use of water in the United States in 1980, U.S. Geological Survey Circular 1001, 56 p.
State of West Virginia and U.S. Environmental Protection Agency, Federal Water-Quality Administration, 1970, West Virginia's water-pollution control program: Charleston, 36 p.
U.S. Environmental Protection Agency, 1982, Amendment to National Oil and Hazardous Substance Contingency Plan; the Na tional Priorities List: Federal Register, v. 47, no. 251, December 30, 1982, p. 58476-58485.
West Virginia Department of Natural Resources, Division of Water Resources, 1975, Basin water-quality plan for the Kanawha River basin: Charleston, 560 p.
.1979, Water-quality status assessment 1977-1979: Charleston,105 p.
.1982, Little Kanawha River basin plan: Charleston, 195 p.

Wisconsin 233
WISCONSIN WATER ISSUESAs identified by the Wisconsin District Office of the U.S.
Geological Survey in consultation with State officials
Wisconsin has more than 14,000 lakes, and is bounded part ly by two of the Great Lakes and by the Mississippi River. The State receives an average annual precipitation of about 32 inches. Changes in water and land use have created increasing concerns about water supply, water quality, water-related environmental conditions, and water management. As a result of an extended drought during the 1970's, ground-water with drawals increased significantly in agricultural areas where sprinkler irrigation is possible. Municipalities also began relying more on ground water for their supplies. With a very environmentally aware populace, the State has been trying to provide legal, financial, and technical support for the correc tion or prevention of deficiencies in water supply and water quality. The State has encouraged municipalities to upgrade their waste-treatment plants and has developed, and finan cially supports, a program designating priority watersheds that encourages the implementation of management practices to control nonpoint sources of pollution. The use of phosphates in detergents was banned for several years until July 1, 1982. The State Legislature is considering reinstatement of the ban and instituting ground-water-protection measures.
Major water issues are summarized by category below. The letters and numerical subscripts identify issues shown on the map; an asterisk instead of a numerical subscript indicates that the issue is not shown on the map.
WATER-AVAILABILITY ISSUESGround water A,
Increasing pumpage of ground water from a confined aquifer in eastern Wisconsin has caused large declines in water levels. Ground-water pumpage centered in Milwaukee and Waukesha Counties in southeastern Wisconsin has created an extensive cone of depression; water levels have declined more than 100 feet throughout a large area (Erickson and Cotter, 1983). This cone 01 depression is merging with the cone of depression in the Chicago, 111., area, where water levels have declined more than 850 feet, and is causing a controversy be tween the two States (Fetter, 1981). Municipal and industrial pumpage in the lower Fox River Valley has caused water levels to decline hundreds of feet since pumping began in the 1880's. In 1957, after the city of Green Bay started using water from Lake Michigan, ground-water levels recovered 200 feet at Green Bay; however, water levels again are declining because of increasing industrial and municipal pumping (Erickson and Cotter, 1983). The acreage irrigated by ground water in the Central Sand Plain is expected to triple from the present 133,000 acres by the year 1990. If this increase in irrigated acreage occurs, lowered water levels, decreased streamflow, higher water temperatures, and the potential for ground-water pollution from increased use of fertilizers and pesticides may be significant resource-management issues in the near future.
WATER-QUALITY ISSUESSurface water Point and nonpoint sources of pollution Bi
Pollutants and sediment associated with runoff from agricultural and urban areas are affecting many streams and lakes. About 130 of the State's 330 watersheds are considered to be susceptible to nonpoint pollution (Wisconsin Department of Natural Resources, 1982). Although the State began a pollution-abatement program in 1978 to decrease damage resulting from nonpoint pollution, it will take several decades and an estimated $280 million to complete the program (Konrad, 1982). The inner and outer harbors of Milwaukee are polluted by frequent overflows of the combined storm and sanitary sewer system and by pollutants in runoff from urban and rural areas. This pollution impairs shoreline development
for esthetic reasons, threatens the safe use of nearby Lake Michigan beaches, and may threaten water quality at the water-supply intakes of Milwaukee and other nearby commu nities. Efforts are underway to decrease the pollution (South eastern Wisconsin Regional Planning Commission, 1981). The Fox River and southern Green Bay area contain water enriched with phosphorus and ammonia, deficient dissolved- oxygen concentrations, and bottom sediments polluted with nutrients, polychlorinated biphenyls, heavy metals, and other pollutants. Although programs have been implemented to decrease the pollution, it is still a major concern of the Great Lakes Water Quality Board (1982). The quality of the Menominee and Sheboygan Rivers (Marinette and Sheboygan Counties) also is of concern, but to a lesser degree (Great Lakes Water Quality Board, 1982).
Ground water Point and nonpoint sources of pollution B2
Between 1980 and 1982, the pesticide aldicarb was discov ered in well water in central Wisconsin in concentrations in excess of the maximum allowable concentration of 10 micro- grams per liter (Wisconsin Department of Natural Resources, 1983). This discovery prompted the State to restrict use of the pesticide and to consider the possibility that other pesticides may be present in ground water. Other concerns include animal wastes and the disposal of whey, a waste product of the State's large dairy industry. Ground-water pollution from sulfide ore mines and mills in the southwestern and northern parts of the State also is a present and future concern (Wiscon sin Department of Natural Resources, 1983).
Acidic precipitation 63
The pH of precipitation in northern Wisconsin is about 4.6 (James Buchanan, University of Wisconsin Madison, Department of Soil Science, written commun., 1983). Area residents are concerned that acidic precipitation will affect the quality of the thousands of lakes in the area, with a resulting decrease in sport fish, which could affect the State's tourism industry.
Ground water Hazardous-waste sites B,
Wisconsin has an estimated 2,000 abandoned or improperly closed landfills (Braun, 1983). Some of these sites already have polluted ground water pumped from domestic wells of adjacent land owners. The potential for additional pollution is signifi cant because many domestic wells obtain water from shallow water-table aquifers, which are the most susceptible to pollu tion from landfills. Similarly, numerous municipal, industrial, and private waste-disposal ponds and lagoons throughout the State may be leaking wastes and polluting aquifers (Wisconsin Department of Natural Resources, 1983). New regulations for waste disposal should help prevent ground-water pollution at recently constructed or future sites.
HYDROLOGIC HAZARDS AND LAND-USE ISSUESWetlands C,
About 2.5 million acres remain of the original 7.5 million to 10 million acres of wetlands in Wisconsin (U.S. Water Resources Council, 1982). This acreage is being decreased by drainage, filling, and grazing at a rate exceeding 20,000 acres per year (Novitzki, 1982). In Wisconsin, only wetlands adja cent to navigable streams and lakes in unincorporated areas are subject to regulation.
Erosion and sedimentation C.
Soil loss from crop lands in the southern two-thirds of the State is a major concern. In addition, streambank erosion and erosion from urban development continue to occur despite continuing educational efforts by the State. Progress is being made in some areas, but erosion control is expensive and it will take time to implement plans and practices (Wisconsin Depart ment of Natural Resources, 1982).

234 National Water Summary 1983
Flooding C.
Urban and rural flooding is still a concern in Wisconsin. Many municipalities have adopted ordinances regulating flood-plain development, but damages still occur to existing development in flood-prone areas. Floods in rural areas occa sionally ruin crops and prevent timely use of the land for plant ing and harvesting.
INSTITUTIONAL AND MANAGEMENT ISSUESWater laws D.
The authority for the protection and use of ground water is divided among several State laws and administrative codes. State agencies are working with the Wisconsin Legislature to develop comprehensive ground-water protection legislation.
Inland lake management and protection D.
Protection and improvement of Wisconsin's thousands of lakes for recreational and other uses is of local and State con cern. Locally, more than 200 lake districts and associations have been formed to manage and protect their lakes.
REFERENCESBraun, Brace, 1983, Bill on old dumps prompts debate: Milwaukee
Journal, March 11, 1983.Erickson, R. M., and Cotter, R. D., 1983, Trends in ground-water
levels in Wisconsin through 1981: Wisconsin Geological and Natural History Survey Information Circular 43, 139 p.
Fetter, C. W., Jr., 1981, Interstate conflict over ground water Wisconsin-Illinois: Ground Water, v. 19, no. 2, p. 201-213.
Great Lakes Water Quality Board, 1982, 1982 report on Great Lakes water quality: International Joint Commission report, 153 p.
Konrad, John, 1982, The turning point for nonpoint source pollution, in Wisconsin Department of Natural Resources, All riled up: Sup plement to Wisconsin Natural Resources Magazine, v. 6, no. 3, May-June, 1982, p. 45-65.
Last, D., 1982, Potential for more irrigation seen: Milwaukee Sen tinel, August 21, 1982.
Novitzki, R. P., 1982, Hydrology of Wisconsin wetlands: WisconsinGeological and Natural History Survey Information Circular 40,22 p.
Solley, W. B., Chase, E. B., and Mann, W. B., IV, 1983, Estimateduse of water in the United States in 1980: U.S. Geological SurveyCircular 1001, 56 p.
Southeastern Wisconsin Regional Planning Commission, 1981, Study design for the Milwaukee Harbour Estuary comprehensive water resources planning program: Waukesha, Wise., 291 p.
U.S. Water Resources Council, 1982, Analysis of methodologies used for assessment of wetland values: Washington, D. C., A draft report prepared for the Director of the U.S. Water Resources Council, 68 p.
Wisconsin Department of Natural Resources, 1982, All riled up: Sup plement to Wisconsin Natural Resources Magazine, November 1982, v. 6, no. 3, May-June, 1932, 31 p.
____1983, Groundwater Wisconsin's buried treasure: Supple ment to Wisconsin Natural Resources Magazine, v. 7, no. 5, September-October, 1983, 31 p.

Wisconsin 235
92
EXPLANATION
issues are described in text. Color identifies type of issue. Letter and number identify specific issue described in text.
WATER-AVAILABILITY ISSUES
Ground water
WATER-QUALITY ISSUES
p Surface water-Point and nonpoint 1 sources of pollution
Ground water-Point and nonpoint sources of pollution
63 Acidic precipitation
HYDRDLOGIC HAZARDS AND LAND-USE ISSUES
llllllll|Ci Wetlands (see small map)
100 KILOMETERS
SUMMARY OF WATER USE IN WISCONSIN. IN MILLION GALLONS PER DAY, 1980
[Data rounded to two significant figures and may not add to totals because of independent rounding. Source: So Hey, Chase, and Mann, 1983]
Withdrawals
Use
Offstream use:
Rural domestic and livestock .
Self -supplied industrial: Thermoelectric power use .
Instream use:
Ground water
Frash Saline
290 .... 140 .... 82 ....
1.2 .... 96 0
610 0
71,000
Surface water
Frash Saline
280 .... 3.0 .... 3.0
4,500 0 350 0
5,200 0
Total frash water
570 150 85
4,500 450
5,800
Consump tive use,
fresh water
57 82 77
46 45
310

236 National Water Summary 1983
WYOMING WATER ISSUESAs identified by the Wyoming District Office of the U.S.
Geological Survey in consultation with State officials
Precipitation in the mountains of Wyoming usually exceeds 30 inches per year. However, more than three-fourths of the State's 97,900 square miles consists of semiarid high plains and intermontane basins where the average precipitation is less than 15 inches annually. Thus, reservoir storage is essential for adequate year-round water supplies. Wyoming's mostly rural population of about 470,000 uses less than one-fifth of the 17 million acre-feet of water originating in or flowing through the State. Much of the unused water belongs to downstream users through the provisions of interstate compacts and court decrees. Wyoming's surface and ground water are adminis tered under the doctrine of prior appropriation. Although ground water provides only about 10 percent of the water used, its use is increasing. In many parts of the State, natural salinity in ground water makes it unsuitable for domestic use; how ever, some aquifers, particularly in the central and southeast ern parts of the State, contain water that is suitable for most purposes. The State's economy is dominated by agriculture, recreation and tourism, and the minerals industry; conse quently, water issues tend to focus on the traditional agricul tural base of the economy, the quality of recreation resources, and the development of oil and gas, coal, uranium, and other minerals. Rapid population and attendant water-use increases related to energy-mineral development are expected to be the principal stresses on the State's water resources. In anticipa tion of future water needs, the State developed a comprehen sive water plan in 1973 (Wyoming Water Planning Program, 1973). In 1979, the Wyoming Water Development Commis sion was created by the State Legislature to further the work begun by the Water Planning Program.
Major water issues are summarized by category below. The letters and numerical subscripts identify issues shown on the map; an asterisk instead of a numerical subscript indicates that the issue is not shown on the map.
WATER-AVAILABILITY ISSUESSurface water A,
Surface water is abundant in some parts of the State and is scarce in others. Runoff from the mountains commonly ex ceeds 20 inches per year, but runoff in the plains is less than 1 inch per year. Uneven distribution of surface water areally and throughout the year is a constraint on agricultural and indus trial development and results in competition for the available supply. Many small communities near energy-mineral resources have become boomtowns, with a corresponding need for increased water supplies. On the water-short plains, agricultural and industrial users compete for the available water supplies. Conversion of land and water from agricultural to industrial or other uses is an increasing practice and of con cern to many of Wyoming's citizens (Jacobs and others, 1982). New storage and diversion structures are being planned to have the usable surface-water supply available at the time and place it is needed. The Wyoming Water Development Com mission is implementing such projects, many of which have been authorized for intensive study.
WATER-QUALITY ISSUESSurface water Upper Colorado River salinity Bi
Because salinity is an increasing problem in the Lower Colo rado River Basin, the control or decrease of salinity throughout the entire river system is the subject of several Federal laws. Most notable of these laws are the Colorado River Basin Salinity Control Act of 1974 (Public Law 93-320) and the Federal Water Pollution Control Act Amendments of 1977 (Clean Water Act, Public Law 95-217). In Wyoming, the average dissolved-solids load of the Green River (a major
tributary of the Colorado River) between Fontenelle Dam and Flaming Gorge Reservoir has increased by 49 percent (from 410,000 to 612,000 tons per year), whereas streamflow has increased only 5 percent. The sources of most of the salinity increase are saline-water seeps and irrigation return flows.in the Big Sandy River (DeLong, 1977), a principal tributary to the Green River. One salinity-control measure being consid ered is diversion of saline water from the Big Sandy River for consumptive use by industries.
Eutrophication B2
Phosphorus, primarily from natural sources, but also from agricultural and human sources, is enriching the water and bottom sediment in many of the large reservoirs in Wyoming. The adverse effects of eutrophication are most noticeable in Flaming Gorge Reservoir in southwestern Wyoming.
Acidic precipitation B3
Lakes and streams in the mountains are susceptible to acidification because of the lack of alkaline soils to neutralize acid precipitation. A reconnaissance study of alkalinity in sur face waters (Omernik, 1982) indicates that most of Wyoming's mountain lakes and streams contain relatively small concentra tions of alkalinity, especially in the Wind River Range.
Ground water Point and nonpoint sources of pollution B.
Ground-water pollution by leachates, particularly from point sources such as landfills, mine tailings, and oil-field holding ponds may occur locally. A hazardous-waste site near Laramie, resulting from the treating of railroad ties, has been included in the U.S. Environmental Protection Agency's Na tional Priorities List (1982). Pollution of ground water by nitrate from nonpoint agricultural sources has been identified in southeastern Wyoming (Lowry and Grist, 1967); this type of pollution also may occur in other intensively farmed areas.
HYDROLOGIC HAZARDS AND LAND-USE ISSUESFlooding Ci
Jackson Lake Dam, constructed at the natural outlet of Jackson Lake, poses a potential flood threat to the principal visitor area in Grand Teton National Park and to the com munity of Jackson Hole, because the west side of the lake is bordered by the Teton fault. Recent seismic studies (Gilbert and others, 1983) indicate that an earthquake large enough to cause the dam to fail is possible. Under provisions of the Reclamation Safety of Dams Act of 1978 (Public Law 95-578), the U.S. Bureau of Reclamation has developed alternative solutions to the problem, one of which is to relocate the dam, and is seeking public views on the matter. In the meantime, the Bureau has restricted the operating level of the lake (U.S. Bureau of Reclamation, 1983).
Wet soils, drainage, and wetlands C2
Many irrigation projects in Wyoming were developed with inadequate provision for drainage. As a consequence, ground- water levels in some areas rose near or to the land surface and caused boggy areas that are untillable or that are alkaline because of the accumulation of salts. Thousands of acres of former farm land are unsuitable for cultivation because of these man-induced alkaline deposits. The wetlands created by these irrigation practices are a loss to agriculture but locally provide wildlife habitats. Groups interested in protecting wildlife oppose reclamation of these newly created wetlands.
Resource development Energy-minerals development C 3
Water-resources issues associated with energy-minerals development include increased water demands for mineral ex traction and processing, municipal supplies, and potential transport of coal in slurry pipelines. During the last decade,

Wyoming 237
100 KILOMETERS
EXPLANATION/ss//fs arf described in text. Color identifies type of issue.
Letter and number identify specific issue described in text.
WATER-QUALITY ISSUES
^^^ BI Surface water-Upper Colorado River salinity
A 62 Eutrophication
^^^ BS Acidic precipitation
HYDROLOGIC HAZARDS AND LAND-USE ISSUES
A C 1 Flooding
O C 2 Wet soils, drainage, and wetlands
|r^H'| 3 Resource development-Energy minerals development
INSTITUTIONAL AND MANAGEMENT ISSUES
| | DI Indian water rights
I | D2 Water-resources managment Ground water
D 9 Water-resources management- J Municipal supplies
SUMMARY OF WATER USE IN WYOMING, IN MILLION GALLONS PER DAY, 1980
[Data rounded to two significant figures and may not add to totals because of independent rounding. Source: Solley, Chase, and Mann, 1983]
Withdrawals
Use
Offstream use:
Rural domestic and livestock .
Self -supplied industrial Thermoelectric power use . Other industrial uses ....
Instream use: Hydroelectric power .....
Ground water
Fresh Saline
27 .... 12 ...
370 ....
1.1 .... 130 24
540 24
7,200
Surface water
Fresh Saline
55 .... 13 ....
4,500 ....
220 0 44 0
4,800 0
Total fresh water
82 25
4,900
220 170
5,300
Consump tive use,
fresh water
48 21
2,500
45 25
2,600

238 National Water Summary 1983
Wyoming has had significant increases in exploration, mining, and transporting of coal, oil and gas, oil shale, and uranium. Coal production from surface mines in the Powder River basin is expected to be 122 million tons per year by the year 1990 (Glass, 1980). Intense exploration for oil and gas is occurring in the Overthrust Belt of western Wyoming. Thousands of seismograph and mineral-exploration holes have been drilled in Wyoming; many of these are holes improperly plugged and provide conduits for flow between aquifers that result in changes in water levels and possible pollution of freshwater aquifers. Development of oil shale in southwestern Wyoming has been suspended because of the present worldwide oil glut; however, renewed interest in oil shale development is expected as other sources of oil decrease. Uranium mining, principally in the Powder River basin, has decreased significantly because of a surplus of uranium. The decreases in oil shale and uranium mining have eased demands on local water resources.
INSTITUTIONAL AND MANAGEMENT ISSUESIndian water rights Di
The Wind River Indian Reservation, an area of more than 3,000 square miles in west-central Wyoming, is owned by the Arapahoe and Shoshone Tribes. The Indians claim ownership of the water originating in or flowing through the reservation. This issue of reserved rights for the reservation is being litigated; the final decision will affect Indian and non-Indian water users in the Wind and Bighorn River basins.
Water-resources management Ground water D2
Ground-water levels in several areas of the State have declined because of increased pumpage for irrigation and urban development. Several ground-water control areas have been established that use a permit system to control the quan tity of water withdrawn. Selection of these control areas is initi ated by water users, and, once established, the areas are administered by the State Engineer who is advised by an elected advisory board. Control areas have been established for the irrigated areas in Laramie (Grist, 1980) and Platte Coun ties and at Prairie Center in northwestern Goshen County. A control area is being considered for the Gillette area in Camp bell County because of the large increase in ground-water pumpage for urban supplies.
Water-resources management Municipal supplies D3
Many small communities in Wyoming have had moderate to significant increases in population. Ground water is being developed for supplies in urban areas because the use of sur face water for increasing municipal supplies usually requires purchase of an existing water right and construction of a pipeline. Reliable, but inexpensive, supplies are being sought; however, information about the local resources generally is lacking. A grant program administered by the Wyoming Water Development Commission has been established to aid communities in the exploration and development of ground- water resources.
Water allocation D.
Many streams in the State already are fully appropriated for offstream uses. In many places, ground water in shallow aquifers, particularly alluvium, is hydraulically connected to adjacent streams. Because of this, the development of shallow ground-water supplies is likely to be constrained by the poten tial effects on previously appropriated surface water. Legisla tion to assure adequate aquatic habitat by maintaining minimum flows in streams was defeated by the Wyoming Legislature in 1983.
Treaties and compacts D.
Interstate compacts and court decrees specify the quantities of water that must be allowed to flow out of Wyoming for downstream use and the quantities of water that can be used within Wyoming. There is considerable interest by some water
users and managers in interbasin transfers of water from areas where Wyoming's share is not completely used (such as the Green River basin) to areas within the State where there is in sufficient water available to meet demands. However, such transfers from the Green River basin would have to comply with requirements in the Colorado River Compact of 1922 (Arizona, California, Colorado, Nevada, New Mexico, Utah, and Wyoming), the Upper Colorado Basin River Compact of 1948 (Arizona, Colorado, New Mexico, Utah, and Wyoming), and the Rio Grande, Colorado, and Tijuana Treaty of 1944 with Mexico. The Yellowstone River Compact of 1950 (Mon tana, North Dakota, and Wyoming) and the Snake River Compact of 1949 (Idaho and Wyoming) contain an additional constraint: Unanimous agreement of the member States is re quired for diversion of water out of the basins. There are pro posals to divert water from the Yellowstone River basin to the coal areas in northeastern Wyoming that are outside the Yellowstone River basin. Ground-water considerations gener ally are not included in existing interstate compacts; however, the contribution of tributary ground water to flow in the Bear River is being studied because of requirements in the Amended Bear River Compact of 1980 (Idaho, Utah, and Wyoming); this compact requires that interception of ground water that otherwise would discharge into the river be counted in each State's allocation.
River-system management D.
Several coal-slurry pipelines have been proposed, the most publicized being that of Energy Transportation Systems, Inc., which would use 20,000 acre-feet of water per year to transport pulverized coal from Wyoming's Powder River basin to Arkansas and other intermediate points. Originally, the pipeline developer planned to use ground water from the Madison aquifer, but many Wyoming residents opposed this use of the State's water. Subsequently, the pipeline developer purchased water from Lake Oahe Reservoir in South Dakota, which has resulted in concerns about such use of Missouri River basin's water in downstream States (Iowa, Kansas, Missouri, and Nebraska).
REFERENCESGrist, M. A., 1980, Effects of pumpage on ground-water levels as
modeled in Laramie County, Wyoming: U.S. Geological Survey, Water-Resources Investigations Open-File Report 80-1104, 26 p.
DeLong, L. L., 1977, An analysis of salinity in streams of the Green River basin, Wyoming: U.S. Geological Survey Water-Resources Investigations 77-103, 32 p.
Gilbert, J. D., Ostenaa, Dean, and Wood, Christopher. 1983, Seismotectonics study, Jackson Lake Dam and Reservoir, Mini- docka Project, Idaho-Wyoming: Denver, U.S. Bureau ol Reclamation Seismotectonics Report, [in press]
Glass, G. B., 1980, Wyoming coal production and summary of coal contracts: Geological Survey of Wyoming Public Information Cir cular 12, 99 p.
Jacobs, J. J., Bradley, E. B., and Vanvig, Andrew, 1982, Coal- energy development and agriculture in northeast Wyoming's Powder River basin: University of Wyoming Agricultural Experi ment Station Report RB-178, 77 p.
Lowry, M. E., and Grist, M. A., 1967, Geology and ground-water resources of Laramie County, Wyoming: U.S. Geological Survey Water-Supply Paper 1834, 71 p.
Omernik, J. M., 1982, Total alkalinity of surface waters: U.S. En vironmental Protection Agency map, EPA-600/D-82-333 scale 1:7,500,000.
Solley, W. B., Chase, E. B., and Mann, W. B., IV, 1983, Estimated use of water in the United States in 1980: U.S. Geological Survey Circular 1001, 56 p.
U.S. Bureau of Reclamation, 1983, Jackson Lake safety of dams study: U.S. Bureau of Reclamation information summary brochure, 23 p.
U.S. Environmental Protection Agency, 1982, Amendment to National Oil and Hazardous Substance Contingency Plan; the Na tional Priorities List: Federal Register, v. 47, no. 251, December 30, 1982, p. 58476-58485.
Wyoming Water Planning Program, 1973, The Wyoming framework water plan: Cheyenne, Wyoming State Engineer, Wyoming Water Planning Program report, 243 p.

Wyoming 239
Photograph by Dawn Reed, U.S. Geological Survey.

240 National Water Summary 1983
GLOSSARYAcre-foot The volume of water required to cover 1 acre
of land (43,560 square feet) to a depth of 1 foot; equiva lent to 325,851 gallons.
Absorption The process by which substances in gaseous, liquid, or solid form dissolve or mix with other substances.
Adsorption Adherence of gas molecules, ions, or molecules in solution to the surface of the solids.
Alluvium A general term for clay, silt, sand, gravel, or similar material deposited in a streambed, on a flood plain, delta, or at the base of a mountain during com paratively recent geologic time.
Anion An atom that has a negative electrical charge for example, nitrate and chloride ions are anions.
Aquiculture The art and science of farming organisms that live in water, such as fish, shellfish, and algae.
Aquifer A geologic formation, group of formations, or part of a formation that contains sufficient saturated permeable material to yield significant quantities of water to wells and springs. See also confined aquifer and unconfined aquifer.
Artesian aquifer See confined aquifer.Base flow Sustained or fair-weather flow of a stream. In
most places, base flow is derived from ground water in flow to the stream channel.
Basal ground water Basal lens A term that originated in Hawaii and refers to a major body of fresh ground water in contact with saline water and occurring in the lower part of the freshwater flow system.
Benthic organism A form of aquatic life that lives on the bottom or near bottom of streams, lakes, or the oceans.
Bolson A term applied in the desert regions of Southwestern United States; an extensive, flat, saucer- shaped, alluvium-floored basin or depression, almost or completely surrounded by mountains from which drainage has no surface outlet.
Bolson plain A broad, intermontane plain in the central part of a bolson or semibolson, underlain by thick alluvial deposits washed into the basin from the surrounding mountains.
Brackish Water that generally contains 1,000-10,000 milligrams per liter of dissolved solids.
Brine Water that generally contains more than 100,000 milligrams per liter of dissolved solids.
Cation An atom that has a positive electrical charge for example, sodium and calcium.
Cone of depression A depression in the potentiometric surface around a well from which water is being withdrawn.
Confined aquifer An aquifer in which ground water is confined under a pressure which is significantly greater than atmospheric pressure. Synonym: artesian aquifer. See also aquifer, semiconfined aquifer, and unconfined aquifer.
Conjunctive use Coordinated use of water supplied from ground and surface sources.
Connate water Water entrapped in the interstices of a rock at the time of its deposition.
Consumptive use The quantity of water that is no longer available because it has been evaporated, trans pired, or incorporated into products, plant tissue, or animal tissue. Also referred to as water consumption and water consumed.
Denitrification A process by which oxidized forms of nitrogen such as nitrate (NOs) are reduced to form nitrites, nitrogen oxides, ammonia, or free nitrogen; commonly brought about by the action of denitrifying bacteria and usually resulting in the escape of nitrogen to the air.
Desorb To free from a sorbed state, to remove a sorbed substance by the reverse of adsorption or absorption. See also absorption, adsorption, and sorb.
Dissolved oxygen Oxygen dissolved in water and available for use by aquatic life.
Dissolved solids Solid material such as minerals dissolved in water.
Drawdown The difference between the water level in a well before pumping, and the water level in the well during pumping. Also, for flowing wells, the reduction of the pressure head as a result of the withdrawal of water. See also pressure head.
Eutrophic lake A standing body of water containing an excessive concentration of plant nutrients, especially phosphorus and nitrogen, which results in excessive algal production, especially blue-green algae.
Eutrophication The process by which waters become enriched with plant nutrients, especially phosphorus and nitrogen.
Evapotranspiration A collective term that includes water lost through evaporation from the soil and surface-water bodies and by plant transpiration.
Freshwater Water that generally contains 0-1,000 milligrams per liter of dissolved solids.
Ground water In the broadest sense, all subsurface water, as distinct from surface water; as more com monly used, that part of the subsurface water in the saturated zone.
Hydraulic gradient In an aquifer, the rate of change of head per unit of distance in the direction of most rapid change. See also pressure head.
Igneous A rock that solidified from molten or partly molten material, also applied to processes leading to, or resulting from the formation of such rocks. Igneous rocks constitute one of the three main classes into which all rocks are divided that is, igneous, metamorphic, sedimentary.
Infiltration The flow of a fluid into a soil or rock through pores or small openings.
Instream use Water use taking place within the stream channel. Examples are hydroelectric power generation, navigation, water-quality improvement, fish propaga tion, recreation, and other uses. Also called nonwith drawal use or inchannel use.
Ion A positively or negatively charged atom or group of atoms. See also anion and cation.
Ion exchange The reversible chemical replacement of one ion by another.
Karst A type of topography that results from dissolu tion and collapse of limestone, dolomite, or gypsum

Glossary 241
beds, and characterized by closed depressions or sink holes, caves, and underground drainage.
Liquefaction The process by which a solid may be con verted to the liquid phase by heat, or the conversion of a gas into a liquid by increased pressure and cooling.
Mesotrophic lake A lake that contains a moderate sup ply of plant nutrient matter, especially phosphorus and, to a lesser extent, nitrogen. A mesotrophic lake is intermediate between a eutrophic and an oligotrophic lake.
Metamorphic Any rock derived from preexisting rocks in response to marked changes in temperature, pressure, shearing stress, and chemical environment at depth in the Earth's crust (below the zones of weathering and cementation). Metamorphic rocks constitute one of the three main classes into which all rocks are divided that is, igneous, metamorphic, and sedimentary.
Mining of ground water Ground-water withdrawals in excess of recharge. See also overdraft.
Nonpoint source of pollution Pollution from sources that cannot be defined as originating from discrete points, such as areas of fertilizer and pesticide applica tion and leaking sewer systems.
Offstream use Water withdrawn or diverted from a ground- or surface-water source for public supply, in dustry, irrigation, and rural uses.
Oligotrophic lake A lake that is characterized by a low concentration of plant nutrients, especially phosphorus and nitrogen.
Overdraft Withdrawals of ground water at rates perceived to be excessive. See also mining of ground water.
Perched ground water Unconfined ground water separated from an underlying main body of ground water by an unsaturated zone.
Permafrost Any soil, subsoil, surficial deposit, or bedrock, in arctic or subarctic regions where below- freezing temperatures have existed continuously from two years to tens of thousands of years.
Permeability The capacity of a porous rock, sediment, or soil for transmitting a fluid without altering its physical structure; a measure of the relative ease of fluid flow under pressure.
Point source of pollution Pollution originating from any confined or discrete source, such as the outflow from a pipe, ditch, tunnel, well container, concentrated animal-feeding operation, or floating craft.
Pollution plume An area of a stream or aquifer con taining degraded water resulting from migration of a pollutant.
Potable water Water that is safe and palatable for human use.
Potentiometric surface An imaginary surface repre senting the static head of ground water in tightly cased wells that tap a particular water bearing rock unit (aquifer), or, in the case of unconfined aquifers, the water table.
Pressure head Hydrostatic pressure or force per unit area expressed as the height of a column of water that the pressure can support, relative to a specific datum such as land surface or sea level.
Prior appropriation A concept in water law under which users who demonstrate earlier use of water from a particular source are said to have prior appropriation rights over all later users of water from the same source.
Pyroclastic Rock material formed by volcanic explo sion or aerial expulsion from a volcanic vent.
Radionuclide A species of atom that emits alpha, beta, or gamma rays for a measureable length of time. Indi vidual radionuclides are distinguished by their atomic weight and atomic number.
Reaeration The replenishment of oxygen into water that has previously had the oxygen reduced or removed.
Recharge The process of addition of water to the zone of saturation. See also saturated zone.
Recurrence interval The average interval of time within which the magnitude of a given event, such as a flood or storm, will be equaled or exceeded once.
Rem The dosage of an ionizing radiation that will cause the same biological effect as one roentgen of X-ray or gamma-ray dosage.
Renewable water supply The rate of supply of water (volume per unit time) potentially or theoretically available for use in a region on an essentially perma nent basis.
Return flow That part of irrigation water that is not consumed by evapotranspiration and that returns to its source or another body of water. The term is also ap plied to water that is discharged from industrial plants.
Riparian rights A concept of water law under which authorization to use water in a stream is based on own ership of the land adjacent to the stream.
Runoff That part of precipitation or snow melt that ap pears in streams or surface-water bodies.
Safe yield (ground water) The amount of water that can be withdrawn from an aquifer without producing an undesired effect.
Safe yield (surface water) The amount of water that can be withdrawn or released from a reservoir on an ongoing basis with an acceptably small risk of supply interruption.
Saline water Water that generally contains 10,000- 100,000 milligrams per liter of dissolved solids.
Saturated zone A subsurface zone in which all the in terstices or voids are filled with water under a pressure greater than that of the atmosphere.
Sedimentary A rock resulting from the consolidation of loose sediment that has accumulated in layers either mechanically, by precipitation from solution, or from the remains or secretions of plants and animals. Also applied to processes leading to, or resulting from, the formation of such rocks. Sedimentary rocks constitute one of the three main classes into which all rocks are divided that is, igneous, metamorphic, and sedimentary.
Semiconfined aquifer An aquifer that is partially con fined by a layer (or layers) of low permeability through which recharge and discharge occur. See also aquifer, confined aquifer, and unconfined aquifer.
Sheet and rill erosion Erosion in which relatively thin layers of surface material are gradually removed more

242 National Water Summary 1983
or less evenly from an extensive area of gently sloping land by broad, continuous sheets of running water. See also sheet flow.
Sheet flow An overland flow or downslope movement of water taking the form of a relatively thin, continuous film flowing over relatively smooth soil or rock surfaces and not concentrated into channels.
Silviculture A branch of forestry dealing with the development and care of forests.
Sole-source aquifer As defined by the U.S. Environ mental Protection Agency, an aquifer that supplies 50 percent or more of the drinking water of an area.
Sorb To take up and hold either by absorption or ad sorption. See also absorption and adsorption.
Thermal loading The amount of waste heat discharged to a water body.
Transpiration The process by which water in liv ing organisms, primarily plants, passes into the atmosphere.
Turbidity The state, condition, or quality of opa
queness or reduced clarity of a fluid due to the presence of suspended matter.
Unconfined aquifer An aquifer whose upper surface is a water table free to fluctuate up or down under atmos pheric pressure. See also aquifer, confined aquifer, and semiconfined aquifer.
Upconing The process by which saline water underly ing freshwater in an aquifer rises upward into the fresh water zone as a result of pumping water from the fresh water zone.
Water table The water surface in an unconfined aquifer at atmospheric pressure. It is the water level in wells that penetrate the uppermost part of an uncon fined aquifer.
Water year A continuous 12-month period arbitrarily selected to present data relative to hydrologic or meteorologic phenomena during which a complete an nual hydrologic cycle occurs. The water year selected by the U.S. Geological Survey is the period October 1 through September 30.
Photograph by Dawn Reed, U.S. Geological Survey.
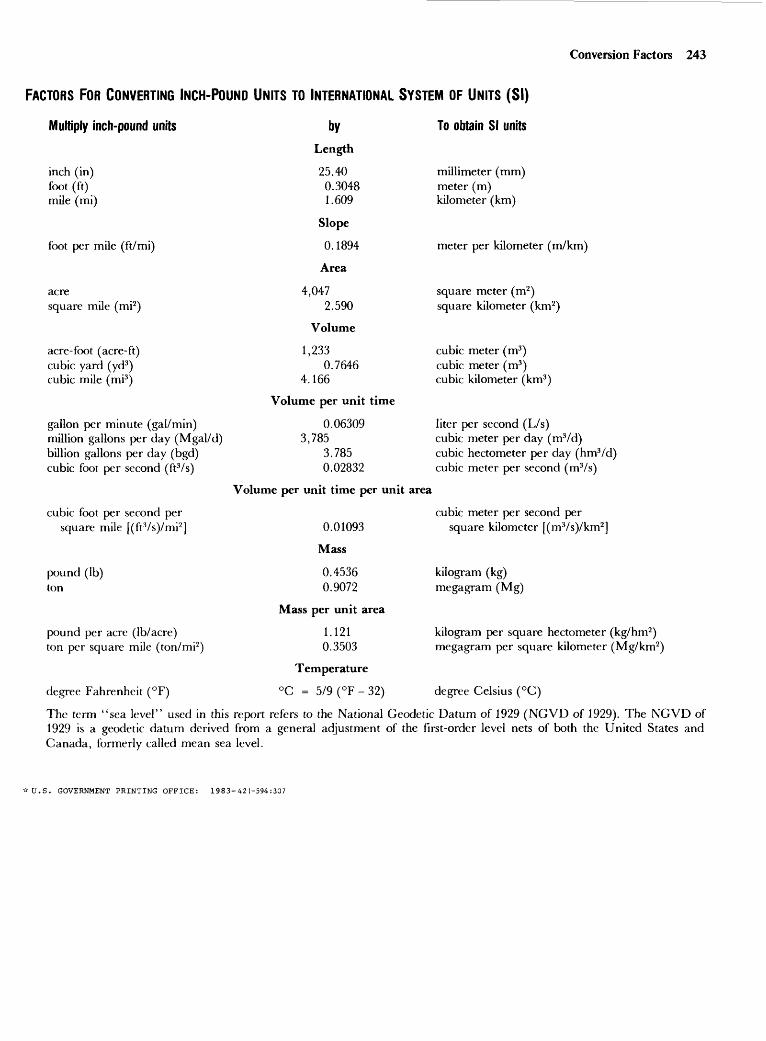
Conversion Factors 243
FACTORS FOR CONVERTING INCH-POUND UNITS TO INTERNATIONAL SYSTEM OF UNITS (SI)
Multiply inch-pound units
inch (in) foot (ft) mile (mi)
foot per mile (ft/mi)
acresquare mile (mi2 )
acre-foot (acre-ft) cubic yard (yd3 ) cubic mile (mi3)
gallon per minute (gal/min) million gallons per day (Mgal/d) billion gallons per day (bgd) cubic foot per second (ft3 /s)
cubic foot per second per square mile [(ftVs)/mi2 ]
pound (Ib) ton
pound per acre (Ib/acre) ton per square mile (ton/mi2 )
degree Fahrenheit (°F)
byLength
25.400.30481.609
Slope
0.1894
Area
4,0472.590
Volume
1,2330.7646
4.166
Volume per unit time
0.063093,785
3.7850.02832
Volume per unit time per unit area
0.01093
Mass
0.45360.9072
Mass per unit area
1.1210.3503
Temperature
°C = 5/9 (°F - 32)
To obtain SI units
millimeter (mm) meter (m) kilometer (km)
meter per kilometer (m/km)
square meter (m2 ) square kilometer (km2)
cubic meter (m3) cubic meter (m3) cubic kilometer (km3 )
liter per second (L/s) cubic meter per day (m3/d) cubic hectometer per day (hmVd) cubic meter per second (m3 /s)
cubic meter per second per square kilometer [(m3/s)/km2 ]
kilogram (kg) megagram (Mg)
kilogram per square hectometer (kg/hm2 ) megagram per square kilometer (Mg/km2 )
degree Celsius (°C)
The term "sea level" used in this report refers to the National Geodetic Datum of 1929 (NGVD of 1929). The NGVD of 1929 is a geodetic datum derived from a general adjustment of the first-order level nets of both the United States and Canada, formerly called mean sea level.
*U.S. GOVERNMENT PRINTING OFFICE: 1983-421-594:307