GIS Methodology for Characterizing Historical Conditions of the Willamette River Flood Plain, Oregon
19
Volume 8 Issue 3 June 2004 ISSN 1361-1682 Editors: John P Wilson, A Stewart Fotheringham, Gary J Hunter
-
Upload
independent -
Category
Documents
-
view
5 -
download
0
Transcript of GIS Methodology for Characterizing Historical Conditions of the Willamette River Flood Plain, Oregon

Guest Editorial Page
Communication about Space 291S Winter
Research Articles
Knowledge Discovery from Area-Class Resource Maps: Data Preprocessing for Noise Reduction 297F Qi
Integrated Framework for the Simulation of Biological Invasions in a Heterogeneous Landscape 309P Ming and J Albrecht
Selection of Streets from a Network Using Self-Organizing Maps 335B Jiang and L Harrie
A Hybrid Spatio-Temporal Data Model and Structure (HST-DMS) for Efficient Storage and Retrieval of Land Use Information 351R Sengupta and C Yan
GIS Methodology for Characterizing Historical Conditions of the Willamette River Flood Plain, Oregon 367D R Oetter, L R Ashkenas, S V Gregory and P J Minear
Book Reviews 385
Plates 393
This journal is available online.Contact your librarian or visitwww.blackwell-synergy.com
Vo
lum
e 8Issu
e3
Jun
e 20
04
V o l u m e 8 I s s u e 3 J u n e 2 0 0 4 I S S N 1 3 6 1 - 1 6 8 2
Editors:John P Wilson, A Stewart Fotheringham, Gary J Hunter
TGIS_v8_i3_OBC_OFC 4/26/04 9:23 PM Page 1
Transactions in GIS
, 2004, 8(3): 367–383
© Blackwell Publishing Ltd. 2004. 9600 Garsington Road, Oxford OX4 2DQ, UK and 350 Main Street, Malden, MA 02148, USA.
Research Article
GIS Methodology for Characterizing Historical Conditions of the Willamette River Flood Plain, Oregon
Doug R Oetter Linda R Ashkenas
Department of Forest Science Department of Fisheries and WildlifeOregon State University Oregon State University
Stanley V Gregory Paula J Minear
Department of Fisheries and Wildlife Department of Fisheries and WildlifeOregon State University Oregon State University
Keywords:
river flood plain; river channel mapping; historical mapping; Willamette Valley, Oregon
Abstract
Recent environmental developments have stimulated an interest in conservation andrestoration of the historical Willamette River flood plain, both to protect againstflooding and to provide wildlife habitat. In order to best utilize scarce resources,we characterized historical and modern river channel and flood-plain conditions toevaluate changes and help prioritize restoration sites. Using cartographic andphotographic data sources, we developed a Geographic Information System (GIS) tomap active channels, side channels, islands and tributaries for four separate dates,as well as riparian and flood-plain vegetation characteristics for pre-Europeansettlement and modern time periods. Coverages based on flood records and otherboundaries were used to partition the flood plain into spatial subsets for analysis.The GIS allowed comparisons between historical and present conditions for a varietyof environmental factors. Much of the pre-settlement channel complexity has beenremoved. Total channel length in 1995 was 26% less than in 1850, with almost 58%of the river’s side channels disconnected from the system. In addition, we founda 72% loss of flood-plain forest from 1850 to 1995, since it was converted toagricultural and urban land uses. Selected river and flood-plain variables weremade available for a spatial model to prioritize potential locations for flood-plainrestoration.
Address for correspondence:
Doug Oetter, Department of History and Geography, Georgia College& State University, Milledgeville, GA 31061-0490, USA. E-mail: [email protected]
368
D R Oetter, L R Ashkenas, S V Gregory and P J Minear
© Blackwell Publishing Ltd. 2004
1 Introduction
One of the signs of progressive environmental management is the ability to incorporatemodern techniques to solve problems born out of a long legacy of ecological change. A seriesof events surrounding the Willamette River in northwest Oregon has recently inspirednew directions in floodplain management which may provide opportunities to substan-tially improve environmental conditions in a variety of ways. Floodplain restoration hasbeen proposed through a joint effort among public and private entities to achieve manyenvironmental management goals (Willamette Riverkeeper 1996, Gardiner 1999). Theproposal is to reclaim riparian farmlands to allow replanting of native floodplain forestsand recovery of riparian wetlands. Among the many potential benefits of restoration areflood control and habitat improvement, concerns made more crucial following a majorflood event in 1996 as well as the continued decline of anadromous salmon runs on theWillamette River. Scientific research to support floodplain restoration in the Willamette Valleyhas now gained considerable momentum, concurrent with increasing public regard forpollution, recreation, scenic, and wildlife issues along the Willamette River (WRI 2001).
There are a variety of ecological, geomorphological, and hydrological connectionsbetween rivers and their flood plains (Petts et al. 1992, Malanson 1993, Large and Petts1996, Newson 1997). Most of the ecological qualities of a river are directly influencedby its surrounding landscape as well as the human activities that the landscape supports(Décamps et al. 1988, White 1995, Naiman et al. 1988, Gurnell 1997b, Ward et al.1999). In addition, a river has a direct influence on its surroundings, frequently alteringthe physical and biological conditions of its flood plain (Shankman 1993, Brookes1996). Current science supports the notion of a river as a complex dynamic physical andecological system, with a necessary level of natural integrity required to function effect-ively (Gregory et al. 1991, Graf 2001). There are significant economic and ecologicaladvantages to be gained from the restoration of large river flood plains (Bayley 1995),and the science of floodplain restoration is developing rapidly (Boon et al. 1992, NRC-CRAE 1992, Sedell et al. 1992, Schiemer et al. 1999).
The capacity of a Geographic Information System (GIS) to portray, analyze, andmodel spatio-temporal information makes it ideal for river flood-plain studies (Iversonand Risser 1987, Lam 1989, Allen 1994, Muller 1997). Many aspects of floodplainmanagement have been enhanced by the incorporation of a GIS, including riparianbuffer analysis and delineation (Narumalani et al. 1997, Moser et al. 2004), channelplanform change (Doward et al. 1994, Mossa and McLean 1997, Gurnell 1997a, Graf2000, Winterbottom and Gilvear 2000), and floodplain vegetation change (Johnson etal. 1995, Allen 1999, Dixon and Carter 1999, Gutowsky 2000). A GIS can integratespatial data from a variety of sources, and this feature enhances location models whichrank potential restoration sites based on numerous economical, ecological, and physicalvariables (Llewellyn et al. 1996, Russell et al. 1997, Iverson et al. 2001).
1.1 Study area
The Willamette River basin provides an ideal setting to develop the principles of floodplainrestoration (Figure 1). Running about 300 km from south of Eugene to its confluence withthe Columbia River north of Portland, the mainstem Willamette is the thirteenth largestriver in the United States with a mean annual flow of 900 m
3
/s (Willamette Riverkeeper1996, Gardiner 1999). It drains a 29,700 km
2
basin which is dominated by intensively
Willamette Flood Plain GIS
369
© Blackwell Publishing Ltd. 2004
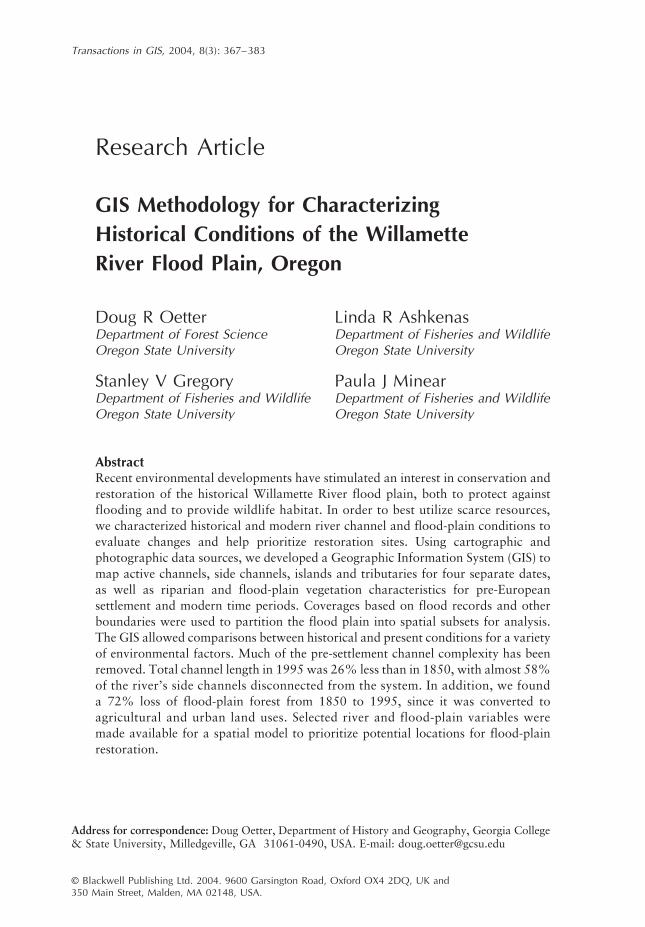
managed upland forests in the Cascade and Coast Range mountains and highly productiveagricultural fields throughout the valley floor. Only 6% of the basin area is occupiedby urban land cover, yet that land houses over 2.4 million people (67% of Oregon’spopulation). The Willamette valley is over 175 km long and about 40 km wide, andconsists of deep Missoula flood silts broken by volcanic remnants (Hulse et al. 2002).
The Willamette River drains fractured basalt lava flows in the Cascade mountainsand descends through heavily wooded Douglas-fir (
Pseudotsuga menziesii
) and westernhemlock (
Tsuga heterophylla
) forests to its valley floor, where it continues north to theColumbia River through thick riparian hardwood forests of alder (
Alnus
spp.), willow(
Salix
spp.), bigleaf maple (
Acer macrophyllum
), Oregon ash (
Fraxinus latifolia
), Oregonwhite oak (
Quercus garryana
), black cottonwood (
Populus trichocarpa
) and others(Towle 1982). Flowing across numerous gravel-lined channels in its upper stretchesfrom Eugene to Albany, the river cuts through sedimentary deposits in its middle stretchfrom Albany to Newberg, and then enters a highly constrained lower reach from Newberg
Figure 1 The Willamette River basin in northwest Oregon. The slices analysis coverage wascreated by combining the flood extents for four major floods (1861, 1943, 1964, and 1996) andthen constructing a floodplain axis line to define perpendicular segments at 1 km lengths

370
D R Oetter, L R Ashkenas, S V Gregory and P J Minear
© Blackwell Publishing Ltd. 2004
Pool over the Willamette Falls to Portland (Figure 1). Below Portland, it leaves theWillamette Valley and enters the Columbia River over 500 km from its source at WaldoLake (Sedell and Froggatt 1984, Dykaar and Wigington 2000).
The modern Willamette River has changed dramatically since the initial settlementof the valley by Europeans in the 1830s. Extensive floodplain hardwood forests wereremoved, both to fuel steamboats and to clear land for agriculture. The braided gravelchannels in the upper reaches of the valley were channelized and their river bankshardened by revetments and other structures. As a result, the river system is much lesscomplex than it was 150 years ago, with almost 50% of the historical channels removedfrom some portions of the river network (Sedell and Froggatt 1984, Benner and Sedell1997). Thirteen tributary dams now regulate the river. These impoundments reduce thefrequency and severity of major floods and block sediment flow, a process which allowsdowncutting of the river channel and further inhibits overflow events (Dykaar andWigington 2000). Riparian vegetation, which was once in a dynamic equilibrium withflooding, now appears to be stabilizing as a mature hardwood forest, with disturbancemade less frequent by a lack of overbank events (Gutowsky 2000). In addition, the riveris recovering from over a century of human pollution, especially from cities and pulpmills. In the 1930s the river’s water quality was so bad that anadromous salmoncould barely survive the swim through Portland harbor because of precipitously lowdissolved oxygen content (Willamette Riverkeeper 1996, Mullane 1997). Only throughaggressive efforts in the last 40 years has the water quality recovered to make recre-ational use of the river again feasible. Such efforts were rewarded by the designationof the Willamette in 1998 as one of the fourteen initial American Heritage Rivers(Gardiner 1999).
The combination of events surrounding the Willamette River’s recovery has ledmany scientists and politicians to call for a continued recovery plan which wouldinclude restoration of historical flood plain (Frenkel et al. 1991). In 1998, the Wil-lamette Restoration Initiative was established by State Executive Order 98-18 to developa “basinwide strategy to protect and restore fish and wildlife habitat, increase populationsof declining species, enhance water quality, and properly manage floodplain areas – allwithin the context of human habitation and continuing basin growth (WRI 2001: ii).”The restoration effort has been joined by the U.S. Army Corps of Engineers (ACOE),which has funded a floodplain restoration feasibility study (Gardiner 1999), as well asthe U.S. Fish and Wildlife Service, which has acquired riparian farmland for restorationof native forests and wetlands. One important task is to determine which floodplainlands are most suitable for restoration (NRC-CRAE 1992, Gregory 1999).
1.2 Objectives
In the face of limited funding and given an expansive flood plain, decision makersrequired a scientific method of prioritizing floodplain restoration efforts (Gregory1999). To address this need, we developed a GIS to characterize the historical floodplain and to help select potential areas for riparian restoration.
The goal of our research was to develop GIS methodologies for the temporal analy-sis of the flood plain, keeping in mind the requirements of a spatial model that wouldidentify potential areas for riparian restoration. The purpose of this paper is to presentthe GIS methodology for characterizing historical and present-day floodplain conditions.The complete results of the historical analysis and restoration modeling are quite extensive

Willamette Flood Plain GIS
371
© Blackwell Publishing Ltd. 2004
and are presented elsewhere in great detail (Hulse et al. 2002, Gregory et al. 2004).It is important to note that the data presented here may not exactly match those works,as summaries were prepared independently.
2 Methods
There were three basic steps to the methodology. First, we created polygon coveragesbased on the functional extent of the flood plain to define the study area and subregionsof interest. Then, we mapped the river channel extents at four separate dates. Finally,we mapped floodplain vegetation for two periods with reliable land cover data. Afterthe creation of these spatial data layers, the GIS was available for queries to producenumerical data for the generation of tables, graphs and GIS-based output maps, as wellas to drive a restoration siting model.
2.1 Generation of floodplain extent
Because of the linear nature of rivers, a useful technique for describing floodplainfeatures is to partition the flood plain into segments along the length of the river(Downward et al. 1994, Mossa and McLean 1997, Gurnell 1997a). Structuring the floodplain in this manner allows comparison of upstream and downstream characteristics,which can vary widely depending on channel slope, channel constrictions, and other geo-morphological considerations (Petts and Calow 1996). Furthermore, using the flood-plainlength instead of river length allows consistency over time, since river distances changeregularly. For this study, the flood plain was delineated based on the historical floodrecord, and then for analytical purposes this area was subdivided into longitudinalsections, or ‘slices,’ along the length of the flood plain (based on suggestions fromDr. Hervé Piégay , Université Lyon, 18, rue Chevreul, 69007 Lyon, France).
The floodplain extent was determined using historical flood maps created by theU.S. Army Corps of Engineers (ACOE) for major floods in 1861 (the largest on record),1943, and 1964. These paper maps were based on eyewitness reports, photographs,high water marks, and other information. The maps were manually digitized into vectorpolygon coverages denoting the spatial extent of floodwaters. For a fourth flood inFebruary 1996, the ACOE created a detailed coverage based on aerial photographyacquired during the flood. A combined flood extent layer was created from the spatialunion of the four floods, with most internal ‘islands’ (areas of higher ground that werenot underwater but were completely surrounded by floodwater) removed to create anunbroken boundary (Figure 1).
Following the delineation of the maximum lateral floodplain extent, we created acoverage that subdivided the entire flood plain into 227 unequal sections defined bynormal lines perpendicular to the floodplain axis intersected at 1 km transect points(Figure 1). The floodplain axis was drawn to maximize separation of the flood plaininto longitudinal segments, which could then be used to divide the flood plain intosignificant reaches. Where the axis changed directions, irregular wedge-shaped sliceswere formed. These transitional slices, where the floodplain axis changes direction,created interpretation problems due to their irregular shape, and so they were labeledas ‘corners’ for identification during analysis. The coverage required extensive handediting to label polygon attributes and perform fine-scale adjustments.

372
D R Oetter, L R Ashkenas, S V Gregory and P J Minear
© Blackwell Publishing Ltd. 2004
In addition, two other analysis containers were created. The first was the 100-yearflood plain as defined by Federal Emergency Management Agency (FEMA) NationalFlood Insurance Program maps (http://www.fema.gov/mit/tsd/). Digital forms of thesemaps were appended, edgematched, and then reselected for 100-year flood plain. Thelast container was the boundary of the Willamette River Greenway (WRG), as drawnon paper maps (ODOT 1976). The WRG is a land use designation created by statelegislation to restrict non-essential land development within immediate proximity of theriver. To translate the greenway boundary into a digital coverage, the line work wasscreen digitized over a collection of 1995-era digital orthophotographs.
2.2 Channel mapping
The next phase of the methodology was mapping the historical extent of the river channelfor four different time periods using separate data sources and approaches (Figure 2).
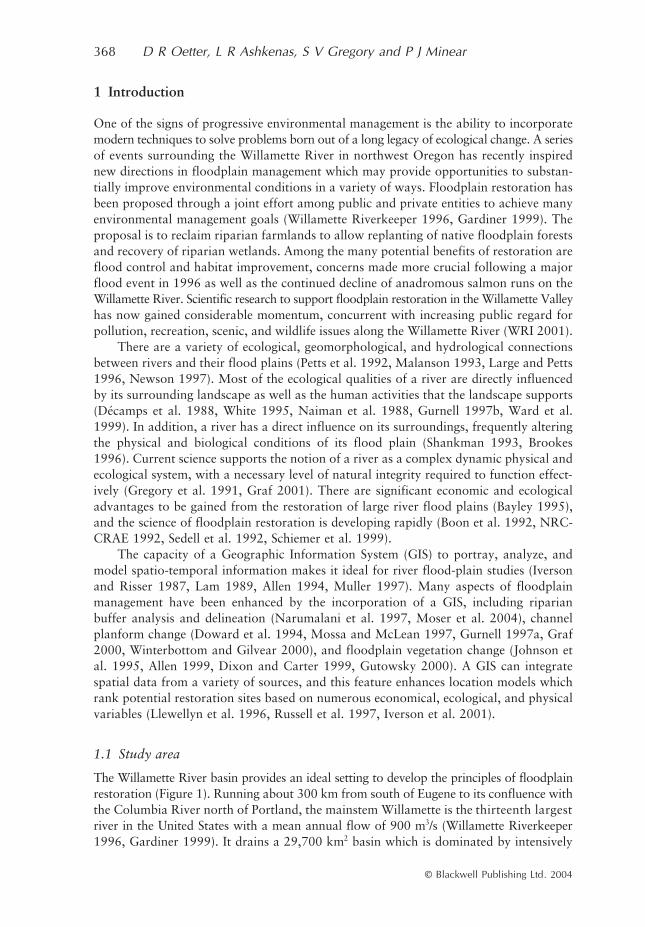
Figure 2 River channel maps for four separate years were constructed from General LandsOffice survey records (1850), U.S. Army Corps of Engineers river maps (1895 and 1932) anddigital orthophotography (1995). In each case, polygons were digitized from the source datato represent the river’s main channel, side channels, alcoves, and islands
Willamette Flood Plain GIS
373
© Blackwell Publishing Ltd. 2004
For each period, we outlined the active channel of the river and labeled polygons formain channel, secondary (side) channel, tributary, alcove (remnant slough that connectsto the main channel), and island.
The initial channel mapping effort was based on detailed interpretation of GeneralLand Office (GLO) survey records (Schulte and Mladenoff 2001) by the Oregon NaturalHeritage Program (Christy and Alverson 2004). While laying out the township and rangeboundaries for the Willamette Valley, GLO surveyors pinpointed the river channelsand main tributaries that crossed boundaries and mapped their general positionswithin the section. In most cases, their plat maps included line drawings indicating thelocation of both banks for rivers and single lines for streams. Technicians interpretedthose maps and survey reports to create detailed vector coverages using a digital versionof the township and range grid as a reference. While it took forty years (1850–1890) tosurvey the entire valley (Christy and Alverson 2004), the townships near the river werefinished in the first ten years, so the initial date (1850) was assigned to the channel mapderived from this source.
The ACOE conducted thorough surveys of the Willamette River in 1895 and 1932,and created a series of navigation-grade maps for each date (ACOE 1895, 1932). The 1895series consisted of fifteen maps at 1:12000 scale. In 1932 the ACOE used a scale of 1:5000,which took 52 maps to cover the river from Eugene to Portland. Paper copies of these mapswere scanned and imported into GIS software as raster files. The images were georectifiedto a common geographic reference system using the township and range registrationmarks drawn on the maps and some semi-permanent features (rock formations, bridges,ferry crossings, etc.). The map elements were then converted to digital coverages usingan automated pattern recognition tool (ESRI ArcScan) and a significant amount ofscreen editing and attributing. From these two series of maps, we obtained coverages forriver active channel (or high flow), river low flow channel, river maximum depth, riverstructures (dams, spillways, etc.), riverbank roads and railroads, and riverbank vegetation.
To map the 1995 river channel, we created mosaics from 164 separate panchromaticdigital orthophotographs at a pixel resolution of 0.67 m. Channel features and otherwater bodies were screen digitized and attributed using visual reference. Where the highwater line was obscured by clouds, shadows or other features, expert judgment was usedto continue the digitizing, often with ancillary data or field reference.
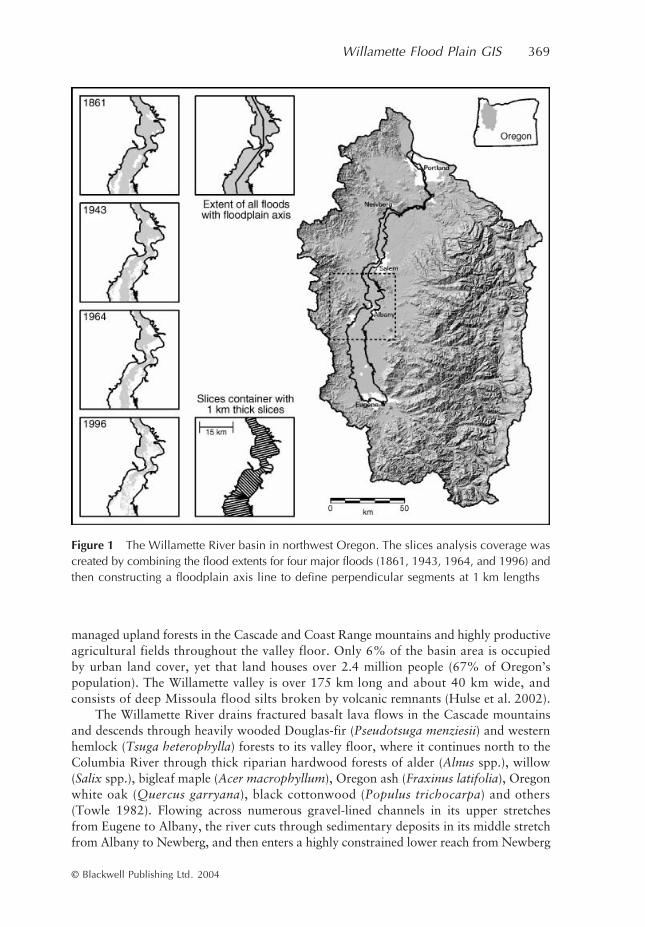
For each of the four dates, a river thalweg line coverage was screen digitized toidentify the main channel and provide a reference for river length. For 1850, the thalwegwas located at the channel centerline. The ACOE river survey maps from 1895 and1932 included depth soundings, which we used to delineate the main channel. For 1995,we used visual clues to delineate the main channel. The thalweg coverage was coded toindicate channel complexity by labeling each line segment as either single channel, mul-tiple channel, or tributary junction (minimum length for coding was 500 m) (Figure 3).In addition, the thalweg was similarly coded to indicate the presence of revetments orwing dams on one or both banks as a measure of structural complexity.
2.3 Flood-plain vegetation mapping
Vegetation cover for the flood plain was characterized for two dates, 1850 and 1995.Ideally, this would have been done for 1895 and 1932 as well, but the ACOE river surveymaps only included scant descriptions of streambank vegetation, and complete land coverdata for the entire flood plain were not available.

374
D R Oetter, L R Ashkenas, S V Gregory and P J Minear
© Blackwell Publishing Ltd. 2004
The 1850 land cover characterization was generated by the same process as the1850 channels, using the GLO plat maps and survey notes (Christy and Alverson 2004).The interpreters mapped the Willamette valley for 55 different land cover classes, basedon the detailed descriptions of surveyors, as well as modern topographic and soils data.Their line work was developed into a polygon coverage that was rasterized to 25 m pixels.
The 1995-era data came from a land cover/land use map developed for a regionalproject (Hulse et al. 2002). The primary source for the map was a multi-temporalLandsat Thematic Mapper (TM) data set from 1992, interpreted into 40 different landcover classes at 25 m pixel resolution (Oetter et al. 2001). This base map was thenamended and enhanced by the addition of geospatial information and GIS coverages foragricultural fields, census data, transportation routes, land use zoning, and water bodiesto produce a 58-class land use/land cover map (Hulse et al. 2002).
To allow effective comparisons between the two land cover data sources, each 1850land cover code was cross-referenced to a modern code (Hulse et al. 2002). This procedurerequired several assumptions to reconcile detailed nineteenth-century ground-level notes
Figure 3 For each river channel map, a thalweg line coverage was drawn along the center-line or deepest channel. The channel and forest bank complexity attributes were determinedfor the thalweg line using visual reference from the active channel coverage and vegetationmaps (for 1850 and 1995). Each river length was coded to indicate the complexity alongthat segment
Willamette Flood Plain GIS
375
© Blackwell Publishing Ltd. 2004
with the broad land cover classes derived from modern remote sensing imagery. Forexample, community-level subclasses of prairie and savanna were collapsed into onevery broad class named ‘natural shrub and grasslands.’ Different woodland classes werecross-referenced to either ‘open forest’ or ‘semi-open forest.’ Further details can befound in Hulse et al. (2002).
As an index for riparian management, we mapped streambank vegetation withinthe flood plain. For both 1850 and 1995, the river channel coverages were bufferedaway from the water (inward buffer for islands) to identify pixels immediately adjacentto the water. A similar procedure was used to capture pixels within a ‘riparian zone ofinfluence’ (Gregory et al. 1991), defined as the area within 30 and 120 m of the activechannel edge. To tally the riparian pixels, raster masks based on the channel vectorcoverages were used to query vegetation cover images.
For each of the four dates, streambank vegetation descriptions were used to gener-ate a forest bank complexity index. The river thalweg line coverage was attributed toindicate the presence of riparian forest on none, one, or both banks. This allowed adirect comparison for riparian forest cover for the four dates, including 1895 and 1932,which lacked areal flood-plain data (Figure 3).
3 Results
The GIS approach to mapping historical and current floodplain conditions in theWillamette River flood plain produced a vast quantity of information; each of the 227 riverslices was queried across the four dates for channel type and area, streambank vegetation,channel complexity, structural complexity, and forest bank complexity. A brief synopsisof the results is presented here to demonstrate the methods. A more in-depth ecologicalexplanation of the findings can be found in Hulse et al. (2002) and Gregory et al. (2004).
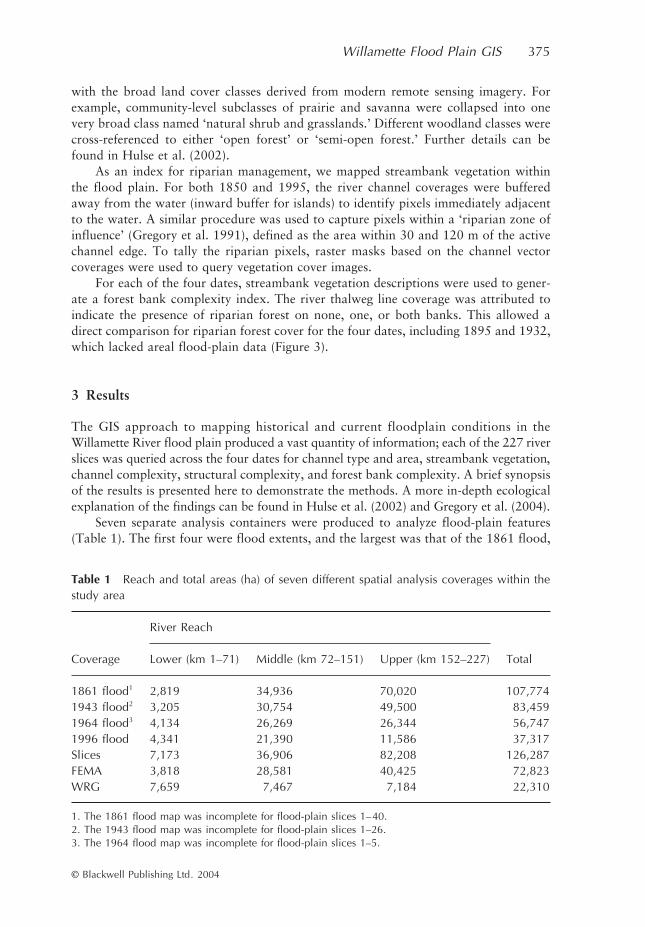
Seven separate analysis containers were produced to analyze flood-plain features(Table 1). The first four were flood extents, and the largest was that of the 1861 flood,
Table 1 Reach and total areas (ha) of seven different spatial analysis coverages within thestudy area
River Reach
Coverage Lower (km 1–71) Middle (km 72–151) Upper (km 152–227) Total
1861 flood1 2,819 34,936 70,020 107,7741943 flood2 3,205 30,754 49,500 83,4591964 flood3 4,134 26,269 26,344 56,7471996 flood 4,341 21,390 11,586 37,317Slices 7,173 36,906 82,208 126,287FEMA 3,818 28,581 40,425 72,823WRG 7,659 7,467 7,184 22,310
1. The 1861 flood map was incomplete for flood-plain slices 1–40.2. The 1943 flood map was incomplete for flood-plain slices 1–26.3. The 1964 flood map was incomplete for flood-plain slices 1–5.
376
D R Oetter, L R Ashkenas, S V Gregory and P J Minear
© Blackwell Publishing Ltd. 2004
for at least two reasons. By many accounts, the 1861 flood was the greatest Willametteflood in post-settlement history (Hulse et al. 2002). In addition, the 1861 flood extentcoverage was derived from a map based largely on extrapolation of historical informa-tion, so some smoothing likely occurred. The smallest flood extent was the 1996 flood,which resulted from a variety of factors, including the effectiveness of flood controlprojects, the improved precision of modern photo-based mapping techniques, and thefact that the 1996 flood was simply not as large as many earlier floods.
For each of theflood extent maps, the majority of inundated land was found in the upper reach ofthe river, between Eugene and Albany, where the flood plain is broad and flat and thereare few channel constrictions. In the lower reach, from Newberg to below Portland,where the river is downcutting through bedrock, the flood plain is very narrow withconcomitant small flood extents.
A union of the four flood extent maps was used to create a fifth coverage, namedslices, which segmented the entire flood-plain extent into 227 sections. Twenty-five(fewer than 10%) of the slices were located at points where the floodplain axis changeddirection. These irregular slices represent only 6.5% of the coverage area. The slicescoverage was only 17% larger than the 1861 flood extent, which indicates that muchof the floodplain area defined for this study was derived from that flood. The slicescoverage is larger because some dryland internal polygons from each flood coveragewere included in the maximum flood extent, and the full extent was buffered outwardfor analysis reasons. The mean slice area is 556 ha; if each slice was 1 km long, thiswould suggest a mean slice (and floodplain) width of 5.6 km. The sixth container wasthe FEMA 100-year floodplain coverage, based on post-dam estimates. The FEMAcoverage depicts lands restricted by special zoning ordinances within the 100-year floodplain; these areas may be more promising for conservation or restoration. The finalanalysis container was the 1976-era Willamette River Greenway boundary. As a special-use zoning boundary, this coverage contained the least area, and was used for analysisspecific to that designation.
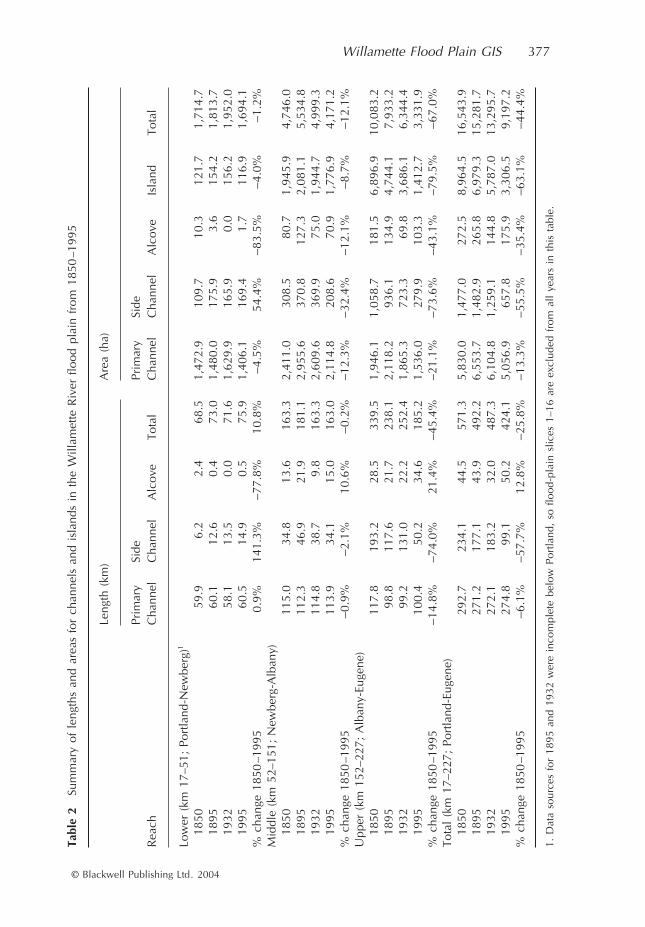
For each of the four channel mapping dates, results for diversity of channel typesand areal coverage of each channel type were tabulated by floodplain slice (Table 2). Thegreatest number and extent of channels was found in the upper reach in 1850. Becauseof channelization and flood control, the number of channels in this reach droppeddramatically by 1995. In the lower reach, there was less channel reduction, partlybecause the flood plain was already geologically confined.
The simplification of the Willamette River over time was further evidenced by thechannel and forest bank complexity analysis (Table 3). From 1850 to 1990, multiplechannel lengths decreased by almost 40%, while single channels increased. Again,the channel change in the upper reach was the most dramatic. The length of river withforests on both banks dropped as well, by over 75% along the whole river. Over 360separate channel structures, covering over 50% of the river’s length, were built from1850 to 1995 (Hulse et al. 2002). These installations are a major reason for the declinein river channel and riparian forest extent.
The floodplain vegetation analysis was performed for 1850 and 1995; simplifiedresults are shown in Table 4. Overall, the trend has been towards replacement of thenative floodplain vegetation, especially riparian hardwood forests and prairies, withagriculture and urban land cover types. A similar trend was observed with streambankvegetation, indicating that forest removal also occurred along the riverbanks. The riparianforest complexity results demonstrate that much of the riparian forest was removed by
Willamette Flood Plain GIS
377
© Blackwell Publishing Ltd. 2004
Tabl
e 2
Sum
mar
y of
len
gths
and
are
as f
or c
hann
els
and
isla
nds
in t
he W
illam
ette
Riv
er f
lood
pla
in f
rom
185
0–1
995
Leng
th (
km)
Are
a (h
a)
Rea
chPr
imar
y C
hann
elSi
de
Cha
nnel
Alc
ove
Tota
lPr
imar
y C
hann
elSi
de
Cha
nnel
Alc
ove
Isla
ndTo
tal
Low
er (
km 1
7–51
; Po
rtla
nd-N
ewbe
rg)
1
1850
59.
9
6.2
2.
4 6
8.5
1,47
2.9
109
.7 1
0.3
121
.71,
714.
718
95 6
0.1
12.
6
0.4
73.
01,
480.
0 1
75.9
3.6
154
.21,
813.
719
32 5
8.1
13.
5
0.0
71.
61,
629.
9 1
65.9
0.0
156
.21,
952.
019
95 6
0.5
14.
9
0.5
75.
91,
406.
1 1
69.4
1.7
116
.91,
694.
1%
cha
nge
1850
–199
50.
9%14
1.3%
−
77.8
%10
.8%
−
4.5%
54.4
%
−
83.5
%
−
4.0%
−
1.2%
Mid
dle
(km
52–
151;
New
berg
-Alb
any)
1850
115
.0 3
4.8
13.
6 1
63.3
2,41
1.0
308
.5 8
0.7
1,94
5.9
4,74
6.0
1895
112
.3 4
6.9
21.
9 1
81.1
2,95
5.6
370
.8 1
27.3
2,08
1.1
5,53
4.8
1932
114
.8 3
8.7
9.
8 1
63.3
2,60
9.6
369
.9 7
5.0
1,94
4.7
4,99
9.3
1995
113
.9 3
4.1
15.
0 1
63.0
2,11
4.8
208
.6
70.9
1,77
6.9
4,17
1.2
% c
hang
e 18
50–1
995
−
0.9%
−
2.1%
10.6
%
−
0.2%
−
12.3
%
−
32.4
%
−
12.1
%
−
8.7%
−
12.1
%U
pper
(km
152
–227
; A
lban
y-Eu
gene
)18
50 1
17.8
193
.2 2
8.5
339
.51,
946.
11,
058.
7 1
81.5
6,89
6.9
10,0
83.2
1895
98.
8 1
17.6
21.
7 2
38.1
2,11
8.2
936
.1 1
34.9
4,74
4.1
7,93
3.2
1932
99.
2 1
31.0
22.
2 2
52.4
1,86
5.3
723
.3
69.8
3,68
6.1
6,34
4.4
1995
100
.4 5
0.2
34.
6 1
85.2
1,53
6.0
279
.9 1
03.3
1,41
2.7
3,33
1.9
% c
hang
e 18
50–1
995
−
14.8
%
−
74.0
%21
.4%
−
45.4
%
−
21.1
%
−
73.6
%
−
43.1
%
−
79.5
%
−
67.0
%To
tal
(km
17–
227;
Por
tland
-Eug
ene)
1850
292
.7 2
34.1
44.
5 5
71.3
5,83
0.0
1,47
7.0
272
.58,
964.
516
,543
.918
95 2
71.2
177
.1 4
3.9
492
.26,
553.
71,
482.
9 2
65.8
6,97
9.3
15,2
81.7
1932
272
.1 1
83.2
32.
0 4
87.3
6,10
4.8
1,25
9.1
144
.85,
787.
013
,295
.719
95 2
74.8
99.
1 5
0.2
424
.15,
056.
9 6
57.8
175
.93,
306.
59,
197.
2%
cha
nge
1850
–199
5
−
6.1%
−
57.7
%12
.8%
−
25.8
%
−
13.3
%
−
55.5
%
−
35.4
%
−
63.1
%
−
44.4
%
1. D
ata
sour
ces
for
1895
and
193
2 w
ere
inco
mpl
ete
belo
w P
ortla
nd,
so f
lood
-pla
in s
lices
1–1
6 ar
e ex
clud
ed f
rom
all
year
s in
thi
s ta
ble.

378
D R Oetter, L R Ashkenas, S V Gregory and P J Minear
© Blackwell Publishing Ltd. 2004
Tabl
e 3
Sum
mar
y of
cha
nges
in
chan
nel
char
acte
rist
ics
for
the
Will
amet
te R
iver
fro
m 1
850
–199
5
Cha
nnel
com
plex
ity
1
Fore
st b
ank
com
plex
ity
2
Stru
ctur
al c
ompl
exity
3
Sing
le
chan
nel
Mul
tiple
ch
anne
lTr
ibut
ary
junc
tion
Unf
ores
ted
rive
rban
k
One
ba
nk
fore
sted
Bot
h ba
nks
fore
sted
Tota
l th
alw
eg
leng
th (
km)
Num
ber o
f st
ruct
ures
Leng
th o
f st
ruct
ures
(k
m)
Low
er r
each
(km
1–5
1;
Col
umbi
a R
. to
New
berg
)18
5063
,521
7,66
2 3
,876
2,1
5032
,027
40,8
83 7
5.1
00.
019
9561
,501
10,0
98 3
,285
38,
893
29,1
396,
852
74.
913
862
.4Pe
rcen
t ch
ange
−
3.2%
31.
8%
−
15.3
%17
09.3
%
−
9.0%
−
83.2
%
−
0.2%
− −
Mid
dle
reac
h (k
m 5
2–15
1;
New
berg
to
Alb
any)
1850
88,3
2124
,022
2,5
62 1
,604
38,1
8875
,113
114
.90
0.0
1995
79,5
1929
,115
3,4
58 2
1,98
359
,700
30,4
09 1
12.1
117
35.3
Perc
ent
chan
ge
−
10.0
% 2
1.2%
35.0
%12
70.6
% 5
6.3%
−
59.5
%
−
2.4%
− −
Upp
er r
each
(km
152
–227
; A
lban
y to
Eug
ene)
1850
37,9
5482
,758
3,8
15
025
,679
98,8
48 1
24.5
00.
019
9572
,194
30,3
55 3
,003
44,
653
47,7
7113
,127
105
.611
357
.3Pe
rcen
t ch
ange
90.
2%
−63
.3%
−21.
3%−
86.
0% −
86.7
%−1
5.2%
− −
Tota
l (k
m 1
–227
; C
olum
bia
R.
to E
ugen
e)18
5018
9,79
611
4,44
2 1
0,25
2
3,75
495
,894
214,
844
314
.50
0.0
1995
213,
214
69,5
69 9
,745
105
,530
136,
610
50,3
89 2
92.5
368
155.
0Pe
rcen
t ch
ange
12.
3% −
39.2
%−4
.9%
2711
.4%
42.
5% −
76.5
%−7
.0%
− −
1. C
hann
el c
ompl
exity
is
the
leng
th o
f th
alw
eg i
n m
eter
s as
soci
ated
with
eith
er s
ingl
e ch
anne
ls,
mul
tiple
cha
nnel
s, o
r a
trib
utar
y ju
nctio
n.2.
For
est
bank
com
plex
ity i
s th
e le
ngth
of
thal
weg
in
met
ers
asso
ciat
ed w
ith e
ither
unf
ores
ted
bank
, fo
rest
on
one
bank
, or
for
est
on b
oth
bank
s.3.
Str
uctu
ral
com
plex
ity i
s th
e le
ngth
of
thal
weg
in
met
ers
with
rev
etm
ents
or
othe
r st
ruct
ures
alo
ng e
ither
ban
k.
Willamette Flood Plain GIS 379
© Blackwell Publishing Ltd. 2004
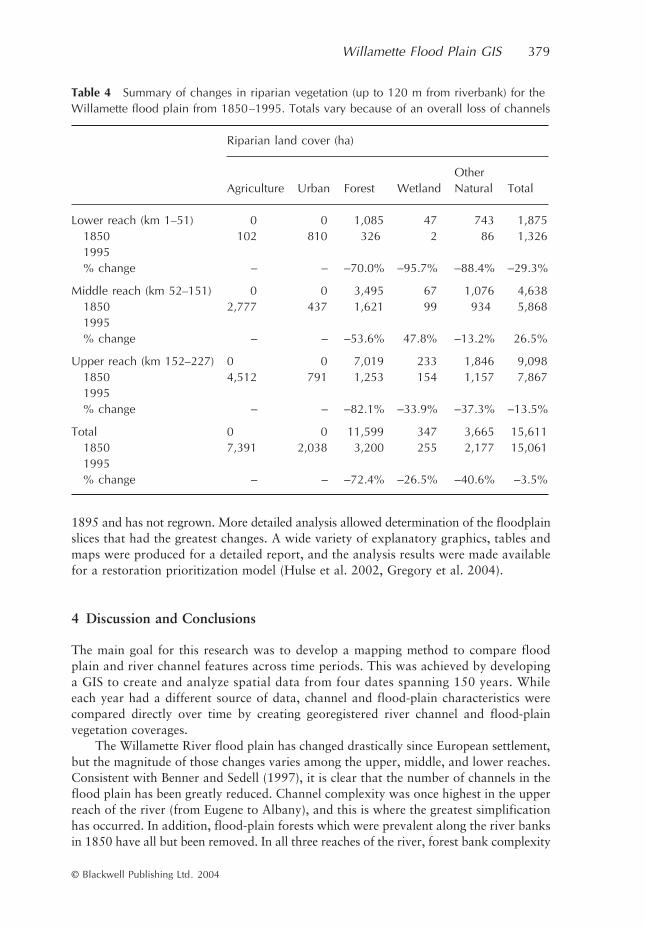
1895 and has not regrown. More detailed analysis allowed determination of the floodplainslices that had the greatest changes. A wide variety of explanatory graphics, tables andmaps were produced for a detailed report, and the analysis results were made availablefor a restoration prioritization model (Hulse et al. 2002, Gregory et al. 2004).
4 Discussion and Conclusions
The main goal for this research was to develop a mapping method to compare floodplain and river channel features across time periods. This was achieved by developinga GIS to create and analyze spatial data from four dates spanning 150 years. Whileeach year had a different source of data, channel and flood-plain characteristics werecompared directly over time by creating georegistered river channel and flood-plainvegetation coverages.
The Willamette River flood plain has changed drastically since European settlement,but the magnitude of those changes varies among the upper, middle, and lower reaches.Consistent with Benner and Sedell (1997), it is clear that the number of channels in theflood plain has been greatly reduced. Channel complexity was once highest in the upperreach of the river (from Eugene to Albany), and this is where the greatest simplificationhas occurred. In addition, flood-plain forests which were prevalent along the river banksin 1850 have all but been removed. In all three reaches of the river, forest bank complexity
Table 4 Summary of changes in riparian vegetation (up to 120 m from riverbank) for the Willamette flood plain from 1850–1995. Totals vary because of an overall loss of channels
Riparian land cover (ha)
Agriculture Urban Forest WetlandOther Natural Total
Lower reach (km 1–51) 0 0 1,085 47 743 1,8751850 102 810 326 2 86 1,3261995% change − − −70.0% −95.7% −88.4% −29.3%
Middle reach (km 52–151) 0 0 3,495 67 1,076 4,6381850 2,777 437 1,621 99 934 5,8681995% change − − −53.6% 47.8% −13.2% 26.5%
Upper reach (km 152–227) 0 0 7,019 233 1,846 9,0981850 4,512 791 1,253 154 1,157 7,8671995% change − − −82.1% −33.9% −37.3% −13.5%
Total 0 0 11,599 347 3,665 15,6111850 7,391 2,038 3,200 255 2,177 15,0611995% change − − −72.4% −26.5% −40.6% −3.5%
380 D R Oetter, L R Ashkenas, S V Gregory and P J Minear
© Blackwell Publishing Ltd. 2004
has been reduced and native flood plain has been replaced with agricultural fields andother human developments. The lower reach, from Newberg to below Portland, saw theleast channel change and flood-plain alteration, but this is primarily because this partof the river is topographically constricted and was historically less complex. Much ofthe channel change and riparian vegetation removal occurred over 100 years ago, duringan aggressive period of river modification (Hulse et al. 2002).
The GIS was used to build a model to quantify conservation and restoration potentialfor each flood-plain slice, based on the calculation of socioeconomic and biophysicalindices (Hulse and Gregory 2001, Hulse et al. 2002). The relatively simple modelformulation was based on the assumption that the best sites for restoration would be inflood-plain slices that were not overly developed (low socioeconomic value) and had alsoseen high levels of historical flood-plain complexity (high biophysical value). The modelis flexible in that the threshold for suitable slices can be adjusted to suit new criteria. Infact, all 227 slices could be ranked by either index or a combination of the two. Whileit is highly unlikely that riparian forests and flood-plain channels will be returned totheir historical levels of abundance, opportunities exist along the entire length of themainstem river for either recovery or preservation of existing channel complexity.
This research project was ideally suited to a GIS approach. In fact, it is difficult toimagine how the tasks could have been accomplished without using a GIS. Forgoing theexpense of software and training (Harris et al. 1997), the GIS methodology allowed usto characterize fine-scaled landscape details across a large area over four different timeperiods. There were errors associated with geographic registration, however, thoseerrors were small in relation to spatial misregistration in the original data. As well, therewere certainly errors associated with converting the GLO surveys and ACOE river mapsand digital orthophotographs into digital line work. While the complete accuracy andreliability of our data remain unknown, our sources were the best available and areacceptable for regional analysis.
Perhaps the greatest advantage of using a GIS for this research was the flexibilityof having the data in digital form (Downward et al. 1994, Russell et al. 1997). Usingidentity and zonal functions in the GIS software, digital summary estimates of lengthand area were easily manipulated into spreadsheet software to produce graphs andtables, and to generate the restoration indices. Mapping flood-plain change with a GISenabled the employment of spatially explicit algorithms for more detailed analyses(Muller 1997). An added advantage was the ability to switch the focus of the studyrapidly by replacing the slices coverage with one of the other container coverages. In all,there were seven different analysis containers for summarizing flood-plain characteristics.In addition, the digital data are preserved indefinitely and can be re-analyzed repeatedlyby different researchers with different analysis goals.
The major shortcoming of the GIS approach has to do with the digitization andregistration of the source data, both of which required extensive manual effort. Althoughsome steps were automated, the conversion of spatial information from paper maps todigital form entailed careful manipulation and detailed attention, both of which requiredskilled technician time and expense.
In summary, the research goals were achieved by the application of GIS techniquesto data creation and analysis for a complex historical flood-plain environment. Withoutthe GIS, it would have been very difficult to integrate the wide variety of source dataavailable or to model and query a spatial extent as large as the Willamette River floodplain. The GIS approach enabled the creation of a digital model to evaluate restoration

Willamette Flood Plain GIS 381
© Blackwell Publishing Ltd. 2004
potential, which will allow decision makers to focus their efforts on the most promisingsites. While the GIS was not required to characterize historical changes in the WillametteRiver flood plain, it was definitely the most efficient method available.
Acknowledgments
This work was partially funded by the U.S. Environmental Protection Agency (EPA) andOregon State University through the Pacific Northwest Research Consortium as part ofcooperative agreement #CR824682. Although the research described in this paper hasbeen funded (wholly or in part) by the EPA, it has not been subjected to the Agency’sreview and therefore does not necessarily reflect the views of the Agency, and no officialendorsement should be inferred. We are very grateful for the energetic work and scient-ific support of Bob Peak and Greg Bertrand at the ACOE district office in Portland,Oregon, and Willa Nehlsen at the U.S. Fish and Wildlife Service. Without their incredibleefforts to scan and digitize the historical flood and river maps, this project never wouldhave gotten off the ground. Likewise, the dedication of John Christy, Ed Alverson, andSue Kolar of the Oregon Natural Heritage Program and The Nature Conservancy werecritical to the completion of this research, and we are greatly indebted.
References
Allen C D 1994 Ecological perspective: Linking ecology, GIS, and remote sensing to ecosystemmanagement. In Sample V A (ed) Remote Sensing and GIS in Ecosystem Management.Covelo, CA, Island Press: 111–139
Allen T H 1999 Areal distribution, change, and restoration potential of wetlands within the lowerColumbia River riparian zone, 1948–1991. Unpublished Ph.D. Dissertation, Department ofGeography, Oregon State University
Bayley P B 1995 Understanding large river-floodplain ecosystems. BioScience 45: 153–8Benner P A and Sedell J R 1997 Upper Willamette River landscape: A historic perspective. In
Laenen A and Dunnette D A (eds) River Quality: Dynamics and Restoration. Boca Raton,FL, Lewis Publishers: 23–47
Boon P J, Calow P, and Petts G E 1992 River Conservation and Management. Chichester, JohnWiley and Sons
Brookes A 1996 River channel change. In Petts G E and Calow P (eds) River Flows and ChannelForms. Oxford, Blackwell Science: 221–42
Christy J A, and Alverson E A 2004 Historic vegetation of Willamette Valley, Oregon, in 1850.Manuscript in preparation
Décamps H, Fortune M, Gazelle F, and Pautou G 1988 Historical influence of man on the ripariandynamics of a fluvial landscape. Landscape Ecology 1: 163–73
Dixon M D, and Johnson W C 1999 Riparian vegetation along the middle Snake River, Idaho:Zonation, geographical trends, and historical changes. Great Basin Naturalist 59: 18–34
Downward S R, Gurnell A M , and Brookes A 1994 A methodology for quantifying river channelplanform change using GIS. In Kovar K (ed) Variability in Stream Erosion and SedimentTransport. Wallingford, International Association for the Hydrological Sciences: 449–56
Dykaar B B and Wigington, P J 2000 Floodplain formation and cottonwood colonization patternson the Willamette River, Oregon, USA. Environmental Management 25: 87–104
Frenkel R E, Gregory S V, and Sedell J R 1991 The Willamette River: An Ecosystem in Need ofa New Vision. Unpublished monograph
Gardiner J L 1999 Willamette River Floodplain Restoration Study: Section 905(b) ReconnaissanceReport. Portland, OR, Philip Williams & Associates (Report prepared for U.S. Army Corpsof Engineers)
382 D R Oetter, L R Ashkenas, S V Gregory and P J Minear
© Blackwell Publishing Ltd. 2004
Graf W L 2000 Locational probability for a dammed, urbanizing stream: Salt River, Arizona,USA. Environmental Management 25: 321–35
Graf W L 2001 Damage control: Restoring the physical integrity of America’s rivers. Annals ofthe Association of American Geographers 91: 1–27
Gregory S V 1999 Ecological, Demographic, and Economic Evaluation of Opportunities andConstraints for Riparian Restoration. Unpublished monograph
Gregory S V, Hulse D W, Landers D H, and Whitelaw E 1998 Integration of biophysical andsocioeconomic patterns in riparian restoration of large rivers. In Wheater H and Kirby C (eds)Hydrology in a Changing Environment: Volume 1, Ecological and Hydrological Interactions.Chichester, John Wiley and Sons: 231–47
Gregory S V, Landers D, Ashkenas L, Wildman R, Minear P, Oetter D, Bayley P, Andrus C,Pearson M, and Fernald S 2004 Historical and future trajectories of floodplains, forests, andoff-channel habitats of the mainstem Willamette River. Ecological Applications 14: in press
Gregory S V, Swanson F J, McKee W A, Cummins K W 1991 An ecosystem perspective of riparianzones. BioScience 41: 540–51
Gurnell A M 1997a Channel change on the River Dee meanders, 1946–1992, from the analysisof air photographs. Regulated Rivers: Research and Management 13: 13–26
Gurnell A M 1997b The hydrological and geomorphological significance of forested floodplains.Global Ecology and Biogeography Letters 6: 219–29
Gutowsky S L 2000 Riparian cover changes associated with flow regulation and bank stabilizationalong the Upper Willamette River in Oregon between 1939 and 1996. Unpublished Master’sThesis, Department of Geography, Oregon State University
Harris R R, Hopkinson P, McCaffrey S, and Huntsinger L 1997 Comparison of a GeographicalInformation System versus manual techniques for land cover analysis in a riparian restorationproject. Journal of Soil and Water Conservation 52: 112–7
Hulse D W, and Gregory S V 2001 Alternative futures as an integrative framework for riparianrestoration of large rivers. In Dale V H and Haeuber R A (eds) Applying Ecological Principlesto Land Management. New York, Springer-Verlag: 194–212
Hulse D, Gregory S, and Baker J (eds) 2002 Willamette River Basin: A Planning Atlas. Corvallis,OR, Oregon State University Press
Iverson L R and Risser P G 1987 Analyzing long-term changes in vegetation with geographicinformation system and remotely sensed data. Advances in Space Research 7: 183–94
Iverson L R, Szafoni D L, Baum S E, and Cook E A 2001 A riparian wildlife habitat evaluationscheme developed using GIS. Environmental Management 28: 639–54
Johnson W C, Dixon M D, Simons R, Jenson S, and Larson K 1995 Mapping the response ofriparian vegetation to possible flow reductions in the Snake River, Idaho. Geomorphology13: 159–73
Lam, A H S 1989 Geographic information systems for river corridor and wetland management.In Kusler J A and Daly S (eds) Wetlands and River Corridor Management. New York,Association of Wetland Managers: 404–7
Large A R G and Petts G E 1996 Historical channel-floodplain dynamics along the River Trent:Implications for river rehabilitation. Applied Geography 16: 191–209
Llewellyn D W, Shaffer G P, Craig N J, Creasman L, Pashley D, Swan M, and Brown C 1996 Adecision-support system for prioritizing restoration sites on the Mississippi River alluvialplain. Conservation Biology 10: 1446–55
Malanson G P 1993 Riparian Landscapes. New York, Cambridge University PressMoser T J, Lindeman D R, Wigington P J, Schuft M J, and Van Sickle J 2004 Methods for multi-
spatial scale characterization of riparian corridors. Journal of the American Water ResourcesAssociation 40: in press
Mossa J and McLean M 1997 Channel planform and land cover changes on a mined river flood-plain, Amite River, Louisiana, USA. Applied Geography 17: 43–54
Mullane N 1997 The Willamette River of Oregon: A river restored? In Laenen A and Dunnette DA (eds) River Quality: Dynamics and Restoration. Boca Raton, FL, Lewis Publishers: 65–75
Muller E 1997 Mapping riparian vegetation along rivers: old concepts and new methods. AquaticBotany 58: 411–37
Naiman R J, Décamps H, Pastor J, and Johnston C A 1988 The potential importance of boundar-ies to fluvial ecosystems. Journal of the North American Benthological Society 7: 289–306
Willamette Flood Plain GIS 383
© Blackwell Publishing Ltd. 2004
Narumalani S, Zhou Y, and Jensen J R 1997 Application of remote sensing and geographicinformation systems to the delineation and analysis of riparian buffer zones. Aquatic Botany58: 393–409
National Research Council Committee on Restoration of Aquatic Ecosystems-Science, Technology,and Public Policy [NRC-CRAE] 1992 Restoration of Aquatic Ecosystems: Science, Technology,and Public Policy. Washington, D.C., National Academy Press
Newson M D 1997 Land, Water and Development: Sustainable Management of River BasinSystems. London, Routledge
Oetter D R, Cohen W B, Berterretche M, Maiersperger T K, and Kennedy R E 2001 Land covermapping in an agricultural setting using multi-seasonal Thematic Mapper data. RemoteSensing of Environment 76:139–55
Petts G E and Calow P 1996 River Flows and Channel Forms. Oxford, Blackwell SciencePetts G E, Large A R G, Greenwood M T, and Bickerton M A 1992 Floodplain assessment for
restoration and conservation: linking hydrogeomorphology and ecology. In Carling P A andPetts G E (eds) Lowland Floodplain Rivers: Geomorphological Perspectives. Chichester, JohnWiley and Sons: 217–34
Russell G D, Hawkins C P, and O’Neill M P 1997 The role of GIS in selecting sites for riparianrestoration based on hydrology and land use. Restoration Ecology 5: 56–68
Schiemer F, Baumgartner C, and Tockner K 1999 Restoration of floodplain rivers: The ‘DanubeRestoration Project’. Regulated Rivers: Research and Management 15: 231–44
Schulte L A and Mladenoff D J 2001 The original U.S. public land survey records: Their use andlimitations in reconstructing presettlement vegetation. Journal of Forestry 99: 5–10
Sedell J R and Froggatt J L 1984 Importance of streamside forests to large rivers: The isolation ofthe Willamette River, Oregon, USA, from its floodplain by snagging and streamside forestremoval. Verhandlungen der Internationalen Vereinigung für Limnologie 22: 1828–34
Sedell J R, Steedman R J, Regier H A, and Gregory S V 1991 Restoration of human impacted land-water ecotones. In Holland M M, Risser P G, and Naiman R J (eds) Ecotones: The Role ofLandscape Boundaries in the Management and Restoration of Changing Environments. NewYork, Routledge, Chapman, and Hall: 110–29
Shankman D 1993 Channel migration and vegetation patterns in the Southeastern coastal plain.Conservation Biology 7: 176–83
Towle J C 1982 Changing geography of Willamette Valley woodlands. Oregon Historical Quarterly83: 67–90
U S Army Corps of Engineers [ACOE] 1895 Willamette River, Oregon, Portland to Eugene.Map series
U S Army Corps of Engineers [ACOE] 1932 Willamette River, Oregon, Portland to Eugene.Map series
Ward J V, Tockner K, and Schiemer F 1999 Biodiversity of floodplain river ecosystems: Ecotonesand connectivity. Regulated Rivers: Research and Management 15: 125–39
White R 1995 The Organic Machine. New York, Hill and WangWillamette Restoration Initiative [WRI] 2001 Restoring a River of Life: The Willamette Restoration
Strategy Overview. Salem, OR, Willamette Restoration Initiative Willamette Riverkeeper 1996 Riverlands Report. Portland, OR, Willamette Riverkeeper Winterbottom S J and Gilvear D J 2000 A GIS-based approach to mapping probabilities of river
bank erosion: Regulated River Tummel, Scotland. Regulated Rivers: Research and Management16: 127–40