Characterizing Result Errors in Internet Desktop Grids
19
Characterizing Result Errors in Internet Desktop Grids Derrick Kondo 1 Filipe Araujo 2 Paul Malecot 1 Patricio Domingues 3 Luis Moura Silva 2 Gilles Fedak 1 Franck Cappello 1 1 INRIA Futurs, France 2 University of Coimbra, Portugal 3 Polytechnic Institute of Leiria, Portugal [dkondo, malecot, fedak, fci]@lri.fr, [filipius, luis]@dei.uc.pt, [email protected] CoreGRID Technical Report Number TR-0040 12th October 2006 Institute on System Architecture CoreGRID - Network of Excellence URL: http://www.coregrid.net CoreGRID is a Network of Excellence funded by the European Commission under the Sixth Framework Programme Project no. FP6-004265
-
Upload
independent -
Category
Documents
-
view
2 -
download
0
Transcript of Characterizing Result Errors in Internet Desktop Grids
Characterizing Result Errors in Internet Desktop Grids
Derrick Kondo1 Filipe Araujo2 Paul Malecot1 Patricio Domingues3
Luis Moura Silva2 Gilles Fedak1 Franck Cappello1
1INRIA Futurs, France 2University of Coimbra, Portugal3Polytechnic Institute of Leiria, Portugal
[dkondo, malecot, fedak, fci]@lri.fr,[filipius, luis]@dei.uc.pt, [email protected]
CoreGRID Technical ReportNumber TR-004012th October 2006
Institute on System Architecture
CoreGRID - Network of ExcellenceURL: http://www.coregrid.net
CoreGRID is a Network of Excellence funded by the European Commission under the Sixth Framework Programme
Project no. FP6-004265

Characterizing Result Errors in Internet Desktop Grids
Derrick Kondo1 Filipe Araujo2 Paul Malecot1 Patricio Domingues3
Luis Moura Silva2 Gilles Fedak1 Franck Cappello1
1INRIA Futurs, France 2University of Coimbra, Portugal3Polytechnic Institute of Leiria, Portugal
[dkondo, malecot, fedak, fci]@lri.fr,[filipius, luis]@dei.uc.pt, [email protected]
CoreGRID TR-0040
12th October 2006
Abstract
Desktop grids use the free resources in Intranet and Internet environments for large-scale computation and stor-age. While desktop grids offer a high return on investment, one critical issue is the validation of results returned byparticipating hosts. Several mechanisms for result validation have been previously proposed. However, the character-ization of errors is poorly understood. To study error rates, we implemented and deployed a desktop grid applicationacross several thousand hosts distributed over the Internet. We then analyzed the results to give quantitative, em-pirical characterization of errors rates. We find that in practice, error rates are widespread across hosts but occurrelatively infrequently. Moreover, we find that error ratestend to not be stationary over time nor correlated betweenhosts. In light of these characterization results, we evaluated state-of-the-art error detection mechanisms and describethe trade-offs for using each mechanism. Finally, based on our empirical results, we conduct a benefit analysis ofa mechanism that we proposed recently for the detection of errors in long-running applications. This mechanism isbased on using the digest of intermediate checkpoints, and we show in theory and simulation that the relative benefitof this method compared to the state-of-the-art is as high as45%.
1 Introduction
Desktop grids use the free resources in Intranet and Internet environments for large-scale computation and storage.For over 10 years, desktop grids have been one of the largest distributed systems in the world providing TeraFlops ofcomputing power for applications from a wide range of scientific domains, including climate prediction, computationalbiology, and physics [6]. Despite the huge computational and storage power offered by desktop grids and their highreturn on investment, there are several challenges in usingthis volatile and shared platform effectively. One criticalissue is the validation of results computed by insecure and possibly malicious hosts. For example, in [15], the authorsreport that errors can be caused by both hardware or softwareerrors (for example, CPU’s corrupted by overclocking,or by incorrect modifications of the application or desktop grid software1). Other times, errors can be caused by a ma-licious user who for example submit fabricated results [12]. For these reasons, effective error detections mechanismsare essential and several methods have been proposed previously [14, 16].
This research work is carried out under the FP6 Network of Excellence CoreGRID funded by the European Commission (ContractIST-2002-004265).
However, little is known about the nature of errors in real systems. Yet, the trade-offs and efficacy among differenterror detection mechanisms is dependent on how errors occurin real systems. Thus, we investigate errors in a realsystem by focusing on the following critical questions:
1. What is the frequency and distribution of host error rates?
2. How stationary are host error rates?
3. How correlated are error rates between hosts?
4. In light of the error characterization, what is the efficacy of state-of-the-art error detection mechanisms and cannew mechanisms be proposed?
To help answer those questions, we deployed an Internet desktop grid application across several thousand desktophosts. We then validated the results returned by hosts, and we analyzed the invalid results to characterize quantitativelythe error rates in a real desktop grid project.
The paper is organized as follows. In Section 2, we define the basic terminology used throughout the paper. InSection 3, we describe related work in terms of error characterization and detection. In Section 4, we defined our errormeasurement method. In Section 5, we study the frequency, stationarity, and correlation of host errors. In Section 6,based on our empirical results, we present a benefit analysisof a mechanism that we proposed recently for errordetection in long-running applications based on intermediate checkpoints. Finally, in Section 7, we conclude with asummary of our specific contributions and future work.
2 Background
At a high level, a typical desktop grid system consists of a server from whichworkunits of an application aredistributed to aworker daemon running on each participating host. The workunits are then executed when the CPUis available, and upon completion, theresult is return back to the server. We define a resulterror to be any resultreturned by a worker that is not the correct value or within the correct range of values. We call any host that has orwill commit at least one error anerroneous host(whether intentionally or unintentionally).
Workunits of an application are often organized in groups ofworkunits orbatches. To achieve overall low ratesfor a batch of tasks, the individual error rate per host must be made small. Consider the following scenario describedin [14] where a computation consists of 10 batches, each with100 workunits. Assuming that any work unit error wouldcause the entire batch to fail, then to achieve an overall error rate of 0.01, the probability of a result being erroneousmust be no greater than1 × 10−5. Many applications (for example, those from from computational biology [15] andphysics [6]) require (low) bounds on error rates as the correctness of the computed results are essential for makingaccurate scientific conclusions.
3 Related Work
To the best of our knowledge, there has been no previous studythat gives quantitative estimates of error rates fromempirical data. Several previous works [9] studyfailure rates of executing tasks, where a failure is any event thatcauses a task’s execution to terminate. However, the definition of failures in those studies is different from the notionof errors as it does not take into account result correctness.
Several mechanisms for reducing errors in desktop grids have been proposed. We discuss three of the most commonstate-of-the-art methods [14, 16, 15] namely spot-checking, majority voting, and credibility-based techniques, andemphasize the issues related to each method.
Themajority voting method detects erroneous results by sending identical workunits to multiple workers. Afterthe results are retrieved, the result that appears most often is assumed to be correct. In [14], the author determinesthe amount of redundancy for majority voting needed to achieve a bound on the frequency of voting errors given theprobability that a worker returns a erroneous result. Let the error rateϕ be the probability that a worker is erroneousand returns an erroneous result unit, and letε be the percentage of final results (after voting) that are incorrect (for a
CoreGRID TR-0040 2

summary of parameter definitions see Table 2 in the Appendix). Letm be the number of identical results out of2m−1required before a vote is considered complete and a result isdecided upon. Then the probability of an incorrect resultbeing accepted after a majority vote is given by:
εmajv(ϕ,m) =2m−1∑
j=m
(
2m − 1j
)
ϕj(1 − ϕ)2m−1−j (1)
The redundancy of majority voting ism1−f, wheref is fraction of hosts can commit at least one error.
The main issues for majority voting are the following. First, the error bound assumes that error rates are not cor-related among hosts. Second, majority voting is most effective when error rates are relatively low (≤ 1%); otherwisethe required redundancy could be too high.
A more efficient method for error detection isspot-checking, whereby a workunit with a known correct result isdistributed at random to workers. The workers’ results are then compared to the previously computed and verifiedresult. Any discrepancies cause the corresponding worker to beblacklisted, i.e., any past or future results returnedfrom the erroneous host are discarded (perhaps unknowinglyto the host).
Erroneous workunit computation was modelled as a Bernoulliprocess [14] to determine the error rate of spot-checking given the portion of work contributed by the host, and the rate at which incorrect results are returned. Themodel uses a work pool that is divided into equally sized batches.
Allowing the model to exclude coordinated attacks, letq be the frequency of spot-checking, and letn be theamount of work contributed by the erroneous worker.(1 − qs)n is probability that erroneous host is not discoveredafter processingn workunits. The rate which spot-checking with blacklistingwill fail to catch bad results is given by:
εscbl(q, n, f, s) =sf(1 − qs)n
(1 − f) + f(1 − qs)n(2)
The amount of redundancy of spot-checking is given by11−q
.There are several critical issues related to spot-checkingwith blacklisting. First, it assumes that blacklisting will
effectively remove erroneous hosts, in spite of the possibility of hosts registering with new identities or high hostchurn as shown by [3]. Without blacklisting, the upper boundon the error rate is much higher and does not decreaseinversely with n. Second, spot-checking is effective only if error rates are consistent over time. Third, spot-checkingis most effective when error rates are high (>1%); otherwise, the number of workunits to be computed per workernmust be extremely high.
To address the potential weaknesses of majority voting and spot-checking,credibility-based systemswere pro-posed [14], which use the conditional probabilities of errors given the history of host result correctness. Due to spacelimitations, we only describe the method at a high-level. The idea is based on the assumption that hosts that havecomputed many results with relatively few errors have a higher probability of errorless computation than hosts witha history of returning erroneous results. Workunits are assigned to hosts such that more attention is given to theworkunits distributed to higher risk hosts.
To determine the credibility of each host, any error detection method such as majority voting, spot-checking, orvarious combinations of the two can be used. The credibilities are then used to compute the conditional probability ofa result’s correctness. As such, this method, like spot-checking, assumes that the error rate per host remain consistentover time as it uses each host’s past performance to determine workunit assignment.
4 Method
We studied the error rates of a real Internet desktop grid project called XtremLab [11]. XtremLab uses the BOINCinfrastructure [2] to collect measurement data of desktop resources across the Internet. The XtremLab applicationcurrently gathers CPU availability information by continuously computing floating point and integer operations, andevery 10 seconds, the application will write the number of operations completed to file. Every 10 minutes, the outputfile is uploaded to the XtremLab server.
CoreGRID TR-0040 3
In this study, we analyze the outputs of the XtremLab application to characterize the rate at which errors can occurin Internet-wide distributed computations. In particular, we collected traces between April 20, 2006 to July 20, 2006from about 4400 hosts. From these hosts, we obtained over1.3×108 measurements of CPU availability from2.2×106
output files. We focused our analysis on about 600 hosts with more then 1 week worth of CPU time in order to ensurethe statistic significance of our conclusions2.
Errors in the application output are determined as follows.Output files uploaded by the workers are processed bya validator. The validator conducts both syntactical and semantics checks of the output files returned by each worker.The syntactical checks verify the format of the output file (for example, that the time stamps recorded were floatingnumbers, the correct number of measurements were made, and each line contains the correct number of data). Thesemantic checks verify the correctness of the data to ensurethat the values reported fall in the range of feasible CPUavailability values. Any output files that failed these checks were marked as erroneous, and we assume any output filethat fails a syntactic or semantic check would correspond toan error of a workunit in a real desktop grid project.
To date, there has been little specific data about error ratesin Internet desktop environments, and we believe thatthe above detection method gives a first-order approximation of the error rates for a real Internet desktop grid project.However, there are limitations in our methodology, which wedetail in the Appendix. One limitation is that we cannotdetermine the exact cause of errors. For example, if an output file is corrupt, we cannot determine whether the causewas due to hardware malfunction, software code modifications, a malicious user, or any other cause. Nevertheless,we do not believe the errors are due to network failures during transfers of output files. This is because BOINC has aprotocol to recover from failures (of either the worker of server) during file transmission that ensures the integrity offiles transfers [2]. In this protocol, the length of the transfer is transmitted before the actual file, and so the server isable to determine if the transfer was completed. If a failureoccurs during transmission, the worker will retry sendingthe file later from where it left off before the failure. Thus,we believe most errors occurred on the host machine itself.Note that detecting all possible causes of errors in large-scale distributed systems and being able to detect all possiblesymptoms of those causes is a challenging and open issue, andwe will refine our validation process in future work.
5 Error Characterization
5.1 Frequency of Errors
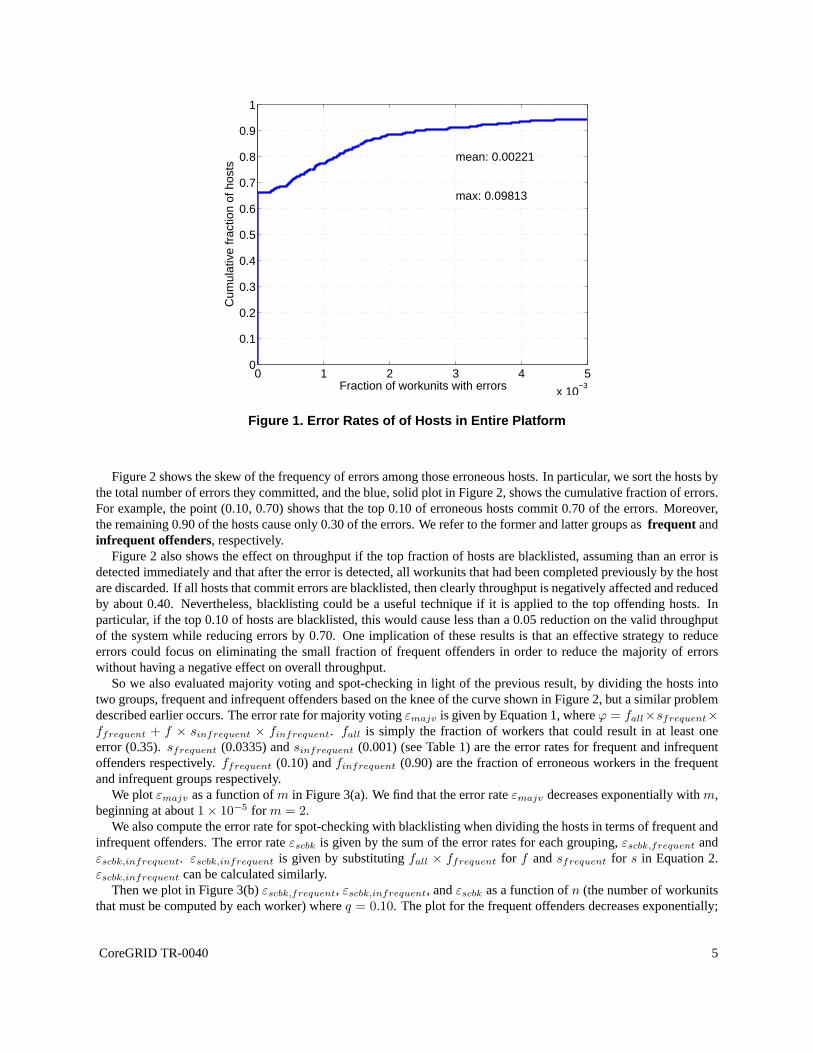
The effectiveness of different methods by which errors are detected is heavily dependent on the frequency of errorsamong hosts. We measured the fraction of workunits with errors per host, and show the cumulative distributionfunction (CDF) of these fractions in Figure 1. For example, the point (1 × 10⁻³, 0.78) shows that 0.78 of the hostshad error rates less than or equal to1 × 10−3. The mean error rate was 0.002, and the max error rate was 0.098.
We find that a remarkably high percentage of hosts (about 35%)returned at least one corrupt result in the 3 monthtime frame. Given that the overall error rate is low and a significant fraction of hosts result in at least one error,blacklisting all erroneous may not be an efficient way of preventing errors.
An error rate of 0.002 may seem so low that error correction, detection and prevention are moot, but consider thescenario in Section 2 again where the desired overall error rate is 0.01. In that case, the probability of a result beingerroneous must be no greater than1 × 10−5. If ϕ = 0.002 as shown in Figure 1, we can simply conduct a majorityvote wherem = 2 to achieve an error rate less then1×10−5. That is, ifm = 2, then the error rate given by Equation 1is ǫmajv = 0.000004, and the redundancy is about 2.00.
While spot-checking can achieve a similar error rate of about1 × 10−5, spot-checking requires a large numberof workunits to be processed before achieving it. For example, to achieve a similar error rate of1 × 10−5 via spot-checking whereq = 0.10, f = 0.35 (from Figure 1),s = 0.003 (as shown in Table 1), Equation 2 requires that thenumber of workunits (n) processed by each worker be greater than 5300. While redundancy is lower at 1.11 comparedto majority voting, if each workunit requires 1 day of CPU time (which is a conservative estimate as shown in [6]),it would require at least 14.5 years of CPU timeper workerbefore the desired rate could be achieved. Even if weincreaseq to 0.25 (and redundancy is 1.33), spot-checking requiresn = 3500 (or at least 9.5 years of CPU time perworker assuming a workunit is 1 day of CPU time in length).
We also focused on characterizing the hosts that returned atleast one corrupt result (see Figure 8 in the Appendixfor details). The mean error rate over this set of hosts is still relatively low at 0.0065.
CoreGRID TR-0040 4
0 1 2 3 4 5
x 10−3
0
0.1
0.2
0.3
0.4
0.5
0.6
0.7
0.8
0.9
1
Fraction of workunits with errors
Cum
ulat
ive
frac
tion
of h
osts
mean: 0.00221
max: 0.09813
Figure 1. Error Rates of of Hosts in Entire Platform
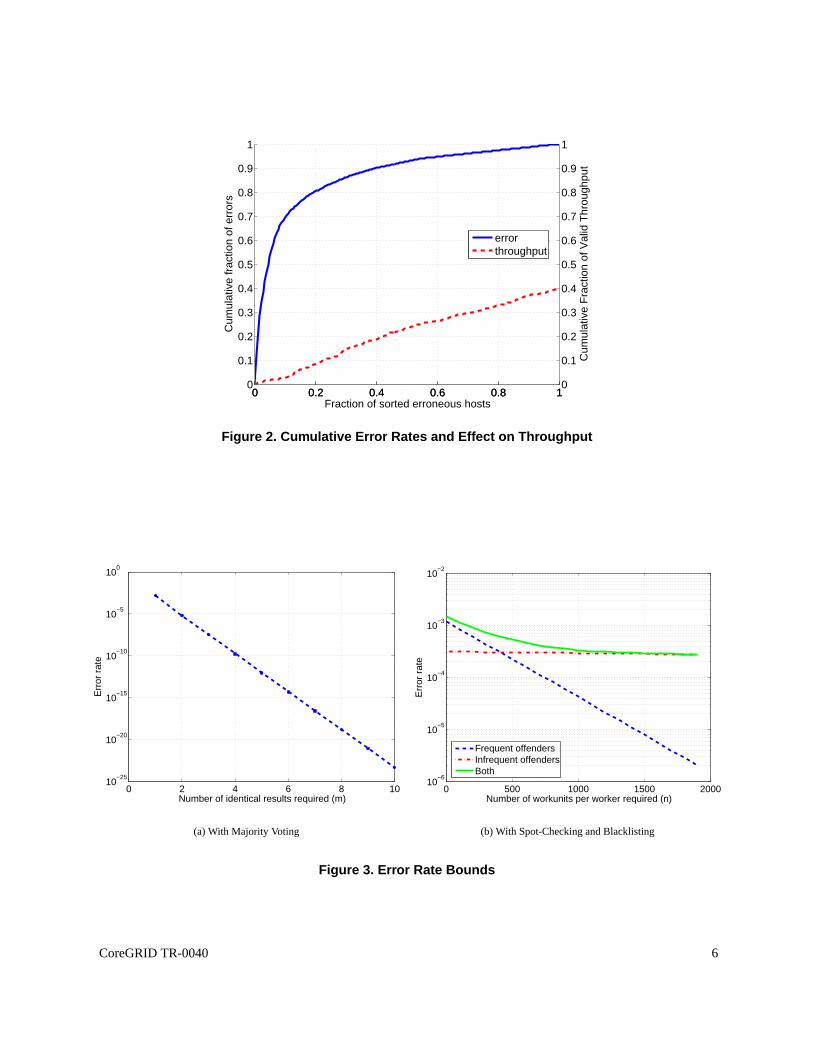
Figure 2 shows the skew of the frequency of errors among thoseerroneous hosts. In particular, we sort the hosts bythe total number of errors they committed, and the blue, solid plot in Figure 2, shows the cumulative fraction of errors.For example, the point (0.10, 0.70) shows that the top 0.10 oferroneous hosts commit 0.70 of the errors. Moreover,the remaining 0.90 of the hosts cause only 0.30 of the errors.We refer to the former and latter groups asfrequent andinfrequent offenders, respectively.
Figure 2 also shows the effect on throughput if the top fraction of hosts are blacklisted, assuming than an error isdetected immediately and that after the error is detected, all workunits that had been completed previously by the hostare discarded. If all hosts that commit errors are blacklisted, then clearly throughput is negatively affected and reducedby about 0.40. Nevertheless, blacklisting could be a usefultechnique if it is applied to the top offending hosts. Inparticular, if the top 0.10 of hosts are blacklisted, this would cause less than a 0.05 reduction on the valid throughputof the system while reducing errors by 0.70. One implicationof these results is that an effective strategy to reduceerrors could focus on eliminating the small fraction of frequent offenders in order to reduce the majority of errorswithout having a negative effect on overall throughput.
So we also evaluated majority voting and spot-checking in light of the previous result, by dividing the hosts intotwo groups, frequent and infrequent offenders based on the knee of the curve shown in Figure 2, but a similar problemdescribed earlier occurs. The error rate for majority voting εmajv is given by Equation 1, whereϕ = fall×sfrequent×ffrequent + f × sinfrequent × finfrequent. fall is simply the fraction of workers that could result in at least oneerror (0.35).sfrequent (0.0335) andsinfrequent (0.001) (see Table 1) are the error rates for frequent and infrequentoffenders respectively.ffrequent (0.10) andfinfrequent (0.90) are the fraction of erroneous workers in the frequentand infrequent groups respectively.
We plotεmajv as a function ofm in Figure 3(a). We find that the error rateεmajv decreases exponentially withm,beginning at about1 × 10−5 for m = 2.
We also compute the error rate for spot-checking with blacklisting when dividing the hosts in terms of frequent andinfrequent offenders. The error rateεscbk is given by the sum of the error rates for each grouping,εscbk,frequent andεscbk,infrequent. εscbk,infrequent is given by substitutingfall × ffrequent for f andsfrequent for s in Equation 2.εscbk,infrequent can be calculated similarly.
Then we plot in Figure 3(b)εscbk,frequent, εscbk,infrequent, andεscbk as a function ofn (the number of workunitsthat must be computed by each worker) whereq = 0.10. The plot for the frequent offenders decreases exponentially;
CoreGRID TR-0040 5
0 0.2 0.4 0.6 0.8 10
0.1
0.2
0.3
0.4
0.5
0.6
0.7
0.8
0.9
1
Fraction of sorted erroneous hosts
Cum
ulat
ive
frac
tion
of e
rror
s
0 0.2 0.4 0.6 0.8 10
0.1
0.2
0.3
0.4
0.5
0.6
0.7
0.8
0.9
1
Cum
ulat
ive
Fra
ctio
n of
Val
id T
hrou
ghpu
t
errorthroughput
Figure 2. Cumulative Error Rates and Effect on Throughput
0 2 4 6 8 1010
−25
10−20
10−15
10−10
10−5
100
Number of identical results required (m)
Err
or r
ate
(a) With Majority Voting
0 500 1000 1500 200010
−6
10−5
10−4
10−3
10−2
Number of workunits per worker required (n)
Err
or r
ate
Frequent offendersInfrequent offendersBoth
(b) With Spot-Checking and Blacklisting
Figure 3. Error Rate Bounds
CoreGRID TR-0040 6

this is because the error rate for the hosts is relatively high, and so after a series of workunit computations, the erroneoushosts are rapidly detected. The plot for the infrequent offenders decreases very little even asn increases significantly.This is because the error rates for the infrequent offendersare relatively low, and thus, increasingn does not improvedetection nor reduce errors significantly. The effect of thenet error rateε is that it initially decreases rapidly forn inthe range [0, 1000]. Thereafter, the error rate decreases little. We also looked at much larger ranges, and the decreasein error rate was relatively small.
Thus, spot-checking acts as a low-pass filter in the sense that hosts with high error rates can be easily detected (andcan then be blacklisted); however, hosts with low error rates remain in the system. If all frequent offenders are detectedby spot-checking and blacklisted, then by Figure 2, this will reduce error rates by 0.70 (or equivalently, an error rate of63 × 10−5) and cause only a 0.05 reduction in throughput due to blacklisting. However, to reduce the error rate downto 1× 10⁻⁵, spot-checking must detect errors from both frequentand infrequent offenders. As shown by Figure 3(b),spot-checking will not efficiently detect errors from infrequent offenders because it requires a huge number workunitsto be processed by each worker. From Figure 3(b), we concludethat spot-checking can reduce error rates down toabout2× 10−4 quickly and efficiently. To achieve lower error rates, one should consider using majority voting. In thenext section, we show that spot-checking may have other difficulties in real-world systems.
5.2 Stationarity of Error Rates
Intuitively, a process is stationary if its statistical properties do not change with time. In particular, a stationaryprocess will have a constant mean. In this section, we investigate how stationary the mean of the host error rates isover time, and describe the implications for error detection mechanisms given our findings.
0 0.01 0.02 0.03 0.04 0.05 0.060
0.1
0.2
0.3
0.4
0.5
0.6
0.7
0.8
0.9
1
Change in mean error rate
Cum
ulat
ive
frac
tion
of c
hang
es mean: 0.00507
median: 0.00347
max: 0.06597
Figure 4. Error Rate Stationarity
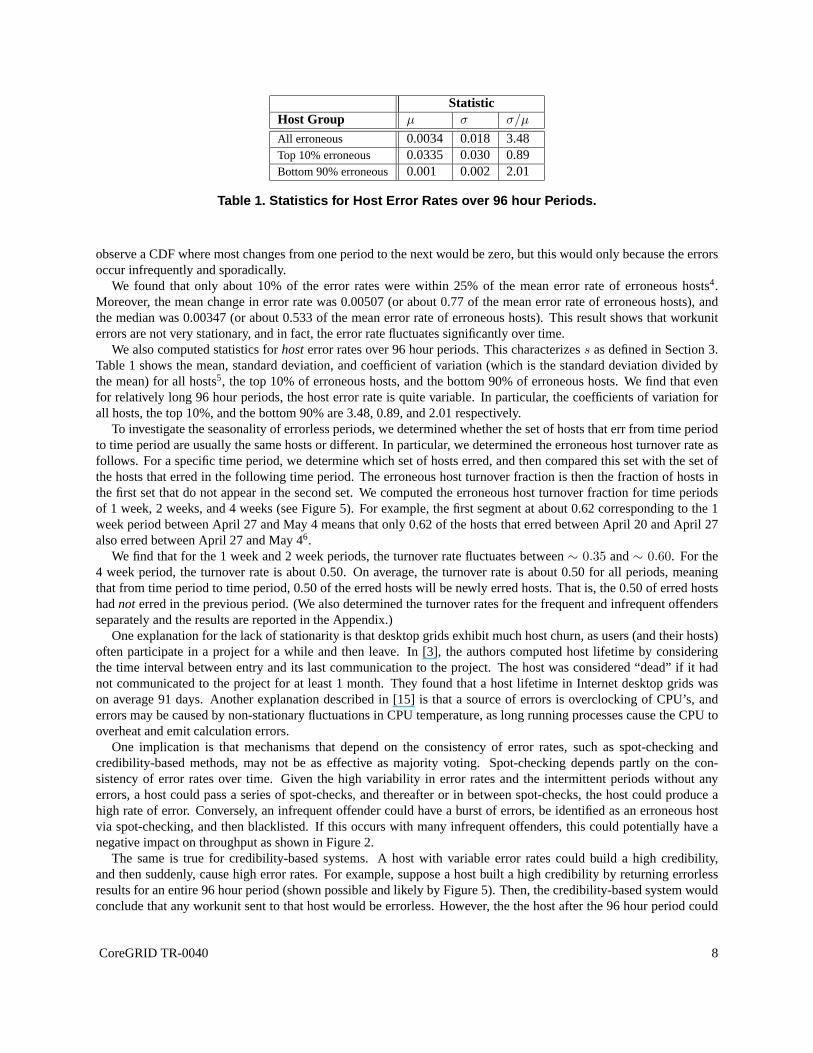
We measured the stationarity of error rates by determining the change in mean error rates over 96 hour periods foreach host. That is, for every 96 hours of wall-clock time during which the worker had been active, we determinedthe mean error rate on each host, and measured the change in error rates from one period to the next3. After closeinspection of the results, we found that hosts often have long periods with no errors, and that when errors occurred,they occurred sporadically. Figure 4 shows the cumulative distribution function of error rate changes over all hosts.Because hosts often had relatively long periods without anyerrors, we excluded the data when the error rate for thecurrent and previous interval was 0. Otherwise, including such data, would “skew” the distribution; that is, we would
CoreGRID TR-0040 7
StatisticHost Group µ σ σ/µ
All erroneous 0.0034 0.018 3.48Top 10% erroneous 0.0335 0.030 0.89Bottom 90% erroneous 0.001 0.002 2.01
Table 1. Statistics for Host Error Rates over 96 hour Periods .
observe a CDF where most changes from one period to the next would be zero, but this would only because the errorsoccur infrequently and sporadically.
We found that only about 10% of the error rates were within 25%of the mean error rate of erroneous hosts4.Moreover, the mean change in error rate was 0.00507 (or about0.77 of the mean error rate of erroneous hosts), andthe median was 0.00347 (or about 0.533 of the mean error rate of erroneous hosts). This result shows that workuniterrors are not very stationary, and in fact, the error rate fluctuates significantly over time.
We also computed statistics forhosterror rates over 96 hour periods. This characterizess as defined in Section 3.Table 1 shows the mean, standard deviation, and coefficient of variation (which is the standard deviation divided bythe mean) for all hosts5, the top 10% of erroneous hosts, and the bottom 90% of erroneous hosts. We find that evenfor relatively long 96 hour periods, the host error rate is quite variable. In particular, the coefficients of variation forall hosts, the top 10%, and the bottom 90% are 3.48, 0.89, and 2.01 respectively.
To investigate the seasonality of errorless periods, we determined whether the set of hosts that err from time periodto time period are usually the same hosts or different. In particular, we determined the erroneous host turnover rate asfollows. For a specific time period, we determine which set ofhosts erred, and then compared this set with the set ofthe hosts that erred in the following time period. The erroneous host turnover fraction is then the fraction of hosts inthe first set that do not appear in the second set. We computed the erroneous host turnover fraction for time periodsof 1 week, 2 weeks, and 4 weeks (see Figure 5). For example, thefirst segment at about 0.62 corresponding to the 1week period between April 27 and May 4 means that only 0.62 of the hosts that erred between April 20 and April 27also erred between April 27 and May 46.
We find that for the 1 week and 2 week periods, the turnover ratefluctuates between∼ 0.35 and∼ 0.60. For the4 week period, the turnover rate is about 0.50. On average, the turnover rate is about 0.50 for all periods, meaningthat from time period to time period, 0.50 of the erred hosts will be newly erred hosts. That is, the 0.50 of erred hostshadnot erred in the previous period. (We also determined the turnover rates for the frequent and infrequent offendersseparately and the results are reported in the Appendix.)
One explanation for the lack of stationarity is that desktopgrids exhibit much host churn, as users (and their hosts)often participate in a project for a while and then leave. In [3], the authors computed host lifetime by consideringthe time interval between entry and its last communication to the project. The host was considered “dead” if it hadnot communicated to the project for at least 1 month. They found that a host lifetime in Internet desktop grids wason average 91 days. Another explanation described in [15] isthat a source of errors is overclocking of CPU’s, anderrors may be caused by non-stationary fluctuations in CPU temperature, as long running processes cause the CPU tooverheat and emit calculation errors.
One implication is that mechanisms that depend on the consistency of error rates, such as spot-checking andcredibility-based methods, may not be as effective as majority voting. Spot-checking depends partly on the con-sistency of error rates over time. Given the high variability in error rates and the intermittent periods without anyerrors, a host could pass a series of spot-checks, and thereafter or in between spot-checks, the host could produce ahigh rate of error. Conversely, an infrequent offender could have a burst of errors, be identified as an erroneous hostvia spot-checking, and then blacklisted. If this occurs with many infrequent offenders, this could potentially have anegative impact on throughput as shown in Figure 2.
The same is true for credibility-based systems. A host with variable error rates could build a high credibility,and then suddenly, cause high error rates. For example, suppose a host built a high credibility by returning errorlessresults for an entire 96 hour period (shown possible and likely by Figure 5). Then, the credibility-based system wouldconclude that any workunit sent to that host would be errorless. However, the the host after the 96 hour period could
CoreGRID TR-0040 8

0
0.2
0.4
0.6
0.8
1
Date
27−A
pr−2
006
04−M
ay−2
006
11−M
ay−2
006
18−M
ay−2
006
25−M
ay−2
006
01−J
un−2
006
08−J
un−2
006
15−J
un−2
006
22−J
un−2
006
29−J
un−2
006
06−J
ul−20
06
13−J
ul−20
06
20−J
ul−20
06
Err
oneo
us H
ost T
urno
ver
Fra
ctio
n
1 week mean: 0.5112 week mean: 0.4904 week mean: 0.500
1 week
2 weeks
4 weeks
Figure 5. Turnover Rate of Erroneous Hosts
return erroneous results at a rate of 0.065 (as shown by Figure 4), which the credibility-based system would not detect,as it assumes consistency of host error rates (in this case 0). Thus, the estimated bounds resulting from spot-checkingor credibility-based methods may not be accurate in real-world systems.
By contrast, majority voting is not as susceptible to fluctuations in error rates, as the error rate (and confidencebounds on the error rate) decrease exponentially with the number of votes. Ifm = 2, the expected error rate is about1 × 10−5 with a standard deviation of8.2 × 10−7. Alternatively, if we assume the near-worst case scenario wherehosts have a relatively high failure rate of 0.0214 (= 0.0034 + 0.018), we can still reliably achieve an error rate lessthan1 × 10−5 by replicating each workunitm = 4 times, resulting in a redundancy of about 4. Nevertheless, theeffectiveness of majority voting could be hampered by correlated errors, which we investigate in the next section.
5.3 Correlation of Error Rates
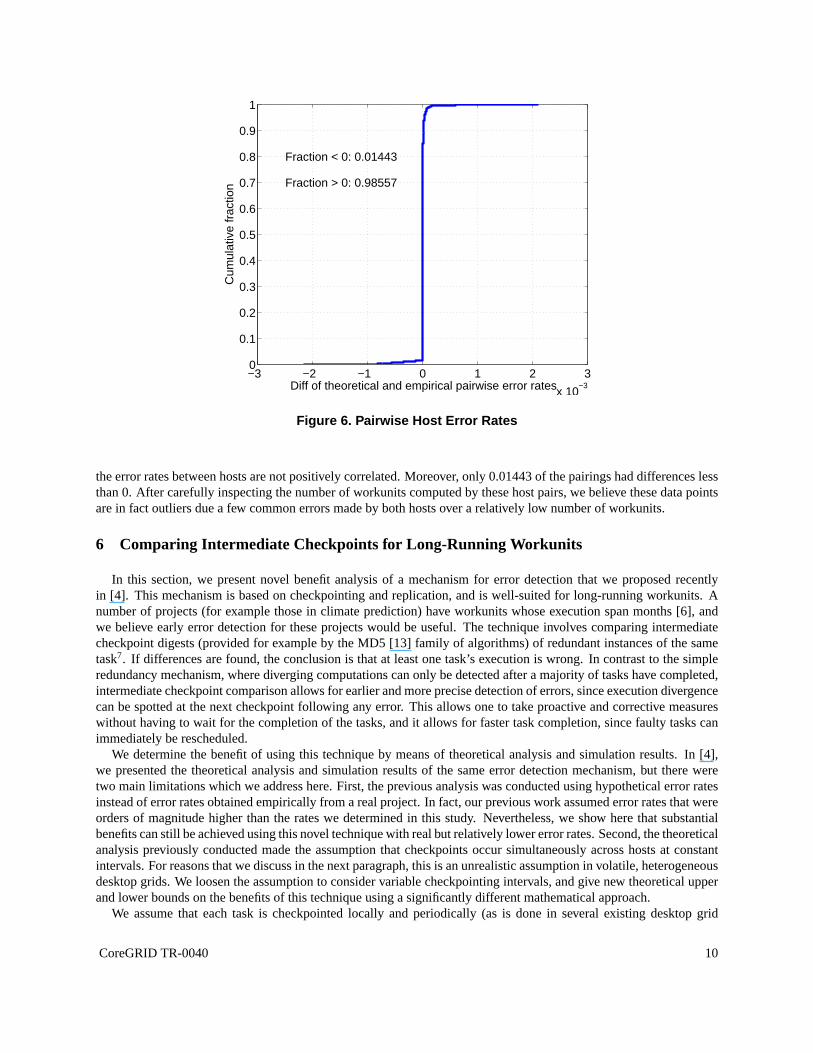
Using the trace of valid and erroneous workunit completion times, we computed the empirical probability that anytwo hosts had an error at the same time. That is, for each 10 minute period between April 20 to July 20, 2006, andfor each pair of hosts, we counted the number of periods in which both hosts computed an erroneous workunit, andthe total number of periods in which both hosts computed a workunit (erroneous or correct). Using those counts,we then determined the empirical probability that any two hosts would give an error simultaneously, i.e., within thesame 10 minute period. In this way, we determined the the empirical joint probability of two hosts having an errorsimultaneously.
We then determined the “theoretical” probability of two hosts having an error simultaneously by taking the productof their individual host error rates. The individual host error rates are given by dividing the number of erroneousworkunits per host by the total number of workunits computedper host (as described in Section 5.1). After determin-ing the “theoretical” probabilities for each host pair, we then determined the difference between the theoretical andempirical probabilities for each host pair. If the error rates for each pair of hosts are not positively correlated, thenthetheoretical probability should be greater than or equal to the empirical, and the difference should be nonnegative.
Figure 6 shows the cumulative distribution for the differences between theoretical and empirical pairwise errorrates. We find most (0.986) of the theoretical pairwise errorrates were greater than the empirical. This suggests that
CoreGRID TR-0040 9
−3 −2 −1 0 1 2 3
x 10−3
0
0.1
0.2
0.3
0.4
0.5
0.6
0.7
0.8
0.9
1
Diff of theoretical and empirical pairwise error rates
Cum
ulat
ive
frac
tion
Fraction < 0: 0.01443
Fraction > 0: 0.98557
Figure 6. Pairwise Host Error Rates
the error rates between hosts are not positively correlated. Moreover, only 0.01443 of the pairings had differences lessthan 0. After carefully inspecting the number of workunits computed by these host pairs, we believe these data pointsare in fact outliers due a few common errors made by both hostsover a relatively low number of workunits.
6 Comparing Intermediate Checkpoints for Long-Running Workunits
In this section, we present novel benefit analysis of a mechanism for error detection that we proposed recentlyin [4]. This mechanism is based on checkpointing and replication, and is well-suited for long-running workunits. Anumber of projects (for example those in climate prediction) have workunits whose execution span months [6], andwe believe early error detection for these projects would beuseful. The technique involves comparing intermediatecheckpoint digests (provided for example by the MD5 [13] family of algorithms) of redundant instances of the sametask7. If differences are found, the conclusion is that at least one task’s execution is wrong. In contrast to the simpleredundancy mechanism, where diverging computations can only be detected after a majority of tasks have completed,intermediate checkpoint comparison allows for earlier andmore precise detection of errors, since execution divergencecan be spotted at the next checkpoint following any error. This allows one to take proactive and corrective measureswithout having to wait for the completion of the tasks, and itallows for faster task completion, since faulty tasks canimmediately be rescheduled.
We determine the benefit of using this technique by means of theoretical analysis and simulation results. In [4],we presented the theoretical analysis and simulation results of the same error detection mechanism, but there weretwo main limitations which we address here. First, the previous analysis was conducted using hypothetical error ratesinstead of error rates obtained empirically from a real project. In fact, our previous work assumed error rates that wereorders of magnitude higher than the rates we determined in this study. Nevertheless, we show here that substantialbenefits can still be achieved using this novel technique with real but relatively lower error rates. Second, the theoreticalanalysis previously conducted made the assumption that checkpoints occur simultaneously across hosts at constantintervals. For reasons that we discuss in the next paragraph, this is an unrealistic assumption in volatile, heterogeneousdesktop grids. We loosen the assumption to consider variable checkpointing intervals, and give new theoretical upperand lower bounds on the benefits of this technique using a significantly different mathematical approach.
We assume that each task is checkpointed locally and periodically (as is done in several existing desktop grid
CoreGRID TR-0040 10
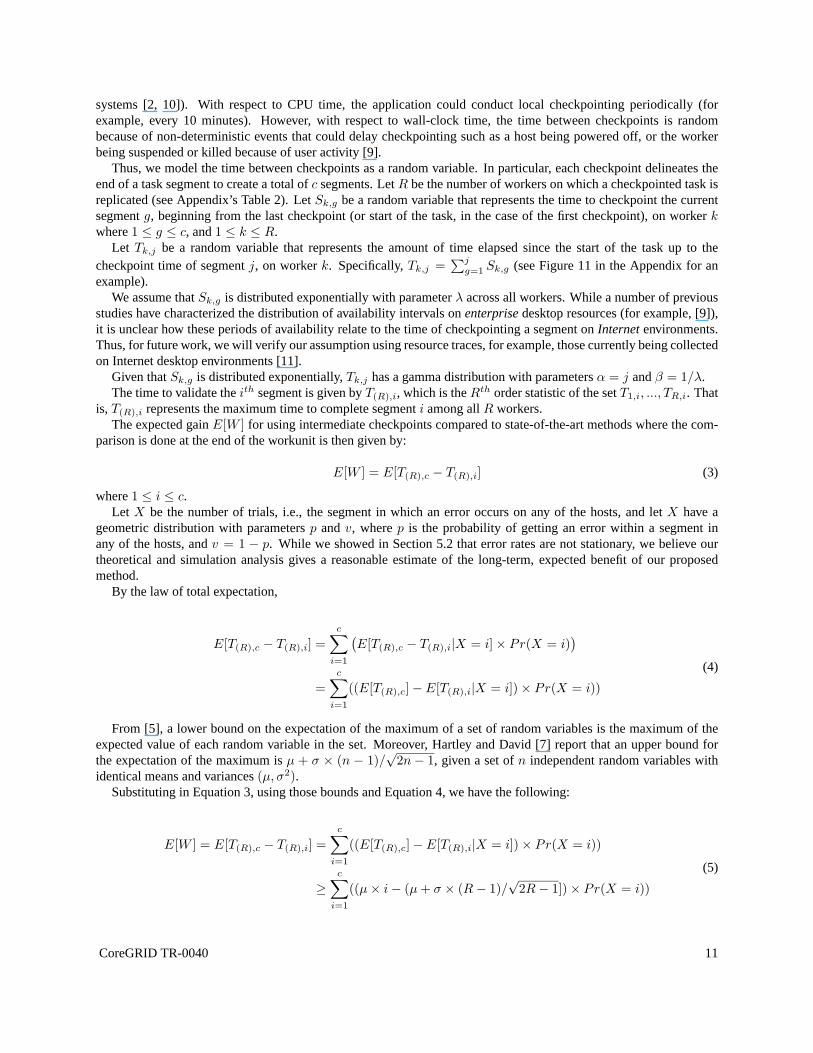
systems [2, 10]). With respect to CPU time, the application could conduct local checkpointing periodically (forexample, every 10 minutes). However, with respect to wall-clock time, the time between checkpoints is randombecause of non-deterministic events that could delay checkpointing such as a host being powered off, or the workerbeing suspended or killed because of user activity [9].
Thus, we model the time between checkpoints as a random variable. In particular, each checkpoint delineates theend of a task segment to create a total ofc segments. LetR be the number of workers on which a checkpointed task isreplicated (see Appendix’s Table 2). LetSk,g be a random variable that represents the time to checkpoint the currentsegmentg, beginning from the last checkpoint (or start of the task, inthe case of the first checkpoint), on workerkwhere1 ≤ g ≤ c, and1 ≤ k ≤ R.
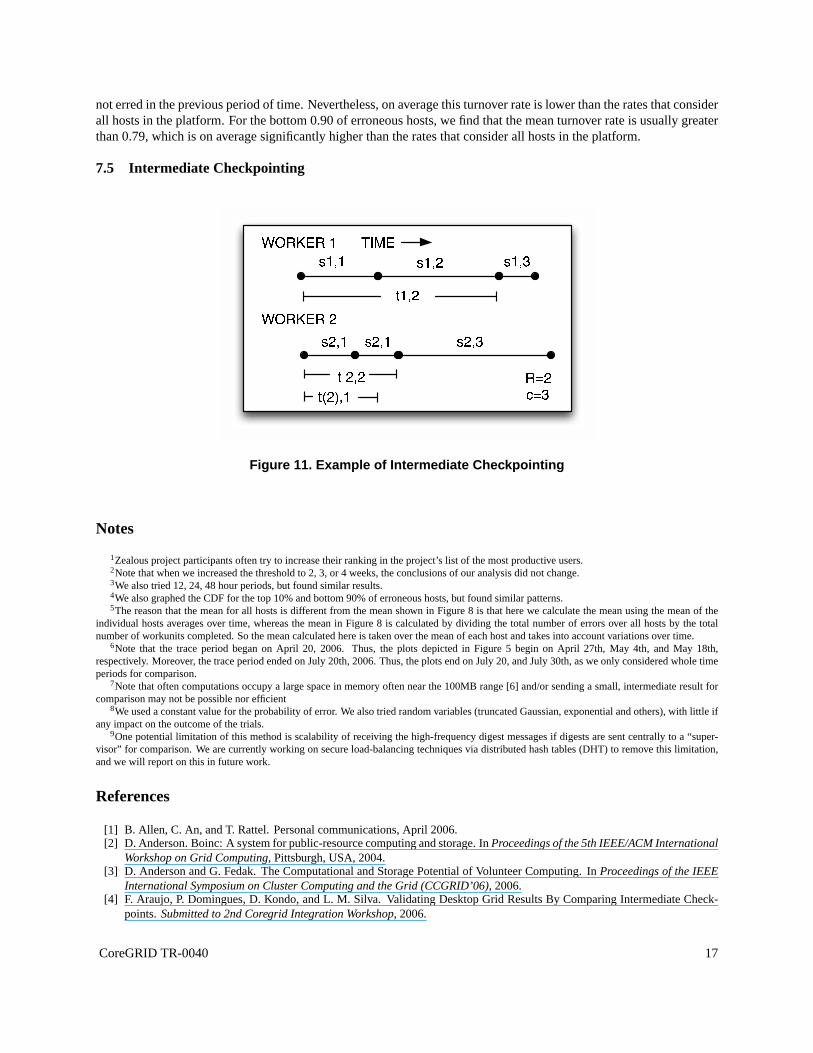
Let Tk,j be a random variable that represents the amount of time elapsed since the start of the task up to thecheckpoint time of segmentj, on workerk. Specifically,Tk,j =
∑j
g=1 Sk,g (see Figure 11 in the Appendix for anexample).
We assume thatSk,g is distributed exponentially with parameterλ across all workers. While a number of previousstudies have characterized the distribution of availability intervals onenterprisedesktop resources (for example, [9]),it is unclear how these periods of availability relate to thetime of checkpointing a segment onInternetenvironments.Thus, for future work, we will verify our assumption using resource traces, for example, those currently being collectedon Internet desktop environments [11].
Given thatSk,g is distributed exponentially,Tk,j has a gamma distribution with parametersα = j andβ = 1/λ.The time to validate theith segment is given byT(R),i, which is theRth order statistic of the setT1,i, ..., TR,i. That
is, T(R),i represents the maximum time to complete segmenti among allR workers.The expected gainE[W ] for using intermediate checkpoints compared to state-of-the-art methods where the com-
parison is done at the end of the workunit is then given by:
E[W ] = E[T(R),c − T(R),i] (3)
where1 ≤ i ≤ c.Let X be the number of trials, i.e., the segment in which an error occurs on any of the hosts, and letX have a
geometric distribution with parametersp andv, wherep is the probability of getting an error within a segment inany of the hosts, andv = 1 − p. While we showed in Section 5.2 that error rates are not stationary, we believe ourtheoretical and simulation analysis gives a reasonable estimate of the long-term, expected benefit of our proposedmethod.
By the law of total expectation,
E[T(R),c − T(R),i] =
c∑
i=1
(
E[T(R),c − T(R),i|X = i] × Pr(X = i))
=
c∑
i=1
((E[T(R),c] − E[T(R),i|X = i]) × Pr(X = i))
(4)
From [5], a lower bound on the expectation of the maximum of a set of random variables is the maximum of theexpected value of each random variable in the set. Moreover,Hartley and David [7] report that an upper bound forthe expectation of the maximum isµ + σ × (n − 1)/
√2n − 1, given a set ofn independent random variables with
identical means and variances(µ, σ2).Substituting in Equation 3, using those bounds and Equation4, we have the following:
E[W ] = E[T(R),c − T(R),i] =
c∑
i=1
((E[T(R),c] − E[T(R),i|X = i]) × Pr(X = i))
≥c
∑
i=1
((µ × i − (µ + σ × (R − 1)/√
2R − 1]) × Pr(X = i))
(5)
CoreGRID TR-0040 11
0.5 1 1.5
x 10−3
0
0.1
0.2
0.3
0.4
0.5
0.6
0.7
0.8
0.9
1
Probability of error in segment computation
Ben
efit
rela
tive
to e
xpec
ted
max
imum
tim
e
upper boundlower boundsimulation
(a) Varying probability of error
500 1000 15000
0.1
0.2
0.3
0.4
0.5
0.6
0.7
0.8
0.9
1
Number of checkpoints
Ben
efit
rela
tive
to e
xpec
ted
max
imum
tim
e
upper boundlower boundsimulation
(b) Varying checkpoint frequency
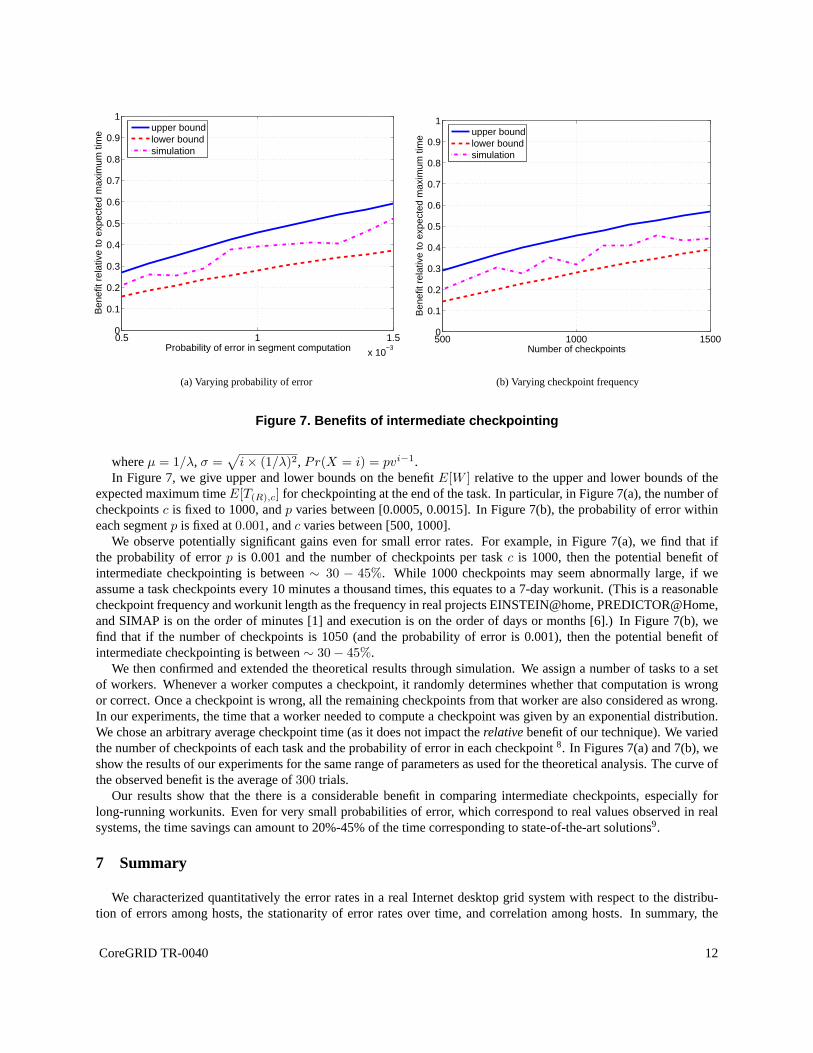
Figure 7. Benefits of intermediate checkpointing
whereµ = 1/λ, σ =√
i × (1/λ)2, Pr(X = i) = pvi−1.In Figure 7, we give upper and lower bounds on the benefitE[W ] relative to the upper and lower bounds of the
expected maximum timeE[T(R),c] for checkpointing at the end of the task. In particular, in Figure 7(a), the number ofcheckpointsc is fixed to 1000, andp varies between [0.0005, 0.0015]. In Figure 7(b), the probability of error withineach segmentp is fixed at0.001, andc varies between [500, 1000].
We observe potentially significant gains even for small error rates. For example, in Figure 7(a), we find that ifthe probability of errorp is 0.001 and the number of checkpoints per taskc is 1000, then the potential benefit ofintermediate checkpointing is between∼ 30 − 45%. While 1000 checkpoints may seem abnormally large, if weassume a task checkpoints every 10 minutes a thousand times,this equates to a 7-day workunit. (This is a reasonablecheckpoint frequency and workunit length as the frequency in real projects EINSTEIN@home, PREDICTOR@Home,and SIMAP is on the order of minutes [1] and execution is on theorder of days or months [6].) In Figure 7(b), wefind that if the number of checkpoints is 1050 (and the probability of error is 0.001), then the potential benefit ofintermediate checkpointing is between∼ 30 − 45%.
We then confirmed and extended the theoretical results through simulation. We assign a number of tasks to a setof workers. Whenever a worker computes a checkpoint, it randomly determines whether that computation is wrongor correct. Once a checkpoint is wrong, all the remaining checkpoints from that worker are also considered as wrong.In our experiments, the time that a worker needed to compute acheckpoint was given by an exponential distribution.We chose an arbitrary average checkpoint time (as it does notimpact therelativebenefit of our technique). We variedthe number of checkpoints of each task and the probability oferror in each checkpoint8. In Figures 7(a) and 7(b), weshow the results of our experiments for the same range of parameters as used for the theoretical analysis. The curve ofthe observed benefit is the average of300 trials.
Our results show that the there is a considerable benefit in comparing intermediate checkpoints, especially forlong-running workunits. Even for very small probabilitiesof error, which correspond to real values observed in realsystems, the time savings can amount to 20%-45% of the time corresponding to state-of-the-art solutions9.
7 Summary
We characterized quantitatively the error rates in a real Internet desktop grid system with respect to the distribu-tion of errors among hosts, the stationarity of error rates over time, and correlation among hosts. In summary, the
CoreGRID TR-0040 12

characterization findings were as follows:
1. A significant fraction of hosts (about 35%) will commit at least a single error over time.
2. The mean error rate over all hosts (0.0022) and over only erroneous hosts (0.0065) is quite low.
3. A large fraction of errors result from a small fraction of hosts. For example, about 70% of error are caused byonly 10% of the hosts.
4. Error rates over time vary greatly and do not seem stationary. Error rates can vary as much as 3.48 over time.The turnover rate for erroneous hosts can be as high as 50%.
5. Error rates between two hosts often seem uncorrelated.While correlation errors could occur during a coordi-nated attack, we do not believe it commonly occurs in practice.
In light of these characterization findings, we showed the effectiveness of several error prevention and detectionmechanisms namely blacklisting, majority voting, spot-checking, and credibility-based methods. We concluded thefollowing (in parenthesis are are the point numbers in the characterization listing above from which the conclusionwas drawn):
1. If one can afford redundancy or one needs an error rate to be less then2×10−4, then majority voting should bestrongly considered.Majority voting will reduce errors exponentially. Form = 2, the expected error rate wouldbe about1 × 10−5 (2, 5)
2. If one can afford an error rate greater than2 × 10−4 and can make batches relatively long (ideally with atleast 1000 work units and at least 1 week of CPU time per worker), then spot-checking with blacklisting shouldbe strongly considered. To minimize the affects of non-stationary error rates such false positives and falsenegatives, one should use spot-checking for as long as a period as possible on as many workunits as possible.Blacklisting should be used because it is an effective way ofremoving frequent offenders. (3, 4)
3. Fluctuations in error rates over time may limit the effectiveness of credibility-based systems.For example,a worker could build up good credibility (either intentionally or simply because error rates appear to be non-stationary), and then once it is assigned work, perform frequent errors. By contrast, majority voting is lesssusceptible as error rates and also the confidence bounds on error rates decrease exponentially with the numberof votes. (4)
4. If one has a long-running application (> 1 week), then one should consider using the digest of intermediatecheckpoints to accelerate error detection.We presented novel analysis of a mechanism for error detection thatwe recently proposed, which applies majority voting for comparing the digest of intermediate checkpoints. Weshow both theoretically and in simulation significant time gains (as high as 45%) compared to the state-of-the-artreplication mechanisms.
Appendix
7.1 P2P Reputation System
Several P2P reputation systems have been proposed to prevent the dissemination of inauthentic files (for example,the EigenTrust system developed at Stanford, and the NICE system developed at the University of Maryland). Ingeneral, these systems associate trust values for each peer, and have various ways of computing, storing, and searchingtrust values in a decentralized manner. The usefulness of P2P reputation systems for desktop grids is limited. First, thesystems assume that error detection (of an inauthentic file)can be done by the user herself. Clearly, in a desktop grid,the user seldom has the expertise nor capability to verify the correctness of a computation. Second, P2P reputationsystems are designed to prevent the common case where a peer or group of malicious peers try to spread manyinauthentic files. However, none of these systems were designed for peers that have low error rates [8] to begin withnor for reducing error rates down to levels as low as1 × 10−5.
CoreGRID TR-0040 13
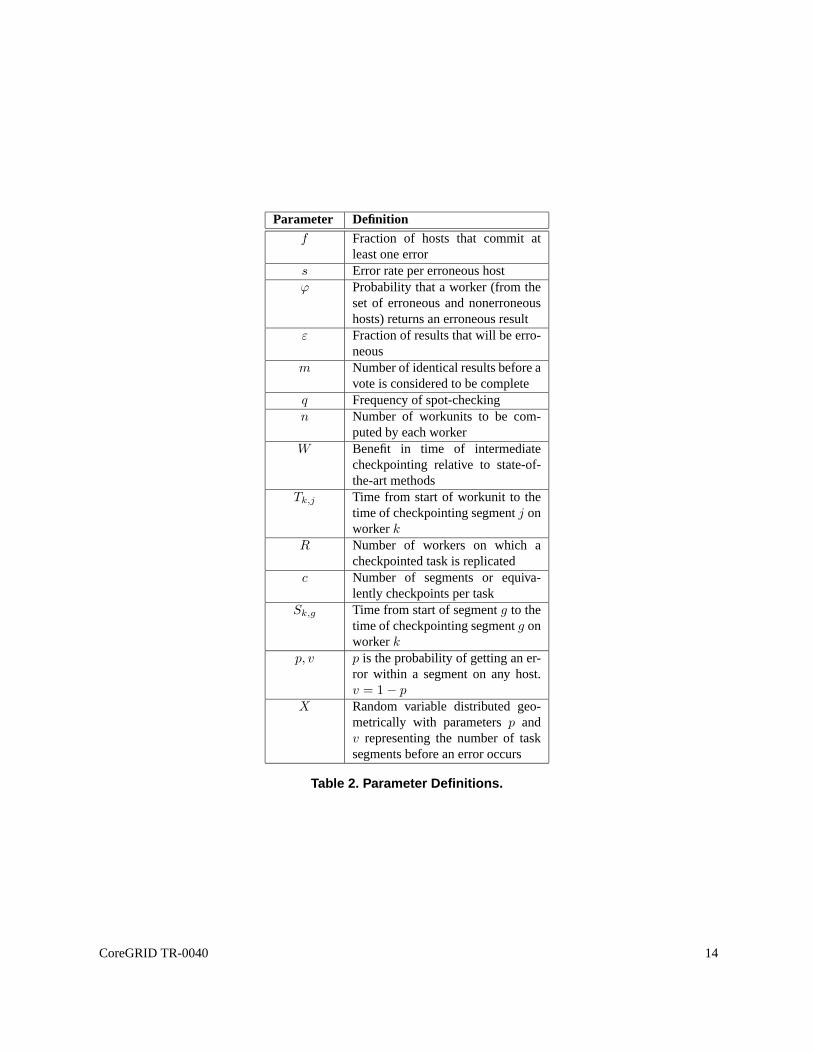
Parameter Definitionf Fraction of hosts that commit at
least one errors Error rate per erroneous hostϕ Probability that a worker (from the
set of erroneous and nonerroneoushosts) returns an erroneous result
ε Fraction of results that will be erro-neous
m Number of identical results before avote is considered to be complete
q Frequency of spot-checkingn Number of workunits to be com-
puted by each workerW Benefit in time of intermediate
checkpointing relative to state-of-the-art methods
Tk,j Time from start of workunit to thetime of checkpointing segmentj onworkerk
R Number of workers on which acheckpointed task is replicated
c Number of segments or equiva-lently checkpoints per task
Sk,g Time from start of segmentg to thetime of checkpointing segmentg onworkerk
p, v p is the probability of getting an er-ror within a segment on any host.v = 1 − p
X Random variable distributed geo-metrically with parametersp andv representing the number of tasksegments before an error occurs
Table 2. Parameter Definitions.
CoreGRID TR-0040 14

7.2 Limitations of Method
The limitations of our method include the following. First,the method measures the error rates of only a single,compute-intensive application. While we believe this application is representative of most Internet desktop grid ap-plications in terms of its high ratio of computation compared to communication, applications with different IO orcomputation patterns could potentially differ in error rates. Nonetheless, we believe this is the first study of a realproject to give quantitative estimates of error rates. Second, the method will not be able to detect all possible errors,for example those errors that cause workunits to be correct both syntactically and semantically. Third, we cannotdetermine the exact cause of errors. For example, if an output file is corrupt, we cannot determine whether the causewas due to hardware malfunction, software code modifications, a malicious user, or any other cause. Nevertheless,we do not believe the errors are due to network failures during transfers of output files. This is because BOINC has aprotocol to recover from failures (of either the worker of server) during file transmission that ensures the integrity offiles transfers [2]. In this protocol, the length of the transfer is transmitted before the actual file, and so the server isable to determine if the transfer was completed. If a failureoccurs during transmission, the worker will retry sendingthe file later from where it left off before the failure. Thus,we believe most errors occurred on the host machine itself.
Detecting all possible causes of errors in large-scale distributed systems and being able to detect all possible symp-toms of those causes is a challenging and open issue, and we will refine our validation process in future work.
7.3 Distribution of Error Rates
0 0.01 0.02 0.03 0.04 0.050
0.1
0.2
0.3
0.4
0.5
0.6
0.7
0.8
0.9
1
Fraction of workunits with errors
Cum
ulat
ive
frac
tion
of h
osts
with
err
ors
mean: 0.00651
median: 0.00143
min: 0.00019
max: 0.09813
Figure 8. Error Rates of Erroneous Hosts Only
Figure 8 shows the cumulation distribution of the fraction of workunits with errors for all hosts with at least onecorrupt result. We observe that about 80% of the hosts have error rates of .005 or less.
7.4 Turnover of Error Rates
We also computed the turnover rate for the top 0.10 of erroneous hosts (see Figure 9) and the bottom 0.90 oferroneous hosts (see Figure 10). For the top 0.10 of erroneous hosts, we find that even among the hosts that err themost often, the turnover rate can be substantial, i.e., usually greater than 0.20. This means that 0.20 of the hosts had
CoreGRID TR-0040 15

0
0.2
0.4
0.6
0.8
1
Date
27−A
pr−2
006
04−M
ay−2
006
11−M
ay−2
006
18−M
ay−2
006
25−M
ay−2
006
01−J
un−2
006
08−J
un−2
006
15−J
un−2
006
22−J
un−2
006
29−J
un−2
006
06−J
ul−20
06
13−J
ul−20
06
20−J
ul−20
06
Err
oneo
us H
ost T
urno
ver
Fra
ctio
n
1 week mean: 0.3322 week mean: 0.2724 week mean: 0.210
1 week
2 weeks
4 weeks
Figure 9. Turnover Rate of Top .10 of Erroneous Hosts
0
0.2
0.4
0.6
0.8
1
Date
27−A
pr−2
006
04−M
ay−2
006
11−M
ay−2
006
18−M
ay−2
006
25−M
ay−2
006
01−J
un−2
006
08−J
un−2
006
15−J
un−2
006
22−J
un−2
006
29−J
un−2
006
06−J
ul−20
06
13−J
ul−20
06
20−J
ul−20
06
Err
oneo
us H
ost T
urno
ver
Fra
ctio
n
1 week mean: 0.8662 week mean: 0.8164 week mean: 0.790
1 week
2 weeks
4 weeks
Figure 10. Turnover Rate of Bottom .90 of Erroneous Hosts
CoreGRID TR-0040 16
not erred in the previous period of time. Nevertheless, on average this turnover rate is lower than the rates that considerall hosts in the platform. For the bottom 0.90 of erroneous hosts, we find that the mean turnover rate is usually greaterthan 0.79, which is on average significantly higher than the rates that consider all hosts in the platform.
7.5 Intermediate CheckpointingW O R K E R 1W O R K E R 2s 1 , 1 s 1 , 2 s 1 , 3
s 2 , 1 s 2 , 1 t 1 , 2 s 2 , 3t 2 , 2T I M E
t ( 2 ) , 1 c = 3R = 2Figure 11. Example of Intermediate Checkpointing
Notes
1Zealous project participants often try to increase their ranking in the project’s list of the most productive users.2Note that when we increased the threshold to 2, 3, or 4 weeks, the conclusions of our analysis did not change.3We also tried 12, 24, 48 hour periods, but found similar results.4We also graphed the CDF for the top 10% and bottom 90% of erroneous hosts, but found similar patterns.5The reason that the mean for all hosts is different from the meanshown in Figure 8 is that here we calculate the mean using the mean of the
individual hosts averages over time, whereas the mean in Figure 8 is calculated by dividing the total number of errors over all hosts by the totalnumber of workunits completed. So the mean calculated here is taken over the mean of each host and takes into account variations over time.
6Note that the trace period began on April 20, 2006. Thus, the plots depicted in Figure 5 begin on April 27th, May 4th, and May18th,respectively. Moreover, the trace period ended on July 20th, 2006. Thus, the plots end on July 20, and July 30th, as we onlyconsidered whole timeperiods for comparison.
7Note that often computations occupy a large space in memory often near the 100MB range [6] and/or sending a small, intermediateresult forcomparison may not be possible nor efficient
8We used a constant value for the probability of error. We alsotried random variables (truncated Gaussian, exponential and others), with little ifany impact on the outcome of the trials.
9One potential limitation of this method is scalability of receiving the high-frequency digest messages if digests are sentcentrally to a “super-visor” for comparison. We are currently working on secure load-balancing techniques via distributed hash tables (DHT) to remove this limitation,and we will report on this in future work.
References
[1] B. Allen, C. An, and T. Rattel. Personal communications, April 2006.[2] D. Anderson. Boinc: A system for public-resource computing andstorage. InProceedings of the 5th IEEE/ACM International
Workshop on Grid Computing, Pittsburgh, USA, 2004.[3] D. Anderson and G. Fedak. The Computational and Storage Potential of Volunteer Computing. InProceedings of the IEEE
International Symposium on Cluster Computing and the Grid (CCGRID’06), 2006.[4] F. Araujo, P. Domingues, D. Kondo, and L. M. Silva. Validating Desktop Grid Results By Comparing Intermediate Check-
points.Submitted to 2nd Coregrid Integration Workshop, 2006.
CoreGRID TR-0040 17

[5] T. Aven. Upper (lower) bounds on the mean of the maximum (minimum) of a number of random variables.Journal ofApplied Probability, 22:723–728, 1985.
[6] Catalog of boinc projects. http://boinc-wiki.ath.cx/index.php?title=Catalog_of_BOINC_Powered_Proje%cts.
[7] H. Hartely and H. David. Universal bounds for mean range and extreme observations.The Annals of Mathematical Statistics,25:85–89, 1954.
[8] S. Kamvar, M. Schlosser, and H. Garcia-Molina. The EigenTrustAlgorithm for Reputation Management in P2P Network. InProceedings of the Twelfth International World Wide Web Conference, May 2003.
[9] D. Kondo, M. Taufer, C. Brooks, H. Casanova, and A. Chien. Characterizing and Evaluating Desktop Grids: An EmpiricalStudy. InProceedings of the IPDPS’04, April 2004.
[10] M. Litzkow, M. Livny, and M. Mutka. Condor - A Hunter of Idle Workstations. InProceedings of the 8th InternationalConference of Distributed Computing Systems (ICDCS), 1988.
[11] P. Malecot, D. Kondo, and G. Fedak. Xtremlab: A system for characterizing internet desktop grids (abstract). Inin Proceed-ings of the 6th IEEE Symposium on High-Performance Distributed Computing, 2006.
[12] D. Molnar. The SETI@home Problem.ACM Crossroads Student Magazine, september 2000.[13] R. Rivest. RFC-1321 The MD5 Message-Digest Algorithm.Network Working Group, IETF, April 1992.[14] L. Sarmenta. Sabotage-tolerance mechanisms for volunteer computing systems. InProceedings of IEEE International
Symposium on Cluster Computing and the Grid, May. 2001.[15] M. Taufer, D. Anderson, P. Cicotti, and C. L. B. III. Homogeneous redundancy: a technique to ensure integrity of molecular
simulation results using public computing. InProceedings of the International Heterogeneity in Computing Workshop, 2005.[16] S. Zhao and V. Lo. Result Verification and Trust-based Scheduling in Open Peer-to-Peer Cycle Sharing Systems. InProceed-
ings of IEEE Fifth International Conference on Peer-to-Peer Systems, May 2001.
CoreGRID TR-0040 18