Characterizing Galectin and Lysosomal Rupture's Role in ...
290
Loyola University Chicago Loyola University Chicago Loyola eCommons Loyola eCommons Dissertations Theses and Dissertations 2021 Characterizing Galectin and Lysosomal Rupture's Role in Characterizing Galectin and Lysosomal Rupture's Role in Spreading Parkinson Disease Pathology Spreading Parkinson Disease Pathology Kevin Burbidge Follow this and additional works at: https://ecommons.luc.edu/luc_diss Part of the Molecular and Cellular Neuroscience Commons Recommended Citation Recommended Citation Burbidge, Kevin, "Characterizing Galectin and Lysosomal Rupture's Role in Spreading Parkinson Disease Pathology" (2021). Dissertations. 3836. https://ecommons.luc.edu/luc_diss/3836 This Dissertation is brought to you for free and open access by the Theses and Dissertations at Loyola eCommons. It has been accepted for inclusion in Dissertations by an authorized administrator of Loyola eCommons. For more information, please contact [email protected]. This work is licensed under a Creative Commons Attribution-Noncommercial-No Derivative Works 3.0 License. Copyright © 2021 Kevin Burbidge
-
Upload
khangminh22 -
Category
Documents
-
view
2 -
download
0
Transcript of Characterizing Galectin and Lysosomal Rupture's Role in ...

Loyola University Chicago Loyola University Chicago
Loyola eCommons Loyola eCommons
Dissertations Theses and Dissertations
2021
Characterizing Galectin and Lysosomal Rupture's Role in Characterizing Galectin and Lysosomal Rupture's Role in
Spreading Parkinson Disease Pathology Spreading Parkinson Disease Pathology
Kevin Burbidge
Follow this and additional works at: https://ecommons.luc.edu/luc_diss
Part of the Molecular and Cellular Neuroscience Commons
Recommended Citation Recommended Citation Burbidge, Kevin, "Characterizing Galectin and Lysosomal Rupture's Role in Spreading Parkinson Disease Pathology" (2021). Dissertations. 3836. https://ecommons.luc.edu/luc_diss/3836
This Dissertation is brought to you for free and open access by the Theses and Dissertations at Loyola eCommons. It has been accepted for inclusion in Dissertations by an authorized administrator of Loyola eCommons. For more information, please contact [email protected].
This work is licensed under a Creative Commons Attribution-Noncommercial-No Derivative Works 3.0 License. Copyright © 2021 Kevin Burbidge
LOYOLA UNIVERSITY CHICAGO
CHARACTERIZING GALECTIN AND LYSOSOMAL RUPTURE’S ROLE IN SPREADING
PARKINSON DISEASE PATHOLOGY
A DISSERTATION SUBMITTED TO
THE FACULTY OF THE GRADUATE SCHOOL
IN CANDIDACY FOR THE DEGREE OF
DOCTORATE IN PHILOSOPHY
PROGRAM IN NEUROSCIENCE
BY
KEVIN BURBIDGE
CHICAGO, ILLINOIS
DECEMBER 2021

Copyright by Kevin Burbidge, 2021
All rights reserved.

iii
ACKNOWLEDGEMENTS
I would like to thank and acknowledge …
To my parents Ann and Steve Burbidge for believing me, raising me, and helping me get
to where I am now. I would not be here had it not been for your endless amounts of love, time,
and energy. You both have taught me so much on what it takes to be successful. You have
pushed me and provided me with the resources to allow me to do anything. To my Dad for
instilling me a scientific curiosity and the brains to understand what it means and to my Mom for
giving me the charisma to be a successful communicator.
To my brothers Andy and Jack for believing in me and supporting me. Thank you for
being the best siblings I could imagine.
To my grandparents, Jack and Nancy Burbidge and Jack and Ginger Overbye for all that
you have done to help me succeed in life. I cannot thank you enough for all that you have done
for me.
To my friends who helped me get here, taught me something new, took the time to make
me a better scientist, and gave me the support to be successful. I cannot count or list the number
of times you all have helped me.
To Ed Campbell for mentoring, polishing, and refining a rough stone to make it shine. I
appreciate to no end the skills that you have imparted to me and the relationship we have. You
have taught me much about how to be both a successful scientist and person.
To the members of the Campbell lab, past and present, who have taught me the scientific
methods and techniques to be successful. For supporting me, giving me a positive work

iv
environment, and generally being good people. To Alex Simon who cloned the DSP-α-syn
constructs and provided the initial foundation for my master’s degree project. To Bill Flavin for
imparting on me microscopy skills and the framework for my doctoral work. To Adarsh Dharan
for teaching me and assisting with endless amounts of technical help. A special thanks to Jessica
Mattick and Stephanie Zack for differentiating iPSCs into neurons for me.
To Dave Rademacher for helping me publish papers, differentiating iPSCs, making me a
better a writer, and showing me that scientific curiosity is never lost. Your assistance through
this last year is beyond what was expected, thank you.
To David, Melanie, and Steven for being a second family to me. You treat me like a
son/brother, and I am so blessed to have you all in my life. Thank you for all you have done to
help me get to where I am today. I look forward to the time we will spend together.
Finally, to my wife Kathleen for everything. For being there to celebrate in my victories
and assist me in my times of need. For being understanding in all things both school and life
related. Everyone listed here has played a role in helping me get to this point, but you have done
more. You have been a tireless foundation in supporting me, and I would not be here if not for
you. You inspire me to do good work and I am so lucky to have found someone like you. Thank
you so much for believing in me and loving me. I may not know what happens next, but I cannot
wait to spend it with you.

This work is dedicated in three parts. First, to my friends and family for all you have
done to get me here. Second, to my family members who have suffered with neurodegenerative
diseases. To my Grandma Nancy Burbidge who suffered with primary progressive aphasia and
my Grandpa Jack Burbidge for his commitment to her. To my great Grandma Virginia “Yoo-
Hoo” Mears who had Parkinson’s disease. Third, to the betterment of science and the hope of
finding a cure for Parkinson’s disease and all other neurodegenerative diseases; may this work
ultimately contribute to this process
vi
TABLE OF CONTENTS
ACKNOWLEDGEMENTS ….......................................................................................................iii
LIST OF TABLES ..........................................................................................................................x
LIST OF FIGURES .......................................................................................................................xi
LIST OF ABBREVIATIONS .....................................................................................................xiv
ABSTRACT...............................................................................................................................xxvi
CHAPTER ONE: REVIEW OF LITERATURE
Introduction to Synucleinopathies................................................................................................1
Parkinson’s Disease......................................................................................................................3
Substantia Nigra, Dopaminergic Neurons, and Neuronal Degeneration......................................4
Lewy Pathology............................................................................................................................8
α-Syn’s Original Link to Parkinson’s Disease Pathology..........................................................10
α-Syn’s Structure........................................................................................................................10
Native α-Syn’s Structure and Function.......................................................................................11
Pathological Species of α-Syn....................................................................................................13
Conformation and Structure.....................................................................................................15
Cell-to-Cell Propagation of α-Syn..............................................................................................18
Braak Staging and Hypothesis.................................................................................................18
The Prion-Like Hypothesis......................................................................................................20
Cellular α-Syn Transmission Pathways......................................................................................21
The Unconventional Secretion of α-Syn.....................................................................................24
Extracellular Vesicle Associated Transmission of α-Syn........................................................26
Non-Extracellular Vesicle Associated α-Syn Transmission....................................................29
Autophagy...................................................................................................................................31
Microautophagy, Chaperone Mediated Autophagy, and Macroautophagy.............................32
Autophagy in Neurons.............................................................................................................35
Evidence for Autophagy’s Contribution to α-Syn Accumulation...........................................38
ALP Dysfunction, Secretory Autophagy, and α-Syn................................................................40
Lysosome Dysfunction is a Hallmark of PD..............................................................................42
Lysosomes................................................................................................................................44
Lysosomal Degradation Impairment in Parkinson’s Disease...................................................45
mTOR Signaling......................................................................................................................47
AMPK Signaling......................................................................................................................51
mTOR, AMPK and Parkinson’s Disease.................................................................................52
Transcriptional Regulation of Lysosomes and Autophagosomes.............................................54
TFEB and Neurodegenerative Diseases....................................................................................56
The Cellular Response to Lysosomal Stress.............................................................................59
Galectins’ Function in the Central Nervous System.....................................................................60
vii
Galectin Facilitated Clearance of Ruptured Lysosomes...............................................................62
Lysosomal Membrane Rupture and Galectins in Neurodegenerative Diseases.........................65
Galectins, Inflammation, and Neurodegenerative Diseases.......................................................66
Galectin-8..............................................................................................................................66
Galectin-1…..........................................................................................................................67
Galectin-3…..........................................................................................................................68
Galectins as Biomarkers for Neurodegenerative Diseases..........................................................71
Concluding Remarks...................................................................................................................74
CHAPTER TWO: MATERIALS AND METHODS
Tissue Culture.............................................................................................................................75
Culture of SH-SY5Y and HeLa Cell Lines................................................................................75
Culture of iCell DopaNeurons....................................................................................................75
Culture of Human IPSCs............................................................................................................76
Induction of Midbrain Floor Plate Progenitors...........................................................................77
Differentiation of MDA Neurons................................................................................................78
Generation of DSP-α-Syn Constructs, FLuc Gal3, mCherry Gal3, and Inducible YFP-LC3B
Plasmids...................................................................................................................................79
Generation of Stable α-Syn DSP A+B, FLuc Gal3, and mCherry Gal3 Cell Lines...................79
Generation of Gal3 CRISPR Plasmids and KO Cell Lines........................................................80
Stabile Expression of S15 mCherry Construct...........................................................................81
Purification of Extracellular Vesicles from S15 mCherry 293Ts...............................................81
Purification of Extracellular Vesicles from DSP-α-Syn SH-SY5Y or IPSC MDA Neurons.....82
Nanoparticle Tracking Analysis (NTA)......................................................................................83
Non-Reducing SDS-PAGE, Western Blots & Western Antibodies...........................................83
Transmission Electron Microscopy of Cells...............................................................................85
Transmission Electron Microscopy and Immunogold Labeling of EVs....................................86
Immunofluorescence Staining of EVs........................................................................................87
Indirect ELISA of EVs................................................................................................................88
Human Bodily Fluid Sample Collection, Preparation, and Processing......................................89
Saliva........................................................................................................................................89
Plasma......................................................................................................................................91
PKH Dye Labeling of EVs.........................................................................................................92
Cell treatment and EV-MAC Immunofluorescence Staining.....................................................93
Fixation and Immunofluorescence Staining of Cells..................................................................95
Imaging Analysis Paradigm........................................................................................................96
Wide-field Fluorescence Deconvolution Microscopy and Analysis..........................................96
Bitplane Imaris Spots and Surface Algorithm Generation.........................................................99
Sensitivity and Detection in Deconvolved and Undeconvolved Images..................................101
Serial Dilutions of S15Ch EVs.................................................................................................102
Empirical Measurement of the Point Spread Function and Binning........................................104
Flow Cytometry........................................................................................................................105
Characterization of α-Syn Fibrils..............................................................................................106
Cell Viability Assay..................................................................................................................108
α-Syn Fibril and Drug Concentrations and Treatment Paradigm.............................................109
siRNA Transfection..................................................................................................................109
viii
Renilla Luciferase Assay..........................................................................................................111
MDA Neuronal Culture Transduction and Firefly Luciferase Assay.......................................112
MDA Neuronal Culture Quantitative Real-Time Polymerase Chain Reaction Assay..............113
MDA Neuronal Culture YFP-LC3B Transduction, Induction, and Treatment..........................114
α-Syn and Galectin-3 Sandwich ELISA...................................................................................115
Lysosome Dysfunction Assay and Autophagic Flux................................................................117
Statistical Analysis....................................................................................................................118
CHAPTER THREE: GENERATION AND VALIDATION OF THE EXTRACELLULAR
VESICLE MULTIPLEX ANALYSIS OF CO-LOCALIZATION (EV-MAC) WORKFLOW
Rationale...................................................................................................................................119
Results.......................................................................................................................................122
Generation of S15-mCherry Positive EVs for the Characterization of
Immunofluorescence Analysis...........................................................................................122
Immunofluorescence Imaging to Characterize EV Populations by Multiplexed Analysis
of Co- localization (EV-MAC)...........................................................................................126
The Majority of EVs in Solution are Bound to Coverslips Following Spinoculation...........133
Serial Dilution Allows Relative EV Concentration to be Determined using EV-MAC........135
PKH Dye can be used in Conjunction with EV-MAC to Identify EVs.................................136
EV-MAC can be used to Interrogate Human Biological Samples.........................................136
Discussion.................................................................................................................................139
CHAPTER FOUR: LYSOSOMAL MEMBRANE DAMAGE, AND THE SUBSEQUENT
GAL3 MEDIATED RESPONSE, CONTRIBUTE TO THE SECRETION OF α-SYN BY
AN AUTOPHAGIC MECHANISM
Rationale...................................................................................................................................143
Results.......................................................................................................................................147
Exogenous α-Syn Fibrils are Re-secreted with Endogenous α-Syn and Gal3 by the ALP...147
Exogenous and Endogenous -Syn are Released in Gal3-Containing EVs..........................153
Characterization of Human IPSC Derived Midbrain Dopamine Neurons.............................160
Lysosomal Membrane Damage Inhibits mTOR and Upregulates Autophagy in Human
MDA Neurons....................................................................................................................162
The Reciprocal Secretion of α-Syn and Gal3 is Regulated by Trim16 and ATG16L1.........163
-Syn Fibrils Increase the Association of Trim16 and ATG16L1 with mCherry Gal3........168
Depletion of Gal3 and Trim16 in MDA Neurons Reduces the Recruitment of α-Syn
Fibrils to Autophagic Compartments..................................................................................171
Gal3 Depletion Impairs Lysosomal Degradative Function and Reduces Autophagic Flux
During α-Syn Fibril Treatment...........................................................................................172
Lysosomal Damage Increases α-Syn and Gal3 Secretion in Association with Increased
Autophagic Activity............................................................................................................176
Gal3 Affects Endo/Lysosomal Membrane Damage Induced Amphisome Formation..........182
Gal3 is Readily Released in α-Syn Associated EVs..............................................................185
Depletion of Gal3 or Trim16 Affects the Co-Localization of Secreted α-Syn......................188
Early Inhibition of Autophagy Reduces Autophagosome-Associated α-Syn Secretion........193
Discussion.................................................................................................................................195
Concluding Remarks ................................................................................................................203

ix
APPENDIX..................................................................................................................................208
REFERENCES ............................................................................................................................210
VITA ...........................................................................................................................................262

x
LIST OF TABLES
Table 1. Primer Table..................................................................................................................114
xi
LIST OF FIGURES
Figure 1: Structure and Domains of α-Syn. ..................................................................................13
Figure 2: Cellular Activation of Autophagy and Autophagosome Formation................................33
Figure 3: Lysosomal Signaling Pathways in Response to Various Stimuli.....................................50
Figure 4: Relationship between Lysosomal Function and TFEB Translocation.............................57
Figure 5: Detection of endogenous protein markers on EVs released from 293T cells.................123
Figure 6: EV-MAC Reproducibly Stains EV Populations Following Enrichment from Tissue
Culture Supernatant.......................................................................................................125
Figure 7: Masking Algorithms Selectively Removes S15Ch+ Aggregates and is Selective
for Cultured Media.......................................................................................................127
Figure 8: S15Ch EVs Relative Levels of LAMP1 and Tetraspanin Proteins Determined by
Indirect EV ELISA.......................................................................................................129
Figure 9: Deconvolution Does Not Change the Co-localization Distribution of S15Ch+ EVs
with Tetraspanins and LAMP1.....................................................................................130
Figure 10: Deconvolution Increases the Limit of Detection of Spots Masking Algorithm...........132
Figure 11: Analysis of EV Recovery and Quantification using EV-MAC....................................133
Figure 12: PKH Dyed WT 293T EVs Co-localize with CD81, LAMP1, and Readily Identify
S15Ch 293T EVs........................................................................................................136
Figure 13: EV-MAC of Concentrated EVs Isolated from Plasma and Saliva.............................138
Figure 14: Cartoon Schematics of the Dual Split Protein (DSP) α-Syn Construct........................147
Figure 15: Western blot Validation of α-Syn DSP -A and -B Construct Integrity in
Co-transduced Cells....................................................................................................148
Figure 16: DSP-α-Syn is Secreted in Response to Lysosomal Acidification Inhibition and
Exogenously Added α-Syn Fibrils..............................................................................149
xii
Figure 17: Secreted Gal3 and DSP-α-Syn are in EVs.................................................................154
Figure 18: Secreted Gal3 and DSP-α-Syn Co-localize with Exogenously Added α-Syn
Fibrils..........................................................................................................................156
Figure 19: DSP-α-syn Intensity is Greater in DSP-α-Syn EVs Positive for α-syn Fibrils.............158
Figure 20: Characterization of Human MDA Neuronal Cultures Derived from Human IPSCs....159
Figure 21: MDA Neurons Derived from Human iPSCs Form Symmetric (Functionally
Inhibitory or Modulatory) Synapses..........................................................................161
Figure 22: Lysosomal Damage Following α-Syn Fibril or LLOME Treatment Elicits an
Autophagic Response in MDA Neurons.....................................................................162
Figure 23: Neuronal Gal3 Influences α-Syn Secretion and is Reciprocally Secreted During
α-Syn Fibrils Treatment.............................................................................................164
Figure 24: Neuronal Depletion of Trim16 or ATG16L1 Influences α-Syn and Gal3 Secretion....166
Figure 25: TBK1 and Optineurin Knockdown Reduces DSP-α-Syn and Gal3 secretion in
DSP-α-syn SH-SY5Y Cells........................................................................................168
Figure 26: Stabile mCherry Gal3 Expression in SH-SY5Y Cells.................................................169
Figure 27: α-Syn Fibril Treatment Increases the Co-localization of Trim16 and ATG16L1
with mCherry Gal3 and α-Syn Fibrils........................................................................170
Figure 28: Gal3 and Trim16 Knockdown in MDA Neurons Reduces the Recruitment of
α-Syn Fibrils to Autophagosomes...............................................................................171
Figure 29: Gal3 Depletion or α-Syn Fibrils Treatment Impairs Lysosome Function....................173
Figure 30: Gal3 Depletion Reduces Autophagic Flux During α-Syn Fibrils Treatment...............175
Figure 31: Relative Gal3 and Gal8 Expression in DSP-α-Syn and MDA Neurons.......................176
Figure 32: Lysosomal Damage Increases α-Syn and Gal3 Secretion in Association with
Increased Autophagic Activity Relative Fold Difference in α-Syn............................178
Figure 33: Lysosomal Damage Affects Autophagosome Formation in Gal3 or Trim16
Depleted MDA Neurons.............................................................................................180
Figure 34: TFEB Translocation and Transcription is Maintained in Gal3 KO SH-SY5Y cells.....181

xiii
Figure 35: Lysosomal Rupture Increases the Formation of Amphisomes.....................................183
Figure 36: Gal3 KO Reduces Lysosome Rupture Induced Amphisome Formation......................184
Figure 37: Gal3 Inhibition Affects the Composition of Secreted Extracellular Vesicles from
MDA Neurons.............................................................................................................186
Figure 38: ATG7 Depletion Does Not Affect MDA Cell Viability..............................................189
Figure 39: Gal3 and Trim16 Depletion Reduce Gal3 and α-Syn Associated Secretion.................190
Figure 40: Impaired Autophagosomes Formation Decreases the Unconventional Secretion of
α-Syn and Gal3...........................................................................................................194
Figure 41: Summary Cartoon of Hypothesized Mechanism........................................................197

xiv
LIST OF ABBREVIATIONS
Microgram (μg)
Microliter (μl)
Micrometer (μm)
transmission electron microscopy (TEM)
central nervous system (CNS)
Alzheimer’s disease (AD)
Amyotrophic lateral sclerosis (ALS)
Parkinson’s disease (PD)
Huntington’s disease (HD)
multiple systems atrophy (MSA)
dopamine/dopaminergic (DA)
substantia nigra (SN)
SN pars compacta (SNpc)
Lewy Bodies (LBs
Acetylcholine/cholinergic (ACh)
norepinephrine/noradrenergic (NE)
1-methyl-4-phenyl-1,2,3,6-tetrahydropyridine (MPTP)
Desmethylprodine (MPPP)
adenosine-triphosphate (ATP)
reactive oxygen species (ROS)

xv
L-dihydroxyphenylalanine (L-DOPA)
induced pluripotent stem cells (IPSCs)
midbrain DA (mDA)
glucocerebrosidase (GBA1)
Hematoxylin and eosin (H&E)
Lewy neurites (LNs)
multiple systems atrophy (MSA)
glial cytoplasmic inclusions (GCIs)
Alanine53Threonine (A53T)
amyloid-binding central domain (NAC)
both β- and γ-synuclein (β-syn and γ-syn)
terminal Soluble N-ethylmaleimide-sensitive factor Attachment Protein Receptor (SNARE)
complexes
picrotoxin (PTX),
gamma-aminobutyric acid (GABA)
tetrodotoxin (TTX)
kilodalton (kDa)
wild-type (WT)
Prion Protein (PrP)
amyloid beta (amyloid β/Aβ)
Alzheimer’s disease (AD)
TAR DNA-binding protein 43 (TDP43)
superoxide dismutase 1 (SOD1)

xvi
endoplasmic reticulum (ER)
interluken-1 (IL-1)
interluken-1beta (IL-1β)
ATP-binding cassette (ABC) transporters
extracellular vesicle (EVs)
intraluminal vesicles (ILVs)
multivesicular bodies (MVBs)
the endosomal sorting complex required for transport protein complex (ESCRT)
vacuolar protein sorting associated protein 4 (Vps4)
programmed cell death 6 interacting protein (ALIX)
tumor susceptibility gene 101 (TSG101)
cerebral spinal fluid (CSF)
dual-split protein (DSP)
4-hydroxynonenal (HNE)
human embryonic kidney (HEK)
lymphocyte activation gene 3 (LAG3)
α3-Na+/K+-ATPase (α3-NKA)
amyloid β precursor-like protein 1 (APLP1)
toll-like receptor-2 (TLR2)
autophagic-lysosomal pathway (ALP)
AuTophaGy-related (ATG)
chaperone mediated autophagy (CMA)
mammalian target of rapamycin (mTOR)
xvii
coat protein complex II (COPII)
Unc-51 Like Autophagy Activating Kinase 1 (ULK1/ATG1)
phosphatidylinositol 3-kinase (PI3K III)
phosphatidylinositol 3-phosphate (PI3P)
WD repeat domain phosphoinositide interacting protein 2 (WIPI2)
microtubule-associated protein 1 light chain 3 (LC3)
sequestosome 1 (p62/SQSTM-1)
nuclear dot protein 52 kDa/calcium-binding and coiled-coil domain containing protein 2
(NDP52/CALCOCO2)
neighbor of breast cancer 1 gene (NBR1)
optineurin (OPTN)
γ-aminobutyric acid receptor-associated protein (GABARAP)
short-hairpin RNA (shRNA)
ATG7 knockout (KO)
leucine-rich repeat kinase 2 (LRRK2)
3-methyladenine (3-MA)
high mobility group box 1 (HMGB1)
knockdown (KD)
bafilomycin-A1 (Baf-A1)
transcription factor EB (TFEB)
tubulin polymerization promoting protein (TPPP)
enhanced green fluorescence protein (eGFP)
parkin (PRKN)
xviii
PTEN inducible kinase 1 (PINK1)
genome wide associated studies (GWAS)
lysosome associated membrane protein -1 and -2 (LAMP1 and LAMP2)
glucocerebrosidase (GCase)
recombination activation gene (RAG)
guanosine triphosphatase (GTPase)
Na+/ glutamine and arginine amino acid transporter 2 (SLC38A2)
Coordinated Lysosomal Expression and Regulation (CLEAR)
MTOR Associated Protein, LST8 Homolog (mLST8)
DEP Domain Containing MTOR Interacting Protein (DEPTOR)
Tel2 interacting protein 1 (Tti1)
Telomere length regulation protein 2 (Tel2)
proline-rich AKT substrate of 40 kDa (PRAS40)
Rapamycin-insensitive companion of mammalian target of rapamycin (RICTOR)
Ras homolog enriched in brain (RHEB)
GTPase activating protein (GAP)
Adenosine diphosphate ribosylation factor-1 (ARF1)
Folliculin-Folliculin interacting protein 2 (FNIP2)
liver kinase B1 (LKB1)
AMP-activated protein kinase (AMPK)
adenosine monophosphate (AMP)
tuberous sclerosis complex -1 and -2 (TSC1-TSC2)
The microphthalmia transcription factor gene family (MIT/TFE)

xix
transcription factor binding to IGHM enhancer 3 (TFE3)
microphthalmia-associated transcription factor (MITF)
the Krüppel-associated box (KRAB)
c-Jun N-terminal kinase (JNK) activity
charged multivesicular body protein 4B (CHMP4B)
Calcium (Ca2+)
soybean ascorbate peroxidase (APE1)
carbohydrate recognition domain (CRD)
L1 neural cell adhesion molecule (L1CAM/CD171)
casein kinase 1 (CK1)
glycyl-l-phenylalanine 2-naphthylamide (GPN),
leucyl-L-leucine methyl ester (LLOME)
GFP-PolyQ74 (huntingtin protein)
lipopolysaccharide (LPS)
inducible nitric oxide synthase (iNOS)
cyclooxygenase-2 (COX-2)
tumor necrosis factor-α (TNF-α)
single nucleotide polymorphisms (SNPs)
interleukin-2 and -12 (IL-2 and IL-12)
human umbilical cord mesenchymal stem cells (hUC-MSCs)
Amyotrophic Lateral Sclerosis (ALS)
fused in sarcoma (FUS)
enzyme linked immunosorbent assay (ELISA)

xx
inflammatory bowel disease (IBD)
mini-mental state exam (MMSE)
fetal bovine serum (FBS)
American Type Culture Collection (ATCC)
reverse transcriptase-polymerase chain reaction (RT-PCR)
knockout serum replacement (KSR)
Small Mothers Against Decapetaplegic (SMAD)
human sonic hedgehog N-terminus (SHH)
human fibroblast growth factor 8 a isoform (FGF8a)
Minimum Essential Media Non-Essential Amino Acids solution (MEM-NEAA)
2-mercopatoethanol (2-ME)
human brain-derived neurotrophic factor protein (BDNF)
dibutyryl cyclic adenosine monophosphate (cAMP)
polyethylenimine (PEI)
Nanoparticle tracking analysis (NTA)
SDS-polyacrylamide gel electrophoresis (SDS-PAGE)
Glyceraldehyde-3-Phosphate Dehydrogenase (GAPDH)
2,4,6-Tris-(dimethylaminomethyl)phenol (DMP-30)
normal donkey serum (NDS)
streptavidin (SAV)
S15-mCherry (S15Ch)
wheat germ agglutinin (WGA)
piperazine-N-N′bis[2-ethanesulfonic acid] (PIPES)
xxi
fluorescein isothiocyanate (FITC)
Dulbecco’s phosphate buffered saline (DPBS)
4′,6-diamino-2-phenylindole (DAPI)
3-dimensional (3D)
maximum intensity projections (MIPs)
bicinchoninic acid (BCA)
yellow fluorescence protein (YFP)
point spread function (PSF)
full width half max (FWHM)
phosphate buffered saline (PBS)
phenylmethanesulfonyl fluoride (PMSF)
l-lactate dehydrogenase (LDH)
Methoxyphenazine methosulfate (MPMS)
nicotinamide adenine dinucleotide (NAD)
iodonitrotetrazolium chloride (INT)
dimethyl sulfoxide (DMSO)
Renilla luciferase (RLuc)
complementary DNA (cDNA)
Actin γ 1 (ACTG1)
NADH:ubiquinone oxidoreductase subunit B1 (NDUFB1)
3,3′, 5, 5-tetramethylbenzidine (TMB)
relative fluorescence units (RFU)
extracellular vesicle multiplex analysis of co-localization (EV-MAC)

xxii
single molecule localization microscopy (qSMLM)
autophagy-lysosomal pathway (ALP)
galectin-8 (Gal8)
galectin-9 (Gal9)
tripartite motif containing 16 (Trim16)
Dual Split Protein (DSP)
phospho-serine129 (pSer129) α-syn
positive (+)
Secondary antibody (2°Ab)
midbrain dopamine (mDA)
stage specific embryonic antigen 4 (SSEA-4)
tumor rejection antigen 1-81 (Tra-1-81)
octamer binding transcription factor 3/4 (OCT 3/4)
LIM homeobox transcription factor 1, alpha (LMX1A)
forkhead box protein A2 (FOXA2)
nuclear receptor related protein 1 (Nurr1)
tyrosine hydroxylase (TH)
transmission electron microscopy (TEM)
P70 ribosomal protein S6 kinase (P70 S6K1)
Firefly Luciferase (FLuc)
Small interfering ribonucleic acid (siRNA)
tank binding kinase 1 (TBK1)
optineurin (OPTN)
xxiii
Autophagy Related 16 Like 1 (ATG16L1)
yellow fluorescent protein-Microtubule-associated proteins 1A/1B light chain 3B (YFP-LC3B)
area under the curve (AUC)
relative light units (RLUs)
relative fluorescence units (RFUs)
Wortmannin (Wor)
phosphatidylinositol 3-kinase (PI3K)
xxiv
ABSTRACT
The misfolding and subsequent accumulation of alpha-synuclein (α-syn) is central to the
pathogenesis of Parkinson’s disease (PD) [258, 292, 304, 305, 407]. Several lines of evidence
suggest pathological α-syn spread cell-to-cell via a “prion-like” mechanism [258, 292, 304, 305,
407]. Furthermore, this pathological α-syn is capable of “seeding” further misfolding of non-
pathological α-syn, converting them to the pathological form. While a vast body of both genetic
and experimental evidence indicates that α-syn is critical to PD development, how α-syn induces
progressive neuronal dysfunction and cell death remains unclear.
Autophagy, conventional for macroautophagy, is the primary degradation pathway for α-
syn aggregates [211]. Autophagy also influences the unconventional secretion of both
pathological and non-pathological α-syn [63, 106, 182]. Evidence ranging from genetic,
experimental, and PD brain tissue strongly implicate impaired autophagy as both a symptom and
contributor to disease pathology [211, 386]. Additionally, autophagic dysfunction influences the
secretion of pathological α-syn via extracellular vesicles (EVs) [41, 132, 155, 184, 192, 225, 279,
387]. Notwithstanding, methods to identify and characterize subpopulations of EVs from the
total population are lacking. To address this, an imaging-based workflow utilizing
immunofluorescence staining and quantitative fluorescent microscopy was formulated to assess
the protein composition to characterize individual EVs via Multiplexed Analysis of Co-
localization (EV-MAC). Using this EV-MAC workflow secreted α-syn associated EVs were
analyzed in the context of PD pathological stimuli.
xxv
Our lab previously showed that treating cells with oligomerized, α-syn fibrils results in
their endocytosis into endo/lysosomal compartments, where they induced rupture, and are then
recruited to the autophagic-lysosomal pathway [147, 153]. PD brain tissue stained for the known
lysosomal rupture marker, galectin-3 (Gal3), revealed pathological α-syn aggregates were readily
Gal3 positive, suggesting a potential link between lysosomal rupture, Gal3, and α-syn
accumulation [147]. However, like α-syn, Gal3 is unconventionally secreted in association with
EVs and during autophagy impairment. Yet, whether Gal3 or lysosomal rupture affects α-syn
secretion, and the underlying mechanisms by which this process could occur are unknown.
Here, evidence for a cellular mechanism that explains the cell-to-cell transfer of
pathological forms of α-syn is provided. We demonstrate lysosomal rupture, Gal3 recruitment
and, in association with its autophagic adaptor protein, tripartite motif containing 16 (Trim16),
and autophagy related 16 like 1 (ATG16L1), stimulate α-syn secretion via an unconventional
autophagic pathway. Collectively, this work may contribute to improved diagnostic methods and
therapeutics for synucleinopathies.
1
CHAPTER 1
REVIEW OF THE LITERATURE
Introduction to Synucleinopathies.
The central nervous system (CNS), comprised of the brain and the spinal cord, is
responsible for communicating incredibly complex signals through-out the body in fractions of
seconds. This process occurs through the transfer of chemical messages that generate electrical
signals within the primary communicating cells of the CNS, known as neurons. Most of these
neurons are formed during gestation and are meant to last an entire lifetime. It is the deterioration
of neurons that results in neurodegenerative diseases. Initially, neuronal loss may result in mild
symptoms, such as an inability to remember a name or issues with coordination. As large
numbers of neurons are lost, symptoms worsen which can result in the inability to think clearly,
walk unassisted, or generally function in the world. Ultimately, most neurodegenerative diseases
are fatal.
It is unknown what causes neurodegenerative diseases. Familial cases from genetic
mutations within specific genes makeup a relatively small fraction of total cases. Thus, most
cases are of idiopathic (or sporadic) origin, with no known cause. Currently in the United States,
5.8 million with Alzheimer’s disease (AD), ~1 million with Parkinson’s disease (PD), 400,000
with multiple systems atrophy (MSA), 50,000 with Amyotrophic lateral sclerosis (ALS or Lou
Gehrig’s disease), and 41,000 with Huntington’s disease (HD) [301, 321, 351, 522, 549]. Age is
the greatest risk factor for the development of neurodegenerative diseases. Because

2
neurodegenerative diseases occur primarily later in life, the incidence rate is expected to rise
with an increasingly aging population. There is no cure for neurodegenerative diseases and few
treatment options exist. It is of increasing urgency to find treatment options and cures to combat
these diseases.
Overall, neurodegenerative diseases share several commonalities including the
accumulation of aggregated proteins within the brain and progressive cell death. The shared
commonalities between neurodegenerative disease make the discovery of therapeutic
interventions for one disease potentially useful for multiple neurodegenerative diseases.
Among the categories of neurodegenerative diseases are synucleinopathies. The defining
criterion of synucleinopathies is the accumulation of the protein alpha-synuclein (α-syn) within
the brain [8, 160]. During synucleinopathy disease progression, it is believed α-syn accumulation
stems from its misfolding. Misfolded α-syn can template and catalyze further misfolding of
native α-syn subsequently resulting in its aggregation. These aggregated forms of α-syn can
induce cellular dysfunction and result in the formation of dense, proteinaceous inclusions known
as Lewy pathology which accumulate in cells. In addition to accumulating within cells,
misfolded α-syn is thought to spread from cell-to-cell during disease progression. In this way,
misfolded α-syn can spread cellular dysfunction via transfer and subsequently templating further
misfolding of α-syn in the recipient cells in a continuous cycle. Thus, misfolded α-syn is
believed responsible for the spreading pathology and cellular dysfunction that is observed in PD
and other synucleinopathies. Understanding what influences α-syn misfolding, and how
misfolded α-syn is transferred and accumulates are integral to developing effective treatments.
In PD and the other synucleinopathies, the observed clinical symptoms are thought to
occur from self-propagating pathology that spreads throughout the brain [258, 292, 304, 305,

3
407]. The consequence of this spreading pathology results in physiological dysfunction,
inflammation, and cell death in the affected tissues [480]. The primary treatment for PD is
levodopa which is used as a replacement therapy during the early stages of the disease [92]. Yet,
the continuing progression of disease reduces the effectiveness of levodopa overtime. Deep brain
stimulation is another treatment for advance stage individuals with PD, but similarly does not
treat the underlying cause of the disease [388]. Therefore, understanding cellular mechanisms
associated with disease progression can inform possible treatment options.
In this chapter, a review of the following topics will be covered: (1) a general background
on synucleinopathies, (2) α-syn and cell-to-cell pathological spreading, (3) Autophagy and its
involvement in α-syn accumulation and transmission, (4) Autophagic-lysosomal pathway
dysfunction in connection with synucleinopathies, (5) The role of galectins in neurodegenerative
diseases.
Parkinson’s Disease
Among synucleionpathies, PD is the most infamous. PD is the second most prevalent
neurodegenerative disease and is estimated to affect 7 in 100,000 of individuals between the ages
of 40-50 [58]. This incidence rate increases with age, where it is estimated to affect 1,900 in
100,000 of people over 80 [58]. Historically, the first documented cases of PD were by James
Parkinson in his work “Essay on the Shaking Palsy” more than 200 years ago [366]. In his essay,
Parkinson characterized a disease associated with motor dysfunction from six individuals. Many
of the symptoms Parkinson’s initially described remain hallmark diagnostic criteria of the
disease including bradykinesia, tremors, rigid movement, and postural instability. On the whole,
these symptoms are referred to as “Parkinsonisms”. Yet, individuals with PD also suffer from
non-motor symptoms such as depression, constipation, and REM sleep disorder which may
4
precede motor symptoms in some individuals [388]. Additionally, even with efficacious
treatment of underlying motor symptoms ~80% of individuals will experience cognitive decline
and ultimately progress to Parkinson’s disease Dementia (PDD) [223]. Individuals who suffer
from either PDD or Dementia with Lewy bodies (DLB), another prominent synucleinopathy,
display similar levels of cognitive decline and have comparable deficits in executive function,
visual-spatial processing, and verbal learning [7]. Pathologically, distinguishing between PDD
and DLB is nearly impossible [7]. However, individuals with DLB first show signs of cognitive
deficits before progressing to motor dysfunction. Thus, PDD and DLB diagnostic criteria is
predicated on the temporal manifestation of symptoms rather than pathology [521]. Notably, in
addition to the formation of intracellular deposits α-syn, the majority of synucleinopathies have
eventual dopaminergic neuron degeneration. As a result, the majority of work surrounding PD
and other synucleinopathies focuses on the loss dopaminergic neurons (DA).
Substantia Nigra, Dopaminergic Neurons, and Neuronal Degeneration
The substantia nigra (SN), Latin for “black substance”, gets its name from its distinct
dark complexion. The striking difference in color makes it identifiable by the naked eye in
coronal, midbrain cross-sections relative to the other neighboring regions of the basal ganglia.
This unique characteristic is due to the large number of DA neurons, which produce a dark,
neuromelanin as a byproduct of dopamine synthesis and metabolism. Thus, DA neurons slowly
accumulate neuromelanin over one’s lifetime. The accumulation of this neuromelanin is most
prominent within the SN pars compacta (SNpc) and is the region that undergoes the most
extensive degeneration in PD.
In PD, disease diagnosis requires both the presence of Lewy Bodies (LBs) as well as
clinical motor symptoms resulting from selective loss of SN DA neurons. According to the
5
United Parkinson disease Rating Scale, ~50% of the nigral DA neurons are lost by disease onset
and continuing symptoms correlate with increased loss. It has been shown other regions of the
brain are also affected. For example, the cholinergic (ACh) and noradrenergic (NE) neurons of
the pedunculopontine nucleus and locus coeruleus, respectively, both undergo degeneration
during PD [169, 205]. Increasing evidence suggests that PD pathology does not originate in the
SN, but rather progresses to it. The point remains, that the nigral DA neurons are the most
affected during synucleinopathy pathogenesis. Thus, the question is raised, “Why are the
dopaminergic neurons of substantia nigra particularly vulnerable?”
A multitude of mechanistic factors are known to contribute to nigral DA neuron death as
a part of PD and other synucleinopathy pathogenesis. The underlying cause can be from either
genetic or environmental means. The most extreme of these environmental factors being the
small group of drug addicts whom selectively induced DA neuron death and developed PD after
injecting the accidently synthesized 1-methyl-4-phenyl-1,2,3,6-tetrahydropyridine (MPTP)
during the production of the opioid, Desmethylprodine (MPPP) [272]. In addition, exposure to
pesticides which including the herbicide, paraquat, and the insecticide, rotenone, are associated
with increased PD [49, 163, 176, 201, 297]. Conversely, mutations in genes such as SNCA, the
gene that encodes for α-syn, are also causative in familial PD. Moreover, the misfolding,
accumulation, and transmission of α-syn is believed responsible for the development of
idiopathic PD and is supported by a vast body of literature. In this way, mechanisms that
contribute to the α-syn pathology such as impaired autophagy, lysosomal dysfunction, and
inflammation are ultimately responsible for developing PD and other synucleinopathies by
causing DA neuron death. Before reviewing these individual mechanisms, this section will focus
on the why nigral dopaminergic neurons are lost.

6
One compelling explanation articulated by Bolam and Pissadaki [39], but previously
proposed by others [45, 46, 227, 358], argues that the nigral DA neuron’s morphology and high
energy requirements put them at a unique disadvantage to stressors. One commonality among the
neurons within the regions that undergo degeneration (the ACh neurons of the pedunculopontine
nucleus, the NE neurons of the locus coeruleus, as well as the DA neurons of the SN) are their
relatively long, unmyelinated regions and extensive number of synapses which require
tremendous amounts of energy to maintain [39, 45, 46]. To further illustrate this point, if the
totality of arborizations from an average human SNpc DA neuron were arranged from end-to-
end, they would have an estimated length of 4.5 meters. In addition, it is estimated that these
neurons form between 1 and 2.4 million synapses on average [39]. In point of comparison, in rat
brains, the SNpc DA neurons form at least two orders of magnitude more synapses relative to
other basal ganglia neurons. DA neurons function as pacemaker neurons, constantly oscillating
between firing states, and subsequently require a massive pool of adenosine-triphosphate (ATP)
to reset their membrane potential. For frame of reference, while the brain is 2% of the total
human body by mass, it uses 20% of its energy at resting levels, of which the majority of that
20% is used to run the sodium (Na+)/potassium (K+) pump to reset neuronal membrane potential
[136]. Bolam and Pissadaki go on to argue that under normal conditions these dopaminergic
neurons are capable of maintain their function but have minimal room to compensate in response
to insult. Furthermore, they propose when these dopaminergic neurons misstep they can
snowball. Thus, slight impairments in DA neuronal function may ultimately escalate into total
misfunction.
Another commonality shared between pathogenically susceptible DA and NE neurons are
their neurotransmitter synthesis pathway, in that dopamine is a precursor to norepinephrine.
7
Fundamentally, the production of reactive oxygen species (ROS) is a toxic process and a
contributing factor in nearly all diseases including synucleinopathies. Mechanistically, ROS can
damage DNA, lipids, and proteins in cells resulting in cellular dysfunction and apoptosis. On an
intrinsic level, the generation of ATP by aerobic cellular respiration leads to the production of
ROS. Therefore, cells that utilize large amounts of energy, such as DA neurons, also have the
potential to generate large amounts of ROS. In the case of DA neurons, they also must cope with
being a terminally differentiated cell that are expected to last an entire lifetime, as well as the
produce and metabolize dopamine. The breakdown of DA generates ROS. Additionally,
dopamine and its precursor L-dihydroxyphenylalanine (L-DOPA) are highly prone to enzymatic
oxidation which also results in the production of ROS. To combat these issues, cells have
evolved so dopaminergic synaptic vesicles also contain antioxidant molecules, such as ascorbic
acid [477]. Interestingly, the generation of neuromelanin is thought to correlate with improper
cytosolic DA metabolism as artificially increasing cytosolic DA levels in a DA neuronal culture
model increased neuromelanin pigmentation [476]. Moreover, it is thought that increased
neuromelanin production is associated with increased cell death.
Further supporting DA neurons innate vulnerability and low stress tolerance, are studies
using induced pluripotent stem cells (IPSCs) initially derived from individuals with PD which
are then differentiated into midbrain DA (mDA) cultures. Multiple studies using cells derived
from individuals with PD, both familial and idiopathic, reproduced phenotypic changes when
differentiated into mDA neurons consistent with disease pathology despite being derived from
fibroblasts or hemopoietic cells [429, 440, 567]. MDA neurons generated from IPSCs derived
from familial PD patients, two different SNCA triplication lines and a N370S glucocerebrosidase
(GBA1) line, had reduced lysosomal degradative enzyme activity [330]. Multiple patient derived

8
IPSCs from individuals with idiopathic PD and the familial PD mutant, G2019S leucine-rich
repeat kinase 2 (LRRK2), had impaired autophagic capabilities and increased caspase-3
activation compared to control differentiated mDA neurons [429]. IPSC derived mDA neurons
from two individuals with early onset PD showed marked changes at the stage of neuronal stem
cells including impaired autophagy, cell division, and other phenotypic changes consistent with
accelerated aging [567]. Collectively, the low stress tolerance of DA neurons, because of their
unique structure and function, puts them at a marked disadvantage to cope with the consequences
of synucleinopathy pathogenesis. This results in their misfunction and cell death. Thus, DA
neurons may suffer from being the proverbial “canary in the coalmine” during PD disease
pathogenesis. However, unlike the canary which served to warn miners of imminent danger, by
the time motor dysfunction is observed, considerable DA neuron death has occurred [141, 414].
Therefore, the discovery of biomarkers for earlier synucleinopathy disease diagnosis in
combination with neuroprotectives to prevent vulnerable neuron cell death represent a possible
therapeutic avenue to slow disease progression.
Lewy Pathology
The histopathological diagnostic definition of synucleinopathies is the formation of
degradation resistant, proteinaceous inclusions primarily composed of misfolded, aggregated α-
syn in the brain. The identification of these inclusions was first described by Fritz Jacob Heinrich
Lewy in his document “Paralysis agitans” in 1912 [412]. In Fritz Lewy’s original work, he noted
that abnormal round, perinuclear deposits were present in PD brain tissue. Hematoxylin and
eosin (H&E) staining of this tissue revealed that these deposits were eosinophilic with a dense,
granular core. Six years later these structures would be coined “Lewy Bodies” (LBs) by
Konstantin Tretiakoff in his 1919 doctoral thesis where he first described an association between
9
the presence of LBs and significant degeneration of the SN among post-mortem PD brains [412].
In 1997, a paper demonstrated the presence of α-syn in Lewy bodies for the first time and in
1998, the same lab showed that filamentous α-syn surrounded the dense core of LBs by electron
microscopy [464, 465].
In addition to LBs, other types of α-syn deposits are present in synucleinopathies. Lewy
neurites (LNs) are another common histopathological feature in PD, DLB, as well as another rare
synucleinopathy known as multiple systems atrophy (MSA). Together LBs and LNs are referred
to as Lewy pathology and share similar features including filamentous α-syn, dense granular
structure. However, LNs differ from LBs in that they are more abundant and are found within
neuronal axons or dendrites rather than in close proximity to the nucleus [249]. By comparison,
pale bodies (PBs), are cytoplasmic inclusions also primarily composed of filamentous α-syn but
are structurally unorganized and not readily stained with H&E. PBs are often found in neurons
that also have LBs present and correlate in number. Yet, because PBs often outnumber LBs in
individuals with non-symptomatic or short duration synucleinopathies, PBs are thought to be
precursors to LBs [104]. Finally, glial cytoplasmic inclusions (GCIs) are commonly found in
MSA [512]. Relative to the previous described inclusions, GCIs are specifically found in the
glial oligodendrocytes rather than in neurons and are rarely found next to the nucleus [512].
While the identification of one or more of these inclusions in post-mortem brain tissue is
required for a definitive diagnosis of a synucleinopathy, their role in these diseases is unknown
and hotly debated. It was once believed the formation of these aggregates was responsible for
underlying disease pathogenesis. This line of thinking has since been contested, as current work
suggests the formation of these inclusions is a cellular defensive mechanism. Instead, the initial
10
misfolding and formation of higher order α-syn species is thought responsible for the underlying
cellular dysfunction and neurotoxicity observed in synucleinopathies.
α-Syn’s Original Link to Parkinson’s Disease Pathology
In 1988, Maroteaux et al. discovered alpha-synuclein (α-syn) after its extraction from
Torpedo Ray and named it based on its cellular localization at the synapse and nucleus [320]. It
was not until 1997 that mutations in SNCA, the gene that encodes for α-syn, were first linked to
PD [390]. To this end, In 1996 Polymeropoulos et. al, first determined mutations within the
chromosome 4q21-q23 segment were associated with familial PD from a large Italian kindred
with a strong pedigree of the disease [389]. In 1997, they identified the resulting mutation caused
a substitution in the 53rd amino acid of Alanine for Threonine (A53T) in α-syn [390].
Ultimately, it was approximated that among family members who carried the A53T mutation,
85% developed PD [390]. This was the first documented case of a single gene being sufficient
for the development of PD. Both the discovery of this α-syn mutation as an underlying cause of
familial PD as well as the inclusion of fibrillar α-syn in LBs [464, 465] would ultimately
contribute to α-syn becoming the primary candidate responsible for the development of
idiopathic PD.
α-Syn’s Structure
α-syn is a 140 amino acid protein made up of three domains, the lipid-binding α-helix
domain at the N-terminal, the amyloid-binding central domain (NAC), and the C-terminal acidic
domain [134]. The N-terminal domain represents the first 1-87 amino acids domains and
contains seven sequences of 11 amino acid repeats. Each of these 11 amino acids contains the
hexameric KTKEGV motif also found in the α-helical domain of apolipoproteins [514]. This
KTKEGV motif is responsible for α-syn’s ability to interact with lipid domains and form a
11
helical structure [48]. Markedly, this KTKEGV is also shared among both β- and γ-synuclein (β-
syn and γ-syn). In contrast to α-syn, both beta- and gamma-synuclein (β- and γ-syn) are not
linked to synucleionpathy pathogenesis [479].
The hydrophobic NAC domain overlaps with the N-terminal domain and is contained
within amino acids 61-95. It is this region that allows α-syn to undergo fibrillization and
aggregate by supporting the formation of a secondary β-structure [413, 460]. This is achieved by
the VTGVTAVAQKTV 12 amino acid stretch at 71-82 which also confers degradation
resistance [172]. Finally, the C-terminal domain represents the 96-140 amino acids and forms an
acidic tail which takes on a random coil structure. This negatively charged domain is thought to
interact with the amyloid-binding central domain to prevent α-syn aggregation. This interaction
is inhibited during phosphorylation of α-syn at Serine 129 (pS129) and is associated with
aggregation formation [139]. Interestingly, the C-terminal region shares homology with heat
shock proteins, and thus, suggested to give α-syn a role mediating cellular protein denaturing in
response to insult [248].
Native α-Syn’s Structure and Function
Despite the heavy focus on determining misfolded α-syn’s underlying involvement in PD
and other synucleinopathies pathogenesis, relatively little remains known about its native
structure and function. At present, there is no agreement on the native structure of α-syn. It has
been characterized as intrinsically unfolded [48, 494], helical [30, 525], or a mixture of the two
[55]. In part, this may be due to a lack of understanding of native α-syn’s function which could
provide insight into interacting partners. Notably, it has been shown that α-syn more readily take
on a helical structure in the presence of phospholipid membranes [159, 418].

12
The current consensus regarding α-syn’s function is that it promotes membrane
curvature, thus allowing it to contribute to vesicular trafficking and budding, particularly at
synaptic regions [65, 214]. In agreement with this idea, α-syn has been shown to associate with
presynaptic terminal Soluble N-ethylmaleimide-sensitive factor Attachment Protein Receptor
(SNARE) complexes [214] and promote assembly [54]. These interactions have led those to
hypothesize α-syn participates in regulating DA synaptic vesicle release. This has in turn led
others to investigate if α-syn transmission between cells occurs at synaptic terminals, indicating a
potential for α-syn to be intrinsically be transferred from cell-to-cell.
Indeed, a direct relationship between neuronal activity has been positively linked to α-syn
exocytosis [542]. While caveated that synaptic transmission may not be responsible for the
release, Yamada et al., 2018 demonstrated that administration of picrotoxin (PTX), a gamma-
aminobutyric acid (GABAA) receptor “A” antagonist, increased neuronal activity, and α-syn in
brain interstitial fluid collected from the hippocampal region of freely moving mice. Conversely,
the administration of the Na+ channel blocker tetrodotoxin (TTX), reduced neuronal activity, and
reduced α-syn levels in brain interstitial fluid. When α-syn was extracted from brain interstitial
fluid by size exclusion chromatography, it was primarily found to elute at 60kDa suggesting a
possible multimerization or association with other proteins.
Interestingly, while the current paradigm suggests that native α-syn is predominately
found as an unstructured monomer, there is some evidence to suggest that native α-syn forms
homotetrameric α-helix structures in the presence of lipids [30, 525] indicating that vesicular α-
syn may take on a helical structure.

13
Pathological Species of α-Syn
Since the originally identified A53T α-syn mutation as a source for familial PD [390],
five other autosomal dominant, single amino acid mutations have also been identified: A30P,
E46K, H50Q, G51D, and A53E [263, 289, 368, 392, 557]. In total, all six of these mutations are
found within the N-terminal domain of α-syn and thus disruption of this region is thought to be
pathogenic. To this end, both the A30P and the A53T have been shown to have an increased
propensity to undergo fibrilization compared to wild-type (WT) α-syn [291]. A recent series of
work investigating the conferred pathogenicity of α-syn’s N-terminal domain identified that a
portion of this region is necessary for its conversion into the β-cross secondary formation. It was
shown that antibodies against the 15-65 amino acid portion of α-syn reduced the formation of
higher weight molecular species [446]. Furthermore, it was more recently shown that amino
acids 36-42 are required for aggregation and during acidification this 36-42 amino acid
sequences interacts with amino acids 45-57 [124]. In this study, they went on to show that while
deletion of the 36-42 region prevents aggregation in vitro, it also changes α-syn’s ability to
mediate vesicle fusion by affecting its conformational properties when lipid bound [124].
In addition to SNCA mutations being linked to PD, increased gene copy number increases
the likelihood of developing PD and in these individuals a faster rate of disease occurs [69, 116,
142, 454]. Among those individuals’ duplications, triplications, and quadruplications are
associated with progressively earlier diagnosis and greater clinical severity with respect to
expression [69, 116, 142, 454]. These findings suggest that in addition α-syn mutations,
increased expression of WT α-syn is also associated with pathogenesis.

14
In further support of this paradigm, a paper identified β2-adrenoreceptor as a bidirectional
regulator of α-syn expression by modulating SNCA promoter and enhancer acetylation through
histone 3 lysine 27 [341]. To determine the relevance of this finding, they followed up on 4
million Norwegians over an 11-year period taking the β2-adrenoreceptor agonist salbutamol and
antagonist propranolol [341]. While taken to treat asthma, salbutamol as well as the β blocker,
propranolol, can readily cross the blood-brain barrier and thus were hypothesized to regulate α-
syn expression in the brain. The findings from this study showed the use of salbutamol was
associated with a reduced risk of developing PD and in contrast, propranolol was associated with
an increased risk [341].
Additionally, while knockout (KO) mouse models of SNCA have minor phenotypic
differences associated with alterations in DA transmission, no motor deficits or
neurodegeneration is observed [57]. However, it is also known that germ-line KO models can
develop compensatory expression to overcome loss of function. Thus, several groups have
explored the consequences of late-stage α-syn depletion.
Figure 1: Structure and Domains of α-Syn. N-terminal Domain amino acids (AA) 1-87, the amyloid-binding
central domain (NAC) Domain AA 60-95, C-terminal Domain 95-140. 11 amino acid repeat KTKEGV motifs
shown in Tan. Individual amino acids represent known mutations or post-translation location sites that affect α-
syn’s propensity to aggregate or function. familial PD autosomal dominant mutations A30P, E46K, H50Q, G51D,
A53T, and A53E. Identified artificial point mutations at E35K and E57K increase oligomerization. E57K, A53T,
E46K, and E35K mutants increases the rate of membrane interaction [501]. S87 and S129 phosphorylation
associated with pathological α-syn. However, S129 phosphorylation is associated with increased rate of
oligomerization while S87 phosphorylation is associated with reduced oligomerization. Y125 or S129 increases
the binding affinity of Cu(II), Pb(II), and Fe(II). Adapted from [303].
15
Marked differences are reported when α-syn is depleted in adult models, ranging from
substantial neuronal loss and degeneration to no differences [33, 174, 254, 564]. To explain these
differences, it has been proposed that the levels of α-syn depletion influence neuronal loss, where
complete depletion negatively impacts survival. This explanation is consistent with recent papers
where reducing α-syn expression does not negatively impact neuronal survival while complete
deletion does [174, 564]. These studies suggest α-syn has a role in normal DA neuronal function,
which can be compensated for in the cases of germ-like deletion. Particularly, they indicate
improper α-syn function, which may result from mutations that compromise native function,
increase its propensity to aggregate, or excessive affect expression levels lead to the development
of disease pathology.
Conformation and Structure.
While both mutation and relative expression of α-syn are directly linked to
synucleinopathies, the mechanism by which α-syn initially misfolds, accumulates, and
subsequently induces a diseased state remains unknown. Additionally, the primary toxic
aggregate species of α-syn is unknown; with compelling evidence to support α-syn fibrils as well
as prefibrillar species of α-syn such as oligomers. To further complicate this matter, work from
over the past couple decades demonstrates α-syn can form a multitude of oligomerized
conformations [405]. α-syn oligomers derived from recombinant α-syn can have different
molecular weights and secondary structures composed of varying degrees of α-helical, β-sheet,
and disorder regions based on the method of preparation. Interestingly, many of these conditions
can mimic those found in a cell. To this end, exposing α-syn to different physical and/or
chemical conditions such as lipids, metal ions, alcohol, or pH can influence oligomerization
propensity as well as structure [473]. These different conditions can also confer different

16
biological properties and ultimately influence cellular activity profiles to varying degrees [5,
100, 105, 369, 398, 513]. For example, in Danzer et al., 2007 α-syn oligomers were prepared
based on three separate protocols (A, B, and C) with or without the addition of iron (1 or 2) for a
total of six different preparations. Oligomers from each preparation were then characterized for
their physical structure, their ability to elicit changes in calcium (Ca2+) influx, cell toxicity,
caspase activation, and seeding potential. A1 and A2 oligomers were found to have a more
annular structure while B1 and B2 as well as C1 and C2 oligomers had a spheroid, globular
structure but differing degrees of particle size. When primary cortical neurons were treated with
each α-syn oligomer preparation, only A1 and A2 oligomers elicited a change in Ca2+ influx and
membrane potential or increased cell death and caspase-3 activation in the tested time frame. In
contrast, B1 and B2 as well as C1 and C2 α-syn oligomers were found to seed α-syn while A1
and A2 did not. Among the B and C oligomers, the oligomers purified in the presence of iron, B2
and C2, had markedly higher seeding potential compared to those purified in the absence of iron,
B1 and C1. This example demonstrates the wide range of qualities different α-syn oligomers can
possess.
While a vast number of conformations are possible, empirically α-syn oligomers
generally share a common quaternary structure. Both atomic force and electron microscopy
indicate α-syn oligomers predominately form a spheroid shape that is ~30 nm in diameter and 2
to 10 nm in height [74, 93, 94, 121]. Intrinsically, these oligomeric species can be further
subdivided into species that will either take on a fibril formation or exhibit stability that impedes
the formation of fibrils [100, 369]. Moreover, the formation of these different conformational
species is not mutually exclusive and can occur concurrently [100, 105, 369]. While great
advances have been made in these areas, α-syn’s ability to conform to a vast number of

17
oligomeric states with varying degrees of stability, seeding kinetics and experimental properties
makes it especially difficult to understand their specific contribution to underlying pathology.
Aside from oligomeric α-syn species, both protofibrils and fibrils are associated with
synucleinopathies. The fibril form of α-syn is predominately found associated with LBs [520].
Relative to oligomeric species of α-syn which have a size of ~400 kDa, α-syn fibrils take on
sizes a full order of magnitude higher, in the mDa [4]. These fibrillar species of α-syn are
believed to contribute to degeneration by seeding soluble α-syn into higher molecular weight
aggregates which in-turn disrupts cellular mechanisms. The administration of sonicated α-syn
fibril aggregates, has been shown to affect ion homeostasis [42], disrupt cellular proteostasis
[47], and compromise multiple organelle’s function including the endoplasmic reticulum, the
golgi apparatus, mitochondria, as well as lysosomes [147, 153]. α-syn fibril formations also
perpetuate an inflammatory state resulting in chronic inflammation another contributing factor to
neurodegeneration [181, 186, 207, 378]. In contrast to oligomers where lesions are not observed,
when extracted mDA sized α-syn aggregates are injected into the CNS of animal models ranging
from mice to non-human primates, they develop lesions akin to those observed in PD regardless
of whether the α-syn was originally derived from PD patient brain homogenates or Lewy
pathology-like deposits from other animal model brains [305, 306, 325, 346, 394, 404, 448, 527].
This occurs even in the absence of human α-syn over-expression [304, 325, 404, 448]. This
paradigm is also true from α-syn aggregates extracted from other types of synucleinopathies, α-
syn from individuals with MSA results in the development of brain lesions and a phenotype
consistent with MSA pathogenesis when injected into the CNS of animal models [304, 305, 325,
346, 394, 404, 448, 527]. Similarly, injecting de novo generated α-syn fibrils can also induce the
aggregation of endogenous α-syn in the brains of animal models akin to α-syn aggregates
18
isolated from PD or MSA brains [304, 305, 375, 406, 407, 519]. Thus, providing credence for
the use of de novo fibrils to study a synucleinopathy associated pathological state faithfully.
Finally, these works also support the primary accepted hypothesis for the underlying cause of
PD, largely postulated by the neuroanatomists couple Heiko and Eva Braak. known as the prion-
like hypothesis.
Cell-to-Cell Propagation of α-Syn
Braak Staging and Hypothesis.
In 2003, Braak et al. published a proposed staging system for the transmission of
pathological α-syn in relation to the progression of idiopathic PD. These works would mark the
foundation for the prion-like hypothesis of PD. In these works, Braak used neuroanatomical
evidence in which known areas involved in clinical PD were assessed for LNs and LBs within
neurons. These regions were assessed for pathology among a spectrum of cases and severities
using an assumption that non-symptomatic cases are indicative of mildest pathology and the
most symptomatic represent the end of disease spectrum. In his assumed premise, he postulated
that neuronal damage during disease is not random but follows a defined sequence based on
topographical characteristics. During this work, Braak identified origin sites of pathology based
on α-syn inclusions which moved upward through the brain in a total of six stages. In stage one,
α-syn associated legions initially found in the dorsal motor nucleus of the glossopharyngeal and
vagal cranial nerves as well as the anterior olfactory bulb. Stage two further includes the caudal
raphe nuclei, gigantocellular reticular nucleus, and coeruleus–subcoeruleus complex. Stage three
further includes the midbrain with a noted predominates of α-syn associated legions in the
substantia nigra pars compacta. Stage four further includes confined regions of the cortex
specifically the temporal mesocortex located in the transentorhinal region and CA2-plexus of the

19
allocortex. Stage five further includes progression into the higher order sensory areas and
prefrontal cortex. Finally, stage six further includes progression to first order sensory associated
areas of the cortex and premotor areas.
Braak published a second paper in 2003 which included the “Braak Hypothesis” based on
his staging system. In this second paper, Braak hypothesized idiopathic PD may initially
originate outside of the CNS potentially by a still unknown pathogen. Braak noted that both
regions of stage one, the dorsal motor nucleus and the anterior olfactory bulb, have neuronal
fibers that feed into regions outside of the CNS and could be potentially exposed to outside
environmental factors. He also noted α-syn inclusion could form and have been observed in the
submucosal Meissner plexus and Auerbach plexus of the gastrointestinal tract in PD patients. He
further rationalized if an unknown pathogen were responsible for PD, retrograde transport into
the CNS from these regions of the enteric nervous system could be achieved through the
visceromotor projections of the vagus nerve which synapses onto these regions.
In 2007, Christopher Hawkes and Heiko Braak published their “dual-hit hypothesis”,
providing further evidence for the origins of idiopathic PD as originating outside of the CNS
[193]. In their document, they highlighted the existence of a long phase of prodromal symptoms
(non-motor symptoms) that corresponded with early PD. Among these being loss of smell,
gastrointestinal disorders, cardiac distress, and sleep issues. Importantly, they postulated the
observed changes in the gastrointestinal tract, heart, and sleep during early PD all share neuronal
connectivity via the vagus nerve. They further rationalized an unknown infectious particle could
initially be exposed to the nasal passage and gain access to olfactory bulb through the cribifrom
plate. This infectious particle could then be swallowed, penetrate the intestinal lining, infect the
enteric nervous system via the Meissner’s plexus, and access the vagus nerve where it could
20
travel retrograde into the brain. Ultimately, they proposed that the source of this infection was an
unknown neurotropic factor of viral origin. They also suggested that a prion-like substance
would also fit their described criteria. While a viral pathogen has yet to be identified in
connection with PD, considerable overlap in qualities among prions and misfolded α-syn have
since been identified from this proposal.
The Prion-Like Hypothesis.
The word “prion” was originally coined in 1982 to refer to a proteinaceous, infectious
particle that caused transmissible spongiform encephalopathies in mammals [393]. The
originally discovered prion particles were primarily composed of the mammalian Prion Protein
(PrP). This discovery was unprecedented because it marked the discovery of an infectious,
disease spreading agent, that lacked nucleic acids yet was capable of disease transmission among
organisms. In 1994, Reed Wickner published a study highlighting the conformational
rearrangement of host proteins based on a misfolded variant of itself in yeast which he stated
functioned as a prion [535]. Wickner also noted these misfolded protein species catalyzed the
misfolding of the host protein and were transferred from cell-to-cell. The current defining criteria
of a prion is: Any unit capable of sustained propagation of protein or proteins through an altered
state and are propagated by infection within individual organisms (such as mammalian PrP) or
by inheritance into organisms’ progeny through cytoplasmic or nuclear material (such as
URE3/Sup35 in budding yeast [535]) [190]. In the recipient organism, propagation of the prions
is achieved by co-opting homologs, which may or may not be transgenic to the infecting protein
[190].
In 1997, Sunde et al. demonstrated six pathogen associated proteins, including PrP and
amyloid beta (amyloid β/Aβ), take on a near identical amyloid structure while in their misfolded
21
state by synchroton x-ray diffraction [478]. Amyloids are defined as aggregated proteins with a
fibrillar morphology, form a cross-β, β-sheet secondary structure, and is stained with congo red
dye [130]. It is now recognized that many neurodegenerative diseases are associated with the
formation of amyloid protein aggregates including AD, associated with the formation of amyloid
β and fibrillar tau; PD, associated with fibrillar α-syn; Huntington’s disease (HD), associated
with polyglutamate expanded fibrillar Huntingtin; ALS, associated with TAR DNA-binding
protein 43 (TDP43), superoxide dismutase 1 (SOD1), and fused in sarcoma (FUS) aggregates.
The commonalities shared among these neurodegenerative diseases and with transmissible
spongiform encephalopathies includes the formation of amyloid aggregates that are degradation
resistant, undergo transmission from cell-to-cell, propagate further protein misfolding by
catalyzed co-opting of the host proteins, and progressive cell death. Decidedly, because current
evidence suggests these listed neurodegenerative proteins do not undergo transmission from
person-to-person, they do not fit the criteria for a prion. Yet, due to shared commonalities among
these proteins and prions, they are often referred to as prion-like or propagons [137].
In the context of PD and other synucleinopathies, the prion-like hypothesis proposes the
abnormal, aggregation of protein of which is mainly α-syn, is the underlying source of disease.
To this end, abnormal α-syn undergoes misfolding into an amyloid structure, transmission to
neighboring brain regions, and causes further aggregation of the endogenous, native α-syn within
the recipient cells. This aggregation process is due to the misfolded α-syn’s ability to catalyze
further misfolding of native α-syn by acting as a template seed and thus propagating pathology.
The accumulation and transmission of this abnormal α-syn results in underlying cellular
dysfunction due to disrupted or compromised function, and eventually cell death resulting in the
observed disease phenotype.
22
Cellular α-Syn Transmission Pathways
Multiple levels of evidence indicate the transfer of misfolded α-syn from cell-to-cell
propagates the underlying cellular dysfunction that is observed in synucleinopathies. Among the
most prominent evidence for this pathological transmission comes from Kordower et al., 2008
and Li et al., 2008 where LB pathology was observed in the embryonic nigral grafts several years
after their transplant into PD patient brains. The observations in post-mortem brain tissue led
them to hypothesize that a host-to-graft transmission had occurred. Quickly after these
publications, Desplats et al., 2009 published work in which 15% of green fluorescent protein
(GFP) labeled mouse cortical neuronal stem cells were positive for human α-syn, four weeks
after their engraftment into the hippocampus of transgenic mice expressing human α-syn [115].
Since these initial publications, animal models ranging from rodents to non-human primates have
recapitulated these findings [106, 115, 153, 189, 258, 259, 282, 292, 305, 375, 407]. Indeed,
treatment with recombinantly generated α-syn fibrils substantially increases cell-to-cell
transmission in vivo alongside increases in the levels of insoluble forms of α-syn, akin to those
observed in PD patients [304-306, 375, 407]. These changes occur alongside progressive motor
dysfunction symptoms in treated animals [304-306, 375, 407]. Recasens et al., 2014
demonstrated injecting brain homogenates from PD patients spread PD pathology in WT mice
however, no pathology was observed in the α-syn KO mice. Moreover, they showed that
injecting PD brain homogenates into the striatum of rhesus macaques induced SN dopaminergic
neuronal loss and resulted in the formation of inclusions in multiple brain regions. Yet, despite
these observations, the cellular mechanisms responsible for cell-to-cell transmission remain
poorly understood.

23
While considerable work suggests the transmission of pathological α-syn species are
capable of propagating disease pathology, it remains unclear to what extent the transfer of native
(non-pathological) α-syn contributes to disease progression. Furthermore, it is unknown how α-
syn initially becomes misfolded. Genetic studies investigating families with SNCA duplication
and triplication indicate increased abundance of α-syn is sufficient for the development of the PD
and these individuals develop comparable brain histopathology to those with idiopathic PD [69,
116, 142, 454]. Animal models over-expressing human α-syn develop intracellular α-syn
inclusions, experience neuronal loss, and recapitulate a parkinsonian phenotype [34, 143, 150,
244, 323, 346, 448, 527]. IPSC mDA neurons over-expressing α-syn have comparable
phenotypes to those derived from familial PD mutations including increased α-syn secretion and
transfer as well as reduced lysosomal degradative capacity [144, 408, 440]. In contrast, evidence
from animal model suggests reducing the expression of α-syn can prevent disease manifestation
and/or reduce disease progression depending on the paradigm [174, 564]. These works suggest
increased α-syn results in the development of PD. Therefore, processes that dysregulate the
intracellular balance of native α-syn, such as abnormal transmission between cells, may play a
role in disease onset. However, considerably more research is still required to understand its role.
In Christopher Hawkes and Heiko Braak’s “dual-hit hypothesis”, they proposed PD may
start in the gut. While this proposal was considered controversial in 2007, increasing work
supports this hypothesis [296, 421, 500]. α-syn aggregates are observed in the intestinal tissue,
predominately in the enteric neurons in individuals with PD [167, 421]. Rats injected with
pathological α-syn into the vagal nerve at the location of the gut was sufficient to induce PD-like
pathology in the brain [209, 506]. In humans, the likelihood of developing PD is negatively
correlated with a truncal vagotomy, a once common procedure for peptic ulcers where the vagal

24
trunks are severed [270, 483]. Additionally, differences in gut microbiome are observed in
individuals with PD [145, 500]. These works support the premise, which is now generally agreed
upon, that synucleinopathies can start in the gut. However, it remains contested whether the gut
is the origin in all cases [328, 345]. Other work supports a second premise for the spread of α-
syn into the enteric nervous system [511]. Thus, despite the advancements in our understanding,
there is still a long way to go to determine the original insult that results in development of PD or
other synucleinopathies.
The Unconventional Secretion of α-Syn
Studies in the early 2000s first demonstrated that both monomeric and oligomeric species
of α-syn could be found outside cells and in human bodily fluids, including cerebral spinal fluid
(CSF) and plasma [40, 133]. However, by standard convention, α-syn lacks the prerequisite N-
terminal signal sequence to undergo classical secretion. Thus, how α-syn is transferred from cell-
to-cell to spread pathology remains an important unanswered question. Current work supports
that unconventional secretion by way of the endo-lysosomal pathway as well as by autophagy
can spread pathology by influencing α-syn’s exocytosis [9, 132, 135, 279, 340, 387]. The extent
these unconventional secretion mechanisms to contribute to spreading disease pathogenesis
remains unclear.
In 1999, Gunter Blobel won the Nobel Prize for discovering the N-terminal signal
peptide, a sequence that directs the ribosomes to the endoplasmic reticulum (ER) and transports
the protein undergoing synthesis across the ER membrane. A subset of proteins that finish their
synthesis in ER are translocated to the Golgi Apparatus and eventually trafficked to the plasma
membrane where they are secreted. This ER-Golgi secretion mechanism is known as classical
secretion. Yet, not all proteins that undergo secretion use this classical secretion mechanism.

25
Among the earliest evidence for non-classical secretion was the recognition that interluken-1 (IL-
1) did not contain a N-terminal signal sequence in 1984 by Auron et al. [14]. It was later shown
that IL-1β’s secretion in response to cellular stress was unaffected by pharmacological inhibition
of the classical secretion pathway by Rubartelli et al., 1990 suggesting an alternative secretory
pathway [420]. It has since been shown that a myriad of leaderless proteins lacking a signal
sequence undergo non-classical secretion by unconventional secretory mechanisms, including
the β-galactoside binding proteins, galectins [215, 307] as well as α-syn and other
neurodegenerative disease associated proteins [41].
Several secretory mechanisms have been identified to mediate the unconventional
secretion of proteins [399]. Collectively, these mechanisms are characterized as Types. Type I
refers to pore-mediated translocation across the plasma membrane; Type II refers to ATP-
binding cassette (ABC) transporters mediate secretion; and Type III refers to
endosome/autophagosome driven secretion. A Type IV secretion mechanism also exists known
as Golgi-bypass, where proteins with the ER N-terminal signal peptide are translated into the ER,
packaged, and directly trafficked to the plasma-membrane. An important consideration regarding
unconventional secretion is that some proteins, such as IL-1β, may use multiple secretion
mechanisms (Type I and III) [77, 224, 239, 561]. Considerable evidence supports that α-syn’s
secretion is mediated by a Type III mechanism, yet the exact process is unclear with evidence
supporting both unassociated and vesicular associated release processes [41, 132, 155, 184, 192,
225, 279, 387]. To this point are works demonstrating that α-syn is released in or in association
with exosomes, an endosome derived extracellular vesicle (EVs), as well as by autophagy
mediated secretion [9, 106, 127, 132, 208, 387, 507].
26
Extracellular Vesicle Associated Transmission of α-Syn.
Cells release populations of extracellular vesicles (EVs) of various sizes containing a
multitude of cargoes including RNA, proteins, and lipids [178, 457, 487]. While EVs were once
thought to be relegated strictly to the task of shedding unwanted cellular waste, it is now
appreciated that EVs play an integral role in cell-to-cell communication [308] and that all cell
types produce EVs under both healthy and pathological cellular states [545]. As a result,
understanding mechanisms associated with the transport and characterization of EVs has become
an increasingly popular focus. In particular, by identifying specific EV cargoes under
pathological conditions, EVs have the potential to be excellent biomarkers to assist in earlier
detection and diagnosis of a variety of diseases [456, 529].
The most cited subtypes of EVs are exosomes, microvesicles, and apoptotic bodies, all
derived from distinct cellular mechanisms and sub-cellular compartments. Due to the differences
by which these different EVs subtypes originate, they are normally distinguished based on their
size and protein composition [178, 260, 536, 537]. Experimentally, multiple methods are
normally required to validate these characteristics which in addition to evaluating protein
content, often require characterizing size and the existence of a membrane. Microvesicles have a
dynamic size range at 20-1000 nm and bud directly from the plasma-membrane, while apoptotic
bodies originate from dying cells and have a diameter over 1000 nm [178, 260, 536, 537].
Exosomes typically range between 30-150 nm and originate as intraluminal vesicles (ILVs)
formed from the inward budding of the endosome’s membrane and are enriched in tetraspanin
proteins [178, 260, 536, 537].
The specific type of endosomes that generates ILVs are known as multivesicular bodies
(MVBs) [178, 260, 536, 537]. There are two known mechanisms that form MVBs. The first is

27
the endosomal sorting complex required for transport protein (ESCRT) dependent pathway and
the second is the ESCRT independent pathway. The ESCRT dependent pathway is a stepwise
mechanism driven by the sequential interactions of the ESCRT -0, -I, -II, -III complexes [81, 85,
198, 280, 332, 462]. ESCRT complexes -0 and -I recognize ubiquitinated transmembrane cargo,
re-organize the endosomal microdomain surrounding the cargo, facilitate membrane curvature,
and recruit the ESCRT-III complex. Bound ESCRT-III complex subsequently interacts with the
ESCRT-II complex to promote the scission of the inward blebbing to form a nascent ILV in
combination with the ATPase, vacuolar protein sorting associated protein 4 (Vps4). Markedly,
the known ESCRT interacting protein programmed cell death 6 interacting protein (Alix) can
also mediate the interaction of ESCRT complexes to form ILVs independent of ubiquitination
through the intermediate Syndecan [21]. In the ESCRT independent pathway, ILVs are formed
based on the lipid raft architecture of the endosomal membrane. The presence of ceramides
formed during the conversion of sphingolipids by neutral sphingomyelinases and cholesterols
induces steric rigidity on the endosomal membrane that promotes its inward budding and the
formation of ILVs [457, 499, 530]. The formation of ILVs via these mechanisms results in their
enrichment in tetraspanins such as CD9, CD63, and CD81, as well as certain ESCRT complex
proteins such as tumor susceptibility gene 101 (Tsg 101) or Alix, the enrichment of these
proteins makes them commonly used identifiers to distinguish exosomes from the other EV
subtypes [61, 260, 487, 490].
Compelling evidence for exosomes’ ability to transfer pathological α-syn from cell-to-
cell exists. Emmanouilidou et al., 2010 was the first to publish the presence of α-syn in isolated
EVs, which were likely exosomes [135]. In the same study, they reported their model had
comparable α-syn concentrations in the conditioned culture media as what is reported in cerebral

28
spinal fluid (CSF). They further showed that concentrated EVs were capable of inducing toxicity
when added to WT cortical neurons [135]. Alvarez-Erviti et al., 2011 demonstrated α-syn
contained within EVs was taken up into recipient cells and that following EV membrane
disruption, this was prevented [9]. They also demonstrated lysosomal inhibition increased the
amount of α-syn observed within the exosomal fraction of cell cultured media [9].
Perhaps the most prolific early link for exosomes being a critical contributor for the
pathological transmission of α-syn being is Danzer et al., 2012 [106]. They demonstrated
detergent resistant, oligomeric species of α-syn were present in exosomes. Additionally, these α-
syn associated exosomes were preferentially taken-up and more toxic to recipient cell compared
to non-EV associated α-syn [106]. Furthermore, they demonstrated autophagy regulated the
release of α-syn and that α-syn was present both on the inside and the outside of EVs [106].
Therefore, α-syn is commonly referred to as being associated with EVs unless specifically
determined as residing inside of them.
Studies investigating the CSF from individuals with PD consistently report reduced levels
of total α-syn when compared to age matched controls. These reports have led others to
investigate whether this is also true within isolated EV found with these primary fluids. Stuendl
et al., 2016 reported lower levels of α-syn were found within both the total CSF and EV fraction
from those with PD and DLB. However, when exosomes isolated from equal volumes of CSF
were added to an α-syn oligomerization detecting, bimolecular fluorescence complementation
(BiFC) protein reporter cell-line, increased complementation was observed from the PD derived
exosomes while isolated exosomes from individuals with DLB did not. Yet, when the relative
concentrations of α-syn were normalized among DLB and control patient exosomes, on the
justification that lower levels may be due to increased cell death, an increase in complementation
29
was observed from the DLB derived exosomes. Consistent with these previous results, Ngolab et
al., 2017 found injecting exosomes derived from DLB patient CSF into the brains of non-
transgenic mice increased pS129 α-syn levels and human and mouse α-syn was found co-
localized when evaluated at four weeks post-injection.
Exosomes may also contribute to neurodegenerative disease pathogenesis through the
transfer of lipids. Grey et al., 2015 found that α-syn aggregates at a faster rate when exposed to
exosomes. Interestingly, these aggregation kinetics were not affected by whether the exosomes
were derived from control or α-syn over expressing cells [180]. This led them to postulate
phospholipid composition may be an important determinant to aggregation [180]. Consistent
with these findings, Zhang et al., 2018b found that α-syn over-expressing human embryonic
kidney (HEK) cells treated with the lipid peroxidation product 4-hydroxynonenal (HNE), which
forms during ROS exposure and was previously connected to autophagic impairment, increased
cellular α-syn aggregation [562]. When collected EVs were injected into the dorsal striatum of
wild type (WT) mice, the EVs derived from the HNE treated HEK cells resulted in α-syn
aggregate accumulations within the hippocampus, SN, and cerebral cortex while the EVs from
the untreated cells did not [562]. Zhang et al., 2018b proposed that because the formation HNE is
naturally elevated in aging brains, further elevated in association with α-syn pathology, and can
affect autophagy, it may be linked to pathogenesis through compromised mitochondrial turnover
and altered lipid content [562].
Non-Extracellular Vesicle Associated α-Syn Transmission.
While considerable evidence supports EVs capability to spread pathological α-syn
species among cells, whether they represent the primary form of transmission is unknown. A
considerable quantity of EVs are often used to demonstrate effects experimentally. This is in part

30
due to isolation strategies which regularly damage EVs in the process. A side effect of these high
levels raises the question of physiological relevance at times. EV associated α-syn represents a
small percentage of the total α-syn released from cells. Stuendl et al., 2016 reported that
approximately two percent of the total CSF α-syn was found in the exosomal fraction [474]. This
relatively low association of α-syn with EVs raises the question of whether other unconventional
secretion mechanisms might also contribute to the pathological spreading of α-syn. To this end,
both EV associated and non-EV associated α-syn can spread pathology.
Numerous studies have shown injecting α-syn fibrils into the CNS is sufficient for
inducing, spreading, and accumulating α-syn and pathology in a variety of animal models [304,
305, 325, 394, 404, 448, 527]. When α-syn fibrils are added to neurons, they are shown to
interact with the cellular plasma membrane where they are then endocytosed [204]. One
experiment found that α-syn fibrils were more readily taken up than α-syn oligomers [219]. This
has led researchers to look for the existence of a receptor that mediates this process. Heparan
sulfate proteoglycan [219], lymphocyte activation gene 3 (LAG3) [319], and α3-Na+/K+-ATPase
(α3-NKA) [449] have all been shown to preferentially bind to fibril conformation α-syn and
mediate its internalization into neurons compared to non-fibrillar conformations. Neurexin-1β as
well as amyloid β precursor-like protein 1 (APLP1) are also capable of internalizing α-syn into
neurons but are not conformationally specific [319]. In microglial cells, toll-like receptor-2
(TLR2) can mediate oligomeric α-syn’s endocytosis where it can be more readily cleared [245].
There is also some evidence for pore-forming conformation α-syn oligomers which could
theoretically mediate both α-syn’s entry and exit from cells [105, 107, 473]. Finally, while
apoptotic or necrotic neurons have the potential to secrete pathogenic α-syn, these processes
have repeatedly been discounted from being involved in spreading pathology [99, 182, 505].
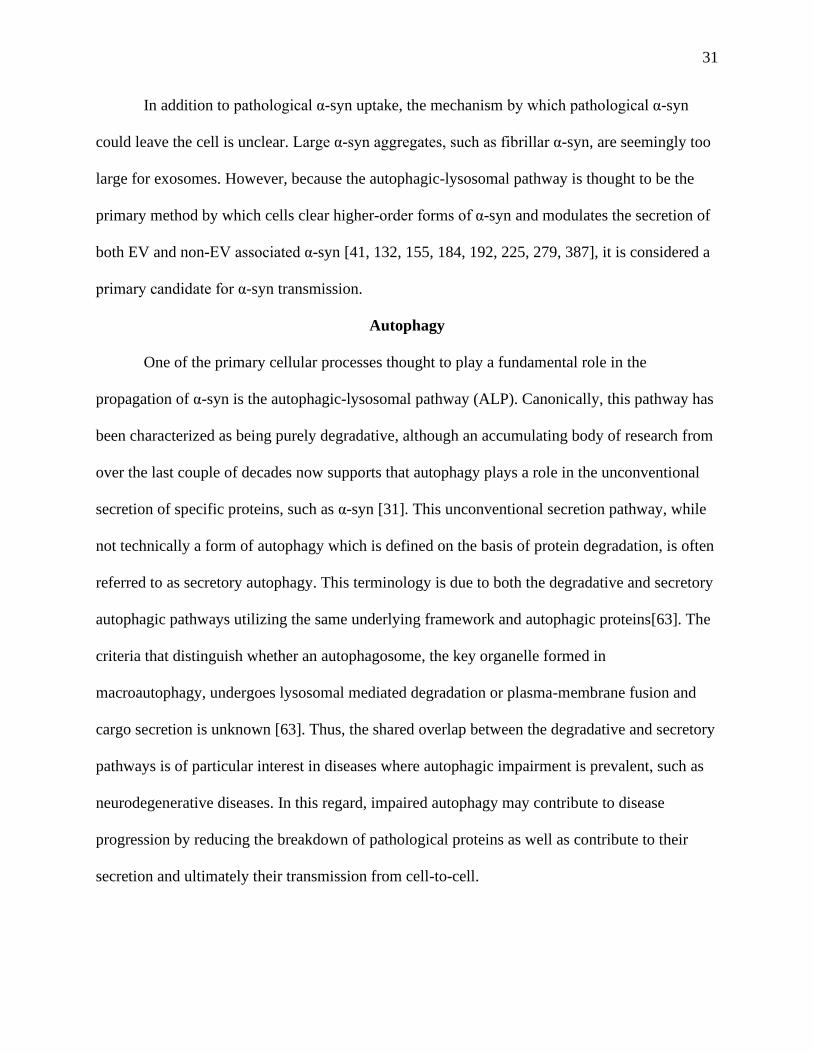
31
In addition to pathological α-syn uptake, the mechanism by which pathological α-syn
could leave the cell is unclear. Large α-syn aggregates, such as fibrillar α-syn, are seemingly too
large for exosomes. However, because the autophagic-lysosomal pathway is thought to be the
primary method by which cells clear higher-order forms of α-syn and modulates the secretion of
both EV and non-EV associated α-syn [41, 132, 155, 184, 192, 225, 279, 387], it is considered a
primary candidate for α-syn transmission.
Autophagy
One of the primary cellular processes thought to play a fundamental role in the
propagation of α-syn is the autophagic-lysosomal pathway (ALP). Canonically, this pathway has
been characterized as being purely degradative, although an accumulating body of research from
over the last couple of decades now supports that autophagy plays a role in the unconventional
secretion of specific proteins, such as α-syn [31]. This unconventional secretion pathway, while
not technically a form of autophagy which is defined on the basis of protein degradation, is often
referred to as secretory autophagy. This terminology is due to both the degradative and secretory
autophagic pathways utilizing the same underlying framework and autophagic proteins[63]. The
criteria that distinguish whether an autophagosome, the key organelle formed in
macroautophagy, undergoes lysosomal mediated degradation or plasma-membrane fusion and
cargo secretion is unknown [63]. Thus, the shared overlap between the degradative and secretory
pathways is of particular interest in diseases where autophagic impairment is prevalent, such as
neurodegenerative diseases. In this regard, impaired autophagy may contribute to disease
progression by reducing the breakdown of pathological proteins as well as contribute to their
secretion and ultimately their transmission from cell-to-cell.

32
Microautophagy, Chaperone Mediated Autophagy, and Macroautophagy.
The term “Autophagy” comes from ancient Greek and means “self-eating” and was
originally coined by Christian de Duve in 1963 in his work “The Lysosome Concept” [110]. In
2016, Yoshinori Ohsumi was awarded the Nobel prize for his characterization of the autophagic
machinery proteins, specifically, the AuTophaGy-related (ATG) genes proteins [502].
Conceptually, autophagy is defined as a process by which cytoplasmic content is trafficked into
the lysosome for degradation [158]. While this characterization is broad, it is distinct in that
autophagy does not refer to when endocytosed, non-cytoplasmic content is routed to the
lysosome for degradation [158]. Although autophagy is commonly used to reference
macroautophagy, there are three major types of autophagy: microautophagy, chaperone mediated
autophagy, and macroautophagy. Microautophagy or endosomal microautophagy is the direct
degradation of internalized cytoplasmic content through the inward budding and formation of
ILVs in late endosomes or lysosomes. The distinction between microautophagy and endosomal
microautophagy is the use of ESCRT proteins, where inward budding of the membrane is
ESCRT independent in microautophagy and ESCRT dependent in endosomal microautophagy.
Regardless, these processes result in ILV degradation indirectly during late endosome-lysosome
fusion or directly when formed in the lysosome. In chaperone mediated autophagy (CMA),
cytosolic content is degraded through its direct insertion into the lysosome [240]. In contrast to
microautophagy, CMA does not use vesicles, and instead, single proteins are unfolded and
directly translocated across the lysosomal membrane through a pore-forming translocation
complex [240]. Proteins that undergo CMA are initially targeted and recruited to the lysosome
based on a conserved KFERQ sequence. Finally, in macroautophagy, the formation of an
enclosed double- or multi-layered isolation membrane isolation called an autophagophore occurs

33
that surrounds, engulfs cytosolic content, and upon closure, forms a vesicular compartment
known as an autophagosome [151, 533]. Afterwards, the engulfed content undergoes degradation
through autophagosome-lysosome fusion. While macroautophagy was initially identified during
starvation, where autophagophores were described to indiscriminate sequester cytoplasmic
content, it is now appreciated that selective clearance also occurs in macroautophagy [354, 502].
The precursor structure to the autophagosome known as an autophagophore begins as an
isolated membrane that grows in structure and shape at a location known as an omegasome
named for its resemblance to the Greek letter “omega” [264]. During the formation of the
autophagophore, the omegasome detaches from the ER to become the initial membrane
component. As the autophagophore grows, it receives membrane from multiple organelle sources
to varying degrees. The ER [16, 195], the endoplasmic reticulum-golgi intermediate complex
[166], mitochondria [188], plasma membrane [403], recycling endosomes [396], and coat protein
complex II (COPII) vesicles [447] have all been shown to donate membrane to the developing
autophagophore. However, it is unknown what determines an organelle’s specific contribution or
whether it is conserved among cell types.
In addition to receiving increasing membrane donations, the maturation of an omegasome
to an autophagophore and ultimately autophagosome depends on a large number of proteins.
This maturation process can be broken down into three primary steps: initiation, elongation, and
expansion [317]. In brief, the formation of an autophagosome begins with the inhibition of the
mammalian target of rapamycin (mTOR). which results in increased activity of Unc-51, like
Autophagy Activating Kinase 1 (ULK1/ATG1) [317]. This increase in ULK1 activity is crucial
for the formation of the multiprotein initiator complex. This complex is composed of several
proteins including: Beclin-1, as well as vacuolar protein sorting-associated protein 15 (VPS15)
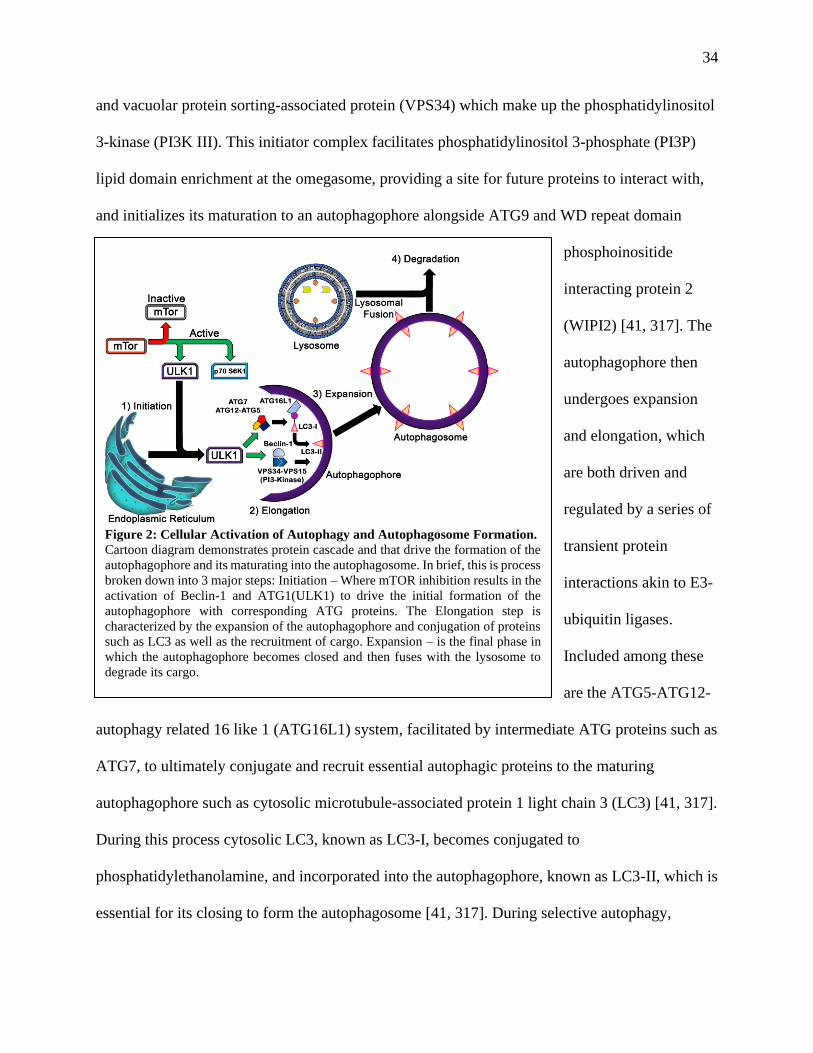
34
and vacuolar protein sorting-associated protein (VPS34) which make up the phosphatidylinositol
3-kinase (PI3K III). This initiator complex facilitates phosphatidylinositol 3-phosphate (PI3P)
lipid domain enrichment at the omegasome, providing a site for future proteins to interact with,
and initializes its maturation to an autophagophore alongside ATG9 and WD repeat domain
phosphoinositide
interacting protein 2
(WIPI2) [41, 317]. The
autophagophore then
undergoes expansion
and elongation, which
are both driven and
regulated by a series of
transient protein
interactions akin to E3-
ubiquitin ligases.
Included among these
are the ATG5-ATG12-
autophagy related 16 like 1 (ATG16L1) system, facilitated by intermediate ATG proteins such as
ATG7, to ultimately conjugate and recruit essential autophagic proteins to the maturing
autophagophore such as cytosolic microtubule-associated protein 1 light chain 3 (LC3) [41, 317].
During this process cytosolic LC3, known as LC3-I, becomes conjugated to
phosphatidylethanolamine, and incorporated into the autophagophore, known as LC3-II, which is
essential for its closing to form the autophagosome [41, 317]. During selective autophagy,
Figure 2: Cellular Activation of Autophagy and Autophagosome Formation.
Cartoon diagram demonstrates protein cascade and that drive the formation of the
autophagophore and its maturating into the autophagosome. In brief, this is process
broken down into 3 major steps: Initiation – Where mTOR inhibition results in the
activation of Beclin-1 and ATG1(ULK1) to drive the initial formation of the
autophagophore with corresponding ATG proteins. The Elongation step is
characterized by the expansion of the autophagophore and conjugation of proteins
such as LC3 as well as the recruitment of cargo. Expansion – is the final phase in
which the autophagophore becomes closed and then fuses with the lysosome to
degrade its cargo.

35
autophagic adaptor proteins such as sequestosome 1 (p62/SQSTM-1), calcium-binding and
coiled-coil domain containing protein 2 (NDP52/CALCOCO2), neighbor of breast cancer 1 gene
(NBR1), and optineurin (OPTN) recognize ubiquitinated cargo and directly link them to the
nascently forming autophagophores by binding to LC3-II before closing. After the
autophagosome forms, it can then go on to fuse with other organelles including endosomes and
MVBs to form a hybrid organelle known as an amphisome. The autophagosome, or newly
formed amphisome, can then fuse with a lysosome to form an autolysosome and degrade its
sequestered cargo or alternatively fuse with the plasma-membrane and release its cargo into the
extracellular space.
Autophagy in Neurons.
Autophagy plays an important role in nearly all cell types including neurons. In
comparison to other cells, neurons have unique challenges with regards to autophagy.
Evolutionarily, the importance of proper brain development results in its prioritization for
nutrients [510]. CNS neurons are among the few cell types to express the glucose transporter 3
which has the highest glucose uptake rate among all twelve of the glucose transporters [484]. In
point of contrast to most cells, neurons do not store glucose, and thus depend on nutrients being
readily available. Astrocytes and erythrocytes facilitate neuronal energy requirements by
“feeding” them glucose and lactate in response to their activity [29, 53, 313, 417, 453]. This
process is tightly regulated and conducted in such a way that neurons receive the proper amounts
of glucose or lactate in direct relation to their active state. The tight regulation of glucose uptake
into brain results in relatively low fluctuation in their glucose levels even when blood glucose is
low [53, 417, 453]. Thus, the quintessential mTOR inhibition following starvation, and
subsequent upregulation in autophagy is unlikely to occur in neurons, as glucose starvation is
36
effectively non-existent in a health brain. [67, 187, 220, 229, 300, 337, 437, 438, 492, 539, 546].
Moreover, it is unclear if changes in nutrients influence neuronal autophagy; experiments
subjecting neurons to starvation suggest there is little to no effect on the neuronal autophagy
response [310, 342]. Amazingly, the same autophagic proteins used to generate autophagosomes
in other cells are also used in neurons [310, 311]. However, despite mTOR associated changes
being able to drive autophagy in neurons, starvation does not affect this process, and instead
neuronal autophagy is a constant process under basal conditions to compensate [310, 311].
Further challenges that neurons face regarding autophagy are their vast structure,
compartmentalization, trafficking across long distances, and constant remodeling through
activity dependent plasticity. Neurons combat these challenges by utilizing different forms of
autophagy in different subcellular compartments [468, 469, 558]. For example, lysosomes are
formed primarily in the neuronal cell-body while autophagosomes are formed primarily in distal
axons [310, 311]. Consequently, autophagosomes must be trafficked retrograde to the
perinuclear region of the cell-body to undergo lysosomal fusion to degrade cargo [310, 558].
While the generation of autophagosomes within dendrites and the cell-body is rare, it does occur.
When formed in these regions, autophagosomes can ultimately modulate neuronal excitation,
inhibition, and dendritic arborization depending on the neuronal subtype [79, 90, 311, 419]. The
γ-aminobutyric acid receptor-associated protein (GABARAP) family of proteins, which includes
LC3, were initially identified based on the interaction of GABARAP with the GABAA receptor
[524]. GABARAP plays an important role in trafficking the GABAA receptor and its lipidation
influences GABAA receptor’s localization at the cell surface [78, 286]. Collectively, the
GABARAPs family are shown to play a critical role in activating ULK1, phagophore
development during starvation, and are fundamental in the formation of the autophagosome [183,
37
266]. In ATG7 KO mice, which results in reduced autophagosomes formation, reduced cell
surface levels of the GABAA receptor occurs from its mislocalization in GABAergic
interneurons [78, 286]. In contrast, the upregulation of autophagy following rapamycin treatment
also reduced cell surface GABAA receptor localization but did not affect total cellular levels,
suggesting autophagy modulates GABAA receptors localization in GABAergic neurons [216]. In
excitatory neurons, dendritic autophagy influenced AMPA receptor degradation and its co-
localization with autophagic machinery in response to stimuli, indicating a role for autophagy in
synaptic remodeling [419]. Consistent with this premise, ATG7 depletion in forebrain excitatory
neurons in a mouse model impaired dendritic spine pruning in association with social behavior
defects [489]. Short-hairpin RNA (shRNA) mediated knockdown (KD) of ATG7 in hippocampal
neurons reduced dendritic spine elimination, suggesting impaired neuronal remodeling [489].
Tyrosine hydroxylase (TH) promoter driven conditional ATG7 KO resulted in swollen dendrites
in DA neurons, dendritic dystrophy in tyrosine hydroxylase positive neurons, and presynaptic
accumulation of both α-syn and the PD associated protein, leucine-rich repeat kinase 2 (LRRK2)
in a mouse model [154]. Hernandez et al., 2012 found autophagy in DA neurons affected their
function by modulating dopamine release and presynaptic recovery. The amplitude of dopamine
release was and the presynaptic recovery was increased in ATG7 KO mice. Whereas, rapamycin
induced mTOR inhibition increased presynaptic autophagosome number, decreased the number
of synaptic vesicles, and decreased axonal profile volumes in the WT neurons [199]. The totality
of these works indicate that autophagy influences neuronal function on multiple levels. In that
dendritic autophagosomes affect dendrite remodeling by either influencing synaptic spine
pruning, neurotransmitter receptor turnover, or the localization neurotransmitter receptors
depending on the neuron type. They also indicate that over- or under- active levels of autophagy
38
may be detrimental to neuronal function. This is outlined particularly in DA neurons, where
increased autophagy reduces neurotransmitter release through DA synaptic vesicle clearance and
neuronal profiling. Inversely, decreased autophagy affects α-syn accumulation but increases DA
release and DA neuronal firing recovery. Thus, the misbalance of neuronal autophagy has
dramatic consequences, and as such, requires that they walk a fine line. The consequences of
misbalancing autophagy are further exemplified in how it affects the clearance of aggregated
proteins.
Evidence for Autophagy’s Contribution to α-Syn Accumulation.
One challenge neurons face as post-mitotic cells, is the ability to successfully remove
stressors, such as defective organelles and aggregated proteins, so they may last an entire
lifespan. In this way, autophagy is critical to sustaining neuronal health. In studies investigating
autophagy impairment or altered levels α-syn and neuronal cell death are observed. Abnormal
expression of α-syn is associated with earlier synucleionopathy disease onset and disease
progression [116, 142, 454], SNCA familial mutations increase disease propensity and result in
age of onset, as covered earlier [263, 289, 368, 392, 557]. The underlying mechanism is
unknown, but work indicates that increased levels of WT α-syn or mutant α-syn may overwhelm,
resist standard cellular degradation mechanisms, and subsequently increase the accumulation of
α-syn in the brain. It is believed that the dysregulation of theses underlying mechanisms, such as
autophagy, may further impair the removal of other problematic cellular components which in-
turn contributes to increasing cellular dysfunction.
Following conditional ATG7 KO by way of DA neuron associated dopamine reuptake
transporter, engrailed homeobox 1, or TH promoters a substantial loss of neurons, reduced
striatal dopamine, increased α-syn accumulation, as well as increased p62 and ubiquitin
39
inclusions are reported [3, 436]. Similarly, while autophagic inhibition by Beclin-1 KD in a
neuroblastoma cell line increased the levels of α-syn oligomers [556], lentiviral induced over-
expression of Beclin-1 within the hippocampus and temporal cortex of α-syn transgenic mice
reduced α-syn accumulation [463]. The effects of Beclin-1 over-expression were further
increased by treating with rapamycin and partially prevented with the PI3K class III inhibitor, 3-
methyladenine (3-MA) [463]. Treatment of zebrafish with MPTP, reduced ATG5 levels in
association with impaired autophagic flux, DA neuronal loss, and motor deficits [213]. However,
following over-expression of ATG5, zebrafish were rescued from the effects of MPTP treatment
[213].
Over-expression of α-syn in mouse models and cell-lines was linked to autophagy
impairment by the mislocalization of ATG9 and subsequently decreased autophagophore
formation [538]. This mislocalization was due to RAB1A inhibition, which is involved in proper
trafficking of proteins, including ATG9, between the endoplasmic reticulum and the golgi
apparatus [538]. Over-expression of RAB1A reversed this mislocalization and restored this
autophagic impairment [538]. In PC12 cells, α-syn over-expression inhibited autophagy by
binding to high mobility group box 1 (HMGB1) [461]. α-syn bound HMGB1 in both the nucleus
and cytosol impaired the interaction between HMGB1 and Beclin-1, strengthening the
interaction between Beclin-1 and BCL2, and disrupting HMGB1 translocation from the cytosol
to the nucleus [461]. Over-expression of Beclin-1 restored autophagy and increased α-syn
clearance [461]. HMGB1 KD prevented the α-syn over-expression associated autophagic
impairment but reduced basal autophagy, while HMGB1 over-expression restored the α-syn
over-expression induced autophagic impairment [461]. In a study using differentiated IPSCs
from PD patients harboring the SNCA gene triplication, upregulated autophagy and greater

40
degree of autophagic flux was measured when comparing the change in LC3 puncta during
chloroquine induced lysosomal activity quenching [359]. The over-expression of WT or A53T α-
syn, but not A30P α-syn, in rat primary midbrain neurons increased the presence of LC3 when
lysosomal activity was quenched by bafilomycin-A1 (Baf-A1) treatment [253].
The differences reported among these studies may be the result of the models used, the
timeline in which cells were tested, or be a consequence of compensatory autophagy
upregulation. To this ladder point, autophagy may be critical for clearing monomeric α-syn and
subsequently become compromised when challenged with degradation resistant α-syn
aggregates. Consistent with this premise, an adeno-associated virus α-syn over-expression PD
mouse model, found increased Beclin-1 and LC3-II levels during early, pre-symptomatic stages
while at later stages, they were considerably reduced [111]. This progressive change in Beclin-1
and LC3-II were associated with increasing levels of α-syn and cytoplasmic retention of
transcription factor EB (TFEB) process, a master regulator of lysosomal protein transcription
[111].
ALP Dysfunction, Secretory Autophagy, and α-Syn.
In contrast to autophagy (degradative cargo breakdown through autophagic-lysosomal
fusion), during autophagy mediated secretion (or secretory autophagy) the autophagosome does
not fuse with the lysosome, but instead fuses with the plasma-membrane, and subsequently
releases its cargo into the extracellular space. During this process, the formation of an
amphisome during autophagosome-MVB fusion allow autophagy to also influence the release of
EVs [184].
Early studies investigating ALP dysfunction found that autophagy impairment increased
both EV and non-EV associated α-syn secretion [41, 132, 155, 184, 192, 225, 279, 387].
41
However, most of these early studies predated an understanding of secretory autophagy and did
not consider at what point autophagy was inhibited. Broadly speaking, commonly used
autophagic inhibitors either block the initiator complex activity through PI3K inhibition or
prevent lysosome acidification and lysosome-autophagosome fusion. Theoretically, these latter
“inhibitors” do not prevent secretory autophagy and may increase it by diverting
autophagosomes to the plasma-membrane for secretion rather than accumulate proteins. In
contrast, these former initiator complex inhibitors prevent the initial generation of
autophagosomes and thus would inhibit both secretory and degradative autophagy.
Collectively, the literature agrees that treatment with the lysosome acidification and/or
autophagosome fusion inhibitors chloroquine or Baf-A1, increase the secretion of both non-EV
and EV α-syn [9, 86, 106, 279, 340, 387]. In contrast, studies report marked differences when
autophagy is inhibited during the initiation step which prevents autophagosome formation. A
couple of studies found when cells over-expressing α-syn were treated with the PI3K inhibitor 3-
MA which blocks the initiator complex, an increase in α-syn secretion occurred [155, 279].
Within another study using immortalized dopaminergic precursor cells, 3-MA treatment did not
increase secretion within the non-vesicular fraction. Yet, they found that ATG5 depletion
concurrently increased the levels of α-syn and exosomal marker CD81 in the isolated EVs [155].
In another study, 3-MA did not increase secretion in either the total or EV fraction of cultured
media from a H4 cell model [387]. Moreover, PC12 cells over-expressing A30P α-syn as well as
tubulin polymerization promoting protein (TPPP), which they showed reduced autophagosome-
lysosome fusion, reduced α-syn secretion when depleted of ATG5 [132]. Furthermore, canonical
autophagic activation by rapamycin treatment reduces secretion [106] while trehalose, a non-
canonical autophagic activator that circumvents mTOR, increases secretion [132, 550].

42
Interestingly, in a recently published motor-degeneration model study, following trehalose
administration to motor neurons, small amounts of lysosomal damage were observed with
correspondingly increased levels of enhanced GFP (eGFP)-Gal3, increased TFEB nuclear
translocation, and upregulated autophagy [422] consistent with other works investigating
lysosomal membrane damage, galectins, and TFEB [231, 232, 234]. In total, these results
highlight the complicated relationship between α-syn and secretory autophagy, particularly with
regard to early autophagic inhibition, where mixed results are reported.
Lysosome Dysfunction is a Hallmark of PD
The largest risk factor for developing PD and other neurodegenerative disease is age. As
we age, cells deteriorate in association with changes that increase susceptibility to disease.
López-Otin et al., 2013 suggests that there are nine “hallmarks” of aging that can be categorized
into primary, antagonists, and integrative [302]. These hallmarks are widely used by those who
study aging. The primary hallmarks are genomic instability, telomere attrition, epigenetic
changes, and loss of cellular degradative mechanisms. The antagonistic hallmarks are
mitochondrial dysfunction, cellular senescence, and deregulated nutrient sensing which occur
alongside or in response to primary hallmarks and are believed to be compensatory but
ultimately deleterious. Finally, the integrative hallmarks are stem cell exhaustion and altered
intercellular communication which result from the primary and antagonist hallmarks, and
responsible for functional decline from aging. Regarding neurodegenerative diseases, reduced
protein degradation from a decline in cellular degradative mechanisms and deregulation of
nutrient sensing may explain the increased propensity for PD and age. There is considerable
genetic and experimental evidence to support that impaired lysosome function and autophagy is
a hallmark of disease pathogenesis.

43
PD is characterized as either being sporadic or familial depending on the cause. Sporadic
(or idiopathic) PD refers to disease development with no clear genetic link and accounts for 85-
90% of total cases [211]. Whereas, familial cases are characterized by a family history of PD,
thought to arise from mono- or multi- genic mutations, and account for 10-15% of total cases
[211]. In total, over 24 genes have been linked to familial PD [66]. While most PD cases are
sporadic, monogenic familial cases account for the majority of individuals who experience early
disease onset, ~10% of total cases [251]. Thus, familial cases are further characterized as being
either early- (before 60 years of age) or late-onset associated. While familial, early-onset PD is
rare [252], the identification of genes such as SNCA, parkin (PRKN), LRRK2, PTEN inducible
kinase 1 (PINK1) provide valuable insight into disease pathogenesis. Similarly, the use of
genome wide associated studies (GWAS) to determine common genetic mutations among
individuals with sporadic PD has helped determine genetic risk factors and underlying
dysfunctional cellular pathways. Among these are several genes that either regulate or contribute
to autophagy and lysosome function including: SNCA, LRRK2, PARK7, VPS35, GBA1, PINK1,
PRKN, F-Box only protein 7 (FBXO7), VPS13C [66, 251, 252]. Thus, it has been proposed that
idiopathic PD is not the result of a single monogenic mutation but arises from cellular
dysfunction that converges on lysosomal failure [251]. This failure could either be from a single
genetic mutation, multiple genetic mutations, a combination of genetic and environmental
factors, or purely environmental factors. However, despite the cause, this converging failure on
the lysosome and lysosome associated pathways could explain the observed accumulation of α-
syn that occurs in synucleinopathies.
44
Lysosomes.
Lysosomes are acidified organelles with a pH between 4-5 and are responsible for the
degradation of unwanted cellular content and the recycling of their components. The
acidification of the lysosome facilitates the degradation of cargo by both disrupting protein
interactions and activating low pH sensitive hydrolases including cathepsins. Lysosomal pH is
generated and maintained by the lysosomal transmembrane vacuolar-ATPase proton (V-ATPase
H+) pump in accompaniment with chloride channels and ion transporters. Most lysosomal
proteins, such as lysosome associated membrane protein -1 and -2 (LAMP1 and LAMP2), are
transmembrane and highly glycosylated on their intraluminal regions [138, 268, 290]. This
relative abundance of intraluminal glycans is thought to protect the lysosomal membrane from
self-degradation [22, 268]. Lysosome biogenesis begins with endocytic vesicles which progress
from early endosomes to late endosomes followed by lysosomes. During this maturation process,
these endocytic vesicles accumulate lysosomal proteins from the Golgi network and begin to
acidify. Proper trafficking of lysosomal hydrolases to endocytic vesicles results from their
mannose-6-phosphate glycosylation which serves as signaling sequence for the mannose-6-
phosphate receptors in the Golgi network [171, 384, 534]. Subsequently, these mannose-6-
phosphate receptors dissociate in low pH environments [171, 384, 534]. The mis-trafficking or
impairment of lysosomal hydrolase function can result in improper degradation of lysosomal
cargo and ultimately cellular dysfunction. For example, individuals homozygous for the N370S
GBA1 gene mutation, which encodes for the lysosomal hydrolase glucocerebrosidase (GCase),
develop the lysosomal storage disorder Gaucher’s disease. While heterozygous carriers of N370S
GBA1 do not develop Gaucher’s disease, they are five-to-six times more likely to develop PD
[451]. In individuals with Gaucher’s disease, significantly higher levels of oligomeric α-syn have
45
been observed in their plasma [355]. This has also been seen from individuals with other
lysosomal storage disorders such as Niemann-Pick type C disease and Krabbe’s disease [322,
373]. Increased α-syn accumulation has also been linked to the lysosomal storage disorders
Niemann-Pick type C disease, Tay-Sachs disease, β-galactosialidosis, Batten’s disease, and
Krabbe’s disease [131, 322, 481]. These finds suggest lysosomal dysfunction is central to PD
pathogenesis [251].
Lysosomal Degradation Impairment in Parkinson’s Disease.
Experimentally, mutations in PD associated genes support the concept that altered
lysosomal function dysregulates α-syn clearance and leads to disease pathogenesis. Mutant
VPS35 mouse models accumulate α-syn in their mDA neurons [488]. The familial PD associated
mutation, R524W VPS35 was shown to impair the trafficking of lysosomal hydrolases which
subsequently resulted in higher levels of α-syn aggregates relative to WT [149]. In a Sandhoff
disease mouse model, a lysosomal storage disorder associated with the loss of β-hexaminidase
activity, mice accumulated lipids due to impaired enzymatic degradation, along with increased α-
syn [481].
Further evidence for lysosomal dysfunction’s involvement in disease pathology includes
the lysosomal hydrolases, known as cathepsins. Of the 50 cathepsins contributing to protein
degradation, multiple have been shown to degrade both monomeric and aggregated α-syn in
lysosomes [87, 102, 335, 397, 444]. Specifically, cathepsin D can fully degrade monomeric and
aggregated forms of α-syn [102, 397, 444]. Cathepsin B and cathepsin L can degrade monomeric
and fibril α-syn in some capacity[87, 335]. However, in one model, these hydrolases resulted in
the production of highly aggregate prone C-terminal α-syn fragments [334].
46
Impaired GCase function also results in α-syn accumulation and aggregation in both cell
and animal models, although it does not directly degrade α-syn [329, 333, 482, 485, 568].
Mazzulli et al., 2011 found depletion of GCase impaired lysosomal protein degradative capacity
and led to α-syn accumulation in human IPSC cortical neurons [329]. In cells over expressing
either WT α-syn or A53T α-syn, GCase KD increased soluble and insoluble high molecular
weight α-syn aggregate species in accompaniment with increased neurotoxicity. Increased
soluble and insoluble high molecular weight α-syn was also observed in the brains of Gaucher’s
disease (4L/PS-NA) mouse models relative to WT. In Gaucher’s disease, reduced GCase activity
impairs the metabolism of glucosylceramide into ceramide resulting in glucosylceramide
accumulation [241]. Mazzulli et al., 2011 demonstrated that glucosylceramide stabilized soluble
oligomeric α-syn intermediates. Notably, the relative ratio of glucosylceramide to ceramide was
found to positively correlate with the ratio of α-syn dimers to monomers in blood samples from
individuals with Gaucher’s disease [344]. Thus, impaired GCase activity may contribute to
synucleinopathies by promoting degradation resistant forms of α-syn aggregates.
Another contributing aspect of GCase activity impairment and disease pathogenesis may
be from reduced ceramide levels in endo/lysosomal compartments [196, 333]. Ceramide binds to
and promotes the cleavage of cathepsin D to its active form [196]. Thus, lower ceramide and
subsequently reduced cathepsin D activity could result in increased α-syn accumulation. This
premise is consistent with lower levels of ceramide and altered ceramide acyl chain composition
in the anterior cingulate cortex from individuals with PD compared to those without PD [1, 82].
Experimentally, inhibition of acid ceramidase, the enzyme that metabolizes ceramide into
sphingosine and free fatty acids, increased ceramide levels in GCase-deficient cells and reduced
α-syn in IPSC DA neurons derived from an individual with the PD associated heterozygous
47
N370S GBA1 mutation [247]. Consistent with reduced ceramide being involved in PD, acid
sphingomyelinase, galactosylceramidase, and GCase catalyze ceramide production in lysosomes.
Like GCase, mutations in the genes SMPD1 and GALC which encode for acid sphingomyelinase
and galactosylceramidase, respectably, are known susceptibility factors for PD and other
synucleinopathies [6, 31, 89, 103, 161, 162, 322]. Reduced acid sphingomyelinase in the blood
was associated with earlier PD onset by 3.5 to 5.8 years [6]. Galactosylsphingosine which is
metabolized by galactosylceramidase into ceramide, was observed to be increased in the cerebral
cortex from individuals with PD compared to age matched controls [322]. Galactosylsphingosine
has also been shown to increase α-syn aggregation in a dose dependent manner in vitro [459].
The consequence of impaired α-syn degradation in lysosomal compartments could
facilitate its accumulation in endosomal or lysosomal compartments. This may in-turn accelerate
α-syn aggregation, as acidic pH has been shown to promotes α-syn’s oligomerization [48, 51,
508]. Treatment with the lysosomal acidification and lysosomal-autophagosome fusion inhibitor
[326, 327, 543], Baf-A1, increases α-syn accumulation as well as its exocytosis [9, 106, 132,
155, 387]. Haploid insufficiency of cathepsin D, GCase depletion, and heterozygous N370S
GBA1 mutants also increases the secretion of EV associated α-syn [19, 20, 247] and accumulate
α-syn in lysosomal compartments [185, 208, 235]. The increase in α-syn secretion may be
compensatory due to reduce α-syn aggregate accumulation and neurotoxicity [155]. The
secretion may also promote cell-to-cell transfer of pathological α-syn, compromise degradation
within the recipient cell, and perpetuate the cycle [471].
mTOR Signaling.
Recent studies demonstrate lysosomes are not simply degradative organelles but also
function as an important scaffolding for cellular signaling proteins, including one of the master
48
regulators of autophagy, mTOR[455]. mTOR, a singular serine/threonine kinase, is the primary
regulator of a myriad of essential functions within the body ranging from coordinating cell
growth, cell size, organ shape, and the degradation of proteins and lipids via the autophagic-
lysosomal pathway [17, 119, 423, 546]. in mammals, mTOR forms two distinct complexes
known as mTORC1 and mTORC2 [17, 546]. Both mTORC1 and mTORC2 share the common
interacting proteins MTOR Associated Protein, LST8 Homolog (mLST8), DEP Domain
Containing MTOR Interacting Protein (DEPTOR), and the Tel2 interacting protein 1
(Tti1)/Telomere length regulation protein 2 (Tel2) complex which function to stabilize mTOR
complex assembly. Only mTORC1 associates with the scaffolding protein Raptor which
influences mTORC1 assembly, stability, regulation, and substrate specificity [17, 432].
Additionally, the proline-rich AKT substrate of 40 kDa (PRAS40) exclusively blocks mTORC1
activity [17]. In contrast, mTORC2 associates with Rapamycin-insensitive companion of
mammalian target of rapamycin (RICTOR) and mSin1 [299, 432]. Rictor facilitates mTORC2
assembly, stability, substrate specificity, and subcellular localization [432]. mSin1 assists in
anchoring mTORC2 to the plasma-membrane to facilitate proper activation in response to stimuli
[299].
The different interacting partners of mTORC1 and mTORC2 ultimately result in distinct
regulation of their respective pathways by affecting their subcellular localization. While
mTORC2 is primarily plasma-membrane bound, mTORC1 is localized to the endosomal and
lysosomal membranes. Indeed, mTORC1 plays a critical role in regulating autophagy and is
considered the canonical master regulator. Moreover, only mTORC1 is sensitive to rapamycin
induced inhibition which has long been recognized to upregulate autophagy [432]. mTORC1

49
activity is also closely coupled to nutrient levels within the cell and becomes inactivated during
starvation which results in increased autophagy.
Generally, active mTORC1 promotes anabolism. These associated anabolic pathways
require cells to have the necessary building blocks to promote growth. Thus, the regulation of
mTORC1 activity is dependent on the cellular availability of these necessary building blocks,
where increased levels promote mTORC1 activation and reduced levels reduce mTORC1
activation. This paradigm is the basis of mTORC1 signaling and thus signaling factors associated
with growth, energy level, amino acid concentrations, oxygen availability, and DNA homeostasis
all influence mTORC1 activity.
The recombination activation gene (RAG) complex plays a prominent role in activating
mTORC1 by functioning as an amino acid sensor [246, 427, 428]. The RAG complex is a
heterodimer guanosine triphosphatase (GTPase) composed of different combinations of RAG
A/RAG B with RAG C/RAG D and is bound to the lysosomal membrane via Lamptor to form
the RAGULATOR complex [24, 427]. During amino acid stimulation, the RAG proteins bind
GTP and undergo a confirmational change that allows for mTORC1 to bind and interact with the
lysosomal bound Ras homolog enriched in brain (RHEB) [119, 220, 300, 427, 428, 492]. RHEB
interacts with the catalytic domain of mTORC1 and is require for its full activation [220, 300,
492].
Active mTORC1 resides on the outer membrane of lysosomes interacting with RHEB,
the RAG GTPase complex, and the lysosomal Na+/ glutamine and arginine amino acid
transporter 2 (SLC38A2). SLC38A2 forms a complex with the lysosomal transmembrane
protein, SLC38A9, which senses intraluminal arginine and glutamine levels and regulates the
RAGULATOR complex via Lamptor which subsequently control mTORC1 activity. This

50
SLC38A2-SLC38A9 complex also associate with the V-ATPase H+ pump responsible for
generating the proton gradient resulting in lysosomal acidification.
While active, mTORC1 keeps key regulators of autophagy and lysosomal biogenesis in
the inactive state. mTORC1 phosphorylates ULK1 [317] at S637 and S757 keeping it inhibited.
Similarly, transcription factor EB (TFEB), is also held in an inactive state when mTOR is active.
Subsequently, mTORC1 inhibition increases ULK1 activity and the translocation of TFEB to the
nucleus, binds to its Coordinated Lysosomal Expression and Regulation (CLEAR) motif,
increasing the expression of lysosomal and autophagosomal proteins [97, 222]. mTORC1 senses
Figure 3: Lysosomal Signaling Pathways in Response to Various Stimuli. Diagram demonstrates the
network of proteins that become active during nutrient rich, starvation, and cargo overload conditions. In
brief, the nutrient rich condition increases ZKSCAN3 and MYC translocation to the nucleus to reduce
lysosomal protein synthesis. Growth factors activate AKT to reduce FOXO and TSC function. Intraluminal
cholesterol and arginine in the lysosome are recognized by SLC38A9, act on RAGULATOR complex
proteins, affecting RHEB, keeping mTOR active, and subsequently resulting in increased TFEB/3
phosphorylation and its sequestration in the cytosol by the chaperone protein 14-3-3. In the starvation
condition or during ROS generation, increased TFEB/3 and FOXO translocation to the nucleus occurs
resulting in increased lysosomal protein transcription. LKB1 phosphorylates and activates AMPK. Low
intraluminal cholesterol and amino acids sensed by SLC38A9, results in mTOR inhibition and its
disassociation from the RAGULATOR complex. This process is mediated by other nutrient sensing cellular
mechanisms including: Castor1, FLCN/FNIP2, and GATOR1. Image originally published in: “How
Lysosomes Sense, Integrate, and Cope with Stress”[424]. Used with publisher’s permission.

51
cytosolic amino acids via its interaction with the GATOR1 and GATOR2 complexes, as well as
through adenosine diphosphate ribosylation factor-1 (ARF1) and folliculin-folliculin interacting
protein 2 (FNIP2) complex [68, 229, 275, 367, 376, 383, 503, 540]. GATOR1 is tethered to the
lysosomal membrane, is a GTPase activating protein (GAP) for RAG A/B, and thus inhibits
mTORC1 by hydrolyzing bound RAG-GTP [540]. Contrarily, GATOR2 positively regulates
mTORC1 by binding to lysosomal GATOR1 [68, 367]. GATOR2’s interaction with GATOR1
can be further regulated by Sestrin-2 and cytosolic arginine sensor for mTORC1 (CASTOR1) by
binding to GATOR2 and preventing the GATOR2-GATOR1 interaction [67, 437, 438, 539]. In
this way, Sestrin-2 and CASTOR1 function as amino acid sensors, as their interaction with
GATOR2 requires them to be unassociated with arginine and leucine, respectively [67, 437, 438,
539]. The ARF1 GTPase mediates the re-localization of mTORC1 in response to glutamine
levels [229]. The GDP-bound FNIP2 complex, which forms when not bound to arginine, binds to
mTORC1, functions as a GAP for RAG C/D, and thus positively regulates mTORC1 [275, 383,
503].
AMPK Signaling.
Like mTORC1, AMP-activated protein kinase (AMPK) regulates cell energy levels and
senses the cell’s energy status. In contrast to mTORC1, AMPK phosphorylates downstream
targets to increase catabolism to restore ATP levels [202]. Under basal conditions, a portion of
AMPK are constitutively localized to the outer membrane of the lysosome. During high cellular
glucose and abundant ATP conditions, AMPK remains inactive [560]. Conversely, AXIN and
the AMPK activating kinase, liver kinase B1 (LKB1), re-localize in response to low glucose to
form a complex with lysosomal AMPK via interactions with the RAGULATOR complex and the
V-ATPase [559, 560]. Additionally, increased adenosine monophosphate (AMP) levels
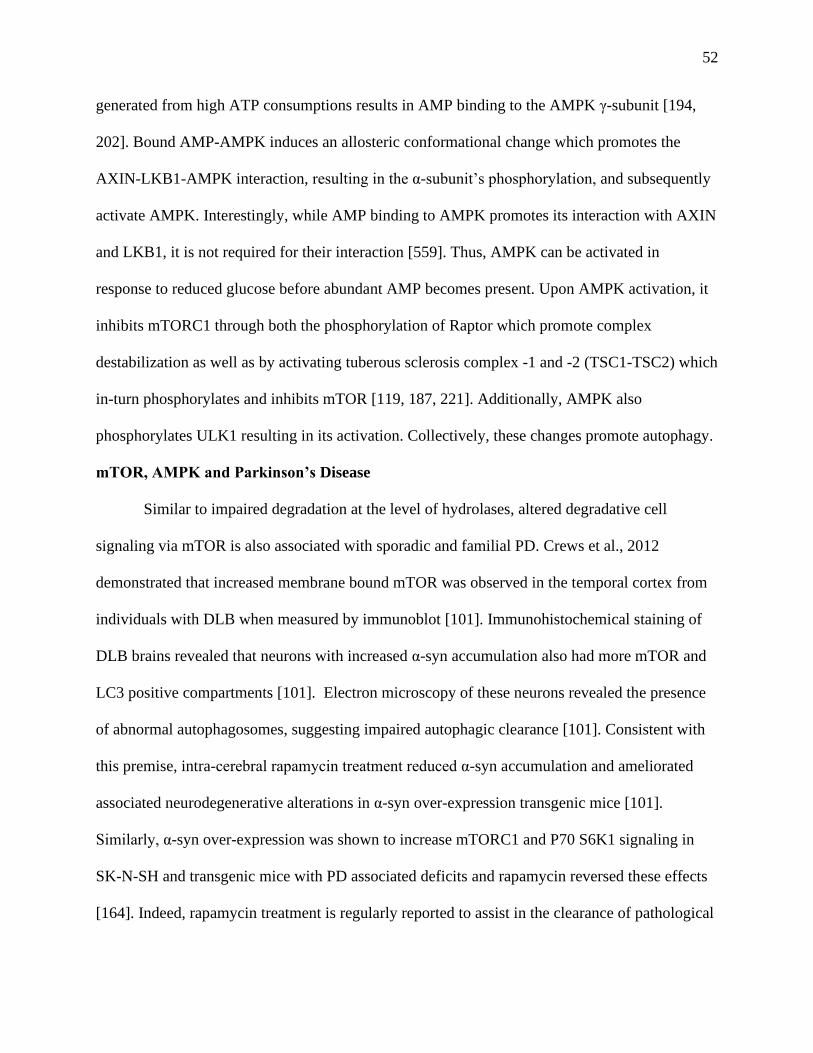
52
generated from high ATP consumptions results in AMP binding to the AMPK γ-subunit [194,
202]. Bound AMP-AMPK induces an allosteric conformational change which promotes the
AXIN-LKB1-AMPK interaction, resulting in the α-subunit’s phosphorylation, and subsequently
activate AMPK. Interestingly, while AMP binding to AMPK promotes its interaction with AXIN
and LKB1, it is not required for their interaction [559]. Thus, AMPK can be activated in
response to reduced glucose before abundant AMP becomes present. Upon AMPK activation, it
inhibits mTORC1 through both the phosphorylation of Raptor which promote complex
destabilization as well as by activating tuberous sclerosis complex -1 and -2 (TSC1-TSC2) which
in-turn phosphorylates and inhibits mTOR [119, 187, 221]. Additionally, AMPK also
phosphorylates ULK1 resulting in its activation. Collectively, these changes promote autophagy.
mTOR, AMPK and Parkinson’s Disease
Similar to impaired degradation at the level of hydrolases, altered degradative cell
signaling via mTOR is also associated with sporadic and familial PD. Crews et al., 2012
demonstrated that increased membrane bound mTOR was observed in the temporal cortex from
individuals with DLB when measured by immunoblot [101]. Immunohistochemical staining of
DLB brains revealed that neurons with increased α-syn accumulation also had more mTOR and
LC3 positive compartments [101]. Electron microscopy of these neurons revealed the presence
of abnormal autophagosomes, suggesting impaired autophagic clearance [101]. Consistent with
this premise, intra-cerebral rapamycin treatment reduced α-syn accumulation and ameliorated
associated neurodegenerative alterations in α-syn over-expression transgenic mice [101].
Similarly, α-syn over-expression was shown to increase mTORC1 and P70 S6K1 signaling in
SK-N-SH and transgenic mice with PD associated deficits and rapamycin reversed these effects
[164]. Indeed, rapamycin treatment is regularly reported to assist in the clearance of pathological
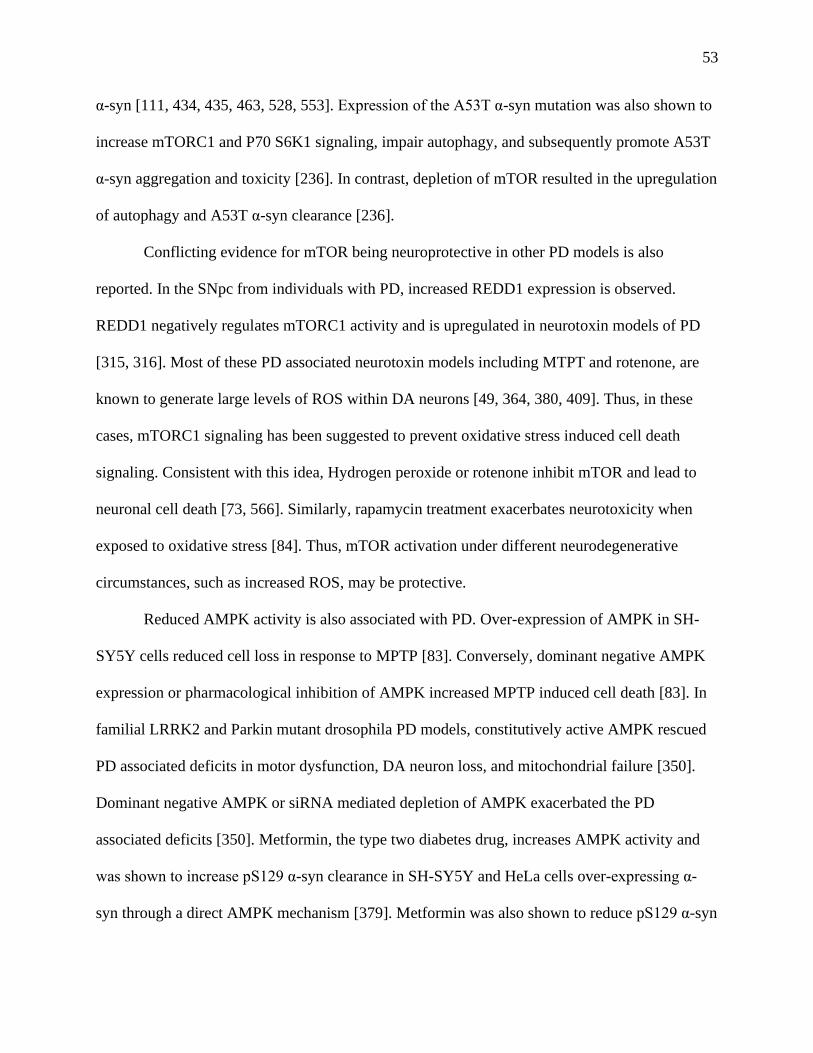
53
α-syn [111, 434, 435, 463, 528, 553]. Expression of the A53T α-syn mutation was also shown to
increase mTORC1 and P70 S6K1 signaling, impair autophagy, and subsequently promote A53T
α-syn aggregation and toxicity [236]. In contrast, depletion of mTOR resulted in the upregulation
of autophagy and A53T α-syn clearance [236].
Conflicting evidence for mTOR being neuroprotective in other PD models is also
reported. In the SNpc from individuals with PD, increased REDD1 expression is observed.
REDD1 negatively regulates mTORC1 activity and is upregulated in neurotoxin models of PD
[315, 316]. Most of these PD associated neurotoxin models including MTPT and rotenone, are
known to generate large levels of ROS within DA neurons [49, 364, 380, 409]. Thus, in these
cases, mTORC1 signaling has been suggested to prevent oxidative stress induced cell death
signaling. Consistent with this idea, Hydrogen peroxide or rotenone inhibit mTOR and lead to
neuronal cell death [73, 566]. Similarly, rapamycin treatment exacerbates neurotoxicity when
exposed to oxidative stress [84]. Thus, mTOR activation under different neurodegenerative
circumstances, such as increased ROS, may be protective.
Reduced AMPK activity is also associated with PD. Over-expression of AMPK in SH-
SY5Y cells reduced cell loss in response to MPTP [83]. Conversely, dominant negative AMPK
expression or pharmacological inhibition of AMPK increased MPTP induced cell death [83]. In
familial LRRK2 and Parkin mutant drosophila PD models, constitutively active AMPK rescued
PD associated deficits in motor dysfunction, DA neuron loss, and mitochondrial failure [350].
Dominant negative AMPK or siRNA mediated depletion of AMPK exacerbated the PD
associated deficits [350]. Metformin, the type two diabetes drug, increases AMPK activity and
was shown to increase pS129 α-syn clearance in SH-SY5Y and HeLa cells over-expressing α-
syn through a direct AMPK mechanism [379]. Metformin was also shown to reduce pS129 α-syn
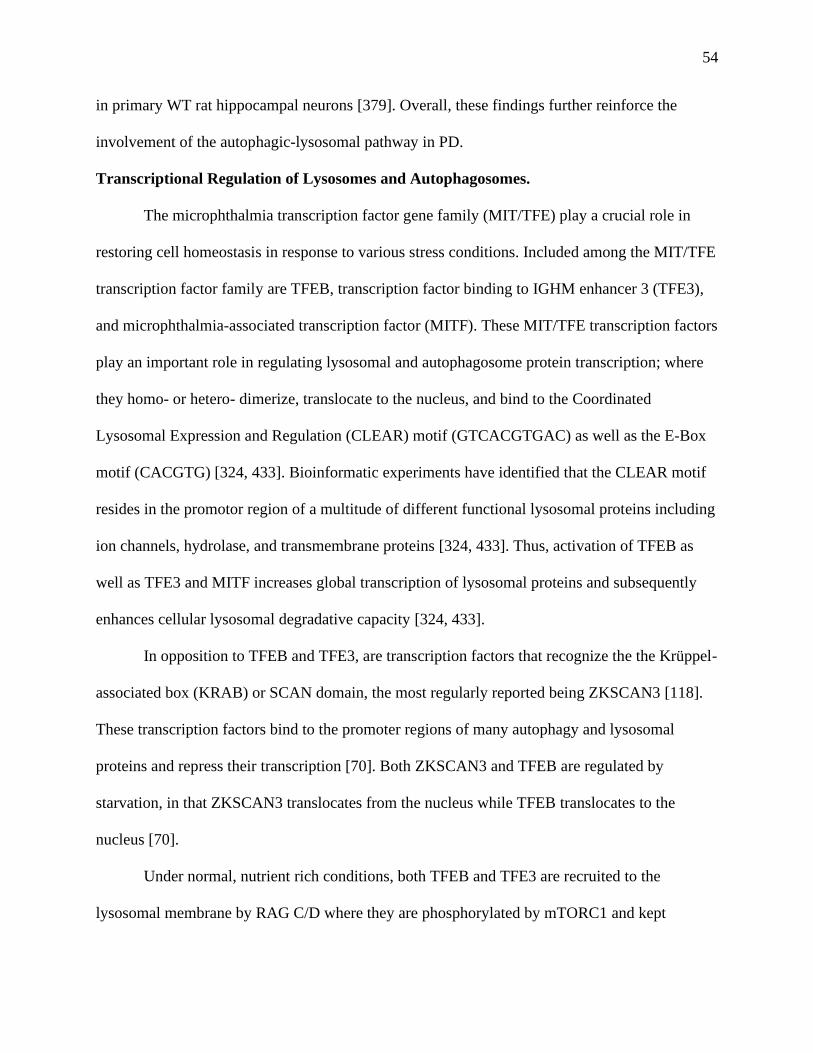
54
in primary WT rat hippocampal neurons [379]. Overall, these findings further reinforce the
involvement of the autophagic-lysosomal pathway in PD.
Transcriptional Regulation of Lysosomes and Autophagosomes.
The microphthalmia transcription factor gene family (MIT/TFE) play a crucial role in
restoring cell homeostasis in response to various stress conditions. Included among the MIT/TFE
transcription factor family are TFEB, transcription factor binding to IGHM enhancer 3 (TFE3),
and microphthalmia-associated transcription factor (MITF). These MIT/TFE transcription factors
play an important role in regulating lysosomal and autophagosome protein transcription; where
they homo- or hetero- dimerize, translocate to the nucleus, and bind to the Coordinated
Lysosomal Expression and Regulation (CLEAR) motif (GTCACGTGAC) as well as the E-Box
motif (CACGTG) [324, 433]. Bioinformatic experiments have identified that the CLEAR motif
resides in the promotor region of a multitude of different functional lysosomal proteins including
ion channels, hydrolase, and transmembrane proteins [324, 433]. Thus, activation of TFEB as
well as TFE3 and MITF increases global transcription of lysosomal proteins and subsequently
enhances cellular lysosomal degradative capacity [324, 433].
In opposition to TFEB and TFE3, are transcription factors that recognize the the Krüppel-
associated box (KRAB) or SCAN domain, the most regularly reported being ZKSCAN3 [118].
These transcription factors bind to the promoter regions of many autophagy and lysosomal
proteins and repress their transcription [70]. Both ZKSCAN3 and TFEB are regulated by
starvation, in that ZKSCAN3 translocates from the nucleus while TFEB translocates to the
nucleus [70].
Under normal, nutrient rich conditions, both TFEB and TFE3 are recruited to the
lysosomal membrane by RAG C/D where they are phosphorylated by mTORC1 and kept

55
inactive. Chaperone protein 14-3-3 mediates their inactivity by recognizing and binding to
phosphorylated TFEB and TFE3, preventing their dimerization and occluding their nuclear
localization signal. Other proteins, such as GSK-3β, ERK2, can also phosphorylate TFEB and
TFE3 contributing to their interaction with 14-3-3[293, 443].
In response to cellular stress, such as nutrient deprivation, TFEB and TFE3 become
dephosphorylated due to mTORC1 inactivation. TFEB and TFE3 dephosphorylation releases
bound 14-3-3 resulting in their rapid translocation to the nucleus [97, 222]. TFEB and TFE3 can
also be directly dephosphorylated by specific phosphatases such as calcineurin or protein
phosphatase 2A to induce the translocation of these transcription factors. Thus, other stimuli can
also upregulate lysosomal and autophagosomal protein expression independent of mTOR by
acting on these phosphatases.
While TFEB, TFE3, and MITF all upregulate lysosomal and autophagic genes to increase
cellular degradative capacity, there are observable differences among the genes each
transcription factor upregulates [324]. In one study comparing the over-expression of TFEB,
TFE3, and MITF, MITF upregulated only 6 of 17 lysosomal genes tested. In contrast, both TFEB
and TFE3 upregulated 16 of the 17 lysosomal genes with a shared overlap in 15 of the genes.
Similarly, when a standard array of autophagy PCR primers was used to measure difference in
gene expression, 36 of 83 associated genes were upregulated by TFEB over-expression; 29 of 83
were upregulated by TFE3 over-expression; and 7 of 83 were upregulated by MITF over-
expression. Interestingly, both TFEB and TFE3 over-expression also increased SNCA
transcription, while MITF did not [324]. Others have also reported that increased TFEB
induction increases SNCA expression [11, 486].

56
Evaluation of autophagy in response to TFEB, TFE3, and MITF over-expression revealed
an increased relative ratio of LC3-II to LC3-I indicative of the increased autophagosomes among
transcription factor over-expressing cells compared to the control cells [324]. These finds are
consistent with TFEB and TFE3 both upregulating autophagy and lysosome production while
MITF had a lesser role in this process which had previously been suggested prior to this study
[206]. However, because concomitant over-expression of TFE3 and KD of TFEB elicits a similar
transcription profile to TFE3 over-expression alone and vice versa, it suggests both TFEB and
TFE3 are capable of upregulating lysosome and autophagy independent of each other [324, 371].
Ultimately, the differences among the genes each transcription factors upregulates may be
important for different physiological cellular responses. Consistent with this idea, the over-
expression of TFEB and TFE3 were shown to increase lysosomal exocytosis while MITF did not
in ARPE-19 retinal epithelial cells [324]. Both the over-expression of TFEB and TFE3 increased
the number of lysosomes near the plasma-membrane as well as promoted their fusion [324, 336].
The mechanism by which TFEB and TFE3 drove lysosomal exocytosis was the result of
upregulating and activating the lysosomal Ca2+ channel MCOLN1 which increases the
intracellular Ca2+ concentration [336]. Additionally, differences in TFEB, TFE3, and MITF are
reported from different tissue types which could correspond with differences in function in
association with differences in transcript expression [324].
TFEB and Neurodegenerative Diseases.
Changes in TFEB associated expression are thought to be linked to many
neurodegenerative diseases including PD and other synucleinopathies whereby reduced TFEB
driven CLEAR protein expression is associated with disease pathogenesis. In synucleionpathies,
this may be due to a direct mechanism, as α-syn may physically block TFEB translocation. α-syn
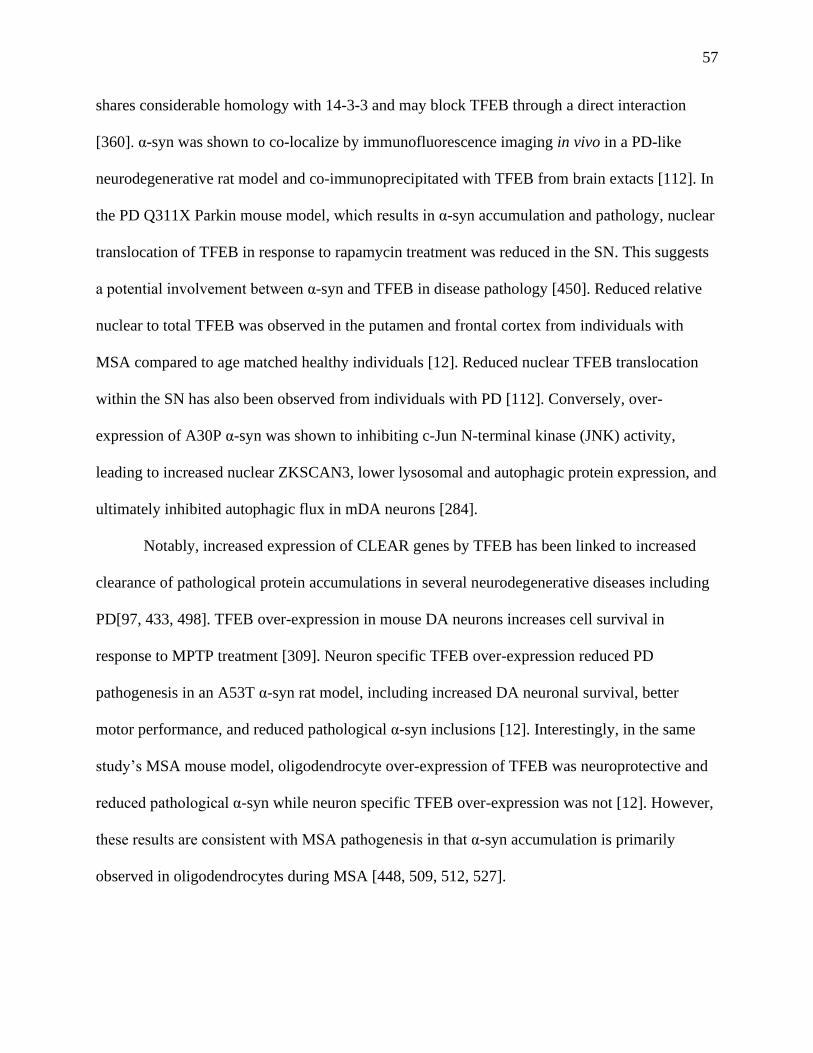
57
shares considerable homology with 14-3-3 and may block TFEB through a direct interaction
[360]. α-syn was shown to co-localize by immunofluorescence imaging in vivo in a PD-like
neurodegenerative rat model and co-immunoprecipitated with TFEB from brain extacts [112]. In
the PD Q311X Parkin mouse model, which results in α-syn accumulation and pathology, nuclear
translocation of TFEB in response to rapamycin treatment was reduced in the SN. This suggests
a potential involvement between α-syn and TFEB in disease pathology [450]. Reduced relative
nuclear to total TFEB was observed in the putamen and frontal cortex from individuals with
MSA compared to age matched healthy individuals [12]. Reduced nuclear TFEB translocation
within the SN has also been observed from individuals with PD [112]. Conversely, over-
expression of A30P α-syn was shown to inhibiting c-Jun N-terminal kinase (JNK) activity,
leading to increased nuclear ZKSCAN3, lower lysosomal and autophagic protein expression, and
ultimately inhibited autophagic flux in mDA neurons [284].
Notably, increased expression of CLEAR genes by TFEB has been linked to increased
clearance of pathological protein accumulations in several neurodegenerative diseases including
PD[97, 433, 498]. TFEB over-expression in mouse DA neurons increases cell survival in
response to MPTP treatment [309]. Neuron specific TFEB over-expression reduced PD
pathogenesis in an A53T α-syn rat model, including increased DA neuronal survival, better
motor performance, and reduced pathological α-syn inclusions [12]. Interestingly, in the same
study’s MSA mouse model, oligodendrocyte over-expression of TFEB was neuroprotective and
reduced pathological α-syn while neuron specific TFEB over-expression was not [12]. However,
these results are consistent with MSA pathogenesis in that α-syn accumulation is primarily
observed in oligodendrocytes during MSA [448, 509, 512, 527].

58
In addition to over-expression models, pharmacological induced TFEB activation
facilitates α-syn clearance [113, 243]. Treatment of mice with Ambraxol, an mucolytic
decongestant that induces the secretion of surfactant storing lysosomes via dysregulating Ca2+
stores [148], was also shown to increase GCase activity in WT, L444P GBA1 mutant, and α-syn
over-expressing mice as well as decrease α-syn found in the brains in the α-syn over-expressing
mice when compared to
untreated [339]. In another
study, Ambraxol treated mouse
cortical neurons were shown to
have increased TFEB
expression [312]. The same
study found that Ambraxol
also increased the secretion of
both α-syn and EVs but
appeared to impair autophagic
flux, as LC3-II levels were comparable when lysosomal acidification was quenched following
concomitant BAF-A1 treatment [312]. Interestingly, despite Ambraxol treatment increasing α-
syn expression and increasing total levels of intracellular α-syn, reduced pathologically
associated pS129 α-syn levels were found [312]. Reduced pS129 α-syn has also been observed in
other studies [158, 339]. The efficacy of Ambraxol has gone so far as to be considered as
preventative for individuals with GBA1, where it was shown to positively reduce PD related
symptoms [347]. These results indicate that upregulated TFEB facilitates clearance of
pathological α-syn by increasing autophagic and lysosomal proteins. Additionally, it suggests
Figure 4: Relationship Between Lysosomal Function and TFEB
Translocation. Cartoon depicts the relationship between TFEB
inhibition and TFEB translocation based on the active state of the
lysosome and mTOR.
59
TFEB upregulation may represent a promising avenue for therapeutics in treating
synucleinopathies and other neurodegenerative disorders.
The Cellular Response to Lysosomal Stress.
Lysosomal membrane stress can be induced by a variety of insults ranging from
intracellular pathogens, protein aggregates such as misfolded α-syn, and crystals such as silica
[80, 147, 153, 372, 496]. Continual membrane stress may eventually lead to lysosomal
membrane rupture, the release of intraluminal content including cathepsins and other hydrolases
into the cytosol, and subsequently cell death [523]. To combat this, cells have evolved a
mechanism to recognize lysosomal membrane rupture and either repair or remove damaged
lysosomes.
Small disruptions in the lysosomal membrane result in a repair response to reseal the
membrane. The resealing of the membrane is mediated by the ESCRT protein complexes
including Tsg101, Alix, and charged multivesicular body protein 4B (CHMP4B), which are
recruited through a Ca2+ dependent mechanism [458]. Lysosomes are among the cellular
organelles that store intracellular Ca2+ [276]. Thus, leaking Ca2+ following lysosomal membrane
damage may help facilitate this resealing response [276].
A recent publication indicates that Gal3 plays an important role in the recruitment of the
ESCRT proteins to facilitate disrupted lysosomal membrane repair [234]. Galectins are a family
of proteins containing a carbohydrate recognition domain (CRD) which allows them to bind to
the glycosylated proteins found within the intraluminal lysosomal membrane [237, 372, 496]. In
the recent publication, proximity based biotinylation was used by generating a recombinantly
linked APEX2-Gal3 construct. The APEX2 construct derived from the genetically modified
soybean ascorbate peroxidase (APE1) protein biotinylates proteins in the presence of hydrogen
60
peroxide. Using this APEX2-Gal3 construct, a proteomic screen was performed to evaluate the
change in the Gal3 interactome following lysosomal membrane damage. They found that an
increased association between Gal3 with both lysosomal proteins and the ESCRT protein ALIX
occurred during early stages of lysosomal membrane damage [234]. They found a reduced
recruitment of ALIX to LAMP1 positive compartments in Gal3 KO cells and in the R186S Gal3
mutant which does not bind to damaged lysosomes [426].
Galectins’ Function in the Central Nervous System
Galectins are a family of proteins that share a CRD motif that interacts with different β-
galactoside sugars, which can present on proteins by either O- or N- glycosylation, and were
initially discovered based on their binding to glycosylated cell-surface proteins [237]. Fifteen
galectin family members have been identified in total, with broad degrees of expression among
members depending on the tissue or cell type [237]. Mechanistically, galectins are well
characterized for their ability to recognize ruptured endosomal or lysosomal membranes, to be
unconventional secreted, and moderate the activity and trafficking of glycoproteins within the
lumen of intracellular compartments or at the plasma-membrane. These characteristics have
implicated them in a broad range of cellular functions including immune responses, signaling,
inflammation, and autophagy [237].
Among the galectin family, roles for galectin-1 (Gal1), Gal3, and galectin-4 (Gal4) have
been identified in CNS development by influencing axonal guidance, growth, and branching as
well as proper myelination and re-myelination. Within the cells of the CNS, Gal1 is primarily
expressed in neurons where it plays an important role in their development. Gal1 KO mice are
shown to have aberrant olfactory axon topography, indicating that Gal1 facilitates neurite
arborization and contributes to axonal guidance, this has also been observed for somatosensory
61
neurons as well [165, 210, 395]. Expression of Gal3 and -4 occurs during neuronal development
and the onset of myelination but is then downregulated [123, 370, 467].
In myelinated neurons, L1 neural cell adhesion molecule (L1CAM/CD171) interacts with
oligodendrocyte contactin-1 to stimulate myelin basic protein synthesis and myelination at these
regions. Gal4 in cortical and olfactory neurons sorts and organizes the axonal glycoprotein,
L1CAM, by binding to terminal glycosylations to facilitate its distribution in microdomains
within the axonal plasma membrane [467, 515]. Similarly, Gal4 plays an important role in
organizing membrane microdomains in polarized epithelial cells [470]. Immobilized
extracellular pS6 Gal3 by casein kinase 1 (CK1), but not unphosphorylated Gal3, increased
branching in cultured hippocampal neurons through interactions with membrane bound L1CAM.
Conversely, microdomains of Gal4 are present in the axonal nodes of Ranvier where it interacts
with contactin-1, sequesters it, and precludes myelination at these regions [27, 120]. Secreted
neuronal Gal4 also regulates oligodendrocyte progenitor cells differentiation, influencing
temporal myelination onset. Gal4 produced and secreted by unmyelinated neurons has been
shown to bind to immature oligodendrocytes, modulating their differentiation and proliferation
[257, 515]. Oligodendrocytes also express Gal4 where it is thought to participate in the
trafficking of glycoproteins and lipids, similar to other polarized cells such as neurons and
epithelial cells [27, 314, 467, 470, 515]. In comparison to unmyelinated neurons, Gal4 does not
appear to be secrete from oligodendrocytes [27, 314, 515]. However, in oligodendrocytes Gal4
affects the trafficking of the crucial myelin proteolipid protein, the protein that makes up more
than 50% of CNS myelin’s total protein [28, 179, 191, 362]. Gal4 also affects the expression of
myelin basic protein by binding to transcription factor SP1 and activating p27 [531, 532].

62
In comparison to WT mice, Gal3 KO mice had down-regulated myelin basic protein,
fewer myelinated axons, and less compact myelin [212, 370]. These Gal3 KO mice also had
increased oligodendrocyte progenitor cells and behavioral deficits consistent with
hypomyelination. Similar to Gal3 KO mice, Gal1 KO mice have significantly less myelinated
axons and less compact myelin [410]. These works suggest Gal3 is important for the
differentiation of oligodendrocyte progenitor cells as well as a role for Gal3 and Gal1 in proper
myelination of neuronal axons.
Galectin Facilitated Clearance of Ruptured Lysosomes
Although not shared among all the galectin family members, Gal1, Gal3, galectin-8
(Gal8), and galectin-9 (Gal9) all have CRD’s that interact and adhere to the glycans present on
the intraluminal membrane proteins of endosomes and lysosomes [237, 372, 496]. Thus, these
galectins re-localize and recognize exposed glycans on the inside of ruptured endosomes and
lysosomes that are otherwise normally hidden [237, 372, 496]. This re-localization event is best
characterized among Gal3 and Gal8 which subsequently recruit their respective, specific
autophagic adaptor proteins [237, 372, 496]. Gal8 recruits NDP52 while in contrast, Gal3
recruits Trim16 though its interaction with ULK1 and subsequently provides scaffolding for
autophagic proteins such as ATG16L1 to bind and form a complex to drive autophagy [71, 232,
234, 237, 265]. These subsequent interactions facilitate direct conjugation of the ruptured
lysosome to the autophagophore for clearance by selective autophagy [71, 232, 234, 237, 265].
In addition to facilitating the clearance of ruptured lysosomes, specific roles for Gal3,
Gal8, and Gal9 in coordinating autophagy and lysosome biogenesis at the mechanistic and/or
transcriptional level have been identified [71, 232, 234, 250, 265]. Gal8 was shown to bind to
SLC38A9 in response to lysosome membrane rupture induced by glycyl-l-phenylalanine 2-
63
naphthylamide (GPN), where it ultimately regulated mTORC1’s translocation from the lysosome
to the cytosol [232]. Gal8 KO cells also had reduced nuclear translocation of TFEB when
following GPN treatment compared control KO cells [232]. Gal8 KO HeLa and bone marrow
derived macrophages had fewer autophagosomes, measured by LC3 puncta number, when
challenged with GPN. This suggests that Gal8 KO cells have maintained increase in mTORC1
signaling in response to lysosomal membrane rupture, indicating a role for Gal8 in regulating
mTORC1 signaling and cellular autophagy in this context.
In the same study investigating Gal8’s role in coordinating autophagy, Gal9 was found to
associate with transforming growth factor-β-activated kinase 1 (TAK1), an upstream regulator of
AMPK, which subsequently positively regulates ULK1, and negatively regulates mTORC1
following GPN treatment [232]. A follow-up paper from the same authors further clarified the
Gal9 associated signaling pathway during lysosomal membrane rupture [233]. Gal9 was found to
displace the deubiquitinase USP9X on TAK1, promote K63 ubiquitination, and lysosomal
AMPK activation [233]. In addition, another publication demonstrated Gal9 interacts with
LAMP2 to assist in maintaining lysosomal function under steady state conditions [475].
In contrast, Gal3 facilitates both lysosomal membrane repair during early membrane
stress that precedes rupture and coordinates degradation following membrane rupture. During
early stress, Gal3 recruited ESCRT proteins such as Alix to mediate ESCRT associated lysosome
membrane repair [234]. In response to rupture, the interaction between Gal3 and Alix became
decreased and an increased association with Trim16, ULK1, and ATG16L1 occurred [71, 75,
234]. While it was determined that WT and Gal3 KO cells had a similar response to mTORC1
associated signaling when challenged with GPN [232], Gal3 KO was shown to increase TFEB
translocation in response to the lysosomal membrane rupturing agent, leucyl-L-leucine methyl
64
ester (LLOME) [234]. Similarly, Trim16 KO increased TFEB nuclear translocation at basal
conditions and in response to lysosomal rupturing agent [71, 226]. TFEB over-expression is
shown to promote autophagic flux, increase autophagosome number, and lysosome acidification
[565]. However, the number of autophagosomes, measured by the puncta number for LC3,
ATG13, and ATG16L1, were all reduced in both the Gal3 KO and the CRD inactivate R186S
Gal3 mutant cells relative to WT when treated with LLOME. Similarly, Trim16 KO significantly
reduced the number of autophagosomes, as measured by LC3 puncta, in response to LLOME
treatment relative to WT [71, 226]. Furthermore, both Trim16 KO and Gal3 KO cells had
reduced lysosomal acidification, lysosomal cathepsin activity, and degradative potential when
challenged with lysosomal membrane damaging stimuli including α-syn fibrils [43, 71, 226,
234]. Contrarily, Gal3 over-expression increased lysosomal cathepsin activity in the presence of
LLOME compared to WT [234]. These findings indicate that despite an increase in nuclear
translocation of TFEB, Gal3 and Trim16 appear to regulate autophagy on another unknown axis.
One possibility previously suggested is that Trim16 controls lysosome quality [265]. Gal3 also
maintains lysosome quality by facilitating lysosome repair. In further support of this premise,
Trim16 has been shown to regulate autophagic flux in motor neurons, and consequently, when
Trim16 KO cells were transfected with GFP-PolyQ74 (huntingtin protein) they accumulated
significantly increased levels of insoluble huntingtin protein compared to transfected WT [226].
KD of Gal3 or Trim16 reduced autophagic function while Gal3 or Trim16 over-expression
increased autophagic function in human bone marrow stem cells [75]. Ultimately, more work is
needed to determine the mechanism by which Gal3 and Trim16 regulate autophagy.

65
Lysosomal Membrane Rupture and Galectins in Neurodegenerative Diseases.
Previous work by our lab shows that pathological forms of α-syn, such as α-syn fibrils,
can induce lysosomal membrane rupture resulting in their recruitment to autophagic
compartments [147, 153, 237]. The ability to induce lysosomal membrane rupture was also
observed for pathological forms of huntingtin, Aβ, and aggregated tau assemblies [147]. When
brain tissue from individuals with PD were evaluated to determine the pathological relevance,
imaging revealed the presence of Gal3 around LBs, forming an outer corona. In total, 170 of the
305 LBs examined across five PD patients’ brain tissue had Gal3 coronas [147]. The presence of
Gal3 in endo/lysosomal and autophagic compartments as well as around LBs implies a history of
lysosomal membrane damage and a possible involvement of Gal3 in PD disease pathology.
Gal8 was shown to have a possible beneficial role in AD by promoting the clearance of
aggregated tau assemblies in cell models. Falcon et al., 2017 demonstrated exogenous
recombinant tau assemblies, escape from endosomal compartments, gain access to the cytosol,
and induce aggregation of soluble tau following clathrin-independent endocytosis in
immortalized cell-lines. These damaged endosomal compartments were shown to be recognized
by Gal8 and recruited to autophagic compartments following NDP52 binding to Gal8. Knocking-
down Gal8, NDP52, or LC3C increased the levels of insoluble tau in HeLa cells over-expressing
the P301S tau mutant and treated with pathologically associated P301S tau aggregates compared
to control siRNA cells. Similarly, SH-SY5Y cells over-expressing P301S tau as well as either the
NDP52 mutants lacking its Gal8 or LC3C binding domain had increased insoluble tau levels
following P301S tau aggregate treatment compared to those expressing WT NDP52.

66
Galectins, Inflammation, and Neurodegenerative Diseases.
Microglia are the resident immune cells of the brain and play an important role in
homeostatic immune surveillance, phagocytic scavenging, and monitor neuronal activity [32,
157]. In response to inflammatory stimuli, such as injury or pathogens, microglia can become
activated resulting in a dramatic morphological change[32, 157]. Active microglia clear dead
neurons and other cellular debris as well as secrete cytokines and chemokines to assist in
resolving the inflammatory insults [32, 157, 283, 378]. In this way, acute inflammation may have
a positive role in protecting neurons.
A prominent feature of neurodegenerative disease pathogenesis is neuroinflammation
which arises from chronic inflammation. During neuroinflammation, which can stem from
misfolded proteins such as α-syn fibrils or Aβ plaques, activated microglia are thought to
contribute to neurodegeneration by generating increased levels of ROS and through the
continued secretion of inflammatory cytokines result in neuronal apoptosis [168, 283, 353, 378].
Galectin proteins are well documented mediators of inflammation and are thought to be involved
in a variety of diseases including PD and other neurodegenerative diseases [13, 25, 442, 491,
547, 548]. Secreted galectins can modulate neuroinflammation associated cascades in cells such
as microglia and astrocytes [237]. Recent work suggests Gal1, Gal8, Gal9 are anti-inflammatory
while Gal3 can be pro-inflammatory or anti-inflammatory, depending on the context.[466] These
qualities make them attractive candidates for potential neurodegenerative disease therapeutics.
Yet, the extent to which galectins contribute neurodegenerative diseases is unclear and has
recently begun to be studied.
Galectin-8. Pardo et al., 2019 found Gal8 pre-treatment followed by neurotoxic stimuli
including hydrogen peroxide-induced oxidative stress, glutamate-induced excitotoxicity,
67
prolonged nutrient deprivation, or Aβ oligomers increased the survival of rat hippocampal
neuron primary cultures relative to non-pretreated neurons [365]. Concomitant pretreatment of
Gal8 and the Gal8 glycan domain inhibitor, thiodigalactoside, prevented the neuroprotective
effects relative to Gal8 only pretreatment and resulted in comparable decreases to non-pretreated
neurons. Evaluation of the mechanism by which Gal8 mediates neuroprotection revealed that
exogenously added Gal8 binds to β1-integrins, α3 and α5β1, and activates downstream ERK1/2
and AKT in hippocampal neurons. Blocking the activation of PI3K/AKT or ERK1/2 by treating
with the PI3K inhibitor, wortmannin, or ERK1/2 inhibitor, PD98059, increased hippocampal
neuron death in response to glutamate-induced excitotoxicity compared to the uninhibited
neurons. To determine the relevance of these findings, they demonstrated that Gal8 was
expressed in rat hippocampal neurons and in the hippocampus of mouse brains albeit relatively
low compared to other regions such as the thalamus. Additionally, Gal8 KO mice increased cell
death associated markers from hippocampal homogenates following stereotaxic injection of
hydrogen peroxide compared to WT. Similarly, primary culture rat hippocampal neurons had
reduced survival following culture with antibodies against human Gal8 isolated from individuals
with systemic lupus erythematosus. These findings indicate, Gal8 confers neuroprotection to
hippocampal neurons likely through binding to β1-integrins and mediating PI3K/AKT and
ERK1/2 signaling cascades.
Galectin-1. Gal1 was found to have a neuroprotective effect in a MPTP PD mouse model
in part by modulating neuroinflammation [294]. Li et al., 2020 observed treating BV2 microglial
cells with recombinant Gal1 reduced microglial activation in response to lipopolysaccharide
(LPS) and reduced SK-N-SH neuronal cell death following culturing with the BV2 microglial
cultured media. To determine if Gal1 influenced neuron survival in vivo, mice were co-

68
administered Gal1 and MPTP and compared to MPTP only. Co-administration of Gal1 and
MPTP in mice resulted in increased SN DA neuron survival, reduced microglia activation, and
increased motor associated behavior compared to MPTP only mice. Analysis of SN brain
homogenates revealed reduced inducible nitric oxide synthase (iNOS) and cyclooxygenase-2
(COX-2) protein levels, associated with microglial activation, and reduced inflammatory
cytokines, IL-1β and tumor necrosis factor-α (TNF-α), from the Gal1 MPTP co-treated mice
compared to the MPTP only mice. Mechanistic evaluation of the underlying pathway revealed
that Gal1 and LPS co-treatment reduced p38 and ERK1/2 phosphorylation and the associated
inflammatory IκB/NFκB signaling pathway compared to LPS only treated microglial cells. These
effects were prevented when Gal1 and LPS co-treatment was conducted with the Gal1 CRD
competitor, β-D-galactose. Collectively suggesting, Gal1 mediates microglial activation by
attenuating p38 and ERK1/2 driven IκB/NFκB signaling resulting in less inflammatory cytokine
production and increased neuronal survival.
Galectin-3. A recent GWAS primarily interested in identifying mitochondrial associated
genes linked to late-onset PD, identified Lgals3, the gene that encodes for Gal3 [37]. Another
study correlating disease phenotype and differentially expressed genes by analyzing individuals’
single nucleotide polymorphisms (SNPs) determined that the Lgals3 region was linked to PD
[122]. However, they dismissed its authenticity based on Bayesian test for co-localization
relative to previously published GWAS data [122]. A meta-analysis of Lgals3 SNPs from
previously published GWAS data identified a connection between Gal3 and AD [44]. While only
five of the sixty Lgals3 SNPs fit the criteria of three independent publications among GWAS
studies, all five were associated with increased AD frequency [44]. Interestingly, all five Lgals3
SNPs were associated with high Gal3 linkage disequilibrium, the region that allows Gal3 to self-
69
associate into pentamers. The importance of this unknown. Gal3 binding protein was also
identified in a random cross-species validation approach as a candidate for α-syn clearance
[416]. Depleting Gal3 binding protein in a drosophila model of PD reduced motor dysfunction
and increased α-syn clearance in a mammalian cell-line model [416].
In the context of PD and inflammation, Boze-Serrano et al., 2014 demonstrated that the
BV-2 microglial cell line became activated when treated with α-syn aggregate as determined by
increased iNOS levels and the inflammatory cytokines TNF-α, interleukin-2 and -12 (IL-2 and
IL-12) [43]. Concurrent treatment of α-syn aggregates and the Gal3 inhibitor, TD139 reduced the
levels of iNOS and inflammatory cytokines [43]. TD139 also reduced the phagocytic capacity of
microglia treated with α-syn aggregates while recombinant Gal3 treatment increased
phagocytosis [43]. Following the injection of oligomeric and fibril α-syn into the olfactory bulb
of mice, increased Gal3 expression was observed suggesting a potential role for Gal3 in the
phagocytosis of pathological α-syn [43].
Gal3 is also implicated in AD pathogenesis. Increased Gal3 is observed in the CSF and
plasma of individuals with AD [13, 526].Two studies published within months of each other by
Boza-Serrano et al., 2019 and Tao et al., 2020 both demonstrated elevated levels of Gal3 in AD
human brain slices and its co-localization with extracellular Aβ plaques [44, 491]. Heterozygous
deletion of Gal3 in amyloid precursor protein (APP)/presenilin 1 (PS1) mutant transgenic mice
and Gal3 KO in the 5 familial AD gene mutant (5xFAD) transgenic mice reduced Aβ
oligomerization, plaque formation, and correlated with better cognition compared to those
expressing Gal3 [44, 491]. Tao et al., 2020 demonstrated that Gal3 co-immunoprecipitated with
Aβ monomers from APP/PS1 AD mouse model hippocampal isolates and Aβ oligomerization
was increased in the presence of Gal3 in vitro in a concentration dependent manner [491]. Boza-
70
Serrano et al., 2019, found concurrent Gal3 and monomeric Aβ treatment increased Aβ uptake
and 5xFAD Gal3 KO mice had increased Aβ42 oligomers in their CSF at six months [44].
Treatment with Aβ fibrils increased Gal3 secretion as well as inflammatory cytokine secretion
from microglial while Gal3 KO reduced inflammatory cytokine secretion [44]. Gal3 was also
shown to bind to triggering receptor expressed on myeloid cells 2 (TREM2), which has
previously been implicated in promoting a disease associated phenotype in microglial cells
[555]. These results suggest that Gal3 plays a detrimental role in AD by increasing Aβ plaque
formation by contributing to inflammatory microglial activation. Moreover, Gal3 may increase
Aβ uptake into microglial, where it fails to degrade, rather than allowing Aβ to drain from the
brain via the CSF.
Interestingly, Gal3 was shown to be important in preventing seeded tau hyper-
phosphorylation in human umbilical cord mesenchymal stem cells (hUC-MSCs) [295]. Control
hUC-MSCs injected into brains of 5x FAD mice reduced levels of hyper-phosphorylated tau.
Additionally, cultured media from control siRNA treated hUC-MSCs prevented the formation of
tau aggregates in vitro while Gal3 siRNA treated Gal3 hUC-MSCs was not [295]. Analysis of
Gal3 interactions revealed that it co-immunoprecipitates with pathological species of tau both in
cell culture and in the 5xFAD mouse model [295]. Injection of recombinant Gal3 into the brains
of 5X FAD mice reduced hyper-phosphorylated tau and was associated with reduced GSK-3β
activity as measured by reduced pY216 levels. GSK-3β is the primary kinase implicated in tau
hyper-phosphorylation during AD pathogenesis [274]. Therefore, Gal3 may prevent hyper-
phosphorylated tau aggregates but may promote Aβ oligomerization. Whether this is ultimately
positive or negative for AD in the context of human disease will require further research.
71
ALS is another neurodegenerative disease characterized by motor dysfunction, loss of
motor neurons in the brain and spinal cord [331]. In individuals with sporadic ALS, increased
Gal3 and Gal9 levels were observed in spinal cords [288]. Immunofluorescence imaging
revealed the increased levels of Gal3 was primarily in microglial cells. Interestingly, in one study
using the G93A SOD1 ALS transgenic mouse model, concurrent Gal3 KO increased disease
severity. Longitudinal evaluation revealed Gal3 KO mice had earlier disease onset, reduced
motor performance on multiple tests, and reduced life expectancy compared to WT SOD1
transgenic mice [288]. Gal3 KO was also associated with increased spinal cord TNF- α and
aggregated protein levels at late-stage disease. Thus, Gal3 may be beneficial in the context of
ALS.
Galectins as Biomarkers for Neurodegenerative Diseases
The considerable advances in the last twenty years in identifying the underlying
mechanisms responsible for neurodegenerative diseases has led many to search for early
diagnostic biomarkers. Theoretically, the ability to diagnose neurodegenerative diseases before
they physically manifest could reverse or significantly reduce disease progression with proper
pharmacological intervention. At the forefront of biomarker candidates are secreted proteins.
Mechanistically, the release of proteins that undergo unconventional protein secretion in
response to underlying cellular pathology, such as dysfunctional protein degradation could offer
valuable insight into the underlying health of an individual. Unsurprising, evaluating secreted
pathological proteins such as misfolded α-syn is one such considered way for PD. However,
because red blood cells also express α-syn [26], discerning differences between α-syn from
plasma can be challenging and collecting CSF is painful, intrusive, and requires considerably
more training than plasma [493]. Thus, the ability to measure biomarkers in other fluids is
72
desirable. To this end, changes in other proteins such as galectins have the potential to be early
diagnostic biomarkers.
In one study, mass spectrometry was used to characterize differences in proteins found in
the CSF from individuals with PD and healthy controls [294]. Based on the criteria that an
identified protein must be present in at least five of the ten PD CSF samples, a total of 482
proteins were identified, of which 32 proteins were significantly different compared to control
individuals. Following up on these differences, Gal1 was tested as a potential biomarker by
enzyme-linked immunosorbent assay (ELISA). When Gal1 CSF levels were compared among
individuals with PD, atypical parkinsonian disorders, and healthy controls, Gal1 was
significantly reduced in PD compared to control but was not significantly different compared to
atypical parkinsonian disorders. Those with atypical parkinsonian disorders trended toward
having lower Gal1 levels compared to controls but were not significant. As a predictive
diagnostic biomarker, reduced Gal1 was characterized as having a moderate-high accuracy by
the study at ~70%.
Similarly, pilot studies measuring difference in galectins concentrations in the serum
among individuals with PD and healthy controls have been conducted. Both Gal3 and Gal4 were
significantly elevated in the serum among individuals with idiopathic PD [64]. While the
variance for Gal3 among samples was relatively large, the concentrations of Gal4 were
considerably less varied among both control and PD individuals. These findings suggest it may
be a useful indicator of disease [64]. Interestingly, in a study using tear fluid as a biomarker
medium, mass spectroscopy profiling among individuals found that Gal3 and Gal3 binding
protein were reduced in individuals with PD compared to healthy controls [38].

73
Serum Gal3 levels are increased in individuals with other diseases including
inflammatory bowel disease (IBD) which includes Crohn’s disease and ulcerative colitis [552].
Correlative work suggests individuals who develop IBD are also at an increased likelihood of
also developing PD [50]. Overlapping genetic propensities have also been identified between
Crohn’s disease and PD [50, 217, 415]. Constipation is regularly reported among individuals
with PD [374] and is a proposed prodromal symptom of PD by Braak [45, 46, 193].
Increased Gal3 concentrations in primary fluids have also been observed in several other
neurodegenerative diseases. Increased Gal3 in either the plasma or CSF in AD patients has been
reported in among studies [294, 526, 548]. In a Huntington’s disease mouse model, increased
Gal3 in the CSF and serum was observed, and correlated with disease severity [452]. In one
recent study, Gal3 levels in the serum and CSF were compared among individuals with AD,
ALS, and healthy controls [13]. They found Gal3 was significantly increased in both the CSF
and serum in those with AD compared to controls [13]. Gal3 levels in the CSF and serum were
increased in ALS patients relative to controls but were not significant [13]. No significant
difference in Gal3 levels were detected among AD and ALS individuals in either the serum or
CSF [13]. Another, earlier study found plasma Gal3 levels were significantly higher among
female ALS patients compared to female healthy controls but not significantly different among
males [544]. When Gal3 levels were compared among individuals with AD and ALS to their
performance on the mini-mental state exam (MMSE), a test used to evaluate dementia severity, a
significant positive correlation between Gal3 levels and dementia severity was observed [294].
Consistent with these findings, another study determined among those with AD, the stage of the
disease was significantly correlated with increased Gal3 levels, patient age, and disease duration
[548]. Collectively, these works suggest changes in secreted galectins can be observed in many

74
neurodegenerative diseases. The ability to measure these changes may ultimately be useful in
disease diagnosis. The relative variance from individual-to-individual is a limitation that will
need to be addressed before using them as effective diagnostic biomarkers. To this end, the
simultaneous evaluation of several markers may ultimately be more effective for an accurate
diagnosis. Finally, determining if changes in galectins occurs before the onset of disease
symptoms will ultimately be necessary for early disease diagnosis but has enormous potential to
revolutionize the process.
Concluding Remarks
The understanding of neurodegenerative diseases has grown considerably in the past
decades. As of now, there is no cure for PD or any of the other synucleinopthies, although not
from a lack of trying. The tireless work and dedication performed by doctors and researchers to
unravel the underlying mechanisms of these diseases is palpable. The future is promising as
current therapies are underway to help with earlier disease diagnosis and treatment. The next
chapters focus on my contribution to the collective knowledge on PD and other
synucleinopathies.
75
CHAPTER TWO
MATERIALS AND METHODS
Tissue Culture
The HEK293T (CRL-3216) and the THP-1 (TIB-202) immortalized cell-lines were
purchased from the American Type Culture Collection (ATCC). HEK293T were cultured at
37oC and 5% CO2 in Dulbecco's modified Eagle's Medium (DMEM) containing phenol red
(Invitrogen), supplemented with the 10% fetal bovine serum (FBS) (Hyclone), 10ug/ml
ciprofloxacin hydrochloride, 100IU/ml penicillin, and 100ug/ml streptomycin. To generate EV
depleted media, FBS was diluted 4x in DMEM was ultracentrifuged for 18 hours. Afterwards the
supernatant was collected and added to DMEM and supplemented with antibiotics.
Culture of SH-SY5Y and HeLa Cell Lines
The SH-SY5Y human neuroblastoma cell line and the HeLa immortalized cell line were
acquired from the American Type Culture Collection (ATCC). Cells were cultured in an
incubator at 37oC with 5% CO2 in Dulbecco's modified Eagle's Medium (DMEM) containing
phenol red (Invitrogen), supplemented with 10% fetal bovine serum (FBS) (Hyclone), 10 µg/ml
ciprofloxacin hydrochloride, 100 IU/ml penicillin, and 100 µg/ml streptomycin.
Culture of iCell DopaNeurons
The iCell DopaNeurons were purchased from Fujifilm Cellular Dynamics. iCell
DopaNeurons are a pre-differentiated culture of iPSC-derived human mDA neurons generated
using protocols licensed and adapted from the Lorenz Studer lab. Cells were thawed, plated, and
cultured using the protocol listed in the iCell DopaNeuron user guide. The cells were plated in
76
24-well plates onto coverslips (Thermo Fisher Scientific) coated with 0.01% poly-L-ornithine
(Millipore Sigma) and laminin (Millipore Sigma) at 2 × 10⁵ cells per well. The plated cells were
kept in culture for at least 7 days before any experiments were conducted to facilitate arborized
cellular morphology. Cells were cultured in an incubator at 37oC with 5% CO2 and incubated in
iCell Neural Base Medium containing iCell Nervous System Supplement 1 (Fujifilm Cellular
Dynamics), iCell Neural Supplement B (Fujifilm Cellular Dynamics), 100 IU/ml penicillin
(Thermo Fisher Scientific), and 100 µg/ml streptomycin (Thermo Fisher Scientific).
Culture of Human IPSCs
The iPSC cell line used in the experiments described herein was obtained from Joseph R.
Mazzulli laboratory (Northwestern University, Feinberg School of Medicine, Chicago, IL). This
iPSC cell line was produced from primary human fibroblasts by retroviral expression of the
reprogramming factors OCT4, SOX2, cMYC, and KLF4 (described in Seibler et al. 2011)[441].
This cell line has been characterized through the expression of pluripotency markers (i.e. Oct3/4,
Tra-1-60, SSEA-4, Nanog)[330], genomic integrity through G-banding karyotype analysis
(described in Mazzulli et al. 2011)[329], tetranoma analysis (described in Cooper et al. 2012)
[95], and reverse transcriptase-polymerase chain reaction (RT-PCR) analysis of pluripotency
markers (described in Cooper et al. 2012)[95]. iPSCs (passage 50-60) were cultured on 6-well
plates coated with either Matrigel (Stem Cell Technologies) or Vitronectin XF (Stem Cell
Technologies). Medium consisted of mTeSR1 basal medium containing 10% mTeSR1 5×
supplement (Stem Cell Technologies) and was changed every other day. iPSCs were groomed by
the manual removal of differentiated cells, passaged en bloc weekly by the manual dissection of
iPSC colonies into 2 mm2 chunks of cells and placement into a Matrigel (Stem Cell
Technologies) or Vitronectin (Stem Cell Technologies) coated 6-well plate. Prior to floor plate
77
induction, iPSCs were grown to 80-90% confluence. iPSC cultures were monitored daily with an
in-hood EVOS Core XL cell imaging system (Thermo Fisher Scientific).
Induction of Midbrain Floor Plate Progenitors
iPSCs were incubated in knockout serum replacement (KSR) media containing the Small
Mothers Against Decapetaplegic (SMAD) inhibitors, LDN193189 (LDN, 100 nM; ReproCell)
and SB431542 (SB, 10 µM; Tocris) for 24 hours, KSR media containing LDN, SB, recombinant
human sonic hedgehog N-terminus (SHH, 100 pg/µl; R&D Systems), purmorphomine (2 µM;
ReproCell), and recombinant human fibroblast growth factor 8 a isoform (FGF8a, 100 pg/µl;
R&D Systems) for 48 hours, and KSR media containing LDN, SB, SHH, purmorphomine,
FGF8a, and CHIR99021 (3 µM, CHIR; ReproCell) for 48 hours. KSR media was comprised of
82.20% KnockOut Dulbecco’s Modified Eagle’s Medium (KO DMEM, Thermo Fisher
Scientific), 14.68% Knockout Serum Replacement (KO SR, Thermo Fisher Scientific), 0.98%
200 mM L-glutamine (Thermo Fisher Scientific), 0.98% Minimum Essential Media Non-
Essential Amino Acids solution (MEM-NEAA, Thermo Fisher Scientific), 0.18% 55 mM 2-
mercopatoethanol (2-ME), and 0.98% 10,000 U/ml penicillin-streptomycin solution (Thermo
Fisher Scientific). Next, iPSCs were incubated with a 3 to 1 ratio of KSR media to SM1 media
containing LDN, SB, SHH, purmorphomine, FGF8a, and CHIR for 48 hours, a 1 to 1 ratio of
KSR media to SM1 media containing LDN and CHIR for 48 hours, and 1 to 3 ratio of KSR
media to SM1 media containing LDN and CHIR for 48 hours. SM1 media was comprised of
96.16% Neurobasal Medium (Thermo Fisher Scientific), 1.92% NeuroCult SM1 Neuronal
Supplement (Stem Cell Technologies), 0.96% 200 mM L-glutamine solution (Thermo Fisher
Scientific), and 0.96% 10,000 U/ml penicillin-streptomycin solution (Thermo Fisher Scientific).

78
The cultures were monitored daily with an in-hood EVOS Core XL cell imaging system (Thermo
Fisher Scientific).
Differentiation of MDA Neurons.
Floor plate induced iPSCs were differentiated to mature mDA neurons by incubating
them in SM1 media containing CHIR, DAPT (10 µM; ReproCell), recombinant human brain-
derived neurotrophic factor protein (BDNF, 20 pg/µl; R&D Systems), ascorbic acid (AA, 200
µM; Millipore Sigma), recombinant human glial-derived neurotrophic factor protein (GDNF, 5
pg/µl; R&D Systems), recombinant human transforming growth factor beta 3 protein (TGFβ3, 1
pg/µl; R&D Systems), and dibutyryl cyclic adenosine monophosphate (cAMP, 500 µM; Enzo
Life Sciences) for 48 hours and SM1 media containing DAPT, BDNF, AA, GDNF, TGFβ3, and
cAMP for 24-48 hours. The neuronal culture was allowed to expand by passaging them en bloc
by mechanical dissociation of the thickened cell layer into 2 mm2 squares, which were plated
onto poly-d-lysine (66 µg/ml, Millipore Sigma) and mouse laminin (1.25 µg/ml, Millipore
Sigma) coated 10 cm culture dishes at 2 × 10⁵ cells/cm2. The neurons were incubated in SM1
media containing the neuralization factors DAPT, BDNF, AA, GDNF, TGFβ3, and cAMP for 10
days. The neurons were passaged by incubation with Accutase (Stem Cell Technologies) then
plated into poly-d-lysine (66 µg/ml, Millipore Sigma) and mouse laminin (1.25 µg/ml, Millipore
Sigma) coated 24-, 48-, or 96-well dishes. The neurons were incubated in SM1 media containing
DAPT, BDNF, AA, GDNF, TGFβ3, and cAMP for 15 days; this media was changed every 3
days. The neurons were incubated in SM1 media without the aforementioned neuralization
factors until analyses; this media was changed every 3 days. The neurons were considered
terminally differentiated to mDA neurons 50 days after floor plate induction had begun. Neurons
79
were monitored daily with an in-hood EVOS Core XL cell imaging system (Thermo Fisher
Scientific).
Generation of DSP-α-Syn Constructs, FLuc Gal3, mCherry Gal3, and Inducible YFP-
LC3B Plasmids
Expression plasmids were all generated by PCR-based cloning and restriction enzyme
strategies. The initial generation α-syn DSP constructs A and B were made by first inserting the
generating PCR primers against DSP1-7 and DSP8-11, which have previously been
characterized in detail [255] and inserting them into the lentiviral pLVX plasmid after restriction
digest. Primers against α-syn were generated and the amplified sequence was then inserted on the
C-terminal of the DSP1-7 and DSP8-11 sequence. The pLVX DSP1-7 α-syn is the α-syn DSP A
construct and the pLVX DSP8-11 α-syn is the α-syn DSP B construct. Similarly, primers against
FLuc were used to first amplify by PCR and then insert into the pLVX lentiviral construct by
restriction digest. Primers against Gal3 were also generated to amplify the Gal3 sequence, which
was then subcloned by adding it to the C-terminal of the now pLVX FLuc construct by
restriction digest. pLVX mCherry Gal3 construct was made using primers to amplify Gal3 and
inserting it at the C-terminal of the pLVX-mCherry-C1 lentiviral construct. The generation of the
tetracycline inducible YFP-LC3B lentiviral plasmid was conducted by generating primers
against YFP-LC3B, amplifying the sequence by PCR, and inserting it into the EZ-TET-pLKO-
puromycin plasmid by restriction digest.
Generation of Stable α-Syn DSP A+B, FLuc Gal3, and mCherry Gal3 Cell Lines
To generate stable SH-SY5Y cell lines, lentiviral particles were generated by overnight
polyethylenimine (PEI) transfection of HEK 293T cells using equal concentrations of VSV-g,
ΔNRF or psPax2, and FLuc Gal3 or mCherry Gal3. The next morning, the cell medium was
80
changed. The cultured medium was collected 48 hours later, and lentiviral particles were
collected and purified using a 0.45 µm (Millipore Sigma) syringe filter. The purified FLuc Gal3
or mCherry Gal3 lentiviral particles were added to SH-SY5Y cells and spinoculated at 13°C for
2 hours at 1200 × g. At 72 hours post-transduction, cells were treated with supplementing
DMEM with puromycin for selection (5 µg/ml, Hyclone). The generation of α-syn DSP A+B
SH-SY5Y and HeLa cell lines occurred by the simultaneous transduction of the α-syn DSP A
and α-syn DSP B constructs with purified lentiviral particles. The lentiviral particles were
generated by transfection of HEK 293T cells using equal concentrations of VSV-g, ΔNRF or
psPax2, and pLVX α-syn DSP A or pLVX α-syn DSP B and purified as stated previous. The
purified α-syn DSP A and α-syn DSP B lentiviral particles were added in equal concentration to
either SH-SY5Y or HeLa cells and spinoculated. At 72 hours post-transduction, cells were
treated with puromycin supplementing DMEM. Approximately 96 hours later, the puromycin-
selected cells were further selected by flow cytometry based on the GFP signal.
Generation of Gal3 CRISPR Plasmid and KO Cell Lines
The initial generation of CRISPR plasmids was conducted by identifying guide
sequences, which was accomplished through the use of the MIT CRISPR design tool and the
GeCKO library tool (http://guides.sanjanalab.org/#/). The oligonucleotide guide sequences
targeting Gal3 using the 5’-CACCGGGGAAGGGAAGAAAGACAGT-3’ sequence and the
control sequence 5’-CACCGGCACTACCAGAGCTAACTCA-3’. The guide sequence
oligonucleotides were annealed and inserted into the Lenti-CRISPRV2 plasmid (Addgene) by
BsmBI digestion and PCR reaction using the published protocol [431]. PEI transfection of HEK
293T to generate, collect, and purify lentiviral particles was then performed as described in the
previous section. Lentiviral particles were then added to generate Gal3 knockouts in the α-syn
81
DSP A+B SH-SY5Y or WT SH-SY5Y cells. The transduced SH-SY5Y were then selected by
supplementing DMEM with hygromycin (5 µg/ml, Hyclone) 72 hours post-transduction.
Following a 1 weeklong selection period in hygromycin, knockout was validated with respect to
the control transduced cells by western blots. The heterogeneously selected cells were then used
for experiments. Western blots demonstrating successful KO are shown upon experiment
completion.
Stabile Expression of S15 mCherry Construct
HEK293T cells were transduced to stably express S15-mCherry using the lentiviral
vector (pLVX) backbone containing a CMV promoter to drive the expression of S15-mCherry.
Lentiviral particles were generated by polyethylenimine (PEI) transfection of HEK293T cells.
The transfection was performed overnight with equal DNA concentrations of VSV-g, ΔNRF or
psPax2, and pLVX-CMV-S15-mCherry plasmid. The next morning the cell medium was
changed. The cultured medium from the transfected HEK293T cells was collected 48 hours later
and filtered through a 0.45µm syringe filter (Millipore). The purified medium was directly added
to HEK 293T cells. 72 hours later the cells were selected for expression of our S15-mCherry
construct by supplementing DMEM or RPMI 1640 with 5ug/ml puromycin (Hyclone).
Purification of Extracellular Vesicles from S15 mCherry 293Ts
HEK293T Cells were plated in a 10cm or 15cm tissue culture plate at 50% confluency
with either 10ml or 25ml of media, respectively, for 48hrs before media was collected. EVs were
isolated in a 15ml or 50ml conical which was centrifuged in a tabletop centrifuge at 2000g for 20
minutes at 4°C. The supernatant was collected and added to either Beckman Coulter
polycarbonate centrifuge tubes (#349622) or (#344058) and spun at 10,000g with either SW41
TI or SW28 Beckman rotors, respectively, in an Optima L-90K ultracentrifuge at 4oC for 30
82
minutes. Subsequently, the supernatant was collected and ultracentrifuged at 100,000g for 150
minutes at 4oC using new centrifuge tubes, as above. Afterwards, the supernatant was discarded,
and the pellet was resuspended in PBS. The resuspended pellet was subjected to another round of
100,000g centrifugation with same rotor and machine for 150 minutes at 4oC. The supernatant
was discarded, and the pellet was resuspended overnight in 100ul of PBS on an orbital shaker.
The resuspended pellets were stored at 4oC and used within two weeks. Resuspended EVs were
visually inspected before use to verify that a new pellet had not formed before use.
Purification of Extracellular Vesicles From DSP-α-Syn SH-SY5Y or IPSC MDA Neurons
Cultured media from DSP-α-syn SH-SY5Y or iPSC mDA neurons was spun in a 15ml or
50ml conical in a tabletop centrifuge at 300g for 10 minutes at 4°C. The supernatant was
collected and added to either Beckman Coulter polycarbonate centrifuge tubes (#349622) or
(#344058) and spun at 10,000g with either SW41 TI or SW28 Beckman rotors, respectively, in
an Optima L-90K ultracentrifuge at 4oC for 30 minutes. Subsequently, the supernatant was
collected and ultracentrifuged at 100,000g for 150 minutes at 4oC using new centrifuge tubes.
Afterwards, the supernatant was discarded, and the pellet was resuspended in PBS. The
resuspended pellet was subjected to another round of 100,000g centrifugation with same rotor
and machine for 150 minutes at 4oC. The supernatant was discarded, and the pellet was
resuspended in 50µl of PBS when used for TEM or EV-MAC. When used for non-reducing
SDS-PAGE, pellet was immediately lysed in lysis buffer plus protease inhibitor cocktail
(Roche). The resuspended pellets were stored at 4oC and used within two weeks. Concentrated
EVs from was collected from DSP-α-syn SH-SY5Y cells plated in 10cm plates at an initial
confluency of 60-70% percent. Culture media was collected from iPSC mDA neurons plated in a
24-well plate. Collected samples from multiple wells, n=3 or more, undergoing the same
83
conditions were used for vehicle, TD139, α-syn fibril, and α-syn plus TD139 conditions to
acquire sufficient sample size to assess EVs by non-reducing SDS-PAGE.
Nanoparticle Tracking Analysis (NTA)
NTA was performed using the NanoSight300 (NanoSight, Northwestern University, IL,
USA). 300 µl of the resuspended sample were injected into the NanoSight300 chamber with a
red, λ= 642 nm excitation laser. Five measurements (technical replicates) at 60 second intervals
were performed for each sample. The default “auto” adjustment provided by the software
developer were used for the “Blur” and “Minimal track lengths” settings. The camera level (13-
15) and detection threshold (4-5) were manually adjusted for each sample as per the
manufacturer’s recommendation. The NTA analysis software (NanoSight NTA version 3.4, build
3.4.4) was used to for data capture and analysis. In brief, each particle’s mean square
displacement was determined via the recorded video. The software then determined the diffusion
coefficient and sphere-equivalent hydrodynamic radius using the Stokes-Einstein equation.
Concentrated DSP-α-syn or mDA neuronal EVs were pelleted as previously describe and
samples were resuspended in 1ml of 1xPBS. DSP-α-syn resuspended samples were diluted 1:10-
70, with tested concentrations ranging among 4.66 x 10⁸ - 9.16 x 10⁸ particle per ml
(quintuplicate technical replicates from n = 3 samples). mDA resuspended samples were diluted
1:10, with tested concentrations ranging among 2.76 x 10⁸ - 3.86 x 10⁸ particle per ml
(quintuplicate technical replicates from n = 3 samples; samples from independent mDA
differentiations). EV sizes binned in 1 nm increments with a bin center of 0.5 nm.
Non-Reducing SDS-PAGE, Western Blots & Western Antibodies
Proteins from pelleted cells or concentrated media were isolated by the addition of lysis
buffer composed of 100 mM Tris pH 8.0, 1% NP- 40, and 150 mM NaCl and protease inhibitor
84
cocktail (Roche) on ice for 30 minutes. The lysates were centrifuged for 10 minutes at 10,000g
and afterwards the supernatant collected. The collected supernatants’ protein concentrations were
determined by Pierce BCA protein assay kit (Thermo Scientific). An equal fraction of non-
reducing SDS solution was added to the proteins and the contents were boiled on a dry-block for
5 minutes. Subsequently, the protein contents were equally loaded and ran on a 10%
polyacrylamide gel for SDS-polyacrylamide gel electrophoresis (SDS-PAGE). After separation,
the proteins were transferred to a nitrocellulose membrane (Bio-Rad), and probed overnight at
4°C with the respective primary antibodies diluted in powdered milk block solution at
2.5g/50mL of TBST. The primary antibodies were rabbit anti-ATG7 (1:350, Invitrogen), rabbit
anti-Lamp1 (1:2,000, Abcam), mouse anti-GAPDH (1:3,000, Santa Cruz), rabbit anti-pS757
ULK1 (1:500, Cell Signaling Technology), rabbit anti-ULK1 (1:1,000, Cell Signaling
Technology), anti-pT389 p70 S6K1 (1:1,000, Cell Signaling Technology), anti-p70 S6K1
(1:1,000, Cell Signaling Technology), mouse anti-α-synuclein (211, 1:2,000, Santa Cruz), rabbit
anti-α-synuclein (MJFR1, 1:2,000, Abcam), Rabbit anti-GFP (#A6455, 1:1000, Thermo
Scientific), mouse anti-GFP (B-2, 1:2000, Santa Cruz), rabbit anti-alpha-synuclein (phosphor-
S129) [MJF-R13 (8-8)] (1:2,000, Abcam), rabbit anti-alpha-synuclein aggregate antibody
[MJFR-14-6-4-2] (1:2,000, Abcam), rabbit anti-Trim16/EBBP (1:2,000, Bethyl Laboratory),
mouse anti-Trim16 (1:500, Santa Cruz), mouse anti-ATG16L1 (1:500, Santa Cruz), mouse anti-
Optineurin (1:500, Santa Cruz), mouse anti-TBK1 (1:500, Santa Cruz), mouse anti-galectin-3
(1:2,000, BD Pharmingen), rat anti-HA HRP conjugated (1:2000, Roche), mouse anti-ALIX
(1:500, Invitrogen), Mouse and rabbit anti-LC3B (1:2,000, Abcam). mouse anti-CD9 (1:1000,
BD Pharmingen #555370); mouse anti-CD63 (1:1000, BD Pharmingen #5556019); mouse anti-
CD81 (1:1000, BD Pharmingen #555675); rabbit anti-TSG101 (1:1000, Abcam ab125011);

85
rabbit anti-LAMP1 antibodies (1:2000, Abcam #24170); mouse anti-GAPDH (1:3000, Santa
Cruz SC-32233); or rabbit anti-mCherry (1:1000, Novus bio NBP2-25157). The nitrocellulose
was washed in TBST and probed with the respective HRP conjugated donkey anti-mouse or anti-
rabbit (ThermoScientific) diluted in milk block solution at 1:10,000 for 30 minutes. HRP was
detected with the addition of SuperSignal West Femto Chemiluminescent Substrate (Thermo
Fisher Scientific). Chemiluminescence levels were measured using the FlourchemE Imaging
System (Protein Simple) containing a CCD camera with 5 logs of bitrate.
Transmission Electron Microscopy of Cells
Terminally differentiated mDA neurons, grown in 24-well culture dishes with each well
containing one poly-d-lysine (66 µg/ml, Millipore Sigma) and mouse laminin (1.25 µg/ml,
Millipore Sigma) coated cover glass (Carolina Biological Supply Company, circles, 12 mm
diameter), were fixed by incubation in PBS containing 2% paraformaldehyde (Electron
Microscopy Sciences), 2% glutaraldehyde (Electron Microscopy Sciences), and 2% acrolein
(Polysciences, Inc) for 30 minutes at room temperature. Cells were fixed in phosphate buffer
(PB) containing 1% osmium tetroxide (Electron Microscopy Sciences) and 1.5% potassium
ferricyanide (Electron Microscopy Sciences) for 1 hour at room temperature in the dark. Next,
the cells were dehydrated by incubation in an ascending series of hexylene glycol (25, 50, 75, 95,
100%, Electron Microscopy Sciences) followed by incubation in a 1 to 1 ratio of hexylene glycol
to epoxy resin (comprised of a mixture of EMbed 812, nadic methyl anhydride, dodecenyl
succinic anhydride, and 2,4,6-Tris-(dimethylaminomethyl)phenol (DMP-30); Electron
Microscopy Sciences) for 12 hours at room temperature on a rotary mixer (Ted Pella, Inc). Next,
the cells were incubated with 100% epoxy resin for 12 hours at room temperature on a rotary
mixer (Ted Pella, Inc). The epoxy resin was changed, and the cells were incubated for 2 hours at
86
room temperature on a rotary mixer (Ted Pella, Inc). The cover glass was removed from the
culture dish, inverted, placed onto an embedding capsule filled with epoxy resin, then baked at
70˚C for 12 hours. The cells, cover glass, and embedding capsule filled with epoxy resin were
immersed in liquid N2 to separate the cells from the cover glass. Ultrathin sections (70 nm) were
cut with an ultramicrotome (EM UC7, Leica Microsystems), mounted on formvar- and carbon-
coated 200 mesh copper grids then stained with filtered 2% uranyl acetate and Reynold’s lead
citrate prior to imaging. Samples were imaged with a Philips CM 120 transmission electron
microscope (TSS Microscopy) equipped with a BioSprint 16- megapixel digital camera
(Advanced Microscopy Techniques).
Transmission Electron Microscopy and Immunogold Labeling of EVs
Concentrated EV samples were fixed in 2% paraformaldehyde for 30 minutes at room
temperature. Formvar- and carbon-coated 200 mesh nickel grids (Electron Microscopy
Sciences), pretreated with 0.002% Alcian blue in 0.03% acetic acid to increase the hydrophilicity
of the grids, were floated on top of 50µl drops of fixed EV samples for 20 minutes at room
temperature. The grids were washed thrice in PBS then incubated with 50mM glycine to quench
free aldehyde groups. After the grids were thoroughly washed, they were incubated in PBS
containing 5% bovine serum albumin (BSA), 0.1% cold water fish skin gelatin, and 5% normal
goat serum (Electron Microscopy Sciences) for 30 minutes at room temperature. Grids were
thoroughly washed with PBS containing 0.2% acetylated bovine serum albumin (BSA-c)
(Electron Microscopy Sciences) then incubated with PBS-0.2% BSA-c containing 0.05%
saponin and either mouse anti-human CD63 (BD Pharmingen #5556019) (1:20) or mouse anti-
human CD81 (BD Pharmingen #555675) (1:20) for 2 hours at room temperature. The grids were
thoroughly washed in PBS-0.2% BSA-c then incubated with goat anti-mouse IgG conjugated to
87
20 nm gold (Cytodiagnostics #AC-20-02) (1:20). The grids were incubated with 1%
glutaraldehyde for 15 minutes at room temperature then thoroughly washed with deionized
water. The sample was negatively stained by floating the grid on a 50µl drop of uranyl-oxalate
(pH 7) for 5 minutes at room temperature followed by floating the grid on an 50µl drop of a
methyl cellulose-uranyl acetate-phosphotungstic acid (MC-UA-PTA) solution (700µl 2% methyl
cellulose, 100µl 3% uranyl acetate (pH 3.5), 25µl 1% phosphortungstic acid (pH 7.2), and 75µl
deionized water) for 10 minutes on wet ice. After the grids were removed from the MC-UA-PTA
solution with nichrome loops (3.5mm internal diameter, Ted Pella, Inc), they were blotted
against a sheet of Whatman filter paper so that a thin layer of film was left on the EV side of the
grid. The sample was placed into a grid storage box and allowed to dry for 12 hours prior to
imaging with a Philips CM120 transmission electron microscope (TSS Microscopy) equipped
with a BioSprint 16-megapixel digital camera (Advanced Microscopy Techniques).
Immunofluorescence Staining of EVs
In order to adhere EVs to coverslips, either 80µl of resuspended concentrated EV was
added to 420µl of PBS totaling 500µl or, for unconcentrated EVs, 500µl of supernatant cultured
media was added into the well of 24-well plate containing a glass coverslip (Fischerbrand
microscope cover slides, 12-545-J, 22X60-1). Coverslips were initially held in a 50ml conical in
70% ethanol and were added to individual wells of a tissue culture, 24-well plate and
subsequently washed with PBS three times. The final round of PBS was left in the well and
aspirated immediately before continuing. The contents of the 24-well plate were spinoculated by
centrifugation at 13°C for 2 hours at 1200g onto the coverslips and subsequently fixed in a
solution of 0.1 M PIPES containing 3.7% formaldehyde (Polysciences) for 15 minutes and
washed 3 times with PBS. The coverslips were permeabilized with a 0.1% solution of saponin in

88
block solution composed of 500mL of PBS supplemented with 10% normal donkey serum
(NDS), and 0.01% NaN3 for 5 minutes. After washing 3 times, the coverslips were incubated
with rabbit anti-LAMP1 antibodies (Abcam #24170) or rabbit anti-TSG101 (Abcam ab125011)
and either mouse anti-CD9 (BD Pharmingen #555370), mouse anti-CD63 (BD Pharmingen
#5556019), or mouse anti-CD81 (BD Pharmingen #555675), in the previously stated block
solution for 1 hour at room temperature. All primary antibodies were used at 1:1000. In
experiments using lectins, biotin conjugated lectins (Vector Laboratories) were used at a working
concentration of 5g/mL in place of primary antibodies for 1 hour at room temperature.
Afterwards the coverslips were washed with PBS and subsequently incubated with secondary
antibodies of conjugated donkey anti-mouse 488 (Jackson ImmunoResearch Laboratories, Inc.)
and donkey anti-rabbit 647 (Jackson ImmunoResearch Laboratories, Inc.) at a concentration of
1:400 for 30 minutes at room temperature diluted in PBS block solution and washed with PBS.
Additionally, FITC conjugated streptavidin (SAV) (Jackson ImmunoResearch Laboratories, Inc.
016-600-084) at 1:1000 was added for 1 hour at room temperature, diluted in PBS block, and
washed with PBS. Afterwards, coverslips were fixed and mounted (Electron Microscopy
Sciences, Fluoro-gel with Tris buffer, #17985-11) onto slides (Globe Scientific Inc., Diamond
White Glass 25x75x1mm, .5 gloss, #1380-30). In experiments using poly-L-lysine coated
coverslips, coverslips were coated by adding 500µl of 0.1% of poly-L-Lysine solution (Sigma
Aldrich) to the well and incubated at 37oC for 1 hour. Following incubation, the coverslips were
washed 3x with PBS before continuing with spinoculations.
Indirect ELISA of EVs
LAMP1 (Abcam #24170) antibody was diluted in pH 9.6 carbonate buffer to a final
concentration of 4µg/mL and used to coat the wells of a 96-well Maxisorp ELISA Plate (NUNC)
89
at 4oC for 16 hours on orbital shaker. The wells were washed with PBS thrice before being
blocked in equal portions of 10% BSA supplemented DMEM and PBS for 2 hours at room
temperature and subsequently washed 5x with PBS. 25µl of concentrated EVs resuspended in
PBS were added to each well for 24 hours at 4oC. Wells were washed eight times with PBS.
Detection antibodies, either CD9, CD63, CD81 (BD Pharmingen) diluted to a final concentration
of 625ng/mL in 1x ELISA Diluent Solution (eBioscience), were added to sample captured wells
for 24 hours at 4oC on orbital shaker. Afterwards, wells were washed with PBS five times before
secondary anti-mouse HRP conjugated antibodies diluted in 1x ELISA Diluent Solution were
added for 30 minutes at room temperature on rocker. A final five times wash of the plate with
PBS was conducted before 100µl of 1xTMB (Invitrogen) was added for ~15 minutes before the
reaction was quenched with 2N H2SO4 solution. The absorbance was read at 450 nm on BioTek
PowerWave XS plate reader in conjunction with Gen5 software. 3 independent replicates were
conducted from independent preparations of S15-mCherry (S15Ch) isolated EVs that were
concentrated by ultracentrifugation as described previously. The concentrated EVs were
resuspended in 250µl of PBS. The same PBS was used as a control and added to wells in which
LAMP1 capture antibodies and either CD9, CD63, CD81 detection antibodies, followed by
secondary anti-mouse HRP conjugated antibody solutions were used.
Human Bodily Fluid Sample Collection, Preparation, and Processing
Saliva.
Whole saliva from a healthy male or female donor between the ages of 25 and 32 was
collected according to a previously published saliva collection protocol[109]. Samples were
either stored at 4°C for no more than 36 hours, or at -20°C until needed. If frozen, samples were
thawed at room temperature. The saliva was sequentially centrifuged. The initial centrifuged
90
using in 2ml eppendorfs in a tabletop centrifuge at 2000g for 20 minutes at 4°C. The supernatant
was collected, pooled, and added to Beckman Coulter polycarbonate centrifuge tubes (#349622)
and spun at 10,000g with SW41 TI Beckman rotors in an Optima L-90K Ultracentrifuge at 4oC
for 30 minutes. Subsequently, the supernatant was collected and ultracentrifuged at 100,000g for
150 minutes at 4oC using new of the previously stated tubes, rotors, and ultracentrifuge.
Afterwards, the supernatant was discarded, and the pellet was resuspended in PBS. The
resuspended pellet was subjected to another round of 100,000g centrifugation with same rotor
and machine for 150 minutes at 4oC. The supernatant was discarded, and the pellet was
resuspended overnight in 500µl of PBS on an orbital shaker. The pelleted EVs were stored at -
20oC until needed and thawed at room temperature.
In these experiments, 2ml of saliva was subjected to differential ultracentrifugation, and
50µl of concentrated saliva EVs were mixed with 450µl of PBS so that a total volume of 500µl
was added to glass coverslips in a 24-well plate. The plate was spun at 13°C for 2 hours at 1200g
to spinoculate the samples onto the coverslips. The coverslips were fixed in a solution of 0.1 M
PIPES with 3.7% formaldehyde (Polysciences) for 15 minutes and washed 3 times with PBS,
followed by a 5 minute permeabilization step using a 0.1% saponin block solution composed of
500mL of PBS supplemented with 10% normal donkey serum (NDS), and 0.01% NaN3 and
washed another 3 times with PBS. The spinoculated saliva was incubated with biotin-conjugated
wheat germ agglutinin (WGA) (Vector Laboratories, B-1025) (at working concentration of
5ug/mL) at room temperature for 1 hour resuspended in the block solution like the
aforementioned one, but without the 0.1% saponin. After 1 hour of incubation, the WGA
solution was removed, and the samples washed 3 times with PBS. The samples were incubated
with FITC conjugated streptavidin (SAV) (Jackson ImmunoResearch Laboratories, Inc. 016-

91
600-084) (1:2000) at room temperature for 1 hour, again in the saponin-free block solution. After
another 3 washes of PBS, the samples were incubated with rabbit anti-Lamp1 antibody (Abcam
#24170) (1:1000) and mouse anti-CD63 (BD Pharmingen #5556019) (1:1000) at room
temperature for 1 hour, again in the block solution without the saponin. Samples were washed 3
times with PBS and incubated in the no saponin block with secondary Fab antibodies conjugated
donkey anti-mouse 594 (Jackson ImmunoResearch Laboratories, Inc.) (1:400) and donkey anti-
rabbit 647 (Jackson ImmunoResearch Laboratories, Inc.) (1:400) at room temperature for 30
minutes. Coverslips were washed 3 times with PBS and mounted onto to glass slides. This
yielded on average 1245 WGA puncta per image.
Plasma.
Whole blood from 3 healthy male donors between the ages of 22 and 36 was drawn into
conicals containing 10%, by volume, of 3.8% sodium citrate, and subsequently homogenized in
new concials. Lymphocyte separation medium (Corning 25-072-CV) was carefully layered into
the bottom of the conical, and the whole blood was spun at 400g for 15 minutes. The plasma
layer was carefully pipetted out, aliquoted, and immediately stored at -80°C until needed. Frozen
samples were thawed at room temperature and was sequentially centrifuged. The initial
centrifugation was done using in 2ml eppendorfs in a tabletop centrifuge at 2000g for 20 minutes
at 4°C. The supernatant was collected, pooled, and added to Beckman Coulter polycarbonate
centrifuge tubes (#349622) and spun at 10,000g with a SW41 TI Beckman rotor in an Optima L-
90K Ultracentrifuge at 4oC for 30 minutes. Subsequently, the supernatant was collected and
ultracentrifuged at 100,000g for 150 minutes at 4oC using new of the previously stated tubes,
rotors, and ultracentrifuge. Afterwards, the supernatant was discarded, and the pellet was
resuspended in PBS. The resuspended pellet was subjected to another round of 100,000g
92
centrifugation with same rotor and machine for 150 minutes at 4oC. The supernatant was
discarded, and the pellet was resuspended overnight in 500µl of PBS on an orbital shaker. The
pelleted EVs were stored at -20oC until needed and thawed at room temperature.
In these experiments, 2ml of plasma was subjected to differential ultracentrifugation, and
50µl of concentrated plasma EVs were mixed with 450µl of PBS so that a total volume of 500µl
was added to glass coverslips in a 24-well plate. Plasma samples were spinoculated, fixed, and
stained in the same manner as the saliva samples detailed above. This yielded on average 175
WGA puncta per image.
PKH Dye Labeling of EVs
EVs from saliva and plasma were isolated as previously described in the collection,
preparation and processing methodology section. Similarly, wildtype or S15Ch 293Ts pelleted
EVs were concentrated via previously described purification of extracellular vesicle
methodology using starting volumes that filled SW28, Beckman Coulter polycarbonate
centrifuge tubes (#344058). Afterwards, 293T concentrated EVs were directly resuspended in
100µl of PBS, while saliva and plasma EVs were resuspended in 500µl of PBS overnight on the
orbital shake 4oC as described previously. To prepare the EVs for staining, 50µl of either
concentrated WT or S15Ch 293T EVs were added to 950µl of Diluent C (Phanos Technologies)
while 200µl of concentrated saliva EVs or 500µl of plasma EVs were added to 800µl or 500µl of
Diluent C, respectively. Next, a master mix of 0.2µl or 0.4µl of PKH26 or PKH67 (Phanos
Technologies) was added to 1ml of Diluent C (Phanos Technologies) per sample to create a final
concentration of 200nM or 400nM, respectively. A 200nM PKH67 dye master mix was used for
both saliva and plasma EVs. 1ml of the PKH dye master mix was added to the 1ml EVs and
Diluent C mixture and was gently pipetted for 30 seconds, followed by being shaken at room

93
temperate on an orbital shaker at 100rpm, for 5 minutes. Afterwards, the reaction was quenched
by adding 2ml of 10% BSA (Sigma-Aldrich, #05470) resuspended in PBS. 4.5ml of serum free
DMEM was added to the quenched reaction to a total volume of 8.5ml. Next, to minimize
turbulence, the 8.5ml mixture was very gently floated on-top of a 1.5ml .971M sucrose (Sigma-
Aldrich, #S9378) cushion in a Beckman Coulter polycarbonate centrifuge tube (#349622) and
topped off with serum free DMEM. This was followed by centrifugation at 190,000g for 2 hours
at 4oC via the SW41 TI rotor to pellet the EVs while removing excess dye. The supernatant and
the sucrose cushion were carefully aspirated, and the pellet was resuspended in 500µl of PBS by
gentle pipetting. The resuspended S15Ch or WT 293T pellet was used immediately or stored at -
20oC for later use. The resuspended saliva and plasma EVs were stored at -20oC until need and
thawed at room temperature. In preparation for imaging, 250µl of the WT or S15Ch
resuspension was added to 250µl of PBS and spinoculated onto uncoated coverslips per
condition. Conversely, 50µl of the thawed plasma or saliva EVs were added to 450µl of PBS and
spinoculated onto 0.1% Poly-L-Lysine (Sigma Aldrich) coated coverslips as described
previously. EVs were then subjected to immunofluorescence staining as described in
immunofluorescence staining methodology section.
Cell Treatment and EV-MAC Immunofluorescence Staining
The experiments involving α-syn DSP A+B HeLa cells were performed by treating cells
with either Baf-A1 and/or 200 nM α-syn fibrils (Proteos) labelled with Dylight 550 N-
hydroxysuccinimide (Thermo Fisher Scientific) or leaving them untreated for 24 hours. For the
experiments involving the iCell DopaNeurons, the cells were transfected with siRNA as
previously described and cultured media at 24-72 hours post-transfection. Collected cultured
media was initially centrifuged at 1,200 × g for 5 minutes at 4oC to remove cellular debris. Next,

94
500 µl of the supernatant cultured media was added to a well of a 24-well plate containing a
glass coverslip (Thermo Fisher Sciences). Coverslips were initially held in a 50 ml conical in
70% ethanol and were added to individual wells of a 24-well tissue culture plate and
subsequently washed thrice with PBS. The final round of PBS was left in the well and aspirated
immediately before continuing. In order for the contents of the cultured media to adhere to the
coverslips, the cultured media was spinoculated by centrifugation at 13°C for 2 hours at 1,200 ×
g and subsequently fixed in a solution of 0.1M piperazine-N-N′bis[2-ethanesulfonic acid]
(PIPES) buffer containing 3.7% formaldehyde (Polysciences) for 15 minutes and washed thrice
with PBS. The coverslips were permeabilized with a 0.1% solution of saponin in block solution,
composed of 500 ml of PBS supplemented with 10% NDS and 0.01% sodium azide, for 5
minutes. After washing 3 times, the coverslips were incubated with either mouse anti-galectin-3
(1:1,000, BD Pharmingen), mouse anti-CD9 (1:1000, BD Bioscience), mouse anti-CD63
(1:1000, BD Bioscience), mouse anti-CD81 (1:1000, BD Bioscience), or rabbit anti-α-synuclein
(MJFR1, 1:1,500, Abcam) for 1 hour at room temperature and then washed three times with
PBS. Where applicable, biotin conjugated wheat germ agglutinin (WGA, Vector Laboratories)
was used at a working concentration of 5 g/ml for 1 hour at room temperature after incubation
with the solution containing primary antibody. Afterwards, primary antibodies were labelled
using fluorophore conjugated donkey anti-mouse or donkey anti-rabbit antibodies (1:400,
Jackson ImmunoResearch Laboratories) for 30 minutes at room temperature. Depending on the
set of experiments, the conjugated fluorophore color varied. Alexa 594 donkey anti-mouse was
used to label the Gal3 antibody from α-syn DSP A+B culture media. Alexa 647 donkey anti-
mouse and Alexa 594 donkey anti-rabbit were used to label the Gal3 and α-synuclein antibodies,
respectively, in iCell DopaNeuron culture media. Afterwards, the coverslips were washed with
95
PBS. If the coverslips underwent lectin staining, biotin conjugated WGA was labelled using
PBS-diluted fluorescein isothiocyanate (FITC) conjugated streptavidin (SAV, 1:1,000, Jackson
ImmunoResearch Laboratories, Inc.) for 1 hour at room temperature. Afterwards, coverslips
were fixed and mounted with Fluoro-Gel (Electron Microscopy Sciences) onto slides (Globe
Scientific Inc.).
Fixation and Immunofluorescence Staining of Cells
In preparation for immunofluorescence antibody staining, cells were fixed in a solution of
4% formaldehyde in Dulbecco’s phosphate buffered saline (DPBS) for 15 minutes and gently
washed twice in DPBS. Cells were permeabilized, blocked, and probed with primary antibody in
a block solution composed of DPBS supplemented with 2% FBS, 2% NDS, and 0.2% Triton X-
100 sterile filtered through a 0.22 µm filter. The following immunofluorescence antibodies were
used at the specified concentrations: mouse anti-galectin-3 (1:1,000, BD Pharmingen), mouse
anti-OCT3/4 (1:500, Santa Cruz), rabbit anti-LMX1A (1:1,000, EMD Millipore), mouse anti-
nestin (1:500, Santa Cruz), rabbit anti-tyrosine hydroxylase (1:1,000, EMD Millipore), rabbit
anti-Trim16/EBBP (1:1,000, Bethyl Laboratory), mouse anti-Trim16 (1:500, Santa Cruz), rabbit
anti-LC3B (1:400, Abcam), mouse anti-ATG16L1 (1:500, Santa Cruz), mouse anti-CD63
(1:1000), and mouse anti-beta-III tubulin (1:500, Santa Cruz). Cells were incubated at room
temperature for 1 hour and washed thrice in DPBS. Non-overlapping conjugated donkey anti-
mouse and/or anti-rabbit were used at either 488, 594, or 647 (1:400, Jackson ImmunoResearch
Laboratories) in blocking buffer. When used, 4′,6-diamino-2-phenylindole (DAPI, Sigma-
Aldrich) and/or phalloidin (Sigma-Aldrich) was added to the secondary antibody solution. Cells
were incubated with secondary antibody solution for 30 minutes at room temperature and

96
subsequently washed thrice with DPBS. Afterwards, coverslips were fixed and mounted onto
slides (Globe Scientific Inc.).
Imaging Analysis Paradigm
The collected z-stack images were used as reconstructed 3-dimensional (3D) maximum
intensity projections (MIPs) for analysis with Imaris software (version 7.6.4, Bitplane) in order
to use the 3D masking algorithm function. The same masking algorithm was applied to all
images of a single experiment regardless of condition to permit valid between groups
comparisons using the Batch Coordinator tool (Bitplane).
In cultured media experiments, non-representative images where the focal plane was not
correctly imaged were excluded. No more than 2 images per condition, per replicate were
excluded. The relative background levels of maximum intensity for each respective channel were
determined based on the secondary antibody controls for mouse, rabbit, and SAV (where
applicable) by determining the 95th percentile’s maximum fluorescence intensity from each
image and, subsequently, averaging them.
Wide-field Fluorescence Deconvolution Microscopy and Analysis
Imaging of cultured media or cells was performed on a DeltaVision wide-field
fluorescent microscope (Applied Precision, GE) outfitted with a digital camera (CoolSNAP
HQ2; Photometrics), while using the oil immersion Olympus Plan Apo 60× objective lens (1.42
numerical aperture) with ResolveTM immersion oil with a refraction index of 1.5150 (Richard
Allen Scientific, #M3004). A 250watt Xenon Arc lamp was used to direct excitation lighting
from the back of the microscope and focused from below onto the coverslip held on an Olympus
IX-71 stage. Dichroic filter set uses the Alexa setting: FITC Excitation: 475/28 Emission:
523/36; A594 Excitation: 575/25 Emission: 632/30; CY5 Excitation: 632/20 Emission: 676/34;
97
DAPI Excitation: 390/18 Emission: 435/48. Exposure times range from experimental conditions
depending on staining conditions. Conditions for S15Ch experiments use FITC exposure time of
.05-.1 seconds; A594 exposure time of .08-.1 seconds; CY5 exposure time of .025-.1 seconds.
100% transmission was used for all exposure conditions. S15Ch EVs and WGA: FITC exposure
time .05 seconds, 50% transmission; A594 exposure time of .1 seconds, 100% transmission.
PKH26 Dye: FITC exposure time .01 seconds, 100% transmission; A594 exposure time of .05
seconds, 50% transmission; CY5 exposure time of .025 seconds, 100% transmission. PKH67
Dye: FITC exposure time .05 seconds, 50% transmission; A594 exposure time of .015 seconds,
100% transmission; CY5 exposure time of .025 seconds, 100% transmission. Exposure times
were not altered among staining conditions of a collected sample. Exposure times were kept
consistent among all collected samples and were only adjusted to prevent signal over-exposure.
Secondary only conditions were collected and compared to determine thresholds for each
collected sample.
The number of images taken per experiment is stated in the figure legend. Data was
collected by Z-stack imaging and was analyzed as maximum intensity projections. In each case,
the images taken were from different locations on the coverslip with the intent of creating a
representative sample of the total population. During some experiments, the “panels” function of
the SoftWoRx software (Applied Precision) was used to take non-biased images with the same
set of panels applied to each coverslip. In these cases, the z-stack distance was manually
recalibrated for each coverslip to ensure that the images remained in focus.
Data were collected by capturing a total of 30-40 z-stacks at a depth of .2µm between
each stack. These dimensions were constant among coverslips and all data shown uses the same
dimensional constants. Data was imaged so that Z-stacks started and ended on either side of the
98
focal plane. The use of Z-stack imaging was used to facilitate the constrained Iterative
deconvolution performed by SoftWoRx (Applied Precision, Inc.) a type of image restorative
deconvolution to increase the signal-to-noise ratio (Lifting the Fog: Image Restoration by
Deconvolution). The OTF used in the deconvolution process was a prerecorded, empirically
generated OTF for the 60x 1.42NA Olympus Plan Apo objective created by Applied Precision
Inc. for deconvolution. The CoolSnap HQ2 camera; the Olympus 60x Plan Apo Objective; the
SoftWoRx deconvolution software and solid-state illumination source; are all standard for the
DeltaVision microscope system, which was initially purchased from Applied Precision, Inc.
(Now GE Biosciences)
Collected Z-stack images were ultimately used as reconstructed 3D maximum intensity
projections for analysis by with Bitplane: Imaris software version 7.6.4. These 3D
reconstructions facilitated the formation of a 3D masking algorithms which we built around our
signal of interest (i.e. S15Ch or a lectin) within the 3D deconvolved reconstructions. The
deconvolved reconstructions were used for all data sets if not specifically addressed.
All S15 mCherry acquired 3D reconstructions were subjected to the same spots masking
algorithm via the Batch Coordinator tool (Bitplane) to each respective signal. Non-representative
images indicating that the focal plane containing EVs was not imaged as intended were removed.
No more than 2 images per condition per replicate were excluded. Panels containing an example
of a Spots algorithm are shown as maximum intensity projections (MIPs). Panels containing no
spots algorithm are show as individual Z-Stacks within the 3D reconstruction.
Background levels of maximum intensity for each respective channel were determined based on
secondary antibody controls for mouse (CD9, CD63, and CD81) or rabbit (LAMP1 or TSG101),
and streptavidin (SAV)-only controls (WGA, LEL, etc) via a gating process analogous to
99
flowcytometry. In cases where the threshold for above background signal was not visually
obvious, the 99th percentile was determined and used as the threshold when all images collected
from a single coverslip were pooled. When each image from a single coverslip was evaluated
individually, the 95th percentile from each image was used and subsequently averaged to
determine the above background signal value. The average number of THP-1 EVs among
experiments was in the range of 50-800 per image depending on the condition and sample
preparation.
To remove aggregates that were initially identified by our Spots masking algorithm, we
exclude Spots with more than 85 voxels. This was conducted by excluding Spot’s masks’ data
generated from the batching process which is provided under the “voxels” spreadsheet and
contains the voxel number of each spot identified. The visualization of these excluded spots was
conducted by going to the “Filters tab” of the Spots masking algorithm and changing the max
inclusion threshold to 85 voxels. Afterwards, a secondary Spots algorithm was created with the
applied voxel filter by “Replicating Spots”. A more in-depth explanation of how to exclude
initially included spots and the advantages to doing this rather than adding increased exclusion
criteria is provided in the legend of Fig. 7.
Bitplane Imaris Spots and Surface Algorithm Generation
The exact spots algorithm for our unconcentrated and concentrated Spots is as follows:
[Algorithm]
Enable Region Of Interest = false
Enable Region Growing = true
Enable Tracking = false
[Source Channel]

100
Source Channel Index = 2
Estimated XY Diameter = 0.300 um
Estimated Z Diameter = 0.600 um
Background Subtraction = true
[Classify Spots]
"Quality" above 25.0
"Distance to Image Border XY" between 2.00 um and 64.0 um
[Spot Region Type]
Region Growing Type = Local Contrast
[Spot Regions]
Region Growing Automatic Threshold = false
Region Growing Manual Threshold = 40
Region Growing Diameter = Diameter From Volume
Create Region Channel = false
Small variations of this algorithm were used for other experiments. However, the core gating
variables remain relatively unchanged.
In experiments in which the surfaces mask feature in Imaris Bitplane was used, the
surfaces mask algorithm was created using the same gating strategy as the spots mask, with the
key parameter being “sphericity” instead of quality. A representative surfaces algorithm is shown
below:
[Algorithm]
Enable Region Of Interest = false
Enable Region Growing = false
101
Enable Tracking = false
[Source Channel]
Source Channel Index = 1
Enable Smooth = true
Surface Grain Size = 0.100 um
Enable Eliminate Background = true
Diameter Of Largest Sphere = 0.400 um
[Threshold]
Enable Automatic Threshold = false
Manual Threshold Value = 234
Active Threshold = true
Enable Automatic Threshold B = false
Manual Threshold Value B = 5288.04
Active Threshold B = false
[Classify Surfaces]
"Sphericity" above 0.810
"Position X" between 2.00 um and 64.0 um
"Position Y" between 2.00 um and 64.0 um
Sensitivity and Detection in Deconvolved and Undeconvolved Images
15 fields from a dilute solution of tetraspecks, ranging from 1-6 beads, with increasing
exposure times in the FITC channel stopping at .1 seconds exposure time (Fig. 6). To determine
if the difference in spot number was a consequence of deconvolution artifacts, we manually
compared the images and the relative ability of our algorithm to identify individual puncta. Our
102
algorithm did not detect puncta in deconvolved images that were not identifiable in
undeconvolved images at longer exposure conditions. between the undeconvolved and
deconvolved counterparts; representative examples shown in (Fig. 6A). the differences observed
appeared to be from our Spots masking algorithm’s inability to distinguish the signal at our
algorithm parameters. Collectively, the deconvolved images had a ~4.26-fold increase in signal
compared to their undeconvolved counterpart, suggesting the differences in spot number were
the result of increased signal-to-noise (Fig. 6B). To determine if these results were comparable
under conditions that better simulate what we normally observe for EVs, we used the same
experimental paradigm for two separate coverslips with more concentrated bead concentrations
the number of spots recognized at each exposure condition for the undeconvolved and
deconvolved counterparts, we observed that the spots algorithm quickly recognized the signal in
the deconvolved fields and remained at the same number while the undeconvolved fields reached
was less sensitive at lower exposure conditions (Fig. 6C).
Serial Dilutions of S15Ch EVs
200µl of concentrated S15Ch EVs, as previously described, were resuspended in 1ml of
PBS to generate the stock dilution of concentration X. 600µl of our stock dilution was serially
added to eppendorfs containing 600µl of PBS to generate subsequent S15Ch dilutions of .5X,
.25X, .125X, .0625X, and .03125X. From each dilution, 100µl was saved for bicinchoninic acid
(BCA) assay to determine initial protein concentration, while 500µl of each dilution was
spinoculated onto coverslips that were coated with 0.1% poly-L-lysine, as described previously.
After spinoculation, the PBS and EV mixture was collected and reserved for BCA to determine
the post-spinoculation protein concentration, and the coverslips were fixed and stained with
CD81 and LAMP1 as previously explained. Z-stack images of the coverslips were collected

103
using the points function to generate 15 unbiased 3D reconstructions and number of S15Ch
puncta and CD81 puncta were measured using the following Spots algorithm:
[Algorithm]
Enable Region Of Interest = false
Enable Region Growing = true
Enable Tracking = false
[Source Channel]
Source Channel Index = 1 (CD81), 2 (S15Ch)
Estimated XY Diameter = 0.300 um
Estimated Z Diameter = 0.600 um
Background Subtraction = true
[Classify Spots]
"Quality" above 150
"Distance to Image Border XY" above 2.00 um
[Spot Region Type]
Region Growing Type = Local Contrast
[Spot Regions]
Region Growing Automatic Treshold = false
Region Growing Manual Threshold = 29
Region Growing Diameter = Diameter From Volume
Create Region Channel = false
To determine the initial and post-spinoculation protein concentration, a modified version
of the PierceTM BCA Protein Assay Kit (ThermoScientific, #23225) protocol was used in

104
conjunction with its kit. The bovine serum albumin (BSA) standard was initially serial diluted to
create a standard curve to better assist in measuring protein concentrations within the expected
protein concentrations of our EVs. To generate a standard curve, the initial standard was
prepared by adding 8µl of 20% SDS, to 4µl of 2mg/ml of BSA, and 108µl of PBS. 60µl was
serial diluted by mixing with a mixture of 56µl of PBS and 4µl of 20% SDS. This was conducted
10 times. A negative control was also prepared by adding 4µl of 20% SDS to 56µl of PBS.
Subsequently, 30µl of each standard as well as the negative control were plated in duplicate in a
96-well plate (Pierce, #15041). Samples were prepared by adding 30ul of each sample in
duplicate with the addition of 2µl of 20% SDS. The plate was added to an orbital shaker for 30
seconds. Afterwards, a 170 µl of Reagent A and Reagent B mixed at a ratio of 20:1 was added to
each well by 12-well multichannel pipetter. A plate-sealer was added to the 96-well plate and the
plate was incubated at 37C for 4 hours before being read on BioTek PowerWave XS plate reader
in conjunction with Gen5 software at an absorbance wavelength of 562 nm.
Empirical Measurement of the Point Spread Function and Binning
To measure the point spread function (PSF), 100 nm Tetraspeck (Invitrogen, T7279)
Microspheres were originally diluted 1:5000 in purified water and applied to coverslips based on
the manufacture’s protocol. Ten fields containing 1-6 microspheres were collected as Z-stack
images at a depth of .2µm per stack. Each field was collected with increasing exposure times
ranging across 0.005, 0.010, 0.015, 0.025, 0.05, 0.08, and 0.1 seconds. The microspheres were
imaged in the FITC channel with the excitation laser set to 100% laser transmission and the
DeltaVision microscopes Alexa filter set with same size pinhole. All images were captured with
the CoolSNAP HQ2 (Photometrics) digital camera from the Olympus Plan Apo 60× objective
105
lens (1.42 numerical aperture), while using ResolveTM immersion oil with a refraction index of
1.5150 (Richard Allen Scientific, #M3004).
The Point Spread Function (PSF) was calculated both before and after deconvolution
which includes using a bin size of 2x2 to enhance sensitivity as in EV-MAC experiments
(Appendix 1, Fig. 1A). Fields containing 1-6 fluorospheres, with increasing exposure conditions
were imaged to calculate the PSF by determining the full width half max (FWHM) from
individual fluorospheres with the single pinhole function of the ImageJ plugin, Adrian’s FWHM.
Adrian’s FWHM (Martin, A. (2008). (http://imagej.nih.gov/ij/plugins/ fwhm/index.html) uses a
Levenburg-Marquardt implementation to apply a Gaussian fit to determine the PSF. This was
conducted from 10 fields, and the same fluorosphere was measured for both undeconvolved and
deconvolved images at all tested exposure conditions. As per the plugin designer’s
recommendation, measured values with an error above 1e-6 were excluded. Undeconvolved
images had lower PSF functions at all exposure conditions calculated when compared to the
deconvolved (Appendix 1, Fig. 1A). The PSF of S15Ch EVs and FITC tetraspecks (100 nm)
revealed no significant differences, revealing that the majority of S15Ch EVs were below the
resolution limit of our microscope (Appendix 1, Fig. 1B). Similar resulted were observed using
1x1 binning (Appendix 1, Fig. 1C). No differences were observed when images were analyzed
using 1x1 or 2x2 binning (Appendix 1, Fig. 1D).
Flow Cytometry
The procedure to prepare mature mDA neurons for analysis by flow cytometry was based
on published protocol (Menon et al. 2014)[338] with minor modifications. A suspension of
single cells was created by incubating the cells with Accutase (Stem Cell Technologies). The
single cell suspension was centrifuged at 220 × g for 5 minutes at room temperature then

106
resuspended in 2% FBS in phosphate buffered saline (PBS) (Stem Cell Technologies). The cells
were counted, distributed in aliquots, then fixed in 4% paraformaldehyde in PBS for 30 minutes
at room temperature on a rotary mixer (Ted Pella, Inc). When the antigen was intracellular, the
cells were permeabilized by incubation with a 0.5% saponin solution for 15 minutes at room
temperature on a rotary mixer (Ted Pella, Inc). This permeabilization step was omitted for
surface antigens. After a PBS wash, the cells were incubating with a primary antibody solution
containing primary antibody, 1% bovine serum albumin (BSA), 10% normal donkey serum
(NDS) in PBS for 45 minutes at room temperature on a rotary mixer. When the antigen was
intracellular, the primary antibody solution contained 0.5% saponin. When the antigen was
expressed on the cell surface, saponin was omitted from the primary antibody solution. The
primary antibodies used were TH (EMD Millipore), Nurr1 (Santa Cruz Biotechnology, Inc),
LMX1A (Abcam), and FOXA2 (Santa Cruz Biotechnology, Inc). After a PBS wash, the cells
were incubated in a secondary antibody solution containing secondary antibody, 1% bovine
BSA, 10% NDS in PBS for 45 minutes at room temperature on a rotary mixer. The secondary
antibody was either Alexa Fluor 488 or Alexa Fluor 647 (Vector Laboratories). Cells were
washed in PBS then resuspended in 2% FBS in PBS. Flow cytometry was performed on a FACS
Canto II (BD Biosciences) and analyzed using FACS DIVA software (BD Biosciences). Cells
were identified by light scatter for 10,000 gated events.
Characterization of α-Syn Fibrils
Human wild-type α-syn was expressed in E. coli BL21 DE3 CodonPlus cells (Stratagene,
San Diego, CA, USA) and purified as described previously [170]. Monomeric human wild-type
α-syn (100 µM) was assembled into fibrils by incubation in 50 mM Tris–HCl, pH 7.5, 150 mM
KCl at 37°C under continuous shaking in an Eppendorf Thermomixer set at 600 r.p.m for 5 days
107
[42].The assembly reaction was monitored by withdrawing aliquots (20 µl) from the assembly
reaction at different time intervals, mixing them with Thioflavin T (10 µM final) and recording
the fluorescence increase on a Cary Eclipse Fluorescence Spectrophotometer (Varian Medical
Systems Inc., Palo Alto, CA, USA) using an excitation wavelength = 440 nm, an emission
wavelength = 480 nm and excitation and emission slits set at 5 and 10 nm, respectively. To label
α-syn fibrils with extrinsic fluorophores, the fibrils were centrifuged twice at 15,000 g for 10 min
and re-suspended twice in PBS at 1,446 g/L and two molar equivalents of ATTO-488 NHS-ester
(Atto-Tec GmbH, Siegen, Germany, #AD 488-35) fluorophore in DMSO were added. The mix
was incubated for 1h at room temperature. The labeling reactions were arrested by addition of
1mM Tris pH 7.5. The unreacted fluorophore was removed by a final cycle of two
centrifugations at 15,000 g for 10 min and resuspensions of the pellets in PBS. The fibrillar
nature of α-syn was assessed by Transmission Electron Microscopy (TEM) after adsorption of
the fibrils onto carbon-coated 200 mesh grids and negative staining with 1% uranyl acetate using
a Jeol 1400 transmission electron microscope. The images were recorded with a Gatan Orius
CCD camera (Gatan, Pleasanton, CA, USA). The resulting α-syn fibrils were fragmented by
sonication for 20 min in 2-ml Eppendorf tubes in a Vial Tweeter powered by an ultrasonic
processor UIS250v (250 W, 2.4 kHz; Hielscher Ultrasonic, Teltow, Germany) to generate
fibrillar particles with an average size 42-52 nm as assessed by TEM analysis. The fingerprint of
the resulting fibrils was obtained by subjecting them to limited proteolysis using proteinase K
[405]. The fibrillar polymorphs were diluted to 100 µM in PBS and incubated at 37°C with
proteinase K (3.8 µg/mL). At different time intervals, samples were withdrawn from the
degradation reaction and supplemented with protease inhibitor phenylmethanesulfonyl fluoride
(PMSF) (to a final concentration of 3.3 µM). Samples were then frozen in liquid nitrogen and

108
dehydrated. Fibrils were then disassembled by treatment with 100% hexafluoro-2-propanol
(HFIP) for 1 hour. Samples were then air-dried, dissolved in 15 µl of Laemmli sample buffer and
denatured for 5 min at 80°C. Samples were then analyzed on Tris-Glycine-SDS-polyacrylamide
(15%) gel (SDS-PAGE), stained by Coomassie blue and imaged using a ChemiDocTM MP
(BioRad).
Cell Viability Assay
Cell viability was measured by l-lactate dehydrogenase (LDH) assay based on the
methodology described in Kaja et al., 2017 [238]. In brief, Assay buffer components A,
composed of 4mM iodonitrotetrazolium chloride (INT), in 0.2 M Tris-HCl, pH 8.2, and Assay
buffer B, composed of 6.4 mM nicotinamide adenine dinucleotide (NAD), 320 mM lithium
lactate, in 0.2 M Tris-HCl buffer, pH 8.2 were made, frozen at -20oC, and thawed at the time of
the experiment. 150 mM 1-Methoxyphenazine methosulfate (MPMS) in Tris buffer was also
made and frozen at -20oC. Activate Assay buffer was made by adding 5mL of Assay buffer A,
5mL of Assay buffer B, and 0.5μl of 150mM MPMS in Tris buffer. To measure released LDH,
50μl of a conditioned sample cultured media was plated in duplicate in a clear, flat-bottom 96-
well plate. 50μl of active Assay Buffer was added by multichannel pipetter, incubated in the dark
for one hour, at room temperature, and subsequently quenched with the addition of 50μl 1M
acetic acid. Signal was measured by reading absorbance at λ = 490 nm on a Synergy HTX Multi-
Mode plate reader (BioTek Instruments) in conjunction with Gen5 software. To determine
relative cell viability, secreted culture media LDH was compared to untreated lysed cells in lysis
buffer composed of 9% Triton X-100 in water. The volume of lysis solution used at a 1-to-1 ratio
with the experimental sample cell cultured media. Viability was calculated by taking the
background subtracted condition sample absorbance and dividing it by the background
109
subtracted lysed cell absorbance. This value was subtracted by 1 and multiplied by 100 to
determine the percent viability. All reagents used were purchased from Sigma.
α-Syn Fibril and Drug Concentrations and Treatment Paradigm
The experiments involving α-syn fibril treatment were performed at a final concentration
of 200 nM. For the experiments involving drug treatments, the respective culture media was
supplemented with the stated drug at the listed final concentration: vehicle (0.1% dimethyl
sulfoxide (DMSO)), rapamycin (100 µM), Baf-A1 (100 nM), 3-MA (5 mM), Wor (100 nM)
(InvivoGen), TD139 (1 µM, Cayman Chemical), GW4869 (10 µM, Cayman Chemical), and
LLOME (2 µM). All experiments involving drug treatments, if not otherwise stated, were
performed for 24 hours except for those in which LLOME was used. LLOME treatments were
conducted for 4 hours. In the case of the mTOR activation experiments, vehicle, rapamycin, and
α-syn fibril treatment were conducted for 24 hours, and LLOME treatment was conducted for 4
hours so that all treatments finished at the same time. All drugs were purchased from Sigma
Aldrich unless otherwise stated.
siRNA Transfection
SMARTpool Accell siRNA for control, Gal3, Trim16, ATG16L1, and ATG7 were
purchased from Horizon Discovery to generate knockdowns in mDA neuronal cultures and iCell
DopaNeurons. siRNAs were initially resuspended in 1× siRNA Buffer at a stock concentration of
100 µM as described by Horizon Discovery’s siRNA Resuspension Protocol
(https://horizondiscovery.com/-/media/Files/Horizon/resources/Protocols/basic-sirna-
resuspension-protocol.pdf). Stock siRNAs were then aliquoted and frozen at -20oC to minimize
freeze-thaw. Before use, aliquots were thawed at room temperature and 5 µl was added to 500 µl
of room temperature Accell siRNA Delivery Media and gently mixed and added to the neuronal

110
culture as stated in the Dharmacon Accell siRNA delivery protocol
(https://horizondiscovery.com/-/media/Files/Horizon/resources/Protocols/accell-delivery-
protocol.pdf). The transfection media was changed to SM1 Neurobasal media or iCell Neural
Base Medium 24 hours later. Experiments including transfections using iCell DopaNeurons were
conducted at initial cell concentrations of 2 × 10⁵ cells per well at 72 hours post-transfection for
all targets. Experiments involving mDA neuronal cultures were performed at a 72 hours post-
transfection for all targets, except for the evaluation of α-syn and Gal3 levels in the cultured
medium from Trim16 KD cells, which was performed at 48 hours post-transfection. To evaluate
KD of each target, cells were removed from their adhered well with either the addition of
TrypLE express Enzyme 1×, no phenol red (Gibco) or trypsin and incubated at 37oC for 7
minutes and pipetted into 1 ml Eppendorf tubes. The wells were washed twice with an equal
volume of 10% FBS supplemented DMEM and added to the Eppendorf tube to quench trypsin.
The cells were then pelleted by sequential centrifugation at 4oC at 300 × g for 5 minutes
followed by 10,000 × g for 10 minutes, and the supernatant was carefully aspirated in order to
not disrupt the pellet.
DSP-α-syn SH-SY5Y cells transfections were performed with Lipofectamine 2000
(Thermofischer) using a modified version of the manufacturer protocol. 2000ng of 4x CLEAR-
luciferase reporter plasmid, 4µl of 10µM control, pooled Optineurin, or TBK1 siRNAs (Santa
Cruz), or 8 µl of Lipofectamine 2000 were added to 100 µl of GE Accell siRNA delivery
medium for 20 minutes at room temperature. Equal parts of siRNA or 4x CLEAR plasmid
containing media were briefly mixed with the Lipofectamine 2000 containing media, allowed to
rest for 30 minutes at room temperature, and 200 µl of combined transfection media was added
to 800 µl GE Accell siRNA delivery medium. 2 ml total mixture was added to a well of 70%

111
confluency cells in a 6-well plate. The cells were incubated for 24 hours in transfection media
before fresh DMEM was added. For 4x CLEAR transfected cells experiments, cells were
trypsinized and moved to 4 wells of a 24-well plates at 24 hours post-transfection. At 48 hours
post-transfection, the cells were then treated with 200nM α-syn fibrils for 24 hours relative to
untreated or at 72 hours post-transfection to 1% DMSO vehicle or LLOME (2 µM). For siRNA
transfected cells, 48 hours post-transfection, cells were trypsinized and moved to 4 wells of a 24-
well plates. The conditioned 48-72 hours post-transfection media was collected from the siRNA
transfected cells to evaluate luciferase or Gal3 levels by luciferase or ELISA, respectively.
Additionally, cell lysates from the 72 hours post-transfection were collected for western blot to
evaluate knockdown efficiency. The 4XCLEAR-luciferase reporter was a gift from Albert La
Spada (Addgene plasmid # 66800 ; http://n2t.net/addgene:66800 ; RRID:Addgene_66800)
Renilla Luciferase Assay
Renilla luciferase (RLuc) experiments were performed with HeLa or SH-SY5Y α-syn
DSP A+B cells that were equally plated in a 24-well plate at a density of 0.65-2.1 × 10⁵ cells per
well depending on the experiment. The cells were then treated with the stated drug at the
previously stated concentration. Vehicle or Baf-A1 were treated simultaneously with 200 nM α-
syn fibril for 24 hours. Afterwards, the cultured media was collected and centrifuged at 4oC for
5-10 minutes and at 1,200 × g. Next, the supernatant was collected and plated in triplicate at 50
µl per well, in a 96-well, for a luciferase assay. Depending on the experiment, 50-100 µl of
coelenterazine (NanoLight) solution was added via machine administration Veritas microplate
luminometer (Turner BioSystems, Inc) in combination with GloMax software (version 1.9.3).
Each experiment was performed in triplicate unless otherwise specified.
112
MDA Neuronal Culture Transduction and Firefly Luciferase Assay
mDA neuronal culture experiments were performed by co-transducing mDA neuronal
cultures with lentiviral pLVX RLuc and either pLVX firefly Gal3 or an empty pLVX plasmid.
PEI transfection of HEK 293T cells to generate, collect, and purify lentiviral particles was
performed as described previously, using equal DNA concentrations of VSV-g and psPax2, as
well as either pLVX RLuc, empty pLVX, or pLVX firefly Gal3 plasmid. After purifying
lentiviral particles with a 0.45 µm syringe filter, 5 ml aliquots of the particle containing media
were concentrated by overnight centrifugation at 5,000 × g. The media was then aspirated and
the pellet was immediately resuspended in 1 ml of SM1 Neurobasal media by pipetting. The
resuspended pellet was then gently rocked on ice in a 4oC cold room for 1 hour to facilitate
redistribution of particles. The media was then allowed to come to room temperature and added
to 3 wells of a 24-well plate of mDA neurons. The media was changed 72 hours after
transduction and subsequently collected to evaluate α-syn levels by an α-syn ELISA. Afterwards,
firefly Gal3 cells were treated with 200 nM α-syn fibrils or left untreated for 48 hours and then
culture media was collected in preparation for a firefly luciferase assay. To evaluate the firefly
signal, cultured media was centrifuged at 4oC for 10 minutes and 10,000 × g to remove any cells.
Afterwards, the supernatant was collected and 150 µl was plated in triplicate in a 96-well plate.
The 96-well plate was then added to a Veritas microplate Luminometer and 150 µl of firefly
luciferin substrate was added by machine injection and immediately read in combination with
GloMax software (version 1.9.3). Background levels were determined by measuring the cultured
media from the empty vector cells.

113
MDA Neuronal Culture Quantitative Real-Time Polymerase Chain Reaction Assay
RNA was isolated from mDA cell lysates following the manufacturer’s protocol for the
Nucleospin RNA Plus kit (Macherey-Nagel). The RNA was then reverse transcribed to the
complementary DNA (cDNA) sequence using an oligodeoxythymidylic acid primer following
the manufacturer’s protocol (Promega). Real-time PCR (RT-PCR) was performed on the cDNA
with iTaqTM Universal SYBR® Green Supermix (Bio-Rad). Briefly, the reaction mixture
contained 2 uL cDNA and 2.25 uM of each forward and reverse PCR primer for a 20 uL reaction
following the manufacturer’s protocol. For RT-PCR amplification of the target genes, the
reaction was performed at 50°C for 2 minutes, 95°C for 10 minutes, followed by 40 cycles of
95°C for 30 seconds then 50°C for 1 minute on a CFX96 real-time PCR detection system (Bio-
Rad). Assays were performed in triplicate to control for technical errors. To select appropriate
reference genes, the qBase+ software package was used to calculate gene expression stability
(GeNorm M) and to calculate the variation for using n reference genes to determine the lowest
number of genes required for accurate normalization (GeNorm V) as previously described
(BioGazelle, Zwijnaarde, Belgium) [197]. Actin γ 1 (ACTG1) and NADH:ubiquinone
oxidoreductase subunit B1 (NDUFB1) were used as the reference genes for normalization. The
mRNA levels of both LGALS3 and LGALS8 were normalized to ACTG1 and NDUFB1 mRNA
levels. Fold change in gene expression was then calculated.

114
Table 1. Primer Table.
Gene
Name
Forward (5’-3’) Reverse (5’-3’)
ACTG1
AGAGGCTGGCAAGAACCAGTTGTT CAATGACGTGTTGCTGGGGCC
T
NDUFB
1
TTATTTAGACAGAAAGAGTGATGAAC
G
GGTAACTTCTTCACTGGGTTG
C
LGALS3 GCCAACGAGCGGAAAATGG TCCTTGAGGGTTTGGGTTTCC
LGALS8 ACACTCTGGGCATTTATGGC TTTAACGACGACAGTTCGTCC
MDA Neuronal Culture Transduction YFP-LC3B, Induction, and α-syn Fibrils Treatment
The PEI transfection of HEK 293T to generate, collect, and purify lentiviral particles was
performed as described previously, using equal DNA concentrations of either pLVX inducible
YFP-LC3B plasmid, VSV-g and psPax2. After purifying lentiviral particles with a 0.45 µm
syringe filter, the particles were concentrated by overnight centrifugation of 5 ml of lentiviral
particle-containing media at 5,000 × g. The media was then aspirated and the pellet was
resuspended in 1 ml of SM1 Neurobasal media (Gibco) by pipetting. The resuspended pellet was
then gently rocked on ice in a 4oC cold room for 1 hour to facilitate redistribution of particles.
The media was then allowed to come to room temperature and added to 3 wells of a 24-well
plate of mDA neuronal cultures. Experiments were conducted at least 72 hours post-transduction.
To perform experiments, cells were transfected with siRNAs as previously described. At
24 hours after transfection, the media was changed to SM1 Neurobasal media (Gibco)
115
supplemented with doxycycline monohydrate (Sigma-Aldrich) at a working concentration of
1:10,000 for 24 hours to induce the expression of YFP-LC3B. Afterwards, the media was
changed, and the cells were treated with 200 nM ATTO 647 α-syn fibrils for 24 hours (48 hours
post-transfection). Cells were then fixed in 4% formaldehyde solution diluted in DPBS at 72
hours post-siRNA transfection. They were subjected to immunofluorescence staining as
previously described.
The number of images taken per experiment is stated in the figure legend. Data was
collected by z-stack imaging and was analyzed as maximum intensity projections (MIPs). Cells
were imaged using z-stacks with 0.5 µm between each stack and a total of 30 z-stacks. The
imaging of yellow fluorescence protein (YFP)-LC3B was conducted by visually identifying
YFP-LC3B positive cells. A subset of non-transduced YFP-LC3B cells were also imaged to help
evaluate background fluorescence levels in the siRNA-treated control cells. Similarly, DSP-α-
syn, Control KO, and Gal3 KO experiments were conducted with secondary only antibody
controls to determine background fluorescence. The same exposure conditions were used for all
coverslips and experiments.
α-Syn and Galectin-3 Sandwich ELISA
Evaluation of α-syn or Gal3 in the culture media was determined by an in-house
sandwich ELISA using commercially available antibodies. When serial dilutions were added to
uncultured media, a standard curve was generated for α-syn (Appendix 1, Fig. 2A) and Gal3
(Appendix 1, Fig. 2B). The characterization of antibodies used in an α-syn sandwich ELISA has
been previous reviewed in-depth including their specific binding epitopes [117, 273, 278, 439,
509]. Similarly, epitope mapping to specific regions of Gal3 with the following antibodies has
116
been previously described and/or used in direct ELISA: anti-Gal3 antibodies B2C10 (Santa
Cruz), A3A12 (Santa Cruz), and M3/38 (Millipore Sigma) [13, 114, 173, 298, 385].
For the α-syn sandwich ELISA, mouse anti-α-synuclein (42/α-synuclein, BD
Biosciences) and Gal3 sandwich ELISA mouse anti-Gal3 (B2C10 or A3A12, Santa Cruz)
antibodies were diluted in pH 9.6 carbonate buffer to a final concentration of 1 µg/ml and added
to wells of a 96-well Maxisorp ELISA plate (Nunc) at 4oC for 16 hours on an orbital shaker to
coat the wells. The wells were then washed with PBS-T three times. Afterwards, the wells were
blocked in equal portions of 10% BSA supplemented DMEM and PBS for 2 hours at room
temperature and subsequently washed thrice with PBS-T. For the α-syn and Gal3 sandwich
ELISA, 50 µl or 100 µl of cultured media, respectively, from each sample as well as serial
dilutions of recombinant human α-syn monomer (Proteos) or Gal3 (Biolegend) were added in
triplicate for 24 hours at 4oC. Wells were then washed thrice with PBS-T. HRP conjugated
mouse anti-α-synuclein (211, Santa Cruz) was diluted to a final concentration of 1 µg/ml or
biotin conjugated rat anti-Gal3 (M3/38, Biolegend) was diluted to a final concentration of 500
ng/ml in 1× ELISA Diluent solution (eBioscience) and then added to wells for 24 hours at 4oC
on an orbital shaker. Afterwards, the wells were washed thrice with PBS-T. For the Gal3 ELISA,
HRP conjugated SAV was diluted to 1 µg/ml in 1× ELISA Diluent solution and added for 30
minutes at room temperature on a rocker. The plate was then washed 5 times and with PBS-T
and the HRP signal was detected with the addition of 1× 3,3′, 5, 5-tetramethylbenzidine (TMB,
Invitrogen) and the reaction was quenched with 2N sulfuric acid. The absorbance was read at
450 nm on a PowerWave XS plate reader (BioTek Instruments) in conjunction with Gen5
software.
117
Lysosome Dysfunction Assay and Autophagic Flux
An equal concentration of mDA neuronal culture cells were plated in a clear bottom,
black 96-well plate (Costar) during the penultimate steps of the differentiation process to mature
until day 50 post-initial differentiation at ~100,000 cells per well. Cells were treated with control
or Gal3 siRNA as previously described. The media was changed 24 hours post-treatment. At 48
hours post-transfection, the media was changed and either supplemented with α-syn fibrils or left
untreated. At 72 hours post-transfection, the wells were washed thrice then treated with vehicle
(0.1% DMSO) or 200 nM Baf-A1 diluted in SM1 Neurobasal (Gibco) media for 2 hours then
subsequently loaded with reconstituted Magic Red cathepsin B (ImmunoChemistry
Technologies) for 30 minutes. Magic Red cathepsin B was reconstituted and loaded based on the
manufacturers’ protocol. Cells were then washed thrice with clear Neurobasal media (Gibco) at
room temperature, and clear Neurobasal media (Gibco) supplemented with vehicle or Baf-A1
was added to cells, based on previous treatments. The cells were then placed in a plate reader
warmed to 37oC and supplemented with 5% CO2. The Magic Red fluorescence signal was
measured using a 528 nm excitation wavelength and 628 nm emission wavelength at baseline
and every 15 minutes over a 4-hour period. At the end of the 4 hours, the cells were lysed and
saved for western blot analysis. A total of 6-8 wells were used for each of the vehicle treatments
(control/Gal3 siRNA and ± α-syn fibril) and a total of 2-4 wells for the Baf-A1 treatments
(control/Gal3 siRNA and ± α-syn fibril in each experiment). The graphed data was normalized to
the endpoint relative fluorescence units (RFU) of the control siRNA plus vehicle minus that of
the α-syn fibril and subsequently extrapolated to all time points and conditions within each row
of the 96-well plate, which contains one of every possible variable combination. Each row was
considered a biological replicate and was pooled with all other replicates from a total of 4
118
independent experiments (n = 17-25 among conditions). Lysate from 2 wells from each treatment
condition was pooled to obtain enough protein, ran on an SDS-PAGE gel, then transferred for
western blot analysis. Wells in which insufficient KD was observed (< 40% Gal3 depletion)
relative to that of the comparable treatments’ control siRNA condition were excluded. Western
blot quantifications were used to determine autophagic flux: n = 8, control siRNA plus vehicle
conditions; n = 8, Gal3 siRNA plus vehicle; n = 6, control siRNA plus Baf-A1; n = 6, Gal3
siRNA plus Baf-A1; n = 6, control siRNA plus α-syn fibrils; n = 6, Gal3 siRNA plus α-syn
fibrils; n =6, control siRNA plus α-syn fibrils + Baf-A1; and n = 6, Gal3 siRNA plus α-syn
fibrils + Baf-A1.
Statistical Analysis
All statistical analyses were conducted with and graphs were made with Prism (version
6.0, GraphPad Software, Inc.). Data from a single cultured media preparation or coverslip are
given as M ± SD. Data from experiments in which multiple cultured media preparations and
independent coverslips were imaged are given as M ± SE. The statistical test and post hoc
analysis for each experiment are stated in the figure legend. Each graph shows the mean value,
and each data point indicates a biological replicate and is the mean value when a sample was
tested multiple times. For all statistical tests *, **, ***, ****, or #, ##, ###, ####, p < 0.05, 0.01,
0.001, and 0.0001, respectively.
119
CHAPTER THREE
GENERATION AND VALIDATION OF THE EXTRACELLULAR VESICLE MULTIPLEX
ANALYSIS OF CO-LOCALIZATION (EV-MAC) WORKFLOW
Rationale
The ability to diagnose neurodegenerative diseases before they physically manifest could
reverse or significantly reduce disease progression with proper pharmacological intervention. At
the forefront of biomarker candidates are secreted proteins. Mechanistically, the release of
proteins that undergo unconventional protein secretion in response to underlying cellular
pathology such as dysfunctional protein degradation could offer valuable insight into the
underlying health of an individual. Unsurprising, evaluating secreted pathological proteins such
as misfolded α-syn is one such considered way. However, because red blood cells also express α-
syn, discerning differences between α-syn from plasma can be challenging and collecting CSF is
painful, intrusive, and requires considerably more training than plasma. Thus, the ability to
measure biomarkers in other fluids is desirable. To this end, changes in other proteins such as
those released in EVs have the potential to be early diagnostic biomarkers.
Cells release populations of EVs of various sizes which contain a multitude of cargoes
including RNA, proteins, and lipids [178, 457, 487]. While EVs were once thought to be
relegated strictly to the task of shedding unwanted cellular waste, it is now appreciated that EVs
play an integral role in cell-to-cell communication [308] and that all cell types produce EVs
under both healthy and pathological cellular states [545]. As a result, understanding mechanisms
associated with the transport and characterization of EVs has become an increasingly important.
120
In particular, by identifying specific EV cargoes under pathological conditions, EVs have
the potential to be excellent biomarkers to assist in earlier detection and diagnosis of a variety of
diseases [456, 529].
The most often cited subtypes of EVs are exosomes, microvesicles, and apoptotic bodies,
which are derived from distinct mechanisms and sub-cellular compartments. As a result, the
different EV subtypes are characterized based on their size, protein composition and origin [178,
260, 536, 537]. Exosomes are typically appreciated to range between 30 and 150 nm in diameter
and originate as intraluminal vesicles (ILVs) formed within multivesicular bodies (MVBs) [178,
260, 536, 537]. The process of secretory autophagy leads to the release of an EV population
similar to exosomes, which is known to be upregulated by lysosomal dysfunction [203, 349, 517,
541]. In comparison, microvesicles have a more dynamic size range (i.e. 20-1000 nm in
diameter) and bud directly from the plasma-membrane, while apoptotic bodies are much larger
(>1000 nm) in diameter and originate from dying cells [178, 260, 536, 537]. In addition to size,
researchers often validate the isolation of exosomes or EVs by demonstrating the presence of
specific cellular proteins, including the tetraspanins CD9, CD63, and CD81 [61, 260, 487, 490,
495].
Experimentally, EV populations are typically isolated and separated from cell debris via a
series of centrifugation steps [256, 495]. Other commonly employed isolation methods include
filtration and purification based on highly enriched EV markers. These isolated EVs can then be
used for a variety of assays, such as western blots, ELISAs, or mass spectrometry to measure
protein composition. Utilizing these techniques and defining EVs by these previously stated
criterion has led to an impressive advancement in understanding the differences in EV
composition and their potential impact on neighboring cells [177]. However, there is also
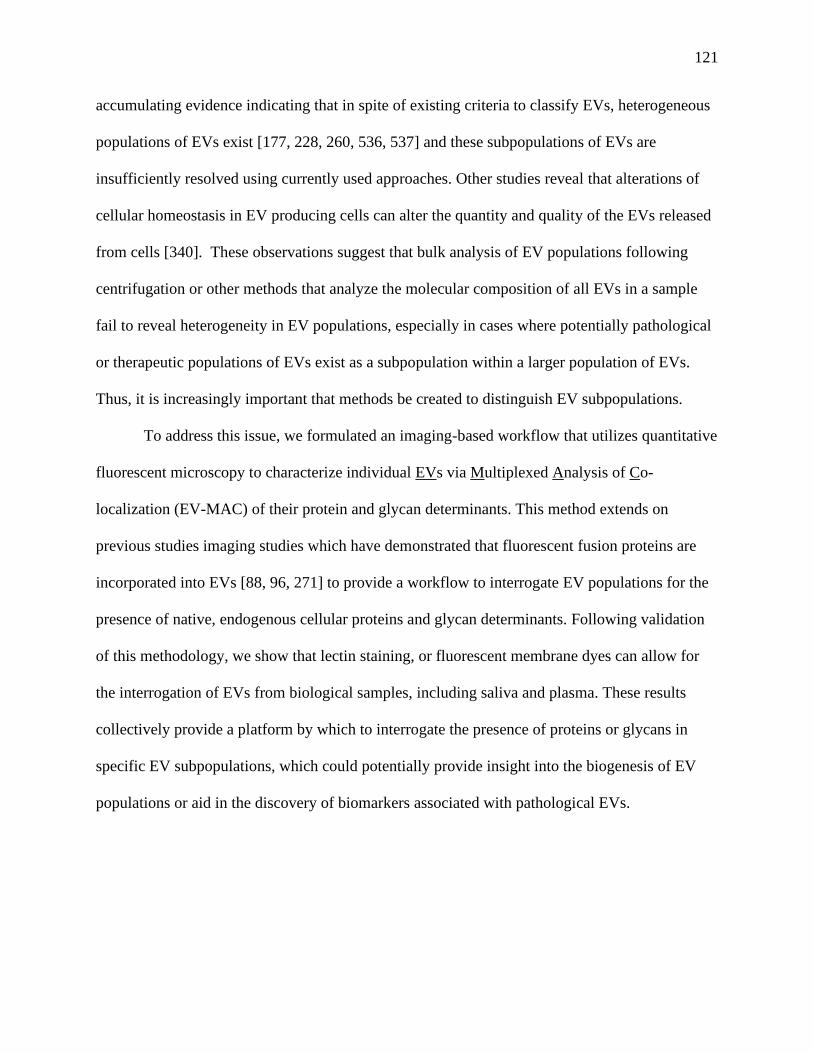
121
accumulating evidence indicating that in spite of existing criteria to classify EVs, heterogeneous
populations of EVs exist [177, 228, 260, 536, 537] and these subpopulations of EVs are
insufficiently resolved using currently used approaches. Other studies reveal that alterations of
cellular homeostasis in EV producing cells can alter the quantity and quality of the EVs released
from cells [340]. These observations suggest that bulk analysis of EV populations following
centrifugation or other methods that analyze the molecular composition of all EVs in a sample
fail to reveal heterogeneity in EV populations, especially in cases where potentially pathological
or therapeutic populations of EVs exist as a subpopulation within a larger population of EVs.
Thus, it is increasingly important that methods be created to distinguish EV subpopulations.
To address this issue, we formulated an imaging-based workflow that utilizes quantitative
fluorescent microscopy to characterize individual EVs via Multiplexed Analysis of Co-
localization (EV-MAC) of their protein and glycan determinants. This method extends on
previous studies imaging studies which have demonstrated that fluorescent fusion proteins are
incorporated into EVs [88, 96, 271] to provide a workflow to interrogate EV populations for the
presence of native, endogenous cellular proteins and glycan determinants. Following validation
of this methodology, we show that lectin staining, or fluorescent membrane dyes can allow for
the interrogation of EVs from biological samples, including saliva and plasma. These results
collectively provide a platform by which to interrogate the presence of proteins or glycans in
specific EV subpopulations, which could potentially provide insight into the biogenesis of EV
populations or aid in the discovery of biomarkers associated with pathological EVs.
122
Results.
Generation of S15-mCherry Positive EVs for the Characterization of Immunofluorescence
Analysis.
In order to allow EVs secreted from cultured cells to be visualized, we transduced HEK
293T cells to express a S15-mCherry construct (S15Ch). The S15Ch construct contains the 15 N-
terminal amino acids of c-SRC appended to the N-terminal of the mCherry fluorescent protein. It
has previously been shown that these 15 amino acids are necessary and sufficient for the addition
of the myristoyl lipid anchor on the N-terminal glycine of c-SRC, leading to its plasma
membrane localization [60, 411]. In experiments in which this construct was used to label HIV-1
viral particles [60, 411], we also observed that this construct is incorporated into EVs which lack
HIV-1 p24 and is released from cells constitutively and independently of virus production [60],
similar to the manner in which a palmitoylated fluorescent protein is incorporated into EV
populations when expressed in cells [271]. To verify that this construct was incorporated into
EVs, we collected culture supernatant from 293T cells expressing S15Ch following transient
transfection and isolated EVs by differential ultracentrifugation. The S15Ch construct was
observed within the ultracentrifuged EV fraction, which also contained the canonical exosomal
proteins, CD9, CD63, and CD81 (Fig. 5A). To determine if the S15Ch protein was associated
with EV membranes, we also added 0.1% SDS to cultured medium prior to ultracentrifugation.
The addition of SDS, which causes disruption of lipid membranes, eliminated the presence of
S15Ch recovered following ultracentrifugation (Fig. 5A), demonstrating that S15Ch is
incorporated into EVs. Transmission electron microscopy of EVs isolated by ultracentrifugation
revealed lipid enclosed structures between 30 and 150 nm in diameter and were positive for
CD63 and CD81 (Fig. 5B), consistent with what is reported for EVs [178, 260, 536, 537].
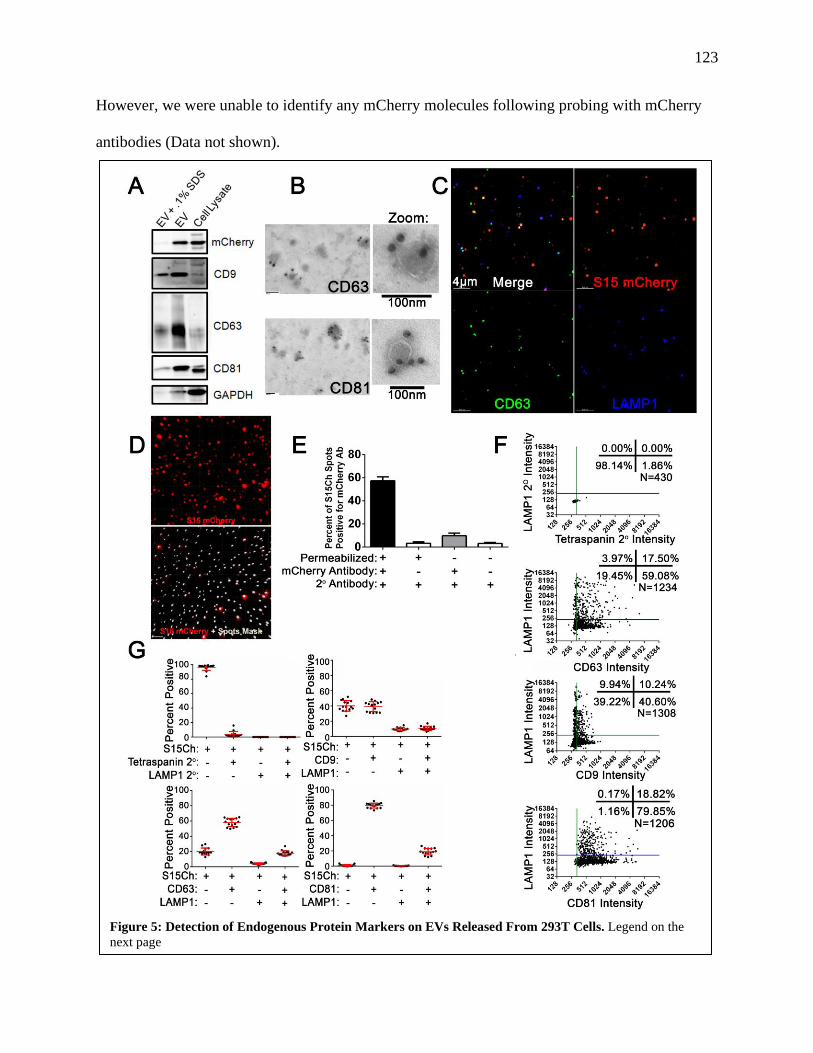
123
However, we were unable to identify any mCherry molecules following probing with mCherry
antibodies (Data not shown).
Figure 5: Detection of Endogenous Protein Markers on EVs Released From 293T Cells. Legend on the
next page
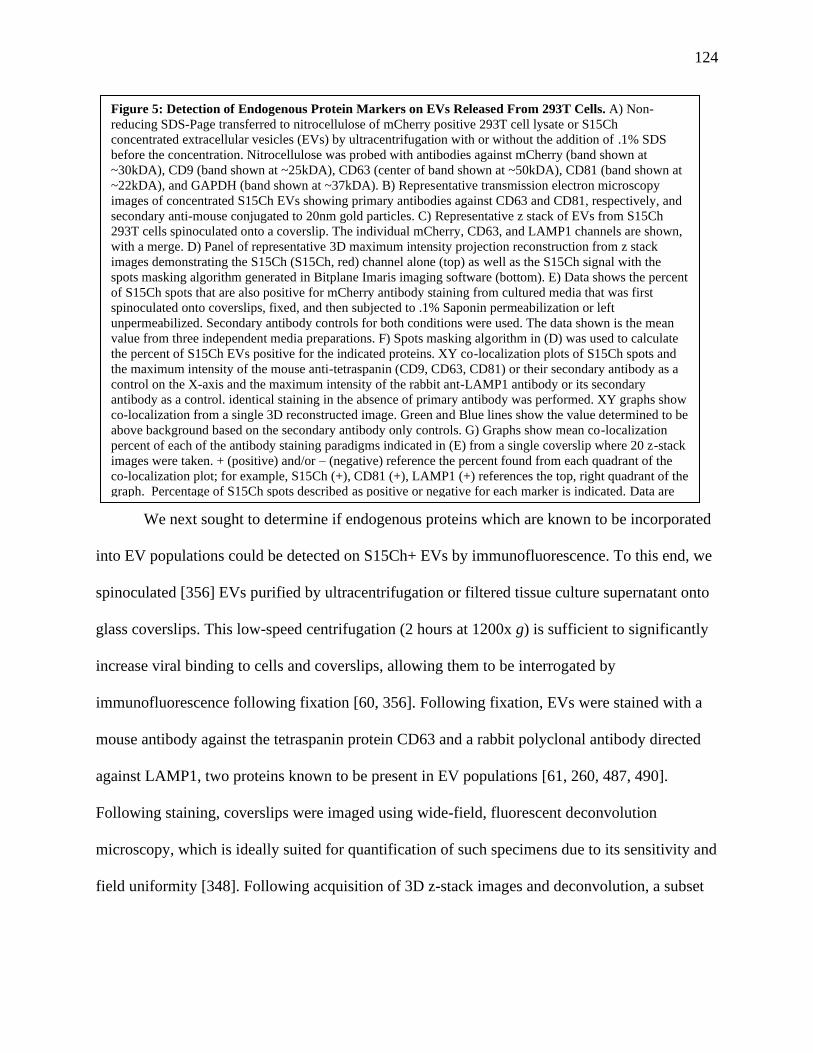
124
We next sought to determine if endogenous proteins which are known to be incorporated
into EV populations could be detected on S15Ch+ EVs by immunofluorescence. To this end, we
spinoculated [356] EVs purified by ultracentrifugation or filtered tissue culture supernatant onto
glass coverslips. This low-speed centrifugation (2 hours at 1200x g) is sufficient to significantly
increase viral binding to cells and coverslips, allowing them to be interrogated by
immunofluorescence following fixation [60, 356]. Following fixation, EVs were stained with a
mouse antibody against the tetraspanin protein CD63 and a rabbit polyclonal antibody directed
against LAMP1, two proteins known to be present in EV populations [61, 260, 487, 490].
Following staining, coverslips were imaged using wide-field, fluorescent deconvolution
microscopy, which is ideally suited for quantification of such specimens due to its sensitivity and
field uniformity [348]. Following acquisition of 3D z-stack images and deconvolution, a subset
Figure 5: Detection of Endogenous Protein Markers on EVs Released From 293T Cells. A) Non-
reducing SDS-Page transferred to nitrocellulose of mCherry positive 293T cell lysate or S15Ch
concentrated extracellular vesicles (EVs) by ultracentrifugation with or without the addition of .1% SDS
before the concentration. Nitrocellulose was probed with antibodies against mCherry (band shown at
~30kDA), CD9 (band shown at ~25kDA), CD63 (center of band shown at ~50kDA), CD81 (band shown at
~22kDA), and GAPDH (band shown at ~37kDA). B) Representative transmission electron microscopy
images of concentrated S15Ch EVs showing primary antibodies against CD63 and CD81, respectively, and
secondary anti-mouse conjugated to 20nm gold particles. C) Representative z stack of EVs from S15Ch
293T cells spinoculated onto a coverslip. The individual mCherry, CD63, and LAMP1 channels are shown,
with a merge. D) Panel of representative 3D maximum intensity projection reconstruction from z stack
images demonstrating the S15Ch (S15Ch, red) channel alone (top) as well as the S15Ch signal with the
spots masking algorithm generated in Bitplane Imaris imaging software (bottom). E) Data shows the percent
of S15Ch spots that are also positive for mCherry antibody staining from cultured media that was first
spinoculated onto coverslips, fixed, and then subjected to .1% Saponin permeabilization or left
unpermeabilized. Secondary antibody controls for both conditions were used. The data shown is the mean
value from three independent media preparations. F) Spots masking algorithm in (D) was used to calculate
the percent of S15Ch EVs positive for the indicated proteins. XY co-localization plots of S15Ch spots and
the maximum intensity of the mouse anti-tetraspanin (CD9, CD63, CD81) or their secondary antibody as a
control on the X-axis and the maximum intensity of the rabbit ant-LAMP1 antibody or its secondary
antibody as a control. identical staining in the absence of primary antibody was performed. XY graphs show
co-localization from a single 3D reconstructed image. Green and Blue lines show the value determined to be
above background based on the secondary antibody only controls. G) Graphs show mean co-localization
percent of each of the antibody staining paradigms indicated in (E) from a single coverslip where 20 z-stack
images were taken. + (positive) and/or – (negative) reference the percent found from each quadrant of the
co-localization plot; for example, S15Ch (+), CD81 (+), LAMP1 (+) references the top, right quadrant of the
graph. Percentage of S15Ch spots described as positive or negative for each marker is indicated. Data are
expressed as M ± SD.

125
of S15Ch+ puncta could be observed to co-localize with both markers to some degree (Fig. 5C),
although not all S15Ch+ puncta were positive for CD63 or LAMP1.
Figure 6: EV-MAC Reproducibly Stains EV Populations Following Enrichment from Tissue Culture
Supernatant A) Cultured media containing EVs were either left unconcentrated or concentrated via
differential ultracentrifugation. The EVs were then stained with either CD9, CD63, CD81, in addition to
LAMP1. Data shows the mean value from three independently collected S15Ch 293T media preparations,
where each of the media preparations were split among the four staining paradigms and spun onto a separate
coverslip. 20 images were taken per coverslip. Error bars depict standard error of the mean. No significant
differences were found among each respective staining paradigms among the unconcentrated and
concentrated EVS when subjected to a two-way ANOVA with Tukey’s multiple comparison post-hoc test. B)
Data compares the mean value among three independent coverslips and media preparations for S15 mCherry
co-localization as determined by either “each image measure” or “Pooled images measure. 20 images were
taken per coverslip. All data shown was subjected to two-way ANOVA with Tukey’s multiple comparison
post-hoc and found non-significant. Data are expressed as M ± SE, n = 3.

126
To further validate that the S15Ch signal observed represented intact EVs, we next asked
if antibodies to mCherry could stain mCherry in the absence of detergent. We observed that
labeling S15Ch EVs with -mCherry antibody was detergent dependent, as most of the staining
was eliminated in the absence of detergent (Fig. 5E). These findings are agreement with our
inability to identify mCherry molecules when S15Ch EVs were subjected to immunogold
labeling and suggests the S15Ch label is on the intraluminal side of EVs.
Immunofluorescence Imaging to Characterize EV Populations by Multiplexed Analysis of
Co-localization (EV-MAC).
We next determined if this approach could allow for the reproducible multiplexed
analysis of EV populations based on the markers present on EVs detected by indirect
immunofluorescence. To this end, we stained individual coverslips with mouse antibodies to the
tetraspanins CD63, CD81 and CD9 and a rabbit polyclonal antibody directed against LAMP1.
Following acquisition of 3D z-stack images and deconvolution, software-based algorithms were
generated to identify individual S15Ch+ puncta using defined size and intensity criteria and
create individual 3D masks around these puncta (Fig. 5D). Following manual validation of the
algorithm in a subset of images to ensure that individual puncta were reliably identified, the
algorithm was applied to all images collected and the multiplexed intensity of tetraspanin and
LAMP1 staining present in each S15Ch+ puncta in these images was determined. Secondary
antibody controls were used as a negative control to define the background staining intensity in
each channel and establish threshold intensities above which individual EVs were considered
positive for individual tetraspanins or LAMP1 staining (Fig. 5F). For example, greater than 98%
of the S15Ch+ EVs analyzed exhibited CD81 staining above background, while approximately
50% were positive for CD9 (Fig. 5F). Regardless of the tetraspanin examined in parallel, the

127
amount of LAMP1 signal on these EVs was observed to be consistent, with approximately 20%
of S15Ch+ EVs exhibiting LAMP1 staining above background (Fig. 5F). Multiplex analysis of
EV populations identified by masking events identified in the S15Ch channel revealed
differential staining of tetraspanin markers on these populations when data from individual
images was examined. When data from multiple images were compared as technical replicates,
the percentage of EVs positive for one or both markers was highly reproducible (Fig. 5G). For
comparative purposes, we refer to this type of analysis as “individual image measurement”.
We also observed that pooling data from the entire dataset yielded the same result
obtained when individual images were analyzed as independent technical replicates (Fig. 6A)
hereafter “pooled image measurement”. We found that the mean values obtained via both
methodologies were highly reproducible across multiple independent cultured media and
coverslip preparations, as nearly identical outcomes could be obtained regardless of analysis
approach (Fig. 6A).
We next asked if EV-MAC could detect differences EV populations obtained through
differential centrifugation and those spun directly onto glass from conditioned media. We did not
detect a significant difference in the relative staining of tetraspanins or LAMP1 when S15mCh+
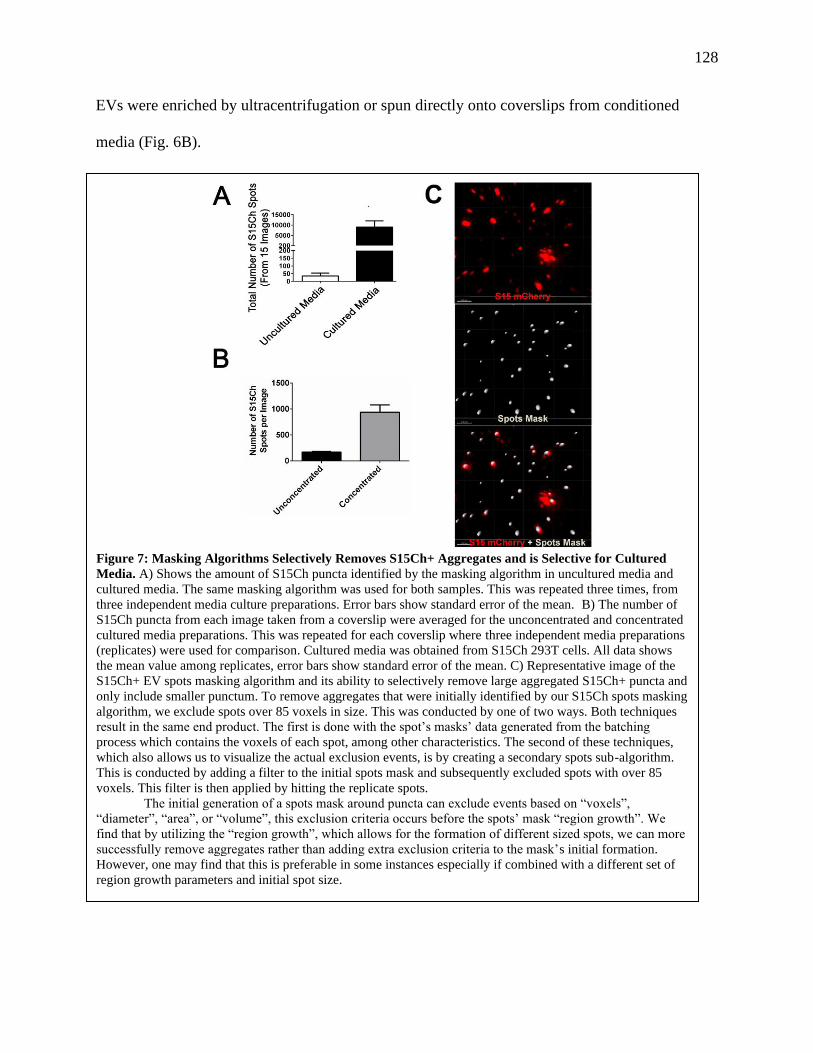
128
EVs were enriched by ultracentrifugation or spun directly onto coverslips from conditioned
media (Fig. 6B).
Figure 7: Masking Algorithms Selectively Removes S15Ch+ Aggregates and is Selective for Cultured
Media. A) Shows the amount of S15Ch puncta identified by the masking algorithm in uncultured media and
cultured media. The same masking algorithm was used for both samples. This was repeated three times, from
three independent media culture preparations. Error bars show standard error of the mean. B) The number of
S15Ch puncta from each image taken from a coverslip were averaged for the unconcentrated and concentrated
cultured media preparations. This was repeated for each coverslip where three independent media preparations
(replicates) were used for comparison. Cultured media was obtained from S15Ch 293T cells. All data shows
the mean value among replicates, error bars show standard error of the mean. C) Representative image of the
S15Ch+ EV spots masking algorithm and its ability to selectively remove large aggregated S15Ch+ puncta and
only include smaller punctum. To remove aggregates that were initially identified by our S15Ch spots masking
algorithm, we exclude spots over 85 voxels in size. This was conducted by one of two ways. Both techniques
result in the same end product. The first is done with the spot’s masks’ data generated from the batching
process which contains the voxels of each spot, among other characteristics. The second of these techniques,
which also allows us to visualize the actual exclusion events, is by creating a secondary spots sub-algorithm.
This is conducted by adding a filter to the initial spots mask and subsequently excluded spots with over 85
voxels. This filter is then applied by hitting the replicate spots.
The initial generation of a spots mask around puncta can exclude events based on “voxels”,
“diameter”, “area”, or “volume”, this exclusion criteria occurs before the spots’ mask “region growth”. We
find that by utilizing the “region growth”, which allows for the formation of different sized spots, we can more
successfully remove aggregates rather than adding extra exclusion criteria to the mask’s initial formation.
However, one may find that this is preferable in some instances especially if combined with a different set of
region growth parameters and initial spot size.

129
As a control, we
performed an identical
analysis on uncultured
media depleted of EVs. In
this situation, virtually all
of the algorithm identified
surfaces were eliminated,
demonstrating that S15Ch
EVs are effectively
identified with minimal
background. (Fig. 7A).
However, we did find that
centrifugation did enrich
the number of S15Ch
puncta present in each
image (Fig. 7B). We also
noted that differential
centrifugation tended to
lead to the appearance of
larger accumulations of
fluorescent signal that
likely represent EVs aggregated during centrifugation. However, these aggregations could be
excluded from the analysis by incorporation of size constraints into the mask algorithm (Fig.
Figure 8: S15Ch EVs Relative Levels of LAMP1 and Tetraspanin
Proteins Determined by Indirect EV ELISA. A) The absorbance of
concentrated S15Ch EVs that were subjected to indirect ELISA as
determined by quenched TMB. Plates were first coated with LAMP1
antibody before EV samples were added. The detection of LAMP1 positive
EVs for either CD9, CD63, or CD81 was determined by the addition of
antibody. The same concentration of antibody was used for each of the
tetraspanin antibodies. For the Control condition, the same PBS used to
resuspend concentrated S15Ch EVs was added to a well coated with
LAMP1 followed by a detection antibody for each of the tetraspanins tested,
respectively. B) Data from (A) was used to compare the relative distribution
of EVs captured by bound LAMP1 antibody and detected by CD9 antibody
to normalize and determine the corresponding abundance in distribution
relative to the captured LAMP1 and detection of either CD63 or CD81.
These relative levels were then compared to the percent of S15Ch+ EVs that
were also double positive for LAMP1 and either CD9, CD63, or CD81 from
concentrated S15Ch+ EVs. The data shown is the mean value from three
independent media preparations (replicates). Data was found non-significant
by one-way ANOVA. Data are expressed as M ± SE (n = 3).
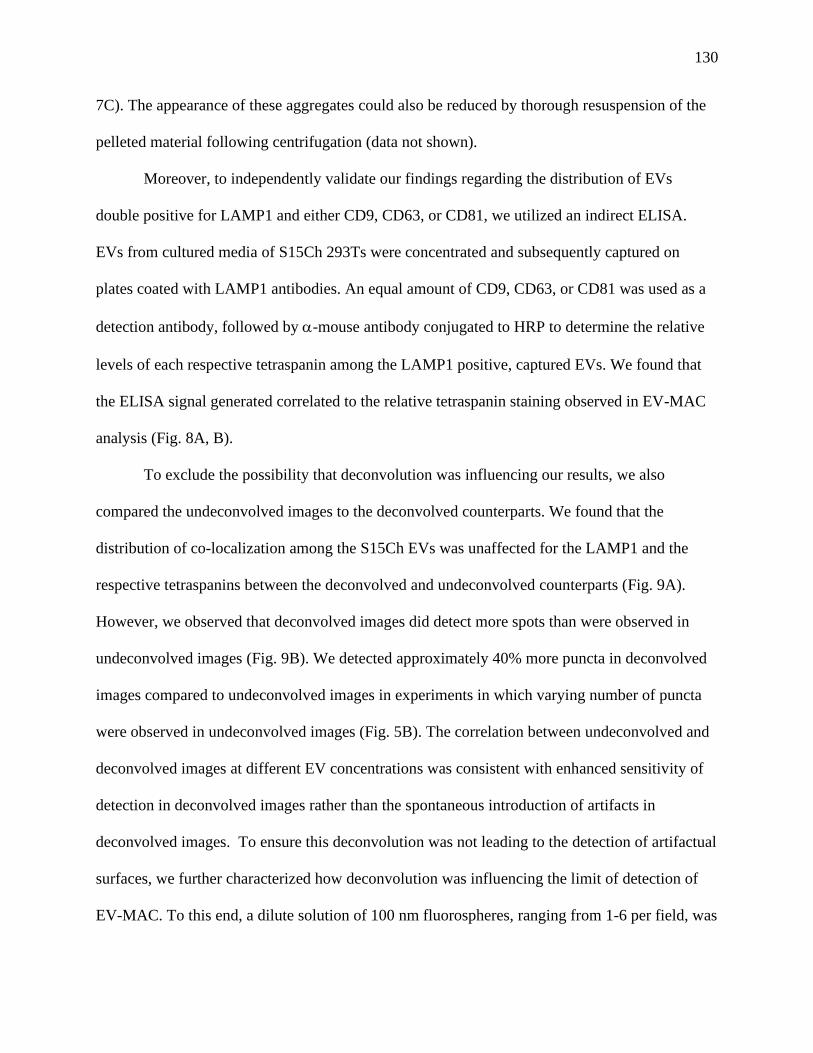
130
7C). The appearance of these aggregates could also be reduced by thorough resuspension of the
pelleted material following centrifugation (data not shown).
Moreover, to independently validate our findings regarding the distribution of EVs
double positive for LAMP1 and either CD9, CD63, or CD81, we utilized an indirect ELISA.
EVs from cultured media of S15Ch 293Ts were concentrated and subsequently captured on
plates coated with LAMP1 antibodies. An equal amount of CD9, CD63, or CD81 was used as a
detection antibody, followed by -mouse antibody conjugated to HRP to determine the relative
levels of each respective tetraspanin among the LAMP1 positive, captured EVs. We found that
the ELISA signal generated correlated to the relative tetraspanin staining observed in EV-MAC
analysis (Fig. 8A, B).
To exclude the possibility that deconvolution was influencing our results, we also
compared the undeconvolved images to the deconvolved counterparts. We found that the
distribution of co-localization among the S15Ch EVs was unaffected for the LAMP1 and the
respective tetraspanins between the deconvolved and undeconvolved counterparts (Fig. 9A).
However, we observed that deconvolved images did detect more spots than were observed in
undeconvolved images (Fig. 9B). We detected approximately 40% more puncta in deconvolved
images compared to undeconvolved images in experiments in which varying number of puncta
were observed in undeconvolved images (Fig. 5B). The correlation between undeconvolved and
deconvolved images at different EV concentrations was consistent with enhanced sensitivity of
detection in deconvolved images rather than the spontaneous introduction of artifacts in
deconvolved images. To ensure this deconvolution was not leading to the detection of artifactual
surfaces, we further characterized how deconvolution was influencing the limit of detection of
EV-MAC. To this end, a dilute solution of 100 nm fluorospheres, ranging from 1-6 per field, was
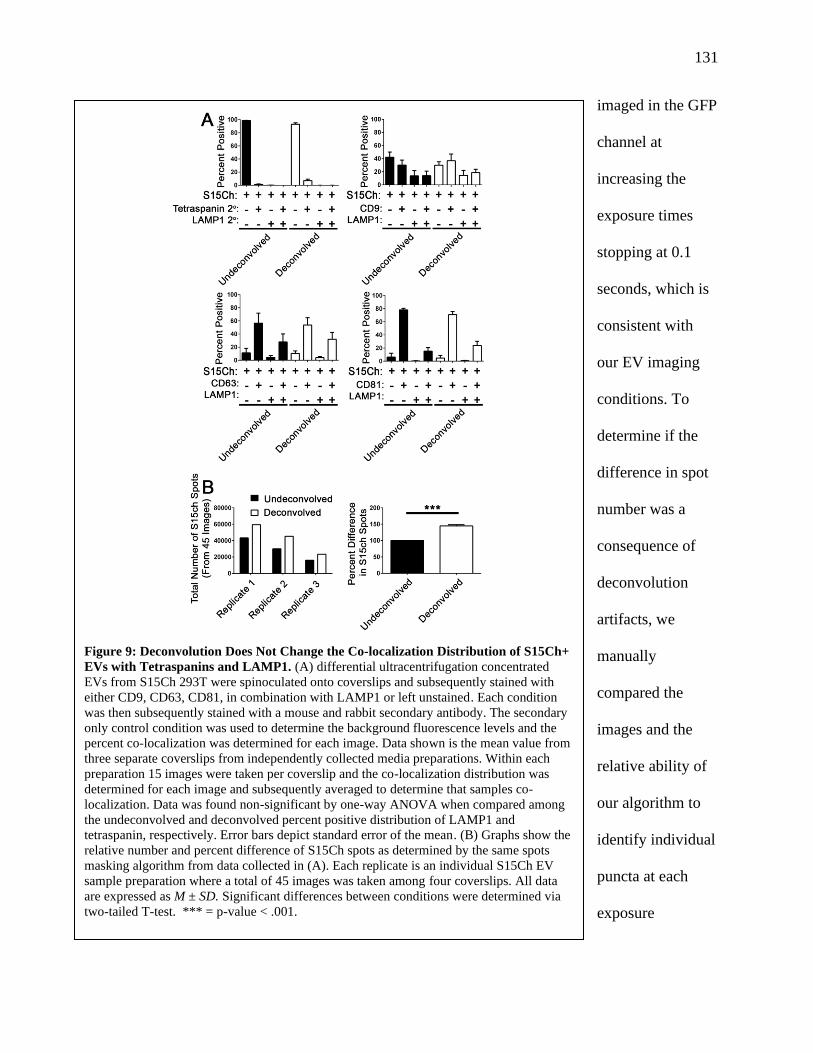
131
imaged in the GFP
channel at
increasing the
exposure times
stopping at 0.1
seconds, which is
consistent with
our EV imaging
conditions. To
determine if the
difference in spot
number was a
consequence of
deconvolution
artifacts, we
manually
compared the
images and the
relative ability of
our algorithm to
identify individual
puncta at each
exposure
Figure 9: Deconvolution Does Not Change the Co-localization Distribution of S15Ch+
EVs with Tetraspanins and LAMP1. (A) differential ultracentrifugation concentrated
EVs from S15Ch 293T were spinoculated onto coverslips and subsequently stained with
either CD9, CD63, CD81, in combination with LAMP1 or left unstained. Each condition
was then subsequently stained with a mouse and rabbit secondary antibody. The secondary
only control condition was used to determine the background fluorescence levels and the
percent co-localization was determined for each image. Data shown is the mean value from
three separate coverslips from independently collected media preparations. Within each
preparation 15 images were taken per coverslip and the co-localization distribution was
determined for each image and subsequently averaged to determine that samples co-
localization. Data was found non-significant by one-way ANOVA when compared among
the undeconvolved and deconvolved percent positive distribution of LAMP1 and
tetraspanin, respectively. Error bars depict standard error of the mean. (B) Graphs show the
relative number and percent difference of S15Ch spots as determined by the same spots
masking algorithm from data collected in (A). Each replicate is an individual S15Ch EV
sample preparation where a total of 45 images was taken among four coverslips. All data
are expressed as M ± SD. Significant differences between conditions were determined via
two-tailed T-test. *** = p-value < .001.
132
condition. Our algorithm did not detect puncta in deconvolved images that were not identifiable
in undeconvolved images at longer exposure conditions, as the number of puncta detected in
deconvolved images
plateaued and was
eventually matched in
undeconvolved images at
longer exposure times
(Fig. 10A). This is
consistent with the ability
of constrained iterative
deconvolution to restore
signal emanating from
out of focus planes to
their correct focal origin,
thus enhancing signal to
noise [348]. Collectively,
the deconvolved images
had a ~4.26-fold increase
in signal compared to
their undeconvolved counterpart, suggesting the differences in spot number were the result of
increased signal-to-noise (Fig. 10B). To determine if these results were comparable under
conditions that better simulate the number of EVs imaged in a representative field in our
experiments, we used the same experimental paradigm for two separate coverslips with more
Figure 10: Deconvolution Increases the Limit of Detection of Spots
Masking Algorithm: (A) Two Representative examples of undeconvolved
and deconvolved 3D reconstructed Max Intensity Projections (MIPs) of
100nm tetraspecks at increasing exposure times and our Imaris spot
algorithm’s ability to recognize their signal. Algorithm’s ability to detect
signal is based on center fluorescence intensity in contrast to local background
intensity. A total of 12 images were initially compared. (B) Comparative
center intensity of Tetraspeck spots from undeconvolved and deconvolved the
same 3D MIPs at .1 seconds exposure time. Data demonstrates that the spot’s
algorithm identified tetraspecks in the deconvolved images have a greater
center intensity than the undeconvolved. Data pooled from 15 images and
Error bars show standard deviation. (C) Spot’s algorithm’s ability to detect
larger concentrations of 100nm Tetraspecks signal from undeconvolved and
deconvolved images demonstrate similar limitations of sensitivity to dilute
levels. 15 images were captured from a single coverslip, data are expressed as
M ± SD (n = 3).

133
concentrated fluorospheres. Using the same masking algorithm, we determined the number of
spots recognized for each image and compared that to the exposure time for the undeconvolved
and deconvolved images (Fig. 10C). These conditions recapitulated the results obtained at lower
bead concentration, where the number of puncta identified in deconvolved images plateaued at a
lower exposure time while the number of puncta identified in undeconvolved images approaches
the number of puncta identified in deconvolved images at longer exposure times. This suggests
that despite a decreased ability to identify signal, EV-MAC can be utilized on both
undeconvolved and deconvolved 3D reconstructed images, while deconvolution enhances the
sensitivity of detection of EVs at lower exposure times.
The Majority of EVs in Solution are Bound to Coverslips Following Spinoculation.
We next determined the fraction of EVs bound to coverslips by spinoculation. To
understand the fraction of EVs bound to coverslips by spinnoculation, we examined EV binding
using both untreated and poly-L-lysine (PLL) treated coverslips. PLL treatment significantly
increased the amount S15Ch observed (Fig. 11A). When supernatants were spinoculated onto
two coverslips in sequential spinoculations, we observed a reduction in the number of S15Ch+
puncta in the second spinoculation onto both uncoated and PLL coverslips (Fig. 11B). This was
mirrored by a reduction in the protein concentration in these samples measured before and after
spinoculation (Fig. 11C). The similar protein loss in each sample suggests that the increased
number of puncta observed in PLL treated coverslips is due to better retention of EVs on PLL
coverlips during the staining procedure rather than increased binding of EVs during
spinnoculation. No significant differences were observed when S15Ch+ EVs were stained for
CD81 and LAMP1 following spinnoculation onto untreated or PLL treated coverslips (Fig. 11D).
Furthermore, we observed no significant differences in marker co-localization in serial
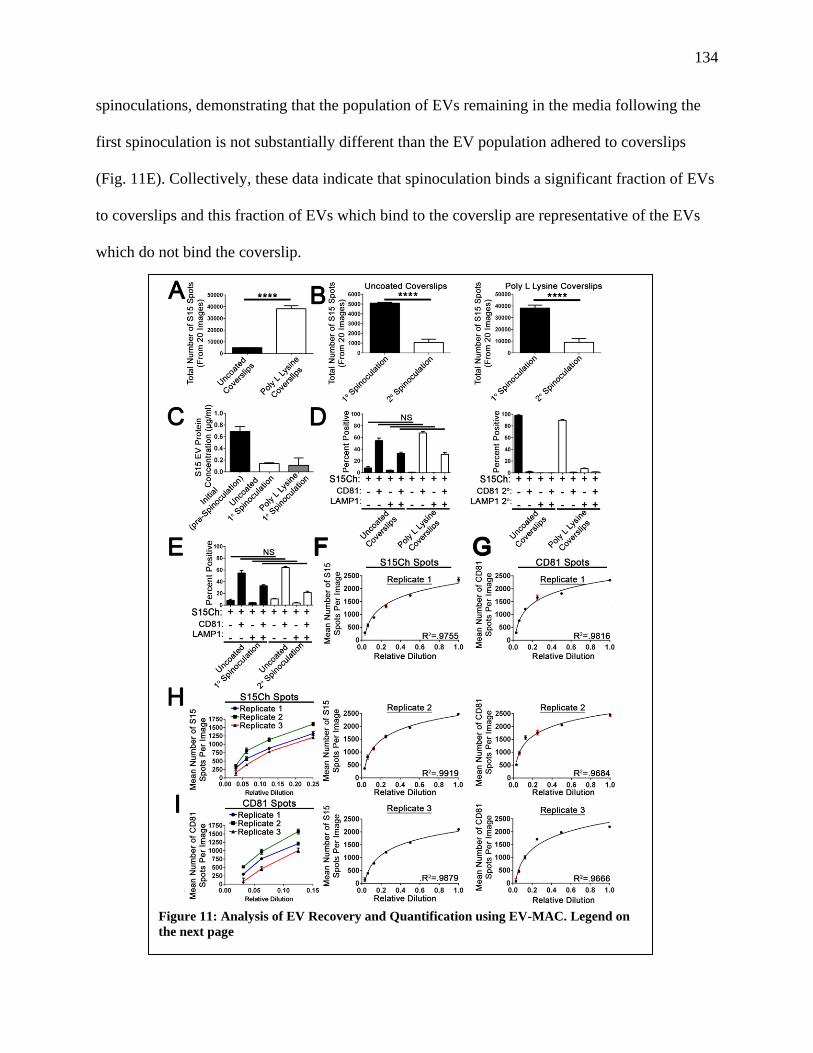
134
spinoculations, demonstrating that the population of EVs remaining in the media following the
first spinoculation is not substantially different than the EV population adhered to coverslips
(Fig. 11E). Collectively, these data indicate that spinoculation binds a significant fraction of EVs
to coverslips and this fraction of EVs which bind to the coverslip are representative of the EVs
which do not bind the coverslip.
Figure 11: Analysis of EV Recovery and Quantification using EV-MAC. Legend on
the next page
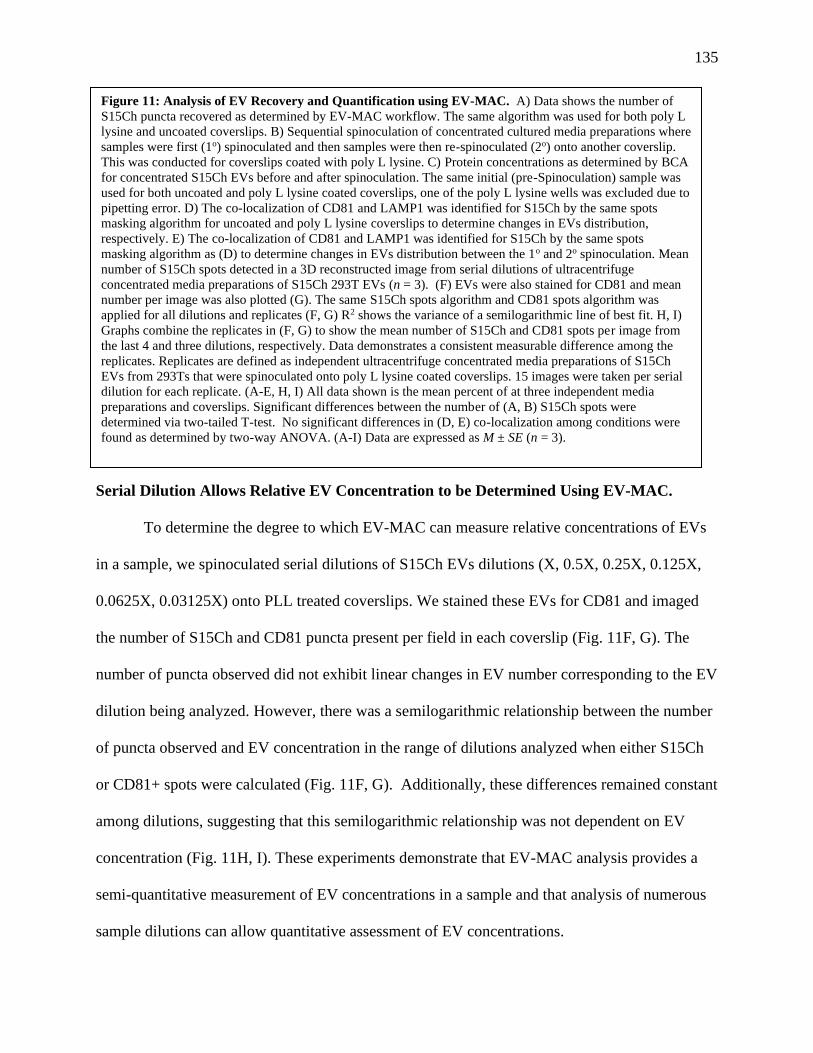
135
Serial Dilution Allows Relative EV Concentration to be Determined Using EV-MAC.
To determine the degree to which EV-MAC can measure relative concentrations of EVs
in a sample, we spinoculated serial dilutions of S15Ch EVs dilutions (X, 0.5X, 0.25X, 0.125X,
0.0625X, 0.03125X) onto PLL treated coverslips. We stained these EVs for CD81 and imaged
the number of S15Ch and CD81 puncta present per field in each coverslip (Fig. 11F, G). The
number of puncta observed did not exhibit linear changes in EV number corresponding to the EV
dilution being analyzed. However, there was a semilogarithmic relationship between the number
of puncta observed and EV concentration in the range of dilutions analyzed when either S15Ch
or CD81+ spots were calculated (Fig. 11F, G). Additionally, these differences remained constant
among dilutions, suggesting that this semilogarithmic relationship was not dependent on EV
concentration (Fig. 11H, I). These experiments demonstrate that EV-MAC analysis provides a
semi-quantitative measurement of EV concentrations in a sample and that analysis of numerous
sample dilutions can allow quantitative assessment of EV concentrations.
Figure 11: Analysis of EV Recovery and Quantification using EV-MAC. A) Data shows the number of
S15Ch puncta recovered as determined by EV-MAC workflow. The same algorithm was used for both poly L
lysine and uncoated coverslips. B) Sequential spinoculation of concentrated cultured media preparations where
samples were first (1o) spinoculated and then samples were then re-spinoculated (2o) onto another coverslip.
This was conducted for coverslips coated with poly L lysine. C) Protein concentrations as determined by BCA
for concentrated S15Ch EVs before and after spinoculation. The same initial (pre-Spinoculation) sample was
used for both uncoated and poly L lysine coated coverslips, one of the poly L lysine wells was excluded due to
pipetting error. D) The co-localization of CD81 and LAMP1 was identified for S15Ch by the same spots
masking algorithm for uncoated and poly L lysine coverslips to determine changes in EVs distribution,
respectively. E) The co-localization of CD81 and LAMP1 was identified for S15Ch by the same spots
masking algorithm as (D) to determine changes in EVs distribution between the 1o and 2o spinoculation. Mean
number of S15Ch spots detected in a 3D reconstructed image from serial dilutions of ultracentrifuge
concentrated media preparations of S15Ch 293T EVs (n = 3). (F) EVs were also stained for CD81 and mean
number per image was also plotted (G). The same S15Ch spots algorithm and CD81 spots algorithm was
applied for all dilutions and replicates (F, G) R2 shows the variance of a semilogarithmic line of best fit. H, I)
Graphs combine the replicates in (F, G) to show the mean number of S15Ch and CD81 spots per image from
the last 4 and three dilutions, respectively. Data demonstrates a consistent measurable difference among the
replicates. Replicates are defined as independent ultracentrifuge concentrated media preparations of S15Ch
EVs from 293Ts that were spinoculated onto poly L lysine coated coverslips. 15 images were taken per serial
dilution for each replicate. (A-E, H, I) All data shown is the mean percent of at three independent media
preparations and coverslips. Significant differences between the number of (A, B) S15Ch spots were
determined via two-tailed T-test. No significant differences in (D, E) co-localization among conditions were
found as determined by two-way ANOVA. (A-I) Data are expressed as M ± SE (n = 3).

136
PKH Dye Can Be Used in Conjunction with EV-MAC to Identify EVs.
To move towards the ability to utilize EV-MAC to analyze EV populations lacking
fluorescently labelled proteins produced in tissue culture, we next sought to utilize PKH
fluorescent dyes to label EV populations. We collected and concentrated EVs from 293T cells
labelled EVs by incubation with PKH26 dye at concentrations of 200nM or 400nM. We
subsequently removed excess dye by ultracentrifugation through a sucrose cushion. Afterwards,
the resuspended EVs were subjected to our EV-MAC workflow and their co-localization with
CD81 and LAMP1 was determined (Fig. 12A, 12B, 12C). We found that both concentrations of
dye yielded similar co-localization with CD81 and LAMP1 markers (Fig. 12D, 12E). When
PKH67 was used to label S15Ch+ EVs produced from 293T cells, we observed that
approximately half of the PKH67+ puncta were positive for S15Ch (Fig. 12F), suggesting that
S15Ch labels a subset of EVs produced from 293T cells following transient transfection. To
estimate the effectiveness of EV labelling, we asked what percentage of S15Ch surfaces were
labeled with PKH67, finding that nearly 100% of S15Ch+ EVs were labelled with PKH67 (Fig.
12G). These data demonstrate that the fluorescent membrane dye PKH67 can be used to reliably
label EVs for EV-MAC analysis.
EV-MAC Can Be Used to Interrogate Human Biological Samples.
We next sought to apply EV-MAC to the analysis of biological samples. To this end, we
labelled EVs from saliva and plasma using either PKH67 or the lectin WGA, using signals from
these labels to create masks for subsequent analysis of CD63 and LAMP1 association (Fig. 13A-
D). After validating this method with EVs collected from cell culture supernatants, we asked if
our technique could be used to characterize EVs found in human bodily fluid samples. Samples
of saliva and plasma were paneled with combinations of the lectin Wheat Germ agglutinin
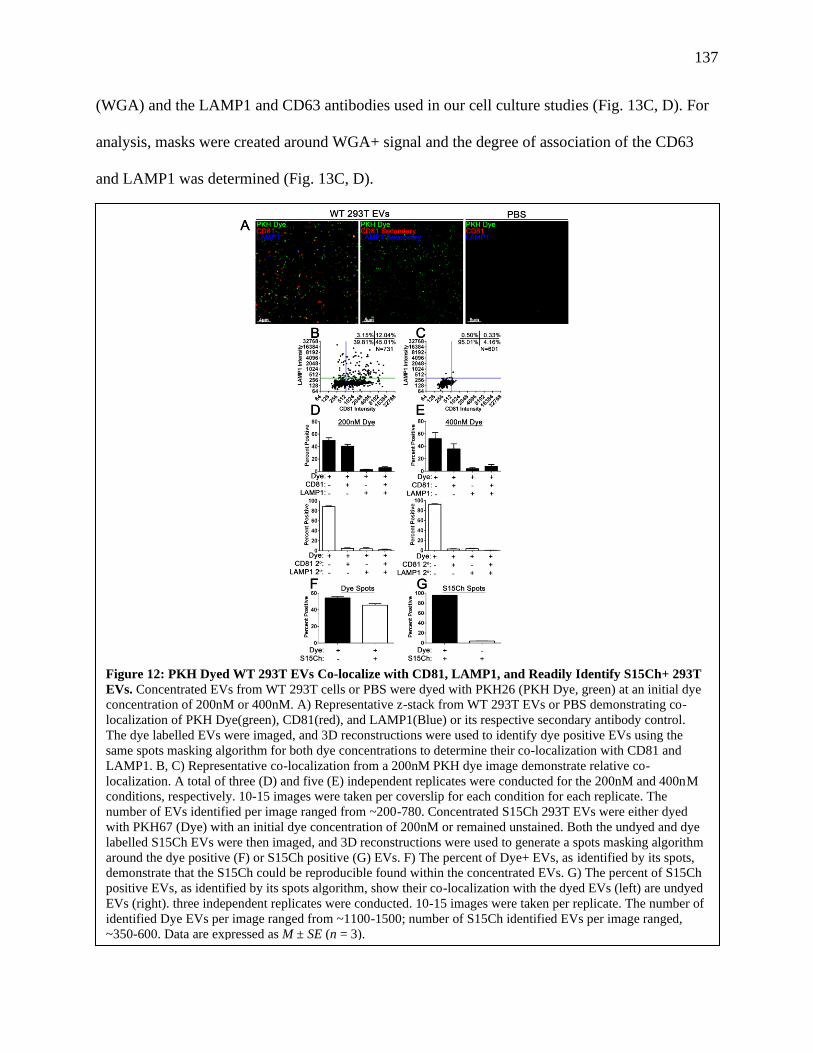
137
(WGA) and the LAMP1 and CD63 antibodies used in our cell culture studies (Fig. 13C, D). For
analysis, masks were created around WGA+ signal and the degree of association of the CD63
and LAMP1 was determined (Fig. 13C, D).
Figure 12: PKH Dyed WT 293T EVs Co-localize with CD81, LAMP1, and Readily Identify S15Ch+ 293T
EVs. Concentrated EVs from WT 293T cells or PBS were dyed with PKH26 (PKH Dye, green) at an initial dye
concentration of 200nM or 400nM. A) Representative z-stack from WT 293T EVs or PBS demonstrating co-
localization of PKH Dye(green), CD81(red), and LAMP1(Blue) or its respective secondary antibody control.
The dye labelled EVs were imaged, and 3D reconstructions were used to identify dye positive EVs using the
same spots masking algorithm for both dye concentrations to determine their co-localization with CD81 and
LAMP1. B, C) Representative co-localization from a 200nM PKH dye image demonstrate relative co-
localization. A total of three (D) and five (E) independent replicates were conducted for the 200nM and 400nM
conditions, respectively. 10-15 images were taken per coverslip for each condition for each replicate. The
number of EVs identified per image ranged from ~200-780. Concentrated S15Ch 293T EVs were either dyed
with PKH67 (Dye) with an initial dye concentration of 200nM or remained unstained. Both the undyed and dye
labelled S15Ch EVs were then imaged, and 3D reconstructions were used to generate a spots masking algorithm
around the dye positive (F) or S15Ch positive (G) EVs. F) The percent of Dye+ EVs, as identified by its spots,
demonstrate that the S15Ch could be reproducible found within the concentrated EVs. G) The percent of S15Ch
positive EVs, as identified by its spots algorithm, show their co-localization with the dyed EVs (left) are undyed
EVs (right). three independent replicates were conducted. 10-15 images were taken per replicate. The number of
identified Dye EVs per image ranged from ~1100-1500; number of S15Ch identified EVs per image ranged,
~350-600. Data are expressed as M ± SE (n = 3).
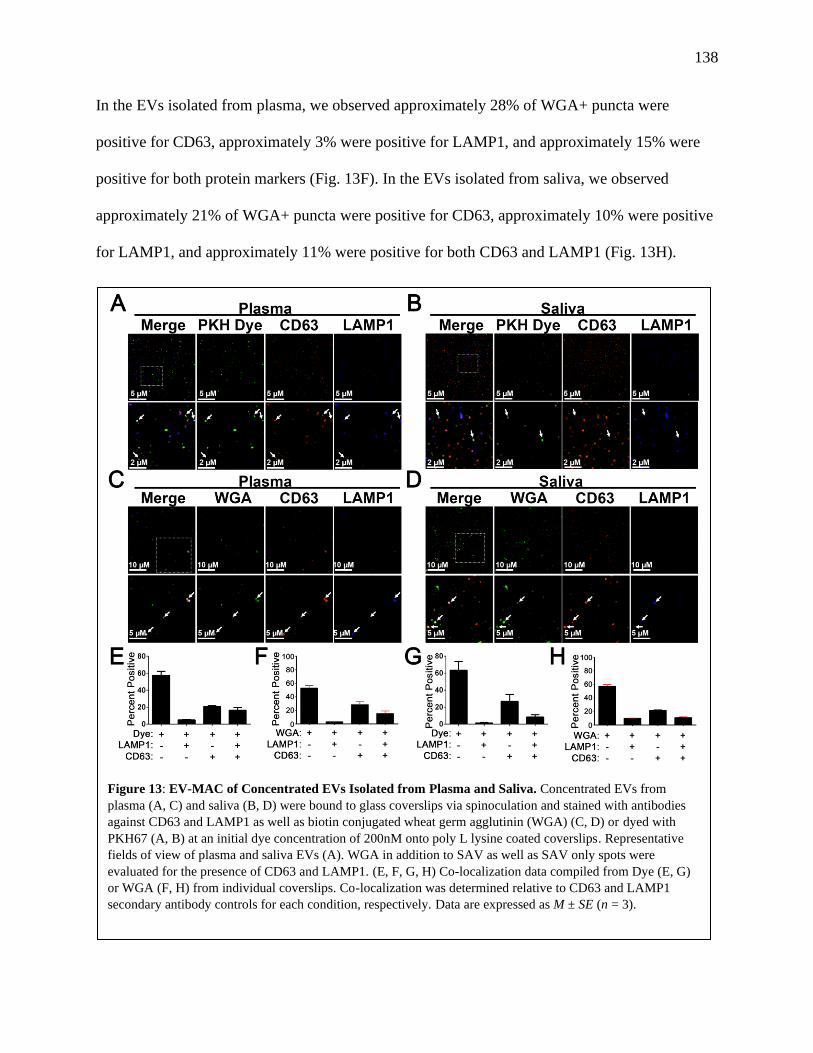
138
In the EVs isolated from plasma, we observed approximately 28% of WGA+ puncta were
positive for CD63, approximately 3% were positive for LAMP1, and approximately 15% were
positive for both protein markers (Fig. 13F). In the EVs isolated from saliva, we observed
approximately 21% of WGA+ puncta were positive for CD63, approximately 10% were positive
for LAMP1, and approximately 11% were positive for both CD63 and LAMP1 (Fig. 13H).
Figure 13: EV-MAC of Concentrated EVs Isolated from Plasma and Saliva. Concentrated EVs from
plasma (A, C) and saliva (B, D) were bound to glass coverslips via spinoculation and stained with antibodies
against CD63 and LAMP1 as well as biotin conjugated wheat germ agglutinin (WGA) (C, D) or dyed with
PKH67 (A, B) at an initial dye concentration of 200nM onto poly L lysine coated coverslips. Representative
fields of view of plasma and saliva EVs (A). WGA in addition to SAV as well as SAV only spots were
evaluated for the presence of CD63 and LAMP1. (E, F, G, H) Co-localization data compiled from Dye (E, G)
or WGA (F, H) from individual coverslips. Co-localization was determined relative to CD63 and LAMP1
secondary antibody controls for each condition, respectively. Data are expressed as M ± SE (n = 3).
.
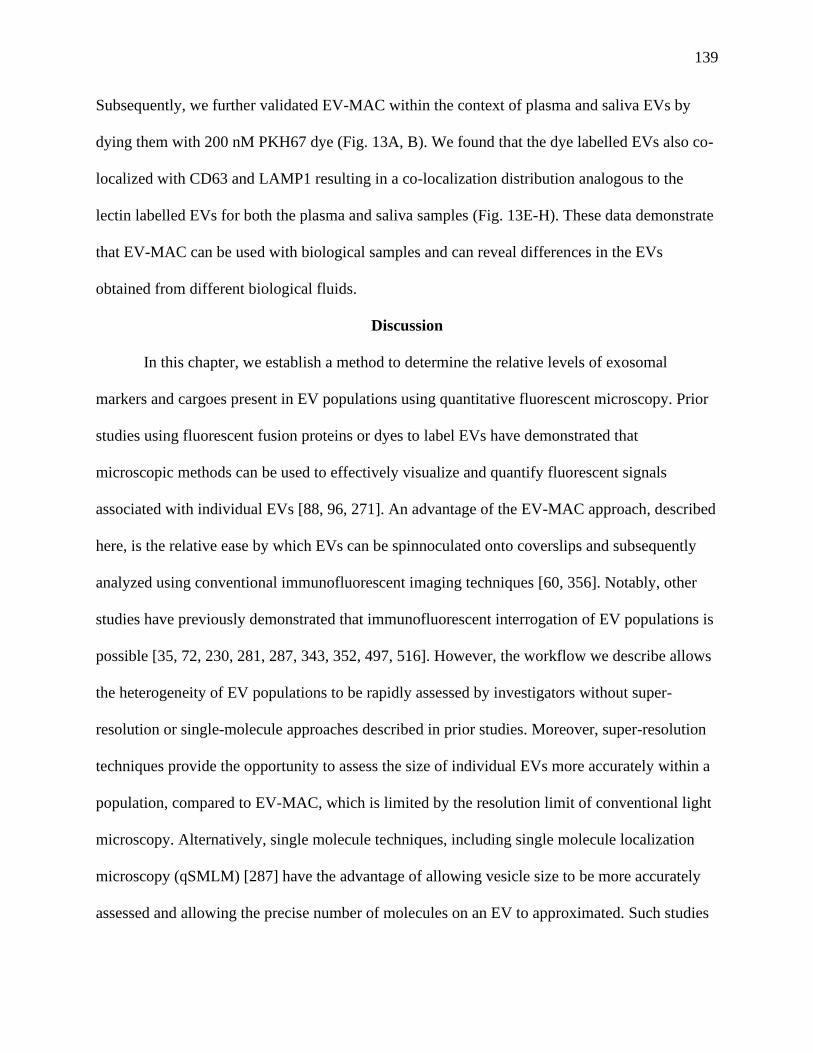
139
Subsequently, we further validated EV-MAC within the context of plasma and saliva EVs by
dying them with 200 nM PKH67 dye (Fig. 13A, B). We found that the dye labelled EVs also co-
localized with CD63 and LAMP1 resulting in a co-localization distribution analogous to the
lectin labelled EVs for both the plasma and saliva samples (Fig. 13E-H). These data demonstrate
that EV-MAC can be used with biological samples and can reveal differences in the EVs
obtained from different biological fluids.
Discussion
In this chapter, we establish a method to determine the relative levels of exosomal
markers and cargoes present in EV populations using quantitative fluorescent microscopy. Prior
studies using fluorescent fusion proteins or dyes to label EVs have demonstrated that
microscopic methods can be used to effectively visualize and quantify fluorescent signals
associated with individual EVs [88, 96, 271]. An advantage of the EV-MAC approach, described
here, is the relative ease by which EVs can be spinnoculated onto coverslips and subsequently
analyzed using conventional immunofluorescent imaging techniques [60, 356]. Notably, other
studies have previously demonstrated that immunofluorescent interrogation of EV populations is
possible [35, 72, 230, 281, 287, 343, 352, 497, 516]. However, the workflow we describe allows
the heterogeneity of EV populations to be rapidly assessed by investigators without super-
resolution or single-molecule approaches described in prior studies. Moreover, super-resolution
techniques provide the opportunity to assess the size of individual EVs more accurately within a
population, compared to EV-MAC, which is limited by the resolution limit of conventional light
microscopy. Alternatively, single molecule techniques, including single molecule localization
microscopy (qSMLM) [287] have the advantage of allowing vesicle size to be more accurately
assessed and allowing the precise number of molecules on an EV to approximated. Such studies
140
require access to super resolution instrumentation with single molecule sensitivity as well as
antibodies labeled in a way that ensures antibodies are conjugated to a single fluorophore. EV-
MAC may be an attractive alternative in cases where the relative differences in EV composition
without a need to appreciate the precise number of target proteins present on EVs need to be
assessed. The utility of EV-MAC in characterizing EV populations using conventional
microscopy, with or without deconvolution, using conventional combinations of primary and
secondary antibodies commonly used in immunofluorescence studies. In total, these may make it
more accessible and easily utilized to interrogate EV populations in many contexts.
In the workflow described in this manuscript, the generation of masks around individual
fluorescent signals, such as S15Ch, allows quantitative, multiplexed analysis of EV populations
according to their incorporation of canonical EV markers including tetraspanins, and LAMP1.
Additionally, the generation of this masking algorithm allowed us to analyze images in an
unbiased, semi-high throughput manner and evaluate thousands of EVs in a short period of time
with a small quantity of sample. This approach is highly reproducible across biological and
technical replicates (Fig. 6, 8, 12, 13). Furthermore, we demonstrate how it can be flexibly
adapted to either evaluate images individually in a process analogous to technical replicates
(Individual Image Measure) or by first pooling data from multiple images and then determining
co-localization (Pooled Image Measure). This latter method becomes useful when few events of
interest are observed in each image as determining co-localization from small sample sizes
becomes impractical due to increased variance. However, we demonstrate that this can be
overcome by pooling data from all the images when necessary, to increase sample size. These
experiments collectively reveal that EV populations are very heterogenous, consistent with
previous studies using other approaches [177, 228, 260, 536, 537] and EV-MAC can reliably

141
and reproducibly monitor these differences. In this regard, it should be noted that while EV-
MAC can reproducibly characterize EVs following spinnoculation onto coverslips, it is possible
that spinnoculation may not capture all EVs present in a sample. It is possible that EVs of
extremely small size or those with electrostatic properties that make them less likely to bind
coverslips could be underrepresented in EV-MAC analysis. Altering the spinnoculation
conditions or coverslip treatment may be needed to overcome these issues if they are
encountered.
As is the case with flow cytometry, this method requires control staining lacking primary
antibodies specific for individual antigens, which we achieve by staining using secondary
antibody controls. Wide field, deconvolution microscopy was applied in this approach because of
its sensitivity and field uniformity [348], and because algorithm based analysis using Imaris
software requires 3D acquisition to establish reliable algorithm masks. Similar approaches using
different acquisition systems and masking approaches are likely possible, so long as the
fluorescent excitation field across an image is sufficiently uniform and the instrumentation is
capable of quantifying differences between secondary negative control samples and experimental
samples. It should be noted that the resolution limits of conventional fluorescent microscopy
preclude meaningful analysis of EV size, surface area or volume, as the majority of EVs are
below the 250 nm resolution limit of light microscopy. Moreover, as is the case with flow
cytometry, such an analysis is dependent on the specificity of the antibody(s) utilized. As such,
this method should not be used to determine the precise number of proteins of interest in a given
EV or used to infer that a given protein is completely absent from an EV or population of EVs.
This approach is best suited to studies using fluorescent protein fusions to proteins of interest and
imaging approaches capable of single molecule detection [96]. However, the ability to define EV

142
populations of interest, according to their incorporation of endogenously expressed, native
proteins, provides a platform by which the composition of EVs containing specific cargoes of
interest can be interrogated.
We also exploited the broad staining ability of lectins and fluorescent dyes to serve as a
pan-EV marker in the analysis of EVs from biological samples, including saliva and serum.
These approaches yielded generally similar results (Fig. 9 and Fig. 10), providing a workflow to
use EV-MAC to characterize EV populations from patients. These approaches provided similar
results when saliva or plasma samples were analyzed. Using both labelling approaches in parallel
is particularly advantageous, as corroboration between methods can ensure that each label is
being applied in a reliable and reproducible manner. In this regard, careful titration of each label
using EVs at a defined concentration can ensure that these labelling methods are reliably
detecting EVs and artifacts are not being measured. In the case of lectin staining, we have
observed that the lectin staining must be performed prior to antibody labelling and carefully
titrated, as excess lectin can interact with glycans present on many antibodies if these aspects of
the workflow are not carefully controlled. Similarly, titration of PKH dye and removal of
unbound dye is critical to prevent the detection of dye micelles. However, the corroboration of
these methods (Fig. 13) demonstrate that these potential issues can be controlled to provide
reliable and reproducible multiplexed analysis of EV cargos. This approach is a highly attractive
way to characterize EV populations, as the relative composition of EVs containing any given
protein of interest can be compared to an internal control of all EVs labelled using these pan-EV
markers, thus allowing the identification of proteins which are enriched in specific EV
populations of interest. Cell-type specific markers may also be used in this way to identify EVs
released from specific cell types within a heterogenous population of EVs in biological samples.

143
In the next chapter, the EV-MAC workflow will be leveraged to evaluate co-localization
among endogenously expressed α-syn with recombinantly added α-syn fibrils, α-syn with Gal3,
and from multiple cell types including induced pluripotent derived midbrain dopaminergic
neurons.
143
CHAPTER FOUR
LYSOSOMAL MEMBRANE DAMAGE, AND THE SUBSEQUENT GAL3 MEDIATED
RESPONSE, CONTRIBUTE TO THE SECRETION OF α-SYN BY AN AUTOPHAGIC
MECHANISM
Rationale
Synucleinopathies are a category of neurodegenerative disorders associated with the
accumulation of α-syn aggregates and progressive cell death throughout the central nervous
system. Like many other neurodegenerative diseases, an integral aspect of PD and other
synucleinopathies is a self-propagating pathology that, ultimately, leads to physiological
dysfunction, inflammation, and cell death in the affected tissues. In PD and Lewy body dementia
(LBD), the accumulation of misfolded, insoluble α-syn in Lewy bodies (LBs) and neurites,
collectively called Lewy pathology, are the histopathological definition of these diseases [157],
and numerous converging lines of experimental and genetic evidence support the premise that α-
syn plays a central role in disease pathogenesis [200, 518].
The cell-to-cell spread of misfolded species of α-syn is thought to be paramount to
synucleinopathy disease progression. Multiple levels of evidence, ranging from tissue culture
[106, 153, 282], to rodent and non-human primate models [115, 189, 305, 375, 407] to putamen
grafts in PD patients [258, 259, 292], indicate that transfer of misfolded α-syn between cells is
associated with disease pathology. In addition to cell-to-cell transfer, another key aspect of
disease progression is misfolded α-syn’s ability to permissively template or “seed” the
conversion of endogenously expressed α-syn into misfolded forms. Indeed, the addition of
144
exogenous recombinant, α-syn fibrils substantially increases detergent insoluble forms of α-syn
that are akin to those observed in pathology as well as cell-to-cell transmission in vivo [304-306,
375, 407]. However, a critical understanding of the cellular mechanisms responsible for this cell-
to-cell spread and propagation of further α-syn misfolding remains poorly understood.
The autophagy-lysosomal pathway (ALP) is one of the primary degradative pathways in
cells, responsible for the turnover of cytosolic content, such as protein aggregates, by lysosomal
degradation [151, 533]. In macroautophagy, hereafter referred to as autophagy, the formation of
an isolation double membrane, called an autophagophore, engulfs organelles and cytosolic
proteins, and subsequently closes to form a vesicular compartment known as an autophagosome
[151, 533]. Degradation then occurs upon autophagosome fusion with the lysosome, exposing
the engulfed contents to the hydrolytic enzymes within the lysosome [151, 533].
Canonically, the inhibition of the mammalian target of rapamycin (mTOR) drives the
autophagic cellular response [317]. The initial generation of an autophagophore begins with the
enrichment of a phosphatidylinositol 3-phosphate (PI3P) lipid domain, typically at the
endoplasmic reticulum. This process is driven by unc-51 like autophagy activating kinase 1
(ULK1) to form the multiprotein initiator complex, which includes the autophagy related (ATG)
proteins, beclin-1 and phosphatidylinositol 3 kinase (PI3K). The formation of PI3K is essential
for the recruitment of effector proteins to create the autophagophore [41]. The autophagophore
then undergoes expansion and elongation, increasing in size and protein recruitment; both are
driven and regulated by a series of transient protein interactions. Included among these are the
ATG5-ATG12-ATG16L1 complex that depends on intermediate ATG proteins, such as ATG7,
to ultimately conjugate and recruit proteins to the maturing autophagophore [41, 317]. Among
the proteins recruited, microtubule-associated protein 1 light chain 3 (LC3) is the most well-
145
known and remains on the autophagosome throughout its lifecycle. During this process, cytosolic
LC3, known as LC3-I, is conjugated to phosphatidylethanolamine, known as LC3-II, by ATG
proteins and incorporated into the autophagophore and, ultimately, assists in its closing to form
the autophagosomes [41, 317]. The galectins are a family of proteins that share a CRD motif that
interacts with β-galactoside glycans [237]. Galectin proteins play a role in a broad range of
cellular functions including immune responses, signaling, inflammation, and autophagy [237].
Several galectins, including Gal1, Gal3, Gal8, and Gal9, have CRDs that interact and adhere to
the glycans present on the intraluminal membrane proteins of endosomes and lysosomes, such
that damage to these vesicles leads to the recruitment of galectin proteins to these damaged
vesicles [237, 372, 496]. Galectin recruitment to damaged vesicles is known to lead to the
recognition of these damaged vesicles by autophagic adapter proteins and, subsequently, to their
degradation [401, 402, 496]. We and others have previously demonstrated that fibrillar forms of
-syn, tau and other amyloids can induce vesicle damage following endocytosis, leading to the
recruitment of Gal3 and Gal8 and autophagic adaptors and effector proteins [56, 140, 147, 153].
When postmortem brain tissue from five PD patients was stained for Gal3 and pS129 α-syn to
identify LBs, consistent with LBs being a mix of aggregated α-syn and lipid organelles [445],
170 of 305 LBs examined displayed Gal3 coronas surrounding the pathological inclusions [147].
The presence of Gal3 in LBs suggests a history of membrane damage.
Accumulating evidence reveals that the biological functions of galectin proteins are
central to the ALP dysfunction that occurs in PD and other neurodegenerative diseases [13, 37,
122, 416, 422]. The Deretic group demonstrated that the re-localization of Gal3, Gal8, and Gal9
to damaged lysosomal compartments both coordinates and drives the cellular autophagic
response [71, 232, 234, 250, 265]. Specifically, in combination with tripartite motif containing
146
16 (Trim16) and ULK1, Gal3 facilitated the removal of damaged lysosomal membranes in
response to rupture in part by recruiting ATG16L1 [234, 265]. Two recent genome wide
association studies reported that single nucleotide polymorphisms in LGALS3, the gene that
encodes for Gal3, were associated with PD [37, 122]. Additionally, increased Gal3 in the
cerebral spinal fluid of PD patients has been reported [13, 122, 526]. Mechanistically, recent
papers indicate that lysosomal damage triggers autophagy-dependent unconventional secretion of
cytokines utilizing Trim16 [250] and other groups found that these same cytokines require Gal3
for secretion in certain cell types by an unknown intracellular mechanism [452, 504].
Recent studies have also demonstrated that galectins and proteins normally associated
with ALP degradation also act to promote an unconventional secretory mechanism referred to as
secretory autophagy [126, 250, 391]. Although no studies have specifically examined how
secretory autophagy may drive the release of -syn, -syn is known to be released via an
unconventional secretory mechanism that is modulated by ALP perturbations [9, 86, 106, 279,
340, 387]. Specifically, studies have shown that dysfunctional alterations in the ALP influence
the secretion of both extracellular vesicle (EV) and non-EV associated α-syn [41, 132, 155, 184,
192, 225, 279, 387]. In the context of the cell-to-cell spread of -syn, the role of galectins in
mediating secretory autophagy and their association with vesicles damaged by fibrillar -syn and
other amyloid proteins raises the possibility that galectins, following vesicular damage, may
promote the release of -syn from cells, thereby contributing to the pathological spread of -syn
between cells. Thus, we sought to determine whether Gal3 contributes to the release of α-syn
from cells. We observe that both endogenously expressed -syn and exogenous -syn fibrils co-
localize in galectin positive intracellular vesicles and, ultimately, in EVs released from these
cells. We also observe that the depletion of Gal3 or the associated autophagic adaptor protein,
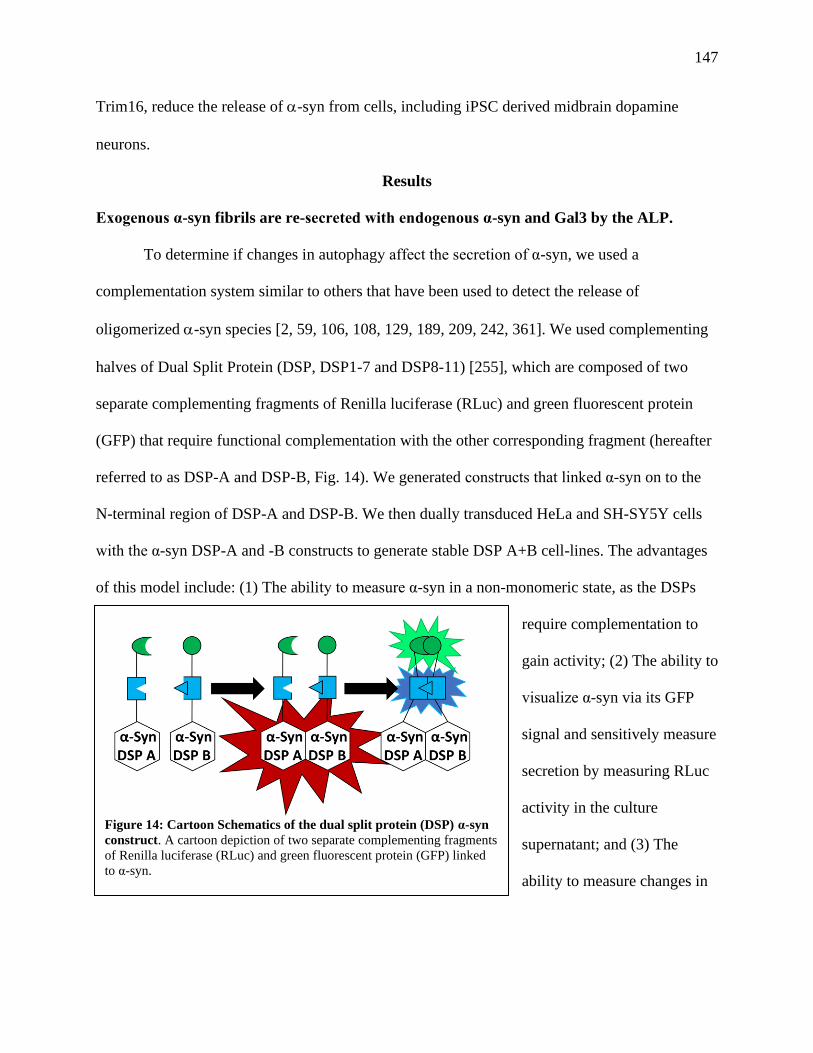
147
Trim16, reduce the release of -syn from cells, including iPSC derived midbrain dopamine
neurons.
Results
Exogenous α-syn fibrils are re-secreted with endogenous α-syn and Gal3 by the ALP.
To determine if changes in autophagy affect the secretion of α-syn, we used a
complementation system similar to others that have been used to detect the release of
oligomerized -syn species [2, 59, 106, 108, 129, 189, 209, 242, 361]. We used complementing
halves of Dual Split Protein (DSP, DSP1-7 and DSP8-11) [255], which are composed of two
separate complementing fragments of Renilla luciferase (RLuc) and green fluorescent protein
(GFP) that require functional complementation with the other corresponding fragment (hereafter
referred to as DSP-A and DSP-B, Fig. 14). We generated constructs that linked α-syn on to the
N-terminal region of DSP-A and DSP-B. We then dually transduced HeLa and SH-SY5Y cells
with the α-syn DSP-A and -B constructs to generate stable DSP A+B cell-lines. The advantages
of this model include: (1) The ability to measure α-syn in a non-monomeric state, as the DSPs
require complementation to
gain activity; (2) The ability to
visualize α-syn via its GFP
signal and sensitively measure
secretion by measuring RLuc
activity in the culture
supernatant; and (3) The
ability to measure changes in
Figure 14: Cartoon Schematics of the dual split protein (DSP) α-syn
construct. A cartoon depiction of two separate complementing fragments
of Renilla luciferase (RLuc) and green fluorescent protein (GFP) linked
to α-syn.

148
cell expressed -syn in response to exogenously added fibrillar -syn, which can otherwise be
hard to discern.
To validate whether either of the DSP-α-syn constructs were undergoing cleavage, lysate
from SH-SY5Y cells transduced with either α-syn DSP A, α-syn DSP B, or concurrently α-syn
DSP-A and -B was evaluated by western blot. An equal amount of transduced cell lysate was
loaded across multiple wells to evaluate construct authenticity using antibodies against α-syn,
RLuc, or GFP (Fig. 15A).
Figure 15: Western Blot Validation of α-Syn DSP -A and -B Construct Integrity in Co-transduced
Cells. (A) α-syn DSP-A and α-syn DSP-B transduced, and dual-transduced DSP-α-syn SH-SY5Y cell
lysates run in parallel, representative western blots. The same lysates probed against α-syn (211 epitope,
left), polyclonal RLuc, (left-center), polyclonal GFP (right-center), or GAPDH (right). Staining with an
antibody against RLuc resulted in bands at ~33 kDa in the α-syn DSP-B and α-syn DSP A+B lysates but not
in the α-syn DSP-A lysate. Varying degrees of faint bands at ~44-50 kDa, and at ~75 kDa were observed in
the α-syn DSP-A and α-syn DSP-B lysates. These bands are most likely due to non-specific binding rather
than high molecular weight α-syn, as one would expect to observe bands at different molecular weights
corresponding to the size of the α-syn DSP-A and DSP-B constructs, which differ. A GFP band was
observed at ~48 kDa in the α-syn DSP-A and α-syn DSP A+B cells but not the α-syn DSP-A lysate. (B, C)
Representative western blots of HeLa α-syn DSP A+B (B) and SH-SY5Y α-syn DSP A+B (C) lysates ran in
parallel and probed for GFP (B-2 epitope, left), α-syn (211 epitope, right), or GAPDH.
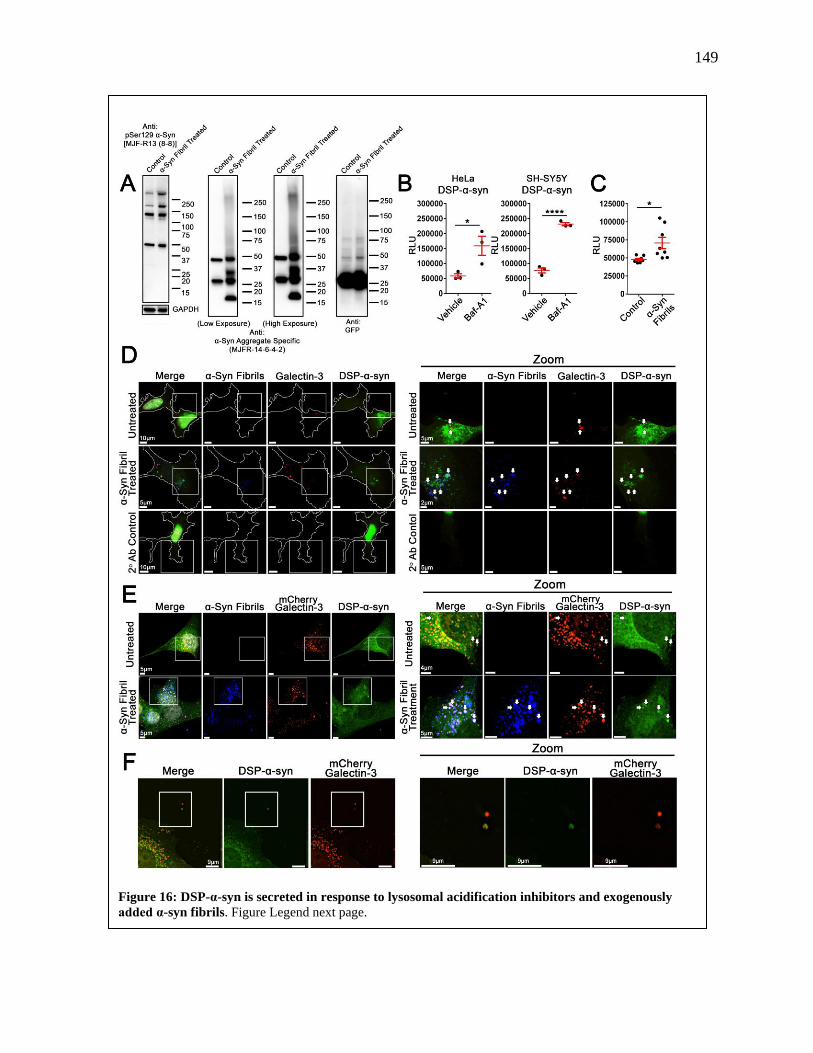
149
Figure 16: DSP-α-syn is secreted in response to lysosomal acidification inhibitors and exogenously
added α-syn fibrils. Figure Legend next page.

150
Notably, the α-syn DSP A+B lysate quantity was adjusted to better visualize differences
in construct expression relative to the α-syn DSP A and α-syn DSP B lysates. Both constructs
were observed at different molecular weights according to the predicted molecular weight of
these fusion proteins, which were visible using antibodies to -syn, RLuc, and GFP (Fig. 15A,).
Given the division of the GFP-RLuc DSP constructs, differences in the extent to which the RLuc
and GFP polyclonal antibodies recognized the α-syn DSP-A and -B halves were observed.
Both constructs were observed at different molecular weights according to the predicted
molecular weight of these fusion proteins ~33kDa and ~48kDA, which were visible using
antibodies to -syn, RLuc luciferase and GFP when lysates were run in parallel (Fig. 15A).
Staining for α-syn (Syn 211) resulted in the presence of band at ~17kDa in all lysates, consistent
with monomeric α-syn in SH-SY5Y cells [277]. Parallel lysates from WT HeLa and HeLa -syn
DSP A+B cells as well as WT SH-SY5Y and SH-SY5Y -syn DSP A+B cells further confirmed
the presence of endogenous -syn at ~17kDa (Fig. 15B, C) and that the monoclonal (B-2) GFP
antibody only recognizes the -syn DSP B construct.
Figure 16: DSP-α-Syn is Secreted in Response to Lysosomal Acidification Inhibitors and Exogenously
added α-Syn Fibrils. (A) Representative non-denaturing SDS-PAGE of SH-SY5Y DSP-α-syn cell lysates from
a single experiment ran in parallel (n = 3). The same representative lysates are used for A. SDS-PAGE probed
against (A) pSer129 α-syn (left), conformation specific α-syn (middle), GFP (right), GAPDH (bottom-left). (B)
Relative light units (RLUs) were measured from the Renilla Luciferase (RLuc) signal in the cultured media from
the stated cell lines 24 hours after treatment with vehicle (0.1% DMSO) or Bafilomycin-A1 (Baf-A1) indicating
the levels of complemented DSP-α-syn. (C) RLU signal detected in the cultured media from SH-SY5Y DSP-α-
syn cells 24 hours after control or α-syn fibril treatment. Statistical significance determined by paired t-test. Data
shows the mean value from at least three independent experiments where each data point indicates a biological
replicate. Data are expressed as M ± SE. For all statistical tests *, **, ***, ****, p < 0.05, 0.01, 0.001, and
0.0001, respectively. (D) A representative z-stack of dually transduced DSP-α-syn SH-SY5Y cells from
untreated and α-syn fibril treated cells probed for Gal3. Cell boundaries are shown as a white border. (E) and (F)
Z-stacks of untreated or fluorescently labelled α-syn fibril treated HeLa DSP-α-syn and mCherry Gal3
expressing cells. (E) Arrows indicates co-localization of DSP-α-syn+ and mCherry Gal3+ events in untreated
cells and co-localization of DSP-α-syn+, mCherry Gal3+, and α-syn fibril+ events in the α-syn fibril treated
cells. (F) Extracellular co-localization of DSP-α-syn+ and mCherry Gal3+ event observed in untreated cells

151
We next evaluated how -syn fibril treatment influenced the formation of higher
molecular weight -syn in the DSP--syn SH-SY5Y cells. Previous work suggests that fibrillar
α-syn can recruit monomeric α-syn in cell culture resulting in increased high molecular weight α-
syn species [42]. Additionally, following α-syn fibril treatment, endogenous α-syn represents the
primary component of phospho-serine129 (pSer129) α-syn species found within inclusions
[306]. To better understand the species of -syn present in these cells before and after treatment
with exogenous fibrils, we used antibodies specific for pSer129 α-syn, aggregated conformation
-syn (MJFR-14-6-4-2) and GFP. DSP-α-syn SH-SY5Y cells lysates were assessed by non-
denaturing SDS-PAGE and the same quantity of lysates was evaluated multiple times (Fig. 16A).
In all cases, a band at ~48kDa was observed for both the control and the α-syn fibril treated cells
lysates regardless of the antibody used (Fig. 16A). However, higher molecular weight bands
were also observed in all blots. Moreover, when probed for pSer129 α-syn, α-syn fibril treatment
resulted in more intense high molecular weight (> 150 KDa) bands (Fig. 16A, left). An increased
band intensity at ~48 kDa was also observed in the α-syn fibril treated cell lysates when probed
for GFP, which should exclude the possibility of α-syn fibrils detection (Fig. 16A, right).
Interestingly, the GFP antibody appeared to recognize a considerably larger portion of the
smaller molecular DSP-α-syn when run under non-reducing conditions versus the portion of the
smaller molecular DSP-α-syn recognized when run under reducing conditions (Fig. 15A & Fig.
16A). Finally, increased band intensity was also observed in the α-syn fibril treated cell lysates
relative to the control lysates when probed with the α-syn aggregate specific antibody (Fig. 16A,
middle).
To determine how ALP impairment alters the secretion of DSP-α-syn, DSP--syn HeLa
and SH-SY5Y were treated with Bafilomycin A1 (Baf-A1), a lysosomal acidification inhibitor

152
that also prevents lysosome-autophagosome fusion [326, 327, 543]. Baf-A1 treatment
significantly increased complemented DSP-α-syn secretion (Fig. 16B), consistent with other
studies examining native α-syn release and studies using similar complementation systems [9,
132, 144, 225, 279, 340, 387]. These data, therefore, demonstrate that the increase in -syn
secretion observed in other studies is recapitulated by DSP--syn, revealing it as a useful model
to monitor -syn release and characterize the pathway promoting secretion.
We next wanted to determine if the ALP dysfunction induced by exogenous -syn fibrils
can drive the release of endogenously expressed -syn, which would provide a putative
mechanism for the cell- to-cell transfer of -syn. To this end, we applied recombinant -syn
fibrils dyed with ATTO 647 [147, 304], to DSP--syn SH-SY5Y cells. Measuring the luciferase
activity specific to the DSP--syn fusion, we observed a modest but significant increase in the
release of DSP α-syn secretion after the SH-SY5Y cells were treated with α-syn fibrils (Fig. 16C,
left panel). These data suggest that late-stage impairment in autophagic degradation increases α-
syn secretion as does α-syn fibril treatment.
In previous work, we found that -syn fibril treatment induced lysosomal rupture
resulting in Gal3 re-localization in cells over-expressing mCherry Gal3 [147, 153]. Thus, we
performed experiments to determine if endogenous Gal3 was co-located with DSP--syn within
the DSP--syn SH-SY5Y cells in the presence and absence of -syn fibrils (Fig. 16D). In both
the untreated and -syn fibril treated DSP--syn cells, endogenous Gal3 was observed within
brighter DSP--syn regions. Additionally, in the -syn fibril treated cells, we observed instances
in which endogenous Gal3 was associated with dual labeled, DSP--syn positive (+) and -syn
fibril+ areas (Fig. 16D). These events were even more apparent in DSP--syn HeLa cells
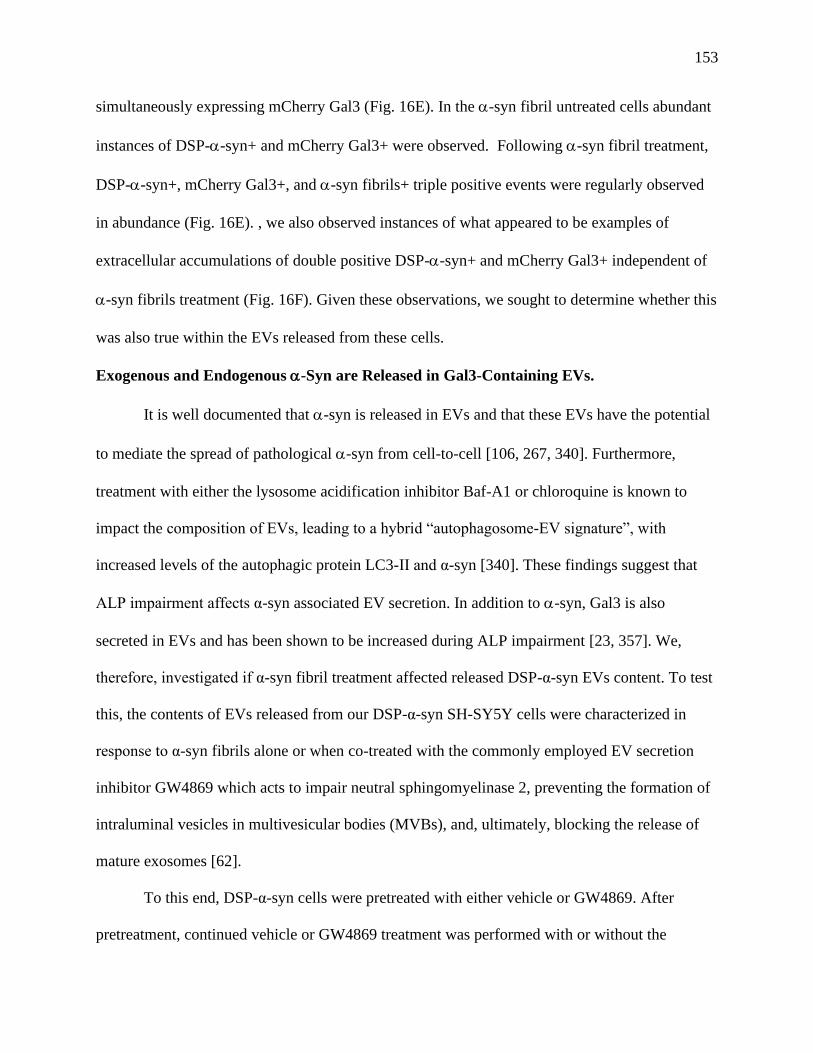
153
simultaneously expressing mCherry Gal3 (Fig. 16E). In the -syn fibril untreated cells abundant
instances of DSP--syn+ and mCherry Gal3+ were observed. Following -syn fibril treatment,
DSP--syn+, mCherry Gal3+, and -syn fibrils+ triple positive events were regularly observed
in abundance (Fig. 16E). , we also observed instances of what appeared to be examples of
extracellular accumulations of double positive DSP--syn+ and mCherry Gal3+ independent of
-syn fibrils treatment (Fig. 16F). Given these observations, we sought to determine whether this
was also true within the EVs released from these cells.
Exogenous and Endogenous -Syn are Released in Gal3-Containing EVs.
It is well documented that -syn is released in EVs and that these EVs have the potential
to mediate the spread of pathological -syn from cell-to-cell [106, 267, 340]. Furthermore,
treatment with either the lysosome acidification inhibitor Baf-A1 or chloroquine is known to
impact the composition of EVs, leading to a hybrid “autophagosome-EV signature”, with
increased levels of the autophagic protein LC3-II and α-syn [340]. These findings suggest that
ALP impairment affects α-syn associated EV secretion. In addition to -syn, Gal3 is also
secreted in EVs and has been shown to be increased during ALP impairment [23, 357]. We,
therefore, investigated if α-syn fibril treatment affected released DSP-α-syn EVs content. To test
this, the contents of EVs released from our DSP-α-syn SH-SY5Y cells were characterized in
response to α-syn fibrils alone or when co-treated with the commonly employed EV secretion
inhibitor GW4869 which acts to impair neutral sphingomyelinase 2, preventing the formation of
intraluminal vesicles in multivesicular bodies (MVBs), and, ultimately, blocking the release of
mature exosomes [62].
To this end, DSP-α-syn cells were pretreated with either vehicle or GW4869. After
pretreatment, continued vehicle or GW4869 treatment was performed with or without the
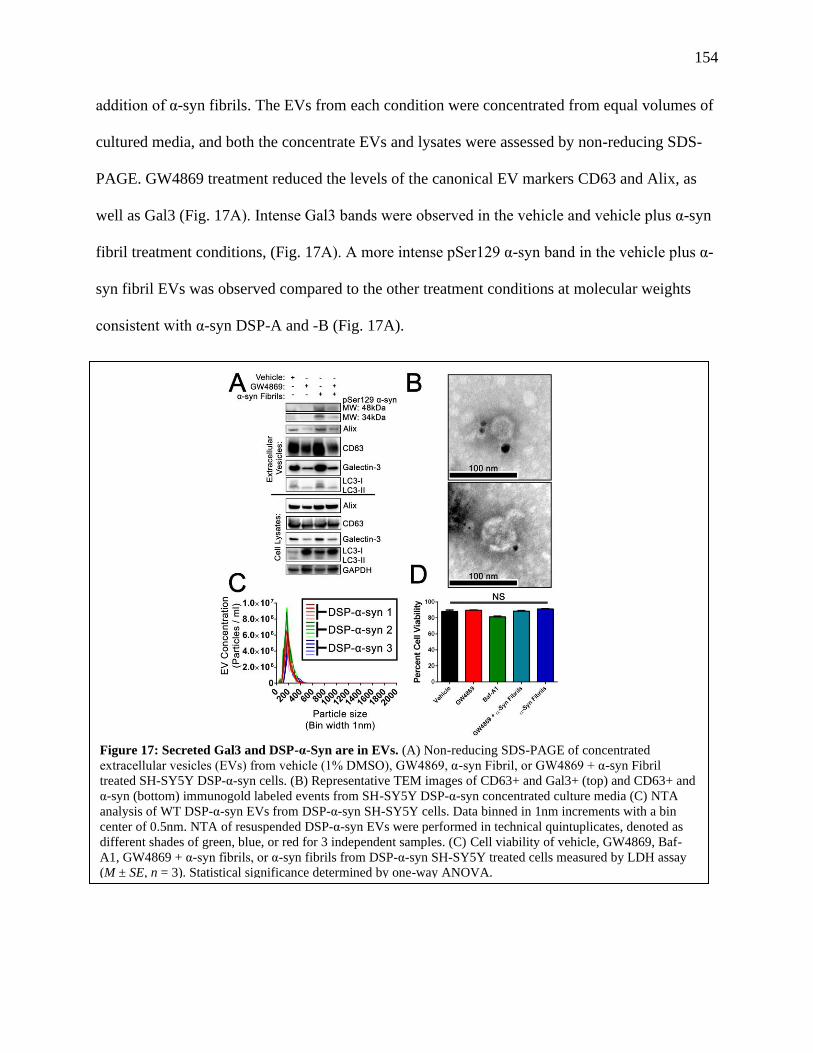
154
addition of α-syn fibrils. The EVs from each condition were concentrated from equal volumes of
cultured media, and both the concentrate EVs and lysates were assessed by non-reducing SDS-
PAGE. GW4869 treatment reduced the levels of the canonical EV markers CD63 and Alix, as
well as Gal3 (Fig. 17A). Intense Gal3 bands were observed in the vehicle and vehicle plus α-syn
fibril treatment conditions, (Fig. 17A). A more intense pSer129 α-syn band in the vehicle plus α-
syn fibril EVs was observed compared to the other treatment conditions at molecular weights
consistent with α-syn DSP-A and -B (Fig. 17A).
Figure 17: Secreted Gal3 and DSP-α-Syn are in EVs. (A) Non-reducing SDS-PAGE of concentrated
extracellular vesicles (EVs) from vehicle (1% DMSO), GW4869, α-syn Fibril, or GW4869 + α-syn Fibril
treated SH-SY5Y DSP-α-syn cells. (B) Representative TEM images of CD63+ and Gal3+ (top) and CD63+ and
α-syn (bottom) immunogold labeled events from SH-SY5Y DSP-α-syn concentrated culture media (C) NTA
analysis of WT DSP-α-syn EVs from DSP-α-syn SH-SY5Y cells. Data binned in 1nm increments with a bin
center of 0.5nm. NTA of resuspended DSP-α-syn EVs were performed in technical quintuplicates, denoted as
different shades of green, blue, or red for 3 independent samples. (C) Cell viability of vehicle, GW4869, Baf-
A1, GW4869 + α-syn fibrils, or α-syn fibrils from DSP-α-syn SH-SY5Y treated cells measured by LDH assay
(M ± SE, n = 3). Statistical significance determined by one-way ANOVA.

155
Previous works indicates that GW4869 also affects the formation of autophagosomes and the
secretion of LC3 [18, 285]. Thus, we also compared LC3-II levels across all conditions. In
agreement with these previous works GW4869 also reduced LC3-II levels compared to vehicle
as well as compared to GW4869 plus α-syn fibrils compared to vehicle plus α-syn fibrils
treatment (Fig. 17A). Immunogold labeling of CD63 (10 nm), α-syn (5 nm), and Gal3 (15 nm)
and TEM of concentrated, conditioned culture media revealed the presence of CD63+ and Gal3+
(Fig. 17B, top) as well as CD63+ and α-syn+ objects (Fig. 17B, bottom). Nanoparticle tracking
analysis (NTA) confirmed the relative size distribution of the vesicular structures had a 202.3 ± 4
nm mean diameter while the most common diameter was 144.5 nm from concentrated culture
media (Fig. 17C). No difference in cell viability among treatments thus far were observed when
measured by a l-lactate dehydrogenase (LDH) assay (Fig. 17D). Collectively, these data suggest
that released EVs from DSP-α-syn cells are primarily exosomes, contain Gal3, the pathologically
associated pSer129 α-syn, the autophagic marker LC3-II, and that their secretion is not stemming
from treatment induced cell death.
Based on these findings, we next imaged EVs released from HeLa DSP--syn cells
treated with ATTO 647 -syn fibrils to determine if DSP--syn could be detected in EVs in
association with Gal3. To this end, low speed centrifugation of DSP--syn cell culture
supernatant was performed to adhere EVs released from cells onto coverslips in preparation for
fluorescent microscopy imaging and analysis. Such low-speed centrifugation (i.e. 1,200 × g for 2
hours) is sufficient to bind viral particles and EVs to glass, but is insufficient to promote the
binding of soluble proteins [52, 356]. Following centrifugation, the bound EVs were fixed then
probed with an anti-Gal3 antibody to determine if -syn+ EVs were associated with cell
expressed Gal3. The EVs were then imaged by wide-field fluorescence microscopy where puncta
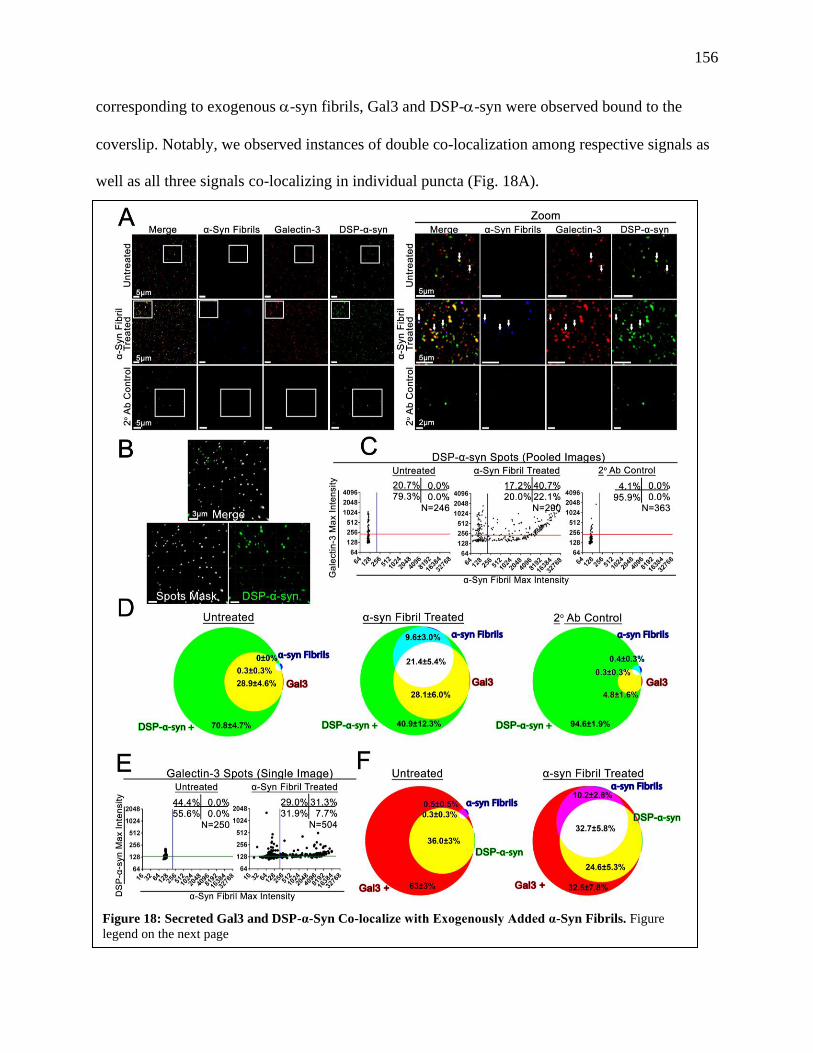
156
corresponding to exogenous -syn fibrils, Gal3 and DSP--syn were observed bound to the
coverslip. Notably, we observed instances of double co-localization among respective signals as
well as all three signals co-localizing in individual puncta (Fig. 18A).
Figure 18: Secreted Gal3 and DSP-α-Syn Co-localize with Exogenously Added α-Syn Fibrils. Figure
legend on the next page

157
We next used EV multiplex analysis of co-localization (EV-MAC) [52], to characterize the EV
populations released from these cells. This approach allows for the interrogation of EVs at the
single EV level to assess the relative co-localization of individual EV cargos from within the
total EV population using a gating process similar to that used in flow cytometry. We applied
this approach to determine the relative percent positive puncta for DSP--syn, recombinant
exogenous -syn fibrils and Gal3 to discern the degree of dual labeled and triple labeled co-
located EVs. We first assessed the degree to which DSP-α-syn+ EVs co-localized with Gal3
from the cultured media of untreated cells as well as Gal3 and -syn fibrils from exogenous -
syn fibril treated cells. This was done by using image analysis software (Imaris, Bitplane) to
create a Spots mask around the DSP-α-syn signal and measuring the respective Gal3 and -syn
fibril maximum fluorescence intensity relative to the secondary antibody (2°Ab) only control.
The masking algorithm detected all of the DSP α-syn+ puncta (Fig. 18B). The degree of co-
Figure 18: Secreted Gal3 and DSP-α-Syn Co-localize with Exogenously Added α-Syn Fibrils. (A) A
representative z-stack from a constructed z-stack maximum intensity projection obtained from the cultured media
of untreated HeLa α-syn DSP-α-syn and those treated with α-syn fibrils. Representative maximum intensity
projections of z-stack images for cultured media obtained from untreated HeLa DSP-α-syn processed for
immunofluorescence without the primary antibody (2˚ Ab treatment) are also given. (B) Demonstration of the
Spots masking algorithm built around the DSP-α-syn channel from z-stack maximum intensity projection
showing specificity for the desired channel. (C) Representative co-localization plots of the maximum fluorescence
intensities of the Gal3 (Y-axis) and α-syn fibril (X-axis) signal found within each DSP-α-syn masking algorithm
Spot pooled from a total of 15 images from a single treatment conditions’ coverslip. Each data point represents a
single recognized DSP-α-syn+ spot within an image. Quadrant numbers indicate the percent co-localization of
DSP-α-syn+ where the relative background signal was determined based on the Gal3 and α-syn Fibril maximum
intensity signal found in the 2o Ab Control condition. Bottom left quadrants indicate single DSP-α-syn+ positive,
bottom right DSP-α-syn+ α-syn Fibril+ double positive, top left DSP-α-syn+ Gal3+ double positive, and top right
DSP-α-syn+ α-syn Fibril+ Gal3+ triple positive. (D) Summarized average co-localization of DSP-α-syn+ masking
algorithm Spots from four independent experiments. DSP-α-syn+ Spots that are single positive (green), DSP-α-
syn+ α-syn Fibril+ double positive (cyan), DSP-α-syn+ Gal3+ double positive (yellow), and DSP-α-syn+ α-syn
Fibril+ Gal3+ triple positive (white). (E) Representative co-localization plots of the maximum fluorescence
intensities of the DSP-α-syn (Y-axis) and α-syn Fibril (X-axis) signal found within each Gal3 masking algorithm
Spot from the same images set of images. Co-localization plots are from a single image. (F) Summarized average
co-localization of Gal3+ masking algorithm Spots from four independent experiments. Gal3+ Spots that are single
positive (red), Gal3+ α-syn Fibril+ double positive (magenta), Gal3 DSP-α-syn+ double positive (yellow), and
Gal3+ DSP-α-syn+ α-syn Fibril+ triple positive (white). Summarized average co-localization of (D) DSP-α-syn or
(F) Gal3 masking algorithm Spots from four independent experiments. Degree of co-localization DSP-α-syn or
Gal3 with respective other channels was determined based on the background signal found in the 2o Ab Control.
Data are expressed as M ± SE (n = 4 coverslips, where M was determined from 15 images). The scale bars are
equal to 2 µm.
158
localization of the DSP-α-syn Spots mask with Gal3 and -syn fibrils from each of 20 images
was calculated and, subsequently, averaged for each replicate. A representation of a single
image’s distribution shown in Fig. 18C. The totality of these experiments yielding a summarized
co-localization distribution (Fig. 18D). For the untreated cells, 70.8 ± 4.7% and 28.9 ± 4.6% of
the spots were single labeled, DSP--syn+ and dual labeled, DSP--syn+ and Gal3+,
respectively (Fig. 18D, left). Treatment with
exogenous α-syn fibrils decreased the percentage of
single labeled, DSP--syn+ EVs to 40.9 ± 12.3%
and dual labeled, DSP--syn+ and Gal3+ EVs to 9.6
± 3%. However, 21.4 ± 5.4% of DSP--syn+ EVs
were α-syn fibril+. Additionally, 28.1 ± 6.0% DSP-
-syn+ EVs were both Gal3+ and α-syn fibrils+
(Fig. 18D, middle).
The reciprocal analysis of the degree of
Gal3’s co-localization with DSP-α-syn from the
untreated cells and DSP-α-syn and α-syn fibrils from
the exogenously α-syn fibril treated cells was
conducted from the same set of images. This process was performed by using image analysis
software (Imaris, Bitplane) to create a Spots masking algorithm around the Gal3 signal and
measuring its co-localization from each image analogous to the previous DSP--syn analysis
(Fig. 18E). The subsequent analysis revealed that Gal3+ was single labeled 63.0 ± 3.0% of the
time and dual labeled, Gal3+ and DSP--syn+ 36.0 ± 3.0% of the time (Fig. 18F, left). Of the
EV from the exogenous α-syn fibrils treatment, 32.5 ± 7.8%, 10.2 ± 2.8%, and 32.7 ± 5.8% were
Figure 19: DSP-α-Syn Intensity is
Greater in DSP-α-Syn EVs Positive for α-
Syn Fibrils. Maximum fluorescence
intensities of DSP-α-syn+ masking algorithm
Spots that are either α-syn fibril- and α-syn
fibril+ from the cultured media of α-syn
fibril treated cells. α-syn fibril+ events were
determined based on 2oAb controls as shown
in Figure 18C. Data shown are representative
from one of four independent experiments
and are expressed as M ± SE (α-syn fibril-, n
= 860 spots; α-syn fibril+, n =238) from a
total of 15 images. Statistical significance
determined by unpaired t-tests. ***, p <
0.001.
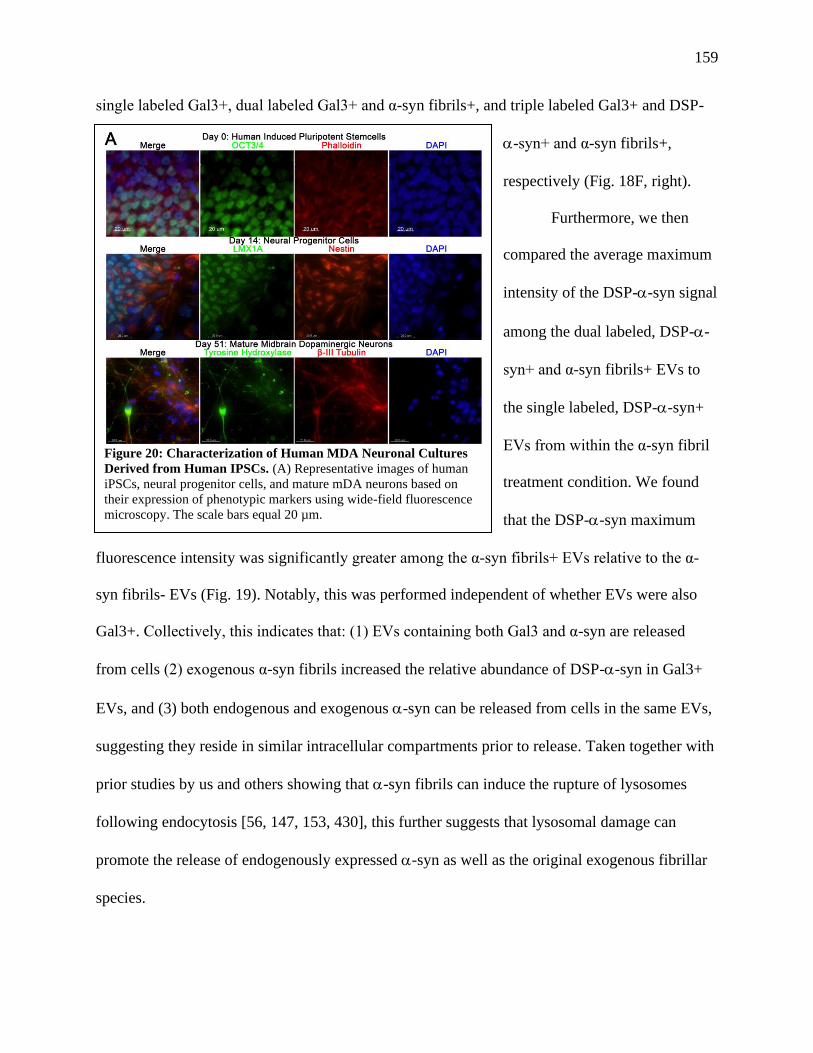
159
single labeled Gal3+, dual labeled Gal3+ and α-syn fibrils+, and triple labeled Gal3+ and DSP-
-syn+ and α-syn fibrils+,
respectively (Fig. 18F, right).
Furthermore, we then
compared the average maximum
intensity of the DSP--syn signal
among the dual labeled, DSP--
syn+ and α-syn fibrils+ EVs to
the single labeled, DSP--syn+
EVs from within the α-syn fibril
treatment condition. We found
that the DSP--syn maximum
fluorescence intensity was significantly greater among the α-syn fibrils+ EVs relative to the α-
syn fibrils- EVs (Fig. 19). Notably, this was performed independent of whether EVs were also
Gal3+. Collectively, this indicates that: (1) EVs containing both Gal3 and α-syn are released
from cells (2) exogenous α-syn fibrils increased the relative abundance of DSP--syn in Gal3+
EVs, and (3) both endogenous and exogenous -syn can be released from cells in the same EVs,
suggesting they reside in similar intracellular compartments prior to release. Taken together with
prior studies by us and others showing that -syn fibrils can induce the rupture of lysosomes
following endocytosis [56, 147, 153, 430], this further suggests that lysosomal damage can
promote the release of endogenously expressed -syn as well as the original exogenous fibrillar
species.
Figure 20: Characterization of Human MDA Neuronal Cultures
Derived from Human IPSCs. (A) Representative images of human
iPSCs, neural progenitor cells, and mature mDA neurons based on
their expression of phenotypic markers using wide-field fluorescence
microscopy. The scale bars equal 20 µm.
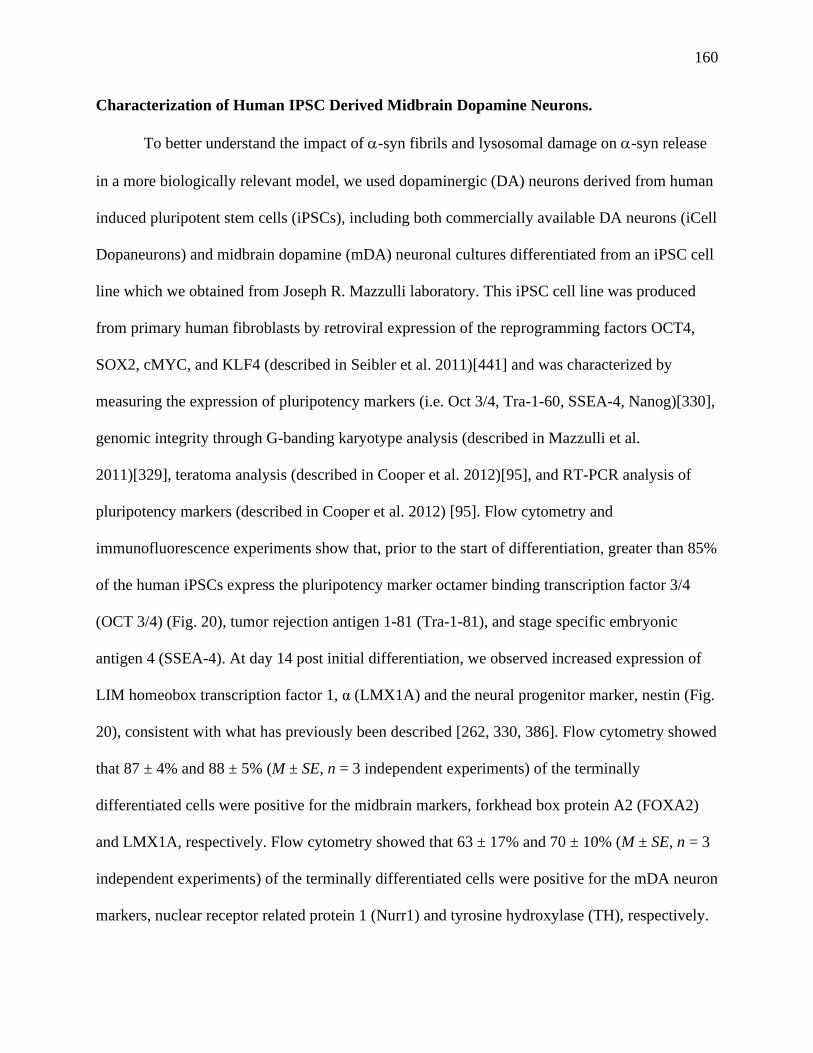
160
Characterization of Human IPSC Derived Midbrain Dopamine Neurons.
To better understand the impact of -syn fibrils and lysosomal damage on -syn release
in a more biologically relevant model, we used dopaminergic (DA) neurons derived from human
induced pluripotent stem cells (iPSCs), including both commercially available DA neurons (iCell
Dopaneurons) and midbrain dopamine (mDA) neuronal cultures differentiated from an iPSC cell
line which we obtained from Joseph R. Mazzulli laboratory. This iPSC cell line was produced
from primary human fibroblasts by retroviral expression of the reprogramming factors OCT4,
SOX2, cMYC, and KLF4 (described in Seibler et al. 2011)[441] and was characterized by
measuring the expression of pluripotency markers (i.e. Oct 3/4, Tra-1-60, SSEA-4, Nanog)[330],
genomic integrity through G-banding karyotype analysis (described in Mazzulli et al.
2011)[329], teratoma analysis (described in Cooper et al. 2012)[95], and RT-PCR analysis of
pluripotency markers (described in Cooper et al. 2012) [95]. Flow cytometry and
immunofluorescence experiments show that, prior to the start of differentiation, greater than 85%
of the human iPSCs express the pluripotency marker octamer binding transcription factor 3/4
(OCT 3/4) (Fig. 20), tumor rejection antigen 1-81 (Tra-1-81), and stage specific embryonic
antigen 4 (SSEA-4). At day 14 post initial differentiation, we observed increased expression of
LIM homeobox transcription factor 1, α (LMX1A) and the neural progenitor marker, nestin (Fig.
20), consistent with what has previously been described [262, 330, 386]. Flow cytometry showed
that 87 ± 4% and 88 ± 5% (M ± SE, n = 3 independent experiments) of the terminally
differentiated cells were positive for the midbrain markers, forkhead box protein A2 (FOXA2)
and LMX1A, respectively. Flow cytometry showed that 63 ± 17% and 70 ± 10% (M ± SE, n = 3
independent experiments) of the terminally differentiated cells were positive for the mDA neuron
markers, nuclear receptor related protein 1 (Nurr1) and tyrosine hydroxylase (TH), respectively.
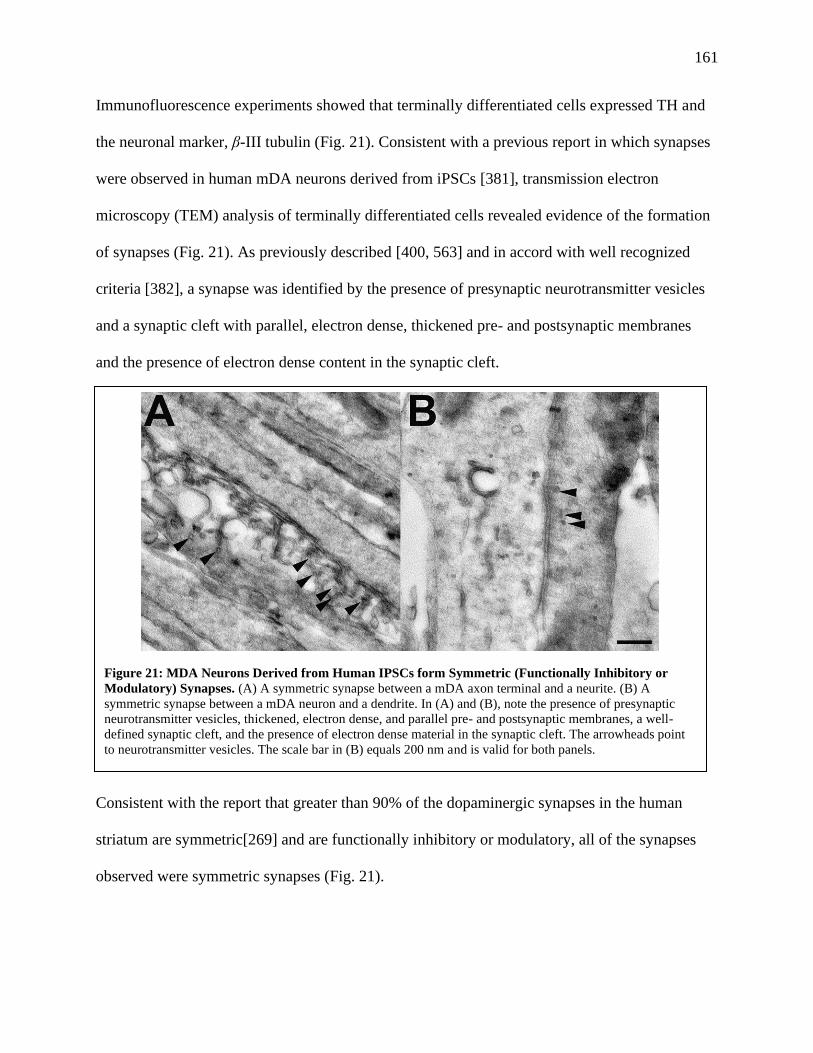
161
Immunofluorescence experiments showed that terminally differentiated cells expressed TH and
the neuronal marker, β-III tubulin (Fig. 21). Consistent with a previous report in which synapses
were observed in human mDA neurons derived from iPSCs [381], transmission electron
microscopy (TEM) analysis of terminally differentiated cells revealed evidence of the formation
of synapses (Fig. 21). As previously described [400, 563] and in accord with well recognized
criteria [382], a synapse was identified by the presence of presynaptic neurotransmitter vesicles
and a synaptic cleft with parallel, electron dense, thickened pre- and postsynaptic membranes
and the presence of electron dense content in the synaptic cleft.
Consistent with the report that greater than 90% of the dopaminergic synapses in the human
striatum are symmetric[269] and are functionally inhibitory or modulatory, all of the synapses
observed were symmetric synapses (Fig. 21).
Figure 21: MDA Neurons Derived from Human IPSCs form Symmetric (Functionally Inhibitory or
Modulatory) Synapses. (A) A symmetric synapse between a mDA axon terminal and a neurite. (B) A
symmetric synapse between a mDA neuron and a dendrite. In (A) and (B), note the presence of presynaptic
neurotransmitter vesicles, thickened, electron dense, and parallel pre- and postsynaptic membranes, a well-
defined synaptic cleft, and the presence of electron dense material in the synaptic cleft. The arrowheads point
to neurotransmitter vesicles. The scale bar in (B) equals 200 nm and is valid for both panels.
162
Lysosomal Membrane Damage Inhibits mTOR and Upregulates Autophagy in Human
MDA Neurons.
We have previously
demonstrated that treating
cells with α-syn fibrils results
in uptake into endo-lysosomal
compartments where they
elicit membrane damage [147,
153]. Recent studies have
shown that lysosomal damage
results in an upregulated
cellular autophagic response in
a variety of cell lines [71, 232,
234, 265]. Thus, experiments
were performed to determine
if similar results would be
obtained using human mDA
neurons in response to the
lysosomal damaging agent, L-
leucyl-L-leucine methyl ester
(LLOME), or α-syn fibril
treatment.
Figure 22: Lysosomal Damage Following α-Syn Fibril or LLOME
Treatment Elicits an Autophagic Response in MDA Neurons. (A) Cell
viability of mDA neurons from 24-hour control untreated, rapamycin, or α-
syn fibrils; or 4-hour vehicle (0.1% DMSO) or LLOME treated cells.(B, E)
Representative western blot of Lamp1, pS757 ULK1, total ULK1 (tULK1),
pT389 P70 S6K1, total P70 S6K1 (tP70 S6K1), Gal3, LC3-I, LC3-II, and
GAPDH for mDA neurons treated with vehicle (0.1% DMSO), rapamycin,
LLOME, or α-syn fibrils. (C, D) The quantification of pT389 S6K1, tP70
S6K1, pS757 ULK1, and tULK1. Quantification of Lamp1, Gal3, and LC3-
II for LLOME (E) and α-syn fibrils treatment (E). Cells were treated with α-
syn fibrils, rapamycin, or vehicle for 24 hours; cells were treated with
LLOME for 4 hours. (C) Data are expressed as M ± SE (n = 3). (D-F) Data
are expressed as M ± SE (n = 4). Statistical significance was determined
following natural log transformation and one-way ANOVA with Tukey’s
post hoc tests. For all statistical tests *, **, ***, ****, p < 0.05, 0.01, 0.001,
and 0.0001, respectively.
163
To assess the autophagic activation state in response to these treatments, phosphorylation of P70
ribosomal protein S6 kinase (P70 S6K1) at threonine 389 (T389) and the phosphorylation of
ULK1 at serine 757 (S757) was assessed. Notably, mTOR suppresses autophagy by
phosphorylating P70 S6K1 at T389 and ULK1 at S757. The ratio of each phosphorylated protein
was compared to its respective total levels to control for possible differences in protein
degradation or expression. Western blot analysis revealed that treatment with either LLOME, α-
syn fibrils, or the mTOR inhibitor rapamycin reduced the relative band intensity of both
phosphorylated ULK1 at S757 (pS757 ULK1) and phosphorylated P70 S6K1 at T389 (pT389
P70 S6K1) (Fig. 22B-D). No differences in cell viability were observed among treatment
conditions (Fig. 22A). These findings indicate that treatment of human mDA neurons with
LLOME, α-syn fibrils, or rapamycin resulted in an increased autophagic state.
In addition, we determined the effects of LLOME or α-syn fibril treatment on lysosome
and autophagosome levels by measuring the lysosomal marker, lysosome associated membrane
protein 1 (Lamp1) and the autophagosomal marker, LC3-II. Moreover, we also measured Gal3,
which we hypothesized would be elevated during increased lysosomal damage [472]. Both α-syn
fibril and LLOME treatment had no effect on Lamp1 LLOME (Fig. 22E-G). Additionally, both
LLOME and α-syn fibril treatment increased Gal3 and LC3-II (Fig. 22E-G). Collectively, these
data suggest that lysosomal damage results in an increased cellular autophagic response in
human mDA neurons.
The Reciprocal Secretion of α-Syn and Gal3 is Regulated by Trim16 and ATG16L1.
To determine if Gal3 directly affects α-syn secretion, two human mDA neuronal cell
lines were depleted of Gal3 by enzyme-linked immunosorbent assay (ELISA).

164
Gal3 knockdown (KD) significantly decreased α-syn secretion in both mDA neuronal lines,
Figure 23: Neuronal Gal3 Influences α-Syn Secretion and is Reciprocally Secreted During α-Syn Fibrils
Treatment. (A, B) Mean fold difference in α-syn in human mDA neuron culture media 48-72 hours post
siRNA transfection and relative depletion of Gal3, and representative KD. (A) Different colors represent
matched replicates. (B) Values were determined by ELISA and normalized to mean control (C) Correlative plot
of the paired mean normalized α-syn secretion data combined from the data shown in (A, B) comparing relative
Gal3 depletion (X-axis) and the mean fold α-syn secretion (Y-axis). (D) Relative fold difference in α-syn from
mDA cultured media treated with TD139 (5 μM) or vehicle (0.1% DMSO) treated control after 24 hours
measured by ELISA. (E) RLUs of RLuc activity of cultured media from CRISPR-Cas9-mediated KO of Gal3
or control in SH-SY5Y DSP-α-syn cell-lines after 24 hours and demonstration of Gal3 KO. (F) RLUs of RLuc
activity from control or Gal3 CRISPR-Cas9 mediated KO SH-SY5Y DSP-α-syn cell lysates after 24 hours (n =
3). (G) Cell viability of control or Gal3 KO SH-SY5Y DSP-α-syn cells over 24 hours (n = 3). (H) Level of α-
syn in the cultured media of mDA neuronal cultures at 48 hours post-transfection measured by ELISA. (I) α-syn
concentration present in empty vector (EV) control or firefly Gal3 transduced mDA neurons cell lysates after 96
hours. (J) RLU levels detected from mDA neurons cultured transduced with FLuc Gal3 and either left untreated
or treated with α-syn fibrils at 48 hours post-transduction. (K) RLUs of RLuc activity from lysates of dually
transduced FLuc Gal3 and RLuc mDA neurons after 48 hours of untreated control or α-syn fibrils indicating
comparable transduction efficiency among conditions. All data are expressed as M ± SE (A, n = 8; B, n = 3; C,
n = 11; D, n = 6; E, F n = 6; G, n = 3; H, n = 12; I, n = 4; J, n = 5; K, n = 5). Statistical significance was
determined by a Pearson correlation with two tailed t-test (C), paired t-test (A, D, E, F, G, H, I, and J), or ratio
paired t-test (B) to better account for the distribution of values < 1. For all statistical tests *, **, ****, p < 0.05,
0.01. and 0.0001, respectively.
165
although the effect was modest in some experiments (Fig. 23A, B). However, we also observed
that the degree of Gal3 depletion by siRNA was variable between experiments, and that the
degree of Gal3 depletion correlated to the degree of reduction in -syn release observed (Fig.
23C). In follow-up, mDA neurons were treated with the Gal3 inhibitor, TD139. TD139 treatment
significantly reduced α-syn secretion compared to vehicle (Fig. 23D). Similarly, CRISPR-Cas9-
mediated Gal3 knockout (KO) in SH-SY5Y DSP-α-syn cells significantly decreased DSP--syn
secretion (Fig. 23E). Corresponding measurements of the lysates revealed that DSP--syn levels
were significantly greater in the SH-SY5Y DSP-α-syn Gal3 KO cells compared to that observed
in the lysates of the control KO cells (Fig. 23F), suggesting the change in α-syn secretion was not
driven by differences in relative α-syn levels. No differences in cell viability were observed in
these cells (Fig. 23G). In a reciprocal fashion, we also asked if Gal3 over-expression influences
endogenous α-syn secretion we generated a lentiviral HA-Firefly Gal3 (FLuc Gal3) construct.
Next, human mDA neurons were dually transduced with FLuc Gal3 and RLuc (to control for
transduction efficiency) and then endogenous α-syn release was evaluated. FLuc Gal3 over-
expression increased α-syn secretion (Fig. 23H). Conversely, FLuc Gal3 transduced mDA
lysates had significantly less α-syn when measured by α-syn ELISA (Fig. 23I). Moreover, when
the transduced human mDA neurons were treated with α-syn fibrils, increased FLuc Gal3 was
detected in the cultured media (Fig. 23J). Yet, the RLuc signal was comparable among the FLuc
Gal3 cells regardless of treatment, suggesting comparable transduction efficiency (Fig. 23K). An
analysis of the lysate revealed the FLuc construct was not undergoing cleavage (Fig. 24A), and
that cell viability was comparable among the empty vector control and the FLuc Gal3 cells (Fig.
24B). Finally, when wild type (WT) mDA neurons were treated with α-syn fibrils, significantly
increased Gal3 secretion was also observed in the cultured media when measured by ELISA
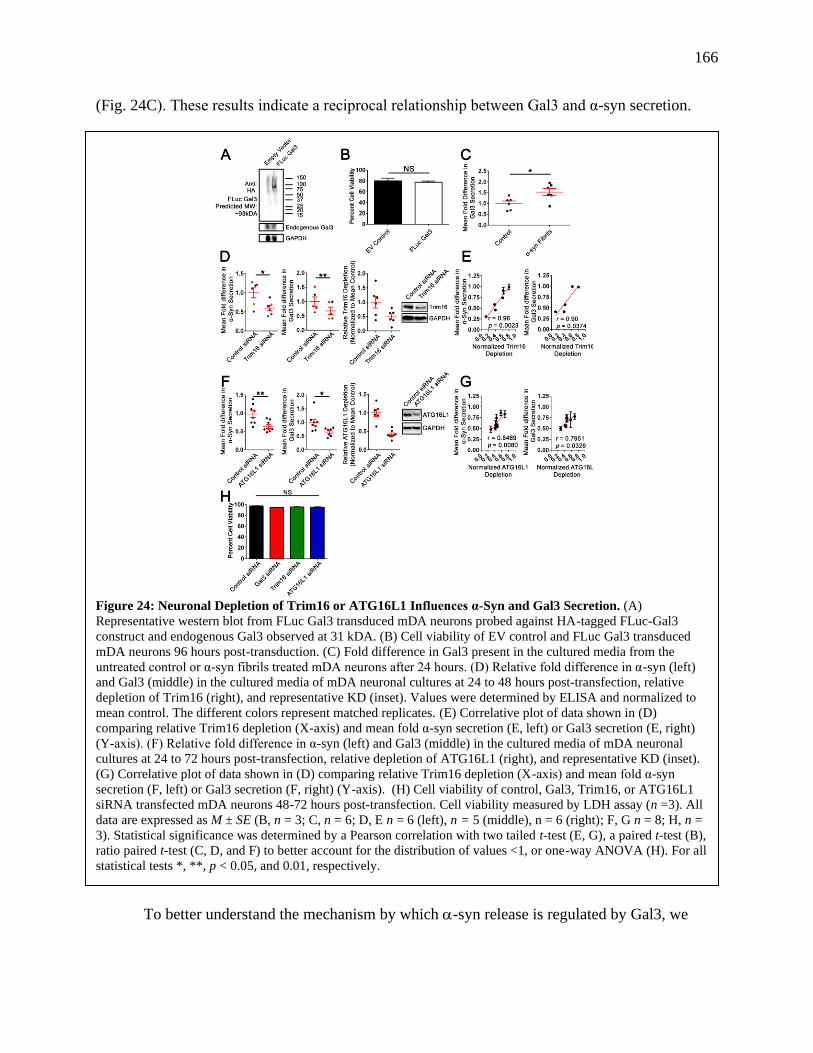
166
(Fig. 24C). These results indicate a reciprocal relationship between Gal3 and α-syn secretion.
To better understand the mechanism by which -syn release is regulated by Gal3, we
Figure 24: Neuronal Depletion of Trim16 or ATG16L1 Influences α-Syn and Gal3 Secretion. (A)
Representative western blot from FLuc Gal3 transduced mDA neurons probed against HA-tagged FLuc-Gal3
construct and endogenous Gal3 observed at 31 kDA. (B) Cell viability of EV control and FLuc Gal3 transduced
mDA neurons 96 hours post-transduction. (C) Fold difference in Gal3 present in the cultured media from the
untreated control or α-syn fibrils treated mDA neurons after 24 hours. (D) Relative fold difference in α-syn (left)
and Gal3 (middle) in the cultured media of mDA neuronal cultures at 24 to 48 hours post-transfection, relative
depletion of Trim16 (right), and representative KD (inset). Values were determined by ELISA and normalized to
mean control. The different colors represent matched replicates. (E) Correlative plot of data shown in (D)
comparing relative Trim16 depletion (X-axis) and mean fold α-syn secretion (E, left) or Gal3 secretion (E, right)
(Y-axis). (F) Relative fold difference in α-syn (left) and Gal3 (middle) in the cultured media of mDA neuronal
cultures at 24 to 72 hours post-transfection, relative depletion of ATG16L1 (right), and representative KD (inset).
(G) Correlative plot of data shown in (D) comparing relative Trim16 depletion (X-axis) and mean fold α-syn
secretion (F, left) or Gal3 secretion (F, right) (Y-axis). (H) Cell viability of control, Gal3, Trim16, or ATG16L1
siRNA transfected mDA neurons 48-72 hours post-transfection. Cell viability measured by LDH assay (n =3). All
data are expressed as M ± SE (B, n = 3; C, n = 6; D, E n = 6 (left), n = 5 (middle), n = 6 (right); F, G n = 8; H, n =
3). Statistical significance was determined by a Pearson correlation with two tailed t-test (E, G), a paired t-test (B),
ratio paired t-test (C, D, and F) to better account for the distribution of values <1, or one-way ANOVA (H). For all
statistical tests *, **, p < 0.05, and 0.01, respectively.
167
depleted human mDA neuron cultures of Trim16 and ATG16L1. Previous work suggests that
Gal3 recruits autophagic machinery through Trim16 via ULK1 when bound to damaged
endosomes and/or lysosomes [71, 226, 234]. This process was shown to be mediated by
connections with the autophagic protein ATG16L1 to clear damaged endosomes and/or
lysosomes [71, 226, 234]. Trim16 depletion significantly decreased the level of both α-syn and
Gal3 in the cultured media (Fig. 24D). When the relative levels of Trim16 depletion were
compared following Trim16 siRNA treatment, a consistent trend in Trim16 depletion relative to
α-syn and Gal3 ELISA data was observed (Fig. 24E). Similarly, following successful
knockdown ATG16L1, reduced secretion of both α-syn and Gal3 occurred in mDA neurons (Fig.
24F). The relative levels of ATG16L1 depletion also trended with the relative levels of α-syn and
Gal3 (Fig. 24G). No differences in cell viability were observed in response to Trim16,
ATG16L1, or Gal3 depletion in mDA neurons (Fig. 24H), suggesting that changes in secretion
were not the result of cell death. Collectively, these results indicate that the secretion of both -
syn and Gal3 are regulated by Trim16 and ATG16L1.
A previous study found that both tank binding kinase 1 (TBK1) and optineurin (OPTN)
were shown to be recruited to Gal3+ compartments in microglia following α-syn fibril treatment
[56]. Interestingly, when cells were treated with α-syn fibrils following specific inhibition of
TBK1, reduced levels of LC3 puncta formed but Gal3’s ability to recognized damaged
endosomal and/or lysosomal compartments remained intact. These findings suggest that TBK1
inhibition impairs the recruitment of endosomal and/or lysosomal compartments damaged by
treatment with α-syn fibrils. Given these findings, we also investigated if OPTN or TBK1
affected α-syn or Gal3 secretion in the DSP--syn SH-SY5Y cells.

168
Following the depletion of OPTN or TBK1 by siRNA treatment (Fig. 25A), reduced levels of
secreted DSP--syn and Gal3 occurred (Fig. 25B, C). No difference in cell viability was
observed among the control, OPTN, or TBK1 siRNA treated cells (Fig. 25D). These data further
suggest that impaired recruitment of autophagic proteins to damaged endosomal and/or
lysosomal compartments may affect the secretion of α-syn or Gal3 via an autophagic
mechanism.
α-Syn Fibrils Increase the Association of Trim16 and ATG16L1 with mCherry Gal3.
To determine if Trim16 and ATG16L1 were being recruited to membrane bound Gal3
following α-syn fibril induced endosomal and/or lysosomal damage, we measured the change in
Figure 25: TBK1 and Optineurin Knockdown Reduces DSP-α-Syn and Gal3 Secretion in DSP-α-Syn SH-
SY5Y Cells. (A) Representative depletion following TBK1 or Optineurin siRNA treatment in DSP-α-syn SH-
SY5Y cells 72 hours post-transfection. (B) RLUs of RLuc activity or (C) Level of Gal3 from SH-SY5Y DSP-α-
syn cell-line conditioned cultured media collected from cells 48 to 72 hours post-transfection measured by Renilla
luciferase assay or Gal3 sandwich ELISA (B, n = 4; C, n = 8). Different colors represent matched replicates. (D)
Cell viability of control, TBK1, or Optineurin siRNA transfected SH-SY5Y DSP-α-syn cells 72 hours post-
transfection (n = 4). Data are expressed as M ± SE. Statistical significance was determined by paired one-way
ANOVA with Dunnett’s post hoc tests (B, C) or Tukey’s post hoc tests (D). *, p < 0.05.
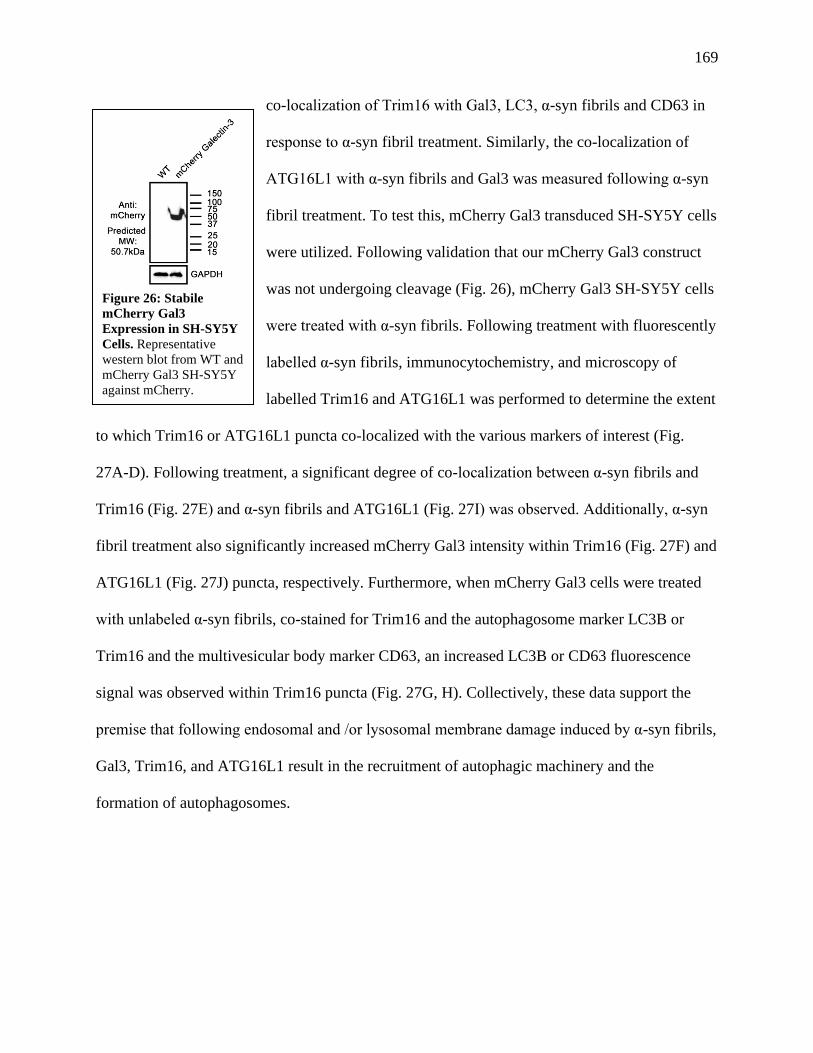
169
co-localization of Trim16 with Gal3, LC3, α-syn fibrils and CD63 in
response to α-syn fibril treatment. Similarly, the co-localization of
ATG16L1 with α-syn fibrils and Gal3 was measured following α-syn
fibril treatment. To test this, mCherry Gal3 transduced SH-SY5Y cells
were utilized. Following validation that our mCherry Gal3 construct
was not undergoing cleavage (Fig. 26), mCherry Gal3 SH-SY5Y cells
were treated with α-syn fibrils. Following treatment with fluorescently
labelled α-syn fibrils, immunocytochemistry, and microscopy of
labelled Trim16 and ATG16L1 was performed to determine the extent
to which Trim16 or ATG16L1 puncta co-localized with the various markers of interest (Fig.
27A-D). Following treatment, a significant degree of co-localization between α-syn fibrils and
Trim16 (Fig. 27E) and α-syn fibrils and ATG16L1 (Fig. 27I) was observed. Additionally, α-syn
fibril treatment also significantly increased mCherry Gal3 intensity within Trim16 (Fig. 27F) and
ATG16L1 (Fig. 27J) puncta, respectively. Furthermore, when mCherry Gal3 cells were treated
with unlabeled α-syn fibrils, co-stained for Trim16 and the autophagosome marker LC3B or
Trim16 and the multivesicular body marker CD63, an increased LC3B or CD63 fluorescence
signal was observed within Trim16 puncta (Fig. 27G, H). Collectively, these data support the
premise that following endosomal and /or lysosomal membrane damage induced by α-syn fibrils,
Gal3, Trim16, and ATG16L1 result in the recruitment of autophagic machinery and the
formation of autophagosomes.
Figure 26: Stabile
mCherry Gal3
Expression in SH-SY5Y
Cells. Representative
western blot from WT and
mCherry Gal3 SH-SY5Y
against mCherry.

170
Figure 27: α-Syn Fibril Treatment Increases the Co-localization of Trim16 and ATG16L1 with
mCherry Gal3 and α-Syn Fibrils. Representative images from mCherry Gal3 SH-SY5Y cells treated with
α-syn fibrils and stained for Trim16 and LC3B (B), Trim16 and CD63 (C), or ATTO 647 labelled α-syn
Fibrils and stained for Trim16 (A) or ATG16L1 (D). The white arrows point to instances of triple co-
localization. (E-J) α-syn fibrils (A, D, E, I) mCherry Gal3 (A, B, D, F, J), LC3B (B, G) or CD63 (C, H)
within an Imaris masking algorithm built around Trim16 (A-C, E-H) or ATG16L1 puncta (D, J). Each data
point represents the averaged maximum intensity from the total masked puncta in an individual image. The
same algorithm was applied to all experiments and treatment conditions. Intensity data are expressed as M ±
SE (n = 3 independent experiments, 7-10 images per experiment). Statistical significance was determined by
unpaired t-tests. For all statistical tests *, **, ***, ****, p < 0.05, 0.01, 0.001, and 0.0001, respectively.

171
Depletion of Gal3 and Trim16 in MDA Neurons Reduces the Recruitment of α-Syn Fibrils
to Autophagic Compartments.
Given our previous findings in the mCherry Gal3 SH-SY5Y cells, we next evaluated if
the depletion of Gal3 or Trim16 would affect α-syn fibrils recruitment to autophagic
compartments in mDA neurons. To test this, mDA neuronal cultures were transduced with
inducible yellow fluorescent protein-LC3B (YFP-LC3B), transfected with control, Gal3, or
Trim16 siRNA, then fluorescently labeled α-syn fibrils were added to the cells. Afterwards, the
cells were fixed, stained for Gal3, and imaged (Fig. 28A). Depletion of Gal3 or Trim16
significantly decreased the number of YFP-LC3B puncta per image.
Figure 28: Gal3 and Trim16 Knockdown in MDA Neurons Reduces the Recruitment of α-Syn Fibrils to
Autophagosomes. (A) Representative images of induced YFP-LC3 (green) transduced mDA neuronal cultures
treated with α-syn fibrils (blue) and stained for endogenous Gal3 (red) shown at the same intensities for each of
the channels for each condition. YFP-LC3 induction was initiated 24 hours post-transfection. α-Syn fibrils
treatment was done 48 hours post-transfection. Staining was conducted 72 hours post-transfection. (B)
Quantification of the number of YFP-LC3 puncta recognized by a masking algorithm among images for the
indicated siRNA pretreated condition. Quantification of the degree of masked YFP-LC3 puncta co-localized
with α-syn fibrils puncta (C) and Gal3 puncta (D). Each data point is the mean of 3 randomly selected
coverslips (n = 15-20 images per coverslip). Data are expressed as M ± SE. Statistical significance was
determined by one-way ANOVA with Tukey’s post hoc tests. For all statistical tests *, **, ***, ****, p < 0.05,
0.01, 0.001, and 0.0001, respectively.

172
This finding suggests that Gal3 or Trim16 knockdown decreased the number of autophagosomes
(Fig. 28B). In addition, Gal3 or Trim16 knockdown decreased the degree of co-localization
between LC3B puncta and α-syn fibril puncta (Fig. 28C) and the degree of co-localization
between LC3B puncta and Gal3 puncta (Fig. 28D). Taken together, these results suggest that
initial depletion of Gal3 or Trim16 in mDA neurons reduces the recruitment of α-syn fibrils to
the autophagic pathway.
Gal3 Depletion Impairs Lysosomal Degradative Function and Reduces Autophagic Flux
During α-Syn Fibril Treatment.
Gal3 was recently shown to be recruited to lysosomes in response to membrane stress
that precedes full-out rupture, whereby it recruits ESCRT proteins to facilitate membrane repair
and maintain lysosomal acidification [234, 458]. However, during lysosomal rupture Gal3
switches to recruit Trim16 and other autophagic machinery [234, 458]. Based on these reports,
we investigated how changes in lysosomal acidification were affected by Gal3 depletion and
within the context of α-syn fibril treatment as a function of cathepsin B activity. To test this,
human mDA neuronal cultures were transfected with control or Gal3 siRNA followed by α-syn
fibril treatment. Afterwards, cathepsin B activity was measured to evaluate lysosomal
acidification based on the fluorescent Magic Red signal. To determine the relative lysosomal
contribution, the cells were treated with either vehicle, to assess total cellular levels of cathepsin
B activity, or with Baf-A1, to inhibit lysosome acidification, to assess the non-lysosomal fraction
of activity. Fluorescence intensity was then measured every 15 minutes for 4 hours (Fig. 29A,
B), the area under the curve (AUC) was integrated for each of the treatments, and the lysosomal
contribution was calculated by subtracting the AUC for the vehicle treated condition from the
AUC for the treatment condition (Fig. 29C). Gal3 depletion or treatment with α-syn fibrils

173
decreased lysosomal degradative activity. There was no significant difference in the degree of
lysosomal degradative activity for mDA neurons that received a Gal3 KD and were treated with
α-syn fibrils compared to the mDA neurons that were Gal3 depleted or were treated with α-syn
fibrils alone (Fig. 29C).
Figure 29: Gal3 Depletion or α-Syn Fibrils Treatment Impairs Lysosome Function. (A, B) Lysosomal
dysfunction assay shows the normalized relative fluorescence units (RFU) from mDA neuronal cultures loaded
with Magic Red cathepsin B dye. Data from A and B are from the same experiments; the data is displayed in 2
graphs to increase clarity. RFU normalization was calculated from the endpoint of the control siRNA plus vehicle
(0.1% DMSO) condition. Validation of KD shown in Figure 30 and conducted as part of the same experiments. (C)
Quantification of the area under the curve for each stated condition. The vehicle minus Baf-A1 was used to
determine lysosomal activity. (D) Cell viability of Control and Gal3 siRNA transfected mDA neurons subsequently
treated with α-syn Fibrils or left untreated 48 hours post-transfection (n = 3). (E) Lysosomal dysfunction assay
shows the normalized relative fluorescence units (RFU) from SH-SY5Y DSP-α-syn cells loaded with Magic Red
cathepsin B dye. RFU normalization was calculated from the endpoint of the SH-SY5Y DSP-α-syn vehicle (0.1%
DMSO) treated condition. (F) Quantification of the AUC for each stated condition. The vehicle minus Baf-A1 was
used to determine lysosomal activity (n = 3). Data are expressed as M ± SE (n = 3). Statistical significance was
determined by paired two-tailed t-tests (F) or one-way ANOVA (C and D) with a Dunnett’s post-hoc test. For all
statistical tests *, **, ***, p < 0.05, 0.01, and 0.001, respectively.
174
The degree of cell viability of the nondepleted and Gal3 depleted mDA neurons during α-syn
treatment was comparable to the degree of cell viability of untreated mDA neurons (Fig. 29D).
Similarly, when SH-SY5Y DSP-α-syn cells treated with the Gal3 inhibitor, TD139, and then
subjected to the same assay, significantly reduced lysosomal degradative activity relative to
those treated with vehicle was observed (Fig. 29E, F).
In follow up, the corresponding previously used mDA neurons were lysed to evaluate
autophagic flux by western blot. This was performed by comparing the relative levels of p62 and
LC3-II among the vehicle and Baf-A1 treated cells with respect to the other conditions (Fig.
30A). The levels of lysosome inhibited cells to the levels of lysosome uninhibited cells were
compared to determine if changes in autophagosomes in response to Gal3 depletion or α-syn
fibril treatment are the result of upregulated autophagy or reduced autophagic clearance.
Although Baf-A1 treatment significantly increased p62 levels in control siRNA treated cells, it
had no effect on the p62 levels in any of the other conditions. Treatment with either α-syn fibrils
or α-syn fibrils and Baf-A1 had no effect on p62 levels (Fig. 30B). Notably, following α-syn
fibril treatment in both Gal3 depleted and non-depleted cells, p62 levels were more variable, with
varying degrees of higher molecular weight bands observed. Both Baf-A1 and α-syn fibrils
increased LC3-II, while Gal3 KD decreased LC3-II (Fig. 30C). While it trended toward an
increase, no significant difference in LC3-II was observed in Baf-A1 or α-syn fibrils among Gal3
depleted mDA neurons. LC3-II levels were significantly greater for control siRNA treated than
Gal3 siRNA treated mDA neurons after Baf-A1 treatment (Fig. 30C). LC3-II levels were
significantly greater for mDA neurons co-treated with Baf-A1 and α-syn fibrils compared to
mDA neurons treated with α-syn fibrils only (Fig. 30C). In mDA neurons in which Gal3 was
depleted, there was no difference in LC3-II levels for those treated withα-syn fibrils and those

175
co-treated with Baf-A1 and α-syn fibrils. No differences in LC3-II levels were observed between
Gal3 depleted mDA neurons and nondepleted neurons treated with α-syn fibrils and Gal3
depleted mDA neurons and nondepleted neurons co-treated with Baf-A1 and α-syn fibrils (Fig.
30C). Although treatment of mDA neurons with α-syn fibrils increased Gal3 levels, no other
between groups differences were observed (Fig. 30D). Finally, Gal3 levels were significantly
increased in the control siRNA α-syn fibrils treated cells compared to vehicle (Fig. 30D).
Collectively, these results suggest that Gal3 plays a role in governing lysosome function under
Figure 30: Gal3 Depletion Reduces Autophagic Flux During α-Syn Fibrils Treatment. Data shown
conducted in tandem with Data shown in Figure 38. (A) Representative western blot demonstrates p62, Gal3,
LC3-I, LC3-II, and GAPDH for the stated condition. (B-D) Quantification of western blot band intensity of
p62 (B), LC3-II (C), and Gal3 (D). The data given in A-C was from 4 independent experiments. (B-D)
Western blot quantification for each of the stated proteins and conditions whereby band intensity was
normalized to GAPDH. These values were then normalized to the mean control siRNA vehicle condition.
Data are expressed as M ± SE. Statistical significance determined by paired one-way ANOVA t-tests, with
Dunnett’s post hoc tests following natural log transformation to better account for the distribution of values
<1. For all statistical tests *, **, ***, p < 0.05, 0.01, and 0.001, respectively.
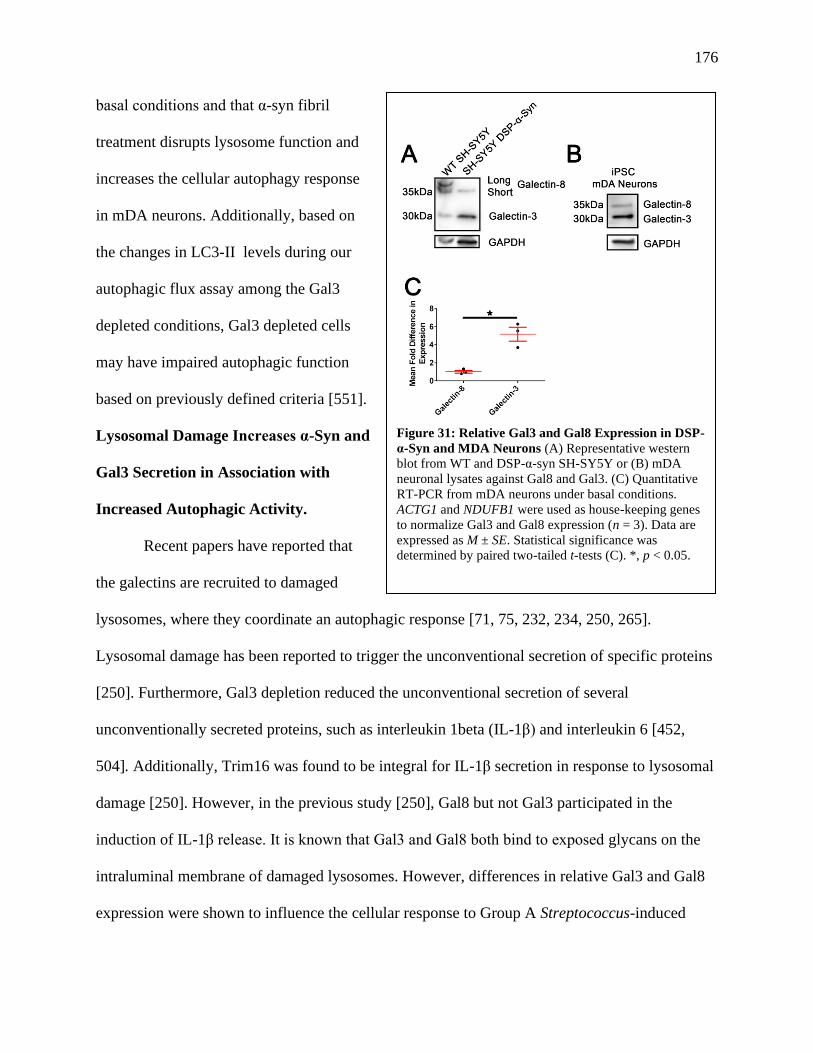
176
basal conditions and that α-syn fibril
treatment disrupts lysosome function and
increases the cellular autophagy response
in mDA neurons. Additionally, based on
the changes in LC3-II levels during our
autophagic flux assay among the Gal3
depleted conditions, Gal3 depleted cells
may have impaired autophagic function
based on previously defined criteria [551].
Lysosomal Damage Increases α-Syn and
Gal3 Secretion in Association with
Increased Autophagic Activity.
Recent papers have reported that
the galectins are recruited to damaged
lysosomes, where they coordinate an autophagic response [71, 75, 232, 234, 250, 265].
Lysosomal damage has been reported to trigger the unconventional secretion of specific proteins
[250]. Furthermore, Gal3 depletion reduced the unconventional secretion of several
unconventionally secreted proteins, such as interleukin 1beta (IL-1β) and interleukin 6 [452,
504]. Additionally, Trim16 was found to be integral for IL-1β secretion in response to lysosomal
damage [250]. However, in the previous study [250], Gal8 but not Gal3 participated in the
induction of IL-1β release. It is known that Gal3 and Gal8 both bind to exposed glycans on the
intraluminal membrane of damaged lysosomes. However, differences in relative Gal3 and Gal8
expression were shown to influence the cellular response to Group A Streptococcus-induced
Figure 31: Relative Gal3 and Gal8 Expression in DSP-
α-Syn and MDA Neurons (A) Representative western
blot from WT and DSP-α-syn SH-SY5Y or (B) mDA
neuronal lysates against Gal8 and Gal3. (C) Quantitative
RT-PCR from mDA neurons under basal conditions.
ACTG1 and NDUFB1 were used as house-keeping genes
to normalize Gal3 and Gal8 expression (n = 3). Data are
expressed as M ± SE. Statistical significance was
determined by paired two-tailed t-tests (C). *, p < 0.05.

177
lysosomal membrane damage [80]. Based on these differences, we evaluated the relative levels
of Gal3 and Gal8 in WT and DSP-α-syn SH-SY5Y cells as well as in mDA neurons lysates by
western blot. In the WT SH-SY5Y cell lysate, both the 40.3k Da (long) and 35.8 kDa (short)
isoforms of Gal8 [36] appeared to be more intense than the Gal3 band (Fig. 31A). However,
following the over-expression of the DSP-α-syn constructs, reduced levels of both Gal8 isoforms
and increased Gal3 levels were observed (Fig. 31A). Among the WT and DSP-α-syn SH-SY5Y
cells, the mDA neurons expression resembled the DSP-α-syn SH-SY5Y cells, with
corresponding lower levels of Gal8 and higher levels of Gal3 (Fig. 31B). In follow up, evaluation
of relative Gal3 and Gal8 expression in mDA neurons was determined by RT-PCR, which
revealed that a significantly greater amount of Gal3 mRNA was present compared to Gal8
mRNA (Fig. 31C). Taken together, this led us to hypothesize that lysosomal damage triggers
increased α-syn secretion and that Gal3 and Trim16 may be involved in coordinating this
response.
To determine if lysosomal damage influenced the secretion of α-syn and/or Gal3, human
mDA neurons were treated with LLOME then the cultured media was analyzed. LLOME
treatment of mDA neurons significantly increased extracellular levels of both α-syn and Gal3
(Fig. 32A, B). Similarly, LLOME treatment also increased the secretion of DSP-α-syn from SH-
SY5Y DSP-α-syn cells (Fig. 32C). To evaluate if Gal3 or Trim16 mediated this process, α-syn
secretion was measured in response to LLOME treatment in mDA neuronal cultures first
depleted of either Gal3 or Trim16. Western blot analysis of Gal3 or Trim16 levels demonstrated
successful Gal3 or Trim16 knockdown (Fig. 32F, H and Fig. 33A, C). Treatment of mDA
neurons with LLOME increased α-syn secretion in control siRNA, Gal3 siRNA, and Trim16
siRNA treated cells (Fig. 32D, E).

178
Figure 32: Lysosomal Damage Increases α-Syn and Gal3 Secretion in Association with Increased Autophagic
Activity. Relative fold difference in α-syn (A) and Gal3 (B) in the cultured media of mDA cultures 4 hours after
vehicle (0.1% DMSO) or LLOME treatment measured by ELISA and normalized to mean vehicle (D) RLUs of RLuc
activity from vehicle (0.1% DMSO) or LLOME treated DSP-α-syn SH-SY5Y cells after 4 hours (n = 4). (D, E)
Relative fold difference in α-syn from cultured media from either control and Gal3 (D) or control and Trim16 (E)
siRNA transfected mDA neurons followed by 4 hours of vehicle or LLOME treatment. Vehicle or LLOME treatment
was performed 72 hours post control or Gal3 siRNA transfection, or 48 hours post control or Trim16 siRNA
transfection. (F, H) Representative mDA neuronal lysate western blots demonstrating phosphorylated (pS757) ULK1,
total(t) ULK1, phosphorylated (pT389) P70 S6K1, total (t)P70 S6K1, Gal3 (H) as well as successful knockdown of
Gal3 (F) or Trim16 (H) from the same experiments shown in (D and E). (G, I) Quantification of western blot relative
band intensities to control siRNA and normalized to GAPDH. (J) Cell viability of control, Gal3, or Trim16 siRNA
transfected mDA neurons 72- or 48- hours post-transfection, subsequently treated with vehicle or LLOME for 4 hours.
Data are expressed as M ± SE. Statistical significance was determined by paired two-tailed t-tests (A-C) or one-way
ANOVA with Dunnett’s post hoc tests (D-E, G, I, J) following natural log transformation to better account for the
distribution of values <1. For all statistical tests *, **, ***, p < 0.05, 0.01, and 0.001, respectively.
179
However, the difference in the control siRNA treated cells was significantly greater than that
observed for the Gal3 KD or Trim16 KD mDA neurons treated with LLOME (Fig. 32F, H). No
difference in cell viability was observed among the vehicle and LLOME treated control, Gal3, or
Trim16 depleted cells (Fig. 32J). Thus, the lysosomal damage-induced increase in α-syn
secretion is dependent on Gal3 or Trim16 in human mDA neuronal cultures.
Next, we assessed the autophagic activation state in response to LLOME in Gal3 and
Trim16 depleted mDA neurons. Gal3 or Trim16 depletion did not influence baseline levels of
pS757 ULK1 to total ULK1 (tULK1) or pT389 P70 S6K1 to total p70 S6K1 (tP70 S6K1) (Fig.
32F-I). Additionally, the change in pS757 ULK1 or pT389 P70 S6K1 levels in response to
LLOME treatment was not different for the mDA neurons that had undergone prior Gal3 or
Trim16 siRNA treatment compared to those mDA neurons that had received control siRNA (Fig.
32F-I). No difference in cellular Gal3 levels were observed in control and Trim16 siRNA cells in
both the vehicle or LLOME treatment conditions (Fig. 32I), consistent with a previous report in
Trim16 depleted human bone marrow-derived mesenchymal stem cells [75]. No difference in
cell viability was observed among the vehicle and LLOME treated control, Gal3, or Trim16
depleted cells (Fig. 32J).
Similarly, evaluation of Lamp1 in the Gal3 or Trim16 depleted cells was not significantly
different for the LLOME-treated mDA neurons compared to Lamp1 observed in the mDA
neurons that had received the corresponding control siRNA treatment (Fig. 33A-D). Evaluation
of autophagosome levels revealed that Gal3 KD significantly decreased LC3-II levels in the
vehicle-treated cells (Fig. 33B); Trim16 KD had no effect on LC3-II levels (Fig. 33D). Whereas
LLOME treatment increased LC3-II levels, Gal3 KD slightly but significantly decreased LC3-II
levels while Trim16 KD did not affect the LLOME-induced increase in LC3-II levels (Fig. 33A,

180
D). Notably, the changes in LC3-II levels among the Gal3 and Trim16 depleted mDA neurons in
response to either vehicle or LLOME suggest the occurrence of abnormalities in autophagosome
levels. Collectively, they indicate that in human mDA neurons: (1) Normal, steady state levels of
autophagosomes are dependent on the degree of Gal3 expression; (2) Normal, steady state levels
of autophagosomes are not dependent on the degree of Trim 16 expression; and (3) The
upregulation of autophagy and
autophagosomes that occurs in
response to lysosomal damage is
not dependent on either Gal3 or
Trim16, but they are likely
involved in autophagosome
turnover.
Recent work
demonstrates that in response to
lysosomal membrane damage,
mTOR inactivation subsequently
results in increased transcription
factor EB (TFEB) nuclear
translocation [231, 232, 234].
Following nuclear translocation,
TFEB binds to the coordinated lysosomal expression and regulation (CLEAR) gene network
comprised of lysosomal and lysosome-associated processes genes which include autophagy,
endocytosis, and exocytosis [363]. To further confirm our previous findings from Gal3 depleted
Figure 33: Lysosomal Damage Affects Autophagosome
Formation in Gal3 or Trim16 Depleted MDA Neurons. (A, C)
Representative mDA neuronal lysate western blots demonstrating
Lamp1 and LC3-I and LC3-II levels, as well as successful
knockdown of Gal3 (A) or Trim16 (C) from the same experiments
shown in Figure 32. (B, D) Quantification of western blot relative
band intensities to control siRNA and normalized to GAPDH. All
data are expressed as M ± SE (A-B, n = 3; C-D, n = 4). Statistical
significance was determined by a paired one-way ANOVA with
Dunnett’s post hoc tests following natural log transformation to
better account for the distribution of values <1. For all statistical
tests *, p < 0.05.
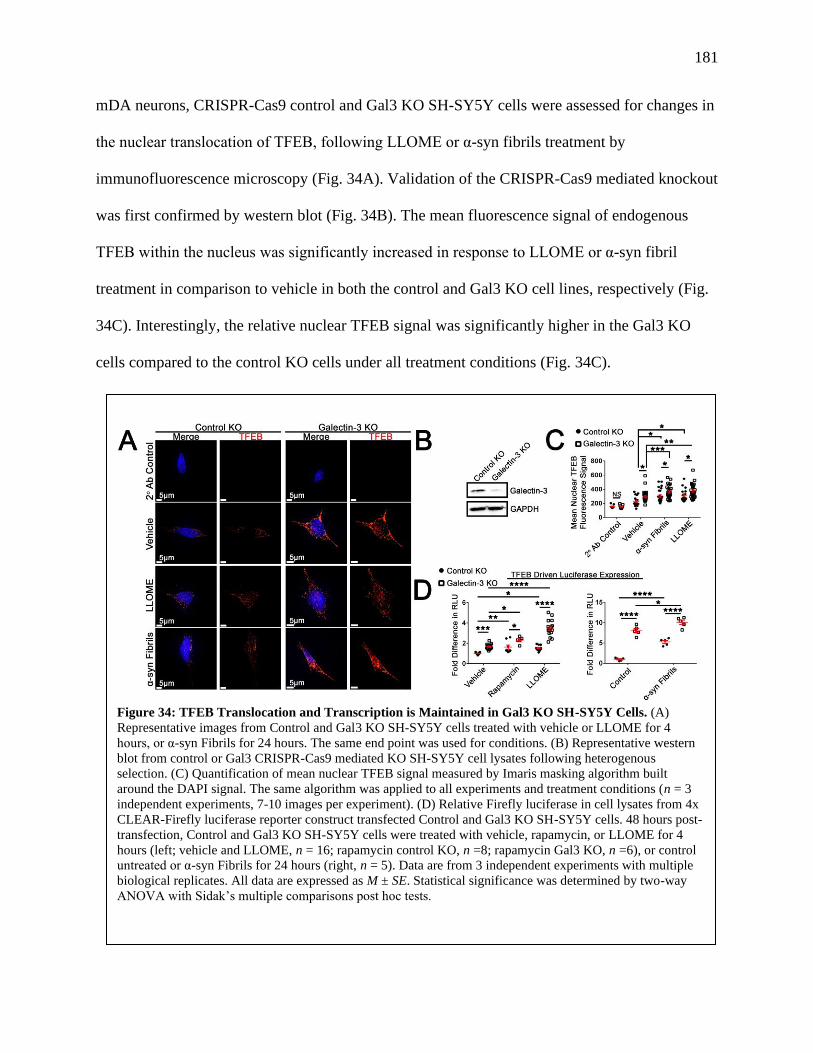
181
mDA neurons, CRISPR-Cas9 control and Gal3 KO SH-SY5Y cells were assessed for changes in
the nuclear translocation of TFEB, following LLOME or α-syn fibrils treatment by
immunofluorescence microscopy (Fig. 34A). Validation of the CRISPR-Cas9 mediated knockout
was first confirmed by western blot (Fig. 34B). The mean fluorescence signal of endogenous
TFEB within the nucleus was significantly increased in response to LLOME or α-syn fibril
treatment in comparison to vehicle in both the control and Gal3 KO cell lines, respectively (Fig.
34C). Interestingly, the relative nuclear TFEB signal was significantly higher in the Gal3 KO
cells compared to the control KO cells under all treatment conditions (Fig. 34C).
Figure 34: TFEB Translocation and Transcription is Maintained in Gal3 KO SH-SY5Y Cells. (A)
Representative images from Control and Gal3 KO SH-SY5Y cells treated with vehicle or LLOME for 4
hours, or α-syn Fibrils for 24 hours. The same end point was used for conditions. (B) Representative western
blot from control or Gal3 CRISPR-Cas9 mediated KO SH-SY5Y cell lysates following heterogenous
selection. (C) Quantification of mean nuclear TFEB signal measured by Imaris masking algorithm built
around the DAPI signal. The same algorithm was applied to all experiments and treatment conditions (n = 3
independent experiments, 7-10 images per experiment). (D) Relative Firefly luciferase in cell lysates from 4x
CLEAR-Firefly luciferase reporter construct transfected Control and Gal3 KO SH-SY5Y cells. 48 hours post-
transfection, Control and Gal3 KO SH-SY5Y cells were treated with vehicle, rapamycin, or LLOME for 4
hours (left; vehicle and LLOME, n = 16; rapamycin control KO, n =8; rapamycin Gal3 KO, n =6), or control
untreated or α-syn Fibrils for 24 hours (right, n = 5). Data are from 3 independent experiments with multiple
biological replicates. All data are expressed as M ± SE. Statistical significance was determined by two-way
ANOVA with Sidak’s multiple comparisons post hoc tests.
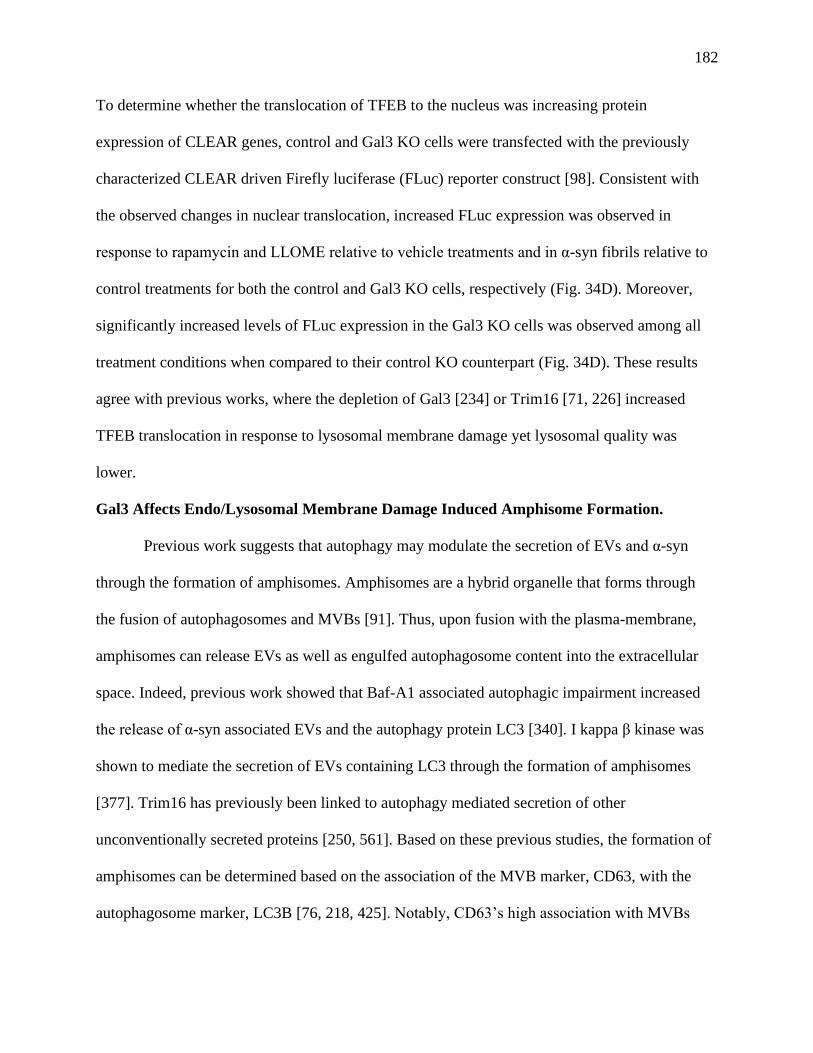
182
To determine whether the translocation of TFEB to the nucleus was increasing protein
expression of CLEAR genes, control and Gal3 KO cells were transfected with the previously
characterized CLEAR driven Firefly luciferase (FLuc) reporter construct [98]. Consistent with
the observed changes in nuclear translocation, increased FLuc expression was observed in
response to rapamycin and LLOME relative to vehicle treatments and in α-syn fibrils relative to
control treatments for both the control and Gal3 KO cells, respectively (Fig. 34D). Moreover,
significantly increased levels of FLuc expression in the Gal3 KO cells was observed among all
treatment conditions when compared to their control KO counterpart (Fig. 34D). These results
agree with previous works, where the depletion of Gal3 [234] or Trim16 [71, 226] increased
TFEB translocation in response to lysosomal membrane damage yet lysosomal quality was
lower.
Gal3 Affects Endo/Lysosomal Membrane Damage Induced Amphisome Formation.
Previous work suggests that autophagy may modulate the secretion of EVs and α-syn
through the formation of amphisomes. Amphisomes are a hybrid organelle that forms through
the fusion of autophagosomes and MVBs [91]. Thus, upon fusion with the plasma-membrane,
amphisomes can release EVs as well as engulfed autophagosome content into the extracellular
space. Indeed, previous work showed that Baf-A1 associated autophagic impairment increased
the release of α-syn associated EVs and the autophagy protein LC3 [340]. I kappa β kinase was
shown to mediate the secretion of EVs containing LC3 through the formation of amphisomes
[377]. Trim16 has previously been linked to autophagy mediated secretion of other
unconventionally secreted proteins [250, 561]. Based on these previous studies, the formation of
amphisomes can be determined based on the association of the MVB marker, CD63, with the
autophagosome marker, LC3B [76, 218, 425]. Notably, CD63’s high association with MVBs
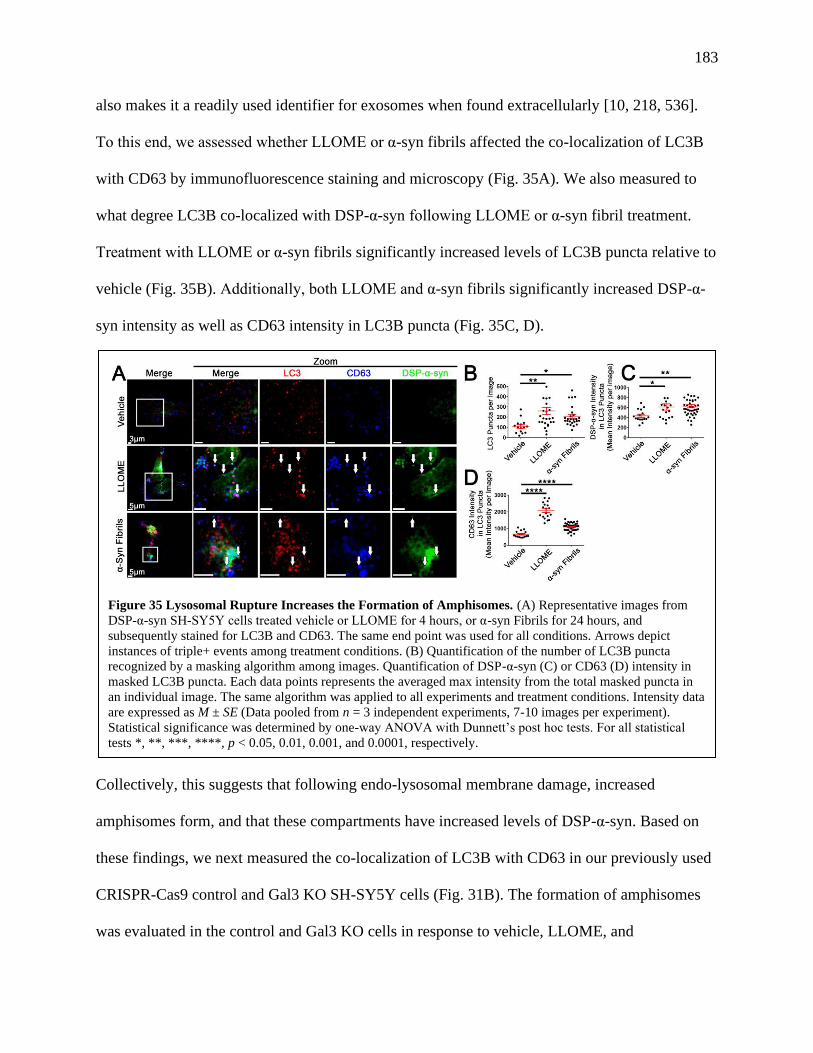
183
also makes it a readily used identifier for exosomes when found extracellularly [10, 218, 536].
To this end, we assessed whether LLOME or α-syn fibrils affected the co-localization of LC3B
with CD63 by immunofluorescence staining and microscopy (Fig. 35A). We also measured to
what degree LC3B co-localized with DSP-α-syn following LLOME or α-syn fibril treatment.
Treatment with LLOME or α-syn fibrils significantly increased levels of LC3B puncta relative to
vehicle (Fig. 35B). Additionally, both LLOME and α-syn fibrils significantly increased DSP-α-
syn intensity as well as CD63 intensity in LC3B puncta (Fig. 35C, D).
Collectively, this suggests that following endo-lysosomal membrane damage, increased
amphisomes form, and that these compartments have increased levels of DSP-α-syn. Based on
these findings, we next measured the co-localization of LC3B with CD63 in our previously used
CRISPR-Cas9 control and Gal3 KO SH-SY5Y cells (Fig. 31B). The formation of amphisomes
was evaluated in the control and Gal3 KO cells in response to vehicle, LLOME, and
Figure 35 Lysosomal Rupture Increases the Formation of Amphisomes. (A) Representative images from
DSP-α-syn SH-SY5Y cells treated vehicle or LLOME for 4 hours, or α-syn Fibrils for 24 hours, and
subsequently stained for LC3B and CD63. The same end point was used for all conditions. Arrows depict
instances of triple+ events among treatment conditions. (B) Quantification of the number of LC3B puncta
recognized by a masking algorithm among images. Quantification of DSP-α-syn (C) or CD63 (D) intensity in
masked LC3B puncta. Each data points represents the averaged max intensity from the total masked puncta in
an individual image. The same algorithm was applied to all experiments and treatment conditions. Intensity data
are expressed as M ± SE (Data pooled from n = 3 independent experiments, 7-10 images per experiment).
Statistical significance was determined by one-way ANOVA with Dunnett’s post hoc tests. For all statistical
tests *, **, ***, ****, p < 0.05, 0.01, 0.001, and 0.0001, respectively.
184
fluorescently labelled α-syn fibril treatment, stained for LC3B and CD63, and analyzed by
microscopy (Fig. 36A). Significantly increased levels of LC3B puncta were observed in the
control KO in response to LLOME and α-syn fibril treatment compared to the respective
condition in the Gal3 KO cells (Fig. 36B).
No change in the number of LC3B puncta was observed in response to either treatment in the
Gal3 KO cells. Similarly, CD63 intensity within LC3B puncta was significantly greater in the
Figure 36: Gal3 KO Reduces Lysosome Rupture Induced Amphisome Formation. (A) Representative
images from Control and Gal3 KO SH-SY5Y cells treated with vehicle or LLOME for 4 hours, or Atto 550
labelled α-syn Fibrils for 24 hours, and subsequently stained for LC3B, CD63, and Gal3. The same end point
was used for conditions. Arrows depict instances of triple+ events among treatment conditions. (B)
Quantification of the number of LC3B puncta recognized by a masking algorithm among images.
Quantification of Gal3 (C), CD63 (D), or α-syn Fibrils (E) intensity in masked LC3B puncta. Each data points
represents the averaged max intensity from the total masked puncta in an individual image. The same algorithm
was applied to all experiments and treatment conditions. (F) Relative fluorescence units of Atto 550 labelled α-
syn Fibrils at 0 hours and after media change at 24 hours. Fluorescence signal of the total coverslip was read on
a plate reader set to (λ = EX: 554, EM: 575). Data are expressed as M ± SE (A-E, Data pooled from n = 5
independent experiments, 7-10 images per experiment), (F, n = 3). Statistical significance was determined by
unpaired t-test (C, E), paired two-tailed t-test (F) or one-way ANOVA with Dunnet’s post hoc tests (B, D). For
all statistical tests *, **, ***, ****, p < 0.05, 0.01, 0.001, and 0.0001, respectively.

185
control KO cells when compared to the Gal3 KO cells under vehicle, LLOME, and α-syn fibril
treatment conditions (Fig. 36D). No significant change in CD63 intensity within LC3B puncta
was observed in the Gal3 KO cells (Fig. 36D). Following LLOME treatment, increased Gal3
intensity in LC3B puncta was observed in the control KO cells (Fig. 36C). Furthermore,
significantly increased α-syn fibril intensity was observed in LC3B puncta in the control KO
cells relative to the Gal3 KO cells (Fig. 36E). In whole, these data suggest that Gal3 depletion
reduces the formation of autophagosomes, the recruitment of α-syn fibrils to autophagosomes,
and the formation of CD63-LC3B positive compartments consistent with amphisomes. To
validate that Gal3 KO did not affect these observed differences by affecting α-syn fibril uptake,
the fluorescence intensities of the α-syn fibrils was measured using a plate reader immediately
after treatment and 24 hours later, before the cells were fixed in preparation for imaging. No
significant difference was observed between the control and Gal3 KO cells at either time point
(Fig. 36F).
Gal3 is Readily Released in α-Syn Associated EVs.
Since the results of previous experiments suggested that Gal3 and Trim16 are associated
with specific recruitment of exogenous fibrillar α-syn to the secretory autophagic pathway, that
Gal3 and Trim16 depletion influence mDA neuronal secretion of endogenous α-syn, and that
Gal3, α-syn, and LC3B were secreted in association with EVs released from the DSP-α-syn SH-
SY5Y cell line, we rationalized that Gal3 may affect α-syn associated EVs released from mDA
neurons via this autophagic mechanism. To this end, EVs from mDA neurons were first
evaluated to determine if Gal3 associates with the EVs released from mDA neurons. EVs from
the cultured media of mDA neurons were concentrated by differential ultracentrifugation,
subsequently labelled for CD63 (10 nm), Gal3 (15 nm), and α-syn (5 nm) by immunogold, and

186
TEM was performed (Fig. 37A).
Figure 37: Gal3 Inhibition Affects the Composition of Secreted Extracellular Vesicles from MDA
Neurons (A) TEM from concentrated WT mDA culture media following immunogold labeling.
Representative image shows α-syn+ (5 nm), CD63+ (10 nm), and Gal3+ (15 nm) triple positive EV. (B)
NTA analysis of EVs from WT mDA neurons following differential ultracentrifugation. EV sizes binned in
1nm increments with a bin center of 0.5nm. NTA of resuspended mDA EVs were performed in technical
quintuplicates, denoted as different shades of green, blue, or red for 3 independent samples. Each sample was
from distinct mDA differentiation. (C) Representative z-stack from a constructed z-stack maximum intensity
projection obtained from concentrated extracellular vesicles from mDA neuron cultured media. Concentrated
EVs were stained for Gal3, α-syn, and combined pool of mouse anti-tetraspanin antibodies against CD9,
CD63, and CD81 referred to as tetraspanin. Processed immunofluorescence with only the Gal3 primary
antibody and the secondary antibodies against all three channels (2o antibody control) was also performed to
determine relative background. (D) Summarized average co-localization of Gal3+ masking algorithm Spots
from three independent experiments. Gal3+ Spots that are single positive (green), Gal3+ α-syn+ double
positive (yellow), Gal3+ tetraspanin+ double positive (Cyan), and Gal3+ α-syn+ tetraspanin+ triple positive
(white). (E) Representative non-reducing SDS-PAGE of concentrated EVs and the corresponding lysates
from mDA neurons treated with vehicle, TD139, α-syn Fibrils, or TD139 + α-syn Fibrils. (F) Cell viability
of mDA neurons based on LDH present in the culture media. Data are expressed as M ± SE. Intensity data
(C-D) (n = 3 independent experiments, 15 images per experiment, pooled co-localization data from each
image among experiments). E, pooled cultured media from n = 3. F, n = 3 significance determined by one-
way ANOVA.
187
Vesicles double- and triple-positive for the exosomal marker CD63, as well as Gal3 and α-syn
were observed (Fig. 37A). Further characterization by NTA revealed that the mean size of mDA
EVs was 149.4 ± 7.4 nm with the most common size being 106.5 nm (Fig. 37B). These results
are consistent with the triple positive vesicle’s size observed by TEM (Fig. 37A, right) and what
is commonly reported for exosomes in the literature [125].
Using the EV-MAC workflow, the extent Gal3 co-localized with α-syn and the collective
tetraspanin EV markers CD9, CD63, and CD81 was determined by using pooled antibodies
against the previously stated tetraspanin markers (hereafter referred to as a tetraspanin, Fig.
37C). The degree to which Gal3 co-localized with a tetraspanin independent of α-syn was 50.4 ±
2.4%, and double co-localized with a tetraspanin and α-syn was 21.0 ± 2.0% (Fig. 37D).
Conversely, the percentage of Gal3 co-localized with α-syn independent of the tetraspanins was
negligible. Based on observations of primary omit control staining, we interpret this finding to be
due to background staining. The degree to which Gal3 did not co-localize with either α-syn or a
tetraspanin marker was 27.8 ± 1.5% (Fig. 37D).
Given the results of our previous experiments, EVs from mDA neurons were evaluated
following an extended time course in which cells were subjected to vehicle or the Gal3 inhibitor,
TD139, treatment with or without an initial treatment of α-syn fibrils. The cultured media over
the course of a month was collected from each condition. Subsequently, the culture media was
pooled from three independent cultures from the same, respective treatment condition, and
concentrated to get a sufficient sample quantity.
Non-reducing SDS-PAGE of the concentrated EVs and lysate was performed (Fig. 37E).
The presence of the canonical EV marker CD81 was observed in all treatment conditions.
Similarly, CD63 was observed in all conditions. However, TD139 treatment appeared to reduce
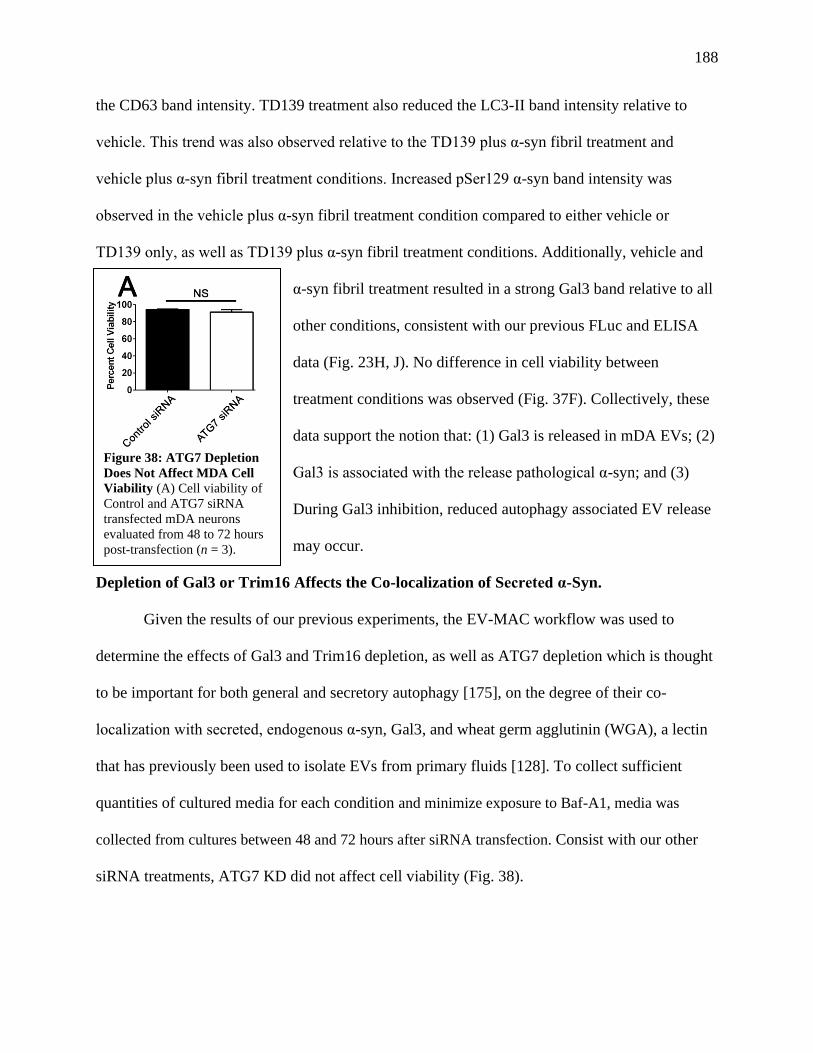
188
the CD63 band intensity. TD139 treatment also reduced the LC3-II band intensity relative to
vehicle. This trend was also observed relative to the TD139 plus α-syn fibril treatment and
vehicle plus α-syn fibril treatment conditions. Increased pSer129 α-syn band intensity was
observed in the vehicle plus α-syn fibril treatment condition compared to either vehicle or
TD139 only, as well as TD139 plus α-syn fibril treatment conditions. Additionally, vehicle and
α-syn fibril treatment resulted in a strong Gal3 band relative to all
other conditions, consistent with our previous FLuc and ELISA
data (Fig. 23H, J). No difference in cell viability between
treatment conditions was observed (Fig. 37F). Collectively, these
data support the notion that: (1) Gal3 is released in mDA EVs; (2)
Gal3 is associated with the release pathological α-syn; and (3)
During Gal3 inhibition, reduced autophagy associated EV release
may occur.
Depletion of Gal3 or Trim16 Affects the Co-localization of Secreted α-Syn.
Given the results of our previous experiments, the EV-MAC workflow was used to
determine the effects of Gal3 and Trim16 depletion, as well as ATG7 depletion which is thought
to be important for both general and secretory autophagy [175], on the degree of their co-
localization with secreted, endogenous α-syn, Gal3, and wheat germ agglutinin (WGA), a lectin
that has previously been used to isolate EVs from primary fluids [128]. To collect sufficient
quantities of cultured media for each condition and minimize exposure to Baf-A1, media was
collected from cultures between 48 and 72 hours after siRNA transfection. Consist with our other
siRNA treatments, ATG7 KD did not affect cell viability (Fig. 38).
Figure 38: ATG7 Depletion
Does Not Affect MDA Cell
Viability (A) Cell viability of
Control and ATG7 siRNA
transfected mDA neurons
evaluated from 48 to 72 hours
post-transfection (n = 3).

189
Figure 39: Gal3 and Trim16 Depletion Reduce Gal3 and α-Syn Associated Secretion. Legend on the next
page
190
Collected EVs from each condition were spinoculated onto coverslips, and α-syn and Gal3 were
identified by immunocytochemistry after light permeabilization of EVs. This process was also
applied within the context of lysosomal inhibition by Baf-A1 treatment. Evaluation of the
cultured media from mDA neurons by the EV-MAC workflow revealed that α-syn co-localized
with Gal3 (Fig. 39A), a finding consistent with what was observed in a HeLa DSP-α-syn cell line
EVs (Fig. 18). After validating proper KD of each respective target (Fig. 39B), the image
analysis software (Imaris, Bitplane) was used to build a Spots masking algorithm around the α-
syn fluorescence signal to determine its relative co-localization with Gal3 and WGA as
previously described. Using the secondary antibody control, the relative background signal for
Gal3 and WGA was determined (Fig. 39C). Based on these values, α-syn from the cultured
media of mDA neurons treated with either control, Gal3, Trim16, or ATG7 siRNA followed by
vehicle or Baf-A1 was compared. Moreover, we also evaluated the relative quantity of secreted
α-syn based on our generated masking algorithm. In the cultured media from mDA neurons
treated with siRNA vehicle, 54.1 ± 1.9% of the spots were single labeled, α-syn+, 17.3 ± 1.7% of
the spots were dual labeled, α-syn+ WGA+, 24.1 ± 2.7% of the spots were dual labeled, α-syn+
Gal3+, and 4.5 ± 0.7% of the spots were triple labeled, α-syn+ WGA+ Gal3+ (Fig. 39D). In
Figure 39: Gal3 and Trim16 Depletion Reduce Gal3 and α-Syn Associated Secretion. (A) A representative
z-stack from multiple z-stack MIPs of imaged mDA neurons’ cultured media. Cells were first transfected with
siRNAs followed by either vehicle (0.1% DMSO) or Baf-A1 treatment 48 hours post-transfection for 24 hours.
(B) A representative western blot that demonstrates successful depletion of Gal3, Trim16, or ATG7. (C)
Representative co-localization plot from a single image demonstrating relative co-localization of secreted
endogenously expressed α-syn as determined by antibodies against α-syn (clone MJFR-1) with Gal3 (y-axis) or
WGA (x-axis) based on their respective maximum fluorescence intensity from Imaris Spots masking algorithm
identified α-syn. The secondary antibody control (2o Ab control) was used to determine Gal3 and WGA
background levels. (D) Summarized percent co-localization of α-syn+ Spots that are single α-syn+ positive
(blue), α-syn+ WGA+ double positive (cyan), α-syn+ Gal3+ double positive (magenta), and α-syn+ WGA+
Gal3+ triple positive (white). The number of α-syn puncta (E) or WGA puncta (F) from each image based on the
same Imaris masking algorithm as a measure of relative differences between the conditions. Each data point is
the mean of 20 images for each independent experiments. There were 4 independent experiments. Statistical
significance was determined by a two-way ANOVA, with Dunnett’s post hoc tests. * indicates significance
relative to control plus vehicle, # indicates significance relative to control plus Baf-A1.
191
control siRNA treated mDA neurons, Baf-A1 treatment decreased the percentage of single
labeled, α-syn+ spots yet had no effect on the percentage of dual labeled, α-syn+ Gal3+ spots,
the percentage of spots that were dual labeled, α-syn+ WGA+, and the percentage of spots that
were triple labeled, α-syn+ WGA+ Gal3+ (Fig. 39D). However, this change was observed in all
of the Baf-A1 treated mDA neurons except for those depleted of ATG7 (Fig. 39D). Gal3
depleted mDA neurons treated with vehicle had a decreased percentage of dual labeled, α-syn+
spots that were also Gal3+. Gal3 depletion had no effect on the percentage of spots were single
labeled, α-syn+, the percentage of spots that were dual labeled, α-syn+ WGA+, and the
percentage of spots that were triple labeled, α-syn+ WGA+ Gal3+. For mDA neurons that
received a Gal3 KD, Baf-A1 treatment decreased the percentage of single labeled, α-syn+ spots
and dual labeled, α-syn+ Gal3+ spots yet had no effect on the percentage of spots that were dual
labeled, α-syn+ WGA+ and the percentage of spots that were triple labeled, α-syn+ WGA+
Gal3+. Trim16 KD increased the percentage of spots were single labeled, α-syn+ and decreased
the percentage of spots that were dual labeled, α-syn+ Gal3+, yet had no effect on the percentage
of spots that were dual labeled, α-syn+ WGA+ and the percentage of spots that were triple
labeled, α-syn+ WGA+ Gal3+. For mDA neurons that received a Trim16 KD, Baf-A1 treatment
increased the percentage of single labeled, α-syn+ spots and decreased the percentage of dual
labeled, α-syn+ Gal3+ spots yet had no effect on the percentage of spots that were dual labeled,
α-syn+ WGA+, and the percentage of spots that were triple labeled, α-syn+ WGA+ Gal3+.
ATG7 knockdown followed by vehicle treatment did not significantly influence the percentage
of single labeled, α-syn+, dual labeled, α-syn+ Gal3+ or α-syn+ WGA+, as well as triple labeled,
α-syn+ WGA+ Gal3+ spots. However, ATG7 knockdown followed by Baf-A1 treatment reduced
the number of dual labeled, α-syn+ WGA+ spots yet had no effect on the percentage of spots that
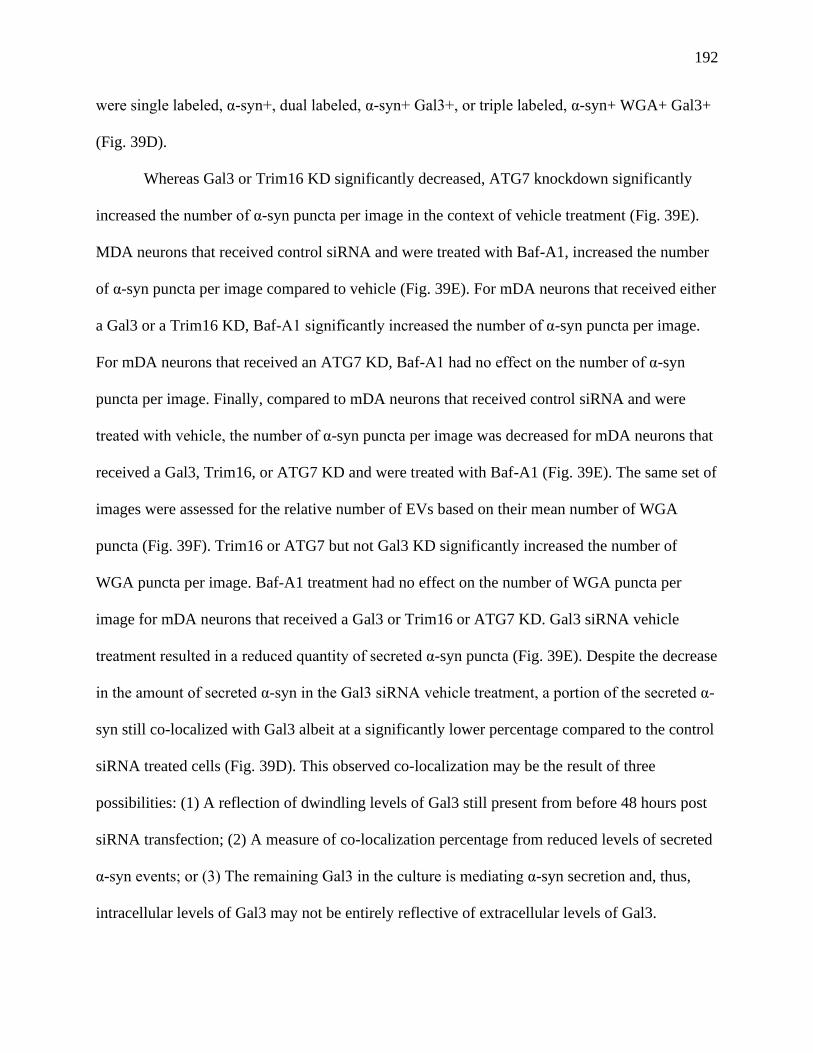
192
were single labeled, α-syn+, dual labeled, α-syn+ Gal3+, or triple labeled, α-syn+ WGA+ Gal3+
(Fig. 39D).
Whereas Gal3 or Trim16 KD significantly decreased, ATG7 knockdown significantly
increased the number of α-syn puncta per image in the context of vehicle treatment (Fig. 39E).
MDA neurons that received control siRNA and were treated with Baf-A1, increased the number
of α-syn puncta per image compared to vehicle (Fig. 39E). For mDA neurons that received either
a Gal3 or a Trim16 KD, Baf-A1 significantly increased the number of α-syn puncta per image.
For mDA neurons that received an ATG7 KD, Baf-A1 had no effect on the number of α-syn
puncta per image. Finally, compared to mDA neurons that received control siRNA and were
treated with vehicle, the number of α-syn puncta per image was decreased for mDA neurons that
received a Gal3, Trim16, or ATG7 KD and were treated with Baf-A1 (Fig. 39E). The same set of
images were assessed for the relative number of EVs based on their mean number of WGA
puncta (Fig. 39F). Trim16 or ATG7 but not Gal3 KD significantly increased the number of
WGA puncta per image. Baf-A1 treatment had no effect on the number of WGA puncta per
image for mDA neurons that received a Gal3 or Trim16 or ATG7 KD. Gal3 siRNA vehicle
treatment resulted in a reduced quantity of secreted α-syn puncta (Fig. 39E). Despite the decrease
in the amount of secreted α-syn in the Gal3 siRNA vehicle treatment, a portion of the secreted α-
syn still co-localized with Gal3 albeit at a significantly lower percentage compared to the control
siRNA treated cells (Fig. 39D). This observed co-localization may be the result of three
possibilities: (1) A reflection of dwindling levels of Gal3 still present from before 48 hours post
siRNA transfection; (2) A measure of co-localization percentage from reduced levels of secreted
α-syn events; or (3) The remaining Gal3 in the culture is mediating α-syn secretion and, thus,
intracellular levels of Gal3 may not be entirely reflective of extracellular levels of Gal3.
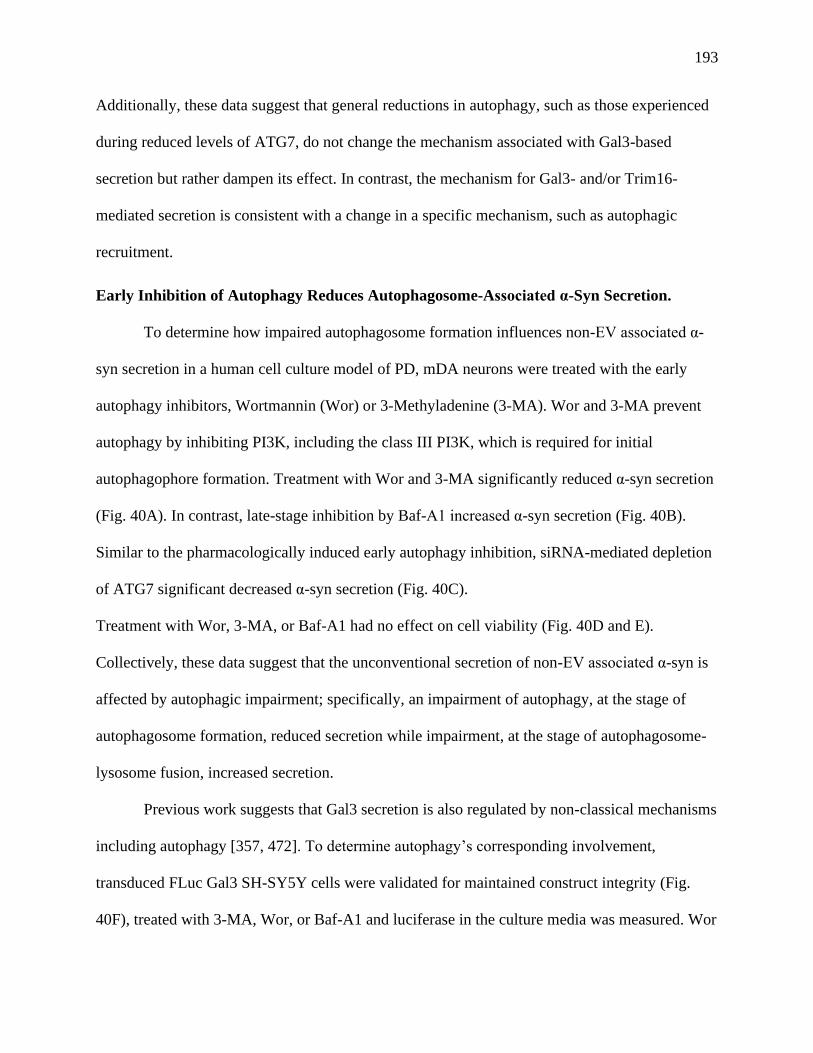
193
Additionally, these data suggest that general reductions in autophagy, such as those experienced
during reduced levels of ATG7, do not change the mechanism associated with Gal3-based
secretion but rather dampen its effect. In contrast, the mechanism for Gal3- and/or Trim16-
mediated secretion is consistent with a change in a specific mechanism, such as autophagic
recruitment.
Early Inhibition of Autophagy Reduces Autophagosome-Associated α-Syn Secretion.
To determine how impaired autophagosome formation influences non-EV associated α-
syn secretion in a human cell culture model of PD, mDA neurons were treated with the early
autophagy inhibitors, Wortmannin (Wor) or 3-Methyladenine (3-MA). Wor and 3-MA prevent
autophagy by inhibiting PI3K, including the class III PI3K, which is required for initial
autophagophore formation. Treatment with Wor and 3-MA significantly reduced α-syn secretion
(Fig. 40A). In contrast, late-stage inhibition by Baf-A1 increased α-syn secretion (Fig. 40B).
Similar to the pharmacologically induced early autophagy inhibition, siRNA-mediated depletion
of ATG7 significant decreased α-syn secretion (Fig. 40C).
Treatment with Wor, 3-MA, or Baf-A1 had no effect on cell viability (Fig. 40D and E).
Collectively, these data suggest that the unconventional secretion of non-EV associated α-syn is
affected by autophagic impairment; specifically, an impairment of autophagy, at the stage of
autophagosome formation, reduced secretion while impairment, at the stage of autophagosome-
lysosome fusion, increased secretion.
Previous work suggests that Gal3 secretion is also regulated by non-classical mechanisms
including autophagy [357, 472]. To determine autophagy’s corresponding involvement,
transduced FLuc Gal3 SH-SY5Y cells were validated for maintained construct integrity (Fig.
40F), treated with 3-MA, Wor, or Baf-A1 and luciferase in the culture media was measured. Wor

194
or 3-MA treatment significantly reduced the release of Fluc Gal3 (Fig. 40G). Conversely, Baf-
A1 treatment significantly increased FLuc Gal3 secretion (Fig. 40H). These corresponding
changes are in-line with what was observed for α-syn secretion (Fig. 40A and B).
Figure 40: Impaired Autophagosome Formation Decreases the Unconventional Secretion of α-Syn and
Gal3. mDA neurons were plated for 7 days then treated with early autophagy inhibitors Wor or 3-MA (A), the
late-autophagy inhibitor Baf-A1 (C) or vehicle (0.1% DMSO) for 24 hours. α-Syn levels were measured from
unlysed, cultured media by ELISA. (C) A representative western blot demonstrating KD of ATG7 from mDA
neurons and α-syn from unlysed, cultured media by ELISA. Cultured media was collected from 48-72 hours
post-transfection. (D) Cell viability of vehicle, 3-MA, and Wor (A), or vehicle and Baf-A1 (B) treated mDA
neurons. (E) Representative western blot of WT and FLuc Gal3 transduced SH-SY5Y cells probed against HA-
tagged FLuc-Gal3 construct and endogenous Gal3 observed at 31 kDA. Relative change in secretion of FLuc
Gal3 from FLuc Gal3 transduced SH-SY5Y cells in response to (G) vehicle (0.1% DMSO), Wor, and 3-MA or
(H) vehicle and Baf-A1 after 24 hours. Data are expressed as M ± SE. Statistical significance was determined by
(D) paired one-way ANOVA with Dunnett’s post hoc tests or (B) paired two-tailed t-tests.All data are expressed
as M ± SE. Statistical significance was determined by paired two-tailed t-tests.

195
Discussion
In this study, we examined the secretory pathway of -syn to understand how cellular
perturbations of the ALP system may impact its release. To do this, we began by examining how
the release of a DSP--syn fusion protein was impacted by ALP stress, including ALP stress
induced by exogenous -syn fibrils. In these studies, we were able to utilize the differential
labelling of DSP--syn and exogenous -syn fibrils to observe colocalization of these forms of
-syn in cells and in EVs secreted from these cells. The DSP-α-syn model is unique in that it
allows for the evaluation of the interactions between endogenous α-syn and exogenously added
α-syn fibrils, which can otherwise be hard to evaluate. We also found that α-syn fibril treatment
influenced the amount of high molecular weight α-syn in our DSP-α-syn cells as well as both the
secretion and the fluorescence intensity of DSP-α-syn+ in EVs containing exogenous fibrils.
While it is possible that vesicular association of these two forms of -syn may potentially be
locations of templated misfolding of endogenous -syn to other, pathological species, the use of
DSP--syn fusions precludes such a conclusion, as such fusions may not behave the same as
endogenous, untagged forms of a-syn. However, they do reveal co-localization and secretion of
-syn in a context that is consistent with our previous studies of exogenous -syn fibrils [146,
153] and other studies examining the degradation or secretion of endogenous -syn [9, 132, 235,
387], as well as other similar fusions that increase the release of -syn [59, 106]. The
colocalization of these different forms of -syn minimally reflect the central role of ALP
pathway in the cellular response to exogenous -syn fibrils as well as the secretion of -syn.
We also observed that: (1) Gal3 and α-syn are secreted together by an autophagic
mechanism; (2) that Gal3 or Trim16 depletion reduces α-syn secretion; (3) This secretion occurs
in response to lysosomal rupture (Fig. 32). To this end, we found that lysosomal rupture triggers
196
the secretion of α-syn and Gal3 and upregulates autophagy by inhibiting mTOR in mDA
neurons. Additionally, depletion of Gal3 or Trim16 reduced both basal and lysosomal rupture-
induced α-syn secretion; however, the changes in mTOR mediated phosphorylation of ULK1 or
p70 S6K1 were comparable to the control and Gal3 or Trim16 siRNA treated cells, respectively,
in response to rupture. Our investigation of the underlying mechanism revealed that reduced
recruitment of α-syn fibrils to autophagic compartments occurred when either Gal3 or Trim16
were depleted. Additionally, depletion of either Gal3 or Trim16 reduced the observed degree of
co-localization of secreted Gal3 and α-syn. Furthermore, Gal3 depletion was associated with
autophagic flux impairment and reduced lysosomal cathepsin activity. Collectively, this work
has led us to propose a mechanism whereby mDA cells respond to lysosomal membrane damage
which can be induced by pathological forms of α-syn by upregulating the cellular autophagy
response due to mTOR inhibition. Subsequently, Gal3 and Trim16 are recruited and facilitate the
ruptured lysosomes to autophagosomes, which, ultimately, increases α-syn secretion from mDA
neurons. This response may act as a defensive mechanism in response to compromised
lysosomal integrity. Additionally, we found that Gal3 also facilitates general lysosomal
degradative capacity under basal conditions. These mechanisms are illustrated in Fig. 41. To our
knowledge, we are the first to link Gal3 or lysosomal rupture to α-syn secretion.
In previous work by our lab, treating cells with α-syn fibrils resulted in their endocytosis
into endo-lysosomal compartments where they induced rupture followed by their recruitment to
the ALP [147, 153]. To evaluate the relevance of these findings, Gal3 immunoreactivity was
observed within and surrounding LBs in brain sections obtained postmortem from PD patients.
These findings suggest a link between α-syn aggregates, lysosomal rupture, and cellular

197
pathology. In this work, we connected lysosomal rupture, which is induced by pathological α-
syn, to secretion, which could subsequently result in cell-to-cell transfer.
Figure 41: Summary cartoon of hypothesized mechanism Cartoon illustrates hypothetical mechanism where
endocytosed pathological α-syn enters the cell and induce lysosomal rupture. Lysosomal rupture results in
mTOR inactivation subsequently increasing ULK1 and p70 S6K1 activity. Concurrently, lysosomal rupture
exposures its inner-luminal glycans which are recognized by Gal3. Bound Gal3 recruit Trim16 and ULK1 to
mediate autophagic machinery assembly, increase cellular autophagy, and promote autophagosome
development. This response ultimately increases α-syn secretion. (Bottom) Gal3 recruitment to lysosomes
during early membrane stress facilitate membrane repair.

198
Consequently, lysosomal rupture may explain how native and pathological α-syn interact to
subsequently seed further misfolding of native α-syn based on the observed co-localization of
secreted α-syn fibrils and DSP--syn. Moreover, this failure within the ALP could link spreading
and accumulation to a singular mechanism.
Recently, the Deretic group have extensively characterized the galectins’ involvement in
autophagy at both the mechanistic and cell signaling level [71, 232, 234, 250, 265]. They
originally demonstrated Gal3’s interaction with Trim16 through ULK1, which was also
demonstrated by another group in bone marrow derived mesenchymal stem cells [71, 75, 226].
Our work specifically links these protein interactions to PD pathology. We found that Gal3 was
involved in α-syn fibril’s recruitment to autophagic compartments and that depletion of either
Gal3 or Trim16 reduced its secretion via the ALP. Gal3 depletion also reduced autophagic flux
in response to α-syn fibril treatment, a finding that is consistent with what was recently described
in response to lysosomal rupture [234] and basally in bone marrow derived mesenchymal stem
cells [75]. Notably, Gal3 inhibited microglia were shown to have a reduced phagocytic capacity
and clear less α-syn fibrils [43], a finding consistent with the observed decrease in lysosomal
cathepsin B activity reported herein. Similar to Gal3, Trim16 KO cells had impaired autophagic
flux and a reduced capacity to clear protein aggregates and accumulated autophagosomes [226].
Yet, despite an impairment in autophagic clearance, both Trim16 KO and Gal3 KO cells were
reported to have increased TFEB translocation, which one would expect to increase degradative
capacity. Interestingly, when TFEB over-expressing cells underwent pharmacologically induced
impairment of autophagic flux, they lost their ability to clear protein aggregates [565]. Thus,
despite increases in TFEB translocation, they may be unable to clear α-syn due to impaired
autophagy at the level of recruitment or autophagosome formation. Collectively, these results

199
may indicate that Gal3 is important for maintaining lysosome integrity and when impaired or
depleted, Gal3 slows turnover or secretion of damaged lysosomes by reducing their initiation
into the ALP. TBK1 and Optineurin were shown to be recruited to Gal3 positive compartments
in microglia following α-syn fibril treatment [56]. Treatment with the TBK1 specific inhibitor,
Amlexanox, was found to reduce LC3 puncta formation but did not prevent Gal3’s recognition
of damaged lysosomal compartments following α-syn fibril treatment. Gal3, ATG9A, ULK1,
OPTN, and Beclin-1 have all been shown to be recruited to salmonella or Coxiella burnetti
vacuoles to repair damaged endosomal membranes and have been suggested to use a conserved
pathway to facilitate this response [261, 318]. It is tempting to think these other proteins might
further be involved in recruitment of Gal3+ compartments to the autophagic pathway in mDA
neurons.
In this work, we demonstrate a link between Gal3, α-syn, and autophagy. However, we
cannot rule out the possibility that other galectins, such as Gal8 or Gal9, are also involved in PD
pathology, as it is now appreciated that Gal3, Gal8, and Gal9 all participate in coordinating an
upregulated cellular autophagic response at both the transcriptional and mechanistic levels [71,
232, 234, 250, 265]. Furthermore, we found that Trim16 and ATG16L1 were involved in α-syn
and Gal3 secretion via autophagy mediated secretion, which was previously shown to be
important for IL-1β secretion in response to lysosomal rupture and inflammasome activation
[250, 561]. However, in contrast to these previous findings, IL-1β secretion was dependent on
Gal8 and nuclear dot protein 52 kDa (NDP52) but not on Gal3 in THP-1 cells and mouse bone
marrow derived macrophages. However, intracellular Gal3 inhibition reduced the secretion of
inflammatory cytokines, such as IL-1β and IL-6, in microglial cells isolated from a Huntington’s
disease model [452]. Additionally, differences in relative Gal3 and Gal8 expression have

200
previously been linked to altered cellular responses to lysosomal membrane rupture induced by
Group A Streptococcus [80]. It is well recognized that Gal3 participates in inflammation and
evokes an inflammatory response in immune cells [44, 452]. Thus, Gal3-mediated secretion may
be cell-type specific and to prevent self-stimulated inflammation. It is tempting to extrapolate
from this paradigm; given that because neurons have a lower phagocytic capacity relative to
macrophages or microglia [156, 157], they may secrete membrane bound Gal3 compartments for
microglia to clear rather than accumulate them. This paradigm is consistent with Boza-Serrano et
al., 2014 in which Gal3 inhibition reduced BV2 microglial activation, phagocytic capacity, and
clearance of α-syn fibrils [43]. They postulated a similar pathological ultimatum, in which
substantial reductions in phagocytosis and reduced microglia activation were observed during
Gal3 inhibition yet, consequently, increased α-syn phagocytosis by microglia could reduce
pathological α-syn load during early pathology. This may explain why increased Gal3 is
observed in the cerebrospinal fluid of those with PD as well as other neurodegenerative diseases
[13, 526]. Moreover, this paradigm is further supported by Danzer et al., 2011 where they
showed exosome associated α-syn released during degradative autophagy impairment was more
readily taken-up by microglial cells compared to neurons [106].
Canonically, autophagy is the process by which autophagosomes mediate the degradation
of engulfed content through their fusion with lysosomes. Therefore, an autophagic inhibitor is
defined based on its ability to impair this previously mentioned process. While Wortmannin, 3-
MA, and Bafilomycin-A1 are all autophagic inhibitors, the mechanism by which they prevent
autophagy differ. Wortmannin and 3-MA are best classified as early-stage inhibitors while Baf-
A1 is a late-stage inhibitor. Wortmannin and 3-MA are phosphatidylinositol 3-kinase (PI3K)
inhibitors. The class III PI3K, composed of Vps34 and Vps15, form a complex with Beclin-1,
201
and play an essential role in the development of the autophagophore [554]. Thus, wortmannin
and 3-MA prevent autophagy by blocking the formation of autophagosomes to ultimately
prevent the degradation of content. In contrast, Baf-A1 inhibits the V-ATPase H+ pump on
lysosomes, preventing lysosome acidification, as well as preventing autophagosome-lysosome
fusion [326, 327]. Therefore, Baf-A1 prevents autophagy by affecting the lysosomes degradative
capacity. This impairs autophagy but does not affect the formation of autophagosomes.
Collectively, the literature agrees that late stage inhibition of autophagy increases both non-EV
and EV associated α-syn secretion [9, 86, 106, 279, 340, 387] and has been shown to also
increase the secretion of the autophagic markers LC3-II and p62 in primary neurons [340].
Similarly, Gal3 secretion can be modulated by autophagy [357, 472]. Our work reinforces these
previous findings, as both α-syn and Gal3 secretion were elevated when measured by multiple
assays and with several cell types.
In contrast, studies report marked differences during early autophagy inhibition [132,
155, 279, 387]. A couple of studies found that when cells over-expressing α-syn were treated
with 3-MA, an increase in α-syn secretion occurred [155, 279]. However, 3-MA treatment did
not increase secretion within the non-vesicular fraction in a study in which immortalized
dopaminergic precursor cells were used [155]. Yet, ATG5 depletion concurrently increased α-
syn secretion within the EV fraction as well as the exosomal marker CD81 [155]. Conversely, in
another study, 3-MA did not increase secretion in either the total or EV fraction of the cultured
media from H4 cells [387]. Another study found, in PC12 cells over-expressing A30P α-syn as
well as tubulin polymerization promoting protein, reduced autophagosome-lysosome fusion and
reduced α-syn secretion occurred when depleted of ATG5 [132]. Rab27b knockdown impaired
autophagy and reduced general α-syn secretion and clearance [507]. However, the α-syn that was
202
secreted had a higher molecular weight. Here, we found that early autophagic inhibition in mDA
neurons by 3-MA, Wor, or ATG7 depletion decreased the secretion of non-vesicular α-syn but
increased the number of α-syn EVs measured by EV-MAC. Interestingly, Fussi et al., 2018
showed that inhibition of EV secretion blocked the increase in α-syn secretion when ATG5 was
knocked down [155]. They hypothesized that inhibition of autophagy was shunting α-syn into
the exosomal secretion pathway to compensate for failed degradation. Our work supports this
hypothesis. Furthermore, it may be that continued early autophagic inhibition pronounces this
compensatory mechanism alongside accumulation, which could explain the apparent
discrepancies between studies. However, more work is necessary before definitive conclusions
can be drawn.
Notably, a final category of autophagic modulators are activators. Canonical autophagic
activation by rapamycin treatment reduced α-syn secretion [106]. However, trehalose, a non-
canonical autophagic activator that circumvents mTOR, increased secretion [132, 550].
Interestingly, a recent paper found that trehalose increases autophagy in a motor-degeneration
model by inducing small amounts of lysosomal damage that upregulates TFEB and coincide with
increased levels of eGFP-Gal3 [422]. The mechanism by which lysosomal membrane damaging
agents drive α-syn secretion could be, in part, by compromised lysosomal function, which is
similar to our lysosome acidification inhibitor data, as well as through the specific recruitment of
damaged lysosomes to the autophagic pathway. Changes in TFEB associated gene regulation are
known to occur following lysosomal membrane damage. This process upregulates both
lysosomal and autophagy associated proteins [231, 232, 234, 265, 266] thus increasing the
number of lysosomes to restore the cellular pool following comprised function. Galectins
regulate this process and recognize damaged lysosomes. Therefore, galectins, such as Gal3, may
203
act as sensors to deviate autophagosomes to the secretory pathway upon recognizing that
lysosome integrity is compromised following membrane damage. In neurons, this mechanism
may be especially important, as they are long-lived cells expected to last a lifetime.
Concluding Remarks
In this document, a mechanism by which mDA neurons secrete α-syn in response to
lysosomal membrane rupture following the recruitment of Gal3 and the subsequent autophagic
proteins including Trim16 and ATG16L1 is outlined. Additionally, it was shown that the cellular
response to lysosomal membrane rupture results in increased mTOR inhibition, increased TFEB
translocation, increased amphisome formation, and increased secretion of α-syn. This secreted α-
syn is observed in collected EVs in association with Gal3. Depletion of Gal3, Trim16, or
ATG16L1 reduces the secretion of α-syn. Similarly, depletion of Trim16 or ATG16L1 also
reduces the secretion of Gal3. Gal3 depletion also reduced α-syn secretion during lysosomal
rupture, the formation of amphisomes, and lysosomal degradative capacity. However, depletion
of Gal3 did not influence mTOR associated signaling. These processes support a premise that
pathological α-syn may result in a cellular defense mechanism resulting in its secretion in
association with Gal3 following lysosomal membrane damage.
It is ultimately unclear if this mechanism is beneficial or detrimental to the spreading of
disease. It is reasonable that this mechanism may facilitate the removal of pathological α-syn
from neuronal cells, which on a single cell level is beneficial. However, long-term this may be
ultimately detrimental if pathological α-syn is transferred to neighboring neurons or when the
surrounding microenvironment is over-burdened. In contrast, the secretion of α-syn via this
mechanism may facilitate total brain clearance, by degradative cells, such as microglia or by CSF
drainage. During the early stages of PD this process may be beneficial but ultimately problematic

204
in later-stages when microglial become overwhelmed. Moreover, this secretion mechanism may
ultimately increase neuroinflammation by excessively activating microglia through increased
Gal3 secretion which is known to activate inflammatory cascades.
An important consideration for future work would be to look at how mDA neuron
associated secretion of Gal3 and α-syn affects the surround cells and whether microglia are able
to clear secreted pathological forms of α-syn. The result of this experiment would provide insight
into the previous unanswered questions. Additionally, this document primarily focuses on
autophagy in the context of secretion. The effects of Gal3 or Trim16 depletion on the
accumulation and degradation of α-syn are not readily explored in the context of DA neurons.
However, work by other supports suggests that Gal3 or Trim16 depletion would increase α-syn
accumulation [226, 295].
Here it was shown that Gal3 depletion reduced cathepsin activity. Whether this process is
the result of reduced lysosomal acidification, mistrafficking of cathepsins, or from impaired
lysosomal repair was not confirmed. However, an important consideration is that dopaminergic
secretory vesicles also depend on their acidification for antiport coupled uptake of dopamine. It
is feasible that Gal3 depletion also affects dopamine secretion by influencing dopaminergic
secretory vesicles V-ATPase in a process akin to the lysosomal V-ATPase, which could also
ultimately contribute to a PD phenotype by further reducing available dopamine following an
action potential.
Another important consideration is that the mechanism highlighted here also affects other
amyloid proteins. In other neurodegenerative diseases, particularly in the context of AD, Gal3
associated secretion of amyloid proteins may be further complicated by the presence of both
hyper-phosphorylated tau and amyloid-β. If the same mechanism identified here affects the
205
secretion of both hyper-phosphorylated tau and amyloid-β, then Gal3 may exacerbate early
amyloid-β pathology by increasing its secretion. In later stages of AD, secretion of hyper-
phosphorylated tau may further overwhelm disease pathology or contrastingly reduce cellular
burden at the single cell level. Further complicating things, increased Gal3 secretion is associated
with insulin resistance and diabetes which are linked to AD [152]. In agreement with this
proposed scenario, increased Gal3 expression was linked to increased amyloid-β associated
pathology but reduced intracellular hyperphosphorylated tau [44, 295, 491].
In other neurodegenerative diseases, several of the proteins identified here that affected
the secretion of α-syn have been identified in GWAS studies for other neurodegenerative
diseases. It is also known that other amyloid proteins also undergo unconventional secretion.
Specifically, mutations in the Gal3 gene, LGALS3, and the Optineurin gene, OPTN, have been
liked to other neurodegenerative diseases including Huntington’s disease and ALS [32]. These
transcriptional studies seem to indicate that inflammation pathways are also dysregulated by
these proteins. It is unknown if Gal3 or Optineurin also affect the secretion of inflammatory
cytokines in other cell-types or from neurons. Furthermore, it remains unclear the role neurons
specifically contribute to total CNS inflammation which may ultimately be useful to the
collective understanding of neurodegenerative disorders including synucleinopathies.
Another important point of clarification is Gal3’s role in facilitating autophagy also
remains unclear. The data here suggests that Gal3 depletion reduces the total activation of
autophagy, lowering autophagic flux and lysosomal associated degradative capacity. However,
TFEB associated signaling was not impaired in Gal3 depleted cells but instead heightened. Despite
this finding, Gal3 depletion or inhibition reduced lysosomal degradative capacity. This suggests
that Gal3 is involved in facilitating cellular degradative clearance at level beyond transcription.

206
Notably, upon scouring the literature, only GSK-3B and Trim16 were found to affect lysosomal
acidification and/or degradative potential when upregulated TFEB signaling was intact [15, 71,
75]. It was previously proposed that Trim16 depletion reduced lysosomal quality despite increased
TFEB translocation following lysosomal membrane damage [71]. This hypothesis is in line with
the data shown here. However, mechanistically this is puzzling, as in nearly all cases increased
TFEB translocation results in increased lysosomal degradative capacity [97, 266].
Here, I provide evidence that α-syn is released via an unconventional secretion
mechanism in mDA neurons using autophagic machinery and through the ALP. I highlighted
the involvement of Gal3 and its associating proteins, Trim16 and ATG16L1, to mediate selective
autophagy to drive secretion. Furthermore, I showed that secretion occurs in association with
Gal3 which, along with its autophagic adaptor, Trim16 and ATG16L1 mediate the autophagic
response to lysosomal damage induced by pathological species of α-syn. Additionally, I also
showed that Gal3 plays a role in maintaining lysosomal function and general autophagy in mDA
neuronal cultures. During the depletion of these proteins reduced α-syn occurs by failing to be
recruited to autophagic compartments. Based on my data, this process requires the formation of
autophagosomes and prevents the secretion of both Gal3 and α-syn. Additionally, this data
supports that specific recruitment α-syn to autophagic compartments by Gal3-Trim16-ATG16L1
is important for this process. Additionally, I found that autophagosome associated protein LC3-II
and Gal3 were secreted in EVs from both our DSP-α-syn and mDA neurons. Following the
inhibition of EV secretion within our DSP-α-syn cell-line or inhibition of Gal3 in mDA neurons,
lower levels of these proteins in EVs were observed while treatment with α-syn fibrils increased
these proteins. To this end, the mechanism is likely occurring through the formation of
amphisomes. The fusion of these amphisomes with the plasma membrane may explain how
207
autophagy modulates the release of EV associated α-syn via gal3. Thus, I propose that Gal3
assists in mediating α-syn release in mDA neurons. Theoretically, this response may initially be
beneficial, by increasing microglial uptake and clearance. However, as pathological α-syn load
increases, continual secretion may tip the scales in favor of a disease state due to excessive
microglial response, inflammation, and transmission between cells. This data may ultimately be
useful in the identification of biomarkers that are released by this mechanism. Furthermore,
drugs that modulate these pathways may ultimately be useful therapeutics for the treatment of
PD, synucleinopathies in general, and other neurodegenerative diseases.

208
APPENDIX
ADDITIONAL FIGURES FOR REFERENCE

209
Appendix Figure 1: Characterization of the Point Spread Function by Empirical Testing. A) Empirically
tested Full Width Half Max (FWHM) of 100nm Tetraspecks at increasing exposure times in the FITC channel to
determine point spread function. Images were collected with a Bin 2x2 to best compare the tetraspeck data to the
S15Ch data. B, C) FWHM of deconvolved 100nm FITC Tetraspecks and concentrated S15Ch EVs with similar
laser intensity and exposure conditions with a Bin size of 2x2 and 1x1, respectively. Data was subjected to a
two-tailed T-test, no significant differences were found. Error bars show SEM D) S15Ch co-localization
distribution for S15Ch EVs stained with CD81 and LAMP1 from Bin 1x1 and Bin 2x2 collected fields. 12
images were taken per coverslip. All data are expressed M ± SE (n = 3).
Appendix Figure 2: Validation of α-Syn and Gal3 ELISA An in-house α-syn (A) and Gal3 (B) sandwich
ELISA using commercially available antibodies. A representative example of α-syn (A) or Gal3 (B) serial
dilutions demonstrate the generation of a standard curve when added to uncultured media.

210
REFERENCE LIST
1. Abbott SK, Li H, Muñoz SS, Knoch B, Batterham M, Murphy KE, Halliday GM, Garner
B (2014) Altered ceramide acyl chain length and ceramide synthase gene expression in
Parkinson’s disease. Mov Disord 29: 518-526 Doi 10.1002/mds.25729
2. Aelvoet SA, Ibrahimi A, Macchi F, Gijsbers R, Van den Haute C, Debyser Z, Baekelandt
V (2014) Noninvasive bioluminescence imaging of alpha-synuclein oligomerization in
mouse brain using split firefly luciferase reporters. J Neurosci 34: 16518-16532 Doi
10.1523/JNEUROSCI.4933-13.2014
3. Ahmed I, Liang Y, Schools S, Dawson VL, Dawson TM, Savitt JM (2012) Development
and characterization of a new Parkinson's disease model resulting from impaired
autophagy. The Journal of neuroscience : the official journal of the Society for
Neuroscience 32: 16503-16509 Doi 10.1523/JNEUROSCI.0209-12.2012
4. Alam P, Bousset L, Melki R, Otzen DE (2019) alpha-synuclein oligomers and fibrils: a
spectrum of species, a spectrum of toxicities. J Neurochem 150: 522-534 Doi
10.1111/jnc.14808
5. Alam P, Bousset L, Melki R, Otzen DE (2019) α-synuclein oligomers and fibrils: a
spectrum of species, a spectrum of toxicities. Journal of Neurochemistry 150: 522-534
Doi 10.1111/jnc.14808
6. Alcalay RN, Mallett V, Vanderperre B, Tavassoly O, Dauvilliers Y, Wu RYJ, Ruskey
JA, Leblond CS, Ambalavanan A, Laurent SBet al (2019) SMPD1 mutations, activity,
and α-synuclein accumulation in Parkinson's disease. Mov Disord 34: 526-535 Doi
10.1002/mds.27642
7. Aldridge GM, Birnschein A, Denburg NL, Narayanan NS (2018) Parkinson's Disease
Dementia and Dementia with Lewy Bodies Have Similar Neuropsychological Profiles.
Front Neurol 9: 123 Doi 10.3389/fneur.2018.00123
8. Alegre-Abarrategui J, Brimblecombe KR, Roberts RF, Velentza-Almpani E, Tilley BS,
Bengoa-Vergniory N, Proukakis C (2019) Selective vulnerability in alpha-
synucleinopathies. Acta Neuropathol 138: 681-704 Doi 10.1007/s00401-019-02010-2
9. Alvarez-Erviti L, Seow Y, Schapira AH, Gardiner C, Sargent IL, Wood MJ, Cooper JM
(2011) Lysosomal dysfunction increases exosome-mediated alpha-synuclein release and
transmission. Neurobiol Dis 42: 360-367 Doi 10.1016/j.nbd.2011.01.029
211
10. Andreu Z, Yanez-Mo M (2014) Tetraspanins in extracellular vesicle formation and
function. Front Immunol 5: 442 Doi 10.3389/fimmu.2014.00442
11. Arotcarena ML, Bourdenx M, Dutheil N, Thiolat ML, Doudnikoff E, Dovero S, Ballabio
A, Fernagut PO, Meissner WG, Bezard Eet al (2019) Transcription factor EB
overexpression prevents neurodegeneration in experimental synucleinopathies. JCI
Insight 4: Doi 10.1172/jci.insight.129719
12. Arotcarena ML, Teil M, Dehay B (2019) Autophagy in Synucleinopathy: The
Overwhelmed and Defective Machinery. Cells 8: Doi 10.3390/cells8060565
13. Ashraf GM, Baeesa SS (2018) Investigation of Gal-3 Expression Pattern in Serum and
Cerebrospinal Fluid of Patients Suffering From Neurodegenerative Disorders. Front
Neurosci 12: 430 Doi 10.3389/fnins.2018.00430
14. Auron PE, Webb AC, Rosenwasser LJ, Mucci SF, Rich A, Wolff SM, Dinarello CA
(1984) Nucleotide sequence of human monocyte interleukin 1 precursor cDNA. Proc Natl
Acad Sci U S A 81: 7907-7911 Doi 10.1073/pnas.81.24.7907
15. Avrahami L, Farfara D, Shaham-Kol M, Vassar R, Frenkel D, Eldar-Finkelman H (2013)
Inhibition of glycogen synthase kinase-3 ameliorates beta-amyloid pathology and restores
lysosomal acidification and mammalian target of rapamycin activity in the Alzheimer
disease mouse model: in vivo and in vitro studies. J Biol Chem 288: 1295-1306 Doi
10.1074/jbc.M112.409250
16. Axe EL, Walker SA, Manifava M, Chandra P, Roderick HL, Habermann A, Griffiths G,
Ktistakis NT (2008) Autophagosome formation from membrane compartments enriched
in phosphatidylinositol 3-phosphate and dynamically connected to the endoplasmic
reticulum. J Cell Biol 182: 685-701 Doi 10.1083/jcb.200803137
17. Aylett CH, Sauer E, Imseng S, Boehringer D, Hall MN, Ban N, Maier T (2016)
Architecture of human mTOR complex 1. Science 351: 48-52 Doi
10.1126/science.aaa3870
18. Back MJ, Ha HC, Fu Z, Choi JM, Piao Y, Won JH, Jang JM, Shin IC, Kim DK (2018)
Activation of neutral sphingomyelinase 2 by starvation induces cell-protective autophagy
via an increase in Golgi-localized ceramide. Cell Death Dis 9: 670 Doi 10.1038/s41419-
018-0709-4
19. Bae EJ, Yang NY, Lee C, Kim S, Lee HJ, Lee SJ (2015) Haploinsufficiency of cathepsin
D leads to lysosomal dysfunction and promotes cell-to-cell transmission of α-synuclein
aggregates. Cell Death Dis 6: e1901 Doi 10.1038/cddis.2015.283
20. Bae EJ, Yang NY, Song M, Lee CS, Lee JS, Jung BC, Lee HJ, Kim S, Masliah E, Sardi
SPet al (2014) Glucocerebrosidase depletion enhances cell-to-cell transmission of alpha-
synuclein. Nat Commun 5: 4755 Doi 10.1038/ncomms5755

212
21. Baietti MF, Zhang Z, Mortier E, Melchior A, Degeest G, Geeraerts A, Ivarsson Y,
Depoortere F, Coomans C, Vermeiren Eet al (2012) Syndecan-syntenin-ALIX regulates
the biogenesis of exosomes. Nat Cell Biol 14: 677-685 Doi 10.1038/ncb2502
22. Bajaj L, Lotfi P, Pal R, Ronza AD, Sharma J, Sardiello M (2019) Lysosome biogenesis in
health and disease. J Neurochem 148: 573-589 Doi 10.1111/jnc.14564
23. Banfer S, Jacob R (2020) Galectins in Intra- and Extracellular Vesicles. Biomolecules 10:
Doi 10.3390/biom10091232
24. Bar-Peled L, Schweitzer LD, Zoncu R, Sabatini DM (2012) Ragulator is a GEF for the
rag GTPases that signal amino acid levels to mTORC1. Cell 150: 1196-1208 Doi
10.1016/j.cell.2012.07.032
25. Barake F, Soza A, Gonzalez A (2020) Galectins in the brain: advances in
neuroinflammation, neuroprotection and therapeutic opportunities. Curr Opin Neurol 33:
381-390 Doi 10.1097/WCO.0000000000000812
26. Barbour R, Kling K, Anderson JP, Banducci K, Cole T, Diep L, Fox M, Goldstein JM,
Soriano F, Seubert Pet al (2008) Red blood cells are the major source of alpha-synuclein
in blood. Neurodegener Dis 5: 55-59 Doi 10.1159/000112832
27. Baron W, Hoekstra D (2010) On the biogenesis of myelin membranes: sorting,
trafficking and cell polarity. FEBS Lett 584: 1760-1770 Doi
10.1016/j.febslet.2009.10.085
28. Baron W, Ozgen H, Klunder B, de Jonge JC, Nomden A, Plat A, Trifilieff E, de Vries H,
Hoekstra D (2015) The major myelin-resident protein PLP is transported to myelin
membranes via a transcytotic mechanism: involvement of sulfatide. Mol Cell Biol 35:
288-302 Doi 10.1128/MCB.00848-14
29. Barros LF, San Martín A, Ruminot I, Sandoval PY, Fernández-Moncada I, Baeza-
Lehnert F, Arce-Molina R, Contreras-Baeza Y, Cortés-Molina F, Galaz Aet al (2017)
Near-critical GLUT1 and Neurodegeneration. J Neurosci Res 95: 2267-2274 Doi
10.1002/jnr.23998
30. Bartels T, Choi JG, Selkoe DJ (2011) alpha-Synuclein occurs physiologically as a
helically folded tetramer that resists aggregation. Nature 477: 107-110 Doi
10.1038/nature10324
31. Bellomo G, Paciotti S, Gatticchi L, Parnetti L (2020) The vicious cycle between alpha-
synuclein aggregation and autophagic-lysosomal dysfunction. Mov Disord 35: 34-44 Doi
10.1002/mds.27895
32. Benmamar-Badel A, Owens T, Wlodarczyk A (2020) Protective Microglial Subset in
Development, Aging, and Disease: Lessons From Transcriptomic Studies. Frontiers in
immunology 11: 430-430 Doi 10.3389/fimmu.2020.00430
213
33. Benskey MJ, Perez RG, Manfredsson FP (2016) The contribution of alpha synuclein to
neuronal survival and function - Implications for Parkinson's disease. J Neurochem 137:
331-359 Doi 10.1111/jnc.13570
34. Betemps D, Verchere J, Brot S, Morignat E, Bousset L, Gaillard D, Lakhdar L, Melki R,
Baron T (2014) Alpha-synuclein spreading in M83 mice brain revealed by detection of
pathological alpha-synuclein by enhanced ELISA. Acta Neuropathol Commun 2: 29 Doi
10.1186/2051-5960-2-29
35. Bianco F, Perrotta C, Novellino L, Francolini M, Riganti L, Menna E, Saglietti L,
Schuchman EH, Furlan R, Clementi Eet al (2009) Acid sphingomyelinase activity
triggers microparticle release from glial cells. EMBO J 28: 1043-1054 Doi
10.1038/emboj.2009.45
36. Bidon-Wagner N, Le Pennec JP (2002) Human galectin-8 isoforms and cancer.
Glycoconj J 19: 557-563 Doi 10.1023/B:GLYC.0000014086.38343.98
37. Billingsley KJ, Barbosa IA, Bandres-Ciga S, Quinn JP, Bubb VJ, Deshpande C, Botia JA,
Reynolds RH, Zhang D, Simpson MAet al (2019) Mitochondria function associated
genes contribute to Parkinson's Disease risk and later age at onset. NPJ Parkinsons Dis 5:
8 Doi 10.1038/s41531-019-0080-x
38. Boerger M, Funke S, Leha A, Roser AE, Wuestemann AK, Maass F, Bähr M, Grus F,
Lingor P (2019) Proteomic analysis of tear fluid reveals disease-specific patterns in
patients with Parkinson's disease - A pilot study. Parkinsonism Relat Disord 63: 3-9 Doi
10.1016/j.parkreldis.2019.03.001
39. Bolam JP, Pissadaki EK (2012) Living on the edge with too many mouths to feed: why
dopamine neurons die. Mov Disord 27: 1478-1483 Doi 10.1002/mds.25135
40. Borghi R, Marchese R, Negro A, Marinelli L, Forloni G, Zaccheo D, Abbruzzese G,
Tabaton M (2000) Full length alpha-synuclein is present in cerebrospinal fluid from
Parkinson's disease and normal subjects. Neurosci Lett 287: 65-67 Doi 10.1016/s0304-
3940(00)01153-8
41. Borland H, Vilhardt F (2017) Prelysosomal Compartments in the Unconventional
Secretion of Amyloidogenic Seeds. Int J Mol Sci 18: Doi 10.3390/ijms18010227
42. Bousset L, Pieri L, Ruiz-Arlandis G, Gath J, Jensen PH, Habenstein B, Madiona K,
Olieric V, Bockmann A, Meier BHet al (2013) Structural and functional characterization
of two alpha-synuclein strains. Nat Commun 4: 2575 Doi 10.1038/ncomms3575
43. Boza-Serrano A, Reyes JF, Rey NL, Leffler H, Bousset L, Nilsson U, Brundin P, Venero
JL, Burguillos MA, Deierborg T (2014) The role of Galectin-3 in alpha-synuclein-
induced microglial activation. Acta Neuropathol Commun 2: 156 Doi 10.1186/s40478-
014-0156-0
214
44. Boza-Serrano A, Ruiz R, Sanchez-Varo R, Garcia-Revilla J, Yang Y, Jimenez-Ferrer I,
Paulus A, Wennstrom M, Vilalta A, Allendorf Det al (2019) Galectin-3, a novel
endogenous TREM2 ligand, detrimentally regulates inflammatory response in
Alzheimer's disease. Acta Neuropathol 138: 251-273 Doi 10.1007/s00401-019-02013-z
45. Braak H, Rub U, Gai WP, Del Tredici K (2003) Idiopathic Parkinson's disease: possible
routes by which vulnerable neuronal types may be subject to neuroinvasion by an
unknown pathogen. J Neural Transm (Vienna) 110: 517-536 Doi 10.1007/s00702-002-
0808-2
46. Braak H, Tredici KD, Rüb U, de Vos RAI, Jansen Steur ENH, Braak E (2003) Staging of
brain pathology related to sporadic Parkinson’s disease. Neurobiology of Aging 24: 197-
211 Doi 10.1016/s0197-4580(02)00065-9
47. Brehme M, Voisine C, Rolland T, Wachi S, Soper JH, Zhu Y, Orton K, Villella A, Garza
D, Vidal Met al (2014) A chaperome subnetwork safeguards proteostasis in aging and
neurodegenerative disease. Cell Rep 9: 1135-1150 Doi 10.1016/j.celrep.2014.09.042
48. Breydo L, Wu JW, Uversky VN (2012) Alpha-synuclein misfolding and Parkinson's
disease. Biochim Biophys Acta 1822: 261-285 Doi 10.1016/j.bbadis.2011.10.002
49. Brown TP, Rumsby PC, Capleton AC, Rushton L, Levy LS (2006) Pesticides and
Parkinson's disease--is there a link? Environ Health Perspect 114: 156-164 Doi
10.1289/ehp.8095
50. Brudek T (2019) Inflammatory Bowel Diseases and Parkinson's Disease. Journal of
Parkinson's disease 9: S331-S344 Doi 10.3233/JPD-191729
51. Buell AK, Galvagnion C, Gaspar R, Sparr E, Vendruscolo M, Knowles TP, Linse S,
Dobson CM (2014) Solution conditions determine the relative importance of nucleation
and growth processes in α-synuclein aggregation. Proc Natl Acad Sci U S A 111: 7671-
7676 Doi 10.1073/pnas.1315346111
52. Burbidge K, Zwikelmaier V, Cook B, Long MM, Balva B, Lonigro M, Ispas G,
Rademacher DJ, Campbell EM (2020) Cargo and cell-specific differences in extracellular
vesicle populations identified by multiplexed immunofluorescent analysis. Journal of
Extracellular Vesicles 9: Doi 10.1080/20013078.2020.1789326
53. Burdakov D, Luckman SM, Verkhratsky A (2005) Glucose-sensing neurons of the
hypothalamus. Philosophical Transactions of the Royal Society B: Biological Sciences
360: 2227-2235 Doi doi:10.1098/rstb.2005.1763
54. Burre J, Sharma M, Tsetsenis T, Buchman V, Etherton MR, Sudhof TC (2010) Alpha-
synuclein promotes SNARE-complex assembly in vivo and in vitro. Science 329: 1663-
1667 Doi 10.1126/science.1195227

215
55. Burre J, Vivona S, Diao J, Sharma M, Brunger AT, Sudhof TC (2013) Properties of
native brain alpha-synuclein. Nature 498: E4-6; discussion E6-7 Doi
10.1038/nature12125
56. Bussi C, Peralta Ramos JM, Arroyo DS, Gallea JI, Ronchi P, Kolovou A, Wang JM,
Florey O, Celej MS, Schwab Yet al (2018) Alpha-synuclein fibrils recruit TBK1 and
OPTN to lysosomal damage sites and induce autophagy in microglial cells. J Cell Sci
131: Doi 10.1242/jcs.226241
57. Cabin DE, Shimazu K, Murphy D, Cole NB, Gottschalk W, McIlwain KL, Orrison B,
Chen A, Ellis CE, Paylor Ret al (2002) Synaptic Vesicle Depletion Correlates with
Attenuated Synaptic Responses to Prolonged Repetitive Stimulation in Mice Lacking α-
Synuclein. The Journal of Neuroscience 22: 8797-8807 Doi 10.1523/jneurosci.22-20-
08797.2002
58. Cacabelos R (2017) Parkinson's Disease: From Pathogenesis to Pharmacogenomics. Int J
Mol Sci 18: Doi 10.3390/ijms18030551
59. Cai W, Feng D, Schwarzschild MA, McLean PJ, Chen X (2018) Bimolecular
Fluorescence Complementation of Alpha-synuclein Demonstrates its Oligomerization
with Dopaminergic Phenotype in Mice. EBioMedicine 29: 13-22 Doi
10.1016/j.ebiom.2018.01.035
60. Campbell EM, Perez O, Melar M, Hope TJ (2007) Labeling HIV-1 virions with two
fluorescent proteins allows identification of virions that have productively entered the
target cell. Virology 360: 286-293 Doi 10.1016/j.virol.2006.10.025
61. Canfran-Duque A, Pastor O, Quintana-Portillo R, Lerma M, de la Pena G, Martin-
Hidalgo A, Fernandez-Hernando C, Lasuncion MA, Busto R (2014) Curcumin promotes
exosomes/microvesicles secretion that attenuates lysosomal cholesterol traffic
impairment. Mol Nutr Food Res 58: 687-697 Doi 10.1002/mnfr.201300350
62. Catalano M, O'Driscoll L (2020) Inhibiting extracellular vesicles formation and release: a
review of EV inhibitors. J Extracell Vesicles 9: 1703244 Doi
10.1080/20013078.2019.1703244
63. Cavalli G, Cenci S (2020) Autophagy and Protein Secretion. J Mol Biol: Doi
10.1016/j.jmb.2020.01.015
64. Cengiz T, Turkboylari S, Gencler OS, Anlar O (2019) The roles of galectin-3 and
galectin-4 in the idiopatic Parkinson disease and its progression. Clin Neurol Neurosurg
184: 105373 Doi 10.1016/j.clineuro.2019.105373
65. Chandra S, Chen X, Rizo J, Jahn R, Sudhof TC (2003) A broken alpha -helix in folded
alpha -Synuclein. J Biol Chem 278: 15313-15318 Doi 10.1074/jbc.M213128200
216
66. Chang D, Nalls MA, Hallgrimsdottir IB, Hunkapiller J, van der Brug M, Cai F,
International Parkinson's Disease Genomics C, andMe Research T, Kerchner GA, Ayalon
Get al (2017) A meta-analysis of genome-wide association studies identifies 17 new
Parkinson's disease risk loci. Nat Genet 49: 1511-1516 Doi 10.1038/ng.3955
67. Chantranupong L, Scaria SM, Saxton RA, Gygi MP, Shen K, Wyant GA, Wang T,
Harper JW, Gygi SP, Sabatini DM (2016) The CASTOR Proteins Are Arginine Sensors
for the mTORC1 Pathway. Cell 165: 153-164 Doi 10.1016/j.cell.2016.02.035
68. Chantranupong L, Wolfson RL, Orozco JM, Saxton RA, Scaria SM, Bar-Peled L,
Spooner E, Isasa M, Gygi SP, Sabatini DM (2014) The Sestrins interact with GATOR2 to
negatively regulate the amino-acid-sensing pathway upstream of mTORC1. Cell Rep 9:
1-8 Doi 10.1016/j.celrep.2014.09.014
69. Chartier-Harlin M-C, Kachergus J, Roumier C, Mouroux V, Douay X, Lincoln S,
Levecque C, Larvor L, Andrieux J, Hulihan Met al (2004) α-synuclein locus
duplication as a cause of familial Parkinson's disease. The Lancet 364: 1167-1169 Doi
10.1016/S0140-6736(04)17103-1
70. Chauhan S, Goodwin JG, Chauhan S, Manyam G, Wang J, Kamat AM, Boyd DD (2013)
ZKSCAN3 is a master transcriptional repressor of autophagy. Mol Cell 50: 16-28 Doi
10.1016/j.molcel.2013.01.024
71. Chauhan S, Kumar S, Jain A, Ponpuak M, Mudd MH, Kimura T, Choi SW, Peters R,
Mandell M, Bruun JAet al (2016) TRIMs and Galectins Globally Cooperate and TRIM16
and Galectin-3 Co-direct Autophagy in Endomembrane Damage Homeostasis. Dev Cell
39: 13-27 Doi 10.1016/j.devcel.2016.08.003
72. Chen C, Zong S, Wang Z, Lu J, Zhu D, Zhang Y, Cui Y (2016) Imaging and Intracellular
Tracking of Cancer-Derived Exosomes Using Single-Molecule Localization-Based
Super-Resolution Microscope. ACS Appl Mater Interfaces 8: 25825-25833 Doi
10.1021/acsami.6b09442
73. Chen L, Xu B, Liu L, Luo Y, Yin J, Zhou H, Chen W, Shen T, Han X, Huang S (2010)
Hydrogen peroxide inhibits mTOR signaling by activation of AMPKalpha leading to
apoptosis of neuronal cells. Lab Invest 90: 762-773 Doi 10.1038/labinvest.2010.36
74. Chen SW, Drakulic S, Deas E, Ouberai M, Aprile FA, Arranz R, Ness S, Roodveldt C,
Guilliams T, De-Genst EJet al (2015) Structural characterization of toxic oligomers that
are kinetically trapped during alpha-synuclein fibril formation. Proc Natl Acad Sci U S A
112: E1994-2003 Doi 10.1073/pnas.1421204112
75. Chen WT, Zhang F, Zhao XQ, Yu B, Wang BW (2020) Galectin-3 and TRIM16
coregulate osteogenic differentiation of human bone marrow-derived mesenchymal stem
cells at least partly via enhancing autophagy. Bone 131: 115059 Doi
10.1016/j.bone.2019.115059

217
76. Chen Y-D, Fang Y-T, Cheng Y-L, Lin C-F, Hsu L-J, Wang S-Y, Anderson R, Chang C-
P, Lin Y-S (2017) Exophagy of annexin A2 via RAB11, RAB8A and RAB27A in IFN-γ-
stimulated lung epithelial cells. Scientific Reports 7: 5676 Doi 10.1038/s41598-017-
06076-4
77. Chen Y, Wang H, Shen J, Deng R, Yao X, Guo Q, Lu A, Sun B, Zhang Y, Meng G
(2019) Gasdermin D Drives the Nonexosomal Secretion of Galectin-3, an Insulin Signal
Antagonist. J Immunol 203: 2712-2723 Doi 10.4049/jimmunol.1900212
78. Chen Z-W, Chang C-SS, Leil TA, Olsen RW (2007) C-terminal modification is required
for GABARAP-mediated GABA(A) receptor trafficking. The Journal of neuroscience :
the official journal of the Society for Neuroscience 27: 6655-6663 Doi
10.1523/JNEUROSCI.0919-07.2007
79. Cheng X-T, Zhou B, Lin M-Y, Cai Q, Sheng Z-H (2015) Axonal autophagosomes recruit
dynein for retrograde transport through fusion with late endosomes. Journal of Cell
Biology 209: 377-386 Doi 10.1083/jcb.201412046
80. Cheng YL, Wu YW, Kuo CF, Lu SL, Liu FT, Anderson R, Lin CF, Liu YL, Wang WY,
Chen YDet al (2017) Galectin-3 Inhibits Galectin-8/Parkin-Mediated Ubiquitination of
Group A Streptococcus. mBio 8: Doi 10.1128/mBio.00899-17
81. Chiaruttini N, Redondo-Morata L, Colom A, Humbert F, Lenz M, Scheuring S, Roux A
(2015) Relaxation of Loaded ESCRT-III Spiral Springs Drives Membrane Deformation.
Cell 163: 866-879 Doi 10.1016/j.cell.2015.10.017
82. Chiasserini D, Paciotti S, Eusebi P, Persichetti E, Tasegian A, Kurzawa-Akanbi M,
Chinnery PF, Morris CM, Calabresi P, Parnetti Let al (2015) Selective loss of
glucocerebrosidase activity in sporadic Parkinson's disease and dementia with Lewy
bodies. Mol Neurodegener 10: 15 Doi 10.1186/s13024-015-0010-2
83. Choi JS, Park C, Jeong JW (2010) AMP-activated protein kinase is activated in
Parkinson's disease models mediated by 1-methyl-4-phenyl-1,2,3,6-tetrahydropyridine.
Biochem Biophys Res Commun 391: 147-151 Doi 10.1016/j.bbrc.2009.11.022
84. Choi KC, Kim SH, Ha JY, Kim ST, Son JH (2010) A novel mTOR activating protein
protects dopamine neurons against oxidative stress by repressing autophagy related cell
death. J Neurochem 112: 366-376 Doi 10.1111/j.1471-4159.2009.06463.x
85. Christ L, Raiborg C, Wenzel EM, Campsteijn C, Stenmark H (2017) Cellular Functions
and Molecular Mechanisms of the ESCRT Membrane-Scission Machinery. Trends
Biochem Sci 42: 42-56 Doi 10.1016/j.tibs.2016.08.016
86. Christensen DP, Ejlerskov P, Rasmussen I, Vilhardt F (2016) Reciprocal signals between
microglia and neurons regulate alpha-synuclein secretion by exophagy through a
neuronal cJUN-N-terminal kinase-signaling axis. J Neuroinflammation 13: 59 Doi
10.1186/s12974-016-0519-5
218
87. Chu Y, Dodiya H, Aebischer P, Olanow CW, Kordower JH (2009) Alterations in
lysosomal and proteasomal markers in Parkinson's disease: relationship to alpha-
synuclein inclusions. Neurobiol Dis 35: 385-398 Doi S0969-9961(09)00135-1 [pii]
10.1016/j.nbd.2009.05.023
88. Chuo ST, Chien JC, Lai CP (2018) Imaging extracellular vesicles: current and emerging
methods. J Biomed Sci 25: 91 Doi 10.1186/s12929-018-0494-5
89. Clark LN, Chan R, Cheng R, Liu X, Park N, Parmalee N, Kisselev S, Cortes E, Torres
PA, Pastores GMet al (2015) Gene-Wise Association of Variants in Four Lysosomal
Storage Disorder Genes in Neuropathologically Confirmed Lewy Body Disease. PLOS
ONE 10: e0125204 Doi 10.1371/journal.pone.0125204
90. Clark SG, Graybeal LL, Bhattacharjee S, Thomas C, Bhattacharya S, Cox DN (2018)
Basal autophagy is required for promoting dendritic terminal branching in Drosophila
sensory neurons. PLOS ONE 13: e0206743 Doi 10.1371/journal.pone.0206743
91. Cohen MJ, Chirico WJ, Lipke PN (2020) Through the back door: Unconventional protein
secretion. The Cell Surface: Doi 10.1016/j.tcsw.2020.100045
92. Connolly BS, Lang AE (2014) Pharmacological treatment of Parkinson disease: a review.
Jama 311: 1670-1683 Doi 10.1001/jama.2014.3654
93. Conway KA, Lee SJ, Rochet JC, Ding TT, Harper JD, Williamson RE, Lansbury PT, Jr.
(2000) Accelerated oligomerization by Parkinson's disease linked alpha-synuclein
mutants. Ann N Y Acad Sci 920: 42-45 Doi 10.1111/j.1749-6632.2000.tb06903.x
94. Conway KA, Lee SJ, Rochet JC, Ding TT, Williamson RE, Lansbury PT, Jr. (2000)
Acceleration of oligomerization, not fibrillization, is a shared property of both alpha-
synuclein mutations linked to early-onset Parkinson's disease: implications for
pathogenesis and therapy. Proc Natl Acad Sci U S A 97: 571-576 Doi
10.1073/pnas.97.2.571
95. Cooper O, Seo H, Andrabi S, Guardia-Laguarta C, Graziotto J, Sundberg M, McLean JR,
Carrillo-Reid L, Xie Z, Osborn Tet al (2012) Pharmacological rescue of mitochondrial
deficits in iPSC-derived neural cells from patients with familial Parkinson's disease. Sci
Transl Med 4: 141ra190 Doi 10.1126/scitranslmed.3003985
96. Corso G, Heusermann W, Trojer D, Gorgens A, Steib E, Voshol J, Graff A, Genoud C,
Lee Y, Hean Jet al (2019) Systematic characterization of extracellular vesicle sorting
domains and quantification at the single molecule - single vesicle level by fluorescence
correlation spectroscopy and single particle imaging. J Extracell Vesicles 8: 1663043 Doi
10.1080/20013078.2019.1663043
97. Cortes CJ, La Spada AR (2019) TFEB dysregulation as a driver of autophagy dysfunction
in neurodegenerative disease: Molecular mechanisms, cellular processes, and emerging
therapeutic opportunities. Neurobiol Dis 122: 83-93 Doi 10.1016/j.nbd.2018.05.012

219
98. Cortes CJ, Miranda HC, Frankowski H, Batlevi Y, Young JE, Le A, Ivanov N, Sopher
BL, Carromeu C, Muotri ARet al (2014) Polyglutamine-expanded androgen receptor
interferes with TFEB to elicit autophagy defects in SBMA. Nat Neurosci 17: 1180-1189
Doi 10.1038/nn.3787
99. Costanzo M, Zurzolo C (2013) The cell biology of prion-like spread of protein
aggregates: mechanisms and implication in neurodegeneration. Biochem J 452: 1-17 Doi
10.1042/bj20121898
100. Cremades N, Cohen SIA, Deas E, Abramov AY, Chen AY, Orte A, Sandal M, Clarke
RW, Dunne P, Aprile FAet al (2012) Direct observation of the interconversion of normal
and toxic forms of α-synuclein. Cell 149: 1048-1059 Doi 10.1016/j.cell.2012.03.037
101. Crews L, Spencer B, Desplats P, Patrick C, Paulino A, Rockenstein E, Hansen L, Adame
A, Galasko D, Masliah E (2010) Selective molecular alterations in the autophagy
pathway in patients with Lewy body disease and in models of alpha-synucleinopathy.
PLoS One 5: e9313 Doi 10.1371/journal.pone.0009313
102. Cullen V, Lindfors M, Ng J, Paetau A, Swinton E, Kolodziej P, Boston H, Saftig P,
Woulfe J, Feany MBet al (2009) Cathepsin D expression level affects alpha-synuclein
processing, aggregation, and toxicity in vivo. Molecular brain 2: 5-5 Doi 10.1186/1756-
6606-2-5
103. Dagan E, Schlesinger I, Ayoub M, Mory A, Nassar M, Kurolap A, Peretz-Aharon J,
Gershoni-Baruch R (2015) The contribution of Niemann-Pick SMPD1 mutations to
Parkinson disease in Ashkenazi Jews. Parkinsonism Relat Disord 21: 1067-1071 Doi
10.1016/j.parkreldis.2015.06.016
104. Dale GE, Probst A, Luthert P, Martin J, Anderton BH, Leigh PN (1992) Relationships
between Lewy bodies and pale bodies in Parkinson's disease. Acta Neuropathologica 83:
525-529 Doi 10.1007/BF00310030
105. Danzer KM, Haasen D, Karow AR, Moussaud S, Habeck M, Giese A, Kretzschmar H,
Hengerer B, Kostka M (2007) Different species of alpha-synuclein oligomers induce
calcium influx and seeding. J Neurosci 27: 9220-9232 Doi 10.1523/JNEUROSCI.2617-
07.2007
106. Danzer KM, Kranich LR, Ruf WP, Cagsal-Getkin O, Winslow AR, Zhu L, Vanderburg
CR, McLean PJ (2012) Exosomal cell-to-cell transmission of alpha synuclein oligomers.
Mol Neurodegener 7: 42 Doi 1750-1326-7-42 [pii] 10.1186/1750-1326-7-42
107. Danzer KM, Krebs SK, Wolff M, Birk G, Hengerer B (2009) Seeding induced by alpha-
synuclein oligomers provides evidence for spreading of alpha-synuclein pathology. J
Neurochem 111: 192-203 Doi 10.1111/j.1471-4159.2009.06324.x
108. Danzer KM, Ruf WP, Putcha P, Joyner D, Hashimoto T, Glabe C, Hyman BT, McLean
PJ (2011) Heat-shock protein 70 modulates toxic extracellular alpha-synuclein oligomers
and rescues trans-synaptic toxicity. FASEB J 25: 326-336 Doi 10.1096/fj.10-164624
220
109. Davidovich E, Aframian DJ, Shapira J, Peretz B (2010) A comparison of the
sialochemistry, oral pH, and oral health status of Down syndrome children to healthy
children. Int J Paediatr Dent 20: 235-241 Doi 10.1111/j.1365-263X.2010.01045.x
110. de Duve C (1963) The Lysosome Concept. Ciba Foundation Symposium - Lysosomes,
City, pp 1-35
111. Decressac M, Mattsson B, Weikop P, Lundblad M, Jakobsson J, Bjorklund A (2013)
TFEB-mediated autophagy rescues midbrain dopamine neurons from alpha-synuclein
toxicity. Proc Natl Acad Sci U S A 110: E1817-1826 Doi 10.1073/pnas.1305623110
112. Decressac M, Mattsson B, Weikop P, Lundblad M, Jakobsson J, Björklund A (2013)
TFEB-mediated autophagy rescues midbrain dopamine neurons from α-synuclein
toxicity. Proc Natl Acad Sci U S A 110: E1817-1826 Doi 10.1073/pnas.1305623110
113. Dehay B, Bove J, Rodriguez-Muela N, Perier C, Recasens A, Boya P, Vila M (2010)
Pathogenic lysosomal depletion in Parkinson's disease. J Neurosci 30: 12535-12544 Doi
10.1523/JNEUROSCI.1920-10.2010
114. Delacour D, Greb C, Koch A, Salomonsson E, Leffler H, Le Bivic A, Jacob R (2007)
Apical sorting by galectin-3-dependent glycoprotein clustering. Traffic 8: 379-388 Doi
10.1111/j.1600-0854.2007.00539.x
115. Desplats P, Lee HJ, Bae EJ, Patrick C, Rockenstein E, Crews L, Spencer B, Masliah E,
Lee SJ (2009) Inclusion formation and neuronal cell death through neuron-to-neuron
transmission of alpha-synuclein. Proc Natl Acad Sci U S A 106: 13010-13015 Doi
0903691106 [pii] 10.1073/pnas.0903691106
116. Devine MJ, Ryten M, Vodicka P, Thomson AJ, Burdon T, Houlden H, Cavaleri F,
Nagano M, Drummond NJ, Taanman JWet al (2011) Parkinson's disease induced
pluripotent stem cells with triplication of the alpha-synuclein locus. Nat Commun 2: 440
Doi 10.1038/ncomms1453
117. Dhillon JS, Riffe C, Moore BD, Ran Y, Chakrabarty P, Golde TE, Giasson BI (2017) A
novel panel of alpha-synuclein antibodies reveal distinctive staining profiles in
synucleinopathies. PLoS One 12: e0184731 Doi 10.1371/journal.pone.0184731
118. Di Malta C, Cinque L, Settembre C (2019) Transcriptional Regulation of Autophagy:
Mechanisms and Diseases. Front Cell Dev Biol 7: 114 Doi 10.3389/fcell.2019.00114
119. Dibble CC, Elis W, Menon S, Qin W, Klekota J, Asara JM, Finan PM, Kwiatkowski DJ,
Murphy LO, Manning BD (2012) TBC1D7 is a third subunit of the TSC1-TSC2 complex
upstream of mTORC1. Mol Cell 47: 535-546 Doi 10.1016/j.molcel.2012.06.009
120. Díez-Revuelta N, Higuero AM, Velasco S, Peñas-de-la-Iglesia M, Gabius H-J, Abad-
Rodríguez J (2017) Neurons define non-myelinated axon segments by the regulation of
galectin-4-containing axon membrane domains. Scientific Reports 7: 12246 Doi
10.1038/s41598-017-12295-6
221
121. Ding TT, Lee SJ, Rochet JC, Lansbury PT, Jr. (2002) Annular alpha-synuclein
protofibrils are produced when spherical protofibrils are incubated in solution or bound to
brain-derived membranes. Biochemistry 41: 10209-10217 Doi 10.1021/bi020139h
122. Diogo D, Tian C, Franklin CS, Alanne-Kinnunen M, March M, Spencer CCA, Vangjeli
C, Weale ME, Mattsson H, Kilpelainen Eet al (2018) Phenome-wide association studies
across large population cohorts support drug target validation. Nat Commun 9: 4285 Doi
10.1038/s41467-018-06540-3
123. Dodd J, Jessell TM (1986) Cell surface glycoconjugates and carbohydrate-binding
proteins: possible recognition signals in sensory neurone development. J Exp Biol 124:
225-238
124. Doherty CPA, Ulamec SM, Maya-Martinez R, Good SC, Makepeace J, Khan GN, van
Oosten-Hawle P, Radford SE, Brockwell DJ (2020) A short motif in the N-terminal
region of α-synuclein is critical for both aggregation and function. Nature Structural &
Molecular Biology 27: 249-259 Doi 10.1038/s41594-020-0384-x
125. Doyle LM, Wang MZ (2019) Overview of Extracellular Vesicles, Their Origin,
Composition, Purpose, and Methods for Exosome Isolation and Analysis. Cells 8: Doi
10.3390/cells8070727
126. Dupont N, Jiang S, Pilli M, Ornatowski W, Bhattacharya D, Deretic V (2011)
Autophagy-based unconventional secretory pathway for extracellular delivery of IL-
1beta. EMBO J 30: 4701-4711 Doi 10.1038/emboj.2011.398
127. Ebrahimi-Fakhari D, Cantuti-Castelvetri I, Fan Z, Rockenstein E, Masliah E, Hyman BT,
McLean PJ, Unni VK (2011) Distinct roles in vivo for the ubiquitin-proteasome system
and the autophagy-lysosomal pathway in the degradation of alpha-synuclein. J Neurosci
31: 14508-14520 Doi 10.1523/JNEUROSCI.1560-11.2011
128. Echevarria J, Royo F, Pazos R, Salazar L, Falcon-Perez JM, Reichardt NC (2014)
Microarray-based identification of lectins for the purification of human urinary
extracellular vesicles directly from urine samples. Chembiochem 15: 1621-1626 Doi
10.1002/cbic.201402058
129. Eckermann K, Kugler S, Bahr M (2015) Dimerization propensities of Synucleins are not
predictive for Synuclein aggregation. Biochim Biophys Acta 1852: 1658-1664 Doi
10.1016/j.bbadis.2015.05.002
130. Eisenberg D, Jucker M (2012) The amyloid state of proteins in human diseases. Cell 148:
1188-1203 Doi 10.1016/j.cell.2012.02.022
131. Eitan E, Suire C, Zhang S, Mattson MP (2016) Impact of lysosome status on extracellular
vesicle content and release. Ageing Res Rev 32: 65-74 Doi 10.1016/j.arr.2016.05.001

222
132. Ejlerskov P, Rasmussen I, Nielsen TT, Bergstrom AL, Tohyama Y, Jensen PH, Vilhardt
F (2013) Tubulin polymerization-promoting protein (TPPP/p25alpha) promotes
unconventional secretion of alpha-synuclein through exophagy by impairing
autophagosome-lysosome fusion. J Biol Chem 288: 17313-17335 Doi
10.1074/jbc.M112.401174
133. El-Agnaf OM, Salem SA, Paleologou KE, Cooper LJ, Fullwood NJ, Gibson MJ, Curran
MD, Court JA, Mann DM, Ikeda Set al (2003) Alpha-synuclein implicated in Parkinson's
disease is present in extracellular biological fluids, including human plasma. Faseb j 17:
1945-1947 Doi 10.1096/fj.03-0098fje
134. Emamzadeh FN (2016) Alpha-synuclein structure, functions, and interactions. J Res Med
Sci 21: 29-29 Doi 10.4103/1735-1995.181989
135. Emmanouilidou E, Melachroinou K, Roumeliotis T, Garbis SD, Ntzouni M, Margaritis
LH, Stefanis L, Vekrellis K (2010) Cell-produced alpha-synuclein is secreted in a
calcium-dependent manner by exosomes and impacts neuronal survival. J Neurosci 30:
6838-6851 Doi 30/20/6838 [pii] 10.1523/JNEUROSCI.5699-09.2010
136. Engl E, Attwell D (2015) Non-signalling energy use in the brain. J Physiol 593: 3417-
3429 Doi 10.1113/jphysiol.2014.282517
137. Eraña H (2019) The Prion 2018 round tables (II): Aβ, tau, α-synuclein… are they prions,
prion-like proteins, or what? Prion 13: 41-45 Doi 10.1080/19336896.2019.1569451
138. Eskelinen EL (2006) Roles of LAMP-1 and LAMP-2 in lysosome biogenesis and
autophagy. Mol Aspects Med 27: 495-502 Doi 10.1016/j.mam.2006.08.005
139. Esposito A, Dohm CP, Kermer P, Bähr M, Wouters FS (2007) α-Synuclein and its
disease-related mutants interact differentially with the microtubule protein tau and
associate with the actin cytoskeleton. Neurobiology of Disease 26: 521-531 Doi
https://doi.org/10.1016/j.nbd.2007.01.014
140. Falcon B, Noad J, McMahon H, Randow F, Goedert M (2018) Galectin-8-mediated
selective autophagy protects against seeded tau aggregation. J Biol Chem 293: 2438-2451
Doi 10.1074/jbc.M117.809293
141. Fearnley JM, Lees AJ (1991) Ageing and Parkinson's disease: substantia nigra regional
selectivity. Brain 114 ( Pt 5): 2283-2301 Doi 10.1093/brain/114.5.2283
142. Ferese R, Modugno N, Campopiano R, Santilli M, Zampatti S, Giardina E, Nardone A,
Postorivo D, Fornai F, Novelli Get al (2015) Four Copies of SNCA Responsible for
Autosomal Dominant Parkinson's Disease in Two Italian Siblings. Parkinsons Dis 2015:
546462 Doi 10.1155/2015/546462
143. Fernagut PO, Chesselet MF (2004) Alpha-synuclein and transgenic mouse models.
Neurobiol Dis 17: 123-130 Doi 10.1016/j.nbd.2004.07.001
223
144. Fernandes HJ, Hartfield EM, Christian HC, Emmanoulidou E, Zheng Y, Booth H,
Bogetofte H, Lang C, Ryan BJ, Sardi SPet al (2016) ER Stress and Autophagic
Perturbations Lead to Elevated Extracellular alpha-Synuclein in GBA-N370S Parkinson's
iPSC-Derived Dopamine Neurons. Stem Cell Reports 6: 342-356 Doi
10.1016/j.stemcr.2016.01.013
145. Fitzgerald E, Murphy S, Martinson HA (2019) Alpha-Synuclein Pathology and the Role
of the Microbiota in Parkinson's Disease. Frontiers in neuroscience 13: 369-369 Doi
10.3389/fnins.2019.00369
146. Flavin WP, Bousset L, Green ZC, Chu Y, Skarpathiotis S, Chaney MJ, Kordower JH,
Melki R, Campbell EM (2017) Endocytic vesicle rupture is a conserved mechanism of
cellular invasion by amyloid proteins. Acta Neuropathol: Doi 10.1007/s00401-017-1722-
x
147. Flavin WP, Bousset L, Green ZC, Chu Y, Skarpathiotis S, Chaney MJ, Kordower JH,
Melki R, Campbell EM (2017) Endocytic vesicle rupture is a conserved mechanism of
cellular invasion by amyloid proteins. Acta Neuropathol 134: 629-653 Doi
10.1007/s00401-017-1722-x
148. Fois G, Hobi N, Felder E, Ziegler A, Miklavc P, Walther P, Radermacher P, Haller T,
Dietl P (2015) A new role for an old drug: Ambroxol triggers lysosomal exocytosis via
pH-dependent Ca²⁺ release from acidic Ca²⁺ stores. Cell Calcium 58: 628-637 Doi
10.1016/j.ceca.2015.10.002
149. Follett J, Bugarcic A, Yang Z, Ariotti N, Norwood SJ, Collins BM, Parton RG, Teasdale
RD (2016) Parkinson Disease-linked Vps35 R524W Mutation Impairs the Endosomal
Association of Retromer and Induces α-Synuclein Aggregation. J Biol Chem 291: 18283-
18298 Doi 10.1074/jbc.M115.703157
150. Frahm S, Melis V, Horsley D, Rickard JE, Riedel G, Fadda P, Scherma M, Harrington
CR, Wischik CM, Theuring Fet al (2018) Alpha-Synuclein transgenic mice, h-α-SynL62,
display α-Syn aggregation and a dopaminergic phenotype reminiscent of Parkinson's
disease. Behav Brain Res 339: 153-168 Doi 10.1016/j.bbr.2017.11.025
151. Frake RA, Ricketts T, Menzies FM, Rubinsztein DC (2015) Autophagy and
neurodegeneration. J Clin Invest 125: 65-74 Doi 10.1172/JCI7394473944 [pii]
152. Frazier HN, Ghoweri AO, Anderson KL, Lin RL, Popa GJ, Mendenhall MD, Reagan LP,
Craven RJ, Thibault O (2020) Elevating Insulin Signaling Using a Constitutively Active
Insulin Receptor Increases Glucose Metabolism and Expression of GLUT3 in
Hippocampal Neurons. Front Neurosci 14: 668 Doi 10.3389/fnins.2020.00668
153. Freeman D, Cedillos R, Choyke S, Lukic Z, McGuire K, Marvin S, Burrage AM, Sudholt
S, Rana A, O'Connor Cet al (2013) Alpha-synuclein induces lysosomal rupture and
cathepsin dependent reactive oxygen species following endocytosis. PLoS One 8: e62143
Doi 10.1371/journal.pone.0062143 PONE-D-12-39385 [pii]
224
154. Friedman LG, Lachenmayer ML, Wang J, He L, Poulose SM, Komatsu M, Holstein GR,
Yue Z (2012) Disrupted autophagy leads to dopaminergic axon and dendrite degeneration
and promotes presynaptic accumulation of α-synuclein and LRRK2 in the brain. J
Neurosci 32: 7585-7593 Doi 10.1523/jneurosci.5809-11.2012
155. Fussi N, Hollerhage M, Chakroun T, Nykanen NP, Rosler TW, Koeglsperger T, Wurst
W, Behrends C, Hoglinger GU (2018) Exosomal secretion of alpha-synuclein as
protective mechanism after upstream blockage of macroautophagy. Cell Death Dis 9: 757
Doi 10.1038/s41419-018-0816-2
156. Galloway DA, Phillips AEM, Owen DRJ, Moore CS (2019) Corrigendum: Phagocytosis
in the Brain: Homeostasis and Disease. Front Immunol 10: 1575 Doi
10.3389/fimmu.2019.01575
157. Galloway DA, Phillips AEM, Owen DRJ, Moore CS (2019) Phagocytosis in the Brain:
Homeostasis and Disease. Front Immunol 10: 790 Doi 10.3389/fimmu.2019.00790
158. Galluzzi L, Baehrecke EH, Ballabio A, Boya P, Bravo-San Pedro JM, Cecconi F, Choi
AM, Chu CT, Codogno P, Colombo MIet al (2017) Molecular definitions of autophagy
and related processes. EMBO J 36: 1811-1836 Doi 10.15252/embj.201796697
159. Galvagnion C, Buell AK, Meisl G, Michaels TC, Vendruscolo M, Knowles TP, Dobson
CM (2015) Lipid vesicles trigger alpha-synuclein aggregation by stimulating primary
nucleation. Nat Chem Biol 11: 229-234 Doi 10.1038/nchembio.1750
160. Galvin JE, Lee VM-Y, Trojanowski JQ (2001) Synucleinopathies: Clinical and
Pathological Implications. Archives of Neurology 58: 186-190 Doi
10.1001/archneur.58.2.186
161. Gan-Or Z, Dion PA, Rouleau GA (2015) Genetic perspective on the role of the
autophagy-lysosome pathway in Parkinson disease. Autophagy 11: 1443-1457 Doi
10.1080/15548627.2015.1067364
162. Gan-Or Z, Ozelius LJ, Bar-Shira A, Saunders-Pullman R, Mirelman A, Kornreich R,
Gana-Weisz M, Raymond D, Rozenkrantz L, Deik Aet al (2013) The p.L302P mutation
in the lysosomal enzyme gene SMPD1 is a risk factor for Parkinson disease. Neurology
80: 1606-1610 Doi 10.1212/WNL.0b013e31828f180e
163. Gao HM, Hong JS, Zhang W, Liu B (2003) Synergistic dopaminergic neurotoxicity of
the pesticide rotenone and inflammogen lipopolysaccharide: relevance to the etiology of
Parkinson's disease. J Neurosci 23: 1228-1236 Doi 10.1523/jneurosci.23-04-01228.2003
164. Gao S, Duan C, Gao G, Wang X, Yang H (2015) Alpha-synuclein overexpression
negatively regulates insulin receptor substrate 1 by activating mTORC1/S6K1 signaling.
Int J Biochem Cell Biol 64: 25-33 Doi 10.1016/j.biocel.2015.03.006
225
165. Gaudet AD, Steeves JD, Tetzlaff W, Ramer MS (2005) Expression and functions of
galectin-1 in sensory and motoneurons. Curr Drug Targets 6: 419-425 Doi
10.2174/1389450054021864
166. Ge L, Melville D, Zhang M, Schekman R (2013) The ER-Golgi intermediate
compartment is a key membrane source for the LC3 lipidation step of autophagosome
biogenesis. Elife 2: e00947 Doi 10.7554/eLife.00947
167. Gelpi E, Navarro-Otano J, Tolosa E, Gaig C, Compta Y, Rey MJ, Martí MJ, Hernández I,
Valldeoriola F, Reñé Ret al (2014) Multiple organ involvement by alpha-synuclein
pathology in Lewy body disorders. Mov Disord 29: 1010-1018 Doi 10.1002/mds.25776
168. George S, Rey NL, Tyson T, Esquibel C, Meyerdirk L, Schulz E, Pierce S, Burmeister
AR, Madaj Z, Steiner JAet al (2019) Microglia affect alpha-synuclein cell-to-cell transfer
in a mouse model of Parkinson's disease. Mol Neurodegener 14: 34 Doi 10.1186/s13024-
019-0335-3
169. Gesi M, Soldani P, Giorgi FS, Santinami A, Bonaccorsi I, Fornai F (2000) The role of the
locus coeruleus in the development of Parkinson's disease. Neurosci Biobehav Rev 24:
655-668 Doi 10.1016/s0149-7634(00)00028-2
170. Ghee M, Melki R, Michot N, Mallet J (2005) PA700, the regulatory complex of the 26S
proteasome, interferes with alpha-synuclein assembly. FEBS J 272: 4023-4033 Doi
10.1111/j.1742-4658.2005.04776.x
171. Ghosh P, Dahms NM, Kornfeld S (2003) Mannose 6-phosphate receptors: new twists in
the tale. Nature Reviews Molecular Cell Biology 4: 202-213 Doi 10.1038/nrm1050
172. Giasson BI, Murray IV, Trojanowski JQ, Lee VM (2001) A hydrophobic stretch of 12
amino acid residues in the middle of alpha-synuclein is essential for filament assembly. J
Biol Chem 276: 2380-2386 Doi 10.1074/jbc.M008919200
173. Giuseppe Pugliese FP, Gaetano Leto, Lorena Amadio, Carla Iacobini, Giulio Romeo,
Luisa Lenti, Patrizio Sale, Roberto Gradini, Fu-Tong Liu, and Umberto Di Mario (2000)
The Diabetic Milieu Modulates the Advanced Glycation End Product–Receptor Complex
in the Mesangium by Inducing or Upregulating Galectin-3 Expression. DIABETES VOL.
49: 1249-1257
174. Goloborshcheva VV, Chaprov KD, Teterina EV, Ovchinnikov R, Buchman VL (2020)
Reduced complement of dopaminergic neurons in the substantia nigra pars compacta of
mice with a constitutive "low footprint" genetic knockout of alpha-synuclein. Mol Brain
13: 75 Doi 10.1186/s13041-020-00613-5
175. Gonzalez CD, Resnik R, Vaccaro MI (2020) Secretory Autophagy and Its Relevance in
Metabolic and Degenerative Disease. Frontiers in Endocrinology 11: Doi
10.3389/fendo.2020.00266
226
176. Gorell JM, Johnson CC, Rybicki BA, Peterson EL, Richardson RJ (1998) The risk of
Parkinson's disease with exposure to pesticides, farming, well water, and rural living.
Neurology 50: 1346-1350 Doi 10.1212/wnl.50.5.1346
177. Gould SJ, Raposo G (2013) As we wait: coping with an imperfect nomenclature for
extracellular vesicles. J Extracell Vesicles 2: Doi 10.3402/jev.v2i0.20389
178. Greening DW, Simpson RJ (2018) Understanding extracellular vesicle diversity - current
status. Expert Rev Proteomics 15: 887-910 Doi 10.1080/14789450.2018.1537788
179. Greer JM, Lees MB (2002) Myelin proteolipid protein--the first 50 years. Int J Biochem
Cell Biol 34: 211-215 Doi 10.1016/s1357-2725(01)00136-4
180. Grey M, Dunning CJ, Gaspar R, Grey C, Brundin P, Sparr E, Linse S (2015)
Acceleration of alpha-synuclein aggregation by exosomes. J Biol Chem 290: 2969-2982
Doi 10.1074/jbc.M114.585703
181. Gribaudo S, Tixador P, Bousset L, Fenyi A, Lino P, Melki R, Peyrin JM, Perrier AL
(2019) Propagation of alpha-Synuclein Strains within Human Reconstructed Neuronal
Network. Stem Cell Reports 12: 230-244 Doi 10.1016/j.stemcr.2018.12.007
182. Grozdanov V, Danzer KM (2018) Release and uptake of pathologic alpha-synuclein. Cell
Tissue Res 373: 175-182 Doi 10.1007/s00441-017-2775-9
183. Grunwald DS, Otto NM, Park JM, Song D, Kim DH (2020) GABARAPs and LC3s have
opposite roles in regulating ULK1 for autophagy induction. Autophagy 16: 600-614 Doi
10.1080/15548627.2019.1632620
184. Gudbergsson JM, Johnsen KB (2019) Exosomes and autophagy: rekindling the vesicular
waste hypothesis. J Cell Commun Signal 13: 443-450 Doi 10.1007/s12079-019-00524-8
185. Guiney SJ, Adlard PA, Lei P, Mawal CH, Bush AI, Finkelstein DI, Ayton S (2020)
Fibrillar α-synuclein toxicity depends on functional lysosomes. Journal of Biological
Chemistry: Doi 10.1074/jbc.RA120.013428
186. Gustot A, Gallea JI, Sarroukh R, Celej MS, Ruysschaert JM, Raussens V (2015) Amyloid
fibrils are the molecular trigger of inflammation in Parkinson's disease. Biochem J 471:
323-333 Doi 10.1042/bj20150617
187. Gwinn DM, Shackelford DB, Egan DF, Mihaylova MM, Mery A, Vasquez DS, Turk BE,
Shaw RJ (2008) AMPK phosphorylation of raptor mediates a metabolic checkpoint. Mol
Cell 30: 214-226 Doi 10.1016/j.molcel.2008.03.003
188. Hailey DW, Rambold AS, Satpute-Krishnan P, Mitra K, Sougrat R, Kim PK, Lippincott-
Schwartz J (2010) Mitochondria supply membranes for autophagosome biogenesis
during starvation. Cell 141: 656-667 Doi 10.1016/j.cell.2010.04.009
227
189. Hansen C, Angot E, Bergstrom AL, Steiner JA, Pieri L, Paul G, Outeiro TF, Melki R,
Kallunki P, Fog Ket al (2011) alpha-Synuclein propagates from mouse brain to grafted
dopaminergic neurons and seeds aggregation in cultured human cells. J Clin Invest 121:
715-725 Doi 10.1172/JCI4336643366 [pii]
190. Harbi D, Harrison PM (2014) Classifying prion and prion-like phenomena. Prion 8: 161-
165 Doi 10.4161/pri.27960
191. Hartman BK, Agrawal HC, Agrawal D, Kalmbach S (1982) Development and maturation
of central nervous system myelin: comparison of immunohistochemical localization of
proteolipid protein and basic protein in myelin and oligodendrocytes. Proc Natl Acad Sci
U S A 79: 4217-4220 Doi 10.1073/pnas.79.13.4217
192. Hasegawa T, Konno M, Baba T, Sugeno N, Kikuchi A, Kobayashi M, Miura E, Tanaka
N, Tamai K, Furukawa Ket al (2011) The AAA-ATPase VPS4 regulates extracellular
secretion and lysosomal targeting of alpha-synuclein. PLoS One 6: e29460 Doi
10.1371/journal.pone.0029460
193. Hawkes CH, Del Tredici K, Braak H (2007) Parkinson's disease: a dual-hit hypothesis.
Neuropathol Appl Neurobiol 33: 599-614 Doi 10.1111/j.1365-2990.2007.00874.x
194. Hawley SA, Selbert MA, Goldstein EG, Edelman AM, Carling D, Hardie DG (1995) 5'-
AMP activates the AMP-activated protein kinase cascade, and Ca2+/calmodulin activates
the calmodulin-dependent protein kinase I cascade, via three independent mechanisms. J
Biol Chem 270: 27186-27191 Doi 10.1074/jbc.270.45.27186
195. Hayashi-Nishino M, Fujita N, Noda T, Yamaguchi A, Yoshimori T, Yamamoto A (2009)
A subdomain of the endoplasmic reticulum forms a cradle for autophagosome formation.
Nat Cell Biol 11: 1433-1437 Doi 10.1038/ncb1991
196. Heinrich M, Wickel M, Schneider-Brachert W, Sandberg C, Gahr J, Schwandner R,
Weber T, Saftig P, Peters C, Brunner Jet al (1999) Cathepsin D targeted by acid
sphingomyelinase-derived ceramide. Embo j 18: 5252-5263 Doi
10.1093/emboj/18.19.5252
197. Hellemans J, Mortier G, De Paepe A, Speleman F, Vandesompele J (2007) qBase relative
quantification framework and software for management and automated analysis of real-
time quantitative PCR data. Genome Biology 8: R19 Doi 10.1186/gb-2007-8-2-r19
198. Henne WM, Stenmark H, Emr SD (2013) Molecular mechanisms of the membrane
sculpting ESCRT pathway. Cold Spring Harb Perspect Biol 5: Doi
10.1101/cshperspect.a016766
199. Hernandez D, Torres CA, Setlik W, Cebrián C, Mosharov EV, Tang G, Cheng H-C,
Kholodilov N, Yarygina O, Burke REet al (2012) Regulation of presynaptic
neurotransmission by macroautophagy. Neuron 74: 277-284 Doi
10.1016/j.neuron.2012.02.020

228
200. Hernandez DG, Reed X, Singleton AB (2016) Genetics in Parkinson disease: Mendelian
versus non-Mendelian inheritance. J Neurochem 139 Suppl 1: 59-74 Doi
10.1111/jnc.13593
201. Hertzman C, Wiens M, Bowering D, Snow B, Calne D (1990) Parkinson's disease: a
case-control study of occupational and environmental risk factors. Am J Ind Med 17:
349-355 Doi 10.1002/ajim.4700170307
202. Herzig S, Shaw RJ (2018) AMPK: guardian of metabolism and mitochondrial
homeostasis. Nat Rev Mol Cell Biol 19: 121-135 Doi 10.1038/nrm.2017.95
203. Hessvik NP, Llorente A (2018) Current knowledge on exosome biogenesis and release.
Cell Mol Life Sci 75: 193-208 Doi 10.1007/s00018-017-2595-9
204. Hijaz BA, Volpicelli-Daley LA (2020) Initiation and propagation of α-synuclein
aggregation in the nervous system. Molecular Neurodegeneration 15: 19 Doi
10.1186/s13024-020-00368-6
205. Hirsch E, Graybiel AM, Agid YA (1988) Melanized dopaminergic neurons are
differentially susceptible to degeneration in Parkinson's disease. Nature 334: 345-348 Doi
10.1038/334345a0
206. Hoek KS, Schlegel NC, Eichhoff OM, Widmer DS, Praetorius C, Einarsson SO,
Valgeirsdottir S, Bergsteinsdottir K, Schepsky A, Dummer Ret al (2008) Novel MITF
targets identified using a two-step DNA microarray strategy. Pigment Cell Melanoma
Res 21: 665-676 Doi 10.1111/j.1755-148X.2008.00505.x
207. Hoffmann A, Ettle B, Bruno A, Kulinich A, Hoffmann AC, von Wittgenstein J, Winkler
J, Xiang W, Schlachetzki JCM (2016) Alpha-synuclein activates BV2 microglia
dependent on its aggregation state. Biochem Biophys Res Commun 479: 881-886 Doi
10.1016/j.bbrc.2016.09.109
208. Hoffmann AC, Minakaki G, Menges S, Salvi R, Savitskiy S, Kazman A, Vicente
Miranda H, Mielenz D, Klucken J, Winkler Jet al (2019) Extracellular aggregated alpha
synuclein primarily triggers lysosomal dysfunction in neural cells prevented by trehalose.
Sci Rep 9: 544 Doi 10.1038/s41598-018-35811-8
209. Holmqvist S, Chutna O, Bousset L, Aldrin-Kirk P, Li W, Bjorklund T, Wang ZY,
Roybon L, Melki R, Li JY (2014) Direct evidence of Parkinson pathology spread from
the gastrointestinal tract to the brain in rats. Acta Neuropathol 128: 805-820 Doi
10.1007/s00401-014-1343-6
210. Horie H, Inagaki Y, Sohma Y, Nozawa R, Okawa K, Hasegawa M, Muramatsu N,
Kawano H, Horie M, Koyama Het al (1999) Galectin-1 Regulates Initial Axonal Growth
in Peripheral Nerves after Axotomy. The Journal of Neuroscience 19: 9964-9974 Doi
10.1523/jneurosci.19-22-09964.1999

229
211. Hou X, Watzlawik JO, Fiesel FC, Springer W (2020) Autophagy in Parkinson's Disease.
J Mol Biol: Doi 10.1016/j.jmb.2020.01.037
212. Hoyos HC, Marder M, Ulrich R, Gudi V, Stangel M, Rabinovich GA, Pasquini LA,
Pasquini JM (2016) The Role of Galectin-3: From Oligodendroglial Differentiation and
Myelination to Demyelination and Remyelination Processes in a Cuprizone-Induced
Demyelination Model. Adv Exp Med Biol 949: 311-332 Doi 10.1007/978-3-319-40764-
7_15
213. Hu ZY, Chen B, Zhang JP, Ma YY (2017) Up-regulation of autophagy-related gene 5
(ATG5) protects dopaminergic neurons in a zebrafish model of Parkinson's disease. J
Biol Chem 292: 18062-18074 Doi 10.1074/jbc.M116.764795
214. Huang M, Wang B, Li X, Fu C, Wang C, Kang X (2019) alpha-Synuclein: A
Multifunctional Player in Exocytosis, Endocytosis, and Vesicle Recycling. Front
Neurosci 13: 28 Doi 10.3389/fnins.2019.00028
215. Hughes RC (1999) Secretion of the galectin family of mammalian carbohydrate-binding
proteins. Biochim Biophys Acta 1473: 172-185 Doi 10.1016/s0304-4165(99)00177-4
216. Hui KK, Takashima N, Watanabe A, Chater TE, Matsukawa H, Nekooki-Machida Y,
Nilsson P, Endo R, Goda Y, Saido TCet al (2019) GABARAPs dysfunction by autophagy
deficiency in adolescent brain impairs GABA<sub>A</sub> receptor
trafficking and social behavior. Science Advances 5: eaau8237 Doi
10.1126/sciadv.aau8237
217. Hui KY, Fernandez-Hernandez H, Hu J, Schaffner A, Pankratz N, Hsu NY, Chuang LS,
Carmi S, Villaverde N, Li Xet al (2018) Functional variants in the LRRK2 gene confer
shared effects on risk for Crohn's disease and Parkinson's disease. Sci Transl Med 10:
Doi 10.1126/scitranslmed.aai7795
218. Hurwitz SN, Cheerathodi MR, Nkosi D, York SB, Meckes DG, Jr. (2018) Tetraspanin
CD63 Bridges Autophagic and Endosomal Processes To Regulate Exosomal Secretion
and Intracellular Signaling of Epstein-Barr Virus LMP1. J Virol 92: e01969-01917 Doi
10.1128/JVI.01969-17
219. Ihse E, Yamakado H, van Wijk XM, Lawrence R, Esko JD, Masliah E (2017) Cellular
internalization of alpha-synuclein aggregates by cell surface heparan sulfate depends on
aggregate conformation and cell type. Scientific reports 7: 9008-9008 Doi
10.1038/s41598-017-08720-5
220. Inoki K, Li Y, Xu T, Guan KL (2003) Rheb GTPase is a direct target of TSC2 GAP
activity and regulates mTOR signaling. Genes Dev 17: 1829-1834 Doi
10.1101/gad.1110003
221. Inoki K, Zhu T, Guan K-L (2003) TSC2 Mediates Cellular Energy Response to Control
Cell Growth and Survival. Cell 115: 577-590 Doi 10.1016/S0092-8674(03)00929-2
230
222. Inpanathan S, Botelho RJ (2019) The Lysosome Signaling Platform: Adapting With the
Times. Front Cell Dev Biol 7: 113 Doi 10.3389/fcell.2019.00113
223. Irwin DJ, Lee VM, Trojanowski JQ (2013) Parkinson's disease dementia: convergence of
alpha-synuclein, tau and amyloid-beta pathologies. Nat Rev Neurosci 14: 626-636 Doi
10.1038/nrn3549
224. Iula L, Keitelman IA, Sabbione F, Fuentes F, Guzman M, Galletti JG, Gerber PP,
Ostrowski M, Geffner JR, Jancic CCet al (2018) Autophagy Mediates Interleukin-1beta
Secretion in Human Neutrophils. Front Immunol 9: 269 Doi 10.3389/fimmu.2018.00269
225. Jang A, Lee HJ, Suk JE, Jung JW, Kim KP, Lee SJ (2010) Non-classical exocytosis of
alpha-synuclein is sensitive to folding states and promoted under stress conditions. J
Neurochem 113: 1263-1274 Doi 10.1111/j.1471-4159.2010.06695.x
226. Jena KK, Kolapalli SP, Mehto S, Nath P, Das B, Sahoo PK, Ahad A, Syed GH, Raghav
SK, Senapati Set al (2018) TRIM16 controls assembly and degradation of protein
aggregates by modulating the p62-NRF2 axis and autophagy. EMBO J 37: Doi
10.15252/embj.201798358
227. Jenner P, Schapira AHV, Marsden CD (1992) New insights into the cause of
Parkinson's disease. Neurology 42: 2241 Doi 10.1212/WNL.42.12.2241
228. Jeppesen DK, Fenix AM, Franklin JL, Higginbotham JN, Zhang Q, Zimmerman LJ,
Liebler DC, Ping J, Liu Q, Evans Ret al (2019) Reassessment of Exosome Composition.
Cell 177: 428-445 e418 Doi 10.1016/j.cell.2019.02.029
229. Jewell JL, Kim YC, Russell RC, Yu FX, Park HW, Plouffe SW, Tagliabracci VS, Guan
KL (2015) Metabolism. Differential regulation of mTORC1 by leucine and glutamine.
Science 347: 194-198 Doi 10.1126/science.1259472
230. Ji Y, Qi D, Li L, Su H, Li X, Luo Y, Sun B, Zhang F, Lin B, Liu Tet al (2019)
Multiplexed profiling of single-cell extracellular vesicles secretion. Proc Natl Acad Sci U
S A 116: 5979-5984 Doi 10.1073/pnas.1814348116
231. Jia J, Abudu YP, Claude-Taupin A, Gu Y, Kumar S, Choi SW, Peters R, Mudd MH,
Allers L, Salemi Met al (2019) Galectins control MTOR and AMPK in response to
lysosomal damage to induce autophagy. Autophagy 15: 169-171 Doi
10.1080/15548627.2018.1505155
232. Jia J, Abudu YP, Claude-Taupin A, Gu Y, Kumar S, Choi SW, Peters R, Mudd MH,
Allers L, Salemi Met al (2018) Galectins Control mTOR in Response to Endomembrane
Damage. Mol Cell 70: 120-135 e128 Doi 10.1016/j.molcel.2018.03.009
233. Jia J, Bissa B, Brecht L, Allers L, Choi SW, Gu Y, Zbinden M, Burge MR, Timmins G,
Hallows Ket al (2020) AMPK, a Regulator of Metabolism and Autophagy, Is Activated
by Lysosomal Damage via a Novel Galectin-Directed Ubiquitin Signal Transduction
System. Mol Cell 77: 951-969 e959 Doi 10.1016/j.molcel.2019.12.028
231
234. Jia J, Claude-Taupin A, Gu Y, Choi SW, Peters R, Bissa B, Mudd MH, Allers L,
Pallikkuth S, Lidke KAet al (2020) Galectin-3 Coordinates a Cellular System for
Lysosomal Repair and Removal. Dev Cell 52: 69-87 e68 Doi
10.1016/j.devcel.2019.10.025
235. Jiang P, Gan M, Yen SH, McLean PJ, Dickson DW (2017) Impaired endo-lysosomal
membrane integrity accelerates the seeding progression of alpha-synuclein aggregates.
Sci Rep 7: 7690 Doi 10.1038/s41598-017-08149-w
236. Jiang TF, Zhang YJ, Zhou HY, Wang HM, Tian LP, Liu J, Ding JQ, Chen SD (2013)
Curcumin ameliorates the neurodegenerative pathology in A53T α-synuclein cell model
of Parkinson's disease through the downregulation of mTOR/p70S6K signaling and the
recovery of macroautophagy. J Neuroimmune Pharmacol 8: 356-369 Doi
10.1007/s11481-012-9431-7
237. Johannes L, Jacob R, Leffler H (2018) Galectins at a glance. J Cell Sci 131: Doi
10.1242/jcs.208884
238. Kaja S, Payne AJ, Naumchuk Y, Koulen P (2017) Quantification of Lactate
Dehydrogenase for Cell Viability Testing Using Cell Lines and Primary Cultured
Astrocytes. Curr Protoc Toxicol 72: 2 26 21-22 26 10 Doi 10.1002/cptx.21
239. Kankkunen P, Teirila L, Rintahaka J, Alenius H, Wolff H, Matikainen S (2010) (1,3)-
beta-glucans activate both dectin-1 and NLRP3 inflammasome in human macrophages. J
Immunol 184: 6335-6342 Doi 10.4049/jimmunol.0903019
240. Kaushik S, Cuervo AM (2012) Chaperone-mediated autophagy: a unique way to enter the
lysosome world. Trends Cell Biol 22: 407-417 Doi 10.1016/j.tcb.2012.05.006
241. Kazui A, Ono M, Handa K, Hakomori S (2000) Glycosylation affects translocation of
integrin, Src, and caveolin into or out of GEM. Biochem Biophys Res Commun 273:
159-163 Doi 10.1006/bbrc.2000.2903
242. Kiechle M, von Einem B, Hofs L, Voehringer P, Grozdanov V, Markx D, Parlato R,
Wiesner D, Mayer B, Sakk Oet al (2019) In Vivo Protein Complementation
Demonstrates Presynaptic alpha-Synuclein Oligomerization and Age-Dependent
Accumulation of 8-16-mer Oligomer Species. Cell Rep 29: 2862-2874 e2869 Doi
10.1016/j.celrep.2019.10.089
243. Kilpatrick K, Zeng Y, Hancock T, Segatori L (2015) Genetic and chemical activation of
TFEB mediates clearance of aggregated α-synuclein. PLoS One 10: e0120819 Doi
10.1371/journal.pone.0120819
244. Kilpelainen T, Julku UH, Svarcbahs R, Myohanen TT (2019) Behavioural and
dopaminergic changes in double mutated human A30P*A53T alpha-synuclein transgenic
mouse model of Parkinson s disease. Sci Rep 9: 17382 Doi 10.1038/s41598-019-54034-z

232
245. Kim C, Ho D-H, Suk J-E, You S, Michael S, Kang J, Joong Lee S, Masliah E, Hwang D,
Lee H-Jet al (2013) Neuron-released oligomeric α-synuclein is an endogenous agonist of
TLR2 for paracrine activation of microglia. Nature communications 4: 1562-1562 Doi
10.1038/ncomms2534
246. Kim E, Goraksha-Hicks P, Li L, Neufeld TP, Guan KL (2008) Regulation of TORC1 by
Rag GTPases in nutrient response. Nat Cell Biol 10: 935-945 Doi 10.1038/ncb1753
247. Kim MJ, Jeon S, Burbulla LF, Krainc D (2018) Acid ceramidase inhibition ameliorates
α-synuclein accumulation upon loss of GBA1 function. Hum Mol Genet 27: 1972-1988
Doi 10.1093/hmg/ddy105
248. Kim TD, Choi E, Rhim H, Paik SR, Yang C-H (2004) α-Synuclein has structural and
functional similarities to small heat shock proteins. Biochemical and Biophysical
Research Communications 324: 1352-1359 Doi
https://doi.org/10.1016/j.bbrc.2004.09.208
249. Kim WS, Kagedal K, Halliday GM (2014) Alpha-synuclein biology in Lewy body
diseases. Alzheimers Res Ther 6: 73 Doi 10.1186/s13195-014-0073-2
250. Kimura T, Jia J, Kumar S, Choi SW, Gu Y, Mudd M, Dupont N, Jiang S, Peters R,
Farzam Fet al (2017) Dedicated SNAREs and specialized TRIM cargo receptors mediate
secretory autophagy. EMBO J 36: 42-60 Doi 10.15252/embj.201695081
251. Klein AD, Mazzulli JR (2018) Is Parkinson's disease a lysosomal disorder? Brain 141:
2255-2262 Doi 10.1093/brain/awy147
252. Klein C, Westenberger A (2012) Genetics of Parkinson's disease. Cold Spring Harb
Perspect Med 2: a008888 Doi 10.1101/cshperspect.a008888
253. Koch JC, Bitow F, Haack J, d'Hedouville Z, Zhang JN, Tönges L, Michel U, Oliveira
LMA, Jovin TM, Liman Jet al (2015) Alpha-Synuclein affects neurite morphology,
autophagy, vesicle transport and axonal degeneration in CNS neurons. Cell Death &
Disease 6: e1811-e1811 Doi 10.1038/cddis.2015.169
254. Kokhan VS, Afanasyeva MA, Van'kin GI (2012) alpha-Synuclein knockout mice have
cognitive impairments. Behav Brain Res 231: 226-230 Doi 10.1016/j.bbr.2012.03.026
255. Kondo N, Miyauchi K, Meng F, Iwamoto A, Matsuda Z (2010) Conformational changes
of the HIV-1 envelope protein during membrane fusion are inhibited by the replacement
of its membrane-spanning domain. J Biol Chem 285: 14681-14688 Doi
10.1074/jbc.M109.067090
256. Konoshenko MY, Lekchnov EA, Vlassov AV, Laktionov PP (2018) Isolation of
Extracellular Vesicles: General Methodologies and Latest Trends. Biomed Res Int 2018:
8545347 Doi 10.1155/2018/8545347

233
257. Kopitz J, Ballikaya S, André S, Gabius H-J (2012) Ganglioside GM1/Galectin-
Dependent Growth Regulation in Human Neuroblastoma Cells: Special Properties of
Bivalent Galectin-4 and Significance of Linker Length for Ligand Selection.
Neurochemical Research 37: 1267-1276 Doi 10.1007/s11064-011-0693-x
258. Kordower JH, Chu Y, Hauser RA, Freeman TB, Olanow CW (2008) Lewy body-like
pathology in long-term embryonic nigral transplants in Parkinson's disease. Nat Med 14:
504-506 Doi nm1747 [pii] 10.1038/nm1747
259. Kordower JH, Chu Y, Hauser RA, Olanow CW, Freeman TB (2008) Transplanted
dopaminergic neurons develop PD pathologic changes: a second case report. Mov Disord
23: 2303-2306 Doi 10.1002/mds.22369
260. Kowal J, Arras G, Colombo M, Jouve M, Morath JP, Primdal-Bengtson B, Dingli F,
Loew D, Tkach M, Thery C (2016) Proteomic comparison defines novel markers to
characterize heterogeneous populations of extracellular vesicle subtypes. Proc Natl Acad
Sci U S A 113: E968-977 Doi 10.1073/pnas.1521230113
261. Kreibich S, Emmenlauer M, Fredlund J, Ramo P, Munz C, Dehio C, Enninga J, Hardt
WD (2015) Autophagy Proteins Promote Repair of Endosomal Membranes Damaged by
the Salmonella Type Three Secretion System 1. Cell Host Microbe 18: 527-537 Doi
10.1016/j.chom.2015.10.015
262. Kriks S, Shim JW, Piao J, Ganat YM, Wakeman DR, Xie Z, Carrillo-Reid L, Auyeung G,
Antonacci C, Buch Aet al (2011) Dopamine neurons derived from human ES cells
efficiently engraft in animal models of Parkinson's disease. Nature 480: 547-551 Doi
10.1038/nature10648
263. Krüger R, Kuhn W, Müller T, Woitalla D, Graeber M, Kösel S, Przuntek H, Epplen JT,
Schols L, Riess O (1998) AlaSOPro mutation in the gene encoding α-synuclein in
Parkinson's disease. Nature Genetics 18: 106-108 Doi 10.1038/ng0298-106
264. Ktistakis NT (2020) ER platforms mediating autophagosome generation. Biochim
Biophys Acta Mol Cell Biol Lipids 1865: 158433 Doi 10.1016/j.bbalip.2019.03.005
265. Kumar S, Chauhan S, Jain A, Ponpuak M, Choi SW, Mudd M, Peters R, Mandell MA,
Johansen T, Deretic V (2017) Galectins and TRIMs directly interact and orchestrate
autophagic response to endomembrane damage. Autophagy 13: 1086-1087 Doi
10.1080/15548627.2017.1307487
266. Kumar S, Jain A, Choi SW, da Silva GPD, Allers L, Mudd MH, Peters RS, Anonsen JH,
Rusten TE, Lazarou Met al (2020) Mammalian Atg8 proteins and the autophagy factor
IRGM control mTOR and TFEB at a regulatory node critical for responses to pathogens.
Nat Cell Biol 22: 973-985 Doi 10.1038/s41556-020-0549-1
234
267. Kunadt M, Eckermann K, Stuendl A, Gong J, Russo B, Strauss K, Rai S, Kugler S,
Falomir Lockhart L, Schwalbe Met al (2015) Extracellular vesicle sorting of alpha-
Synuclein is regulated by sumoylation. Acta Neuropathol 129: 695-713 Doi
10.1007/s00401-015-1408-1
268. Kundra R, Kornfeld S (1999) Asparagine-linked oligosaccharides protect Lamp-1 and
Lamp-2 from intracellular proteolysis. J Biol Chem 274: 31039-31046 Doi
10.1074/jbc.274.43.31039
269. Kung L, Force M, Chute DJ, Roberts RC (1998) Immunocytochemical localization of
tyrosine hydroxylase in the human striatum: A postmortem ultrastructural study. The
Journal of Comparative Neurology 390: 52-62 Doi 10.1002/(sici)1096-
9861(19980105)390:1<52::Aid-cne5>3.0.Co;2-p
270. Lagoo J, Pappas TN, Perez A (2014) A relic or still relevant: the narrowing role for
vagotomy in the treatment of peptic ulcer disease. Am J Surg 207: 120-126 Doi
10.1016/j.amjsurg.2013.02.012
271. Lai CP, Kim EY, Badr CE, Weissleder R, Mempel TR, Tannous BA, Breakefield XO
(2015) Visualization and tracking of tumour extracellular vesicle delivery and RNA
translation using multiplexed reporters. Nat Commun 6: 7029 Doi 10.1038/ncomms8029
272. Langston JW, Ballard P, Tetrud JW, Irwin I (1983) Chronic Parkinsonism in humans due
to a product of meperidine-analog synthesis. Science 219: 979-980 Doi
10.1126/science.6823561
273. Lassen LB, Gregersen E, Isager AK, Betzer C, Kofoed RH, Jensen PH (2018) ELISA
method to detect alpha-synuclein oligomers in cell and animal models. PLoS One 13:
e0196056 Doi 10.1371/journal.pone.0196056
274. Lauretti E, Dincer O, Praticò D (2020) Glycogen synthase kinase-3 signaling in
Alzheimer's disease. Biochimica et Biophysica Acta (BBA) - Molecular Cell Research
1867: 118664 Doi https://doi.org/10.1016/j.bbamcr.2020.118664
275. Lawrence RE, Fromm SA, Fu Y, Yokom AL, Kim DJ, Thelen AM, Young LN, Lim C-
Y, Samelson AJ, Hurley JHet al (2019) Structural mechanism of a Rag GTPase activation
checkpoint by the lysosomal folliculin complex. Science 366: 971 Doi
10.1126/science.aax0364
276. Lawrence RE, Zoncu R (2019) The lysosome as a cellular centre for signalling,
metabolism and quality control. Nature Cell Biology 21: 133-142 Doi 10.1038/s41556-
018-0244-7
277. Lee BR, Kamitani T (2011) Improved immunodetection of endogenous alpha-synuclein.
PLoS One 6: e23939 Doi 10.1371/journal.pone.0023939

235
278. Lee HJ, Bae EJ, Jang A, Ho DH, Cho ED, Suk JE, Yun YM, Lee SJ (2011) Enzyme-
linked immunosorbent assays for alpha-synuclein with species and multimeric state
specificities. J Neurosci Methods 199: 249-257 Doi 10.1016/j.jneumeth.2011.05.020
279. Lee HJ, Cho ED, Lee KW, Kim JH, Cho SG, Lee SJ (2013) Autophagic failure promotes
the exocytosis and intercellular transfer of alpha-synuclein. Exp Mol Med 45: e22 Doi
10.1038/emm.2013.45
280. Lee IH, Kai H, Carlson LA, Groves JT, Hurley JH (2015) Negative membrane curvature
catalyzes nucleation of endosomal sorting complex required for transport (ESCRT)-III
assembly. Proc Natl Acad Sci U S A 112: 15892-15897 Doi 10.1073/pnas.1518765113
281. Lee K, Fraser K, Ghaddar B, Yang K, Kim E, Balaj L, Chiocca EA, Breakefield XO, Lee
H, Weissleder R (2018) Multiplexed Profiling of Single Extracellular Vesicles. ACS
Nano 12: 494-503 Doi 10.1021/acsnano.7b07060
282. Lee SJ, Desplats P, Lee HJ, Spencer B, Masliah E (2012) Cell-to-cell transmission of
alpha-synuclein aggregates. Methods Mol Biol 849: 347-359 Doi 10.1007/978-1-61779-
551-0_23
283. Lee Y, Lee S, Chang SC, Lee J (2019) Significant roles of neuroinflammation in
Parkinson's disease: therapeutic targets for PD prevention. Arch Pharm Res 42: 416-425
Doi 10.1007/s12272-019-01133-0
284. Lei Z, Cao G, Wei G (2019) A30P mutant alpha-synuclein impairs autophagic flux by
inactivating JNK signaling to enhance ZKSCAN3 activity in midbrain dopaminergic
neurons. Cell Death Dis 10: 133 Doi 10.1038/s41419-019-1364-0
285. Leidal AM, Huang HH, Marsh T, Solvik T, Zhang D, Ye J, Kai F, Goldsmith J, Liu JY,
Huang YHet al (2020) The LC3-conjugation machinery specifies the loading of RNA-
binding proteins into extracellular vesicles. Nat Cell Biol 22: 187-199 Doi
10.1038/s41556-019-0450-y
286. Leil TA, Chen ZW, Chang CS, Olsen RW (2004) GABAA receptor-associated protein
traffics GABAA receptors to the plasma membrane in neurons. J Neurosci 24: 11429-
11438 Doi 10.1523/jneurosci.3355-04.2004
287 Lennon KM, Wakefield DL, Maddox AL, Brehove MS, Willner AN, Garcia-Mansfield
K, Meechoovet B, Reiman R, Hutchins E, Miller MMet al (2019) Single molecule
characterization of individual extracellular vesicles from pancreatic cancer. J Extracell
Vesicles 8: 1685634 Doi 10.1080/20013078.2019.1685634
288. Lerman BJ, Hoffman EP, Sutherland ML, Bouri K, Hsu DK, Liu FT, Rothstein JD,
Knoblach SM (2012) Deletion of galectin-3 exacerbates microglial activation and
accelerates disease progression and demise in a SOD1(G93A) mouse model of
amyotrophic lateral sclerosis. Brain Behav 2: 563-575 Doi 10.1002/brb3.75

236
289. Lesage S, Anheim M, Letournel F, Bousset L, Honore A, Rozas N, Pieri L, Madiona K,
Durr A, Melki Ret al (2013) G51D alpha-synuclein mutation causes a novel
parkinsonian-pyramidal syndrome. Ann Neurol 73: 459-471 Doi 10.1002/ana.23894
290. Lewis V, Green SA, Marsh M, Vihko P, Helenius A, Mellman I (1985) Glycoproteins of
the lysosomal membrane. J Cell Biol 100: 1839-1847 Doi 10.1083/jcb.100.6.1839
291. Li J, Uversky VN, Fink AL (2001) Effect of Familial Parkinson's Disease Point
Mutations A30P and A53T on the Structural Properties, Aggregation, and Fibrillation of
Human α-Synuclein. Biochemistry 40: 11604-11613 Doi 10.1021/bi010616g
292. Li JY, Englund E, Widner H, Rehncrona S, Bjorklund A, Lindvall O, Brundin P (2010)
Characterization of Lewy body pathology in 12- and 16-year-old intrastriatal
mesencephalic grafts surviving in a patient with Parkinson's disease. Mov Disord 25:
1091-1096 Doi 10.1002/mds.23012
293. Li S, Song Y, Quach C, Guo H, Jang GB, Maazi H, Zhao S, Sands NA, Liu Q, In GKet al
(2019) Transcriptional regulation of autophagy-lysosomal function in BRAF-driven
melanoma progression and chemoresistance. Nat Commun 10: 1693 Doi
10.1038/s41467-019-09634-8
294. Li Y, Chen N, Wu C, Lu Y, Gao G, Duan C, Yang H, Lu L (2020) Galectin-1 attenuates
neurodegeneration in Parkinson's disease model by modulating microglial
MAPK/IkappaB/NFkappaB axis through its carbohydrate-recognition domain. Brain
Behav Immun 83: 214-225 Doi 10.1016/j.bbi.2019.10.015
295. Lim H, Lee D, Choi WK, Choi SJ, Oh W, Kim DH (2020) Galectin-3 Secreted by
Human Umbilical Cord Blood-Derived Mesenchymal Stem Cells Reduces Aberrant Tau
Phosphorylation in an Alzheimer Disease Model. Stem Cells Int 2020: 8878412 Doi
10.1155/2020/8878412
296. Lionnet A, Leclair-Visonneau L, Neunlist M, Murayama S, Takao M, Adler CH,
Derkinderen P, Beach TG (2018) Does Parkinson’s disease start in the gut? Acta
Neuropathologica 135: 1-12 Doi 10.1007/s00401-017-1777-8
297. Liou HH, Tsai MC, Chen CJ, Jeng JS, Chang YC, Chen SY, Chen RC (1997)
Environmental risk factors and Parkinson's disease: a case-control study in Taiwan.
Neurology 48: 1583-1588 Doi 10.1212/wnl.48.6.1583
298. Liu FT, Hsu DK, Zuberi RI, Hill PN, Shenhav A, Kuwabara I, Chen SS (1996)
Modulation of functional properties of galectin-3 by monoclonal antibodies binding to
the non-lectin domains. Biochemistry 35: 6073-6079 Doi 10.1021/bi952716q
299. Liu P, Gan W, Chin YR, Ogura K, Guo J, Zhang J, Wang B, Blenis J, Cantley LC, Toker
Aet al (2015) PtdIns(3,4,5)P3-Dependent Activation of the mTORC2 Kinase Complex.
Cancer Discov 5: 1194-1209 Doi 10.1158/2159-8290.Cd-15-0460
237
300. Long X, Lin Y, Ortiz-Vega S, Yonezawa K, Avruch J (2005) Rheb binds and regulates
the mTOR kinase. Curr Biol 15: 702-713 Doi 10.1016/j.cub.2005.02.053
301. Longinetti E, Fang F (2019) Epidemiology of amyotrophic lateral sclerosis: an update of
recent literature. Curr Opin Neurol 32: 771-776 Doi 10.1097/WCO.0000000000000730
302. Lopez-Otin C, Blasco MA, Partridge L, Serrano M, Kroemer G (2013) The hallmarks of
aging. Cell 153: 1194-1217 Doi 10.1016/j.cell.2013.05.039
303. Lu Y, Prudent M, Fauvet B, Lashuel HA, Girault HH (2011) Phosphorylation of α-
Synuclein at Y125 and S129 Alters Its Metal Binding Properties: Implications for
Understanding the Role of α-Synuclein in the Pathogenesis of Parkinson’s Disease and
Related Disorders. ACS Chemical Neuroscience 2: 667-675 Doi 10.1021/cn200074d
304. Luk KC, Kehm V, Carroll J, Zhang B, O'Brien P, Trojanowski JQ, Lee VM (2012)
Pathological alpha-synuclein transmission initiates Parkinson-like neurodegeneration in
nontransgenic mice. Science 338: 949-953 Doi 10.1126/science.1227157338/6109/949
[pii]
305. Luk KC, Kehm VM, Zhang B, O'Brien P, Trojanowski JQ, Lee VM (2012) Intracerebral
inoculation of pathological alpha-synuclein initiates a rapidly progressive
neurodegenerative alpha-synucleinopathy in mice. J Exp Med 209: 975-986 Doi
10.1084/jem.20112457jem.20112457 [pii]
306. Luk KC, Song C, O'Brien P, Stieber A, Branch JR, Brunden KR, Trojanowski JQ, Lee
VM (2009) Exogenous alpha-synuclein fibrils seed the formation of Lewy body-like
intracellular inclusions in cultured cells. Proc Natl Acad Sci U S A 106: 20051-20056
Doi 0908005106 [pii] 10.1073/pnas.0908005106
307. Lutomski D, Fouillit M, Bourin P, Mellottée D, Denize N, Pontet M, Bladier D, Caron
M, Joubert-Caron R (1997) Externalization and binding of galectin-1 on cell surface of
K562 cells upon erythroid differentiation. Glycobiology 7: 1193-1199 Doi
10.1093/glycob/7.8.1193
308. M HR, Bayraktar E, G KH, Abd-Ellah MF, Amero P, Chavez-Reyes A, Rodriguez-
Aguayo C (2017) Exosomes: From Garbage Bins to Promising Therapeutic Targets. Int J
Mol Sci 18: Doi 10.3390/ijms18030538
309. Ma S, Fang Z, Luo W, Yang Y, Wang C, Zhang Q, Wang H, Chen H, Chan CB, Liu Z
(2016) The C-ETS2-TFEB Axis Promotes Neuron Survival under Oxidative Stress by
Regulating Lysosome Activity. Oxid Med Cell Longev 2016: 4693703 Doi
10.1155/2016/4693703
310. Maday S (2016) Mechanisms of neuronal homeostasis: Autophagy in the axon. Brain Res
1649: 143-150 Doi 10.1016/j.brainres.2016.03.047
238
311. Maday S, Holzbaur EL (2014) Autophagosome biogenesis in primary neurons follows an
ordered and spatially regulated pathway. Dev Cell 30: 71-85 Doi
10.1016/j.devcel.2014.06.001
312. Magalhaes J, Gegg ME, Migdalska-Richards A, Schapira AH (2018) Effects of ambroxol
on the autophagy-lysosome pathway and mitochondria in primary cortical neurons. Sci
Rep 8: 1385 Doi 10.1038/s41598-018-19479-8
313. Maher F, Simpson IA (1994) The GLUT3 glucose transporter is the predominant isoform
in primary cultured neurons: assessment by biosynthetic and photoaffinity labelling.
Biochem J 301 ( Pt 2): 379-384 Doi 10.1042/bj3010379
314. Maier O, Hoekstra D, Baron W (2008) Polarity development in oligodendrocytes: sorting
and trafficking of myelin components. J Mol Neurosci 35: 35-53 Doi 10.1007/s12031-
007-9024-8
315. Malagelada C, Jin ZH, Greene LA (2008) RTP801 is induced in Parkinson's disease and
mediates neuron death by inhibiting Akt phosphorylation/activation. J Neurosci 28:
14363-14371 Doi 10.1523/jneurosci.3928-08.2008
316. Malagelada C, Ryu EJ, Biswas SC, Jackson-Lewis V, Greene LA (2006) RTP801 is
elevated in Parkinson brain substantia nigral neurons and mediates death in cellular
models of Parkinson's disease by a mechanism involving mammalian target of rapamycin
inactivation. J Neurosci 26: 9996-10005 Doi 10.1523/jneurosci.3292-06.2006
317. Manning BD, Toker A (2017) AKT/PKB Signaling: Navigating the Network. Cell 169:
381-405 Doi 10.1016/j.cell.2017.04.001
318. Mansilla Pareja ME, Bongiovanni A, Lafont F, Colombo MI (2017) Alterations of the
Coxiella burnetii Replicative Vacuole Membrane Integrity and Interplay with the
Autophagy Pathway. Front Cell Infect Microbiol 7: 112 Doi 10.3389/fcimb.2017.00112
319. Mao X, Ou MT, Karuppagounder SS, Kam TI, Yin X, Xiong Y, Ge P, Umanah GE,
Brahmachari S, Shin JHet al (2016) Pathological alpha-synuclein transmission initiated
by binding lymphocyte-activation gene 3. Science 353: Doi 10.1126/science.aah3374
320. Maroteaux L, Campanelli JT, Scheller RH (1988) Synuclein: a neuron-specific protein
localized to the nucleus and presynaptic nerve terminal. The Journal of Neuroscience 8:
2804-2815 Doi 10.1523/jneurosci.08-08-02804.1988
321. Marras C, Beck JC, Bower JH, Roberts E, Ritz B, Ross GW, Abbott RD, Savica R, Van
Den Eeden SK, Willis AWet al (2018) Prevalence of Parkinson's disease across North
America. NPJ Parkinsons Dis 4: 21 Doi 10.1038/s41531-018-0058-0
322. Marshall MS, Jakubauskas B, Bogue W, Stoskute M, Hauck Z, Rue E, Nichols M,
DiAntonio LL, van Breemen RB, Kordower JHet al (2018) Analysis of age-related
changes in psychosine metabolism in the human brain. PLoS One 13: e0193438 Doi
10.1371/journal.pone.0193438
239
323. Martin LJ, Pan Y, Price AC, Sterling W, Copeland NG, Jenkins NA, Price DL, Lee MK
(2006) Parkinson's disease alpha-synuclein transgenic mice develop neuronal
mitochondrial degeneration and cell death. J Neurosci 26: 41-50 Doi
10.1523/JNEUROSCI.4308-05.2006
324. Martina JA, Diab HI, Lishu L, Jeong AL, Patange S, Raben N, Puertollano R (2014) The
nutrient-responsive transcription factor TFE3 promotes autophagy, lysosomal biogenesis,
and clearance of cellular debris. Sci Signal 7: ra9 Doi 10.1126/scisignal.2004754
325. Masuda-Suzukake M, Nonaka T, Hosokawa M, Oikawa T, Arai T, Akiyama H, Mann
DM, Hasegawa M (2013) Prion-like spreading of pathological α-synuclein in brain. Brain
136: 1128-1138 Doi 10.1093/brain/awt037
326. Mauvezin C, Nagy P, Juhasz G, Neufeld TP (2015) Autophagosome-lysosome fusion is
independent of V-ATPase-mediated acidification. Nat Commun 6: 7007 Doi
10.1038/ncomms8007
327. Mauvezin C, Neufeld TP (2015) Bafilomycin A1 disrupts autophagic flux by inhibiting
both V-ATPase-dependent acidification and Ca-P60A/SERCA-dependent
autophagosome-lysosome fusion. Autophagy 11: 1437-1438 Doi
10.1080/15548627.2015.1066957
328. Mazurskyy A, Howitt J (2019) Initiation and Transmission of α-Synuclein Pathology in
Parkinson's Disease. Neurochem Res: Doi 10.1007/s11064-019-02896-0
329. Mazzulli JR, Xu YH, Sun Y, Knight AL, McLean PJ, Caldwell GA, Sidransky E,
Grabowski GA, Krainc D (2011) Gaucher disease glucocerebrosidase and alpha-
synuclein form a bidirectional pathogenic loop in synucleinopathies. Cell 146: 37-52 Doi
10.1016/j.cell.2011.06.001
330. Mazzulli JR, Zunke F, Isacson O, Studer L, Krainc D (2016) alpha-Synuclein-induced
lysosomal dysfunction occurs through disruptions in protein trafficking in human
midbrain synucleinopathy models. Proc Natl Acad Sci U S A 113: 1931-1936 Doi
10.1073/pnas.1520335113
331. McAlary L, Plotkin SS, Yerbury JJ, Cashman NR (2019) Prion-Like Propagation of
Protein Misfolding and Aggregation in Amyotrophic Lateral Sclerosis. Frontiers in
Molecular Neuroscience 12: Doi 10.3389/fnmol.2019.00262
332. McCullough J, Clippinger AK, Talledge N, Skowyra ML, Saunders MG, Naismith TV,
Colf LA, Afonine P, Arthur C, Sundquist WIet al (2015) Structure and membrane
remodeling activity of ESCRT-III helical polymers. Science 350: 1548-1551 Doi
10.1126/science.aad8305
333. McGlinchey R, Lee J (2015) Effect of Glucocerebrosidase and Its Substrate,
Glucosylceramide on α-Synuclein Aggregation and Degradation. The FASEB Journal 29:
564.567 Doi https://doi.org/10.1096/fasebj.29.1_supplement.564.7

240
334. McGlinchey RP, Lacy SM, Huffer KE, Tayebi N, Sidransky E, Lee JC (2019) C-terminal
α-synuclein truncations are linked to cysteine cathepsin activity in Parkinson's disease.
The Journal of biological chemistry 294: 9973-9984 Doi 10.1074/jbc.RA119.008930
335. McGlinchey RP, Lee JC (2015) Cysteine cathepsins are essential in lysosomal
degradation of α-synuclein. Proc Natl Acad Sci U S A 112: 9322-9327 Doi
10.1073/pnas.1500937112
336. Medina DL, Fraldi A, Bouche V, Annunziata F, Mansueto G, Spampanato C, Puri C,
Pignata A, Martina JA, Sardiello Met al (2011) Transcriptional activation of lysosomal
exocytosis promotes cellular clearance. Dev Cell 21: 421-430 Doi
10.1016/j.devcel.2011.07.016
337. Menon S, Dibble CC, Talbott G, Hoxhaj G, Valvezan AJ, Takahashi H, Cantley LC,
Manning BD (2014) Spatial control of the TSC complex integrates insulin and nutrient
regulation of mTORC1 at the lysosome. Cell 156: 771-785 Doi
10.1016/j.cell.2013.11.049
338. Menon V, Thomas R, Ghale AR, Reinhard C, Pruszak J (2014) Flow cytometry protocols
for surface and intracellular antigen analyses of neural cell types. J Vis Exp: Doi
10.3791/52241
339. Migdalska-Richards A, Daly L, Bezard E, Schapira AH (2016) Ambroxol effects in
glucocerebrosidase and alpha-synuclein transgenic mice. Ann Neurol 80: 766-775 Doi
10.1002/ana.24790
340. Minakaki G, Menges S, Kittel A, Emmanouilidou E, Schaeffner I, Barkovits K,
Bergmann A, Rockenstein E, Adame A, Marxreiter Fet al (2018) Autophagy inhibition
promotes SNCA/alpha-synuclein release and transfer via extracellular vesicles with a
hybrid autophagosome-exosome-like phenotype. Autophagy 14: 98-119 Doi
10.1080/15548627.2017.1395992
341. Mittal S, Bjornevik K, Im DS, Flierl A, Dong X, Locascio JJ, Abo KM, Long E, Jin M,
Xu Bet al (2017) beta2-Adrenoreceptor is a regulator of the alpha-synuclein gene driving
risk of Parkinson's disease. Science 357: 891-898 Doi 10.1126/science.aaf3934
342. Mizushima N, Yamamoto A, Matsui M, Yoshimori T, Ohsumi Y (2004) In vivo analysis
of autophagy in response to nutrient starvation using transgenic mice expressing a
fluorescent autophagosome marker. Molecular biology of the cell 15: 1101-1111 Doi
10.1091/mbc.e03-09-0704
343. Mondal A, Ashiq KA, Phulpagar P, Singh DK, Shiras A (2019) Effective Visualization
and Easy Tracking of Extracellular Vesicles in Glioma Cells. Biol Proced Online 21: 4
Doi 10.1186/s12575-019-0092-2
241
344. Moraitou M, Dermentzaki G, Dimitriou E, Monopolis I, Dekker N, Aerts H, Stefanis L,
Michelakakis H (2016) α-Synuclein dimerization in erythrocytes of Gaucher disease
patients: correlation with lipid abnormalities and oxidative stress. Neurosci Lett 613: 1-5
Doi 10.1016/j.neulet.2015.12.013
345. Mou L, Ding W, Fernandez-Funez P (2020) Open questions on the nature of Parkinson's
disease: from triggers to spreading pathology. J Med Genet 57: 73-81 Doi
10.1136/jmedgenet-2019-106210
346. Mougenot AL, Nicot S, Bencsik A, Morignat E, Verchère J, Lakhdar L, Legastelois S,
Baron T (2012) Prion-like acceleration of a synucleinopathy in a transgenic mouse
model. Neurobiol Aging 33: 2225-2228 Doi 10.1016/j.neurobiolaging.2011.06.022
347. Mullin S, Smith L, Lee K, D'Souza G, Woodgate P, Elflein J, Hallqvist J, Toffoli M,
Streeter A, Hosking Jet al (2020) Ambroxol for the Treatment of Patients With Parkinson
Disease With and Without Glucocerebrosidase Gene Mutations: A Nonrandomized,
Noncontrolled Trial. JAMA Neurol 77: 427-434 Doi 10.1001/jamaneurol.2019.4611
348. Murray JM, Appleton PL, Swedlow JR, Waters JC (2007) Evaluating performance in
three-dimensional fluorescence microscopy. J Microsc 228: 390-405 Doi JMI1861 [pii]
10.1111/j.1365-2818.2007.01861.x
349. Murrow L, Malhotra R, Debnath J (2015) ATG12-ATG3 interacts with Alix to promote
basal autophagic flux and late endosome function. Nat Cell Biol 17: 300-310 Doi
10.1038/ncb3112
350. Ng CH, Guan MS, Koh C, Ouyang X, Yu F, Tan EK, O'Neill SP, Zhang X, Chung J, Lim
KL (2012) AMP kinase activation mitigates dopaminergic dysfunction and mitochondrial
abnormalities in Drosophila models of Parkinson's disease. J Neurosci 32: 14311-14317
Doi 10.1523/jneurosci.0499-12.2012
351. Nichols E, Szoeke CEI, Vollset SE, Abbasi N, Abd-Allah F, Abdela J, Aichour MTE,
Akinyemi RO, Alahdab F, Asgedom SWet al (2019) Global, regional, and national
burden of Alzheimer's disease and other dementias, 1990–2016: a systematic analysis for
the Global Burden of Disease Study 2016. The Lancet Neurology 18: 88-106 Doi
10.1016/s1474-4422(18)30403-4
352. Nizamudeen Z, Markus R, Lodge R, Parmenter C, Platt M, Chakrabarti L, Sottile V
(2018) Rapid and accurate analysis of stem cell-derived extracellular vesicles with super
resolution microscopy and live imaging. Biochim Biophys Acta Mol Cell Res 1865:
1891-1900 Doi 10.1016/j.bbamcr.2018.09.008
353. Nomura K, Vilalta A, Allendorf DH, Hornik TC, Brown GC (2017) Activated Microglia
Desialylate and Phagocytose Cells via Neuraminidase, Galectin-3, and Mer Tyrosine
Kinase. J Immunol 198: 4792-4801 Doi 10.4049/jimmunol.1502532
242
354. Novikoff AB, Essner E, Quintana N (1964) GOLGI APPARATUS AND LYSOSOMES.
Fed Proc 23: 1010-1022
355. Nuzhnyi E, Emelyanov A, Boukina T, Usenko T, Yakimovskii A, Zakharova E, Pchelina
S (2015) Plasma oligomeric alpha-synuclein is associated with glucocerebrosidase
activity in Gaucher disease. Mov Disord 30: 989-991 Doi 10.1002/mds.26200
356. O'Doherty U, Swiggard WJ, Malim MH (2000) Human immunodeficiency virus type 1
spinoculation enhances infection through virus binding. J Virol 74: 10074-10080
357. Ohman T, Teirila L, Lahesmaa-Korpinen AM, Cypryk W, Veckman V, Saijo S, Wolff H,
Hautaniemi S, Nyman TA, Matikainen S (2014) Dectin-1 pathway activates robust
autophagy-dependent unconventional protein secretion in human macrophages. J
Immunol 192: 5952-5962 Doi 10.4049/jimmunol.1303213
358. Olanow CW (1992) An introduction to the free radical hypothesis in Parkinson's disease.
Ann Neurol 32 Suppl: S2-9 Doi 10.1002/ana.410320703
359. Oliveira LM, Falomir-Lockhart LJ, Botelho MG, Lin KH, Wales P, Koch JC, Gerhardt E,
Taschenberger H, Outeiro TF, Lingor Pet al (2015) Elevated α-synuclein caused by
SNCA gene triplication impairs neuronal differentiation and maturation in Parkinson's
patient-derived induced pluripotent stem cells. Cell Death Dis 6: e1994 Doi
10.1038/cddis.2015.318
360. Ostrerova N, Petrucelli L, Farrer M, Mehta N, Choi P, Hardy J, Wolozin B (1999) alpha-
Synuclein shares physical and functional homology with 14-3-3 proteins. J Neurosci 19:
5782-5791 Doi 10.1523/jneurosci.19-14-05782.1999
361. Outeiro TF, Putcha P, Tetzlaff JE, Spoelgen R, Koker M, Carvalho F, Hyman BT,
McLean PJ (2008) Formation of toxic oligomeric alpha-synuclein species in living cells.
PLoS One 3: e1867 Doi 10.1371/journal.pone.0001867
362. Ozgen H, Schrimpf W, Hendrix J, de Jonge JC, Lamb DC, Hoekstra D, Kahya N, Baron
W (2014) The lateral membrane organization and dynamics of myelin proteins PLP and
MBP are dictated by distinct galactolipids and the extracellular matrix. PloS one 9:
e101834-e101834 Doi 10.1371/journal.pone.0101834
363. Palmieri M, Impey S, Kang H, di Ronza A, Pelz C, Sardiello M, Ballabio A (2011)
Characterization of the CLEAR network reveals an integrated control of cellular
clearance pathways. Hum Mol Genet 20: 3852-3866 Doi 10.1093/hmg/ddr306
364. Panov A, Dikalov S, Shalbuyeva N, Taylor G, Sherer T, Greenamyre JT (2005) Rotenone
model of Parkinson disease: multiple brain mitochondria dysfunctions after short term
systemic rotenone intoxication. J Biol Chem 280: 42026-42035 Doi
10.1074/jbc.M508628200
243
365. Pardo E, Barake F, Godoy JA, Oyanadel C, Espinoza S, Metz C, Retamal C, Massardo L,
Tapia-Rojas C, Inestrosa NCet al (2019) GALECTIN-8 Is a Neuroprotective Factor in the
Brain that Can Be Neutralized by Human Autoantibodies. Mol Neurobiol 56: 7774-7788
Doi 10.1007/s12035-019-1621-3
366. Parkinson J (2002) An essay on the shaking palsy. The Journal of neuropsychiatry and
clinical neurosciences 14: 223-236
367. Parmigiani A, Nourbakhsh A, Ding B, Wang W, Kim YC, Akopiants K, Guan KL, Karin
M, Budanov AV (2014) Sestrins inhibit mTORC1 kinase activation through the GATOR
complex. Cell Rep 9: 1281-1291 Doi 10.1016/j.celrep.2014.10.019
368. Pasanen P, Myllykangas L, Siitonen M, Raunio A, Kaakkola S, Lyytinen J, Tienari PJ,
Poyhonen M, Paetau A (2014) Novel alpha-synuclein mutation A53E associated with
atypical multiple system atrophy and Parkinson's disease-type pathology. Neurobiol
Aging 35: 2180 e2181-2185 Doi 10.1016/j.neurobiolaging.2014.03.024
369. Paslawski W, Mysling S, Thomsen K, Jørgensen TJD, Otzen DE (2014) Co-existence of
Two Different α-Synuclein Oligomers with Different Core Structures Determined by
Hydrogen/Deuterium Exchange Mass Spectrometry. Angewandte Chemie International
Edition 53: 7560-7563 Doi 10.1002/anie.201400491
370. Pasquini LA, Millet V, Hoyos HC, Giannoni JP, Croci DO, Marder M, Liu FT,
Rabinovich GA, Pasquini JM (2011) Galectin-3 drives oligodendrocyte differentiation to
control myelin integrity and function. Cell Death Differ 18: 1746-1756 Doi
10.1038/cdd.2011.40
371. Pastore N, Vainshtein A, Klisch TJ, Armani A, Huynh T, Herz NJ, Polishchuk EV,
Sandri M, Ballabio A (2017) TFE3 regulates whole-body energy metabolism in
cooperation with TFEB. EMBO Mol Med 9: 605-621 Doi 10.15252/emmm.201607204
372. Paz I, Sachse M, Dupont N, Mounier J, Cederfur C, Enninga J, Leffler H, Poirier F,
Prevost MC, Lafont Fet al (2010) Galectin-3, a marker for vacuole lysis by invasive
pathogens. Cell Microbiol 12: 530-544 Doi 10.1111/j.1462-5822.2009.01415.x
373. Pchelina SN, Nuzhnyi EP, Emelyanov AK, Boukina TM, Usenko TS, Nikolaev MA,
Salogub GN, Yakimovskii AF, Zakharova EY (2014) Increased plasma oligomeric alpha-
synuclein in patients with lysosomal storage diseases. Neurosci Lett 583: 188-193 Doi
10.1016/j.neulet.2014.09.041
374. Pedrosa Carrasco AJ, Timmermann L, Pedrosa DJ (2018) Management of constipation in
patients with Parkinson's disease. NPJ Parkinson's disease 4: 6-6 Doi 10.1038/s41531-
018-0042-8
375. Peelaerts W, Bousset L, Van der Perren A, Moskalyuk A, Pulizzi R, Giugliano M, Van
den Haute C, Melki R, Baekelandt V (2015) alpha-Synuclein strains cause distinct
synucleinopathies after local and systemic administration. Nature 522: 340-344 Doi
10.1038/nature14547

244
376. Peng M, Yin N, Li MO (2017) SZT2 dictates GATOR control of mTORC1 signalling.
Nature 543: 433-437 Doi 10.1038/nature21378
377. Peng X, Yang L, Ma Y, Li X, Yang S, Li Y, Wu B, Tang S, Zhang F, Zhang Bet al
(2021) IKKβ activation promotes amphisome formation and extracellular vesicle
secretion in tumor cells. Biochimica et Biophysica Acta (BBA) - Molecular Cell
Research 1868: 118857 Doi https://doi.org/10.1016/j.bbamcr.2020.118857
378. Peralta Ramos JM, Iribarren P, Bousset L, Melki R, Baekelandt V, Van der Perren A
(2019) Peripheral Inflammation Regulates CNS Immune Surveillance Through the
Recruitment of Inflammatory Monocytes Upon Systemic alpha-Synuclein
Administration. Front Immunol 10: 80 Doi 10.3389/fimmu.2019.00080
379. Pérez-Revuelta BI, Hettich MM, Ciociaro A, Rotermund C, Kahle PJ, Krauss S, Di
Monte DA (2014) Metformin lowers Ser-129 phosphorylated α-synuclein levels via
mTOR-dependent protein phosphatase 2A activation. Cell Death Dis 5: e1209 Doi
10.1038/cddis.2014.175
380. Perier C, Bové J, Vila M, Przedborski S (2003) The rotenone model of Parkinson's
disease. Trends Neurosci 26: 345-346 Doi 10.1016/s0166-2236(03)00144-9
381. Perrier AL, Tabar V, Barberi T, Rubio ME, Bruses J, Topf N, Harrison NL, Studer L
(2004) Derivation of midbrain dopamine neurons from human embryonic stem cells. Proc
Natl Acad Sci U S A 101: 12543-12548 Doi 10.1073/pnas.0404700101
382. Peters A, Palay SL, Webster HdF (1991) Neurons and Their Supporting Cells. . Oxford
University Press, City
383. Petit CS, Roczniak-Ferguson A, Ferguson SM (2013) Recruitment of folliculin to
lysosomes supports the amino acid-dependent activation of Rag GTPases. J Cell Biol
202: 1107-1122 Doi 10.1083/jcb.201307084
384. Pfeffer SR (1988) Mannose 6-phosphate receptors and their role in targeting proteins to
lysosomes. The Journal of Membrane Biology 103: 7-16 Doi 10.1007/BF01871928
385. Pieter Muntendam SW (2017) GALECTIN-3 IMMUNOASSAY. City
386. Pitcairn C, Wani WY, Mazzulli JR (2019) Dysregulation of the autophagic-lysosomal
pathway in Gaucher and Parkinson's disease. Neurobiol Dis 122: 72-82 Doi
10.1016/j.nbd.2018.03.008
387. Poehler AM, Xiang W, Spitzer P, May VE, Meixner H, Rockenstein E, Chutna O,
Outeiro TF, Winkler J, Masliah Eet al (2014) Autophagy modulates SNCA/alpha-
synuclein release, thereby generating a hostile microenvironment. Autophagy 10: 2171-
2192 Doi 10.4161/auto.36436
245
388. Poewe W, Seppi K, Tanner CM, Halliday GM, Brundin P, Volkmann J, Schrag A-E,
Lang AE (2017) Parkinson disease. Nature Reviews Disease Primers 3: 17013 Doi
10.1038/nrdp.2017.13
389. Polymeropoulos MH, Higgins JJ, Golbe LI, Johnson WG, Ide SE, Iorio GD, Sanges G,
Stenroos ES, Pho LT, Schaffer AAet al (1996) Mapping of a Gene for Parkinson's
Disease to Chromosome 4q21-q23. Science 274: 1197 Doi
10.1126/science.274.5290.1197
390. Polymeropoulos MH, Lavedan C, Leroy E, Ide SE, Dehejia A, Dutra A, Pike B, Root H,
Rubenstein J, Boyer Ret al (1997) Mutation in the alpha-synuclein gene identified in
families with Parkinson's disease. Science 276: 2045-2047 Doi
10.1126/science.276.5321.2045
391. Ponpuak M, Mandell MA, Kimura T, Chauhan S, Cleyrat C, Deretic V (2015) Secretory
autophagy. Curr Opin Cell Biol 35: 106-116 Doi 10.1016/j.ceb.2015.04.016
392. Proukakis C, Dudzik CG, Brier T, MacKay DS, Cooper JM, Millhauser GL, Houlden H,
Schapira AH (2013) A novel alpha-synuclein missense mutation in Parkinson disease.
Neurology 80: 1062-1064 Doi 10.1212/WNL.0b013e31828727ba
393. Prusiner SB (1982) Novel proteinaceous infectious particles cause scrapie. Science 216:
136-144 Doi 10.1126/science.6801762
394. Prusiner SB, Woerman AL, Mordes DA, Watts JC, Rampersaud R, Berry DB, Patel S,
Oehler A, Lowe JK, Kravitz SNet al (2015) Evidence for α-synuclein prions causing
multiple system atrophy in humans with parkinsonism. Proc Natl Acad Sci U S A 112:
E5308-5317 Doi 10.1073/pnas.1514475112
395. Puche AC, Poirier F, Hair M, Bartlett PF, Key B (1996) Role of galectin-1 in the
developing mouse olfactory system. Dev Biol 179: 274-287 Doi 10.1006/dbio.1996.0257
396. Puri C, Renna M, Bento CF, Moreau K, Rubinsztein DC (2013) Diverse autophagosome
membrane sources coalesce in recycling endosomes. Cell 154: 1285-1299 Doi
10.1016/j.cell.2013.08.044
397. Qiao L, Hamamichi S, Caldwell KA, Caldwell GA, Yacoubian TA, Wilson S, Xie Z-L,
Speake LD, Parks R, Crabtree Det al (2008) Lysosomal enzyme cathepsin D protects
against alpha-synuclein aggregation and toxicity. Molecular Brain 1: 17 Doi
10.1186/1756-6606-1-17
398. Qin Z, Hu D, Han S, Reaney SH, Di Monte DA, Fink AL (2007) Effect of 4-hydroxy-2-
nonenal modification on alpha-synuclein aggregation. J Biol Chem 282: 5862-5870 Doi
10.1074/jbc.M608126200
399. Rabouille C (2017) Pathways of Unconventional Protein Secretion. Trends Cell Biol 27:
230-240 Doi 10.1016/j.tcb.2016.11.007
246
400. Rademacher DJ, Mendoza-Elias N, Meredith GE (2015) Effects of context-drug learning
on synaptic connectivity in the basolateral nucleus of the amygdala in rats. Eur J
Neurosci 41: 205-215 Doi 10.1111/ejn.12781
401. Randow F, MacMicking JD, James LC (2013) Cellular self-defense: how cell-
autonomous immunity protects against pathogens. Science 340: 701-706 Doi
10.1126/science.1233028
402. Randow F, Youle RJ (2014) Self and nonself: how autophagy targets mitochondria and
bacteria. Cell Host Microbe 15: 403-411 Doi 10.1016/j.chom.2014.03.012
403. Ravikumar B, Moreau K, Jahreiss L, Puri C, Rubinsztein DC (2010) Plasma membrane
contributes to the formation of pre-autophagosomal structures. Nat Cell Biol 12: 747-757
Doi 10.1038/ncb2078
404. Recasens A, Dehay B (2014) Alpha-synuclein spreading in Parkinson's disease. Front
Neuroanat 8: 159 Doi 10.3389/fnana.2014.00159
405. Rey NL, Bousset L, George S, Madaj Z, Meyerdirk L, Schulz E, Steiner JA, Melki R,
Brundin P (2019) alpha-Synuclein conformational strains spread, seed and target
neuronal cells differentially after injection into the olfactory bulb. Acta Neuropathol
Commun 7: 221 Doi 10.1186/s40478-019-0859-3
406. Rey NL, Petit GH, Bousset L, Melki R, Brundin P (2013) Transfer of human alpha-
synuclein from the olfactory bulb to interconnected brain regions in mice. Acta
Neuropathol 126: 555-573 Doi 10.1007/s00401-013-1160-3
407. Rey NL, Steiner JA, Maroof N, Luk KC, Madaj Z, Trojanowski JQ, Lee VM, Brundin P
(2016) Widespread transneuronal propagation of alpha-synucleinopathy triggered in
olfactory bulb mimics prodromal Parkinson's disease. J Exp Med 213: 1759-1778 Doi
10.1084/jem.20160368
408. Reyes JF, Olsson TT, Lamberts JT, Devine MJ, Kunath T, Brundin P (2015) A cell
culture model for monitoring alpha-synuclein cell-to-cell transfer. Neurobiol Dis 77: 266-
275 Doi 10.1016/j.nbd.2014.07.003
409. Richardson JR, Quan Y, Sherer TB, Greenamyre JT, Miller GW (2005) Paraquat
neurotoxicity is distinct from that of MPTP and rotenone. Toxicol Sci 88: 193-201 Doi
10.1093/toxsci/kfi304
410. Rinaldi M, Thomas L, Mathieu P, Carabias P, Troncoso MF, Pasquini JM, Rabinovich
GA, Pasquini LA (2016) Galectin-1 circumvents lysolecithin-induced demyelination
through the modulation of microglial polarization/phagocytosis and oligodendroglial
differentiation. Neurobiology of Disease 96: 127-143 Doi
https://doi.org/10.1016/j.nbd.2016.09.003
247
411. Rodgers W (2002) Making membranes green: construction and characterization of GFP-
fusion proteins targeted to discrete plasma membrane domains. Biotechniques 32: 1044-
1046, 1048, 1050-1041 Doi 10.2144/02325st05
412. Rodrigues e Silva AM, Geldsetzer F, Holdorff B, Kielhorn FW, Balzer-Geldsetzer M,
Oertel WH, Hurtig H, Dodel R (2010) Who was the man who discovered the "Lewy
bodies"? Mov Disord 25: 1765-1773 Doi 10.1002/mds.22956
413. Rodriguez JA, Ivanova MI, Sawaya MR, Cascio D, Reyes FE, Shi D, Sangwan S,
Guenther EL, Johnson LM, Zhang Met al (2015) Structure of the toxic core of α-
synuclein from invisible crystals. Nature 525: 486-490 Doi 10.1038/nature15368
414. Ross GW, Petrovitch H, Abbott RD, Nelson J, Markesbery W, Davis D, Hardman J,
Launer L, Masaki K, Tanner CMet al (2004) Parkinsonian signs and substantia nigra
neuron density in decendents elders without PD. Ann Neurol 56: 532-539 Doi
10.1002/ana.20226
415. Ross OA, Soto-Ortolaza AI, Heckman MG, Aasly JO, Abahuni N, Annesi G, Bacon JA,
Bardien S, Bozi M, Brice Aet al (2011) Association of LRRK2 exonic variants with
susceptibility to Parkinson's disease: a case-control study. Lancet Neurol 10: 898-908 Doi
10.1016/s1474-4422(11)70175-2
416. Rousseaux MWC, Vazquez-Velez GE, Al-Ramahi I, Jeong HH, Bajic A, Revelli JP, Ye
H, Phan ET, Deger JM, Perez AMet al (2018) A Druggable Genome Screen Identifies
Modifiers of alpha-Synuclein Levels via a Tiered Cross-Species Validation Approach. J
Neurosci 38: 9286-9301 Doi 10.1523/JNEUROSCI.0254-18.2018
417. Routh VH (2002) Glucose-sensing neurons: are they physiologically relevant? Physiol
Behav 76: 403-413 Doi 10.1016/s0031-9384(02)00761-8
418. Rovere M, Sanderson JB, Fonseca-Ornelas L, Patel DS, Bartels T (2018) Refolding of
helical soluble alpha-synuclein through transient interaction with lipid interfaces. FEBS
Lett 592: 1464-1472 Doi 10.1002/1873-3468.13047
419. Rowland AM, Richmond JE, Olsen JG, Hall DH, Bamber BA (2006) Presynaptic
terminals independently regulate synaptic clustering and autophagy of GABAA receptors
in Caenorhabditis elegans. J Neurosci 26: 1711-1720 Doi 10.1523/JNEUROSCI.2279-
05.2006
420. Rubartelli A, Cozzolino F, Talio M, Sitia R (1990) A novel secretory pathway for
interleukin-1 beta, a protein lacking a signal sequence. Embo j 9: 1503-1510
421. Ruffmann C, Parkkinen L (2016) Gut Feelings About α-Synuclein in Gastrointestinal
Biopsies: Biomarker in the Making? Mov Disord 31: 193-202 Doi 10.1002/mds.26480
248
422. Rusmini P, Cortese K, Crippa V, Cristofani R, Cicardi ME, Ferrari V, Vezzoli G,
Tedesco B, Meroni M, Messi Eet al (2019) Trehalose induces autophagy via lysosomal-
mediated TFEB activation in models of motoneuron degeneration. Autophagy 15: 631-
651 Doi 10.1080/15548627.2018.1535292
423. Sabatini DM (2017) Twenty-five years of mTOR: Uncovering the link from nutrients to
growth. Proc Natl Acad Sci U S A 114: 11818-11825 Doi 10.1073/pnas.1716173114
424. Saftig P, Puertollano R (2020) How Lysosomes Sense, Integrate, and Cope with Stress.
Trends Biochem Sci: Doi 10.1016/j.tibs.2020.09.004
425. Salimi L, Akbari A, Jabbari N, Mojarad B, Vahhabi A, Szafert S, Kalashani SA, Soraya
H, Nawaz M, Rezaie J (2020) Synergies in exosomes and autophagy pathways for
cellular homeostasis and metastasis of tumor cells. Cell & Bioscience 10: 64 Doi
10.1186/s13578-020-00426-y
426. Salomonsson E, Carlsson MC, Osla V, Hendus-Altenburger R, Kahl-Knutson B, Oberg
CT, Sundin A, Nilsson R, Nordberg-Karlsson E, Nilsson UJet al (2010) Mutational
tuning of galectin-3 specificity and biological function. J Biol Chem 285: 35079-35091
Doi 10.1074/jbc.M109.098160
427. Sancak Y, Bar-Peled L, Zoncu R, Markhard AL, Nada S, Sabatini DM (2010) Ragulator-
Rag complex targets mTORC1 to the lysosomal surface and is necessary for its activation
by amino acids. Cell 141: 290-303 Doi 10.1016/j.cell.2010.02.024
428. Sancak Y, Peterson TR, Shaul YD, Lindquist RA, Thoreen CC, Bar-Peled L, Sabatini
DM (2008) The Rag GTPases bind raptor and mediate amino acid signaling to mTORC1.
Science 320: 1496-1501 Doi 10.1126/science.1157535
429. Sanchez-Danes A, Richaud-Patin Y, Carballo-Carbajal I, Jimenez-Delgado S, Caig C,
Mora S, Di Guglielmo C, Ezquerra M, Patel B, Giralt Aet al (2012) Disease-specific
phenotypes in dopamine neurons from human iPS-based models of genetic and sporadic
Parkinson's disease. EMBO Mol Med 4: 380-395 Doi 10.1002/emmm.201200215
430. Sandhof CA, Hoppe SO, Druffel-Augustin S, Gallrein C, Kirstein J, Voisine C,
Nussbaum-Krammer C (2020) Reducing INS-IGF1 signaling protects against non-cell
autonomous vesicle rupture caused by SNCA spreading. Autophagy 16: 878-899 Doi
10.1080/15548627.2019.1643657
431. Sanjana NE, Shalem O, Zhang F (2014) Improved vectors and genome-wide libraries for
CRISPR screening. Nat Methods 11: 783-784 Doi 10.1038/nmeth.3047
432. Sarbassov DD, Ali SM, Kim DH, Guertin DA, Latek RR, Erdjument-Bromage H, Tempst
P, Sabatini DM (2004) Rictor, a novel binding partner of mTOR, defines a rapamycin-
insensitive and raptor-independent pathway that regulates the cytoskeleton. Curr Biol 14:
1296-1302 Doi 10.1016/j.cub.2004.06.054

249
433. Sardiello M, Palmieri M, di Ronza A, Medina DL, Valenza M, Gennarino VA, Di Malta
C, Donaudy F, Embrione V, Polishchuk RSet al (2009) A gene network regulating
lysosomal biogenesis and function. Science 325: 473-477 Doi 10.1126/science.1174447
434. Sarkar S, Davies JE, Huang Z, Tunnacliffe A, Rubinsztein DC (2007) Trehalose, a novel
mTOR-independent autophagy enhancer, accelerates the clearance of mutant huntingtin
and alpha-synuclein. J Biol Chem 282: 5641-5652 Doi 10.1074/jbc.M609532200
435. Sarkar S, Floto RA, Berger Z, Imarisio S, Cordenier A, Pasco M, Cook LJ, Rubinsztein
DC (2005) Lithium induces autophagy by inhibiting inositol monophosphatase. J Cell
Biol 170: 1101-1111 Doi 10.1083/jcb.200504035
436. Sato S, Uchihara T, Fukuda T, Noda S, Kondo H, Saiki S, Komatsu M, Uchiyama Y,
Tanaka K, Hattori N (2018) Loss of autophagy in dopaminergic neurons causes Lewy
pathology and motor dysfunction in aged mice. Sci Rep 8: 2813 Doi 10.1038/s41598-
018-21325-w
437. Saxton RA, Chantranupong L, Knockenhauer KE, Schwartz TU, Sabatini DM (2016)
Mechanism of arginine sensing by CASTOR1 upstream of mTORC1. Nature 536: 229-
233 Doi 10.1038/nature19079
438. Saxton RA, Knockenhauer KE, Wolfson RL, Chantranupong L, Pacold ME, Wang T,
Schwartz TU, Sabatini DM (2016) Structural basis for leucine sensing by the Sestrin2-
mTORC1 pathway. Science 351: 53-58 Doi 10.1126/science.aad2087
439. Schmid AW, Fauvet B, Moniatte M, Lashuel HA (2013) Alpha-synuclein post-
translational modifications as potential biomarkers for Parkinson disease and other
synucleinopathies. Mol Cell Proteomics 12: 3543-3558 Doi 10.1074/mcp.R113.032730
440. Schondorf DC, Aureli M, McAllister FE, Hindley CJ, Mayer F, Schmid B, Sardi SP,
Valsecchi M, Hoffmann S, Schwarz LKet al (2014) iPSC-derived neurons from GBA1-
associated Parkinson's disease patients show autophagic defects and impaired calcium
homeostasis. Nat Commun 5: 4028 Doi 10.1038/ncomms5028
441. Seibler P, Graziotto J, Jeong H, Simunovic F, Klein C, Krainc D (2011) Mitochondrial
Parkin recruitment is impaired in neurons derived from mutant PINK1 induced
pluripotent stem cells. J Neurosci 31: 5970-5976 Doi 10.1523/JNEUROSCI.4441-
10.2011
442. Seki T, Kanagawa M, Kobayashi K, Kowa H, Yahata N, Maruyama K, Iwata N, Inoue H,
Toda T (2020) Galectin 3-binding protein suppresses amyloid-beta production by
modulating beta-cleavage of amyloid precursor protein. J Biol Chem 295: 3678-3691 Doi
10.1074/jbc.RA119.008703
443. Settembre C, Zoncu R, Medina DL, Vetrini F, Erdin S, Erdin S, Huynh T, Ferron M,
Karsenty G, Vellard MCet al (2012) A lysosome-to-nucleus signalling mechanism senses
and regulates the lysosome via mTOR and TFEB. EMBO J 31: 1095-1108 Doi
10.1038/emboj.2012.32
250
444. Sevlever D, Jiang P, Yen S-HC (2008) Cathepsin D is the main lysosomal enzyme
involved in the degradation of alpha-synuclein and generation of its carboxy-terminally
truncated species. Biochemistry 47: 9678-9687 Doi 10.1021/bi800699v
445. Shahmoradian SH, Lewis AJ, Genoud C, Hench J, Moors TE, Navarro PP, Castaño-Díez
D, Schweighauser G, Graff-Meyer A, Goldie KNet al (2019) Lewy pathology in
Parkinson's disease consists of crowded organelles and lipid membranes. Nat Neurosci
22: 1099-1109 Doi 10.1038/s41593-019-0423-2
446. Shen N, Song G, Yang H, Lin X, Brown B, Hong Y, Cai J, Cao C (2019) Identifying the
Pathological Domain of Alpha- Synuclein as a Therapeutic for Parkinson's Disease. Int J
Mol Sci 20: Doi 10.3390/ijms20092338
447. Shima T, Kirisako H, Nakatogawa H (2019) COPII vesicles contribute to
autophagosomal membranes. Journal of Cell Biology 218: 1503-1510 Doi
10.1083/jcb.201809032
448. Shimozawa A, Ono M, Takahara D, Tarutani A, Imura S, Masuda-Suzukake M, Higuchi
M, Yanai K, Hisanaga SI, Hasegawa M (2017) Propagation of pathological α-synuclein
in marmoset brain. Acta Neuropathol Commun 5: 12 Doi 10.1186/s40478-017-0413-0
449. Shrivastava AN, Redeker V, Fritz N, Pieri L, Almeida LG, Spolidoro M, Liebmann T,
Bousset L, Renner M, Léna Cet al (2015) α-synuclein assemblies sequester neuronal α3-
Na+/K+-ATPase and impair Na+ gradient. Embo j 34: 2408-2423 Doi
10.15252/embj.201591397
450. Siddiqui A, Bhaumik D, Chinta SJ, Rane A, Rajagopalan S, Lieu CA, Lithgow GJ,
Andersen JK (2015) Mitochondrial Quality Control via the PGC1α-TFEB Signaling
Pathway Is Compromised by Parkin Q311X Mutation But Independently Restored by
Rapamycin. J Neurosci 35: 12833-12844 Doi 10.1523/jneurosci.0109-15.2015
451. Sidransky E, Nalls MA, Aasly JO, Aharon-Peretz J, Annesi G, Barbosa ER, Bar-Shira A,
Berg D, Bras J, Brice Aet al (2009) Multicenter analysis of glucocerebrosidase mutations
in Parkinson's disease. N Engl J Med 361: 1651-1661 Doi 10.1056/NEJMoa0901281
452. Siew JJ, Chen HM, Chen HY, Chen HL, Chen CM, Soong BW, Wu YR, Chang CP,
Chan YC, Lin CHet al (2019) Galectin-3 is required for the microglia-mediated brain
inflammation in a model of Huntington's disease. Nat Commun 10: 3473 Doi
10.1038/s41467-019-11441-0
453. Silver IA, Erecińska M (1994) Extracellular glucose concentration in mammalian brain:
continuous monitoring of changes during increased neuronal activity and upon limitation
in oxygen supply in normo-, hypo-, and hyperglycemic animals. J Neurosci 14: 5068-
5076 Doi 10.1523/jneurosci.14-08-05068.1994
454. Singleton AB, Farrer M, Johnson J, Singleton A, Hague S, Kachergus J, Hulihan M,
Peuralinna T, Dutra A, Nussbaum Ret al (2003) alpha-Synuclein locus triplication causes
Parkinson's disease. Science 302: 841 Doi 10.1126/science.1090278
251
455. Sironi J, Aranda E, Nordstrom LU, Schwartz EL (2019) Lysosome Membrane
Permeabilization and Disruption of the Molecular Target of Rapamycin (mTOR)-
Lysosome Interaction Are Associated with the Inhibition of Lung Cancer Cell
Proliferation by a Chloroquinoline Analog. Mol Pharmacol 95: 127-138 Doi
10.1124/mol.118.113118
456. Skog J, Wurdinger T, van Rijn S, Meijer DH, Gainche L, Sena-Esteves M, Curry WT, Jr.,
Carter BS, Krichevsky AM, Breakefield XO (2008) Glioblastoma microvesicles transport
RNA and proteins that promote tumour growth and provide diagnostic biomarkers. Nat
Cell Biol 10: 1470-1476 Doi 10.1038/ncb1800
457. Skotland T, Sandvig K, Llorente A (2017) Lipids in exosomes: Current knowledge and
the way forward. Prog Lipid Res 66: 30-41 Doi 10.1016/j.plipres.2017.03.001
458. Skowyra ML, Schlesinger PH, Naismith TV, Hanson PI (2018) Triggered recruitment of
ESCRT machinery promotes endolysosomal repair. Science 360: Doi
10.1126/science.aar5078
459. Smith BR, Santos MB, Marshall MS, Cantuti-Castelvetri L, Lopez-Rosas A, Li G, van
Breemen R, Claycomb KI, Gallea JI, Celej MSet al (2014) Neuronal inclusions of α-
synuclein contribute to the pathogenesis of Krabbe disease. J Pathol 232: 509-521 Doi
10.1002/path.4328
460. Sode K, Ochiai S, Kobayashi N, Usuzaka E (2006) Effect of reparation of repeat
sequences in the human alpha-synuclein on fibrillation ability. Int J Biol Sci 3: 1-7 Doi
10.7150/ijbs.3.1
461. Song JX, Lu JH, Liu LF, Chen LL, Durairajan SS, Yue Z, Zhang HQ, Li M (2014)
HMGB1 is involved in autophagy inhibition caused by SNCA/alpha-synuclein
overexpression: a process modulated by the natural autophagy inducer corynoxine B.
Autophagy 10: 144-154 Doi 10.4161/auto.26751
462. Spencer B, Emadi S, Desplats P, Eleuteri S, Michael S, Kosberg K, Shen J, Rockenstein
E, Patrick C, Adame Aet al (2014) ESCRT-mediated uptake and degradation of brain-
targeted alpha-synuclein single chain antibody attenuates neuronal degeneration in vivo.
Mol Ther 22: 1753-1767 Doi 10.1038/mt.2014.129
463. Spencer B, Potkar R, Trejo M, Rockenstein E, Patrick C, Gindi R, Adame A, Wyss-
Coray T, Masliah E (2009) Beclin 1 gene transfer activates autophagy and ameliorates
the neurodegenerative pathology in alpha-synuclein models of Parkinson's and Lewy
body diseases. J Neurosci 29: 13578-13588 Doi 10.1523/JNEUROSCI.4390-09.2009
29/43/13578 [pii]
464. Spillantini MG, Crowther RA, Jakes R, Hasegawa M, Goedert M (1998) alpha-Synuclein
in filamentous inclusions of Lewy bodies from Parkinson's disease and dementia with
lewy bodies. Proc Natl Acad Sci U S A 95: 6469-6473 Doi 10.1073/pnas.95.11.6469

252
465. Spillantini MG, Schmidt ML, Lee VM, Trojanowski JQ, Jakes R, Goedert M (1997)
Alpha-synuclein in Lewy bodies. Nature 388: 839-840 Doi 10.1038/42166
466. Srejovic I, Selakovic D, Jovicic N, Jakovljevic V, Lukic ML, Rosic G (2020) Galectin-3:
Roles in Neurodevelopment, Neuroinflammation, and Behavior. Biomolecules 10: Doi
10.3390/biom10050798
467. Stancic M, Slijepcevic D, Nomden A, Vos MJ, de Jonge JC, Sikkema AH, Gabius HJ,
Hoekstra D, Baron W (2012) Galectin-4, a novel neuronal regulator of myelination. Glia
60: 919-935 Doi 10.1002/glia.22324
468. Stavoe AKH, Holzbaur ELF (2019) Autophagy in Neurons. Annu Rev Cell Dev Biol 35:
477-500 Doi 10.1146/annurev-cellbio-100818-125242
469. Stavoe AKH, Holzbaur ELF (2019) Axonal autophagy: Mini-review for autophagy in the
CNS. Neurosci Lett 697: 17-23 Doi 10.1016/j.neulet.2018.03.025
470. Stechly L, Morelle W, Dessein AF, André S, Grard G, Trinel D, Dejonghe MJ, Leteurtre
E, Drobecq H, Trugnan Get al (2009) Galectin-4-regulated delivery of glycoproteins to
the brush border membrane of enterocyte-like cells. Traffic 10: 438-450 Doi
10.1111/j.1600-0854.2009.00882.x
471. Steiner JA, Angot E, Brundin P (2011) A deadly spread: cellular mechanisms of α-
synuclein transfer. Cell Death Differ 18: 1425-1433 Doi 10.1038/cdd.2011.53
472. Stewart SE, Menzies SA, Popa SJ, Savinykh N, Petrunkina Harrison A, Lehner PJ,
Moreau K (2017) A genome-wide CRISPR screen reconciles the role of N-linked
glycosylation in galectin-3 transport to the cell surface. J Cell Sci 130: 3234-3247 Doi
10.1242/jcs.206425
473. Stöckl MT, Zijlstra N, Subramaniam V (2013) α-Synuclein oligomers: an amyloid pore?
Insights into mechanisms of α-synuclein oligomer-lipid interactions. Mol Neurobiol 47:
613-621 Doi 10.1007/s12035-012-8331-4
474. Stuendl A, Kunadt M, Kruse N, Bartels C, Moebius W, Danzer KM, Mollenhauer B,
Schneider A (2016) Induction of alpha-synuclein aggregate formation by CSF exosomes
from patients with Parkinson's disease and dementia with Lewy bodies. Brain 139: 481-
494 Doi 10.1093/brain/awv346
475. Sudhakar JN, Lu HH, Chiang HY, Suen CS, Hwang MJ, Wu SY, Shen CN, Chang YM,
Li FA, Liu FTet al (2020) Lumenal Galectin-9-Lamp2 interaction regulates lysosome and
autophagy to prevent pathogenesis in the intestine and pancreas. Nat Commun 11: 4286
Doi 10.1038/s41467-020-18102-7
476. Sulzer D, Bogulavsky J, Larsen KE, Behr G, Karatekin E, Kleinman MH, Turro N,
Krantz D, Edwards RH, Greene LAet al (2000) Neuromelanin biosynthesis is driven by
excess cytosolic catecholamines not accumulated by synaptic vesicles. Proc Natl Acad
Sci U S A 97: 11869-11874 Doi 10.1073/pnas.97.22.11869
253
477. Sulzer D, Mosharov E, Talloczy Z, Zucca FA, Simon JD, Zecca L (2008) Neuronal
pigmented autophagic vacuoles: lipofuscin, neuromelanin, and ceroid as
macroautophagic responses during aging and disease. Journal of neurochemistry 106: 24-
36 Doi 10.1111/j.1471-4159.2008.05385.x
478. Sunde M, Serpell LC, Bartlam M, Fraser PE, Pepys MB, Blake CC (1997) Common core
structure of amyloid fibrils by synchrotron X-ray diffraction. J Mol Biol 273: 729-739
Doi 10.1006/jmbi.1997.1348
479. Surguchev AA, Surguchov A (2017) Synucleins and Gene Expression: Ramblers in a
Crowd or Cops Regulating Traffic? Front Mol Neurosci 10: 224 Doi
10.3389/fnmol.2017.00224
480. Surmeier DJ (2018) Determinants of dopaminergic neuron loss in Parkinson's disease.
FEBS J 285: 3657-3668 Doi 10.1111/febs.14607
481. Suzuki K, Iseki E, Togo T, Yamaguchi A, Katsuse O, Katsuyama K, Kanzaki S, Shiozaki
K, Kawanishi C, Yamashita Set al (2007) Neuronal and glial accumulation of alpha- and
beta-synucleins in human lipidoses. Acta Neuropathol 114: 481-489 Doi
10.1007/s00401-007-0264-z
482. Suzuki M, Fujikake N, Takeuchi T, Kohyama-Koganeya A, Nakajima K, Hirabayashi Y,
Wada K, Nagai Y (2015) Glucocerebrosidase deficiency accelerates the accumulation of
proteinase K-resistant α-synuclein and aggravates neurodegeneration in a Drosophila
model of Parkinson's disease. Hum Mol Genet 24: 6675-6686 Doi 10.1093/hmg/ddv372
483. Svensson E, Horváth-Puhó E, Thomsen RW, Djurhuus JC, Pedersen L, Borghammer P,
Sørensen HT (2015) Vagotomy and subsequent risk of Parkinson's disease. Annals of
Neurology 78: 522-529 Doi https://doi.org/10.1002/ana.24448
484. Szablewski L (2017) Glucose Transporters in Brain: In Health and in Alzheimer's
Disease. J Alzheimers Dis 55: 1307-1320 Doi 10.3233/jad-160841
485. Taguchi YV, Liu J, Ruan J, Pacheco J, Zhang X, Abbasi J, Keutzer J, Mistry PK,
Chandra SS (2017) Glucosylsphingosine Promotes α-Synuclein Pathology in Mutant
GBA-Associated Parkinson's Disease. J Neurosci 37: 9617-9631 Doi
10.1523/jneurosci.1525-17.2017
486. Tan S, Yu CY, Sim ZW, Low ZS, Lee B, See F, Min N, Gautam A, Chu JJH, Ng KWet
al (2019) Pomegranate activates TFEB to promote autophagy-lysosomal fitness and
mitophagy. Sci Rep 9: 727 Doi 10.1038/s41598-018-37400-1
487. Tan SS, Yin Y, Lee T, Lai RC, Yeo RW, Zhang B, Choo A, Lim SK (2013) Therapeutic
MSC exosomes are derived from lipid raft microdomains in the plasma membrane. J
Extracell Vesicles 2: Doi 10.3402/jev.v2i0.22614
254
488. Tang FL, Erion JR, Tian Y, Liu W, Yin DM, Ye J, Tang B, Mei L, Xiong WC (2015)
VPS35 in Dopamine Neurons Is Required for Endosome-to-Golgi Retrieval of Lamp2a, a
Receptor of Chaperone-Mediated Autophagy That Is Critical for α-Synuclein
Degradation and Prevention of Pathogenesis of Parkinson's Disease. J Neurosci 35:
10613-10628 Doi 10.1523/jneurosci.0042-15.2015
489. Tang G, Gudsnuk K, Kuo SH, Cotrina ML, Rosoklija G, Sosunov A, Sonders MS, Kanter
E, Castagna C, Yamamoto Aet al (2014) Loss of mTOR-dependent macroautophagy
causes autistic-like synaptic pruning deficits. Neuron 83: 1131-1143 Doi
10.1016/j.neuron.2014.07.040
490. Tang Q, Zhang X, Zhang W, Zhao S, Chen Y (2017) Identification and characterization
of cell-bound membrane vesicles. Biochim Biophys Acta Biomembr 1859: 756-766 Doi
10.1016/j.bbamem.2017.01.013
491. Tao CC, Cheng KM, Ma YL, Hsu WL, Chen YC, Fuh JL, Lee WJ, Chao CC, Lee EHY
(2020) Galectin-3 promotes Abeta oligomerization and Abeta toxicity in a mouse model
of Alzheimer's disease. Cell Death Differ 27: 192-209 Doi 10.1038/s41418-019-0348-z
492. Tee AR, Manning BD, Roux PP, Cantley LC, Blenis J (2003) Tuberous sclerosis
complex gene products, Tuberin and Hamartin, control mTOR signaling by acting as a
GTPase-activating protein complex toward Rheb. Curr Biol 13: 1259-1268 Doi
10.1016/s0960-9822(03)00506-2
493. Teil M, Arotcarena ML, Faggiani E, Laferriere F, Bezard E, Dehay B (2020) Targeting
alpha-synuclein for PD Therapeutics: A Pursuit on All Fronts. Biomolecules 10: Doi
10.3390/biom10030391
494. Theillet FX, Binolfi A, Bekei B, Martorana A, Rose HM, Stuiver M, Verzini S, Lorenz
D, van Rossum M, Goldfarb Det al (2016) Structural disorder of monomeric alpha-
synuclein persists in mammalian cells. Nature 530: 45-50 Doi 10.1038/nature16531
495. Thery C, Witwer KW, Aikawa E, Alcaraz MJ, Anderson JD, Andriantsitohaina R,
Antoniou A, Arab T, Archer F, Atkin-Smith GKet al (2018) Minimal information for
studies of extracellular vesicles 2018 (MISEV2018): a position statement of the
International Society for Extracellular Vesicles and update of the MISEV2014 guidelines.
J Extracell Vesicles 7: 1535750 Doi 10.1080/20013078.2018.1535750
496. Thurston TL, Wandel MP, von Muhlinen N, Foeglein A, Randow F (2012) Galectin 8
targets damaged vesicles for autophagy to defend cells against bacterial invasion. Nature
482: 414-418 Doi 10.1038/nature10744
497. Tian T, Zhu YL, Zhou YY, Liang GF, Wang YY, Hu FH, Xiao ZD (2014) Exosome
uptake through clathrin-mediated endocytosis and macropinocytosis and mediating miR-
21 delivery. J Biol Chem 289: 22258-22267 Doi 10.1074/jbc.M114.588046
255
498. Torra A, Parent A, Cuadros T, Rodriguez-Galvan B, Ruiz-Bronchal E, Ballabio A,
Bortolozzi A, Vila M, Bove J (2018) Overexpression of TFEB Drives a Pleiotropic
Neurotrophic Effect and Prevents Parkinson's Disease-Related Neurodegeneration. Mol
Ther 26: 1552-1567 Doi 10.1016/j.ymthe.2018.02.022
499. Trajkovic K, Hsu C, Chiantia S, Rajendran L, Wenzel D, Wieland F, Schwille P, Brügger
B, Simons M (2008) Ceramide triggers budding of exosome vesicles into multivesicular
endosomes. Science 319: 1244-1247 Doi 10.1126/science.1153124
500. Troncoso-Escudero P, Parra A, Nassif M, Vidal RL (2018) Outside in: Unraveling the
Role of Neuroinflammation in the Progression of Parkinson's Disease. Front Neurol 9:
860 Doi 10.3389/fneur.2018.00860
501. Tsigelny IF, Sharikov Y, Kouznetsova VL, Greenberg JP, Wrasidlo W, Overk C,
Gonzalez T, Trejo M, Spencer B, Kosberg Ket al (2015) Molecular determinants of α-
synuclein mutants' oligomerization and membrane interactions. ACS Chem Neurosci 6:
403-416 Doi 10.1021/cn500332w
502. Tsukada M, Ohsumi Y (1993) Isolation and characterization of autophagy-defective
mutants of Saccharomyces cerevisiae. FEBS Letters 333: 169-174 Doi
https://doi.org/10.1016/0014-5793(93)80398-E
503. Tsun ZY, Bar-Peled L, Chantranupong L, Zoncu R, Wang T, Kim C, Spooner E, Sabatini
DM (2013) The folliculin tumor suppressor is a GAP for the RagC/D GTPases that signal
amino acid levels to mTORC1. Mol Cell 52: 495-505 Doi 10.1016/j.molcel.2013.09.016
504. Uchino Y, Woodward AM, Mauris J, Peterson K, Verma P, Nilsson UJ, Rajaiya J,
Argueso P (2018) Galectin-3 is an amplifier of the interleukin-1beta-mediated
inflammatory response in corneal keratinocytes. Immunology 154: 490-499 Doi
10.1111/imm.12899
505. Ulusoy A, Musgrove RE, Rusconi R, Klinkenberg M, Helwig M, Schneider A, Di Monte
DA (2015) Neuron-to-neuron α-synuclein propagation in vivo is independent of neuronal
injury. Acta Neuropathologica Communications 3: 13 Doi 10.1186/s40478-015-0198-y
506 Ulusoy A, Rusconi R, Pérez-Revuelta BI, Musgrove RE, Helwig M, Winzen-Reichert B,
.Di Monte DA (2013) Caudo-rostral brain spreading of α-synuclein through vagal
connections. EMBO Mol Med 5: 1119-1127 Doi 10.1002/emmm.201302475
507. Underwood R, Wang B, Carico C, Whitaker RH, Placzek WJ, Yacoubian TA (2020) The
GTPase Rab27b regulates the release, autophagic clearance, and toxicity of alpha-
synuclein. J Biol Chem: Doi 10.1074/jbc.RA120.013337
508. Uversky VN, Li J, Fink AL (2001) Evidence for a partially folded intermediate in alpha-
synuclein fibril formation. J Biol Chem 276: 10737-10744 Doi 10.1074/jbc.M010907200

256
509. Vaikath NN, Majbour NK, Paleologou KE, Ardah MT, van Dam E, van de Berg WD,
Forrest SL, Parkkinen L, Gai WP, Hattori Net al (2015) Generation and characterization
of novel conformation-specific monoclonal antibodies for alpha-synuclein pathology.
Neurobiol Dis 79: 81-99 Doi 10.1016/j.nbd.2015.04.009
510. Valentine CJ (2020) Nutrition and the developing brain. Pediatric Research 87: 190-191
Doi 10.1038/s41390-019-0650-y
511. Van Den Berge N, Ferreira N, Gram H, Mikkelsen TW, Alstrup AKO, Casadei N, Tsung-
Pin P, Riess O, Nyengaard JR, Tamgüney Get al (2019) Evidence for bidirectional and
trans-synaptic parasympathetic and sympathetic propagation of alpha-synuclein in rats.
Acta Neuropathol 138: 535-550 Doi 10.1007/s00401-019-02040-w
512. Van der Perren A, Gelders G, Fenyi A, Bousset L, Brito F, Peelaerts W, Van den Haute
C, Gentleman S, Melki R, Baekelandt V (2020) The structural differences between
patient-derived alpha-synuclein strains dictate characteristics of Parkinson's disease,
multiple system atrophy and dementia with Lewy bodies. Acta Neuropathol: Doi
10.1007/s00401-020-02157-3
513. van Diggelen F, Hrle D, Apetri M, Christiansen G, Rammes G, Tepper A, Otzen DE
(2019) Two conformationally distinct α-synuclein oligomers share common epitopes and
the ability to impair long-term potentiation. PLoS One 14: e0213663 Doi
10.1371/journal.pone.0213663
514. Varkey J, Isas JM, Mizuno N, Jensen MB, Bhatia VK, Jao CC, Petrlova J, Voss JC,
Stamou DG, Steven ACet al (2010) Membrane curvature induction and tubulation are
common features of synucleins and apolipoproteins. J Biol Chem 285: 32486-32493 Doi
10.1074/jbc.M110.139576
515. Velasco S, Díez-Revuelta N, Hernández-Iglesias T, Kaltner H, André S, Gabius HJ,
Abad-Rodríguez J (2013) Neuronal Galectin-4 is required for axon growth and for the
organization of axonal membrane L1 delivery and clustering. J Neurochem 125: 49-62
Doi 10.1111/jnc.12148
516. Verderio C, Muzio L, Turola E, Bergami A, Novellino L, Ruffini F, Riganti L, Corradini
I, Francolini M, Garzetti Let al (2012) Myeloid microvesicles are a marker and
therapeutic target for neuroinflammation. Ann Neurol 72: 610-624 Doi
10.1002/ana.23627
517. Villarroya-Beltri C, Baixauli F, Mittelbrunn M, Fernandez-Delgado I, Torralba D,
Moreno-Gonzalo O, Baldanta S, Enrich C, Guerra S, Sanchez-Madrid F (2016)
ISGylation controls exosome secretion by promoting lysosomal degradation of MVB
proteins. Nat Commun 7: 13588 Doi 10.1038/ncomms13588
518. Visanji NP, Brotchie JM, Kalia LV, Koprich JB, Tandon A, Watts JC, Lang AE (2016)
alpha-Synuclein-Based Animal Models of Parkinson's Disease: Challenges and
Opportunities in a New Era. Trends Neurosci 39: 750-762 Doi 10.1016/j.tins.2016.09.003
257
519. Volpicelli-Daley LA, Gamble KL, Schultheiss CE, Riddle DM, West AB, Lee VM
(2014) Formation of alpha-synuclein Lewy neurite-like aggregates in axons impedes the
transport of distinct endosomes. Mol Biol Cell 25: 4010-4023 Doi 10.1091/mbc.E14-02-
0741
520. Wakabayashi K, Tanji K, Mori F, Takahashi H (2007) The Lewy body in Parkinson's
disease: molecules implicated in the formation and degradation of alpha-synuclein
aggregates. Neuropathology 27: 494-506 Doi 10.1111/j.1440-1789.2007.00803.x
521. Walker L, Stefanis L, Attems J (2019) Clinical and neuropathological differences
between Parkinson's disease, Parkinson's disease dementia and dementia with Lewy
bodies - current issues and future directions. J Neurochem 150: 467-474 Doi
10.1111/jnc.14698
522. Wallin MT, Culpepper WJ, Campbell JD, Nelson LM, Langer-Gould A, Marrie RA,
Cutter GR, Kaye WE, Wagner L, Tremlett Het al (2019) The prevalence of MS in the
United States: A population-based estimate using health claims data. Neurology 92:
e1029-e1040 Doi 10.1212/WNL.0000000000007035
523. Wang F, Gomez-Sintes R, Boya P (2018) Lysosomal membrane permeabilization and
cell death. Traffic 19: 918-931 Doi 10.1111/tra.12613
524. Wang H, Bedford FK, Brandon NJ, Moss SJ, Olsen RW (1999) GABA(A)-receptor-
associated protein links GABA(A) receptors and the cytoskeleton. Nature 397: 69-72 Doi
10.1038/16264
525. Wang W, Perovic I, Chittuluru J, Kaganovich A, Nguyen LT, Liao J, Auclair JR, Johnson
D, Landeru A, Simorellis AKet al (2011) A soluble alpha-synuclein construct forms a
dynamic tetramer. Proc Natl Acad Sci U S A 108: 17797-17802 Doi
10.1073/pnas.1113260108
526. Wang X, Zhang S, Lin F, Chu W, Yue S (2015) Elevated Galectin-3 Levels in the Serum
of Patients With Alzheimer's Disease. Am J Alzheimers Dis Other Demen 30: 729-732
Doi 10.1177/1533317513495107
527. Watts JC, Giles K, Oehler A, Middleton L, Dexter DT, Gentleman SM, DeArmond SJ,
Prusiner SB (2013) Transmission of multiple system atrophy prions to transgenic mice.
Proc Natl Acad Sci U S A 110: 19555-19560 Doi 10.1073/pnas.1318268110
528. Webb JL, Ravikumar B, Atkins J, Skepper JN, Rubinsztein DC (2003) Alpha-Synuclein
is degraded by both autophagy and the proteasome. J Biol Chem 278: 25009-25013 Doi
10.1074/jbc.M300227200
529. Webber J, Clayton A (2013) How pure are your vesicles? J Extracell Vesicles 2: Doi
10.3402/jev.v2i0.19861
258
530. Wei H, Malcor JM, Harper MT (2018) Lipid rafts are essential for release of
phosphatidylserine-exposing extracellular vesicles from platelets. Sci Rep 8: 9987 Doi
10.1038/s41598-018-28363-4
531. Wei Q, Eviatar-Ribak T, Miskimins WK, Miskimins R (2007) Galectin-4 is involved in
p27-mediated activation of the myelin basic protein promoter. J Neurochem 101: 1214-
1223 Doi 10.1111/j.1471-4159.2007.04488.x
532. Wei Q, Miskimins WK, Miskimins R (2003) The Sp1 family of transcription factors is
involved in p27(Kip1)-mediated activation of myelin basic protein gene expression. Mol
Cell Biol 23: 4035-4045 Doi 10.1128/mcb.23.12.4035-4045.2003
533. Weidberg H, Shvets E, Elazar Z (2011) Biogenesis and cargo selectivity of
autophagosomes. Annu Rev Biochem 80: 125-156 Doi 10.1146/annurev-biochem-
052709-094552
534. Whyte JRC, Munro S (2001) A yeast homolog of the mammalian mannose 6-phosphate
receptors contributes to the sorting of vacuolar hydrolases. Current Biology 11: 1074-
1078 Doi https://doi.org/10.1016/S0960-9822(01)00273-1
535. Wickner RB (1994) [URE3] as an altered URE2 protein: evidence for a prion analog in
Saccharomyces cerevisiae. Science 264: 566 Doi 10.1126/science.7909170
536. Willms E, Cabanas C, Mager I, Wood MJA, Vader P (2018) Extracellular Vesicle
Heterogeneity: Subpopulations, Isolation Techniques, and Diverse Functions in Cancer
Progression. Front Immunol 9: 738 Doi 10.3389/fimmu.2018.00738
537. Willms E, Johansson HJ, Mager I, Lee Y, Blomberg KE, Sadik M, Alaarg A, Smith CI,
Lehtio J, El Andaloussi Set al (2016) Cells release subpopulations of exosomes with
distinct molecular and biological properties. Sci Rep 6: 22519 Doi 10.1038/srep22519
538. Winslow AR, Chen CW, Corrochano S, Acevedo-Arozena A, Gordon DE, Peden AA,
Lichtenberg M, Menzies FM, Ravikumar B, Imarisio Set al (2010) α-Synuclein impairs
macroautophagy: implications for Parkinson's disease. J Cell Biol 190: 1023-1037 Doi
10.1083/jcb.201003122
539. Wolfson RL, Chantranupong L, Saxton RA, Shen K, Scaria SM, Cantor JR, Sabatini DM
(2016) Sestrin2 is a leucine sensor for the mTORC1 pathway. Science 351: 43-48 Doi
10.1126/science.aab2674
540. Wolfson RL, Chantranupong L, Wyant GA, Gu X, Orozco JM, Shen K, Condon KJ, Petri
S, Kedir J, Scaria SMet al (2017) KICSTOR recruits GATOR1 to the lysosome and is
necessary for nutrients to regulate mTORC1. Nature 543: 438-442 Doi
10.1038/nature21423
541. Xu J, Camfield R, Gorski SM (2018) The interplay between exosomes and autophagy -
partners in crime. J Cell Sci 131: Doi 10.1242/jcs.215210

259
542. Yamada K, Iwatsubo T (2018) Extracellular α-synuclein levels are regulated by neuronal
activity. Molecular Neurodegeneration 13: 9 Doi 10.1186/s13024-018-0241-0
543. Yamamoto A, Tagawa Y, Yoshimori T, Moriyama Y, Masaki R, Tashiro Y (1998)
Bafilomycin A1 prevents maturation of autophagic vacuoles by inhibiting fusion between
autophagosomes and lysosomes in rat hepatoma cell line, H-4-II-E cells. Cell Struct
Funct 23: 33-42 Doi 10.1247/csf.23.33
544. Yan J, Xu Y, Zhang L, Zhao H, Jin L, Liu WG, Weng LH, Li ZH, Chen L (2016)
Increased Expressions of Plasma Galectin-3 in Patients with Amyotrophic Lateral
Sclerosis. Chin Med J (Engl) 129: 2797-2803 Doi 10.4103/0366-6999.194656
545. Yanez-Mo M, Siljander PR, Andreu Z, Zavec AB, Borras FE, Buzas EI, Buzas K, Casal
E, Cappello F, Carvalho Jet al (2015) Biological properties of extracellular vesicles and
their physiological functions. J Extracell Vesicles 4: 27066 Doi 10.3402/jev.v4.27066
546. Yang H, Rudge DG, Koos JD, Vaidialingam B, Yang HJ, Pavletich NP (2013) mTOR
kinase structure, mechanism and regulation. Nature 497: 217-223 Doi
10.1038/nature12122
547. Yazar HO, Yazar T, Cihan M (2019) A preliminary data: Evaluation of serum Galectin-3
levels in patients with Idiopathic Parkinson's Disease. J Clin Neurosci 70: 164-168 Doi
10.1016/j.jocn.2019.08.032
548. Yazar T, Olgun Yazar H, Cihan M (2020) Evaluation of serum galectin-3 levels at
Alzheimer patients by stages: a preliminary report. Acta Neurol Belg: Doi
10.1007/s13760-020-01477-1
549. Yohrling G, Raimundo K, Crowell V, Lovecky D, Vetter L, Seeberger L (2020)
Prevalence of Huntington’s Disease in the US (954). Neurology 94: 954
550. Yoon YS, Cho ED, Jung Ahn W, Won Lee K, Lee SJ, Lee HJ (2017) Is trehalose an
autophagic inducer? Unraveling the roles of non-reducing disaccharides on autophagic
flux and alpha-synuclein aggregation. Cell Death Dis 8: e3091 Doi
10.1038/cddis.2017.501
551. Yoshii SR, Mizushima N (2017) Monitoring and Measuring Autophagy. Int J Mol Sci 18:
Doi 10.3390/ijms18091865
552. Yu TB, Dodd S, Yu LG, Subramanian S (2020) Serum galectins as potential biomarkers
of inflammatory bowel diseases. PLoS One 15: e0227306 Doi
10.1371/journal.pone.0227306
553. Yu WH, Dorado B, Figueroa HY, Wang L, Planel E, Cookson MR, Clark LN, Duff KE
(2009) Metabolic activity determines efficacy of macroautophagic clearance of
pathological oligomeric alpha-synuclein. Am J Pathol 175: 736-747 Doi
10.2353/ajpath.2009.080928

260
554. Yu X, Long YC, Shen HM (2015) Differential regulatory functions of three classes of
phosphatidylinositol and phosphoinositide 3-kinases in autophagy. Autophagy 11: 1711-
1728 Doi 10.1080/15548627.2015.1043076
555. Yuan P, Condello C, Keene CD, Wang Y, Bird TD, Paul SM, Luo W, Colonna M,
Baddeley D, Grutzendler J (2016) TREM2 Haplodeficiency in Mice and Humans Impairs
the Microglia Barrier Function Leading to Decreased Amyloid Compaction and Severe
Axonal Dystrophy. Neuron 90: 724-739 Doi 10.1016/j.neuron.2016.05.003
556. Yue Z, Friedman L, Komatsu M, Tanaka K (2009) The cellular pathways of neuronal
autophagy and their implication in neurodegenerative diseases. Biochim Biophys Acta
1793: 1496-1507 Doi 10.1016/j.bbamcr.2009.01.016
557. Zarranz JJ, Alegre J, Gomez-Esteban JC, Lezcano E, Ros R, Ampuero I, Vidal L,
Hoenicka J, Rodriguez O, Atares Bet al (2004) The new mutation, E46K, of alpha-
synuclein causes Parkinson and Lewy body dementia. Ann Neurol 55: 164-173 Doi
10.1002/ana.10795
558. Zatyka M, Sarkar S, Barrett T (2020) Autophagy in Rare (NonLysosomal)
Neurodegenerative Diseases. J Mol Biol 432: 2735-2753 Doi 10.1016/j.jmb.2020.02.012
559. Zhang CS, Hawley SA, Zong Y, Li M, Wang Z, Gray A, Ma T, Cui J, Feng JW, Zhu Met
al (2017) Fructose-1,6-bisphosphate and aldolase mediate glucose sensing by AMPK.
Nature 548: 112-116 Doi 10.1038/nature23275
560. Zhang CS, Jiang B, Li M, Zhu M, Peng Y, Zhang YL, Wu YQ, Li TY, Liang Y, Lu Zet
al (2014) The lysosomal v-ATPase-Ragulator complex is a common activator for AMPK
and mTORC1, acting as a switch between catabolism and anabolism. Cell Metab 20:
526-540 Doi 10.1016/j.cmet.2014.06.014
561. Zhang M, Kenny SJ, Ge L, Xu K, Schekman R (2015) Translocation of interleukin-1beta
into a vesicle intermediate in autophagy-mediated secretion. Elife 4: Doi
10.7554/eLife.11205
562. Zhang S, Eitan E, Wu TY, Mattson MP (2018) Intercellular transfer of pathogenic alpha-
synuclein by extracellular vesicles is induced by the lipid peroxidation product 4-
hydroxynonenal. Neurobiol Aging 61: 52-65 Doi 10.1016/j.neurobiolaging.2017.09.016
563. Zhang Y, Meredith GE, Mendoza-Elias N, Rademacher DJ, Tseng KY, Steece-Collier K
(2013) Aberrant restoration of spines and their synapses in L-DOPA-induced dyskinesia:
involvement of corticostriatal but not thalamostriatal synapses. J Neurosci 33: 11655-
11667 Doi 10.1523/JNEUROSCI.0288-13.2013
564. Zharikov A, Bai Q, De Miranda BR, Van Laar A, Greenamyre JT, Burton EA (2019)
Long-term RNAi knockdown of alpha-synuclein in the adult rat substantia nigra without
neurodegeneration. Neurobiol Dis 125: 146-153 Doi 10.1016/j.nbd.2019.01.004
261
565. Zheng G, Zhan Y, Li X, Pan Z, Zheng F, Zhang Z, Zhou Y, Wu Y, Wang X, Gao Wet al
(2018) TFEB, a potential therapeutic target for osteoarthritis via autophagy regulation.
Cell Death Dis 9: 858 Doi 10.1038/s41419-018-0909-y
566. Zhou Q, Liu C, Liu W, Zhang H, Zhang R, Liu J, Zhang J, Xu C, Liu L, Huang Set al
(2015) Rotenone induction of hydrogen peroxide inhibits mTOR-mediated S6K1 and 4E-
BP1/eIF4E pathways, leading to neuronal apoptosis. Toxicol Sci 143: 81-96 Doi
10.1093/toxsci/kfu211
567. Zhu L, Sun C, Ren J, Wang G, Ma R, Sun L, Yang D, Gao S, Ning K, Wang Zet al
(2019) Stress-induced precocious aging in PD-patient iPSC-derived NSCs may underlie
the pathophysiology of Parkinson's disease. Cell Death Dis 10: 105 Doi 10.1038/s41419-
019-1313-y
568. Zunke F, Moise AC, Belur NR, Gelyana E, Stojkovska I, Dzaferbegovic H, Toker NJ,
Jeon S, Fredriksen K, Mazzulli JR (2018) Reversible Conformational Conversion of α-
Synuclein into Toxic Assemblies by Glucosylceramide. Neuron 97: 92-107.e110 Doi
10.1016/j.neuron.2017.12.012

262
VITA
The author, Kevin Burbidge, was born in Edina, MN on February 15, 1989 to Steve and
Ann Burbidge. He attended the University of Denver in Denver, Colorado where he earned a
Bachelor of Science in Biological and Psychological Sciences in June of 2011. In 2015, Kevin
matriculated into the Loyola University Chicago Stritch School Neuroscience Graduate Program
and joined the laboratory of Dr. Ed Campbell. Kevin completed his Master of Science in
Neuroscience in the summer of 2017, at Loyola University Chicago. In the fall of 2017, Kevin
subsequently matriculated into the Integrated Program in Biomedical Sciences to pursue his
Doctor of Philosophy continuing his work in the Laboratory of Dr. Ed Campbell. Upon
completion of his doctorate, Kevin Burbidge will be working as a post-doctoral fellow at the
Northwestern University in Chicago, Illinois in the laboratory of Dr. Joe Mazzulli.