From a NEXRAD Rainfall Map to a Flood Inundation Map
9
From a NEXRAD Rainfall Map to a Flood Inundation Map Timothy L. Whiteaker 1 ; Oscar Robayo 2 ; David R. Maidment 3 ; and Dan Obenour 4 Abstract: An application integrating the Hydrologic Engineering Center’s HEC-Hydrologic Modeling System hydrologic simulation model and the HEC-River Analysis System hydraulic simulation model into a seamless floodplain mapping application is presented. The application is implemented with an ArcGIS 9 workflow model called Map to Map, which converts a map of rainfall data to a flood inundation map. The simulation models are integrated into the application by establishing information exchange points at which time series of information are passed to a model or returned from a model. Communication between simulation models and the Geographic Information System GIS is made possible by interface data models, which provide a one-to-one mapping between data structures within the simulation model and the GIS. A case study is presented for Rosillo Creek in Texas, in which the Map-to-Map model computes flood inundation polygons from rainfall data. Map to Map gives the user a powerful floodplain mapping and real-time flood forecasting tool. DOI: 10.1061/ASCE1084-0699200611:137 CE Database subject headings: Geographic information systems; Hydrologic models; Hydraulic models; Flood hydrology; Mapping. Introduction Current water-resources engineering problems demand solutions that use output from more than one type of hydrologic simulation model. For example, a real-time flood-forecasting model not only requires a hydrologic component to convert rainfall to runoff but also a hydraulic component to route the flow through the stream network and predict the timing and severity of the flood wave. Direct integration of different models is very difficult, if not im- possible. Such a task may require manipulation of the source code in the models themselves, as well as reconciliation between time series structures and feature representations between the models. This paper presents a more feasible approach utilizing geospa- tial integration, in which simulation models and a Geographic Information System GIS are integrated through the exchange of information at information exchange points on the stream net- work. This information exchange is supported by interface data models, which provide a one-to-one mapping between data struc- tures in a GIS and those in a simulation model. A case study implementing the methodology for a floodplain mapping applica- tion for Rosillo Creek in the San Antonio River Basin is pre- sented. The model presented in the case study, called Map to Map, automatically executes the Hydrologic Engineering Center’s HEC Hydrologic Modeling System HMS and River Analysis System RAS simulation models and links the models to a GIS in a workflow sequence that computes flood inundation polygons from rainfall data in a matter of minutes. Definition of Terms The following terms are utilized in this paper: Data bridge: A software application that facilitates the exchange of information between two separate applications or data models. Data model: A model that provides a data structure for storing information to support a particular purpose. This structure groups features into logical categories or classes and provides attributes in those classes to further describe the features. Dynamic Linked Library (DLL): A library of objects or pro- cedures, which are accessed by a calling application. A DLL does not control its own lifetime; it does not run on its own. Rather, an application such as an executable calls a DLL, accessing useful functions or objects from the DLL. Thus, an executable uses a DLL to provide functionality in addition to that provided by the executable alone. While a DLL is typically called by an execut- able, DLLs may also be called from scripts. Executable: A software application packaged as a single file that is run by the user. Executables keep running until some event triggers the executable to close. The executable typically responds to perform work as directed by the user. Extensible markup language (XML): A subset of SGML standard generalized markup language that is used to describe data. XML files are independent of operating system and are read- able by any text editor. Geographic Information System (GIS): A computerized system for storing and analyzing spatial data. 1 Institute for Geophysics, P.O. Box 7456, MC R2200, Univ. ofTexas, Austin, TX 78712 corresponding author. Email: [email protected] 2 Graduate Research Assistant, Center for Research in Water Resources, Pickle Research Campus, Bldg. 119, MC R8000, Univ. of Texas, Austin, TX 78712. Email: [email protected] 3 Professor of Civil Engineering, Center for Research in Water Resources, Pickle Research Campus, Bldg. 119, MC R8000, Univ. of Texas, Austin, TX 78712. Email: [email protected] 4 Engineer, Freese and Nichols Inc., 10814 Jollyville Rd., Building IV, Ste. 100, Austin, TX 78759. Email: [email protected] Note. Discussion open until June 1, 2006. Separate discussions must be submitted for individual papers. To extend the closing date by one month, a written request must be filed with the ASCE Managing Editor. The manuscript for this paper was submitted for review and possible publication on December 22, 2004; approved on April 5, 2005. This paper is part of the Journal of Hydrologic Engineering, Vol. 11, No. 1, January 1, 2006. ©ASCE, ISSN 1084-0699/2006/1-37–45/$25.00. JOURNAL OF HYDROLOGIC ENGINEERING © ASCE / JANUARY/FEBRUARY 2006 / 37
Transcript of From a NEXRAD Rainfall Map to a Flood Inundation Map

From a NEXRAD Rainfall Map to a Flood Inundation MapTimothy L. Whiteaker1; Oscar Robayo2; David R. Maidment3; and Dan Obenour4
Abstract: An application integrating the Hydrologic Engineering Center’s �HEC�-Hydrologic Modeling System hydrologic simulationmodel and the HEC-River Analysis System hydraulic simulation model into a seamless floodplain mapping application is presented. Theapplication is implemented with an ArcGIS 9 workflow model called Map to Map, which converts a map of rainfall data to a floodinundation map. The simulation models are integrated into the application by establishing information exchange points at which timeseries of information are passed to a model or returned from a model. Communication between simulation models and theGeographic Information System �GIS� is made possible by interface data models, which provide a one-to-one mapping between datastructures within the simulation model and the GIS. A case study is presented for Rosillo Creek in Texas, in which the Map-to-Map modelcomputes flood inundation polygons from rainfall data. Map to Map gives the user a powerful floodplain mapping and real-time floodforecasting tool.
DOI: 10.1061/�ASCE�1084-0699�2006�11:1�37�
CE Database subject headings: Geographic information systems; Hydrologic models; Hydraulic models; Flood hydrology;Mapping.
Introduction
Current water-resources engineering problems demand solutionsthat use output from more than one type of hydrologic simulationmodel. For example, a real-time flood-forecasting model not onlyrequires a hydrologic component to convert rainfall to runoff butalso a hydraulic component to route the flow through the streamnetwork and predict the timing and severity of the flood wave.Direct integration of different models is very difficult, if not im-possible. Such a task may require manipulation of the source codein the models themselves, as well as reconciliation between timeseries structures and feature representations between the models.
This paper presents a more feasible approach utilizing geospa-tial integration, in which simulation models and a GeographicInformation System �GIS� are integrated through the exchange ofinformation at information exchange points on the stream net-work. This information exchange is supported by interface datamodels, which provide a one-to-one mapping between data struc-tures in a GIS and those in a simulation model. A case studyimplementing the methodology for a floodplain mapping applica-
1Institute for Geophysics, P.O. Box 7456, MC R2200, Univ. of Texas,Austin, TX 78712 �corresponding author�. Email: [email protected]
2Graduate Research Assistant, Center for Research in WaterResources, Pickle Research Campus, Bldg. 119, MC R8000, Univ. ofTexas, Austin, TX 78712. Email: [email protected]
3Professor of Civil Engineering, Center for Research in WaterResources, Pickle Research Campus, Bldg. 119, MC R8000, Univ. ofTexas, Austin, TX 78712. Email: [email protected]
4Engineer, Freese and Nichols Inc., 10814 Jollyville Rd., Building IV,Ste. 100, Austin, TX 78759. Email: [email protected]
Note. Discussion open until June 1, 2006. Separate discussions mustbe submitted for individual papers. To extend the closing date by onemonth, a written request must be filed with the ASCE Managing Editor.The manuscript for this paper was submitted for review and possiblepublication on December 22, 2004; approved on April 5, 2005. Thispaper is part of the Journal of Hydrologic Engineering, Vol. 11, No. 1,
January 1, 2006. ©ASCE, ISSN 1084-0699/2006/1-37–45/$25.00.JOURNAL OF HYDR
tion for Rosillo Creek in the San Antonio River Basin is pre-sented. The model presented in the case study, called Map toMap, automatically executes the Hydrologic Engineering Center’s�HEC� Hydrologic Modeling System �HMS� and River AnalysisSystem �RAS� simulation models and links the models to a GIS ina workflow sequence that computes flood inundation polygonsfrom rainfall data in a matter of minutes.
Definition of Terms
The following terms are utilized in this paper:Data bridge: A software application that facilitates the
exchange of information between two separate applications ordata models.
Data model: A model that provides a data structure for storinginformation to support a particular purpose. This structure groupsfeatures into logical categories or classes and provides attributesin those classes to further describe the features.
Dynamic Linked Library (DLL): A library of objects or pro-cedures, which are accessed by a calling application. A DLL doesnot control its own lifetime; it does not run on its own. Rather, anapplication �such as an executable� calls a DLL, accessing usefulfunctions or objects from the DLL. Thus, an executable uses aDLL to provide functionality in addition to that provided by theexecutable alone. While a DLL is typically called by an execut-able, DLLs may also be called from scripts.
Executable: A software application packaged as a single filethat is run by the user. Executables keep running until some eventtriggers the executable to close. The executable typically respondsto perform work as directed by the user.
Extensible markup language (XML): A subset of SGML�standard generalized markup language� that is used to describedata. XML files are independent of operating system and are read-able by any text editor.
Geographic Information System (GIS): A computerized
system for storing and analyzing spatial data.OLOGIC ENGINEERING © ASCE / JANUARY/FEBRUARY 2006 / 37
Geospatial data model: The portion of an interface datamodel that stores geospatial data.
Hydrologic Information System: A system that integrates aGIS with simulation models to support hydrologic modeling.
Interface data model: A model that defines a GIS data struc-ture that includes information required by a particular simulationmodel, allowing for a one-to-one mapping between data in theGIS and data in the simulation model. An interface data modeldoes not contain the simulation model itself, but rather the infor-mation that the simulation model requires prior to execution, aswell as outputs from the simulation model after execution. Thus,an interface data model facilitates two-way communication be-tween a GIS and a simulation model.
Preprocessing data model: A model that contains the struc-ture necessary to store geospatial inputs required by a simulationmodel. The direction of communication between the geospatialdatabase and the simulation model is typically one-way, from thedatabase to the simulation model.
Script: Programming code stored as text. The code within ascript is written to conform to the rules of a script compiler,which interprets and carries out commands in the script. Each linein a script is executed until the script is finished.
Simulation model: Model that uses equations to simulatephysical processes.
Time series data model: The portion of an interface datamodel that stores time series data.
Workflow model: A model that defines input data and asequence of processes to produce output data.
Previous Work
A GIS is a valuable tool in support of hydrologic and hydraulicmodeling. Several applications have been developed over theyears covering a variety of water-resources concerns, includingwater quality �Yoon 1996; Prisloe et al. 2000� and floodplainmapping �Robbins and Phipps 1996; Correia et al. 1999; Koussiset al. 2003�.
A GIS manages large volumes of geospatial data, such thatdistributed parameters, rather than lumped parameters, can beused in a simulation model �Ogden et al. 2001; Gao et al. 1993;Vieux 2001�. This can result in a more accurate depiction of thereality that the engineer is attempting to model. However, as deRoo �1998� points out, if the GIS data contain errors or do nottranslate correctly into model inputs, a distributed model mayperform no better than a lumped one.
As GIS and simulation models are designed separately, thetype of data in a GIS may not conform to what the simulationmodel is expecting. Scale, precision, data structure, and datameaning are among the domains in which error could arise duringcommunication between the GIS and the simulation model �Vieux2001�. Roberts and Moore �1998� observed the importance of adata model for easy data query and retrieval in decision supportsystems. Maidment �2002� developed a data model for water re-sources features, called Arc Hydro, to assist in GIS and modelintegration.
Charnock et al. �1996� describe two levels of GIS and simu-lation model integration. The first combines GIS and modelsthrough tight integration, with the two components communicat-ing directly with each other. This results in large developmentcosts but typically requires less expertise from an end user. Thesecond links GIS and models through communicating programs
or bridges, in which the model and GIS programs are executed38 / JOURNAL OF HYDROLOGIC ENGINEERING © ASCE / JANUARY/FEB
separately and simply share data through the bridge. Storck et al.�1998� provide an example of this type of integration by using aGIS as a pre- and postprocessor for the distributed soil-hydrology-vegetation model �DHSVM�, with information beingexchanged between the GIS and DHSVM through binary orASCII files. This approach requires less development time butmore expertise from the end user, as the user must be aware of theproblems in matching the model’s data requirements and repre-sentation of reality with what’s available in the GIS �Charnocket al. 1996�. Again, the Arc Hydro data model �Maidment 2002�ameliorates this problem by providing a GIS data structureadapted for hydrologic and hydraulic modeling. Kopp �1996� fur-ther illustrates the importance in using data models, as a robustdata structure alleviates some of the difficulties in developing databridges. Kopp also observes that the connection of GIS andhydrologic simulation models through data bridges is the mostcommon type of integrated application that has been developed.
Clark �1998� observes that the emerging view of the role of aGIS is that of a database support and analysis system. The GIS isone of several applications, such as hydrologic simulation mod-els, that support a central database of information. This setup isbest supported by the use of data bridges, as several applicationsmust interact through the central database or with each other.
The research presented in this paper utilizes bridges to transfergeospatial and temporal data between a GIS and hydrologic andhydraulic simulation models. The bridges are associated withdiscrete information exchange points where the transfer of infor-mation between HMS and RAS simulation models may occur.Each bridge is custom-built for each simulation model.
Methodology
This research uses geospatial integration to link simulation mod-els with a GIS. In geospatial integration, a hydrologic informationsystem is constructed containing a central GIS database and thesimulation models required for the analysis. Each hydrologicmodel’s execution occurs independently of other components inthe system, while the outputs of a model simulation are importedinto the GIS to be used as input to another simulation model orfor further geospatial analysis and interpretation of results. Thedata bridges facilitating the exchange of information between GISand simulation models are implemented using two key concepts:interface data models and information exchange points.
Interface Data Models
Hydrologic models typically require data that describe the prop-erties and connectivity of features that transmit or affect themovement of water throughout the landscape. Thus, the nature ofa hydrologic model is not only governed by the fundamental hy-drologic principles, equations, and numerical methods uponwhich the model is based, but also by the quality, precision, andavailability of the data to be used in the model. Increases in com-puting power, data collection, and data distribution through meanssuch as the Internet allow hydrologists to use more distributedmodels with increasingly large spatial data requirements.
While Arc Hydro provides a good starting point for adaptingdata to hydrologic models, it cannot accommodate every aspect ofgeospatial information that every model requires. Thus, an inter-face data model is created to provide a two-way link between theGIS and hydrologic simulation model �Fig. 1�. A separate inter-
face data model is created for each specific simulation model.RUARY 2006

Therefore, if a geodatabase supports inputs for three independentsimulation models, then three interface data models will be devel-oped within the geodatabase. In some cases, such as with theHydrologic Engineering Center’s HMS and RAS models, compo-nents of interface data models may overlap.
An interface data model is composed of a geospatial datamodel for storing geospatial features and a time series data modelfor storing time series information. Through these components, aninterface data model integrates spatial data �the strength of theGIS� and temporal data �the strength of the simulation model� ina manner that both the GIS and simulation model can understand.
To further illustrate the concept of interface data models, con-sider the way that geospatial integration of GIS with models wasaccomplished previously. As evidenced in applications such asHudgens and Maidment �1999�, distinct geodatabases and prepro-cessors were developed for each model application. The role ofthe GIS was predominantly as a preprocessor for geospatial inputsinto the model. Thus, a preprocessing data model was developedfor each application.
While often serving the purpose of linking to a specific modelquite well, applications built with preprocessing data models aredifficult to extend so that other simulation models can take ad-vantage of geospatial data development for the initial model. Inother words, the geodatabases are not compatible between differ-ent model applications.
With interface data models, the components needed to describea given model’s inputs, properties, and outputs are stored in aGIS, thus facilitating the two-way exchange of information be-tween the GIS and simulation model. Because the interface datamodel is designed to work specifically with the simulation model,communication between the interface data model and the simula-tion model is efficient and manageable.
Furthermore, by storing model data in the geodatabase and byrecognizing common hydrologic features in different simulationmodels as extensions of core Arc Hydro features, data may beshared among multiple simulation models. By using Arc Hydro asa data standard for core hydrologic features, a single source ofhydrologic geospatial data, such as watershed and stream networkinformation, can be used in multiple simulation models. Addition-ally, the output from one simulation model, such as HMS, may beused as input into another model, such as RAS, by bringing thedata into an interface data model for HMS, through Arc Hydro,and then through another interface data model for RAS �Fig. 2�.
In summary, interface data models provide a means of storinggeospatial data for model input, storing model output, and sharingdata between interface data models through Arc Hydro, while stillmaintaining the autonomy of simulation models.
Information Exchange Points
Because the focus of this methodology is on water-resources
Fig. 1. Mapping between simulation model and Arc Hydro withinterface data model
applications, the exchange of information between simulation
JOURNAL OF HYDR
models occurs only at information exchange points within theGIS, where an information exchange point is defined as any pointof interest that holds significance regarding the flow of water overthe land surface. These points are typically located at hydrojunc-tions, which may be linked to watersheds, cross sections, andother features through relationships. The types of information thatmay be exchanged at information exchange points include timeseries and attribute information, such as streamflow and waterquality loads. This integration of space and time, from simulationmodels to GIS, forms the essence of a hydrologic informationsystem �Fig. 3�.
In this methodology, the information exchange occurs betweenmodel simulations, rather than during a given simulation. Whilethis approach may not be as powerful as fully coupled, simulta-neous execution of simulation models, it is much easier to imple-ment and still provides useful and flexible solutions for situationsin which the simulation models may be executed sequentially,such as with rainfall-runoff-routing applications. Additionally, be-cause the models are not hardwired directly with each other, dif-ferent models may be substituted to simulate a given hydrologicor hydraulic process, as long as an interface for that model hasbeen created to communicate with the GIS. The case study in thispaper illustrates the above methodology.
Fig. 2. Information flow in the Map-to-Map model
Fig. 3. Components of a hydrologic information system
OLOGIC ENGINEERING © ASCE / JANUARY/FEBRUARY 2006 / 39

Procedure of Application
The above methodology is implemented using ArcGIS 9 work-flow models. ArcGIS 9 provides a new geoprocessing frameworkthat allows geoprocessing tasks to be chained together in work-flow models to perform useful work. A geoprocessing tasktypically takes one or more inputs, performs an operation on thoseinputs, and produces a derived dataset. These tasks may be ar-ranged from the standard tools in ArcGIS 9, as well as customtools created by the user and stored in custom toolboxes. Customtools may be generated from developer’s code, scripts, or GISmodels. Workflow models are assembled in the ArcGIS 9 Model-Builder environment. In ModelBuilder, a set of inputs, a geopro-cessing task, and outputs make up a process. A chain of processesmakes up a workflow model. The outputs from one processbecome the inputs to the next process in the chain �Fig. 4�.
While standard ArcGIS tools are suitable for many applica-tions, sometimes more specialized or advanced functionality isrequired. The user may create this functionality by programminga script tool. A script tool is associated with a script on disk,written in a scripting language such as VBScript. ArcGIS ex-ecutes the script to perform work when the associated script toolis called from a workflow model. Once a workflow model hasbeen created, it may be reused and inserted into other models.Thus, the user has a variety of options for creating and assem-bling a workflow model.
Fig. 4. ArcGIS 9 workflow model
Fig. 5. Rosillo Creek in Texas
40 / JOURNAL OF HYDROLOGIC ENGINEERING © ASCE / JANUARY/FEB
Fig. 6. Features in the geodatabase and Hydrologic Modeling System�HMS� are linked through HMSCode
Fig. 7. Geodatabase �left� and River Analysis System �RAS� �right�view of cross sections
RUARY 2006
The case study presented in this paper uses both standardArcGIS tools and custom script tools in a workflow model. Thescripts are used to call DLLs that serve as data bridges betweenthe GIS and simulation models. Scripts are also used to call theHMS and RAS simulation models.
Case Study: Map to Map for Rosillo Creek
The purpose of the application described in this case study is toconvert NEXRAD rainfall data for Rosillo Creek, a tributary ofthe San Antonio River in Texas �Fig. 5�, to inundation polygons.The Rosillo Creek Basin covers an area of 73 km2 and exhibits ashort response time, on the order of hours, to rainfall events. Theautomated procedure for this case study involves converting therainfall time series to runoff hydrographs for each watershed in
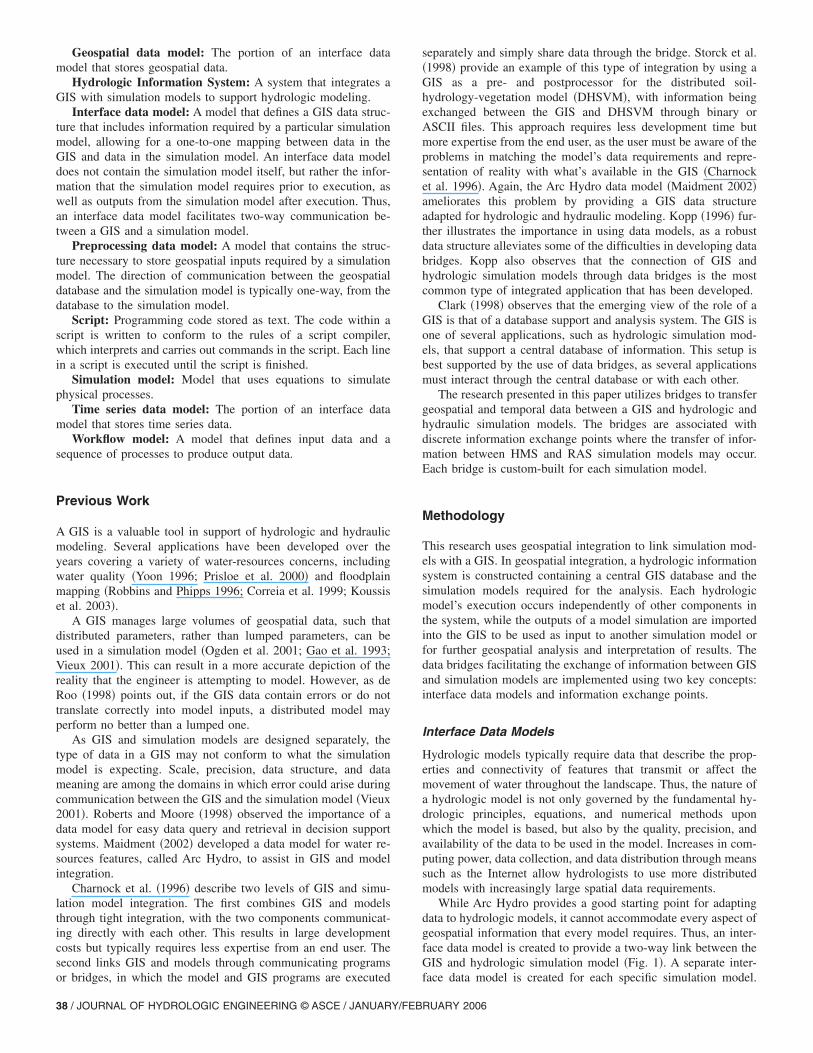
Fig. 8. Time series exchanged at information exchange points,including �1� watersheds, �2� watershed outlet junctions, and �3� crosssections, to produce �4� water surface elevations on all cross sections
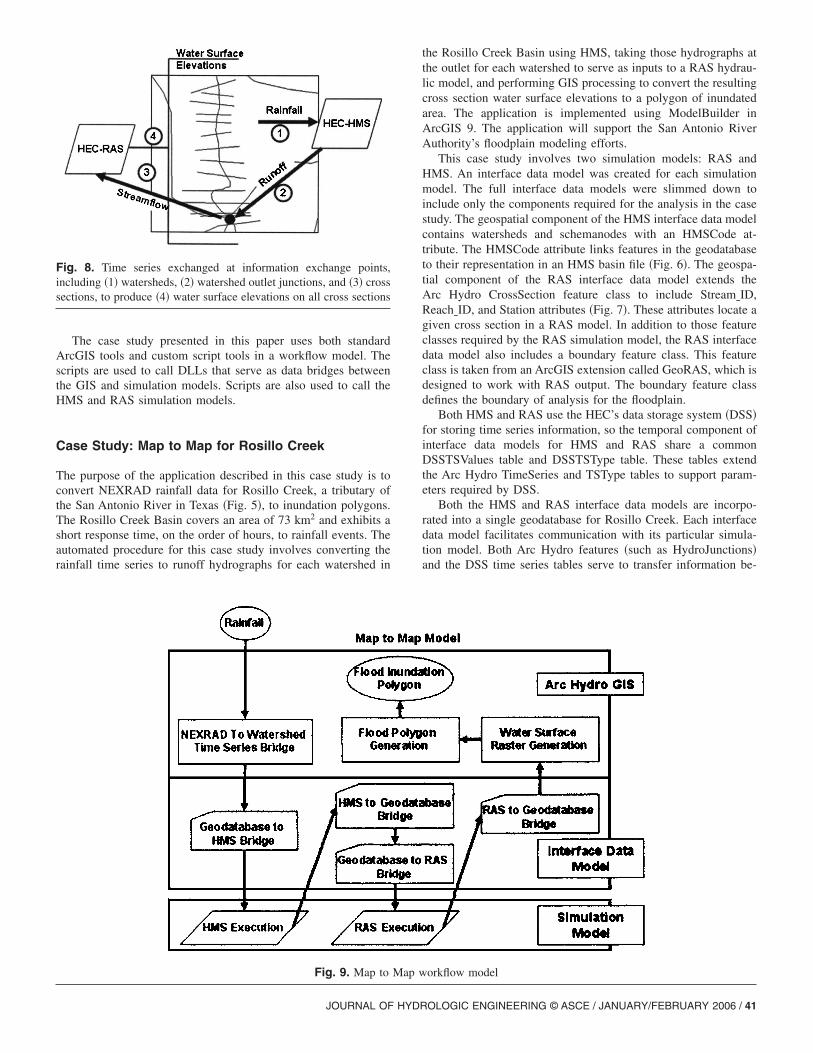
Fig. 9. Map to
JOURNAL OF HYDR
the Rosillo Creek Basin using HMS, taking those hydrographs atthe outlet for each watershed to serve as inputs to a RAS hydrau-lic model, and performing GIS processing to convert the resultingcross section water surface elevations to a polygon of inundatedarea. The application is implemented using ModelBuilder inArcGIS 9. The application will support the San Antonio RiverAuthority’s floodplain modeling efforts.
This case study involves two simulation models: RAS andHMS. An interface data model was created for each simulationmodel. The full interface data models were slimmed down toinclude only the components required for the analysis in the casestudy. The geospatial component of the HMS interface data modelcontains watersheds and schemanodes with an HMSCode at-tribute. The HMSCode attribute links features in the geodatabaseto their representation in an HMS basin file �Fig. 6�. The geospa-tial component of the RAS interface data model extends theArc Hydro CrossSection feature class to include Stream�ID,Reach�ID, and Station attributes �Fig. 7�. These attributes locate agiven cross section in a RAS model. In addition to those featureclasses required by the RAS simulation model, the RAS interfacedata model also includes a boundary feature class. This featureclass is taken from an ArcGIS extension called GeoRAS, which isdesigned to work with RAS output. The boundary feature classdefines the boundary of analysis for the floodplain.
Both HMS and RAS use the HEC’s data storage system �DSS�for storing time series information, so the temporal component ofinterface data models for HMS and RAS share a commonDSSTSValues table and DSSTSType table. These tables extendthe Arc Hydro TimeSeries and TSType tables to support param-eters required by DSS.
Both the HMS and RAS interface data models are incorpo-rated into a single geodatabase for Rosillo Creek. Each interfacedata model facilitates communication with its particular simula-tion model. Both Arc Hydro features �such as HydroJunctions�and the DSS time series tables serve to transfer information be-
orkflow model
Map wOLOGIC ENGINEERING © ASCE / JANUARY/FEBRUARY 2006 / 41

tween interface data models for each simulation model.Before any simulations can be run, data must be prepared in
the geodatabase, as well as the simulation files required by HMSand RAS. GIS data were obtained from the City of San Antonio,including the stream network, cross sections, watersheds, and0.6096 m �2 ft� contours. The contours were used to generate adigital elevation model �DEM� for the area. Once the data wereloaded into a geodatabase, the Arc Hydro schema was applied.Subsequently, the resulting geodatabase was further adapted toincorporate the HMS and RAS interface data models. Informationexchange points were established between the GIS and HMS atthe outlets of 17 watersheds within the basin. These outlets werestored in the HydroJunction feature class and located on thestream network. The information exchange points between theGIS and RAS were established at each next downstream crosssection from the hydrojunction serving as each watershed’s outlet.These cross sections were also represented by a hydrojunction onthe stream network. The configuration of 223 cross sections inRosillo Creek was considered dense enough so that a watershed’shydrograph could be associated with the next downstream crosssection without compromising the integrity of the data. All crosssections were used when importing RAS results back into thegeodatabase �Fig. 8�.
HMS and RAS project files �and other supporting files� werealso set up for Rosillo Creek. These files contain the informationnecessary to run an HMS or RAS simulation. Certain sections ofthose files reflect inputs from the GIS, such as rainfall data for anHMS meteorological record. Features in the HMS and RAS filespossess identifiers to link them with features in the geodatabase.
The application in this case study was implemented by creat-ing an ArcGIS 9 workflow model called Map to Map, using Mod-elBuilder. The model contains 19 tools, including script tools,model tools, and standard ArcGIS tools. The script tools call bothDLLs and executables to perform advanced work. With modelconnectivity established through information exchange points,
Fig. 10. Associating NEXRAD rai
Map to Map seamlessly integrates a hydrologic and hydraulic
42 / JOURNAL OF HYDROLOGIC ENGINEERING © ASCE / JANUARY/FEB
simulation model into a single floodplain mapping application. Asummary of the workflow for Map to Map is shown in Fig. 9. Thebasic sequence of model execution is described below.
NEXRAD to Watershed Time Series Bridge
First, the model ingests NEXRAD rainfall data into the geodata-base for a set of NEXRAD polygons covering the study area, andthen it transfers the rainfall time series from the NEXRAD poly-gons to watersheds for the Rosillo Creek Basin. The model uses aPixelID text file to identify NEXRAD cells for which time seriesdata are available. The data are stored in individual ASCII datafiles, which are indexed by a DataFileList text file. The toolmatches available cells with NEXRAD polygon features in thegeodatabase and then imports the time series of rainfall into theArc Hydro TimeSeries table. Then the model transfers time seriesassociated with the NEXRAD polygons to watersheds for theRosillo Creek Basin. The tool analyzes the extent to which eachNEXRAD cell covers a given watershed, and then based on thatextent, it calculates a weighted average of rainfall for that water-shed at each time step �Fig. 10�.
Geodatabase to Hydrologic Modeling System Bridge
Once rainfall data have been associated with each watershed, thedata may be passed to the HMS hydrologic simulation model tocalculate an outflow hydrograph for each watershed. Bridges werecreated for this research so that information could be transferredbetween the GIS and HEC’s DSS files. For the geodatabase toHMS bridge, each watershed in the geodatabase has a corre-sponding basin object in the HMS basin file, identified by theHMSCode attribute in each watershed. With this attribute, a DSSfile could be written to supply HMS with rainfall data, with eachrainfall time series associated with the correct basin object inHMS. Once GIS data have been entered into a DSS file, HMS
ata with Rosillo Creek watersheds
nfall dmay use the data for hydrologic simulations.
RUARY 2006
Hydrologic Modeling System Execution
After a DSS file has been created from GIS rainfall data, the HMShydrologic simulation model executes rainfall-runoff calculationsfor each watershed in the Rosillo Creek Basin. The result is a setof runoff hydrographs for nodes in the stream network, with thenodes representing watershed outlets and stream confluences.Once HMS is called by ArcGIS in the Map-to-Map workflowmodel, HMS runs its entire simulation without user interaction.The GIS waits for HMS to finish before continuing with the nextstep in the workflow model.
Hydrologic Modeling System to Geodatabase Bridge
HMS writes the results of its simulation to a DSS file. Mapto Map then uses a bridge to transfer time series data from theDSS file into a geodatabase time series table. The time series areassociated with HMS nodes in the geodatabase and are identifiedby an HMSCode attribute. These nodes are stored in theSchemaNode feature class and are related to hydrojunctions at theappropriate location on the stream network �Fig. 11�.
Geodatabase to River Analysis System Bridge
Cross sections describing the river channel are also related tohydrojunctions on the stream network. Through hydrojunction
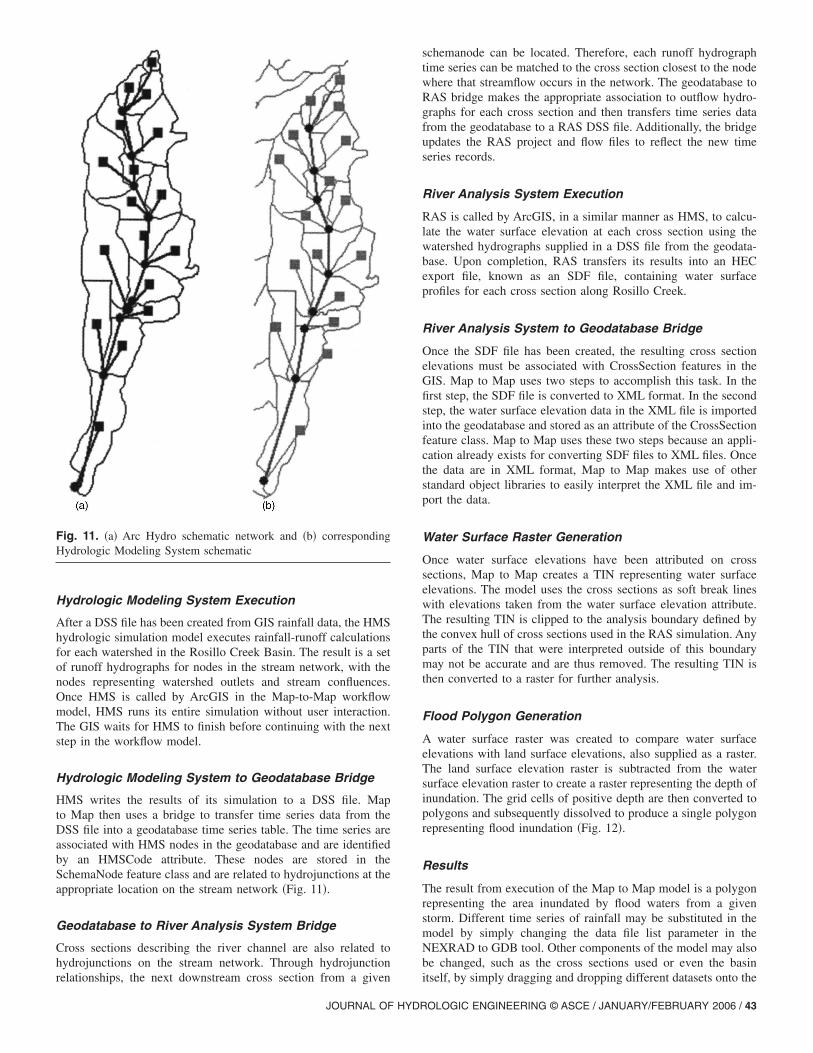
Fig. 11. �a� Arc Hydro schematic network and �b� correspondingHydrologic Modeling System schematic
relationships, the next downstream cross section from a given
JOURNAL OF HYDR
schemanode can be located. Therefore, each runoff hydrographtime series can be matched to the cross section closest to the nodewhere that streamflow occurs in the network. The geodatabase toRAS bridge makes the appropriate association to outflow hydro-graphs for each cross section and then transfers time series datafrom the geodatabase to a RAS DSS file. Additionally, the bridgeupdates the RAS project and flow files to reflect the new timeseries records.
River Analysis System Execution
RAS is called by ArcGIS, in a similar manner as HMS, to calcu-late the water surface elevation at each cross section using thewatershed hydrographs supplied in a DSS file from the geodata-base. Upon completion, RAS transfers its results into an HECexport file, known as an SDF file, containing water surfaceprofiles for each cross section along Rosillo Creek.
River Analysis System to Geodatabase Bridge
Once the SDF file has been created, the resulting cross sectionelevations must be associated with CrossSection features in theGIS. Map to Map uses two steps to accomplish this task. In thefirst step, the SDF file is converted to XML format. In the secondstep, the water surface elevation data in the XML file is importedinto the geodatabase and stored as an attribute of the CrossSectionfeature class. Map to Map uses these two steps because an appli-cation already exists for converting SDF files to XML files. Oncethe data are in XML format, Map to Map makes use of otherstandard object libraries to easily interpret the XML file and im-port the data.
Water Surface Raster Generation
Once water surface elevations have been attributed on crosssections, Map to Map creates a TIN representing water surfaceelevations. The model uses the cross sections as soft break lineswith elevations taken from the water surface elevation attribute.The resulting TIN is clipped to the analysis boundary defined bythe convex hull of cross sections used in the RAS simulation. Anyparts of the TIN that were interpreted outside of this boundarymay not be accurate and are thus removed. The resulting TIN isthen converted to a raster for further analysis.
Flood Polygon Generation
A water surface raster was created to compare water surfaceelevations with land surface elevations, also supplied as a raster.The land surface elevation raster is subtracted from the watersurface elevation raster to create a raster representing the depth ofinundation. The grid cells of positive depth are then converted topolygons and subsequently dissolved to produce a single polygonrepresenting flood inundation �Fig. 12�.
Results
The result from execution of the Map to Map model is a polygonrepresenting the area inundated by flood waters from a givenstorm. Different time series of rainfall may be substituted in themodel by simply changing the data file list parameter in theNEXRAD to GDB tool. Other components of the model may alsobe changed, such as the cross sections used or even the basin
itself, by simply dragging and dropping different datasets onto theOLOGIC ENGINEERING © ASCE / JANUARY/FEBRUARY 2006 / 43

model diagram. Map to Map was run using NEXRAD input datafiles containing hourly data for a storm event on July 1, 2002,from 4:00 a.m. to midnight. The execution of Map to Map for thegiven design storm takes 2 min on a 2 GHz computer with512 MB RAM. Map to Map gives the user the ability to calculateinundation zones from rainfall data in a matter of minutes, savingtime not only in historical analyses but also in real-time floodprediction as well.
Conclusions
This research has shown how models can be integrated with theGIS through Arc Hydro and ModelBuilder. ModelBuilder pro-vides the framework to assemble the components of a hydrologicinformation system, while Arc Hydro provides the data structurethrough which components communicate with each other. Thisdata structure includes information exchange points at whichmodeling computations occur, as well as the input and output ofthe models �e.g., time series, plus other attribute information�.Information exchange points provide a common geospatial indexthrough which models may communicate, using the geodatabaseas the medium for data exchange. The integration of each modelwith the GIS is facilitated through the use of interface data mod-els, which provide mapping between a model’s data and param-eters and the corresponding GIS representation of those data andparameters.
A key idea that evolved from this work is that a hydrologicinformation system need not be designed based strictly on thesimulation models incorporated into the system. In the Map toMap example, a hydraulic simulation model other than RAScould have been used to produce water surface elevations oncross sections, provided that the model:• Contains cross section data corresponding to Arc Hydro cross
sections in the GIS; and• Accepts flows at key cross sections and returns elevation data
associated with all cross sections.Thus, the nature of the information exchange points and the
information being passed through them guides the developmentof the hydrologic information system. RAS is not aware of the
Fig. 12. Inundation polygon is produced by subtracting the landsurface from the water surface
source of the hydrograph time series data in its input DSS file. It
44 / JOURNAL OF HYDROLOGIC ENGINEERING © ASCE / JANUARY/FEB
does not know or care that the data came from HMS and passedthrough a GIS before being stored in the DSS file. It simplyknows that it has received hydrograph time series data at specificpoints �information exchange points� and must execute to producewater surface elevations for specific points. Thus, the Map to Mapapplication may operate with any simulation model, as long asthat model receives or passes the right kind of time series data atthe right information exchange points.
Two interface data models and several ModelBuilder toolswere developed for this research. An online catalog of interfacedata models and ModelBuilder tools would allow users to sharetheir work with others. Interface data models and ModelBuildertools are easily documented and transported as UML �unifiedmodeling language� diagrams and ArcGIS toolboxes, respec-tively. As developers create new interface data models and tools,they could be added to the catalog. The catalog could functionsimilarly to ESRI’s current geography network. A search for aparticular simulation model would return an interface data modelfor that model as well as tools related to that model’s operation.
An important type of tool that would be very useful to othersworking with simulation models is the data bridge. Data bridgesallow data exchange between two formats. Six bridges were de-veloped for the Map to Map application:• ASCII NEXRAD to GIS;• GIS TimeSeries to HMS DSS;• GIS TimeSeries to RAS DSS;• DSS to GIS TimeSeries;• SDF RAS output to XML; and• XML to GIS cross section elevations
An online repository of interface data models, bridges, andother model tools would be a significant benefit to developers ofhydrologic information systems. This repository could beorganized according to metadata associated with each of theseresources. Each resource could then be searched just as normaldatasets are searched online.
In addition to the online catalog, an improvement on thisresearch could be made in error handling within the ModelBuilderenvironment. As ModelBuilder is a very new development, arobust scheme for trapping and handling errors has yet to beimplemented. While some techniques and capabilities that mayprove useful in that arena already exist, insufficient time wasavailable during the course of this research to explore thoseavenues.
This research could have also been improved in terms ofscenario management, an important component of model simula-tions that allows users to test a variety of different model configu-rations or scenarios to determine the best solution. Within anindividual simulation model, such as HMS, utilities for scenariomanagement are typically available. However, a scenario man-agement utility or scheme in ModelBuilder has yet to be devel-oped. This task may prove complicated, as a ModelBuilder modelmay require management for several simulation models, eachwith its own requirements regarding scenario management.
While exchanging information through the GIS at informationexchange points proved effective for the floodplain mapping ap-plication presented in this research, the methodology may not bevalid for all applications. Difficulties may arise when iterationsbetween models are necessary or when the hydrologic informa-tion system seeks to solve a variety of water resources problems,such as hydrology, water quality, and water supply. Developinghydrologic information systems for a specific type of modelingframes the problem at hand and limits the scope of database and
tool development to manageable levels, especially given the lim-RUARY 2006

ited experience with ArcGIS’s new ModelBuilder environment.As experience grows, and the concepts of interface data modelingand hydrologic information systems mature, applications incorpo-rating a variety of model types could perhaps be developed.
Currently, the Map-to-Map model only generates a singlepolygon per execution, representing the steady state solution. Afuture enhancement would include the ability to produce multiplepolygons for unsteady flow, so that an animation could beproduced to show inundated area over time. Smaller enhance-ments include better error handling and a more robust tool designto facilitate the extension of model components toward otherapplications.
Carrying out these recommendations would greatly enhancethe development of geographically integrated hydrologic model-ing systems. The Map-to-Map tool will be valuable in evaluatingmanagement alternatives for flood control plans, land develop-ment, and flood scenarios for the San Antonio River Authority,the City of San Antonio, and Bexar County. Additionally, the toolserves as a valuable prototype in linking GIS and simulationmodels through Arc Hydro and the ArcGIS ModelBuilderenvironment.
Acknowledgments
This research was financially supported by the GIS in Water Re-sources Consortium, the Texas Commission on EnvironmentalQuality, the San Antonio River Authority, Bexar County, the Cityof San Antonio, and PBS&J Austin. We appreciate the efforts ofESRI’s Water Resources team in providing technical assistance.
References
Charnock, T. W., Hedges, P. D., and Elgy, J. �1996�. “ Linking multipleprocess level models with GIS.” Proc., Application of GeographicInformation Systems in Hydrology and Water Resources Management,International Association of Hydrological Sciences, Vienna, Austria,29–36.
Clark, M. J. �1998�. “Putting water in its place: A perspective on GIS in
JOURNAL OF HYDR
hydrology and water management.” Hydrolog. Process., 12�6�,821–824.
Correia, F. N., et al. �1999�. “Floodplain management in urban develop-ing areas Part II. GIS-based flood analysis and urban growth model-ling.” Water Resour. Manage., 13�1�, 23–37.
de Roo, A. P. J. �1998�. “Modelling runoff and sediment transport incatchments using GIS.” Hydrolog. Process., 12�6�, 905–922.
Gao, X., Sorooshian, S., and Goodrich, D. C. �1993�. “Linkage of a GISto a distributed rainfall-runoff model.” Environmental modeling withGIS, M. F. Goodchild, B. O. Parks, and L. T. Steyaert, eds. OxfordUniversity Press, New York, 182–187.
Hudgens, B. T., and Maidment, D. R. �1999�. “Geospatial data in wateravailability modeling.” thesis, Univ. of Texas at Austin, Tex.
Kopp, S. M. �1996�. “Linking GIS and hydrological models: Where wehave been, where we are going.” Proc., Application of GeographicInformation Systems in Hydrology and Water Resources Management,International Association of Hydrological Sciences, Vienna, Austria,133–140.
Koussis, A. D., et al. �2003�. “Flood forecasts for urban basin with inte-grated hydro-meteorological model.” J. Hydrologic Eng., 8�1�, 1–11.
Maidment, D. R., ed. �2002�. Arc Hydro: GIS for water resources, ESRIPress, Redlands, Calif.
Ogden, F. L., et al. �2001�. “GIS and distributed watershed models. II:Modules, interfaces, and models.” J. Hydrologic Eng., 6�6�, 515–523.
Prisloe, M. P. Jr., et al. �2000�. “A simple GIS-based model to character-ize water quality in Connecticut watersheds.” Proc., 4th Int. Conf. onIntegrating GIS and Environmental Modeling, Banff, Canada.
Robbins, C., and Phipps, S. P. �1996�. “GIS/water resources tools forperforming floodplain management modeling analysis.” Proc., Symp.on GIS and Water Resources, AWRA, Fort Lauderdale, Fla.
Roberts, A. M., and Moore, R. V. �1998�. “Data and databases for deci-sion support.” Hydrolog. Process., 12�6�, 823–834.
Storck, P., et al. �1998�. “Application of a GIS-based distributed hydrol-ogy model for prediction of forest harvest effects on peak streamflowin the Pacific Northwest.” Hydrolog. Process., 12�6�, 889–904.
Vieux, B. E. �2001�. Distributed hydrologic modeling using GIS, KluwerAcademic Publishers, Dordrecht, The Netherlands.
Yoon, J. �1996�. “Watershed-scale nonpoint source pollution modelingand decision support system based on a model-GIS-RDBMS linkage.”Proc., Symp. on GIS and Water Resources, AWRA, Fort Lauderdale,Fla.
OLOGIC ENGINEERING © ASCE / JANUARY/FEBRUARY 2006 / 45