Estimating Evapotranspiration using Artificial Neural Network
7
Estimating Evapotranspiration Using Artificial Neural Network and Minimum Climatological Data S. S. Zanetti 1 ; E. F. Sousa 2 ; V. P. S. Oliveira 3 ; F. T. Almeida 4 ; and S. Bernardo 5 Abstract: The objective of this study was to test an artificial neural network ANN for estimating the reference evapotranspiration ETo as a function of the maximum and minimum air temperatures in the Campos dos Goytacazes county, State of Rio de Janeiro. The data used in the network training were obtained from a historical series September 1996 to August 2002 of daily climatic data collected in Campos dos Goytacazes county. When testing the artificial neural network, two historical series were used September 2002 to August 2003 relative to Campos dos Goytacazes, and Viçosa, State of Minas Gerais. The ANNs multilayer perceptron type were trained to estimate ETo as a function of the maximum and minimum air temperatures, extraterrestrial radiation, and the daylight hours; and the last two were previously calculated as a function of either the local latitude or the Julian date. According to the results obtained in this ANN testing phase, it is concluded that when taking into account just the maximum and minimum air temperatures, it is possible to estimate ETo in Campos dos Goytacazes. DOI: 10.1061/ASCE0733-94372007133:283 CE Database subject headings: Climatic data; Forecasting; Evapotranspiration; Neural networks. Introduction Water is becoming a rare and expensive resource in most civilized areas throughout the world. The increased competition of water between urban and agricultural areas is noticeable. It is estimated that more than half of the world population depends on agricul- tural irrigated products Lima et al. 1999. Irrigated agriculture is exposed to a high danger of failing when it is inadequately designed and managed. According to Sousa et al. 2002, an irrigation system is well designed and managed when the application of water is rationally performed at the amount and frequency desirable for the complete development of the crop, by discerningly using the available water resources. Therefore, the quantification of the cropping evapotranspiration is very important. According to Kumar et al. 2002, evapotranspiration is a complex and nonlinear phenomenon, because it depends on the interaction of several climatic elements solar radiation, wind speed, air humidity, and temperature, as well as on the type and growth stage of the crop. According to Pereira et al. 2002, the selection of a method for estimating the evapotranspiration depends on several factors. One of these factors is the availability of meteorological data, as the complex methods requiring a high number of variables have applicability only when all necessary data are available. When there is availability of data, Allen et al. 1998 recommend the application of the Penman-Monteith PM as the sole standard method for the definition and computation of the reference evapo- transpiration ETo. Mendonça et al. 2003 compared the ETo measured in lysim- eter daily and average values at 3, 7, and 10 days in Campos dos Goytacazes with ETo estimated by the PM method. The research- ers found that the PM method satisfactorily estimates ETo. The best estimates are for average values for 7 and 10 days. Although the meteorological variables necessary for the appli- cation of the PM method are not always universally available, in particular those related to the solution of the aerodynamic term wind speed and the deficit of water vapor pressure in the air. So, the methods for estimating ETo as a function of the climatic ele- ments that might be obtained on a more practical way, such as the air temperature and the extraterrestrial radiation, are very impor- tant Hargreaves and Samani 1985; Samani 2000. A tool that can be used to estimate ETo is the artificial neural network ANN. The ANNs are parallel distributed systems, which are composed of simple processing units that calculate some mathematical functions. Such units are arranged into one or more layers and interlinked by a high number of connections. In most models, these connections are associated to weights that store the knowledge represented in the model after the learning process. The behavior of these networks is based on a biological structure conceived by nature: the human brain Braga et al. 2000; Haykin 2001; Kovács 2002. The ANNs have been successfully used to model the relation- ships involving the complex temporary series in several areas of knowledge. According to Galvão et al. 1999, because of their 1 CNPq Grantee, Northern Rio de Janeiro State Univ., Campos dos Goytacazes, Rio de Janeiro, Brazil. 2 Professor, Northern Rio de Janeiro State Univ., Campos dos Goytacazes, Rio de Janeiro, Brazil. 3 Professor, Federal Center of Technological Education of Campos, Campos dos Goytacazes, Rio de Janeiro, Brazil. 4 Professor, Northern Rio de Janeiro State Univ., Campos dos Goytacazes, Rio de Janeiro, Brazil. 5 Professor, Northern Rio de Janeiro State Univ., Campos dos Goytacazes, Rio de Janeiro, Brazil. Note. Discussion open until September 1, 2007. Separate discussions must be submitted for individual papers. To extend the closing date by one month, a written request must be filed with the ASCE Managing Editor. The manuscript for this paper was submitted for review and pos- sible publication on March 11, 2005; approved on June 1, 2006. This paper is part of the Journal of Irrigation and Drainage Engineering, Vol. 133, No. 2, April 1, 2007. ©ASCE, ISSN 0733-9437/2007/2-83–89/ $25.00. JOURNAL OF IRRIGATION AND DRAINAGE ENGINEERING © ASCE / MARCH/APRIL 2007 / 83 Downloaded 07 Feb 2012 to 200.137.65.103. Redistribution subject to ASCE license or copyright. Visit http://www.ascelibrary.org
Transcript of Estimating Evapotranspiration using Artificial Neural Network
Estimating Evapotranspiration Using Artificial NeuralNetwork and Minimum Climatological Data
S. S. Zanetti1; E. F. Sousa2; V. P. S. Oliveira3; F. T. Almeida4; and S. Bernardo5
Abstract: The objective of this study was to test an artificial neural network �ANN� for estimating the reference evapotranspiration �ETo�as a function of the maximum and minimum air temperatures in the Campos dos Goytacazes county, State of Rio de Janeiro. The dataused in the network training were obtained from a historical series �September 1996 to August 2002� of daily climatic data collected inCampos dos Goytacazes county. When testing the artificial neural network, two historical series were used �September 2002 to August2003� relative to Campos dos Goytacazes, and Viçosa, State of Minas Gerais. The ANNs �multilayer perceptron type� were trained toestimate ETo as a function of the maximum and minimum air temperatures, extraterrestrial radiation, and the daylight hours; and the lasttwo were previously calculated as a function of either the local latitude or the Julian date. According to the results obtained in this ANNtesting phase, it is concluded that when taking into account just the maximum and minimum air temperatures, it is possible to estimateETo in Campos dos Goytacazes.
DOI: 10.1061/�ASCE�0733-9437�2007�133:2�83�
CE Database subject headings: Climatic data; Forecasting; Evapotranspiration; Neural networks.
Introduction
Water is becoming a rare and expensive resource in most civilizedareas throughout the world. The increased competition of waterbetween urban and agricultural areas is noticeable. It is estimatedthat more than half of the world population depends on agricul-tural irrigated products �Lima et al. 1999�.
Irrigated agriculture is exposed to a high danger of failingwhen it is inadequately designed and managed. According toSousa et al. �2002�, an irrigation system is well designed andmanaged when the application of water is rationally performed atthe amount and frequency desirable for the complete developmentof the crop, by discerningly using the available water resources.Therefore, the quantification of the cropping evapotranspiration isvery important.
According to Kumar et al. �2002�, evapotranspiration is acomplex and nonlinear phenomenon, because it depends on theinteraction of several climatic elements �solar radiation, wind
1CNPq Grantee, Northern Rio de Janeiro State Univ., Campos dosGoytacazes, Rio de Janeiro, Brazil.
2Professor, Northern Rio de Janeiro State Univ., Campos dosGoytacazes, Rio de Janeiro, Brazil.
3Professor, Federal Center of Technological Education of Campos,Campos dos Goytacazes, Rio de Janeiro, Brazil.
4Professor, Northern Rio de Janeiro State Univ., Campos dosGoytacazes, Rio de Janeiro, Brazil.
5Professor, Northern Rio de Janeiro State Univ., Campos dosGoytacazes, Rio de Janeiro, Brazil.
Note. Discussion open until September 1, 2007. Separate discussionsmust be submitted for individual papers. To extend the closing date byone month, a written request must be filed with the ASCE ManagingEditor. The manuscript for this paper was submitted for review and pos-sible publication on March 11, 2005; approved on June 1, 2006. Thispaper is part of the Journal of Irrigation and Drainage Engineering,Vol. 133, No. 2, April 1, 2007. ©ASCE, ISSN 0733-9437/2007/2-83–89/
$25.00.JOURNAL OF IRRIGATION
Downloaded 07 Feb 2012 to 200.137.65.103. Redistribution subject t
speed, air humidity, and temperature�, as well as on the type andgrowth stage of the crop.
According to Pereira et al. �2002�, the selection of a methodfor estimating the evapotranspiration depends on several factors.One of these factors is the availability of meteorological data, asthe complex methods requiring a high number of variables haveapplicability only when all necessary data are available. Whenthere is availability of data, Allen et al. �1998� recommend theapplication of the Penman-Monteith �PM� as the sole standardmethod for the definition and computation of the reference evapo-transpiration �ETo�.
Mendonça et al. �2003� compared the ETo measured in lysim-eter �daily and average values at 3, 7, and 10 days� in Campos dosGoytacazes with ETo estimated by the PM method. The research-ers found that the PM method satisfactorily estimates ETo. Thebest estimates are for average values for 7 and 10 days.
Although the meteorological variables necessary for the appli-cation of the PM method are not always universally available, inparticular those related to the solution of the aerodynamic term�wind speed and the deficit of water vapor pressure in the air�. So,the methods for estimating ETo as a function of the climatic ele-ments that might be obtained on a more practical way, such as theair temperature and the extraterrestrial radiation, are very impor-tant �Hargreaves and Samani 1985; Samani 2000�.
A tool that can be used to estimate ETo is the artificial neuralnetwork �ANN�. The ANNs are parallel distributed systems,which are composed of simple processing units that calculatesome mathematical functions. Such units are arranged into one ormore layers and interlinked by a high number of connections. Inmost models, these connections are associated to weights thatstore the knowledge represented in the model after the learningprocess. The behavior of these networks is based on a biologicalstructure conceived by nature: the human brain �Braga et al. 2000;Haykin 2001; Kovács 2002�.
The ANNs have been successfully used to model the relation-ships involving the complex temporary series in several areas of
knowledge. According to Galvão et al. �1999�, because of theirAND DRAINAGE ENGINEERING © ASCE / MARCH/APRIL 2007 / 83
o ASCE license or copyright. Visit http://www.ascelibrary.org

nonlinear structure, the ANNs are able to capture the more com-plex characteristics of the data, which is not always possible withthe application of the traditional statistical techniques.
According to Sudheer et al. �2003�, the main advantage ofANNs in comparison to the conventional methods is that ANNsdo not require detailed information on the physical processes ofthe system to be modeled, as this one is explicitly described underthe mathematical form �input-output model�.
Several researchers have conducted research with ANNsaimed at the estimation of the evapotranspiration as a functionof climatic elements �Odhiambo et al. 2001; Kumar et al. 2002;Silva 2002; Sudheer et al. 2003; Trajkovic et al. 2003; Arca et al.2004�. These researchers found satisfactory results, even betterthan those obtained from the PM conventional method �Kumaret al. 2002�.
Although they got satisfactory results, those researchers usingthe ANNs to estimate ETo, except for Sudheer et al. �2003� andArca et al. �2004�, did not simplify the input variables but usedthe same climatic data required for application of the PM method,as shown in Table 1.
Sudheer et al. �2003� adopted three options for input data toestimate ETo. In the more simplified option, ETo was estimatedas a function of the average air temperature only, but with a dataseries restricted to a few days. Arca et al. �2004� tested 11combinations to estimate ETo. Under the most simplified com-bination, ETo was estimated as a function of two variables:Extraterrestrial solar radiation and air temperature.
In addition to the available works concerning the simplifica-tion of the input data addressed to the estimate of ETo, it is alsoobserved that there are other options for the use of limited cli-matic data to be studied. The present study was motivated by thepossibility for such studies to provide more efficient models thanthose available in the literature.
Thus, considering the importance of the evapotranspiration ineither irrigation management or hydrological modeling, this studywas carried out to study using an ANN for estimation of thereference evapotranspiration as a function of the maximum andminimum temperatures of the air, for Campos dos Goytacazes
Table 1. Input Data Proposed in the Available Literature for EToEstimate with the Neural Artificial Networks
Author Inputs
Odhiambo et al.�2001�
Solar radiation, difference between dailymaximum and minimum air temperatures,relative humidity, and wind speed
Kumar et al.�2002�
Solar radiation, maximum and minimum airtemperatures, maximum and minimum relativehumidity, and wind speed
Silva �2002� None revealed
Sudheer et al.�2003�
Average temperature, relative humidity,wind speed, and sunshine durationAverage temperature, relative humidity,and wind speedAverage temperature alone
Trajkovic et al.�2003�
Air temperature, relative humidity,wind speed, and sunshine duration
Arca et al.�2004�
Combinations of ETo estimated byHargreaves, Hargreaves-Samani, andBlaney-Criddle methods, vapor pressuredeficit, wind speed, extraterrestrial solarradiation, and air temperature
county, State of Rio de Janeiro.
84 / JOURNAL OF IRRIGATION AND DRAINAGE ENGINEERING © ASCE /
Downloaded 07 Feb 2012 to 200.137.65.103. Redistribution subject t
Materials and Method
Climatic Data
The historical series of the climatic elements used in this re-search, that comprises the period from September 1996 to August2003, was obtained from the Evapotranspirometric Station per-taining to UENF/PESAGRO-Rio, and located in Campos dosGoytacazes county �latitude 21°45� S, longitude 41°18� W, and11 m altitude�—Fig. 1. The daily data of temperature and relativeair humidity, solar radiation, atmospheric pressure, and windspeed were collected by an automatic meteorological station�Thies Clima model, Adolf Thies GmbH and Co. KG, Germany�.The historical series was divided into two parts: The first part�from September 1996 to August 2002� was used for networktraining and the second part �from September 2002 to August2003� was used for testing the trained network.
A series of climatic elements from September 2002 to August2003, obtained from Viçosa meteorological station—State ofMinas Gerais �latitude 20°45� S, longitude 42°51� W, and 600 maltitude� was used to obtain an indication of the ANN how wellperformed in another location.
For each climatic element found in the daily readings of thehistorical series used, the average values �variable averages� for3, 7, 15, and 30 days were calculated. The average values werecalculated in order to estimate ETo over the periods compatiblewith the frequency of irrigation usually used. Also using the av-erage values increases the possibility the proposed method will beused.
For ANN training, both the daily and variable averages valueswere gathered into one group in order to obtain a network that hasa higher regional capacity, that could be applied either to estimatethe daily values or the average values for several days. Whentesting the ANN, the data for each period were separatelyanalyzed.
The maximum and minimum air temperatures �°C�, the extra-2
Fig. 1. Map of the meteorological station locations in Campos dosGoytacazes �State of Rio de Janeiro� and Viçosa �state of MinasGerais�, Brazil
terrestrial radiation �MJ/m /day�, and the daylight hours �h� were
MARCH/APRIL 2007
o ASCE license or copyright. Visit http://www.ascelibrary.org

adopted as input variables for the ANN. The last two variableswere calculated as a function of the local latitude and Julian data,according to the equations presented by Allen et al. �1998�. Thus,the proposed model only needs the daily values of the maximumand minimum air temperatures for estimating the ETo.
By combining daily and average values of ETo �calculated bythe PM method�, maximum and minimum air temperatures, ex-traterrestrial radiation, and daylight hours, a data set with 9,538observations were obtained and used for network training.
According to Allen et al. �1998�, the PM method is summa-rized by the following equation:
EToPM =
0.408��RnG� + �900
T + 273u2�es − ea�
� + ��1 + 0.34u2��1�
where EToPM=reference evapotranspiration calculated by the PMmethod �mm/day�; �=slope vapour pressure curve �kPa/°C�;Rn=net radiation at the crop surface �MJ/m2/day�; G=soil heatflux density �MJ/m2/day�; �=psychrometric constant �kPa/°C�;T=mean daily air temperature �°C�; u2=wind speed at 2 m height�m/s�; es=saturation vapour pressure �kPa�; and ea=actual vapourpressure �kPa�.
Methods
An ANN of the multilayer perceptron �MLP� type was used. Inthis network, the input sign spreads layer-by-layer forward �feed-forward�, then it is backpropagated for the correction of the error�synaptic weight adjustments�. This procedure is repeated for sev-eral iterations until the finalization of the training.
All neurons found in the ANN used were configured, based onthe model by Haykin �2001�, as shown in Fig. 2. In the synapticweights �wk,j�, the index k refers to the neuron under question,and the index j refers to the input sign of the synapsis the weightrefers to.
The summing junction is used to sum up all input signs �xj�weighed by the synaptic weights of each neuron. The role of thebias is either increasing or reducing the influence of the net en-trance value for the activation of the neuron. On the other hand,the activation function acts by restricting the output amplitude ofa certain neuron and adding nonlinearity to the model. From amathematical viewpoint, the neuron shown in Fig. 2 may be de-scribed by
uk = �n
wk,jxj �2�
Fig. 2. Nonlinear model of the neurons used in the artificial neuralnetwork
j=1
JOURNAL OF IRRIGATION
Downloaded 07 Feb 2012 to 200.137.65.103. Redistribution subject t
�k = uk + bk �3�
yk = �k��k� �4�
where uk=linear combiner �summing junction�; w� k,1�,w� k,2� , . . . ,w� k,n�=synaptic weights; x1, x2 , . . . ,xn=input signs;�k=activation potential; b=bias; yk=sign of the neuron-k output;and ��·�=activation function. In the network output neuron, theETo corresponds to its respective sign yk.
The ANN was trained under supervision with the Levenberg-Marquardt �LM� algorithm �Hagan and Menhaj 1994�, which usesthe Newton’s method for approaching the error function mini-mum given by
MSE =
�i=1
n
�yi − yi�2
n�5�
where MSE=mean sum of square error �mm/day�; n=number ofobservations; y=ETo estimated by PM method; and y=ETo esti-mated by the ANN model.
This algorithm was selected because of its superiority, relativeto the backpropagation algorithm, as reported by Soares andNadal �1999�. According to Soares and Nadal �1999�, althoughthe LM algorithm demands a longer processing time than thebackpropagation for each training iteration, its fast convergencesensibly reduces the total number of iterations that are necessaryto the training, therefore reducing the processing time too.
As a criterion to finalize the training, the training method withthe earliest interruption was used �Haykin 2001�. This methodmade it possible to identify the beginning of the excessive train-ing, by using cross validation. So, the training data were dividedinto two subsets: One for estimation and another for validation.The estimation subset was used to train the network, and thetraining section was interrupted after each iteration in order toaccomplish the cross validation. When mean-square error �MSE�
Table 2. Architectures of the Tested Neural Networks with TheirRespective Performance Index �c� and Mean-Square Error, Obtained atthe Training and Cross Validation Phases
Networkarchitecture
Activationfunctiona
Training Cross validation
cMSE
�mm/day�2 cMSE
�mm/day�2
4-5-1 1 0.915 0.158 0.923 0.160
2 0.922 0.146 0.921 0.169
4-10-1 �1� �0.921� �0.147� �0.926� �0.157�
2 0.901 0.185 0.915 0.169
4-15-1 1 0.919 0.151 0.925 0.156
2 0.922 0.146 0.923 0.164
4-20-1 1 0.919 0.152 0.919 0.170
2 0.920 0.150 0.923 0.157
4-5-5-1 1 0.909 0.170 0.916 0.174
2 0.894 0.196 0.914 0.173
4-10-10-1 1 0.902 0.182 0.924 0.157
2 0.914 0.161 0.918 0.161
4-15-15-1 1 0.919 0.151 0.924 0.159
2 0.918 0.155 0.926 0.158
4-20-20-1 1 0.919 0.153 0.921 0.166
2 0.920 0.150 0.924 0.160a1=hyperbolic tangent sigmoid and 2=logarithmic sigmoid.
of the validation subset was lower than its value in the previous
AND DRAINAGE ENGINEERING © ASCE / MARCH/APRIL 2007 / 85
o ASCE license or copyright. Visit http://www.ascelibrary.org
iteration, the training of the network proceeded; otherwise, thistraining was finalized, since according to Haykin �2001�, after thispoint the network essentially learns the noise contained in thetraining data, therefore causing losses in the generalization abilityamong the similar input-output patterns.
Several tests were conducted to select an ANN providing thebest performance. The number of hidden layers were varied, aswell as the neuron numbers and activation function in each layer.The network was trained and tested for each combination of thosecharacteristics, therefore making possible the selection of the bestANN to estimate ETo. The output layer of the network was pre-defined with only one neuron and the linear activation function.
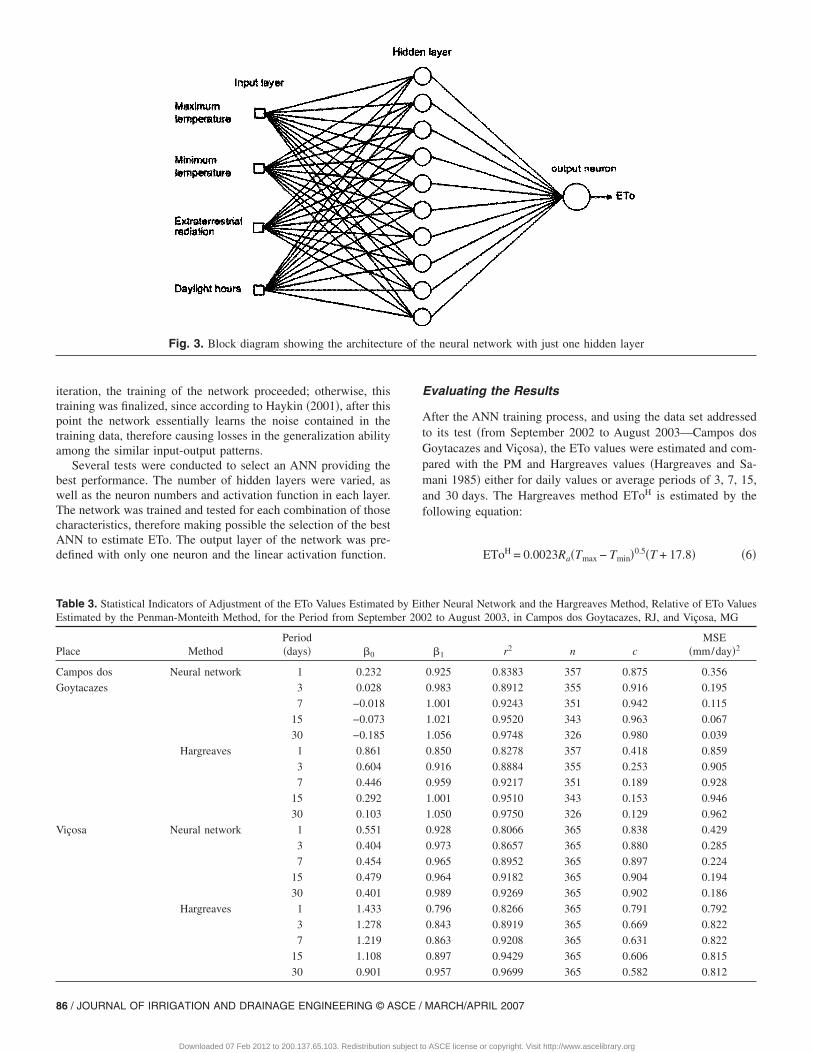
Table 3. Statistical Indicators of Adjustment of the ETo Values EstimatedEstimated by the Penman-Monteith Method, for the Period from Septem
Place MethodPeriod�days� �0
Campos dos Neural network 1 0.232
Goytacazes 3 0.028
7 −0.018
15 −0.073
30 −0.185
Hargreaves 1 0.861
3 0.604
7 0.446
15 0.292
30 0.103
Viçosa Neural network 1 0.551
3 0.404
7 0.454
15 0.479
30 0.401
Hargreaves 1 1.433
3 1.278
7 1.219
15 1.108
30 0.901
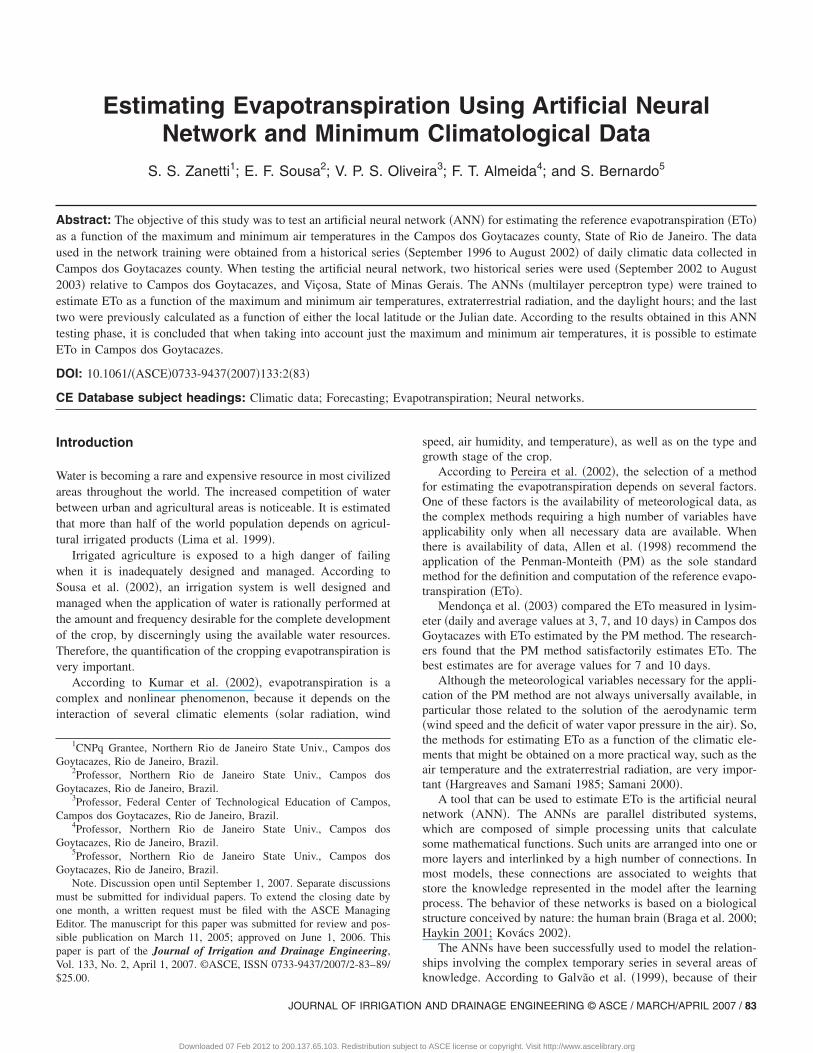
Fig. 3. Block diagram showing the architectu
86 / JOURNAL OF IRRIGATION AND DRAINAGE ENGINEERING © ASCE /
Downloaded 07 Feb 2012 to 200.137.65.103. Redistribution subject t
Evaluating the Results
After the ANN training process, and using the data set addressedto its test �from September 2002 to August 2003—Campos dosGoytacazes and Viçosa�, the ETo values were estimated and com-pared with the PM and Hargreaves values �Hargreaves and Sa-mani 1985� either for daily values or average periods of 3, 7, 15,and 30 days. The Hargreaves method EToH is estimated by thefollowing equation:
EToH = 0.0023Ra�Tmax − Tmin�0.5�T + 17.8� �6�
ther Neural Network and the Hargreaves Method, Relative of ETo Values2 to August 2003, in Campos dos Goytacazes, RJ, and Viçosa, MG
�1 r2 n cMSE
�mm/day�2
0.925 0.8383 357 0.875 0.356
0.983 0.8912 355 0.916 0.195
1.001 0.9243 351 0.942 0.115
1.021 0.9520 343 0.963 0.067
1.056 0.9748 326 0.980 0.039
0.850 0.8278 357 0.418 0.859
0.916 0.8884 355 0.253 0.905
0.959 0.9217 351 0.189 0.928
1.001 0.9510 343 0.153 0.946
1.050 0.9750 326 0.129 0.962
0.928 0.8066 365 0.838 0.429
0.973 0.8657 365 0.880 0.285
0.965 0.8952 365 0.897 0.224
0.964 0.9182 365 0.904 0.194
0.989 0.9269 365 0.902 0.186
0.796 0.8266 365 0.791 0.792
0.843 0.8919 365 0.669 0.822
0.863 0.9208 365 0.631 0.822
0.897 0.9429 365 0.606 0.815
0.957 0.9699 365 0.582 0.812
he neural network with just one hidden layer
by Eiber 200
re of t
MARCH/APRIL 2007
o ASCE license or copyright. Visit http://www.ascelibrary.org

where EToH=reference evapotranspiration calculated by Har-greaves method �mm/day�; Ra=extraterrestrial radiation �mm/day�; and Tmax and Tmin=maximum and minimum air tempera-tures �°C�, respectively.
A single lineal regression �Y =�0+�1X� was accomplishedfor each place and each period, by considering the EToPM
and EToH values as the independent variable and the ETo
Fig. 4. Comparison between ETo estimated by neural network and th�b� 3; �c� 7; �d� 15; and �e� 30 days over the period from September
value estimated with the neural network as the dependent vari-
JOURNAL OF IRRIGATION
Downloaded 07 Feb 2012 to 200.137.65.103. Redistribution subject t
able, respectively. The results were analyzed, by using the coef-ficients ��0, �1, and r2� of the equations. The t test was used tostatistically evaluate the value of either the intercept �H0: �0=0�or slope of the straight line �H0: �1=1� at the 1% probabilitylevel.
In addition, the performance index �c� proposed by Camargoand Sentelhas �1997� was calculated to quantify the adjustment
estimated by Penman-Monteith, for �a� daily and average values ofto August 2003, in Campos dos Goytacazes, RJ
e ETo2002
level between the observed and estimated values
AND DRAINAGE ENGINEERING © ASCE / MARCH/APRIL 2007 / 87
o ASCE license or copyright. Visit http://www.ascelibrary.org

c = dr �7�
d = 1 −
�i=1
n
�yi − yi�2
�i=1
n
��yi − y� + �yi − y��2
�8�
where d=adjustment coefficient proposed by Willmott �1981�;r=correlation coefficient; and y=average of the y values. Theindex c is a dimensionless value, ranging from 0 to 1, as a valueof 1 represents a complete adjustment, whereas the zero valueindicates the opposite.
Results and Discussion
A summary with the statistics �performance index and meansquare error� obtained during the training and crossed validationphases for the different architectures of the neural networks underevaluation is shown in Table 2.
The selected ANN, or the one showing the highest perfor-mance index and the lowest mean square error, is constituted byan input layer �with four variables�, a hidden layer �with ten neu-rons� and an output layer, as shown in Fig. 3. The selection of anetwork with only a hidden layer confirms the results of Kumar etal. �2002� and Arca et al. �2004�, as these authors concluded thatan ANN with just a hidden layer is enough to represent the non-linear relationship between the climatic elements and the corre-sponding ETo.
For neurons of the hidden layer, the hyperbolic tangent sig-moid activation function �the following equation� was adopted,which is one of the functions proposed by Demuth and Beale�2003�
���� =2
1 + exp�− 2��− 1 �9�
Such a function was selected because it provided the best results.The statistical indicators of the adjustment of the ETo values
estimated by ANN �as a function of the maximum and minimumair temperatures� and EToH, relative to EToPM, for the daily andaverage periods of 3, 7, 15, and 30 days are shown in Table 3.
In relation to the neural network, the coefficients �0 and �1
obtained for either the daily values or the average periods of 3, 7,15, and 30 days in Campos dos Goytacazes, were not statisticallydifferent from 0 and 1, respectively. This infers that the ETo val-ues estimated by the neural network did not differ from theEToPM values. The quality of the adjustment may be further con-firmed by the high values of the index c, since all of them indicatean excellent performance �c�0.85�, according to the classifica-tion presented by Camargo and Sentelhas �1997�.
For Viçosa, the values of the coefficients �1 was not statisti-cally different in relation to 1. The coefficients �0, however, wasstatistically different from zero. This result demonstrates thatthe neural network has the potential to estimate the referenceevapotranspiration in other localities, but some care should betaken when establishing a correction factor to eliminate the biaspresent.
In relation to the index c, the adjustment of the averageETo values for 3, 7, 15, and 30 days also displayed a perfor-
mance classified as an excellent one. For the values of the daily88 / JOURNAL OF IRRIGATION AND DRAINAGE ENGINEERING © ASCE /
Downloaded 07 Feb 2012 to 200.137.65.103. Redistribution subject t
ETo, however, the performance was classified as a very goodone �0.76�c�0.85�, according to the classification presented byCamargo and Sentelhas �1997�.
It might also be observed that either for Campos dos Goyta-cazes and Viçosa the good adjustment is also confirmed by thehigh r2 values and the low MSE values, and all indicators areimproved with the increase in the number of days in which thedaily values were grouped into averages due to their highest sta-bilization. The large number of the observations used in both thetraining and neural network testing phases allows for higher con-fidence, when drawing conclusions from the results obtained inthe present study.
The quality of the adjustment among the values of EToestimated by ANN and EToPM, for daily and average values of3, 7, 15, and 30 days, may also be visually observed graphicallyin Fig. 4.
For both Campos dos Goytacazes and Viçosa, the Hargreavesmethod showed an inferior-qualified adjustment for the great ma-jority of the criteria adopted in evaluation �statistical indicators—Table 3�, when compared to the ANN-based model.
In spite of the satisfactory results, the ANN-based modelshows some limitation, as it is an empiric model and has a lowpotential to estimate ETo in other places, as demonstrated forViçosa. Probably, this limitation may be minimized by the use ofdata from several places, as inserting their geographic coordinatesinto the ANN for the network to detect the influence of the spacevariation on the estimate of evapotranspiration.
The greatest practical advantage of the method proposed inthis study is using daily readings of the maximum and minimumair temperatures, which makes possible the estimate of ETo bysimply using a minimum-maximum thermometer.
Conclusions
The reference evapotranspiration in Campos dos Goytacazes maybe estimated, either for daily and average values of 3, 7, 15, and30 days, by means of the artificial neural networks, by using onlythe maximum and minimum air temperatures as input data;
The neural network �MLP� presenting the best results is com-posed of a single hidden layer �with ten neurons and hyperbolictangent sigmoid-type activation function�;
When using the artificial neural network for other locations�e.g., Viçosa�, some restrictions should be taken into account,such as the obtainment and adoption of a correction factor inorder to get a better handle on the ETo estimates.
References
Allen, R. G., Pereira, L. S., Raes, D., and Smith, M. �1998�. “Cropevapotranspiration: Guidelines for computing crop water require-ments.” FAO Irrigation and Drainage Paper 56, Food and Agricul-tural Organization of the United Nations �FAO�, Rome.
Arca, B., Beniscasa, F., and Vincenzi, M. �2004�. “Evaluation ofneural network techniques for estimating evapotranspiration.”National Research Council, �http://server.ss.ibimet.cnr.it/~arcal/papers/Evaluation%20of%20neural%20newtork%20techniques%20for%20estimating%20evapotranspiration_EANN_2001.pdf� �July 2,2004�.
Braga, A. P., Ludemir, T. B., and Carvalho, A. C. P. L. F. �2000�. Redesneurais artificiais: Teoria e aplicações, LTC, Rio de Janeiro.
Camargo, A. P., and Sentelhas, P. C. �1997�. “Avaliação do desempenho
de diferentes métodos de estimativa da evapotranspiração potencialMARCH/APRIL 2007
o ASCE license or copyright. Visit http://www.ascelibrary.org

no Estado de São Paulo, Brazil.” Revista Brasileira de Agrometeoro-logia, 5�1�, 89–97.
Demuth, H., and Beale, M. �2003�. Neural network toolbox: For use withMATLAB, User’s guide version 4.0, The MathWorks, Inc., Natick,Mass.
Galvão, C. O., Valença, M. J. S., Vieira, V. P. P. B., Diniz, L. S., Lacerda,E. G. M., Carvalho, A. C. P. L. F., and Ludermir, T. B. �1999�.“Sistemas inteligentes: Aplicações a recursos hídricos e ciênciasambientais.” Universidade Federal do Rio Grande do Sul/AssociaçãoBrazileira de Recursos Hídricos, Porto Alegre, Rio Grande do Sul,Brazil.
Hagan, M. T., and Menhaj, M. B. �1994�. “Training feedforward net-works with the Marquardt algorithm.” IEEE Trans. Neural Netw.,5�6�, 989–993.
Hargreaves, G. H., and Samani, Z. �1985�. Reference crop evapotranspi-ration from ambient air temperature, American Society of AgricultureEngineering Meeting, Chicago, Paper 85–2517.
Haykin, S. �2001�. Redes Neurais: Princípios e prática, 2nd. Ed., Book-man, Porto Alegre, Rio Grande do Sul, Brazil.
Kovács, Z. L. �2002�. Redes neurais artificiais: Fundamentos e apli-cações, 3rd Ed., Livraria da Física, São Paulo, Brazil.
Kumar, M., Raghuwanshi, N. S., Singh, R., Wallender, W. W., and Pruitt,W. O. �2002�. “Estimating evapotranspiration using artificial neuralnetwork.” J. Irrig. Drain. Eng., 128�4�, 224–233.
Lima, J. E. F. W., Ferreira, R. S. A., and Christofidis, D. �1999�. “O usoda irrigação no Brazil.” O Estado das Águas no Brazil, Perspectivasde gestão e informação de recursos hídricos �CD-ROM�, AgênciaNacional de Energia Elétrica, World Meteorological Organization,Brasília, Distrito Federal, Brazil.
Mendonça, J. C., Sousa, E. F., Bernardo, S., Dias, G. P., and Grippa, S.
�2003�. “Comparação entre métodos de estimativa da evapotrans-JOURNAL OF IRRIGATION
Downloaded 07 Feb 2012 to 200.137.65.103. Redistribution subject t
piração de referência �ETo� na região Norte Fluminense, RJ.” RevistaBrasileira de Engenharia Agricola e Ambiental, 7�2�, 275–279.
Odhiambo, L. O., Yoder, R. E., Yoder, D. C., and Hines, J. W. �2001�.“Optimization of fuzzy evapotranspiration model through neuraltraining with input-output examples.” Trans. ASAE, 44�6�,1625–1633.
Pereira, A. R., Angelocci, L. R., and Sentelhas, P. C. �2002�. Agrometeo-rologia: Fundamentos e aplicações práticas, Editora Agropecuária,Guaíba, Rio Grande do Sul, Brazil.
Samani, Z. �2000�. “Estimating solar radiation and evapotranspirationusing minimum climatological data.” J. Irrig. Drain. Eng., 126�4�,265–267.
Silva, A. F. �2002�. “Previsão da evapotranspiração de referência utili-zando redes neurais.” Dissertação de Mestrado, Univ. Federal deViçosa, Viçosa, Minas Gerais, Brazil.
Soares, P. P. S., and Nadal, J. �1999�. “Aplicação de uma rede neuralfeedforward com algoritmo de Levenberg-Marquardt para classifi-cação do segmento ST do eletrocardiograma.” Congr. Bras. RedesNeurais, 4., Anais…, São José dos Campos, ITA, 384–389.
Sousa, E. F., Bernardo, S., Azevedo, H. J., Berbert, P. A., and Viana, A.P. �2002�. “Estimativa da demanda hídrica provável na região nortefluminense.” Eng. Agríc., 22�3�, 322–331.
Sudheer, K. P., Gosain, A. K., and Ramasastri, K. S. �2003�. “Estimatingactual evapotranspiration from limited climatic data using neural com-puting technique.” J. Irrig. Drain. Eng., 129�3�, 214–218.
Trajkovic, S., Todorovic, B., and Stankovic, M. �2003�. “Forecasting ofreference evapotranspiration by artificial neural networks.” J. Irrig.Drain. Eng., 129�6�, 454–457.
Willmott, C. J. �1981�. “On the validation of model.” Phys. Geogr., 2�2�,184–194.
AND DRAINAGE ENGINEERING © ASCE / MARCH/APRIL 2007 / 89
o ASCE license or copyright. Visit http://www.ascelibrary.org