Comparison of Fenugreek Crop Evapotranspiration Measured ...
22
International Journal of Agriculture, Environment and Biotechnology Citation: IJAEB: 14(1): 29-49, March 2021 DOI: 10.30954/0974-1712.01.2021.5 AGRICULTURAL ENGINEERING How to cite this article: Kumar, D. and Rank, H.D. 2021. Comparison of Fenugreek Crop Evapotranspiration Measured by a Micro-lysimeter, Field Water Balance Method and Automatic Closed Canopy Chamber. IJAEB, 14(1): 29-49. Source of Support: None; Conflict of Interest: None ASSOCIATION FOR AGRICULTURE ENVIRONMENT AND BIOTECHNOLOGY A A E B Comparison of Fenugreek Crop Evapotranspiration Measured by a Micro-lysimeter, Field Water Balance Method and Automatic Closed Canopy Chamber Deepak Kumar* and H.D. Rank Department of Soil and Water Conservation Engineering, CAET, JAU, Junagadh, Gujarat, India *Corresponding author: [email protected] (ORCID ID: 0000-0002-9360-7658) Paper No. 880 Received: 14-01-2021 Revised: 24-02-2021 Accepted: 08-03-2021 ABSTRACT The aempt was to design and develop an automatic closed canopy chamber (ACCC) having dimension of 1.2 m×1.2 m× 1.2 m for crop evapotranspiration measurement by using transparent acrylic sheet of 4 mm thickness. Between two small fans a temperature and relative humidity sensor was used to measure vapor density. The intermediate circuit was developed for making automation system in ACCC. The arduino based coding was developed as per desired logic operation. The top lead of chamber was automatically closed for 2 minutes when inside and outside temperature and relative humidity of ambient air were similar. During measurement mode of ACCC, the two fans were started automatically. Aſter measurement mode, fans were automatically stopped and top lead was opened. The ACCC was calibrated by evaporating mass of water from water filled tray which was placed inside the automatic closed canopy chamber. The validation of the developed ACCC were made using micro-lysimeters (ML S ) having size of 0.2 m × 0.2 m × 0.2 m by growing shallow rooted crop like fenugreek. The depth of irrigation was computed based on soil moisture content before irrigation and field capacity. The field testing of ACCC was made by placing chamber in plots of fenugreek crop. The irrigation was applied by drip irrigation as per crop water consumption. The sensor sensed and recorded the instantaneous temperature and relative humidity at 1 second interval for 24 hours. Two sample t-tests were done to compare the data pair of crop evapotranspiration obtained by the ML S inside the ACCC with that of outside the ACCC to ascertain whether there is any effect of the change in micro-climate for a short period of 2 minute on the crop growth physiological processes. Also, the data pair of crop evapotranspiration measured by the MLs, ACCC using the sensor data of temperature-relative humidity were compared and statistically analyzed through t-test. Similarly, the data pair of ET C measured by the FWB (Field Water Balance Method) and ACCC using the sensor data of temperature-relative humidity were also compared and statistically analyzed through t-test. The calibration factor of the ACCC was found as 1.666. The results revealed that there was no significant difference in the crop evapotranspiration measured by the MLs inside and outside ACCC. Also in case of validation and field testing of ACCC, there were no significant difference between the ET C measured by the ACCC, MLs and FWB at 95 percent confidence level. This implies that there are no effects of the change in micro-climate for a short period of 2 minutes in the chamber, on the plant physiological processes. The ETc rate of fenugreek increases as sun rises and reaches the peak aſter one to two hour from mid-day and then continuously decreases with time. During validation and field testing of ACCC, the fenugreek crop coefficients varied from 0.72 to 1.04 and 0.69 to 1.02 respectively. The developed ACCC is portable as well as more comfortable and cost effective compared to the lysimeter for the measurement of the actual crop evapotranspiration and the crop coefficient. Highlights m The calibration factor of the ACCC was found as 1.666. m There was no significant difference in the crop evapotranspiration measured by the MLs inside and outside ACCC.
-
Upload
khangminh22 -
Category
Documents
-
view
2 -
download
0
Transcript of Comparison of Fenugreek Crop Evapotranspiration Measured ...

International Journal of Agriculture, Environment and BiotechnologyCitation: IJAEB: 14(1): 29-49, March 2021
DOI: 10.30954/0974-1712.01.2021.5
AGRICULTURAL ENGINEERING
How to cite this article: Kumar, D. and Rank, H.D. 2021. Comparison of Fenugreek Crop Evapotranspiration Measured by a Micro-lysimeter, Field Water Balance Method and Automatic Closed Canopy Chamber. IJAEB, 14(1): 29-49.
Source of Support: None; Conflict of Interest: None
ASSOCIATION FOR AGRICULTUREENVIRONMENT AND BIOTECHNOLOGY
A A
E B
Comparison of Fenugreek Crop Evapotranspiration Measured by a Micro-lysimeter, Field Water Balance Method and Automatic Closed Canopy ChamberDeepak Kumar* and H.D. Rank
Department of Soil and Water Conservation Engineering, CAET, JAU, Junagadh, Gujarat, India
*Corresponding author: [email protected] (ORCID ID: 0000-0002-9360-7658)
Paper No. 880 Received: 14-01-2021 Revised: 24-02-2021 Accepted: 08-03-2021
ABSTRACT
The attempt was to design and develop an automatic closed canopy chamber (ACCC) having dimension of 1.2 m×1.2 m× 1.2 m for crop evapotranspiration measurement by using transparent acrylic sheet of 4 mm thickness. Between two small fans a temperature and relative humidity sensor was used to measure vapor density. The intermediate circuit was developed for making automation system in ACCC. The arduino based coding was developed as per desired logic operation. The top lead of chamber was automatically closed for 2 minutes when inside and outside temperature and relative humidity of ambient air were similar. During measurement mode of ACCC, the two fans were started automatically. After measurement mode, fans were automatically stopped and top lead was opened. The ACCC was calibrated by evaporating mass of water from water filled tray which was placed inside the automatic closed canopy chamber. The validation of the developed ACCC were made using micro-lysimeters (MLS) having size of 0.2 m × 0.2 m × 0.2 m by growing shallow rooted crop like fenugreek. The depth of irrigation was computed based on soil moisture content before irrigation and field capacity. The field testing of ACCC was made by placing chamber in plots of fenugreek crop. The irrigation was applied by drip irrigation as per crop water consumption. The sensor sensed and recorded the instantaneous temperature and relative humidity at 1 second interval for 24 hours. Two sample t-tests were done to compare the data pair of crop evapotranspiration obtained by the MLS inside the ACCC with that of outside the ACCC to ascertain whether there is any effect of the change in micro-climate for a short period of 2 minute on the crop growth physiological processes. Also, the data pair of crop evapotranspiration measured by the MLs, ACCC using the sensor data of temperature-relative humidity were compared and statistically analyzed through t-test. Similarly, the data pair of ETC measured by the FWB (Field Water Balance Method) and ACCC using the sensor data of temperature-relative humidity were also compared and statistically analyzed through t-test. The calibration factor of the ACCC was found as 1.666. The results revealed that there was no significant difference in the crop evapotranspiration measured by the MLs inside and outside ACCC. Also in case of validation and field testing of ACCC, there were no significant difference between the ETC measured by the ACCC, MLs and FWB at 95 percent confidence level. This implies that there are no effects of the change in micro-climate for a short period of 2 minutes in the chamber, on the plant physiological processes. The ETc rate of fenugreek increases as sun rises and reaches the peak after one to two hour from mid-day and then continuously decreases with time. During validation and field testing of ACCC, the fenugreek crop coefficients varied from 0.72 to 1.04 and 0.69 to 1.02 respectively. The developed ACCC is portable as well as more comfortable and cost effective compared to the lysimeter for the measurement of the actual crop evapotranspiration and the crop coefficient.
Highlights
m The calibration factor of the ACCC was found as 1.666.
m There was no significant difference in the crop evapotranspiration measured by the MLs inside and outside ACCC.

Kumar and Rank
30Print ISSN : 0974-1712 Online ISSN : 2230-732X
m Also in case of validation and field testing of ACCC, there were no significant difference between the ETC measured by the ACCC, MLs and FWB at 95 percent confidence level.
m There were no effects of the change in micro-climate for a short period of 2 minutes in the chamber, on the plant physiological processes.
m The developed ACCC is portable as well as more comfortable and cost effective compared to the lysimeter for the measurement of the actual crop evapotranspiration and the crop coefficient.
Keywords: Evapotranspiration, automatic closed canopy chamber, vapour pressure density, micro-lysimeter, crop coefficient
Land and water are two essential requirements for improvement in agriculture and economic expansion of any country. Demand of water increases continuously, while its supply decreases. India has about 16% of the world’s population as compared to only 4 % of its water resources. Therefore, these resources are need to be managed efficiently, optimally and sustainably in a country like India, where demand of these natural resources for ever increasing population outdoes the availability of these resources. India occupies only 329 Mha (Million hectare) area. India has 2 % of the world’s land area. India has about 140 Mha of cultivable land. 42% of the country’s cultivable land lies in drought-prone areas/districts. Irrigated area of India is 64.7 Mha. Moreover, 54% of India’s net sown area depends on rain, rain fed agriculture plays an important role in the country’s economy. India’s annual rainfall is around 1183 mm, out of which 75% is received in a short span of four months during monsoon (June to September). This result is run offs during monsoon and calls for irrigation investments for rest of the year. India receives an average of 4000 BCM (Billion Cubic Meters) of precipitation every year. However, only 48% of it is used in India’s surface and groundwater bodies. It is estimated that owing to topographic, hydrological and other constraints, the utilizable water with conventional approach is 1137 BCM which comprises of 690 BCM of surface water and 447 BCM of replenishable ground water resources. In India per capita surface water availability in the years 1991 and 2017 were 2309 and 1544 m3 and these are projected to reduce to 1401 and 1191 m3 by the years 2025 and 2050 respectively (Dhavan 2017). The Gujarat state has an area of 19.6 Mha, representing 6% area of the country. Out of total geographical area of Gujarat state, 12.5 Mha is cultivable land. Gujarat state has 33% irrigated area. Irrigation area covered by surface water and ground water is 1.8 and 2.0 Mha respectively. Gujarat’s total water resource potential
is 55,608 MCM (Million Cubic Meter) of which the surface water is about 38,100 MCM (68.5 %) and groundwater is about 17,508 MCM (31.5%). North, South and Central Gujarat regions have 17 river basins, having 89 % share in the total surface water. Kutch region has the highest number of river basins (97 river basins), having only 2% share in the total surface water. Saurashtra region has 71 river basins, having 9% share in the total surface water of the state (Narmada, Water Resources, Water supply and Kalpsar Department 2010).Evapotranspiration (ET) is the combined loss of water due to evaporation and transpiration. The main climatic factors affecting evapotranspiration are Solar radiation, air temperature, air humidity and wind speed etc. Soil water content, which relates to soil water movement, vapour transfer and soil root relationships, is another vital factor for ET (Allen et al. 1998; Campbell and Norman 1998). ET is a key component of the field water balance in the soil-vegetation-atmosphere continuum (Yang et al. 2006), and it is a major sink of precipitation and irrigation, particularly in semiarid and arid farmland. Thus, ET becomes an indicator of plant water stress (Wagner and Reicosky 1992; Reicosky and Peters 1977). Because of the large latent heat of vaporization of water, ET is also an important term in the soil surface energy balance (Gowda et al. 2013). With the change of climate and atmospheric conditions, obtaining soil-vegetation-atmosphere interaction especially the ET from the plant canopy layer becomes more important (IPCC 2001; Burkart et al. 2007). Therefore, it is meaningful to measure the ET flux for different plant canopies.The weighing lysimeter allows the mass or volumetric soil-water content change to be measured by weighing the lysimeter and finding its mass change over time. Lysimeters are used for accurate measurement of crop evapotranspiration ETC. However, there are some limitations for using

Comparison of Fenugreek Crop Evapotranspiration Measured by a Micro-lysimeter, Field Water...
31Print ISSN : 0974-1712 Online ISSN : 2230-732X
lysimeters on field scale due to its higher initial cost, need for regular maintenance, complex and difficult construction and usage limitations to a single crop at a time. Lysimeters cannot be transported from one place to another place due to its immovable establishment.Indirect and direct methods have been used to quantify ET fluxes. Indirect methods include the use of micrometeorological techniques such as eddy covariance (EC) (Baldocchi et al. 1996; Rana and Katerji 2000; Burkart et al. 2007), surface energy balance and field water balance approaches (Bowen, 1926; Gowda et al. 2013). The indirect methods do not interrupt the plant canopy; however, they need large homogeneous fields to obtain established, applicable results. In many agricultural studies, the size of research plots is often too small to allow the use of micrometeorological methods (Stewart 1984). A direct method may comprise equipment to get and isolate gas samples from plant canopies, and examine the changes of water vapour concentration to find out ET. A common strategy is to use a canopy chamber to test the air. The numerous criteria of chamber design, such as leaf chambers for plant physiology studies and canopy chambers for field crop studies. Although a chamber was first used approximately 80 years ago by (Thomas and Hill 1937), ongoing development of gas analyzers enables even more accurate and rapid measurements with canopy chambers of varying shapes and dimensions. There are three types of chamber design (Bekku et al. 1997); the open flow method, based on the difference between the gas concentration in ambient air and the air passing through the chamber, the closed-chamber method, where gas samples are taken from the chamber at different point of time and the dynamic closed chamber, where the gas from chamber is circulated through tubes from a gas analyzer and returned to the chamber. The latter has the advantages of being easily adapted for an automated system which allows for the calculation of ET when the analyzed gas is water vapor (Steduto et al. 2002). Fast measurement for brief periods (2 min or so) are used to stay away chamber-induced canopy micro-climate variation.The direct measurement of crop evapotranspiration and crop coefficient can be obtained easily and accurately by canopy chamber due to its
simple construction and portability. With the help of canopy chamber, one can estimate the crop evapotranspiration and crop coefficient for many crops through diurnal planning of ETc measurement. An automatic transient state closed system canopy chamber is used for gas exchange determinations of field crops to allow unattended day and night, high frequency H2O exchange measurements, with short measurement time and high scanning rate. An essential characteristic of the transient-type chambers is their portability from place to place in the field, achieved by mounting them on carriers such as farm tractors, fork lifts, gantries, or simply However, in all cases the need for human intervention during night-time imposes strong limitations on the monitoring program. In order to overcome these problems, an automated closed system chamber has been developed to allow day and night high frequency measurements of H2O gas-exchanges. After 2 or 3 days of gas-exchange flux monitoring, the chamber is removed manually and placed at a different location. The advantages obtained in terms of automated and unattended monitoring of the gas-exchange are, of course, at the expense of a reduced number of replicates, or sampled sites. However, such studies have not been conducted yet in India. Therefore, keeping in view the above issues and importance of ETC measurement, present study was carried out .
MATERIALS AND METHODS
Study Area
Location
The experiment was conducted at the Instructional farm of the Soil and Water Conservation Engineering Department, College of Agricultural Engineering and Technology, Junagadh Agricultural University, Junagadh. It is located at 21.5° N latitude and 70.1° E longitude with an altitude of 82 m above mean sea level on the western side foothills of Mountain Girnar. The location map of study area is show in Fig. 1.
Climate
The climate of the study area is subtropical and semi-arid type with an average annual rainfall of 900 mm and average annual pan evaporation of

Kumar and Rank
32Print ISSN : 0974-1712 Online ISSN : 2230-732X
5.6 mm/day. The area is characterized by climatic condition of fairly cold and dry winter, hot and dry summer and warm and moderately humid during monsoon. Winter sets in the month of November and continues till the end of February. Summer commences in the second fortnight of February and ends in the middle of June. April and May are the hottest month of Summer. According to last 35 years weather data recorded at the JAU observatory located near to experimental site, the monthly mean of daily maximum temperature, minimum temperature, relative humidity, wind speed, bright sunshine hours and pan evaporation during the crop period ranged from 30.2 °C to 38.9 °C, 12.2 °C to 22.2°C, 62.2 % to 74.4 %, 3.5 km/hr to 6.6 km/hr, 8.1 to 9.5 hours and 4.6 to 9.5 mm, respectively.
Fig. 1: Location map of study area
Physiochemical Properties of the soil
Physiochemical properties including fertility status of soil in the experimental soil are presented in Table 1. The texture of the soil was clay loam.
Table 1: Physiochemical properties of the soil of experimental field
Sl. No. Particular Values Unit(A) Physical Properties1 Sand 25 %2 Silt 33 %
3 Clay 38.06 %4 Field Capacity 27.70 %5 Bulk Density 1.43 g/cc6 Infiltration rate 3.00 cm/hr7 Porosity 37.95 %8 Specific gravity 2.50 g/cc(B) Chemical Properties1 pH (1:2.5) 8.902 EC (1:2.5) 0.20 ds/m3 Nitrogen (kg/ha) 210 Kg/ha4 Phosphate (P2O5) 12 Kg/ha5 Potash (K2O) 450 Kg/ha6 Sulphur 20.08 Ppm7 Copper 3.82 Ppm8 Iron 2.08 Ppm9 Mangenese 10.97 Ppm10 Zinc 1.95 Ppm11 Boron 0.32 Ppm
Water Quality Analysis
Ground water was used to irrigate the Fenugreek crop. The analysed quality of irrigation water was depicted in Table 2 and quality of water was found good for irrigation.
Table 2: Quality analysis of irrigation water
Sl. No. Constituents Values
1 Carbonate (CO3) (ppm) —
2 Bicarbonate (HCO3) (ppm) 590.00
3 Calcium (Ca) (ppm) 96.00
4 Chlorine (Cl) (ppm) 236.50
5 Sodium (Na) (ppm) 221.0
6 EC(ds/m) 1.06
7 pH 6.94
8 Magnesium(ppm) 68.00
9 Sodium absorption ratio (SAR) 3.51
10 Total Dissolved Salts (ppm) 711.20
EXPERIMENTAL MATERIALSThe resources and materials used during the experiment are described in subsequent heads.
Transparent Acrylic sheet
Transparent acrylic sheet having 4 mm thickness and 95% transmittance was used for fabrication of chamber.

Comparison of Fenugreek Crop Evapotranspiration Measured by a Micro-lysimeter, Field Water...
33Print ISSN : 0974-1712 Online ISSN : 2230-732X
Framing material
The supporting frame was made using 0.75” GI square pipe to support the acrylic sheet and the mounting of components like sensors and fan.
Temperature/ Relative Humidity sensors with datalogger
HTC easy log Temperature and Humidity datalogger was used for sensing and recording the temperature and relative humidity inside the automatic closed canopy chamber. Temperature sensor was used for measuring temperature of air within the chamber. This compact datalogger has a built-in LCD screen to monitor the current temperature, relative humidity, logging status, battery use and the memory consumption in between the readouts.
Small fans
Two small fans were used as per requirement for proper air and water vapour mixing inside the chamber.
Power source
The battery of 12 Volt and more than 476 Ampere hour was used for power supply to the 12 volt dc geared motor for opening and closing of top lead of chamber and two small fans.
Intermediate Circuit
For making automatic closed canopy chamber, intermediate circuit was developed by using following components:
Arduino Mega 2560
The Arduino Mega 2560 is a microcontroller board based on the ATmega 2560. The arduino Mega 2560 has hardware parts and software parts. The hardware parts include 54 digital input/output pins. Out of 54 digital input/output pins 14 can be used as PWM (Pulse Width Modulation) outputs, 16 analog inputs, 4 UARTs (Universal Asynchronous receiver Transmitter) hardware serial ports, a 16 MHz crystal oscillator, a USB (Universal Serial Bus) connection, a power jack, an ICSP (In Circuit Serial Programming) header and a reset button. The software parts include IDE (Integrated Development Environment) and Sketch.
Breadboard
A breadboard is a solderless device for temporary prototype with electronics and test circuit designs. Breadboard is a board on which electronic circuits can be built. The breadboard has strips of metal underneath the board and connect the holes on the top of the board. The metal strips are laid as shown below. The top and bottom rows of the holes are connected horizontally and split in the middle while the remaining holes are connected vertically. The set of connected holes can be called a node. Most electronic components in electronic circuits can be interconnected by inserting their leads or terminals into the holes and then making connections through wires where appropriate.
Jumper wires
Jumper wires are simply wires that have connector pins at each end, allowing them to be used to connect two points to each other without soldering. Jumper wires are typically used with breadboard and other prototyping tools to make it easy to change a circuit as needed.
USB cable
USB cable allows to connect Arduino Mega 2560 to personal computer for programming. It also provides power to the Arduino Mega2560.
AC to DC power adapter
The AC to DC adaptor having barrel connector was used for supplying an input of 7-12 V. This is regulated to 5 V by the onboard voltage regulator and the board is powered on.
4 Channel relay
High voltage electronic devices can be controlled by using relays. A relay is actually a switch which is electrically operated by an electromagnet. The electromagnet is activated with a low voltage, for example 5 volts from a microcontroller and it pulls a contact to make or break a high voltage circuit. 4 channel relay has 4 relays with rating of 10 A @ 250 and 250 V AC and 15 A @ 125 V AC. The high voltage output connector has 3 pins, the middle one is the common pin and one of two other pins is for normally open connection and other one for normally closed connection.

Kumar and Rank
34Print ISSN : 0974-1712 Online ISSN : 2230-732X
On the other side of the module has 2 sets of pins. The first one has 4 pins, a ground and a VCC pin for powering the module and 4 input pins IN1, IN2, IN3 and IN4. The second set of pins has 3 pins with a jumper between the JDVcc and the Vcc pin. With this configuration, the electromagnet of the relay is directly powered from the arduino board and if sometimes goes wrong with relay the microcontroller could get damaged.
12 V DC geared motor
DC gear motor is also called as DC geared Motor, Geared DC motor or Gearbox motor. DC Geared motor consists of a electric DC motor and a gearbox or gear head. DC motor was used for converting electrical energy into mechanical energy when electricity is applied to its leads. Coils of wire inside the motor become magnetized when current flows through them. These magnetic fields attract and repel magnets, causing the shaft to spin. If the direction of the electricity is reversed, the motor was spinned in the opposite direction. The gear heads are used to reduce the DC motor speed, while increase the DC motor torque. Therefore, lower speed and higher torque can be generated from gear motor. 12 V DC Geared Motor was used for opening and closing of top cover of Automatic closed canopy chamber.
Weight balance
The electronic balance was used for weighting the micro-lysimeters having capacity of 20 kg and least count of 0.1 g.
Micro-lysimeters
Ten weighing type microlysimeters of size approximately 0.20 × 0.20 × 0.20 m fabricated from aluminium sheet of 1 mm thickness were used. It was used for growing crops by filling soil inside.
Square Aluminium Tray
A square aluminium tray was used for filling the water and measuring the evaporation by the automatic closed canopy chamber as well as the pan evaporation method.
METHODOLOGY
Design criteria of automatic portable closed canopy chamber
The chamber was constructed according to a design approach used in a previous study (Street et al. 2007). Basal areas of chamber to be designed for standard field operation commonly range between 175 cm2 and 2.7 m2 (Reicosky 1990) and all their heights was dimensioned according to canopy height (Livingston and Hutchinson 1995). The same principle was applied in this study by choosing a 1.44 m2 basal area and a multi-component system which height was adjusted to the growing Rabi season crop by leaving between 20 and 30 cm air space between chamber and canopy top. Volume to basal area was ranged between 0.3 and 1.2.
DC geared motor selection
The Automatic closed chamber had top cover of 10 kg weight. The force of gravity pulling it down from centre of mass is
W = m × g …(1)
= 10 kg × 9.81 m⁄s2
= 98.1 N
The lifting force (T) was applied to top cover with angle of 45° with horizontal. Then vertical component of lifting force (T) was T sin 45°. Therefore, moment of vertical component of lifting force (T) at (X = 1.2 m) distance from hinge point balanced moment of force due to weight (W) at centre of mass located at 0.6 m distance from hinge point of top cover of automatic closed chamber.
Tsin45º × X = W × (X/2) …(2)
98.134.68
2sin 45 2 1.414T N= = =
° ×
Since force was applied tangentially on pulley having radius of 0.02 m. Therefore, torque (τ) needed at pulley due to tension in string was,
τ = T × r …(3)
= 34.68 × 0.02
= 0.6936 Nm.

Comparison of Fenugreek Crop Evapotranspiration Measured by a Micro-lysimeter, Field Water...
35Print ISSN : 0974-1712 Online ISSN : 2230-732X
After considering the friction, the actual torque was taken as 0.7 Nm.Physically, power is defined as the rate of doing work. For rotational motion, the power is the product of torque multiplied by the rotational distance per unit time.
Prot = τ × ω …(4)
Where,Prot = Rotational mechanical power (Watt)T = Torque (Nm)ω = Angular velocity (rad/sec)
/ sec
2
60rad rpm
πω ω = × …(5)
230
60
π = ×
= 30×10.47
= 314.1 rad/sec
ωrpm = RPM of pulley taken as 30 revolution per minute.From equation (4):
Prot = τ × ω = 0.7×314.1= 219.87 watt= 0.22 kilowatt
The overall efficiency of DC geared motor depends on the number of reduction stages: on average is 90% per stage. Therefore, a two stage reduction gives 90 × 90 = 81%; 3 stage was 72.9% and a 4 stage reduction was 66%. Therefore, efficiency of motor was considered as 66%. So the motor should be having capacity of as below:
219.87333.136 watt 0.33 kilowatt
0.66rot
motor
PP
η= = = =
Therefore, the direct current geared motor having torque of 0.7 Newton-meter and power rating of 0.33 Kilowatt was selected.
Solar panel selection
Since, DC motor was runned 10.8 minutes out of
1 hours. Therefore, working hour was 4.32 hour per day.Energy consumption = 330 W × 4.32 hr = 1425.6 Watt hourConsidering 30% energy lost in the system.So, total Energy consumption = 1425.6 × 1.3 = 1853.28 Watt hour/dayThe solar panel converts the sunlight into electricity as direct current (DC). These are typically categorized as Monocrystalline or Polycrystalline. Monocrystalline is costlier and efficient than the polycrystalline panel. Solar panels are generally rated under standard test conditions (STC): irradiance of 1000 W/m2, the solar spectrum of AM 1.5 and module temperature at 25°C.The solar panel was selected in such a way that it charges the battery fully during the day time.During the 12 hr day time, the sunlight is not uniform. It also differs according to location around the globe. Therefore, 4 hours was assumed as effective sunlight hours which will generate the rated power.Total Wp of PV panel capacity needed = 1853.28 Wh /4h = 463.25 W.By taking some margin, the solar panel of 470 W, 12 V was chosen.
Battery selection
Battery capacity was rated in terms of Ampere Hour.Power = Voltage × CurrentWatt Hour = Voltage (Volts) × Current (Amperes) × Time (Hours)Battery Voltage = 12 V (as our system is 12 V)Battery capacity = Load/Voltage = 1853.28 /12 = 154.44 AhPractically battery is not ideal, so 15% will be considered as battery loss.So, battery capacity required was 154.44/.85 = 286 AhFor better battery life, flooded lead-acid battery 60% depth of discharge (DOD) was considered as good practice.So capacity required = 286/.6 = 476.6 AhTherefore, Battery of more than 476.6 Ah capacity was selected.

Kumar and Rank
36Print ISSN : 0974-1712 Online ISSN : 2230-732X
Selection of solar charge controller
A solar charge controller is a device that was placed between a solar panel and a battery. It regulated the voltage and current coming from solar panels. It was used to maintain the proper charging voltage on the batteries. As the input voltage from the solar panel raised, the charge controller regulated the charge to the batteries preventing any overcharging.Usually, the solar power systems used 12-volt battery, however, solar panels could deliver far more voltage than is required to charge the battery. By, in essence, converting the excess voltage into amperes, the charge voltage could be kept at an optimal level while the time required to fully charge the battery was reduced. This allowed the solar power system to operate optimally at all times.Since solar system was rated 12 V, the charge controller was of 12 V.Current rating = Power output of panels/ Voltage = 470W/12V = 39.16 ABy taking a 20 % margin, 39.16 × 1.2 = 47 A charge controller.Therefore, Charge controller of 12 V and a current rating of 47 A was chosen.
Fabrication of the Automatic Closed Canopy Chamber
The chamber consisted essentially of a parallelepiped with five transparent Acrylic walls (4 mm thick), was held together by a narrow metallic angular frame (1 cm wide). The same materials was for constructing adapter frames for different heights. Four different heights of canopy chambers were designed to match different crop growth stages. A short chamber was more portable to be transported from one sample site to another sample site, while a large chamber has large capacity of water vapor for large ET flux and reduce the possibility for internal condensation occurring on the acrylic film. Therefore, it was suitable to use chambers of different heights to measure ET fluxes for different canopy heights. The ground surface area of chamber was 1.44 m2 (1.2 m × 1.2 m) and different heights of chamber for different crop growing stages were 0.30 m, 0.60 m, 0.90 m and 1.20 m, respectively, with total volume of chamber at different crop growing stage were 0.432, 0.864, 1.296 and 1.728 m3 respectively.
The height of chamber was changed by placing another chamber over previous chamber assembly and it was fitted by using nuts and bolts. The gasket air tight rubber was placed between top of lower section and bottom of upper section of chamber for avoiding air leakage. All corners was enforced with angle iron using a drill and iron rivets. A 1.44 m2 acrylic glass sheet was glued on top of a frame which was serves as the chamber cover.A rubber sealing was placed on the closing edge of the top-cover, with a magnetic strip inside, to allow tight closure during measurements upon release by the rotating pulley. Two water proof fans were installed at 45° angles in the chamber corners facing to each other for constant air mixing. While taking measurements, the atmosphere inside the chamber was stirred by two high-speed brushless fans.The bottom side of the chamber consisted of a metallic frame with lateral sharp blades sunk in the soil. The top-cover was pivoted by using exterior door hinges on one side so that a simple pulley driven string can pull up the other side. The alternate motion of pulling and releasing the string (to open and close the top cover) was run by a simple rotating 12 V Direct current motor with relay by using microcontroller (Arduino MEGA2560) through an intermediary circuit. Between the fans, a combination temperature and relative humidity sensor was mounted inside the chamber to monitor internal atmosphere. A data-logger was used for the data collection and storage for all of the data of sensors connected to the canopy chamber. The measured values were used to verify that the climate condition inside the chamber is similar to the ambient climate condition during measurement. The air temperature inside of the chamber increased during measurements, because of the greenhouse effect of the chamber. Changes in water vapor concentration inside the chamber was measured to evaluate the ET flux. A portable rechargeable battery was utilized as power supply.The arduino based intermediate circuit was developed for making automatic closed canopy chamber. The programming code was based on required logic of operation of canopy chamber. Developed intermediate circuit of automatic closed canopy chamber is shown in Fig. 2.

Comparison of Fenugreek Crop Evapotranspiration Measured by a Micro-lysimeter, Field Water...
37Print ISSN : 0974-1712 Online ISSN : 2230-732X
Fig. 2: Developed intermediate circuit of automatic closed canopy chamber
Two operational mode was recognized: stand-by mode, when the top cover was open, fans were off and another operational mode was measurement mode, when fans were on, the top cover was closed and fans are set off and top cover opens again. Temperature and relative humidity sensor sensed temperature and relative humidity continuously. When inside and outside temperature and relative humidity were same, then measurement mode started. Similarly, this cycle was repeated. The conceptual design of automatic closed canopy chamber was shown in Fig. 3.
Fig. 3: Conceptual design of automated closed canopy chamber
Checking of transparency of acrylic sheet
Generally, the transparency of 4 mm acrylic sheet is 95%. The transparency of the acrylic sheet with and without overlapping was checked using lux meter at different time intervals.
Fabrication of micro-LysimetersMicro-lysimeters were fabricated from light aluminium sheets of 1 mm thickness. The size of each micro-lysimeters was 20 cm × 20 cm × 20 cm. Soil was filled in it in such a way that the properties of the soil inside the micro-lysimeters are just similar to in-situ conditions. The shallow rooted crops like Fenugreek was grown in micro-lysimeters. The average weight of empty microlysimeter was 0.553 kg.
Filling of soil in micro-lysimetersAll the 10 micro lysimeters were filled with soil of Instructional Farm of Soil and Water Conservation Engineering Department in such a way that the bulk density of the soil was maintained at the field value. The average weight of the soil in the micro lysimeters were 11.4 kg and the volume in each micro lysimeter was 7600 cm3. The bulk density of soil in the micro-lysimeter was 1.5 g/cm3 which was same as the field value. The faces of adjacent micro lysimeters were kept just touching each other.
Sowing of leafy vegetable in micro-lysimetersThe Fenugreek crop was sown manually in the micro lysimeters on 7/12/2019. The seed to seed distance was maintained at 2-3 cm and the depth was maintained at 1 cm. The average germination percentage of seed was 90%.
Irrigation applicationIrrigation was applied manually with a measuring flask as per the crop water requirement calculation. The crop water requirement was obtained from the lysimeter and irrigation water depth was calculated. Application of irrigation water in micro-lysimeter was in such a way that there was no drainage due to deep percolation.
Seedbed PreparationSeedbed was prepared by tractor operated cultivator. The dimension of seed bed was 1.8 × 10 m. Three seed beds were prepared for fenugreek crop.

Kumar and Rank
38Print ISSN : 0974-1712 Online ISSN : 2230-732X
Sowing of Crop in Seed Bed
Crops were sown manually in seedbed by keeping 30 cm and 10 cm for row to row and plant to plant spacing respectively.
Calibration of Water Meter
The calibration of water meter was done by using volumetric bucket. Water was passed through the water meter. The actual amount of water filled in bucket was compared with water meter reading. The ratio of the actual amount of water collected in volumetric bucket to water meter reading was considered as calibration factor of water meter.
Installation of Lateral and Water Meter
Water meter was connected between submain and laterals. The inline lateral spacing was 0.6 meter and dripper spacing of 0.4 m having discharge of 2 lph.
Fertilizer Application
Fertilizer was applied as per recommended dose in kg/ha of fenugreek crop. The recommended dose of Nitrogen, Phosphorus and Potassium for fenugreek crop was considered as 20, 25 and 20 kg/ha respectively. The amount of application of DAP, Urea and Murate of Potash were 308.1, 126.51 and 189 gm respectively. Before irrigation DAP was applied as basal dose according to recommended dose of fertilizer.
Irrigation
Irrigation was applied through drip irrigation once in three days according to soil moisture depletion from field capacity. Soil sample before irrigation and 24 hour after irrigation was collected by auger hole method. The augers were penetrated upto effective root zone depth. Soil samples were taken from slots of augors and placed in moisture box. The initial weight of soil sample was taken and placed in oven dryer at 105 oC for 24 hours. The final weight of oven dried sample was recorded. Dry basis moisture content was calculated. This moisture content was converted into volumetric moisture content by multiplying bulk density of soil sample. The effective root zone depth of fenugreek was considered as 20 cm. The water was applied according to difference between volumetric moisture content of soil sample after irrigation and
before irrigation. The amount of delivered water to the field was recorded by water meter reading by considering calibration factor of water meter.
Calibration and Validation of the Automatic Closed Canopy Chamber
When inside and outside microclimate is same, the chamber was automatically closed for 2 minutes and chamber was opened. When chamber was closed, the fans were automatically started and circulated air water mixture for 2 minutes. This cycle was repeated for 24 hours. The sensor sensed and recorded the instantaneous temperature and relative humidity at 1 second intervals for 24 hours continuously.
Measurement of evapotranspiration in automatic closed canopy chamber
The crop evapotranspiration data were collected over a period of 2 minutes during closed condition of chamber throughout the day. The automatic closed canopy chamber was positioned over the fenugreek crop grown in the micro-lysimeters. The chamber was automatically closed for 2 minutes under similar micro-climate condition of inside and outside of automatic closed canopy chamber.
Fig. 4: Measurement of fenugreek crop evapotranspiration in the automatic closed canopy chamber
After 2 minutes, chamber was automatically opened to obtain micro-climate similar to open atmosphere.

Comparison of Fenugreek Crop Evapotranspiration Measured by a Micro-lysimeter, Field Water...
39Print ISSN : 0974-1712 Online ISSN : 2230-732X
While a data logger measured the temperature and relative humidity at every 1 second for 24 hours continuously. Efforts were made not to block solar radiation during measurement. Datasets were collected within 2 minutes and datasets were repeated whenever chambers were closed. The measurement of fenugreek crop evapotranspiration in automatic closed canopy chamber is shown in Fig. 4.Automatic closed canopy chamber was placed in different plots having fenugreek crops once in two weeks. The chamber was placed in such a way that crops inside the chamber should not disturb. The evapotranspiration of field crops was measured under closed condition of chamber for 2 minutes by automatic closed canopy chamber. The measurement of fenugreek crop evapotranspiration in the automatic closed canopy chamber is shown in Fig. 5.
Fig. 5: Measurement of fenugreek crop evapotranspiration of field crops in the automatic closed canopy chamber
Estimation of water vapour density from temperature and RH data
Saturation water vapour pressure
Temperature and relative humidity measurements were converted into saturation vapour pressure (Es), actual vapour pressure (Ea), and vapour density (ρv) as per (McLeod et al. 2004):
17.50.611
241.2
TEs
e T=
+ …(6)
Where,Es = Saturation vapour pressure (Pa); T = Temperature of air (°C).Actual vapour pressure (Ea) was calculated using relative humidity as:
100
RHEa Es= × …(7)
Where,Ea = Actual vapour pressure (Pa); RH = Relative humidity (%)The density of water vapour inside the chamber was calculated as,
0.6221000
d
Ea
R Tρ∨ = × …(8)
Where,ρV = Water vapour density (g/m3); Ea = Actual vapour pressure (Pa); Rd = Universal gas constant (287.04 J/kg/K); T = Temperature (K)
Calculation of ET rate from the water vapour density (Stannard, 1988)
86.4MVC
ETA
= …(9)
Where,ET = Evapotranspiration rate (mm/day); M = Maximum slope of water vapour density time series (g/m3 s); V = Volume of chamber, (m3); C = Calibration factor of the chamber (unitless); A = Land surface area covered by the chamber (m2)86.4 is a factor that converts g/m3 s to mm/day using the density of water.
Area factor for the automatic closed canopy chamber
The soil surface area in micro-lysimeters was 0.2 m2 and the base area of automatic closed canopy chamber was 1.44 m2. There was no evapotranspiration from the remaining area and that much less water vapour was generated. So the area factor for calculation of ETc under automatic closed canopy chamber was taken as 1.44/0.2 = 7.2. It was multiplied by the chamber ETc for correction of automatic closed chamber ETc.
Kumar and Rank
40Print ISSN : 0974-1712 Online ISSN : 2230-732X
The area factor of automatic closed canopy chamber was calculated by following equation,
bac
ss
AF
A= …(10)
Fac = Area correction factor; Ab = Base area of automatic closed canopy chamber, m2; Ass = Total soil surface area of all micro lysimeters, m2
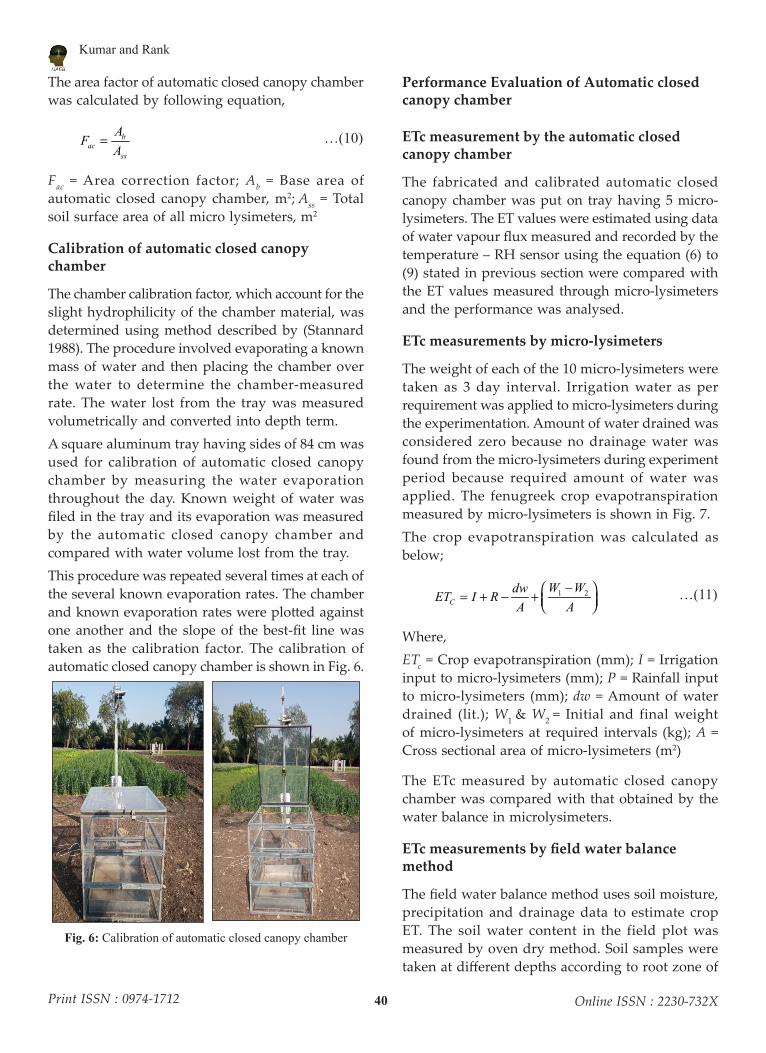
Calibration of automatic closed canopy chamber
The chamber calibration factor, which account for the slight hydrophilicity of the chamber material, was determined using method described by (Stannard 1988). The procedure involved evaporating a known mass of water and then placing the chamber over the water to determine the chamber-measured rate. The water lost from the tray was measured volumetrically and converted into depth term.A square aluminum tray having sides of 84 cm was used for calibration of automatic closed canopy chamber by measuring the water evaporation throughout the day. Known weight of water was filed in the tray and its evaporation was measured by the automatic closed canopy chamber and compared with water volume lost from the tray.This procedure was repeated several times at each of the several known evaporation rates. The chamber and known evaporation rates were plotted against one another and the slope of the best-fit line was taken as the calibration factor. The calibration of automatic closed canopy chamber is shown in Fig. 6.
Fig. 6: Calibration of automatic closed canopy chamber
Performance Evaluation of Automatic closed canopy chamber
ETc measurement by the automatic closed canopy chamber
The fabricated and calibrated automatic closed canopy chamber was put on tray having 5 micro-lysimeters. The ET values were estimated using data of water vapour flux measured and recorded by the temperature – RH sensor using the equation (6) to (9) stated in previous section were compared with the ET values measured through micro-lysimeters and the performance was analysed.
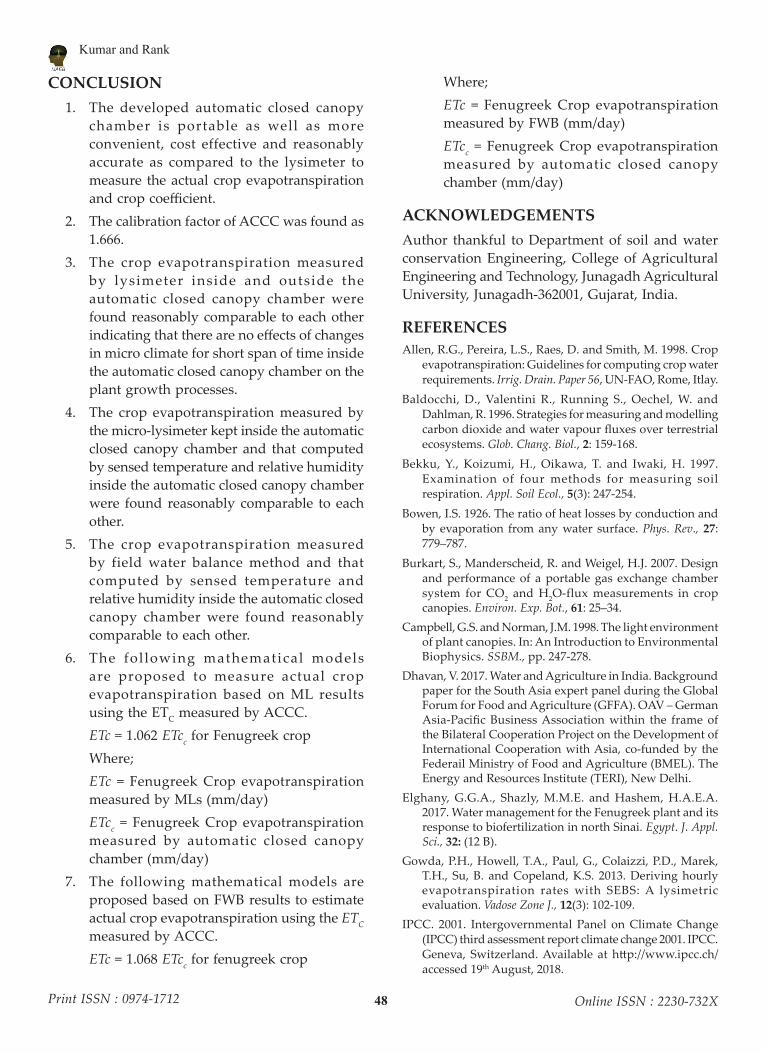
ETc measurements by micro-lysimeters
The weight of each of the 10 micro-lysimeters were taken as 3 day interval. Irrigation water as per requirement was applied to micro-lysimeters during the experimentation. Amount of water drained was considered zero because no drainage water was found from the micro-lysimeters during experiment period because required amount of water was applied. The fenugreek crop evapotranspiration measured by micro-lysimeters is shown in Fig. 7.The crop evapotranspiration was calculated as below;
1 2C
W WdwET I R
A A
− = + − + …(11)
Where,ETc = Crop evapotranspiration (mm); I = Irrigation input to micro-lysimeters (mm); P = Rainfall input to micro-lysimeters (mm); dw = Amount of water drained (lit.); W1 & W2 = Initial and final weight of micro-lysimeters at required intervals (kg); A = Cross sectional area of micro-lysimeters (m2)
The ETc measured by automatic closed canopy chamber was compared with that obtained by the water balance in microlysimeters.
ETc measurements by field water balance method
The field water balance method uses soil moisture, precipitation and drainage data to estimate crop ET. The soil water content in the field plot was measured by oven dry method. Soil samples were taken at different depths according to root zone of

Comparison of Fenugreek Crop Evapotranspiration Measured by a Micro-lysimeter, Field Water...
41Print ISSN : 0974-1712 Online ISSN : 2230-732X
crops grown in field. Soil water storage in the root zone was computed.
Fig. 7: ETc measurements by micro-lysimeters
The water was given in precise amount to prevent drainage. The field water balance method is based on the following equation,
( )1 2cET I P R D Zθ θ= + − − + − × …(12)
Where,I = Irrigation application (mm); P = Precipitation (mm); D = Drainage is assumed to be zero (mm); R = Surface runoff is assumed to be zero (mm); (θ1– θ2) = Change in moisture content (% V/V) between irrigations; Z = Root zone depth (m).
The aim of field water balance method is to quantify all water balance components on the left hand side of the equation number (12) to compute ET. Accurately monitoring short term changes in soil moisture is one of the challenges of this method. Timlin et al. (2007) reported that low time resolution and time lag are two potential drawbacks for the field water balance method, due to the soil root interaction and soil and plant water capacity, which can buffer instantaneous variations of ET. Thus, the field water balance was compared with chamber results over a long time period.
Crop Coefficient
Fundamentally, the crop coefficient is defined as the ratio of crop ET (ETc) to some reference ET (ETo) as defined by weather data. In FAO-56, values listed
for Kc represent ET under growing conditions having a high level of management and with little or no water or other ET reading stress and thus represent what are referred to as potential level of crop ET.Kc curve comprises of four straight line segments representing the initial period, the development period, the mid season period, and the late season period. These segments are defined by three primary Kc values; Kc during initial period Kc ini, Kc during mid season (full cover) period Kc mid, and Kc at harvest (or at the end of late season) Kc end. The Kc ini defines the horizontal portion of the Kc curve during the initial period until approximately 10% of ground is covered by vegetation. The Kc mid defines the value for Kc during the peak period for the crop, which is normally when the crop is at “effective full cover”. This period is described by a horizontal line extending through Kc mid. The development period is defined by a sloping line that connects the initial and mid season period. The late season has a sloping line that connects the end of the mid season period with the harvest (end) date.The crop coefficient can be calculated by the following equation.
CC
O
ETK
ET= …(13)
Where,Kc = Crop coefficient; ETc = Crop evapotranspiration (mm); ETo = Reference evapotranspiration (mm)
Calculation of Reference Crop Evapotranspiration
Allen et al. 1998 defined and published the FAO paper no. 56 the penman Montieth ETo, as the rate from a hypothetical reference crop with an assumed crop height (12 cm), a fixed surface resistance (70 s/m) and albedo (0.23), closely resembling the ET from an extensive surface of the green grass cover with adequate water. Using daily or monthly data it can be simplified as follows,
( ) ( )( )
2
2
9000.408
2731 0.34
n S a
O
R G u e eTET
u
γ
γ
∆ − + −+=
∆ + + …(14)
Where,ETO = Reference evapotranspiration (mm/day)

Kumar and Rank
42Print ISSN : 0974-1712 Online ISSN : 2230-732X
Rn = Net radiation at the crop surface (MJ/m2 day); G = Soil heat flux density (MJ/m2 day); T = Mean daily air temperature at 2 m height (oC); u2 = Wind speed at 2 m height (m/s); es = Saturation vapour pressure (kPa); ea = Actual vapour pressure (kPa); es– ea = Saturation vapour pressure deficit (kPa), Δ = Slope vapour pressure curve (kPa/oC); γ = Psychrometric constant (kPa/oC)
STATISTICAL ANALYSISA two sample t test was used to compare the 2 sets of data to check whether they are significantly different or not. It is rigorous test of the hypothesis that the two samples are drawn from a population having the same variance. t – Test is significantly used only with small samples. If m is the mean of the sample of size n and s is the standard deviation as estimated from the sample and if we are testing the deviation of m from a hypothetical value µ then the t-Test used to test whether the means are different or not that can be calculated as follows (Panse and Sukhatme 1967).
1 2
1 2
1 1p
m mt
Sn n
−=
+
…(15)
( ) ( )1 2
2 21 2
1 2
1 1
2x x
p
n S n SS
n n
− + −=
+ − …(16)
Where,m1 and m2 = mean of sample 1 and 2; n1 and n2 = size of sample 1 and 2 and Sx1 and Sx2 = standard deviation of sample 1 and 2.In these formulae, n1 – 1 is the number of degrees of freedom for each group, and the total sample size minus two (that is, n1 + n2 – 2) is the total number of degrees of freedom, which is used in significance testing.
RESULTS AND DISCUSSIONDaily maximum and minimum temperature observed during December to March 2019-20 is shown in Fig. 8. The maximum and minimum temperature during the crop period ranged between 22.6 OC to 38.7 OC and 6.5 OC to 25.5 OC respectively. Daily maximum and minimum relative humidity observed during season is shown in Fig. 9. The average relative humidity varied from 32.31 %
to 71% during the season. The highest relative humidity was observed on 27th January 2020 and lowest relative humidity was observed on 15th and 16th March 2020. The wind speed during the growing season varied from 2 km/hr to 11.5 km/hr. Maximum wind speed was observed on 27 March 2020 as shown in Fig. 10. The maximum bright sunshine hours was observed as 10.6 hrs on 16th march and 30th March 2020 while minimum bright sunshine hour was observed as 0.1 hrs on 6th December and 7th December 2019 as shown in Fig.11.
05
101520253035404550
Tem
per
atu
re (
˚C)
Date
Tmax
Tmin
Fig. 8: Daily maximum and minimum temperature during December 2019 to March 2020
0102030405060708090
100
Rela
tive H
um
idit
y(
%)
Date
RH max
RH min
Fig. 9: Daily maximum and minimum relative humidity during December 2019 to March 2020
0
2
4
6
8
10
12
Win
d S
peed
(k
m/h
)
Date
Fig. 10: Daily wind speed during December 2019 to March 2020
02468
1012
Su
nsh
ine h
ou
rs
Date
Fig. 11: Daily bright sunshine hours during December 2019 to March 2020

Comparison of Fenugreek Crop Evapotranspiration Measured by a Micro-lysimeter, Field Water...
43Print ISSN : 0974-1712 Online ISSN : 2230-732X
Calibration of automatic closed canopy chamber
The calibration of automatic closed canopy chamber was done by evaporating a known mass of water and then placing the chamber over the water to determine evaporation rate based on temperature and relative humidity measurement. The evaporation of water estimated by measuring the volume of evaporated water from tray and automatic closed canopy chamber are shown in table 3.
Table 3: Calibration of automatic closed canopy chamber
DateEvaporation measured by Pan Evaporation
Evaporation measured by automatic closed canopy Chamber
13-Dec-19 3.1 1.8514-Dec-19 3 1.815-Dec-19 3 1.816-Dec-19 4.7 2.817-Dec-19 6.8 4.1
The chamber and known evaporation rate was plotted against one another as shown in Fig. 12 and the slope of the best fit line was taken as the calibration factor. Accordingly, the calibration factor of the automatic closed canopy chamber was found as 1.666. The calibration factor is comparable with the value of 1.298 obtained by McJannet et al. 1996. The slightly greater value found in the present study is most likely due to the greater water absorption by leak proof material attached between two consecutive section of chamber.
y = 1.666x
1.52.02.53.03.54.04.55.05.56.06.57.07.58.0
1.5 2.0 2.5 3.0 3.5 4.0 4.5
Pa
n E
va
po
ra
tio
n (
mm
)
Evaporation Measered by Automatic Closed Canopy Chamber (mm)
Fig. 12: Calibration of automatic closed canopy chamber
Validation of the automatic closed canopy chamber
The weight of micro-lysimeters were measured at the required intervals. Two sets of 5 micro-lysimeters were used for fenugreek crop. One set
of 5 micro-lysimeters was used for estimating the crop evapotranspiration of fenugreek inside the automatic closed canopy chamber and another set was kept outside the automatic closed canopy chamber having condition of continuous open atmosphere. The input of irrigation was kept similar in both the sets. Using the water balance of each micro-lysimeter, the fenugreek ETC was measured for both set.
y = 0.972x + 0.133R² = 0.751
2
3
4
5
2 3 4 5
ETc b
y ML
in o
pen
atm
osph
ere
(mm
/day
)ETc by ML inside the ACCC(mm/day)
Fig. 13: Comparison of ETc of fenugreek crop by ML inside the ACCC and open atmosphere
Comparison of ETc of fenugreek crop by ML inside the ACCC and open atmosphere are graphically represented in Fig. 13. It is revealed that there was no significant effect of change in micro climate for short period in chamber on plant physiology.
Statistical analysis of ETc by MLs inside the ACCC and open atmosphere
The ETc by micro-lysimeter inside the automatic closed canopy chamber and open atmosphere were recorded for statistical comparison. Statistical analysis of ETc by micro-lysimeter inside the automatic closed canopy chamber and open atmosphere was carried out to check whether these two values are statistical at par or not. The data of ETc by micro-lysimeter inside the automatic closed canopy chamber and open atmosphere value were considered as two separate groups and two sample t-test was conducted assuming equal variance at 95 percent confidence level of each group.The Statistical comparison by t-test of ETc by MLs inside the ACCC and open atmosphere for fenugreek crop is presented in Table 4. The values of number of samples, degree of freedom and ttable and tcal for fenugreek crop were 8, 14, 2.144 and 0.176 respectively. The value of tcal lower than ttable revealed that there are non-significance difference between

Kumar and Rank
44Print ISSN : 0974-1712 Online ISSN : 2230-732X
ETc by MLs inside the ACCC and open atmosphere at 95 percent confidence level. Hence, the data of ETc by MLs inside the ACCC and open atmosphere are matching with each other without any significant statistical differences. It indicated that the change in micro-climate inside the ACCC did not affect the plant growth physiological process.
Table 4: The t-test result of statistical comparison of fenugreek ETc by MLs inside the ACCC and open
atmosphere
ETc by MLs inside the ACCC
ETc by MLs in open atmosphere
Mean 3.12625 3.175
Variance 0.270026786 0.34Observations 8 8Hypothesized Mean Difference 0
df 14TCalculated 0.176540829
TTable 2.144786681
Evapotranspiration measurement by micro-lysimeters and field water balance method
The present investigation was carried out in Rabi Season (7th December 2019 to 30 March 2020). The fenugreek crop was sown in MLs as well as in field plots. Water balance method was adopted to measure the crop evapotranspiration. The volume of water balance components consists of irrigation, precipitation, variation of soil water contents, drainage and finally actual ETC values during experimental study. The precipitation component of water balance method was considered zero during Rabi season because no effective rainfall were observed during study period. The drainage component was also considered as zero because precise amount of water was applied inside the MLs as well as field plots.
0.00
1.00
2.00
3.00
4.00
5.00
6.00
3 6 9 12 15 18 21 24 27 30 33 36 39 42 45 48 51 54 57 60 63 66 69 72 75 78 81 84
Fen
ugr
eek
Cro
p
Eva
pot
ran
spir
atio
n(m
m/d
ay)
DAS
MLs
FWB
Fig. 14: Fenugreek crop evapotranspiration measured by MLs and FWB during Rabi season
Fig. 14 shows pattern of variation of fenugreek crop evapotranspiration measured by MLs and FWB during Rabi season with respect to days after sowing (DAS). The fenugreek crop evapotranspiration measured by MLs and FWB were ranged 2.15 to 4.35 mm/day and 1.76 to 5.41 mm/day respectively. Fig. 14 reveals that the values of ETC measured by MLs during 9th set of three days records (27 DAS) were lower than those during the 9th to 18th set of three days records (27 DAS to 54 DAS) and increased gradually and reached to highest values during 18th set of three days records (54 DAS) and finally decreased during the 20th to 23st set of three days records (60 to 69 DAS) in Rabi season. While, the values of ETC measured by FWB during 6th set of three days records (18 DAS) were lower than those during the 7th to 19th set of three days records (21 DAS to 57 DAS) and increased gradually and reached to highest values during the 19th set of three days period (57 DAS) and decreased during the 20 and 21st set of three days records (60 DAS and 63 DAS). It indicates availability of least vegetations in initial stage resulting into least evapotranspiration. After initial stage, leaf area index rapidly increases due to presence of dense vegetation resulting into rapidly increment in crop evapotranspiration with respect to days after sowing. Finally, the values of ETC was found to decline due to reduction in evaporative demand of crop with respect to days after sowing.
Field evaluation of automatic closed canopy chamber
Comparison of Crop evapotranspiration measured by ACCC and MLs
The crop evapotranspiration (ETc) of fenugreek measured by automatic closed canopy chamber at 11 days interval and its comparison with micro-lysimeters measured ETc is shown in Fig. 15(a).
0
1
2
3
4
5
Cro
p E
vap
otr
an
spir
ati
on
(m
m/d
ay)
Date
ETc by MLs ETc by ACCC
Fig. 15 (a): Comparison of fenugreek crop evapotranspiration measured by ACCC and MLs

Comparison of Fenugreek Crop Evapotranspiration Measured by a Micro-lysimeter, Field Water...
45Print ISSN : 0974-1712 Online ISSN : 2230-732X
Comparison of fenugreek crop Evapotranspiration measured by automatic closed canopy chamber (ACCC) and Micro-lysimeters (MLs) during Rabi season is represented in Fig. 15(a). It can be seen from Fig. 15(a) that micro-lysimeters overestimates crop evapotranspiration throughout the crop period. Minor damage to plant around the edge of chamber measurement area may lower crop evapotranspiration measured by ACCC compared to MLs.
y = 1.062xR² = 0.973
2.0
2.5
3.0
3.5
4.0
4.5
2.0 2.5 3.0 3.5
ET
c m
easu
rem
ent b
y M
Ls
(mm
/day
)
ETc measurement by ACCC (mm/day)
Fig. 15(b): Relation between Fenugreek crop evapotranspiration measured by ACCC and MLs
Relation between crop evapotranspiration measured by ACCC and MLs for fenugreek crop is represented by plotting Fig. 15(b). From Fig. 15(b), it can be seen that crop evapotranspiration measured by ACCC and MLs for fenugreek crop are reasonably agreed with each other during Rabi Season. It can also be interpreted that micro-lysimeter overestimate crop evapotranspiration than automatic closed canopy chamber for fenugreek by 6.2 % respectively. However, there is general agreement between crop evapotranspiration measured by ACCC and MLs that suggest the use of ACCC in providing reasonable estimates of crop evapotranspiration under field condition.
Statistical Analysis of crop evapotranspiration measured by ACCC and MLs
The crop evapotranspiration of fenugreek measured by ACCC and MLs was statistically analysed. Statistical analysis of crop evapotranspiration of fenugreek measured by ACCC and MLs was carried out to check whether these two values are statistically at par or not. The data of crop evapotranspiration of fenugreek measured by ACCC and MLs value were considered as two separate groups and two sample t-test was conducted assuming equal variances at 95 percent confidence level of each group.
Table 5: The t-test result of statistical comparison of Fenugreek crop evapotranspiration measured by
ACCC and MLs
ETc by ACCC ETc by MLsMean 2.950669635 3.128310218Variance 0.188418574 0.27078311Observations 8 8Hypothesized Mean Difference 0df 14TCalculated 0.741456109
TTable 2.144786681
The Statistical comparison by t-test of ETc measured by ACCC and MLs for fenugreek by ACCC and MLs are presented in table 5. The values of number of samples, degree of freedom and ttable and tcal for fenugreek crop were 8, 14, 2.144 and 0.74 respectively. The value of tcal lower than ttable revealed that there are non-significance difference between ETc computed by MLs and that of ACCC at 95 percent confidence level. Hence, the data of ETc computed by MLs and that of ACCC are matching with each other without any significant statistical differences.
Comparison of Crop Evapotranspiration Measured by ACCC and FWB
Comparison of fenugreek crop evapotranspiration measured by ACCC and FWB during Rabi season is represented in Fig. 16(a).
0
1
2
3
4
5
Cro
p E
vapo
tran
spir
atio
n (m
m/d
ay)
Date
ETc measured by FWB ETc by ACCC
Fig. 16(a): Comparison of fenugreek crop evapotranspiration measured by ACCC and FWB
It can be seen from Fig. 16(a) that FWB overestimates crop evapotranspiration throughout the crop period. This may be due to unsaturated flow below root zone which was reselected in the study. However, the maximum difference between crop evapotranspiration measured by FWB and

Kumar and Rank
46Print ISSN : 0974-1712 Online ISSN : 2230-732X
ACCC was 0.54 for fenugreek crop. McLeod et al. (2004) also found that the difference in pasture evapotranspiration measured by field water balance and canopy chamber is within 0.9 mm/day.Relation between fenugreek crop evapotranspiration measured by ACCC and FWB for fenugreek is represented by plotting Fig. 16(b).
y = 1.068xR² = 0.977
1.5
2.5
3.5
4.5
1.5 2.5 3.5 4.5
ET
c co
mpu
ted
by F
WB
ETc measured by ACCC
Fig. 16(b): Relationship between fenugreek crop evapotranspiration measured by ACCC and FWB
From Fig. 16(b), it can be seen that fenugreek crop evapotranspiration measured by ACCC and FWB is reasonably agreed with each other during Rabi Season. It can also be interpreted that field water balance method overestimate fenugreek crop evapotranspiration than automatic closed canopy chamber by 6.8 %. Similar study has been conducted by (Luo 2018) and they found that the difference between field water balance and chamber method were within 10%. The crop evapotranspiration measured by ACCC matched well with crop evapotranspiration measured by FWB during entire growth period of crop. McLeod et al. (2004) also observed a reasonable agreement between crop evapotranspiration measured by FWB and canopy chamber method.
Statistical analysis of fenugreek crop evapotranspiration measured by ACCC and FWB
T h e f e n u g r e e k c r o p e va p o t r a n s p i r a t i o n measured by ACCC and FWB were statistically analysed. Statistical analysis of fenugreek crop evapotranspiration measured by ACCC and FWB was carried out to check whether these two values are statistically at par or not. The data of fenugreek crop evapotranspiration measured by ACCC and FWB value were considered as two separate groups
and two sample t-test was conducted assuming equal variances at 95 percent confidence level of each group.
Table 6: The t-test result of statistical comparison of fenugreek crop evapotranspiration measured by
ACCC and FWB
ETc by ACCC ETc by FWBMean 2.991305515 3.185162457Variance 0.775758662 0.975899083Observations 8 8Hypothesized Mean Difference 0df 14TCalculated 0.414287399
TTable 2.144786681
The Statistical comparison by t-test of fenugreek crop evapotranspiration measured by ACCC and FWB are presented in Table 6. The values of number of samples, degree of freedom and ttable and tcal for fenugreek crop were 8, 14, 2.144 and 0.414 respectively. The value of tcal lower than ttable revealed that there are non-significance difference between fenugreek crop evapotranspiration computed by FWB and that of ACCC at 95 percent confidence level. Hence the data of fenugreek crop evapotranspiration computed by FWB and that of ACCC are matching with each other without any significant statistical differences. However, the difference in mean fenugreek crop evapotranspiration measured by FWB and ACCC was 0.19.
Diurnal variation of fenugreek crop evapotranspiration under validation and field testing of ACCC
The diurnal var iat ion of fenugreek crop evapotranspiration rate under validation and field testing of ACCC is shown in Fig. 17 and 18 respectively.From Fig. 17 and 18, it is revealed that the ETc rate of fenugreek increases as sun rises and reaches at the peak within one to two hours after mid-day and then continuously decreases with time. The ETc rates were found constant during the night time which indicated that major contribution of soil evaporation component.

Comparison of Fenugreek Crop Evapotranspiration Measured by a Micro-lysimeter, Field Water...
47Print ISSN : 0974-1712 Online ISSN : 2230-732X
0123456789
1011121314151617181920
7:34 9:04 10:34 12:04 13:34 15:04 16:34 18:04 19:34 21:04 22:34 0:04 1:34 3:04 4:34 6:04 7:34
AC
CC
ET
rat
e (m
m/d
ay)
Time of the day (hr) 11th February 2020
Fig. 17: Diurnal variation of fenugreek ETc rate on 11th February 2020 under validation of ACCC
0
1
2
3
4
5
6
9:36 11:05 12:35 14:04 15:33 17:21 18:51 20:20 21:49 23:18 0:44 2:08 3:36 5:04 6:35 8:14 9:44
AC
CC
ET
c ra
te (m
m/d
ay)
Time of Day (hr) 5th February
Fig. 18: Diurnal variation of fenugreek ETC rate on 5th February 2020 under field testing of ACCC
I t w a s f o u n d t h a t d u r i n g n i g h t t i m e , evapotranspiration was very less as compared to the day time evapotranspiration. This is consistent with the previous study with the enclosed portable chamber (Stannard 1988). In contrast, crop evapotranspiration measured by ACCC obtained during night time give significant proportion of daily Crop evapotranspiration. It may be due to heat released when the earth surface is cooling and interpreted it as available energy for crop evapotranspiration and would continuously predict appreciable crop evapotranspiration rates.
Crop Coefficient
The crop coefficient (KC) was taken as the ratio of the actual evapotranspiration to reference evapotranspiration. The actual evapotranspiration (ETC) was measured by MLs and FWB and reference evapotranspiration (ET0) was estimated using Penman Monteith equation.
Crop Coefficient measured by MLs under validation of Automatic closed canopy chamber
Fig. 19 shows the stage-wise variation of fenugreek crop coefficient with respect to days after sowing.
According to FAO 56, the growing period of fenugreek crop is divided in 4 sections as initial (0 to 7 DAS), development (7 to 38 DAS), mid (38 to 65 DAS) and late (65 and onwards) period (Fig. 19).
0
0.2
0.4
0.6
0.8
1
1.2
0 10 20 30 40 50 60 70 80 90
Cro
p C
oeff
icie
nt K
c
DAS
Initial Stage
Development Stage
Mid Stage
Harvest Stage
Fig. 19: The seasonal variation of fenugreek crop coefficient obtained by MLs under validation of ACCC
From Fig. 19, it can be interpreted that the average crop coefficient of fenugreek crop for initial stage, mid stage and harvest stage are 0.72, 1.04 and 0.82 respectively. Since, there is no reference to the crop coefficient of fenugreek by using micro-lysimeters, the above value can be recommended.
Fenugreek crop coefficient measured by MLs under field testing of ACCC
The growth stage-specific KC value of fenugreek crop were determined based on KC curves that represent the distribution of KC over time throughout the season (Fig. 20). The growth period of fenugreek crop for initial stage, development stage, mid stage and late-season stage were found as 0 to 7 DAS, 7 to 38 DAS, 38 to 65 DAS and beyond 65 DAS respectively. The stage-specific KC values of fenugreek crop were 0.69, 1.02 and 0.87 at initial stage, mid stage and late-season stage respectively. This result is Similar to result found by (Elghany et al. 2017).
0
0.2
0.4
0.6
0.8
1
1.2
0 10 20 30 40 50 60 70 80 90
Cro
p C
oeff
icie
nt K
c
DAS
Initial Stage
Development Stage
Mid Stage
Harvest Stage
Fig. 20: The seasonal variation of fenugreek crop coefficient obtained by FWB under field testing of ACCC
Kumar and Rank
48Print ISSN : 0974-1712 Online ISSN : 2230-732X
CONCLUSION 1. The developed automatic closed canopy
chamber is portable as well as more convenient, cost effective and reasonably accurate as compared to the lysimeter to measure the actual crop evapotranspiration and crop coefficient.
2. The calibration factor of ACCC was found as 1.666.
3. The crop evapotranspiration measured by lysimeter inside and outside the automatic closed canopy chamber were found reasonably comparable to each other indicating that there are no effects of changes in micro climate for short span of time inside the automatic closed canopy chamber on the plant growth processes.
4. The crop evapotranspiration measured by the micro-lysimeter kept inside the automatic closed canopy chamber and that computed by sensed temperature and relative humidity inside the automatic closed canopy chamber were found reasonably comparable to each other.
5. The crop evapotranspiration measured by field water balance method and that computed by sensed temperature and relative humidity inside the automatic closed canopy chamber were found reasonably comparable to each other.
6. The fol lowing mathematical models are proposed to measure actual crop evapotranspiration based on ML results using the ETC measured by ACCC.
ETc = 1.062 ETcc for Fenugreek crop Where; ETc = Fenugreek Crop evapotranspiration
measured by MLs (mm/day) ETcc = Fenugreek Crop evapotranspiration
measured by automatic closed canopy chamber (mm/day)
7. The following mathematical models are proposed based on FWB results to estimate actual crop evapotranspiration using the ETC measured by ACCC.
ETc = 1.068 ETcc for fenugreek crop
Where; ETc = Fenugreek Crop evapotranspiration
measured by FWB (mm/day) ETcc = Fenugreek Crop evapotranspiration
measured by automatic closed canopy chamber (mm/day)
ACKNOWLEDGEMENTSAuthor thankful to Department of soil and water conservation Engineering, College of Agricultural Engineering and Technology, Junagadh Agricultural University, Junagadh-362001, Gujarat, India.
REFERENCESAllen, R.G., Pereira, L.S., Raes, D. and Smith, M. 1998. Crop
evapotranspiration: Guidelines for computing crop water requirements. Irrig. Drain. Paper 56, UN-FAO, Rome, Itlay.
Baldocchi, D., Valentini R., Running S., Oechel, W. and Dahlman, R. 1996. Strategies for measuring and modelling carbon dioxide and water vapour fluxes over terrestrial ecosystems. Glob. Chang. Biol., 2: 159-168.
Bekku, Y., Koizumi, H., Oikawa, T. and Iwaki, H. 1997. Examination of four methods for measuring soil respiration. Appl. Soil Ecol., 5(3): 247-254.
Bowen, I.S. 1926. The ratio of heat losses by conduction and by evaporation from any water surface. Phys. Rev., 27: 779–787.
Burkart, S., Manderscheid, R. and Weigel, H.J. 2007. Design and performance of a portable gas exchange chamber system for CO2 and H2O-flux measurements in crop canopies. Environ. Exp. Bot., 61: 25–34.
Campbell, G.S. and Norman, J.M. 1998. The light environment of plant canopies. In: An Introduction to Environmental Biophysics. SSBM., pp. 247-278.
Dhavan, V. 2017. Water and Agriculture in India. Background paper for the South Asia expert panel during the Global Forum for Food and Agriculture (GFFA). OAV – German Asia-Pacific Business Association within the frame of the Bilateral Cooperation Project on the Development of International Cooperation with Asia, co-funded by the Federail Ministry of Food and Agriculture (BMEL). The Energy and Resources Institute (TERI), New Delhi.
Elghany, G.G.A., Shazly, M.M.E. and Hashem, H.A.E.A. 2017. Water management for the Fenugreek plant and its response to biofertilization in north Sinai. Egypt. J. Appl. Sci., 32: (12 B).
Gowda, P.H., Howell, T.A., Paul, G., Colaizzi, P.D., Marek, T.H., Su, B. and Copeland, K.S. 2013. Deriving hourly evapotranspiration rates with SEBS: A lysimetric evaluation. Vadose Zone J., 12(3): 102-109.
IPCC. 2001. Intergovernmental Panel on Climate Change (IPCC) third assessment report climate change 2001. IPCC. Geneva, Switzerland. Available at http://www.ipcc.ch/ accessed 19th August, 2018.

Comparison of Fenugreek Crop Evapotranspiration Measured by a Micro-lysimeter, Field Water...
49Print ISSN : 0974-1712 Online ISSN : 2230-732X
Livingston, G. and Hutchinson, G.L. 1995. Enclosure based measurement of trace gas exchange: applications and sources of error. In: Matson, P., Harris, R. (Eds.), Biogenic trace gases: Measuring emissions from soil and water. Blackwell Scientific Publications, Oxford.
Luo, C. 2018. Portable canopy chamber measurements of evapotranspiration in corn, soybean and reconstructed prairie. Agric. Water Manag., 198: 1-9.
McJannet, D.L.,Vertessy, R.A., Tapper, N.J., O’Sullivan, S.K., Beringer, J. and Cleugh, H. 1996. Soil and litter evaporation beneath re-growth and old-growth mountain ash forest. CRC for Catchment Hydrology, Clayton, Vic.
McLeod, M.K., Daniel, H., Faulkner, R. and Murison, R. 2004. Evaluation of an enclosed portable chamber to measure crop and pasture actual evapotranspiration at small scale. Agric. Water Manag., 67: 15–34.
Narmada, Water Resources, Water supply and Kalpsar Department, 2010. Details of surface water and ground water resources of Gujarat. Available at https://guj-nwrws.gujarat.gov.in. Assessed on 11th October 2019.
Panse, V.G. and Sukhatme, P.V. 1967. Statistical methods for agricultural workers. ICAR., New Delhi, pp. 57-67.
Rana, G. and Katerji, N. 2000. Measurement and Estimation of Actual Evapotranspiration in the Field under Mediterranean Climate: A Review. Eur. J. Agron., 13: 125-153.
Reicosky, D. 1990. Canopy gas exchange in the field: closed chambers. Remote Sens. Reviews., 5: 163-177.
Reicosky, D.C. and Peters, D.B. 1977. A portable chamber for rapid evapotranspiration measurements on field plots. Agron. J., 69: 729-732.
Stannard, D.I. 1988. Use of a hemispherical chamber for measurement of evapotranspiration. USGS SIRs., 1988-452, pp. 18.
Steduto, P., Cetinkoku, O., Albrizio, R. and Kanber, R. 2002. Automated closed-system canopy chamber for continuous field-crop monitoring of CO2 and H2O fluxes. Agric. For. Meteorol., 111: 171-186.
Stewart, J.B. 1984. Measurements and predictions of evapotranspiration from forested and agricultural catchments. Agric. Water Manag., 8: 1–28.
Street, L.E., Shaver, G.R., William, M., Van Wijik, M.T. 2007. What is the relationship between changes in canopy leaf area and changes in photosynthetic CO2 flux in arctic ecosystems? J. Ecol., 95: 139-150.
Thomas, M.D. and Hill, G.R. 1937. The continuous measurement of photosynthesis, respiration, and transpiration of alfalfa and wheat growing under field conditions (I). Plant Physiol., 12: 285–307.
Wagner, S.W. and Reicosky, D.C. 1992. Closed-chamber effects on leaf temperature, canopy photosynthesis, and evapotranspiration. Agron. J., 84: 731–738.
Yang, F., White, M.A., Michaelis, A.R., Ichii, K., Hashimoto, H., Votava, P., Zhu, A.X. and Nemani, R.R. 2006. Prediction of continental-scale evapotranspiration by combining MODIS and AmeriFlux data through support vector machine. IEEE Trans Geosci Remote Sens., 44: 3452–3461.