MRI-measured pelvic bone marrow adipose tissue is inversely related to DXA-measured bone mineral in...
14
MRI-measured pelvic bone marrow adipose tissue is inversely related to DXA-measured bone mineral in younger and older Adults Wei Shen, M.D. 1 , Jun Chen, B.S. 1 , Madeleine Gantz, B.S. 1 , Mark Punyanitya, M.S. 1 , Steven B Heymsfield, M.D. 2 , Dympna Gallagher, Ed.D. 1 , Jeanine Albu, M.D. 1 , Ellen Engelson, Ph.D. 1 , Donald Kotler, M.D. 1 , Xavier Pi-Sunyer, M.D. 1 , and Vicente Gilsanz, M.D. 3 1 , New York Obesity Nutrition Research Center, St. Luke's-Roosevelt Hospital and Institute of Human Nutrition, Columbia University, New York, NY 2 , Pennington Biomedical Research Center, Baton Rouge, LA 3 , Children's Imaging Research Program, Children's Hospital Los Angeles, University of Southern California, Los Angeles, CA Abstract Background/Objective—Recent research has shown an inverse relationship between bone marrow adipose tissue (BMAT) and bone mineral density (BMD). There is a lack of evidence at the macro-imaging level to establish whether increased BMAT is a cause or effect of bone loss. This cross-sectional study compared the BMAT and BMD relationship between a younger adult group at or approaching peak bone mass (PBM) (age 18.0-39.9 yrs) and an older group with potential bone loss (PoBL) (age 40.0-88 yrs). Subjects/Methods—Pelvic BMAT was evaluated in 560 healthy men and women with T1- weighted whole body magnetic resonance imaging. BMD was measured using whole body dual- energy x-ray absorptiometry. Results—An inverse correlation was observed between pelvic BMAT and pelvic, total, and spine BMD in the younger PBM group (r=-0.419 to -0.461, P<0.001) and in the older PoBL group (r=-0.405 to -0.500, P<0.001). After adjusting for age, sex, ethnicity, menopausal status, total body fat, skeletal muscle, subcutaneous and visceral adipose tissue, neither subject group (younger PBM vs. older PoBL) nor its interaction with pelvic BMAT significantly contributed to the regression models with BMD as dependent variable and pelvic BMAT as independent variable (P=0.434 to 0.928). Conclusion—Our findings indicate that an inverse relationship between pelvic BMAT and BMD is present both in younger subjects who have not yet experienced bone loss and also in older subjects. These results provide support at the macro-imaging level for the hypothesis that low BMD may be a result of preferential differentiation of mesenchymal stem cells from osteoblasts to adipocytes. Address Correspondence to: Wei Shen, MD 1090 Amsterdam Avenue, 14H New York, NY 10025 212-523-1738 212-523-3571 (fax) [email protected]. Disclosure The authors state that they have no conflicts of interest. CONFLICT OF INTEREST The authors state that they have no conflicts of interest. NIH Public Access Author Manuscript Eur J Clin Nutr. Author manuscript; available in PMC 2013 March 01. Published in final edited form as: Eur J Clin Nutr. 2012 September ; 66(9): 983–988. doi:10.1038/ejcn.2012.35. NIH-PA Author Manuscript NIH-PA Author Manuscript NIH-PA Author Manuscript
Transcript of MRI-measured pelvic bone marrow adipose tissue is inversely related to DXA-measured bone mineral in...
MRI-measured pelvic bone marrow adipose tissue is inverselyrelated to DXA-measured bone mineral in younger and olderAdults
Wei Shen, M.D.1, Jun Chen, B.S.1, Madeleine Gantz, B.S.1, Mark Punyanitya, M.S.1, StevenB Heymsfield, M.D.2, Dympna Gallagher, Ed.D.1, Jeanine Albu, M.D.1, Ellen Engelson, Ph.D.1, Donald Kotler, M.D.1, Xavier Pi-Sunyer, M.D.1, and Vicente Gilsanz, M.D.31, New York Obesity Nutrition Research Center, St. Luke's-Roosevelt Hospital and Institute ofHuman Nutrition, Columbia University, New York, NY2, Pennington Biomedical Research Center, Baton Rouge, LA3, Children's Imaging Research Program, Children's Hospital Los Angeles, University of SouthernCalifornia, Los Angeles, CA
AbstractBackground/Objective—Recent research has shown an inverse relationship between bonemarrow adipose tissue (BMAT) and bone mineral density (BMD). There is a lack of evidence atthe macro-imaging level to establish whether increased BMAT is a cause or effect of bone loss.This cross-sectional study compared the BMAT and BMD relationship between a younger adultgroup at or approaching peak bone mass (PBM) (age 18.0-39.9 yrs) and an older group withpotential bone loss (PoBL) (age 40.0-88 yrs).
Subjects/Methods—Pelvic BMAT was evaluated in 560 healthy men and women with T1-weighted whole body magnetic resonance imaging. BMD was measured using whole body dual-energy x-ray absorptiometry.
Results—An inverse correlation was observed between pelvic BMAT and pelvic, total, andspine BMD in the younger PBM group (r=-0.419 to -0.461, P<0.001) and in the older PoBL group(r=-0.405 to -0.500, P<0.001). After adjusting for age, sex, ethnicity, menopausal status, totalbody fat, skeletal muscle, subcutaneous and visceral adipose tissue, neither subject group (youngerPBM vs. older PoBL) nor its interaction with pelvic BMAT significantly contributed to theregression models with BMD as dependent variable and pelvic BMAT as independent variable(P=0.434 to 0.928).
Conclusion—Our findings indicate that an inverse relationship between pelvic BMAT andBMD is present both in younger subjects who have not yet experienced bone loss and also in oldersubjects. These results provide support at the macro-imaging level for the hypothesis that lowBMD may be a result of preferential differentiation of mesenchymal stem cells from osteoblasts toadipocytes.
Address Correspondence to: Wei Shen, MD 1090 Amsterdam Avenue, 14H New York, NY 10025 212-523-1738 212-523-3571(fax) [email protected].
Disclosure The authors state that they have no conflicts of interest.
CONFLICT OF INTERESTThe authors state that they have no conflicts of interest.
NIH Public AccessAuthor ManuscriptEur J Clin Nutr. Author manuscript; available in PMC 2013 March 01.
Published in final edited form as:Eur J Clin Nutr. 2012 September ; 66(9): 983–988. doi:10.1038/ejcn.2012.35.
NIH
-PA Author Manuscript
NIH
-PA Author Manuscript
NIH
-PA Author Manuscript
Keywordsbody composition; bone marrow adipose tissue; bone mineral density; dual-energy X-rayabsorptiometry; magnetic resonance imaging; aging
INTRODUCTIONRecent studies have reported an inverse relationship between bone marrow adipose tissue(BMAT) and bone mineral density (BMD) in human subjects (6-10). However, it isunknown whether this relationship represents a preferential differentiation of mesenchymalstem cells (MSC) into adipocytes instead of osteoblasts (3-5); or a passive accumulation ofBMAT as bone is lost and marrow space increases with aging. In the present study, wecompared the association of BMAT and BMD in younger adults who are at or approachingtheir peak bone mass (PBM) with older adults who have potential bone loss (PoBL). Aninverse correlation between BMAT and BMD before the onset of bone loss would supportthe notion of a preferential differentiation of MSCs into adipocytes instead of osteoblasts.On the other hand, if the inverse relationship between BMAT and BMD is found only inolder PoBL adults, either passive accumulation of BMAT or preferential differentiation ofMSCs into adipocytes could explain the pathophysiology related to aging.
In the present study, we investigated the relationship between BMAT and BMD in ananatomically matched region (i.e., pelvic BMAT and pelvic BMD), non-anatomicallymatched region (i.e. pelvic BMAT and spine BMD), and regional and whole body (i.e.pelvic BMAT and whole body BMD). This study design allows us to investigate therelationship between BMAT and BMD not only on a local level (i.e., MSC level) but also ona systemic level (i.e., hormonal level). A clearer understanding of the relationship betweenbone mineral and marrow fat is a critical first step toward the development of prevention andtreatment strategies for bone loss; possibly through enhancing the osteogenic differentiationof progenitor cells.
Bone interacts with both bone marrow fat and total body fat (1-2). It has been shown thatbone mass is positively related to body weight. The effect of body weight on bone mass isprobably attributed to both fat mass and lean mass (11). In this study we adjusted bodycomposition for whole body MRI measured visceral adipose tissue (VAT), subcutaneousadipose tissue (SAT) and skeletal muscle as well as fat mass index and fat free index ratio(12). Accurate adjustment of body composition allows us to investigate the relationshipbetween BMAT and BMD independent of other body components.
Some previous studies have used magnetic resonance spectroscopy (MRS) to measuremarrow fat (7-8, 13). Although MRS is considered a reference method for the measurementof fat content within a small volume of tissue (14), its application to quantifying marrow fatis limited because marrow fat is not homogeneously distributed in the cavity of one bone oracross bones (15). In contrast, magnetic resonance imaging (MRI) overcomes this limitationof MRS by measuring adipose tissue across multiple bones (9, 16). T1-weighted MRI hasnot only been validated for quantifying regional adipose tissue volume (17-18), it has alsobeen widely applied to adipose tissue measurement and serves as a reference method foradipose tissue quantification (19-22). The recently optimized water-fat imaging methods(23-24), combine the merits of both MRS and volumetric MRI methods. However, to thebest of our knowledge, there is no large scale marrow fat dataset measured by water-fatimaging available. The unique large scale T1-weighted MRI dataset (n=560) in the presentstudy enables us to provide timely evidence of the interaction between marrow fat and boneat the human macroscopic imaging level. In the present study we measured BMAT in the
Shen et al. Page 2
Eur J Clin Nutr. Author manuscript; available in PMC 2013 March 01.
NIH
-PA Author Manuscript
NIH
-PA Author Manuscript
NIH
-PA Author Manuscript
pelvic region because of its large quantifiable cancellous bone volume and its highcorrelation with BMD as shown in our previous studies (9).
SUBJECTS AND METHODSProtocol and Design
The present study analyzed existing data of healthy subjects archived at the New YorkObesity Nutrition Research Center, St. Luke's-Roosevelt Hospital, New York City, NewYork, USA. Participants were a sample of healthy men and women over the age of 18 yrsand all completed a medical history screening, physical examination, and blood studies.Ethnicity was established for each subject by self-report. Athletes, women within six monthsof delivery or breast feeding, and subjects with a history of anorexia nervosa or any otherdisease conditions were excluded by medical history review. Subjects weighing more than136.2 kg were excluded from the study due to the weight limits of MRI and dual-energy x-ray absorptiometry (DXA) system. Weight, height, and body composition were measured onthe same day as the screening examination was done.
In this study, we defined the younger PBM group as ages 18.0-39.9 years and the oldergroup as ages 40.0-88.0 years. The rationale for the cut-off ages of the younger PBM groupwas to include subjects who reached bone maturity (25) and to exclude peri-menopausalwomen who may have experienced bone loss (26-27). We used the same cut-off ages in bothmen and women to simplify comparison between genders in the regression analysis.
Because there are inconsistencies regarding the age at which bone loss begins (26-28), wehave also used an age range of 18.0-29.9 years to define the younger PBM group and50.0-88.0 years to define older PoBL group in order to eliminate the potential overlapbetween the two groups. Due to the exclusion of a large number of subjects from thesedefined age ranges (i.e., 306 vs. 560), this part of the analysis was retained as exploratory.
Dual-Energy X-Ray AbsorptiometryDXA (DPX GE Lunar, software version 4.7e, Madison, WI, USA) was used to estimateBMD, total body fat, and %fat using the whole body scan mode. All scans were acquiredand read by trained technologists. We report pelvic BMD because this site approximates thepelvic region used to measure BMAT by MRI. In addition, we also report total body BMDand total spine BMD because of their availability. The estimated precision for BMD and%fat is 1.28% and 3.3%, respectively (29). The system was routinely calibrated and qualitycontrol measures were followed as recommended by the manufacturer.
Magnetic Resonance ImagingWhole-body MRI scans were acquired as previously reported by our group (30-31) using a1.5 T General Electric system (6X Horizon, Milwaukee, WI, USA). The MRI data wereobtained using a T1-weighted, spin-echo sequence with 200-ms repetition time and a 17-msecho time. A 26-s breath hold was required during abdominal slice imaging. The field ofview is 48 cm by 48 cm with a matrix is 256 by 256. The protocol involved acquisition ofapproximately forty 10 mm thick axial images at 40 mm intervals from fingers to toes. Thesubject rested in either a prone or supine position during the procedure with the L4-L5intervertebral disc as the point of origin. Following acquisition, the bone marrow, visceral,and subcutaneous adipose tissue compartments, and skeletal muscle were segmented at theNew York Image Reading Center by trained, and cross-validated technicians using imageanalysis software (SliceOmatic, Tomovision Inc., Montreal, Canada). Technicians wereblinded to patient demographic information and test results. From a total of 596 subjects, 36were excluded due to severe inhomogeneity of the MRI adipose tissue signal. The remaining
Shen et al. Page 3
Eur J Clin Nutr. Author manuscript; available in PMC 2013 March 01.
NIH
-PA Author Manuscript
NIH
-PA Author Manuscript
NIH
-PA Author Manuscript
560 subjects were included in the study. The threshold for BMAT segmentation was set atthe same level as SAT on the grey scale (9, 16). The intraclass correlation coefficients forvolume rendering of BMAT, subcutaneous adipose tissue, visceral adipose tissue, andskeletal muscle for the same scan by different analysts are 0.99, 0.99, 0.95, and 0.99,respectively. Tissue compartment volume was calculated as:
where V is volume, Ai is each scan's cross-sectional area, h is the between-slice interval, t isthe thickness of each slice, and N is the total number of slices. Pelvic BMAT volumes werecalculated from the region that matched the pelvic region of DXA and included ilium,sacrum, ischium, pubis, coccyx and femoral heads. The pelvic region was selected forevaluation because of its large quantifiable cancellous bone volume and its high correlationwith BMD as shown in our previous studies (9). Lumbar spine BMAT is not reportedseparately because the small amount of adipose tissue in the lumbar spine could not bereliably quantified in some subjects with the current MRI protocol (9).
ETHICSThe exempt status of the present study was reviewed and approved by the InstitutionalReview Board ofSt. Luke's-Roosevelt Hospital. The original study was approved by theInstitutional Review Board ofSt. Luke's-Roosevelt Hospital and each subject gave writtenconsent to participate.
STATISTICSData are presented as the mean ± SD (Table 1). Pearson correlation coefficients amongpelvic BMAT, total body, pelvic and spine BMD were calculated separately for the youngerPBM group and the older PoBL group. Correlation coefficients were calculated betweenpelvic BMAT and BMD in the two groups after adjustment by multiple regression for age,weight and total body fat. Correlation coefficients were also calculated between pelvicBMAT and BMD in the two groups after adjustment by multiple regression for age, weight,total body fat, subcutaneous adipose tissue, visceral adipose tissue, skeletal muscle, sex,ethnicity and menopausal status.
Regression models were established with pelvic BMD, total body BMD, or spine BMD asthe dependent variable and pelvic BMAT, age, weight, total body fat, subcutaneous adiposetissue, visceral adipose tissue, skeletal muscle, sex, ethnicity, menopausal status, subjectgroup (i.e., younger PBM vs. older PoBL), and biological plausible two-way interactions aspotential independent variables. The above regression models were also tested bysubstituting muscle and fat mass by fat mass index to fat free mass index ratio.
Levene's test was used to evaluate the equality of variance among groups and the Shapiro-Wilk test was applied to test the normality of the residual distributions. When necessary,variable values were mathematically transformed to normalize the residual distributions andto equalize the residual variance across sex and ethnicity. Log transformations were appliedinitially and followed by Box-Cox transformations when necessary.
The intraclass correlation coefficient was calculated with subjects as a random effect andanalysts as a fixed effect.
Shen et al. Page 4
Eur J Clin Nutr. Author manuscript; available in PMC 2013 March 01.
NIH
-PA Author Manuscript
NIH
-PA Author Manuscript
NIH
-PA Author Manuscript
All statistical analyses were carried out using SAS 9.2 program package (SAS Institute. Inc.,Cary, NC, USA). Two-tailed (α=0.05) tests of significance were used.
RESULTSDescriptive Statistics
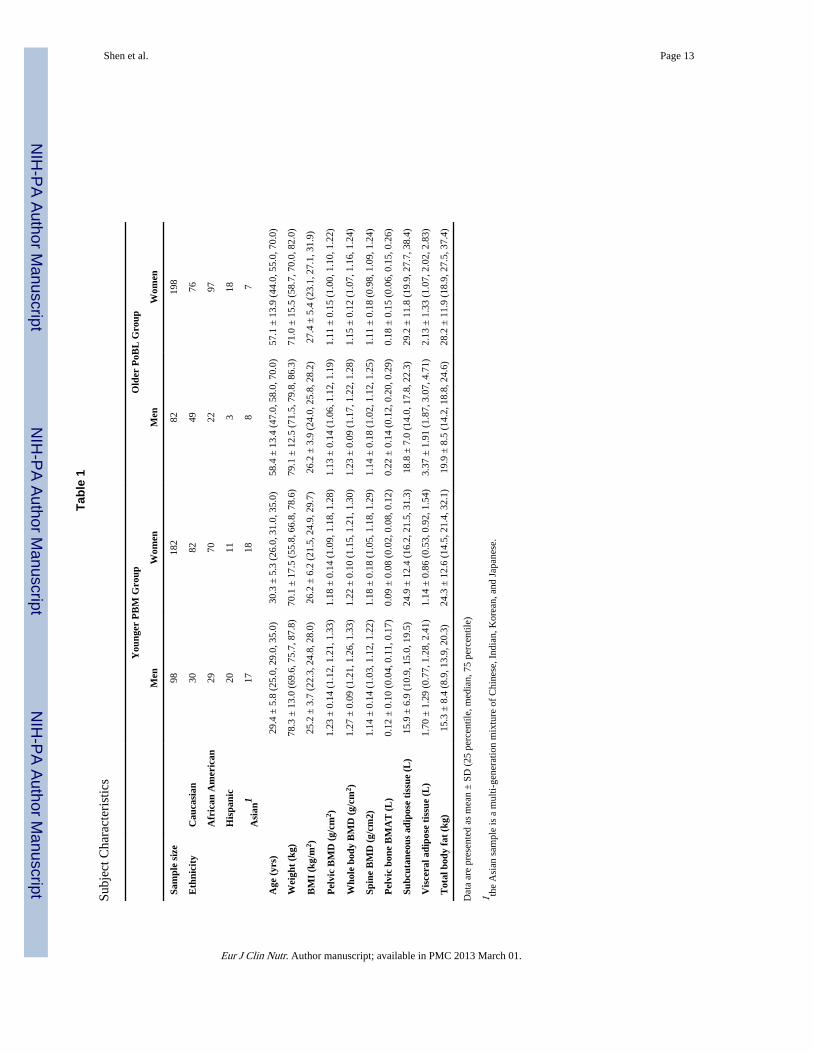
The characteristics of the subjects are shown in Table 1. Of the 380 total women, 254 werepre-menopausal and 115 were post-menopausal. The menopausal status information on 11women was missing.
Total body BMAT of the younger PBM group ranged from 0.60 to 3.08 L with a mean of1.52 L. Total body BMAT of the older PoBL group ranged from 0.50 to 3.27 L with a meanof 1.74 L. BMAT ranged from 1.1% to 31.6% of total adipose tissue with a mean of 8.0%.
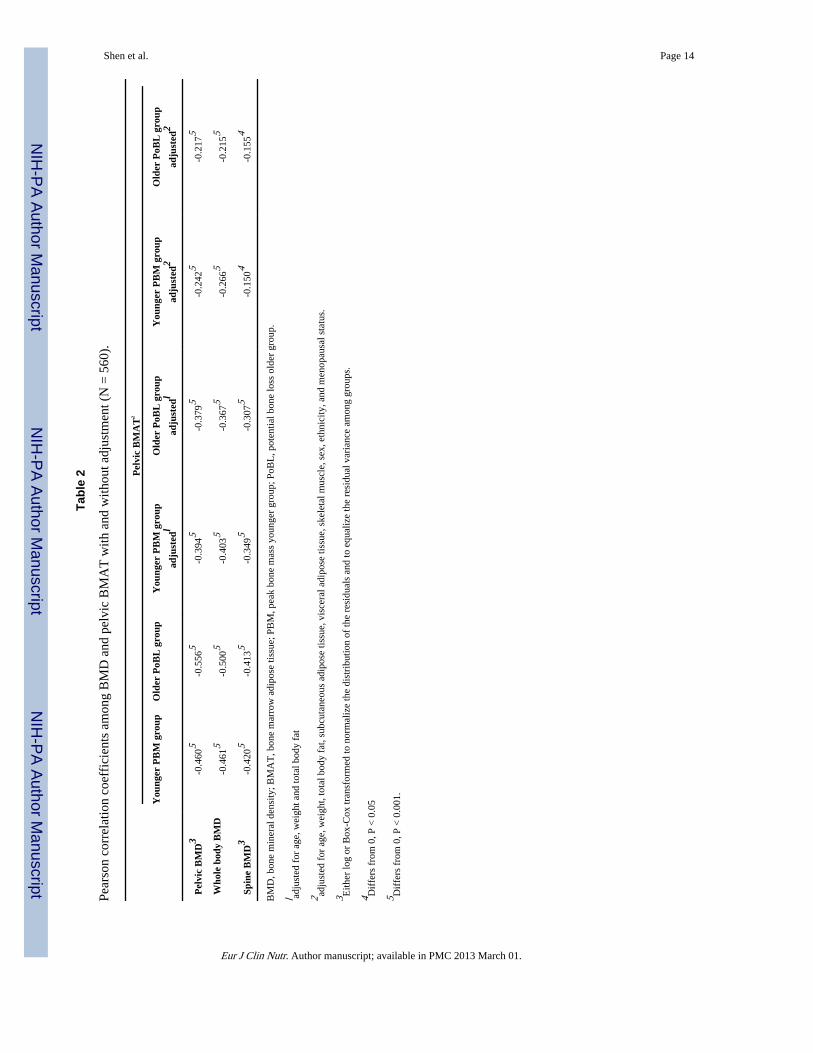
Relationship between BMAT and BMD in younger PBM and older PoBL groupAn inverse correlation was observed between logarithm or Box-Cox transformed pelvicBMAT and BMD in both the younger PBM group (pelvic BMD, r = -0.460; total BMD, r =-0.461; spine BMD, r = -0.420; all P < 0.001, n = 280) and the older PoBL group (pelvicBMD, r = -0.556; total BMD, r =-0.500, spine BMD, r = -0.413; all P < 0.001, n=280)(Figure 1). After adjustment for age, weight and total body fat, or additionally adjusted forsubcutaneous adipose tissue, visceral adipose tissue, skeletal muscle, sex, ethnicity,menopausal status, the correlation between pelvic BMAT and BMD dropped in magnitudebut remained significant (Table 2). There was no significant difference between thecorrelation coefficient of the younger PBM and older PoBL group with adjustment (P =0.532 to 0.953) and without adjustment (P = 0.149 to 0.926).
Regression models were developed with pelvic BMD, total body BMD, or spine BMD asthe dependent variable; and pelvic BMAT, age, weight, total body fat, subcutaneous adiposetissue, visceral adipose tissue, skeletal muscle, sex, ethnicity, menopausal status, and subjectgroup (i.e., younger PBM vs. older PoBL) as potential independent variables. Biologicalplausible two-way interactions were also included in the regression model as potentialindependent variables. Neither subject group nor its interaction with BMAT significantlycontributed to the BMD prediction (pelvic BMD, P = 0.438, P = 0.921 respectively; totalBMD, P = 0.896, P = 0.451 respectively; spine BMD, P = 0.683, P = 0.500 respectively). Inthese regression models, pelvic BMAT significantly contributed to BMD measures(standardized regression coefficients = -0.337 to -0.380, P < 0.001).
When fat mass index to fat free mass index ratio substituted fat and muscle mass for bodycomposition adjustment in the above regression, neither subject group nor its interactionwith BMAT significantly contributed to the BMD prediction (pelvic BMD, P = 0.464, P =0.949 respectively; total BMD, P = 0.820, P = 0.373 respectively; spine BMD, P = 0.716, P= 0.492 respectively). In these regression models, pelvic BMAT significantly contributed toBMD measures (standardized regression coefficients = -0.511 to -0.529, P < 0.001).
We also performed the above regression analyses with the younger PBM defined as age18.0-29.9 years (n=131) and the older PoBL group defined as 50.0-88.8 years (n=175).Neither age group nor its interaction with pelvic BMAT significantly entered into anyregression models with BMD as the dependent variable (pelvic BMD, P = 0.856, P = 0.738respectively; total BMD, P = 0.775, P = 0.958 respectively; spine BMD, P = 0.350, P =0.167, respectively).
Shen et al. Page 5
Eur J Clin Nutr. Author manuscript; available in PMC 2013 March 01.
NIH
-PA Author Manuscript
NIH
-PA Author Manuscript
NIH
-PA Author Manuscript
DISCUSSIONUsing MRI and DXA, the current findings provide additional support at the macroscopiclevel for an inverse relationship between BMAT and BMD; which we believe represents thecompetitive differentiation of MSCs into either osteoblasts or adipocytes. In a diversepopulation, we observed an inverse correlation between BMAT and BMD in both the olderPoBL and younger PBM groups. A strength of the present study is that, unlike mostprevious studies, we adjusted for body composition measured by whole body MRI, whichallows evaluation of interaction between fat and bone independent of SAT or VAT.Although previous studies have reported inverse relationships between BMAT and BMD(7-10), the present study is the first that systematically compares the relationship betweenBMAT and BMD in a younger PBM group and an older PoBL group of adults. Because ourresults show an inverse relationship between BMAT and BMD in the younger PBM group,this finding supports the notion that the differentiation of MSCs to either osteoblasts oradipocytes is competitive even before the onset of bone loss. Since only healthy adults wereincluded in this dataset, we assume that the possibility that we included subjects who hadundergone bone loss in the younger PBM group is low. Therefore, the low BMD in theyounger PBM group is likely due to either decreased differentiation or decreasedproliferation of MSCs (32-33). In the older group of adults, the inverse relationship betweenBMAT and BMD may also be explained by a competitive differentiation of MSCs toosteoblasts or adipocytes. It is also possible that BMAT passively fills the empty space oftrabecular bone loss with aging.
In the present study, we observed an inverse relationship between BMAT and BMD in ananatomically matched region (i.e., pelvic BMAT and pelvic BMD), non-anatomicallymatched region (i.e. pelvic BMAT and spine BMD), and regional and whole body (i.e.pelvic BMAT and whole body BMD). Therefore, it is plausible that both local level MSCdifferentiation and systemic level hormonal factors contribute to the observed inverserelationship between BMAT and BMD. Future studies may investigate potential targets toprevent and treat osteoporosis at both the MSC level and hormonal level.
Our results provide in vivo human imaging evidence in support of in vitro studies that haveshown osteoblastogenesis and adipogenesis are competing processes. In vitro studies havefound that activation of peroxisome proliferator-activated receptor-γ (PPARγ) promotesadipogenesis and that suppression of PPARγ transactivation switches cell fate of bonemarrow stem cells from adipocytes into osteoblasts (34-35). Although certainthiazolidinedione derivatives can activate PPARγ and enhance bone marrow adipositywithout altering BMD (34, 36), it remains plausible that adipocyte expansion may occur atthe expense of bone in the absence of pharmaceutical intervention. In addition, other studieshave found that PPARγ and its ligands promote osteoclast differentiation and boneresorption (37-38). In vitro studies have shown that mechanical influences enhanceosteoblastogenesis through inhibiting adipogenesis (39). Future studies should investigatewhether pharmaceutically or mechanically inhibiting adipogenesis in bone marrow could beused to prevent and treat osteoporosis. There are multiple factors that influence thedifferentiation of bone marrow MSCs through multi-pathways (40) and the ways in whichthese factors work are not fully understood. The application of combined molecular biologytechniques and human imaging methods could further our understanding of thephysiological role of bone marrow fat to facilitate the prevention and treatment ofosteoporosis (40).
A critical aspect of the present study design was determining the cut-off ages for bothmaturity of bone and bone loss. Since females reach skeletal maturity at about age 17 andmales at about age 18 (41-42), we used age 18 as the cutoff for both genders. The cut-off
Shen et al. Page 6
Eur J Clin Nutr. Author manuscript; available in PMC 2013 March 01.
NIH
-PA Author Manuscript
NIH
-PA Author Manuscript
NIH
-PA Author Manuscript
age between the younger PBM group and the older PoBL group was set at 40 years to avoidincluding peri-menopausal subjects in the younger PBM group. Since we only includedhealthy subjects in this dataset, we assume that no major bone loss had occurred in theyounger PBM group. Although some studies suggest that bone loss begins as early as thethird decade (28), most evidence suggests that bone loss does not begin until menopause inwomen and approximately age 65 in men (26-27). Setting age 40 as the lower age limit forthe older PoBL groups could lead to the inclusion of subjects without bone loss in this groupand could therefore slightly under power the study. However, the large sample size shouldhave compensated for this small loss of power.
Because of the inconsistencies regarding the age at which bone loss begins (26-28), we alsoexamined the BMD and BMAT relationship using ages 18.0-29.9 years to define theyounger PBM group, and ages 50.0-88.0 years to define the older PoBL group, and theresults did not change. It would have been ideal if the present study also investigated a PBMgroup of subjects below the age of 25 who had reached sexual and bone maturity. However,we did not have an adequate sample size for subjects below the age of 25. An earlier studyreported an inverse relationship between marrow fat and BMD in women below age 25 (10).Our studies and previous ones collectively contribute to the growing evidence supporting acompetitive relationship between marrow fat and BMD.
Limitations and future directionsDXA BMD readings can be underestimatd when BMAT is present. This raises the questionof whether the observed inverse relationship between BMAT and BMD is an artifact.Previous studies have shown that the underestimation of BMD caused by marrow fat is onlysevere in osteoporosis with a small amount of extraosseous fat (43). Hangartner et al.reported that a 50% increase in marrow fat content could only cause underestimation of theapparent areal bone density by 5–6% (44). In addition, the same change in soft-tissue fatcontent (not in the path of the beam traversing the bone) causes overestimation of bonedensity (6, 43-44). Considering that subjects in the present study had a mean BMD ≥ 1.14 g/cm2 and a mean subcutaneous fat of ≥ 17.4 L, it is unlikely that there was a majorunderestimation of BMD, if at all. More detailed discussion can be found in our previousreport (9). A recent study has also shown that the changes in BMAT are not related tochanges in BMD during weight loss (16). In addition, the underestimation of BMD causedby the presence of BMAT is unlikely to play a major role in the inverse relationship betweenBMAT and BMD when BMAT and BMD are measured at different locations (i.e., betweenspine BMD and pelvic BMAT).
A second limitation of the present study is that the sample is cross-sectional; therefore, wecannot directly evaluate the relationship between BMD loss and BMAT increase. A recentlongitudinal study found that bone acquisition is inversely related to marrow fat adipositychanges in cortical bone in young females (45). Future longitudinal studies should ideallyinvestigate whether BMAT contributes to bone quality and fracture risk by examining therelationship with both cortical and cancellous bone density and architecture in a diversepopulation.
A third limitation is that we did not have DXA measurements available for the femoral neckand lumbar spine; which could have been used to determine which individuals hadosteoporosis (46). In addition, studies using Quantitative Computed Tomography (QCT) areadvantageous since this method allows for the differentiation of cortical and cancellous bone(47). Future studies should therefore include QCT methods as a means to expand ourfindings, and it would be especially interesting in an osteoporotic population.
Shen et al. Page 7
Eur J Clin Nutr. Author manuscript; available in PMC 2013 March 01.
NIH
-PA Author Manuscript
NIH
-PA Author Manuscript
NIH
-PA Author Manuscript
A fourth limitation is that BMAT was semi-quantitatively measured using the singlethreshold MRI methods applied in the current study. However, less accurate methods reduceobserved correlations from their potential maximum. Thus, it is likely that the application ofmore accurate BMAT measurement methods would strengthen the observed inverseassociation between BMD and BMAT. In addition, the use of 10 mm skip 40 mm MRIacquisition protocol can induce ~6% error compared to a contiguous protocol (unpublisheddata, n=27, r = 0.97, P<0.001). We expect that future studies that use contiguous MRIacquisition protocol will strengthen the observed association between BMD and BMAT.
Information on bone turnover biomarkers, hormonal measures, and vitamin D levels was notavailable in the present study. This serves as a limitation since these factors are known to berelated to BMD.
Methods that can accurately quantify BMAT in cancellous bones, both in a single bone andmultiple bones, need to be developed to better understand the relationship between BMATand BMD. These future studies would ideally investigate whether BMAT contributes tobone quality and fracture risk by examining the relationship with both cortical andcancellous bone density and architecture. Longitudinal studies could help clarify whether therelationship between BMAT and BMD is causal in cancellous bone across diversepopulations. In vivo studies have recently found that biphosphonates reduce marrow fat (48)and in vitro studies have found that mechanical influences enhance osteoblastogenesisthrough inhibiting adipogenesis (39). Future studies could rigorously test whether inhibitingadipogenesis in bone marrow could prevent and treat osteoporosis. There are many factorsinfluencing the differentiation of bone marrow MSCs through multi-pathways (40) and theways in which these factors work are not fully understood. The application of combinedmolecular biology techniques and human imaging methods could also help explain thephysiological role of bone marrow fat as well as facilitate the prevention and treatment ofosteoporosis (40).
CONCLUSIONSOur findings indicate that an inverse relationship between BMAT and BMD exists in bothhealthy older adults with potential bone loss and healthy younger adults at or approachingpeak bone mass. This result provides macro-imaging level support for the concept that lowBMD may be a result of preferential differentiation of MSCs into adipocytes instead ofosteoblasts.
AcknowledgmentsThe project described was supported by Award Number R21DK082937 from the National Institute Of DiabetesAnd Digestive And Kidney Diseases, United States. The content is solely the responsibility of the authors and doesnot necessarily represent the official views of the National Institute Of Diabetes And Digestive And KidneyDiseases or the National Institutes of Health. The project was also supported by National Institutes of Health GrantsR01 DK40414, R01 DK42618, and P30 DK26687, R29-AG14715, F32-AG05679, M01 RR00645, UL1RR024156.
REFERENCES1. Duque G. Bone and fat connection in aging bone. Curr Opin Rheumatol. Jul; 2008 20(4):429–34.
[PubMed: 18525356]
2. Rosen CJ, Bouxsein ML. Mechanisms of disease: is osteoporosis the obesity of bone? Nat ClinPract Rheumatol. Jan; 2006 2(1):35–43. [PubMed: 16932650]
3. Quarto R, Thomas D, Liang CT. Bone progenitor cell deficits and the age-associated decline in bonerepair capacity. Calcif Tissue Int. Feb; 1995 56(2):123–9. [PubMed: 7736320]
Shen et al. Page 8
Eur J Clin Nutr. Author manuscript; available in PMC 2013 March 01.
NIH
-PA Author Manuscript
NIH
-PA Author Manuscript
NIH
-PA Author Manuscript
4. Mullender MG, van der Meer DD, Huiskes R, Lips P. Osteocyte density changes in aging andosteoporosis. Bone. Feb; 1996 18(2):109–13. [PubMed: 8833204]
5. Rickard DJ, Kassem M, Hefferan TE, Sarkar G, Spelsberg TC, Riggs BL. Isolation andcharacterization of osteoblast precursor cells from human bone marrow. J Bone Miner Res. Mar;1996 11(3):312–24. [PubMed: 8852942]
6. Wehrli FW, Hopkins JA, Hwang SN, Song HK, Snyder PJ, Haddad JG. Cross-sectional study ofosteopenia with quantitative MR imaging and bone densitometry. Radiology. Nov; 2000 217(2):527–38. [PubMed: 11058656]
7. Shih TT, Chang CJ, Hsu CY, Wei SY, Su KC, Chung HW. Correlation of bone marrow lipid watercontent with bone mineral density on the lumbar spine. Spine. Dec 15; 2004 29(24):2844–50.[PubMed: 15599288]
8. Griffith JF, Yeung DK, Antonio GE, Lee FK, Hong AW, Wong SY, et al. Vertebral bone mineraldensity, marrow perfusion, and fat content in healthy men and men with osteoporosis: dynamiccontrast-enhanced MR imaging and MR spectroscopy. Radiology. Sep; 2005 236(3):945–51.[PubMed: 16055699]
9. Shen W, Chen J, Punyanitya M, Shapses S, Heshka S, Heymsfield SB. MRI-measured bone marrowadipose tissue is inversely related to DXA-measured bone mineral in Caucasian women. OsteoporosInt. May; 2007 18(5):641–7. [PubMed: 17139464]
10. Di Iorgi N, Rosol M, Mittelman SD, Gilsanz V. Reciprocal relation between marrow adiposity andthe amount of bone in the axial and appendicular skeleton of young adults. J Clin EndocrinolMetab. Jun; 2008 93(6):2281–6. [PubMed: 18381577]
11. Reid IR. Relationships between fat and bone. Osteoporos Int. May; 2008 19(5):595–606. [PubMed:17965817]
12. Kyle UG, Piccoli A, Pichard C. Body composition measurements: interpretation finally made easyfor clinical use. Curr Opin Clin Nutr Metab Care. Jul; 2003 6(4):387–93. [PubMed: 12806211]
13. Schellinger D, Lin CS, Lim J, Hatipoglu HG, Pezzullo JC, Singer AJ. Bone marrow fat and bonemineral density on proton MR spectroscopy and dual-energy X-ray absorptiometry: their ratio as anew indicator of bone weakening. AJR Am J Roentgenol. Dec; 2004 183(6):1761–5. [PubMed:15547224]
14. Kim H, Taksali SE, Dufour S, Befroy D, Goodman TR, Petersen KF, et al. Comparative MR studyof hepatic fat quantification using single-voxel proton spectroscopy, two-point dixon and three-point IDEAL. Magn Reson Med. Mar; 2008 59(3):521–7. [PubMed: 18306404]
15. Vande Berg BC, Malghem J, Lecouvet FE, Maldague B. Magnetic resonance imaging of normalbone marrow. Eur Radiol. 1998; 8(8):1327–34. [PubMed: 9853209]
16. Bosy-Westphal A, Later W, Schautz B, Lagerpusch M, Goele K, Heller M, et al. Impact of intra-and extra-osseous soft tissue composition on changes in bone mineral density with weight loss andregain. Obesity (Silver Spring). Jul; 2011 19(7):1503–10. [PubMed: 21372803]
17. Abate N, Burns D, Peshock RM, Garg A, Grundy SM. Estimation of adipose tissue mass bymagnetic resonance imaging: validation against dissection in human cadavers. J Lipid Res. Aug;1994 35(8):1490–6. [PubMed: 7989873]
18. Mitsiopoulos N, Baumgartner RN, Heymsfield SB, Lyons W, Gallagher D, Ross R. Cadavervalidation of skeletal muscle measurement by magnetic resonance imaging and computerizedtomography. J Appl Physiol. 1998; 85:115–22. [PubMed: 9655763]
19. Brambilla P, Bedogni G, Moreno LA, Goran MI, Gutin B, Fox KR, et al. Crossvalidation ofanthropometry against magnetic resonance imaging for the assessment of visceral andsubcutaneous adipose tissue in children. Int J Obes (Lond). Jan; 2006 30(1):23–30. [PubMed:16344845]
20. Ross R, Leger L, Morris D, Guise Jd, Guardo R. Quantification of adipose tissue by MRI:relationship with anthropometric variables. J Appl Physiol. Feb; 1992 72(2):787–95. [PubMed:1559959]
21. Owens S, Litaker M, Allison J, Riggs S, Ferguson M, Gutin B. Prediction of visceral adipose tissuefrom simple anthropometric measurements in youths with obesity. Obes Res. Jan; 1999 7(1):16–22. [PubMed: 10023726]
Shen et al. Page 9
Eur J Clin Nutr. Author manuscript; available in PMC 2013 March 01.
NIH
-PA Author Manuscript
NIH
-PA Author Manuscript
NIH
-PA Author Manuscript

22. Grunfeld C, Rimland D, Gibert CL, Powderly WG, Sidney S, Shlipak MG, et al. Association ofupper trunk and visceral adipose tissue volume with insulin resistance in control and HIV-infectedsubjects in the FRAM study. J Acquir Immune Defic Syndr. Nov 1; 2007 46(3):283–90. [PubMed:18167644]
23. Xiang QS. Two-point water-fat imaging with partially-opposed-phase (POP) acquisition: anasymmetric Dixon method. Magn Reson Med. Sep; 2006 56(3):572–84. [PubMed: 16894578]
24. Meisamy S, Hines CD, Hamilton G, Sirlin CB, McKenzie CA, Yu H, et al. Quantification ofhepatic steatosis with T1-independent, T2-corrected MR imaging with spectral modeling of fat:blinded comparison with MR spectroscopy. Radiology. Mar; 2011 258(3):767–75. [PubMed:21248233]
25. Kalkwarf HJ, Zemel BS, Gilsanz V, Lappe JM, Horlick M, Oberfield S, et al. The bone mineraldensity in childhood study: bone mineral content and density according to age, sex, and race. JClin Endocrinol Metab. Jun; 2007 92(6):2087–99. [PubMed: 17311856]
26. Branca F, Valtuena S. Calcium, physical activity and bone health--building bones for a strongerfuture. Public Health Nutr. Feb; 2001 4(1A):117–23. [PubMed: 11255501]
27. Khosla S, Riggs BL. Pathophysiology of age-related bone loss and osteoporosis. Endocrinol MetabClin North Am. Dec; 2005 34(4):1015–30. xi. [PubMed: 16310636]
28. Cromer B, Harel Z. Adolescents: at increased risk for osteoporosis? Clin Pediatr (Phila). Oct; 200039(10):565–74. [PubMed: 11063037]
29. Russell-Aulet M, Wang J, Thornton J, Pierson RNJ. Comparison of dual-photon absorptiometrysystems for total-body bone and soft tissue measurements: dual-energy X-rays versus gadolinium153. J Bone Miner Res. Apr; 1991 6(4):411–5. [PubMed: 1858524]
30. Gallagher D, Belmonte D, Deurenberg P, Wang Z, Krasnow N, Pi-Sunyer FX, et al. Organ-tissuemass measurement allows modeling of REE and metabolically active tissue mass. Am J Physiol.Aug; 1998 275(2 Pt 1):E249–58. [PubMed: 9688626]
31. Heymsfield SB, Gallagher D, Kotler DP, Wang Z, Allison DB, Heshka S. Body-size dependenceof resting energy expenditure can be attributed to nonenergetic homogeneity of fat-free mass. AmJ Physiol Endocrinol Metab. Jan; 2002 282(1):E132–8. [PubMed: 11739093]
32. Bianco P, Gehron Robey P. Marrow stromal stem cells. J Clin Invest. Jun; 2000 105(12):1663–8.[PubMed: 10862779]
33. Pittenger MF, Mackay AM, Beck SC, Jaiswal RK, Douglas R, Mosca JD, et al. Multilineagepotential of adult human mesenchymal stem cells. Science. Apr 2; 1999 284(5411):143–7.[PubMed: 10102814]
34. Lazarenko OP, Rzonca SO, Hogue WR, Swain FL, Suva LJ, Lecka-Czernik B. Rosiglitazoneinduces decreases in bone mass and strength that are reminiscent of aged bone. Endocrinology.Jun; 2007 148(6):2669–80. [PubMed: 17332064]
35. Takada I, Suzawa M, Matsumoto K, Kato S. Suppression of PPAR transactivation switches cellfate of bone marrow stem cells from adipocytes into osteoblasts. Ann N Y Acad Sci. Nov.20071116:182–95. [PubMed: 17656564]
36. Botolin S, McCabe LR. Inhibition of PPARgamma prevents type I diabetic bone marrow adipositybut not bone loss. J Cell Physiol. Dec; 2006 209(3):967–76. [PubMed: 16972249]
37. Takagi K, Kudo A. Bone marrow stromal cell lines having high potential for osteoclast-supportingactivity express PPARgamma1 and show high potential for differentiation into adipocytes. J BoneMiner Metab. 2008; 26(1):13–23. [PubMed: 18095059]
38. Wan Y, Chong LW, Evans RM. PPAR-gamma regulates osteoclastogenesis in mice. Nat Med.Dec; 2007 13(12):1496–503. [PubMed: 18059282]
39. Sen B, Xie Z, Case N, Styner M, Rubin CT, Rubin J. Mechanical signal influence on mesenchymalstem cell fate is enhanced by incorporation of refractory periods into the loading regimen. JBiomech. Feb 24; 2011 44(4):593–9. [PubMed: 21130997]
40. Gimble JM, Zvonic S, Floyd ZE, Kassem M, Nuttall ME. Playing with bone and fat. J CellBiochem. May 15; 2006 98(2):251–66. [PubMed: 16479589]
41. Matkovic V, Jelic T, Wardlaw GM, Ilich JZ, Goel PK, Wright JK, et al. Timing of peak bone massin Caucasian females and its implication for the prevention of osteoporosis. Inference from across-sectional model. J Clin Invest. Feb; 1994 93(2):799–808. [PubMed: 8113412]
Shen et al. Page 10
Eur J Clin Nutr. Author manuscript; available in PMC 2013 March 01.
NIH
-PA Author Manuscript
NIH
-PA Author Manuscript
NIH
-PA Author Manuscript
42. Heaney RP, Abrams S, Dawson-Hughes B, Looker A, Marcus R, Matkovic V, et al. Peak bonemass. Osteoporos Int. 2000; 11(12):985–1009. [PubMed: 11256898]
43. Bolotin HH, Sievanen H, Grashuis JL. Patient-specific DXA bone mineral density inaccuracies:quantitative effects of nonuniform extraosseous fat distributions. J Bone Miner Res. Jun; 200318(6):1020–7. [PubMed: 12817754]
44. Hangartner TN, Johnston CC. Influence of fat on bone measurements with dual-energyabsorptiometry. Bone Miner. Apr; 1990 9(1):71–81. [PubMed: 2337690]
45. Di Iorgi N, Mo AO, Grimm K, Wren TA, Dorey F, Gilsanz V. Bone acquisition in healthy youngfemales is reciprocally related to marrow adiposity. J Clin Endocrinol Metab. Jun; 2010 95(6):2977–82. [PubMed: 20392872]
46. Assessment of fracture risk and its application to screening for postmenopausal osteoporosis:report of a WHO study group. World Health Organization; Geneva, Switzerland: 1994. ReportNo.: Technical report series, no. 843
47. Engelke K, Libanati C, Liu Y, Wang H, Austin M, Fuerst T, et al. Quantitative computedtomography (QCT) of the forearm using general purpose spiral whole-body CT scanners:accuracy, precision and comparison with dual-energy X-ray absorptiometry (DXA). Bone. Jul;2009 45(1):110–8. [PubMed: 19345291]
48. Duque G, Li W, Adams M, Xu S, Phipps R. Effects of risedronate on bone marrow adipocytes inpostmenopausal women. Osteoporos Int. Jul 27.2010
Shen et al. Page 11
Eur J Clin Nutr. Author manuscript; available in PMC 2013 March 01.
NIH
-PA Author Manuscript
NIH
-PA Author Manuscript
NIH
-PA Author Manuscript
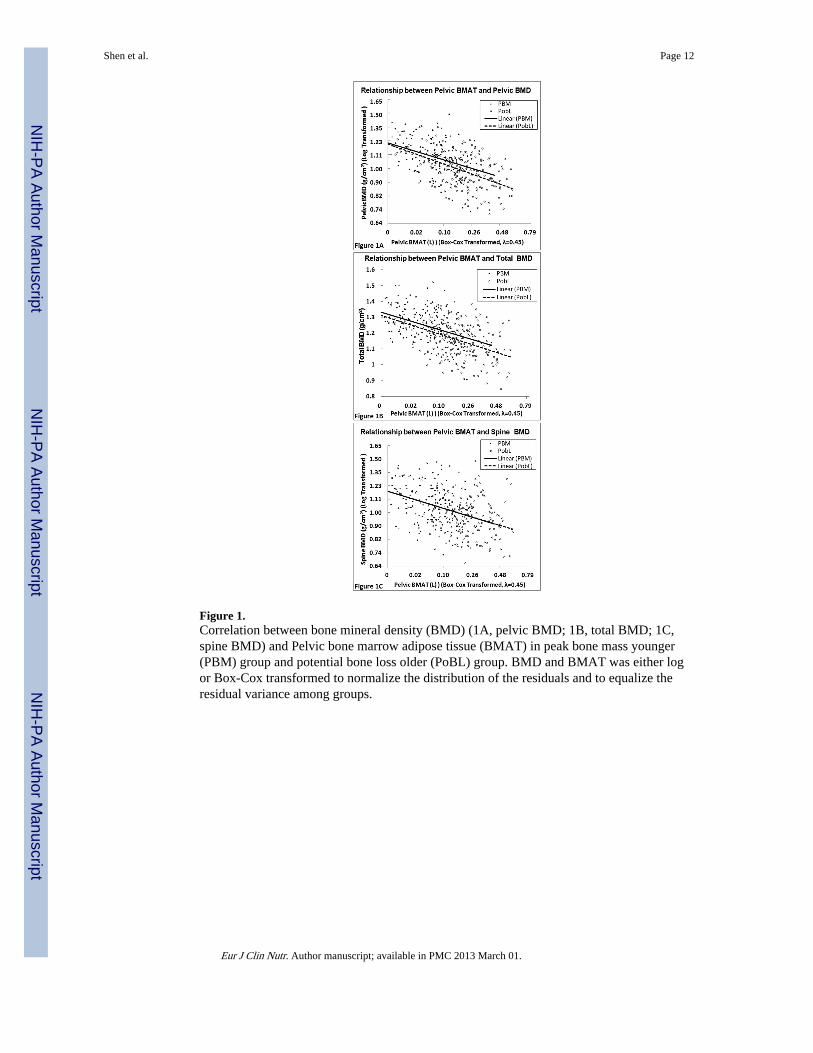
Figure 1.Correlation between bone mineral density (BMD) (1A, pelvic BMD; 1B, total BMD; 1C,spine BMD) and Pelvic bone marrow adipose tissue (BMAT) in peak bone mass younger(PBM) group and potential bone loss older (PoBL) group. BMD and BMAT was either logor Box-Cox transformed to normalize the distribution of the residuals and to equalize theresidual variance among groups.
Shen et al. Page 12
Eur J Clin Nutr. Author manuscript; available in PMC 2013 March 01.
NIH
-PA Author Manuscript
NIH
-PA Author Manuscript
NIH
-PA Author Manuscript
NIH
-PA Author Manuscript
NIH
-PA Author Manuscript
NIH
-PA Author Manuscript
Shen et al. Page 13
Tabl
e 1
Subj
ect C
hara
cter
istic
s
You
nger
PB
M G
roup
Old
er P
oBL
Gro
up
Men
Wom
enM
enW
omen
Sam
ple
size
9818
282
198
Eth
nici
tyC
auca
sian
3082
4976
Afr
ican
Am
eric
an29
7022
97
His
pani
c20
113
18
Asi
an1
1718
87
Age
(yr
s)29
.4 ±
5.8
(25
.0, 2
9.0,
35.
0)30
.3 ±
5.3
(26
.0, 3
1.0,
35.
0)58
.4 ±
13.
4 (4
7.0,
58.
0, 7
0.0)
57.1
± 1
3.9
(44.
0, 5
5.0,
70.
0)
Wei
ght
(kg)
78.3
± 1
3.0
(69.
6, 7
5.7,
87.
8)70
.1 ±
17.
5 (5
5.8,
66.
8, 7
8.6)
79.1
± 1
2.5
(71.
5, 7
9.8,
86.
3)71
.0 ±
15.
5 (5
8.7,
70.
0, 8
2.0)
BM
I (k
g/m
2 )25
.2 ±
3.7
(22
.3, 2
4.8,
28.
0)26
.2 ±
6.2
(21
.5, 2
4.9,
29.
7)26
.2 ±
3.9
(24
.0, 2
5.8,
28.
2)27
.4 ±
5.4
(23
.1, 2
7.1,
31.
9)
Pel
vic
BM
D (
g/cm
2 )1.
23 ±
0.1
4 (1
.12,
1.2
1, 1
.33)
1.18
± 0
.14
(1.0
9, 1
.18,
1.2
8)1.
13 ±
0.1
4 (1
.06,
1.1
2, 1
.19)
1.11
± 0
.15
(1.0
0, 1
.10,
1.2
2)
Who
le b
ody
BM
D (
g/cm
2 )1.
27 ±
0.0
9 (1
.21,
1.2
6, 1
.33)
1.22
± 0
.10
(1.1
5, 1
.21,
1.3
0)1.
23 ±
0.0
9 (1
.17,
1.2
2, 1
.28)
1.15
± 0
.12
(1.0
7, 1
.16,
1.2
4)
Spin
e B
MD
(g/
cm2)
1.14
± 0
.14
(1.0
3, 1
.12,
1.2
2)1.
18 ±
0.1
8 (1
.05,
1.1
8, 1
.29)
1.14
± 0
.18
(1.0
2, 1
.12,
1.2
5)1.
11 ±
0.1
8 (0
.98,
1.0
9, 1
.24)
Pel
vic
bone
BM
AT
(L
)0.
12 ±
0.1
0 (0
.04,
0.1
1, 0
.17)
0.09
± 0
.08
(0.0
2, 0
.08,
0.1
2)0.
22 ±
0.1
4 (0
.12,
0.2
0, 0
.29)
0.18
± 0
.15
(0.0
6, 0
.15,
0.2
6)
Subc
utan
eous
adi
pose
tis
sue
(L)
15.9
± 6
.9 (
10.9
, 15.
0, 1
9.5)
24.9
± 1
2.4
(16.
2, 2
1.5,
31.
3)18
.8 ±
7.0
(14
.0, 1
7.8,
22.
3)29
.2 ±
11.
8 (1
9.9,
27.
7, 3
8.4)
Vis
cera
l adi
pose
tis
sue
(L)
1.70
± 1
.29
(0.7
7, 1
.28,
2.4
1)1.
14 ±
0.8
6 (0
.53,
0.9
2, 1
.54)
3.37
± 1
.91
(1.8
7, 3
.07,
4.7
1)2.
13 ±
1.3
3 (1
.07,
2.0
2, 2
.83)
Tot
al b
ody
fat
(kg)
15.3
± 8
.4 (
8.9,
13.
9, 2
0.3)
24.3
± 1
2.6
(14.
5, 2
1.4,
32.
1)19
.9 ±
8.5
(14
.2, 1
8.8,
24.
6)28
.2 ±
11.
9 (1
8.9,
27.
5, 3
7.4)
Dat
a ar
e pr
esen
ted
as m
ean
± S
D (
25 p
erce
ntile
, med
ian,
75
perc
entil
e)
1 the
Asi
an s
ampl
e is
a m
ulti-
gene
ratio
n m
ixtu
re o
f C
hine
se, I
ndia
n, K
orea
n, a
nd J
apan
ese.
Eur J Clin Nutr. Author manuscript; available in PMC 2013 March 01.
NIH
-PA Author Manuscript
NIH
-PA Author Manuscript
NIH
-PA Author Manuscript
Shen et al. Page 14
Tabl
e 2
Pear
son
corr
elat
ion
coef
fici
ents
am
ong
BM
D a
nd p
elvi
c B
MA
T w
ith a
nd w
ithou
t adj
ustm
ent (
N =
560
).
Pel
vic
BM
AT
†
You
nger
PB
M g
roup
Old
er P
oBL
gro
upY
oung
er P
BM
gro
up
adju
sted
lO
lder
PoB
L g
roup
adju
sted
lY
oung
er P
BM
gro
up
adju
sted
2O
lder
PoB
L g
roup
adju
sted
2
Pel
vic
BM
D3
-0.4
605
-0.5
565
-0.3
945
-0.3
795
-0.2
425
-0.2
175
Who
le b
ody
BM
D-0
.461
5-0
.500
5-0
.403
5-0
.367
5-0
.266
5-0
.215
5
Spin
e B
MD
3-0
.420
5-0
.413
5-0
.349
5-0
.307
5-0
.150
4-0
.155
4
BM
D, b
one
min
eral
den
sity
; BM
AT
, bon
e m
arro
w a
dipo
se ti
ssue
; PB
M, p
eak
bone
mas
s yo
unge
r gr
oup;
PoB
L, p
oten
tial b
one
loss
old
er g
roup
.
l adju
sted
for
age
, wei
ght a
nd to
tal b
ody
fat
2 adju
sted
for
age
, wei
ght,
tota
l bod
y fa
t, su
bcut
aneo
us a
dipo
se ti
ssue
, vis
cera
l adi
pose
tiss
ue, s
kele
tal m
uscl
e, s
ex, e
thni
city
, and
men
opau
sal s
tatu
s.
3 Eith
er lo
g or
Box
-Cox
tran
sfor
med
to n
orm
aliz
e th
e di
stri
butio
n of
the
resi
dual
s an
d to
equ
aliz
e th
e re
sidu
al v
aria
nce
amon
g gr
oups
.
4 Dif
fers
fro
m 0
, P <
0.0
5
5 Dif
fers
fro
m 0
, P <
0.0
01.
Eur J Clin Nutr. Author manuscript; available in PMC 2013 March 01.