MEASURED PERFORMANCE OF SLURRY WALLS ENF MAY ...
361
MEASURED PERFORMANCE OF SLURRY WALLS ENF by Dimitrios C. Konstantakos B.S. Civil and Environmental Engineering, University of Massachusetts Lowell, 1998 Submitted to the Department of Civil and Environmental Engineering in Partial Fulfillment of the Requirements for the Degree of MASTER OF SCIENCE IN CIVIL AND ENVIRONMENTAL ENGINEERING At the Massachusetts Institute of Technology DUNY. 20001 May 2000 © 2000, Massachusetts Institute of Technology All rights reserved MASSACHUSETTS lAISTITUTE MAY 1 o 2000 LIBRARIES Signature of Author IUepartment of Civil and Environmental Engineering May 19, 2000 Certified by / 4: Andrew J. Whittle Associate Professor Civil and Environmental Engineering Thesis Supervisor Accepted by Daniele Veneziano Chairman, Departmental Committee on Graduate Studies
-
Upload
khangminh22 -
Category
Documents
-
view
0 -
download
0
Transcript of MEASURED PERFORMANCE OF SLURRY WALLS ENF MAY ...

MEASURED PERFORMANCE OF SLURRY WALLS ENF
by
Dimitrios C. Konstantakos
B.S. Civil and Environmental Engineering,
University of Massachusetts Lowell, 1998
Submitted to the Department of Civil and Environmental Engineering
in Partial Fulfillment of the Requirements for the Degree of
MASTER OF SCIENCE IN CIVIL AND ENVIRONMENTAL ENGINEERING
At the
Massachusetts Institute of TechnologyDUNY. 20001
May 2000© 2000, Massachusetts Institute of Technology
All rights reserved
MASSACHUSETTS lAISTITUTE
MAY 1 o 2000
LIBRARIES
Signature of AuthorIUepartment of Civil and Environmental Engineering
May 19, 2000
Certified by/ 4: Andrew J. Whittle
Associate Professor Civil and Environmental EngineeringThesis Supervisor
Accepted byDaniele Veneziano
Chairman, Departmental Committee on Graduate Studies

-A
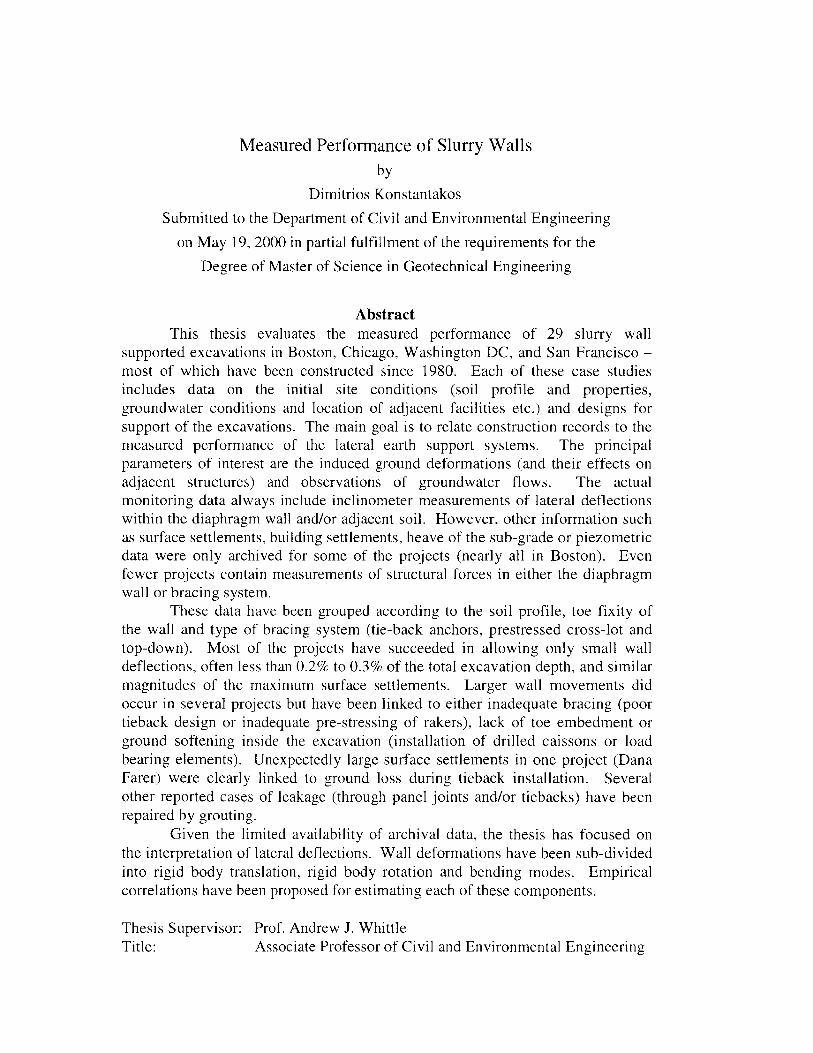
Measured Performance of Slurry Wallsby
Dimitrios Konstantakos
Submitted to the Department of Civil and Environmental Engineering
on May 19, 2000 in partial fulfillment of the requirements for the
Degree of Master of Science in Geotechnical Engineering
AbstractThis thesis evaluates the measured performance of 29 slurry wall
supported excavations in Boston, Chicago, Washington DC, and San Francisco -most of which have been constructed since 1980. Each of these case studiesincludes data on the initial site conditions (soil profile and properties,groundwater conditions and location of adjacent facilities etc.) and designs forsupport of the excavations. The main goal is to relate construction records to themeasured performance of the lateral earth support systems. The principalparameters of interest are the induced ground deformations (and their effects onadjacent structures) and observations of groundwater flows. The actualmonitoring data always include inclinometer measurements of lateral deflectionswithin the diaphragm wall and/or adjacent soil. However, other information suchas surface settlements, building settlements, heave of the sub-grade or piezometricdata were only archived for some of the projects (nearly all in Boston). Evenfewer projects contain measurements of structural forces in either the diaphragmwall or bracing system.
These data have been grouped according to the soil profile, toe fixity ofthe wall and type of bracing system (tie-back anchors, prestressed cross-lot andtop-down). Most of the projects have succeeded in allowing only small walldeflections, often less than 0.2% to 0.3% of the total excavation depth, and similarmagnitudes of the maximum surface settlements. Larger wall movements didoccur in several projects but have been linked to either inadequate bracing (poortieback design or inadequate pre-stressing of rakers), lack of toe embedment orground softening inside the excavation (installation of drilled caissons or loadbearing elements). Unexpectedly large surface settlements in one project (DanaFarer) were clearly linked to ground loss during tieback installation. Severalother reported cases of leakage (through panel joints and/or tiebacks) have beenrepaired by grouting.
Given the limited availability of archival data, the thesis has focused onthe interpretation of lateral deflections. Wall deformations have been sub-dividedinto rigid body translation, rigid body rotation and bending modes. Empiricalcorrelations have been proposed for estimating each of these components.
Thesis Supervisor: Prof. Andrew J. WhittleTitle: Associate Professor of Civil and Environmental Engineering

Acknowledgements.
I would like to acknowledge the contribution of all of those who made this
research possible. First of all to my thesis supervisor Andrew Whittle who
arranged for this thesis to take place and survived through numerous phone calls
of mine when I was looking for a research at MIT. I would like to encourage other
companies to support research in institutions like MIT, just as Schnabel
Foundation has given me the opportunity to work on this very interesting subject.
Thus, special thanks to David Weatherby from Schnabel Foundations for making
this research possible. I would also like to acknowledge the contribution of all of
the following:
All the owners of the projects for their kind permission to study and
report on their properties.
Clark Foundations, Washington DC: Mamoud Hosseini for being extremely
helpful in providing us with access to data, and David Rothenberg for helping
out with data from the convention center.
GEL, Boston: David Shields for being so helpful when I was working on my
first case study.
Haley & Aldrich for giving us access to their large archived and ongoing
projects in Boston: Steven Kraemer, librarian Ed Dickie, Keith Johnson, Joel
Mooney, Bill McDermet, and Joan Marie Dewsnap.
Mueser Rutledge Consulting Engineers, NY: George Tamaro for providing
us with a list of projects, and for directing us for more data.
STS Consultants, Illinois: Clyde Baker, Charlie Pfingsten for all their
willingness to help, and the librarian George Prapuleonis (I hope I got it right)
for his help about getting around the STS library and of course Chicago.
Tredwell & Rollo, San Francisco: Ramin Golesorski, for the willingness to
help us with the Yerba Buena project.
Trevilcos, Boston: Arturo Ressi, for a delightful interview regarding slurry
walls, and for helping arrange a site visit at a job in Boston.
5

TSC, Illinois: Michael Machalinski, for data from the Loyola Business
School,
(I apologize to anyone that I have forgotten).
Once again to my research supervisor at MIT, Prof. Andrew J. Whittle for
picking me to work on such a practical and useful research, and for all the help
and guidance. Also, to my parents and sister for their continuous support
throughout my studies at MIT. I hope this research proves to be useful for the
whole civil engineering community within and outside the United States. The
world out there is waiting.
Dimitrios Konstantakos, 16- May- 2000.
6

Table of Contents
Abstract 3Acknowledgments 5Table of Contents 7List of Tables 11List of Figures 14
I. INTRODUCTION 27
1.1 Introduction 29
1.2 A Brief Historical Overview 29
1.3 Advantages & Disadvantages of Slurry Walls 31
1.4. Goals of Thesis 321.5 Research Methodology 33
1.6 Studied Projects 33
II. SLURRY WALL CONSTRUCTION 37
2.1 General Methods of Slurry Wall Construction 392.1.1 Panel Size 49
2.1.2 Bentonite and Polymer Slurries 502.1.3 End Stops 532.1.4 Guide Walls 552.1.5 Tremied Concrete 57
2.2 Alternative Wall Systems 582.2.1 Post-Tensioned Diaphragm Walls 582.2.2 Prefabricated Diaphragm Walls 592.2.3 Slurry Walls Reinforced with Soldier Piles & SPTC Wall 602.2.4 Bored Piles or Caissons and Slurry Wall Panels 622.2.5 T-Walls 63
2.3 Bracing Systems 642.3.1 Tiedback Walls 642.3.2 Cross-Lot Braced Slurry Wall Excavations 692.3.3 Top/Down Slurry Wall Excavations 71
2.4 Watertightness 742.5 Wall Finish 76
7

III. INSTRUMENTATION FOR PERFORMANCE 77MONITORING
3.1 Instrumentation in Deep Excavations 793.1.1 Optical surveys 823.1.2 Inclinometers 843.1.3 Subsurface Settlement Gages 873.1.4 Multi Point Borehole Extensometers 893.1.5 Heave Gages 893.1.6 Tape Extensometers 903.1.7 Crack Gages 903.1.8 Tiltmeters 903.1.9 Trench width gages 913.1.10 Strain Gages 913.1.11 Load Cells 923.1.12 Observation Wells and Piezometers 923.1.13 Earth Pressure Cells 93
3.2 Previous Performance Data for Slurry Wall Excavations 943.2.1 Wall & Ground Movements 94
3.3 Classification of Inclinometer Deflections 104
IV. BOSTON SLURRY WALL PROJECTS 1054.1 Introduction 1074.2 Soil Conditions in Boston 1104.3 Soil Testing Results 1164.4 Summary of Boston Projects 1184.5 Individual Case Studies 122
4.5.1 Case Study B1, South Cove 1224.5.2 Case Study B2, 60 State Street 1234.5.3 Case Study B3, State Transportation Building (Park Plaza) 1264.5.4. Case Study B4, 75 State Street 1334.5.5 Case Study B5, Rowes Wharf 1354.5.6 Case Study B6, One Memorial Drive 1364.5.7 Case Study B7, 500 Boylston Street 1424.5.8 Case Study B8, Flagship Wharf 1474.5.9 Project B9, 125 Summer Street 1534.5.10 Case Study B10, Post Office Square Garage 1534.5.11 Case Study B 11, Beth Israel Deaconess Hospital 1624.5.12 Case Study B12, Dana Farber Tower 1684.5.13 Case Study B13, Millennium Place 181
4.6 Summary of Wall Deflections 1834.7 Summary of Measured Settlements 1874.8 Special Observations 1884.9 Summary of Boston Slurry Wall Experience 191
8

V. CHICAGO SLURRY WALL EXCAVATIONS
5.1. Introduction5.2 Chicago Soil Conditions5.3. Summary of Chicago Slurry Wall Excavations5.4 Individual Case Studies
StudyStudyStudyStudyStudyStudyStudyStudyStudy
Cl,C2,C3,C4,C5,C6,C7,C8,C9,
CNA CenterSears TowerAMOCO (Standard Oil) BuildingWater TowerLoyola University Business SchoolPrudential TwoAT&T Corporate CenterGuest Quarters HotelNorthwestern University Memorial
Parking Garage5.4.10 Case Study C10, Museum of Science and Industry
Parking Garage5.4.11 Case Study C11, 311 South Wacker DriveSummary of Inclinometer DeflectionsSpecial ObservationsSummary of Chicago Slurry Wall Excavation Experience
195
197201207212212216217222228228232235240
245
248251255257
VI. WASHINGTON, DC, PROJECTS6.1 Introduction6.2 Washington DC geology and subsurface conditions6.3 Measured Performance6.4 Individual Case Studies
6.4.1 Case Study W- 1, World Bank6.4.2 Case Study W2, Petworth Subway Station6.4.3 Case Study W3, Washington Convention Center6.4.4 Case Study W4, Metro Center II
6.5 Summary of Wall Deflections for Washington DC slurrywall excavations6.6 Special observations6.7 Summary
259
261263270271271277280283285
288.290
9
5.4.15.4.25.4.35.4.45.4.55.4.65.4.75.4.85.4.9
CaseCaseCaseCaseCaseCaseCaseCaseCase
5.55.65.7

VII. San Francisco, Other US. Projects, Review of Existing 291Literature
7.1 Scope of this Chbater 2937.2 San Francisco 296
7.2.1 Reported Performance of Excavations in San Francisco 2977.2.2 Case Study C9, Yerba Buena Tower 3027.2.3 Summary of San Francisco Experience 309
7.3 Other Projects in the US. 309
VII. SUMMARY MEASURED PERFORMANCE OF SLURRY 311WALLS8.1 Introduction 3138.2 Measured performance of floating slurry walls 3148.3 Measured Performance of keyed tieback slurry walls 3188.4 Measured performance of Top/Down slurry wall 322
excavations8.5 Measured Performance of Cross-lot and internally braced 326
excavations8.6 Statistical analysis of all Inclinometer deflections 3308.7 Measured maximum wall deflections plotted according to 334
Clough8.8 Measured settlement performance 3358.9 Wall translation, rotation, and bending. 337
IX. SUMMARY, CONCLUSIONS, AND RECOMMENDATIONS 3479.1 Summary 3499.2 Conclusions 3519.3 Recommendations 352
LIST OF REFERENCES 355
10

List of Tables
Table 1.1 (a) Boston Slurry Wall Excavations 34
Table 1.1 (b) Chicago Slurry Wall Excavations 35
Table 1.1 (c) Washington DC & San Francisco slurry wall 35excavations
Table 2.1 Typical Slurry Mix Specifications & Observed 52Conditions (from case studies)
Table 3.1 Instrumentation used in slurry wall construction (after 80Xanthakos 1991)
Table 3.2 Measured and archived performance monitoring 81instrumentation used in slurry wall excavations (B)Boston, (C) Chicago, (W) Washington DC, (S) SanFrancisco.
Table 3.3 Limit equilibrium calculations of base stability (after 99Terzaghi, 1943).
Table 4.1 List of studied slurry wall excavations in Boston 109Table 4.2 Other known slurry wall excavations in Boston 109Table 4.3 Typical Engineering Soil Properties in Boston 115
(Johnson, 1989).
Table 4.4 Summary of measured performance of slurry walls in 120Boston.
Table 4.5 Performance data for the 125 Summer Street (B9), 153after Becker & Haley [1989]
Table 4.6 Typical tieback design loads and data, (B 12). 171
Table 4.7 Summary of system stiffness input parameters and 184horizontal deflections for diaphragm wall excavationsin Boston.
11

Table 4.8 Inclinometers per project (Boston) used to derive 184statistics in Fig. 4.59 & Fig. 4.60.
Table 4.9 Special observations for slurry wall excavations in 190Boston
Table 5.1 List of studied slurry wall excavations in Chicago, IL. 198Table 5.2 Summary of measured performance of slurry walls in 208
Chicago
Table 5.3 Summary of system stiffness input parameters and 252horizontal deflections for diaphragm walls in Chicago.
Table 5.4 Inclinometers per project (Chicago), used to derive the 253frequency plots in Figures 5.32 & 5.33.
Table 5.5 Special observations for slurry wall excavations in 256Chicago.
Table 6.1 List of studied slurry wall excavations in Washington, 262DC.
Table 6.2 Other known slurry wall excavations in Washington 262DC
Table 6.3 Cretaceous strata, WMATA notation,(USGS notation 267in parentheses)
Table 6.4 Pleistocene Terrace deposits, WMATA 1989, (USGS 267in parentheses)
Table 6.5 Soil properties in Washington DC, for design, 268(adapted from WMATA 1989).
Table 6.6 Summary of slurry wall excavation performance, 270Washington DC
Table 6.7 Inclinometers used to derive frequency plots for 285Washington DC, projects.
Table 6.8 Summary of system stiffness input parameters and 286horizontal deflections for diaphragm wall excavationsin Washington DC.
Table 6.9 Special observations in Washington DC slurry wall 288excavations
12

Table 7.1 List of San Francisco and Other Projects 294
Table 7.2 Summary system stiffness input parameters for 295various projects.
Table 8.1 Floating slurry wall excavations 314
Table 8.2 Keyed tieback walls 318
Table 8.3 List of top/down slurry wall excavations 323Table 8.4 List of cross-lot and internally braced slurry wall 326
excavationsTable 8.5 Summary of deformations for studied projects, by 331
category.
Table 8.6 Equations used to standardize wall bending 339deflections
Table 8.7 Summary of excavation basic components describing 341deflection modes.
13

List of Figures
Figure 1.1 Central Artery Tunnel Project, Boston MA (Ladd et 30al, 1999)
Figure 2.1 Trenching Equipment (Xanthakos 1991), 41(a) Clamshell bucket attached to a kelly. (b) Verticalpercussive bit with reverse circulation, (c) Percussivebenching bit. (d) Rotary benching bit. (e) Rotary bitwith vertical cutter. (f) Rotary drilling machine withreverse circulation. (g) Bucket scraper. (h) Bell-mouthsuction rotary cutter with direct circulation.(i) Horizontal auger machine.
Figure 2.2 Trenching equipment, (A) Mechanical clamshell in 42front and hydraulic clamshell in the back, (B) Smallersize mechanical clamshell
Figure 2.3 Close-up pictures of excavating buckets, (A) 42Mechanical clamshell, (B) Hydraulic clamshell
Figure 2.4 Hydromills, (A) Original hydromill with reverse 43circulation, powering engines are within the counterrotating mills, (B) Casagrande machine: chainedpowered hydromill, chain is also used for chiseling therock notch, (C) Bauer machine: hydromill withkicking teeth to knock off the rock notch, engines arewithin the counter rotating mills.
Figure 2.5 Soletanche Hydrofraise (http://www.bachy.com/) 44Figure 2.6 Bauer trench cutters (http://www.bauer.de/index.htm) 44Figure 2.7 Typical construction sequence of slurry walls: (A) 46
Trenching under slurry, (B) End stop inserted (steeltube or other), (C) Reinforcement cage lowered intothe slurry-filled trench, (D) Concreting by tremiepipes.
Figure 2.8 Slurry Wall Construction (Reinforcement cage left, 47scale given by worker near the cage, Trenching of aT-panel right)
14

Figure 2.9
Figure 2.10
Figure 2.11
Figure 2.12
Figure 2.13
Figure 2.14
Figure 2.15
Figure 2.16
Figure 2.17
Figure 2.18
FigureFigureFigure
2.192.202.21
Figure 2.22Figure 2.23
Slurry wall construction for the MBTA Courthousesubway station in South BostonAlternate panel construction sequence, (A) Panels 1 &2 concreted, (B) Middle panel trenched, end stopsremoved, (C) Middle panel concreted.Typical trenching sequence, (A) outer bites excavated,middle bite left in place, (B) middle bite excavatedprior typically the same day when lowering of thereinforcement cage and concreting is scheduled.End stops and resulting panel joints, (A) Round tube,(B) Steel H-Beam, (C) Flexible sheet pile with malewaterstop notch, (D) Keyed steel end stop withchemical waterstop. (Xanthakos, 1994, Parkison &Gilbert, 1991, Ressi, 1999).Top left: end stop in ground with wooden plankbehind notch used to insert waterstop, Bottom left:details of same end stop (top view), Top right: two keyend-stops resting on the site , Bottom right: Key endstop without notch (MBTA Courthouse SubwayStation, Site visit, Nov. 1999)Guidewalls, (A) Guidewall and trench under slurry,(B) Guide wall and concreted panel, note the concretebulges usually observed under the guidewalls, (C)Plan of a rectangular guide wall, (D) Plan of a cornerguidewallGuidewalls, (A) corner guidewall during trenching,(B) rectangular guidewall prior to lowering of thereinforcement cage.Top concrete layer, slurry contaminated concreteeasily crumbles with finger pressure (author's hand),note fissures at the concretePost-tensioned diaphragm wall (Based on Fuchburer,1980)Precast slurry wall project in Boston (Seaborn Hotel,Boston), courtesy of Trevilcos Boston.Construction SequenceSPTC Wall Project (Trevilcos Boston)Slurry wall panel and caisson combination (or boredpiles)T-Slurry wallReinforcement cage for a T-Slurry wall, (MBTACourthouse Subway Station, South Boston)
15
47
48
49
53
54
56
56
57
58
59
606061
6262

Figure 2.24
Figure 2.25
Figure 2.26Figure 2.27
Figure 2.28
Figure 2.29
Figure 2.30
Figure 2.31
Figure 2.32
Figure 2.33
Figure 2.34
Figure 2.35
Figure 2.36
Figure 2.37
Figure 2.38
Picture from a tieback slurry wall excavation (WorldBank Project Washington, Case Study W-1)Tieback slurry wall excavation (Dana Farber Tower,Boston: Case Study B-12).Tieback configuration, free and fixed lengthsSteps in making a tieback: (a) hole drilled; (b) barplaced in hole; (c) concrete poured for anchor; (d) wallconnection made (Schnabel, 1982).Steps in making a multilevel tieback excavation,(A) first level of tiebacks installed and second level oftiebacks drilled, (B) second level of tiebacks installed(drawn by author)Typical excavation sequence in cross-lot excavations:(A) V-cut initial cantilever excavation, (B) Strutinstallation and pre-loading in small trenches in soilberms, (C) V-cut excavation to next level and strutinstallation, (B) Final grade.(a) preloading arrangement, and (b) measured brace
stiffness (BDC Website)Methods of preloading struts; Wedging (top),Telescoping pipe (bottom)Top/Down Excavation (Beth Israel DeaconessHospital, Boston, Case study B-11)Millenium Place excavation. Left: Looking up at aglory hole, Top right: author in the lowest most levelnote LBE on the left and the barrette, Bottom right:close up view the same barrette (LBE) and steel beam(B 13).Basic construction stages for top/down method (B 11)(a) Slurry wall and basement column construction(b) Ground floor construction and pouring(c) excavation and floor construction under and above
the ground floor(d) Excavation & lowest basement floor completed
Typical waterstopping details at the tieback slurry wallinterface , Dana Farber Tower (B 12)Permanent tieback and sealing details, ADEKA is ahydrophilic material that expands when exposed towater forming a seal (B 12)Concrete overbreaks due to strata change (after ICE,1976)Excess concrete at a corner panel (left), chipping ofexcess concrete at a corner panel (right)
16
66
67
6708
68
70
70
70
72
72
73
75
75
76
76

Figure 3.1
Figure 3.2
Figure 3.3
Figure 3.4
Figure 3.5
FigureFigureFigure
3.63.73.8
Figure 3.9
FigureFigureFigureFigureFigure
3.103.113.123.133.14
Figure 3.15
Figure 3.16
Figure 3.17
Figure 3.18
Figure 3.19
Figure 3.20
Building reference point detail (Case Study B-13,Millenium Place)Horizontal offset monitoring survey detail (CaseStudy W3: Washington Convention Center).(A) Theodolite (TopCon), (B) Automated Level,(C) Tripod, (D) Reflector
GeoKon Model 6000 Inclinometer probe and readoutdevice.Inclinometer grooves, A+A- is the primary direction,B+B- is the secondary directionInclinometer probeInclinometer survey description, (Geokon manual)(A) Single point "Borros" anchor, (B) Multi-point
settlement gage.(a) Magnetic settlement anchors, (b) Settlement
meter.Borehole multipoint extensometerTape extensometerPagani D240 Wire Crackmeter (Pagani website).Pendulum tiltmeters (Pagani website)(A) Vibrating wire strain gages, (B) Strain gage
electirc resistor, (C) Rebar strain gages.Load cells by Pagani, (a) Strain gage load cell, (b)Electric anchor cell, (c) Hydraulic anchor cell(http://www.pagani-geotechnical.com/)Piezometers by Pagani, (a) Vibrating wire, (b)Casagrande standpipe piezometer and water levelmeter, (c) Electrical piezometers (http://www.pagani-geotechnical.com/)Pressure cells by Pagani, (a) Earth pressure cells, (b)Concrete pressure cells.Empirical settlement data; (a) Peck 1969, and(b) O'Rourke 1976Correlation between basal heave stability andmeasured wall deflections (Mana & Clough, 1981).Horizontal movement 8, toward wall of braced opencut in clay, at distance x from face of cut, for variousvalues of factor of safety F against heave of bottomcut, as determined by finite element calculations (afterClough et. al. 1989). Values of maximum lateralmovement 6 hmax to be determined from Figure 3.19.
17
83
83
83
85
86
868688
88
8989909091
92
92
93
95
98
98
Figure 3.21
Figure 3.22
Figure 3.23
Figure 3.24
Figure 3.25
Figure 3.26
Figure 3.27
Figure 4.1
Figure 4.2
Figure 4.3
Figure 4.4
Figure 4.5
Figure 4.6
FigureFigure
4.74.8
Figure 4.9Figure 4.10
Figure 4.11
Figure 4.12Figure 4.13
Wall deformations/ Excavation depth versus systemstiffness and factor of safety against basal heave(Clough et. al. 1989). Terzaghi , Peck & Mesri [1996]data plotted.Summary of measured settlements caused by theinstallation of concrete diaphragm walls.Comparisons of computed results with centrifuge testand field measurements (Charles & Ryan, 1998).Maximum horizontal soil movements versus distancebehind wall panel (Poh, & Wong, 1997).Magnitude and changes in total lateral force (DiBiagio& Roti,1972)Long-term measurements and changes in lateral earthpressures for a wall in Oslo (DiBiagio & Roti 1979)Classification of inclinometer deflection shapes.
Colonial shoreline superimposed over current map ofBoston.Map of the Boston Metropolitan Area showing thehistory of land filling that expanded the city's original783 acres to over 3000 acres today, (after BostonSociety of Architects 1976).Geologic units encountered in typical majorfoundations in Boston (after Johnson 1989).Soil Profile, Index Properties and Piezocone Data(Ladd et. al. 1999).Stress History from 1 -D Consolidation Tests (Ladd et.al. 1999).K0 versus Elevation from Laboratory and In SituTesting (Ladd et al. 1999).Studied slurry wall excavations in BostonMiscellaneous data and comparison of wall movementfor slurry wall and sheeting, South Cove Excavation(B 1), (From D'Appolonia, 1973)60 State Street site plan, B2, (after Johnson 1976).Typical excavation section , 60 State Street, B2,(Johnson 1976).Initial, maximum, and final horizontal movements forthe 60 State Street Excavation, (Johnson 1976).State Transportation (B3) site plan.Settlement contours, State Transportation Building(B3)
18
99
101
101
102
103
103
104
111
112
113
116
117
118
121122
125125
125
129130

Figure 4.14
Figure 4.15
FigureFigure
4.164.17
Figure 4.18
Figure 4.19
FigureFigureFigure
4.204.214.22
Figure 4.23
Figure 4.24
Figure 4.25
Figure 4.26
Figure 4.27
Figure 4.28
Figure 4.29Figure 4.30
Figure 4.31
Figure 4.32Figure 4.33
Figure 4.34
Figure 4.35
Deflections at inclinometers 1-83 (Upper) and 1-24(Lower), State Transportation (B3).Tieback loads at panel 24 as determined by load cells(B3).Slope failure at a panel trenched 20' without slurry.75-State Street project (B4), a) site and cross-section,b) wall deflections (after Becker & Haley 1990).Settlement next to the excavation as a function ofdistance from the edge of the excavation (Becker &Haley, 1990).Rowes Wharf excavation (B5), plan, cross section andwall deflections (after Becker & Haley 1990).One Memorial Drive (B6) site plan & cross sectionDeflections at In-1, One Memorial Drive (B6).Wall deflections as determined by offset surveys, OneMemorial Drive (B6).Surface & building Settlements, One Memorial Drive(B6)Tieback loads from load cells, One Memorial Drive(B6).500 Boylston Street project (B7), site and cross-section.Wall deflections along western slurry wall (1-10), 500Boylston Street (B7).Horizontal soil deformations in front of TrinityChurch, 1-2, 500 Boylston Street (B7).Maximum settlements and wall deflections with timeand construction events along Clarendon Street, 500Boylston Street (B7)Flagship Wharf (B8), site plan and Cross Section A-AInclinometer 1-2 & 1-6 Wall Movements, FlagshipWharf (B8)Settlements along F-Line (inches), Flagship Wharf(B8)Measured strut loads at Flagship Wharf project (B8).Post Office Square Garage (B 10), Site andinstrumentationSelected soil profiles reflecting initial conditions, PostOffice Square Garage (B 10).Actual and Theoretical pouring volumes of concretefor slurry wall construction, Post Office SquareGarage (B 10)
19
131
132
132134
134
136
139140141
141
142
144
145
146
147
150151
152
152156
157
158

Figure 4.36
Figure 4.37
Figure 4.38
Figure 4.39Figure 4.40
Figure 4.41
Figure 4.42Figure 4.43
Figure 4.44Figure 4.45
Figure 4.46
Figure 4.47
FigureFigureFigureFigure
4.484.494.504.51
Figure 4.52
Figure 4.53
Figure 4.54
Figure 4.55
Figure 4.56
Figure 4.57Figure 4.58
Figure 4.59
Maximum measured horizontal wall and soildeflections for Post Office Square Garage (B 10)
Inclinometers IN-13 & IN-14, Pearl Street, EasternWall (B 10).Final settlements versus distance behir e7'-n(B 10).Subsurface settlements (measured by extensometers)Piezometric measurements at B 11 0-PZ and PZ-4 andconstruction (B 10).Beth Israel Deaconess site and adjacent buildings(B 11)Initial and final cross sections of the excavation (B 11)Longwood Avenue slurry wall deflections &horizontal soil movements, Beth Israel DeaconessHospital (B 11).Total building and surface settlements (B 11).Dana Farber Tower Site (B 12)
Initial soil profiles at the Dana Farber project site(B 12).Excavation cross-sections at the final stage, DanaFarber (B 12).Settlements with time and construction events (B 12).Settlement troughs at line A, (B 12).Settlement troughs at line B, (B12).Wall deflections at inclinometer In-1, Dana FarberTower (B 12).Wall deflections at Inclinometer In-3, Dana FarberTower (B 12).Wall deflection at inclinometer In-4, Dana FarberTower (B 12).Moments on eastern slurry wall, deduced from straingages attached to the diaphragm wall reinforcement,Dana Farber Tower (B 12).Axial force on the eastern slurry wall as determined byembedment gages, Dana Farber Tower (B 12).Millennium Place (B 13) project site.
Typical wall section at Millennium Place (B 13).Maximum wall deflections for Boston projects plottedaccording to Clough 1989 methodStatistics of maximum and final inclinometerdeflections for all inclinometers in slurry wall projectsin Boston
20
158
159
160
161161
165
166167
168172
173
174
175175176177
178
179
180
180
182
182183
186

Figure 4.60
Figure 4.61
Figure 4.62
Figure 5.1
Figure 5.2
Figure 5.3
Figure 5.4
Figure 5.5
Figure 5.6
Figure 5.7
Figure 5.8Figure 5.9
Figure 5.10:
Figure 5.11
Figure 5.12
FigureFigureFigureFigure
5.135.145.155.16
Statistics of maximum and final inclinometerdeflections as percentages of the excavation depth forall inclinometers in BostonSettlements at distances from the excavation,standardized by the excavation depth, for slurry wallexcavations in BostonMaximum settlement/excavation depth againstmaximum wall deflection/excavation depth
Locations of downtown Chicago slurry wallexcavationsLocations of Chicago slurry wall excavations outsidethe downtown areaTypical soil profile in Downtown Chicago (Loop),(Peck, 1948).Comparison of su(UU) and equations proposed byFinno [1992], plotted against depth for ChicagoprojectsComparison of S(UU) and Finno equations for Su,plotted against vertical effective stress for ChicagoprojectsWater contents and unit weights plotted against depthfor Chicago projectsExcavation movements at CNA Center (C9)(Cunningham & Fernandez 1972)Typical slurry wall sections, CNA project C1.Sears Tower site, excavation profile, and measuredbracing loads (C2), (after Cunningham, andCarpenter, 1975).Generalized soil profile and inclinometer data forAMOCO (Standard Oil) building (C3), (Cunningham& Fernandez, 1972).Horizontal deflections vs. time, AMOCO (StandardOil) Building, (Cunningham & Fernandez, 1972).Slurry wall and excavation details after Gnaedinger etal. [1975]Inclinometer data, after Gnaedinger et al. (1975)Inclinometer data, after Gnaedinger et al. (1975)Prudential Two, site and bracing (C6).Inclinometers In-1 & In-2 (Northern wall), PrudentialTwo (C6).
21
186
187
188
199
200
203
204
205
206
214
215217
220
221
225
226227230231

Figure 5.17
Figure 5.18
Figure 5.19
Figure 5.20
Figure 5.21
Figure 5.22
Figure 5.23
Figure 5.24
Figure 5.25Figure 5.26
FigureFigureFigureFigure
5.275.285.295.30
Figure 5.31
Figure 5.32
Figure 5.33
AT&T Corporate Center (C7), excavation profile,inclinometer deflections, and settlements (Baker et al.,1987).Guest Quarters Hotel (C8) site, slurry wall, andinclinometers.Inclinometer I-1 vs. time, Guest Quaiirs Hotel (C8).
Inclinometer I-1, northern slurry wall, Guest QuartersHotel (C8).Inclinometer 1-5, western slurry wall, near re-entrantcorner, Guest Quarters Hotel (C8).Northwestern University Memorial Parking Garagesite (C9)Inclinometer 1-3, northern slurry wall, NU project(C9).Inclinometer 1-3 deflections with time, NU project(C9).Special observations at NU project (C9).MSI (C 10) site and maximum final inclinometerdeflections.Inclinometer 1-32, MSI (C10).Inclinometer 1-47, MSI (C10).311 South Wacker Drive (Cl 1), (Gill et al, 1989).Inclinometer deflection at 311 South Wacker Drive(C 11).Maximum wall deflections versus system stiffness forChicago slurry wall excavations, (excavation inducedmovements only, when applicable the effect of caissoncaused deflections was eliminated)Statistics of maximum and final inclinometerdeflections for all inclinometers in slurry wall projectsin Chicago.Statistics of maximum and final inclinometerdeflections as percentages of the final excavationdepth for inclinometers in slurry wall projects inChicago.
22
234
237
237
238
239
242
243
244
244247
247248249250
252
254
254

Figure 6.1
Figure 6.2
FigureFigureFigureFigureFigureFigure
6.36.46.56.66.76.8
Figure 6.9Figure 6.10Figure 6.11Figure 6.12
Figure 6.13Figure 6.14Figure 6.15
Figure 6.16
Figure 6.17
Figure 6.18
Figure 6.19
Figure 6.20
Figure 6.21
Figure 6.22
Location of studied slurry wall excavations,Washington DC"Fall line" and the Coastal Plain (Vroblesky & Fleck,1991)Geologic map of Washington DC, (USGS 1994)World-Bank (W-1), site, deflections, and settlementsTypical soil Profile. World Bank (WI)Inclinometer In-1, World Bank (WI).Inclinometer In-4, World Bank (W1).Slurry wall settlements and construction activities,(W1).Piezometric levels and construction activities, (WI).Petworth Subway Station site (W2).Inclinometer deflections at Panel 1 east, (W2).Inclinometer deflections at Panel 1, East and West(W2)Inclinometer deflections at panel 12, (W2).Washington Convention Center (W3), project site.Wall and soil deflections at 55'-deep section ofWashington Convention Center [W3(b)].Wall and soil deflections at 29'-deep section ofWashington Convention Center, [W3(a)].Metro Center II (W4), Washington DC (Winter et al.,1991).Wall deflections at Metro Center II (W4), (Winter etal., 1991)Maximum wall deflections for Washington DCprojects plotted according to the Clough 1989approach.Statistical analysis of maximum and final inclinometerdeflections as percentages of excavation depth,Washington DC.Statistical analysis of maximum and final inclinometerdeflections for slurry wall excavations in WashingtonDC.Large void at a slurry wall panel due to poor cleaning(A) Large void, (B) A person inside the void, (C)Water leaking through the void, (D) Distorted panelreinforcement
23
263
266
269273274275275276
276278279279
279282282
283
284
284
286
287
287
289

Figure 7.1
Figure 7.2
Figure 7.3
Figure 7.4Figure 7.5
Figure 7.6
FigureFigure
7.77.8
Figure 7.9Figure 7.10
Figure 8.1
Figure 8.2
Figure 8.3
Figure 8.4
Figure 8.5
Figure 8.6
Figure 8.7
Maximum wall deflections for San Francisco andother diaphragm wall excavations plotted according tothe Clough et al. (1989).Map of downtown San Francisco, and Yerba BuenaTower i 7Measured lateral wall movement profiles forEmbacedero BART Station and One Market PlazaBuiliding slurry walls, Clough and Buchanini, 1981.Islais Contract E, (Adams and Robison, 1996).Deformations measured at Muni Turnback project(Koutsoftas et al. 2000).Yerba Buena Tower (S9): a) site, b) level 1 bracing atEl. 18ft, c) level 2 bracing at El. -5 ft, and d) level 3bracing (rakers) at El -19.75ft, surface at approx. El.32ft, excavation base at El. -32 ft to El. -36 ft,(SFCD).Generalized soil profile, Yerba Buena Tower (S9).Inclinometers 1-2 & 1-4 at Market Street, Yerba BuenaTower (S9)Settlements vs. time for points at Market Street, (S9).Maximum settlements/excavation depth (%) vs.distance from excavation/excavation depth, (S9).
Inclinometer deflections for floating slurry wallexcavationsStatistical analysis of inclinometer deflections forfloating slurry wall excavationsStatistical analysis of inclinometer deflections/FinalExcavation depth %, for floating slurry wallexcavationsWall deflections for keyed tieback slurry wallexcavationsStatistical distribution of wall deflections for studiedkeyed tieback slurry wall excavations.Statistical distribution of wall deflection as apercentage of the final excavation depth for thestudied keyed tieback slurry wall excavations.Selected inclinometer deflections from top/downslurry wall
24
295
299
300
301302
305
306307
308308
316
317
317
320
321
321
324

Figure 8.8
Figure 8.9
Figure 8.10
Figure 8.11
Figure 8.12
Figure 8.13
Figure 8.14
Figure 8.15
Figure 8.16
Figure 8.17
Figure 8.18
Figure 8.19
Figure 8.20
Figure 8.21
Figure 8.22
Figure 8.23
Statistical distribution of maximum and finalinclinometer deflections for top/down slurry wallexcavations.Statistical distribution of maximum and finalinclinometer deflections as a percentage of the finalexcavation depth, for top/down slurry wallexcavations.Selected inclinometer deflections for cross-lot andinternally braced slurry wallStatistical distribution of inclinometer deflections forprojects B8, W2, and S9.Statistical distribution of inclinometer deflections as apercentage of the final excavation depth for projectsB8, W2, and S9.Statistical distribution of maximum and finalinclinometer deflections for projects studied in thisthesis, (Chapters 4, 5, and 6).Statistical distribution of maximum and finalinclinometer deflections as a percentage of the finalexcavation depth for projects studied in this thesis,(Chapters 4, 5, and 6).Statistical distribution of maximum and finalinclinometer deflections for projects studied in thisthesis and referenced projects, (Chapters 4, 5, 6, and 7).Statistical distribution of maximum and finalinclinometer deflections as a percentage of the finalexcavation depth for projects studied in this thesis andreferenced projects, (Chapters 4, 5, 6, and 7).Wall movements for all the slurry wall excavations vs.system stiffness (Clough et al, 1989 approach).Summary of settlements for slurry wall supportedexcavations.
Separation of wall deflections and standardizationapproach: (1) rigid translation, (2) rigid rotation, (C)Bending, H is the wall depth.Rigid translation deflections for floating tiebackexcavations.Rigid Rotational Deflections CR for floating tiebackdiaphragm walls.Rigid Rotational Deflections CR for top/downexcavations.Wall Bending Deflections CM for floating tiebackdiaphragm walls.
25
325
325
328
329
329
332
332
333
333
334
336
340
342
342
343
343

Figure 8.24
Figure 8.25
Figure 8.26
Wall Bending Deflections Cm for top/down diaphragmwall excavations.Wall Bending Deflections Cm for cross-lot andinternally braced diaphragm wall excavations.Results from proposed method of standardizing wallbending
26
344
344
345

Chapter 1
Introduction
27

28

Chapter 1Introduction
1.1 Introduction
The continuous diaphragm wall (also referred to as slurry wall) is a structure
formed and cast in a slurry trench (Xanthakos, 1994). The trench is initially
supported by either bentonite polymer based slurries. The term "diaphragm walls"
refers to the final condition when the slurry is replaced by tremied concrete that
acts as a structural system either for temporary excavation support or as part of
the permanent structure. The term slurry wall is also applied to walls that are used
as flow barriers (mainly in waste containment), by providing a low permeability
barrier to contaminant transport. This thesis focuses only on the structural role of
diaphragm walls when used for deep excavation support.
1.2 A Brief Historical Overview
Slurry wall technology hinges on specialized equipment for excavating slurry
trenches. The simplest type of trenching equipment is the mechanical clamshell
attached on a kelly bar. Individual contractors have developed their own
specialized trenching equipment like hydraulic clamshells, fraise or hydromills
(sample manufacturers: Icos, Bauer, Casagrande, Case Foundation, Rodio etc). A
more detailed description of trenching equipment is given in section 2.2.
The first diaphragm walls were tested in 1948 and the first full scale slurry
wall was built by Icos in Italy in 1950 (Puller, 1996) with bentonite slurry support
as a cut-off wall. Icos constructed the first structural slurry wall in the late 1950s
for the Milan Metro (Puller, 1996). Slurry walls were introduced in the US in the
mid 1960s by European contractors. The first application in the US was in New
York City [1962] for a 7m diameter by 24m deep shaft (Tamaro, 1990), that was
followed by the Bank of California in San Francisco (Clough and Buchignani,
1980), the CNA building in Chicago (Cunningham and Fernandez, 1972), and the
World Trade Center in New York (Kapp, 1969, Saxena, 1974). The majority of
29

diaphragm wall projects in the US are located in six cities Boston, Chicago,
Washington DC, San Francisco and New York.
Diaphragm walls are extensively used in the Central Artery/Tunnel project
(CA/T1 in Boston, Massachusetts (Fig. 1.1). Work in the CA/T involves many cut
and cover tunnels constructed under the existing artery. Some of the deepest T-
slurry walls, extending 120' below the surface have been constructed for the
Central Artery (Lambrechts et al., 1998).
44m
BROSTON AiWArr
RAW 4t
4# 104, g-
I
~~~rv~;wty
'1 Rotft IA
East Boston~
I'
Southt 64
.Eisting Floadways and ThararlProposed Roadway AbovAeradeAt-arade Taniio 5ec bion
* **Proposec Tunnel $aac~ons with PFrtal
30
Figure 1.1: Central Artery Tunnel Project, Boston MA (Ladd et al., 1999)
X--1

1.3 Advantages & Disadvantages of Slurry Walls
The critical design criteria for diaphragm walls are: 1) structural strength and
integrity, 2) permanence, and 3) impermeability (Millet and Perez, 1981).
According to Puller [1996] diaphragm walls are generally efficient in cost and
construction time where they are used for both permanent and temporary subsoil
retention for walls of medium, and greater depth.
Some of the quoted advantages of diaphragm walls are (Puller, 1996; Tamaro,
1990; Hajnal et al., 1984):
1) They perform in multiple functions simultaneously, earth retention,
groundwater flow control, and load bearing.
2) Minimization of excavation induced deformations since diaphragm walls
are stiffer than sheet piling.
3) Minimization of water leakage and eliminate dewatering outside the site.
4) Eliminate underpinning of adjacent structures
5) The practical wall depth is limited by the properties of the excavating
machinery
6) The method is mechanized and thus savings on labor can be achieved.
7) Slurry wall installation causes very little noise compared to traditional pile
and sheet pile driving.
8) Layout arrangement is variable and can be adjusted to meet local
conditions.
9) No major surface grading is required prior to trenching
The disadvantages of diaphragm walls are (Puller, 1996; Tamaro, 1990;
Hajnal et al., 1984):
1) Except for precast panels, the surface quality of diaphragm walls depends
on the equipment and the type of soil to be excavated.
2) Special precautions have to be taken to handel waste products of the slurry
operations.
3) Inspection during construction is only possible by indirect methods since
the wall is prepared under slurry.
31

4) Special precautions have to be taken when slurry walls are to be
constructed a) in open water, b) in layers bearing artesian water, c) in
poorly compacted fill, d) near existing buildings, or unknown utilities, e)
in soil where a significant and rapid slurry loss is anticipated.
5) Generally more expensive than other methods.
However, the quoted advantages of slurry walls may not always materialize.
For example, there have been very few cases where the effects of trenching and
wall installation on deformations were considered on the overall performance
(e.g., Koutsoftas et al., 2000). Soil movements during trenching may become
crucial in cases where deformation tolerances are very strict. Slurry walls tend to
be more watertight than sheet pile walls but total sealing can be a very difficult, if
not impossible to achieve. Local defects in the diaphragm walls and in holes
opened for tiebacks tend to control leakage. Much of the reasoning for using
slurry walls for the permanent structure is relating to the advertised
watertightness.
Furthermore, it is not clear if the stiffness of diaphragm walls is a big
advantage since comparable stiffness can be obtained by built steel sections (e.g.
sheet pile and H-pile combination). The actual magnitude of deformations
depends on the used bracing system as much as the choice between a diaphragm
wall and a sheet pile or other type of a retaining wall. Unfortunately, there have
not been any cases of direct comparison of performance of slurry walls and sheet
pile walls of comparable stiffness under the same conditions.
1.4. Goals of Thesis
This thesis provides an update (FHW, 1980) on the use and experience of
slurry wall practice in the US, mainly for deep basement construction. This has
been achieved by developing a database of well documented projects.
32
1.5 Research Methodology
The projects studied in this research were selected by a) reviewing existing
literature, and by b) contacting companies for help in identifying well-
instrumented case studies. Each case study provides information on:
a) Site conditions, soil profile etc.
b) Design of the wall and bracing system.
c) Summary of instrumentation.
d) Assessment of performance:
- Deformations, i.e. wall deflections, settlements.
- Construction problems (panel collapses etc.)
- Other data: water table & piezometric level readings, strut loads etc.
- Unexpected or unusual features.
Once a sufficient database was created then performance was compared on a
city by city basis (Chapters 4, 5, 6, and 7). Finally, the performance of all the case
studies were concluded in Chapter 8. When applicable and possible, the effect of
evolving construction practices has also been discussed. Measured performance
data is reported according to existing prediction methods (e.g. Clough et al., 1989,
Peck, 1969).
1.6 Studied Projects
In the course of compiling projects, it became obvious that the applications of
slurry walls are concentrated mainly in 5 major urban areas - Boston, Chicago,
Washington DC, San Francisco, and New York. The main focus of this thesis is in
the first three cities where the author was able to obtain relatively complete data
from archived records. In San Francisco there is only one recent slurry wall
project studied since local practice has shifted towards SPTC walls.
Unfortunately, we were not able to locate any data on recent diaphragm wall
projects in New York. The full data on each case study is presented in a separate
data report (Konstantakos and Whittle, 2000). Tables 1.1 (a), (b), (c) provide the
complete list of the studied projects.
33

Table 1.1 (a): Boston Slurry Wall ExcavationsExc. Wall Levei ofDept (inche Instrumentation or
ID Project Name Year h (ft) s) Bracing & Wall available dataBI * MBTA South Cove 1973 50 36 3-Levels CLB Good
B2 60-State Street 1975 35 30 3 & 2 -Levels Very Good
B3 State Transportation 1982 27 24 2-Levels TB GoodBuilding___
B4 * 75 State Street 1983 65 30 6-Levels TD No data
B5 Rowes Wharf 1984 55 30 5-Lev TD PoorB6 One Memorial Drive 1985 30 24 2 or I Levels TB Good
4 Levels TB,B7 500 Boylston 1987 42 24 1 Level TB & 2 Very good
R
B8 Flagship Wharf 1989 47 30 3-Levels CLB, Very good
B9 * 125 Summer Street 1990 60 30 6-Levels TD No data
B10 Post Office Square 1991 75 36 7-Levels TD ExcellentGarage___________
B11 Beth Israel Deaconess 1994 65 36 5-Levels TD Very goodB12 Dana Farber Tower 1995 90 36 6-Levels TB ExcellentB13 Millenium Place 2000 55 36 TD Excellent
Note: TB -Tiebacks, CLB - Cross-Lot Bracing, TD - Top/down, R - Rakers, SB- Soil Berms,CB - Corner Bracing, PC - Precast, PT - Post Tensioned, SP - Soldier Piles* Project only referenced from existing literature, not studied in detail
34

Table 1.1 (b): Chicago Slurry Wall ExcavationsExc. Level of
Depth Wall Instrumentation or
ID Project Name Year (ft) (inches) Bracing & Wall available data
C1** CNA Building 1971 31 30 1 Level R, SB FairC2 ** Sears Tower 1971 32 30 3 Levels R, SB Poor
C3 Amoco Standard 1973 23, 30 1 Level TB, SP, B Good
C4 ** Water Tower 1974 44 24 1 Level TB & Very good______ ~I Level RVeygo
C5 Loyola University 1993 20 --- 1 Level Struts Very poor____Business School est._________
C6 Prudential Two 1986 25 27 1 Level. TB, & Good______~~~ I________ Level R, CB
C7 ** AT&T Corporate 1987 27 30 3 Levels R GoodCenter
C8 Guest Quarters 1989 35 24 3-Levels TD Good____Hotel
Northwestern
C9 University 1990 23 24 1 Level TB GoodMemorial ParkingGarage
C1O Museum of 1997 34 30 3 levels GoodScience & Industry I permanent TB
C11* 311 South Wacker 1987 35 24 TB, TD, CB, R GoodDrive I I
Table 1.1 (c): Washington DC & San Francisco slurry wall excavationsLevel of
Exc. InstrumentationDepth Wall or available
ID Project Name Year (ft) (inches) Bracing & Wall data
Washington
WI World Bank 1991 60 30 5 Levels TB Excellent
W2 Storth Subway 1995 36 5 - 6 Levels CLB Below average
30- 36- 1 or 2 Levels TB, &
W3 Washington 2000 48 1 Level R Very goodConvention Center
1__ 55 36 3 Levels TB,
W4 * Metro Center II 1991 31 24 2 Levels TB
San Francisco2 Lev. CB, I Lev. R
S9 Yerba Buena Tower 1999 66 36 or 3 Lev. TB, and ExcellentI Level R
Note: TB -Tiebacks, CLB - Cross-Lot Bracing, TD - Top/down, R - Rakers, SB- Soil Berms,CB - Corner Bracing, PC - Precast, PT - Post Tensioned, SP - Soldier Piles* Project only referenced from existing literature, not studied in detail** Summary of performance based on existing literature and/or revisited archived data.
35

36
Chapter 2
Slurry Wall Construction
37

38

Chapter 2Slurry Wall Construction
2.1 General Methods of Slurry Wall Construction
Slurry wall design and construction requires careful consideration of many
factors including panel size, slurry materials (i.e. processing), and excavating
equipment. For example, the depth of the slurry wall may be dictated by the soil
conditions in the site, while the site layout may constraint panel sizes. Adjacent
buildings and existing utilities are always encountered in urban excavations and
they always have to be protected or relocated. Waterstopping details should be
given special attention since slurry walls are often part of the permanent structure.
Working schedules can also be affected by requirements for traffic maintenance.
Thus construction procedures should address such and other issues in order to
optimize the whole construction.
A slurry wall is constructed by joining a series of slurry wall panels in a
predetermined order. The panels are excavated to specified dimensions while
slurry or another stabilizing fluid is circulated in the trench. Excavation
equipment ranges from clamshell buckets, hydraulic clamshells to hydrofraises
(Xanthakos, 1994, Parkison & Gilbert, 1991, Ressi, 1999, Bauer, 2000).
Individual contractors have developed their own (typically) patented trenching
equipment. Figure 2.1 shows a variety of trenching equipment used for slurry wall
construction. The major types of excavating equipment are as follows:
I Mechanical Clamshells: Mechanical clamshells are simple and efficient
devices that use mechanical power to move the buckets and excavate soil.
They are not fixed with a crane and can work in mixed ground. A big
advantage is that the clamshell can be changed with chiseling equipment
very easily when rock has to be excavated. (Figs. 2.2 a, 2.3 a)
II Hydraulic Clamshells: Hydraulic clamshells are more productive than
mechanical clamshells, but are more expensive and more difficult to set
39

up. Hydraulic clamshells use hydraulic power to move the excavating
buckets instead of mechanical power. Chiseling of rock is not easy with
the same machine when hydraulic clamshells are used. (Fig. 2.2 b, Fig.
2.13 b)
III Hydromills: (Fig. 2.4). Hydromills have two counter rotating mills and
work with reverse circulation. Excavated material is brought to the plant
where coarse and fine materials are separated. They are more expensive
than hydraulic clamshells and thus they are only used for large-scale
projects (Ressi, 1999). In contrast to the hydraulic clamshell, the
hydromill can handle rock chiseling. One design issue which arises when
chiseling rock is the removal of the rock left between the two mills.
Different contractors have developed techniques for knocking of this
notch. One approach relies on vibration of the wheels to remove the rock
notch. Initially, the hydraulic motors where situated in the wheels and that
restricted the motor size and the available power. In contrast, Casagrande
has designed a hydromill with which a toothed chain to drive the wheels,
and also cut the rock notch. The chain cannot handle hard rocks (breakage
of chain) and was changed such that the chain was dragged along and
power was transmitted separately to the wheels. The German BAUER
(http://www.bauer.de/index/htm) hydromill (Fig. 2.6) uses a set of kicking
teeth at the bases of the wheels to knock of the rock notch, but rock the
teeth can break in hard rock.
IV Hydrofraise: The Hydrofraise system was developed by Soletanche
(Parkison & Gilbert, 1991), and was designed to excavate cohesionless
soils as well as hard rock in a single pass without chiseling. It consists of
a) a heavy-duty crawler crane of 100 to 150 ton capacity; b) a hydraulic
power pack; c) the hydrofraise equipment; and d) the slurry treatment
plant (Fig. 2.5). Three motors are located at the base of the system, two of
which power the cutting drums while the third operates a special pump
40

mounted centrally just above the cutting drums (Xanthakos, 1994). The
panel width can be controlled by changing the cutting drums from 25" to
5ft. According to Bachy-Soletanche quotes the system can be used to
excavate walls down to 400-ft (http://www.bachy.com/). Bauer has
developed its own range of cutters (Fig. 2.6)
(0) (b) (c) (d (e) (f) (g) (h) (I)
Figure 2.1: Trenching Equipment (Xanthakos, 1991), (a) Clamshell bucket
attached to a kelly. (b) Vertical percussive bit with reverse circulation, (c)
Percussive benching bit. (d) Rotary benching bit. (e) Rotary bit with vertical
cutter. (f) Rotary drilling machine with reverse circulation. (g) Bucket scraper. (h)
Bell-mouth suction rotary cutter with direct circulation. (i) Horizontal auger
machine.
41

(A) (B)
Figure 2.2: Trenching equipment, (A) Mechanical clamshell in front and
hydraulic clamshell in the back, (B) Smaller size mechanical clamshell
(A) (B)Figure 2.3: Close-up pictures of excavating buckets, (A) Mechanical clamshell,(B) Hydraulic clamshell
42

Soil
Rock
Engines
CourRotcMills
nterating
Chaintransferspower tomills 8.chisselsrocknotch
Rock Notch
(B)
)gines
(C)
Figure 2.4: Hydromills, (A) Original hydromill with reverse circulation,
powering engines are within the counter rotating mills (B) Casagrande design, (C)
Bauer hydromill.
43

Figure 2.5: Soletanche Hydrofraise (http://www.bachy.com/)
Pump
Cutting
I'
BC-20 BC-25 BC-30 BC-33 BC-40 BC-50Torque Knxm 2x81Width (mm) 500-1000Length (mm) 2200Pump 6"Weight (tons) 12-20
2x81640-1500
28005"
2x81640-2400
28006"
2x81640-1500
28006"
25 25-35 20-35
Figure 2.6: Bauer trench cutters (http://www.bauer.de/index.htm)
44
2x100800-2100
28006"
30-45
2x1351200-32002800-3200
8"40-50

Figure 2.7 illustrates the basic steps in typical slurry wall construction, while
Figures 2.8 and 2.9 show selected pictures from construction of a new subway in
Boston (MBTA South Boston Transit way). The first stage involves clearing the
site of possible obstructions. Guide walls are then constructed to help stabilize the
upper few feet of soil and guide the trenching equipment (controlling the
verticality of the panels). End-stops are inserted into the panel when trenching has
finished in order to help form water-tight joints connecting adjacent panels. The
end-stops are withdrawn when the adjacent panel is trenched.
Once a panel is excavated to the specified dimensions, then a reinforcement
cage is inserted into the slurry filled trench (Fig. 2.7). Occasionally reinforcement
cages are spliced if the required cages are too heavy for lifting equipment. In
some projects soldier piles have also been used as slurry wall reinforcement or as
bearing elements of the slurry wall (Case studies C3 and C6).
The bottom of each panel is cleaned before concreting since sands and other
soils may form intrusions that undermine the wall integrity (water-tightness,
strength, and stiffness). Concrete is then carefully tremied into the trench and
continuously displaces the slurry. Two or three tremie pipes are usually used to
concrete each panel (typically 20ft long) but up to four pipes have been used to
accelerate construction. The freshly tremied concrete is then given time to harden
and construction progresses with the construction of another panel. The top few
inches of the panel are always chipped as to expose fresh and competent concrete
since slurry is trapped in the upper few inches of the panel.
One of the major issues during concreting is segregation of concrete
aggregates during fast concreting. Occasionally slurry is entrapped within the
tremied concrete and thus soft zones are created within the slurry walls. If the
panel bottom is not adequately cleaned then the soil and the waste that may have
accumulated in the bottom is displaced upwards during concreting. While part of
this "waste" is carried to the top of the wall where it is later cleaned, another part
flows into the bottom corners of panels and between the panel joints. Such
45

problems can cause large leakage problems. Successful construction relies heavily
on good quality control on site.
Excavating Equip. ConcretedoncretedPanel
(A)
Reinforcement
Slurry
CageEnd
--
(C)
(B)
Stop
I-
(D)
Figure 2.7: Typical construction sequence of slurry walls: (A) Trenching under
slurry, (B) End stop inserted (steel tube or other), (C) Reinforcement cage
lowered into the slurry-filled trench, (D) Concreting by tremie pipes.
46

Figure 2.8: Slurry Wall Construction (Reinforcement cage left, scale given by
worker near the cage, Trenching of a T-panel right)
(A) The reinforcement cage isInserted into the slurry filledtrench(B) The reinforcement cage istottaly inside the trench(C) Concreted panel withend-stops still in place
Figure 2.9: Slurry wall construction for the MBTA Courthouse subway station in
South Boston
47

Panels are typically constructed in an alternate sequence (Fig. 2.10) since
freshly tremied concrete needs time to gain strength before the adjacent panel can
be constructed. As Figure 2.10 illustrates, the intermediate panel is constructed
after the two primary panels have gained sufficient strength. Coninuou; ; r
construction sequence is rather rare but it has been used in large-scale
transportation projects (Trevilcos Company Brochure, 1999, Parkison & Gilbert,
1991).
(1) (2)
(A)
(B3)
(3)
Figure 2.10: Alternate panel construction sequence, (A) Panels
(B) Middle panel trenched, end stops removed, (C) Middle panel
1 & 2 concreted,
concreted.
The panel trenching sequence obviously depends on the panel size and the
type of trenching equipment that is used. In small panels, only one equipment
pass is required, but more are required for longer panels. For a typical 20ft panel
trenching is done in three bites (Fig. 2.11), beginning with the outer two bites and
proceeding to the middle bite. This reduces the potential for trench instability by
minimizing the time of full panel length excavation prior to concreting.48

Concreted Excavating Equip. ConcretedPanet Panel
- (1) (3) (2)
Excavating Equip.
(1) (3) (2)
(B)
Figure 2.11: Typical trenching sequence, (A) outer bites excavated, middle bite
left in place, (B) middle bite excavated typically on the same day when concreting
is scheduled.
2.1.1 Panel Size
The selection of panel size is determined by the site conditions and by the
excavating equipment. Smaller panel lengths enhance trench stability through
arching, but increase the required number of construction joints. Longer panels on
the other hand require fewer construction joints but are less stable during
trenching. Panels have been constructed up to lengths of 30' feet, but the typical
length is 20'. The wall thickness typically ranges from 2' to 4'. The excavating
equipment determines the panel thickness as well as the minimum possible panel
size, since a panel can not be smaller than one pass of the equipment.
The panel depth depends on design requirements and is limited by verticality
tolerance limits 1/100th to 1/200' of wall depth (Xanthakos, 1994, ICE, 1996).
Where it is economically feasible panels are keyed into stiff strata so that
movements of the wall and of the retained are minimized during the excavation.
In some cases panels have been constructed with stilts (i.e. where a fraction of the
panel is extended deeper in a key fashion) that extend down to firmer strata (B 11).49

2.1.2 Bentonite and Polymer Slurries
Slurry does indeed possess remarkable properties which make it suitable for
trenching (Parkison & Gilbert, 1994). The slurry has the following basic tasks: a)
support the excavated trench, b) fill in voids in the trench, c) keep solids
excavated in suspension. Slurry in a trench can be regarded as a plastic fluid due
to the continuous movement of the trenching tool, while slurry infiltrating into the
soil acts as a thixotropic fluid in a gel state.
The traditional bentonite slurry that has been used in most projects and only
lately polymer mixtures have been developed. The use of additives in the blend
remains limited, except for a few alchemists who concentrate on the slurry and
ignore other aspects of the work (Tamaro, 1990).
During trenching an impermeable barrier is formed at the interface, which
functions in two ways a) it separates the soil from the slurry, and b) it allows the
slurry to exert its full hydrostatic thrust (Xanthakos, 1994). A seal is formed by
colloid particles that are deposited along the interface according to "thixotropy",
which describes the tendency of particles of the same nature to adhere upon
contact. This deposition and accumulation of slurry particles forming a packed
zone of solid materials, is commonly called "filter cake". The process of "filter
cake" formation is affected by the permeability of the soil. A "filter cake" can not
be formed in open grounds (high permeability), where there are large voids, or
where the penetration is close to zero.
A typical bentonite slurry mix design is given in Table 2.1. Selection of the
appropriate mix involves satisfying contradicting requirements. To facilitate
adequate displacement by concrete, the slurry mix must have a low viscosity, but
lowering the viscosity decreases the ability of the slurry to carry suspended solids.
The initial fluid loss decreases with increasing bentonite content and increasing
sand content (Hutchinson et al, 1974). However, the mix can become too viscous
to use if the bentonite content is too high (Hodgson, 1977). A Marsh funnel
50

viscometer is almost always used as an index test to assess the mix viscosity on
site.
Polymer slurries on the other hand work by decanting the sand and solids to the
bottom of the panel (Ressi, 1999). Panels trenched with polymers are easier to
clean than panels trenched with bentonite but one has to wait for the sand in the
slurry to settle down. Polymers do not form a filter cake as bentonite does and
thus they can not be used in more permeable soils due to loss of polymer in the
surrounding soil. Individual companies have developed their own types of
patented polymer slurries, and as a result there is no published information
regarding their properties.
Polymers are easier to dispose of than bentonite as they can be dissolved the
easily and cheaply by using additives. However, the polymers can not be used in
sites with organic soils since they can dissolve the organics, inducing settlements
etc. Polymers have much smaller viscosity than bentonite and thus there is no
need to chip the top of the wall, as there is a clean displacement by the concrete
tremie. A cost-effective combination is to mix a little bit of bentonite with
polymer so that a filter cake is formed (Ressi, 1999). In general selection of
mixes is more like an art than a science and previous experience can be very
valuable.
51

Table 2.1
Typical Slurry Mix Specifications & Observed Conditions (from case studies)
Parameter Quantity
Mix 300 lbs. Sodium Bentonite per 600 gals of
Water, (6% by weight)
Sand Content <5% by weight
Prior to concreting
Unit Weight Controlled from 66 pcf to 75 pcf
Physical Purity 90% Montmorillonite minimum, 10% native
sediment, maximum
Chem. Purity 60% Sodium montmorillonite min., 40%
calcium and magnesium
PH Controlled between 7 to 11
Viscosity* 40 sec max. with a standard Marsh Funnel
Viscometer
Filtrate Loss 20cc maximum in 30 minutes*
Dry Fineness 80% minimum passing #200 mesh
Notes:
* Tests based on a suspension of 6% solids, by weight mixed in distilled water
** Other specifications control the loss from 15cc to 30 cc in 30 minutes.
52
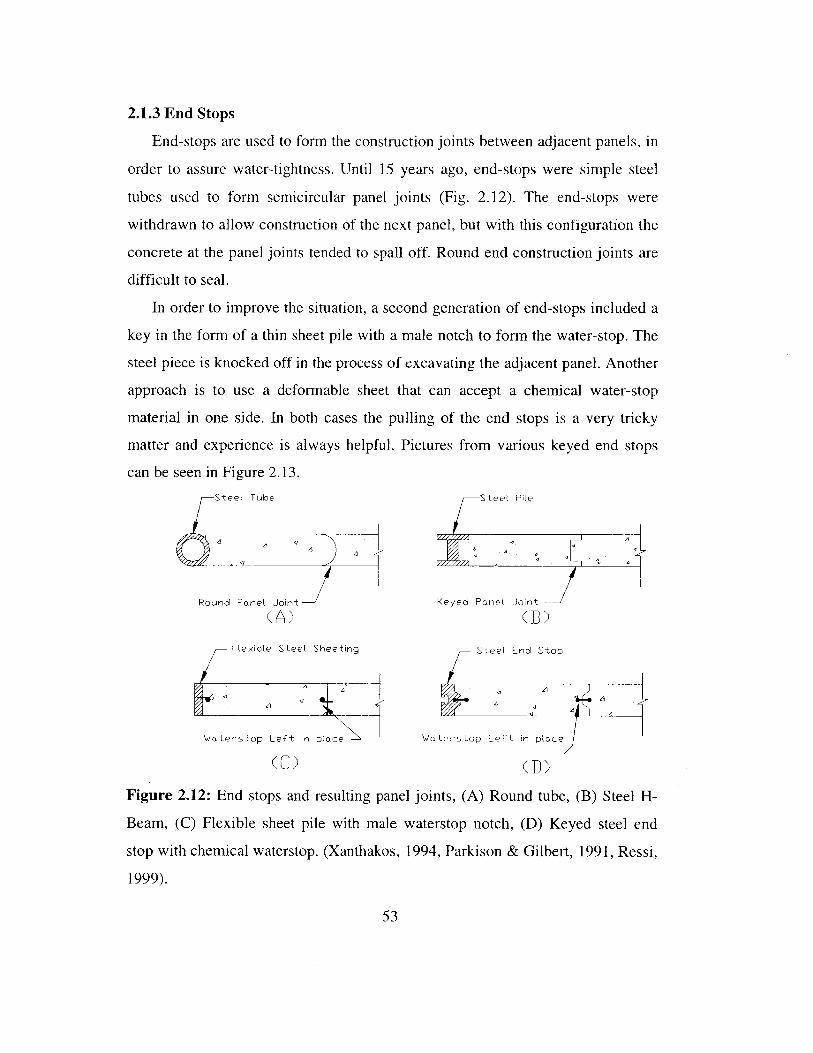
2.1.3 End Stops
End-stops are used to form the construction joints between adjacent panels, in
order to assure water-tightness. Until 15 years ago, end-stops were simple steel
tubes used to form semicircular panel joints (Fig. 2.12). The end-stops were
withdrawn to allow construction of the next panel, but with this configuration the
concrete at the panel joints tended to spall off. Round end construction joints are
difficult to seal.
In order to improve the situation, a second generation of end-stops included a
key in the form of a thin sheet pile with a male notch to form the water-stop. The
steel piece is knocked off in the process of excavating the adjacent panel. Another
approach is to use a deformable sheet that can accept a chemical water-stop
material in one side. In both cases the pulling of the end stops is a very tricky
matter and experience is always helpful. Pictures from various keyed end stops
can be seen in Figure 2.13.
Steel Tulbe Steel Pile
Round Panel Joint
( A )Keyed Panel
(B)
Steel End Stop
Waterstop Left in place W ' aterstop Left in place
(C) (D)Figure 2.12: End stops and resulting panel joints, (A) Round tube, (B) Steel H-
Beam, (C) Flexible sheet pile with male waterstop notch, (D) Keyed steel end
stop with chemical waterstop. (Xanthakos, 1994, Parkison & Gilbert, 1991, Ressi,
1999).
53
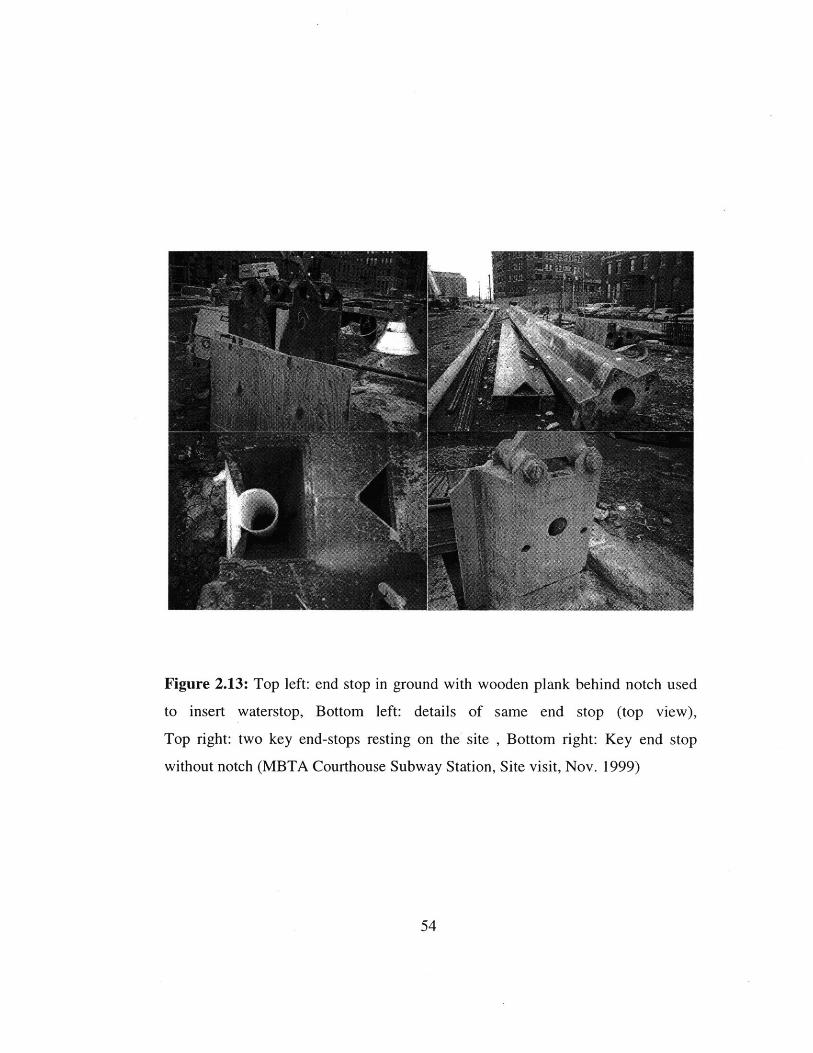
Figure 2.13: Top left: end stop in ground with wooden plank behind notch used
to insert waterstop, Bottom left: details of same end stop (top view),
Top right: two key end-stops resting on the site , Bottom right: Key end stop
without notch (MBTA Courthouse Subway Station, Site visit, Nov. 1999)
54

2.1.4 Guide Walls
Guide walls are simple reinforced concrete sections of a suitable configuration
built at grade and along the exact alignment of the trench (Xanthakos, 1994).
They are constructed before any trenching and serve only for temporary
construction. The exposed side of the guide wall is eventually dismantled, while
the side in the retained part of the soil is usually left in place.
Some of the functions of guide walls are:
(I) They layout the plan of the slurry wall panel and control the range of
movement of the trenching equipment.
(II) They help the verticality of the excavating equipment and thus aid
vertical panel construction.
(III) They retain the typically unstable upper few feet of soil, and protect it
from dynamic vibrations and loads from construction equipment.
(IV) They protect the upper section from the up-down passage of the
trenching equipment
(V) They can allow for the excavation to start from a lower level and thus
one can trench around buried utilities.
(VI) Together with the trench they function as a reservoir for the slurry.
(VII) They support prefabricated panels when used.
Figure 2.14 shows guidewalls in soft ground and typical rectangular and a
corner guidewalls. Figure 2.15 shows an actual guide wall. The distance between
guide walls is typically 2" to 4" wider than the required wall thickness. If guide
walls are not constructed deep enough then the retained soil may become unstable
and slide under the guide wall. During concreting, the tremie concrete may bulge
just below the guidewalls requiring chipping at the excavation side.
In sites next to busy streets care should be given guide wall stability since
traffic vibrations may cause the guide walls to collapse. Unreinforced guidewalls
55

have been constructed but they have a tendency to break and collapse into the
trench.
(C)
Guide Wal -
(B) (D)
Figure 2.14: Guidewalls, (A) Guidewall and trench under slurry, (B) Guide wall
and concreted panel, note the concrete bulges usually observed under the
guidewalls, (C) Plan of a rectangular guide wall, (D) Plan of a corner guidewall
(A) (B)
Figure 2.15: Guidewalls, (A) corner guidewall during trenching, (B) rectangular
guidewall prior to lowering of the reinforcement cage.56
2.1.5 Tremied Concrete
The big issue with tremied concrete is the uncertainty of the quality and
strength since the process is not standardized. Concrete in slurry wall panels cures
under ideal conditions since it is constantly in contact with pore water in the
surrounding soil. It has been claimed that the concrete strength obtained by testing
core samples from slurry walls 2 years after the panels were concreted averaged
fe'=8000psi whereas the design strength was only fc'=5000psi (Hosseini, 1999).
Unfortunately, we have no data to verify this claim. Problems arise when slurry or
soft material is entrapped between the concrete during the tremie process. These
zones of soft material have very little to no strength and allow water leakage
through if exposed. If the tremie process is done slowly and carefully then such
problems can be avoided.
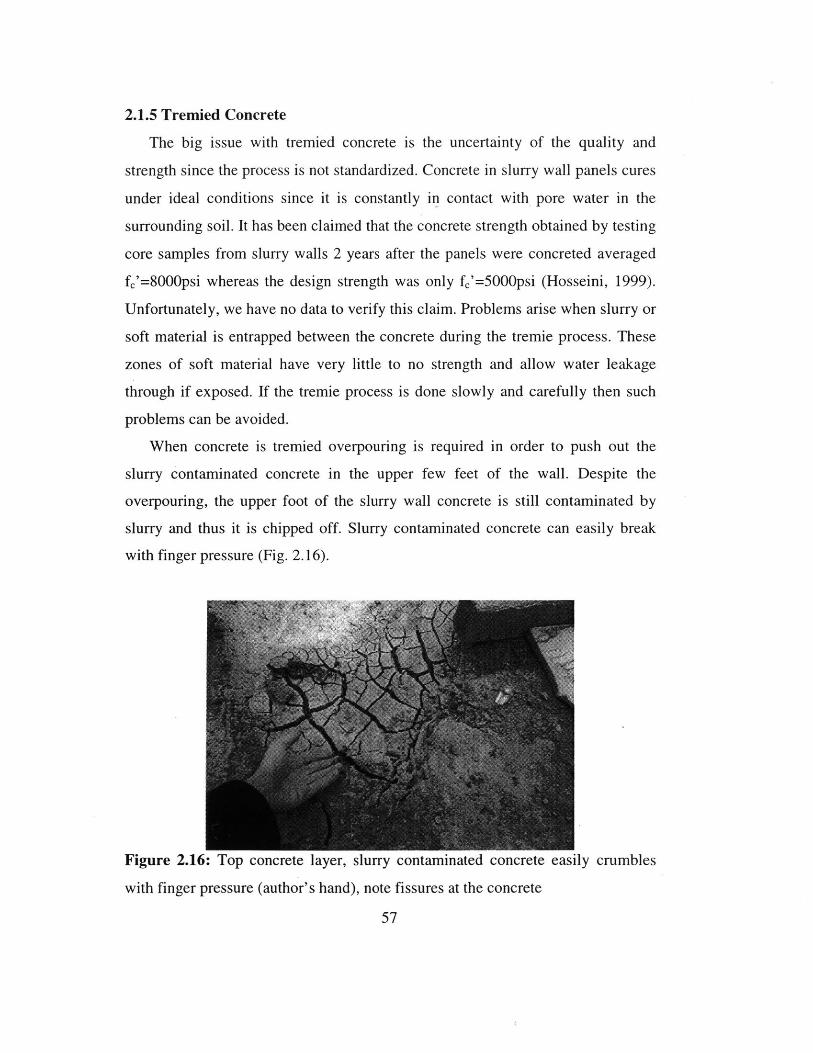
When concrete is tremied overpouring is required in order to push out the
slurry contaminated concrete in the upper few feet of the wall. Despite the
overpouring, the upper foot of the slurry wall concrete is still contaminated by
slurry and thus it is chipped off. Slurry contaminated concrete can easily break
with finger pressure (Fig. 2.16).
Figure 2.16: Top concrete layer, slurry contaminated concrete easily crumbles
with finger pressure (author's hand), note fissures at the concrete
57

2.2 Alternative Wall Systems
While most of the projects use the standard design of reinforcing cage and
tremied concrete, other wall designs have also been used:
2.2.1 Post-Tensioned Diaphragm Walls
The principles of prestressing have been applied to diaphragm walls in order
to extend their effective unbraced structural depth. Prestressing introduces internal
compressive stresses on the concrete and thus the whole concrete section is more
effectively utilized (since concrete can not resist tensile stresses). Individual
companies have developed their own proprietary systems (ICOS-Flex, B8).
Figure 2.17 shows general schematic of a post-tensioned diaphragm wall
(Fuchsberger, 1980).
Post-tensioning is a very common concept in the construction industry. A
common procedure is to post-tension high-strength steel wire strands (similar to
those used in tieback anchors), properly located in the panel, after the concrete
has cured (Xanthakos, 1994). Because post-tensioning increases the wall stiffness
larger unbraced lengths are allowed, and the expected wall deflections should be
smaller.
Figure 2.17: Post-tensioned diaphragm wall (Based on Fuchsberger, 1980)
58

2.2.2 Prefabricated Diaphragm Walls
Prefabricated slurry walls are constructed by inserting precast concrete panels
in slurry trenches in place of the concrete tremie. The prefabricated panels are
detailed so that they allow adjacent panels to interlock and form watertight joints.
However, this might prove to be a difficult task. On several occasions in the
Seaborn Hotel in Boston (Fig. 2.18), the tongues and grooves of the panels did not
align properly, and the ill-fitting panels had to be removed, re-cut and reinstalled
(BDC, 2000). Prestressing can easily be used in precast panels as was the case for
the Pilot House Project in Boston (Kirmani et al., 1998).
The process requires more interaction between the slurry and the wall at the
final configuration. In the single grout method the initial slurry that is used to
support the trench is also used to form the final grout that seals panels and forms
the interface between the precast panel and the retained soil. In contrast, in the
displacement grout method the initial slurry is replaced by suitable bonding grout
just before the precast sections are placed. In both methods the grout that remains
in the excavation face of the panel is removed.
The big advantage of prefabricated walls is that they allow for better quality
control through manufacturing. Also if constructed carefully the final wall finish
of prefabricated walls is better than that of conventional diaphragm walls. Their
major disadvantage is that the panel size is limited by the capacity of the lifting
equipment and by handling limitations. It is also difficult to guarantee water-
tightness between adjacent panels, especially when differential movements
between panels occur.
Figure 2.18: Precast slurry wallproject in Boston (Seaborn Hotel,Boston), courtesy of TrevilcosBoston.
59
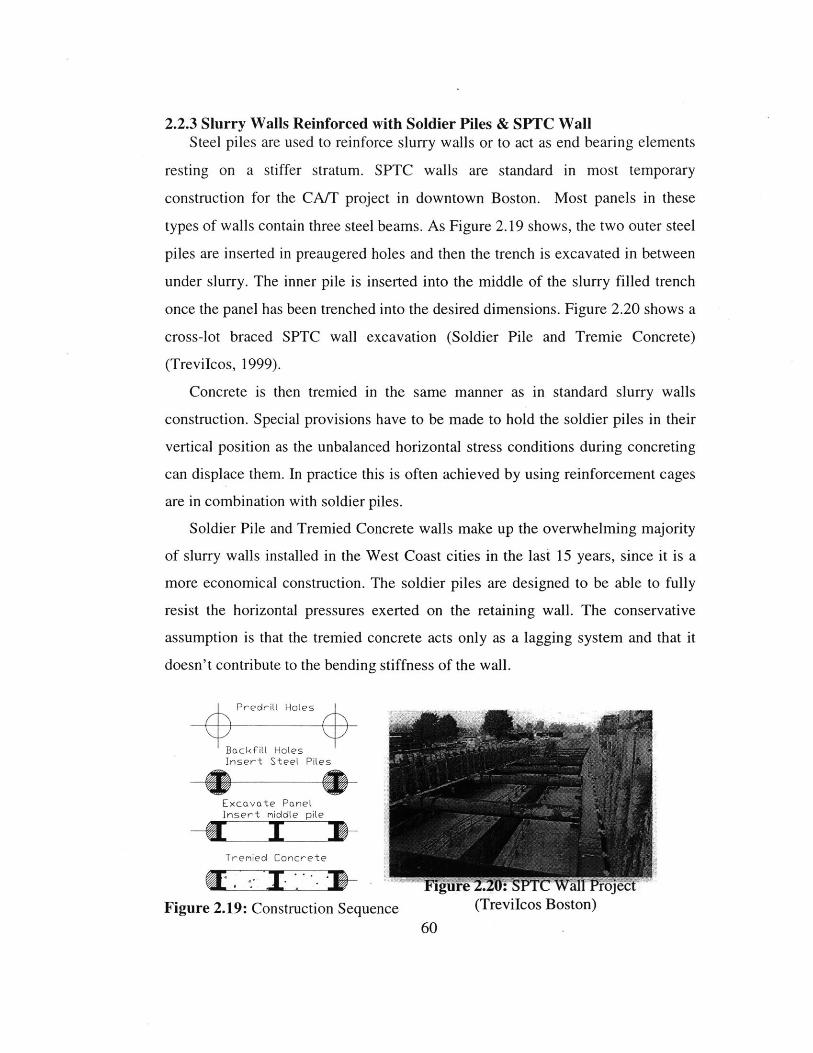
2.2.3 Slurry Walls Reinforced with Soldier Piles & SPTC WallSteel piles are used to reinforce slurry walls or to act as end bearing elements
resting on a stiffer stratum. SPTC walls are standard in most temporary
construction for the CA/T project in downtown Boston. Most panels in these
types of walls contain three steel beams. As Figure 2.19 shows, the two outer steel
piles are inserted in preaugered holes and then the trench is excavated in between
under slurry. The inner pile is inserted into the middle of the slurry filled trench
once the panel has been trenched into the desired dimensions. Figure 2.20 shows a
cross-lot braced SPTC wall excavation (Soldier Pile and Tremie Concrete)
(Trevilcos, 1999).
Concrete is then tremied in the same manner as in standard slurry walls
construction. Special provisions have to be made to hold the soldier piles in their
vertical position as the unbalanced horizontal stress conditions during concreting
can displace them. In practice this is often achieved by using reinforcement cages
are in combination with soldier piles.
Soldier Pile and Tremied Concrete walls make up the overwhelming majority
of slurry walls installed in the West Coast cities in the last 15 years, since it is a
more economical construction. The soldier piles are designed to be able to fully
resist the horizontal pressures exerted on the retaining wall. The conservative
assumption is that the tremied concrete acts only as a lagging system and that it
doesn't contribute to the bending stiffness of the wall.
Predrill Holes
Backfill HolesInsert Steel Piles
Excavate PanelInsert middle pile
Tremied Concrete
Figure 2.19: Construction Sequence (Trevilcos Boston)
60

2.2.4 Bored Piles or Caissons and Slurry Wall Panels
In some projects bored piles or caissons have been used in combination with
slurry wall panels (Water Tower: C4, NU Parking Garage: C9, Chicago). The
usual purpose of the caissons or the bored piles is to minimize settlement of the
slurry wall when the panels do not bear on a stiff stratum. This can be a serious
consideration when the slurry wall is to carry part of the vertical superstructure
loads. Figure 2.21 shows a slurry wall and caisson combination.
Excavation of the bored piles or the caissons is carried under slurry in order to
avoid soil movements. Care should be taken when excavating caissons since if
oversized holes are drilled then soil movements can be very large despite the stiff
slurry wall system. Caissons (or piles) may be constructed first and then the slurry
wall panels may be trenched and concreted in between. The opposite construction
sequence is also possible, but in both cases special attention should be given to
the waterstopping details in the joints between caissons and slurry wall panels.
Slurry W ll
Caissons or Bored Piles
Figure 2.21: Slurry wall panel and caisson combination (or bored piles)
61

2.2.5 T-Walls
Buttressed or T-walls are typically analyzed as stiffened cantilevers and not as
gravity retaining structures (Xanthakos, 1994). Some of the deepest T-walls are
been used in the CA/T project in Boston (Lambrechts et al., 1998), and in the
Dam No. 2 Hydropower Project on the Arkansas River (Berger & Tryon, 1999).
Figure 2.22 illustrates the basic arrangement of a cantilever T-panel, where the
flange acts in compression, while part of the stem is in tension. Stability analyses
may include the skin friction at the stem yielding a more economical design. The
extra rigidity allows for greater unbraced lengths but the wall stability is
eventually controlled by its embedment. Figure 2.23 shows a reinforcement cage
for a T-panel for the MBTA Courthouse Subways Station in Boston.
RetainedSoil
ExcavationFigure 2.22: T-Slurry wall
MI AW I UOMi
Figure 2.23: Reinforcement cage for a T-Slurry wall, (MBTA CourthouseSubway Station, South Boston)
62

2.3 Bracing Systems
2.3.1 Tiedback Walls
Anchored walls have become popular in braced excavations because of a) the
substantial progress in the technology and availability of high-capacity anchor
systems, and b) the absence of interior obstructions that permit uninterrupted earth
moving and thus improve the construction conditions of the underground portion
of a building (Xanthakos, 1994). Figures 2.24 and 2.25 show a photo and a
schematic of tied-back slurry wall excavations. In some projects tiebacks have
been used in combination with rakers and soil berms and/or corner braces
(Gnaedinger et al., 1975, B7). Tieback anchors comprise a barrel anchorage
located either in a bearing layer (Fig. 2.25) which is tensioned at the front face of
the wall. The part of the anchor that transfers the force to the surrounding soil is
frequently called the "fixed length", while the "free length" transmits forces from
the fixed length through the anchor head to the slurry wall (Fig. 2.26).
In order to minimize wall movement and ground settlement, tieback anchors
are designed to achieve the highest stiffness possible within economical
considerations. In urban cities like Boston, Chicago, New York, and Washington
where land is precious such deep excavations are more common. Tieback capacity
depends on the vertical and horizontal spacing of anchors and on surcharge
conditions. Prestress levels typically range from 40 to 250 kips when the grouted
portion of tiebacks is within soil, higher loads are used when the ties are located
in bedrock. Typical tieback spacing ranges from 7ft to 13ft in the vertical, and
from 5ft to 15ft in the horizontal direction (from the current database). Tieback
capacity is reduced if the spacing is too close due to interference between adjacent
grouted zones.
Often the tiebacks are used only for temporary excavation support, while the
basement floors provide permanent lateral earth support. In such projects the
tiebacks are detensioned when the basement floors have gained sufficient
strength. The basement floors should be designed to resist permanent lateral earth
63

pressures, since stress transfer from the tiebacks to the floor system will take
place when the ties are detensioned. This stress transfer has reportedly caused
long-term cracking of many the basement floors where slurry wall excavations
were braced with temporary tiebacks (B3).
Tieback installation follows a predetermined sequence as to minimize soil
movements and speed the excavation construction (Fig. 2.27). The excavation is
carried a couple of feet below the tieback to enable access for the drill rig. Further
excavation occurs only after prestressing and proof-testing of the anchors. As
Figure 2.28 illustrates, the process can be repeated for additional levels of
tiebacks. Building codes require that all tiebacks are proof-tested to an excess
percentage of their final lock-off load, which usually ranges from 120 to 150% of
the final lock-off load. Regroutable tiebacks are most commonly used because
their capacity can be increased by regrouting (to meet test requirements) without
having to drill a new anchor hole.
A tieback is made by first drilling a hole with an auger and then placing a bar
(tendon) in the hole, concrete is then poured in the hole and the connection with
wall is made (Figure 2.26). Different types of augers are used to drill the tieback
holes. The choice of the drilling method depends on the soil/rock conditions on
the site. The main types of drilling equipment fall under the following categories:
I. Percussive Drills: These accomplish penetration by the action of an
impulsive blow, usually exerted from a chisel or wedge-shaped bit
(Xantakos, 1991). Mawdsley [1970], reports three main types:
a) Type A, with a compressed air-powered drifter driving standard
coupled rods.
b) Type B, with a compressed air-powered drifter driving special
coupled drill rods which also act as the anchor.
c) Type C, with an independent rotation compressed air-powered
drifter simultaneously driving coupled drill tubes and drill rods,
also known as "Atlas Copco overburden method" .
64

II. Rotary Drills: They work by combining axial thrust and rotational
torque. The main types are:
a) Auger driving with coupled flight augers. Augers are most
commonly used in self-supporting materials like stiff to hard clays,
marls and soft rocks. They can be further subdivided to
1) continuous flight augers with hollow couplings, that allow
water, bentonite, or grout to be pumped into the hole, 2) standard
continuous flight augers for open hole drilling, most commonly
used in cohesive soils, and 3) hollow-stem augers with a
removable center bit allowing sampling during drilling.
b) Normal rotary drills with flush coupled drill rods and usually a
drag bit as the cutting component.
III. Rotary-Percussive Drills: These combine the characteristics of the two
previous types, with: a) axial thrust and torque but lower than rotary
drills, b) impact like the percussive type but smaller in magnitude.
Drilling should be done carefully since inadequate procedures can cause
significant soil losses. The biproduct of drilling is removed by flushing the hole
with either air, water, or slurry. Air is most efficient in dry ground, but it requires
special attention because it can become entrapped during drilling, building up
zones of high pressure in the soil that can eject material for several feet and at
high speeds (potentially injuring workers). Water flushing is best used in sticky
clayey soil, and it also cleans the sides of the hole by its sweeping action,
providing a stronger bond at the grout-anchor interface. Bentonite slurry flushing
works the best since it keeps particles in suspension, while the sealing action
keeps the hole from collapsing.
Significant soil losses through the tiebacks cause significant settlements even
if the retaining walls do not move towards the excavation. In granular soils the
drilled hole must be cased to avoid collapse.
65

Some tieback creep can be expected especially if the ties are very short and
the fixed length of the tie is within soft ground. For stability reasons, the fiexed
anchor should be located beyond the active zone of movements. As a result,
tieback anchors may not be an option at sites congested whcre ther- Ire adjecent
underground utilities or when adjacent owners do not grant permission to drill
them under their properties.
Special attention should be given to the waterproofing details at the anchor
heads and at the tieback holes. Significant leakage can be caused by inadequate
waterstopping details at these locations (see section 2.3).
Figure 2.24: Picture from a tieback slurry wall excavation (World Bank Project
Washington, Case Study W-1)
66

West Wall (IN-1
F TTING OF...- RED STONE BUILDING
W T
7
East V
Cup Bea)
B- ~ -~
all (IN-3) q'U
5 FE FE~ R1 T .E . ...... .
Figure 2.25: Tieback slurry wall excavation (Dana Farber Tower, Boston: Case
Study B-12).
Jack Unbonded "Free Length"
Anchor headPlate
"Fixed Length"Bonded
Grout
Figure 2.26: Tieback configuration, free and fixed lengths (Schnabel, 1982)
67
-0

Bar
(a) (b)
Earth Backfill ~ Nut and Plates
Concrete Wale
(c) (d)
Figure 2.27: Steps in making a tieback: (a) hole drilled; (b) bar placed in hole;
(c) concrete poured for anchor; (d) wall connection made (Schnabel, 1982).
(A) (B)
Figure 2.28: Steps in making a multilevel tieback excavation, (A) first level of
tiebacks installed and second level of tiebacks drilled, (B) second level of tiebacks
installed.
68
2.3.2 Cross-Lot Braced Slurry Wall Excavations
Cross-lot bracing transfers the lateral earth (and water pressures) between
opposing walls through compressive struts. Typically the struts are either pipe or
I- beam sections and are usually preloaded to provide a very stiff system.
Installation of the cross-lot struts is done by excavating soil locally around the
strut and only continuing the excavation once preloading is complete. A typical
sequence of excavation in cross-lot braced excavations is shown in Figure 2.29.
The struts rest on a series of wale beams that distribute the strut load to the
diaphragm wall.
Pre-loading ensures a rigid contact between interacting members and is
accomplished by inserting a hydraulic jack as each side of an individual pipe strut
between the wale beam and a special jacking plate welded to the strut
(Fig. 2.30, Xanthakos, 1994). The strut load can either be measured with strain
gages or can be estimated using equations of elasticity by measuring the increased
separation between the wale and the strut. Figure 2.31 shows the basic
arrangement for the wedging, and the telescoping preloading methods.
In some earlier projects the struts were not preloaded, and as a result when the
excavation progressed deeper the soil and the wall movements were large (Cl).
Thus it has become standard practice to preload struts in order to minimize wall
movements.
Cross-lot bracing makes sense in narrow excavations (60ft to 120ft) when
tieback installation is not feasible. The struts can bend excessively under their
own weight if the excavation spacing is too large. In addition, special provisions
have to taken to account for thermal expansion and contraction of the struts.
The typical strut spacing is in the range of 15ft, both in the vertical and the
horizontal direction. This is larger than the typical spacing when tiebacks are
used, because the pre-loading levels are much higher. A clear benefit of using
struts is that there are no tieback openings in the slurry wall, thus eliminating one
source of leakage.
69

Cross-lot Brace
(C) (D)Figure 2.29: Typical excavation sequence in cross-lot excavations: (A) V-cutinitial cantilever excavation, (B) Strut installation and pre-loading in smalltrenches in soil berms, (C) V-cut excavation to next level and strut installation,(B) Final grade.
1.0 r
0-5
6r-
01
01 I I I 1 170 90 110
(315) (405) (495)Preload, ips (kN)
(a)
Figure 2.30: (a) preloading arrangement, and(Xanthakos, 1994)
(b)
(b) measured brace stiffness
Wedging
Telescoping pipe
Figure 2.31: Methods of preloading struts; Wedging (top), Telescoping pipe(bottom)
70

2.3.3 Top/Down Slurry Wall Excavations
Top/down or up/down construction methods are another method for
constructing deep excavations. In this case the basement floors are constructed as
the excavation progresses. The top/down method has been used for deep
excavation projects where tieback installation was not feasible and soil
movements had to be minimized. Figures 2.32 through 2.33 show construction
photographs from two top/down excavations in Boston (B 11, B 13). The general
top/down construction sequence is shown in Figure 2.34 (B 11). The Post Office
Square Garage in Boston (B 10) (7-levels deep) is one of the best-instrumented
and documented top/down projects in the US (Whittle, et al., Whitman et al.,
1991).
The sequence construction begins with slurry wall installation and then load-
bearing elements that will carry the future super-structure. The basement columns
(typically steel beams) are constructed before any excavation takes place and rest
on the load bearing elements. These load bearing elements are typically concrete
barrettes constructed under slurry (or caissons). The top few feet of a barrette with
a steel beam can be seen in Figure 2.33. Then the top floor slab is constructed
with at least on construction (glory) hole left open to allow removal of spoil
material (Figs. 2.33, 2.34).
The excavation starting at the glory hole begins once the top floor has gained
sufficient strength. Soil under the top basement floor is excavated around the
basement columns to slightly lower than the first basement floor elevation in
order to allow for the installation of the forms for the first level basement slab.
Glory holes are left open within each newly formed basement floor slab and the
procedure is repeated. Each floor rests on the basement columns that were
constructed earlier (Fig. 2.33).
71

Figure 2.32:Top/Down Excavation (Beth Israel Deaconess Hospital, Boston,
Case study B-11)
Figure 2.33: Millenium Place excavation. Left: Looking up at a glory hole,
Top right: author in the lowest most level note LBE on the left and the barrette,
Bottom right: close up view the same barrette (LBE) and steel beam (B 13).
72

Th::! H-d
Misc SPme
Miscellaneous -PPil
Marin Sand Clay
_ _. A + - U ilz BBC)
Marine Clay 13,k6I 20 5Glacial Td
G ial Till -
Load Beaing NlallSlurry Element (LBE)Wall
a) Slurry wall and basement column construction
E i -- n H m
MCA.
Elemen HaBE
b) nuaGound floor cnstrctonndpouin
Miscy
Marne Sand ClavBBC)
Manne CI-ayBl
Glacial TUI
G1.6i Till
Load Bearing wSlunrElement (LBE)Wall
b) Groun d floor construction and pouring
-~~-- - - ------------ G l~ ~l ,I
Fge.4Tcon( M slane
73
Marine Sand HMCav
(B36C)0
Marne Clay2
BaddLBEGlacial Till
Glacial Till
c) Excavation and floor construction under and above the ground floor
sc.
M scLlaneou :2
MarneMarne Sand Ca
Mlaine Clay
G1acia1 Tdl
d) Excavation & lowest basement floor completed
Figure 2.34: Top/down basic construction (Bl11)73

2.4 Watertightness
Watertightness is very important especially since slurry walls are either used
as part of the permanent underground basement structures or are selected in part
to control groundwater flow during excavation. Although minimal water can flow
through the mass concrete, significant leakage can occur at joints, in openings for
tiebacks or when there is a breach in the wall integrity. The risk of leakage is
increased when the number of construction joints is increased. Therefore, water
leakage is usually controlled by minor defects on the wall. Filling with hydraulic
cement and grouting are the most common methods of repairing leakage. Typical
grouts used are either cement grouts, chemical, or a combination of both.
Special attention should be given to the waterstopping details at the interface
of tiebacks with slurry walls (Fig. 2.35) (B12). When tiebacks are permanent
waterstops at the concrete and at the anchor head should be designed for multiple
safety. Figure 2.36 (B12) shows the water-stopping details for a permanent
tieback.
Differential movement at panel joints usually results in dampness around
joints. In order to avoid such leakage contractors have developed waterstops that
are inserted with the help of the end stops (Fig. 2.12) (Xanthakos, 1994, Parkison
& Gilbert, 1991, Ressi, 1999). These waterstops maybe chemical or plastic but in
both cases care should be given during construction. The usual remedy for
excessively leaking joints is to grout behind the joint once the movements of the
wall have stabilized stopped. However, additional differential deflections can
occur between adjacent panels if too much grout is inserted behind the wall, and
thus sealing will not be effective.
Improper cleaning of the panel bottom after trenching can result in leaking
construction joints. After trenching has finished, soil cutting material can
accumulate at the bottom of the panel. If this material is not cleaned then it is
pushed up during concreting. Part of the material reaches the top of the panel
where it is later chipped and removed, but some can get entrapped between the
74

panel joints. When exposed, water can easily leak through these contaminated
joint sections.
GALV. PLATE 14"x3"xl'4"ASTM A588 GRADE 50
16"x3/4"x1'-4"PLATE WITH 10"DIA.OPENING -A572GRADE 50GALVANIZED
3/4" PLYWOOD ATTACHEDTO PIPEW/ NAILS & SPOTWELDED CLIPS(OR SIMILAR TECHNIQUE)
-10" DIA, EXTRA STRONGSTEEL PIPE ASTM A500GRADE C-GALVANIZED
Figure 2.35: Typical waterstopping details at the tieback slurry wall interface
Dana Farber Tower (B 12)
\<NCHI ERHE. AD ~A DRYPACK
NNSTRINK
E NCA PSUL T
A -EE A TE
.r HET
R L'
Figure 2.36: Permanent tieback and sealing details, ADEKA is a hydrophilic
material that expands when exposed to water forming a seal (B 12)
75

2.5 Wall Finish
With the exception of precast panels, slurry walls never have a perfect wall
finish. The final wall finish contains irregularities and protrusions from the
average wall face. The usual overbreak tolerance is 3" to 4" from the specified
wall thickness but this depends on the soil conditions in the site, excess concrete
beyond the specified tolerance is chipped away. The tendency for overbreaks
increases in loose sands and heavily fissured clays. Large excess concrete
volumes are sometimes observed at locations where strata change like from soil to
bedrock (Figure 2.37). Excess concrete is occasionally observed in corner panels
(Fig. 2.38).
Doterite ELiiBedrock
Figure 2.37: Concrete overbreaks due to strata change (after ICE, 1976)
Figure 2.38: Excess concrete at a corner panel (left), chipping of excess concrete
at a corner panel (right)76

Chapter 3
Instrumentation for Performance Monitoring
77

78

Chapter 3
Instrumentation for Performance Monitoring
3.1 Instrumentation in Deep Excavations
The principal parameters of interest in monitoring are: (1) wall and soil
deformations, (2) stresses acting on structural elements (wall and bracing), and
3) ground water pressures and inflows. Table 3.1. summarizes the parameters and
methods of measurements used for slurry wall excavations.
Inclinometers, piezometers and optical surveys have been used to monitor the
majority of the projects compiled in this database. Table 3.2 lists the performance
monitoring measured and what archived data could be retrieved for each case
study. Generally, the quality of the available instrumentation was dictated by the
project requirements. The quality of data in more recent projects tends to be better
since computers have facilitated data acquisition and archiving.
Clearly, inclinometers and surface settlement surveys have been used in
almost all the projects but the latter were not archived in many projects. Thus,
inclinometer deflections have been more widely used for comparisons between
cases due to their availability in almost all the archives. Water levels and
piezometric levels were measured in most projects but were not always available
in the archives.
In a few cases, strain gages or load cells were used to monitor bracing loads
but these cases tend to be the exception rather than the rule. A truly rare case is
the Dana Farber Tower (B12) project in Boston, where strain gages and
embedment gages where used to deduce moments and axial forces in the slurry
wall.
Sometimes, single point extensometers have been used to measure subsurface
settlements, but multipoint borehole extensometers have only rarely been used.
Earth pressure cells have been used only in test programs.
79

Monitoring strategies are not significantly different from city to city but the
extent of instrumentation does depend on local practices. For example, in Boston,
the majority of the inclinometers were installed within the diaphragm walls while
in Chicago they have been installed within the retain1ed sa0il. In Washington,
inclinometers have been installed both within the walls and within the
surrounding soil.
Table 3.1
Instrumentation used in slurry wall construction (after Xanthakos 1991)
Geotechnical Parameter of Interest Possible measurement methodsProblem
Trench stability Width of trench 0 Trench width gagee Inclinometer
Trench verticality Alignment of sides of trench e Inclinometer in temporarycasing
Guide wall stability Horizontal and vertical movement e Optical surveyof guide wall
Ground and wall Horizontal movement of ground e Optical surveymovement or wall e Inclinometer in wall or in soil
* Horizontal multipointextensometer (HMPBX)
e Tape extensometer across theexcavation
Vertical movement of ground or * Optical surveywall e Subsurface settlement gage ie.
Settlement rods or MultiplePoint Borehole Extensometers(MPBX)
Movement of adjacent structures e Photographye Optical surveye Tiltmetere Crack gage
Cross-lot bracing Loads in struts or braces e Strain gageTieback bracing Tieback load e Strain gage
e Load gageAnchor movement e Telltale
Basal stability Bottom heave or horizontal e Heave gageground movement e Inclinometer
Groundwater Groundwater level e Observation wellPore pressure e Piezometer
Advanced Wall moments, axial forces, e Strain gagesinformation stresses in wall or reinforcement
Earth stresses e Earth pressure cells
80

Table 3.2: Measured and archived performance monitoring instrumentation usedin slurry wall excavations (B) Boston, (C) Chicago, (W) Washington DC, (S) SanFrancisco.
SbS,SS, MPBX, PZ - SG - RsG -
ID ?roectfane Year IN HoS VoS EX OW LC TM EG Quality
Boston M A MA M A M A M AMA M A M ABI * MBTA South Cove 1973 v v Iv 1 v" v Lv v vI _ GoodB2 ** 60-State Street 1975 V v v v v v v v Very GoodB3 State Transportation Building 1982 V v v v v v I v v v Good
B4 * 75 State Street 1983 v v v v No dataB5 Rowes Wharf 1984 V t/ poorB6 One Memorial Drive 1985 11 V vv v v v GoodB7 500 Boylston 1987 v Li V i v v Ve goodB8 Flagship Wharf 1989 v v V I V v I v Very goodB9* 125 Summer Street 1990 v L V No dataB1O Post Office Square Garage 1991 v Li i v Iv V I Li v I ExcellentB11 Beth Israel Deaconess 1994 v v v i v v Very goodB 12 Dana Farber Tower 1995 P v v i v i v L v i ExcellentB13 Millenium Place 2000 v V i I v v Excellent
SbS,SS, MPBX, PZ- SG - RsG -
ID Project Name Year IN HoS VoS EX OW LC TM EG Quality
Chicago M A MAMAM A MAMAMAMACI* CNA Building 1971 p Lv v vI vI FairC2 ** Sears Tower 1971 L p L v/ V v _ PoorC3 ** Amoco Standard Oil 1973 v' V v Li Lv _ GoodC4 ** Water Tower 1974 v v v' v v LI L Lv vVery GoodC5 Loyola University Business Sch 1993 L I v v p Very PoorC6 Prudential Two 1986 u Lv I ' GoodC7** AT&T Corporate Center 1987 1 v v v/ GoodC8 Guest Quarters Hotel 1989 v v L L/ GoodC9 Northwestern University Memori 1990 v/ v v i GoodCIO Museum of Science & Industry 1997 I 1v 1v v Good
C11 * 311 South Wacker Drive 1997 v L v Good
SbS,SS, MPBX, PZ - SG - RsG -
ID Project Name Year IN HoS VoS EX OW LC TM EG Quality
M A MAMAM A MAMAMAMA
,WashingtonWl World Bank 1991 Li V V V v V L V v v _ ExcellentW2 Petworth Subway Station 1995 v v v i PoorW3 Washington Convention Center 2000 v v v v v I i V L LV v I" ExcellentW4 * Metro Center II 1991 v V P v Not avail.I __ San Francisco __+__E e nS9 Yerba Buena Tower 1999 v v v v v v v v Excellent
Note: M - Measured, A - Archived, * Only Referenced, ** Referenced and revisited archives,IN-Inclinometers, HoS - Horizontal Offset Surveys (Optical), SS - VoS- Surface Settlements &Vertical offset Surveys (Optical), PZ OW- Piezometers and Observation Wells, SG - StrainGages, LC - Load Cells, EG - Embedement Strain Gages (Concrete), RsG - Reinforcement strainGages, SbS - Subsurface Settlements, EX - Extensometers, MPBX - Multiple Point BoreholeExtensometer
81
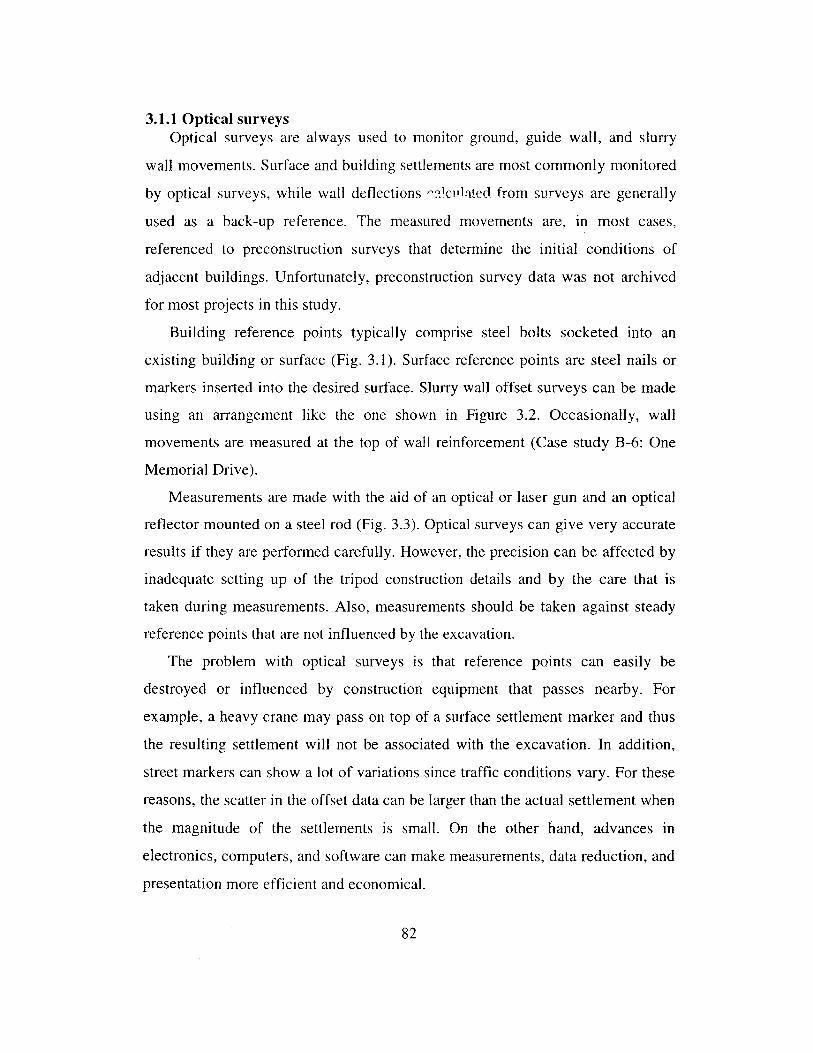
3.1.1 Optical surveysOptical surveys are always used to monitor ground, guide wall, and slurry
wall movements. Surface and building settlements are most commonly monitored
by optical surveys, while wall deflections 'eulhted from surveys are generally
used as a back-up reference. The measured movements are, in most cases,
referenced to preconstruction surveys that determine the initial conditions of
adjacent buildings. Unfortunately, preconstruction survey data was not archived
for most projects in this study.
Building reference points typically comprise steel bolts socketed into an
existing building or surface (Fig. 3.1). Surface reference points are steel nails or
markers inserted into the desired surface. Slurry wall offset surveys can be made
using an arrangement like the one shown in Figure 3.2. Occasionally, wall
movements are measured at the top of wall reinforcement (Case study B-6: One
Memorial Drive).
Measurements are made with the aid of an optical or laser gun and an optical
reflector mounted on a steel rod (Fig. 3.3). Optical surveys can give very accurate
results if they are performed carefully. However, the precision can be affected by
inadequate setting up of the tripod construction details and by the care that is
taken during measurements. Also, measurements should be taken against steady
reference points that are not influenced by the excavation.
The problem with optical surveys is that reference points can easily be
destroyed or influenced by construction equipment that passes nearby. For
example, a heavy crane may pass on top of a surface settlement marker and thus
the resulting settlement will not be associated with the excavation. In addition,
street markers can show a lot of variations since traffic conditions vary. For these
reasons, the scatter in the offset data can be larger than the actual settlement when
the magnitude of the settlements is small. On the other hand, advances in
electronics, computers, and software can make measurements, data reduction, and
presentation more efficient and economical.
82

1-1/2 IN. LONG, 1/4 IN. DIA.STAINLESS STEEL SOCKET HEADCAP SCREW WITH STMJNLESS
-1/2 IN. SE WASHER
| 3/4 IN. J0 i
1/2 j(
1/4 IN. LEAD TAMP-I 3/8 IN. MIN.
EPOXY COMPOUND-- - EXSTING BUILDING OR
TYPICAL BUILDING REFERENCE POINT (BRP) DETAlLNOT TO SCALE
Figure 3.1:
Building reference point detail(Case Study B-13, Millenium Place)
(A)
(C)
2-2-0/0- 44GLE18" IN LENGTH4
r.,8' BASE PLATE
Figure 3.2:
Horizontal offset monitoring surveydetail (Case Study W3: WashingtonConvention Center).
(B)
(D)
Figure 3.3:
(D) Reflector.
a(A) Theodolite (TopCon), (B) Automated level, (C) Tripod,
83

3.1.2 Inclinometers
Inclinometers are the most important source of geotechnical data during
construction (Erikson et. al., 1992). Inclinometers are widely used to measure
lateral soil and wall movements in slurry wall and deep excavations (Fig. 3.4).
They fall into two categories, 1) probe inclinometers and 2) fixed- in-place
inclinometers (Laplante, 1998). Only probe inclinometers have been used in all
the studied projects. In either type, a casing with four orthogonal grooves is
installed in a borehole in the ground or within the slurry wall (Fig. 3.5). The
grooves are designed to fit the wheels of the inclinometer probe (Fig. 3.6). The
angle of the probe from the vertical axis is measured in both directions with the
use of a sensitive gravity pendulum, tiltmeters, or a servo accelerometer. The
deflections are calculated automatically from this angular measurement and from
the distance between the wheels (which is known). Deflections are always
compared to an initial reading since the casing may not be installed in the vertical
position.
Typically measurements are reported at two foot intervals and a process
requires up to 15 minutes (Fig. 3.7). The reduced data maybe erroneous and
certainly will be less accurate if the measurements are taken at steps greater than
the typical two-foot distance between the probe wheels (W3). For better results it
is advisable that the inclinometer casing extends to a firm stratum (or to a great
enough depth) so that the inclinometer base does not move. For example, walls in
floating excavations tend to translate at their bases (B3, B7) and these movements
will not be picked up if the inclinometers do not extend beneath the base of the
wall (B6). Movements during slurry wall construction can not be measured when
all the inclinometers are installed within the diaphragm wall. Thus in order to get
a more realistic view of soil movements during slurry wall construction it is
suggested that a few inclinometers be installed within soil. In ideal conditions,
soil inclinometers should be installed before any construction takes place.
84

The limitation of inclinometers is that they measure only horizontal ground
deformations. Deformation data is necessary to appease abutters worried about
potential damage to their property (Laplante, 1998).
Figure 3.4: GeoKon Model 6000 Inclinometer probe and readout device.
85

(reference direction)
B-
A-
Figure 3.5: Inclinometergrooves, A+A- is the primary
direction, B+B- is thesecondary direction
Cable Fitting
Wheel Assembly
A-
Accelerometer Housing
Bottom Cushion
Figure 3.6:Inclinometer probe
GK-603 Readout
Coupling
Bottom Cap
I ZLsinON
Casing Alignment--(exaggerated)
L si
Reading Interval --- L j
Probe
Wheels
4- True Venical
Figure 3.7: Inclinometer survey description, (Geokon manual)
86

3.1.3 Subsurface Settlement Gages
Subsurface settlement gages fall under two general categories, single-point
and multipoint gages. As the name indicates they are used to measure subsurface
settlements at one or more reference points. The "Borros" anchor point is the most
commonly used single-point gage and it consisting of a steel anchor mechanically
set at the bottom of a borehole (Fig. 3.8a). A heave/settlement point consists of a
three-pronged anchor, a 1/4" inner pipe, and a 1" outer pipe, both steel. The inner
pipe is attached to the anchor and is free to move inside the 1" pipe. An optical
survey is used to determine the elevation of the top of the inner pipe. Changes in
its elevation indicate an equivalent amount of settlement or heave at the anchor.
Single-point settlement gages are sometimes used in deep excavations (Case
Study B-3: State Transportation Building). Their accuracy is in the order of 0.1"
(Xanthakos 1994).
Multipoint settlement gages are rarely used in common projects but they are
widely used in test programs and for research purposes (Case Study B-10: Post
Office Square Garage). A corrugated plastic pipe is installed in a nominally
vertical borehole with stainless-steel wire rings around the pipe placed at intervals
of 5' to 10' (Fig. 3.8b). A grout with a modulus similar to that of the surrounding
soil is inserted in the annular space between the pipe and the borehole wall.
Settlements are measured by lowering a probe containing an inductive coil within
the pipe on the end of an electrical cable and a survey tape .The standard accuracy
is in the order or 0.1" but it can be improved by modifying the basic arrangement.
Another type uses magnetic rings instead of the inductive coils and a magnetic
probe (Fig. 3.9a). With careful sizing and detailing it is possible to combine an
inclinometer and a multipoint settlement gage in the same borehole (Xanthakos).
87

Pipe GroundSurface
Grout withSimilar Modulus-
to Soil
Bottom ofBorehole
Cable & Tape
-Corrugated
Plastic Pipe
Steel Wirings7 at Regular
IntervalsProbe withInductive Coil
Bottom ofBorehole
Anchor
(B)
Figure 3.8: (A) Single point "Borros" anchor, (B) Multi-point settlement gage.
(a) (b)
Figure 3.9: (a) Magnetic settlement anchors, (b) Settlement meter.
88
GroundSurface
(A)
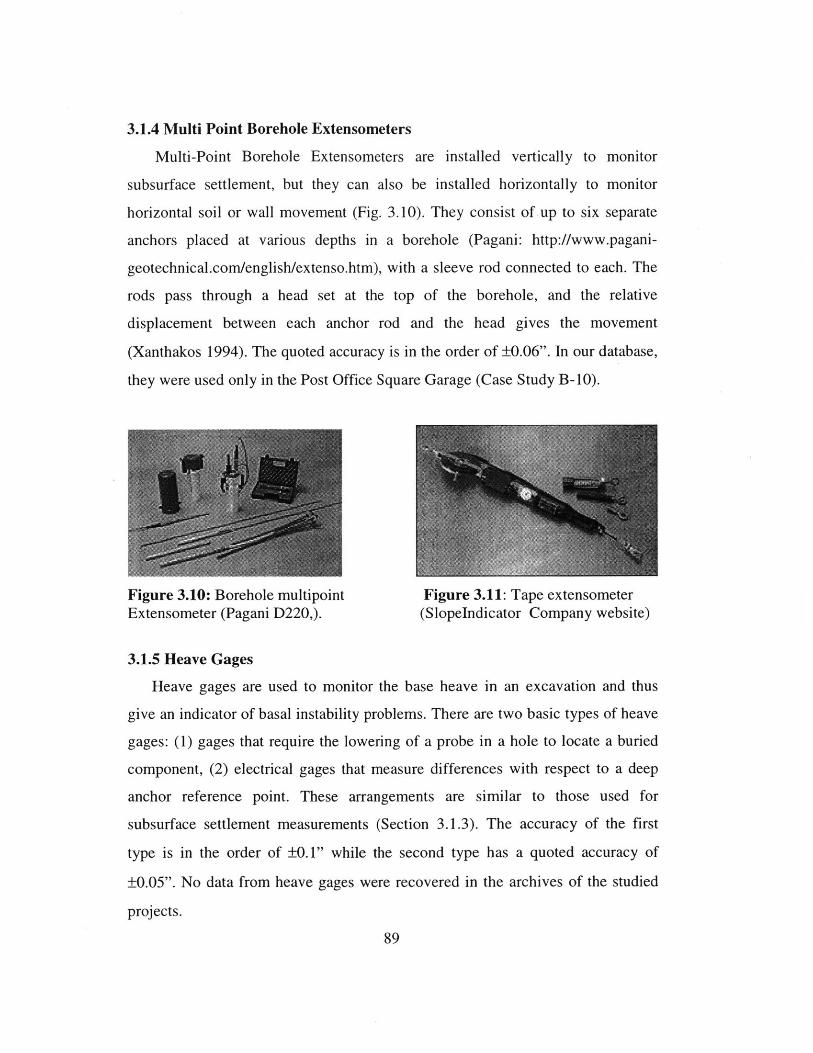
3.1.4 Multi Point Borehole Extensometers
Multi-Point Borehole Extensometers are installed vertically to monitor
subsurface settlement, but they can also be installed horizontally to monitor
horizontal soil or wall movement (Fig. 3.10). They consist of up to six separate
anchors placed at various depths in a borehole (Pagani: http://www.pagani-
geotechnical.com/english/extenso.htm), with a sleeve rod connected to each. The
rods pass through a head set at the top of the borehole, and the relative
displacement between each anchor rod and the head gives the movement
(Xanthakos 1994). The quoted accuracy is in the order of ±0.06". In our database,
they were used only in the Post Office Square Garage (Case Study B-10).
Figure 3.10: Borehole multipoint Figure 3.11: Tape extensometerExtensometer (Pagani D220,). (SlopeIndicator Company website)
3.1.5 Heave Gages
Heave gages are used to monitor the base heave in an excavation and thus
give an indicator of basal instability problems. There are two basic types of heave
gages: (1) gages that require the lowering of a probe in a hole to locate a buried
component, (2) electrical gages that measure differences with respect to a deep
anchor reference point. These arrangements are similar to those used for
subsurface settlement measurements (Section 3.1.3). The accuracy of the first
type is in the order of ±0.1" while the second type has a quoted accuracy of
±0.05". No data from heave gages were recovered in the archives of the studied
projects.
89

3.1.6 Tape Extensometers
Tape extensometers are used to detect and monitor changes in the distance
between two reference points (Fig. 3.11). The change in distance between two
points can be obtained by comparing the current and initial readings. They are
easy and cheap to get repeatable measurements up to spans of 66'. Reference
points are typically stainless steel eyebolts that are economical and easy to keep
clean. The eyebolts can be bolted or welded to the structure or threaded into
groutable or expansion-type anchors (Slopeindincator: http://slopeindicator.con/).
The resolution can be as high as 0.01 mm (Pagani: http://www.pagani-
geotechnical.com/).
3.1.7 Crack Gages
Crack gages are commonly used to measure the behavior of existing or newly
formed cracks in adjacent structures during the excavation (Fig. 3.12) (Case Study
B-12: Dana Farber Tower). Sometimes they are even used to measure the trend of
cracks in slurry wall joints (Case Study B-3: State Transportation Building). They
typically consist of a mechanical or electrical gage that bridges the crack.
Figure 3.12: Pagani D240 Wire Figure 3.13: Pendulum tiltmeters.Crackmeter (Pagani website). (Pagani website)
3.1.8 Tiltmeters
Tiltmeters are used to measure tilts of adjacent buildings or surface during the
excavation (Fig. 3.13). They usually consist of a ceramic plate attached to the
surface where the tilt is to be measured, and the readings are made with a portable
tiltmeter. Tiltmeters are quite common in excavations but their accuracy is
relatively limited. In the studied projects they have been used in the World Bank
(W1), in the State Transportation Building (B3), and in the 500 Boylston (B7).
90

3.1.9 Trench width gages
Trench width gages can be used only to measure distance changes between
opposing trench faces. Their application has been very limited with only a few
research programs having used them. Their sensitivity is in the order of 0.1"
(Xanthakos 1994). They have not been used in any of the studied excavations.
3.1.10 Strain Gages
Strain gages are quite commonly used to deduce loads in cross-lot struts or
braces. The load is deduced from the measured strain, assuming a modulus of
elasticity for the member that is tested. The actual load can be deduced only if the
gages are installed before the struts are pre-loaded. The strain gages should have
a modulus of thermal expansion approximately equal to that of the member they
are attached to avoid any strain measurements due to temperature change. The
gages should also be installed at a distance greater than 5' from the member end
in order to avoid measuring the combined effect of bending and axial strains on
struts. Strain gages have also been used to deduce tieback loads.
Strain gages have also been used to deduce loads, moments, and stresses in
the reinforcement and in the slurry wall (Fig. 3.14c). Gages attached to the
reinforcement cage can be used to deduce the stress at the reinforcement.
Embedment gages in the concrete can be used to monitor the stress within the
concrete. Sister bar gages are short lengths of reinforcement in a bridge resistance
circuit that are cast in the concrete. They can be used to deduce the wall moments
(Dana Farber case study: B-9).
(A) (B) (C)Figure 3.14: (A) Vibrating wire strain gages, (B) Strain gage electric resistor, (C)Rebar strain gages.
91
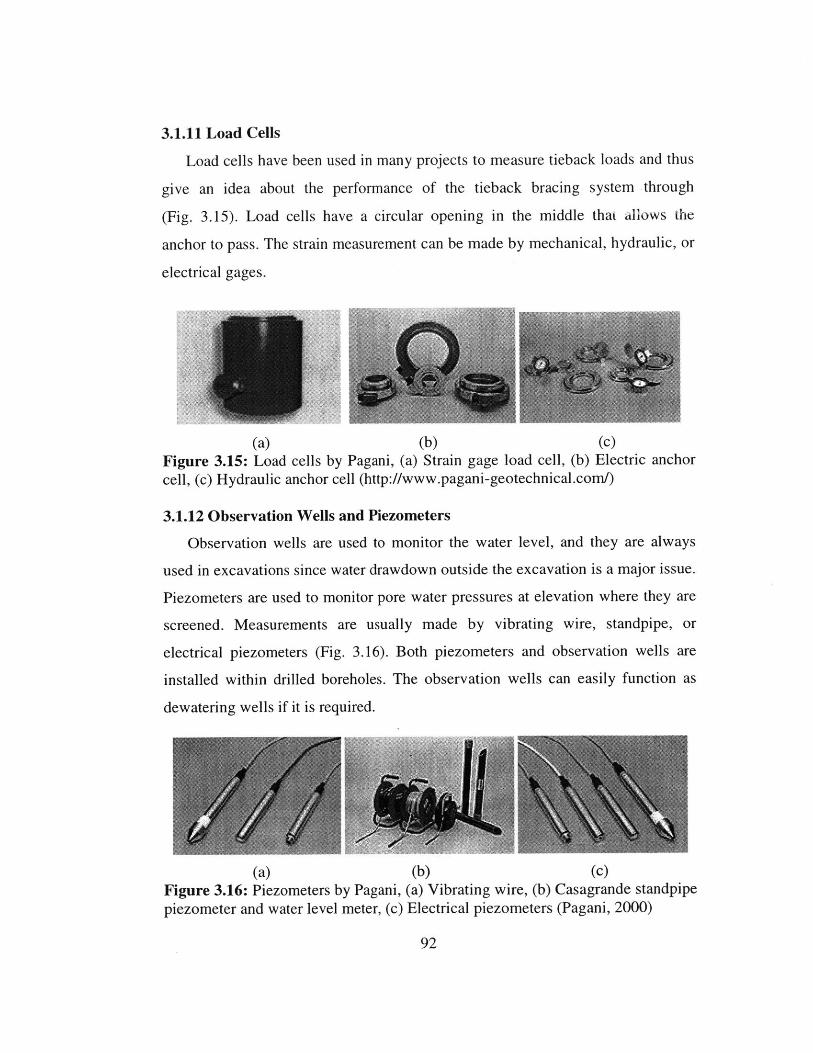
3.1.11 Load Cells
Load cells have been used in many projects to measure tieback loads and thus
give an idea about the performance of the tieback bracing system through
(Fig. 3.15). Load cells have a circular opening in the middle that allows the
anchor to pass. The strain measurement can be made by mechanical, hydraulic, or
electrical gages.
(a) (b) (c)Figure 3.15: Load cells by Pagani, (a) Strain gage load cell, (b) Electric anchorcell, (c) Hydraulic anchor cell (http://www.pagani-geotechnical.com/)
3.1.12 Observation Wells and Piezometers
Observation wells are used to monitor the water level, and they are always
used in excavations since water drawdown outside the excavation is a major issue.
Piezometers are used to monitor pore water pressures at elevation where they are
screened. Measurements are usually made by vibrating wire, standpipe, or
electrical piezometers (Fig. 3.16). Both piezometers and observation wells are
installed within drilled boreholes. The observation wells can easily function as
dewatering wells if it is required.
(a) (b) (c)Figure 3.16: Piezometers by Pagani, (a) Vibrating wire, (b) Casagrande standpipepiezometer and water level meter, (c) Electrical piezometers (Pagani, 2000)
92

3.1.13 Earth Pressure Cells
They have been used only in research projects to measure earth pressures and
compare them with theoretically calculated pressures (Xanthakos, 1994). A
piezometer must be placed in proximity if effective stresses are to be measured.
Pressure cells can also be used to measure pressured within concrete. Earth and
concrete pressure cells can be seen in Figure 3.17.
(a) (b)
Figure 3.17: Pressure cells by Pagani, (a) Earth pressure cells, (b) Concrete
pressure cells.
3.2 Previous Performance Data for Slurry Wall Excavations
3.2.1 Wall & Ground Movements
The first major compilation of excavation field data was published by Peck
[1969]. He compiled ground deformation measurements from excavations in
performed in San Francisco, Chicago, St. Louis, and Oslo (Norway). All of these
excavations were supported by either soldier piles and lagging or sheet pile walls.
A variety of wall supports were included in the case studies ranging from cross-
lot bracing, pre-stressed rakers, H-pile tiebacks, and anchors. In addition to the
variation in wall support system, the excavations took place within wide range of
soils - soft to medium clay, stiff clay, cemented sand, and cohesionless sand. The
excavation depths, H, range from 20' to 63' [6-m to 19m]. With this database,
Peck generated a summary of the expected normalized limits and normalized
magnitudes of the settlement troughs as a function of soil type, excavation depth,93

and "workmanship"; both the limits and the magnitudes were normalized with
respect to the total excavation depth, H.
Figure 3.18 shows the design chart presented by Peck (1969) together with
data compiled by 0' Rourke (1976) from projects in Chig,. i 2k subdivides the
movements into three categories according to the dominant soil type, and
excavation conditions. Zone I soils are described as sands and soft to hard clays,
with an average workmanship. Zone II conditions have very soft to soft clays to a
limited depth below the excavation, while Zone III conditions have very soft clays
to a significant depth below the excavation.
The maximum predicted settlement even in Zone I is quite large if we have a
deep excavation. For example, for zone I the chart would predict a maximum
settlement equal to 1% of the excavation depth. This implies up to 7.2" of
settlement for 60'-deep excavation, while in zone III the chart suggests in excess
of 14", with the zone of disturbance extending up to 240ft (44m) from the
excavation.
Currently, there are no standard design methods for estimating ground
deformations caused by deep excavations. The current prediction methods fall
under two basic categories: 1) empirical, and 2) numerical. However, neither of
the two approaches can satisfactorily account and quantify the influence of every
factor which contributes to ground movements because of the inherent
complexities in staged excavations.
It is very diffucult to determine the influence of the individual factors from
empirical data due to the limited number of excavations under similar soil and
construction conditions. On the other hand, existing numerical solutions tend to
be site-specific and not available to design recommendations. Non the less, both
these general approaches can help in understanding the problem of
excavation- induced deformations.
94

4>
U)
2 3 4
Oistance from Excovation dExcavaion Depth H
(a) Peck 1969I - Sand ond Soft to Hard Clay, Average Workmanship
I- Very Soft to Soft ClayL Limited Devth of ClOy Below Excavction Bottom
2. Significont Deoth of Cloy Below Excavation BottomBjt Nb <Nct
- Very Soft to Soft Clay to a Significant OecthBelow Exccovction Bottom and Nb > Ncb
N$b:Stability No. Using St Below Base Level -
N: Criticai Stab No. for 8csol Heave
Distance from Excavation Settlement
Max Depth of Excavation Depth of Excavation
0 0.5 1.0 1.5 20 2.5 3.0
1.07
S51
Distance from ExcavationMax Depth ofExcavation
T 0 1.0 2.0 3.0 4.0
$ . 2.0 Zones recommended10 by Peck 1969
Zones based on summary ofsettlements adjacent to strutted
0 excavations in Chicago2.0
3.0
3.0
Notes: (1) Zone I - Well-braced excavations with slurry wall or substantial berms left permanenly n place
(2) Zone II - Excavations with temporary berms and raking support(3) Zone III - Excavations with ground loss from caisson construction or insufficient wall support
(b) O'Rourke (1976) - Data for Chicago Projects
Figure 3.18: Empirical settlement data; (a) Peck 1969, and (b) O'Rourke 1976
95

Mana and Clough [1981] presented a more detailed analysis of observed wall
movements for braced cuts in clay. Their study also focuses on excavations
supported by sheetpile walls or soldier piles (mostly with cross-lot bracing). A
total of 11 case histories were included in theii stuay. aiuever, a further 100 case
studies were eliminated because large deformations were caused by "unusual
construction effects" such as consolidation due to dewatering. They report a
definite correlation between the measured normalized lateral wall deflection
(S, / H ) and the factor of safety against basal heave greater than 1.5 as defined by
Terzaghi [1943] (Fig. 3.19). For factors of safety against basal heave greater than
1.5, the expected maximum wall movement is in the range of 0.2% 8W /H
1.0%. However, much larger wall deflections can occur for deep excavations in
soft clay where factors of safety against basal heave are usually less than 1.5.
Uncertainties in the estimates of 8w are generally much larger than are needed in
design. Since damage to adjacent structures is related to surface settlements and
horizontal displacements, Mana & Clough [1981] also attempted to relate
maximum lateral wall movement to maximum settlement. Figure 3.20 shows that
the maximum settlement, 8v, is generally between 0.5 to 1.0 times the maximum
wall displacements, 8w. Currently settlements by Peck [1969] and Mana & Clough
[1981] findings are based on observations from excavations supported by soldier
piles or sheet piles, and therefore, cannot be relatively extrapolated to other
support conditions easily.
Clough et. al. [1989], updated the existing database by incorporating the
performance of excavations supported by diaphragm walls and relating the
deformations to the support conditions and soil profiles. They attempted to
correlate the wall movements, Sw/H, with the stiffness of the lateral earth support
system through a stiffness parameter, EI/(ywh 4 ave). In this definition El is the
elastic bending stiffness of the wall, have the average vertical spacing between
supports, and yw is the unit weight of water. Their proposed design method
(Fig. 3.21) was guided by results of FE analyses and suggests that wall
96

movements decrease significantly with system stiffness. Although the limited
experimental data (Fig. 3.20 from Terzaghi, Peck, & Mesri [1996]) provide only
minimal justification for the proposed design chart, the results are widely quoted
and have been used. to justify the selection of stiff diaphragm wall sections to
control ground movements.
It is clear that the big limitation of the system stiffness approach is the generic
assumption that wall deflections are primarily related to deformations occurring
between support levels. In individual projects, there may be several length scales
affecting the wall deflections depending on the toe fixity of the wall, the depth to
bedrock, the wall embedment below the base of the excavation, the width of the
excavation, the size of berms, and the initial unsupported excavation depth.
Furthermore, the proposed method of Clough et. al. [1989] takes not account of
the stiffness profile in the retained soil.
Recently, a much more detailed finite element study has carried out by Jen
[1998]. These finite analyses consisted of three main groups of parametric
analyses to quantify the effects of excavation geometry, soil profile, and support
system. The parameters she studied included: I) Geometry (wall length,
excavation width, depth to bedrock), II) Soil Profile (overconsolidation ratio of
the clay, cohesionless layer over a clay stratum, presence of clay crust over low
OCR clay stratum), and III) Support System (stiffness of support wall, and
bracing components).
Jen [1998] found that walls basically undergo three phases of deformation: i)
Unsupported cantilever deflections; ii) bulging (subgrade bending); and iii) toe
kickout. She concluded that the actual deformation phase was determined by the
wall embedment depth. Wall stiffness was more effective in reducing
deformations for soft soils but had a smaller effect in stiffer soils. She also found
that the depth to bedrock had a significant impact on the surface settlement at a
distance from the excavation.
97

E 2
FreeEnd
0
ro OsloF~xd Ed Wlto San Franc scoFixd Ed Wit Chiccq
Bowline Pt, Niv
Fe End EnWal Bostona San rrancisco
Chicoqo Excavations (fixLed wCl)
0 ,3
2
* Berm-and-rakerconstruction withsheet pile andsoldier pile walls
concrJete diaphroqrnwalls
3Factor of Safety Against Bosal Heave
Figure 3.19: Correlation between basal heave stability and measured wall
deflections (Mana & Clough, 1981).
X
Figure 3.20: Horizontal movement 8x toward wall of braced open cut in clay, atdistance x from face of cut, for various values of factor of safety F against heaveof bottom cut, as determined by finite element calculations (after Clough et. al.1989). Values of maximum lateral movement 6 hmax to be determined fromFigure 3.19.
98
I
yo- Limits
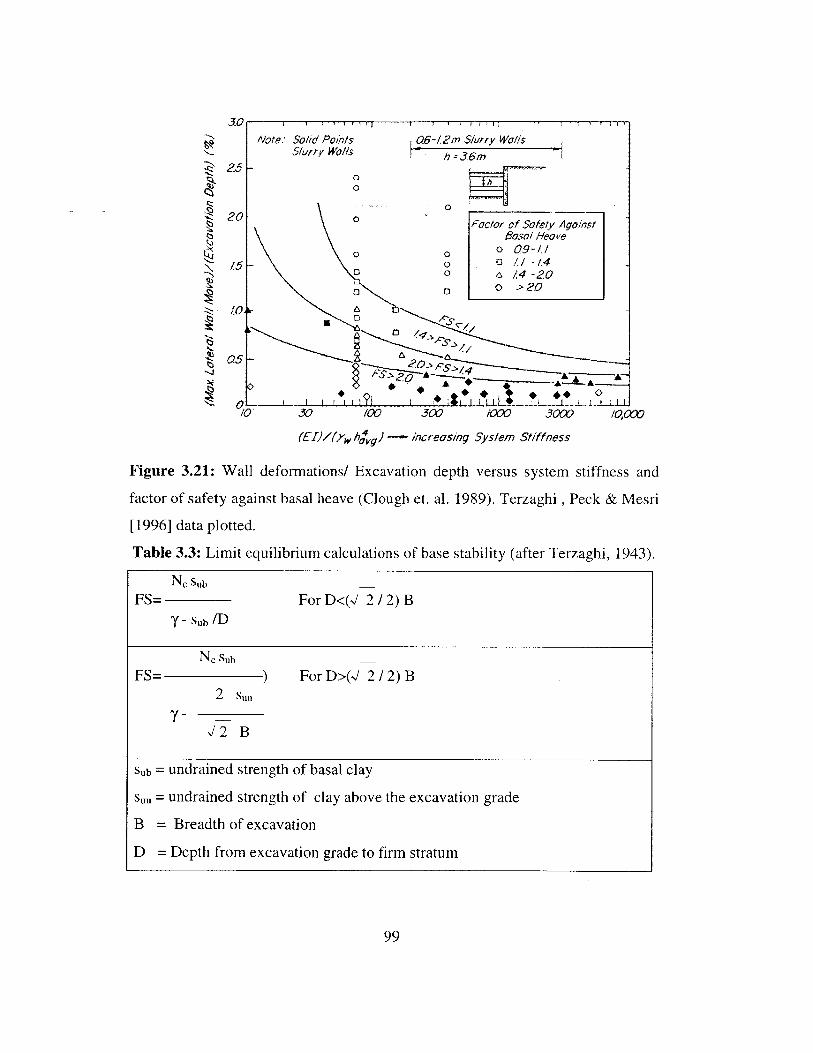
30Note: Solid Pomts Q06-12m Slurry Wal/s
Slurry Wa/Is h36m
20- 0
20 actor of Safety Against8aBo Heave
0 09-41S 5 - a / -14
0 1 a 4-20aco >20
0 0 0 1
10 30 /OO 3X 1OW 30X0 /0,00
(EZ}/f7w h~ ig} -~- Increasing System Stiffness
Figure 3.21: Wall deformations! Excavation depth versus system stiffness and
factor of safety against basal heave (Clough et. al. 1989). Terzaghi , Peck & Mesri
[1996] data plotted.
Table 3.3: Limit equilibrium calculations of base stability (after Terzaghi, 1943).
Nc sub
FS= For D<(J 21/2) B0 - ub /D
Nc sub
FS= ) For D>(/2 / 2) B2 su
Sub = undrained strength of basal clay
su= undrained strength of clay above the excavation grade
B = Breadth of excavation
D = Depth from excavation grade to firm stratum
99
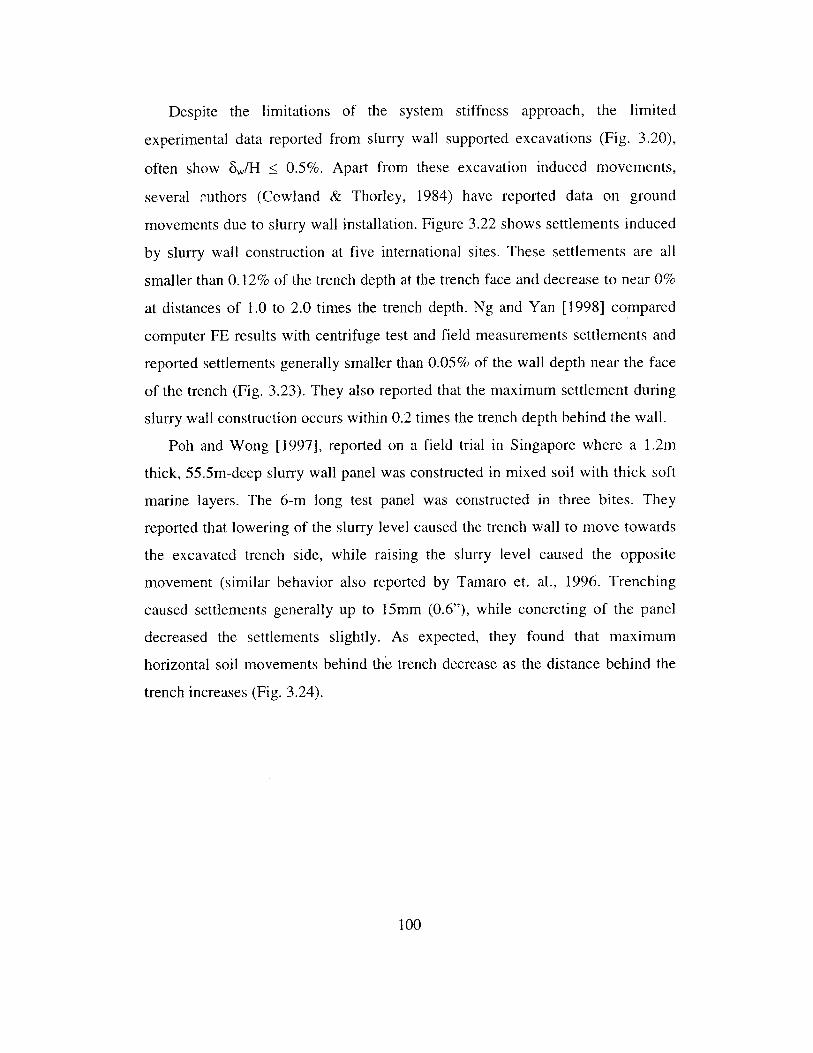
Despite the limitations of the system stiffness approach, the limited
experimental data reported from slurry wall supported excavations (Fig. 3.20),
often show Sw/H s; 0.5%. Apart from these excavation induced movements,
several authors (Cowland & Thorley, 1984) have reported data on ground
movements due to slurry wall installation. Figure 3.22 shows settlements induced
by slurry wall construction at five international sites. These settlements are all
smaller than 0.12% of the trench depth at the trench face and decrease to near 0%
at distances of 1.0 to 2.0 times the trench depth. Ng and Yan [1998] compared
computer FE results with centrifuge test and field measurements settlements and
reported settlements generally smaller than 0.05% of the wall depth near the face
of the trench (Fig. 3.23). They also reported that the maximum settlement during
slurry wall construction occurs within 0.2 times the trench depth behind the wall.
Poh and Wong [1997], reported on a field trial in Singapore where a 1.2m
thick, 55.5m-deep slurry wall panel was constructed in mixed soil with thick soft
marine layers. The 6-m long test panel was constructed in three bites. They
reported that lowering of the slurry level caused the trench wall to move towards
the excavated trench side, while raising the slurry level caused the opposite
movement (similar behavior also reported by Tamaro et. al., 1996. Trenching
caused settlements generally up to 15mm (0.6"), while concreting of the panel
decreased the settlements slightly. As expected, they found that maximum
horizontal soil movements behind the trench decrease as the distance behind the
trench increases (Fig. 3.24).
100

Distance from ExcovationMax, Trench Depth
1.0 1.5 2.0 2.5
7Legend:
Honq Konq V sell Common (50)Ixcavtwions (12) N South Cove (22)
A London NPY (48) * Studenterdunden (24)
Figure 3.22: Summary of measured settlements caused by the installation of
concrete diaphragm walls.
Noma DintnMos Mf m toe Ede of Tench y/D0.5 1.1 1.5
x ...........x. w~ w-
0.10-Ii7A*
x
caw* & XM9W - 9nuo WadwftouadWaWd Wd w udbM
Newiale Yd(DelWag)29m wal dqep i10 o0muhmant ofpmunmsasrlas
kWIKO ODW OAkqmX4 IISUWM dqp& * 103. "O4 ovubvdm =*wW*WIfb
Eu r---(be W.awaOan4d30 wAdtesmovkmdIh avrp.atrmdiaSrIIs
Vinie mPlac nlr wae wmO 30. wndepe wl Iiia wdmgudena a-fIMB
Figure 3.23: Comparisons of computed results with centrifuge test and field
measurements (Ng & Ryan, 1998).
101
0
8
C.
~, ~-. 0)
0
0.2
/
V.UU i2Ao

60
EE -0-M ured
~Esdrmated
0
E 40
20
EE
130-
0 4 6 8 10 12
Distance behind wall panel (m)
Figure 3.24: Maximum horizontal soil movements versus distance behind wall
panel (Poh, & Wong, 1997).
DiBiagio and Roti [1972, 1979], report on a diaphragm wall excavation where
lateral earth pressures where measured during and after construction. They
reported that the total force on the wall decreased as the excavation proceeded but
the total resultant force was always located between 0.44 and 0.45 of the wall
height from the bottom. The lateral earth stresses showed a tendency to increase
long term. Figures 3.25 and 3.26 show the lateral earth pressured measured at the
reported excavation.
102
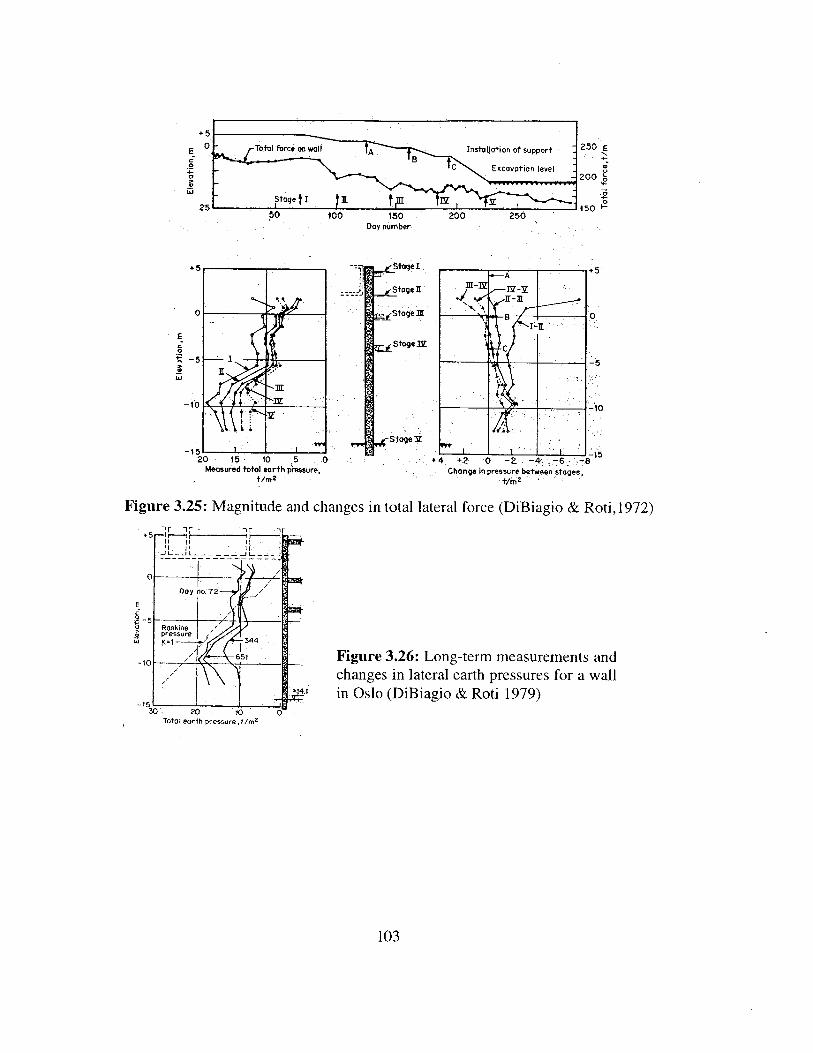
E
4-
.2
+501
25
250 E
200 s
0150 -
Day nuMber
.E
t/m2 Change in pressure between stages,
t/i2
Figure 3.25: Magnitude and changes in total lateral force (DiBiagio & Roti,1972)
J L__ JL - -- --- J L_ .j
0
Day no. 72
E-
O Ronkinepressure
-1 651 Figure 3.26: Long-term measurements and
changes in lateral earth pressures for a wallin Oslo (DiBiagio & Roti 1979)
-1530 20 10 0
Total earth pressure,t/rn2
103

3.3 Classification of Inclinometer Deflections
Figure 3.27 classified inclinometer deflections according to their mode of
deflection. Inclinometer deflections fall under six categories, which are explained
in more detail within the figure. These types of deflections will be used in the
following chapters to give quick comparisons to horizontal soil and wall
deflections.
Movement Towards the Excavation -
Movement Away from the Excavation
Top of wallorI N Inclinometer
Type ILittle bending aboveexcavation base
Type IP
Type IIBending below andabove excavationbase
Type V
Pulling back of wall
Bottom of Wallor Inclinometer
Top of wallorInclinometer
Base ofExcavation
Bottom of Wallor Inclinometer
Cantilever Irregular Majority ofmovementbelowexcavation base
Figure 3.27: Classification of inclinometer deflection shapes.104

Chapter 4
Boston Slurry Wall Projects
105

106

Chapter 4
Boston Slurry Wall Projects
4.1 Introduction
Boston is one of the cities in the U.S. with the largest concentration of
diaphragm wall supported excavations. Slurry wall excavations were first
introduced in the city of Boston in the early 1969 with the South Cove cut-and-
cover tunnel (Lambe et. al, 1972, D'Appolonia, 1973), and the 60-State Street
Office building in 1975 (Johnson, 1976). More diaphragm wall projects were
carried as expertise increased, and today major parts of the Central Artery Tunnel
(CA/T) project are supported by slurry walls (often SPTC type). Currently, there
are several ongoing projects using slurry walls as well as three proposed projects
on the MIT campus, i) the Stata Center, and ii) the Media Center. Table 4.1 lists
the projects that have been studied in this research, while Table 4.2 lists other
known diaphragm wall excavations in Boston.
Boston does present some relatively unique issues regarding deep
excavations:
- The soil profile is dominated by post-glacial deposits. The depth to
bedrock can exceed 150' in some locations (notably south Boston), and
the dominant Boston Blue Clay (BBC) is a soft and sensitive marine clay.
- Many old structures, some historic and supported by wooden piles like the
Trinity Church in the 500-Boylston St. case study (B7), have to be
protected from excavation induced damage.
- Lowering of the groundwater table in the upper fill can cause decay of the
old wooden pile foundations.
- Groundwater inflow is generally not a problem given that the profile often
includes clay. However, there is a high water table and the fill/till/ and
rock strata are more permeable thus problems with inflow from these
layers can result.
107

Slurry walls are generally more expensive than other methods of lateral earth
support. Diaphragm walls were used as part of the permanent structure (for the
Post Office Square Garage, B10), while ground deformation control was the
primary reason they were adopted in most of the projects. Movement control was
important in the 60-State St. project (B2) because the excavation was next to the
MBTA orange line and other historic structures. The same was true for the 500-
Boylston Street excavation (B7), where the historic Trinity Church and the
MBTA Green Line had to be protected. The 60' to 90'-deep Dana Farber
excavation (B12) was right next to an operating power plant and other structures
that had to be protected. In the Millennium Place (B 13), the 55'-deep excavation
is abutted by several buildings and the MBTA Orange Line.
Requirements in the Dana Farber project (B12) called for the building to be
isolated from vibrations of an adjacent power plant. The adopted design used
permanent diaphragm walls extending into bedrock isolated from the rest of the
basement structure. Slurry walls were also used in waterfront projects like the
Flagship Wharf (B8), Rowes Wharf (B5), and One Memorial Drive (B6), to
minimize potential water inflow.
In the CA/T project, huge T-walls have been used in cut & cover tunnels to
minimize damage to adjacent structures and to avoid basal stability problems.
The extended use of diaphragm walls in the CA/T project probably reflects the
confidence of the local geotechnical consultants in recommending this
technology.
108

Table 4.1: List of studied slurry wall excavations in Boston
Project De th(ft) Thick Soil Wall ToeID Name Year H D (inches) T Bracing Type FixityB1* MBTA 1969 50 30 36 A 3-Lev CLB RCDW
South CoveB2 60-State 1975 35 27 30 A, B 3, 2 -Lev RCDW '
Street TBB3 State 1982 27 19 24 B 2-Lev TB RCDW
Transportation Building
B4 75 State 1984 65 35 30 A 6-Lev TD RCDW** StreetB5 Rowes 1984 55 15 30 B 5-Lev TD RCDW '
WharfB6 One 1985 30 11 24 A 2, 1-Lev. TB RCDW
MemorialDrive
B7 500 1987 42 14 24 A 4 Lev. TB RCDWBoylston or 1-TB, 2 R
B8 Flagship 1989 47 13 30 C 3-Lev CLB PTWharf
B9 125 Summer 1990 60 ? 30 B 5-Lev TD RCDW '* Street
B1O Post Office 1989 75 12 36 A 7-Lev TD RCDWSquareGarage
B11 Beth Israel 1994 65 24 36 B 5-Lev TD RCDW -Deaconess
B12 Dana Farber 1995 60 2 36 B 4-Lev TB RCDW 1Tower 90 6-Lev TB
B13 Millennium 1999 55 41 36 B 5-Lev TD RCDWPlace 2000
Note: * According to Johnson 1986, H -Tiebacks, CLB - Cross-Lot Bracing, TD -
Excavation Depth, D- Embedment depth, TB -Top/Down, R - Rakers, SB- Soil Berms, CB -
Corndr Bracing, IB-Internal Bracing, PC - Precast, PT - Post Tensioned, SP - SoldierPiles, RCDW - Reinforced Concrete Diaphragm Wall, SPTC - Soldier Piles & TremieConcrete.
Table 4.2: Other known slurry wall excavations in BostonProject Year Project Year
MBTA Washington St. 1980s Cambridge Hospital 1998Subway Station
Harvard Sq. Station 1988 World Trade Hotel 1999
Pilot House Extension 1996 Trinity Place 1999
Seaborn Hotel 1998 MBTA Silver Line, South 2000Boston Station
109

4.2 Soil Conditions in Boston
The principal soils in Boston are primarily post-glacial deposits or manmade
fills. When the city was first colonized in the 1600s it was situated on a peninsula
that became an island during high tide (Fig. 4.1 shows the colonial shoreline).
Subsequent infilling of the shallow marshlands and bays begun in the 1820s and
continues to this day (Fig. 4.2).
The predominant upper bedrock in Boston is the Cambridge Argillite
(Johnson, 1989). When it is fresh and unweathered, the argillite is typically a
hard, blue-gray, finely laminated rock. Locally layers of tuff and sandstone are
also typical of this formation as well as numerous intrusive sills and dikes of
diabase, diorite or basalt. However, in many areas the argillite is highly weathered
or altered, containing zones of clay-like kaolinized material. The thickness of
these clay-like zones may vary from a few inches to hundreds of feet (Humphrey
& Soydemir 1991). Humphrey and Soydemir point out that kaolinization has been
encountered and reported in many areas in Boston, and that the alteration has been
found in all rock types including the conglomerate.
Conglomerates may be encountered locally in southern and western portions
in Roxbury and Brookline. Conglomerate is a very hard and durable rock, usually
molted brown in color, with embedded round to angular pebbles, and resembles a
dense concrete material (Johnson, 1989).
Johnson [1989] proposes three typical soil profiles in the greater Boston area:
" Profile A is widely distributed and is typical of Back Bay and marginal
waterfront areas
" Profile B is representative of intermediate areas adjacent to the original
Boston Peninsula.
" Profile C comprises moraine deposits over bedrock found typically
within the limits of the original colonial shoreline of the Boston
Peninsula
110

Figure 4.1: Colonial shoreline superimposed over current map of Boston.
The Glacial till (VI) is a very compact, unsorted layer comprising of either a
clayey or sandy matrix containing cobbles and boulders. Engineering properties
of the till are highly variable and SPT N-values are typically used to describe the
strength of this layer. Glacial till overlies the bedrock throughout most of greater
Boston. Zones of softer material are also can be found within the glacial till.
Outwash deposits (Unit V) are of glaciofluvial origin and consist of medium
dense, stratified sands and gravels. Outwash deposits are typically discontinuous
and overlie the till layer.
The marine clay or Boston Blue Clay (BBC) is the predominant layer
throughout most of the infilled areas. The thickness of the clay layer varies widely
within the Boston area. In the Back Bay the clay thickness is in the order of 100',
in East and in South Boston it is up to 150ft thick. Engineering properties of BBC
have been thoroughly investigated for foundation design. The BBC deposits
I1

typically have a relatively stiff crust overlying nearly normally consolidated clay,
such that net loadings can cause significant long term settlements and deep
excavations can pose severe ptoblems due to bottom instability and movement of
adjacent ground (Ladd et. al., 1999). The crust is overconsolidated with maximum
OCR= 4 - 6 and has much higher undrained shear strengths (su = 2ksf) compared
to the lower portion of the clay (so = 0.6 - 1.2ksf). Discontinuous sand layers and
lenses are often found within the upper clay.
1. West Cove 80 1803-18632. Mill Pond 70 1807-18293. South Cove 86 1806-18434.EastCove 112 1823-18745. South Boston 714 1836-Present6. South Bay 138 1850-Present7. BackBay 580 1857-18948. Charlestown 416 1860-18969. Fenway 322 1878-189010. East Boston 370 1880-Present11. Marine Park 57 1883-190012. Columbus park 165 1890-190113. Logan Airport 150 1922-Present.
Figure 4.2: Map of the Boston Metropolitan Area showing the history of landfilling that expanded the city's original 783 acres to over 3000 acres today, (afterBoston Society of Architects, 1976).
112

Profile A Profile B Profile CGeologic Geologic Geologic
Thickne5s Unit Thickness Unit Thickness Unit
3-9 15-7.5 1 Fill 25)(10-30) I Fill (5
0-6 11 Organics1.5-9 11 Oranics 2 lit Outwash VI-A Moraine(5121 .DDeposits0-7.5 11 Outwash 6-30' (D ormed(0-25) Depsits __I______Marine I(20-100) Glacial Till
(Stiff) V3-ISA MarineIV Marine (10.50. Deposits
(Medium) Clay(Boston 0-3 Outwash(40-140) Blue 0-1- -- epositsclay) fcaClay) 0-45 VI Glacial ~Bkc
(0il5 -I Bedrock03' VUIW55
1." VI Glacial VII BedrockTill
VII Bedrock nTy~ ass In fwhk fa kn e, et s lft Ni) wi
Figure 4.3: Geologic units encountered in typical major foundations in Boston(Johnson, 1989).
Much of the present city of Boston has been constructed on fills that were
placed gradually since the colonial times. Woodhouse [1989] gives more
information about the sequence of fill placement in the Boston. The fill layers are
loose and variable in content, with brick fragments and occasional building
remnants.
Unit III consists of well-stratified outwash sands and gravels that were
deposited over the surface of weathered clay in some areas, following another
advance of glacial ice (Johnson, 1989). These deposits are present in some areas
while in others they are absent. They are medium to compact and are relatively
highly permeable, with the layer thickness ranging from 10 to 25 ft.
Organic silt and clay deposits were formed throughout the lower lying areas
surrounding Boston following the ice age (Johnson, 1989). The thickness and the113

content of this layer varies greatly. When present, the organic layer thickness
ranges from 5ft to 25ft. In infilled areas like the Back Bay this layer has been
compressed due to the weight of overlying fill.
Johnson also summarized engineering properties of foundation material in
Boston. Table 4.3 shows basic soil properties as summarized by Johnson [1989].
More recently, Ladd et. al. [1999] researched extensively the engineering
properties of Boston Blue Clay as part of a special testing program for the CA/T
project in South Boston.
114

Table 4.3: Typical Engineering Soil Properties in Boston (Johnson, 1989).
Geologic GeneralUnit Description
L Miscellaneous Loose to very dense sand,F:!! E,rs'!y sand nr sandy
gravel, intermixed with vary-ing amounts of silt, cobblesor boulders, & miscel-laneous brick, rubble, trashor other foreign materials.
II. Organics Very soft to medium stiff,grey clayey organic silt orbrown fibrous peat withtrace amounts of shells, finesand & wood.
Ill. Outwash Medium dense to dense,Deposits brown coarse to fine or
medium to fine sand withvarying amounts of gravel &silt.
IV. Marine Clay Stiff, yellow-grey silty clay.
Medium stiff, grey silty clay,occasional layers of finesand or silt.
Soft to very soft, gray siltyclay, occasional layers offine sand or silt. (Note: Thisunit sometimes becomes stif-fer at lower levels.)
IV-A. Marine Interbedded grey silty orDeposits sandy clay, silty fine sand &
fine sandy silt
V. Outwash Medium to dense, stratifiedDeposits sands & gravels in discon- .
tinuous layers.
VI. Glacial Till Dense to very dense,heterogenous mixture ofsand, gravel, clay & silt withcobbles & rock fragments.
SaturatedUnit Weightkg/m
3
(lb/ft')
1600-2000(100-125)
1440-1760(90-110)
1760-2160(110-135)
1840-2000(115-125)
1824-1920(114-120)
1810-1890(113-118)
Too variable
2000-2240(125-140)
NaturalWaterContent(percent)
40-100
25-35
AtterbergL imits(percent)LL PI
UndrainedShearStren rtkg/m(lb/ft
2) Other
- 1465-3900 Organic Content -
(300-800) 5-25%
40-55 15-30 3900-9760(800-2000) Compression
Ratio =30-40 40-55 15-30 2930-5860 0.15-0.25
(600-1200)RecompressionRatio =
30-50 40-55 15-30 1950-3900 0.02-0.04(400-800)
10-20 15-30 10-20 9760-39000(2000-8000)
VI-A. Moraine Miscellaneous deposits of Too variableDeposits deformed glacial till, out-
wash & clays.
VII. Bedrock Cambridge Argillite. -
Roxbury Conglomerate. -
Note: Metric units above English units in parentheses.
AllowableBearingPressurekg/m
2
(lb/ft2)
19500-48800(4000-10000)
14650-39000(3000-8000)
9760-19500(2000-4000)
4880-9760(1000-2000)
Variable
Variable
39000-98000(8000-20000)
Variable
78000-195000(16000-40000)
195000-975000(40000-200000)
115

4.3 Soil Testing Results
Ladd et. al [1999] conducted an extensive program of lab and in-situ tests in
BBC in at two special test sites in South Boston (SB) and East Boston (EB) for
the Central Artery Project. This program sought to develop correlations and
guidelines for BBC characterization that would be useful for geotechnical practice
throughout the Boston area. Figure 4.4 shows the general stratigraphy at the test
sites together with index properties at the test sites.
Natural Water ContentAtterberg Limits
(%)
SB2 SB2 EB2 0 20 40 60120 ~ -21 -23 -162
EI.1I1.3 EI110.9 EI.110.8_ Plastic LiquidGF Limit LimitGF - GF - TE.107.3 Wp Wn WI
100 - CF CF S_ CF _ _ MS Natural Water Content, Wn
MS MS T *SB HEB80 5 3 8
10 1Q) 10 MC
(> 60 - 9 (BBC) -
9
8 8 *40 - MC - - -
> 4 9 .(BBC)2 MC 4 .
. 20 (BBC)0
3 EI.104.8 -
3
GM
-20 -- .99.4 BR
GM * GT
-40 - GTLegend: GF - Granular Fill, CF - Cohesive Fill
MS - Marine Sand, MC - Marine ClayGM - Glaciomarine, GT - Glacial TillBR - Bedrock, * - WOR
Soil Profile, Index Properties and Piezocone Data (Ladd et. al. 1999).
Figure 4.4 shows that natural water contents within the crust range from 29%
to 40%, and approximately 40% in the normally consolidated BBC. Liquid limits
ranged from 40% to 60% which is typical for BBC and illitic clays in New
England.
116
Figure 4.4:

Figure 4.5 shows that there are major variations in the stress history profile
between the South and East Boston sites. For example there is a 20ft difference in
the elevation of the base of the crust.
so
m. South Boston
40
(10
000
40
0 Symbol
0 5 10 15 0 5Stress History, oand o (KSF)
Figure 4.5: Stress History from 1-D Consolidation
10 15 20
Tests (Ladd et. al. 1999).
The overconsolidation ratio within the crust ranges from 7 and decreases to
1.1. Using the SHANSEP method (Ladd & Foott 1974), Ladd et. al [1999] report
the following undrained shear strength for this clay profile su = 0.2 a', (OCR)0 .8
which leads to average su= 2.0 ksf in the upper clay crust, which decreases to
su=0.9 ksf in the lower normally consolidated clay.
At rest coefficients of lateral earth pressure (K0 ) were also estimated using lab
and in-situ dilatometer tests (Marchetti, 1980). Figure 4.6 shows that KO decreases
from KO =1.0 to 1.5 at the top of the clay to KO =0.5 in the normally consolidated
clay.
117

60
40* .Z UHJUhI
0) 00/ ++ x
CX
0 O20 + 0
+X x+
0 X + In-Situ Tests
Earth PressureO X ._xcell+ x 0 SBPT with
X excellent rating
-20 + x X SB DMT -D1
+ rx + ISB DMT - B3+ x
0 0.5 1.0 1.5 2.0
Coefficient of Earth Pressure At-Rest (K0 )
Figure 4.6: K0 versus Elevation from Laboratory and In Situ Testing (Ladd et al.
1999).
4.4 Summary of Boston Projects
Table 4.4 summarizes the measured performance from the database that has
been developed for slurry wall projects in Boston. The first of these projects
occurred in 1969 when diaphragm walls were used to mitigate potential damage
to the Don Bosco school due to underground construction of the MBTA Orange
Line at South Cove (now called the New England Medical Center Subway). This
project was extensively documented by researchers at MIT (Lambe et. al., 1972,
Jaworski, 1973). Although slurry walls have been used extensively in the CA/T
project and are currently being constructed for the MBTA South Boston
Transitway, all of the other projects listed in Table 4.4 are related to construction
of basements and underground parking facilities of multi-story buildings.
Figure 4.7. shows the project locations listed in Table 4.1. The main cluster
are in the downtown and waterfront areas (B2, B4, B5, B10), two in the
Longwood Medical area (B 11, B 12), three projects were within the old peninsula118

(B9, and near the Boston Common B3, B13), one in Back Bay (B7), and one in
Cambridge in similar conditions to Back Bay (B6). Only one of the projects is
located was constructed in profile C conditions (i.e. moraine deposits) (Flagship
Wharf, B8).
When ever it was possible and feasible, the diaphragm walls were keyed into
the stiff glacial till in order to minimize horizontal movements at the toe of the
wall and to transfer vertical superstructure loads. Some walls (B6, B7) were
embedded into the clay crust because it was impractical to reach glacial till. These
projects were located in Back Bay and in Cambridge near the Charles River
where glacial till is found in depths in the order of 130'. The Boston database
covers projects with a range of excavation depths from 27' to 90' and with a
variety of different bracing systems. Temporary tieback bracing was used in three
projects (B3, B6, B7), while top/down construction has been used in six projects.
There are only two cases where cross-lot bracing was used (B I, B8).
Table 4.6 shows that most of the excavations performed well with small wall
deformations induced by the excavations. Horizontal wall deflections were
generally less than 1.5", with settlements in the same order. Most of the walls
deflected in a bowing pattern (B2, B3, B4, B5, B8, B10, B11, B13)(Type II,
Figure 3.27), although different deflection modes were observed within the same
project (B2, B7, B12, B13). Walls anchored with tieback but no toe fixity (B3,
B6, B7)(i.e. floating walls), generally wall bending beneath the lowest support
level (Type I), and very little bending between bracing levels. Walls with toe
fixity measured smaller deflections on average than walls with no toe fixity.
119

Table 4.4: Summary of measured performance of slurry walls in Boston.
Fxcav.Soil Bracing/ Wall Defl.Type Excav. Depth (ft) Thick Swmax 6 vmax Toe Shape
ID Year Project Name * Method H D (inch) (Inches) (inch) Fix. TypeB1 1969 MBTA South A 3-Lev 50 30 36 1.35 0.5 I
Cove CLBB2 1975 60 State Street B 2-3 Lev. 32 27 30 1.3 1 IV
TB 0.92 1.2 IIB3 1982 State A 2 Lev. TB 27 19 24 1.25 1.2 I
Transportation R, CBL IIBuilding
B4 1984 75 State Street A 6-Lev. TD 65 35 30 1.85 4.0 IIB5 1984 Rowes Wharf B 5 Lev. TD 55 15 30 0.41 1 IIB6 1985 One Memorial A 2 Lev. TB 30 11 24 1.3 1.2 I
Drive BuildingB7 1987 500 Boylston A 4 Lev. 42 14 24 3.3 4.5 IV
Building TB, RB8 1989 Flagship C 3 Lev 47 13 30 1.81 1.7 1 II
Wharf CLBB9 1990 125 Summer St B 6-Lev TD 60 -- 30 0.6 0.38 --
B10 1989 Post Office A 7-Lev TD 75 12 36 2.15 2.75 IISquare Garage
B 11 1994 Beth Israel B 5-Lev TD 55 24 36 0.85 0.7 IIDeaconess
B 12 1995 Dana Farber B 6-Lev 90 2 36 0.72 0.64 I, VTower Rock TB 0.4 2.8
B13 1998 Millennium B 5-Lev. TD 55 41 36 0.8 0.7 7 1, IIPlace I
Notes: * According to Johnson see section 4.2
120

Figure 4-7: Studied slurry wall excavations in Boston
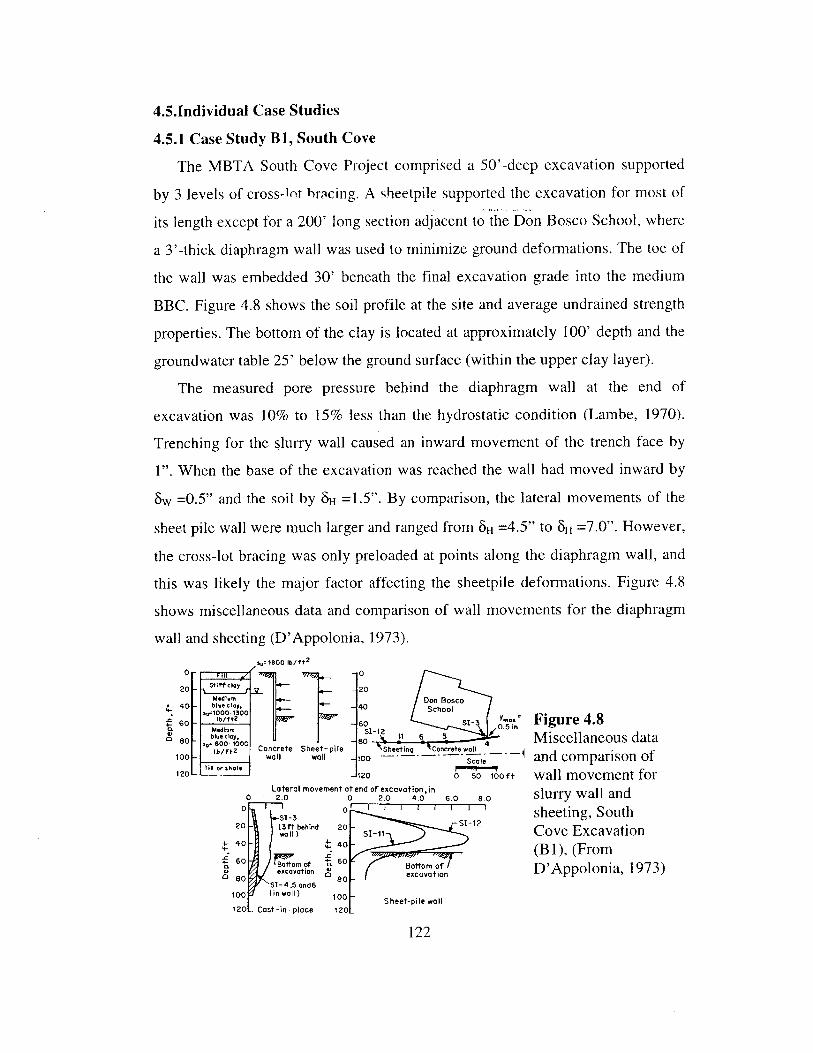
4.5.Individual Case Studies
4.5.1 Case Study Bi, South Cove
The MBTA South Cove Project comprised a 50'-deep excavation supported
by 3 levels of cross-lot bracing. A sheetpile supported the excavation for most of
its length except for a 200' long section adjacent to the Don Bosco School, where
a 3'-thick diaphragm wall was used to minimize ground deformations. The toe of
the wall was embedded 30' beneath the final excavation grade into the medium
BBC. Figure 4.8 shows the soil profile at the site and average undrained strength
properties. The bottom of the clay is located at approximately 100' depth and the
groundwater table 25' below the ground surface (within the upper clay layer).
The measured pore pressure behind the diaphragm wall at the end of
excavation was 10% to 15% less than the hydrostatic condition (Lambe, 1970).
Trenching for the slurry wall caused an inward movement of the trench face by
1". When the base of the excavation was reached the wall had moved inward by
8w =0.5" and the soil by 6 H =1.5". By comparison, the lateral movements of the
sheet pile wall were much larger and ranged from SH =4.5" to 8H =7.0". However,
the cross-lot bracing was only preloaded at points along the diaphragm wall, and
this was likely the major factor affecting the sheetpile deformations. Figure 4.8
shows miscellaneous data and comparison of wall movements for the diaphragm
wall and sheeting (D'Appolonia, 1973).su 1800 lb/ft2
0- Fil0
20- St f l20Medium eDoBsc
40 - blue cly, -40 Sch osco
60 o -lO 6o Si -3. Figure 4.8CL Medium 0.51 in0
bl0 e Lctera S1280 O- 3 80 4 Miscellaneous datalb/ft2 Concrete Sheet-pile Sheeting 'Concrete waill100- wall w all 100 c. . ,Scale ---- and comparison of
o * 20 050 oort wall movement forLtrlmovement at enid of excavation, in suf n
0 2.0 0 2.0 4.0 6.0 80 slurry wall and
sheeting, South20 - bhnd 2 s1-12 Cove Excavation
4C (B1), (Fromexcavation o D'Appolonia, 1973)
80 - 4,5 and6cavation
100 (in wall) 100 Sheet-pile wall120- Cast-in-place 120
122

4.5.2 Case Study B2, 60 State Street
The 60 State Street building is a 38-Story office tower located at the
northeastern corner of Congress and State Streets in Boston, Massachusetts.
Foundation construction for this project took place- in 1975. Many important
structures and historic sites surround the building such as the Boston City Hall,
the Government Center Complex, the Old State House, Faneuil Hall and the
Quincy Markets area. To the east of the project is an 1 1-story office building at
84-State Street and the 5-story historical Sanborn Building. The MBTA subway
passes beneath State St. on the south side (Fig. 4.9).
A three-level deep basement extends to the property limits on all sides and
includes an area to the north under the plaza level. The tower, located in the
center of the project, is supported on a mat foundation on glacial till, 35' to 50'
below street level.
A tied-back perimeter 2.0'-thick diaphragm wall was selected to provide
temporary and permanent earth support and water retention. The slurry walls
extended to intact bedrock and thus provided a seepage barrier. The tiebacks were
prestressed at 100% of their design load. No underpinning of adjacent structures
was needed and the construction was completed with a minimum of noise and
disruption to this congested neighborhood.
A typical section through east and south sides of the project is shown in
Figure 4.10. The marine clay layer lies directly below the fill and has thickness
varying from 4' to 35' generally increasing towards the northeast. The upper
portion of the clay is a yellow very stiff clay crust containing random lenses or
layers of sand. A very compact glacial till varying from clayey to sandy till with
boulders or cobbles underlies these deposits. Rock encountered beneath the
glacial till is variable but typically is a highly jointed and fractured soft to
medium-hard Argillite (Fig. 4.10).
Two or three levels of temporary soil tiebacks were used to hold the slurry
walls as the excavation progressed to a final depth of roughly 30' to 37'
123

depending on location. Permanent bracing was provided by the two interior floors
and the basement floor slab.
Small lateral soil movements occurred during panel construction.
Inclinometer I-1 showed a 6 H=0.3" movement towards the open trench when the
adjacent slurry wall panel was excavated and infilled with bentonite slurry. When
panels were concreted the soil was pushed back to its original position and
beyond (1-4 net apparent movement H= -0.5" back into the soil).
Larger movements occurred in the initial stages of the excavation despite the
fact that the slurry walls were embedded in dense glacial till. Including the effect
of the wall rigidity, the cantilever movements reached up to 6w=1.3" at the top of
the slurry wall (initial stages). This was surprising since the excavation had only
been carried to a depth of 10 to 12'. Wall bending developed as highly prestressed
tiebacks were installed, in some cases the wall moved further into the soil than its
initial profile. Subsequent building settlements were roughly the same as
maximum wall movements at respective locations. Building settlements near the
excavation typically ranged from 0.5" to 1" and gradually diminished with
increasing distance from the excavation. However, some of the settlement could
have been caused by the tieback drilling procedures and may not have been due to
wall movements.
Tiebacks were drilled using water and air through a 4"-steel casing and
generally performed well. The upper level of tiebacks showed an initial load loss
of up to 28 Tons which was more than the theoretical 8 Tons loss resulting from
elastic tieback shortening. It was assumed that yielding in the grouting zone and
seating losses were the causes of these load losses. The lower level of tiebacks
showed slow progressive load decay that matched the theoretical load loss
resulting from elastic shortening.
124

Figure 4.9: 60 State Street site plan, (after Johnson, 1976).
s c
-
I
,MSE -Lc-A fIl
LACIA& SIL
soUTH sD
Figure 4.10: Typical excavation section , 60 State Street, (Johnson, 1976).TOP OF WALL (ASSUMED)
0 12
A initial Excavation 13/123
50 - -- - - 13
4 silil E covatlon
20
BFmnO DEcatio 14 3
Ifar SectioncSc14
so-
I.. S E4ovOlt.
toSol ///~IS25
Bottom Depth of WON1--Varies of Each Sectio
i#*1
.. a~~/
LAWhINITIAL MOVEMENT(contilover Wall )
LATERAL MOVEMENT (INCHES)
MAXIMUM MOVEMENT FINAL MOVEMENT
Figure 4.11: Initial, maximum, and final horizontal movements for the 60 StateStreet Excavation (Johnson, 1976).
125
sr.re srgtrr

4.5.3 Case Study B3, State Transportation Building (Park Plaza)
The Transportation Building is a nine-floor structure located at the corner of
Tremont and Stuart Streets in Boston MA. Perimeter slurry walls 2.0ft thick
formed the basement walls of the two levels underground parking. Tremont and
Stuart Streets bound the eastern and southern sides of the project. Buildings
adjacent to the north slurry wall are on shallow foundations and thus settlement
control was important due to their proximity to the excavation. A plan of the site
can be seen in Figure 4.12.
Soil profiles in the site are variable as Figure 4.14 shows. The soil profile near
1-83 can be described by Profile A, while near 1-24 it resembles mostly Profile B
(Johnson, 1989).
The diaphragm wall was for this project had panels 20' long, 2' wide, and 45'
deep. The panels were trenched starting about 8' below the street elevation (El.
25ft), because of pre-existing foundation removal (Fig. 4.14). In addition to earth
retention, the slurry walls served as a water seepage cut-off. Eight deep sumps
within the excavation perimeter were used to dewater the site during construction.
Two levels of temporary tiebacks were used to support the slurry walls.
Typical tieback lock-off loads varied from 50 kips to 90 kips as indicated by load
cells (compared to design load of 72 kips). Figure 4.15 shows that measured
tieback loads remained fairly constant as the excavation progressed. Corner
braces were used for additional support in the eastern and northwestern project
corners. The superstructure walls were constructed on top of the slurry walls.
Figure 4.13 shows the contours of settlements at the end of excavation.
Building settlements were generally small to insignificant on the northern
excavation side. Points in the northwestern corner settled a little less than 0.4"
whereas most other points in that area settled less than 0.2". Reference points in
the southern side showed the largest settlements during the excavation
progression. Near inclinometer 1-70 a Borros anchor reference point settled a little
more than 1.0". The increase in settlement in that area coincided with the
maximum movements (towards the excavation 0.5") recorded by 1-70.126

Wall movements were generally small throughout the project site. Figure 4.14
compares records from inclinometers 1-83 (south wall) and 1-24 (north wall). 1-24
bulged towards the excavation by 6w=0. 9 ", while the toe of the wall translated by
0.4" towards the excavation. Most panels on the northern side ofthe project
deflected less than 0.6".
Corner braces provided additional support at the southeastern project corner .
In the southern slurry wall, inclinometer 1-83, was embedded in the clay. The wall
at 1-83 moved inwards by approximately Sw=1. 2 " with 6w=0. 5" at the toe at the
end of excavation (after mat installation). The final deflections were much smaller
than then maximum deflections (at the end of excavation). The measured
deflections at 1-83 decreased when the deflections at the east wall increased and
vise versa. Thus the corner braces transferred movements across the walls they
were bracing. Apparently, stiffening of the local corner bracing was effective in
reducing wall movements in 1-83. Measured settlements in the vicinity of panel
1-83 were smaller than 0.2", despite the fact that panel 83 had the largest wall
deflections in the project.
A gas main located near panel 75 (Fig. 4.13: P75) showed settlement up to
1.3" (0.2" of which occurred during the slurry wall installation). However, it is
not clear if these settlements should be considered as representative of surface
settlements because steel hangers supported the gas main.
During slurry wall trenching problems arose with the guide walls since in
many instances guide walls pieces cracked and fell within the excavated trench. A
slope failure took place during trenching of a panel (panel 75) without slurry (Fig.
4.16. The slurry wall contractor had some difficulty maintaining the required
slurry levels during that period in time. Slurry pockets were removed from
completed panels in two instances. Minor leaks through the panel jointing were
observed and they were easily patched with concrete. The slurry wall finish
required occasionally that the slurry wall contractor return and cut excess concrete
pieces. Leaks were also recorded in some tieback sleeve holes. At the final stages
127

of the project (near total completion) there were some cracks recorded in the
upper garage floor, probably caused by stress transfer from the slurry walls.
Water levels outside the excavation were not significantly affected either by
the excavation or by the dewatering process. Overall, the slurry wall earth support
system performance was satisfactory. Settlement control was successful in crucial
areas and wall movements were typically small to moderate.
128

Figure 4.12: State Transportation (B3) site plan.

."2".
c 2 P754/1 15 'j
Figure 4.13: Settlement contours, State Transportation Building (B3)
130

Top o -SLL'r-y We Top oF Cazsro
EL -tL7.A
FInst +-Sep-Bl-- FLL -Locslend 14-3eSp-eBt
. mIAGE
YELLOW SLTY INST. 1-SpCLAY AKM1-e
TIES [NST. 10-Sep.. CK 2B-3Qp
BACE[NST. 10-Nov
FINE SAM JACKED 14-NOvAND S31-T
TPUCTUPAL MT.L -B Ia-nBc-fl
- RAY SELTY- LAY L. -31 L-Dc-BL
-- NY N 11TMO
Ti elks-eLI~-OEi-~L
6> 3tkr,~6I
K '-N'~ -SI
~
3I-D~t-OL
II-S~k-'~2
Movement Towards the Excova-tlon (Inches)
(1-83)
CPopSLrrV %d q Top of Cashp
L EL. +e02
FILL
Inst -Jun-BLLcd-ed 21-Jul-
TIES INST. 2D-#D 1-3ep
YELLDV SILTY *CLAY
F1DE SAM.IANIT SILT
GRAY SILTY
CLAY
SANDY CLAY
91
0~9
1-Der-L
STRUCT i -TI
Tl11D OFCAS5.EL-5L9
.0 -0.5 U -0.5 +1.0 -+1.' +Movenent Towards the Exccvatlon (inches)
1-24
GLACIAL TILL
N
L -24
1-83
Figure 4.14: Deflections at inclinometers 1-83 (Upper) and 1-24 (Lower), State
Transportation (B3).
131
15
0
6 -5
-J5A
--s5
-45
-5
-5
L-p;
-65'
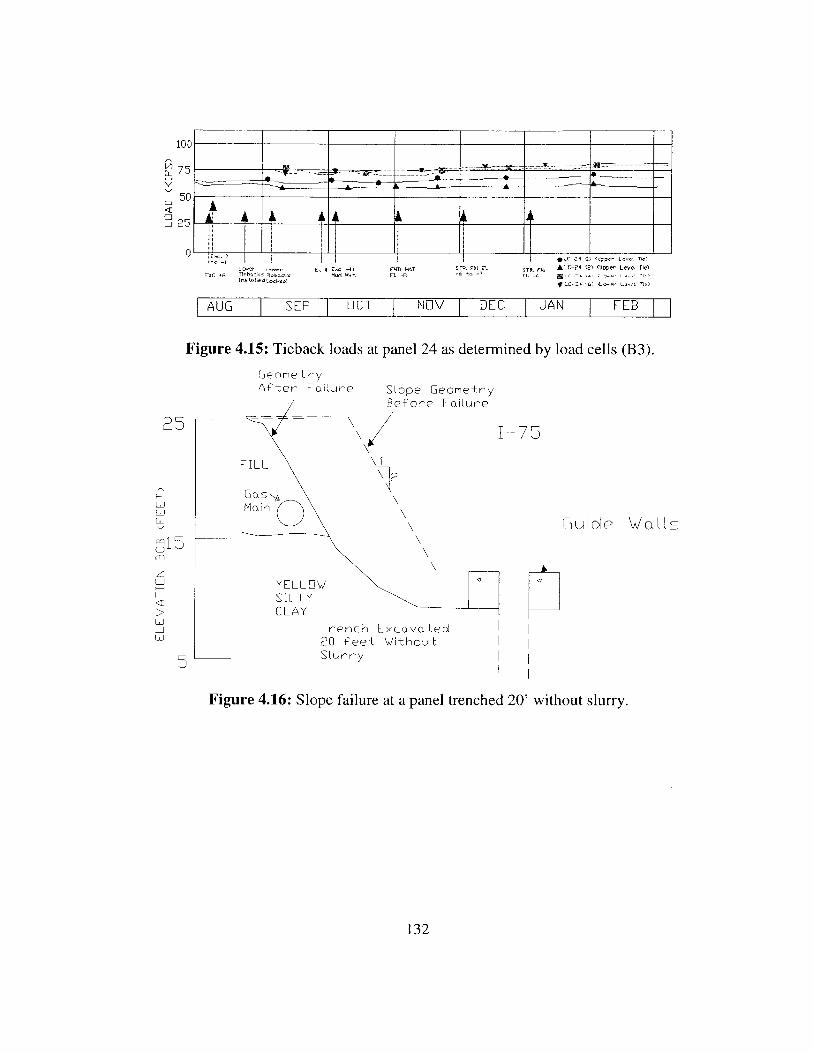
0
-J
Loer r k 1 Exe -11 FI MAT l- El El STR. Fiti ALC-24 (2) (Upper Levet Tie)
E~r 46 !e'-k 1 .b, NMU M)t EL -8 -.6 ~-
AUG SEP OCT NOV DEC JAN FEB
Figure 4.15: Tieback loads at panel 24 as determined by load cells (B3).
GeometryAfter Failure Slope Geometry
Before Failure
FILL
YELLOWSILTYCLAY
Trench Excavated20 feet WithoutSlurry
Gulde WLs
-
Figure 4.16: Slope failure at a panel trenched 20' without slurry.
132
Li
15mMz
__j

4.5.4. Case Study B4, 75 State Street
The 75 State Street building is a 31-story office tower with six levels of
below-grade space utilized primarily for parking. Permanent and lateral earth
support was provided by 2.5'-thick, 85'-deep diaphragm wall constructed with the
slurry trench method. The 65-ft deep excavation was constructed by the top/down
method, braced by 5 floor levels. The diaphragm wall extends 20' below the final
excavation grade into the underlying till. The plan and a typical cross section of
the excavation can be seen in Figure 4.17.
Soil conditions at the structure site are typical of the Boston area located
outside the old colonial shoreline. The overburden soils consist primarily of fill,
Boston Blue Clay, glacial till, and highly altered bedrock 70' to 100' below the
surface. The upper 1Oft to 20 ft top of the clay is an overconsolidated crust, (OCR
>2). The overconsolidation ratio decreases rapidly with increasing depth as the
clay becomes almost normally consolidated (OCR= 1 to 1.1).
The bedrock at the site belongs to the Cambridge Argillite formation and it is
highly altered, containing zones of clay-like kaolinized material. Thickness of
these clay-like "soil" zones may vary from a few inches to hundreds of feet
(Humphrey & Soydemir, 1991).
The largest movements took place where the clay was the thickest and a two
level high mechanical room existed (Fig. 4.17). Adjacent building within 5' to 20'
from the excavation settled from I" to 4". However, 50% of this movement
occurred prior to the start of excavation and can be attributed to earlier pile
extraction and caisson installation. Horizontal movements were within the
predicted range for an excavation of this size. However, settlements were
significantly larger than predicted (Fig. 4.18).
133

\eN
CO
Straight -'shaft
caisson
(a)Figure 4.17: 75-State Street projectdeflections (after Becker & Haley, 1990
/H%
2
At
movement in Inches0
Fily
clay
Till
Rock
LLI
LL2
LL3
1&4
1±5
LLO
1 2
75 Stat. Street(South wal)
Excavation to El.-12ground floor set
Excavation to EL-31LL3 poured
0 It excavation complet1 ft = 0.3048 m LLO poured
(b)(B4), a) site and cross-section, b) wall
DIH
Legend:
o Diaphragm wall - tledback (5, 6)
& Diaphragm wall - internally braced (9)
N 75 State Street - up-down construction
Figure 4.18: Settlement next to the excavation as a function of distance from the
edge of the excavation, (Becker & Haley, 1990).
134

4.5.5 Case Study B5, Rowes WharfThe Rowes Wharf building is located on the easterly flank of Fort Hill, one of
the three original drumlins in Boston. The project consists of a main 15-story
building along with three wharf buildings extending out over the water, and a
700-car five level underground parking. A 2.5' tihick, 65' deep, with 10'
embedment perimeter slurry wall. Rowes Wharf saw the introduction of
Up/Down construction in the northeastern U.S. (Becker & Haley, 1990). Figure
4.19 shows the plan, a typical cross section, and measured wall deflections of the
project.
In addition to providing excavation support the slurry walls were designed to
reduce leakage and avoid excavation dewatering. A major issue that had to be
addressed was that the uplift pressure was greater than the building weight. This
problem was addressed by providing seepage cutoff with the diaphragm wall
extending below the excavation level into the glacial till. This allowed for the
lowest level floor to be designed as a fully relieved slab-on grade. Slurry wall
panels were typically constructed in alternate 20' sections
According to Haley (1986), wall movements were small (Fig. 4.19). This
project faced serious problems with seepage through panel construction joints and
through the slurry wall itself. The slurry wall panel bottoms wall were not cleaned
adequately before concreting, and as a result waste material had accumulated at
the panel bottom. Concrete tremieing pushed part of this waste material to the top
of the slurry wall but a lot of that material got entrapped between panel joints, and
at the bottom corners of the slurry wall panels. These zones of soft material
leaked excessively when they where exposed by the excavation activities. Major
sealing efforts including grouting behind the wall and filling with hydraulic
cement were undertaken.
135

N
0 1 2Wal Mo-ements (inches)
LUI0 -
Fill
LL2
Ha r bor4
V Glaclo-marlne
a Concrete -50 - Till-- --- -
q wall-5 Tl
0J Steel sheet pie
FI - F00
es Rowe WharfGlacio-marine i ft = 0.3048 m (East wal)
-e- Excavation to EL-10Earti Retaining Si lures 1986
Conrete Beled Excava to EL-17
diaphragm caisson 1-2 pouredwan 0 50 f Excavation complete
.1oo- Rock 1 ft 0.3048 m LL5 poured
Figure 4.19: Rowes Wharf excavation (B5), plan, cross section and wall
deflections (after Becker & Haley, 1990).
4.5.6 Case Study B6, One Memorial Drive
The project site is triangular in shape and is located between Memorial Drive
and Main Street near Kendall Square in Cambridge. An asphalt lot separates the
project from adjacent buildings on the west side. Approximately 35' from the
north side is the MBTA Red Line subway tunnel. The project plan and a typical
cross section can be seen in Figure 4.20. The ground surface is at approximately
El. 21' CCD (City of Cambridge Datum). Three basement/parking levels (P-IB,
P-2B, P-3B) extend beneath the entire building footprint
A 2'-thick perimeter slurry wall provided lateral earth support for the
excavation of this project. Most of the slurry wall was constructed in 20'-long
panels, and was supported by one level of tiebacks. The slurry walls were
136

typically 36' deep with the toe embedment depth below the excavation base
ranging from 11' to 16'.
The subsurface exploration for this project indicated the presence of six major
strata namely: fill, organic silt, sand, BBC, glacial till and bedrock. Soil
conditions are similar to those in Back Bay corresponding to a soil profile A
according to Johnson [1989].
Two levels of tiebacks supported central panels on long faces. Tieback design
loads ranged from 85 to 130 kips with average of 124 kips. The design line loads
ranged from 10.90 kips/ft to 16.74 kips/ft with the latter being most common.
Loads of around 50 kips were used for second level tiebacks. Estimated total
tieback lengths averaged 40' to 45' with some tiebacks having total lengths of
35'. All tiebacks picked up load as the excavation progressed and wall
movements increased, until equilibrium was reached (Fig. 4.24).
The overall performance of the lateral earth support system used in this
project was satisfactory. Lateral movements of the slurry wall were moderate to
insignificant (maximum 1.3", Fig. 4.21). Most of the wall movement occurred
prior to tieback installation, when the wall cantilevered. After the excavation was
completed an additional movement of up to 0.3" occurred when loads were
transferred from the tiebacks to the base mat. Such movements should be
expected since stress transfer from the tiebacks to the floor bracing does take
place (Fig. 4.21).
Wall movements were noticeable despite the fact that the excavation was
relatively shallow. The floating slurry wall of this project translated up to 0.15"
near its base as offset surveys indicated (Fig. 4.21). Such translation at the toe of
the slurry wall is to be expected when the wall is floating. One of the interesting
aspects that offset surveys indicated was that wall movements can vary
significantly even between adjacent panels (Fig. 4.22). For example, at one stage
one panel moved back into the soil by as much as an adjacent panel moved
towards the excavation.
137
Excavation for this project did not affect any adjacent structures. Figure 4.23
shows that settlements increased as the excavation progressed deeper and reached
8v=1.05" near the excavation, while building settlements further away were
practically insignificant.
One panel did cave-in during trenching, due to fill "sliding" into the trench
under the guide walls. This was probably caused by the difficulties in stabilizing
the loose granular fill. Slurry wall water leakage was very small and temporary
(i.e. detensioning and removal of tiebacks, covering of the sleeve hole).
138

MAIN STREET322'-
0 *0 20 40(FEET)
Figure 4.20: One Memorial Drive (B6) site plan & cross section.
139
30
20
10
0
-10
-20
-30
-40
-50
-60
-70
-80
30
20
10
0-10
-20
-30
-40
-50
-60
-70
-80

TOP OF IN-1GUIDEWALLEL. 16.0
FILL
REINFORCEDCONCRETEDIAPHRAGM WALL(PANEL N8)
L. 13.79 15
TIEBACKS LOCKED OFF4/25/85
5
TIEBACK LOCKED OFF5/31/85
-5
3.5' MAT
CONCRETE FOUNDATIONPOURED 7/24/85
3' LEANCONCRETE -15MOD. MAT
10
< 0
-10
Li
-25-0.5 0.5
Movement Towards the Excavation (inches)
Figure 4.21: Deflections at In-1, One Memorial Drive (B6).
140
Kil -
ORGANICSILT
SAND
- -: 10
20-
BOTTOM
k/'OFA INCLINOMETERCASING
INCLINOMETER BOTTOM OFCASING DIAPHRAGM4-IN DIAM WALL EL. -24PVC PIPE
-20 -
-25-
2-JUL-85 15-Aug5
E d of MatExc vation Com leted
CLAY
1.5

SA' STR EE
NW N N .i N9
Figure 4.22: Wall deflections as determined by offset surveys, One Memorial
Drive (B6).
0
-0.2
-0.4
-0.6<I>
-5 -0.8
E -1
Ee -1.2
-1.4
-1.6 - -
-1.8-
-2 -
Apr-85 May-85 Jun-85 Jul-85 Aug-85 Sep-85
Date
Figure 4.23: Surface & building Settlements, One Memorial Drive (B6)
141

140
120
100
0.
80 LC-1 LC-2
60--
SLC-3
40-
LC-1 -C-2 -LC-3
20 LC-2 & LC-3 in Upper Level TiesLC-1 for Lower Level Ties
0Apr-85 May-85 Jun-85 Jul-85 Aug-85 Sep-85
Date
Figure 4.24: Tieback loads from load cells, One Memorial Drive (B6).
4.5.7 Case Study B7, 500 Boylston Street
The 500 Boylston Street building is located in the Back-Bay Boston area and
includes two medium-rise towers, numerous low-rise structures and plaza areas.
Boylston Street bounds the site to the north, with the MBTA Green Line subway
running underneath. Clarendon Street bounds the site to the west, with historic
Trinity Church opposite of the site. St. James Street bounds the southern side of
the project. Subsurface conditions at the site are typical of the Back Bay area in
Boston (Johnson, 1989).
The 2.0'-thick slurry walls were typically 40' to 45' deep with a final toe
embedment, 15' below the base of excavation (BOE). Four levels of tiebacks
provided temporary lateral support along the western wall. Tieback inclinations of
120, 50, 300, and 300 were used for the 1", 2 ", 3 rd, and 4 levels respectively.
Floor bracing provided permanent lateral support. Tiebacks were spaced at 5 ft
intervals horizontally, and a minimum of 10 ft vertically. Numerous additional
tiebacks were used due to the poor performance of the original tiebacks so that the
142

final tieback spacing was even smaller. Rakers were used together with tiebacks
along St. James Street for the same reasons. Figure 4.25 shows the project site and
a typical north-south excavation profile.
In this project, settlement control was very important along Clarendon and
Boylston Streets. Lateral wall movements were the greatest along Clarendon
Street (Fig. 4.26: 1-10) where there was significant lateral soil straining as well
near the Church (Fig. 4.27: 1-2). The maximum horizontal slurry wall deflection
was Sw=3. 3 " along Clarendon (1-10) whereas other walls deflected to a much
smaller extend. Inclinometer 1-2 in front of Trinity Church and opposite of 1-10
across Clarendon had a maximum deflection of close to SH=2". Ties were not
successful in reducing wall movements since their tensioning was not able to
reduce inward wall deflections. Wall movements were smaller along St. James
Street, where rakers were used in place of the three lower levels of tiebacks. Walls
translated up to 1" at their bases even though they all extended into stiff
overconsolidated clay. Such translation movements should be expected under
such conditions where the wall is floating and soft base material is present.
Excessive surface settlements along Clarendon and St. James Streets were
observed during the excavation. Maximum settlement was 8v = 5.2" along
Clarendon Street and 3" along St. James whereas the Boylston Street settlements
were insignificant. Settlements along St. James are puzzling since rakers were
used in place of the three lower levels of tiebacks. Possibly the groundwater
lowering below minimum levels that went on for three or more weeks might be
responsible for these settlements.
Figure 4.28 shows that wall deflections were smaller than surface settlements
along Clarendon Street (same was true for other project sides). This indicates that
there were possible soil losses through the tiebacks or soil disturbance caused by
the tieback installation procedure. Tieback load deficiencies are also to blame for
the excessive movements. Major parts of the effective length of tiebacks were in
the organic silt, resulting in load shedding and excessive creep. Furthermore when
143

additional tiebacks were installed adjacent previously locked tiebacks could not
sustain their initial lock-off loads. Wooden pile extraction in the preliminary
excavation construction phase may be responsible for part of the induced
movements. Building settlements were small, with Trinity Church settling up to
6v=0. 6 2 ". The excavation did not affect other buildings, supported by pile
foundations.
Church Ct Low Rise IMBTA Tunnel
o coti)
Tower
0 1 Sewer
0 n 0 200 ftfI Seuee Picn hlf5s
Ma usd in Tower FoundationS inc e er upl ift<S etrc Weigh
sSt. James Ave.
Low Rised nTower ewerdaio
Hold-down Piles used in low RiseSince water uplift> Structure Weight Clay
TillRock
0010 ft
Figure 4.25: 500 Boylston Street project (B7), site and cross-section.
144

Sturry WaltPanel W7EL. 12.1
Ties I,,st~lei 11 jw4 BeTies Ten~sk>tcd 17-M1o-86
Ex on 29-J-86Ties t~st.Be 10 to 18 Sep 00Tes Tensioned 19 to 24-Sep-B
Eo -.
B... Stob os13-l,-87
Bottomof oalEL. -35.0
Bottom ofCasingEL. -61.5
Top of Casing
Figure 4.26: Wall deflections along western slurry wall (1-10), 500 Boylston
Street (B7).
145
EL. 13.09
STREETt
EL. 17
Fil
30
20
- Org
Clay
< 10Li
CO0
z -10V)
-20
30
-40
-50
-60
-70
j
20 -- --. ....
2013-Mva r- 87 &
16-Oct-36 2C Oct.86 19-Dec 86 6-Sep-87
10 _____ _____ __
0-
701 0 I 2 3
Moement Tards The Excatoln (inch*e
I -13
P. ASE LINE ]
C: CO3
F KEY PLAN
r-
--

Top o-f Coslng
SIDEW LK EL
Fill kA
Org.M LO
- Silt
Sand
Clay
LuJ
IL0
UZ
AL
0
Bottom of CasiEl. -43.80
. 17.2 20
10
0
-10
-20
-30
-40
ng-50
Casbn approximately45' behind the excavation
-60
-70
- R20-Oct-86
30-Jul-86 -j 24-Dec-86 -
-1 0 1 2 4Movement T owards the Excavation (inches)
14 1[J] kh:31 LINE
Iii 12
Hw;wII I KEY FLAN
E
Figure 4.27: Horizontal soil deformations in front of Trinity Church, 1-2,
500 Boylston Street (B7).
146
:3 0 r
10
U
-30 -
-40
-50
-60
-70
I
11
--- -----------
- -. - - --.. -.. .. . - - -... -... ... .... ......... ..... .. .......... .
-

U)-U) ) U
s Claredon St. Settlement(inches)
S N-U-11 Horizontal Movement0) (inches)
-10 Construction
02
Clarendon
4
S
JUL AUG SEP OCT NOV DEC JAN 87 FEB MAR APR MAY JUN
6
Figure 4.28: Maximum settlements and wall deflections with time and
construction events along Clarendon Street, 500 Boylston Street (B7)
4.5.8 Case Study B8, Flagship Wharf
The Flagship Wharf project was an addition to a pre-existing building in
Charlestown, and was constructed in land reclaimed from the sea. It consists of
two eleven story residential/retail towers and a low-rise (3 story) plaza/retail
terrace structure built above a four level below-grade parking. The plan area of
the excavation for this project is 255 ft. (E-W) by 107 ft. (N-S), (Fig. 4.29).
A 60-ft deep, 2.5-ft thick slurry wall provided temporary and permanent
lateral earth support for the excavation. The excavation is approximately 50-ft
deep, and thus the slurry wall was embedded 10ft into glacial till (Fig. 4.29). The
slurry wall was constructed using the patented "ICOS-FLEX" wall system. This
wall differs from traditional slurry walls in that the wall is reinforced with post-
tensioned, high strength strands, similar to those used for tieback anchors.
The soils found in the site and the surrounding area comprised of
miscellaneous fill, organic deposits, glaciomarine, and glacial till deposits (Fig.147
4.29). The stratigraphy can be classified as profile C according to Johnson [1989]
(Fig. 4.3).
The concrete diaphragm wall serves as both the temporary excavation support
wall and permanent foundation wall. The slurry wall was designed to resist
temporary and permanent static lateral pressures from soil, water, and lateral
surcharge loads from building #197 to the north, and other adjacent surface
loadings.
Cross-lot bracing was used for the lateral support of the foundation walls of
this project. Three levels of temporary prestressed (jacked) steel struts and corner
braces supported the slurry wall. The struts were hollow cylinder steel pipes with
a diameter ranging from 24" to 34" and 3/8" to 0.5" wall thickness. Steel HP
sections were in the connections between struts supporting the north and south
wall (Fig. 4.29). The horizontal forces jacked on the struts were transferred on the
wall by means of walers. The arrangement of the struts can be seen in Figure 4.29.
The schematic of the wale-HP steel section-strut arrangement can be seen in
Figure 4.30.
Most wall movements at the Flagship Wharf project were moderate but along
the northern slurry they were large reaching Sw=2". The caissons of building #197
added significantly more surcharge on the northern slurry wall, and as a result, the
southern wall was pushed back into the retained soil by as much as 1" at the top.
Wall movements at opposite panels, braced by common struts, showed opposing
trends (0). That is when a panel moved towards the excavation the opposite panel
moved back into the soil. The concave bending seen in the slurry walls of this
project is indicative of the cross-lot bracing construction sequence.
Settlement control was important in the north side of the project due to the
proximity of building #197 that was supported by a series of caissons. Settlements
up to 8v=1.8" occurred along the section containing the caissons but the
settlements were not transmitted to the exterior walls or the floors of the building
(1). Wall movements and settlements tied very well together.
148

A cave-in occurred during trenching of a panel, at a small depth in the fill
layer during excavation without slurry. Clearly if trenching was carried out under
slurry this cave-in might have been avoided. The cave-in caused additional
problems with the vertical construction of the trench. Construction of this panel
took a longer time since numerous underground obstructions were encountered.
Figure 4.32 shows strut loads as measured from strain gages. A quick 0.5"
movement at 1-2 occurred as a result of a jacking box failure that resulted in the
sharp load loss of the L3 strut during April 1989 (2). The structural factor of
safety of the struts was only F,=1.2 and as a result 50% of the total wall
movement occurred after the excavation base was reached (indicating some creep
movement in the bracing). The upper and lower level struts picked up only 70%
of the design loads, that were in the order of 500 tons for the 3'd level (2). The
load at second level struts picked up as the excavation progressed to the third
level (El -38ft).
More frequent readings indicated that daily variations in temperature caused
expansion and contraction of the struts that showed up as variations in the strain
gage readings.
149

Building 197Project North
@ o o
2 55- 6' -
-- MYRR
APPROXIMATEMUDLINE
Figure 4.29: Flagship Wharf (B8), site plan and Cross Section A-A
150
I.
20
10
0
-10-
-20
30
-40
-50
-60
t
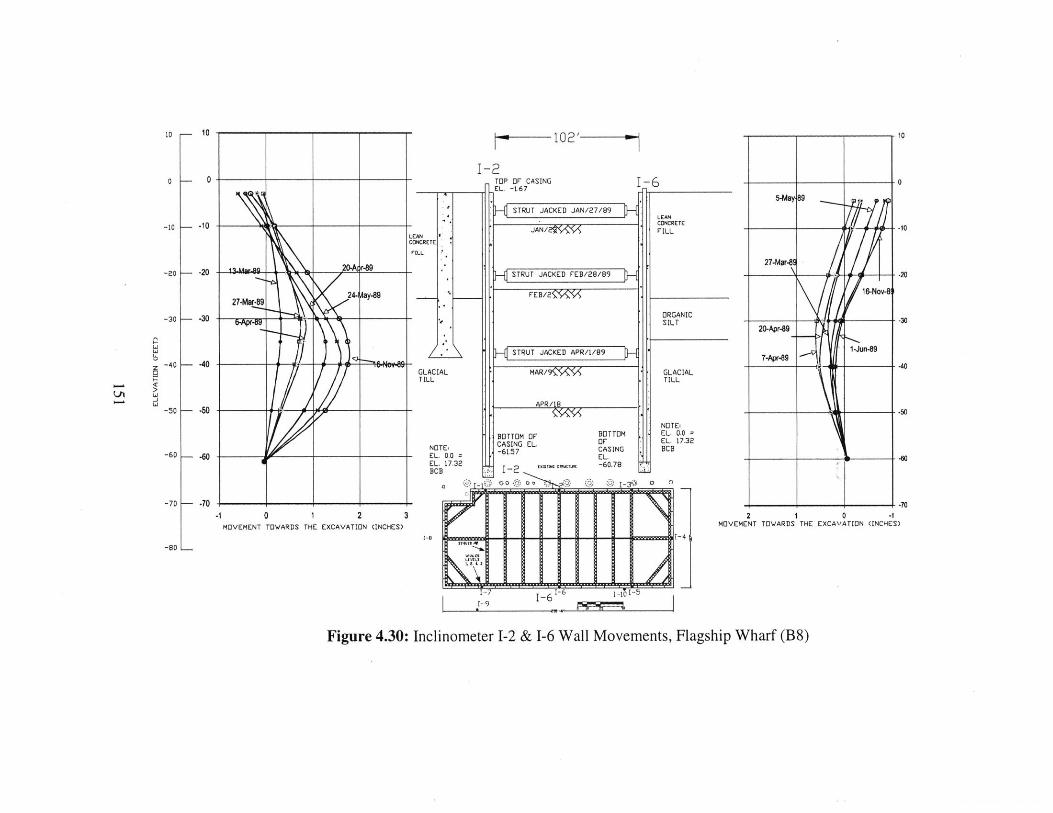
2 1 0MOVEMENT TOVARDS THE EXCAVATION
19 __
Figure 4.30: Inclinometer 1-2 & 1-6 Wall Movements, Flagship Wharf (B8)
10
0
-10
- 10
- 0
- -10
-00 F- -20
-30 - -30
5-MayJ89
Li
z0
- ~~JaLi
Li
10
0
-10
-20
| -30
-40 - -40
-50 - -50
-60 -60
-70 -- -70
27-Mar-8!
20-Apr-89
7-Apr-891-Jun-89
-80 L
-w
f- -70-1
(INCHES)
,
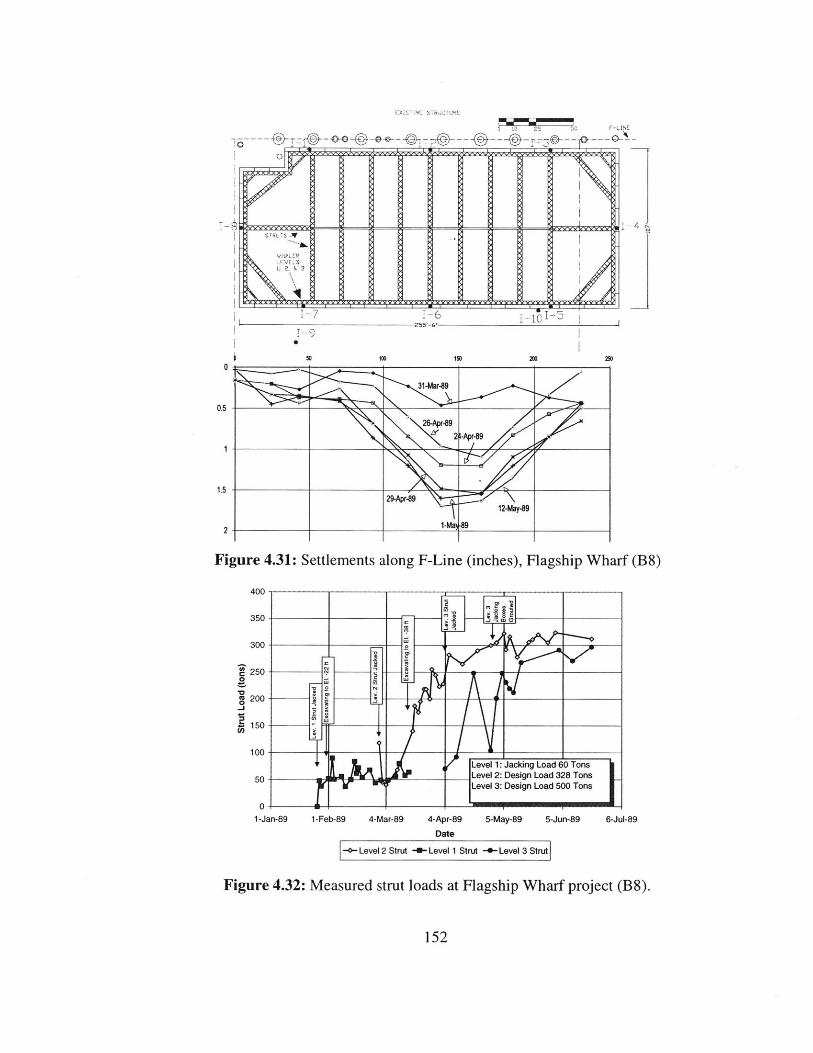
VX:-: ' S .
255'-6'
50 100 1SO 2DD 25D0
0.5
11
1.5
2912-Ma-89
2~1-Ma) -89
Figure 4.31: Settlements along F-Line (inches), Flagship Wharf (B8)
400 - - - - - - - - - - - - r - - - r - - -
350
300-
250 - - --- -- - -0
200-
100-
Level 1: Jacking Load E0 Tons50- Level 2: Design Load 328 Tons5 Level 3: Design Load 500 Tons
1-Jan-89 1-Feb-89 4-Mar-89 4-Apr-89 5-May-89 5-Jun-89
Date
-*- Level 2 Strut -U- Level 1 Strut -*--Level 3 Strut
6-Jul-89
Figure 4.32: Measured strut loads at Flagship Wharf project (B8).
152
0

4.5.9 Project B9, 125 Summer Street
Performance data for this project was obtained for Becker & Haley [1989],
which are shown in Table 4.5. No further was recovered for this project and thus
extensive conclusions can not made. Non the less, the reported deformations
induced by the 6't-deep top/down excavation were very small.
Table 4.5: Performance data for the 125 Summer Street (B9), after Becker &
Haley [1989]
Excavation SlurryBracing/ Exc. Wall Defl.
Soil Excavation Depth Thick. 6Hmax 8Vmax Shape
ID Year Project Name Type* Method (ft) (inches) (inches) (inch) TypeB9 1990 125 Summer St A 6-Lev 60 30 0.6 0.38
Top/Down
4.5.10 Case Study 310, Post Office Square Garage
The Post Office Square Garage includes a 7-level, 75'-deep underground
garage, constructed with the top/down method, bounded by Franklin, Milk, Pearl,
and Congress Streets. Existing buildings up to 40 stories tall are located adjacent
to the site. The plan site can be seen in Figure 4.33.
A perimeter slurry wall, 3.0' thick, extended approximately 10ft into bedrock,
provided both the temporary and permanent earth pressure support for the
excavation. The diaphragm wall is internally braced by the garage floor slabs
(LL1 -LL7), which are supported by interior steel H-section columns founded on
bedrock at depths 85' to 96' below the ground surface. The interior columns,
installed using slurry trenching methods, were concreted into till and rock to form
load bearing elements (LBE).
Most of the site is located within the old Boston peninsula; however, the
northwestern section is located in an area reclaimed from the sea. Figure 4.34
shows two selected cross sections through the site reflecting the initial conditions
(Internal Report H&A, 1987). Soils in the two sections (3: E-E, D-D) comprise
15' of fill, local pockets of organic silt, 30' to 40' thick clay (Boston Blue Clay,
153

BBC), 0' to 16' of sand, 3' to 20' of glacial till, weathered bedrock, and sound
bedrock. Boring logs in the Boston show significant variations in the thickness of
the individual strata across the site, reflecting the complex glacial geology in
Boston (Johnson, 1989).
Figure 4.35 plots the actual tremied concrete volumes for each constructed
panel against the theoretical panel volume (theoretical panel volume = panel
width x length x depth). Concrete overpours were small and averaged 9.2% of the
theoretical panel volume. There was only one panel cave-in during trenching that
was backfilled with concrete and re-excavated later. This panel collapse can easily
be distinguished in Figure 4.35 since the required panel volume was much higher
than the theoretical panel volume. Otherwise, cobbles and boulders in the glacial
till and in the clay caused some difficulties in slurry wall construction.
Figure 4.36 shows the maximum measured wall deflections at various
inclinometers as wells as the floor levels were the maximum wall deflections
occurred. All the walls bulged towards the excavation by up to 6 w=2.2" at
elevations in the clay (LL3 to LL4).
Figure 4.37 shows inclinometer deflections inclinometers IN-13 and IN-14
installed in the eastern wall and 34' behind the excavation along Pearl Street
respectively. The wall at IN-14 deflected the most near the current excavation
level until the LL3 or LL4 slab was completed (4.37). Thereafter, maximum wall
deflections did not change significantly in magnitude and in position. Horizontal
soil movements at IN-13 were smaller than wall movements at IN-14, reaching up
to 8H=0.75" at the top of the inclinometer. Deflections at IN-3 increased the most
from the construction of the LL2 slab until the construction of the LL4 slab.
As the excavation progressed beneath LL3 and LL4 the upper part of the wall
was slightly pushed back into the retained soil. At the same time, wall deflections
beneath the LL3 level steadily increased. One possible mechanism could be that
as the excavation progressed deeper the lower slabs pick up more of the total
lateral earth load and thus the load that the upper slabs shared decreased. As a
154

result, the upper slabs slightly expand and the top of the slurry wall is pushed
back. Thermal expansion and creep deformations of the upper slabs could also
have contributed to the deflection decrease at the top of the wall. When the base
of excavation was reached, there was very little wall bending above the LL3 and
beneath the LL5 slabs. The rock where the slurry walls were keyed appeared to
act as a pin support.
Figure 4.38 shows building and surface settlements caused by the garage
excavation. Building settlements were much smaller than surface settlements. The
Meridien Hotel settled up to 0.65". Buildings supported by deep foundations were
essentially unaffected by the excavation. Surface settlements on the other hand
reached up to 2.75" within 20' from the excavation along Pearl Street, where wall
movements were the largest. Again, a large settlement increase occurred by the
time the LLI slab was installed. Surface settlements further away from the
excavation started increasing when the excavation progressed beneath the LL3
slab, as a result of deep soil movements. Figure 4.39 plots shows subsurface
settlements measured within the BBC by multiple point extensometers at two
construction stages (LL3 slab completed, and LL7 level reached). Subsurface
settlements were much smaller than surface settlements (0.65" maximum,
typically less than 0.4"). Figure 4.39 also indicates that subsurface settlements
within the Boston Blue Clay decrease with increasing depth.
Figure 4.40 plots piezometric levels at two locations near the southeastern
project corner. The excavation did not affect water levels in the fill, while slightly
lowered the piezometric head in the clay by 10'. However, dewatering within the
site and excavation beneath LL3, decreased the piezometric head in the rock at
one location by 45'(Fig. 4.40).
The excavation did not affect adversely any adjacent structures. However,
deformations were larger than expected because the backfill material that was
used for the LBEs was softer than the surrounding soil. Thus wall deflections
were larger along the eastern wall (2.0"), where the LBEs formed a parallel to the
wall zone of softer material (Figs. 4.5.10.3, & 5). A major portion of the155

deformations occurred in the initial stages of the excavation, before the roof or the
first level slab was installed. During these first stages, the lateral earth loads were
transferred to the softer LBE backfill material, through out the wall depth, thus
causing large cantilever movements. Movements were smaller in locations where
the LBEs were further away from wall.
/
State Street Bank
MeridienOne j hotelPostOfficeSquare
#10 D NewETele
E Bui
nglandphoneiding
'3,
Post OfficeSquare
I;
-- ----
3/
..'X 3 ~ 4 . 4 ......... .......
......
~7~P h*~I 5
S
/"'3
/
Figure 4.33: Post Office Square Garage (B10), Site and instrumentation
156
..........

...0 .. 1.. ................
20-
0 4
C'Clay -
BBC
@ Sand - - -
Glacial Til ~~~1~~ ~ - ~
rprox.-80 @-Bedrock - ------ Garage d'Base
.! .....
rA $. ........---
--... } .....
-
Cross Section E-E
Clay ~- -
- ?Sand ---
{)Glacial Till :
*I - - - - --- - - -- - -'4 %Bedrock j
.~~p r x -......
[ Base
0 10Cross Section D-D
Figure 4.34: Selected soil profiles reflecting initial conditions, Post Office Square
Garage (B 10).
157

350
300 --
-2
250 ---a)E
0 200 - -0
2 150 -
100 --
100 125 150 175 200 225 250 275 300
Theoretical Panel Volume (Cubic Yards)
I Actual Volume Poured - Theoretical=Actual - -Linear (Actual Volume Poured) |
Figure 4.35: Actual and Theoretical pouring volumes of concrete for slurry wall
construction, Post Office Square Garage (B 10)
Pearl StreetN
I-
C./) I
c')
Figure 4.36: Maximum measured horizontal wall and soil deflections for Post
Office Square Garage (B 10)
158

Horizontal Deformation Towards the Excavation (inches)IN-13 ( In0510IN- 14 1-0El. 30Oft r
Figure 4.37: Inclinometers IN-13 & IN-14, Pearl Street, Eastern Wall (B 10).
Pearl
11

Distance Behind the Excava
0 50 100 150 200
M+F
MC
UOP
* N- - -- B
* S
0 M
pC
X B
M, + T
0~ 02
- F
tion (feet)
2F' 300 3cm;- )K '0 1 X*
SolidSettle
0
Points: Surfacement Reference
Points
Figure 4.38: Final settlements versus distance behind excavation (B 10).
160
50
0
0.5
1
C:a)
E
Cl)
1.5
ranklin Street (South)
ongress Street (West)
ost Office Square (north)
earl Street (East)
ew England Telephoneuildingtate Street Bank
eridian Hotel &One Postffice Squareuilding #10
he McCormack Building
4 to 74 Federal Street
irst National Bank
2
2.5 -
3

Extensometer Data0-
-5 i
-10
-15
-20
.2 -25
iu -30
-35
-401 j
-45
A x
Within Glacial Till MBPX2
All pointswithin Clay
(BBC)
> MBPX1 (LL3)
o MBPX2 (LL3)
A MBPX3 (LL3)
o MBPX5 (LL3)
o MBPX6 (LL3)*MBPX1 (LL7)
MBPX2 (LL7)A MBPX3 (LL7)* MBPX5 (LL7)
MBPX6 (LL7)
-0.4 -0.2 0 0.2 0.4 0.6 0.8 1
- Heave (inches) Settlement (inches) -
Figure 4.39: Subsurface settlements (measured by extensometers)20-
In Clay El. 0.3'
10 +.g
0In Clay El. -18.7
-10
-30 B110-PZ - - ------
N n Till In Bedrock El. -83.2-0-El. -62.8] L
-40PZ-4
LL6
-50 - ---
-60 -- - - -
M) M>0 0) M) 0) 0) 0.) 0) C) CD CD C> CD CD C5 CD C3 0D 0D C>00 W o 00 W o 00 00 W WcM 0) 0) M a 0) 0) 0) 0) 0)M 0) OD
0. ~ : (U a> C ~
B110-PZ-C (El. -83.2') -o-B 110-PZ-B (El. -18.7') -+- B110-PZ-C (El. 0 3')o Excavation Progress - x- PZ4 (El. -62.8')
Figure 4.40: Piezometric measurements at B 11 O-PZ and PZ-4 and construction(B 10).
161
I
aO
0
0
U
-

4.5.11 Case Study B11, Beth Israel Deaconess Hospital
The Beth Israel Deaconess (BID) Hospital is located in the corner of
Longwood and Brookline Avenues in Boston Massachusetts. The building
consists of a 4-storey low-rise area and a 19-storie higb-rise section. A 5-level
underground parking garage was constructed under the building using the
up/down construction method. The Massachusetts College of Arts building
(MCA) previously occupied a major portion of the site. This added to the
complexity of the project since the facade of the MCA building facing Brookline
Avenue had to be incorporated to the new BID building. The foundation
perimeter walls were constructed using the slurry trenching method (slurry walls)
with a saw-toothed configuration.
Settlement control was important since damage to adjacent buildings had to be
minimized. The type of foundations that respective buildings have affects their
settlement during an adjacent excavation (including the up/down construction
method). Buildings with deep foundations like end-bearing piles typically
experience smaller settlements during adjacent excavations from buildings
founded on shallow foundations. A plan of the site is shown in Figure 4.41.
Five major soil strata and two major rock units were encountered in the test
boring program conducted for the BID project namely: 6'-15' miscellaneous fill
(SPT<15 bpf), over 10'-36.5' of loose to very dense medium to fine sand
(30<N<50), 25' to 64' marine clay (BBC), 3'-10' glaciomarine deposits, and
either Argillite or Conglomerate bedrock. The soil conditions at the site are usual
of the glacial past of the Boston area and the soil profile can be classified as
profile B according to Johnson [1989] (Fig. 4.3). Typical cross sections reflecting
the initial and final conditions and can be seen in Figure 4.42.
The top/down construction method required that deep foundation units were
installed prior to the general excavation. Load Bearing Elements (LBE) were used
to support the basement columns. LBE's were designed as to utilize both skin
friction and end bearing. The reinforced concrete diaphragm (slurry) wall served
both for temporary and permanent earth support of the basement area. The below162

grade garage floors provided temporary and permanent bracing of the slurry
walls. The walls were embedded a minimum of 3ft into glacial till in locations
where the walls carried vertical loading from the superstructure. An allowable
pressure of 30ksf was used for slurry wall bearing design. Slurry wall panels were
typically 20' long with most panels at the northern, eastern, and southern sides of
the project 2.5' thick, while some other panels were 3.0ft thick
Horizontal wall movements in this project were moderate to small. Maximum
wall deflections ranged up to 0.88" at LL4 (Fig. 4.43). Most of the wall
deflections occurred after the excavation reached below the third or the fourth
garage level. At the final stages in the Brookline Avenue slurry wall the point of
maximum wall movement occurred between the fourth and the base slab levels.
Soil horizontal movements that were monitored next to slurry wall
inclinometers were smaller than wall movements. Typically soil movements
matched slurry wall deflections with the exception of some erroneous
inclinometer data. Horizontal soil movements were observed at considerable
depths below the ground surface despite the large slurry wall embedments (15 to
30 feet). Maximum horizontal soil movements up to 0.64" occurred at the
Brookline Avenue side inclinometer where wall deflections were the largest
throughout the project.
Horizontal soil movements along Longwood Avenue were slightly larger
reaching up to 0.6" ten feet below the ground surface. Slurry wall deflections at
the Longwood panels were also moderate reaching up to 0.84" between the fourth
and the base garage slab. At the base slab elevation the maximum horizontal soil
movements was 0.25" and the corresponding wall deflection was close to 0.75".
Figure 4.44 shows final measured settlement contours. Typical building
settlements were small to moderate with the exception of the MCA facade. The
MCA facade settled as much as 1.4" but close to 0.4" of this settlement occurred
before any foundation construction probably due to the demolition of most of the
MCA building. Buildings supported on shallow foundations closer to the east face
of the excavation had moderate settlements. The southwestern corner of the163
Kirstein Building settled close to 0.8" (closer to the excavation) and the Beth
Israel garage settled up to 0.5". The Kirstein building was founded on spread
footings while the Beth Israel garage has pressure injected footings at 20' below
ground surface, while other buildings settled less than 0.2".
Overall, performance of the BID foundation system was satisfactory since
most slurry wall deflections and adjacent building settlements ranged from small
to moderate values. There were no reports regarding cave-ins during slurry wall
construction or other notices regarding slurry wall leakage.
164

Project North
Recreation Fields
BROOKLNE AVENUE o 80 1SOSCALE IN FEET
Figure 4.41: Beth Israel Deaconess site and adjacent buildings (B11)

Load eing'Slury Wl lement (NLE)
ExitingCA
FacadeThat Hadto Remmain
Misc.Fill
Marinc Sand12
Marine Clay -1
Glacial Till
Slttrry WallUndrslab Dndnage SCstem
BinneyStreet
MiscellaneousFill
MarineClay(BBC)
Glacial Till
Slurry Wall
inney
i slausFill
MarineClay(BBC)
Glacial Till
Sirry Wall
Figure 4.42: Initial and final cross sections of the excavation (B 11)
440
Z7
40
;-4

SI-301INCUMOMETER
SKETCH
40lOP OF
CASN EL24.7
EL25.0--\
20 FLu.
10-
SAND
If 0
MARINECLAY
--20 .
TW L--0
-70
40
30
-0.5 0.0 0.5
SW-05(PANEL NO.42)INCUNOMETERCONSTRUCTION SEQUENCE
SKETCH
TOP OF
CASM4 EL.25.
U.24 0 -
Fil_GF
GF EXCAVATIONANIDFLOOR SLABCOMPLETE AS OF 2 NOV'93
0 - LL1
SAND LL3 EXCAVATON ANDFLOOR SLAB
MAIECOMPLETED AS OrF25JUN'4
-20 .. LL4u.4 XCAVATION AND FLOOR sL-AB
COMPLETED
T-30 LL5
-40
-50
-so
GLACIAL.TILL
LL51~F
LEGEND:
0 20 May'94a 25 Jun '94A6 Aug'94
9 Sep'9412 Oct'94
Figure 4.43: Longwood Avenue slurry
movements, Beth Israel Deaconess Hospital
LLS EXCAVATION AND FLOOR SLABCOMPLETED ASOF 12 OCT-4
BINNEY STREET
0
9 -,p 0 NCH
L !.L 11 1 11 14 -0
W * ; ; ; I I I ( U
-- -
N -
BROOKUfNE AVENUE
wall deflections & horizontal soil
(B 11).
167
:to
S.1
9
.5 1.0
ES)

BROOKLNJE AVENUE 0 .0 1SO
SCALE IN FEET
0
c0 D MOli00.4
mn0.6 Beth Israetthe nDeaconess HospitalC: 0. EXCAVATION
+1.
Figure 4.44: Total building and surface settlements (B I1).
4.5.12 Case Study B12, Dana Farber Tower
The Dana-Farber Research Tower is located in the Longwood Medical Area at
the northwest corner of Binney Street and Deaconess road. The tower has 14
above-ground stories devoted to office and research laboratory uses and five
underground parking levels. The structure occupies the entire site, with the
building perimeter as close to the property line as practical. The bottom floor of
the garage is at about EL. -9 feet or about 52 feet below the original grade
(El. 43 ft). The research tower is abutted by existing structures on three sides of
the site and by Binney Street along the southern edge (Fig. 4.45).
Two orthogonal cross-sections (A-A, B-B) through the center of the site are
shown in Figure 4.46. The stratigraphy of the studied sections is typical of the
168
subsurface of the site. The soil profiles d include the following layers: 1'-14' of
miscellaneous fill, over 13' to 22' of sand, 31' to 57'-thick BBC with a 8'-10'
yellow crust at the top of the layer, glacial till, and conglomerate bedrock. The
bedrock was medium to hard, slightly weathered gray to purple, coarse-grained
conglomerate with closely spaced dipping joints. The Rock Quality Designation
(RQD) ranged from 28 to 40%. The depth to bedrock varied between
approximately 66' and 90'. Based on the information form borings T1-T6 and
from boring EC-17 drilled within the limits of the proposed tower and the slurry
wall installation, the bedrock surface drops from east to west and from north to
south. As discovered by the slurry wall installation the actual bedrock surface
between borings was fairly irregular.
The tied back slurry wall provided temporary support during the excavation
of the basement, but is not part of the permanent structure of the research tower.
Instead it acts as a permanent lateral earth support system and a barrier that
isolates the tower from vibrations (mainly from the adjacent MATEP power
plant) in order to protect delicate (and expensive) medical experiments. The
research tower itself is founded on a series of caissons that bear on the underlying
bedrock (Roxbury Conglomerate).
The slurry walls are supported by six- (6) level of tiebacks to bedrock at an
average inclination of 450 to the horizontal. All the tiebacks extend to bedrock
and have a bonded length of about 20'. The actual bonded length is unknown.
Typical design values for the lock-off loads of the tiebacks are shown in
Table 4.6.
On the east wall the first two levels of tiebacks do not exist because of the
existence of the MATEP utility tunnel. A prestressed concrete edge was used to
provide the necessary lateral support for the east wall, supported at the north and
south walls. Figure 4.47 shows the final profiles of the excavation along sections
A-A and B-B.
169

The design thickness of the slurry wall is 3' feet, and the wall extends a
minimum of 2' feet in the underlying bedrock. The slurry wall/bedrock friction
was designed to be enough to counteract the lateral forces without the need for the
2' key that provides added safety.
Slurry wall deflections were very small, with a maximum value reached close
to 8H=0.7" in the south wall (Fig. 4.53). Most slurry walls were slightly pulled
back for major portions of their length although at some construction stages small
inward movements were recorded (Figs. 4.51 & 4.52).
Despite the small wall movements or even the pulled back walls, the
settlements were excessive in the eastern and western sides. Air drilling caused
ground softening and ground losses can explain the occurrence of small wall
movements and large settlements (Fig. 4.48). As indicated by Figures 4.49 and
4.50 the settlement troughs were typical of excavation projects. Maximum
settlements were recorded near the wall and diminished with increased distance.
Settlements up to 6 v=2.8" were measured in the eastern side within the MATEP
utility tunnel. Inward east wall movements in combination with the soil losses
through the tiebacks contributed to the increased settlements in the MATEP
tunnel. Clearly excessive settlements were induced by soil and water losses
through the anchor heads. On the slurry walls that the losses through the tiebacks
were kept to a minimum the settlements were acceptable and the damage to the
adjacent structures was kept to a minimum. Adjacent buildings (Jimmy Fund, and
Brigham and Women's Hospital buildings) settled far less than the tunnels and
with no recorded damage.
The strain gages placed at the bottom of the slurry wall reinforcement showed
that all of the vertical forces induced on the slurry wall by the tiebacks were
transferred to the base of the wall (Fig. 4.55). This could be expected because the
slurry wall was not allowed to settle and thus no side friction developed between
the slurry wall and the retained soil. Induced moments at the bottom of the slurry
170

wall became significant only after the excavation had reached the 5th level (out of
6 levels total) (Fig. 4.49).
At the slurry wall construction phase two cave-ins with sinkholes developing
at the ground surface occurred (Case Study B12: south wall: Section 5.1). One of
the cave-ins occurred when a panel excavation was resumed after a halt of 4 days
for logistical reasons (panel SWP-4). The depth reached when the cave-in
occurred was into the deep silty sand stratum. A 3-foot diameter and 5 foot deep
sinkhole developed on the ground surface. It was presumed that a channel had
developed between the face of the panel excavation and the sinkhole at the ground
surface. Another cave-in and a soil depression occurred at panel SWP-2 on the
day of the concrete pour. The reasons for this cave in are not known.
Table 4.6: Typical tieback design loads and data, (B 12).
Design ValuesApproximate
Vertical Lock-Off Test StressingAngle Load Load No. of length
LEVEL (Degrees) (Kips) (kips) Strands (feet)Level P1 --- --- --- --- ---Level P2 --- --- --- --- ---Level P3 45 354 531 12 80Level P4 45 484 726 16 64Level P5 45 438 663 15 50Level P6 45 421 632 16 36
171

iGDN UFACESY:U .N MDN['DR"N PD[NTSONSIT rrF PK: NA!:'S ft ASPH:AL.T, T LSSTEE LAAE H:D'LT I R C 1"HISE: " ?ARKS [N
CO)NMRETE, AND PUN MR S I ITEl. MANHULE.
STA!NLESS TELCARR.IAGE -OL NHIRMZDNTAL SUR -ACES AN SYA Ni.ESS STEE! .S WIETHADULLS ON VERICAL SUR7ACES
3. SETT:..EXNNT PD!NTrS VR NTRD0 fI!CAL. SUR'AVEY, -W!TH A RESQLU.TV, lGN1 +&
T. (A IUTt AND AN ACUAYD m-1F4. TA 'If EXK!NSINE TERS WLTT MNGPIS
B.N[ - D STATNLES',S S- EEi. EYSLSACALIBRATEDI TAPE r.xrENSDMETER WAS USED - TO
OETVEE-N MDIN1wRkNG PO1NT VTH A RESIKLUrIGNGF , 001 MNCH AND AIPRDXINATE C :i;RACY eOF*
+,00S 0u-FDGT SPAN TO +-1.01 [NZriUlT.,F:,C! SPAN)
5. CRACK GAIES VERE LASED MG MNIEGR RELAT[VEMOGVENENT% OF EXISTN C SA.S T WE GAElVER GAPP(lNG CURSDIR AND GQ1D TYPE 5AGES THATPERMIT D[~RECT VISUAL RE.ADING GF BIT;HGOiTDTAL. AND VIERVlCAL l.SLCMN VWT ARESM; ,T KN IOFr..02 fNCH.F i.r.CAT10NS 0, CRACk(G;AUGElS VCR. DETERVINED IASI[D ON THC
PREf.-CNTRl:;U TIDN CONIMON SURVEY Ir riHEMAJMEN STRUCTURE-S.
F, IN LLIMETE'RS VER!E 1;SED Q -EA AR LATERA:.GEET F THE- SLU RRY VAI..LS ILI -O.0! LNGH
41 !H AN A:PPRO)GMA'!E. ACCUpArCy DF I 01STCIn OTD F ALL). 'if-E INCL-IN.WERis VErE
NTAEDIN SLEEVES 'CAST IN ! HE SL.URRY VALAND EXYTENDEDr. APOlRiLXIATE:LY $i-EIT
BEUOC HELNV UE BITITIM LF TH WLUR ALL..?.PIEZOMAT-ERS VERE USED TO MIN!TDR 'fHl GRGUNDl
VATER L.EVEL. (PIEMMETRIC i.EVEL.) DUTSIDE THES:LURRY VAL: IN THE LAN" -6R GLACiAL TILi.STRATA fMMEH DtATELY BELDnV FHE * LMAY STRATUM.11.ADETINA [STRMET~i!"N AS ;NSTAL LED 3 Y
THE GNTACTR AD SME ~i~IT IS NFT S;4nvN6N THIS DRAVW.M NCUDS
nTVO PEDTRS(NS'ALLEDl IIME THE-LRYVL uMNITR THE fllfUMil
VAERi.VL [N 214E RGCX:* lLOV THEEXCVA TlN1, . 1 P !(!A: SURVEYS TO !EASUI. ' :-ATELt
CAP M RENSPOTIG- TEP - ' iM- 4E 1SLU:.RRY VAL.L AL.ONG7 3INNEY STREEfT.9. 7ImF. SE.TTi.NT NFINITTORWNG POiNTs LSE EG
VEREr DES[GNATEr AS IN I;CA':IGR PGINNIS AN!% V;ER9EFMNTRDON A VEkY JAS'S. THE RENAMN6SETEEM NT MNETORNG 90NS VEREl: DNri~TDRED
PERfDOMCAL I!!.J ELIROiVIDE A COPEE9091AT1:CTT IRAL.S Al) UPDNk CO)MP AETN 1:1F
ClNTRC ILON
SP ItP1 P-43
Sp.. 1; 11P1- 5 DP- 43
AtP--49
Figure 4.45: Dana Farber Tower Site (B 12)

North Sturry Vatt (rN-2)Sou-th SLurry WoAl GN-4)
T11& -:&&~N ~-AN --JILL
- -- 4
1INTER3BE33E VHSILT AN3 SAN
-- ... .. ..... ...
.-.....
T9
I
S2
T~LL~
o o-nr.xcDor---- -
.
= ----- ------- -11 s -o - - -
-u )(3401anxTun - -
ExistingDano-FarberMding -- 7
CC109
a) Section (A-A).
West Watl GN-D
FOOTING OFREDSTONE B 4ILDING (T4
CLAY AND --S-I-T
MUN - - . -
3 T S -- - IN------ -- -- PAS
-GRVIIHO~ SIt AD GRAVEL
AV~fi SAND
East Walt 1N-3) Brighm ard Veen's Hospta
c17 3O4
BRVN CLAYAND, SILT WM1T SAND -~ T
so S TTUCs.
A CLAYPI-TERBEDDED VITHLT AND SAND
tfLtY.FINdE1
.SILT AND- - -VM..
BUTCUNUGUMRAT~r;= W
- -mie.-m,- feet
4 to 25 40 50
b) Section (B-B).
Figure 4.46: Initial soil profiles at the Dana Farber project site (B 12).
173
MO..TEP
50
0 20
E-D-to
>i -40
'50
.0
3020
-10
-20
~30
-pHERDEDDE n -
--" --0 to iM 40 w
.............- .. ----
+ -... ...... ..-. ... .. .....
Ffc
- --- - -

E 'xcava-c 1-n Lat CD-321 M/18/951
South Sturry Woll GN-4) North Slurry Wail GIN-2)
T9 T5 1
TIl
MATEP
- -- ----
-2LME E
a) Section (A-A).
West VQlt <IN-ID Excavation ot CD-295 (9/12/95)Leve, 6 Tieback Prestressig ad
CD-301 (9/29/95, and CD-207 (10/4/955Cap Beam
FOrmNi Or
16 (T5
-D -- - - -FUN a
s6 -t C30 SO
-4-20 P tI
2 a :242:s
East Wait (IN-3> arigOa an 1vrn' -^sat
-1724 -
"""*--- - -- --s- - - - -
-T
... - -...
b) Section (B-B).
Figure 4.47: Excavation cross-sections at the final stage, Dana Farber (B12).
174

_0|_|5 P3 P4 |P5 P6| | | | | | | |-5III-I F i 5 F ii I I II iII120 140 160 180 200 220 240 260 280 300 320 340 360 380 400 420 440 460 480 500 520 540
Construction Date as Measured from Dec./1/1994
Figure 4.48: Settlements with time and construction events (B 12).
.MATEP Settlements vs Time for Line A
Horizontal Distance from BPI-14 (feet)
560
Old Dana-Farber Cancer
Institute 15Story Building
1 CDo -- 138 -6- 152 L1 X)( 187 L2 -)- 216L3+ -e 244P4
-2- -- 258 P4 273 P5 0 308 P6 * 313 -G 354 -- 432
Figure 4.49: Settlement troughs at line A, (B 12).
175
I
3
2.5
.2
. 1.5
E1
0.5
0
E
I

BP-4 BP-3 BPI-5 BPI-6 BPI-7 -
CDo - -148 -A-174L1+- -X- 21(L3+ O 24434+ -"" "26,95-273 - - 313 P6 -316 Lf --- 432 -E-495
Figure 4.50: Settlement troughs at line B, (B 12).
176
-0.5
0
E
CD

50WEST SLURRY WALL
IN-I
1 0
0 -
.- -
Figure 4.51: Wall deflections at inclinometer In-1, Dana Farber Tower (B 12).
177
450
4.6 -0.4 -0.2 0 0.2 0.4 0.6 O.8 1Law NeCO f)
1SIL
B N e d sc
tijL. u.R R Y W ALA. ---...
La UedNor -h
IN -4.......
0 2 0 50 0
7N-3

EAST SLURRY WALLIN-3 CONCR
50
40
30
20
10
4 0
-10
-20
-30
-40
-50
-60
-0.6 .0.4 -02 0 0.2 0.4
Lakaldecio fach)
Figure 4.52: Wall deflections at Inclinometer In-3, Dana Farber Tower (B 12).
178
0- ~ ~ .10 P 0 0N-4
~ N-
0.6 0. 1
v
1a-
H O
0
!15
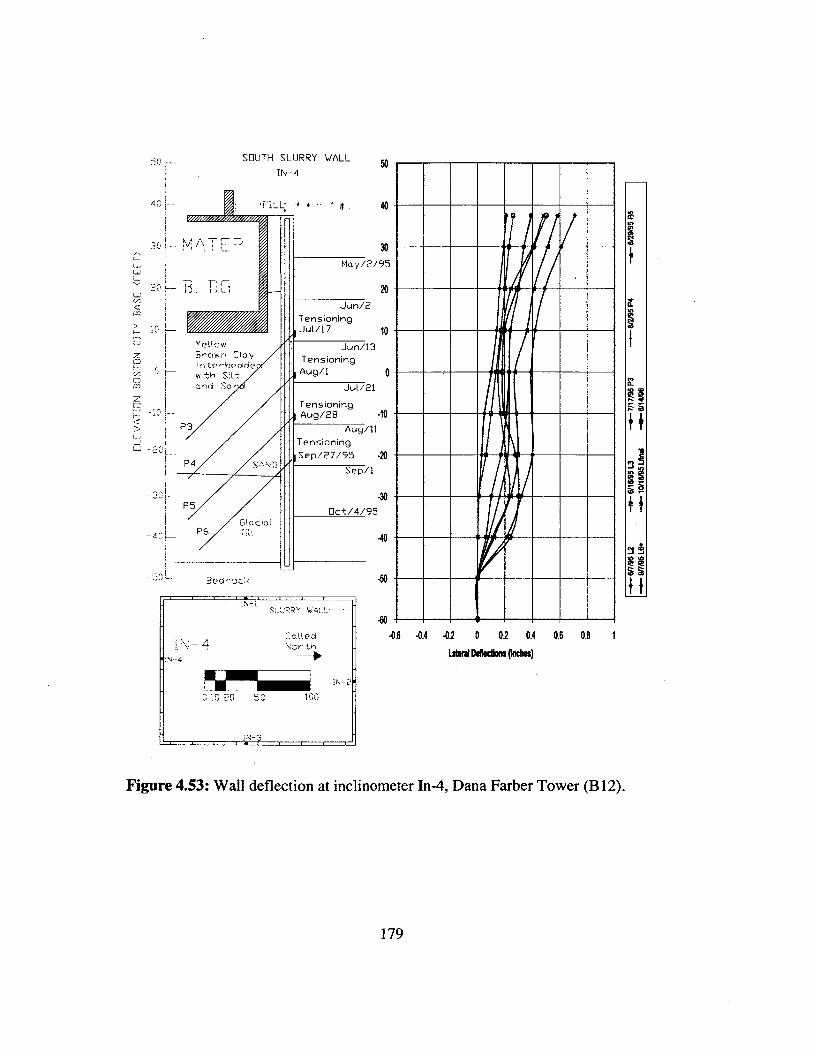
SDUTH SLURRY WALL
IN-450
> -
P4
U-
U- 0
-0.6 -0.4 -0.2 0 0.2 0.4 0.6 0.8 1
Figure 4.53: Wall deflection at inclinometer In-4, Dana Farber Tower (B 12).
179
IV
-50
-60
II
2
lea
N--4N~I -2 ort
0120 50 10
N-H

120
100-
80pL
cc 60- e 60P3 P4L2 L4
L5
0 40 L1 P L3
E *E4&50
UE5&
Cap Beamo2 o 1
C- .- - N N 0 )
Construction Date as Measured from Dec/1/1994
Figure 4.54: Moments on eastern slurry wall, deduced from strain gages attached
to the diaphragm wall reinforcement, Dana Farber Tower (B 12).
200
180
160P2 P3 P4
140
S120-
a)
2 1000U-
80 P
60Strain Gages are
40--- Located at EL. -2X atPanel EWP-6
20-I Cumulative P k/ft
0 - -
200 220 240 260 280 300 320 340
Construction Date as Measured from Dec/1/1994
Figure 4.55: Axial force on the eastern slurry wall as determined by embedment
gages, Dana Farber Tower (B 12).
180
4.5.13 Case Study B13, Millennium Place
The Millennium Place project includes a 55'-deep excavation with five
underground parking levels constructed by the up/down method. The excavation
has just been recently completed. Numerous buildings are right next to the
excavation along the northern, western, and southern sides of the project. The
MBTA Orange Line runs under Washington Street to the east of the excavation.
Thus, slurry walls were selected to protect adjacent structures from excavation
induced damage. Figure 4.56 shows the site plan and Figure 4.57 displays a
typical wall section.
Soils at the site are representative of profile B as classified by Johnson 1989.
The soil profile consists of fill, organics, outwash deposits, marine deposits,
outwash deposits, glacial till, and bedrock.
The diaphragm walls are 3.0'-thick and have their toe embedded 40' beneath
the base of the excavation, into the marine and glacial till deposits. Load bearing
elements and caissons were constructed to carry the vertical loads from the
basement floors and the superstructure.
Measured wall deflections are in the order of 0.3" to 0.8" towards the
excavation, with some bending evident. Measured settlements are in the same
order as wall deflections but at some localized points settlements were larger
probably because of other construction activities.
181

0 a c02
Figue 4.6: Mllenium lace(B13 prjct site.
3P141R
GlacialW DIPJDeposits
Fiur .5:TyialwllsctRiona ilenu Plc ( 13)
04E 9.0w 182

0
4.6 Summary of Wall Deflections
Figure 4.58 shows the maximum wall deflections for Boston projects plotted
as a function of the system stiffness approach as proposed by Clough et. al.
[1989]. Table 4.7 summarizes the input parameters used to plot Figure 4.58. The
majority of the projects plots have Sw/H<0.4%, with a notable exception of 500-
Boylston St. in which movements were up to 0.66%. Top down projects generated
movements Sw/H<0.15% corresponding to the higher system stiffness. Floating
tieback projects generated larger wall deflection ratios than top/down projects .
If we exclude the 500-Boylston project (B7) then there is correlation of
decreasing wall movements with increasing system stiffness. Top/down projects
do not show any significant correlation with system stiffness.
The two tieback projects that were keyed into glacial till or bedrock (B2 &
B12) showed smaller wall deflections Sw/H than those with no toe fixity (B3, B6,
B7).1
0.9
0.80 .
0C 0.7
0.4
ca> 0.6- .w
020.4
3: 0.3
Projects In Order of Increasing StiffnessB2) 60 State Street (2-3 Ties, Keyed in Ti)- 8) Flagship Wharf (3 Lev. Cross-lot, keyed Glacial Till)81) South Cave (31lev. Cross-lot)- - --
B3) State Transportation (2-Ties Floating 7)B4) 75 State St. (6 lev.Top/Down, Keyed Glacial lilt)B5) Rowes Wharf (5 Lev, Top/Down, Keyed Glacial Till) - -B7) 500 Boylston (4 Ties Floating)86) One Meronal Drive (2 1 Ties floating)- 9)125 Summer Street (5 ev Top/Down)8 10) Foot Office Square (7-1ev. Top/Down)B11) BD Hospital (s Lev. Top/Down, Keyed in Till) !B7B -2) Dana Farber Tower (6 Ties k keyed to bedrock)813) - -llennium Place (5-ev Top/Down- keyed in Til) - - -
I B6
AB3 - -- - - -
Rakers &Soil Berrns
Ties and/orRakers
Ties (Wallkeyed intoGlacialTill)
Top/DownConstruction
Cross-LotBracing
13 B10
0.__2 - -- B10 B B2 B48
0 .1 - - -? 1-- - - - - - - -- - -
B5 i 9
0 _B12
1 10 100 1000 10000
System Stiffness = (EI)/(,yh 4)Figure 4.58: Maximum wall deflections for Boston projects plotted according to
Clough 1989 method
183
0

Table 4.7: Summary of system stiffness input parameters and horizontal
deflections for diaphragm wall excavations in Boston.
Horizontal Deflections
Wall Vertical (inches)
Thick E.c. Depth Support Caisson+ Exc. SystemProject (ft) (ft) Spacing (ft) fc '(ksi) Other Total Only Stiffness
t H h S6 6E EI/y. h SExcH
BI South Cove 3 50 15 3.5 0 1.35 1.35 345.9 0.225
B2 60-State Street 2 35 17 3.5 0.25 0.92 0.67 62.1 0.160
B3 State Transportation 2 27 10 3.5 0 0.85 0.85 518.8 0.262
B4 75 State Street 2.5 65 11 3.5 0.8 1.85 1.05 692.1 0.135
B5 Rowes Wharf 2.5 55 11 4.5 0 0.41 0.41 784.7 0.062
B6 One Memorial Drive 2 30 9 4.5 0 1.3 1.3 896.6 0.361
B7 500 Boylston Street 2 42 9 4.5 0 3.3 3.3 896.6 0.655
B8 Flagship Wharf 2.5 47 16 4.5 0 1.81 1.81 175.3 0.321
B9 125 Summer Street 2.5 60 10 4.5 0 0.6 0.6 1148.9 0.083
BIO Post Office Square 3 75 10 5.5 0 0.85 0.85 2194.9 0.094
B Il Beth Israel Hospital 3 55 11 5.5 0 2.1 2.1 1499.2 0.318B12 Dana Farber 3 88 10 5.5 0 0.72 0.72 2194.9 0.068
B13 Millennium Place 3 55 11 5.5 0 0.8 0.8 1499.2 0.121
Note:Modulus of Elasticity: E (psi)=570004 (fe' (psi) => E(psf)= 395.83 1 (fe' (psi)
fe' : 28 Day strength of concrete
Moment of Inertia of Uncracked Section = I
I(ft4)= (I ft) t3
12t (ft) = Diaphragm wall thickness
yw = Unit weight of water = 62.4 pcf
Table 4.8: Inclinometers per project (Boston) used to derive statistics in Fig. 4.59& Fig. 4.60.
ID Project InclinometersB1 60 State Street 4B2 MBTA South Cove 3B3 State Transportation Building 19B4 75 State Street 1B5 Rowes Wharf 1B6 One Memorial Drive 5B7 500 Boylston St. 8B8 Flagship Wharf 11B9 125 Summer Street 1B10 Post Office Square 13
Beth Israel DeaconessB11 Hospital 15B12 Dana Farber Tower 4B13 Millennium Place
Total 85
184
(ACI-8.5. 1)

Figure 4.59 summarizes a frequency plot of the maximum and final
deflections of the 85 inclinometers used in the 13 study projects in Boston. The
same data are replotted in Figure 4.60 in terms of the dimensionless ratio Sw/H
where H is the final excavation depth. Deflections, were subdivided into 0.5"
intervals , like -1.0" to -0.5", and 0.0" to 0.5" (negative sign indicates movement
back into the retained soil). For the Sw/H the selected interval was 0.1% of the
final excavation depth. Table 4.8 gives the number of inclinometers per project
used to derive the frequency plots in Figures 4.59 & 4.60.
From Figure 4.59 we can clearly see that the overwhelming majority of the
inclinometers deflected less than 1.0", while only 16% of the inclinometers had a
final deflection greater than 1.0". The average maximum deflections is
6 H =0.70" ± 0.68", while the final deflections 6 H = 0.60" ± 0.59". However, the
movements within a project varied more than this figure implies. The effect of
actions to reduce wall movements can be seen in this figure. In particular the
percentage of deflections in the range of 1.0" to 1.5" decreased by about 5% in
favor of smaller range of movements. It is interesting to note that almost 50% of
the inclinometers deflected from 0" to 0.5".
Figure 4.60 seems to suggest that the frequency of SH/H follows a lognormal
skewed to the left distribution, for both the maximum and final wall deflections.
The mean deflection ratio for the maximum cases are SH/H = 0.171%± 0.132%,
while for the final deflections SH/H = 0.158± 0.130%. Almost 70% of all the
inclinometers had a ratio of 6 H/H smaller than 0.2% while the most prominent
range of movements fell in the range from 0.1% to 0.2% of the final excavation
depth. For greater ranges of movements the percentages steadily decreased. Only
17% of the inclinometers had a 6H/H greater than 0.3%. The effect of actions to
reduce wall movements shows up since the percentage of inclinometers in the
range SH/H > 0.2% decreased by 5% in the final stage compared to the maximum
measured.
185

o CL 0 LA
o 0 .2 .2 .2- - LO 0 LO
9A 0
LA
0
0
0
00A
LA
0
0C\J
0CV)0
LA
LACYj
0
06
0 LA +.~j. .~i 1
C6)
0
Inclinometer Deflection Range (Inches)
Figure 4.59: Statistics of maximum and final inclinometer deflections for all
inclinometers in slurry wall projects in Boston
4542.4 Percentages Obtained II
40 From 85 Data Inclinometer Points40- -mmmv
35 Mean 0*/ H 0.18*H
STD 0.132 %H 0. 130 %H
E 300
0 25 - Maximum Deflections
18.4 E Final Deflections< 20---0
CU
9.2Uo .10
CL4 4-5 -
0C\1 0 o t o o o CD o o 0 +
% o 6 c 6 c 6 6 0 0 0 0 0 0 0 0 0 -
U) . C. 0 CVJ (f) It LO (D r- Co
0R 65 6; 6 6 65 6 6
% Inclinometer Deflection! Final Excavation Depth
Figure 4.60: Statistics of maximum and final inclinometer deflections as
percentages of the excavation depth for all inclinometers in Boston
186
50
45
840
o 35E0
.C- 30
25
0 20
15
1a) 10a3-
5 l
0
43.5 Percentages Obtained---- 42.2 435rom 85 Data Inclinometers
---- Maximum FinalMean 0.702" 0.597"
--. STD 0.68 4" 0.594"
27.7 121Maximum Deflections
MMA E Final Deflections
-L--
-12.0I1.
1[3.536
20.00.0 1 2
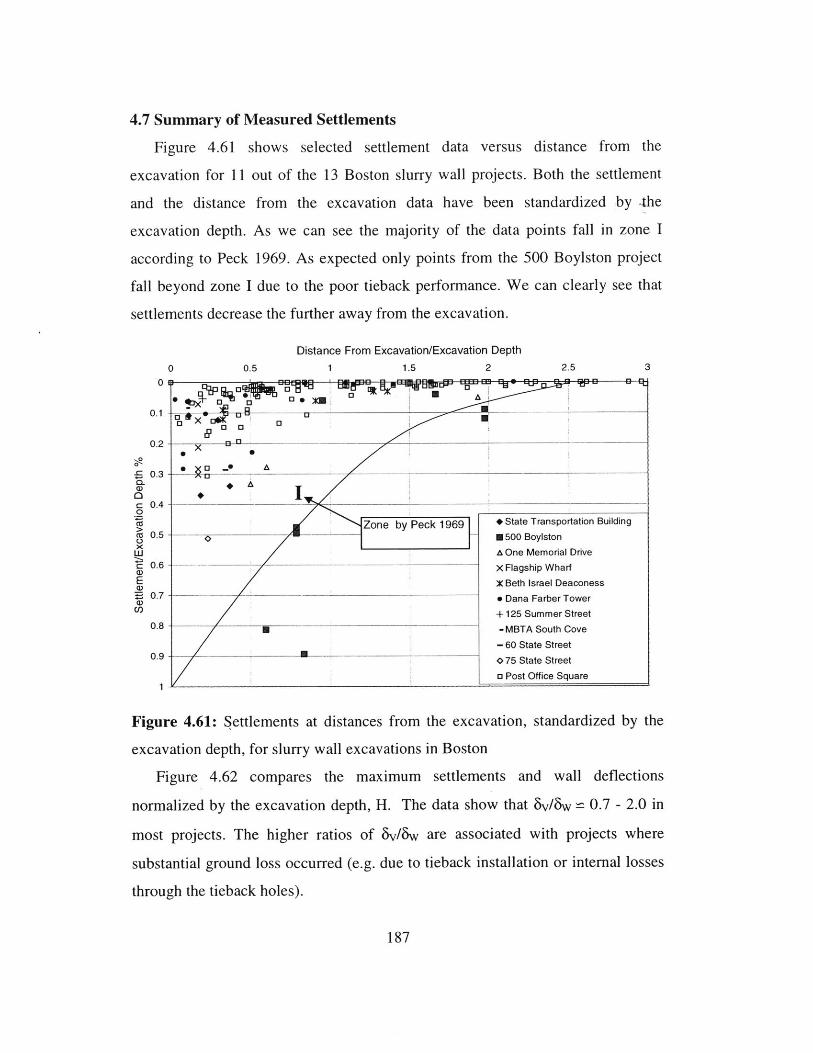
4.7 Summary of Measured Settlements
Figure 4.61 shows selected settlement data versus distance from the
excavation for 11 out of the 13 Boston slurry wall projects. Both the settlement
and the distance from the excavation data have been standardized by -the
excavation depth. As we can see the majority of the data points fall in zone I
according to Peck 1969. As expected only points from the 500 Boylston project
fall beyond zone I due to the poor tieback performance. We can clearly see that
settlements decrease the further away from the excavation.
Distance From Excavation/Excavation Depth
0 0.5 1 1.5 2 2.5 3
0X u
0.1 o0 X 04Z
EA On1eoia3rv
0.2 - X F s W
£0.3 - - - eDnaFrbrToe
-_ 60Sat3tre
0.3-
c0.4-
0.9 Z * State Transportation Building
v o d h 500 Boylston
m p e A One Memorial Drivec0.6 X Flagship Wharf
su a Beth Israel DeaconessthroughDana Farber Tower
0.8 + 125 Summer Street0.8 -MBTA South Cove
-60 State Street0.9 0 75 State Street
r3 Post Office Square
Figure 4.61: Settlements at distances from the excavation, standardized by the
excavation depth, for slurry wall excavations in Boston
Figure 4.62 compares the maximum settlements and wall deflections
normalized by the excavation depth, H. The data show that 8v/86 w 0.7 - 2.0 in
most projects. The higher ratios of 6 v/6 w are associated with projects where
substantial ground loss occurred (e.g. due to tieback installation or internal losses
through the tieback holes).
187

Horizontal Wall Movement SHmax/Excavation Depth %
0.1 0.2 0.3 0.4 0.5 0.6 0.7 0.8
0
Figure 4.62: Maximum settlement/excavation depth against
deflection/excavation depth.
maximum wall
4.8 Special Observations
Table 4.9 summarizes special observations during construction of slurry walls
in Boston. Many of these projects report cave-ins (usually not more than I panel).
Leaving panels open during rains or over long periods of several caused some of
these cave-ins. In two projects (B3, B8) the contractor trenched panels without
slurry to a 15' depth before the panels collapsed. Otherwise, obstructions during
trenching caused some delays and difficulties. Also in the B3 project, the guide
walls were unstable and tended to crack and collapse.
Horizontal soil movements during slurry wall were not measured in the
majority of projects. When they were measured (B2, B 11) they were in the order
of 0.2" towards the slurry filled trench. These movements were largely reduced or
reversed after concreting (B2, B 11).
188
0
B 9 ___ __1___1_13( B9 s M Ba I__ Proiects
8 -- 1) South Cove (3 lev. Cross-lot)Bi1 B11 B2) 60 State Street (2-3 Ties, Keyed in Till)
B3) State Transportation (2-Ties, Floating ?)134) 75 State St. (6 lev.,Top/Down, Keyed Gic,a Till)
B5) Rowes Wharf (5 Lev, Top/Down, Keyed Glacial Till)
1. B8 B6) One Memorial Drive (2-1 Ties, floating)1- B B7) 500 Boylston (4 Ties, Floating)
- 12 -2 U - - -8) Flagship Wharf (3 Lev. Cross-lot, keyed Glacial Till)0 B6 B9) 125 Summer Street (5 Lev Top Down)
B3 0 B10) Post Office Square (7-Lev. Top Down)1311) BID Hospital (5 Lev. Top Down, Keyed in Till)B12) Dana Farber Tower (6 Ties, keyed to bedrock)
B4 B13) Millenium Place (5-Lev. Top/Down, keyed in Till)
7
0.1
o 0.2
0.30C:0
CZ)0.5
WX0.5
E0.6
C
E 0.7
CD)U) 0.8
0.9
1

The use of tiebacks in combination with slurry walls has been problematic in
several projects (B3, B7, B 12). For example, in the Dana Farber Tower (B 12) and
the 500 Boylston Street, the water stop detailing of tiebacks was not adequate and
water leakage through the tiebacks was quite common. In the 500-Boylston Street
(B7), there reports that tiebacks at one side of the excavation were leaking for an
extended period of three weeks. Drilling tiebacks with air tended to soften the
retained ground and cause soil losses as well (B2, B9). Pile extraction in two
cases softened the ground and caused large soil movements (B7, B4).
Water leakage through panel joints was observed in nearly all the projects and
was repaired with cement or chemical grouting. Only in the Rowes Wharf (B5)
project was leakage through joints a major issue. In this project the bottom of the
panels was not cleaned properly before concreting. During concreting the "waste"
material that had accumulated at the panel bottom was displaced by the concrete.
Some of this "waste" soil material eventually got entrapped between the panel
joints and the tremie concrete. These zones of soft material leaked considerably
when the excavation exposed them.
189

Table 4.9: Special observations for slurry wall excavations in Boston
E
Movements- o F * During Slurry
. P L C Cave-ins Wall Other SpecialJob ID ) (A,B or C) > Reported Construction Observqtions
0.25" Towards opentrench during
60 State A & C, 62' to trenching. ReversedStreet B2 1975 bedrock 2 60 22 No reports during concreting Non mentioned
Many guidewalls cracked& collapsed,Bentonite pocketslocated at some panels,Excess concretePeriodically chipped,Small water leaks-Patching at 7 locations,
A slope failure some at Tieback
State when a panel was locations ,Transportati 1 .08 - dug 20' without Small Cracks at two
on Building B3 1982 A 2 48 18 1.20 slurry Not measured panels
A, with no75 State organics 70- 1" by pile extraction2
Street B4 1983 100feet 2.5 85 - No data No data (Johnson 1985)
Serious leakageobserved, poor wallfinish, cleaning of bottomof panels very poor,
B, Glaciomarine slurry "contaminated"
Rowes waterfront concrete got entrapped in
Wharf B5 1984 sloping protle 2.5 65 20 No data available No data available joints
One cave-in, looseOne granular fill couldMemorial 1 .08 - not be supportedDrive B6 1985 A, typical 2 44 20 1.20 by slurry head Not measured Not mentioned
One trench Large wall deflectionscollapsed, Left caused partially by pileopen during extractions, Water
500 A, typical of 1.08 tO weekend with leakage through tieback
Boylston St. 67 1987 Back Bay soils 2 48 20 1.15 heavy rains Not measured holes for 3 weeks
Numerous obstructionsencountered duringtrenching slowed slurry
One cave-in wall construction,
Flagship Corner panel within Some water leakage at
Wharf 68 1989 B, Charestown 2.5 57 20 till Not measured panel joints easily sealed
Post Office One cave-in Occasionally boulders
Square backfilled with lean were encountered during
Garage 610 1989 A, Downtown 3 85 24 concrete Not measured trenching
Obstructions had to beA, no organics, removed beforeoccasionally trenching,
Beth Israel small Overall very small, Slurry contaminated
Deaconess glaciomarine 1.09 - back into the soil concrete at top of walls
Hospital 611 1994 layer 3 89 22 1.20 None typical chipped
Two cave-ins, Oneafter trenching was
Similar to A, but suspended for 4major sand days for logistical
Dana outwash reasons, shortlyFarber deposits below after a 3' deep Major problems of tiebac
Tower B12 1995 BBC 3 92 20.5 sinkhole depeloped Not measured sealing
1): General soil profiles as mentioned by Johnson 1989
190

4.9 Summary of Boston Slurry Wall Excavation Experience
Most slurry wall excavations in Boston have performed well with moderate
measured wall movements and settlements (B1, B2, B3, B5, B6, B9, B 11, B13).
Walls. deflected excessively when the tieback bracing was inadequate (B7) or
when pile extraction caused ground softening (B4, B7). Inadequate tieback
installation procedures, like drilling with air, caused ground losses in one case
(B 12) and while the wall did not deflect much or was pushed back into the soil the
ground settled much more.
It is interesting to note that wall deflections within the same project showed a
considerable range of values. The maximum deflections were measured in
localized sections and reflect only about 17% of the total instrumented panels.
Some of these maximum deformations were caused by local deficiencies in the
bracing (B7) or variations in local conditions. Slightly less than 70% of the
instrumented wall panels deflected less than 0.2% of the final excavation depth.
Floating slurry walls embedded in BBC (B3, B6, B7) translated at their bases
by up to 0.5" to 1.0". These translative wall movements were not observed when
the walls were keyed into the stiff glacial till or into bedrock. The diaphragm
walls in floating excavations showed very little bending above the excavation
base, with most of the bending observed beneath the mud mat or base slab. The
basic wall deflection shape in floating walls was that of type I (bending only
beneath the lower bracing level), but a lot of panels deflected in the shape mode
Type II. The wall deflected with no signs of bending (Deflection shape: Type IV)
when the tiebacks did not provide sufficient restraining (B7). Tieback creep is an
issue and has to be considered if the anchored tieback zone is installed within clay
(B6, B7). Maximum settlements in floating tieback walls were typically slightly
greater than maximum wall deflections as a result of soil losses and soil
disturbance caused by the tiebacks (B2, B3, B6, B7, B 12).
Top/down construction in Boston has given the best results in the minimizing
excavation induced movements. It is interesting to note the bowing deflection
shape (Type II) that has been the most common deflection pattern in top/down191

excavations in Boston. The elevation where the maximum wall deflection is
observed in top/down excavations is close or slightly above the current excavation
level, within the Boston Blue Clay (B4, B10, B 11). Keying wall in a stiff stratum
such as glacial till or bedrock caused the wall to rotate qs if it is resting on a pin
support at its base (B4, B10, B 11).
Wall deflections and settlements in one top/down project were large but only
because of ground softening by pile extraction (B4). In the Post Office Square
Garage (B10), movements during the initial cantilever excavation were large
because the backfill for the Load Bearing Elements formed a zone of soft material
behind the wall. Settlements in top/down projects were in the same order or
smaller than the maximum wall movements. Of course, this was the case when
there were no problems with pile extraction.
Cross-lot braced excavations displayed similar deflection shapes with the
top/down excavations (B 1, B8). Excessive strut forces tend to push the walls back
into the soil in many cases (B8). As expected, struts picked up load as the
excavation progressed deeper. Thermal expansion and contraction seem to have a
more profound affect on strut loads than expected (B8).
Water leakage through panel joints was easily repairable with the exception of
one project where many pockets of soft slurry contaminated material were
entrapped in the concrete (B5). Leakage through the tiebacks and the tieback
holes has been a quite difficult issue, since the water stopping details in some
cases were not adequate (B7, B 12).
Cave-ins or soil collapses during trenching have been encountered in most
projects. One to two cave-ins were reported in several cases. Leaving panels open
for a long time, or over rains caused most of these cave-ins. In some cases the
guidewalls were not deep enough to prevent fill from sliding under them during
trenching. The stabilizing effects of slurry during trenching are clear since when
one panel was trenched without slurry it collapsed causing a slope failure. Soil
movements during trenching have been in the range of 0.2" to 0.3", with most of
192

them reversing during concreting. Occasionally, obstructions have caused
difficulties and in slurry wall construction.
193

194

Chapter 5Chicago Slurry Wall Excavations
195

196

Chapter 5Chicago Slurry Wall Excavations
5.1. IntroductionChicago was among the first cities in the USA to use slurry walls for
excavation support in the 1970 construction of the CNA building. Data have been
compiled for 11 projects in Chicago, 4 of which were archived from the 1970's
(Table 5.1). In all of these projects the excavation depth ranges from 25 ft to 44 ft
(i.e. much shallower than projects described in Boston Chapter 4).
In Chicago the upper 35 ft to 45 ft of the ground profile comprises soft clay
layers with low undrained shear strengths, below which are much stiffer deposits
(more details about soil properties in Chicago can be found in the following
section). As a result, in all of these projects the slurry walls are embedded into the
stiffer underlying clays as to increase the stability of the excavation.
In most cases, the slurry walls were not intended to act as major load carrying
elements but typically only carry their own weight and their proportional share of
the connecting basement slabs with the upper floors carried by independent
columns and column foundations extending through the wall or immediately
adjacent to the wall (Baker, Pfingsten, & Gnaedinger, 1998). Vertical loads from
the superstructure are typically all carried by caissons bearing either on "hardpan"
or bedrock.
Slurry walls were basically selected to: a) minimize excavation-induced
deformations, and b) reduce water seepage (high water table due to Lake
Michigan).
Figure 5.1 shows the location of these projects in Downtown Chicago, while
Figure 5.2 shows the location of projects in southern Chicago. Ten out of the
eleven studied excavations are located within downtown Chicago. Only the
Museum of Science and Industry (C 10) is located in south Chicago. Other known
slurry wall excavations in Chicago are: 1) Olympia Center, 2) Provident Hospital,
3) Northwestern University Memorial Hospital, and 4) 311 River East (Figures
5.1 & 5.2: Projects 1 to 3 are 80, 81, 37 respectively, and 4) not shown).
197

Table 5.1: List of studied slurry wall excavations in Chicago, IL.
Project Dep th(ft) Thick Soil Wall ToeID Name Year H D (inches) Type Bracing Type Fixity
CI CNA 1970 31 33 30 Typ. 1-Lev CLB RCDW
C2 Sears Tower 1970 32 24 30 Typ. 3-Lev R, SB RCDW
C3 Amoco 1971 23 15 30 Typ. 1-Lev. TB RCDWStandard Oil 44 SB Bearing
* SP
C4 Water 1973 44 22 24 Typ. 1-Lev. TB, RCDW,Tower 1-Lev, R Caissons
C5 Loyola 1993 20 -- -- Typ. 1-Lev. CLB RCDW
University Est. IB,
Business Estimated
SchoolC6 Prudential 1986 25 28 27 Typ. 1-Lev. TB & RCDW
Two 1-Lev. R SP
C7 AT&T 1987 27 32 30 Typ. 3-Lev. R, & RCDW
Corporate CB
Center
C8 Guest 1989 35 20 24 Typ. 3-Lev. TD RCDW
QuartersHotel 60
C9 Northwestern 1990 23 25 24 Typ. 1-Lev. TB RCDW
UniversityMemorialParkingGarage
CIO Museum of 1997 34 10 30 Out- 3-Lev. TB RCDWScience & sideIndustry Down
TownC1I 311 South 1987 35 31 24 TD, TB, R, RCDW
Wacker IBDrive
Note: H - Excavation Depth, D- EmbedmentBracing, TD - Top/Down, R - Rakers, SB- Soil
depth, TB -Tiebacks, CLB - Cross-LotBerms, CB - Corner Bracing, IB-Internal
Bracing, PC - Precast, PT - Post Tensioned, SP - Soldier Piles, RCDW - Reinforced
Concrete Diaphragm Wall, SPTC - Soldier Piles & Tremie Concrete.
198

Figure 5.1: Locations of downtown Chicago slurry wall excavations
199

imi
aPark
c Cormick Place
81
C10
Illinois
Indiana
Figure 5.2: Locations of Chicago slurry wall excavations outside the downtown
area
200

5.2 Chicago Soil Conditions
Soils in the Chicago area are primarily glacial and post-glacial sediments from
the most recent advance of the continental glaciers (Finno, 1992). This section
summarizes the undrained shear strengths of soft glacial clays in the Chicago area
slurry wall projects that were studied in this research. Figure 5.3 shows the
general soil profile in downtown Chicago (Peck 1948).
Bretz [1939] and Otto [1942] suggested that soil was deposited in six fairly
distinct till sheets. These sheets are presented in order of deposition: Valparaiso,
Tinley, Park Ridge, Deerfield, Blodgett, and Highland Park tills. The Deerfield
and Blodgett tills have higher water contents and are characterized as
compressible by Peck and Reed (1954).
Finno characterizes these compressible clays as supraglacial or subglacial tills.
Subglacial tills are deposited beneath the glacier, have a uniform texture, and are
overconsolidated as result of ice weight. The degree of overconsolidation of
subglacial tills depends on the glacier thickness as the stratum was deposited,
drainage conditions, permeability, and the duration that the ice remained in place.
Supraglacial tills are deposited near the front of the glacier as result of three
main processes: melting of ice, mudflows and slumps, and sedimenting from
meltwater (Finno, 1992). Therefore these deposits are rather erratic and are
deposited in normally consolidated state. According to Dreimanis [1976]
waterlaid soils tend to be uniform clays with little or no coarse-grained particles.
The erratic water content and composition together with low OCR
(overconsolidation ratio) indicate that the Blodgett till is supraglacial in origin.
Otto [1942] attributed these low OCR values as the result of poor drainage at the
lower boundary during deposition in combination with a relatively short duration
of ice loading.
Finno was able to define relationships using the SHANSEP characterization of
undrained shear strength (Ladd & Foott, 1974) for the Deerfield tills. Local
practice in the Chicago area has developed such that undrained shear strengths su
of these compressible clays are defined in terms of unconfined compression (U),
201

unconsolidated undrained (UU), triaxial compression test results, or occasionally
using a field vane. The U and UU tests are relatively unreliable methods of
estimating su values (sample disturbance, variability of natural deposits. The
norimlized relationships for the Deerfield and Blodgett clays reported by Finno
[1992] are based on CKOUC (Ko Consolidated, Undrained triaxial compresion
shear tests):
For triaxial compression:
SuTC= 0.46(0.90 -w)OCR 0.9 (1)
GVO
For triaxial extension:
SuTE=0.31(0.90 - w1 ) OCR (2)
VO
In the absence of extensive lab tests, these equations were used for estimating
the reference values of undrained shear strengths for the slurry wall projects
studied in this report (assuming OCR=1 .1 for both Blodgett and Deerfield tills).
Effective stresses were estimated by using hydrostatic conditions and soil unit
weights as indicated or estimated from boring logs.
Figure 5.4 compares profiles of undrained clay strengths from unconfined
compression tests with su values computed using the Finno equations (1) and (2).
Figure 5.5 shows further comparison as a function of the effective vertical stress.
Equations (1) and (2) generate a much smaller scatter in su compared to the UU
test data.
In both Figures 5.4 and 5.5 there is a distinct breakdown of equations (1) and
(2) in the stiff to very stiff clay and the hardpan layers existing below 50 feet
depth (or Y'y, > 3.0 ksf). The dashed lines below the depth of 50 feet (or 3000psf)
contain the majority of the UU tests in these strata. Thus the equations (1) and (2)
can only b e applied in the supraglacial and Deerfield clays. The Museum of
Science and Industry project (C 10: MSI) can clearly be distinguished in these two
202

figures compared to the downtown Chicago jobs. Clay water contents for the MSI
project were smaller than clay water contents in the downtown areas at the same
depth or effective vertical stress.
Figures 5.6 compares water contents and unit weights for the Deerfield and
Blodgett clays versus depth. These data show an increase of the total unit weight
of the clay below 50ft depth with increasing depth the water content decreases.
...,+/S- Surface.
-1 .v NiscC//oneous'.r /, US/a'//9 gran7U/ar
Sandy111 gray inoranic sli
-- dV -Water LevelS/iff blue and yellow c/og crust
Very soft blue clayLiquid limit 34% f lo60-/ N/ur 4 w/er ca7/en' 2% to 50
n-/rconned compressive s/reng/h less /han r 35ompers ft
Soft to mea'ium b/ue c/ay-30 L/ 7 uid limit 3o% to 35%
N Aafra/ woer confent 20% fo 2VU/ncon A7hea' compressive sfrengfh 025 to Ofa7S per s. ft
~-49
S///f to very sliff b/ue c/ayLiquid limt 26% to 30%Naturaf sweer content /6% to 22%-6cnfl-ed compree dreng 4/ 4.tom p s f
~-60 y
for-d to very hard unso/ura/ed gray c/ag-70 fluid /imif less thearj z z
Nufuro/ water co,/ent 6 to /6%ncafined comessIve. s/re/7/tb re fer /a 4/O as per s ft
: Sand, s;//, bou/ers, wafer-bearkig-80 .
~ iyaarao lmestonet
Figure 5.3: Typical soil profile in Downtown Chicago (Loop), (Peck, 1948).
203

0 500
4)
0)
Undrained Shear Strength, s,1000 1500 2000 2500 3000
Figure 5.4: Comparison of s, (UU) and equations proposed by Finno [1992],plotted against depth for Chicago projects
204

Clay Strength Su (ps)
00
Vertical 500Effective
Stress(ps),
1000
1500ClaySoft
2000
2500
3000
Stiffto
very 3500Stif f
Clay
4000
500 1000 1500 2000 2500 3000
4500(Hard OlSKY to UU Tests Only
ISandylClay)
5000
Figure 5.5: Comparison of s,,(UU) and Finno equations for s,,, plotted againstvertical effective stress for Chicago projects
205

Water Content (%), Unit Weight (pcf)0
0
10
20
30
-40a)CD
50
60
70
80
Figure 5.6:projects
50 100 150
9 0 1 I I I ' 1 1 1 1 1Water contents and unit weights plotted against depth for Chicago
206

5.3. Summary of Chicago Slurry Wall Excavations
Table 5.2 summarizes the measured performance from the database that has
been developed for slurry wall projects in Chicago. The first of these projects was
the CNA building in 1970. In an article from a local newspaper the slurry wall
construction was mentioned as the method to overcome "mushy" soil (Chicago
Tribune). The Sears Tower (C2) is currently the 2 tallest building in the world.
The main cluster of jobs is located in downtown Chicago, within the Loop and
north of the loop near N. Michigan Avenue. Only the Museum of Science and
Industry (C 10) out of the eleven studied projects is located in south Chicago.
Rakers were extensively used to brace early slurry wall excavations in
Chicago. In most of these jobs, the rakers were not prestressed as more reliance
was placed on soil berms for wall support (C1, C2, C3). Caisson construction
was a major issue in the majority of these early jobs since caissons were
constructed without casings or in oversized holes (C1, C2, C3). Lateral soil
movements caused by caisson construction totaled more than 3.0" in the Sears
Tower (C2), 2.2" for the CNA building (C1) and up to 1.1" for the AMOCO
building (C3). In the CNA building the slurry wall was constructed before the
caissons whereas caisson construction was done prior to wall installation for
AMOCO (C3). Caisson construction only caused up to 0.4" of horizontal
movements for the Water Tower (C4), which was the latest of the early 1970's
projects. In projects after 1974 caisson construction methods were changed and
movements caused were decreased significantly.
The AMOCO building (C3) introduced a new concept in slurry walls at that
time. The slurry walls for this project were supported by steel H-piles bearing on
stiffer strata in order to decrease wall settlements and meet bearing capacity
requirements on the slurry wall.
Slurry wall panels at the Water Tower project spanned across caissons that
were designed to resist the entire soil pressures alone. Additional support was
provided by one level of ties
207

Table 5.2: Summary of measured performance of slurry walls in Chicago.
Excav.Soil Bracing/ Wall Defl.Type Excav. Depth(ft) T imax va Toe Shape
ID Year Project Name Method H D (inch) (inches) (inch) Fix. TypeC1 1970 CNA Typ. 1-Lev CLB 31 33 30 3.3 5C2 1970 Sears Tower Typ. 3-Lev R, SB 32 24 30 6+ 6+C3 1971 Amoco Typ. 1-Lev. TB 23 15 24 4.6 -- IV
Standard Oil SB 44*C4 1973 Water Tower Typ. 1-Lev. TB, 44 22 24 2.5 1.5 1,11
1-Lev, RC5 1993 Loyola Typ. 1-Lev. CLB 20 -- -- 0.8 -- IV
University IB, Est.Business EstimatedSchool
C6 1986 Prudential Two Typ. 1-Lev. TB 25 28 27 0.45 -- I1-Lev. R
C7 1987 AT&T Typ. 3-Lev. R, & 27 32 30 1.55 1.55 IICorporate CBCenter
C8 1989 Guest Quarters Typ. 3-Lev. TD 35 20 30 0.65 -- I, VIHotel 60
C9 1990 Northwestern Typ. 1-Lev. TB 23 25 24 0.45 -- IUniversityMemorialParking Garage
C10 1997 Museum of Out 3-Lev. TB 34 10 30 0.8 -- IScience & side IVIndustry Down
TownC11 1987 311 South Typ. TD, TB, R, 35 31 24 2.95 -- IV
Wacker Drive IB 0.65 II
* At the center of the site
208

Maximum horizontal soil or wall movements caused only by the excavation
ranged up to 3.5", but typically the range was up to 2.2" maximum. However,
total horizontal deflections were much larger, especially for the earlier jobs (Cl,
C2, C3) as they reached SH > 6" for the Sears Tower (C2). Most walls did not
bend significanily, as many walls cantilevered and translated about their bases
(C3, C5, C10, C11) (Type IV). The majority of the tieback and raker-supported
walls showed some wall bending beneath the lowest bracing level (Type I), (C4,
C6, C8, C9, C10). A few walls did bulge towards the excavation (Type II) (C4,
C7, C 11), but they represent the minority of the observed movements. In the
Guest Quarters Hotel (C8), the wall at one location deflected the most beneath the
base of the excavation. In projects were data was available, horizontal soil
deformations were measured to a considerable depth beneath the toe of the wall
(C3, C4, C5, C6, C7, C8, C9, Cl l). These deformations were in the order of 0.1"
to 0.2" towards the excavation in projects with no major caisson construction
problems (C5, C6, C8, C9). This suggests that in soft clays, small ground
deformations occur well beneath the toe of diaphragm wall even when the
excavation is relatively shallow.
Settlements for the early jobs were large, is some cases exceeding 6" (C1, C2,
C3). Most of the total settlement was caused by caisson construction and not by
excavation activities. For the CNA project (C1) settlements at an adjacent
elevated train rail reached up to 5", with 2.8" inches occurring prior to any
excavation. In the Sears Tower street settlements exceeded 6" with 3" induced by
caisson construction. Maximum settlements were much smaller for the Water
Tower (C4) since steel casing was provided for the caissons. For this later job
maximum settlements reached up to 1.5" within 40 feet of the excavation and
decreased at larger distances. Unfortunately, there were no settlement data
archived for the rest of the projects.
In these early slurry wall excavations the most major issue was improper
caisson construction and bracing design. Caisson construction caused most of the
observed soil and wall movements. Over-reliance on soil berms for wall support
209

and non-prestressed rakers increased deflections in these earliest projects. These
kinds of difficulties could be expected since these jobs were amongst the first
slurry wall projects in the United States.
Bracing in most projects during the 80's and 90's included tiebacks and/or
rakers (C6, C7, C9, CIO) with one excavation constructed by the top/down
method (C8). The major issue in these slurry walls was to achieve adequate toe
embedment into the stiffer clays at depths below 45 ft, in order to minimize
translative displacement of the toe of the wall and increase the stability of the
excavation. Soil movements were much smaller for these projects than projects
for the 1970 to 1980 period. Caisson construction induced movements were
limited to less than 8H=0.5" and in most cases were less than 8H = 0.3". In the
AT&T project (C7) caisson and slurry wall induced soil movements combined to
a maximum of 8H = 0.5" with 6 H = 0.15" being caused by slurry wall installation.
For the Guest Quarters Hotel (C8) caisson construction caused up to 8H = 0.33" of
wall movements. The 311 South Wacker project (C 11) is special in that it used all
the known types of bracing namely rakers, tiebacks or deadman, top/down, and
cross-lot struts or comer braces. Not a lot of information exists about the C5
project but it is most likely that it was braced by one level of cross-lot struts.
Most of the observed soil movements occurred before or immediately after the
first level of bracing was installed. For the AT&T center (C7) up to Svl 1. 1" of the
total 1.5" settlement and 8H 1.0" out of 1.5" of horizontal soil movement
occurred before the 1s' level of rakers was installed. For Guest Quarters Hotel
(C8) movements where the largest before the first level garage slab was installed.
In the Prudential Two job (C6) very small movements up to 6 H = 0.45" due to
excavation were observed. In this job soil movements increased very slowly as
the excavation progressed. Soil movements caused by slurry wall construction
reached up to 6 H = 0.2 inches towards the open trench.
Top/down construction was very effective in minimizing horizontal soil
movements. The Guest Quarters Hotel basement (C8) was constructed by the
top/down method. The Museum of Science and Industry (MSI) (C10) can not be210
directly compared to the downtown Chicago excavations since clay strengths at
the MSI site are higher than shear strengths of downtown clays (see Figs. 5.3, 5.4,
5.5, 5.6). In the NU project (C9) caissons were constructed in between slurry wall
panels to support superstructure loads. Tiebacks braced the slurry walls in both
projects, with the excavation depths were relatively shallow compared to other
contemporary excavations in Boston (Chapter 4). In the MSI site tiebacks were
permanent whereas temporary tiebacks were used for the NU job. Minimizing
damage to adjacent structures as well as water seepage was key to both projects.
The MSI garage was constructed next to the northern side of the existing museum,
thus damage control was very important Slurry walls were embedded into stiff
clays in both projects as to minimize movements.
211
5.4 Individual Case Studies
5.4.1 Case Study C1, CNA Center
The CNA Center is a 45-story steel frame building located at the northeast
corner of Wabash Avenue and Van Buren Street The structure occupies the entire
site with the dimensions at basement level being approximately 248 ft. in the
north-south and 176 ft. in the east-west direction (Fig. 5.7). The building is
supported in on 32 caissons extending to rock and partially on the slurry wall. The
CNA Center was the first project in Chicago to use slurry walls for temporary and
permanent earth retention for a two-level deep basement. The lowest top of slab
elevation is El. -11.37ft CCD (Chicago City Datum), with the maximum cut
being El. -17ft CCD for grade beams, and the street level at El. +14.5ft CCD
(Fig. 5.8). Soil conditions at the site are typical of those within the Loop
(Downtown Chicago).
A 30"-thick slurry wall was used along three sides of the site, the east, the
south, and the west. The slurry wall along the eastern side of the site was designed
to carry a vertical load of 25klf, or a bearing pressure of 10 ksf at the base of the
wall. Along the southern and western walls the required bearing pressure was
only 2 ksf. Therefore, the wall was designed to extend to El. -50ft CCD along the
east side and El. -45ft CCD along the south and west sides.
Because of the favorable size of the lot and the desire to minimize ground
movements, the wall was cross-lot braced during construction in the east-west
direction, using permanent building steel at both floor levels (Cunningham &
Fernandez, 1972). Along the south wall, a cantilever excavation was carried to the
first level and braced at this level to carry the reaction of the sub-basement level
slab, since the adjacent wall could not support the loads.
Lateral movements were measured by offset surveys at the top of the slurry
wall cap beams. Final movements at the western wall were the greatest reaching
up to 6 H=3.5". The slurry wall at that location also settled by as much as 8v=3.6"
at the final reading. Along the south slurry wall deflections reached 6 H =2" while
212

wall settlement reached Sv = 0.9". In the eastern slurry wall, deflections and wall
settlements were very small.
Settlement data were also taken at Elevated train columns on a survey line
parallel to the west wall at distances of 35 and 51 feet (Fig. 5.7). The nearest
column to the excavation settled by as much as 6v = 5" before it was jacked up by
3" in order to reduce differential settlement. In this column most of the settlement
occurred during caisson construction (8v -= 2.7"). The vertical and horizontal
movements of the west slurry wall increased considerably during slurry wall
construction. The west wall moved in by 2.5" as the result of caisson installation
while it settled by as much as 2.9" in the same period.
Cunningham and Fernandez [1972] report that the maximum ground
settlement occurred not at the wall face, but at some distance away. At a distance
of 2 to 3 times the excavation depth no movement was recorded. Maximum
surface settlement was 0.45% and 1.60% of excavation depth, at the south and
west walls respectively, and occurred at 0.50 to 0.70 times the excavation depth
from the walls.
"Squeezing" occurred at two caisson locations along the west wall while
drilling below the upper casing to such an extend that the ground surface around
the caisson depressed in a dish-shaped pattern 2' or 3' deep, causing the rig to tip.
These two caissons were the first to be installed and were probably the cause of
the excessive movements observed along the western side of the excavation.
213

0ATE
SETTLEMENT vs TiME
AT ZLEVATED TRA1i1 COLUMUI0 ON SURVEY LI1NE 3CKA CENTER
DATE
I I "
TOP OF WALL MOVEMENT -CNA CEN4TER
TOP OF WALL MOVEMENT - WEST WALLCNA CENTER
Figure 5.7: Excavation movements at CNA Center (C9) (Cunningham & Fernandez, 1972)
2

OENVRALIZED SQCL PROFILE
V CC20-O
MISC. FILLa I I9 psf
S.TfY V. F3NE SAND ' -
L091 (WM -Mel10 st
SiLTY ctis', rR.
SAND B AIIAYEL Q
. C7 79 STIFF J
-20 (C0)
Y-~ IJ,>f*
I-0
VERY Mom ro0 AA RD CLAY WMTH
OCCASCIJVAL SILTLAYERS
00
-100
V vENSE SAND a aLT
0CC4510NAL SOLDKIS
.. YPIt, SLURRY WALL SECTIONS
TOP Of SLUM? WAICLop of CtmOD .
89MUArL. .. NE lto 3 2
E1H Lf 1. 3kC D8tE
(1-t-a'cOOD ---
5JI38110T OFL LIN
--a;
(--Z2VASI S
I IC7
.1.V.
VAN BUREN ST
-f. fL.IN.1.J54tC
EO. F LINE 13 ,
.g
Isot: or MLi.* D. -48'0CC
WABASH AVE.
LoEStr. NEcoOReOP*
- TOP Of SWffVLC6, 7 000
Li0..8940
S BmSS t FLAINE
I L -ii4ao
ALLEY
CN A CENTER
CHICAGO- ILLIS
Figure 5.8: Typical slurry wall sections, CNA project Cl.
tQ

5.4.2 Case Study C2, Sears Tower
The Sears Tower was among the first high-rises to use slurry walls to form the
basement. There was little data available in this project since most of the recorded
data was not archived. The site plan and a general excavation profile can be seen
in Figure 5.9.
Cunningham and Carpenter [1975] reported measured raker loads as deduced
from strain gages. Raker loads were generally smaller than design loads as
determined by Terzaghi and Peck. The lowest level of rakers did not pick up as
much load as initially designed. Design loads for most rakers were in the order of
485 kips, while the lowest level of rakers did not pick up loads more than 115
kips (Fig. 5.9). Maximum raker loads occurred at the end of the excavation.
No direct inclinometer or settlement data was left to retrieve in this project.
However, indirect horizontal soil movements and settlement data could be
retrieved from internal references and memos.
Caisson construction caused large soil movements along the northern side of
the project. Horizontal soil movements at inclometers (similar to inclinometers)
reached up to 6" in the north while Adams Street settled by as much as 3" during
caisson construction. There is no direct mention of wall movements during the
excavation. However, movements must have been large since Cunningham and
Carpenter (1975) mention that the rakers displaced the base piles for a
considerable distance out of plumb. Cracks along the northern slurry wall were
observed with water running through fairly rapidly until it froze.
216

- -I
UI-
TEMPORARY OIAPHRAGN WALL OF 7'SOLDIER 39AMS 0 LAGGING
y- ~NPHASE Xt
JACKSON BLVD. seel-oIf 4
% S E A RS SI T E PLAN
MOTE: TOP TIER @RACE$ ONLY SHOWNFG - FOR EACH PHAS f
FIG. I -Site plan and Ornce Iovations for 3 earr Tower excaratiort.
EL. CCOE~iSYiN4 WALL
+14%0
FILL
t 2-0CLAY
-6'-0 03 o TO I4
SOFT CLAYCx 0.4(3F
-- 29,0
C - 0.6 TOo 0
--39*-0
CLAYC. L.O TO 2.
-414,-0 ~1.1 .
,14'-0 CCC TOP OF GROUND
f3'-O TOP OF SLURRY WALL
3 TIERS OF WALES WITH INCLINIORACERS OR CORNER BRACESELEV. - 0. -12, - 20 CCU
-1-0 CCD BoTTOM Or EXCAVATION
WITHIN MAT AREA
5S'0 CCD BOTTOM OF SLURRY WALL
SEARS WALL SEC T 1-0N I-
FIG. 2-Wall and soil pro)fle for Sears Tower excavalion.
TABLE I-Stars Tower brace loads.Measured. Design.
Mark Location kips kips
Adams No. 12 top tier 406 405Adams No. 12 mid tier 250 390Adams No. 12 bottom tier 73 362
Franklin No. 31 top tier 295 425Franklin No. 31 med tier ;06 461Franklin No. 31 bottom tier 47 405
Adams No. II top tier 461 405Adams - No. II mid tier 334 390Adams No, II bottom tier 126 362
Wacker No. 30 top tier 117 250Wacker No. 50) mid tier 221 4400Wacker No. 50 bottom tier 31 381
16-27 N.E. Ist (top) tier 636 50018-25 N.E. 2nd tier 480 55619-24 N.E. 2nd tier 350 48619-24 N.E. 3rd tier III 486
Figure 5.9: Sears Tower site, excavation profile, and measured bracing loads (C2),(after Cunningham, and Carpenter, 1975).

5.4.3 Case Study C3, AMOCO (Standard Oil) Building
The Standard Oil Building is an 80-story steel "tube" building placed near the
center of a 5-story reinforced concrete plaza structure. There are two separate
buildings although they function as a single unit. The project is located at 200
East Randolph Street in Chicago, Illinois, covering the entire city block bounded
by Randolph Street, Stenson Avenue, Lake Street, and Columbus Drive on the
south, west, north and east (Cunningham & Fernandez, 1972). The project
consists of a high-rise and a low-rise portion that are supported separately due to
dissimilarity of loading and boundary conditions. Caissons extending to hardpan
and rock were used to support these two areas.
Slurry walls were used in conjunction with steel piles were used to construct
the basement for the AMOCO building. The piles were used as load bearing
elements for the slurry wall and not as wall reinforcing. The slurry wall scheme
was adopted after caisson construction had already been built when a restraining
order was issued to halt construction. The slurry walls were 21" thick and
extended from El. +8.Oft to El. -32ft CCD (Chicago City Datum), and bracing
consisted of one level of temporary tiebacks at El. +1.5ft (Fig. 5.10).
Movements at the top of the slurry wall reached up to 4.6" at one station
(Sta. #2) while other inclometers measured deflections close to 2" at the top of the
casing (Fig. 5.11). Cunningham and Fernandez [1972] reported deflection data
10' below the top of the casing in order to minimize surface effects. Soil
movements started as soon as the center of the site was excavated to El -26ft
CCD even while a 25' wide berm was left in place. Apparently the berm was not
sufficient to restraint deformations since movements increased by as much as 0.8"
during this period. Movement continued as the perimeter was excavated to
El. -15ft CCD. Movements did not stabilize until some time after removal of the
berm was complete. Although tiebacks were restressed on several occasions,
actually pushing the wall back somewhat, the average rate of movement did not
seem to change. This indicates that re-stressing of the tie-backs provided only
temporary restraint to the movement that was initiated by a change in the stress
218
equilibrium of the soil mass, and the movement stopped only after a new state of
equilibrium was reached (Cunningham & Fernandez, 1972). Most of the slurry
walls translated and rotated about their toe, with very little to no wall bending
evident. The horizontal toe translation was in the order of 1.0".
Considerable difficulties were experienced in compacting the backfill between
the slurry wall and the deadman sheetpile wall (installation of tieback rods), due
to freezing weather and/or water. This was particularly true along the east and
south walls, and resulted in relatively poor compaction of the backfill with the
exception of a 20-ft strip in front of the deadman wall, where select and relatively
dry material was utilized. It is possible that large movement along the east wall
may have been partly due to this condition.
Significant lateral movements were observed to a considerable depth. In
stations 2, 3, and 4 the slurry wall had clearly rotated about its base since there
was no sign of bending at any elevation higher than El. -32ft CCD. This clearly
indicates that the embedment of the slurry wall was not enough to restraint
movement of the stiff slurry wall. As it is shown in Figure 5.10, the slurry walls
were embedded in medium clay; clearly this clay did not possess enough strength
to resist the lateral loads imposed on the slurry wall.
219

GENERALIZED SOIL PROFILE
+10 +8
+ 2 - MISCELLANE-0 OUS FILL
-5DENSE SANSOFT CLAY
-I5-20
-30 MEDIUMCLAY
-40
-50
-60
-45
STIFF TO
VERY STIFFCLAY
-70 -70HARD SILTY
-80 TO SANDYCLAY WITH OC-CASIONAL SILT
-90 5 SAND SEAMS(HARDPAN)
-100 LIMESTONEBEDROCK
0 2
TIE-BACKS,+15CCD
MAX. EXCAVATIOND ADJACENT TO
SLURRY WALL- 15CCD
MAX. EXCAr1ON-26
AT CENTER
-- BOTTOM OFSLURRY WALL(TYPICAL)-32CCD
DEFLECTION, NORTH
(IN)STATION#I
0 I 2 3" 4 5"
DEFLECTION , WEST (IN)
STATION# 2
0 " 2" 3" 0 I" P 0 I" 2" 3"
DEFLECTION, SOUTH
(IN)STATION#3
DEFLECTION,EAST
(IN)STATION#4
Generalized soil profile and
DEFLECTION, EAST
(IN)STATION#5
inclinometer data for AMOCO
(Standard Oil) building (C3), (Cunningham & Fernandez, 1972).
220
+10
0
-10
-20
-30
-40
-50
-60
-70
-80
Figure 5.10:
I NCLOM ETER DATA

DATE
00
TIE- BACKS WERE
2 2
RE -STRESnE
-- STA-#2 .. -- ' t t
RE- STRESSED
EXCAVATION
> TO 0 CCD
-JC
t.3 E XCA V A fDN
< AT C ENTER
TO - 26CCDO
NOTE; To MNI MIZE EFFECTS
4 OF SURFACE DISTURBANCE, P E RI ME T E RPLOTTED DATA SHOWS MOVE- EX CAVATION
MENT lO FT BELOW TOP OF TO - 15 CCDINCLOMETER WELLS.
Figure 5.11: Horizontal deflections vs. time, AMOCO (Standard Oil) Building,
(Cunningham & Fernandez, 1972).
221
5.4.4 Case Study C4, Water Tower
The Water Tower Place consists of a 74-story tower with a contiguous 14-
story commercial building, both of reinforced concrete and with four levels of
underground parking. The site is located at the northeast corner f Michigan
Avenue and Pearson Street The excavation for the parking covered an area of
530' by 212' and extended to 44' below the surface.
Slurry walls 30"- thick, 62 ft deep, spanning between the shafts of foundation
perimeter caissons were used as the basement walls. The caisson shafts were
designed to carry part of the lateral load. Two levels of bracing were provided:
one level of tiebacks at 11' from the top of the slurry wall, and a lower level of
inclined rakers at 27' below the top. The slurry wall was designed to span
between the perimeter drilled caissons. The drilled caissons supporting the slurry
wall are spaced 30' to 31' of center, most having a 5'-diameter and an 11' bell at
the bottom. The caissons were designed to resist part of the earth pressure and act
as cantilevers. Slurry wall panels, 25' to 26' long, were constructed in between
the caissons. Details of the slurry wall excavation can be seen in Figure 5.12.
Soil conditions in the site were typical of downtown Chicago: 7' of fill, 18' of
fine sand (SP), 30' of soft to tough silty clay (CL), over very tough to hard clay
(CL), and hardpan. The soft clay has undrained shear strength su = 0.4 - 1.0 ksf,
increasing with depth.
The tiebacks were inclined from 10.3' to 17' in order to obtain a grouted zone
of 10' to 20' within the sand stratum. All ties were regroutable with a design
capacity of 60 Tons each. Five tiebacks and two rakers were installed in each
slurry wall panel. The rakers had a design capacity of 225 Tons each, with one
raker placed at a drilled caisson and another placed midway between caissons.
Construction operations involved some overlapping but generally followed the
below sequence:
I. Site excavated to -5'.
H. Inclinometer installation outside of wall.
IfI. Foundation caisson installation.
222

IV. Slurry wall installation and wall inclinometer installation
immediately.
V. Site excavated to -12'.
VL .Tieback installation, five ties per panel. Each tieback was
preloaded to 80 Tons, which was maintained until no movement
occurred. Then the load was reduced to 60 Tons and locked off.
VII. Site was excavated to the final level (-44') leaving a berm having a
minimum dimension of 40' from the face of the wall. The berm top
was at -28'and it was at least 23' wide at the top.
VIII. Base concrete slab was placed in the central excavated area with a
deadman beam on its edge.
IX. Rakers installed maintaining a symmetrical bracing configuration
for balanced load transfer across the slab. Each raker was
prestressed to 50 Tons.
X. Excavation of the berm in segments and placement of the base slab
up to the slurry wall
XI. Alternate rakers supporting drilled caissons were removed
XII. Third level basement construction and removal of remaining
rakers.
Out of the 174 ties, 14 did not obtain the design capacity and had to be
regrouted to give acceptable results. All ties were locked off at 60 Tons but load
picked up from 63 Tons to 75 Tons. Tieback loads remained at prestress levels
while the berm was not removed. All tiebacks were cut-off once the ground-floor
slab was in place. The average maximum raker load was 200 Tons, slightly less
than the 225-Tons design capacity. Readings taken at the longest diagonal strut at
the northeast corner showed an axial load varying from 31 Tons to 181 Tons, with
a design load of 320 tons. It was believed that soil arching partly caused the
smaller observed load.
Offset surveys indicated that maximum wall movements at the top of the wall
were in the range of 1" to 3". Lateral movements as measured from the surveys
223

were smaller than inclinometer measurements at the top of the wall. Inclinometer
deflection data is displayed in Figures 5.13 & 5.14 (Gnaedinger et al., 1975).
Maximum soil movement as determined by inclinometers was slightly more than
6", but most were less than 2" throughout the depth of 0 inclinometer casing.
These large movements at the top the casing most likely reflect fill sliding under
the guidewalls or other surface construction activities. The bottom of the slurry
wall translated by as much as 1.2" towards the excavation, which emphasizes the
importance of adequate embedment into a stiff stratum for controlling such
deformations.
Wall movements were more or less observed throughout the wall perimeter.
This indicates that the wall actually spanned across the drilled caissons as
designed. Lateral movements were increasing as the excavation progressed. The
effect of tieback prestressing can be seen in the sharply bent deflection shapes at
the tie elevations. Raker prestress did not seem enough to prevent the bulging
deflections that occurred in most locations. Apparently the raker prestress level
was not high enough to prevent such a condition.
Under 200 tons with a 50-ton prestress the calculated elastic yielding is close
to 0.21" for each raker. This means that the average maximum stress on each steel
pipe was 14 ksi. This calculation was made assuming that the rakers were under
compression only. Apparently the walls deflected much more than the 0.21" at the
raker elevation, which suggests that either the base slab shortened under the raker
load or that the rakers actually slipped to accommodate for the typical 2"
observed movements.
Settlement observations were only made at distances greater than 20' to 40'
from the wall. At points within 40' of the wall settlements were in the order of
1.5" on Pearson, Seneca, and Chestnut Streets, and 0.5" on Michigan Avenue. On
Chestnut and Pearson Streets maximum settlements at 60' from the excavation
were about linch. At the same distance the maximum settlement at Michigan
Ave. and Seneca was close to 0.5". At this project there were little to no
movement during caisson construction since the perimeter caissons were provided
224

with steel liners, and cement grouting was used to seal the space between the liner
and the excavated hole.
SECTION A-A OETAIL B-
Figure 5.12: Slurry wall and excavation details after Gnaedinger et al. [1975]
225

INCLItOMETER --- DEFLECTIONS -
) 0 ()o 2loo N' Wc L r V V *
0 -
-n1
10 50
- 14-73 --3440S- -N ,
WALL /4-3.-A7TOhi -
e .e
6-147
VI.Lso soIXCAVATION Uv0t
WALL DEVL. AT TOPISURJVEY O A TA) I
U CCU* C.ICAGO CITY DATUM
*oo ----. -- 100--DISTANCE FROM WALL IN FE ET
Figure 5.13: Inclinometer data, after Gnaedinger et al. (1975)

INC LINOMETER - DEFLECTIONS
a.Ii'hih.
k) Ik)
go
to
'0.47-u
* 3-2-7.1o-w-i'-0.73
#4I..
#4
_ ISTANCC-VROWWALL-SN -FEET
Figure 5.14: Inclinometer data, after Gnaedinger et al. (1975)

5.4.5 Case Study C5, Loyola University Business School
Very little data archived data exists regarding this project. Field reports
mentioned that one level of struts was used but the excavation profile could not be
reconstructed. The wall thickness in not known either, nor have any settlement
data been preserved. Inclinometer data showed cantilever deflections reaching up
to 0.8" at the top of the wall, and translational movements in the order of 0.2" at
near the toe of the wall. When permission was obtained to publish data for this
project, the owners mentioned that they had long term leakage problems with this
type of construction, which they had to repair.
5.4.6 Case Study C6, Prudential Two
The Prudential Two is a 60-story high-rise located in the southwestern corner
of Stenson Avenue & Lake Street. The new building was constructed next to the
pre-existing 41-story Prudential building at Randolph & Stenson Streets. Five
levels of parking were constructed under the tower portion of the site. Three out
of these parking levels are below the lower street level at Stenson Street (eastern
side). Stenson Street has three levels with the lower being at El. +6'2"CCD, the
mid-level at El. +26'CCD, and the upper at varying elevation close to El. +46'ft.
To the north of the project there is the 80-story AMOCO (Standard Oil) (C3)
building constructed during the 70s with its basement constructed using slurry
walls as well. A plaza area occupies the northwestern portion of the site.
Slurry walls 26"-thick, 56'-deep, formed the walls for the 3-level basement
(base of the excavation at El. -21'3"ft CCD). Tiebacks, rakers, and corner braces
were used to brace the slurry walls during excavation (Fig. 5.15). On the north
wall a tie-rod and deadman sheetpile system was used in place of the simple
tieback bracing because of space restrictions. Tiebacks at 6' depth, inclined at100
from the horizontal and prestressed rakers to 100 tons'placed at the second level
provided additional support for the east and north slurry walls. The south slurry
wall was braced by tiebacks inclined 450 at El. -10ft CCD at the slurry wall face,
with fixed length within the hardpan stratum.
228

Steel H-Beams placed at regular intervals reinforced the slurry wall together
with reinforcing steel cages that provided additional tensile strength. Drilled
caissons extending to the limestone bedrock were used to support the
superstructure loads from the 60-story tower.
Geologically the site lies in a portion of the city that was once below the lake
level. The soil profile generally consists of fill, underlain by fine sand, stiff clay,
soft to medium clay and stiff to very stiff clay extending to a sandy clay
"hardpan" at El. -70ft approximately. Extremely dense silt with variable amounts
of cobbles and boulders was found above the surface of bedrock to elevations in
the range of El. -90 to El. -100 ft. A deep groundwater table (El. -60'CCD)
exists at the site and is associated with the water level in the rock and the dense
silt below the hardpan. A shallower perched water level within the sand soils
ranged from El. 0' to El. -3'.
During slurry wall and caisson construction soil moved towards the slurry
filled trenches by as much as 0.25" inches. During excavation construction, soil
moved towards the excavation by as much as 0.5". There was very little wall
bending observed in this project, with the wall also slightly translating towards
the excavation by 0.15" at its base (Fig. 5.16).
In one inclinometer 25' away from the excavation (In-lA), the upper few feet
of soil moved up to 0.75" towards the excavation while 5' from the excavation
they reached 0.3". This effect was caused by the deadman sheetpile and tie
configuration that was used along the northern project side.
Horizontal soil movements slowly increased while the excavation progressed.
Generally most of the movement happened after the soil berm was left in place
and the first level ties were tensioned. The final inclinometer reading was taken
when most of the rakers were jacked.
Slurry wall construction faced only one major problem regarding the tilt of the
slurry wall reinforcing steel H-members during or after panel concreting.
Reinforcing cages had to be shortened in many cases because of the large bending
of steel H-beams in slurry walls during or after concreting. With the exceptions of
229

some sand pockets in the sand upper sand layer slurry wall construction
encountered no other difficulties. There were no records of any slurry wall leaks
or any other special observations regarding slurry wall quality found.
Overall, the earth retention system performed very well since the basement
excavation caused very small horizontal movements and probably small
settlements as well. Actual settlements although not measured but must have been
small as well if we consider that maximum lateral soil movements reached up to
0.75".
--- r-- D DMAN SHEETING USED WITHLAKE ST. 0TIERO AT EL. OAT SLURRY WALL
~-- F + - - N
N R IN-1
- I . - - - - TIEBACKS AT -EL0 IN SAND LAYER
ExistingPrudential--Building-
15-Feet
TEF DA-K-- --
EL-I Of t4Dg
TypICA 21"iT WAl : IN.ThWLINOME TER IN-3 --- -~
Figure 5.15: Prudential Two, site and bracing (C6).
230

In-IA In-]Steel H-BeamsSF1 Off Center Typical
ExcavatedFill
E---------- -- Tie locked ±10-Nov-87
Sand
El. -IIft CCD=> 15-Oc
So'Il Berm\ o eLocal Ber
e Grade B
Soft to w w ' 4-Dec-87Medium i 12-Jan-88 CenterSilty (Excavation PortionClay d Completed)
26'"
StiffClay e
Slurry Wall
VeyStiff to Hard Clay
I{ CIiyey Sand
In-1A In-IDeflections (inches)
N 0 IS N
0
t-87 -10
m Excam
-20
-30
U-40
-50
60
Very Stiff to Hard Clay20'
Aprox.-x t 5' Aproximate
Limestone Bedrock
-70
-80
-90
4-
*41
Ii
',1~
C'
100 1
(43'-
ci)-
N
I,-
-7;
Figure 5.16: Inclinometers In-I & In-2 (Northern wall), Prudential Two (C6).
231
(1) 16-Jun-87Loose Casing(2) 21-Jul-87Adjacent PanelsCompleted
Inclinometersdamaged andrestored Sep-87
(3) 15-Oct-87 Exc-1 1CCD
(4) 2-Nov-87
(5) 4-Dec-87
(6) 29-Dec-87Concreting ofcentral coregrade beams
(7) 4-Jan-88Partial RakerInstallation
5.4.7 Case Study C7, AT&T Corporate Center
The AT&T Corporate Center is a 60-story composite office tower with an
attached 16-story low-rise and two basement levels. It is located at the southeast
corne, of Monroe and Franklin Streets. The presence of an adjacent 10-story
structure supported on footings over soft clay required a conservative slurry wall
design, construction and bracing. Subsurface conditions consist of fill, thin clay
crust, soft to medium clay, stiff to very stiff silty clay, hardpan, and water bearing
very dense silt-sand & gravel, which is typical of downtown Chicago.
A principal concern in this project was the effects of excavating a 2-level
basement on the movements of the 10-story building on the east (Fig. 5.17). It
was felt that settlement of this building would be anticipated, regardless of
whether the building was underpinned or whether a stiff retention system was
adopted (Baker et al., 1987). A 30"-thick slurry wall constructed in 7' to 9' long
panels was chosen on the east side of the project. On the other three sides a 2'
thick slurry wall was used constructed in normal 20' to 22' panel lengths. The
slurry wall extends from street grade at El. +14 ft CCD to elevation El. -45ft
CCD.
Three levels of rakers were used to support the east slurry wall. These rakers
rested on the caisson caps (Figure 5.17). Raker installation was accomplished
with the use of soil berms along the east wall. Two inclinometers were installed to
monitor movements along the east wall. One inclinometer monitored movements
on the western side along Franklin Street where there was a major sewer line.
Baker et al. [1989], report that slurry wall construction took place without
incident. Small concrete overpours in the order of 10% were typical during slurry
wall construction (archived information). Small movements, up to 8H = 0.15"
towards the excavation, occurred during slurry wall construction (mostly observed
below El. Oft CCD along the eastern project side). Above El. Oft CCD, soil moved
slightly back by as much as 0.35" during slurry wall construction. In the western
side these movements were practically not existent.
232

Caisson construction caused additional soil movements up to 5 H = 0.5" at 25'
depth. When the first level of rakers was installed soil movements reached close
to 8H = 1.15" along the east and 6 H = 0.5" along the west. Final horizontal
movements at the final stage reached SH = 1.5" along the east and SH = 1.0" along
the west (Fig. 5.4.7.1). The added building surcharge on the eastern wall was the
cause of this difference in eastern and western wall deflections.
Seventy percent (70%) of the total settlement occurred during the first level
raker installation. This settlement was close to 8v = 0.09ft (6 v = 1.08"). An
additional 0.02ft settlement occurred when the 3rd level of rakers was installed
and removed. A total of 6v = 0.11 ft of settlement is directly attributed to the
excavation and raker installation. When all the rakers were removed settlements
increased to a total of 6v = 0.1 3ft (8v = 1.56").
233

>2 /ry LIMEfSTONE BEDROCK
Typical excavation Profile
D 770'TTN - INCH ES DEFE.O .. R3 EELE-QGN NCH-1-50 -. 75 U.00 +G,75 -50 -75 5 000 +0.-5 LD50 -0.75 0.00 5
* -'40--'~3L o-,~" 4 1
7j-20- \ \ 20 \ -2-- -- 60
~ ~ 2 (~\~ 60-0
MOVE-MIENT DURINGSLURRY 'VALLCONSTRUCTION
MOVEMENT DURINGCAISSON CONSTRUCTION
MIDVEMENT UNTIL FIRSTRAKERS INSTALLED
TDTAL MOVEMENT
STATION, 1- EASTSIDE STATION, 1-2 EASTSIDE STATIONt I-3 VESTSIDE
OCT NOV, DEC JAN ,FEB MAR APR MAY JUNJUL AUGSEP OCT NOV DECLJAN E, MAR APR
L3 RAKERS INSTALLED 005F.=03500~"- AND REMOVED (4/17)
L1 RAKER DONE C3/24' .9010-- CORE DUG TO -10' CC .1
!0.5 L2 RAKERS BGNE (4/03' - EXCAVATION ANZ RAKER INSTALLATION
RAKERS REMOVED BY AUGUST
SLURRY VALL D EEP VELL DEVATERING
Inclinometers, and Surface Settlements
Figure 5.17: AT&T Corporate Center (C7), excavation profile, inclinometer
deflections, and settlements (Baker et al., 1987).
234
U64L
+20-
+10-
0- b
-20-
-30
-40
-50-
-60-
-70-
-80
-go.

5.4.8 Case Study C8, Guest Quarters Hotel
The Beacon Guest Quarters Hotel is a 30-story reinforced concrete structure
with a three level basement constructed with the top/down method, located at the
southwest corner of E. Walton Place and N. Mies Van der Rohe Way. Drilled and
underreamed caisson foundations support the vertical loads from the building with
a slurry wall earth retention system was used as the basement wall. A general plan
of the site and adjacent structures can be seen in Figure 5.18. Soil conditions are
typical of downtown Chicago.
Immediately to the west of the site there is a 12-story high-rise Knickerbocker
Hotel, with a one level basement. The University of Chicago Business School is
located to the west of the site. There is also an abandoned 10-foot diameter water
tunnel crossing the site at 100' depth. Until that time, the usual practice was to
bulkhead the tunnel at the property lines, dewater the bulkheaded section and fill
the tunnel with grout or concrete in the dry (Baker, Pfingsten et al., 1998).
However, at the Guest Quarters Hotel dewatering caused the brick work of the
tunnel to collapse because there were breaks or weaknesses. It was thus necessary
to construct the bulkheads in the wet using low-slump grout and to fill the tunnel
by pressure grouting with alternate grout holes serving as vent holes for water
displacement (combined with leakage past the bulkheads) (Baker, Pfingsten et al.,
1998).
The 2-foot thick slurry wall was theoretically able to carry wall loads in the
order of 5 to 110 kips per foot. The slurry wall penetrated from 58' to 90' below
grade depending on location (90' being adjacent to the University of Chicago
Business School).
The top/down slurry wall excavation at the Guest Quarters Hotel performed
well, as final wall deflections were in the order of 6H=0. 6 " and only in one point
did they reached 6 w=1.0" (Fig. 5.19, 5.20). Caisson construction caused to slurry
walls to deflect by as much as 0.35" inwards, with typical induced movements
were smaller (Fig. 5.19). Surprisingly, inclinometer In-I deflected up to Sw=0.97"
in the cantilever excavation phase (about 15' below street), but movements
235

decreased to 6w=0.5" when the second level slab was completed (24' below
street).
Other wall locations deflected up to 8w=0.62" below the lowest slab level.
One of the inclinometers had its maximum deflection 8' feet belo- LL2 reas
another deflected the most at the LL3 level (34ft-depth). It is clear that the larger
wall deflections below the excavation base are associated with the transition from
soft to stiff silty clay, where the slurry walls were embedded.
Near a re-entrant corner, movements up to 0.56" in the primary direction at
the top of the slurry wall and up to 0.3" in the secondary direction occurred at the
final stage of the excavation (Fig. 5.21). The combined primary and secondary
movement totaled 0.62" close to 30' below street level. This suggests that
deformations near re-entrant corners are affected by construction activities at both
excavating faces, and are directed towards the axis of the corner.
There were no settlement data available, thus actual settlements are not
known. Settlements could be expected to be in the same magnitude or less than
wall movements if we consider that the top-down construction method was used.
The granular nature of the rubble fill caused problems in the guidewall
construction. Vibrations from the street caused some guidewall trenches to
collapse as they were excavated. This caused a section of the curb along Mies
Van der Rohe Way to slough into the excavation. It was decided to use soldier
piles and wood lagging on parts of the exterior slurry wall face as to avoid this
situation again.
Slurry leaked into a basement when panels were trenched in the northwestern
section of the project (Fig. 5.18). The slurry leak into the Knickerbacker hotel was
observed 12' below street level, where the retained soil consists of rubble fill.
This, clearly demonstrates that running fills (i.e. very permeable) may not be able
to form an adequate cake filter. Guidewall construction was a little problematic
due to vibrations from street traffic that caused soil collapses of the original
guidewalls that had to be re-constructed to a greater depth.
236

Although no data was available building settlements are not expected to have
been significant considering the small wall movements that occurred in this
project.
.. .i ~ ....
Knickerbacker Hotel() Q 4'
[ 1~-6 Icw
Uni 4ersitv of__ jT r T1 I j j.--i-
I T
A ()
L
I'l ~
K1N. MIES VAN3ER RhME W Y
3 I *
Figure 5.18: Guest Quarters Hotel (C8) site, slurry wall, and inclinometers.
1.2
0.8
0.6
0.4
0.2
0
-0.2 ' + Gompleted
-0.4
Nov-88 Dec-88 Jan-89 Feb-89 Mar-89 Apr-89 May-89 Jun-89 Jul-89 Aug-89 Sep-89 Oct-89 Nov-89 Dec-89
Date
Figure 5.19: Inclinometer I-1 vs. time, Guest Quarters Hotel (C8).
237
-M
CD0
.2
E
E
(C0M0)
it

Rubble Fill
Silty ClayFill
Rubble Fill
Medium Denseto Very DenseBrown Fine toSilty FineSand
Soft to StiffGray SiltyClay
InclinometerCasing
NI-1i
0
-5
LL1 9-May-89- (5)
April-89
LL2 20-July-89 (7)
15-June-89 (6)
LL3 7-Nov-89
12-Sep-89 (8)
Soft to StiffGray SiltyClay
2.0' Slurry Wall
-10
-15
-20
-25
-30
T-35
S-40
-45
-50
-55
7-Apr-89: Completionof All Caissons
1-6
Very Stiff to Hard Gray_ 15 ..Silty Clay 1 -
1-3 I-2
(inches)0
I 6-Dec-882 28-Mar-893 4-Apr-894 2-May-895 9-May-896 15-Jun-89789
20-Jul-8912-Sep-897-Nov-89
Figure 5.20: Inclinometer I-1, northern slurry wall, Guest Quarters Hotel (C8).
238
S1

Secondary Primary Axis
Axis N (inches) E1.0g 0 1'-3
Rubble Fill
Medium Denseto Very DenseBrown Fine toSilty FineSand
Soft to StiffGray SiltyClay
InclinometerCasing
Very Stiffto HardGray SiltyClay
'11zLz111z2zJ
LLI 9-May-89
(3)April-89
LL2 20-July-89
J)
LL3 7-Nov-89
12-Sep-89
I Soft to StiffGray Silty
- Clay
-35
-40
-451-Nov-89 7
2.0' Slurry Wall
7-Apr-89: Completionof All Caissons
I 6-Dec-882 28-Mar-89 & 4-Apr-893 26-Apr-89 & 9-May-89& 30-May-89
4 15-Jun-89 -5 13-Jul-89 & 20-Jul-89
6 12-Sep-89 & 1-Nov-89Gray Silt toClayey Silt
Hard Gray Sandy ClayJ--6
1-3 1-2
Figure 5.21: Inclinometer 1-5, western slurry wall, near re-entrant corner, Guest
Quarters Hotel (C8).
239

5.4.9 Case Study C9, Northwestern University Memorial Parking Garage
The Northwestern University Parking Garage is a twelve level structure
bounded by Superior, St. Clair, and Huron Streets. Olsen Pavilion of
Northwestern Memorial Hospital occupies the pastern portion of this block. The
garage includes a relatively deep (23'), single basement level for loading dock
facilities. Slurry walls were used to construct the basement walls of the new
garage structure. Caissons were constructed in between slurry wall panels since
the slurry wall bearing capacity was would not have been sufficient to carry the
superstructure loads (Fig. 5.22). The soil profile at the site is typical of downtown
Chicago. Street level at the site is approximately at elevation El. +13 CCD
(Chicago City Datum).
In order to construct the slurry wall and the foundation caissons on the same
alignment the caissons were constructed first to the top level of the slurry wall and
then the slurry wall panels were excavated in between caissons. The caissons
were provided with a steel shell with welded stubs of sheetpiles or a pipe for
connection with the slurry wall. The stubs were to extend into the slurry wall by
4" to 6" to reduce seepage along the contact of steel shell and the slurry wall
concrete.
Most slurry wall panels were close to 18' long and 39' deep, all being 2.0'
thick. Bracing was provided by temporary tiebacks installed at El. +3.0 CCD at
140 inclination from the horizontal. Two tiebacks were placed near the caissons
with a typical 4'3" horizontal spacing. Measured data was available until the site
was thereafter excavated to El. -4.5ft CCD, after which there were no more
available data regarding the performance of the retention system. It is known that
the final excavation reached El. -7.Oft CCD.
The slurry wall excavation system performed well with small horizontal soil
movements occurring during the excavation (Figs. 5.23 & 5.24). Caisson
construction caused small near surface soil movements in the order of 0.05",
while slurry wall construction caused horizontal soil to movements up to 0.1"
towards the site.
240

Excavation to 11' below street caused soil to move towards the excavation by
as much as 0.35", while tieback installation reversed deflections by as much as
0.15". Thereafter soil movements slightly increased as the excavation progressed
to 17.5 ft below street level. The upper 2' of all inclinometer casings deflected
more than the remainder portion of the casing, whereas 4' below the deflection
was much smaller (Fig. 5.24). Most likely this additional deflection was caused
by backfilling against the casing.
One inclinometer was placed 20' from the western slurry wall (1-2) while
other two others were located 5' from the slurry wall (I-1, 1-3). All these
inclinometers did not show any significant differences in the magnitude of the soil
movements except for the upper portion of the casing but movements for the
inclinometer 20' from the excavation were slightly smaller below the tieback
elevation (C9). The final deflection shape of the inclinometer 20' away was
mostly cantilevering whereas other inclinometers displayed some translative
motion at the toe of the wall as well (0.2"). Measurable deep-seated soil
movements were observed in all inclinometers down to 40' below the slurry wall
base. These movements were related to the clay that is present below the
excavation, and clearly show that deep-seated soil movements occur in soft clays
even for relatively shallow excavations.
Despite the fact that there was mention of settlement markers there was no
available settlement data found for this project. However, settlements must have
been small if we consider the small magnitude of soil movements and the fact that
the excavation was not very deep.
There were numerous locations where seepage was observed at the joints
between caissons and slurry wall panels, despite the care had been taken to
construct watertight joints (Fig. 5.25). These leaks were to be repaired with
grouting or another sealing method.
In several areas wet bentonite was observed along the wall which was later
removed. In addition several voids were observed at the slurry wall face that had
to be patched with concrete. Although all of the above needed repair work was
241
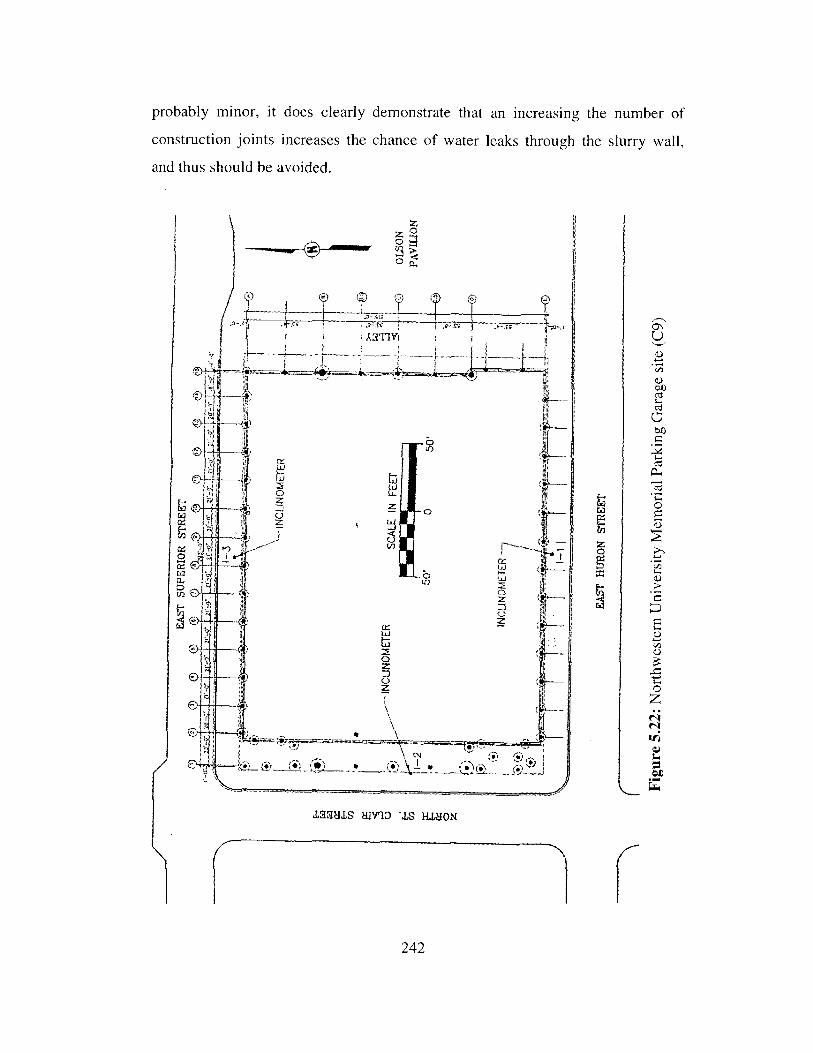
probably minor, it does clearly demonstrate that an increasing the number of
construction joints increases the chance of water leaks through the slurry wall,
and thus should be avoided.
Cta4~
-7t
JISSHLS HIVID 'IS h1.LHON
242
1H
0z0

1-3
Lfree= 18'Lbonded= 19'
14.00
MediunSand
SoftClay
StiffClay
5- -ITop of SlurryWall El. +9'6"CCD
10Ties (I 8-Apr)
I+2.OCCD 23-Nov-93
10-Jun-94Exc. Completed
SoftClay
10
-20
StiffClay
(1) - 27-Sep-93Adjacent Caissons
(2) - 12-Dec-9 &22-Dec-93Exc. +2.OCCD(3) - 1-Jan-94& 26-Jan-94Groundlevel Slab(4) - 22-Feb-94
(5) - 4-Mar-94
(6) - 17-Mar-94Backfill
-30
-40
-50
-60
(7) - 18-Apr-94Tiebacks(8) - 19-May-94 & -7010-Jun-94ExcavationCompleted
-80
(inches)0 (3)-0.5 0.5 (6'I I
(4) ' (5) _ _ _
(7/
424
U
U
0t
I _ ___________
1 _______
11 ___
A
I A
I. /
1-3
Figure 5.23: Inclinometer 1-3, northern slurry wall, NU project (C9).
243
i

0.9
0.7 - -70
0.6 --Ex
EL'0 a E o
C 0.5 C.- 0 __o E a3
o < L)0.4 co -- o) cd
o
0
0 00.3 - - - - - -
0.2 - -- -- --. Readings taken from ---- - -Top of Slurry Wall Elevation
0.1(El. +9'6CCD)0.1 / ~~at Inclinometer 1-3 - -----
0 (East Superior Street)
Aug-93 Sep-93 Oct-93 Nov-93 Dec-93 Jan-94 Feb-94 Mar-94 Apr-94 May-94 Jun-94 Jul-94 Aug-94Date
Figure 5.24: Inclinometer 1-3 deflections with time, NU project (C9).
7 -
- T
- ~ ~~ ~~ J omgna.o
Sov- MC S AT
C. btGr - n~tS VA OH A
El. YACI 0QM" 04 $4J .- $LO?
0CC 1.D ZJ1xro~t1
]An
JCFu- at (
0. AC' CONUStf It1O!- joor
5Q.1 P Alot
*~~~~~~~~~ .4'10 . F ......... 7u~ ' ~ ''~1 -~ ~
Figure 5.25: Special observations at NU project (C9).
244

5.4.10 Case Study C10, Museum of Science and Industry Parking Garage
The Museum of Science and Industry is located in 57th and Lake Shore Drive.
An underground 3-level parking was constructed adjacent to the northern side of
the existing Museum Building as to satisfy parking needs. Slurry walls 2.5'-thick
and 45'-deep braced with three levels of permanent tiebacks were used to
construct the underground parking. Tiebacks were air-drilled and extend into the
hardpan soils with the grouted body being about 60' away from the slurry wall
face. The excavation was 34'-deep and covered an area of 633'x 278' for the
parking and a smaller lobby section on the south (Fig. 5.26).
The site of the Museum is located on reclaimed land from lake Michigan.
Soils in the site consist of 20' of sand fill, over 20'-thick medium to stiff clay,
and very stiff clay for the next 20' feet The water table at the site is controlled by
the lake water elevation, which is at El. +3 ft CCD. Borings did not penetrate
more than 60' of soil but it is known that "hardpan" soils exist below that depth.
Clays at the site have larger unconfined strengths than downtown Chicago clays.
The medium clay at depths of 20' to 40' has typical unconfined undrained
strengths slightly more than 1.0 ksf (su UU value) whereas for downtown clays
unconfined shear strengths range from 0.3 ksf to I ksf at the same depths. Clays at
depths of more than 40' typically had unconfined undrained su strengths in the
range of 2.0 ksf to 5.0 ksf.
Maximum slurry wall deflections were kept to small values throughout the
excavation period (Fig. 5.26). Most monitored slurry wall panels deflected up to
0.5" with some panels deflecting up to 0.87" (1-32, Fig. 5.27 & 5.28). Maximum
wall movements were observed above or close to the second levels of tiebacks.
Slurry walls generally rotated about their base with slight bending observed above
the second level of tiebacks (Figs. 5.27 & 5.28). In some locations, approximately
half of the total measured deflections might have been caused by the extensive
grouting efforts that were undertaken to seal water leaks (i.e. 0.4").
Injection grouting was used to repair water leaks through slurry walls during
excavation. It was mentioned that in many locations this grouting caused the wall
245

to move laterally up to 0.25". The exact locations where these grout induced wall
movements were observed are not known but inclinometer deflections increased
considerably after the 3rd level of ties was installed. It was also reported that the
southeastern re-entrant corner from 1-17 to 1-8 had seriously cracked during the
excavation and that repeated grouting had attenuated this cracking.
During the installation of the second level of tiebacks in the southeast corner
of the construction site, cracks were observed in the asphalt concrete pavement
and the concrete slab supporting the observation tower of the Museum. These
cracks were situated approximately 20' to 35' further south from the slurry wall in
which the tiebacks were being installed. Tieback installation in this location
started on Oct 2 1st and progressed easterly to panel 18 by Oct 23 d. During this
period cracking was observed as the tiebacks were installed. According to present
engineers the platform of the tower raised in elevation by approximately 0.5" and
then later in the day it settled back about 0.25". Inclinometer 1-17 in that location
indicated that movement at the top of the wall towards the north was in the order
of 0.38". It was believed that drilling with air through the stiff to very stiff clayey
soils resulted in incomplete removal of the clay cuttings between the drill pipe
and the side of the drill hole thus not allowing air pressure to escape (field report).
246

633'4" I
-99 -1012 1-104Existing Museum of Science & Industry
Figure 5.26: MSI (C 10) site and maximum final inclinometer deflections.
Deflection (inches)
-0.5 -0.25 0 0.25 0.5 0.75 1 1.25 1.5
10 _
15
20
25
30
35
40
45
Figure 5.27: Inclinometer 1-32, MSI (C 10).
247
1-32
0
-10
-20
0
-30
-40

Deflection (inches)
-0.5 -0.25 0 0.25 0.5 0.75 1 1.25 1.50 |0
-10
-20
00
-30
-40
1-Oct-96
12-Nov-96
- Fill --
10* 124Kips
Sand
77Kips
Su (UU)1.1ksfMediumClay
-- 170Kips
Stiff to veryStiff ClaySu (UU)=2. ks f to5 0 ksf
Figure 5.28: Inclinometer 1-47, MSI (C 10).
5.4.11 Case Study C11, 311 South Wacker Drive
The 311 South Wacker Drive project is located at the southwest corner of
Jackson Boulevard and Franklin Street It covers a "T" shaped area approximately
395' by 330' in plan (Fig. 5.29). The structure has a three level, 34.5'-deep
basement. A 2.0'-thick diaphragm wall that extends 65' below the surface
provided both temporary and permanent lateral earth support for the excavation.
The slurry wall was constructed in 18' to 25' long panels. Soil conditions are
typical of downtown Chicago.
Four types of bracing were used in this project (Gill et al., 1989) namely
cross-lot struts and inclined rakers, corner braces, tied back deadman, and
top/down construction. The core area was excavated to the base of the core mat in
a rectangular sheeted cofferdam covering an area of 145' by 56', that was braced
by three levels of cross-lot pipe struts and corner struts (Gill et al. 1989).
248
4-Dec-96
G-Level Slab PouredJul-97
5
10
15
20
25
30
35
40
45
L47

Significant lateral displacements occurred when an open excavation was made
in the interior using the sheeted cofferdam for the construction of the tower mat.
Although the cofferdam was braced by three levels of cross-lot struts, the effect of
excavation was observed at Inclinometer 1-3 at a distance of about 60' (18.3m)
from the face of the excavation (Gill et al, 1989) (Fig. 5.30). Ground
displacements might have also been attributed to open excavation close to the
slurry wall for removal of obstructions from previous construction, from
excavation of caissons and from oversize excavations at each caisson for
constructing columns for the top/down section. Inclinometer 1-3 showed mostly
cantilevering deflections totaling up to 2.75" near the top of the casing. The
horizontal translation measured at 1-3 at the elevation of the bottom of the wall
was close to 1".
Deflections at inclinometer 1-6 were much smaller than those measured at 1-3,
as they reached a maximum of 0.60" (15mm). However, 1-6 did not extend
beneath the excavation base and thus any translative movements of the toe of the
could not be recorded. If we apply the translation of 1" measured at the base of
the wall at 1-3, then actual movements at 1-6 could have been as large as 1.60".
JACKSON BLVD.
TOWER AREA -TOP DOWN CONSTRUCTION
WINTER GARDEN 1-4 0102M
(OPEN CUT) scale:
INCLINOMETER(TYPICAL)
1-36
z
TIEBACKS SLURRY WALL 1-2 ViDEAD MAN
CONE MAT TEMPORARY RAKERSCFlFFFRr)AM FOR GRADE BEAM
0
Figure 5.29: 311 South Wacker Drive (C 11), (Gill et al, 1989).
249

MOVEMENT - MM
7
INITIAL12-22-871-15-88-1-26-886-21-888-9-88
INITIAL6-2-877-14-8710-13-872-18-883-10-889-9-88
MOVEMENT-20
543MAX. CUT
2
0MM
324
MAX.
1-6
1-6
CUT TO LEVEL 1CUT TO LEVEL 2CUT TO LEVEL 3FINAL CUT (-9.8FINAL READING
1-3
BRACINGBRACINGBRACINGM)
CAISSON CONSTRUCTIONEXCAVATION FOR CORE AREA
SLURRY WALL EXCAVATIONCUT FOR P-2 LEVEL -7.0CUT FOR P-3 LEVEL -10.7FINAL CUT (-12.84 M)
-2.0 M- 5.5 M-7.62 M)
M)M)
Figure 5.30: Inclinometer deflection at 311 South Wacker Drive (C 11).
250
0
810
20
0
10
CUT
20
t)wUi
z
Li0
30 30_j2.3.4.5.6.7.
2.3.4.5.6.7.8.

5.5 Summary of Inclinometer Deflections
Figure 5.31 summarizes the maximum wall or horizontal soil deflections
measured for Chicago slurry wall excavations plotted as a function of the system
stiffness as proposed by Clough et al. [1989]. The effects of improper caisson
construction were removed by subtracting the deformation caused by caisson
construction from the total deflection at the same elevation. Table 5.3 summarizes
the input parameters used to plot Figure 5.31. Projects in Figure 5.31 can easily be
distinguished by the bracing that was used.
The majority of the excavations have a lateral deflection ratio 6 H/H<0.4%
(C4, C6, C7, C8, C9, C1O, Cl1(a)). Two of the projects that plot above
6 H/H=0.4%, are early excavations and thus movements can be attributed to poor
bracing performance (C2) or inadequate toe embedment (C3). Projects braced by
tiebacks in combination with rakers suggest a correlation of decreasing
movements with increasing system stiffness (C3, C4, C6, C9, C10). Most of these
projects (C3, C4, C6, C9) can be relatively easily compared to each other because
the site conditions were quite similar. Out of all projects the top/down project
(C8) had the smallest ratio of maximum wall movement to excavation depth
aH/H=0.064%. Two of the raker supported projects (C2, C I1 (b)) with similar
system stiffness plotted very close to each other.
Figure 5.32 summarizes a frequency plot of the maximum and final
deflections for the 47 of the inclinometers used in 10 out of the 11 projects
studied (C5 excluded). The same data are replotted in Figure 5.33 in terms of the
dimensionless ratio 6H/H where H is the final excavation depth. The effect of
improper caisson construction was not accounted for in constructing the
frequency plots. Table 5.4 gives the number of inclinometers per project used to
derive the frequency plots in Figures 5.32 & 5.33. Unfortunately, the inclinometer
database for the Chicago projects is not as extensive as the one for the Boston
case studies. The database is drawn from only 47 inclinometers.
251

1
0.9
.K 0.8
0.
S0.57
0
C|: 0.3
> 0.6ca
0.5
00.4
3: 0.3
-Ze 0.2CZ
0.1
0
ProjectsCl) CNA (2-Cross Lot+Berms)C2) Sears Tower (3 Levels Rakers, berms)C3) Amoco (1 T es1berms Soldier Piles)C4) Water Tower (1 ies & 1 Rakers)C6) Prudential 2 (1 Ties, 1 Rakers, berms)C7) AT&T (3 Levels Rakers, berms) - - - - -C8) Guest Quarters (Top/Down)C9) NU Parking (1 Level Ties)C102)MSI (2 lev ies)-- -- -
C-1)311 South W. (a) 3-Lev.Cross Lot, 32(b) Rakers, 42'-deep
. 4
6 C9- _- - --- 11 ---
10 100
System Stiffness=(EI)/(,'W h4avg)
1000 10000
Figure 5.31: Maximum wall deflections versus system stiffness for Chicagoslurry wall excavations, (excavation induced movements only, when applicablethe effect of caisson caused deflections was eliminated)
Table 5.3: Summary of system stiffness input parameters and horizontaldeflections for diaphragm walls in Chicago.
Vertical Horizontal DeflectionsWall Exc. Support (inches)Thick Depth Spacing fc' Caisson+ Exc. System
Project (ft) (ft) (ft) (ksi) Other Total Only Stiffnesst H h S ,0., Stotal 8Exc EL/y, h4
SExcmH %
Cl CNA 2.5 31 13 3.5 2.2 3.3 Li 354.8 0.296C2 Sears Tower 2.5 45 11 3.5 3 6 3 692.1 0.556C3 AMOCO 1.75 34 16.5 3.5 1.1 4.6 3.5 46.9 0.858C4 Water Tower 2.5 44 16 3.5 0.4 2.2 1.8 154.6 0.341C6 Prudential Two 2.25 25 13 4.5 0 0.45 0.45 293.3 0.150C7 AT&T Corp. Center 2.5 28 9 4.5 0.5 1.5 1 1751.2 0.298C8 Guest Quarters Hotel 2 35 11 4.5 0.33 0.6 0.27 401.8 0.064C9 NU Mem Parking Gar. 2 19 7.5 4.5 0.1 0.49 0.39 1859.2 0.171CIO Museum Scien. Indus. 2.5 30 12 4.5 0 0.8 0.8 554.1 0.222CII (a) 311 South Wacker 2 32 7.4 4.5 0 0.6 0.6 1961.7 0.156C lI (b) 311 South Wacker 2 42 9.8 4.5 0 2.75 2.75 637.8 0.546
Note:Modulus of Elasticity: E (psi)=57000d (fc' (psi) => E(psf)= 395.83 4 (fc' (psi)
fe' : 28 Day strength of concrete
Moment of Inertia of Uncracked Section = I
I(ft4)= (Ift) t 3
12t (ft) = Diaphragm wall thicknessy,= Unit weight of water = 62.4 pcf
252
(ACI-8.5. 1)
0
1I
Soil Berrns
Ties and/orRakers
Construction
cross-lotBracing
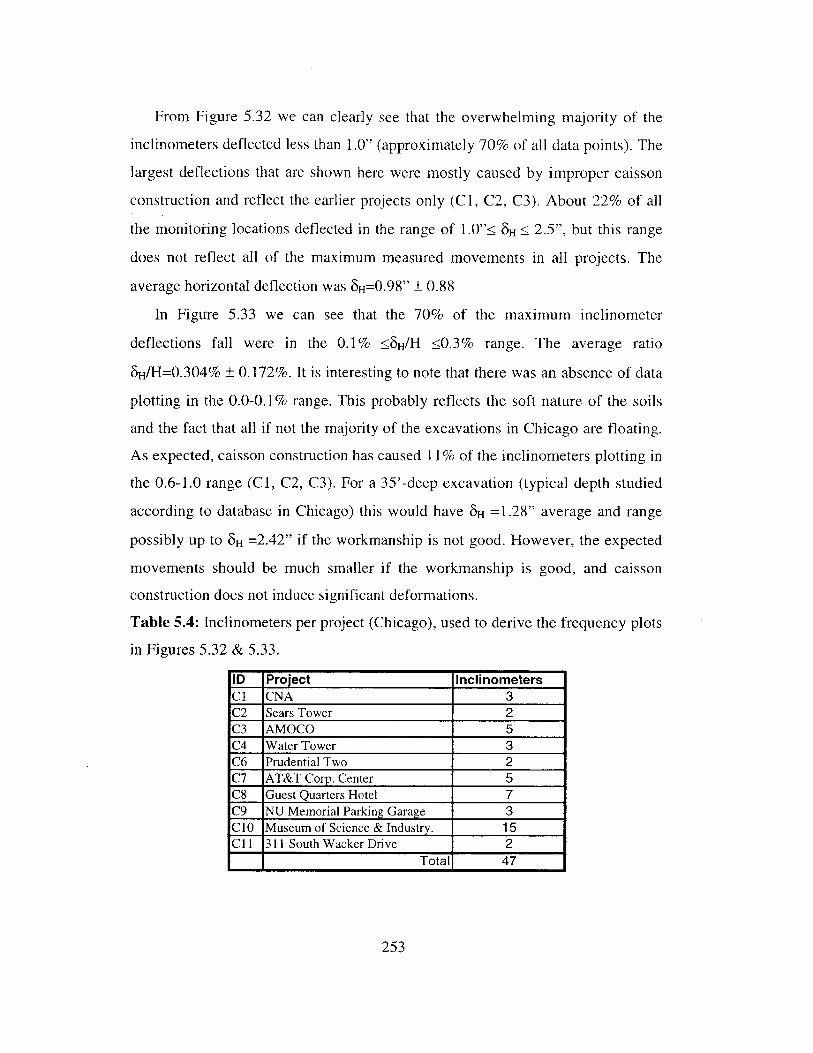
From Figure 5.32 we can clearly see that the overwhelming majority of the
inclinometers deflected less than 1.0" (approximately 70% of all data points). The
largest deflections that are shown here were mostly caused by improper caisson
construction and reflect the earlier projects only (C1, C2, C3). About 22% of all
the monitoring locations deflected in the range of 1.0" 8H 2.5", but this range
does not reflect all of the maximum measured movements in all projects. The
average horizontal deflection was 6 H=O.9 8" ± 0.88
In Figure 5.33 we can see that the 70% of the maximum inclinometer
deflections fall were in the 0.1 % SH/H 0.3% range. The average ratio
6 H/H=0.304% ± 0.172%. It is interesting to note that there was an absence of data
plotting in the 0.0-0.1 % range. This probably reflects the soft nature of the soils
and the fact that all if not the majority of the excavations in Chicago are floating.
As expected, caisson construction has caused I I% of the inclinometers plotting in
the 0.6-1.0 range (C1, C2, C3). For a 35'-deep excavation (typical depth studied
according to database in Chicago) this would have SH =1.28" average and range
possibly up to 6 H =2.42" if the workmanship is not good. However, the expected
movements should be much smaller if the workmanship is good, and caisson
construction does not induce significant deformations.
Table 5.4: Inclinometers per project (Chicago), used to derive the frequency plots
in Figures 5.32 & 5.33.
ID Project InclinometersC1 CNA 3C2 Sears Tower 2C3 AMOCO 5C4 Water Tower 3C6 Prudential Two 2C7 AT&T Corp. Center 5C8 Guest Quarters Hotel 7C9 NU Memorial Parking Garage 3CIO Museum of Science & Industry. 15CII 311 South Wacker Drive 2
1Total 47
253

Percentages ObtainedFrom 47 Inclinometers
Maximum FinalMean 0.984" 0.984"STD 0.880" 0.880"
40
35-
30-
E0 25-
20--
0
o o 0 0 0 0
-\ -\ c'J c o
0
+CD
Inclinometer Deflection Range (Inches)
Figure 5.32: Statistics of maximum and final inclinometer deflections for all
inclinometers in slurry wall projects in Chicago.
29.8 29.8
Okid6
0
Percentages ObtainedFrom 47 Inclinometers
13 Maximum Deflections* Final Deflections
10.6 10.6-8.5 8.5 8.5
2.1 2.1 2.1 2.1
c)
cli6d
IT
C;)d6
Ul)dS
o
Co
0to6 o
co0d
o6co0
+0
Maximum Inclinometer Deflection/ Final Excavation Depth (%)
Figure 5.33: Statistics of maximum and final inclinometer deflections as
percentages of the final excavation depth for inclinometers in slurry wall projects
in Chicago.
254
0 Maximum DeflectionsN Final Deflections
) 10
10
0.
5
0
o20
q
0
CD6
LD
0
02
0
0
IQ)0
45-
40-
35
Wc 30-
Eo 25-
20--
15 -
10-
5-
06I0
d6
00
9
00
6O 60
0~
0
-
- 8.5 8.5 8.5
- 4.34.3 4.3 4.32. 21
36.2 36.234.034.0

5.6 Special Observations
Table 5.5 summarizes various special observations made during slurry wall
construction and the excavation for projects in the Chicago. In regards to slurry
wall consrqgimn special agtention must be given to the Prudential Two project
(C6). In this job tilting problems were encountered with the steel H-beams that
reinforced the slurry wall. In particular the H-beams bent considerably about their
weak axis of bending during concreting of the slurry wall panels. It was believed
that this condition was caused by the unbalanced soil and tremie concrete
pressures that were acting on the H-beams during concreting.
Attention must also be given to the Museum of Science and Industry (C10),
where the southeastern re-entrant corner (Fig. 5.34) cracked considerably, and
major leaks were observed. It was reported that large volumes of grout were used
to seal these leaks, and that they caused some of the slurry wall movement.
Additional grout sometimes caused new leakage because of the new differential
movements that were induced. The exact volumes of grouting and the volumes of
water inflow are not known.
Water leakage problems were considerable when caissons were incorporated
into the slurry walls (C9), because the water stopping details between the slurry
wall and caissons was inadequate. In earlier projects, the large wall movements
caused serious cracks in the slurry walls resulting in water leakage (Sears Tower,
C2). Other problems during slurry wall construction included instability of guide
walls due to street traffic vibrations. In the Guest Quarters Hotel (C8), the guide
walls and small sections of the sidewalk collapsed due to such vibrations. These
guide walls were installed in open trenches and without the use of any slurry as it
is commonly used. Slurry wall construction caused small horizontal soil
movements towards the trench in the order of 0.1" to 0.2" (C6, C7, C8, C9).
Small concrete overpours, typically 10% of the theoretical panel volume, were
measured during construction of these slurry wall projects. Occasionally, small
sand pockets were found within slurry walls that were subsequently filled with
expansive concrete (C6, C9).
255

Table 5.5: Special observations for slurry wall excavations in Chicago.
cc c -MovementsC: - " .y e During Slurry
Soil 2 ., M .g T r Cave-ins Wall Other Special
Job ID Year Profile 4 - >"3 > 4 Reported Construction Observations
Typ. No data/ nonDowntown mentioned in
CNA Building C1 1970 Chicago RC 2.5 54 29 referenced papers Practically none
Typ.Downtown Cracks along one wall/
Sears Tower C2 1970 Chicago RC 2.5 60 - non mentioned no data left water running rapidly
Caisson and Slurrywall constructioncombined for up to1.0 at one location One 6" crack with leak -near the surface, later patched,Some
Typ. RC No data/ not otherwise in the slurry wall bearing SteelAmoco Downtown & 10 & mentioned in order of 0.3" for H-piles encounteredStandard Oil C3 1971 Chicago BP 1.75 40 20 referenced papers both obstructions
Small but can notTyp. RC No data/ not be distinguished
Water Tower Downtown & mentioned in from publishedPlace C4 1973 Chicago CS 2.5 62 12 referenced papers paper
Loyola Water LeakageUniversity problems mentionedBussiness several years afterSchool C5 1993 No data available No data available construction
Excess Tilt of steel H-members in slurry wallduring concreting,Sand pocketsoccasionallyencounetered in theupper sand,
Typ. RC up to 0.25" towards ObstructionsDowntown & 12 to 1.03 to the trench near the encountered during
Prudential Two C6 1987 Chicago CS 2.25 53 20 1.12 Not mentioned top of the slurry wall trenching
AT&T Typ. 0.15" towards theCorporate Downtown Not mentioned in excavated trench/ Small concreteCenter C7 1987 Chicago RC 2.5 60 - referenced paper excavation overpours 10%
Slurry leak into anadjacent basement,Pile foundationsencountered duringtrenching,
Typ. Street traffic vibrationsGuest Quarters Downtown 13 & In the order of 0.1 caused 60' of guidewallHotel Ct 1989 Chicago PC 2 55 18 _ Not mentioned to 0.2 inches to collapse
Numerous problemswith seepage betweencaissons and slurrywall,Wet bentonite observed
In the order of 0.1 along the wall,NU Memorial Typ. to 0.2 inches Several voids in theParking Downtown towards the slurry wall had to beGarage C9 1994 Chicago RC 2 39 19 1 06 Not mentioned excavation patched
Major cracking of a re-Outside soft Not measured/ entrant comer,
Museum of clays but Inclinometeres Excessive leakageScience & stiffer than within the slurry required major groutingIndustry C10 1997 downtown RC 2.5 40 Not mentioned walls efforts
Note: RC- Reinforced Concrete, SP- Soldier Piles as reinforcing,BP-Bearing Piles incorporated into wall,Caissons incorporated into the wall
5.7 Summary of Chicago Slurry Wall Excavation Experience
CS
256

The slurry walls in all of the studied projects in Chicago have been floating
walls in soft to medium clays. Depths of excavation were smaller than other cities
in the U.S. since no excavation was deeper than 44'. The first slurry wall in
Chicago was installed in the CNA building in Chicago (C 1).
Earlier projects had major problems with inadequate caisson construction that
caused large movements before any excavation took place. In these early projects
the bracing was not adequate since the rakers that were used were not preloaded.
Thus the walls showed very little bending between supports and mostly rotated
and translated about their bases (C3, C4). The large differential movements
between panels caused major cracks in the slurry wall concrete that were resulting
in considerable seepage (C2).
Projects from 1980 after performed much better with the wall movements
being kept to small values (C5, C6, C7, C8, C9, CIO). Caisson construction in
these projects did not cause any significant movements since experience with
previous projects had accumulated, and caissons were constructed with steel
lining and not in oversized holes. In most of the recent projects the walls showed
pure translation with little bending above the base of the excavation (Type I,
deflection shape) (C6, C7, C9, CIO). These translative movements at the toe of
the walls were expected since the all the slurry walls in Chicago are embedded
into medium clays that can not provide a lot of resistance as glacial till or
bedrock. Bending in these walls was mostly observed below the lowest bracing
level or the excavation base.
Close to 70% of the wall movements fell in the range of 0.0% 6 H/110.3%,
which is the same as the percentage of inclinometer deflections in the
0.0" 6 f l .0" range. Earlier projects contributed to the larger movements in the
range of 0.6% 6 H/H 1.0% (Cl, C2, C3, C4). However, the range of wall
movements within each project was not as large as that of Boston (Chapter 4).
Unfortunately, very little to no settlement data was found in archived in the
records of slurry wall excavations in Chicago.
257

258

Chapter 6Washington, DC, Projects
259

260

Chapter 6Washington, DC, Projects
6.1 Introduction
Slurry wall excavations have been quite popular in Washington DC, with the
first projects constructed in the 1970s. Sections of WMATA subway tunnels
constructed with the cut and cover method were amongst the first slurry wall
projects in the city. Today the ongoing construction of the Washington
Convention Center (W3) is the largest single slurry wall basement excavation in
the United States, covering five and one-half city blocks. The reasons for using
slurry walls for deep excavation support in Washington are as follows:
I. Control ground deformations caused, and mitigate potential effects on
adjacent structures (notably WMATA tunnels).
H. Minimize or avoid underpinning of adjacent structures.
III. Minimize groundwater leakage
IV. Economic reasons when used as the permanent basement wall.
In all projects, toe fixity was provided by embedding the walls into bedrock,
decomposed rock, or extremely stiff layers. Table 6.1 lists the five slurry wall
projects studied and referenced in this research, while Figure 6.1 shows their
locations. The author is aware of at least 10 other projects in the Washington DC
area (Table 6.2), but unfortunately was not able to locate any performance data
from these projects.
261

Table 6.1: List of studied slurry wall excavations in Washington, DC.
Project De h(ft) Thick Wall ToeID Name Year H D (inches) Soil Type Bracing Type FixityW1 World Bank 1991 60 7 30 Cretaceous 5-Lev. TB RCDW -
W2 Petworth 1995 60- 12 36 Cretaceous 5-Lev CLB RCDWSubway 100 16 6-Lev CLBStation
W3 Washington 1999 30- 18 36, Cretaceous 1,2 Lev TB RCDWConvention 2000 55 23 48 Pleistocene & 1 Lev RCenter 3-Lev.TB
W4 Metro Center 1990 31 22 24 SandClay 2-Lev. Ties RCDW 1II
W5 Federal Center 1973 60 36 Sand, Clay 3 Cross Lot RCDW 1* Station (6) 1 1
Note: * Performance data only, Tamaro & Gould 1993.H - Excavation Depth, D- Embedment depth, TB -Tiebacks, CLB - Cross-Lot Bracing,TD - Top/Down, R - Rakers, SB- Soil Berms, CB - Corner Bracing, IB-Internal Bracing,PC - Precast, PT - Post Tensioned, SP - Soldier Piles, RCDW - Reinforced ConcreteDiaphragm Wall, SPTC - Soldier Piles & Tremie Concrete.
Table 6.2: Other known slurry wall excavations in Washington DC
Project CommentsFederal Triangle Supported by tiebacksMarriott Hotel Permanent basement wall to protect adjacent National
Press Club & National TheatreSmithsonian South Quadrangle Permanent basement wall and protection to adjacent
buildingsNational Geographic Society Alternative to sheeting, bracing and underpinning1411 New York Avenue Permanent basement wall / protect adjacent buildingCorcoran Office Building Permanent basement wallTechworld Barrette slurry wall used to protect adjacent subwayMetro Center 5A Protect adjacent subway on two sides
Hub Building Protect adjacent subwayWashington Subway, Federal Center, In lieu of underpinning and sheetingSouthwest Station, Sect. D004
262

Figure 6.1: Location of studied slurry wall excavations, Washington DC
6.2 Washington DC geology and subsurface conditions
Washington DC is characteristic of the "fall line cities" along the Atlantic
seacoast where deep water access is terminated abruptly by former falls and
rapids (Gould et. al 1998). The southeastern portion of the District lies in the
"coastal plain" which consists of a broad belt of deep flat-lying sediments over
deep bedrock (WMATA, 1969), while the northwestern District lies within the
"Piedmont" province with a relatively thin soil cover of crystalline bedrock.
A "fall line", running southwest from the Montgomery County boundary
through Farragut Square, passing south of the Pentagon, forms the boundary of
these two units (Fig. 6.2). This causes the Cretaceous plain sediments to dip
southeast in wedge shaped lenses. These coastal plain sediments comprise
263

continental and near-shore deposits, alternating layers of arkosic sands with clays,
all heavily pre-consolidated (mainly by erosion cycles). Table 6.3 provides a more
detailed description and subdivision of the Cretaceous deposits, which are locally
referred to as the Potomac Group of the Cretaceous period or just P-group
(WMATA 1989).
Pleistocene sands and gravels, deposited as terraces during sea level
fluctuations of glacial times overlie the Cretaceous soils (directly on bedrock).
The terrace soils deposited during the Pleistocene era are also locally referred to
by the WMATA as the T-group (Table 6.4). The deposits formed as glacial
meltwater carried runoff sediments from the western upland and they primarily
comprise of crudely bedded gravel, and sand with interstitial silt and clay. In the
central district these deposits form amphitheater like steps. Boulders and coarse
soils are often found at the base of the Pleistocene terrace. The different zones of
T-group have been subjected to varying degrees of weathering.
Slightly organic Holocene clays deposited during the rise of the sea level after
the last glacial recession are found near the existing river borders. These clays
have a stiff desiccated upper crust over lightly overconsolidated material (similar
to the Boston Blue Clay).
Bedrock in the District is primarily Wissahickon schistose gneiss, with small
amounts of intrusive rock and alteration products. Typically a layer of weathered
in-situ (residual soil or saprolite) decomposed rock lies over the competent
bedrock. The decomposed bedrock is very hard with Standard Penetration
Resistance ranging close to 100 blows per foot.
Table 6.5 design soil properties for design for the T & P groups as proposed
by WMATA [1989]. The TI clay stratum has shear strengths from 0.7 ksf [(TI)C]
to 3.5 ksf [(TI)D]. The Cretaceous clays are highly overconsolidated (24 to 40
ksf) and have higher shear strengths (2 ksf to 6ksf) compared to the TI clays.
The T and P notations used by WMATA [1989] are contradictory with the
USGS notations. USGS [1994] refers to the Pleistocene deposits as Q3, Q4, Q5
(late, middle, and middle Pleistocene respectively), while the T-group is classified
264
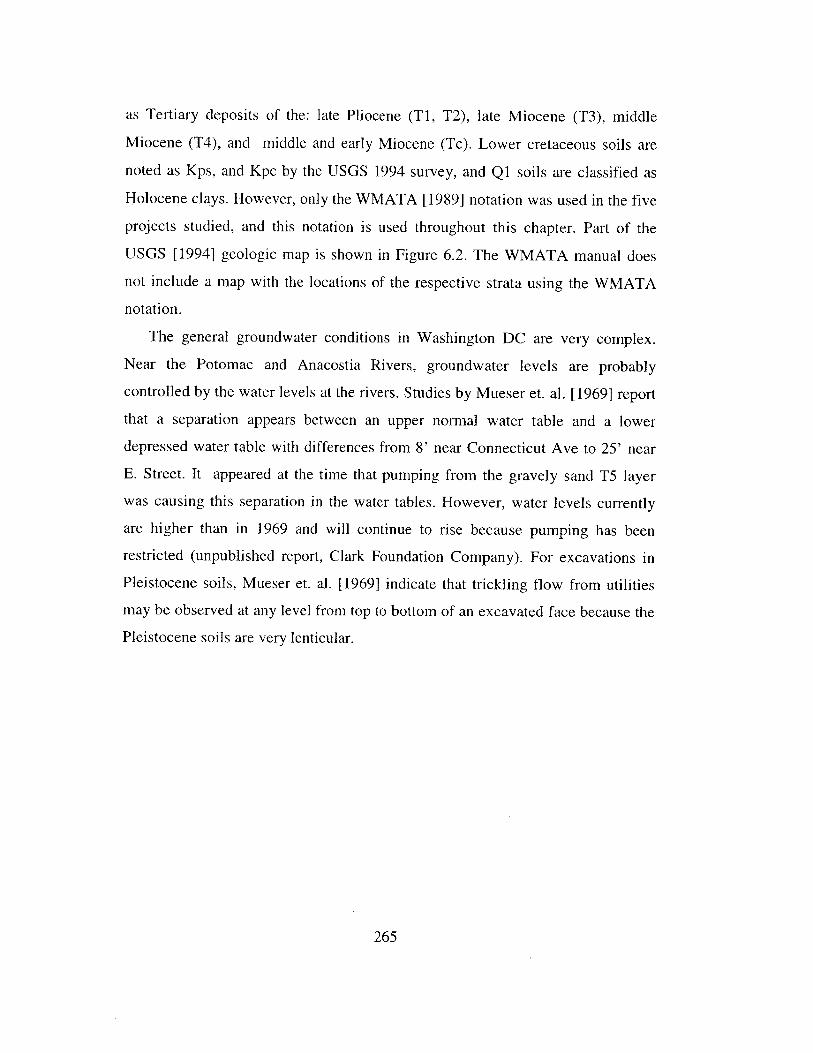
as Tertiary deposits of the: late Pliocene (TI, T2), late Miocene (T3), middle
Miocene (T4), and middle and early Miocene (Tc). Lower cretaceous soils are
noted as Kps, and Kpc by the USGS 1994 survey, and Q1 soils are classified as
Holocene clays. However, only the WMATA [1989] notation was used in the five
projects studied, and this notation is used throughout this chapter. Part of the
USGS [1994] geologic map is shown in Figure 6.2. The WMATA manual does
not include a map with the locations of the respective strata using the WMATA
notation.
The general groundwater conditions in Washington DC are very complex.
Near the Potomac and Anacostia Rivers, groundwater levels are probably
controlled by the water levels at the rivers. Studies by Mueser et. al. [1969] report
that a separation appears between an upper normal water table and a lower
depressed water table with differences from 8' near Connecticut Ave to 25' near
E. Street. It appeared at the time that pumping from the gravely sand T5 layer
was causing this separation in the water tables. However, water levels currently
are higher than in 1969 and will continue to rise because pumping has been
restricted (unpublished report, Clark Foundation Company). For excavations in
Pleistocene soils, Mueser et. al. [1969] indicate that trickling flow from utilities
may be observed at any level from top to bottom of an excavated face because the
Pleistocene soils are very lenticular.
265

39"
3e0
Figure 6.2: "Fall line" and the Coastal Plain (Vroblesky & Fleck, 1991)
266

Table 6.3: Cretaceous strata, WMATA notation,(USGS notation in parentheses)
Stratum Description UnifiedSoil Class
Prim Sec
P1 Plastic clay, generally CH or MH or CL with moisture content nearthe plastic limit containing lignites CH CL
P2 Clay or silty sand with some fairly clean sand, containing lignite andcemented sand layers, classified SC, SM, SP-SM or SP S SP
P3 Extremely hard clayey sand and sandy clay. This is a distinctive
(Kps) material, gray-green in color, varying from CL to MH or SC. In may S SMcases it is difficult to distinguish from the decomposed bedrock fromwhich it is derived. Blow counts are >60 bpf.
P4 Clayey sand, some gravel, scattered cobbles and boulders. This is thelowermost Cretaceous material, apparently regularly above the SM SP
(Kpc) bedrock surface and exhibiting a relatively high permeability andnumerous and erratic oversized rock fragments. It is the very earliestCretaceous deposit laid down by rapidly flowing streams and olderosion surface in the underlying bedrock.
Table 6.4: Pleistocene Terrace deposits, WMATA 1989, (USGS in parentheses)Stratum Description Unified
Soil ClassPrim Sec
TI Stiff to medium stiff light brown or gray or mottled brown-gray silty Len-clay or clayey silt with lenses of brown silty fine sand. In some areas, CL ses
several separate layers of Pleistocene clays have been encountered, CH SMwhich are distinguished by a letter suffix: TIA, TIC, etc. SC
TO Medium stiff to stiff dark gray organic clay with numerous woodfragments, usually found interlensed with stratum T4.
T2 Medium compact to compact brown and red-brown silty clayey fine SM SPto medium sand with trace of gravel and occasional boulders SC SW
T3 Medium compact to compact gray and gray-brown fine to coarse sand Sw SP
(Q3) with some silt and gravel and variable amounts of cobbles and SM GM
boulders.
T4 Medium compact to compact gray and gray-brown fine to mediumsand with some silt and small gravel. Containing lenses of dark gray SM
(Q4) clay, occasionally slightly organic
T5 Compact to very compact gray and gray-brown fine to coarse sandwith some silt and small gravel. Some to trace of silt and variable Sw SP
(Q5) amounts of cobbles and boulders, often concentrated at the base of the SM GM
layer.
267

Table 6.5: Soil properties in Washington DC, for design, (adapted from WMATA
1989).
EffectiveOverconsolidation Shear friction Total Unitstress for Cohesive Strength angle <b' Weight
STRATUM Strata (ksf) (ksf) degrees (pcf)(F) Fill _________ _____28-30 120-130(T) Pleistocene(T1)A &(T1)G Silty Clay 3 to 5 1.5 to 2.5 25 to 28 130
2 to 3,higher near
(T2)B Organic Clay 3.0 to 5.0 surface 25 1300.7 to 0.9
higher near(T1)C & ground(T1)F Silty Clay 1.0 to 2.0 surface 25 130(T1)D Plastic Clay 5.0 to 6.0 2.5 to 3.5 25 130(T1)E Medium Plastic Clay 6.0 2 to 3 25 130(T1)H Plastic Clay 3.0 to 5.0 1.3 to 1.5 25 130(T2) Silty Sand 34 130(T3) Gravely Sand 34 to 38 130(T4) Silty Sand 30 to 34 130(T5) Gravely Sand 32 to 34 130(P) Cretaceous(P1) Plastic Clay North & West of New 4.0 to 5.0 25 130
Jersey Ave 30 to 40Plastic Clay East of New Jersey 2.0 to 5.0 25 130
Ave 24 to 28(P2) Clayey Sand 33 to 36 130(P3) Sandy Clay 30 to 40 4.0 to 6.0 34 130(P4) Gravely Sand 34 to 38 130
268

Q5: (Middle Pliostocene) gravel, sand, silt, and clay, gray to gray brown crudely to well bedded.
Found mainly beneath irregular surface between 40' and 105' in Elevation, Kps: Lower
cretaceous sand, Kpc: Lower Cretaceous Clay, T2: Late Pliocene, gravel, sand, silt, and clay.
Figure 6.3: Geologic map of Washington DC, (USGS 1994)
269

6.3 Measured Performance
Only a limited assessment of slurry wall performance is possible given that
data were available only from five projects, representing a small fraction of the
slurry wall work carried out in Washington DC. Tiebacks were used for bracing in
three of the five projects (WI, W3, W4), and cross-lot bracing in the other two
(both subway stations, W2, W5).
Table 6.6 summarizes the performance of the five excavations. According to
the data, the slurry walls have performed very well, with deformations less than
8H=1 .0" induced by the excavations (though deflections varied widely within the
same project). Individual panel behavior was affected by local variations in
construction and by differing surcharge conditions for adjacent structures.
Table 6.6Summary of slurry wall excavatio performance, Washington DC
Excav.Soil Bracing/ Wall Defl.Type Excav. Depth (ft) Thick 6max 6 vmax Toe Shape
ID Year Project Name Method H D (inch) (inches) (inch) Fix. TypeW1 1991 World Bank Cretac 5-L. TB 60 7 30 0.45 0.4 J II
eous -0.45 IVW2 1995 Petworth Cretac 5-6 CLB 60 12 36 0.75 -- 1 II
Subway eous 100 16Station
W3 1999 Washington Cretac 1,2 L TB & 30 18 36, 0.75 0.3 1 I2000 Convention eous 1 R 48
Center Pleisto -cene 3-L. TB 55 23 36 0.70 I
W4 1990 Metro Center SandC 2-L. TB 31 22 24 0.38 -- ! IIII lay
W5 1973 Federal Sand, 3-Lev CLB 60 36 0.62 -- J IICenter ClayStation
Walls braced by tiebacks either slightly bowed towards the excavation
(Deflection mode: Type II) or showed very little bending above the lowest
bracing level (Type I). The walls in the W2 & W5 projects, where cross lot
bracing was used, deflected in the same bowing Type II mode. Building and
surface settlements were generally smaller than horizontal wall movements,
270

typically less than 0.5". The scatter in the surface settlement data was some times
larger than the actual settlements. In the World Bank Project, slurry wall
settlements had large variations even within adjacent panels. The presence of soft
zones at the base of some panels in combination with large vertical tieback forces
may account for high local settlements in the order of 2".
6.4 Individual Case Studies
6.4.1 Case Study W-1, World Bank
This project involved the construction of a 12-story tower with a 5-level deep
basement, in the World Bank complex at the southwestern corner of 18 th St. N.W
and H St. N.W. Excavation support was provided by a permanent 30"-thick
perimeter slurry wall, keyed into decomposed bedrock, and braced with 4 to 5
levels of permanent tiebacks. Slurry walls were selected in this project in order to
minimize settlements and water seepage. Settlement control was crucial along the
western and southern sides of the site due to the protection of other existing
World Bank buildings (A, D: Fig. 6.4).
The soil profile at the site comprises 28' of sandy clay/ clayey sand (Stratum
I) overlying 13' to 40' of sand and gravel with cobbles and boulders (Stratum II),
9' of sandy clay (Stratum III), 12' of decomposed rock (Stratum IV), and Gneiss
bedrock (Stratum V) (Fig. 6.5). The water table is located approximately 35' to
42' below the ground surface at approx. El. 60'MSL (Mean Sea Level) in stratum
II. Piezometric heads measured in the decomposed rock layer were about 8' to
10' lower than the water table at the same locations.
The lateral earth support system of this project provided very good control of
wall movements and surface settlements (Figs. 6.4, 6.6-6.9). However, the
variation of the measured deflections of slurry wall panels was very large (twice
the actual maximum deflections) (Figs. 6.4 6.6, 6.7). Maximum slurry wall
deflections towards the excavation reached up to 0.45" at the final readings (Fig.
6.5.1.3). Most of the slurry wall deflections occurred after the excavation
progressed below the 3rd level of tiebacks (25 to 30ft deep) as shown in Figures
6.6 and 6.7.
271

The wall bulged in locations were the sandy clay (Stratum III) and the
decomposed bedrock was present and moved back in a location where these
layers were absent (30-May-91: Figs 6.6, & 6.7). In addition, the base of the wall
appears to have translated by as much as 0.2" when the panels were embedded in
decomposed rock. Walls adjacent to buildings moved towards the excavation.
Most slurry wall panels did not show significant settlement or heave but a few
panels settled more than 1.0" (Figs. 6.4, 6.8). It is very interesting that almost
adjacent panels displayed large differences in the magnitudes of settlement. One
panel that was embedded in decomposed rock and moved towards the excavation
settled by as much as 1.9" whereas a panel that was embedded in rock and moved
back into soil moved upwards by 0.6" (Fig. 6.8). Surprisingly there were no
surface settlements observed in locations (8v=-0.2" to 0.1") where the slurry wall
settled measurably along the 18 th Street (8v=1.2" to 1.9") (southeastern section:
Fig. 6.4).
Otherwise, surface settlements were very small at the final stages of
excavation. Although not expected, surface settlement points in the northern
project corners (H Street, 18th and H Street intersection) moved up to 0.6" of
heave at the final excavation grade (Fig. 6.4). This result could be related to the
prestress at these locations.
According to data from tiltmeters building rotations were kept very small,
with the most of the rotations occurring after installation of the 4th level of
tiebacks (9-Apr, 2-May, 91). Building rotations typically ranged from 0.050 and
to 0.07' at monitoring points along the western project side.
Water levels in observation wells during the excavation remained steady
throughout the excavation. However, one piezometer screened in the decomposed
rock showed a 15' local drop (Fig. 6.9). Tieback drilling probably dewatered the
decomposed bedrock at that location, which was isolated from water recharge by
the overlying clay.
272

Note:Heave (-), Settlement (+)
North
Figure 6.4: World Bank (W-1), site, deflections, and settlements
D, 25' 50' 1v
Plan Scale (Feet) W

ELEVATION(feet, ms.)
70 -
ESIMATED FIEELEVATION WI 4SELOW--RADEE LUveI.B 7
ESTIMAED ANPR4 P.00ELEVATI0* wiT *BELOW -GRADM LEVELS I
ELEVATION(eet, mal.)
-70FAPROXIMATE LIMITS OF PROPOSED COMPLEX-*jSOM-4
-6
ia
'4
a
Mir
STRATUM IXSANDY CLAY
STRATUM XL0/r
EoMCxEMOOT
8-7. ExinN GROUND
sURFACE
10
STRATUM Its
EANDY CLAY/CLAYEY SAND
STRATUM U
SANDS AND GRAVELE WITHCOSLES AND BQIJLDERE
R..
e I
-a__
20
91
10
It
00/40e I
17
1 STRATUM;
est-..--"o/c
100/c
Figure 6.5: Typical soil Profile. World Bank
60 1
40-
30-
20.tQ
A
10
80
-50
-40
20
-0
-.rIO-104
-
S
00r STRATUMY3CONEISI.
ISCALE : HORIZONTAL :1 - 40'
VERTICAL: 1' - 10'
=s/v

Eastern Slurry Wall
18th Street N.W. In-I
Inclinometer Deflection(inches)
-I-----Sandy Clay/ t--Clayey Sand 0
Sands andGravels withCobbles andBoulders
GneissBedrock
Future FloorSlabs
(2) Ties El. 46.5 50
40El. 34 5'
--(3) Exc.
-- 28-Mar-91 (Exc)El. 22.5'
I 1-Apr-91 (Ties) - - - L201
2 -May-91 (Exc+Ties) El. 9 10
(10) 3-Jun-91 (Ties) El- 0-- (9) Late May Exc. - - - 0
30"-Slurry Wall
(0) 25-Jan-91
(1) 1 -Feb-91
(2) 8-Feb-91
(3) 21-Feb-91
(5) 22-Apr-91(6) 7-May-91(7) 10-May-91(8) 13-May-91
(9) 30-May-91(10) 3-Jun-91
Building "A" x
North
In-I18th N.W. Street
Figure 6.6: Inclinometer In-1, World Bank (W1).
- -10Gneiss 30"-Slurry WallBedrock Building "A"
9 n-4
(0) 21-Feb-91
5- Mabr-91
(2) 8-Mar-91
(3) 30-Apr-91(4) 1-May-91(5) 28-May-91
(6) 30-May-91
-4. North
Figure 6.7: Inclinometer In-4, World Bank (WI).
275
E
E
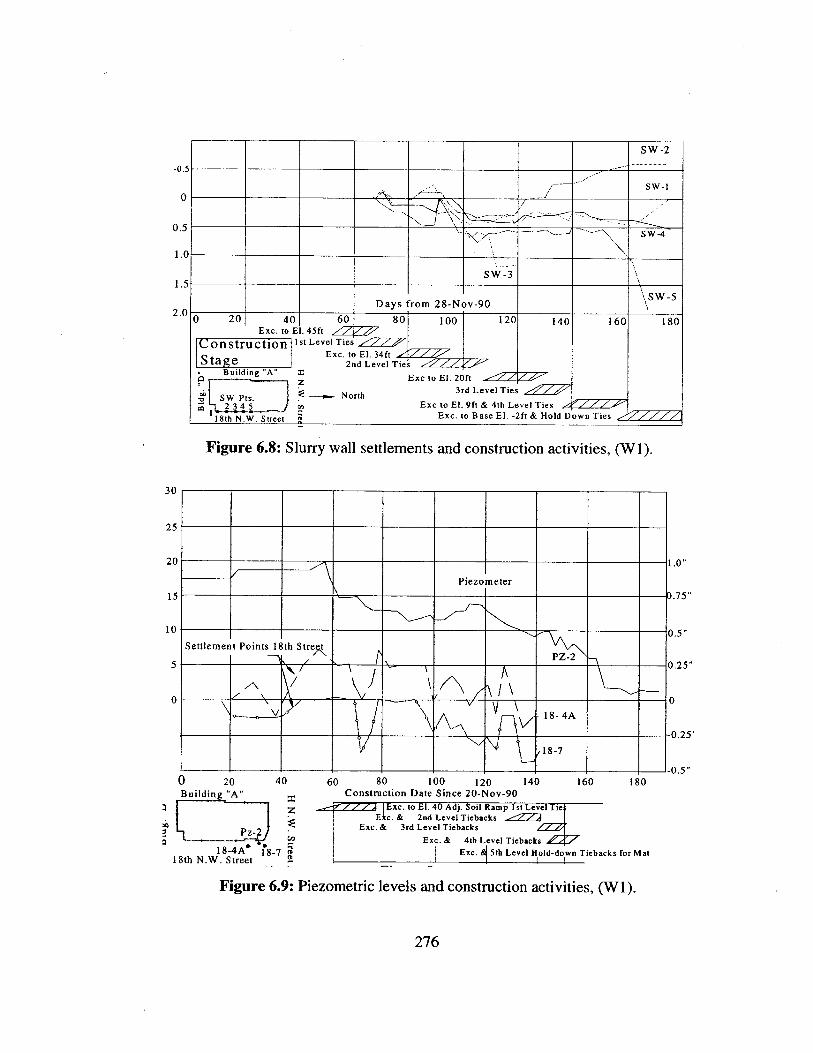
SW -2
.5 -
SW-1
5 - ~ -- SW-4
.0
SW-3.5
S W-5
Days from 28-Nov-900 20 40 60 80 100 120 140 160 180
Exc. to El. 45ft
onstruction 1st Level Ties /////Exc. to El. 34ftStage 2nd Level Ties
Building "A" Exc to El. 20ft
SWPt.-;Not 3rd Level Ties z~2 345 JNrExc to El. 9ft & 4th Level Ties
18th N.W. Street ~Exc. to Base El. -2ft & Hold Down Ties
Figure 6.8: Slurry wall settlements and construction activities, (WI).
60 80 100 120 140 160 180Construction Date Since 20-Nov-90
.-- / / Exc. to El. 40 Adj. Soil Ramp 1st Level Tie-Eic. & 2nd Level Tiebacks .-- '/2
Exc.& 3rd Level TiebacksExc. & 4th Level Tiebacks Z 7
Exc. 5th Level Hold-down Tiebacks for Mat
Figure 6.9: Piezometric levels and construction activities, (W I).
276
-0
0.
2.
30
0

6.4.2 Case Study W2, Petworth Subway Station
The 1100 ft long Petworth Subway station lies 60 ft to 100 ft below New
Hampshire Ave, includes two entrances which are located on the east and west
sides of Georgia Avenue, NW and tie into a passageway leading to the station
(Fig. 6.10). Soil retention consists of a 3.Oft-thick permanent slurry wall with
cross-lot bracing, while in the south service room, crossover box and entrance
soldier beams and lagging wall were used (also with cross-lot bracing). Figure
6.10 also shows the re-routing of New Hampshire Ave. during the three year
construction.
Slurry walls were selected in order to mitigate potential for damage to
buildings along New Hampshire Avenue and to minimize groundwater drawdown
and water inflow into the excavation. Soldier pile and lagging supported a smaller
part of the excavation to the south of the site where large diameter utility lines
crossed. These remained operational throughout the subway construction. The
station was constructed with the cut and cover method.
The site's geology comprised Cretaceous era deposits, but unfortunately a
complete subsurface investigation could not be found in the archived data.
Internal references mentioned that: Clays (P1) and silty-sands (P2) extended 50 ft
to 80 ft to a thin (0 ft to 3 ft) layer of a clay over decomposed to weathered mica-
schist bedrock.
The range of horizontal movements was larger than the magnitude of
movements itself. Maximum slurry wall movements ranged up to 6 = 0.75" (Fig.
6.11, 6.13) towards the excavation, and up to Sw = 0.75" away from the
excavation (W2: Fig. 8). Horizontal soil movements were slightly larger for the
soldier pile and lagging wall than the slurry wall. Soil 22' behind the soldier pile
and lagging wall moved towards the excavation by up to 6 H = 0.75" whereas soil
at the interface of the slurry wall and soldier pile and lagging wall 15' from the
excavation moved by up to 8H = 0.5" towards the excavation (Fig. 6.11).
277

The cross-lot construction sequence clearly affected the bulging wall
deflection modes observed in this project (Figs. 6.11, 6.12, and 6.13). Most slurry
wall panels bulged the most near the current excavation level.
The excavation at the soldier pile and lagging wall faced major leaking
problems in the sandy T2 soils. The dewatering methods used were ineffective,
and construction delays resulted. Minor leaks were observed in many panel joints
in the slurry wall, where Cretaceous P1 and P2 soils dominate. Grouting easily
repaired most leaking joints, except at two panel joints where leaking persisted
even after many grouting efforts (Panel 36W).
SLURRY WALLSO LDERBEAM Panel1
Figure 6.10: Petworth Subway Station site (W2).
278
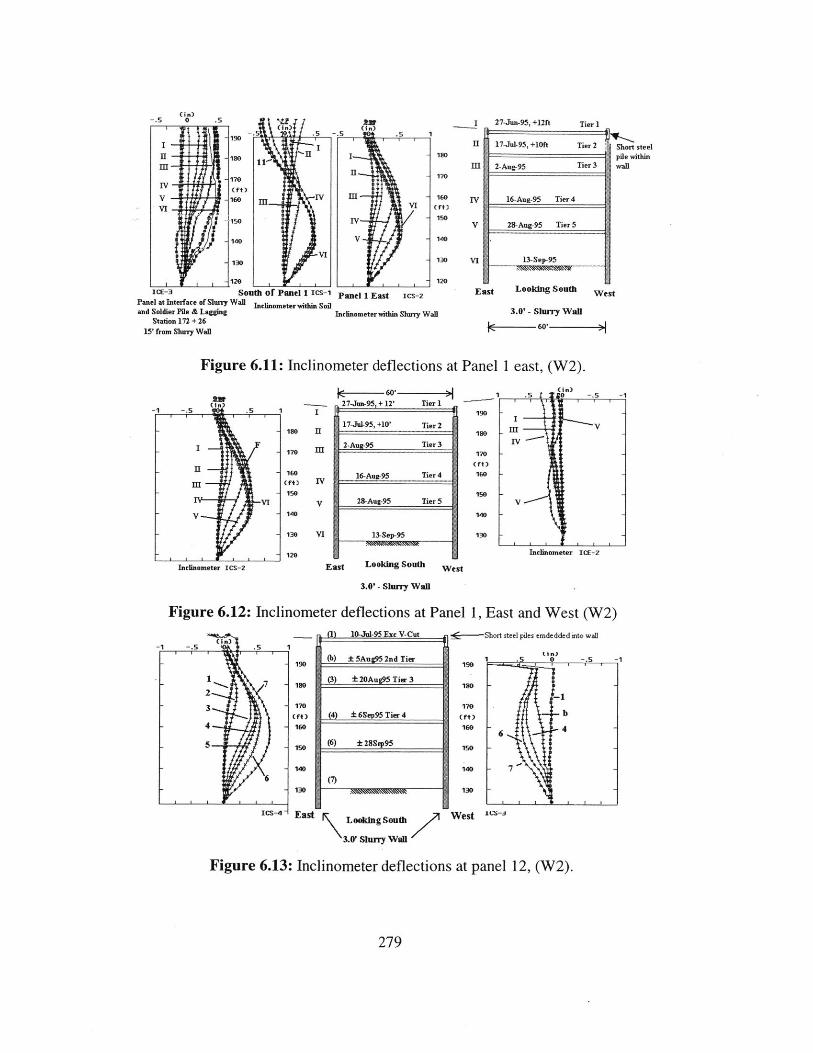
(in)--. 0 . 27-Jun-95,+12ft Tier I
-1% - S .5 -5 .15 1
1 17-Jul-95, +10ft Tier 2 Short steel
pile within11 IH 2Aug95 Tier 3 wall
IM~~~i ~170 11 2Ag9
V - 11 IV I 160 IV 16-Aug-95 Tier 4
V 28-Aug-95 Tier 5
VI.140 VI - 4
130 130 VI 13-Sep-95
120 - 120IcE-3 South of Panel 1 Ics-1 Panel 1 East IcS2 East Looking South West
Panel at Interface of Slurry Wall Inclinometer within Soiland Soldier Pile & Lagging Inclinometer within Slury Wall 3.0' - Slurry Wall
Station 172 +26 60
15' from Slurry Wall
Figure 6.11: Inclinometer deflections at Panel 1 east, (W 2).
c ---....... 27J n-5+)Te-1 -. 5 .5 1 g -.
17-Jul-95, +10' Tier 2-10 H150 _VH
17 l 2-Aug95 Tier 3 10 -T- 170 - - - - - - 7
(Mt)16-Aug-95 Tier 4 160 -
150 150 -VI v 28-Aug-95 Tier 5 y
- yV 140 140
130 VI 13-Sep-95 130
120 Inclinometer ICE-2
Inclinometer Ics-z East Looking South West
3.0' - Slurry Wall
Figure 6.12: Inclinometer deflections at Panel 1, East and West (W2)(1) 10-Jul-95 Exc V-Cut - Short steel piles emdedded into wall
-1 -. 5 .5 1 N n))
(b) ± 5Au 2nd Tier 5 0 -. 5 -1-190 190
7 17 (3) ±20Aug95 Tier 3
2 -
3 - 170170
tEt) 4 ±6Sep95 Tier 4 -- b
4 - 16 1e - 4
5 .1O (6) 128Sep95
- 140 10 7
- 13 -130
I ~~ I RM 'RMIMM
Ics- - East LookingSouth West
3.0' Shury Wall
Figure 6.13: Inclinometer deflections at panel 12, (W2).
279

6.4.3 Case Study W3, Washington Convention Center
The Washington Convention Center project occupies five and one half city
blocks between Mt. Vernon Place NW on the south and N Street on the north and
from 7th Street NW on the east into 9th Street NW on the west, in Washington DC
(Fig. 6.14). The project is at the present time the largest single basement slurry
wall excavation in the United States. The excavation has been partially completed
as of this date (7-Mar-2000), as some portions of the site remain unexcavated.
The excavation site is approximately 1480' long by 500' wide, and encompasses a
493,700 sq. ft. area (Fig. 6.14). At the north the excavation is 55' deep along N
Street, but only 30' deep along the southern side.
Slurry wall panels adjacent to the subway at 7th Street are 3.5'-thick, while at
all other location the wall thickness is 3.0'. This was done in order to minimize
the impact of the excavation on the adjacent subway along 7 th Street. The slurry
walls also provide water cut-off and thus minimize the dewatering efforts that are
required. Temporary bracing for this excavation consists of a mix of tiebacks and
prestressed rakers, depending on location.
Subsurface conditions are typical of north central Washington DC, combining
a Pleistocene terrace deposit, over Cretaceous coastal plain sediments, lying on a
gently slopping bedrock surface at a depth of 90' to 110' across the site.
Three levels of soil tiebacks along the N-Street and the East alley brace the
excavation (Fig. 6.15). Along other locations, one or two levels of tiebacks are
used in combination with a raker, and a raker heel block system (Fig. 6.16).
Adjacent to tunnels, an upper level of tiebacks and a lower level of rakers was
used for temporary support. Two levels of rakers and corner braces will be used at
the re-entrant corner where an entrance structure to the subway will be located.
The raker block is a concrete mass constructed into a depth of 16' below the
excavation base, used for the rakers to transfer the load to (Konstantakos and
Whittle, 2000). One level of tiebacks, and rakers was used in most panels along
Mt. Vernon Pl. NW. where the excavation is approximately 30' deep (Fig. 6.16).
An additional level of tiebacks was installed in deeper sections of the excavation.
280

Currently, the slurry wall excavation at the Washington Convention center has
performed well. Conclusions about the overall performance can not be made
because the excavation has finished partially as of the last date when data was
available tgus,.The data in this report only cover up to the completed excavation
for the northern and southern project sides. In addition, the accuracy of the
available inclinometer data is limited since readings were taken at 5ft intervals
instead of the regular 2ft, while none of the inclinometers extended beneath the
base of the slurry walls.
The largest slurry wall deflection, 8H = 0.7", occurred at the deepest section of
the excavation along N Street, where the wall was braced by three levels of
tiebacks (Fig. 6.15). This deflection was not measured directly but it was
reconstructed from data before and after re-initialization of inclinometers took
place. The wall slightly bent only below the lowest tieback level, and above that
showed very little to no bending. Cantilever movements dominated until the
second tieback level was installed.
The largest horizontal soil movement, 8H =0.75", occurred at the southern side
where the excavation was only 30' deep, braced by an upper level of tiebacks and
a lower level of rakers (Fig. 6.16). The corresponding wall deflection was not
equal to the measured soil deflection because the soil inclinometer extended
deeper than the base of the wall. This clearly shows the limitations of measured
accuracy when inclinometers lack reliable data. Unfortunately, the inclinometers
at that location were damaged before the excavation was completed. Measured
surface and building settlements were too small and inconsistent to report on. The
subway tunnels along next to the excavation 7th Street did not show any
significant settlement.
According to interviews with the field engineer, slurry wall construction did
not face any major difficulties, nor were there any serious leakage problems from
tiebacks or slurry wall joints.
281

-9--- N7th Street N.W.
0 100 200Scale (feet)
1
z
0
L ---- -... ... ... ... ... .. ... ... ...... ....... ..... ..
Figure 6.14: Washington Convention Center (W3), project site.
N. Street N.W.S-198 SW-198
FillPleistoceneTerraceDeposit,
250
7 Kips
0*
CretaceousDeposits
Top ofDecomposedBedrock El. -42ft
Installed 16-Jun-1999Proof Tested 7-Jul-1999
Installed 20-Jul-1999Proof Tested 26-Jul-1999
Installed 14-Aug-1999Proof Tested 26-Aug-1999
24-Sep-1999 Excavationto Subgrade
S-198-N
SW-198
S-198 SW-198Movement Towards the Excavation
1.0 0.
Figure 6.15: Wall and soil deflections at 55'-deep section of WashingtonConvention Center [W3(b)].
282
90 -
80 -
70 -
60 -
040 50
40
V 20
2
203 Kip
275 Kip
30 -
20 -
10 --

Panel 113 Movement (inches)
70 Mt. Vernon Pl. N.W. No -data after S-109S-109 Jitia 7-Apn tr 9 1.0 SW-113Inclinometers 22-Apr-99
SW-113 destroyed 0 1.060
Installed 7-Jun-1999Pleistocene Proof Tested 21-Jun-1999
40 22.9930-Jul-i 999
Kips 2. IM9Kips 2-ull 9 Excavation to
30 Cretaceous Subgrade
Deposits 36'. P3'-Thbick Slurry Wall
20 - 20' N Static20 UTop f i.Heelblock
Decomposed SW-113 S-10910- Bedrock El. -42ft 1
Figure 6.16: Wall and soil deflections at 29'-deep section of Washington
Convention Center, [W3(a)].
6.4.4 Case Study W4, Metro Center II
This project involved the construction of a 3-level deep basement next to a
historic church, which lies 10' from the excavation. A 2.0'ft-thick diaphragm wall
was selected to protect the historic church from excavation induced damage. The
soil profile comprises 1Oft of fill, underlain by sand to clay to about 50ft to 70ft.
Winter et. al. [1991] report that for temporary conditions, the wall was designed
with trapezoidal pressures p = 0.247yH which included a 20% increase over
normally expected pressured to account for the effect of the existing foundation.
The wall was braced by two levels of tiebacks. A typical excavation profile can be
seen in Figure 6.17. Winter et al. [1991] report very small bulging deflection less
than 0.4" (Fig. 6.18).
283

EL 50 Existing Ft
building EL 42.5 EL 42.7
EL 40 -
.--8 - E 3 .
EL 30
EL 38.8
EL 22EL 20 EL 20.8
,,' Tibacks EL 11.8EL 10- - - - - -
Slurry wallT panel
EL 0 EL 0.0 Beyond
EL - 10
EL -12
Figure 6.17: Metro Center II (W4), Washington DC (Winter et al., 1991).Depth (metre)
(a)
-4 -2 '0 2 4 6 8 10 12
Horizontal displacements (mm)
Depth (metre)
0 2 4 6 8 10 12
Horizontal displacements (mm)
Figure 6.18: Wall deflections at Metro Center II (W4), (Winter et al., 1991)
284

6.5 Summary of Wall Deflections for Washington DC slurry wall excavations
Figure 6.19 summarizes the maximum wall deflection data after Clough et. al.
[1989]. Table 6.8 lists the input parameters used to plot Figure 6.19. Most walls
deflected less than 6w/H=0. 1%, with only one project generating movements with
6w/H>0.2%. Wall deflection ratio Sw/H appears to be independent of the system
stiffness factor as defined by Clough et al.[1989].
Figures 6.20 and 6.21 show a statistical summary of final and maximum
inclinometer deflections from 23 inclinometers. Table 6.7 lists the number of
inclinometers per project used to make the statistical summary. Only 6 out of the
70 inclinometers from the Washington Convention Center (W3) were used in
order to avoid excessive bias towards the performance of that project. These
figures can not be generalized since they are drawn from a limited database. Most
inclinometer locations (52.2%) deflected from 0" to 0.5" towards the excavation,
while 34.8% deflected from 0.5" to 1.0". In the database all inclinometers
deflected less than 1.0", and most likely this is not representative of other
projects. There were very small differences in maximum and final wall
deflections that did not show up in the frequency plots.
The average values for maximum and final deflections the same namely
Sw/H= 0.07% ± 0.11% or 8w=0.34" ± 0.38".
Table 6.7: Inclinometers used to derive frequency plots for Washington DC,projects.
ID Project InclinometersW1 World Bank 7W2 Petworth Station 8W3 Washington Covention Center 6W4 Metro Center I 1W5 Federal Center Station 11_ _ 1Total 23
285

I I i 1 1 1 1 1 1 1 111| | lProjects Bracinq(W-1) World Bank (5-Lev. Tiebacks, Keyed into Rock)(W-2) Petworth Subway
Station (5, 6 -Lev Cross-Lot Struts)(W-3) Washington Convention( 1-Lev Ties, 1-L Fakers W-3 (a))
Center (3-Lev, Ties W-3 (b))(W-4) Metro Center il (2-Lev, Tiebacks)(W-5) Federal CenterStation (3-Lev Cross-lot Stru o
-- r - -
10 100
[0.9
0.8
c 0.70.
cc> 0.60w
0.5co~
:3:0.3
-Jx 0.2
0.1
01000 10000
Rakers &Soil Berms
Ties and/orRakers
Ties (Wallkeyed intostiffstratum)
Top/DownConstruction
Cross-LotBracing
System Stiffness= (EI)/(y, h4 avg)
Figure 6.19: Maximum wall deflections for Washington DC projects plotted
according to the Clough 1989 approach.
Table 6.8: Summary of system stiffness input parameters and horizontal
deflections for diaphragm wall excavations in Washington DC.
Note:Modulus of Elasticity: E (psi)=570004 (fe' (psi) => E(psf)= 395.83 1 (fe' (psi) (ACI-8.5.1)
fe' : 28-Day strength of concrete
Moment of Inertia of Uncracked Section = I
I(ft')= (I ft) t 3
12t (ft) = Diaphragm wall thickness
y,= Unit weight of water = 62.4 pcf
286
0
W-3()
-5 - (
Horizontal DeflectionsWall Exc. Vertical (inches)Thick Depth Support Caisson+ Exc. System
Project (ft) (ft) Spacing (ft) fc' (ksi) Other Total Only Stiffnesst H h 8. r toa 8E E1/ya h4
Ec %
Wi World Bank 2.5 53 11 5 0 0.45 0.45 827.2 0.071W2 Petworth Station 3 72 14 5.5 0 0.75 0.75 571.4 0.087
WashingtonW3 (a) Covention Center 3 29 8 5.5 0 0.75 0.75 5358.7 0.216
WashingtonW3(b) Covention Center 3 56 14 5.5 0 0.7 0.7 571.4 0.104W4 Metro Center l 2 31 13 5 0 0.38 0.38 217.1 0.102W5 Federal Center Statio 3 60 16 3.5 0 0.6 0.6 267.2 0.083
-
-
-
1

60-
6052.2Percentages Obtained
50- From 23 Data Inclinometers
Maximum Final.D 40- Mean 0.070 %H 0.070 %H
STD 0.110 %H 0.110 %HE0
30.4030 - E3 Maximum Deflections
N Final Deflections
0 20-.0
13.0
10-10 - 4.3
0-0 11 , 0 C C Nt U i ,q 0 +9 O - N C> 0 C> 0 > 0 +
o 6 o o 6 6 6 6 6 6 6 - o' 0 C~ 2 2 2 2 02 0 0
6 0 - Uj M to D (0 _ 0oR o o 6 6 6 6 6 6 6
Maximum Inclinometer Deflection/ Final Excavation Depth (%)
Figure 6.20: Statistical analysis of maximum and final inclinometer deflectionsas percentages of excavation depth, Washington DC.
60
52.2 52.250--- Percentages Obtained
From 23 Data Inclinometer Points
E 40-- um Final034.8 34.8 Mean 0.337" 0.337"4.83,STD 0.380" 0.380"
30-EMaximum Deflections
0 0 Final Deflections
em20-C
a 108.78.7
4.34.3
0o qD 0to 0 11O 0 LO 0 C +
0 6 ) 6 - C~i Ci C6~ cvi Nr It C
0o 0 0 0 0) 0 U0 0 0O 0 U0 0
O C0 0 -1- - N (i U,
Inclinometer Deflection Range (inches)
Figure 6.21: Statistical analysis of maximum and final inclinometer deflections
for slurry wall excavations in Washington DC.
287

6.6 Special observations
Table 6.9 summarizes the special observations made from three of the five
projects in Washington DC. Slurry wall construction in these projects did not face
any unexpected difficulties. Occasionally, excess concrete had to be chipped
away.
Small leakage was observed through some tieback holes and in some joints. In
the World Bank project (WI) a panel near a re-entrant corner was not cleaned
properly and as a result a large soil pocket formed in the panel (Fig. 6.23). When
this pocket was cleaned it was large enough to fit a single person. Surprisingly,
there was very little water infiltration through the open hole at that time. It is most
likely that a local zone of low permeability material restricted the water inflow
through the open hole.
On the other hand, one panel joint in the Petworth Subway Station, leaked
repeatedly despite many sealing efforts. In the same project, a soldier pile and
wood lagging also faced serious leakage and caused delays in construction
Table 6.9: Special observations in Washington DC slurry wall excavations
- - Cave-ins Other SpecialCL CL CU C
Job Year Soil Profile 4> 0 . *E Reported ObservationsPoor cleaning in one panelresulted in a large soil
Sand and pocket, which whenClay, with cleaned was large enough
(W1) gravel and to fit a person. Small leaksWorld Bank 1991 cobbles 2.5 65 18 1.1 no cave-ins though tiebacks.
Excess concrete had to bechipped in many locations.One panel joint was veryhard to seal despite many
grouting efforts. Smallexcess concrete overpour
of 2% was a majorsuccess.The slurry wall
(W2) Lower leaked far less than aPetworth Cretaceous soldier pile and woodSubway sands and one cave-in lagging wall for the sameStation 1995 clays, Kps 1.75 75 -98 25 - mentioned subway
Cretaceous &(W3) Pleistocene, none mentionedWashington Gravel, fromConvention 1999, sands, silt interviewing field Small leaks throughCenter 2000 and clay 2.5 54 25 engineers tiebacks.
288

(A) (B)
(C) (D)
Figure 6.22: Large void at a slurry wall panel due to poor cleaning (A) Large
void, (B) A person inside the void, (C) Water leaking through the void,
(D) Distorted panel reinforcement
289

6.7 Summary
The five slurry wall excavations in Washington DC have performed very well,
as the excavation induced deformations were small. Maximum wall deflections
did not exceed 1.0" and were typically in the order of 0.5" to 0.75". Wall
deflections varied a lot even within the same project, since in some panels in the
same job deflected back into the retained soil by as much as other panels deflected
towards the excavation. Walls subjected to building surcharge deflected in a
bowing mode (Type II), whereas walls not subject to building surcharge tended
not to bow.
Measured building and surface settlements were generally smaller than wall
deflections. Settlement of individual slurry wall panels depends on construction or
local soil variations (like softer soil zones at the bottom of the wall).
Small water leakage or dampness was occasionally observed through panel
joints or tieback holes. In most cases, grouting easily repaired leakage through
panel joints. Other for utilities buried in shallow soil, slurry wall construction in
the studied projects did not face any major difficulties.
The major lesson learned from Washington DC projects is that when
deformations caused by the excavation are very small, individual panel behavior
can be affected by local details in construction, soil profile, and adjacent
surcharge loading.
290

Chapter 7San Francisco, Other US. Projects, Review of Existing Literature
291

292

Chapter 7San Francisco, Other US. Projects, Review of Existing Literature
7.1 Scope of this Chapter
This chapter discusses the performance of slurry wall excavations in cities
other than Boston, Chicago, and Washington DC. Only one of these projects,
Yerba Buena Tower (S9, Konstantakos & Whittle, 2000) in San Francisco,
represents a new case study. Information for the rest of the projects has been
obtained from the published literature. The list of these projects can be seen in
Table 7.1. Figure 7.1 shows the maximum wall deflections from these projects
plotted as a function of system stiffness as proposed by Clough et al. [1989].
Table 7.2 summarizes the input parameters used to plot Figure 7.1. The majority
of the projects plotted beneath 6 H/H=0.3%, and the ratio 6H/H decreases slightly
with increased system stiffness. However, the system stiffness does not seem a
sensitive factor for the measured final deflections.
293

Table 7.1: List of San Francisco and Other Projects
Vertical Horizontal Factor ofWall Exc. Support Deflections (inches) Safety
Thick Depth Spacing tc - xc. System a inst Basal1Project (ft) (ft) (ft) (ksi) Other Total Only Stiffness Heave
t H h - Sfler 8.w SE, El/7 h4 6EUH % FS
San FranciscoS1 Security National Bank 3 48.5 11 3 0 0.9 0.9 1107.2 0.155 >2S2 Embacardero Bart Zone 1 3.5 70 10 3 0 0.3 0.3 2574.2 0.036 >2S3 Embacardero Bart Zone 2 3.5 70 10 3 0 0.4 0.4 2574.2 0.048 >2S4 Embarcadero Bart Zone 3 3.5 70 10 3 0 0.5 0.5 2574.2 0.060 >2S5 Embarcadero Bart Zone 4 3.5 70 10 3 0 1.1 1.1 2574.2 0.131 1.8S6 Civic Center Bart Station 3 78 11 3 0 1.2 1.2 1107.2 0.128S7 One Market Plaza 2.5 36 10 3 0 4 4 938.1 0.926 1.7S8 China Basin Pump Plant 3 64 14.5 3 0 1.4 1.4 366.7 0.182 >2S9 Yerba Buena Tower 3 66 14.5 5 0 0.8 0.8 473.4 0.101 >2.4S10 Islais Contract E 3.333 45 20 4.5 o 1.2 1.2 170.2 0.222SI MUNI Metro Turnback 3 36 10 4.5 0 2.3 2.3 1985.4 0.529S12 Southern Pacific 2.5 37 20 3 0 4.0 4.0 58.6 0.901
New YorkNI World Trade Center 3 70 17 3 0 2.88 2.88 194.1 0.343
.ArkansasP1 Wilbur Mills. D. Dam 3-T 79 49 5 0 0.85 0.85 356.5 0.090
BostonP2 Harvard Square Station 3 38.5 12 4.5 0 0.45 0.45 957.5 0.097
OregonP3 Bonnevile Navigation Lock 3 50 12 4.5 0 -l.2 -1.2 957.5 -0.200
Note: TB -Tiebacks, CLB - Cross-Lot Bracing, TD - Top/down, R - Rakers, SB-Soil Berms, CB - Corner Bracing, IB-Internal Bracing, PC - Precast, PT-PostTensioned, SP - Soldier Piles
294
Project Authors
S9 Konstantakos & Whittle, 2000
S1-S8 Clough and Buchignani, 1981
Sli1 Adams and Robinson, 1996
SlO Koutsoftas et al., 2000
NI Saxena, 1974
P1 Berger and Tryon, 1999
P2 Hansmire et al., 1989
S12 Clough, 1975
P3 Munger et al., 1990

I
1
0.9
0.8
0.7
0.
0 0.5
0.4
j 0.
-L 0.3C
0.120
-0.1
-0.2
-0.3
S12 S
XSi 1
<NI
5I10 S8
P2 5- - -- - - - --- --- - - - - - P'i g se - 1
S2E X XS4
P3
100 100010
eSiUS2aS3x S4
0 S5US6
358ZS9OsloMS11OS12*N1op'* P2oP3
10000
System Stiffness= El/ 7 .h4
Cross Lot Bracing Internal Bracing C Tiebacks Kydinto rock
Figure 7.1: Maximum wall deflections for San Francisco and other diaphragmwall excavations plotted according to the Clough et al. (1989).
Table 7.2: Summary system stiffness input parameters for various projects.Vertical Horizontal Factor of
Wall Exc. Support Deflections (inches) SafetyThick Depth Spacing tc' xc- System against Basal
Project (ft) (ft) (ft) (ksi) Other Total Only Stiffness Heavet H h S.er Sa 4 EI/y h 5
EC/H % FSSan Francisco
S1 Security National Bank 3 48.5 11 3 0 0.9 0.9 1107.2 0.155 >2S2 Embacardero Bart Zone 1 3.5 70 10 3 0 0.3 0.3 2574.2 0.036 >2S3 Embacardero Bart Zone 2 3.5 70 10 3 0 0.4 0.4 2574.2 0.048 >2S4 Embarcadero Bart Zone 3 3.5 70 10 3 0 0.5 0.5 2574.2 0.060 >2S5 Embarcadero Bart Zone 4 3.5 70 10 3 0 1.1 1.1 2574.2 0.131 1.8S6 Civic Center Bart Station 3 78 11 3 0 1.2 1.2 1107.2 0.128S7 One Market Plaza 2.5 36 10 3 0 4 4 938.1 0.926 1.7S8 China Basin Pump Plant 3 64 14.5 3 0 1.4 1.4 366.7 0.182 >2S9 Yerba Buena Tower 3 66 14.5 5 0 0.8 0.8 473.4 0.101 >2.4SIO Islais Contract E 3.333 45 20 4.5 0 1.2 1.2 170.2 0.222SiI MUNI Metro Turnback 3 36 10 4.5 0 2.3 2.3 1985.4 0.529S12 Southern Pacific 2.5 37 20 3 0 4.0 4.0 58.6 0.901
New YorkNI World Trade Center 3 70 17 3 0 2.88 2.88 194.1 0.343
Arkansas IP1 Wilbur Mills. D. Dam 3-T 79 49 5 0 0.85 0.85 356.5 0.090
Boston IIP2 Harvard Square Station 3 38.5 12 4.5 0 0.45 0.45 957.5 0.097
,Oregon I IP3 Bonnevile Navigation Lock 3 50 12 4.5 0 -1.2 -1.2 957.5 -0.200
295
0
1I

7.2 San Francisco
Clough and Buchignani [1981] carried out a major review of slurry wall
excavations in San Francisco. The local slurry wall excavation practice was
dominated by soldier pile and tremie concrete walls. The s;oil conditions iin ihese
projects vary from sand to deep soft clay, where basal stability is a major design
issue.
The San Francisco Bay Area is in the California Coastal Range Province, a
region characterized by northwest-trending ridges and valleys that generally
parallel the major geologic structures such as the San Andreas and Hayward fault
systems. The Bay Area bedrock is composed of highly consolidated, tectonically
deformed, sedimentary, volcanic, and metamorphic rocks of the Franciscan
assemblage. Franciscan rocks are closely associated with large bodies of
serpentine. The Franciscan rocks usually consist of sheared shale and sandstone,
with isolated masses of other rock types that are referred to as melagne.
There are three major active faults in the San Francisco area: San Andreas,
Hayward, and Cavaleras faults. The closest of these faults to the site (8.5 miles) is
the San Andreas fault which is capable of Richter scale 7 devastating earthquakes,
thus seismic loading is a major consideration in design.
In the eastern part of the city, soft Bay Mud soils dominate, while sands are
present further inside. The general soil profile in eastern San Francisco consists
of: a) 20' of Rubble Fill, b) 50' Recent Bay Mud with Undrained shear strength
increasing linearly with depth from su = 0.6 ksf at the top to su = 1.25 ksf at the
base of the layer, c) a variable thickness dense sand layer, d) and a variable
thickness Old Bay Mud. The Recent Bay Mud thickness increases from 0' at
2200' from the Bay to 100 ft near the Bay in the vicinity of Market Street (Fig.
7.2). Other for the high water table the sands do not create any other difficulties.
296

7.2.1 Reported Performance of Excavations in San Francisco
Clough and Buchignani [1981] report the following regarding the slurry wall
excavations that they have studied:
1-) No problems were associated with wall movements or street settlements
where slurry walls were used in the Bay area.
2) Wall movements associated with slurry walls have been relatively small
although the system stiffnesses were similar to those used in sheet pile
systems.
3) Lack of problems with movements were attributed to: a) the low level of
ground disturbance during slurry wall installation; b) the ability of the
slurry wall to cut off water flow during the excavation; c) the intimate
contact created between the soil and the slurry wall by tremie concrete
pressure.
4) Leakage: minor amounts of leakage occurred through panel joints in
almost all cases below the water table.
The walls deflected in a bowing shape in all the cases for which Clough and
Buchignani [1981] reported deflection patterns (Fig. 7.3). The largest wall
deflections occurred in the 36'-deep One Market Plaza project, reaching 6 H =
4.0" slightly below the excavation base. In this project, only one level of internal
braces was used in combination with 25'-deep soil berms adjacent to the wall
face. Deflections reached 6 H = 3.0" when the excavation base was reached at the
center of the site, with an additional 6 H = 1.0" movement caused by the removal
of the soil berm. The braces where effective at restricting movements at the top of
the wall but the soil berm was not able to restrict deformations since the Recent
Bay Mud is particularly soft at the upper 25'.
In the Islais Creek Contract E (Adams, and Robinson, 1996), a jet grout kicker
slab was constructed below the final grade before any excavation took place (Fig.
7.4). The SPTC wall was pushed back by the grouting operations for the kicker
slab installation. The kicker slab was effective in restricting movements as the
297

wall deformed primarily by bending between the lowest strut and the kicker slab.
All soldier piles were keyed into the underlying rock at a depth of 100'.
It is interesting to note that the outer soldier piles of the first constructed
panels showed considerable axial bending abou the we-ak axs during concreting,
and in some cases broke out of their restraints at the guide walls. Inclinometers
that were attached on the soldier piles indicated that the piles had deflected at
their bases initial position by as much as 4" at the middle of the Bay Mud. It was
believed that this was caused by the unbalanced pressures between the concrete
tremie and the soil acting on the weak axis of the piles.
In the 42'-deep MUNI Metro Tumback project (Koutsoftas et al, 2000), the
tremied part of the SPTC wall extended to 66' beneath the surface, and the soldier
piles extended to 135'. The 3 levels of bracing effectively restricted deformations
above the excavation base. However, deformations caused by the excavation were
larger beneath the base of excavation, reaching 8H =2.3" near the base of the
concreted part of the wall (Fig. 7.5). The net effect of concreting and pile driving
construction caused soil to move away from the excavation by 1.1". This suggests
that the pressures from the concrete tremie are larger than those exerted by the
soft Bay Mud.
298

Figure 7.2: Map of downtown San Francisco, and Yerba Buena Tower (S9).
299
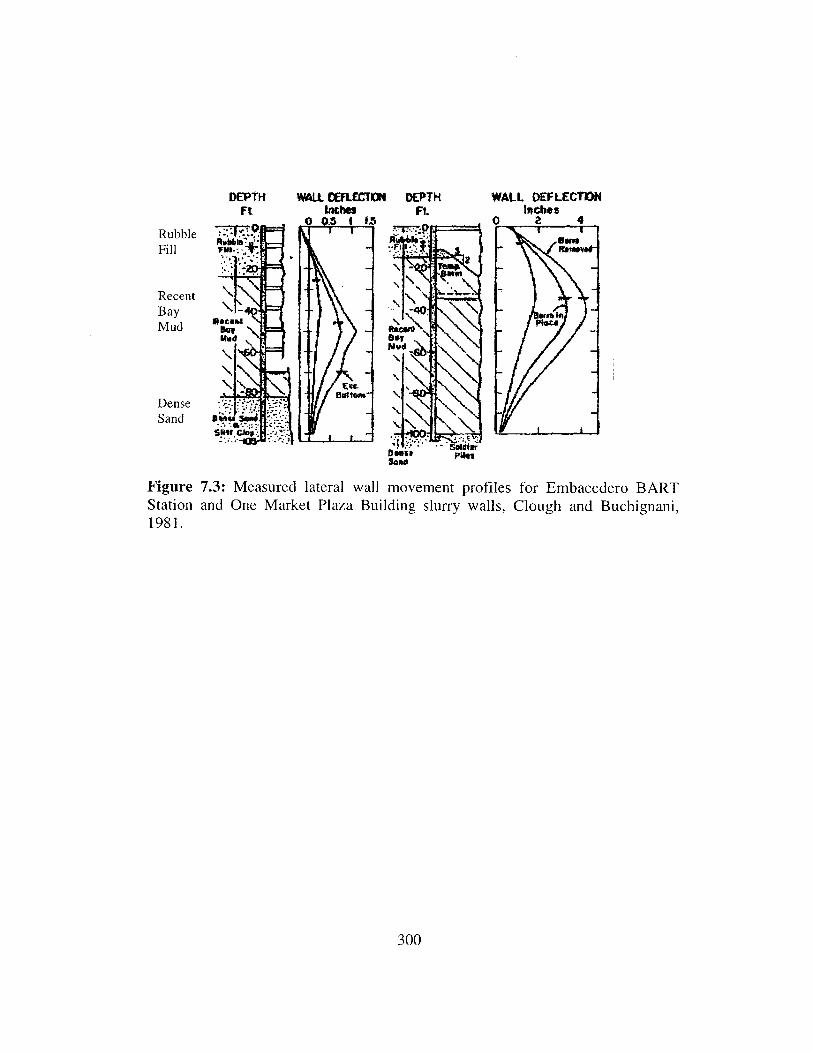
DEPTH WALL WELECTIONFt Iaches
RubbleFill
RecentBayMud
DenseSand
DEPTHFt.
WALL DEFLECTIONfiches
0 C% 4
Figure 7.3: Measured lateral wall movement profiles for Embacedero BARTStation and One Market Plaza Building slurry walls, Clough and Buchignani,1981.
300

Islais Creek, inclinometer I-1
Deflction (in)
-1.6
-0-5 0 015
Cumulative Deflection - Direction A
Initial
4 .
3 Nov 94
2 Dec 94
4 Ian 95
4--t 9 Mar 95
--C 14 Mar 95
3-c- Excavation to 444 Depth- Excavation to 10-ft DepthLevl I Bracing Compkted
- Excavation to 22-ft DepthLevel 2 Bracing Completed
29 Mar 95 - Fxcavation to 35-ft Depth
4 Apr 95 - Excavaion to 42-4 Depth30 Apr 95 - Excavaion CompWe
21 Apr9 - Invert Slab aced
Reference Elevaon 0.66 ft
Figure 7.4: Islais Contract E, (Adams and Robison, 1996).
301
1.5.
-20
-40
0
S-60
-100
-20
-40
-0
40
-100
I.$

-gff -7iwomrlr --
L( R DEFORMATIONSED3F. HINlES LATE-AL DEFORMATIONSED1 T ONNDES WL
AM LML? T AnVOSE V C dl
T , nh a4os C
10 AFUBI*LC --1w-
UU
AiA
EXCAVARMO
Figure 7.5: Deformations measured at Muni Turnback project (Koutsoftas et al.
2000).
7.2.2 Case Study C9, Yerba Buena Tower
The Yerba Buena Tower (S9) (or CB-1 Tower) is the only known recent
project in the city to be constructed as a standard reinforced concrete diaphragm
wall without soldier piles. The project is located on the south side of Market
Street between Third and Fourth Streets, in San Francisco (Fig. 7.2). The
excavation encompasses a flat area of 205' by 210' in dimension, where a 7-level,
66'-deep basement has been constructed (Fig. 7.6). The construction of the 39-
floor tower was not completed as of 2-Feb-2000, but the base of the excavation
has been reached and the basement floors have been constructed.
Slurry walls were selected for temporary and permanent support of the
excavation, mainly because important adjacent structures (BART and MUNI
tunnels) are located beneath Market Street to the north of the project (Fig. 7.8).
The Marriott Hotel is located to the west of the project and it includes two
underground parking levels. A six story brick building with one basement level
302
LATERAL DEFORMATIONk, INCHES LATERAL DEFORMATIONS, INCHES

(735 Market Street) is located along the northeastern project border and a two-
story former PG&E substation, is located along the southern project side. Figure
7.6 shows the site plan.
A general subsurface profile can be seen in Figure 7.7. The static groundwater
table is located 36 ft beneath the surface. The general subsurface profile at the site
consists of:
a) 4 ft-15ft of miscellaneous fill.
b) 5 ft-14 ft dune sand.
c) Thin 3 ft to 5 ft-thick dark brown marsh deposit (loose to medium stiff to
stiff, silty clay to clayey silt, trace sand and gravel).
d) 15 ft to 17ft of medium dense to dense clayey sand layer with interbedded
sandy clay lenses.
e) 45 ft to 60 ft-thick dense to very silty sand.
f) 30 ft to 50 ft-thick (at 90 ft to 143 ft depth) Old Bay Clay (OBC). This
clay is stiff, slightly overconsolidated, moderately compressible, with high
plasticity.
g) Dense to very dense silty sand interbedded with very stiff to hard clay
lenses.
h) Franciscan bedrock underlies the site at about 230 ft depth.
Slurry walls 3'-thick, approximately 102' deep, embedded a minimum of 10'
into the Old Bay Clay were used to form the deep basement walls. The base of the
excavation reached from El. -32 ft to El. -36ft depending on location
(approximate depth of 65ft). Internal bracing was used to support the northern
side of the project since tiebacks were not possible (obstructed by BART and
MUNI tunnels). Temporary tiebacks braced part of the eastern, western, and the
whole of the southern slurry walls, with the fixed length installed within the silty
sand layer. Typical tieback lock-off loads were about 100 kips. Preloaded inclined
rakers, installed within soil berms provided the lowest level of support. Four
levels of tiebacks were used along Stevenson Street, while one level of tiebacks
was used along the Marriott Hotel. Bracing plans can also be seen in Figure 7.6.303

The slurry wall along Marriott was constructed from El. Oft (surface at El. 32ft)
and a concrete wall extending to the surface was thereafter constructed.
The excavation performed well, as deflections and settlements were kept to
moderate values. Deformations in this job occurred mostly below the base of the
excavation, since the internal bracing was effective in restricting deflections
above the excavation base. Maximum horizontal soil movements according to
inclinometers ranged up to 6 H=0.85" along Market Street at 5.5' from the
excavation, where BART & MUNI tunnels run under (Fig. 7.8). At 22.5' from the
excavation the maximum horizontal soil movement decreased to 6H=0.75".
When the excavation base was reached, walls along Market Street deflected
the below the excavation base. The embedded portion of the wall simply
translated with little to no signs of bending (12-Aug-99: Fig. 7.8). Thereafter, wall
deflections increased as basement floor construction progressed.
Adjacent points along the Marriott Hotel heaved by up to 1.2", while points
along Stevenson Streets and 735 Market Street building settled by as much as
1.8". The majority of the settlement at the 735 Market Street building occurred
before any excavation took place and was probably caused by slurry wall
construction, and fill sliding under the guidewalls. Surprisingly, one point 57'
away from the excavation settled by 6 v=1.55" most likely most likely because of
tieback disturbance (Konstantakos and Whittle, 2000, S9). Surface and building
settlements ranged from Sv/V=+0.2% to 6v/V=-0.15% (heave), and almost no
movement occurred more than 60' from the excavation (Fig. 7.10). Along Market
Street settlements were smaller reaching 6 v=0.85" (Fig. 7.9). Before the
excavation base was reached, settlements at Market Street were in the order of
6 v=0.2", but they increased as wall movements increased during basement floor
construction.
Inclinometers indicated that slurry wall construction caused larger soil
movements in the upper 10' of the fill layer (SH=2.7"). Sliding of the fill under the
guidewalls probably caused these deformations. Horizontal soil movements that
304

were caused by slurry wall construction were almost constant for the rest of the
wall depth (8v=0.1"-0.2 ").
Market Street'" I-
. 2 10. 1 A
4"
--2
hMaruti 21
TiIelweBasenent
A 21
I- A!'
Proj.North
A North
(b) Lev. 1
ill a
toi A 41-422S H1i-
1,3
4 r0 10 25 50 100
Scale (feet)
41 725-731 And735 Alarket Strvut
Buildings
42-6+4 ZZZ
4f12
az Former PG&E SubS Li4t U u iling
(a) Site plan
(c) Lev. 2 (d) Lev. 3
Figure 7.6: Yerba Buena Tower (S9): a) site, b) level I bracing at El. 18ft,
c) level 2 bracing at El. -5 ft, and d) level 3 bracing (rakers) at El -19.75ft,
surface at approx. El. 32ft, excavation base at El. -32 ft to El. -36 ft, (SFCD).
305
7-
4

40 -
Market Street
20- L
o-4
Figure 7.7: Generalized soil profile, Yerba Buena Tower (S9).
ON
Former PG&E -40
Substation
TR5
-20
- SANO wit SILTKip - SM
?
Y lenses (SC)
-- 20
-4040
-60KI
-20-
U-
-40-
LU-j
-60-
-80-
-100-
-120-

Movement Towards the Excavation (inches)0 0.6 0 0.5 1.0 1.5 2.0
1-4 1-2 1-4 1 1
Fill Silty Top of Slurry WallSand Bracing El. +18
20 withdebris
Sandirsh- Deposit
0 clayey Bracing El. -5' 27-Apr-99 BaselineSand Reading
-16-Dec-99
Bracing El. -19'-9" Following
-20 -'- 4-Jan-99 Level I-2'- Bracing Str1
2n FollowingS Sand 4-a-9 Level 2
-40 -- BART with Bracing StrTUNNEL 10' Min.
- _ Excavation- - -12-Mar-99 Approx.
3'-Thick El. -22ft
-60 Slurry Wall Excavation12-Aug-99 Approx.
\ El. -36ft
---- 29-Apr-99
-80 -ld Bya 12-Aug-99
-- After- - -29-Nov-99 Removal of
- 3' Level I
-100 -- - - raci ng
16'
Figure 7.8: Inclinometers 1-2 & 1-4 at Market Street, Yerba Buena Tower (S9)
2.8

DateSep- Oct- Nov- Dec- Jan- Feb- Mar- Apr- May- Jun- Jul- Aug- Sep- Oct- Nov- Dec-98 98 98 98 99 99 99 99 99 99 99 99 99 99 99 99
-0.2
-0.1
0 Rn tU) 0.1
c 0.2
c 0.3
S0.4--
0.5CI)
-SS-50.6
-a- SS-100.7
0.8AA AAA
Figure 7.9: Settlements vs. time for points at Market Street, (S9).
Distance from the Excavation/Excavation Depth
0 0.5 1.5 2 2.5 3
-0.2
-0.15 A
'0 -0.1
S-0.05
A AA
c X O
CO 0 -00 A 0 0) 0 & A
0.05
E 0.10.15
0.15 0 735 Market Street
X Market Street0.2 a Marriott
0.25
Figure 7.10: Maximum settlements/excavation depth (%) vs. distance from
excavation/excavation depth, (S9).
308
1

7.2.3 Summary of San Francisco Experience
Small deformations have been measured in excavations supported by
diaphragm walls in San Francisco. Basal stability is very important in these jobs
since the dominant Bay Mud Clay is very soft. The factor of safety against basal
heave for the studied San Francisco projects was generally higher than 2 (FS=2.4
for Yerba Buena, S9). The soft Bay Mud causes the majority of the deformations
to occur beneath the base of the excavation even when very deep soldier piles
have been used. The pressure from the concrete tremie tends to push back the soft
Bay Mud away from the excavation. Thus, in some cases, slurry wall construction
partially counterbalances the deflections induced by the excavation.
7.3 Other Projects in the US.
The World Trade Center (Saxena, 1974), New York, is one of the deepest
early diaphragm wall projects in the US. The slurry wall was keyed into bedrock
or hardpan by 8'. Six levels of rock anchors braced the excavation in most
locations except at a section adjacent to a subway tunnel where only four levels
were used. The wall cantilevered up to 6" before the first bracing level was
installed, and was thereafter pushed back into the soil by up to 2.4" when all
anchors were installed. Only, at the section adjacent to the subway did the wall
moved towards the excavation (2.4") in a cantilevering mode. In that location, the
first anchor level was installed under the subway, 35' below the surface.
The Bonneville Navigation lock (Hanshmire et al., 1989) used a temporary
slurry wall keyed into diabase bedrock by 10' more or less, and braced by four
levels of tiebacks. The diaphragm wall in this project was also pushed back into
the retained soil by the large tieback forces that were applied.
Special attention must be given to the 84-ft-deep excavation for the Wilbur D.
Mills Dam in Arkansas (Berger and Tryon, 1999). Huge T-diaphragm wall with
9' long panels, 3'-thick at the face, and with a web 14'-long and 3'-thick, stem
were used to form the headrace and tailrace channel training walls and a portion
of the powerhouse retaining walls for the dam. The headrace and tailrace channel
309

walls were braced by a single level deadman anchor system with loads from 300
kips to 1866 kips. Soils at the site horizontally bedded with the upper 55ft
consisting of dense sand, underlain by 10ft of intermediate clay, 15ft of dense
sand, 10ft of intermediate clay, and 20 ft of dense sand, over tertiary clay. The T-
panels were embedded by 49' since only one bracing level was used and water
levels between the retained soil and the channel can vary significantly. The T-wall
slightly curved towards the excavation by up to 0.85".
310

Chapter 8Summary Measured Performance of Slurry Walls
311

312

Chapter 8Summary Measured Performance of Slurry Walls
8.1 Introduction
This chapter evaluates the measured performance of the slurry wall projects
presented in chapters 4 through 7. The evaluation focuses primarily on
inclinometer deflections for comparison of projects since these are both widely
available and more reliable and available than other measured data. Settlements
were not available or reliable for all jobs and therefore extensive conclusions can
not be drawn from them. The exception is Boston where settlement data have
been extensively recorded and archived.
The case studies have been divided into four categories:
I) Floating walls: When the toe of the wall is embedded within a soft
stratum. Most of these projects were supported using tieback anchors,
and/or in combination with rakers.
II) Keyed, tieback walls: Cases where the toe of the wall is embedded
into a stiff stratum like glacial till or bedrock, and the wall is braced
tiebacks or rock anchors.
III) Top/Down (Up/Down): The basement floors are constructed as the
excavation progresses (Thesis section 2.3.3). In all cases the slurry
wall extended into a stiff stratum.
IV) Cross-Lot, Internally braced walls: Cross-lot excavations are
typically braced by preloaded large diameter steel pipes spanning
across opposite walls, in narrow excavations (<120ft). For wider
excavations, the bracing usually is provided by corner strut systems.
The site layout determines the arrangement of the cross-lot or the
internal braces. The walls in most projects extend into a stiff stratum.
313

8.2 Measured performance of floating slurry walls
Table 8.1 lists the floating excavations studied in this thesis. Profiles of these
excavations can be seen in the previous chapters. These excavations are relatively
shallow, with most 35'-deep and supported by two or three levels of bracing.
Thickness of these diaphragm walls ranges from 2' to 2.5', and all of them are
embedded into clay. In Chicago, the designs called for the walls to extend by a
minimum of 5' into a stiff clay stratum (1.0 tsf to 4.0 tsf) that underlies softer
clays and fills, at 50' to 55' beneath the surface. In Boston, the designs aim to
extend the diaphragm walls into either the desiccated clay crust, or in sand lenses
between the crust and the lower BBC. Tiebacks were the preferred bracing type
for these excavations, but some projects used rakers.
Table 8.1: Floating slurry wall excavations
Excavation SlurryBracing/ Exc. Wall Defl.
Soil Excavation Depth Thick. SHmax 8Vmax ShapeID Year Project Name Type Method (ft) (inches) (inches) (Inch) Type Fig.
BostonB3 1982 State A* 2 Levels TB, R, 27 24 1.25 1.2 1,11 4.14
Transportation Corner B 36building
B6 1985 One Memorial A* 2 Levels TB 30 24 1.3 1.2 I 4.21Drive Building
B7 1987 500 Boylston A* 4 Levels TB, 42 24 3.3 4.5 IV 4.26Building Rakers
ChicagoC3 1971 Amoco Standard Soft I Level Ties, 23 30 4.6 IV 5.10
Oil clays, Soldier piles, 44 atover Soil berms centerstiff
C4 1973 Water Tower Down I Level TB & 1 44 24 2.5 1.5 1,11 5.13town Rakers 5.14
C6 1987 Prudential Two Down I Level Ties, 1 25 27 0.45 I 5.16town Level R,
C7 1987 AT&T corporate Down 3 Levels of 27 30 1.55 1.5 II 5.17center town rakers and 5
corner braces
C9 1993 Northwestern Down 1 Level of 23 24 0.45 I 5.23University town TiebacksMemorialParking Garage
CI 1996 Museum of Stiffer 3 levels TB 34 30 0.85 I, II 5.27
1997 Science and clays 5.28Industry Parkinggarage
Notes: * According to Johnson see section 4.2
314

With the exception of three projects (B7, C3, & C4), wall deflections and
surface settlements were small and both ranged up to 1.55". Shallow excavations
in Chicago showed very little wall bending with the wall base translating slightly
towards the excavation (0.2" to 0.5"). In most monitoring locations, the wall
primarily bent between the lowest bracing level and the final excavation grade,
with very little to no bending between the bracing supports. Maximum settlements
were generally on the same order as maximum wall deflections. Figure 8.1
displays selected typical inclinometer deflection data for most of the projects
included in Table 8.1. Maximum settlements were in the same order as maximum
wall deflections.
The C3 and C4 projects were early slurry wall excavations in Chicago in the
1970s, and thus experience had not fully accumulated at that time. Caisson
construction caused soil softening in these projects. Tieback creep and load loss
problems in combination with ground softening due to pile extraction caused the
large deformations in the 500 Boylston (B7 case study). The tiebacks in this
project were not long enough to extend beyond the active zone of soil movements
and in addition, the fixed lengths of some ties were located within the fill layer. In
addition, the proximity of ties led to inefficiencies due to interactions between the
grouted zones of adjacent anchors. Small wall embedment (10ft) did not prove
adequate to restraint movements as the wall rotated as a rigid body despite being
braced by four levels of tiebacks.
Figure 8.2 shows statistical analysis of measured deformations by
inclinometers installed in all the floating projects. Figure 8.3 uses the same data
but plotted over the final excavation depth. We can clearly see that 75% of all
monitoring locations deflected less than 1.0", with only 14% deflecting more than
1.5" towards the excavation. There were only small differences in the maximum
and final measured wall deflections. Most of the monitored wall sections (81%)
deflected from 6w/H=0.1% to 0.4%. For a 30'-deep excavation this would
correspond to a maximum 1.5" wall deflection.
315

C-4 C-7 C-6 B-3 (1) B-3 (2)
- -
+
UBase of Wall
U
0
j3.7
4~1
~iJI5-0
I
C-9 C-10 B-6
U
.4
U-
L
I--iI. I
I I0
wu
0
I
I10
I 20
30I
940
!S
50
60
70
Deflection (inches)0 0.5 1 1.5 2 2.5 3 3.5
C-9 C B 6 C-4
B-7
rC-6+
B- (1)
B-3
(2)
C-7
Figure 8.1: Inclinometer deflections for floating slurry wall excavations
ON
I
I
4
II
4
I
I

45
40
S35
E 300
200
0
o 15
10
n.
7 0 0C - C C ~ Cq M V O 0
o 2 o 2 2 2 2 .2 2 .2 .2 2 "i
(0 N No 0O CO C) 0 to 0 to t
Inclinometer Deflection Range (inches)
Figure 8.2: Statistical analysis of inclinometer deflections for floating slurry wallexcavations
45
40
35
0$; 30
Eo 25E
= 0 15__0
15- -
10
50.0 1.51.5
0.0 0.0 0.00
9 d9d 0
9D 9i
CMJ CO L O CD r- CO 9C +6; 6 o ; 6 o 6
- - 2 2 .2 .2 2 2 -
C~i CO) L n CD r- C6 6 6; 6 6 6 6 6
Inclinometer Deflection/Final Excavation Depth (%)
Figure 8.3: Statistical analysis of inclinometer deflections/Final Excavation depth%, for floating slurry wall excavations
317

8.3 Measured Performance of keyed tieback slurry walls
Table 8.2 lists four projects where walls were keyed into underlying bearing
layers. The 60-State Street project is keyed into glacial till, while the Dana Farber
excavation is the deepest tieback slurry wall excavation in Boston. In
Washington, the World Bank is keyed into decomposed bedrock, while the
Washington Convention Center is keyed into very stiff sands and clays.
Table 8.2: Keyed tieback walls
Exc. WallDepth thickness Bracing SHmax SVmax Defl.
ID Year Project Name (feet) (inches) Type (inches) (inch) Type FigureBoston
B2 1975 60-State 32 30 3 or 2 Levels 1.3 I, II 4.11Street TB, wall keyed
into glacial till 0.92** 1.2B12 1995 Dana Farber 65 36 6-Levels 0.72 0.64 I, 4.53
Tower - Permanent Rock 0.4 2.8 V90 tiebacks
Washington
W1 1991 World Bank 60 30 5-Lev. TB 0.45 0.45 II 6.7-0.45 IV 6.6
W3 1999 Washington 30 36, 48 1-Ties, I Rakers. 0.75 0 I 6.162000 Convention
Center - 3-L. Ties55 36 0.70 I 6.15
Overall, maximum and final wall deflections and settlements were small in
most cases. Only in the B2 case study did the wall deflections exceed 1.0", in all
other projects wall deflections were smaller than 1.0". However, the maximum
wall movements shown in Table 8.2 do not reflect the range of measured
deflections which was larger than the absolute magnitude of deformations towards
the excavation. In most projects, some sections of the slurry wall deflected back
towards the retained soil by as much as other wall sections deflected towards the
excavation. In these projects, deformations were eventually controlled by minor
variations in construction and site conditions.
Figure 8.4 compares selected inclinometer deflections from these keyed
tieback excavations. The effect of building surcharge can clearly be seen in the
318

World Bank and the Dana Farber Tower deflections were the walls bent slightly
above the excavation base.
The distribution of measured final and maximum wall deflections is shown in
Figure 8.5. The statistical distribution of inclinometer deflections as a percentage
of the final excavation depth can be seen in Figure 8.6. The data shown in these
figures can not be generalized because the distributions have been derived from
only 21 inclinometers. Conclusions can thus be made only for the studied
projects.
Half of the monitored wall sections deflected from 0" to 0.5" towards the
excavation, while 14% of all inclinometers deflected back into the soil from 0' to
0.5". The mean maximum deflection was 6 w=0.3 9 3 " ± 0.412", and average
6w/H= 0.086% ± 0.124%. For the final deflections had was 8w=0. 2 7 4 " ± 0.326",
and S,/H= 0.055% ± 0.097%, while for the final readings they were
Sw=0. 2 7 4 " ± 0.326". Inclinometers used in these four excavations (B2, B12, WI,
W3) (represent 34% of the total wall sections that were monitored. About 60% of
the monitored inclinometers deflected from 0% to 0.1% of the final excavation
depth.
In the Dana Farber Tower, soil losses during tieback drilling caused most
slurry wall panels to deflect back into the retained soil, while the surface
settlement ranged up to 2.8". The scatter in the measured settlements in the
Washington projects was in most cases larger than the settlement itself.
Embedment strain gages installed within the slurry wall in the Dana Farber
project (B12) indicate that when a wall is keyed into a stiff stratum like bedrock
then the full vertical force of the tiebacks is carried to the bottom of the wall (thus
there is very little side friction between the slurry wall and the retained soil).
319

B12
0
U
IO
W-3 W-1 B-2
B
Bedrock
Bedrock
80I jExavation Base
T Bedrock
Bottom ofDiaphragm Wall
100
-0.250 -
20 -
40 - -
'0-
60
0
Deflection (inches)0.25 0.5 0.75
Figure 8.4: Wall deflections for keyed tieback slurry wall excavations
1 1.25
C
4
I
I

E00
0C
0
0IM
o U) 0C?) U) 0 U) 0 U? U) +
o o o 2 2 2 0o 0> 0 0 0 0 +
U) 9 q) 0 q U) U) 0 U) 0 U) U)- 0 0 0 - - M 01 i M 6 O 6
Inclinometer Deflection Range (inches)
Figure 8.5: Statistical distribution of wall deflections for studied keyed tieback
slurry wall excavations.
.0 0.0 P0.0 0.00.0 0.0 0.00.0 0.0 0.00.0 0.0
N 0 -_ C1 CO 1 U) CO r- tO 0 +
9 o o C5 6 o o 6 65 62 2 N1 2 2 .2 2 2 2 2 2 21P It 9 C\- 0 Cl? 11 U) 1P rl- CR
9 0? 6 61 6 6 6 6 6 6
Inclinometer Deflection/Excavation Depth (%)
Figure 8.6: Statistical distribution of wall deflection as a percentage of the final
excavation depth for the studied keyed tieback slurry wall excavations.
321
60
50
40
E0i30
20
10
0

8.4 Measured performance of Top/Down slurry wall excavations
Table 8.3 lists the top/down excavations studied in this research, five out of
the six projects are in Boston and one is in Chicago. Excavation profiles for these
projects except for B9 can be seen in the referenced figures. The top/down
excavations in Boston are 55' to 75' deep, while the project C8 in Chicago is only
35' deep. All the walls in Boston are keyed into either glacial till or bedrock.
Maximum wall deflections ranged up to 2.2" (B10) while maximum
settlements induced by the excavation only where roughly in the same order as
maximum wall deflections. In the B4 case, pile extraction caused ground
softening and thus surface settlements were larger. In B10, larger than expected
wall deflections at some locations were attributed to poor control on the
backfilling for Load Bearing Elements (LBE's). In all other projects, maximum
wall deflections and settlements were typically less than 1.0".
Figure 8.7 shows selected inclinometer deflections of top/down excavations in
Boston and in Chicago. In Boston projects where profile A dominated (Boston
Blue Clay), the walls tended to bow towards the excavation with the maximum
wall deflection taking place within the clay (B4, B10, Bi 1). In these excavations,
wall deflections were larger from excavations where Glaciomarine soils
dominated (B5, B13: soil profile B). Walls in excavations within B soil profiles
did not have that profound bending as walls in soil profiles where Boston Blue
Clay dominated.
About 71 % to 80% of all the inclinometers installed in top/down excavations
deflected from 0" to 1.0" towards the excavation (Fig. 8.8). The remaining 20% to
30% of all the measured wall deflections reflect data from the 75 State Street and
the Post Office Square projects. For the maximum deflections the average was
6H=0.689" ± 0.556". while the average final deflections were 8H=0.566" ± 0.37 1".
The statistical distribution of inclinometer deflections as a percentage of the final
excavation depth is shown in Figure 8.9. The average deflections were
6 H/H=0.126% ± 0.076% for the maximum deflections, and 6 H/H=O.121% ±
0.073% for the final deflections respectively. Close to 80% of the monitoring322

locations deflected from 0% to 0.2% of the final excavation depth, while the
remaining 20% deflected from 0.2% to 0.3%. This would imply that there is an
80% chance that 60' -deep top/down slurry wall excavation would deflect by up
to 1.5%.
Table 8.3: List of top/down slurry wall excavations
Exc. WallProject Soil Depth thick. Bracing SHmax Ovmax Deflecti-
ID Year Name Typ (feet) (inches) Type (inches) (inch) on Type FiguresBoston
B4 1983 75 State A* 65 30 6-Levels 1.85 4.0 II 4.17Street
B5 1984 Rowes B 55 30 5 Levels 0.41 II 4.19Wharf
B9** 1990 125 A* 60 30 6-Levels 0.6 0.38Summer St
B10 1989 Post Office A* 75 36 7-Levels 2.15 2.75 II 4.37SquareGarage
B11 1994 Beth A* 55 36 5-Levels 0.85 0.7 II 4.43IsraelDeaconess
B13 1998 Millenium B* 55 36 5-Levels 0.7 .45 I, II --
Place
Chicago
C8 1989 Guest Typ/ 35 24 3-Levels 0.65 I 5.20Quarters DownHotel town
* A: Fill, Organic Silt, Boston Blue Clay, Glacial Till, Bedrock, B: Fill, Glaciomarine, Glacial
Till, Bedrock, according to Johnson 1989,
** Only referenced
323

Deflection (inches)
B-4 B-11 B-10 B 5 C-8 -0.5 0 0.5 1 15 2 2.5
7 B 4B-10 (2)
B-5
2 0 1 1 1 0 ( 1 )
I -1
U aB"I
M1 C-
II I I 60 ----
I~I 80/
100
Figure 8.7: Selected inclinometer deflections from top/down slurry wall

60
50.0 50.0S50--
(I)
Percentages Obtained40- -- 38.0 From 50 Inclinometers
0.C Maximum Final
U 32.0 Mean 0.689" 0.570"
30 STD 0.566
15 M Maximum Deflectionsa) N Maximum DeflectionsCa20--C(D
P 10.010.0CD)
CL 10 - - -4. 2.0 4.0
0-q U) 0 U) 9 10 q LQ t) 1 +
Co 6 - N~ C~j C6 COi LO 0o o 2 .2 2 .2 2 .2 2 2 0 2 10
LO 1 0 UO 9 V) 0 LO) 0 LO LO0 q 0 6 - - N 6 0) )
Inclinometer Deflection Range (Inches)
Figure 8.8: Statistical distribution of maximum and final inclinometer deflections
for top/down slurry wall excavations.
5045.8
45Percentages Obtained
40 -3 -- -- - From 50 Inclinometers3
35 -- - - --- Maximum Final
a) Mean 0.126 %H 0.121 %HE 3 -- -- - - - -- TD 0.076 %H 0.073 %H --
0 25- Maximum DeflectionsFinal Deflections
20-0 .7015 --
10 - --
5-
0*S C"! 0 N C 10 (q N*- 00 0 +
o? o 0 0 ; 0 0 6 16 -: 0>
.2 2 .2 2 2 .2 2 .2 2 .2 .20 - m Co) ' LO Co t- +o
6 6 6 o^ 6 6 6 6 6 6 6 6;
Inclinometer Deflection/Excavation Depth (%)
Figure 8.9: Statistical distribution of maximum and final inclinometer deflections
as a percentage of the
excavations.
final excavation depth, for top/down slurry wall
325

8.5 Measured Performance of Cross-lot and internally braced excavations
Table 8.4 lists slurry wall excavations supported by cross-lot braces or internal
bracing. Cross-lot bracing was preferred in relatively narrow sites where the
opposite walls were 50ft to 120ft from each other. All of the cross-lot braced
walls were keyed into a stiff stratum (glacial till or bedrock). Cross-lot
excavations in Boston and in Washington ranged from 47ft to 100ft deep.
Complicated corner bracing was used in the 66'-deep Yerba Buena Tower
excavation, where the slurry wall was 115' deep. The two Chicago excavations
are not representative of modern practice since they were amongst the first slurry
wall excavations constructed in the US.
Table 8.4: List of cross-lot and internally braced slurry wall excavations
Exc. wallSoil Depth thick. Bracing Hmax Ovmax Deflecti
ID Year Project Name Typ (feet) (inches) Type (inches) (inch) on Type FigureBoston
B1 1973 MBTA South A* 53 36 3 Levels 1.35 0.5 I 4.8Cove Cross-lot
B8 1989 Flagship C 47 30 3 Levels 1.81 1.7 II 4.30Wharf Cross-lotWashington
W2 1995 Petworth Sands 60 36 5-6 Levels 0.75 - II 6.11Subway and - Cross Lot 6.12Station Clays 100 6.13Chicago
C1 1970 CNA Typ. 31 30 (lRakers+ 3.3 5 - 5.7Downt Berms,own Cross Lot
permanentfloor steelmixed)
C2 1971 Sears Tower Typ. 32 30 3 Levels 6+ IV --
Downt Rakers,own soil berms
San
Francisco
S9 1999 Yerba Buena Fill, 66 36 2 Lev, Int 0.8 0.5 V 7.8Tower Sand, Brac,
Clay I Lev.Rakers
326

Figure 8.10 shows selected inclinometer deflections from the B8, W2, and S9
excavations. Wall deflections for the cross-lot braced excavations were moderate,
ranging up to 1.8" for the B8 project. In the deep Petworth Subway wall
deflections were smaller and ranged up to 0.75" towards the excavation. In the
Yerba Buena Tower, the underlying clays were not able to restraint the base of the
wall and thus soil deformations occurred throughout the depth of the slurry wall.
None the less, wall deflections were small and ranged up to 0.8" towards the
excavation.
The range of wall deflections was almost double the maximum wall
movement for B8 and W2, since some panels deflected back into the retained soil
by as much as other panels deflected towards the excavation. This can be seen in
Figure 8.11, which shows the statistical distribution of wall deflections for the B8,
W2, and S9 excavations. The average deflection was 8w=0.409" i 0.610" (for
both maximum and final conditions). General conclusions can not be drawn
because these percentages are derived from a limited number of inclinometers.
About 75% of all the monitored sections deflected towards the excavation from 0"
to 1.0", and close to 16% of all walls moved back into the retained soil by as
much as 1.0". There were very small differences between the maximum and the
final wall deflections.
The statistical distribution of inclinometer deflections as a percentage of the
final excavation depth can be seen in Figure 8.12. The average was
6w/H=0.082% ± 0.112%" for both maximum and final deflections. Close to 72%
of all the inclinometers deflected from 0% to 0.2% of the final excavation depth,
and 9% of the inclinometers deflected from 0.2% to 0.4%. For a 65'-deep
excavation this would imply that there is a 72% probability that a wall panel will
deflect up to 1.5" towards the excavation.
Thermal expansion and contraction can be very important when the bracing
struts are too long. Flagship Wharf (B8) was the only project where inclinometer
deflections at both ends and raking loads were measured.
327

Deflection (inches)B-8
L
I
I
IL
.tol I
6 I
f
,6rpom
I I
C0 ap
IC I
-- J I
-0.50 --
20 -
40 -
60 -
W I
I"
B a se of Excavation
+1+I I .
Base of Wall
100
120
0 0.5 1 1.5
Figure 8.10: Selected inclinometer deflections for cross-lot and internally braced slurry wall
880
2
00
S-_9 W..2 (2) W-2 (1)
I

40.9 40.9
rcentages Obtained onlym 22 Data triclinometers,nerar conclusions can not
be drawn
Maximum DFcins
Final Deflections
o U? o0 6
0
U)6
L 0 U2
> o 0C ) CV
40
* 35a)
E 30-0C
25 -
0
a)C.)
210-C-
5-
0-
UCdm
U
0
U)0U)Co)
0
0o)
Inclinometer Deflection Range (inches)
Figure 8.11: Statistical distribution of inclinometer deflections for projects B8,
W2, and S9.
40-0.36.4 36.4 36.4
35-Percentages Obtained only
From 22 Data Inclinometers,30- General conclusions can not
be drawn
25 -0 0 Maximum Final
182MeanI0.082 %H 0.082%H
0 0
0 8-0 0E Final Deflections
S C\! 0O -o r' ) ~ U O - CD 0 +6 69 6 6; 6 6 C)
00 -
02 02 N 2 . . .2 2 0 02 02 0 -
lp V: 9 9 N q Nt LQ ' I' r C a6 6 0 6 6 0 0 6 0) 0 0>
Inclinometer Deflection/Excavation Depth (%)
Figure 8.12: Statistical distribution of inclinometer deflections as a percentage of
the final excavation depth for projects B8, W2, and S9.
329
45
4.54.5 4.5 4.5 4.5 4.5
o Uod 9
0o 2
9
0
06
+
U)
31. 3.8 -Pe
- Ge

8.6 Statistical analysis of all Inclinometer deflections
This section discusses the statistical distribution of inclinometer deflections in
slurry wall excavations. Figures 8.13 and 8.14 plot the statistical distributions of
inclinometer defk.tious for all the case studies included in the data report, while
Figures 8.15 and 8.16 show similar plots that include other projects referenced
from Chapter 7. Wall deflections induced by the excavation were overall small.
From Figure 8.13 we can see that the overwhelming 75% of all the monitored
walls deflected from 0" to 1.0" towards the excavation. Movements from 1.0" to
2.0" represent only 10% to 15% of all the inclinometers. Deflections above 2.0"
are very rare and mostly occurred in earlier jobs, or when the bracing was not
adequate, or when caisson construction or pile extraction caused ground
softening. The average deflection was Sw=0.70" ± 0.70" for maximum deflection
(dor final excavated grades the average was slightly smaller 6 w=0.64" ± 0.66").
Most monitored panels (30% to 36%) deflected from Sw/H=0.1% to
Sw/H=0.2%, with average Sw/H=0.184% ± 0.158% (Maximum deflections). For
the final deflections the average was 6w/H=0.177% ± 0.157%. Close to 78% of all
the inclinometers deflected from 0% to 0.3% of the final excavation depth.
The statistical distribution of inclinometer deflections changed slightly when
the performance data from archival projects were added (e.g. Ch. 7: Clough &
Buchignani, 1981). About 70% of all the inclinometers deflected from 0" to 1.0"
towards the excavation. Deflections from 1.0" to 2.5" make up 20% of the all the
monitored inclinometers. In both Figures 8.13 and 8.15 we can see that
percentages decrease as the deflection range increases. Very few of the mentioned
walls were pushed back into the retained soil.
Table 8.5 summarizes the average deflections and variances for all the studied
projects. The final deflections are smaller than the maximum deflections for all
categories. The average deflection and variance for floating excavation was larger
than any other type of excavation (6w= 0.83" + 0.74", and 6w/H=0.27% ± 0.15%).
Cross-lot and internally braced excavations and keyed tieback walls had the same
330

average deflection (6 w=0.4 1" and 6w=0.39"), but the standard deviation was
larger for the cross-lot excavations. For top/down projects the average deflections
were 8w=0. 6 8 9 " (6w/H=0. 126%) for maximum deflections and 8H=0.57" and
SH/H=0.121% for final deflections. For all the studied pojeacts, ,he deviations of
the deflections were almost equal or slightly larger than the actual deflections
(w=0.7 0 " ± 0.70" for maximum, Sw=0. 6 4" ± 0.66" for final). By including the
archival projects the averages were increased slightly (OH = 0.78" ± 0.84"
maximum, and 6H = 0.70"±0.77" for final). Thus, the variance of measured
deflections was just as large or slightly larger than the average measured
deflections.
Table 8.5: Summary of deformations for studied projects, by category.
Deflections divided FinalDeflections Excavation Depth
Maximum Final Maximum FinalVariance Variance Variance Variance
Inclino- of of of ofmeters 6H 6H 0
H 6H 6H/H 6H/H 6H/H 6H/H
(inches) (inches) (inches) (inches) % % % %
Floating Excavations 68 0.827 0.739 0.813 0.741 0.27 0.154 0.267 0.151Cross-Lot & Internal Bracing 22 0.409 0.61 0.353 0.547 0.082 0.112 0.082 0.112
Keyed Tiebacked Walls 21 0.393 0.412 0.274 0.326 0.086 0.124 0.055 0.097Top/Down 50 0.689 0.566 0.57 0.371 0.126 0.076 0.121 0.073
Total 161Previous Total + Database,
Including W4, & C2 164 0.184 0.158 0.177 0.157+C5 167 0.699 0.698 0.638 0.662
+Referenced without C5 192 1 1 0.191 0.19 0.181 0.186+Referenced + C5 195 0.778 0.843 0.704 0.772
331

50
44.945 42.
U40- -ecnaesOtie
(D 35-E 32 7 Maximum Final
0 Mean 0.699" 0.638"30 STD 0.698 " 0.662"
25< ElMaximumn Deflections
5 20-- - Final Deflectionsa,)Cz
15-
8.3oD 10 -_
51.81.8 4.2 3.0 1.8 1.81.0 .M.0 0.00.0 0.6 0.6 0.0 0.0
o U) U) U) 0 11 0 L 0 LO +o 0 6 o o CM co o 4 o U+o - 2 2 o2 0 2 2 2 2 I
Un q I) 0 U U) 0 U) q0m 0M M V 1 01 0 ) qt
Inclinometer Deflection Range (Inches)
Figure 8.13: Statistical distribution of maximum and final inclinometerdeflections for projects studied in this thesis, (Chapters 4, 5, and 6).
40
36.0
35 33.3 111111111
30--- Percentages Obtained
30 Fo164 Inclinometers3 0 -2 6 .1 2 6 .2
E25 Maximum Final0 Mean 0.184 %H 0.177%Ho 20.0 STD 0.158 %H 0.157 %H53 20 ___
.3
< 15-- Elaximumn Deflections5 15 -Final Deflections
80
10-7
4.2 4.91 5.545-
0.0 0.0 0.0 0.0 0.60.6 0.0
N~CL 0 - CM M' qc U) CO q D +
6? 6 o 6 6 6 6 6 61 6)00
2 2 01 2M 2 2 2 .2 2 . 2 06 o - 'V Co iN rO D rs - co o6 6 6 0 S 6 6 6 0 0
Inclinometer Deflection/Excavation Depth (%)
Figure 8.14: Statistical distribution of maximum and final inclinometerdeflections as a percentage of the final excavation depth for projects studied inthis thesis, (Chapters 4, 5, and 6).
332

42.34
40-
co35----31.4
3 30 PercentagesObtained
~~ 25E0 -- -- From 195 Data inclinometroit
25 -- -- -- Maximum Final
Mean 0.778" 0.704"
< 20-STD 0.843" 0.772"20
I0 Maximum Deflections
15- 10.39.8 0 Final Deflections
0C5
i~l~ 1515 * 2 0505 .53 1.5 1.50. 05
o Lo 0 0 M0 0 0 0
LA0 0 LA 0 A 0 LA 0 L
o 6o N
Inclinometer Deflection Range (Inches)
Figure 8.15: Statistical distribution of maximum and final inclinometdeflections for projects studied in this thesis and referenced projects, (Chapters5, 6, and 7).
40
35
30
25
20
15
10
5
0
Figuredeflectiothis thesi
.01.0 0.0 101.0 0.50 .01.b0.0 F'M 0.0
N ~ 0 - 0J co 't L) to r- 00 0 +
6 6 o o 6o 6 6 6 6 -
o . 2 2 2 -2 2 .2 2 .2 2 -2
(0 C.5 0 - 'J CY) 'T LA CD Ir. 009 9 6 6 6 6; 65 6 6; 6 6
Inclinometer Deflection/Excavation Depth (%)
8.16: Statistical distribution of maximum and final inclinons as a percentage of the final excavation depth for projects studs and referenced projects, (Chapters 4, 5, 6, and 7).
333
4,
meteried in
E0
0

II
8.7 Measured maximum wall deflections plotted according to Clough
Figure 8.17 plots maximum inclinometer deflections as a percentage of the
final excavation depth versus the system stiffness factor (Clough et al., 1989). The
data was plotted by assuming an uncracked concrete section and ignoring wall
reinforcement. The modulus of elasticity of the tremie concrete was estimated
from the 28-day peak strength fe' according to an equation specified by the
American Concrete Institute. The deflections reported in this figure exclude
movements that were associated with activities such as caisson construction.
This approach of plotting the data has some obvious limitations because a) the
spacing between vertical supports varies little from project to project average 9ft
to I1ft with 7ft minimum and l7ft maximum, b) the wall thickness typically
varies from 2' to 3', c) the effects of bracing forces are totally ignored, and d) the
effect of soil conditions is accounted in the basal stability factor, while the
majority of the walls are keyed into a stiff stratum.
With a few notable exceptions all the projects generated 6w/H 0.35%. Data
from cross-lot projects suggest that deflections increase as the system stiffness
decreases, while tieback excavations show a lot of scatter.
09 - Rakers"R 4A & Soil
0.. Ties and/orRakers
0 Ties "/allkeyed into
S06 - - - - - - - - Glacial Till)0x
System SiffnessC(En)/(ycthian
>
0t ( g aprac
334tU1U
0 - - __ -
1 10 100 1000 10000
System Stiffness= (EI)I(y, h 4 O
Figure 8.17: Wall movements for all the slurry wall excavations vs. systemstiffness (Clough et al, 1989 approach).
334
0

8.8 Measured settlement performance
Figure 8.18 plots surface and building settlements for slurry wall excavations
versus the distance behind the wall standardized by the final excavation depth.
The largest settlements occurred between 0 and 0.5 times the excavation depth,
while the maximum settlement generally occurred at a distance from 0.2 to 0.25
times the final excavation depth. Almost all the measured settlements fell within
Zone I (Peck, 1969). Settlement data in this Figure reflect mostly on the Boston
slurry wall excavations which were very well instrumented. Settlements in
Washington DC were too small to be considered.
Most settlements were generally less than 0.2% of the final excavation depth.
Larger movements measured in the 500 Boylston (B7) and in the 75 State Street
(B4) projects are not representative of the vast majority of projects. Tieback
problems and ground softening due to pile extraction were the main causes of
these data.
One should expect settlements in the order of 6v/H=0. 1% to 0.2% within 25%
of H from the face of the excavation. The ratio 6v/H gets smaller for deeper
excavations (BlO, B12). Settlements rapidly decrease at a distance 70% of H
behind the wall. For a 60'-deep excavation this would generate settlements in the
order of 8v=0.7" to 1.5" within 42 ft from the excavation face.
335

Distance from the Excavation/Excavation Depth
00
0.1
0.2
0.3
0.4
0.5
0.6
0.7
0.8
0.9
1
0.5 1 1.5 2 2.5 3
Figure 8.18: Summary of settlements for slurry wall supported excavations.
336
CL
0
10
0
E,

8.9 Wall translation, rotation, and bending.
In order to compare wall deflections from different projects the final
movements of the wall have been subdivided into three basic modes
corresponding to rigid body translation, rigid body rotation, and bending (Fig.
8.19), characterized by modal components C, CR or 0, and Cm, respectively. The
excavations are described by the wall depth Hw and embedment Hd, the
excavation depth H, and the average vertical support spacing h (Figures 8.20 to
8.28). Table 8.7 summarizes all the derived parameters corresponding to these
deflection modes.
Figure 8.20 correlates the ratio of Ct/Hd (%) to the ratio H/Hd for floating
tieback excavations. The linear trendline fitted through the data is very accurate
(R2 =0.965). Hence, the maximum rigid translation C is related directly to the
excavation depth, H, and to the wall embedment, Hd. Rigid body translations C
for floating walls ranged from 0.14" (C6) to 1.05" (B7) maximum.
Figure 8.21 correlates the ratio CR/Hw (%) (= tanO) measured at the top of the
floating walls to the ratio H/(Hd+h). A linear trendline fitted through the majority
of the data produced very satisfactory results. Only two were excluded from the
linear trendline fit projects (C3 because of caisson construction, and B6 to provide
a better fit). It can thus be concluded that the rigid body rotation CR measured at
the top of floating walls is directly related to the ratio of the excavation depth H to
the depth Hd below the lowest level of support (Hd+h). Wall rotations CR for
floating excavations ranged from 0.13" (C6) to 3.65" (C3).
Rigid body rotations for keyed tieback excavations generated inconclusive
results. The magnitude of the bracing forces most likely controlled the rigid
rotations for these walls. Rigid body rotations for keyed tieback projects ranged
from CR=0.3" (WI) to CR=0.86" (B2).
Figure 8.22 plots the ratio of CR /Hw versus H/(Hd+h) for top/down diaphragm
wall excavations. The data shows some scatter but a line can be fitted accurately
through the C8, B10 (1), and B10 (2) data points. This fitted trendline can only
337

serve as an upper limit for CR for top/down projects. Rigid rotations for top/down
excavations ranged from CR=-0.2 2 " (B5) to CR=1.52".
Rotational movements were almost zero for four out of the five projects
supported by cross-lots and internal braces. Bending deflectic ... (C.) l keyed
tieback diaphragm walls did not generate any trend because the data was very
limited. Wall bending deflections for keyed tieback walls ranged from Cm=0.16"
to Cm=O.5 1".
Figure 8.23 correlates CM/HM and the ratio Hw/(Hd+h) for floating
excavations. A linear correlation can be fitted through the data with good
accuracy (R2 =0.8 1). Bending deflections for floating walls were generally small
ranging from Cm=0.0" (B7, C3) to CR=0.5 1" (C4).
Figure 8.24 shows that there is a good new correlation (R 2=0.94) between
CM/HM and the ratio Hw/(Hd+h) for top/down excavations. The B4 project was
excluded from the trendline fit because it plotted too high. This suggests that there
is a strong relation between maximum wall bending and the ratios Hw/Hd and
H/Hw. Maximum bending deflections for top/down projects ranged from Cm=0. 3 "
(C8) to Cm=1.58" (B10).
Figure 8.25 plots CM/HM as a function of Hw/(Hd+h) for cross-lot and
internally braced diaphragm wall excavations. The trendline on this figure is
based only on four projects. This trendline suggests that bending deflections for
these projects generally increase as the ratio Hw/(Hd +h) increases. Maximum
bending deflections for cross-lot and internally braced walls ranged from Cm=0. 3 "
(S9) to Cm=1.9" (B8). The larger scatter in the data compared to other types of
excavations is most likely the result of bracing forces.
The bending mode shape (Cm/CmMax) is plotted as a function of the depth ratio
y/Hw, for 16 of the slurry wall excavations in Figure 8.26. Wall bending can be
standardized by this method for a variety of projects (R 2=0.73). Floating walls in
Chicago generated bending mode shapes that did not follow the general pattern
and were excluded from this graph. Maximum wall bending occurs between 30%
and 60% of the wall depth but the average maximum bending occurs slightly
338

below 50% of the wall depth. For the studied projects, the average maximum
deflection was at 54% of Hw as measured from the top of the wall or 46% of Hw
as measured from the base of the wall. This result is consistent wit the findings of
DiBiagio, and 'Rdti [1979] who reported that the total resultant force on a
diaphragm wall in Oslo was located between 44% and 45% of the wall height
from the bottom.
Two sinusoidal curves were fitted through the data with reasonable accuracy.
The peak of the two curves was at the location where the average maximum wall
bending Cm occurred. These sinusoidal curves yielded effective wall lengths of
66%Hw and 63%Hw for the part of the walls above and below the point of
maximum wall bending respectively (where dCm/dy = 0 if the curves where
extended). The sinusoidal equations used to fit the data and their input parameters
are listed in Table 8.6.
Table 8.6: Equations used to standardize wall bending deflections
For, d/H, ;54%
Ci=Cm/CmMax=(sinOI - sin(-A))(1-sin(-X))
with900 + X0
61= (d) - X
For d/H, ;>54%
C2 = Cm/Cmjax=(sin0 2 - sin(I 80'+ p))(l -sin(p))
with900 + p0
2= (d-p) -
For the projects in Figure 8.29:
X= 57.5', p= 65.50, and =HmfHw=54% for the location of the Maximum Bending
point from top of wall.
d = depth divided by the wall depth (y/ H,).
339

(1) (2) (3)
CR
Hm
Ct + 0 + CmHW
CR = tan(O) Hw
Figure 8.19: Separation of wall deflections and standardization approach:(1) rigid translation, (2) rigid rotation, (C) Bending, H is the wall depth.
340

Table 8.7: Summary of excavation basic components describing deflection
modes.
H. Wall depth
H Excavation depth
Hd Embedment depth
Ct Rigid Body Translation
CR Rigid Body Rotation
Cm Bending deflection
0 Rigid Body Rotation
Hm Depth to Maximum Bending Deflection Measured from Top of Wall as a% of Wall Depth
h Spacing from lowest support level
341
H. H Hd h Ct 0 CR Cm Hm/Hw
ID Project (ft) (ft) (ft) (ft) (inches) Degrees (inches) (inches) %
Floating Tiedback WallsB3 (1) State Transportation1 48 27 19 10 0.425 0.0711 0.715 0.378 44.0B3 (2) State Transportation2 46.5 25 19 10 0.190 0.0374 0.364 0.461 46.2B6 One Memorial Drive 47 30 24 9 0.140 0.1178 1.160 0.298 56.8B7 500 Boylston 47 42 14 9 1.050 0.2235 2.200 0.000 0.0C3 Amoco (Standard Oil) 40 23 15 17 1.000 0.4357 3.650 0 0.0C4 Water Tower 57 44 22 15 0.940 0.1181 1.410 0.511 43.9C6 Prudential Two 52 25 28 13 0.143 0.0120 0.131 0.116 61.5C7 AT&T 55 27 30 9 0.147 0.0353 0.407 0.427 22.7C9 NU Parking Garage 37.5 23 24 7.5 0.185 0.0193 0.152 0.0845 38.3C10 Museum Science Industry 40 34 10 12 0.000 0.0704 0.590 0.306 31.6Keyed Tiedback WallsB2 60 State Street 60 35 27 15 0 0.0684 0.859 0.509 41.7B12 Daba Farber Tower 50 88 2 10 0 0.0372 0.390 0.166 40.0W1 World Bank 60 60 7 11 0 0.0241 0.303 0.309 52.2W3 Washington Convention Center 77 55 23 14 0 0.0414 0.667 0.246 62.3Top/Down ExcavationsB4 75 State Street 100 65 30 11 0 0.0408 0.854 1.458 53.0B5 Rowes Wharf 74 55 30 11 0 -0.0143 -0.222 0.525 49.0B10 (1) Post Office Squarel 91.8 75 12 10 0.100 0.0300 0.577 1.583 57.6B10 (2) Post Office Square2 88 75 16 10 0.127 0.0824 1.519 1.179 56.8B11 Beth Israel Deaconess 98 65 24 11 0 0.0050 0.103 0.842 56.5C8 Guest Quarters Hotel 52.5 35 24 11 0 0.0457 0.503 0.3 66.7
Cross-lot and Internally BracedExcavationsB8 Flagship Wharf 64 47 13 16 0 -0.0246 -0.330 1.888 55.2W2 (1) Petworth Subway Station1 72 60 12 14 0 0.0043 0.065 0.5465 58.4W2 (2) Petworth Subway Station2 76 60 16 14 0 0.0000 0.000 0.7325 50.0W5 Federal Center Subway Station 74 60 14 16 0 0.0000 0.000 0.625 46.7S9 Yerba Buena Tower (CB1) 111.5 66 46 15 0.426 -0.0034 -0.080 0.303 52.2

0.7
06
CL &5
E-0 04
E
0.3
0
0.2
020.1
All* B3 (1)o B3 (2)* B6* B7X C30C40 C6A C7
C90 S9
- Linear (All)
0 1 i | I |
0.0 0.5 1.0 1.5 2.0 2.5 3.0 3.5
Excavation Depth (H)fEmbedment Depth (HK)
Figure 8.20: Rigid translation deflections for floating tieback excavations.
1.0
0.8
C 0.6
0
0.40
0.2 -
0.0 -
0.0 -0.5 1.0 1.5
Floating
* B3 (1)
o B3 (2)
86
+87
Z C3
C4
o C6
A C7
*C9
C 010
- Linear(Floating)
2.0
Excavation Depth/ (Embedment Depth+ Spacing from Lowest Support) H(Hd+h)
Figure 8.21: Rigid Rotational Deflections CR for floating tieback diaphragm
walls.
342
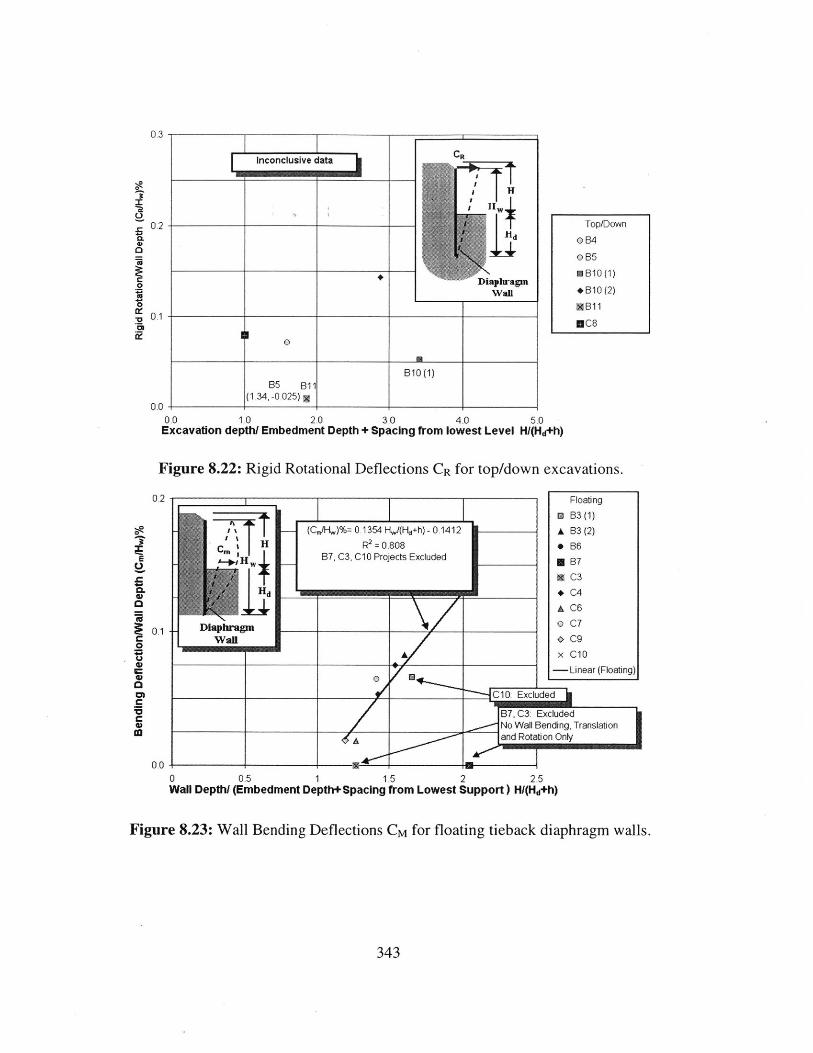
0.3
X
a
'U
0.2
0
0.1
0.0
Inconclusive data
-d
Diarlu-agm
B10 (1)B5 Bl
(1.34.-025)
Top/Down
o B4
oB5
* B10 (1)
+ B10 (2)
MB11*C8
0.0 1.0 2.0 3.0 4.0 5.0Excavation depth/ Embedment Depth + Spacing from lowest Level H/(Hd+h)
Figure 8.22: Rigid Rotational Deflections CR for top/down excavations.
0.2
0-1
0.00 0.5 1 1.5 2 2.5Wall Depth/ (Embedment Depth+ Spacing from Lowest Support) Hl(Hd+h)
Figure 8.23: Wall Bending Deflections CM for floating tieback diaphragm walls.
343
0.0
0
ar

03
j:0.25
E
S0.2
S0.15
0
S0.1
S0.05
0 1 4.0 1 2 3 4 5 6
Wall Depth/(Embedent Depth + Spacing from lowest support) Hw/(Hd+h)
Figure 8.24: Wall Bending Deflections Cm for top/down diaphragm wall
excavations.
CLB & lB
a B8o W2 (1)* W2 (2)
A W5
N S9
-Linear (CLB & IB)
0 1 I 4| 10 1 2 3 4 5Wall Depth/ (Embedment Depth+ Spacing from lowest support) Hwl(Hd+h)
Figure 8.25: Wall Bending Deflections CM for cross-lot and internally braced
diaphragm wall excavations.
344
0.5
004E
0.3
0.2
S0_1

100 -8 12: Dana Farberp na c2 0 86: One Memorial
0 f E N 68: Flaship WharfS90 2= 0 _i u: B iSat hr
E R0.73 e 3: State Transportation1E 0 B3: StatetWs T au eratonC-)~ ~~~~~~~ B___ ___ ___ ___ 10: Post Office Square2_______ B 10: Post Office Squarel
E 80 -- - 02: 60-State Street* W1: World Bank
U U * W3: Washington Convention Center- 7 0 S9: Yerba Buena Tower
.2 70 - ---- BC4: 5 State Street-. aB85 Rowes Wharf
n - -SIN.(FN
i 50 -Two Sine Curves Fitteda) mabove and below 54%
40 ------ -- - -- -See Table 8.6 for equationsE 40 -4E o
30 - The Effective Length for the Upperpart of the Wall is 66% of the Total
0 Wall Depth20 20
I.I Hw=54% The Effective Length for the Lower10 - -- --- part of the Wall is 65.5% of the
Total Wall Depth
00 10 20 30 40 50 60 70 80 90 100
Depth/Wall Depth y/Hw %Figure 8.26: Results from proposed method of standardizing wall bending

346

Chapter 9Summary, Conclusions, and Recommendations
347

348

Chapter 9Summary, Conclusions, and Recommendations
9.1 Summary
This thesis studied the performance of 29 slurry wall excavations in Boston,
Chicago, Washington DC, and San Francisco from 1970 to 2000. Of the 29
excavations, 25 were constructed after 1980 and a few have just recently been
completed. Archived performance data was gathered for each project and a
complete case study was constructed for each excavation. Published data was
incorporated into the thesis wherever possible. Each case study provides
information about a) soil and site conditions, b) excavation profiles at various
stages of construction, c) measured performance data for various construction
stages (deformations, settlements, brace loads, water levels etc.), d) qualitative
data (water leaks, problems with slurry wall construction etc.), and e) a summary
of each case study. The complete case studies can be found in the MIT Research
Report by Konstantakos & Whittle [2000] that will be published in the summer of
2000. The thesis itself contains a brief summary of each case study. The database
will also be posted on the Internet during summer 2000.
Once the complete database was constructed, projects were grouped into four
categories according to bracing type and wall fixity. The four categories were
1) floating tieback walls, 2) keyed tieback walls, 3) top/down excavations, and
4) cross-lot and internally braced excavations.
Wall deflections for each category were subdivided into three types namely:
1) rigid body translations, 2) rigid body rotations, and 3) bending. Frequency plots
were constructed for the wall deflections for all different excavation types.
Deflection data was also plotted versus the system stiffness as proposed by
Clough [1981]. Settlements were plotted for all the projects for which they were
available.
349

9.2 Conclusions
The vast majority of the studied slurry wall excavations cause very small
deformations, which in most cases are less than 1.0". Settlements are in the same
order as wall deformations, but they are also affected by other factors such as the
drilling method of tiebacks if used. Variations of deformations can be large even
within the same project. In all cases, the maximum deformations represented only
a small fraction of all the slurry wall locations that were monitored. Small local
variations in construction and in the site conditions seem to control the occurrence
of maximum deformations in a given project. The effect of the increased wall
rigidity was evident in most cases since the walls did not bend a lot between
significantly between supports.
Deformations were larger in earlier projects and in projects were other factors
induced large soil movements. Such factors were: a) ground softening due to
caisson construction, b) ground losses through tiebacks, c) ground softening due
to pile extraction, d) ground softening due to soft backfill material for Load
Bearing Elements, e) inadequate wall embedment, and f) inadequate bracing and
load loss in the bracing.
Rigid body translations are most important in floating excavations. The
translative movements at the base of the wall were found to be related to the
excavation depth and to the wall embedment depth. Translative movements
ranged up to 1.1" (C3, B7) when adequate embedment was not provided. Rigid
body wall rotations are nearly correlated to the ratio of excavation depth to
embedment depth plus the vertical spacing from the lowest support level to the
excavation grade. For floating tieback walls the correlation between the two is
linear with great accuracy. Top/down excavations showed larger scatter in wall
rotations than floating walls, and the vertical support did not affect the magnitude
of movements. Cross-lot and internally braced walls showed little to no rotation
due larger bracing forces in the upper bracing levels. Rigid body rotations were
the largest for floating walls, reaching 3.7" and 2.2" for the C3 and the B7
projects respectively.
350

The ratio of bending deflection to wall depth is closely related to the ratio of
excavation depth to wall depth plus the vertical spacing from the lowest support
level to the excavation grade. The linear relations that were derived provided an
excellent fit for top/down excavations, a good fit for floating walls, and a
moderate fit for and cross-lot braced excavations. -Bending deflections were
generally the largest in top/down excavations reaching 1.6" at the B10 excavation.
The B8 cross-lot project had the largest bending with roughly 1.9" towards the
excavation. Floating tieback excavations generate small wall bending in the order
of 0.5".
For many projects, wall bending can be standardized by the wall depth and by
the maximum bending deflection. It was found that two sinusoidal curves could
describe with reasonable accuracy the bending deflections for many projects. The
maximum bending deflection generally occurred at 54% of the diaphragm wall
depth as measured from the top (or 46% from the base of the wall).
Water leakage is very difficult if not virtually impossible to avoid. Minor
leakage between panel joints will occur even if the best precautions are taken.
Attention must be given to water-stopping details at tieback holes or when
caissons are constructed between slurry wall panels. Generally, increasing the
number of openings and the number of joints in a diaphragm wall increases the
chances of water leakage.
Slurry wall construction faces some other minor problems. It is usual that a
panel or two will collapse during trenching in each job. Some of the collapses
were caused by fill that slid under the guidewalls, while others were due to panels
being left open for an extended period of time. In two cases (B3, B8), panels
collapsed when the contractor trenched without slurry.
Occasionally, zones of soft soil-slurry material get entrapped between the
tremied concrete. This can cause major problems when the bottom of the panels is
not cleaned adequately, since the flow of the tremied concrete will entrap a large
portion of this material within the panel. These pockets of soft material will leak
excessively when the excavation exposes them.
351

Concluding, the slurry walls studied in this thesis performed very well and
induced small wall deflections and settlements except for cases when other
construction practices caused problems. Thus, diaphragm walls can be very
effective when deformation control is important providing that bracing and wall
embedment are adequate.
9.3 Recommendations
This thesis and the associated data report (Konstantakos & Whittle, 2000)
have attempted to develop a perspective on the performance of slurry wall
supported excavations, based mainly on projects carried out during the last 20
years. The project has illustrated most clearly the limitations of data mining from
projects archived in the files of engineering companies (consultants and
contractors). Of the 29 projects investigated during this research, only a small
subset have archived all of the performance monitoring data that were obtained
during the construction. This reflects the limited storage capabilities (in the pre-
digital age) and the progressive pruning of the archives over time. It is clear that
the most reliable data have been obtained from projects that are either on-going or
recently completed (perhaps the most notable example is the Dana-Farber project,
B12) or those that have been perceived as a particular technical challenge (e.g.,
Post Office Square, B 10). Given this situation, the geotechnical profession should
invest more energy in reporting results from well documented case studies, or
disseminate these data through some more centralized database. The Author
plans to provide access to the current database through the internet (work to be
completed during the Summer 2000).
The interpretation of performance data for the slurry wall projects described in
this thesis has focused heavily on lateral wall deflections, based on inclinometer
records. In contrast, there is much less archival data on ground movements and
their effect on adjacent structures (data was notably absent from projects in
Chicago). There is even less data for measuring the actual structural loads in the
bracing (only found in 5 out of the 29 case studies) and only qualitative records of
352

leakage problems. Hence, the current database provides only a modest
contribution to the empirical prediction of surface settlements. However, the data
have confirmed the importance of tieback installation procedures, and other
ancillary construction activities (caisson or LBE construction, pile extraction etc.)
on surface settlements. The data have offered no new insight into the structural
design of bracing systems. However, recent experience in the CA/T project
(Whittle, 1999) has confirmed that these bracing systems are generally
overdesigned using apparent earth pressure envelopes. Future projects should
place greater emphasis in recording ground movements and relating them to
construction activities and in measuring forces in key structural elements.
The current study has focused exclusively on diaphragm walls. There remains
almost no quantitative data to compare the performance of different types of wall
systems (i.e. soldier pile and lagging, sheet pile, contiguous bored pile, soil-mix
etc.). This type of comparison could be carried out by numerical analyses (by
finite element methods), but this type of computational study will be less
persuasive to the practice than well documented field data.
The current database includes several well documented projects that deserve
further study and can serve as useful sources for validation of analyses.
353

354

List of References
Adams, D. N, and Robinson, M. J., (1996), "Construction & Performance of JetGrout Supported Soldier Pile Tremie Concrete Walls in Weak Clay", CivilEngineering Practice, 13-34
Bachy-Soletanche Company Web site: http://www.bachy.coml
Baker, C. N. Jr.,. Busher, S. A., and Baker, W. F. Jr., (1989), "Complex High-Rise Foundation Design and Construction", Foundation Engineering, 1445-1458.
Baker, C. N., Pfingsten, C. W., and Gnaedinger, J. P., (1998), "History of ChicagoHigh Rise Building Foundations, 1948-1998", Task Force Report, ChicagoCommittee on High-Rise Buildings, Report No. 13, Dec.
Bauer Company web site, (2000): http://www.bauer.de/index.htm
Becker, J. M., and Haley, M. X, (1990), "Up/Down Construction", Design andPerformance of Earth Retaining Structures, Proceedings/GeotechnicalEngineering Division, Cornell University, Ithaca, New York - June 18-21, 170-189.
Berger D. J., and Tryon S. 0., (1999), "Approach to Designing Structural SlurryWalls", Journal of Geotechnical and Geoenvironmental Engineering, ASCE,125 (11), 1011-1022.
Bretz , J. H., (1939), "Geology of the Chicago region, Part I - General.", Bulletin65, Illinois State Geological Survey.
Boston Society of Architects, (1976), "Architecture Boston", Barre Publishing,Boston, 182.
Building Design and Construction web site: http://bdcmag.com/archives/
Ng C. W. W., and Ryan W. M. Y., (1998), " Stress transfer and deformationmechanisms around a diaphragm wall panel", Journal of Geotechnical andGeoenvironmental Engineering, ASCE, 124 (7), 638-647
Clough, G. W., (1975), "Deep Excavations and Retaining Structures", StanfordUniversity Press, Stanford California.
355

Clough G. W., and Buchignani A. L, (1981), "Slurry Walls in the San FranciscoBay Area", ASCE, Preprint 81-142.
Clough, G. W., Smith, E. M., and Sweeney, B. P., (1989), "Movement control ofexcavation support systems by iterative design", Proc. ASCE Found. Engrg.Congr., ASCE, New York, N. Y., Vol. 1, 869-884.
Cowland, J.W., and Thorley C.B., (1984), "Ground and building settlementassociated with slurry trench excavation", Proc. 3 rd Int. Conf Ground Movementand Structures, Cardiff, 723-738 (Discussion, 871-876).
Cunningham J. A., and Fernandez J. I., (1972), "Performance of Two Slurry WallSystems in Chicago", Proceedings of the Specialty Conference on thePerformance of Earth and Earth-Supported Structures, 1425-1447.
Cunningham, J. A., and Carpenter, L.D., (1975), "Monitoring of Two BracedExcavations in Chicago", ", Special Technical Publication 584, ASTM, 20-31.
D' Appolonia, D. J., (1973), "Cut-and-Cover Tunneling", U.S. Dept. ofTransportation, Fed. Hwy. Admin. San Francisco Proj. Rev. Meet. September.(after Xanthakos, 1994)
DiBiagio, E., and Roti, J. A., (1972), "Earth pressure measurements on a bracedslurry trench wall in soft clay", Proc. 5' Eur. Conf Soil Mech. Found. Eng.,Madrid.
Dreimanis, A., (1976), "Tills: Their origin and properties.", Glacial Till, SpecialPublication 12, Royal Society of Canada, Ottawa, Canada, 11-49.
Erikson, C., Kraemer, S., and Johnson, E., (1992), "Geotechnical Instrumentationfor Deep Excavations in Boston", Civil Engineering Practice, Boston Society ofCivil Engineers, 7(1), 47-66.
Finno, R. J., and Chung, C. K., (1992), "Stress-Strain-Strength Responses ofCompressible Chicago Glacial Clays", Journal of Geotechnical Engineering,ASCE, 118(10), 1607-1625.
FHWA, Federal Highway Administration, (1980), "Slurry Walls for UndergroundTransportation Facilities", Proceedings Symposium Aug 1979, Cambridge,Massachusetts, U.S. Department of Transportation.
356

Fuchsberger, M., (1980), "The Posttensioned Diaphragm Wall", Proc. Symp.Slurry Walls for Underground Transportation Facilities, U.S. Department ofTransportation, Cambridge, Mass., 293-314.
Gnaedinger J.P., Gill S.A., and Keim P. A., (1975), "Performance of Tied-BackExcavation at Water Tower Place", Special Technical Publication 584, ASTM,78-99.
Gould J. P., Heflin L. H., and Tello S. L., (1998), "Digging for the WashingtonDC Metro System", Big Digs Around the World, ASCE Geotechnical SpecialPublication Geo Congress, 297-314.
Hajnal, I., Marton, I., and Regele, Z., (1984), "Construction of Diaphragm Walls",A Wiley-Interscience Publication, John Willey & Sons
Haley & Aldrich, (1987), "Report on Subsurface Investigations and LaboratoryTesting Post Office Square Garage Development Boston, Massachusetts",Unpublished internal report.
Hansmire, W. H, Russell, H. A., Rawnsley, R. P., Abbott, E. L., (1989), "FieldPerformance of Structural Slurry Wall", Journal of Geotechnical Engineering,ASCE, 115(2), 141-155
Hodgson, F. T., (1977), "Design and Control of Bentonite/Clay suspensions andConcrete in Diaphragm Wall Construction", A Review of Diaphragm Walls,Institution of Civil Engineers, London, 79-92.
Humphrey, J. T., and Soydemir, C., (1991), "Special Bedrock Conditions inGreater Boston", Detection of and Construction at the Soil/Rock Interface,Geotechnical Special Publication No. 28, ASCE, 45-57.
Hosseini, (1999), Personal Communication
Hutchinson, M. T., et al., (1974), "The Properties of Bentonite Slurries Used inDiaphragm Walling and Their Control ", Proc. Diaphragm Walls Anchorages,Inst. Civ. Eng., London.
ICE, (1976), "A review of diaphragm walls", Proc. Diaphragm WallsAnchorages, Seminar Record, Institute of Civil Engineers, London, 49
Institution of Civil Engineers (ICE), (1996), "Specification for Piling andEmbedded Retaining Walls", Institution of Civil Engineers, London, ThomasTelford Publishing.
357

Jaworksi, W. E., (1973), "An evaluation of the performance of a bracedexcavation", Sc.D. thesis, Department of Civil Engineering, MassachusettsInstitute of Technology, Cambridge, Mass.
Jen, L. C., (1998), " The Design and Performance of Deep Excavations Jn Cv",Ph.D. thesis, Department of Civil & Environmental Engineering, MassachusettsInstitute of Technology, Cambridge Mass.
Johnson, E. G., (1989), "Geotechnical Characteristics of the Boston Area", CivilEngineering Practice, Boston Society of Civil Engineers, 4(1), 53-64.Johnson, J. G., 1976: "Performance of a slurry wall excavation in Boston"
Kapp, M. S., (1969), "Slurry-Trench Construction for Basement Wall of WorldTrade Center", Civil Engineering, ASCE, 36-39.
Kirmani M., Highfill S., and Xu, J., (1998) "Precast Prestressed Slurry Wall forPilot House Project", Design and Construction of Earth Retaining Systems,ASCE, Geotechnical Special Publication No. 83., 82-89.
Konstantakos D. C., and Whittle, A. J., (2000), "Case Studies on MeasuredPerformance on Diaphragm-Wall-Supported Excavations", MIT Research ReportR: 00-01, Department of Civil and Environmental Engineering, MassachusettsInstitute of Technology, Cambridge, Mass.
Koutsoftas, D. C., Frobenius, P., Wu, C. L., Meyrsohn, D., and Kulesza, R.,(2000): "Deformations During Cut-And-Cover Construction of MUNI MetroTurnback Project", Journal of Geotechnical and Geoenvironmental Engineering,126 (4), 344 -358.
Ladd, C. C, and Foott, (1974): "Stress History And Normalized Soil EngineeringProperties", JGED, ASCE, 100 (7), 736-786.
Ladd, C. C., Young, G. A., Kraemer, S. A., and Burke, D. M., (1999),"Engineering Properties of Boston Blue Clay From Special Testing Program",Proceedings of Sessions of Geo-Congress 98, ASCE, Boston, Massachusetts, 1-27
Lambe T.W., (1970), "Braced Excavations, Lateral Stresses in the Ground, andDesign of Earth-Retaining Structures", Spec. Conf Lateral Stresses and EarthRet. Structures, ASCE, Cornell University, 1-27.
Lambe T.W., Wolfkill, L.A., and Jaworksi, W. E., (1972), "The Performance of aSubway Excavation, Performance of Earth and Earth-Supported Structures, ASCESpecialty Conference Proceedings, Purdue University, 1(2), 1403-1424.
358

Lambrechts, J. R., Roy, P. A., and Wishart, E. J., (1998), "Design Conditions andAnalysis Methods for Soil-Cement Buttress in Fort Point Channel", Design andConstruction of Earth Retaining Systems, Geotechnical Special PublicationNumber 83, Proceedings of Sessions of Geo-Congress, 153-174.
Laplante, J. P., (1998), "Instrumentation to Monitor Building Damage fromExcavation Induced Ground Movement", M. Eng. Thesis, Department of Civiland Environmental Engineering, Massachusetts Institute of Technology,Cambridge Mass.
Mana A.I, and Clough G. W., (1981), "Prediction of movements for braced cutsin clay", Journal of Geotechnical Engineering, ASCE, Vol. 107, 759-777.
Mawdsley, J. M., (1970), "Choice of Drilling Methods for AnchorageInstallations", Ground Anchors, Cons. Eng., London, 5-6.
Millet, R. A., and Perez, J. Y., (1981), "Current USA Practice: Slurry WallSpecifications", Journal of Geotechnical Engineering Division, ASCE, Vol. 107,1041- 1055.
Munger, D. F., Jones, P. T., and Johnson, J., (1990), "Temporary Tieback Wall,Bonneville Navigation Lock", Design and Performance of Earth RetainingStructures, ASCE, Geotechnical Special Publication, No. 25, 778.
Otto, G. H., (1942), "An Interpretation of the glacial stratigraphy of the city ofChicago", Ph.D. thesis, University of Chicago, Chicago, IL.
O'Rourke, (1981), "Ground Movement Caused by Braced Excavations", Journalof Geotechnical Engineering Division, ASCE, 1159-1177.
Pagani, Company website, (2000): http://www.pagani-geotechnical.com/
Parkison, J. J., and Gilbert, C. M., (1991), "Design and Construction of SlurryWalls", ASTM Int. Symposium, ASTM, Atlantic City, N.J.
Peck, R. B., (1948), "History of Building Foundations in Chicago", University ofChicago Bulletin, Vol. 25.
Peck, R. R., and Reed, W. C., (1954), "Engineering Properties of ChicagoSubsoils.", Bulletin No. 423, Engineering Experiment Station, Univ. of Illinois,Urbana, IL.
359

Peck R. B, (1969), "Deep Excavations and Tunneling in Soft Ground", Prof. 7th
Int. Conf. S.M.F.E., Mexico, State-of-the-art volume, 225-290.
Puller M., (1996), "Deep Excavations, a Practical Manual", Thomas TelfordPublishing, London.
Ressi, (1999), Personal communication
Saxena, S. K., (1974), "Measured Performances of a Rigid Concrete Wall at theWorld Trade Center", Proceedings Conference Diaphragm Walls andAnchorages, Institution of Civil Engineers, London.
Schnabel, H. J., (1982), "Tiebacks in Foundation Engineering & Construction",McGraw-Hill, Inc.
Slopeindicator, Company website, (2000): http://slopeindicator.con
Tamaro, G. J., (1990), "Slurry Wall Design and Construction", paper on 'Designand Performance of Earth Retaining Structures', ASCE, Geotechnical SpecialPublication No. 25, 540-550.
Tamano, T., Fukui, S., Suzuki, H., and Usehita, K., (1996), "Stability of slurrytrench excavation in soft clay.", Soils and Foundations, Japanese GeotechnicalSociety, Tokyo, Japan, 36(2), 101-110.
Tamaro, G. J., and Gould, J. P., (1993), "Analysis and design of cast in situ walls(diaphragm walls)", Retaining Structures, Institution of Civil Engineers, London,343-352.
Terzaghim K., "Theoretical Soil Mechanics", John-Willey and Sons, New York,N.Y, 1943.
Trevilcos Corporation, Boston, (1999), Company Brochure.
U.S.G.S., (1994), "Geologic Map of the Washington West Quadrangle, District ofColumbia, Montgomery and Prince Georges Counties, Maryland, and Arlingtonand Fairfax Counties, Virginia.", by: A., H., Fleming, A.,A., Drake, L., McCartan
Vroblesky D. A., and Fleck W. B., (1991), "Regional Aquifer-System Analysis -Northern Atlantic Coastal Plain", Hydreologic Framework of the Coastal Plain ofMaryland, Delaware, and the District of Columbia, USGS Survey ProfessionalPaper 1404-E,
360

Xanthakos P. P., (1991), "Ground Anchors and Anchored Structures", A Wiley-Interscience Publication, John Willey and Sons, New York, N.Y.
Xanthakos, P.P., 1994: "Slurry Walls as Structural Systems", Second Edition,McGraw-Hill, New York.
Washington Metropolitan Area Rapid Transit Authorized Basic System, (1969),"Subsurface Investigation, Benning Route and Portion of the Pentagon Route",PB 185 757, Volume IV, July.
WMATA, (1989), "Adjacent Construction Manual", Revision 1, Office ofengineering & architecture, Washington Metropolitan Area Transit Authority.
Winter, E., Nordmark T. S., and Tallard G., (1991), "Slurry Wall PerformanceAdjacent to Historic Church", Symposium Slurry Walls, ASTM, Atlantic City.
Whitman, R. V., Johnson, E. G., Abbot, E. L., and Becker, J. M., (1991): "FieldInstrumentation Program Plays Vital Role in Deep Excavation Project", Proc.Geotech. Engrg. Congress, ASCE, 1, 173-174.
Whittle, A. J., and Hashash, Y., (1992), "Analysis of the behavior of proppeddiaphragm walls in a deep clay deposit.", Proc. Int. Conf On RetainingStructures, Institute of Civil Engineers.
Whittle, A. J, Hashash, Y. M. A., and Whitman, R. V., (1993), "Analysis of DeepExcavation in Boston", Journal of Geotechnical Engineering, ASCE, 119(1),Paper No. 2508, 69-91
Whittle, A.J. (1999), "Role of finite element methods in geotechnical
engineering", BSCE Journal of Civil Engineering Practice, Fall, 14 (2), 81-88.
Woodhouse, D., (1989), "The History of Boston: The Impact of Geology", CivilEngineering Practice, Boston Society of Civil Engineers Journal, 4 (1), 33-38.
361