Investigating Slurry Transport Beneath a Wafer during Chemical Mechanical Polishing Processes
38
-
Upload
independent -
Category
Documents
-
view
0 -
download
0
Transcript of Investigating Slurry Transport Beneath a Wafer during Chemical Mechanical Polishing Processes

Investigating Slurry Transport beneath a Wafer during Chemical
Mechanical Polishing Processes
Coppeta, J., Rogers, C., Racz, L., Philipossian, A., Kaufman, F. B.
1 Abstract
In order to better understand the role of the uid behavior in CMP, we measured slurry transport
beneath a glass wafer. We quanti�ed the slurry transport using Residence Time Distribution techniques and
two measures of slurry transport e�ciency de�ned as the percentage of new slurry beneath a wafer. Slurry
transport e�ciency depended on platen speed, ow rate, and the conditioning method. We found that the
average uid residence times under the wafer decreased roughly linearly with platen speed. A threefold
increase in platen speed decreased slurry mean residence times by three and a half times. Changing the
ow rate from 20 cc/min to 50 cc/min decreased the slurry mean residences by 80%. In situ conditioning
generally increased the slurry mean residence times and the amount of slurry mixing. In situ conditioning
also decreased gradients in the slurry composition across the wafer. Pad topography had a large e�ect on
the slurry gradients that developed across the wafer. Finally, we found that the slurry mixing history can
be accurately modeled using a simple continuous function.
2 Introduction
Since its introduction into integrated circuit (IC) manufacturing by IBM corporation in the mid 1980s,
chemical mechanical planarization (CMP) has become a key enabling technology to the semiconductor in-
dustry. All of the major IC manufacturers including Intel, Motorola, and IBM now incorporate CMP in the
1
production of its chips. In addition to IC production, CMP applications have spread into other manufacturing
processes including DRAM chips, hard drives, and modem chips.
Given the magnitude of capital invested in this technology, there is a large impetus to develop a funda-
mental understanding of the process. Research with this goal in mind is being performed, however, an overall
understanding of the process remains elusive because of the multi-disciplinary nature of CMP. Researchers
have focused on individual aspects of the process such as slurry chemistry [1, 2, 3, 4, 5], wafer-pad dynamics
[6, 7, 8], wear mechanisms [9, 10, 11, 12, 13, 14], and numerical simulations of the slurry uid mechanics
[15, 16, 17]. There has been, however, little experimental research regarding slurry uid mechanics.
Several researchers have commented on the importance of slurry ow and slurry distribution beneath the
wafer although to date no one has shown it experimentally. Stavreva et al. [18] discussed how the pad's
ability to transport slurry could a�ect the polishing rate and uniformity during copper CMP. Parikh found
that slurry ow rate had a large e�ect on the polishing uniformity on an orbital polisher [19]. Ali et al [20]
stated that the slurry composition, ow rate and direction of slurry impingement onto the polishing pad all
play important roles in interdielectric removal rates. Singer [21] reported that the manner in which slurry is
transported from the outside of the wafer to its center is critically important. Sugimoto et al. [22] showed
that slurry transport in grooved pads is important in reducing thermal gradients across a wafer. Since
polishing rates are temperature dependent, a reduction in thermal gradients across the wafer is believed
to reduce the within-wafer-non-uniformity. Ali et al. [23] postulated that the degradation in the removal
rates of pads without conditioning is due to the decrease in the pad's slurry holding capacity. Liang et al.
[24] postulated that Cabot's new open cell pads do not need macroscopic surface topography because of
the pad's e�ciency in channeling the slurry. Despite the fact that slurry ow generally is considered to be
an important factor in the CMP process, there has not been an experimental study of the slurry ow or a
numerical simulation sophisticated enough to examine the slurry behavior under realistic conditions.
Slurry transport and mixing could in uence the polishing performance two ways; 1.) transport of polished
material and 2.) non-uniform slurry transport. The �rst mechanism was postulated by Cook in his research
on glass polishing [4]. Cook suggested polishing removal rate is in uenced by the transport of polished
2

material away from the wafer's surface and substrate material is removed only if it is transported away from
the wafer or chemically bound in some manner. Therefore, slower slurry entrainment rates should yield
slower polishing rates. The same physical argument applies to slurry mixing. A reduction in slurry mixing
should increase the polishing rate (provided that the slurry is e�eciently transported to and from the wafer
surface) because polished material is not mixing with the new slurry, resulting in more new slurry delivery
to the wafer surface.
Non-uniform slurry transport may also in uence the polishing uniformity. Uneven or asymmetrical
mixing across the wafer's surface may cause some areas of the wafer to be constantly exposed to a di�erent
slurry environment than other areas of the wafer. We have noted that our polishing rates correlate with the
non-linear slurry transport across the wafer's surface. That is, the center of the wafer entrains new slurry
more slowly than the edges of the wafer and the polishing rates are faster on the edge of the glass compared
with the center of the glass. Although our results do not prove that the edge fast polishing is caused by
the uneven slurry transport, further investigation is warranted. This paper focuses on factors that in uence
slurry transport beneath a wafer while polishing.
3 Experimental Apparatus
We have created a functional small scale version of an industrial silicon dioxide (oxide) chemical mechani-
cal polishing platform in order to develop a fundamental understanding of the CMP process. Although there
are a variety of other polishing con�gurations including linear and orbital polishers, the rotary polisher is
the least complicated and therefore was adopted as a starting point. Likewise, our setup was built to mimic
oxide substrates because it the most common type of polishing and the simplest in terms of slurry chemistry
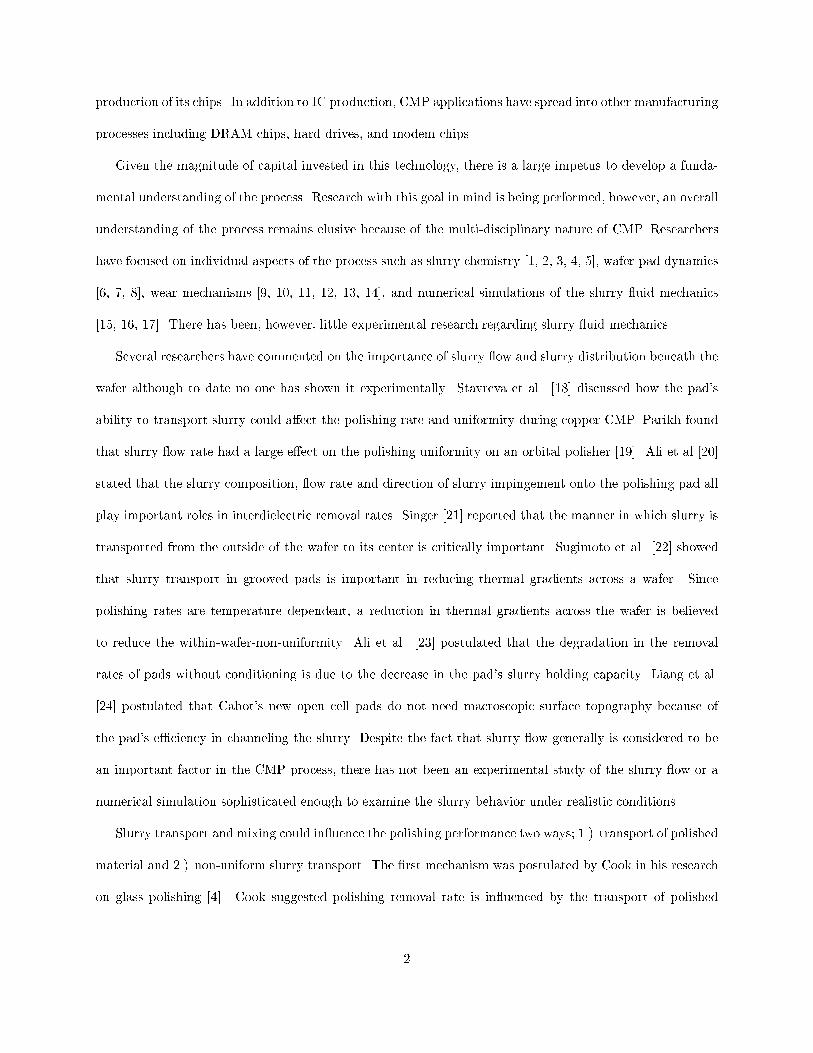
and consumable sets. Figure 1 shows an example of typical polishing rates obtained on the tabletop polisher.
The polishing substrate was BK7 optical glass polished on an IC1000 pad with Cab-O-Sperse SC1 slurry.
Note that the polishing rates are approximately 2000 �A/min. Our system consistently has higher removal
rates on the edges of the wafer compared to the center of the wafer (edge-fast polishing). Experiments
3

showed that the polishing rates are not a�ected by the presence of uorescent dyes.
[Figure 1 about here.]
In order to create a 1:2 scale model of an industrial polisher, there were a number of parameters that
had to be scaled. These parameters include platen diameter, wafer diameter, slurry ow rate, platen speed,
head speed and wafer load. Since the IPEC 472 industrial oxide polisher is commonly found in IC circuit
manufacturing centers, this platform was chosen as our industrial model. Scaling factors for each of these
parameters are chosen so that the polishing uid mechanics mimic that of an IPEC 472 polisher. Table 1
shows the appropriate scaling factor for each parameter as well as a numerical comparison of our parameter
values versus typical IPEC 472's parameter values. The ratio of platen to wafer diameters and the slurry
ow rate normalized by the platen area were set equal to values found on an IPEC 472. The platen and
head speeds are scaled by keeping the range of slurry Reynolds numbers equivalent between our model and
the IPEC 472. An equivalent Reynolds number can be achieved by making the relative velocity between pad
and wafer on our model equal to the relative velocity between the pad and wafer on the IPEC 472. This
assumes that the kinematic viscosity of the slurry and the pad-wafer gap on the two polishers is equivalent.
[Table 1 about here.]
Figure 2 shows our modi�ed CMP setup used to study the slurry ow beneath a wafer. A tabletop
Struers RotoPol-31 polisher is used to rotate a 30.5 cm (12") polishing pad. The standard RotoPol head
has been replaced with a 20" industrial rated drill press that both rotates and applies down force to a 76
mm (3") wafer. A weighted carriage mounted on a traverse provides a variable (7-70 kPa +/-1 kPa or 1-10
psi +/- 0.2 psi) down force to the wafer. The traverse is attached to the drill press at two locations; the
traverse's pivot point is located above the drill press supporting column while the other end of the traverse is
prevented from pivoting by the drill press shaft. This arrangement allows the down force to be transmitted
to the wafer without creating a moment about the drill press itself. The wafer is gimbaled so that it remains
roughly parallel to the pad surface.
[Figure 2 about here.]
4

Since we are measuring uid parameters using an optical technique known as dual emission laser-induced
uorescence or DELIF (drescribed in Section 4) [25], the wafer must be transparent and a pure silicon wafer
cannot be used. Instead, a glass wafer that is transparent to visible light is used. Two high-resolution
spatially aligned 12 bit digital cameras are used to measure the uorescence beneath the wafer. In situ or
ex situ pad conditioning can be performed using the device shown in Figure 3. A 76 mm (3") diamond grit
wafer co-rotating with the platen conditions the pad by periodically sweeping across the pad radius. Many
of the polishing parameters including platen speed, down force, slurry delivery, and conditioning speeds are
computer controlled and monitored. In addition, the computer synchronizes the camera to the polishing
process so that we can interrogate the wafer at any point in the polishing process.
[Figure 3 about here.]
4 DELIF Measurement Technique
The DELIF technique uses the uorescence from two di�erent dyes each uorescing at di�erent wave-
lengths to measure mixing, uid depth, or temperature and is described in detail in Coppeta and Rogers [25].
The uorescence from one dye contains the information about the parameter of interest as well as the laser
distribution and �lm thickness information. If mixing is the desired parameter, uorescence from the second
dye will contain the laser distribution and �lm thickness information. Normalizing the uorescence of the
�rst dye by the uorescence from the second dye causes the resulting ratio to be a function of mixing only.
Our previous work (Coppeta et al. [26] - [27]) has shown that by injecting tagged commercially available
slurry with two uorescent dyes, slurry mixing, entrainment beneath the wafer, residence time on the pad,
and �lm thickness can be measured. For the purposes of this paper, we are concerned with the slurry mixing
only.
Repeated calibration curves have shown that the uncertainty in the DELIF measurements of mixing
are less than 2% of the volumetric mixing. Mixing measurements beneath the wafer are an exponentially
weighted average of the slurry mixing values at each uid depth between the pad and wafer with the slurry
5

closest to the wafer having the greatest weighting factor. For the system we are investigating, uid at depths
greater than 400 �m below the slurry surface does not contribute to the average measurement (although
this number varies depending upon the dye concentrations and the excitation and emission wavelengths).
Therefore, we are unable to measure the slurry mixing in pad grooves greater than 400 �m (15 mils).
5 Methodology
The two-camera system acquires a series of images whenever a pulse of "new" slurry is injected onto the
pad where "new" slurry refers to the uorescent dye used to tag the slurry. Unless otherwise noted, slurry
tagged with Dihydroxypthalonitrile (green uorescence) is considered "new" slurry and slurry tagged with
Coumarin (blue uorescence) is considered "old" slurry. New slurry was pulsed onto the pad for a 60 second
duration. Images were typically acquired at 0.5 Hz for up to two minutes in order to capture the entire
mixing history. The exposure time for each image was 700 ms.
Figure 4 shows an example of the mixing history beneath the wafer; note the two runs are very repeatable.
Time zero is de�ned by the moment when the new slurry reaches the pad. Since mixing measurements were
made under the wafer, one can see the time delay between when the new slurry is �rst introduced onto
the pad (time zero) and when the new slurry is entrained beneath the wafer as evident in the rise of the
mixing curve (Figure 4). Through image processing, we aligned the two images to within a fraction of one
pixel in the vertical and horizontal directions. Since each pixel maps onto 50 �m in the image plane, our
spatial resolution is less than 100 �m in each direction. Image processing was also used to select a subsection
from each image for analysis. The image subsections were then used to calculate statistics such as the mean
concentration of new slurry, standard deviation, and mixing gradients. The image subsection was selected by
the user for each case, and all images within a case were analyzed using the same image subsection. Because
the camera may have been moved over a period of days, the image subsection had to be re-selected between
cases so that the same part of the wafer was analyzed. The subsection was centered about the center of
the wafer and was approximately 2.25 by 3.8 cm, as shown in Figure 5. This image area is focused onto
6
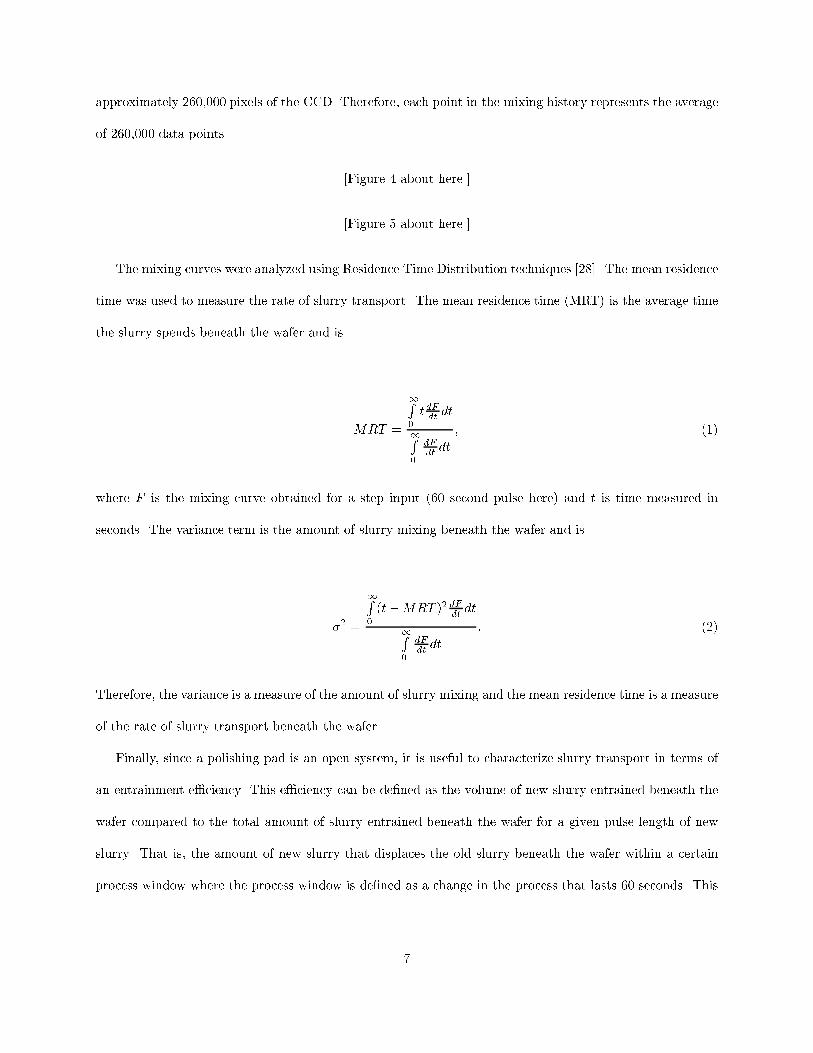
approximately 260,000 pixels of the CCD. Therefore, each point in the mixing history represents the average
of 260,000 data points.
[Figure 4 about here.]
[Figure 5 about here.]
The mixing curves were analyzed using Residence Time Distribution techniques [28]. The mean residence
time was used to measure the rate of slurry transport. The mean residence time (MRT) is the average time
the slurry spends beneath the wafer and is
MRT =
1R0
tdFdtdt
1R0
dFdtdt
; (1)
where F is the mixing curve obtained for a step input (60 second pulse here) and t is time measured in
seconds. The variance term is the amount of slurry mixing beneath the wafer and is
�2 =
1R0
(t�MRT )2 dFdtdt
1R0
dFdtdt
: (2)
Therefore, the variance is a measure of the amount of slurry mixing and the mean residence time is a measure
of the rate of slurry transport beneath the wafer.
Finally, since a polishing pad is an open system, it is useful to characterize slurry transport in terms of
an entrainment e�ciency. This e�ciency can be de�ned as the volume of new slurry entrained beneath the
wafer compared to the total amount of slurry entrained beneath the wafer for a given pulse length of new
slurry. That is, the amount of new slurry that displaces the old slurry beneath the wafer within a certain
process window where the process window is de�ned as a change in the process that lasts 60 seconds. This
7

e�ciency can refer to just the wafer or the system as a whole. The �rst, a wafer e�ciency, treats the wafer
as a separate system independent of the platen and can be written as
�wafer =VNewEntrained
VTotalEntrained� 100; (3)
where �wafer is the transport e�ciency, VNewEntrained is the volume of new slurry that becomes entrained
beneath the wafer, and VTotalEntrained is the total amount of slurry entrained beneath the wafer in a given
period of time. For �wafer the amount of new uid is compared to the total uid beneath the wafer when
the new slurry �rst begins to be entrained. The second e�ciency that can be de�ned includes the slurry
transport to the wafer and is written as
�system =VNewEntrained
VTotalEntrained� 100; (4)
where �system is the slurry transport across the pad and beneath the wafer. The two e�ciencies �wafer and
�system di�er by the slurry uid mechanics that transport the slurry to the wafer and are shown schematically
in Figure 10. Note that �system will be less than �wafer because of the additional slurry entrained beneath
the wafer before the new slurry is transported to the wafer.
[Figure 6 about here.]
Both formulations of e�ciency are time dependent since a longer pulse of new slurry will have a higher
e�ciency; a longer pulse length will cause the transient mixing to become less signi�cant. We feel the time
dependence in the e�ciencies is important because wafers are typically polished for a relatively short period
of time. In cases where the transients in the mixing curves can be on the same order of magnitude as the
polishing time (minutes), the transient behavior is important.
8

6 Experimental Results
This section shows how slurry transport is in uencec by platen speed, ow rate, conditioning, and pad
grooving. Plots with the pre�x "cond" in the legend refer to data taken with in situ conditioning; those
without refer to runs with ex situ conditioning. Time zero in the plot is when the new slurry �rst hits the
center of the pad.
A single example of the wafer mixing history (Figure 7) illustrates a number of important concepts.
First, the 60 second mixing curves are generally shaped like an asymmetrical sigmoid. The rate of new
slurry entrainment is very fast initially but then slows down as the concentration of new slurry beneath the
wafer approaches 100 percent. This is due to the fact that initially all new slurry is displacing pure old slurry
both on the pad and beneath the wafer, causing a fast increase in the concentration of new slurry. As time
progresses, the new uid displaces a mixture of old and new slurry. As the slurry beneath the wafer and
on the pad approaches 100 percent new slurry, the new slurry introduced onto the pad is displacing slurry
that is very nearly the same concentration. After the 60 second period, no more "new" or tagged slurry is
introduced onto the pad and therefore the mixing plot drops back to zero.
Figure 7 also shows that in situ conditioning reduces the rate of new slurry entrainment beneath the
wafer for grooved pads. This is re ected in the slurry MRT which is 60% higher with in situ conditioning (22
seconds) compared with ex situ conditioning (13.5 seconds). Flow visualization shows that the conditioner
pulls uid out of the grooves to the top of the pad. This action would reduce the rate of new slurry
entrainment by impeding the slurry ow in the grooves and mixing the new slurry with old slurry on the
pad and in the pocket that holds the conditioning wafer. The conditioner's motion signi�cantly enhances
slurry mixing as measured by the variance in the slurry mixing. With in situ conditioning the variance is
0.74 and compared to 0.41 with ex situ conditioning. In addition, the oscillations in the conditioning mixing
curves match the oscillation period of the conditioner sweeping across the pad. As the conditioner moves
away from the pad center more slurry is drawn onto the pad surface where it accumulates in a standing
wave at the leading edge of the wafer (bow wave). Since the slurry deposited on the pad surface by the
conditioner is a mixture and is older than the new slurry introduced onto the pad, the rate of new slurry
9

decreases as the conditioner moves away from the pad center. The wafer's slurry transport e�ciency is 13%
higher with ex situ conditioning (84%) compared with in situ conditioning (71%) because the conditioner is
diluting the new slurry with old slurry. The system's transport e�ciencies are 79% and 67% for ex situ and
in situ respectively. The system e�ciencies are characteristically lower than the wafer's e�ciency since pure
old slurry is entrained beneath the wafer until the new slurry is transported to the wafer. The di�erence
between �wafer and �system are similar between the in situ and ex situ conditioning cases indicating that
the conditioner does not play a large role in bulk slurry transport to the wafer for grooved pads.
[Figure 7 about here.]
While in situ conditioning reduces new slurry entrainment rates for grooved pads it has the opposite e�ect
for at pads as shown in Figure 8 (Rodel IC1000 pad, 60 rpm, 35 cc/min, 4 psi, no grooving). The slurry
MRT for in situ conditioning is 30% lower than ex situ conditioning (13.8 versus 19.5 seconds respectively).
Flow visualization shows that in the absence of in situ conditioning, the slurry forms a pool in the center
of the pad and the wafer precludes the slurry from e�ciently spreading out across the entire pad. With in
situ conditioning, the conditioner breaks up the pool of new slurry in the center of the pad and distributes
it across the entire pad thus increasing the slurry entrainment e�ciency. This motion causes a 40% increase
in the slurry mixing compared to the ex situ conditioning. Note that the conditioner still causes oscillations
in the mixing curves. The �rst two oscillations cause a large increase in the mixing rate as each time the
conditioner moves to the center of the pad it distributes the pool of new slurry beneath the wafer. The wafer's
slurry transport e�ciency is approximately the same for both conditioning methods. The wafer's transport
e�ciencies were 77% and 78% for ex situ and in situ conditioning respectively. A signi�cant di�erence is
evident in the �system which is 70% and 78% for ex situ and in situ conditioning respectively. This di�erence
indicates that unlike grooved pads, in situ conditioning plays a role in bulk slurry transport for at pads.
The higher �system with in situ conditioning indicates that the conditioner sweeps slurry from the center of
the pad to the wafer faster than the slurry would normally be transported without the conditioner.
[Figure 8 about here.]
10

In situ conditioning can reduce the rate of mixing for at pads when the pad is ooded with slurry. This
occurs when the platen is rotating slowly and the ow rates are moderate to high. Figure 9 shows an example
of this situation (Cabot pad, 30 rpm, 35 cc/min, 4 psi, no grooving). A ooded pad stores a lot of old slurry
because the slurry does not leave the pad very quickly. In situ conditioning forces the new slurry to mix
with all of the old slurry on the pad thereby reducing the entrainment rate. With ex situ conditioning new
slurry can displace the old slurry without having to completely mix with it, although recirculation patterns
on the pad do cause some mixing to occur. In situ conditioning causes the slurry MRT to double compare
to ex situ conditioning. These recirculation patterns are responsible for the oscillations evident in the ex
situ conditioning mixing curves. The transport e�ciencies were �wafer=62% �system=57% and �wafer=45%
�system=45% for ex situ and in situ conditioning respectively. These values of �wafer and �system are the
lowest of all of the conditions investigated and indicate that low platen speeds entrain new uid ine�ciently.
Again in situ conditioning plays a large role in the bulk slurry transport to the wafer and dilutes the new
slurry on the pad.
[Figure 9 about here.]
In addition to conditioning, platen speed and ow rate have a large e�ect on the mixing curves. Increasing
either ow rate or platen speed increases the entrainment rate, as seen in Figures 10 and 11 respectively.
Figure 10 shows that tripling the platen speed (30 to 90 rpm) causes the slurry MRT to decrease by a factor
of 3.5. The transport e�ciencies are �wafer=88%, �system=84% and �wafer=62%, �system=54% for 90 rpm
and 30 rpm respectively. Higher platen speeds decrease the slurry MRT and increase the e�ciencies because
the pad stores less old slurry on the pad and increases the slurry ow in the pad's radial direction. As
expected the platen speed has a large e�ect on the slurry transport from the center of the wafer to the wafer
as seen in di�erence between the wafer and system e�ciencies in the 30 rpm and 90 rpm cases.
Figure 11 shows that increasing the ow rate from 20 cc/min to 50 cc/min causes the slurry MRT to
decrease by 80%. Increasing the slurry ow rate has a similar e�ect as platen speed in increasing the slurry
ow in the radial direction. However, unlike platen speed, increasing the slurry ow rate can increase the
storage of slurry on the pad that may dilute the new slurry. The transport e�ciencies are �wafer=87%,
11

�system=81% and �wafer=77%, �system=74% for 50 cc/min and 20 cc/min respectively. It is evident that
increasing the ow rate increases the slurry transport e�ciency by increasing the rate of slurry ow in the
radial direction.
[Figure 10 about here.]
[Figure 11 about here.]
In addition to the mean mixing pro�les, one can examine gradients in the slurry composition across the
wafer. Pad grooving and in situ conditioning have a large e�ect on the slurry gradients in the pad's radial
direction, that is, in the direction along a line drawn from the center of the pad to the edge of the pad
passing through the center of the wafer. Figure 12 shows the average percentage of new slurry across the
wafer shortly (20 seconds) after a pulse of new slurry. Each point in the graph is an average of the image
column or an average of the percentage of new slurry in the direction perpendicular to the pad's radial line.
Note that the ex situ conditioning line has a steep gradient towards the edge of the wafer closest to the pad's
center. This gradient may be caused by the location of new slurry impinging on the wafer. The edge of the
wafer closest to the center of the pad prevents the slurry pool from spreading out and is in direct contact with
new slurry causing a gradient. The gradient may also be caused by the manner in which the pad conforms
to the wafer. The wafer has a 10-15 micron bow across its diameter. In situ condition distributes and mixes
the slurry, eliminating the gradient.
[Figure 12 about here.]
Grooved pads have a very di�erent slurry gradient pattern for ex situ conditioning, as shown in Figure
13. The grooved pads support a linear gradient in the concentration of new slurry across the wafer. This
is because the grooved pads channel the slurry in the radial direction and prevent slurry from mixing with
its nearest neighbor. Like the at pad, conditioning reduces slurry gradients by mixing and distributing the
slurry across the pad.
[Figure 13 about here.]
12

7 Modeling
We performed 46 di�erent mixing measurements in a statistically designed experiment to investigate the
e�ects of the main CMP parameters including platen speed, ow rate, wafer down force, pad manufacturer,
and pad topography. We found that all of the mixing curves could be described by the following simple
function;
F =ktn
1 + ktn(5)
where k and n are constants and t is time. This function has been proposed by Racz and Abedian (1998)[29]
for polymer cure kinetics. Figures 14 and 15 shows that this function �ts the mixing curves extremely well.
[Figure 14 about here.]
[Figure 15 about here.]
The correlation coe�cients for the best �t lines are greater than 0.99 for the ex situ conditioning curves
and greater than 0.97 for the in situ conditioning curves. The correlation coe�cient is lower for the in situ
conditioning curves because Equation 3 cannot �t the oscillatory behavior of the mixing curves. The high
correlation coe�cients imply a physical signi�cance to Equation 3 explained below.
For the ideal case of unrestricted mixing, the mixing rate will be
�i = kt; (6)
where k is a constant, t is time, and �i is the ideal volumetric fraction containing uid "A" (new uid). The
ideal volumetric fraction, �i, can be expressed as
13

�i =Va
Vt; (7)
where Va is the volume of uid "A" and Vt is the total volume. This ideal volumetric fraction �i will be a
function of a number of paramters;
�i(bow wave composition, pore composition, conditioning, pad fluid storage:::) (8)
Each of these independent variables may also be a function of time. We assume a simple model;
�i = ktn: (9)
The amount of mixing beneath the wafer will be the amount of unrestricted mixing multiplied by some
weighting factors. As more new slurry covers the pad and becomes entrained beneath a wafer, the mixing
rate will decrease. This is because the new slurry (A) will have a higher probability than the old slurry (B)
of replacing new slurry in a uid element as new slurry becomes more abundant. Therefore the weighting
factors should be a function of the amount of the amount of uid "B" left on the pad and beneath the wafer.
These weighing factors will have two contributing parts: (1) mixing with slurry in the bow wave and on the
pad (VbVt) and (2) mixing under the wafer itself (also Vb
Vt).The rate of restricted mixing, d�, can be written
d� = d�iVb
Vt
Vb
Vt; (10)
where Vb is the volume of uid "B" and d� is the change in the unrestricted mixing. Since Vb can be written
14
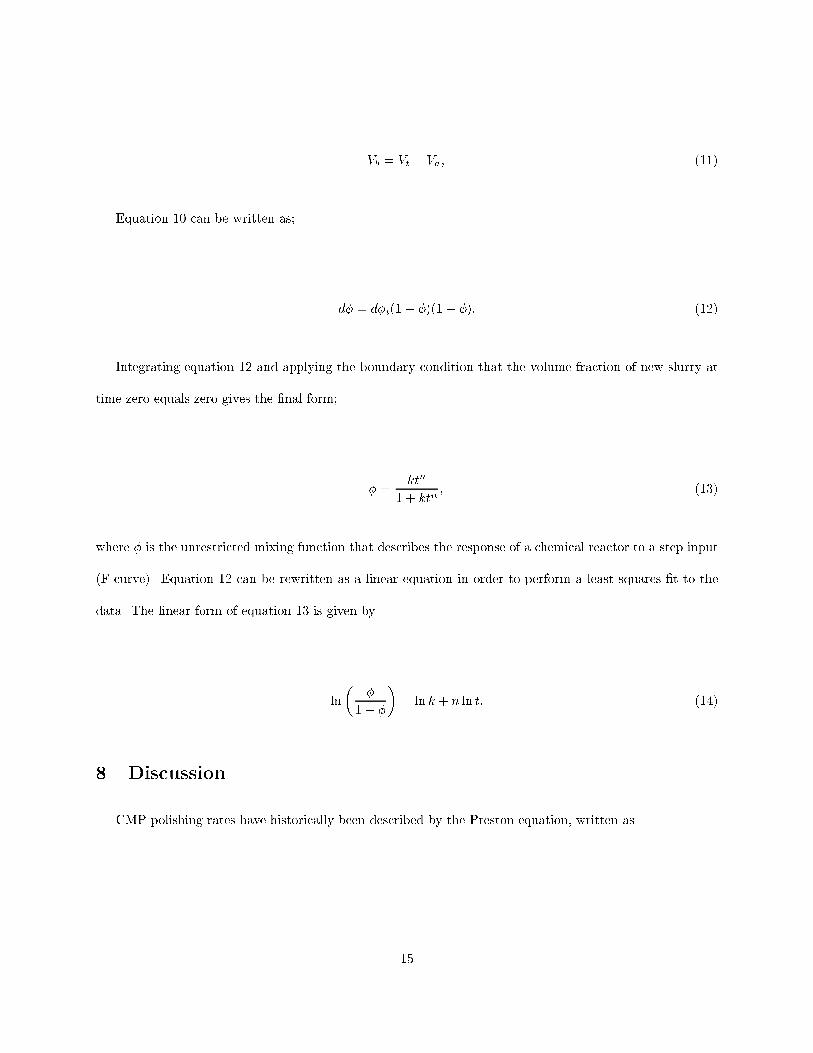
Vb = Vt � Va; (11)
Equation 10 can be written as;
d� = d�i(1� �)(1� �): (12)
Integrating equation 12 and applying the boundary condition that the volume fraction of new slurry at
time zero equals zero gives the �nal form;
� =ktn
1 + ktn; (13)
where � is the unrestricted mixing function that describes the response of a chemical reactor to a step input
(F-curve). Equation 12 can be rewritten as a linear equation in order to perform a least squares �t to the
data. The linear form of equation 13 is given by
ln
��
1� �
�= ln k + n ln t: (14)
8 Discussion
CMP polishing rates have historically been described by the Preston equation, written as
15

dh
dt= k �
ds
dt
N
A; (15)
where h is the thickness of the substrate being polished, s is the total sliding distance traveled by the
substrate, N is the normally applied load on area A, and t is time. Equation 15 shows that the removal
rate increases linearly with the platen speed. This coincides with slurry transport rates beneath the wafer
which also increases almost linearly with platen speed. Slurry transport would be expected to contribute
to the increase in removal rates with platen speed if Cook's model [4] of polishing is correct. Equation 15
also shows that the removal rate increases linearly with down force. Slurry transport was not signi�cantly
in uenced by slurry transport, which implies that down force is a purely mechanical e�ect provided the
wafer is operating within one lubrication regime. Finally, the Preston equation considers chemical and other
e�ects as one lump constant k. Slurry transport may in uence the polishing chemistry and therefore the
magnitude of this constant.
9 Conclusion
In this paper, we examined factors in uencing slurry transport. Slurry transport beneath a wafer while
polishing was quanti�ed by four di�erent measures; slurry mean residence time, slurry mixing, wafer slurry
transport e�ciency, �wafer, and system slurry transport e�ciency, �system. The slurry transport e�ciencies
varied from approximately 45% to 90%. Both measures of slurry transport e�ciency increased with increasing
platen speed and ow rate. These e�ciencies are useful for general physical insight into the slurry transport
and may be replaced after further research �ndings. Mean slurry transport can be modeled with a simple
continuous function for all of the conditions investigated. Signi�cant di�erences were seen between slurry
gradients that developed across a wafer surface on a at pad as compared with a grooved pad, implying that
pad topography plays a strong role in maintaining uniformity across the wafer. In situ conditioning was
shown to have a large e�ect on the slurry transport. In general, the amount of slurry mixing increased and
16

the rate of slurry transport decreased with in situ conditioning. Changes in �system with in situ conditioning
showed that in situ conditioning aided slurry transport to the wafer with at polishing pads. Finally, in
situ conditioning reduced gradients in the slurry age across the wafer. Future investigations will attempt
to correlate the polishing performance to the slurry behavior observed. Also the results shown here will be
reproduced on an IPEC 372 tool to ensure that all of the scaling arguments apply.
10 Acknowledgements
The authors would like to thank Intel and Cabot corporations for funding this research. We would also
like to thank VEECO corporation for donation of a Dektak 200 Si diamond tip pro�lometer that enabled us
to measure removal rates. We would also like to thank Freudenberg Nonwovens for donating FX-9 polishing
pads.
17

References
[1] Z Lin, J Zahka, and G Vasilopoulos. Pou �ltration of silica-based cmp slurries using planagard �lters.
Technical Report MA071, Millipore Corporation, 1998.
[2] G Grover, H Liang, S Ganeshkumar, and W Fortino. E�ect of slurry viscosity modi�cation on oxide
and tungsten CMP. Wear, 214(1):10{13, 1997.
[3] R Lachapelle. US Patent 3,328,141, June 1967.
[4] L Cook. Chemical Processes in Glass Polishing. Journal of Non-Crystalline Solids, 120:152{171, 1990.
[5] G J Pietsch, Y J Chabal, and G S Higashi. The atomic scale removal mechanism during chemo-
mechanical polishing of Si(100) and Si(111). Surface Science, 331:395{401, 1995.
[6] J Levert, R Baker, F Mess, R Salant, and S Danyluk. Mechanisms of Chemical-Mechanical Polishing
of Silicon Dioxide Dielectric on Integrated Circuits. Tribology Transactions, 41(4):593{599, 1998.
[7] L Weidan, D Shin, M Tomozawa, and S Murarka. The e�ect of the polishing pad treatments on the
chemical-mechanical polishing of SiO2 �lms. Thin Solid Films, 270:601{606, 1995.
[8] F Mess, J Levert, and S Danyluk. Vertical di�erential displacements at a pad/sapphire interface during
polishing. Wear, 211(2):311{315, 1997.
[9] C Liu, B Dai, W Tseng, and C Yeh. Modeling of the Wear Mechanism during Chemical Mechanical
Polishing. Journal of Electrochemical Society, 143(2):716{721, 1996.
[10] L Cook, J Wang, D James, and A Sethuraman. Theoretical and Practical Aspects of Dielectric and
Metal CMP. Semiconductor International, pages 141{144, November 1995.
[11] T K Yu, C C YU, and M Orlowski. A statistical polishing pad model for chemical-mechanical polish
planarization. IEDM Tech. Dig., 270:865{868, 1993.
[12] D Wang, J Lee, K Holland, T Bibby, S Beaudoin, and T Cale. Von Mises Stress in Chemical Mechanical
Polishing Processes. Journal of Electrochemical Society, 144(3):1121{1127, 1997.
18

[13] W Tseng, Y Hsieh, C Lin, M Tsai, and M Feng. Chemical-Mechanical Polishing and Material Charac-
teristics of Plasma-Enhanced Chemically Vapor Deposited Fluorinated Oxide Thin Films. Journal of
the Electrochemical Society, 144(3):1100{1106, 1997.
[14] N Brown. Some Speculations on the Mechanisms of Abrasive Grinding and Polishing. Precision Engi-
neering, 9(3):129{138, 1987.
[15] S Soares, D Baselt, J Black, K Jungling, and W Stowell. Float-polishing process and analysis of oat-
polished quartz. Applied Optics, 33(1):89{95, jan 1994.
[16] S Runnels and L Eyman. Tribology analysis of chemical mechanical polishing. Journal of Electrochemical
Society, 141(6):1698{1701, June 1994.
[17] S Runnels. Feature-scale uid-based erosion modeling for chemical mechanical polishing. Journal of
Electrochemical Society, 141(7):1900{1904, June 1994.
[18] Z Stavreva, D Zeidler, M Plotner, and K Drescher. Characterisitics in chemical-mechanical polishing of
copper: comparison of polishing pads. Applied Surface Science, 108:39{44, 1997.
[19] P Parikh, J Lee, D Kreager, H Nguyen, J Yang, and K Holland. Oxide CMP on High-Throughput
Orbital Polisher. In Second International Chemical-Mechanical Polish (C.M.P.) for ULSI Multilevel
Interconnection Conference (CMP-MIC), pages 69{72, 1997.
[20] I Ali, R Sudipto, and R Shinn. Chemical mechanical polishing of interlayer dielectric: A review. Solid
State Technology, pages 63{70, October 1994.
[21] P Singer. Chemical Mechanical Polishing: A New Focus on Consumables. National Semiconductor,
pages 48{51, February 1994.
[22] F Sugimoto et al. Simultaneous Temperature Measurement of Wafers in Chemical Mechanical Polishing
of Silicon Dioxide Layer. Japanese Journal of Applied Physics, 34:6314{6320, 1995.
19

[23] I Ali and S Roy. Pad Conditioning in Interlayer Dielectric CMP. Solid State Technology, pages 185{191,
June 1997.
[24] H Liang and F Kaufman. Wear phenomenon in chemical mechanical polishing. Wear, 211(2):271{279,
1997.
[25] J Coppeta and C Rogers. Dual Emission Laser Induced Fluorescence For Direct Planar Scalar Behavior
Measurements. Experiments in Fluids, 25:141{144, 1997.
[26] J Coppeta, C Rogers, L Racz, A Philipossian, and F Kaufman. Characterizing Slurry Flow During
CMP Using Laser Induced Fluorescence. In Second International Chemical-Mechanical Polish (C.M.P.)
for ULSI Multilevel Interconnection Conference (CMP-MIC), pages 307{314, 1997.
[27] J Coppeta, C Rogers, L Racz, A Philipossian, and F Kaufman. The in uence of CMP process parameters
on slurry transport. In Fourth International Chemical-Mechanical Polish (C.M.P.) for ULSI Multilevel
Interconnection Conference (CMP-MIC), pages 37{44, 1998.
[28] Gilbert F Froment and Kenneth B Bischo�. Chemical Reactor Analysis and Design. John Wiley and
Sons, 1990.
[29] L Racz and B Abedian. Cure kinetics of light-activated polymers. Journal of Polymer Science: Part
B: Polymer Physics, 36:2887{2894, 1998.
20

List of Figures
1 Polishing results of BK-7 glass . . . . . . . . . . . . . . . . . . . . . . . . . . . . . . . . . . . 22
2 Experimental Apparatus . . . . . . . . . . . . . . . . . . . . . . . . . . . . . . . . . . . . . . . 23
3 In situ conditioner . . . . . . . . . . . . . . . . . . . . . . . . . . . . . . . . . . . . . . . . . . 24
4 Mixing history beneath wafer during polish . . . . . . . . . . . . . . . . . . . . . . . . . . . . 25
5 Mixing measurement interrogation region . . . . . . . . . . . . . . . . . . . . . . . . . . . . . 26
6 Graphical representation of �wafer and �system . . . . . . . . . . . . . . . . . . . . . . . . . . 27
7 Mixing history with in situ and ex situ conditioning . . . . . . . . . . . . . . . . . . . . . . . 28
8 E�ects of in situ conditioning on at pad mixing history . . . . . . . . . . . . . . . . . . . . . 29
9 In situ conditioning with a ooded at pad . . . . . . . . . . . . . . . . . . . . . . . . . . . . 30
10 E�ect of platen speed on mixing history . . . . . . . . . . . . . . . . . . . . . . . . . . . . . . 31
11 E�ect of ow rate on mixing history . . . . . . . . . . . . . . . . . . . . . . . . . . . . . . . . 32
12 E�ect of in situ conditioning on slurry gradients on a at pad . . . . . . . . . . . . . . . . . . 33
13 E�ect in situ conditioning on slurry gradients on a grooved pad . . . . . . . . . . . . . . . . . 34
14 Model �t versus ex situ conditioning mixing curves . . . . . . . . . . . . . . . . . . . . . . . . 35
15 Model �t versus in situ conditioning mixing curves . . . . . . . . . . . . . . . . . . . . . . . . 36
21

Fraction of Wafer Radius
PolishingRate(Angstroms/min)
10.80.60.40.20
3000
2500
2000
1500
1000
500
0
Figure 1: Polishing results of BK-7 glass
22

Figure 2: Experimental Apparatus
23

Figure 3: In situ conditioner
24

Run bRun a
Cond Run bCond Run a
Time (sec)
VolumetricPercentMixing
160140120100806040200-20
100
90
80
70
60
50
40
30
20
10
0
Figure 4: Mixing history beneath wafer during polish
25

Figure 5: Mixing measurement interrogation region
26

Figure 6: Graphical representation of �wafer and �system.
27

Run bRun a
Cond Run bCond Run a
Time (sec)
VolumetricPercentMixing
160140120100806040200-20
100
90
80
70
60
50
40
30
20
10
0
Figure 7: Mixing history with in situ and ex situ conditioning
28

Ex Situ bEx Situ aIn Situ bIn Situ a
Time (sec)
VolumetricPercentMixing
120100806040200-20
100
90
80
70
60
50
40
30
20
10
0
Figure 8: E�ects of in situ conditioning on at pad mixing history
29

Ex Situ bEx Situ aIn Situ bIn Situ a
Time (sec)
VolumetricPercentMixing
160140120100806040200-20
100
90
80
70
60
50
40
30
20
10
0
Figure 9: In situ conditioning with a ooded at pad
30

90 rpm b90 rpm a30 rpm b30 rpm a
Time (sec)
VolumetricPercentMixing
200180160140120100806040200-20
100
90
80
70
60
50
40
30
20
10
0
Figure 10: E�ect of platen speed on mixing history
31

50 cc/min b50 cc/min a20 cc/min b20 cc/min a
Time (sec)
VolumetricPercentMixing
120100806040200-20
100
90
80
70
60
50
40
30
20
10
0
Figure 11: E�ect of ow rate on mixing history
32

Ex Situ CondIn Situ Cond
Distance (cm)
VolumetricPercentMixing
43.532.521.510.50
100
80
60
40
20
0
Figure 12: E�ect of in situ conditioning on slurry gradients on a at pad
33

Ex Situ CondIn Situ Cond
Distance (cm)
VolumetricPercentMixing
43.532.521.510.50
100
80
60
40
20
0
Figure 13: E�ect in situ conditioning on slurry gradients on a grooved pad
34

k-n ModelData
Time (sec)
VolumetricPercentMixing
6050403020100-10
100
80
60
40
20
0
Figure 14: Model �t versus ex situ conditioning mixing curves
35

k-n ModelData
Time (sec)
VolumetricPercentMixing
9080706050403020100-10
100
80
60
40
20
0
Figure 15: Model �t versus in situ conditioning mixing curves
36

List of Tables
1 Comparison of Parameter Values . . . . . . . . . . . . . . . . . . . . . . . . . . . . . . . . . . 38
37

Parameter Scaling Factor IPEC472 Struers
Down Force 1 4 psi (13.790 kPa) 4 psi (13.790 kPa)
Platen Speed Reynolds Number 30 rpm 54 rpm
(linear velocity 0.5 m/s) (linear velocity 0.5 m/s)
Platen DiameterDplaten
Dwafer22 inches (56 cm) 12 inches (30.5 cm)
Wafer DiameterDplaten
Dwafer6 inches (150 mm) 3 inches (76 mm)
Flow Rate Platen Surface Area 100 ml/min 25 ml/min
Table 1: Comparison of Parameter Values
38