Simulation analysis of the connecting transport AMHS in a wafer fab
10
IEEE TRANSACTIONS ON SEMICONDUCTOR MANUFACTURING, VOL. 16, NO. 3, AUGUST 2003 555 Simulation Analysis of the Connecting Transport AMHS in a Wafer Fab James T. Lin, Fu-Kwun Wang, and Chun-Kuan Wu Abstract—This paper analyzes the performance of the con- necting transport automated material handling system (AMHS) in a wafer fab. Discrete-event simulation models are developed in e-M Plant to study connecting transport in a simplified 300 mm wafer fab. A two-phase experimental approach evaluates the connecting transport. In phase I, the simulation results show that the connecting transport method has a significant effect on average travel time, throughput, and vehicle utilization. The relationship between vehicle quantity and the material flow rate is investigated in a simulation model for three connecting transport methods. The performance measures of these two factors can be predicted with a response surface method. However, none of the connecting transport methods outperforms the others in the different operating scenarios. In phase II, the connecting transport method is a mixture of the three existing methods. Thus, the optimum combination of these methods can be obtained with a mixture of experiment. Index Terms—Automated material handling system, connecting transport, mixture experiments, simulation analysis. I. INTRODUCTION W ITH the current downturn in the semiconductor industry, companies are increasingly shifting capital expenditure away from 200-mm fabs toward 300-mm programs. The major reasons are the availability of more chips per wafer and the more acceptable economies of scale for 300 mm fabs. How- ever, the weight of the 300 mm wafer carriers [which are front- opening unified pods (FOUPs)] exceeds the recommended limit that workers can repetitively move. Thus, 300-mm factories re- quire a much higher level of automation. Such automation re- sults in higher factory efficiency if it is used cost-effectively to ensure that the right material is delivered to the right place at the right time, and that it is processed correctly. For example, some companies’ 300-mm strategies include fully automated in-bay material handling. Full-fab automation includes two key elements: an automated material handling system (AMHS) that moves WIP from one process equipment to another, and factory management software that converts the flow of data into infor- mation, thus transforming the fab into an intelligent manufac- turing environment [1]. An AMHS in semiconductor manufac- turing optimizes productivity, improves equipment utilization and ergonomics, and reduces particle contamination and vibra- tion shock to the wafers [2]. Furthermore, fewer operators are Manuscript received July 10, 2002; revised March 10, 2003. J. T. Lin and C. K. Wu are with the Department of Industrial Engineering and Engineering Management, National Tsing Hua University, Hsinchu 300, Taiwan, R.O.C. F. K. Wang is with the Department of Industrial Engineering and Manage- ment, National Taipei University of Technology, Taipei 106, Taiwan, R.O.C. (e-mail: [email protected]). Digital Object Identifier 10.1109/TSM.2003.815211 necessary. Nevertheless, the savings from modest staff reduc- tions can be offset by the cost of equipment and systems, but automation can generate positive effects on overall equipment effectiveness (OEE), yields, development time, ramp time, and cycle time. These benefits should be substantially greater than those that are accrued from staff reductions [1]. Research into AMHS is generally conducted with simulation analysis, and is directed at track layout, performance analysis, and management issues such as dispatch rules for vehicle con- trol and transport types. Pierce and Stafford [3] studied three types of interbay layout by simulation: spine, perimeter, and custom track systems. The simulation results showed that the custom layout had a 16% more efficient delivery time than the spine layout, and that the perimeter layout had the worst perfor- mance in terms of delivery time, vehicle utilization, and track length requirement. The most practical approach to enhancing interbay AMHS performance is to minimize the distances be- tween stockers by using a custom track layout with turntables. Kurosaki et al. [4] and Pillai et al. [5] addressed the linking of interbay and intrabay track options for a 300-mm fab layout. They found that the delivery time of isolated and linking track systems was highly dependent on the traffic type. Peters and Yang [6] presented a combination of a space filling curve and network flow procedures that could efficiently and effectively solve the integrated layout and material handling system design problem for both the spine and perimeter configurations. Ting and Tanchoco [7] used an analytical approach to develop op- timal single-spine and double-spine overhead track layouts and minimize travel distance. They also indicated that the simplicity, track length, and flow distances of the spine layout made it suit- able for 300-mm fab. When the layout and material handling equipment have been determined, performance analysis can be used to evaluate AMHS design alternatives. Cardarelli and Pelagagge [8] used discrete event simulation to examine system performance with such factors as stocker capacity, production planning and scheduling, and system management. They showed that the storage capacity distribution along the interbay track is important in maintaining AMHS performance. Mackulak et al. [9] investigated the relationship between the vehicle carrying capacity and the tool batch size of an intrabay system. The results showed that vehicle capacity had the most significant effect on average delivery time. Paprotny et al. [10] compared continuous flow transport (CFT) and overhead monorail vehicles (OMVs). They found that the delivery time of OMV’s was half that of the cost-effective CFT system, but the standard deviation of OMV was almost 10 times larger than that of the CFT system. Mackulak and Savory [11] compared the intrabay 0894-6507/03$17.00 © 2003 IEEE
Transcript of Simulation analysis of the connecting transport AMHS in a wafer fab

IEEE TRANSACTIONS ON SEMICONDUCTOR MANUFACTURING, VOL. 16, NO. 3, AUGUST 2003 555
Simulation Analysis of the Connecting TransportAMHS in a Wafer Fab
James T. Lin, Fu-Kwun Wang, and Chun-Kuan Wu
Abstract—This paper analyzes the performance of the con-necting transport automated material handling system (AMHS)in a wafer fab. Discrete-event simulation models are developedin e-M Plant to study connecting transport in a simplified 300mm wafer fab. A two-phase experimental approach evaluatesthe connecting transport. In phase I, the simulation results showthat the connecting transport method has a significant effecton average travel time, throughput, and vehicle utilization. Therelationship between vehicle quantity and the material flow rate isinvestigated in a simulation model for three connecting transportmethods. The performance measures of these two factors canbe predicted with a response surface method. However, noneof the connecting transport methods outperforms the others inthe different operating scenarios. In phase II, the connectingtransport method is a mixture of the three existing methods. Thus,the optimum combination of these methods can be obtained witha mixture of experiment.
Index Terms—Automated material handling system, connectingtransport, mixture experiments, simulation analysis.
I. INTRODUCTION
W ITH the current downturn in the semiconductor industry,companies are increasingly shifting capital expenditure
away from 200-mm fabs toward 300-mm programs. The majorreasons are the availability of more chips per wafer and themore acceptable economies of scale for 300 mm fabs. How-ever, the weight of the 300 mm wafer carriers [which are front-opening unified pods (FOUPs)] exceeds the recommended limitthat workers can repetitively move. Thus, 300-mm factories re-quire a much higher level of automation. Such automation re-sults in higher factory efficiency if it is used cost-effectively toensure that the right material is delivered to the right place atthe right time, and that it is processed correctly. For example,some companies’ 300-mm strategies include fully automatedin-bay material handling. Full-fab automation includes two keyelements: an automated material handling system (AMHS) thatmoves WIP from one process equipment to another, and factorymanagement software that converts the flow of data into infor-mation, thus transforming the fab into an intelligent manufac-turing environment [1]. An AMHS in semiconductor manufac-turing optimizes productivity, improves equipment utilizationand ergonomics, and reduces particle contamination and vibra-tion shock to the wafers [2]. Furthermore, fewer operators are
Manuscript received July 10, 2002; revised March 10, 2003.J. T. Lin and C. K. Wu are with the Department of Industrial Engineering
and Engineering Management, National Tsing Hua University, Hsinchu 300,Taiwan, R.O.C.
F. K. Wang is with the Department of Industrial Engineering and Manage-ment, National Taipei University of Technology, Taipei 106, Taiwan, R.O.C.(e-mail: [email protected]).
Digital Object Identifier 10.1109/TSM.2003.815211
necessary. Nevertheless, the savings from modest staff reduc-tions can be offset by the cost of equipment and systems, butautomation can generate positive effects on overall equipmenteffectiveness (OEE), yields, development time, ramp time, andcycle time. These benefits should be substantially greater thanthose that are accrued from staff reductions [1].
Research into AMHS is generally conducted with simulationanalysis, and is directed at track layout, performance analysis,and management issues such as dispatch rules for vehicle con-trol and transport types. Pierce and Stafford [3] studied threetypes of interbay layout by simulation: spine, perimeter, andcustom track systems. The simulation results showed that thecustom layout had a 16% more efficient delivery time than thespine layout, and that the perimeter layout had the worst perfor-mance in terms of delivery time, vehicle utilization, and tracklength requirement. The most practical approach to enhancinginterbay AMHS performance is to minimize the distances be-tween stockers by using a custom track layout with turntables.Kurosakiet al. [4] and Pillaiet al. [5] addressed the linking ofinterbay and intrabay track options for a 300-mm fab layout.They found that the delivery time of isolated and linking tracksystems was highly dependent on the traffic type. Peters andYang [6] presented a combination of a space filling curve andnetwork flow procedures that could efficiently and effectivelysolve the integrated layout and material handling system designproblem for both the spine and perimeter configurations. Tingand Tanchoco [7] used an analytical approach to develop op-timal single-spine and double-spine overhead track layouts andminimize travel distance. They also indicated that the simplicity,track length, and flow distances of the spine layout made it suit-able for 300-mm fab.
When the layout and material handling equipment havebeen determined, performance analysis can be used to evaluateAMHS design alternatives. Cardarelli and Pelagagge [8] useddiscrete event simulation to examine system performancewith such factors as stocker capacity, production planningand scheduling, and system management. They showed thatthe storage capacity distribution along the interbay track isimportant in maintaining AMHS performance. Mackulaket al.[9] investigated the relationship between the vehicle carryingcapacity and the tool batch size of an intrabay system. Theresults showed that vehicle capacity had the most significanteffect on average delivery time. Paprotnyet al. [10] comparedcontinuous flow transport (CFT) and overhead monorailvehicles (OMVs). They found that the delivery time of OMV’swas half that of the cost-effective CFT system, but the standarddeviation of OMV was almost 10 times larger than that of theCFT system. Mackulak and Savory [11] compared the intrabay
0894-6507/03$17.00 © 2003 IEEE
556 IEEE TRANSACTIONS ON SEMICONDUCTOR MANUFACTURING, VOL. 16, NO. 3, AUGUST 2003
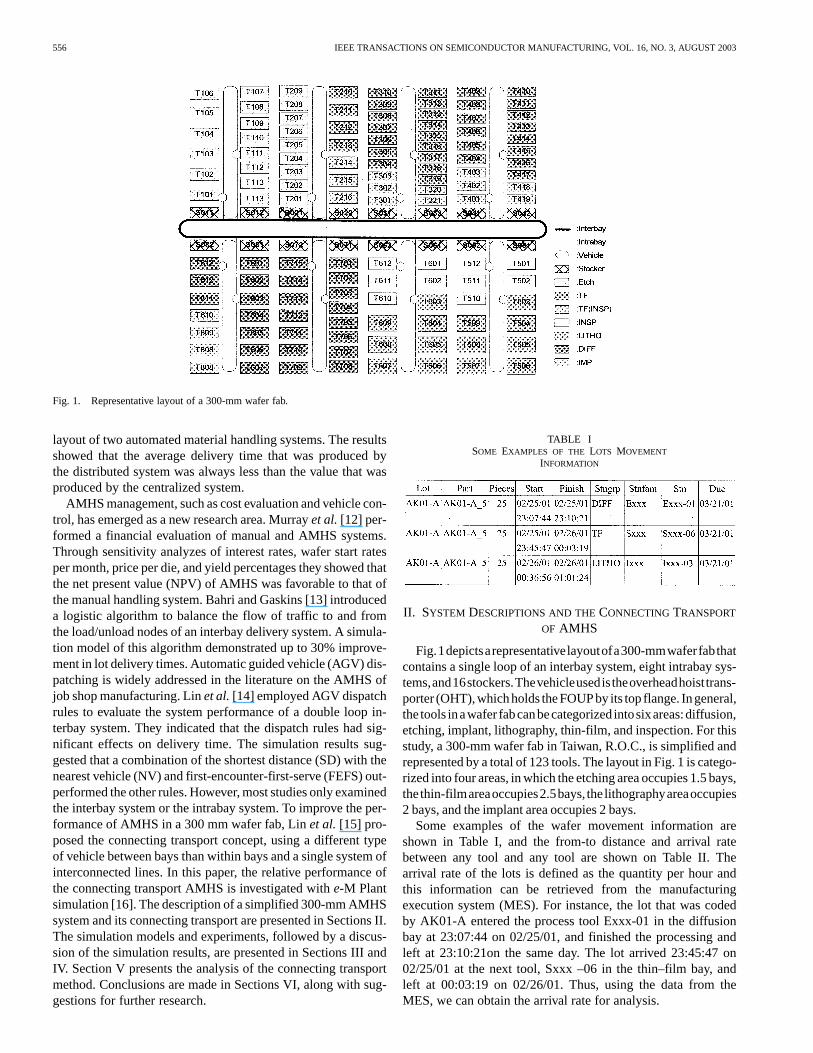
Fig. 1. Representative layout of a 300-mm wafer fab.
layout of two automated material handling systems. The resultsshowed that the average delivery time that was produced bythe distributed system was always less than the value that wasproduced by the centralized system.
AMHS management, such as cost evaluation and vehicle con-trol, has emerged as a new research area. Murrayet al.[12] per-formed a financial evaluation of manual and AMHS systems.Through sensitivity analyzes of interest rates, wafer start ratesper month, price per die, and yield percentages they showed thatthe net present value (NPV) of AMHS was favorable to that ofthe manual handling system. Bahri and Gaskins [13] introduceda logistic algorithm to balance the flow of traffic to and fromthe load/unload nodes of an interbay delivery system. A simula-tion model of this algorithm demonstrated up to 30% improve-ment in lot delivery times. Automatic guided vehicle (AGV) dis-patching is widely addressed in the literature on the AMHS ofjob shop manufacturing. Linet al.[14] employed AGV dispatchrules to evaluate the system performance of a double loop in-terbay system. They indicated that the dispatch rules had sig-nificant effects on delivery time. The simulation results sug-gested that a combination of the shortest distance (SD) with thenearest vehicle (NV) and first-encounter-first-serve (FEFS) out-performed the other rules. However, most studies only examinedthe interbay system or the intrabay system. To improve the per-formance of AMHS in a 300 mm wafer fab, Linet al. [15] pro-posed the connecting transport concept, using a different typeof vehicle between bays than within bays and a single system ofinterconnected lines. In this paper, the relative performance ofthe connecting transport AMHS is investigated withe-M Plantsimulation [16]. The description of a simplified 300-mm AMHSsystem and its connecting transport are presented in Sections II.The simulation models and experiments, followed by a discus-sion of the simulation results, are presented in Sections III andIV. Section V presents the analysis of the connecting transportmethod. Conclusions are made in Sections VI, along with sug-gestions for further research.
TABLE ISOME EXAMPLES OF THE LOTS MOVEMENT
INFORMATION
II. SYSTEM DESCRIPTIONS AND THECONNECTINGTRANSPORT
OF AMHS
Fig.1depictsarepresentativelayoutofa300-mmwaferfabthatcontains a single loop of an interbay system, eight intrabay sys-tems,and16stockers.Thevehicleusedistheoverheadhoisttrans-porter (OHT),whichholds theFOUPby its top flange. Ingeneral,the tools inawafer fabcanbecategorized intosixareas:diffusion,etching, implant, lithography, thin-film, and inspection. For thisstudy, a 300-mm wafer fab in Taiwan, R.O.C., is simplified andrepresented by a total of 123 tools. The layout in Fig. 1 is catego-rized into four areas, in which the etching area occupies 1.5 bays,thethin-filmareaoccupies2.5bays, the lithographyareaoccupies2 bays, and the implant area occupies 2 bays.
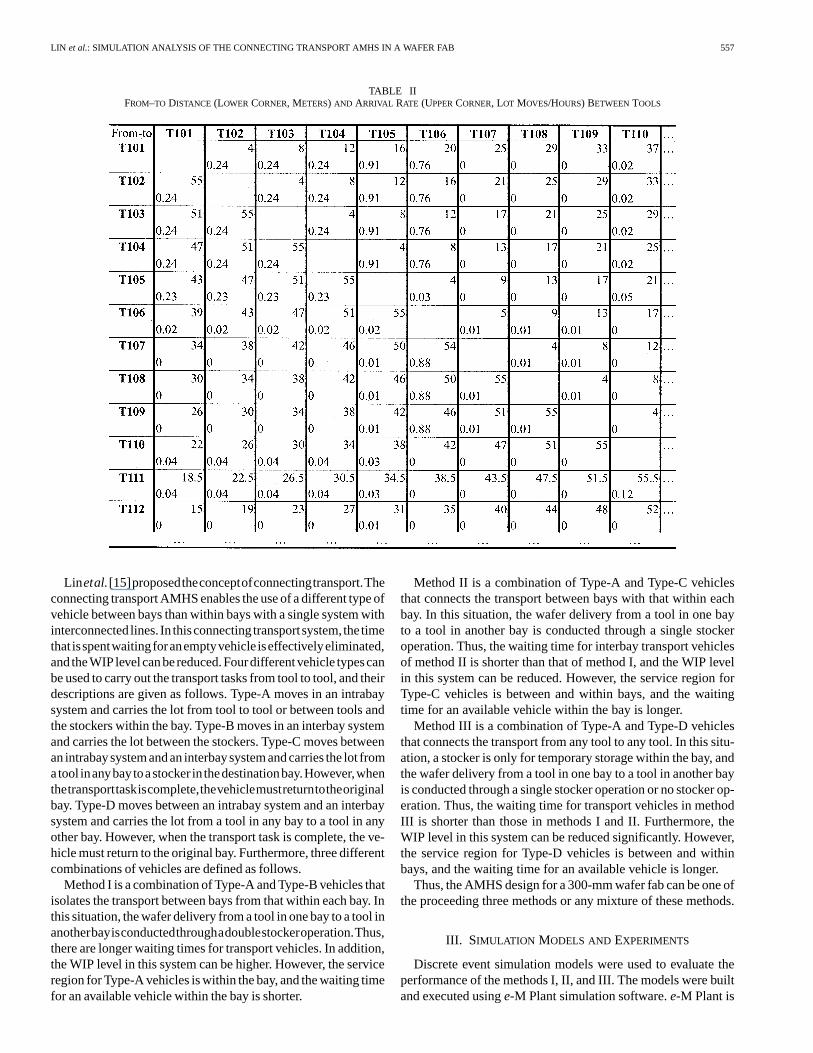
Some examples of the wafer movement information areshown in Table I, and the from-to distance and arrival ratebetween any tool and any tool are shown on Table II. Thearrival rate of the lots is defined as the quantity per hour andthis information can be retrieved from the manufacturingexecution system (MES). For instance, the lot that was codedby AK01-A entered the process tool Exxx-01 in the diffusionbay at 23:07:44 on 02/25/01, and finished the processing andleft at 23:10:21on the same day. The lot arrived 23:45:47 on02/25/01 at the next tool, Sxxx –06 in the thin–film bay, andleft at 00:03:19 on 02/26/01. Thus, using the data from theMES, we can obtain the arrival rate for analysis.
LIN et al.: SIMULATION ANALYSIS OF THE CONNECTING TRANSPORT AMHS IN A WAFER FAB 557
TABLE IIFROM–TO DISTANCE (LOWER CORNER, METERS) AND ARRIVAL RATE (UPPERCORNER, LOT MOVES/HOURS) BETWEEN TOOLS
Lin etal.[15]proposedtheconceptofconnectingtransport.Theconnecting transport AMHS enables the use of a different type ofvehicle between bays than within bays with a single system withinterconnected lines. In thisconnecting transportsystem, thetimethat isspentwaitingforanemptyvehicle iseffectivelyeliminated,and theWIP levelcanbereduced.Fourdifferentvehicle typescanbe used to carry out the transport tasks from tool to tool, and theirdescriptions are given as follows. Type-A moves in an intrabaysystem and carries the lot from tool to tool or between tools andthe stockers within the bay. Type-B moves in an interbay systemand carries the lot between the stockers. Type-C moves betweenan intrabaysystemandan interbaysystemandcarries the lot fromatool inanybaytoastocker in thedestinationbay.However,whenthetransporttaskiscomplete,thevehiclemustreturntotheoriginalbay. Type-D moves between an intrabay system and an interbaysystem and carries the lot from a tool in any bay to a tool in anyother bay. However, when the transport task is complete, the ve-hicle must return to the original bay. Furthermore, three differentcombinations of vehicles are defined as follows.
Method I is a combination of Type-A and Type-B vehicles thatisolates the transport between bays from that within each bay. Inthis situation, the wafer delivery from a tool in one bay to a tool inanotherbayisconductedthroughadoublestockeroperation.Thus,there are longer waiting times for transport vehicles. In addition,the WIP level in this system can be higher. However, the serviceregion for Type-A vehicles is within the bay, and the waiting timefor an available vehicle within the bay is shorter.
Method II is a combination of Type-A and Type-C vehiclesthat connects the transport between bays with that within eachbay. In this situation, the wafer delivery from a tool in one bayto a tool in another bay is conducted through a single stockeroperation. Thus, the waiting time for interbay transport vehiclesof method II is shorter than that of method I, and the WIP levelin this system can be reduced. However, the service region forType-C vehicles is between and within bays, and the waitingtime for an available vehicle within the bay is longer.
Method III is a combination of Type-A and Type-D vehiclesthat connects the transport from any tool to any tool. In this situ-ation, a stocker is only for temporary storage within the bay, andthe wafer delivery from a tool in one bay to a tool in another bayis conducted through a single stocker operation or no stocker op-eration. Thus, the waiting time for transport vehicles in methodIII is shorter than those in methods I and II. Furthermore, theWIP level in this system can be reduced significantly. However,the service region for Type-D vehicles is between and withinbays, and the waiting time for an available vehicle is longer.
Thus, the AMHS design for a 300-mm wafer fab can be one ofthe proceeding three methods or any mixture of these methods.
III. SIMULATION MODELS AND EXPERIMENTS
Discrete event simulation models were used to evaluate theperformance of the methods I, II, and III. The models were builtand executed usinge-M Plant simulation software.e-M Plant is
558 IEEE TRANSACTIONS ON SEMICONDUCTOR MANUFACTURING, VOL. 16, NO. 3, AUGUST 2003
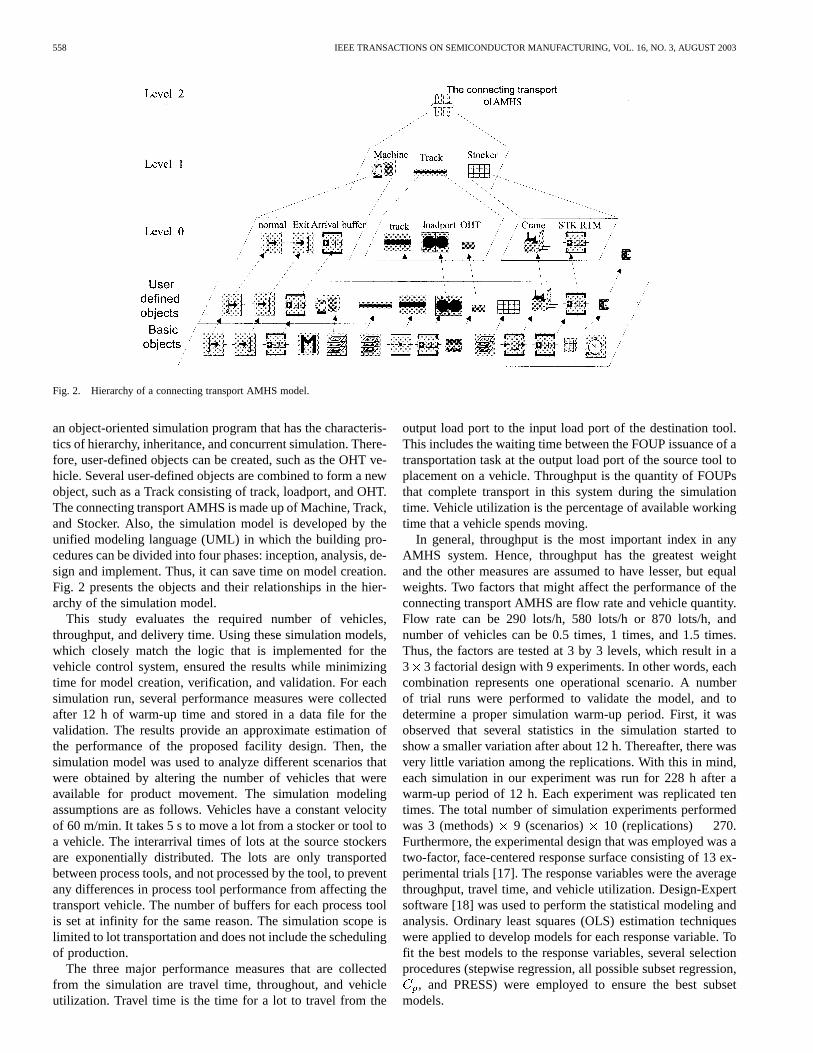
Fig. 2. Hierarchy of a connecting transport AMHS model.
an object-oriented simulation program that has the characteris-tics of hierarchy, inheritance, and concurrent simulation. There-fore, user-defined objects can be created, such as the OHT ve-hicle. Several user-defined objects are combined to form a newobject, such as a Track consisting of track, loadport, and OHT.The connecting transport AMHS is made up of Machine, Track,and Stocker. Also, the simulation model is developed by theunified modeling language (UML) in which the building pro-cedures can be divided into four phases: inception, analysis, de-sign and implement. Thus, it can save time on model creation.Fig. 2 presents the objects and their relationships in the hier-archy of the simulation model.
This study evaluates the required number of vehicles,throughput, and delivery time. Using these simulation models,which closely match the logic that is implemented for thevehicle control system, ensured the results while minimizingtime for model creation, verification, and validation. For eachsimulation run, several performance measures were collectedafter 12 h of warm-up time and stored in a data file for thevalidation. The results provide an approximate estimation ofthe performance of the proposed facility design. Then, thesimulation model was used to analyze different scenarios thatwere obtained by altering the number of vehicles that wereavailable for product movement. The simulation modelingassumptions are as follows. Vehicles have a constant velocityof 60 m/min. It takes 5 s to move a lot from a stocker or tool toa vehicle. The interarrival times of lots at the source stockersare exponentially distributed. The lots are only transportedbetween process tools, and not processed by the tool, to preventany differences in process tool performance from affecting thetransport vehicle. The number of buffers for each process toolis set at infinity for the same reason. The simulation scope islimited to lot transportation and does not include the schedulingof production.
The three major performance measures that are collectedfrom the simulation are travel time, throughout, and vehicleutilization. Travel time is the time for a lot to travel from the
output load port to the input load port of the destination tool.This includes the waiting time between the FOUP issuance of atransportation task at the output load port of the source tool toplacement on a vehicle. Throughput is the quantity of FOUPsthat complete transport in this system during the simulationtime. Vehicle utilization is the percentage of available workingtime that a vehicle spends moving.
In general, throughput is the most important index in anyAMHS system. Hence, throughput has the greatest weightand the other measures are assumed to have lesser, but equalweights. Two factors that might affect the performance of theconnecting transport AMHS are flow rate and vehicle quantity.Flow rate can be 290 lots/h, 580 lots/h or 870 lots/h, andnumber of vehicles can be 0.5 times, 1 times, and 1.5 times.Thus, the factors are tested at 3 by 3 levels, which result in a3 3 factorial design with 9 experiments. In other words, eachcombination represents one operational scenario. A numberof trial runs were performed to validate the model, and todetermine a proper simulation warm-up period. First, it wasobserved that several statistics in the simulation started toshow a smaller variation after about 12 h. Thereafter, there wasvery little variation among the replications. With this in mind,each simulation in our experiment was run for 228 h after awarm-up period of 12 h. Each experiment was replicated tentimes. The total number of simulation experiments performedwas 3 (methods) 9 (scenarios) 10 (replications) 270.Furthermore, the experimental design that was employed was atwo-factor, face-centered response surface consisting of 13 ex-perimental trials [17]. The response variables were the averagethroughput, travel time, and vehicle utilization. Design-Expertsoftware [18] was used to perform the statistical modeling andanalysis. Ordinary least squares (OLS) estimation techniqueswere applied to develop models for each response variable. Tofit the best models to the response variables, several selectionprocedures (stepwise regression, all possible subset regression,
, and PRESS) were employed to ensure the best subsetmodels.

LIN et al.: SIMULATION ANALYSIS OF THE CONNECTING TRANSPORT AMHS IN A WAFER FAB 559
TABLE IIISUMMARY OF SIMULATION RESULTS OFMULTIPLE RANGE TEST FORALL METHODS
IV. A NALYSIS OF SIMULATION RESULTS
For each connecting transport method, the residual analysisshowed that the assumptions (normality, constant variance forerror term and independent) were satisfied for all scenarios, andfurther statistical analysis could be carried out. The results ofthe analysis of variance in Table III indicate that the connectingtransport method significantly affects the average travel timeat 95% confidence level for all scenarios. The method signif-icantly affects the average throughput for scenarios 4, 7, and 9,and significantly affects the average vehicle utilization for allscenarios at 95% confidence level. The least significant differ-ence (LSD) method is used to compare all pairs of the threeconnecting transport methods under each of the nine scenarios.Results of the paired test analysis are summarized in Table III.The three methods are ranked best (top) to worst under each sce-nario for average travel time, average throughput, and vehicleutilization. Each value is the mean of the performance data thatwas collected in the 10 replications. An overall 95% confidencelevel is used in paired test analysis. With these methods, threepairwise comparisons can be conducted under each scenario foreach performance measure. The information that is containedin Table III can provide guidance for decision makers in the se-lection of preferable methods, based on the different operationenvironment and performance measures. Ranking comparisonsfor all three methods based on Table III show that no method
outperformed the others. The generated response models for thedifferent methods are as follows.
Method I:
The values are 0.8299, 0.8452, and 0.9366, respec-tively. The residual analysis of these models validated theassumptions. A three-dimensional (3-D) surface for the de-sirability function is presented in Fig. 3. Flow rate and ve-hicle number had significant effects on travel time and ve-hicle utilization. However, throughput was only affected bythe flow rate.Method II:
560 IEEE TRANSACTIONS ON SEMICONDUCTOR MANUFACTURING, VOL. 16, NO. 3, AUGUST 2003
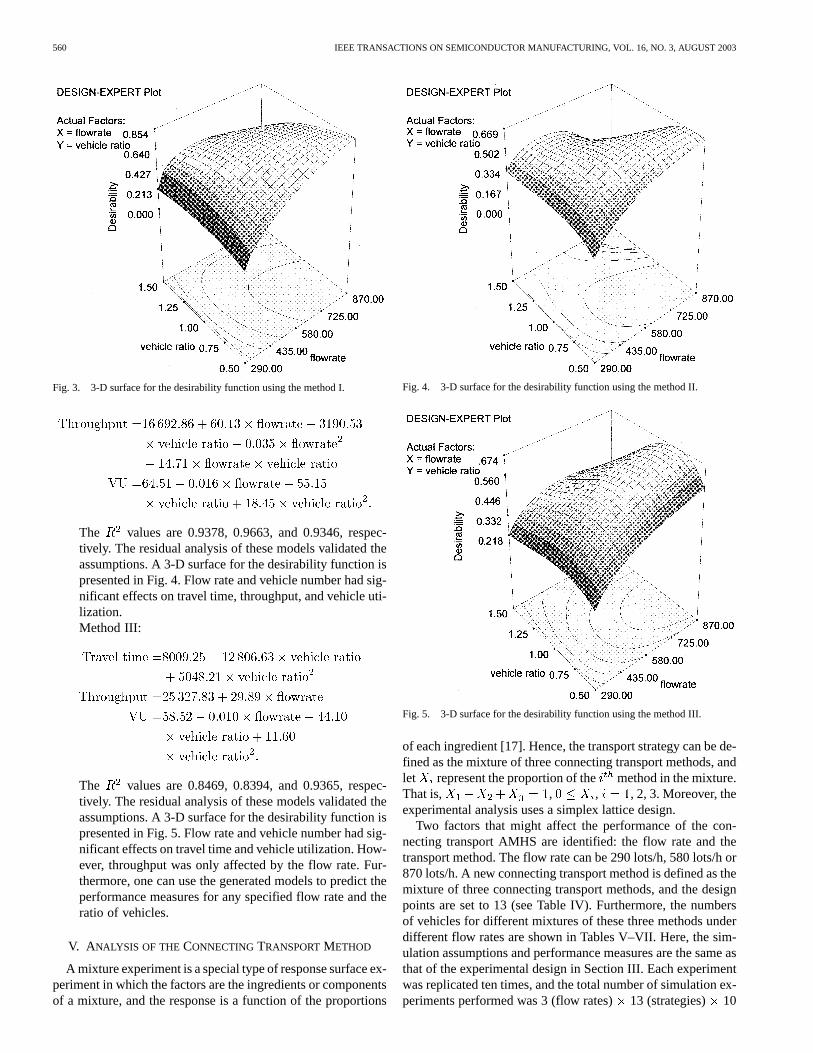
Fig. 3. 3-D surface for the desirability function using the method I.
The values are 0.9378, 0.9663, and 0.9346, respec-tively. The residual analysis of these models validated theassumptions. A 3-D surface for the desirability function ispresented in Fig. 4. Flow rate and vehicle number had sig-nificant effects on travel time, throughput, and vehicle uti-lization.Method III:
The values are 0.8469, 0.8394, and 0.9365, respec-tively. The residual analysis of these models validated theassumptions. A 3-D surface for the desirability function ispresented in Fig. 5. Flow rate and vehicle number had sig-nificant effects on travel time and vehicle utilization. How-ever, throughput was only affected by the flow rate. Fur-thermore, one can use the generated models to predict theperformance measures for any specified flow rate and theratio of vehicles.
V. ANALYSIS OF THECONNECTINGTRANSPORTMETHOD
A mixture experiment is a special type of response surface ex-periment in which the factors are the ingredients or componentsof a mixture, and the response is a function of the proportions
Fig. 4. 3-D surface for the desirability function using the method II.
Fig. 5. 3-D surface for the desirability function using the method III.
of each ingredient [17]. Hence, the transport strategy can be de-fined as the mixture of three connecting transport methods, andlet represent the proportion of the method in the mixture.That is, , , , 2, 3. Moreover, theexperimental analysis uses a simplex lattice design.
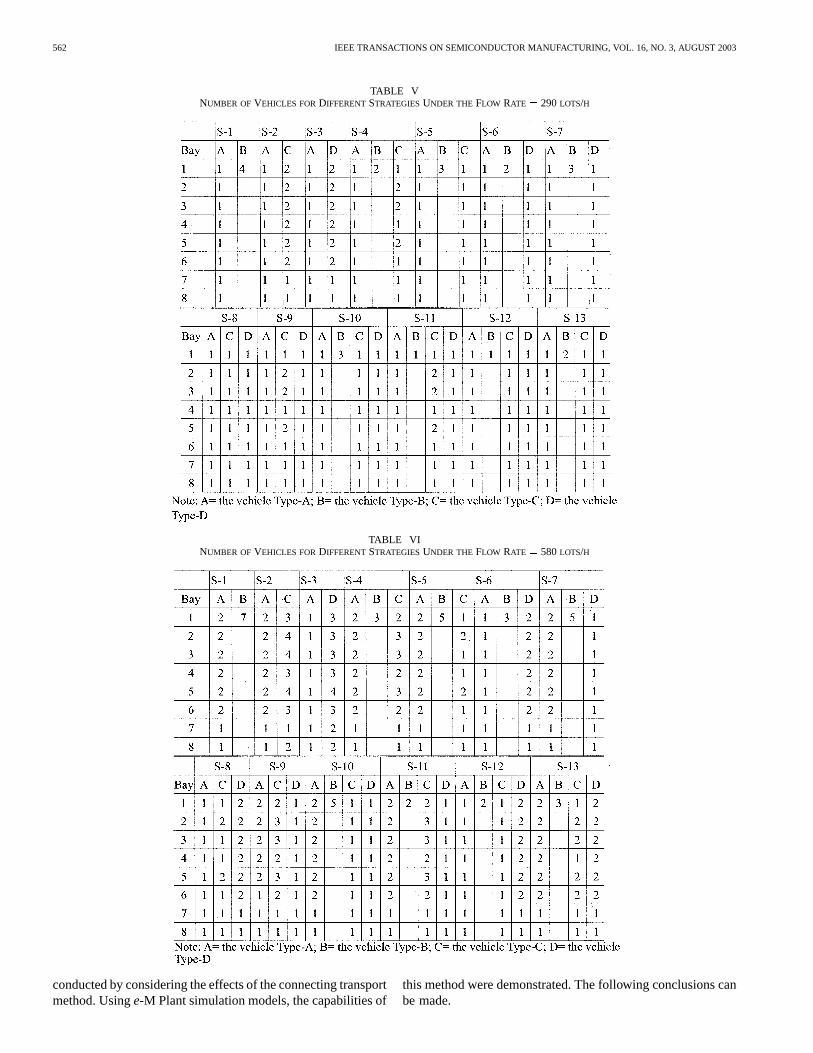
Two factors that might affect the performance of the con-necting transport AMHS are identified: the flow rate and thetransport method. The flow rate can be 290 lots/h, 580 lots/h or870 lots/h. A new connecting transport method is defined as themixture of three connecting transport methods, and the designpoints are set to 13 (see Table IV). Furthermore, the numbersof vehicles for different mixtures of these three methods underdifferent flow rates are shown in Tables V–VII. Here, the sim-ulation assumptions and performance measures are the same asthat of the experimental design in Section III. Each experimentwas replicated ten times, and the total number of simulation ex-periments performed was 3 (flow rates)13 (strategies) 10
LIN et al.: SIMULATION ANALYSIS OF THE CONNECTING TRANSPORT AMHS IN A WAFER FAB 561
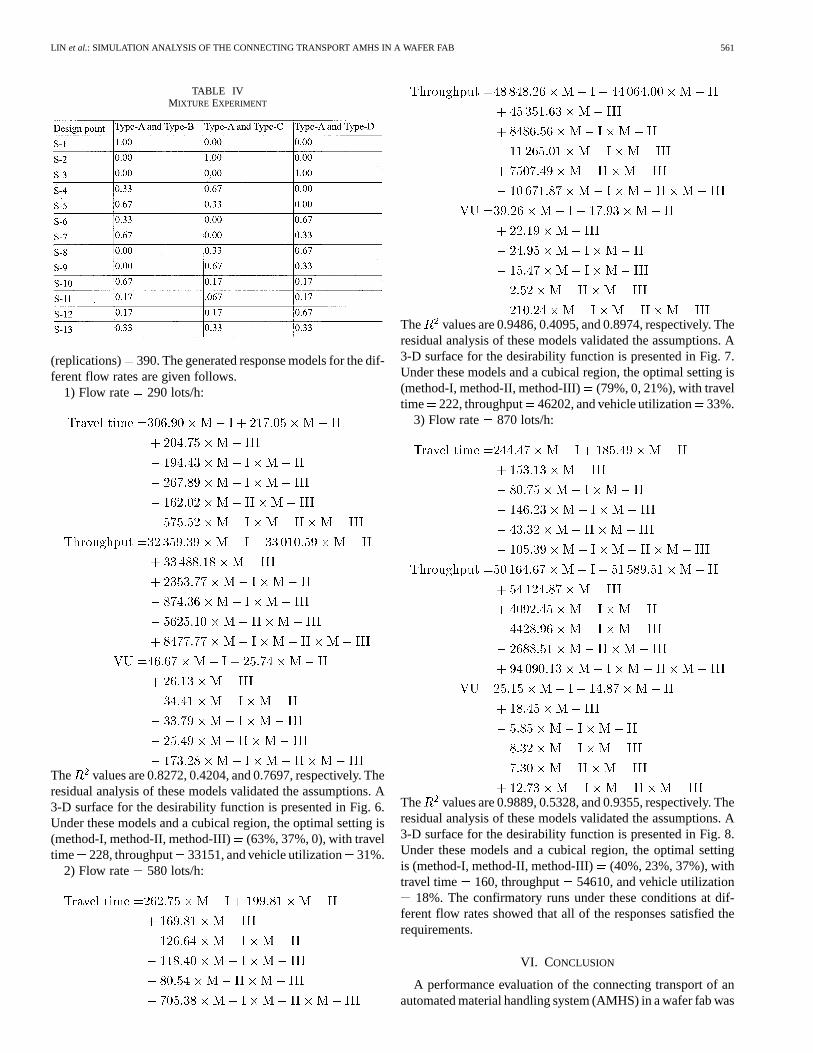
TABLE IVMIXTURE EXPERIMENT
(replications) 390. The generated response models for the dif-ferent flow rates are given follows.
1) Flow rate 290 lots/h:
The values are 0.8272, 0.4204, and 0.7697, respectively. Theresidual analysis of these models validated the assumptions. A3-D surface for the desirability function is presented in Fig. 6.Under these models and a cubical region, the optimal setting is(method-I, method-II, method-III) (63%, 37%, 0), with traveltime 228, throughput 33151, and vehicle utilization 31%.
2) Flow rate 580 lots/h:
The values are 0.9486, 0.4095, and 0.8974, respectively. Theresidual analysis of these models validated the assumptions. A3-D surface for the desirability function is presented in Fig. 7.Under these models and a cubical region, the optimal setting is(method-I, method-II, method-III) (79%, 0, 21%), with traveltime 222, throughput 46202, and vehicle utilization 33%.
3) Flow rate 870 lots/h:
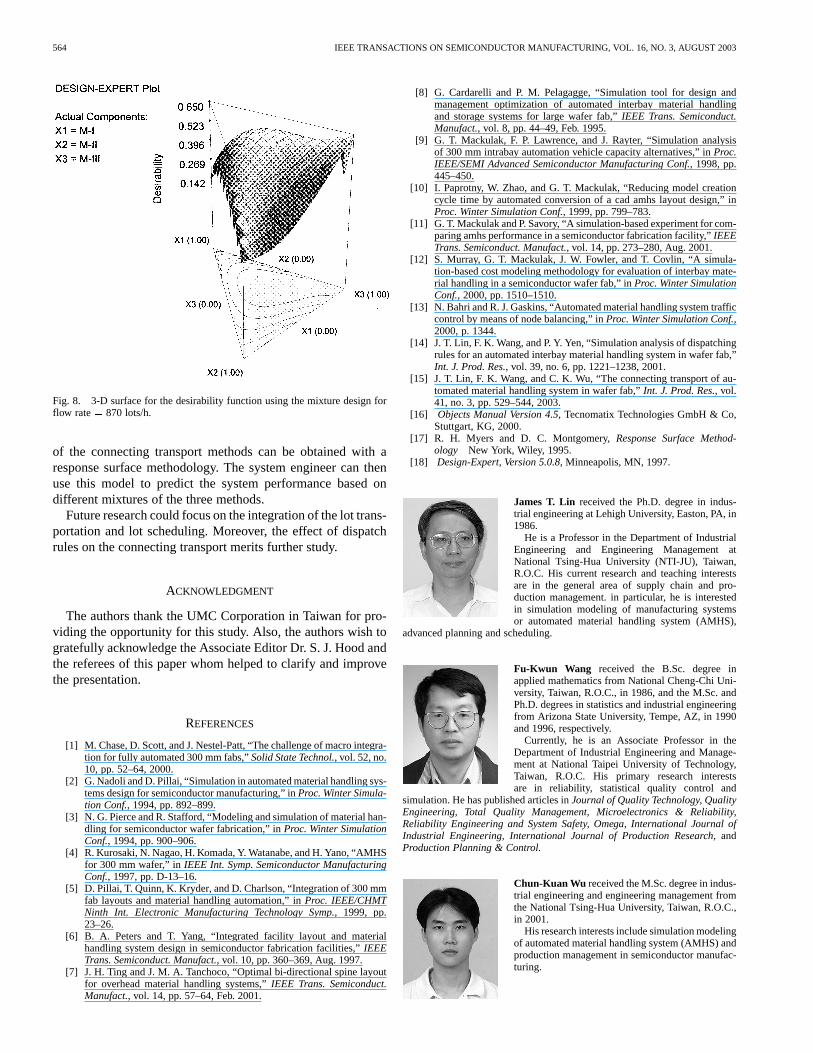
The values are 0.9889, 0.5328, and 0.9355, respectively. Theresidual analysis of these models validated the assumptions. A3-D surface for the desirability function is presented in Fig. 8.Under these models and a cubical region, the optimal settingis (method-I, method-II, method-III) (40%, 23%, 37%), withtravel time 160, throughput 54610, and vehicle utilization
18%. The confirmatory runs under these conditions at dif-ferent flow rates showed that all of the responses satisfied therequirements.
VI. CONCLUSION
A performance evaluation of the connecting transport of anautomated material handling system (AMHS) in a wafer fab was
562 IEEE TRANSACTIONS ON SEMICONDUCTOR MANUFACTURING, VOL. 16, NO. 3, AUGUST 2003
TABLE VNUMBER OF VEHICLES FORDIFFERENTSTRATEGIESUNDER THE FLOW RATE = 290LOTS/H
TABLE VINUMBER OF VEHICLES FORDIFFERENTSTRATEGIESUNDER THE FLOW RATE = 580LOTS/H
conducted by considering the effects of the connecting transportmethod. Usinge-M Plant simulation models, the capabilities of
this method were demonstrated. The following conclusions canbe made.
LIN et al.: SIMULATION ANALYSIS OF THE CONNECTING TRANSPORT AMHS IN A WAFER FAB 563
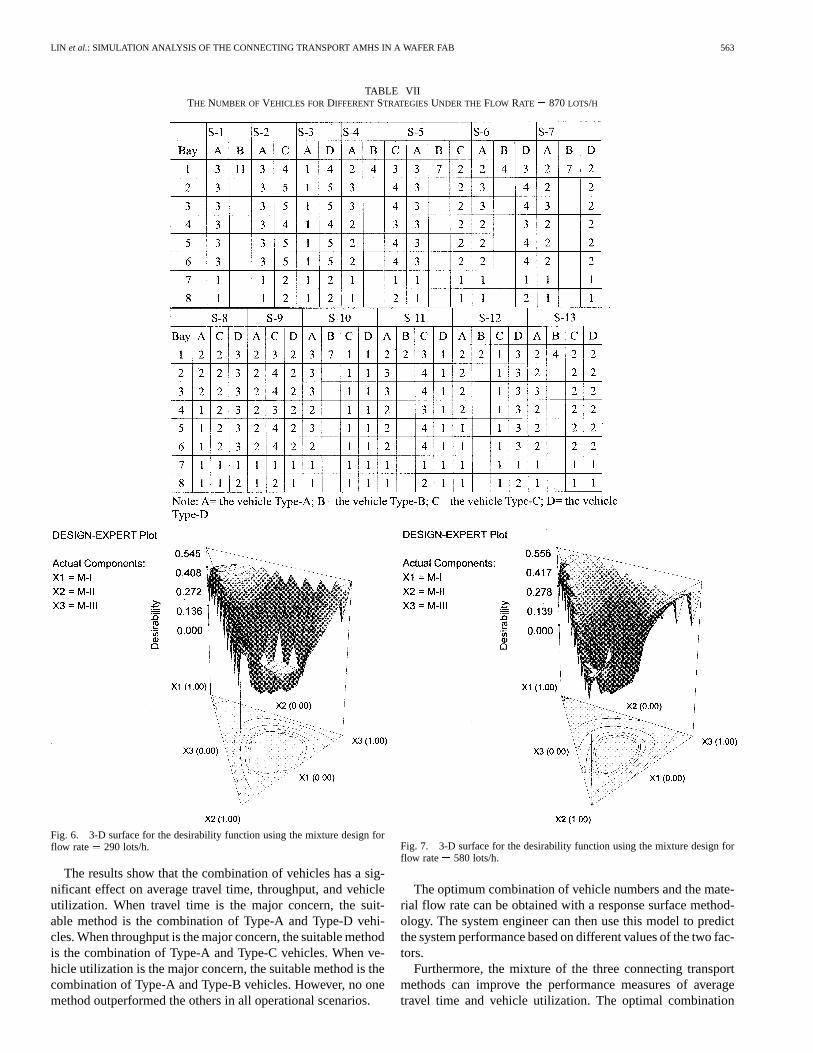
TABLE VIITHE NUMBER OF VEHICLES FORDIFFERENTSTRATEGIESUNDER THE FLOW RATE = 870LOTS/H
Fig. 6. 3-D surface for the desirability function using the mixture design forflow rate= 290 lots/h.
The results show that the combination of vehicles has a sig-nificant effect on average travel time, throughput, and vehicleutilization. When travel time is the major concern, the suit-able method is the combination of Type-A and Type-D vehi-cles. When throughput is the major concern, the suitable methodis the combination of Type-A and Type-C vehicles. When ve-hicle utilization is the major concern, the suitable method is thecombination of Type-A and Type-B vehicles. However, no onemethod outperformed the others in all operational scenarios.
Fig. 7. 3-D surface for the desirability function using the mixture design forflow rate= 580 lots/h.
The optimum combination of vehicle numbers and the mate-rial flow rate can be obtained with a response surface method-ology. The system engineer can then use this model to predictthe system performance based on different values of the two fac-tors.
Furthermore, the mixture of the three connecting transportmethods can improve the performance measures of averagetravel time and vehicle utilization. The optimal combination
564 IEEE TRANSACTIONS ON SEMICONDUCTOR MANUFACTURING, VOL. 16, NO. 3, AUGUST 2003
Fig. 8. 3-D surface for the desirability function using the mixture design forflow rate= 870 lots/h.
of the connecting transport methods can be obtained with aresponse surface methodology. The system engineer can thenuse this model to predict the system performance based ondifferent mixtures of the three methods.
Future research could focus on the integration of the lot trans-portation and lot scheduling. Moreover, the effect of dispatchrules on the connecting transport merits further study.
ACKNOWLEDGMENT
The authors thank the UMC Corporation in Taiwan for pro-viding the opportunity for this study. Also, the authors wish togratefully acknowledge the Associate Editor Dr. S. J. Hood andthe referees of this paper whom helped to clarify and improvethe presentation.
REFERENCES
[1] M. Chase, D. Scott, and J. Nestel-Patt, “The challenge of macro integra-tion for fully automated 300 mm fabs,”Solid State Technol., vol. 52, no.10, pp. 52–64, 2000.
[2] G. Nadoli and D. Pillai, “Simulation in automated material handling sys-tems design for semiconductor manufacturing,” inProc. Winter Simula-tion Conf., 1994, pp. 892–899.
[3] N. G. Pierce and R. Stafford, “Modeling and simulation of material han-dling for semiconductor wafer fabrication,” inProc. Winter SimulationConf., 1994, pp. 900–906.
[4] R. Kurosaki, N. Nagao, H. Komada, Y. Watanabe, and H. Yano, “AMHSfor 300 mm wafer,” inIEEE Int. Symp. Semiconductor ManufacturingConf., 1997, pp. D-13–16.
[5] D. Pillai, T. Quinn, K. Kryder, and D. Charlson, “Integration of 300 mmfab layouts and material handling automation,” inProc. IEEE/CHMTNinth Int. Electronic Manufacturing Technology Symp., 1999, pp.23–26.
[6] B. A. Peters and T. Yang, “Integrated facility layout and materialhandling system design in semiconductor fabrication facilities,”IEEETrans. Semiconduct. Manufact., vol. 10, pp. 360–369, Aug. 1997.
[7] J. H. Ting and J. M. A. Tanchoco, “Optimal bi-directional spine layoutfor overhead material handling systems,”IEEE Trans. Semiconduct.Manufact., vol. 14, pp. 57–64, Feb. 2001.
[8] G. Cardarelli and P. M. Pelagagge, “Simulation tool for design andmanagement optimization of automated interbay material handlingand storage systems for large wafer fab,”IEEE Trans. Semiconduct.Manufact., vol. 8, pp. 44–49, Feb. 1995.
[9] G. T. Mackulak, F. P. Lawrence, and J. Rayter, “Simulation analysisof 300 mm intrabay automation vehicle capacity alternatives,” inProc.IEEE/SEMI Advanced Semiconductor Manufacturing Conf., 1998, pp.445–450.
[10] I. Paprotny, W. Zhao, and G. T. Mackulak, “Reducing model creationcycle time by automated conversion of a cad amhs layout design,” inProc. Winter Simulation Conf., 1999, pp. 799–783.
[11] G. T. Mackulak and P. Savory, “A simulation-based experiment for com-paring amhs performance in a semiconductor fabrication facility,”IEEETrans. Semiconduct. Manufact., vol. 14, pp. 273–280, Aug. 2001.
[12] S. Murray, G. T. Mackulak, J. W. Fowler, and T. Covlin, “A simula-tion-based cost modeling methodology for evaluation of interbay mate-rial handling in a semiconductor wafer fab,” inProc. Winter SimulationConf., 2000, pp. 1510–1510.
[13] N. Bahri and R. J. Gaskins, “Automated material handling system trafficcontrol by means of node balancing,” inProc. Winter Simulation Conf.,2000, p. 1344.
[14] J. T. Lin, F. K. Wang, and P. Y. Yen, “Simulation analysis of dispatchingrules for an automated interbay material handling system in wafer fab,”Int. J. Prod. Res., vol. 39, no. 6, pp. 1221–1238, 2001.
[15] J. T. Lin, F. K. Wang, and C. K. Wu, “The connecting transport of au-tomated material handling system in wafer fab,”Int. J. Prod. Res., vol.41, no. 3, pp. 529–544, 2003.
[16] Objects Manual Version 4.5, Tecnomatix Technologies GmbH & Co,Stuttgart, KG, 2000.
[17] R. H. Myers and D. C. Montgomery,Response Surface Method-ology New York, Wiley, 1995.
[18] Design-Expert, Version 5.0.8, Minneapolis, MN, 1997.
James T. Lin received the Ph.D. degree in indus-trial engineering at Lehigh University, Easton, PA, in1986.
He is a Professor in the Department of IndustrialEngineering and Engineering Management atNational Tsing-Hua University (NTI-JU), Taiwan,R.O.C. His current research and teaching interestsare in the general area of supply chain and pro-duction management. in particular, he is interestedin simulation modeling of manufacturing systemsor automated material handling system (AMHS),
advanced planning and scheduling.
Fu-Kwun Wang received the B.Sc. degree inapplied mathematics from National Cheng-Chi Uni-versity, Taiwan, R.O.C., in 1986, and the M.Sc. andPh.D. degrees in statistics and industrial engineeringfrom Arizona State University, Tempe, AZ, in 1990and 1996, respectively.
Currently, he is an Associate Professor in theDepartment of Industrial Engineering and Manage-ment at National Taipei University of Technology,Taiwan, R.O.C. His primary research interestsare in reliability, statistical quality control and
simulation. He has published articles inJournal of Quality Technology, QualityEngineering, Total Quality Management, Microelectronics & Reliability,Reliability Engineering and System Safety, Omega, International Journal ofIndustrial Engineering, International Journal of Production Research,andProduction Planning & Control.
Chun-Kuan Wu received the M.Sc. degree in indus-trial engineering and engineering management fromthe National Tsing-Hua University, Taiwan, R.O.C.,in 2001.
His research interests include simulation modelingof automated material handling system (AMHS) andproduction management in semiconductor manufac-turing.