An Evaluation of Coal Water Slurry Fuel Burners and ... - DTIC
Upload
khangminh22Category
view
0download
0
Bangor University
DOCTOR OF PHILOSOPHY
The effect of slurry processing on phosporus bioavailability and mobility
Li, Yuhong
Award date:2017
Awarding institution:Bangor University
Link to publication
General rightsCopyright and moral rights for the publications made accessible in the public portal are retained by the authors and/or other copyright ownersand it is a condition of accessing publications that users recognise and abide by the legal requirements associated with these rights.
• Users may download and print one copy of any publication from the public portal for the purpose of private study or research. • You may not further distribute the material or use it for any profit-making activity or commercial gain • You may freely distribute the URL identifying the publication in the public portal ?
Take down policyIf you believe that this document breaches copyright please contact us providing details, and we will remove access to the work immediatelyand investigate your claim.
Download date: 29. Jun. 2022

THE EFFECT OF SLURRY
PROCESSING ON PHOSPHORUS
BIOAVAILABILITY AND MOBILITY
A thesis submitted to Bangor University by
Yuhong Li
In candidature for the degree
Philosophiae Doctor
2017
Supervisors: Professor Dave R. Chadwick, Professor Davey L. Jones, and Professor
Qing Chen
School of Environment, Natural Resources and Geography
Bangor University
Bangor Gwynedd
LL57 2UW
UK


i
Declaration and Consent
Details of the Work
I hereby agree to deposit the following item in the digital repository maintained by Bangor
University and/or in any other repository authorized for use by Bangor University.
Author Name: Yuhong Li
Title: The effect of slurry processing on phosphorus bioavailability and mobility
Supervisor/Department: Prof. David R. Chadwick/SENRGy, Prof. David L.
Jones/SENRGy, Prof. Qing Chen/CAU
Funding body (if any): Bangor University-China Scholarship Council (CSC)
Qualification/Degree obtained: PhD in Environmental Science
This item is a product of my own research endeavours and is covered by the agreement
below in which the item is referred to as “the Work”. It is identical in content to that
deposited in the Library, subject to point 4 below.
Non-exclusive Rights
Rights granted to the digital repository through this agreement are entirely non-exclusive. I
am free to publish the Work in its present version or future versions elsewhere.
I agree that Bangor University may electronically store, copy or translate the Work to any
approved medium or format for the purpose of future preservation and accessibility. Bangor
University is not under any obligation to reproduce or display the Work in the same formats
or resolutions in which it was originally deposited.
Bangor University Digital Repository
I understand that work deposited in the digital repository will be accessible to a wide variety
of people and institutions, including automated agents and search engines via the World
Wide Web.
I understand that once the Work is deposited, the item and its metadata may be incorporated
into public access catalogues or services, national databases of electronic theses and

ii
dissertations such as the British Library’s EThOS or any service provided by the National
Library of Wales.
I understand that the Work may be made available via the National Library of Wales Online
Electronic Theses Service under the declared terms and conditions of use
(http://www.llgc.org.uk/index.php?id=4676). I agree that as part of this service the National
Library of Wales may electronically store, copy or convert the Work to any approved
medium or format for the purpose of future preservation and accessibility. The National
Library of Wales is not under any obligation to reproduce or display the Work in the same
formats or resolutions in which it was originally deposited.
Statement 1:
This work has not previously been accepted in substance for any degree and is not being
concurrently submitted in candidature for any degree unless as agreed by the University for
approved dual awards.
Signed ………………………………………….. (candidate)
Date ……………………………………………..
Statement 2:
This thesis is the result of my own investigations, except where otherwise stated. Where
correction services have been used, the extent and nature of the correction is clearly marked
in a footnote(s).
All other sources are acknowledged by footnotes and/or a bibliography.
Signed …………………………………………. (candidate)
Date …………………………………………….
Statement 3:

iii
I hereby give consent for my thesis, if accepted, to be available for photocopying, for inter-
library loan and for electronic storage (subject to any constraints as defined in statement 4),
and for the title and summary to be made available to outside organisations.
Signed …………………………………………. (candidate)
Date …………………………………………….
Statement 4:
Choose one of the following options
a) I agree to deposit an electronic copy of my thesis (the Work) in the Bangor University
(BU) Institutional Digital Repository, the British Library ETHOS system, and/or in any other
repository authorized for use by Bangor University and where necessary have gained the
required permissions for the use of third party material.
b) I agree to deposit an electronic copy of my thesis (the Work) in the Bangor University
(BU) Institutional Digital Repository, the British Library ETHOS system, and/or in any other
repository authorized for use by Bangor University when the approved bar on access has been
lifted.
c) I agree to submit my thesis (the Work) electronically via Bangor University’s e-submission
system, however I opt-out of the electronic deposit to the Bangor University (BU) Institutional
Digital Repository, the British Library ETHOS system, and/or in any other repository authorized
for use by Bangor University, due to lack of permissions for use of third party material.
Options B should only be used if a bar on access has been approved by the University.
In addition to the above I also agree to the following:
1. That I am the author or have the authority of the author(s) to make this
agreement and do hereby give Bangor University the right to make available the
Work in the way described above.
2. That the electronic copy of the Work deposited in the digital repository and
covered by this agreement, is identical in content to the paper copy of the Work
deposited in the Bangor University Library, subject to point 4 below.
3. That I have exercised reasonable care to ensure that the Work is original and,
to the best of my knowledge, does not breach any laws – including those relating to
defamation, libel and copyright.
4. That I have, in instances where the intellectual property of other authors or
copyright holders is included in the Work, and where appropriate, gained explicit
permission for the inclusion of that material in the Work, and in the electronic form
of the Work as accessed through the open access digital repository, or that I have

iv
identified and removed that material for which adequate and appropriate permission
has not been obtained and which will be inaccessible via the digital repository.
5. That Bangor University does not hold any obligation to take legal action on
behalf of the Depositor, or other rights holders, in the event of a breach of intellectual
property rights, or any other right, in the material deposited.
6. That I will indemnify and keep indemnified Bangor University and the
National Library of Wales from and against any loss, liability, claim or damage,
including without limitation any related legal fees and court costs (on a full
indemnity bases), related to any breach by myself of any term of this agreement.
Signature: ………………………………………………………
Date : …………………………………………….

v
Dedication
A dedication to my friends and family who always support me

vi
Acknowledgements
Thanks to Bangor University and China Scholarship Council funding me, this
financial help enabled me finally to complete this PhD project and thesis.
I would like to express my great gratitude to my honourable and supportive
supervisors Professor Dave Chadwick, Professor Davey Jones and Professor Qing Chen, for
their patience, concerns and guidance throughout my study period. It has been an honour to
have such a chance to learn from them.
Thanks to the assistance from our Technicians, Gordon, Sarah, Jonathan, Mark and
Llinos. Their professional help saved me a lot of troubles in operations in the lab and field.
I am also thankful for the great help and inspiration from Prof. Paul Withers, Paul
Hill, Helen Glanville, which was important for my study.
I would also like to thank my friends Saufi and Aziz, Chinese academics and students,
Baozhen Li, Jing Yuan, Yan Ma, Ruixue Chang, Lili Jiang, Jinyang Wang, for their
company and encouragement.
Last, I would like to thank my parents for their continuous love and support.
Thanks for all the people I’ve met during the four years. You are the most beautiful
scenery over this journey.

vii
Abstract
Livestock slurry is a valuable source of phosphorus (P) fertiliser for crops, but can
also result in eutrophication following mobilisation and delivery to watercourses. The
transfer of slurry-derived P to watercourses is likely to be strongly influenced by its particle
size distribution and the chemical form of the P within the slurry. Advanced slurry
processing (e.g. acidification, anaerobic digestion) is also likely to alter the forms and
distribution of P within slurry particle size fractions. In response to this, this thesis explores
the effects of slurry processing on P speciation within a range of slurry particle size fractions
and on potential P bioavailability and movement through soil. The P characteristics of cattle
slurry, acidified slurry, anaerobically digested slurry, in terms of P speciation of different
particle size fractions, was studied in Chapter 3-5. The results showed that in the whole
untreated cattle slurry, labile inorganic P (IP-H2O + IP-NaHCO3) and labile organic P (OP-
H2O + OP-NaHCO3) dominated the total P (TP) of the whole slurry (45% and 24% of TP
respectively). Acidification increased the labile inorganic P proportion to 55% of TP and
decreased the stable P (IP-HCl + OP-HCl + TP-Residue) proportion from 21% to 15% of the
TP of whole slurry. Anaerobic digestion increased the labile inorganic P and moderately
labile P (IP-NaOH + OP-NaOH) proportions of whole slurry to 53% and 12%, but decreased
the labile organic P proportion to 12% of TP. After physical separation, the proportion of TP
in the liquid fractions (<2000, <500, <63 µm) represented by labile inorganic P were greater
than that of the solid fractions (>2000, >500, >63 µm), while solid fractions tended to show
greater proportions of moderately labile and stable P than liquid fractions. After acidification,
the P speciation of the solid fractions showed little change. However, the labile inorganic P
and the moderately labile P proportions increased in TP in the acidified liquid fractions,
while stable P proportion in the liquid fractions decreased. After anaerobic digestion, in the
TP of both solid and liquid fractions, the labile inorganic P and moderately labile P
proportions increased, while the labile organic P proportion was reduced. The colloidal
fraction (0.45-63 µm) accounted for 62% of the TP of whole untreated cattle slurry.
Acidification reduced this proportion, while anaerobic digestion did not change it. In contrast,
anaerobic digestion increased the labile inorganic P content of the colloids. P availability in
soil after slurry application was explored in an incubation experiment monitored by
sequential fractionation method (Chapter 7), and in a pot experiment involving P uptake by
ryegrass (Chapter 8). The vertical mobility of P in soil was studied in laboratory microcosms
(Chapter 6) and a pot experiment (Chapter 8). The results showed that untreated and treated
cattle slurry increased the labile P content of soil and the P lability decreased gradually over
time. Ryegrass P uptake was also increased by addition of different slurries. However, the
differences between untreated and treated slurry amended treatments was not necessarily
significant for labile P content in the soil and P uptake by ryegrass. In Chapter 6, the results
implied that colloid-associated P in cattle slurry caused greater potential P leaching and that
anaerobic digestion even increased this mode of P loss. Although in the pot experiment,
slurry amended treatments showed no difference in cumulative P leaching compared to the
control, the colloidal fraction in untreated and treated slurries was still a dominant fraction
associated with a large portion of P. Further work is necessary to demonstrate the effect of
slurry processing on P bioavailability and mobility at the plot- and field-scale, and on
recovering colloidal P prior to land spreading.
viii
Abbreviations
AD Anaerobic digested slurry
ADL Anaerobically digested liquid slurry
ADS Anaerobically digested solid slurry
AD+ Inoculatedly anaerobically digested slurry
AL Acidified liquid slurry
AS Acidified solid slurry
C Carbon
CL Untreated liquid cattle slurry
CS Untreated solid cattle slurry
Ca Calcium
CH4 Methane
CO2 Carbon dioxide
DM Dry matter
EC Electrical conductivity
ha-1 Per hectares(s)
HCl Hydrochloric acid
H2O Water
H2SO4 Sulphuric acid
IP Inorganic P
K Potassium
KCl Potassium chloride
kg Kilogram(s)
L Litre(s)
M Molar(s)
mg Milligram(s)
Mg Magnesium
mL Millilitre(s)
mM Millimolar(s)
N Nitrogen
NaHCO3 Sodium bicarbonate
NaOH Sodium hydroxide
NH3 Ammonia
NH4+ Ammonium

ix
NON Non-digested slurry without inoculum
NON+ Non-digested slurry with inoculum
OP Organic Phosphorus
P Phosphorus
PO43- Phosphate
VS Volatile solids
μ Micro
μL Microliter(s)
μg Microgram(s)
μm Micrometer(s)
μS cm-1 MicroSiemens per centimetre

x
Table of Contents
Declaration and Consent ........................................................................................................... i
Dedication ................................................................................................................................ v
Acknowledgements ................................................................................................................. vi
Abstract .................................................................................................................................. vii
Abbreviations ........................................................................................................................ viii
Table of Contents ..................................................................................................................... x
List of figures ......................................................................................................................... xv
List of tables ......................................................................................................................... xvii
1 Introduction .......................................................................................................................... 1
2 Literature review: effect of processing strategies on phosphorus cycle from livestock slurry
to soil ........................................................................................................................................ 7
2.1 Abstract ........................................................................................................................ 7
2.2 Introduction.................................................................................................................... 8
2.3 P in livestock slurry ....................................................................................................... 8
2.4 P dynamics in soil .......................................................................................................... 9
2.4.1 P transformation derived by livestock slurry .......................................................... 9
2.4.2 P losses from livestock slurry amended soil ......................................................... 11
2.5 Effect of processing strategies on P in livestock slurry and soil ................................. 12
2.6 Conclusions.................................................................................................................. 15
2.7 References.................................................................................................................... 16
3 The effect of acidification on N and P forms and their distribution in cattle slurry ........... 30
3.1 Abstract ...................................................................................................................... 30
3.2 Introduction.................................................................................................................. 31
3.3 Materials and Methods ................................................................................................ 32
3.3.1 Sample Collection ................................................................................................. 32
3.3.2 Particle fractionation ............................................................................................. 33

xi
3.3.3 P sequential fractionation ..................................................................................... 33
3.3.4 Calculation ............................................................................................................ 34
3.4 Results ...................................................................................................................... 35
3.4.1 Particle fractionation ............................................................................................. 35
3.4.2 P form distribution in the whole slurry ................................................................. 39
3.5 Discussion .................................................................................................................... 41
3.5.1 DM, N and P in untreated and acidified slurry ..................................................... 41
3.5.2 P speciation and distribution ................................................................................. 44
3.6 Conclusions.................................................................................................................. 46
3.7 References.................................................................................................................... 46
4 Anaerobic digestion alters the forms and distribution of N and P in cattle slurry .............. 51
4.1 Abstract ...................................................................................................................... 51
4.2 Introduction.................................................................................................................. 52
4.3 Materials and Methods ................................................................................................ 53
4.3.1 Sample Collection ................................................................................................. 53
4.3.2 Particle fractionation ............................................................................................. 54
4.3.3 P sequential fractionation ..................................................................................... 55
4.3.4 Calculation ............................................................................................................ 55
4.4 Results and Discussion ................................................................................................ 56
4.4.1 Particle fractionation ............................................................................................. 56
4.4.2 P speciation and distribution in particle size fractions ......................................... 64
4.4.3 Separation efficiency ............................................................................................ 68
4.5 Conclusions.................................................................................................................. 71
4.6 References.................................................................................................................... 71
5 Phosphorus and nitrogen distribution in colloids and nanoparticles of untreated, acidified
and anaerobically digested cattle slurry ................................................................................. 76
5.1 Abstract ...................................................................................................................... 76

xii
5.2 Introduction.................................................................................................................. 77
5.3 Materials and Methods ................................................................................................ 78
5.3.1 Sample Collection ................................................................................................. 78
5.3.2 Particle Fractionation ............................................................................................ 79
5.3.3 P sequential fractionation ..................................................................................... 82
5.3.4 Calculation ............................................................................................................ 83
5.4 Results and discussion ................................................................................................. 83
5.4.1 Colloids in livestock slurry ................................................................................... 83
5.4.2 Nanoparticles in livestock slurry .......................................................................... 91
5.4.3 P fractionation in the colloidal fraction ................................................................ 94
5.5 Conclusions.................................................................................................................. 98
5.6 References.................................................................................................................... 98
6 The colloidal phosphorus fraction regulates the vertical movement of P after the
application of treated cattle slurry to soil ............................................................................. 104
6.1 Abstract .................................................................................................................... 104
6.2 Introduction................................................................................................................ 105
6.3 Materials and methods ............................................................................................... 106
6.3.1 Livestock slurry collection and treatment .......................................................... 106
6.3.2 Soil collection ..................................................................................................... 107
6.3.3 Phosphorus sorption isotherms ........................................................................... 108
6.3.4 Phosphorus leaching experiment ........................................................................ 108
6.3.5 Statistical analysis ............................................................................................... 109
6.4 Results and Discussion .............................................................................................. 109
6.4.1 Phosphorus distribution in untreated and treated slurry ..................................... 109
6.4.2 Effect of untreated cattle slurry on P movement in soils .................................... 111
6.4.3 Effect of acidification on slurry-derived P movement ....................................... 114
6.4.4 Effect of anaerobic digestion on slurry-derived P movement ............................ 115

xiii
6.5 Conclusions................................................................................................................ 118
6.6 References.................................................................................................................. 119
7 Phosphorus fractionation changes in soils affected by solid and liquid fractions of
processed cattle slurry .......................................................................................................... 123
7.1 Abstract .................................................................................................................... 123
7.2 Introduction................................................................................................................ 124
7.3 Materials and methods ............................................................................................... 126
7.3.1 Cattle slurry collection and separation ............................................................... 126
7.3.2 Incubation and sampling ..................................................................................... 128
7.3.3 Modified Hedley fractionation ........................................................................... 128
7.3.4 Statistical analysis ............................................................................................... 128
7.4 Results and discussion ............................................................................................... 129
7.4.1 Livestock slurry derived P in soil ....................................................................... 129
7.4.2 Patterns of P forms during incubation ................................................................ 134
7.5 Conclusions................................................................................................................ 137
7.6 References.................................................................................................................. 137
8 The effect of slurry processing on phosphorus availability for plant uptake and potential
leaching ................................................................................................................................ 145
8.1 Abstract .................................................................................................................... 145
8.2 Introduction................................................................................................................ 146
8.3 Materials and methods ............................................................................................... 148
8.3.1 Soil collection ..................................................................................................... 148
8.3.2 Cattle slurry collection and treatments ............................................................... 149
8.3.3 Experimental treatments ..................................................................................... 149
8.3.4 Statistical analyses .............................................................................................. 151
8.4 Results .................................................................................................................... 152
8.4.1 Separated untreated cattle slurry, acidified cattle slurry, anaerobically digested
cattle slurry .............................................................................................................. 152

xiv
8.4.2 Potential P leaching ............................................................................................ 152
8.4.3 Harvested ryegrass .............................................................................................. 157
8.4.4 Chemistry of different soil depths ...................................................................... 159
8.5 Discussion .................................................................................................................. 160
8.5.1 Effect of untreated livestock slurry on P dynamics in soil ................................. 160
8.5.2 Effect of acidification, anaerobic digestion and separation on P dynamics ....... 162
8.6 Conclusions................................................................................................................ 164
8.7 References.................................................................................................................. 165
9 Summary and discussion .................................................................................................. 171
9.1 Objectives and hypothesis ......................................................................................... 171
9.2 P cycling from livestock slurry to soil ....................................................................... 173
9.2.1 Untreated Cattle Slurry ....................................................................................... 173
9.2.2 Separation ........................................................................................................... 174
9.2.3 Acidification ....................................................................................................... 176
9.2.4 Anaerobic Digestion ........................................................................................... 178
9.2.5 Discussion and implication ................................................................................. 180
9.3 Conclusions................................................................................................................ 184
9.4 Further work and recommendations .......................................................................... 184
9.5 References.................................................................................................................. 186

xv
List of figures
Figure 1.1 Summary of the thesis outline................................................................................. 3
Figure 3.1 Distribution of DM, VS and C in different slurry particle size fractions. Values
represent means ± SEM, n = 3. .............................................................................................. 36
Figure 3.2 The contents and distribution of NH4+-N, organic N and total nitrogen (TN) in
different slurry particle size fractions. Values represent means ± SEM, n = 3. ..................... 38
Figure 3.3 The water extractable P and total P (TP) in different slurry particle size fractions.
Values represent means ± SEM, n = 3. .................................................................................. 39
Figure 3.4 Distribution of P forms in untreated and acidified cattle slurry. Values represent
means ± SEM, n = 3. .............................................................................................................. 41
Figure 4.1 Distribution of dry matter (DM), volatile solid (VS) and carbon (C) in untreated
cattle slurry without (NON) and with inoculum (NON+), anaerobic digestate without (AD)
and with inoculum (AD+). Values represent means ± SEM, n = 3. ....................................... 58
Figure 4.2 Distribution of NH4+-N and total N (TN) in different particle fractions in the NON,
AD, NON+ and AD+ treatments. Values represent means ± SEM, n = 3. ............................ 61
Figure 4.3 Distribution of the water extractable P and total P (TP) in different particle
fractions in the NON, AD, NON+ and AD+ treatments. Values represent means ± SEM, n =
3. ............................................................................................................................................. 63
Figure 4.4 Distribution of P forms in each particle size fraction in the NON, AD, NON+ and
AD+ treatments. Values represent means ± SEM, n = 3. ....................................................... 65
Figure 5.1 The contents of P forms of the colloidal fractions of non-acidified and acidified
cattle slurry. Values represent means ± SEM, n = 3. ............................................................. 95
Figure 5.2 The quantities of P forms in the colloidal fraction on a fresh basis of whole slurry.
Values represent means ± SEM, n = 3. .................................................................................. 97
Figure 6.1 The Olsen-P content of soil from untreated and acidified slurry treatments. Values
represent means ± SEM, n = 4. ............................................................................................ 112
Figure 6.2 The inorganic P (IP) and organic P (OP) content of leachates from untreated and
acidified slurry treatments. Values represent means ± SEM, n = 4. .................................... 113
Figure 6.3 The Olsen-P content of soil from the untreated slurry, the non-inoculated
anaerobically digested slurry (AD) and the inoculated anaerobically digested slurry (AD+)
treatments. Values represent means ± SEM, n = 3. .............................................................. 116

xvi
Figure 6.4 The IP and OP content of leachates from the untreated slurry, the non-inoculated
anaerobically digested slurry (AD) and the inoculated anaerobically digested slurry (AD+)
treatments. Values represent means ± SEM, n = 3. .............................................................. 118
Figure 7.1 The change of the proportion of P forms in TP of different treatments. Values
represent means ± SEM, n = 4. ............................................................................................ 135
Figure 8.1 Inorganic and organic P concentrations of leachates over the incubation period.
Values represent means ± SEM, n = 4. ................................................................................ 154
Figure 8.2 Cumulative inorganic and organic P mass of leachates. Values represent means ±
SEM, n = 4. .......................................................................................................................... 156
Figure 8.3 Dry matter weight, P concentration, and total P mass of harvest ryegrass. Values
represent means ± SEM, n = 4. ............................................................................................ 158
Figure 8.4 pH, EC and Olsen-P content of different soil depths at the end of the incubation.
Values represent means ± SEM, n = 4. ................................................................................ 159
Figure 9.1 P cycle from livestock slurry to soil ................................................................... 172

xvii
List of tables
Table 3.1 Characteristics of untreated and acidified cattle slurry (Data expressed on a fresh
weight basis). Values represent means ± SEM, n = 3. ........................................................... 37
Table 3.2 Separation efficiency of DM, VS, C, NH4+-N, TN, water extractable P and TP by
different filter pore sizes separating solid fractions (%). Values represent means, n = 3. ..... 43
Table 3.3 The P form distribution in the separated solid and liquid fractions by different filter
pore sizes (%). Values represent means, n = 3. ...................................................................... 45
Table 4.1 Characteristics of untreated cattle slurry without (NON) and with inoculum
(NON+), anaerobic digestate without (AD) and with inoculum (AD+) (on a fresh weight
basis). Values represent means ± SEM, n = 3. ....................................................................... 54
Table 4.2 Separation efficiency of DM, VS, C, NH4+-N, TN, water extractable P and TP by
different filter pore sizes separating solid fractions (%). Values represent means, n = 3. ..... 69
Table 4.3 The P form distribution in the separated solid and liquid products by different filter
pore sizes (%). Values represent means, n = 3. ...................................................................... 70
Table 5.1 Characteristics of whole non-acidified and acidified cattle slurry, non-digested
slurry without inoculum (NON) and non-digested slurry with inoculum (NON+), anaerobic
digestate without inoculum (AD) and anaerobic digestate with inoculum (AD+) (on a fresh
weight basis). Values represent means ± SEM, n = 3. ........................................................... 80
Table 5.2 Classification of particles and the measured and calculated characteristics of
different particle size fractions. .............................................................................................. 81
Table 5.3 The nutrient content (g kg-1 based on fresh weight of whole slurry) and percentage
of colloidal and dissolved fractions in the whole slurry and the liquid fraction of non-
acidified and acidified treatments (%). Values represent means, n = 3. ................................ 85
Table 5.4 The nutrient content (g kg-1 based on fresh weight of whole slurry) and percentage
of colloidal and dissolved fractions in the whole slurry and the liquid fraction in untreated
and anaerobic digestion treatments (%). Values represent means, n = 3. .............................. 88
Table 5.5 The distribution of NH4+, TN, TC, inorganic P and TP within the dissolved
fractions of non-acidified and acidified treatments (mg kg-1 based on fresh weight of whole
slurry). Values represent means, n = 3. .................................................................................. 92
Table 5.6 The distribution of NH4+, TN, TC, inorganic P and TP within the dissolved
fractions of untreated and anaerobic digestion treatments (mg kg-1 based on fresh weight of
whole slurry). Values represent means, n = 3. ....................................................................... 94

xviii
Table 6.1 Application rates for different slurry treatments. Values represent means, n = 4 for
untreated and acidified treatments, n = 3 for AD and AD+ treatments................................ 110
Table 7.1 Characteristics of solid and liquid fractions of cattle slurry, acidified slurry,
anaerobically digested slurry (on a dry weight basis). Values represent means ± SEM, n = 4.
.............................................................................................................................................. 127
Table 7.2 The concentration of P forms in soil amended with different livestock slurry at day
1 and day 126 (mg kg-1 on a dry weight basis). Values represent means, n = 4. ................. 131
Table 7.3 The proportion of slurry-derived different P forms (as a% of slurry-derived TP) in
the soil of each treatment at day 1 and day 126 (%). Values represent means, n = 4. ......... 132
Table 7.4 Index of first order kinetics of the decrease in the IP-H2O concentration in soils of
different treatments. Values represent means ± SEM, n = 4. ............................................... 136
Table 8.1 Characteristics of untreated, acidified and anaerobically digested cattle slurry (dry
weight basis, except DM and VS). Values represent means ± SEM, n = 4. ........................ 150
Table 8.2 Characteristics of solid and liquid fractions of untreated, acidified and
anaerobically digested cattle slurry (on dry weight basis except dry matter and volatile solid
contents). Values represent means ± SEM, n = 4. ................................................................ 153
1
1 Introduction
Phosphorus (P) is an essential nutrient for crop production. The world phosphate rock
reserves, the source of P fertiliser production, is estimated to become depleted in the the next
<100 up to 400 years (Cordell et al., 2009; Van Vuuren et al., 2010; Desmidt et al., 2015;
Withers et al. 2015). Livestock slurry represents a great substitute for inorganic fertiliser and
is routinely used as an organic amendment to soil. This helps to recycle nutrients and
enhance soil organic matter within a range of crop production systems (Waldrip-Dail et al.,
2009; Liu et al., 2016). However, the risk of nutrient loss (e.g. P, N and K) from land can
increase following livestock slurry application and can result in severe environmental
pollution (Sharpley et al., 1999; King et al., 2015).
The characteristics of P in the livestock slurry can subsequently influence P
availability and P mobility in soil after application (Bol et al., 2016; Mackay et al., 2017).
Furthermore, manure processing strategies, such as mechanical separation, acidification and
anaerobic digestion, may have an impact on the characteristics of livestock slurry, thereafter
influencing P availability and mobility in soil after application. Therefore, this thesis aims to
(1) determine the effects of different slurry processing strategies on the physicochemical
properties of cattle slurry, and (2) explore how slurry processing affects P availability, P
speciation and P loss in soil after application. The overall hypotheses are that a) small
particle size fractions of cattle slurry dominate the total P content, and have great mobility in
soil, and b) slurry acidification and anaerobic digestion modify the P speciation and
distribution in cattle slurry, and thereafter affect P availability and mobility in soil.
The thesis comprises 9 chapters with Chapters 3-8 describing laboratory and pot
experiments. Chapter 2 is a literature review describing the recent understanding of the
effects of slurry processing strategies on livestock slurry properties, especially P forms, and
subsequent implications for P cycling and losses from soil. From this literature review we
identified weaknesses and/or gaps in knowledge of the effects of slurry processing on P
cycling, that were addressed in subsequent experimental Chapters. Chapters 3-5 focussed on
the characterization of differently processed cattle slurries, whilst Chapters 6-8 focussed on
slurry-P availability and mobility in soil.
In Chapters 3 and 4, acidified and anaerobically digested slurry were sieved
into >2000, 500-2000, 63-500 and <63 µm particle size fractions, and P speciation was

2
analysed using the modified Hedley fractionation procedure. In Chapter 5, further detailed
analysis was conducted on the smaller slurry size particle fractions. This specifically focused
on particles <63 µm, of differently processed slurries, as these are believed to be more
bioavailable and at greater risk of being vertically transported through the soil profile. These
particles were operationally separated into 0.45-63 µm (colloids), 0.03-0.45 µm
(nanoparticles), 0.001-0.03 µm (nanoparticles), and <0.001 µm fractions. A modified Hedley
fractionation was conducted on the colloidal fraction, and reactive (inorganic) and unreactive
(organic) P was differentiated within the fractions <0.45 µm. Based on the findings in
Chapter 5, a small-scale experiment was performed to explore the effect of slurry processing
on potential P leaching of colloidal and nanoparticulate slurry fractions (Chapter 6). Chapter
7 determined changes in P forms in soil following the applications of separated solid and
liquid fractions of untreated, acidified and anaerobically digested cattle slurries (based on
Chapters 3 & 4 results) in an 18 week-incubation experiment with a grassland soil. In
Chapter 8, a pot experiment was used to evaluate P uptake by ryegrass following the
application of differently processed cattle slurry fractions. Potential P leaching was also
assessed in this experiment. The links between these chapters are shown below in Figure 1.1.

3
Figure 1.1 Summary of the thesis outline

4
The main content and hypotheses for each chapter are described in the following
section:
Chapter 3 describes the effects of slurry acidification on N and P forms and their
distribution in cattle slurry. The hypotheses were (1) in cattle slurry, the major proportion of
dry matter and carbon would be distributed in the coarse particle size fractions, whilst the
majority of the N and P would be in the small particle size fractions; (2) acidification would
result in even greater N and P distributing in the small particle size fractions; and (3)
acidification would increase the potential bioavailability of N and P in separated slurry size
fractions.
Chapter 4 describes the effect of anaerobic digestion on N and P forms and their
distribution in cattle slurry. The hypotheses were that (1) the dry matter and C distribution
would be altered by anaerobic digestion, and the proportion of coarse particle fraction would
be smaller in the anaerobically digested slurry; (2) bioavailability of N and P in livestock
slurry, especially in small particle size fractions, would be increased by anaerobic digestion;
and (3) anaerobic digestion would reduce the mechanical separation efficiency of the dry
matter, C, N, and P contents.
Chapter 5 determines the P and N distribution in colloids and nanoparticles of
untreated, acidified and anaerobically digested cattle slurry. The hypotheses were: (1)
colloids and nanoparticles contain a significant proportion of the N and P content of the
livestock slurry; and (2) acidification and anaerobic digestion both increase the potential
bioavailability of N and P in the separated liquid slurry fraction (<63 µm), which is primarily
associated with the colloidal fraction.
Chapter 6 explores colloidal P fraction transport (vertical movement) after the
application of processed cattle slurry to soil. The hypothesis was that acidification and
anaerobic digestion would reduce P mobility and potential P leaching by conversion of
colloidal P to orthophosphate which readily sorbs to mineral surfaces, reducing its vertical
movement in soil.
Chapter 7 evaluates P fractionation changes in soils applied with solid and liquid
fractions of processed cattle slurry. The hypotheses were: (1) addition of livestock slurry,
non-processed and processed, would immediately increase the labile P content of the soil; (2)
the potential bioavailability of P forms would reduce over time; (3) both acidified and
anaerobically digested slurry would result in a greater labile P content of soil than untreated

5
slurry; and (4) organic P in the liquid fractions would mineralise to a greater degree, and at a
faster rate than organic P in solid fractions.
Chapter 8 determines the effect of slurry processing on P availability for plant uptake
and potential leaching. The hypotheses were: (1) livestock slurry, untreated and treated,
could improve plant growth and P uptake, and increase potential P leaching; (2) acidified
and anaerobically digested slurry would result in more P uptake and potential P leaching
from soil than untreated slurry; and (3) the liquid fraction of separated slurry treatments
would result in greater P uptake and potential P leaching in soil than from the solid fraction.
This thesis provides new insights into the mechanisms of P cycling from differently
processed livestock slurry to soil. It does this by providing a better understanding of P
speciation associated with particle distribution after slurry acidification, anaerobic digestion
and slurry separation.
References
Bol, R., Julich, D., Brödlin, D., Siemens, J., Kaiser, K., Dippold, M.A., Spielvogel, S., Zilla,
T., Mewes, D., von Blanckenburg, F. and Puhlmann, H., 2016. Dissolved and
colloidal phosphorus fluxes in forest ecosystems—an almost blind spot in ecosystem
research. Journal of Plant Nutrition and Soil Science, 179(4), pp.425-438.
Cordell, D., Drangert, J.O. and White, S., 2009. The story of phosphorus: global food
security and food for thought. Global Environmental Change, 19(2), pp.292-305.
Desmidt, E., Ghyselbrecht, K., Zhang, Y., Pinoy, L., Van der Bruggen, B., Verstraete, W.,
Rabaey, K. and Meesschaert, B., 2015. Global phosphorus scarcity and full-scale P-
recovery techniques: a review. Critical Reviews in Environmental Science and
Technology, 45(4), pp.336-384.
King, K.W., Williams, M.R., Macrae, M.L., Fausey, N.R., Frankenberger, J., Smith, D.R.,
Kleinman, P.J. and Brown, L.C., 2015. Phosphorus transport in agricultural
subsurface drainage: A review. Journal of Environmental Quality, 44(2), pp.467-485.
Liu, J., Kleinman, P.J., Beegle, D.B., Dell, C.J., Veith, T.L., Saporito, L.S., Han, K., Pote,
D.H. and Bryant, R.B., 2016. Subsurface application enhances benefits of manure
redistribution. Agricultural & Environmental Letters, pp.1-4.

6
Mackay, J.E., Macdonald, L.M., Smernik, R.J. and Cavagnaro, T.R., 2017. Organic
amendments as phosphorus fertilisers: Chemical analyses, biological processes and
plant P uptake. Soil Biology and Biochemistry, 107, pp.50-59.
Sharpley, A.N., Daniel, T., Sims, T., Lemunyon, J., Stevens, R. and Parry, R., 1999.
Agricultural phosphorus and eutrophication. US Department of Agriculture,
Agricultural Research Service, ARS-149, pp.42.
Van Vuuren, D.P., Bouwman, A.F. and Beusen, A.H., 2010. Phosphorus demand for the
1970–2100 period: a scenario analysis of resource depletion. Global environmental
change, 20(3), pp.428-439.
Waldrip-Dail, H., He, Z., Erich, S.M. and Honeycutt, W.C., 2009. Soil phosphorus dynamics
in response to poultry manure amendment. Soil Science, 174(4), pp.195-201.
Withers, P.J., Elser, J.J., Hilton, J., Ohtake, H., Schipper, W.J. and Van Dijk, K.C., 2015.
Greening the global phosphorus cycle: how green chemistry can help achieve
planetary P sustainability. Green Chemistry, 17(4), pp.2087-2099.

7
2 Literature review: effect of processing strategies on
phosphorus cycle from livestock slurry to soil
2.1 Abstract
Phosphorus (P) is a critical but finite element for our food production systems. To
improve the use efficiency and reduce loss are the challenges in P management. Livestock
slurry is an important nutrient source for crop production. This chapter reviews the P
characteristics of livestock slurry, and its subsequent behaviour in the soil after application.
Specifically, the chapter explores the impact of slurry processing strategies, i.e. separation,
acidification and anaerobic digestion, on P solubility and bioavailability in livestock slurry
and soil. P is present in livestock slurry in either inorganic or organic P. The solubility and
availability of added P in soil is controlled by desorption/adsorption,
dissolution/precipitation and mineralization/immobilization processes. Added soluble P
tends to be adsorbed to clay and mineral oxides in soil. The sorption affinity of inorganic P
to soil is generally greater than organic P, except for phytic acid. Colloids from slurry and
soil can facilitate P transport in soil. Solid fractions produced from mechanical separation
generally contain higher amounts of dry matter and have a higher C/P ratio, and lower
quantities of nutrients and microbial activity than separated liquid fractions. The liquid
fraction could result in greater organic P mineralisation than the solid fraction after
application. Acidification lowers the pH and increases P solubility in livestock slurry. The
acidified slurry could provide more available P to crop initially after application, but the pH
may increase P sorption in soil. Degradation of organic matter during anaerobic digestion
increases inorganic P concentration, but precipitation occurs during this process, which
reduces the P solubility. In addition, decomposition during anaerobic digestion may impact
on the mobility of colloid-associated P. The P characteristics in livestock slurry would partly
influence P transformation and movement in soil after application. The particle sizes of
differently treated livestock slurry, with which P associated, may determine the contact with
microorganisms and clay and minerals in soil, affecting the P sorption/desorption,
immobilisation/mineralisation, dissolve/precipitation. Moreover, colloid-associated P is
likely to transport further. However, information on P in slurry associated with different
sizes of particles and how they may affect P in soil is limited. Therefore, this thesis tried to
address such questions.

8
2.2 Introduction
Annually >200 million tons of phosphate rock are mined globally (U.S. Geological
Survey, 2017), most of which are used in agricultural applications, especially fertiliser
production (Cisse & Mrabet, 2004; Desmidt et al., 2015). The world phosphate rock reserves
are approximately 68 billion tons estimated in 2016 (U.S. Geological Survey, 2017). And it
has been predicted to be depleted in the next <100 up to 400 years (Cordell et al., 2009; Van
Vuuren et al., 2010; Desmidt et al., 2015; Withers et al. 2015). To avoid or slow down the
depletion, efforts should be made on closing the global phosphorus (P) cycle by improving
use efficiency, lowering P demand, and minimising P losses and generation of waste P that
can no longer be re-used (Withers et al. 2015). P is an unsubstitutable and essential element
for crop production in agriculture. Livestock slurry is a good resource for P, recycling waste
from livestock industry. Moreover, P loss from farmland to surface water and groundwater is
of serious concern (Schindler et al., 2008; McDowell et al., 2015). Livestock slurry use
efficiency and control of P losses should be considered priorities in crop production.
However, P bioavailability and potential P loss from slurry amended soil are related
not only to total P input from slurry, but also associated with slurry P species and their
interactions with the soil matrix (He et al., 2004; Toth et al., 2006). There are some
processing strategies for different purposes, which may alter the P characteristics in livestock
slurry. It is therefore important to understand the original P characteristics in differently
processed slurries and its implication on the interaction between slurry-derived P and soils
over time.
Therefore, this chapter reviewed the P characteristics in livestock slurry and P
dynamics in slurry amended soils (in terms of the change of P species and P loss from soil),
and the effect of processing strategies of separation, acidification and anaerobic digestion.
2.3 P in livestock slurry
Livestock slurries contain considerable P. For example, cattle slurry contains 0.5-
0.7g P kg-1, and swine slurry contains 0.6-1.3 g P kg-1 on fresh weight basis (Møller et al.,
2002; Fangueiro et al., 2012). P in manure generally includes two forms of inorganic and
organic P. Studies have shown that inorganic P constitutes more than 50% of TP in swine
and cattle manure (Dou et al., 2000; Sharpley & Moyer, 2000; Ajiboye et al., 2004; Pagliari
& Laboski, 2012). Struvite (MgNH4PO4·6H2O) and dicalcium phosphate dihydrate
(CaHPO4·2H2O) are the main phases controling P solubility in swine and cattle manure

9
based on analysis of X-ray absorption near-edge structure (XANES) (Ajiboye et al., 2007;
He & Zhang, 2014). Güngör et al. (2007) found 57% and 43% of P of 25-53µm size particle
fraction of dairy manure was associated with dicalcium phosphate anhydrous (CaHPO4) and
struvite respectively. Such P solubility is controlled by pH. Most Ca-P minerals could be
dissolved at pH 5.5-6.7 (Fordham & Schwertmann, 1977).
Monoesters phosphate and phytate have been reported to be the predominant forms
of organic P in swine and cattle manure by 31P NMR and enzyme hydrolysis methods
(Leinweber et al., 1997; He & Honeycut, 2001; Turner & Leytem, 2004; McDowell &
Stewart, 2005; He et al., 2009; Pagliari & Laboski, 2012). Turner & Leytem (2004) and
Pagliari & Laboski (2012) combined sequential fractionation with 31P NMR and enzyme
hydrolysis, respectively, to speciate organic P in swine and cattle manure. Turner & Leytem
(2004) found monoester-P made up the majority of organic P in the H2O, NaHCO3, and
NaOH extracts, while phytate was the major form of organic P in the HCl and NaOH
extracts in swine and cattle manure (Turner & Leytem, 2004). In the study of Pagliari &
Laboski (2012), hydrolysable organic P accounted for about half of the total organic P in
swine and cattle manure. And they claimed phytate was the dominant hydrolyzable organic P
in the H2O extract, representing over 30% of organic P in swine and cattle manure, while in
the NaHCO3 extract, monoester-P was the main organic P form. They also presented a
difference between swine and cattle manure in phytate proportion in the NaOH and HCl
extracts. Phytate accounted for a larger proportion of organic P in the NaOH and HCl
extracts than monoester in swine manure, but represented a less or equivalent proportion to
monoester in cattle manure, which is due to their different digesting systems (Taylor, 1965).
2.4 P dynamics in soil
2.4.1 P transformation derived by livestock slurry
Biological, biochemical and physicochemical processes regulate the P dynamics in
soils (Bünemann, 2015). Inorganic orthophosphate (HPO42-, H2PO4-) is the primary source of
P for plants (and microorganisms) (Kruse et al., 2015). Livestock slurry contains a
considerable amount of such available P, and can supply to soils after application. However,
the solubility and availability of added P after slurry application gradually decrease over
time, which is mainly controlled by physicochemical processes. The inorganic P can adsorb
onto surfaces of clay and oxides minerals, and be taken up by plants and microbes when
enters the soil matrix (Sato et al, 2005). At high soil pH, the precipitation to Ca-P dominates,

10
while binding to Al and Fe oxides prevails at low soil pH (Kruse et al., 2015). In a
calcareous soil, long-term manure applications result in the transformation of relatively
soluble Ca-P, such as monetite and brushite, into more crystalline Ca-P, such as ᵝ-tricalcium
P (TCP) and octacalcium P (OCP) (Sato et al., 2005; Audette et al., 2016). In acid soil, bind
with Fe and Al oxides is the main limiting factor for P solubility (Kruse et al., 2015). The
sorption increases with decreased pH (Perassi & Borgnino, 2014). Factors that can influence
solubility of Al- and Fe-oxides, such as redox, can also affect P solubility (Kruse et al.,
2015). Some organic acids from livestock slurry inhibit crystallization of Fe and Al oxides in
soils. Abdala et al. (2015) observed a sharp increase in amorphous Fe and Al amounts (55%
and 80% increase) due to the consecutive application of manures, which may otherwise
enhance P sorption through the creation of highly-reactive amorphous oxide minerals.
Organic matter in manure could impact sorption properties of soils (He et al., 2004). Low
molecular organic anions represent important competitors with P for sorption sites and help
to improve P solubility and mobility in soil (Grossl and Inskeep, 1991; Violante and Pigna,
2002; Sato et al., 2005; Kruse et al., 2015). Organic P moieties may also be adsorbed and
precipitate in a similar mechanism as inorganic P (He et al., 2006). For example, in soil with
pH greater than 6.5, the formation of Ca-organic P complexes, such as Ca-phytates may
occur (Audette et al., 2016).
The biological P dynamic process is controlled primarily by bacterial immobilization,
and mineralization, (Bolan, 1991; Walbridge, 1991; Mackay et al., 2017). Organic P release
is negatively correlated with the C/P ratio and positively correlated with initial P content of
the organic amendments. Organic matter with a total P content of >2 g kg-1 (on a dry weight
basis) generally results in positive net P mineralization (Floate, 1970; Nziguheba et al.,
1998). Different chemical forms of the organic P from organic amendments may be different
in mineralisation. Diester-P tends to be mineralized more rapidly than monoester-P (Turner
et al., 2002; Condron et al., 2005). Phytic acid, a monoester, has a higher charge density than
other monoesters, allowing it to form relatively stable complexes in soil that are protected
from microbial degradation (Greaves & Webley, 1965; Celi et al., 1999).
Furthermore, livestock slurry also provides microorganisms, exophosphatases to soil
(Dick & Tabatabai, 1984; Crouse et al., 2002). Microbial and exoenzyme activities derived
by slurry may contribute to P dynamics. And the inorganic P from slurry could influence
biological processes in soil by stimulating microbial growth (Martin, 1970).

11
2.4.2 P losses from livestock slurry amended soil
P losses from agricultural land is an important P source of eutrophication (Haygarth
et al., 1998; Heathwaite and Dils, 2000; Withers & Lord, 2002). It has been estimated that
about half of the annual P load to UK waters is from agriculture land (Defra, 2004). Manure
addition influences the P runoff and leaching from the agricultural field. P losses sourced
from manure is reported to be greater than from inorganic fertilizer (Frossard et al., 1989;
Simard et al., 1995; McDowell et al., 2005). Vadas et al (2015) estimated that 30% of P
runoff from pasture was derived from manure. In addition, it is also suggested that manure
represents the main source of leachable P from soil (Gerritse, 1981; Toor, 2003).
Addition of livestock slurry negatively affects P sorption while positively affects P
availability in soil as well as inorganic P fertilisers (Siddique & Robinson, 2003). When the
P sorption capacity of the Al- and Fe-oxides is saturated, P leaching losses reach critical
levels, and tend to increase (Kruse et al., 2015). Extraction of slurry can provide estimation
of P which may saturating P sorption sites in soil. Water extractable P of manure has been
reported to be correlated to potential P runoff and leaching from manure freshly amended
soils (Sharpley and Moyer, 2000; Elliott et al., 2002; Miller et al., 2006; Kleinman et al.,
2007; Roberts & Israel, 2017), although the relationship between water extractable P in
manure and P runoff was poor in Volf et al. (2007). Typically, organic P leaching dominates
P leaching, due to the weaker sorption affinity of organic P to binding sites than inorganic P
(Anderson & Magdoff, 2005; Bol et al., 2016), with exceptions such as phytic acid (Lessa &
Anderson, 1996; Leytem et al., 2002).
Colloids transport in soil is an important pathway for colloid-associated P loss,
primarily through macropores during high flow events (Haygarth et al., 1997; de Jonge et al.,
2004; Schelde et al., 2006; Withers et al., 2009; Glæsner et al., 2013; Regelink et al., 2013).
In P-unsaturated soil, colloid-facilitated P loss is dominant in P loss from soil (Turner et al.,
2003a; Heathwaite et al., 2005), although Rick et al. (2011) evidenced that nanoparticles of
10-200 nm in soil only contained a trace amount of P, and they did not necessarily contribute
to P transport. Preedy et al. (2001) also suggested the potential of slurry particles to act as
carriers for P transfer in soil. Makris et al. (2006) isolated soil colloids from manured soil
and applied to soil column, and detected 30% of the added colloids in the effluent and
observed particulate P vertical movement. However, we lack information on slurry particles
and colloids, and P they associated with, and colloids in soil originated from slurry at present.

12
2.5 Effect of processing strategies on P in livestock slurry and
soil
The characteristics of livestock slurry, such as P species, P-particle association,
particle composition, pH, C, microorganisms, and etc., could impact the P biological,
biochemical and physico-chemical process in soil after application. Processing strategies, e.g.
separation, acidification, and anaerobic digestion, on livestock slurry may alter these
characteristics, thereafter affect P performance in soil.
Separation
Solid-liquid separation is developed to reduce the volume of slurry requiring storage,
and to save the cost of transporting water. The separated liquid fraction is intended for on-
farm use, whilst the solid fraction can be exported to fields further more distant from the
farmstead, and even off-farm (Møller et al., 2000; Sørensen et al., 2003). Separation may
also benefit a reduction in odour emission (Zhang & Westerman, 1997).
Particle size composition of the slurry is an important factor for separation
performance. For example, filtration will only retain particles above a certain size, and
particles between 1 nm and 1 µm (i.e. colloids) are subject to Brownian motion and hardly
settle (Hjorth et al., 2010). Slurry separation technologies vary in their features for separation
of different particle sizes. Typically, solid fractions produced from mechanical separation
technologies contain high amounts of dry matter and low amounts of nutrients due to the
specific separation of larger particles (Møller et al., 2000; Møller et al., 2002). Peters et al.
(2011) stated that particles >25µm represent the majority of C in solid fractions, while
particles <25µm accounted for larger proportions of N and P. Meyer et al. (2007) also
observed that >80% of N and P of cattle slurry was in the <125µm fraction. Some studies
show that >70% of the undissolved N and P in cattle slurry is in particles between 0.45 and
250µm (Masse et al., 2005; Meyer et al., 2007). Some studies suggest separated liquid
manure has greater microbial activity than solid manure (Ghonsikar & Miller, 1973; Magid
et al., 1996; Turner et al., 2003b; Hansen et al. 2004).
Decomposition of manure in soils may be related to their particle size distribution.
Smaller particles have a larger surface area to volume ratio, thereafter are more susceptible
to microbial degradation (Magid et al., 2010). Further, smaller particles can be more mobile,
transporting from the soil surface to the upper soil or even deeper (McGechan, 2002).

13
Acidification
Acidification is introduced to address the ammonia volatilisation problem from
livestock production, which maintains manure N fertiliser value (Ndegwa et al., 2008;
Aguerre et al., 2012). Acidification has been shown to reduce NH3 emissions from pig
houses (70%), storage (10%) and following application (67%) (Kai et al., 2008). As well as
mitigation of ammonia emission, acidification can also reduce methane emissions by 87%
from slurry stores (Petersen et al., 2012; Bastami et al., 2016).
Moreover, acidification has also been reported to improve the dissolved P content of
slurry (Güngör et al., 2007; Fangueiro et al., 2015). Struvite and brushite are the main phases
controling P solubility in swine and cattle manure. Most such P minerals and other occluded
P can be dissolved at pH 5.5-6.7 (Fordham and Schwertmann, 1977; Güngör et al., 2007; He
& Zhang, 2014; Fangueiro et al., 2015). Some papers also suggest that acidification can
induce slurry particle aggregation and accelerated hydrolysis (Hjorth et al., 2015). Roboredo
et al. (2012) observed that the total phosphorus (TP) content distributed in the solid fraction
of separated (by centrifugation) slurry was reduced by 50% after acidification.
Addition of acidified slurry to soil causes greater labile P content of soil compared
with non-acidified slurry (Roboredo et al., 2012; Petersen et al., 2012). The increase in labile
P and other nutrients in soil after application of acidified slurry is found to improve crop
production (Kai et al., 2008; Petersen et al., 2012; Birkmose & Vestergaard, 2013). Acidity
could also alter microbial structure and function and P sorption in soil after application. It is
reported that acidified slurry decreases soil respiration, nitrification and microbial biomass C
(Fangueiro et al., 2013). Roboredo et al. (2012) claimed acidification may inhibit P
immobilisation, but accelerate mineralisation in soil after application. However, there does
not appear to be any studies on the effect of acidified manure on P loss in soil after
application.
Anaerobic digestion
Anaerobic digestion is a green energy production technology of importance,
producing biogas for heat and power generation, and reducing odour and pathogens in
livestock slurry (Smet et al., 1999; Sahlström, 2003; Clemens et al., 2006). Anaerobic
digestion is conservative in terms of slurry nutrients, unless N is lost via ammonia
volatilisation from digestate storage, and hence can be applied as a source of nutrients for
crop/grass production (Walsh et al., 2012).

14
Anaerobic digestion reduces the dry matter and C concentration of animal slurry, but
maintain P concentration (Marcato et al., 2008). Organic P mineralisation is negatively
correlated with the C/P ratio and positively correlated with initial P content of the organic
materials (Floate, 1970; Mafongoya et al., 2000). Thus, the anaerobically digested slurry
may result in greater mineralization in soil after application than untreated slurry. In addition,
the particle size distribution changes during anaerobic digestion (Shon & Vigeswaran, 2006;
Marcato et al., 2008; Hjorth et al., 2010). In anaerobic digesters, warm and stirred condition
facilitates microbial degradation of large particles, leaving relatively small particles with
slowly degradable material (Hjorth et al., 2010). In a cold unstirred slurry, the slow
transformation of particles primarily degrades small particles, transforming only a minor
fraction of the large particulate material (Hjorth et al., 2010). Bacterial flocs and filaments
may form during anaerobic digestion (Marcato et al., 2008). Masse et al. (2005) observed
that particles <10µm accounted for 64% of dry matter content in raw slurry, while it
increases to 84% of dry matter content in anaerobically digested slurry. Researchers reported
particles <1 or <1.6µm were most susceptible to biodegradation during anaerobic digestion
(Elmitwalli et al., 2001; Møller et al., 2002; Shon & Vigeswaran, 2006). And Shon &
Vigeswaran (2006) observed that particles >10 µm appeared more recalcitrant during
anaerobic digestion. Marcato et al. (2008) found the 3-25µm particles contributed greatest
(30%) to the specific surface area of the whole slurry than other particle size fractions, and
their area increased (40%) after digestion.
During anaerobic digestion, degradation processes transforms organic P into
inorganic P (Masse et al., 2005). Inorganic P especially dissolved orthophosphate is
bioavailable (Rausch & Bucher, 2002). But anaerobic digestion tends to reduce P solubility,
due to the formation of struvite and Ca-P (Suzuki et al., 2007; Marcato et al. 2008; Güngör
& Karthikeyan, 2008; Rico et al. 2012). In the 25-53µm particle fraction of the anaerobically
digested slurry, 78% of P presents as struvite and 22% of P is associated with
hydroxylapatite (HAp) (Güngör et al., 2007). Stutter (2015) claimed that although
precipitation reactions limit inorganic P solubility, no crystalline P minerals were observed
in digestates.
After addition of digestates to soil, the bulk density is reported to decrease and
saturated hydraulic conductivity and moisture retention capacity of soil increase (Garg et al.,
2005). Microbial basal respiration and metabolic quotient in soil are higher following
digestate amendment, indicating greater microbial activity, than with untreated slurry

15
amendment (Bougnom et al., 2012; Hupfauf et al., 2016). Hupfauf et al. (2016) argues that P
availability is reduced in digestate by the formation of recalcitrant P minerals during the
fermentation process, triggering microbes to increase their metabolic activity, compared to
undigested slurry, to obtain sufficient amounts of P for development. But in the study of
Juárez et al. (2013), the basal respiration showed no difference between untreated and
anaerobically digested slurry treatments. Sapp et al. (2015) indicates the bacterial diversity
may be slightly greater in soils amended with digestate than inorganic nutrients. Bachmann
et al. (2016) showed lower soil enzymes activities in digestates amended treatments than
untreated slurry amended treatments.
Some studies report that digestates are found to positively influence plant growth and
P uptake (Bachmann et al., 2011; Abubaker et al., 2012; Hupfauf et al., 2016). However,
compared to untreated slurry, most available results from field experiments have indicated
no additional effect of digestates on plant P uptake and P availability in soil (Loria & Sawyer,
2005; Möller & Stinner, 2010; Bachmann et al., 2011; Bachmann et al., 2014). Moreover,
Stutter (2015) observed that digestates weakened P sorption in soil columns compared to
control soil, suggesting short-term leaching risks for soil applied digestates. This may result
from the competition of organic molecules in digestates. For P runoff, García‐Albacete et al.
(2016) found digestates resulted in lower P runoff loss than undigested slurry.
2.6 Conclusions
Livestock slurry is an important nutrient source for crops, but also represent a source
of P loss, which is thought to be greater than from inorganic P fertilisers. Slurry provides
inorganic and organic P forms for crop production. The availability and solubility of added P
in soil is controlled by desorption/adsorption, dissolution/precipitation and
mineralization/immobilization processes. Soluble P added from slurry tends to be adsorbed
to clay and mineral oxides in soil. The sorption affinity of organic P to soil is generally
lower than inorganic P, except phytic acid. Organic matter added from slurry could compete
for sorption site with P and weaken P sorption. However, organic acid increases amorphous
Fe and Al release, and may enhance P sorption. Colloid associated P has a great mobility and
is an important source of P loss.
Processing strategies, such as separation, acidification and anaerobic digestion, may
alter P species, particle size composition and other properties of livestock slurry, with
impacts on soil processes after application. For example, solid fractions produced by

16
mechanical separation technologies generally contain high amounts of dry matter and C/P
ratios, and lower quantities of nutrients and microbial activity than liquid fractions. This may
result in more labile P input from liquid fraction and greater organic P decomposition in soil
after liquid fraction amendments. Acidification increases P solubility and availability in
livestock slurry. Anaerobic digestion has a greater impact on particle composition of slurry
than acidification, which may influence the mobility of colloid associated P. Degradation of
organic P increases inorganic P content, but precipitation occurs during this process, which
may affect the P solubility.
At present, the information on particle size composition, especially colloids in
livestock slurry and P characteristics associated with these particles is limited. There are
some researches revealing the effect of anaerobic digestion on slurry particles, but without
detailed description or discussion on possible P transformation in soil after application
related to these particle changes. Such information on acidified slurry is even less. To better
understand the effect of addition of differently treated livestock slurry on P dynamics in soil
and improve livestock slurry recommendation, further exploration on particle-associated P in
livestock slurry and its transformation and movement in soil is needed. Therefore, this thesis
tried to elucidate the effect of differently treated livestock slurry on P availability and
mobility in soil with respect to P speciation of different particle sizes of slurry.
2.7 References
Abdala, D.B., da Silva, I.R., Vergütz, L. and Sparks, D.L., 2015. Long-term manure
application effects on phosphorus speciation, kinetics and distribution in highly
weathered agricultural soils. Chemosphere, 119, pp.504-514.
Aguerre, M.J., Wattiaux, M.A., Hunt, T. and Lobos, N.E., 2012. Effect of nitrogen content
and additional straw on changes in chemical composition, volatile losses, and
ammonia emissions from dairy manure during long-term storage. Journal of Dairy
Science, 95(6), pp.3454-3466.
Ajiboye, B., Akinremi, O.O., Hu, Y. and Flaten, D.N., 2007. Phosphorus speciation of
sequential extracts of organic amendments using nuclear magnetic resonance and X-
ray absorption near-edge structure spectroscopies. Journal of Environmental Quality,
36(6), pp.1563-1576.

17
Ajiboye, B., Akinremi, O.O. and Racz, G.J., 2004. Laboratory characterization of
phosphorus in fresh and oven-dried organic amendments. Journal of Environmental
Quality, 33(3), pp.1062-1069.
Abubaker, J., Risberg, K. and Pell, M., 2012. Biogas residues as fertilisers–Effects on wheat
growth and soil microbial activities. Applied Energy, 99, pp.126-134.
Anderson, B.H. and Magdoff, F.R., 2005. Relative movement and soil fixation of soluble
organic and inorganic phosphorus. Journal of Environmental Quality, 34(6), pp.2228.
Audette, Y., O'Halloran, I.P. and Voroney, R.P., 2016. Kinetics of phosphorus forms applied
as inorganic and organic amendments to a calcareous soil. Geoderma, 262, pp.119-
124.
Bachmann, S., Gropp, M. and Eichler-Löbermann, B., 2014. Phosphorus availability and soil
microbial activity in a 3 year field experiment amended with digested dairy slurry.
Biomass and Bioenergy, 70, pp.429-439.
Bachmann, S., Uptmoor, R. and Eichler-Löbermann, B., 2016. Phosphorus distribution and
availability in untreated and mechanically separated biogas digestates. Scientia
Agricola, 73(1), pp.9-17.
Bachmann, S., Wentzel, S. and Eichler‐Löbermann, B., 2011. Codigested dairy slurry as a
phosphorus and nitrogen source for Zea mays L. and Amaranthus cruentus L. Journal
of Plant Nutrition and Soil Science, 174(6), pp.908-915.
Bastami, M.S.B., Jones, D.L. and Chadwick, D.R., 2016. Reduction of Methane Emission
during Slurry Storage by the Addition of Effective Microorganisms and Excessive
Carbon Source from Brewing Sugar. Journal of Environmental Quality, pp.45(6).
Birkmose, T. and Vestergaard, A., 2013, June. Acidification of slurry in barns, stores and
during application: review of Danish research, trials and experience. In 15th
RAMIRAN International Conference, pp.10-13.
Bol, R., Julich, D., Brödlin, D., Siemens, J., Kaiser, K., Dippold, M.A., Spielvogel, S., Zilla,
T., Mewes, D., von Blanckenburg, F. and Puhlmann, H., 2016. Dissolved and
colloidal phosphorus fluxes in forest ecosystems—an almost blind spot in ecosystem
research. Journal of Plant Nutrition and Soil Science, 179(4), pp.425-438.

18
Bolan, N.S., 1991. A critical review on the role of mycorrhizal fungi in the uptake of
phosphorus by plants. Plant and Soil, 134(2), pp.189-207.
Bougnom, B.P., Niederkofler, C., Knapp, B.A., Stimpfl, E. and Insam, H., 2012. Residues
from renewable energy production: their value for fertilizing pastures. Biomass and
Bioenergy, 39, pp.290-295.
Bünemann, E.K., 2015. Assessment of gross and net mineralization rates of soil organic
phosphorus–A review. Soil Biology and Biochemistry, 89, pp.82-98.
Celi, L., Lamacchia, S., Marsan, F.A. and Barberis, E., 1999. Interaction of inositol
hexaphosphate on clays: Adsorption and charging phenomena. Soil Science, 164(8),
pp.574-585.
Cisse, L. and Mrabet, T., 2004. World phosphate production: overview and prospects.
Phosphorus Research Bulletin, 15, pp.21-25.
Clemens, J., Trimborn, M., Weiland, P. and Amon, B., 2006. Mitigation of greenhouse gas
emissions by anaerobic digestion of cattle slurry. Agriculture, Ecosystems &
Environment, 112(2), pp.171-177.
Condron, L.M., Turner, B.L. and Cade-Menun, B.J., 2005. Chemistry and dynamics of soil
organic phosphorus. Phosphorus: Agriculture and the Environment, (phosphorus
agric), pp.87-121.
Cordell, D., Drangert, J.O. and White, S., 2009. The story of phosphorus: global food
security and food for thought. Global Environmental Change, 19(2), pp.292-305.
Crouse, D.A., Sierzputowska-Gracz, H., Mikkelsen, R.L. and Wollum, A.G., 2002.
Monitoring phosphorus mineralization from poultry manure using phosphatase
assays and phosphorus-31 nuclear magnetic resonance spectroscopy.
Communications in Soil Science and Plant Analysis, 33(7-8), pp.1205-1217.
Defra. 2004. Developing measures to promote catchment-sensitive farming A joint Defra-
HM Treasury Consultation. http://www.defra.gov.
de Jonge, L.W., Moldrup, P., Rubæk, G.H., Schelde, K. and Djurhuus, J., 2004. Particle
leaching and particle-facilitated transport of phosphorus at field scale. Vadose Zone
Journal, 3(2), pp.462-470.

19
Desmidt, E., Ghyselbrecht, K., Zhang, Y., Pinoy, L., Van der Bruggen, B., Verstraete, W.,
Rabaey, K. and Meesschaert, B., 2015. Global phosphorus scarcity and full-scale P-
recovery techniques: a review. Critical Reviews in Environmental Science and
Technology, 45(4), pp.336-384.
Dick, W.A. and Tabatabai, M., 1984. Kinetic parameters of phosphatases in soils and
organic waste materials. Soil Science, 137(1), pp.7-15.
Dou, Z., Toth, J.D., Galligan, D.T., Ramberg, C.F. and Ferguson, J.D., 2000. Laboratory
procedures for characterizing manure phosphorus. Journal of Environmental Quality,
29(2), pp.508-514.
Elliott, H.A., O'Connor, G.A. and Brinton, S., 2002. Phosphorus leaching from biosolids-
amended sandy soils. Journal of Environmental Quality, 31(2), pp.681-689.
Elmitwalli, T.A., Soellner, J., De Keizer, A., Bruning, H., Zeeman, G. and Lettinga, G., 2001.
Biodegradability and change of physical characteristics of particles during anaerobic
digestion of domestic sewage. Water Research, 35(5), pp.1311-1317.
Fangueiro, D., Hjorth, M. and Gioelli, F., 2015. Acidification of animal slurry–a review.
Journal of Environmental Management, 149, pp.46-56.
Fangueiro, D., Lopes, C., Surgy, S. and Vasconcelos, E., 2012. Effect of the pig slurry
separation techniques on the characteristics and potential availability of N to plants in
the resulting liquid and solid fractions. Biosystems Engineering, 113(2), pp.187-194.
Fangueiro, D., Surgy, S., Coutinho, J. and Vasconcelos, E., 2013. Impact of cattle slurry
acidification on carbon and nitrogen dynamics during storage and after soil
incorporation. Journal of Plant Nutrition and Soil Science, 176(4), pp.540-550.
Floate, M.J.S., 1970. Decomposition of organic materials from hill soils and pastures: II.
Comparative studies on the mineralization of carbon, nitrogen and phosphorus from
plant materials and sheep faeces. Soil Biology and Biochemistry, 2(3), pp.173-185.
Fordham, A.W. and Schwertmann, U., 1977. Composition and reactions of liquid manure
(Gülle), with particular reference to phosphate: II. Solid phase components. Journal
of Environmental Quality, 6(2), pp.136-140.

20
Frossard, E., Stewart, J.W.B. and St. Arnaud, R.J., 1989. Distribution and mobility of
phosphorus in grassland and forest soils of Saskatchewan. Canadian Journal of Soil
Science, 69(2), pp.401-416.
García‐Albacete, M., Requejo, M.I. and Cartagena, M.C., 2016. Phosphorus Runoff Losses
After Application of Organic Waste. CLEAN–Soil, Air, Water, 44(12), pp.1628-
1635.
Garg, R.N., Pathak, H., Das, D.K. and Tomar, R.K., 2005. Use of flyash and biogas slurry
for improving wheat yield and physical properties of soil. Environmental Monitoring
and Assessment, 107(1), pp.1-9.
Gerritse, R., 1981. Mobility of phosphorus from pig slurry in soils. MPKV; Maharastra.
Ghonsikar, C.P. and Miller, R.H., 1973. Soil inorganic polyphosphates of microbial origin.
Plant and Soil, 38(3), pp.651-655.
Glæsner, N., Kjaergaard, C., Rubæk, G.H. and Magid, J., 2013. Relation between soil P test
values and mobilization of dissolved and particulate P from the plough layer of
typical Danish soils from a long‐term field experiment with applied P fertilizers. Soil
Use and management, 29(3), pp.297-305.
Greaves, M.P. and Webley, D.M., 1965. A Study of the Breakdown of Organic Phosphates
by Micro‐organisms from the Root Region of Certain Pasture Grasses. Journal of
Applied Bacteriology, 28(3), pp.454-465.
Grossl, P.R. and Inskeep, W.P., 1991. Precipitation of dicalcium phosphate dihydrate in the
presence of organic acids. Soil Science Society of America Journal, 55(3), pp.670-
675.
Güngör, K., Jürgensen, A. and Karthikeyan, K.G., 2007. Determination of phosphorus
speciation in dairy manure using XRD and XANES spectroscopy. Journal of
Environmental Quality, 36(6), pp.1856-1863.
Güngör, K. and Karthikeyan, K.G., 2008. Phosphorus forms and extractability in dairy
manure: a case study for Wisconsin on-farm anaerobic digesters. Bioresource
Technology, 99(2), pp.425-436.
Hansen, J.C., Cade-Menun, B.J. and Strawn, D.G., 2004. Phosphorus speciation in manure-
amended alkaline soils. Journal of Environmental Quality, 33(4), pp.1521-1527.

21
Haygarth, P.M., Chapman, P.J., Jarvis, S.C. and Smith, R.V., 1998. Phosphorus budgets for
two contrasting grassland farming systems in the UK. Soil Use and Management,
14(s4), pp.160-167.
Haygarth, P.M., Warwick, M.S. and House, W.A., 1997. Size distribution of colloidal
molybdate reactive phosphorus in river waters and soil solution. Water Research,
31(3), pp.439-448.
He, Z. and Honeycutt, C.W., 2001. Enzymatic characterization of organic phosphorus in
animal manure. Journal of Environmental Quality, 30(5), pp.1685-1692.
He, Z., Griffin, T.S. and Honeycutt, C.W., 2004. Evaluation of soil phosphorus
transformations by sequential fractionation and phosphatase hydrolysis. Soil Science,
169(7), pp.515-527.
He, Z., Waldrip, H.W., Honeycutt, C.W., Erich, M.S. and Senwo, Z.N., 2009. Enzymatic
quantification of phytate in animal manure. Communications in Soil Science and
Plant Analysis, 40(1-6), pp.566-575.
He, Z., Senwo, Z.N., Mankolo, R.N. and Honeycutt, C.W., 2006. Phosphorus fractions in
poultry litter characterized by sequential fractionation coupled with phosphatase
hydrolysis. Journal of Food Agriculture and Environment, 4(1), p.304.
He, Z. and Zhang, H. eds., 2014. Applied manure and nutrient chemistry for sustainable
agriculture and environment. Lavoisier: Springer.
Heathwaite, A.L. and Dils, R.M., 2000. Characterising phosphorus loss in surface and
subsurface hydrological pathways. Science of the Total Environment, 251, pp.523-
538.
Heathwaite, L., Haygarth, P., Matthews, R., Preedy, N. and Butler, P., 2005. Evaluating
colloidal phosphorus delivery to surface waters from diffuse agricultural sources.
Journal of Environmental Quality, 34(1), pp.287-298.
Hjorth, M., Christensen, K.V., Christensen, M.L. and Sommer, S.G., 2010. Solid–liquid
separation of animal slurry in theory and practice. A review. Agronomy for
Sustainable Development, 30(1), pp.153-180.

22
Hjorth, M., Cocolo, G., Jonassen, K., Abildgaard, L. and Sommer, S.G., 2015. Continuous
in-house acidification affecting animal slurry composition. Biosystems Engineering,
132, pp.56-60.
Hupfauf, S., Bachmann, S., Juárez, M.F.D., Insam, H. and Eichler-Löbermann, B., 2016.
Biogas digestates affect crop P uptake and soil microbial community composition.
Science of the Total Environment, 542, pp.1144-1154.
Juárez, M.F.D., Waldhuber, S., Knapp, A., Partl, C., Gómez-Brandón, M. and Insam, H.,
2013. Wood ash effects on chemical and microbiological properties of digestate-and
manure-amended soils. Biology and Fertility of Soils, 49(5), pp.575-585.
Kai, P., Pedersen, P., Jensen, J.E., Hansen, M.N. and Sommer, S.G., 2008. A whole-farm
assessment of the efficacy of slurry acidification in reducing ammonia emissions.
European Journal of Agronomy, 28(2), pp.148-154.
Kleinman, P., Sullivan, D., Wolf, A., Brandt, R., Dou, Z., Elliott, H., Kovar, J., Leytem, A.,
Maguire, R., Moore, P. and Saporito, L., 2007. Selection of a water-extractable
phosphorus test for manures and biosolids as an indicator of runoff loss potential.
Journal of Environmental Quality, 36(5), pp.1357-1367.
Kruse, J., Abraham, M., Amelung, W., Baum, C., Bol, R., Kühn, O., Lewandowski, H.,
Niederberger, J., Oelmann, Y., Rüger, C. and Santner, J., 2015. Innovative methods
in soil phosphorus research: A review. Journal of Plant Nutrition and Soil Science,
178(1), pp.43-88.
Leinweber, P., Haumaier, L. and Zech, W., 1997. Sequential extractions and 31P-NMR
spectroscopy of phosphorus forms in animal manures, whole soils and particle-size
separates from a densely populated livestock area in northwest Germany. Biology
and Fertility of Soils, 25(1), pp.89-94.
Lessa, A.S.N. and Anderson, D.W., 1996. Laboratory estimation of nutrient losses by
leaching on an Oxisol from Brazil. Tropical Agriculture, 73(2), pp.100-107
Leytem, A.B., Mikkelsen, R.L. and Gilliam, J.W., 2002. Sorption of organic phosphorus
compounds in Atlantic coastal plain soils. Soil Science, 167(10), pp.652-658.
23
Loria, E.R. and Sawyer, J.E., 2005. Extractable soil phosphorus and inorganic nitrogen
following application of raw and anaerobically digested swine manure. Agronomy
Journal, 97(3), pp.879-885.
Mackay, J.E., Macdonald, L.M., Smernik, R.J. and Cavagnaro, T.R., 2017. Organic
amendments as phosphorus fertilisers: Chemical analyses, biological processes and
plant P uptake. Soil Biology and Biochemistry, 107, pp.50-59.
Mafongoya, P.L., Barak, P. and Reed, J.D., 2000. Carbon, nitrogen and phosphorus
mineralization of tree leaves and manure. Biology and Fertility of Soils, 30(4),
pp.298-305.
Magid, J., De Nowina, K.R., Lindedam, J. and Andren, O., 2010. Organic matter in size‐
density fractions after 16–50 years of grass ley, cereal cropping and organic
amendments. European Journal of Soil Science, 61(4), pp.539-550.
Magid, J., Tiessen, H. and Condron, L.M., 1996. Dynamics of organic phosphorus in soils
under natural and agricultural ecosystems. Humic substances in terrestrial ecosystems.
Elsevier, Amsterdam, pp.429-466.
Makris, K.C., Grove, J.H. and Matocha, C.J., 2006. Colloid-mediated vertical phosphorus
transport in a waste-amended soil. Geoderma, 136(1), pp.174-183.
Marcato, C.E., Pinelli, E., Pouech, P., Winterton, P. and Guiresse, M., 2008. Particle size
and metal distributions in anaerobically digested pig slurry. Bioresource Technology,
99(7), pp.2340-2348.
Martin, J.K., 1970. Organic phosphate compounds in water extracts of soils. Soil Science,
109(6), pp.362-375.
Masse, L., Masse, D.I., Beaudette, V. and Muir, M., 2005. Size distribution and composition
of particles in raw and anaerobically digested swine manure. Transactions-American
Society of Agricultural Engineers, 48(5), p.1943.
McDowell, R.W., Cox, N., Daughney, C.J., Wheeler, D. and Moreau, M., 2015. A national
assessment of the potential linkage between soil, and surface and groundwater
concentrations of phosphorus. JAWRA Journal of the American Water Resources
Association, 51(4), pp.992-1002.

24
McDowell, R.W., R.M. Monaghan, L.C. Smith, G.F. Koopmans, and I. Stewart. 2005.
Enhanced losses of phosphorus in mole-tile drainage water following short-term
applications of dairy effluent to pasture. In: A.R. Burk, editor, Water pollution: New
research. Nova Science Publishers, p. 55–76.
McDowell, R.W. and Stewart, I., 2005. Phosphorus in fresh and dry dung of grazing dairy
cattle, deer, and sheep. Journal of Environmental Quality, 34(2), pp.598-607.
McGechan, M.B., 2002. SW—soil and water: transport of particulate and colloid-sorbed
contaminants through soil, part 2: trapping processes and soil pore geometry.
Biosystems Engineering, 83(4), pp.387-395.
Meyer, D., Ristow, P.L. and Lie, M., 2007. Particle size and nutrient distribution in fresh
dairy manure. Applied Engineering in Agriculture, 23(1), p.113.
Miller, J.J., Olson, E., Chanasyk, D.S., Beasley, B.W., Larney, F.J. and Olson, B.M., 2006.
Phosphorus and nitrogen in rainfall simulation runoff after fresh and composted beef
cattle manure application. Journal of Environmental Quality, 35(4), pp.1279-1290.
Møller, H.B., Lund, I. and Sommer, S.G., 2000. Solid–liquid separation of livestock slurry:
efficiency and cost. Bioresource Technology, 74(3), pp.223-229.
Møller, H.B., Sommer, S.G. and Ahring, B.K., 2002. Separation efficiency and particle size
distribution in relation to manure type and storage conditions. Bioresource
Technology, 85(2), pp.189-196.
Möller, K. and Stinner, W., 2010. Effects of organic wastes digestion for biogas production
on mineral nutrient availability of biogas effluents. Nutrient Cycling in
Agroecosystems, 87(3), pp.395-413.
Ndegwa, P.M., Hristov, A.N., Arogo, J. and Sheffield, R.E., 2008. A review of ammonia
emission mitigation techniques for concentrated animal feeding operations.
Biosystems Engineering, 100(4), pp.453-469.
Nziguheba, G., Palm, C.A., Buresh, R.J. and Smithson, P.C., 1998. Soil phosphorus fractions
and adsorption as affected by organic and inorganic sources. Plant and Soil, 198(2),
pp.159-168.

25
Pagliari, P.H. and Laboski, C.A., 2012. Investigation of the inorganic and organic
phosphorus forms in animal manure. Journal of Environmental Quality, 41(3),
pp.901-910.
Perassi, I. and Borgnino, L., 2014. Adsorption and surface precipitation of phosphate onto
CaCO 3–montmorillonite: effect of pH, ionic strength and competition with humic
acid. Geoderma, 232, pp.600-608.
Peters, K., Hjorth, M., Jensen, L.S. and Magid, J., 2011. Carbon, nitrogen, and phosphorus
distribution in particle size–fractionated separated pig and cattle slurry. Journal of
Environmental Quality, 40(1), pp.224-232.
Petersen, S.O., Andersen, A.J. and Eriksen, J., 2012. Effects of cattle slurry acidification on
ammonia and methane evolution during storage. Journal of Environmental Quality,
41(1), pp.88-94.
Preedy, N., McTiernan, K., Matthews, R., Heathwaite, L. and Haygarth, P., 2001. Rapid
incidental phosphorus transfers from grassland. Journal of Environmental Quality,
30(6), pp.2105-2112.
Rausch, C. and Bucher, M., 2002. Molecular mechanisms of phosphate transport in plants.
Planta, 216(1), pp.23-37.
Regelink, I.C., Koopmans, G.F., van der Salm, C., Weng, L. and van Riemsdijk, W.H., 2013.
Characterization of colloidal phosphorus species in drainage waters from a clay soil
using asymmetric flow field-flow fractionation. Journal of Environmental Quality,
42(2), pp.464-473.
Rick, A.R. and Arai, Y., 2011. Role of natural nanoparticles in phosphorus transport
processes in ultisols. Soil Science Society of America Journal, 75(2), pp.335-347.
Rico, C., Rico, J.L. and Lasa, C., 2012. Anaerobic digestion of the liquid fraction of dairy
manure separated by screw pressing and centrifugation in a upflow anaerobic sludge
blanket reactor at 25ºC. Biosystems Engineering, 112(4), pp.344-351.
Roberts, J. and Israel, D.W., 2017. Influence of Soil Properties and Manure Sources on
Phosphorus in Runoff during Simulated Rainfall. Communications in Soil Science
and Plant Analysis, 48(2), pp.222-235.

26
Roboredo, M., Fangueiro, D., Lage, S. and Coutinho, J., 2012. Phosphorus dynamics in soils
amended with acidified pig slurry and derived solid fraction. Geoderma, 189, pp.328-
333.
Sahlström, L., 2003. A review of survival of pathogenic bacteria in organic waste used in
biogas plants. Bioresource Technology, 87(2), pp.161-166.
Sapp, M., Harrison, M., Hany, U., Charlton, A. and Thwaites, R., 2015. Comparing the
effect of digestate and chemical fertiliser on soil bacteria. Applied Soil Ecology, 86,
pp.1-9.
Sato, S., Solomon, D., Hyland, C., Ketterings, Q.M. and Lehmann, J., 2005. Phosphorus
speciation in manure and manure-amended soils using XANES spectroscopy.
Environmental Science & Technology, 39(19), pp.7485-7491.
Schelde, K., de Jonge, L.W., Kjaergaard, C., Laegdsmand, M. and Rubæk, G.H., 2006.
Effects of manure application and plowing on transport of colloids and phosphorus to
tile drains. Vadose Zone Journal, 5(1), pp.445-458.
Schindler, D.W., Hecky, R.E., Findlay, D.L., Stainton, M.P., Parker, B.R., Paterson, M.J.,
Beaty, K.G., Lyng, M. and Kasian, S.E.M., 2008. Eutrophication of lakes cannot be
controlled by reducing nitrogen input: results of a 37-year whole-ecosystem
experiment. Proceedings of the National Academy of Sciences, 105(32), pp.11254-
11258.
Sharpley, A. and Moyer, B., 2000. Phosphorus forms in manure and compost and their
release during simulated rainfall. Journal of Environmental Quality, 29(5), pp.1462-
1469.
Shon, H.K., Vigneswaran, S. and Snyder, S.A., 2006. Effluent organic matter (EfOM) in
wastewater: constituents, effects, and treatment. Critical Reviews in Environmental
Science and Technology, 36(4), pp.327-374.
Siddique, M.T. and Robinson, J.S., 2003. Phosphorus sorption and availability in soils
amended with animal manures and sewage sludge. Journal of Environmental Quality,
32(3), pp.1114-1121.

27
Simard, R.R., Cluis, D., Gangbazo, G. and Beauchemin, S., 1995. Phosphorus status of
forest and agricultural soils from a watershed of high animal density. Journal of
Environmental Quality, 24(5), pp.1010-1017.
Smet, E., Van Langenhove, H. and De Bo, I., 1999. The emission of volatile compounds
during the aerobic and the combined anaerobic/aerobic composting of biowaste.
Atmospheric Environment, 33(8), pp.1295-1303.
Stutter, M.I., 2015. The composition, leaching, and sorption behavior of some alternative
sources of phosphorus for soils. Ambio, 44(2), pp.207-216.
Sørensen, C.G., Jacobsen, B.H. and Sommer, S.G., 2003. An assessment tool applied to
manure management systems using innovative technologies. Biosystems Engineering,
86(3), pp.315-325.
Suzuki, K., Tanaka, Y., Kuroda, K., Hanajima, D., Fukumoto, Y., Yasuda, T. and Waki, M.,
2007. Removal and recovery of phosphorous from swine wastewater by
demonstration crystallization reactor and struvite accumulation device. Bioresource
Technology, 98(8), pp.1573-1578.
Taylor, T.C., 1965. The availability of the calcium and phosphorus of plant materials for
animals. Proceedings of the Nutrition Society, 24(01), pp.105-112.
Toor, G.S., Condron, L.M., Di, H.J., Cameron, K.C. and Cade-Menun, B.J., 2003.
Characterization of organic phosphorus in leachate from a grassland soil. Soil
Biology and Biochemistry, 35(10), pp.1317-1323.
Toth, J.D., Dou, Z., Ferguson, J.D., Galligan, D.T. and Ramberg, C.F., 2006. Nitrogen-vs.
phosphorus-based dairy manure applications to field crops. Journal of Environmental
Quality, 35(6), pp.2302-2312.
Turner, B.L., Cade-Menun, B.J. and Westermann, D.T., 2003a. Organic phosphorus
composition and potential bioavailability in semi-arid arable soils of the western
United States. Soil Science Society of America Journal, 67(4), pp.1168-1179.
Turner, B.L. and Leytem, A.B., 2004. Phosphorus compounds in sequential extracts of
animal manures: Chemical speciation and a novel fractionation procedure.
Environmental Science & Technology, 38(22), pp.6101-6108.

28
Turner, B.L., Mahieu, N. and Condron, L.M., 2003b. The phosphorus composition of
temperate pasture soils determined by NaOH–EDTA extraction and solution 31 P
NMR spectroscopy. Organic Geochemistry, 34(8), pp.1199-1210.
Turner, B.L., Papházy, M.J., Haygarth, P.M. and McKelvie, I.D., 2002. Inositol phosphates
in the environment. Philosophical Transactions of the Royal Society B: Biological
Sciences, 357(1420), pp.449-469.
U.S. Geological Survey. (2012). Mineral Commodity Summaries January 2012, Phosphorus.
United States Government Printing Office.
https://minerals.usgs.gov/minerals/pubs/commodity/phosphate_rock/mcs-2017-
phosp.pdf
Vadas, P.A., Busch, D.L., Powell, J.M. and Brink, G.E., 2015. Monitoring runoff from
cattle-grazed pastures for a phosphorus loss quantification tool. Agriculture,
Ecosystems & Environment, 199, pp.124-131.
Van Vuuren, D.P., Bouwman, A.F. and Beusen, A.H., 2010. Phosphorus demand for the
1970–2100 period: a scenario analysis of resource depletion. Global Environmental
Change, 20(3), pp.428-439.
Violante, A. and Pigna, M., 2002. Competitive sorption of arsenate and phosphate on
different clay minerals and soils. Soil Science Society of America Journal, 66(6),
pp.1788-1796.
Volf, C.A., Ontkean, G.R., Bennett, D.R., Chanasyk, D.S. and Miller, J.J., 2007. Phosphorus
losses in simulated rainfall runoff from manured soils of Alberta. Journal of
Environmental Quality, 36(3), pp.730-741.
Walbridge, M.R., Richardson, C.J. and Swank, W.T., 1991. Vertical distribution of
biological and geochemical phosphorus subcycles in two southern Appalachian forest
soils. Biogeochemistry, 13(1), pp.61-85.
Walsh, J.J., Jones, D.L., Edwards‐Jones, G. and Williams, A.P., 2012. Replacing inorganic
fertilizer with anaerobic digestate may maintain agricultural productivity at less
environmental cost. Journal of Plant Nutrition and Soil Science, 175(6), pp.840-845.

29
Withers, P.J., Elser, J.J., Hilton, J., Ohtake, H., Schipper, W.J. and Van Dijk, K.C., 2015.
Greening the global phosphorus cycle: how green chemistry can help achieve
planetary P sustainability. Green Chemistry, 17(4), pp.2087-2099.
Withers, P.J.A., Hartikainen, H., Barberis, E., Flynn, N.J. and Warren, G.P., 2009. The effect
of soil phosphorus on particulate phosphorus in land runoff. European Journal of Soil
Science, 60(6), pp.994-1004.
Withers, P.J. and Lord, E.I., 2002. Agricultural nutrient inputs to rivers and groundwaters in
the UK: policy, environmental management and research needs. Science of the Total
Environment, 282, pp.9-24.
Zhang, R.H. and Westerman, P.W., 1997. Solid-liquid separation of annual manure for odor
control and nutrient management. Applied Engineering in Agriculture, 13(3), pp.385-
393.

30
3 The effect of acidification on N and P forms and their
distribution in cattle slurry
3.1 Abstract
Acidification is known to reduce ammonia losses from livestock slurry management.
However, this mitigation strategy may modify the forms and relative distribution of
phosphorus (P) and nitrogen (N) in the acidified slurry with implications for nutrient
availability for crops and the risk of losses to the environment. In this study, untreated and
acidified (pH 5.5) slurry was separated into different particle size fractions and analysed for
N and P content and forms. Sequential fractionation was conducted on each particle size
fraction to determine the effects of slurry acidification on P speciation. In untreated cattle
slurry, the <63 µm particle size fraction represented 35% of the dry matter content, and ca.
70% of the total N (TN) and total P (TP) content of the whole slurry. The NH4+-N and water
extractable P contents of cattle slurry doubled after acidification and this change was mainly
associated with the <63 µm fraction. The TP-H2O, TP-NaHCO3, TP-NaOH, TP-HCl and TP-
residue forms accounted for 31%, 38, 10%, 10% and 11% of the TP in the untreated cattle
slurry. Further, >55% of the TP-H2O, TP-NaHCO3 and TP-HCl forms was present as
inorganic P (IP). Acidification increased the labile P (IP-H2O+IP-NaHCO3) content,
dissolved the precipitated P (IP-HCl) and degraded the OP-NaHCO3 form. After separation,
different to the untreated slurry, the liquid fractions (<2000, <500 and <63 µm) separated
from the acidified slurry had a higher proportion of labile P than the solid fractions
(>2000, >500 and >63 µm). This study showed that acidification increases the bioavailability
of N and P in livestock slurry.

31
3.2 Introduction
Ammonia (NH3) emissions from livestock production represent a severe challenge
for manure management, resulting in a significant reduction in the manure N fertiliser value
(Ndegwa et al., 2008; Aguerre et al., 2012), as well as a significant environmental risk to
natural and semi-natural ecosystems (Fangmeier et al., 1994). Acidification has been shown
to reduce NH3 emissions from animal houses, slurry stores and following application to land
(Vandre & Clemens, 1996; Clemens et al., 2002; Kai et al., 2008). Acidification can also
reduce methane emissions from slurry stores (Petersen et al., 2012).
To improve the management of livestock slurry, mechanical separation is commonly
utilised, so that the solid fraction can be composted, and transported to, and spread on fields
further from the farm steading, whilst liquid fractions may be pumped more easily and
perhaps used for fertigation (Roboredo et al., 2012). The separated solid and liquid fractions
have different characteristics and may display different N and P dynamics in the soil after
application. Generally, in untreated cattle and pig slurry, although the dry matter and carbon
content can be concentrated in the solid fraction after separation, a large proportion of the
nutrients (N, P) tend to be present in the liquid fraction (Meyer et al., 2007; Hjorth et al.,
2010). Peters et al. (2011) reported that the majority of C in the separated solid fraction of
cattle and pig slurry was present in particles >25 µm, whereas the total N and P were present
in larger proportions in particles <25 µm. Meyer et al. (2007) observed that 80% of the total
N and P in cattle slurry occurs in particle size classes <125 µm. When applying the separated
liquid slurry fraction to soil, it supplies more available N and P nutrients to plants (Hjorth et
al., 2010; Sommer et al., 2015). Smaller slurry particle size fractions have larger surface
area-to-volume ratios and may be more susceptible to bacterial colonisation and reaction,
leading to greater hydrolysis (Levine et al., 1991; Masse et al., 2005). Additionally, smaller
particles have greater potential to be transported through soil pores than larger particles
(McGechan & Lewis, 2002).
However, acidification may alter the physical and chemical characteristics of
livestock slurry, and influence the separation performance, and thereafter the N and P
dynamics in soil. Acidification has been reported to markedly increase NH4+-N and
dissolved P content in slurry (Güngör et al., 2007; Fangueiro et al., 2013; Sommer et al.,
2015; Fangueiro et al., 2015). As a result, less N and P is recovered in the solid fraction of
slurry (Roboredo et al., 2012; Sommer et al., 2015). Changes in slurry characteristics during

32
acidification also include increased electrical conductivity, a greater content of free metals
(Hjorth et al., 2015) and solubilisation of inorganic precipitates (Fangueiro et al., 2009;
Hjorth et al., 2015). It has been also reported that acidification can induce slurry particle
aggregation and accelerate hydrolysis (Hjorth, 2015). Soil application of acidified slurry is
reported to decrease soil respiration, nitrification, and microbial biomass values, and increase
slurry P bioavailability (Roboredo et al., 2012; Fangueiro et al.,2013).
The simple description of P forms as dissolved P, TP, and organic P does not present
the more complex transformations of P and the range of P forms that exist in livestock slurry.
Sequential fractionation offers an approach to quantify the forms of P that can be
progressively extracted by increasingly strong extractants (i.e. in water, bicarbonate,
hydroxide and acid), providing information on readily available P forms through to
‘recalcitrant’ (unavailable) residual P (Cross & Schlesinger, 1995). Sequential fractionation
although does not directly identify P species, it does give indirect information about the P
solubility (He & Zhang, 2014). Inorganic P (IP) extracted by these reagents in livestock
manure is interpreted sequentially as: water-soluble; physically adsorbed on crystalline
surfaces; associated with surface of Ca carbonates, Al and Fe oxides; and mineral or
amorphous phases of Ca-P (He et al., 2006). Organic P forms can also be defined using the
same approach (He et al., 2006). Acidification could improve the availability of P in manure
by dissolving the dominant precipitates of struvite and Ca-P at low pH (Güngöret al., 2007).
Therefore, this study aimed to determine the N and P forms associated with different
particle size fractions in cattle slurry, and the effect of acidification on these characteristics.
Particle sizes were operationally defined by different mesh sizes, and we used the Hedley
fractionation method (Dou et al., 2000) to determine the P forms in each particle size
fraction. We hypothesized that: (1) in cattle slurry, a large proportion of dry matter and
carbon would distribute in the coarse particle size fractions, while the majority of N and P
would be in the smaller particle size fractions; (2) acidification would exacerbate this
imbalance in the N and P distribution; and (3) acidification would increase the availability of
N and P in separated slurry size fractions.
3.3 Materials and Methods
3.3.1 Sample Collection
Three 10 L samples of cattle slurry was collected independently from a commercial
beef farm in Wales, UK. These slurry samples were stored in a cold room (4°C) in closed

33
vessels until acidification could take place. From these samples, three replicate batches of
1.5 L of slurry were acidified to pH 5.5 by adding ca. 35 ml 15% H2SO4 L-1 to the slurry.
Three untreated 1.5 L slurry samples remained non-acidified. All slurry samples were stored
in a 4°C cold room for 7 d until slurry separation and subsequent Hedley fractionation.
3.3.2 Particle fractionation
Approximately 800 ml of untreated and acidified slurry were wet-sieved sequentially
and separated into fractions of >2000, 500-2000, 63-500, and <63 μm. The fresh total weight
of each fraction was recorded. Subsamples of particle fractions were taken for determination
of the dry matter (DM) content and volatile solid (VS) content by drying at 105ºC and 550ºC
respectively, whilst the remaining sample was air-dried and stored for further analysis. 4 g of
fresh >2000, 500-2000, 63-500 and <63 μm fractions were also extracted by shaking with 20
ml 0.5 M K2SO4 for 0.5 h. Extracts were centrifuged at 18,500 g for 10 min and the
suspension was kept for the determination of the NH4+-N and PO4
3--P concentrations by
colorimetric methods (Mulvaney, 1996; Murphy & Riley, 1962). In a preliminary test we
demonstrated no statistical difference in the extractable PO43--P concentration between slurry
fraction shaken with water (1:200) or 0.5 M K2SO4 (1:5 w/v) (data not shown). Thus, the
term of ‘water extractable P’ was used in this study. TP was also determined by combusting
dried samples at 550°C overnight and dissolving the ash in 20% (v/v) HCl. The DM, TP, TN,
and all N and P form contents for whole slurry were calculated by summing the contents of
all the particle size fractions. The total carbon (C) and TN content of the different particle
size fractions was determined by TruSpec® CN analyzer (Leco Corp., St Joseph, MO). Since
NH4+ is the dominant inorganic N form in livestock slurry (Fangueiro et al., 2014), we
assumed that the organic N content of the different particle size fractions was the difference
between TN and NH4+-N.
3.3.3 P sequential fractionation
P sequential fractionation (Dou et al., 2000) was applied to the whole slurry and
the >2000, 500-2000, 63-500, and <63 μm fractions of untreated and acidified slurry. 0.3 g
air-dried samples were sequentially extracted by 30 ml of distilled water, 0.5 M NaHCO3,
0.1 M NaOH, and 1 M HCl, in triplicate. During each extraction, the mixture of sample and
extractant was shaken for 16 h and then centrifuged at 13,600 g for 10 min. Finally, the
supernatant was filtered through Whatman 42 filter papers, and residues on the filters were
rinsed with the next extractant into centrifuge tubes in preparation for the next extraction.

34
Extracted inorganic P (IP) in each fraction was detected by the colorimetric method (Murphy
& Riley, 1962). TP was determined after persulfate digestion (Rowland & Haygarth, 1997).
Finally, the undissolved residue was combusted in a muffle furnace at 550˚C and then
dissolved in 20% HCl for TP analysis. The difference between TP and IP was defined as
organic P (OP).
3.3.4 Calculation
The quantity of a N or P form in a particle size fraction is expressed on the basis of
one kg of fresh whole slurry as shown in Eqn (1).
Ci= 𝐶𝐹𝑖×𝑊𝐹𝑖/1000 (1)
In the above equation, CFi = concentration of a N or P form of the particle fraction i
on this fraction’s dry basis (g kg-1); WFi = dry weight of the particle fraction i in 1 kg of fresh
whole slurry (g); Ci = total amount of a N or P form of the particle fraction i in 1 kg of fresh
whole slurry (g kg-1).
The distribution of a N or P form in the whole slurry is expressed as the proportion of
a N or P form in a particle size fraction represents in the total quantity of such N or P form of
the whole slurry, Eqn (2).
Pi= 𝐶𝑖×100%/∑ 𝐶𝑖𝑛𝑖=1 (2)
In the above equation, Pi = the proportion of a N or P form of the particle fraction i in
the total quantity of such N or P form of whole slurry (%).
The P form distribution in the whole slurry is defined as the proportion (%) of the TP
of the whole slurry represented by the different P forms of the particle fractions, Eqn (3).
Pij= 𝐶𝑖𝑗×100%/∑ ∑ 𝐶𝑖𝑗𝑛𝑖=1
𝑚𝑗=1 (3)
Cij= the quantity of a P form j of the particle fraction i in 1 kg of dry whole slurry (g
kg-1); Pij = the proportion of the P form j of the particle fraction i in the TP of whole slurry
(%).
The P form distribution in separated solid or liquid fraction is defined as the
proportion (%) of the TP of separated fraction represented by each P form, Eqn (4).
PFij= 𝐶𝑖𝑗×100%/∑ 𝐶𝑖𝑗𝑚𝑗=1 (4)

35
In the above equation, PFij = the proportion of the P form j in the particle fraction i
(%).
All statistics were performed with SPSS 22. Comparison between untreated and
acidified slurry was performed by t-test with effects considered significant at p<0.05.
3.4 Results
3.4.1 Particle fractionation
Particle size composition
There were differences in the particle composition between the untreated and
acidified cattle slurry based on the distribution of DM among different particle size fractions.
In untreated cattle slurry, the >2000 µm and <63 µm fractions contained most of the DM,
composing 40% and 35% of the DM of whole slurry, respectively (Figure 3.1). The
remaining fractions, 500-2000 and 63-500 µm, contained 14% and 12% of the total DM
content, respectively (Figure 3.1). In the acidified slurry, the proportion of the >2000 µm
fraction increased to 51%, while 500-2000 and 63-500 µm fractions decreased to 11% and
10% (p<0.05) (Figure 3.1). In addition, the <63 µm fraction accounted for a similar
proportion in the acidified slurry and the untreated slurry (Figure 3.1).
For the VS, the comparison between untreated and acidified treatments was
consistent with the DM. 43% and 35% of VS was allocated in the >2000 µm and <63 µm
fractions of the untreated slurry, and 47% and 35% of VS were in these fractions in the
acidified slurry (Figure 3.1). In contrast to DM and VS, the distribution of C was not
affected by acidification (Figure 3.1).

36
Figure 3.1 Distribution of DM, VS and C in different slurry particle size fractions. Values represent means ± SEM, n = 3.

37
N and P distribution in particle size fractions
In the untreated cattle slurry, the majority of the NH4+-N content (82%) was in
particles <63 µm as expected, as it is present in a soluble form. A large proportion of the TN
(69%) and organic N (69%) was also in the <63 µm fraction (Figure 3.2). This is supported
by other studies (Meyer et al., 2007; Peters et al., 2011).
Acidification did not influence the TN and organic N content of the whole slurry
(Table 3.1) and distribution in different particle size fractions (Figure 3.2). However, the
NH4+-N content and distribution changed after acidification (Figure 3.2). The NH4
+-N
content of the whole slurry rose over 2 times from 0.17 g kg-1 to 0.42 g kg-1 after
acidification. The increase in the NH4+-N content of the whole slurry after acidification was
mainly associated with the >2000 and <63 µm fractions (Figure 3.2). In 1 kg of fresh whole
slurry, the NH4+-N quantity of the >2000 μm fraction increased from 0.014 g kg-1 to 0.047 g
kg-1, and the quantity of the <63 μm fraction increased from 0.14 g kg-1 to 0.34 g kg-1
(Figure 3.2). The <63 µm fraction contained the largest proportion of NH4+-N (81%) in the
whole slurry of acidified treatment (Figure 3.2).
Table 3.1 Characteristics of untreated and acidified cattle slurry (Data
expressed on a fresh weight basis). Values represent means ± SEM, n = 3.
Index Untreated cattle slurry Acidified cattle slurry
DM g kg-1 109.1(±9.0) 144.0(±15.9)*
VS g kg-1 74.5(±3.4) 78.4(±1.4)
TP g kg-1 0.60(±0.03) 0.75(±0.05)*
TN g kg-1 3.8 (±0.6) 4.6(±0.3)
Organic N g kg-1 3.6(±0.6) 4.2(±0.3)
C g kg-1 21.0(±4.9) 36.7(±6.5)
NH4+-N g kg-1 0.17(±0.01) 0.42(±0.1)*
Water extractable P g kg-1 0.16(0.09) 0.34(0.01)*
EC mS cm-1 6.4(±0.2) 7.0(±0.8)
pH 7.4(±0.1) 5.6(±0.0)*
ORP mv -42.3(±3.2) -64.0(±1.5)*
*indicates statistically significant difference between untreated and acidified
treatments (p<0.05).

38
Figure 3.2 The contents and distribution of NH 4+-N, organic N and total
nitrogen (TN) in different slurry particle size fractions. Values represent means ±
SEM, n = 3.
The water extractable P content of the whole slurry increased from 0.16 g kg-1 to 0.34
g kg-1 after acidification (Table 3.1). In addition, the water extractable P quantities of all
fractions increased to different extents due to acidification. Further, the largest increase
caused by acidification was seen in the water extractable P quantities of the >2000 and <63
μm fractions, almost doubling from 0.02 g kg-1 to 0.05 g kg-1 and from 0.14 g kg-1 to 0.28 g
kg-1 respectively, resulting in the increase in the water extractable P content of the whole
slurry (Figure 3.3). The distribution in the whole slurry experienced a slight change.
The >2000, 500-2000, 63-500 and <63 μm fractions accounted for 10%, 5%, 7% and 78% of
the water extractable P content of whole slurry in the untreated treatment respectively, and
represented 13%, 4%, 5% and 78% in the acidified slurry, respectively (Figure 3.3).

39
Figure 3.3 The water extractable P and total P (TP) in different slurry particle
size fractions. Values represent means ± SEM, n = 3.
The change of the distribution for TP was consistent with the water extractable P,
which included the increase in the >2000 μm fraction and a decrease in the 63-500 μm
fraction. Specifically, the >2000, 500-2000, 63-500 and <63 μm fractions accounted for 19%,
7%, 7% and 67% of the TP in untreated slurry respectively, and 21%, 5%, 5% and 69% in
acidified slurry respectively (Figure 3.3).
Acidification helped release P into water extractable forms and increased water
extractable P/ TP ratios of whole slurry and most fractions. The water extractable P/TP ratio
of whole slurry increased from 30% to 47% and this ratio also increased in each particle size
fraction.
3.4.2 P form distribution in the whole slurry
The calculated TP contents, by adding up all P form fractions, of the untreated whole
slurry were 0.57 g kg-1, respectively. They seemed smaller than measured TP contents in
Table 3.1, but there was no significant difference between the calculated and measured TP.
The same was true for the acidified treatments. In untreated cattle slurry, the particle size
fractions of >2000, 500-2000, 63-500 and <63 μm accounted for 20%, 7%, 8% and 65% of
the TP of whole cattle slurry, respectively. This distribution was similar to the result in
Figure 3.3 calculated from the measured TP contents of particle fractions. After acidification,

40
the TP content of whole slurry of the acidified treatment was 0.65 g kg-1, statistically the
same as the untreated treatment. The distribution of TP between the different slurry particle
size fractions was not affected much by acidification. In the acidified slurry 22%, 5%, 6%
and 68% of the TP was in the fractions of >2000, 500-2000, 63-500 and <63 μm,
respectively.
In the untreated cattle slurry, the TP-H2O, TP-NaHCO3, TP-NaOH, TP-HCl and TP-
residue forms represented 31%, 38, 10%, 10% and 11% of the TP of the whole slurry. 79%,
55%, 27% and 62% of the TP-H2O, TP-NaHCO3, TP-NaOH and TP-HCl was inorganic P.
In the composition of particle sizes, the <63 μm particles contributed the largest quantity of
P in every form. The <63 μm fraction accounted for 14%, 17%, 2%, 4%, 5%, 11%, 4%, 3%
and 6% of the TP of the whole slurry of the untreated treatment as IP-H2O, IP-NaHCO3, IP-
NaOH, IP-HCl, OP-H2O, OP-NaHCO3, OP-NaOH, OP-HCl, and TP-residue, respectively.
In addition, the second largest proportion was in the >2000 μm fraction (Figure 3.4).
Acidification transformed IP-NaHCO3, IP-HCl, OP-NaHCO3 and OP-HCl into IP-
H2O and OP-NaOH in the whole cattle slurry. Ca. 50% of the IP-NaHCO3, IP-HCl and OP-
HCl proportion and 25% of OP-NaHCO3 proportion in the TP of whole slurry was reduced.
The proportion of IP-H2O and OP-NaOH increased by 85% and 24%, respectively. These
transformations were more associated with smaller particle fractions. The >2000 μm fraction
seldom contributed to the alteration of the whole slurry. The increase of IP-H2O and OP-
NaOH contents in the whole slurry was due to the increase in the amount of IP-H2O and OP-
NaOH of the <63 µm fraction (Figure 3.4), the quantities of which increased by 95% and
20%, respectively. The quantity of IP-NaHCO3 decreased in the 500-2000, 63-500 and <63
µm fractions (Figure 3.4), resulting in ca. 50% reduction of the IP-NaHCO3 content of the
whole slurry. The reductions of the quantities of IP-HCl and OP-NaHCO3 in the 63-500
fraction, were 48% and 52%, respectively, and their decrease in the <63 µm fraction was 68%
and 29% after acidification, resulting in the decrease of the whole slurry. The quantity of
OP-HCl in the 500-2000 µm fraction of the acidified slurry was 68% lower than in the
untreated slurry. The quantities of IP-NaOH, OP-H2O and TP-residue were relatively stable.

41
Figure 3.4 Distribution of P forms in untreated and acidified cattle slurry.
Values represent means ± SEM, n = 3.
3.5 Discussion
3.5.1 DM, N and P in untreated and acidified slurry
The majority of the DM in the cattle slurry used in our study was present in the
coarse fractions rather than in the small fractions <63 µm. However, this distribution is quite
different to studies using pig slurry (Fernandes et al., 1988; Møller et al., 2002; Peters et al.,
2011). More DM is in the small particle size fractions in pig slurry. For example, the <50 μm
fraction represented between 53% and 70% of DM of pig slurry (Fernandes et al., 1988;
Møller et al., 2002).
The acidified whole cattle slurry showed a greater DM content than untreated slurry
(Table 3.1). This was not expected and was not seen in our preliminary experiment. This
difference may be because in this experiment we acidified a greater volume of cattle slurry
42
to ensure enough sample analysis. In addition, during acidification the foaming made the
volume of cattle slurry expand in the container, so although we tried to mix the sample
thoroughly, we may take more long straw residue and large particles out for particle
fractionation, resulting in overestimation of the DM content of the whole acidified slurry and
large particle fractions. For the same reason, the TP, VS, TN, and C contents of the acidified
whole slurry also tended to be slightly greater than the untreated slurry, but only the
difference in TP proved significant (Table 3.1). The observed increase of the proportion of
the >2000 µm fraction in the DM of whole slurry after acidification may also be a result of
this overestimation. However, Hjorth et al. (2015) observed an increase in the percentage of
particles of 100-1000 µm in pig slurry, and a decrease in the percentage of particles <100
µm after acidification, and argued that this could be the result of particle aggregation and
coagulation during acidification. Thus, this could also be a possible reason for the increase of
the proportion of the >2000 µm fraction in our study of cattle slurry.
Hjorth et al. (2013) claimed acidification accelerated hydrolysis of organic matter,
and they found reduced particles quantity <50 µm after acidification and observed more
carbohydrate hydrolysis products in the acidified slurry. Although in our result, acidification
tended to lower the DM quantity of the <63 μm fraction, this was not significant. This may
because of the short processing period. In the study of Hjorth et al. (2013), the experiment
was conducted for over 70 days with a daily addition of acid, while in our study the
acidification period was only one week with a two-stage acid addition.
Mechanical separation is a common practice used in livestock farms (Hjorth et al.,
2010). Generally, filtration retains particles above a certain size, e.g pore sizes of 700-3200
µm for pressurized filtration (Hjorth et al., 2010). In our study, we used three pore sizes of
sieves, 2000, 500 and 63 µm for particle fractionation. Table 3.2 summarized the calculated
separation efficiency for these three pore sizes, i.e. the ratios of >2000 µm /whole, >500 µm
/whole and >63 µm /whole. The P form distribution in these solid fractions
(>2000, >500, >63 µm) and liquid fractions (<2000, <500, <63 µm) separated from these
three pore sizes was also calculated and shown in Table 3.3. Although solid fractions
separated from these three pore sizes all hold a large proportion of DM, a large quantity of N
and P tends to concentrate in the liquid fractions (Table 3.2), as stated in our hypothesis that
in cattle slurry, large proportion of dry matter and carbon would distribute in the coarse
particle size fractions, while majority of N and P would be in the small particle size fractions.
Even to use the smallest pore size of 63 μm in our study, the separation efficiency of N and P

43
was still lower than 35% (Table 3.2). Peters et al. (2011) also observed that the majority of
TN and TP was in particles <25 μm. Further, Meyer et al. (2007) found over 80% TN and
TP in cattle slurry was in particles <125 μm. In pig slurry, some reported that 85-88% of TN
and 93-95% of TP in the fraction <500 μm (Møller et al., 2000), and 70% of TP was in the
<10 μm fraction (Masse et al., 2005).
Table 3.2 Separation efficiency of DM, VS, C, NH 4+-N, TN, water extractable
P and TP by different filter pore sizes separating solid fractions (%). Values represent
means, n = 3.
Measurements Separation size µm 2000 500 63
DM Untreated 40.0 53.9 65.0
Acidified 50.7* 61.2 69.7
VS Untreated 43.2 56.0 64.8
Acidified 46.5 57.1 65.5
C Untreated 48.8 61.8 77.3
Acidified 58.3 69.6 82.1
NH4+-N
Untreated 7.9 12.5 17.9
Acidified 11.2* 14.8 19.5
TN Untreated 16.5 21.9 30.5
Acidified 17.9 22.7 28.9
Water extractable P Untreated 10.3 15.5 22.2
Acidified 12.9 16.7 21.7
TP Untreated 18.6 26.0 33.1
Acidified 21.0 25.8 30.5
Note: * indicates the significant difference between untreated and acidified
treatments (p<0.05).
Acidification increased NH4+-N and water extractable P contents of cattle slurry,
especially in the <63 µm fraction, but the separation efficiency of NH4+-N and water
extractable P, TN and TP was not changed significantly (Table 3.2). Therefore, our
hypothesis that acidification would exacerbate this imbalance in the N and P distribution was
not supported. But acidification did increase the quantities of the inorganic N and extractable
P of both separated solid and liquid fractions, improving their N and P nutrient availability to
crops. On the other hand, acidification could increase the risk of N and P leaching after
application to soil. This is especially so for the liquid fractions separated from acidified

44
slurry, where the available N and P is not only high because of the acidification, but N and P
associated with the smaller particles is more reactive (because of the high surface area to
volume ratio) and the smaller particle sizes can be transported through the soil (McGechan,
2002). A high water extractable P content of manure has been related to increased risk of P
runoff (Kleinman et al., 2003; Roberts & Israel, 2017). Therefore, the potential P runoff was
also increased by acidification.
3.5.2 P speciation and distribution
Our sequential fractionation presented the information on readily available P forms
through to recalcitrant residual P for untreated and acidified different cattle slurry particle
sizes (Cross & Schlesinger, 1995). The measurements of water extractable P (Figure 3.3)
showed differences to the IP-H2O from sequential fractionation. However, the two values for
the whole slurry and most particle size fractions showed no significant difference, except for
the <63 µm particle size fraction. The IP-H2O content of the <63 µm fraction was less than
water extractable P, resulting in a larger separation efficiency if using IP-H2O. This may be
because the sample for water extractable P was fresh, while for sequential fractionation it
was air-dried. Also, the <63 µm fraction contained much higher water content before air dry
than other fractions. During air drying, the water soluble P in the <63 µm fraction may have
transformed to other P forms e.g. IP-NaHCO3, while this effect on other fractions was
minimal. Thus, when analysing the P result from sequential fractionation, we define both IP-
H2O and IP-NaHCO3 as labile inorganic P. In untreated cattle slurry, the labile inorganic P
represented a large proportion in both solid and liquid fractions separated from any of the
three pore sizes (Table 3.3). In addition, the labile inorganic P proportion in the liquid
fractions were significantly larger than in the solid fraction, except for separation with 2000
µm pore sizes. If applied to the crop field on a TP basis, the liquid slurry may show
advantage in improving crop production than solid slurry due to the greater labile P input.
Acidification increased the IP-H2O proportion and decreased the IP-NaHCO3 and IP-
HCl proportions in cattle slurry. The increase in the IP-H2O quantity was mainly the result
from dissolution and hydrolysis. The IP-NaHCO3 pool represents the P that was weakly
sorbed to Fe and Al oxides, and slightly soluble Ca-P precipitates (Cross & Schlesinger,
1995). IP-HCl mainly represents the compounds of struvite and Ca-P, which are the
dominant precipitates in livestock manure, especially in poultry manure (Güngör et al.,
2007). The low pH dissolved these compounds resulting in the increase in the IP-H2O
content. In addition, after separation, these alterations were reflected in the P speciation of

45
both solid and liquid fractions (Table 3.3). The labile inorganic P proportion in the TP of the
liquid fractions of slurry was significantly higher in acidified treatment than untreated
treatment, which is supportive to our hypothesis that acidification would increase the
availability of P in separated slurry size fractions. In the acidified treatment, this labile
inorganic P proportion in the liquid fractions was larger than the solid fractions, while the
proportion of IP-HCl and TP-residue in the liquid fractions was smaller than the solid
fractions. Thus, the liquid fraction from acidified slurry would have better agronomic benefit
than the solid fraction.
Table 3.3 The P form distribution in the separated solid and liquid fractions by
different filter pore sizes (%). Values represent means, n = 3.
Separated
fractions
µm
Treatment >2000 <2000 >500 <500 >63 <63
IP-H2O Untreated 34.6 25.3 34.4 26.6 33.7 26.8
Acidified 45.4* 50.5* 44.1* 50.0* 45.3* 49.4*
IP-NaHCO3 Untreated 12.0 26.4 12.4 24.3 13.8 24.0
Acidified 6.2* 13.3* 6.1* 12.2* 6.1* 12.2*
IP-NaOH Untreated 3.6 3.0 3.7 3.1 3.7 3.1
Acidified 3.3 2.6 3.2 2.8 3.2 2.7
IP-HCl Untreated 6.4 7.0 6.5 6.9 6.9 6.8
Acidified 6.9 2.8* 7.2 3.4* 6.9 3.5*
OP-H2O Untreated 6.2 7.6 5.8 7.6 6.2 7.3
Acidified 6.8 5.2 6.6 5.5 6.8 5.4
OP-
NaHCO3
Untreated 21.7 18.9 21.8 19.2 21.3 19.4
Acidified 19.1 13.2* 20.3 13.9 19 14.6
OP-NaOH Untreated 10.8 7.7 10.6 8.2 10.2 8.2
Acidified 10.8 10.0* 10.9 10.1 11 10.1
OP-HCl Untreated 4.8 4.2 4.9 4.3 4.3 4.4
Acidified 1.4 2.4 1.6 2.2 1.8 2.1*
TP-residue Untreated 14.9 11.5 15.2 11.8 15.0 12.0
Acidified 14.8 9.8 14.6 10.7 14.5 10.6
Note: * indicates the significant difference between untreated and acidified
treatments (p<0.05).
Hydrolysis is suggested to be accelerated under acidification (Hjorth et al., 2013),
thus contributing to the increase in the quantity of IP. It was reported that ca. 50% of the OP-
H2O in cattle and pig slurry was hydrolysable (He & Honeycutt, 2001). The hydrolysable

46
rate of other OP forms was also quite low (He & Honeycutt, 2001). However, in our study,
there was no significant reduction in OP-H2O. The OP-NaHCO3 and OP-HCl forms were the
two organic pools that decreased significantly after acidification. A small proportion of this
decrease may contribute to the increase of OP-NaOH, but the larger proportion might be
associated with mineralisation. These transformations in organic P were also shown in the
proportions of TP of the separated solid and liquid fractions, although this was not always
significant (Table 3.3). The difference in terms of the OP-NaHCO3 proportion between the
liquid and solid fractions tended to increase after acidification (Table 3.3). Hayes et al. (2000)
and He & Honeycutt (2001) suggest that ca. 90% of OP-NaHCO3 in livestock slurry is not
enzymatically hydrolysable. In our acidification, ca. 25% of OP-NaHCO3 of cattle slurry
was hydrolysed, markedly improving the P availability and alleviating the difficulty of
organic P decomposition in soil after application.
3.6 Conclusions
In cattle slurry, the <63 µm particle size fraction represented 35% of DM content,
and ca. 70% of TN and TP of the whole slurry. The NH4+-N and water extractable P contents
of cattle slurry doubled after acidification and this change was mainly associated with the
<63 µm fraction. However, the proportion of NH4+-N and water extractable P, TN and TP in
the <2000, <500 and <63 µm was not influenced by acidification.
The TP-H2O, TP-NaHCO3, TP-NaOH, TP-HCl and TP-residue forms accounted for
31%, 38%, 10%, 10% and 11% of the TP content of untreated cattle slurry. 79%, 55%, 27%
and 62% of the TP-H2O, TP-NaHCO3, TP-NaOH and TP-HCl was inorganic P.
Acidification increased the P bioavailability of cattle slurry by increasing the labile P (IP-
H2O+IP-NaHCO3) content, dissolving the precipitated P (IP-HCl) and degrading the OP-
NaHCO3. After separation, the liquid fractions separated from the acidified slurry had a
higher proportion of labile P than the solid fractions. Acidification increases the N and P
availability of cattle slurry, especially in the liquid fraction.
3.7 References
Aguerre, M.J., Wattiaux, M.A., Hunt, T. and Lobos, N.E., 2012. Effect of nitrogen content
and additional straw on changes in chemical composition, volatile losses, and
ammonia emissions from dairy manure during long-term storage. Journal of Dairy
Science, 95(6), pp.3454-3466.
47
Cross, A.F. and Schlesinger, W.H., 1995. A literature review and evaluation of the. Hedley
fractionation: Applications to the biogeochemical cycle of soil phosphorus in natural
ecosystems. Geoderma, 64(3-4), pp.197-214.
Dou, Z., Toth, J.D., Galligan, D.T., Ramberg, C.F. and Ferguson, J.D., 2000. Laboratory
procedures for characterizing manure phosphorus. Journal of Environmental Quality,
29(2), pp.508-514.
Fangueiro, D., Coutinho, J., Borges, L., Cabral, F. and Vasconcelos, E., 2014. Nitrogen and
carbon availability of liquid and solid fractions of pig slurry obtained using different
separation technologies. Biology and Fertility of Soils, 50(2), pp.333-341.
Fangmeier, A., Hadwiger-Fangmeier, A., Van der Eerden, L. and Jäger, H.J., 1994. Effects
of atmospheric ammonia on vegetation—a review. Environmental Pollution, 86(1),
pp.43-82.
Fangueiro, D., Hjorth, M. and Gioelli, F., 2015. Acidification of animal slurry–a review.
Journal of Environmental Management, 149, pp.46-56.
Fangueiro, D., Ribeiro, H., Vasconcelos, E., Coutinho, J. and Cabral, F., 2009. Treatment by
acidification followed by solid–liquid separation affects slurry and slurry fractions
composition and their potential of N mineralization. Bioresource Technology,
100(20), pp.4914-4917.
Fangueiro, D., Surgy, S., Coutinho, J. and Vasconcelos, E., 2013. Impact of cattle slurry
acidification on carbon and nitrogen dynamics during storage and after soil
incorporation. Journal of Plant Nutrition and Soil Science, 176(4), pp.540-550.
Fernandes, L., McKyes, E. and Obidniak, L., 1988. Performance of a continuous belt
microscreening unit for solid liquid separation of swine waste. Canadian Agricultural
Engineering, 30(1), pp.151-155.
Güngör, K., Jürgensen, A. and Karthikeyan, K.G., 2007. Determination of phosphorus
speciation in dairy manure using XRD and XANES spectroscopy. Journal of
Environmental Quality, 36(6), pp.1856-1863.
Hayes, J.E., Richardson, A.E. and Simpson, R.J., 2000. Components of organic phosphorus
in soil extracts that are hydrolysed by phytase and acid phosphatase. Biology and
Fertility of Soils, 32(4), pp.279-286.
48
He, Z. and Honeycutt, C.W., 2001. Enzymatic characterization of organic phosphorus in
animal manure. Journal of Environmental Quality, 30(5), pp.1685-1692.
He, Z., Senwo, Z.N., Mankolo, R.N. and Honeycutt, C.W., 2006. Phosphorus fractions in
poultry litter characterized by sequential fractionation coupled with phosphatase
hydrolysis. Journal of Food Agriculture and Environment, 4(1), pp.304.
He, Z. and Zhang, H. eds., 2014. Applied manure and nutrient chemistry for sustainable
agriculture and environment. Lavoisier: Springer.
Hjorth, M., Christensen, K.V., Christensen, M.L. and Sommer, S.G., 2010. Solid–liquid
separation of animal slurry in theory and practice. A review. Agronomy for
Sustainable Development, 30(1), pp.153-180.
Hjorth, M., Cocolo, G., Jonassen, K. and Sommer, S.G., 2013. Acidifications effect on
transformations in and composition of animal slurry. In Proceedings of 15th
International Conference, Ramiran 2013.
Hjorth, M., Cocolo, G., Jonassen, K., Abildgaard, L. and Sommer, S.G., 2015. Continuous
in-house acidification affecting animal slurry composition. Biosystems Engineering,
132, pp.56-60.
Kai, P., Pedersen, P., Jensen, J.E., Hansen, M.N. and Sommer, S.G., 2008. A whole-farm
assessment of the efficacy of slurry acidification in reducing ammonia emissions.
European Journal of Agronomy, 28(2), pp.148-154. Kleinman, P.J., Sharpley, A.N.,
Moyer, B.G. and Elwinger, G.F., 2002. Effect of mineral and manure phosphorus
sources on runoff phosphorus. Journal of Environmental Quality, 31(6), pp.2026-
2033.
Kleinman, P.J. and Sharpley, A.N., 2003. Effect of broadcast manure on runoff phosphorus
concentrations over successive rainfall events. Journal of Environmental Quality,
32(3), pp.1072-1081.
Levine, A.D., Tchobanoglous, G. and Asano, T., 1991. Size distributions of particulate
contaminants in wastewater and their impact on treatability. Water Research, 25(8),
pp.911-922.

49
Masse, L., Masse, D.I., Beaudette, V. and Muir, M., 2005. Size distribution and composition
of particles in raw and anaerobically digested swine manure. Transactions-American
Society of Agricultural Engineers, 48(5), p.1943.
McGechan, M.B., 2002. SW—soil and water: transport of particulate and colloid-sorbed
contaminants through soil, part 2: trapping processes and soil pore geometry.
Biosystems Engineering, 83(4), pp.387-395.
McGechan, M.B. and Lewis, D.R., 2002. SW—Soil and water: Transport of particulate and
colloid-sorbed contaminants through soil, Part 1: General Principles. Biosystems
Engineering, 83(3), pp.255-273.
Meyer, D., Ristow, P.L. and Lie, M., 2007. Particle size and nutrient distribution in fresh
dairy manure. Applied Engineering in Agriculture, 23(1), p.113.
Mulvaney, R.L., 1996. Nitrogen—inorganic forms. Methods of soil analysis part 3—
Chemical methods, Methods of Soil Analysis Volume 3), pp.1123-1184. SSSA,
Madison, WI.
Murphy, J., and J.P. Riley. 1962. A modified single solution method for determination of
phosphate in natural waters. Analytica Chimica Acta 27:31–36.
Møller, H.B., Lund, I. and Sommer, S.G., 2000. Solid–liquid separation of livestock slurry:
efficiency and cost. Bioresource Technology, 74(3), pp.223-229.
Møller, H.B., Sommer, S.G. and Ahring, B.K., 2002. Separation efficiency and particle size
distribution in relation to manure type and storage conditions. Bioresource
Technology, 85(2), pp.189-196.
Ndegwa, P.M., Hristov, A.N., Arogo, J. and Sheffield, R.E., 2008. A review of ammonia
emission mitigation techniques for concentrated animal feeding operations.
Biosystems Engineering, 100(4), pp.453-469.
Peters, K., Hjorth, M., Jensen, L.S. and Magid, J., 2011. Carbon, nitrogen, and phosphorus
distribution in particle size–fractionated separated pig and cattle slurry. Journal of
Environmental Quality, 40(1), pp.224-232.
Petersen, S.O., Andersen, A.J. and Eriksen, J., 2012. Effects of cattle slurry acidification on
ammonia and methane evolution during storage. Journal of Environmental Quality,
41(1), pp.88-94.

50
Roberts, J. and Israel, D.W., 2017. Influence of Soil Properties and Manure Sources on
Phosphorus in Runoff during Simulated Rainfall. Communications in Soil Science
and Plant Analysis, 48(2), pp.222-235.
Roboredo, M., Fangueiro, D., Lage, S. and Coutinho, J., 2012. Phosphorus dynamics in soils
amended with acidified pig slurry and derived solid fraction. Geoderma, 189, pp.328-
333.
Rowland, A.P. and Haygarth, P.M., 1997. Determination of total dissolved phosphorus in
soil solutions. Journal of Environmental Quality, 26(2), pp.410-415.
Sommer, S.G., Hjorth, M., Leahy, J.J., Zhu, K., Christel, W. and Sørensen, C.G., 2015. Pig
slurry characteristics, nutrient balance and biogas production as affected by
separation and acidification. The Journal of Agricultural Science, 153(01), pp.177-
191.
Vandré, R. and Clemens, J., 1996. Studies on the relationship between slurry pH,
volatilization processes and the influence of acidifying additives. Nutrient Cycling in
Agroecosystems, 47(2), pp.157-165.

51
4 Anaerobic digestion alters the forms and distribution
of N and P in cattle slurry
4.1 Abstract
Non-digested, non-inoculated and inoculated anaerobically digested cattle slurry
were separated into different particle size fractions, and measurements of dry matter (DM),
volatile solid (VS), carbon (C), NH4+-N, water extractable P, total N (TN) and total P (TP)
followed. P speciation was conducted by sequential fractionation. Results showed that
particles >63 µm dominated the DM, VS and C contents in the non-digested slurry. In
contrast, the majority of the NH4+-N, water extractable P, TN and TP was in the <63 µm
particle fraction. Anaerobic digestion increased NH4+-N, water extractable P and labile
inorganic P contents, especially in the <63 µm fractions. These increases were not affected
by the presence of an inoculum. 60% of the OP-NaHCO3 content in the cattle slurry
degraded during anaerobic digestion. After mechanical separation, the solid fraction
contained more moderately labile P and recalcitrant P, while the liquid fraction had more
labile inorganic P. Anaerobic digestion lowered the separation efficiency of DM, VS, water
extractable P, labile inorganic P, and TN. Results show that anaerobic digestion increases the
bioavailability of both N and P, particularly in the smaller particle size fraction with
implications for both plant uptake and potential increased losses to the environment.

52
4.2 Introduction
Anaerobic digestion is a green energy production technology of importance,
producing biogas for heat and power generation, and reducing odour and pathogens in
livestock slurry (Smet et al., 1999; Sahlström, 2003; Clemens et al., 2006). Anaerobic
digestion is conservative in terms of slurry nutrients, unless N is lost as ammonia from
digestate stores, and hence can be applied as a source of nutrients for crop/grass production
(Walsh et al., 2012). Although the process of anaerobic digestion has been utilised and
studied for several decades (Yenigün & Demirel, 2013), information on the effects of
anaerobic digestion on nutrient forms and distribution is largely lacking.
The particle size composition and chemical form of N and P in livestock slurry may
be influenced by the anaerobic digestion process. During mechanical separation, particles
above a certain size will be retained in the solid fraction while some smaller particles may
end up in the liquid fraction (Hjorth et al., 2010). It has been reported that N and P are more
difficult to recover in the solid fraction by some separation techniques (Hjorth et al., 2010).
For example, the pore size of pressurized filtration ranges from 700-3200 µm, and the
separation efficiency of dry matter (DM) is 13%-64%, while the separation efficiency of
total N and total P is only 4%-13% and 7%-46% respectively (Hjorth et al., 2010).
Mineralisation during anaerobic digestion reduces the DM and volatile solid (VS)
contents (Marcato et al., 2008). The total N (TN) content is conserved during the anaerobic
process itself (Masse et al., 2005; Marcato et al., 2008). However, studies have showed the
NH3-N/TN ratio increased from 0.74 in non-digested manure to 0.85 in anaerobically
digested manure, mostly due to the mineralization of organic N during anaerobic treatment
(Masse et al., 2005.). The organic P fraction can also mineralize by anaerobic digestion
(Hjorth et al., 2009). Small particle sizes have a greater surface area/volume ratio than large
particles, and are more susceptible to bacterial colonisation and reaction (Hills and Nakano,
1984; Levine et al., 1991; Magid et al., 2010). Thus, the smaller slurry particulate organic
matter is expected to degrade to a greater extent during anaerobic digestion (Marcato et al.,
2008). Shon and Vigeswaran (2006) found the proportion of small slurry particles (i.e. <1
µm) was reduced via degradation during anaerobic digestion. On the other hand, bacterial
flocs and filaments containing immobilised N and P are formed (Marcato et al., 2008). Some
studies also suggest that large slurry particles break apart and reduce in size during anaerobic
digestion (Masse et al., 2005). Hjorth et al. (2010) concluded that anaerobic digesters which

53
are stirred and held at high temperatures facilitate the microbial degradation of large
particles in comparison to smaller particles. In contrast, in digesters containing cold unstirred
slurry, the microbial community primarily degrades the small particles. The mineralised N
and P tends to be more soluble, resulting in a high nutrient content in the smaller particles or
separated liquid fractions. In contrast, the formation of struvite and Ca-P and other
precipitates (Marcato et al. 2008; Güngör & Karthikeyan, 2008; Rico et al. 2012) increases
the P level in solid fractions.
Sequential fractionation is a practical approach to quantifying P speciation in
livestock slurry. It was originally developed for soil samples, and has subsequently been
modified and used in manure studies (Leinweber et al., 1997; Dou et al., 2000; He et al.,
2006; Pagliari & Laboski, 2012). Briefly, P forms are sequentially extracted by increasingly
stronger extractants, i.e. water, bicarbonate, hydroxide and acid, providing information on
readily available P forms through to recalcitrant residual P (He et al., 2006). P extracted by
these reagents in livestock manure is interpreted sequentially as: water-soluble; physically
adsorbed on crystalline surfaces; associated with the surface of Ca carbonates, Al and Fe
oxides; and mineral or amorphous phases of Ca-P (He et al., 2006).
Therefore, this study aimed to determine changes in particle size during the anaerobic
digestion of cattle slurry, and the N and P speciation associated with these different slurry
particle size fractions. We hypothesized:(1) DM and C distribution would be altered by
anaerobic digestion and the proportion of coarse particles would be less in the anaerobically
digested slurry; (2) bioavailability of N and P in livestock slurry, especially in small particle
size fractions, would be increased by anaerobic digestion; and (3) anaerobic digestion would
reduce the mechanical separation efficiency of the DM, C, N, and P contents.
4.3 Materials and Methods
4.3.1 Sample Collection
Three cattle slurry samples of 10 L were collected from a commercial beef farm in
Wales, UK. The slurry was stored in a cold room (4ºC) in closed vessels until processing
could take place. Three slurry samples of 1.5 L were anaerobically digested without
inoculum (AD), and with inoculum (AD+) under laboratory conditions. The remaining slurry
samples remained in the cold room until analysis. A digestate inoculum was collected from a
commercial anaerobic digester in Wrexham, Wales, UK, that received cattle slurry and
poultry manure. The inoculum added in the treatment of AD+ was at the rate of 30% by

54
volume. The dry matter (DM) content of the cattle slurry with and without inoculum was
both adjusted to 8% with distilled water before incubation, in order to maximise the methane
production (Sun et al., 2012). The containers were then sealed and connected to foil bags for
gas collection, and incubated at 35°C for 30 days. The containers were shaken gently for 1 h
every day and the gas in the bags was released when full. The properties of untreated and
treated cattle slurry are summarised in Table 4.1.
Table 4.1 Characteristics of untreated cattle slurry without (NON) and with
inoculum (NON+), anaerobic digestate without (AD) and with inoculum (AD+) (on a
fresh weight basis). Values represent means ± SEM, n = 3.
Index NON NON+ AD AD+
DM g kg-1 80.0 (±0.0) 80.0 (±0.0) 49.0 (±2.6) 48.6 (±1.7)
VS g kg -1 55.0 (±2.0) 49.3 (±2.2) 31.5 (±1.9) 30.9 (±1.0)
TC g kg -1 15.4 (±3.6) 13.2 (±2.0) 22.2 (±4.3) 27.7 (±10.6)
NH4+-N g kg -1 0.1 (±0.0) 0.6 (±0.0) 0.5 (±0.1) 0.9 (±0.1)
TN g kg -1 2.8 (±0.4) 3.5 (±0.4) 4.0 (±0.5) 4.3 (±0.5)
Water
extractable P g
kg -1
0.1 (±0.0) 0.1 (±0.0) 0.2 (±0.0) 0.3 (±0.0)
TP g kg -1 0.4 (±0.0) 0.6 (±0.0) 0.5 (±0.0) 0.5 (±0.0)
EC mS cm -1 6.4 (±0.2) - 9.7 (±0.6) 11.4 (±0.3)
pH 7.4 (±0.1) - 7.8 (±0.0) 8.6 (±0.0)
ORP mV -42.3 (±3.2) - -43.0 (±2.3) -81.3 (±2.2)
4.3.2 Particle fractionation
Non-digested cattle slurry (NON), non-inoculated digested and inoculated digested
slurry and the inoculum samples were wet-sieved sequentially and separated into fractions
of >2000, 500-2000, 63-500, and <63 μm. The original fresh weight of each fraction
(whole, >2000, 500-2000, 63-500, <63 μm) was recorded.
Subsamples of particle fractions were taken for determination of the dry matter
content (DM) and volatile solid content (VS) by drying at 105ºC and 550ºC respectively,
whilst remaining sample was air-dried and stored for further analysis. Fresh samples (4 g) of
the >2000, 500-2000, 63-500 and <63 μm fractions were also extracted with 0.5 M K2SO4
(20 ml) by shaking for 0.5 h and centrifuging at 18,500 g for 5 min. Extracts were

55
determined by colorimetric methods for NH4+-N and PO4
3--P (Mulvaney, 1996; Murphy &
Riley, 1962). The K2SO4 extracts were interpreted as water extractable P, because in a
preliminary experiment, this 0.5 M K2SO4 (1:5 w/v) extractable P showed no statistical
difference to water (1:200 w/v) extractable P (data not shown). TP was also detected by
combusting dried samples in 550°C overnight and dissolving the ash in 20% (v/v) HCl. The
values of the whole slurry were calculated by summing the values of all particle fractions.
Total carbon (C) and total nitrogen (TN) were measured for these particle size fractions
using a TruSpec® CN analyzer (Leco Corp., St Joseph, MO). Since NH4+ is the dominant
inorganic N form present in livestock slurry (Fangueiro et al., 2014), we assume the organic
N content is the difference between TN and NH4+-N.
4.3.3 P sequential fractionation
P sequential fractionation was applied to the sieved particle fractions (described
above) of the NON, AD and AD+ treatments and the inoculum. A modified protocol for
sequential extraction was used (Dou et al., 2000). 0.3 g air-dried samples were sequentially
extracted by 30 ml of distilled water, 0.5 M NaHCO3, 0.1 M NaOH, and 1 M HCl, in
triplicate. During each extraction, the mixture of sample and extractant was shaken for 16 h.
The suspension was then centrifuged at 13,600 g for 10 min. Finally, the supernatant was
filtered with Whatman 42 and residues on filters were rinsed with the next extractant into
centrifuge tubes for next extraction. Extracted inorganic P in each fraction was detected by a
colorimetric method (Murphy & Riley, 1962). TP was determined after persulfate digestion.
Finally, the undissolved residue was combusted in a muffle furnace under 550°C and then
the ash was dissolved in 20% (v/v) HCl for TP analysis. The difference between TP and IP
was defined as organic P (OP). The forms of inorganic and organic P extracted by H2O,
NaHCO3, NaOH and HCl and P in the residue include IP-H2O, IP-NaHCO3, IP-NaOH, IP-
HCl, OP-H2O, OP-NaHCO3, OP-NaOH, OP-HCl, TP-residue, in this study.
4.3.4 Calculation
The quantity of a N or P form in a particle size fraction is expressed on the basis of
one kg of fresh whole slurry, Eqn (1).
Ci= 𝐶𝐹𝑖×𝑊𝐹𝑖/1000 (1)
In the above equation, CFi = Concentration of a N or P form of the particle fraction i
on this fraction’s dry basis (g kg-1); WFi = dry weight of the particle fraction i in 1 kg of fresh

56
whole slurry (g); Ci = total amount of a N or P form of the particle fraction i in 1 kg of fresh
whole slurry (g kg-1).
The distribution of a N or P form in the whole slurry is expressed as the proportion of
a N or P form in a particle size fraction represents in the total quantity of such N or P form of
the whole slurry, Eqn (2).
Pi = 𝐶𝑖×100%/∑ 𝐶𝑖𝑛𝑖=1 (2)
In the above equation, Pi = the proportion of a N or P form of the particle fraction i in
the total quantity of such N or P form of whole slurry (%).
The P form distribution in the whole slurry is defined as the proportion (%) of the TP
of the whole slurry represented by the different P forms of the particle fractions, Eqn (3).
Pij = 𝐶𝑖𝑗×100%/∑ ∑ 𝐶𝑖𝑗𝑛𝑖=1
𝑚𝑗=1 (3)
Cij = the quantity of a P form j of the particle fraction i in 1 kg of dry whole slurry (g
kg-1); Pij =the proportion of the P form j of the particle fraction i in the TP of whole slurry
(%).
The P form distribution in separated solid or liquid fraction is defined as the
proportion (%) of the TP of separated fraction represented by each P form, Eqn (4).
PFij = 𝐶𝑖𝑗×100%/∑ 𝐶𝑖𝑗𝑚𝑗=1 (4)
In the above equation, PFij = the proportion of the P form j in the particle fraction i
(%).
All statistical analyses were performed with SPSS v22 (IBM Inc., Armonk, NY).
Comparison between the slurry of NON and AD, NON+ and AD+ was performed using
paired t-test with effects considered significant at p<0.05.
4.4 Results and Discussion
4.4.1 Particle fractionation
DM, VS, and C distribution in particle size fractions
Due to the degradation of organic matter during anaerobic digestion, the slurry DM
and VS contents were significantly reduced by ca. 40% (Table 4.1). This degradation and
reduction of the DM and VS contents is consistent with other research on pig slurry and

57
wastewater sludge (Lake et al., 1985; Hsu & Lo, 2001; Marcato et al. 2008). In contrast,
there was no significant difference in the carbon (C) content between the NON and AD, or
between the NON+ and AD+ treatments, due to the high sample variability. There was no
significant difference in the DM, VS and TC between the AD and AD+ treatments either.
According to Figure 4.1, coarse fractions >63 µm in cattle slurry (NON) dominated
the DM, VS and C contents rather than the <63 µm fraction. In the DM of the whole slurry
in the NON treatment, the >2000, 500-2000, 63-500 and <63 µm fractions accounted for
40%, 14%, 11% and 35%, respectively. In addition, they also represented 43%, 13%, 9%
and 35% of the VS of the whole NON slurry, and 49%, 13%, 15%, 23% of the C of the
whole NON slurry. The particle size distribution in cattle slurry is different to pig slurry
presented in other papers. The DM content of cattle slurry tends to be distributed more in the
coarser size fractions than pig slurry. In pig slurry, 38-41% of the DM content was in
the >500 μm fraction (Møller et al., 2000) and 27% was in the >1000 μm fraction (Fernandes
et al., 1988), which is much lower than the percentage of DM distributed in the coarse
fraction in our cattle slurry. Further, 53% of DM was in the <50 μm fraction of pig slurry in
the study of Fernandes et al. (1988) and 60% of DM was in the <10 μm fraction of pig slurry
in the study of Masse et al. (2005), which is quite high compared with the small fraction
present in our cattle slurry.
The DM and VS distribution in both NON and NON+ slurry was influenced by
anaerobic digestion. All particle size fractions degraded during anaerobic digestion, showing
a decline in DM quantity, except for the 63-500 μm fraction. Also, the degradation of coarse
particles >500 μm was larger than for smaller size particles. As a result, the proportion of the
particle size fractions of >2000 and 500-2000 µm in the DM of whole slurry reduced to 24%
and 9% in the AD treatment, respectively (Figure 4.1). While the DM proportions
represented by 63-500 and <63 µm fractions significantly increased from 11% to 17% and
from 35% to 50% respectively, when comparing the slurry of NON and AD treatments
(Figure 4.1). The same pattern was seen between the NON+ and AD+ treatments (Figure
4.1).

58
Figure 4.1 Distribution of dry matter (DM), volatile solid (VS) and carbon (C) in untreated cattle slurry without (NON) and with
inoculum (NON+), anaerobic digestate without (AD) and with inoculum (AD+). Values represent means ± SEM, n = 3.

59
The change in the VS distribution as a result of anaerobic digestion was similar to the
DM distribution. Such alteration was also seen in the distribution of C. The comparison
between NON+ and AD+ in C distribution showed the proportion of >2000 µm fractions in
the AD+ treatment was significantly lower than the NON+ treatment, while the 63-500 µm
fraction proportion in the AD+ treatment was significantly higher than the NON+ treatment,
but no difference was seen between the NON and AD treatments (Figure 4.1). Masse et al.
(2005) found particles <10 μm increased from 64% to 84% of the DM of whole pig slurry
after anaerobic digestion, which lends support to the hypothesis that the degradation rate of
coarse particles is greater than for small particles. In contrast, Møller et al. (2002) observed
the concentration of particles <1.6 µm was reduced most during anaerobic storage in slurry
stores. Generally, in anaerobic digesters under the condition of stirring and high
temperatures, microbial degradation of large particles is relatively fast compared to small
particles (Hjorth et al., 2010). In the digesters with a cold unstirred slurry, the particles
transformation primarily degrades small particles (Hjorth et al., 2010).
N distribution in particle size fractions
In the cattle slurry of the NON treatment, the majority of NH4+-N content (82%) was
in particles <63 µm as expected, since it is a soluble form. A large proportion of TN (69%)
was also in the <63 µm fraction (Figure 4.2). This is similar to other studies (Meyer et al.,
2007; Peters et al., 2011).
Mineralisation during anaerobic digestion resulted in a greater proportion of the
total N content as NH4+ in livestock slurry (Masse et al., 2005). The NH4
+-N content of both
whole NON and NON+ slurry significantly increased after anaerobic digestion. The NH4+-N
content of the AD treatment was almost 5 times greater than the content of the NON
treatment, and the AD+ treatment was about 1.5 times greater than the NON+ treatment.
This indicates that the inoculation does not necessarily accelerate the degradation of organic
N. The TN content of the whole slurry was not affected by the anaerobic digestion process,
which agrees with Masse et al. (2005).
The NH4+-N quantity in >2000, 63-500 and <63 µm fractions of NON increased after
anaerobic digestion (Figure 4.2), contributing to the significant increase of the NH4+-N
quantity of the whole slurry. In addition, the increase in the quantity of NH4+-N in the <63
µm fraction was ca. 10 times greater than the other two fractions (Figure 4.2). The NH4+-N
quantity in the NON+ treatment was affected by anaerobic digestion to a similar extent.

60
Therefore, the particle size fraction of <63 µm dominated the NH4+-N quantity change of the
whole slurry. As for the NH4+-N distribution between particle size fractions, >2000, 500-
2000, 63-500 and <63 μm fractions accounted for 8.0%, 4.6%, 5.4% and 82% in the NON
treatment, respectively, and 2.4%, 2.4%, 6.9% and 88% in the NON+ treatment, respectively
(Figure 4.2). Anaerobic digestion did not change this distribution. In addition, the inoculum
did not influence the NH4+-N content and distribution change, since no difference was seen
between AD and AD+ treatments.
The increase in the NH4+-N content of whole slurry can be ascribed to the
mineralisation of organic matter present in the slurry. However, no statistically significant
reduction was seen in the organic N content of whole slurry after anaerobic digestion, maybe
because of the large variability. Only some changes in organic N distribution was observed.
Specifically, the proportion of the 500-2000 µm fraction was reduced, while the proportion
of the <63 µm fraction increased, in the comparison between NON and AD (p<0.05).
As for TN, the proportion of small particle fractions in the digested slurry tended to
be greater than in the non-digested slurry. The TN proportion of whole slurry represented by
the >2000 µm fraction in the AD+ treatment was significantly smaller than the NON+
treatment, while the proportion of the <63 µm fraction in the AD+ treatment was
significantly greater (Figure 4.2). The same trend was seen for the NON and AD treatments,
but was not statistically significant. The TN proportion of the 500-2000 µm fraction in the
AD slurry was significantly smaller than in the NON slurry (Figure 4.2). The increased TN
and NH4+-N quantity of the <63 μm fraction of the digested slurry may indicate a greater risk
of potential N leaching following application to the land, although the greater availability of
N in this fraction would also benefit crop growth if applied at appropriate rates and times.
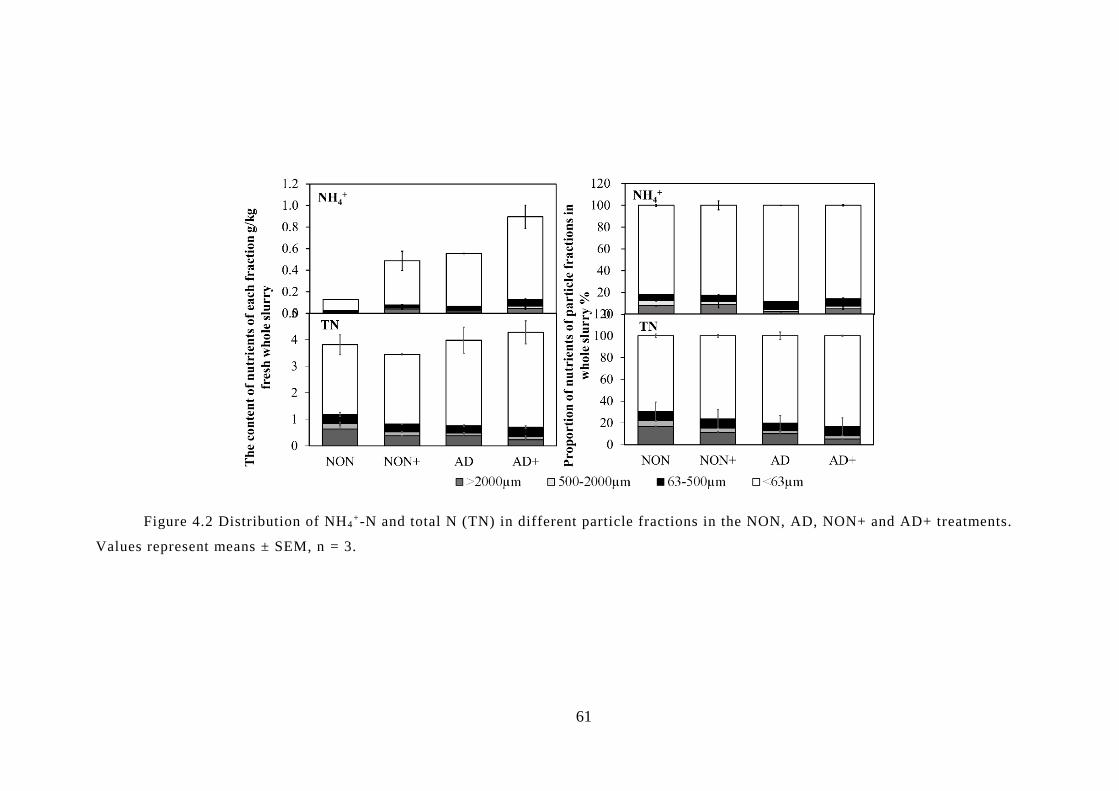
61
Figure 4.2 Distribution of NH4+-N and total N (TN) in different particle fractions in the NON, AD, NON+ and AD+ treatments.
Values represent means ± SEM, n = 3.

62
P distribution in particle size fractions
In the NON treatment, the TP content of the whole slurry was 0.4 g kg-1, of which 67%
was present in the <63 μm fraction, which is similar to other studies (Meyer et al., 2007;
Peters et al., 2011). The other particle size fractions of >2000, 500-2000 and 63-500 μm
accounted for 19%, 7% and 7% of the TP of whole cattle slurry, respectively (Figure 4.3).
During anaerobic digestion, the TP content of the whole slurry did not show any change on a
fresh weight basis, but due to the decline of the DM content from 8% to 5% during anaerobic
digestion, on a dry weight basis the TP content increased about 1.6 times. With respect to the
distribution of TP in the particle size fractions, only the TP quantity of the 500-2000 µm
fraction decreased, while the 63-500 µm fraction increased after anaerobic digestion
(p<0.05), so were the proportions represented by these two fractions (Figure 4.3). The TP
proportions of >2000, 500-2000, 63-500 and <63 µm fractions changed to 19%, 5%, 10%,
66% after anaerobic digestion (Figure 4.3), respectively. Comparison between NON+ and
AD+ treatments showed the same trend.
The water extractable P content of the whole slurry of the NON and NON+
treatments both significantly increased on a fresh weight basis after anaerobic digestion, due
to organic matter decomposition. Water extractable P contents of the whole slurry of the AD
and AD+ treatments were over 1.6 times greater than the content of the NON and NON+
treatments, respectively. Similar to TP, the <63 µm fraction represented the largest
proportion of water extractable P in NON and NON+ treatments (both 79%) (Figure 4.3). In
the NON slurry, the water extractable P of >2000, 500-2000, and 63-500 μm fractions
accounted for 10%, 5%, and 7% of the water extractable P of whole slurry, respectively
(Figure 4.3). The water extractable P quantity of the 63-500 and <63 µm fractions of the
NON slurry increased by 0.008 g kg-1 and 0.075 g kg-1 of fresh whole slurry respectively,
while the 500-2000 µm fraction decreased by 0.002 g kg-1, resulting in the increase of water
extractable P content of the whole slurry after anaerobic digestion (Figure 4.3). Therefore,
the increase in the <63 µm fraction dominated the change of the water extractable P. In
addition, after anaerobic digestion the water extractable P in the <63 µm fraction increased
to 83% of the AD slurry. The trend was similar comparing NON+ and AD+ treatments. AD
and AD+ treatments did not have differences in terms of water extractable P content and
distribution among particle fractions.

63
Figure 4.3 Distribution of the water extractable P and total P (TP) in different particle fractions in the NON, AD, NON+ and
AD+ treatments. Values represent means ± SEM, n = 3.

64
4.4.2 P speciation and distribution in particle size fractions
The P speciation in the different particle size fractions quantified by sequential
fractionation is shown in Figure 4.4 as the percentage of the TP of the whole slurry. The
summed TP content of whole slurry, by adding up all P form fractions, were 0.42, 0.43, 0.55
and 0.52 g kg-1 for NON, AD, NON+ and AD+ treatments, respectively. Overall, they
showed no difference to the above measured TP in Table 4.1. TP-H2O, TP-NaHCO3, TP-
NaOH, TP-HCl and TP-residue forms represented 31%, 38, 10%, 10% and 11% of the TP of
the whole slurry of the NON treatment. A similar distribution was measured in the NON+
treatment. This distribution of P forms is within the range presented by Sharpley & Moyer
(2000). However, the proportion of TP-H2O is smaller than the 70% from Dou et al. (2000).
In our study, 79%, 55%, 27% and 62% of the TP-H2O, TP-NaHCO3, TP-NaOH and TP-HCl
was present as inorganic P. The IP content (sum of IP-H2O, IP-NaHCO3, IP-NaOH, IP-HCl)
increased (p<0.05) due to organic matter degradation during anaerobic digestion. The IP
content of the whole slurry of AD was 1.3 times greater than in the slurry of the NON
treatment, and the IP content of the AD+ slurry was 1.1 times greater than in the NON+
slurry. Further, after anaerobic digestion, the content of IP-H2O, TP-residue, and OP-
NaHCO3 of the whole NON slurry decreased by 71% (0.071 g kg-1), 18% (0.008 g kg-1), and
58% (0.042 g kg-1), while the content of IP-NaHCO3, IP-HCl and OP-NaOH increased by
127% (0.111 g kg-1), 67% (0.017 g kg-1) and 35% (0.011 g kg-1). Similarly, comparing the
slurry of NON+ and AD+, the content of IP-H2O, IP-NaOH, TP-residue, and OP-NaHCO3
decreased, and the content of IP-NaHCO3 increased significantly.

65
Figure 4.4 Distribution of P forms in each particle size fraction in the NON, AD, NON+ and AD+ treatments. Values represent
means ± SEM, n = 3.

66
All particle size fractions contributed to the increase in the IP-NaHCO3 content and
the decrease in the IP-H2O content of the whole NON slurry during anaerobic digestion.
Further, the decrease in the OP-NaHCO3 content of whole NON slurry caused by anaerobic
digestion was associated with all particle size fractions, except for the >2000 μm fraction.
The increase of the IP-HCl and OP-NaOH contents of the whole NON slurry resulted from
the increase in the 63-500 and <63 μm fractions. As for the TP-residue content, only the 500-
2000 μm fraction showed a statistically significant decrease, although the >2000 μm fraction
had decreased markedly. Similar changes in the IP-NaHCO3 and OP-NaHCO3 content were
also seen in the NON+ treatment. The decrease of the IP-H2O content of NON+ after
anaerobic digestion was only associated with 500-2000 and <63 μm particles. Less TP-
residue quantity was found in the >2000, 500-2000 and <63 μm fractions, and less IP-NaOH
quantity was measured in the 500-2000 and 63-500 μm fractions in the AD+ slurry than the
NON+ slurry.
The <63 μm particles contributed the largest quantity of P in every form of whole
slurry in NON and NON+ treatments (Figure 4.4), and dominated the change of each P form
content of whole slurry during anaerobic digestion. During anaerobic digestion, over 60% of
the change in the content of almost every P form was associated with the <63 µm fraction.
For example, ca. 66% and 72% of the decrease of IP-H2O and OP-NaHCO3 of the whole
NON slurry, 82% and 64% of the increase of IP-HCl and OP-NaOH content of the whole
NON slurry (respectively) was associated with the <63 μm fraction.
Water-extractable P content of fresh manure is reported to be well correlated with P
runoff, and has been suggested as a good indicator of potential P runoff (Kleinman et al.,
2002). However, the IP-H2O quantified by sequential fractionation in this section showed
differences to the water extractable P measured (section 4.4.1.3). This may be because of the
differences in methods used, e.g. the extraction time for sequential fractionation (16 h) was
much longer than the 0.5 M K2SO4 extraction (0.5 h), which is supposed to extract more P in
the solution. The water extractable P quantities were significantly smaller than the IP-H2O
quantities in the >2000 and 500-2000 µm fractions of the NON and NON+ treatments.
However, the water extractable P of whole slurry of the AD and AD+ were all significantly
greater than the IP-H2O content. Also, the water extractable P quantities were greater than
the IP-H2O quantity in the <63 µm fractions of the NON and NON+ treatments and 63-500
and <63 µm fractions of the AD and AD+ treatments. This may be because the extraction of
sequential fractionation was conducted on air-dried samples, while the 0.5 M K2SO4
67
extraction used fresh samples. During air drying, under alkaline condition, water soluble P
may be adsorbed onto the surface of particles, contributing to the IP-NaHCO3 form.
Especially in the <63 µm fraction, where the water content was quite high, and digested
slurry contained higher pH, which may be two factors resulting in greater alteration.
However, the water extractable P had a good linear relationship with the sum of IP-H2O and
IP-NaHCO3 (n = 60) (R2 = 0.92). The influence of anaerobic digestion on the water
extractable P and the sum of IP-H2O and IP-NaHCO3 showed the same pattern. The sum of
IP-H2O and IP-NaHCO3 represented the labile inorganic P form, provided a better indicator
of bioavailability and lability of P, and may be a better indicator of potential P runoff.
The labile P (sum of TP-H2O and TP-NaHCO3) was mainly present as inorganic P
(65% and 71% in the NON and NON+ treatments, respectively), representing high
bioavailability. While in the moderate labile P group (TP-NaOH), organic P was dominant
(73%). 62% of occluded P (TP-HCl) was present as inorganic P. Cattle as a ruminant animal
is better at utilising phytate, so the OP-HCl content, which is mainly composed of phytate
(Baxter et al., 2003; He et al., 2004), represented a minor portion of the total. The labile
inorganic P content, significantly increased after anaerobic digestion, implying an improved
bioavailability of P in digestates, and a higher potential P runoff if applied to the land.
Crystal formation of struvite and Ca-P during anaerobic digestion (Güngör et al.,
2007; Marcato et al., 2008), which is composed of the IP-HCl, occurred mainly in particles
<500 μm. OP-NaHCO3 is reported to be a hardly hydrolysable source (Hayes et al., 2000; He
& Honeycutt, 2001). It is the largest proportion in organic P (Figure 4.4). The considerable
reduction of 60% of the OP-NaHCO3 content during anaerobic digestion was mainly
transferred to inorganic P by microbial breakdown. This could be a positive effect in terms
of crop availability. There may also be a slight transformation of OP-NaHCO3 to OP-NaOH
according to the minor increase in OP-NaOH in comparison between NON and AD
treatments (p<0.05). In addition, smaller particles are more likely to leach through soil
(McGechan, 2002). In addition, more IP proportion was seen in the <63 μm fraction of
digested slurry. Thus, this may indicate higher IP leaching risk from digestate amended soil.
The addition of a microbial inoculant is expected to accelerate and improve organic
matter degradation during the digestion process. In comparing the AD and AD+ treatments,
the labile inorganic P, IP and TP contents of the whole slurry were significantly greater in
AD+ treatment compared to the AD treatment. However, the comparison between the ratios

68
of AD/NON and AD+/NON+ (representing the increase extent) in the labile inorganic P and
IP contents of whole slurry showed a contrasting result (p<0.05). Again, this ratio of the
particle size fractions did not display any difference between non-inoculated and inoculated
treatments, except in the 63-500 µm fraction that the AD/NON ratio of the IP quantity was
higher than the AD+/NON+ ratio. This implies that the inoculation does not necessarily
accelerate the transformation of organic P to inorganic P.
4.4.3 Separation efficiency
Slurry particle size distribution is an important factor for recovering the solid and
liquid fractions by mechanical separation technology. Generally, filtration retains particles
above a certain size (Hjorth et al., 2010). For example, the filter pore size for drainage
technologies is ca. 100-3000 µm, and filter pore size of pressurized filtration is ca. 700-3200
µm (Hjorth et al., 2010). The separation efficiency of filter pore size of 2000, 500 and 63
µm of our study is listed in Table 4.2. Separation methods simply based on filtration could
relatively efficiently retrieve DM, VS and C. Pore size of 500 µm could separate out about
half of the DM (Table 4.2). However, for N and P, the separation efficiency was quite low.
Even the smallest size of 63 µm only obtained ca. 30% of TN and TP in the solid product
(Table 4.2). Therefore, to improve the N and P recovery rates, other treatments, e.g.
chemical additions (flocculants) and centrifuges would be needed, singly or in combination
as shown in other studies (Hjorth et al., 2008; Hjorth et al., 2010; Karunanithi et al., 2015).
Anaerobic digestion degraded large size particles more than small size particles, and
more nutrients tended to concentrate in the small size fractions. As a result, using the same
pore sizes of filters, the separation efficiency of DM, VS and water extractable P of the AD
slurry was significantly lower than the NON slurry (Table 4.2). Besides, the separation
efficiency of C and TN of the AD+ treatment was also lower than the NON+ treatment
(Table 4.2).
The solid and liquid products showed different P form distribution (Table 4.3).
Generally, solid products for both non-digested and digested treatments always contained
higher proportion of IP-H2O, IP-NaOH, OP-NaOH and TP-residue than liquid products,
while IP-NaHCO3 represented larger proportion in the liquid products than the solid
products. The labile inorganic P tended to be more in liquid portion of non-digested slurry
than in the solid product, although not statistically significant. If applied on the same total P

69
basis, the solid fraction may provide more moderately labile P and recalcitrant P, while the
liquid fraction has more labile inorganic P.
Table 4.2 Separation efficiency of DM, VS, C, NH 4+-N, TN, water extractable P
and TP by different filter pore sizes separating solid fractions (%). Values represent
means, n = 3.
Filter pore
size µm 2000 500 63
2000 500 63
DM NON 40.0 53.9 65.0 NON+ 34.5 47.3 59.2
AD 24.4* 33.1* 49.8* AD+ 14.6* 23.5* 42.6*
VS NON 43.2 56.0 64.8 NON+ 36.9 48.9 58.8
AD 28.2* 36.2* 49.9* AD+ 16.7* 25.7* 42.5*
C NON 48.8 61.8 77.3 NON+ 40.5 53.3 70.4
AD 40.9 53.1 76.2 AD+ 24.9* 39.3* 71.6
NH4+-N
NON 7.9 12.5 17.9 NON+ 2.35 4.71 11.59
AD 8.95 11.88 17.32 AD+ 5.0 7.41 14.27
TN NON 16.5 21.9 30.5 NON+ 11.1 15.3 23.8
AD 10.1 12.8* 19.8 AD+ 5.3* 8.2* 16.4*
Water
extractable
P
NON 10.3 15.5 22.2 NON+ 8.0 12.7 21.4
AD 7.4 9.5* 17.4* AD+ 4.4* 7.0* 17.4
TP NON 18.6 26.0 33.1 NON+ 13.0 19.6 33.8
AD 18.5 23.6 33.6 AD+ 9.8* 16.0 32.9
Note: * indicates the differences between the NON and AD treatments, or
between the NON+ and AD+ treatments are statistically significant (p<0.05).
In the digested slurry, IP-NaHCO3 and OP-NaOH represented a larger proportion of
the TP of both liquid and solid products than the non-digested slurry, while IP-H2O and TP-
residue accounted for a lesser proportion (Table 4.2). Further, the proportion of the labile
inorganic P was also greater in the liquid and solid products from digested slurry, indicating
better agronomic benefit than undigested slurry. In contrast to the non-digested slurry, in the
digested treatments, no difference in the labile inorganic P proportion was seen between the
solid and liquid products. Thus, if applied to land on a TP basis, the solid and liquid products
from digested slurry would provide similar amount of bioavailable P to plants.

70
Table 4.3 The P form distribution in the separated solid and liquid products by
different filter pore sizes (%). Values represent means, n = 3.
Particle size
µm >2000 <2000 >500 <500 >63 <63
IP-H2O NON 30.1 22.7 29.9 23.8 29.3 23.9
AD 12.1* 5.7* 12.6* 6.5* 11.9* 6.4*
IP-NaHCO3 NON 10.4 23.7 10.7 21.7 12.0 21.4
AD 34.7* 48.9* 35.1* 46.8* 36.8* 47.0*
IP-NaOH NON 3.1 2.7 3.2 2.7 3.2 2.7
AD 3.6 2.2 3.5 2.4 3.3 2.4
IP-HCl NON 5.5 6.3 5.6 6.1 6.0 6.0
AD 6.7 10.6* 7.0 10.0* 7.6 10.0*
OP-H2O NON 5.4 6.8 5.0 6.8 5.4 6.6
AD 6.0 5.6 6.0 5.6 6.0 5.6
OP-NaHCO3 NON 18.9 16.9 18.9 17.2 18.5 17.3
AD 12.8 5.5* 11.6* 6.8* 10.1* 6.9*
OP-NaOH NON 9.4 6.9 9.2 7.3 8.9 7.3
AD 11.1* 9.3* 11.3* 9.6* 11.0* 9.6*
OP-HCl NON 4.2 3.7 4.2 3.8 3.8 4.0
AD 3.3 3.8 3.3 3.8 4.1 3.5
TP-residue NON 12.9 10.3 13.2 10.6 13.1 10.7
AD 9.7* 8.3* 9.6* 8.5* 9.1* 8.6*
Particle size
µm >2000 <2000 >500 <500 >63 <63
IP-H2O NON+ 29.9 19.6 30.1 20.3 25.4 21.4
AD+ 21.5 12.0* 20.6 12.7* 18.6 12.3*
IP-NaHCO3 NON+ 11.0 25.2 11.8 23.9 19.9 21.9
AD+ 32.2* 44.9* 32.8* 44.1* 35.8* 44.5*
IP-NaOH NON+ 3.5 4.6 4.1 4.4 6.6 3.4
AD+ 4.1 2.9* 4.1 3.0* 4.0* 2.9*
IP-HCl NON+ 6.5 14.0 7.5 13.2 10.3 12.8
AD+ 8.8 13.0 9.5 12.6 11.6 12.3

71
OP-H2O NON+ 5.3 6.0 4.8 6.1 4.3 6.3
AD+ 5.2 6.0 5.4 5.9 5.2 6.1
OP-NaHCO3 NON+ 17.9 10.9 16.6 11.7 12.9 12.6
AD+ 5.8* 2.4* 5.4* 2.6* 4.3* 2.6*
OP-NaOH NON+ 9.3 6.7 9.0 7.0 7.9 7.2
AD+ 10.7 7.6 10.5 7.8 9.2 8.0
OP-HCl NON+ 4.1 4.3 4.0 4.3 3.2 4.7
AD+ 2.6 4.1 2.8 4.0 3.5 3.9
TP-residue NON+ 12.4 8.8 12.1 9.1 9.6 9.9
AD+ 9.1* 7.1* 8.9* 7.3* 7.9* 7.4*
Note: * indicates the differences between the NON and AD treatments, or
between the NON+ and AD+ treatments are statistically significant ( p<0.05).
4.5 Conclusions
Particles >63 µm dominated the DM, VS and C contents in non-digested cattle slurry,
while the majority of N and P was present in particles <63 µm. Anaerobic digestion
increased NH4+-N, water extractable P and labile inorganic P contents, especially in the <63
µm fractions. The inoculation did not necessarily accelerate the degradation of organic N
and P. After mechanical separation, the solid fraction tended to have more moderately labile
and recalcitrant P, while the liquid fraction has more labile IP. Anaerobic digestion lowered
the separation efficiency of DM, VS, water extractable P, labile inorganic P, and TN.
4.6 References
Baxter, C.A., Joern, B.C., Ragland, D., Sands, J.S. and Adeola, O., 2003. Phytase, high-
available-phosphorus corn, and storage effects on phosphorus levels in pig excreta.
Journal of Environmental Quality, 32(4), pp.1481-1489.
Clemens, J., Trimborn, M., Weiland, P. and Amon, B., 2006. Mitigation of greenhouse gas
emissions by anaerobic digestion of cattle slurry. Agriculture, Ecosystems &
Environment, 112(2), pp.171-177.
Dou, Z., Toth, J.D., Galligan, D.T., Ramberg, C.F. and Ferguson, J.D., 2000. Laboratory
procedures for characterizing manure phosphorus. Journal of Environmental Quality,
29(2), pp.508-514.

72
Fangueiro, D., Coutinho, J., Borges, L., Cabral, F. and Vasconcelos, E., 2014. Nitrogen and
carbon availability of liquid and solid fractions of pig slurry obtained using different
separation technologies. Biology and Fertility of Soils, 50(2), pp.333-341.
Fernandes, L., McKyes, E. and Obidniak, L., 1988. Performance of a continuous belt
microscreening unit for solid liquid separation of swine waste. Canadian Agricultural
Engineering, 30(1), pp.151-155.
Güngör, K. and Karthikeyan, K.G., 2008. Phosphorus forms and extractability in dairy
manure: a case study for Wisconsin on-farm anaerobic digesters. Bioresource
Technology, 99(2), pp.425-436.
Güngör, K., Jürgensen, A. and Karthikeyan, K.G., 2007. Determination of phosphorus
speciation in dairy manure using XRD and XANES spectroscopy. Journal of
Environmental Quality, 36(6), pp.1856-1863.
Hayes, J.E., Richardson, A.E. and Simpson, R.J., 2000. Components of organic phosphorus
in soil extracts that are hydrolysed by phytase and acid phosphatase. Biology and
Fertility of Soils, 32(4), pp.279-286.
He, Z., Griffin, T.S. and Honeycutt, C.W., 2004. Evaluation of soil phosphorus
transformations by sequential fractionation and phosphatase hydrolysis. Soil Science,
169(7), pp.515-527.
He, Z. and Honeycutt, C.W., 2001. Enzymatic characterization of organic phosphorus in
animal manure. Journal of Environmental Quality, 30(5), pp.1685-1692.
He, Z., Senwo, Z.N., Mankolo, R.N. and Honeycutt, C.W., 2006. Phosphorus fractions in
poultry litter characterized by sequential fractionation coupled with phosphatase
hydrolysis. Journal of Food Agriculture and Environment, 4(1), p.304.
Hills, D.J. and Nakano, K., 1984. Effects of particle size on anaerobic digestion of tomato
solid wastes. Agricultural Wastes, 10(4), pp.285-295.
Hjorth, M., Christensen, M.L. and Christensen, P.V., 2008. Flocculation, coagulation, and
precipitation of manure affecting three separation techniques. Bioresource
Technology, 99(18), pp.8598-8604.

73
Hjorth, M., Christensen, K.V., Christensen, M.L. and Sommer, S.G., 2010. Solid–liquid
separation of animal slurry in theory and practice. A review. Agronomy for
Sustainable Development, 30(1), pp.153-180.
Hjorth, M., Nielsen, A.M., Nyord, T., Hansen, M.N., Nissen, P. and Sommer, S.G., 2009.
Nutrient value, odour emission and energy production of manure as influenced by
anaerobic digestion and separation. Agronomy for Sustainable Development, 29(2),
pp.329-338.
Hsu, J.H. and Lo, S.L., 2001. Effect of composting on characterization and leaching of
copper, manganese, and zinc from swine manure. Environmental Pollution, 114(1),
pp.119-127.
Karunanithi, R., Szogi, A.A., Bolan, N., Naidu, R., Loganathan, P., Hunt, P.G., Vanotti,
M.B., Saint, C.P., Ok, Y.S. and Krishnamoorthy, S., 2015. Chapter Three-
Phosphorus Recovery and Reuse from Waste Streams. Advances in Agronomy, 131,
pp.173-250.
Kleinman, P.J., Sharpley, A.N., Moyer, B.G. and Elwinger, G.F., 2002. Effect of mineral
and manure phosphorus sources on runoff phosphorus. Journal of Environmental
Quality, 31(6), pp.2026-2033.
Lake, D.L. and Lester, J.N., 1985. The effects of anaerobic digestion on heavy metal
distribution in sewage sludge. Water Pollution Control, 84(4), pp.549-559.
Leinweber, P., Haumaier, L. and Zech, W., 1997. Sequential extractions and 31P-NMR
spectroscopy of phosphorus forms in animal manures, whole soils and particle-size
separates from a densely populated livestock area in northwest Germany. Biology
and Fertility of Soils, 25(1), pp.89-94.
Levine, A.D., Tchobanoglous, G. and Asano, T., 1991. Size distributions of particulate
contaminants in wastewater and their impact on treatability. Water Research, 25(8),
pp.911-922.
Marcato, C.E., Pinelli, E., Pouech, P., Winterton, P. and Guiresse, M., 2008. Particle size
and metal distributions in anaerobically digested pig slurry. Bioresource Technology,
99(7), pp.2340-2348.

74
Magid, J., De Nowina, K.R., Lindedam, J. and Andren, O., 2010. Organic matter in size‐
density fractions after 16–50 years of grass ley, cereal cropping and organic
amendments. European Journal of Soil Science, 61(4), pp.539-550.
Masse, L., Masse, D.I., Beaudette, V. and Muir, M., 2005. Size distribution and composition
of particles in raw and anaerobically digested swine manure. Transactions-American
Society of Agricultural Engineers, 48(5), p.1943.
McGechan, M.B., 2002. SW—soil and water: transport of particulate and colloid-sorbed
contaminants through soil, part 2: trapping processes and soil pore geometry.
Biosystems Engineering, 83(4), pp.387-395.
Meyer, D., Ristow, P.L. and Lie, M., 2007. Particle size and nutrient distribution in fresh
dairy manure. Applied Engineering in Agriculture, 23(1), p.113.
Mulvaney, R.L., 1996. Nitrogen—inorganic forms. Methods of soil analysis part 3—
Chemical methods, Methods of Soil Analysis Volume 3), pp.1123-1184. SSSA,
Madison, WI.
Murphy, J., and J.P. Riley. 1962. A modified single solution method for determination of
phosphate in natural waters. Analytica Chimica Acta, 27:31–36.
Møller, H.B., Lund, I. and Sommer, S.G., 2000. Solid–liquid separation of livestock slurry:
efficiency and cost. Bioresource Technology, 74(3), pp.223-229.
Møller, H.B., Sommer, S.G. and Ahring, B.K., 2002. Separation efficiency and particle size
distribution in relation to manure type and storage conditions. Bioresource
Technology, 85(2), pp.189-196.
Pagliari, P.H. and Laboski, C.A., 2012. Investigation of the inorganic and organic
phosphorus forms in animal manure. Journal of Environmental Quality, 41(3),
pp.901-910.
Peters, K., Hjorth, M., Jensen, L.S. and Magid, J., 2011. Carbon, nitrogen, and phosphorus
distribution in particle size–fractionated separated pig and cattle slurry. Journal of
Environmental Quality, 40(1), pp.224-232.

75
Rico, C., Rico, J.L. and Lasa, C., 2012. Anaerobic digestion of the liquid fraction of dairy
manure separated by screw pressing and centrifugation in a upflow anaerobic sludge
blanket reactor at 25° C. Biosystems Engineering, 112(4), pp.344-351.
Sahlström, L., 2003. A review of survival of pathogenic bacteria in organic waste used in
biogas plants. Bioresource Technology, 87(2), pp.161-166.
Sharpley, A. and Moyer, B., 2000. Phosphorus forms in manure and compost and their
release during simulated rainfall. Journal of Environmental Quality, 29(5), pp.1462-
1469.
Shon, H.K., Vigneswaran, S. and Snyder, S.A., 2006. Effluent organic matter (EfOM) in
wastewater: constituents, effects, and treatment. Critical Reviews in Environmental
Science and Technology, 36(4), pp.327-374.
Smet, E., Van Langenhove, H. and De Bo, I., 1999. The emission of volatile compounds
during the aerobic and the combined anaerobic/aerobic composting of biowaste.
Atmospheric Environment, 33(8), pp.1295-1303.
Sun Y., Fu B., Liu Q., Yan L., Wang W., and Wang Y., 2012. Optimization of cattle manure
hydrolysis and acidification for methane production. Chinese Journal of Eco-
Agriculture, 20(9), p.1222-1229.
Walsh, J.J., Jones, D.L., Edwards‐Jones, G. and Williams, A.P., 2012. Replacing inorganic
fertilizer with anaerobic digestate may maintain agricultural productivity at less
environmental cost. Journal of Plant Nutrition and Soil Science, 175(6), pp.840-845.
Yenigün, O. and Demirel, B., 2013. Ammonia inhibition in anaerobic digestion: a review.
Process Biochemistry, 48(5), pp.901-911.

76
5 Phosphorus and nitrogen distribution in colloids and
nanoparticles of untreated, acidified and anaerobically
digested cattle slurry
5.1 Abstract
Livestock slurry applications supply colloids and nanoparticles to soil, which are
important carriers of phosphorus (P) and other nutrients that can be transported through and
over the soil to watercourses. However, advanced slurry processing, such as acidification
and anaerobic digestion could alter the proportions of different slurry particles (including
nanoparticles) as well as the P forms associated with these smaller slurry particle sizes. In
this study, we separated colloidal and nanoparticulate fractions from the liquid fraction (<63
m) of untreated, acidified and anaerobically digested cattle slurry using vacuum filtration
(through a 0.45 µm filter) and ultrafiltration (through 0.03 µm (100 kDa) and 0.001 µm (3
kDa) filters). Phosphorus forms that passed through a 0.45 µm filter were operationally
defined as dissolved. Thus, in this study, the 0.45-63 µm particles were categorised as the
colloidal fraction, and the <0.45 µm fraction was the dissolved fraction. Nanoparticles were
therefore within the dissolved fraction. The quantity of total carbon (TC), total nitrogen (TN)
and total P (TP) were analysed in the colloidal and nanoparticulate fractions, and P
sequential fractionation was applied to the colloidal fraction only. Results showed that the
colloidal fraction of the untreated liquid cattle slurry accounted for >80% of the dry matter,
TC, and TP contents, and all P forms contents, while >90% of NH4+ and TN was in the
dissolved fraction. Nanoparticles of the untreated cattle slurry existed in the 0.03-0.45 µm
range and contained only a small amount of P. Acidification increased NH4+, organic N and
TN quantity of the liquid cattle slurry, which was mainly associated with the colloidal
fraction. While anaerobic digestion increased the NH4+ quantity of the dissolved fraction and
the organic N quantity of the colloidal fraction. There was a smaller quantity of P associated
with nanoparticles after anaerobic digestion, while there was almost no P associated with
nanoparticles after acidification. Whilst the TP content of the colloidal fraction was not
influenced by acidification and anaerobic digestion, acidification did reduce the quantity of
IP-H2O, IP-NaHCO3, IP-NaOH, IP-HCl, TP-residue and OP-NaHCO3 forms of the colloidal
fraction significantly. Anaerobic digestion decreased the quantity of IP-H2O, TP-residue and
OP-NaHCO3 forms of the colloidal fraction, and increased the quantity of IP-NaHCO3 and
IP-HCl forms. In summary, acidification increased inorganic and organic N content and

77
reduced the labile P content of the colloidal fraction, anaerobic digestion increased organic N
and labile P content of the colloidal fraction, with implications for crop utilisation and losses
to watercourses. The nanoparticulate fractions of untreated and treated slurry may have little
impact on potential P leaching.
5.2 Introduction
Colloid- and nanoparticle-facilitated vertical transport is important in nutrient
movement through soils (Hens and Merckx, 2002; McGechan & Lewis, 2002; Heathwaite et
al., 2005). Makris et al. (2006) isolated colloids from long-term manured soil and added
them to silt loam columns and found that 30% of the added colloids could be recovered in
leachate from the base of the columns. de Jonge et al. (2004) and Hens & Merckx (2002)
both found nanoparticles in leachates from the soil. However, Rick & Arai (2011)
questioned the role of nanoparticle in P transport, based on the unreactive results from their
P desorption and P retention and release experiments. Moreover, recently colloidal P from
some soil has been reported to contribute to plant P uptake (Montalvo et al., 2015).
Livestock slurry as a source of particulate carriers of nutrients, its particle composition is an
important factor that influences nutrient (N and P) mobilization and even loss from the soil
after application. Moreover, decomposition of organic matter in soil tends to be accelerated
with decreasing particle size due to the higher surface area/volume ratio (Levine et al., 1991).
However, to date there have been few studies on the colloid and nanoparticle
characterization of livestock slurry. Furthermore, advanced slurry processing strategies, e.g.
acidification and anaerobic digestion, may alter not only the slurry particle size
characteristics, but also the N and P forms associated with these slurry particles.
Acidification is an approach to reduce NH3 emissions from manure management (Kai
et al., 2008), retaining N and the fertiliser value of livestock slurry (Eriksen et al., 2008;
Sutaryo et al., 2013). Indeed, the available P content of slurry also increases during
acidification (Güngör et al., 2007; Fangueiro et al., 2015). Roboredo et al. (2012) separated
untreated and acidified pig slurry by centrifugation at 1509 g for 15 min, and found the TP
distributed in the solid fraction decreased by >50% after acidification compared to untreated
slurry. Anaerobic digestion is a green energy production technique, providing biogas
generation and odour and pathogen reduction (Clemens et al., 2006; Lee & Han, 2012).
Anaerobic digestion degrades organic matter and reduces the dry matter and volatile solids
content of livestock slurry (Marcato et al., 2008), but increases NH3 or NH4+ content

78
(Angelidaki & Ahring, 1993; Masse et al., 2005). Hjorth et al. (2010) claimed microbial
degradation during anaerobic digestion proceeds faster on large particles relative to small
particles, under the condition of stirring and high temperatures. In contrast, under non-stirred
and cold conditions, the degradation is mainly associated with small particles. Masse et al.
(2005) found the NH3-N/TN ratio increased from 74% in non-digested manure to 85% in
anaerobically digested manure, and due to the increase in NH4+-N concentration, the pH
value of livestock slurry is generally found to be increased (Strik et al., 2006; Pang, 2008).
As the pH increases, the solubilisation of P is reduced and P associated with solid phases is
stabilised after anaerobic digestion (Güngör & Karthikeyan, 2008). However, more
information on the effect of acidification and anaerobic digestion on both colloidal and
nanoparticulate size characterization, and the N and P forms associated with these smaller
slurry particle size fractions is still needed.
Thus, this study aimed to improve our understanding of the colloidal (0.45-63 µm)
and nanoparticulate (0.001-0.45 µm) composition and their N and P distribution in untreated,
acidified and anaerobically digested livestock slurries. We hypothesised that: 1) colloids and
nanoparticles contain a significant proportion of the N and P content of the livestock slurry;
and 2) acidification and anaerobic digestion both increase the availability of N and P in the
separated liquid slurry fraction (<63 µm), which is primarily associated with the colloidal
fraction.
5.3 Materials and Methods
5.3.1 Sample Collection
Cattle slurry was collected from a commercial beef farm in Gwynedd, Wales, UK.
Cattle slurry samples (2 L) were taken on 3 separate occasions as three replicates, and then
treated by acidification or anaerobic digestion. Cattle slurry samples were acidified to pH 5.5
by adding ca. 35 ml 15% (v/v) H2SO4 per L of slurry. Anaerobic digestion was conducted in
the laboratory using two approaches (with three replicates of each), i) with a 30% (v/v)
inoculum (collected from a nearby commercial anaerobic digester receiving cattle slurry and
food waste feedstocks), and ii) without an inoculum. The dry matter (DM) content of the two
slurry treatments was adjusted to 8% with distilled water prior to incubation, in order to
maximise methane production (Sun et al., 2012), and then sealed in 2 L containers connected
to foil bags for gas collection, and incubated at 35°C for 30 d. The containers were shaken

79
gently for 1 h every day and the gas in the bags was released when full. The properties of
untreated and treated cattle slurry are summarised in Table 5.1.
5.3.2 Particle Fractionation
Replicate batches of untreated cattle slurry, acidified cattle slurry, the inoculum,
inoculated anaerobically digested slurry (AD+) and non-inoculated anaerobically digested
slurry (AD) were wet-sieved through a 63 μm mesh. Then the <63 μm fraction was vacuum
filtered through a 0.45 μm membrane to separate out particles of 0.45-63 μm. Colloids are
generally defined as particles between 1 μm and 1 nm in size (Kretzschmar et al., 1999).
Here we operationally defined particles of 0.45-63 μm as the colloidal fraction. The <0.45
μm regarded as the dissolved fraction (Haygarth & Sharpley, 2000), was subsequently
ultrafiltered into <0.03 and <0.001 µm fractions with 100 and 3 kDa filters (Millipore
Ultracel® 100 kDa Ultrafiltration Discs, Millipore Ultracel® 3 kDa Ultrafiltration Discs),
respectively (Turner et al., 2004). Particles of 0.001-0.45 μm were operationally defined as
nanoparticles (Henderson et al., 2012). The classification of particles and measured and
calculated characteristics are summarized in Table 5.2.
The DM content and volatile solid content (VS) of whole slurry and the liquid
fraction were determined by drying at 105ºC and 550ºC, respectively. Whole slurry and the
liquid fraction was also extracted with 0.5 M K2SO4 (1:5 w/v), shaking for 0.5 h and
centrifuging at 18,500 g for 5 min. The NH4+ and P in the extracts was determined
colorimetrically using the methods of Mulvaney (1996) and Murphy & Riley (1962),
respectively. An aliquot of the extract of the liquid slurry was also used to determine the
total organic carbon (TOC) content using a N/C 2100 analyzer (Analytik Jena, Jena,
Germany). The P extracted by 0.5 M K2SO4 was interpreted as water extractable P, because
a preliminary experiment showed this 0.5 M K2SO4 (1:5 w/v) extractable P had no statistical
difference to water (1:200 w/v) extractable P (data not shown).

80
Table 5.1 Characteristics of whole non-acidified and acidified cattle slurry, non-digested slurry without inoculum (NON) and
non-digested slurry with inoculum (NON+), anaerobic digestate without inoculum (AD) and anaerobic digestate with inoculum (AD+)
(on a fresh weight basis). Values represent means ± SEM, n = 3.
Non-acidified
cattle slurry
Acidified cattle
slurry NON NON+ AD AD+
DM g kg-1 109.1(±9.0) 144.0(±15.9) 80.0(±0.0) 80.0(±0.0) 49.0(±2.6) 48.6(±1.7)
VS g kg -1 74.5(±3.4) 78.4(±1.4) 55.0(±2.0) 49.3(±2.2) 31.5(±1.9) 30.9(±1.0)
NH4+ g kg -1 0.2(±0.01) 0.4(±0.1) 0.1(±0.0) 0.6(±0.0) 0.5(±0.1) 0.9(±0.1)
TP g kg -1 0.6(±0.03) 0.75(±0.05) 0.4(±0.0) 0.6(±0.0) 0.5(±0.0) 0.5(±0.0)
TN g kg -1 3.8 (±0.6) 4.6(±0.3) 2.8 (±0.4) 3.5(±0.4) 4.0(±0.5) 4.3(±0.5)
TC g kg -1 21.0(±4.9) 36.7(±6.5) 15.4(±3.6) 13.2(±2.0) 22.2(±4.3) 27.7(±10.6)
EC mS cm -1 6.4(±0.2) 7.0(±0.8) - - 9.66(±0.6) 11.37(±0.3)
pH 7.4(±0.1) 5.6(±0.0) - - 7.79(±0.0) 8.62(±0.0)
ORP mV -42.3(±3.2) -64.0(±1.5) - - -43.0(±2.3) -81.33(±2.2)

81
Table 5.2 Classification of particles and the measured and calculated characteristics of different particle size fractions.
Particle
size µm
Fraction
categories TN TP TC TOC DM NH4
+ Extractable
P
Sequential
fractionation
<63 Liquid
fraction Measured Measured Measured Measured Measured Measured Measured Measured
<0.45 Dissolved
fraction Measured Measured Measured Measured
Calculated
difference Measured Measured -
<0.03
Measured Measured Measured Measured - Measured Measured -
<0.001 Soluble
fraction Measured Measured Measured Measured - Measured Measured -
0.45-63 Colloidal
fraction
Calculated
difference
Calculated
difference
Calculated
difference
Calculated
difference Measured
Calculated
difference
Calculated
difference Measured
0.03-
0.45
Nanoparticl
es ANOVA ANOVA ANOVA ANOVA
-
ANOVA ANOVA
-
0.001-
0.03
Nanoparticl
es - -

82
The total P (TP) content of the whole slurry and the liquid fraction was also detected
by combusting dried samples at 550ºC overnight and dissolving the ash in 2.4 M HCl. The
total carbon (TC) and total nitrogen (TN) content of the whole slurry and the liquid fraction
were determined by TruSpec® CN analyzer (Leco Corp., St Joseph, MO). The difference
between TN and NH4+ was assumed to be organic N, since in livestock slurry the content of
NO3- is minimal. The total P content of the dissolved fraction, and the <0.03 and <0.001 µm
fractions was determined after persulfate acid digestion (1 mL slurry + 2 mL 0.9 M H2SO4 +
0.1 g ammonium persulfate, 120ºC, 5 h). The dissolved fraction, and the <0.03 and <0.001
µm fractions were also measured for NH4+, inorganic P (reactive P), TC, TN, and TOC
content. For the colloidal fraction (0.45-63 µm), due to the small quantity available, only the
DM content was measured, and the rest was kept for P sequential fractionation. The N and P
quantity of the colloidal fraction was calculated by subtracting the values in the dissolved
fraction from the liquid fraction. The water extractable P content of the colloidal fraction
was calculated by subtracting the inorganic P content of the dissolved fraction from the
water extractable P of the liquid fraction. The DM content of the dissolved fraction was the
difference between colloidal and liquid fractions. Organic P of the dissolved fraction, and the
<0.03 and <0.001 µm fractions were calculated by the difference between TP and inorganic
P.
5.3.3 P sequential fractionation
P sequential fractionation was applied to the colloidal fractions of the untreated and
treated slurry treatments and the inoculum. A modified protocol for sequential extraction
was used (Dou et al., 2000). 0.3 g air-dried samples were sequentially extracted by 30 ml of
distilled water, 0.5 M NaHCO3, 0.1 M NaOH, and 1 M HCl, in triplicate. During each
extraction, the mixture of sample and extractant was shaken for 16 h. The suspension was
then centrifuged at 13,600 g for 10 min. Finally, the supernatant was filtered with membrane
(MilliporeSigma HVLP04700 Durapore® PVDF Membrane Filter, 0.45 µm), and residues on
filters were rinsed with the next extractant into centrifuge tubes in preparation for the next
extraction. Extracted inorganic P in each fraction was detected colorimetrically (Murphy &
Riley, 1962). TP was determined after persulfate digestion (as described earlier). Finally, the
undissolved residue was combusted in a muffle furnace at 550ºC and then the ash was
dissolved in 20% HCl prior to TP analysis. The difference between TP and IP was organic P
(OP). Then P forms of inorganic and organic P extractable by H2O, NaHCO3, NaOH and

83
HCl and P in the residue represent the following forms; IP-H2O, IP-NaHCO3, IP-NaOH, IP-
HCl, OP-H2O, OP-NaHCO3, OP-NaOH, OP-HCl, TP-residue in this study.
5.3.4 Calculation
Nutrient content/quantity in a particle size fraction is expressed on the basis of one kg
of the fresh whole slurry, Eqn (1).
Mi= 𝐶𝑖×𝑊𝐹𝑖/1000 (1)
Where, Ci=Concentration of nutrient of the particle size fraction ‘i’ on fresh basis (g
kg-1); WFi= fresh weight of the particle size fraction ‘i’ in 1 kg of fresh whole slurry (g); Mi=
total nutrient amount of the particle size fraction ‘i’ in 1 kg of fresh whole slurry (g kg-1).
The nutrient distribution in the whole slurry/the liquid slurry was defined as the
proportion (%) of the total nutrient quantity of the whole slurry/the liquid slurry represented
by the nutrient quantity of the particle size fractions, Eqn (2).
Pi= 𝐶𝑖×100%/∑ 𝐶𝑖𝑛𝑖=1 (2)
Ci= total nutrient quantity of the particle size fraction ‘i’ in 1 kg of fresh whole
slurry/ liquid slurry (g kg-1); Pi=the proportion of the nutrient quantity of the particle size
fraction ‘i’ in the total nutrient quantity of whole slurry/liquid slurry (%). The values for
non-acidified slurry were the values measured for the untreated slurry. But the values for
DM adjusted non-digested slurry (NON) was calculated using values of untreated slurry and
DM adjust ratio (DM was adjusted to 8% as described above). The values for inoculated
non-digested slurry (NON+) was calculated by values of the inoculum, untreated slurry and
their mixture ratio.
All statistical analyses were performed with SPSS v22 (IBM Inc., Armonk, NY).
Comparison between the slurry of non-acidified and acidified, NON and AD, NON+ and
AD+ were analysed using paired t-tests, with effects considered significant at p<0.05.
Comparisons of nutrient content between different particle size fractions within the same
slurry were conducted by ANOVA with Tukey pairwise post-hoc testing, with effects
considered significant at p<0.05.
5.4 Results and discussion
5.4.1 Colloids in livestock slurry
Comparison between the untreated and acidified slurry

84
Separated liquid slurry (<63 µm) represented the majority of the TN and TP, and half
the DM content of whole cattle slurry (Chapter 3). In the separated liquid fraction of the non-
acidified treatment, 79% of particles were in the colloidal fraction (0.45-63 µm) (Table 5.3).
Moller et al. (2002) and Masse et al. (2005) also reported that colloidal particles of 1.6-50
μm and 0.45-10 μm represented a considerable proportion of the DM content of the whole
slurry, respectively. Correspondingly, the colloidal fraction accounted for the majority of the
TOC, TC, water extractable P, and TP content in the separated liquid slurry fraction, while
the dissolved fraction (<0.45 µm) contained the largest proportion of NH4+ and TN (Table
5.3). Masse et al. (2005) also found 50% of the TP of whole pig slurry was in the 0.45-10
μm fraction, and 20% was in the <0.45 μm fraction.
Acidification did not influence the distribution of DM and TC in the separated liquid
slurry fraction, but did result in a change in the NH4+, TN, water extractable P and TP
quantity and distribution. Slurry acidification is promoted for the mitigation of ammonia
emission (Ottosen et al., 2009; Sorensen & Eriksen, 2009; Petersen et al., 2012; Wang et al.,
2014). In our study, the NH4+ and TN contents of the separated liquid slurry fraction
increased markedly by the acid as expected (p<0.05) (Table 5.3). This increase was more
associated with the colloidal fraction rather than the dissolved fraction. The NH4+ quantity of
the colloidal fraction increased substantially by the addition of acid, by almost 18 times
(p<0.05) (Table 5.3). In contrast, the NH4+ quantity in the dissolved fraction did not change.
Only 7% of the NH4+ quantity and 3% of the TN quantity of the separated liquid slurry
fraction was in the colloidal fraction in the non-acidified treatment, while it was 53% of the
NH4+ quantity and 25% of the TN quantity in the colloidal fraction in the acidified treatment
(Table 5.3). Acidification protonated NH3 and NH4+ can become electrically absorbed on
colloidal surfaces. The TN quantity of the colloidal fraction increased by 1.02 g kg-1 fresh
whole slurry, and the increase in the NH4+ quantity of the colloidal fraction was 0.17 g kg-1
fresh whole slurry, indicating the increase in the TN quantity mainly resulted from the
increase of organic N, which may be from the break-down of coarse particles.

85
Table 5.3 The nutrient content (g kg -1 based on fresh weight of whole slurry)
and percentage of colloidal and dissolved fractions in the whole slurry and the liquid
fraction of non-acidified and acidified treatments (%). Values represent means, n = 3.
Treatme
nt
Particle size
fraction
Quantity g kg -1
Percent
age in
whole
%
Percentage in
the liquid
fraction %
Non-
acidified
Acidifi
ed
Non-
acidifie
d
Acidifi
ed
Non-
acidifi
ed
Acidifi
ed
DM
Liquid slurry 38.07 43.05
* 35.0 30.3 100 100
Colloids 30.24 31.80 27.8 22.2 79.4 73.9
Dissolved 7.84 11.25 7.2 8.1 20.6 26.1
TC
Liquid slurry 4.65 6.30 22.7 18.0 100 100
Colloids 3.84 5.28 18.3 12.1 80.6 67.1
Dissolved 0.81 1.02 4.4 5.9 19.4 32.9
TOC
Liquid slurry 22.07 21.54 - - 100 100
Colloids 20.81 19.49 - - 94.4 90.5
Dissolved 1.26 2.05 * - - 5.6 9.6
NH4+
Liquid slurry 0.14 0.34 * 82.1 80.5 100 100
Colloids 0.01 0.18 * 8.3 42.2 * 6.7 52.5 *
Dissolved 0.13 0.15 76.6 38.3 * 93.4 47.5 *
TN
Liquid slurry 3.80 4.55 * 69.5 71.1 100 100
Colloids 0.13 1.15 * 2.3 17.7 3.3 24.9 *
Dissolved 3.67 3.40 67.2 53.4 96.7 75.1 *
Water
extracta
ble P
Liquid slurry 0.14 0.27 * 77.8 78.3 100 100
Colloids 0.12 0.07 * 66.7 18.8 * 85.7 24.0 *
Dissolved 0.02 0.21 * 11.1 59.5 * 14.3 76.0 *
TP
Liquid slurry 0.39 0.52 66.9 69.5 100 100
Colloids 0.37 0.27 62.1 36.5 * 92.9 52.5 *
Dissolved 0.03 0.24 * 4.8 33.0 * 7.1 47.5 *
Note: * indicates the differences between non -acidified and acidified treatments
are statistically significant (p<0.05).

86
The water extractable P content in the separated liquid slurry fraction also increased
significantly as a result of acidification (Table 5.3). In contrast to NH4+ above, this increase
of the water extractable P content was mainly associated with the dissolved fraction, of
which the quantity of water extractable P was increased by ca. 10 times after acidification
(Table 5.3). This is in agreement with other research (Christensen et al., 2009; Hjorth et al.,
2010). In contrast, the quantity of water extractable P of the colloidal fraction decreased
(Table 5.3). Therefore, the proportion in the whole slurry occupied by the dissolved fraction
increased. The increased water extractable P resulted mainly from desorption and
solubilisation of precipitates. The acidification process was conducted on the whole slurry
before separation. The dissolution of dominant precipitates, i.e. struvite and calcium
phosphate and other occluded P, and P desorption occurs at low pH in whole slurry (Güngör
et al., 2007; Güngör & Karthikeyan, 2008). After separation, this dissolved and desorbed P
from both solid and liquid fractions entered the dissolved fraction. Hjorth et al. (2015)
suggest accelerated hydrolysis of organic matter during acidification, so this may also be a
source of the increased P content in in the dissolved fraction.
Similarly, the TP quantity of the dissolved fraction increased ca. 8 times after
acidification, while the TP quantity of the colloidal fraction did not change. Thereafter, the
proportion of TP of the dissolved fraction was increased in both the separated liquid slurry
fraction and whole slurry.
Colloid-facilitated transport is thought to be an important pathway for P leaching,
and slurry is one potential sources for organic matter colloids (McGechan & Lewis, 2002;
Siemens et al., 2004). In an unsaturated P soil, if separated liquid slurry was applied on a TP
basis, P in the soluble fraction is more likely to be bound by soil minerals, while P in the
colloidal and nanoparticulate fractions may dictate the vertical movement of P in soil. Since
the proportion of the colloidal fraction in the TP of the acidified liquid slurry was lower than
in the non-acidified liquid slurry, it should follow that potential TP leaching associated with
colloids from the liquid acidified slurry would be less than the non-acidified liquid slurry.
Likewise, the risk of inorganic P (water extractable P) leaching would also be less in the
acidified liquid treatment. On the other hand, when a separated liquid slurry fraction is
applied to cropping land on a TP basis, the available P in the soil would be increased
immediately, and acidified slurry treatment would result in greater available P to plants than
from a non-acidified slurry treatment, as other studies have reported (Roboredo et al., 2012).

87
In our study, the NH4+/TP ratio was 0.36 and 0.65 for non-acidified and acidified
separated liquid slurry fraction, respectively, thus the N benefit for crops would also be
higher in acidified slurry treatment. If applied on a TN basis, the TN/TP ratio of the acidified
separated liquid slurry fraction would be 8.7, less than the 9.7 for the non-acidified treatment.
Thus, more N and P input with a greater potential agronomic benefit would be expected from
an acidified separated liquid slurry fraction. P leaching associated with the colloidal fraction
from acidified liquid slurry would still be less than non-acidified liquid slurry. The NH4+ and
organic N proportion of the colloidal fraction in the acidified liquid slurry was greater than
in the non-acidified liquid slurry, so the colloid-facilitate N leaching would be greater in
acidified slurry treatment.
Comparison between the untreated and anaerobically digested slurry
Anaerobic digestion reduces the DM content of livestock slurry (Lake et al., 1985;
Hsu & Lo, 2001; Marcato et al., 2008; Chapter 3) and after separation the liquid slurry
fraction contained less DM. The DM of the whole slurry was reduced by 40%, while for the
separated liquid slurry fraction the reduction in DM content was only 13% (NON) or 15%
(NON+). The DM quantity of the colloidal fraction of the NON and NON+ treatments
decreased by 18% and 7% after anaerobic digestion, respectively (p<0.05). Hjorth et al.
(2010) suggested that in anaerobic digesters, stirring and high temperatures facilitate
microbial degradation of large particles, leaving relatively small particles which are more
recalcitrant. This supports our observation of the low DM reduction in the separated liquid
slurry fraction and colloidal fraction relative to whole slurry. The breakdown of large
particles may also supplement the colloid loss during anaerobic digestion. The TC quantity
of the colloidal fraction of the NON and NON+ treatments tended to decrease after
anaerobic digestion, but this was not statistically significant.

88
Table 5.4 The nutrient content (g kg -1 based on fresh weight of whole slurry) and percentage of colloidal and dissolved fractions
in the whole slurry and the liquid fraction in untreated and anaerobic digestion treatments (%). Values represent means, n = 3.
Treatment
Particle
size
fraction
Quantity g kg -1 Percentage in whole % Percentage in the liquid
fraction %
NON AD NON
+ AD+ NON AD
NON
+ AD+
NO
N AD
NO
N+ AD+
DM
Liquid
slurry 28.02 24.46 * 32.62 27.80 * 35.00 50.2 * 40.8 57.4 * 100 100 100 100
Colloids 22.28 18.30 * 22.39 20.78 * 27.80 37.4 31.9 42.9 79.4 74.8 68.6 74.8
Dissolved 5.74 6.16 10.23 7.02 7.20 12.8 8.9 14.5 * 20.6 25.2 31.4 25.3 *
TC
Liquid
slurry 3.41 2.10 3.90 2.52 22.68 23.8 29.6 28.4 100 100 100 100
Colloids 2.82 1.29 3.22 1.81 15.22 13.0 24.5 20.4 80.6 54.5 82.6 71.8
Dissolved 0.59 0.81 0.68 0.71 3.06 10.8 5.2 8.0 19.4 45.5 17.4 28.2
TOC
Liquid
slurry 16.20 21.18 16.65 15.54 - - - - 100 100 100 100
Colloids 15.27 19.90 15.53 14.35 - - - - 94.4 93.9 93.3 92.4
Dissolved 0.92 1.28 1.12 1.19 - - - - 5.6 6.1 6.7 7.6
NH4+
Liquid
slurry 0.11 0.41 0.49 0.77 82.10 82.7 88.4 85.7 100 100 100 100
Colloids 0.01 0.08 0.26 0.26 5.50 14.7 47.0 28.5 6.7 17.1 53.2 33.2
Dissolved 0.10 0.33 0.23 0.51 * 76.60 68.0 41.4 57.2 93.3 83.0 46.8 66.8

89
Treatment
Particle
size
fraction
Quantity g kg -1 Percentage in whole % Percentage in the liquid
fraction %
NON AD NON
+ AD+ NON AD
NON
+ AD+
NO
N AD
NO
N+ AD+
TN
Liquid
slurry 2.79 3.57 2.63 5.14 * 2.31 80.2 76.2 83.6 * 100 100 100 100
Colloids 0.10 1.43 0.72 3.08 * -
57.70 28.9 20.8 50.1 * 3.3 36.0 27.3 59.9 *
Dissolved 2.69 2.14 1.91 2.06 60.01 51.3 55.3 33.5 * 96.7 64.0 72.7 40.1 *
Water
extractable P
Liquid
slurry 0.10 0.18 * 0.12 0.22 * 77.80 82.6 * 78.6 82.6 100 100 100 100
Colloids 0.09 0.17 * 0.11 0.22 * 66.70 80.0 * 69.0 81.0 * 85.7 96.9 * 87.7 98.1 *
Dissolved 0.01 0.00 * 0.01 0.00 * 11.10 2.6 * 9.6 1.6 * 14.3 3.1 * 12.3 1.9 *
TP
Liquid
slurry 0.29 0.30 0.37 0.34 66.90 66.4 66.2 67.1 100 100 100 100
Colloids 0.27 0.28 0.35 0.33 62.10 62.0 62.4 64.8 92.9 93.4 94.2 96.6
Dissolved 0.02 0.02 0.02 0.01 4.80 4.4 3.8 2.3 7.1 6.6 5.8 3.5
Note: * indicates the differences between NON and AD, or between NON+ and AD+ treatments are statistically significant
(p<0.05).

90
Anaerobic digestion increased the quantity of NH4+, organic N and TN of the
separated liquid slurry fraction, although the differences between NON and AD treatments
were not statistically significant. The difference in the TN quantity of the separated liquid
slurry fraction was significant between NON+ and AD+ treatments. In contrast to
acidification, the increase in the NH4+ quantity of the separated liquid slurry fraction caused
by digestion was associated with the dissolved fraction rather the colloidal fraction (Table
5.4). But the increase of organic N and TN quantity of the liquid fraction was more
associated with the colloidal fraction (Table 5.4). Decomposition of organic matter during
anaerobic digestion results in mineralisation of organic N to NH3, solubilisation of which
resulted in the increase of NH4+ and OH- content in the dissolved fraction. On the other hand,
although the organic N in the liquid fraction was mineralised, the breakdown of coarse
particles supplemented the organic N quantity of the liquid fraction, and tended to
concentrate on colloids rather than in a dissolved form. Thus, the organic N quantity of the
liquid fraction was not reduced, in contrast, it increased.
There was no impact on TP quantities of these fractions after anaerobic digestion.
But the water extractable P content of the separated liquid slurry fraction increased after
anaerobic digestion (Table 5.4). In contrast to acidification, the water extractable P quantity
of the dissolved fraction decreased in both NON and NON+ treatments by 0.01 g kg-1 fresh
whole slurry after anaerobic digestion, due to precipitation of dissolved inorganic P with Ca
and Mg (Güngör & Karthikeyan, 2008; Marcato et al., 2008; Rico et al., 2012). But the
water extractable P quantity of the colloidal fraction increased by 0.08-0.11 g kg-1 fresh
whole slurry (Table 5.4), contributing to the increase in the separated liquid slurry fraction.
This increase in P content in the colloidal fraction may be related to decomposition of
organic P during the anaerobic digestion process. As a result, in the separated liquid slurry
fraction, the percentage of water extractable P represented by the colloidal fraction increased,
and the percentage of the dissolved fraction decreased. This water extractable result is
different from the IP-H2O from sequential fractionation, which is discussed in more detail in
section 5.4.3.2. The added inoculant treatment did not make a significant difference in P
distribution and speciation in our study.
Since the water extractable P/TP ratio for the separated liquid slurry fraction
increased, and the water extractable P in the colloidal fraction increased after anaerobic
digestion, the risk of colloid-facilitated P leaching could be greater from the anaerobic
digestion treatment, because more bioavailable P may transfer into water. This study also

91
suggests that colloid-facilitated organic N leaching from digested slurry may also be of
concern.
5.4.2 Nanoparticles in livestock slurry
Within the dissolved fraction, nanoparticles existed and comprised inorganic and
organic compounds. In non-acidified slurry, significant differences were seen between the
<0.03 and <0.45 µm fractions in the inorganic P, organic P, TP, and TC contents, indicating
that nanoparticles between 0.03-0.45 µm contained inorganic and organic P compounds, and
carbonate crystal or organic carbon. However, no NH4+ or TN was found in this
nanoparticulate range. The TOC content of the nanoparticle size fractions (Table 5.5)
appeared to be greater than the TC content. This may be because of dilution errors associated
with analysis of the TOC, which often required diluting by >200 times to fit within the
detection range of the instrument and protect the needles from being damaged by the high
salinity. Such dilutions may amplify errors during calculations. However, we still have
confidence in the use of these data to explore the relationship between TOC contents of
different nanoparticle size fractions. There is a trend that the TOC quantity decreases with
the reduction of the ultrafilter size in both the non-acidified and acidified treatment, but
differences between the two successive fractions were not significant (Table 5.5). This may
indicate that organic carbon exists within the 0.03-0.45 µm or within 0.001-0.03 µm size
fractions as nanoparticles, but they were not detected because of the large variability.
Through calculating the quantities of inorganic P, organic P, TP, TOC and TC in the
nanoparticles by differences between two successive fractions, we found that over half of
inorganic P, organic P and TP, 40% of TOC and 26% of TC of the dissolved fraction was
seen in the nanoparticulate fraction of 0.03-0.45 µm.

92
Table 5.5 The distribution of NH 4+, TN, TC, inorganic P and TP within the
dissolved fractions of non-acidified and acidified treatments (mg kg -1 based on fresh
weight of whole slurry). Values represent means, n = 3.
Treatment
Separated
fraction
µm
NH4+ TN Inorganic P TP TOC TC
Non-
acidified
<0.45 133 3667 20 a Ɨ 28 a Ɨ 1258 a Ɨ 807 a
<0.03 140 3279 9 b Ɨ 13 b Ɨ 733 ab Ɨ 599 b
<0.001 134 3279 9 b Ɨ 12 b Ɨ 617 b Ɨ 469 bƗ
ns ns * * * *
Acidified
<0.45 154 3405 205 244 a 2048 a 1019
<0.03 158 3664 203 238 a 1754 ab 717
<0.001 147 3291 196 225 b 1535 b 821
ns ns ns * * ns
Note: ns indicates no difference, and * indicates significant difference between
three fractions and the letter a,b,c indicates the significant difference between three
fractions of <0.45, <0.03 and <0.001 in the same slurry ( p<0.05). Ɨ indicates the
significant difference between the non-acidification and acidification treatments
(p<0.05).
Acidification increased the inorganic P, organic P, TP and TOC contents of the <0.45,
<0.03 and <0.001µm fractions markedly (p<0.05) (Table 5.5). But the NH4+ and TN
quantities of these fractions were not influenced by the acidification treatment. In the
acidified slurry, not only was there no difference between <0.03 and <0.45 µm fractions in
NH4+ and TN, but such difference in the TC content, inorganic P, organic P and TP also
disappeared. This change might because that P bound in nanoparticles of 0.03-0.45µm were
dissolved by acid, or nanoparticles of 0.03-0.45 µm were degraded releasing P during
acidification, transforming P to the <0.03 µm fraction. The difference observed in the
untreated slurry, in TC content between the <0.45 and <0.03 µm fractions was not apparent
in the acidified slurry, perhaps due to the large variability. The TOC content of the 0.03-0.45
µm and 0.001-0.03 µm and 0.001-0.45 µm nanoparticle ranges, showed no significant
differences between non-acidified and acidified treatments. So the increased TOC content
caused by acidification was generally found in the <0.001 µm fraction. That is also the
reason for the significant increase in the TC content of that fraction.

93
Anaerobic digestion tended to increase the NH4+ concentration of the <0.45, <0.03
and <0.001 µm fractions, although the differences between the NON and AD treatments
were not significant (Table 5.6). The TN quantity of these fractions was stable during
anaerobic digestion. In contrast to the acidification treatment, anaerobically digested slurry
still contained nanoparticles associated with inorganic P, organic P and TP in the fraction of
0.03-0.45 µm, based on the significant difference between <0.03 and <0.45 µm fractions.
The formation of struvite and Ca-P may occur (Marcato et al., 2008; Güngör & Karthikeyan,
2008) and influence the inorganic P content in these fractions. The inorganic P content of the
<0.45, <0.03 and <0.001 µm fractions tended to decrease after anaerobic digestion, although
not significantly in the <0.03 and <0.001 µm fractions. Also, the inorganic P content of the
nanoparticles in the 0.03-0.45 µm fraction of anaerobically digested slurry seemed lower
than in non-digested slurry, although this was only significant between the NON+ and AD+
treatments. The organic P and TP quantities of nanoparticles between 0.03-0.45 µm were not
affected by anaerobic digestion. But the organic P and TP quantities of the <0.001 µm were
significantly reduced by anaerobic digestion, comparing both the NON and AD, and NON+
and AD+ treatments. In contrast, the impact of anaerobic digestions on TOC content was
rarely seen in these fractions. The smallest organic P compound in the <0.001 µm fraction
may be the easiest to be decomposed, but the magnitudes of organic P and TOC of the
<0.001 µm fraction were not the same, so the decomposition of organic P could not be
reflected in the TOC change.
The DM, TOC, TC, and the P quantity associated with nanoparticles (0.001-0.03,
0.03-0.45µm) were very small compared to the colloidal fractions. Therefore, the impact of
nanoparticles on potential P leaching in soil may be small. The reported importance of
nanoparticles in P mobility and pollution in other studies may be more associated with the
native nanoparticles developed within soils, rather than organic matter nanoparticles
associated with slurry amendments. Relatively, the colloidal fractions of slurry may have a
larger influence on P leaching than the nanoparticles of slurry.

94
Table 5.6 The distribution of NH 4+, TN, TC, inorganic P and TP within the
dissolved fractions of untreated and anaerobic digestion treatments ( mg kg -1 based on
fresh weight of whole slurry). Values represent means, n = 3.
Treatment
Separated
fraction
µm
NH4+ TN Inorganic P TP TOC TC
NON
<0.45 98 2691 14 a Ɨ 21 a 923 a 592 a
<0.03 102 2406 6 b 9 b 538 ab Ɨ 440 b
<0.001 98 2406 6 b 9 b 453 b 344 b
ns ns * * * *
AD
<0.45 334 2143 5 a 20 a 1282 a 806 a
<0.03 306 2280 4 b 6 b 866 ab 576 ab
<0.001 306 1985 4 b 5 b 551 b 406 b
ns ns * * * *
NON+
<0.45 229 Ɨ 1907 a 14 a Ɨ 21 a 1119 679 a
<0.03 230 1736
ab 7 b 10 b 834 584 a
<0.001 229 Ɨ 1554 b 6 b 9 b Ɨ 612 363 b
ns * * * ns *
AD+
<0.45 506 2061 4 a 12 a 1187 a 706 a
<0.03 502 2234 4 b 6 ab 1085 a 553 ab
<0.001 490 1805 3 b 4 b 522 b 350 b
ns ns * * * *
Note: ns indicates no difference, and * indicates significant difference between
three fractions and the letter a,b,c indicates the significant difference between three
fractions of <0.45, <0.03 and <0.001 in the same slurry ( p<0.05). Ɨ indicates the
significant difference between the NON and AD, or between NON+ and AD+
treatments (p<0.05).
5.4.3 P fractionation in the colloidal fraction
Comparison between the untreated and acidified slurry
The colloidal fraction of untreated and treated slurry is important in storing P and
facilitating P movement through and from soil as described above. To better understand this,

95
further analysis was conducted on the P speciation on this colloidal fraction by sequential
fractionation.
According to our results (Table 5.3), the majority of P in each form in the separated
liquid slurry fraction was allocated to the colloidal fraction in the non-acidified slurry.
Specifically, particles of the colloidal fraction represented almost all of the IP-H2O, IP-
NaOH, IP-HCl, and OP-NaOH forms, and TP-residue of the separated liquid slurry fraction.
Also, 60% of the IP-NaHCO3, 32% of OP-H2O, 77% of OP-NaHCO3 and 64% of OP-HCl
content of the separated liquid slurry fraction was seen in the colloidal fraction. However, in
the acidified slurry this situation changed significantly. After acidification, the quantity of
the four IP forms and OP-NaHCO3 decreased significantly (Figure 5.1). P-NaHCO3, P-
NaOH and P-HCl represent P that is physically adsorbed on crystalline surfaces, associated
with the surface of Ca carbonates, Al and Fe oxides, and mineral or amorphous phases of
Ca-P, respectively (He et al., 2006). The reduction caused by acidification was mainly
associated with dissolution and desorption, transforming P from colloids to the dissolved
fraction. As a result, in the acidified separated liquid slurry fraction, only 24% of IP-H2O, 15%
of IP-NaHCO3, 50% of IP-NaOH and 62% of IP-HCl forms were in the colloidal fraction,
respectively.
Figure 5.1 The contents of P forms of the colloidal fractions of non -acidified
and acidified cattle slurry. Values represent means ± SEM, n = 3.

96
The water extractable P quantity of the non-acidified and acidified colloidal fraction
in Table 5.3 was lower than the value of IP-H2O by sequential fractionation. This may be
because the extraction time of sequential fractionation was longer than the 0.5 M K2SO4
extraction, leading to more P solubilised in the extractant. But the difference between non-
acidified and acidified colloidal fractions of these two extractions showed the same trend.
As for the P distribution in the colloidal fraction, in the non-acidified fraction, the IP-
H2O, IP-NaHCO3, IP-NaOH, IP-HCl, OP-H2O, OP-NaHCO3, OP-NaOH, OP-HCl and TP-
residue forms accounted for 25%, 20%, 4%, 7%, 3%, 17%, 9%, 3% and 12% of the TP,
respectively. After acidification, the percentage represented by IP-NaHCO3, IP-NaOH and
IP-HCl forms decreased to 5%, 3% and 3%, respectively, while the proportion of TP-residue,
OP-H2O and OP-NaOH forms increased to 19%, 8% and 16%, respectively. We speculate
that colloid-facilitated P leaching from acidified slurry may be dominated by organic P.
Comparison between the untreated and anaerobic digestion
Anaerobic digestion decreased the quantity of IP-H2O, TP-residue and OP-NaHCO3
forms of the colloidal fraction, and increased the quantity of IP-NaHCO3 and IP-HCl forms
(Figure 5.2). Specifically, comparing the colloidal fraction of the NON and AD treatments,
52% of the quantity of IP-H2O, 17% of TP-residue and 57% of OP-NaHCO3 form of the
colloidal fraction was reduced after anaerobic digestion. And the IP-NaHCO3 and IP-HCl
quantities of the colloidal fraction increased by 165% and 79%, respectively. Comparing the
NON+ and AD+ treatments, the quantity of IP-H2O, TP-residue and OP-NaHCO3 forms in
the colloidal fraction was reduced by 41%, 21% and 74%, while the quantity of NaHCO3
and IP-HCl forms increased by 149% and 13%, respectively. The IP-H2O quantity of the
colloidal fraction may be reduced mainly by adsorption and formation of struvite and Ca-P
(Cooperband & Good, 2002; He et al., 2004; Marcato et al., 2008; Güngör & Karthikeyan,
2008), resulting in the increase of IP-NaHCO3 and IP-HCl forms. Another explanation for
the marked increase in the IP-NaHCO3 quantity of the colloidal fraction was the break-down
of larger particle size fractions. Anaerobic digestion was performed on the whole cattle
slurry and biodegradation processes occurred in each particle size fraction, producing more
labile IP. After separation, most of this released labile IP was concentrated in the liquid
fraction. And because of the adsorption capacity of colloidal particles, much labile IP
remained in this particle fraction as IP-NaHCO3.

97
Figure 5.2 The quantities of P forms in the colloidal fraction on a fresh basis of
whole slurry. Values represent means ± SEM, n = 3.
Comparing the AD and AD+ treatments, no differences were seen in the quantities of
OP forms of the colloidal fraction. But the quantity of almost all IP forms except for IP-
NaOH and TP of the AD+ slurry of the colloidal fraction was higher than the AD slurry.
Based on our results of the NON and NON+ treatments, this difference in IP forms was
mainly because of the original high amount of IP in the inoculum used in the AD+ treatment,
rather than accelerated decomposition caused by inoculation.
The quantity of water extractable P in the colloidal fraction of the NON and NON+
treatments (Table 5.4) was lower than the value for IP-H2O measured by sequential
fractionation. The reason for this is the same as that explained earlier, but for AD and AD+
the opposite was true. This may be because the extractions for sequential fractionation were
conducted on air dried samples, while the 0.5 M K2SO4 extraction used fresh samples. In the
AD and AD+ treatments, perhaps the high pH condition made the water soluble P more
susceptible to being adsorbed on the surface of particles during air drying, contributing to the
IP-NaHCO3 form. Therefore, although the quantity of IP-H2O of non-digested slurry was
higher than anaerobically digested slurry, which is in contrast to the conclusion of water
extractable P, the sum of the IP-H2O and IP-NaHCO3 forms in the non-digested slurry was
smaller than anaerobically digested slurry.
The colloidal fractions in both non-digested and digested liquid slurry accounted for
the same proportion of TP. Thus, when applying slurry based on a TP loading, colloids from
digested liquid slurry may transport more bioavailable P into the subsurface, potentially
leading to greater P transfer to watercourses than non-digested slurry. Therefore, recovering

98
the colloidal fraction and P could be a direction to improve the separation strategy in
livestock slurry management.
5.5 Conclusions
The colloidal fraction accounted for over 80% of the DM, TC, and TP content, and
all other measured P forms in untreated liquid fraction of cattle slurry. While over 90% of
the NH4+ and TN in untreated liquid fraction of cattle slurry was present in the dissolved
fraction. Nanoparticles existed in the 0.03-0.45µm range and contained only a small amount
of P (4% of the TP of the liquid fraction, 8% of the water extractable P of the liquid fraction).
Acidification increased the quantity of NH4+ and TN in the separated liquid cattle
slurry fraction, which was associated with colloidal fraction, while the increase in NH4+
quantity of liquid cattle slurry caused by anaerobic digestion was mainly related to the
dissolved fraction. In the dissolved fraction, the inorganic P and TP quantity increased by ca.
10 times after acidification, but the content of these P forms was reduced in the colloidal
fraction. In contrast, after anaerobic digestion, the water extractable P quantity of the
colloidal fraction increased, while in the dissolved fraction it declined. There was a smaller
quantity of P on nanoparticles after anaerobic digestion, while there was almost no P left on
nanoparticles after acidification. The TP quantity of the colloidal fraction was not affected
by acidification or anaerobic digestion. In the P fractionation, acidification decreased the
quantity of IP-H2O, IP-NaHCO3, IP-NaOH, IP-HCl, TP-residue and OP-NaHCO3 forms of
the colloidal fraction significantly. While anaerobic digestion decreased the quantity of IP-
H2O, TP-residue and OP-NaHCO3 forms of the colloidal fraction, and increased the quantity
of IP-NaHCO3 and IP-HCl forms.
The characteristics of colloids may regulate N and P potential losses from soil. Both
acidification and anaerobic digestion improved the agronomic benefit of liquid livestock
slurry, but may increase the risk of N leaching. Moreover, the anaerobically digested liquid
slurry may increase the risk of potential P leaching because of its effect on available P
content of the colloidal fraction.
5.6 References
Angelidaki, I. and Ahring, B.K., 1993. Thermophilic anaerobic digestion of livestock waste:
the effect of ammonia. Applied Microbiology and Biotechnology, 38(4), pp.560-564.

99
Christensen, M.L., Hjorth, M. and Keiding, K., 2009. Characterization of pig slurry with
reference to flocculation and separation. Water Research, 43(3), pp.773-783.
Clemens, J., Trimborn, M., Weiland, P. and Amon, B., 2006. Mitigation of greenhouse gas
emissions by anaerobic digestion of cattle slurry. Agriculture, Ecosystems &
Environment, 112(2), pp.171-177.
Cooperband, L.R. and Good, L.W., 2002. Biogenic phosphate minerals in manure:
implications for phosphorus loss to surface waters. Environmental Science &
Technology, 36(23), pp.5075-5082.
de Jonge, L.W., Moldrup, P., Rubæk, G.H., Schelde, K. and Djurhuus, J., 2004. Particle
leaching and particle-facilitated transport of phosphorus at field scale. Vadose Zone
Journal, 3(2), pp.462-470.
Dou, Z., Toth, J.D., Galligan, D.T., Ramberg, C.F. and Ferguson, J.D., 2000. Laboratory
procedures for characterizing manure phosphorus. Journal of Environmental Quality,
29(2), pp.508-514.
Fangueiro, D., Hjorth, M. and Gioelli, F., 2015. Acidification of animal slurry–a review.
Journal of Environmental Management, 149, pp.46-56.
Güngör, K., Jürgensen, A. and Karthikeyan, K.G., 2007. Determination of phosphorus
speciation in dairy manure using XRD and XANES spectroscopy. Journal of
Environmental Quality, 36(6), pp.1856-1863.
Güngör, K. and Karthikeyan, K.G., 2008. Phosphorus forms and extractability in dairy
manure: a case study for Wisconsin on-farm anaerobic digesters. Bioresource
Technology, 99(2), pp.425-436.
Haygarth, P.M. and Sharpley, A.N., 2000. Terminology for phosphorus transfer. Journal of
Environmental Quality, 29(1), pp.10-15.
He, Z., Griffin, T.S. and Honeycutt, C.W., 2004. Evaluation of soil phosphorus
transformations by sequential fractionation and phosphatase hydrolysis. Soil Science,
169(7), pp.515-527.
He, Z. and Zhang, H. eds., 2014. Applied manure and nutrient chemistry for sustainable
agriculture and environment. Lavoisier: Springer.

100
He, Z., Senwo, Z.N., Mankolo, R.N. and Honeycutt, C.W., 2006. Phosphorus fractions in
poultry litter characterized by sequential fractionation coupled with phosphatase
hydrolysis. Journal of Food Agriculture and Environment, 4(1), p.304.
Heathwaite, L., Haygarth, P., Matthews, R., Preedy, N. and Butler, P., 2005. Evaluating
colloidal phosphorus delivery to surface waters from diffuse agricultural sources.
Journal of Environmental Quality, 34(1), pp.287-298.
Henderson, R., Kabengi, N., Mantripragada, N., Cabrera, M., Hassan, S. and Thompson, A.,
2012. Anoxia-induced release of colloid-and nanoparticle-bound phosphorus in
grassland soils. Environmental Science & Technology, 46(21), pp.11727-11734.
Hens, M. and Merckx, R., 2002. The role of colloidal particles in the speciation and analysis
of “dissolved” phosphorus. Water Research, 36(6), pp.1483-1492.
Hjorth, M., Cocolo, G., Jonassen, K., Abildgaard, L. and Sommer, S.G., 2015. Continuous
in-house acidification affecting animal slurry composition. Biosystems Engineering,
132, pp.56-60.
Hjorth, M., Christensen, K.V., Christensen, M.L. and Sommer, S.G., 2010. Solid–liquid
separation of animal slurry in theory and practice. A review. Agronomy for
Sustainable Development, 30(1), pp.153-180.
Hsu, J.H. and Lo, S.L., 2001. Effect of composting on characterization and leaching of
copper, manganese, and zinc from swine manure. Environmental Pollution, 114(1),
pp.119-127.
Kai, P., Pedersen, P., Jensen, J.E., Hansen, M.N. and Sommer, S.G., 2008. A whole-farm
assessment of the efficacy of slurry acidification in reducing ammonia emissions.
European Journal of Agronomy, 28(2), pp.148-154.
Kretzschmar, R., Borkovec, M., Grolimund, D. and Elimelech, M., 1999. Mobile subsurface
colloids and their role in contaminant transport. Advances in Agronomy, 66, pp.121-
193.
Lake, D.L. and Lester, J.N., 1985. The effects of anaerobic digestion on heavy metal
distribution in sewage sludge. Water Pollution Control, 84(4), pp.549-559.

101
Lee, Y.S. and Han, G.B., 2012. Pig slurry treatment by a hybrid multi-stage unit system
consisting of an ATAD and an EGSB followed by a SBR reactor. Biosystems
Engineering, 111(3), pp.243-250.
Levine, A.D., Tchobanoglous, G. and Asano, T., 1991. Size distributions of particulate
contaminants in wastewater and their impact on treatability. Water Research, 25(8),
pp.911-922.
Makris, K.C., Grove, J.H. and Matocha, C.J., 2006. Colloid-mediated vertical phosphorus
transport in a waste-amended soil. Geoderma, 136(1), pp.174-183.
Marcato, C.E., Pinelli, E., Pouech, P., Winterton, P. and Guiresse, M., 2008. Particle size
and metal distributions in anaerobically digested pig slurry. Bioresource Technology,
99(7), pp.2340-2348.
Masse, L., Masse, D.I., Beaudette, V. and Muir, M., 2005. Size distribution and composition
of particles in raw and anaerobically digested swine manure. Transactions-American
Society of Agricultural Engineers, 48(5), p.1943.
McGechan, M.B. and Lewis, D.R., 2002. SW—Soil and water: Transport of particulate and
colloid-sorbed contaminants through soil, Part 1: General Principles. Biosystems
Engineering, 83(3), pp.255-273.
Møller, H.B., Sommer, S.G. and Ahring, B.K., 2002. Separation efficiency and particle size
distribution in relation to manure type and storage conditions. Bioresource
Technology, 85(2), pp.189-196.
Montalvo, D., Degryse, F. and McLaughlin, M.J., 2015. Natural colloidal P and its
contribution to plant P uptake. Environmental Science & Technology, 49(6),
pp.3427-3434.
Mulvaney, R.L., 1996. Nitrogen—inorganic forms. Methods of soil analysis part 3—
Chemical methods, Methods of Soil Analysis Volume 3), pp.1123-1184. SSSA,
Madison, WI.
Murphy, J., and J.P. Riley. 1962. A modified single solution method for determination of
phosphate in natural waters. Analytica Chimica Acta 27, 31–36.

102
Ottosen, L.D., Poulsen, H.V., Nielsen, D.A., Finster, K., Nielsen, L.P. and Revsbech, N.P.,
2009. Observations on microbial activity in acidified pig slurry. Biosystems
Engineering, 102(3), pp.291-297.
Pang, Z., 2008. Phosphorus enrichment in the treatment of pig manure in China using
anaerobic digestion technology. PhD thesis.
Peters, K., Hjorth, M., Jensen, L.S. and Magid, J., 2011. Carbon, nitrogen, and phosphorus
distribution in particle size–fractionated separated pig and cattle slurry. Journal of
Environmental Quality, 40(1), pp.224-232.
Petersen, S.O., Andersen, A.J. and Eriksen, J., 2012. Effects of cattle slurry acidification on
ammonia and methane evolution during storage. Journal of Environmental Quality,
41(1), pp.88-94.
Rick, A.R. and Arai, Y., 2011. Role of natural nanoparticles in phosphorus transport
processes in ultisols. Soil Science Society of America Journal, 75(2), pp.335-347.
Rico, C., Rico, J.L. and Lasa, C., 2012. Anaerobic digestion of the liquid fraction of dairy
manure separated by screw pressing and centrifugation in a upflow anaerobic sludge
blanket reactor at 25° C. Biosystems Engineering, 112(4), pp.344-351.
Roboredo, M., Fangueiro, D., Lage, S. and Coutinho, J., 2012. Phosphorus dynamics in soils
amended with acidified pig slurry and derived solid fraction. Geoderma, 189, pp.328-
333.
Shon, H.K., Vigneswaran, S. and Snyder, S.A., 2006. Effluent organic matter (EfOM) in
wastewater: constituents, effects, and treatment. Critical Reviews in Environmental
Science and Technology, 36(4), pp.327-374.
Siemens, J., Ilg, K., Lang, F. and Kaupenjohann, M., 2004. Adsorption controls mobilization
of colloids and leaching of dissolved phosphorus. European Journal of Soil Science,
55(2), pp.253-263.
Sørensen, P. and Eriksen, J., 2009. Effects of slurry acidification with sulphuric acid
combined with aeration on the turnover and plant availability of nitrogen. Agriculture,
Ecosystems & Environment, 131(3), pp.240-246.

103
Strik, D.P.B.T.B., Domnanovich, A.M. and Holubar, P., 2006. A pH-based control of
ammonia in biogas during anaerobic digestion of artificial pig manure and maize
silage. Process Biochemistry, 41(6), pp.1235-1238.
Sun Y., Fu B., Liu Q., Yan L., Wang W., and Wang Y., 2012. Optimization of cattle manure
hydrolysis and acidification for methane production. Chinese Journal of Eco-
Agriculture, 20(9), p.1222-1229.
Turner, B.L., Kay, M. a & Westermann, D.T., 2004. Colloidal phosphorus in surface runoff
and water extracts from semiarid soils of the western United States. Journal of
Environmental Quality, 33(4), pp.1464–72.
Wang, K., Huang, D., Ying, H. and Luo, H., 2014. Effects of acidification during storage on
emissions of methane, ammonia, and hydrogen sulfide from digested pig slurry.
Biosystems Engineering, 122, pp.23-30.

104
6 The colloidal phosphorus fraction regulates the vertical
movement of P after the application of treated cattle
slurry to soil
6.1 Abstract
Slurry processing such as acidification and anaerobic digestion are being used to
retain nitrogen within the manure management chain, and generate renewable energy,
respectively. However, these processes may modify the chemical form and molecular weight
of organic and inorganic phosphorus (P) in slurry, altering their availability to plants, as well
as their potential for transfer to watercourses. To better understand the impact of applying
treated cattle slurry on soil P movement, three particle size fractions (<63, <0.45 and <0.03
µm) of untreated, acidified and anaerobically digested cattle slurry were applied to the
surface of an agricultural sand-textured soil in laboratory microcosms and subjected to
leaching. After application of simulated rainfall, the location of the slurry-derived P in the
soil was determined by performing Olsen-P and total-P (TP) extracts at different depths (0-
16cm). Inorganic P (IP) and TP contents of leachates were also measured. The results
showed that P leaching from the livestock slurry was largely associated with the colloidal
slurry fraction (0.45-63 µm). Slurry acidification and anaerobic digestion both increased the
proportion of IP in the <63 µm fraction. However, whilst acidification resulted in no
measurable increase in P leaching, anaerobic digestion increased potential P leaching in
comparison with untreated slurry. We ascribe both to the importance of the colloidal fraction.
We conclude that the colloidal fraction is a key regulator of movement of slurry-derived P in
soil and that pre-treating slurry has the potential to significantly alter this process.

105
6.2 Introduction
Livestock slurry contains large amounts of phosphorus (P) and is frequently applied
to soil to recycle essential nutrients required for crop growth (Dao & Schwartz, 2010).
However, if livestock slurry is repeatedly applied to fields, P gradually accumulates and is at
greater risk of transfer to water bodies via runoff and leaching (McDowell & Sharpley, 2001;
Volf et al., 2007; Hahn et al., 2012; Liu et al., 2012). It is thought that the progressive
saturation of P sorption sites in soil, and the input of colloidal slurry particles (which act as P
‘carriers’) are two main factors that contribute to the loss of livestock slurry-derived P
(Sharpley et al., 1994; Siemens et al., 2004).
After application to soil, P contained within livestock slurry can be sorped to Al and
Fe oxyhydroxide, Ca and clay surfaces until the mineral surfaces become saturated, at which
point P becomes susceptible to desorption and leaching (Hinsinger, 2001; McGechan &
Lewis, 2002a; Guppy et al., 2005). The sorption affinity of organic P (OP) to soil has been
shown to be lower than for inorganic P (IP) (Anderson & Magdoff, 2005), except phytate
(Leytem et al., 2002). Toor et al. (2003) found organic P leaching prevailed in grassland
receiving dairy slurry. Further, organic matter competes with P for sorption sites and
decreases P sorption (Perassi & Borgnino, 2014; Kruse et al., 2015).
Colloid- and nanoparticle- facilitated P transport in soil has been reported to
dominate P loss from P unsaturated soils (Turner et al., 2003; de Jonge et al., 2004;
Heathwaite et al., 2005; Makris et al., 2006; Schelde et al., 2006; Regelink et al., 2013).
However, Rick & Arai (2011) questioned the role of nanoparticles in P transport, based on
the unreactive results from their P desorption and P retention and release experiments. Slurry
is an important source of colloids and nanoparticles that are already carrying considerable
sorbed P when applied to the soil (McGechan & Lewis, 2002b).
Different slurry management regimes are increasingly being utilised within the
livestock industry to achieve greater sustainability. For example, acidification of slurry can
greatly reduce ammonia volatilisation leading to increased N retention (Kai et al. 2008),
while anaerobic digestion can be used to generate CH4 for renewable energy production
(Clemens et al., 2006; Lee & Han, 2012). These processes, however, are also expected to
lead to shifts in a range of chemical, biological and physical properties of the slurry that may
affect their subsequent behaviour after addition to soil. For example, studies have shown that
acidification can increase the dissolved P content of slurry (Güngör et al., 2007; Fangueiro et

106
al., 2015). It implies soil amended with acidified slurry could be more subjected to P
leaching from saturated soil in comparison with untreated slurry. However, P sorption in soil
increases with decreased pH (Gustafsson et al., 2012). Acidified slurry may cause greater P
sorption. It is difficult to know if the greater dissolved P content and greater P sorption in
acidified treatment would result in more or less P leaching. No information on the effect of
acidified slurry on P leaching has been revealed yet, as far as we aware.
Anaerobic digestion with stirred and high temperature conditions are more likely to
degrade large particles in comparison to smaller particles (Hjorth et al. 2010). Marcato et al.
(2008) observed that <10% of particles in a pig slurry and a digested slurry were <3 µm, and
particles of 3-25 µm made a strong contribution to the total specific surface area (30% and
40% for untreated and digested slurry). They also suggested that anaerobic digestion resulted
in greater biodegradation of smaller sized organic matter particles <3 µm. This is supported
by Elmitwalli et al. (2001) and Shon et al. (2006) who observed that particles <1 µm were
most susceptible to biodegradation, while particles >10 µm appeared more recalcitrant
during anaerobic digestion. Stutter (2015) observed that anaerobic digestate reduced P
sorption in soil columns, suggesting an increased short-term leaching risk after digestate
application. However, information on the effect of anaerobically digested slurries on P loss
are still limited.
The aim of this study was to explore the effect of the liquid (<63 µm) fractions of
differently treated livestock slurry on the potential P leaching from soil, especially the role of
colloid- and nanoparticle-associated P in potential P vertical movement. We hypothesized
that, (1) both acidification and anaerobic digestion would increase solubility of P contained
in liquid livestock slurry, (2) addition of liquid livestock slurry, untreated and treated, to soil
would increase potential P leaching from the soil, and this would be particularly associated
to the colloidal fraction, and (3) compared with untreated liquid slurry, acidification and
anaerobic digestion would reduce mobility of P and potential P leaching by conversion of
colloidal P to orthophosphate which readily sorbs to mineral surfaces, reducing its vertical
movement in soil.
6.3 Materials and methods
6.3.1 Livestock slurry collection and treatment
Four replicates of cattle slurry samples were collected on four independent occasions
from a commercial beef farm in Gwynedd, Wales, UK. Slurry samples were then treated by

107
acidification or anaerobic digestion. Four replicates of cattle slurry were acidified to pH 5.5
by adding 15% H2SO4 to achieve a final sulfuric acid concentration of ca. 100 mM in the
slurry. Anaerobic digestion with three replicates (due to the space limitation in the laboratory
incubator used for the anaerobic digestion of the slurry) was conducted in the laboratory
using two approaches, i) with a 30% (v/v) inoculum (collected from a nearby commercial
anaerobic digester receiving cattle slurry and food waste feedstocks), and ii) without an
inoculum. The dry matter (DM) contents of both slurries was adjusted to 8% with distilled
water prior to incubation and then sealed in containers connected to foil bags for gas
collection, and incubated at 35°C for 30 d. The containers were shaken gently for 1 h every
day and the gas in the bags was released when full.
Replicate batches of untreated cattle slurry, acidified cattle slurry, anaerobically
digested slurry inoculated (AD+) and non-inoculated (AD) slurry were wet-sieved with 63
µm for the liquid fraction of slurry (<63 µm). The liquid fraction was vacuum filtered
through a 0.45 μm membrane for the <0.45 µm fraction. The <0.45 µm fraction was
subsequently ultrafiltered into <0.03 µm fractions with 100 kDa filters (Millipore Ultracel®
100 kDa Ultrafiltration Discs) (Turner et al., 2004). The weight ratio of slurry before and
after 0.45 μm filtration was recorded. It was assumed the volume and weight of slurry before
and after 100 kDa ultrafiltration was same. The TP content of the <63 µm fraction was
measured after combusting samples at 550°C and dissolving the ash in 2.4 M HCl. The TP
content of the <0.45 and <0.03 µm fractions were measured after digestion with ammonium
persulfate in an autoclave (Rowland & Haygarth, 1997). TP and IP concentrations in digests
and slurries were subsequently determined using the molybdate blue method of Murphy &
Riley (1962). The difference between the IP and TP content of a fraction was assumed to be
organic P (OP). The values for the 0.03-0.45 µm and 0.45-63 µm fraction were calculated by
difference.
6.3.2 Soil collection
The sand textured Eutric Cambisol (80% sand, 12% silt, 8% clay) was collected from
the upper soil layer (0-15 cm; Ahp horizon) of a grassland field located in Abergwyngregyn,
Gwynedd, Wales, UK (53° 14' 33'' N, 4° 1' 15'' W). The site has a temperate oceanic climate
with mean annual temperature of 10.6°C and annual rainfall of 1060 mm. After collection,
the soil was sieved to pass 2 mm to remove roots and stones. The soil had a gravimetric
moisture content of 19.2 %, a pH of 5.84 (1:2.5 w/v distilled water extract), electrical

108
conductivity of 30 µS cm-1 (1:5 w/v distilled water extract), Olsen-P content of 9.2 mg kg-1
and a total P content of 0.4 g kg-1.
6.3.3 Phosphorus sorption isotherms
To determine the relative affinity of inorganic P for soil, an adsorption isotherm was
performed. Briefly, soil (1 g) was shaken (200 rev min-1, 24 h, 20°C) with solutions (25 ml)
containing different levels of P (0 to 80 mg l-1 in 0.01 M CaCl2). Chloroform (25 µl) was
added to the tubes as an inhibitor of microbial activity. After centrifugation (3000 g, 15 min),
the equilibrium P concentration in the supernatant was determined using the molybdate blue
method of Murphy & Riley (1962). The Langmuir Equation
C/S = 1/(k × Smax) + C/Smax (Eqn. 1)
was then fitted to the experimental data, where S is the amount of P adsorbed to the
solid phase (mg kg-1), k is affinity constant (L mg-1), Smax is sorption maxima (mg kg-1), and
C is the equilibrium solution P concentration (mg L-1). A similar sorption isotherm was also
carried out for the <63 µm cattle slurry fraction as described above.
6.3.4 Phosphorus leaching experiment
Following the method described in Abaas et al. (2012), polyethylene tubes (0.8 cm
diameter, 16 cm long) were packed with 9.60 g (fresh weight) of field-moist soil and
suspended over a leachate collection vial. The 4 slurry types (acidified, digested + inoculum,
digested – inoculum, untreated) each with 3 size fractions (<63 µm, <0.45 µm, <0.03 µm)
and a control of distilled water were added to the surface of individual soil columns. There
were 8 columns for each treatment, including 4 replicates for Olsen-P determination and 4
replicates for TP determination, except for AD and AD+ treatments with 6 columns. The
slurry application rate for all treatments were based on the same weight of the <63 µm
fraction, which was applied at an equivalent of 10 kg TP ha-1 (49 µg TP column-1). The
summary of the application rates is shown in Table 1.
After slurry application, the surfaces of the columns were sealed with Parafilm M®
(Bemis Inc., Oshkosh, WI) to reduce evaporative water loss and the columns placed in a
climate-control room at 10 °C. After 24 h, 2 ml of distilled water (equivalent to a 1 h rainfall
storm event of 40 mm h-1) was applied to the soil surface of each column. After 48 h, the
leachate was recovered, its volume recorded, and the columns sectioned using a scalpel into
the following depths; 0-1, 1-2, 2-3, 3-4, 4-6, 6-8, 8-10 and 10-16 cm. Soil samples recovered

109
from each depth were analysed for Olsen P (0.5 M NaHCO3), TP (aqua regia digest) and
gravimetric moisture content (105°C, 24 h). The TP concentrations of leachates were
measured after digestion with ammonium persulfate in an autoclave (Rowland & Haygarth,
1997) and determined using the molybdate blue method (Murphy & Riley, 1962). Aliquots
of leachates were directly measured by the molybdate blue method for IP concentrations. OP
concentration of leachates was calculated by the difference between the IP and TP
concentration.
6.3.5 Statistical analysis
All statistical analysis was performed with SPSS v22 (IBM Inc., Armonk, NY).
Differences in IP, OP and TP leachate concentrations and Olsen-P and TP contents of soil
between any slurry amended treatment and control were analysed using unpaired t-tests, and
between untreated and treated slurry treatments were analysed by paired t-tests, both with
effects considered significant at p<0.05. Comparisons of Olsen-P and TP among different
soil depths within the same column were conducted by ANOVA with Tukey pairwise post-
hoc testing with effects considered significant at p<0.05.
6.4 Results and Discussion
6.4.1 Phosphorus distribution in untreated and treated slurry
Within the cattle slurry (<63 µm), 28% of the TP was present as IP (Table 6.1). After
size fractionation, we found that the majority of P was present in the 0.45-63 µm particle
fraction, representing ca. 80% of the total IP and 95% of the total OP present in the slurry
(<63 µm). The nanoparticulate fraction (0.03-0.45 µm) contained a small amount of P
according to the significant difference between the <0.45 and <0.03 µm fractions. Further,
the majority of TP of the <0.45 and <0.03 µm fraction was present as IP (64% and 63%
respectively).
Acidification was conducted on the whole cattle slurry before separation and released
IP from coarse particles, resulting in a large increase in the IP content of the <63 µm slurry
(from 28% to 49% of the TP) while the IP content of the <0.45 and <0.03 µm slurry also
rose 6-fold (Table 6.1). Concomitantly, around 38% of the IP, 31% of the OP and 35% of TP
of the 0.45-63 µm fraction was lost during acidification. The nanoparticulate fraction (0.03-
0.45 µm) contained no detectable amount of IP or TP after acidification.

110
Table 6.1 Application rates for different slurry treatments. Values represent
means, n = 4 for untreated and acidified treatments, n = 3 for AD and AD+ treatments.
Particle
fraction
µm
TP
µg column -1
IP
µg
column -1
OP
µg
column -1
IP/TP
of <63
µm %
OP/TP
of <63
µm %
TP/TP
of <63
µm %
Untreated
<63 48.9 13.7 35.2 28.3 71.7 100
0.45-63 44.3 10.8 33.5 22.5 68.4 90.9
<0.45 4.6 2.9 1.7 5.8 3.3 9.1
0.03-0.45 1.0 0.6 0.4 1.4 0.7 2.1
<0.03 3.6 2.3 1.3 4.4 2.6 7.0
Acidified
<63 48.9 23.8 25.1 48.8 51.2 100
0.45-63 28.7 6.2 22.5 12.7 46.3 59.0
<0.45 20.2 17.6 2.6 36.1 4.9 41.0
0.03-0.45 1.0 -0.3 1.3 -0.4 2.3 1.9
<0.03 19.2 17.9 1.3 36.5 2.6 39.1
AD
<63 48.9 28.4 20.5 58.2 41.8 100
0.45-63 45.6 27.4 18.2 56.4 37.0 93.4
<0.45 3.3 1.0 2.3 1.8 4.8 6.6
0.03-0.45 2.3 0.3 2.0 0.7 3.9 4.6
<0.03 1.0 0.7 0.3 1.1 0.9 2.0
AD+
<63 48.9 30.7 18.2 62.9 37.1 100
0.45-63 47.3 30.0 17.3 61.7 34.8 96.5
<0.45 1.6 0.7 0.9 1.2 2.3 3.5
0.03-0.45 0.6 0.0 0.6 0.2 1.6 1.8
<0.03 1.0 0.7 0.3 1.0 0.7 1.7
Anaerobic digestion significantly increased the proportion of IP and decreased OP in
the TP of <63 µm cattle slurry irrespective of inoculation status (Table 6.1). This was most
evident in the 0.45-63 µm particle fraction, in which IP proportion increased from 28% to 60%
(AD) or 64% (AD+) and OP proportion decreased from 72% to 40% (AD) or 36% (AD+).
Further, more TP was observed in the 0.45-63 µm fraction (p<0.05). On the contrary, less TP
and IP was seen in the <0.45 and <0.03 µm fractions (Table 6.1), although the decrease of
TP of the <0.45 µm fraction was not statistically significant. In contrast to the acidified

111
slurry, the nanoparticulate fraction (0.03-0.45 µm) was found to contain P. No significant
difference in IP, OP and TP was found between the AD and AD+ treatments.
6.4.2 Effect of untreated cattle slurry on P movement in soils
In this study, the Langmuir Equation for the P sorption isotherm of this sandy soil
was C/S = 0.0045+ 0.0038C. The measured soil P sorption maxima (Smax) was 86 mg kg-1,
and ‘k’ was 58480 L mg-1. To avoid saturation-driven P leaching, the application rate
selected in this study was 49 µg column-1 of TP of <63 µm slurry (=10 kg TP ha-1),
containing 14 µg column-1 of IP (Table 6.1), and the adsorption capacity of the first 1 cm soil
already exceeded the IP amount from the <63 µm cattle slurry.
The Olsen-P contents at the different soil depths is shown in Figure 6.1. Due to the
short period of this experiment (48 h) and low temperature (10 °C), OP had little chance to
mineralize into IP. Thus, the Olsen-P content of different depths of soil was more associated
with the movement of IP. In the control treatment, no change in the Olsen-P content of the
soil was seen at the different depths (8-9 mg kg-1), except a slight decrease in the last 10-16
cm layer (6 mg kg-1) (p<0.05) (Figure 6.1). However, in the <63 µm treatment there was a
significant decreasing trend down the column (p<0.05). The 2-3 cm layer of soil in the <63
µm treatment contained significantly higher Olsen-P (11 mg kg-1) content than the control
(Figure 6.1). It is implied that P from the <63 µm slurry was transported over 1 cm in the
soil profile and some was gradually retained.

112
Figure 6.1 The Olsen-P content of soil from untreated and acidified slurry treatments. Values represent means ± SEM, n = 4.

113
In the leachate, the <63 µm treatment resulted in significantly more IP, OP and TP
than the control (Figure 6.2). The amount leached equated to 0.15 µg IP column-1 and 0.24
µg OP column-1 in the leachate of control, while in the <63 µm treatment it was 0.61 µg IP
column-1 and 0.84 µg OP column-1. The quantity of additional P leached relative to the
control was equivalent to ca. 3.3% of the added IP and 1.7% of OP of the <63 µm slurry.
Figure 6.2 The inorganic P (IP) and organic P (OP) content of leachates from
untreated and acidified slurry treatments. Values represent means ± SEM, n = 4.
Soil TP content of the control was consistent at the different depths from 0.36 to 0.46
g kg-1. Because the quantity of TP applied in the slurry was relatively low compared with the
original TP content of soil, there was no apparent change in the TP content of the soil after
the <63 µm application.
The <0.45 and <0.03 µm treatments did not result in any differences in terms of
Olsen-P and TP content of soil, nor with TP and IP contents of leachates compared with the
control, because of the low TP and IP content in the <0.45 and <0.03 µm fractions. In this
study the TP and IP contents of <0.45 and <0.03 µm fractions were statistically different
(Table 6.1), indicating a certain amount of P contained in the nanoparticles of 0.03-0.45µm.
Nanoparticles are supposed to facilitate P mobility (Hens & Merckx, 2002; Regelink et al.,
2013). However, maybe because the number of nanoparticles in cattle slurry was very small,

114
no differences in the soil and leachate were made in the comparison in the <0.45 and <0.03
µm treatments.
In comparison, the 0.45-63 µm particles had a much greater influence on P leaching
than the nanoparticulate fraction. Small or colloidal particles have small volumes and large
surface area to volume ratios indicating the high mobility and the high P adsorption capacity
(Marcato et al., 2008). Particles of 0.45-63 µm contained the majority IP and OP in the <63
µm slurry. The high mobility of these particles enabled the IP and OP they carried to be
collected in leachate. In addition, the sorption isotherm test for slurry failed to show any
measurable sorption, indicating that the slurry particles were already P saturated. Thus, no P
from soil, adsorbed and carried by slurry particles, contributed to the extra P leaching caused
by cattle slurry.
6.4.3 Effect of acidification on slurry-derived P movement
At the same application rate of TP of the fraction <63 µm in both untreated and
acidified treatments, the acidified treatment significantly input more IP than the untreated
treatment (Table 6.1). As a result, the 3-4 cm and 10-16 cm soils in acidified treatment
possessed significantly higher Olsen-P content (11 and 7 mg kg-1, respectively) than the
untreated treatment (10 and 6 mg kg-1, respectively) (Figure 6.1). The acidified <0.45 µm
slurry fraction contained >6 times more IP than the corresponding untreated treatment (Table
6.1). This increase was also reflected in the Olsen-P content. The 0-4cm soil in the acidified
<0.45 µm treatment contained significantly higher Olsen-P (11-14 mg kg-1) than the
untreated treatment (9-10 mg kg-1) (Figure 6.1). Although the acidified slurry was adjusted
to pH 5.5, the fractions in the acidified treatments were diluted with distilled water before
application for the identical TP and water volume application rate. Consequently, the pH was
not as low as present in the bulk acidified slurry. Because the quantity of TP applied was
relatively low compared with the original TP content of soil, no statistical differences were
seen in the TP content of soil between untreated and acidified treatments and control.
In comparison with the control, the acidified <63 µm treatments caused significantly
higher IP, OP and TP leaching (0.55, 0.89 and 1.44 µg column-1, respectively), while the
acidified <0.45 and <0.03 µm treatments did not show any difference (Figure 6.2). Thus, the
0.45-63 µm again strongly contributed to the IP, OP and TP leaching in the acidified
treatment. The IP, OP and TP content of acidified 0.45-63 µm slurry were only 62%, 69%
and 65% of the amount found in the untreated slurry, respectively. However, compared with

115
the untreated treatments, no significant difference was seen in the leachates, which indicates
that the amount of P (IP and OP) transported by colloidal particles to the leachates was the
same between untreated and acidified <63 µm treatments. It also implies that the particle
characteristics (such as mobility and P content) of 0.45-63 µm particles are similar between
untreated and acidified slurry. Hjorth et al. (2015) suggested a long-term treatment of
acidification could accelerate hydrolysis. However, in this study, the acidification process
was relatively short (over a period of 7 d), and the particle size distribution may not have
been altered greatly. To reflect long slurry storage periods, further work is therefore required
to look at the impact of long term acidification on P leaching.
6.4.4 Effect of anaerobic digestion on slurry-derived P movement
AD and AD+ treatments of the <63 µm slurry fractions both resulted in a
significantly higher Olsen-P content than the control in the 1-2 cm and 0-3 cm layers of soil,
respectively (Figure 6.3). However, no treatments affected the TP content of the soil.
Although the IP contents of the <63 µm slurry of both AD and AD+ were almost 2-times
greater than untreated slurry (Table 6.1), unlike the acidified slurry, no significant
augmentation in the Olsen-P content of the different soil depths was found compared with
the untreated treatment (Figure 6.3).

116
Figure 6.3 The Olsen-P content of soil from the untreated slurry, the non -inoculated anaerobically digested slurry (AD) and the
inoculated anaerobically digested slurry (AD+) treatments. Values represent means ± SEM, n = 3.

117
The AD and AD+ <63 µm treatments resulted in significantly higher IP, OP and TP
contents of leachates than the control as expected (Figure 6.4). Additionally, the AD <63 µm
treatment tended to results in greater IP and OP leaching (1.01 and 1.92 µg column-1
respectively) than the untreated treatment (0.61 and 0.84 µg column-1 respectively) (although
the rise in the IP content of the leachates was not statistically significant). Again, the 0.45-63
µm particle size fraction dominated P leaching. The difference in the IP and OP content of
the leachates between the AD and untreated <63 µm treatments should be associated with
the 0.45-63 µm particles. The percentage of the added IP from the <63 µm slurry
transported into the leachate was similar (ca. 3.0%) in both untreated and AD treatments.
The IP associated with the slurry colloids interacts with the soil matrix via sorption and
desorption during the vertical movement, and a certain amount of IP was retained in the soil.
But due to the higher content of IP of the 0.45-63 µm slurry in the AD treatments, more IP
leaching was seen in the AD <63 µm treatments than untreated treatment. In contrast, a
greater percentage (8.2%) of the added OP from the <63 µm slurry of AD treatment was
transported to leachate than the untreated treatment (1.7%). Thus, although the OP content of
the <63 µm slurry in the AD treatment was significantly smaller than untreated slurry,
greater OP leaching was observed. This difference in OP leaching may be because
biodegradation during the AD process changed the characteristics of the OP associated
colloids, either in terms of increased colloid content or reduced colloidal size, or alteration of
OP species. Karr and Keinath (1978) found the concentration of 1-100 µm colloidal particles
increased in municipal wastewater after anaerobic digestion. Marcato et al. (2008) found
particles of 3-25 µm made a strong contribution to the total specific surface area of both
untreated and digested slurry, and the contribution was even larger in digested slurry. On the
other hand, different species of OP show different sorption affinity with soil particles. For
example, phytic acid (myo-inositol hexakisphosphate) is a strong competitor for P sorption
sites. Hansen et al. (2004) found phytic acid added from manure tended to be retained on the
upper soil, while other orthophosphate monoesters were found to be higher in the deeper
layer than in the upper layer of soil. Therefore, in the AD liquid slurry, we speculate that the
proportion of bindable OP was lower, and the mobility of OP colloids was greater than
untreated slurry.

118
Figure 6.4 The IP and OP content of leachates from the untreated slurry, the
non-inoculated anaerobically digested slurry (AD) and the inoculated anaerobically
digested slurry (AD+) treatments. Values represent means ± SEM, n = 3.
Comparing AD and AD+ showed no significant difference in the P contents of the
slurry fractions (Table 6.1), but the Olsen-P contents of the 8-10 and 10-16 cm layers was
significantly greater in the AD+ <63 µm treatment (Figure 6.3), coupled with the lower IP
content of leachate (Figure 6.4). This may indicate that more P in the AD+ treatment was
adsorbed by the soil, while more P in the AD treatment was transferred to leachate. This
implies that particles of 0.45-63 µm in AD slurry tend to be more mobile than AD+ slurry.
6.5 Conclusions
The majority of the P in the <63 µm slurry was contained in the 0.45-63 µm particle
size fraction. Acidification increased the overall IP content of the cattle slurry and
specifically reduced TP in the 0.45-63 µm particle fraction. Anaerobic digestion tended to
increase the proportion of IP in the <63 µm slurry and distributed more IP and less OP into
0.45-63 µm particles. The colloidal fraction (0.45-63 µm) in cattle slurry had a substantial
influence on P mobility through the soil. Despite the increase in the proportion of TP as IP in
acidified slurry, the potential for P leaching was not increased by acidification, which may
be because the colloidal particles characteristics were not altered. Anaerobic digestion may

119
promote the transformation of the colloidal particles characteristics and could cause a higher
risk of P leaching, but would need verifying in field trials.
6.6 References
Abaas, E., Hill, P.W., Roberts, P., Murphy, D.V. and Jones, D.L., 2012. Microbial activity
differentially regulates the vertical mobility of nitrogen compounds in soil. Soil
Biology and Biochemistry, 53, pp.120-123.
Anderson, B.H. and Magdoff, F.R., 2005. Relative movement and soil fixation of soluble
organic and inorganic phosphorus. Journal of Environmental Quality, 34(6), p.2228.
Clemens, J., Trimborn, M., Weiland, P. and Amon, B., 2006. Mitigation of greenhouse gas
emissions by anaerobic digestion of cattle slurry. Agriculture, Ecosystems &
Environment, 112(2), pp.171-177.
Dao, T.H. and Schwartz, R.C., 2010. Mineralizable phosphorus, nitrogen, and carbon
relationships in dairy manure at various carbon-to-phosphorus ratios. Bioresource
Technology, 101(10), pp.3567-3574.
de Jonge, L.W., Moldrup, P., Rubæk, G.H., Schelde, K. and Djurhuus, J., 2004. Particle
leaching and particle-facilitated transport of phosphorus at field scale. Vadose Zone
Journal, 3(2), pp.462-470.
Elmitwalli, T.A., Soellner, J., De Keizer, A., Bruning, H., Zeeman, G. and Lettinga, G., 2001.
Biodegradability and change of physical characteristics of particles during anaerobic
digestion of domestic sewage. Water Research, 35(5), pp.1311-1317.
Fangueiro, D., Hjorth, M. and Gioelli, F., 2015. Acidification of animal slurry–a review.
Journal of Environmental Management, 149, pp.46-56.
Guppy, C.N., Menzies, N.W., Moody, P.W. and Blamey, F.P.C., 2005. Competitive sorption
reactions between phosphorus and organic matter in soil: a review. Soil Research,
43(2), pp.189-202.
Güngör, K., Jürgensen, A. and Karthikeyan, K.G., 2007. Determination of phosphorus
speciation in dairy manure using XRD and XANES spectroscopy. Journal of
Environmental Quality, 36(6), pp.1856-1863.

120
Gustafsson, J.P., Mwamila, L.B. and Kergoat, K., 2012. The pH dependence of phosphate
sorption and desorption in Swedish agricultural soils. Geoderma, 189, pp.304-311.
Hahn, C., Prasuhn, V., Stamm, C. and Schulin, R., 2012. Phosphorus losses in runoff from
manured grassland of different soil P status at two rainfall intensities. Agriculture,
Ecosystems & Environment, 153, pp.65-74.
Hansen, J.C., Cade-Menun, B.J. and Strawn, D.G., 2004. Phosphorus speciation in manure-
amended alkaline soils. Journal of Environmental Quality, 33(4), pp.1521-1527.
Heathwaite, L., Haygarth, P., Matthews, R., Preedy, N. and Butler, P., 2005. Evaluating
colloidal phosphorus delivery to surface waters from diffuse agricultural sources.
Journal of Environmental Quality, 34(1), pp.287-298.
Hens, M. and Merckx, R., 2002. The role of colloidal particles in the speciation and analysis
of “dissolved” phosphorus. Water Research, 36(6), pp.1483-1492.
Hinsinger, P., 2001. Bioavailability of soil inorganic P in the rhizosphere as affected by root-
induced chemical changes: a review. Plant and Soil, 237(2), pp.173-195.
Hjorth, M., Cocolo, G., Jonassen, K., Abildgaard, L. and Sommer, S.G., 2015. Continuous
in-house acidification affecting animal slurry composition. Biosystems Engineering,
132, pp.56-60.
Kai, P., Pedersen, P., Jensen, J.E., Hansen, M.N. and Sommer, S.G., 2008. A whole-farm
assessment of the efficacy of slurry acidification in reducing ammonia emissions.
European Journal of Agronomy, 28(2), pp.148-154.
Karr, P.R. and Keinath, T.M., 1978. Influence of particle size on sludge dewaterability.
Water Pollution Control Federation, pp.1911-1930.
Kruse, J., Abraham, M., Amelung, W., Baum, C., Bol, R., Kühn, O., Lewandowski, H.,
Niederberger, J., Oelmann, Y., Rüger, C. and Santner, J., 2015. Innovative methods
in soil phosphorus research: A review. Journal of Plant Nutrition and Soil science,
178(1), pp.43-88.
Lee, Y.S. and Han, G.B., 2012. Pig slurry treatment by a hybrid multi-stage unit system
consisting of an ATAD and an EGSB followed by a SBR reactor. Biosystems
Engineering, 111(3), pp.243-250.

121
Leytem, A.B., Mikkelsen, R.L. and Gilliam, J.W., 2002. Sorption of organic phosphorus
compounds in Atlantic coastal plain soils. Soil Science, 167(10), pp.652-658.
Liu, J., Aronsson, H., Ulen, B. and Bergström, L., 2012. Potential phosphorus leaching from
sandy topsoils with different fertilizer histories before and after application of pig
slurry. Soil Use and Management, 28(4), pp.457-467.
Makris, K.C., Grove, J.H. and Matocha, C.J., 2006. Colloid-mediated vertical phosphorus
transport in a waste-amended soil. Geoderma, 136(1), pp.174-183.
Marcato, C.E., Pinelli, E., Pouech, P., Winterton, P. and Guiresse, M., 2008. Particle size
and metal distributions in anaerobically digested pig slurry. Bioresource Technology,
99(7), pp.2340-2348.
Masse, L., Masse, D.I., Beaudette, V. and Muir, M., 2005. Size distribution and composition
of particles in raw and anaerobically digested swine manure. Transactions of the
ASAE, 48(5), pp.1943-1949.
McDowell, R.W. and Sharpley, A.N., 2001. Phosphorus losses in subsurface flow before and
after manure application to intensively farmed land. Science of the Total
Environment, 278(1), pp.113-125.
McGechan, M.B. and Lewis, D.R., 2002a. SW—soil and water: sorption of phosphorus by
soil, part 1: Principles, equations and models. Biosystems Engineering, 82(1), pp.1-
24.
McGechan, M.B. and Lewis, D.R., 2002b. SW—soil and water: transport of particulate and
colloid-sorbed contaminants through soil, part 1: general principles. Biosystems
Engineering, 83(3), pp.255-273.
Meyer, D., Ristow, P.L. and Lie, M., 2007. Particle size and nutrient distribution in fresh
dairy manure. Applied Engineering in Agriculture, 23(1), pp.113-118.
Murphy, J., and J.P. Riley. 1962. A modified single solution method for determination of
phosphate in natural waters. Analytica Chimica Acta, 27, pp.31–36.
Perassi, I. and Borgnino, L., 2014. Adsorption and surface precipitation of phosphate onto
CaCO 3–montmorillonite: effect of pH, ionic strength and competition with humic
acid. Geoderma, 232, pp.600-608.

122
Peters, K., Hjorth, M., Jensen, L.S. and Magid, J., 2011. Carbon, nitrogen, and phosphorus
distribution in particle size–fractionated separated pig and cattle slurry. Journal of
Environmental Quality, 40(1), pp.224-232.
Regelink, I.C., Koopmans, G.F., van der Salm, C., Weng, L. and van Riemsdijk, W.H., 2013.
Characterization of colloidal phosphorus species in drainage waters from a clay soil
using asymmetric flow field-flow fractionation. Journal of Environmental Quality,
42(2), pp.464-473.
Rowland, A.P. and Haygarth, P.M., 1997. Determination of total dissolved phosphorus in
soil solutions. Journal of Environmental Quality, 26(2), pp.410-415.
Schelde, K., de Jonge, L.W., Kjaergaard, C., Laegdsmand, M. and Rubæk, G.H., 2006.
Effects of manure application and plowing on transport of colloids and phosphorus to
tile drains. Vadose Zone Journal, 5(1), pp.445-458.
Sharpley, A.N., Chapra, S.C., Wedepohl, R., Sims, J.T., Daniel, T.C. and Reddy, K.R., 1994.
Managing agricultural phosphorus for protection of surface waters: Issues and
options. Journal of Environmental Quality, 23(3), pp.437-451.
Shon, H.K., Vigneswaran, S. and Snyder, S.A., 2006. Effluent organic matter (EfOM) in
wastewater: constituents, effects, and treatment. Critical Reviews in Environmental
Science and Technology, 36(4), pp.327-374.
Siemens, J., Ilg, K., Lang, F. and Kaupenjohann, M., 2004. Adsorption controls mobilization
of colloids and leaching of dissolved phosphorus. European Journal of Soil Science,
55(2), pp.253-263.
Stutter, M.I., 2015. The composition, leaching, and sorption behavior of some alternative
sources of phosphorus for soils. Ambio, 44(2), pp.207–216.
Turner, B.L., Kay, M. a & Westermann, D.T., 2004. Colloidal phosphorus in surface runoff
and water extracts from semiarid soils of the western United States. Journal of
Environmental Quality, 33(4), pp.1464–72.
Volf, C.A., Ontkean, G.R., Bennett, D.R., Chanasyk, D.S. and Miller, J.J., 2007. Phosphorus
losses in simulated rainfall runoff from manured soils of Alberta. Journal of
Environmental Quality, 36(3), pp.730-741.

123
7 Phosphorus fractionation changes in soils affected by
solid and liquid fractions of processed cattle slurry
7.1 Abstract
Livestock slurry is an important nutrient source for crops. A range of slurry
processing strategies (e.g. acidification, anaerobic digestion and mechanical separation) are
now being practiced to reduce their environmental footprint and improve handling. However,
these processes can alter their chemical, biological and physical properties which may result
in a difference in P dynamics and speciation when applied to soil. To elucidate the potential
impact following land application, slurry was treated by acidification (A) or anaerobic
digestion (AD) and then separated into solid (S) and liquid (L) fractions. The separated
untreated and treated slurry fractions were incorporated into an agricultural sandy loam soil
and incubated for 4 months. Soil samples were taken on days 1, 11, 21, 42, 84 and 126, and
sequential fractionation was used to analyse the P forms present. The results showed that
application of livestock slurry instantly increased the contents of most P forms in soil,
especially the labile P form. At day 1, the slurry-derived labile P fractions in all slurry
amended treatments were 16-30% of IP-H2O, 12-19% of OP-H2O, 10-14% of IP-NaHCO3
and 12-21% of OP-NaHCO3. The content of IP-H2O form decreased following first order
decay kinetics in all treatments and the proportion of slurry-derived moderately labile and
stable P tended to increase during the incubation. The value of the IP-H2O first order decay
rate constant tended to be larger for the acidified slurry amended treatments but smaller for
the anaerobically digested slurry amended treatments. We also conclude that acidification
may help improve lability of occluded P in soil. Anaerobically digested slurry may represent
a better slow-release P supply for plants than untreated slurry. Liquid fraction of slurry with
smaller C/P ratio may induce faster P degradation in soil than the solid fraction.

124
7.2 Introduction
Phosphorus (P) is a primary element for plant growth (Waldrip-Dail et al., 2009). Its
dynamics in soil are complex and controlled by physico-chemical factors (sorption-
desorption) and by biological reactions (immobilization-mineralization) (Cross &
Schlesinger, 1995; Buehler et al., 2002). Some studies claimed that exchangeable P during
soil incubation can partly or even predominantly (20-90%) result from biological and
biochemical rather than physico-chemical processes (Bünemann, 2015). But He et al. (2004)
and Griffin et al. (2003) indicated IP-NaHCO3 and IP-NaOH forms are controlled by the
sorption/immobilization capacity of Al and Fe oxides in soil. Indeed, the relative
contribution of biological and biochemical processes tends to be lower in arable soils than
under grassland and forest soils, and is negatively related to the availability of inorganic P
and positively to concentrations of soil organic carbon (Bünemann, 2015). P hydrolysis in
soil is also related to soil clay content, where soils with a high clay content result in greater
phytate adsorption, preventing its hydrolysis (Celi et al., 2001; Giaveno et al., 2010; Pagliari
& Laboski, 2014). Pagliari & Laboski (2014) suggest that soils with a clay content <71 g/kg
provides conditions that are suitable for hydrolysis of enzymatic hydrolysable P. In a silt
loam, IP-NaHCO3 and IP-NaOH forms fluctuated less than in a sandy loam, indicating the
silt loam had a higher capacity to regulate changes in inorganic P (He et al., 2004). IP-NaOH
is reported to be important in buffering available P supply while significant depletion of
organic forms are rarely measured (Buehler et al., 2002). Waldrip-Dail et al. (2009) also
monitored a transformation from IP-NaHCO3 to IP-NaOH over an 84 d incubation after
poultry manure application to a sandy loam soil.
Livestock slurry addition affects the P dynamics by altering the physico-chemical,
biological, and biochemical soil properties (He et al., 2004). First, livestock slurry contains
considerable amounts of P, especially labile P forms such as H2O, bicarbonate and NaOH
extractable inorganic P (Guo & Yost, 1998; Pagliari & Laboski, 2012). Repeated
applications of manures increase soil P content, with a predominance of inorganic P over
organic P (Hountin et al., 2000; Abdala et al., 2015). In addition, livestock slurry also
provides microorganisms and exophosphatases to soil (Crouse et al., 2002). He et al. (2004)
suggest that in the first 14 d after application to soil, manure-borne microbial and exoenzyme
activities might contribute to more variable P dynamics, and that P amendments stimulate
microbial organic P utilization. Cooperband & Good (2002) also argue that the organic
carbon (C) content of manure could alter soil structure (e.g. through a lower bulk density and

125
greater aggregate stability), leading to changes in the sorptive properties. They found both
inorganic P fertiliser and dairy manure increased the soil IP-H2O content initially. But
eventually the IP-H2O level of inorganic P fertiliser treatment decreased to the same level as
in the unamended soil, while in dairy manure treated soil the IP-H2O content remained at a
higher level. Some researchers have claimed that the transformation of stable organic P
forms (e.g. OP-HCl) could be an important mechanism for maintaining a long-term balance
between labile and immobile P in soils (He et al., 2008; Waldrip-Dail et al., 2009).
Slurry processing strategies change the properties of slurry, so may affect the
interaction of slurry nutrients with soil after incorporation. Acidification generally improves
P bioavailability within slurry (Fangueiro et al., 2015; Sommer et al., 2015; Chapter 3), and
anaerobic digestion induces the biodegradation of organic P (Hjorth et al., 2009; Chapter 4),
but the differences in pH and other aspects may result in additional effects on soil processes.
Acidified slurry contains more labile P and the lower pH could alter microbial structure and
function and soil P sorption after application. On the other hand, digestates have greater
proportions of less labile or recalcitrant P (Marcato et al., 2008; Güngör & Karthikeyan,
2008; Rico et al. 2012; Chapter 4), and the high pH may induce P precipitation or sorption
with calcium in soil (Hinsinger, 2001). Digestates tend to cause greater microbial basal
respiration in soil than untreated slurry (Hupfauf et al., 2016). Separated solid and liquid
slurry fractions contain different amounts of organic C, and hence have different C/P ratios.
Cumulative P release by mineralisation was negatively correlated with the C/P ratio and
positively correlated with initial P content of the organic amendments (Floate, 1970;
Mafongoya et al., 2000). It is also reported that separated liquid slurry has greater microbial
activity than the solid slurry (Hansen et al., 2004), which also applied to digestates (Nkoa,
2014).
Therefore, this study explored the changes in inorganic and organic P forms in soil
after incorporation with solid and liquid fractions of untreated, acidified, and anaerobically
digested cattle slurry. The aim was to elucidate the influences of differently processed slurry
addition on P forms in soil. The hypotheses were, i) addition of livestock slurry, non-
processed and processed, would increase labile P content of soil instantly, ii) the availability
of P forms would reduce over time, iii) both acidified and anaerobically digested slurry
would cause greater labile P content of soil than untreated slurry, and iv) organic P in liquid
fractions would mineralise to a greater degree, and at a faster rate than organic P in solid
fractions.

126
7.3 Materials and methods
7.3.1 Cattle slurry collection and separation
Cattle slurry was collected from a commercial beef farm on four independent
occasions as four replicates in Gwynedd, Wales, UK. Slurry samples were kept at 4ºC in the
laboratory before processing by acidification or anaerobic digestion. Cattle slurry was
acidified to pH 5.5 by adding ca. 35 ml 15% H2SO4 L-1 slurry per week. Anaerobic digestion
(AD) was simulated and conducted in the laboratory. The dry matter (DM) content of the
cattle slurry was adjusted to 8% with distilled water prior to incubation to maximise the
methane production (Sun et al., 2012), and then sealed in containers connected to foil bags
for gas collection, and incubated at 35°C for 35 d. The containers were shaken gently for 1 h
every day and the gas in the bags was released when full. The untreated and acidified
samples were both stored under 10°C for these 35 d. Replicate batches of untreated and
treated samples were wet-sieved into solid (>63 µm) and liquid (<63 µm) fractions This
resulted in 6 slurry treatments: solid fraction of untreated cattle slurry (CS), liquid fraction of
untreated cattle slurry (CL), solid fraction of acidified slurry (AS), liquid fraction of
acidified slurry (AL), solid fraction of AD slurry (ADS), and liquid fraction of AD slurry
(ADL). Sub-samples of each slurry treatment were combusted at 550°C and then dissolved
by 2.4 M HCl and the TP content finally determined by the molybdate blue method of
Murphy& Riley (1962). The total C of separated fractions was also measured on fresh
subsamples by TruSpec® CN analyzer (Leco Corp., St Joseph, MO). The characteristics of
separated slurry are shown in Table 7.1.

127
Table 7.1 Characteristics of solid and liquid fractions of cattle slurry, acidified slurry, anaerobically digested slurry (on a dry
weight basis). Values represent means ± SEM, n = 4.
Treatment CS CL AS AL ADS ADL
TC content g kg -1 365 (±25) 322 (±39) 388 (±11) 281 (±2) 447 (±8) 341 (±12)
TP content g kg -1 4.8 (±0.3) 11.5 (±0.5) 3.9 (±0.4) 9.6 (±0.6) 5.8 (±0.2) 11.5 (±0.2)
TN content g kg -1 24.8(±1.5) 113.1(±10.4) 31.8(±2.0) 107.0(±13.5) 46.5(±3.3) 116.4(±4.3)
C/P 76.6 (±6.7) 28.5 (±4.7) 99.4 (±4.9) 29.2 (±1.1) 77.8 (±3.9) 29.7 (±0.6)
C/N 14.8(±1.0) 2.9(±0.3) 12.3(±0.8) 2.8(±0.4) 9.7(±0.7) 2.9(±0.1)

128
7.3.2 Incubation and sampling
250 g fresh soil was packed in plastic containers of 9 cm diameter and 3 cm height.
All separated slurries were adjusted to the same water content and incorporated into the soil.
Due to the water content of the liquid slurry fractions (and to avoid excess water application),
the application rate for all treatments was set at 60 mg TP kg-1 dry soil (equivalent to 22 kg
TP ha-1). Then the soil was kept at field capacity during the incubation. Containers were
incubated at 20°C in the dark for 126 days, and covered with perforated polyethylene film to
maintain aeration and to limit evaporative losses. Approximately 1 g of soil was sampled
from each container at days 1, 11, 21, 42, 84 and 126 for modified Hedley fractionation of P
forms.
7.3.3 Modified Hedley fractionation
1 g soil was sequentially extracted by 20 ml of distilled water (H2O), 0.5 M NaHCO3,
0.1 M NaOH, and 1 M HCl. During each extraction, sample and extractant were shaken for
16 h. The suspension was then centrifuged at 18,500 g for 10 min. Inorganic P in each
suspension was detected by colorimetry after Murphy & Riley (1962). TP was determined
after persulfate digestion. The undissolved residue was digested with aqua regia for 4 h at
120°C for TP analysis. The deference between TP and IP was taken as organic P (OP). The P
forms of inorganic and organic P extractable by H2O, NaHCO3, NaOH and HCl and P in the
residue represent as IP-H2O, IP-NaHCO3, IP-NaOH, IP-HCl, OP-H2O, OP-NaHCO3, OP-
NaOH, OP-HCl, TP-residue in this study. We define IP-H2O, OP-H2O, IP-NaHCO3, OP-
NaHCO3 as labile P, IP-NaOH and OP-NaOH as moderately labile P, and IP-HCl and OP-
HCl and residual-P as stable P forms (Negassa & Leinweber, 2009).
7.3.4 Statistical analysis
The concentration of P in this study is expressed as mg kg-1 on a dry weight basis.
The proportions of slurry-derived total P from livestock slurry represented by the different P
forms was calculated by subtracting the respective concentration of P in the control and then
dividing by the total P difference to control. The distribution of P forms in the soil during the
incubation are presented as proportions of total P of soil.
Temporal changes in the IP-H2O concentration of the soil after the different slurry
applied was fitted to a first order kinetics equation (1) (Petrucci, 2007).
ln(Pt/P0) = -kt (1)

129
Where Pt was the IP-H2O proportion in the soil after application at time t. P0 was the
IP-H2O in the soil after application at time zero while k is a decay rate constant (day-1). The
half-lives of IP-H2O in the soil after slurry application is t1/2 (Petrucci, 2007).
t1/2 = ln2/k (2)
Statistical analysis was conducted with SPSS v22 (IBM Inc., Armonk, NY). The
differences between treatments and between sampling dates were analysed by ANOVA with
Tukey pairwise post-hoc testing with effects considered significant for p<0.05.
7.4 Results and discussion
7.4.1 Livestock slurry derived P in soil
On day 1, the addition of the six treatments resulted in greater TP concentration of
soil (530-539 mg kg-1) than the control (462 mg kg-1) (Table 7.2). In addition, the differences
in TP concentrations on day 1 between amended treatments of CS, AS, ADS, CL, AL, ADL
and control were 77±9 mg kg-1, 74±5mg kg-1, 68±4 mg kg-1, 72±5 mg kg-1, 75±5 mg kg-1,
and 76±8 mg kg-1, respectively, which are all close to the added TP rate of 60 mg kg-1.
Generally, the moderately labile and stable P forms are the dominant P pools in soil (Cross
& Schlesinger, 1995). In our experiment, the moderately labile and stable P forms
represented 90% of TP in the control on day 1. Slurry contains a large portion of labile P (He
et al., 2006; Pagliari & Laboski, 2012; Chapter 3&4). On day 1, there were greater
concentrations of IP-H2O, OP-H2O and IP-NaHCO3 forms in the slurry amended treatments
than the control. Table 7.3 summarises the proportion of P forms in the slurry-derived TP.
On day 1, a large portion of this slurry-derived TP in all slurry amended treatments was in
the labile P forms of IP-H2O (16-30%), OP-H2O (12-19%), IP-NaHCO3 (10-14%) and OP-
NaHCO3 (12-21%) (Table 7.3), which is consistent with other studies (Sui et al., 1999;
Contreras et al., 2007; Roboredo et al., 2012). In the study of Roboredo et al. (2012), slurry-
derived P-resin represented an even greater proportion (over 70%) of slurry-derived TP in
the whole untreated, whole acidified, solid untreated and solid acidified slurry treatments
following an application rate of 120 mg TP kg-1, which was twice that of our application rate.
The slurry-derived OP-HCl proportion of all slurry treatments and the slurry-derived OP-
NaOH proportion of the CS, ADS and ADL treatments showed negative values on day 1,
indicating transformation of OP-NaOH and OP-HCl to other P forms. Untreated and
digested slurry with high pH may increase the soil pH, reducing P sorption to Al and Fe
oxides in soil. Gustafsson et al. (2012) showed that in soils with <10% clay, P sorption

130
increased with decreasing pH. In addition, organic matter from slurry may associate with Al
and Fe, decreasing P sorption and increasing P availability (Iyamuremye et al., 1996),
resulting in the low or negative slurry-derived OP-NaOH proportion in those treatments. In
contrast, in the AS and AL treatments, the slurry-derived OP-NaOH proportion was positive.
The low pH enhanced P sorption with Fe and Al oxides in soil (Holmén & Casey, 1996;
Waldrip et al., 2011). Plus the competitive organic matter, in the AS and AL treatments the
increase and decrease of P sorption may counterbalance.
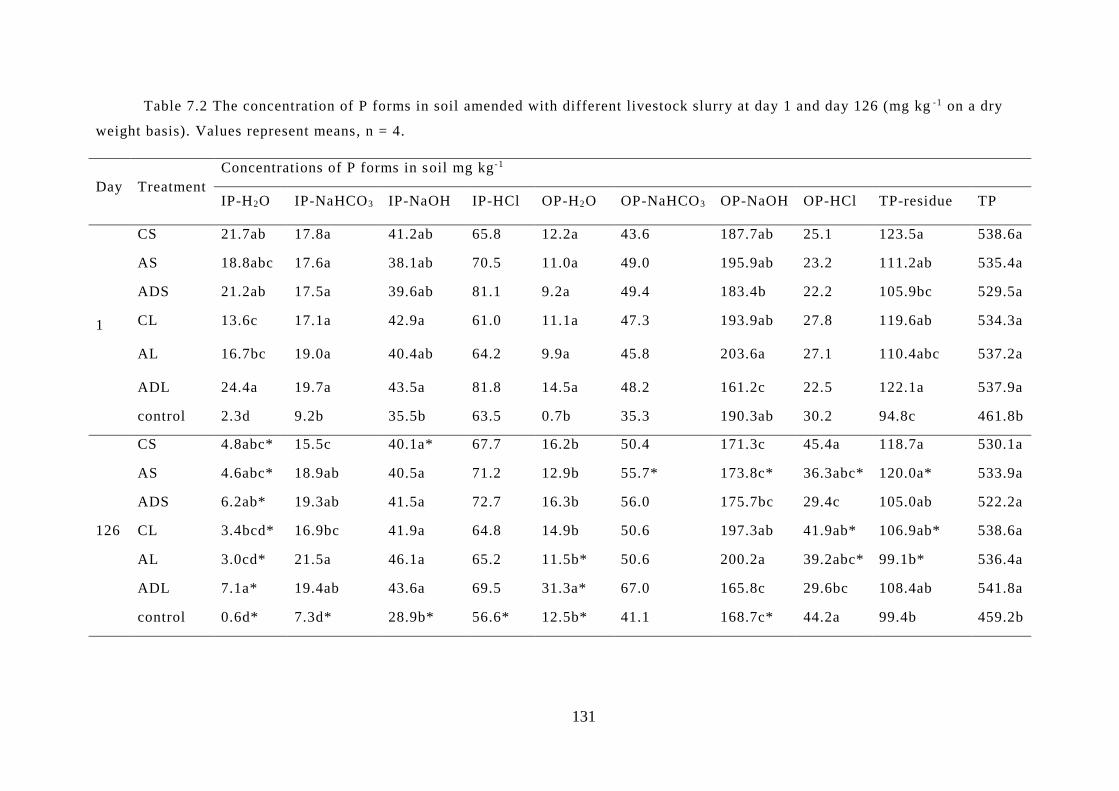
131
Table 7.2 The concentration of P forms in soil amended with different livestock slurry at day 1 and day 126 (mg kg -1 on a dry
weight basis). Values represent means, n = 4.
Day Treatment
Concentrations of P forms in soil mg kg -1
IP-H2O IP-NaHCO3 IP-NaOH IP-HCl OP-H2O OP-NaHCO3 OP-NaOH OP-HCl TP-residue TP
1
CS 21.7ab 17.8a 41.2ab 65.8 12.2a 43.6 187.7ab 25.1 123.5a 538.6a
AS 18.8abc 17.6a 38.1ab 70.5 11.0a 49.0 195.9ab 23.2 111.2ab 535.4a
ADS 21.2ab 17.5a 39.6ab 81.1 9.2a 49.4 183.4b 22.2 105.9bc 529.5a
CL 13.6c 17.1a 42.9a 61.0 11.1a 47.3 193.9ab 27.8 119.6ab 534.3a
AL 16.7bc 19.0a 40.4ab 64.2 9.9a 45.8 203.6a 27.1 110.4abc 537.2a
ADL 24.4a 19.7a 43.5a 81.8 14.5a 48.2 161.2c 22.5 122.1a 537.9a
control 2.3d 9.2b 35.5b 63.5 0.7b 35.3 190.3ab 30.2 94.8c 461.8b
126
CS 4.8abc* 15.5c 40.1a* 67.7 16.2b 50.4 171.3c 45.4a 118.7a 530.1a
AS 4.6abc* 18.9ab 40.5a 71.2 12.9b 55.7* 173.8c* 36.3abc* 120.0a* 533.9a
ADS 6.2ab* 19.3ab 41.5a 72.7 16.3b 56.0 175.7bc 29.4c 105.0ab 522.2a
CL 3.4bcd* 16.9bc 41.9a 64.8 14.9b 50.6 197.3ab 41.9ab* 106.9ab* 538.6a
AL 3.0cd* 21.5a 46.1a 65.2 11.5b* 50.6 200.2a 39.2abc* 99.1b* 536.4a
ADL 7.1a* 19.4ab 43.6a 69.5 31.3a* 67.0 165.8c 29.6bc 108.4ab 541.8a
control 0.6d* 7.3d* 28.9b* 56.6* 12.5b* 41.1 168.7c* 44.2a 99.4b 459.2b

132
Note: the different letters in the same column indicate the significant difference between different treatments in the same P form
(p<0.05). The column with no letters indicates no significant difference between treatments. * indicates significant differences between
day 1 and day 126 (p<0.05). Same in Table 7.3.
Table 7.3 The proportion of slurry-derived different P forms (as a% of slurry-derived TP) in the soil of each treatment at day 1
and day 126 (%). Values represent means, n = 4.
Day Treatment IP-H2O IP-NaHCO3 IP-NaOH IP-HCl OP-H2O OP-NaHCO3 OP-NaOH OP-HCl TP-residue
1
CS 27.9 12.1 7.7 0.6 16.4 12.2 -5.9a -10.5 39.4a
AS 22.9 11.7 3.5 9.2 14.4 18.9 7.0a -9.7 22.2ab
ADS 28.0 12.2 6.2 25.1 12.5 20.7 -9.3ab -11.9 16.6b
CL 15.9 11.0 10.4 -4.2 14.8 16.6 4.8a -3.4 34.1ab
AL 19.3 13.0 6.4 1.2 12.3 14.3 17.2a -4.3 20.5ab
ADL 30.4 14.2 10.8 21.3 18.5 17.5 -38.3b -10 35.7ab
126
CS 6.0ab* 11.8 16.2* 16.1 5.3b 13.1 3.2c 0.6a 27.8a
AS 5.6ab* 16.2 16.1* 20.1 0.5b* 20.4 4.6c -11.0abc 27.4a
ADS 9.5a* 20.2 21.1* 22.9 6.1b 25.0 12.6bc* -23.8c* 6.3b
CL 3.7b* 12.4 15.9 10.7* 3.0b* 11.9* 35.4ab* -2.4ab 9.4ab*
AL 3.4b* 19.2 22.8* 12.0 -1.3b* 9.3 41.2a* -6.8ab 0.2b*
ADL 7.7ab* 15.0 18.4 17.1 24.1a 29.5 -4.4c* -18.5bc 11.1ab

133
Acidification increases IP-H2O concentration and decreases IP-NaHCO3 of both solid
and liquid slurry (Chapter 3), while AD decreased IP-H2O concentration and increased IP-
NaHCO3 concentration of slurry (Chapter 4). Acidification decreased IP-HCl concentration
of liquid slurry (Chapter 3), while AD increased IP-HCl concentration of liquid slurry
(Chapter 4). Both acidification and AD decreased OP-NaHCO3 concentration, and increased
OP-NaOH concentration of solid and liquid slurry (Chapter 3 & 4). Roboredo et al. (2012)
found at the beginning of their incubation that the application of acidified pig slurry
increased the IP-resin content in soil to a larger extent than untreated pig slurry. However, in
our results, these concentration differences in different processed slurries were not reflected
in the slurry-derived P form proportions of soil on day 1 (Table 7.3). This may be because
the differences between different slurries were not big enough and variability between
replicates was large. In addition, the separated solid fractions contained greater IP-H2O
concentrations than the liquid fractions in untreated, acidified and anaerobic digested slurry
(Chapter 3&4). After application, the slurry-derived IP-H2O proportion of the CL and AL
treatments tended to be less than the CS and AS treatments respectively, although this was
not statistically significant on day 1 (Table 7.3).
Over the 126 days of incubation, the slurry-derived IP-H2O, IP-NaOH, OP-NaOH,
OP-HCl, TP-residue proportions consistently presented differences between slurry
treatments (Appendix 7.1). Finally, after 126 d of incubation, the labile IP form of the IP-
H2O concentration of all treatments had decreased compared with day 1, by 71%-82%
(Table 7.2). Also, the proportion of slurry-derived IP-H2O of all slurry treatments was
significantly reduced when comparing the amount present at day 1 and day 126. The slurry-
derived OP-H2O proportion of the AS, CL, AL treatments also decreased significantly from
day 1 to day 126, and in the CS and ADS treatments this proportion also tended to decrease,
although not statistically. The other labile P forms, IP-NaHCO3 and OP-NaHCO3, did not
show much change in concentration or in the slurry-derived proportion in each slurry
treatment when comparing day 1 and day 126. In contrast, the proportion of slurry-derived
moderately labile and stable P tended to increase after 126 d. Further, this increase in the
slurry-derived IP-NaOH of the CS, AS, ADS and AL treatments, and the slurry-derived OP-
NaOH of the ADS, CL, AL and ADL treatments was significant (Table 7.3). Therefore, we
suggest that of the slurry-derived TP, the availability of P reduced during incubation, and
that the transformation of P from IP-H2O and OP-H2O to IP-NaOH and OP-NaOH
dominated. It is believed that organic materials with >2 mg kg-1 of TP show net P

134
mineralization (Floate, 1970). Roboredo et al. (2012) monitored a significant increase in
slurry-derived total IP proportion over 184 days incubation in whole untreated, whole
acidified, solid untreated and solid acidified slurry treatments. However, although in our
study, the TP concentration of all slurry applied was over 2 mg kg-1, the slurry-derived total
IP proportion only showed a significant increase in the CL, AS and AL treatments between
day 1 to day 126, indicating rates of mineralization dominated those for immobilization.
Anaerobically digested slurry may contain less degradable organic matter, and
mineralization may be counterbalanced by immobilization. The extent of change in slurry-
derived P forms from day 1 to day 126 was also calculated by dividing the value at day 126
by the value at day 1 (data not shown), but no differences were found between different
slurry amended treatments in this ratio.
7.4.2 Patterns of P forms during incubation
Technically, the TP concentration of soil should not change during incubation. To
avoid the impact of variability of concentration, the changes of P forms during incubation for
each treatment were presented as the change in proportions of TP (Figure 7.1). The
transformation of P forms are controlled both by sorption-desorption and immobilization-
mineralization (Daroub et al., 2000; Buehler et al., 2002; He et al., 2004).
Over the incubation period, the IP-H2O proportion of all treatments gradually
decreased and shifted to the IP-NaHCO3 and IP-NaOH forms. In the first 21 d, there was a
significant decrease in the IP-H2O proportion and a significant increase in the IP-NaHCO3
and IP-NaOH proportions in all treatments (Figure 7.1), which is in agreement with Daroub
et al. (2000), who found a movement of the isotope label from IP-resin to IP-NaOH over
their 34 d incubation. In our study, after reaching the first peak at day 21, the proportion of
IP-NaHCO3 in each treatment gradually decreased until it became lower than on day 1
(Figure 7.1). He et al. (2004) found the IP-NaHCO3 concentration of soil incubated with
dairy manure fluctuated in the opposite manner to the IP-NaOH concentration, implying a
transformation from IP-NaHCO3 to IP-NaOH during the incubation. Other researchers also
suggest IP-NaOH acts as a sink for added IP, and a source for IP-NaHCO3 in the soil (Beck
& Sanchez, 1994; Buehler et al., 2002; Zheng et al., 2002). However, the IP-NaHCO3 and
IP-NaOH proportion in our results did not show such counterbalanced pattern.

135
Figure 7.1 The change of the proportion of P forms in TP of different treatments. Values represent means ± SEM, n = 4.

136
The IP-H2O concentration was mainly controlled by sorption and desorption kinetics,
and the change of the IP-H2O concentration of all treatments in our result fitted well to a first
order decay kinetics (Table 7.4). The value of the decay rate constant, ‘k’, of treatments
showed no significant differences between six slurry amended treatments. The six slurry
amended treatments all presented significantly greater ‘k’ values than the control. However,
there was a trend that AL > CS > CL > AS > ADL > ADS > control, indicating the decrease
in the IP-H2O concentration in the AL treatment was the fastest, and in the ADS treatment
was the slowest between all slurry amended treatments. Comparing solid and liquid fractions,
we found that the IP-H2O concentration in the AL treatment decayed at a faster rate than the
AS treatment, perhaps because the AL treatment resulted in the exposure of more sorption
sites, accelerating P sorption to a greater extent than for the AS treatment.
Table 7.4 Index of first order kinetics of the decrease in the IP -H2O
concentration in soils of different treatments. Values represent means ± SEM, n = 4.
Treatment k days -1 R2 t1/2 days
CS 0.0141(±0.0026) 0.27(±0.11) 56(±13)
AS 0.0125(±0.0011) 0.70(±0.03) 57(±5)
ADS 0.0102(±0.0010) 0.75(±0.04) 70(±8)
CL 0.0132(±0.0017) 0.42(±0.16) 56(±8)
AL 0.0172(±0.0033) 0.52(±0.21) 45(±8)
ADL 0.0124(±0.0009) 0.40(±0.30) 57(±4)
Control 0.0074(±0.0007) 0.55(±0.02) 96(±8)
Mineralization and immobilization of P occur during incubations in soil (Roboredo et
al., 2012). However, we could not quantify such changes based on our data. The study of
Buehler et al. (2002) suggested inorganic P immobilization, because they found in soils with
no P addition, >14% of the added inorganic 33P was recovered in the OP-NaOH and OP-HCl
forms after 14 d of incubation. Although our study did not present a relationship between the
IP proportion and the OP-NaOH and OP-HCl proportions, the OP-NaOH and OP-HCl
proportions were two quite changeable forms in all treatments (Figure 7.1).
The AS treatment had less TP-residue proportion at day 21 and day 84, compared
with the CS treatment, and the AL treatment had a smaller TP-residue proportion at day 84
than the CL treatment, implying the release of occluded P in the acidified slurry amended
soil. The ADL treatment was found to have a greater proportion of IP-NaHCO3 at day 21
and 42, and less OP-HCl proportion at day 42 and day 126 than the CL treatment. Therefore,
137
it indicates that anaerobically digested slurry, especially the liquid fraction, could be a
slower but longer-term P supply product than untreated slurry.
Some researchers have argued that liquid manure has more microbial activity than
solid manure (Ghonsikar & Miller, 1973; Magid et al., 1996; Turner et al., 2003).
Mafongoya et al. (2000) also suggested cumulative P released in soil was negatively
correlated with the C/P ratio. In our study, the solid fraction of slurry had a higher C/P than
liquid fraction (Table 7.1). Thus, liquid treatments were expected to show higher or faster
degradation of OP (Hansen et al., 2004). There was a significant reduction in the OP-H2O
form proportion in the first day 11 or day 21 for the three solid treatments, while in the three
liquid treatments the proportion of OP-H2O form remained stable. This may be related to the
C/P ratio and microbial activity.
7.5 Conclusions
Application of livestock slurry instantly increased the soil content of most P forms,
especially the labile P form. The soil concentration of IP-H2O decreased via first order
kinetics. The AL treatment tended to show a quicker reduction of IP-H2O, while the ADL
and ADS treatments tended to show a slower reduction of IP-H2O.. The proportion of slurry-
derived moderately labile and stable P tended to increase over the incubation period.
Addition of acidified slurry tended to increase lability of the occluded P in soil.
Anaerobically digested slurry may represent a better slow-release P supply for plants than
untreated slurry. The liquid fraction of slurry with smaller C/P ratio may induce faster P
turnover in soil than the solid fraction.
7.6 References
Abdala, D.B., da Silva, I.R., Vergütz, L. and Sparks, D.L., 2015. Long-term manure
application effects on phosphorus speciation, kinetics and distribution in highly
weathered agricultural soils. Chemosphere, 119, pp.504-514.
Beck, M.A. and Sanchez, P.A., 1994. Soil phosphorus fraction dynamics during 18 years of
cultivation on a Typic Paleudult. Soil Science Society of America Journal, 58(5),
pp.1424-1431.
Buehler, S., Oberson, A.R.A.O.I.M., Rao, I.M., Friesen, D.K. and Frossard, E., 2002.
Sequential phosphorus extraction of a P-labeled Oxisol under contrasting agricultural
systems. Soil Science Society of America Journal, 66(3), pp.868-877.

138
Bünemann, E.K., 2015. Assessment of gross and net mineralization rates of soil organic
phosphorus–A review. Soil Biology and Biochemistry, 89, pp.82-98.
Celi, L., Presta, M., Ajmore-Marsan, F. and Barberis, E., 2001. Effects of pH and
electrolytes on inositol hexaphosphate interaction with goethite. Soil Science Society
of America Journal, 65(3), pp.753-760.
Contreras, L. A.Y., Hernández-Valencia, I. and López-Hernández, D., 2007. Fractionation of
soil phosphorus in organic amended farms located on savanna sandy soils of
Venezuelan Amazonian. Biology and Fertility of Soils, 43(6), pp.771-777.
Cooperband, L.R. and Good, L.W., 2002. Biogenic phosphate minerals in manure:
implications for phosphorus loss to surface waters. Environmental Science &
Technology, 36(23), pp.5075-5082.
Cross, A.F. and Schlesinger, W.H., 1995. A literature review and evaluation of the. Hedley
fractionation: Applications to the biogeochemical cycle of soil phosphorus in natural
ecosystems. Geoderma, 64(3-4), pp.197-214.
Crouse, D.A., Sierzputowska-Gracz, H., Mikkelsen, R.L. and Wollum, A.G., 2002.
Monitoring phosphorus mineralization from poultry manure using phosphatase
assays and phosphorus-31 nuclear magnetic resonance spectroscopy.
Communications in Soil Science and Plant Analysis, 33(7-8), pp.1205-1217.
Daroub, S.H., Pierce, F.J. and Ellis, B.G., 2000. Phosphorus fractions and fate of
phosphorus-33 in soils under plowing and no-tillage. Soil Science Society of
America Journal, 64(1), pp.170-176.
Fangueiro, D., Hjorth, M. and Gioelli, F., 2015. Acidification of animal slurry–a review.
Journal of Environmental Management, 149, pp.46-56.
Floate, M.J.S., 1970. Decomposition of organic materials from hill soils and pastures: II.
Comparative studies on the mineralization of carbon, nitrogen and phosphorus from
plant materials and sheep faeces. Soil Biology and Biochemistry, 2(3), pp.173-185.
Ghonsikar, C.P. and Miller, R.H., 1973. Soil inorganic polyphosphates of microbial origin.
Plant and Soil, 38(3), pp.651-655.

139
Giaveno, C., Celi, L., Richardson, A.E., Simpson, R.J. and Barberis, E., 2010. Interaction of
phytases with minerals and availability of substrate affect the hydrolysis of inositol
phosphates. Soil Biology and Biochemistry, 42(3), pp.491-498.
Griffin, T.S., Honeycutt, C.W. and He, Z., 2003. Changes in soil phosphorus from manure
application. Soil Science Society of America Journal, 67(2), pp.645-653.
Guo, F., and R.S. Yost. 1998. Partitioning soil phosphorus into three discrete pools of
differing availability. Soil Science, 163(10), pp.822-833.
Gustafsson, J.P., Mwamila, L.B. and Kergoat, K., 2012. The pH dependence of phosphate
sorption and desorption in Swedish agricultural soils. Geoderma, 189, pp.304-311.
Güngör, K. and Karthikeyan, K.G., 2008. Phosphorus forms and extractability in dairy
manure: a case study for Wisconsin on-farm anaerobic digesters. Bioresource
Technology, 99(2), pp.425-436.
Hansen, J.C., Cade-Menun, B.J. and Strawn, D.G., 2004. Phosphorus speciation in manure-
amended alkaline soils. Journal of Environmental Quality, 33(4), pp.1521-1527.
He, Z., Griffin, T.S. and Honeycutt, C.W., 2004. Evaluation of soil phosphorus
transformations by sequential fractionation and phosphatase hydrolysis. Soil Science,
169(7), pp.515-527.
He, Z., Honeycutt, C.W., Cade-Menun, B.J., Senwo, Z.N. and Tazisong, I.A., 2008.
Phosphorus in poultry litter and soil: Enzymatic and nuclear magnetic resonance
characterization. Soil Science Society of America Journal, 72(5), pp.1425-1433.
He, Z., Senwo, Z.N., Mankolo, R.N. and Honeycutt, C.W., 2006. Phosphorus fractions in
poultry litter characterized by sequential fractionation coupled with phosphatase
hydrolysis. Journal of Food Agriculture and Environment, 4(1), pp.304.
Hinsinger, P., 2001. Bioavailability of soil inorganic P in the rhizosphere as affected by root-
induced chemical changes: a review. Plant and Soil, 237(2), pp.173-195.
Hjorth, M., Nielsen, A.M., Nyord, T., Hansen, M.N., Nissen, P. and Sommer, S.G., 2009.
Nutrient value, odour emission and energy production of manure as influenced by
anaerobic digestion and separation. Agronomy for Sustainable Development, 29(2),
pp.329-338.

140
Holmén, B.A. and Casey, W.H., 1996. Hydroxamate ligands, surface chemistry, and the
mechanism of ligand-promoted dissolution of goethite [α-FeOOH (s)]. Geochimica et
Cosmochimica Acta, 60(22), pp.4403-4416.
Hountin, J.A., Karam, A., Couillard, D. and Cescas, M.P., 2000. Use of a fractionation
procedure to assess the potential for P movement in a soil profile after 14 years of
liquid pig manure fertilization. Agriculture, Ecosystems & Environment, 78(1),
pp.77-84.
Hupfauf, S., Bachmann, S., Juárez, M.F.D., Insam, H. and Eichler-Löbermann, B., 2016.
Biogas digestates affect crop P uptake and soil microbial community composition.
Science of The Total Environment, 542, pp.1144-1154.
Iyamuremye, F., Dick, R.P. and Baham, J., 1996. Organic amendments and phosphorus
dynamics: I. Phosphorus chemistry and sorption. Soil Science, 161(7), pp.426-435.
Mafongoya, P.L., Barak, P. and Reed, J.D., 2000. Carbon, nitrogen and phosphorus
mineralization of tree leaves and manure. Biology and Fertility of Soils, 30(4),
pp.298-305.
Magid, J., Tiessen, H. and Condron, L.M., 1996. Dynamics of organic phosphorus in soils
under natural and agricultural ecosystems. Humic substances in terrestrial ecosystems.
Elsevier, Amsterdam, pp.429-466.
Marcato, C.E., Pinelli, E., Pouech, P., Winterton, P. and Guiresse, M., 2008. Particle size
and metal distributions in anaerobically digested pig slurry. Bioresource Technology,
99(7), pp.2340-2348.
Miranda, K.M., Espey, M.G. and Wink, D.A., 2001. A rapid, simple spectrophotometric
method for simultaneous detection of nitrate and nitrite. Nitric oxide, 5(1), pp.62-71.
Mulvaney, R.L., 1996. Nitrogen—inorganic forms. Methods of Soil Analysis Part 3—
Chemical Methods, (methodsofsoilan3), pp.1123-1184.
Murphy, J., and J.P. Riley., 1962. A modified single solution method for determination of
phosphate in natural waters. Analytica Chimica Acta, 27, pp.31–36.
Negassa, W. and Leinweber, P., 2009. How does the Hedley sequential phosphorus
fractionation reflect impacts of land use and management on soil phosphorus: a
review. Journal of Plant Nutrition and Soil Science, 172(3), pp.305-325.
141
Nkoa, R., 2014. Agricultural benefits and environmental risks of soil fertilization with
anaerobic digestates: a review. Agronomy for Sustainable Development, 34(2),
pp.473-492.
Pagliari, P.H. and Laboski, C.A., 2012. Investigation of the inorganic and organic
phosphorus forms in animal manure. Journal of Environmental Quality, 41(3),
pp.901-910.
Pagliari, P.H. and Laboski, C.A., 2014. Effects of manure inorganic and enzymatically
hydrolyzable phosphorus on soil test phosphorus. Soil Science Society of America
Journal, 78(4), pp.1301-1309.
Petrucci, R.H., 2007. General Chemistry: Principles and Modern Application. 9th ed.
Pearson Education, New Jersey.
Roboredo, M., Fangueiro, D., Lage, S. and Coutinho, J., 2012. Phosphorus dynamics in soils
amended with acidified pig slurry and derived solid fraction. Geoderma, 189, pp.328-
333.
Rico, C., Rico, J.L. and Lasa, C., 2012. Anaerobic digestion of the liquid fraction of dairy
manure separated by screw pressing and centrifugation in a upflow anaerobic sludge
blanket reactor at 25° C. Biosystems Engineering, 112(4), pp.344-351.
Sommer, S.G., Hjorth, M., Leahy, J.J., Zhu, K., Christel, W. and Sørensen, C.G., 2015. Pig
slurry characteristics, nutrient balance and biogas production as affected by
separation and acidification. The Journal of Agricultural Science, 153(01), pp.177-
191.
Sui, Y., Thompson, M.L. and Shang, C., 1999. Fractionation of phosphorus in a Mollisol
amended with biosolids. Soil Science Society of America Journal, 63(5), pp.1174-
1180.
Sun Y., Fu B., Liu Q., Yan L., Wang W., and Wang Y., 2012. Optimization of cattle manure
hydrolysis and acidification for methane production. Chinese Journal of Eco-
Agriculture, 20(9), pp.1222-1229.
Turner, B.L., Mahieu, N. and Condron, L.M., 2003. The phosphorus composition of
temperate pasture soils determined by NaOH–EDTA extraction and solution 31 P
NMR spectroscopy. Organic Geochemistry, 34(8), pp.1199-1210.

142
Waldrip-Dail, H., He, Z., Erich, S.M. and Honeycutt, W.C., 2009. Soil phosphorus dynamics
in response to poultry manure amendment. Soil Science, 174(4), pp.195-201.
Waldrip, H.M., He, Z. and Erich, M.S., 2011. Effects of poultry manure amendment on
phosphorus uptake by ryegrass, soil phosphorus fractions and phosphatase activity.
Biology and Fertility of Soils, 47(4), pp.407-418.
Zheng, Z., Simard, R.R., Lafond, J. and Parent, L.E., 2002. Pathways of soil phosphorus
transformations after 8 years of cultivation under contrasting cropping practices. Soil
Science Society of America Journal, 66(3), pp.999-1007.

143
Appendix 7.1 The proportion of slurry-derived different P forms (as a percentage of slurry -derived TP) in the soil of each
treatment for each sampling date of the incubation. Values represent means, n = 4.
Treatment Day
The proportion of slurry-derived P forms %
IP-H2O IP-
NaHCO3 IP-NaOH IP-HCl OP-H2O
OP-
NaHCO3 OP-NaOH OP-HCl
TP-
residue
CS
1
27.9 12.1 7.7 0.6 16.4 12.2 -5.9a -10.5 39.4a
AS 22.9 11.7 3.5 9.2 14.4 18.9 7.0a -9.7 22.2ab
ADS 28.0 12.2 6.2 25.1 12.5 20.7 -9.3ab -11.9 16.6b
CL 15.9 11.0 10.4 -4.2 14.8 16.6 4.8a -3.4 34.1ab
AL 19.3 13.0 6.4 1.2 12.3 14.3 17.2a -4.3 20.5ab
ADL 30.4 14.2 10.8 21.3 18.5 17.5 -38.3b -10.0 35.7ab
CS
11
14.0abc 18.1 9.7ab 13.7 -0.6 28.4 -9.2b 18.7a 7.3
AS 13.9abc 14.6 7.5ab -0.6 -1.1 31.5 25.7a 11.4ab -3.0
ADS 21.7a 18.2 14.3a -0.3 4.4 33.2 24.1a -24.1b 8.4
CL 6.8c 16.1 8.9ab 3.8 6.5 20.8 5.4ab 22.5a 9.2
AL 9.9bc 13.4 5.3b -2.5 2.8 24.9 12.2ab 34.6a -0.5
ADL 15.8ab 15.1 7.9ab -0.9 8.2 25.8 -4.4ab 18.2ab 14.4
CS
21
11.1b 17.5 9.5c 15.9 0.6ab 6.2 -11.4c -1.5 52.1a
AS 12.9ab 19.8 14.7bc 10.9 -3.1b 16.5 25.7a -8.9 11.5b
ADS 16.3ab 17.8 11.7bc 6.8 -3.5b 12.1 1.6bc 1.7 35.4ab
CL 10.0b 18.0 23.1a 13.9 10.8a 13.4 3.7bc -10.8 18.0b

144
AL 9.7b 19.0 12.4bc 23.8 3.2ab 9.3 8.5ab -8.0 22.1ab
ADL 19.2a 23.0 17.4ab 15.0 7.5ab 15.1 -10.8c -7.6 21.1ab
CS
42
5.6abc 13.1 6.9c 26.7 7.4 42.6a -43.3 14.4ab 26.5a
AS 6.5abc 14.4 8.6bc -11.7 1.4 37.1ab 16.2 18.2ab 9.3ab
ADS 10.7a 18.1 16.8ab -2.7 3.5 43.7a 22.3 -13.6b 1.2ab
CL 2.1c 10.6 9.6bc -3.4 0.4 23.0b -6.2 63.9a 0.0ab
AL 2.5bc 13.5 9.2bc -9.5 3.0 27.3b 9.0 58.8a -13.8b
ADL 8.0ab 18.0 21.0a 13.2 6.0 33.7ab 7.5 -22.7b 15.2ab
CS
84
10.4 19.3 16.6 23.1 5.4 25.0 -45.9ab 5.1 40.9a
AS 7.5 17.3 11.0 31.9 2.5 28.3 2.2ab 1.4 -2.1b
ADS 11.9 21.1 28.4 11.2 0.5 25.2 -25.2ab 1.6 25.3ab
CL 4.8 22.2 37.0 19.9 2.6 29.0 -55.0b -0.9 40.5a
AL 5.0 20.4 17.7 13.9 3.1 25.2 18.3a -1.7 -1.9b
ADL 8.8 18.4 26 19.0 3.6 16.7 -12.3ab 3.2 16.6ab
CS
126
6.0ab 11.8 16.2 16.1 5.3b 13.1 3.2c 0.6a 27.8a
AS 5.6ab 16.2 16.1 20.1 0.5b 20.4 4.6c -11.0abc 27.4a
ADS 9.5a 20.2 21.1 22.9 6.1b 25.0 12.6bc -23.8c 6.3b
CL 3.7b 12.4 15.9 10.7 3.0b 11.9 35.4ab -2.4ab 9.4ab
AL 3.4b 19.2 22.8 12.0 -1.3b 9.3 41.2a -6.8ab 0.2b
ADL 7.7ab 15.0 18.4 17.1 24.1a 29.5 -4.4c -18.5bc 11.1ab
Note: the different letters in the same column indicate the significant difference between different treatments ( p<0.05).

145
8 The effect of slurry processing on phosphorus
availability for plant uptake and potential leaching
8.1 Abstract
Slurry processing approaches, such as separation, acidification and anaerobic
digestion, have been applied in livestock slurry management to achieve greater sustainability.
However, these processes may alter the phosphorus (P) bioavailability to plants and mobility
in the soil after field application. To better understand the impact of applying processed
cattle slurry on P plant uptake and potential P leaching from soil, separated solid and liquid
fractions of untreated, acidified and anaerobically digested cattle slurries were applied to the
surface of a ryegrass sward established on sand textured Eutric Cambisol in a pot experiment.
Slurry treatments were applied on an equal total P loading basis, of 10 kg P ha-1 equivalent.
Leachates were collected weekly after simulated water events, and ryegrass was harvested
every three weeks for 12 weeks. Inorganic P (IP) and total P (TP) contents of leachates, and
TP content of ryegrass were measured throughout the experiment. The Olsen-P content of
the different depths of soil at the end of the experiment was also determined. Results showed
that addition of the untreated, acidified and anaerobic digested solid and liquid slurry tended
to increase offtake compared to the control treatment, especially the difference between the
total P offtake of the 4 harvests of the acidified liquid slurry and anaerobic digested liquid
slurry treatments and the control was significant. The untreated and anaerobic digested slurry
treatments tended to increase the pH of soil, while the acidified slurry treatment decreased
soil pH compared to the control. In addition, untreated, acidified, anaerobic digested slurry
treatments all showed greater soil electrical conductivity (EC) than the control. Compared to
the untreated slurry treatments, acidified slurry resulted in lower pH in the surface soil (0-3
cm), and greater EC in the whole soil column, but anaerobically digested slurry treatment
showed no difference for soil pH and EC compared to the untreated slurry treatment.
Application of the untreated, acidified, and anaerobically digested solid and liquid slurry
significantly increased the Olsen-P content of the top 0-1 cm of soil. However, there was no
difference in the Olsen-P content between different slurry-amended treatments. The
inorganic and organic P concentration in leachates over the 12 weeks was not influenced
much by addition of the slurry treatments, and there was no effect of the different treatments
on the cumulative inorganic and organic P loss during the experiment in comparison with the
control. The difference between separated solid and liquid slurry treatments was only found

146
in P offtake and P content of leachate between the anaerobic digested solid and liquid slurry
treatments. P offtake of the third harvest, and the P lost from the fourth leaching event were
significantly greater from the anaerobic digested liquid slurry treatment than the anaerobic
digested solid fraction treatment. In summary, addition of untreated livestock slurry
increased Olsen-P content in the surface soil and increased P offtake. Acidified and
anaerobically digested slurry were both represented similar P sources for plants in
comparison to untreated slurry, increasing the Olsen-P content of soil and P offtake of
ryegrass to a similar extent. The liquid fraction of anaerobically digested slurry was better in
improving P availability in soil than the solid fraction. The different slurry types did not
greatly impact upon the potential for P leaching on one application.
8.2 Introduction
Phosphorus (P) is an essential nutrient for plant growth. Livestock slurry is an
important source of P and other nutrients in agriculture (Waldrip-Dail et al., 2009). As well
as the untreated slurry supplied directly from the animal house or reception pit, some slurries
are treated by different approaches for the benefit of greater sustainability, e.g. acidification
to reduce ammonia emission (Kai et al., 2008), and anaerobic digestion (AD) to produce
green energy and reduce odour and viable pathogens (Smet et al., 1999; Clemens et al.,
2006), and mechanical separation to concentrate dry matter in the solid fraction. The
agronomic value may be different between these differently processed livestock slurries.
Acidification has been reported to improve the bioavailability of P in livestock slurry
(Güngör et al., 2007; Hjorth et al., 2015). Low pH dissolves the dominant precipitates of
struvite and Ca-P in livestock slurry (Güngör et al., 2007; Christensen et al., 2009). In
Chapter 3, we also found acidification increased the labile P (IP-H2O+IP-NaHCO3) content,
dissolving the precipitated P (IP-HCl) and degrading the OP-NaHCO3 form. In addition, the
acidity may release P from Ca-P complexes (Hinsinger, 2001), but may also release
amorphous Fe and Al, increasing P sorption to soil (Holmén & Casey, 1996; Waldrip et al.,
2011). During anaerobic digestion, degradation processes are thought to improve P plant
availability of livestock slurry (Masse et al., 2011; Chapter 4). On the other hand, recalcitrant
P minerals, i.e. struvite and calcium bound phosphates, are also formed during anaerobic
digestion (Güngör et al., 2004; Marcato et al., 2008; Chapter 4). Digestates have been shown
to cause higher microbial basal respiration in soils after being applied than untreated slurry
(Hupfauf et al., 2016). However, Bachmann et al. (2014) detected, in comparison to

147
untreated slurry, lower activities of soil enzymes after application of digestates. In addition,
most results from field experiments have indicated no effects of anaerobic digestion on P
availability in soil (Loria & Sawyer, 2005; Moller & Stinner, 2010; Bachmann et al., 2011).
Apart from the agronomic benefit of livestock slurry, whether treated or not, P loss
via leaching from soils receiving livestock slurry can result in eutrophication of watercourses
(Sharpley et al., 1999). In livestock slurry, P distributed in different sizes of particles may
affect its mobility (McGechan, 2002). Hansen et al. (2004) noticed lagoon manure resulted
in higher inorganic P concentration in subsurface soil than solid manure, but it was the
opposite for organic P. Different P forms have different sorption affinities to soil minerals.
The sorption affinity of organic P to soils was lower in comparison with inorganic P (IP) in
the study of Anderson & Magdoff (2005), but higher in the results of Lessa & Anderson
(1996), Leytem et al. (2002) and Berg & Joern (2006). Phytate, an important organic P form
in livestock slurry, is the most competitive for P sorbing sites (Berg & Joern, 2006). Some
research has reported organic P to be the main source of leaching after pig slurry application
(Gerritse, 1981; Toor, 2003).
Acidification results in the transfer of some P from the solid fractions to liquid
fractions in livestock slurry (Roboredo et al., 2012). In Chapter 3, we showed that a greater
proportion of the labile P (IP-H2O+IP-NaHCO3) was distributed in the liquid fraction in the
acidified slurry than in the untreated slurry. Other effects of acidifying slurry include a lower
pH, higher EC, and greater content of free metals (Fangueiro et al., 2009; Hjorth et al., 2015).
The degradation processes during anaerobic digestion are thought to work to a greater extent
on smaller particles, leading to larger proportion of coarse particles in digestates (Shon et al.,
2006; Marcato et al., 2008). Stutter (2015) observed that anaerobic digestion reduced P
sorption in soil columns, suggesting an increased short-term leaching risk after digestate
application. However, most previous studies did not consider plant growth and P uptake
when evaluating P leaching risk. Ryegrass is P-efficient due to a high root/shoot ratio (Föhse
et al., 1988), and its yield and P uptake increase with increasing P application rate (Tunney
& Pmmel, 1987; Szogi et al., 2010). Hence, we used ryegrass in the following experiment.
Therefore, the aims of this study were to i) determine P movement and its potential to
leach from soil after application of separated solid and liquid fractions from untreated,
acidified and anaerobically digested slurry, and ii) determine the relative plant growth and P
uptake following application of solid and liquid fractions from untreated, acidified and
148
anaerobically treated slurries. Specifically, the experiment was designed to test the
hypotheses that: i) livestock slurry, untreated and treated, could improve plant growth and P
uptake, and increase potential P leaching; ii) acidified and anaerobically digested slurry
would cause more P uptake and potential P leaching from soil than untreated slurry; and iii)
the liquid fraction of separated slurry treatments would result in greater P uptake and
potential P leaching in soil than from the solid fraction.
8.3 Materials and methods
8.3.1 Soil collection
A sandy loam textured Eutric Cambisol (80% sand, 12% silt, 8% clay) was collected
from the Ahp horizon (0-15 cm) of a grassland field located in Abergwyngregyn, Gwynedd,
Wales, UK (53° 14' 33'' N, 4° 1' 15'' W). The site has a temperate oceanic climate with mean
annual temperature of 10.6ºC and annual rainfall of 1060 mm. After collection, the soil was
sieved to pass a 5.6 mm mesh to remove roots and stones. The soil was dried at 105ºC for 24
h to determine moisture content. Fresh soil sample was mixed with distilled water to
determine pH (1:2.5 w/v) and electrical conductivity (EC) (1:5 w/v). The Olsen-P content
was determined by extracting 1 g (fresh weight) of soil with 20 ml 0.5 M NaHCO3. The
extraction comprised shaking at 200 rev min-1 (SM30 Edmund Bühler GmbH) for 0.5 h and
centrifuging (Eppendorf centrifuge 5810, UK) at 18,500 g for 5 min, and the extractable P
content of the suspension was determined by Murphy and Riley (1962). The total P (TP)
measurement was conducted by digesting 1 g fresh soil with 10 ml of aqua regia at 120ºC for
5 h, and determining the P concentration by Murphy & Riley (1962) after cooling and
making up to 20 ml volume. Exchangeable K was determined by extracting 2 g fresh soil
with 20 ml 1 M NH4OAc, shaking for 0.5 h and centrifuging at 18,500 g for 5 min, and
determining the K concentration using flame emission spectroscopy (Sherwood 410 flame
photometer, Sherwood Scientific, Cambridge, UK) (Sparks, 1996). Soil samples (4 g fresh
weight) were also extracted with 20 ml 0.5 M K2SO4 (1:5 w/v) and shaken for 0.5 h and
centrifuged at 18,500 g for 5 min, for the determination of NO3- and NH4
+ (Miranda et al.,
2001; Mulvaney, 1996). The soil had a gravimetric moisture content of 13.2 %, a pH of 5.9,
EC of 55.5 µS cm-1, Olsen-P content of 7 mg kg-1, a TP content of 0.5 g kg-1, NO3- content of
9 mg kg-1, NH4+ content of 2 mg kg-1, and exchangeable K content of 71 mg kg-1.

149
8.3.2 Cattle slurry collection and treatments
Cattle slurry samples were collected on four independent occasions as four replicates
from a commercial beef farm in Gwynedd, Wales, UK. Slurry samples were kept at 4ºC
before processing by acidification or anaerobic digestion. Four replicates of cattle slurry
were acidified to pH 5.5 by adding 15% H2SO4, using ca. 35 ml L-1 slurry. Anaerobic
digestion was conducted in the laboratory. The dry matter (DM) content of the cattle slurry
was adjusted to 8% with distilled water prior to incubation, in order to maximise the methane
production (Sun et al., 2012), and then sealed in containers connected to foil bags for gas
collection, and incubated at 35ºC for 35 d. The containers were shaken gently for 1 h every
day and the gas in the bags was released when full. The untreated and acidified samples were
both stored under 10ºC for these 35 d. The characteristics of cattle slurry before and after
processing are shown in Table 8.1.
Replicate batches of untreated and treated samples were wet-sieved into solid
fraction (>63 µm) and liquid fraction (<63 µm). Approximately 1 g of the separated fractions
were combusted at 550ºC, then the ash was dissolved with 2 ml 2.4 M HCl and the volume
made up to 20 ml, and finally the total P concentration determined by the molybdate blue
method (Murphy & Riley, 1962). The total K content was also determined from this HCl
dissolved solution by flame emission spectroscopy (Sherwood 410 flame photometer,
Sherwood Scientific, Cambridge, UK). 4 g of slurry fraction was extracted with 20 ml 0.5 M
K2SO4, to determine the extractable NH4+ content (Mulvaney, 1996). Water extractable P
was conducted at 1:200 w/v ratio (Wolf et al., 2005). Total C and total N was also measured
with fresh slurry fraction samples by TruSpec® CN analyzer (Leco Corp., St Joseph, MO).
8.3.3 Experimental treatments
There were 7 treatments (with four replicates of each) as follows:
• solid fraction of untreated cattle slurry (CS)
• liquid fraction of untreated cattle slurry (CL)
• solid fraction of acidified slurry (AS)
• liquid fraction of acidified slurry (AL)
• solid fraction of AD slurry (ADS)
• liquid fraction of AD slurry (ADL)
• control.

150
Table 8.1 Characteristics of untreated, acidified and anaerobically digested
cattle slurry (dry weight basis, except DM and VS). Values represent means ± SEM, n
= 4.
Measurements Untreated cattle
slurry
Acidified cattle
slurry
Anaerobically
digested cattle slurry
DM content % 14.6 (±0.1) 15.6 (±0.1) 6.3(±0.4)
VS content % 11.1(±0.1) 11.7(±0.1) 4.6(±0.3)
pH 7.5(±0.0) 5.5(±0.0) 7.4(±0.1)
EC mS cm -1 14.6(±0.3) 14.2(±1.4) 16.1(±0.5)
ORP mv -28.3(±1.6) -80.0(±0.9) -24.8(±1.6)
TC g kg -1 426.8(±8.6) 386.0(±3.7) 392.4(±23.0)
TN g kg -1 46.2(±2.3) 39.2(±4.3) 75.9(±8.7)
TP g kg -1 8.0(±0.2) 6.6(±0.3) 9.5(±0.3)
TK g kg -1 36.3(±2.3) 35.0(±1.3) 29.8(±3.9)
NH4+ g kg -1 12.3(±1.2) 11.1(±0.7) 21.6(±1.7)
Water extractable P g
kg -1 4.0(±0.1) 4.4(±0.2) 4.1(±0.2)
C/N 9.3(±0.5) 8.9(±0.3) 5.6(±0.7)
C/P 53.3(±1.1) 59.5(±3.4) 41.7(±3.6)
4 kg (fresh weight) of sieved soil was packed into 28 pots, 16.5 cm diameter and 16
cm deep, at a bulk density of 1.24 g cm-3 on dry weight basis. A mixed perennial ryegrass
(Lolium perenne L.) sward (Abergrain, Aberplentiful, Aberchoice; 1:1:1) was sown at a rate
equivalent to 34 kg ha-1. Nitrogen and potassium fertilizers (NH4NO3 and K2SO4) were
applied to the soil at the equivalent rate of 100 kg N ha-1 and 12.4 kg K ha-1, to ensure they
were non-limiting. The pots were randomly placed on a bench in a greenhouse and regularly
re-randomized. Air temperature was recorded every 4 h during the experiment by an iButton.
Slurry application and leachate collection
The soil was kept at 60% water holding capacity for the first 6 weeks before slurry
application. At the end of 6th week, 885 ml water (equivalent to a 1 h rainfall storm event of
40 mm h-1) was applied to the soil surface and the leachate was collected the following day
in bottles as the background sample.

151
The ryegrass was cut to 2 cm above the soil surface before slurry addition.
Differently processed slurries, adjusted to same water content, were then applied to the soil
surface at the equivalent rate of 10 kg TP ha-1. Additional N and K fertilizers were added to
all treatments, including the control, at 50 kg N ha-1 and 65 kg K ha-1, to ensure they were
not limiting (Defra, 2010).
Water was added at a rate of 885 ml pot-1 and leachates were collected weekly after
slurry application. Leachate volumes of 12 leaching events were recorded by weight. The
inorganic P (reactive P) concentration of leachates was determined according to Murphy &
Riley (1962). The leachates were also digested with ammonium persulfate (1 ml leachate +
0.1 g ammonium persulfate + 2 ml 0.9 M H2SO4) in the autoclave for the TP concentration.
Organic P concentration was calculated by the difference (Total P – inorganic P). The P
mass of the leachates (mg pot-1) were calculated by multiplying the volume by the P
concentration for each leaching event.
Ryegrass was harvested every 3 weeks (to a height of 2 cm above soil surface) after
slurry application and there were four harvests. Total fresh ryegrass harvested was weighed
and then grass was dried at 80ºC to determine total dry weight. After being ground, 0.5 g of
dried ryegrass sample was combusted in a muffle at 550ºC, then dissolved in 2 ml 2.4 M
HCl and made volume to 20 ml for TP concentration determination. The P offtake (mg pot-1)
was calculated by multiplying the TP concentration of the ryegrass by the total dry weight
for each harvest. After the last ryegrass harvest, the soil was sectioned by depth; 0-1, 1-2, 2-3,
3-5, 5-10, 10-16 cm, and analysed for soil moisture content, pH, EC and Olsen-P.
8.3.4 Statistical analyses
The differences in leachate chemistry between different dates of leaching events were
analysed by ANOVA with Tukey pairwise post-hoc testing with effects considered
significant for p<0.05. The same statistical approach was used for the ryegrass harvest data.
The comparisons between acidified and untreated treatments, between digested and
untreated treatments, between solid and liquid treatments within each slurry processing
approach were conducted by paired t-test, and between each amended treatment and control
were analysed by unpaired t-test, both with effects considered significant at p<0.05. The
statistical analysis was conducted with SPSS v22 (IBM Inc., Armonk, NY).
152
8.4 Results
8.4.1 Separated untreated cattle slurry, acidified cattle slurry,
anaerobically digested cattle slurry
The information on properties of the amended materials are summarised in Table 8.2.
After slurry separation, more water was allocated in the liquid fraction, resulting in the low
DM and volatile solid (VS) contents in this fraction. Anaerobic digestion increased the total
P (TP) and water extractable P contents of the solid fraction of cattle slurry, due to
substantial loss of DM during biodegradation. Acidification only increased the water
extractable P content of the liquid fraction of cattle slurry. Since the application rate was
based on the same TP loading, the water extractable P/TP ratio may reflect the labile P input
from each slurry-amended treatment. There was no significant difference in this ratio
between untreated slurry and digested slurry treatments. The AL treatment showed a
significant greater ratio than the CL treatment. Further, there was no difference in this ratio
between solid and liquid treatments.
8.4.2 Potential P leaching
There was little effect of the different slurry treatments on the concentrations of
inorganic and organic P in the leachate compared to the control treatment. Figure 8.1 shows
that the only occasions there were significant effects of the slurry treatments on P leaching
were; i) the 7th leaching event when the inorganic P concentration of the ADL treatment was
greater than the control, ii) the organic P concentration of the 1st and 8th leaching events of
the CL treatment were greater than the control, and iii) the 5th leaching event, when the
organic P concentration of the ADS treatment were significantly greater than the control
treatment. Acidification and anaerobic digestion did not significantly affect the inorganic and
organic P concentration of leachates. Slurry separation tended to cause higher inorganic and
organic P concentration in the leachates from the liquid slurry fraction treatments than the
solid fraction treatments. Specifically, the inorganic P concentration of the 5th and 6th
leachates of the ADL treatment was significantly greater than for the ADS treatment (Figure
8.1). The inorganic P concentration of the 9th and 10th leachates of the AL treatment was also
higher than the AS treatment (Figure 8.1). The organic P concentration of the 1st leachate of
the CL treatment was larger than the CS treatment. The organic P concentration of the 10th
leachate of the AL treatment was larger than the AS treatment (Figure 8.1).

153
Table 8.2 Characteristics of solid and liquid fractions of untreated, acidified and anaerobically digested cattle slurry (on dry
weight basis except dry matter and volatile solid contents). V alues represent means ± SEM, n = 4.
Treatments Untreated cattle slurry Acidified cattle slurry Anaerobically digested cattle slurry
Particle size
fraction Solid Liquid Solid Liquid Solid Liquid
Dry matter
content % 14.2(±0.4) 3.8(±0.4) 14.8(±0.5) 4.1(±0.1) 11.4(±0.4) 3.5(±0.2)
Volatile solid
content % 11.3(±0.2) 2.6(±0.3) 12(±0.3) 2.7(±0.1) 8.9(±0.3) 2.4(±0.2)
C g kg -1 365(±25) 321(±39) 388(±11) 280(±2) 446(±9) 341.2(±12)
TN g kg -1 24.8(±1.5) 113.1(±10.4) 31.8(±2.0) 107.0(±13.5) 46.5(±3.3) 116.4(±4.3)
TK g kg -1 23.4(±1.2) 29.2(±2.4) 20.2(±2.2) 55.2(±3.6) 31.8(±1.1) 34.1(±3.0)
Water
extractable P g
kg -1
2.4(±0.3) 5.2(±0.6) 2.4(±0.1) 7.5(±0.1) 3.4(±0.1) 5.8(±0.7)
TP g kg -1 4.9(±0.4) 10.5(±0.8) 3.9(±0.2) 11.0(±0.5) 6.5(±0.2) 12.3(±0.2)
Water
extractable P/TP
ratio
0.5(±0.1) 0.5(±0.1) 0.6(±0.0) 0.7(±0.0) 0.5(±0.0) 0.5(±0.1)
C/P 76.0(±8.8) 30.0(±1.7) 99.5(±5.7) 25.5(±1.1) 68.8(±2.1) 28.8(±0.9)

154
Figure 8.1 Inorganic and organic P concentrations of leachates over the incubation period. Values represent means ± SEM, n = 4.

155
There were no significant differences in inorganic P loss in each leachate from the
different treatments compared to the control. Acidified and anaerobically digested treatments
did not show much difference in the inorganic P lost in each leachate compared with
untreated cattle slurry, irrespective of the solid or liquid fractions. Only for the 1st leachate of
the AL treatment and the 5th leachate of the ADL treatment was there a significantly greater
inorganic P loss than the CL treatment. Comparing the solid and liquid slurry treatments,
there was a significant difference in the 4th and 5th leachates between the ADS and ADL
treatments. Specifically, there was a greater inorganic P loss in the 4th and 5th leaching events
from the ADL treatment than the ADS treatment (p<0.05).
Comparing the organic P loss of each leaching event, the 2nd leachate of the AL
treatment and the 8th leachate of the CL treatment contained more than the control treatment.
Within the solid treatments, the AS and ADS treatment caused less organic P leaching than
CS in the 8th leachate (p<0.05). Within the liquid treatments, both AL and ADL treatments
showed less organic P loss in the 8th leachate than the CL treatment (p<0.05). No difference
was seen between the solid and liquid treatments of any of the slurry treatments.
A similar pattern in the cumulative loss of inorganic and organic P from the different
treatments was observed over time (Figure 8.2). Comparing the cumulative inorganic and
organic P mass of leachates between different treatments, no significant difference was seen
over time. The total inorganic and organic P loss of all treatments over the 12 weeks was -
0.53% - 0.12% and 0.11% - 0.66% of applied TP amount, respectively, without significant
differences between these treatments.

156
Figure 8.2 Cumulative inorganic and organic P mass of leachates. Values represent means ± SEM, n = 4.
157
8.4.3 Harvested ryegrass
There were no significant differences in the P offtake and dry matter yields of
ryegrass for the solid fractions of the different slurries treatments on any of the harvests
compared to the control treatment (Figure 8.3). In contrast, for the liquid fractions, the P
offtake of the ADL treatment was consistently significantly greater than the control in the 1st,
2nd and 3rd harvests, and for the 3rd harvest also had a greater dry matter yield than the
control (Figure 8.3). The CL and AL treatments resulted in a greater P offtake for the 2nd
harvest than the control (Figure 8.3). In comparison to the untreated slurry amended
treatments, acidified and anaerobically digested treatments showed no significant difference
in the P offtake and dry matter of ryegrass of each harvest (Figure 8.3). Comparing solid and
liquid treatments, there was only a significant difference for the anaerobically digested slurry,
with a larger P offtake for the 3rd harvest for the liquid fraction treatment than the solid
fraction treatment (Figure 8.3).
The cumulative P offtake after slurry application (i.e. sum of harvests 1-4) was 19-23
mg pot-1 in these treatments. The slurry-amended treatments tended to result in greater P
offtake than the control treatment. The cumulative P offtake of the AL (23 mg pot-1) and
ADL (23 mg pot-1) treatments were significant greater than the control (19 mg pot-1), but
differences between other slurry-amended treatments with the control were not statistically
significant. There was also no difference in cumulative P offtake between untreated and
acidified treatments, and between untreated and digested treatments. But there was an effect
of separation on cumulative P offtake, with the cumulative P offtake of the ADL treatment
being significantly greater than the ADS treatment.

158
Figure 8.3 Dry matter weight, P concentration, and total P mass of harvest ryegrass. Values represent means ± SEM, n = 4.

159
8.4.4 Chemistry of different soil depths
Soil pH
The untreated slurry and digested slurry tended to increase the soil pH compared to
the control, while the acidified slurry tending to decrease the pH (Figure 8.4). Specifically,
the 0-1 cm and 3-5 cm soil of the CS treatment, 0-1 cm 1-2 cm, and 3-5 cm soil of the ADS
and CL treatments, 1-2 cm and 3-5 cm soil of the ADL treatment showed significantly
higher pH than the control (Figure 8.4). The pH of the 0-1 cm soil of the AS treatment and
the pH of the 0-1 cm and 1-2 cm soil of the AL treatment was significantly lower than the
control (Figure 8.4). Compared to the untreated slurry treatments, the digested treatments
had no effect on soil pH. While the pH of the AS treatment was significant lower than the
CS treatment in the 0-1 cm soil, and the pH of the AL treatment was lower than the CL
treatment in the 0-3 cm soil (Figure 8.4). There was no difference between the CS and CL
treatments, and between the ADS and ADL treatments. But the pH of the 1-2 cm soil of the
AL treatment was significantly lower than the AS treatment (Figure 8.4). There was little
change in soil pH with depth through the soil column, except in the AS and AL columns,
which displayed a trend of increasing soil pH with depth (p<0.05).
Figure 8.4 pH, EC and Olsen-P content of different soil depths at the end of the
incubation. Values represent means ± SEM, n = 4.

160
Soil EC
Slurry addition tended to increase the EC of soil. Compared with the control
treatment, the EC of the 0-1, 1-2, 2-3, 3-5 cm soil of the AS treatment, the 0-1 cm soil of CL,
the 0-1 and 2-3 cm of AL, the 0-1 and 1-2 cm soil of the ADL treatment were significantly
higher. The soil EC values in the slurry-amended soil cores decreased with depth (Figure
8.4), especially between the top two cm layers. Both AS and AL treatments had significantly
greater EC values than the other two types of slurry treatments throughout the whole soil
column, except the 5-10 cm soil of the AS treatment and the 10-16 cm soil of the AL
treatment. Comparison between solid and liquid treatments did not show any difference in
EC.
Olsen P content
All slurry-amended treatments had significantly greater Olsen-P contents than the
control in the 0-1 cm layer (Figure 8.4). The Olsen-P contents of all treatments except the
control showed a significant decrease with depth, comparing the 0-1 and 1-2 cm layers. The
AS, AL and CL treatments also showed a trend that the Olsen-P content gradually decreased
with greater depth (p<0.05), while the remaining treatments showed no difference between
the different depths below upper 2 cm. There was no significant difference in the Olsen-P
content of the 0-1 cm soil between the different slurry-amended treatments. Furthermore,
there was seldom any significant differences seen between any treatments, including the
control, in the Olsen-P content below the top 1 cm. Only the AS and AL treatments attained
greater Olsen-P content in the 1-2 cm soil depth than the control. In addition, the 2-3 cm soil
of the CL treatments was significantly lower than the AL and ADL treatments. No difference
in the Olsen-P content was found between the solid and liquid fractions of any of the slurry
treatments.
8.5 Discussion
8.5.1 Effect of untreated livestock slurry on P dynamics in soil
Addition of untreated livestock slurry improves the P offtake by ryegrass, because,
the available P direct from livestock slurry acts as an inorganic P fertilizer. Also, addition of
livestock slurry is known to accelerate organic P mineralisation in the soil, especially in
long-term consecutive application experiments (Whalen et al., 2001; Leytem et al., 2002;
Pagliari & Laboski, 2014). Moreover, some studies suggest that some organic P forms (e.g.

161
phytate) from livestock slurry might preferentially sorb onto soil particles, and exchange for
indigenous soil inorganic P (Celi et al., 1999; Marshall & Laboski, 2006; Karathanasis &
Shumaker, 2009).
As expected, our CS and CL treatments resulted in greater total P offtake than the
control, which agrees with the hypothesis that livestock slurry improves P offtake of plants,
although this was not necessarily significant. The lack of significance may because ryegrass
roots located all over the soil column, absorbing P from both slurry and soil. The applied
amount of P of slurry was small compared to the total and available P reserves in the soil
profile. Further, most of the applied P remained in the upper soil layer where only some of
the roots were located. Thus, the uptake of native P from soil may have dominated over than
present in the added slurry. In addition, our results did demonstrate that ryegrass took P from
soil reserves, based on the Olsen-P content reduction (28%-51%) of all depths of the control
column compared to original sampled soil. If the slurry had been incorporated with the soil
thoroughly rather than spread on the surface, this problem of interference from soil P
reserves may have been avoided. But in that case, the slurry had to be applied before sown,
while in this experiment we expected to conduct on mature root system simulating the field
condition.
Our application rate may be conservative, resulting in larger portion of P uptake from
soil than slurry. Föhse et al. (1988) found when the P fertilizer rate is lower than 0.10 mg g-1,
the shoot P content and dry weight of ryegrass increases with increasing P fertilizer rate in a
linear manner. Therefore, we used a low application rate of livestock slurry in order to
ensure it fell within this linear range and reflect the role of P input from livestock slurry, and
avoid P site saturation in soil disturbing colloid-facilitate P leaching which is consistent with
the Chapter 6.
In the study of Haque et al. (2015), their treatment of 5 g kg-1 of dry cattle slurry
(which is close to the situation in our study if assuming that the 10 kg ha-1 of slurry is
incorporated with upper 2 cm of soil) resulted in 6-12 mg kg-1 extra Olsen-P than the control
over their monitoring incubation period, and P mineralization (the difference in Olsen-P
content to the control) reached a peak within the 4th-6th week of incubation after slurry
addition. In our study, we did not monitor the P of soils during the incubation, but the Olsen-
P content at the end of the incubation in the untreated slurry treatments resulted in 4-7 mg
kg-1 extra Olsen-P in the 0-1 cm soil layer compared with the control. Haque et al. (2015) did
162
not include any plants, while we grew ryegrass. Consequently, the Olsen-P content in our
experiment was lower than theirs because of the ryegrass uptake.
It is already known that in the soil with saturated P sorption sites added P could move
deeper with irrigation (Sharpley et al., 1994; Menzies et al., 1999). However, in the short-
term small-scale study of Chapter 6, we demonstrate that liquid slurry could cause greater
potential P leaching under unsaturated conditions due to the transport of the colloidal slurry
fraction. Therefore, in this experiment, we expected a similar behaviour for colloidal P in a
soil sown with ryegrass over a longer period. The same soil type and slurry application rate
was used. For organic P loss, we did find significantly greater organic P loss in the 8th
leachates in the CL treatment than the control. However, an expected significantly greater
inorganic P loss from untreated slurry treatments than the control was not shown. In Chapter
6, the interval between the slurry application and leachate collection was only one day, but in
this chapter, there was a week interval between the slurry application and the 1st leachate
collection, which was sufficient for upper soil to bind the P from slurry and for ryegrass to
absorb the labile P, preventing inorganic P leaching. Therefore, the hypothesis that addition
of livestock slurry increases potential P leaching was rejected.
8.5.2 Effect of acidification, anaerobic digestion and separation on P
dynamics
Acidified slurry
Opposite to the hypothesis, in comparison to the untreated slurry treatments, the
acidified treatments did not result in greater plant P offtake and potential P leaching.
Acidification is known to dissolve the dominant precipitates of struvite and Ca-P in livestock
slurry (Güngör et al., 2007; Christensen et al., 2009), and improve the bioavailability, as
indicated by the water extractable P/TP ratio in our results. However, the absolute value
difference of the water extractable P content between acidified and untreated slurry was not
large enough to make a difference in plant P offtake and potential inorganic P leaching.
However, the Olsen-P content of the 2-3 cm soil layer showed a greater value in the AL
treatment than the CL treatment, which may be associated with the increased water
extractable P content of the acidified slurry. The main impact of applying acidified slurry to
soil is more likely to be associated with the reduction in soil pH and increase in soil EC. The
AS and AL treatments resulted in significantly lower pH in the 0-1 cm and the 0-3 cm soil
respectively than the CS and CL treatments. Low soil pH enhances the adsorption of P to Fe

163
or Al oxides, reducing P mobility (Gahoonia et al., 1992; Waldrip-Dail et al., 2009).
Moreover, the low pH dissolved and released salt ions (Hjorth et al., 2015), so we detected
significantly greater EC values at almost all depths within the soil columns than the
untreated slurry treatments. Since there was no difference in EC between untreated and
acidified slurry, the increase EC in soil should be ascribed to low pH.
Anaerobically digested slurry
Anaerobic digestion is expected to improve P plant availability through the
degradation processes (Masse et al., 2005), but our result showed the water extractable P/TP
ratio of solid and liquid fractions was not significantly increased by anaerobic digestion.
Anaerobic digestion could increase the microbial biomass and activity and basal respiration
(Bougnom et al., 2012; Hupfauf et al., 2016). Organic P mineralisation is negatively
correlated with the C/P ratio (Mafongoya et al., 2000). In our results, the ADS and ADL
slurry tended to have less C/P than the CS and CL slurry, although not significantly so. Thus,
the digested slurry treatments are supposed to cause higher organic P mineralization than
untreated slurry treatments. However, neither our results of the Olsen-P content of soil nor P
offtake in the ryegrass presented significant differences between the digested and the
untreated slurry treatments. Many other field experiments also did not find significant effects
of anaerobic digestion on P availability (Loria & Sawyer, 2005; Moller & Stinner, 2010;
Bachmann et al., 2011). So despite measuring differences in the available P content of
anaerobically digested slurry (compared to untreated slurry), these do not always result in
agronomic benefit, which is opposite to our hypothesis.
Separated liquid and solid slurry
The liquid slurry fraction had a significantly lower C/P than the solid slurry fraction
in the untreated, acidified and anaerobic digestion treatments in our results. Some
researchers have argued that liquid manure has a greater microbial activity than the solid
manure (Ghonsikar & Miller, 1973; Magid et al., 1996; Turner et al., 2003). Hence, the
liquid manure-amended soil could have greater degradation of organic matter, including P
associated with organic materials, than the solid manure-amended soil. Moreover, small size
particles in slurry liquid fraction have greater mobility in soil than large sized particles in the
slurry solid fraction (McGechan, 2002). Therefore, the liquid slurry treatments were
expected to show more inorganic P release and mobility in terms of Olsen-P, or P offtake, or
inorganic P leaching, compared to slurry solid treatments, as we hypothesised. For example,

164
Pagliari & Laboski (2013) showed that the application of the liquid fraction of separated
slurry increased soil test P (Bray-1) more than the application of the solid fraction. Hao et al.
(2015) reported a greater yield and total P offtake in corn following a liquid swine manure
treatment than a solid swine manure treatment, although this was not seen in soybean. The
study of Hansen et al. (2004) with long-term (>10 years) application of liquid manure
(lagoon manure) and solid manure suggested that the liquid manure treatment resulted in
greater inorganic P content in subsurface soil (45-65 cm). However, in our study, such
expected results were not seen for the Olsen-P content of soil layers, total P offtake or total P
leaching loss over the experiment. Only for P offtake at the 3rd harvest and the total P loss in
the 4th leachate, were there greater P values for the ADL treatment than the ADS treatment.
This lack of significance may be because (1) the labile P content was similar in the solid and
liquid fractions in our slurry samples, based on the water extractable P/ TP ratio, (2) the
ryegrass roots took up P from the whole soil column rather than only the upper layer where
most slurry remained, and (3) our slurry was only applied once and the rate may have been
too low to have observed such differences. If the liquid and solid slurry had been applied for
a longer period for several times or with a greater rate, the difference in C/P and organic P
degradation, and particle mobility may have resulted in significant difference in soil test P,
plant P uptake and potential P leaching.
8.6 Conclusions
The untreated, acidified and anaerobic digested solid and liquid slurry-amended
treatments tended to result in a greater total P offtake than the control treatment, with the
difference between the total P offtake of the AL and ADL treatments and the control being
significant. Addition of untreated and anaerobic digested slurry tended to increase the pH of
soil compared to the control, while addition of acidified slurry decreased soil pH. The
untreated, acidified, and anaerobic digested slurry all increased soil EC. Comparing different
slurry treatments, the acidified slurry caused lower pH than the untreated slurry in the top 3
cm of soil, and greater EC over the whole soil column. However, the anaerobically digested
slurry resulted in no difference in soil pH and EC compared to the untreated slurry treatment.
Application of untreated, acidified, anaerobic digested solid and liquid slurry significantly
increased the Olsen-P content of 0-1 cm soil layer, but no difference was found between
different slurry-amended treatments in the Olsen-P content. The cumulative inorganic and
organic P loss in leachates over the 12 weeks was not influenced much by addition of
untreated, acidified, or anaerobically digested slurry compared to the control, and there was

165
no difference between slurry treatments. The difference between solid and liquid slurry was
only found between the ADS and ADL treatments, where the P offtake of the 3rd harvest and
the P lost in the 4th leachate of the ADL treatment were significantly greater than the ADS
treatment.
In summary, our results from this pot experiment suggested that addition of untreated
livestock slurry increased Olsen-P in the surface soil and tended to increase plant P offtake.
Acidified and anaerobically digested slurry were both comparable P sources for plants to
untreated slurry, increasing the Olsen-P content of soil and P offtake of ryegrass to a similar
extent. The liquid fraction of anaerobically digested slurry was better in improving P
availability in soil than the solid fraction. Potential P leaching was largely unaffected by
addition of differently processed slurries.
8.7 References
Anderson, B.H. and Magdoff, F.R., 2005. Relative movement and soil fixation of soluble
organic and inorganic phosphorus. Journal of Environmental Quality, 34(6), p.2228.
Bachmann, S., Gropp, M. and Eichler-Löbermann, B., 2014. Phosphorus availability and soil
microbial activity in a 3 year field experiment amended with digested dairy slurry.
Biomass and Bioenergy, 70, pp.429-439.
Bachmann, S., Wentzel, S. and Eichler‐Löbermann, B., 2011. Codigested dairy slurry as a
phosphorus and nitrogen source for Zea mays L. and Amaranthus cruentus L. Journal
of Plant Nutrition and Soil Science, 174(6), pp.908-915.
Berg, A.S. and Joern, B.C., 2006. Sorption dynamics of organic and inorganic phosphorus
compounds in soil. Journal of Environmental Quality, 35(5), pp.1855-1862.
Bougnom, B.P., Niederkofler, C., Knapp, B.A., Stimpfl, E. and Insam, H., 2012. Residues
from renewable energy production: their value for fertilizing pastures. Biomass and
Bioenergy, 39, pp.290-295.
Celi, L., Lamacchia, S., Marsan, F.A. and Barberis, E., 1999. Interaction of inositol
hexaphosphate on clays: Adsorption and charging phenomena. Soil Science, 164(8),
pp.574-585.
Christensen, M.L., Hjorth, M. and Keiding, K., 2009. Characterization of pig slurry with
reference to flocculation and separation. Water Research, 43(3), pp.773-783.
166
Clemens, J., Trimborn, M., Weiland, P. and Amon, B., 2006. Mitigation of greenhouse gas
emissions by anaerobic digestion of cattle slurry. Agriculture, Ecosystems &
Environment, 112(2), pp.171-177.
Defra, 2010. Nutrient Management Guide (RB209). 8th ed. The Stationery Office, London.
Fangueiro, D., Ribeiro, H., Vasconcelos, E., Coutinho, J. and Cabral, F., 2009. Treatment by
acidification followed by solid–liquid separation affects slurry and slurry fractions
composition and their potential of N mineralization. Bioresource Technology,
100(20), pp.4914-4917.
Föhse, D., Claassen, N. and Jungk, A., 1988. Phosphorus efficiency of plants: I. External and
internal P requirement and P uptake efficiency of different plant species. Plant and
Soil, pp.101-109.
Gahoonia, T.S., Claassen, N. and Jungk, A., 1992. Mobilization of phosphate in different
soils by ryegrass supplied with ammonium or nitrate. Plant and Soil, 140(2), pp.241-
248.
Gerritse, R., 1981. Mobility of phosphorus from pig slurry in soils. MPKV; Maharastra.
Ghonsikar, C.P. and Miller, R.H., 1973. Soil inorganic polyphosphates of microbial origin.
Plant and Soil, 38(3), pp.651-655.
Güngör, K., Jürgensen, A. and Karthikeyan, K.G., 2007. Determination of phosphorus
speciation in dairy manure using XRD and XANES spectroscopy. Journal of
Environmental Quality, 36(6), pp.1856-1863.
Hansen, J.C., Cade-Menun, B.J. and Strawn, D.G., 2004. Phosphorus speciation in manure-
amended alkaline soils. Journal of Environmental Quality, 33(4), pp.1521-1527.
Hao, X.J., Zhang, T.Q., Tan, C.S., Welacky, T., Wang, Y.T., Lawrence, D. and Hong, J.P.,
2015. Crop yield and phosphorus uptake as affected by phosphorus-based swine
manure application under long-term corn-soybean rotation. Nutrient Cycling in
Agroecosystems, 103(2), pp.217-228.
Haque, M.A., Jahiruddin, M., Rahman, M.M. and Saleque, M.A., 2015. Phosphorus
mineralization of bioslurry and other manures in soil. Journal of Environment and
Waste Management, 2(2), pp.079-083.

167
Hinsinger, P., 2001. Bioavailability of soil inorganic P in the rhizosphere as affected by root-
induced chemical changes: a review. Plant and Soil, 237(2), pp.173-195.
Hjorth, M., Cocolo, G., Jonassen, K., Abildgaard, L. and Sommer, S.G., 2015. Continuous
in-house acidification affecting animal slurry composition. Biosystems Engineering,
132, pp.56-60.
Holmén, B.A. and Casey, W.H., 1996. Hydroxamate ligands, surface chemistry, and the
mechanism of ligand-promoted dissolution of goethite [α-FeOOH (s)]. Geochimica et
Cosmochimica Acta, 60(22), pp.4403-4416.
Hupfauf, S., Bachmann, S., Juárez, M.F.D., Insam, H. and Eichler-Löbermann, B., 2016.
Biogas digestates affect crop P uptake and soil microbial community composition.
Science of The Total Environment, 542, pp.1144-1154.
Kai, P., Pedersen, P., Jensen, J.E., Hansen, M.N. and Sommer, S.G., 2008. A whole-farm
assessment of the efficacy of slurry acidification in reducing ammonia emissions.
European Journal of Agronomy, 28(2), pp.148-154.
Karathanasis, A.D. and Shumaker, P.D., 2009. Preferential sorption and desorption of
organic and inorganic phospates by soil hydroxyinterlayered minerals. Soil Science,
174(8), pp.417-423.
Lessa, A.S.N. and Anderson, D.W., 1996. Laboratory estimation of nutrient losses by
leaching on an Oxisol from Brazil. Tropical Agriculture, 73(2), pp.100-107.
Leytem, A.B., Mikkelsen, R.L. and Gilliam, J.W., 2002. Sorption of organic phosphorus
compounds in Atlantic coastal plain soils. Soil Science, 167(10), pp.652-658.
Loria, E.R. and Sawyer, J.E., 2005. Extractable soil phosphorus and inorganic nitrogen
following application of raw and anaerobically digested swine manure. Agronomy
Journal, 97(3), pp.879-885.
Magid, J., Tiessen, H. and Condron, L.M., 1996. Dynamics of organic phosphorus in soils
under natural and agricultural ecosystems. Humic Substances in Terrestrial
Ecosystems. Elsevier, Amsterdam, pp.429-466.
Marshall, S.K. and Laboski, C.A., 2006. Sorption of inorganic and total phosphorus from
dairy and swine slurries to soil. Journal of Environmental Quality, 35(5), pp.1836-
1843.

168
Masse, L., Masse, D.I., Beaudette, V. and Muir, M., 2005. Size distribution and composition
of particles in raw and anaerobically digested swine manure. Transactions-American
Society of Agricultural Engineers, 48(5), p.1943.
Mafongoya, P.L., Barak, P. and Reed, J.D., 2000. Carbon, nitrogen and phosphorus
mineralization of tree leaves and manure. Biology and Fertility of Soils, 30(4),
pp.298-305.
Marcato, C.E., Pinelli, E., Pouech, P., Winterton, P. and Guiresse, M., 2008. Particle size
and metal distributions in anaerobically digested pig slurry. Bioresource Technology,
99(7), pp.2340-2348.
McGechan, M.B., 2002. SW—soil and water: transport of particulate and colloid-sorbed
contaminants through soil, part 2: trapping processes and soil pore geometry.
Biosystems Engineering, 83(4), pp.387-395.
Menzies, N.W., Skilton, J.A. and Guppy, C.N., 1999. Phosphorus storage on effluent
irrigated land. Journal of Environmental Quality, 28(3), pp.750-754.
Miranda, K.M., Espey, M.G. and Wink, D.A., 2001. A rapid, simple spectrophotometric
method for simultaneous detection of nitrate and nitrite. Nitric Oxide, 5(1), pp.62-71.
Mulvaney, R.L., 1996. Nitrogen—inorganic forms. Methods of soil analysis part 3—
Chemical methods, Methods of Soil Analysis Volume 3), pp.1123-1184. SSSA,
Madison, WI.
Murphy, J., and J.P. Riley. 1962. A modified single solution method for determination of
phosphate in natural waters. Analytica Chimica Acta, 27:31–36.
Möller, K. and Stinner, W., 2010. Effects of organic wastes digestion for biogas production
on mineral nutrient availability of biogas effluents. Nutrient Cycling in
Agroecosystems, 87(3), pp.395-413.
Roboredo, M., Fangueiro, D., Lage, S. and Coutinho, J., 2012. Phosphorus dynamics in soils
amended with acidified pig slurry and derived solid fraction. Geoderma, 189, pp.328-
333.
Pagliari, P.H. & Laboski, C.A.M., 2013. Dairy manure treatment effects on manure
phosphorus fractionation and changes in soil test phosphorus. Biology and Fertility
of Soils, 49(8), pp.987–999.
169
Pagliari, P.H. and Laboski, C.A., 2014. Effects of manure inorganic and enzymatically
hydrolyzable phosphorus on soil test phosphorus. Soil Science Society of America
Journal, 78(4), pp.1301-1309.
Sharpley, A.N., Chapra, S.C., Wedepohl, R., Sims, J.T., Daniel, T.C. and Reddy, K.R., 1994.
Managing agricultural phosphorus for protection of surface waters: Issues and
options. Journal of Environmental Quality, 23(3), pp.437-451.
Sharpley, A.N., Daniel, T., Sims, T., Lemunyon, J., Stevens, R. and Parry, R., 1999.
Agricultural phosphorus and eutrophication. US Department of Agriculture,
Agricultural Research Service, ARS-149, 42.
Shon, H.K., Vigneswaran, S. and Snyder, S.A., 2006. Effluent organic matter (EfOM) in
wastewater: constituents, effects, and treatment. Critical Reviews in Environmental
Science and Technology, 36(4), pp.327-374.
Stutter, M.I., 2015. The composition, leaching, and sorption behavior of some alternative
sources of phosphorus for soils. Ambio, 44(2), pp.207-216.
Smet, E., Van Langenhove, H. and De Bo, I., 1999. The emission of volatile compounds
during the aerobic and the combined anaerobic/aerobic composting of biowaste.
Atmospheric Environment, 33(8), pp.1295-1303.
Sparks, D.L., editor, 1996. Methods of soil analysis. Part 3. Chemical Methods. SSSA Book
Ser. 5. ASA, Madison, WI.
Stutter, M.I., 2015. The composition, leaching, and sorption behavior of some alternative
sources of phosphorus for soils. Ambio, 44(2), pp.207–216.
Sun Y., Fu B., Liu Q., Yan L., Wang W., and Wang Y., 2012. Optimization of cattle manure
hydrolysis and acidification for methane production. Chinese Journal of Eco-
Agriculture, 20(9), p.1222-1229.
Szogi, A.A., Bauer, P.J. and Vanotti, M.B., 2010. Fertilizer effectiveness of phosphorus
recovered from broiler litter. Agronomy Journal, 102(2), pp.723-727.
Toor, G.S., Condron, L.M., Di, H.J., Cameron, K.C. and Cade-Menun, B.J., 2003.
Characterization of organic phosphorus in leachate from a grassland soil. Soil
Biology and Biochemistry, 35(10), pp.1317-1323.

170
Tunney, H. and Pommel, B., 1987. Phosphorus uptake by ryegrass from monocalcium
phosphate and pig manure on two soils in pots. Irish Journal of Agricultural Research,
pp.189-198.
Turner, B.L., Mahieu, N. and Condron, L.M., 2003. The phosphorus composition of
temperate pasture soils determined by NaOH–EDTA extraction and solution 31 P
NMR spectroscopy. Organic Geochemistry, 34(8), pp.1199-1210.
Waldrip-Dail, H., He, Z., Erich, S.M. and Honeycutt, W.C., 2009. Soil phosphorus dynamics
in response to poultry manure amendment. Soil Science, 174(4), pp.195-201.
Waldrip, H.M., He, Z. and Erich, M.S., 2011. Effects of poultry manure amendment on
phosphorus uptake by ryegrass, soil phosphorus fractions and phosphatase activity.
Biology and Fertility of Soils, 47(4), pp.407-418.
Whalen, J.K., Chang, C. and Olson, B.M., 2001. Nitrogen and phosphorus mineralization
potentials of soils receiving repeated annual cattle manure applications. Biology and
Fertility of Soils, 34(5), pp.334-341.
Wolf, A.M. et al., 2005. Development of a water-extractable phosphorus test for manure: An
interlaboratory study. Soil Science Society of America Journal, 69(3), p.695.

171
9 Summary and discussion
9.1 Objectives and hypothesis
Livestock slurry can be used to provide P for crops. Orthophosphate is the most
bioavailable form, and livestock slurry does contain considerable amount of this P form
(Guo & Yost, 1998; Pagliari & Laboski, 2012). However, different P species in livestock
slurry are subject to a series of biological, chemical and physical processes in soil after
application (Bünemann, 2015), with implication for P bioavailability in soil, and potential
loss to watercourses (Simard et al., 1995; Vadas et al., 2015). In livestock slurry, particles of
different sizes have different surface area/volume ratios, relating to bacterial colonisation
and reaction, and interaction with soil clay minerals (Magid et al., 2010), and have different
C/P ratios, with impacts on microbial immobilisation/mineralisation (Takeda et al., 2009;
Malik et al., 2013). Furthermore, small particles, i.e. colloids, can facilitate P mobility in soil
(Haygarth et al., 1997; de Jonge et al., 2004; Schelde et al., 2006; Withers et al., 2009;
Glæsner et al., 2013).
Acidification and anaerobic digestion have the potential to affect slurry composition
(Marcato et al., 2008; Fangueiro et al., 2015; Hjorth et al., 2015). However, we lack a clear
understanding of the effects of these slurry processes on P speciation associated with
particles of different sizes in differently treated livestock slurry and their effect on P
bioavailability and P loss in soil after application.
Therefore, this thesis focused on both P speciation and particle size composition and
distribution in livestock slurry to study the P cycle from livestock slurry through to the soil.
This thesis aimed to characterize P in the differently processed cattle slurries with respect to
P speciation of different sizes of particles, and to elucidate P bioavailability and mobility in
soil after application. The overall hypotheses were a) small particle size fractions of cattle
slurry dominate the total P content, and have great mobility in soil, and b) slurry
acidification and anaerobic digestion modify the P speciation and distribution in cattle slurry,
and thereafter affect P availability and mobility in soil. This Chapter synthesises the effects
of slurry processing on P speciation and distribution within the different slurry particle sizes
and on P availability and mobility in soil after application before returning to these specific
hypotheses in the conclusions.
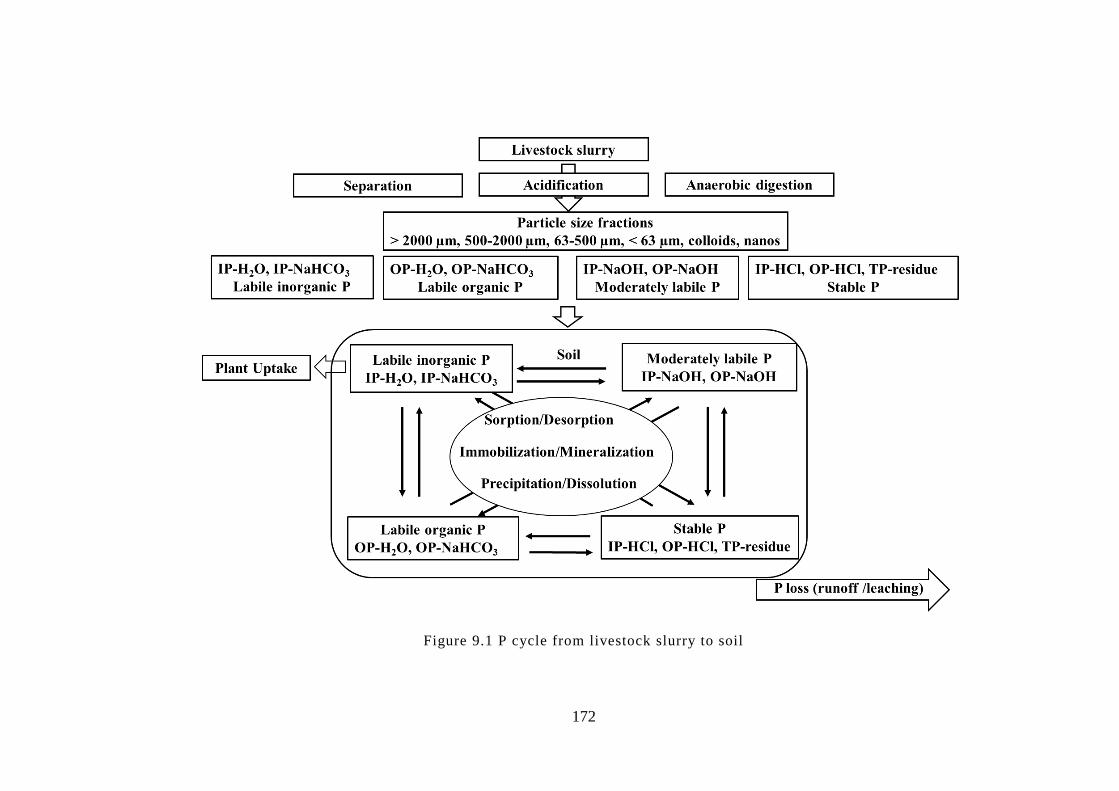
172
Figure 9.1 P cycle from livestock slurry to soil

173
9.2 P cycling from livestock slurry to soil
In this section, we discuss the P cycle from cattle slurry to soil (Figure 9.1) mainly
based on our results from previous chapters. Slurry is composed of different particle size
fractions which are associated with P species with different solubility and bioavailability.
Advanced slurry processing, separation, acidification and anaerobic digestion, alter slurry P
nutrient characteristics, which is largely related to the P speciation of different particle size
fractions. Once applied to the soil, livestock slurry-derived P whether treated or untreated,
experiences a series of biogeochemical processes, including sorption/desorption,
immobilisation/mineralisation, precipitation/dissolution. As a result, transformation between
different P pools occur over time, affecting plant P uptake and potential P loss.
9.2.1 Untreated Cattle Slurry
In untreated cattle slurry (DM of 11% and TP of 0.6 g kg-1 (on fresh basis)), the
labile inorganic P (IP-H2O + IP-NaHCO3) and labile organic P (OP-H2O + OP-NaHCO3)
represented 45% and 24% of TP of the whole slurry, respectively (Chapter 3). The
moderately labile P (IP-NaOH + OP-NaOH) and stable P (IP-HCl + OP-HCl + TP-residue)
fractions represented 10% and 21% of TP content of the whole slurry, respectively (Chapter
3). These results are consistent with other studies concluding labile P dominates in cattle
slurry (Dou et al., 2000; He et al., 2006; Pagliari & Laboski, 2012) . In contrast, in soil,
moderately labile and stable P forms are the dominant P pools (Cross & Schlesinger, 1995).
Addition of slurry provides labile P to soil which is bioavailable for plants.
Dry matter (DM) distribution in the four (operationally defined) particle size
fractions of >2000, 500-2000, 63-500 and <63 µm were 40%, 14%, 12% and 35%, and the
TP distribution were 19%, 7%, 7% and 67%, respectively (Chapter 3), which is similar to
other studies (Meyer et al., 2007; Peters et al., 2011). Other livestock slurry may show
different characteristics. For example, in contrast to cattle slurry, in pig slurry, more DM is
distributed in the smaller particle size fractions than larger particle size fractions (Møller et
al., 2000; Masse et al., 2005). In poultry manure, struvite and Ca-P are the major P forms
(Pagliari & Laboski, 2012).
To separate further, the small particle sizes of 0.45-63 µm, categorized as colloids in
our study, accounted for 62% of TP of the whole untreated cattle slurry. The proportions of
labile inorganic P, labile organic P, moderately labile P, and stable P in the colloidal fraction
were 46%, 20%, 12%, and 22%, respectively. While the <0.45 µm fraction only accounted

174
for 5% of TP of the whole cattle slurry. Similarly, Masse et al. (2005) also found 50% of the
TP of whole pig slurry was in the 0.45-10 μm fraction, but greater proportion (20%) was in
the <0.45 μm fraction. The nanoparticulate fraction of 0.03-0.45 µm represented only 3% of
TP of whole cattle slurry (Chapter 5). Almost all the rest 2% of TP was in the most soluble
fraction of <0.001 µm. Small particles are more likely to leach through soil, and colloid- and
nanoparticle-facilitated transport is thought to be an important pathway for P leaching (Hens
& Merckx, 2002; McGechan & Lewis, 2002; Siemens et al., 2004; Regelink et al., 2013).
Therefore, it was expected that colloid-associated P would have great mobility in soil
and increase potential P leaching after slurry application, whist the nanoparticulate fraction
would not contribute much to potential P leaching because of its low content. In Chapter 6,
we confirmed this. In this leaching study, we demonstrated that the colloidal fraction
predominantly contributed to potential P leaching after applying the liquid fraction of
separated slurry to a low P status soil under unsaturated conditions, and 2.4% of the TP of
the added colloidal fraction was transported to the leachate. The nanoparticulates in the
separated cattle slurry made no difference to potential P leaching.
9.2.2 Separation
We estimated the characteristics of solid and liquid fractions from slurry separation,
using results of the particle size composition and P distribution analysis following sieving
through different sieve sizes. For the untreated cattle slurry, the separation efficiencies
(solid/whole ratio) of DM for separating through sieve sizes of 2000, 500, 63 µm were 40%,
54% and 65%, respectively. The separation efficiencies of TP for these three sizes were 19%,
26% and 33%, respectively (Chapter 3).
Generally, in the liquid fractions of untreated cattle slurry from three separating sizes
(<2000, <500, <63 µm), the proportion of TP represented by labile inorganic P (46%, 46%,
45%) were greater than that in solid fractions (41%, 41%, 41%), while solid fractions tended
to show greater proportion of moderately labile (13%, 12%, 12%) in TP than liquid fractions
(10%, 10%, 10%) (Chapter 3). Labile organic P proportions were ca. 24% in both solid and
liquid fractions (Chapter 3).
Some researchers have argued that liquid manure has a greater microbial activity than
the solid manure (Magid et al., 1996; Turner et al., 2003). Also, since liquid fractions have
lower C/P ratio and small particle sizes (Chapter 3), it was expected that application of liquid
slurry fractions would result in a greater labile inorganic P content in soil than solid fractions;

175
and that organic P in liquid fractions would mineralise to a greater degree, and at a faster rate
than in solid fractions; and that the liquid fraction would result in greater plant P uptake and
potential P leaching from soil than from the solid fraction.
In Chapters 7 and 8, cattle slurry was separated with a 63 µm sieve to generate solid
and liquid fractions. These separated fractions were applied on the same TP and water
volume basis. When incorporated with the soil, on the day 1, in the solid fraction (<63 µm)
of the untreated cattle slurry amended treatment, the slurry-derived labile inorganic P, labile
organic P, moderately labile P, stable P represented 40%, 29%, 2% and 29% of soil TP
respectively. This showed no significant differences with values of 27%, 31%, 15%, and 27%
respectively for the liquid fraction treatment (Chapter 7). So, in contrast to expectation, the
liquid fraction did not cause greater labile inorganic P in soil than the solid fraction.
During incubation of the applied slurry-P in the soil, P solubility and availability is
controlled by sorption/desorption, immobilisation/mineralisation, precipitation/dissolution
(Bünemann, 2015). The soluble P content should decrease once it enters the soil, due to
sorption of P to Fe and Al hydroxides and precipitation with Ca, and experiencing adsorption
precipitation onto mineral surface crystallisation (Perassi & Borgnino, 2014). However,
organic molecules from slurry may associate with Al and Fe, decreasing P sorption
(Iyamuremye et al., 1996). Moreover, some organic P forms, e.g. phytate, from livestock
slurry might preferentially sorb onto soil particles, and exchange for indigenous soil
inorganic P (Celi et al., 1999; Marshall & Laboski, 2006; Karathanasis & Shumaker, 2009).
Therefore, slurry would maintain soil solution P for a longer period than inorganic P
fertiliser as demonstrated in other studies (Audette et al., 2016), although this was not tested
in this thesis. According to the fitting of a sorption first order kinetics in Chapter 7, the IP-
H2O concentrations, representing soil solution P, in the solid and liquid cattle slurry
treatments had half-lives of 65 and 69 days, respectively.
Mineralisation and immobilisation occur simultaneously in soil. Buehler et al. (2002)
found inorganic 33P was immobilised to the OP-NaOH and OP-HCl forms after 14 d of
incubation in soil. Organic materials with >2 mg kg-1 of TP are believed to show net P
mineralization (Floate, 1970; Roboredo et al.,2012). Addition of livestock slurry can
accelerate organic P mineralisation in the soil, especially in long-term repeat application
experiments (Whalen et al., 2001; Leytem et al., 2002; Pagliari & Laboski, 2014). Liquid
manure tends to have greater microbial activity and a lower C/P ratio than solid manure

176
(Magid et al., 1996; Turner et al., 2003, Chapter 3). Cumulative P released in soil was
negatively correlated with the C/P ratio (Mafongoya et al., 2000). Thus, after application, the
liquid slurry fraction is expected to cause greater net mineralisation than the solid fraction.
After 126 days of incubation (Chapter 7), the labile inorganic P proportions of both
untreated solid and liquid slurry treatments decreased significantly, and there was no
difference in the reduction rates between these two treatments. However, the slurry-derived
total inorganic P proportion showed a significant increase in the untreated liquid slurry
treatment between day 1 and day 126, indicating rates of mineralization dominated those for
immobilization, while there was no change in the untreated solid treatment (Chapter 7),
implying greater P release from organic matter of the untreated liquid slurry treatment than
the CS treatment, which is consistent with the hypothesis above. In Chapter 8, both the
untreated solid and liquid slurry fractions increased soil pH, EC, and the Olsen-P content of
the upper soil, and yielded slightly greater ryegrass P offtake, although there was no
significant difference between the untreated solid and liquid treatments. Thus, the difference
in P speciation between solid and liquid fractions was not large enough to make differences
in speciation and transformation of added P in soil, when applied once on the same TP and
water volume basis. Repeated long-term application may present differences. Further, in
practice, solid and liquid fractions of slurry are applied to fields without maintaining the
same water volume input as we did in the laboratory condition. The liquid fraction would
add more water to soil, which may facilitate P desorption and movement through the soil.
9.2.3 Acidification
Acidification had little effect on the DM and TP distributions in the different particle
size fractions (Chapter 3). However, the labile inorganic P proportion increased from 45% to
55% of TP of whole acidified cattle slurry (Chapter 3), mainly due to P desorption and the
dissolution of dominant precipitates, i.e. struvite, Ca-P and other occluded P (Güngör et al.,
2007; Güngör & Karthikeyan, 2008; Christensen et al., 2009). In contrast, the proportion of
stable P decreased from 21% to 15% of TP of whole acidified slurry (Chapter 3). Following
separation of the acidified slurry, the P form proportions in the solid fractions (>
2000, >500, >63 µm), from three sieve sizes, showed little change (Chapter 3). However, in
the liquid fractions (<2000, <500, <63 µm), the labile inorganic P proportion of TP increased
from 46%, 46%, and 45% to 58%, 56%, and 56%, respectively, and the moderately labile P
proportion increased from 10%, 10%, and 10% to 11%, 12%, and 12%, respectively. While

177
the stable P proportions in the liquid fractions decreased from 20%, 21%, and 21% to 14%,
15%, and 15%, respectively (Chapter 3).
Acidification did not alter the DM quantity of colloids, but the TP quantity of the
colloidal fraction decreased from 62% of TP of whole untreated slurry to 37% of TP of
whole acidified slurry. The P form composition of the untreated colloidal fraction was 46%
of labile inorganic P, 20% of labile organic P, 12% of moderately labile P, and 22% of stable
P, and changed to 33%, 22%, 19%, and 26%, respectively, in the acidified colloidal fraction,
due to labile P being dissolved and transferred into the <0.45 µm fraction. At the same time,
the TP content of the <0.45 µm fraction increased >8 times, and the increased P was mainly
in the soluble fraction of <0.001 µm. The nanoparticle-associated P was interpreted by the
significant difference between the <0.45 and <0.03 µm or between the <0.03 and <0.001 µm
fractions. However, as a result of this substantial increase in soluble P and its relatively large
variability, no significant differences were monitored in TP and IP concentrations between
the <0.45 and <0.03 µm or between the <0.03 and <0.001 µm fractions. We could not
conclude if the nanoparticle-associated P content had changed or not. But even if the
nanoparticle associated P was changed by acidification, it was not large enough to result in
greater potential P leaching from soil.
Therefore, it was expected that acidified slurry would result in a greater labile P
content of the soil and greater plant P uptake than untreated slurry, but would not show
differences in potential P leaching from soil compared to the untreated slurry. However, in
Chapter 7, the differences in labile and stable P contents between untreated and acidified
slurries were not big enough to be reflected in the slurry-derived labile and stable P
proportions of soil on day 1, and the slurry-derived P change during the soil incubation
showed little difference to untreated slurry treatments. However, Roboredo et al. (2012)
showed that an acidified pig slurry treatment resulted in greater labile P than from an
untreated slurry treatment, with double the P application rate we used. Thus, our low P
application rate may be one of the reasons for the insignificant differences in labile P
comparison between untreated and acidified slurry treatments in Chapter 7. In addition, the
acidified treatments did not result in greater plant P offtake than untreated slurry (Chapter 8).
But in Chapter 8, 12 weeks after slurry applied, the Olsen-P content of the 2-3 cm soil layer
was significantly greater in the acidified liquid slurry treatment than the untreated liquid
slurry treatment. The acidified solid and liquid slurry treatments resulted in significantly
lower pH in the upper soil compared with the untreated solid and liquid slurry treatments.

178
Moreover, although no difference was seen between the EC values of untreated and acidified
slurry before application, the low pH in acidified slurry dissolved and released salt ions in
soil (Hjorth et al., 2015), resulting in significantly greater EC values of all depths of soil
columns compared to the untreated slurry treatments. In soils with <10% clay, P sorption
increased with decreasing pH (Gahoonia et al., 1992; Holmén & Casey, 1996; Waldrip-Dail
et al., 2009; Gustafsson et al., 2012). But potential P leaching results from both Chapter 6
and Chapter 8 showed no significant differences between untreated and acidified slurry
treatments.
9.2.4 Anaerobic Digestion
Anaerobic digestion reduced the cattle slurry DM content by 40%. Further, because
the degradation of organic matter occurred unevenly across the different slurry particle size
fractions, the DM distribution was also altered. In anaerobic digesters under the condition of
stirring and high temperatures, microbial degradation of large particles is relatively fast
compared to small particles (Hjorth et al., 2010). In our results, the DM reduction extent was
greatest for larger particles >500 µm than smaller particles <500 µm. As a result, the
proportions of >2000, 500-2000, 63-500, and <63 µm fractions of total DM of the
anaerobically digested slurry changed from 40%, 14%, 12% and 35% to 24%, 9%, 17% and
50%, respectively. Similarly, Masse et al. (2005) found particles <10 μm proportion of the
DM of whole pig slurry increased after anaerobic digestion. Less change was found in the
TP distribution in these particle fractions, compared to DM. The proportions of >2000, 500-
2000, 63-500 and <63 µm fractions in TP of whole anaerobically digested slurry were 19%,
5%, 10%, 66%, respectively.
The labile inorganic P and moderately labile P proportions of TP of whole cattle
slurry increased to 53% and 12% respectively after anaerobic digestion, while labile organic
P proportion decreased to 13%. The proportion of stable P did not change much. In the solid
fractions from the three separating sieve sizes, the labile inorganic P proportions also
increased to 47%, 48% and 49%, respectively. Moderately labile P proportions in the solid
fractions increased to 15%, 15% and 14% respectively. The labile organic P decreased to
19%, 18%, 16% respectively. In the liquid fractions from the three separation sieve sizes, the
labile inorganic P proportions increased to 55%, 53% and 53%, respectively. The moderately
labile P increased to 12%, 12%, 12%. The labile organic P of solid fractions decreased to
11%, 13%, 13%.

179
The DM mass of the colloidal fraction decreased during anaerobic digestion by 18%,
which was lower than the reduction in other larger particle size fractions. Consequently, its
proportion of total DM of the whole slurry increased from 28% to 37%, with no change in
the colloid proportion of the DM of the <63 µm fraction. The TP of the colloidal fraction
still represented the same proportion of TP of the whole slurry after anaerobic digestion. The
P form change of the colloidal fraction was mainly in the reduction of labile organic P and
an increase of labile inorganic P content. The proportions of labile inorganic P, labile organic
P, moderately labile P, and stable P of the colloidal fraction of digested slurry changed to
54%, 10%, 14%, and 22%, respectively. Colloid-facilitated P leaching following application
of the digested slurry may result in greater inorganic P loss. In the nanoparticlulate fraction,
anaerobic digestion resulted in only a small (insignificant) decrease in the inorganic P
content of the 0.03-0.45 µm fraction. The organic P and TP contents of the <0.001 µm
fraction were significantly reduced by anaerobic digestion. The inorganic P content of the
<0.001 µm fraction was also reduced, but not significantly. The magnitude of these changes
in the nanoparticulate and soluble fractions was small and would not be expected to
influence P dynamics in the soil after application.
Therefore, it was expected that application of anaerobically digested slurry to soil
would cause greater labile inorganic P and moderately labile P contents of the soil, greater
plant P uptake and potential inorganic P leaching from soil than untreated slurry. However,
in Chapter 7, on the day 1, there was no difference in the slurry-derived labile inorganic P
proportion of the soil between untreated and anaerobically digested treatments. In contrast,
the slurry-derived moderately labile P proportion of the anaerobically digested liquid
treatment was a negative value and lower than the untreated liquid treatment, which may be
because degraded organic products in digested slurry resulted in greater P desorption from
Fe- and Al-P in soil. After 126 days of incubation, the anaerobically digested solid and liquid
slurry treatments resulted in greater slurry-derived labile inorganic and organic P proportions
than untreated solid and liquid slurry treatments. While the untreated liquid slurry treatment
resulted in greater slurry-derived moderately labile P proportion than the anaerobically
digested liquid slurry treatment. However, in Chapter 8, 12 weeks after slurry application,
the soil Olsen-P content did not result in significant differences between the digested and the
untreated slurry treatments. In addition, the measured differences in the available P content
of anaerobically digested slurry compared to untreated slurry were not large enough to
influence the cumulative ryegrass P offtake and cumulative P leaching over the 12-week

180
experiment. Other researchers have also reported field experiments where they did not find
significant effects of anaerobic digestion on P availability (Loria and Sawyer, 2005; Möller
and Stinner, 2010; Bachmann et al., 2011). However, in Chapter 6, the two-day experiment
did imply anaerobically digested liquid fraction (<63 µm) caused greater potential inorganic
and organic P leaching facilitated by colloids. The different time intervals between slurry
application and leachate collection may be the main reason leading to the different results
from Chapter 6 and 8. In Chapter 8, there was one week between slurry application and
water event, allowing sufficient time for slurry P bound with soil. Thus, the slurry
application should be recommended with consideration of irrigation or local rainfall events
to reduce P loss risk.
9.2.5 Discussion and implication
P recycling from manure
In China < 50% of manure P is being recycled to cropland (Bai et al., 2016), which is
much smaller than the nearly 100% recycling rate in the UK and EU (Ott & Rechberger,
2012). Efforts should be made within the manure management chain, i.e. ‘feed-excretion-
housing-storage-treatment-application’, to reduce P loss and improve P cycling efficiency
(Bai et al., 2016).
60%-90% of nutrients in feed are typically excreted via dung and urine and vary for
different animal species and managements (Suttle, 2010). For example, ruminant livestock
such as cattle typically have a lower P content in their manure because of their more efficient
digestion system than non-ruminant animals such as pigs (Pagliari & Laboski, 2012). Poultry
manure contains greater Ca-P than swine and cattle manure (He et al., 2006; Pagliari &
Laboski, 2012). In addition, mineral supplements are sometimes added to improve livestock
performance and health (Liu et al., 2017). Added elements may affect P use efficiency in
livestock feed and thereafter influence excreted P speciation and solubility in manure. It has
been reported that the increase in dietary Ca reduces phytate adsorption efficiency for
animals (Suttle, 2010). Balanced element supplements and phytase additives are important to
improve feed P adsorption efficiency and reduce nutrient excretion.
Our results on P speciation and particle size composition of cattle slurry are
applicable to the slurry from only one farm, and cattle slurry particle size composition may
vary due to the different practices and management such feeding, cleaning water volume and
bedding materials on different farms. Some farms may also apply mechanical separation to

181
generate solid and liquid manure fractions. But we have generated useful information on P
form composition in terms of P solubility and availability for each range of particle sizes,
which could be used to estimate P solubility of certain cattle slurry samples by its water
content and approximate particle size composition if cows were on a similar diet. Similarly,
the performance of mechanical separation and P in separated fractions could also be
estimated as discussed in section 9.2.2.
Manure/slurry is typically stored for several months before being recycled to
cropland and grassland. This is especially the case if a farm is in a Nitrate Vulnerable Zone,
where farmers with high available N content manures are prohibited in spreading manure to
land during the winter months when the risk of nitrate leaching is greatest. In such
circumstances, there is a requirement to store these high available N content manures for 6-9
months (Oenema, 2004). During storage, slurry composition may change vertically in the
store, due to the various densities of different slurry particles. Light fibrous material such as
straw may float on the surface and form a crust, whist heavier material may sink within the
depth of slurry (Burton & Turner, 2003). Based on our observation, the smaller particle size
fractions (above 0.45 µm) had a greater density than the larger particle size fractions in the
cattle slurry. Old natural crusts are a porous matrix in contact with the air, allowing some
diffusion of oxygen into the crust (Nielsen et al., 2010). Thus, aerobic and anaerobic
microorganisms are distributed differently throughout the slurry depth, so biological
processes are also different throughout the slurry store. In the deeper depths under anaerobic
condition, small particles may degrade to a greater extent than larger particles (Hjorth et al.,
2010). Therefore, the P proportion represented by small particulate or colloidal fractions may
decrease during storage. On the other hand, pH may also increase during storage, resulting in
precipitation of Ca-P and struvite, replenishing colloidal P or particulate P.
Anaerobic digestion maximises the slurry conditions to generate biogas. It is a green
energy technology producing biogas for heat and power generation, and benefit in reducing
odour and pathogens in livestock slurry (Smet et al., 1999; Sahlström, 2003; Clemens et al.,
2006). Under the warm and stirred condition in the digester, large particles degrade faster
than small particles (Hjorth et al., 2010). Organic P is mineralised, with the formation of
struvite and other P precipitates (see section 4.4.2). Anaerobically digested slurry with
reduced dry matter is also be mechanically separated into solid and liquid fractions.

182
Separated liquid slurry cannot form crusts due to its low fibre content, but
sedimentation of heavier, more dense particles may still occur. Based on our results, a large
proportion of the slurry P is distributed in this liquid fraction. Its high-water content (and
volume) means storage and transportation costs are high, whilst its high P content means that
application rates are limited. Therefore, strategies to recover P from the liquid fraction of
separated slurry prior to spreading may be attractive in some situations where the local
landbank is limited by high soil P status. In addition, the efficiency of recycling manure P to
cropland is only about 30%-62% in China (Bai et al., 2016). The main loss pathway is direct
discharge to watercourses. Without appropriate and effective regulation, the benefit in
recycling manure as a substitute for inorganic fertilisers is not attractive to Chinese farmers,
especially as the costs of constructing large storage tanks or paying for the transportation of
manure to distant nutrient-demanding fields are prohibitively high.
Perhaps the upcycling of these ‘wastes’ into high-value chemical products would be
more profitable. Chemical treatment processes include addition of cations for formation of
Ca-P, Fe-P or struvite (MgNH4PO4.6H2O). Struvite recovers both P and NH4+ from slurry,
and it has been demonstrated to be a good low-release fertiliser (Talboys et al., 2016).
Acidification increases the solubility of P and both the NH4+ and P content in dissolved
fraction in cattle slurry is high (3.4.1). Thus, acidification could be a pre-treatment before
separation, followed by an adjustment of the pH and addition of Mg for an optimal formation
of struvite.
The separated slurry solid fraction can be further processed by composting to reduce
its volume, odour and pathogen content, and stabilise the organic matter (Chowdhury et al.,
2013). Materials such as straw break down in the manure, and the bulk density of this solid
fraction increases during composting (Chowdhury et al., 2013). The water extractable P
content has been reported to decrease after composting, but the composted solid fraction did
not result in any P deficiency after applied to soil (Jorgensen et al., 2010).
P loss from agricultural fields
Besides the challenge of the low recycling rate of manure in China, the low P use
efficiency and P losses from agriculture land following manure applications is also a serious
issue both in China and the UK in terms of water quality. After manure or fertiliser
applications, high nutrient concentrations can be found in runoff water (Smith et al., 2007;
Allen & Mallarino, 2008). Vadas et al. (2015) used a modelling approach to estimate P
183
runoff from pasture, and showed that ca. 30% was from dung, 10% from fertilizer, 15% from
soil dissolved P, and 45% from soil erosion.
Organic and inorganic P are transported by water flow, either in solution, associated
with particles, or incorporated in microorganisms (Schoumans et al., 2014). The
concentration of soluble inorganic P in runoff water depends highly on the amount of
adsorbed P. The amount of soluble inorganic P in surface runoff shows a good relationship
with the soil P status of the plough layer (Allen et al., 2006). Manure/slurry addition
instantly increases the P content of the upper soil layer, especially with labile inorganic P
(see section 7.4.1; Chardon et al., 2007). Moreover, organic P in runoff may dominate
inorganic P because of its lower sorption affinity to soil minerals. In addition, coarse
fractions of cattle slurry are more likely to be retained on the soil surface if surface applied,
and are at greater risk of being lost via runoff due to its low density. Thus, shallow injection
of slurry would be a better practice, avoiding coarse fraction runoff (assuming injection slots
are across the slope) and benefiting root uptake.
Acidified slurry and anaerobically digested slurry have different pHs, which may
influence P sorption in soil and thereafter affect P loss with water flow. In calcareous soil,
Ca-P sorption dominates and the addition of the high pH of digested slurry would increase P
sorption, while acidified slurry would reduce P sorption and increase P mineral dissolution.
Acidification of slurry may result in increased P availability to crops (i.e. it may have a
greater fertiliser value), but it also represents a greater potential risk of P loss. In contrast, in
acid soil, Fe-P and Al-P prevails in P sorption. The addition of digested slurry would reduce
P sorption, while acidified slurry would increase P sorption in acid soil. The digested slurry
could also be a slow-release fertiliser in this case.
Dissolved inorganic P leaching seems to be strongly influenced by the phosphate
saturation of the soil (Schoumans and Groenendijk, 2000), and many studies have analysed
the critical threshold soil P test values in different soils. As shown in section 7.4.2, P
solubility in soil decreases with time after slurry application, so avoiding rainfall events
immediately after application may help to reduce P leaching losses. However, colloidal P
could be important in transporting P through and over soil due to the relatively high mobility
of colloids. We showed that ca. 3% of inorganic P and 2% of organic P from liquid slurry
could be transported with colloids to soil depths below 15 cm (see section 6.4.2), which may

184
contribute to leached P. Perhaps recovery of P from liquid slurry, especially colloidal P, or
chemical aggregation of colloidal P in slurry could benefit in reducing colloidal P loss.
9.3 Conclusions
In response to the original objective and hypothesis of the thesis that small particle
size fractions of cattle slurry dominate the total P content, and have great mobility in soil,
our results positively showed that the majority of P in cattle slurry, untreated and treated,
was labile P (>65%), and the TP distribution was dominated by the smaller particle size
fraction (<63 µm, >65%). The colloid-associated P accounted for a large proportion of the
TP in cattle slurry and has the potential to increase P leaching from soil. In agreement with
the hypothesis that slurry acidification and anaerobic digestion modify the slurry P
speciation, we found acidification increased the labile inorganic P content and decreased the
stable P content of cattle slurry, whilst anaerobic digestion increased the labile inorganic P
and moderately labile P contents, and decreased the labile organic P content. However, in
contrast to the hypothesis that slurry acidification and anaerobic digestion affect P
availability and mobility in soil, the changes in slurry P characteristics resulting from
acidification and anaerobic digestion did not necessarily influence plant P uptake and
potential P leaching after only one slurry application. More factors, such as water/rain event,
should be considered when recommending slurry application and predicting crop production
and P loss risk.
9.4 Further work and recommendations
In this thesis, cattle slurry was only collected from one farm, so representativeness
may have been limited. A larger sampling size would be necessary to account for differences
in farm management regimes, and different livestock types, e.g. pigs, should be explored. To
simplify the work, particle size fractions could be reduced to only >63 and <63 µm.
In addition, the anaerobic digestion process in this thesis was conducted under
constrained laboratory conditions. In the further work, samples could be collected directly
from biogas industries from the influent and effluent.
P speciation of particle size fractions of cattle slurry was analysed by sequential
fractionation in this thesis. Whilst it is a useful method to evaluate P solubility and
availability, specific P compounds cannot be differentiated. In addition, the analytical
accuracy could be affected by humic acid precipitation, acid hydrolysis of organic P,

185
presence of pyro- and poly-phosphates, and complexation and occlusion of inorganic P and
incomplete extraction (Condron & Newman, 2011). Further analysis work could use another
technology such 31P NMR and XANES to specify the bound of Fe-, Al-, Ca-, OM-P.
In the analysis of colloids of cattle slurry, the upper size range was operationally
defined at 63 µm, which is larger than the commonly used definition size of 1 µm or 10 µm
(Buddemeier & Hunt, 1988; McGechan & Lewis, 2002). This broader definition of colloids
greatly contributed to the additional P leaching in Chapter 6, but the true colloidal faction
may only have accounted for a part of the DM and C we defined in Chapter 5. Further
detailed separations should be carried out within the 0.45-63 µm slurry fraction. With this
additional information, the greater P leaching from the anaerobic digested slurry treatment in
Chapter 6 could be better explained. A better understanding of the specific forms of the P
associated with colloids and nanoparticles in differently processed slurry is needed to
elucidate how acidification and anaerobic digestion affects P cycling in slurry and
subsequently in soil. The Fe, Al, Mg, Si content should be determined by ICP for evaluation
of P species. Field-flow fractionation coupled with ICP has been developed for river sample
analysis. This technology has the potential to be used in the analysis of slurry colloids.
The P application rate used in Chapter 6 was small, and the nanoparticles contained a
very small quantity of P. In contrast to other researchers, this experiment did not conclude
the important contribution of nanoparticles to P leaching. This may have been due to the low
P loading rate. Further research could use increased P application rates, or use of isotope
tracking, e.g. specific 33P forms to elucidate the nanoparticulate P movement in soil.
In Chapter 7, the transformation of P forms did not show changing patterns over
times as clear as other researchers (Roboredo et al., 2012). Again, perhaps the P application
rate was not high enough. But because the water content of the liquid slurry fraction was so
high, to avoid exceeding the soil’s water holding capacity, the low rate was the most
practical one. Perhaps freeze-drying of the liquid slurry fraction could have been used to
reduce its water content. But this could have modified the shapes and sizes of the slurry
particles.
After application of slurry P to soil, rapid changes in inorganic P solubility occur due
to chemical, biological and physical processes, e.g. sorption/desorption and microbial
immobilisation/mineralisation. Isotopes can help elucidate these processes. For example, the
33P dilution method has been used to analyse microbial organic P mineralisation (Spohn et

186
al., 2013), and could be used to explore other P cycling processes following the application
of slurry-derived P to soil.
In Chapter 8, to maintain a simulated grassland condition, ryegrass was sown in pots
and grown for 6 weeks before slurry application. When the slurry was applied to the grass
sward, the root system was mature and located all depths of the pot. Therefore, the slurry
was spread on the surface rather than incorporated into the soil. In addition, the application
rate was not very high. As a result, the P uptake from the soil prevailed rather than from the
slurry, and expected differences in P uptake between slurry treatments were difficult to
measure. Long-term field trials with repeated application of differently processed slurries are
needed to study whether and how untreated and treated slurry influence P speciation and
mobility in soil. Different soil types, P saturation conditions, P levels, P application rates
and water/rain events should also be included as factors. This thesis only studied P loss via
leaching. Runoff, is another important loss pathway, and could also be studied with respect
of the P distribution in particle sizes fractions of livestock slurry.
Since the colloidal fraction contained the majority of P in cattle slurry, further slurry
separation development could focus on recovering P from these colloids. This may require
multiple technologies, e.g. centrifugation, membrane filtration, coagulation and flocculation.
Recovery of colloid-associated P from livestock slurries could help in reducing the risk of P
transfers to watercourses via leaching and runoff, and hence reduce the potential for
eutrophication.
9.5 References
Allen, B.L., Mallarino, A.P., Klatt, J.G., Baker, J.L. and Camara, M., 2006. Soil and surface
runoff phosphorus relationships for five typical USA Midwest soils. Journal of
environmental quality, 35(2), pp.599-610.
Allen, B.L. and Mallarino, A.P., 2008. Effect of liquid swine manure rate, incorporation, and
timing of rainfall on phosphorus loss with surface runoff. Journal of Environmental
Quality, 37(1), pp.125-137.
Audette, Y., O'Halloran, I.P. and Voroney, R.P., 2016. Kinetics of phosphorus forms applied
as inorganic and organic amendments to a calcareous soil. Geoderma, 262, pp.119-
124.

187
Bachmann, S., Wentzel, S. and Eichler‐Löbermann, B., 2011. Codigested dairy slurry as a
phosphorus and nitrogen source for Zea mays L. and Amaranthus cruentus L. Journal
of Plant Nutrition and Soil Science, 174(6), pp.908-915.
Bai, Z., Ma, L., Jin, S., Ma, W., Velthof, G.L., Oenema, O., Liu, L., Chadwick, D. and
Zhang, F., 2016. Nitrogen, phosphorus, and potassium flows through the manure
management chain in China. Environmental science & technology, 50(24), pp.13409-
13418.
Buddemeier, R.W. and Hunt, J.R., 1988. Transport of colloidal contaminants in groundwater:
radionuclide migration at the Nevada Test Site. Applied Geochemistry, 3(5), pp.535-
548.
Buehler, S., Oberson, A., Rao, I.M., Friesen, D.K. and Frossard, E., 2002. Sequential
phosphorus extraction of a P-labeled Oxisol under contrasting agricultural systems.
Soil Science Society of America Journal, 66(3), pp.868-877.
Bünemann, E.K., 2015. Assessment of gross and net mineralization rates of soil organic
phosphorus–A review. Soil Biology and Biochemistry, 89, pp.82-98.
Burton C.H., Turner C., 2003. Manure Management: Treatment Strategies for Sustainable
Agriculture, 2nd ed., Silsoe Research Institute, UK.
Celi, L., Lamacchia, S., Marsan, F.A. and Barberis, E., 1999. Interaction of inositol
hexaphosphate on clays: Adsorption and charging phenomena. Soil Science, 164(8),
pp.574-585.
Chardon, W.J. and Schoumans, O.F., 2007. Soil texture effects on the transport of
phosphorus from agricultural land in river deltas of Northern Belgium, The
Netherlands and North‐West Germany. Soil Use and Management, 23(s1), pp.16-
24.
Chowdhury, M.A., de Neergaard, A. and Jensen, L.S., 2014. Prediction of changes in
important physical parameters during composting of separated animal slurry solid
fractions. Environmental technology, 35(2), pp.220-231.
Christensen, M.L., Hjorth, M. and Keiding, K., 2009. Characterization of pig slurry with
reference to flocculation and separation. Water Research, 43(3), pp.773-783.

188
Clemens, J., Trimborn, M., Weiland, P. and Amon, B., 2006. Mitigation of greenhouse gas
emissions by anaerobic digestion of cattle slurry. Agriculture, ecosystems &
environment, 112(2), pp.171-177.
Condron, L.M. & Newman, S., 2011. Revisiting the fundamentals of phosphorus
fractionation of sediments and soils. Journal of Soils and Sediments, 11(5), pp.830–
840.
Cross, A.F. and Schlesinger, W.H., 1995. A literature review and evaluation of the. Hedley
fractionation: Applications to the biogeochemical cycle of soil phosphorus in natural
ecosystems. Geoderma, 64(3-4), pp.197-214.
de Jonge, L.W., Moldrup, P., Rubæk, G.H., Schelde, K. and Djurhuus, J., 2004. Particle
leaching and particle-facilitated transport of phosphorus at field scale. Vadose Zone
Journal, 3(2), pp.462-470.
Dou, Z., Toth, J.D., Galligan, D.T., Ramberg, C.F. and Ferguson, J.D., 2000. Laboratory
procedures for characterizing manure phosphorus. Journal of Environmental Quality,
29(2), pp.508-514.
Fangueiro, D., Hjorth, M. and Gioelli, F., 2015. Acidification of animal slurry–a review.
Journal of Environmental Management, 149, pp.46-56.
Floate, M.J.S., 1970. Decomposition of organic materials from hill soils and pastures: II.
Comparative studies on the mineralization of carbon, nitrogen and phosphorus from
plant materials and sheep faeces. Soil Biology and Biochemistry, 2(3), pp.173-185.
Gahoonia, T.S., Claassen, N. and Jungk, A., 1992. Mobilization of phosphate in different
soils by ryegrass supplied with ammonium or nitrate. Plant and Soil, 140(2), pp.241-
248.
Glæsner, N., Kjaergaard, C., Rubæk, G.H. and Magid, J., 2013. Relation between soil P test
values and mobilization of dissolved and particulate P from the plough layer of
typical Danish soils from a long‐term field experiment with applied P fertilizers. Soil
Use and Management, 29(3), pp.297-305.
Guo, F., and R.S. Yost. 1998. Partitioning soil phosphorus into three discrete pools of
differing availability. Soil Science, 163(10), pp.822-833.

189
Gustafsson, J.P., Mwamila, L.B. and Kergoat, K., 2012. The pH dependence of phosphate
sorption and desorption in Swedish agricultural soils. Geoderma, 189, pp.304-311.
Güngör, K., Jürgensen, A. and Karthikeyan, K.G., 2007. Determination of phosphorus
speciation in dairy manure using XRD and XANES spectroscopy. Journal of
Environmental Quality, 36(6), pp.1856-1863.
Güngör, K. and Karthikeyan, K.G., 2008. Phosphorus forms and extractability in dairy
manure: a case study for Wisconsin on-farm anaerobic digesters. Bioresource
Technology, 99(2), pp.425-436.
Haygarth, P.M., Warwick, M.S. and House, W.A., 1997. Size distribution of colloidal
molybdate reactive phosphorus in river waters and soil solution. Water Research,
31(3), pp.439-448.
He, Z., Senwo, Z.N., Mankolo, R.N. and Honeycutt, C.W., 2006. Phosphorus fractions in
poultry litter characterized by sequential fractionation coupled with phosphatase
hydrolysis. Journal of Food Agriculture and Environment, 4(1), pp.304.
Hens, M. and Merckx, R., 2002. The role of colloidal particles in the speciation and analysis
of “dissolved” phosphorus. Water Research, 36(6), pp.1483-1492.
Hjorth, M., Christensen, K.V., Christensen, M.L. and Sommer, S.G., 2010. Solid–liquid
separation of animal slurry in theory and practice. A review. Agronomy for
Sustainable Development, 30(1), pp.153-180.
Hjorth, M., Cocolo, G., Jonassen, K., Abildgaard, L. and Sommer, S.G., 2015. Continuous
in-house acidification affecting animal slurry composition. Biosystems Engineering,
132, pp.56-60.
Holmén, B.A. and Casey, W.H., 1996. Hydroxamate ligands, surface chemistry, and the
mechanism of ligand-promoted dissolution of goethite [α-FeOOH (s)]. Geochimica et
Cosmochimica Acta, 60(22), pp.4403-4416.
Iyamuremye, F., Dick, R.P. and Baham, J., 1996. Organic amendments and phosphorus
dynamics: I. Phosphorus chemistry and sorption. Soil Science, 161(7), pp.426-435.
Jorgensen, K., Magid, J., Luxhoi, J. and Jensen, L.S., 2010. Phosphorus distribution in
untreated and composted solid fractions from slurry separation. Journal of
environmental quality, 39(1), pp.393-401.

190
Karathanasis, A.D. and Shumaker, P.D., 2009. Preferential sorption and desorption of
organic and inorganic phospates by soil hydroxyinterlayered minerals. Soil Science,
174(8), pp.417-423.
Leytem, A.B., Mikkelsen, R.L. and Gilliam, J.W., 2002. Sorption of organic phosphorus
compounds in Atlantic coastal plain soils. Soil Science, 167(10), pp.652-658.
Liu, Q., Wang, J., Bai, Z., Ma, L. and Oenema, O., 2017. Global animal production and
nitrogen and phosphorus flows. Soil Research, 55, pp.451-462.
Loria, E.R. and Sawyer, J.E., 2005. Extractable soil phosphorus and inorganic nitrogen
following application of raw and anaerobically digested swine manure. Agronomy
Journal, 97(3), pp.879-885.
Mafongoya, P.L., Barak, P. and Reed, J.D., 2000. Carbon, nitrogen and phosphorus
mineralization of tree leaves and manure. Biology and Fertility of Soils, 30(4),
pp.298-305.
Magid, J., De Nowina, K.R., Lindedam, J. and Andren, O., 2010. Organic matter in size‐
density fractions after 16–50 years of grass ley, cereal cropping and organic
amendments. European Journal of Soil Science, 61(4), pp.539-550.
Magid, J., Tiessen, H. and Condron, L.M., 1996. Dynamics of organic phosphorus in soils
under natural and agricultural ecosystems. Humic substances in terrestrial ecosystems.
Elsevier, Amsterdam, pp.429-466.
Malik, M.A., Khan, K.S., Marschner, P. and Ali, S., 2013. Organic amendments differ in
their effect on microbial biomass and activity and on P pools in alkaline soils.
Biology and Fertility of Soils, 49(4), pp.415-425.
Marcato, C.E., Pinelli, E., Pouech, P., Winterton, P. and Guiresse, M., 2008. Particle size
and metal distributions in anaerobically digested pig slurry. Bioresource Technology,
99(7), pp.2340-2348.
Marshall, S.K. and Laboski, C.A., 2006. Sorption of inorganic and total phosphorus from
dairy and swine slurries to soil. Journal of Environmental Quality, 35(5), pp.1836-
1843.

191
Masse, L., Masse, D.I., Beaudette, V. and Muir, M., 2005. Size distribution and composition
of particles in raw and anaerobically digested swine manure. Transactions-American
Society of Agricultural Engineers, 48(5), p.1943.
McDowell, R.W. and Stewart, I., 2005. Phosphorus in fresh and dry dung of grazing dairy
cattle, deer, and sheep. Journal of Environmental Quality, 34(2), pp.598-607.
McGechan, M.B. and Lewis, D.R., 2002. SW—soil and water: transport of particulate and
colloid-sorbed contaminants through soil, part 1: general principles. Biosystems
Engineering, 83(3), pp.255-273.
Meyer, D., Ristow, P.L. and Lie, M., 2007. Particle size and nutrient distribution in fresh
dairy manure. Applied Engineering in Agriculture, 23(1), pp.113.
Møller, H.B., Lund, I. and Sommer, S.G., 2000. Solid–liquid separation of livestock slurry:
efficiency and cost. Bioresource Technology, 74(3), pp.223-229.
Möller, K. and Stinner, W., 2010. Effects of organic wastes digestion for biogas production
on mineral nutrient availability of biogas effluents. Nutrient Cycling in
Agroecosystems, 87(3), pp.395-413.
Nielsen, D.A., Nielsen, L.P., Schramm, A. and Revsbech, N.P., 2010. Oxygen distribution
and potential ammonia oxidation in floating, liquid manure crusts. Journal of
environmental quality, 39(5), pp.1813-1820.
Oenema, O., 2004. Governmental policies and measures regulating nitrogen and phosphorus
from animal manure in European agriculture. Journal of Animal Science,
82(13_suppl), pp.E196-E206.
Ott, C. and Rechberger, H., 2012. The European phosphorus balance. Resources,
Conservation and Recycling, 60, pp.159-172.
Pagliari, P.H. and Laboski, C.A., 2012. Investigation of the inorganic and organic
phosphorus forms in animal manure. Journal of Environmental Quality, 41(3),
pp.901-910.
Pagliari, P.H. and Laboski, C.A., 2014. Effects of manure inorganic and enzymatically
hydrolyzable phosphorus on soil test phosphorus. Soil Science Society of America
Journal, 78(4), pp.1301-1309.

192
Perassi, I. and Borgnino, L., 2014. Adsorption and surface precipitation of phosphate onto
CaCO3-montmorillonite: Effect of pH, ionic strength and competition with humic
acid. Geoderma, 232–234, pp.600–608.
Peters, K., Hjorth, M., Jensen, L.S. and Magid, J., 2011. Carbon, nitrogen, and phosphorus
distribution in particle size–fractionated separated pig and cattle slurry. Journal of
Environmental Quality, 40(1), pp.224-232.
Regelink, I.C., Koopmans, G.F., van der Salm, C., Weng, L. and van Riemsdijk, W.H., 2013.
Characterization of colloidal phosphorus species in drainage waters from a clay soil
using asymmetric flow field-flow fractionation. Journal of Environmental Quality,
42(2), pp.464-473.
Roboredo, M., Fangueiro, D., Lage, S. and Coutinho, J., 2012. Phosphorus dynamics in soils
amended with acidified pig slurry and derived solid fraction. Geoderma, 189, pp.328-
333.
Sahlström, L., 2003. A review of survival of pathogenic bacteria in organic waste used in
biogas plants. Bioresource Technology, 87(2), pp.161-166.
Schelde, K., de Jonge, L.W., Kjaergaard, C., Laegdsmand, M. and Rubæk, G.H., 2006.
Effects of manure application and plowing on transport of colloids and phosphorus to
tile drains. Vadose Zone Journal, 5(1), pp.445-458.
Schoumans, O.F., Chardon, W.J., Bechmann, M.E., Gascuel-Odoux, C., Hofman, G.,
Kronvang, B., Rubæk, G.H., Ulén, B. and Dorioz, J.M., 2014. Mitigation options to
reduce phosphorus losses from the agricultural sector and improve surface water
quality: a review. Science of the Total Environment, 468, pp.1255-1266.
Schoumans, O.F. and Groenendijk, P., 2000. Modeling soil phosphorus levels and
phosphorus leaching from agricultural land in the Netherlands. Journal of
Environmental Quality, 29(1), pp.111-116.
Siemens, J., Ilg, K., Lang, F. and Kaupenjohann, M., 2004. Adsorption controls mobilization
of colloids and leaching of dissolved phosphorus. European Journal of Soil Science,
55(2), pp.253-263.

193
Simard, R.R., Cluis, D., Gangbazo, G. and Beauchemin, S., 1995. Phosphorus status of
forest and agricultural soils from a watershed of high animal density. Journal of
Environmental Quality, 24(5), pp.1010-1017.
Smet, E., Van Langenhove, H. and De Bo, I., 1999. The emission of volatile compounds
during the aerobic and the combined anaerobic/aerobic composting of biowaste.
Atmospheric Environment, 33(8), pp.1295-1303.
Smith, D.R., Owens, P.R., Leytem, A.B. and Warnemuende, E.A., 2007. Nutrient losses
from manure and fertilizer applications as impacted by time to first runoff event.
Environmental Pollution, 147(1), pp.131-137.
Spohn, M., Ermak, A. and Kuzyakov, Y., 2013. Microbial gross organic phosphorus
mineralization can be stimulated by root exudates–A 33 P isotopic dilution study.
Soil Biology and Biochemistry, 65, pp.254-263.
Suttle, N.F., 2010. Mineral nutrition of livestock. 4th edn. (CABI International Publishing:
Wallingford, UK).
Takeda, M., Nakamoto, T., Miyazawa, K., Murayama, T. and Okada, H., 2009. Phosphorus
availability and soil biological activity in an Andosol under compost application and
winter cover cropping. Applied Soil Ecology, 42(2), pp.86-95.
Talboys, P.J., Heppell, J., Roose, T., Healey, J.R., Jones, D.L. and Withers, P.J., 2016.
Struvite: a slow-release fertiliser for sustainable phosphorus management? Plant and
soil, 401(1-2), pp.109-123.
Turner, B.L., Mahieu, N. and Condron, L.M., 2003. The phosphorus composition of
temperate pasture soils determined by NaOH–EDTA extraction and solution 31 P
NMR spectroscopy. Organic Geochemistry, 34(8), pp.1199-1210.
Vadas, P.A., Busch, D.L., Powell, J.M. and Brink, G.E., 2015. Monitoring runoff from
cattle-grazed pastures for a phosphorus loss quantification tool. Agriculture,
Ecosystems & Environment, 199, pp.124-131.
Waldrip-Dail, H., He, Z., Erich, S.M. and Honeycutt, W.C., 2009. Soil phosphorus dynamics
in response to poultry manure amendment. Soil science, 174(4), pp.195-201.

194
Whalen, J.K., Chang, C. and Olson, B.M., 2001. Nitrogen and phosphorus mineralization
potentials of soils receiving repeated annual cattle manure applications. Biology and
Fertility of Soils, 34(5), pp.334-341.
Withers, P.J.A., Hartikainen, H., Barberis, E., Flynn, N.J. and Warren, G.P., 2009. The effect
of soil phosphorus on particulate phosphorus in land runoff. European Journal of Soil
Science, 60(6), pp.994-1004.
Copyright © 2022 FDOKUMEN