Comparative antioxidant and bioavailability studies of Vitamin ...
Upload
khangminh22Category
view
0download
0
Dietary Phosphorus – Bioavailability and Associations with Vascular Calcifi cation in a Middle-Aged Finnish Population
DEPARTMENT OF FOOD AND ENVIRONMENTAL SCIENCESFACULTY OF AGRICULTURE AND FORESTRYDOCTORAL PROGRAMME IN POPULATION HEALTHUNIVERSITY OF HELSINKI
SUVI ITKONEN
DISSERTATIONES SCHOLAE DOCTORALIS AD SANITATEM INVESTIGANDAM UNIVERSITATIS HELSINKIENSIS 9/2015
9/2015
Helsinki 2015 ISSN 2342-3161 ISBN 978-951-51-0604-9
SU
VI IT
KO
NE
N D
ietary Ph
osph
orus –
Bioavailability an
d A
ssociations w
ith V
ascular C
alcifi cation in
a Mid
dle-A
ged F
inn
ish P
opu
lation
Recent Publications in this Series
39/2014 Enzo ScifoSystematic Analysis of Disease Pathways in Congenital, Infantile and Juvenile Neuronal Ceroid Lipofuscinoses40/2014 Ida SurakkaGenetics of Circulating Blood Lipids41/2014 Juho MiettinenActivation of Innate Immune Response in Human Macrophages by Herpes Simplex Virus-1 and Crystallized Monosodium Urate42/2014 Sari MölsäLong-Term Outcome in Dogs After Surgical Repair of Cranial Cruciate Ligament Disease43/2014 Vassilis StratouliasStudies on the Neurotrophic Factor Manf and the Pleiotropic Factor Lin-28 during Drosophila Development44/2014 Mikko KoskinenF-Actin Dynamics in Dendritic Spines45/2014 Robertas UrsacheNovel Regulators of Vascular Development in Arabidopsis thaliana46/2014 Elisa KallioLipopolysaccharide: a Link between Periodontitis and Cardiometabolic Disorders47/2014 Tuomas LiliusNew Insights into Enhancing Morphine Analgesia: from Glia to Pharmacokinetics48/2014 Anmol KumarRole of 3’UTR in the Regulation of Neurotrophic Factors BDNF and GDNF49/2014 Yuezhou ZhangInvestigating Phosphate Structural Replacements through Computational and Experimental Approaches1/2015 Bjørnar den HollanderNeuropharmacology and Toxicology of Novel Amphetamine-Type Stimulants2/2015 Jenni VanhanenNeuronal Histamine and H3 Receptor in Alcohol-Related Behaviors - Focus on the Interaction with the Dopaminergic System3/2015 Maria VoutilainenMolecular Regulation of Embryonic Mammary Gland Development4/2015 Milica MaksimovicBehavioural and Pharmacological Characterization of a Mouse Model for Psychotic Disorders – Focus on Glutamatergic Transmission5/2015 Mohammad-Ali ShahbaziEffect of Surface Chemistry on the Immune Responses and Cellular Interactions of Porous Silicon Nanoparticles6/2015 Jinhyeon YunImportance of Maternal Behaviour and Circulating Oxytocin for Successful Lactation in Sows - Effects of Prepartum Housing Environment7/2015 Tuomas HervaAnimal Welfare and Economics in Beef Production8/2015 Anna-Maria KuivalainenPain and Associated Procedural Anxiety in Adults Undergoing Bone Marrow Aspiration and Biopsy – Therapeutic Effi cacy and Feasibility of Various Analgesics

1
Dissertationes Scholae Doctoralis Ad Sanitatem Investigandam UniversitatisHelsinkiensis 9/2015
Department of Food and Environmental SciencesUniversity of Helsinki
Helsinki
Dietary phosphorus– Bioavailability and Associations with Vascular
Calcification in a Middle-Aged Finnish Population
Suvi Itkonen
ACADEMIC DISSERTATION
To be presented, with the permission of the Faculty of Agriculture andForestry of the University of Helsinki, for public examination in Auditorium
XII, University Main Building,on February 21st 2015, at 10 AM.
Helsinki 2015
2
Supervisor
Professor Christel Lamberg-AllardtDepartment of Food and Environmental Sciences (Nutrition)University of Helsinki, Finland
Reviewers
Professor Riitta KorpelaInstitute of BiomedicineUniversity of Helsinki, Finland
Professor Hannu MykkänenInstitute of Public Health and Clinical NutritionUniversity of Eastern Finland, Finland
Opponent
Mona S. Calvo, Ph. D.Center for Food Safety and Applied NutritionU.S. Food and Drug Administration, United States
Cover picture: Niina Thuneberg
ISBN 978-951-51-0604-9 (paperback)ISSN 2342-3161 (paperback)
ISBN 978-951-51-0605-6 (PDF)ISSN 2342-317X (PDF)
HansaprintHelsinki 2015

3
To those who did not survive

4
Contents:
Tiivistelmä, Finnish summary 7
Abstract 10
List of original publications 13
Abbreviations 14
1. Introduction 15
2. Review of the literature 172.1. Phosphorus in human nutrition 17
2.1.1. Dietary intake and recommendations 172.1.2. Functions of phosphate in the body 182.1.3. Phosphorus balance 192.1.4. Regulators of phosphate metabolism 21
2.2. Sources and bioavailability of dietary phosphorus 252.2.1. Natural sources 262.2.2. Other sources 282.2.3. Methods for assessment phosphorus contentsand bioavailability in foodstuffs 32
2.2.4.1. Basic chemical methods toanalyze phosphorus contents 322.2.4.2. Methods to assess mineralbioavailability 33
2.3. Gaps in the knowledge on intake and bioavailability of dietaryphosphorus 35 2.3.1. Food additive phosphorus intake 35
2.3.2. Bioavailability of phosphorus 37
2.4. Phosphorus, vascular calcification and cardiovascular diseases 38
2.4.1. Calcification and cardiovascular diseases 382.4.1. Methods to measure vascular calcification andrisk or progression of atherosclerosis 42
2.5. Current knowledge on phosphorus and cardiovascular healthfrom an epidemiological point of view 44
2.5.1. Serum phosphate and cardiovascular health 44 2.5.2. Dietary phosphorus and cardiovascular health 46

5
2.5.3. Regulators of phosphate metabolism andcardiovascular health 50
3. Aims of the thesis 52
4. Subjects and methods 53
4.1 Food studies (Studies I and II) 534.1.1. Samples 534.1.2 Study designs and hypotheses 554.1.3. Methods 56
4.1.3.1. Analysis of in vitro digestiblephosphorus 564.1.3.2. Analysis of total phosphorus 594.1.3.3. Assay quality control 594.1.3.4. Statistical analyses 60
4.2. Human study (Study III) 614.2.1. Subjects 614.2.2. Study design and hypothesis 614.2.3. Methods 62
4.2.3.1. Dietary intake and backgrounddata collection 624.2.3.2. Measurement of the carotidintima-media thickness and bloodpressure 644.2.3.3. Laboratory analyses 664.2.3.4. Final sample 674.2.3.5. Statistical analyses 69
5. Results 71
5.1. Study I 715.1.1. Usefulness of the method for analysis of in vitrodigestible phosphorus 715.1.2. In vitro digestible and total phosphorus contentsin differently processed cereals 72
5.2. Study II 765.2.1. In vitro digestible and totalphosphorus contents in the analyzedplant-based foodstuffs 76
6
5.3. Study III 795.3.1. Characteristics of subjects 795.3.2. Associations between phosphorus intakevariables and carotid intima-media thickness 82
6. Discussion 86
6.1. Bioavailability of phosphorus in foodstuffs 866.1.1. Reliability of the analysis method for in vitrodigestible phosphorus 866.1.2. Effect of processing on in vitro digestible andtotal phosphorus contents in cereals 866.1.3. In vitro digestible and total phosphorus contentsin other plant-based foodstuffs 886.1.4. Conclusions about phosphorus bioavailability inanalyzed foodstuffs 91
6.2. Dietary phosphorus as a potential cardiovascular risk factor 936.2.1. Total phosphorus intake and cardiovascularhealth 936.2.2. Food additive phosphorus intake andcardiovascular health 946.2.3. Serum phosphate and other regulators ofphosphate metabolism and cardiovascular health 956.2.4. Conclusions about dietary phosphorus as apotential cardiovascular risk factor 97
6.3. Strengths and limitations of the studies 996.3.1. Food studies (Studies I and II) 996.3.2. Human study (Study III) 100
7. Conclusions and future perspectives 102
Acknowledgements 104
References 106
Appendix 124
Original publications

7
Tiivistelmä, Finnish summary
Fosforin saanti on länsimaissa kaksin-kolminkertaista suhteessaravitsemussuosituksiin. Fosforin kokonaissaantia on kasvattanutfosforilisäaineiden käyttö elintarviketeollisuudessa ja on arvioitu, että jopa 10-50 prosenttia fosforin saannista on peräisin lisäaineista.Elintarvikekoostumustietokannoissa reseptipohjaisten elintarvikkeidenfosforipitoisuudet on laskettu raaka-aineiden pitoisuuksien perusteella, jolloinne eivät perustu kemiallisesti analysoituihin tietoihin. Tällöin lisäaineidenosuutta fosforipitoisuuksissa ei välttämättä ole otettu huomioon. Fosforintodellisen saannin arviointia vaikeuttaa myös fosforin hyväksikäytettävyydenvaihtelevuus eri fosforilähteiden välillä; lisäaineperäinen epäorgaaninen fosforiimeytyy elimistöön paremmin kuin elintarvikkeen luontainen, orgaaninenfosfori. Munuaistautipotilailla runsaan fosforin saannin haitallisuus on olluttiedossa jo pitkään, ja fosforirajoitteista ruokavaliota käytetään osana heidänhoitoaan, jotta mm. verisuonten kalkkeutumista voitaisiin estää;kalkkeutumisessa kalsiumfosfaattia saostuu suonten seinämiin. Viime vuosinaon saatu tutkimustuloksia seerumin kohonneen fosfaattipitoisuudenhaittavaikutuksista sydän- ja verisuonitautien riskiin ja verisuontenkalkkeutumiseen myös terveellä väestöllä, mutta ravinnon fosforin osaltatutkimustietoa on niukasti. Tämän väitöskirjatyön tavoitteena on valottaarunsaan fosforin saannin mahdollisia terveysriskejä Suomessa tuottamalla tietoaelintarvikkeiden fosforin hyväksikäytettävyydestä ja runsaan fosforin saanninyhteyksistä sydän- ja verisuonitautien riskitekijöihin väestötasolla.
Väitöskirjan ensimmäisessä osatyössä kehitettiin in vitro -analyysimenetelmäliukoisen, ns. elimistöön imeytyvän ja hyväksikäytettävissä olevan, fosforinpitoisuuksien määrittämiseen elintarvikkeista sekä analysoitiin liukoisen jakokonaisfosforin määriä eri tavoin käsitellyistä ruis-, vehnä- ja ohranäytteistä.Hypoteesina oli, että viljatuotteiden prosessointi lisää liukoisen fosforin määrää.Analyysimenetelmästä johtuva laskennallinen epävarmuus vaikutti liukoisenfosforin pitoisuuksiin näytteissä suhteellisen vähän. Hapatetuissa viljatuotteissaliukoisen fosforin määrä oli suurempi kuin hapattamattomissa, myös pitkäkypsennysaika lisäsi liukoisen fosforin pitoisuuksia. Tämä johtunee viljojen
8
sisältämän fosforipitoisen fytaatin pilkkoutumisesta käsittelyn aikana, jolloinsiitä vapautuu liukoista, epäorgaanista fosforia.
Toisessa osatyössä hyödynnettiin ensimmäisessä osatyössä kehitettyämenetelmää liukoisen fosforin pitoisuuksien määrittämiseen valikoiduistakasvipohjaisista elintarvikkeista ja juomista. Myös kokonaisfosforipitoisuudetmääritettiin ja liukoisen fosforin pitoisuuksia verrattiin niihin. Hypoteesina oli,että lisäainefosforia sisältävissä tuotteissa liukoisen fosforin osuudet ovatsuhteellisesti korkeampia kuin tavanomaisissa tuotteissa. Tutkimuksessahavaittiin, että analysoidut kasvipohjaiset elintarvikkeet sisälsivät vaihteleviamääriä fosforia, mutta suurin osa siitä ei ollut liukoista lukuun ottamattalisäainefosforia sisältäviä tuotteita. Lisäainefosforia sisältävissä tuotteissa,kuten kolajuomissa ja leivinjauheella kohotetuissa muffinseissa, oli suurempiliukoisen fosforin osuus verrattuna tavanomaisiin tuotteisiin.
Kolmannessa osatyössä tutkittiin poikkileikkausasetelmalla keski-ikäisillämiehillä ja vaihdevuosi-ikää edeltävillä naisilla fosforin kokonaissaannin,ravinnon fosforitiheyden (fosforin saanti suhteutettuna energian saantiin) sekälisäainefosforin saannin yhteyksiä sydän- ja verisuonitautien riskitekijään,kaulavaltimon seinämän paksuuteen (n=546). Lisäainefosforin saantia tutkittiinruoankäytön frekvenssikyselylomakkeella, muut ruoankäyttötiedot kerättiinkolmen vuorokauden ruokapäiväkirjanpidolla. Hypoteesina oli, että runsasfosforin saanti, etenkin lisäainefosforin muodossa, on yhteydessä verisuontenkalkkeutumista kuvaavaan paksumpaan kaulavaltimon seinämään ja tätensuurentuneeseen sydän- ja verisuonitautien riskiin. Tutkimuksessa havaittiinlineaarinen yhteys ravinnon fosforitiheyden ja lisäainefosforin saannin sekäkaulavaltimon seinämän paksuuden välillä koko aineistossa, ja naisillalisäainefosforin saannin ja kaulavaltimon seinämän paksuuden välillä. Miehillätilastollisesti merkitseviä tuloksia ei ollut havaittavissa. Tulosten perusteellarunsas fosforin saanti, etenkin lisäainefosforin muodossa, saattaisi olla yksisydän- ja verisuonitautien riskitekijöistä myös väestötasolla, ei ainoastaanmunuaistautipotilailla.
Väitöskirjan tulokset tukevat aiempaa käsitystä siitä, että fosforilähteellä onmerkitystä arvioitaessa fosforin saantia väestötasolla. Kasvikunnan tuotteet
9
yleisesti sisältävät vähäisiä määriä liukoista fosforia muttalisäainefosforipitoiset kasvipohjaiset elintarvikkeet sisältävät suhteellisestisuurempia liukoisen fosforin pitoisuuksia verrattuna tavanomaisiin tuotteisiin.Tulosten perusteella liukoisen fosforin määritysmenetelmä elintarvikkeista onluotettava mutta tarvitsee vertailuarviointia in vivo -analyysimenetelmän kanssaennen kuin tuloksia voidaan yleistää. Vaikka runsaan fosforin saannin(ravinnon fosforitiheys ja lisäainefosforin saanti) havaittiin olevan yhteydessäyhteen sydän- ja verisuonitautien riskitekijään, kaulavaltimon seinämänpaksuuteen, poikkileikkaustutkimusasetelman perusteella syy-seuraussuhteita eikuitenkaan voida päätellä. Tämän vuoksi etenkin hyvin imeytyvänlisäainefosforin mahdollisia haittavaikutuksia sydän- ja verisuoniterveyteenpitäisi tutkia tarkemmin sekä interventio- että seurantatutkimuksilla ennen kuinrunsaan fosforin saannin mahdollisesta haitallisuudesta väestötasolla voidaantehdä lopullisia johtopäätöksiä. Tämän selvittämiseksi tarvitaan lisää tietoamyös fosforilisäaineiden käytöstä elintarviketeollisuudessa sekä päivitettyjäanalyysitietoja elintarvikkeiden fosforipitoisuuksista.
AVAINSANAT: elintarvikelisäaineet, elintarvikkeet, fosfaatti, fosfori,hyväksikäytettävyys, kasvipohjaiset elintarvikkeet, kaulavaltimon seinämänpaksuus, liukoinen fosfori, sydän- ja verisuonitaudit, verisuontenkalkkeutuminen, viljatuotteet
10
Abstract
Phosphorus (P) intake in Western countries exceeds the nutritionalrecommendations 2- to 3-fold, and the increased use of food additivephosphates (FAPs) in the food industry has augmented total P (TP) intake; anestimated 10-50% of TP intake comes from additives. Difficulties in measuringtrue P intake occur because bioavailability of P differs between foodstuffs;inorganic P from additives is absorbed better in the intestine than natural,organic P. Moreover, in food composition databases, P contents of the recipe-based foodstuffs are calculated based on nutrient contents of raw materials, andnot on chemically analyzed values. Thus, the amounts of FAPs may have notbeen taken into account. It has been stated that all P sources cannot be definedsimilarly as detrimental to health due to differing absorbability andbioavailability. The harmfulness of high P intake to kidney patients has beenknown for years, and dietary P restriction is used in the treatment of the disease,to avoid vascular calcification, which occurs due to calcium-phosphatedeposition in the vascular vessel wall. However, recently, concerns have beenraised about the role of elevated serum phosphate concentrations incardiovascular health in the general population, but data on dietary P is scarce.This thesis aims to offer new insights into the potential health risks related tohigh dietary P intake in Finland by providing knowledge on the bioavailabilityof P in foodstuffs, and on the association of high dietary P intake withcardiovascular disease risk factors in the general population.
In Study I, a new method was developed for analysis of in vitro digestible P(DP), indicating bioavailable and absorbable P, and in vitro DP and TP contentsof certain differently processed rye, wheat and barley samples were detetrmined.The hypothesis was that processing of cereals increases the content of DP. Thecalculated uncertainty of the analysis method had little effect on the DPcontents in the samples. Soured cereals contained more DP than unsouredcereals, and the long processing time increased the amounts of DP. Thisprobably is due to the degradation of P-containing phytate, which releasesdigestible, inorganic P.
11
In Study II, the DP contents of selected plant-based foodstuffs and beverageswere determined by the analysis method developed in Study I. Also TP contentswere analyzed, and DP contents in the same foods were compared to them. Thehypothesis was that the proportion of DP is lower in plant-based FAP-freeproducts than in products containing FAPs. The analyzed plant-based productscontained varying amounts of P, but most P was not absorbable, except in FAP-containing foodstuffs. The FAP-containing products, especially cola drinks andbaking powder-leavened muffins, had higher amounts of DP relative to FAP-free products.
In Study III, a cross-sectional design was used to investigate the associationsbetween TP intake, P density of the diet (TP intake related to energy intake),FAP intake, and a risk factor of cardiovascular disease, carotid intima-mediathickness in middle-aged males and premenopausal females (n=546). Data onFAP intake were collected by food frequency questionnaires, and nutrientsother than FAP were assessed by 3-day food records. Hypothesis was that highdietary P intake, especially in the form of FAP, is associated with vascularcalcification in terms of high carotid intima-media thickness and thus, withincreased risk of cardiovascular diseases. Here, linear associations among Pdensity of the diet, FAP intake, and carotid intima-media thickness were foundwhen all subjects were included in the analysis, and between FAP intake andcarotid intima-media thickness in females. However, among males nosignificant associations were found. These findings suggest that high dietary Pintake, especially in the form of FAP, could be a cardiovascular risk factor notonly in renal patients but also in the general population.
In conclusion, results of this thesis reinforce the previous understanding aboutthe importance of the source of P when assessing P intake in a population. Theplant-based foodstuffs generally contain low amounts of absorbable P, but theFAP-containing plant-based products have relatively higher absorbable Pcontents than FAP-free products. The method developed for the analysis of DPis reliable but requires validation against an in vivo method before these resultscan be generalized. Albeit high dietary P intake (P density of the diet and FAPintake) was associated with a cardiovascular disease risk factor, carotid intima-media thickness, due to the cross-sectional design of the study, no causal

12
relationships can be inferred. Thus, the potential adverse effects of highlyabsorbable FAPs should be further investigated both in intervention and infollow-up studies before final conclusions about the harmfulness of high Pintake for the general population can be drawn. To find this out, data on use ofFAPs in the food industry and updated information on P contents in foodstuffsare also needed.
KEY WORDS: bioavailability, cardiovascular diseases, carotid intima-mediathickness, cereals, digestible phosphorus, food additives, foodstuffs, phosphate,phosphorus, plant-based foodstuffs, vascular calcification
13
List of original publications
This thesis is based on the following publications, referred to in the text by theirRoman numerals (I-III):
I: Itkonen ST, Ekholm PJ, Kemi VE, Lamberg-Allardt CJE. Analysis of invitro digestible phosphorus content in selected processed rye, wheat and barleyproducts. J Food Comp Anal 2012;25:185-189.
II: Karp H, Ekholm P, Kemi V, Itkonen S, Hirvonen T, Närkki S, Lamberg-Allardt C. Differences among total and in vitro digestible phosphorus content ofplant foods and beverages. J Ren Nutr 2012;22:416-422.
III: Itkonen ST, Karp HJ, Kemi VE, Kokkonen EM, Saarnio EM, Pekkinen MH,Kärkkäinen MUM, Laitinen EKA, Turanlahti MI, Lamberg-Allardt CJE.Associations among total and food additive phosphorus intake and carotidintima-media thickness – A cross-sectional study in a middle-aged populationin Southern Finland. Nutr J 2013;12:94.
These publications have been reprinted with the kind permission of theircopyright holders. In addition, some unpublished results are presented.
Contribution of the authors to Studies I-III
I: PJE designed the analyses and STI performed the sampling. STI conducted the Panalyses. STI analyzed and interpreted the data. STI drafted the manuscript with thehelp of PJE. All authors read, reviewed and approved the final manuscript.
II: HK, PE, VK, TH and CLA planned the study. SN carried out the laboratoryanalysis. HK, PE, and SI analyzed the data. HK wrote the manuscript with PE and TH,and SI and the other co-authors critically reviewed the paper.
III: STI, HJK, VEK, and CJELA designed the study. MIT designed the IMTmeasurement. STI, HJK, VEK, EMS, MHP, and MUMK collected the data. STI andEMK analyzed the data. STI, CJELA, and EMK interpreted the data. STI drafted themanuscript with the help of CJELA. STI, EMK, and CJELA are responsible for theintegrity of data analysis. All authors read, reviewed and approved the final manuscript.
14
Abbreviations1,25(OH)2D 1,25-hydroxy vitamin D, calcitriol25(OH)D 25-hydroxy vitamin D, calcidiolANCOVA analysis of covarianceANOVA analysis of varianceBMI body mass indexCa calciumCaPi calcium-phosphatecIMT carotid intima-media thicknessCKD chronic kidney diseaseCRP C-reactive proteinC-terminal FGF23 carboxy-terminal fibroblast growth factor 23CV% coefficient of variation percentageCVD cardiovascular diseaseCYP2R1 cytochrome P 450 2R1CYP24A1 cytochrome P 450 24A1CYP27B1 cytochrome P 450 27B1DP digestible phosphorusEFSA European Food Safety AuthorityeGFR estimated glomerulus filtration rateFAP food additive phosphateFFQ food frequency questionnaireFGF23 fibroblast growth factor 23GFR glomerulus filtration rateHDL high-density lipoproteinHDL-C high-density lipoprotein cholesterolHNO3 nitric acidhs-CRP high-sensitivity C-reactive proteiniCa ionized calciumiPTH intact parathyroid hormoneICP-AES inductively coupled plasma -atomic emission spectrometryICP-MS inductively coupled plasma -mass spectrometerICP-OES inductively coupled plasma -optical emission spectrometerIMT intima-media thicknessLDL low-density lipoproteinLDL-C low-density lipoprotein cholesterolMg magnesiumNa sodiumNaPi 2a sodium-dependent phosphate cotransporter 2aNaPi 2b sodium-dependent phosphate cotransporter 2bNaPi 2c sodium-dependent phosphate cotransporter 2cP phosphorusPi phosphatePTH parathyroid hormoneP-Pi plasma phosphateS-Pi serum phosphateTP total phosphorus
15
1. Introduction
The Western population is aging and the incidence of many diseases is on therise. Cardiovascular diseases (CVD) are leading causes of mortality andmorbidity worldwide (O’Leary and Bots 2010), and the incidence of renaldisease is also increasing as an adjuvant disease of type 2 diabetes (Niemi andWinell 2005). Traditional risk factors for CVD are well known, but concernshave recently been raised on the role of high dietary phosphorus (P) intake inCVD. Especially in patients with chronic kidney disease (CKD), high dietary Pintake has been shown to be deleterious, and high serum phosphate (S-Pi)concentrations in this patient group are associated with a higher risk ofmortality (Qunibi et al. 2002). CKD patients are unable to excrete P properly,thus, they are treated with dietary P restriction (Qunibi et al. 2002). Subsequentresearch data have revealed associations between high S-Pi concentrations andhigher risk of cardiovascular diseases and mortality also in the generalpopulation (Tonelli et al. 2005, Foley et al. 2009, Ruan et al. 2010).
P intake in Western countries exceeds 2- to 3-fold (Calvo 1993, Welch et al.2009, Helldán et al. 2013a, Massé et al. 2014) the nutritional recommendations(600-700 mg/d) (Food and Nutrition Board 1997, Nordic Council of Ministers2013). Results on the detrimental effects of high P intake on bone metabolismhave been reported (Kärkkäinen and Lamberg-Allardt 1996, Kemi et al. 2006,2008, 2009, 2010), but information on high P intake and CVD in the generalpopulation is scarce. Experimental work has shown that high dietary P intakeinduces vascular calcification; deposition of calcium-phosphate (CaPi)complexes in the vascular vessel wall (Uribarri and Calvo 2013). High P intakehas also caused the left ventricular hypertrophy of the heart (Yamamoto et al.2013) and has acutely impaired the endothelial function of the vascular system(Shuto et al. 2009). A recent study of the NHANES III population showed thathigh P intake was associated with increased all-cause mortality (Chang et al.2014a).
Dietary P is an important element in energy metabolism, in phosphorylation ofproteins, in maintaining the acid-base equilibrium, and in bone as a componentof hydroxyapatite. Almost all foodstuffs contain P, but the intake has mainly

16
increased as a consequence of the expanding use of food additive phosphates(FAP) in the food industry (Suurseppä et al. 2001, Winger et al. 2012).Carrigan et al. (2014) estimated that 10-50 % of total P (TP) intake in Westerncountries comes from FAPs, and intake values of up to 1000 mg/d have beenpresented (Winger et al. 2012). Bioavailability of P differs between foodstuffs;in cereals and legumes P is in the form of phytic acid and thus, not soluble untildegraded in food processing (Sandberg 2002). However, more than 90% of Pfrom FAPs is absorbed by the human body (Sullivan et al. 2007). Whenassessing P intake, some difficulties exist: natural P and FAP cannot bedistinguished analytically (Suurseppä et al. 2001); thus, the P contents offoodstuffs in food composition databases are reported as TP. Moreover, in foodcomposition databases, P contents of the recipe-based foodstuffs are calculatedbased on nutrient contents of raw materials, and not on chemically analyzedvalues. Thus, the amounts of FAPs may have not been taken into account(Oenning et al. 1988, Sullivan et al. 2007).
Thus, a new method is needed to assess in vitro the digestible P (DP)(corresponding to the bioavailable P) in foodstuffs. Because of raised concernson potential adverse health effects of high P intake and elevated S-Piconcentrations (Tonelli et al. 2005, Kemi et al. 2006, Huttunen et al. 2006, 2007,Foley et al. 2009, Shuto et al. 2009, Ruan et al. 2010), the scope of this studywas widened to include the normal population and habitual dietary P intake asTP and FAP. A new analytical method is developed for measurement of the invitro DP contents in foodstuffs, and analysis of DP in differently processedcereals is carried out (Study I), as well as the differences between TP and invitro DP content in selected popular P-containing plant-based foodstuffs (StudyII) are examined. Moreover, associations between dietary P and cardiovascularhealth in terms of carotid intima-media thickness (IMT) are discussed (StudyIII).

17
2. Review of the literature
2.1. Phosphorus in human nutrition
2.1.1. Dietary intake and recommendations
The National Nutrition Council recommends a P intake of 600 mg/d for adultsof both sexes (National Nutrition Council 2014), based on Nordic NutritionRecommendations (Nordic Council of Ministers 2013) (Table 1). The upperlimit of daily P intake is 5000 mg/d (National Nutrition Council 2014). In theUnited States, the estimated average requirement (except for adolescents) is 400mg/d, and the recommended daily intake is 700 mg/d (Food and NutritionBoard 1997). The European Food Safety Authority produced a report in 2005concerning the potential adverse effects of high P intake, but made norecommendations based on these effects (EFSA 2005).
Table 1. Recommended phosphorus (P) intakes in different age groups 1.
Age Recommendation (P mg/d)<6 months -6-11 months 42012-23 months 4702-5 years 4706-9 years 54010-13 years 70014-17 years 70018-20 years 700Adults >20 years 600Pregnant women 700Breastfeeding women 9001National Nutrition Council 2014

18
Dietary P intake in Western countries exceeds 2- to 3-fold (Calvo 1993, Welchet al. 2009, Helldán 2013a) the nutritional recommendations (600-700 mg/d)(Food and Nutrition Board 1997, Nordic Council of Ministers 2013). Meanintake of P in the National FINDIET 2012 Survey was among females 1369mg/d and among males 1694 mg/d, being lower in the older age groups(Helldán et al. 2013a). In Finland, the most important sources of P are dairyproducts (males 36%, females 35% of P intake), cereal products (males 20%,females 24%) and meat products (males 17%, females 14%) (Helldán et al.2013a). Table 2 shows the approximate mean P intake ranges in the Europeancountries that participated in the EPIC study (Welch et al. 2009). Whencomparing mean dietary P intakes in Finland from 2002 to 2012, the meanintakes have decreased (males: from 1928 to 1694 mg/d; females from 1465 to1369 mg/d), however, the different assessment methods (3-day food records vs.48-h food recalls) may impair the comparability between the results (Kleemolaet al. 1994, Helldán et al. 2013a).
2.1.2. Functions of phosphate in the body
P, in the form of phosphate (Pi), is required in several biological processes inthe human body. Pi participates in the energy metabolism as a component of
Table 2. Approximate ranges of phosphorus (P) intakes stratified by gender in the EPICstudy in European countries (based on Welch et al. 2009).
Country Females MalesGreece 1500 2100Spain 1150-1400 1550-1900Italy 1100-1200 1500-1700France 1300 -Germany 1100-1200 1500The Netherlands 1350-1500 1800United Kingdom 1200-1300 1400-1600Denmark 1400-1500 1800Sweden 1200-1300 1500-1650Norway 1350 2100
Approximate range of P intake (mg/d)

19
adenosine triphosphate, creatinine Pi and other phosphorylated compounds suchas nucleic acids (Knochel 2006). For instance, some hormones need Pi for thephosphorylation process. Pi exists also as a part of phospholipids in membranes,it acts as a buffer in acid-base homeostasis on the bone surface and regulatesproton balance in the kidneys (Knochel 2006). An adult human body containsapproximately 700 g P (Gaasbeek and Meinders 2005). Most of this, i.e. 60%,occurs as hydroxyapatite in the bone. A further 9% is in skeletal muscles, 10.9%in internal organs, and 0.1% in the extracellular matrix. In blood, Pi occurs inboth organic and inorganic forms. The organic form comprises carbohydrates,lipids, and proteins. Of inorganic Pi, 85% occurs as free Pi ions (HPO4
-2,H2PO4
-1 ja PO4-3), 10% is bound to proteins, and 5% exists as a component of
calcium- (Ca), magnesium- (Mg) and sodium- (Na) bound compounds(Gaasbeek and Meinders 2005).
2.1.3. Phosphorus balance
An adult weighing 70 kg gets about 1600 mg P daily from the diet, and of this,about 40-80 % is absorbed in the intestinal tract, and about 1 g is excreted in theurine. The kidneys are the main regulator of P balance in the body (Heaney2004, Bergwitz and Jüppner 2010). Absorption is regulated by parathyroidhormone (PTH), calcitriol (1,25-hydroxy vitamin D, i.e. 1,25(OH)2D), andfibroblast growth factor 23 (FGF23), the latter needing Klotho as its co-receptor.About 30% of P absorption is regulated by 1,25(OH)2D (Bergwitz and Jüppner2010) and the rest is absorbed in a paracellular fashion. Most of P is absorbed inthe jejunum, where sodium-dependent phosphate cotransporter 2b (NaPi2b)mediates active intestinal P absorption, and is regulated by 1,25(OH)2D.Absorbed P is stored in the skeleton (Bergwitz and Jüppner 2010). Figure 1shows the balance between absorption and excretion of P.

20
Figure 1. Phosphorus balance in humans (adapted from Berndt and Kumar2007).
P homeostasis interfaces with Ca homeostasis in the kidney (Peacock 2010). Preabsorption from urine in renal proximal tubules by type 2 and 3 sodium-dependent phosphate cotransporters (NaPi2 and NaPi3) is the main factormaintaining blood Pi homeostasis, and this is regulated by PTH and FGF23(Bergwitz and Jüppner 2010). Pi is taken up into the cells from the circulationvia these transporters. In addition, some other hormones, such as insulin,hormones on the somatotrophic pituitary axis, and possibly also fibroblastgrowth factor 7, matrix extracellular glycoprotein and secreted frizzled-relatedprotein-4, seem to participate in P homeostasis, but their exact functions haveyet to be elucidated (Bergwith and Jüppner 2010). When dietary P intake ishigh, FGF23 is secreted from bone to bloodstream. This suppresses secretionand synthesis of PTH, Pi reabsorption in the kidney, and production of1,25(OH)2D (Kuro-o 2013). FGF23 works synergistically with PTH to increaserenal Pi excretion by reducing expression of sodium-dependent phosphate

21
cotransporters 2a and 2c (NaPi2a and NaPi2c) in the proximal tubules(Bergwith and Jüppner 2010). PTH, which has receptors in the kidney,increases renal phosphate clearance and stimulates synthesis of 1,25(OH)2D(Bergwith and Jüppner 2010). However, the receptor that senses the S-Piconcentration has not yet been identified (Peacock 2010). Furthermore, doseresponse between S-Pi and FGF23 is much less rapid than, for instance,between Ca and its regulating hormones (Peacock 2010).
Pi is analyzed from serum or plasma as inorganic phosphate. The normal rangesfor serum phosphate (S-Pi) concentrations are for females 0.85-1.50 mmol/l(corresponding to 2.63-4.64 mg/dl), for males ≤50 years of age 0.75-1.65mmol/l (corresponding to 2.32-5.11 mg/dl), and for males ≥50 years 0.75-1.35mmol/l (corresponding to 2.32-4.18 mg/dl) (Yhtyneet Medix Laboratoriot2014). Normal Pi concentrations in children are higher than in adults, graduallylowering with age.
2.1.4. Regulators of phosphate metabolism
Many regulators participate in the Pi metabolism: PTH, FGF23 and it’s co-receptor Klotho, 1,25(OH)2D, Ca, secreted frizzled-related protein-4 and matrixextracellular glycoprotein. It is noteworthy that FGF23 and its contribution to Pimetabolism were unknown when many of the earlier studies on high P intakewere done (Calvo and Tucker 2013); thus, newer studies have uncovered novelinformation on this topic. Figure 2 presents the regulators of P metabolism andtheir interactions.
Serum phosphate and serum calcium
One percent of Pi in the human body is in serum, which is controlled to somedegree by dietary P. Dietary P is known to have an impact on the biphasiccircadian rhythm of S-Pi (Portale et al. 1987, Kärkkäinen and Lamberg-Allardt1996). Changes in dietary P intake have an effect on the first phase of therhythm pattern but independent of diet, the peak in S-Pi concentrations occurs
22
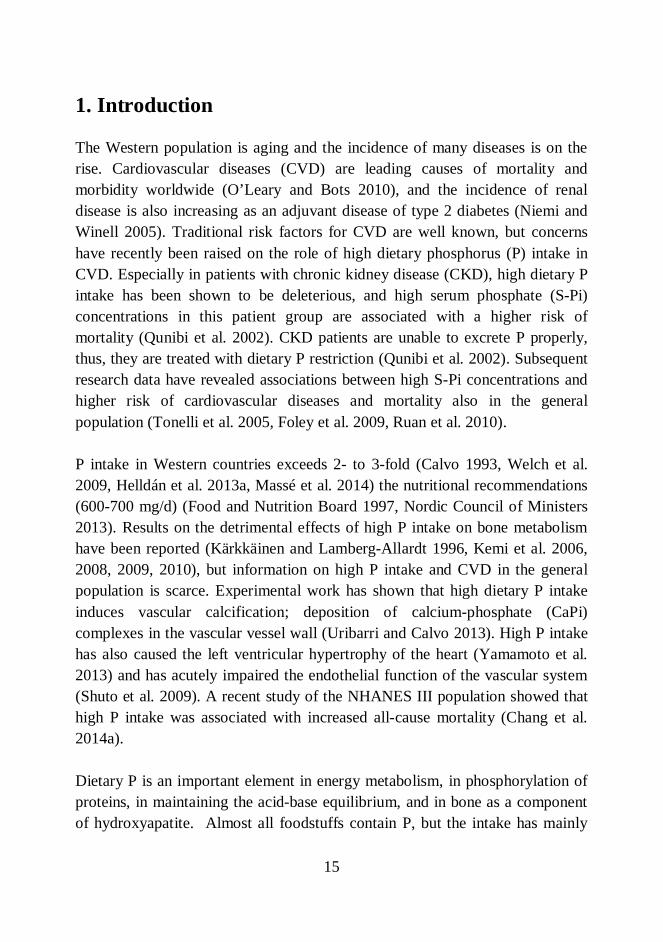
in the early morning (Portale et al. 1987). However, dietary P has only a smallimpact on S-Pi when measured after fasting or randomly, but increasing Pintake acutely increases S-Pi (Portale et al. 1987, Kemi et al. 2006). Mean 24-hS-Pi concentrations and peak S-Pi after P load are proposed to be more usefulthan fasting S-Pi concentrations when assessing the effects of dietary P intake(Uribarri 2013). It is notable that in healthy adults and animals a high P diet forweeks can result in increased FGF23 or PTH without any perceivable changesin S-Pi (Uribarri and Calvo 2013). Increased Ca intake increases serum ionizedCa (iCa), which decreases S-PTH, leading to a lower excretion of P in urine(Mortensen and Charles 1996). Calcium sensing receptor reacts to elevatedconcentrations of S-Ca, inducing lowering of S-PTH concentrations. High S-Caconcentration stimulates FGF23 excretion and suppresses PTH secretion (Silverand Naveh-Many 2009).
Figure 2. Relationships between dietary phosphorus and regulator ofmetabolism. S-Pi = serum phosphate, S-Ca = serum calcium, 1,25(OH)2D =
23
calcitriol, PTH = parathyroid hormone, FGF-23 = fibroblast growth factor 23(adapted from Silver and Naveh-Many 2009).
Parathyroid hormone
PTH is secreted from parathyroid glands (Bergwitz and Jüppner 2010). Itregulates S-Pi, and elevated S-Pi stimulates PTH, probably by loweringextracellular Ca, and increasing stability of PTH messenger RNA. Continuousexposure to PTH induces bone resorption by activating osteoclasts butintermittent PTH increases bone formation by activating osteoblasts (Bergwitzand Jüppner 2010). PTH secretion is regulated by S-Pi and FGF23 and Klothoin the parathyroid gland. FGF23 is able to inhibit the synthesis of 1,25(OH)2D,which may negatively affect the secretion of PTH (Bergwith and Jüppner 2010).However, PTH concentrations have been perceived to increase in response toincreased S-Pi independently of S-Ca (Kärkkäinen and Lamberg-Allardt 1996).PTH is downregulated by increased S-Ca and 1,25(OH)2D and possibly byincreased FGF23. PTH acts through G protein-coupled receptor PTHR1 toincrease osteoblast activity (and thus, indirectly osteoclast activity) to inhibitrenal Pi absorption, and to stimulate 1,25(OH)2D synthesis, which causes anincrease in S-Ca and a decrease in S-Pi (Bergwith & Jüppner 2010). PTH andFGF23 work synergistically to increase renal Pi excretion by reducingexpression of NaPi2a and NaPi2c (Bergwitz and Jüppner 2010).
There is circadian variation in S-PTH concentrations, being lowest in themorning. Sex differences also appear to exist in the rhythm (Calvo et al. 1991).The rhythm is biphasic, as in S-Pi. PTH responds acutely to high dietary P load(Block et al. 2013), thus increasing urinary Pi excretion.
Calcitriol, i.e. 1,25-dihydroxy vitamin D
Vitamin D exists as cholecalciferol (vitamin D3) and ergocalciferol (vitamin D2).The former is produced in the skin after exposure to ultra-violet irradiation,normally sunlight, or received from the diet, the latter originates only from
24
plant-derived foods (Haussler et al. 2012). In the body vitamin D goes through25-hydroxylation in the liver and is converted in the kidney to 1,25-dihydroxyvitamin D (1,25(OH)2D), i.e. calcitriol, which is the active form of vitamin D(Bergwitz and Jüppner 2010). Circulating 25-hydroxy vitamin D (25(OH)D)describes the vitamin D status in the body. Cytochrome P 2R1 (CYP2R1) isresponsible for 25-hydroxylation. Cytochrome P 27B1 (CYP27B1), the enzymeresponsible for 1–α-hydroxylation in the kidney, is induced by calcitonin, PTH,hypocalcemia and hypophosphatemia. FGF23, hypercalcemia andhyperphosphatemia repress CYP27B1 expression (Haussler et al. 2012), andfibroblast growth factor 7 and secreted frizzled-related protein-4 seem todownregulate this synthesis. FGF23 and 1,25(OH)2D also induce activity ofrenal cytochrome P 24A1 (CYP24A1) expression which converts 25(OH)D and1,25(OH)2D into inactive metabolites (Haussler et al. 2012).
Fibroblast growth factor 23 and Klotho
FGF23 is the major regulator of renal Pi handling (Ketteler et al. 2013). FGF23,which needs Klotho as it’s co-receptor, is produced in osteocytes andosteoblasts (Ketteler et al. 2013) and secreted from bone by an unknownmechanism (Kuro-o 2013). Vitamin D receptor and 1,25(OH)2D induceexpression of FGF23 in bone, and increased S-Pi also accelerates the expressionof FGF23. Dentin matrix protein 1 and phosphate-regulating gene withhomologies to endopeptidases on the X chromosome suppress FGF23production in bone, probably by indirect mechanisms (Bergwith and Jüppner2010). FGF23 is an attenuator of 1,25(OH)2D action (Haussler et al. 2012).1,25(OH)2D and dietary P induce synthesis of FGF23 (Bergwith and Jüppner2010). FGF23 facilitates kidney Pi handling by decreasing expression ofNaPi2a, NaPi2c and CYP27B1 in proximal tubules, thus, increasing urinary Piexcretion. Many organs have FGF receptors, but Klotho is expressed only in thedistal tubulus, parathyroid gland chief cells and the choroid plexus of the brain.Klotho is needed to improve the affinity of FGF receptors to FGF23.
FGF23 seems to follow an inherent circadian rhythm, and both intact FGF23and carboxy-terminal FGF23 (C-terminal FGF23) concentrations have been

25
shown to increase in humans after feeding a high P diet (Vervloet et al. 2011).Intact FGF23 is known to response more sensitively to dietary P load than C-terminal FGF23 (Burnett et al. 2006). It is also claimed that due to high dietaryP load, FGF23 increases only when high P intake is continuous (Block et al.2013, Uribarri and Calvo 2013).
All of these P metabolism-regulating hormones (parathyroid hormone, FGF-23,and 1,25(OH)2D) have been independently associated with adverse bone andCVD health aspects even when S-Pi concentrations have been in the normalrange (Uribarri and Calvo 2013).
2.2. Sources and bioavailability of dietary phosphorus
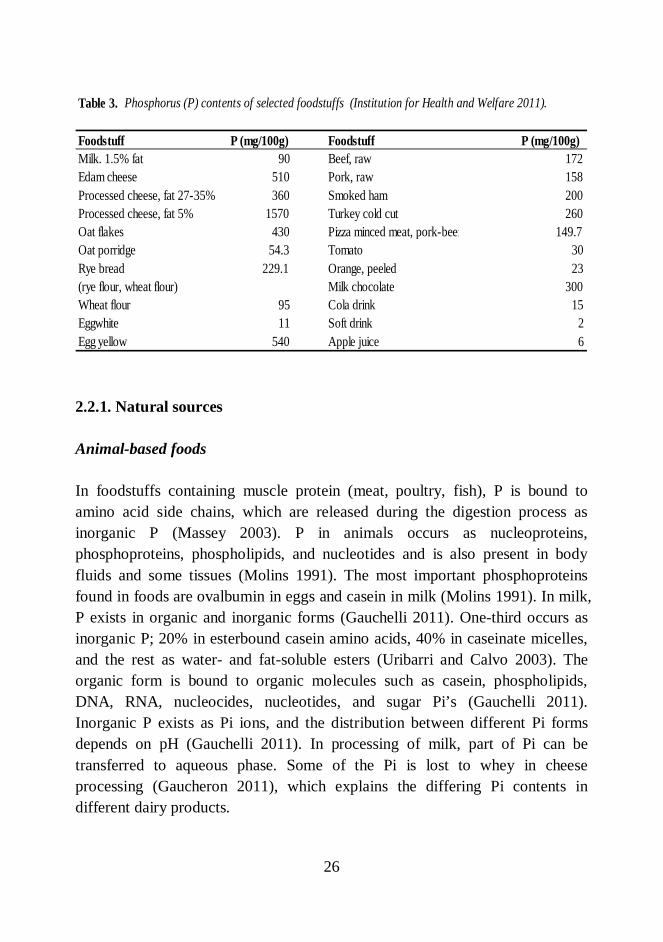
P occurs widely in foodstuffs, but the highest contents are in protein-rich foods,including meat, fish, eggs, dairy, legumes, whole-grain cereals, nuts and seeds(Kalantar-Zadeh et al. 2010). Inorganic Pi’s and organic starch-based Pi’s areused as food additives in various foodstuffs (Kalantar-Zadeh et al. 2010). Alsosome dietary supplements and some drugs contain P (Uribarri 2013). Tap wateralso contains P, albeit in very small amounts (EFSA 2005). P content ofdrinking water is legally restricted to 2.2 mg/l (European Union 1980). Infoodstuffs P occurs in the form of Pi but nutritional recommendations andnutrient contents of foodstuffs are reported as P. Table 3 displays P contents ofselected foodstuffs.
26
2.2.1. Natural sources
Animal-based foods
In foodstuffs containing muscle protein (meat, poultry, fish), P is bound toamino acid side chains, which are released during the digestion process asinorganic P (Massey 2003). P in animals occurs as nucleoproteins,phosphoproteins, phospholipids, and nucleotides and is also present in bodyfluids and some tissues (Molins 1991). The most important phosphoproteinsfound in foods are ovalbumin in eggs and casein in milk (Molins 1991). In milk,P exists in organic and inorganic forms (Gauchelli 2011). One-third occurs asinorganic P; 20% in esterbound casein amino acids, 40% in caseinate micelles,and the rest as water- and fat-soluble esters (Uribarri and Calvo 2003). Theorganic form is bound to organic molecules such as casein, phospholipids,DNA, RNA, nucleocides, nucleotides, and sugar Pi’s (Gauchelli 2011).Inorganic P exists as Pi ions, and the distribution between different Pi formsdepends on pH (Gauchelli 2011). In processing of milk, part of Pi can betransferred to aqueous phase. Some of the Pi is lost to whey in cheeseprocessing (Gaucheron 2011), which explains the differing Pi contents indifferent dairy products.
Table 3. Phosphorus (P) contents of selected foodstuffs (Institution for Health and Welfare 2011).
Foodstuff P (mg/100g) Foodstuff P (mg/100g)Milk. 1.5% fat 90 Beef, raw 172Edam cheese 510 Pork, raw 158Processed cheese, fat 27-35% 360 Smoked ham 200Processed cheese, fat 5% 1570 Turkey cold cut 260Oat flakes 430 Pizza minced meat, pork-beef 149.7Oat porridge 54.3 Tomato 30Rye bread 229.1 Orange, peeled 23(rye flour, wheat flour) Milk chocolate 300Wheat flour 95 Cola drink 15Eggwhite 11 Soft drink 2Egg yellow 540 Apple juice 6

27
Plant-based foods
Phytic acid i.e. myo-inositol hexakisphosphoric acid (C6H18O24P6) is a natural Pcompound in many plant-based foods (Figure 3). Phytic acid and its salts arecommonly called phytates (Reddy and Sathe 2002). In grains and seeds most ofthe P is in the form of phytate, which stores inositol and P (Reddy 2002).However, small amounts of P in plant products occur as phospholipids (Molins1991).
Figure 3. Chemical structure of phytic acid.
Grains and seeds contain reasonably high amounts of phytate. Legumes aredefined as dicotyledonous seeds, thus, they also contain phytate. Nuts also havehigh amounts of phytate compared with tubers, fruits, leafy products andvegetables (Reddy et al. 2002). Among leafy products and vegetables, tomatoesand okra contain high amounts of phytate, but no phytate is detected in manyfruits (Reddy et al. 2002). However, in cereals phytate constitutes the majorityof TP; in wheat 60-80%, in barley 55-70%, in oat 49%, in rye 38-66%, inbrown rice 74-81%, and in polished rice 51-61% of TP occurs in the form ofphytate (Reddy 2002). Because phytate is present in the outer layers of grains,in whole-grain cereals phytate contents are greater than in raffinated products.Phytate constitutes 50-70% of TP in soybeans, 27-87% in lentils, 40-95% inchickpeas, 40-95% in broad beans, 57-82% in peanuts, 36-53% peas, and 95%in tofu (Reddy 2002). In some tubers and fruits phytate P accounts for 20-34%of TP (Reddy 2002).
28
Phytate can be degraded during processing of foodstuffs or in the intestine(Sandberg 2002); however, the capability of the human intestine to degradephytate is limited (Iqbal et al. 1994). Phytase enzymes are responsible for theenzymatic degradation: they appear in plants, microbes, and some animaltissues (Sandberg and Andlid 2002). Non-enzymatic degradation of phytateoccurs at a low pH or at high temperatures and pressure. Phytate is degraded tolower inositol phosphates (IP5, IP4, IP3, IP2, IP), and the same process formsbioavailable, inorganic Pi (Sandberg 2002). Phytate is thermostable, and thus, itdoes not degrade easily with cooking, autoclaving, roasting or with othertraditional heat processing methods (Sathe and Venkatachalam 2002).Hydrolysis of phytate during fermentation and bread-making is affected bymany variables such as type and freshness of flours, use of yeast, pH of dough,water content, possible fermentation, leavening time and temperature (Türk etal. 1996, Sathe and Venkatachalam 2002). The effects of soaking on phytatehydrolysis depend on the soaking time and temperature. Because phytate iswater-soluble, removal of soaking water has an impact on the final phytatecontent of the product (Sathe and Venkatachalam 2002). Phytates may alsochelate with other minerals and impair bioavailability of Ca, iron and zinc in thefoodstuffs (Lopez et al. 2002).
2.2.2. Other sources
Food additive phosphates (FAPs) are used for a number of reasons; they enablefood products to achieve, for example, better texture, taste, emulsification,acidification, leavening, anti-caking, moisture binding, antimicrobial action,color stability, iron binding, buffering, and freeze-thaw stability (Uribarri andCalvo 2013). In lean meat products (processed beef, pork, and chicken), FAPsare used to maintain tenderness and moisture during cooking (Uribarri 2013). Amixture of water, salt and sodium phosphate can be added to spice up meatproducts and prevent their drying. FAPs are used in ham, bacon and cold cuts asanti-oxidizing agents, stabilizing agents, and agents to improve taste and color.Also frozen fish products can be rinsed with sodium phosphate solution prior tofreezing to prevent loss of protein during the thawing process. In dry foodmixes, e.g. soups, FAPs are used as anti-caking agents. Also some canned fish
29
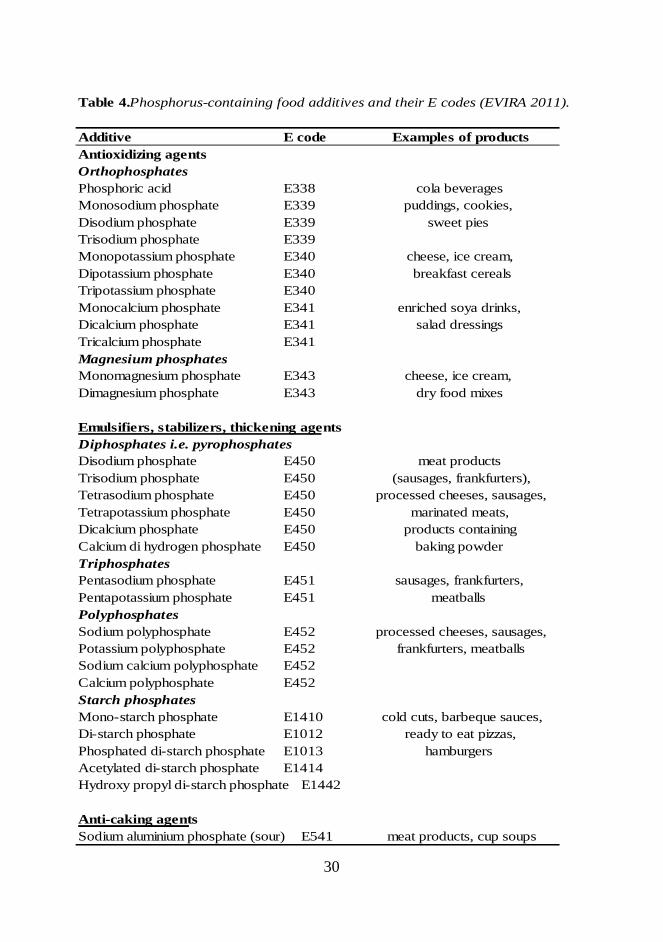
products contain FAPs. Without FAPs, the shelf-life of many foodstuffs wouldbe shorter (Uribarri 2007). Further, it should be noted that some Ca-enrichedproducts (e.g. soy drinks, other milk alternatives, and fortified juices) contain Piin the form of CaPi (Fitzpatrick and Heaney 2003, Kung 2010). Moreover,some bakery products (cookies, biscuits, cakes, muffins) contain FAPsoriginated from baking powder. Phosphoric acid is used as an acidity regulatorin cola beverages, and some countries also in other beverages. Table 4 displaysapproved FAPs, their E codes, and examples of products containing specificadditives.
In the European Union, the use of FAPs is regulated by a CommissionRegulation (European Union 2011). Legally allowed maximum amounts ofFAPs are calculated as phosphorus pentoxide (P2O5). One mg of P correspondsto 2.29 mg P2O5. The maximum amount allowed varies with the regulatoryclassification of the foodstuff; starch Pi’s are usually distinguished from theothers, and their addition to products is often allowed quantum satis. Forbreakfast sausages and processed meat, the maximum amount of FAP is 5000mg/kg (P2O5). For processed cheeses the maximum amount is 20 000 mg/kg(P2O5), while for unripened cheeses the amount is 2000 mg/kg (P2O5). Forbreakfast cereals, spreadable fats, and frozen potatoes, the maximum is 5000mg/kg (P2O5). For many foods, e.g. baby foods, FAP addition is not allowed(European Union 2011).
A market survey done in Finland (Suurseppä et al. 2001) showed thatapproximately 10% of food products on the market contain FAPs. After Finlandjoined the European Union, the food additive contents of foodstuffs becamesignificantly higher due to more generous allowances in European Unionlegislation. FAP-content in cold cuts and sausages was doubled and that in liverpates rose by 25%, even though the levels were within allowed limits (20% ofthe maximum, earlier 30%) (Blomberg and Penttilä 1999). The maximum FAPamounts in sausages were tripled relative to the situation of the earlierlegislation. However, the FAP levels in the analyzed products were far belowthe maximum limits, even though contents in processed cheeses were fairlyhigh (Suurseppä et al. 2001). When comparing the P content based of analysiswith that provided by manufacturers, about half of P in sausages seemed to be
30
Table 4.Phosphorus-containing food additives and their E codes (EVIRA 2011).
Additive E code Examples of productsAntioxidizing agentsOrthophosphatesPhosphoric acid E338 cola beveragesMonosodium phosphate E339 puddings, cookies,Disodium phosphate E339 sweet piesTrisodium phosphate E339Monopotassium phosphate E340 cheese, ice cream,Dipotassium phosphate E340 breakfast cerealsTripotassium phosphate E340Monocalcium phosphate E341 enriched soya drinks,Dicalcium phosphate E341 salad dressingsTricalcium phosphate E341Magnesium phosphatesMonomagnesium phosphate E343 cheese, ice cream,Dimagnesium phosphate E343 dry food mixes
Emulsifiers, stabilizers, thickening agentsDiphosphates i.e. pyrophosphatesDisodium phosphate E450 meat productsTrisodium phosphate E450 (sausages, frankfurters),Tetrasodium phosphate E450 processed cheeses, sausages,Tetrapotassium phosphate E450 marinated meats,Dicalcium phosphate E450 products containingCalcium di hydrogen phosphate E450 baking powderTriphosphatesPentasodium phosphate E451 sausages, frankfurters,Pentapotassium phosphate E451 meatballsPolyphosphatesSodium polyphosphate E452 processed cheeses, sausages,Potassium polyphosphate E452 frankfurters, meatballsSodium calcium polyphosphate E452Calcium polyphosphate E452Starch phosphatesMono-starch phosphate E1410 cold cuts, barbeque sauces,Di-starch phosphate E1012 ready to eat pizzas,Phosphated di-starch phosphate E1013 hamburgersAcetylated di-starch phosphate E1414Hydroxy propyl di-starch phosphate E1442
Anti-caking agentsSodium aluminium phosphate (sour) E541 meat products, cup soups
31
originating from FAPs (Suurseppä et al. 2001). However, in the United Statesthe use of FAPs is more common than in Finland. According to León et al.(2013), 44% of the 2394 best-selling branded grocery products contained FAPs;the most common were frozen foods (72%), dry food mixes (70%), packagedmeat (65%), bakery goods (57%), soups (54%) and yogurts (50%). In theirstudy, these products were matched to similar FAP-free products and P contentswere analyzed. FAP-containing products had significantly higher P content thanregular products. Authors also collected meals based on FAP-containingfoodstuffs and regular foodstuffs, and they noticed that the difference betweenthe mean P intakes was as high as the recommended daily allowance for Pintake (736 mg/d) when consuming FAP-containing products. Carrigan et al.(2014) compared low-FAP and high-FAP meals based on 4-day menusdeveloped by a specific nutritional software, and found that the intake of P fromadditives may reach harmful levels at least in kidney patients. Based on earlierdata in the United States, the estimations of FAP intake have been criticized asbeing too low (Carrigan et al. 2014). The current use of FAP-containingproducts in Finland is unknown. The only study investigating FAP contents offoodstuffs in Finland was published in 2001 (Suurseppä et al. 2001). Since then,the market shares of products have changed, new products have becomeavailable, and food consumption patterns have changed (Mäkelä et al. 2008).
Also some dietary supplements may contain P (EFSA 2005). In a British studyof multivitamin supplements, the P contents in supplements ranged between 15to 1100 mg/portion (EFSA 2005). The contribution of these supplements to TPintake is, however, quite low at the population level. The NHANES 2007-2008data in the United States showed that average P intake via supplements was 108mg/day/portion (range 31-130 mg/d) (Uribarri 2013). To date, P contents ofdietary supplements in Finland have not been analyzed.
Recently, concern has arisen on P content of the inactive ingredients in bothprescription and over-the-counter medications (Uribarri 2013). According toUribarri, these medications can cause a rise in TP intake if many P-containingmedications are used at the same time, and Uribarri notes that in themanagement of CKD this can cause problems when estimating the TP intake onP-restricted diets. According to Calvo and Park (1996), also packaging material
32
and other P-containing compounds used in the manufacturing process may endup in foodstuffs, but they consider the effect on TP intake to be negligible.
2.2.4. Methods for assessment phosphorus contents and bioavailability infoodstuffs
2.2.4.1. Basic chemical methods to analyze phosphorus contents
Different chemical methods can be used to analyze the P content in foodstuffs.However, because foods have complex textures and P can be bound to otherelements, the same methods as used for pure Pi solutions cannot be used. Thesamples are usually pre-treated, e.g. the fat is removed, before the analysis. Incolorimetric methods, the P content in foodstuffs is assessed based on theintensity of the color formed in the reaction. The color can be assessed by eithera method based on formation of ammonium phosphomolybdate, which isreduced to ammonium blue (Olson and Summers 1982, Nordic Committee onFood Analysis 1994), or a molybdate vanadate method, where P reacts withmolybdate vanadate complex and forms a yellow color (Olson and Summers1982, AOAC 965.17, Phosphorus in animal feed and pet food). This method isnot as precise as the former one, but it can be used for the assessment of higherP contents. Most of the P contents in foodstuffs in the Finnish food compositiondatabase Fineli®, especially cereals, are analyzed using this method (Varo 1980).In titrimetric methods (AOAC Official method 964.06 Phosphorus in AnimalFeed, AOAC Official Method 948.09 Phosphorus in flour), the addedphenoliphtalein forms a pink color in the titrated solution. Molybdate solutionand Na hydroxide can be used as a reagent solution in the first phase, and eitherMg nitrate or molybdate solution in the second phase.
P contents can also be assessed by plasma-atomic emission spectrometry, butnot by atomic absorption spectrometry or atomic fluorescence spectrometry(Lajunen 1986). In this method, the high temperature produces kinetic energyfor the particles, which transforms the atoms to an excited stage and ions to ahigher level, where their excess energy is emitted as photons. Each compound
33
emits its own radiation with many wave-lengths. The emission forms aspectrum, the compounds of which can be recognized and the contents analyzed.Inductively coupled plasma mass spectrometer (ICP-MS) is one of these plasmaemission spectrometry methods. In ICP-MS, the recognition and sorting of ionsis based on their mass-charge ratio. The device is sensitive and the repeatabilityof the measurements is good (PerkinElmerSciex Instruments 2001). Alsoinductively coupled plasma optical emission spectrometry (ICP-OES) andinductively coupled plasma atomic emission spectrometry (ICP-AES) can beused to analyze P contents in foodstuffs; with these techniques, the intensity ofthe emission describes the concentration of the element in the sample.
2.2.4.2. Methods to assess mineral bioavailability
In vivo methods
Methods for assessment of mineral bioavailability in vivo utilize livingorganisms such as animals, humans and plants (Hur et al. 2011). These methodsmay, for example, investigate mineral contents in serum or urine, mineralbalance in the presence of stable or radioactive compounds, or effects of themineral on target organs (Heaney 2001). When evaluating only serumconcentrations, the strictly regulated metabolism may not result in dose-dependent changes in concentrations, and moreover, for many nutrients goldstandards are not available as biomarkers of bioavailability. When analyzingonly urine excretion, it is important to take into account the glomerulusfiltration rate (GFR), which depends on the subject and causes biologicalchanges in the results. Investigating the impact on target organs is effective, butbiological responses differ between subjects. Radioactive methods are sensitive,quick, and easy. A labeled isotope, stable or radioactive, can be used todetermine the amount of absorbed mineral. Also ileostomic patients have beenused as subjects to investigate mineral bioavailability because their intestinalcontents can easily be accessed (Kivistö et al. 1986, Sandberg et al. 1987,Sandberg et al. 1988). It is notable that in ileostomic patients only absorption inthe area of small intestine can be evaluated, not possible absorption in the colon

34
(Kivistö et al. 1986). Generally, human studies are time-consuming, expensiveand difficult to carry out (Sandberg 2005).
Using animal studies to investigate mineral bioavailability also has somedrawback due to differences between animals and humans in mineral needs andabsorption. For example, Fe absorption in rats is dissimilar to that in humans,thus hindering extrapolation of results to humans (Sandberg 2005). Rats havephytase activity in their gut, while humans have only marginal phytase activity(Hotz 2005), affecting the results when studying bioavailability of plant-basedfoodstuffs.
In vitro methods
Cells or biological molecules can also be studied outside their normal biologicalcontext. In vitro methods are faster, less expensive, and easier to control than invivo methods (Sandberg 2005). In vitro methods usually mimic the processingof food in the alimentary tract. In in vitro methods evaluating mineralbioavailability, the foodstuff is first digested enzymatically (e.g. by alpha-amylase, pepsin and pancreatine) and the rest of the processing depends on thefiltration method chosen. In in vitro dialysis/solubility methods, the digestion istwo-phased: first the processing of food in the alimentary tract is mimicked andthen the sample is dialyzed through a half-permeable membrane based onmolecular weight describing the absorption process (Sandberg 2005).Depending on the method, the incubation times, enzymes used, and endprocessing are variable (Hur et al. 2011). Restrictions of in vitro methods arethat the interaction between the alimentary tract and food or food componentscannot be measured (Sandberg 2005). In practice, the transit time in thealimentary tract depends on the content of the meal, and absorption capabilityof the different parts of the alimentary tract differs. The content andconcentrations of alimentary enzymes also depend on the content of the meal.Neither intestinal microbiota nor circulation exist in in vitro methods.

35
2.3. Gaps in the knowledge on intake and bioavailability ofdietary phosphorus
2.3.1. Food additive phosphorus intake
When assessing the P contents in foodstuffs, the natural P and FAP cannot bedistinguished analytically (Suurseppä et al. 2001), and thus, P contents in foodcomposition databases are reported as total P. Moreover, in food compositiondatabases, P contents of the recipe-based foodstuffs are calculated based onnutrient contents of raw materials, and not on chemically analyzed values(National Institute for Health and Welfare 2011). Thus, the amounts of FAPsmay have not been taken into account. The consumption of ready-to-eat mealshas increased four-fold over the last two decades in Finland (Mäkelä et al.2008), and food composition databases have not taken into account possibleFAPs in these foodstuffs (Oenning et al. 1988, Sullivan et al. 2007). Thus,often the only way to obtain information about FAP contents is from themanufacturers, which can be problematic (Calvo and Park 1996). Voluntarylabeling of P contents in foodstuffs has not been popular in the United States,even though the National Kidney Association recommends labeling (Uribarriand Calvo 2013). However, in the European Union, the legislation requires thatany food additives used are listed as E codes or their names on the package(European Union 2011).
In the United States, the estimated FAP intake in 1979 was 320 mg/day,approximately 20-30 % of total P intake (Greger and Krystofiak 1982). The Pintake from additives in the United States has been estimated to have increasedfrom 470 mg/d in 1990 to 1000 mg/d in 2012 – now with 50% of P intakecoming from additives as “hidden phosphorus” (Winger et al. 2012).Information about the use of FAPs in Finland is scarce and out of date. FinnishFood Authority and Customs Laboratory conducted a survey of FAP-containingfoodstuffs in 2000. Based on their results, the main sources of FAPs weresausages and other meat products, baked goods leavened with baking powder,and some ready-to-eat and processed meals such as pizza (Suurseppä et al.2001). Also phosphoric acid-containing cola beverages were considered a
36
potential high-FAP source. The authors concluded that FAP intake can beexcessive in small children or persons consuming particular products, e.g.sausages and other processed meat products or cola beverages in abundance. Anearlier survey showed that mean FAP intake from meat products was 13 mg/damong women and 38 mg/d among men (Ovaskainen et al. 2000). The meanintake among adults was 25 mg/d. In this survey, only FAP intake from meatproducts was estimated; food consumption data was based on in the NationalFINDIET Study 1997, and analytical values were derived from Blomberg andPenttilä’s surveys (1999). However, the FAP contents in the products wereclearly lower than the allowed maximum amounts in foodstuffs (Blomberg andPenttilä 1999). Further, the current FAP intake in Finland is not known due tolack of comprehensive studies.
Oenning et al. (1988) compared P and Ca intake based on chemically analyzedresults and nutrient databases. On the basis of database values, the P intake was15-25% lower than when it was analyzed chemically, although the correlationbetween the methods in Ca intake was good. This may cause underestimation ofthe true P intake. Most studies comparing P contents of FAP-enhanced andregular products are conducted on animal products (Sherman and Mehta 2009a,Sherman and Mehta 2009b, Benini et al. 2011). Sullivan et al. (2007) did asurvey about chicken products: 35 of the analyzed 38 chicken productscontained FAPs (92%). In almost all FAP-containing products, the P contentswere higher than content expected from nutrient databases. P contents betweenmanufacturers differed by up to 100 mg/100 g product. Researchers concludedthat additives seemingly increased P content of chicken products. Recently,Carrigan et al. (2014) analyzed P contents of high- and low-FAP-containingmeals over an entire day, and surprisingly, no significant differences werefound between calculated and analyzed P content of high-FAP-containing meals,contradicting earlier results. Nevertheless, in examining the low-FAP-containing meals, the P content between calculated and analyzed content didshow a difference. Calvo and Tucker (2013) propose as an important futurework to improve food composition databases that the natural and additivesources of P be identified.

37
2.3.2. Bioavailability of phosphorus
FAP-containing foodstuffs have been shown to cause more adverse effects inCa and bone metabolism than foods without FAPs (Bell et al. 1977, Kemi et al.2006, Karp et al. 2007, Karp et al. 2012) indicating better bioavailability ofFAPs, however, in above-mentioned studies only in terms of mineralmetabolism markers. No differences have emerged between different forms ofFAPs, e.g. mono- and polyphosphates, concerning mineral metabolism (Karp etal. 2013). Also the bioavailability of P in animal origin foodstuffs has beenstated to be better than in vegetable origin foodstuffs (Moe et al. 2011, Karp etal. 2012). In the whole-foods approach intervention study of Karp et al. (2007),the metabolic response was different for different foods (cheese, meat, whole-grain), indicating different bioavailability. However, no generally reliablemethods to assess bioavailability of P in the foodstuffs have been developed.Benini et al. (2011) and Cupisti et al. (2012) have developed methods to assessdifferent fractions of soluble P in meat products with or without FAPs, however,these methods need further development to be used in P analysis of otherfoodstuffs.
Further, the recent study of Chang et al. (2014a) instigated discussion about theassessment of P bioavailability (McCarty 2014, Chang et al. 2014b). McCartypaid attention to the lower bioavailability of plant-derived P and proposed useof a correction factor in P intake for plant-derived P. However, according toChang et al., correction factors are likely to introduce error into results untilreliable methods are developed to estimate P bioavailability. The authors furtherstated that problems are caused by unknown exposure to FAPs as well as byfood preparation. They recommended the use of 24-h urine Pi excretionmeasurement, which has been shown to be a reliable method for estimating truedietary P intake (Morimoto et al. 2014). However, 24-h urine collections havenot been available in many studies, including that of Chang et al. Calvo andTucker (2013) propose the use of algorithms to better quantify P bioavailability,thus producing better estimates for actual P intake. Thus, in addition to these,there is a need to develop a method to analyze bioavailable P contents infoodstuffs.

38
2.4. Phosphorus, vascular calcification and cardiovasculardiseases
2.4.1. Calcification and cardiovascular diseases
Mineralization occurs in normal bone, but when it occurs in soft tissue and notas a result of aging, it is called ectopic calcification. In the vascular system, thisis a pathological condition due to mineral (mostly Ca and Pi) deposition in thevascular vessel wall (Marulanda et al. 2014). Vascular calcification isassociated with atherosclerosis, diabetes, kidney disease, and some genetic andmetabolic disorders (Wu et al. 2013). It predicts independently cardiovascularevents in the normal population, renal patients, and diabetics (Marulanda et al.2014). Figure 4 presents the nomenclature of biological calcifications.
Figure 4. Nomenclature of biological calcifications (adapted from Lanzer et al.2014).

39
Vascular calcification comprises two distinct disorders: intimal (atherosclerotic)and medial calcification (Mönckebergs sclerosis) (Lanzer et al. 2014).Knowledge about molecular mechanisms in vascular calcification is growing.Deposition of CaPi i.e. hydroxyapatite, different initiating and propagatingmolecular mechanisms, and diverse crystalline compositions of Ca apatitecrystals can be present in vascular calcification, in both intimal and medialcalcification (Lanzer et al. 2014). Both of these calcifications result in ectopicvascular calcification, but the triggering biochemical cascades between intimaland medial calcification differ; in intimal calcification atheroplaque is formed,but in medial calcification the cascades are initiated by damages to elastic fibers(Lanzer et al. 2014). Figure 5 presents a cross-section of a normal vessel.Normally, the intimal layer consists of endothelial cells and a small amount ofconnective tissue. In the case of atherosclerosis, inflammation, thickening, andcalcification occur. Calcification seems to increase atheroma plaque rupture risk,mainly in older persons with heavily calcified arteries (Sakakura et al. 2013).Further, media consists of smooth muscle cells and an elastin-rich extracellularmatrix, and medial calcification occurs in the elastic lamina. Medialcalcification, affecting diabetics, renal patients, persons with osteoporosis, andhypertension patients, leads to stiffening of the arterial wall, is associated withelevated blood pressure, and entails a higher risk of cardiovascular mortality(Wu et al. 2013).
Figure 5. Cross-section of a vessel.

40
Vascular calcification was earlier considered a passive phenomenon occurringwithin aging, but now it is known to be an active process with inductive andinhibitive reactions (Wu et al. 2013). The process of calcification is similar tobone formation; the same mediators participate in both processes, and incalcification vascular cells undergo a phenotypic change to osteoblast-like cells.The major mechanisms revealed thus far for calcification are disturbedanticalcific processes, induction of osteochondrogenesis, cell death,abnormalities in Ca and Pi homeostasis, formation and circulation ofcalciprotein particles, and modifications in the matrix (Wu et al. 2013).Calcified vascular smooth muscle cells express the same proteins as osteoblasts(Jono et al. 2000), and it has been suggested that the regulators of bonemetabolism, osteoprotegerin/RANK/RANK ligand axis, bone morphogenprotein, matrix Gla protein and fetuin A, may play a role in vascularcalcification, indicating mineralization similar to bone (van Campenhout andGolledge 2009, Figueiredo et al. 2013). Further, CVD and osteoporosis havebeen found to be associated in epidemiological studies (see den Uyl et al. 2011),giving rise to the hypothesis that these two diseases may share some commonmechanisms as well as P’s common role in them. Data from someepidemiological studies indicates associations between vascular calcification,impaired bone metabolism, and increased mortality (Cannata-Andia et al. 2011).In renal patients these associations are even stronger.
Pi can participate in vascular calcification via multiple mechanisms (see Figure6); for instance, cytotoxicity of Pi in cultivated vascular cells, Pi acting as anendothelial toxin, and calciprotein particle production have been suggested tounderlie P’s role in CVD. Pi may act as an endothelial toxin because in thepresence of high Pi concentrations endothelial cells have been shown to impairnitric oxide synthesis, increase reactive oxygen species generation, and undergoapoptosis. Calciprotein particles induce phenotypical changes in vascular cells,but it is notable that Pi is not the only factor that participates in crystalformation and dissolution under conditions of high intracellular Ca level (Ellamand Chico 2012).
Elevated S-Pi concentrations also provoke metabolic responses; increases inFGF23 and PTH concentration, and decreases in calcitriol concentration, which

41
may also underlie P’s role in vascular health. FGF23 can directly act oncardiomyocytes to promote left ventricular hypertrophy, which is also linked tolow vitamin D status and elevated S-PTH concentrations. Calcitriol can act inthe renin-angiotensin system by suppressing renal renin secretion; increasedrenin concentration in blood has been shown to be a CVD risk factor. Calcitriolcan also interfere in CVD via anti-inflammatory effects on vascularmacrophages (McCarty and DiNicolantonio 2014).
Figure 6. Potential mechanisms by which phosphate could be involved invascular calcification (from Ellam and Chico 2012). Pi phosphate; FGF23 fibroblastgrowth factor 23; ROS reactive oxygen species; VSMC vascular smooth muscle cells; PTHparathyroid hormone; LVH left ventricular hypertrophy

42
2.4.2. Methods to measure calcification and risk or progression ofatherosclerosis
Biomarkers of cardiovascular disease risk
Several biomarkers can be used to measure CVD risk. Traditional risk factors,such as high concentrations of low-density lipoprotein cholesterol (LDL-C) andhigh blood pressure are well known, but other factors have also been considered.Inflammation markers measured in blood, such as white blood cells, C-reactiveprotein (CRP), interleukin-6, and macrophage colony-stimulating factor areconnected to atherogenesis and plaque instability (Ikonomidis et al. 2008).Recently, markers of mineral metabolism, such as osteocalcin, osteopontin,bone morphogen protein, fetuin A, matrix Gla protein, and FGF23, have beenproposed to act as potential signaling molecules in arterial calcification (Everett2010). The strongest evidence exists for associations between CVD and lowfetuin A, low undercarboxylated matrix Gla protein, and high FGF23concentrations (Everett 2010). Nevertheless, more research about these markersand prediction of CVD risk is required.
Intima-media thickness measurement and other non-invasive methods tomeasure vascular calcification
Various non-invasive measurement methods can be used to assess vascularcalcification: arterial stiffness (a predictor of mortality and coronary heartdisease) with pulse wave analysis or pulse wave velocity, endothelial functionassessment with flow-mediated dilation, nitro-glycerin-mediated dilation andbrachial artery diameter measurement, peripheral flow with ankle-brachialindex either at rest or after exercise, and arterial wall thickness measurement interms of carotid intima-media thickness (cIMT) (Holewijn et al. 2010).Coronary artery calcification can be measured by computed tomographicangiocardiography (Kwan et al. 2013). However, cIMT measurement is themost common and easiest method to use. cIMT measurement can be applied toassess CVD risk and to monitor disease progression (O’Leary and Bots 2010).Ultrasound imaging of the carotid gives reliable prediction of state of
43
atherosclerosis in other arteries, and the results correlate with histology of thevessel. Many epidemiological studies have established cIMT as a marker ofsubclinical atherosclerosis, and it is associated with CVD risk factors and withprevalent and incident CVD (O’Leary and Bots 2010). Echoimaging of thecarotid has revealed that IMT correlates even in young persons with futureCVD risk (Raitakari et al. 2003).

44
2.5. Current knowledge on phosphorus and cardiovascularhealth from an epidemiological point of view
It has long been known that renal patients have impaired mineral metabolismand are unable to excrete P properly, causing e.g. vascular calcification if nottreated with P-restricted diets (Qunibi et al. 2002). Information from short-termand intervention studies in the general population suggests that high P intakeespecially together with low Ca intake might be harmful for bone and Cametabolism (Calvo and Park 1996, Kärkkäinen and Lamberg-Allardt 1996,Kemi et al. 2006, 2009, 2010). Also different P sources have different effectson mineral metabolism: FAP seems to be more harmful than natural P (Karp etal. 2007, Kemi et al. 2009).
In recent studies, some concern has been raised about excess dietary P intakeand vascular calcification, cancer, obesity, and hypertension (Anderson 2013).Several organs and tissues are affected by elevated S-Pi concentrationsfollowing high P intake (Anderson 2013). High S-Pi concentrations have alsobeen speculated to cause inflammation, adipocyte hyperplasia, increasedtriglyceride concentrations, insulin resistance, tumors, and Alzheimer’s disease,although data for neurological conditions are limited (Anderson 2013).Excessive phosphorylation of protein kinase Akt in all kinds of cells has beensuggested to be the main actor in cell metabolism associated with many chronicdiseases (e.g. cancer, type 2 diabetes, and neurological and cardiovasculardiseases) (Hers et al. 2011).
2.5.1. Serum phosphate and cardiovascular health
Decreased P excretion followed by hyperphosphatemia is associated withprogression of secondary hyperparathyroidism, renal osteodystrophy andincreased mortality and morbidity in dialysis patients (Slatopolsky and Delmez1994, Block et al. 1998, Block et al. 2004). Hyperphosphatemia is also linked tovascular calcification and CVD mortality in these patients (Block et al. 1998,Qunibi et al. 2002, Kestenbaum et al. 2005). However, in the last decade, high

45
S-Pi has been found to be associated with CVD risk also in large population-based studies of subjects with normal renal function (Tonelli et al. 2005,Dhingra et al. 2007, Foley et al. 2008). Table 5 presents the main findings ofstudies on S-Pi and cardiovascular health in the general population. Elevated S-Pi even in young persons was associated with atherosclerosis risk (Foley et al.2009) and higher cIMT, a subclinical marker of atherosclerosis (Ruan et al.2010). In an earlier study of Onufrak et al. (2008), S-Pi was associated withcIMT in males but not in females. A Korean study (Park et al. 2010) reportedan association between lower S-Pi and less coronary artery calcification. In theMESA study in individuals with normal kidney function to moderate kidneydisease, high S-Pi was associated with high ankle brachial pressure, a marker ofarterial stiffness, however, not with arterial elasticity (Ix et al. 2009). Further,Kendrick et al. (2010) showed in the NHANES population that S-Pi, evenwithin normal reference limits, was associated with higher ankle brachialpressure. In a longitudinal study, S-Pi independently predicted coronary arterycalcification (Tuttle and Short 2009). Larsson et al. (2010) reported thatelevated S-Pi was associated with risks of total, cardiovascular, and non-cardiovascular mortality in the general population. High S-Pi was related togreater risk of mortality also in the study of Sim et al. (2013).
The reported data on the deleterious effects of high S-Pi is from follow-up andcross-sectional studies, but the only case-control study (Taylor et al. 2011)failed to show evidence of an association between plasma Pi (P-Pi) anddevelopment of coronary heart disease. However, the subjects in the latter studycomprised only males. The only meta-analysis on the topic, including 24studies, concluded that S-Pi non-linearly predict risk of CVD deaths/events andtotal mortality, but not coronary heart disease events (Li et al. 2014).Nevertheless, these data cannot be extrapolated to the general populationbecause also studies carried out on subjects with impaired kidney function(CKD stages 1-2 [range 1-5]) and CVD were included.
Thus, results of these epidemiological studies support the evidence that high orelevated-normal S-Pi concentrations may be harmful for vascular system andhealth. Nevertheless, some studies show differences between the sexes in theassociation between S-Pi concentrations and CVD risk factors. Some authors

46
have stated that S-Pi could be considered a novel cholesterol, and in the futurePi binders (now used in CKD patients) could possibly be used also in thenormal population in the prevention of CVD (Ketteler et al. 2013, McCarty andDiNicolantonio 2014).
2.5.2. Dietary phosphorus and cardiovascular health
Several studies on the effects of high dietary P intake have been conducted withuremic animal models that better describe circumstances under deficient kidneyfunctions (e.g. El-Abbadi et al. 2009, Nikolov et al. 2012, Che et al. 2013).However, a high-P diet has increased vascular calcification in mice (Román-García et al. 2010), and in ApoE-deficient mice reduced atherosclerosisformation in an atherosclerotic condition, which was an unexpected result(Shiota et al. 2011). Dietary P restriction also reduced vulnerability to high-cholesterol diet-induced dyslipidemia in mice (Tanaka et al. 2013).
Only limited data are available on the effects of a high-P diet on cardiovascularhealth outside CKD in humans (see Table 6). Acute high P intake (1200 mg)reduced endothelium-dependent flow-mediated brachial artery dilation ineleven healthy men (Shuto et al. 2009). In the study of Yamamoto et al. (2013)a high dietary P intake (assessed by food frequency questionnaires [FFQs]) insubjects (n=4494, mean age 62 years) was associated with left ventricularhypertrophy among women (highest P intake quintile 1346-4069 mg/d) but notamong men. Their data was adjusted for demographics, Na and energy intake,lifestyle factors, comorbidities, and established left ventricular hypertrophy riskfactors. Chang et al. (2014a) showed in the NHANES cohort (n=2686, age 20-80 years) that dietary P intake >1400 mg/d and P density of the diet >0.35mg/kcal were associated with all-cause mortality. High P density (>0.35mg/kcal) was associated with CVD mortality, but no such results were foundfor total dietary P intake. Interestingly, also low P density (<0.35 mg/kcal) wasassociated with increased mortality risk. In that study, P intake was assessed by24-hour recalls, and the data was adjusted for demographics, CVD risk factors,kidney function, and energy intake, and the results remained so when Na andsaturated fat intake were introduced as covariates. Neither differences between

47
diet quality subgroups based on the Healthy Eating Index were perceived. In arecent Korean study on subjects with preserved renal function, no associationbetween dietary P intake and coronary artery calcification was found (Kwak etal. 2014), but the mean P intakes in the study population were very low, lessthan 800 mg/d. However, because P and Ca interact (Peacock 2010), it isimportant to consider intake of Ca as a confounding factor. These studies failedto do this and also the sources of dietary P intake were not separated, whichmay explain the finding that no association between dietary intake of P andcoronary artery calcification.
Some cross-sectional population-based studies propose that high dietary Pintake is associated with lower blood pressure (Joffres et al. 1987, Beydoun etal. 2008, Elliott et al. 2010). However, the effects of confounding factors cannotbe excluded in these studies. In the study by Elliott et al., the study populationwas from four different countries with differing main P sources and total Pintakes were not reported. Other limits of their study are high intercorrelationsbetween P and Ca intake and between P and Mg intake. Also Joffres et al.(1987) reported high intercorrelations between the nutrients, and in themultivariate analyses the data were adjusted only for age and body mass index(BMI). In the study of Beydoun et al. (2008), in addition to P, cheese and lowfat milk consumption were inversely associated with blood pressure, which mayreflect more the role of dairy products than P itself. Similarly, Alonso et al.(2010) showed in their prospective follow-up study on the MESA and ARICstudy populations (n=13 444, P intake measured by FFQ) that P from dairyproducts, but not from other sources was associated with lower baseline bloodpressure. The mean P intakes in the lowest quintiles were about 900-1000 mg/d,compared with 1500 mg/d in the highest intake quintiles, within the overallreported P intake range from 0 mg/d to 3570 mg/d. However, the intakes of0mg/d can be questioned; that low intakes do not appear real, and those subjectscould have been excluded from the analyses. However, according to the authors,dairy products (with or without the effects of P) may mainly explain thenegative association between P and blood pressure. When other dietary factors(e.g. intakes of Ca, Mg, potassium) were introduced to the models, the effectsof dietary P on blood pressure were attenuated, but remained statisticallysignificant when all subjects were pooled in the analyses. Further, based on

48
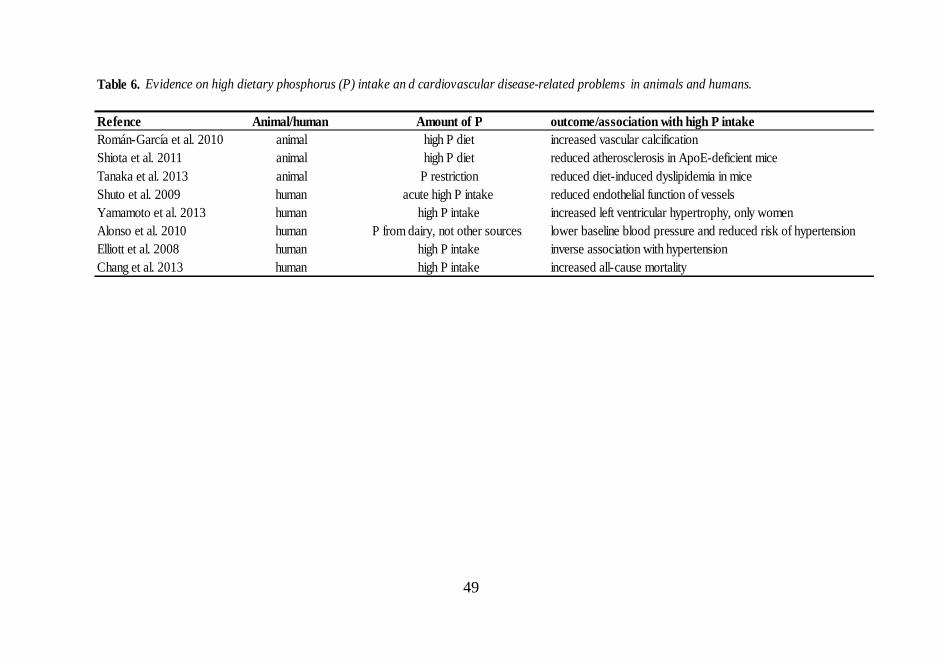
49
Table 6. Evidence on high dietary phosphorus (P) intake an d cardiovascular disease-related problems in animals and humans.
Refence Animal/human Amount of P outcome/association with high P intakeRomán-García et al. 2010 animal high P diet increased vascular calcificationShiota et al. 2011 animal high P diet reduced atherosclerosis in ApoE-deficient miceTanaka et al. 2013 animal P restriction reduced diet-induced dyslipidemia in miceShuto et al. 2009 human acute high P intake reduced endothelial function of vesselsYamamoto et al. 2013 human high P intake increased left ventricular hypertrophy, only womenAlonso et al. 2010 human P from dairy, not other sources lower baseline blood pressure and reduced risk of hypertensionElliott et al. 2008 human high P intake inverse association with hypertensionChang et al. 2013 human high P intake increased all-cause mortality
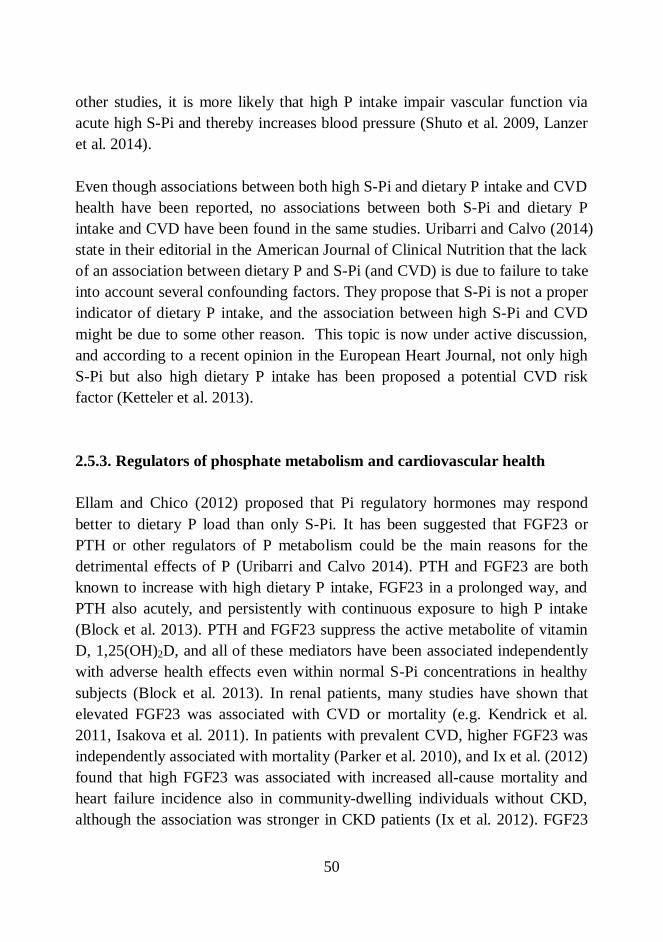
50
other studies, it is more likely that high P intake impair vascular function viaacute high S-Pi and thereby increases blood pressure (Shuto et al. 2009, Lanzeret al. 2014).
Even though associations between both high S-Pi and dietary P intake and CVDhealth have been reported, no associations between both S-Pi and dietary Pintake and CVD have been found in the same studies. Uribarri and Calvo (2014)state in their editorial in the American Journal of Clinical Nutrition that the lackof an association between dietary P and S-Pi (and CVD) is due to failure to takeinto account several confounding factors. They propose that S-Pi is not a properindicator of dietary P intake, and the association between high S-Pi and CVDmight be due to some other reason. This topic is now under active discussion,and according to a recent opinion in the European Heart Journal, not only highS-Pi but also high dietary P intake has been proposed a potential CVD riskfactor (Ketteler et al. 2013).
2.5.3. Regulators of phosphate metabolism and cardiovascular health
Ellam and Chico (2012) proposed that Pi regulatory hormones may respondbetter to dietary P load than only S-Pi. It has been suggested that FGF23 orPTH or other regulators of P metabolism could be the main reasons for thedetrimental effects of P (Uribarri and Calvo 2014). PTH and FGF23 are bothknown to increase with high dietary P intake, FGF23 in a prolonged way, andPTH also acutely, and persistently with continuous exposure to high P intake(Block et al. 2013). PTH and FGF23 suppress the active metabolite of vitaminD, 1,25(OH)2D, and all of these mediators have been associated independentlywith adverse health effects even within normal S-Pi concentrations in healthysubjects (Block et al. 2013). In renal patients, many studies have shown thatelevated FGF23 was associated with CVD or mortality (e.g. Kendrick et al.2011, Isakova et al. 2011). In patients with prevalent CVD, higher FGF23 wasindependently associated with mortality (Parker et al. 2010), and Ix et al. (2012)found that high FGF23 was associated with increased all-cause mortality andheart failure incidence also in community-dwelling individuals without CKD,although the association was stronger in CKD patients (Ix et al. 2012). FGF23
51
has also been associated with left ventricular hypertrophy in longitudinal studyin older adults (Mirza et al. 2009). However, in the prospective case-controlstudy of Taylor et al. (2011) plasma FGF23 was not associated with incidentcoronary heart disease among males.
Moreover, a meta-analysis of 15 prospective studies showed that high PTH wasassociated with increased risk of CVD events (van Ballegooijen et al. 2013).However, for total CVD events (10 studies included in the analysis) only threeof the studies showed a positive association between PTH and CVD, with therest seven studies showing no association (van Ballegooijen et al. 2013).Nevertheless, in a longitudinal study in older adults not included in the meta-analysis, high PTH even within normal range, was associated with CVD(Buizert et al. 2013). In the same study, high PTH was associated withabdominal aortic calcification among males, but not among females (Buizert etal. 2013).
Even though low 25(OH)D status has been related to CVD, recent reviews statethat the causal link between low 25(OH)D status and CVD remains to beelucidated (Lamberg-Allardt et al. 2013, Cashman 2014). From a mechanisticpoint of view, however, low concentrations of 1,25(OH)2D, the active form ofvitamin D, has been shown to have a potential role in CVD (Cashman 2014).Thus far, no consensus exists about the role of regulators of P metabolism andtheir role in CVD.

52
3. Aims of the thesis
This thesis aims to offer new insights into the potential health risks related tohigh dietary P intake in Finland by providing knowledge on the bioavailabilityof dietary P, and on the association of high dietary P intake with cardiovasculardisease (CVD) risk factors in the general population. The first aim was toinvestigate in vitro digestible and total phosphorus (DP and TP, respectively)contents in differently processed cereals and other selected plant-basedfoodstuffs using a new analysis method. Another aim was to determine at apublic health level whether high dietary P intake, especially in the form ofhighly absorbable food additive phosphorus (FAP), is associated with vascularcalcification in terms of high carotid intima-media thickness (cIMT), and thus,with increased risk of CVD, in a middle-aged Finnish population. Previous tothis work no studies on these topics have been published. Specific researchquestions were as follows:
I: Are there differences in in vitro DP and TP contents in differentlyprocessed cereals? Does the processing affect the DP concentrations? Is theanalysis method of in vitro DP trustworthy?
II: Are there differences in in vitro DP and TP contents of selectedcommonly used plant-based foods and beverages? Do the FAP-containingfoodstuffs have higher proportions of DP than FAP-free products?
III: Is high dietary P intake associated with higher cIMT in a generalmiddle-aged Finnish population in a cross-sectional design? Are theredifferences in associations between total dietary P and FAP intake in cIMT?

53
4. Subjects and methods
4.1. Food studies (Studies I and II)
4.1.1. Samples
Study I
The samples were different cereal products commonly used in Finland (Table 7).The samples were bought at two local grocery stores in Helsinki in June 2007.The rye sourdough originated from a bakery in Helsinki. All flours, grits, yeasts,and breads were from the same batch to ensure homogeneity of the samples.Three different kinds of breads were baked: sourdough rye bread, sourdoughwheat bread, and yeast-fermented (non-soured) wheat bread. Barley porridgewas made with barley grits, water, and salt. More information about the home-baked samples is provided in Appendix (Table 1). All breads, doughs andporridges were stored at -18ºC, and the dry products were stored at roomtemperature until they were analyzed. Before the analysis, all dry samples weremixed and homogenized in a blender (Braun 4250 Multimixture Machine,Braun Ab, Frankfurt/M, Germany). The breads were also homogenized and onesample of each was taken for analysis, for a total of five samples of one product.In the final P analysis by ICP–MS, the samples were analyzed in duplicate.
Study II
Legumes and cereals are important sources of plant-based protein and P, andthus, products from these food groups were included in the analyses (Table 8).Further, foodstuffs containing FAPs, i.e. baking powder-leavened bakeryproducts as well phosphoric acid-containing cola beverages, were analyzed.Among cereals and cola beverages, several labels were analyzed to clarify Pcontents in the products of different manufacturers.

54
To improve representativeness of the analyses in Study II, the focus was on thenationally most popular products in each food category. Market shares of the
Sample n Sampling method Frozen (-18˚C) before analysisHome-made/original productsRye flour 5 Mixed -Rye dough 5 1/dough +Rye bread 5 1/bread, ground +Wheat flour 5 Mixed -Wheat dough 5 1/dough +Wheat bread 5 1/bread, ground +Soured wheat dough 5 1/dough +Soured wheat bread 5 1/bread, ground +Barley grit 5 Mixed, ground -Barley porridge 5 1/porridge, ground +
Bakery productsWheat bread 5 1/bread, ground +Rye bread with potato 5 1/pack a +Rye bread 5 1/bread, ground +
Table 7. Samples, n's, sampling method, and possible freezing before analysis in Study I.
(+ frozen before analysis, - not frozen before analysis, a from every pack one bread was ground to one sample)
Table 8. Products analyzed in Study II.
Breads Sweet bakery products Seeds and beans DrinksRye bread pool Muffin pool a Sesame seed (with hull) Pepsi Max b
Rye crisp Sweet bun pool Tofu (firm) Coca-Cola light b
Small rye bread containing potato 1 Cookie pool Green bean Coca-Cola b
Small rye bread containing potato 2 Green pea (frozen) Cola pool b
Mixed grain bread with seeds Chickpea (soaked) Freeway Cola light b
Red lentil BeerGreen lentil
a Contains sodium polyphosphate as an additiveb Contains phosphoric acid as an additive
55
products were based on a substudy of the national dietary survey FINDIET2007 (Reinivuo et al. 2010). A subsample (50%) of the participants (n =1025)of the FINDIET 2007 Study filled in a 5-day product purchase diary toinvestigate the purchase and use of voluntarily fortified foods. A total of 930subjects (91%) returned the diary, 918 (90%) of which were of acceptablequality. Each food item was assigned with a food identifier from the Finnishfood composition database Fineli®, enabling data classification. Market sharesof each product were calculated by dividing the total amount (kg) of purchasedproduct by the total amount of purchased food in the same food class.
Of the most popular trademarks, 2-7 of each were pooled for each sample item.The leading trademark in each sample category was analyzed as such. Thechosen sample items were purchased from grocery stores in the Helsinki area.The number of purchased trademarks was twice the proportion of that item inthe pool (40% in the pool, corresponding to 8 subsamples). The minimum wastwo subsamples for each pooled per trademark. The samples were homogenizedin a blender, packed into polyethylene bags, and stored at -20ºC until analysis.The samples were analyzed with five replicates.
4.1.2. Study designs and hypotheses
Study I: A new method for analysis of in vitro DP, indicating bioavailable P,was developed, and the in vitro DP and TP contents of certain differentlyprocessed cereals were determined. The hypothesis was that processed cerealscontain more DP than the unprocessed ones due to the baking processes for ryeand wheat breads and the effects of long processing time on barley porridges,all of which may degrade phytate resulting in higher DP contents.
Study II: By the analysis method developed in Study I, the DP and TP contentsof different plant-based products considered to be good dietary P sources wereanalyzed. The foodstuffs were chosen based on market shares, and the analysesincluded both natural and FAP-enhanced products. The hypotheses were thatdifferences exist in DP and TP contents in the plant-based foodstuffs and theproportion of DP to TP is lower in plant-based FAP-free products than inproducts prepared with FAPs.
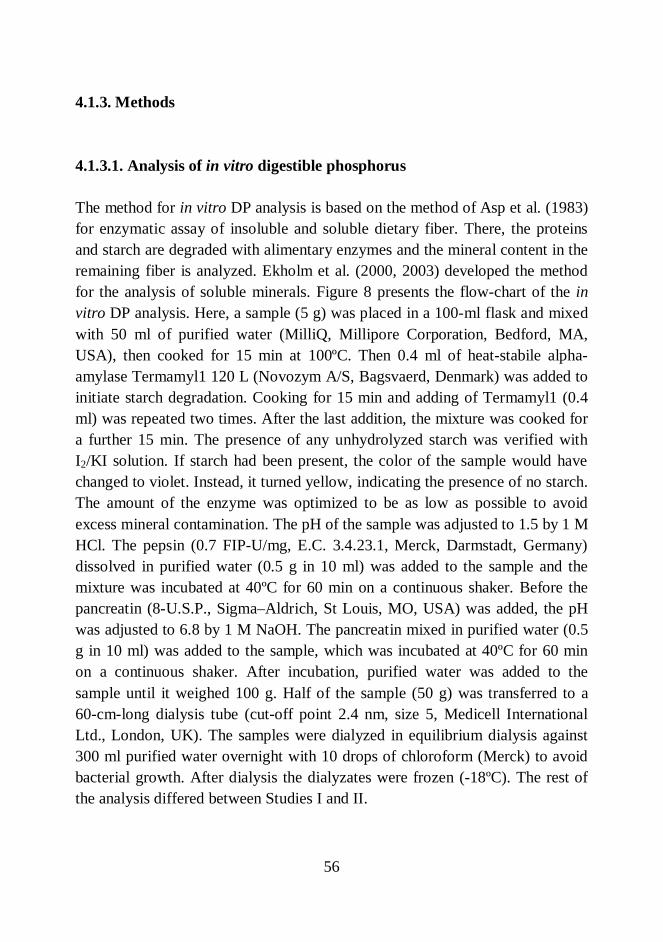
56
4.1.3. Methods
4.1.3.1. Analysis of in vitro digestible phosphorus
The method for in vitro DP analysis is based on the method of Asp et al. (1983)for enzymatic assay of insoluble and soluble dietary fiber. There, the proteinsand starch are degraded with alimentary enzymes and the mineral content in theremaining fiber is analyzed. Ekholm et al. (2000, 2003) developed the methodfor the analysis of soluble minerals. Figure 8 presents the flow-chart of the invitro DP analysis. Here, a sample (5 g) was placed in a 100-ml flask and mixedwith 50 ml of purified water (MilliQ, Millipore Corporation, Bedford, MA,USA), then cooked for 15 min at 100ºC. Then 0.4 ml of heat-stabile alpha-amylase Termamyl1 120 L (Novozym A/S, Bagsvaerd, Denmark) was added toinitiate starch degradation. Cooking for 15 min and adding of Termamyl1 (0.4ml) was repeated two times. After the last addition, the mixture was cooked fora further 15 min. The presence of any unhydrolyzed starch was verified withI2/KI solution. If starch had been present, the color of the sample would havechanged to violet. Instead, it turned yellow, indicating the presence of no starch.The amount of the enzyme was optimized to be as low as possible to avoidexcess mineral contamination. The pH of the sample was adjusted to 1.5 by 1 MHCl. The pepsin (0.7 FIP-U/mg, E.C. 3.4.23.1, Merck, Darmstadt, Germany)dissolved in purified water (0.5 g in 10 ml) was added to the sample and themixture was incubated at 40ºC for 60 min on a continuous shaker. Before thepancreatin (8-U.S.P., Sigma–Aldrich, St Louis, MO, USA) was added, the pHwas adjusted to 6.8 by 1 M NaOH. The pancreatin mixed in purified water (0.5g in 10 ml) was added to the sample, which was incubated at 40ºC for 60 minon a continuous shaker. After incubation, purified water was added to thesample until it weighed 100 g. Half of the sample (50 g) was transferred to a60-cm-long dialysis tube (cut-off point 2.4 nm, size 5, Medicell InternationalLtd., London, UK). The samples were dialyzed in equilibrium dialysis against300 ml purified water overnight with 10 drops of chloroform (Merck) to avoidbacterial growth. After dialysis the dialyzates were frozen (-18ºC). The rest ofthe analysis differed between Studies I and II.
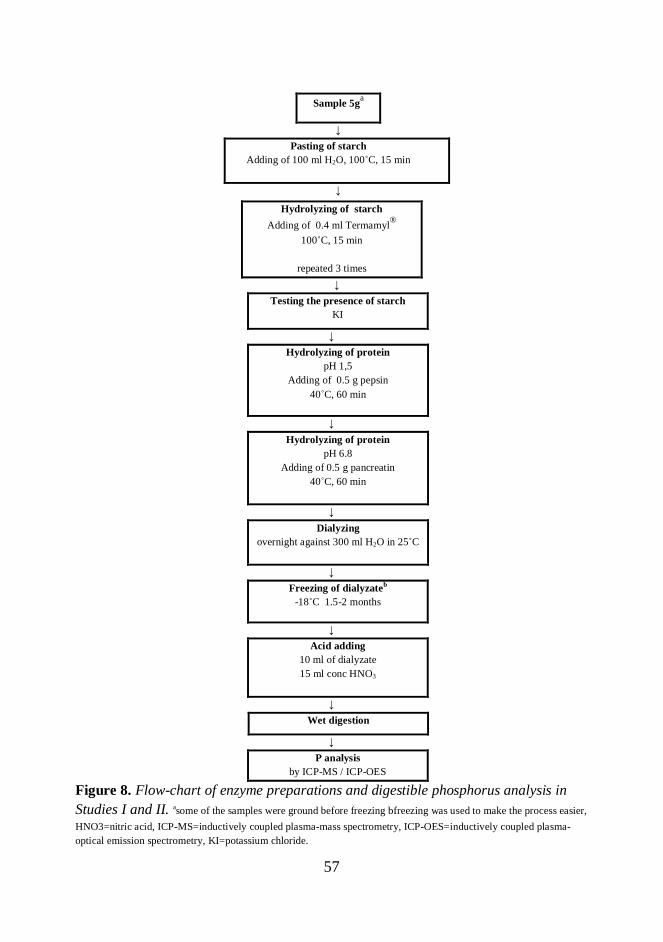
57
Sample 5ga
↓Pasting of starch
Adding of 100 ml H2O, 100˚C, 15 min
↓
↓Testing the presence of starch
KI
↓Hydrolyzing of protein
pH 1,5Adding of 0.5 g pepsin
40˚C, 60 min
↓Hydrolyzing of protein
pH 6.8Adding of 0.5 g pancreatin
40˚C, 60 min
↓Dialyzing
overnight against 300 ml H2O in 25˚C
↓Freezing of dialyzateb
-18˚C 1.5-2 months
↓Acid adding
10 ml of dialyzate15 ml conc HNO3
↓Wet digestion
↓P analysis
by ICP-MS / ICP-OES
Figure 8. Flow-chart of enzyme preparations and digestible phosphorus analysis inStudies I and II. asome of the samples were ground before freezing bfreezing was used to make the process easier,HNO3=nitric acid, ICP-MS=inductively coupled plasma-mass spectrometry, ICP-OES=inductively coupled plasma-optical emission spectrometry, KI=potassium chloride.
Hydrolyzing of starchAdding of 0.4 ml Termamyl®
100˚C, 15 min
repeated 3 times

58
Study I
Two replicates of every dialyzate (10 ml) remained at room temperature with15 ml of concentrated nitric acid (HNO3) (69.0–70.0%, J.T. Baker, Phillipsburg,NJ, USA) in a wet digestion tube and later processed in a wet digestionapparatus (Foss 2040 Digestor, Foss Tecator, Hillerod, Denmark). The wetdigestion program for DP analysis is shown in Appendix (Table 2). Later, everysample was moved quantitatively to a 25-ml flask by flushing the wet digestionremnant with purified water and filling the flask to the 25-ml mark.
For the ICP–MS analysis, 400 ml of the sample were moved to an ICP tube.Rhodium (1 ml, c = 1000 mg/l, AccuTraceTM Reference Standard Rhodium1000 mg/l; AccuStandard, New Haven, CT, USA) was added as an internalstandard, and the samples were diluted to 2% HNO3 (8.6 ml). Five P standardsolutions (AccuTraceTM Reference Standard Phosphorus 1000 mg/ml;AccuStandard) with concentrations of 100, 200, 400, 1000 and 2000 mg/l wereused. The standard curves were obtained at the above-mentioned concentrations.The samples were analyzed by using an ICP–MS device (Elan6000PerkinElmerSciex, PerkinElmer, Waltham, MA, USA) using the isotope 31P.DP contents were calculated as mean per 100 g/product. Percentages of DP/TP(TP analysis described in Section 4.1.3.2.) were also calculated.
Study II
Ten milliliters of the dialyzate was digested in a microwave oven with 10 ml ofconcentrated HNO3. The sample was transferred to a 50-ml volumetric flaskwith purified water. The concentrations of P in the dialyzate were determinedby ICP-OES (Thermo Scientific iCAP 6000 Series ICP Spectrometer, Waltham,MA, USA). The quantitation was performed by using an external calibrationcurve with five different concentrations. P was analyzed radially withwavelengths of 177.4, 178.2, 178.7, and 213.6 nm. The fat was removed fromsamples if the fat content was more than 6-8%. Petroleum ether (200 ml, bp:60ºC to 71ºC) was added and the suspension was agitated with a magneticstirrer at room temperature for 15 min. The solvent was filtered and the samplewas air-dried at room temperature overnight, and analyzed by ICP-OES.

59
The results were calculated as means. DP contents of analyzed foods werecalculated per 100 g of the product. The percentages of DP/TP (TP analysisdescribed in Section 4.1.3.2.) were determined.
4.1.3.2. Analysis of total phosphorus
Study I
In the TP analysis a homogenized sample (0.5 g) was weighed in a tube, and thesample remained in concentrated HNO3 (10 ml) overnight before wet digestion.The wet digestion program is shown in Appendix (Table 2). After digestion thesamples were treated as in DP analysis and the TP content was analyzed by anICP-MS device using the isotope 31P.
Study II
The food sample (0.5 g) was digested in a microwave oven with 10 ml ofconcentrated HNO3. The sample was transferred to a 50-ml volumetric flaskwith purified water, and the content of P was analyzed with ICP-OES.
TP contents of analyzed foods in Studies I and II were calculated per 100 g ofproduct.
4.1.3.3. Assay quality control
To avoid possible contamination, all glassware used in ICP analyses was acid-washed (HNO3/HCl) and rinsed with purified water (MilliQ). The enzymesused in DP analysis contain P, which could have affected the results. Therefore,the amounts of P in all enzymes (i.e. the background level) were analyzed fromthe same amount of enzymes as in the analysis without any substrate. Thesevalues were taken into account in the results. To test accuracy and precision ofthe analytical method, each determination set of the TP analysis included in
60
duplicate (in Study II: a single sample) two different reference samples, NIST1567a wheat flour standard reference material (National Institute of Standardsand Technology, Gaithersburg, MD, USA) and an in-house wheat flourstandard (Saari and Paaso 1980), both containing a known amount of P. Toestimate the repeatability of the method, in DP analysis an unofficial in-housewhite wheat flour sample was used in duplicate as a reference material in eachdetermination set. All analyses were carried out at the Laboratory of GeneralChemistry, at the Department of Appied Chemistry and Microbiology.
The measurement uncertainty was calculated taking into account all possiblesources of uncertainty in the analysis procedure and quantifying the uncertaintyaccording to the statistical methods (Ellison et al. 2000). Approximateconfidence interval of 95% was used, implying that 95% of the results areinside the limits of measurement uncertainty. The calculations were performedfor both DP and TP.
4.1.3.1. Statistical analyses
The statistical analysis was performed by SPSS (Statistical Package for SocialSciences for Windows, version 13.0.1, SPSS Inc., Chicago, IL, USA).Statistical differences between the means of the TP and DP contents were testedby paired t-test (Study I). In Study I, the home-baked breads were also tested bypaired t-test; the amount of DP in the bread and dough originating from 100 gof flour was compared with the DP amount in 100 g of flour. For barley, thedifference between the amount of grits from which 100 g of porridge originatedwas compared with the amount of DP in 100 g of porridge. The differenceswere significant at p<0.05. The differences between the means of the groups inthe flours, doughs, and breads in Study I were tested by F-test, using one-wayanalysis of variance (ANOVA) for repeated measures. The normality of thedata was first tested by Shapiro–Wilk’s test. The sphericity of the results of thegroups was tested, and if the sphericity assumption had been violated, a Huyhn-Feldt adjustment was used.

61
4.2. Human study (Study III)
4.2.1. Subjects
A randomly collected sample of 1920 subjects aged 37-47 years (50% males,50% females) and living in the Helsinki area was derived from the PopulationRegister Center in Finland. Subjects were contacted by mail in November 2009(1st sampling) and February 2010 (2nd sampling) and invited to participate in thestudy. A total of 678 persons participated in the first visit to the research uniteither in January or March 2010, and 653 of these attended the second visitduring spring 2010 (discontuation for unknown reasons, n=25). Subjects weremiddle-aged, and thus, possibly already had some changes in cIMT. The initialexclusion criterion was pregnancy, and also post-menopausal females andpersons with impaired kidney functions (estimated GFR, i.e. eGFR, <60 ml/min)were excluded from the analyses due to their improper P metabolism.
The study protocol of the study was approved by the Helsinki Uusimaa HospitalDistrict Ethics Committees. All subjects gave their informed consent to theprocedures, which were in accord with the Helsinki Declaration. They also wereinformed that they could withdraw from the study and for any reason. After thestudy, subjects received information about their dietary intake relative to thenutritional recommendations as well as results on their vitamin D status (serum25(OH)D concentrations) and tibial and radial bone mineral density comparedwith the age-matched population. Medical experts checked the results, and ifhealth problems were perceived, the subjects were informed after the analysesand advised to contact a local doctor.
4.2.2. Study design and hypothesis
The study design was cross-sectional and the study population comprised free-living, middle-aged males and premenopausal females, i.e. the generalpopulation. Associations among TP intake, P density of the diet, FAP intake,and cIMT were investigated. Subjects visited the research unit two times during

62
spring 2010. On the first visit, fasting blood samples were collected andsubjects were advised to fill in the study form, which included food records,food frequency questionnaires (FFQ) concerning intakes of P, Ca, and vitaminD intake, and a background questionnaire. Before the second visit, subjectswere advised to abstain from caffeine-containing products and smoking for fourhours. During this visit the common cIMT was scanned by ultrasonography,blood pressure was measured by an automatic device, and subjects’ height andweight were measured. Some other measurements (e.g. bone mineral densityassessments) not included in the present study were also carried out; the powercalculation of the study is based on bone mineral density assessments (seeSection 4.2.3.4.). The hypothesis was that when taking into account thepotential confounding factors, high P intake, especially in the forms of FAP, isassociated with higher IMT, thus, high dietary P intake should be considered aCVD risk factor in the general population.
4.2.3. Methods
4.2.3.1. Dietary intake and background data collection
Habitual dietary intake data of subjects were collected by 3-day food records,which included two weekdays and one weekend day. The subjects wereinstructed to maintain their normal food habits during the recording period andto record all foods, beverages, and dietary supplements immediately afterconsumption. Nutrient intake was calculated using a computer-based program(Diet 32 version 1.4.6.2, Aivo2000, Turku, Finland) based on the Finnish foodcomposition database Fineli® (Institution of Health and Welfare, Helsinki,Finland). Approximately 400 new recipes were added to the program to ensureaccurate calculation of nutrient intake. Vitamin D and Ca supplementation wastaken into account in the calculations. P intake was calculated as total P intake(mg/d), and as P density of the diet [P intake (mg/d)/energy intake (kJ/d)].
FAP intake calculations were based on one-month food use frequency data,which were collected by a validated FFQ concerning P intake, ranging from

63
“less than one portion per month” to daily portions (Kemi 2010). The FFQincluded P sources in different food groups, distinguishing FAP-containingfoodstuffs from natural P-containing foodstuffs, and also including P sourcesnot consumed every day. For FAP intake calculations, products known tocontain FAP were chosen and separated these into food groups (meat productslike marinated meat, sausages, and cold cuts; cola beverages; processed cheeses,Table 9). FAP intake from different sources was calculated from the portions ofFAP-containing foodstuffs as grams and recorded on the FFQ, using themaximum amount of FAP allowed in the foodstuff according to EuropeanUnion regulations (meat products 5 g/kg; cola beverages 700 mg/L; processedcheeses 20 g/kg (European Union 2011)). Only these products in which theamount of added FAP is regulated were included in the analysis (for example,starch-based FAPs were not included). Cookies were excluded from thecalculations because some do not contain FAPs. The subjects were divided intotertiles of intake in each FAP group (meat products, cola beverages, processedcheeses), with score 0 indicating the lowest intake tertile, score 1 the middletertile, and score 2 the highest tertile, and the scores from different FAP sourceswere summed for each subject; thus, each person was given a score from zero tosix. Since no one received a score of 0, thus, the scoring was 1-6 and dividedthe subjects into six groups of unequal size. However, the final group sizeswere sufficient for analysis of covariance (ANCOVA).
Background data were collected by a questionnaire covering disease history andlifestyle factors such as smoking status (current/former or non-smoker),physical activity, and state of menopause. Body mass index (BMI) wascalculated as weight (kg) / height (m)2. All self-reported forms were checked bythe researchers, and additional information was requested if needed.

64
4.2.3.2. Measurement of the carotid intima-media thickness and bloodpressure
Common carotid artery IMT was measured by a semi-automatic measurementprogram using high-resolution ultrasonography (Esaote MyLab30Gold, Firenze,Italy). The image is based on high ultrasound frequencies, which reflect fromthe tissues in different ways. In practice, this means that the thicker the whiteline, i.e. the intima-media in the image, the more calcification occurs (Figure 7).However, this technique does not distinguish between the intimal and mediallayers of the artery (O’Leary and Bots 2010). Ultrasound provides a two-dimensional image, thus, either the far or near wall can be measured. Theconsensus statement proposed that cIMT be used to measure the far wall of thecommon carotid artery. Measurement of the near wall is not as reliable becausethe ultrasound reflects from the adventitia to the intima, i.e. from the moreechoing part to the less echoing part, and the wall thickness can be suboptimal(Stein et al. 2008). The thickness of the cIMT varies depending on cardiac cycle,being thickest at the end of diastole and thinnest at the peak of the systole; thus,
Table 9. Food additive phosphate (FAP) -containing products included in FAP intake calculations.
FAP-containing product Portion size
Processed meat productsProcessed, marinated chicken, turkey, beef, 1 steak (130 g)pork, or other meatLiver pâté and liver sausage, regular and light 1 tablespoon (15 g)Sausages / frankfurters, regular and light 10 cm slice of big sausage, 3 frankfurters
or 1 barbeque sausage (100 g)Meat cold cuts, regular and light 1 slice (15 g)Sausage-style cold cuts, regular and light 1 slice (15 g)
Processed cheesesWith different fat contents: 1 tablespoon or>24%, 20-24%, 9-19%, and 9% one individually packed slice (15 g)
Cola beveragesRegular and light One glass (200 ml)

65
measurement should be done in all subjects at the same time phase (O’Learyand Bots 2008, Holewijn et al. 2010).
Here, IMT was measured from a 1-cm sample from the bifurcation (bulb) withan 8- or 10-mHz linear array transducer by three experienced sonographers. Thesoftware measured the far wall thickness bilaterally for the 1-cm segment. Themeasurement was carried out on the left and right carotid in duplicate with the
C
Figure 7. Above: Ultrasound image of carotid artery. Intima-mediathickness (IMT) is commonly measured 10 mm left of bifurcation. Left fromA = internal carotid artery, B = bifurcation (bulb), C = common carotidartery (adapted from Lorenz et al. (2007)).Below: Illustration of a carotid artery (with permission of O. Raitakari).

66
subject in a supine position (Stein et al. 2008). The mean intima-media complexthickness was automatically calculated in micrometers in diastolic phase scans.The averages of these four measurements were used in the analyses.Repeatability of the measurements was ensured by rescanning 18 participantswithin one week of the first IMT scanning. In addition, cIMT of 15 participantswas measured by two sonographers. The coefficients of variation between themeasurements obtained by the same sonographer (intra CV%) and betweenmeasurements obtained by different sonographers (inter CV%) are shown inTable 10. Systolic and diastolic blood pressures were measured after the IMTmeasurement in supine position in duplicate by an automatic device (OmronMIT Elite Digital Automatic Blood Pressure Monitor, OMRON HealthcareEurope B.V., Hoofddorp, the Netherlands), and the second result was used inthe analyses. Pulse pressure was calculated as systolic – diastolic.
4.2.3.3. Laboratory analyses
Twelve-hour fasting blood samples were collected between 7:30 am and 9:15am during the first visit. For serum samples, Venoject gel tubes and forplasma/whole blood EDTA tubes were used. Serum/plasma was extracted fromblood (except whole-blood samples) by centrifugation at 3000 rpm for 15 minwithin half an hour after sampling and stored immediately after sampling at -20°C to -70°C until analysis. The samples were collected in the morning due tothe circadian rhythm of Pi and its metabolites (Calvo et al. 1991) as well asduring wintertime to avoid the effects of sunlight on serum 25(OH)Dconcentrations (Lamberg-Allardt et al. 1983).
Table 10 describes the assessments carried out, the devices and methods used,and the inter and intra CV%’s. LDL-C/high-density lipoprotein cholesterol(HDL-C) ratio was calculated as LDL-C/HDL-C. eGFR was determined byusing the Cockroft-Gault formula (Poggio et al. 2005). All analyses wereconducted at the Laboratory of Nutrition, at the Department of Food andEnvironmental Sciences.

67
4.2.3.4. Final sample
IMT and food intake data were successfully collected from 627 persons. Ofthese, postmenopausal females (n=41, data collected by a questionnaire) wereexcluded from the analyses, as were persons with moderate renal dysfunction(estimated glomerular filtration rate, eGFR<60 ml/min) (n=21). In addition, 19persons were excluded because they did not complete the study due to lack of
Table 10. Inter and intra coefficients of variation percentages (inter CV%; intra CV%) of thelaboratory analyses and IMT measurements.Assessment Device Method inter CV% intra CV%S-Total cholesterol Konelab20 1 photometric 4.6 4.6S-HDL-C Konelab20 1 photometric 4.6 4.6S-LDL-C Konelab20 1 photometric 4.6 4.6S-Triglycerides Konelab20 1 photometric 4.6 4.6S-Creatinine Konelab20 1 photometric 4.6 4.6S-Glucose Konelab20 1 photometric 4.6 4.6S-hs-CRP Konelab20 1 photometric 4.6 4.6S-Calcium Konelab20 1 photometric 4.6 4.6S-Phosphate Konelab20 1 photometric 4.6 4.6HbA1c% Konelab20 1 photometric 4.6 4.6S-25(OH)D* IDS Kit 2 enzyme immuno assay 2.7 3.2S-iPTH Immulite1000 3 immunolumisnescence 8 <5.5S-Insulin Immulite1000 3 immunolumisnescence <4.9 <6.2P-FGF-23 Immutopics kit 4 enzyme-linked immuno assay <5.5 <7.7IMT MyLab30Gold 5 ultrasound 9.2 6.6
*reproducibility ensured by Vitamin D External Quality Assessment Scheme (DEQAS)HDL-C high density lipoprotein cholesterol; LDL-C low density lipoprotein cholesterol; hs-CRP high sensitive C-reactiveprotein; HbA1c% glycosylated haemoglobin; 25(OH)D 25-hydroxy vitamin D; iPTH intact parathyroid hormone;FGF23 fibroblast growth factor 23; IMT intima-media thickness
5 Esaote MyLab30Gold, Firenze, Italy
1 Thermo Clinical Labsystems, Espoo, Finland2 Immunodiagnostics Systems Ltd., Boldon, UK3 Siemens Healthcare Diagnostics, Malvern, PA, USA4 Immutopics INC., San Clemente, CA, USA

68
background data or non-fasting blood samples. The final analyses included 370females and 176 males for whom full nutrition, IMT, background, andbiomarker data were available. Sampling and study protocol are shown inFigure 9.
Figure 9. Flow-chart of sampling and protocol of Study III. IMT= intima-media thickness, eGFR=estimated glomerular filtration rate, FFQ=foodfrequency questionnaire, F=female, M=male.
69
4.2.3.5. Statistical analyses
The power of the study (80%, α=0.05) was calculated basing on the primaryvariable of the main study, to find a 4% difference in forearm bone mineraldensity between the highest and lowest P intake tertiles. 800 subjects (400females, 400 males) were expected to participate. Thus, taking into account theestimated initial drop-out rate of 40%, 720 subjects were invited to the firstsampling. However, the drop-out rate was higher than expected (about 60%)and to the second sampling 1200 subjects were invited to ensure sufficientpower of the study including the drop out rate during the study. For IMTanalyses no power calculations were performed due to lack of reference values.
Statistical analysis was performed using PASW Statistics version 18.0.2 (IBM,Armonk, NY, USA). The normality and homogeneity of the data were verified.Equality of the variances in quintiles and FAP groups was assessed by Levene’stest.
Correlations among IMT, TP, P density of the diet, and FAP intake andpotential confounding factors were assessed by Pearson correlation coefficients(data not shown). The covariates were chosen depending on their correlationwith IMT and P intake and their contextual significance. Highly intercorrelated(r>0.2) confounding factors were not used in the same models. Due to the highcorrelation between Ca and P intake, Ca was excluded from the covariates. BMIcorrelated with IMT, TP intake, and almost all potential covariates, and thus,BMI was also excluded from the covariates. Serum LDL-C/HDL-C ratio wasused because it predicts IMT progression better than HDL-C or LDL-C alone(Enomoto et al. 2011). IMT scanning results of one sonographer differedsignificantly from the others; thus, sonographer class was coded as a dummyvariable (0 for non-differing sonographer, 1 for differing sonographer) and usedas a random factor in ANCOVA. Smoking status was also coded as dummy (0for never-smoker, 1 for former or current smoker). The final covariates weresex (when analyzing all subjects), age, smoking status, LDL-C/HDL-C ratio,and IMT sonographer as a random factor. Pulse pressure was also included insome models, but this did not strengthen the results (data not shown). P valueless than 0.05 was considered statistically significant.

70
Differences between quintiles of TP intake/P density of the diet and six FAPgroups, considering potential confounding factors, were assessed by analysis ofvariance (ANOVA, unadjusted for covariates). ANCOVA was used to analyzedifferences in IMT between quintiles of TP/P density of the diet and FAPgroups. Especially under interest was to determine whether high TP/P densityof the diet/ FAP intake is associated with higher IMT, or are there differences inIMT between high and low P intake. Tests for significant linear trends inassociations between P variable intakes and IMT were performed by contrastanalysis.
71
5. Results
5.1. Study I
5.1.1. Usefulness of the method for analysis of in vitro digestiblephosphorus
In the DP analysis, the mean P content of the unofficial in-house white wheatflour reference samples (n=32) was 49.7 mg P/100 g (SD 9.0 mg). Due to thenewness of the analysis method, no earlier results of DP content in the referencematerial were available and these results only estimate the repeatability of themethod. The accuracy and precision of the TP analysis was tested by a certifiedreference sample (NIST 1567a, wheat flour, n=10) and by an unofficial inhousewheat flour reference sample (n=10). The mean values (±SD) for the referenceswere 133.4±8.6 mg P/100 g and 342.7±8.6 mg P/100 g, respectively. The NIST1567a value was in accordance with the certified range (134±6 mg P/100 g)analyzed by a standard methodology (National Institute of Standards andTechnology) by the manufacturer and acceptable (361±8 mg P/100 g) for thein-house reference (Saari and Paaso 1980). For the P analysis by ICP-MS, thelimit of detection was 0.3 mg/l and the limit of quantitation 3 mg/l (equivalentto 60 mg/kg in the original sample). The values were based on 14 standardblanks and were calculated as 3*SD and 10*SD of the standard blank,respectively. The quantitation was made by using external calibration with 5points between 0 and 2000 mg/l. The curve type linear through zero was used.The typical correlation factor of the standard curve was 0.99999 and the linearmeasurement range was from 0 mg/l to 6000 mg/l. The calculated uncertaintyfor the in vitro DP analysis was 7.4%, and for the TP analysis 6.4%.

72
5.1.2. In vitro digestible and total phosphorus contents in differentlyprocessed cereals
The absolute values of DP and TP contents in analyzed foodstuffs withinmeasurement uncertainty are shown in Appendix, Table 3. In rye samples, TPcontent was higher in rye flour than in rye breads (Figure 10A). In rye breadsthe percentage DP relative to TP was similar (68–78%) in all breads analyzed.Differences between the DP contents of home-baked and bakery breads werenot significant (p>0.05). The amount of DP in the rye sourdough was almost100%, indicating that some of DP has become insoluble in the baking process,when comparing to the DP contents which were lower in bread. The high DPamount in dough can also be explained by the measurement uncertainty. Figure10B shows DP contents in rye dough and bread originating from 100 g of flour.When the results of DP in dough and bread originating from 100 g of flour weretested by paired t-test, the differences were significant (p<0.001) between allpairs compared (flour-dough, flour-bread, dough-bread).
In wheat samples, DP content was 46–51% of TP in wheat breads, 56–83% indoughs, and 43% in flour (Figure 11A). The analyzed non-soured wheat cerealscontained lower percentages of DP than soured cereals. Figure 11B shows DPcontents in wheat dough and bread originating from 100 g of flour. When DPcontents in dough and bread originating from 100 g of flour were compared bypaired t-test, the differences were significant (p<0.001) between all pairscompared (flour–dough, flour–bread, dough–bread), except for wheat flour –non-soured bread (p=0.158). In wheat flour – non-soured dough, the differenceswere also significant (p=0.002). However, DP, as well TP contents in wheatproducts were lower than in rye samples.
In processing of barley, the 3-h baking time degraded the phytate in largeamounts and increased the DP content from 29% in grits to 69% in porridge(p<0.001) (Figure 12A). Figure 12B shows DP contents in barley productsconsidering the grits used for 100 g of porridge; there was an almost 2.5-foldincrease in the DP contents. Like in wheat samples, the DP and TP contents inbarley samples were lower than in rye samples.

73
Figure 10. Panel A: Total and digestible phosphorus contents in analyzed rye products. Error bars show standarddeviation. Percentages indicate digestible phosphorus/total phosphorus. TP total phosphorus = DP digestiblephosphorus; HB = home-baked bread; B-WP bread = bakery bread also containing wheat and potato; B-WR bread= bakery whole rye bread.Panel B: Digestible phosphorus contents in rye products considering the amount of dough and bread originatingfrom 100 g of flour.
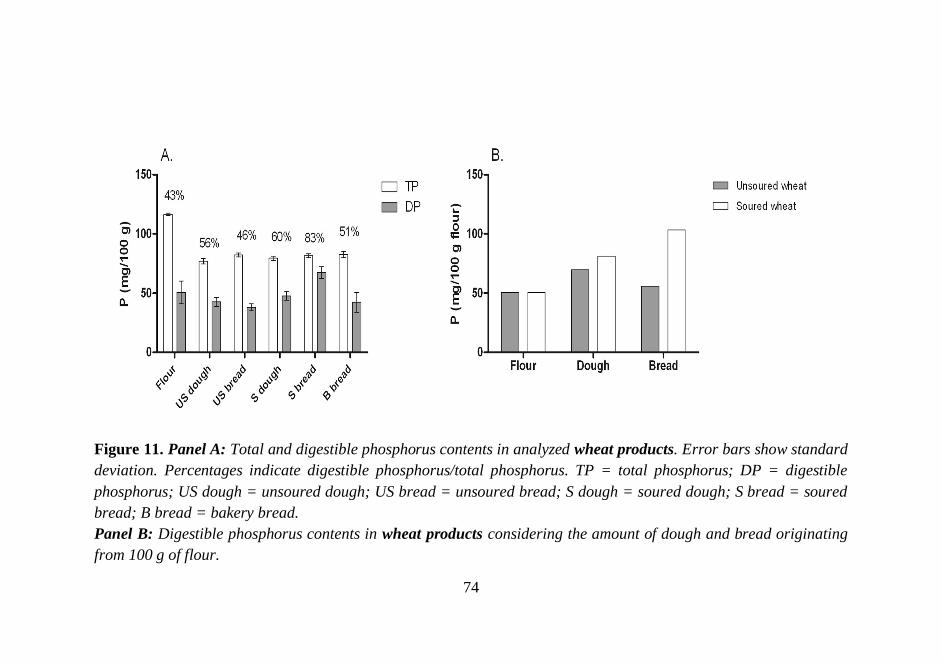
74
Figure 11. Panel A: Total and digestible phosphorus contents in analyzed wheat products. Error bars show standarddeviation. Percentages indicate digestible phosphorus/total phosphorus. TP = total phosphorus; DP = digestiblephosphorus; US dough = unsoured dough; US bread = unsoured bread; S dough = soured dough; S bread = souredbread; B bread = bakery bread.Panel B: Digestible phosphorus contents in wheat products considering the amount of dough and bread originatingfrom 100 g of flour.

75
Figure 12. Panel A: Total and digestible phosphorus contents in analyzed barley products. Error bars showstandard deviation. Percentages indicate digestible phosphorus/total phosphorus. TP = total phosphorus; DP =digestible phosphorus.Panel B: Digestible phosphorus contents in barley products considering the grits used for 100 g porridge.

76
5.2. Study II
5.2.1. In vitro digestible and total phosphorus contents in the analyzedplant-based foodstuffs
Table 11 presents the TP and DP contents of analyzed plant foods(Section A: Bakery products, Section B: Legumes and seeds, Section C:Beverages). Percentages of DP/TP contents are shown in Figure 13.
The highest P contents were found in rye crisp (TP 291 mg/100 g; DP 191mg/100 g) (Table 11A). The TP contents of all other breads, except in ryecrisp, were similar (189-208 mg/100 g), but DP contents of the breadsvaried more (54-123 mg/100 g). Some differences were found in DPcontents between two very similar small rye breads containing potato (89vs. 54 mg/100 g). FAP-containing muffins had relatively high contents ofboth TP (212 mg/100 g) and DP (201 mg/100 g), as well the percentagesof DP (Figure 13). Cookies and sweet buns had lower TP and DP contentsthan muffins (116-125 mg/100 g TP, 43-60 mg/100 g DP, respectively).
TP contents among the analyzed legume and seed products variedbetween 57 (green beans) and 667 mg/100 g (sesame seeds) (Table 11B).The lowest DP content was found in green bean (24 mg/100 g), whichhad, however, the highest percentage of DP (42%). Apparently, thelowest percentage of DP/TP was present in sesame seeds (6%) (Figure13).
DP and TP contents in all cola beverages and beer were of lowest of thefoods analyzed in this study (Table 11C). Almost all of the P in thesebeverages was in vitro digestible P (beer 22 mg/100 g, colas 10-16mg/100 g). The percentages of DP for some beverages exceeded 100%,probably due to the inaccuracy of the analysis method with regard to lowP contents (Table 11C). FAP-containing cola drinks had high percentagesof DP.

77
Table 11. Total phosphorus (TP) and in vitro digestible phosphorus (DP)contents of the analyzed plant foods.
Product TP (mg/100 g) DP (mg/100 g)A: Bakery productsRye bread pool 208 123Rye crisp 291 191Small rye bread containing potato 1 192 89Small rye bread containing potato 2 206 54Mixed grain bread with seeds 189 116
Muffin poola 212 201Sweet bun pool 116 60Cookie pool 125 43B: Legumes and seedsSesame seed (with hull) 667 42Tofu (firm) 164 51Green bean 57 24Green pea (frozen) 118 50Chickpea (soaked) 149 53Red lentil 432 167Green lentil 400 120C: Beverages
Pepsi Maxb 14 15
Coca-Cola lightb 13 13
Coca-Colab 19 16
Cola poolb 17 16
Freeway Cola lightb 11 10Beer 21 22a Contains sodium polyphosphate as an additiveb Contains phosphoric acid as an additive
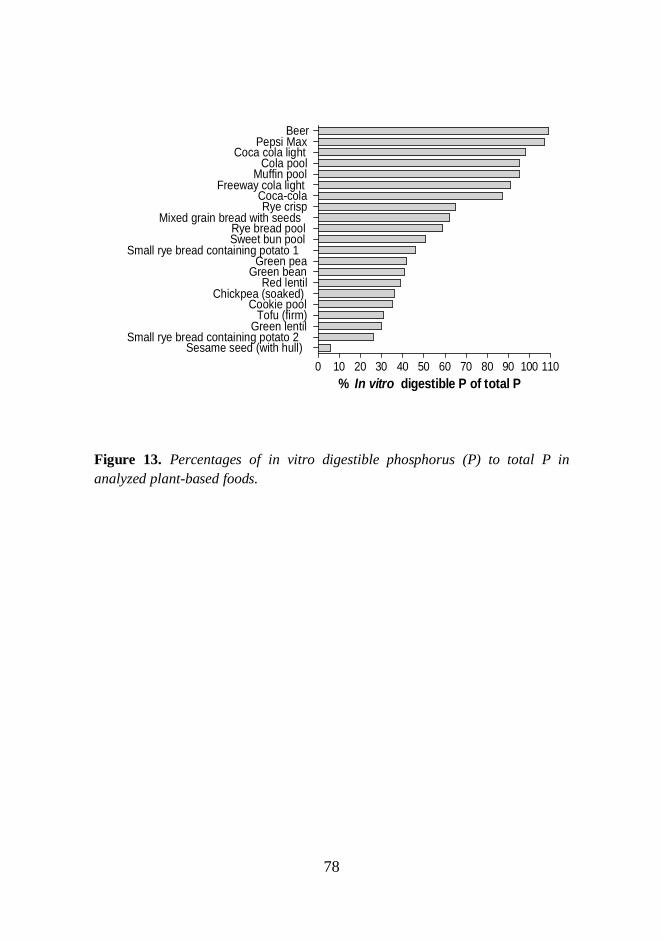
78
0 10 20 30 40 50 60 70 80 90 100 110Sesame seed (with hull)
Small rye bread containing potato 2Green lentil
Tofu (firm)Cookie pool
Chickpea (soaked)Red lentil
Green beanGreen pea
Small rye bread containing potato 1Sweet bun poolRye bread pool
Mixed grain bread with seedsRye crisp
Coca-colaFreeway cola light
Muffin poolCola pool
Coca cola lightPepsi Max
Beer
% In vitro digestible P of total P
Figure 13. Percentages of in vitro digestible phosphorus (P) to total P inanalyzed plant-based foods.

79
5.3. Study III
5.3.1. Characteristics of subjects
The study population was 37-to-47-year old, slightly overweight, andnormotensive. Two-third were females, half of the population was currentor earlier smokers. The subjects were to some extenthypercholesterolemic, otherwise healthy considering the assessedbiomarkers (Tables 12 and 13). The nutrient intakes were according to therecommendations; however, the mean P intake exceeded therecommendations (Table 12).
Table 12. Background and nutrient intake data of study subjects. Values are presented as mean ± SD.
Variable All Females Males(n=546) (n=370) (n=176)
Background dataIntima-media thickness (µm) 552 ± 69 544 ± 70 567 ± 66Body mass index (kg/m 2) 26.8 ± 4.9 26.6 ± 5.2 27.2 ± 3.9Age (years) 41.9 ± 2.8 41.9 ± 2.7 42.1 ± 3Sex (% females) 67 ± 47 -Current or former smoker (%) 48 ± 50 45 ± 50 55 ± 50Systolic blood pressure (mmHg) 125 ± 14 122 ± 14 129 ± 13Diastolic blood pressure (mmHg) 77 ± 11 76 ± 11 80 ± 11Pulse pressure (mmHg) 48 ± 6 47 ± 6 50 ± 6All physical activity (mins/week) 479 ± 380 515 ± 397 406 ± 332
Nutrient intake dataEnergy intake (kJ/d) 8413 ± 1994 7944 ± 1807 9398 ± 2014Fat intake (g/d) 80 ± 26 76 ± 26 88 ± 25Saturated fat intake (g/d) 29 ± 11 28 ± 11 32 ± 11Phosphorus intake (mg/d) 1617 ± 428 1532 ± 378 1795 ± 469Calcium intake (mg/d) * 1199 ± 453 1195 ± 435 1207 ± 489Vitamin D intake ( µ g/d) * 9.1 ± 8.6 9.4 ± 9.3 8.4 ± 6.8Phosphorus density of the diet (mg/MJ/d) 194 ± 36 195 ± 37 192 ± 34FAP intake score 3.2 ± 1.4 3.1 ± 1.3 3.6 ± 1.4* supplements included; FAP=food additive phosphate
100
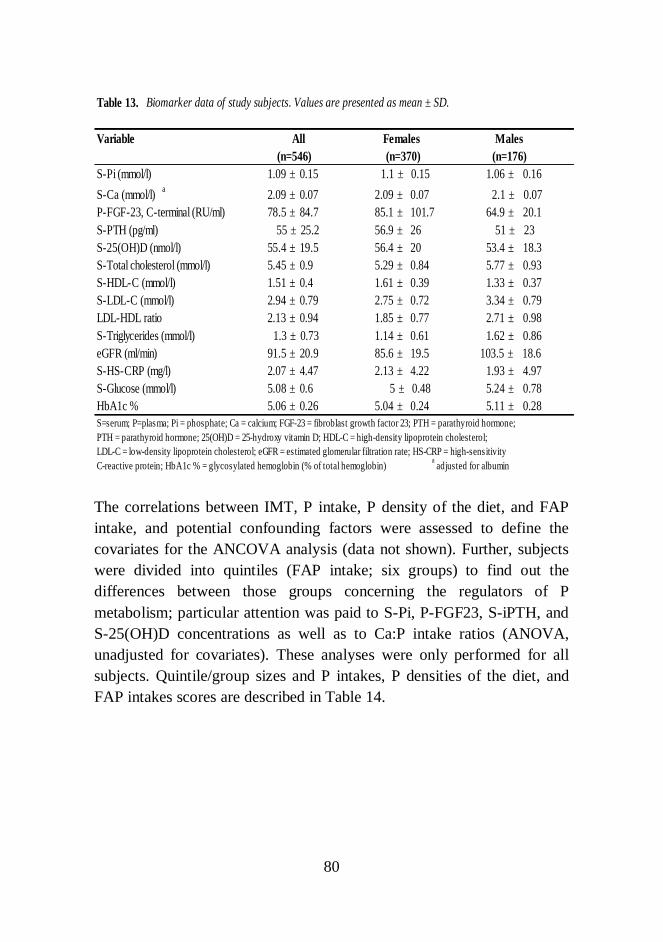
80
The correlations between IMT, P intake, P density of the diet, and FAPintake, and potential confounding factors were assessed to define thecovariates for the ANCOVA analysis (data not shown). Further, subjectswere divided into quintiles (FAP intake; six groups) to find out thedifferences between those groups concerning the regulators of Pmetabolism; particular attention was paid to S-Pi, P-FGF23, S-iPTH, andS-25(OH)D concentrations as well as to Ca:P intake ratios (ANOVA,unadjusted for covariates). These analyses were only performed for allsubjects. Quintile/group sizes and P intakes, P densities of the diet, andFAP intakes scores are described in Table 14.
Table 13. Biomarker data of study subjects. Values are presented as mean ± SD.
Variable All Females Males(n=546) (n=176)
S-Pi (mmol/l) 1.09 ± 0.15 1.1 ± 0.15 1.06 ± 0.16S-Ca (mmol/l) a 2.09 ± 0.07 2.09 ± 0.07 2.1 ± 0.07P-FGF-23, C-terminal (RU/ml) 78.5 ± 84.7 85.1 ± 101.7 64.9 ± 20.1S-PTH (pg/ml) 55 ± 25.2 56.9 ± 26 51 ± 23S-25(OH)D (nmol/l) 55.4 ± 19.5 56.4 ± 20 53.4 ± 18.3S-Total cholesterol (mmol/l) 5.45 ± 0.9 5.29 ± 0.84 5.77 ± 0.93S-HDL-C (mmol/l) 1.51 ± 0.4 1.61 ± 0.39 1.33 ± 0.37S-LDL-C (mmol/l) 2.94 ± 0.79 2.75 ± 0.72 3.34 ± 0.79LDL-HDL ratio 2.13 ± 0.94 1.85 ± 0.77 2.71 ± 0.98S-Triglycerides (mmol/l) 1.3 ± 0.73 1.14 ± 0.61 1.62 ± 0.86eGFR (ml/min) 91.5 ± 20.9 85.6 ± 19.5 103.5 ± 18.6S-HS-CRP (mg/l) 2.07 ± 4.47 2.13 ± 4.22 1.93 ± 4.97S-Glucose (mmol/l) 5.08 ± 0.6 5 ± 0.48 5.24 ± 0.78HbA1c % 5.06 ± 0.26 5.04 ± 0.24 5.11 ± 0.28S=serum; P=plasma; Pi = phosphate; Ca = calcium; FGF-23 = fibroblast growth factor 23; PTH = parathyroid hormone;PTH = parathyroid hormone; 25(OH)D = 25-hydroxy vitamin D; HDL-C = high-density lipoprotein cholesterol;LDL-C = low-density lipoprotein cholesterol; eGFR = estimated glomerular filtration rate; HS-CRP = high-sensitivityC-reactive protein; HbA1c % = glycosylated hemoglobin (% of total hemoglobin) a adjusted for albumin
(n=370)

81
No significant differences in S-Pi (p=0.739), P-FGF-23 (p=0.511), S-iPTH (p=0.173), or S-25(OH)D (p=0.073) concentrations emergedbetween TP quintiles. Ca:P ratios between quintiles differed almostsignificantly with a tendency towards higher Ca:P ratio with higher TPintake (p=0.059). S-Pi and P-FGF-23 concentrations did not differsignificantly across P density quintiles (p=0.731 and p=0.187,respectively). S-iPTH concentrations were lower (p=0.045) and S-25(OH)D concentrations higher (p=0.004) with higher P density. Ca:Pratios were lower with lower P density (p=0.018). Between FAP groups,no significant differences emerged in P-FGF-23 (p=0.499), S-iPTH(p=0.313), S-25(OH)D concentrations (p=0.418), or Ca:P ratios
Table 14. Quintile/group sizes and ranges of P intakes, P densities of diet, and FAP intakes scores in quintiles/groups.
1st 2nd 3rd 4th 5th 6thAll subjects (n) 109 109 109 109 110 -P intake (mg/d) 0-1272 1273-1462 1463-1665 1666-1962 1963-3205 -
Females (n) 74 74 75 73 74 -P intake (mg/d) 0-1232.7 1233-1390 1391-1563 1564-1795 1796-2800 -
Males (n) 34 35 35 36 35 -P intake (mg/d) 0-1443 1444-1610 1611-1850 1851-2163.9 2164.0-3205 -
All subjects (n) 109 109 109 109 110 -P density of diet (mg/MJ/d) 0-162.1 162.2-182.8 182.9-200.85 200.86-222.1 222.2-320 -
Females (n) 74 74 75 73 74 -P density of diet (mg/MJ/d) 0-164.5 164.6-183.0 183.1-203.0 203.1-224.0 224.1-310 -
Males (n) 35 35 35 36 35 -P density of diet (mg/MJ/d) 0-160 161-182 183-198 199-218.0 218.1-320 -
All subjects (n) 66 111 151 109 85 29FAP score 1 2 3 4 5 6
Females (n) 45 77 101 73 55 20FAP score 1 2 3 4 5 6
Males (n) 16 39 54 28 33 10FAP score 1 2 3 4 5 6
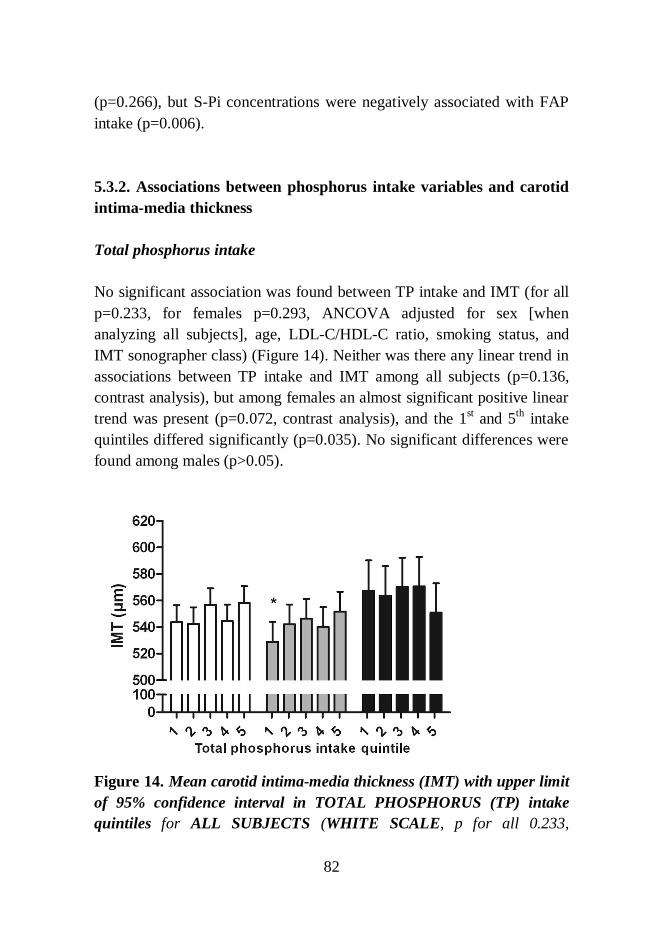
82
(p=0.266), but S-Pi concentrations were negatively associated with FAPintake (p=0.006).
5.3.2. Associations between phosphorus intake variables and carotidintima-media thickness
Total phosphorus intake
No significant association was found between TP intake and IMT (for allp=0.233, for females p=0.293, ANCOVA adjusted for sex [whenanalyzing all subjects], age, LDL-C/HDL-C ratio, smoking status, andIMT sonographer class) (Figure 14). Neither was there any linear trend inassociations between TP intake and IMT among all subjects (p=0.136,contrast analysis), but among females an almost significant positive lineartrend was present (p=0.072, contrast analysis), and the 1st and 5th intakequintiles differed significantly (p=0.035). No significant differences werefound among males (p>0.05).
Figure 14. Mean carotid intima-media thickness (IMT) with upper limitof 95% confidence interval in TOTAL PHOSPHORUS (TP) intakequintiles for ALL SUBJECTS (WHITE SCALE, p for all 0.233,

83
ANCOVA), for FEMALES (GRAY SCALE, p for all 0.293, ANCOVA)and for MALES (BLACK SCALE, p for all 0.719, ANCOVA).Statistically significant differences from the highest TP intake quintile(ANCOVA) are shown with an asterisk (* p<0.05) (between all othergroups p>0.05).
Phosphorus density of the diet
No significant association existed between P density of the diet and IMT(for all p=0.289, for females p=0.231, ANCOVA adjusted for sex [whenanalyzing all subjects], age, LDL-C/HDL-C ratio, smoking status, andIMT sonographer class) (Figure 15). However, in between-quintilecomparison among all subjects the 1st and 5th intake quintiles differedalmost significantly (p=0.064), and among females, the 1st quintilediffered almost significantly (p=0.065) and the 2nd quintile differedsignificantly (p=0.034) from the 5th quintile in IMT. Furthermore, asignificant positive linear trend occurred between P density of the diet andIMT among all subjects (p=0.039, contrast analysis), and among femalesan almost significant positive linear trend was present (p=0.067, contrastanalysis). No significant differences were found among males (p>0.05).

84
Figure 15. Mean carotid intima-media thickness (IMT) with upper limitof 95% confidence interval in P density quintiles for ALL SUBJECTS(WHITE SCALE, p for all 0.289, ANCOVA), for FEMALES (GRAYSCALE, p for all 0.231, ANCOVA), and for MALES (BLACK SCALE, pfor all 0.432, ANCOVA). Significant differences from the highest Pdensity quintile (ANCOVA) / statistically significant trends (contrastanalysis) between P density and IMT are indicated with asterisks(*p<0.05) (between all other groups p>0.05).
Food additive phosphate intake
The population was divided into six groups based on FAP intake scores.No significant association between FAP intake and IMT was observed(for all p=0.097, for females p=0.267, ANCOVA adjusted for sex [whenanalyzing all subjects], age, LDL-C/HDL-C ratio, smoking status, andIMT sonographer class) (Figure 16). Nevertheless, comparison of theintake groups revealed that among all subjects, IMT was higher withhigher FAP intake, and the 6th intake group differed significantly fromalmost all other groups (1st p=0.009, 2nd p=0.032, 3rd p=0.052, 4th p=0.006,
P density quintile

85
5th p=0.038); this was also the case among females (1st p=0.037, 2nd
p=0.045, 3rd p=0.086, 4th p=0.019, 5th p=0.113). In addition, a significantpositive linear trend existed between FAP intake and IMT among allsubjects (p=0.022, contrast analysis) and among females (p=0.045,contrast analysis). Among males, no significant differences were found(p>0.05).
Figure 16. Mean carotid intima-media thickness (IMT) with upper limitof 95% confidence interval in FOOD ADDITIVE PHOSPHATE (FAP)intake groups for ALL SUBJECTS (WHITE SCALE, p for all 0.097,ANCOVA), for FEMALES (GRAY SCALE, p for all 0.267, ANCOVA),and for MALES (BLACK SCALE, p for all 0.372, ANCOVA).Statistically significant differences from the highest FAP intake group(ANCOVA) / statistically significant trends (contrast analysis) betweenFAP intake and IMT are indicated with asterisks (*p<0.05, **p<0.01)(between all other groups p>0.05).

86
6. Discussion
6.1. Bioavailability of phosphorus in foodstuffs
6.1.1. Reliability of the analysis method for in vitro digestiblephosphorus
According to measurement uncertainty calculation, the analysis methodfor in vitro digestible P seems to be trustworthy. The method originallydeveloped by Asp et al. (1983) for the analysis of dietary fiber was latermodified by Ekholm et al. (2000, 2003). Here, some modifications for thedetermination of DP were made. The rationale of the method was tomimic the processing of foodstuffs in the alimentary tract usingalimentary enzymes with changes in pH and processing temperatures.Based on the calculations, the impact of measurement uncertainty on theDP results was 7.4%. In Study II, the proportion of DP in some foodstuffsexceeded 100%, which may be explained by the measurement uncertainty.However, in vitro methods only yield suggestive information onbioavailability, since the interaction between alimentary tract and foodcannot be measured, neither the circulation exists (Sandberg 2005). Thisnaturally increases the uncertainty in the in vitro results and limits theextrapolation of these results to in vivo circumstances, and thus,validation in vivo is needed (Miller and Berner 1989).
6.1.2. Effect of processing on in vitro digestible and total phosphoruscontents in cereals
In the present study, different rye breads were found to have similarproportions of DP (68-78 %), while in rye dough, the proportion of DPwas almost 100%. In some earlier studies, the phytic acid content in ryebread was almost reduced to zero during processing (Larsson andSandberg 1991, Fretzdorff and Brümmer 1992), which probably also

87
occurred in our study, but during baking of rye bread some P of doughmay have become insoluble for unknown reasons, because he DP contentsin bread were lower than in dough.
The results resemble those of previous studies in which phytates weremostly degraded in sourdough rye bread (Plaami and Kumpulainen 1995),and are also compatible with Karp et al. (2007) study, who found that theintake of unfermented cereals did not increase S-Pi concentrationcompared with other P sources, such as cheese and meat, indicating alower bioavailability of P in cereals. Here, the bakery breads did notseemingly differ in P contents compared with home-baked bread, eventhough they might not have been leavened for as long time as home-baked breads. Rye bread in Finland is prepared by fermenting the dough,traditionally without yeast. However, exact information aboutfermentation times of the bakery products is not available. Whencompared to other analyzed cereals, the TP contents in flour were muchhigher (about 300 mg/100g) than in doughs or breads, which, however, islogical because doughs and breads also contain ingredients besides flour.
TP contents in wheat samples were lower than in rye products becausealso fiber and whole-grain contents were lower. In the studied wheatsamples, the mean proportion of DP was about 50%, and it increased withprocessing especially in soured wheat bread. As shown in t-test,significant differences were present between flour-dough, flour-bread,and dough-bread pairs, except for flour-unsoured dough pair. Naturally,wheat flour had the highest contents of total P (about 110 mg/100 g)because no water or other ingredients were added as in doughs and breads.When comparing the amounts of DP in dough and bread originating from100 g of flour, DP in wheat sourdough and soured wheat bread increasedsignificantly relative to flour or unsoured dough and bread. The souredwheat bread contained a small amount of rye sourdough, but it likewiseseemed not to affect the results, although souring is known to decreasephytic acid content (le Francois 1988), while in a previous study addingof rye sourdough increased phytic acid hydrolysis in oat-containingdoughs (Larsson and Sandberg 1991). These results support the studies of

88
Reale et al. (2004), in which the fermentation time of yeast-containingbread was not long enough to degrade phytates: neither changes in DPcontents between flour and yeast-fermented dough were seen here. Theadded amount of yeast was probably too low to cause an increase in theDP content of the breads, although yeast contains a small amount ofphytase (Türk et al. 1996).
Barley porridge, which was baked in the oven for three hours, contained amuch higher percentage of DP than barley grits, indicating that a longhydrothermal processing causes degradation of phytate and thus,increases inorganic, digestible P contents (Sandberg 2002). The DPcontent in that amount of barley grits needed for 100 g porridge was morethan double when comparing to the original DP content of grits.Nevertheless, one must take into account that barley porridge is usuallymade with milk, which includes Ca. Ca prevents phytate degradation, atleast in doughs (Türk and Sandberg 1992), and milk also contains P,which would also affect the results. Thus, the results of milk-basedporridge would probably be different.
6.1.3. In vitro digestible and total phosphorus contents in other plant-based foodstuffs
Both TP and DP contents varied widely in food groups analyzed. Proteincontent mainly explains the differences in TP contents in regular products,but the proportion of DP can be affected by food processing in foodcontaining phytic acid (as seen in Study I), or by the use of P-containingfood additives. In cereals, seeds, and legumes, phytate-derived P accountsfor the majority of TP (Reddy 2002), but it needs to be hydrolyzed torelease inorganic Pi in a form available for absorption in the body.Although phytase activity in human gut is very low (Iqbal et al. 1994),different food processing methods can hydrolyze phytic acid (Plaami1997). Thus, more P is likely to be digestible from processed (i.e.fermented, soaked) plant-derived foodstuffs than from raw or unprocessedfoods.

89
Of the sweet bakery products, sweet buns (leavened with yeast) andcookies (containing no FAPs) had a P content similar to that in whitewheat bread (analyzed in Study I). However, industrially preparedmuffins containing FAP (baking powder) differed from other wheatproducts; the percentage of DP was almost 100%. TP content of muffinswas similar to that of rye bread, but DP content was higher than in anybreads. An average muffin and sweet bun both weight about 50 g; if amuffin with FAP is chosen, the amount of DP is 100 mg, but if the yeast-leavened sweet bun was chosen, the amount of DP is only 30 mg.Therefore, persons who consume large amounts of FAP-containingbakery products may ingest substantial amounts of bioavailable P.
Of the foods analyzed in this study, the proportion of DP from TP waslowest in legumes and seeds (6-42% of TP). Earlier results havesuggested that bioavailability of P in beans is only 25% (Uribarri 2007).Findings of the current study, by contrast, indicate DP contents inlegumes to be on average higher than this. However, similarly to lentils,beans, and peas, sesame seeds with hull had a low DP content (42 mg/100g). This is in line with the results of an earlier short-term controlled study,where whole sesame seeds did not affect the concentrations of S-Piindicating them to be poor sources of bioavailable P (Kärkkäinen et al.1997). Nevertheless, the cooking time of lentils, green beans, and peas isrelatively short, and these products do not require soaking before cooking(except dry peas), which would decrease phytate contents and releaseinorganic Pi (Sandberg 2002). Thus, it is unlikely that a large proportionof phytate is hydrolyzed during processing, and therefore, DP content inlentils, green beans, and peas would not rise notably, if at all, when theseproducts are cooked. Nevertheless, to evaluate the bioavailable P inlegumes requiring long soaking and cooking times (such as soy beans andchick peas), more analyses of the effects of processing on DP contents areneeded.
In beer and cola beverages, all P was digestible. This result is in line withprevious results on high absorbability of P from food additives such as

90
phosphoric acid in cola drinks which appears to absorb completely in theintestine (Bell et al. 1977, Karp et al. 2007). TP contents in both coladrinks and beer were comparable with values published earlier (Murphy-Gutekunst 2005, Institution for Health and Welfare 2011). In beer, Poriginates from the grain used in preparing the product; in Finland, this ismost often barley. Based on these results, it seems that during malting andother processing of grain when preparing beer, P is efficiently releasedfrom the grain to a highly digestible form, resulting in a high proportionof DP. Processing of beer also includes fermentation with yeast, which isknown to contain phytase, and thus, the ability to degrade phytate tobioavailable P (Türk et al. 2006). However, in beer, as in some colabeverages the amount of DP exceeded the amount of TP. This may beexplained by the uncertainty of the analysis method under circumstancesof low P content; the calculated measurement uncertainty for the DPanalysis method in Study I was 7.4%. Thus, at small concentrations of DP(beer 22 mg/100g, colas 10-16 mg/100g), a 1-2 mg change within the DPcontents can be explained by the variability of the method. Nevertheless,even though the amounts of P in these beverages are not very high,persons consuming beer or cola drinks in abundance may ingest aconsiderable amount of DP in these drinks. This may be importantbecause replacing milk (containing Ca and natural P) with cola beveragesand increasing beverage consumption in the general population can haveadverse effects on Ca and bone metabolism (Fernando et al. 1999,Kristensen et al. 2005, Tucker et al. 2006).
Based on the results of Studies I and II, in vitro DP content in differentrye breads can vary substantially, most likely depending on the amountand proportion of rye flour and crushed rye grain, the content of othergrains or potato, the use of yeast, and the length of fermentation (Türk etal. 1996, Sathe and Venkatachalan 2002). Further, the grounding stage ofthe flour generally results in differences in P contents; DP content ofwhite wheat bread analyzed in Study I was lower than DP content of ryeor mixed-grain bread in Study II. In practice, the differences in theamounts of P from foodstuffs can easily be demonstrated by calculatingregular portions of P in DP and TP. If one person eats 5 slices of bread

91
(here: small rye bread containing potato 1 from Study II, 33 g/each) perday, the amount of P intake varies markedly depending on whethercalculated by TP or DP; TP from bread is 317 mg, and DP is 147 mg. Theamount of P calculated as TP is double that of DP. If the same amount ofwhite wheat bread (Study I) is chosen, the amount of TP would be 136mg, and DP 70 mg. This shows that depending on the calculation methodto take into account TP or DP, P intake can vary widely. At least in CKDpatients, this may be relevant because in practice they must follow a P-restricted diet and food choices can have a real effect on P intake anddiversity of the diet. However, use of different porridges made of flakes(oat, rye, mixed cereals) is also common in Finland (Helldán et al. 2013b),and analysis of their DP contents should be considered.
6.1.4. Conclusions about phosphorus bioavailability in analyzedfoodstuffs
The in vitro DP content in processed cereals was less than the inunprocessed cereals, confirming the hypothesis. This is probably becauseduring processing of foodstuffs phytate was degraded to lower inositolPi’s and the same process formed inorganic Pi, which increased the DPcontent (Sandberg 2002). The products were processed undercircumstances where both enzymatic and non-enzymatic degradation canoccur (low pH, high temperature, presence of yeast, hydrothermalprocessing) (Sandberg 2002, Sandberg and Andlid 2002); some of thedoughs were soured and some were leavened with yeast and baked whichshould increase the inorganic Pi contents.
DP contents among other studied plant-based foodstuffs seemed to differsubstantially among different foodstuffs. Despite high TP content,legumes and seeds may be relatively poor P sources of bioavailable P.Results support previous understanding of the effective absorbability of Pfrom P additives. Bakery products containing baking powder maysubstantially increase intake of DP. Thus, these bakery products can be animportant source of highly bioavailable, in addition to meat products,
92
processed cheeses, and cola beverages. However, the results of DPprovide only suggestive data on P bioavailability, and thus, should beconfirmed with an in vivo method. If DP analysis is proven a validmethod for evaluating P availability, it could be used to estimate thebioavailability of P in eg. P-restricted diets.
These results indicate that different P sources their bioavailability shouldbe taken into account more seriously in research on P intake and healthoutcomes. The original aim was to use the results of bioavailable Pcontents of Studies I and II in assessing the associations of dietary P withCVD risk factors (Study III). This, however, proved to be impossiblebecause only particular foodstuffs among the thousands included in foodcomposition databases were analyzed. Nevertheless, in Study III, we wereable to analyze the data concerning both total P sources, and thepotentially more detrimental FAP-containing products.
93
6.2. Dietary phosphorus as a potential cardiovascular riskfactor
6.2.1. Total phosphorus intake and cardiovascular health
This study demonstrated that high dietary P intake should be taken intoaccount as a potential cardiovascular risk factor in the general population.Positive linear trends in associations among P density of diet and IMTwere found. IMT of females was significantly higher in the highest TPintake quintile than in the lowest intake quintile, and an almost significantlinear trend emerged between TP intake and IMT. Here, attention waspaid to TP intake, which, when divided by energy intake describes the Pdensity of the diet, excluding energy intake as a potential confoundingfactor. In the study of Chang et al. (2014a) in particular high P density ofthe diet was associated with adverse mortality outcomes. The resultssupport the hypothesis that in addition to elevated S-Pi concentration, alsohigher dietary P intake may be a cardiovascular risk factor in terms ofhigh IMT in a normal, healthy population. Individuals with lowglomerular filtration rate (eGFR <60 ml/min) were excluded, and thus,the possible effects of improper kidney function did not affect the results.Earlier data on health effects of high P intake on the normal populationare scarce, and most studies carried out on P intake have focused on bonehealth (Calvo 1993, Kärkkäinen and Lamberg-Allardt 1996, Kemi et al.2006, 2009, 2010).
The subjects, who participated in the present study, were middle-aged andon average overweight (mean BMI 26.8 kg/m2). Dietary P intake in studysubjects was slightly higher than the habitual P intake in the nationalFINDIET 2012 Study (females 1532 mg/d vs. 1369 mg/d, males 1795mg/d vs. 1694 mg/d) (Helldán et al. 2013a). While marked variation in TPintake can be seen between the quintiles (smallest intake quintile ca. 1100mg/d, and highest ca. 2300 mg/d), on average all subjects exceeded therecommended intakes (National Nutrition Council 2014). P density of thediets was similar to mean intakes in the FINDIET 2012 Study (females

94
195 mg/MJ/d vs. 197 mg/MJ/d, males 192 mg/MJ/d vs. 187 mg/MJ/d)(Helldán et al. 2013a). The mean Ca intake met the recommendations(National Nutrition Council 2014) and vitamin D intake and the S-25(OH)D concentrations were satisfactory, especially taking into accountthat the study was carried out during the dark season. Thus, the studypopulation may have had a better Ca balance and nutritional status thanother populations because of the adequate intakes of Ca and vitamin D(e.g. Welch et al. 2009).
However, human data on dietary P intake and CVD risk factors arelimited. Acute high P intake has decreased endothelial function of thevessels (Shuto et al. 2009), and high dietary P intake was associated withleft ventricular hypertrophy among women but not among men(Yamamoto et al. 2013). Recently, in the NHANES cohort, dietary Pintake >1400 mg/d and P density of diet >0.35 mg/kcal (corresponding to146 mg/MJ) were associated with all-cause mortality, and high P density(>0.35 mg/kcal) was associated with CVD mortality (Chang et al. 2014a).In that study, also low P density of diet (<0.35 mg/kcal) was associatedwith increased mortality risk. Notable in these above-mentioned studies isthat the P intakes associated with adverse health effects, are similar to orlower than the average intakes in Finland (Helldán et al. 2013a). TheNHANES Study produced much discussion about P sources and theirbioavailability (McCarty 2014); the results of Studies I and II contributeto this discussion.
6.2.2. Food additive phosphorus intake and cardiovascular health
Here, the research question was addressed separately for TP intake andFAP intake because FAP is more absorbable in the intestine than naturalP (Bell et al. 1977, Karp et al. 2007). As noted in Study II, and consistentwith an in vitro study by Karp et al. (2012), the amounts of DP are higherin foodstuffs containing FAPs than products without FAPs. As mentionedearlier, the contribution of FAP to TP are mainly unknown and amountsof FAP in foodstuffs vary greatly between manufacturers. In the current

95
study, positive linear trends in association between FAP intake and IMTwere found when analyzing all subjects and females.
Previous data on FAP intake are scarce and studies on health outcomes ofFAP are mainly concerned on bone health (Fernando et al. 1999,Kristensen et al. 2005, Tucker et al. 2006, Karp et al. 2007, Kemi et al.2009, Karp et al. 2013). In the earlier-mentioned studies on dietary P andCVD (see Section 6.2.1.), FAP intake data was unavailable. Here, FAP-containing meat products, processed cheeses, and cola beverages wereincluded in calculations, and significant differences in IMT emergedbetween subjects having high and those having low FAP intake.Nevertheless, in nutrient values based on food composition databases,FAPs may not have been taken into account due to the calculatednutrients values which are not based on chemically analyzed values.Many studies conclude that TP content in, for example, meat products canbe twice as high as that calculated from the nutritional programs based onfood composition databases, since analyzed data on FAP content ismissing in the current databases (Oenning et al. 1988, Calvo et al. 2014).This can also uncertainty in results of the current study.
6.2.3. Serum phosphate and other regulators of phosphatemetabolism and cardiovascular health
A few studies have been conducted to assess the associations betweenelevated S-Pi concentrations and IMT or vascular calcification, but thisstudy is one of the first to investigate the association of dietary P withIMT. Ruan et al. (2010) found that even in young persons S-Pi wasassociated with higher cIMT. Onufrak et al. (2008), in turn, showed thatS-Pi was associated with IMT among males but not among females. In aKorean study (Park et al. 2010) low S-Pi was associated with lesscoronary calcification, and Foley et al. (2009) found high S-Pi to beassociated with coronary calcification. Tuttle and Short (2009) showed ina longitudinal design in adult population that S-Pi concentrationsindependently predicted coronary artery calcification. Numerous other

96
data on association of high S-Pi and CVD risk also exist (Tonelli et al.2005, Dhingra et al. 2007, Foley et al. 2008, Ix et al. 2009, Kendrick et al.2010, Larsson et al. 2010, Sim et al. 2013), but the findings of Taylor et al.(2011) showing no association of plasma Pi with development ofcoronary heart disease among males are not in accord with the others.
Interestingly, in the current study, S-Pi was highest with the lowest FAPintake scores among all subjects. Earlier cross-sectional studies haveshown that dietary P intake correlates only weakly with S-Pi (Mataix et al.2006, de Boer et al. (2009). Uribarri (2013) suggests that due to the highcircadian variation of S-Pi and very weak correlation between P intakeand S-Pi in cross-sectional studies, peak S-Pi concentration after oral Piload, in addition to mean 24-h S-Pi concentrations, could be betterindicators of potential adverse health effects. Ellam and Chico (2012)state that high bioavailability of P in Western diets may cause high post-prandial Pi peaks, and in healthy humans, oral Pi supplementation hasbeen noted to cause S-Pi to rise to the to upper level of the normal range(Kärkkäinen and Lamberg-Allardt 1996, Kemi et al. 2006, Karp et al.2007). However, in our study, we were only able to measure fasting S-Piconcentrations. Thus, in future research, more resources should bedirected to more extensive S-Pi assessments, not only relying on fastingconcentrations. Also measuring urine Pi excretion would be valuable(Karp et al. 2007, Morimoto et al. 2014); however, 24-h urine collectionis laborous to carry out and can only be used for subjects with normalrenal function.
The main factors involved in P metabolism, namely FGF23, PTH, andcalcitriol, have been found to be independently adversely associated withcardiovascular health (Uribarri and Calvo 2014). Although dietary P loadhas been shown to increase FGF23 concentration during a long exposure(Block et al. 2013), one failed to find any association between P-FGF23concentration and dietary P intake in the current study, probably due tothe cross-sectional study design. Also the analysis of the C-terminalfraction of FGF23 may explain the lack of the correlations in the currentstudy; as mentioned earlier, intact FGF23 has been found to respond
97
better to dietary P load (Burnett et al. 2006). FGF23 has been speculatedto participate in the effects of P on CVD, but the mechanisms arehypothetical and mainly unknown (Kendrick et al. 2011). High FGF23has been associated with CVD risk factors (Gutiérrez et al. 2011) andCVD itself (Dalal et al. 2011) but results of studies are discordant (Tayloret al. 2011, Schoppet et al. 2012), and to date, no studies have focused onFGF23 and IMT in the general population.
PTH concentrations increase acutely after dietary P load (Vervloet et al.2011, Block et al. 2013). However, in the present study dietary Pvariables were associated with IMT, but no correlation between serumiPTH concentrations and IMT was observed (data not shown). A meta-analysis of 15 prospective studies showed that higher PTH concentrationswere associated with increased risk of CVD events (van Ballegooijen et al.2013). However, with regard total CVD events (10 studies included in theanalysis) only three of the studies showed a positive association betweenPTH and CVD, the rest reporting no association (van Ballegooijen et al.2013). In the present study, S-Pi, FGF23 and iPTH analyses concerningIMT were not adjusted for potential covariates because they were notmain parameters of the study but the data will be further analyzed in othermanuscripts. However, the results should be interpreted with caution:more investigation on these surrogate markers of P intake andcardiovascular health are warranted.
6.2.4. Conclusions about dietary phosphorus as a potentialcardiovascular risk factor
The results show significant linear trends in the associations among Pdensity of the diet, FAP intake, and carotid IMT in a healthy, middle-agedCaucasian population. Based on these results, high dietary P intake shouldbe further investigated due to its potential association with CVD riskfactors in the general population, not only in renal patients. Furthermore,prospective, or even better, long-term intervention studies are required to

98
evaluate the possible impact of dietary P burden on risk of CVD. Also theregulators of P metabolism should be taken into account.
99
6.3. Strengths and limitations of the studies
6.3.1. Food studies (Studies I and II)
In the method for DP analysis, the processing of the food in thealimentary tract was mimicked, but this in vitro method do not take intoaccount the interaction between the alimentary tract and food orcomponents of food (Sandberg 2005), and therefore the results on DPneed further validation with an in vivo method. For example, the transittime in the alimentary tract depends on the content of the meal, andabsorption capability in the different parts of the alimentary tract varies.Moreover, the produced alimentary enzymes differ in contents andconcentrations depending on the composition of ingested food, neitherwas the circulation present in this method. This naturally causesuncertainty in extrapolating the in vitro results to in vivo circumstances.
The ICP-MS and ICP-OES methods for total P analysis are reliable andwell validated (PerkinElmerSciex Instruments 2001). The differences inresults for P contents in breads between Studies I and II can be partlyexplained by sampling differences. In Study I, the focus was on theeffects of processing on P contents in particular foodstuffs, while in StudyII the sampling was ensured to be representative of the most populartrademarks in each food category, and the food consumption dataoriginated from a population study in Finland. Nevertheless, becauseStudy I was a methodological study, the samples were not chosen to begenerally representative; the main aims were to develop a new analysismethod and to examine the effect of baking processes on the DP contents.
The percentage of DP from TP was in some foodstuffs more than 100%,which may be explained by the variance in the uncertainty of the method,at least at low P concentrations. Measurement accuracy was, however,improved by extraction of fat from high-fat-containing foodstuffs. In thepresent studies, only plant-based foodstuffs were analyzed but the same
100
method has been used for analysis of animal-based foodstuffs in the studyby Karp et al. (2012).
6.3.2. Human study (Study III)
Here, a large variety of biomarkers were analyzed and extensivebackground data were available. Further, the study subjects werehomogeneous in age and the females were in specified state of menopause(premenopausal). The potential effects of impaired kidney functions weretaken into account by excluding persons with eGFR<60 ml/min. In largestudies where the main focus is not nutritional, food intake data may havebeen collected less accurately than in our study. Nevertheless, among thestudy subjects Ca intake was high, and serum 25-hydroxy vitamin Dstatus was fairly satisfactory, both of which interact with P metabolismand may hide adverse effects of high P intake. One limitation of the studyis its cross-sectional design, which prevents an evaluation of causality.The number of males (176 vs. 400 expected) may have been too small toshow statistically significant results.
One problem with dietary intake calculation programs is that the analyzedTP content, for example in meat products, can be twice as high as thatbased on food composition databases due to a lack of analyzed data forFAP content (Calvo et al. 2014). Here, the food intake (except FAP intake)was assessed only with self-reported food records (3 days); however, therecords were checked by researchers, in an attempt to improve the qualityof the data. In addition, 400 new recipes were introduced to the nutrientcalculation program to ensure more accurate assessment of P intake andother nutrients. However, the database used is based on Fineli®, whichhas limited information on FAPs. Thus, it is important to have data onconsumption of FAP-containing foodstuffs measured by a validated FFQ.Also different processing methods for foods actually consumed and thesubjects’ former diets may have affected the associations of dietary P withother measured parameters. Food records and FFQs were not repeated,and reveal the only current dietary intake and it is difficult to know

101
whether the dietary intake method used is indicative of the usual diet. Themethod by which FAP intake is calculated can also be criticized; in thepresent study FAP intakes were not able to calculate precisely, and onlyFAP-containing meat products, processed cheeses, and cola beverageswere included in the FAP intake calculations, but, however, informationon exact amounts of FAPs in foodstuffs was not available.
IMT measurement by sonography is a reproducible, rapid, inexpensive,and radiation-free technique to evaluate the condition of arteries and riskof CVD (Mookadam et al. 2010, O’Leary and Bots 2010). Here, thepopulation was middle-aged, and the age group was chosen based onliterature suggesting that some changes in vessels probably already occurby this time. However, it was not able to distinguish between carotidintima and media layers of the vessels, thus, one cannot be sure whetherthis calcification occurs in the intima, media, or both. That leaves theeffect of the P separately on intima and media unknown. Moreassessments, e.g. measurement of endothelial function of the vessels,would have provided valuable additional information.
102
7. Conclusions and future perspectives
This thesis aimed to provide new insights into the potential health risksrelated to P intake in Finland by producing new infomation on thebioavailability of P from foodstuffs commonly used in Finland in terms ofin vitro digestible P. Due to increased consumption of processed meals, itis important to pay attention to the sources of bioavailable P. Furthermore,the study yielded population-based data on the associations of dietary P,especially food additive P, and vascular calcification in Finland.Cardiovascular diseases are common causes of death in Finland, and theinformation about the potential detrimental role of dietary P in thesediseases is highly important.
Specific findings of the studies were as follows:
Food studies (Studies I and II): Information on in vitro digestible Pcontents in differently processed cereals, as well different plant-basedfoodstuffs was attained. Also a new reliable analysis method was tested.Despite high total P content, cereals, legumes and seeds may be relativelypoor sources of bioavailable P, even though processing of the cerealsincreases DP contents. Results support previous understanding of theeffective absorption of P from additives. The use of food additivephosphate-containing products may substantially increase the intake ofhighly bioavailable P. The results of in vitro digestible P should, however,be confirmed with an in vivo method.
Human study (Study III): High P density of the diet i.e. total dietary Pintake relative to energy intake, and high food additive phoshate intakewere associated with carotid intima-media thickness in healthy middle-aged Finnish adults. However, due to the cross-sectional design, causaleffects cannot be shown. Based on these results, high dietary P should befurther investigated for its potential association with cardiovasculardisease risk factors in the general population, not only in renal patients.The relationship between high P intake and vascular calcification requiresalso further elucidation.

103
In conclusion, the present results highlight the importance of the source ofP when analyzing P intake and P burden in a population. Food additivephosphate-containing foodstuffs have higher contents of in vitrodigestible P, and also processing increases the digestible P contents. Bothintervention and follow-up studies are warranted on different populationsbefore final conclusions about the harmfulness of high P intake oncardiovascular health in the general population can be drawn. Data on useof food additive phosphates in the food industry and updated informationon P contents in foodstuffs are also needed.
104
Acknowledgements
The project was carried out at the Calcium Research Unit, Division ofNutrition, Department of Food and Environmental Sciences, University ofHelsinki, Finland. I thank the Head of the Division, Professor MarjaMutanen for providing me excellent research facilities. Professor MikaelFogelholm is thanked for insightful feedback on the manuscript.
This work was supported by the Future Fund of the University of Helsinki,the Juho Vainio Foundation, the Raisio plc Research Foundation, theFinnish Cultural Foundation, the Research Foundation of the FinnishFood and Drink Industries’ Federation, Medicinska UnderstödsföreningenLiv Och Hälsa, the Academy of Finland, Doctoral School in HealthSciences, and the National Doctoral Programme of MusculoskeletalDisorders and Biomaterials (TBDP). All these contributors are deeplyappreciated.
I am grateful to my supervisor, Professor Christel Lamberg-Allardt, forsupervision of this thesis, for support and guidance, and for interestingscientific conversations during these years.
The reviewers of this thesis, Professor Hannu Mykkänen and ProfessorRiitta Korpela are thanked for careful pre-examination of the manuscriptand valuable suggestions for improving its content.
I warmly thank my co-authors, Adjunct Professors Päivi Ekholm, MerjaKärkkäinen, Kalevi Laitinen, Dr. Maila Turanlahti, and Dr. TeroHirvonen for their contributions and comments on the manuscripts. Ithank my co-author Silja Närkki for performing laboratory analyses forStudy II. Statistician Elina Vaara (neé Kokkonen) is thanked for help withstatistical analysis of the data in Study III. I warmly thank my present andpast colleagues at the Calcium Research Unit; Elisa Saarnio, Virpi Kemi,Heini Karp, Minna Pekkinen, Noora Vainio, Jenna Rautanen, MerjaKärkkäinen, Maijaliisa Erkkola, Pilvi Saaristo, Essi Skaffari, and TainaÖhman for collaboration and for providing the greatest working

105
environment ever! I also thank Anu Heiman-Lindh for assistance withlaboratory work of the PHOMI Study. I thank all personnel at theDivision of Nutrition for fruitful collaboration.
My greatest thanks belong to my dear friend Anni for listening to all mycomplaints and angst over these years. I thank all my crazy friends,especially Ohrekarouh and Siksap, for support; “tutkia” Itkonen is finallyready! I thank “porukat” and my dear grandmother Mummo, Kirsti, Kaisu,Markku, Satu and other relatives for being there. I can hardly believe thatI’ve truly finished!
Helsinki, January 2015,
Suvi Itkonen

106
References
Alonso A, Nettleton JA, Ix JH, de Boer IH, Folsom AR, Bidulescu A,Kestenbaum BR, Chambless LE, Jacobs DR, Jr. Dietary phosphorus, bloodpressure, and incidence of hypertension in the Atherosclerosis Risk inCommunities Study and Multi-Ethnic Study of Atherosclerosis. Hypertension2010;55:776-784.
Anderson JB. Potential health concerns of dietary phosphorus; cancer, obesity,and hypertension. Ann N Y Acad Sci 2013;1301:1-8.
AOAC Official methods of analysis. p. 4. Chapter 32.1.11. AOAC International2000, Gaithersburg, Maryland, USA.
AOAC Official methods of analysis. p. 44. Chapter 4.8.13 AOAC International2000, Gaithersburg, Maryland, USA.
AOAC Official methods of analysis. p. 44. Chapter 4.8.14 AOAC International2000, Gaithersburg, Maryland, USA.
Asp NG, Johansson CG, Hallmer H, Siljeström M. Rapid enzymatic assay ofinsoluble and soluble dietary fiber. J Agric Food Chem 1983;31:476-482.
van Ballegooijen AJ, Reinders I, Visser M, Brouwer IA. Parathyroid hormoneand cardiovascular disease events: A systematic review and meta-analysis ofprospective studies. Am Heart J 2013;165:655-664.
Bell RR, Draper HH, Tzeng DYM, Shin HK, Schmidt GR. Physiologicalresponses of human adults to foods containing phosphate additives. J Nutr1977;107:42-50.
Benini O, D’Alessandro C, Gianfaldoni D, Cupisti A. Extra-phosphate load fromfood additives in commonly eaten foods: a real and insidious danger for renalpatients. J Ren Nutr 2011;21:303-308.
Bergwitz C, Jüppner H. Regulation of phosphate homeostatis by PTH, vitamin D,and FGF23. Annu Rev Med 2010;61:91-104.
Berndt T, Kumar R. Phosphatonins and the regulation of phosphate homeostasis.Annu Rev Physiol 2007;69:341-359.

107
Block GA, Hulbert-Shearon TE, Levin NW, Port FK. Association of serumphosphorus and calcium x phosphate product with mortality riskin chronickidney disease. Am J Kidney Dis 1998;31:607-617.
Block GA, Ix JH, Ketteler M, Martin KJ, Thadhani RI, Tonelli M, Wolf M,Jüppner H, Hruska K, Wheeler DC. Phosphate homeostasis in CKD: Report of ascientific symposium sponsored by National Kidney Foundation. Am J KidneyDis 2013;62:457-473.
Block GA, Klassen PS, Lazarus JM, Ofsthun N, Lowrie EG, Chertow GM.Mineral metabolism, mortality, and morbidity in maintenance hemodialysis. JAm Soc Nephrol 2004;15:2208-2218.
Blomberg, K. and Penttilä, P-L. Supervision of additives in Finland in 1997 and1998. Helsinki 1999. National Food Administration / Research Notes 8/1999, 35pp + app.
de Boer IH, Rue TC, Kestenbaum B: Serum phosphorus concentrations in theThird National Health and Nutrition Examination Survey (NHANES III). Am JKidney Dis 2009;53:399-407.
Buizert PJ, van Schoor NM, Simsek S, Lips P, Heijboer AC, den Heijer M, DeegDJ, Eekhoff EM. PTH: a new target in arteriosclerosis? J Clin Endocrinol Metab2013;98:E1583-E1590.
Burnett SM, Gunawardene SC, Bringhurst FR, Jüppner H, Lee H, Finkelstein JS.Regulation of C-terminal and intact FGF-23 by dietary phosphate in men andwomen. J Bone Miner Res 2006;21:1187-1196.
Calvo MS. Dietary phosphorus, calcium metabolism and bone. J Nutr1993;123:1627-1633.
Calvo MS, Eastell R, Offord KP, Berstrahl EJ, Burritt MF. Circadian variationin ionized calcium and intact parathyroid hormone: evidence for sex differencesin calcium homeostasis. J Clin Endocrin Metab 1991;72:69-76.
Calvo MS, Park YK. Changing phosphorus content of the U.S. diet: Potential foradverse effects on bone. J Nutr 1996;126:1168S-1180S.
Calvo MS, Tucker KL. Is phosphorus intake that exceeds dietary requirements arisk factor in bone health? Ann NY Acad Sci 2013;1301:29-35.

108
Calvo MS, Moshfegh AJ, Tucker KL. Assessing the health impact ofphosphorus in the food supply: issues and considerations. Adv Nutr 2014;5:104-113.
van Campenhout A, Golledge J. Osteoprotegerin, vascular calcification andatherosclerosis. Atherosclerosis 2009;204:321-329.
Cannata-Andia JB, Roman-Garcia P, Hruska K. The connections betweenvascular calcification and bone health. Nephrol Dial Transplant 2011;26:3429-3436.
Carrigan A, Klinger A, Choquette SS, Luzuriaga-McPherson A, Bell EK,Darnell B, Gutiérrez OM. Contribution of food additives to sodium andphosphorus content of diets rich in processed foods. J Ren Nutr 2014;24:13-19.
Cashman KD. A review of vitamin D status and CVD. Proc Nutr Soc2014;73:65-72.
Chang AR, Lazo M, Appel LJ, Gutiérrez OM, Grams ME. High dietaryphosphorus intake is associated with all-cause mortality: results from NHANESIII. Am J Clin Nutr 2014;99:320-327. (2014a)
Chang AR, Lazo M, Appel LJ, Gutiérrez OM, Grams ME. Reply to MFMcCarty. Am J Clin Nutr 2014;99:966-967. (2014b)
Cupisti A, Benini O, Ferretti V, GIanfaldoni, kalantar-Zadeh K. Noveldifferential measurement of natural and added phosphorus in cooked ham withor without preservatives. J Ren Nutr 2012;22:533-540.
Dalal M, Sun K, Cappola AR, Ferrucci L, Crasto C, Fried LP, Semba RD.Relationship of serum fibroblast growth factor with cardiovascular disease inolder community-dwelling women. Eur J Endocrin 2011;165:797-803.
Dhingra R, Sullivan LM, Fox CS, Wang TJ, D’agostino RB, Gaziano JM, VasanRS. Realtions of serum phosphorus and calcium levels to the incidence ofcardiovascular disease in the community. Arch Intern Med 2007;167:879-885.
EFSA. Opinion of the scientific panel on dietetic products, nutrition andallergies on a request from the commission related to the tolerable upper intakelevel of phosphorus. The EFSA Journal 2005;233:1-19.
Einstein ST. Introduction to the poo. J Faecal Sci 1982;666:2-9.
109
Ekholm P, Virkki L, Ylinen M, Johansson L. The effect of phytic acid and somenatural chelating agents on the solubility of mineral elements in oat bran. FoodChem 2003;80:165-170.
Ekholm P, Virkki L, Ylinen M, Johansson L, Varo P. Effects of natural chelatingagents on the solubility of some physiologically important mineral elements inoat bran and oat flakes. Cereal Chem 2000;77:562-566.
El-Abbadi MM, Pai AS, Leaf EM, Yang H-Y, Bartley BA, Quan KK, IngallsCM, Liao HW, Giachelli CM. Phosphate feeding induces arterial medialcalcification in uremic mice: role of serum phosphorus, FGF-23 and osteopontin.Kidney Int 2009;75:1297-1307.
Ellam TJ, Chico TJ. Phosphate: the new cholesterol? The role of the phosphateaxis in non-uremic vascular disease. Atherosclerosis 2012;220:310-318.
Elliott P, Kesteloot H, Appel LJ, Dyer AR, Ueshima H, Chan Q, Brown IJ, ZhaoL, Stamler j. Dietary phosphorus and blood pressure: International study ofmacro- and micro-nutrients and blood pressure. Hypertension 2008;51:669-675.
Ellison SLR, Rosslein M, Williams A. (eds.). EURACHEM/CITAC Guide CG4.Quantifying Uncertainty in Analytical Measurement. (2000). 2nd edition.QUAM 2000.1. ISBN 0 948926 15 5
Enomoto M, Adachi H, Hirai Y, Fukami A, Satoh A, Otsuka M, Kumagae S,Nanjo Y, Yoshikawa K, Esaki E, Kumagai E, Ogata K, Kasahara A, TsukagawaE, Yokoi K, Ohbu-Murayama K, Imaizumi T. LDL-C/HDL-C ratio predictscatorid intima-media thickness progression better than HDL-C or LDL-C only. JLipids 2011;2011:549137.
European Union: Commission Regulation 80/778/EEC: directive about drinkingwater.
European Union: Commission regulation No 1129/2011. Off J Eur Union2011;L295:1-177.
Everett BM. Markers of mineral metabolism and cardiovascular disease. AnnIntern Med 2010;152:683-684.
EVIRA. E-koodiavain. (E code key, in Finnish). 2011. Available athttp://www.evira.fi/portal/fi/tietoa+evirasta/julkaisut/?a=view&productId=52Accessed 11th January 2015.
110
Fernando GR, Martha RM, Evangelina R. Consumption of soft drinks withphosphoric acid as risk factor for the development of hypocalcemia inpostmenopausal women. J Clin Epidemiol 1999;52:1007-1010.
Figueiredo CP, Rajamannan NM, Lopes JB, Caparbo VF, Takayama L, KuroishiME, Oliveira IS, Menezes PR, Scazufca M, Bonfá E, Pereira RM. Serumphosphate and hip bone mineral density as additional factors for high vascularcalcification scores in a community-dwelling: the São Paulo Ageing & HealthStudy (SPAH). Bone 2013;52:354-359.
Fitzpatrick L, Heaney RP. Got soda? J Bone Miner Res 2003;18:1570-1571.
Foley RN, Collins AJ, Herzog CA, Ishani A, Kalra PA. Serum phosphoruslevels associate with coronary atherosclerosis in young adults. J Am SocNephrol 2009;20:397-404.
Foley RN, Collins AJ, Ishani A, Kalra PA. Calcium-phosphate levels andcardiovascular disease in community-dwelling adults: the Atherosclerosis Riskin Communities (ARIC) Study. Am Heart J 2008;156:556-563.
Food and Nutrition Board, Standing Committee on the Scientific Evaluation ofDietary Reference Intakes, National Research Council, Institute of Medicine.Dietary reference intakes: calcium, phosphorous, magnesium, vitamin D, andfluoride. National Academy Press: Washington DC; 1997.
Food Standards Agency. McCance and Widdowson’s the Composition of Foods.6th summary ed., Cambridge, England, Royal Society of Chemistry, 2002.
le Francois P. Phytic acid and zinc contents of cereal products: relation to themanufacturing process. J Food Comp Anal 1988;1:139-145.
Fretzdorff B, Brümmer J-M. Reduction of phytic acid during breadmaking ofwhole-meal breads. Cereal Chem 1992;69:266-270.
Gaasbeek A, Meinders AE. Hypophosphatemia: an update on its etiology andtreatment. Am J Med 2005;118:1094-1101.
Gaucheron F. Milk and dairy products: a unique micronutrient combination. JAm Coll Nutr 2011;30:400S-409S.
Greger JL, Krystofiak M. Phosphorus intake of Americans. Food Technol1982;36:78-84.
111
Gutiérrez OM, Wolf M, Taylor EN. Fibroblast growth factor 23, cardiovasculardisease risk factors, and phosphorus intake in the Health Professionals Follow-Up Study. Clin J Am Soc Nephrol 2011; 12:2871-2878.
Haussler MR, Whitfield GK, Kaneko I, Forster R, Saini R, Hsich J-C, HausslerCA, Jurutka PW. The role of vitamin D in the FGF23, klotho, and phosphatebone-kidney endocrine axis. Rev Endocr Metab Disord 2012;13:57-69.
Heaney RP. Phosphorus nutrition and the treatment of osteoporosis. Mayo ClinPro 2004;79:91-97.
Heaney RP. Factors influencing the measurement of bioavailability, takingcalcium as a model. J Nutr 2001;131:1344S-1348S.
Helldán A, Raulio S, Kosola M, Tapanainen H, Ovaskainen M-L, Virtanen S.Finravinto 2012 –tutkimus – The National FINDIET 2012 Survey. Reports ofInstitution of Health and Welfare, 2013_016. (2013a)
Helldán A, Helakorpi S, Virtanen S, Uutela A. Suomalaisen aikuisväestönterveyskäyttäytyminen ja terveys, kevät 2013 – Health Behaviour Among theFinnish Adult Population Spring 2013. Reports of Institution of Health andWelfare, 2013_021. Available at http://urn.fi/URN:ISBN:978-952-302-051-1(2013b)
Hers I, Vincent EE, Tavaré JM. Akt signaling in health and disease. Cell Sign2011;23:1515-1527.
Holewijn S, den Heijer M, Stalenhoef AFH, de Graaf J. Non-invasivemeasurements of atherosclerosis (NIMA): current evidence and futureperspectives. Neth J Med. 2010;68:388-399.
Hotz C. Evidence for the usefulness of in vitro dialyzability, Caco-2 cell models,animal models, and algorithms to predict zinc bioavailability in humans. Int JVit Nutr Res 2005;75:423-35.
Hur SJ, Lim BO, Decker EA, McClements DJ. In vitro human digestion modelsfor food applications. Food Chem 2011;125:1-12.
Huttunen MM, Pietilä PE, Viljakainen HT, Lamberg-Allardt CJE. Prolongedincrease in dietary phosphate intake alters bone mineralization in adult male rats.J Nutr Biochem 2006;17:479-484.
112
Huttunen MM, Tillman I, Viljakainen HT, Tuukkanen J, Peng Z, Pekkinen M,Lamberg-Allardt CJ. High dietary phosphate intake reduces bone strenght in thegrowing rat skeleton. J Bone Miner Res 2007;22:83-92.
Ikonomidis I, Stamatelopoulos K, Lekakis J, Vamvakou GD, Kremastinos DT.Inflammatory and non-invasive vascular markers: The multimarker approach forrisk stratification in coronary artery disease. Atherosclerosis 2008;199:3-11.
Iqbal TH, Lewis KO, Cooper BT. Phytase activity in the human and rat smallintestine. Gut 1994;35:1233-1236.
Isakova T, Xie H, Yang W, Xie D, Anderson AH, Scialla J, Wahl P, GutiérrezOM, Steigerwalt S, He J, Schwartz S, Lo J, Ojo A, Sondheimer J, Hsu CY, LashJ, Leonard M, Kusek JW, Feldman HI, Wolf M; Chronic Renal InsufficiencyCohort (CRIC) Study Group. Fibroblast growth factor 23 and risks of mortalityand end-stage renal disease in patients with chronic kidney disease. JAMA2011;305:2432-2439.
Ix JH, De Boer IH, Peralta CA, Adeney KL, Duprez DA, Jenny NS, SiscovickDS, Kestenbaum BR. Serum phosphorus concentrations and arterial stiffnessamong individuals with normal kidney function to moderate kidney disease inMESA. Clin J Am Soc Nephrol 2009;4:609-615.
Ix JH, Katz R, Kestenbaum BR, de Boer IH, Chonchol M, Mukamal KJ, RifkinD, Siscovick DS, Sarnak MJ, Shlipak MG. Fibroblast growth factor-23 anddeath, heart failure, and cardiovascular events in community-living individuals:CHS (Cardiovascular Health Study). J Am Coll Cardiol 2012;60:200-207.
Joffres MR, Reed DM, Yano K. Relationship of magnesium intake and otherdietary factors to blood pressure: the Honolulu heart study. Am J Clin Nutr1987;45:469-475.
Jono S, McKee MD, Murry CE, Shioi A, Nishizawa Y, Mori K, Morii H,Giachelli CM. Phosphate regulation of vascular smooth muscle cell calcification.Circ Res 2000;87:e10-e17.
Kalantar-Zadeh K, Gutekunst L, Mehrotra R, Kovesdy CP, Bross R, ShinabergerCS, Noori N, Hirschberg R, Benner D, Nissenson AR, Kopple JD.Understanding sources of dietary phosphorus in the treatment of patients withchronic kidney disease. Clin J Am Soc Nephrol 2010;5:519-530.
Karp H, Ekholm P, Kemi V, Hirvonen T, Lamberg-Allardt C. Differencesamong total and in vitro digestible phosphorus content of meat and milkproducts. J Ren Nutr 2012;22:344-349.
113
Karp HJ, Kemi VE, Lamberg-Allardt CJE, Kärkkäinen MUM. Mono- andpolyphosphates have similar effects on calcium and phosphorus metabolism inhealthy young women. Eur J Nutr 2013;52:991-996.
Karp HJ, Vaihia KP, Kärkkäinen MU, Niemistö MJ, Lamberg-Allardt CJE.Acute effects of different phosphorus sources on calcium and bone metabolismin young women: a whole foods approach. Calcif Tissue Intl 2007;80:251-258.
Kemi V. Effects of dietary phosphorus and calcium-to-phosphorus ratio oncalcium and bone metabolism in healthy 20- to 43 year old Finnish women.Academic dissertation. Helsinki University Print, Helsinki 2010.
Kemi VE, Kärkkäinen MU, Lamberg-Allardt CJ. High phosphorus intakesacutely and negatively affect Ca and bone metabolism in a dose-dependentmanner in healthy young females. Br J Nutr 2006;96:545-552.
Kemi VE, Kärkkäinen MUM, Rita HJ, Laaksonen MM, Outila TA, Lamberg-Allardt CJE. Low calcium:phosphorus ratio in habitual diets affects serumparathyroid hormone concentration and calcium metabolism in healthy womenwith adequate calcium intake. Br J Nutr 2010;103:561-568.
Kemi VE, Rita HR, Kärkkäinen MUM, Viljakainen HT, Laaksonen MM, OutilaTA, Lamberg-Allardt CJE. Habitual high phosphorus intakes and foods withphosphate additives negatively affect serum parathyroid hormone concentrations:a cross-sectional study on healthy premenopausal women. Public Health Nutr2009;12:1885-1892.
Kendrick J, Ix JH, Targher G, Smits G, Chonchol M. Relation of serumphosphorus levels to ankle brachial pressure index (from the Third NationalHealth and Nutrition Examination Survey). Am J Cardiol 2010;106:564-568.
Kendrick J, Cheung AK, Kaufman JS, Greene T, Roberts WL, Smits G,Chonchol M; HOST Investigators. FGF-23 associates with death, cardiovascularevents, and initiation of chronic dialysis. J Am Soc Nephrol 2011;22:1913-1922.
Kestenbaum B, Sampson JN, Rudser KD, Patterson DJ, Seliger SL, Young B,Sherrard DJ, Andress DL. Serum phosphate levels and mortality risk amongpeople with chronic kidney disease. J Am Soc Nephrol 2005;16:520-528.
Ketteler M, Wolf M, Hahn K, Ritz E. Phosphate: a novel cardiovascular riskfactor. Eur Heart J 2013;34:1099-1101.
Kivistö B, Andersson H, Cederblad G, Sandberg A-S, Sandström B. Extrusioncooking of a high-fibre cereal product. 2. Effects on apparent absorption of zinc,
114
iron, calcium, magnesium and phosphorous in humans. Br J Nutr 1986;55:255-260.
Kleemola P, Virtanen M, Pietinen P. The 1992 Dietary Survey of Finnish Adults.Helsinki 1994;Yliopistopaino, Pikapaino.
Knochel JP. Phosphorus. In Shils ME, Olson JA, Shike M, Ross AC. Modernnutrition in health and disease. 10th ed. Lippincott Williams & Wilkins:Baltimore, Maryland, USA 2006.
Kristensen M, Jensen M, Kudsk J, Henriksen M, Molgaard C. Short-term effectson bone turnover of replacing milk with cola beverages: a 10-day interventionalstudy in young men. Osteoporosis Int 2005;16:1803-1808.
Kung C-W. Milk alternatives. J Ren Nutr 2010;20:e7-e15.
Kuro-o M. Klotho, phosphate and FGF-23 in ageing and disturbed mineralmetabolism. Nat Rev Nephrol 2013;9:650-660.
Kwak SM, Kim JS, Choi Y, Chang Y, Kwon MJ, Jung JG, Jeong C, Ahn J, KimHS, Shin H, Ryu S. Dietary intake of calcium and phosphorus and serumconcentration in relation to the risk of coronary artery calcification inasymptomatic adults. Arterioscler Thromb Vasc Biol 2014;34:1763-1769.
Kwan AC, Cater G, Vargas J, Bluemke DA. Beyond coronary stenosis:Coronary computed tomographic angiography for the assessment ofatherosclerotic plaque burden. Curr Cardiovasc Imaging Rep 2013;6:89-101.
Kärkkäinen M, Lamberg-Allardt C. An acute intake of phosphate increasesparathyroid hormone secretion and inhibits bone formation in young women. JBone Miner Res 1996;11:1905-1912.
Kärkkäinen MUM, Wiersma JW, Lamberg-Allardt CJE. Postprandialparathyroid hormone response to four calcium-rich foodstuffs. Am J Clin Nutr1997;65:1726-1730.
Lajunen LHJ. Atomispektrometria. Juva: WSOY 1986. (Atomspectrometry. InFinnish)
Lamberg-Allardt C, Brustad M, Meyer HE, Steingrimsdottir L. Vitamin D – asystematic review for the 5th edition of the Nordic Nutrition Recommendations.Food Nutr Res 2013;3:57.

115
Lamberg-Allardt C, Kirjaranta M, Dessypris AG. Serum 25-hydroxy-vitamin D,parathyroid hormone and calcium levels in adult inhabitants above the arcticcircle in Northern Finland. Ann Clin Res 1983;15:142-145.
Lanzer P, Boehm M, Sorribas V, Thiriet M, Janzen J, Zeller T, St Hilaire C,Shahanan C. Medial vascular calcification revisited: review and perspectives.Eur Heart J 2014;35:1515-1525.
Larsson M, Sandberg A-S. Phytate reduction in bread containing oat flour, oatbran or rye bran. J Cereal Sci 1991;14:141-149.
Larsson TE, Olauson H, Hagström E, Ingelsson E, Arnlöv J, Lind L, SundströmJ. Conjoint effects of serum calcium and phosphate on risk of total,cardiovascular, and noncardiovascular mortality in the community. ArteriosclerThromb Vasc Biol 2010;30:333-339.
León JB, Sullivan CM, Sehgal AR. Prevalence of phosphorus-containing foodadditives in top-selling foods in grocery stores. J Ren Nutr 2013;23:265-270.
Li JW, Xu C, Wang Y, Xiao YB. Can serum levels of alkaline phosphatase andphosphate predict cardiovascular diseases ad total mortality in individuals withpreserved renal function? A systematic review and meta-analysis. PLos One2014;9:e102276.
Lopez HW, Leenhardt F, Coudray C, Remesy C. Minerals and phytic acidinteractions: is it a real problem for human nutrition. Int J Food Sci Technol2002;37:727-739.
Lorenz MW, Markus HS, Bots ML, Rosvall M, Sitzer M. Prediction of clinicalcardiovascular events with carotid intima-media thickness: a systematic reviewand meta-analysis. Circulation 2007;115:459-67.
Marulanda J, Algarni S, Murshed M. Mechanims of vascular calcification andassociated diseases. Curr Pharm Des 2014;20:5801-5810.
Massé PG, Dosy J, Tranchant CC, Dallaire R. Dietary macro- and micronutrientintakes of nonsupplemented pre-and postmenopausal women with a perspectiveon menopause-associated diseases. J Hum Nutr Dietet 2004;17:121-132.
Massey LK. Dietary animal and plant protein and human bone health: a wholefoods approach. J Nutr 2003;133:862S-865S.

116
Mataix J, Aranda P, López-Jurado M, Sánchez C, Planells E, Llopis J. Factorsinfluencing the intake and plasma levels of calcium, phosphorus and magnesiumin southern Spain. Eur J Nutr 2006;45:349-354.
McCarty MF. Lower bioavailability of plant-derived phosphorus. Am J ClinNutr 2014;99:966.
McCarty MF, DiNicolantonio JJ. Bioavailable dietary phosphate, a mediator ofcardiovascular disease, may be decreased with plant-based diets, phosphatebinders, niacin, and avoidance of phosphate additives. Nutrition 2014;30:739-747.
Miller DD, Berner LA. Is solubility in vitro a reliable predictor of ironbioavailability? Biol Trace Elem Res 1989;19:11-24.
Mirza MA, Larsson A, Melhus H, Lid L, Larsson TE. Serum intacts FGF23associate with left ventricular mass, hypertrophy and geometry in an elderlypopulation. Atherosclerosis 2009;207:546-551.
Moe SM, Zidehsarai MP, Chambers MA, Jackman LA, Radcliffe JS, TrevinoLL, Donahue SE, Asplin JR. Vegetarian compared with meat dietary proteinsource and phosphorus homeostasis in chronic kidney disease Clin J Am SocNephrol 2011;6:257–264.
Molins R. Food phosphates. CRC Press, Boca Raton, Florida, USA 1991.
Mookadam F, Moustafa SE, Lester SJ, Warsame T. Subclinical atherosclerosis:evolving role of carotid intima-media thickness. Prev Cardiol 2010;13:186-97.
Morimoto Y, Sakuma M, Ohta H, Suzuki A, Matsushita A, Umeda M, IshikawaM, Taketani Y, Takeda E, Arai H. Estimate of dietary phosphorus intake using24-h urine collection. J Clin Biochem Nutr 2014;55:62-66.
Mortensen L, Charles P. Bioavailability of calcium supplements and the effect ofvitamin D: comparisons between milk, calcium carbonate, and calciumcarbonate plus vitamin D. Am J Clin Nutr 1996;63:354-357.
Murphy-Gutekunst L. Hidden phosphorus in popular beverages: part 1. J RenNutr 2005;15:e1-e6.
Mäkelä J, Varjonen J, Viinisalo M. Muuttuva syöminen muuttuvassamaailmassa. Hyvinvointikatsaus 2008;4. Tilastokeskus 2008. (Changing dietaryhabits in the changing world. In Finnish)

117
National Institute for Health and Welfare, Nutrition Unit. Fineli. Finnish foodcomposition database. Release 16. Helsinki 2013. http://www.fineli.fi AccessedOctober 28, 2014.
National Nutrition Council. Suomalaliset ravitsemussuositukset – Terveyttäruoasta. (Finnish Nutrition Recommendations – Health from food, in Finnish)Juvenes, Helsinki 2014.
Niemi M, Winell K. Diabetes Suomessa. Väliraportti tutkimusprojektissaAlueellinen vertailu hoidon laadun mittariksi. STAKES, Diabetesliitto ja KELA2005 (Diabetes in Finland, in Finnish).
Nikolov IG, Joki N, Nguyen-Khoa T, Guerrera IC, Maizel J, Benchitrit J,Machado dos Resil L. Edelman A, Lacour B, Jorgetti V, Drüeke TB, Massy ZA.Lanthanum carbonate, like sevelamer-HCl, retards the progression of vascularcalcification and atherosclerosis in uremic apolipoprotein E-deficient mice.Nephrol Dial Transplant 2012;27:505-513.
Nordic Committee on Food Analysis. Phosphorus. Spectrophotometricdetermination after dry ashing in food. NMKL method No 57, 2. Ed. 1994.
Nordic Council of Ministers. Nordic Nutrition Recommendations 2012.Copenhagen: Nordisk Ministerråd; 2013.
O’Leary DH, Bots ML. Imaging of atherosclerosis: carotid intima-mediathickness. Eur Heart J 2010;31:1682-9.
Oenning LL, Vogel J, Calvo MS. Accuracy of methods estimating calcium andphosphorus intake in daily diets. J Am Diet Assoc 1988;88:1076-1080.
Olson SR, Sommers LE. Phosphorus. In Page AL (ed.). Methods of soil analysis,part 2. Chemical and microbiological properties (s. 406-407). USA: ASA-SSSA.
Onufrak SJ , Bellasi A, Shaw LJ, Herzog CA, Cardarelli F, Wilson PW,Vaccarino V, Raggi P. Phosphorus levels are associated with subclinicalatherosclerosis in the general population. Atherosclerosis 2008;199:424-431.
Ovaskainen M-L, Penttilä P-L, Korpela K and Valsta L. Estimating the intake offood additives among the Finnish adult population. Helsinki 2000. NationalFood Administration / Research Reports 2/2000, 28 pp. (in Finnish)
Park KS, Chang JW, Kim TY, Kim HW, Lee EK, Kim H-S, Yang WS, Kim SB,Park S-K, Lee SK, Park JS. Lower concentrations of serum phosphorus withinthe normal range could be associated with less calcification of the coronary

118
artery in Koreans with normal renal function. Am J Clin Nutr 2011;94:1465-1470.
Parker BD, Schurgers LJ, Brandenburg VM, Christenson RH, Vermeer C,Ketteler M, Shlipak MG, Whooley MA, Ix JH. The associations of fibroblastgrowth factor 23 and uncarboxylated matrix Gla protein with mortality incoronary artery disease: the Heart and Soul Study. Ann Intern Med2010;152:640-648.
Peacock M. Calcium metabolism in health and disease. Clin J Am Soc Nephrol2010;5 suppl 1:S23-S30.
PerkinElmerSciex Instruments. The 30-Minute guide to ICP-MS. PerkinElmerInc 2001. Printed in USA.http://las.perkinelmer.com/Content/TechnicalInfo/TCH_ICPMSThirtyMinuteGuide.pdf
Plaami S, Kumpulainen J. Inositol phosphate content of some cereal-based foods.J Food Comp Anal 1995;8:324-335.
Plaami S. Myoinositol phosphates: analysis, content in foods and effects innutrition. Lebensm.-Wiss. u.-Technol 1997;30:633-647.
Poggio ED, Nef PC, Wang X, Greene T, Van Lnete F, Hall PM. Performance ofthe modification of diet in renal disease and Cockcroft-Gault equations in theestimation of GFR in health and in chronic kidney disease. J Am Soc Nephrol2005;16:459-466.
Portale AA, Halloran BP, Morris RC Jr. Dietary intake of phosphorus modulatesthe circadian rhythm in serum concentration of phosphorus. J Clin Inv1987;80:1147-1154.
Qunibi WY, Nolan CA, Ayus JC. Cardiovascular calcification in patients withend-stage renal disease: A century-old phenomenon. Kidney Int 2002;82:S73-S80.
Raitakari OT, Juonala M, Kähönen M, Taittonen L, Laitinen T, Mäki-Torkko N,Järvisalo MJ, Uhari M, Jokinen E, Rönnemaa T, Akerblom HK, Viikari JS.Cardiovascular risk factors in childhood and carotid artery intima-mediathickness in adulthood: the Cardiovascular Risk in Young Finns Study. JAMA2003;290:2277-83.

119
Reale A, Mannina L, Tremonte P, Sobole AP, Succi M, Sorrentino E, Coppola R.Phytate degradation by lactic acid bacteria and yeasts during the wholemealdough fermentation: a 31P NMR study. J Agric Food Chem 2004;52:6300-6305.
Reddy NR. Occurrence, distribution, content, and dietary intake of phytate. InRukma NR, Sathe SK, eds. Food Phytates. CRC Press. Boca Raton, Florida,USA 2002.
Reinivuo H, Hirvonen T, Ovaskainen ML, Korhonen T, Valsta LM. Dietarysurvey methodology of FINDIET 2007 with a risk assessment perspective.Public Health Nutr 2010;13:915-919.
Román-García P, Carrillo-López N, Fernández-Martín J, Naves-Díaz M, Ruiz-Torres MP, Cannata-Andía JB. High phosphorus diet induces vascularcalcification, a related decrease in bone mass and changes in the aortic geneexpression. Bone 2010;46:121-128.
Ruan L, Chen W, Srinivasan SR, Xu J, Toprak A, Berenson GS. Relation ofserum phosphorus level to carotid intima-media thickness in asymptomaticyoung adults (from the Bogalusa Heart Study). Am J Cardiol 2010;106:793-797.
Saari E, Paaso A. Mineral element composition of Finnish foods. II Analyticalmethods. Acta Agric Scand 1980;22:15-25.
Sakakura K, Nakano M, Otsuka F, Ladich E, Kologdie FD, Virmani R.Pathophysiology of atherosclerosis plaque progression. Heart, lung andcirculation 2013;22:399-411.
Sandberg A-S, Andersson H, Carlsson N-G, Sandström B. Degradation productsof bran phytate formed during digestion in the human small intestine: effect ofextrusion cooking on digestibility. J Nutr 1987;117:2061-2065.
Sandberg A-S, Andersson H. Effect of dietary phytase on the digestion ofphytate in the stomach and small intestine of humans. J Nutr 1988;118:469-473.
Sandberg A-S. In vitro and in vivo degradation of phytate. In Rukma NR, SatheSK, eds. Food Phytates. CRC Press. Boca Raton, Florida, USA 2002.
Sandberg A-S, Andlid T. Phytogenic and microbial phytases in human nutrition.Int J Food Sci Tech 2002;37:823-833.
Sandberg A-S. Methods and options for in vitro dialyzability; benefits andlimitations. Int J Vitam Nutr Res 2005;75:395-404.
120
Sathe SK, Venkatachalam M. Influence of prosessing technologies on phytateand its removal. In Reddy NR and Sathe SK, eds. Food Phytates. CRC Press.Boca Raton, Florida, USA 2002.
Schoppet M, Hofbauer LC, Brinskelle-Schmal N, Varennes A, Goudable J,Richard M, Hawa G, Chapurlat R, Szulc P. Serum level of the phosphaturicfactor FGF23 is associated with abdominal aortic calcification in Men: TheSTRAMBO Study. J Clin Endocrinol Metab 2012;97:E575-83.
Sherman RA, Mehta O. Phosphorus and potassium content of enhanced meatand poultry products: implications for renal patients who receive dialysis. Clin JAm Soc Nephrol 2009;4:1370-1373. (2009a)
Sherman RA, Mehta O. Dietary phosphorus restriction in dialysis patients:potential impact of processed meat, poultry, and fish products as protein sources.Am J Kidney Dis 2009;54:18-23. (2009b)
Shiota A, Taketani Y, Maekawa Y, Yasutomo K, Sata M, Sakai T, Mizuno R,Isshiki M, Yamamoto H, Takeda E. High phosphate diet reduces atherosclerosisformation in apolipoprotein E-deficient mice. J Clin Biochem Nutr 2011;49:109-114.
Shuto E, Taketani Y, Tanaka R, Harada N, Isshiki M, Sato M, Nashiki K, AmoK, Yamamoto H, Higashi Y, Nakaya Y, Takeda E. Dietary phosphorus acutelyimpairs endothelial function. J Am Soc Nephrol 2009;20:1504-1512.
Silver J, Naveh-Many T. Phosphate and the parathyroid. Kidney Int2009;75:898-905.
Sim JJ, Bhandari SK, Smith N, Chung J, Liu IL, Jacobsen SJ, Kalantar-Zadeh K.Phosphorus and risk of renal failure in subjects with normal renal function. Am JMed 2013;126:311-318.
Slatopolsky E, Delmez JA. Pathogenesis of secondary hyperparathyroidism. AmJ Kidney Dis 1994;23:229-236.
Stein JH, Korcarz CE, Hurst RT, Lonn E, Kendall CB, Mohler ER, Naijat SS,Rembold CM, Post WS. Use of carotid ultrasound to identify subclinicalvascular disease and evaluate cardiovascular disease risk: a consensus statementfrom the American Society of Echocardiography carotid intima-media thicknesstask force endorsed by the Society for Vascular Medicine. J Am SocEchocardiogr 2008;21:93-111.
121
Sullivan CM, Leon JB, Sehgal AR. Phosphorus containing food additives andthe accuracy of nutrient databases: implications for renal patients. J Ren Nutr2007;17:350-354.
Suurseppä P, Penttilä P-L, Henttonen S, Niemi E. Phosphate as an additive infoodstuffs. Helsinki 2001. National Food Administration / Research Reports12/2000, 14 pp. + appendices (in Finnish)
Tanaka S, Yamamoto H, Nakahashi O, Kagawa T, Ishiguro M, Masuda M,Kozai M, Ikeda S, Taketani Y, Takeda E. Dietary phosphate restriction induceshepatic lipid accumulation through dysregulation of cholesterol metabolism inmice. Nutr Res 2013;33:586-593.
Taylor EN, Rimm EB, Stampfer MJ, Curhan GC. Plasma fibroblast growthfactor 23, parathyroid hormone, phosphorus, and risk of coronary heart disease.Am Heart J 2011;161:956-962.
Tonelli M, Sacks F, Rfeffer M, Gao Z, Curhan G. Relation between serumphosphate level and cardiovascular event rate in people with coronary disease.Circulation 2005;112:2627-2633.
Tucker KL, Morita K, Qiao N, Hannan MT, Cupples LA, Kiel DP. Colas, butnot other beverages, are associated with low bone mineral density in olderwomen: The Framingham Osteoporosis Study. Am J Clin Nutr 2006;84:936-942.
Tuttle KR, Short RA. Longitudinal relationships among coronary arterycalcification, serum phosphorus, and kidney function. Clin J Am Soc Nephrol2009;12:1968-1973.
Türk M, Sandberg A-S. Phytate degradation during breadmaking: effect ofphytase addition. J Cereal Sci 1992;15:281-294.
Türk M, Carlsson N-G, Sandberg AS. Reduction in the levels of phytate duringwholemeal bread making: effect of yeast and wheat phytases. J Cereal Sci1996;23:257-264.
Uribarri J. Phosphorus homeostasis in normal health and in chronic kidneydisease patients with special emphasis on dietary phosphorus intake. Semin Dial2007;20:295-301.
Uribarri J. Dietary phosphorus and kidney disease. Ann NY Acad Sci2013,1301;11-19.

122
Uribarri J, Clavo MS. Hidden sources of phosphorus in the typical Americandiet: Does it matter in nephrology? Semin Dial 2003;16:186-188.
Uribarri J, Calvo M. Dietary phosphorus excess: A risk factor in chronic bone,kidney, and cardiovascular disease? Adv Nutr 2013;4:542-544.
Uribarri J, Calvo MS. Dietary phosphorus intake and health 1-3. Am J Clin Nutr2014;99:247-248.
den Uyl D, Nurmohamed MT, van Tuyl LHD, Raterman HG, Lems WF.(Sub)clinical cardiovascular disease is associated with increased bone loss andfracture risk; a systematic review of the association between cardiovasculardisease and osteoporosis. Arth Res Ther 2011;13;R5.
Varo P, Nuurtamo M, Saari E, Koivistoinen P. Mineral element composition ofFinnish foods. IV Flours and bakery products. Acta Agric Scand 1980;22:37-55.
Welch AA, Fransen H, Jenab M, Boutron-Ruault MC, Tumino R, Agnoli C,Ericson U, Johansson I, Ferrari P, Engeset D, Lund E, Lentjes M, Key T,Touvier M, Niravong M, Larrañaga N, Rodríguez L, Ocké MC, Peeters PHM,Tjønneland A, Bjerregaard L, Vasilopoulou E, Dilis V, Linseisen J, Nöthlings U,Riboli E, Slimani N, Bingham S. Variation in intakes of calcium, phosphorus,magnesium, iron and potassium in 10 countries in the European ProspectiveInvestigation into Cancer and Nutrition study. Eur J Clin Nutr 2009;63:S101-121.
Vervloet MG, van Ittersum, Büttler RM, Heijboer AC, Blankenstein MA, terWee PM. Effects of dietary phosphate and calcium intake on fibroblast growthfactor-23. Clin J Am Soc Nephrol 2011;6:383-389.
Winger RJ, Uribarri J, Lloyd L. Phosphorus-containing food additives: Aninsidious danger for people with chronic kidney disease. Trends Food SciTechnol 2012;24:92-102.
Wu M, Rementer C, Giachelli CM. Vascular calcification: An update onmechanisms and challenges in treatment. Calcif Tissue Int 2013;93:365-373.
Yamamoto KT, Robinson-Cohen C, de Oliveira MC, Kostina A, Nettleton JA,Ix JH, Nguyen H, Eng J, Lima JAC, Siscovick DS, Weiss NS, Kestenbaum B.Dietary phosphorus is associated with greater left ventricular mass. Kidney Int2013;83:707-714.

123
Yhtyneet Medix Laboratoriot. Laboratoriokäsikirja. 2014. available athttp://www.medix.fi/tuotekuvaus_show.php (accessed December 23th, 2014)(Laboratory handbook, in Finnish)
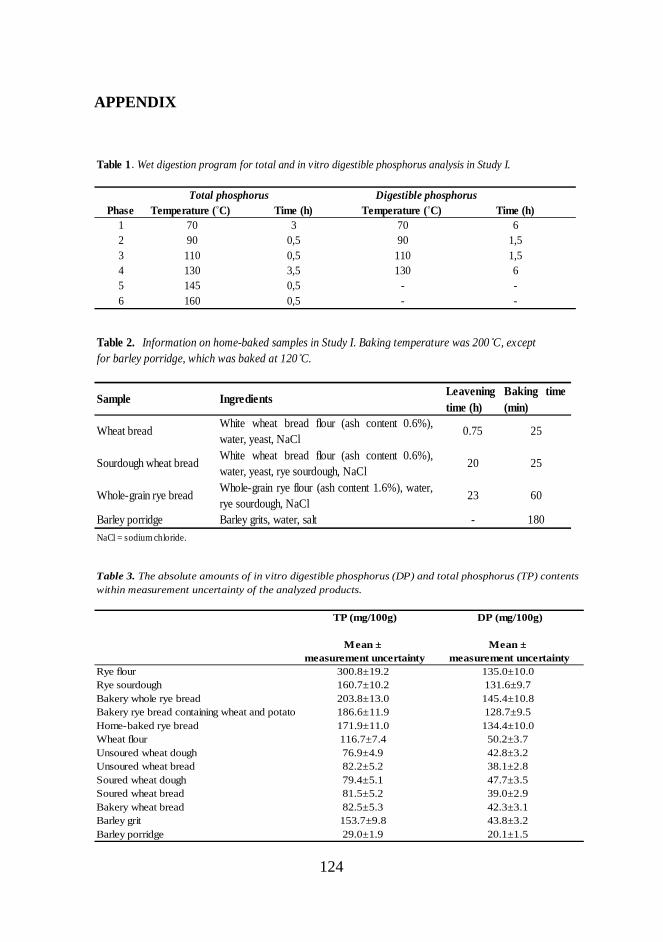
124
APPENDIX
Table 1 . Wet digestion program for total and in vitro digestible phosphorus analysis in Study I.
Total phosphorus Digestible phosphorusPhase Temperature (˚C) Time (h) Temperature (˚C) Time (h)
1 70 3 70 62 90 0,5 90 1,53 110 0,5 110 1,54 130 3,5 130 65 145 0,5 - -6 160 0,5 - -
Table 2. Information on home-baked samples in Study I. Baking temperature was 200˚C, exceptfor barley porridge, which was baked at 120˚C.
Sample Ingredients Leaveningtime (h)
Baking time(min)
Whole-grain rye bread Whole-grain rye flour (ash content 1.6%), water,rye sourdough, NaCl
23 60
Barley porridge Barley grits, water, salt - 180NaCl = sodium chloride.
Wheat bread White wheat bread flour (ash content 0.6%),water, yeast, NaCl
0.75 25
Sourdough wheat bread White wheat bread flour (ash content 0.6%),water, yeast, rye sourdough, NaCl
20 25
Table 3. The absolute amounts of in vitro digestible phosphorus (DP) and total phosphorus (TP) contentswithin measurement uncertainty of the analyzed products.
TP (mg/100g) DP (mg/100g)
Mean ± Mean ±measurement uncertainty measurement uncertainty
Rye flour 300.8±19.2 135.0±10.0Rye sourdough 160.7±10.2 131.6±9.7Bakery whole rye bread 203.8±13.0 145.4±10.8Bakery rye bread containing wheat and potato 186.6±11.9 128.7±9.5Home-baked rye bread 171.9±11.0 134.4±10.0Wheat flour 116.7±7.4 50.2±3.7Unsoured wheat dough 76.9±4.9 42.8±3.2Unsoured wheat bread 82.2±5.2 38.1±2.8Soured wheat dough 79.4±5.1 47.7±3.5Soured wheat bread 81.5±5.2 39.0±2.9Bakery wheat bread 82.5±5.3 42.3±3.1Barley grit 153.7±9.8 43.8±3.2Barley porridge 29.0±1.9 20.1±1.5
Copyright © 2022 FDOKUMEN