Comparison of Two DXA Systems, Hologic Horizon W and GE ...
13
www.e-enm.org 1219 Endocrinol Metab 2021;36:1219-1231 https://doi.org/10.3803/EnM.2021.1274 pISSN 2093-596X · eISSN 2093-5978 Original Article Comparison of Two DXA Systems, Hologic Horizon W and GE Lunar Prodigy, for Assessing Body Composition in Healthy Korean Adults Seung Shin Park 1 , Soo Lim 1 , Hoyoun Kim 2 , Kyoung Min Kim 3 1 Department of Internal Medicine, Seoul National University Bundang Hospital, Seoul National University College of Medicine; 2 Biomedical Research Institute, Seoul National University Bundang Hospital, Seongnam; 3 Division of Endocrinology, Department of Internal Medicine, Yongin Severance Hospital, Yonsei University College of Medicine, Yongin, Korea Background: Dual-energy X-ray absorptiometry (DXA) is the most widely used method for evaluating muscle masses. The aim of this study was to investigate the agreement between muscle mass values assessed by two different DXA systems. Methods: Forty healthy participants (20 men, 20 women; age range, 23 to 71 years) were enrolled. Total and regional body compo- sitional values for fat and lean masses were measured consecutively with two DXA machines, Hologic Horizon and GE Lunar Prod- igy. Appendicular lean mass (ALM) was calculated as the sum of the lean mass of four limbs. Results: In both sexes, the ALM values measured by the GE Lunar Prodigy (24.8±4.3 kg in men, 15.8±2.9 kg in women) were sig- nificantly higher than those assessed by Hologic Horizon (23.0±4.0 kg in men, 14.8±3.2 kg in women). Furthermore, BMI values or body fat (%), either extremely higher or lower levels, contributed greater differences between two systems. Bland-Altman analy- ses revealed a significant bias between ALM values assessed by the two systems. Linear regression analyses were performed to de- velop equations to adjust for systematic differences (men: Horizon ALM [kg] = 0.915×Lunar Prodigy ALM [kg]+0.322, R 2 = 0.956; women: Horizon ALM [kg] = 1.066×Lunar Prodigy ALM [kg]–2.064, R 2 = 0.952). Conclusion: Although measurements of body composition including muscle mass by the two DXA systems correlated strongly, sig- nificant differences were observed. Calibration equations should enable mutual conversion between different DXA systems. Keywords: Absorptiometry, photon; Sarcopenia; Muscles INTRODUCTION Sarcopenia is a condition of frailty resulting from age-related loss of muscle mass and muscle function [1,2]. From the age of 60 years, skeletal muscle mass decreases by about 3% every year, and it is known that individuals in their 80s have a 30% to 50% reduction in skeletal muscle mass compared with that in their 40s [3]. Many biological changes related to aging contrib- ute to this muscle loss, including declining hormone levels, de- nervation of muscle fibers, increased intracellular oxidative Received: 24 September 2021, Revised: 14 November 2021, Accepted: 19 November 2021 Corresponding author: Kyoung Min Kim Division of Endocrinology, Department of Internal Medicine, Yongin Severance Hospital, Yonsei University College of Medicine, 363 Dongbaekjukjeon-daero, Giheung-gu, Yongin 16995, Korea Tel: +82-31-5189-8798, Fax: +82-31-5189-8567 E-mail: [email protected] Copyright © 2021 Korean Endocrine Society This is an Open Access article distributed under the terms of the Creative Com- mons Attribution Non-Commercial License (https://creativecommons.org/ licenses/by-nc/4.0/) which permits unrestricted non-commercial use, distribu- tion, and reproduction in any medium, provided the original work is properly cited.
-
Upload
khangminh22 -
Category
Documents
-
view
3 -
download
0
Transcript of Comparison of Two DXA Systems, Hologic Horizon W and GE ...
www.e-enm.org 1219
Endocrinol Metab 2021;36:1219-1231https://doi.org/10.3803/EnM.2021.1274pISSN 2093-596X · eISSN 2093-5978
OriginalArticle
Comparison of Two DXA Systems, Hologic Horizon W and GE Lunar Prodigy, for Assessing Body Composition in Healthy Korean AdultsSeung Shin Park1, Soo Lim1, Hoyoun Kim2, Kyoung Min Kim3
1Department of Internal Medicine, Seoul National University Bundang Hospital, Seoul National University College of Medicine; 2Biomedical Research Institute, Seoul National University Bundang Hospital, Seongnam; 3Division of Endocrinology, Department of Internal Medicine, Yongin Severance Hospital, Yonsei University College of Medicine, Yongin, Korea
Background: Dual-energy X-ray absorptiometry (DXA) is the most widely used method for evaluating muscle masses. The aim of this study was to investigate the agreement between muscle mass values assessed by two different DXA systems.Methods: Forty healthy participants (20 men, 20 women; age range, 23 to 71 years) were enrolled. Total and regional body compo-sitional values for fat and lean masses were measured consecutively with two DXA machines, Hologic Horizon and GE Lunar Prod-igy. Appendicular lean mass (ALM) was calculated as the sum of the lean mass of four limbs. Results: In both sexes, the ALM values measured by the GE Lunar Prodigy (24.8±4.3 kg in men, 15.8±2.9 kg in women) were sig-nificantly higher than those assessed by Hologic Horizon (23.0±4.0 kg in men, 14.8±3.2 kg in women). Furthermore, BMI values or body fat (%), either extremely higher or lower levels, contributed greater differences between two systems. Bland-Altman analy-ses revealed a significant bias between ALM values assessed by the two systems. Linear regression analyses were performed to de-velop equations to adjust for systematic differences (men: Horizon ALM [kg]=0.915×Lunar Prodigy ALM [kg]+0.322, R2=0.956; women: Horizon ALM [kg]=1.066×Lunar Prodigy ALM [kg]–2.064, R2=0.952).Conclusion: Although measurements of body composition including muscle mass by the two DXA systems correlated strongly, sig-nificant differences were observed. Calibration equations should enable mutual conversion between different DXA systems.
Keywords: Absorptiometry, photon; Sarcopenia; Muscles
INTRODUCTION
Sarcopenia is a condition of frailty resulting from age-related loss of muscle mass and muscle function [1,2]. From the age of 60 years, skeletal muscle mass decreases by about 3% every
year, and it is known that individuals in their 80s have a 30% to 50% reduction in skeletal muscle mass compared with that in their 40s [3]. Many biological changes related to aging contrib-ute to this muscle loss, including declining hormone levels, de-nervation of muscle fibers, increased intracellular oxidative
Received: 24 September 2021, Revised: 14 November 2021, Accepted: 19 November 2021
Corresponding author: Kyoung Min KimDivision of Endocrinology, Department of Internal Medicine, Yongin Severance Hospital, Yonsei University College of Medicine, 363 Dongbaekjukjeon-daero, Giheung-gu, Yongin 16995, KoreaTel: +82-31-5189-8798, Fax: +82-31-5189-8567 E-mail: [email protected]
Copyright © 2021 Korean Endocrine SocietyThis is an Open Access article distributed under the terms of the Creative Com-mons Attribution Non-Commercial License (https://creativecommons.org/licenses/by-nc/4.0/) which permits unrestricted non-commercial use, distribu-tion, and reproduction in any medium, provided the original work is properly cited.
Park SS, et al.
1220 www.e-enm.org Copyright © 2021 Korean Endocrine Society
stress, and decreased caloric intake [4-7]. Because muscle plays diverse critical roles in human beings, sarcopenia is linked to various negative health outcomes, including falls, fractures, metabolic impairment, cardiovascular diseases and eventually, increased mortality [8-10]. Therefore, as the global population ages, sarcopenia is becoming an increasing important public health issue.
Sarcopenia is defined by low muscle mass accompanied by muscle weakness and/or impaired muscle function [1]. There-fore, diagnosis of sarcopenia requires documentation of low muscle mass plus either low muscle strength or low physical performance [11]. Therefore, accurate assessment of muscle mass is the most critical step in identifying sarcopenic individu-als who have a high risk of negative health outcomes.
Several modalities have been used or studied to measure skel-etal muscle mass, including bioelectrical impedance analysis (BIA), dual-energy X-ray absorptiometry (DXA), computed to-mography (CT), and magnetic resonance imaging (MRI) [12]. CT and MRI are the gold standards for accurate measurement of muscle mass, but they are expensive and have limited acces-sibility [13]. BIA is highly accessible compared with CT or MRI, and also has benefits in terms of cost and radiation expo-sure risk. However, it has limited reliability because it can be greatly affected by the patient’s hydration status and recent ac-tivity [14]. DXA is becoming the most widely used method to evaluate body composition parameters, including fat and lean mass, because of its superior accuracy and precision compared with BIA and its lower cost and radiation exposure risk com-pared with CT and MRI [15,16].
Currently, several DXA machines are widely used; these in-clude Hologic Horizon (Hologic Inc., Bedford, MA, USA), GE Lunar Prodigy (GE Healthcare Lunar, Madison, MI, USA), Norland (Norland Corp., Fort Atkinson, WI, USA). However, the measured values can differ significantly depending on the type of DXA machine used. In the case of bone mineral density (BMD) measurements, several conversion equations have been developed and used in clinical practice or research to allow data from different DXA machines to be merged or compared [17-19]. However, conversion equations have not been developed for more recent applications of DXA, including body composi-tion parameters such as lean mass. Therefore, standardizing muscle mass measured using different DXA machines remains difficult. In the present study, we analyzed the agreement be-tween the muscle mass values assessed by the most widely used DXA machines, GE Lunar Prodigy and Hologic Horizon, in measuring body composition parameters and developed conver-
sion equations to allow data obtained using these two systems to be compared. We also aimed whether any clinical parameters could affect greater differences between two DXA systems.
METHODS
ParticipantsThe subjects were voluntarily included at the Seoul National University Bundang Hospital who agreed to undergo body com-positional analysis using the two machines. We targeted the subjects with ages ranged from 20 to 70 years and their body mass index (BMI) from 15 to 40 kg/m2. We categorized ages into five age groups with 10-year intervals between 20 and 70 years old: younger than 30 years old, 30 to 39 years old, 40 to 49 years old, 50 to 59 years old, and older than 60 years. We also classified BMI as four categories with 5 kg/m2 intervals be-tween 15 and 40 kg/m2: lower than 20 kg/m2, 20 to 25 kg/m2, 26 to 30 kg/m2, and over 30 kg/m2. Then, we made a target enroll-ment table with five age groups and four BMI groups, totaling 20 categories of each age and BMI category, and tried to enroll at least one man and one woman in each category. Based on this enrollment target, we finally included 40 subjects (20 men and 20 women). Subjects who had a history of chronic or systemic diseases such as diabetes were excluded. Subjects with any medical histories that could affect their mobility and body com-position, including osteoporosis and fracture, and, subjects hav-ing recent intentional weight loss or taking any medication that could affect body composition properties were also excluded. All participants provided informed consent. This study was ap-proved by the Seoul National University Bundang Hospital Re-view Board (IRB No.: B-1704-390-007).
Measurement of anthropometric and biochemical parametersHeight and weight were measured to the nearest 0.1 cm and 0.1 kg, respectively, with the participant in light clothing and not wearing shoes. Systolic and diastolic blood pressure was also measured. For biochemical analyses, blood samples were col-lected after overnight fasting of at least 8 hours and parameters including fasting glucose, insulin, lipid profiles, liver profiles, and renal function were assessed using standard protocols.
DXA scans and data analysisFor DXA assessments, all participants were given a light gown and pants to wear. Each participant was scanned consecutively on the same day, using both DXA machines, GE Lunar Prodigy

Comparison of Two Different DXA Systems
Copyright © 2021 Korean Endocrine Society www.e-enm.org 1221
DXA and Hologic Horizon W scanner according to the manu-factures’ standard protocols. The values for lean mass, fat mass, fat percent (%), and BMD for both whole body and regional area were measured in both DXA machines. Scan mode selec-tion was automatically processed by the manufacturer’s soft-ware for GE Lunar Prodigy and array mode was used for Ho-logic Horizon W scanner following each manufacturer’s proto-col for body composition measures [20-22]. The results were analyzed using GE Lunar encore version 13.60 or Hologic APEX software 5.6.0.4. On both scanners, subjects were posi-tioned with lateral hands position and 15° internal position of both feet.
Statistical analysisEach body composition measurement (total body fat mass, total
body lean mass, trunk fat mass, trunk lean mass, and appendicu-lar lean mass [ALM]) by the two machines was analyzed using a paired t test. Differences were considered significant when the P value was <0.05. For each value, a linear regression model between the two machines was calculated. Each regression equation is shown as ‘Hologic Horizon=slope×GE Lunar Prodigy+intercept.’
A Bland-Altman plot was used to compare the measurements by the two DXA systems. To verify the appropriateness of the conversion equation, we also calculated the regression parame-ters for the Hologic Horizon DXA based on the values obtained from the GE Lunar Prodigy DXA and the conversion equation, and compared these with the direct measurements by Hologic Horizon DXA using a Bland-Altman plot.
The chi-square test and Student’s t test were used to compare
Table 1. Baseline Characteristics of Study Subjects by Gender (n=40)
Variable Total (n=40) Men (n=20) Women (n=20) P valuea
Age, yr 42.8±13.8 44.4±14.1 41.2±13.7 0.478
SBP, mm Hg 126.5±15.9 133.3±11.4 119.6±17.0 0.005
DBP, mm Hg 74.8±10.7 77.9±7.8 71.8±12.4 0.067
Weight, kg 70.6±17.3 78.9±14.8 62.3±15.9 0.002
Height, cm 167.4±10.1 175.5±5.8 159.4±6.4 <0.001
BMI, kg/m2 25.1±5.5 25.6±4.5 24.6±6.4 0.194
HbA1c, % 5.5±0.3 5.5±0.4 5.4±0.3 0.105
Insulin, μIU/mL 8.8±4.2 8.4±3.3 9.3±5.0 0.495
Total cholesterol, mg/dL 187.8±36.4 177.5±28.1 198.2±41.3 0.072
Triglyceride, mg/dL 96.8±49.7 98.7±52.3 95.0±48.2 0.820
LDL-C, mg/dL 104.3±27.6 101.8±26.4 106.8±29.2 0.577
HDL-C, mg/dL 57.3±14.5 52.3±12.1 62.4±15.3 0.027
AST, IU/L 22.4±5.4 22.0±4.7 22.9±6.0 0.623
ALT, IU/L 21.9±9.6 25.1±9.8 18.6±8.4 0.030
Calcium, mg/dL 9.4±0.4 9.5±0.3 9.3±0.4 0.148
Phosphate, mg/dL 3.6±0.4 3.5±0.4 3.8±0.4 0.034
Total protein, g/dL 7.4±0.3 7.4±0.4 7.3±0.3 0.291
Albumin, g/dL 4.5±0.2 4.6±0.2 4.5±0.2 0.025
Total bilirubin, mg/dL 0.9±0.4 1.0±0.4 0.8±0.3 0.137
ALP, IU/L 62.5±17.3 62.0±9.2 63.1±15.8 0.837
BUN, mg/dL 13.6±4.1 14.2±4.5 13.0±3.7 0.345
Creatinine, mg/dL 0.8±0.1 0.9±0.1 0.7±0.1 <0.001
Values are expressed as mean±standard deviation.SBP, systolic blood pressure; DBP, diastolic blood pressure; BMI, body mass index; HbA1c, hemoglobin A1c; LDL-C, low dense lipoprotein cholester-ol; HDL-C, high dense lipoprotein cholesterol; AST, aspartate transaminase; ALT, alanine aminotransferase; ALP, alkaline phosphatase; BUN, blood urea nitrogen.aP value for comparisons between men and women.
Park SS, et al.
1222 www.e-enm.org Copyright © 2021 Korean Endocrine Society
the baseline characteristics between the male and female partici-pants. Pearson correlation analysis was used to identify whether the difference between the Hologic Horizon and GE Lunar Prodigy DXA measurements was correlated with other variables.
RESULTS
Baseline characteristics of the study participantsThe baseline characteristics of the 40 participants (20 men, 20 women) are shown in Table 1. The mean age of the participants was 42.8 years and their mean glycated hemoglobin was 5.5%. Mean weight, height and BMI were 70.6 kg, 167.4 cm, and 25.1 kg/m2, respectively. Systemic blood pressure, weight, height, high density lipoprotein, alanine transaminase and creatinine
levels differed significantly between the male and female par-ticipants (P=0.005, P=0.002, P<0.001, P=0.027, P=0.030, and P<0.001, respectively), but the other parameters were simi-lar between the sexes.
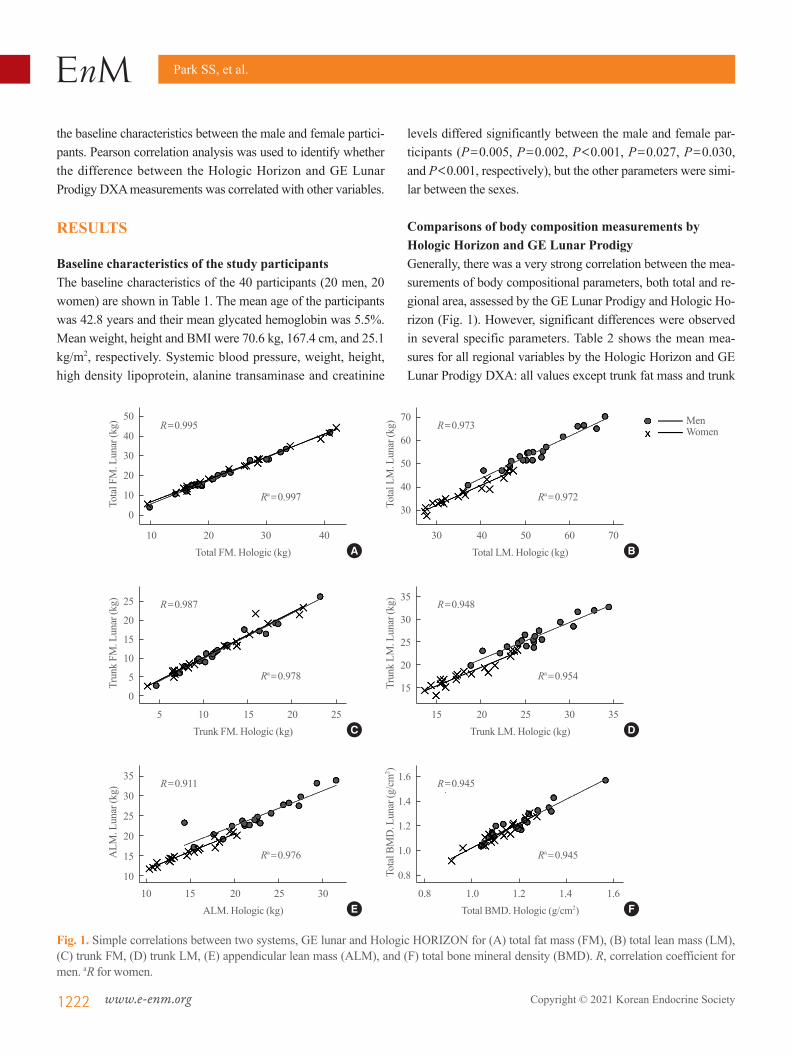
Comparisons of body composition measurements by Hologic Horizon and GE Lunar ProdigyGenerally, there was a very strong correlation between the mea-surements of body compositional parameters, both total and re-gional area, assessed by the GE Lunar Prodigy and Hologic Ho-rizon (Fig. 1). However, significant differences were observed in several specific parameters. Table 2 shows the mean mea-sures for all regional variables by the Hologic Horizon and GE Lunar Prodigy DXA: all values except trunk fat mass and trunk
Fig. 1. Simple correlations between two systems, GE lunar and Hologic HORIZON for (A) total fat mass (FM), (B) total lean mass (LM), (C) trunk FM, (D) trunk LM, (E) appendicular lean mass (ALM), and (F) total bone mineral density (BMD). R, correlation coefficient for men. aR for women.
50
40
30
20
10
0
25
20
15
10
5
0
35
30
25
20
15
10
70
60
50
40
30
35
30
25
20
15
1.6
1.4
1.2
1.0
0.8
Tota
l FM
. Lun
ar (k
g)Tr
unk
FM. L
unar
(kg)
ALM
. Lun
ar (k
g)
Tota
l LM
. Lun
ar (k
g)Tr
unk
LM. L
unar
(kg)
Tota
l BM
D. L
unar
(g/c
m2 )
Total FM. Hologic (kg)
Trunk FM. Hologic (kg)
ALM. Hologic (kg)
Total LM. Hologic (kg)
Trunk LM. Hologic (kg)
Total BMD. Hologic (g/cm2)
R=0.995
R=0.987
R=0.911
R=0.973
R=0.948
R=0.945
Ra=0.997
Ra=0.978
Ra=0.976
Ra=0.972
Ra=0.954
Ra=0.945
10 20 30 40
5 10 15 20 25
10 15 20 25 30
30 40 50 60 70
15 20 25 30 35
0.8 1.0 1.2 1.4 1.6
A
C
E
B
D
F
MenWomen
Comparison of Two Different DXA Systems
Copyright © 2021 Korean Endocrine Society www.e-enm.org 1223
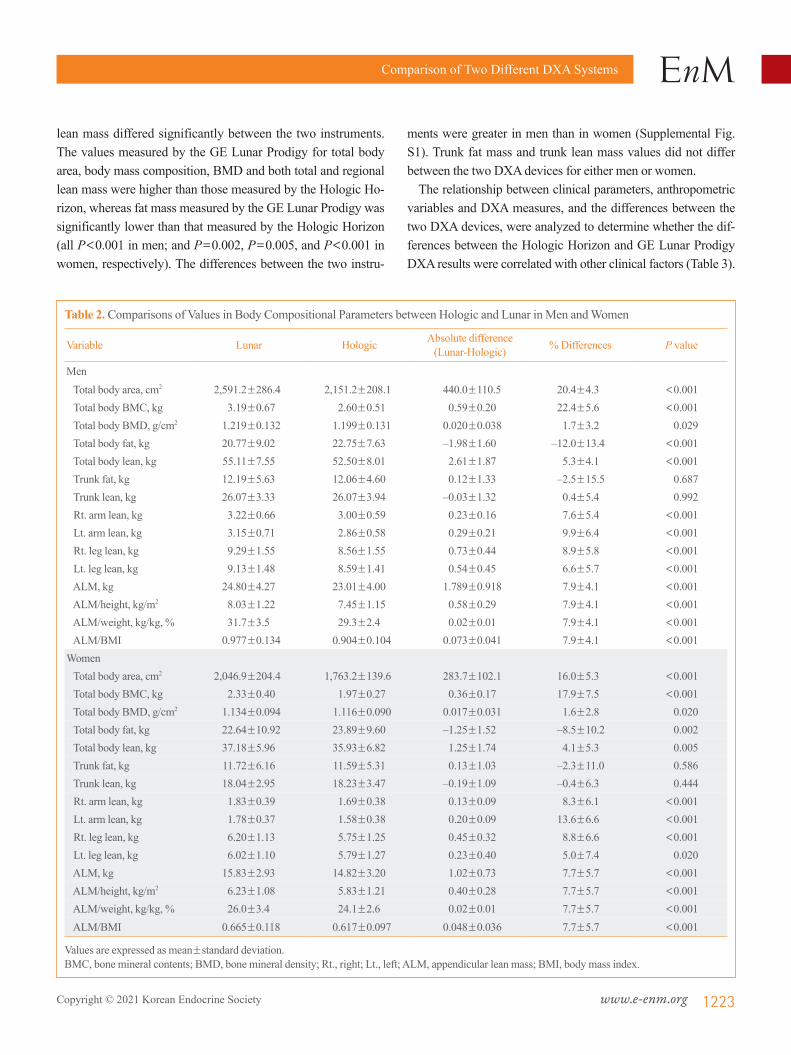
lean mass differed significantly between the two instruments. The values measured by the GE Lunar Prodigy for total body area, body mass composition, BMD and both total and regional lean mass were higher than those measured by the Hologic Ho-rizon, whereas fat mass measured by the GE Lunar Prodigy was significantly lower than that measured by the Hologic Horizon (all P<0.001 in men; and P=0.002, P=0.005, and P<0.001 in women, respectively). The differences between the two instru-
ments were greater in men than in women (Supplemental Fig. S1). Trunk fat mass and trunk lean mass values did not differ between the two DXA devices for either men or women.
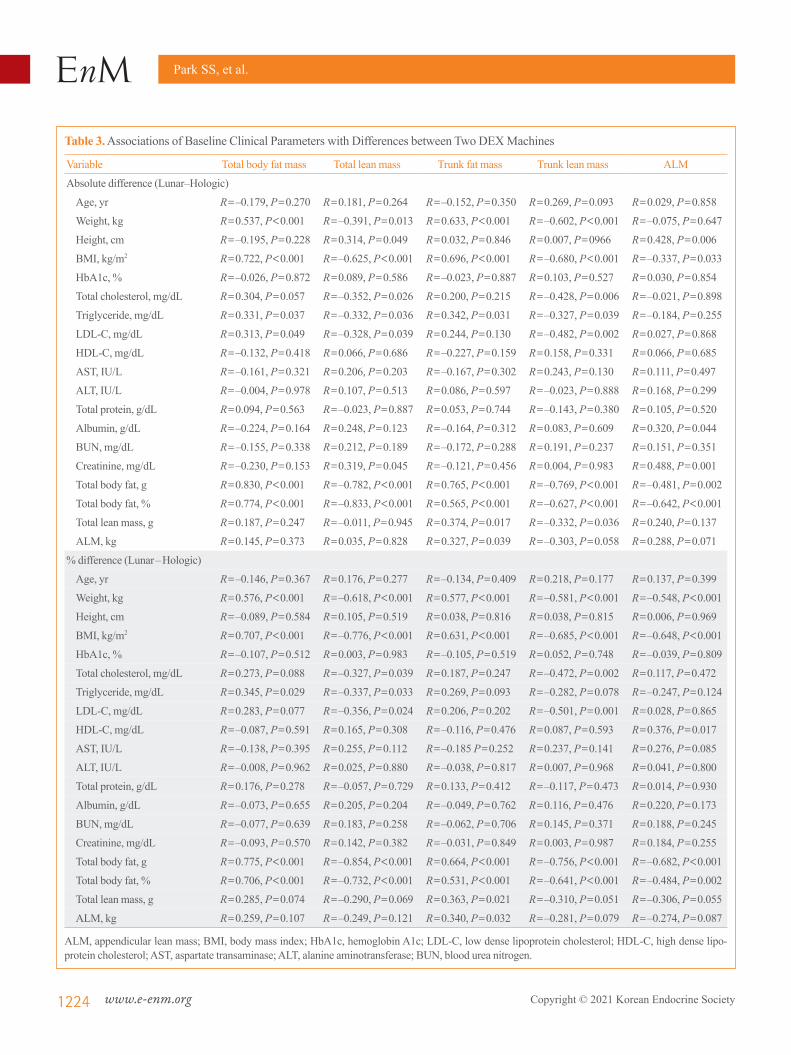
The relationship between clinical parameters, anthropometric variables and DXA measures, and the differences between the two DXA devices, were analyzed to determine whether the dif-ferences between the Hologic Horizon and GE Lunar Prodigy DXA results were correlated with other clinical factors (Table 3).
Table 2. Comparisons of Values in Body Compositional Parameters between Hologic and Lunar in Men and Women
Variable Lunar Hologic Absolute difference (Lunar-Hologic) % Differences P value
Men Total body area, cm2 2,591.2±286.4 2,151.2±208.1 440.0±110.5 20.4±4.3 <0.001 Total body BMC, kg 3.19±0.67 2.60±0.51 0.59±0.20 22.4±5.6 <0.001 Total body BMD, g/cm2 1.219±0.132 1.199±0.131 0.020±0.038 1.7±3.2 0.029 Total body fat, kg 20.77±9.02 22.75±7.63 –1.98±1.60 –12.0±13.4 <0.001 Total body lean, kg 55.11±7.55 52.50±8.01 2.61±1.87 5.3±4.1 <0.001 Trunk fat, kg 12.19±5.63 12.06±4.60 0.12±1.33 –2.5±15.5 0.687 Trunk lean, kg 26.07±3.33 26.07±3.94 –0.03±1.32 0.4±5.4 0.992 Rt. arm lean, kg 3.22±0.66 3.00±0.59 0.23±0.16 7.6±5.4 <0.001 Lt. arm lean, kg 3.15±0.71 2.86±0.58 0.29±0.21 9.9±6.4 <0.001 Rt. leg lean, kg 9.29±1.55 8.56±1.55 0.73±0.44 8.9±5.8 <0.001 Lt. leg lean, kg 9.13±1.48 8.59±1.41 0.54±0.45 6.6±5.7 <0.001 ALM, kg 24.80±4.27 23.01±4.00 1.789±0.918 7.9±4.1 <0.001 ALM/height, kg/m2 8.03±1.22 7.45±1.15 0.58±0.29 7.9±4.1 <0.001 ALM/weight, kg/kg, % 31.7±3.5 29.3±2.4 0.02±0.01 7.9±4.1 <0.001 ALM/BMI 0.977±0.134 0.904±0.104 0.073±0.041 7.9±4.1 <0.001Women Total body area, cm2 2,046.9±204.4 1,763.2±139.6 283.7±102.1 16.0±5.3 <0.001 Total body BMC, kg 2.33±0.40 1.97±0.27 0.36±0.17 17.9±7.5 <0.001 Total body BMD, g/cm2 1.134±0.094 1.116±0.090 0.017±0.031 1.6±2.8 0.020 Total body fat, kg 22.64±10.92 23.89±9.60 –1.25±1.52 –8.5±10.2 0.002 Total body lean, kg 37.18±5.96 35.93±6.82 1.25±1.74 4.1±5.3 0.005 Trunk fat, kg 11.72±6.16 11.59±5.31 0.13±1.03 –2.3±11.0 0.586 Trunk lean, kg 18.04±2.95 18.23±3.47 –0.19±1.09 –0.4±6.3 0.444 Rt. arm lean, kg 1.83±0.39 1.69±0.38 0.13±0.09 8.3±6.1 <0.001 Lt. arm lean, kg 1.78±0.37 1.58±0.38 0.20±0.09 13.6±6.6 <0.001 Rt. leg lean, kg 6.20±1.13 5.75±1.25 0.45±0.32 8.8±6.6 <0.001 Lt. leg lean, kg 6.02±1.10 5.79±1.27 0.23±0.40 5.0±7.4 0.020 ALM, kg 15.83±2.93 14.82±3.20 1.02±0.73 7.7±5.7 <0.001 ALM/height, kg/m2 6.23±1.08 5.83±1.21 0.40±0.28 7.7±5.7 <0.001 ALM/weight, kg/kg, % 26.0±3.4 24.1±2.6 0.02±0.01 7.7±5.7 <0.001 ALM/BMI 0.665±0.118 0.617±0.097 0.048±0.036 7.7±5.7 <0.001
Values are expressed as mean±standard deviation.BMC, bone mineral contents; BMD, bone mineral density; Rt., right; Lt., left; ALM, appendicular lean mass; BMI, body mass index.
Park SS, et al.
1224 www.e-enm.org Copyright © 2021 Korean Endocrine Society
Table 3. Associations of Baseline Clinical Parameters with Differences between Two DEX Machines
Variable Total body fat mass Total lean mass Trunk fat mass Trunk lean mass ALM
Absolute difference (Lunar–Hologic)
Age, yr R=–0.179, P=0.270 R=0.181, P=0.264 R=–0.152, P=0.350 R=0.269, P=0.093 R=0.029, P=0.858
Weight, kg R=0.537, P<0.001 R=–0.391, P=0.013 R=0.633, P<0.001 R=–0.602, P<0.001 R=–0.075, P=0.647
Height, cm R=–0.195, P=0.228 R=0.314, P=0.049 R=0.032, P=0.846 R=0.007, P=0966 R=0.428, P=0.006
BMI, kg/m2 R=0.722, P<0.001 R=–0.625, P<0.001 R=0.696, P<0.001 R=–0.680, P<0.001 R=–0.337, P=0.033
HbA1c, % R=–0.026, P=0.872 R=0.089, P=0.586 R=–0.023, P=0.887 R=0.103, P=0.527 R=0.030, P=0.854
Total cholesterol, mg/dL R=0.304, P=0.057 R=–0.352, P=0.026 R=0.200, P=0.215 R=–0.428, P=0.006 R=–0.021, P=0.898
Triglyceride, mg/dL R=0.331, P=0.037 R=–0.332, P=0.036 R=0.342, P=0.031 R=–0.327, P=0.039 R=–0.184, P=0.255
LDL-C, mg/dL R=0.313, P=0.049 R=–0.328, P=0.039 R=0.244, P=0.130 R=–0.482, P=0.002 R=0.027, P=0.868
HDL-C, mg/dL R=–0.132, P=0.418 R=0.066, P=0.686 R=–0.227, P=0.159 R=0.158, P=0.331 R=0.066, P=0.685
AST, IU/L R=–0.161, P=0.321 R=0.206, P=0.203 R=–0.167, P=0.302 R=0.243, P=0.130 R=0.111, P=0.497
ALT, IU/L R=–0.004, P=0.978 R=0.107, P=0.513 R=0.086, P=0.597 R=–0.023, P=0.888 R=0.168, P=0.299
Total protein, g/dL R=0.094, P=0.563 R=–0.023, P=0.887 R=0.053, P=0.744 R=–0.143, P=0.380 R=0.105, P=0.520
Albumin, g/dL R=–0.224, P=0.164 R=0.248, P=0.123 R=–0.164, P=0.312 R=0.083, P=0.609 R=0.320, P=0.044
BUN, mg/dL R=–0.155, P=0.338 R=0.212, P=0.189 R=–0.172, P=0.288 R=0.191, P=0.237 R=0.151, P=0.351
Creatinine, mg/dL R=–0.230, P=0.153 R=0.319, P=0.045 R=–0.121, P=0.456 R=0.004, P=0.983 R=0.488, P=0.001
Total body fat, g R=0.830, P<0.001 R=–0.782, P<0.001 R=0.765, P<0.001 R=–0.769, P<0.001 R=–0.481, P=0.002
Total body fat, % R=0.774, P<0.001 R=–0.833, P<0.001 R=0.565, P<0.001 R=–0.627, P<0.001 R=–0.642, P<0.001
Total lean mass, g R=0.187, P=0.247 R=–0.011, P=0.945 R=0.374, P=0.017 R=–0.332, P=0.036 R=0.240, P=0.137
ALM, kg R=0.145, P=0.373 R=0.035, P=0.828 R=0.327, P=0.039 R=–0.303, P=0.058 R=0.288, P=0.071
% difference (Lunar–Hologic)
Age, yr R=–0.146, P=0.367 R=0.176, P=0.277 R=–0.134, P=0.409 R=0.218, P=0.177 R=0.137, P=0.399
Weight, kg R=0.576, P<0.001 R=–0.618, P<0.001 R=0.577, P<0.001 R=–0.581, P<0.001 R=–0.548, P<0.001
Height, cm R=–0.089, P=0.584 R=0.105, P=0.519 R=0.038, P=0.816 R=0.038, P=0.815 R=0.006, P=0.969
BMI, kg/m2 R=0.707, P<0.001 R=–0.776, P<0.001 R=0.631, P<0.001 R=–0.685, P<0.001 R=–0.648, P<0.001
HbA1c, % R=–0.107, P=0.512 R=0.003, P=0.983 R=–0.105, P=0.519 R=0.052, P=0.748 R=–0.039, P=0.809
Total cholesterol, mg/dL R=0.273, P=0.088 R=–0.327, P=0.039 R=0.187, P=0.247 R=–0.472, P=0.002 R=0.117, P=0.472
Triglyceride, mg/dL R=0.345, P=0.029 R=–0.337, P=0.033 R=0.269, P=0.093 R=–0.282, P=0.078 R=–0.247, P=0.124
LDL-C, mg/dL R=0.283, P=0.077 R=–0.356, P=0.024 R=0.206, P=0.202 R=–0.501, P=0.001 R=0.028, P=0.865
HDL-C, mg/dL R=–0.087, P=0.591 R=0.165, P=0.308 R=–0.116, P=0.476 R=0.087, P=0.593 R=0.376, P=0.017
AST, IU/L R=–0.138, P=0.395 R=0.255, P=0.112 R=–0.185 P=0.252 R=0.237, P=0.141 R=0.276, P=0.085
ALT, IU/L R=–0.008, P=0.962 R=0.025, P=0.880 R=–0.038, P=0.817 R=0.007, P=0.968 R=0.041, P=0.800
Total protein, g/dL R=0.176, P=0.278 R=–0.057, P=0.729 R=0.133, P=0.412 R=–0.117, P=0.473 R=0.014, P=0.930
Albumin, g/dL R=–0.073, P=0.655 R=0.205, P=0.204 R=–0.049, P=0.762 R=0.116, P=0.476 R=0.220, P=0.173
BUN, mg/dL R=–0.077, P=0.639 R=0.183, P=0.258 R=–0.062, P=0.706 R=0.145, P=0.371 R=0.188, P=0.245
Creatinine, mg/dL R=–0.093, P=0.570 R=0.142, P=0.382 R=–0.031, P=0.849 R=0.003, P=0.987 R=0.184, P=0.255
Total body fat, g R=0.775, P<0.001 R=–0.854, P<0.001 R=0.664, P<0.001 R=–0.756, P<0.001 R=–0.682, P<0.001
Total body fat, % R=0.706, P<0.001 R=–0.732, P<0.001 R=0.531, P<0.001 R=–0.641, P<0.001 R=–0.484, P=0.002
Total lean mass, g R=0.285, P=0.074 R=–0.290, P=0.069 R=0.363, P=0.021 R=–0.310, P=0.051 R=–0.306, P=0.055
ALM, kg R=0.259, P=0.107 R=–0.249, P=0.121 R=0.340, P=0.032 R=–0.281, P=0.079 R=–0.274, P=0.087
ALM, appendicular lean mass; BMI, body mass index; HbA1c, hemoglobin A1c; LDL-C, low dense lipoprotein cholesterol; HDL-C, high dense lipo-protein cholesterol; AST, aspartate transaminase; ALT, alanine aminotransferase; BUN, blood urea nitrogen.
Comparison of Two Different DXA Systems
Copyright © 2021 Korean Endocrine Society www.e-enm.org 1225
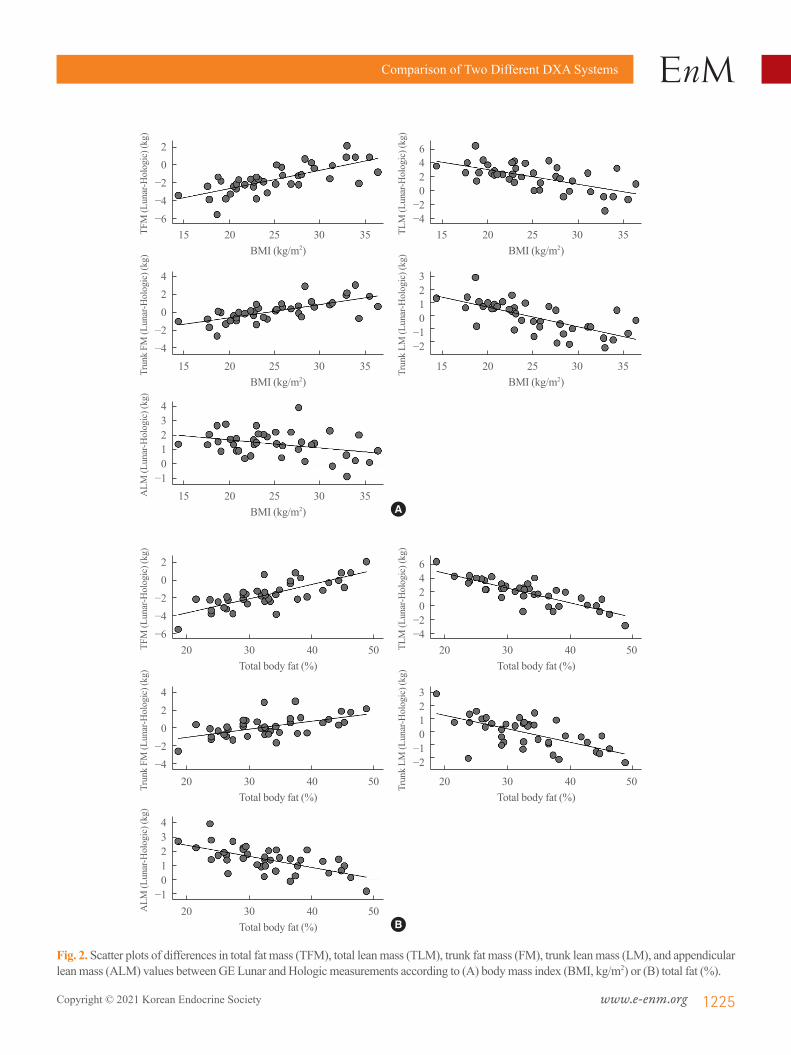
Fig. 2. Scatter plots of differences in total fat mass (TFM), total lean mass (TLM), trunk fat mass (FM), trunk lean mass (LM), and appendicular lean mass (ALM) values between GE Lunar and Hologic measurements according to (A) body mass index (BMI, kg/m2) or (B) total fat (%).
20
−2−4−6
20
−2−4−6
420
−2−4
420
−2−4
43210
−1
43210
−1
6420
−2−4
6420
−2−4
3210
−1−2
3210
−1−2
TFM
(Lun
ar-H
olog
ic) (
kg)
TFM
(Lun
ar-H
olog
ic) (
kg)
Trun
k FM
(Lun
ar-H
olog
ic) (
kg)
Trun
k FM
(Lun
ar-H
olog
ic) (
kg)
ALM
(Lun
ar-H
olog
ic) (
kg)
ALM
(Lun
ar-H
olog
ic) (
kg)
TLM
(Lun
ar-H
olog
ic) (
kg)
TLM
(Lun
ar-H
olog
ic) (
kg)
Trun
k LM
(Lun
ar-H
olog
ic) (
kg)
Trun
k LM
(Lun
ar-H
olog
ic) (
kg)
BMI (kg/m2)
Total body fat (%)
BMI (kg/m2)
Total body fat (%)
BMI (kg/m2)
Total body fat (%)
BMI (kg/m2)
Total body fat (%)
BMI (kg/m2)
Total body fat (%)
15 20 25 30 35
20 30 40 50
15 20 25 30 35
20 30 40 50
15 20 25 30 35
20 30 40 50
15 20 25 30 35
20 30 40 50
15 20 25 30 35
20 30 40 50
A
B

Park SS, et al.
1226 www.e-enm.org Copyright © 2021 Korean Endocrine Society
Both absolute and percent differences in total fat mass and lean mass, trunk fat mass and trunk lean mass and ALM were posi-tively correlated with body weight, BMI, total body fat mass and total body fat (%). Moreover, the differences of trunk fat mass and lean mass were also positively correlated with total lean mass (Table 3). Furthermore, the levels of total cholesterol and low dense lipoprotein cholesterol (LDL-C) also provide consistent negative correlations with differences in lean mass values between two systems for both total and trunk lesions. The levels of triglyceride were also significantly correlated with fat or lean mass for both total and trunk lesions. However, these associations were not significant or were markedly attenuated after adjusting for total body fat percent (%) (data not shown). The associations between BMI or body fat percent (%) and the degree of difference between the two devices are plotted in Fig. 2, and demonstrate that variance of the difference in total fat mass, total lean mass, trunk fat mass, trunk lean mass and ALM measures are greater when BMI is <20 or >30 kg/m2 (Fig. 2A). It showed similar pattern with body fat percent (%), and differ-ences between two systems were greater in subjects with either higher or lower body fat percent (%) (Fig. 2B).
Development of equations to allow conversion of body compositional parameters between GE Lunar Prodigy and Hologic HorizonThe equation ‘Hologic Horizon=slope×GE Lunar Prodigy+
intercept’ was obtained by linear regression of total body fat mass, total body lean mass, trunk fat mass, trunk lean mass, and ALM values. The results of the linear regression are shown in Table 4. All five regression models were found to be statistically significant, and the R2 values were all above 0.9, except for the equation for trunk lean mass in men.
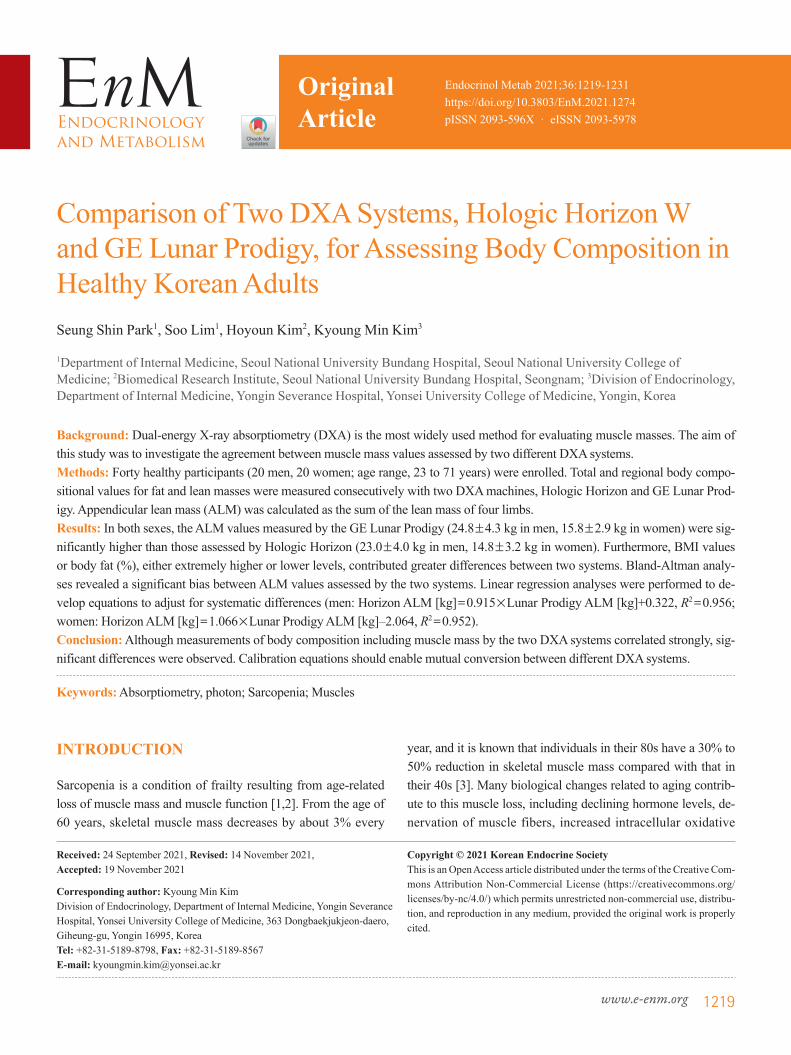
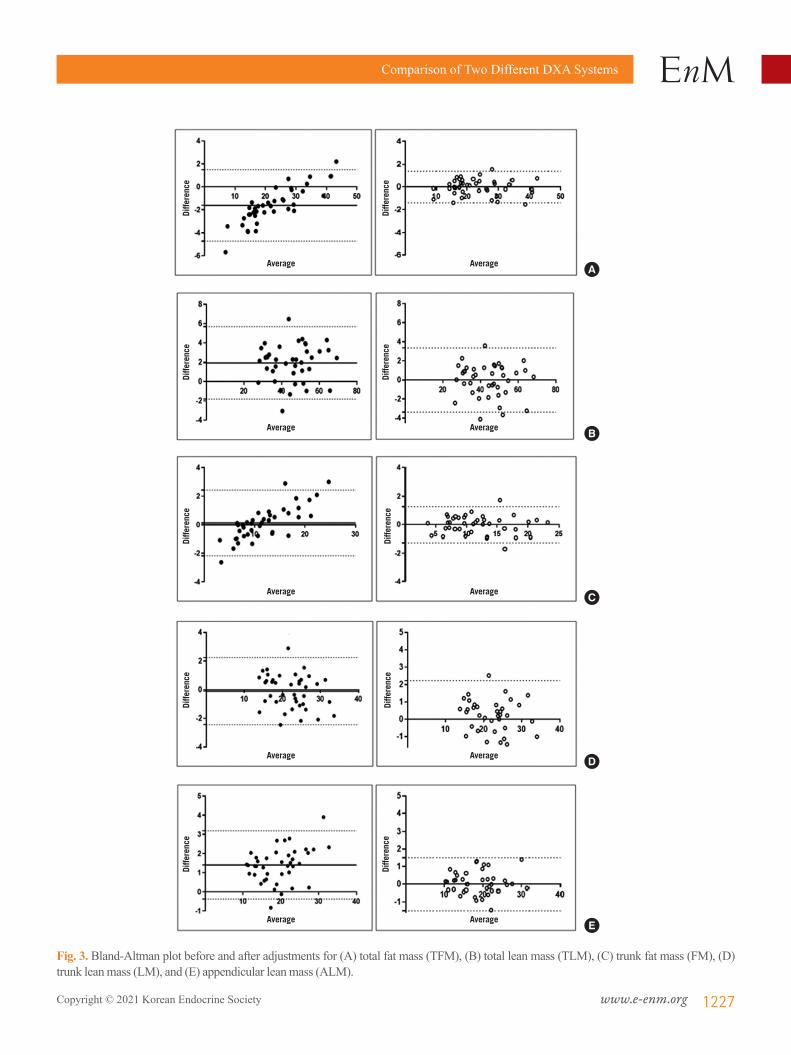
Fig. 3 shows the values produced by the two devices before and after the conversion. The differences in total body fat mass, total body lean mass, trunk fat mass and ALM assessed by the two DXA devices were –1.98, 2.61, 0.12, and 1.79 before con-version, respectively; all decreased to 0 after conversion using the regression equation. In the case of trunk lean mass, the dif-ference decreased from 0.03 to 0.01.
DISCUSSION
In the present study, we compared the body compositional val-ues, especially muscle mass indices, measured by different two DXA systems, Hologic Horizon W and GE Lunar Prodigy, which are both widely used for measuring body composition parameters. Although a strong correlation was found between Hologic Horizon W and GE Lunar Prodigy DXA measure-ments, significant differences in fat mass and lean mass mea-surements were identified, with higher values for lean mass measures and lower values for fat mass measures with the GE Lunar Prodigy than with the Hologic Horizon W. Furthermore,
Table 4. Linear Regression Analyses for Total and Regional Body Fat or Lean Mass Measured GE Lunar and Hologic HORIZON
Parameter Regression equation Slope (P) Intercept (P) r2 P value SEE
Total body fat, kg Male Hologic=0.842×Lunar+5.263 <0.001 <0.001 0.991 <0.001 0.75 Female Hologic=0.876×Lunar+4.046 <0.001 <0.001 0.995 <0.001 0.72Total body lean, kg Male Hologic=1.032×Lunar–4.392 <0.001 0.190 0.946 <0.001 1.91 Female Hologic=1.111×Lunar–5.391 <0.001 0.037 0.944 <0.001 1.65Trunk fat mass, kg Male Hologic=0.805×Lunar+2.250 <0.001 <0.001 0.974 <0.001 0.77 Female Hologic=0.858×Lunar+1.536 <0.001 <0.001 0.995 <0.001 0.56Trunk lean mass, kg Male Hologic=1.123×Lunar–3.194 <0.001 0.188 0.899 <0.001 1.29 Female Hologic=1.123×Lunar–2.030 <0.001 0.194 0.912 <0.001 1.06Appendicular lean mass, kg Male Hologic=0.915×Lunar+0.322 <0.001 0.786 0.956 <0.001 0.87 Female Hologic=1.066×Lunar–2.064 <0.001 0.036 0.952 <0.001 0.72
SEE, standard error of estimate.
Comparison of Two Different DXA Systems
Copyright © 2021 Korean Endocrine Society www.e-enm.org 1227
Fig. 3. Bland-Altman plot before and after adjustments for (A) total fat mass (TFM), (B) total lean mass (TLM), (C) trunk fat mass (FM), (D) trunk lean mass (LM), and (E) appendicular lean mass (ALM).
A
B
C
D
E
Average
Average
Average
Average
Average
Average
Average
Average
Average
Average
Diffe
rence
Diffe
rence
Diffe
rence
Diffe
rence
Diffe
rence
Diffe
rence
Diffe
rence
Diffe
rence
Diffe
rence
Diffe
rence

Park SS, et al.
1228 www.e-enm.org Copyright © 2021 Korean Endocrine Society
obesity evaluated using BMI or body fat percent (%), either ex-tremely high or low, could affect the great variations between the two systems. From the present study, we developed conver-sion equations to convert GE Lunar Prodigy measurements to Hologic Horizon W values, and vice versa.
Sarcopenia, a syndrome of frailty driven by low muscle mass and impaired muscle function, is related to many adverse health outcomes, especially in older people. Therefore, it is of increas-ing concern because of the worldwide aging of society [23]. The accurate assessment of muscle mass in clinical practice is a cru-cial step in classifying sarcopenic individuals who are at high risk of adverse health outcomes. Among several modalities for measuring body composition, DXA is the most widely used be-cause of its easy accessibility, low modality-related risks, reli-ability and lower cost. However, several different DXA systems are used for evaluating body composition parameters, which makes it difficult to compare each measurement accurately in research and clinical settings. For consistency in diagnosis of sarcopenia, a means to convert values obtained by different measuring systems is urgently needed.
Although strong correlations were generally observed be-tween the values obtained by the two systems for both lean and fat masses in the present study, some significant differences were also seen. Values for whole-body fat mass and whole-body lean mass differed significantly between the two devices. Values for specific anatomic region-specific parameters, including arm lean mass, arm fat mass, leg lean mass, leg fat mass and ALM, also differed between the two devices. For measures of lean mass, including total lean mass and arm and leg lean mass, val-ues obtained using the GE Lunar Prodigy were higher than those obtained using the Hologic Horizon. By contrast, mea-surements of fat mass using the Hologic Horizon gave higher values than those obtained using the GE Lunar Prodigy. How-ever, values for trunk fat mass and trunk lean mass did not differ significantly between the two devices. This is consistent with previous studies using machines from the same manufacturers [24-26]. Body composition measurements using DXA are based on photon attenuation in target tissues according to tissue com-position [27]. Although all DXA systems apply this common principle, differences between different systems can exist de-pending on the algorithms applied for selective tissue imaging, edge detection, region of interest definition and calibration methods [21].
The degree of dissimilarity between the two devices for mea-suring both lean mass and fat mass were significantly correlated with the participants’ weight, total body fat (%), and BMI. Fur-
thermore, in terms of biochemical markers, particularly the lipid profiles, the levels of total cholesterol, LDL-C, and triglyceride, also provide significant associations with differences in values for both total and trunk between the two systems. Weight, BMI, total body fat (%), and lipid profiles are related to each other as fundamentally obesity-related profiles. Moreover, the observed associations between lipid profiles and the differences in body composition parameters between the two systems were altered or disappeared after adjusting for total body fat (%). Therefore, it could suggest that obesity might be the main factor affecting the difference between the two devices, indicating variance of the difference in measurements by the two DXA machines may be greater if BMI or total body fat (%) is extremely low or ex-tremely high.
In the present study, the dissimilarities between measure-ments by the GE Lunar Prodigy and Hologic Horizon machines were compared between sexes. Sex disparity in conversion equations between the two DXA systems has been reported pre-viously in evaluating BMD values [28]. In addition, body com-positional properties are quite different according to sex for both quantitatively and proportionally throughout the growing and aging phases [29]. However, most of the previous reports of conversion equations between two different systems for body composition parameters were driven without considering the sex effect [5]. Therefore, we explored the sex effects in the dif-ferences between the two DXA systems and it turned out that significant differences were observed for total body lean mass and ALM, revealing it was greater in men than in women. The reason for this gender difference is not clear, but it may be be-cause of differences in body composition between the genders. Therefore, we developed a linear equation for each gender to reflect these differences more accurately.
This study has several strengths. First, we enrolled partici-pants with relatively wide ranges of BMI and age and attempted to produce equations that could be applied to various BMI and age groups. This wide BMI range in the study subjects may al-low us to apply this equation to sarcopenic subjects with lower BMI or lean body mass. Second, healthy participants without any history of chronic diseases were enrolled to exclude the in-fluence of different health conditions on body composition. Third, we also investigated which clinical and biochemical markers could significantly affect the differences between the two DXA systems and found that body fat (%) could influence the large difference between two DXA machines. This informa-tion can be useful when comparing and interpreting body com-position values measured by different DXA models in the same

Comparison of Two Different DXA Systems
Copyright © 2021 Korean Endocrine Society www.e-enm.org 1229
individual. Gender is another factor influencing the difference, so we provided a gender-specific conversion equation. Lastly, although a conversion equation between Hologic and GE Lunar was previously reported, different versions even from the same manufacturer could provide substantially different values [30]. Therefore, for the cross-calibration and merging of the data from the longitudinal studies or from widely varying systems, an exact conversion equation in each system is needed and we determined the conversion equation between Hologic Horizon W and GE Lunar Prodigy, where the most recent versions were used for assessing body composition. However, this study also had some limitations. First, none of the participants were chil-dren, and none weighed <40 kg. Previous studies have suggest-ed that different equations are needed when the participant’s weight is <40 kg. Therefore, the conversion equations used in the present study are unlikely to be applicable to children or ex-tremely low-weight patients. Second, we did not compare our data with results from gold-standard techniques such as MRI. Comparisons with values from these modalities could help identify which devices are more accurate for measuring muscle mass and fat mass, and may allow the development of equations that convert the measurements by each instrument to a gold standard. Asian Working Group for Sarcopenia (AWGS) sug-gests cutoff values for low muscle mass [31], but does not men-tion the differences in the values measured from each DXA ma-chines. Therefore, future updated guideline should further ad-dress this issue about the differences in body composition mea-sures from different DXA systems and models to suggest abso-lute value when defining low muscle mass. Third, the numbers of study subjects were not calculated based on their statistical power, but were driven by previous reports. Finally, we did not compare the acquired values from the two DXA systems with those of BIA, which is another widely used modality for assess-ing body composition. However, taken together with the present conversion equations between the DXA systems and the previ-ously reported calculation method between DXA and BIA [32], a further conversion from any of the DXA systems to BIA val-ues could be applied.
Although the body composition measurements by two differ-ent DXA systems, Hologic Horizon and GE Lunar Prodigy, were generally consistent and correlated, significant differences were observed between the two systems. Body composition measurements for the trunk region were identical, but those by GE Lunar Prodigy for lean mass were significantly higher and those for fat mass were significantly lower compared with those by Hologic Horizon. We have established a linear equation to
convert between values obtained by Hologic Horizon and GE Lunar Prodigy. This formula is expected to help provide consis-tent diagnosis of sarcopenic individuals with a higher risk of negative health outcomes.
CONFLICTS OF INTEREST
No potential conflict of interest relevant to this article was re-ported.
ACKNOWLEDGMENTS
All the study subject were enrolled and all the data were collect-ed from the Seoul National University Bundang Hospital. This work was supported by the Korean Endocrine Society of Hy-angseol Young Investigator Award 2018 to Kyoung Min Kim.
AUTHOR CONTRIBUTIONS
Conception or design: S.L., K.M.K. Acquisition, analysis, or in-terpretation of data: S.S.P., S.L., H.K., K.M.K. Drafting the work or revising: S.S.P., S.L., K.M.K. Final approval of the manuscript: S.S.P., S.L., H.K., K.M.K.
ORCID
Seung Shin Park https://orcid.org/0000-0001-5719-1539Kyoung Min Kim https://orcid.org/0000-0001-8150-0266
REFERENCES
1. Goodpaster BH, Park SW, Harris TB, Kritchevsky SB, Nev-itt M, Schwartz AV, et al. The loss of skeletal muscle strength, mass, and quality in older adults: the health, aging and body composition study. J Gerontol A Biol Sci Med Sci 2006;61:1059-64.
2. McGregor RA, Cameron-Smith D, Poppitt SD. It is not just muscle mass: a review of muscle quality, composition and metabolism during ageing as determinants of muscle func-tion and mobility in later life. Longev Healthspan 2014;3:9.
3. Landi F, Cruz-Jentoft AJ, Liperoti R, Russo A, Giovannini S, Tosato M, et al. Sarcopenia and mortality risk in frail older persons aged 80 years and older: results from ilSIRENTE study. Age Ageing 2013;42:203-9.
4. Nieuwenhuizen WF, Weenen H, Rigby P, Hetherington MM. Older adults and patients in need of nutritional sup-

Park SS, et al.
1230 www.e-enm.org Copyright © 2021 Korean Endocrine Society
port: review of current treatment options and factors influ-encing nutritional intake. Clin Nutr 2010;29:160-9.
5. Baumgartner RN, Waters DL, Gallagher D, Morley JE, Gar-ry PJ. Predictors of skeletal muscle mass in elderly men and women. Mech Ageing Dev 1999;107:123-36.
6. Meng SJ, Yu LJ. Oxidative stress, molecular inflammation and sarcopenia. Int J Mol Sci 2010;11:1509-26.
7. Nilwik R, Snijders T, Leenders M, Groen BB, van Kranen-burg J, Verdijk LB, et al. The decline in skeletal muscle mass with aging is mainly attributed to a reduction in type II muscle fiber size. Exp Gerontol 2013;48:492-8.
8. Cruz-Jentoft AJ, Landi F, Topinkova E, Michel JP. Under-standing sarcopenia as a geriatric syndrome. Curr Opin Clin Nutr Metab Care 2010;13:1-7.
9. Yoo JI, Choi H, Ha YC. Mean hand grip strength and cut-off value for sarcopenia in Korean adults using KNHANES VI. J Korean Med Sci 2017;32:868-72.
10. Jin WS, Choi EJ, Lee SY, Bae EJ, Lee TH, Park J. Relation-ships among obesity, sarcopenia, and osteoarthritis in the el-derly. J Obes Metab Syndr 2017;26:36-44.
11. Cruz-Jentoft AJ, Baeyens JP, Bauer JM, Boirie Y, Cederholm T, Landi F, et al. Sarcopenia: European consensus on defini-tion and diagnosis. Report of the European Working Group on Sarcopenia in Older People. Age Ageing 2010;39:412-23.
12. Heymsfield SB, Gonzalez MC, Lu J, Jia G, Zheng J. Skele-tal muscle mass and quality: evolution of modern measure-ment concepts in the context of sarcopenia. Proc Nutr Soc 2015;74:355-66.
13. Chien MY, Huang TY, Wu YT. Prevalence of sarcopenia es-timated using a bioelectrical impedance analysis prediction equation in community-dwelling elderly people in Taiwan. J Am Geriatr Soc 2008;56:1710-5.
14. Sun G, French CR, Martin GR, Younghusband B, Green RC, Xie YG, et al. Comparison of multifrequency bioelec-trical impedance analysis with dual-energy X-ray absorpti-ometry for assessment of percentage body fat in a large, healthy population. Am J Clin Nutr 2005;81:74-8.
15. Bilsborough JC, Greenway K, Opar D, Livingstone S, Cordy J, Coutts AJ. The accuracy and precision of DXA for assessing body composition in team sport athletes. J Sports Sci 2014;32:1821-8.
16. Kim J, Wang Z, Heymsfield SB, Baumgartner RN, Gallagh-er D. Total-body skeletal muscle mass: estimation by a new dual-energy X-ray absorptiometry method. Am J Clin Nutr 2002;76:378-83.
17. Xu W, Chafi H, Guo B, Heymsfield SB, Murray KB, Zheng
J, et al. Quantitative comparison of 2 dual-energy X-ray ab-sorptiometry systems in assessing body composition and bone mineral measurements. J Clin Densitom 2016;19:298-304.
18. Lu Y, Fuerst T, Hui S, Genant HK. Standardization of bone mineral density at femoral neck, trochanter and Ward’s tri-angle. Osteoporos Int 2001;12:438-44.
19. Hui SL, Gao S, Zhou XH, Johnston CC Jr, Lu Y, Gluer CC, et al. Universal standardization of bone density measure-ments: a method with optimal properties for calibration among several instruments. J Bone Miner Res 1997;12: 1463-70.
20. Hind K, Oldroyd B, Truscott JG. In vivo precision of the GE Lunar iDXA densitometer for the measurement of total body composition and fat distribution in adults. Eur J Clin Nutr 2011;65:140-2.
21. Oldroyd B, Treadgold L, Hind K. Cross calibration of the GE Prodigy and iDXA for the measurement of total and re-gional body composition in adults. J Clin Densitom 2018; 21:383-93.
22. Sutter T, Duboeuf F, Chapurlat R, Cortet B, Lespessailles E, Roux JP. DXA body composition corrective factors between Hologic Discovery models to conduct multicenter studies. Bone 2021;142:115683.
23. Buford TW. Sarcopenia: relocating the forest among the trees. Toxicol Pathol 2017;45:957-60.
24. Tothill P, Hannan WJ, Wilkinson S. Comparisons between a pencil beam and two fan beam dual energy X-ray absorpti-ometers used for measuring total body bone and soft tissue. Br J Radiol 2001;74:166-76.
25. Watson L, Venables M, Singh P, Murgatroyd P. An investi-gation into differences in body composition measurements between two GE Lunar densitometers and in comparison to a four component model. J Clin Densitom 2015;18:432-3.
26. Kaminsky LA, Ozemek C, Williams KL, Byun W. Precision of total and regional body fat estimates from dual-energy X-ray absorptiometer measurements. J Nutr Health Aging 2014;18:591-4.
27. Plank LD. Dual-energy X-ray absorptiometry and body composition. Curr Opin Clin Nutr Metab Care 2005;8:305-9.
28. Ganda K, Nguyen TV, Pocock N. Gender disparity in BMD conversion: a comparison between Lunar and Hologic den-sitometers. Arch Osteoporos 2014;9:180.
29. Kim KM, Jang HC, Lim S. Differences among skeletal muscle mass indices derived from height-, weight-, and body mass index-adjusted models in assessing sarcopenia.
Comparison of Two Different DXA Systems
Copyright © 2021 Korean Endocrine Society www.e-enm.org 1231
Korean J Intern Med 2016;31:643-50.30. Shepherd JA, Fan B, Lu Y, Wu XP, Wacker WK, Ergun DL,
et al. A multinational study to develop universal standardiza-tion of whole-body bone density and composition using GE Healthcare Lunar and Hologic DXA systems. J Bone Miner Res 2012;27:2208-16.
31. Chen LK, Woo J, Assantachai P, Auyeung TW, Chou MY, Iijima K, et al. Asian Working Group for Sarcopenia: 2019
consensus update on sarcopenia diagnosis and treatment. J Am Med Dir Assoc 2020;21:300-7.
32. Lee SY, Ahn S, Kim YJ, Ji MJ, Kim KM, Choi SH, et al. Comparison between dual-energy X-ray absorptiometry and bioelectrical impedance analyses for accuracy in measuring whole body muscle mass and appendicular skeletal muscle mass. Nutrients 2018;10:738.