The experience and impact of pregnancy in bulimia nervosa: A series of case studies
Upload
charite-deCategory
view
2download
0
"Glass Fairies" and "Bone Children": Adolescents with
anorexia nervosa do show positive reactions towards extremely emaciated body pictures measured by the startle
reflex paradigm.
Journal: Psychophysiology
Manuscript ID: PsyP-2012-0202.R4
Wiley - Manuscript type: Full-length report
Date Submitted by the Author: n/a
Complete List of Authors: Reichel, Valeska; Charite Universitätsmedizin Berlin, Department of Child and Adolescent Psychiatry Schneider, Nora; Charite Universitätsmedizin Berlin, Department of Child and Adolescent Psychiatry Grünewald, Barbara; Klinikum der Universität München LMU, Department of Child and Adolescent Psychiatry Kienast, Thorsten; Charite Universitätsmedizin Berlin, Department of Psychiatry and Psychotherapy
Pfeiffer, Ernst; Charite Universitätsmedizin Berlin, Department of Child and Adolescent Psychiatry Lehmkuhl, Ulrike; Charite Universitätsmedizin Berlin, Department of Child and Adolescent Psychiatry Korte, Alexander; Klinikum der Universität München LMU, Department of Child and Adolescent Psychiatry
Keywords: Emotion < Content, Psychopathological < Groups Studied, Startle Blink < Measures Used, Anorexia nervosa, Pro Ana
Psychophysiology
Psychophysiology
“Glass Fairies” and “Bone Children":
Adolescents and Young Adults with Anorexia Nervosa show Positive Reactions towards
Extremely Emaciated Body Pictures measured by the Startle Reflex Paradigm.
Valeska A. Reichel1,2, Nora Schneider
1,3, Barbara Grünewald
4,
Thorsten Kienast5, Ernst Pfeiffer
1, Ulrike Lehmkuhl
1, & Alexander Korte
1,4
1 Department of Child and Adolescent Psychiatry and Psychotherapy,
Charité Universitätsmedizin Berlin, Germany
2 Department of Psychiatry and Psychotherapy,
Universitätsklinikum Halle (Saale) UKH, Germany
3 Cognitive Science Nutrition & Health Department, Nestec Ltd,
Nestlé Research Center, Lausanne, Switzerland
4 Department of Child and Adolescent Psychiatry and Psychotherapy,
Klinikum der Universität München LMU, Munich, Germany
5Department of Psychiatry and Psychotherapy,
Charité Universitätsmedizin Berlin, Germany
Corresponding authors:
Dipl. Psych. Valeska A. Reichel Dr. med. Alexander Korte
Phone: + 49 (0)345 557 3658 Phone: + 49 (0)89 5160 5903
Mobil: + 49 (0)151 177 56856 Fax: + 49 (0)89 5160 5904
e-mail: [email protected] e-mail: [email protected]ünchen.de
Page 1 of 64
Psychophysiology
Psychophysiology
123456789101112131415161718192021222324252627282930313233343536373839404142434445464748495051525354555657585960
Abstract
OBJECTIVE. In this study we investigated the emotional processing of extremely emaciated
body cues in adolescents and young adults with (n=36) and without (n=36) anorexia nervosa
(AN), introducing a new picture type, which was taken from websites that promote extreme
thinness and is targeted specifically at adolescents interested in extreme thinness.
METHOD. A startle reflex paradigm was used for implicit reactions, while a self-assessment
instrument was used for subjective responses.
RESULTS. We found a significant group difference with a startle inhibition (appetitive
response) among the patients and a startle potentiation (aversive response) among the
controls, whereas no such difference for subjective measures was found.
DISCUSSION. The results are in contrast to previous studies, which proposed a general
failure to activate the appetitive motivational system in AN, but in keeping with findings from
other addictions, where the same response pattern has been found. Implications for prevention
and therapy are discussed.
Page 2 of 64
Psychophysiology
Psychophysiology
123456789101112131415161718192021222324252627282930313233343536373839404142434445464748495051525354555657585960
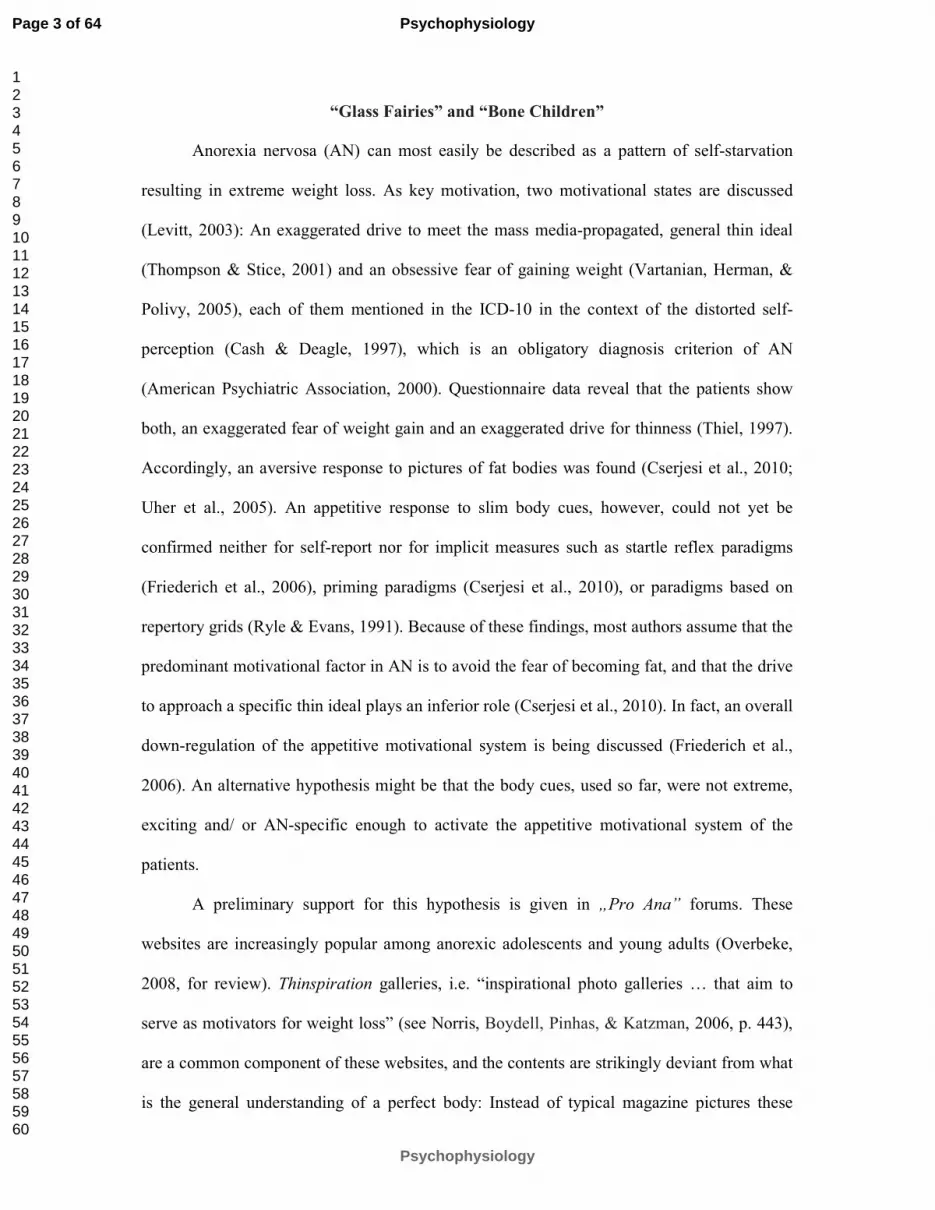
“Glass Fairies” and “Bone Children”
Anorexia nervosa (AN) can most easily be described as a pattern of self-starvation
resulting in extreme weight loss. As key motivation, two motivational states are discussed
(Levitt, 2003): An exaggerated drive to meet the mass media-propagated, general thin ideal
(Thompson & Stice, 2001) and an obsessive fear of gaining weight (Vartanian, Herman, &
Polivy, 2005), each of them mentioned in the ICD-10 in the context of the distorted self-
perception (Cash & Deagle, 1997), which is an obligatory diagnosis criterion of AN
(American Psychiatric Association, 2000). Questionnaire data reveal that the patients show
both, an exaggerated fear of weight gain and an exaggerated drive for thinness (Thiel, 1997).
Accordingly, an aversive response to pictures of fat bodies was found (Cserjesi et al., 2010;
Uher et al., 2005). An appetitive response to slim body cues, however, could not yet be
confirmed neither for self-report nor for implicit measures such as startle reflex paradigms
(Friederich et al., 2006), priming paradigms (Cserjesi et al., 2010), or paradigms based on
repertory grids (Ryle & Evans, 1991). Because of these findings, most authors assume that the
predominant motivational factor in AN is to avoid the fear of becoming fat, and that the drive
to approach a specific thin ideal plays an inferior role (Cserjesi et al., 2010). In fact, an overall
down-regulation of the appetitive motivational system is being discussed (Friederich et al.,
2006). An alternative hypothesis might be that the body cues, used so far, were not extreme,
exciting and/ or AN-specific enough to activate the appetitive motivational system of the
patients.
A preliminary support for this hypothesis is given in „Pro Ana” forums. These
websites are increasingly popular among anorexic adolescents and young adults (Overbeke,
2008, for review). Thinspiration galleries, i.e. “inspirational photo galleries … that aim to
serve as motivators for weight loss” (see Norris, Boydell, Pinhas, & Katzman, 2006, p. 443),
are a common component of these websites, and the contents are strikingly deviant from what
is the general understanding of a perfect body: Instead of typical magazine pictures these
Page 3 of 64
Psychophysiology
Psychophysiology
123456789101112131415161718192021222324252627282930313233343536373839404142434445464748495051525354555657585960

galleries depict extremely emaciated, real anorexic girls or photo-shop-distorted waif-like
models. Instead of classical beauty attributes, features like projecting ribs, hip- and
cheekbones, sunken cheeks and abdomen, which are associated with extreme cachexia (life-
threatening final state of weight loss, which cannot be reversed nutritionally) are highlighted
(Bardone-Cone & Cass, 2006). In studies using the International Affective Picture System
(IAPS) (Lang, Bradley, & Cuthbert, 2008), healthy people reacted aversively and with
(moderately) high arousal to pictures of starving people (see Ito & Lang, 1998, p. 860). Rand,
Resnick, & Seldman (1997) showed that, when assessed by healthy females, extremely
underweight shapes on a figure rating scale were rated as negative and socially undesirable as
extremely overweight shapes. Yet, inside the „Pro Ana” logic, the glorification of cachexia
and its re-interpretation as a “thin ideal” play a central role (Strife & Rickard, 2011), and
community names such as “glass fairies”, “feather girls”, or “bone children” suggest that this
positive re-interpretation is part of the forum identity and also serves as the in-group vs. out-
group differentiation in the forums (Haas, Irr, Jennings, & Wagner, 2011).
Objective and Hypotheses
The current study aimed to introduce extremely emaciated body pictures as a new
stimulus type, and to re-evaluate with this new stimulus whether adolescents and young adults
with AN as compared to healthy controls (CN) show an appetitive reaction or not. In order to
provide a relevant baseline for assessing the emotional reactions, the emaciated body images
were intermixed with images from a standardized affective image set. Accordant to Lang´s bi-
dimensional theory of emotions (1995), two basic components of emotional reactions were
considered: 1. A valence component, ranging from appetitive reactions (such as those we
expected for AN patients while viewing emaciated body cues) to aversive reactions (such as
those we expected for healthy adolescents). 2. An arousal component, ranging from low
emotional arousal to high arousal (since appetitive reactions and aversive reactions both go
along with an increased arousal response, we expected a comparable arousal increase in both
Page 4 of 64
Psychophysiology
Psychophysiology
123456789101112131415161718192021222324252627282930313233343536373839404142434445464748495051525354555657585960
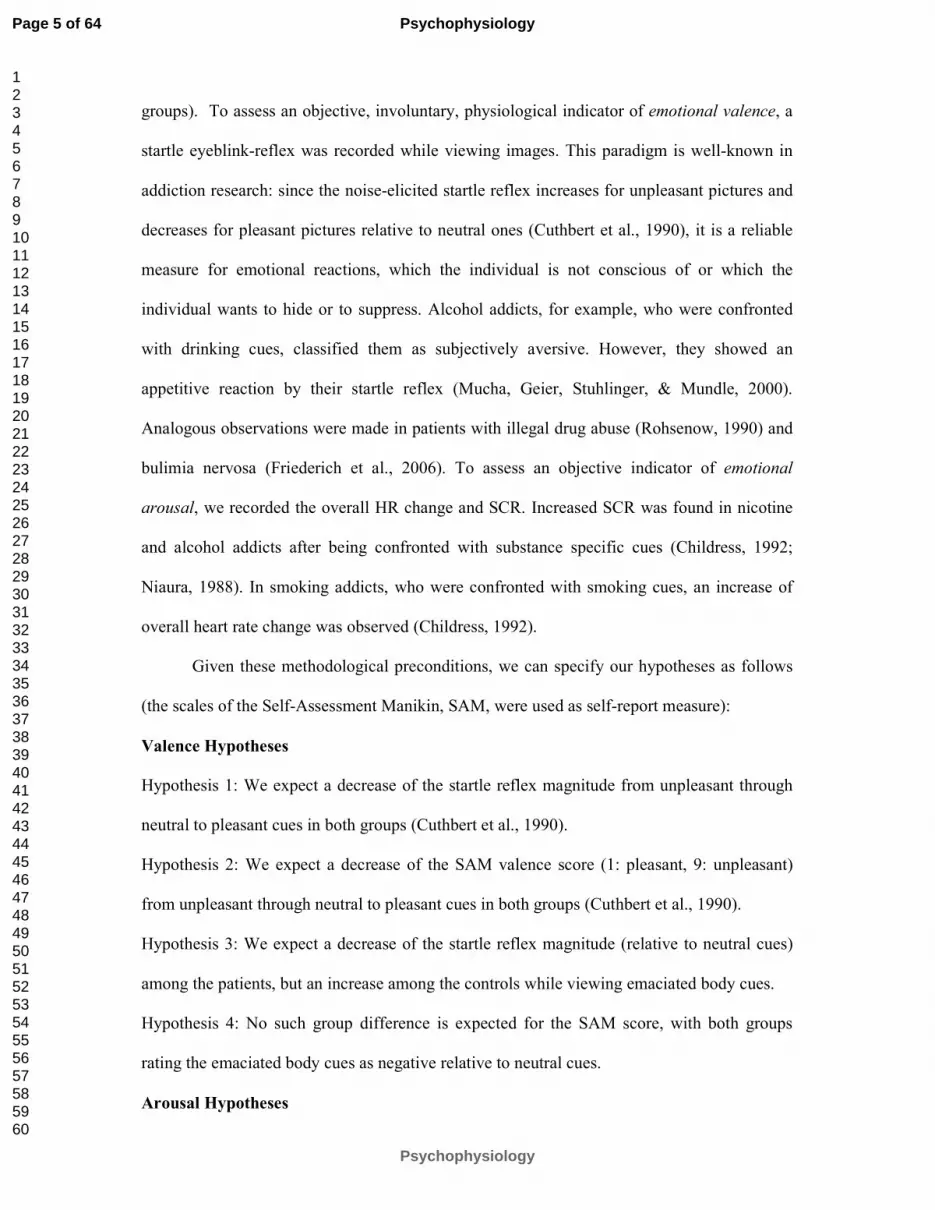
groups). To assess an objective, involuntary, physiological indicator of emotional valence, a
startle eyeblink-reflex was recorded while viewing images. This paradigm is well-known in
addiction research: since the noise-elicited startle reflex increases for unpleasant pictures and
decreases for pleasant pictures relative to neutral ones (Cuthbert et al., 1990), it is a reliable
measure for emotional reactions, which the individual is not conscious of or which the
individual wants to hide or to suppress. Alcohol addicts, for example, who were confronted
with drinking cues, classified them as subjectively aversive. However, they showed an
appetitive reaction by their startle reflex (Mucha, Geier, Stuhlinger, & Mundle, 2000).
Analogous observations were made in patients with illegal drug abuse (Rohsenow, 1990) and
bulimia nervosa (Friederich et al., 2006). To assess an objective indicator of emotional
arousal, we recorded the overall HR change and SCR. Increased SCR was found in nicotine
and alcohol addicts after being confronted with substance specific cues (Childress, 1992;
Niaura, 1988). In smoking addicts, who were confronted with smoking cues, an increase of
overall heart rate change was observed (Childress, 1992).
Given these methodological preconditions, we can specify our hypotheses as follows
(the scales of the Self-Assessment Manikin, SAM, were used as self-report measure):
Valence Hypotheses
Hypothesis 1: We expect a decrease of the startle reflex magnitude from unpleasant through
neutral to pleasant cues in both groups (Cuthbert et al., 1990).
Hypothesis 2: We expect a decrease of the SAM valence score (1: pleasant, 9: unpleasant)
from unpleasant through neutral to pleasant cues in both groups (Cuthbert et al., 1990).
Hypothesis 3: We expect a decrease of the startle reflex magnitude (relative to neutral cues)
among the patients, but an increase among the controls while viewing emaciated body cues.
Hypothesis 4: No such group difference is expected for the SAM score, with both groups
rating the emaciated body cues as negative relative to neutral cues.
Arousal Hypotheses
Page 5 of 64
Psychophysiology
Psychophysiology
123456789101112131415161718192021222324252627282930313233343536373839404142434445464748495051525354555657585960

Hypothesis 5: We expect an increase of physiological arousal (SCR, overall HR change) for
pleasant and unpleasant cues relative to neutral cues in both groups (Cuthbert, 1990).
Hypothesis 6: We expect an increase of the SAM arousal score (1: low arousal; 9: high
arousal) for pleasant and unpleasant relative to neutral cues in both groups (Cuthbert, 1990).
Hypothesis 7: We expect a comparable increase of physiological arousal (SCR, overall HR
change) (relative to neutral cues) during viewing of emaciated body cues in both groups.
Hypothesis 8: We expect a comparable increase of the SAM arousal score (1: low arousal; 9:
high arousal) (relative to neutral cues) during viewing of emaciated body cues in both groups.
Page 6 of 64
Psychophysiology
Psychophysiology
123456789101112131415161718192021222324252627282930313233343536373839404142434445464748495051525354555657585960

Method
Participants
A total of 72 female adolescents and young adults (36 AN, 36 CN) participated in the
study. Both groups were matched for age (14 to 21 years) and education (high school).
Hearing or visual impairments, neurological disease or medication with influence on the
startle reflex such as diazepam, morphine, and buspirone (Davis, Falls, Campeau, & Kim,
1993) were general exclusion criteria for the study.
Inclusion criteria for the patients were AN (ICD-10: F50.0) as primary diagnosis
(restrictive and purging type) and a body weight below the 10th percentile of BMI-for-age.
Mean duration of eating disorder was 1.3 years (± 0.8 years). Mean duration of treatment was
7 months (± 3 months). All patients were recruited from inpatient and outpatient therapy
programs of the Department of Child and Adolescent Psychiatry and the Department of
Psychosomatic Medicine and Psychotherapy, Charité Universitätsmedizin Berlin.
Inclusion criteria for the controls were the absence of any psychiatric diagnosis
described in the ICD-10 and a body weight within the normal range (i.e. above the 10th and
below the 90th percentile of BMI-for-age). Recruitment methods included advertisement in
newspapers, in local youth activity centres and on the university campus.
All psychiatric diagnoses were based on ICD-10 criteria and established by
experienced clinical raters using psychiatric routine measures (Structural Inventory for
Anorexic and Bulimic Eating disorders, SIABS-EX; Composite International Diagnostic
Interview – Diagnostic Inventory Psychiatric Disorders-Expert, CIDI-DIAX). All participants
gave their written informed consent. With respect to minor age adolescents, we additionally
obtained written informed consent of the legal guardians.
Stimuli
Page 7 of 64
Psychophysiology
Psychophysiology
123456789101112131415161718192021222324252627282930313233343536373839404142434445464748495051525354555657585960
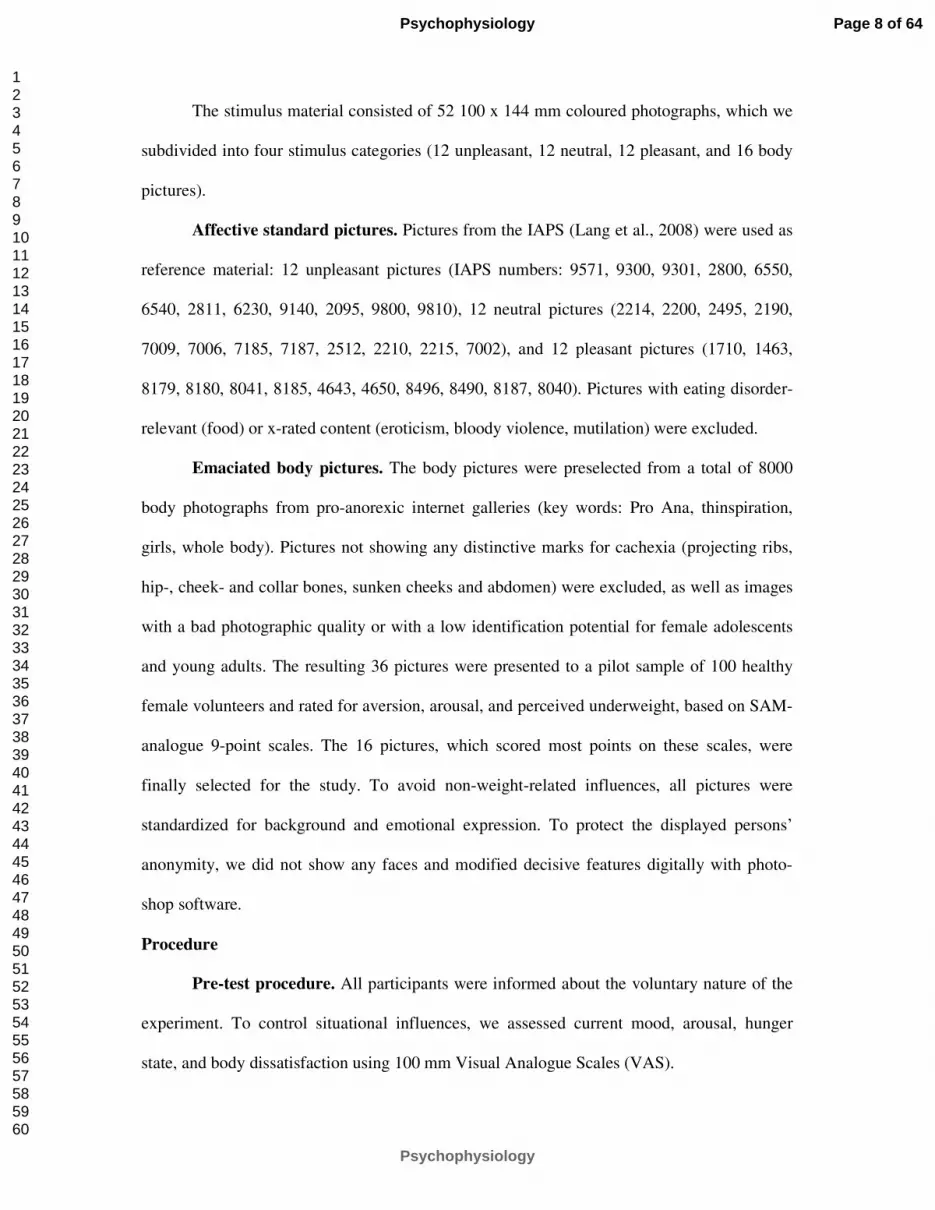
The stimulus material consisted of 52 100 x 144 mm coloured photographs, which we
subdivided into four stimulus categories (12 unpleasant, 12 neutral, 12 pleasant, and 16 body
pictures).
Affective standard pictures. Pictures from the IAPS (Lang et al., 2008) were used as
reference material: 12 unpleasant pictures (IAPS numbers: 9571, 9300, 9301, 2800, 6550,
6540, 2811, 6230, 9140, 2095, 9800, 9810), 12 neutral pictures (2214, 2200, 2495, 2190,
7009, 7006, 7185, 7187, 2512, 2210, 2215, 7002), and 12 pleasant pictures (1710, 1463,
8179, 8180, 8041, 8185, 4643, 4650, 8496, 8490, 8187, 8040). Pictures with eating disorder-
relevant (food) or x-rated content (eroticism, bloody violence, mutilation) were excluded.
Emaciated body pictures. The body pictures were preselected from a total of 8000
body photographs from pro-anorexic internet galleries (key words: Pro Ana, thinspiration,
girls, whole body). Pictures not showing any distinctive marks for cachexia (projecting ribs,
hip-, cheek- and collar bones, sunken cheeks and abdomen) were excluded, as well as images
with a bad photographic quality or with a low identification potential for female adolescents
and young adults. The resulting 36 pictures were presented to a pilot sample of 100 healthy
female volunteers and rated for aversion, arousal, and perceived underweight, based on SAM-
analogue 9-point scales. The 16 pictures, which scored most points on these scales, were
finally selected for the study. To avoid non-weight-related influences, all pictures were
standardized for background and emotional expression. To protect the displayed persons’
anonymity, we did not show any faces and modified decisive features digitally with photo-
shop software.
Procedure
Pre-test procedure. All participants were informed about the voluntary nature of the
experiment. To control situational influences, we assessed current mood, arousal, hunger
state, and body dissatisfaction using 100 mm Visual Analogue Scales (VAS).
Page 8 of 64
Psychophysiology
Psychophysiology
123456789101112131415161718192021222324252627282930313233343536373839404142434445464748495051525354555657585960

Psychophysiological measurement. Subjects were seated in front of a 1.5 x 1.7 m
screen (1.5 m distance) and prepared for psychophysiological measurement. To reduce
habituation effects, four landscape images with three startle-eliciting noises were used as
introduction. Thereafter, the 52 stimuli were presented in two counterbalanced sets of 26
pictures each with a break (lasting 15 minutes) in between (Table 1). Within each set, the
pictures of each stimulus type were presented in an intermingled design and alternated with
black screens in random order. Each picture was shown for a period of 12 s. The same period
was used as the intertrial interval (time between the offset of picture n to the onset of picture
n+1). Three quarters of the pictures of each stimulus category were accompanied by the
presentation of a startle-eliciting noise, whereas the pictures without noise were used for the
acquisition of the arousal data. To control learning effects, the noise occurred at variable
times (3.5, 4.0, or 4.5 s after picture onset). Additional noises were presented during a quarter
of the black screens.
Subjective rating and post-test procedure. After the removal of the electrodes, half
of the pictures were shown again (intermingled with 9 new pictures) and rated subjectively for
“valence” and “arousal” on the SAM scales. In a final step, questionnaires concerning body
image, eating behavior (Eating Disorder Inventory, EDI-2), and general emotional functioning
(Toronto Alexithymia Scale, TAS-26) were completed.
Data Recording
Psychophysiological measurement. A human startle reflex system (Coulbourn
Instruments HMS 500) was used to generate the acoustic noises and to record the
psychophysiological responses. The startle reflex was elicited by 50 ms pulse 95 dB white
noise with instantaneous rise time through headphones (see Cuthbert et al., 1990). To avoid
confounding by the acoustic probes, SCR and HR were scored only for non-startle trials.
Startle reflex response. The eye-blink component of the startle reflex was measured by
recording the electromyographic activity (EMG) over the left orbicularis oculi muscle, using
Page 9 of 64
Psychophysiology
Psychophysiology
123456789101112131415161718192021222324252627282930313233343536373839404142434445464748495051525354555657585960

Ag/AgCl miniature electrodes. After sampling at 1000 Hz and filtering through a 30-500 Hz
pass-band filter, raw EMG signal was rectified and integrated with a time constant of 20 ms.
Digital sampling started 100 ms before and ended 400 ms after the probe noise onset. EMG
waveform was manually scored for magnitude and onset latency. Consistent to Blumenthal et
al. (2005), EMG magnitude was defined as difference between peak EMG (highest EMG
level within the 200 ms after the noise) and baseline (EMG level just before response onset).
Trials with no apparent reflex shape, a magnitude < 0.1 µV, or an onset latency later than 150
ms were categorized as non-response and scored with zero magnitude. Responses with onset
latency less than 20 ms, movement artefacts or excessive baseline activity were defined as
missing and rejected (1.04 %). When the number of zero responses or missings exceeded one-
third of all recorded trials (n=2), the respective participant was classified as a non-responder
and the whole data were rejected (i.e. the sample size was reduced from 74 to 72).
Skin conductance response. SCRs were recorded by a Coulbourn Isolated Skin
Conductance Coupler V71-23 (time constant: 5 s; continual voltage over electrodes: 0.5 V),
using Ag/AgCl standard electrodes on the hypothenar of the non-dominant hand. Digital
sampling (at 10 Hz) started 1000 ms before picture onset and ended 4000 ms after picture
offset. The SCR waveform was digitally scored for magnitude and latency to the peak.
Magnitude was defined as the difference between peak SCR (highest SCR level within the
900 ms to 4000 ms time interval after picture onset) and baseline (averaged SCR for the 1000
ms before picture onset). Latency to the peak was defined as the time interval between picture
onset and peak SCR. Responses with a magnitude less than 0.1 µS were defined as missing.
As there were no participants with electrodermal nonresponding (i.e. maximum response = 0),
the complete data set could be used for analysis.
Heart rate responses. Electrocardiographic activity (ECG) was measured according to
Einthoven lead II, using Ag/AgCl standard electrodes. Raw analogue ECG signal was
sampled at 1000 Hz and filtered through a 0.05-150 Hz pass-band filter. Thereafter, times of
Page 10 of 64
Psychophysiology
Psychophysiology
123456789101112131415161718192021222324252627282930313233343536373839404142434445464748495051525354555657585960
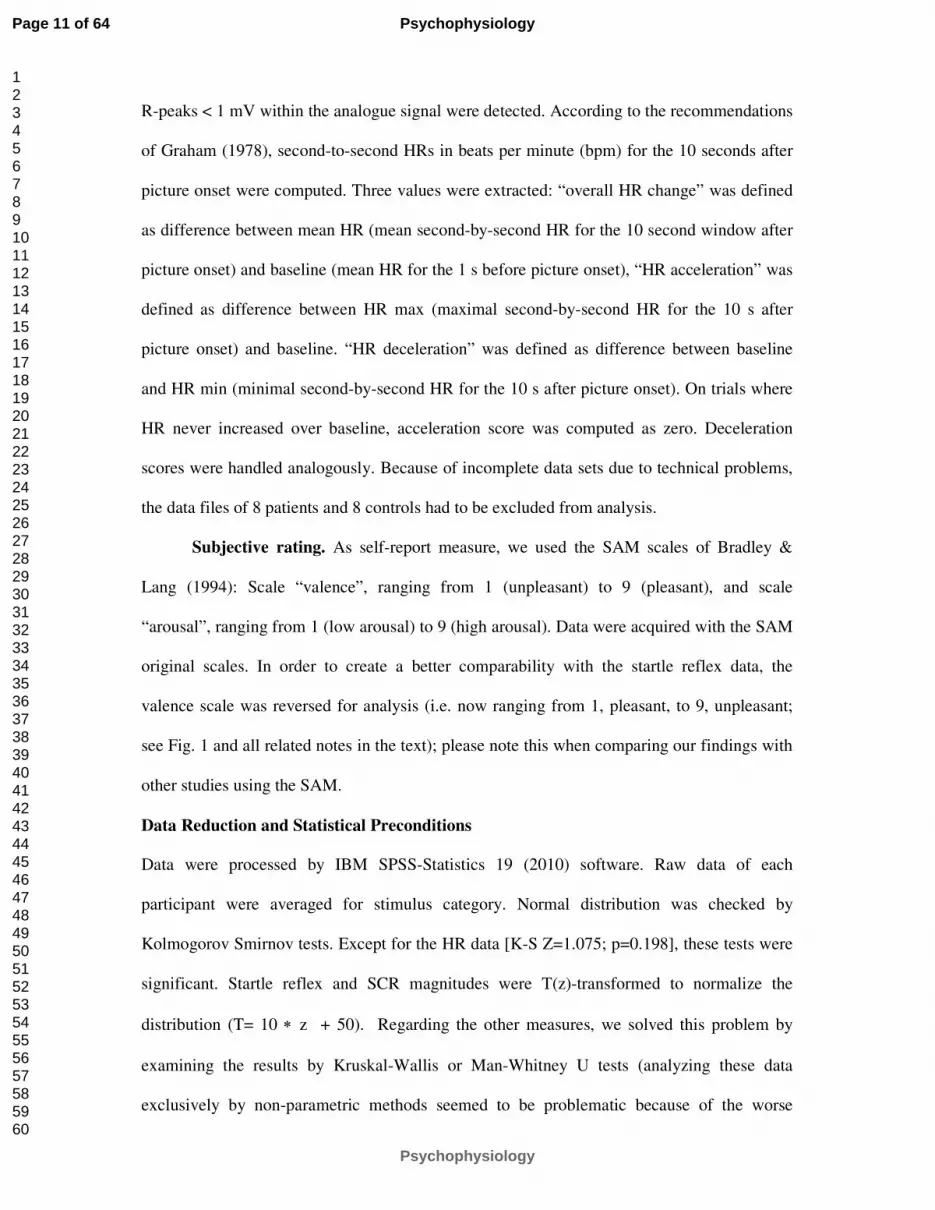
R-peaks < 1 mV within the analogue signal were detected. According to the recommendations
of Graham (1978), second-to-second HRs in beats per minute (bpm) for the 10 seconds after
picture onset were computed. Three values were extracted: “overall HR change” was defined
as difference between mean HR (mean second-by-second HR for the 10 second window after
picture onset) and baseline (mean HR for the 1 s before picture onset), “HR acceleration” was
defined as difference between HR max (maximal second-by-second HR for the 10 s after
picture onset) and baseline. “HR deceleration” was defined as difference between baseline
and HR min (minimal second-by-second HR for the 10 s after picture onset). On trials where
HR never increased over baseline, acceleration score was computed as zero. Deceleration
scores were handled analogously. Because of incomplete data sets due to technical problems,
the data files of 8 patients and 8 controls had to be excluded from analysis.
Subjective rating. As self-report measure, we used the SAM scales of Bradley &
Lang (1994): Scale “valence”, ranging from 1 (unpleasant) to 9 (pleasant), and scale
“arousal”, ranging from 1 (low arousal) to 9 (high arousal). Data were acquired with the SAM
original scales. In order to create a better comparability with the startle reflex data, the
valence scale was reversed for analysis (i.e. now ranging from 1, pleasant, to 9, unpleasant;
see Fig. 1 and all related notes in the text); please note this when comparing our findings with
other studies using the SAM.
Data Reduction and Statistical Preconditions
Data were processed by IBM SPSS-Statistics 19 (2010) software. Raw data of each
participant were averaged for stimulus category. Normal distribution was checked by
Kolmogorov Smirnov tests. Except for the HR data [K-S Z=1.075; p=0.198], these tests were
significant. Startle reflex and SCR magnitudes were T(z)-transformed to normalize the
distribution (T= 10 ∗ z + 50). Regarding the other measures, we solved this problem by
examining the results by Kruskal-Wallis or Man-Whitney U tests (analyzing these data
exclusively by non-parametric methods seemed to be problematic because of the worse
Page 11 of 64
Psychophysiology
Psychophysiology
123456789101112131415161718192021222324252627282930313233343536373839404142434445464748495051525354555657585960
interpretability and the worse comparability with the startle reflex data). To reduce
interindividual variability, the SCR values were additionally range-corrected by dividing each
individual´s score by the participant´s maximum response (Lykken, Rose, Luther, & Maley
,1966). Following Jaccard & Wan (1996), VAS scores were treated like metric data.
Data Analysis
Data were analysed by univariate variance analyses, ANOVAs, with group (AN vs.
CN) as the between-group factor and stimulus category (pleasant, neutral, unpleasant, body)
as the within-group factor, and main effects for group and interaction effects were computed.
As normalizing the data by T(z) transformation levels out any meaningful group differences
in absolute startle magnitude, we desisted from comparing T(z) scores between the groups.
Instead, a table with between-group comparisons for the raw data was included (Table 2).
Effects which were significant for SAM ratings and physiological measures were additionally
examined by multivariate tests (Wilk´s lambda). A-priori hypotheses about the single stimulus
categories were tested by the “pairwise comparisons” option in ANOVA. Following Schmitt
(1988), Bonferroni corrections were used only for post-hoc tests. In order to ensure a better
orientation, we marked the corrected p-values as pc. For all analyses, a p-level < 0.05 (two-
tailed) was defined as statistically significant.
Results
Group Characteristics
Compared to healthy participants, AN patients obtained a significantly lower BMI and
scored higher on the Eating Disorder Inventory EDI-2 and the Toronto Alexithymia Scale
TAS-26, but did not differ in age. All demographic and clinical characteristics of the samples
are displayed in Table 3.
Valence Hypotheses
Affective standard pictures. In a first step, hypotheses regarding the affective
standard pictures were tested by (3x2) ANOVAs with startle reflex (or SAM valence score) as
Page 12 of 64
Psychophysiology
Psychophysiology
123456789101112131415161718192021222324252627282930313233343536373839404142434445464748495051525354555657585960

the dependent variable and stimulus category (unpleasant, neutral, pleasant) and group (AN,
CN) as the independent variables. The results are summarized in Figure 1.
Hypothesis 1: We expect a decrease of the startle reflex magnitude from unpleasant over
neutral to pleasant cues in both groups. As predicted by hypothesis 1, we found a significant
main effect for the stimulus category [F(2,210)=17.7; p<0.001]: The startle reflex magnitude
was significantly higher for unpleasant pictures than for neutral pictures [F(1,284)=13.2;
p<0.001], and it was also significantly higher for neutral pictures than for pleasant pictures
[F(1,284)=4.1; p=0.045] in both groups; consequently, the unpleasant vs. pleasant comparison
was significant as well [F(1,284)=31.9; p<0.001]. No stimulus category x group interaction
effect was observed [F(1,210)=1; p=0.360].
Hypothesis 2: We expect a decrease of the SAM valence score (1: pleasant, 9: unpleasant)
from unpleasant over neutral to pleasant in both groups. Analysis of the SAM data revealed a
significant main effect for the stimulus category [F(2,210) =347.3; p<0.001]: the SAM score
was significantly higher for unpleasant pictures than for neutral pictures [F(1,284)=298.8;
p<0.001] and also for neutral pictures compared with pleasant ones in both groups
[F(1,284)=67.5; p<0.001] (for the sake of completeness, the values for the pleasant vs.
unpleasant comparison were: [F(1,284)= 650.3; p<0.001]). Comparable results were found by
Kruskal-Wallis test [φ²=160.2; p<0.001, asymp.] and after correcting for multivariate testing
(MANOVA; y: SAM score, startle magnitude; x: group, stimulus category) [F(4;418)=118.3;
p<0.001; exact test]. An unexpected interaction effect [F(2,210)=7.5; p=0.001] was found, i.e.
the patients showed a significantly smaller increase of the SAM score for the unpleasant
pictures [F(1,70)=4.5; pc=0.038] and a significantly less decrease for the pleasant pictures
(compared to neutral pictures) [F(1,70)=7.4 pc=0.008] than the controls did. However, as the
examination by Man-Whitney U tests replicated this group difference only for the unpleasant
pictures [U=416.5; pc=0.024], but not for the pleasant pictures [U=448.0; pc=0.069], this side-
result should be taken with care.
Page 13 of 64
Psychophysiology
Psychophysiology
123456789101112131415161718192021222324252627282930313233343536373839404142434445464748495051525354555657585960
Emaciated body pictures. In a second step, the main hypotheses regarding the body
pictures were tested, using (2x2) ANOVAs with stimulus category (body vs. neutral) and
group (AN, CN) as the independent variables. For overview, see Figure 1.
Hypothesis 3: We expect a decrease of the startle reflex magnitude (compared to neutral
cues) among the patients, but an increase among the controls while viewing emaciated body
cues. The overall analysis of body vs. neutral pictures resulted in a significant stimulus
category x group interaction effect [F(1,140)=9.5; p<0.01], which was in a line with
hypothesis 3. Among the patients, the startle reflex response elicited during the viewing of
emaciated bodies was significantly smaller than that elicited during the viewing of the neutral
[F(1,140)=4.6; p=0.030] and unpleasant pictures [F(1,140)=13.0; p<0.001], but not different
from that elicited during the viewing of the pleasant cues [F(1,140)<1]. The controls´
response, in contrast, was significantly larger than that for the neutral [F(1,140)=5.4; p=0.021]
and pleasant pictures [F(1,140)=9.6; p=0.002], but not as large as that for the unpleasant cues
[F(1,140)=4.4; p=0.038]. No main effect for stimulus category was found [F(1,140)<1].
Hypothesis 4: No such group difference is expected for the SAM valence score (1: pleasant, 9:
unpleasant), with both groups rating the emaciated body cues as negative relative to neutral
cues. In contrast to the startle reflex data, self-report answers did not reveal any stimulus
category x group interaction effect [F(1,140)=1.75; p=0.187]. Yet a significant main effect for
stimulus category (body vs. neutral) was observed [F(1,140)=593.1; p<0.001]. This effect was
significant also by Kruskal-Wallis tests [φ²= 105.9; p<0.001, asymp.]. Thus, the body pictures
scored significantly higher and were rated significantly more negatively than neutral pictures
in both groups [AN: F(1,140)=150.5; p<0.001; CN: F(1,140)=291.0; p<0.001]. The body vs.
pleasant comparison [F(1,140)=746.539; p<0.001] and the body vs. unpleasant comparison
[F(1,140)=7.791; p=0.005] were significant, too. This was also true for non-parametric
methods (Man-Whitney U tests: body vs. pleasant: [ U=36.0; p<0.001]; body vs. unpleasant:
[U=1922.5; p=0.007]; all tests exact).
Page 14 of 64
Psychophysiology
Psychophysiology
123456789101112131415161718192021222324252627282930313233343536373839404142434445464748495051525354555657585960

Arousal Hypotheses
The statistical tests were conducted analogously to hypothesis 1-4, but with SCR
(overall HR change, HR acceleration, HR deceleration, and SAM arousal score, respectively)
as the dependent variable. The results are summarized in Figure 2.
Affective standard pictures.
Hypothesis 5: We expect an increase of physiological arousal (SCR, overall HR change) for
pleasant and unpleasant cues relative to neutral cues in both groups. In contrast to our
expectations, analysis of the SCR data did not show any main effect for the stimulus category
[F(2,210)<1], i.e. comparably low SCR scores for pleasant, unpleasant, and neutral pictures
were observed. SCR data did not reveal any stimulus category x group interaction effect
[F(2,210)=2.372; p=0.096] and no main effect for the group [F(1,210)<1]. Yet, a significant
main effect for the stimulus category regarding the overall HR [F(2,162)=17.132; p<0.00]
with a significantly stronger decrease (relative to baseline) for unpleasant pictures than for
pleasant [F(1,110)=27.923 pc=0.002] and neutral pictures [F(1,110)=12.067; pc=0.002] was
found (the pleasant vs. neutral comparison did not reach the level of significance
[F(1,110)=3.319; pc=0.210]). This pattern was replicated by the component scores (i.e. we
found a significant increase of the HR deceleration [F(2,162)=17.132; p<0.001] and
significant decrease of the HR acceleration [(2,162)=6.754; p=0.002] from pleasant over
neutral to unpleasant). No group x stimulus category interaction effect was observed [overall
HR: F(2,162)=2.904; p=0.058, component scores: F(2,162)<1]. However, there was an
unexpected main effect for group with a significantly lower HR deceleration
[F(1,162)=27.745; p<0.001] in AN patients than in controls, and a significantly lower
decrease of the overall HR score relative to baseline [F(1,162)=27,75; p<0.001]) was found.
Hypothesis 6: We expect an increase of the SAM arousal score (1: low arousal; 9: high
arousal) for pleasant and unpleasant cues relative to neutral cues in both groups. The
analysis of the SAM arousal data revealed a significant main effect for the stimulus category
Page 15 of 64
Psychophysiology
Psychophysiology
123456789101112131415161718192021222324252627282930313233343536373839404142434445464748495051525354555657585960

[F(2,210)=108.541; p<0.001]
with a significantly enlarged self-reported arousal for the
pleasant and unpleasant pictures compared to the neutral cues. This effect was significant
even after examining the results by Kruskal-Wallis tests [φ²=81.105; p<0.001; asymp]. No
stimulus category x group interaction effect [F(2,210)=1.063 p=0.347] was found. Analogous
to the HR data, there was an unexpected main effect for group [F(1,210)=12.876; p<0.001]
with a significantly lower self-reported arousal in the patients than in the controls. This was
true even after examining the results by Man-Whitney U tests (U=3023.5; p=0.023) and after
correction for multivariate testing (y: overall HR change, SAM arousal score; x: group,
stimulus category) [F(2,166)=9.512; p<0.001; exact].
Emaciated body pictures
Hypothesis 7: We expect a comparable increase of physiological arousal (SCR, overall HR
change) (relative to neutral cues) during viewing of emaciated body cues in both groups. As
expected, analysis of the SCRs regarding the body vs. neutral pictures did not reveal any main
effect for group [F(1,140)<1], and no stimulus category x group interaction effect
[F(1,140)<1] was found. A significant main effect for the stimulus category was observed
[F(1,140)=13.975; p<0.001], i.e. SCR elicited by emaciated body pictures was significantly
larger than that elicited by neutral cues in both groups. This finding was replicated by non-
parametric methods (Man-Whitney U test, U=1692.5; p<0.001; exact]. In line with the
findings regarding the affective standard cues, HR data showed a significant main effect for
group [F(1,108)=31.029; p<0.001], i.e. a significantly lower HR deceleration
[F(1,108)=21.399; p<0.001] and a significantly lower decrease of the overall HR (relative to
baseline) in AN patients than in controls were found [F(1,108)=31.029; p<0.001]. No main
effects for the stimulus category (body vs. neutral) [overall HR score: F(1,108)=1.896;
p=0.171; component scores: F(1,108)<1] and no group x stimulus category interaction effects
were observed [for all HR scores: F(1,108)<1]. Yet, there was a significant interaction effect
for the body vs. positive comparison: in the controls, emaciated body cues (compared to
Page 16 of 64
Psychophysiology
Psychophysiology
123456789101112131415161718192021222324252627282930313233343536373839404142434445464748495051525354555657585960
pleasant cues) evoked a significantly stronger decrease of the overall HR relative to baseline
[F(1,54)=11.165; p=0.002] and a marginally stronger deceleration response [F(1,54)=2.401;
p=0.127]; in the patients, comparable low overall HR and deceleration responses for body vs.
pleasant cues were found [F(1,54)<1]. For the sake of completeness, we did not find any
significant interaction effect (body vs. pleasant) for the accelerative component [F(1,108)<1].
Hypothesis 8: We expect a comparable increase of the SAM arousal score (1: low arousal, 9:
high arousal) (relative to neutral cues) during viewing of emaciated body cues in both groups.
Analogous to the SCR data, SAM arousal scores showed a significant main effect for the
stimulus category [F(1,140)<287.162; p<0.001] : In both groups, a significant increase of self-
reported arousal for emaciated body cues compared to neutral pictures was found. This main
effect was significant even after correction by Man-Whitney U tests [U=2858; p<0.001] and
after correction for multivariate testing (y: SCR, SAM arousal score; x: group, stimulus
category) [F(2,139)=139.401; p<0.001] (all tests exact). No main effect for group
[F(1,140)=1.638; p=0.203] and no stimulus category x group interaction effect [F(1,140)<1]
were observed.
Potential Confounders
AN patients self-reported a significantly worse mood [F(1,70)=10.9; pc=0.002], a
higher arousal [F(1,70)=5.9; pc=0.017], and a significantly higher body dissatisfaction
[F(1,70)=36.1; pc<0.001] before the testing than healthy participants, but did not differ in
hunger [F(1,70)=1.3; pc=0.268]. To determine, whether one of these factors might have biased
the main results, we calculated (2x2) ANCOVAs analogous to step 2, i.e. with body vs.
neutral as main contrast for stimulus category. As expected, including these covariates did not
make any difference for the results: Main effects for stimulus category [SCR:
Fanc(1,136)=13.975; p<0.001; SAM valence score: Fanc(1,136)=577.5; p<0.001; SAM arousal
score: Fanc(1,136)=287.005; p<0.001] stayed significant, even if these covariates were
included. The same was true for the main effect for group regarding the HR scores [overall
Page 17 of 64
Psychophysiology
Psychophysiology
123456789101112131415161718192021222324252627282930313233343536373839404142434445464748495051525354555657585960

HR score: Fanc(1,102)=11,595 p=0.001; HR deceleration: Fanc(1,102)=11,629 p=0.001] and
for the group x stimulus category interaction effect regarding the startle reflex
[Fanc(1,136)=9.6; p<0.01] (only significant effects were reported).
Within the patient group, we controlled the influence of therapy duration and duration of the
eating disorder: for this, several one-way ANCOVAs with stimulus category (body vs.
neutral) as independent variable were calculated. Also here, the main effect for stimulus
category was significant, independently of whether the covariates were included or not [startle
reflex: Fanc(1;68)=4.4; p=0.040; SCR: Fanc(1,68)=8.277; p=0.005; SAM valence score:
Fanc(1,68)=226.1, p<0.001; SAM arousal score: Fanc(1,68)=145.268; p<0.001].
Page 18 of 64
Psychophysiology
Psychophysiology
123456789101112131415161718192021222324252627282930313233343536373839404142434445464748495051525354555657585960
Discussion
As opposed to previous investigations, which deal with the issue of thin ideal
internalization, this study uses a body cue which is aversive for healthy people (Ito & Lang
1998; Rand et al., 1997): bodies with projecting ribs, hips and cheekbones, sunken cheeks and
abdomen, which are indicative of cachexia. As expected, the results revealed a strikingly
different physiological processing of this stimulus type in both groups.
Valence hypotheses. Healthy participants showed a significant startle potentiation
while being exposed to emaciated bodies. In contrast to that, a significant startle inhibition
was found among AN patients, and the extent of this response was as strong as the one while
viewing of pleasant cues, denoting that the pictures were substantially appealing to anorexic
viewers. This is consistent with findings regarding other addictions (Rohsenow et al., 1990,
for review) and with observations in “Pro Ana” forums (Overbeke, 2008). However, it is in
contrary to findings of previous studies in AN (Cserjesi et al., 2010; Friederich et al., 2006) as
well as the first evidence for automatic appetitive reactions on addiction-specific stimuli in
AN at all. No group difference in general emotional functioning or situational factors, which
might have biased the body cue results, were found. Therapy duration and duration of the
eating disorder did not have any influence on the body cue results either.
No appetitive response, but an aversive one, was found on self-report level, with both
groups rating emaciated body pictures as negative. This discrepancy might be explained as
follows: the patients might have been “unaware” of their automatically activated appetitive
reactions, or, “if aware”, not have been “willing to express them but [have been]… rather
motivated to hide or suppress them in fear of amplified social stigmatization.” (Degner &
Wentura, 2009, p. 215). Berridge (1996) spoke of a discrepancy between “wanting”
(motivation to starve) and “liking” (knowledge of the negative consequences of starving and
of the fact that emaciation is not generally considered beautiful). This conflict is characteristic
for substance dependencies as well, such as for alcoholics, who also want to drink, although
Page 19 of 64
Psychophysiology
Psychophysiology
123456789101112131415161718192021222324252627282930313233343536373839404142434445464748495051525354555657585960
they do not really like the taste or smell and despite knowing the health-damaging effects of
drinking (Mucha et al., 2000). Nevertheless, explaining the phenomenon by social desirability
effects seems to be the more obvious choice, if we regard the setting (in-patient) and the fact,
that denial of illness, non-compliance, and social desirable answering tendencies are often
observed in patients with AN (Vandereycken, 2006).
Arousal hypotheses. In line with Lang (1995), whereupon appetitive reactions (as
observed in AN) and aversive reactions (as observed in CN) necessitate an at least moderately
high arousal degree, a significant increase of physiological (SCR) and self-reported arousal
while viewing emaciated bodies was found. This might explain, why emaciated body cues
evoked an appetitive reaction among the patients, while idealized slim body cues did not:
magazine pictures might have been simply not exciting enough for the patients to activate
their appetitive motivational system. Addictive cues for substance dependencies are usually
high arousal-provoking, too (Childress et al, 1992; Niaura et al, 1988). An unexpected
differential effect regarding the HR data was observed. Healthy controls showed a significant
HR deceleration during viewing of the body cues, which was as strong as the one while
viewing of unpleasant cues (in line with Lang, 1995, whereupon a sustained deceleratory
response is indicative for this picture type). In the patients, in contrast, no HR deceleration,
but a comparable response as observed during viewing of the pleasant cues was found. Even
if this finding seems to support the startle reflex results, it should be taken with care. 18 % of
the HR data was defective due to technical problems. The number of pictures which was used
for the arousal analysis was very low (see Table 1). Most important, this effect was not
specific for the body cues, but an overall reduced deceleratory response for AN vs. CN was
found. This suggests, that differences in general arousal (possibly influenced by somatic
characteristics such as bradycardia, which is a well-known side-effect of continuous starving)
(Casiero & Frishman, 2006; Portilla, 2011) might have been an influencing factor.
Page 20 of 64
Psychophysiology
Psychophysiology
123456789101112131415161718192021222324252627282930313233343536373839404142434445464748495051525354555657585960
Affective standard pictures. Although valence scores (startle reflex, SAM valence
score) and arousal scores (overall HR change, SAM arousal score) separated significantly
between the neutral and unpleasant cues, no significant neutral vs. pleasant comparison was
found (an exception was only the SAM valence score). This might have been due to the
stimulus choice, as pictures which usually provoke high physiological arousal had to be
excluded to adhere to the criteria of youth protection. The choice of the method might have
played a role as well: Even if there is much evidence that the startle reflex magnitude is
significantly larger for unpleasant pictures than for pleasant pictures, many studies failed to
find a startle attenuation for pleasant pictures relative to neutral ones. Regarding the SCR
results (no significant pleasant vs. neutral and no significant neutral vs. unpleasant
comparison), the method of data acquisition might have contributed to the problem, too: SCR
response peaks were scored in the time window between 900 ms and 4000 ms after picture
onset. Prior research, however, showed that the peak of an SCR response can occur within a
window of 0.5 – 5 sec following response onset. It seems possible that this shortened scoring
window could have artificially lowered the SCR values observed. Hence, our results should
be examined by other measures that do not exhibit these problems.
Implications
In this study, we have confirmed for the first time that extremely emaciated body pictures, in
analogy to addictive cues from addiction disorders, evoke automatic appetitive reactions in
adolescents and young adults with AN, but aversive reactions in healthy controls. No index on
an overall down-regulation of the appetitive motivational system in AN (Friederich, 2006)
was found. The assumed special role of AN within addiction research and especially the
presumption that AN would have more similarities (on the motivational level) with anxiety
and obsessive disorders than with addiction disorders (Friederich et al., 2006) appears
therefore at least doubtful. Possibilities for a practical application of the startle reflex
paradigm in AN later on are given: the startle reflex inhibition towards addictive cues is a
Page 21 of 64
Psychophysiology
Psychophysiology
123456789101112131415161718192021222324252627282930313233343536373839404142434445464748495051525354555657585960

worth-wile prognostic parameter (Childress et al., 1992; Loeber et al., 2007), a measure for
treatment effects, and a measure for the effects of exposure therapy beyond the level of self-
report (Mauler, 2006, p.577).
Our results take a new glance at the fear of weight gain vs. drive for thinness debate:
the fear of weight gain theory (Vartanian et al., 2005) proposes that starving primarily serves
as a “tool” to reduce the fear of being or becoming fat (Cserjesi, 2010). The drive for thinness
theory (Thompson & Stice, 2001) also involves a strong motivation to approximate to a
specific body ideal. Our study raises doubts for the exclusive validity of the fear of weight
gain theory. Moreover, it also casts doubts on the common interpretation of the drive for
thinness theory. Since pictures of extremely emaciated bodies provoked an appetitive reaction
among the patients, while pictures of idealized slim bodies did not (Friederich et al., 2006),
one might assume that the role-model function of the often criticized mass media pictures for
anorexic adolescents is not as wide as expected, and that AN patients rather pursue a specific,
extremely cachectic body ideal. As a consequence, AN therapy should abstain from unilateral
focusing on the aspect of weight phobia: in addition to negative learning experiences and
negative role-models (Vartanian et al., 2005), therapists should focus on the rewards or
hedonic values, which the patient might draw from starving, as well as the positive learning
experiences and positive role-models, which might have reinforced the drive to reach an
extremely emaciated body. Unfortunately, “Pro Ana” forums provide, in this respect, an
almost optimal learning environment. This not only includes the way emaciation is portrayed
or how far weight-loss is linked to positive consequences (social support and positive weight-
related comments by others, “rewarding points” for weight loss in “weight contests”), but also
the community-specific obligation to post daily messages in the forums (Overbeke, 2008., for
review) - in this context, a good precondition for successful learning.
Limitations
Page 22 of 64
Psychophysiology
Psychophysiology
123456789101112131415161718192021222324252627282930313233343536373839404142434445464748495051525354555657585960

The results are limited as follows. Firstly, we investigated adolescents and young
adults and cannot generalize for older patients. Secondly, we did not have a comparison group
of non-eating disordered underweight females. Thus, we cannot exclude that the results reflect
a weight-related in-group effect (first described by Degner & Wentura (2009) in a study
regarding overweight females). Thirdly, all patients were in contact with their anorexic fellow
patients, which might have led to a certain habituation to cachectic bodies. The unbalanced
number of pictures should be addressed (12 body, but 9 in each standard category). In general,
averaging over a higher number of presentations could artificially produce a lower startle
response because of habituation. This effect, however, is only relevant if the picture type is
blocked, but not if the pictures of the different stimulus categories are intermingled, as it was
done in our study. Finally, we must mention the cross-sectional design (no valid information
about the temporary stability of the observed effects) and the limited ecologic validity of the
setting.
Summary and Directions for Future Studies
This study is, to the best of our knowledge, the first to examine emotional reactions to
extremely emaciated body pictures in AN measured by the startle reflex paradigm, and the
first to do so with picture material from “Pro Ana” forums. Our data show that extremely
emaciated body pictures, similarly to addictive cues from addiction disorders, evoke
automatic appetitive reactions in patients with AN, but aversive reactions in healthy
individuals. No group difference, but comparably high aversion ratings were found in self-
reports. These findings suggest that a distorted positive view of extreme emaciation is a
relevant motivational factor for self-initiated starving, and that exposure to accordant body
cues (“thinspiration” galleries) evokes the drive to reach this extremely emaciated body ideal.
Future studies should aim to find out how this positive view on emaciation might have
developed, and whether it is rather a precondition or a consequence of the disorder.
Additionally, research should address the possibility of influencing these response patterns
Page 23 of 64
Psychophysiology
Psychophysiology
123456789101112131415161718192021222324252627282930313233343536373839404142434445464748495051525354555657585960
and the (therapeutic) conditions needed thereby. Further approaches for studies are the context
dependency (such as anti-recovery vs. preventive context), the behavioral relevance, and the
potential prognostic value of the findings.
Page 24 of 64
Psychophysiology
Psychophysiology
123456789101112131415161718192021222324252627282930313233343536373839404142434445464748495051525354555657585960

Tables and Figures
Table 1: Block Design for the four Stimulus Categories
Stimulus Category With Noise Without Noise Overall Number
Unpleasant Pictures 9 (A: 4; B: 5) 3 (A: 2; B: 1) 12 (A: 6; B: 6)
Neutral Pictures
9 (A: 5; B: 4) 3 (A: 1; B: 2) 12 (A: 6; B: 6)
Pleasant Pictures 9 (A: 4; B: 5) 3 (A: 2; B: 1) 12 (A: 6; B: 6)
Emaciated Body Pictures 12 (A: 6; B: 6) 4 (A: 2; B: 2) 16 (A: 8; B: 8)
Overall Number 39 (A:19; B:20) 13 (A: 7; B: 6) 52 (A:26; B:26)
Table 1. The 52 stimuli were presented in two blocks (A, B) with a 15 minutes break in
between. Three quarters of the pictures were accompanied by the presentation of a startle-
eliciting noise. The pictures without noise were used for the acquisition of the arousal data.
Table 2: Between-Group Comparisons for the Raw Data
AN Patients Controls, CN AN vs. CN
(n=36) (n=36) p
Startle Reflex Magnitude (µV) 0.508 (0.028) 0.558 (0.027) 0.189
SCR Magnitude (µS) 0.212 (0.053) 0.218 (0.044) 0.933
Mean HR (bpm) 73.53 (2.222) 74.78 (1.138) 0.411
SAM Valence Score 4.832 (0.181) 4.875 (0.215) 0.878
SAM Arousal Score 3.898 (0.199) 4.574 (0.218) 0.023*
Table 2. SCR, Skin Conductance Response; HR, Heart Rate; SAM, Self Assessment Manikin;
Data were averaged over the three standard picture categories. Values are means and standard
errors. Group comparison t-test (two-tailed). Bonferroni corrections for multiple t-tests were
performed: * p < 0.05.
Table 3: Demographic and Clinical Characteristics of the Samples
AN Patients Controls, CN AN vs. CN
(n=36) (n=36) p
Age (years) 15.9 (2.0) 16.1 (1.7) 0.660
BMI (kg/m²)
15.8 (1.4) 20.5 (2.0) < 0.001 ***
TAS-26 Score 43.9 (8.3) 38.1 (8.3) 0.026 *
EDI-2 Overall Score 172.3 (37.5) 120.4 (25.5) 0.043 *
Scale Body Dissatisfaction 30.7 (10.3) 22.5 (7.9) 0.013 *
Scale Drive for Thinness 20.7 (11.0) 13.21 (3.4) 0.033 *
Table 3. TAS-26, Toronto-Alexithymia-Scale; EDI-2, Eating Disorder Inventory;
Values are means and standard deviations; group comparison t-test (two-tailed);
Bonferroni corrections for multiple t-tests were performed: * p < 0.05; *** p < 0.001.
Page 25 of 64
Psychophysiology
Psychophysiology
123456789101112131415161718192021222324252627282930313233343536373839404142434445464748495051525354555657585960
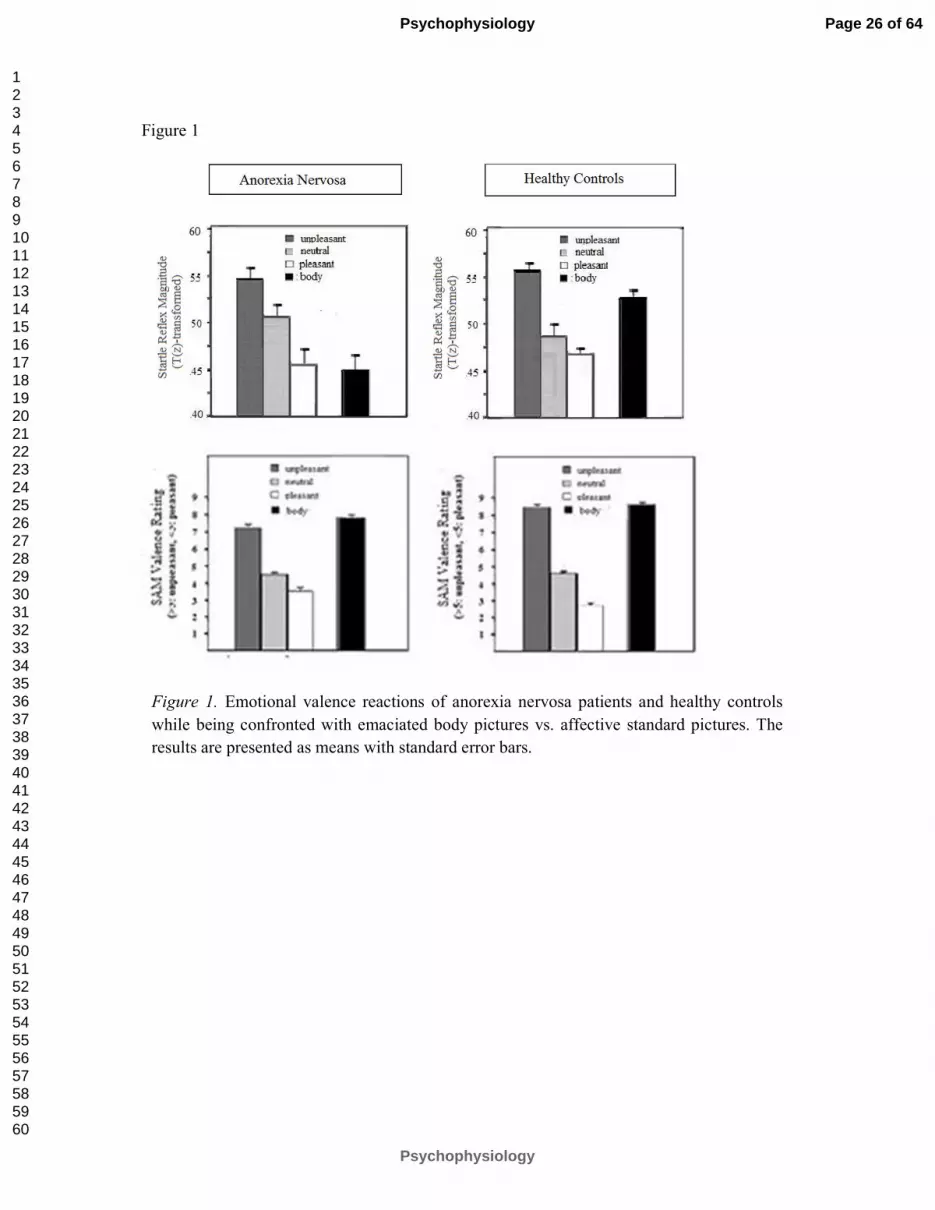
Figure 1
Figure 1. Emotional valence reactions of anorexia nervosa patients and healthy controls
while being confronted with emaciated body pictures vs. affective standard pictures. The
results are presented as means with standard error bars.
Page 26 of 64
Psychophysiology
Psychophysiology
123456789101112131415161718192021222324252627282930313233343536373839404142434445464748495051525354555657585960

Figure 2
.
Figure 2. Emotional arousal reactions of anorexia nervosa patients and healthy controls while
being confronted with emaciated body pictures in comparison to the three standard categories.
The results are presented as means with standard error bars.
Page 27 of 64
Psychophysiology
Psychophysiology
123456789101112131415161718192021222324252627282930313233343536373839404142434445464748495051525354555657585960

References
American Psychiatric Association (2000). Diagnostic and statistical manual for mental
disorders, 4th ed., text rev., Washington, DC: American Psychiatric Press. doi:
10.1176/appi.books.9780890423349
Bardone-Cone, A. M., & Cass, K. M. (2006). Investigating the impact of pro-anorexia
websites: A pilot study. European Eating Disorders Review, 14, 256–262. doi:10.1002
/erv.714.
Berridge, K. C. (1996). Food reward: Brain substrates of wanting and liking. Neuroscience &
Biobehavioral Reviews, 20, 1–25. doi:10.1016/0149-7634(95)00033-B.
Blumenthal, T. D., Cuthbert, B. N., Filion, D. L., Hackley, S., Lipp, O. V., & van Boxtel, A.
(2005). Committee report: Guidelines for human startle eyeblink electromyographic
studies. Psychophysiology, 42, 1-15. doi:10.1111/j.1469-8986.2005.00271.x.
Bradley, M. M., Lang, P. J. (1994). Measuring Emotion: The Self-Assessment Manikin and
the Semantic Differential. Journal of Behavior Therapy und Experimental Psychiatry,
Bradley, M. M., Gianaros, P., & Lang, P. J. (1995). As time goes by: Stability of affective
startle modulation [Abstract]. Psychophysiology, 32, 521.
Cash, T. F., & Deagle, E. A. (1997). The nature and extent of body-image disturbances in
anorexia nervosa and bulimia nervosa: A meta-analysis. International Journal of
Eating Disorders, 22(2), 107-125. doi:10.1002/(SICI)1098-108X(199709)22:2<107::
AID-EAT1>3.0.CO;2-J.
Casiero, D. & Frishman, W. H. (2006). Cardiovascular complications of eating disorders.
Cardiology in Review, 14(5), 227-231. doi:10.1097/01.crd.0000216745.96062.7c.
Childress, A. R., Ehrman, R., Rohsenow, D. J., Robbins, S. J., & O’Brien, C. P. (1992).
Classically conditioned factors in drug dependence. In J. H. Lowinson, P. Ruiz, R. B.
Millman, & J. G. Langrod (Eds.), Substance abuse: A comprehensive textbook (pp.
56-69). Baltimore: Williams & Wilkins.
Page 28 of 64
Psychophysiology
Psychophysiology
123456789101112131415161718192021222324252627282930313233343536373839404142434445464748495051525354555657585960

Cserjési, R., Vermeulen, N., Luminet, O., Marechal, M., Nef, F., Simon, Y., & Lénárd, L.
(2010). Explicit vs. implicit body image evaluation in restrictive anorexia nervosa.
Psychiatry Research, 175, 148–153. doi:10.1016/j.psychres.2009.07.002.
Cuthbert, B. N., Bradley, M. M., & Lang, P. J. (1990). Valence and arousal in startle
modulation. Psychophysiology, 27(Suppl.), 24.
Davis M., Falls, W.A., Campeau, S., & Kim, M. (1993). Fear-potentiated startle: A neural and
pharmacological analysis. Behavioral Brain Research 58: 175-198. doi:10.1016/0166-
4328(93)90102-V.
Degner, J., & Wentura, D. (2009). Not everybody likes the thin and dislikes the fat: One´s
weight matters in the automatic activation of weight-related social evaluations. Social
Cognition, 27(2), 202-221. doi:10.1521/soco.2009.27.2.202.
Friederich, H. C., Kumari, V., Uher, R., Riga, M., Schmidt, U., Campbell, I. C., Herzog, W.,
… Treasure, J. (2006). Differential motivational responses to food and pleasurable
cues in anorexia and bulimia nervosa: A startle reflex paradigm. Psychological
Medicine, 36(9), 1327-1335. doi:10.1017/S0033291706008129.
Gavin, J., Rodham, K., & Poyer, H. (2008). The presentation of "pro-anorexia" in online
group interactions. Qualitative Health Research, 18(3), 325-333. doi:10.1177/1049732
307311640.
Geier, A., Mucha, R. F., & Pauli, P. (2000). Appetitive nature of drug cues confirmed with
physiological measures in a model using pictures of smoking. Psychopharmacology,
150, 283–291. doi:10.1007/s002130000404.
George, L. (1997). The psychological characteristics of patients suffering from anorexia
nervosa and the nurse´s role in creating a therapeutic relationship. Journal of
Advanced Nursing, 26(5):899-908. doi:10.1046/j.1365-2648.1997.00421.x.
Page 29 of 64
Psychophysiology
Psychophysiology
123456789101112131415161718192021222324252627282930313233343536373839404142434445464748495051525354555657585960

Graham, F. K. (1978). Constraints in measuring heart rate and period sequentially through
real and cardiac time. Psychophysiology, 15, 492–495. doi:10.1111/j.1469-8986.1978.
tb01422.x.
Haas, S. M., Irr, M. E., Jennings, N. A., & Wagner, L. M. (2011). Communicating thin: A
grounded model of Online Negative Enabling Support Groups in the pro-anorexia
movement. New Media & Society, 13(1), 40-57. doi:10.1177/1461444810363910.
Ito, T. A. & Lang, P. J. (1998). Eliciting affect using the International Affective Picture
System: Trajectories through evaluative space. Personality and Social Psychology
Bulletin, 24(8), 855-879. doi:10.1177/0146167298248006.
Jaccard, J., & Wan, C. K. (1996). LISREL approaches to interaction effects in multiple
regression. Thousand Oaks, CA: Sage Publications.
Lang, P.J. (1995). The emotion probe. Studies of motivation and attention. American
Psychology, 50, 372–385. doi:10.1037/0003-066X.50.5.372.
Lang, P. J., Bradley, M. M., & Cuthbert, B. N. (2008). International affective picture system
(IAPS): Affective ratings of pictures and instruction manual. Technical Report A-8.
Florida, Gainsville: University of Florida.
Levitt, D. H. (2003). Drive for thinness and fear of fat: Separate yet related constructs? Eating
Disorders: The Journal of Treatment and Prevention, 11, 221–
234. doi:10.1080/10640 260390218729.
Loeber, S., Croissant, B., Nakovics, H., Zimmer, A., Georgi, A., Klein, S., Diener, C., …
Flor, H. (2007). The startle reflex in alcohol-dependent patients: Changes after
cognitive-behavioral therapy and predictive validity for drinking behavior. A pilot
study. Psychotherapy and Psychosomatics, 76(6), 385-390. doi:10.1159/000107567.
Lykken, D. T.. Rose, R.. Luther, B., & Maley, M. (1966). Correcting psychophysiological
measures for individual differences in range. Psychological Bulletin 66, 481-484. doi:
10.1037/h0023922.
Page 30 of 64
Psychophysiology
Psychophysiology
123456789101112131415161718192021222324252627282930313233343536373839404142434445464748495051525354555657585960
Mauler, B. I., Hamm, A. O., Weike, A. I., & Tuschen-Caffier, B. (2006). Affect regulation
and food intake in bulimia nervosa: Emotional responding to food cues after
deprivation and subsequent eating. Journal of Abnormal Psychology, 115(3), 567-579.
doi:10.1037/0021-843X.115.3.567.
Mucha, R. F., Geier, A., Stuhlinger, M., & Mundle, G. (2000). Appetitive effects of drug cues
modeled by pictures of the intake ritual: Generality of cue-modulated startle examined
with inpatient alcoholics. Psychopharmacology, 151, 428–432. doi:10.1007/s0021300
00508.
Niaura, R.S., Rohsenow, D.J., Binkoff, J.A., Monti, P.M., Pedraza, M., Abrahams, D.B.
(1988). Relevance of cue reactivity to understanding alcohol and smoking relapse.
Journal of Abnormal Psychiatry, 97. 133-152. doi:10.1037/0021-843X.97.2.133.
Norris, M. L., Boydell, K. M., Pinhas, L., & Katzman, D. K. (2006). Ana and the Internet: A
review of pro-anorexia websites. International Journal of Eating Disorders, 39, 443–
447. doi:10.1002/eat.20305.
Overbeke G. (2008). Pro-anorexia websites: Content, impact, and explanations of popularity.
Mind Matters: The Wesleyan Journal of Psychology, 3, 49-62. Retrieved from http://
http://www.wesleyan.edu/psyc/mindmatters/volume03/article05.pdf.
Rand, C. S., Resnick, J. L., & Seldman, R. S. (1997). Assessment of socially acceptable body
sizes by university students. Obesity Research, 5(5), 425-429. doi:10.1038/oby
Rohsenow, D. J., Niaura, R. S., Childress, A. R., Abrams, D. B., & Monti, P. M. (1990). Cue
reactivity in addictive behaviors: Theoretical and treatment implications. International
Journal of Addictions, 25(7A-8A), 957-993. doi:10.3109/10826089109071030.
Ryle, A., & Evans, C. D. (1991). Some meanings of body and self in eating disordered and
comparison subjects. British Journal of Medical Psychology, 64(3), 273-283. doi:10.1
111/j.2044-8341.1991.tb01666.x.
Schmidt D. R. (1988). The use of a priori techniques with a MANOVA. Paper presented at
Page 31 of 64
Psychophysiology
Psychophysiology
123456789101112131415161718192021222324252627282930313233343536373839404142434445464748495051525354555657585960

the Annual Meeting of the Mid-South Educational Research Association (17th),
Louisville, KY.
Strife, S. R. & Rickard, K. (2011). The conceptualization of anorexia: The Pro-Ana
perspective. Affilia, 26(2), 213-217. doi:10.1177/0886109911405592.
Thiel, A., Jacobi, C., Horstmann, S., Paul, T., Nutzinger, D. O., & Schüssler, G. (1997). Eine
deutschsprachige Version des Eating Disorder Inventory EDI-2. [A german version of
the Eating Disorder Inventory EDI-2]. Psychotherapie, Psychosomatik, Medizinische
Psychologie, 47(9-10), 365-376.
Thompson, J.K., & Stice, E. (2001). Thin-ideal internalization: Mounting evidence for a new
risk factor for body-image disturbance and eating pathology. Current Directions in
Psychological Science, 10, 181–183. doi:10.1111/1467-8721.00144
Uher, R., Murphy, T., Friederich, H. C., Dalgleish, T., Brammer, M. J., Giampietro, V., &
Phillips, M. L. (2005). Functional neuroanatomy of body shape perception in healthy
and eating disordered women. Biological Psychiatry, 58, 990–997. doi:10.1016/j.biops
ych.2005.06.001.
Vandereycken, W. (2006). Denial of illness in anorexia nervosa – a conceptual review: Part 1
diagnostic significance and assessment. European Eating Disorders Review,
14(5):341-351. doi:10.1002/erv.721.
Vartanian, L. R., Herman, P. C., & Polivy, J. (2005). Implicit and explicit attitudes toward
fatness and thinness: The role of the internalization of societal standards. Body Image,
2(4), 373–381. doi:10.1016/j.bodyim.2005.08.002.
Zonnevylle-Bender, M. J. S., van Goozen, S. H. M., Cohen-Kettenis, P. T., Jansen, L. M. C.,
van Elburg, A., van Engeland, H. (2004). Adolescent anorexia nervosa patients have a
discrepancy between neurophysiological responses and self-reported emotional
arousal to psychosocial stress. Psychiatry Research, 15, 135 (1):45-52. doi:
10.1177/0145445507309027.
Page 32 of 64
Psychophysiology
Psychophysiology
123456789101112131415161718192021222324252627282930313233343536373839404142434445464748495051525354555657585960
“Glass Fairies” and “Bone Children":
Adolescents and Young Adults with Anorexia Nervosa do show Positive Reactions
towards Extremely Emaciated Body Pictures measured by the Startle Reflex Paradigm.
Valeska A. Reichel1, Nora Schneider
1,2, Barbara Grünewald
3,
Thorsten Kienast4, Ernst Pfeiffer
1, Ulrike Lehmkuhl
1, & Alexander Korte
1,3
1 Department of Child and Adolescent Psychiatry and Psychotherapy,
Charité Universitätsmedizin Berlin, Germany
2 Cognitive Science Nutrition & Health Department, Nestec Ltd,
Nestlé Research Center, Lausanne, Switzerland
3Department of Child and Adolescent Psychiatry and Psychotherapy,
Klinikum der Universität München LMU, Munich, Germany
4Department of Psychiatry and Psychotherapy,
Charité Universitätsmedizin Berlin, Germany
Corresponding authors:
Dipl. Psych. Valeska A. Reichel Dr. med. Alexander Korte
Phone: + 49 (0)30 896 44 862 Phone: + 49 (0)89 5160 5903
Mobil: + 49 (0)151 177 56856 Fax: + 49 (0)89 5160 5904
e-mail: [email protected] e-mail: [email protected]ünchen.de
Page 33 of 64
Psychophysiology
Psychophysiology
123456789101112131415161718192021222324252627282930313233343536373839404142434445464748495051525354555657585960
Abstract
OBJECTIVE. In this study we investigated the emotional processing of extremely emaciated
body cues in adolescents and young adults with (n=36) and without (n=36) anorexia nervosa
(AN), introducing a new picture type, which was taken from websites that promote extreme
thinness and is targeted specifically at adolescents interested in extreme thinness.
METHOD. A startle reflex paradigm was used for implicit reactions, while a self-assessment
instrument was used for subjective responses.
RESULTS. We found a significant group difference with a startle inhibition (appetitive
response) among the patients and a startle potentiation (aversive response) among the
controls, whereas no such difference for subjective measures was found.
DISCUSSION. The results are in contrast to previous studies, which proposed a general
failure to activate the appetitive motivational system in AN, but in keeping with findings from
other addictions, where the same response pattern has been found. Implications for prevention
and therapy are discussed.
Page 34 of 64
Psychophysiology
Psychophysiology
123456789101112131415161718192021222324252627282930313233343536373839404142434445464748495051525354555657585960

“Glass Fairies” and “Bone Children”
Anorexia nervosa (AN) can most easily be described as a pattern of self-starvation
resulting in extreme weight loss. As key motivation, two motivational states are discussed
(Levitt, 2003): An exaggerated drive to meet the mass media-propagated, general thin ideal
(Thompson & Stice, 2001) and an obsessive fear of gaining weight (Vartanian, Herman, &
Polivy, 2005), each of them mentioned in the ICD-10 in the context of the distorted self-
perception (Cash & Deagle, 1997), which is an obligatory diagnosis criterion of AN
(American Psychiatric Association, 2000). Questionnaire data reveal that the patients show
both, an exaggerated fear of weight gain and an exaggerated drive for thinness (Thiel, 1997).
Accordingly, an aversive response to pictures of fat bodies was found (Cserjesi et al., 2010;
Uher et al., 2005). An appetitive response to slim body cues, however, could not yet be
confirmed neither for self-report nor for implicit measures such as startle reflex paradigms
(Friederich et al., 2006), priming paradigms (Cserjesi et al., 2010), or paradigms based on
repertory grids (Ryle & Evans, 1991). Because of these findings, most authors assume that the
predominant motivational factor in AN is to avoid the fear of becoming fat, and that the drive
to approach a specific thin ideal plays an inferior role (Cserjesi et al., 2010). In fact, an overall
down-regulation of the appetitive motivational system is being discussed (Friederich et al.,
2006). An alternative hypothesis might be that the body cues, used so far, were not extreme,
exciting and/ or AN-specific enough to activate the appetitive motivational system of the
patients.
A preliminary support for this hypothesis is given in „Pro Ana” forums. These
websites are increasingly more popular among anorexic adolescents and young adults
(Overbeke, 2008, for review). Thinspiration galleries, i.e. “inspirational photo galleries …
that aim to serve as motivators for weight loss” (see Norris, Boydell, Pinhas, & Katzman,
2006, p. 443), are a common component of these websites, and the contents are strikingly
deviant from what is the general understanding of a perfect body: Instead of typical magazine
Page 35 of 64
Psychophysiology
Psychophysiology
123456789101112131415161718192021222324252627282930313233343536373839404142434445464748495051525354555657585960
pictures these galleries depict extremely emaciated, real anorexic girls or photo-shop-distorted
waif-like models. Instead of classical beauty attributes, features like projecting ribsdges, hip-
and cheekbones, sunken cheeks and abdomen, which are associated with extreme cachexia
(life-threatening final state of weight loss, which cannot be reversed nutritionally) are
highlighted (Bardone-Cone & Cass, 2006). In studies using the International Affective Picture
System (IAPS) (Lang, Bradley, & Cuthbert, 2008), healthy people reacted aversively and with
(moderately) high arousal to pictures of starving people (see Ito & Lang, 1998, p. 860). Rand,
Resnick, & Seldman (1997) showed that, when assessed by healthy females, extremely
underweight shapes on a figure rating scale were rated as negative and socially undesirable as
extremely overweight shapes. Yet, inside the „Pro Ana” logic, the glorification of cachexia
and its re-interpretation as a “thin ideal” play a central role (Strife & Rickard, 2011), and
community names such as “glass fairies”, “feather girls”, or “bone children” suggest that this
positive re-interpretation is part of the forum identity and also serves as the in-group vs. out-
group differentiation in the forums (Haas, Irr, Jennings, & Wagner, 2011).
Objective and Hypotheses
The current study aimed to introduce extremely emaciated body pictures as a new
stimulus type, and to re-evaluate with this new stimulus whether adolescents and young adults
with AN as compared to healthy controls (CN) show an appetitive reaction or not. In order to
provide a relevant baseline for assessing the emotional reactions, the emaciated body images
were intermixed with images from a standardized affective image set. Accordant to Lang´s bi-
dimensional theory of emotions (1995), two basic components of emotional reactions were
considered: 1. A valence component, ranging from appetitive reactions (like those we
expected for AN patients while viewing emaciated body cues) to aversive reactions (like those
we expected for healthy adolescents). 2. An arousal component, ranging from low emotional
arousal to high arousal (because appetitive reactions and aversive reactions both go along with
an increased arousal response, we expected a comparable arousal increase in both groups).
Page 36 of 64
Psychophysiology
Psychophysiology
123456789101112131415161718192021222324252627282930313233343536373839404142434445464748495051525354555657585960
To assess an objective, involuntary, physiological indicator of emotional valence, a startle
eyeblink-reflex was recorded while viewing images. This paradigm is well-known in
addiction research: since the noise-elicited startle reflex increases for unpleasant pictures and
decreases for pleasant pictures relative to neutral ones (Cuthbert et al., 1990), it is a reliable
measure for emotional reactions, which the individual is not conscious of or which the
individual wants to hide or to suppress. Alcohol addicts, for example, who were confronted
with drinking cues, classified them as subjectively aversive. However, they showed an
appetitive reaction by their startle reflex (Mucha, Geier, Stuhlinger, & Mundle, 2000).
Analogous observations were made in patients with illegal drug abuse (Rohsenow, 1990) and
bulimia nervosa (Friederich et al., 2006). To assess an objective indicator of emotional
arousal, we recorded the overall HR change and SCR. Increased SCR was found in nicotine
and alcohol addicts after being confronted with substance specific cues (Childress, 1992;
Niaura, 1988). In smoking addicts, who were confronted with smoking cues, an increase of
overall heart rate change was observed (Childress, 1992).
Given these methodological preconditions, we can specify our hypotheses as follows
(the scales of the Self-Assessment Manikin, SAM, were used as self-report measure):
Valence Hypotheses
Hypothesis 1: We expect a decrease of the startle reflex magnitude from unpleasant through
neutral to pleasant cues in both groups (Cuthbert et al., 1990).
Hypothesis 2: We expect a decrease of the SAM valence score (1: pleasant, 9: unpleasant)
from unpleasant through neutral to pleasant cues in both groups (Cuthbert et al., 1990).
Hypothesis 3: We expect a decrease of the startle reflex magnitude (relative to neutral cues)
among the patients, but an increase among the controls while viewing emaciated body cues.
Hypothesis 4: No such group difference is expected for the SAM score, with both groups
rating the emaciated body cues as negative relative to neutral cues.
Arousal Hypotheses
Page 37 of 64
Psychophysiology
Psychophysiology
123456789101112131415161718192021222324252627282930313233343536373839404142434445464748495051525354555657585960

Hypothesis 5: We expect an increase of physiological arousal (SCR, overall HR change) for
pleasant and unpleasant cues relative to neutral cues in both groups (Cuthbert, 1990).
Hypothesis 6: We expect an increase of the SAM arousal score (1: low arousal; 9: high
arousal) for pleasant and unpleasant relative to neutral cues in both groups (Cuthbert, 1990).
Hypothesis 7: We expect Emaciated body cues (compared to neutral pictures) evoke a
comparable increase of physiological arousal (SCR, overall HR change) for emaciated body
cues relative to neutral cues in both groups..
Hypothesis 8: We Emaciated body cues (compared to neutral pictures) evoke a comparable
increase of the SAM expect arousal score (1: low arousal; 9: high arousal) for emaciated body
cues relative to neutral cues in both groups..
Page 38 of 64
Psychophysiology
Psychophysiology
123456789101112131415161718192021222324252627282930313233343536373839404142434445464748495051525354555657585960

Method
Participants
A total of 72 female adolescents and young adults (36 AN, 36 CN) participated in the
study. Both groups were matched for age (14 to 21 years) and education (high school).
Hearing or visual impairments, neurological disease or medication with influence on the
startle reflex such as diazepam, morphine, and buspirone (Davis, Falls, Campeau, & Kim,
1993) were general exclusion criteria for the study.
Inclusion criteria for the patients were AN (ICD-10: F50.0) as primary diagnosis
(restrictive and purging type) and a body weight below the 10th percentile of BMI-for-age.
Mean duration of eating disorder was 1.3 years (± 0.8 years). Mean duration of treatment was
7 months (± 3 months). All patients were recruited from inpatient and outpatient therapy
programs of the Department of Child and Adolescent Psychiatry and the Department of
Psychosomatic Medicine and Psychotherapy, Charité Universitätsmedizin Berlin.
Inclusion criteria for the controls were the absence of any psychiatric diagnosis
described in the ICD-10 and a body weight within the normal range (i.e. above the 10th and
below the 90th percentile of BMI-for-age). Recruitment methods included advertisement in
newspapers, in local youth activity centres and on the university campus.
All psychiatric diagnoses were based on ICD-10 criteria and established by
experienced clinical raters using psychiatric routine measures (Structural Inventory for
Anorexic and Bulimic Eating disorders, SIABS-EX; Composite International Diagnostic
Interview – Diagnostic Inventory Psychiatric Disorders-Expert, CIDI-DIAX). All participants
gave their written informed consent. With respect to minor age adolescents, we additionally
obtained written informed consent of the legal guardians.
Stimuli
Page 39 of 64
Psychophysiology
Psychophysiology
123456789101112131415161718192021222324252627282930313233343536373839404142434445464748495051525354555657585960

The stimulus material consisted of 52 100 x 144 mm coloured photographs, which we
subdivided into four stimulus categories (12 unpleasant, 12 neutral, 12 pleasant, and 16 body
pictures).
Affective standard pictures. Pictures from the IAPS (Lang et al., 2008) were used as
reference material: 12 unpleasant pictures (IAPS numbers: 9571, 9300, 9301, 2800, 6550,
6540, 2811, 6230, 9140, 2095, 9800, 9810), 12 neutral pictures (2214, 2200, 2495, 2190,
7009, 7006, 7185, 7187, 2512, 2210, 2215, 7002) , and 12 pleasant pictures (1710, 1463,
8179, 8180, 8041, 8185, 4643, 4650, 8496, 8490, 8187, 8040). Pictures with eating disorder-
relevant (food) or x-rated content (eroticism, bloody violence, mutilation) were excluded.
Emaciated body pictures. The body pictures were preselected from a total of 8000
body photographs from pro-anorexic internet galleries (key words: Pro Ana, thinspiration,
girls, whole body). Pictures not showing any distinctive marks for cachexia (projecting ribs,
hip-, cheek- and collar bones, sunken cheeks and abdomen) were excluded, as well as images
with a bad photographic quality or with a low identification potential for female adolescents
and young adults. The resulting 36 pictures were presented to a pilot sample of 100 healthy
female volunteers and rated for aversion, arousal, and perceived underweight, based on SAM-
analogue 9-point scales. The 16 pictures, which scored most points on these scales, were
finally selected for the study. To avoid non-weight-related influences, all pictures were
standardized for background and emotional expression. To protect the displayed persons’
anonymity, we did not show any faces and modified decisive features digitally with photo-
shop software.
Procedure
Pre-test procedure. All participants were informed about the voluntary nature of the
experiment. To control situational influences, we assessed current mood, arousal, hunger
state, and body dissatisfaction using 100 mm Visual Analogue Scales (VAS).
Page 40 of 64
Psychophysiology
Psychophysiology
123456789101112131415161718192021222324252627282930313233343536373839404142434445464748495051525354555657585960

Psychophysiological measurement. Subjects were seated in front of a 1.5 x 1.7 m
screen (1.5 m distance) and prepared for psychophysiological measurement. To reduce
habituation effects, four landscape images with three startle-eliciting noises were used as
introduction. Thereafter, the 52 stimuli were presented in two counterbalanced sets of 26
pictures each with a break (lasting 15 minutes) in between (Table 1). Within each set, the
pictures of each stimulus type were presented in an intermingled design and alternated with
black screens in random order. Each picture was shown for a period of 12 s. The same period
was used as the intertrial interval (time between the offset of picture n to the onset of picture
n+1). Three quarters of the pictures of each stimulus category were accompanied by the
presentation of a startle-eliciting noise, whereas the pictures without noise were used for the
acquisition of the arousal data. To control learning effects, the noise occurred at variable
times (3.5, 4.0, or 4.5 s after picture onset). Additional noises were presented during a quarter
of the black screens.
Subjective rating and post-test procedure. After the removal of the electrodes, half
of the pictures were shown again (intermingled with 9 new pictures) and rated subjectively for
“valence” and “arousal” on the SAM scales. In a final step, questionnaires concerning body
image, eating behavior (Eating Disorder Inventory, EDI-2), and general emotional functioning
(Toronto Alexithymia Scale, TAS-26) were completed.
Data Recording
Psychophysiological measurement. A human startle reflex system (Coulbourn
Instruments HMS 500) was used to generate the acoustic noises and to record the
psychophysiological responses. The startle reflex was elicited by 50 ms pulse 95 dB white
noise with instantaneous rise time through headphones (see Cuthberth et al., 1990). To avoid
confounding by the acoustic probes, SCR and HR were scored only for non-startle trials.
Startle reflex response. The eye-blink component of the startle reflex was measured by
recording the electromyographic activity (EMG) over the left orbicularis oculi muscle, using
Formatted: Font: (Default) Times New
Roman, 12 pt
Formatted: Font: (Default) Times New
Roman, 12 pt
Comment [TJ1]: Comment 7: Pictures were shown for 12 s. What was the intertrial interval (and be sure to tell us if that was from picture onset to onset, or picture offset to onset). Answer: The ITI (time between the offset of picture n to the onset of picture n+1) was 12 s. We have added an accordant note in the Methods section, subsection Psychophysiological measurement. I hope I have defined this in the correct way. It may be clearer if I give an example (time in seconds): Time: Trial: Picture: Category: 1-12 1 1 pleasant 13-24 2 1 a black 25-36 3 2 body 37-48 4 2 a black ….. And so on.
Comment [TJ2]:
Comment 8: In Data Recording, Psychophysiological Measurement, “Cuthbert” is misspelled. Answer: Thank you, we have corrected this mistake.
Page 41 of 64
Psychophysiology
Psychophysiology
123456789101112131415161718192021222324252627282930313233343536373839404142434445464748495051525354555657585960

Ag/AgCl miniature electrodes. After sampling at 1000 Hz and filtering through a 30-500 Hz
pass-band filter, raw EMG signal was rectified and integrated with a time constant of 20 ms.
Digital sampling started 100 ms before and ended 400 ms after the probe noise onset. EMG
waveform was manually scored for magnitude and onset latency. Consistent to Blumenthal et
al. (2005), EMG magnitude was defined as difference between peak EMG (highest EMG
level within the 200 ms after the noise) and baseline (EMG level just before response onset).
Trials with no apparent reflex shape, a magnitude < 0.1 µV, or an onset latency later than 150
ms were categorized as non-response and scored with zero magnitude. Responses with onset
latency less than 20 ms, movement artefacts or excessive baseline activity were defined as
missing and rejected (1.04 %). When the number of zero responses or missings exceeded one-
third of all recorded trials (n=2), the respective participant was classified as a non-responder
and the whole data were rejected (i.e. the sample size was reduced from 74 to 72).
Skin conductance response. SCRs were recorded by a Coulbourn Isolated Skin
Conductance Coupler V71-23 (time constant: 5 s; continual voltage over electrodes: 0.5 V),
using Ag/AgCl standard electrodes on the hypothenar of the non-dominant hand. Digital
sampling (at 10 Hz) started 1000 ms before picture onset and ended 4000 ms after picture
offset. The SCR waveform was digitally scored for magnitude and latency to the peak.
Magnitude was defined as the difference between peak SCR (highest SCR level within the
900 ms to 4000 ms time intervall after picture onset) and baseline (averaged SCR for the 1000
ms before picture onset). Latency to the peak was defined as the time interval between picture
onset and peak SCR. Responses with a magnitude less than 0.1 µS were defined as missing.
As there were no participants with electrodermal nonresponding (i.e. maximum response = 0),
the complete data set could be used for analysis.
Heart rate responses. Electrocardiographic activity (ECG) was measured according to
Einthoven lead II, using Ag/AgCl standard electrodes. Raw analogue ECG signal was
sampled at 1000 Hz and filtered through a 0.05-150 Hz pass-band filter. Thereafter, times of
Page 42 of 64
Psychophysiology
Psychophysiology
123456789101112131415161718192021222324252627282930313233343536373839404142434445464748495051525354555657585960

R-peaks < 1 mV within the analogue signal were detected. According to recommendations of
Graham (19878), second-to-second HRs in beats per minutes (bpm) for the 10 seconds after
picture onset were computed. Three values were extracted: “overall HR change” was defined
as difference between mean HR (mean second-by-second HR for the 10 second window after
picture onset) and baseline (mean HR for the 1 s before picture onset), “HR acceleration” was
defined as difference between HR max (maximal second-by-second HR for the 10 s after
picture onset) and baseline. “HR deceleration” was defined as difference between baseline
and HR min (minimal second-by-second HR for the 10 s after picture onset). On trials where
HR never increased over baseline, acceleration score was computed as zero. Deceleration
scores were handled analogously. Because of incomplete data sets due to technical problems,
the data files of 8 patients and 8 controls had to be excluded from analysis.
Subjective rating. As self-report measure, we used the SAM scales of Bradley &
Lang (1994): Scale “valence”, ranging from 1 (unpleasant) to 9 (pleasant), and scale
“arousal”, ranging from 1 (low arousal) to 9 (high arousal). Data were acquired with the SAM
original scales. In order to create a better comparability with the startle reflex data, the
valence scale was reversed for analysis (i.e. now ranging from 1, pleasant, to 9, unpleasant;
see Fig. 1 and all related notes in the text); please note this when comparing our findings with
other studies using the SAM.
Data Reduction and Statistical Preconditions
Data were processed by IBM SPSS-Statistics 19 (2010) software. Raw data of each
participant were averaged for stimulus category. Normal distribution was checked by
Kolmogorov Smirnov tests. Except for the HR data [K-S Z=1.075; p=0.198], these tests were
significant. Startle reflex and SCR magnitudes were T(z)-transformed to normalize the
distribution (T= 10 ∗ z + 50). Regarding the other measures, we solved this problem by
examining the results by Kruskal-Wallis or Man-Whitney U tests (analyzing these data
exclusively by non-parametric methods seemed to be problematic because of the worse
Comment [TJ3]:
Comment 9: In the Data Recording, Heart Rate Responses section, you cite a paper by Graham as “1878.” I am sure that you mean “1978.” Answer: Sorry for this mistake.
Page 43 of 64
Psychophysiology
Psychophysiology
123456789101112131415161718192021222324252627282930313233343536373839404142434445464748495051525354555657585960
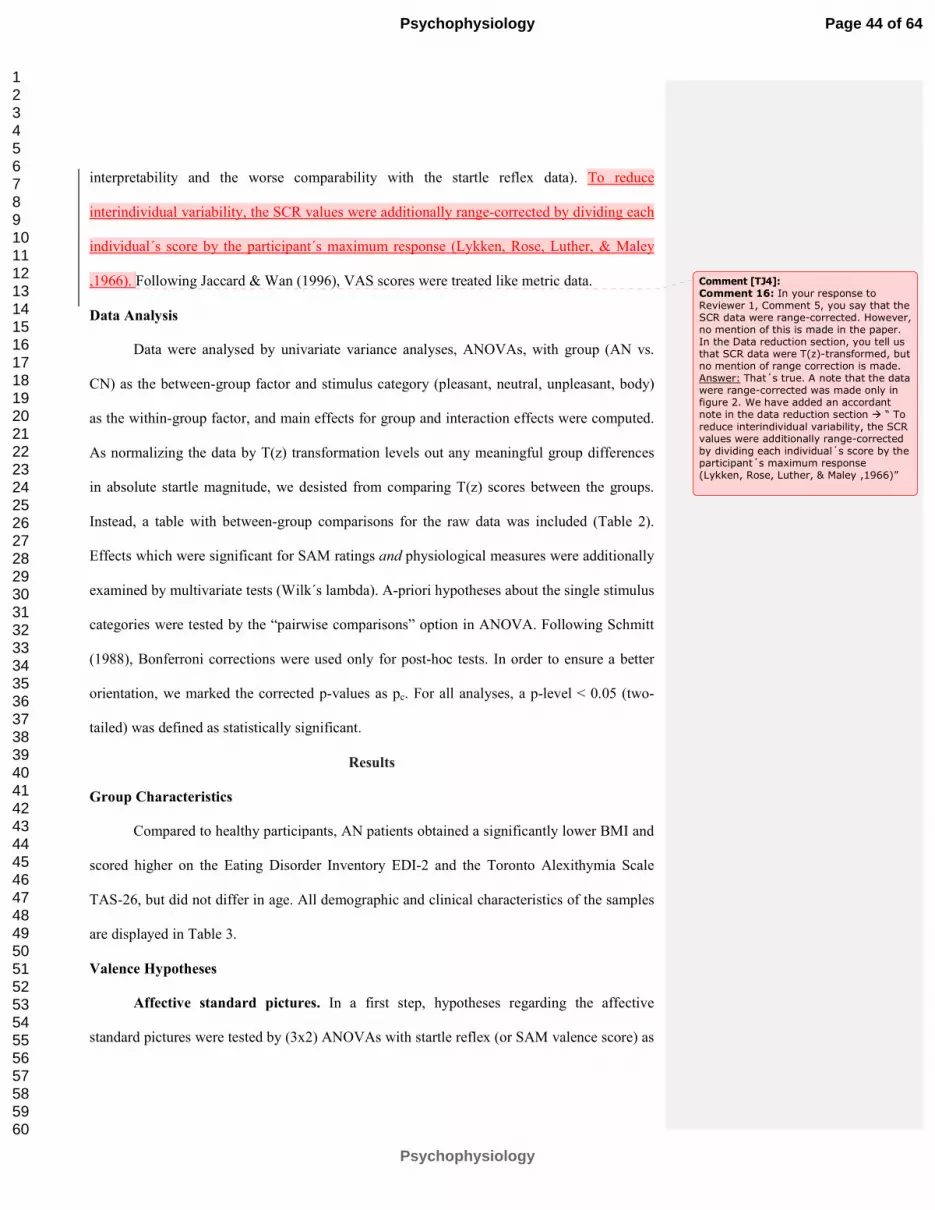
interpretability and the worse comparability with the startle reflex data). To reduce
interindividual variability, the SCR values were additionally range-corrected by dividing each
individual´s score by the participant´s maximum response (Lykken, Rose, Luther, & Maley
,1966). Following Jaccard & Wan (1996), VAS scores were treated like metric data.
Data Analysis
Data were analysed by univariate variance analyses, ANOVAs, with group (AN vs.
CN) as the between-group factor and stimulus category (pleasant, neutral, unpleasant, body)
as the within-group factor, and main effects for group and interaction effects were computed.
As normalizing the data by T(z) transformation levels out any meaningful group differences
in absolute startle magnitude, we desisted from comparing T(z) scores between the groups.
Instead, a table with between-group comparisons for the raw data was included (Table 2).
Effects which were significant for SAM ratings and physiological measures were additionally
examined by multivariate tests (Wilk´s lambda). A-priori hypotheses about the single stimulus
categories were tested by the “pairwise comparisons” option in ANOVA. Following Schmitt
(1988), Bonferroni corrections were used only for post-hoc tests. In order to ensure a better
orientation, we marked the corrected p-values as pc. For all analyses, a p-level < 0.05 (two-
tailed) was defined as statistically significant.
Results
Group Characteristics
Compared to healthy participants, AN patients obtained a significantly lower BMI and
scored higher on the Eating Disorder Inventory EDI-2 and the Toronto Alexithymia Scale
TAS-26, but did not differ in age. All demographic and clinical characteristics of the samples
are displayed in Table 3.
Valence Hypotheses
Affective standard pictures. In a first step, hypotheses regarding the affective
standard pictures were tested by (3x2) ANOVAs with startle reflex (or SAM valence score) as
Comment [TJ4]:
Comment 16: In your response to Reviewer 1, Comment 5, you say that the SCR data were range-corrected. However, no mention of this is made in the paper. In the Data reduction section, you tell us that SCR data were T(z)-transformed, but no mention of range correction is made. Answer: That´s true. A note that the data were range-corrected was made only in figure 2. We have added an accordant note in the data reduction section � “ To reduce interindividual variability, the SCR values were additionally range-corrected by dividing each individual´s score by the participant´s maximum response (Lykken, Rose, Luther, & Maley ,1966)”
Page 44 of 64
Psychophysiology
Psychophysiology
123456789101112131415161718192021222324252627282930313233343536373839404142434445464748495051525354555657585960

the dependent variable and stimulus category (unpleasant, neutral, pleasant) and group (AN,
CN) as the independent variables. The results are summarized in Figure 1.
Hypothesis 1: We expect a decrease of the startle reflex magnitude from unpleasant over
neutral to pleasant cues in both groups. As predicted by hypothesis 1, we found a significant
main effect for the stimulus category [F(2,210)=17.7; p<0.001]: The startle reflex magnitude
was significantly higher for unpleasant pictures than for neutral pictures [F(1,284)=13.2;
p<0.001], and it was also significantly higher for neutral pictures than for pleasant pictures
[F(1,284)=4.1; p=0.045] in both groups; consequently, the unpleasant vs. pleasant comparison
was significant as well [F(1,284)=31.9; p<0.001]. No stimulus category x group interaction
effect was observed [F(1,210)=1; p=0.360].
Hypothesis 2: We expect a decrease of the SAM valence score (1: pleasant, 9: unpleasant)
from unpleasant over neutral to pleasant in both groups. Analysis of the SAM data revealed a
significant main effect for the stimulus category [F(2,210) =347.3; p<0.001]: the SAM score
was significantly higher for unpleasant pictures than for neutral pictures [F(1,284)=298.8;
p<0.001] and also for neutral pictures compared with pleasant ones in both groups
[F(1,284)=67.5; p<0.001] (for the sake of completeness, the values for the pleasant vs.
unpleasant comparison were: [F(1,284)= 650.3; p<0.001]). Comparable results were found by
Kruskal-Wallis test [φ²=160.2; p<0.001, asymp.] and even after correcting for multivariate
testing (MANOVA; y: SAM score, startle magnitude; x: group, stimulus category)
[F(4;418)=118.3; p<0.001; exact test]. An unexpected interaction effect [F(2,210)=7.5;
p=0.001] was found, i.e. the patients showed a significantly smaller increase of the SAM
score for the unpleasant pictures [F(1,70)=4.5; pc=0.038] and a significantly less decrease for
the pleasant pictures (compared to neutral pictures) [F(1,70)=7.4 pc=0.008] than the controls
did. However, as the examination by Man-Whitney U tests replicated this group difference
only for the unpleasant pictures [U=416.5; pc=0.024], but not for the pleasant pictures
[U=448.0; pc=0.069], this side-result should be taken with care.
Comment [TJ5]:
Comment 10: In the results, Valence Hypotheses, refer to Figure 1 in the text. It is currently not mentioned until the Emaciated Pictures section. Answer: We have added a reference to this Figure.
Page 45 of 64
Psychophysiology
Psychophysiology
123456789101112131415161718192021222324252627282930313233343536373839404142434445464748495051525354555657585960

Emaciated body pictures. In a second step, the main hypotheses regarding the body
pictures were tested, using (2x2) ANOVAs with stimulus category (body vs. neutral) and
group (AN, CN) as the independent variables. For overview, see Figure 1.
Hypothesis 3: We expect a decrease of the startle reflex magnitude (compared to neutral
cues) among the patients, but an increase among the controls while viewing emaciated body
cues. The overall analysis of body vs. neutral pictures resulted in a significant stimulus
category x group interaction effect [F(1,140)=9.5; p<0.01], which was in a line with
hypothesis 3. Among the patients, the startle reflex response elicited during the viewing of
emaciated bodies was significantly smaller than that elicited during the viewing of the neutral
[F(1,140)=4.6; p=0.030] and unpleasant pictures [F(1,140)=13.0; p<0.001], but not different
from that elicited during the viewing of the pleasant cues [F(1,140)<1]. The controls´
response, in contrast, was significantly larger than that for the neutral [F(1,140)=5.4; p=0.021]
and pleasant pictures [F(1,140)=9.6; p=0.002], but not as large as that for the unpleasant cues
[F(1,140)=4.4; p=0.038]. No main effect for stimulus category was found [F(1,140)<1].
Hypothesis 4: No such group difference is expected for the SAM valence score (1: pleasant, 9:
unpleasant), with both groups rating the emaciated body cues as negative relative to neutral
cues. In contrast to the startle reflex data, self-report answers did not reveal any stimulus
category x group interaction effect [F(1,140)=1.75; p=0.187]. Yet a significant main effect for
stimulus category (body vs. neutral) was observedfound [F(1,140)=593.1; p<0.001]. This
effect was significant also by Kruskal-Wallis tests [φ²= 105.9; p<0.001, asymp.]. Thus, the
body pictures scored significantly higher and were rated significantly more negatively than
neutral pictures in both groups [AN: F(1,140)=150.5; p<0.001; CN: F(1,140)=291.0;
p<0.001]. The body vs. pleasant comparison [F(1,140)=746.539; p<0.001] and the body vs.
unpleasant comparison [F(1,140)=7.791; p=0.005] were significant, too. This was also true
for non-parametric methods (Man-Whitney U tests: body vs. pleasant: [ U=36.0; p<0.001];
body vs. unpleasant: [U=1922.5; p=0.007]; all tests exact).
Page 46 of 64
Psychophysiology
Psychophysiology
123456789101112131415161718192021222324252627282930313233343536373839404142434445464748495051525354555657585960

Arousal Hypotheses
The statistical tests were conducted analogously to hypothesis 1-4, but with SCR
(overall HR change, HR acceleration, HR deceleration, and SAM arousal score, respectively)
as the dependent variable. The results are summarized in Figure 2.
Affective standard pictures.
Hypothesis 5: We expect an increase of physiological arousal (SCR, overall HR change) for
pleasant and unpleasant cues relative to neutral cues in both groups. In contrast to our
expectations, analysis of the SCR data did not show any main effect for the stimulus category
[F(2,210)<1], i.e. comparably low SCR scores for pleasant, unpleasant, and neutral pictures
were observed. SCR data did not reveal any stimulus category x group interaction effect
[F(2,210)=2.372; p=0.096] and no main effect for the group [F(1,210)<1]. Yet, a significant
main effect for the stimulus category regarding the overall HR [F(2,162)=17.132; p<0.00]
with a significantly stronger decrease (relative to baseline) for unpleasant pictures than for
pleasant [F(1,110)=27.923 pc=0.002] and neutral pictures [F(1,110)=12.067; pc=0.002] was
found (the pleasant vs. neutral comparison did not reach the level of significance
[F(1,110)=3.319; pc=0.210]). This pattern was replicated by the component scores (i.e. we
found a significant increase of the HR deceleration [F(2,162)=17.132; p<0.001] and
significant decrease of the HR acceleration [(2,162)=6.754; p=0.002] from pleasant over
neutral to unpleasant). No group x stimulus category interaction effect was observed [overall
HR: F(2,162)=2.904; p=0.058, component scores: F(2,162)<1]. However, there was an
unexpected main effect for group with a significantly lower HR deceleration
[F(1,162)=27.745; p<0.001] in AN patients than in controls, and a significantly lower
decrease of the overall HR score relative to baseline [F(1,162)=27,75; p<0.001]) was found.
Hypothesis 6: We expect an increase of the SAM arousal score (1: low arousal; 9: high
arousal) for pleasant and unpleasant cues relative to neutral cues in both groups. The
analysis of the SAM arousal data revealed a significant main effect for the stimulus category
Page 47 of 64
Psychophysiology
Psychophysiology
123456789101112131415161718192021222324252627282930313233343536373839404142434445464748495051525354555657585960

[F(2,210)=108.541; p<0.001] with a significantly enlarged self-reported arousal for the
pleasant and unpleasant pictures compared to the neutral cues. This effect was significant
even after examining the results by Kruskal-Wallis tests [φ²=81.105; p<0.001; asymp]. No
stimulus category x group interaction effect [F(2,210)=1.063 p=0.347] was found.
Analogousue to the HR data, there was an unexpected main effect for group
[F(1,210)=12.876; p<0.001] with a significantly lower self-reported arousal in the patients
than in the controls. This was true even after examining the results by Man-Whitney U tests
(U=3023.5; p=0.023) and after correction for multivariate testing (y: overall HR change,
SAM arousal score; x: group, stimulus category) [F(2,166)=9.512; p<0.001; exact].
Emaciated body pictures
Hypothesis 7: We expect a Emaciated body cues (compared to neutral pictures) evoke
comparable increase of physiological arousal (SCR, overall HR change) (relative to neutral
cues) during viewing of emaciated body cues in both groups. As expected, analysis of the
SCRs regarding the body vs. neutral pictures did not reveal any main effect for group
[F(1,140)<1], and no stimulus category x group interaction effect [F(1,140)<1] was found. A
significant main effect for the stimulus category was observed [F(1,140)=13.975; p<0.001],
i.e. SCR elicited by emaciated body pictures was significantly larger than that elicited by
neutral cues in both groups. This finding was replicated by non-parametric methods (Man-
Whitney U test, U=1692.5; p<0.001; exact]. In line with the findings regarding the affective
standard cues, HR data showed a significant main effect for group [F(1,108)=31.029;
p<0.001], i.e. a significantly lower HR deceleration [F(1,108)=21.399; p<0.001] and a
significantly lower decrease of the overall HR (relative to baseline) in AN patients than in
controls were found [F(1,108)=31.029; p<0.001]. No main effects for the stimulus category
(body vs. neutral) [overall HR score: F(1,108)=1.896; p=0.171; component scores:
F(1,108)<1] and no group x stimulus category interaction effects were observed [for all HR
scores: F(1,108)<1]. Yet, there was a significant interaction effect for the body vs. positive
Comment [TJ6]:
Comment 12: In the Results, Hypothesis 6, line 7, change “Analogue” to “Analogous.” Answer: “analogue” was changed to “analogous”.
Page 48 of 64
Psychophysiology
Psychophysiology
123456789101112131415161718192021222324252627282930313233343536373839404142434445464748495051525354555657585960
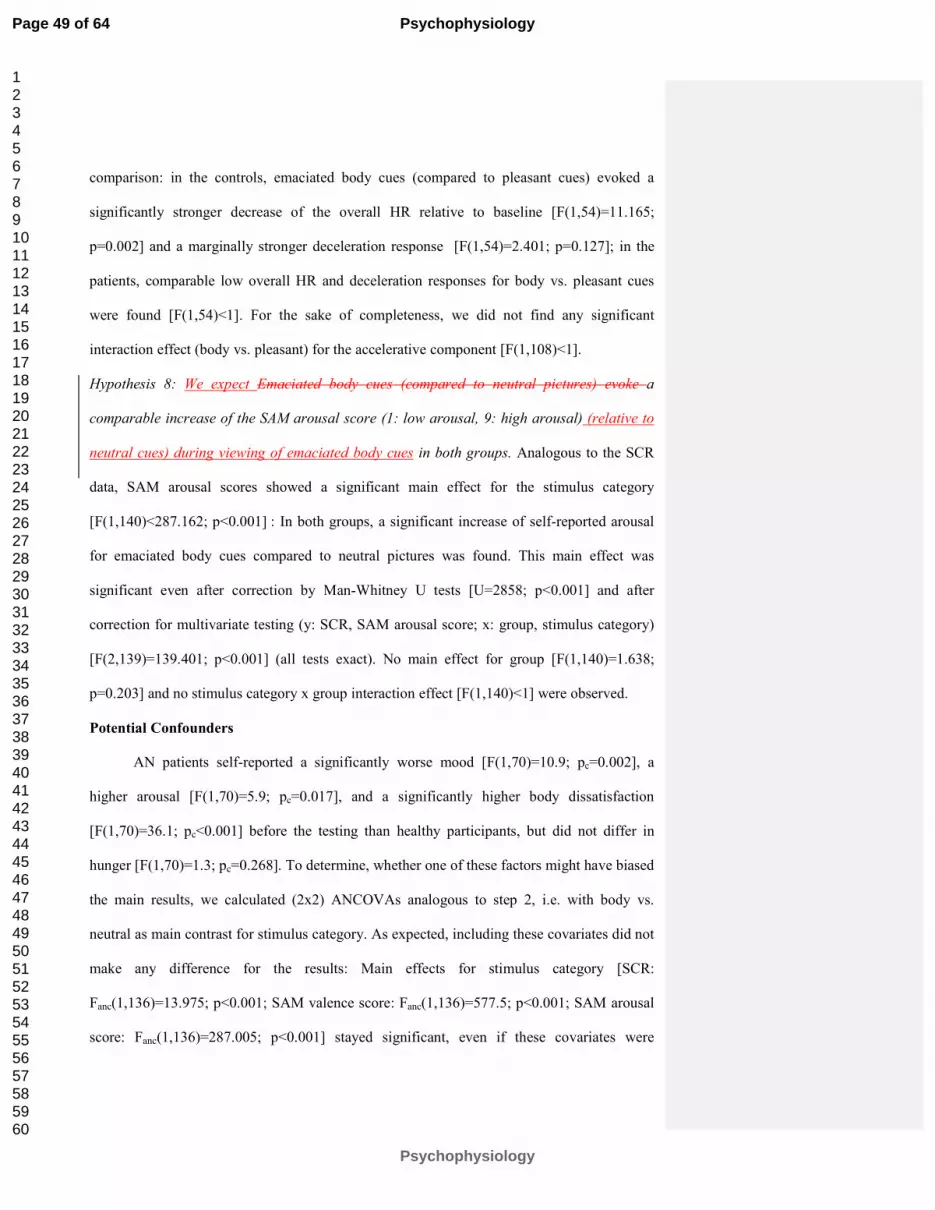
comparison: in the controls, emaciated body cues (compared to pleasant cues) evoked a
significantly stronger decrease of the overall HR relative to baseline [F(1,54)=11.165;
p=0.002] and a marginally stronger deceleration response [F(1,54)=2.401; p=0.127]; in the
patients, comparable low overall HR and deceleration responses for body vs. pleasant cues
were found [F(1,54)<1]. For the sake of completeness, we did not find any significant
interaction effect (body vs. pleasant) for the accelerative component [F(1,108)<1].
Hypothesis 8: We expect Emaciated body cues (compared to neutral pictures) evoke a
comparable increase of the SAM arousal score (1: low arousal, 9: high arousal) (relative to
neutral cues) during viewing of emaciated body cues in both groups. Analogous to the SCR
data, SAM arousal scores showed a significant main effect for the stimulus category
[F(1,140)<287.162; p<0.001] : In both groups, a significant increase of self-reported arousal
for emaciated body cues compared to neutral pictures was found. This main effect was
significant even after correction by Man-Whitney U tests [U=2858; p<0.001] and after
correction for multivariate testing (y: SCR, SAM arousal score; x: group, stimulus category)
[F(2,139)=139.401; p<0.001] (all tests exact). No main effect for group [F(1,140)=1.638;
p=0.203] and no stimulus category x group interaction effect [F(1,140)<1] were observed.
Potential Confounders
AN patients self-reported a significantly worse mood [F(1,70)=10.9; pc=0.002], a
higher arousal [F(1,70)=5.9; pc=0.017], and a significantly higher body dissatisfaction
[F(1,70)=36.1; pc<0.001] before the testing than healthy participants, but did not differ in
hunger [F(1,70)=1.3; pc=0.268]. To determine, whether one of these factors might have biased
the main results, we calculated (2x2) ANCOVAs analogous to step 2, i.e. with body vs.
neutral as main contrast for stimulus category. As expected, including these covariates did not
make any difference for the results: Main effects for stimulus category [SCR:
Fanc(1,136)=13.975; p<0.001; SAM valence score: Fanc(1,136)=577.5; p<0.001; SAM arousal
score: Fanc(1,136)=287.005; p<0.001] stayed significant, even if these covariates were
Page 49 of 64
Psychophysiology
Psychophysiology
123456789101112131415161718192021222324252627282930313233343536373839404142434445464748495051525354555657585960
included. The same was true for the main effect for group regarding the HR scores [overall
HR score: Fanc(1,102)=11,595 p=0.001; HR deceleration: Fanc(1,102)=11,629 p=0.001] and
for the group x stimulus category interaction effect regarding the startle reflex
[Fanc(1,136)=9.6; p<0.01] (only significant effects were reported).
Within the patient group, we controlled the influence of therapy duration and duration of the
eating disorder: for this, several one-way ANCOVAs with stimulus category (body vs.
neutral) as independent variable were calculated. Also here, the main effect for stimulus
category was significant, independently of whether the covariates were included or not [startle
reflex: Fanc(1;68)=4.4; p=0.040; SCR: Fanc(1,68)=8.277; p=0.005; SAM valence score:
Fanc(1,68)=226.1, p<0.001; SAM arousal score: Fanc(1,68)=145.268; p<0.001].
Page 50 of 64
Psychophysiology
Psychophysiology
123456789101112131415161718192021222324252627282930313233343536373839404142434445464748495051525354555657585960

Discussion
As opposed to previous investigations, which deal with the issue of thin ideal
internalization, this study uses a body cue which is aversive for healthy people (Ito & Lang
1998; Rand et al., 1997): bodies with projecting ribs, hips and cheekbones, sunken cheeks and
abdomen, which are indicative of cachexia. As expected, the results revealed a strikingly
different physiological processing of this stimulus type in both groups.
Valence hypotheses. Healthy participants showed a significant startle potentiation
while being exposed to emaciated bodies. In contrast to that, a significant startle inhibition
was found among AN patients, and the extent of this response was as strong as the one while
viewing of pleasant cues, denoting that the pictures were substantially appealing to anorexic
viewers. This is consistent with findings regarding other addictions (Rohsenow et al., 1990,
for review) and with observations in “Pro Ana” forums (Overbeke, 2008). However, it is in
contrary to findings of previous studies in AN (Cserjesi et al., 2010; Friederich et al., 2006) as
well as the first evidence for automatic appetitive reactions on addiction-specific stimuli in
AN at all. No group difference in general emotional functioning or situational factors, which
might have biased the body cue results, were found. Therapy duration and duration of the
eating disorder did not have any influence on the body cue results either.
No appetitive response, but an aversive one, was found on self-report level, with both
groups rating emaciated body pictures as negative. This discrepancy might be explained as
follows: the patients might have been “unaware” of their automatically activated appetitive
reactions, or, “if aware”, not have been “willing to express them but [have been]… rather
motivated to hide or suppress them in fear of amplified social stigmatization.” (Degner &
Wentura, 2009, p. 215). Berridge (1996) spoke of a discrepancy between “wanting”
(motivation to starve) and “liking” (knowledge of the negative consequences of starving and
of the fact that emaciation is not generally considered beautiful). This conflict is characteristic
for substance dependencies as well, such as for alcoholics, who also want to drink, although
Page 51 of 64
Psychophysiology
Psychophysiology
123456789101112131415161718192021222324252627282930313233343536373839404142434445464748495051525354555657585960

they do not really like the taste or smell and despite knowing the health-damaging effects of
drinking (Mucha et al., 2000). Nevertheless, explaining the phenomenon by social desirability
effects seems to be the more obvious choice, if we regard the setting (in-patient) and the fact,
that denial of illness, non-compliance, and social desirable answering tendencies are often
observed in patients with AN (Vandereycken, 2006).
Arousal hypotheses. In line with Lang (1995), whereupon appetitive reactions (as
observed in AN) and aversive reactions (as observed in CN) necessitate an at least moderately
high arousal degree, a significant increase of physiological (SCR) and self-reported arousal
while viewing emaciated bodies was found. This might explain, why emaciated body cues
evoked an appetitive reaction among the patients, while idealized slim body cues did not:
magazine pictures might have been simply not exciting enough for the patients to activate
their appetitive motivational system. Addictive cues for substance dependencies are usually
high arousal-provoking, too (Childress et al, 1992; Niaura et al, 1988). An unexpected
differential effect regarding the HR data was observed. Healthy controls showed a significant
HR deceleration during viewing of the body cues, which was as strong as the one while
viewing of unpleasant cues (in line with Lang, 1995, whereupon a sustained deceleratory
response is indicative for this picture type). In the patients, in contrast, no HR deceleration,
but a comparable response as observed during viewing of the pleasant cues was found. Even
if this finding seems to support the startle reflex results, it should be taken with care. 18 % of
the HR data was defective due to technical problems. The number of pictures which was used
for the arousal analysis was very low (see Table 1). Most important, this effect was not
specific for the body cues, but an overall reduced deceleratory response for AN vs. CN was
found. This suggests, that differences in general arousalemotional functioning (possibly
influenced by somatic characteristics such as bradycardia, which is a well-known side-effect
of continuous starving) (Casiero & Frishman, 2006; Portilla, 2011) might have been an
influencing factor.
Comment [TJ1]: I think this phrase is more
specific
Page 52 of 64
Psychophysiology
Psychophysiology
123456789101112131415161718192021222324252627282930313233343536373839404142434445464748495051525354555657585960
Affective standard pictures. Although valence scores (startle reflex, SAM valence
score) and arousal scores (overall HR change response, SAM arousal score) separated
significantly between the neutral and unpleasant cues, no significant neutral vs. pleasant
comparison was found (an exception was only the SAM valence score). This might have been
due to the stimulus choice, as pictures which usually provoke high physiological arousal had
to be excluded to adhere to the criteria of youth protection. The choice of the method might
have played a role as well: Even if there is much evidence that the startle reflex magnitude is
significantly larger for unpleasant pictures than for pleasant pictures, many studies failed to
find a startle attenuation for pleasant pictures relative to neutral ones. Regarding the SCR
results (no significant pleasant vs. neutral and no significant neutral vs. unpleasant
comparison), the method of data acquisition might have contributed to the problem, too: SCR
response peaks were scored in the time window between 900 ms and 4000 ms after picture
onset. Prior research, however, showed that the peak of an SCR response can occur within a
window of 0.5 – 5 sec following response onset. It seems possible that this shortened scoring
window could have artificially lowered the SCR values observed. Hence, our results should
be examined by other measures that do not exhibit these problems.
Implications
In this study, we have confirmed for the first time that extremely emaciated body pictures, in
analogy to addictive cues from addiction disorders, evoke automatic appetitive reactions in
adolescents and young adults with AN, but aversive reactions in healthy controls adolescents.
No index on an overall down-regulation of the appetitive motivational system in AN
(Friederich, 2006) was found. The assumed special role of AN within addiction research and
especially the presumption that AN would have more similarities (on the motivational level)
with anxiety and obsessive disorders than with addiction disorders (Friederich et al., 2006)
appears therefore at least doubtful. Possibilities for a practical application of the startle reflex
paradigm in AN later on are given: the startle reflex inhibition towards addictive cues is a
Page 53 of 64
Psychophysiology
Psychophysiology
123456789101112131415161718192021222324252627282930313233343536373839404142434445464748495051525354555657585960
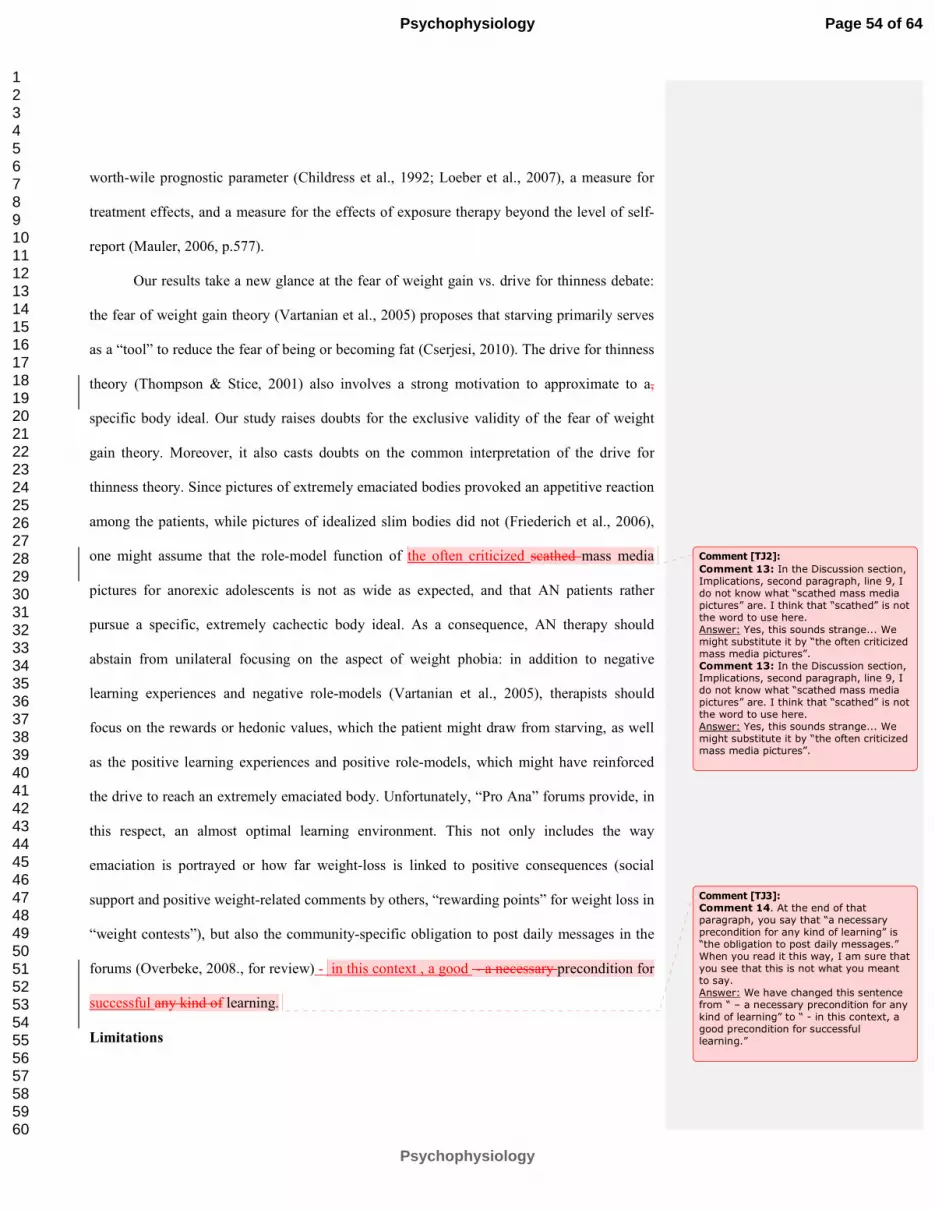
worth-wile prognostic parameter (Childress et al., 1992; Loeber et al., 2007), a measure for
treatment effects, and a measure for the effects of exposure therapy beyond the level of self-
report (Mauler, 2006, p.577).
Our results take a new glance at the fear of weight gain vs. drive for thinness debate:
the fear of weight gain theory (Vartanian et al., 2005) proposes that starving primarily serves
as a “tool” to reduce the fear of being or becoming fat (Cserjesi, 2010). The drive for thinness
theory (Thompson & Stice, 2001) also involves a strong motivation to approximate to a,
specific body ideal. Our study raises doubts for the exclusive validity of the fear of weight
gain theory. Moreover, it also casts doubts on the common interpretation of the drive for
thinness theory. Since pictures of extremely emaciated bodies provoked an appetitive reaction
among the patients, while pictures of idealized slim bodies did not (Friederich et al., 2006),
one might assume that the role-model function of the often criticized scathed mass media
pictures for anorexic adolescents is not as wide as expected, and that AN patients rather
pursue a specific, extremely cachectic body ideal. As a consequence, AN therapy should
abstain from unilateral focusing on the aspect of weight phobia: in addition to negative
learning experiences and negative role-models (Vartanian et al., 2005), therapists should
focus on the rewards or hedonic values, which the patient might draw from starving, as well
as the positive learning experiences and positive role-models, which might have reinforced
the drive to reach an extremely emaciated body. Unfortunately, “Pro Ana” forums provide, in
this respect, an almost optimal learning environment. This not only includes the way
emaciation is portrayed or how far weight-loss is linked to positive consequences (social
support and positive weight-related comments by others, “rewarding points” for weight loss in
“weight contests”), but also the community-specific obligation to post daily messages in the
forums (Overbeke, 2008., for review) - in this context , a good - a necessary precondition for
successful any kind of learning.
Limitations
Comment [TJ2]:
Comment 13: In the Discussion section, Implications, second paragraph, line 9, I do not know what “scathed mass media pictures” are. I think that “scathed” is not the word to use here. Answer: Yes, this sounds strange... We might substitute it by “the often criticized mass media pictures”. Comment 13: In the Discussion section, Implications, second paragraph, line 9, I do not know what “scathed mass media pictures” are. I think that “scathed” is not the word to use here. Answer: Yes, this sounds strange... We might substitute it by “the often criticized mass media pictures”.
Comment [TJ3]: Comment 14. At the end of that paragraph, you say that “a necessary precondition for any kind of learning” is “the obligation to post daily messages.” When you read it this way, I am sure that you see that this is not what you meant to say. Answer: We have changed this sentence from “ – a necessary precondition for any kind of learning” to “ - in this context, a good precondition for successful learning.”
Page 54 of 64
Psychophysiology
Psychophysiology
123456789101112131415161718192021222324252627282930313233343536373839404142434445464748495051525354555657585960
The results are limited as follows. Firstly, we investigated adolescents and young
adults and cannot generalize for older patients. Secondly, we did not have a comparison group
of non-eating disordered underweight females. Thus, we cannot exclude that the results reflect
a weight-related in-group effect (first described by Degner & Wentura (2009) in a study
regarding overweight females). Thirdly, all patients were in contact with their anorexic fellow
patients, which might have led to a certain habituation to cachectic bodies. The unbalanced
number of pictures should be addressed (12 body, but 9 in each standard category). In general,
averaging over a higher number of presentations could artificially produce a lower startle
response because of habituation. This effect, however, is only relevant if the picture type is
blocked, but not if the pictures of the different stimulus categories are intermingled, as it was
done in our study. Finally, we must mention the cross-sectional design (no valid information
about the temporary stability of the observed effects) and the limited ecologic validity of the
setting.
Summary and Directions for Future Studies
This study is, to the best of our knowledge, the first to examine emotional reactions to
extremely emaciated body pictures in AN measured by the startle reflex paradigm, and the
first to do so with picture material from “Pro Ana” forums. Our data show that extremely
emaciated body pictures, similarly to addictive cues from addiction disorders, evoke
automatic appetitive reactions in patients with AN, but aversive reactions in healthy
individuals. No group difference, but comparably high aversion ratings were found in self-
reports. These findings suggest that a distorted positive view of extreme emaciation is a
relevant motivational factor for self-initiated starving, and that exposure to accordant body
cues (“thinspiration” galleries) evokes the drive to reach this extremely emaciated body ideal.
Future studies should aim to find out how this positive view on emaciation might have
developed, and whether it is rather a precondition or a consequence of the disorder.
Additionally, research should address the possibility of influencing these response patterns
Page 55 of 64
Psychophysiology
Psychophysiology
123456789101112131415161718192021222324252627282930313233343536373839404142434445464748495051525354555657585960

and the (therapeutic) conditions needed thereby. Further approaches for studies are the context
dependency (such as anti-recovery vs. preventive context), the behavioral relevance, and the
potential prognostic value of the findings.
Page 56 of 64
Psychophysiology
Psychophysiology
123456789101112131415161718192021222324252627282930313233343536373839404142434445464748495051525354555657585960
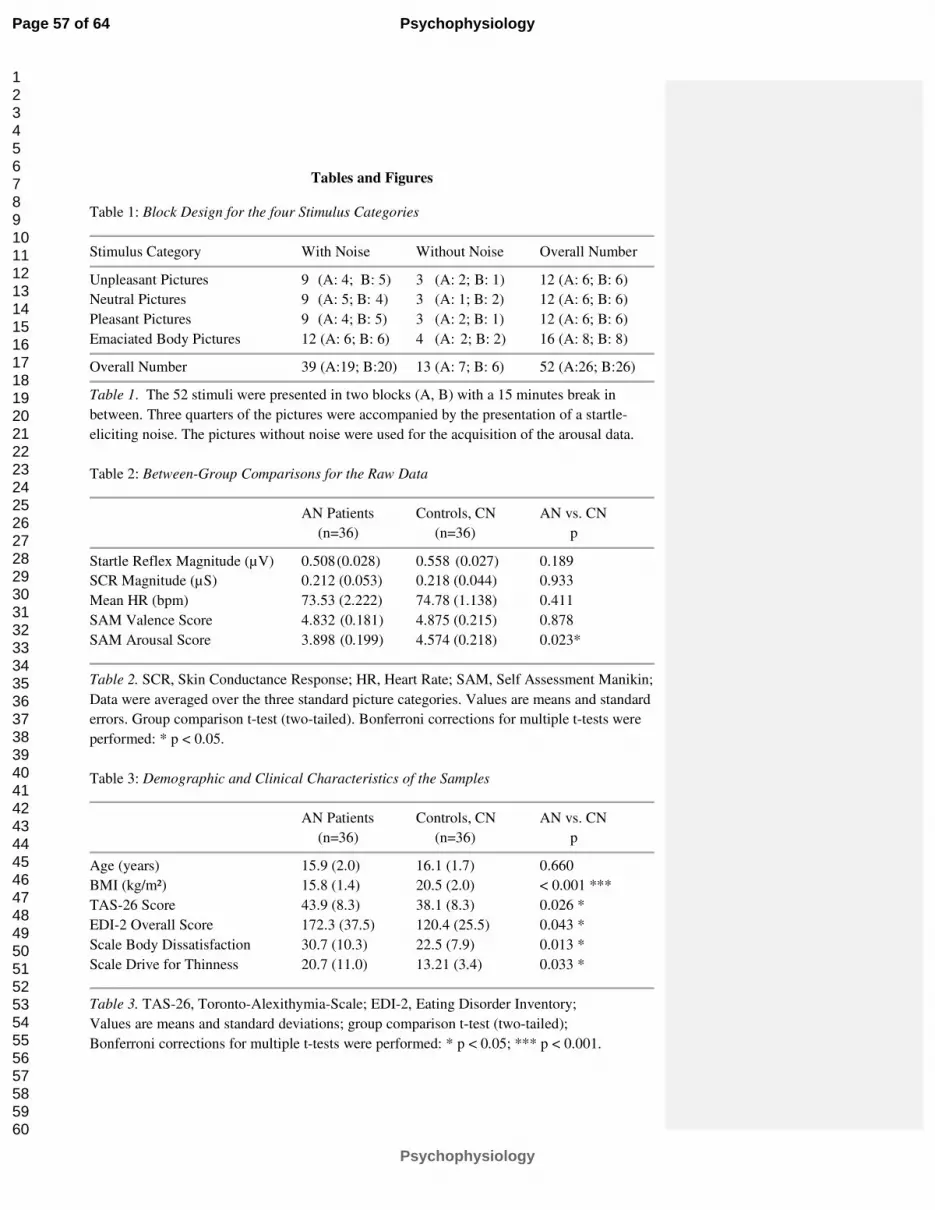
Tables and Figures
Table 1: Block Design for the four Stimulus Categories
Stimulus Category With Noise Without Noise Overall Number
Unpleasant Pictures 9 (A: 4; B: 5) 3 (A: 2; B: 1) 12 (A: 6; B: 6)
Neutral Pictures
9 (A: 5; B: 4) 3 (A: 1; B: 2) 12 (A: 6; B: 6)
Pleasant Pictures 9 (A: 4; B: 5) 3 (A: 2; B: 1) 12 (A: 6; B: 6)
Emaciated Body Pictures 12 (A: 6; B: 6) 4 (A: 2; B: 2) 16 (A: 8; B: 8)
Overall Number 39 (A:19; B:20) 13 (A: 7; B: 6) 52 (A:26; B:26)
Table 1. The 52 stimuli were presented in two blocks (A, B) with a 15 minutes break in
between. Three quarters of the pictures were accompanied by the presentation of a startle-
eliciting noise. The pictures without noise were used for the acquisition of the arousal data.
Table 2: Between-Group Comparisons for the Raw Data
AN Patients Controls, CN AN vs. CN
(n=36) (n=36) p
Startle Reflex Magnitude (µV) 0.508 (0.028) 0.558 (0.027) 0.189
SCR Magnitude (µS) 0.212 (0.053) 0.218 (0.044) 0.933
Mean HR (bpm) 73.53 (2.222) 74.78 (1.138) 0.411
SAM Valence Score 4.832 (0.181) 4.875 (0.215) 0.878
SAM Arousal Score 3.898 (0.199) 4.574 (0.218) 0.023*
Table 2. SCR, Skin Conductance Response; HR, Heart Rate; SAM, Self Assessment Manikin;
Data were averaged over the three standard picture categories. Values are means and standard
errors. Group comparison t-test (two-tailed). Bonferroni corrections for multiple t-tests were
performed: * p < 0.05.
Table 3: Demographic and Clinical Characteristics of the Samples
AN Patients Controls, CN AN vs. CN
(n=36) (n=36) p
Age (years) 15.9 (2.0) 16.1 (1.7) 0.660
BMI (kg/m²)
15.8 (1.4) 20.5 (2.0) < 0.001 ***
TAS-26 Score 43.9 (8.3) 38.1 (8.3) 0.026 *
EDI-2 Overall Score 172.3 (37.5) 120.4 (25.5) 0.043 *
Scale Body Dissatisfaction 30.7 (10.3) 22.5 (7.9) 0.013 *
Scale Drive for Thinness 20.7 (11.0) 13.21 (3.4) 0.033 *
Table 3. TAS-26, Toronto-Alexithymia-Scale; EDI-2, Eating Disorder Inventory;
Values are means and standard deviations; group comparison t-test (two-tailed);
Bonferroni corrections for multiple t-tests were performed: * p < 0.05; *** p < 0.001.
Page 57 of 64
Psychophysiology
Psychophysiology
123456789101112131415161718192021222324252627282930313233343536373839404142434445464748495051525354555657585960
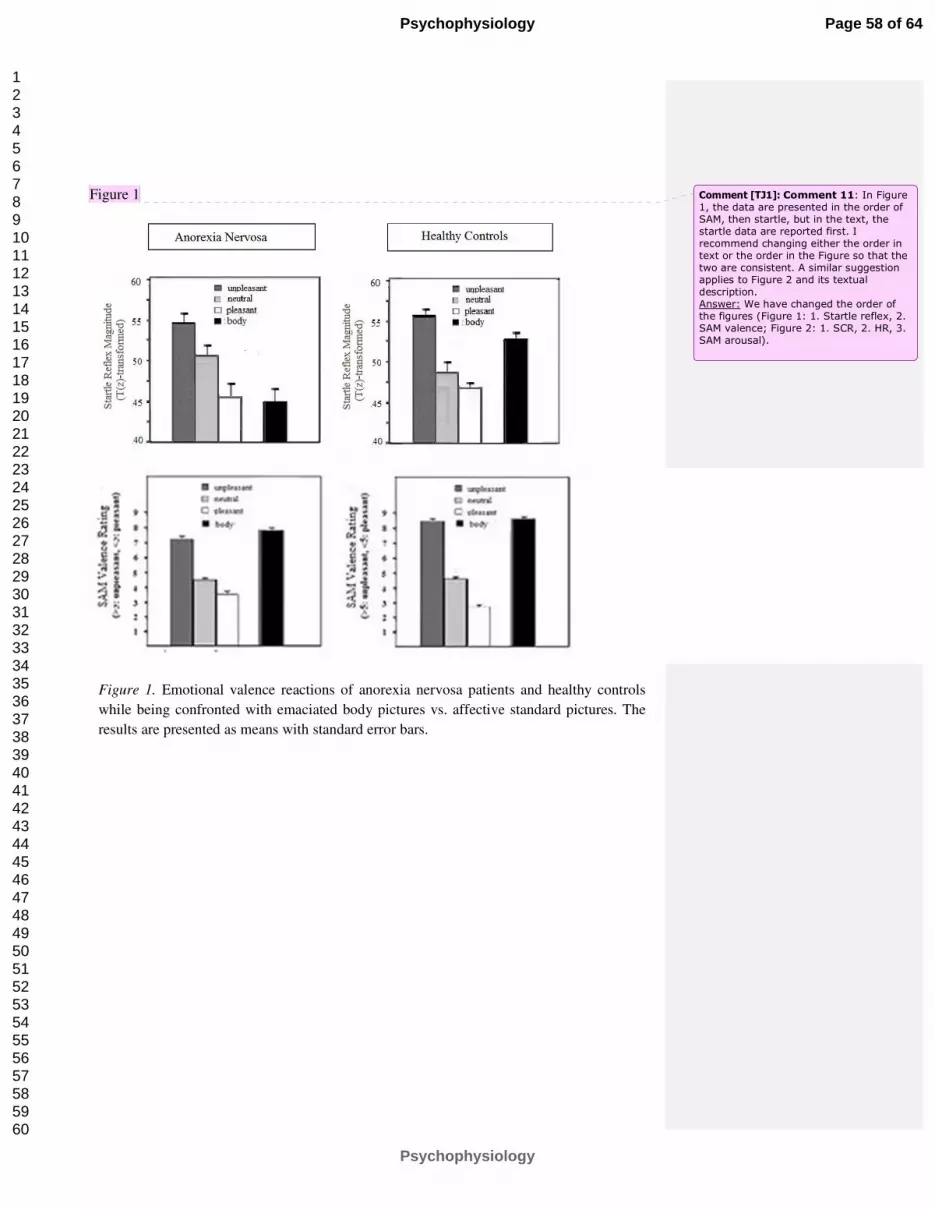
Figure 1
Figure 1. Emotional valence reactions of anorexia nervosa patients and healthy controls
while being confronted with emaciated body pictures vs. affective standard pictures. The
results are presented as means with standard error bars.
Comment [TJ1]: Comment 11: In Figure 1, the data are presented in the order of SAM, then startle, but in the text, the startle data are reported first. I recommend changing either the order in text or the order in the Figure so that the two are consistent. A similar suggestion applies to Figure 2 and its textual description. Answer: We have changed the order of the figures (Figure 1: 1. Startle reflex, 2. SAM valence; Figure 2: 1. SCR, 2. HR, 3. SAM arousal).
Page 58 of 64
Psychophysiology
Psychophysiology
123456789101112131415161718192021222324252627282930313233343536373839404142434445464748495051525354555657585960
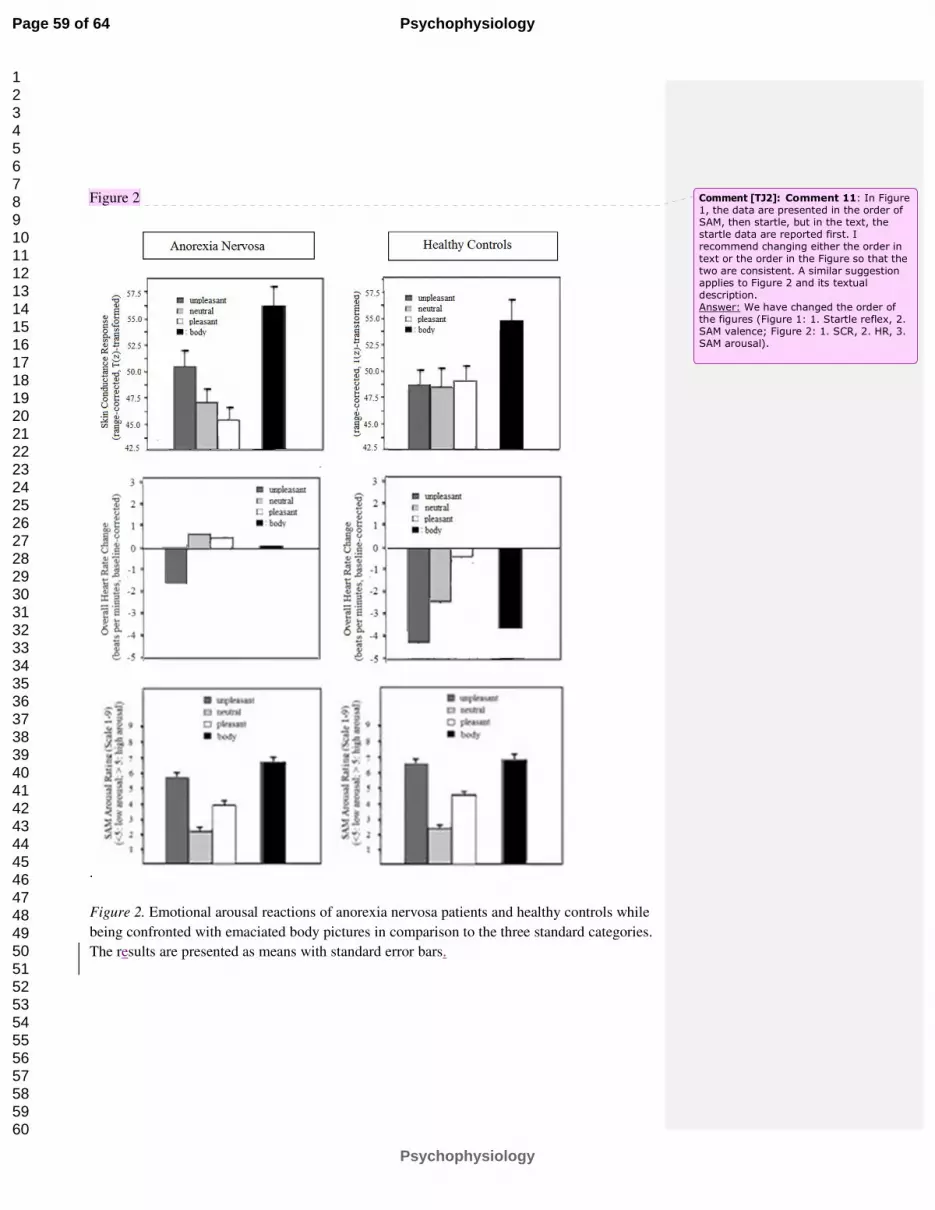
Figure 2
.
Figure 2. Emotional arousal reactions of anorexia nervosa patients and healthy controls while
being confronted with emaciated body pictures in comparison to the three standard categories.
The results are presented as means with standard error bars.
Comment [TJ2]: Comment 11: In Figure 1, the data are presented in the order of SAM, then startle, but in the text, the startle data are reported first. I recommend changing either the order in
text or the order in the Figure so that the two are consistent. A similar suggestion applies to Figure 2 and its textual description. Answer: We have changed the order of the figures (Figure 1: 1. Startle reflex, 2. SAM valence; Figure 2: 1. SCR, 2. HR, 3. SAM arousal).
Page 59 of 64
Psychophysiology
Psychophysiology
123456789101112131415161718192021222324252627282930313233343536373839404142434445464748495051525354555657585960
References
American Psychiatric Association (2000). Diagnostic and statistical manual for mental
disorders, 4th ed., text rev., Washington, DC: American Psychiatric Press. doi:
10.1176/appi.books.9780890423349
Bardone-Cone, A. M., & Cass, K. M. (2006). Investigating the impact of pro-anorexia
websites: A pilot study. European Eating Disorders Review, 14, 256–262. doi:10.1002
/erv.714.
Berridge, K. C. (1996). Food reward: Brain substrates of wanting and liking. Neuroscience &
Biobehavioral Reviews, 20, 1–25. doi:10.1016/0149-7634(95)00033-B.
Blumenthal, T. D., Cuthbert, B. N., Filion, D. L., Hackley, S., Lipp, O. V., & van Boxtel, A.
(2005). Committee report: Guidelines for human startle eyeblink electromyographic
studies. Psychophysiology, 42, 1-15. doi:10.1111/j.1469-8986.2005.00271.x.
Bradley, M. M., Lang, P. J. (1994). Measuring Emotion: The Self-Assessment Manikin and
the Semantic Differential. Journal of Behavior Therapy und Experimental Psychiatry,
Bradley, M. M., Gianaros, P., & Lang, P. J. (1995). As time goes by: Stability of affective
startle modulation [Abstract]. Psychophysiology, 32, 521.
Cash, T. F., & Deagle, E. A. (1997). The nature and extent of body-image disturbances in
anorexia nervosa and bulimia nervosa: A meta-analysis. International Journal of
Eating Disorders, 22(2), 107-125. doi:10.1002/(SICI)1098-108X(199709)22:2<107::
AID-EAT1>3.0.CO;2-J.
Casiero, D. & Frishman, W. H. (2006). Cardiovascular complications of eating disorders.
Cardiology in Review, 14(5), 227-231. doi:10.1097/01.crd.0000216745.96062.7c.
Childress, A. R., Ehrman, R., Rohsenow, D. J., Robbins, S. J., & O’Brien, C. P. (1992).
Classically conditioned factors in drug dependence. In J. H. Lowinson, P. Ruiz, R. B.
Millman, & J. G. Langrod (Eds.), Substance abuse: A comprehensive textbook (pp.
56-69). Baltimore: Williams & Wilkins.
Page 60 of 64
Psychophysiology
Psychophysiology
123456789101112131415161718192021222324252627282930313233343536373839404142434445464748495051525354555657585960

Cserjési, R., Vermeulen, N., Luminet, O., Marechal, M., Nef, F., Simon, Y., & Lénárd, L.
(2010). Explicit vs. implicit body image evaluation in restrictive anorexia nervosa.
Psychiatry Research, 175, 148–153. doi:10.1016/j.psychres.2009.07.002.
Cuthbert, B. N., Bradley, M. M., & Lang, P. J. (1990). Valence and arousal in startle
modulation. Psychophysiology, 27(Suppl.), 24.
Davis M., Falls, W.A., Campeau, S., & Kim, M. (1993). Fear-potentiated startle: A neural and
pharmacological analysis. Behavioral Brain Research 58: 175-198. doi:10.1016/0166-
4328(93)90102-V.
Degner, J., & Wentura, D. (2009). Not everybody likes the thin and dislikes the fat: One´s
weight matters in the automatic activation of weight-related social evaluations. Social
Cognition, 27(2), 202-221. doi:10.1521/soco.2009.27.2.202.
Friederich, H. C., Kumari, V., Uher, R., Riga, M., Schmidt, U., Campbell, I. C., Herzog, W.,
… Treasure, J. (2006). Differential motivational responses to food and pleasurable
cues in anorexia and bulimia nervosa: A startle reflex paradigm. Psychological
Medicine, 36(9), 1327-1335. doi:10.1017/S0033291706008129.
Gavin, J., Rodham, K., & Poyer, H. (2008). The presentation of "pro-anorexia" in online
group interactions. Qualitative Health Research, 18(3), 325-333. doi:10.1177/1049732
307311640.
Geier, A., Mucha, R. F., & Pauli, P. (2000). Appetitive nature of drug cues confirmed with
physiological measures in a model using pictures of smoking. Psychopharmacology,
150, 283–291. doi:10.1007/s002130000404.
George, L. (1997). The psychological characteristics of patients suffering from anorexia
nervosa and the nurse´s role in creating a therapeutic relationship. Journal of
Advanced Nursing, 26(5):899-908. doi:10.1046/j.1365-2648.1997.00421.x.
Page 61 of 64
Psychophysiology
Psychophysiology
123456789101112131415161718192021222324252627282930313233343536373839404142434445464748495051525354555657585960

Graham, F. K. (1978). Constraints in measuring heart rate and period sequentially through
real and cardiac time. Psychophysiology, 15, 492–495. doi:10.1111/j.1469-8986.1978.
tb01422.x.
Haas, S. M., Irr, M. E., Jennings, N. A., & Wagner, L. M. (2011). Communicating thin: A
grounded model of Online Negative Enabling Support Groups in the pro-anorexia
movement. New Media & Society, 13(1), 40-57. doi:10.1177/1461444810363910.
Ito, T. A. & Lang, P. J. (1998). Eliciting affect using the International Affective Picture
System: Trajectories through evaluative space. Personality and Social Psychology
Bulletin, 24(8), 855-879. doi:10.1177/0146167298248006.
Jaccard, J., & Wan, C. K. (1996). LISREL approaches to interaction effects in multiple
regression. Thousand Oaks, CA: Sage Publications.
Lang, P.J. (1995). The emotion probe. Studies of motivation and attention. American
Psychology, 50, 372–385. doi:10.1037/0003-066X.50.5.372.
Lang, P. J., Bradley, M. M., & Cuthbert, B. N. (2008). International affective picture system
(IAPS): Affective ratings of pictures and instruction manual. Technical Report A-8.
Florida, Gainsville: University of Florida.
Levitt, D. H. (2003). Drive for thinness and fear of fat: Separate yet related constructs? Eating
Disorders: The Journal of Treatment and Prevention, 11, 221–
234. doi:10.1080/10640 260390218729.
Loeber, S., Croissant, B., Nakovics, H., Zimmer, A., Georgi, A., Klein, S., Diener, C., …
Flor, H. (2007). The startle reflex in alcohol-dependent patients: Changes after
cognitive-behavioral therapy and predictive validity for drinking behavior. A pilot
study. Psychotherapy and Psychosomatics, 76(6), 385-390. doi:10.1159/000107567.
Lykken, D. T.. Rose, R.. Luther, B., & Maley, M. (1966). Correcting psychophysiological
measures for individual differences in range. Psychological Bulletin 66, 481-484. doi:
10.1037/h0023922.
Page 62 of 64
Psychophysiology
Psychophysiology
123456789101112131415161718192021222324252627282930313233343536373839404142434445464748495051525354555657585960

Mauler, B. I., Hamm, A. O., Weike, A. I., & Tuschen-Caffier, B. (2006). Affect regulation
and food intake in bulimia nervosa: Emotional responding to food cues after
deprivation and subsequent eating. Journal of Abnormal Psychology, 115(3), 567-579.
doi:10.1037/0021-843X.115.3.567.
Mucha, R. F., Geier, A., Stuhlinger, M., & Mundle, G. (2000). Appetitive effects of drug cues
modeled by pictures of the intake ritual: Generality of cue-modulated startle examined
with inpatient alcoholics. Psychopharmacology, 151, 428–432. doi:10.1007/s0021300
00508.
Niaura, R.S., Rohsenow, D.J., Binkoff, J.A., Monti, P.M., Pedraza, M., Abrahams, D.B.
(1988). Relevance of cue reactivity to understanding alcohol and smoking relapse.
Journal of Abnormal Psychiatry, 97. 133-152. doi:10.1037/0021-843X.97.2.133.
Norris, M. L., Boydell, K. M., Pinhas, L., & Katzman, D. K. (2006). Ana and the Internet: A
review of pro-anorexia websites. International Journal of Eating Disorders, 39, 443–
447. doi:10.1002/eat.20305.
Overbeke G. (2008). Pro-anorexia websites: Content, impact, and explanations of popularity.
Mind Matters: The Wesleyan Journal of Psychology, 3, 49-62. Retrieved from http://
http://www.wesleyan.edu/psyc/mindmatters/volume03/article05.pdf.
Rand, C. S., Resnick, J. L., & Seldman, R. S. (1997). Assessment of socially acceptable body
sizes by university students. Obesity Research, 5(5), 425-429. doi:10.1038/oby
Rohsenow, D. J., Niaura, R. S., Childress, A. R., Abrams, D. B., & Monti, P. M. (1990). Cue
reactivity in addictive behaviors: Theoretical and treatment implications. International
Journal of Addictions, 25(7A-8A), 957-993. doi:10.3109/10826089109071030.
Ryle, A., & Evans, C. D. (1991). Some meanings of body and self in eating disordered and
comparison subjects. British Journal of Medical Psychology, 64(3), 273-283. doi:10.1
111/j.2044-8341.1991.tb01666.x.
Schmidt D. R. (1988). The use of a priori techniques with a MANOVA. Paper presented at
Page 63 of 64
Psychophysiology
Psychophysiology
123456789101112131415161718192021222324252627282930313233343536373839404142434445464748495051525354555657585960

the Annual Meeting of the Mid-South Educational Research Association (17th),
Louisville, KY.
Strife, S. R. & Rickard, K. (2011). The conceptualization of anorexia: The Pro-Ana
perspective. Affilia, 26(2), 213-217. doi:10.1177/0886109911405592.
Thiel, A., Jacobi, C., Horstmann, S., Paul, T., Nutzinger, D. O., & Schüssler, G. (1997). Eine
deutschsprachige Version des Eating Disorder Inventory EDI-2. [A german version of
the Eating Disorder Inventory EDI-2]. Psychotherapie, Psychosomatik, Medizinische
Psychologie, 47(9-10), 365-376.
Thompson, J.K., & Stice, E. (2001). Thin-ideal internalization: Mounting evidence for a new
risk factor for body-image disturbance and eating pathology. Current Directions in
Psychological Science, 10, 181–183. doi:10.1111/1467-8721.00144
Uher, R., Murphy, T., Friederich, H. C., Dalgleish, T., Brammer, M. J., Giampietro, V., &
Phillips, M. L. (2005). Functional neuroanatomy of body shape perception in healthy
and eating disordered women. Biological Psychiatry, 58, 990–997. doi:10.1016/j.biops
ych.2005.06.001.
Vandereycken, W. (2006). Denial of illness in anorexia nervosa – a conceptual review: Part 1
diagnostic significance and assessment. European Eating Disorders Review,
14(5):341-351. doi:10.1002/erv.721.
Vartanian, L. R., Herman, P. C., & Polivy, J. (2005). Implicit and explicit attitudes toward
fatness and thinness: The role of the internalization of societal standards. Body Image,
2(4), 373–381. doi:10.1016/j.bodyim.2005.08.002.
Zonnevylle-Bender, M. J. S., van Goozen, S. H. M., Cohen-Kettenis, P. T., Jansen, L. M. C.,
van Elburg, A., van Engeland, H. (2004). Adolescent anorexia nervosa patients have a
discrepancy between neurophysiological responses and self-reported emotional
arousal to psychosocial stress. Psychiatry Research, 15, 135 (1):45-52. doi:
10.1177/0145445507309027.
Page 64 of 64
Psychophysiology
Psychophysiology
123456789101112131415161718192021222324252627282930313233343536373839404142434445464748495051525354555657585960
Copyright © 2022 FDOKUMEN