α-Hemolysin membrane pore density measured on liposomes
7
a-Hemolysin membrane pore density measured on liposomes Jo¨ el Lemi` ere, abcd Karine Guevorkian, abc Cl´ ement Campillo, abc C´ ecile Sykes abc and Timo Betz * abc Membrane pore proteins are powerful tools that allow manipulation of the inside composition of micron sized bioreactors such as artificial liposomes. While the pores self-assemble very reliably on phospholipid bilayers, the determination of the number of pores in situ for liposomes remains difficult. Here we present three independent methods to establish the number of pores on different types of liposomes: (A) the loss of refractive index due to equilibration of the inside and outside buffer conditions, and the loss of volume by (B) membrane aspiration and by (C) membrane tether pulling experiments. With these three methods we are able to determine the pore density on the membrane, and all measurements give similar values; an average pore distance is found on the order of 100 nm. 1 Introduction During the past decades, articial phospholipid bilayer lipo- somes have been extensively studied. One major research theme was the possibility of using these liposomes as microscopic reactors for biomimetic systems. 1,2 The advantage of articial liposomes is the possibility of controlling both the lipid bilayer composition and the inside content. This allows reconstitution of certain aspects of living biological systems, and even rebuilding of certain properties of living cells. Recent advances have shown that it is possible to control the liposome inside solution up to a degree where protein construction via ribosomes is possible, 2 or to even reconstitute the actin cortex of living cells by inducing actin polymerization at the inner membrane. 1 Two important liposome preparation techniques are electroformation and the recently developed inverted emulsion technique. While the electroformation is, today, a simple and common technique, the inverted emulsion method is more complex but allows encapsu- lation of a well dened and precious content within the lipo- somes while having a totally different solution outside. In this report we will investigate both formation methods. Many applications of liposome micro-reactors require a controlled triggering of the inside reactions and a steady control of parameters such as salt concentration, pH or the supply of energy in the form of adenosine triphosphate (ATP). This problem was solved by the addition of membrane pores with a well dened pore diameter, thus allowing the exchange of molecules below a mass threshold, while preserving larger molecules such as proteins inside the liposome. A common pore protein used for that is the bacterial toxin a-hemolysin, which is secreted by the bacteria Staphylococcus aureus as a water soluble monomer with a size of 33.2 kDa. 3–5 Monomers self-assemble spontaneously on a phospholipid bilayer to form a mushroom-shaped pore with a cutoff mass of about 2 kDa, which is permeable to ions and single nucleotides, but blocks larger proteins that do not t through the 1.5 nm pore diam- eter. 3 The a-hemolysin pore therefore satises the mentioned requirement to control pH, ions and ATP-concentration, while conning proteins inside the liposomes. Furthermore, the pore properties can be well controlled by genetic modications. 6 However, the quantication of the pore insertion density has remained a complex problem, which was commonly ignored as the pore protein was added in high concentrations to simply result in a saturation of pores on the membrane. Nevertheless, a good estimation of the pore concentration is important to understand the dynamics of the molecular exchange and to estimate the material uxes of molecules consumed inside the liposome, such as ATP or amino acids. 2 Commonly, the pres- ence of pores is measured by the ion current ow, when applying a membrane potential. However, this method only works well for a small number of pores that are generally situ- ated on a small membrane patch that is aspirated into a micropipet. 6 On liposomes, this technique is not possible as it requires the insertion of an electrode into the liposome, which ruptures the membrane and thus destroys the liposome. Here we address the question of pore density by presenting three different methods, which give consistent results. Inter- estingly, we nd that the equilibration of different inside– outside conditions might take several minutes during which the system is out-of-equilibrium. a Institut Curie, Centre de Recherche, F-75248, Paris, France. E-mail: timo.betz@curie. fr b CNRS, UMR168, F-75248, Paris, France c UPMC Univ Paris 06, UMR 168, F-75005, Paris, France d Univ. Paris Diderot, Sorbonne Paris Cit´ e, F-75205, Paris, France Cite this: Soft Matter, 2013, 9, 3181 Received 16th July 2012 Accepted 9th January 2013 DOI: 10.1039/c3sm27812c www.rsc.org/softmatter This journal is ª The Royal Society of Chemistry 2013 Soft Matter, 2013, 9, 3181–3187 | 3181 Soft Matter PAPER Downloaded by Université Claude Bernard Lyon on 12/04/2013 15:42:58. Published on 07 February 2013 on http://pubs.rsc.org | doi:10.1039/C3SM27812C View Article Online View Journal | View Issue
-
Upload
uni-muenster -
Category
Documents
-
view
0 -
download
0
Transcript of α-Hemolysin membrane pore density measured on liposomes

Soft Matter
PAPER
Dow
nloa
ded
by U
nive
rsité
Cla
ude
Ber
nard
Lyo
n on
12/
04/2
013
15:4
2:58
. Pu
blis
hed
on 0
7 Fe
brua
ry 2
013
on h
ttp://
pubs
.rsc
.org
| do
i:10.
1039
/C3S
M27
812C
View Article OnlineView Journal | View Issue
aInstitut Curie, Centre de Recherche, F-7524
frbCNRS, UMR168, F-75248, Paris, FrancecUPMC Univ Paris 06, UMR 168, F-75005, PdUniv. Paris Diderot, Sorbonne Paris Cite, F
Cite this: Soft Matter, 2013, 9, 3181
Received 16th July 2012Accepted 9th January 2013
DOI: 10.1039/c3sm27812c
www.rsc.org/softmatter
This journal is ª The Royal Society of
a-Hemolysin membrane pore density measured onliposomes
Joel Lemiere,abcd Karine Guevorkian,abc Clement Campillo,abc Cecile Sykesabc
and Timo Betz*abc
Membrane pore proteins are powerful tools that allow manipulation of the inside composition of micron
sized bioreactors such as artificial liposomes. While the pores self-assemble very reliably on phospholipid
bilayers, the determination of the number of pores in situ for liposomes remains difficult. Here we
present three independent methods to establish the number of pores on different types of liposomes:
(A) the loss of refractive index due to equilibration of the inside and outside buffer conditions, and the
loss of volume by (B) membrane aspiration and by (C) membrane tether pulling experiments. With these
three methods we are able to determine the pore density on the membrane, and all measurements give
similar values; an average pore distance is found on the order of 100 nm.
1 Introduction
During the past decades, articial phospholipid bilayer lipo-somes have been extensively studied. One major research themewas the possibility of using these liposomes as microscopicreactors for biomimetic systems.1,2 The advantage of articialliposomes is the possibility of controlling both the lipid bilayercomposition and the inside content. This allows reconstitutionofcertain aspects of living biological systems, and even rebuildingof certain properties of living cells. Recent advances have shownthat it is possible to control the liposome inside solution up to adegree where protein construction via ribosomes is possible,2 orto even reconstitute the actin cortex of living cells by inducingactin polymerization at the inner membrane.1 Two importantliposome preparation techniques are electroformation andthe recently developed inverted emulsion technique. While theelectroformation is, today, a simple and common technique, theinverted emulsion method is more complex but allows encapsu-lation of a well dened and precious content within the lipo-somes while having a totally different solution outside. In thisreport we will investigate both formation methods.
Many applications of liposome micro-reactors require acontrolled triggering of the inside reactions and a steady controlof parameters such as salt concentration, pH or the supply ofenergy in the form of adenosine triphosphate (ATP). Thisproblem was solved by the addition of membrane pores with awell dened pore diameter, thus allowing the exchange of
8, Paris, France. E-mail: timo.betz@curie.
aris, France
-75205, Paris, France
Chemistry 2013
molecules below a mass threshold, while preserving largermolecules such as proteins inside the liposome. A commonpore protein used for that is the bacterial toxin a-hemolysin,which is secreted by the bacteria Staphylococcus aureus as awater soluble monomer with a size of 33.2 kDa.3–5 Monomersself-assemble spontaneously on a phospholipid bilayer to forma mushroom-shaped pore with a cutoff mass of about 2 kDa,which is permeable to ions and single nucleotides, but blockslarger proteins that do not t through the 1.5 nm pore diam-eter.3 The a-hemolysin pore therefore satises the mentionedrequirement to control pH, ions and ATP-concentration, whileconning proteins inside the liposomes. Furthermore, the poreproperties can be well controlled by genetic modications.6
However, the quantication of the pore insertion density hasremained a complex problem, which was commonly ignored asthe pore protein was added in high concentrations to simplyresult in a saturation of pores on themembrane. Nevertheless, agood estimation of the pore concentration is important tounderstand the dynamics of the molecular exchange and toestimate the material uxes of molecules consumed inside theliposome, such as ATP or amino acids.2 Commonly, the pres-ence of pores is measured by the ion current ow, whenapplying a membrane potential. However, this method onlyworks well for a small number of pores that are generally situ-ated on a small membrane patch that is aspirated into amicropipet.6 On liposomes, this technique is not possible as itrequires the insertion of an electrode into the liposome, whichruptures the membrane and thus destroys the liposome.
Here we address the question of pore density by presentingthree different methods, which give consistent results. Inter-estingly, we nd that the equilibration of different inside–outside conditions might take several minutes during which thesystem is out-of-equilibrium.
Soft Matter, 2013, 9, 3181–3187 | 3181

Soft Matter Paper
Dow
nloa
ded
by U
nive
rsité
Cla
ude
Ber
nard
Lyo
n on
12/
04/2
013
15:4
2:58
. Pu
blis
hed
on 0
7 Fe
brua
ry 2
013
on h
ttp://
pubs
.rsc
.org
| do
i:10.
1039
/C3S
M27
812C
View Article Online
2 Methods2.1 Liposome preparation
Liposome composition. EPC, DOGS-NTA-Ni, and DSPE-PEG(2000)-biotin (all purchased from Avanti Polar Lipids) aremixed with a molar ratio of EPC/DOGS-NTA-Ni/biotin of91 : 8 : 1 (EPC/NTA).
Buffer composition. To image liposomes in phase contrastmicroscopy, different inside and outside buffers are used.
The inside buffer (I-Buffer-1) consists of 6.5 mM G-actin(including 20% uorescently labeled actin), 10 mM HEPES (pH7.6), 0.1 mM CaCl2, 100 mg ml�1 dextran, 0.2 mM ATP, 6 mMdithiothreitol (DTT), 0.13 mM diazabicyclo[2,2,2]octane(Dabco), and 280 mM sucrose. The outside buffer (O-Buffer-1)contains 10 mM HEPES (pH 7.5), 2 mM MgCl2, 0.2 mM CaCl2,2 mM ATP, 6 mM DTT, 0.13 mM Dabco, 275 mM glucose,and 0.5 mg ml�1 casein. These buffers were used in liposomeaspiration and tube pulling experiments. The inside buffer(I-Buffer-2) consists of 300 mM sucrose. The outside buffer(O-Buffer-2) contains 300 mM glucose and 0.5 mg ml�1 casein.Contrast loss measurements are applied on liposomes preparedwith these buffers.
Inverted emulsion.1 Lipids are dissolved in mineral oil(Sigma) at a total concentration of 0.5 mg ml�1. A volume of5 ml of this oil–lipid mixture is sonicated in a bath at 35 degreesfor 30 min at a power of 30 W, cooled to room temperature andthen stored at 4 degrees for up to a week. An emulsion betweenthe inside buffer and the oil–lipid mixture is prepared andadded on top of the outside buffer. Subsequent centrifugationtransports the inside solution emulsion across a lipid mono-layer as described earlier1 and liposomes are collected.
Electroformation.7 Briey, the lipid mix is dissolved inchloroform (2.5 mg ml�1) and 10 ml of this solution is applied
Fig. 1 Representation of the three different measurement methods. The contrast lomeasured using a quadrant photodiode (QPD). (B) A typical liposome before pore adby three beads trapped by multiple optical tweezers (black crosses). (C and D) Microthe membrane permeability. (E and F) Tube extrusion from liposomes using hydrodmicrofluidic channel using HTE. A liposome with radius R is adhered to a micro-rodtime. rt is the radius of the tube. (F) Snapshot of a tube formed from a liposome us
3182 | Soft Matter, 2013, 9, 3181–3187
on an ITO glass slide. The slides are stored in vacuum for 1 h toevaporate the solvent. Subsequently, two slides are assembledinto a chamber of width 1 cm and height 2 mm. The cavity islled with the inside buffer. An alternating electric eld (10 Hz,2.3 V) is applied across the chamber for 8 hours. Liposomescreated this way are diluted in the external buffer and stored at 4degrees for up to a week.
a-Hemolysin. The pore-forming protein a-hemolysin (Sigma)is dissolved to a nal concentration of 1 mg ml�1 in a buffercontaining 150 mM KCl and 10 mM HEPES. To achievecomparable results, we always used the same nal concentra-tion of 0.1 mg ml�1 a-hemolysin in the three different experi-ments described here.
2.2 Contrast measurement for the refractive index difference
To determine the relative difference of the refractive indexbetween inside and outside a liposome, we use a recentlydeveloped method8,9 based on light refraction across themembrane. A laser focus positioned at the interface of a lipo-some lled with a higher refractive index buffer refracts thelight as a function of the refractive index differences. We recordthis asymmetry in the far eld of the laser using a quadrantphotodiode (QPD) (see Fig. 1A) mounted on an Olympus IX-71microscope stand equipped with a �60 water immersionobjective (NA 1.2). During the experiments the liposome is xedwith three beads in a multiple optical tweezer system. Eachbead is trapped by an effective power of x5 to 7 mW. Mean-while, we scan the focus of a weak (power # 0.5 mW) IR laser ofwavelength 1064 nm over the membrane and measure the dif-fracted light using a QPD in the back-focal plane of thecondenser. This scan results in a curve as shown in Fig. 2A thatis similar to the one predicted and measured on scans over
ss method (A and B) exploits the refraction of light at the membrane, which can bedition. The probe laser is positioned at the white cross. The liposome is maintainedpipet aspiration directly measures the loss of volume and can be used to measureynamic tube extrusion (HTE) technique. (E) Schematic of tube formation inside aand subjected to a flow U. The length of the tube, L, is measured as a function ofing HTE. Scale bars are 5 mm.
This journal is ª The Royal Society of Chemistry 2013

Fig. 2 (A) Decrease of signal recorded at the QPD after addition of membranechannels a-hemolysin, time (t) is given in minutes. The signal represents the scanin the x direction (black line in the inset) of the diffracted light normalized by thesum signal of the QPD. The position is relative to the membrane. The insetrepresents an image of the membrane with the position of the laser during thescan (black line), scale bar is 1 mm. (B) The decay of the slope quantifies the loss ofrefractive index differences, and a double exponential decay function (red line)monitors the equilibration of the different molecules. Inset: numerical simulationsestablish the linear relation between the slope of the scan curve and the refractiveindex difference. Data points are simulations, and the line is a linear fit. (C) Sucrosepermeability as a function of liposome radius prepared by electroformation (blacktriangle) or inverted emulsion (red square).
Paper Soft Matter
Dow
nloa
ded
by U
nive
rsité
Cla
ude
Ber
nard
Lyo
n on
12/
04/2
013
15:4
2:58
. Pu
blis
hed
on 0
7 Fe
brua
ry 2
013
on h
ttp://
pubs
.rsc
.org
| do
i:10.
1039
/C3S
M27
812C
View Article Online
polystyrene beads.10 According to the Lorenz–Mie theory theslope of the scan curve depends linearly on the refractive indexdifference. The numerical solution of the Lorenz–Mie theory11
conrms the linear dependence of the slope s on the refractiveindex difference Dn as s(t) ¼ g � Dn, where g is a complexfunction of the geometry and the optical conguration (insetFig. 1B). To analyse the data, the linear dependence of the slopeon the refractive index difference is used. We measure thechange in refractive index difference by recording the slope of
This journal is ª The Royal Society of Chemistry 2013
the curve along the edge of the liposomes, while the concen-tration of glucose and sucrose equilibrates.
2.3 Liposome aspiration
Liposomes are aspirated as shown in Fig. 1C and D. Pipets arepulled from glass capillaries using a micropipet puller (P2000,Sutter Instruments, USA). The opening of the pipet is cleaved to adiameter of 3–5 mm by a microforge (MF-830, Narishige, Japan).Micropipets are lled with glucose buffer and mounted on theexperimental chamber.Micropipets and experimental chambersare passivated by applying a 5 mg ml�1 casein solution for 30minutes. Micropipette aspiration experiments are performed ona Nikon TE2000 inverted microscope with a �100/NA 1.3 oilimmersion objective (Nikon). To vary the pressure inside themicropipet, it is connected to a water reservoir of variable heightusing a tube system. Before each experiment, the point of zeropressure between the micropipet and the chamber is measuredby adjusting it to the point of zero ow by aspirating tracerparticles that are observed in the micropipet.
2.4 Hydrodynamic tube pulling
The experimental chamber consists of a single microuidicchannel made out of poly(dimethylsiloxane) (PDMS), which isattached to a cover-glass through plasma activation. One side ofthe channel is cut open to allow the introduction of the lipo-somes and the glass micro-rod. The other end is connected to asyringe pump (KDS Scientic, USA), which operates in aspira-tion mode. The details of the setup are explained elsewhere.12
The channel is 200 mm high, 600 mm wide and 2 cm long. Acoated glass micro-rod is used to attach the liposomes and topull a tether under medium ow. Thin-tip micro-rods areprepared by pulling borosilicate rods (1 mm outer diameter)using a laser-based puller (P-2000, Sutter Inst., USA). The rodsare then forged to 2–3 mm using a micro-forge (Narishige,Japan). Rods are coated with streptavidin to attach themembrane to the glass. This is done by rst cleaning them inplasma cleaner for 30 seconds, then incubating them in 0.1%v/w poly-lysine (Sigma) for 30 minutes. Then they are rinsedwith PBS and incubated in 2.5 mg ml�1 streptavidin (Sigma) inPBS solution for 1 hour. The adhesion of the liposomes to theglass micro-rod takes place through the streptavidin on themicro-rod and the biotinylated lipids in the liposomemembrane. Once the liposome is attached to the rod, it isbrought into the channel using a mechanical micro-manipu-lator and raised to the middle of the channel, see Fig. 1E and F.Using the syringe pump in aspiration mode a xed debit, Df, isapplied. The ow velocity has a Poiseuille distribution, isstrongest at the mid-height of the channel, and is related to Df
as: U ¼ 1.5 � Df/Ac, where Ac is the cross-section of the channel.The tubes are extruded aer equilibration of the sucrose–glucose gradient through the a-hemolysin pores. Liposomes arevisualized in epiuorescence using an inverted microscope(Zeiss Axiovert 100) equipped with a �20 air objective (NA 0.45).Time lapse movies are recorded with a CDD camera (Luca-R,Andor) at 200 ms intervals. Traction of the liposomes is per-formed using ImageJ soware (NIH).
Soft Matter, 2013, 9, 3181–3187 | 3183
Soft Matter Paper
Dow
nloa
ded
by U
nive
rsité
Cla
ude
Ber
nard
Lyo
n on
12/
04/2
013
15:4
2:58
. Pu
blis
hed
on 0
7 Fe
brua
ry 2
013
on h
ttp://
pubs
.rsc
.org
| do
i:10.
1039
/C3S
M27
812C
View Article Online
3 Results and discussion3.1 Time dependent refractive index difference
Before the incorporation of pores into the lipid bilayer, lipo-somes are visible in bright-eld microscopy due to the differ-ence in the refractive indices of sucrose and glucose. Theaddition of pores allows equilibration of the glucose–sucroseconcentrations across the membrane. This in turn reduces theasymmetry measured by the QPD. To quantify the loss ofcontrast we use the linear region of the scan curve as shown inFig. 2A.11 The slope of the linear regime between the minimaland the maximal signal is found by tting a line along the 200nm region centered around the midpoint between the curveminimum and maximum.
Before pore addition, the deection is determined by therefractive indices of the inside buffer and outside buffer, nI ¼1.348 and nO ¼ 1.344, respectively. The initial refractive indexdifference of Dn ¼ 0.004 decreases while the concentrationequilibrates across the membrane through the a-hemolysinpores. To measure the permeability, which allows estimation ofthe pore density, we will only require the time dependence of Dnthat is proportional to the slope s (see Material and methods).
Fig. 2B shows the decrease of the slopes over time, startingright aer the addition of pores. The equilibration of theglucose–sucrose decreases the slope s until the point where onlythe refraction of the lipid bilayer is le. The contribution of thepure membrane is detectable (0.15 V mm�1) and constant asshown in Fig. 2A and B.
In the following, we will use the fact that for small concen-trations, the refractive index is a linear function of theconcentration of molecules in solution; hence n is proportionalto c and we need to consider only the concentration change overtime to model the data. Here we can make use of the knownbehaviour of concentration equilibration due to the perme-ability a, which contributes to the permeability equation:
dci
dt¼ �aA
VDc (1)
where ci is the concentration inside the liposome, a is itspermeability, A is the liposome surface, and Dc ¼ ci � cext theconcentration difference across the membrane. Furthermore,since we know that the outside concentration stays constantdue to the large volume, dci/dt¼ d(Dc)/dt and thus, knowing theradius R of the liposome:
dðDcÞdt
¼ � 3a
RDc; (2)
gives the solution:
DcðtÞ ¼ Dc0 exp
�� 3a
R� t
�(3)
where Dc0 is the initial concentration difference. In fact, thiscalculation needs to be done for bothmolecular species, sucroseand glucose, marked respectively with the indices s and g:
Dcs;gðtÞ ¼ Dcs;g0 exp
�� 3as;g
R� t
�(4)
3184 | Soft Matter, 2013, 9, 3181–3187
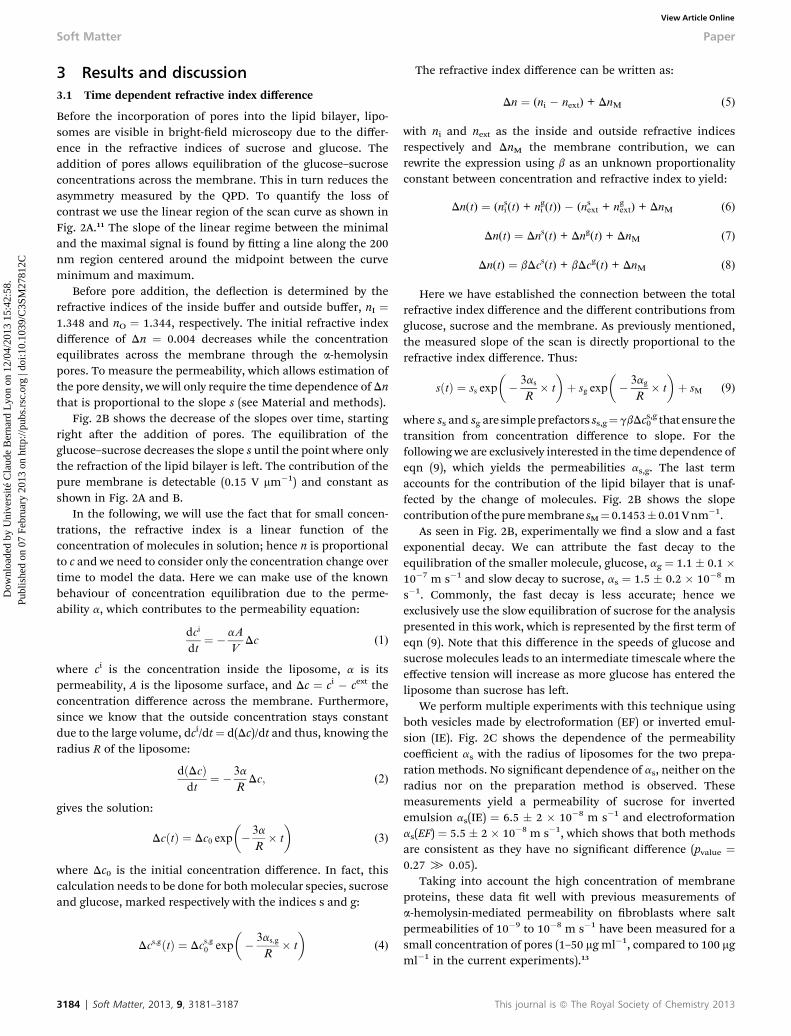
The refractive index difference can be written as:
Dn ¼ (ni � next) + DnM (5)
with ni and next as the inside and outside refractive indicesrespectively and DnM the membrane contribution, we canrewrite the expression using b as an unknown proportionalityconstant between concentration and refractive index to yield:
Dn(t) ¼ (nsi (t) + ngi (t)) � (nsext + ngext) + DnM (6)
Dn(t) ¼ Dns(t) + Dng(t) + DnM (7)
Dn(t) ¼ bDcs(t) + bDcg(t) + DnM (8)
Here we have established the connection between the totalrefractive index difference and the different contributions fromglucose, sucrose and the membrane. As previously mentioned,the measured slope of the scan is directly proportional to therefractive index difference. Thus:
sðtÞ ¼ ss exp
�� 3as
R� t
�þ sg exp
�� 3ag
R� t
�þ sM (9)
where ss and sg are simpleprefactors ss,g¼gbDcs,g0 that ensure thetransition from concentration difference to slope. For thefollowing we are exclusively interested in the time dependence ofeqn (9), which yields the permeabilities as,g. The last termaccounts for the contribution of the lipid bilayer that is unaf-fected by the change of molecules. Fig. 2B shows the slopecontributionof thepuremembrane sM¼0.1453�0.01Vnm�1.
As seen in Fig. 2B, experimentally we nd a slow and a fastexponential decay. We can attribute the fast decay to theequilibration of the smaller molecule, glucose, ag ¼ 1.1 � 0.1 �10�7 m s�1 and slow decay to sucrose, as ¼ 1.5 � 0.2 � 10�8 ms�1. Commonly, the fast decay is less accurate; hence weexclusively use the slow equilibration of sucrose for the analysispresented in this work, which is represented by the rst term ofeqn (9). Note that this difference in the speeds of glucose andsucrose molecules leads to an intermediate timescale where theeffective tension will increase as more glucose has entered theliposome than sucrose has le.
We perform multiple experiments with this technique usingboth vesicles made by electroformation (EF) or inverted emul-sion (IE). Fig. 2C shows the dependence of the permeabilitycoefficient as with the radius of liposomes for the two prepa-ration methods. No signicant dependence of as, neither on theradius nor on the preparation method is observed. Thesemeasurements yield a permeability of sucrose for invertedemulsion as(IE) ¼ 6.5 � 2 � 10�8 m s�1 and electroformationas(EF) ¼ 5.5 � 2 � 10�8 m s�1, which shows that both methodsare consistent as they have no signicant difference (pvalue ¼0.27 [ 0.05).
Taking into account the high concentration of membraneproteins, these data t well with previous measurements ofa-hemolysin-mediated permeability on broblasts where saltpermeabilities of 10�9 to 10�8 m s�1 have been measured for asmall concentration of pores (1–50 mg ml�1, compared to 100 mgml�1 in the current experiments).13
This journal is ª The Royal Society of Chemistry 2013

Table 1 Resulting pore density, r, average pore distance �d and number ofexperiments N for the three different experimental approaches: contrast loss,micropipet aspiration and hydrodynamic tube pulling. Note that for EPC the errorrepresents the 95% confidence interval of the fit
Method Lipids r (mm�2) �d (nm) N
Contr. loss (EF) EPC/NTA 125 � 45 90 � 16 9EPC 34 � 5 171 � 12 1
Contr. loss (IE) EPC/NTA 147 � 45 82 � 12 12EPC 24 � 5 208 � 22 1
Microp. aspiration EPC/NTA 122 � 69 90 � 30 4Hyd. tube pulling EPC/NTA 146 � 67 83 � 30 4
Fig. 3 Loss of volume over time for several examples measured by liposomeaspiration. The lines are the linear fit functions, where all have a good fit quality(R-square values between 0.85 and 0.95).
Paper Soft Matter
Dow
nloa
ded
by U
nive
rsité
Cla
ude
Ber
nard
Lyo
n on
12/
04/2
013
15:4
2:58
. Pu
blis
hed
on 0
7 Fe
brua
ry 2
013
on h
ttp://
pubs
.rsc
.org
| do
i:10.
1039
/C3S
M27
812C
View Article Online
To calculate the density of pores on the surface of the lipo-somes, we use the established model of diffusion through smallpores by Pappenheimer14 and Renkin.15 For a pore of area A0 ¼pr2 (with r as pore radius), the diffusion depends on the size ofthe passing molecule, which is dened by the hydrodynamicradius a. Pappenheimer and Renkin showed that the hydrody-namic drag can be taken into account when the actual pore areaA0 is replaced by an effective pore area Ap, dened as: Ap/A0 ¼(1 � (a/r))2 � [(1 � 2.104(a/r) + 2.09(a/r)3 � 0.95(a/r)5]. Thepermeability coefficient depends on the pore density r, thediffusion constant D ¼ kBT/(6pha) and the length of the pore l,and is described by a ¼ rDAp/l. Using these expressions we cancalculate the pore density from the measured permeability by:
r ¼ al
Ap
� 6pha
kBT(10)
with Ap as dened above.The molecular parameters of the a-hemolysine channel have
been measured previously to yield a pore radius of r ¼ 0.7 nmand a pore length of l ¼ 10 nm.3,4 Furthermore, the hydrody-namic diameter of sucrose has been determined previously,as ¼ 0.5 nm.16 We apply this calculation using a viscosity of h ¼1 � 10�3 Pa � s to estimate the pore density rs(EF) ¼ 124 � 45mm�2 for electroformed liposomes, rs(IE) ¼ 147 � 45 mm�2 forthe inverted emulsion and a respective mean pore distance of�ds(EF)¼ 90� 16 nm, �ds(IE)¼ 82� 12 nm (Table 1). It should benoted that this method directly yields average pore densities offull liposomes, as possible local concentration gradients insidethe liposome equilibrate on a timescale of z150 ms, while thetimescale of sucrose/glucose equilibration across themembrane is 6–12 minutes.
Two other experiments on a pure EPC membrane lead toabout ve times smaller values of the pore densities (seeTable 1), which suggests a dependence of lipid compositions onpore insertion.
3.2 Micropipet aspiration leads to a steady loss of volume
To directly measure the loss of volume in a quasi-equilibratedsituation, we aspirate liposomes with a given pressure, and usethe volume loss to estimate the pore density. These experimentsare performed aer equilibration of the sucrose–glucoseconcentration between the liposome and the buffer. A constantpressure is applied, which forces a constant water ow.Assuming that water permeability increases due to the pores, we
This journal is ª The Royal Society of Chemistry 2013
thus can estimate the pore number. This measurement does inprinciple depend on the correct estimation of the volume lossover time.
In each experiment, we set the aspiration pressure in themicropipet DP to 0 and bring the micropipet tip close to aliposome membrane. Then we apply a constant aspirationpressure DP ¼ 160 Pa and monitor the entry of a liposometongue inside the micropipet. We calculate the volume V(t) ofthe liposome from the measurement of micropipet radius rp(t),the radius of external portion of the liposome R(t) and length ofthe aspirated portion of the liposome L(t)17 (see Fig. 1C):
VðtÞ ¼ 2prp3
3þ prp
�LðtÞ � rp
� þ pRðtÞ33
�2þ 3uðtÞ � uðtÞ3
�(11)
where
uðtÞ ¼ffiffiffiffiffiffiffiffiffiffiffiffiffiffiffiffiffiffiffiffiffiffiffiffiffiffi1�
�rp
RðtÞ�2
s(12)
Fig. 3 shows the evolution of liposome volumes with time forfour examples. We observe that V(t) decreases linearly with time,showing that the ow J is constant for each liposome. Assumingfor simplicity thatmostof thewater is leakingthoughthepores,wecanuse the expression for theux throughN pores of radius rby:18
J ¼ Nr3DP/3hi (13)
where DP ¼ 2s/R, and hi is the viscosity of the uid inside. Thisreasoning allows the estimation of the number of pores to beNasp ¼ 6.1 � 3.5 � 104, which gives a density of 122 � 69 poresper mm2 and an average pore distance of 90 � 30 nm.
While these values are smaller that the measurements of theloss of contrast, they range in the same order of magnitude.
3.3 Hydrodynamic membrane tube pulling
Extrusion of membrane nanotubes from liposomes is used toprobe the membrane tension, bending modulus, and
Soft Matter, 2013, 9, 3181–3187 | 3185

Soft Matter Paper
Dow
nloa
ded
by U
nive
rsité
Cla
ude
Ber
nard
Lyo
n on
12/
04/2
013
15:4
2:58
. Pu
blis
hed
on 0
7 Fe
brua
ry 2
013
on h
ttp://
pubs
.rsc
.org
| do
i:10.
1039
/C3S
M27
812C
View Article Online
permeability of these liposomes. The critical force neededto extrude a tube depends on the bending modulus ofthe membrane, k and the surface tension s as:
ftube ¼ 2pffiffiffiffiffiffiffiffi2ks
p ¼ 2pk=rt, where rt is the tube radius. In thehydrodynamic tube extrusion (HTE) technique, a controlleduid ow is used to apply a force on an anchored liposome. Dueto the rapid nature of this experiment, we cannot assumeequilibrium of the glucose diffusion through the membrane.Therefore, we directly use the ow of water to analyze thisexperiment. The hydrodynamic force, which equals the dragforce on the liposome, is given by: fdrag ¼ 6phRU, where h is theviscosity of the uid, R is the radius of the liposome and U isthe velocity of the ow. When fdrag > ftube, a tube forms betweenthe anchorage point and the liposome body downstream. Oncethe tube is formed, its dynamics is governed by the balancebetween the total friction force, ffriction and ftube:
ffriction ¼ ftube
6phR
�U � L
$�
¼ 2pffiffiffiffiffiffiffiffi2ks
p(14)
where _L ¼ dL/dt is the tube elongation velocity.An impermeable liposome behaves like an entropic spring.
As the tube elongates, the surface tension increases, leading toan augmentation of ftube and decrease of _L. When _L¼ 0, the tubereaches a stationary length, LN, and the tube no longer elon-gates. The surface tension and the bending modulus of animpermeable liposome can hence be obtained by nding LN, asa function of U, as reported previously.12 In contrast, forpermeable liposomes, the membrane tension stays constantand the tube is extruded at constant velocity without reaching astationary length19 (Fig. 4). The elongation of the tube isaccompanied by a decrease of the volume V of the liposomeas the uid inside the liposome leaks out with a rate given by:J ¼ �dV/dt ¼ �4pR2dR/dt. Using the area conservation criteria,�8pR _R ¼ 2prt _L, and the expression of the ux (eqn (13)) we getthe following relationship between the number of pores as afunction ow velocity U and tube extrusion speed _L:
Fig. 4 Hydrodynamic tube extrusion of a liposome decorated with a-hemolysinpores. The tube extends with _L ¼ 9 mm s�1, at U ¼ 125 mm s�1 and retracts oncethe flow stops. The liposome radius is R ¼ 10 mm.
3186 | Soft Matter, 2013, 9, 3181–3187
N ¼ pk2hi
9h3Rr3L$
�U � L
$�3
(15)
Taking r ¼ 0.7 nm for an a-hemolysin pore, k ¼ 10 kBT, andhi ¼ ho ¼ 0.9 � 10�3 Pa � s aer buffer equilibration, we obtainN using eqn (15). The pore density is dened as r¼ N/A, where Ais the area of the liposome at rest. Applying this third non-equilibrium technique, we nd a value of 146 � 67 mm�2 forthe pore density and an average distance between the pores of83 � 30 nm.
These ndings match the results obtained from the micro-pipet aspiration measurements, and are in the same order ofmagnitude as the measurements obtained from the loss ofcontrast method.
4 Conclusion
We provide three different experimental ways of estimating thedensity of a-hemolysin pores that auto-assemble into a lipo-some at a given concentration of protein. Our measurementsgive consistent estimates of the pore density and average poredistance, thus validating the three measurements. The differentways of experiments used the loss of refractive index aer poreaddition, the loss of volume during aspiration in a micropipetand the hydrodynamic extrusion of a membrane tube. Hence,we probed the initial non-equilibrium situation, the long termquasi-equilibrium during aspiration, which took up to 15minutes, and the extension of membrane tubes, whichhappened on the timescale of up to 20 seconds.
Themeasurements of pore density and average pore distancepresented show that even under variable preparation condi-tions, three different measurements produce comparable andconsistent values that are on the order of 100 pores per mm2 forEPC/NTA lipids. Nevertheless, it turns out that liposomesformed by pure EPC lipids seem to have a smaller pore densityas compared to vesicles formed using EPC/NTA mix lipids(Table 1). This shows that a-hemolysin adsorption appears to besensitive to membrane composition.
Acknowledgements
The authors would like to thank Pietro Cicuta, Jean-FrançoisJoanny, Martin Lenz and Matthias Bussonnier for helpfuldiscussion and Patricia Bassereau for support in the micropipetaspiration experiments. TB was supported by the ANR (ANR-11-JSV5-0002). CC was supported by the ANR ”Programme Blanc”(ANR-08-BLAN-0012-12 and ANR- 09-BLAN-0283). JL was sup-ported by AXA Research Fund.
References
1 L. Pontani, J. Van der Gucht, G. Salbreux, J. Heuvingh,J. Joanny and C. Sykes, Biophys. J., 2009, 96, 192–198.
2 V. Noireaux and A. Libchaber, Proc. Natl. Acad. Sci. U. S. A.,2004, 101, 17669–17674.
3 L. Ma and S. L. Cockro, ChemBioChem, 2010, 11, 25–34.
This journal is ª The Royal Society of Chemistry 2013

Paper Soft Matter
Dow
nloa
ded
by U
nive
rsité
Cla
ude
Ber
nard
Lyo
n on
12/
04/2
013
15:4
2:58
. Pu
blis
hed
on 0
7 Fe
brua
ry 2
013
on h
ttp://
pubs
.rsc
.org
| do
i:10.
1039
/C3S
M27
812C
View Article Online
4 G. Menestrina, J. Membr. Biol., 1986, 90, 177–190.5 L. Song, Science, 1996, 274, 1859.6 L. Movileanu, Trends Biotechnol., 2009, 27, 333–341.
7 L. Mathivet, S. Cribier and P. Devaux, Biophys. J., 1996, 70,1112–1121.
8 M. Gogler, T. Betz and J. A. Kas, Opt. Lett., 2007, 32, 1893–1895.
9 T. Betz, M. Lenz, J. Joanny and C. Sykes, Proc. Natl. Acad. Sci.U. S. A., 2009, 106, 15320–15325.
10 F. Gittes and C. F. Schmidt, Opt. Lett., 1998, 23, 7–9.11 T. A. Nieminen, V. L. Y. Loke, A. B. Stilgoe, G. Knner,
A. M. Braczyk, N. R. Heckenberg and H. Rubinsztein-Dunlop, J. Opt. A: Pure Appl. Opt., 2007, 9, S196–S203.
This journal is ª The Royal Society of Chemistry 2013
12 N. Borghi, O. Rossier and F. Brochard-Wyart, Europhys. Lett.,2003, 64, 837–843.
13 M. J. Russo, H. Bayley and M. Toner, Nat. Biotechnol., 1997,15, 278–282.
14 J. R. Pappenheimer, E. M. Renkin and L. M. Borrero, Am. J.Physiol., 1951, 167, 13–46.
15 E. M. Renkin, J. Gen. Physiol., 1954, 38, 225–243.16 S. G. Schultz, J. Gen. Physiol., 1961, 44, 1189–1199.17 K. Olbrich, W. Rawicz, D. Needham and E. Evans, Biophys. J.,
2000, 79, 321–327.18 J. Happel and H. Brenner, Low Reynolds Number
Hydrodynamics: with Special Applications to ParticulateMedia, Springer, 1st edn, 1983.
19 N. Borghi, S. Kremer, V. Askovic and F. Brochard-Wyart,Europhys. Lett., 2006, 75, 666–672.
Soft Matter, 2013, 9, 3181–3187 | 3187