A robust model for pore-water chemistry of clayrock
18
UNCORRECTED PROOF 1 2 A robust model for pore-water chemistry of clayrock 3 E.C. Gaucher a, * , C. Tournassat a, * , F.J. Pearson b , P. Blanc a , C. Crouzet a , 4 C. Lerouge a , S. Altmann c 5 a BRGM, EPI/DES, French Geological Survey, Environment and Process Department, 3 Av. Claude Guillemin, BP 6009, 6 45060 Orle ´ans Cedex 2, France 7 b Ground-Water Geochemistry, New Bern, NC 28562, USA 8 c ANDRA, 1-7, rue Jean-Monnet, 92298 Cha ˆtenay-Malabry, France 9 Received 1 December 2008; accepted in revised form 14 July 2009 10 11 Abstract 12 The chemistry of pore water is an important property of clayrocks being considered as host rocks for long-term storage of 13 radioactive waste. It may be difficult, if not impossible, to obtain water samples for chemical analysis from such rocks because 14 of their low hydraulic conductivity. This paper presents an approach for calculating the pore-water compositions of clayrocks 15 from laboratory-measured properties of core samples, including their leachable Cl and SO 4 concentrations and analysed 16 exchangeable cations, and from mineral and cation exchange equilibria based on the formation mineralogy. New core sam- 17 pling and analysis procedures are presented that reduce or quantify side reactions such as sample oxidation (e.g. pyrite) and 18 soluble mineral dissolution (celestite, SrSO 4 ) that affect measured SO 4 concentrations and exchangeable cation distributions. 19 The model considers phase equilibria only with minerals that are observed in the formation including the principal clay 20 phases. The model has been used to calculate the composition of pore water in the Callovo-Oxfordian clayrock and validated 21 against measurements of water chemistry made in an underground research laboratory in that formation. The model repro- 22 duces the measured, in situ pore-water composition without any estimated parameters. All required parameters can be 23 obtained from core sample analysis. We highlight the need to consider only those mineral phases which can be shown to 24 be in equilibrium with contacting pore water. The consequence of this is that some conceptual models available in the liter- 25 ature appear not to be appropriate for modelling clayrocks, particularly those considering high temperature and/or high pres- 26 sure detrital phases as chemical buffers of pore water. The robustness of our model with respect to uncertainties in the log K 27 values of clay phases is also demonstrated. Large uncertainties in log K values for clay minerals have relatively small effects on 28 modelled pore-water compositions. 29 Ó 2009 Elsevier Ltd. All rights reserved. 30 31 1. INTRODUCTION 32 1.1. Radioactive waste disposal in clayrocks 33 Many countries have chosen to study deep formations 34 rich in clay minerals as host rocks for long-term storage 35 of radioactive waste and have performed exploratory dril- 36 ling for scientific investigations of such formations. These 37 include France (Callovo-Oxfordian (COx) clayrock at 38 Bure), Belgium (Boom Clay at Mol), Hungary (Boda clay- 39 rock at Mecsek), Switzerland (Opalinus Clay at Mont Terri 40 and Benken, and Palfris Formation at Wellenberg), United 41 Kingdom (Oxford Clay), and Canada (Queenston Forma- 42 tion). In what follows we will use the term ‘clayrock’ for 43 all of these materials. Underground research laboratories 44 (URL) have been constructed to carry out detailed studies 45 in several of these formations (Belgium at Mol, Switzerland 46 at Mont Terri, France at Bure). Here we will use data ob- 47 tained in experiments carried out in the Bure URL in 0016-7037/$ - see front matter Ó 2009 Elsevier Ltd. All rights reserved. doi:10.1016/j.gca.2009.07.021 * Corresponding authors. Tel.: +33 2 38 64 47 44; fax: +33 2 38 64 30 62. E-mail addresses: [email protected] (E.C. Gaucher), c.tournassat@ brgm.fr (C. Tournassat). www.elsevier.com/locate/gca Available online at www.sciencedirect.com Geochimica et Cosmochimica Acta xxx (2009) xxx–xxx GCA 6384 No. of Pages 18 10 August 2009 Disk Used ARTICLE IN PRESS Please cite this article in press as: Gaucher E. C., et al. A robust model for pore-water chemistry of clayrock. Geochim. Cosmochim. Acta (2009), doi:10.1016/j.gca.2009.07.021
Transcript of A robust model for pore-water chemistry of clayrock

1
2
3
4
5678
910
11
12
13
14
15
16
17
18
19
20
21
22
23
24
25
26
27
28
2930
31
32
33
34
35
Available online at www.sciencedirect.com
GCA 6384 No. of Pages 18
10 August 2009 Disk UsedARTICLE IN PRESS
www.elsevier.com/locate/gca
Geochimica et Cosmochimica Acta xxx (2009) xxx–xxx
OO
F
A robust model for pore-water chemistry of clayrock
E.C. Gaucher a,*, C. Tournassat a,*, F.J. Pearson b, P. Blanc a, C. Crouzet a,C. Lerouge a, S. Altmann c
a BRGM, EPI/DES, French Geological Survey, Environment and Process Department, 3 Av. Claude Guillemin, BP 6009,
45060 Orleans Cedex 2, Franceb Ground-Water Geochemistry, New Bern, NC 28562, USA
c ANDRA, 1-7, rue Jean-Monnet, 92298 Chatenay-Malabry, France
Received 1 December 2008; accepted in revised form 14 July 2009
RR
EC
TED
PR
Abstract
The chemistry of pore water is an important property of clayrocks being considered as host rocks for long-term storage ofradioactive waste. It may be difficult, if not impossible, to obtain water samples for chemical analysis from such rocks becauseof their low hydraulic conductivity. This paper presents an approach for calculating the pore-water compositions of clayrocksfrom laboratory-measured properties of core samples, including their leachable Cl and SO4 concentrations and analysedexchangeable cations, and from mineral and cation exchange equilibria based on the formation mineralogy. New core sam-pling and analysis procedures are presented that reduce or quantify side reactions such as sample oxidation (e.g. pyrite) andsoluble mineral dissolution (celestite, SrSO4) that affect measured SO4 concentrations and exchangeable cation distributions.The model considers phase equilibria only with minerals that are observed in the formation including the principal clayphases. The model has been used to calculate the composition of pore water in the Callovo-Oxfordian clayrock and validatedagainst measurements of water chemistry made in an underground research laboratory in that formation. The model repro-duces the measured, in situ pore-water composition without any estimated parameters. All required parameters can beobtained from core sample analysis. We highlight the need to consider only those mineral phases which can be shown tobe in equilibrium with contacting pore water. The consequence of this is that some conceptual models available in the liter-ature appear not to be appropriate for modelling clayrocks, particularly those considering high temperature and/or high pres-sure detrital phases as chemical buffers of pore water. The robustness of our model with respect to uncertainties in the log K
values of clay phases is also demonstrated. Large uncertainties in log K values for clay minerals have relatively small effects onmodelled pore-water compositions.� 2009 Elsevier Ltd. All rights reserved.
36
37
38
39
40
41
42
NC
O
1. INTRODUCTION
1.1. Radioactive waste disposal in clayrocks
Many countries have chosen to study deep formationsrich in clay minerals as host rocks for long-term storageof radioactive waste and have performed exploratory dril-
U 4344
45
46
47
0016-7037/$ - see front matter � 2009 Elsevier Ltd. All rights reserved.
doi:10.1016/j.gca.2009.07.021
* Corresponding authors. Tel.: +33 2 38 64 47 44; fax: +33 2 3864 30 62.
E-mail addresses: [email protected] (E.C. Gaucher), [email protected] (C. Tournassat).
Please cite this article in press as: Gaucher E. C., et al. A robust model(2009), doi:10.1016/j.gca.2009.07.021
ling for scientific investigations of such formations. Theseinclude France (Callovo-Oxfordian (COx) clayrock atBure), Belgium (Boom Clay at Mol), Hungary (Boda clay-rock at Mecsek), Switzerland (Opalinus Clay at Mont Terriand Benken, and Palfris Formation at Wellenberg), UnitedKingdom (Oxford Clay), and Canada (Queenston Forma-tion). In what follows we will use the term ‘clayrock’ forall of these materials. Underground research laboratories(URL) have been constructed to carry out detailed studiesin several of these formations (Belgium at Mol, Switzerlandat Mont Terri, France at Bure). Here we will use data ob-tained in experiments carried out in the Bure URL in
for pore-water chemistry of clayrock. Geochim. Cosmochim. Acta
Original text:
Inserted Text
analyzed
Original text:
Inserted Text
long term
C
48
49
50
51
52
53
54
55
56
57
58
59
60
61
62
63
64
65
66
67
68
69
70
71
72
73
74
75
76
77
78
79
80
81
82
83
84
85
86
87
88
89
90
91
92
93
94
95
96
97
98
99
100
101
102
103
104
105
106
107
108
109
110
111
112
113
114
115
116
117
118
119
120
121
122
123
124
125
126
127
128
129
130
131
132
133
134
135
136
137
138
139
140
141
142
143
144
145
146
147
148
149
150
151
152
153
154
155
156
157
158
159
160
161
162
163
2 E.C. Gaucher et al. / Geochimica et Cosmochimica Acta xxx (2009) xxx–xxx
GCA 6384 No. of Pages 18
10 August 2009 Disk UsedARTICLE IN PRESS
UN
CO
RR
E
north-eastern France, built and operated by the FrenchAgency for Nuclear Waste Management (Andra) (Landais,2006; Delay et al., 2007).
The characteristics of clayrocks favourable for the long-term retention of radionuclides are well-known (Chapmanand Mckinley, 1987; Savage, 1995; Horseman et al., 1996;Mazurek et al., 2006). First, the pore waters of such rocksare generally reducing and have circum-neutral pH values,which ensures that the solubilities of a large number of radio-elements including U, Pu and other actinides, will be very low(Bruno et al., 2002). Second, clay surfaces will adsorb cationsby ion exchange and surface complexation, which will greatlydelay the migration of both actinides and other radionuclidessuch as 135Cs, 59Ni and 226Ra (see among others Bradburyand Baeyens, 2005). Fe(II)-containing clay minerals may alsoreduce certain radioelements at their surfaces (79Se, for exam-ple, Bradbury and Baeyens, 2005; Charlet et al., 2007). Final-ly, because diffusion is the principal transport mechanism inclayrocks, and because diffusion rates in clayrocks are verylow, the flux of non-sorbing radionuclides such as 129I and36Cl through clayrock formations will be low and spreadout over time (Van Loon et al., 2003a,b; Van Loon et al.,2004a,b; Appelo and Wersin, 2007; Descostes et al., 2008;Grambow, 2008).
1.2. Why a geochemical model for the pore-water chemistry
of clayrock?
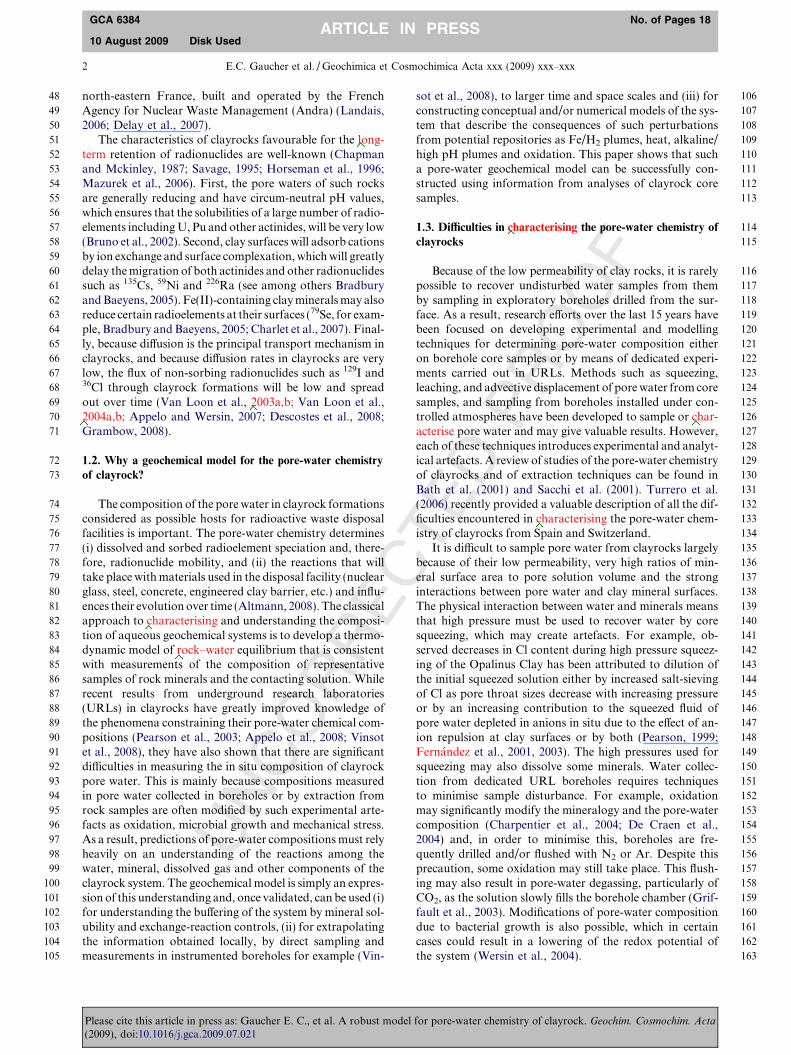
The composition of the pore water in clayrock formationsconsidered as possible hosts for radioactive waste disposalfacilities is important. The pore-water chemistry determines(i) dissolved and sorbed radioelement speciation and, there-fore, radionuclide mobility, and (ii) the reactions that willtake place with materials used in the disposal facility (nuclearglass, steel, concrete, engineered clay barrier, etc.) and influ-ences their evolution over time (Altmann, 2008). The classicalapproach to characterising and understanding the composi-tion of aqueous geochemical systems is to develop a thermo-dynamic model of rock–water equilibrium that is consistentwith measurements of the composition of representativesamples of rock minerals and the contacting solution. Whilerecent results from underground research laboratories(URLs) in clayrocks have greatly improved knowledge ofthe phenomena constraining their pore-water chemical com-positions (Pearson et al., 2003; Appelo et al., 2008; Vinsotet al., 2008), they have also shown that there are significantdifficulties in measuring the in situ composition of clayrockpore water. This is mainly because compositions measuredin pore water collected in boreholes or by extraction fromrock samples are often modified by such experimental arte-facts as oxidation, microbial growth and mechanical stress.As a result, predictions of pore-water compositions must relyheavily on an understanding of the reactions among thewater, mineral, dissolved gas and other components of theclayrock system. The geochemical model is simply an expres-sion of this understanding and, once validated, can be used (i)for understanding the buffering of the system by mineral sol-ubility and exchange-reaction controls, (ii) for extrapolatingthe information obtained locally, by direct sampling andmeasurements in instrumented boreholes for example (Vin-
Please cite this article in press as: Gaucher E. C., et al. A robust model(2009), doi:10.1016/j.gca.2009.07.021
TED
PR
OO
F
sot et al., 2008), to larger time and space scales and (iii) forconstructing conceptual and/or numerical models of the sys-tem that describe the consequences of such perturbationsfrom potential repositories as Fe/H2 plumes, heat, alkaline/high pH plumes and oxidation. This paper shows that sucha pore-water geochemical model can be successfully con-structed using information from analyses of clayrock coresamples.
1.3. Difficulties in characterising the pore-water chemistry of
clayrocks
Because of the low permeability of clay rocks, it is rarelypossible to recover undisturbed water samples from themby sampling in exploratory boreholes drilled from the sur-face. As a result, research efforts over the last 15 years havebeen focused on developing experimental and modellingtechniques for determining pore-water composition eitheron borehole core samples or by means of dedicated experi-ments carried out in URLs. Methods such as squeezing,leaching, and advective displacement of pore water from coresamples, and sampling from boreholes installed under con-trolled atmospheres have been developed to sample or char-acterise pore water and may give valuable results. However,each of these techniques introduces experimental and analyt-ical artefacts. A review of studies of the pore-water chemistryof clayrocks and of extraction techniques can be found inBath et al. (2001) and Sacchi et al. (2001). Turrero et al.(2006) recently provided a valuable description of all the dif-ficulties encountered in characterising the pore-water chem-istry of clayrocks from Spain and Switzerland.
It is difficult to sample pore water from clayrocks largelybecause of their low permeability, very high ratios of min-eral surface area to pore solution volume and the stronginteractions between pore water and clay mineral surfaces.The physical interaction between water and minerals meansthat high pressure must be used to recover water by coresqueezing, which may create artefacts. For example, ob-served decreases in Cl content during high pressure squeez-ing of the Opalinus Clay has been attributed to dilution ofthe initial squeezed solution either by increased salt-sievingof Cl as pore throat sizes decrease with increasing pressureor by an increasing contribution to the squeezed fluid ofpore water depleted in anions in situ due to the effect of an-ion repulsion at clay surfaces or by both (Pearson, 1999;Fernandez et al., 2001, 2003). The high pressures used forsqueezing may also dissolve some minerals. Water collec-tion from dedicated URL boreholes requires techniquesto minimise sample disturbance. For example, oxidationmay significantly modify the mineralogy and the pore-watercomposition (Charpentier et al., 2004; De Craen et al.,2004) and, in order to minimise this, boreholes are fre-quently drilled and/or flushed with N2 or Ar. Despite thisprecaution, some oxidation may still take place. This flush-ing may also result in pore-water degassing, particularly ofCO2, as the solution slowly fills the borehole chamber (Grif-fault et al., 2003). Modifications of pore-water compositiondue to bacterial growth is also possible, which in certaincases could result in a lowering of the redox potential ofthe system (Wersin et al., 2004).
for pore-water chemistry of clayrock. Geochim. Cosmochim. Acta
Original text:
Inserted Text
long term
Original text:
Inserted Text
2003a;
Original text:
Inserted Text
2003b; Van Loon et al., 2004a; Van Loon et al., 2004b;
Original text:
Inserted Text
characterizing
Original text:
Inserted Text
rock-water
Original text:
Inserted Text
characterizing
Original text:
Inserted Text
characterize
Original text:
Inserted Text
characterizing

C
164
165
166
167
168
169
170
171
172
173
174
175
176
177
178
179
180
181
182
183
184
185
186
187
188
189
190
191
192
193
194
195
196
197
198
199
200 Q4
201
202
203
204
205
206
207
208
209
210
211
212
213
214
215
216
217
218
219
220
221
222
223
224
225
226
227
228
229
230
231
232
233
234
235
236
237
238
239
240
241
242
243
244
245
246
247
248
249
250
251
252
253
254
255
256
257
258
259
260
261
262
263
264
265
266
267
268
269
270
271
272
273
274
275
276
277
278
A robust model for pore-water chemistry of clayrock 3
GCA 6384 No. of Pages 18
10 August 2009 Disk UsedARTICLE IN PRESS
UN
CO
RR
E
Considering these difficulties in measuring pore-waterproperties, pore-water models have been developed to bet-ter understand and constrain pore-water chemistry. Thenext section describes the state of the art of modelling reac-tions between clayrock and pore water. Differences betweenmodelling results and the pore-water chemistry determinedby in situ experiments (Vinsot et al., 2008) carried out in theAndra URL situated in the Callovo-Oxfordian (COx) claysat Bure (France) are then discussed. The remainder of thispaper discusses the experimental and additional modellingwork performed to understand the in situ controls on theCOx pore-water chemistry and thereby minimise the differ-ences observed in previous modelling with experimentaldata. Finally, we investigate the effects of using differentmineral assemblages and thermodynamic data on the mod-elling output. This is important in order to demonstrate the‘robustness’ of model predictions of key output parametervalues such as solution pH, ionic strength and total inor-ganic carbon relative to uncertainties in input parameters.
2. STATE OF THE ART OF MODELLING CLAYROCK
PORE WATER
2.1. Towards a model without ‘‘expert judgement’’ parameters
Pioneer studies on the chemistry of clayrock pore wateridentified difficulties of experimental work in clayey media.These include the preservation of core and water samples,measurements of pH and adsorbed ion populations, arte-facts of leaching, redox perturbations, and the difficultiesin finding specific ion exchange constants and solubilityproducts for the clay minerals present. Previous authors(Thorstenson et al., 1979; Appelo et al., 1990; Plummeret al., 1990), Sanjuan and Mossmann (in Griffault et al.,1997) included ion exchange reactions in their modelling.
Alternative approaches to modelling were also proposed.For Boom Clay pore water, Beaucaire et al. (2000) proposeda model with control of K and Na by detrital feldspar minerals(Na-albite and K-feldspar) without ion exchange reactions.The model developed by Motellier et al. (2003) for the Cal-lovo-Oxfordian (COx) formation included multi-site ex-change reactions but, unfortunately, did not considersulphate anions, one of the major solutes in the pore waters.Thus, the model results cannot be compared with measuredin situ water chemistry. In contrast with these modelling at-tempts, Bradbury and Baeyens (1998) considered the adsorbedcation population to be a ‘‘fingerprint” of local equilibriumconditions and took this information into account in theirmodelling approach. Chloride and sulphate concentrationswere fixed in their modelling based on core leaching and as-sumed anion-accessible porosities, with the measured sulphateadjusted downwards as necessary to prevent gypsum oversat-uration during modelling. The way that carbonate systemequilibria are constrained is a particularly important point.Bradbury and Baeyens (1998) used the CO2 partial pressure(PCO2) as a constraint, fixing its value at 10�2 bars based onthe model proposed by Coudrain-Ribstein and Gouze (1993)in which PCO2 was determined by equilibrium among calcite,dolomite, and a Mg-silicate. Note also that none of these mod-els included reactions controlling redox.
Please cite this article in press as: Gaucher E. C., et al. A robust model(2009), doi:10.1016/j.gca.2009.07.021
TED
PR
OO
F
In field and laboratory studies within the framework ofthe Water Sampling (WS) experiment at the Mont TerriURL in the Opalinus clay in north-western Switzerland(Thury and Bossart, 1999; Bath et al., 2001), it was possibleto improve and fully parameterise a cation-exchange, min-eral equilibrium model for pore-water chemistry similar tothat of Bradbury and Baeyens (1998) without requiring in-put values based on ‘‘expert judgement” of experimentallynon measured parameters. This led to an inter-comparisonof models in Pearson et al. (2003) showing the importanceof considering the more complex mineralogy existing inthese types of rocks. For example, Pearson et al. (2003) con-sidered the controls exerted on solution composition bycelestite and Na/Sr exchange (for SO4 and Sr), siderite(for Fe), pyrite (for Eh) and the first PCO2 measurementsobtained on core samples (Lassin et al., 2003).
These models are the first in which all of the main pore-water parameters were constrained by analyses of core sam-ple and thermodynamic equilibria.
2.2. Model development for estimating the pore-water
composition of the Callovo-Oxfordian
A ten-year collaborative research programme between theBRGM and Andra has been dedicated to modelling and mea-suring the composition of pore water present in the COx atthe Bure URL. This programme was carried out in twophases. The first focused on development of a geochemicalmodel specifically adapted to the COx clayrock based onparameters measurable on core samples. The second in-volved measurements of pore-water composition by meansof experiments carried out in the Bure URL. A key aspectwas the combination of the results of these two complemen-tary actions to yield the model presented in this paper.
The Bure URL was placed in service in 2004 and has amain gallery located in the centre of the formation at anapproximate depth of 490 m. Details of the geology andmineralogy of this formation can be found in Gaucheret al. (2004). In 2005, experiments designed to determinein situ pore-water composition were begun at two depths(445 and 490 m). Boreholes were drilled from the driftsusing N2 to limit O2 oxidation, followed by installation ofa downhole system designed to maintain the 1 m longexperimental chamber under Ar atmosphere and to collectwater and gas for analysis (Vinsot et al., 2008). Measure-ments of non-conservative parameters such as pH and Pt-electrode potential were made directly on collected samples.
Before subsurface measurements and pore-water sam-ples were available, Gaucher et al. (2006) developed a mod-elling approach called the THERMOAR methodspecifically for estimating COx pore-water composition.The approach was inspired by that of Pearson et al.(2003), and was based on data obtained by measurementson well-preserved core samples taken from deep boreholes.Measurements included highly detailed mineralogy, deter-minations of water content, anion-accessible porosity,leachable anion content, CO2 partial pressure (PCO2), ad-sorbed cation populations and exchange selectivity coeffi-cients (see details below). The method was later appliedto a series of core samples taken from within the Bure
for pore-water chemistry of clayrock. Geochim. Cosmochim. Acta
Original text:
Inserted Text
minimize
Original text:
Inserted Text
clay-rock
Original text:
Inserted Text
clay-rock
Original text:
Inserted Text
(P
Original text:
Inserted Text
program
Original text:
Inserted Text
program
Original text:
Inserted Text
490m.
Original text:
Inserted Text
(445m
Original text:
Inserted Text
490m).
Original text:
Inserted Text
one meter
Original text:
Inserted Text
(P
279
280
281
282
283
284
285
286
287
288
289
290
291
292
293
294
295
296
297
298
299
300
301
302
303
304
305
306
307
308
309
310
311
312
313
314
315
316
317
318
319
320
321
322
323
324
325
326
327
328
329
330
331
332
333
334
335
4 E.C. Gaucher et al. / Geochimica et Cosmochimica Acta xxx (2009) xxx–xxx
GCA 6384 No. of Pages 18
10 August 2009 Disk UsedARTICLE IN PRESS
URL and from deep boreholes drilled by Andra within 15–20 km of the URL (Gaucher et al., 2004, 2006; Buschaertet al., 2007).
The geochemical model used to calculate pore-waterspeciation was the PHREEQC code with a version of thellnl.dat thermodynamic database (Wolery, 1992; see alsothe PHREEQC web site: www.brr.cr.usgs.gov/projects/GWC_coupled/phreeqc/), modified to include the solubilityconstant for dolomite taken from the NAGRA/PSI data-base (Hummel et al., 2002). The calculations were basedon the following hypotheses:
(i) That the rock–water system is at local equilibrium.This is considered reasonable because the very lowpermeability of the clay formation should lead tovery long solution residence times (Lavastre et al.,2005; Buschaert et al., 2007).
(ii) That anions do not have access to the whole porosityvolume because they are excluded from the water vol-umes in the vicinity of clay negatively charged sur-faces (e.g. Pearson, 1999). In the following, thevolume accessible to anions will be referred to asthe anion-accessible porosity.
(iii) That only minerals actually observed in the rock couldbe included in the model to control the activities of thedissolved components: S(�II), S(VI), C(IV), Si, Ca,Mg, Na, K, Sr, Fe, Al. Accurate modelling of thewater–rock interaction requires a precise and completemineralogical characterisation of the samples using arange of analytical techniques (Gaucher et al., 2006).
UN
CO
RR
ECTable 1
Model results in Gaucher et al. (2006). Modelling is described in Section 2quartz, pyrite and celestite. Simulations ‘‘A” and ‘‘B” are run with firespectively. In simulation ‘‘Chlo”, the PCO2 was not fixed. Instead, it wchlorite. For comparison the measured pore-water composition (Vinsot
Model A (mol/kgw) B (mol/kgw)
Pore-water chemistry
pH 7.10 7.28EhSHE (mV) �163 �176TIC 2.19 � 10�3 1.38 � 10�3
Cl 3.01 � 10�2 3.01 � 10�2
S 3.39 � 10�2 3.40 � 10�2
Na 3.21 � 10�2 3.20 � 10�2
K 7.09 � 10�3 7.07 � 10�3
Ca 1.49 � 10�2 1.48 � 10�2
Mg 1.41 � 10�2 1.41 � 10�2
Sr 1.12 � 10�3 1.12 � 10�3
Si 9.41 � 10�5 9.43 � 10�5
Al 7.36 � 10�9 8.62 � 10�9
Fe 2.14 � 10�4 9.40 � 10�5
Saturation index
Log(PCO2) bar �2.15 fixed �2.51 fixedMg-Chlorite 0.85 2.48
Ion exchange (proportion in molc)
SrX2 4% 4%KX 8% 8%NaX 14% 14%MgX2 28% 28%CaX2 45% 45%
Please cite this article in press as: Gaucher E. C., et al. A robust model(2009), doi:10.1016/j.gca.2009.07.021
ED
PR
OO
F
Phases showing evidence of alteration were notincluded in the model because alteration was consid-ered to be an indication of a phase being out of equilib-rium and undergoing dissolution. On the other hand,overgrowths and regular crystallographic shapes wereconsidered as strong evidence of water–mineral inter-actions at thermodynamic equilibrium (see Table 1 inGaucher et al., 2006).
2.3. Comparing model predictions and in situ water analyses:
identification of discrepancies
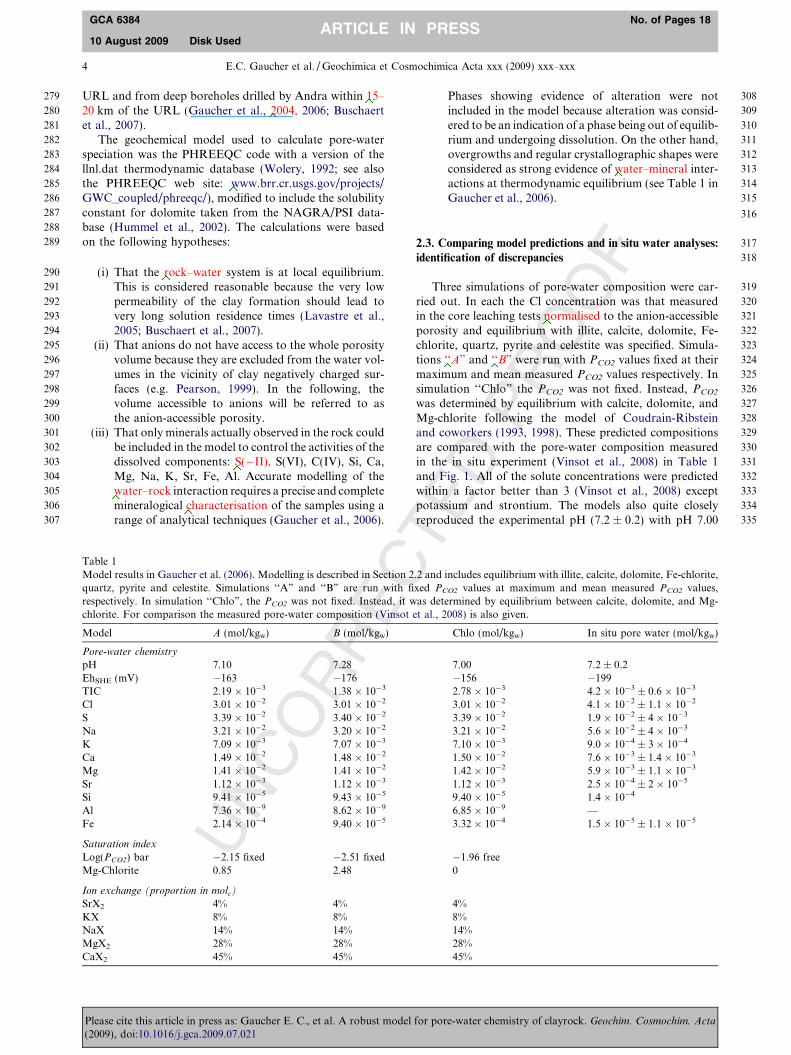
Three simulations of pore-water composition were car-ried out. In each the Cl concentration was that measuredin the core leaching tests normalised to the anion-accessibleporosity and equilibrium with illite, calcite, dolomite, Fe-chlorite, quartz, pyrite and celestite was specified. Simula-tions ‘‘A” and ‘‘B” were run with PCO2 values fixed at theirmaximum and mean measured PCO2 values respectively. Insimulation ‘‘Chlo” the PCO2 was not fixed. Instead, PCO2
was determined by equilibrium with calcite, dolomite, andMg-chlorite following the model of Coudrain-Ribsteinand coworkers (1993, 1998). These predicted compositionsare compared with the pore-water composition measuredin the in situ experiment (Vinsot et al., 2008) in Table 1and Fig. 1. All of the solute concentrations were predictedwithin a factor better than 3 (Vinsot et al., 2008) exceptpotassium and strontium. The models also quite closelyreproduced the experimental pH (7.2 ± 0.2) with pH 7.00
T
.2 and includes equilibrium with illite, calcite, dolomite, Fe-chlorite,xed PCO2 values at maximum and mean measured PCO2 values,as determined by equilibrium between calcite, dolomite, and Mg-
et al., 2008) is also given.
Chlo (mol/kgw) In situ pore water (mol/kgw)
7.00 7.2 ± 0.2�156 �1992.78 � 10�3 4.2 � 10�3 ± 0.6 � 10�3
3.01 � 10�2 4.1 � 10�2 ± 1.1 � 10�2
3.39 � 10�2 1.9 � 10�2 ± 4 � 10�3
3.21 � 10�2 5.6 � 10�2 ± 4 � 10�3
7.10 � 10�3 9.0 � 10�4 ± 3 � 10�4
1.50 � 10�2 7.6 � 10�3 ± 1.4 � 10�3
1.42 � 10�2 5.9 � 10�3 ± 1.1 � 10�3
1.12 � 10�3 2.5 � 10�4 ± 2 � 10�5
9.40 � 10�5 1.4 � 10�4
6.85 � 10�9 —3.32 � 10�4 1.5 � 10�5 ± 1.1 � 10�5
�1.96 free0
4%8%14%28%45%
for pore-water chemistry of clayrock. Geochim. Cosmochim. Acta
Original text:
Inserted Text
15 to 20
Original text:
Inserted Text
2004; Gaucher et al.,
Original text:
Inserted Text
wwwbrr.cr.usgs.gov/projects/GWC_coupled/phreeqc/
Original text:
Inserted Text
rock-water
Original text:
Inserted Text
S(-II),
Original text:
Inserted Text
water-rock
Original text:
Inserted Text
characterization
Original text:
Inserted Text
water-mineral
Original text:
Inserted Text
normalized
Original text:
Inserted Text
“A”
Original text:
Inserted Text
“B”
C336
337
338
339
340
341
342
343
344
345
346
347
348
349
350
351
352
353
354
355
356
357
358
359
360
361
362
363
364
365
366
367
368
369
370
371
372
373
374
375
376
377
378
379
380
381
382
383
384
385
386
387
388
389
390
391
392
393
Fe Si Sr K Mg Ca Na Cl S(6) TIC0.001
0.01
0.1
1
10
100C
once
ntra
tion
(mm
ol L
-1)
Fig. 1. Comparison between in situ experiment results (circles:Vinsot et al. (2008) except for Fe:Q2 Vinsot and Mettler (2007) andthe 2006 THERMOAR model (Gaucher et al., 2006), invertedtriangles: model B with fixed PCO2; triangles: model Chlo with PCO2
imposed by the mineral assemblage). S(VI): total sulphate concen-tration; TIC: total inorganic carbon.
A robust model for pore-water chemistry of clayrock 5
GCA 6384 No. of Pages 18
10 August 2009 Disk UsedARTICLE IN PRESS
RE
for ‘‘Chlo”, 7.10 for ‘‘A” and 7.28 for ‘‘B” models. Notethat almost all major cation concentrations were overesti-mated. This is due to the overestimation of the sulphateconcentration and the requirement that the modelledpore-water be charge balanced.
The impetus behind the work reported in this publica-tion was the need to understand the causes of the differencesbetween the modelled values and measured data in Fig. 1.and to optimise the modelling technique to improve itscapacity to predict and explain the measured water chemis-try. The additional laboratory studies and modelling dataare discussed in the next sections with a focus on under-standing the K, Sr and sulphate controls.
3. MATERIALS AND METHODS
3.1. Sampling and preparation of undisturbed Callovo-
Oxfordian rock samples
One of the possible sources of the differences betweenmodelled and observed compositions is that the values of
UN
CO
RTable 2Leaching experiment results for Cl� and SO4
2� on samples from the �carbonate-rich horizon.
Sample No. and localisation Transport and preparation condition
EST25687 Liquid N2
Middle part <1 ppm O2 atmosphere glove-boxCenter of the core
EST25687 Liquid N2
Middle part <1 ppm O2 atmosphere glove-boxPeriphery of the core
EST25687 H Gas cellUpper part N2 flux glove-box
EST25687 B Gas cellLower part N2 flux glove-box
EST21400H Gas cellN2 flux glove-box
Please cite this article in press as: Gaucher E. C., et al. A robust model(2009), doi:10.1016/j.gca.2009.07.021
TED
PR
OO
F
certain parameters measured on clayrock samples hadchanged during sampling and storage. In order to minimisethis possibility, the core sample characterisation processwas applied to new samples taken directly from a boreholedrilled for another in situ experiment installed at a differentlocation in the Andra URL (borehole PAC-1002, sampleEST 25687). The core was obtained by nitrogen-flusheddrilling which reduced contact with atmospheric O2. Assoon as the core was brought to the surface (�1 h after dril-ling), a hammer was used to obtain a number of samplerock fragments, which were immediately introduced intoa Dewar flask containing liquid N2 (77 K) to minimiseany further oxidation with atmospheric O2. The use of li-quid N2 to preserve clay and soil samples against oxidation(e.g. partial pyrite oxidation) has been successfully tested inprevious studies (Appelo et al., 1998; Gehin et al., 2007).For preservation and further gas analysis (Girard et al.,2005; Gaucher et al., 2006), the remaining parts of the corewere placed in Ar and He cylindrical gas conditioning cells,made of two fitting tubes of stainless steel the joint betweenwhich was hermetically sealed with LoctiteTM 638 glue. Thesamples preserved in liquid N2 were further crushed in ahigh purity atmosphere glove-box (BraunTM, PO2 <1 ppm),whereas samples preserved in gas conditioning cells werecrushed in a glove-box under N2 flux following the standardprocedure used at BRGM for core sample characterisation.Some of the experiments were made on the same core sam-ples used by Tournassat et al. (2008). Table 2 compares theresults of leaching experiments on samples preserved in li-quid N2 and prepared in a glove-box containing <1 ppmO2 with results on samples preserved in gas cells and pre-pared under a N2 flux. The differing sulphate contents ofthe first two and second two samples shows that part ofthe sample is highly susceptible to oxidation. This behav-iour has already been shown using Mossbauer spectrometryto probe Fe(II) reactivity (Tournassat et al., 2006). Thetransport and preservation under liquid N2 prevent oxida-tion of the very reactive part of the samples (Gehin et al.,2007), but pyrite minerals in samples preserved in gas cellswere partially oxidised leading to high sulphate concentra-
475 m core. The first four samples are clay-rich; the last is from a
Leached anion concentrations (mmol/kg rock sample)
Cl� SO42�
1.29 ± 0.1 2.14 ± 0.2
1.29 ± 0.04 2.08 ± 0.8
1.19 ± 0.06 4.18 ± 0.36
1.22 ± 0.02 4.63 ± 0.18
0.46 ± 0.02 1.47 ± 0.08
for pore-water chemistry of clayrock. Geochim. Cosmochim. Acta
Original text:
Inserted Text
“A”
Original text:
Inserted Text
“B”
Original text:
Inserted Text
characterization
Original text:
Inserted Text
LoctiteTM
Original text:
Inserted Text
(BraunTM,
Original text:
Inserted Text
< 1
Original text:
Inserted Text
characterization.
Original text:
Inserted Text
glove box
Original text:
Inserted Text
oxidized

C
394
395
396
397
398
399
400
401
402
403
404
405
406
407
408
409
410
411
412
413
414
415
416
417
418
419
420
421
422
423
424
425
426
427
428
429
430
431
432
433
434
435
436
437
438
439
440
441
442
443
444
445
446
447
448
449
450
451
452
453
454
455
456
457
458
459
460
461
462
463
464
465
466
467
468
469
470
471
472
473
474
475
476
477
478
479
480
481
482
483
484
485
486
487
488
489
490
491
492
493
494
495
496
497
498
499
500
501
502
503
504
505
506
507
6 E.C. Gaucher et al. / Geochimica et Cosmochimica Acta xxx (2009) xxx–xxx
GCA 6384 No. of Pages 18
10 August 2009 Disk UsedARTICLE IN PRESS
UN
CO
RR
E
tions in the leachates. This is confirmation that liquid N2
conditioning is an excellent way to preserve the redox stateof samples as proposed by Appelo et al. (1998) and Appelo(2000).
Porosity, water content, and dry and wet density weremeasured on samples preserved in gas cells using the meth-ods described by Gaucher et al. (2004). Both types of sam-ples were used for leaching experiments (described inSections 3.2 and 4.1) and for determination of exchangeablecation populations (Sections 3.2 and 4.1). Mineralogical,porosity, water content, and dry and wet density analyseswere performed only on samples kept in the gas condition-ing cells.
The clay (<2 lm) fraction of another sample (sampleK119 from the clay-rich layer of core EST205, Gaucheret al., 2004) was used for additional cation-exchange exper-iments. The clay fraction was prepared by saturating thesuspension with NaCl (0.5 mol/L), followed by treatmentwith a H2O2/HNO3 mixture (pH �2) to remove carbonateand organic matter impurities, and with a mixture of so-dium hydrosulphite/HCl (pH 3) to remove iron and manga-nese oxyhydroxides potentially present. Each of thepreceding treatments was followed by careful washing withdeionised water. The clay was then washed with a mixtureof NaCl (1 mol/L) and HCl (10�4 mol/L). The fine fraction(<2 lm) of the sample was then isolated by sedimentation,redispersed in NaCl (1 mol/L) and washed with deionisedwater until the supernatant exhibited a negative responseto the silver nitrate test.
3.2. Leaching experiments
Leaching experiments were performed on whole COxrock samples preserved in gas cells and liquid N2. Leachingwas carried out in a glove-box using ultrapure water (Milli-Q 18.2 MX cm at 25 �C) that was boiled and de-oxygenatedby bubbling with N2. Leaching was done in batch experi-ments with 1 g of powdered sample in 10 mL of water for24 h at room temperature. After centrifugation and filtra-tion (0.1 lm) in the glove-box, the leachates were analysedfor Cl� and SO4
2� by liquid ionic chromatography (HPLC,Dionex).
3.3. Determinations of cation exchange populations and
cation exchange selectivities on illite/smectite mixed layer
fraction
Analyses of cation exchange populations were per-formed on whole rock samples using the cobalt hexaminemethod (Remy and Orsini, 1976; Ciesielski and Sterck-eman, 1997) as previously described (Gaucher et al.,2004, 2006; Tournassat et al., 2007, 2008, 2009). Experi-mental tests showed that carbonate minerals and sulphateminerals (e.g. celestite, SrSO4) can dissolve during thisprocedure. The impact of carbonate mineral dissolutionon the results can be limited by decreasing the samplecontact time (30 min) with the cobalt hexamine solutionand/or by increasing the experimental solid to liquid ra-tio. Based on dissolved inorganic carbon measurements,under our experimental conditions the maximum excess
Please cite this article in press as: Gaucher E. C., et al. A robust model(2009), doi:10.1016/j.gca.2009.07.021
TED
PR
OO
F
of Ca extracted from carbonate minerals was estimatedto be 10 ± 5% of the total extracted Ca. Given this lim-ited dissolution, no correction was applied to the ex-tracted Ca concentration. Sulphate minerals, on theother hand, dissolve too rapidly (Dove and Czank,1995), to allow the effects of this process on measuredparameters to be minimised in the same way.
In addition to in situ cation exchange population deter-mination, a five-element cation-exchange experiment (Na,Ca, Mg, K, Sr) was carried out in order to constrain cationexchange selectivity coefficients on the COx clay fraction.The purified <2 lm fine fraction of sample K119 (after re-moval of carbonates and accessory minerals, see Gaucheret al., 2004 and Tournassat et al., 2009 for details) wasequilibrated with a synthetic water similar to COx porewater having the composition [Na] = 47 mmol/L,[K] = 1 mmol/L, [Ca] = 7.6 mmol/L, [Mg] = 6.5 mmol/L,[Sr] = 0.18 mmol/L, [Cl] = 45 mmol/L, [SO4] = 15.5 m-mol/L. This was done several times, each followed by cen-trifugation and replacement of the supernatant. Allsolutions and suspensions were prepared with ultrapurewater (Milli-Q 18.2 MX cm at 25 �C). Salt solutions wereprepared from analytical grade salts. The cobalt hexaminemethod was used to extract exchanged cations. Cation con-centrations in the supernatant and in the cobalt hexaminesolutions were analysed by liquid ionic chromatography(HPLC, Dionex). Cation exchange selectivity coefficientswere calculated from these data (see Tournassat et al.,2007 for method details).
3.4. Numerical code and databases
All of the calculations were performed with PHRE-EQC v2.14 (Parkhurst and Appelo, 1999). The llnl.datthermodynamic database used for the modelling de-scribed above in Section 2.2 was replaced by solute andmineral species data from a thermodynamic database ef-fort (THERMOCHIMIE) being carried out under thedirection of Andra. Because the database is regularly up-dated, the version of January 2008 which was used forthis paper is given in Electronic Annex 1. Details aboutthe choices of the thermodynamic data can be obtainedfrom a series of ANDRA/BRGM reports (Blanc et al.,2006a,b; Blanc and Gailhanou, 2007) and on the web(http://thermoddem.brgm.fr/index.asp?langue=GB). Thedatabase includes recent experimental (Gailhanou andBlanc, 2007; Gailhanou et al., 2007, in press) and theoret-ical (Vieillard, 2000, 2002, 2007; Blanc and Gailhanou,2007) determinations of the thermodynamic propertiesof clay minerals.
For simplicity when using PHREEQC, exchange selec-tivity coefficients were calculated using the Gaines and Tho-mas convention in which the activities of exchanged speciesare considered equal to their equivalent fractions on the ex-changer (Gaines and Thomas, 1953; Sposito, 1981). Ex-change properties of the rock are attributed to thepresence of three types of minerals: illite, smectite and il-lite/smectite mixed-layer minerals (IS). The rock exchangeproperties are dominated by those of IS. For all of theseexchangers, selectivity coefficients for Na–Me exchange
for pore-water chemistry of clayrock. Geochim. Cosmochim. Acta
Original text:
Inserted Text
(< 2μm)
Original text:
Inserted Text
clay rich
Original text:
Inserted Text
∼ 2)
Original text:
Inserted Text
(< 2
Original text:
Inserted Text
25°C)
Original text:
Inserted Text
(0.1μm)
Original text:
Inserted Text
glove box,
Original text:
Inserted Text
2004; Gaucher et al.,
Original text:
Inserted Text
2007; Tournassat et al., 2008; Tournassat et al.,
Original text:
Inserted Text
minutes)
Original text:
Inserted Text
cation exchange
Original text:
Inserted Text
< 2μm
Original text:
Inserted Text
25°C).
Original text:
Inserted Text
2006a; Blanc et al., 2006b;
Original text:
Inserted Text
2007; Gailhanou et al.,
Original text:
Inserted Text
2000; Vieillard, 2002;
Original text:
Inserted Text
Na-Me
C
F
508
509
510
511
512
513
514
515
516
517
518
519
520
521
522
523
524
525
526
527
529529
530
531
532
533
534
535
536
537
538
539
540
541
542
543
544
545
546
547
548
549
550
551
553553
554
555
556
557
558559
561561
562
563
564
565
566
567568
570570
571
572
573
574
575
576
577
578
579
580
581
582
583
584
585
586
587
588
589
590
591
592
Table 3Illite, smectite, and illite/smectite selectivity coefficients for exchange reactions with a cation exchanger composition representative of sampleEST25687.
log KNa=Caex log KNa=Mg
ex log KNa=Srex log KNa=Fe
ex log KNa=Kex
Illite model 0.7a 0.7a 0.7b 0.7b 1.2a
Smectite model 0.6c 0.6c 0.3c 0.9c 1.1c
Illite/smectite model 0.7d 0.7d 0.6d 0.8d 1.2d
Measured from exchange experiment 0.94 0.85 1.02 Not determined 1.04
a After Tournassat et al. (2007).b Assumed equal to Na/Ca and Na/Mg selectivity coefficients.c After Tournassat et al. (2009).d See text.
A robust model for pore-water chemistry of clayrock 7
GCA 6384 No. of Pages 18
10 August 2009 Disk UsedARTICLE IN PRESS
UN
CO
RR
E(where Me represents Ca, Mg, K, Sr, Fe) are highly depen-dant on the exchanger composition and on the ionicstrength (Tournassat et al., 2007, 2009).
Selectivity coefficients were calculated assuming eitheran illite surface or a smectite surface using exchangemodels given by Tournassat et al. (2007, 2009) at themeasured exchanger composition (Table 3). As a first ap-proach, it was assumed that IS behaves like a mixture ofillite and smectite minerals for exchange reactions. Itmust be noted that the same experimental method usedto determine the exchangeable cation populations of therock samples was also used to measure many of the ex-change isotherms from which the cation exchange selec-tivity coefficients were developed (Tournassat et al.,2007, 2009). This ensured consistency between the modelresults and the cation exchange measurements on theclayrock samples described above.
3.5. Modelling overview
Equilibrium modelling follows Gibbs’ phase rule. Forpore waters at constant T and P this is written:
F ¼ C � P ð1Þ
where C is the number of solute concentrations to be mod-elled, P is the number of phases with which the solution isin equilibrium and F, the number of degrees of freedom. Be-cause the concentrations of free solutes are fixed in themodelling, there are zero degrees of freedom.
The reactions by which mineral or gas phases are for-mally related to solute concentrations include dissolution/precipitation and cation exchange. In addition, a chargebalance constraint is applied accounting for the solutionphase itself. Note that the solutes refer to total concentra-tions which comprise free ions, the activities of which areused in the solubility calculations, and ion pairs. In apply-ing the phase rule, ion pairs are not included as solutes be-cause it is assumed that the stability constant for each ionpair will be included in the modelling, that the activitiesof the ligands of each ion pair will also be calculated andthat each ion pair will be included in the equation for solu-tion electroneutrality.
Cation exchange equilibrium relates the concentrationof each cation Mez+ (K+, Ca2+, Mg2+, Sr2+, Fe2+) differentfrom Na with the dissolved concentration of Na:
Please cite this article in press as: Gaucher E. C., et al. A robust model(2009), doi:10.1016/j.gca.2009.07.021
TED
PR
OO½Mezþ� ¼
czNaþ
cMezþ� ½Naþ�z
KNa=Meex
� EMeX z
EzNaX
ð2Þ
where c’s are the activity coefficients of the solute species,KNa=Me
ex is the selectivity coefficient (in the Gaines and Tho-mas, 1953, convention) for the exchange reactionNa ? Me, and E’s are the charge fraction occupancies.
Solution electroneutrality requires that:
½Cl�� þ 2� SO42�� �¼2� ½Ca2þ� þ 2� ½Mg2þ� þ 2� ½Sr2þ�þ 2� ½Fe2þ� þ ½Naþ� þ ½Kþ� ð3Þ
Note that chloride and sulphate were previously pre-dicted to be the principal anions (Gaucher et al., 2006). Thishas been confirmed by analyses of the samples from thein situ experiment (Vinsot et al., 2008).
Combining Eqs. (2) and (3) leads to the followingequation:
Xdivalent Me
½Naþ�2 �EMeX 2
� c2Naþ � 2
E2NaX � cMe2þ � KNa=Me
ex
!þ ½Naþ� � cNaþ
cKþ � KNa=Kex
� EKX
ENaXþ ½Naþ� � ½Cl�� � 2� SO4
2�� �¼ 0 ð4Þ
Provided that the chloride and sulphate concentra-tions, the exchanger population and the in situ selectivitycoefficients are known, the equation system is completelyconstrained and the Na+, K+, Ca2+, Mg2+, Sr2+, andFe2+ concentrations can be calculated. Equilibria withmineral phases (e.g. quartz, calcite, clay minerals) makeit possible to obtain other solution parameters (pH, pe,Al, Si concentration etc.). Up to this point, the presentapproach is identical with that given in Gaucher et al.(2006). However, in the present paper we give additionalguidance to resolve discrepancies that were identifiedfrom the comparison of the modelling results from Gau-cher et al. (2006) and experimental results given in Vinsotet al. (2008). The principal discrepancies were the use oftoo high a sulphate concentration, obtained from leach-ing tests, and the calculation of potassium concentrationsthat were too high.
The dissolution reactions for the specific minerals cho-sen and their log K (25 �C) values are given in Table 4. Inaccordance with the Gibbs phase rule, one can associateone concentration or parameter with each of these phasesas shown in bold in Table 4. Mathematically, though, each
for pore-water chemistry of clayrock. Geochim. Cosmochim. Acta
Original text:
Inserted Text
F,
Original text:
Inserted Text
γ’s
Original text:
Inserted Text
K(25°C)

RO
OF
593
594
595
596
597
598
599
600
601
602
603
604
605
606
607
608
609
610
611
612
613
614
615
616
617
618
619
620
621
622
Table 4Constraints on the pore-water model and associated calculated parameters. Reactions and log K (25 �C) values are taken from the databaseused for modelling (Electronic Appendix 1).
Numerical constraints Related concentrations/parameters
First calculation step:correctionof exchangeable Sr andleachedsulphate
Exchanger composition: Na, K, Ca, Mg, Sr, Fe Na, K, Ca, Mg, Sr, Fe(II),
Cl, S(VI)Cl and sulphate from leaching experimentCelestite equilibriumElectroneutrality
Second calculation step:equilibriumwith minerals
Quartz: log K (25 �C) = �3.738 Si
SiO2 + H2O, H4SiO4
Calcite: log K (25 �C) = 1.847 Ca, C(IV), pHCaCO3 + H+, Ca2+ + HCO3
�
Pyrite: log K (25 �C) = �24.213 Fe(II), S(–II), S(VI), pHFeS2 + H2O, Fe2+ + 7/4 HS� + 1/4 SO4
2� + 1/4 H+
Illite (Illite-Mg): log K (25 �C) = 10.834 K, Mg, Al, Si, pH
K0.85Mg0.25Al2.35Si3.4O10(OH)2 + 8.4 H+ + 1.6 H2O, 2.35Al3+ + 0.85 K+ + 0.25 Mg2+ + 3.4 H4SiO4
Chlorite (Daphnite-14 A): log K (25 �C) = 51.013 Al, Fe(II), Si, pHFe5Al(AlSi3)O10(OH)8 + 16 H+, 2 Al3+ + 5 Fe2+ + 6 H2O + 3 H4SiO4
8 E.C. Gaucher et al. / Geochimica et Cosmochimica Acta xxx (2009) xxx–xxx
GCA 6384 No. of Pages 18
10 August 2009 Disk UsedARTICLE IN PRESS
of the solution parameters is highly dependent on severalfactors. For example, pH can be calculated with the follow-ing equation (using the phases and solubility products listedin Table 4):
EC
TED
623
624
625
626
627
628
629
630
631
632
633
634
635
636
637
638
639
640
641
pH ¼ 0:85log10ðKþÞ � 5:875log10ðFe2þÞ þ 0:25log10ðMg2þÞ � log10KIllite þ 1:175log10KChlorite � 0:125log10KQuartz
10:4ð5Þ
UN
CO
RRwhere the activities of K+, Fe2+ and Mg2+ can be deduced
from the cation exchanger composition and the chlorideand sulphate concentrations (Eq. (4), Fig. 4). This type ofequation makes possible verification of the robustness ofthe modelling approach with regard to database and exper-imental uncertainties. As an example, an error of one orderof magnitude in the activity of Fe2+ would lead to an errorof less than 0.6 pH units. Illite and chlorite are minerals withsolubilities subject to the greatest uncertainties. However, anerror of 4 orders of magnitude for one of these compoundswould result in an error in pH of less than 0.5 units. One canalso see that even a very large error in the solubility of quartzwould have almost no effect on the modelled pH value. Thesame type of arguments can be made for the aluminium con-centration. Thus, in Table 4 we arbitrarily assigned theparameters pH to illite and Al to chlorite. Si is linked tothe solubility of quartz and the carbonate concentration iscontrolled by calcite. Redox potential can be calculatedfrom the S(VI)/S(�II) balance and so is linked to pyrite sol-ubility (see Table 4). One should understand that these‘‘controls” must be seen as calculation controls that followGibbs phase rule. However, the real control of the chemical
Please cite this article in press as: Gaucher E. C., et al. A robust model(2009), doi:10.1016/j.gca.2009.07.021
Pparameters in the natural systems must be seen as the sum ofall the water–rock interactions. For instance, the calciumconcentration in the pore-water is not only controlled byion exchange but also by equilibrium with, e.g. calcite and
dolomite. These aspects of natural controls are discussedlatter in the paper (Section 5).
4. EXPERIMENTAL RESULTS AND MODELLING
4.1. Cation exchange selectivity coefficient for COx clay
fraction
The exchange model was tested by comparing the pre-dicted illite, smectite and illite/smectite selectivity coeffi-cients with those calculated from the measured exchangercomposition of the <2 lm fine fraction of a COx sampleequilibrated with a synthetic water representative of thein situ pore water. Results are shown in Table 3. The pre-dicted selectivity coefficients for Na–Ca, Na–K and Na–Mg exchange are very similar for illite and smectite. As aconsequence, there is no need to consider two types of ex-change sites in the present work. The Na–Ca, Na–K andNa–Mg exchange selectivity coefficients for IS were takenat values between those predicted for illite and smectite.Predicted IS values are in overall agreement with thosemeasured with differences in log K less than 0.25 units.
for pore-water chemistry of clayrock. Geochim. Cosmochim. Acta
Original text:
Inserted Text
S(VI)/S(-II)
Original text:
Inserted Text
water-rock
Original text:
Inserted Text
porewater
Original text:
Inserted Text
e.g.,
Original text:
Inserted Text
< 2μm
Original text:
Inserted Text
Na-Ca, Na-K
Original text:
Inserted Text
Na-Mg
Original text:
Inserted Text
Na-Ca, Na-K
C
642
643
644
645
646
647
648
649
650
651
652
653
654
655
656
657
658
659
660
661
662
663
664
665
666
667
668
669
670
671
672
673
674
675
676
677
678
679
680
681
682
683
684
685
686
687
688
689
690
691
692
693
694
695
696
697
698
699
700
701
702
703
704
705
706
707
708
709
710
711
712
713
714
715
716
717
718
719
720
721
722
723
724
725
726
727
728
729
730
731
732
Table 5Porosity and apparent (wet) density measurements on core samples. Pore-water Cl� concentrations calculated with Cl porosities equal to halfthe total porosity and to the total porosity are compared to concentrations measured in situ.Q3
Sample No. andlocation
Totalporosity
Apparent density(kg dm�3)
Calculated Cl pore-waterconcentration (mmol/L)
In situ measuredconcentration (mmol/L)
Half porosity Total porosity
EST25687 H 0.172 2.418 36 18 41 ± 1
Upper partEST25687 B 0.163 2.426 38 19Lower partEST21400H 0.041 2.622 60 29 28 ± 1
A robust model for pore-water chemistry of clayrock 9
GCA 6384 No. of Pages 18
10 August 2009 Disk UsedARTICLE IN PRESS
UN
CO
RR
E
However, the measured values are systematically higherthan the predicted one. This is due either to the uncertain-ties associated with the models (Tournassat et al. (2009) re-ported an uncertainty of ±0.2 with their generic model) orto a slightly different behaviour of IS surfaces as comparedto a mix of illite and smectite surfaces. For Na–Sr ex-change, the predicted value is lower that the measured valueby 0.4 units. The effects of these uncertainties on the modelare discussed below where the tabulated, predicted valuesfor IS are termed the ‘‘reference” values.
4.2. Major anion concentrations in pore water: the sulphate
concentration problem
The major anion concentrations in pore water are the keyparameters controlling the total cation concentration be-cause of the electroneutrality relationship (see Eq. (3)). Chlo-ride concentrations in pore water are not controlled bymineral–water reactions. The concentrations of neither chlo-ride nor sulphate could be obtained directly from the coresamples even using squeezing techniques, because the recov-ered anion concentrations varied with applied pressure andtime. This is consistent with the observation of Fernandezet al. (2003) that Cl concentrations in extruded pore water de-creased as squeezing pressure and time increased duringexperiments on Opalinus Clay. This has been attributed toan increasing dilution of the initial solution by one or bothof two processes. First, there may be increased salt-sievingof Cl as the pore throat sizes decrease with increasing pres-sure. Second pore water depleted in anions in situ due tothe effect of anion repulsion at clay surfaces may increasinglycontribute to the squeezed fluid (Pearson, 1999). For this rea-son, the simulations carried out by Gaucher et al. (2006) usedthe total Cl mass per mass rock as determined by leachingexperiments considered to be dissolved in the anion-accessi-ble porosity. Based on textural measurements and compari-sons between clay-rich and carbonate-rich (clay content<20%) zones of the COx, Gaucher et al. (2006) concludedthat the anion-accessible porosity is�50% (±20%) of the to-tal porosity for the more clay-rich zones and is equal to thetotal porosity for the carbonate-rich zones.
Comparison between Cl concentrations calculated fromleaching experiments on Opalinus Clay core samples fromMont Terri with measurements on samples of water frominstrumented boreholes also indicated an anion-accessibleporosity of about half the total porosity (Pearson, 1999;Pearson et al., 2003).
Please cite this article in press as: Gaucher E. C., et al. A robust model(2009), doi:10.1016/j.gca.2009.07.021
TED
PR
OO
F
The estimation method used by Gaucher et al. (2006)based on analyses of core samples could be tested againstthe measured concentrations of in situ water samplescollected from exactly the same location. Tables 2 and5 summarise the results of these analyses and calcula-tions. Sample EST25687 is a clay-rich sample whereassample EST21400H is a very high carbonate sample.The analysis shows that in clayey layers chloride concen-trations can be derived from leachable Cl concentrationsby assuming that half the water-content porosity is acces-sible to anions. On the other hand, in very carbonate-richlayers, the total porosity must be considered. This ‘‘rule”
must be considered as a convenient approximation whenno other data is available to constrain the anion-accessi-ble porosity.
Using the same method as for chloride, the sulphateconcentration in sample EST25687 is between 64 mmol/L(based on results from samples preserved in liquid N2)and 145 mmol/L (based on results from samples preservedin gas cells). Both values are much higher than the valuemeasured in the water sample: 19 mmol/L (Fig. 1 and Table6). This discrepancy leads a priori to a difficulty in predict-ing pore-water compositions based on models constrainedby data measured on rock samples.
4.3. Solving the problem of sulphate and strontium
concentrations
The preservation of samples in liquid N2 precludes per-turbations of SO4 concentration due to pyrite oxidation(see Section 3.1). Nonetheless, the leached sulphate contentfrom the sample preserved in liquid N2 is too high whencompared to the sulphate concentration in the pore waterof the formation (64 vs. 19 mmol/Lpore water i.e.2.14 mmol/kgrock instead of 0.63 mmol/kgrock), and its ori-gin needs explanation. The following additional processescan be considered as possible contributors to thediscrepancy:
(i) The measured concentrations in the in situ experi-ments could have been affected by sulphate reducing bacte-ria (SRB) thus decreasing the total sulphate concentrationin seepage water.
(ii) Sorbed sulphate in addition to solute sulphate could
have been recovered from the leaching experiment.(iii) Mineral phase dissolution could have occurred dur-ing the leaching experiment.
for pore-water chemistry of clayrock. Geochim. Cosmochim. Acta
Original text:
Inserted Text
+/- 0.2
Original text:
Inserted Text
Na-Sr
Original text:
Inserted Text
mineral-water
Original text:
Inserted Text
salt sieving
Original text:
Inserted Text
content<20%)
Original text:
Inserted Text
(+/-20%)
Original text:
Inserted Text
clay rich
Original text:
Inserted Text
carbonate rich
Original text:
Inserted Text
summarize
Original text:
Inserted Text
carbonate rich
Original text:
Inserted Text
L−1
Original text:
Inserted Text
mmol L−1
Original text:
Inserted Text
mmol L−1
Original text:
Inserted Text
3.1).
Original text:
Inserted Text
discrepancy:(i)
Original text:
Inserted Text
experiment.(iii)
UN
CO
RR
EC
733
734
735
736
737
738
739
740
741
742
743
744
745
746
747
748
749
750
751
752
753
754
755
756
757
758
759
760
761
762
763
764
765
766
767
768
769
770
771
772
773
774
775
776
777
778
779
780
781
782
783
784
785
786
787
788
789
790
791
792
Tab
le6
Co
mp
aris
on
of
mea
sure
dco
nce
ntr
atio
ns,
pH
,p
ean
dP
CO
2w
ith
mo
del
led
par
amet
ers
usi
ng
refe
ren
cem
od
el(T
able
4)an
dal
tern
ativ
em
od
els
con
sid
erin
gd
iffer
ent
clay
asse
mb
lage
san
dth
ead
dit
ion
of
sid
erit
ean
dd
olo
mit
e(s
eete
xt).
Err
or
ban
ds
of
the
mea
sure
dva
lues
cove
rth
ew
ho
lera
nge
of
anal
ysed
dat
ap
oin
ts.
pH
pe
PC
O2
(lo
g 10)
Co
nce
ntr
atio
ns
(mm
ol/
L)
Al
Fe
Si
Sr
KM
gC
aN
aC
lS
(VI)
TIC
S(�
II)
Exp
erim
enta
lva
lues
7.2
±0.
2�
3.4
(±0.
5)�
1.9
—0.
015
±0.
011
0.14
0.25
±0.
020.
9±
0.3
5.9
±1.
17.
6±
1.4
56±
441
±11
19±
44.
2±
0.6
Ref
eren
cem
od
elfr
om
Tab
le4
7.1
�2.
9�
2.1
6.2�
10�
60.
062
0.18
0.21
1.0
3.6
10.3
4341
14.7
2.4
3.5�
10�
7
Alt
ern
ati
vere
fere
nce
mo
del
sw
ith
ad
dit
ion
al
ph
ase
s
Mo
del
1:C
hlo
rite
-C
ca2/
Illi
te-I
mt2
7.2
�3.
0�
2.2
30�
10�
60.
047
0.18
0.21
1.0
5.4
8.5
4341
14.7
2.4
4.0�
10�
7
Mo
del
2:D
aph
nit
e-14
A/i
llit
e-Im
t27.
0�
2.8
�1.
831�
10�
60.
048
0.18
0.21
1.1
5.5
8.6
4441
14.6
3.7
4.3�
10�
7
Mo
del
3:D
aph
nit
e-14
A/I
llit
e-M
g7.
2�
3.0
�2.
26.
3�
10�
60.
047
0.18
0.21
1.0
5.4
8.5
4341
14.7
2.4
4.0�
10�
7
Mo
del
4:C
hlo
rite
-C
ca2/
Illi
te-M
g7.
4�
3.2
�2.
67.
3�
10�
60.
046
0.18
0.21
1.0
5.3
8.4
4341
14.7
1.5
3.8�
10�
7
10 E.C. Gaucher et al. / Geochimica et Cosmochimica Acta xxx (2009) xxx–xxx
GCA 6384 No. of Pages 18
10 August 2009 Disk UsedARTICLE IN PRESS
Please cite this article in press as: Gaucher E. C., et al. A robust model f(2009), doi:10.1016/j.gca.2009.07.021
TED
PR
OO
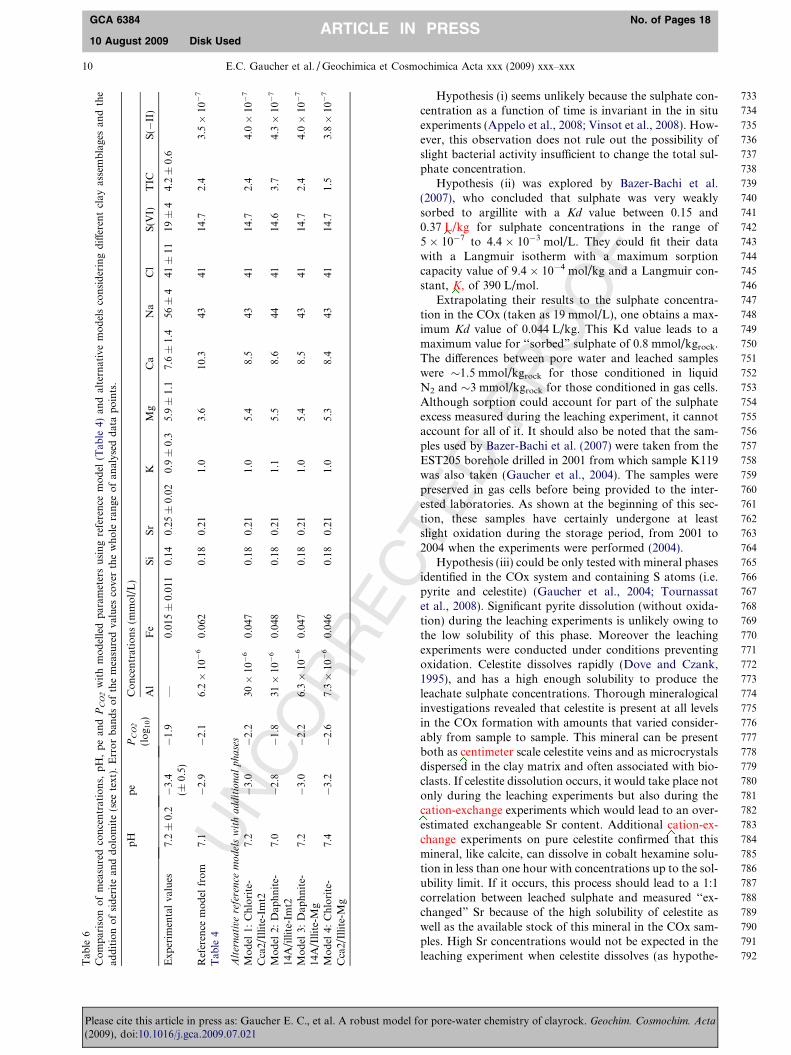
F
Hypothesis (i) seems unlikely because the sulphate con-centration as a function of time is invariant in the in situexperiments (Appelo et al., 2008; Vinsot et al., 2008). How-ever, this observation does not rule out the possibility ofslight bacterial activity insufficient to change the total sul-phate concentration.
Hypothesis (ii) was explored by Bazer-Bachi et al.(2007), who concluded that sulphate was very weaklysorbed to argillite with a Kd value between 0.15 and0.37 L/kg for sulphate concentrations in the range of5 � 10�7 to 4.4 � 10�3 mol/L. They could fit their datawith a Langmuir isotherm with a maximum sorptioncapacity value of 9.4 � 10�4 mol/kg and a Langmuir con-stant, K, of 390 L/mol.
Extrapolating their results to the sulphate concentra-tion in the COx (taken as 19 mmol/L), one obtains a max-imum Kd value of 0.044 L/kg. This Kd value leads to amaximum value for ‘‘sorbed” sulphate of 0.8 mmol/kgrock.The differences between pore water and leached sampleswere �1.5 mmol/kgrock for those conditioned in liquidN2 and �3 mmol/kgrock for those conditioned in gas cells.Although sorption could account for part of the sulphateexcess measured during the leaching experiment, it cannotaccount for all of it. It should also be noted that the sam-ples used by Bazer-Bachi et al. (2007) were taken from theEST205 borehole drilled in 2001 from which sample K119was also taken (Gaucher et al., 2004). The samples werepreserved in gas cells before being provided to the inter-ested laboratories. As shown at the beginning of this sec-tion, these samples have certainly undergone at leastslight oxidation during the storage period, from 2001 to2004 when the experiments were performed (2004).
Hypothesis (iii) could be only tested with mineral phasesidentified in the COx system and containing S atoms (i.e.pyrite and celestite) (Gaucher et al., 2004; Tournassatet al., 2008). Significant pyrite dissolution (without oxida-tion) during the leaching experiments is unlikely owing tothe low solubility of this phase. Moreover the leachingexperiments were conducted under conditions preventingoxidation. Celestite dissolves rapidly (Dove and Czank,1995), and has a high enough solubility to produce theleachate sulphate concentrations. Thorough mineralogicalinvestigations revealed that celestite is present at all levelsin the COx formation with amounts that varied consider-ably from sample to sample. This mineral can be presentboth as centimeter scale celestite veins and as microcrystalsdispersed in the clay matrix and often associated with bio-clasts. If celestite dissolution occurs, it would take place notonly during the leaching experiments but also during thecation-exchange experiments which would lead to an over-estimated exchangeable Sr content. Additional cation-ex-change experiments on pure celestite confirmed that thismineral, like calcite, can dissolve in cobalt hexamine solu-tion in less than one hour with concentrations up to the sol-ubility limit. If it occurs, this process should lead to a 1:1correlation between leached sulphate and measured ‘‘ex-changed” Sr because of the high solubility of celestite aswell as the available stock of this mineral in the COx sam-ples. High Sr concentrations would not be expected in theleaching experiment when celestite dissolves (as hypothe-
or pore-water chemistry of clayrock. Geochim. Cosmochim. Acta
Original text:
Inserted Text
Lkg−1
Original text:
Inserted Text
K,
Original text:
Inserted Text
centimetre
Original text:
Inserted Text
cation exchange
Original text:
Inserted Text
cation exchange

C793
794
795
796
797
798
799
800
801
802
803
804
805
806
807
808
809
810
811
812
813
814
815
816
817
818
819
820
821
822
823
824
825
826
827
828
829
830
831
832
833
834
835
836
837
838
839
840
841
842
843
844
845
846
847
848
849
850
852852
853
854
855
856
857
858
859
860
861
862
863
864
865
866
867
868
869
870
871
872
873
874
875
876
877
878
879
880
881
882
883
884
0 0.002 0.004 0.006 0.008 0.01
0
0.001
0.002
0.003
0.004
0.005
0.006
S(6) leached concentration (molc/kgrock)
"Exc
hang
eabl
e" S
r (m
olc/k
g roc
k)
range of solute S(6)
rang
e of
ex
chan
ged
Sr
Pyrite oxidation Celesti
tedis
solut
ion
Celesti
tedis
solut
ion
Fig. 2. Exchangeable Sr content as a function of leached sulphatecontent for samples preserved in liquid N2 (blue symbols) and gascell samples (red symbols). Circles are for EST25687 samples andtriangles for EST21400H, EST25380 and EST21439 samples.Dashed lines represent 1:1 relationships. See text for the calculatedrange of exchanged Sr and solute sulphate (solid lines). (Forinterpretation of the references to colour in this figure legend, thereader is referred to the web version of this article.)
A robust model for pore-water chemistry of clayrock 11
GCA 6384 No. of Pages 18
10 August 2009 Disk UsedARTICLE IN PRESS
UN
CO
RR
Esised by Buschaert et al., 2007), due to cation exchange reac-tions that favour divalent cations over monovalent ones(mainly Na) in suspensions with low ionic strength. For thisreason, no linear correlation is expected between leachedsulphate and leached strontium in pure water leachingexperiments.
The relationship between leached sulphate and ex-changed strontium can be seen in Fig. 2. There is a positive1:1 correlation between exchanged Sr and leached sulphate(in molc kgrock
�1, where molc is the number of moles ofcharge or equivalents of the solute) of samples preservedin gas cells. However, due to small amounts of pyrite oxida-tion in these samples, one could not derive the pore-watersulphate concentration. Unlike the gas cell samples, thesamples preserved in liquid N2 underwent minimal or nopyrite oxidation. This is also shown in Fig. 2 where samplesoriginating from the same core but preserved in liquid N2
have similar exchanged strontium values but lower leachedsulphate values than samples preserved in the gas cells.
Independent knowledge of the actual value of exchangedSr would permit prediction of the soluble sulphate contentfrom the 1:1 relationship shown on the left of Fig. 2. Thiscan be roughly verified considering that the cation exchangebehaviour of Sr is similar to that of Mg and Ca (see Table3). Exchanged Ca and Mg values are 0.105 and0.041 molc kg�1 respectively. In addition, measured Sr/Caand Sr/Mg ratios in in situ experiments are 0.033 and0.042. From these, the exchanged Sr value can be estimatedto be between 0.0017 and 0.0035 molc kg�1, leading, inturn, to a solute sulphate content between 0.0010 and0.0028 molc kg�1 (Fig. 2), (i.e. between 14.4 and 40 mmol/L, again using the half-total-porosity assumption).Although it is not very precise because of approximationssuch as ignoring differences in Sr, Ca and Mg complexationin solution, this range of concentrations is in agreementwith the measured value (19 mmol/L for the in situ watersample from the borehole from which the core samplewas taken). Because this calculation involves results from
Please cite this article in press as: Gaucher E. C., et al. A robust model(2009), doi:10.1016/j.gca.2009.07.021
TED
PR
OO
F
an in situ water sample, it cannot be seen as a general meth-od for predicting sulphate concentrations. However, it willbe shown in the next section how sulphate concentrationscan be predicted with data from core samples only.
Thus, process (iii) (mineral dissolution) is strongly sup-ported by these experimental and modelling results.
4.4. Modelling cation concentrations and corrections of
sulphate and strontium concentrations
As shown in the previous section, it is not possible to usethe total leached sulphate content directly to estimate thesulphate concentration in pore water even if pyrite oxida-tion in the sample has been prevented. Moreover, measuredexchangeable Sr contents are likely to be too high becausethey may also reflect the dissolution of a significant amountof celestite. However, it is possible to correct the measure-ment for this effect using numerical modelling taking intoaccount mass balance between elements, cation exchangereactions and considering the presence of celestite. Theaddition of celestite equilibrium allows this problem to beovercome by adding an additional constraint to the system:
SrSO4 () Sr2þ þ SO42�Kcelestite
¼ ðSr2þÞ SO42�� �
ðReaction 1Þ
where values in parenthesis represent activities.The PHREEQC file given in Electronic Annex 2 enables
one to solve these equations and constraints. The result ofthis sulphate concentration correction depends on theparameters chosen for cation exchange. Because of thespread in selectivity coefficient values, a sensitivity analysiswas performed to test the robustness of the approach. Todo this, the same calculation was repeated with each ofthe four sets of cation exchange selectivity coefficients givenin Table 3.
Results are shown in Fig. 3. The predicted sulphate con-centration is between 11 and 22 mmol/L while measured sul-phate concentrations ranged from 15 to 23 mmol/L. All ofthe major and minor cation concentrations are reproducedwell except Fe(II). However, exchanged Fe(II) can be consid-ered only as a maximum value (Tournassat et al., 2008) lead-ing in turn to a maximum Fe(II) concentration in solution. Asexpected the modelled amount of exchangeable Sr is lowerthan the measured value because the latter includes Sr fromcelestite dissolution. This correction accounts for approxi-mately 0.05 mol/L pore water, i.e. �0.37 g/kgrock. Thisamount is too low to make possible a correction using thecelestite concentration of the solid phase.
4.5. Modelling complete pore-water composition
For this modelling, the cation exchange selectivity coef-ficients predicted for IS (see Table 3) will be used. Once theconcentrations of major anions and cations are known, it ispossible to add further constraints on the model to calcu-late concentrations of other solutes such as Si, Al andTIC (total inorganic carbonate) and the values of addi-tional parameters such as pH and, Eh. Five additional inde-pendent equations are needed to obtain these additional
for pore-water chemistry of clayrock. Geochim. Cosmochim. Acta
Original text:
Inserted Text
molc
Original text:
Inserted Text
molc
Original text:
Inserted Text
molc
Original text:
Inserted Text
mmol L−1,
Original text:
Inserted Text
mmol L−1
Original text:
Inserted Text
mmol L−1
Original text:
Inserted Text
mmol L−1.

F
885
886
887
888
Fe Sr K Mg Ca Na Cl S(6)0.001
0.01
0.1
1
10
100
Con
cent
ratio
n (m
mol
L-1
)
NaX KX CaX2 MgX2 SrX2 FeX20.01
0.1
1
10
Con
cent
ratio
n (m
ol L
-1)
Fig. 3. Comparison of model prediction (lines represent the envelop of the results) with concentrations measured in in situ experiment (circles)for major and minor species in solution (left) and on the exchanger (right).
12 E.C. Gaucher et al. / Geochimica et Cosmochimica Acta xxx (2009) xxx–xxx
GCA 6384 No. of Pages 18
10 August 2009 Disk UsedARTICLE IN PRESS
unknown parameters. Based on the observed mineralassemblage (Gaucher et al., 2006), five phases were selected:
UN
CO
RR
EC
889
890
891
892
893
894
895
896
897
898
899
900
901
902
903
904
905
906
907
908
909
910
911
912
913
914
915
916917
919919920
922922
923
924
925
926
Fe Si Sr K Mg Ca Na Cl S(6) TIC0.001
0.01
0.1
1
10
100
Con
cent
ratio
ns (m
mol
/L)
pH pe PCO2
6.8
6.9
7
7.1
7.2
7.3
7.4
7.5
pH v
alue
-4
-3.5
-3
-2.5
-2
-1.5
pe a
nd lo
g 10 P
CO
2
Na K Ca Mg Sr Fe0.001
0.01
0.1
1
E Me
Fig. 4. Top: comparison of modelled concentrations (invertedtriangles: Illite-Imt-2/Chlorite-Cca2, squares: Illite Imt-2/Daph-nite-14A, diamonds: Illite-Mg/Daphnite-14A, triangles: Illite-Mg/Chlorite-Cca2) and measured concentrations in the in situ exper-iment (�475 m, filled circles). Middle: comparisons of pH, pe andPCO2 (same legend). Bottom: Comparison of the exchangercomposition before (squares) and after (circles) addition ofdolomite and siderite.
Please cite this article in press as: Gaucher E. C., et al. A robust model(2009), doi:10.1016/j.gca.2009.07.021
TED
PR
OOquartz, illite, chlorite, calcite and pyrite. Results of the com-
plete calculation are shown in Table 6. The PHREEQC cal-culation file is given in Electronic Annex 3. There is goodagreement between measured and modelled concentrations.Note particularly the successful prediction of the pH valueand the CO2 partial pressure.
5. DISCUSSION
Thermodynamic equilibria between rock and porewater: those that are demonstrable, possible andimpossible.
5.1. Additional phases in the model
The model proposed and tested above follows the Gibbsphase rule. Although many additional phases are present inthe rock, none can be added to the model without violatingthis rule. Some of these additional phases (siderite anddolomite, for example) should be at equilibrium becausetheir dissolution and precipitation rates are rapid relativeto the residence time of water in clayrocks. On the otherhand, other phases could be metastable if, for instance, theywere oversaturated but were prevented from precipitatingby energy barriers. The following paragraphs discuss thesepoints.
5.2. Siderite and dolomite equilibria
Dolomite and siderite or sideroplesite (Ca- and Mg-richsiderite) are observed in COx samples. However, includingtheir equilibria in the model would over constrain the mod-el with respect to the Gibbs phase rule. Tournassat et al.(2008) demonstrated that dolomite, siderite and calciteequilibria are linked to the cation exchanger compositionthrough the following relationships
Kdolomite ¼ K2calcite �
EMgX 2
ECaX 2� KCa=Mg
ex
ð6Þ
Ksiderite ¼ Kcalcite �EFeX 2
ECaX 2� KCa=Fe
ex
ð7Þ
where Kdolomite, Ksiderite and Kcalcite are the solubility prod-ucts of dolomite, siderite and calcite, EMgX2, EFeX2 andECaX2 are the fractional exchanger occupancies in equiva-lents of Mg, Fe and Ca, and KCa=Mg
ex and KCa=Feex are selectiv-
for pore-water chemistry of clayrock. Geochim. Cosmochim. Acta
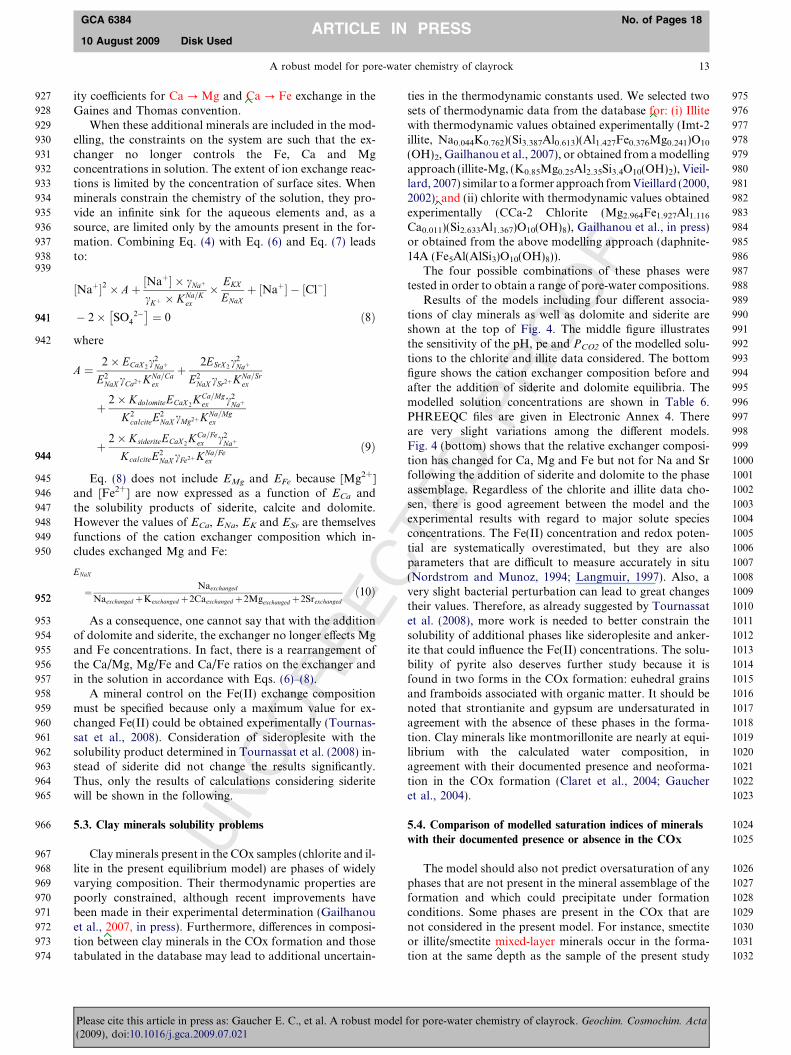
C
927
928
929
930
931
932
933
934
935
936
937
938939
941941
942
944944
945
946
947
948
949
950
952952
953
954
955
956
957
958
959
960
961
962
963
964
965
966
967
968
969
970
971
972
973
974
975
976
977
978
979
980
981
982
983
984
985
986
987
988
989
990
991
992
993
994
995
996
997
998
999
1000
1001
1002
1003
1004
1005
1006
1007
1008
1009
1010
1011
1012
1013
1014
1015
1016
1017
1018
1019
1020
1021
1022
1023
1024
1025
1026
1027
1028
1029
1030
1031
1032
A robust model for pore-water chemistry of clayrock 13
GCA 6384 No. of Pages 18
10 August 2009 Disk UsedARTICLE IN PRESS
UN
CO
RR
E
ity coefficients for Ca ? Mg and Ca ? Fe exchange in theGaines and Thomas convention.
When these additional minerals are included in the mod-elling, the constraints on the system are such that the ex-changer no longer controls the Fe, Ca and Mgconcentrations in solution. The extent of ion exchange reac-tions is limited by the concentration of surface sites. Whenminerals constrain the chemistry of the solution, they pro-vide an infinite sink for the aqueous elements and, as asource, are limited only by the amounts present in the for-mation. Combining Eq. (4) with Eq. (6) and Eq. (7) leadsto:
½Naþ�2 � Aþ ½Naþ� � cNaþ
cKþ � KNa=Kex
� EKX
ENaXþ ½Naþ� � ½Cl��
� 2� SO42�� �¼ 0 ð8Þ
where
A ¼2� ECaX 2
c2Naþ
E2NaX cCa2þKNa=Ca
ex
þ2ESrX 2
c2Naþ
E2NaX cSr2þKNa=Sr
ex
þ2� KdolomiteECaX 2
KCa=Mgex c2
Naþ
K2calciteE
2NaX cMg2þKNa=Mg
ex
þ2� KsideriteECaX 2
KCa=Feex c2
Naþ
KcalciteE2NaX cFe2þKNa=Fe
ex
ð9Þ
Eq. (8) does not include EMg and EFe because [Mg2+]and [Fe2+] are now expressed as a function of ECa andthe solubility products of siderite, calcite and dolomite.However the values of ECa, ENa, EK and ESr are themselvesfunctions of the cation exchanger composition which in-cludes exchanged Mg and Fe:
ENaX
¼ Naexchanged
Naexchanged þKexchanged þ2Caexchanged þ2Mgexchanged þ2Srexchangedð10Þ
As a consequence, one cannot say that with the additionof dolomite and siderite, the exchanger no longer effects Mgand Fe concentrations. In fact, there is a rearrangement ofthe Ca/Mg, Mg/Fe and Ca/Fe ratios on the exchanger andin the solution in accordance with Eqs. (6)–(8).
A mineral control on the Fe(II) exchange compositionmust be specified because only a maximum value for ex-changed Fe(II) could be obtained experimentally (Tournas-sat et al., 2008). Consideration of sideroplesite with thesolubility product determined in Tournassat et al. (2008) in-stead of siderite did not change the results significantly.Thus, only the results of calculations considering sideritewill be shown in the following.
5.3. Clay minerals solubility problems
Clay minerals present in the COx samples (chlorite and il-lite in the present equilibrium model) are phases of widelyvarying composition. Their thermodynamic properties arepoorly constrained, although recent improvements havebeen made in their experimental determination (Gailhanouet al., 2007, in press). Furthermore, differences in composi-tion between clay minerals in the COx formation and thosetabulated in the database may lead to additional uncertain-
Please cite this article in press as: Gaucher E. C., et al. A robust model(2009), doi:10.1016/j.gca.2009.07.021
TED
PR
OO
F
ties in the thermodynamic constants used. We selected twosets of thermodynamic data from the database for: (i) Illitewith thermodynamic values obtained experimentally (Imt-2illite, Na0.044K0.762)(Si3.387Al0.613)(Al1.427Fe0.376Mg0.241)O10
(OH)2, Gailhanou et al., 2007), or obtained from a modellingapproach (illite-Mg, (K0.85Mg0.25Al2.35Si3.4O10(OH)2), Vieil-lard, 2007) similar to a former approach from Vieillard (2000,2002); and (ii) chlorite with thermodynamic values obtainedexperimentally (CCa-2 Chlorite (Mg2.964Fe1.927Al1.116
Ca0.011)(Si2.633Al1.367)O10(OH)8), Gailhanou et al., in press)or obtained from the above modelling approach (daphnite-14A (Fe5Al(AlSi3)O10(OH)8)).
The four possible combinations of these phases weretested in order to obtain a range of pore-water compositions.
Results of the models including four different associa-tions of clay minerals as well as dolomite and siderite areshown at the top of Fig. 4. The middle figure illustratesthe sensitivity of the pH, pe and PCO2 of the modelled solu-tions to the chlorite and illite data considered. The bottomfigure shows the cation exchanger composition before andafter the addition of siderite and dolomite equilibria. Themodelled solution concentrations are shown in Table 6.PHREEQC files are given in Electronic Annex 4. Thereare very slight variations among the different models.Fig. 4 (bottom) shows that the relative exchanger composi-tion has changed for Ca, Mg and Fe but not for Na and Srfollowing the addition of siderite and dolomite to the phaseassemblage. Regardless of the chlorite and illite data cho-sen, there is good agreement between the model and theexperimental results with regard to major solute speciesconcentrations. The Fe(II) concentration and redox poten-tial are systematically overestimated, but they are alsoparameters that are difficult to measure accurately in situ(Nordstrom and Munoz, 1994; Langmuir, 1997). Also, avery slight bacterial perturbation can lead to great changestheir values. Therefore, as already suggested by Tournassatet al. (2008), more work is needed to better constrain thesolubility of additional phases like sideroplesite and anker-ite that could influence the Fe(II) concentrations. The solu-bility of pyrite also deserves further study because it isfound in two forms in the COx formation: euhedral grainsand framboids associated with organic matter. It should benoted that strontianite and gypsum are undersaturated inagreement with the absence of these phases in the forma-tion. Clay minerals like montmorillonite are nearly at equi-librium with the calculated water composition, inagreement with their documented presence and neoforma-tion in the COx formation (Claret et al., 2004; Gaucheret al., 2004).
5.4. Comparison of modelled saturation indices of minerals
with their documented presence or absence in the COx
The model should also not predict oversaturation of anyphases that are not present in the mineral assemblage of theformation and which could precipitate under formationconditions. Some phases are present in the COx that arenot considered in the present model. For instance, smectiteor illite/smectite mixed-layer minerals occur in the forma-tion at the same depth as the sample of the present study
for pore-water chemistry of clayrock. Geochim. Cosmochim. Acta
Original text:
Inserted Text
Ca→Fe
Original text:
Inserted Text
2007; Gailhanou et al.,
Original text:
Inserted Text
for:(i) illite
Original text:
Inserted Text
;and
Original text:
Inserted Text
mixed layer
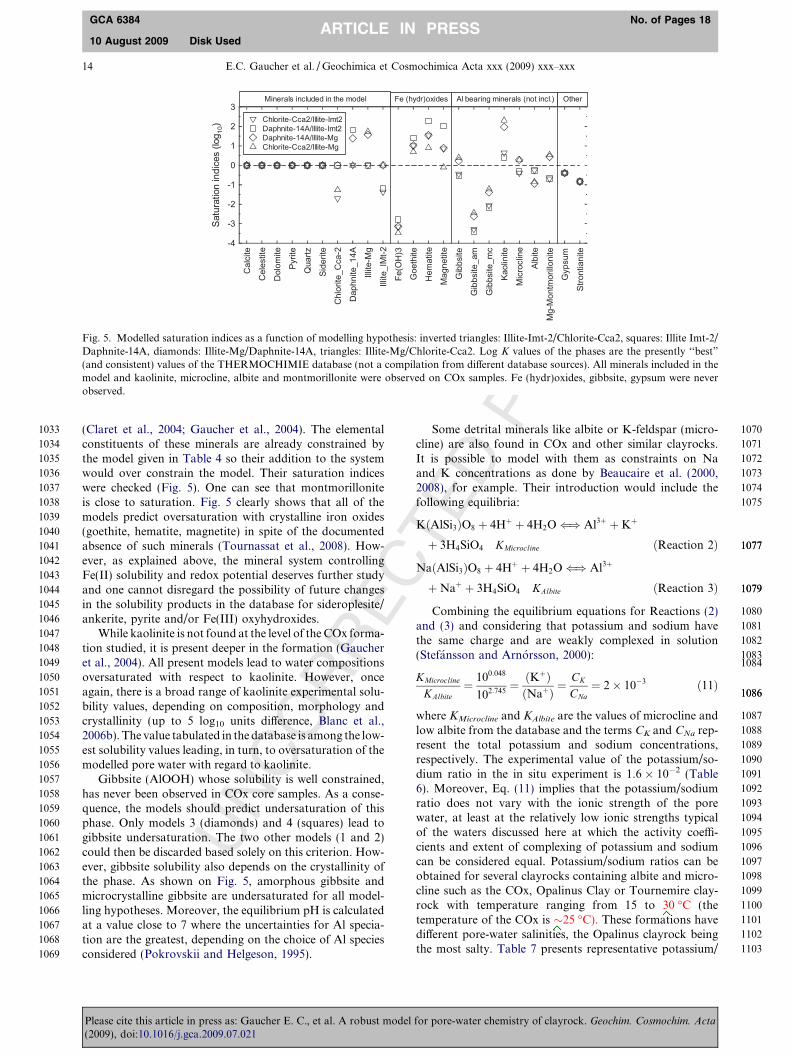
C
RO
OF
1033
1034
1035
1036
1037
1038
1039
1040
1041
1042
1043
1044
1045
1046
1047
1048
1049
1050
1051
1052
1053
1054
1055
1056
1057
1058
1059
1060
1061
1062
1063
1064
1065
1066
1067
1068
1069
1070
1071
1072
1073
1074
1075
10771077
10791079
1080
1081
1082
10831084
10861086
1087
1088
1089
1090
1091
1092
1093
1094
1095
1096
1097
1098
1099
1100
1101
1102
1103
Cal
cite
Cel
estit
e
Dol
omite
Py
rite
Qua
rtz
Sid
erite
Chl
orite
_Cca
-2
Dap
hnite
_14A
Illite
-Mg
Illite
_IM
t-2
Fe(
OH
)3
Goe
thite
Hem
atite
Mag
netit
e
Gib
bsite
Gib
bsite
_am
Gib
bsite
_mc
Kaol
inite
Mic
rocl
ine
Albi
te
Mg-
Mon
tmor
illoni
te
G
ypsu
m
Stro
ntia
nite
-4
-3
-2
-1
0
1
2
3
Satu
ratio
n in
dice
s (lo
g 10) Chlorite-Cca2/Illite-Imt2
Daphnite-14A/Illite-Imt2Daphnite-14A/Illite-MgChlorite-Cca2/Illite-Mg
Minerals included in the model Fe (hydr)oxides Al bearing minerals (not incl.) Other
Fig. 5. Modelled saturation indices as a function of modelling hypothesis: inverted triangles: Illite-Imt-2/Chlorite-Cca2, squares: Illite Imt-2/Daphnite-14A, diamonds: Illite-Mg/Daphnite-14A, triangles: Illite-Mg/Chlorite-Cca2. Log K values of the phases are the presently ‘‘best”(and consistent) values of the THERMOCHIMIE database (not a compilation from different database sources). All minerals included in themodel and kaolinite, microcline, albite and montmorillonite were observed on COx samples. Fe (hydr)oxides, gibbsite, gypsum were neverobserved.
14 E.C. Gaucher et al. / Geochimica et Cosmochimica Acta xxx (2009) xxx–xxx
GCA 6384 No. of Pages 18
10 August 2009 Disk UsedARTICLE IN PRESS
UN
CO
RR
E(Claret et al., 2004; Gaucher et al., 2004). The elementalconstituents of these minerals are already constrained bythe model given in Table 4 so their addition to the systemwould over constrain the model. Their saturation indiceswere checked (Fig. 5). One can see that montmorilloniteis close to saturation. Fig. 5 clearly shows that all of themodels predict oversaturation with crystalline iron oxides(goethite, hematite, magnetite) in spite of the documentedabsence of such minerals (Tournassat et al., 2008). How-ever, as explained above, the mineral system controllingFe(II) solubility and redox potential deserves further studyand one cannot disregard the possibility of future changesin the solubility products in the database for sideroplesite/ankerite, pyrite and/or Fe(III) oxyhydroxides.
While kaolinite is not found at the level of the COx forma-tion studied, it is present deeper in the formation (Gaucheret al., 2004). All present models lead to water compositionsoversaturated with respect to kaolinite. However, onceagain, there is a broad range of kaolinite experimental solu-bility values, depending on composition, morphology andcrystallinity (up to 5 log10 units difference, Blanc et al.,2006b). The value tabulated in the database is among the low-est solubility values leading, in turn, to oversaturation of themodelled pore water with regard to kaolinite.
Gibbsite (AlOOH) whose solubility is well constrained,has never been observed in COx core samples. As a conse-quence, the models should predict undersaturation of thisphase. Only models 3 (diamonds) and 4 (squares) lead togibbsite undersaturation. The two other models (1 and 2)could then be discarded based solely on this criterion. How-ever, gibbsite solubility also depends on the crystallinity ofthe phase. As shown on Fig. 5, amorphous gibbsite andmicrocrystalline gibbsite are undersaturated for all model-ling hypotheses. Moreover, the equilibrium pH is calculatedat a value close to 7 where the uncertainties for Al specia-tion are the greatest, depending on the choice of Al speciesconsidered (Pokrovskii and Helgeson, 1995).
Please cite this article in press as: Gaucher E. C., et al. A robust model(2009), doi:10.1016/j.gca.2009.07.021
TED
PSome detrital minerals like albite or K-feldspar (micro-cline) are also found in COx and other similar clayrocks.It is possible to model with them as constraints on Naand K concentrations as done by Beaucaire et al. (2000,2008), for example. Their introduction would include thefollowing equilibria:
KðAlSi3ÞO8 þ 4Hþ þ 4H2O() Al3þ þKþ
þ 3H4SiO4 KMicrocline ðReaction 2Þ
NaðAlSi3ÞO8 þ 4Hþ þ 4H2O() Al3þ
þNaþ þ 3H4SiO4 KAlbite ðReaction 3Þ
Combining the equilibrium equations for Reactions (2)and (3) and considering that potassium and sodium havethe same charge and are weakly complexed in solution(Stefansson and Arnorsson, 2000):
KMicrocline
KAlbite¼ 100:048
102:745¼ ðK
þÞðNaþÞ ¼
CK
CNa¼ 2� 10�3 ð11Þ
where KMicrocline and KAlbite are the values of microcline andlow albite from the database and the terms CK and CNa rep-resent the total potassium and sodium concentrations,respectively. The experimental value of the potassium/so-dium ratio in the in situ experiment is 1.6 � 10�2 (Table6). Moreover, Eq. (11) implies that the potassium/sodiumratio does not vary with the ionic strength of the porewater, at least at the relatively low ionic strengths typicalof the waters discussed here at which the activity coeffi-cients and extent of complexing of potassium and sodiumcan be considered equal. Potassium/sodium ratios can beobtained for several clayrocks containing albite and micro-cline such as the COx, Opalinus Clay or Tournemire clay-rock with temperature ranging from 15 to 30 �C (thetemperature of the COx is �25 �C). These formations havedifferent pore-water salinities, the Opalinus clayrock beingthe most salty. Table 7 presents representative potassium/
for pore-water chemistry of clayrock. Geochim. Cosmochim. Acta
Original text:
Inserted Text
30°C
Original text:
Inserted Text
∼25°C).
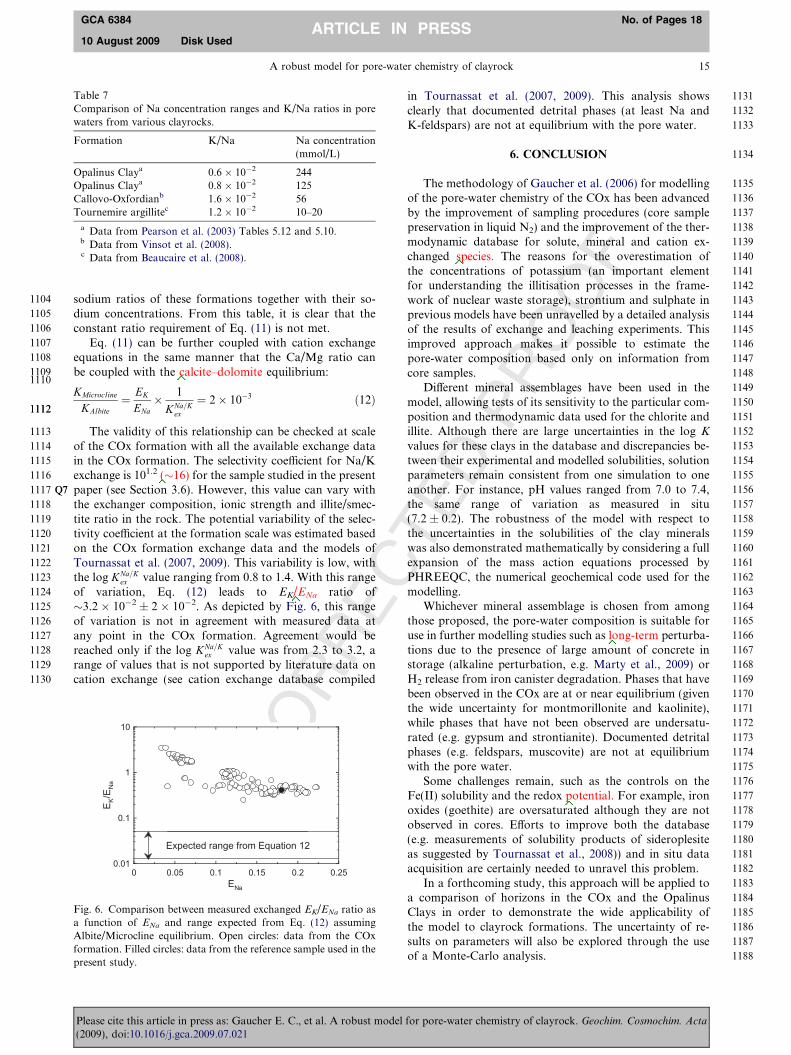
C
1104
1105
1106
1107
1108
11091110
11121112
1113
1114
1115
1116
1117 Q7
1118
1119
1120
1121
1122
1123
1124
1125
1126
1127
1128
1129
1130
1131
1132
1133
1134
1135
1136
1137
1138
1139
1140
1141
1142
1143
1144
1145
1146
1147
1148
1149
1150
1151
1152
1153
1154
1155
1156
1157
1158
1159
1160
1161
1162
1163
1164
1165
1166
1167
1168
1169
Table 7Comparison of Na concentration ranges and K/Na ratios in porewaters from various clayrocks.
Formation K/Na Na concentration(mmol/L)
Opalinus Claya 0.6 � 10�2 244Opalinus Claya 0.8 � 10�2 125Callovo-Oxfordianb 1.6 � 10�2 56Tournemire argillitec 1.2 � 10�2 10–20
a Data from Pearson et al. (2003) Tables 5.12 and 5.10.b Data from Vinsot et al. (2008).c Data from Beaucaire et al. (2008).
A robust model for pore-water chemistry of clayrock 15
GCA 6384 No. of Pages 18
10 August 2009 Disk UsedARTICLE IN PRESS
RE
sodium ratios of these formations together with their so-dium concentrations. From this table, it is clear that theconstant ratio requirement of Eq. (11) is not met.
Eq. (11) can be further coupled with cation exchangeequations in the same manner that the Ca/Mg ratio canbe coupled with the calcite–dolomite equilibrium:
KMicrocline
KAlbite¼ EK
ENa� 1
KNa=Kex
¼ 2� 10�3 ð12Þ
The validity of this relationship can be checked at scaleof the COx formation with all the available exchange datain the COx formation. The selectivity coefficient for Na/Kexchange is 101.2 (�16) for the sample studied in the presentpaper (see Section 3.6). However, this value can vary withthe exchanger composition, ionic strength and illite/smec-tite ratio in the rock. The potential variability of the selec-tivity coefficient at the formation scale was estimated basedon the COx formation exchange data and the models ofTournassat et al. (2007, 2009). This variability is low, withthe log KNa=K
ex value ranging from 0.8 to 1.4. With this rangeof variation, Eq. (12) leads to EK/ENa ratio of�3.2 � 10�2 ± 2 � 10�2. As depicted by Fig. 6, this rangeof variation is not in agreement with measured data atany point in the COx formation. Agreement would bereached only if the log KNa=K
ex value was from 2.3 to 3.2, arange of values that is not supported by literature data oncation exchange (see cation exchange database compiled
UN
CO
R 1170
1171
1172
1173
1174
1175
1176
1177
1178
1179
1180
1181
1182
1183
1184
1185
1186
1187
1188
0 0.05 0.1 0.15 0.2 0.250.01
0.1
1
10
ENa
E K/E
Na
Expected range from Equation 12
Fig. 6. Comparison between measured exchanged EK/ENa ratio asa function of ENa and range expected from Eq. (12) assumingAlbite/Microcline equilibrium. Open circles: data from the COxformation. Filled circles: data from the reference sample used in thepresent study.
Please cite this article in press as: Gaucher E. C., et al. A robust model(2009), doi:10.1016/j.gca.2009.07.021
TED
PR
OO
F
in Tournassat et al. (2007, 2009). This analysis showsclearly that documented detrital phases (at least Na andK-feldspars) are not at equilibrium with the pore water.
6. CONCLUSION
The methodology of Gaucher et al. (2006) for modellingof the pore-water chemistry of the COx has been advancedby the improvement of sampling procedures (core samplepreservation in liquid N2) and the improvement of the ther-modynamic database for solute, mineral and cation ex-changed species. The reasons for the overestimation ofthe concentrations of potassium (an important elementfor understanding the illitisation processes in the frame-work of nuclear waste storage), strontium and sulphate inprevious models have been unravelled by a detailed analysisof the results of exchange and leaching experiments. Thisimproved approach makes it possible to estimate thepore-water composition based only on information fromcore samples.
Different mineral assemblages have been used in themodel, allowing tests of its sensitivity to the particular com-position and thermodynamic data used for the chlorite andillite. Although there are large uncertainties in the log K
values for these clays in the database and discrepancies be-tween their experimental and modelled solubilities, solutionparameters remain consistent from one simulation to oneanother. For instance, pH values ranged from 7.0 to 7.4,the same range of variation as measured in situ(7.2 ± 0.2). The robustness of the model with respect tothe uncertainties in the solubilities of the clay mineralswas also demonstrated mathematically by considering a fullexpansion of the mass action equations processed byPHREEQC, the numerical geochemical code used for themodelling.
Whichever mineral assemblage is chosen from amongthose proposed, the pore-water composition is suitable foruse in further modelling studies such as long-term perturba-tions due to the presence of large amount of concrete instorage (alkaline perturbation, e.g. Marty et al., 2009) orH2 release from iron canister degradation. Phases that havebeen observed in the COx are at or near equilibrium (giventhe wide uncertainty for montmorillonite and kaolinite),while phases that have not been observed are undersatu-rated (e.g. gypsum and strontianite). Documented detritalphases (e.g. feldspars, muscovite) are not at equilibriumwith the pore water.
Some challenges remain, such as the controls on theFe(II) solubility and the redox potential. For example, ironoxides (goethite) are oversaturated although they are notobserved in cores. Efforts to improve both the database(e.g. measurements of solubility products of sideroplesiteas suggested by Tournassat et al., 2008)) and in situ dataacquisition are certainly needed to unravel this problem.
In a forthcoming study, this approach will be applied toa comparison of horizons in the COx and the OpalinusClays in order to demonstrate the wide applicability ofthe model to clayrock formations. The uncertainty of re-sults on parameters will also be explored through the useof a Monte-Carlo analysis.
for pore-water chemistry of clayrock. Geochim. Cosmochim. Acta
Original text:
Inserted Text
calcite - dolomite
Original text:
Inserted Text
(∼ 16)
Original text:
Inserted Text
/E
Original text:
Inserted Text
species .
Original text:
Inserted Text
long term
Original text:
Inserted Text
potential .
C
1189
11901191119211931194119511961197
1198
1199
1200
1201
1202
1203
120412051206120712081209121012111212121312141215121612171218121912201221122212231224122512261227122812291230123112321233123412351236123712381239124012411242124312441245124612471248
124912501251125212531254125512561257125812591260126112621263126412651266126712681269127012711272127312741275127612771278127912801281128212831284128512861287128812891290129112921293129412951296129712981299130013011302130313041305130613071308130913101311131213131314
16 E.C. Gaucher et al. / Geochimica et Cosmochimica Acta xxx (2009) xxx–xxx
GCA 6384 No. of Pages 18
10 August 2009 Disk UsedARTICLE IN PRESS
UN
CO
RR
E
ACKNOWLEDGMENTS
This research has been financially supported by the BRGM–ANDRA scientific partnership (THERMOAR project, 1998–2008), Lise Griffault and Emmanuel Jacquot (ANDRA) areacknowledged for their contribution and support in the initialstages of the project.
Stephan Kramer (A.E.) and three anonymous reviewers aregratefully acknowledged for their very valuable suggestions thatgreatly improved the manuscript.
APPENDIX A. SUPPLEMENTARY DATA
Supplementary data associated with this article canbe found, in the online version, at doi:10.1016/j.gca.2009.07.021.
REFERENCES
Altmann S. (2008) ‘Geo’chemical research: a key building block fornuclear waste disposal safety cases. J. Contam. Hydrol. 102,
174–179.
Appelo C. A. J., Willemsen A., Beekman H. E. and Griffioen J.(1990) Geochemical calculations and observations on salt waterintrusions. II. Validation of a geochemical model with labora-tory experiments. J. Hydr. 120, 225–250.
Appelo C. A. J., Verweij E. and Schafer H. (1998) A hydrogeo-chemical transport model for an oxidation experiment withpyrite/calcite/exchangers/organic matter containing sand. Appl.
Geochem. 13, 257–268.
Appelo C. A. J. (2000) Comment on ‘‘Sulfate transport in a coastalplain confining unit, New Jersey, USA” (Pucci 1999). Hydro-
geol. J. 8, 455–456.
Appelo C. A. J. and Wersin P. (2007) Multicomponent diffusionmodeling in clay systems with application to the diffusion oftritium, iodide, and sodium in Opalinus clay. Environ. Sci.
Technol. 41, 5002–5007.
Appelo C. A. J., Vinsot A., Mettler S. and Wechner S. (2008)Obtaining the porewater composition of a clay rock bymodeling the in- and out-diffusion of anions and cations froman in-situ experiment. J. Contam. Hydrol. 101, 67–76.
Bath A. H., Pearson F. J., Gautschi A. and Waber H. N. (2001)Water–rock interactions in mudrocks and similar low perme-ability material. In Proc. 10th Int. Symp. on Water–Rock
Interaction, Villasimius, Sardinia. A.A. Balkema, Rotterdam,
pp. 3–12.
Bazer-Bachi F., Descostes M., Tevissen E., Meier P., Grenut B.,Simonnot M. O. and Sardin M. (2007) Characterization ofsulphate sorption on Callovo-Oxfordian argillites by batch,column and through-diffusion experiments. Phys. Chem. Earth.
32, 552–558.
Beaucaire C., Pitsch H., Toulhoat P., Motellier S. and Louvat D.(2000) Regional fluid characterisation and modelling of water–rock equilibria in the Boom clay Formation and in the Rupelianaquifer at Mol. Belg. Appl. Geochem. 15, 667–686.
Beaucaire C., Michelot J. L., Savoye S. and Cabrera J. (2008)Groundwater characterisation and modelling of water–rockinteraction in an argillaceous formation (Tournemire, France).Appl. Geochem. 23, 2182–2197.
Blanc P., Ignatiadis I., Lassin A. and Burnol A. (2006a) Thermo-chimie: selection de constantes thermodynamiques pour lechrome, le cobalt et le strontium. Report BRGM RP-55083-FR.
Blanc P., Piantone P., Lassin A. and Burnol A. (2006b) Thermo-chimie: selection de constantes thermodynamiques pour les
Please cite this article in press as: Gaucher E. C., et al. A robust model(2009), doi:10.1016/j.gca.2009.07.021
TED
PR
OO
F
elements majeurs, le plomb et le cadmium. Report ANDRA
C.RP.PSTR.07.0014 or BRGM RP-54902-FR.Blanc P. and Gailhanou H. (2007) Thermochimie: estimation des
entropies, capacites calorifiques et volumes molaires des phyllo-silicates deshydrates et hydrates. Report BRGM/RP-55966-FR.
Bradbury M. H. and Baeyens B. (1998) A physicochemicalcharacterisation and geochemical modelling approach fordetermining porewater chemistries in argillaceous rocks. Geo-
chim. Cosmochim. Acta 62, 783–795.
Bradbury M. H. and Baeyens B. (2005) Modelling the sorption ofMn(II), Co(II), Ni(II), Zn(II), Cd(II), Eu(III), Am(III), Sn(IV),Th(IV), Np(V) and U(VI) on montmorillonite: linear freeenergy relationships and estimates of surface binding constantsfor some selected heavy metals and actinides. Geochim.
Cosmochim. Acta 69, 875–892.
Bruno J., Duro L. and Grive M. (2002) The applicability andlimitations of thermodynamic geochemical models tosimulate trace element behaviour in natural waters. Lessonslearned from natural analogue studies. Chem. Geol. 190, 371–
393.
Buschaert S., Giannesini S., Lavastre V., Benedetti F., Gaucher E.C., Lacroix M., Lavielle B., Michelot J.-L., France-Lanord C.,Bourles D., Lancelot J., Benabderrahmane H., Dewonck S. andVinsot A. (2007) The contribution of water geochemistry to theunderstanding of the regional hydrogeological system. Mem.
Soc. Geol. Fr. 178, 91–114.
Chapman N. and Mckinley I. G. (1987) The Geological Disposal of
Nuclear Waste. John Wiley & Sons, Chichester, UK.Charlet L., Scheinost A. C., Tournassat C., Greneche J. M., Gehin
A., Fernandez-Martinez A., Coudert S., Tisserand D. andBrendle J. (2007) Electron transfer at the mineral/waterinterface: selenium reduction by ferrous iron sorbed on clay.Geochim. Cosmochim. Acta 71, 5731–5749.
Charpentier D., Mosser-Ruck R., Cathelineau M. and GuillaumeD. (2004) Oxidation of mudstone in a tunnel (Tournemire,France): consequences for the mineralogy and crystal chemistryof clay minerals. Clay Miner. 39, 135–149.
Ciesielski H. and Sterckeman T. (1997) Determination of cationexchange capacity and exchangeable cations in soils by meansof cobalt hexamine trichloride. Effects of experimental condi-tions. Agronomie 17, 1–7.
Claret F., Sakharov B. A., Drits V. A., Velde B., Meunier A.,Griffault L. and Lanson B. (2004) Clay minerals in the Meuse-Haute Marne underground laboratory (France): possible influ-ence of organic matter on clay mineral evolution. Clays Clay
Miner. 52, 515–532.
Coudrain-Ribstein A. and Gouze P. (1993) Quantitative study ofgeochemical processes in the Dogger aquifer, Paris Basin. Fr.
Appl. Geochem. 8, 495–506.
Coudrain-Ribstein A., Gouze P. and De Marsily G. (1998)Temperature-carbon dioxide partial pressure trends in confinedaquifers. Chem. Geol. 145, 73–89.
De Craen M., Van Geet M., Wang L. and Put M. (2004) Highsulphate concentrations in squeezed Boom Clay pore water:evidence of oxidation of clay cores. Phys. Chem. Earth 29, 91–
103.
Delay J., Vinsot A., Krieguer J.-M., Rebours H. and Armand G.(2007) Making of the underground scientific experimentalprogramme at the Meuse/Haute-Marne undergroundresearch laboratory, North Eastern France. Phys. Chem. Earth
32, 2–18.
Descostes M., Blin V., Bazer-Bachi F., Meier P., Grenut B.,Radwan J., Schlegel M. L., Buschaert S., Coelho D. andTevissen E. (2008) Diffusion of anionic species in Callovo-Oxfordian argillites and Oxfordian limestones (Meuse/Haute-Marne, France). Appl. Geochem. 23, 655–677.
for pore-water chemistry of clayrock. Geochim. Cosmochim. Acta
Original text:
Inserted Text
BRGM-ANDRA
Original text:
Inserted Text
1998-2008),
C
1315131613171318131913201321 Q5
1322132313241325132613271328132913301331133213331334133513361337133813391340 Q6
1341134213431344134513461347134813491350135113521353135413551356135713581359136013611362136313641365136613671368136913701371137213731374137513761377137813791380
138113821383138413851386138713881389139013911392139313941395139613971398139914001401140214031404140514061407140814091410141114121413141414151416141714181419142014211422142314241425142614271428142914301431143214331434143514361437143814391440144114421443144414451446
A robust model for pore-water chemistry of clayrock 17
GCA 6384 No. of Pages 18
10 August 2009 Disk UsedARTICLE IN PRESS
UN
CO
RR
E
Dove P. M. and Czank C. A. (1995) Crystal chemical controls onthe dissolution kinetics of the isostructural sulfates: celestite,anglesite, and barite. Geochim. Cosmochim. Acta 59, 1907–1915.
Fernandez A. M., Turrero M. J. and Rivas P. (2001) Analysis ofsqueezed pore water as a function of the applied pressure inOpalinus Clay material (Switzerland). Water–Rock Interactionpp. 1323–1326.
Fernandez A. M., Bath A., Waber H. N. and Oyama T. (2003)Water sampling by squeezing drillcores. Annex 2 in Geochem-
istry of Water in the Opalinus Clay Formation at the Mont Terri
Rock Laboratory (eds. F. J. Pearson et al.). Geology Series No.5. Swiss Federal Office for Water and Geology, pp. 319.
Gailhanou H. and Blanc P. (2007) Thermochimie: acquisition desproprietes thermodynamiques sur une saponite et revision desdonnees sur les mineraux argileux. Report BRGM/RP-55925-FR.
Gailhanou H., Van Miltenburg J. C., Rogez J., Olives J., AmouricM., Gaucher E. C. and Blanc P. (2007) Thermodynamicproperties of anhydrous smectite MX-80, illite IMt-2 andmixed-layer illite-smectite ISCz-1 as determined by calorimetricmethods. Part I: heat capacities, heat contents and entropies.Geochim. Cosmochim. Acta 71, 5463–5473.
Gailhanou H., Van Miltenburg J. C., Van Genderen A., Rogez J.,Greneche J. M., Gilles C., Gaucher E. C. and Blanc P. (in press)Thermodynamic properties of ripidolite CCa-2. Part I. Heatcapacities, heat contents and entropies. Geochim. Cosmochim.
Acta.Gaines G. L. and Thomas H. C. (1953) Adsorption studies on clay
minerals. II. A formulation of the thermodynamics of exchangeadsorption. J. Chem. Phys. 21, 714–718.
Gaucher E., Robelin C., Matray J. M., Negrel G., Gros Y., Heitz J.F., Vinsot A., Rebours H., Cassabagnere A. and Bouchet A.(2004) ANDRA underground research laboratory: interpreta-tion of the mineralogical and geochemical data acquired in theCallovian-Oxfordian Formation by investigative drilling. Phys.
Chem. Earth 29, 55–77.
Gaucher E. C., Blanc P., Bardot F., Braibant G., Buschaert S.,Crouzet C., Gautier A., Girard J.-P., Jacquot E., Lassin A.,Negrel G., Tournassat C., Vinsot A. and Altmann S. (2006)Modelling the porewater chemistry of the Callovian-Oxfordianformation at a regional scale. C. R. Geosci. 338, 917–930.
Gehin A., Greneche J.-M., Tournassat C., Brendle J., Rancourt D.G. and Charlet L. (2007) Reversible surface-sorption-induced electron-transfer oxidation of Fe(II) at reactive siteson a synthetic clay mineral. Geochim. Cosmochim. Acta 71, 863–
876.
Girard J.-P., Flehoc C. and Gaucher E. (2005) Stable isotopecomposition of CO2 outgassed from cores of argillites: a simplemethod to constrain d18O of porewater and d13C of dissolvedcarbon in mudrocks. Appl. Geochem. 20, 713–725.
Grambow B. (2008) Mobile fission and activation products innuclear waste disposal. J. Contam. Hydrol. 102, 180–186.
Griffault L., Merceron T., Mossmann J.-R., Neerdael B., DeCanniere P., Beaucaire C., Daumas S., Bianchi A. and ChristenR. (1997) Acquisition and regulation of the water chemistry inclay environment. Project ‘‘Archimede”. Final Report EUR
17454. ISBN 92-827-9046-0.Griffault L., Bauer C., Waber H. N., Pearson F. J., Fierz T., Scholtis
A., Degueldre C. and Eichinger L. (2003) Water sampling andanalyses for boreholes and seepages. Annex 1 in Geochemistry of
Water in the Opalinus Clay Formation at the Mont Terri Rock
Laboratory (eds. F. J. Pearson et al.). Geology Series No. 5. SwissFederal Office for Water and Geology, pp. 319.
Horseman S. T., Higgo J. J., Alexander J. and Harrington J. F.(1996) Water, gas, and solute movement throughargillaceous media. In Rept. CC-96/1 (ed. NEA/OCDE). Paris,France.
Please cite this article in press as: Gaucher E. C., et al. A robust model(2009), doi:10.1016/j.gca.2009.07.021
TED
PR
OO
F
Hummel W., Berner U. R., Curti E., Pearson F. J. and Thoenen T.(2002) NAGRA/PSI Chemical Thermodynamic Data Base 01/01.Universal Publishers/uPublish.com, Parkland, FL.
Landais P. (2006) Advances in geochemical research for theunderground disposal of high-level, long-lived radioactivewaste in a clay formation. J. Geochem. Explor. 88, 32–36.
Langmuir D. (1997) Aqueous Environmental Chemistry: Upper
Saddle River. Prentice Hall, New Jersey.Lassin A., Gaucher E. and Crouzet C. (2003) Dissolved carbon
dioxide and hydrocarbon extraction. Annex 6 in Geochemistry
of Water in the Opalinus Clay Formation at the Mont Terri Rock
Laboratory (eds. J. Pearson et al.). Geology Series No. 5. SwissFederal Office for Water and Geology, pp. 319.
Lavastre V., Jendrzejewski N., Agrinier P., Javoy M. and EvrardM. (2005) Chlorine transfer out of a very low permeability claysequence (Paris Basin, France): 35Cl and 37Cl evidence.Geochim. Cosmochim. Acta 69, 4949–4961.
Marty N. C. M., Tournassat C., Burnol A., Giffaut E. and GaucherE. C. (2009) Influence of reaction kinetics and mesh refinementon the numerical modelling of concrete/clay interactions. J.
Hydr. 364, 58–72.
Mazurek M., Pearson F. J., Volckaert G. and Bock H. (2006)Features, events and processes evaluation. Catalogue forargillaceous media. NEA 4437. ISBN 92-64-02148-5.
Motellier S., Ly J., Gorgeon L., Charles Y., Hainos D., Meier P.and Page J. (2003) Modelling of the ion-exchange propertiesand indirect determination of the interstitial water compositionof an argillaceous rock. Application to the Callovo-Oxfordianlow-water-content formation. Appl. Geochem. 18, 1517–1530.
Nordstrom D. K. and Munoz J. L. (1994) Geochemical Thermo-
dynamics, second ed. Blackwell Scientific Publications, Boston.Parkhurst D. L. and Appelo C. A. J. (1999) User’s guide to
PHREEQC (Version 2) — a computer program for speciation,batch-reaction, one-dimensional transport, and inverse geo-chemical calculations. Denver, CO. U.S. Geological Survey.Water Resources Investigations Report 99-4259, 312 p.
Pearson F. J. (1999) What is the porosity of a mudrock? In Muds
and Mudstones: Physical and Fluid Flow Properties (eds. A. C.Aplin, A. J. Fleet and J. H. S. Macquaker). Geol. Soc. Spec.Pub., London, vol. 158, pp. 9–21.
Pearson F. J., Arcos D., Boisson J.-Y., Fernandez A. M., GablerH.-E., Gaucher E., Gautschi A., Griffault L., Hernan P. andWaber H. N. (2003) Mont Terri Project — Geochemistry of
Water in the Opalinus Clay Formation at the Mont Terri Rock
Laboratory. Geology Series No. 5. Swiss Federal Office ofWater and Geology, Bern.
Plummer L. N., Bubsy F. F., Lee R. W. and Hanshaw B. B. (1990)Geochemical modeling of the madison aquifer in part ofMontana, Wyoming and South Dakota. Water Resour. Res. 26,
1981–2014.
Pokrovskii V. A. and Helgeson H. C. (1995) Thermodynamicproperties of aqueous species and the solubilities of minerals athigh pressures and temperatures: the system Al2O3–H2O–NaCl.Am. J. Sci. 295, 1255–1342.
Remy J. C. and Orsini L. (1976) Utilisation du chlorure decobaltihexamine pour la determination simultanee de la capa-cite d’echange et des bases echangeables dans les sols. Sciences
du Sol 4, 269–275.
Sacchi E., Michelot J.-L., Pitsch H., Lalieux P. and Aranyossy J.-F.(2001) Extraction of water and solutes from argillaceous rocksfor geochemical characterisation: methods, processes, andcurrent understanding. Hydrogeol. J. 9, 17–33.
Savage D. (1995) The Scientific and Regulatory Basis for the
Geological Disposal of Radioactive Waste. John Wiley & Sons.Sposito G. (1981) The Thermodynamics of Soil Solution. Oxford
University Press, New York.
for pore-water chemistry of clayrock. Geochim. Cosmochim. Acta
C
14471448144914501451145214531454145514561457145814591460146114621463146414651466146714681469147014711472147314741475147614771478147914801481148214831484
14851486148714881489149014911492149314941495149614971498149915001501150215031504150515061507150815091510151115121513151415151516151715181519
1520
1521
18 E.C. Gaucher et al. / Geochimica et Cosmochimica Acta xxx (2009) xxx–xxx
GCA 6384 No. of Pages 18
10 August 2009 Disk UsedARTICLE IN PRESS
Stefansson A. and Arnorsson S. (2000) Feldspar saturation state innatural waters. Geochim. Cosmochim. Acta 64, 2567–2584.
Thorstenson D. C., Fisher D. W. and Croft M. G. (1979)Geochemistry of the Fox Hills Basal Hell Creek aquifer inSouthwestern North-Dakota and Northwestern South-Dakota.Water Resour. Res. 15, 1479–1498.
Thury M. and Bossart P. (1999) The Mont Terri rock laboratory, anew international research project in a Mesozoic shale forma-tion, in Switzerland. Eng. Geol. 52, 347–359.
Tournassat C., Greneche J. M., Blanc P., Brendle J., Charlet L.,Gaucher E. C., Gehin A. and Lerouge C. (2006) Mossbauerevidence for Fe(II) high redox reactivity in clay phases ofCallovian-Oxfordian claystones. Methodological implications.In 1st Annual Workshop Proceedings 6TH EC FP — FUNMIG
IP, pp. 236–240.Tournassat C., Gailhanou H., Crouzet C., Braibant G., Gautier A.,
Lassin A., Blanc P. and Gaucher E. C. (2007) Two cationexchange models for direct and inverse modelling of solutionmajor cation composition in equilibrium with illite surfaces.Geochim. Cosmochim. Acta 71, 1098–1114.
Tournassat C., Lerouge C., Brendle J., Greneche J.-M., TouzeletS., Blanc E. and Gaucher E. C. (2008) Cation exchanged Fe(II)as compared to other divalent cations (Ca, Mg, Sr) in theCallovian-Oxfordian formation. Implications for porewatercomposition modelling. Appl. Geochem. 23, 641–654.
Tournassat C., Gailhanou H., Crouzet C., Braibant G., Gautier A.and Gaucher E. C. (2009) Cation exchange selectivity coefficientvalues on smectite and mixed-layer illite/smectite minerals SoilSci. Soc. Am. J. 73, 928–942.
Turrero M. J., Fernandez A. M., Pena J., Sanchez M. D., WersinP., Bossart P., Sanchez M., Melon A., Yllera A., Garralon A.,Gomez P. and Hernan P. (2006) Pore water chemistry of aPaleogene continental mudrock in Spain and a Jurassic marinemudrock in Switzerland: sampling methods and geochemicalinterpretation. J. Iberian Geol. 32, 233–258.
Van Loon L. R., Soler J. M. and Bradbury M. H. (2003a) Diffusionof HTO, 36Cl� and 125I� in Opalinus Clay samples from MontTerri: effect of confining pressure. J. Contam. Hydrol. 61, 73–83.
UN
CO
RR
E
Please cite this article in press as: Gaucher E. C., et al. A robust model(2009), doi:10.1016/j.gca.2009.07.021
TED
PR
OO
F
Van Loon L. R., Soler J. M., Jakob A. and Bradbury M. H.(2003b) Effect of confining pressure on the diffusion of HTO,36Cl� and 125I� in a layered argillaceous rock (Opalinus Clay):diffusion perpendicular to the fabric. Appl. Geochem. 18, 1653–
1662.
Van Loon L. R., Soler J. M., Muller W. and Bradbury M. H.(2004a) Anisotropic diffusion in layered argillaceous rocks: acase study with Opalinus Clay. Environ. Sci. Technol. 38, 5721–
5728.
Van Loon L. R., Wersin P., Soler J. M., Eikenberg J., Gimmi T.,Hernan P., Dewonck S. and Savoye S. (2004b) In-situ diffusionof HTO, 22Na+, Cs+ and I� in Opalinus Clay at the Mont Terriunderground rock laboratory. Radiochim. Acta 92, 757–763.
Vieillard P. (2000) A new method for the prediction of Gibbs freeenergies of formation of hydrated clay minerals based on theelectronegativity scale. Clays Clay Miner. 48, 459–473.
Vieillard P. (2002) A new method for the prediction of Gibbs freeenergies of formation of phyllosilicates (10 A and 14 A) basedon the electronegativity scale. Clays Clay Miner. 50, 352–363.
Vieillard P. (2007) THERMOCHIMIE: estimation des enthalpiesde formation des Phyllosilicates (7, 10 et 14 A) anhydres. Report
CNRS-Hydrasa 2007-1.Vinsot A., Mettler S. and Wechner S. (2008) In situ characteriza-
tion of the Callovo-Oxfordian pore water composition. Phys.
Chem. Earth 33, S75–S86.
Wersin P., Gautschi A., Vinsot A., De Canniere P., Hernan P.,Gabler H.-E., Hama K., Mahara Y. and Gaucher E. (2004)Results from the Porewater Chemistry (PC) experiment atMont Terri, Switzerland. In Proc. of the 11th Inter. Symp. on
Water–Rock Interaction, pp. 523–526.Wolery T. J. (1992) EQ3/6, a software package for geochemical
modeling of aqueous systems: package overview and installa-tion guide. Version: thermo.com.V8.R6.230. Report UCRL-
110662 PTI. Lawrence Livermore National Laboratory, Liver-more, CA.
Associate editor: Stephan M. Kraemer
for pore-water chemistry of clayrock. Geochim. Cosmochim. Acta