The normal ranges of cardiovascular parameters measured ...
12
The University of Notre Dame Australia The University of Notre Dame Australia ResearchOnline@ND ResearchOnline@ND Medical Papers and Journal Articles School of Medicine 2017 The normal ranges of cardiovascular parameters measured using the The normal ranges of cardiovascular parameters measured using the ultrasonic cardiac output monitor ultrasonic cardiac output monitor Giles N. Cattermole P.Y Mia Leung Grace Y.L Ho Peach W.S Lau Cangel P.Y Chan See next page for additional authors Follow this and additional works at: https://researchonline.nd.edu.au/med_article Part of the Medicine and Health Sciences Commons This article was originally published as: Cattermole, G. N., Leung, P. M., Ho, G. Y., Lau, P. W., Chan, C. P., Chan, S. S., Smith, B. E., Graham, C. A., & Rainer, T. H. (2017). The normal ranges of cardiovascular parameters measured using the ultrasonic cardiac output monitor. Physiological Reports, 5 (6). Original article available here: https://doi.org/10.14814/phy2.13195 This article is posted on ResearchOnline@ND at https://researchonline.nd.edu.au/med_article/1078. For more information, please contact [email protected].
-
Upload
khangminh22 -
Category
Documents
-
view
0 -
download
0
Transcript of The normal ranges of cardiovascular parameters measured ...

The University of Notre Dame Australia The University of Notre Dame Australia
ResearchOnline@ND ResearchOnline@ND
Medical Papers and Journal Articles School of Medicine
2017
The normal ranges of cardiovascular parameters measured using the The normal ranges of cardiovascular parameters measured using the
ultrasonic cardiac output monitor ultrasonic cardiac output monitor
Giles N. Cattermole
P.Y Mia Leung
Grace Y.L Ho
Peach W.S Lau
Cangel P.Y Chan
See next page for additional authors
Follow this and additional works at: https://researchonline.nd.edu.au/med_article
Part of the Medicine and Health Sciences Commons This article was originally published as: Cattermole, G. N., Leung, P. M., Ho, G. Y., Lau, P. W., Chan, C. P., Chan, S. S., Smith, B. E., Graham, C. A., & Rainer, T. H. (2017). The normal ranges of cardiovascular parameters measured using the ultrasonic cardiac output monitor. Physiological Reports, 5 (6).
Original article available here: https://doi.org/10.14814/phy2.13195
This article is posted on ResearchOnline@ND at https://researchonline.nd.edu.au/med_article/1078. For more information, please contact [email protected].

Authors Authors Giles N. Cattermole, P.Y Mia Leung, Grace Y.L Ho, Peach W.S Lau, Cangel P.Y Chan, Stewart S.W Chan, Brendan E. Smith, Colin A. Graham, and Timothy H. Rainer
This article is available at ResearchOnline@ND: https://researchonline.nd.edu.au/med_article/1078

© 2017 The Authors. Physiological Reports published by Wiley Periodicals, Inc. on behalf of The Physiological Society and the American Physiological Society. This article has been published in Physiological Reports. Published by Wiley Periodicals, Inc. on behalf of The Physiological Society and the American Physiological Society. Available at: https://doi.org/10.14814/phy2.13195
This is an Open Access article distributed in accordance with the Creative Commons Attribution 4.0 International license (CC BY 4.0), which permits unrestricted use, distribution, and reproduction in any medium, provided the original author and source are credited. See: https://creativecommons.org/licenses/by/4.0/
Cattermole, G.N., Leung, P.Y.M., Ho, G.Y.L., Lau, P.W.S., Chan, C.P.Y., Chan, S.S.W., Smith, B.E., Graham, C.A., and Rainer, T.H. (2017) The normal ranges of cardiovascular parameters measured using the ultrasonic cardiac output monitor. Physiological Reports, 5(6). doi: 10.14814/phy2.13195

ORIGINAL RESEARCH
The normal ranges of cardiovascular parameters measuredusing the ultrasonic cardiac output monitorGiles N. Cattermole1 , P. Y. Mia Leung2, Grace Y. L. Ho3, Peach W. S. Lau4, Cangel P. Y. Chan5,Stewart S. W. Chan5, Brendan E. Smith6,7, Colin A. Graham5 & Timothy H. Rainer5,8
1 Emergency Department, Centre Hospitalier Universitaire de Kigali, Kigali, Rwanda
2 Department of Medicine, Austin/Northern Health, Melbourne, Australia
3 Department of Medicine, Western Health, Melbourne, Australia
4 Accident and Emergency Department, Queen Elizabeth Hospital, Hong Kong SAR
5 Accident and Emergency Medicine Academic Unit, Prince of Wales Hospital, The Chinese University of Hong Kong, Hong Kong SAR
6 School of Medicine, University of Notre Dame Australia, Sydney, New South Wales, Australia
7 Intensive Care Unit, Bathurst Base Hospital, Bathurst, New South Wales, Australia
8 University Hospital of Wales, Heath Park, Heath, Cardiff, U.K.
Keywords
Diagnostic techniques and procedures,
Doppler, hemodynamics, normal ranges,
ultrasonography.
Correspondence
Giles N. Cattermole, Emergency Department,
Centre Hospitalier Universitaire de Kigali,
Kigali, Rwanda.
Tel: +250 7 8412 8319
E-mail: [email protected]
Funding Information
The study was supported by grants of HK
$72,000 (approximately US$9,000) from the
Chinese University of Hong Kong, HK
$100,000 (approximately US$13,000) from
the Hong Kong College of Emergency
Medicine, and HK$466,652 (approximately
US$60,000) from the Health Services
Research Fund of the Food and Health
Bureau of Hong Kong.
Received: 29 October 2016; Revised: 30
January 2017; Accepted: 14 February 2017
doi: 10.14814/phy2.13195
Physiol Rep, 5 (6), 2017, e13195,
doi: 10.14814/phy2.13195
Abstract
The ultrasonic cardiac output monitor (USCOM) is a noninvasive transcuta-
neous continuous wave Doppler method for assessing hemodynamics. There
are no published reference ranges for normal values in adults (aged 18–60 years) for this device. This study aimed to (1) measure cardiovascular
indices using USCOM in healthy adults aged 18–60 years; (2) combine these
data with those for healthy children (aged 0–12), adolescents (aged 12–18),and the elderly (aged over 60) from our previously published studies in order
to present normal ranges for all ages, and (3) establish normal ranges of
USCOM-derived variables according to both weight and age. This was a pop-
ulation-based cross-sectional observational study of healthy Chinese subjects
aged 0.5–89 years in Hong Kong. USCOM scans were performed on all sub-
jects, to produce measurements including stroke volume, cardiac output, and
systemic vascular resistance. Data from previously published studies (children,
adolescents, and the elderly) were included. Normal ranges were defined as
lying between the 2.5th and 97.5th percentiles. A total of 2218 subjects were
studied (mean age = 16.4, range = 0.5–89; 52% male). From previous studies,
1197 children (aged 0–12, 55% male), 590 adolescents (aged 12–18, 49%
male), and 77 elderly (aged 60–89, 55% male) were included. New data were
collected from 354 adults aged 18–60 (47% male). Normal ranges are pre-
sented according to age and weight. We present comprehensive normal ranges
for hemodynamic parameters obtained with USCOM in healthy subjects of all
ages from infancy to the elderly.
Introduction
The ultrasonic cardiac output monitor (USCOM1A;
USCOM Pty Ltd., Coffs Harbour, NSW, Australia) pro-
vides a rapid noninvasive measure of hemodynamic
parameters using continuous wave Doppler ultrasound
(CW Doppler) (USCOM Ltd., 2006a,b).
There is increasing interest in measuring flow-based
hemodynamic parameters such as cardiac output, (CO),
cardiac index (CI), stroke volume (SV), systemic vascular
resistance (SVR), oxygen delivery (DO2), and oxygen con-
sumption (VO2) as these are considered to be not only
basic physiological parameters in health, but also indica-
tors of illness, where they have been shown to be more
ª 2017 The Authors. Physiological Reports published by Wiley Periodicals, Inc. on behalf of
The Physiological Society and the American Physiological Society.
This is an open access article under the terms of the Creative Commons Attribution License,
which permits use, distribution and reproduction in any medium, provided the original work is properly cited.
2017 | Vol. 5 | Iss. 6 | e13195Page 1
Physiological Reports ISSN 2051-817X

effective predictors of response to therapy than static
measures such as blood pressure or central venous pres-
sure (CVP) (Marik et al. 2011).
The emergence of noninvasive devices has opened the
door for measuring hemodynamics in many research and
clinical settings. Noninvasive techniques are at least as
accurate as traditional invasive thermodilution methods, as
well as being more practical and safer. Since its introduc-
tion in 2001, the USCOM has been used in a wide range of
clinical settings, including critical care, anesthesiology,
emergency medicine, obstetrics, and neonatology. Its accu-
racy and reliability have been validated in animal and
human studies against alternative methods including pul-
monary artery thermodilution (Jain et al. 2008; Stewart
et al. 2008; Dhanani et al. 2011; Phillips et al. 2012; McNa-
mara et al. 2014). There is widespread support for the use
of Doppler-based ultrasound methods to assess hemody-
namics for fluid management in resuscitation and periop-
eratively (Brierley et al. 2009; Thiel et al. 2009; Kuper et al.
2011; NHS Technology Adoption Centre 2013).
For any method of clinical measurement, it is impor-
tant to establish the normal ranges of values obtained
using that method in order to determine the significance
of any subsequent individual measurement.
Normal ranges for hemodynamic variables obtained
with USCOM have been published for neonates, children,
adolescents, and the elderly (Cattermole et al. 2010; He
et al. 2011; Ho et al. 2013; Chan et al. 2014). However,
there are no published ranges for adults, nor have ranges
been derived according to subject weight, and no unifying
overview of changes in hemodynamics from the first year
of life to the elderly. The objectives of this study were
therefore:
1 To measure hemodynamic indices using USCOM in
healthy adult ethnic Chinese aged 18–60 years.
2 To combine these data with those for healthy children
(aged 0–12), adolescents (aged 12–18), and the elderly
(aged over 60) from our previously published studies
(Cattermole et al. 2010; Ho et al. 2013; Chan et al.
2014), in order to present normal ranges for all ages.
3 To establish and compare normal ranges of USCOM-
derived hemodynamic variables according to weight
and age.
Methods
Ethical approval
The Clinical Research Ethics Committee of the Chinese
University of Hong Kong approved the study (reference
number CRE-2009.482). Signed informed consent was
obtained from all adult subjects.
This cross-sectional observational study of 18- to 60-
year-olds was conducted in Hong Kong between Septem-
ber 2010 and May 2011 concurrent with the adolescent
study (Ho et al. 2013). Data were obtained from other
studies performed between October 2008 and January
2009 (children) (Cattermole et al. 2010), and between
February and October 2012 (elderly) (Chan et al. 2014).
Participants and setting
Healthy Chinese adults aged 18–60 were recruited. Chil-
dren and adolescents were recruited from local schools as
described previously (Cattermole et al. 2010; Ho et al.
2013). Adults were recruited through St. John’s Ambu-
lance personnel. The elderly were recruited through
friends and colleagues of staff (Chan et al. 2014). Exclu-
sion criteria included lack of consent, acute or chronic
illness, smoking, and current use of any medication. Non-
Chinese subjects were excluded. Similarly, only healthy
Chinese subjects from previously published studies were
included in the analysis.
Sample size of current study
Estimated means and standard deviations for SV were
used to calculate a sample size of 105 subjects in each
subgroup to achieve 95% confidence that the true mean
lies within 5% of that observed. To define up to three age
or weight subgroups (according to the centile curves pro-
duced), 315 subjects were required.
Measurements
USCOM is a direct derivative of echocardiography which
uses CW Doppler ultrasound to provide measurements of
hemodynamic indices. Using either the suprasternal insona-
tion window for the aortic valve, or the left parasternal win-
dow for the pulmonary valve, the device measures the
velocity time integral (VTI) of the ejection flow and heart
rate (HR). A proprietary algorithm based on height (in sub-
jects greater than 50 cm) or weight (less than 50 cm) is used
to derive the cross-sectional area (CSA) of the two valves,
and stroke volume is calculated as SV = CSA 9 VTI. Heart
rate is calculated from the interval between systolic
ejections, while concurrent systolic and diastolic blood
pressure values (SBP, DBP) are entered manually, from
which mean arterial pressure (MAP) is calculated as
MAP = DBP + ([SBP � DBP]/3). From these data,
USCOM derives values for cardiac output (CO =SV 9 HR), systemic vascular resistance (SVR = MAP/CO),
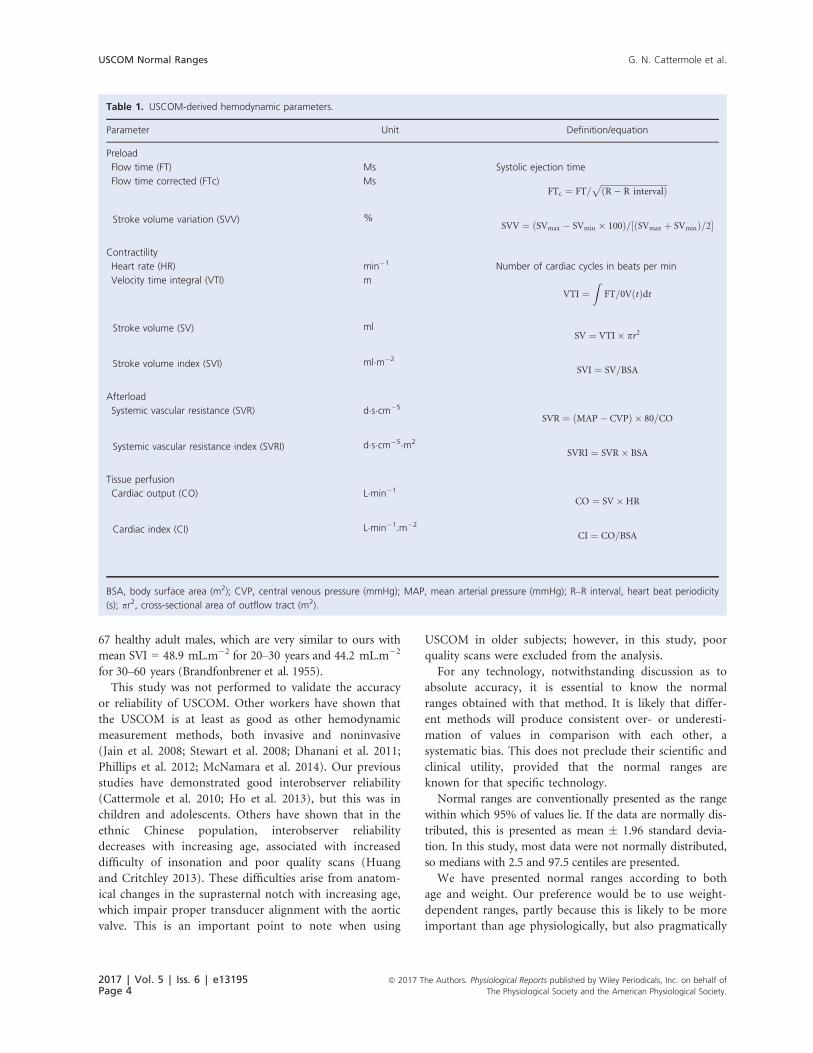
and other hemodynamic parameters as shown in Table 1.
Flow time (FT) is the systolic ejection time in milliseconds.
Stroke volume variation is defined as (SVmax �
2017 | Vol. 5 | Iss. 6 | e13195Page 2
ª 2017 The Authors. Physiological Reports published by Wiley Periodicals, Inc. on behalf of
The Physiological Society and the American Physiological Society.
USCOM Normal Ranges G. N. Cattermole et al.

SVmin 9 100)/([SVmax + SVmin]/2). Currently, the
USCOM measures or derives 22 hemodynamic variables
simultaneously. Body surface area (BSA) is calculated by the
USCOM using the formula of Du Bois and Du Bois (1916),
from which BSA-indexed values for CO, SV, and SVR were
derived (CI, SVI, and SVRI).
Operators were trained to use the USCOM, and data
collection followed the same procedure as described pre-
viously (Cattermole et al. 2010; Ho et al. 2013; Chan
et al. 2014). Standing height was measured barefoot to
the nearest 0.1 cm using a measuring tape (range = 0.0–200.0 cm). Body weight was measured to the nearest
0.2 kg using electronic calibrated scales (Compact Preci-
sion Scale C200H, Conair Far East Ltd., Hong Kong,
China). Blood pressure was then measured with an
appropriately sized cuff using automated oscillometry
(Patient Monitor BX-10ne, Omron Healthcare Co. Ltd.,
Kyoto, Japan), with the subject supine and at rest imme-
diately prior to USCOM examination.
In this study, following a short period of rest and with
the subject lying supine, the suprasternal insonation win-
dow was used to obtain measurements of aortic valve
flow. A minimum of three consecutive Doppler ejection
profiles of diagnostic quality were required for each mea-
surement, and three measurements were made for each
subject. For analysis, the single best quality trace was used
(as defined previously according to the signal characteris-
tics of the flow tracing; Cattermole et al. 2009).
Statistical analysis
LMS Chartmaker Pro v2.3 software (Cole and Pan, Medi-
cal Research Council UK, 2006) was used to describe the
data in centile curves (2.5, 10, 50, 90, 97.5). The relation-
ships between USCOM-derived hemodynamic indices and
both age and weight were modeled by the LMS method of
Cole and Green (1992). Briefly, the relationship is
described by three age-specific cubic spline curves known
as L, M, and S. M represents the median, S is the coeffi-
cient of variation, and L is the Box–Cox transformation
that renders the data to follow a normal distribution, con-
ditional on age. Combination of these three functions gen-
erates centile values for each parameter. Age and weight
subgroups were defined according to the curves produced.
MedCalc v14.12.0 (MedCalc Software bvba, Belgium)
was used for descriptive analysis of the data within weight
and age subgroups. The Shapiro–Wilk test was used to
determine the normality of the distribution. Data were
analyzed using medians and ranges, or means and stan-
dard deviation, as appropriate. Comparison of groups
was made with the appropriate parametric or nonpara-
metric tests.
Results
There was a total of 2218 subjects (mean age = 16.4,
range = 0.5–89; 52% male). From the previous studies, 1197
children (aged 0–12, 55% male), 590 adolescents (aged 12–18, 49% male), and 77 elderly (aged 60–89, 55% male) were
included. New, and previously unpublished, data were col-
lected from 354 adults (aged 18–60, 47% male).
Under 18 years, none of the data were normally dis-
tributed, while in adults the majority of variables were
abnormally distributed.
Under 18 years, there were no significant gender differ-
ences for any variables. Over 18 years there were small
but statistically significant differences between male and
female. Because these differences were largely attributable
to weight, and for ease of use, the rest of the data are pre-
sented without reference to gender.
Centile curves (2.5, 10, 50, 90, 97.5) for stroke volume
(SV), stroke volume index (SVI), cardiac output (CO),
cardiac index (CI), systemic vascular resistance (SVR) and
systemic vascular resistance index (SVRI), mean arterial
pressure (MAP), and heart rate (HR) against each of age
and weight are presented in Figures 1 and 2. Based on
these curves, two adult age groups were defined: 18–30and 30–60 years. Weight subgroups were similarly
defined, using data from all studies.
Medians and 2.5%–97.5% ranges were used to present
normal ranges in age and weight subgroups, for each of
the USCOM variables as shown in Tables 2 and 3.
Discussion
This is the first study of normal ranges for USCOM in
adults, and the first presentation of ranges for use in all
ages from infancy through the elderly. Consistent with
our previous studies, all subjects were healthy Hong Kong
Chinese. Previously published USCOM values for children
and adolescents did not include velocity time integral,
flow time, and stroke volume variability, which are pre-
sented here for all ages. In addition, collation of the data
into a single set permits the generation of smoother and
more precise centile curves using the LMS method.
This is also the largest study of hemodynamic values
obtained in healthy subjects by any method. This knowl-
edge of healthy normal ranges should be helpful both in
physiological research and clinical practice.
Our results are consistent with other published ranges (De
Simone et al. 1997). It is impractical and inappropriate to
perform large-scale studies of healthy subjects using pul-
monary artery catheterization, precluding direct comparison
of derived ranges. However, data for stroke volume index
measured using the Fick method were published in 1955 for
ª 2017 The Authors. Physiological Reports published by Wiley Periodicals, Inc. on behalf ofThe Physiological Society and the American Physiological Society.
2017 | Vol. 5 | Iss. 6 | e13195Page 3
G. N. Cattermole et al. USCOM Normal Ranges
67 healthy adult males, which are very similar to ours with
mean SVI = 48.9 mL.m�2 for 20–30 years and 44.2 mL.m�2
for 30–60 years (Brandfonbrener et al. 1955).
This study was not performed to validate the accuracy
or reliability of USCOM. Other workers have shown that
the USCOM is at least as good as other hemodynamic
measurement methods, both invasive and noninvasive
(Jain et al. 2008; Stewart et al. 2008; Dhanani et al. 2011;
Phillips et al. 2012; McNamara et al. 2014). Our previous
studies have demonstrated good interobserver reliability
(Cattermole et al. 2010; Ho et al. 2013), but this was in
children and adolescents. Others have shown that in the
ethnic Chinese population, interobserver reliability
decreases with increasing age, associated with increased
difficulty of insonation and poor quality scans (Huang
and Critchley 2013). These difficulties arise from anatom-
ical changes in the suprasternal notch with increasing age,
which impair proper transducer alignment with the aortic
valve. This is an important point to note when using
USCOM in older subjects; however, in this study, poor
quality scans were excluded from the analysis.
For any technology, notwithstanding discussion as to
absolute accuracy, it is essential to know the normal
ranges obtained with that method. It is likely that differ-
ent methods will produce consistent over- or underesti-
mation of values in comparison with each other, a
systematic bias. This does not preclude their scientific and
clinical utility, provided that the normal ranges are
known for that specific technology.
Normal ranges are conventionally presented as the range
within which 95% of values lie. If the data are normally dis-
tributed, this is presented as mean � 1.96 standard devia-
tion. In this study, most data were not normally distributed,
so medians with 2.5 and 97.5 centiles are presented.
We have presented normal ranges according to both
age and weight. Our preference would be to use weight-
dependent ranges, partly because this is likely to be more
important than age physiologically, but also pragmatically
Table 1. USCOM-derived hemodynamic parameters.
Parameter Unit Definition/equation
Preload
Flow time (FT) Ms Systolic ejection time
Flow time corrected (FTc) MsFTc ¼ FT=
ffiffiffiffiffiffiffiffiffiffiffiffiffiffiffiffiffiffiffiffiffiffiffiffiffiffiffiffiffiffiffiffiðR� R intervalÞ
p
Stroke volume variation (SVV) %SVV ¼ ðSVmax � SVmin � 100Þ=½ðSVmax þ SVminÞ=2�
Contractility
Heart rate (HR) min�1 Number of cardiac cycles in beats per min
Velocity time integral (VTI) m
VTI ¼Z
FT=0VðtÞdt
Stroke volume (SV) mlSV ¼ VTI� pr2
Stroke volume index (SVI) ml�m�2
SVI ¼ SV=BSA
Afterload
Systemic vascular resistance (SVR) d�s�cm�5
SVR ¼ ðMAP� CVPÞ � 80=CO
Systemic vascular resistance index (SVRI) d�s�cm�5�m2
SVRI ¼ SVR� BSA
Tissue perfusion
Cardiac output (CO) L�min�1
CO ¼ SV�HR
Cardiac index (CI) L�min�1.m�2
CI ¼ CO=BSA
BSA, body surface area (m2); CVP, central venous pressure (mmHg); MAP, mean arterial pressure (mmHg); R–R interval, heart beat periodicity
(s); pr2, cross-sectional area of outflow tract (m2).
2017 | Vol. 5 | Iss. 6 | e13195Page 4
ª 2017 The Authors. Physiological Reports published by Wiley Periodicals, Inc. on behalf of
The Physiological Society and the American Physiological Society.
USCOM Normal Ranges G. N. Cattermole et al.

Stro
ke v
olum
e in
dex
(mL.
m–2
)
10
20
30
40
50
60
70
80
Stro
ke v
olum
e (m
L)
Weight (kg)
0
20
40
60
80
100
120
140
Car
diac
out
put (
L.m
in–1
)
0123456789
10
Car
diac
inde
x (L
.min
–1.m
–2)
0
1
2
3
4
5
6
7
8
Sys
tem
ic v
ascu
lar r
esis
tanc
e (d
.s.c
m–5
)
500
1000
1500
2000
2500
3000
3500
4000
Sys
tem
ic v
ascu
lar r
esis
tanc
e in
dex
(d.s
.cm
–5.m
2 )
0
1000
2000
3000
4000
5000
6000
7000
Mea
n ar
teria
l pre
ssur
e (m
mH
g)
40
50
60
70
80
90
100
110
120
130
Hea
rt ra
te (m
in–1
)
40
60
80
100
120
140
160
0 10 20 30 40 50 60 70 80 90 100
Weight (kg)0 10 20 30 40 50 60 70 80 90 100
Weight (kg)0 10 20 30 40 50 60 70 80 90 100
Weight (kg)0 10 20 30 40 50 60 70 80 90 100
Weight (kg)0 10 20 30 40 50 60 70 80 90 100
Weight (kg)0 10 20 30 40 50 60 70 80 90 100
Weight (kg)0 10 20 30 40 50 60 70 80 90 100
Weight (kg)0 10 20 30 40 50 60 70 80 90 100
Figure 1. Centile curves (2.5, 10, 50, 90, 97.5) of hemodynamic parameters with weight.
ª 2017 The Authors. Physiological Reports published by Wiley Periodicals, Inc. on behalf ofThe Physiological Society and the American Physiological Society.
2017 | Vol. 5 | Iss. 6 | e13195Page 5
G. N. Cattermole et al. USCOM Normal Ranges

Stro
ke v
olum
e in
dex
(mL.
m–2
)
10
20
30
40
50
60
70
80
Stro
ke v
olum
e (m
L)
Age (years)
0
20
40
60
80
100
120
140
0 10 20 30 40 50 60 70 80 90
Age (years)0 10 20 30 40 50 60 70 80 90
Age (years)0 10 20 30 40 50 60 70 80 90
Age (years)0 10 20 30 40 50 60 70 80 90
Age (years)0 10 20 30 40 50 60 70 80 90
Age (years)0 10 20 30 40 50 60 70 80 90
Age (years)0 10 20 30 40 50 60 70 80 90
Age (years)0 10 20 30 40 50 60 70 80 90
Car
diac
out
put (
L.m
in–1
)
0123456789
10
Car
diac
inde
x (L
.min
–1.m
–2)
0
1
2
3
4
5
6
7
8
Sys
tem
ic v
ascu
lar r
esis
tanc
e (d
.s.c
m–5
)
500
900
1300
1700
2100
2500
2900
3300
3700
4100
4500
Sys
tem
ic v
ascu
lar r
esis
tanc
e in
dex
(d.s
.cm
–5.m
2 )
0
1000
2000
3000
4000
5000
6000
7000
Mea
n ar
teria
l pre
ssur
e (m
mH
g)
40
50
60
70
80
90
100
110
120
130
Hea
rt ra
te (m
in–1
)
40
60
80
100
120
140
160
Figure 2. Centile curves (2.5, 10, 50, 90, 97.5) of hemodynamic parameters with age.
2017 | Vol. 5 | Iss. 6 | e13195Page 6
ª 2017 The Authors. Physiological Reports published by Wiley Periodicals, Inc. on behalf of
The Physiological Society and the American Physiological Society.
USCOM Normal Ranges G. N. Cattermole et al.

Table
2.Norm
alranges
forhem
odynam
icparam
etersaccordingto
age.
0–2
.9years
3–5
.9years
6–1
1.9
years
12–1
7.9
years
18–2
9.9
years
30–5
9.9
years
60+
years
n65
353
773
460
267
223
77
MAP(m
mHg)
66.7
(50.7–8
0.0)
69.3
(52.7–8
7.2)
77.3
(60.6–9
6.0)
80.7
(65.3–1
03.7)
84.3
(66.1–1
05.6)
94.0
(71.4–1
18.3)
96.0
(71.7–1
20.0)
HR(m
in�1)
113.9
(79.4–1
46.3)
92.9
(71.8–1
23.1)
80.8
(59.8–1
11.4)
78.6
(56.6–1
06.5)
71.6
(53.3–1
00.9)
71.3
(53.0–9
3.7)
64.4
(46.4–8
9.7)
FT(m
s)283.3
(220.3–3
62.1)
316.7
(250.0–3
66.7)-
326.7
(280.0–3
76.7)
311.4
(244.5–3
70.0)
312.5
(241.0–3
72.7)
355.7
(260.3–4
49.3)
395.0
(303.6–4
76.8)
FTc(m
s)386.2
(296.4–4
49.5)
388.0
(325.2–4
66.1)
379.2
(318.7–4
40.5)
357.0
(274.7–4
23.1)
338.2
(248.8–4
15.0)
385.0
(297.4–4
76.9)
409.3
(341.5–4
90.1)
SVV(%
)9.7
(1.0–7
7.4)
10.6
(1.6–2
9.0)
8.7
(1.4–2
3.4)
16.8
(4.5–3
6.3)
19.1
(7.2–4
4.8)
21.8
(7.2–5
6.4)
14.8
(5.3–5
5.4)
VTI
(m)
23.8
(17.6–3
4.0)
28.6
(22.0–3
8.2)
30.2
(22.5–3
9.8)
29.5
(18.7–4
0.0)
26.8
(17.4–3
7.1)
25.3
(13.7–3
4.6)
31.0
(16.3–4
2.2)
SV(m
L)23.0
(14.0–4
3.0)
40.1
(26.0–5
8.0)
59.2
(39.1–9
4.2)
79.0
(46.0–1
14.9)
76.3
(48.2–1
14.3)
68.8
(39.1–9
8.5)
81.8
(39.7–1
15.3)
SVI(m
L.m
�2)
44.0
(30.4–6
3.9)
53.3
(40.0–7
1.0)
56.6
(42.3–7
6.0)
52.8
(31.1–7
2.7)
47.1
(26.9–6
8.2)
40.3
(23.2–5
6.6)
51.1
(27.9–7
2.0)
SVR(d.s.cm
�5)
2045(1188–3
627)
1496(1003–2
359)
1282(809–1
899)
1043(686–1
883)
1244(795–2
226)
1566(906–2
950)
1435(1015–3
027)
SVRI(d.s.cm
�5.m
2)
1103(698–1
647)
1123(740–1
668)
1350(913–2
082)
1567(963–3
327)
2070(1286–3
838)
2686(1499–5
073)
2446(1504–4
940)
CO
(L.m
in�1)
2.63(1.61–3
.90)
3.68(2.52–5
.34)
4.82(3.10–7
.84)
6.23(3.61–9
.73)
5.42(3.06–9
.00)
4.88(2.51–7
.77)
5.22(2.97–7
.49)
CI(L.m
in�1.m
�2)
4.71(3.41–6
.42)
4.97(3.55–6
.90)
4.57(3.04–6
.68)
4.13(2.17–6
.42)
3.33(1.74–5
.48)
2.82(1.49–4
.69)
3.30(1.88–4
.71)
Ran
ges
presentedas
med
ian(2.5%
–97.5%
range).Parametersas
listedin
Table
1.
Table
3.Norm
alranges
forhem
odynam
icparam
etersaccordingto
weight.
<10kg
10–1
4.9
kg15–1
9.9
kg20–2
9.9
kg30–4
9.9
kg50–7
4.9
kg75+
kg
n18
96
299
451
577
686
91
MAP(m
mHg)
63.8
(na)
69.5
(51.3–8
3.8)
69.3
(53.3–8
9.3)
74.0
(56.3–9
2.3)
79.3
(65.3–1
00.3)
86.7
(67.3–1
13.3)
94.7
(75.2–1
19.6)
HR(m
in�1)
121.0
(na)
102.4
(79.1–1
28.5)
90.7
(70.3–1
19.4)
82.7
(62.0–1
12.1)
78.7
(56.1–1
11.9)
72.2
(52.9–1
00.9)
71.2
(51.1–1
00.9)
FT(m
s)256.7
(na)
296.7
(229.3–3
54.3)
316.7
(250.0–3
70.0)
326.7
(273.3–3
66.7)
326.7
(268.9–3
96.9)
322.9
(246.1–4
38.4)
321.4
(243.1–4
05.3)
FTc(m
s)365.4
(na)
385.7
(314.7–4
58.7)
387.5
(326.8–4
68.3)
382.0
(317.6–4
46.0)
373.6
(311.8–4
40.1)
358.5
(269.2–4
58.7)
349.9
(256.9–4
51.0)
SVV(%
)9.0
(na)
10.6
(1.0–8
4.5)
10.4
(1.5–2
7.6)
9.0
(1.3–2
4.6)
12.4
(2.5–3
6.0)
18.2
(5.3–4
4.9)
18.8
(8.9–5
0.0)
VTI
(m)
20.6
(na)
26.0
(19.1–3
4.5)
28.5
(21.9–3
7.1)
29.6
(22.6–3
8.9)
30.2
(19.8–4
0.0)
27.9
(16.2–4
0.2)
26.0
(13.3–3
9.3)
SV(m
L)16.3
(na)
30.5
(19.2–4
5.1)
40.9
(28.8–5
6.5)
53.1
(37.8–7
6.9)
71.4
(45.9–9
8.0)
77.7
(44.2–1
14.7)
77.8
(42.2–1
15.6)
SVI(m
L.m
�2)
37.0
(na)
49.3
(33.7–6
8.8)
54.0
(40.3–7
4.6)
56.5
(42.1–7
6.9)
55.4
(35.3–7
2.9)
47.1
(26.3–6
8.8)
39.3
(21.1–5
8.7)
SVR(d.s.cm
�5)
2271(na)
1767(1101–2
693)
1538(1073–2
228)
1340(895–1
918)
1145(750–1
879)
1263(725–2
517)
1337(676–2
898)
SVRI(d.s.cm
�5.m
2)
1056(na)
1072(693–1
563)
1142(775–1
654)
1250(833–1
754)
1451(998–2
609)
2071(1166–4
407)
2703(1328–5
604)
CO
(L.m
in�1)
2.04(na)
2.97(2.20–4
.85)
3.63(2.63–5
.22)
4.42(3.04–6
.72)
5.56(3.34–8
.36)
5.51(3.00–9
.35)
5.71(2.69–9
.79)
CI(L.m
in�1.m
�2)
4.43(na)
5.01(3.70–7
.55)
4.93(3.60–6
.72)
4.69(3.35–6
.87)
4.37(2.43–6
.29)
3.37(1.83–5
.68)
2.91(1.39–4
.91)
Ran
ges
presentedas
med
ian(2.5–9
7.5%
range).Parametersas
listedin
Table
1.
ª 2017 The Authors. Physiological Reports published by Wiley Periodicals, Inc. on behalf ofThe Physiological Society and the American Physiological Society.
2017 | Vol. 5 | Iss. 6 | e13195Page 7
G. N. Cattermole et al. USCOM Normal Ranges

as the centile curves are smoother and easier to use. The
extent to which age and weight independently contribute
to the changes in hemodynamic variables is unclear. Simi-
larly, gender is another potential factor, but the differ-
ences observed in age-dependent values were clinically
small even if statistically significant. The gender differ-
ences were minimal after accounting for weight. In keep-
ing with previously published ranges, we have not added
the further complication of separate ranges for gender.
As might be expected, the data show that heart rate falls
and blood pressure rises with age, more rapidly in childhood.
This is partly accounted for by the rapid change in height in
the first 20 years, with later arterial stiffening accounting for
the ongoing rise in blood pressure, reflected by the increasing
vascular resistance index seen throughout life.
Cardiac output rises steadily to reach a peak in the teen-
age years, after which it gradually declines. However, when
considered as cardiac output per square meter of body sur-
face area, CI, then cardiac output peaks in 3–6 years old
children equivalent to a body weight of 10–15 kg. It is
likely that this represents the maximum oxygen require-
ments of the tissues during periods of maximum growth.
The higher absolute cardiac output in the teenage years
probably represents a period where growth and activity
combine to produce maximum oxygen consumption.
From late teens onwards there is little or no growth, but a
steadily declining level of physical activity.
Overall, stroke volume rises steadily until late teens then
tends to decline gradually over the years, but when viewed
against weight, it shows a more linear relationship. Stroke
volume index follows a broadly similar pattern to cardiac
index peaking between 6 and 12 years of age, and at a
body weight of around 30 kg. Unfortunately, our data did
not include lean body mass calculation, so it is unknown
whether this would be a better reference parameter than
either weight or age. As the metabolic requirements of fat
are significantly lower than those of the vital organs and
muscle, it would seem that lean body mass should be a
more accurate reference. Whether this proves to be any
better than the traditional standard of body surface area-
indexed measurements would require further studies.
Limitations
There were very few children in the youngest age group and
under 10 kg. Although the centile curves are less reliable
therefore, we felt it important to include these groups sepa-
rately as it was clear their values were significantly different
from children in the next age and weight groups.
Our study did not include any subjects over 100 kg nor
over 89 years old. From the centile curves it is unlikely that
extrapolation beyond 89 years will result in significant
inaccuracy. Although in Western societies there are
subjects with body weights in excess of several hundred
kilograms, it is unlikely that extrapolation to such extremes
is necessary given the very low perfusional requirements of
body fat. However, it could be useful to study hemody-
namics–weight relationships in heavier subjects, given the
increasing incidence of obesity in the world.
Our study included only Hong Kong Chinese, but pre-
vious comparison with Australian data has not shown
clinically significant differences between our populations
when adjusted for morphometry (Cattermole et al. 2010;
Ho et al. 2013).
This study utilized only the suprasternal approach, mea-
suring flow through the aortic valve. We did not use the
pulmonary valve approach in order to maintain consistency
with the pediatric and adolescent studies where only aortic
valve measurements were used. It is known that it can be
more difficult to obtain good quality traces via the
suprasternal approach in older Chinese subjects which might
increase discomfort (Huang and Critchley 2013). The elderly
study had included both aortic and pulmonary valve
approaches, but found only small differences between the
two: stroke volume was approximately 4% lower using the
aortic approach, while heart rate was only slightly higher. It
is unlikely therefore that patient discomfort caused by using
the suprasternal approach leads to any significant adrener-
gic-induced measurement error. In addition, we have
reported that in children there is little discomfort from
suprasternal USCOM relative to measuring blood pressure
oscillometrically (Chan et al. 2013). To minimize anxiety,
subjects rested before the scan and were fully informed of
what was involved. However, we cannot exclude a small but
real effect on hemodynamics resulting from discomfort, but
this is likely to be far less than the hemodynamic changes
induced by other measurement methods such as pulmonary
artery catheters or arterial pulse wave integration.
A further potential problem with the aortic valve
approach is the possibility of aortic stenosis. (The same is
equally true of the pulmonary valve and pulmonary steno-
sis.) This is easily identified as one of the measures reported
by USCOM is the mean pressure gradient (Pmn) across the
valve being examined. The presence of valvular stenosis is
therefore not only identified qualitatively, but the severity
of stenosis can be quantified from the value of Pmn. In our
study, no subject had evidence of aortic stenosis, but for
practical use, even if aortic stenosis is present then it does
not preclude hemodynamic measurements via the pul-
monary valve, as combined stenosis of the aortic and pul-
monary valves is extremely rare.
Conclusions
We have presented comprehensive means and normal
ranges for hemodynamic parameters obtained with
2017 | Vol. 5 | Iss. 6 | e13195Page 8
ª 2017 The Authors. Physiological Reports published by Wiley Periodicals, Inc. on behalf of
The Physiological Society and the American Physiological Society.
USCOM Normal Ranges G. N. Cattermole et al.

USCOM in healthy subjects of all ages from infancy to
the elderly. We have demonstrated how these parameters
vary with age and weight. These ranges represent a refer-
ence standard for further physiological research, as well as
being of potential value in clinical practice.
Conflict of Interest
G. N. C. has received support for travel and USCOM pre-
sentation from Pacific Medical (the distributors of USCOM
in Hong Kong), none since 2012. C. A. G. and T. H. R. have
received educational support to develop hemodynamics
courses, and the long-term loan of USCOM machines for
clinical and research use. No authors have received any fees
either from USCOM Ltd. or distributors. The remaining
authors have no conflicts of interest.
References
Brandfonbrener, M., M. Landowne, and N. W. Shock. 1955.
Changes in cardiac output with age. Circulation 12:557–566.
Brierley, J., J. A. Carcillo, K. Choong, T. Cornell, A. Decaen,
A. Deymann, et al. 2009. Clinical practice parameters for
hemodynamic support of pediatric and neonatal septic
shock: 2007 update from the American College of Critical
Care Medicine. Crit. Care Med. 37:666–688.Cattermole, G. N., P. Y. M. Leung, and C. O. Tang. 2009.A
new method to score the quality of USCOM scans. Hong
Kong J Emerg Med 16:288.
Cattermole, G. N., M. Leung, P. S. K. Mak, S. S. W. Chan, C.
A. Graham, and T. H. Rainer. 2010. The normal ranges of
cardiovascular parameters in children measured using the
Ultrasonic Cardiac Output Monitor. Crit. Care Med.
38:1875–1881.
Chan, S. S. W., G. N. Cattermole, M. P. Y. Leung, G. Y. L.
Ho, C. A. Graham, and T. H. Rainer. 2013. Children’s
discomfort during noninvasive cardiac output monitoring
by suprasternal ultrasonographic transducer. Hong Kong J
Emerg Med 20:3–8.Chan, C. P. Y., N. Agarwal, K. K. Sin, S. Narain, B. E. Smith,
C. A. Graham, et al. 2014. Age-specific non-invasive
transcutaneous Doppler ultrasound derived haemodynamic
reference ranges in elderly Chinese adults. BBA Clin 48–55.Cole, T. J., and P. J. Green. 1992. Smoothing reference centile
curves: the LMS method and penalized likelihood. Stat.
Med. 11:1305–1319.
de Simone, G., R. B. Devereux, S. R. Daniels, G. Mureddu,
M. J. Roman, T. R. Kimball, et al. 1997. Stroke volume and
cardiac output in normotensive children and adults.
Circulation 95:1837–1843.
Dhanani, S., N. J. Barrowman, R. E. Ward, and K. T. Murto.
2011. Intra- and inter-observer reliability using a
noninvasive ultrasound cardiac output monitor in healthy
anesthetized children. Paediatr Anaesth. 21:858–864.
Du Bois, D., and E. F. Du Bois. 1916. A formula to estimate
the approximate surface area if height and weight be known.
Arch. Intern. Med. 17:863–871.He, S. R., C. Zhang, Y. M. Liu, Y. X. Sun, J. Zhuang, J. M.
Chen, et al. 2011. Accuracy of the ultrasonic cardiac output
monitor in healthy term neonates during postnatal
circulatory adaptation. Chin Med J (Engl). 124:2284–2289.
Ho, G. Y., G. N. Cattermole, S. S. Chan, B. E. Smith, C. A.
Graham, and T. H. Rainer. 2013. Noninvasive
transcutaneous Doppler ultrasound-derived hemodynamic
reference ranges in Chinese adolescents. Pediatr Crit Care
Med 14:e225–e232.Huang, L., and L. A. H. Critchley. 2013. Study to determine
the repeatability of supra-sternal Doppler (ultrasound
cardiac output monitor) during general anaesthesia: effects
of scan quality, flow volume, and increasing age. Br. J.
Anaesth. 111:907–915.
Jain, S., A. Allins, A. Salim, A. Vafa, M. T. Wilson, and D. R.
Margulies. 2008. Noninvasive Doppler ultrasonography for
assessing cardiac function: can it replace the Swan-Ganz
catheter? Am. J. Surg. 196:961–968.
Kuper, M., S. J. Gold, C. Callow, T. Quraishi, S. King, A.
Mulreany. 2011. Intraoperative fluid management guided by
oesophageal Doppler monitoring. BMJ 342:d3016.
Marik, P. E., X. Monnet, and J. L. Teboul. 2011. Hemodynamic
parameters to guide fluid therapy. Ann Intensive Care 1:1.
McNamara, H., P. Barclay, and V. Sharma. 2014. Accuracy
and precision of the ultrasound cardiac output monitor
(USCOM 1A) in pregnancy: comparison with three-
dimensional transthoracic echocardiography. Br. J. Anaesth.
113:669–676.
NHS Technology Adoption Centre. 2013. Intraoperative Fluid
Management Technologies Adoption Pack version 2. (February
update). Available online: http://webarchive.nationalarchive
s.gov.uk/20130701143131/http:/ntac.nhs.uk/web/files/
intra_operative_fluid_management/iofm_adoption_pack_
update_jan_2013.pdf (accessed 17 January 2017).
Phillips, R. A., S. G. Hood, B. M. Jacobson, M. J. West, L.
Wan, and C. N. May. 2012. Pulmonary Artery Catheter
(PAC) Accuracy and Efficacy Compared with Flow Probe
and Transcutaneous Doppler (USCOM): an Ovine Cardiac
Output Validation. Crit Care Res Pract 2012:621496, doi:10.
1155/2012/621496.
Stewart, G. M., H. B. Nguyen, T. Y. Kim, J. Jauregui, S. R.
Hayes, S. Corbett. 2008. Inter-rater reliability for
noninvasive measurement of cardiac function in children.
Pediatr. Emerg. Care 24:433–437.Thiel, S. W., M. H. Kollef, and W. Isakow. 2009. Non-invasive
stroke volume measurement and passive leg raising predict
volume responsiveness in medical ICU patients: an
observational cohort study. Crit. Care 13:R111.
USCOM Ltd. 2006a. The Basics. USCOM Ltd., Sydney.
USCOM Ltd. 2006b. USCOM 1A User Manual. USCOM Ltd.,
Sydney.
ª 2017 The Authors. Physiological Reports published by Wiley Periodicals, Inc. on behalf ofThe Physiological Society and the American Physiological Society.
2017 | Vol. 5 | Iss. 6 | e13195Page 9
G. N. Cattermole et al. USCOM Normal Ranges