yemen-china policy during the saleh administration, 1990-2012
Upload
teknologimalaysiaCategory
view
2download
0
1
ESTIMATING OF REGIONAL EVAPOTRANSPIRATION FOR ARID AREAS
USING LANDSAT THEMATIC MAPPER IMAGES DATA: A CASE STUDY FOR
DATES PLANTATION – HADHRAMOUT- YEMEN
AYOUB AHMED ALMHAB
PhD. Remote Sensing, Researcher, Head GeoSpatial Consultant & Eng. Co,
General Manager Academic Society (ASDAC),
Sana’a ,Republic of Yemen, P.O BOX 13665 maeen post office,
tel. +967714028003 fax. 967 1 226462, e-mail: [email protected]
ABSTRACT In eastern part of Yemen date crop has been considered as an important cash crop.
Thus, water management for date plantation in arid areas has become an important
aspect to ensure a food produce. Except alfalfa, the water used by date trees is greater
than that of most crops. Conventional Point measurement of water needed by one Date
plantation cannot provide accurate estimate for all the orchards in a county. In fact, over
a vast area, the point measurements technique is costly and unpractical. In this paper, a
new approach is suggested to estimate detailed water requirement by date plantation at a
county scale. The proposed technique used LANDSAT-ETM data and M-SEBAL (Modified
- Surface Energy Balance Algorithm for Land) to estimate evapotranspiration over date
plantation in wadi Hadhramout- basin central of Yemen. The M-SEBAL model estimates
evapotranspiration (ET) using the energy balance equations, for which the surface
temperature and reflectance data from ETM image data and metrological data from local
weather station. The model calculates net radiation, soil and sensible heat flux, and
evapotranspiration. Comparing the calculated results with those observed in point
measurements in the field of Date and alfalfa from the period 2007 to 2009 proves that the
M-SEBAL also provides an accurate information. The average relative error between
estimated and observed ET is 10.6%, and the average absolute error is 0.35 mm/day. This
proposed technique has the potential to provide guidelines for various users, including
government agencies on how to evaluate current water-usage schemes.
Keywords: Evapotranspiration; Surface energy balance; M-SEBAL, Wadi
Hadhramout ,Yemen
1. INTRODUCTION
Since Date has been an important cash crop for the oasis areas in central of Yemen, its
water usage should be carefully managed in order to achieve water and good quality yield from the

2
valences water It exists that water use by Date trees is greater than that of most row crops, except
alfalfa. It’s found that Date has an annual evapotranspiration (ET) of about 1.6m to 2.4m irrigation
a year (AREA, 2005). Estimating Date water usage has been an important research issue,
especially in arid areas where water is scarce. In general, the study for water management is based
on ground measurements (point measurement) which are laborious and time consuming.
Furthermore the reclaiming could not be able to provide an accurate spatial estimation, especially
when large area is included. Thus, alternative approach is required to further estimate the study of
water usage in Date plantation. This approach is utilizing satellite images data which are capable
of providing large area coverage. Evapotranspiration (ET), as part of the hydrological cycle, is
affected by many processes at the interface between soil, vegetation and atmosphere. A number of
models for ET estimation have been presented: empirical; semi-empirical models; and physical
models. These have increased the precision of ET estimation [Brutsert, 1979].
The empirical methods assume the daily ET and linearly relates to the cumulative temperature
difference (surface temperature minus the air temperature) (Caurault, et al., 2003). On a local scale,
accuracy could be reached at 85-90% (Steinmetz, et al., 1989). But if the method is used for
regional scale, the accuracy will be around 70-80% because the input parameter (air temperature)
must be interpolated from local measurement.
SEBAL is one of the residual methods of energy budget, developed by (Bastiaanssen, et al., 1998).
It combines empirical and physical parameterization. The inputs include local weather data
(mainly wind speed) and satellite data (radiance). From the input data, the Rn (net solar radiation)
and G (soil heat flux) are calculated. The H sensible heat flux is calculated by contrasting two
points (wet, well-irrigated vegetation and dry ground, desert). Then, the ET is calculated as the
residual of the energy budget (Bastiaanssen, et al., 1998). The accuracy can be 85% in daily basis
and 95% in seasonal basis (Bastiaanssen, et al., 2005). Based on the contrast of wet and dry areas,
similar models like SEBI, -S-SEBI and SEBS were developed (Menenti and Choudhury 1993;
Roerrink, et al., 2000; Su 2002).
Semi-empirical models and physical models deal with soil and plant energy exchange with the
atmosphere with a fine time step of 1 s to 1 hr (Caurault, et al., 2003). These methods accurately
describe crop functioning, and can allow access to the intermediate variables such as soil moisture
and LAI (leaf area index), which are related to the physiological and hydraulic processes that can
be linked to other meteorological and hydrologic models (Caurault, et al., 2003).
Most of the models use data to obtain the surface temperature and need accurate temperature data.
SEBAL avoids the problem (to input accurate surface data) by using the temperature difference
between air and ground for each pixel which is scaled by surface temperature in contrast with dry
and wet spot values. Thus, SEBAL is more attractive for operational applications (wing, et al.,
2006).
The main objective of this study is to study the feasibility of using SEBAL with different
processing levels, LANDSAT5 TM, for 1995 to1998 season , in order to estimate Date water use
by remote sensing over an arid and semi-arid areas with non-homogeneous surface condition in
wadi Asser- Wadi Hadramout- Yemen.
2. MATERIALS AND METHODS
2.1. Study area
Wadi Hadramout is located in the central part of Yemen, it’s one of the most important
agricultural area in the eastern and desert region. (see figure 1.1), The study area covers
approximately 2000 km2, between Heinen (UTM coordinates 921000 E, 1754000 N) and
Qasam (930400 E, 1784000 N). The intake part of the watershed starts from the desert
named Ramlat Assabateen which has a predominantly arid climate although semi-arid

3
conditions prevail in certain internal of the wadi around Tareem and Syoun local areas,
particularly in the middle between the highlands. The mean economic activity is the
agriculture and it famous by the Dates plantation and some irrigation crops and
vegetations.
Figure 1 location of the Wadi Hadramout –central of Yemen
2.2. Dataset
Satellite images LANDSAT7-ETM in year05-09 (Table 1), were evaluated for Land
Surface Heat Fluxes distribution in Wadi Hadramout central Yemen mountains. These
overpass time of these images was 10.30of LANDSAT5-TM – local time. Both images
had favorable weather conditions without or little clouds in the study area. Data from the
field measurement area were available to assist the calculation of the Land Surface Heat
Fluxes in the locations of the study area.
Table 1 National (LANDSAT) acquisition dates during the 95-98ropping season.
Mar 20 2005 June 1 2005 September 20 2005 Dec 12 2005
2.3. Model
SEBAL is essentially an algorithm based on the energy balance at the Earth’s surface
where the values of the requisite parameters are obtained from remotely sensed data. The
method uses the energy budget equation to calculate the instantaneous latent heat loss Rn
– G – H for each pixel at the time of the satellite over flight, where Rn is the net solar
radiation, G is the soil heat flux into the soil, and H is the sensible heat flux into the air (all
in W m-2
). The instantaneous evapotranspiration ETins at the time of the satellite
overflight is then related to the instantaneous latent heat loss via the latent heat of
vaporization, λ, so that
ETins nR G H Eq. 1
The earliest applications of the model were to rather flat, well-watered terrain. Since our
study area is mountainous and arid, or at best semi-arid, we have developed a Modified
SEBAL model (M-SEBAL) by introducing some changes into the existing SEBAL model
to allow for the inclusion of the effects of terrain, mountains and deserts into the
calculations of surface radiation. The main steps in M-SEBAL are
1- Generation of a digital elevation model (DEM),2- Calculation of the surface reflectance
correction,3- Generating model parameters, 4- Determination of radiations, 5- Calculation
of daily and monthly ET.

4
The steps 1 and 2 in the M-SEBAL model prepare the image for use in the SEBAL for an
arid mountainous area. Step 3, which involves the estimation of the albedo and correction
of surface temperature by DEM (Ts-DEM), and step 4, which involves the estimation of soil
heat flux G, and sensible heat flux H, were also modified from the original SEBAL into
M-SEBAL. The M-SEBAL model was implemented using Model Builder in the ERDAS
Imagine 8.5 image processing package. All the model parameters were programmed into
the Model Builder and the values are computed automatically based on the input data.
The general flowchart for the modified SEBAL model is shown in Figure 2.
Ri is the Reflectance correction band I,
Figure 2 The general flowchart of correlations between modified SEBAL model parameter
2.4 Theory
2.4.1 Net Radiation (Rn)
The radiation balance at the Earth’s surface can be regarded as composed of four fluxes,
the incoming short wave radiation (wavelength 0.14 to 4 µm) that arrives from the Sun
(Rs), the amount of this energy that is reflected from the surface (Rs), the incoming long
wave radiation (wavelength > 4 µm) from the atmosphere (RL), and the long wave
radiation emitted from the surface (RL). Thus the net downward flux of radiation is:
LLssn RRRRR Eq. 2
where Rs is related to Rs by α, the short-wave surface albedo, and the two long wave
components can be related to the emissivity and temperature of the air and of the surface,
respectively, so that we can rewrite Eq (2) as:

5
441 ssaasn TTRR
Eq. 3
where σ is the Stefan–Boltzmann constant (5.67 x 10⁻⁸
W m-2
K-4
), εa and εs are the
emissivity of the air and the surface, respectively, Ta is the air temperature measured at
the well-irrigated crop surface with full cover and for which it is assumed that Ta = Ts (this
is called the wet pixel). Ts is derived from a remotely sensed radiometric surface
temperature (K) and εa is the air emissivity taking as (Bastiaanssen, 1995):
εa=1.08(−lnτsw) 0.265
Eq. 4
where τsw is the two way atmospheric transmissivity [τsw = 0.75+2 x 10⁻⁵
z],
where z is the elevation in metres, s is the surface emissivity which is calculated from the
normalized vegetation index (NDVI) using the logarithmic relation of Van de Griend and
Owe (1993) as:
s = 1.0094 + 0.047ln(NDVI) Eq. 5
For the short wave (surface) albedo we take a weighted mean of the reflectances of
the six short wavelength bands of the Landsat TM (Tasumi et al., 2000):
TOA =0.2931
TOA + 0.2742
TOA + 0.2333
TOA +
0.1574TOA
+ 0.0335TOA
+ 0.0117TOA
Eq. 6a
where iTOA
is the reflectance for Landsat data band i, i = 1, 2, 3, 4,5and7 at the top of the
atmosphere.
The incoming short wave radiation (Rs) was computed in this study as follows (Fu, 1998,
Tasuni et al., 2000) in which the diffuse radiation was neglected:
where Gsc is the solar
constant (1367 W m-2
), dr is the relative Earth-Sun distance (dimensionless) given by
365/2cos033.01 DOYdr cos θ is the cosine of the solar zenith angle calculated
by cosθ=cos(π/2-) where is the solar elevation angle in the flat area. In the sloping and
mountainous terrain (as in the present study) the solar incident angle changes with surface
slope and aspect. Therefore we use the equation given by Duffie and Beckman (1991):
sin ssin sin cos + cos cos ssin sin cos +
cos s cos cos cos + cos ssin cos sin - s cos sin sin = cos
Eq. 7
where is the solar declination, , is the (geographical) latitude of the pixel, s is the
ground slope, γ is the surface aspect angle and ω is the hour angle of the Sun. All angles
are in radians.
2.4.2 Soil Heat Flux (G)
The soil heat flux is usually measured with sensors buried just beneath the soil surface. A
remote measurement of G is not possible but several studies have shown that the day time
2cossc
s
r
GR
d
Eq. 7
6
ratio of G/Rn is related to, among other factors, the normalized difference vegetation index
(NDVI). In this study Eq (9) is adopted, in which G is a calibrated function of the
normalized vegetation difference index (NDVI) and net radiation (see Figure 3):
20.4005(NDVI) 0.2207(NDVI) 0.2715nG R Eq. 9
NDVI was calculated as:
NDVI = (R4 - R3) / (R4 + R3) Eq. 10
where R4 and R3 are the reflectance data of bands 4 and 3 in the Landsat TM respectively.
2.4.3 Sensible Heat Flux
For the sensible heat flux calculation, two pixels are chosen in the satellite data. One pixel
is a wet pixel that is a well-irrigated crop surface with full cover and the surface
temperature (Ts) close to the air temperature (Ta). The second pixel is a dry bare
agricultural field where λ(ET) is assumed to be 0. The two pixels tie the calculations for
all other pixels between these two points. At the dry pixel it is assumed that λE =0.
According to equation (1) and the definition of specific heat capacity:
nH R G Eq. 11
And using K-theory (Thom, 1972):
p
ah
dc TH
r
Eq. 12
where is the air density (mol m-3
), cp is the specific heat of air at constant pressure (29.3
J mol-1
ºC-1
), dT is the near surface temperature difference (K), rah is the aerodynamic
resistance to heat transport (m s-1
), where
ku
z
z
rah *
1
2ln
Eq. 13
where z1 is a height just above the zero displacement distance height of plant canopy set to
0.1 m for each pixel, and z2 is the reference height just above the plant canopy set to 2 m
for each pixel, u* is the friction velocity (m s-1
) and k is the von Karman constant (0.4)
according to SEBAL (Bastiaanssen, et al, 1998).
)ln(
)(
mz
dz
kzuu
Eq.14
where u(z) is the wind speed at height z, d is the zero displacement height (m, d=0.65h), h
is the plant height (m), and zm is the roughness length (m, zm=0.1h) (Campbell and
Norman 1998). According to equations 13-14 and the input data, the value of dTdry (dT at

7
the dry spot) can be calculated. At the wet spot we assume H=0 and dTwet (dT at the wet
spot) =0. Then according to the surface temperature at the dry and wet spots (Tsdry and
Tswet), we can get one linear equation for each pixel (Wing et al., 2006),
swets
swetsdray
wetdryTT
TT
dTdTdT
Eq. 15
The value of H for each pixel can be calculated with Eqs 1 and 12-15. The wind speed
assumed at 200 m is the same for each pixel and the wind speed at 200 m is calculated for
the weather station first, and then u* can be estimated for each pixel with Equation 14.
The parameter d in Equation 14 is neglected (d=0), since it is negligible compared to the
value of the reference height (z =200 m). The value for zm for each pixel is calculated by
linear regression against NDVI equation according to the pixel value after Almhab et al
2007.
Due to the fact that atmospheric instability may have effects on H, atmospheric
correction is conducted (Eq. 16). First the u* and wind speed at 200 m at the local weather
station are calculated. Then the zm, u* and dT for each pixel are computed. Then the rah
and H without the atmospheric correction are obtained.
For atmospheric correction, the stability parameter, the Obukhove length, L (m) was
calculated, which was then used to correct u*, rah and H. An iteration was conducted for
L,u*,rah and H until H did not change by more than 10% between two consecutive
iterations. The correction equation is (Campbell and Norman 1998; Stull 2001).
kgH
TuL s
3
Eq. 16
When L<0, H is positive and heat is transferred from the ground surface to the air under
unstable conditions. When L>0, H is negative and heat is transferred from the air to the
ground surface under stable conditions. When L=0, no heat flux occurs, and the air is in a
neutral condition. Because the satellite over flight occurred at local noon time, the
atmosphere should have been unstable. After H is corrected by the atmospheric effects,
λ(ETins) for each pixel is calculated using Equation 1.
2.4.4 Regional ET model
The actual 24 hour ET was estimated by making use of the instantaneous evaporative
fraction EF, and the daily averaged net radiation, Rn,24 (Tasumi et al., 2000):
24,
24
nREFET
ET24
Eq. 17
where ET24 is the actual 24-hour evaporation (mm day-1
), Rn,24 is the 24-h net radiation (J
m-2
d-1
) and Ts is the surface temperature (°C). The EF is calculated as:
GR
HEF
n 1
Eq. 19
where Rn is the instantaneous net radiation, G the instantaneous soil heat flux, and H the
instantaneous sensible heat flux. It is (implicitly) assumed that the EF remains constant
during the day.

8
The daily net radiation can be expressed as:
,24 ,24 ,24(1 )n s LR R R Eq. 21
Where Rs,24 is the daily solar radiation and RL,24 is the daily net long wave radiation (J m-2
d-1
).
So far we have described is the original SEBAL model which is for flat terrain. We will
now present a modification that takes the impact of topography into account. The impact
of the slope and azimuth of the surface on available radiation was considered pixel by
pixel in the calculated instantaneous and daily net radiation. Pixels in the shadow were
excluded from images with the model maker in the ERDAS imagine software package.
The parameters of solar azimuth and solar elevation at the satellite overpass time were
used for this correction. The daily net radiation is estimated by an integral of equation (7)
transmittance for one-way transmittance τ with (c+dn/N):
,24 2( ) sin cos cos cos sin sin sin ]sc
s
r
GnR c d a b s d
N d
Eq. 22
2
,24 2
1
( ) sin cos cos cos sin sin sinscs
r
GnR c d a b s d
N d
Eq. 23
,24 2 1 2 1 2 12( ) sin cos sin sin sin sin cos cos cos
2
sca
r
GnR c d a b s
N d
Eq 24
Where: cossinsincoscoscossincoscossin ssbandssa
)(12 12 N Eq. 25
and where c and d are coefficient of the solar radiation depending on the latitude, climate
and other factors of the study area, respectively; c+d is the fraction of exterritorial
radiation reaching the Earth on clear sky days. n is the actual sunshine duration, N is the
potential sunshine duration, ω1 and ω2 are the sunrise and sunset angle, respectively. For
the estimation of the daily solar radiation, the sunrise and sunset angles for the tilted
surfaces are required. The sunrise and sunset angles for horizontal surfaces are given by
Fu (1983) and Tasumi et al. (2000):
1cos tan tanH Eq. 26
The sunrise and sunset angle for tilted surfaces can be obtained by simple mathematical
manipulation from equation (8) by setting cosθ=0, leading to
2 2
1
2
tan sin sin 1 1 tancos
1
ab s a
a
Eq. 27
The positive or negative sign in the numerator of this equation is determined by

9
2 2
1
2
sin sin tan 1 1 tansin
1
a s b a
a
Eq. 28
Let ωs1 and ωs2 be the roots of Eq 28, where ωs1 > ωs2 . Note the surface receives the solar
radiation only if cos θ in equation (8) is greater than 0. Several relationships are given
below to determine the sunrise and sunset angles (ω1 , ω2 ),
- if ωs1 ≤ ω≤ωs2 and cosθ ≥0, then ωs1 ≥ ωs2, ωs2 ≤ ωs1 ;
- if ω ≤ ωs1 , ωs1 >ωs2 and cosθ>=0 then ω1 ≤ ωs1,ω2 ≥ ωs2.
- Meanwhile, the sunrise and sunset angles for tilted surfaces must also satisty the
condition that sunrise is no earlier and sunset is no later than those for horizontal surfaces.
Namely ω1≥ -│ωH│, ω2≥ ωs2 ≤ │ωH│.
The daily net long wave radiation is given by
4 4
,24L a a s sR T sT Eq. 29
where εa is the daily average atmospheric emissivity (Campbell and Norman, 1998) and Ta
is the daily mean atmospheric temperature (K). The surface temperature determined at
10.30 can be taken to represent the daily average surface temperature for estimation of the
surface daily long wave radiation (Granger, 2000).
3- Observation and simulation Comparison
The measured and simulated is compared. The relative error is calculated as:
nobservatio
nobservatiosimulationrlativeErro
||Re
Eq. 30
The absolute error is calculated as (mm/day):
|| nobservatiosimulationrorAbsoluteEr Eq. 31
The average of the relative error and the absolute error was also calculated, respectively.
To see if a day was water-stressed in alfalfa field, the non-stressed (alfalfa , mm/day)
calculated by FAO Penman-Monteith equation was compared with the corresponding
observation. The was obtained from Yemen NWRA Climate Center . The Date orchard
was always well-irrigated and non stressed.
4. RESULTS AND DISCUSSION
The study has revealed some parameters in M-SEBAL are very sensitive. This can bee
seen from the values of surface parameters derived from satellite image data.
The fallowing figures show results of data processing for different land surface parameters and
calculation of ET for the study area.
The figures show maximum and minimum values of surface parameters and land surface heat over
the study area , which comprises of arid and semi arid conditions.

10
By comparing figures 5c it is found that area which high vegetation induces has a low surface
temperature. the other land area which have low vegetation indices tends to have high surface
temperature. This seen in figure 5b especially the part where there are near the valley which
represent the high vegetation density and the part fare from the valley area has the opposite
situation.
In this study, figure 7 shows that daily ET is increased from bare soil to where Vegetation indices
are high. figure 8 shows comparison between ET derived from LANDSAT5 TM using modified
SEBAL and ET calculation using conventional ET models using data from metrological data in
Wadi Hadramout . Table 2 presents some parameters used from field measurements and
comparisons with that from satellite data.
One sample map for Wadi Asser is shown in Figure 6 (September 24, 1998).
. In this study figure 6 (f) shows that daily ET is increased from bare soil to where
vegetation indices are high, the daily ET distribution by LANDSAT 5 TM 0.1–9.32 mm.
l. Figure 6(e) presents the results of the estimated sensible heat fluxes over the study area.
The latent heat flux (LE) is increased from bare soil to the vegetated area as ET.
11
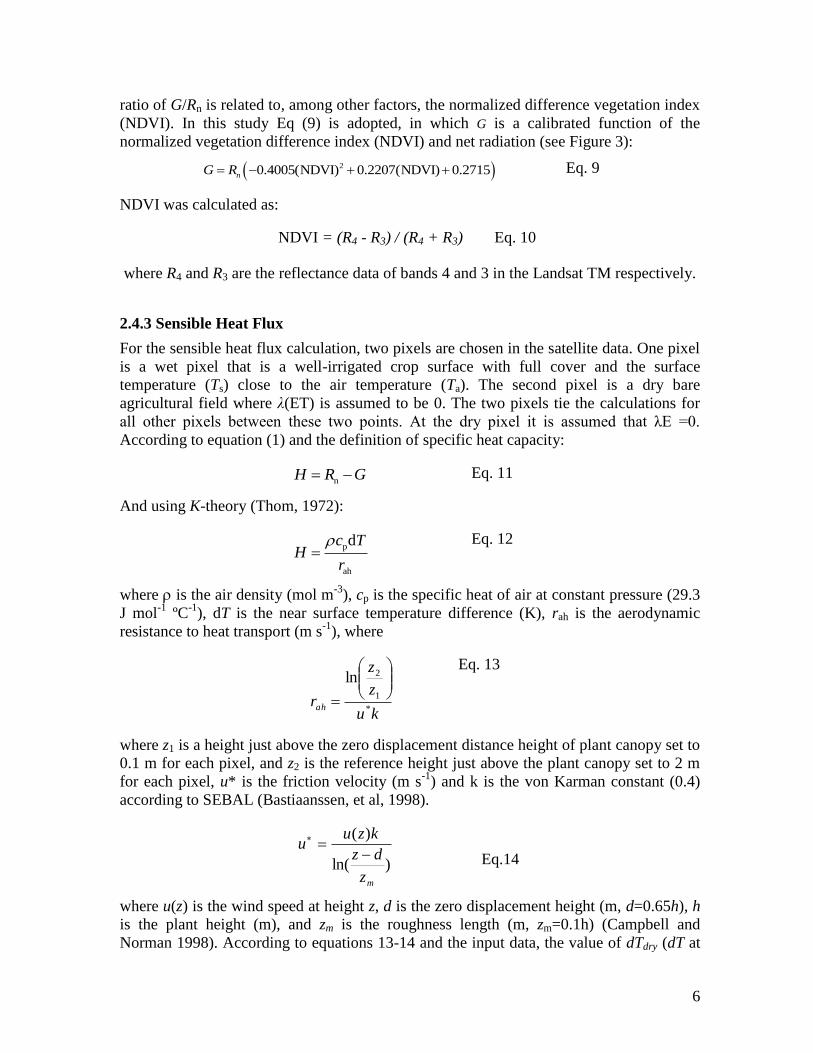
Figure 6 .(a) Estimated surface Albedo; (ndvi)vegetation indices (NDVI);(Ts)
Surface Temperature in Kelvin; (ET24) evapotranspiration ET24 hours derived from
LANDSAT 5 TM for Desert wadi Hadramout, Hadramout, Yemen.
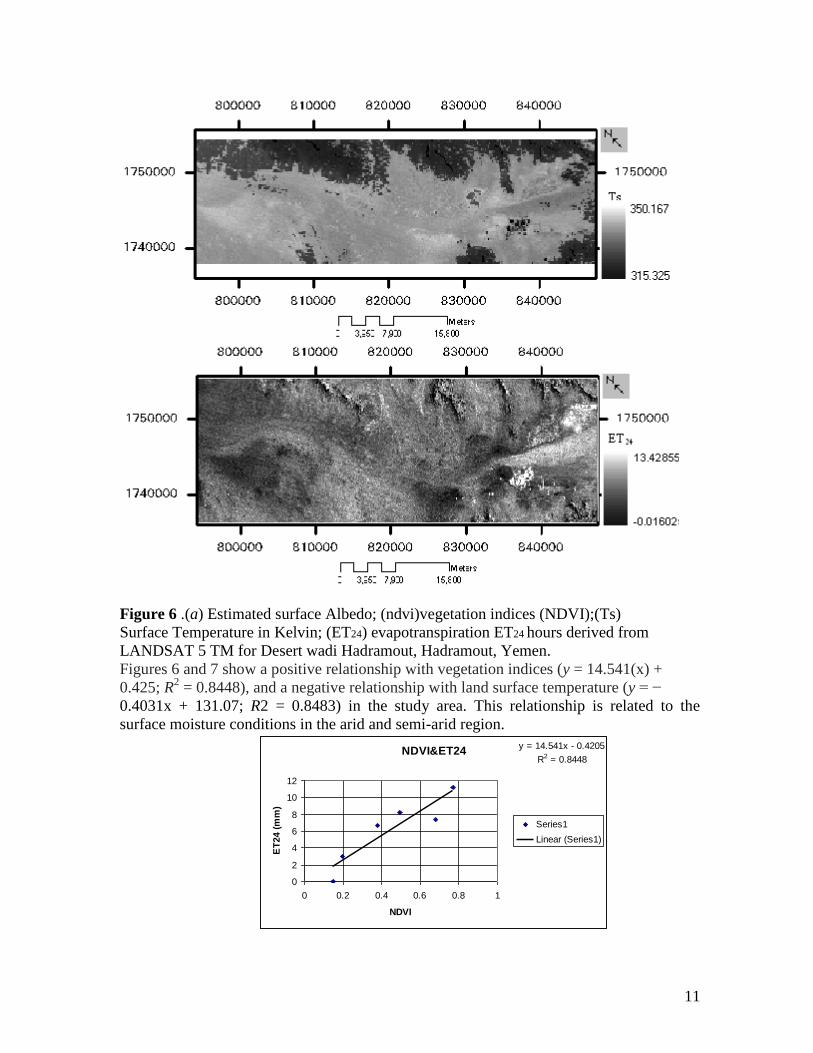
Figures 6 and 7 show a positive relationship with vegetation indices (y = 14.541(x) +
0.425; R2 = 0.8448), and a negative relationship with land surface temperature (y = −
0.4031x + 131.07; R2 = 0.8483) in the study area. This relationship is related to the
surface moisture conditions in the arid and semi-arid region.
NDVI&ET24y = 14.541x - 0.4205
R2 = 0.8448
0
2
4
6
8
10
12
0 0.2 0.4 0.6 0.8 1
NDVI
ET
24 (
mm
)
Series1
Linear (Series1)

12
Figure 7. Curve of relationship of daily evapotranspiration (ET24) with vegetation index
(NDVI)
The model for Date fields is accurate (Table 2, Figure 11). The relative error for DATE
was 11.9%, 9.8% and 1.6% respectively, for the three satellite over flight days. The
absolute errors were within 0.3 mm/day, i.e. 0.5, -0.5, and 0.1 mm/day, respectively.
Figure 11. The Date of simulation vs. observation.
Table 2. The alfalfa and Date of simulation vs. observation
Type of
Crop
date observation simulation Relative
Error
Absolute
Error ET_F.P.M ET-RS
Date 20/03/95 4.2 4.7 0.119 0.5
12/12/95 5.1 4.6 -0.098 -0.5
01/06/98 6.1 6.2 0.016 0.1
Ob: observation (mm/day), Si: simulation (mm/day), RE: Relative error, AE: Absolute error (mm/day).
The model can calculate under both stressed and nonstressed conditions accurately.
The accuracy is comparable with other studies. For example, using SEBAL model, the
daily accuracy can be 85% (Bastiaanssen, et al., 2005). The accuracy of modified SEBAL strongly depends on the quality of the thermal
information which is used to retrieve the radiometric surface temperature of the pixel. Table 5.1.
shows a summary of the results obtained in the model validation. ET values from modified
SEBAL were obtained averaging results from four 30 m x 30 m pixels approximately centered at
the lysimeter site. Table 5.2 includes the values of ET24 (around the five days to the satellite
overpass time) estimated from modified SEBAL, and corresponding ET24 measured at the
lysimeter site. In addition, the corresponding values of reference ET are included for comparative
purposes.

13
Table 5.1. Summary of ET Comparison for 1998 (sorghum), 1995 (alfalfa), and 1995
(peas) EFFA by ET calculated by modified SEBAL model using Landsat
TM images
date
ET-
Lysimeter ET-TM
AE RE A NE
1st JUNE1998 6.91 5.281 -1.629 -0.235 0.764 76
12th december1995 4.05 3.414 -0.636 -0.157 0.842 84
20th MAY1995 7.98 5.91 -2.07 -0.259 0.740 74
ET-lysimeter =
Measured ET values were provided by EFFA archive, 2006
ET-TM= ET calculated by modified SEBAL model using Landsat TM images
AE= The Absolute Error.
RE= The Relative Error.
A= Difference ET(PM) / ET (LYSI) (linear regression coefficient).
NE= Normalized error was calculated as 100*Difference
Negative value in ET difference indicates that ET-TM was lower than the lysimeter ET.
Figure 5.32 Remote sensing estimated ET were compared with the lysimeter water balance ET.
The accuracy of modified SEBAL strongly depends on the quality of the thermal
information which is used to retrieve the radiometric surface temperature of the pixel. Table 5.1.
shows a summary of the results obtained in the model validation. ET values from modified
SEBAL were obtained averaging results from four 30 m x 30 m pixels approximately centered at
the lysimeter site.
The ET estimated by the remote sensing method versus ET estimated by lysimeter
water balance ET on the three days is shown in Figure 5.32. Their relationship can be shown as
ETTM = 0.638 ETlysimeter – 0.835, r2 = 0.999.
where ETTM is the remote sensing method ET modified SEBAL model using Landsat TM images,
and ETlysimeter is the lysimeter water balance method ET. The correlation coefficient indicate a
strong relationship between the remote sensing ET and the lysimeter water balance ET.
As shown in Table 5.1, the Absolute error of the estimate of remote sensing , Landsat
TM recorded ET and lysimeter water balance ET was -1.629 and -2.07for EFFA station may20th
1995 and 1st June1998 , respectively. The largest Normalized error (84%) was with the EFFA

14
lysimeter on 12th december1995. The smallest Normalized error (74%) was with the EFFA
lysimeter on may20th
1995.
Average monthly ratios of actual to potential ET in a long term lysimeter study from EFFA
area in Wadi Hadramout could provide a more reliable monthly λET for the ET estimation in
Wadi Hadramout, Yemen. This result supports the conclusion that modified SEBAL can
accurately estimate ET for agricultural conditions.
5. CONCLUSION
The modified SEBAL is capable calculating the spatial Date daily water use (ET)
with resolution of 90 m × 90 m. The simulated is accurate compared with measurement
under both stressed and no stressed conditions.. This study has been able to demonstrate that some surface parameters such surface
albedo, vegetation index, surface temperature and so on can be accurately derived from satellite
image data. In this case surface parameters have been derived from LANDSAT 5 TM images
captured , with the help of ground truth weather data values of derived surface parameters are
validated to gauge the accuracy .
6.ACKNOWLEDGMENTS
The authors gratefully acknowledges financial support for this research from the
Erasmus Mundus External Cooperation Window Program of the European Union, the
satellite image data Landsat TM from the from NASA website.
7.REFERENCES
Allen, G.R., Pereira, L.S., Raes, D. and Martin, S., 1998, Crop evapotranspiration: guidelines for
computing crop water requirements. FAO Irrigation and Drainage Paper 56, 300.
Bamatraf A.M. 1994, Water Harvesting and conservation system in Yemen , 169-188, in “ Water
harvesting for improved agriculture production” FAO Expert consultation Cairo 21-25
november,1993. FAO. Rome. Italy.
Almhab A., I. Busu, and A. Cracknell, 2007. Comparison of regional evapotranspiration using
NOAA-AVHRR and LANDSAT-TM images: a case study in arid area in the Sana’a basin,
republic of Yemen, The 28th Asian Conference on Remote Sensing (ACRS) 2007P.N. 93,
Kuala Lumpur, Malaysia.
Almhab, Ayoub and Ibrahim Busu , 2008,Estimation of Evapotranspiration with M-SEBAL
model using landsat-TM and NOAA-AVHRR images in arid mountains area, EMS2008)
EDAS( I EEE), Kuala Lumpur, Malaysia.
Almhab, Ayoub, Ibrahim Busu, 2008. Remotely-sensed Evapotranspiration of arid
regions in the central Yemen Mountains with a simple energy balance method , The
Postgraduate Annual Research Seminar 2008 (PARS08), UTM, skudai, johor,
Malaysia.
Almhab, Ayoub and Ibrahim Busu,2007. Estimation of regional scale evapotranspiration
for arid area using NOAA-AVHRR application in republic of Yemen,
MAPASIA2007, Kula Lumpur , Malaysia. Bastiaanssen, W. G. M., E. J. M. Noordman, H. Pelgrum, G. Davids, B. P. Thoreson, and R. G.
Allen, 2005: SEBAL model with remotely sensed data to improve water-resources
management under actual field conditions. J. Irrig DrainageEengin, 131, 85-93
Bastiaanssen, W.G.M., 2000, SEBAL-based sensible and latent heat fluxes in the irrigated Gediz
Basin, Turkey. Journal Hydrology 229(1/2), 87–100.

15
Granger, R.J., 1989, Evaporation from natural nonsaturated surfaces. Journal of Hydrology 111,
21–29.
Bastiaanssen, W.G.M., Menenti, M., Feddes, R.A. and Holtslag, A.A.M., 1998, A remote sensing
surface energy balance algorithm for land (SEBAL) 1,2. Formulation. Journal Hydrology
212/213, 198–212.
Bastiaanssen, W.G.M., 1995, Regionalization of Surface Flux Densities and Moisture Indicators
in Composite Terrain. A Remote Sensing Approach under Clear Skies in Mediterranean
Climates (Wageningen: Agricultural Research Department).
Brutsert, W., 1979, Heat and mass transfer to and from surface with complete vegetation or
similar permeable roughness. Boundary Layer Meteorology 16, 365–388.
Burggeman H.X. 1997.Agro climat Resources of Yemen , part 1 , Agro climat enventory , FAO
project , gcp,YEM/021/NET,Field doc.11, ministry of agriculture and irrigation , agricultur
research and extension authority (AREA), Dhamar, Yemen.
Caurault, D., B. Seguin, and A. Olios, 2003: Review to estimate evapotranspiration from remote
sensing data: some examples from the simplified relationship to the use of mesoscale
atmospheric models. ICID workshop on remote sensing of ET for large regions, 17th
September, 2003.
Diaz-Delgado, R., F. Lloret, and X. Pons, 2003: Influence of fire severity on plant regeneration
by means of remote sensing imagery. Int. J. Remote Sensing_, 24, 8, 1751-1763.
Doorenbos, J. and Pruitt, W.O., 1977, Crop water requirements. FAO Irrigation and Drainage
Paper 24, 156.
Kustas, W. P. and J. M. Norman, 2000: A Two-Source Energy Balance Approach Using
Directional Radiometric Temperature Observations for Sparse Canopy Covered Surfaces.
Agron J, 92, 847-854.
Menenti, M. and B. J. Choudhury, 1993: Parameterization of land surface evavotranspiration
using a location dependent potential evapotranspiration and surface temperature range. In
Exchange processes at the land surface for a range of space and time series, Bolle H.J., R.A.
Feddes, and J.D. Kalma (Eds). IAHS Publ, 212, 561-568.
Miller, D. R., T. W. Sammis, L. J. Simmons, V. P. Gutschick, and J. Wang, 2005: Water use
efficiency and net carbon assimilation in a mature irrigated Date orchard. Applied
Engineering in Agriculture. In review.
Roerrink, G. L., B. Su, and D. Martin, 2000: S-SEBI A simple remote sensing algorithm to
estimate the surface energy balance. Phys. Chim Earth (B), 25, 147-157.
Sammis, T. W., J. G. Mexal, and D. R. Miller, 2004: Evapotranspiration of flood-irrigated Dates.
Agricultural Water Manage, 56, 179-190.
Steinmetz, S., J. P. Lagouarde, R. Delecolle, M. Guerif, and B. Seguin, 1989: Evaporation and
water stress using thermal infared measurements. A general review and a case study on
winter durum wheat in southern France. Symposium on physiology breeding of winter cereals
for stressed mediterranean environments, ICARDA-INRA.
Stull, R. B., 2001: An introduction to boundary layer meteorology. Kluwer Academic.
Su, Z., 2002: The surface energy balance system (SEBS) for estimation of turbulent heat fluxes.
Hydrology Earth Syste Scie, 6, 85-99.
Tasumi, M., Bastiaanssen, W.G.M. and Allen, R.G., 2000, Application of the EBAL
methodology for estimating consumptive use of water and stream flow depletion in the Bear
River Basin of Idaho through remote sensing. EOSDIS Project Final Report, Appendix C.
Van de Griend, A.A. and Owe, M., 1993, On the relationship between thermal emissivity and the
normalized divergence vegetation index for natural surfaces. International Journal of Remote
Sensing 14, 1119–1131.
Vidal A. and Perrier, A, 1989, Analysis of simplified relation used to estimate daily
evapotranspiration from satellite thermal IR data. International Journal of Remote Sensing
10(8), 1327–1337.

16
Wing J, Sammis T.W, Meier C.A, Simmons L.J, Miller D.R, Samani Z, 2006, A Modified
SEBAL model for spatially estimating pecan consumptive water use for las cruces, New
Mexico, Agronomy and Horticaulture Departement, New Mexico State Univ.,las Cruses,
New Mexico, USA.
Walter, I. A., R. G. Allen, R. Elliott, Itenfisu, D. P. Brown, M. E. Jensen, B. Mecham, T. A.
Howell, R. Snyder, S. Eching, T. Spofford, M. Hattendorf, D. Martin, R. H. Cuenca, and J. L.
Wright, 2002: ASCE Standardized Reference Evapotranspiration Equation. Environmental
and Water Resources Institute of the American Society of Civil Engineers Standardization of
Reference Evapotranspiration Task Committee.

17
–: دراسة حالة مزارع التمور ETMتقذير البخر والنتح اإلقليمي للمناطق الجافة باستخذام بيانات القمر الصناعي النذسات
اليمن -حضرموت
اناباعـ اب
ك،، صايؼت حخا ،نـقسى يصاؿك انا ، كهت ظى انؼهياث انضغلاف ػهو اال
@nllivalmhab. -انبلـ االنكخل
انهؾص
ؼـ يغصل انخل ف اناطق انشلقت ي انضكت انت ي اى انغاصم انقـت . نقنك اصبغذ اؿاكة اناة
ف اناطق انضافت ؽاصت يناكع انخك يت صـا نهغافظت ػه اسخلاكت اخاس انغقاء . بإسخزاء يغصل
يت ي قبم اشضاك انؾم اكزل ي يؼضى انغاصم االؽل. انقاساث انخقهـت انؼلفت انبلسى فا انا انسخؾـ
نكت انا انغخاصت ي قبم ينكػت اعـة نهخك ال حقـو يؤشل حقـلاث ؿققت نكم انبساح ف انطقت. ف
هت. ف ق انكقت حى اقخلاط انغققت فإ اسخؾـاو حقت يؤشل انقاه ػه يساعاث اسؼت حؼـ يكهفت غل ػ
يض صــ حفصه حسخؾـو نخقـل كت انا انغخاصت ي قبم يناكع انخك ػه يسخ انطقت. انخقت
M-SEBALفس سبال انغـد LANDSAT-ETMانقخلعت حسؾـو بااث انقل انصخاػ الـساث
)نغاكخت حام طاقت انخلبت ػه سطظ االك، انغـرت( نخقـل انخبؾلخظ ف يناكع انخك ف اؿ
قـك يؼـل انخبؾلخظ باسخؾـاو يؼاؿنت M-SEBALسظ ان. كا ا فس سبال انغـد –عضليث
كقنك ETMصك انقل انصاػ حام انطاقت ، نكم ي ؿكصت علاكة االسطظ انبااث انؼكس ي بااث
بااث يغطاث قاه اناػ االكضت. انفس ؼم ػه عساب صاف االشؼاع انشس ،سلا انغلاكة ف
انخلب سلا انغلاك ف اناء كقا انخبؾلخظ. حى يقاكت انخائش انغسبت ي انفس يغ انخائش انسخقاة ي
، انخ اربخج ا فس سبال 7002عخ 7002نخك انبلسى نهفخل ي حاكؼ قاط انقاه ف عقل ا
% 60.1قـو خائش ؿققت. ا يخسظ يؼـل انؾطاء ب يؤشل انقاه انفس انقخلط M-SEBALانغـد
ل حقى كت انا يى/نهو. ا انخقت انقخلعت نـا انقـكة ػه حقـى عهل ع0.80يخسظ انؾطاء انطهق
انسخؾـيت نكم انخسؾـي با فا انضاث انغكي.
، اؿ عضليث ، ان. M-SEBALيفاحظ انكهاث: انخبؾل ، يؤشل طاقت االسطظ ،
Copyright © 2022 FDOKUMEN