A GIS-based ood risk mapping of Assam, India, using the ...
46
A GIS-based ァood risk mapping of Assam, India, using the MCDA-AHP approach at the regional and administrative level Laxmi Gupta Shiv Nadar University Jagabandhu Dixit ( [email protected] ) Shiv Nadar University Research Article Keywords: Flood hazard, vulnerability, risk, GIS, analytical hierarchy process (AHP), multicriteria decision analysis (MCDA), Assam Posted Date: October 25th, 2021 DOI: https://doi.org/10.21203/rs.3.rs-1015728/v1 License: This work is licensed under a Creative Commons Attribution 4.0 International License. Read Full License
-
Upload
khangminh22 -
Category
Documents
-
view
1 -
download
0
Transcript of A GIS-based ood risk mapping of Assam, India, using the ...
A GIS-based �ood risk mapping of Assam, India,using the MCDA-AHP approach at the regional andadministrative levelLaxmi Gupta
Shiv Nadar UniversityJagabandhu Dixit ( [email protected] )
Shiv Nadar University
Research Article
Keywords: Flood hazard, vulnerability, risk, GIS, analytical hierarchy process (AHP), multicriteria decisionanalysis (MCDA), Assam
Posted Date: October 25th, 2021
DOI: https://doi.org/10.21203/rs.3.rs-1015728/v1
License: This work is licensed under a Creative Commons Attribution 4.0 International License. Read Full License

1
A GIS-based flood risk mapping of Assam, India, using the MCDA-AHP 1
approach at the regional and administrative level 2
Laxmi Gupta, Jagabandhu Dixit* 3
Disaster Management Laboratory, Shiv Nadar University, Delhi NCR, Greater Noida, Uttar 4
Pradesh 201314, India 5
E-mail address of authors: [email protected]; [email protected] 6
*Corresponding Author: Jagabandhu Dixit, Email: [email protected] 7
Abstract 8
Floods are hydrological disasters that can alter the physical, socioeconomic, and environmental 9
settings of a region. The objective of the present study is to develop an efficient and reliable 10
methodology to prepare a flood risk map for Assam, the North-eastern region (NER) of India, 11
by the integration of hazard and vulnerability components. Three indices, namely flood hazard 12
index (FHI), flood vulnerability index (FVI), and flood risk index (FRI), are developed using 13
multi-criteria decision analysis (MCDA) – Analytical hierarchy process (AHP) approach in 14
GIS environment for the regional and administrative level of Assam. The selected hazard and 15
vulnerability indicators define the topographical, geological, meteorological, drainage 16
characteristics, land use land cover, and demographical features of Assam. The results show 17
that more than 70% of the total area lies in the moderate to very high FHI class, 57.37% have 18
moderate to high FVI, and more than 50% have moderate to very high FRI class. 19
Keywords: Flood hazard, vulnerability, risk, GIS, analytical hierarchy process (AHP), 20
multicriteria decision analysis (MCDA), Assam. 21
1. Introduction 22
Natural disasters are caused by geological, hydrological, and meteorological events resulting 23
in immeasurable loss of lives and property and natural landscape damage. Flood is the most 24
2
frequent and expensive hydro-meteorological hazard due to its high intensity of damage 25
(Tabarestani and Afzalimehr 2021). Over the past few decades, the frequency of flood and its 26
extent of destruction have increased significantly due to uneven distribution of rainfall, rapid 27
snow melting, overflow of rivers, deforestation, uncontrolled urbanization, and unplanned 28
human settlement along the coastal areas and riverbanks (Armenakis et al. 2017). From 2000 29
to 2019, floods contributed 44% of the total disaster worldwide, and Asia alone experiences 30
41% of the total flood events of the world, affecting approximately 1.5 billion people (CRED 31
2020). The intensity of flood varies temporally and spatially, and its occurrence and negative 32
consequences cannot be prevented altogether (Dewan et al. 2006). As developing countries are 33
more vulnerable to floods, there is an urgent need to assess and manage future flood events to 34
minimize the adverse impact. Flood management at the regional or local scale begins with 35
identifying vulnerable areas, detailed understanding of interaction and relationships among the 36
social, economic, and environmental factors to provide the rescue and mitigation response in 37
case of emergency. A comprehensive flood risk map is a critical tool for executing an effective 38
flood management system (Chakrabortty et al. 2021). 39
Many studies have been conducted on flood assessment at the regional, national, and global 40
levels using different approaches and methodologies (Chen et al. 2015; Kumar 2016; 41
Majumder et al. 2019; Sharma et al. 2019; Toosi et al. 2019). The studies have inherent 42
challenges and limitations in identifying and quantifying hazard and vulnerability indicators, 43
dealing with uncertainties, assigning a proper weightage of indicators, and validating the result 44
(Sharma et al. 2018; Arora et al. 2021). The indicators involved in the risk assessment are 45
complex and contain temporal and spatial uncertainties (Choubin et al. 2019). The main 46
challenge is acquiring and collecting data of the selected indicators (Mishra and Sinha 2020). 47
Over the past few decades, remote sensing has played a crucial role in monitoring floods, and 48
it has also solved the challenges related to the availability of data (Sharma et al. 2018; Wang 49
3
and Xie 2018; Rong et al. 2020). In recent times, GIS has been widely used in vulnerability 50
and risk assessment studies as a decision support system for its database and analytical ability 51
(Lyu et al. 2018; Choubin et al. 2019; Danso et al. 2020). 52
Armenakis et al. (2017) developed a flood risk map for the Don River watershed, Toronto, 53
using high spatial resolution data and incorporated demographic indicators to enhance 54
mitigation and preparedness planning. Dandapat and Panda (2017) delineated the flood risk 55
zone of Paschim Medinipur in West Bengal, India, and developed a composite vulnerability 56
index, comprising of i) Physical Vulnerability Index, ii) Social Vulnerability Index, and iii) 57
Coping Capacity Index within the GIS framework and estimated that 24.25% of the total 58
population of the study area is located in high to very high flood risk zones. Sharma et al. 59
(2018), using multicriteria analysis (MCA) and geospatial technique, carried out a flood risk 60
assessment for Kopili River Basin (KRB) in Assam, India, and estimated that a significant 61
portion of the crop and village land falls under high and moderate flood risk zones respectively. 62
Arora et al. (2019) applied Shannon’s entropy (SE) and frequency ratio (FR) models to build a 63
flood susceptibility model for Middle Ganga Plain using the 2008 Landsat 5TM image. 64
Khosravi et al. (2020) developed a national scale flood susceptibility map for Iran using a deep 65
learning convolutional neural networks (CNN) algorithm and illustrate the importance of 66
watershed management and prevention of uncontrolled urban expansion to control flood. 67
Zhang et al. (2020) developed a GIS-based model for flood risk assessment at a large basin 68
scale, such as the Yangtze River Basin, China, taking economic, social, and ecological 69
indicators of flood risk. 70
Several researchers have done GIS-based flood vulnerability studies using multiple approaches 71
(Hazarika et al. 2018; Brito et al. 2019; Dekongmen et al. 2021). Rashetnia and Jahanbani 72
(2021) developed a GIS- fuzzy rule-based flood vulnerability index for Moreland city, 73
Melbourne, considering social, economic, and hydrological factors. Sadeghi-Pouya et al. 74
4
(2017) carried out a flood vulnerability assessment of the western coastal cities of Mazandaran 75
Province, Iran, by classifying effective criteria into three indices, i.e., socio-economic, 76
population-environmental, and technical. Sarkar and Mondal (2020) performed a GIS-based 77
flood vulnerability classification of the Kulik river basin using the frequency ratio (FR) model. 78
Detailed flood risk assessment has been carried out by incorporating hazard and vulnerability 79
assessment and hydrological models (Vojtek and Vojteková 2019; Sharma et al. 2018; Pathak 80
et al. 2020). The essential factor in flood risk assessment is the proper weightage assignment 81
to the selected indicators. Many studies have applied Multi-Criteria Decision Analysis 82
(MCDA) to identify, integrate, or rate the flood risk assessment factors (Chen et al. 2015; 83
Arabameri et al. 2019; Toosi et al. 2019; Mishra and Sinha 2020). Chakraborty and 84
Mukhopadhyay (2019) integrated AHP and GIS for the development of flood risk map for 85
Coochbehar district, West Bengal, India, by the quantification of flood risk index (FRI) using 86
flood hazard index (FHI) and flood vulnerability index (FVI). Hazarika et al. (2018) explained 87
that the application of multicriteria analysis in the GIS environment provides flexibility in 88
selecting significant indicators for the flood risk assessment for Dhemaji district in the Upper 89
Brahmaputra River valley Assam, India. 90
India is considered the second most flood-affected country globally, following China, and it 91
experiences about 17 flood events per year on average, affecting approximately 345 million 92
people (CRED 2020). The vast river network system and the world’s most prominent monsoon 93
system make about 5.74 million hectares of the total land area inundated by floods 94
(Subrahmanyam 1988; Dhar and Nandargi 2004). The issue of flood risk is quite prominent in 95
the Assam region of India due to the highly braided Brahmaputra River. It is mainly influenced 96
by the southwest tropical monsoon, making the river experiencing high water levels and strong 97
flows in the pre-monsoon season. Apart from topographic and meteorological factors, other 98
factors like population settlement along the flood plains, erosion, and siltation of the banks 99
5
accelerate the flood problem in the Brahmaputra basin. Every year the region suffers enormous 100
losses and damage in terms of property and lives, so there is an urgent need to conduct a 101
comprehensive food risk assessment and identify vulnerable areas and triggering factors. 102
The flood-related study for the Assam region is limited only to one aspect like hazard, 103
vulnerability, or risk focussing only on a small area, river basin, or district level with a limited 104
number of indicators (Borah et al. 2018; Hazarika et al. 2018; Sharma et al. 2018; Majumder 105
et al. 2019; Pathan and Sil 2020; Sarmah et al. 2020; Pareta 2021). Considering hazard and 106
vulnerability aspects, comprehensive flood risk assessment studies for the entire Assam region 107
are limited. In the present study, a GIS-based comprehensive flood risk assessment of the 108
Assam region at a regional scale and administrative level is conducted by integrating spatial, 109
hydrological, and socio-economic indicators. The weightage of each indicator is determined 110
by the application of the MCDA technique. The final hazard and risk maps are validated by 111
confusion matrix or error matrix, indirect methods of relative mean error (RME), and root of 112
mean-square error (RMSE) based on historical flood events. The study framework provides an 113
opportunity to understand the challenges associated with flood risk management and to 114
implement effective and sustainable flood mitigation measures and policies for urban and rural 115
areas located at flood risk zones. 116
The main objectives of the present study are as follows i) to develop a GIS-based flood hazard, 117
vulnerability, and risk index by the selection of suitable hazard and vulnerability indicators, 118
weighted according to their significance, ii) to produce high-resolution flood risk, hazard, and 119
vulnerability maps by integrating MCDA and GIS to identify flood-prone areas, iii) to analyze 120
the flood risk scenario at the administrative level. 121
2. Study area 122
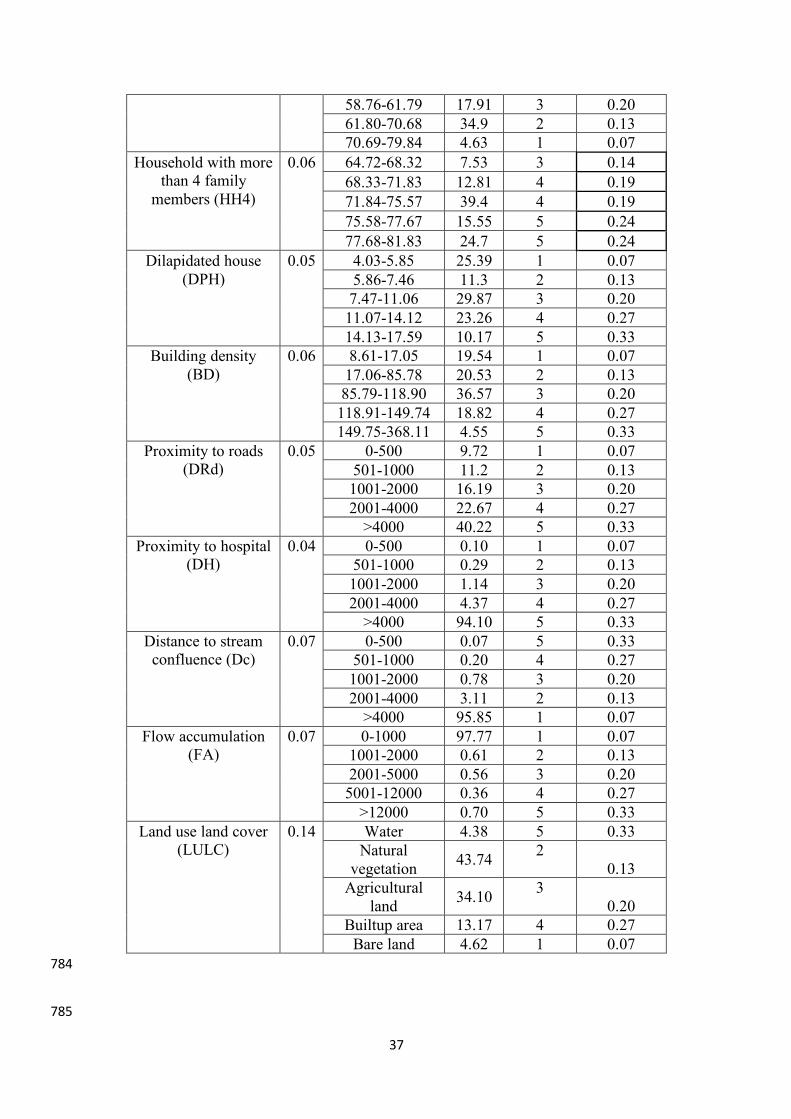
Assam lies in the north-eastern region (NER) of India, covering an area of approximately 123
78,438 km2, extending from 24° 8′ N to 28° 2′ N latitude and 89° 42′ E to 96° E longitude. The 124

6
elevation of the Assam region ranges from 5-1964 m. The neighbouring states of Assam are 125
West Bengal, Arunachal Pradesh, Nagaland, Manipur, Mizoram, Tripura, and Meghalaya. 126
Assam shares its boundary with neighboring countries, Bhutan in the north and Bangladesh in 127
the south (Figure 1). The Guwahati city of Assam, the largest metropolis in NER, is known as 128
the “Gateway to Northeast India” and connects the entire NER with the rest of India. The 129
geographical feature of Assam contains three major physiographic divisions of India i) the 130
northern Himalayas as Eastern hills, ii) Northern plains as Brahmaputra plain, and iii) Deccan 131
plateau as Karbi Anglong (Dikshit and Dikshit 2014). 132
The state of Assam can be divided into five administrative levels as (i) Upper Assam, (ii) Lower 133
Assam, (iii) Central Assam, (iv) North Assam, and (v) Barak Valley (Figure 1). According to 134
the 2011 census, the population growth rate is 16.93%, and districts like Sonitpur, Cachar, 135
Dhubri, Barpeta, Kamprup, Darrang, and Nagaon have high population density (Census 2011). 136
The highest contribution to the economy of Assam is agricultural activities, and the majority 137
of the population is rural involved in the agricultural sector (Figure 1). The climate of Assam 138
is a tropical monsoon rainforest climate with heavy rainfall and high humidity. The summers 139
are warm (temperature 32°-38°) and mild winters (temperature 8°-20°). The region experiences 140
heavy annual rain ranging from 1500 to 3750 mm both in the plain and mountain areas due to 141
the southwest monsoon, mainly in May to September, which causes floods (Chaliha et al. 142
2012). 143
Figure 1 144
Two river systems, Brahmaputra and Barak, are present in the Assam region. In Assam, the 145
Brahmaputra valley is bounded by Himalayan mountains, Patkai hill ranges, and plains of 146
Bangladesh in the northern, eastern, and southern parts, respectively (Deka et al. 2012). Due to 147
the high flood frequency of the Brahmaputra river, it is known as “the river of sorrow” in 148
Assam (Dhar and Nandargi 2004). The tributaries of Brahmaputra River are rainfed in nature 149

7
and classified as north bank tributaries namely Subansiri, Ronganadi, Dikrong, Buroi, 150
Borgong, Jiabharali, Dhansiri (North) Puthimari, Manas, Beki, Aie, Sonkosh and south bank 151
tributaries namely Noadehing, Buridehing, Desang, Dikhow, Bhogdoi, Dhansiri (South), 152
Kopilli, Kulsi, Krishnai, Dhudhnoi, Jinjiran (Jain et al. 2007). 153
The Barak River system is present in the southern part of Assam, forming Barak valley, and it 154
finally drains into Bangladesh (Deka et al. 2012). The main tributaries of Barak rivers are 155
Katakhal, Jiri, Chiri, Modhura, Longai, Sonai, Rukni, and Singla, mainly rainfed tributaries 156
and are highly vulnerable to flooding during rainfall periods (Jain et al. 2007). 157
Assam experiences flood every year, causing inundation of villages, damages to croplands, loss 158
of livelihood, lakhs of families becoming homeless and affecting the entire NER due to 159
connectivity disruption (Sharma et al. 2018). According to Rashtriya Barh Ayog (RBA), the 160
total flood-prone area of Assam is 31.05 Lakh Hectares which constitute about 40 % of the 161
total area of Assam and 9.40% of the total flood-prone area of India. Hence, flood risk mapping 162
is essential for Assam to facilitate effective flood management practice and planning. 163
3. Methodology 164
The methodology can be divided into the following sections: (1) preparation of spatial 165
geodatabase for flood hazard and vulnerability indicator, (2) application of MCDA-AHP for 166
weightage assignment of the indicators, (3) quantification of flood hazard index (FHI), flood 167
vulnerability index (FVI), and flood risk index (FRI) at the regional and administrative level 168
and (4) validation of flood hazard and risk models. 169
3.1. Flood hazard indicators 170
Flood hazard indicators are selected based on literature review, and corresponding thematic 171
layers are generated using GIS. 172
3.1.1. Elevation and slope 173
8
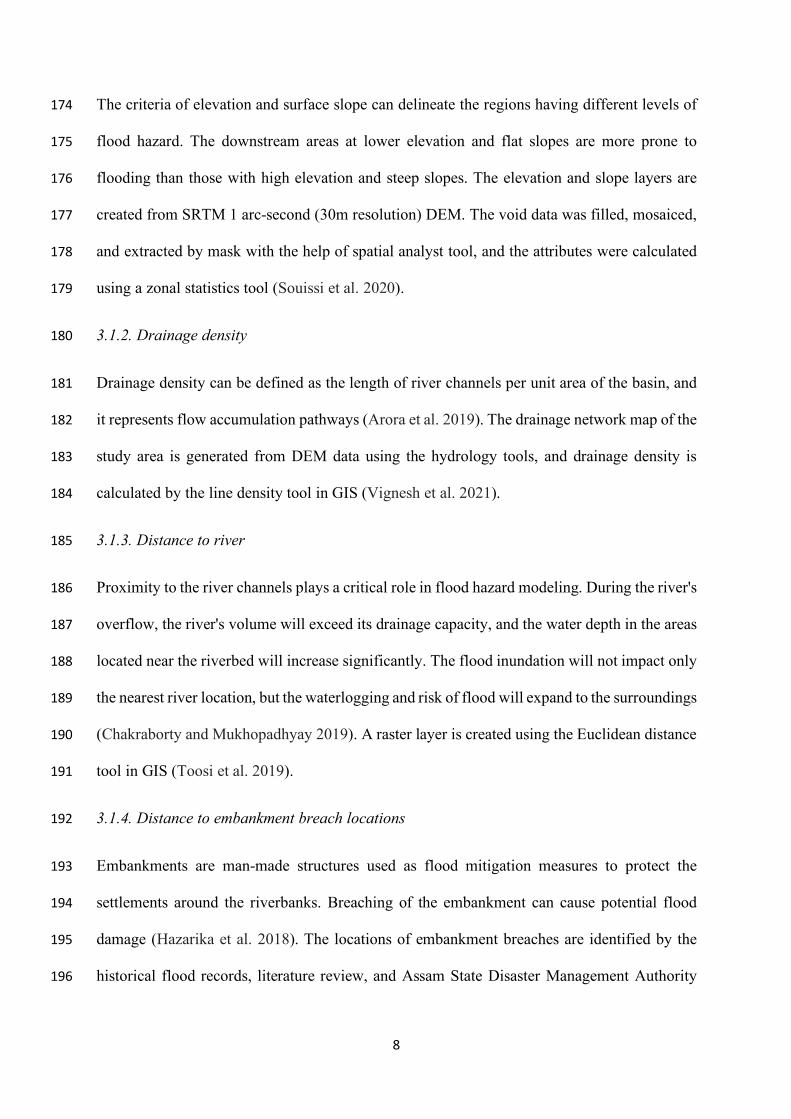
The criteria of elevation and surface slope can delineate the regions having different levels of 174
flood hazard. The downstream areas at lower elevation and flat slopes are more prone to 175
flooding than those with high elevation and steep slopes. The elevation and slope layers are 176
created from SRTM 1 arc-second (30m resolution) DEM. The void data was filled, mosaiced, 177
and extracted by mask with the help of spatial analyst tool, and the attributes were calculated 178
using a zonal statistics tool (Souissi et al. 2020). 179
3.1.2. Drainage density 180
Drainage density can be defined as the length of river channels per unit area of the basin, and 181
it represents flow accumulation pathways (Arora et al. 2019). The drainage network map of the 182
study area is generated from DEM data using the hydrology tools, and drainage density is 183
calculated by the line density tool in GIS (Vignesh et al. 2021). 184
3.1.3. Distance to river 185
Proximity to the river channels plays a critical role in flood hazard modeling. During the river's 186
overflow, the river's volume will exceed its drainage capacity, and the water depth in the areas 187
located near the riverbed will increase significantly. The flood inundation will not impact only 188
the nearest river location, but the waterlogging and risk of flood will expand to the surroundings 189
(Chakraborty and Mukhopadhyay 2019). A raster layer is created using the Euclidean distance 190
tool in GIS (Toosi et al. 2019). 191
3.1.4. Distance to embankment breach locations 192
Embankments are man-made structures used as flood mitigation measures to protect the 193
settlements around the riverbanks. Breaching of the embankment can cause potential flood 194
damage (Hazarika et al. 2018). The locations of embankment breaches are identified by the 195
historical flood records, literature review, and Assam State Disaster Management Authority 196

9
(ASDMA) reports. The coordinates of the locations are extracted from Google Earth and using 197
the Euclidean distance tool, a raster layer is prepared (Chakraborty and Mukhopadhyay 2019). 198
3.1.5. Soil texture 199
Soil texture is a significant flood hazard indicator as the regional internal drainage system, 200
surface runoff, and moisture contents are highly influenced by the prevailing soil texture (Arora 201
et al. 2018). The soil data is obtained from the Food and Agriculture Organization of the United 202
Nations Educational, Scientific and Cultural Organization (FAO-UNESCO) and classified into 203
five soil classes (a) sandy clay loam, (b) loam, (c) clay loam, (d) clay, and (e) sandy loam 204
(Pareta 2021). 205
3.1.6. Geology 206
Geology controls the hydraulic properties of the bedrock of a region. The bedrock with 207
fractured, high porosity and permeability enhances the infiltration rate of rainwater, thus 208
minimizing the risk of flood. The geology map is extracted from the National Geologic Map 209
Database (NGMDB), USGS, and classified into four classes as (a) sedimentary, (b) 210
metamorphic, (c) Precambrian, and (d) Paleozoic rocks (Bhandari et al. 1973). 211
3.1.7. Geomorphology 212
Floods give rise to different landforms like erosional and depositional landforms. The 213
geomorphological data is obtained from the Bhukosh-Geological Survey of India (GSI) 214
(https://bhukosh.gsi.gov.in/Bhukosh/MapViewer.aspx), and classified into (a) structural hills, 215
(b) denudational hills, (c) alluvial plains, (d) pediplain, and (e) floodplain (Vignesh et al. 2021). 216
3.1.8. Topographic Wetness Index (TWI) 217
TWI is used to assess the effect of topography on the hydrological process of a watershed and 218
allows delineation of flood inundated areas (Pourali et al. 2016). For TWI, slope and flow 219

10
accumulation layers are generated from DEM data. TWI is calculated by the equation (1) given 220
by Beven and Kirkby (1979) 221
(1) 222
where A represents source contributing area and tan β is ground surface slope. Higher TWI 223
indicates the area is more prone to flood, and lower value denotes the steepest slope and less 224
flood-prone regions (Arora et al. 2019). 225
Figure 2 226
3.1.9. Rainfall Erosivity Factor (REF) 227
Soil erosion is a significant problem during floods, and its rate depends on rainfall intensity. 228
With the help of REF, the impact of rainfall intensity on soil erosion can be quantified. REF is 229
calculated by equation (2) developed by Singh et al. (1981) using the average daily rainfall data 230
of 21 years from 2000 to 2020 (Pathan and Sil 2020). 231
(2) 232
Here, R and P represent rainfall erosivity factors (MJ mm ha-1 hr-1 year-1) and mean annual 233
precipitation (mm), respectively. 234
3.1.10. Rainfall intensity 235
Rainfall intensity is a crucial parameter that induces the occurrence of floods. Rainfall data 236
from 2000 to 2020 are collected from Indian Meteorological Department (IMD), and rainfall 237
intensity is determined for 114 grid points using equation (3). Rainfall intensity map is 238
developed using Modified Fournier Index (MFI) approach and interpolated by Inverse Distance 239
Weighting (IDW) interpolation in GIS (Toosi et al. 2019). 240
lntan
ATWI
bæ ö
= ç ÷è ø
79 0.363R P= + ´
11
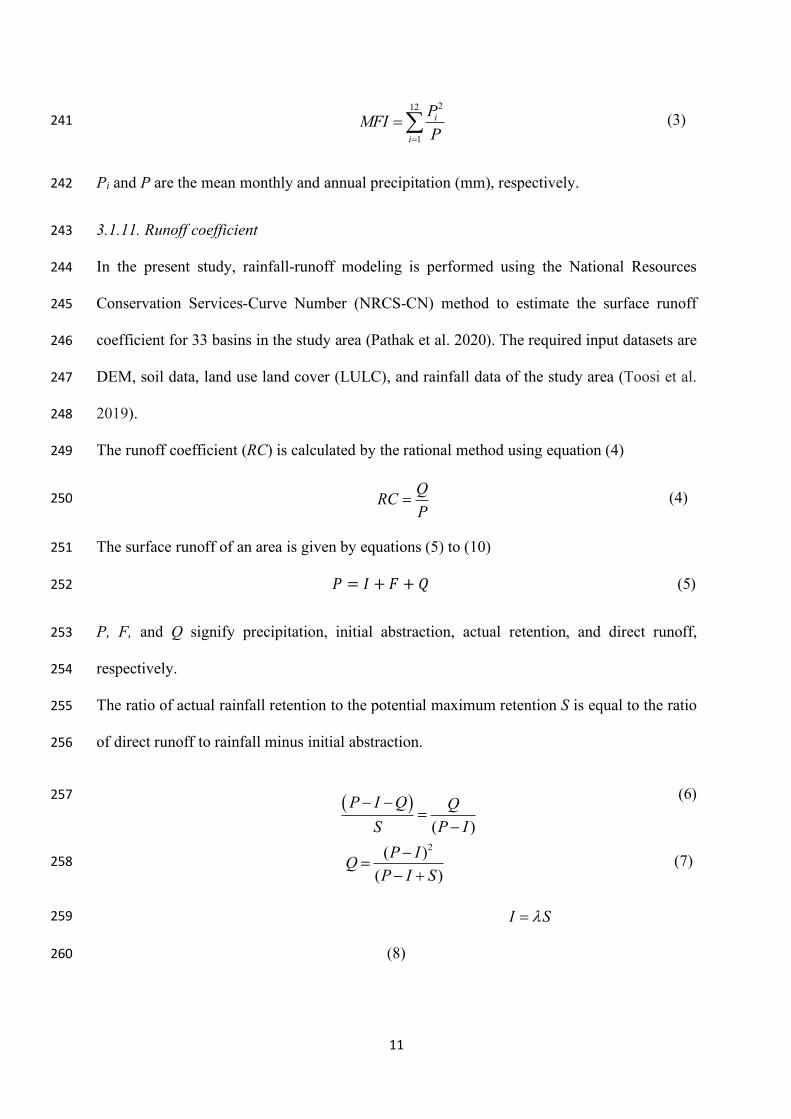
(3) 241
Pi and P are the mean monthly and annual precipitation (mm), respectively. 242
3.1.11. Runoff coefficient 243
In the present study, rainfall-runoff modeling is performed using the National Resources 244
Conservation Services-Curve Number (NRCS-CN) method to estimate the surface runoff 245
coefficient for 33 basins in the study area (Pathak et al. 2020). The required input datasets are 246
DEM, soil data, land use land cover (LULC), and rainfall data of the study area (Toosi et al. 247
2019). 248
The runoff coefficient (RC) is calculated by the rational method using equation (4) 249
(4) 250
The surface runoff of an area is given by equations (5) to (10) 251
𝑃 = 𝐼 + 𝐹 + 𝑄 (5) 252
P, F, and Q signify precipitation, initial abstraction, actual retention, and direct runoff, 253
respectively. 254
The ratio of actual rainfall retention to the potential maximum retention S is equal to the ratio 255
of direct runoff to rainfall minus initial abstraction. 256
(6) 257
(7) 258
259
(8) 260
212
1
i
i
PMFI
P=
=å
QRC
P=
( )( )
P I Q Q
S P I
- -=
-
2( )
( )
P IQ
P I S
-=
- +
I Sl=
12
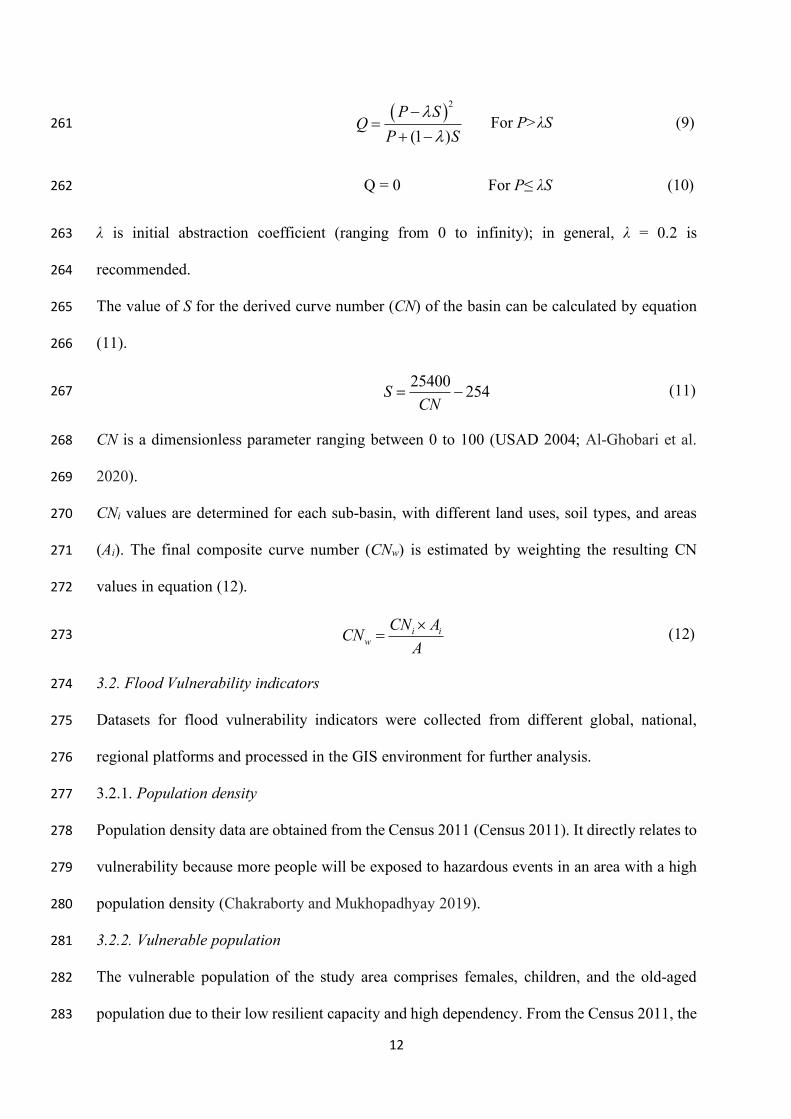
For P>λS (9) 261
Q = 0 For P≤ λS (10) 262
λ is initial abstraction coefficient (ranging from 0 to infinity); in general, λ = 0.2 is 263
recommended. 264
The value of S for the derived curve number (CN) of the basin can be calculated by equation 265
(11). 266
(11) 267
CN is a dimensionless parameter ranging between 0 to 100 (USAD 2004; Al-Ghobari et al. 268
2020). 269
CNi values are determined for each sub-basin, with different land uses, soil types, and areas 270
(Ai). The final composite curve number (CNw) is estimated by weighting the resulting CN 271
values in equation (12). 272
(12) 273
3.2. Flood Vulnerability indicators 274
Datasets for flood vulnerability indicators were collected from different global, national, 275
regional platforms and processed in the GIS environment for further analysis. 276
3.2.1. Population density 277
Population density data are obtained from the Census 2011 (Census 2011). It directly relates to 278
vulnerability because more people will be exposed to hazardous events in an area with a high 279
population density (Chakraborty and Mukhopadhyay 2019). 280
3.2.2. Vulnerable population 281
The vulnerable population of the study area comprises females, children, and the old-aged 282
population due to their low resilient capacity and high dependency. From the Census 2011, the 283
( )2
(1 )
P SQ
P S
l
l
-=
+ -
25400254S
CN= -
i i
w
CN ACN
A
´=

13
data are extracted to estimate the spatial distribution of the vulnerable population (Sharma et 284
al. 2018). 285
3.2.3. Employment rate 286
The economic status of the population highly influences the coping capacity of an area. A well-287
defined income source of a community improves the living standard and increases the 288
community's coping capacity. The employment status for the Assam region is acquired from 289
Census 2011 (Agrawal et al. 2021). 290
3.2.4. Literacy rate 291
The literacy rate of an area is directly related to a community's awareness about the hazard and 292
helps in the preparedness during the hazardous event. Here, the literacy rate of Assam is 293
obtained from Census 2011, and its thematic layer is generated (Sharma et al. 2018). 294
3.2.5. Household with more than four family members 295
The household size directly influences the vulnerability component. A smaller household will 296
be less vulnerable than a household with more family members. The data of households are 297
collected from Census 2011 (Agrawal et al. 2021). 298
3.2.6. Dilapidated house 299
The condition of building structures determines their coping capacity towards any disaster. If 300
the building, mainly a residential building, is dilapidated, its vulnerability will increase. From 301
the Census 2011, data regarding the dilapidated houses are obtained (Agrawal et al. 2021). 302
Figure 3 303
3.2.7. Building density 304
Building density is considered an essential indicator for infrastructure vulnerability assessment, 305
and it is positively correlated with the vulnerability index. For the present study, building 306
density is calculated using the data obtained from the Census 2011 (Agrawal et al. 2021). 307
3.2.8. Distance to roads 308

14
A well-connected and maintained transportation system is one of the essential infrastructure 309
components of a region. Road connectivity plays a critical role in relief and rescue operations 310
during an emergency. Those settlements nearer to the roads are less vulnerable as they can be 311
evacuated or rescued faster than the population residing in the remote areas (Hazarika et al. 312
2018). With the help of OpenStreetMap, major and minor roads are extracted and digitized in 313
GIS. A raster dataset is generated by the Euclidean distance tool in GIS (Pareta 2021). 314
3.2.9. Distance to hospital 315
Proximity to hospitals and healthcare centers will facilitate emergency rescue operations and 316
post-disaster health management activities. The locations of hospitals are obtained from the 317
Department of Health & Family Welfare, Government of Assam. Coordinates of 624 318
government hospitals are extracted from Google Earth, and distance from hospitals is 319
calculated using the Euclidean distance tool in GIS (Chakraborty and Mukhopadhyay 2019; 320
Toosi et al. 2019). 321
3.2.10. Distance to stream confluence 322
The areas near the stream confluence are more prone to flood inundation because during the 323
flood at the confluence point, the channel tends to carry combined discharge and load of two 324
or more upstream tributaries (Chakraborty and Mukhopadhyay 2019). From the drainage 325
network layer of the study area, confluence points are identified, and the distance from the 326
confluence point is determined using the Euclidean distance tool in GIS (Arora et al. 2019). 327
3.2.11. Flow accumulation 328
Flow accumulation is the flow concentration, and it is directly related to flood vulnerability 329
(Vojtek and Vojteková 2019). It is lower upstream but higher downstream as many tributaries 330
join the main channel downstream. For the present study, flow accumulation raster is prepared 331
by 30m resolution of DEM data using hydrology tool in GIS. 332

15
3.2.12. Landuse land cover (LULC) 333
LULC governs the relationship between different hydrological parameters like runoff, 334
infiltration, and rainfall abstraction (Toosi et al. 2019). The urban and pasture land increase the 335
overflow of water, whereas forest and dense natural vegetation increase water infiltration and 336
abstractions. The land use land cover map with ten LULC classes for the study area is derived 337
from Sentinel -2 imagery (10 m resolution) by ESRI (Kontgis et al. 2021). The map is further 338
reclassified into five categories (a) water, (b) built-up area, (c) agricultural land, (d) natural 339
vegetation, and (e) bare land and validated by calculating the kappa coefficient (Vignesh et al. 340
2021). 341
The accuracy of the LULC map is checked by overall accuracy (AOVERALL) and Kappa (K) 342
statistics, User’s and Producer’s accuracy (AUSER and APRODUCER) using equations (13) to (16) 343
(Gibril et al. 2017; Hishe et al. 2020). The detailed error matrix was computed for each 344
classification image, as it allowed evaluation of AUSER and APRODUCER for each of the 345
information classes included in our classification scheme (Table 1). For the present study, 346
Google Earth was used for the validation of classification with N=373 points. 347
𝐾 = (13) 348
(14) 349
= (15) 350
= (16) 351
1 1
2
1
( )( )
( )( )
r r
ii i
i i
r
i
i
i
i
m m m
N m m
N+
= =
+
=
+
+
-
-
å å
å
1
1
OVERALL ii
i
A n
N
g
=
=æ öç ÷è ø
å
PRODUCERA ii
icolumm
n
n
USERA ii
irow
n
n

16
Where r denotes the number of rows, mii number of observations in row i and column i, m+i 352
and mi+ are the marginal total of row (r) and column (i), respectively, nii are the number of 353
observations correctly classified. 354
Table 1 355
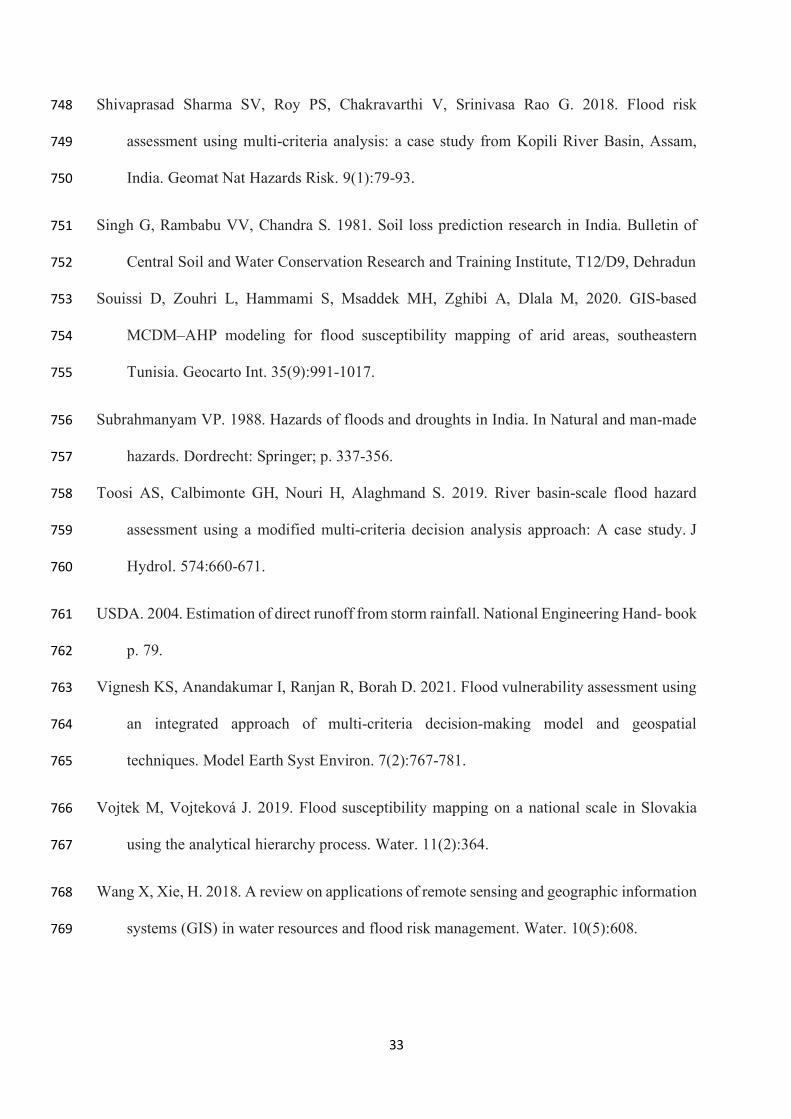
The value of overall accuracy and Kappa coefficient are 90.88% and 0.885, respectively. The 356
Kappa coefficient value close to 1 signifies that the classified image and reference image shows 357
perfect agreement, and hence the classification performed in the study is acceptable. 358
All the thematic layers of flood hazard and vulnerability indicators are resampled to a 30 m 359
raster layer to minimize the error (Chakraborty and Mukhopadhyay 2019). Jenks Natural 360
Breaks method is applied to classify flood hazard and vulnerability indicators, except for 361
distance from rivers, roads, stream confluence, hospitals, embankment breach location, LULC, 362
geology, geomorphology, and soil type (Toosi et al. 2019). 363
3.3. Analytical Hierarchy Process (AHP) as Multi-Criteria Decision Analysis (MCDA) 364
technique 365
The weightage to flood hazard and vulnerability indicators are assigned using Analytical 366
Hierarchy Process (AHP) as Multi-Criteria Decision Analysis (MCDA) technique. It is 367
considered a systematic, multi-objective, and reliable approach developed by Saaty (Saaty 368
2000, 2008). AHP decomposes a problem into a simple and subjective evaluated sub-problem 369
hierarchy (Saaty 2000). The indicators are weighted according to relative importance on a scale 370
from 1 to 9 (Saaty 2008). The steps of AHP are as follows: 371
Step 1. Decompose the complex unstructured problem into a hierarchy of goals, criteria, and 372
indicators. 373
Step 2. Make a pairwise comparison of the indicators based on a qualitative scale (Table 2). 374

17
Step 3. Construct a square matrix of n x n where diagonal elements of the matrix are 1. If the 375
indicator in the ith row of the matrix is more important than the indicator in the jth column, then 376
the element (i, j) will be assigned a value greater than 1, and the element (j, i) will be its 377
reciprocal. 378
Table 2 379
Table 3 380
Step 4. The weights of the pairwise comparison matrix are normalized by the eigenvector 381
method using the equations (17) to (18). 382
(17) 383
(18) 384
where Cij is the indicator value in the pairwise comparison matrix, Xij is the normalized score, 385
and Vij is the priority vector representing the indicators' weight (Wind). 386
Finally, the assigned normalized weights are tested for consistency ratio (CR) using equation 387
(19), where CR must be less than 0.1 and consistency index (CI) is calculated by equation (20). 388
(19) 389
(20) 390
λmax, RI (Table 3), and n are principal eigenvector, random index, and the number of indicators, 391
respectively. 392
3.4. Flood hazard, vulnerability, and risk index 393
Flood hazard index (FHI), flood vulnerability index (FVI), and flood risk index (FRI) are 394
calculated in GIS using a raster calculator by equations (21) to (23). The index scores are 395
1
ij
ij n
ij
i
CX
C=
=
å
1
n
ij
j
ij
X
Vn
=
=
å
CICR
RI=
max
1
nCI
n
l -=
-
18
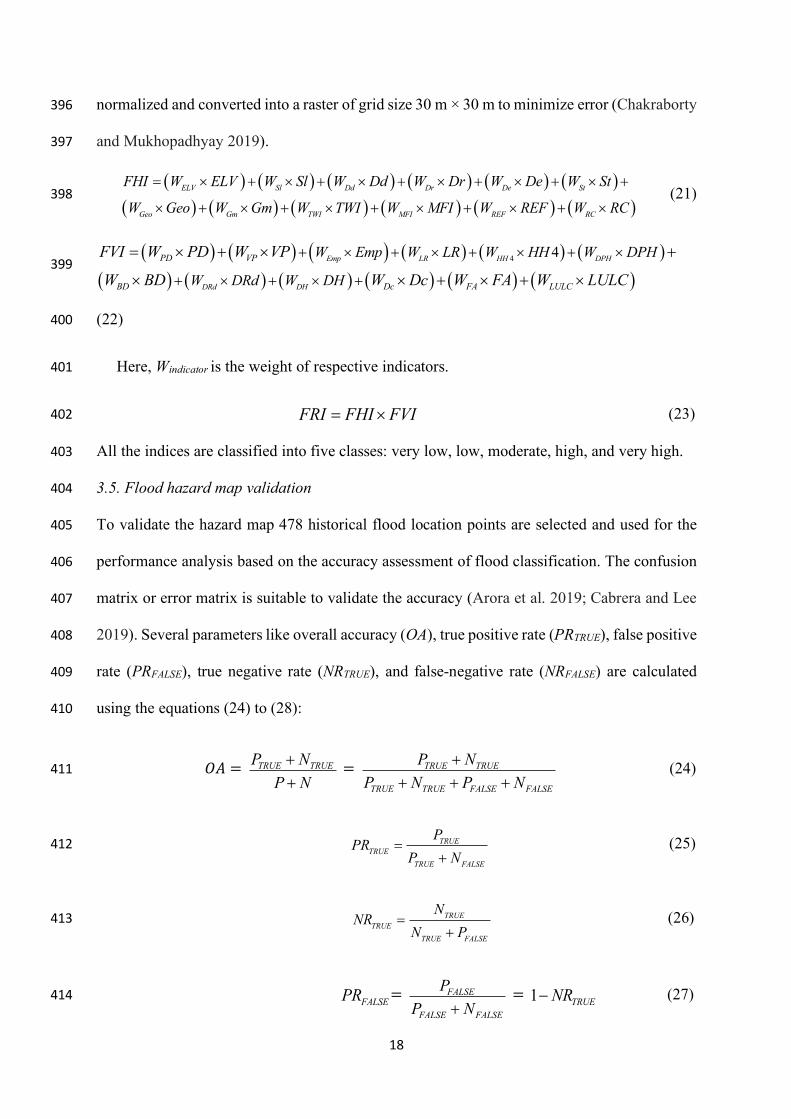
normalized and converted into a raster of grid size 30 m × 30 m to minimize error (Chakraborty 396
and Mukhopadhyay 2019). 397
(21) 398
399
(22) 400
Here, Windicator is the weight of respective indicators. 401
(23) 402
All the indices are classified into five classes: very low, low, moderate, high, and very high. 403
3.5. Flood hazard map validation 404
To validate the hazard map 478 historical flood location points are selected and used for the 405
performance analysis based on the accuracy assessment of flood classification. The confusion 406
matrix or error matrix is suitable to validate the accuracy (Arora et al. 2019; Cabrera and Lee 407
2019). Several parameters like overall accuracy (OA), true positive rate (PRTRUE), false positive 408
rate (PRFALSE), true negative rate (NRTRUE), and false-negative rate (NRFALSE) are calculated 409
using the equations (24) to (28): 410
𝑂𝐴 = = (24) 411
(25) 412
(26) 413
= = (27) 414
( ) ( ) ( ) ( ) ( ) ( )
( ) ( ) ( ) ( ) ( ) ( )
ELV Sl Dd Dr De St
Geo Gm TWI MFI REF RC
FHI W ELV W Sl W Dd W Dr W De W St
W Geo W Gm W TWI W MFI W REF W RC
= ´ + ´ + ´ + ´ + ´ + ´ +
´ + ´ + ´ + ´ + ´ + ´
( ) ( ) ( ) ( ) ( ) ( )
( ) ( ) ( ) ( ) ( ) ( )
44
Emp LR HH DPH
DRd DH
PD VP
BD Dc FA LULC
W Emp W LR W HH W DPH
W DRd W DH
FVI W PD W VP
W BD W Dc W FA W LULC
+ ´ + ´ + ´ + ´
+ ´ + ´ +
= ´ + ´ +
´ ´ + ´ + ´
FRI FHI FVI= ´
TRUE TRUEP N
P N
+
+
TRUE TRUE
TRUE TRUE FALSE FALSE
P N
P N P N
+
+ + +
TRUE
TRUE
TRUE FALSE
PPR
P N=
+
TRUE
TRUE
TRUE FALSE
NNR
N P=
+
FALSEPR FALSE
FALSE FALSE
P
P N+1
TRUENR-

19
= = (28) 415
where P, N, PTRUE, NTRUE, PFALSE, and NFALSE denote positive, negative, true positive, true 416
negative, false positive, and false negative, respectively. 417
For the 478 points, elevations are extracted by using GIS tools. The elevation for the points 418
ranged between 5 m to 135 m. The points are interpolated by the Kriging interpolation method 419
and identified that points belonging to this elevation range are flood-prone areas. 420
3.6. Flood risk map validation 421
Due to a lack of data on flood depths, storm discharge at micro levels, the validation of the 422
result was based on historical flood events and flood-prone areas reported by Disaster 423
Management authorities at state and district levels. A total of 1263 inundation-prone 424
settlements in the study area are identified and converted as georectified points in the GIS 425
environment. From the settlement layer, a set of points are generated for very low to very high 426
flood risk with the help of a spatial statistics tool. To validate the flood risk model (FRM), 427
indirect methods of relative mean error (RME) and root of mean-square error (RMSE) are 428
applied by considering observed locations (OL) for reported sites and predicted locations (PL) 429
for modeled sites (Chakraborty and Mukhopadhyay 2019). The values of RME, RMSE, 430
percentage of relative error (REi), and standard error (SEi) for FRM are calculated using 431
equations (29) to (32). 432
(29) 433
= (30) 434
(31) 435
FALSENR FALSE
FALSE TRUE
N
N P+1
TRUEPR-
1RME REi
n= å
iRE
( ) 100OL PL
OL
- ´
1( )
iRMSE SE
n= å

20
(32) 436
4. Results and discussion 437
4.1. Spatial distribution of Flood hazard and vulnerability indicators 438
The extent of flood hazard and vulnerability depends on topographical, geological, drainage 439
characteristics, hydrological, meteorological, demographical conditions of the region (Toosi et 440
al. 2019; Pathak et al. 2020; Hazarika et al. 2018; Arora et al. 2019). The flood hazard and 441
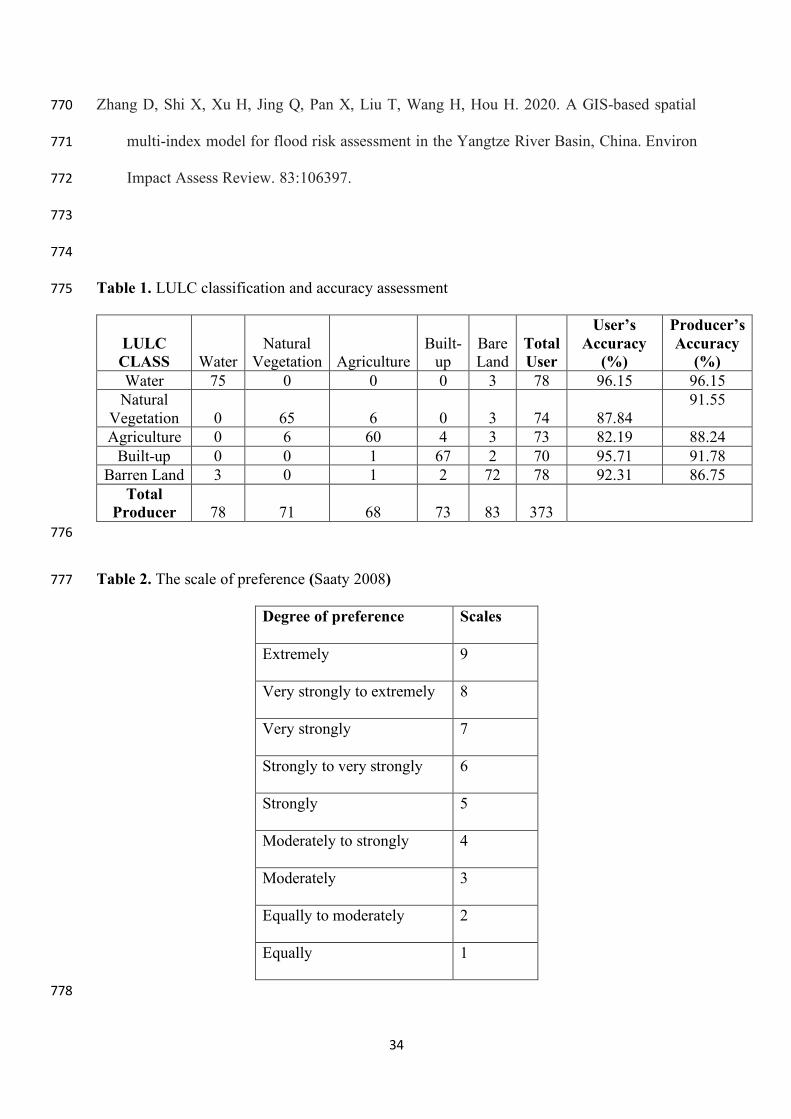
vulnerability indicators are classified into different classes, and effective weights are assigned 442
according to their significance i.e., very low (1), low (2), moderate (3), high (4), and very high 443
(5) (Table 4 and 5) (Chakraborty and Mukhopadhyay 2019; Pathak et al. 2020). 444
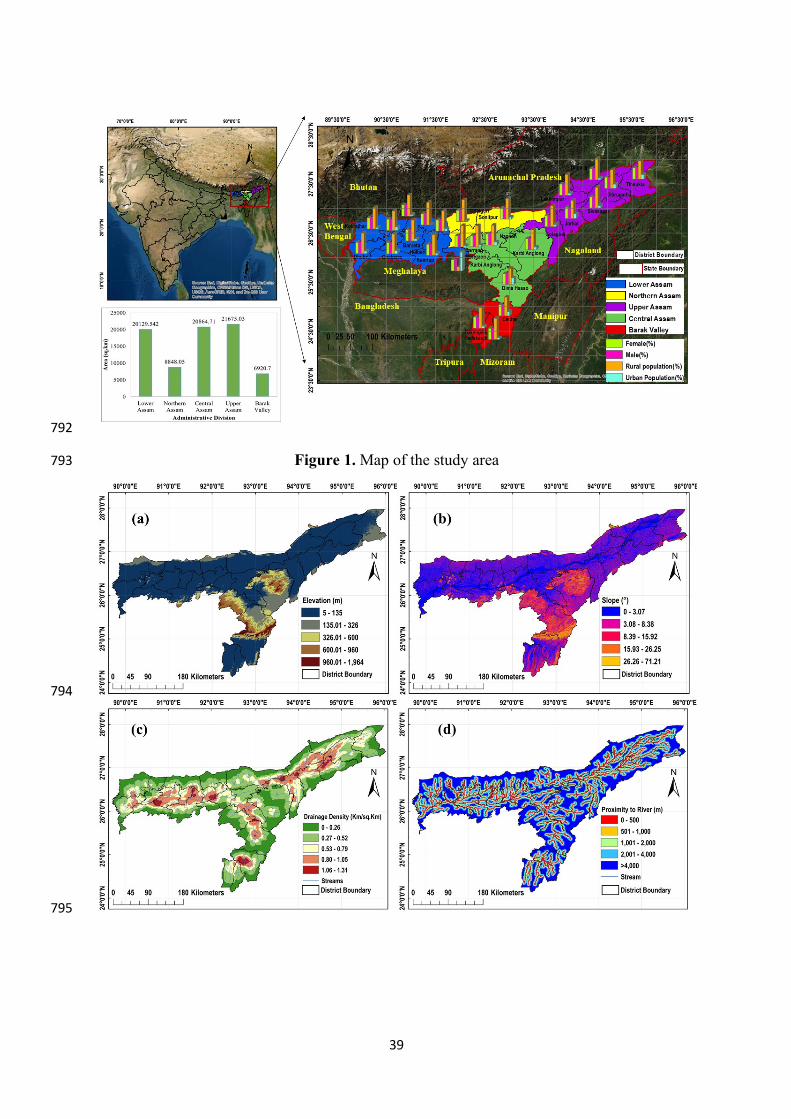
A thematic layer of flood hazard indicators is generated in GIS (Figure 2(a)-2(l)). Lower, 445
North, Upper, and Barak valley of Assam are more flood-prone due to lower elevation, milder 446
slopes, lower TWI, sedimentary rock structure, and sandy clay loam soil texture. The drainage 447
density is relatively low in Northern Assam and high in the Lower, Upper, Central, and Barak 448
valleys of Assam, increasing its flood susceptibility (Vignesh et al. 2021). The Lower, Northern 449
and Upper Assam are highly susceptible to flood due to alluvial and flood plains. The REF 450
values in the Upper and Lower Assam ranges from very low to very high, very high to moderate 451
in the Barak valley, very low to low in Central, and moderate to very low in Northern Assam. 452
The rainfall intensity and runoff coefficient are moderate to very high for the Lower and Barak 453
valley of Assam. 454
Table 4 455
The vulnerability indicators can be grouped into four types of vulnerability (i) socioeconomic 456
(population density, vulnerable population, employment rate, literacy rate, and household with 457
more than 4 family members), (ii) infrastructure (building density, distance to roads, distance 458
to hospital, and several dilapidated houses), (iii) hydrological (flow accumulation and distance 459
2( )i
SE OL PL= -
21
to stream confluences) and (iv) land use (LULC) (Figure 3(a)-3(l)) (Sharma et al. 2018). The 460
population density ranges from very high to moderate for the Lower, Upper, and Barak valley 461
of Assam and low to very low in Central and Northern Assam. 462
Table 5 463
The vulnerable population is very high in some parts of the Lower, Central, Upper, and Barak 464
valley of Assam. The employment rate is very high in the upper region of Assam due to the 465
predominance of agricultural activities, and the majority of the population is self-employed. 466
Very high to moderate literacy rates are found in the Upper, Central, and Barak valley of Assam 467
and can be considered less vulnerable than those with low literacy rates. The housing condition 468
of Central and Upper Assam lies in very low to low vulnerable class along with moderate to 469
high building density. The LULC distribution is classified according to the flood hazard, 470
vulnerability, and risk index for the Assam region (Figure 4(a)-4(d)) (Toosi et al. 2019). The 471
indicators are dynamic and vary spatially and temporally (Souissi et al. 2020). 472
Figure 4 473
4.2. Weightage assignment of indicators by AHP 474
In the present study AHP, a multi-criteria decision analysis approach is used to generate flood 475
hazard index (FHI) and flood vulnerability index (FVI). The consistency ratio (CR) is 0.06 and 476
0.03 for flood hazard and vulnerability indicators, respectively, and the consistency index (CI) 477
is 0.09 for flood hazard and 0.04 for vulnerability indicators. Highly contributing factors for 478
flood hazard are rainfall intensity, slope, runoff coefficient, elevation, distance to rivers, 479
drainage density, and the least significant factors are erosivity factor, geomorphology, and 480
geology (Table 6) (Toosi et al. 2019). 481
Table 6 482
22
For flood vulnerability, highly contributing factors include population density, vulnerable 483
population, land use landcover, whereas the least contributing factors are identified as 484
employment and literacy rate (Table 7) (Chakraborty and Mukhopadhyay 2019). The 485
weightage assigned to the indicators has a critical role in flood risk modeling (Arabameri et al. 486
2019; Chakrabortty et al. 2021). 487
Table 7 488
4.3. Mapping of FHI, FVI, and FRI 489
From the spatial distribution of the FHI, the influence of rainfall intensity, runoff coefficient, 490
elevation, surface slope, distance to the river, and drainage density are highly significant (Toosi 491
et al. 2019). The resulting flood hazard map shows a substantial relationship with the 492
controlling factors and FHI values. Areas with alluvial plains fall under very high to moderate 493
FHI, while regions with structural and denudational hills have very low to low flood hazard 494
zonation (Vignesh et al. 2021). Upper and lower Assam have high TWI, and it comes under 495
very high to high flood hazard zone. The Lower, Upper, and Barak valleys of Assam have very 496
high FHI and low to very low FHI values observed for the Central Assam (Figure 5a). More 497
than 70% of the total area lies in the moderate to very high FHI class (Figure 5d). 498
In the present study, significant weightage is given to demographic, land use landcover 499
infrastructure, and hydrological indicators as vulnerability indicators. The FVI ranges from low 500
to very low for Central and Upper Assam, high to very high for Lower Assam, moderate to low 501
for Northern Assam, and low to very high for the Barak valley. A large proportion of the area 502
is in a very high vulnerable zone located along West Bengal, Meghalaya, and Indo-Bangladesh 503
border. These areas have very high to moderate population density, a very high percentage of 504
the vulnerable population, low literacy and employment rate, and high building density 505
(Chakraborty and Mukhopadhyay 2019). About 57.37% of the total areas have moderate to 506
high FVI (Figure 5d). Very high to moderate FVI are observed for Lower and Barak valley of 507

23
Assam. For Upper and Northern Assam, moderate to very low FVI values are identified, and a 508
large part of Central Assam shows very low flood vulnerability (Figure 5b). 509
Figure 5 510
The FHI and FVI profiles of Assam are different because flood hazards represent real and 511
existing physical elements that alter gradually, and the more dynamic indicators determine 512
flood vulnerability (Sharma et al 2018).513
The spatial distribution of FRI shows that both FHI and FVI contribute significantly to the 514
generation of FRI, but their influences differ in many parts of the study area. Northern Assam 515
has moderate to high FHI, and moderate to low FVI and FRI classes. For Upper Assam, the 516
FHI ranges from moderate to very high, FVI and FRI range from very low to moderate. Barak 517
valley has moderate to very high FHI values, low to high FVI and FRI classes. Lower Assam 518
falls in the moderate to a very high flood risk category, and Central Assam has low to very low 519
flood risk values. The spatial distribution of FRI indicates that flood vulnerability indicators 520
contribute more to the estimation of risk than the hazard indicators (Figure 5c). Moderate to 521
very high FRI is observed for more than 50% of the total study area (Figure 5d). 522
4.4. Mapping of FHI, FVI, and FRI at the administrative level 523
4.4.1. Lower Assam 524
In lower Assam, 90.29%, 86.03%, and 88.32% of the total study area fall under moderate to 525
very high FHI, FVI and FRI classes, respectively (Figure 6(p)-6(r)). Dhubri, Goalpara Barpeta, 526
Bongaigaon, and Chirang lie in high to very high FHI, FVI, and FRI zones. The FRI class for 527
Kokrajhar district ranges from high to low, with moderate FVI and very high FHI. Nalbari lies 528
in very high to high flood hazard zonation with moderate to high FVI resulting in high to 529
moderate FRI. The area of Kamrup and Baksa falls under very high to low FHI and FVI class 530
and high to low FRI class. The Kamprup metropolitan has very low to low FRI due to very low 531
FHI and moderate FVI (Figure 6(a)-6(c)). 532

24
4.4.2. Upper Assam 533
More than 55% of the total area of Upper Assam falls under high to very high FHI class, and 534
less than 10% lies in high to very high FVI and FRI class (Figure 6(p)-6(r)). All the seven 535
Upper Assam districts are in high FHI classes but moderate to very low FVI and FRI classes. 536
(Figure 6(d)-6(f)). 537
4.4.3. Northern Assam 538
The Darrang district lies under high to very high flood hazard, vulnerability, and risk class in 539
the Northern Assam. For Sonitpur, flood risk ranges from moderate to low due to lower flood 540
hazards and vulnerability. Udalgiri district lies in a very high FVI zone but has moderate to 541
low FHI, making it moderate towards flood susceptibility (Figure 6(g)-6(i)). The very high to 542
moderate FHI, FVI, and FRI classes contribute approximately 85%,71%, and 63% of the total 543
study area, respectively (Figure 6(p)-6(r)). 544
Figure 6 545
4.4.4. Central Assam 546
The districts of Morigaon and Nagaon lie in moderate flood hazard and risk zones, having very 547
high FVI due to high population density, low literacy rate, and agricultural lands and built-up 548
areas. Similar variations are observed for FHI, FVI, and FRI classes for Karbi Anglong and 549
Dima Hasao districts (Figure 6(j)-6(l)). About 70% of the total study area falls under very low 550
flood risk and vulnerability zone (Figure 6(q)-6(r)). 551
4.4.5. Barak valley 552
The FVI for the Karimganj district of Barak valley is very high, with moderate to very high 553
FHI and FRI classes. On the other hand, Hailakandi and Cachar districts lie in moderate to low 554
FVI and FRI classes with very high FHI (Figure 6(m)-6(o)). More than 60% of the study area 555
is observed under moderate to very high FRI zones (Figure 6r). 556

25
The detailed study on flood risk assessment is essential to create more comprehensive and 557
integrated flood risk management practices for flood-prone regions like Assam. Many studies 558
have considered MCDA to develop a flood risk model using hydrological, geological, 559
demographical, and LULC indicators (Armenakis et al. 2017; Chakrabortty et al. 2021). The 560
spatial distribution of the indicators has a critical impact on the variation of FHI, FVI, and FRI 561
at the regional and administrative levels. For FRI development, the main limitations are related 562
to the database, including soil, topography, meteorological, lithological, historical flood events, 563
etc (Sarmah et al. 2020; Souissi et al. 2020). In the flood hazard assessment, rainfall intensity 564
is given higher weightage, followed by slope and runoff coefficient (Toosi et al. 2019). Factors 565
like elevation, slope, distance to river, geomorphology, soil type drainage density are used by 566
many researchers for the flood hazard assessment of Assam and other areas (Kumar 2016; 567
Pathak et al. 2020; Pareta 2021). But factors like TWI, REF, and runoff coefficient are limited, 568
especially for Assam. 569
Similarly, for the FVI, more weightage is given to demographical indicators and LULC of the 570
study area. The weightage assignment of the flood and vulnerability indicators is not constant, 571
and it depends from region to region (Sarkar and Mondal 2020; Rashetnia and Jahanbani 2021). 572
The results obtained by integrating MCDA(AHP)-GIS for the flood risk assessment of Assam 573
will provide the urban planners, engineers, policymakers a reliable and efficient tool for 574
identifying flood-prone zones and making effective preparedness and mitigation strategies. 575
5. Result validation 576
5.1. Flood hazard index map 577
Based on 478 historical flood points, a resulting flood map was created by the interpolation 578
method in GIS software and overlaid with the flood hazard index map, obtained by applying 579
AHP. After performing the accuracy assessment by the confusion matrix or error matrix 580
method, the number of pixels that matched correctly (PTRUE) and mistakenly (PFALSE) are 581
26
calculated (Table 8). The estimated accuracy is 90.75%. Calculated PRTRUE, NRTRUE, PRFALSE, 582
and NRFALSE values are 0.90, 0.92, 0.08, and 0.10, respectively. 583
Table 8 584
5.2. Flood risk index map 585
Relative mean error (RME) and root of mean-square error (RMSE) were applied to validate 586
the flood risk map of Assam, based on the selection of 1263 flood-prone locations. The model 587
accurately predicted 1089 locations and has an accuracy of 86.22%, the overall efficiency of 588
the model is found to be satisfactory, with RMSE equal to 0.105 and RME equal to 0.391. For 589
the districts like Barpeta, Chirang, Cachar, Lakhimpur, Nalbari, Morigaon, Tinsukia, 590
Karimganj, Golaghat, Jorhat, Udalguri, Naogaon, Sivasagar, Dima Hasao, Dhubri, Sonitpur, 591
Darrang, Dhemaji, Goalpara, Bongaigaon, Kokrajhar shows accuracy level between 85-96% 592
and district like Kamrup metropolitan, Kamrup rural, Baksa, Hailakandi, Dibrugarh, Karbi 593
Anglong have accuracy level ranging from 78-85%. 594
6. Conclusion 595
In the present study, the flood hazard, vulnerability, and risk maps of Assam at the regional 596
and administrative levels are developed by combining MCDA-AHP and GIS tools. The flood 597
hazard and vulnerability layer are created using different indicators, and AHP is applied to 598
assigned weightage to the indicator. The final flood risk map is obtained by integrating hazard 599
and vulnerability indices in GIS software and validated by confusion matrix, RME, and RMSE 600
based on historical flood events. The results show that more than 70% of the total area lies in 601
the moderate to very high FHI class, and it includes Lower, Upper, and Barak valley of Assam 602
have very high FHI. About 57.37% of the total areas have moderate to high FVI consisting of 603
the Lower and Barak valley of Assam, whereas the Central Assam shows very low flood 604
vulnerability. For more than 50% of the total study area, moderate to very high FRI are 605
observed in the Lower, Upper, and Barak valley of Assam. The FHI, FVI, and FRI indices 606
27
estimate the flood-prone areas of Assam and spatial variation of the indicators responsible for 607
flood occurrence. The districts like Dhubri, Goalpara Barpeta, Bongaigaon, Darrang, 608
Karimganj, and Chirang lie in high to very high FHI, FVI, and FRI zones. The study has 609
inherent limitations related to the database, including soil, topography, meteorological, 610
lithological, historical flood events, and weightage assignment. The results may provide the 611
local governing authorities and stakeholders with a comprehensive tool for flood risk 612
management. The methodology can be implemented in other locations to carry out a flood risk 613
assessment with more accurate and precise data sources using time and cost-effective GIS-614
based tools. 615
Data Availability Statement 616
The authors confirm that the data supporting the findings of this study are available within the 617
article and some of the raw data were generated at our laboratory and derived data supporting 618
the findings of this study are available upon reasonable request. 619
Declaration of Competing Interests 620
The authors declare that they have no known competing financial interests or non-financial 621
interests or personal relationships that are directly or indirectly related to the work submitted 622
for publication that could have appeared to influence the work reported in this paper. 623
References 624
625
Agrawal N, Gupta L, Dixit J. 2021. Assessment of the Socioeconomic Vulnerability to Seismic 626
Hazards in the National Capital Region of India Using Factor Analysis. Sustainability. 627
13(17):9652. 628
Al-Ghobari H, Dewidar A, Alataway A. 2020. Estimation of surface water runoff for a semi-629
arid area using RS and GIS-based SCS-CN method. Water. 12(7):1924. 630

28
Arabameri A, Rezaei K, Cerdà A, Conoscenti C, Kalantari Z. 2019. A comparison of statistical 631
methods and multi-criteria decision making to map flood hazard susceptibility in Northern 632
Iran. Sci Total Environ. 660:443-458. 633
Armenakis C, Du EX, Natesan S, Persad RA, Zhang Y. 2017. Flood risk assessment in urban 634
areas based on spatial analytics and social factors. Geosciences. 7(4):123. 635
Arora A, Pandey M, Siddiqui MA, Hong H, Mishra VN. 2019. Spatial flood susceptibility 636
prediction in Middle Ganga Plain: comparison of frequency ratio and Shannon’s entropy 637
models. Geocarto Int. 1-32. 638
Beven KJ, Kirkby MJ. 1979. A physically based, variable contributing area model of basin 639
hydrology. Hydrol Sci J. 24(1):43-69. 640
Bhandari LL, Fuloria RC, Sastri VV. 1973. Stratigraphy of Assam Valley, India. AAPG 641
Bulletin. 57(4):642-654. 642
Borah SB, Sivasankar T, Ramya MNS, Raju PLN. 2018. Flood inundation mapping and 643
monitoring in Kaziranga National Park, Assam using Sentinel-1 SAR data. Environ 644
monitoring and Assess. 190(9):1-11. 645
Brito MMD, Evers M, Almoradie ADS. 2018. Participatory flood vulnerability assessment: a 646
multi-criteria approach. Hydrol Earth Syst Sci. 22(1):373-390. 647
Cabrera JS, Lee HS. 2019. Flood-prone area assessment using GIS-based multi-criteria 648
analysis: a case study in Davao Oriental, Philippines. Water. 11(11):2203. 649
Census. 2011. Population Census 2011. https://www.census2011.co.in/ 650
Chakrabortty R, Chandra Pal S, Rezaie F, Arabameri A, Lee S, Roy P, Saha A, Chowdhuri I, 651
Moayedi H. 2021. Flash-flood hazard susceptibility mapping in Kangsabati River Basin, 652
India. Geocarto Int. 1-23. 653

29
Chakraborty S, Mukhopadhyay S. 2019. Assessing flood risk using analytical hierarchy 654
process (AHP) and geographical information system (GIS): application in Coochbehar 655
district of West Bengal, India. Nat Hazards. 99(1):247-274. 656
Chaliha S, Sengupta A, Sharma N, Ravindranath NH. 2012. Climate variability and farmer's 657
vulnerability in a flood-prone district of Assam. Int J Climate Change Strategies and 658
Manage. 4:179–200 659
Chen H, Ito Y, Sawamukai M, Tokunaga T. 2015. Flood hazard assessment in the Kujukuri 660
Plain of Chiba Prefecture, Japan, based on GIS and multicriteria decision analysis. Nat 661
Hazards. 78(1):05-120. 662
Choubin B, Moradi E, Golshan M, Adamowski J, Sajedi-Hosseini F, Mosavi A. 2019. An 663
ensemble prediction of flood susceptibility using multivariate discriminant analysis, 664
classification and regression trees, and support vector machines. Sci Total Environ. 665
651:2087-2096. 666
CRED. 2019. EM-DAT:The Int Disaster Database. Centre for Research on the Epidemiology 667
of Disasters. 668
Dandapat K, Panda GK. 2017. Flood vulnerability analysis and risk assessment using analytical 669
hierarchy process. Model Earth Syst Environ. 3(4):1627-1646. 670
Danso SY, Ma Y, Adjakloe YDA, Addo IY. 2020. Application of an Index-Based Approach 671
in Geospatial Techniques for the Mapping of Flood Hazard Areas: A Case of Cape Coast 672
Metropolis in Ghana. Water. 12(12):3483. 673
Deka RL, Mahanta C, Pathak H, Nath KK, Das S. 2013. Trends and fluctuations of rainfall 674
regime in the Brahmaputra and Barak basins of Assam, India. Theoretical and Appl 675
climatology. 114(1):61-71. 676

30
Dekongmen BW, Kabo-bah AT, Domfeh MK, Sunkari ED, Dile YT, Antwi EO, Gyimah RAA. 677
2021. Flood vulnerability assessment in the Accra Metropolis, southeastern Ghana. Appl 678
Water Sci. 11(7):1-10. 679
Dewan AM, Kumamoto T, Nishigaki M. 2006. Flood hazard delineation in greater Dhaka, 680
Bangladesh using an integrated GIS and remote sensing approach. Geocarto Int. 21(2):33-681
38. 682
Dhar ON, Nandargi S. 2004. Rainfall distribution over the Arunachal Pradesh 683
Himalayas. Weather. 59(6):155-157. 684
Dikshit KR, Dikshit JK. 2014. Relief features of north-east India. In North-East India: Land, 685
People and Economy. Dordrecht: Springer ; p.91-125 686
FAO and ITPS. 2015. Main report: Status of the World’s Soil Resources; Food and Agriculture 687
Organization of the United Nations and Intergovernmental Technical Panel on Soils, 688
Rome, Italy. 689
Gibril MBA, Bakar SA, Yao K, Idrees MO, Pradhan B. 2017. Fusion of RADARSAT-2 and 690
multispectral optical remote sensing data for LULC extraction in a tropical agricultural 691
area. Geocarto Int. 32(7):735-748. 692
Hazarika N, Barman D, Das AK, Sarma AK, Borah SB. 2018. Assessing and mapping flood 693
hazard, vulnerability and risk in the Upper Brahmaputra River valley using stakeholders’ 694
knowledge and multicriteria evaluation (MCE). J Flood Risk Manage. 11:S700-S716. 695
Hishe S, Bewket W, Nyssen J, Lyimo J. 2020. Analysing past land use land cover change and 696
CA-Markov-based future modelling in the Middle Suluh Valley, Northern 697
Ethiopia. Geocarto Int. 35(3):225-255. 698
Jain SK, Agarwal PK, Singh VP. 2007. Brahmaputra and Barak Basin. In Hydrology and water 699
resources of India. Dordrecht: Springer; p. 419-472. 700

31
Khosravi K, Panahi M, Golkarian A, Keesstra SD, Saco PM, Bui DT, Lee S. 2020. 701
Convolutional neural network approach for spatial prediction of flood hazard at national 702
scale of Iran. J Hydrol. 591:125552. 703
Kontgis K, et al. “Global land use/land cover with Sentinel-2 and deep learning.” IGARSS 704
2021-2021 IEEE Int Geoscience and Remote Sensing Symposium. IEEE, 2021. 705
Kumar R. 2016. Flood hazard assessment of 2014 floods in Sonawari sub-district of Bandipore 706
district (Jammu & Kashmir): An application of geoinformatics. Remote Sensing 707
Applications: Society and Environ. 4:188-203. 708
Lyu HM, Sun WJ, Shen SL, Arulrajah A. 2018. Flood risk assessment in metro systems of 709
mega-cities using a GIS-based modeling approach. Sci Total Environ. 626:1012-1025. 710
Majumder R, Bhunia GS, Patra P, Mandal AC, Ghosh D, Shit PK. 2019. Assessment of flood 711
hotspot at a village level using GIS-based spatial statistical techniques. Arab J 712
Geosci. 12(13):1-12. 713
Mishra K, Sinha R. 2020. Flood risk assessment in the Kosi megafan using multi-criteria 714
decision analysis: A hydro-geomorphic approach. Geomorphology. 350:106861. 715
Pareta K. 2021. Multi-Criteria Analysis (MCA) for Identification of Vulnerable Areas Along 716
Brahmaputra River in Assam and Their Field Assessment. J of Environ Protection and 717
Sustainable Development. 7(2):15-29. 718
Pathak S, Liu M, Jato-Espino D, Zevenbergen C. 2020. Social, economic and environmental 719
assessment of urban sub-catchment flood risks using a multi-criteria approach: A case 720
study in Mumbai City, India. J Hydrol. 591:125216. 721
Pathan SA, Sil BS. 2020. Prioritization of soil erosion prone areas in upper Brahmaputra River 722
Basin up to Majuli River Island. Geocarto Int. 1-19. 723

32
Pourali SH, Arrowsmith C, Chrisman N, Matkan AA, Mitchell D. 2016. Topography wetness 724
index application in flood-risk-based land use planning. Appl Spatial Analysis and 725
Policy. 9(1):39-54. 726
Rashetnia S, Jahanbani H. 2021. Flood vulnerability assessment using a fuzzy rule-based index 727
in Melbourne, Australia. Sustainable Water Resources Manage. 7(2):1-13. 728
Rong Y, Zhang T, Zheng Y, Hu C, Peng L, Feng P. 2020. Three-dimensional urban flood 729
inundation simulation based on digital aerial photogrammetry. J Hydrol. 584:124308. 730
Saaty TL. 2000. Fundamentals of decision making and priority theory with the analytic 731
hierarchy process (6). RWS publications. 732
Saaty TL. 2008. Decision making with the analytic hierarchy process. Int J Services Sci. 733
1(1):83-98. 734
Sadeghi-Pouya A, Nouri J, Mansouri N, Kia-Lashaki A. 2017. An indexing approach to assess 735
flood vulnerability in the western coastal cities of Mazandaran, Iran. Int J Disaster Risk 736
Reduct. 22:304-316. 737
Sarkar D, Mondal P. 2020. Flood vulnerability mapping using frequency ratio (FR) model: a 738
case study on Kulik river basin, Indo-Bangladesh Barind region. Appl Water Sci. 10(1):1-739
13. 740
Sarmah T, Das S, Narendr A, Aithal BH. 2020. Assessing human vulnerability to urban flood 741
hazard using the analytic hierarchy process and geographic information system. Int J 742
Disaster Risk Reduct. 50:101659. 743
Shahiri Tabarestani E, Afzalimehr H. 2021. A comparative assessment of multi-criteria 744
decision analysis for flood susceptibility modelling. Geocarto Int. 1-24. 745
Sharma TPP, Zhang J, Koju UA, Zhang S, Bai Y, Suwal MK. 2019. Review of flood disaster 746
studies in Nepal: A remote sensing perspective. Int J Disaster Risk Reduct. 34:18-27. 747
33
Shivaprasad Sharma SV, Roy PS, Chakravarthi V, Srinivasa Rao G. 2018. Flood risk 748
assessment using multi-criteria analysis: a case study from Kopili River Basin, Assam, 749
India. Geomat Nat Hazards Risk. 9(1):79-93. 750
Singh G, Rambabu VV, Chandra S. 1981. Soil loss prediction research in India. Bulletin of 751
Central Soil and Water Conservation Research and Training Institute, T12/D9, Dehradun 752
Souissi D, Zouhri L, Hammami S, Msaddek MH, Zghibi A, Dlala M, 2020. GIS-based 753
MCDM–AHP modeling for flood susceptibility mapping of arid areas, southeastern 754
Tunisia. Geocarto Int. 35(9):991-1017. 755
Subrahmanyam VP. 1988. Hazards of floods and droughts in India. In Natural and man-made 756
hazards. Dordrecht: Springer; p. 337-356. 757
Toosi AS, Calbimonte GH, Nouri H, Alaghmand S. 2019. River basin-scale flood hazard 758
assessment using a modified multi-criteria decision analysis approach: A case study. J 759
Hydrol. 574:660-671. 760
USDA. 2004. Estimation of direct runoff from storm rainfall. National Engineering Hand- book 761
p. 79. 762
Vignesh KS, Anandakumar I, Ranjan R, Borah D. 2021. Flood vulnerability assessment using 763
an integrated approach of multi-criteria decision-making model and geospatial 764
techniques. Model Earth Syst Environ. 7(2):767-781. 765
Vojtek M, Vojteková J. 2019. Flood susceptibility mapping on a national scale in Slovakia 766
using the analytical hierarchy process. Water. 11(2):364. 767
Wang X, Xie, H. 2018. A review on applications of remote sensing and geographic information 768
systems (GIS) in water resources and flood risk management. Water. 10(5):608. 769
34
Zhang D, Shi X, Xu H, Jing Q, Pan X, Liu T, Wang H, Hou H. 2020. A GIS-based spatial 770
multi-index model for flood risk assessment in the Yangtze River Basin, China. Environ 771
Impact Assess Review. 83:106397. 772
773
774
Table 1. LULC classification and accuracy assessment 775
LULC
CLASS Water
Natural
Vegetation Agriculture
Built-
up
Bare
Land
Total
User
User’s
Accuracy
(%)
Producer’s
Accuracy
(%)
Water 75 0 0 0 3 78 96.15 96.15
Natural
Vegetation 0 65 6 0 3 74 87.84
91.55
Agriculture 0 6 60 4 3 73 82.19 88.24
Built-up 0 0 1 67 2 70 95.71 91.78
Barren Land 3 0 1 2 72 78 92.31 86.75
Total
Producer 78 71 68 73 83 373
776
Table 2. The scale of preference (Saaty 2008) 777
Degree of preference Scales
Extremely 9
Very strongly to extremely 8
Very strongly 7
Strongly to very strongly 6
Strongly 5
Moderately to strongly 4
Moderately 3
Equally to moderately 2
Equally 1
778

35
Table 3. Value of Random Index (Saaty 2000) 779
n 3 4 5 6 7 8 9 10 11 12 13 14 15
RI 0.52 0.89 1.11 1.25 1.35 1.40 1.45 1.49 1.51 1.54 1.56 1.57 1.58
780
Table 4. Flood hazard indicators 781
Indicator Wind Subclass % of
area
Effective
weight
(EF)
Normalized
EF
Elevation
(ELV)
0.10 5-135 73.69 5 0.33
135.01-326 14.37 4 0.27
326.01-600 6.11 3 0.20
600.01-960 4.62 2 0.13
960.01-1964 1.20 1 0.07
Slope
(Sl)
0.14 0-3.07 48.83 5 0.33
3.08-8.38 30.14 4 0.27
8.39-15.92 12.46 3 0.20
15.93-26.25 6.21 2 0.13
26.26-71.21 2.35 1 0.07
Drainage Density
(Dd)
0.09 0-0.26 30.28 1 0.07
0.27-0.52 29.93 2 0.13
0.53-0.79 23.32 3 0.20
0.80-1.05 14.47 4 0.27
1.06-1.31 2.00 5 0.33
Proximity to the river
(Dr)
0.10 0-500 9.65 5 0.33
501-1000 8.73 4 0.27
1001-2000 15.44 3 0.20
2001-4000 24.68 2 0.13
>4000 41.49 1 0.07
Proximity to
embankment breach
locations (De)
0.05 0-500 0.09 5 0.33
501-1000 0.27 4 0.27
1001-2000 1.04 3 0.20
2001-4000 3.74 2 0.13
>4000 94.86 1 0.07
Soil texture (St) 0.06 Sandy clay loam 52.54 5 0.33
Clay 3.72 4 0.27
Sandy Loam 4.86 3 0.20
Clay Loam 6.01 2 0.13
Loam 32.87 1 0.07
Geology (Geo) 0.02 Metamorphic 0.60 2 0.20
Paleozoic 1.17 1 0.10
Precambrian 12.85 2 0.20
Sedimentary 85.38 5 0.50

36
Geomorphology (Gm) 0.03 Alluvial plain 43.74 5 0.31
Denudational hill 1.53 2 0.13
Flood plain 25.75 5 0.31
Pediplain 5.89 3 0.19
Structural hill 24.89 1 0.06
Topographic wetness
index (TWI)
0.05 2.35-8.06 65.30 2 0.20
8.07-11.83 24.55 3 0.30
11.84-28.33 10.14 5 0.50
Rainfall intensity
(MFI)
0.19 148.45-254.22 28.68 1 0.07
254.23-359.98 47.20 2 0.13
359.99-465.75 14.89 3 0.20
465.76-571.51 6.42 4 0.27
571.52-677.28 2.81 5 0.33
Rainfall Erosivity
Factor (REF)
0.03 419.02-639.71 23.64 1 0.07
639.72-786.84 29.56 2 0.13
786.85-941.32 25.47 3 0.20
941.33-1114.20 14.39 4 0.27
1114.21-1356.96 6.93 5 0.33
Runoff coefficient
(RC)
0.12 0-0.04 30.87 1 0.07
0.05-0.08 29.00 2 0.13
0.09-0.13 26.63 3 0.20
0.14-0.20 10.09 4 0.27
0.21-30 3.40 5 0.33
782
Table 5. Flood vulnerability indicators 783
Indicator Wind Sub class % of
area
Effective
weight
(EF)
Normalized
EF
Population density
(PD)
0.21 43.65-91.79 19.54 1 0.07
91.80-364.22 27.27 2 0.13
364.23-530.01 31.53 3 0.20
530.02-743.15 20.65 4 0.27
743.16-1574.76 1.02 5 0.33
Vulnerable
population (VP)
0.19
59.23-65.34 1.03 3 0.14
65.35-69.34 38.03 4 0.19
69.35-70.44 28.97 4 0.19
70.45-71.19 10.01 5 0.24
71.20-73.48 21.97 5 0.24
Employment rate
(Emp)
0.03
32.49-33.17 6.91 5 0.33
33.18-36.68 22.68 4 0.27
36.69-40.21 33 3 0.20
40.22-42.81 26.06 2 0.13
42.82-46.17 11.34 1 0.07
Literacy rate (LR) 0.03
47.32-53.90 9.99 5 0.33
53.91-58.75 32.56 4 0.27
37
58.76-61.79 17.91 3 0.20
61.80-70.68 34.9 2 0.13
70.69-79.84 4.63 1 0.07
Household with more
than 4 family
members (HH4)
0.06
64.72-68.32 7.53 3 0.14
68.33-71.83 12.81 4 0.19
71.84-75.57 39.4 4 0.19
75.58-77.67 15.55 5 0.24
77.68-81.83 24.7 5 0.24
Dilapidated house
(DPH)
0.05
4.03-5.85 25.39 1 0.07
5.86-7.46 11.3 2 0.13
7.47-11.06 29.87 3 0.20
11.07-14.12 23.26 4 0.27
14.13-17.59 10.17 5 0.33
Building density
(BD)
0.06
8.61-17.05 19.54 1 0.07
17.06-85.78 20.53 2 0.13
85.79-118.90 36.57 3 0.20
118.91-149.74 18.82 4 0.27
149.75-368.11 4.55 5 0.33
Proximity to roads
(DRd)
0.05
0-500 9.72 1 0.07
501-1000 11.2 2 0.13
1001-2000 16.19 3 0.20
2001-4000 22.67 4 0.27
>4000 40.22 5 0.33
Proximity to hospital
(DH)
0.04
0-500 0.10 1 0.07
501-1000 0.29 2 0.13
1001-2000 1.14 3 0.20
2001-4000 4.37 4 0.27
>4000 94.10 5 0.33
Distance to stream
confluence (Dc)
0.07
0-500 0.07 5 0.33
501-1000 0.20 4 0.27
1001-2000 0.78 3 0.20
2001-4000 3.11 2 0.13
>4000 95.85 1 0.07
Flow accumulation
(FA)
0.07
0-1000 97.77 1 0.07
1001-2000 0.61 2 0.13
2001-5000 0.56 3 0.20
5001-12000 0.36 4 0.27
>12000 0.70 5 0.33
Land use land cover
(LULC)
0.14
Water 4.38 5 0.33
Natural
vegetation 43.74
2
0.13
Agricultural
land 34.10
3
0.20
Builtup area 13.17 4 0.27
Bare land 4.62 1 0.07
784
785

38
Table 6. Pair-wise comparison for flood hazard indicators 786
Indicators MFI Sl ELV Dr Dd St REF TWI De Gm RC Geo Wind
MFI 1 3 3 3 3 4 5 3 4 4 1 4 0.19
Sl
1 3 2 2 4 5 3 4 3 1 5 0.15
ELV 1 2 1 3 4 3 3 3 0.33 5 0.10
Dr 1 2 3 4 3 2 3 1 4 0.10
Dd
1 3 4 3 2 3 1 4 0.09
St 1 4 2 2 2 0.50 2 0.06
REF 1 2 1 1 0.20 2 0.03
TWI 1 1 2 1 2 0.05
De 1 3 0.33 4 0.05
Gm 1 0.33 3 0.03
RC 1 4 0.12
Geo 1 0.02
787
Table 7. Pair-wise comparison for flood vulnerability indicators 788
Indicator
s
P
D
V
P
LUL
C
D
c
F
A
B
D
HH
4
DR
d
DP
H
D
H
L
R
Em
p
Win
d
PD 1 1 4 4 4 3 3 4 4 5 4 4 0.21
VP 1 3 3 3 3 3 4 4 5 4 4 0.19
LULC 1 3 4 3 3 3 3 4 4 3 0.14
Dc 1 1 2 2 2 2 1 2 2 0.07
FA 1 1 1 2 2 3 2 2 0.07
BD 1 1 1 2 2 2 2 0.06
HH4 1 1 2 2 2 2 0.06
DRd
1 1 2 1 1 0.05
DPH 1 2 2 2 0.05
DH 1 2 2 0.04
LR
1 1 0.03
Emp 1 0.03 789
Table 8. Confusion matrix for flood hazard 790
Observed
Predicted
Non-Flood Flood Total
Non-Flood PTRUE NFALSE Positive
Flood PFALSE NTRUE Negative
Non-Flood 88878692 10153760 99032452
Flood 5777206 67551350 73328556
791
39
792
Figure 1. Map of the study area 793
794
795

40
796
797
798
799
41
Figure 2. Flood hazard indicators (a) to (l) indicate elevation; slope; drainage density; 800
proximity to the river; proximity to embankment; soil texture; geology; geomorphology; TWI; 801
Rainfall intensity; erosivity factor; and runoff coefficient. 802
803
804
805

42
806
807
808
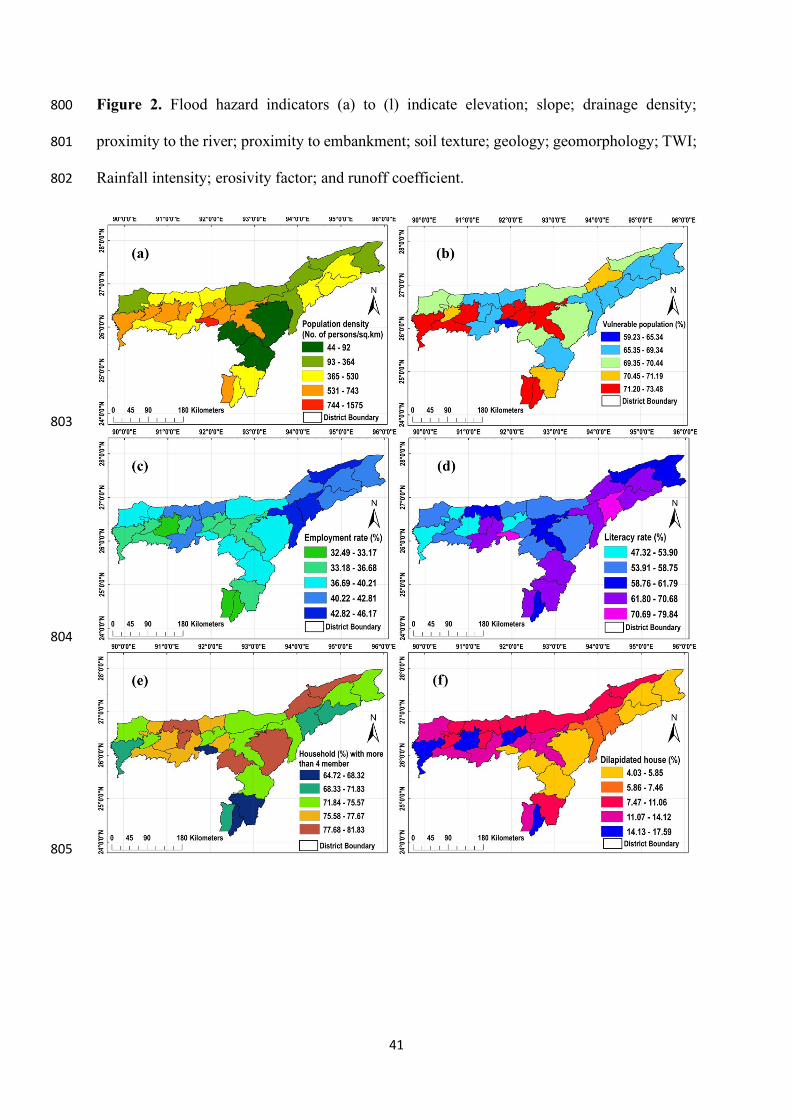
Figure 3. Flood vulnerability indicators (a) to (l) indicate population density; vulnerable 809
population; employment rate; literacy rate; a household with more than 4 members; dilapidated 810
house; building density; proximity to the road; proximity to the hospital; confluence distance; 811
flow accumulation; and LULC. 812

43
813
Figure 4. LULC area distribution for (a) Flood hazard; (b) Flood vulnerability; (c) Flood risk; 814
and (d) LULC distribution. 815
816
817
44
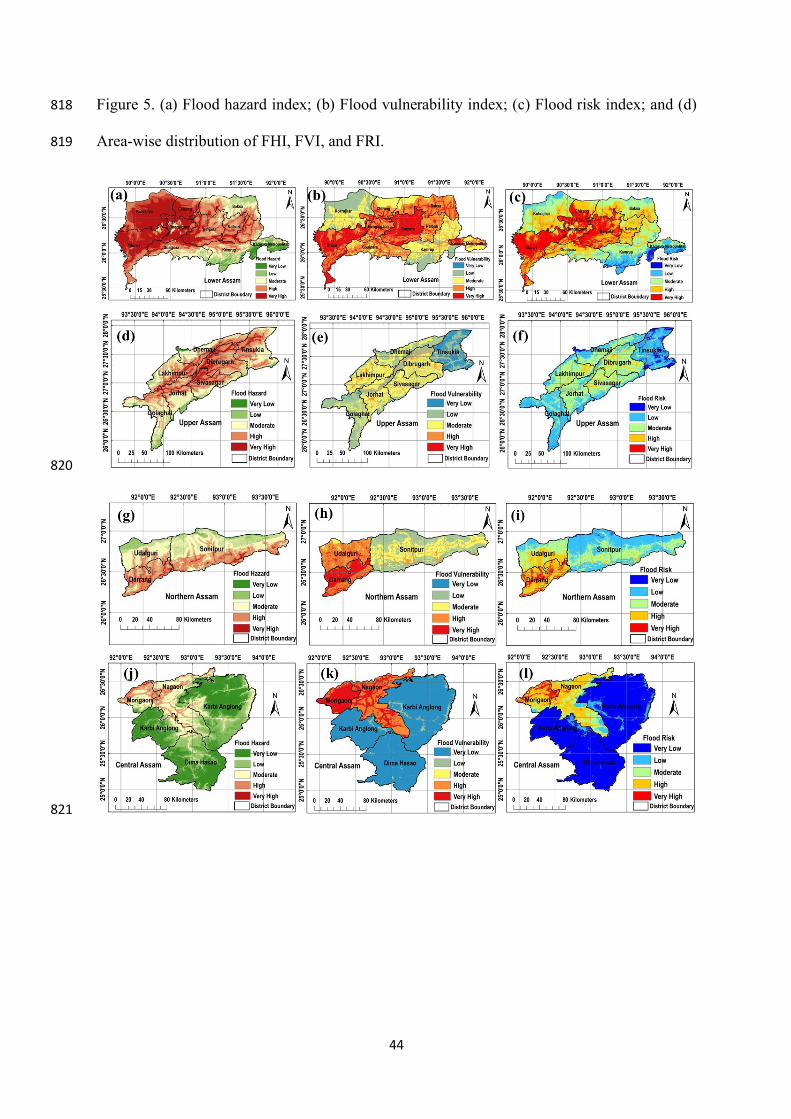
Figure 5. (a) Flood hazard index; (b) Flood vulnerability index; (c) Flood risk index; and (d) 818
Area-wise distribution of FHI, FVI, and FRI. 819
820
821

45
822
Figure 6. Flood profile of Assam at the administrative level (a) to (c) Lower Assam; (d) to (f) 823
Upper Assam; (g) to (i) Northern Assam; (j) to (l) Central Assam; (m) to (o) Barak Valley; and 824
(p) to (r) Area distribution of flood hazard, vulnerability, and risk. 825