MODIS Land Data Products: Generation, Quality Assurance and Validation
Upload
independentCategory
view
0download
0
This article was downloaded by:[Mallick, K.][Mallick, K.]
On: 10 July 2007Access Details: [subscription number 780498699]Publisher: Taylor & FrancisInforma Ltd Registered in England and Wales Registered Number: 1072954Registered office: Mortimer House, 37-41 Mortimer Street, London W1T 3JH, UK
International Journal of RemoteSensingPublication details, including instructions for authors and subscription information:http://www.informaworld.com/smpp/title~content=t713722504
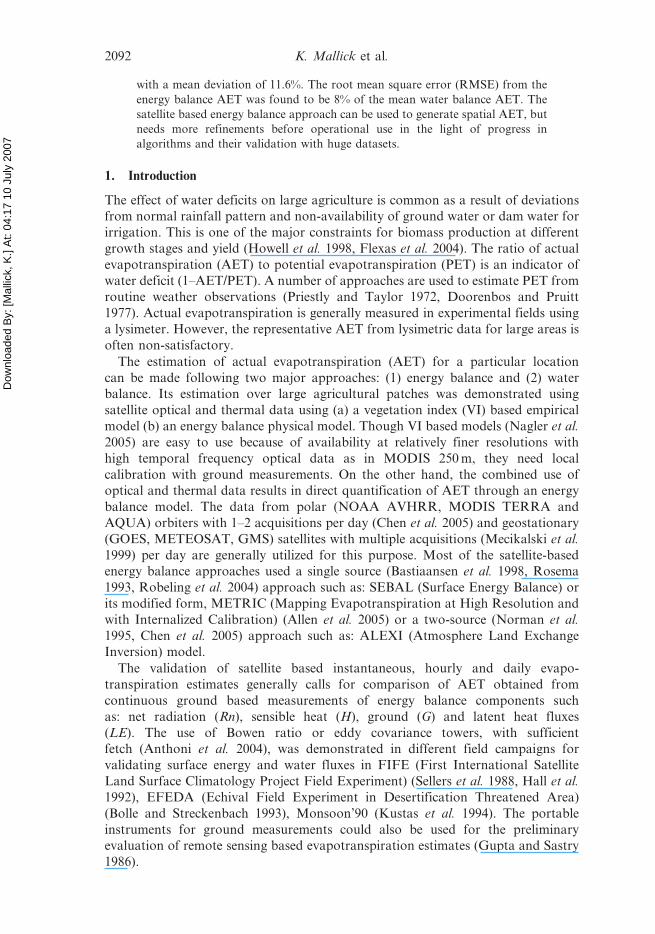
Evapotranspiration using MODIS data and limitedground observations over selected agroecosystems inIndia
Online Publication Date: 01 May 2007To cite this Article: Mallick, K., Bhattacharya, B. K., Chaurasia, S., Dutta, S.,Nigam, R., Mukherjee, J., Banerjee, S., Kar, G., Rao, V. U. M., Gadgil, A. S. andParihar, J. S. , (2007) 'Evapotranspiration using MODIS data and limited groundobservations over selected agroecosystems in India', International Journal ofRemote Sensing, 28:10, 2091 - 2110To link to this article: DOI: 10.1080/01431160600935620
URL: http://dx.doi.org/10.1080/01431160600935620
PLEASE SCROLL DOWN FOR ARTICLE
Full terms and conditions of use: http://www.informaworld.com/terms-and-conditions-of-access.pdf
This article maybe used for research, teaching and private study purposes. Any substantial or systematic reproduction,re-distribution, re-selling, loan or sub-licensing, systematic supply or distribution in any form to anyone is expresslyforbidden.
The publisher does not give any warranty express or implied or make any representation that the contents will becomplete or accurate or up to date. The accuracy of any instructions, formulae and drug doses should beindependently verified with primary sources. The publisher shall not be liable for any loss, actions, claims, proceedings,demand or costs or damages whatsoever or howsoever caused arising directly or indirectly in connection with orarising out of the use of this material.
© Taylor and Francis 2007
Dow
nloa
ded
By:
[Mal
lick,
K.]
At:
04:1
7 10
Jul
y 20
07 Evapotranspiration using MODIS data and limited ground observations
over selected agroecosystems in India
K. MALLICK{, B. K. BHATTACHARYA*{, S. CHAURASIA{, S. DUTTA{,
R. NIGAM{, J. MUKHERJEE{, S. BANERJEE§, G. KAR", V. U. M. RAO**,
A. S. GADGIL{{ and J. S. PARIHAR{
{Agricultural Resources Group, Space Applications Centre (ISRO), Ahmedabad
380015, India
{Department of Agronomy and Agricultural Meteorology, Punjab Agricultural
University, Ludhiana 141004, India
§Department of Agricultural Meteorology, Bidhan Chandra Krishi Viswa Vidyalaya,
Kalyani, Nadia 741235, India
"Water Technology Centre for Eastern Region, Bhubaneshwar, India
**Department of Agricultural Meteorology, CCS Haryana Agricultural University,
Hisar 125004, India
{{Department of Geography, University of Pune, Pune 411007, India
(Received 31 December 2005; in final form 3 May 2006 )
Plant growth processes and productivity of agroecosystems depend highly on
evapotranspiration from the land (soil-crop cover complex) surface. A study was
carried out using MODIS TERRA optical and thermal band data and ground
observations to estimate evaporative fraction and daily actual evapotranspiration
(AET) over agroecosystems in India. Five study regions, each covering a
10 km610 km area falling in agricultural land use, were selected for ground
observations at a time closest to TERRA overpasses. The data on radiation and
crop parameters in paddy (irrigated and rainfed), cotton (rainfed), groundnut
(residual moisture) crops were recorded at 14-day intervals between August 2003
to January 2004 from 2 km62 km homogeneous crop patches within each study
region. Eight MODIS scenes in seven optical (1, 2, 3, 4, 5, 6, 7) and two thermal
bands (31, 32) level 1B data acquired from the National Remote Sensing Agency,
Hyderabad, India and resampled at 1 km, were used to generate surface albedo
(a), land surface temperature (Ts, MODIS) and emissivity (es). Evaporative fraction
and daily AET were generated using a single source energy balance approach
with (i) ground based observations only (‘stand alone’ approach), and (ii) ‘fusion’
of MODIS derived land surface variables on cloud free dates and coincident
ground observations. Land cover classes were assigned using a hierarchical
decision rule applied to multi-date Normalized Difference Vegetation Index
(NDVI). The exponential model could be fitted between 1-EFins, ground (ground
based evaporative fraction) and difference between Ts, MODIS and air temperature
(Ta) with R250.77. Linear fit (R250.74) could be obtained between 1-EFins, ground
and temperature vegetation dryness index (TVDI), derived from Ts, MODIS-NDVI
triangle. Energy balance daily AET from the ‘fusion’ approach was found to
deviate from water balance AET by between 4.3% to 24.5% across five study sites
*Corresponding author. Email: [email protected]
International Journal of Remote Sensing
Vol. 28, No. 10, 20 May 2007, 2091–2110
International Journal of Remote SensingISSN 0143-1161 print/ISSN 1366-5901 online # 2007 Taylor & Francis
http://www.tandf.co.uk/journalsDOI: 10.1080/01431160600935620
Dow
nloa
ded
By:
[Mal
lick,
K.]
At:
04:1
7 10
Jul
y 20
07
with a mean deviation of 11.6%. The root mean square error (RMSE) from the
energy balance AET was found to be 8% of the mean water balance AET. The
satellite based energy balance approach can be used to generate spatial AET, but
needs more refinements before operational use in the light of progress in
algorithms and their validation with huge datasets.
1. Introduction
The effect of water deficits on large agriculture is common as a result of deviations
from normal rainfall pattern and non-availability of ground water or dam water for
irrigation. This is one of the major constraints for biomass production at different
growth stages and yield (Howell et al. 1998, Flexas et al. 2004). The ratio of actual
evapotranspiration (AET) to potential evapotranspiration (PET) is an indicator of
water deficit (1–AET/PET). A number of approaches are used to estimate PET from
routine weather observations (Priestly and Taylor 1972, Doorenbos and Pruitt
1977). Actual evapotranspiration is generally measured in experimental fields using
a lysimeter. However, the representative AET from lysimetric data for large areas is
often non-satisfactory.
The estimation of actual evapotranspiration (AET) for a particular location
can be made following two major approaches: (1) energy balance and (2) water
balance. Its estimation over large agricultural patches was demonstrated using
satellite optical and thermal data using (a) a vegetation index (VI) based empirical
model (b) an energy balance physical model. Though VI based models (Nagler et al.
2005) are easy to use because of availability at relatively finer resolutions with
high temporal frequency optical data as in MODIS 250 m, they need local
calibration with ground measurements. On the other hand, the combined use of
optical and thermal data results in direct quantification of AET through an energy
balance model. The data from polar (NOAA AVHRR, MODIS TERRA and
AQUA) orbiters with 1–2 acquisitions per day (Chen et al. 2005) and geostationary
(GOES, METEOSAT, GMS) satellites with multiple acquisitions (Mecikalski et al.
1999) per day are generally utilized for this purpose. Most of the satellite-based
energy balance approaches used a single source (Bastiaansen et al. 1998, Rosema
1993, Robeling et al. 2004) approach such as: SEBAL (Surface Energy Balance) or
its modified form, METRIC (Mapping Evapotranspiration at High Resolution and
with Internalized Calibration) (Allen et al. 2005) or a two-source (Norman et al.
1995, Chen et al. 2005) approach such as: ALEXI (Atmosphere Land Exchange
Inversion) model.
The validation of satellite based instantaneous, hourly and daily evapo-
transpiration estimates generally calls for comparison of AET obtained from
continuous ground based measurements of energy balance components such
as: net radiation (Rn), sensible heat (H), ground (G) and latent heat fluxes
(LE). The use of Bowen ratio or eddy covariance towers, with sufficient
fetch (Anthoni et al. 2004), was demonstrated in different field campaigns for
validating surface energy and water fluxes in FIFE (First International Satellite
Land Surface Climatology Project Field Experiment) (Sellers et al. 1988, Hall et al.
1992), EFEDA (Echival Field Experiment in Desertification Threatened Area)
(Bolle and Streckenbach 1993), Monsoon’90 (Kustas et al. 1994). The portable
instruments for ground measurements could also be used for the preliminary
evaluation of remote sensing based evapotranspiration estimates (Gupta and Sastry
1986).
2092 K. Mallick et al.
Dow
nloa
ded
By:
[Mal
lick,
K.]
At:
04:1
7 10
Jul
y 20
07
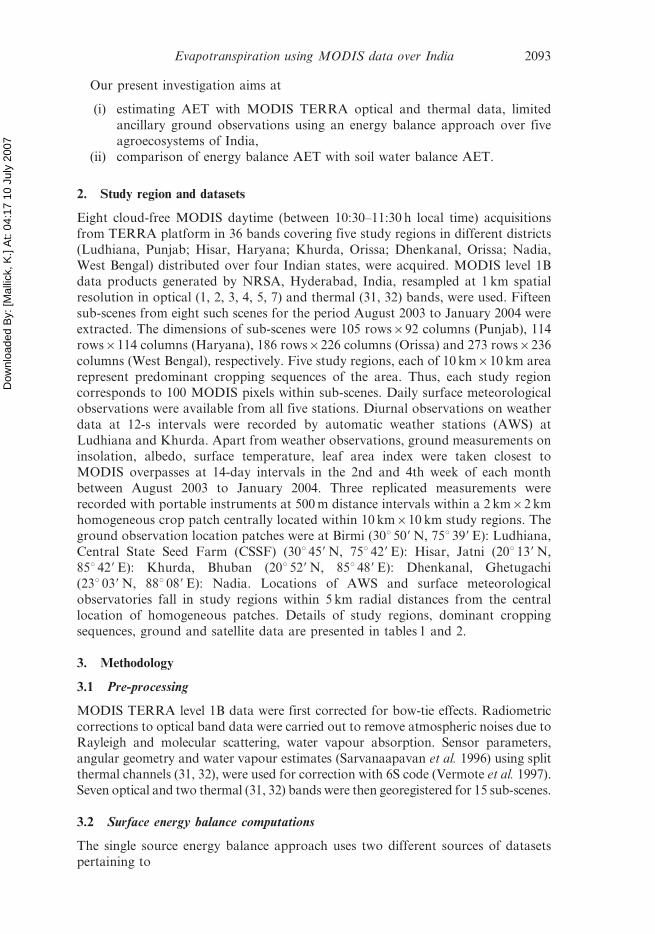
Our present investigation aims at
(i) estimating AET with MODIS TERRA optical and thermal data, limited
ancillary ground observations using an energy balance approach over five
agroecosystems of India,(ii) comparison of energy balance AET with soil water balance AET.
2. Study region and datasets
Eight cloud-free MODIS daytime (between 10:30–11:30 h local time) acquisitions
from TERRA platform in 36 bands covering five study regions in different districts
(Ludhiana, Punjab; Hisar, Haryana; Khurda, Orissa; Dhenkanal, Orissa; Nadia,West Bengal) distributed over four Indian states, were acquired. MODIS level 1B
data products generated by NRSA, Hyderabad, India, resampled at 1 km spatial
resolution in optical (1, 2, 3, 4, 5, 7) and thermal (31, 32) bands, were used. Fifteen
sub-scenes from eight such scenes for the period August 2003 to January 2004 were
extracted. The dimensions of sub-scenes were 105 rows692 columns (Punjab), 114
rows6114 columns (Haryana), 186 rows6226 columns (Orissa) and 273 rows6236
columns (West Bengal), respectively. Five study regions, each of 10 km610 km area
represent predominant cropping sequences of the area. Thus, each study regioncorresponds to 100 MODIS pixels within sub-scenes. Daily surface meteorological
observations were available from all five stations. Diurnal observations on weather
data at 12-s intervals were recorded by automatic weather stations (AWS) at
Ludhiana and Khurda. Apart from weather observations, ground measurements on
insolation, albedo, surface temperature, leaf area index were taken closest to
MODIS overpasses at 14-day intervals in the 2nd and 4th week of each month
between August 2003 to January 2004. Three replicated measurements were
recorded with portable instruments at 500 m distance intervals within a 2 km62 kmhomogeneous crop patch centrally located within 10 km610 km study regions. The
ground observation location patches were at Birmi (30u 509 N, 75u 399 E): Ludhiana,
Central State Seed Farm (CSSF) (30u 459 N, 75u 429 E): Hisar, Jatni (20u 139 N,
85u 429 E): Khurda, Bhuban (20u 529 N, 85u 489 E): Dhenkanal, Ghetugachi
(23u 039 N, 88u 089 E): Nadia. Locations of AWS and surface meteorological
observatories fall in study regions within 5 km radial distances from the central
location of homogeneous patches. Details of study regions, dominant cropping
sequences, ground and satellite data are presented in tables 1 and 2.
3. Methodology
3.1 Pre-processing
MODIS TERRA level 1B data were first corrected for bow-tie effects. Radiometric
corrections to optical band data were carried out to remove atmospheric noises due to
Rayleigh and molecular scattering, water vapour absorption. Sensor parameters,
angular geometry and water vapour estimates (Sarvanaapavan et al. 1996) using splitthermal channels (31, 32), were used for correction with 6S code (Vermote et al. 1997).
Seven optical and two thermal (31, 32) bands were then georegistered for 15 sub-scenes.
3.2 Surface energy balance computations
The single source energy balance approach uses two different sources of datasets
pertaining to
Evapotranspiration using MODIS data over India 2093
Dow
nloa
ded
By:
[Mal
lick,
K.]
At:
04:1
7 10
Jul
y 20
07
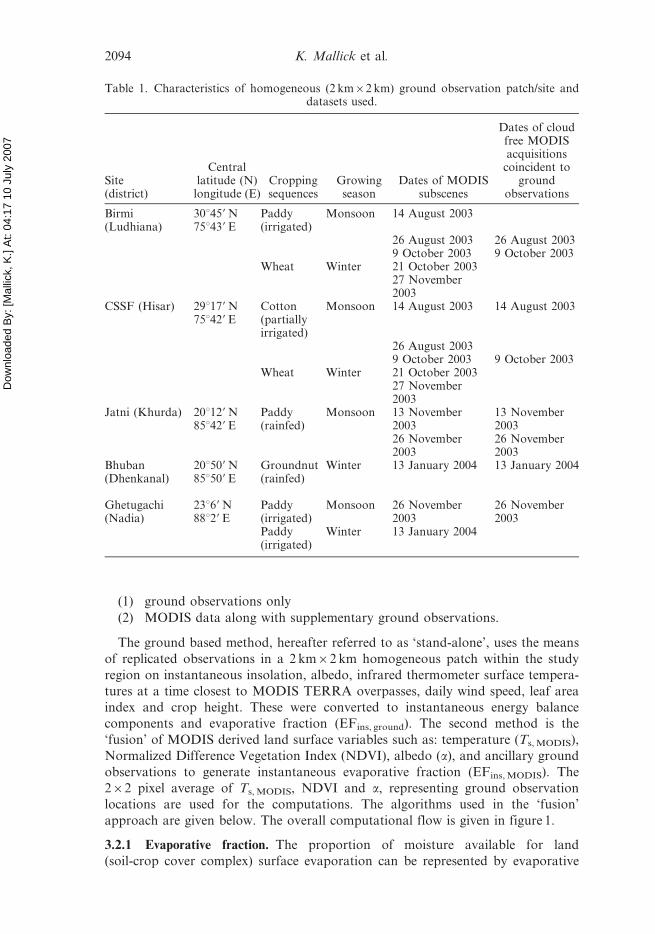
(1) ground observations only
(2) MODIS data along with supplementary ground observations.
The ground based method, hereafter referred to as ‘stand-alone’, uses the means
of replicated observations in a 2 km62 km homogeneous patch within the study
region on instantaneous insolation, albedo, infrared thermometer surface tempera-
tures at a time closest to MODIS TERRA overpasses, daily wind speed, leaf area
index and crop height. These were converted to instantaneous energy balance
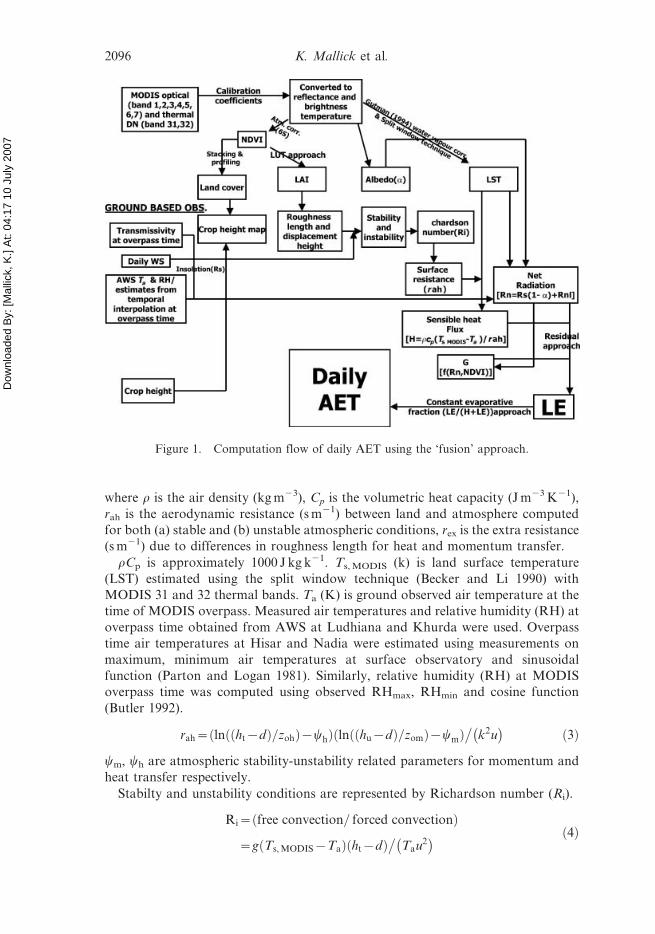
components and evaporative fraction (EFins, ground). The second method is the
‘fusion’ of MODIS derived land surface variables such as: temperature (Ts, MODIS),
Normalized Difference Vegetation Index (NDVI), albedo (a), and ancillary ground
observations to generate instantaneous evaporative fraction (EFins, MODIS). The
262 pixel average of Ts, MODIS, NDVI and a, representing ground observation
locations are used for the computations. The algorithms used in the ‘fusion’
approach are given below. The overall computational flow is given in figure 1.
3.2.1 Evaporative fraction. The proportion of moisture available for land
(soil-crop cover complex) surface evaporation can be represented by evaporative
Table 1. Characteristics of homogeneous (2 km62 km) ground observation patch/site anddatasets used.
Site(district)
Centrallatitude (N)
longitude (E)Croppingsequences
Growingseason
Dates of MODISsubscenes
Dates of cloudfree MODISacquisitions
coincident toground
observations
Birmi(Ludhiana)
30u459 N75u439 E
Paddy(irrigated)
Monsoon 14 August 2003
26 August 2003 26 August 20039 October 2003 9 October 2003
Wheat Winter 21 October 200327 November2003
CSSF (Hisar) 29u179 N75u429 E
Cotton(partiallyirrigated)
Monsoon 14 August 2003 14 August 2003
26 August 20039 October 2003 9 October 2003
Wheat Winter 21 October 200327 November2003
Jatni (Khurda) 20u129 N85u429 E
Paddy(rainfed)
Monsoon 13 November2003
13 November2003
26 November2003
26 November2003
Bhuban(Dhenkanal)
20u509 N85u509 E
Groundnut(rainfed)
Winter 13 January 2004 13 January 2004
Ghetugachi(Nadia)
23u69 N88u29 E
Paddy(irrigated)
Monsoon 26 November2003
26 November2003
Paddy(irrigated)
Winter 13 January 2004
2094 K. Mallick et al.
Dow
nloa
ded
By:
[Mal
lick,
K.]
At:
04:1
7 10
Jul
y 20
07
fraction (EF).
EFins;MODIS~LEins;MODIS= Rnins;MODIS{Gins;MODIS
� �ð1Þ
where Rnins, MODIS-Gins, MODIS is the net available energy, DQins, MODIS (W m22),
Rnins, MODIS is the instantaneous net radiation (W m22), Gins, MODIS is the
instantaneous ground heat flux (W m22), LEins, MODIS is the instantaneous latent
heat flux (W m22) i.e. DQins, MODIS 2 Hins, MODIS and Hins, MODIS is the
instantaneous sensible heat flux (W m22).
The computation of net available energy requires net radiation and ground heat
flux to be computed. All the satellite based approaches are more or less similar for
computing these two energy balance components, but largely differ in sensible heat
flux computation which is the ‘heart’ of energy balance computations.
3.2.1.1 Sensible heat flux. The heat energy exchange between land surface and
overlying air can be ascertained by sensible heat computation as given below. The
differences in the present approach of sensible heat computation from an existing
well-known approach, SEBAL/METRIC, are given in table 3.
Hins Wm{2� �
~rCp Ts, MODIS{Tað Þ�
rahzrexð Þ ð2Þ
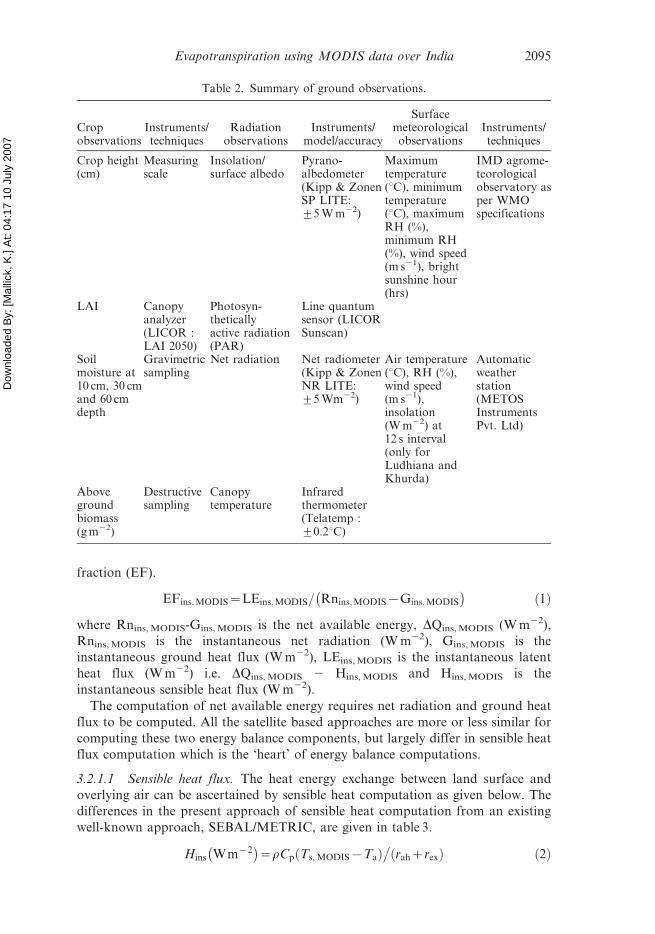
Table 2. Summary of ground observations.
Cropobservations
Instruments/techniques
Radiationobservations
Instruments/model/accuracy
Surfacemeteorologicalobservations
Instruments/techniques
Crop height(cm)
Measuringscale
Insolation/surface albedo
Pyrano-albedometer(Kipp & ZonenSP LITE:¡5 W m22)
Maximumtemperature(uC), minimumtemperature(uC), maximumRH (%),minimum RH(%), wind speed(m s21), brightsunshine hour(hrs)
IMD agrome-teorologicalobservatory asper WMOspecifications
LAI Canopyanalyzer(LICOR :LAI 2050)
Photosyn-theticallyactive radiation(PAR)
Line quantumsensor (LICORSunscan)
Soilmoisture at10 cm, 30 cmand 60 cmdepth
Gravimetricsampling
Net radiation Net radiometer(Kipp & ZonenNR LITE:¡5 Wm22)
Air temperature(uC), RH (%),wind speed(m s21),insolation(W m22) at12 s interval(only forLudhiana andKhurda)
Automaticweatherstation(METOSInstrumentsPvt. Ltd)
Abovegroundbiomass(g m22)
Destructivesampling
Canopytemperature
Infraredthermometer(Telatemp :¡0.2uC)
Evapotranspiration using MODIS data over India 2095
Dow
nloa
ded
By:
[Mal
lick,
K.]
At:
04:1
7 10
Jul
y 20
07
where r is the air density (kg m23), Cp is the volumetric heat capacity (J m23 K21),
rah is the aerodynamic resistance (s m21) between land and atmosphere computed
for both (a) stable and (b) unstable atmospheric conditions, rex is the extra resistance
(s m21) due to differences in roughness length for heat and momentum transfer.
rCp is approximately 1000 J kg k21. Ts, MODIS (k) is land surface temperature
(LST) estimated using the split window technique (Becker and Li 1990) with
MODIS 31 and 32 thermal bands. Ta (K) is ground observed air temperature at the
time of MODIS overpass. Measured air temperatures and relative humidity (RH) at
overpass time obtained from AWS at Ludhiana and Khurda were used. Overpass
time air temperatures at Hisar and Nadia were estimated using measurements on
maximum, minimum air temperatures at surface observatory and sinusoidal
function (Parton and Logan 1981). Similarly, relative humidity (RH) at MODIS
overpass time was computed using observed RHmax, RHmin and cosine function
(Butler 1992).
rah~ ln ht{dð Þ=zohð Þ{yhð Þ ln hu{dð Þ=zomð Þ{ymð Þ�
k2u� �
ð3Þ
ym, yh are atmospheric stability-unstability related parameters for momentum and
heat transfer respectively.
Stabilty and unstability conditions are represented by Richardson number (Ri).
Ri~ free convection= forced convectionð Þ
~g Ts, MODIS{Tað Þ ht{dð Þ�
Tau2� � ð4Þ
Figure 1. Computation flow of daily AET using the ‘fusion’ approach.
2096 K. Mallick et al.

Dow
nloa
ded
By:
[Mal
lick,
K.]
At:
04:1
7 10
Jul
y 20
07
(a) For stable conditions, Ri is taken to be more than 0.025 (Gupta and Sastry 1986)
ym~yh~{5j ð5Þ
j~Ri= 1{5Rið Þ ð6Þ
(b) For unstable conditions, Ri remains between 20.25 to 0.025
ym~2ln 1zxið Þ=2ð Þzln 1zx2i
� ��2
� �{2arctan xið Þzp=2 ð7Þ
yh~2ln 1zxið Þ2.
2� �
ð8Þ
xi~ 1{16jð Þ1=4 ð9Þ
j~Ri ð10Þ
Table 3. Major differences in instantaneous sensible heat computation (Hins) with satelliteand ground data between SEBAL/METRIC and the present algorithm.
Parameters SEBAL/METRIC Present algorithm
1. Hins rCp (dT/rah) rCp (dT/rah + rex)1.1 dT (a) a + bTs, a and b are coefficients
determined through iterativeprocedures while carrying outstability correction for computingaerodynamic resistance
(a) Ts2Ta
(b) dT is the estimated differencebetween near surface (0.1 m) and2 m above surface air temperatures.It compensates for problems causedby differences between radiometricand aerodynamic surfacetemperatures.
(b) extra resistance (rex) due todifferences in roughness length forheat and momentum transfer. Itcompensates also for the differencebetween radiometric and aerodynamicsurface temperatures (Kustas et al.1989). rex5kB21/(0.4ustar)kB215ln(momentum roughnesslength/heat roughness length) ustar5frictional velocity
1.2 rah (a) Stability correction was doneby estimating Z/L using iterativeprocedure applying Monin-Obukhov similarity theory. Itrequires ‘hottest’ and ‘coldest’ pixelsin a heterogeneous landscape, whichmay not occur particularly in largelowland rice agriculture and aridagriculture (Tasumi 2003). It mayrestrict the estimation of Z/Lthrough iterative procedure.
(a) Stability correction was done byRichardson number (Ri) thresholds.The estimation of Ri is independentof surface heterogeneity in wetnesspattern. Moreover, it requires the samenumber of surface and meteorologicalparameters as used to estimate Z/L.
(b)The iterative procedure requirescomputation of instantaneous latentheat flux over hottest and wettestpixel in METRIC. It uses grass referenceinstantaneous ET computed fromweather station data and it also assumescrop coefficient 0.0 and 1.05 for hottestand driest pixels, which may not be true
(b) No assumption on crop coefficientis required
Evapotranspiration using MODIS data over India 2097

Dow
nloa
ded
By:
[Mal
lick,
K.]
At:
04:1
7 10
Jul
y 20
07
rex~kB{1�
kustarð Þ ð11Þ
kB{1~ln zom=zohð Þ ð12Þ
ht is the height (m) of air temperature measurement52.0 m, hu is the height (m) of wind
speed measurement510.0 m, u is the wind speed (m s21) at the top of the canopy,
d~displacement height mð Þ
~ht 1{ 1{exp { 20:6LAIð Þ1=2� �� �.
20:6LAIð Þ1=2� �� � ð13Þ
zom~roughness length for momentum transfer
~ ht{dð Þ= exp k 1=ratioð Þ{Ehð Þð Þð14Þ
ratio~u=u~ CszCrLAI=2ð Þ1=2 ð15Þ
Cs~drag coefficient for unobstructed bare soil
~k2 ln ht{dð Þ=zohð ÞzEhð Þð16Þ
Cr~overstorey drag coefficient ~0:35ð Þ
u�~frictional velocity ms{1� �
~ kuð Þ= ln hu{dð Þ=zomð Þ{ymð Þð17Þ
Eh~vegetation influence function~ln Cwð Þ{1zC{1w ð18Þ
Cw is the dimensionless constant (Cw52.0)
zoh is the roughness length (m) for heat transfer estimated from
IF CszCrLAI=2ð Þ1=2v0:3, ht{dð Þ
.EXP k= CszCrLAI=2ð Þ1=2
� �{yh
� �� �,
�
ht{dð Þ= EXP k=ratioð Þ{yhð Þð Þð19Þ
k is the Von Karman constant(50.41), LAI is the leaf area index estimated from
NDVI and land cover based look-up table for agricultural patches (Liang 2004).
3.2.1.2 Net available energy (DQins, MODIS).
DQins;MODIS~ Rnins;MODIS{Gins;MODIS
� �
Rnins~Rsins 1{að Þz seaesTa4{sesT s
4� � ð20Þ
Where
Rsins is the instantaneous insolation W m{2� �
~1367etcos hð Þ ð21Þ
e~Duffe Backman constant for SunEarth distance correction
~1:00011z0:34221cos dað Þz0:00128sin dað Þz0:000719cos 2dað Þ
z0:000077sin 2dað Þ
ð22Þ
2098 K. Mallick et al.

Dow
nloa
ded
By:
[Mal
lick,
K.]
At:
04:1
7 10
Jul
y 20
07
t is the atmospheric transmissivity obtained from ground measured insolation
closest to MODIS TERRA pass, h is the pixelwise solar zenith angle (radian) from
MODIS data products.
a~surface albedo using narrow band�to�broad band conversion as
reported by Liang 2000ð Þ
~0:160ref1z0:291ref2z0:243ref3z0:116ref4
z0:112ref5z0:081ref7{0:0015
ð23Þ
da is the day angle (radian), ref1 to ref7 represent surface reflectances in MODIS
bands from 1 to 7.
es~1:009z0:047�ALOG NDVIð Þ Van de Griend and Owe 1993ð Þ ð24Þ
NDVI is equal to (ref2-ref1)/(ref2 + ref1). ea is the air emissivity estimated using
ground air temperature (Ta in uC),
RH at MODIS TERRA overpass time and Brutsaert (1975) equation
Gins~instantaneous ground heat flux W m{2� �
~Rnins Ts{273ð Þ=að Þ 0:0032 1{að Þz0:0062 1:1að Þ2� �
1{0:978NDVI4� �
Bastiaansen et al: 1998ð Þ
ð25Þ
3.2.2 Conversion of evaporative fraction into daily actual evapotranspiration
(AET).
AET mm day{1� �
~EFday Rnday
� ��28:588 ð26Þ
EFday is the daily evaporative fraction. Assuming evaporative fraction (Bastiaanssen
et al. 1998) remains almost constant throughout the day,
EFday5EFins :
Rnday~daily net radiation W m{2� �
~ 1{c1að ÞRsdayzRnlday ð27Þ
c1 is the factor (1.1) for converting instantaneous albedo (a) to daily value, Rsday is
the daily average insolation (W m22) computed from station sunshine hours and
daylength, Rnlday is the daily average net longwave radiation (W m22) computed
from station daily average air temperature (Taavg) and humidity (RHavg).
4. Results and discussion
4.1 Evaporative fraction (EF)
Evaporative fraction represents relative moisture status of root zone. Attempts were
made to relate instantaneous evaporative fraction (EFins, ground) derived from ‘stand
alone’ approach to surface-air temperature difference (SATD is the Ts, MODIS-air
temperature) and MODIS derived dryness index. Here, air temperature is at the time
of MODIS TERRA pass obtained from weather observations closest to ground
observation locations.
Evapotranspiration using MODIS data over India 2099
Dow
nloa
ded
By:
[Mal
lick,
K.]
At:
04:1
7 10
Jul
y 20
07
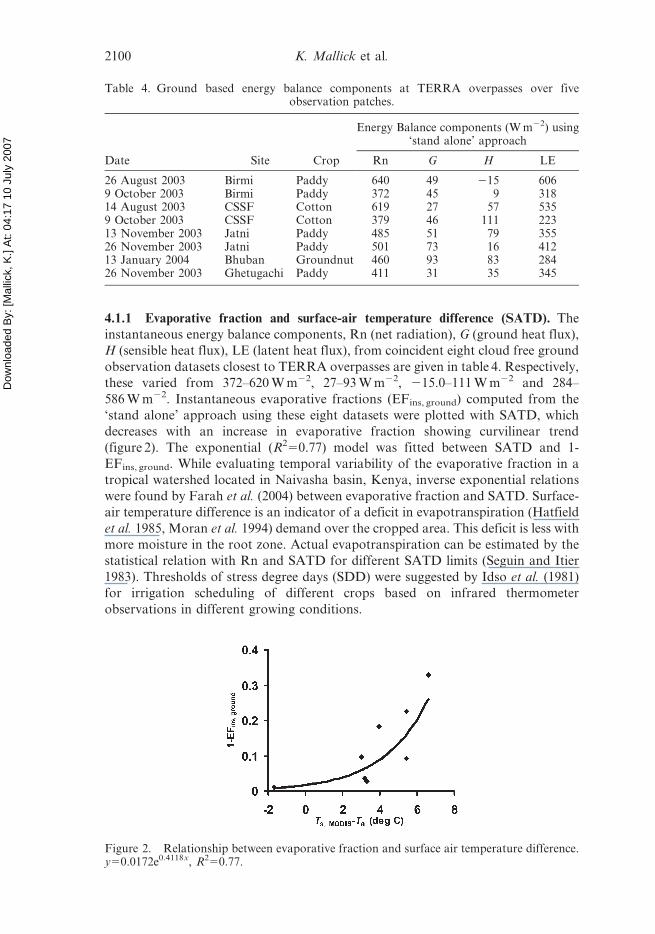
4.1.1 Evaporative fraction and surface-air temperature difference (SATD). The
instantaneous energy balance components, Rn (net radiation), G (ground heat flux),
H (sensible heat flux), LE (latent heat flux), from coincident eight cloud free ground
observation datasets closest to TERRA overpasses are given in table 4. Respectively,
these varied from 372–620 W m22, 27–93 W m22, 215.0–111 W m22 and 284–
586 W m22. Instantaneous evaporative fractions (EFins, ground) computed from the
‘stand alone’ approach using these eight datasets were plotted with SATD, which
decreases with an increase in evaporative fraction showing curvilinear trend
(figure 2). The exponential (R250.77) model was fitted between SATD and 1-
EFins, ground. While evaluating temporal variability of the evaporative fraction in a
tropical watershed located in Naivasha basin, Kenya, inverse exponential relations
were found by Farah et al. (2004) between evaporative fraction and SATD. Surface-
air temperature difference is an indicator of a deficit in evapotranspiration (Hatfield
et al. 1985, Moran et al. 1994) demand over the cropped area. This deficit is less with
more moisture in the root zone. Actual evapotranspiration can be estimated by the
statistical relation with Rn and SATD for different SATD limits (Seguin and Itier
1983). Thresholds of stress degree days (SDD) were suggested by Idso et al. (1981)
for irrigation scheduling of different crops based on infrared thermometer
observations in different growing conditions.
Table 4. Ground based energy balance components at TERRA overpasses over fiveobservation patches.
Date Site Crop
Energy Balance components (W m22) using‘stand alone’ approach
Rn G H LE
26 August 2003 Birmi Paddy 640 49 215 6069 October 2003 Birmi Paddy 372 45 9 31814 August 2003 CSSF Cotton 619 27 57 5359 October 2003 CSSF Cotton 379 46 111 22313 November 2003 Jatni Paddy 485 51 79 35526 November 2003 Jatni Paddy 501 73 16 41213 January 2004 Bhuban Groundnut 460 93 83 28426 November 2003 Ghetugachi Paddy 411 31 35 345
Figure 2. Relationship between evaporative fraction and surface air temperature difference.y50.0172e0.4118x, R250.77.
2100 K. Mallick et al.

Dow
nloa
ded
By:
[Mal
lick,
K.]
At:
04:1
7 10
Jul
y 20
07
The estimation of evaporative fraction from SATD using statistical relations can
be used further for characterizing agriculture root zone moisture status, which is
also input to different productivity models. The empirical models used to estimate
volumetric soil moisture of root zone from SEBAL (Bastiaanssen et al. 1998)
evaporative fraction are already incorporated in AHAS (Parodi 2000). This relation
could be fine tuned with more datasets for general applications to agroecosystem
monitoring in India.
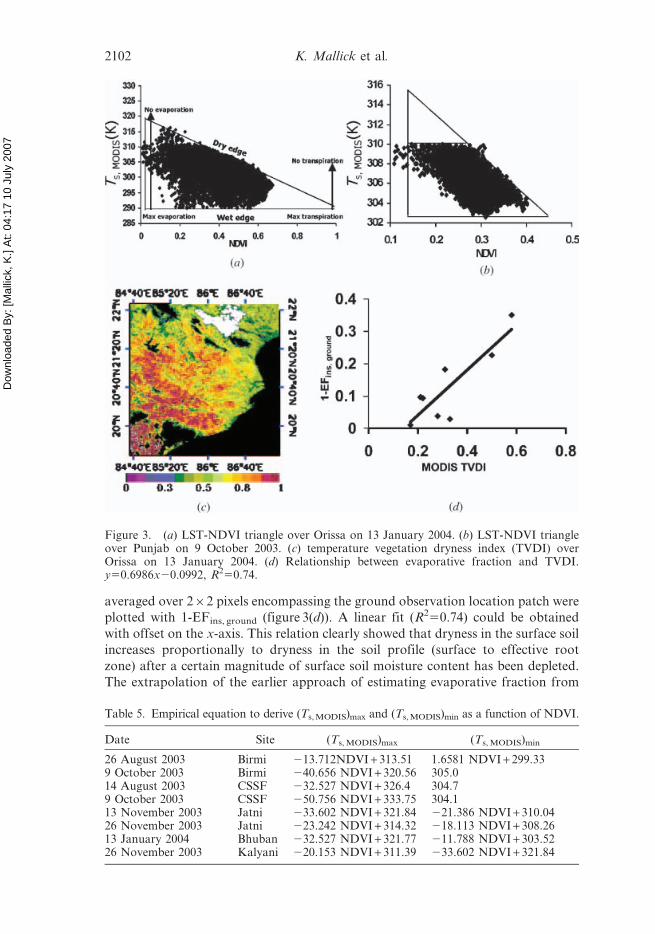
4.1.2 Evaporative fraction and temperature vegetation dryness index (TVDI). This
section explores the possibility of estimating evaporative fraction using MODIS
land surface temperature (Ts, MODIS) and NDVI values. A strong negative
relationship was observed by Nemani et al. (1993) between surface temperature
(Ts) and NDVI over all vegetation cover types. The similarity of Ts/NDVI
relationships over different vegetation surfaces indicated that the fraction of
vegetation cover and soil moisture status has a strong influence on the spatial
variability of Ts. A substantial change in the Ts/NDVI relationship was found
between wet and dry days for different fractional vegetation cover conditions. No
change was observed over irrigated crops.
The triangular variant of Ts, MODIS and NDVI trapezoidal scatter was used to
derive a dryness index called TVDI (Sandholt et al. 2002), which was similar to the
CWSI (Crop Water Stress Index) concept given by Jackson et al. (1981).
TVDI~ T s;MODIS{ T s;MODIS
� �min
� ��T s;MODIS
� �max
{ T s;MODIS
� �min
� �ð28Þ
Where, (Ts, MODIS)max, (Ts, MODIS)min were computed from the dry and wet edges
respectively of the Ts, MODIS - NDVI triangle using linear relations with NDVI.
Ts, MODIS is the current surface temperature in each pixel. TVDI outputs were
generated from Ts, MODIS and NDVI for eight clear sub-scenes using their triangular
relationship. The Ts, MODIS - NDVI scatters over Orissa and Ludhiana on 13 January
2004 and 9 October 2003 are shown in figure 3(a) and (b), respectively. The scatter
over Orissa (figure 3(a)) is an ideal example of a triangle with uniform lower and
upper boundaries forming a ‘wet edge’ and ‘dry edge’ respectively. The intermediate
lines represent the Ts-NDVI relations for different cover types. The scatter deviates
from the ideal triangle to become more trapezoidal in nature in Ludhiana (figure 3(b)).
On other dates, the Ts-NDVI space showed deviations (other scatters not shown)
from the ideal triangle in different agroclimatic regions though the scatter maintained
dry and wet boundaries. The deviations from triangular scatter depend on the surface
heterogeneity in cover types, wetness, growth stages, soil types, the size of sample
subset considered to draw the scatter. A shifting window of uniform size was used by
Nemani et al. (1993) to derive distributed surface wetness from Ts-NDVI inverse
relations in an automatic mode. The empirical linear relations to estimate
(Ts, MODIS)max and (Ts, MODIS)min from NDVI are shown in table 5. An example of
distributed TVDI over Orissa is shown in figure 3(c).
The seasonal variation of TVDI during the crop growth cycle closely follows
wetness-dryness cycles imposed by rainspells (Goward et al. 2002). This index was
also used to derive surface soil (0–5 cm) moisture status (Wang et al. 2004). Since the
evaporative fraction represents the root zone moisture status (Vogt et al. 2001, Scott
et al. 2003), the relation of TVDI with it may exist. Bhattacharya et al. (1997) has
already shown relations between surface and root zone moisture content in upland
soils of northeastern India for monsoon, pre- and post-monsoon seasons. TVDI
Evapotranspiration using MODIS data over India 2101
Dow
nloa
ded
By:
[Mal
lick,
K.]
At:
04:1
7 10
Jul
y 20
07
averaged over 262 pixels encompassing the ground observation location patch were
plotted with 1-EFins, ground (figure 3(d)). A linear fit (R250.74) could be obtained
with offset on the x-axis. This relation clearly showed that dryness in the surface soil
increases proportionally to dryness in the soil profile (surface to effective root
zone) after a certain magnitude of surface soil moisture content has been depleted.
The extrapolation of the earlier approach of estimating evaporative fraction from
Figure 3. (a) LST-NDVI triangle over Orissa on 13 January 2004. (b) LST-NDVI triangleover Punjab on 9 October 2003. (c) temperature vegetation dryness index (TVDI) overOrissa on 13 January 2004. (d) Relationship between evaporative fraction and TVDI.y50.6986x20.0992, R250.74.
Table 5. Empirical equation to derive (Ts, MODIS)max and (Ts, MODIS)min as a function of NDVI.
Date Site (Ts, MODIS)max (Ts, MODIS)min
26 August 2003 Birmi 213.712NDVI + 313.51 1.6581 NDVI + 299.339 October 2003 Birmi 240.656 NDVI + 320.56 305.014 August 2003 CSSF 232.527 NDVI + 326.4 304.79 October 2003 CSSF 250.756 NDVI + 333.75 304.113 November 2003 Jatni 233.602 NDVI + 321.84 221.386 NDVI + 310.0426 November 2003 Jatni 223.242 NDVI + 314.32 218.113 NDVI + 308.2613 January 2004 Bhuban 232.527 NDVI + 321.77 211.788 NDVI + 303.5226 November 2003 Kalyani 220.153 NDVI + 311.39 233.602 NDVI + 321.84
2102 K. Mallick et al.
Dow
nloa
ded
By:
[Mal
lick,
K.]
At:
04:1
7 10
Jul
y 20
07
SATD will suffer if air temperature at overpass time is not available from a dense
network of weather stations. However, the statistical relation based on TVDI can be
extrapolated to a larger area to estimate evaporative fraction using satellite data
only. The relation can be tuned up incorporating more datasets from different
agroecosystems.
4.2 Actual evapotranspiration (AET)
4.2.1 Simulation of seasonal water balance AET. Soil-Water-Atmosphere-Plant
(SWAP), a deterministic agrohydrological model, is used to simulate water balance
AET from actual crop transpiration (AT) and actual soil evaporation (AE) during a
crop growth cycle. The calibrated SWAP model was further used by Van Dam and
Mallick (2003) in India to simulate water balance components in several crops such
as wheat, paddy, cotton, grown in farmers’ fields.
The potential evapotranspiration (PET) was computed from Priestly and Taylor’s
(1972) formulation using daily insolation, average air temperature, humidity and
wind speed. PET is partitioned into potential evaporation (PE) and potential
transpiration (PT) using periodic crop cover from leaf area index (LAI) and crop
specific radiation extinction coefficient. PE was converted to AE based on surface
soil moisture status updated every day after computing inflow (rainfall, irrigation)
and outflow (run-off, deep percolation) components. Potential transpiration (PT) is
converted to actual transpiration (AT) based on soil water fluxes available at the
root zone. Apart from daily weather data, the crop and soil related state variables,
which are inputs to SWAP, were collected from periodic field observations. The data
pertaining to state variables used for SWAP runs and their sources of availability are
listed in table 6.
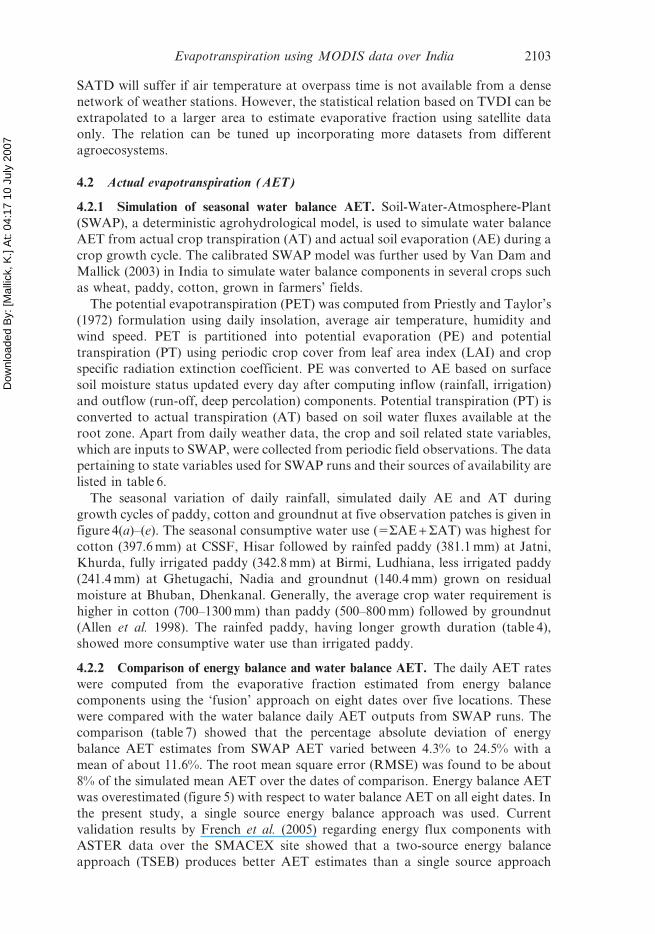
The seasonal variation of daily rainfall, simulated daily AE and AT during
growth cycles of paddy, cotton and groundnut at five observation patches is given in
figure 4(a)–(e). The seasonal consumptive water use (5SAE +SAT) was highest for
cotton (397.6 mm) at CSSF, Hisar followed by rainfed paddy (381.1 mm) at Jatni,
Khurda, fully irrigated paddy (342.8 mm) at Birmi, Ludhiana, less irrigated paddy
(241.4 mm) at Ghetugachi, Nadia and groundnut (140.4 mm) grown on residual
moisture at Bhuban, Dhenkanal. Generally, the average crop water requirement is
higher in cotton (700–1300 mm) than paddy (500–800 mm) followed by groundnut
(Allen et al. 1998). The rainfed paddy, having longer growth duration (table 4),
showed more consumptive water use than irrigated paddy.
4.2.2 Comparison of energy balance and water balance AET. The daily AET rates
were computed from the evaporative fraction estimated from energy balance
components using the ‘fusion’ approach on eight dates over five locations. These
were compared with the water balance daily AET outputs from SWAP runs. The
comparison (table 7) showed that the percentage absolute deviation of energy
balance AET estimates from SWAP AET varied between 4.3% to 24.5% with a
mean of about 11.6%. The root mean square error (RMSE) was found to be about
8% of the simulated mean AET over the dates of comparison. Energy balance AET
was overestimated (figure 5) with respect to water balance AET on all eight dates. In
the present study, a single source energy balance approach was used. Current
validation results by French et al. (2005) regarding energy flux components with
ASTER data over the SMACEX site showed that a two-source energy balance
approach (TSEB) produces better AET estimates than a single source approach
Evapotranspiration using MODIS data over India 2103

Dow
nloa
ded
By:
[Mal
lick,
K.]
At:
04:1
7 10
Jul
y 20
07
(SEBAL). Most of the disagreements between TSEB and SEBAL estimates were
over sparsely vegetated sites, suggesting that the soil-vegetation differentiation
accommodated by TSEB is a significant model benefit. The efficiency of simulating
daily AET from the SWAP model was reported to be between 0.8–0.95 over a wide
range of agroclimatic conditions across a variety of crops. Jiang et al. (2004)
reviewed the efficiency of different satellite remote sensing based AET estimation
methods and found that RMSE varied between 5–25% under different growing
Table 6. SWAP inputs used as state variables for soil water balance simulation.
Parameters
Site/ crop
SourceBirmi/Paddy
CSSF/Cotton
Jatni/Paddy
Bhuban/Groundnut
Ghetugachi/Paddy
1. Growing period(days)
147 170 168 138 129 Phenologicalobservations
2. Extinctioncoefficient
Computed fromfortnightlyradiationobservations
(a) Direct light 0.25 0.70 0.30 0.35 0.30(b) Diffuse light 0.35 0.80 0.35 0.40 0.35
3. Biometricparameters
Periodicobservations
(a) MaximumLeaf Area Index(LAI)
4.7 2.0 4.1 4.7 8.3
(b) Maximumcrop height (cm)
80 110 100 50 100
(c) Maximumroot depth (cm)
75 100 75 45 95
4. Minimumcanopy resistance(m s21)
15 10 10 15 15 Computedfrom periodicobservations
5. Maximumthickness ofponding waterlayer (cm)
6 0 5 0 7 Groundinformation
6. Residualmoisture content(cm3cm23)
0.09 0.08 0.08 0.1 0.08 Groundinformation
7. Saturatedmoisturecontent (cm3cm23)
0.40 0.35 0.35 0.30 0.58 Groundinformation
8. Saturatedhydraulicconductivity(cm d21)
38.3 35.3 35.0 20.7 43.7 Genutchen(1980)
9. Soil textureSand:Silt:Clay(%)
Sandyloam55:33:12
Sandyloam75:12:13
Sandyloam43:20:37
Sandy clayloam39:24:37
Silt clay8:68:24
Groundinformation
10. Soil profiledepth (cm)
150 150 100 58 130 Groundinformation
11. Depth ofimpervious layer(cm)
180 200 90 65 180 Groundinformation
12. Irrigations Groundinformation(a) Number 18 1 0 0 6
(b) Amount (cm) 5 each 7 0 0 6 each
2104 K. Mallick et al.
Dow
nloa
ded
By:
[Mal
lick,
K.]
At:
04:1
7 10
Jul
y 20
07
conditions. Nourbaeva et al. (2003) computed daily evapotranspiration from
NOAA AVHRR surface temperature and NDVI over the Natori river basin and
compared it with water balance AET. The deviation between AVHRR and water
balance AET was of the order of 10–15%.
Figure 4. Major water balance components of SWAP model over five ground observationpatches. (a) Jatni: monsoon paddy 2003, (b) Bhuban: post monsoon groundnut, (c)Ghetugachi: monsoon paddy 2003, (d) Birmi: monsoon paddy 2003, (e) CSSF: cotton 2003.
Table 7. Comparison of soil water balance and energy balance actual evapotranspiration(AET).
Site Crop/dateMODIS AET
(mm d21)
Water Balance(SWAP) AET
(mm d21)Absolute percent
deviation (%)
Birmi Paddy/26 August 2003 7.0 6.5 6.59 October 2003 3.5 3.3 4.9
CSSF Cotton/14 August 2003 6.3 5.6 10.09 October 2003 3.1 2.3 24.5
Jatni Paddy/13 November 2003 4.4 4.1 6.626 November 2003 4.7 4.5 4.3
Bhuban Groundnut/13 January 2004 2.2 1.8 14.4
Ghetugachi Paddy/13 November 2003 4.5 3.5 21.5
Evapotranspiration using MODIS data over India 2105

Dow
nloa
ded
By:
[Mal
lick,
K.]
At:
04:1
7 10
Jul
y 20
07
4.3 Distributed outputs
The generation of distributed energy balance outputs as well as EFins, MODIS from
MODIS data requires ground based information on distribution of crop height,
wind speed, transmissivity of cloud free atmosphere and air temperature at satellite
overpasses. The operational energy balance and AET algorithm of EARSL,
Netherlands (Rosema 1993) with Meteosat data uses temporally varying but
spatially constant transmissivity and wind speed in Africa, China and Europe. In
this study, the distributed crop height was generated by assigning heights to crop
cover classes. Pixel-wise air temperature was generated using the TVX method
(Goward et al. 2002) using LST and NDVI through a shifting window of 969 pixels
over sub-scenes. The transmissivity and wind speed measured near ground
observation locations were kept spatially constant. However, the instantaneous
insolation varies pixel wise based on solar zenith angle. The examples of distributed
outputs on instantaneous net available (Rn-G) energy and evaporative fraction
(EFins, MODIS) over agricultural surfaces in Orissa state on 13 November 2003 are
shown in figure 6(a) and (b).
5. Conclusions
The advantage and value of MODIS data is to obtain a spatial representative
measure of large areas. The individual measurements based on ground observations
represent a point while the MODIS data help to quantify the spatial variation.
Attempts were made for the first time in India to find out statistical relations
between MODIS SATD and ground measured evaporative fraction or MODIS
TVDI and evaporative fraction using the data from five different agroecosystems.
These relations would be helpful to extrapolate to larger areas. Moreover, the
outputs of daily evapotranspiration from the energy balance approach using the
integration of MODIS data and ground observations were validated with daily AET
from the well-calibrated water balance simulation model. The technique of the
generation of distributed outputs of net available energy and evaporative fraction is
also demonstrated in this study. Basically these two are needed to convert to daily
distributed AET output. The future aim is to compare different satellite ET
estimation techniques and accuracy evaluation by comparing with continuous
diurnal measurements throughout the year using Bowen ratio towers at different
Figure 5. Comparison of energy and water balance actual evapotranspiration (AET).y50.9956x + 0.4911, R250.97.
2106 K. Mallick et al.

Dow
nloa
ded
By:
[Mal
lick,
K.]
At:
04:1
7 10
Jul
y 20
07
agroclimatic zones in India. The estimates of distributed evaporative fraction andevapotranspiration at a regional scale would be improved by incorporating
interpolated weather variables such as: air temperature, humidity, insolation
measured diurnally in a network of automatic weather stations (AWS).
Acknowledgments
The authors are highly grateful to Dr N. K. Patel, Head, Crop Inventory and
Modelling Division for his valuable suggestions while carrying out the analysis. We
are thankful to National Remote Sensing Agency (NRSA), Hyderabad, India for
providing satellite data.
ReferencesALLEN, R.G., PEREIRA, L.S., RAES, D. and SMITH, M., 1998, Crop evapotranspiration FAO
irrigation and drainage paper No. 56, United Nations Food and Agriculture
Organisation, Rome, Italy.
ALLEN, R.G., TASUMI, M. and TREZZA, R., 2005, METRIC: Mapping Evapotranspiration at
High Resolution- Applications Manual for Landsat satellite imagery. University of
Idaho, 130 pp.
ANTHONI, P.M., FREIBAUER, A., KOLLE, O. and SCHULZE, E., 2004, Winter wheat carbon
exchange in Thuringia, Germany. Agricultural and Forest Meteorology, 121, pp.
55–67.
BASTIAANSSEN, W.G.M., MENETI, M., FEDDES, R.A. and HOLSTAG, A.A.M., 1998, A remote
sensing surface energy balance algorithm for land (SEBAL) 1.Formulation. Journal of
Hydrology, 212–213, pp. 198–212.
BECKER, F. and LI, Z.L., 1990, Towards a local split window method over land surface
temperature from a satellite. International Journal of Remote Sensing, 11, pp. 369–394.
BHATTACHARYA, B.K., MITRA, S. and DATTA, M., 1997, Identification of water deficit and
surplus periods and prediction of profile water content from surface soil water status
in uplands of Tripura. Journal of Indian Society of Soil Science, 45, pp. 698–701.
(a) (b)
Figure 6. Distributed outputs of (a) net available energy and (b) evaporative fraction over asubscene (186 rows6226 columns) in Orissa on 13 November 2003.
Evapotranspiration using MODIS data over India 2107
Dow
nloa
ded
By:
[Mal
lick,
K.]
At:
04:1
7 10
Jul
y 20
07
BOLLE, H.J. and STRECKENBACH, B. (Eds), 1993, Flux estimates from remote sensing, The
Echival Field Experiment in a Desertification Threatened Area (EFEDA) final report,
Berlin, August, pp. 406–424.
BRUTSAERT, W., 1975, On the derivable formula for long-wave radiation from clear skies.
Water Resources Research, 11, pp. 742–744.
BUTLER, D.R., 1992, Daily patterns of dew-point temperature in a semiarid climate.
Agricultural and Forest Meteorology, 60, pp. 267–278.
CHEN, Y.H., LI, X.B., LI, J., SHI, P.J. and DOU, W., 2005, Estimation of daily
evapotranspiration using a two-layer remote sensing model. International Journal of
Remote Sensing, 26, pp. 1755–1762.
DOORENBOS, J. and PRUITT, W.O., 1977, Guidelines for Predicting Crop Water Requirements
Irrigation and Drainage Paper 24, 2nd edn, FAO, Rome, 114 pp.
FARAH, H.O., BASTIAANSSEN, W.G.M. and FEDDES, R.A., 2004, Evaluation of the temporal
variability of the evaporative fraction in a tropical watershed. International Journal of
Applied Earth Observation, 5, pp. 129–140.
FLEXAS, J., BOTA, J., CIFRE, J., ESCALONA, J.M., GLAMES, J., GULIAS, J., LEFI, E.,
FLORINDA, S., MARIA, M., MORENO, J., CARBO, M., RIERA, D., SAMPOL, B. and
HIPOLITO, M., 2004, Understanding down-regulation of photosynthesis under water
stress: future prospects and searching for physiological tools for irrigation manage-
ment. Annals of Applied Biology, 144, pp. 273–283.
FRENCH, A.N., JACOB, F., ANDERSON, M.C., KUSTAS, W.P., TIMMERMANS, W., GIESKE, A.,
SU, Z., SU, H., MCCABE, M.F., LI, F., PRUEGER, J. and BRUNSELL, N., 2005, Surface
energy fluxes with the Advanced Spaceborne Thermal Emission and Reflection
Radiometer (ASTER) at the IOWA 2002 SMACEX site (USA). Remote Sensing of
Environment, 99, pp. 55–65.
GENUTCHEN, V.M.TH., 1980, A closed–form equation for predicting hydraulic conductivity
of unsaturated soils. Soil Science Society of American Journal, 44, pp. 892–898.
GOWARD, S.N., XUE, Y. and CZAJKOWSKI, K.P., 2002, Evaluating land surface moisture
conditions from the remotely sensed temperature/vegetation index measurements: an
extrapolation with the simplified simple biosphere model. Remote Sensing of
Environment, 79, pp. 225–242.
GUPTA, P.L. and SASTRY, P.S.N., 1986, Estimating evapotranspiration from midday canopy
temperature. Irrigation Science, 7, pp. 237–243.
GUTMAN, G.G., 1994, Global data on land surface parameters from NOAA AVHRR for use
in numerical climate models. Journal of Climate, 7, pp. 669–680.
HALL, F.G., HEUMRICH, K.F., GOETZ, S.J., SELLERS, P.J. and NICKENSON, J.E., 1992,
Satellite remote sensing of surface energy balance: success, failure and unresolved
issues of FIFE. Journal of Geophysical Research, 97, pp. 19061–19089.
HATFIELD, J.L., WANJURA, D.F. and BARKER, G.L., 1985, Canopy temperature response to
water stress under partial canopy. Transactions of the ASAE, 28, pp. 1607–1611.
HOWELL, T.A., TOLK, J.A., SCHNEIDER, A.D. and EVETT, S.R., 1998, Evapotranspiration,
yield, and water use efficiency of corn hybrids differing in maturity. Agronomy
Journal, 90, pp. 3–9.
JACKSON, R.D., IDSO, S.B., REGINATO, R.J. and PINTER, P.J., 1981, Canopy temperature as a
crop water stress index. Water Resources Research, 17, pp. 1133–1138.
JIANG, H., LIU, S., SUN, P., AN, S., ZHOU, G. and LI, C., 2004, The influence of vegetation
type on the hydrological process at the landscape scale. Canadian Journal of Remote
Sensing, 30, pp. 743–763.
KUSTAS, W., CHOUDHURY, B.J., REGINATO, M.M.R., JACKSON, R., GAY, L. and WEAVER, H.,
1989, Determination of sensible heat flux over sparse canopy using thermal infrared
data. Agricultural and Forest Meteorology, 44, pp. 197–216.
KUSTAS, W.P., MORAN, M.S., HUMES, K.S., STANNARD, D.I., PINTER, P.J., HIPPS, L.E.,
SWIATEK, E. and GOODRICH, D.C., 1994, Surface energy balance estimates at local
and regional scales using optical remote sensing from an aircraft platform and
2108 K. Mallick et al.
Dow
nloa
ded
By:
[Mal
lick,
K.]
At:
04:1
7 10
Jul
y 20
07
atmospheric data collected over semiarid rangelands. Water Resources Research, 30,
pp. 1241–1260.
IDSO, S.B., JACKSON, R.D., PINTER, P.J, JR, REGINATO, R.J. and HATFIELD, J.L., 1981c,
Normalizing stress degree-day for environmental variability. Agricultural and Forest
Meteorology, 24, pp. 45–55.
LIANG, S., 2000, Narrowband to broadband conversions of land surface albedo: 1.
algorithms. Remote Sensing of Environment, 76, pp. 213–238.
LIANG, S., 2004, Quantitative Remote Sensing of Land Surfaces (New York: John Wiley &
Sons, Inc.).
MECIKALSKI, J.R., DIAK, G.R., ANDERSON, M.C. and NORMAN, J.M., 1999, Estimating
fluxes on continental scales using remotely sensed data in an atmosphere-land
exchange model. Journal of Applied Meteorology, 38, pp. 1353–1369.
MORAN, M.S., CLARKE, T.R., INOUE, Y. and VIDAL, A., 1994, Estimating crop water deficit
using the relationship between surface-air temperature and spectral vegetation index.
Remote Sensing of Environment, 49, pp. 246–263.
NAGLER, P.L., SCOTT, R.L., WESTENBURG, C., CLEVERLY, J.R., GLENN, E.P. and
HUETE, A.R., 2005, Evapotranspiration on western U.S. rivers estimated using the
Enhanced Vegetation Index from MODIS and data from eddy covariance and Bowen
ratio flux towers. Remote Sensing of Environment, 97, pp. 337–351.
NEMANI, R.R., PIERCE, L., RUNNING, S.W. and GOWARD, S.N., 1993, Developing satellite
derived estimates of surface moisture status. Journal of Applied Meteorology, 32, pp.
548–557.
NORMAN, J.M., KUSTAS, W.P. and HUMES, K.S., 1995b, A two-source approach for estimat-
ing soil and vegetation energy fluxes from observations of directional radiometric
surface temperature. Agricultural and Forest Meteorology, 77, pp. 263–293.
NOURBAEVA, G., KAZAMA, S. and SAWAMOTO, M., 2003, Assessment of daily evapotranspira-
tion using remote sensing data. Environmental Informatics Archives, 1, pp. 421–427.
PARODI, G.N., 2000, AVHRR Hydrological Analysis System, 2000, Algorithms and theory.
Version 1.0, WRES-ITC, Netherlands.
PARTON, W.J. and LOGAN, J.A., 1981, A model for diurnal variation in soil and air
temperature. Agricultural and Forest Meteorology, 23, pp. 205–216.
PRIESTLEY, C.H.B. and TAYLOR, R.J., 1972, On the assessment of surface heat and
evaporation using large-scale parameters. Monthly Weather Review, 100, pp. 81–92.
ROBELING, R.A., VAN PUTTEN, E., GENOVESE, G. and ROSEMA, A., 2004, Application of
Meteosat derived meteorological information for crop yield predictions in Europe.
International Journal of Remote Sensing, 25, pp. 5389–5401.
ROSEMA, A., 1993, Using METEOSAT for operational evapotranspiration and biomass
monitoring in the Sahel region. Remote Sensing of Environment, 46, pp. 27–44.
SANDHOLT, I., KJELD, R. and JENS, A., 2002, A simple interpretation of surface temperature/
vegetation index space for assessment of surface moisture status. Remote Sensing of
Environment, 79, pp. 213–224.
SARVANAAPAVAN, T., DYE, D. and SHIBASAKI, R., 1996, Mid-day atmospheric humidity from
thermal infrared observation of the NOAA-14 AVHRR satellite: validation in
tropical environment. GIS Development.net, AARS, ACRS, 1996, Oceanography/
Meteorology.
SCOTT, C.A., BASTIAANSSEN, W.G.M. and AHMAD, M.D., 2003, Mapping root zone soil
moisture using remotely sensed optical imagery. Journal of Irrigation and Drainage
Engineering, 129, pp. 326–335.
SEGUIN, B. and ITIER, B., 1983, Using midday surface temperature to estimate daily
evaporation from satellite thermal IR data. International Journal of Remote Sensing,
4, pp. 371–383.
SELLERS, P.J., HALL, F.G., ASRAR, G., STREBEL, D.E. and MURPHY, R.E., 1988, The first
ISLSCP field experiment (FIFE). Bulletin of the American Meteorological Society, 69,
pp. 22–27.
Evapotranspiration using MODIS data over India 2109
Dow
nloa
ded
By:
[Mal
lick,
K.]
At:
04:1
7 10
Jul
y 20
07
TASUMI, M., 2003, Progress in operational estimation of regional evapotranspiration using
satellite imagery. PhD dissertation, University of Idaho, Moscow, Idaho.
VAN DAM, J.C. and MALLIK, R.S. (Eds), 2003, Water productivity of irrigated crops in Sirsa
district, India, integration of remote sensing, crop and soil model and geographic
information system. WATPRO final report, including CDROM ISBN 90–6464–264–
6, 173 pp.
VAN DE GRIEND, A.A. and OWE, M., 1993, On the relationship between thermal emissivity
and normalized difference vegetation index for natural surfaces. International Journal
of Remote Sensing, 14, pp. 1119–1131.
VERMOTE, E., TANRE, D., DEUZE, J.L., HERMAN, M. and MORCRETTE, J.J., 1997, Second
simulation of the satellite signal in the solar spectrum (6S). 6s User Guide version 2.
VOGT, J.V., NIEMEYER, S. and VIAU, A.A., 2001, Monitoring water stress at regional scales.
Proceedings of the 23rd Canadian Symposium on Remote Sensing, 21–24 August 2001,
Laval University, Sainte Foy, Quebec, Canada, pp. 315–321.
WANG, C., QI, S., NIU, Z. and WANG, J., 2004, Evaluating soil moisture status in China using
the temperature-vegetation dryness index (TVDI). Canadian Journal of Remote
Sensing, 30, pp. 671–679.
2110 Evapotranspiration using MODIS data over India
Copyright © 2022 FDOKUMEN