Assessment of slope stability using combined probabilistic ...
Upload
independentCategory
view
2download
0
www.elsevier.com/locate/margeo
Marine Geology 227
Geochemistry and sedimentology of shelf and upper slope sediments
of the south-central Black Sea
Muhammet Duman a,*, Sukriye Duman a, Timothy W. Lyons b, Mert AvcV a,
Erol Izdar c, Erkan Demirkurt a
a Institute of Marine Science and Technology, Dokuz Eylul University, Haydar Aliyev BulvarV, No. 10, InciraltV -Izmir, 35340, Turkeyb Department of Earth Sciences, University of California, Riverside, CA, USA
c Piri Reis Foundation for Maritime and Marine Resources, Research, Development and Education, PK 49 Izmir, 35210, Turkey
Received 11 May 2004; received in revised form 31 August 2005; accepted 22 November 2005
Abstract
Eighty-five surface samples from oxic, suboxic and anoxic sites of the south-central Black Sea shelf consist predominantly of
clayey silts and silty clays, reflecting the moderate-to-high energy, wave-dominated hydrological regime. Grain size data and net
sediment transport patterns suggest that the western part of this shelf is an area of east-directed active sediment transport. With the,
exception of localized nearshore zones, the eastern shelf is by contrast an area of major sediment deposition. The sediment transport
vectors are correlated with patterns of surface water circulation and storm-generated longshore currents.
The sources of the shelf sediments are indicated by the total concentrations of 30 major, minor and trace elements in 59 surface
samples. Factor analysis shows that 99.1% of the total variance can be explained by five factors. Factor 1 (As, Cu, Cr, Fe, Pb and
Zn) reflects anthropogenic pollution by the Etibank copper mine. Factor 2 (mainly total organic carbon and S) is linked to anoxia/
redox as saline conditions. Factor 3 (mainly Al, Si) represents aluminosilicates whereas Factor 4 (sand and silt abundance, total
carbonate, Ca and Sr) represents the carbonate component. Factor 5 (Fe, Mn, P, Cr, Ni and V) tracks primary detrital delivery with
strong overprints by redox-dependent, biogeochemical reactions within the anoxic sediments and the oxic/suboxic bottom waters.
The combined data suggest that the sediments on the south-central Black Sea shelf were largely derived from the North
Anatolian Mountains and supplied to the shoreline by a network of small rivers.
D 2005 Elsevier B.V. All rights reserved.
Keywords: Black Sea; shelf; sedimentology; geochemistry
1. Introduction
Along the northern and northwestern Black Sea, the
continental shelves are wide (40–120 km), reflecting a
large sedimentary influx through several major rivers,
including the Danube, Dniester, Dnieper, Don and Bug.
Shelves are notably narrower (5–40 km) in the western,
0025-3227/$ - see front matter D 2005 Elsevier B.V. All rights rese
doi:10.1016/j.margeo.2005.11.009
* Corresponding author.
E-mail addresses: [email protected] (M. Duman),
[email protected] (T.W. Lyons), [email protected] (E. Izdar)
.rved.
southern and eastern portions of the basin, and only a few
small rivers drain into Black Sea from the south, such as
the KVzVlVrmak, YesilVrmak and Sakarya. The shelf-slope
break occurs between 110 and 150 m water depth, and
generally steep (5–98) slopes lead to the floor of the
Black Sea basin at N2200 m. The slope face is dissected
by numerous submarine canyons and gullies, locally
feeding large submarine fans along the slope apron
(Fig. 1).
Two major cyclonic and several mesoscale anticy-
clonic eddies control the surface water circulation in the
(2006) 51–65

Fig. 1. Location map showing the bathymetry of the Black Sea (from International Bathymetric Charts of the Mediterranean) and the Straits of
Bosphorus and Dardanelles. Isobaths are in metres. Inset is the study area, illustrated in Fig. 2.
M. Duman et al. / Marine Geology 227 (2006) 51–6552
Black Sea (Ozsoy and Unluata, 1997). The b75-km-
wide, counter-clockwise rotating peripheral bRim Cur-
rentQ separates the large basinal cyclonic gyres from the
anticyclonic coastal eddies. This current flows eastward
along the Anatolian coast with velocities of 20–40 cm
s�1 and dominates the surface circulation across the
narrow continental shelves (Ozsoy and Unluata, 1997).
Three distinct water masses occur in the Black Sea
basin: (1) the brackish (17.0–18.5x) Black Sea surface
water mass occupying the upper 50–150 m depth and
showing seasonal temperature variability, (2) the colder
(6.5–8.0 8C) and higher salinity (20.5–21.0x) interme-
diate water mass situated between 75 and 200 m depths,
and (3) the slightly warmer (N8.5 8C) and more saline
(N21.0x) Mediterranean water mass occupying basinal
depths below ~200 m (Ozsoy and Unluata, 1997). In the
study area, a permanent halocline, at 100–110 m water
depth, separates the oxygen-rich surface waters from the
oxygen-poor to anoxic-sulfide basinal waters. Thus, the
shelf region from the shoreline to the shelf-break is
situated beneath the oxygenated surface water mass. A
narrow shore-parallel transitional zone extends from the
100 m to ~200 m isobaths and is characterized by sub-
oxic bottom waters ([O2]b5 AM), whereas the upper
slope below the 200 m isobath is overlain by the anoxic
water mass.
Numerous studies have explored the depositional
history, paleoceanography and geochemistry of the
deep basinal sediments in the Black Sea (Calvert and
Karlin, 1991; Lyons, 1997; Wijsman et al., 2001,
Wilkin and Arthur, 2001). However, except for a
small number of localized studies (Lyons et al., 1993;
Anderson et al., 1994), surprisingly little is known
about the sedimentology of the shallow shelves along
the southern Black Sea, north of the Anatolian coast.
This paper presents the contemporary sedimentary pro-
cesses along the south-central Black Sea and delineates
the sources of these surficial sediments.
2. Material and methods
The sediment samples used in this study were collect-
ed using a grab sampler and the Research Vessel K. Piri
Reis of the Institute of Marine Science and Technology,
Izmir, during cruises in 1994–1996 (Fig. 2). This sam-
pler typically recovers sediments from the upper 10–15
cm of the sea bed and often preserves the stratigraphy
moderately well. At each station, the top of the grab
sampler was carefully opened and only the uppermost
5 cm of the sediment was removed into a plastic bag. Of
the 85 surface sediment samples collected, 13 samples
were recovered beneath anoxic bottom waters, 21 sam-
ples were retrieved beneath suboxic bottom waters,
while the remaining 51 samples were recovered beneath
oxic bottom waters. Four additional sediment samples
were collected from the bed of the Zarbana River, im-
mediately downstream from the Etibank copper mine.
All samples were stored in plastic bags in a freezer until
they were dried in the laboratory at 40 8C. The grain-sizedistribution was determined in 85 marine samples using
standard sieve and hydrometer techniques. Samples
were dried above 40 8C and finely ground in a mortar

Fig. 2. (A) Index map of the study area showing the bathymetry and small rivers draining the central North Anatolian Mountains. Isobaths are in
metres. (B) The locations of the surface sediment samples used in this study. S, .=samples with grain size, total organic carbon and total
carbonate and XRF data, .=samples with grain size, total organic carbon and total carbonate data only. Also shown is the geographical distribution
of the oxic, suboxic and anoxic bottom water masses (unpublished data, Institute of Marine Sciences and Technology).
M. Duman et al. / Marine Geology 227 (2006) 51–65 53
for determinations of carbonate and organic carbon con-
tents. Total organic carbon (TOC) was measured using a
modified Walkley-Black method (Gaudette et al., 1974),
which is based on the exothermic heating and oxidation
of organic matter with potassium dichromate and con-
centrated sulphuric acid, followed by back-titration with
ferrous ammonium sulphate using phenyl-amine as an
indicator. The carbonate content was determined using a
gasometric method, which is a modified dScheiblerTgasometer system (Muller, 1967). This method is based
on the volumetric determination of CO2 released by
acidification of the dry sample with 10% HCl solution.
The precision of the analytical methods, estimated using
standard and replicate samples, is F0.5% for total car-
bonate and F0.25% for total organic carbon.
Total sedimentary concentrations of Al, As, Ba, Ca,
Ce, Cl, Cr, Cu, Fe, Ga, K,Mg,Mn, Na, Nb, Ni, P, Pb, Rb,
S, Sc, Si, Sr, Th, Ti, U, V, Y, Zn and Zr were determined
in 59 samples using X-ray fluorescence (XRF) spectrom-
etry. For these analyses, sediments were dried and pow-
dered, and 4 g of powder was mixed with 0.7 g of
phenolic resin binder. After homogenization, pellets
were prepared in a press and baked for 15 min at
200 8C. The analyses were carried out at Memorial
University, Newfoundland, using an ARL 8420+ se-
quential wavelength-dispersive XRF spectrometer with
a Rh end-window X-ray tube and a LiF200 crystal
specially treated for enhanced heavy element sensitivity.
For energies N7.471 keV (20–508 2Q), a scintillation
detector was used with power settings at 75 kV and

M. Duman et al. / Marine Geology 227 (2006) 51–6554
40 mA. For energies b6.398 keV (50–1508 2Q), a flow-
proportional detector was used with power settings at
30 kV and 100 mA. Scan times were 4–6 s for the most
abundant elements, 20 s for the trace elements and 100 s
for Rb, Y and Nb. The intensities were then matrix
corrected using Compton correction for elements with
emission energies greater than Fe and using the La
Chance-Traill algorithm for elements with emission en-
ergies less than and including Fe.
Sediment transport vectors were determined using the
technique developed by Gao and Collins (1992), where
the grain-size trends within a grid of surface samples are
transformed into a residual pattern representing net sed-
iment transport pathways. Several methods using the
grain-size parameters of bottom sediments to establish
their transport directions have been employed over the
last three decades, including those of Gao and Collins
(1992), Chang et al. (2001) and LeRoux et al. (2002). All
Fig. 3. Top: Ternary diagram shows the grain size distribution in the south-
(.) Western shelf=offshore region between Cape Kerempe and Catalzeytin,
Ince. Bottom: Cumulative frequency curves of selected samples from the w
of these methods are based upon the same premise,
namely that sedimentary processes produce changes in
the grain-size parameters (size, sorting and skewness) in
the direction of transport, so that these trends have been
widely used to determine sediment dispersal patterns in
bays and shelf areas (Pedreros et al., 1996; Liu et al.,
2002; Duman et al., 2004).
3. Results
3.1. Grain size distribution
The grain size data, classified using the nomenclature
of Shepard (1954), show that the surface sediments in the
south-central Black Sea shelf and upper slope consist
predominantly of clayey silts and to a lesser extent silty
clays (Fig. 3). The cumulative frequency curves show
that these sediments are generally unimodal (Fig. 3). The
central Black Sea shelf. Sediment nomenclature after Shepard (1954).
and (o) eastern shelf=offshore region between Catalzeytin and Cape
estern and eastern shelf regions.

M. Duman et al. / Marine Geology 227 (2006) 51–65 55
sand content varies from 2% to 14%, and sand is largely
composed of terrigenous siliciclastic grains, but several
samples include varying quantities of mainly carbo-
nate biogenic remains of pelecypods, gastropods and
bivalves. The sand content is highest along the western
segment of the shelf between Cape Kerempe and the
town of Inebolu, but small isolated zones of high sand
content of N10% also occur on the eastern shelf (Fig. 4).
The shoreline along the Black Sea coast of northern
Turkey is composed mainly of coarse sand and gravel,
which quickly fines offshore to sands and silts, reflecting
the high-energy wave dominated nearshore zone. There
is a strong reciprocal relationship between the silt con-
tent and the water depth, with the highest silt abundance
of N70% occurring along the nearshore zone and grad-
ually decreasing seaward to b60%. Silt content is 40–
60% in the western shelf region but increases slightly to
60–72% toward the eastern shelf (Fig. 4). Because the
sand content is generally low, the silt and clay abun-
dances display a reciprocal relationship in the study area.
Clay content is lowest (b20%) along the nearshore zone
but gradually increases seaward, reaching 35–40% near
the shelf edge (Fig. 4). The average size varies between
6.0A and 8.5A on the south-central Black Sea shelf and
upper slope, with an average in the medium-fine silt
range at 7.0A. The surface sediments in the study area
are very poorly sorted, with r1 values ranging between
1.9 and 2.7. Sorting improves with increasing silt content
in the eastern shelf region but deteriorates with increas-
ing sand content in western shelf (Fig. 4).
Fig. 4. (Top) Relationships between sand and silt abundances, sorting (rdistribution maps of sand, silt and clay abundances and sorting (r1) in the
3.2. Chemical composition of sediments and elemental
associations
The geochemical data in this study consist of the
bulk sediment concentrations of 30 elements as well as
the TOC and total carbonate concentrations in 59
samples. Preliminary evaluation of these data suggests
that the surface sediments in the south-central Black
Sea shelf are probably derived from a number of
petrologically complex sources and that mixing of
distinct sources must have occurred during sediment
transport. Present-day redox conditions at and below
the seabed also appear to provide a significant chem-
ical signature. Therefore, this large and complex data
set does not allow an immediate and unambiguous
interpretation of the elemental associations and the
potential sources of sediments. Factor analysis is a
powerful statistical technique, which delineates simple
patterns distributed among complex data by evaluating
the structure of the variance–covariance matrix and
extracting a small number of hypothetical variables
(R-mode) or samples (Q-mode), referred to as
bfactorsQ (Klovan and Imbrie, 1971). The extracted
factors account for a percentage of the total variance
in the data set and represent the relationships among a
large number of interrelated variables (R-mode) and
samples (Q-mode).
Normalization of the elemental concentrations to
textural and/or mineralogical characteristics improves
the sensitivity in comparisons of elemental concentra-
1) and mean grain size and skewness (SK1) and (Bottom) regional
south-central Black Sea shelf surface sediments.
M. Duman et al. / Marine Geology 227 (2006) 51–6556
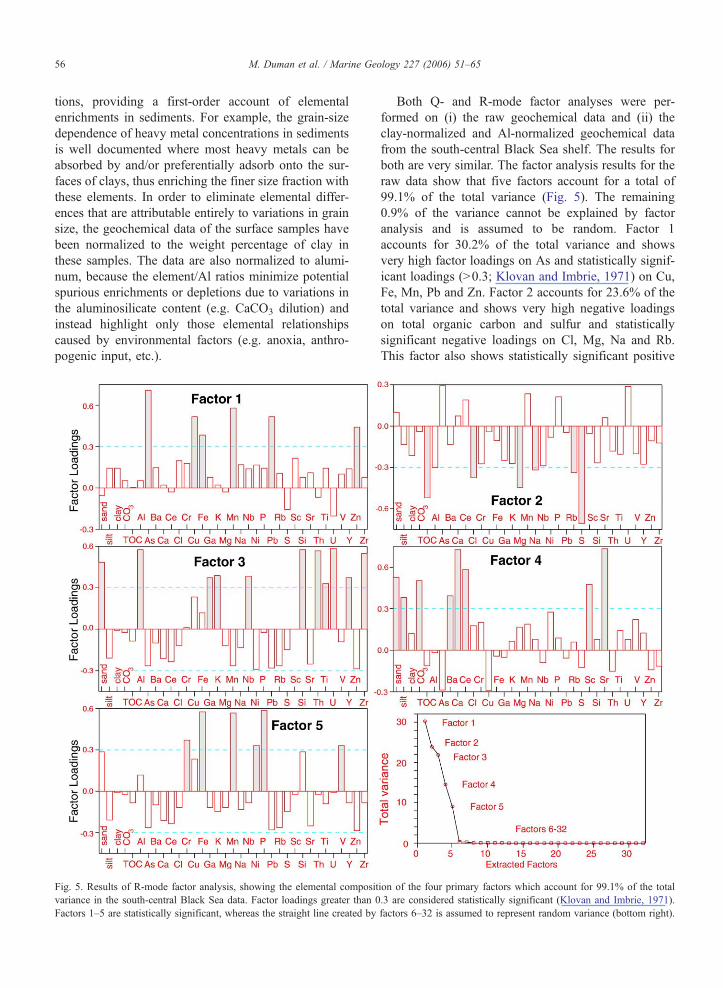
tions, providing a first-order account of elemental
enrichments in sediments. For example, the grain-size
dependence of heavy metal concentrations in sediments
is well documented where most heavy metals can be
absorbed by and/or preferentially adsorb onto the sur-
faces of clays, thus enriching the finer size fraction with
these elements. In order to eliminate elemental differ-
ences that are attributable entirely to variations in grain
size, the geochemical data of the surface samples have
been normalized to the weight percentage of clay in
these samples. The data are also normalized to alumi-
num, because the element/Al ratios minimize potential
spurious enrichments or depletions due to variations in
the aluminosilicate content (e.g. CaCO3 dilution) and
instead highlight only those elemental relationships
caused by environmental factors (e.g. anoxia, anthro-
pogenic input, etc.).
Fig. 5. Results of R-mode factor analysis, showing the elemental composit
variance in the south-central Black Sea data. Factor loadings greater than 0
Factors 1–5 are statistically significant, whereas the straight line created by
Both Q- and R-mode factor analyses were per-
formed on (i) the raw geochemical data and (ii) the
clay-normalized and Al-normalized geochemical data
from the south-central Black Sea shelf. The results for
both are very similar. The factor analysis results for the
raw data show that five factors account for a total of
99.1% of the total variance (Fig. 5). The remaining
0.9% of the variance cannot be explained by factor
analysis and is assumed to be random. Factor 1
accounts for 30.2% of the total variance and shows
very high factor loadings on As and statistically signif-
icant loadings (N0.3; Klovan and Imbrie, 1971) on Cu,
Fe, Mn, Pb and Zn. Factor 2 accounts for 23.6% of the
total variance and shows very high negative loadings
on total organic carbon and sulfur and statistically
significant negative loadings on Cl, Mg, Na and Rb.
This factor also shows statistically significant positive
ion of the four primary factors which account for 99.1% of the total
.3 are considered statistically significant (Klovan and Imbrie, 1971).
factors 6–32 is assumed to represent random variance (bottom right).

M. Duman et al. / Marine Geology 227 (2006) 51–65 57
loadings on Mn and U as redox sensitive elements
(Fig. 5). Factor 3 accounts for 21.9% of the total
variance and shows strong loadings on sand percentage
and Al and Si content and statistically significant load-
ings on Ga, K, Nb, Th, Ti, U, Y and Zr (Fig. 5). Factor
4 accounts for 14.5% of the total variance and shows
high factor loadings on sand and silt abundances, total
carbonate content, Ca, Ce and Sr and significant load-
ings on Ba and Sc (Fig. 5). Factor 5 accounts for 8.9%
of the total variance and shows very high factor
loadings on Fe, Mn and P and statistically significant
loadings on Cr, Ni and V (Fig. 5).
Fig. 6 shows the geographical distribution of the
normalized components of each factor. Factor 1
shows its highest loadings along the western nearshore
zone of the south-central Black Sea shelf, notably
decreasing toward the eastern shelf as well as the
shelf edge (Fig. 6). This distribution trend suggests
that sediments dominated by factor 1 are mainly sup-
plied locally from the small rivers and creeks entering
the Black Sea east of Cape Kerempe, particularly the
Fig. 6. Geographical distribution of the normalized varimax factor compon
variance. Also shown are the correlations between the five varimax factors
Zarbana River. The lowest loadings of factor 1 occur
along the upper slope region beneath anoxic and sulfi-
dic bottom waters. Factor 2 is the dominant factor in
upper slope sediments, seaward of the shelf edge
(Fig. 6). Factor 2 loadings are lowest along the shallow
oxic regions of the shelf but show a sharp increase at
the shelf edge, with highest loadings occurring in the
upper slope (Fig. 6). This geographic trend shows a
remarkable correlation (TOC and S enrichments) with
suboxic, transitional bottom waters between the fully
anoxic and fully oxic regimes. A small zone of high
loadings on factor 2 occurs immediately north of the
mouth of the Zarbana River. Factor 3 has its highest
loadings along the western shelf region, between Cape
Kerempe and Inebolu, and shows a distinct decreasing
trend eastward along the shelf, as well as northward
across the western shelf (Fig. 6). A large zone of
moderate to high loadings on factor 3 occurs between
Catalzeytin and Cape Ince. Factor 4 is generally low in
samples from the western shelf region and then shows
three isolated zones of relatively high loadings imme-
ents (Q-mode) of the five factors accounting for 99.1% of the total
(bottom right).

M. Duman et al. / Marine Geology 227 (2006) 51–6558
diately landward of the shelf edge toward the east (Fig.
6). Another zone of high loadings of factor 4 is found
along the nearshore zone between AyancVk and Cape
Ince (Fig. 6). Factor 5 exhibits its highest loadings
along the eastern shelf between Catalzeytin and Cape
Ince and shows a sharp decrease in its contribution both
westward along the shelf, as well as northward across the
shelf (Fig. 6).
The correlation coefficient matrix of the extracted
factors indicates that factor 1 has strong negative and
positive relationships with factors 2 and 3, respectfully,
but shows little relationship with factors 4 and 5
(Fig. 6). Factor 2 displays variable but strong relation-
ships with all factors. Factor 3 has strong correlation
with factor 1 but weak to moderate relationships with
factors 4 and 5 (Fig. 6). Factor 4 has a moderate
negative relationship with factor 2 but displays weak
to moderate inverse correlation with factor 3 and weak
positive correlations with factors 1 and 5. Factor 5
shows moderate positive and negative correlations
with factors 3 and 2, respectively, but exhibits weak
relationships with factors 1 and 4 (Fig. 6).
4. Discussion
4.1. Sedimentary processes
A recent study across the western Black Sea shelf
showed that thick (20–25 m) blanket of transgressive
sediments was deposited during the post-glacial sea-
level rise (Algan et al., 2002). There are no high-
resolution seismic reflection profiles from the south-
central Black Sea shelf, but a similar sedimentary
history can be envisioned, depositing a thin veneer of
transgressive sediments across the study area. There-
fore, the ages of the surface sediments in the study area
are critical for better understanding of sedimentary
processes and provenance.
Storm deposits on modern continental shelves range
in thickness from N100 cm along the coastal zone to 4–
10 mm in the middle shelf zone below the wave base
for major storms (the shelf mud zone of Johnson and
Baldwin, 1996). Within the transitional zone between
the wave base for major storms (i.e., 100 years) and the
wave base of average storms (i.e., annual), these depos-
its are typically 5–100 mm thick (e.g. Aigner and
Reineck, 1982). There are no direct age measurements
for the surface sediments from the south-central Black
Sea. However, age determinations using 137Cs and
excess 210Pb profiles in box cores from the southwest-
ern Black Sea shelf, north of the Bosphorus, as well as
in Sinop Bay, immediately east of Cape Ince, show that
the sedimentation rates along the southern Black Sea
shelves range from 55 to 110 cm/1000 years (Anderson
et al., 1994). These rates suggest that the samples used
in this study, which are from the upper ~5 cm, were
deposited during the last 45–90 years. These rates
equate to 6–11 cm of sedimentation during the last
100 years. This amount of sedimentation in 100 years
is less than or approximately equal to the depth to
which the storms with this recurrent interval are capable
of reworking. Therefore, the sedimentary succession in
the study area is likely to consist of storm-reworked and
storm-transported deposits, with an active layer or sur-
face veneer that undergoes erosion, transport and depo-
sition in response to the last major storm in the area.
These storm–sediment relationships strongly suggest
that, on longer time scales of N100 years, the shelf
sediments must be in equilibrium with the wave-dom-
inated shelf environment.
The transport vectors identified using the residual
grain-size trends are illustrated in Fig. 7. These results
show that the main sediment transport is largely east-
directed along the southern central Black Sea shelf,
with the strongest transport vectors occurring along
the narrowest western shelf region between Cape Ker-
empe and the town of Inebolu (Fig. 7). The transport
vectors across the shelf region east of Inebolu show a
notable decrease, although they still exhibit an east-
directed net transport. Except for the shelf edge,
where moderate southeast-directed transport vectors
occur, the shallower offshore regions between Inebolu
and Catalzeytin display very small transport vectors,
which are directed east or south-southeast. East of
Catalzeytin the transport vectors become stronger and
distinctly northeast-directed in the nearshore zone, par-
alleling the coastline, but remain relatively weak off-
shore. The shelf region between AyancVk and Cape Ince
is dominated by generally south-and southwest-direct-
ed, moderate to weak transport vectors (Fig. 7).
Comparison between the surface currents in the
Black Sea and the transport vectors calculated using
the residual grain-size trends shows some remarkable
similarities (Fig. 7). The eastern and western cyclonic
gyres of the Black Sea surface circulation system con-
verge along a line situated at ~34 8E longitude; thus,
the shelf and upper slope between Cape Kerempe and
Cape Ince are situated beneath the Peripheral Rim
Current of the western cyclonic gyre, immediately
west of this convergence. The eastern limb of the
western cyclonic gyre forms a narrow east-flowing jet
along the north Anatolian coast, attaining velocities of
50–75 cm s�1 along the shelf between Cape Kerempe
and Inebolu (Fig. 7; Ozsoy and Unluata, 1997). Strong

Fig. 7. (A) Net sediment transport patterns determined using residual grain-size trends in south-central Black Sea (discussed in text). (B) Surface
water circulation in the study area, showing the southeast segment of the Peripheral Rim Current and anticyclonic Sinop gyre (Ozsoy and
Unluata, 1997).
M. Duman et al. / Marine Geology 227 (2006) 51–65 59
transport vectors identified along the western shelf
between Cape Kerempe and Inebolu correlate well
with the eastern limb of the western cyclonic gyre
(Fig. 7). The predominant winds in the study area are
from the north and northwest, which generate strong
east-directed longshore currents along the southern
Black Sea shelf, particularly during winter storms.
Therefore, the east-directed oceanographic current, to-
gether with the similarly-directed storm-generated long-
shore currents, are probably responsible for the
winnowing of surface sediments along the western
shelf region, explaining the observed increase in sand
content. East of Inebolu, the Peripheral Rim Current is
deflected toward the east-northeast and flows along the
shelf edge with considerably weaker velocities (b40 cm
s�1). Along the shelf region east of Inebolu, the trans-
port vectors show a significant decrease, probably
reflecting the deflection of the Peripheral Rim Current,
as well as the noticeable widening of the shelf in this
region. The shelf region south of the 110 m isobath and
between Inebolu and Cape Ince is characterized by the
anticyclonic Sinop gyre (Fig. 7; Ozsoy and Unluata,
1997). Except for a narrow zone east and north of the
town of Catalzeytin, where the northeast-directed trans-
port vectors are moderately strong, the entire eastern
shelf is dominated by very weak transport vectors,
which are primarily south- and southeast-directed.
This trend resembles the geometry of the anticyclonic
Sinop gyre. Along the zone of convergence between the
eastern and western cyclonic gyres of the principal

M. Duman et al. / Marine Geology 227 (2006) 51–6560
Black Sea surface circulation, the surface currents flow
mainly toward the south. However, the samples ana-
lyzed for this study were recovered significantly
below the effect of this surface circulation, which
mainly dominate the upper ~50 m of the water column
(Ozsoy and Unluata, 1997). Thus, the transport vectors
are more likely indicative of water-mass movements
below the permanent chemocline at ~100–110 m. On
the other hand, the sediment can be transported in
suspension in the upper water column and deposited
below the zone of surface circulation. The overall grain
size data and the net sediment transport patterns suggest
that the western shelf region is an area of net east-
directed active sediment transport, whereas, except for
localized nearshore zones, the eastern shelf region is an
area of little sediment transport.
4.2. Sources of sediments
4.2.1. Factor 1: anthropogenic factor
The geographic distributions of the principal ele-
ments associated with Factor 1 (Fig. 8) are remarkably
similar in that the total sedimentary concentrations of
As, Cu, Fe, Pb and Zn and to a lesser extent Mn show
their highest concentrations in the western shelf region,
immediately north of the mouth of the Zarbana River,
and decrease eastward along the nearshore shelf (Fig.
8). Similarly, the total sedimentary sulfur shows a zone
of anomalously high concentrations in the same region.
Notable loadings of the chalcophile and siderophile
elements on factor 1 and their strong correlations with
one another, as well as with total sulfur (Table 1), are
interpreted to represent inputs via the weathering and
erosion of a proximal massive sulfide metal deposit.
The rocks along the central North Anatolian Mountains
immediately south of the study area contain large out-
crops of Cretaceous to lower Tertiary volcano-sedimen-
tary rocks, which include economically important
massive sulfide deposits.
Continuous copper mining has taken place from an-
cient Greek times to the present (Dincay et al., 1973). In
recent years the annual production of cupriferous pyrite
mounted to 200,000 tons at an average of 5% (Guner,
1980). The mine(s) are located 20 km south of the mouth
of the Zarbana River and discharges its waste waters into
the river. The mine tailings are also stored within the
drainage basin of the Zarbana River and contribute sig-
nificantly to the pollution carried by the river into the
Black Sea. Four samples collected from the bed of the
Zarbana River, immediately south of the Etibank Kure
mine, contain an average of 2197 ppm Cu, 999 ppm Zn,
275 ppm As, ~17.0% Fe (169824 ppm), ~18.6% S
(186149 ppm), 266 ppm Cr, and 111 ppm Pb, clearly
indicating that these sediments are notably contaminated
with respect to these elements. Therefore, factor 1 is
interpreted as an anthropogenic assemblage, with its
elemental enrichments tied to the effluent from a large
copper mine in the region. Eastward-decreasing trends in
the regional distribution maps of all these elements
reflect the effectiveness of loss through oxidation and
sediment transport associated with the east-directed sur-
face-water circulation, antysclonic Sinop gyre (Fig 7)
and storm-induced longshore currents.
4.2.2. Factor 2: anoxia factor
The regional distribution maps for the individual
constituents of factor 2 are illustrated in Fig. 8. The
distribution of TOC on the south-central Black Sea
shelf shows a distinct regional trend. The TOC values
are generally low across the shallow part of the shelf,
ranging between 0.5% and 0.9%. However, a near-
continuous shore-parallel zone of relatively high TOC
values (0.9–1.1%) occurs between the 40 m and 80 m
isobaths. The TOC values then show a progressive
seaward decrease toward the 100 m isobath, reaching
its lowest values of 0.5–0.6% narrow belt paralleling
the shelf edge. The TOC values subsequently show a
sharp seaward increase from 0.6–0.7% at the shelf edge
to N1.8% on the anoxic upper slope (Fig. 8).
The distribution of total sulfur in the study area shows
two distinct areas of higher values (Fig. 8). Sulfur con-
centrations are generally low (1000–2000 ppm) across
the shelf region between the shoreline and the present-
day shelf-edge but show a remarkable and sharp increase
seaward of the shelf break, exceeding 10,000 ppm in
samples from the upper slope (Fig. 8). An exception to
this trend is a narrow zone of high sulfur concentrations
(N8000 ppm) situated immediately seaward of the mouth
of the Zarbana River, which extends with decreasing S
values eastward along the shelf (Fig. 8). The sharp
increase in total sedimentary sulfur values across the
shelf edge is also documented elsewhere (Lein and Iva-
nov, 1991; Lyons, 1997) and correlates well with the
transition from oxic to anoxic-sulfidic bottom water
masses (Figs. 2, 8). The narrow zone of high sulfur
concentrations off the mouth of the Zarbana River clear-
ly indicates a notable influx of sulfur-bearing sediments
from this river (i.e. factor 1) as linked to the mines. The
massive ore bodies consist almost exclusively of sulfides
(90–100%) with only a minor gangue of quartz or, more
rarely, chlorite. The sulfide minerals chiefly comprise
pyrite. In addition, there are varying amounts of chalco-
pyrite, bornite, covellite, sphalerite, digenite, marcasite,
tennantite, carrollite, and traces of idaite and galena.

Fig. 8. Geographic distribution maps of the major constituents of Factor 1 (As, Cu); Factor 2 (total organic carbon=TOC, sulfur); Factor 3 (Al, Si);
Factor 4 (Ca,Sr) and Factor 5 (Fe, Mn) in the study area.
M. Duman et al. / Marine Geology 227 (2006) 51–65 61
The strong similarities between the regional distri-
bution maps of factor 2 (Fig. 6), total organic carbon
and sulfur (Fig. 8), as well as the anoxic bottom water
masses in the study area (Fig. 2), suggest that factor 2 is
related to organic matter and its associated elemental
enrichments under anoxic bottom water conditions.

Table 1
Correlation coefficient matrix of the inorganic geochemical data from the south-central Black Sea shelf
TOC Al As Ba Ca Ce Cl Cr Cu Fe Ga K Mg Mn Na Nb Ni P Pb Rb S Sc S Sr Th Ti U V Y Zn Zr
TOC 0.99 � 0.03 �0.14 0.13 �0.15 �0.21 0.33 0.22 �0.04 0.04 0.44 0.57 0.50 �0.11 0.25 0.37 0.28 �0.13 0.13 0.59 0.71 �0.13 � .03 �0.09 0.08 0.11 0.05 0.23 �0.07 0.10 �0.14
Al �0.03 0.99 0.11 �0.05 0.05 �0.19 0.04 0.53 �0.18 0.17 �0.20 0.07 0.41 0.18 0.42 0.16 0.45 �0.06 �0.38 �0.07 �0.08 0.07 .98 0.00 0.12 0.52 �0.13 0.19 0.33 �0.31 0.29
As �0.14 0.11 0.99 0.19 0.10 0.06 0.31 0.21 0.33 0.75 �0.04 �0.01 0.00 0.69 0.17 0.00 0.28 0.73 0.37 �0.14 �0.28 0.20 .11 0.20 �0.25 0.04 �0.09 0.37 0.12 0.44 �0.19
Ba 0.13 �0.05 0.19 0.99 0.47 0.20 0.56 0.26 �0.39 0.31 0.18 0.53 0.30 0.48 0.24 0.05 0.51 0.55 0.44 0.50 �0.01 0.09 � .05 0.56 �0.19 0.43 0.07 0.68 0.43 �0.15 �0.31
Ca �0.15 0.05 0.10 0.47 0.99 0.30 0.31 0.41 �0.22 0.17 �0.16 �0.08 0.26 0.46 0.10 �0.49 0.40 0.29 0.06 �0.10 �0.11 0.43 .05 0.91 �0.29 0.32 0.03 0.47 0.31 �0.25 �0.62
Ce �0.21 �0.19 0.06 0.20 0.30 0.99 �0.12 �0.08 �0.14 0.00 �0.23 �0.08 �0.09 0.10 �0.23 �0.09 0.01 0.20 0.13 �0.04 �0.22 0.09 � .19 0.34 �0.08 �0.01 �0.13 0.15 0.02 �0.13 �0.12
Cl 0.33 0.04 0.31 0.56 0.31 �0.12 0.99 0.40 �0.18 0.42 0.30 0.53 0.54 0.47 0.76 0.02 0.56 0.48 0.30 0.45 0.28 0.07 .04 0.40 �0.41 0.33 0.05 0.58 0.16 0.05 �0.45
Cr 0.22 0.53 0.21 0.26 0.41 �0.08 0.40 0.99 0.04 0.54 0.02 0.30 0.62 0.39 0.39 0.07 0.81 0.16 0.02 0.31 0.14 0.26 .53 0.36 �0.04 0.61 �0.06 0.62 0.37 0.08 �0.26
Cu �0.04 �0.18 0.33 �0.39 �0.22 �0.14 �0.18 0.04 0.99 0.44 �0.06 �0.31 �0.30 0.03 �0.20 �0.03 �0.22 �0.02 0.11 �0.31 0.13 0.08 � .18 �0.25 0.00 �0.34 �0.08 �0.12 �0.10 0.88 0.00
Fe 0.04 0.17 0.75 0.31 0.17 0.00 0.42 0.54 0.44 0.99 0.07 0.25 0.16 0.71 0.19 0.12 0.50 0.66 0.42 0.17 �0.06 0.28 .17 0.25 �0.18 0.34 �0.12 0.59 0.39 0.58 �0.19
Ga 0.44 �0.20 �0.04 0.18 �0.16 �0.23 0.30 0.02 �0.06 0.07 0.99 0.55 0.29 �0.09 0.12 0.34 0.11 0.02 0.25 0.60 0.29 0.03 � .20 �0.06 0.13 0.19 �0.02 0.06 �0.02 0.13 �0.01
K 0.57 0.07 �0.01 0.53 �0.08 �0.08 0.53 0.30 �0.31 0.25 0.55 0.99 0.58 0.08 0.36 0.49 0.49 0.17 0.29 0.88 0.38 �0.08 .07 0.12 0.00 0.59 �0.01 0.53 0.27 �0.04 �0.08
Mg 0.50 0.41 0.00 0.30 0.26 �0.09 0.54 0.62 �0.30 0.16 0.29 0.58 0.99 0.13 0.60 0.13 0.74 0.00 �0.04 0.52 0.54 0.17 .41 0.31 �0.12 0.49 �0.10 0.48 0.13 �0.22 �0.33
Mn �0.11 0.18 0.69 0.48 0.46 0.10 0.47 0.39 0.03 0.71 �0.09 0.08 0.13 0.99 0.27 �0.11 0.49 0.78 0.43 �0.03 �0.21 0.27 .18 0.53 �0.38 0.29 0.05 0.54 0.36 0.20 �0.35
Na 0.25 0.42 0.17 0.24 0.10 �0.23 0.76 0.39 �0.20 0.19 0.12 0.36 0.60 0.27 0.99 0.07 0.49 0.21 0.00 0.23 0.28 �0.04 .42 0.17 �0.32 0.32 0.05 0.40 0.07 �0.09 �0.17
Nb 0.37 0.16 0.00 0.05 �0.49 �0.09 0.02 0.07 �0.03 0.12 0.34 0.49 0.13 �0.11 0.07 0.99 0.06 �0.05 0.13 0.53 0.21 �0.28 .16 �0.42 0.33 0.31 0.03 �0.01 0.25 0.08 0.55
Ni 0.28 0.45 0.28 0.51 0.40 0.01 0.56 0.81 �0.22 0.50 0.11 0.49 0.74 0.49 0.49 0.06 0.99 0.32 0.11 0.47 0.16 0.21 .45 0.43 �0.11 0.58 �0.08 0.75 0.39 �0.07 �0.37
P �0.13 �0.06 0.73 0.55 0.29 0.20 0.48 0.16 �0.02 0.66 0.02 0.17 0.00 0.78 0.21 �0.05 0.32 0.99 0.60 0.07 �0.33 0.24 � .06 0.44 �0.38 0.18 0.07 0.52 0.20 0.24 �0.27
Pb 0.13 �0.38 0.37 0.44 0.06 0.13 0.30 0.02 0.11 0.42 0.25 0.29 �0.04 0.43 0.00 0.13 0.11 0.60 0.99 0.31 �0.01 �0.03 � .38 0.22 �0.17 0.01 0.19 0.34 0.11 0.42 �0.27
Rb 0.59 �0.07 �0.14 0.50 �0.10 �0.04 0.45 0.31 �0.31 0.17 0.60 0.88 0.52 �0.03 0.23 0.53 0.47 0.07 0.31 0.99 0.39 �0.12 � .07 0.01 0.11 0.46 0.05 0.44 0.28 �0.04 �0.02
S 0.71 �0.08 �0.28 �0.01 �0.11 �0.22 0.28 0.14 0.13 �0.06 0.29 0.38 0.54 �0.21 0.28 0.21 0.16 �0.33 �0.01 0.39 0.99 �0.09 � .08 �0.12 0.00 �0.06 �0.05 0.03 �0.12 0.14 �0.17
Sc �0.13 0.07 0.20 0.09 0.43 0.09 0.07 0.26 0.08 0.28 0.03 �0.08 0.17 0.27 �0.04 �0.28 0.21 0.24 �0.03 �0.12 �0.09 0.99 .07 0.40 �0.08 0.21 �0.13 0.26 0.00 0.10 �0.24
Si �0.03 0.98 0.11 �0.05 0.05 �0.19 0.04 0.53 �0.18 0.17 �0.20 0.07 0.41 0.18 0.42 0.16 0.45 �0.06 �0.38 �0.07 �0.08 0.07 .99 0.00 0.12 0.52 �0.13 0.19 0.33 �0.31 0.29
Sr �0.09 0.00 0.20 0.56 0.91 0.34 0.40 0.36 �0.25 0.25 �0.06 0.12 0.31 0.53 0.17 �0.42 0.43 0.44 0.22 0.01 �0.12 0.40 .00 0.99 �0.35 0.41 0.00 0.58 0.27 �0.17 �0.67
Th 0.08 0.12 �0.25 �0.19 �0.29 �0.08 �0.41 �0.04 0.00 �0.18 0.13 0.00 �0.12 �0.38 �0.32 0.33 �0.11 �0.38 �0.17 0.11 0.00 �0.08 .12 �0.35 0.99 0.07 0.02 �0.30 0.10 �0.07 0.47
Ti 0.11 0.52 0.04 0.43 0.32 �0.01 0.33 0.61 �0.34 0.34 0.19 0.59 0.49 0.29 0.32 0.31 0.58 0.18 0.01 0.46 �0.06 0.21 .52 0.41 0.07 0.99 0.02 0.55 0.58 �0.25 0.05
U 0.05 �0.13 �0.09 0.07 0.03 �0.13 0.05 �0.06 �0.08 �0.12 �0.02 �0.01 �0.10 0.05 0.05 0.03 �0.08 0.07 0.19 0.05 �0.05 �0.13 � .13 0.00 0.02 0.02 0.99 �0.06 0.25 �0.03 0.07
V 0.23 0.19 0.37 0.68 0.47 0.15 0.58 0.62 �0.12 0.59 0.06 0.53 0.48 0.54 0.40 �0.01 0.75 0.52 0.34 0.44 0.03 0.26 .19 0.58 �0.30 0.55 �0.06 0.99 0.36 0.10 �0.46
Y �0.07 0.33 0.12 0.43 0.31 0.02 0.16 0.37 �0.10 0.39 �0.02 0.27 0.13 0.36 0.07 0.25 0.39 0.20 0.11 0.28 �0.12 0.00 .33 0.27 0.10 0.58 0.25 0.36 0.99 �0.06 0.18
Zn 0.10 �0.31 0.44 �0.15 �0.25 �0.13 0.05 0.08 0.88 0.58 0.13 �0.04 �0.22 0.20 �0.09 0.08 �0.07 0.24 0.42 �0.04 0.14 0.10 � .31 �0.17 �0.07 �0.25 �0.03 0.10 �0.06 0.99 �0.12
Zr �0.14 0.29 �0.19 �0.31 �0.62 �0.12 �0.45 �0.26 0.00 �0.19 �0.01 �0.08 �0.33 �0.35 �0.17 0.55 �0.37 �0.27 �0.27 �0.02 �0.17 �0.24 .29 �0.67 0.47 0.05 0.07 �0.46 0.18 �0.12 0.99
M.Dumanet
al./Marin
eGeology227(2006)51–65
62
i
0
0
0
0
0
0
0
0
0
0
0
0
0
0
0
0
0
0
0
0
0
0
0
0
0
0
0
0
0
0
0

M. Duman et al. / Marine Geology 227 (2006) 51–65 63
Weaker negative loadings of Al, Si, K, Nb and Yon this
factor suggest that factor 2 inversely tracks aluminosil-
icate abundances as a consequence of clastic dilution
under high rates of deposition.
A strong positive correlation between organic C and
pyrite S has been recognized for a wide variety of
normal (oxically deposited) marine deposits because
pyrite formation in these settings is often limited by
the availability of reactive organic matter. Although
pyrite formation within euxinic environments, which
are characterized by anoxic and sulfidic bottom waters,
is typically limited by the availability of reactive iron
phases, there is a general relationship of high total
organic carbon occurring with high pyrite sulfur within
the deep-basin sediments of the Black Sea (e.g. Calvert
and Karlin, 1991; Lyons, 1997). Bacterial sulphate
reduction, which is fueled by labile organic matter
and concomitant pyrite formation, is believed to be
the primary mechanism by which sulfur is incorporated
into these sediments (e.g. Lyons, 1997). Underlying the
oxygenated surface waters in the Black Sea water col-
umn, bacteria reduce sulphate ions to form dissolved
sulfide species, which build up to concentrations of
~400 AM in the deep bottom waters.
Provided ample reactive organic matter is present,
bacterial sulfate reduction also occurs within pore
water, beneath both oxic and anoxic bottom waters.
Additional sulphate ions diffuse into the sediment
from the overlying seawater, adding to the accumula-
tion of hydrogen sulphide in the sediments. This sulfide
generally reacts with iron-bearing minerals in the sedi-
ments or the water column to form a variety of iron
sulphide minerals, which are eventually converted to
pyrite with time.
Formation of pyrite within the euxinic Black Sea
water column yields pronounced Fe and S enrichments
in the central basin relative to the detrital fluxes from
the basin margin (Wijsman et al., 2001). On the anoxic
basin margin, however, these enrichments and those of
other redox sensitive elements can be swamped by
rapid rates of siliciclastic sedimentation. As a result,
redox sensitive elements, such as Mn and U are not
noticeable components of factor 2, although S contents
remain high relative to the proximal oxic shelf (com-
pare Lyons et al., 1993 and Lyons, 1997).
Comparison between the TOC values and the re-
gional distribution of the bottom water masses shows a
strong positive correlation between increasing TOC and
decreasing dissolved oxygen in bottom waters. Al-
though the deep, central Black Sea is not a site of
anomalous organic C preservation (Arthur et al.,
1994), concentrations do still average in excess of 5
wt.% (Calvert and Karlin, 1991), compared to values 1–
2 wt.% on the oxic shelf (Lyons et al., 1993). On the
anoxic basin margin, however, siliciclastic dilution
yields concentrations averaging ~2 wt.% despite or-
ganic C accumulation rates that are 17 times greater
than those in the central basin (Sageman and Lyons,
2004). This relationship suggests that the first-order
TOC variations in the study area must be controlled
by the interplay between net primary productivity in
the water column and the relative oxidation of the
organic matter under fully oxygenated versus anoxic
bottom water conditions. Concentrations of TOC are
also obviously controlled by clastic dilution and the
extent of organic C preservation as coupled to bulk
sedimentation rate.
The TOC values observed in the study area are
comparable with those reported from the southern
Black Sea but are notably higher than those found
in the Aegean and Eastern Mediterranean. This differ-
ence probably reflects the comparatively high rate of
primary productivity in the Black Sea, which exceeds
250 g C per m2 year�1 (Lein and Ivanov, 1991).
Collectively, the controls outlined above result in
strong factor 2 (organic C and pyrite S) loading in
the study area under anoxic conditions relative to the
oxic shelf, while high siliciclastic sedimentation (dilu-
tion) mutes the metal enrichments that might other-
wise also be expressed in the euxinic basin-margin
setting.
4.2.3. Factor 3: aluminosilicate factor
The distribution maps of the major elemental con-
stituents of factor 3 (Al, Si) show that the highest
concentrations of these elements occur along the nar-
row western shelf region between Cape Kerempe and
Inebolu. Secondary, but more restricted zones of mod-
erate to high concentrations are also identified across
the central shelf region seaward of Catalzeytin and
AyancVk (Fig. 8) coincide with Sinop gyre (Fig. 7). In
these maps, there is a clear eastward decreasing trend.
The strong correlations between Al, Si, Ga, K, Nb and
Y (Table 1) suggest that this factor represents the most
common constituents of the marine siliciclastic sedi-
ments, the aluminosilicates.
The distribution map of factor 3 (Fig. 6) shows
positive correlations with the patterns of sorting (Fig.
4), where highest factor loadings occur along the nar-
row western shelf region between Cape Kerempe and
Inebolu, which also corresponds with the strongest
sediment transport vectors (Fig. 7). The high degree
of correlation between factor 3, as well as the distinct
inverse relationship of this factor with factor 2 (Fig. 6)

M. Duman et al. / Marine Geology 227 (2006) 51–6564
and its constituents, further suggest that siliciclastics
dilute the factor 2 components.
4.2.4. Factor 4: carbonate factor
The distribution map of factor 4 is largely patchy,
with highest values mainly concentrated along the east-
ern shelf (Fig. 6). A zone of high concentrations of
factor 4 components (total carbonate, Ca, Sr) occurs
along the shoreline between Cape Ince and Catalzeytin
(Fig. 8). The high degree of correlation between Ca and
Sr (r =0.91; Table 1), sand abundance and total carbon-
ate (r=0.67) suggest that most of the carbonate is
stored in the sand fraction. The absence of major car-
bonate-bearing successions along the North Anatolian
Mountains immediately south of the study area and the
visual identifications of pelecypods and gastropods in
samples where factor 4 exhibits its highest loadings
indicate that this factor mainly represents biogenic
carbonate. Moderate local reciprocal relationships ob-
served between factor 4 and the other 3 factors are
interpreted as the dilution of the siliciclastic shelf sedi-
ments by locally abundant calcareous benthic organ-
isms and coccoliths.
4.2.5. Factor 5: iron-manganese factor
The high degree of correlation between Mn, Fe and
P, and to a lesser extent Cr, Ni and V, in factor 5 (Table
1) is interpreted to result from iron-manganese enrich-
ments. Regional distribution maps of the elemental
constituents of factor 5 show notable similarities, with
highest concentrations of these elements occurring
along the eastern segment of the study area between
Catalzeytin and AyancVk (Fig. 8). Comparison between
these maps and the bottom water masses (Fig. 2) clearly
shows that the highest factor loadings occur beneath
oxidizing bottom waters.
The composition of ferromanganese nodules and
micro nodules considerably differs in similar sedimen-
tation conditions (e.g., at the same station). As the
micro nodules grow in the high bioproductivity regions
of the ocean, their composition gradually approaches
that of macro nodules and the reactive part of associ-
ated sediments, reflecting an increasing influence of
early diagenetic processes. The finest micro nodule
fractions are most affected by diagenesis in the low
productivity regions. The composition of micro nodules
approaches that of the hydrogenetic macro nodules with
an increase of their size. As the micro nodules grow
and, consequently, their surface area increases, the
composition of Fe–Mn oxyhydroxides changes due to
an increasing role of diagenesis or hydrogenetic partic-
ulate flux after the segregation of micro nodules from
the sediment. Evolution of the micro nodule composi-
tion and nodule type depend on the productivity of
surface waters, i.e., the amount of organic matter de-
livered to sediments after its oxidation in the water
column (Dubinin, 2004).
Lyons et al. (1993) described pronounced Mn and
Fe enrichments in oxic sediments as a consequence of
past shoaling of the chemocline, but this is also
expressed in high sulfur contents. There is no rela-
tionship between factor 5 and S abundance. The or-
ganic-poor, suboxic pore waters of the oxic shelf show
signs of subsurface Fe and Mn reduction with the
possibility of enrichments in the surface-most sedi-
ment layers beneath oxic bottom waters (Lyons et
al., 1993). Concerning the relationship between Mn,
Fe and P, we can suggest that P may occur as com-
ponent of organic and terrigenous materials, adsorbate
onto Fe oxides.
5. Conclusions
The surface sediments of the south-central Black
Sea shelf and upper slope are composed of clayey
silts and silty clays. The net transport vectors identi-
fied using residual grain-size trends show that the
main sediment transport is largely eastward along
the southern central Black Sea shelf, with the stron-
gest transport vectors occurring along the narrowest
western shelf region between Cape Kerempe and the
town of Inebolu. These data suggest that the western
portion of the shelf is a region of active sediment
transport.
Factor analysis shows that five factors account for
99.1% of the total variance. Factor 1 has statistically
significant loadings in As, Cu, Fe, Mn, Pb and Zn and
represents anthropogenic contamination of the western
shelf region by mine copper mine discharge. Factor 2
shows loadings in total organic carbon, sulphur and
represents marine sediments deposited under anoxic
bottom water conditions. Factor 3 shows loadings in
Al, Si, Ga, K, Nb, Th, Ti, U, Y and Zr characteristic of
an aluminosilicate-dominated assemblage. Along the
western shelf region, this factor represents a coarser-
grained suite, which is winnowed under strong east-
directed oceanic and longshore currents. Factor 4 shows
loadings in sand and silt abundances, total carbonate,
Ca, and Sr and represents carbonate component. Factor
5 has loadings in Fe, Mn, P, Cr, Ni and V. It is
dominated by Fe, Mn oxyhydroxides accumulating
beneath oxic bottom waters, with the possibility of
metal remobilization and surficial enrichments under
suboxic pore water conditions.

M. Duman et al. / Marine Geology 227 (2006) 51–65 65
Acknowledgments
We thank Prof. Dr. Orhan Uslu, the former Director
of the Institute of Marine Sciences and Technology, for
his continued support and encouragement. We ac-
knowledge research funds from (a) the Scientific and
Technical Research Council of Turkey (TUBITAK)
through the Black Sea Monitoring Projects (Hydro-
Black, ComsBlack 91–93) and (b) the Dokuz Eylul
University Grant No. AIK 0921-94-02-02 to Muham-
met Duman. We thank the officers and crew of the RV
K. Piri Reis for their assistance in data acquisition
during the cruises in 1994–1996. We extend our special
thanks to Ali Aksu of the Department of Earth
Sciences, Memorial University of Newfoundland for
his support in the XRF analyses. The manuscript has
benefited from the insightful and constructive reviews
of Gert J. De Lange, Jack Middelburg and one anony-
mous reader.
References
Aigner, T., Reineck, H.-E., 1982. Proximality trends in modern storm
sands from the Helogoland Bight (North Sea) and their implica-
tions for basin analyses. Senckenb. Marit. 14, 183–215.
Algan, O., Gokasan, E., Gazioglu, C., Yucel, Z.Y., Alpar, B., Guneysu,
C., KVrcV, E., Demirel, S., SarV, E., Ongan, D., 2002. A high-
resolution seismic study in Sakarya Delta and Submarine Canyon,
southern Black Sea shelf. Cont. Shelf. Res. 22, 1511–1527.
Anderson, R.F., Lyons, T.W., Cowie, G.L., 1994. Sedimentary record
of a shoaling of the oxic anoxic interface in the Black Sea. Mar.
Geol. 116, 373–384.
Arthur, M.A., Dean, W.E., Neff, E.D., Hay, B.J., King, J., Jones, G.,
1994. Varve calibrated records of carbonate and organic carbon
accumulation over the last 2000 years in the Black Sea. Glob.
Biogeochem. Cycles 8, 195–217.
Calvert, S.E., Karlin, R.E., 1991. Relationships between sulphur,
organic carbon, and iron in the modern sediments of the Black
Sea. Geochim. Cosmochim. Acta 55, 2483–2490.
Chang, Y.H., Scrimshaw, M.D., Lester, J.N., 2001. A revised Grain-
Size Trend Analysis program to define net sediment transport
pathways. Comp. Geosci. 27, 109–114.
Dincay, E., Borekci, M., Terzi, M., Erdemli, T., 1973. Ekonomik
Bolum. Cumhuriyetimizin Ellinci YVlVnda Kure, pp. 48–63
(in Turkish).
Dubinin, A.V., 2004. Geochemistry of rare earth elements in the
ocean. Lithol. Miner. Resour. 39 (4), 289–307.
Duman, M., AvcV, M., Duman, S., Demirkurt, E., DuzbastVlar, M.K.,
2004. Surficial sediment distribution and net sediment transport
pattern in Izmir Bay, western Turkey. Cont. Shelf. Res 24,
965–981.
Gao, S., Collins, M.B., 1992. Net sediment transport patterns inferred
from grain-size trends, based upon definition of transport vectors.
Sediment. Geol. 80, 1–14.
Gaudette, H.E., Flight, W.R., Toner, L., Folger, D.W., 1974. An
inexpensive titration method for the determination of organic
carbon in recent sediments. J. Sediment. Petrol. 44, 249–253.
Guner, M., 1980. Geology and massive sulfide ores of the Kure Area.
The Pontic Ranges, Northern Turkey. Department of Geology,
University of Lund, Sweden, pp. 19–64.
Johnson, H.D., Baldwin, C.T., 1996. Shallow clastic seas. In: Read-
ing, H.G. (Ed.), Sedimentary Environments: Processes, Facies and
Stratigraphy. Blackwell Sciences Limited, Oxford, pp. 232–280.
688 pp.
Klovan, J.E., Imbrie, J., 1971. An algorithm for Fortran-IV program
for large-scale Q-mode factor analysis and calculation of factor
scores. J. Math. Geol. 3, 61–77.
Lein, A.Yu, Ivanov, M.V., 1991. On the sulphur and carbon balances
in the Black Sea. In: Izdar, E., Murray, J.W. (Eds.), Black Sea
Oceanography, NATO ASI Series C, vol. 351. Kluwer Academic
Publishers, London, pp. 307–318.
Le Roux, J.P., O’Brien, R., Rios, F., Cisternas, M., 2002. Analysis of
sediment transport paths using grain-size parameters. Comp.
Geosci. 28, 717–721.
Liu, J.T., Liu, K., Huang, J.C., 2002. The effect of a submarine
canyon on the river sediment dispersal and inner shelf sediment
movements in southern Taiwan. Mar. Geol. 181, 357–386.
Lyons, T.W., 1997. Sulfur isotopic trends and pathways of iron sulfide
formation in upper Holocene sediments of the anoxic Black Sea.
Geochim. Cosmochim. Acta 61, 3367–3382.
Lyons, T.W., Berner, R.A., Anderson, R.F., 1993. Evidence for large
pre-industrial perturbations of the Black Sea chemocline. Nature
365, 538–540.
Muller, C., 1967. Methods in Sedimentary Petrology. Schweizerban,
Stuttgart, p. 283.
Ozsoy, E., Unluata, U., 1997. Oceanography of the Black Sea: a
review of some recent results. Earth-Sci. Rev. 42, 231–272.
Pedreros, R., Howa, H.L., Michel, D., 1996. Application of grain size
trend analysis for the determination of sediment transport path-
ways in intertidal areas. Mar. Geol. 135, 35–49.
Sageman, B.B., Lyons, T.W., 2004. Geochemistry of fine-grained
sediments and sedimentary rocks. In: Mackenzie, F.T. (Ed.),
Sediments, Diagenesis, and Sedimentary Rocks, Treatise on Geo-
chemistry, vol. 7. Elsevier, BV., Amsterdam, The Netherlands,
pp. 115–158.
Shepard, F.P., 1954. Nomenclature based on sand–silt–clay ratios.
J. Sediment. Petrol. 24, 151–158.
Wijsman, J.W.M., Middelburg, J.J., Heip, C.H.R., 2001. Reactive iron
in Black Sea sediments: implications for iron cycling. Mar. Geol.
172, 167–180.
Wilkin, R.T., Arthur, M.A., 2001. Variations in pyrite texture, sulfur
isotope composition, and iron systematics in the Black Sea:
evidence for Late Pleistocene to Holocene excursions of the
O2–H2S redox transition. Geochim. Cosmochim. Acta 65,
1399–1416.
Copyright © 2022 FDOKUMEN