Online Detection of Subsurface Distress by Acoustic Emissions
Upload
khangminh22Category
view
0download
0
GE

Subsurface Stratigraphy and Geochemistry of Late Quaternary Evaporites, Searles Lake, California
By GEORGE I. SMITH
With a section on RADIOCARBON AGES OF STRATIGRAPHIG UNITS By MINZE STUIVER and GEORGE I. SMITH
GEOLOGICAL SURVEY PROFESSIONAL PAPER 1043
Description of the stratigraphic succession of muds and salts deposited by closed-basin lakes that occupied Searles Valley during late Quaternary time
UNITED STATES GOVERNMENT PRINTING OFFICE, WASHINGTON : 1979

UNITED STATES DEPARTMENT OF THE INTERIOR
CECIL D. ANDRUS, Secretary
GEOLOGICAL SURVEY
H. William Menard, Director
Library of Congress Cataloging in Publication Data
Smith, George Irving, 1927-Subsurface stratigraphy and geochemistry of late Quaternary evaporites,Searles Lake, California.
(Geological Survey Professional Paper 1043)Bibliography: p. 118-122.Includes index.1. Evaporites-California-Searles Lake. 2. Geology, Stratigraphic-Quaternary.
3. Geochemistry-California-Searles Lake. 4. Geology-California-Searles Lake. I. Title. II. Series: United States. Geological Survey. Professional paper 1043.
QE471.15.E8S58 551.7'9'0979495 77-10704
For sale by the Superintendent of Documents, U.S. Government Printing OfficeWashington, D.C. 20402
Stock Number 024-001-03163-9

CONTENTS
PageAbstract ______________________________ 1Introduction ___________________________ 2
Discovery and economic development of Searles Lake _ 4Geologic environment and history of Searles Lake _ _ 5Previous geologic studies of Searles Lake ________ 6Acknowledgments ______________________ 8
Stratigraphy of the evaporite deposits ____________ 8Mixed Layer_________________________ 13
Areal extent and thickness _____________ 13Mineral composition and lithology _________ 13
Bottom Mud ___________________ 15Areal extent and thickness_________ 16Mineral composition and lithology _ _ _ _ 16Chemical composition of the Bottom Mud 17
Lower Salt__________________________ 18Areal extent and volume ______________ 20
Saline units ___________________ 20Mud units ____________________ 20
Mineral composition and lithology _________ 34Saline units ___________________ 34Mud units ____________________ 37
Chemical composition ________________ 40Chemical analyses of the solids _________ 40Chemical analyses of the brines ________ 43
Estimated bulk composition of the unit ______ 47Parting Mud ________________________ 47
Areal extent and volume ______________ 47Mineral composition and lithology _________ 48Chemical composition ________________ 54
Upper Salt__________________________ 56Areal extent and volume ______________ 56Mineral composition and lithology _________ 59Chemical composition ________________ 60
Chemical analyses of the solids _________ 60Chemical composition of the brines ______ 60
Stratigraphy of the evaporite deposits Continued Upper Salt Continued
Estimated bulk composition of the unit Overburden Mud _____________________
Areal extent and volume ______________Mineral composition and lithology _________Chemical composition ________________
Radiocarbon ages of stratigraphic units, by Minze Stuiver and George I. Smith __________________
Introduction _________________________Reliability of sampled materials _____________Probable true ages of stratigraphic units ________
Rates of deposition _______________________Geochemistry of sedimentation ________________
Mud Layers ________________________Saline layers_________________________
Phase relations applicable to Searles Lake salts _. Salines in the Mixed layers _____________Salines in the Bottom Mud _____________Salines in the Lower Salt, Upper Salt, and Over
burden Mud __________________Lower Salt ____________________Upper Salt ____________________Overburden Mud _________________
Geochemical influence on shape and thickness of salt bodies _____________________
Source of salt components _____________Geochemistry of diagenesis _________________
Mud layers _________________________Salt layers _________________________
Reconstructed depositional history _____________Correlations with deposits in other areas __________Economic geology _______________________References cited ________________________
Page
6466666668
6868707375787982838485
86869195
9698
100100106108112116118
ILLUSTRATIONS
PLATE 1. Subsurface sections showing relations between stratigraphic units of Searles Lake, California. ________ In pocket2. Diagrams showing components in Mixed Layer and Bottom Mud of Searles Lake, California. _________ In pocket
FIGURE 1. hidex map showing location of Searles Lake and other Pleistocene lakes _________________________ 32. Graphs showing average temperature and rainfall, Searles Valley _____________________________ 43. Map showing location of core holes ______________________________----_--__--_----- 94. Stratigraphic column showing units in Searles Lake _____________________---------_---__- 115. Cross section of Searles Valley showing bedrock profile and stratigraphy of upper part of fill _____________ 126. Graph showing weight percent acid-insoluble material in Bottom Mud __________________________ 187. Contour map on base of Lower Salt ______________________________________________ 19
in
IV CONTENTS
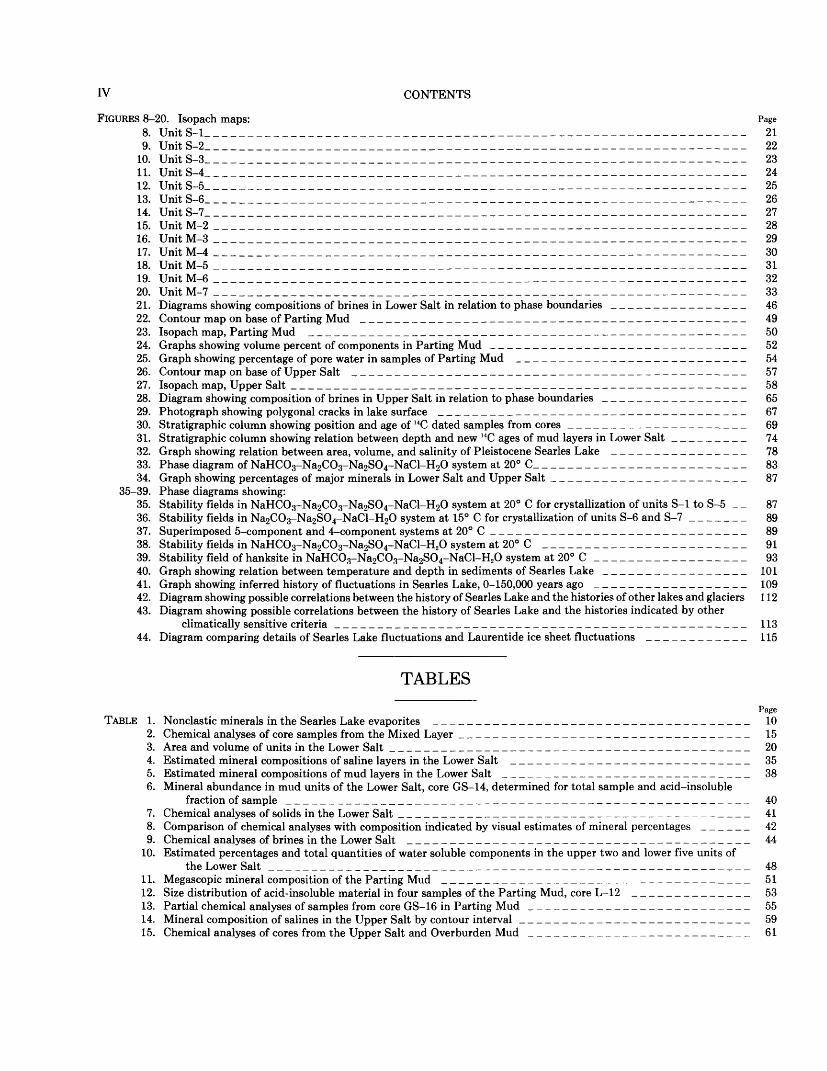
FIGURES 8-20. Isopach maps: Page8. Unit S-l____________________________________________________________ 219. Unit S-2_____________________________________________________________ 22
10. Unit S-3_________________________________________ ______________________ 2311. Unit S-4_____________________________________________________________ 2412. Unit S-5_____________________________________________________________ 2513. Unit S-6____________________________________________________________ 2614. Unit S-7_______________________________________________________________ 2715. UnitM-2 ___________________________________________________________ 2816. Unit M-3 _____________________________________________________________ 2917. UnitM-4 ______________________________________________________________ 3018. UnitM-5 ___________________________________________________________ 3119. UnitM-6 ____________________________________________________________ 3220. UnitM-7 ______________________________________________________________ 3321. Diagrams showing compositions of brines in Lower Salt in relation to phase boundaries ________________ 4622. Contour map on base of Parting Mud _____________________________________________ 4923. Isopach map, Parting Mud ___________________________________---------__----_ 5024. Graphs showing volume percent of components in Parting Mud ______________________________ 5225. Graph showing percentage of pore water in samples of Parting Mud ___________________________ 5426. Contour map on base of Upper Salt ______________________________________________ 5727. Isopach map, Upper Salt _____________________________________________________ 5828. Diagram showing composition of brines in Upper Salt in relation to phase boundaries _________________ 6529. Photograph showing polygonal cracks in lake surface ____________________________________ 6730. Stratigraphic column showing position and age of 14C dated samples from cores _____________________ 6931. Stratigraphic column showing relation between depth and new 14C ages of mud layers in Lower Salt _________ 7432. Graph showing relation between area, volume, and salinity of Pleistocene Searles Lake ________________ 7833. Phase diagram of NaHC03-Na2C03-Na2S04-NaCl-H20 system at20°C________________________ 8334. Graph showing percentages of major minerals in Lower Salt and Upper Salt _______________________ 87
35-39. Phase diagrams showing:35. Stability fields in NaHC03-Na2C03-Na2S04-NaCl-H20 system at 20° C for crystallization of units S-l to S-5 _ _ 8736. Stability fields in Na2C03-Na2S04-NaCl-H20 system at 15° C for crystallization of units S-6 and S-7 _______ 8937. Superimposed 5-component and 4-component systems at 20° C ______________________________ 8938. Stability fields in NaHC03-Na2C03-Na2S04-NaCl-H20 system at20°C ________________________ 9139. Stability field of hanksite in NaHC03-Na2C03-Na2S04-NaCl-H20 system at20°C __________________ 9340. Graph showing relation between temperature and depth in sediments of Searles Lake _________________ 10141. Graph showing inferred history of fluctuations in Searles Lake, 0-150,000 years ago __________________ 10942. Diagram showing possible correlations between the history of Searles Lake and the histories of other lakes and glaciers 11243. Diagram showing possible correlations between the history of Searles Lake and the histories indicated by other
climatically sensitive criteria ________________________________________________ 11344. Diagram comparing details of Searles Lake fluctuations and Laurentide ice sheet fluctuations ____________ 115
TABLES
PageTABLE 1. Nonclastic minerals in the Searles Lake evaporites _____________________________________ 10
2. Chemical analyses of core samples from the Mixed Layer __________________________________ 153. Area and volume of units in the Lower Salt __________________________________________ 204. Estimated mineral compositions of saline layers in the Lower Salt ____________________________ 355. Estimated mineral compositions of mud layers in the Lower Salt _____________________________ 386. Mineral abundance in mud units of the Lower Salt, core GS-14, determined for total sample and acid-insoluble
fraction of sample ______________________________________________________ 407. Chemical analyses of solids in the Lower Salt _________________________________________ 418. Comparison of chemical analyses with composition indicated by visual estimates of mineral percentages ______ 429. Chemical analyses of brines in the Lower Salt ________________________________________ 44
10. Estimated percentages and total quantities of water soluble components in the upper two and lower five units ofthe Lower Salt ________________________________________________________ 48
11. Megascopic mineral composition of the Parting Mud ____________________________________ 5112. Size distribution of acid-insoluble material in four samples of the Parting Mud, core L-12 ______________ 5313. Partial chemical analyses of samples from core GS-16 in Parting Mud __________________________ 5514. Mineral composition of salines in the Upper Salt by contour interval ___________________________ 5915. Chemical analyses of cores from the Upper Salt and Overburden Mud __________________________ 61

CONTENTS V
Page TABLE 16. Chemical analyses of brines from the Upper Salt and Overburden Mud _________________________ 62
17. Estimated percentages and total quantities of water-soluble components in the Upper Salt ______________ 6618. Partial chemical analyses of core GS-40 from the Overburden Mud ____________________________ 6819. New 14C dates on disseminated organic carbon in mud layers of the Lower Salt and top of the Bottom Mud, core L-31 7020. Depositional rates in Parting Mud _______________________________________________ 7721. Comparison of amount of selected components carried by Owens River in
24,000 years with amount now in Owens Lake and Upper Salt of Searles Lake ___________________ 9922. Analyses of brines pumped to chemical plants, 1938-51 ___________________________________ 117


SUBSURFACE STRATIGRAPHY AND GEOCHEMISTRY OF LATE QUATERNARY EVAPORITES, SEARLES LAKE, CALIFORNIA
By GEORGE I. SMITH
ABSTRACT
Searles Lake is a dry salt pan, about 100 km2 in area, that lies on the floor of Searles Valley, in the desert of southeast California. Several salt bodies of late Quaternary age lie beneath the surface, mostly composed of sodium and potassium carbonate, sulfate, chloride, and borate minerals. Mud layers separate the salt bodies, which contain interstitial brine that is the source of large quanti ties of industrial chemicals. The value of annual production from the deposit exceeds $30 million; total production to date exceeds $1 billion.
The salts and muds were deposited during Pleistocene and Holo- cene times by a series of large lakes (200 m maximum depth, 1,000 km2 maximum area) that fluctuated in size in response to climatic change. Salts were deposited during major dry (interpluvial) epi sodes, muds during wet (pluvial) episodes that correlate with gla cial advances in other parts of North America and the world. Data based on cores from the deposit are used in this paper to establish the stratigraphy of the deposit, the chemical and mineral composi tions of successive units, and the total quantities of components contained by them. These parameters are then used to determine the geochemical evolution of the sedimentary layers. The results provide a refined basis for reconstructing the limnology of Searles Lake and the regional climate during late Quaternary time.
Six main stratigraphic units were distinguished and informally named earlier on the basis of their dominant composition:
Unit
Overburden Mud _. Upper Salt _____ Parting Mud _ _ _. Lower Salt _____ Bottom Mud Mixed Layer _ _ _.
Typical thickness
(in meters)7
154
1230
200+
HC age, uncorrected (years B.P.)0 to >3,500
>3,500 to 10,50010,500 to 24,00024,000 to 32,500
32,500 to 130,000> 130,000
(The age of 130,000 years for the Mixed Layer is based on extrapo lated sedimentation rates.) The Lower Salt is subdivided into seven salt units (S-l to S-7) and six mud units (M-2 to M-7), the Mixed Layer into six units (A to F). For each salt unit, the areal extent, volume, shape, mineralogy, and chemical composition of the solids and brines have been determined; for each mud unit (which originally extended over much of the basin), the shape and volume within a standard area, and the mineralogy, have been de termined. The bulk compositions (brines plus salts) of the com bined Lower Salt units S-l to S-5 and units S-6 and S-7, and the Upper Salt, were determined so that the total quantities and ratios of ions in the initial brines could be reconstructed.
The 74 published 14C dates on Searles Lake core samples from all but the oldest unit are supplemented by 14 new dates (determined by Minze Stuiver) on the Lower Salt. Most of the age control comes from dates based on disseminated organic carbon; two dates are on wood; dates on carbonate minerals are less reliable. Although the probable disequilibrium between the carbon in the lake and atmo sphere (because of contamination, slow equilibrium rates, and oth er factors) causes disseminated carbon dates to be an estimated 500-2,500 years "too old," the ages of the major and minor units are relatively well established. The list above indicates rounded and uncorrected ages for the contacts of major units. The age of the only salt bed in the Lower Salt which indicates desiccation (S-5) is about 28,000 years. The average uncorrected sedimentation rate in the Parting Mud is 46 yr/cm. Correcting the indicated Parting Mud sedimentation rate on the basis of the greater acid-insoluble content of the Bottom Mud suggests an average rate for it of 33 yr/cm. Using this figure, the age of the base of the Bottom Mud is estimated to be near 130,000 years.
The stratigraphy and mineralogy, combined with known and in ferred dates, provide a basis for reconstructing the climatically controlled history of Searles Lake. The best known part is for the past 150,000 years, for which more than 30 major changes in lake level are reconstructed. Prior to that time, less detail can be deter mined, but there seems to have been a very long period dominated by dryness.
Close similarities in age exist between the major fluctuations in the levels of Searles Lake and the advances and retreats of glaciers in eastern and western North America, fluctuation in atmospheric and sea surface temperatures, and changes in world sea level. The Upper Salt and Overburden Mud are correlated with Holocene and Valderan deposits of the Laurentide ice sheet in eastern North America, the Parting Mud with Twocreekan and Woodfordian de posits, the upper part of the Lower Salt (S-5 and above) with Farmdalian deposits, the lower part of the Lower Salt and part of the Bottom Mud with Altonian deposits. Thin salt layers in the Bottom Mud that are estimated to be about 105,000 years old are provisionally correlated with Sangamon deposits, the 10 m of mud below them with Illinoian deposits, and most of the Mixed Layer with Yarmouth deposits.
The late Quaternary lakes in Searles Valley contained enough dissolved solids for chemical sediments to form at all times. Rela tively insoluble minerals precipitated from the large fresh to brackish lakes and salts precipitated from the small highly saline lakes. The geochemical reconstruction of the sedimentation pro cesses allows many of the chemical, physical, and limnological con ditions to be approximated. Primary aragonite, calcite, and

SUBSURFACE STRATIGRAPHY AND GEOCHEMISTRY, QUATERNARY EVAPORITES, SEARLES LAKE, CALIF.
possibly dolomite precipitated from even the largest lakes. Some of their precipitation was caused by temperature change and evapo ration, but laminae of aragonite (and possibly some northupite) were apparently caused by mixing along the chemocline between a fresh surface layer and an underlying saline layer of higher density. Diagenesis after burial produced gaylussite and pirssonite (when Na-carbonate brines reacted with Ca-carbonate minerals), anal- cime, searlesite, K-feldspar, and phillipsite. Primary and secon dary carbonate minerals now constitute 60 to 85 percent of most mud units; diagenetic silicates, clastic silicates, and organic mate rial form the balance.
The salt layers contain varying mixtures of saline minerals that are zoned both concentrically and vertically. Published logs pro vide data that allow quantitative estimates of the saline mineral distribution and volume. In the Mixed Layer, halite, trona, and nahcolite are the dominant saline minerals. In the Lower Salt, trona, halite, and burkeite are most abundant; northupite, thenar- dite, hanksite, borax, nahcolite, sulfohalite, and tychite occur in minor to trace quantities. In the Upper Salt, halite, trona, and hanksite are most abundant; borax, burkeite, thenardite, aphthita- lite (glaserite), and sulfohalite occur in that order of decreasing abundance.
Trona constitutes most of the edge facies of all units; other min erals are more abundant in central or intermediate facies. Vertical zonation reflects the original crystallization sequence modified by diagenesis. Units S-l to S-5 in the Lower Salt represent one se quence that was interrupted by four deep lakes that deposited mud: trona is the dominant mineral in units S-l, S-2, and S-3; trona and burkeite make up most of S-4; and halite, trona and bur keite occur in S-5, which represents desiccation. This sequence is best explained by the phase relations in the Na2CO3~NaHCO3- Na2SO4-NaCl-H2O system at 20°C which relates these minerals. Units S-6 and S-7 of the Lower Salt represent two episodes of in complete desiccation; trona and halite make up most of both units. Phase relations in the same system at 15°C best explain the com positions of these units. The Upper Salt represents a single desic cation episode. Borax and trona occur at the base, and halite and hanksite constitute most of the upper part. The initial crystalliza tion sequence was trona (and borax), then thenardite and burkeite, halite, and finally aphthitalite; diagenesis resulted in some hank- site forming at the stratigraphic position of the original thenardite and burkeite, some at the stratigraphically higher position of the aphthitalite. Initial crystallization temperatures were low, causing borax to crystallize, then increased during later stages. Phase rela tions at 20°C in the 5-component system given and in the Na2CO3- Na2SO4-NaCl-KCl-H2O system satisfactorily explain the ob served sequence of primary and diagenetically produced minerals in the Upper Salt. Salts in the Overburden Mud are zoned concen trically because the small lake that formed them shrank and depos ited successive assemblages in successively smaller areas.
Diagenetic reactions account for a high percentage of the miner als in the mud layers and some minerals in the salt layers. In the muds, gaylussite and pirssonite formed by reactions between Na- carbonate brines and Ca-carbonate minerals, the species of min eral determined by the chemical activity of H2O (an2o)- This re flects differences in pore water salinity in the upper 166 m of sedi ments and temperatures greater than about 35°C in deeper sediments. Small accumulations of trona nahcolite, northupite, and tychite probably reflect postburial changes in the chemical ac tivity of CO2 (oco2)- Moderate to large quantities of microcrystal- line halite in the muds probably result from post-depositional increases in salinity during compaction. Aragonite, a thermodyna- mically unstable form of CaCO3 , altered spontaneously to calcite in sediments older than about 50,000 years. Slow reactions between
clastic silicates and pore brines produced a suite of authigenic sili cate minerals consisting of monoclinic K-feldspar, searlesite, ana- cime, and phillipsite. Pyrite was noted in one sample.
Diagenesis of minerals in salt layers includes increases in the sizes of crystals. This is probably a result of cycles that cause slight undersaturation and then supersaturation, the smallest crystals being dissolved during undersaturation cycles and their ingredi ents subsequently added to the larger ones that survived. Hanksite formed by the diagenetic reaction of metastable assemblages of burkeite, thenardite, and aphthitalite. Observations of other saline lakes now forming crystal layers suggests that the values of aco2 and OH2o at the surface, where crystals first formed, differ from those found a short time later in the accumulating salt layer. This environmental change results in an almost immediate change in saline mineral suites, but that change in species was generally the last; most saline minerals found in Searles Lake appear to be the same species as those formed after that initial change.
The composition of the interstitial brines changed some time after initial deposition of both salts and muds, apparently as a re sult of the downward migration of water from the lake surface which produced some solution of the salts. Movement of ground water in this direction is caused by the high hydrostatic head of the brines in the lake relative to the water in the surrounding valley fill.
An estimated 480 X 1012 g of brine has been pumped as the source of 57 X 1012 g of produced salts. This amount represents about 40 percent of the extractable salts in the original brine, but only about 6 percent of the total commercial salt in the deposit. The pumped brines are replaced by waters that dissolve enough salts to reach local chemical equilibrium, but the ratio of components in the re placement brines is less favorable for commercial operations. The quantity of chemicals that can be extracted depends partly on de velopments in extraction technology and partly on the level of un derstanding that can be achieved of the chemical and hydrologic parameters of the deposit that dictate the optimum methods of pumping and recharge.
INTRODUCTION
The Searles Lake evaporites consist of several lay ers of flat-lying Quaternary deposits that underlie the dry lake in the middle of Searles Valley, San Bernar- dino and Inyo Counties, Calif. The valley lies near the southwest corner of the Basin and Range province and just north of the Mojave Desert; Los Angeles is about 200 km to the south-southwest, Bakersfield about 160 km to the west (fig. 1).
Searles Valley has a drainage area of about 1,600 km2 . The valley floor, which trends south then curves to the southwest, is about 60 km long and at places 15 km wide. Searles Lake itself is a nearly dry playa about 15 km long and 11 km wide that covers approxi mately 100 km2 ; about two-thirds of this area is mud, one-third hard salt.
The climate in the valley is hot and arid. In the 36- year period ending in 1973, rainfall averaged about 96.3 mm (3.79 in.) per year, with extremes (calculated for rain years beginning July 1) ranging from 23 to 291 mm (0.92-11.47 in.). During this period, the mean an nual temperature was 19.1°C (66.3°F); record tern-

INTRODUCTION
peratures were 47.8°C (118°F) and -12.2°C (10°F) (fig. 2). The strongest winds come in the spring and fall. During most winters, several centimeters of water stand on Searles Lake for a few weeks or months. In the summer and early fall, the surface is normally free of standing water except for isolated brine pools and areas where the chemical plants and towns have dis charged waste water onto the surface.
The surface of Searles Lake supports no vegetation. The surrounding alluvial fans and mountains are cov ered by a sparse growth of plants typical of the lower Sonoran zone; dominant types include creosote bush (Larrea tridentata), hop sage (Grayia spinosa), de
sert holly (Atriplex hymenelytra), and burro-bush (Franseria dumosa). Pinyon pine grows on the high est parts of the Argus Range; Joshua trees on the high est parts of the Slate Range.
Searles Valley is connected by California State Highway 178 from Ridgecrest to the west, and by the unnumbered continuation of that highway to Pana- mint and Death Valleys to the northeast. Within Searles Valley, numerous dirt roads allow access to many parts of the valley floor. The Trona Railway, which carries only freight, connects the town of Trona with the Southern Pacific Railroad about 55 km to the southwest. In the valley lie the towns of Pioneer Point,
119° 118°
Area of map
0 10 20 30 40 50 60 70 KILOMETERS
EXPLANATION
Present playa or lake
Pleistocene lake
Present river
Pleistocene river
FIGURE 1. Location of Searles Lake and other lakes connected with it in Pleistocene time.

SUBSURFACE STRATIGRAPHY AND GEOCHEMISTRY, QUATERNARY EVAPORITES, SEARLES LAKE, CALIF.
100
90-
30
3.5 —i
3.0 —_
2.5 —
F M A M J O N
± 2.0 —
1.5 —
1.0 —
0.5 —
Average annual rainfall3.79
_
—
—
—
Record high,for month/
-I.
in (9.63 cm)
—
——
—
—
_
—
— 75COCC UJ1-UJ
— 60 ^_l_l
i— 45 -
ZO1-<
— 30 HQ_
OUJCC
-15 °-
F M A M J J A MONTH
FIGURE 2. Present climate of Searles Valley. Measurements by weather station at Trona, for period 1937-73. Data from climatological records of U.S. Department of Commerce (Weather Bureau and Environmental Data Service).
Trona, Argus, South Trona, and Westend. Trona, population about 2,000, is the largest.
DISCOVERY AND ECONOMIC DEVELOPMENT OF SEARLESLAKE
The value of the Searles Lake evaporite deposit is now known to be worth billions of dollars, yet the lake was clearly regarded by the earliest transients as a worthless obstacle. The water was undrinkable and
the surface was difficult to traverse. Records of several groups that commented on the nearly dry lake in the valley are available, among them the nearly starved Bennett-Arcane (Manly) party as they left Death Val ley in 1849. Soon after 1860, prospectors found a rea son for staying in this part of the desert longer than necessary: gold and silver deposits were discovered in the surrounding mountains. These and subsequently discovered deposits were worked intermittently, and their recorded production of gold, silver, lead, zinc, and copper is valued at nearly $3 million (Norman and Stewart, 1951; Smith and others, 1968, p. 28). The mines were small when compared with Darwin, Pana- mint City, Cerro Gordo, and others nearby, but their discovery did serve to bring prospectors and miners into the valley. Among them were the brothers John and Dennis Searles, for whom the lake was later named.
The discovery of borax occurred on February 14, 1873, 1 when Dennis Searles and E. M. Skillings first noted the similarity of material from the lake to the samples of the Nevada borate playas (Hanks, 1883). After confirming the borate content of the crusts (sub sequently found to average about 8 percent), patents for 160 acres were applied for in April 1874 at the U.S. Land Office at Independence by John Searles and J. D. Creigh on behalf of all four men. Production of borax started in that year at a plant on the west side of the lake, and the company holdings were increased in size, eventually covering 2,000 acres (Dyer, 1950). On January 1, 1878, they incorporated under the name San Bernardino Borax Co.
The refining process, which employed about 30 men, operated as follows (De Groot, 1890): The crusts from the lake were collected and dumped into boiling vats of saline solution to dissolve the borax (and other soluble components) and settle out the sediment. The clear liquid was then transferred to wooden crys tallizing tanks and allowed to settle for 5 to 9 days. This formed an impure grade of product that was car ried in that state, or after further purification, to the Southern Pacific Railroad at Mojave by twenty-mule- team wagons. By 1889, the Searles' refinery had pro duced 10,500 tons of borax (Hanks, 1889). Production continued until 1895, when the Pacific Coast Borax Co. purchased the operation and closed it.
'Some uncertainty exists about the exact dates of these events and the size of the original operation. Hanks (1883, p. 26) is the source of the three dates given here for the discovery of borax, patenting of land, and incorporation of the holding company, and he says that the first patent application was for 160 acres. (His report, however, also de scribes Searles Lake as lying in T. 30 S., R. 38 E., the site of Koehn Lake.) Teeple (1929, p. 20) and Dyer (1950, p. 39) report 640 acres as the original amount of land under location. Present records of the U.S. Bureau of Land Management show that patent applications were filed by J. W. Searles and others on October 20,1874, under the com pany name of Ohio Borax, and that it included 640 acres in section 20 and 21, T. 25 S., R. 43 E. (SE1/4 sec. 20, E1/2NE1/4 sec. 20, Wl/2 sec. 21, W1/2NE1/4 sec. 21).

INTRODUCTION
Following this, little activity occurred at Searles Lake until about 1905 or 1906, when the soda ash2 po tential of the lake was realized. This started another episode of economic development that ultimately led to its present state; the first 20 years is described in more detail by Teeple (1929, p. 21-25). By 1908, the California Trona Co. had located claims on most of the deposit and had borrowed a considerable amount of money to develop them, but the firm went into re ceivership the following year. To keep the property in tact, development and exploration were continued by the receiver. By 1914, the reorganized company, called the American Trona Co., had constructed a small plant and completed the Trona Railway, but the new plant never produced. The operation was idled until 1916, when another new plant was finished and com mercial production was started at the town of Trona but the product was potash, not soda ash.
Earlier, in 1913, the U.S. Government had with drawn the unowned parts of Searles Lake as a potash reserve, realizing that the European supply was about to be cut off. The same realization created a strong incentive to the companies on Searles Lake to start producing potash, known to exist in the brines of the lake at least since 1898 (Gale, 1914, p. 309). Potash production began in 1916 at two plants, one at Trona that had been constructed by the American Trona Co., and one at Borosolvay, constructed in that year as a joint effort of the Pacific Coast Borax Co. and the Solvay Process Co. During the acute potash shortage of World War I, the price increased ten times over the prewar level and both producers flourished. But by the end of 1920, the Borosolvay plant closed for good, and the American Trona Co. continued only with dif ficulty.
Following the period of readjustment after World War I, the American Trona Co. added borax to its pro duction (in 1919) and began a long period of research on plant design, the details of which are described by Teeple (1921, 1929). In 1926, it merged into the American Potash and Chemical Corp. Production has continued from that time; new processes have been developed and new products added to the list of mate rials produced.
The West End Chemical Co., at the settlement of Westend, was organized in 1920 by F. M. Smith (widely known as "Borax" Smith), shortly after he lost control of the Pacific Coast Borax Co., which he founded (Hellmers, 1938). The original plant was de signed to produce borax and potash but it was found to be inadequate and was redesigned. In 1927, soda
2Soda ash is the industrial mineral term for sodium carbonate; other terms used in this paper are salt cake, for sodium sulfate, borax, for sodium borate, salt, for sodium chloride; and potash, for potassium oxide and other potassium salts.
ash was first produced, and in 1930, borax was added to the list of products. In 1955, production of sodium sulfate was begun. The production techniques are de scribed by Hellmers (1938) and Ver Planck (1957, p. 480-482).
In 1956, the Stauffer Chemical Co. absorbed the West End Co., and in 1967, the Kerr-McGee Chemical Corp. absorbed the American Potash & Chemical Corp. In 1974, the Kerr-McGee Chemical Corp. pur chased Stauffer's West End plant. The chemical plants at Trona and West End now operate under one ownership. Descriptions of the development and pre sent nature of these operations are given by Gale (1938,1945), Hellmers (1938), Dyer (1950), Hightower (1951), Ryan (1951), Leonardi (1954), Bixler and Saw yer (1957), Ver Planck (1957), Chilton (1958), Garrett (1960), Garrett and Phillips (1960), Goudge and Tom- kins (1960), and Hardt, Moyle, and Dutcher (1972). Both plants extract chemicals from brine pumped from the interstices of the saline layers that underlie the dry lake surface. The plant at Trona produces so dium carbonate and sulfate, potassium chloride and sulfate, lithium carbonate, sodium borate, phosphoric acid, and bromine. The plant at West End produces sodium carbonate, sodium borate, and sodium sulfate. Annual production from both plants is now valued at about $30 million, and total production since 1926 ex ceeds $1 billion.
Leases held by a subsidiary of the Occidental Petro leum Corp., the Searles Lake Chemical Corp., near the south edge of the lake were under development in the early 1970's by two other subsidiary companies, the Garrett Research and Development Co. and the Hooker Chemical Corp. Anticipated production in cluded sodium borate, sodium carbonate, and potas sium sulfate (Phosphorus and Potassium, 1971; Industrial Minerals, 1971) by means of a combined so lar evaporation and plant process (Kallerud, 1966). Seven large evaporation ponds were completed in1971 and pumping of brine for test purposes started in1972 (California Geology, 1972). The operation is in active at this time (1978).
GEOLOGIC ENVIRONMENT AND HISTORY OF SEARLES LAKE
Along the west side of the valley, in the southern part of the Argus Range and in the Spangler Hills, most of the rocks are late Mesozoic plutonic bodies cut by numerous dikes. Near the northwest corner of Searles Valley, these rocks are in contact with large areas of Paleozoic limestone and late Cenozoic basalt and pyroclastic rocks. In the Slate Range, along the east side of Searles Valley, rocks representing all geo logic eras crop out: Cenozoic lake beds, gravel, pyro-

SUBSURFACE STRATIGRAPHY AND GEOCHEMISTRY, QUATERNARY EVAPORITES, SEARLES LAKE, CALIF.
clastic rocks, and mafic lava, late Mesozoic plutonic rocks, early Mesozoic metavolcanic rocks, Paleozoic limestone, and Precambrian metamorphic rocks. No table areas of gypsum-bearing fault gouge crop out along the valley edge. The south edge of Searles Valley is bounded by the Lava Mountains and an unnamed range of low hills that consist mostly of late Tertiary sandstone, pyroclastic rocks, and andesite, and Qua ternary silt, sand, and gravel. The geology of these ranges is shown on the Geologic Map of California Trona Sheet (Jennings and others, 1962) and on maps by Smith (1964) and Smith and others (1968).
Searles Valley is a closed tectonic depression sur rounded by hills and mountains that project 1,000- 1,500 m above the valley floor. Gravity and seismic data show that the pre-Cenozoic(?) bedrock floor of the basin is as much as 1,000 m below the present sur face and 500 m below sea level (Mabey, 1956). This depth and the structural characteristics of the sur rounding ranges indicate that tectonic activity created Searles Valley. Depression of the valley floor and ele vation of the surrounding ranges probably began in late Cenozoic time (Smith and others, 1968, p. 13, 25). By late Quaternary time, Searles Valley had evolved into its present form. Water that drained into it either formed a lake that deposited muds or evaporated to form salines. It is the depositional and geochemical re cord of these late Quaternary lacustrine events, as in dicated by the stratigraphy and mineralogy beneath the valley floor, that is described in this report.
The late Quaternary history of Searles Lake was first described in detail by Gale (1914): Searles Lake was third in a chain of five lakes that received water from the Owens River during pluvial periods of the late Pleistocene (see fig. 1). This river received most of its water from the eastern slopes of the Sierra Nevada and transported it to Owens Lake. When the lake had filled to a level about 60 m above the present surface, water overflowed through a narrow gorge to Indian Wells Valley, where it formed China Lake. China Lake, in turn, attained a depth of about 12 m above the present playa and overflowed into Searles Valley to form a lake as much as 200 m above the present playa; during the highest stages, Searles Lake co alesced with China Lake to form a continuous body of water about twice the size of the present-day Lake Ta- hoe. From Searles Lake, water overflowed around the south end of the Slate Range and into Panamint Val ley, where a lake more than 280 m deep formed. This lake spilled over Wingate Pass into Death Valley.
Core holes have been drilled in four of these basins -and their logs published (Smith and Pratt, 1957). The cores show that the following lithologies are probably representative of the fill in the central parts of these
basins. Owens Lake basin contains fossiliferous fine grained sediments throughout most of the 280 m tested; the top few meters of evaporites were deposited after 1913, when the Owens River was di verted into the Los Angeles Aqueduct. The 220 m of China Lake basin tested consists of silt- and sand- sized clastic sediments plus some calcite and gaylus- site. Searles Lake, cored to a depth of 267 m, contains alternating layers of salines and fine-grained carbon ate muds; the details of this sequence are discussed in this paper. Panamint Lake basin, tested to a depth of 303 m, contains clastic deposits ranging from clay to gravel, small amounts of gypsum, and thick layers of nearly pure halite. Death Valley was not cored be cause logs were available from earlier work (Gale, 1913a, p. 16) that reported alternating layers of mud or clay and rock salt in the upper 30 m of the basin fill.
PREVIOUS GEOLOGIC STUDIES OF SEARLES LAKE
Searles Lake3 first received specific attention from geologists and mineralogists after borates were suc cessfully extracted from it in 1874. Early accounts of these commercial operations are given by Hanks (1883, p. 26-28; 1889) and DeGroot (1890). Hanks (1889) described the deposit and speculated on its geologic origin; he suggested that the water in Searles Lake was derived from Owens Lake and the Owens River, but the statement is not clear, and apparently the connection he proposed consisted of underground seepage rather than a series of surface streams and lakes as was subsequently established. Gilbert (1875, p. 103) had previously traced the path of waters that spilled from Owens Lake as far south as Indian Wells Valley, but as his search for an outlet was restricted to the south edge of that valley, he missed its narrow spillway to the east leading into Searles Valley. In 1896, Fairbanks (p. 69) noted that Searles Lake had shorelines as much as 500 feet above the present val ley floor, and reported that Owens Lake had drained southward into Indian Wells Valley during pluvial periods, but he did not discuss the possibility of a con nection between Indian Wells and Searles Valleys.
Bailey (1902) might be cited as the first to propose a surface waterway connection between Owens Lake and Searles Lake. This proposal was part of a grander concept which postulated (Bailey, 1902, p. 10-12, and map facing p. 32) an extremely large Quaternary lake ("Lake Aubury") that submerged all but the higher
'Searles Lake has been known by several other names that are used in older records. The commonest are Slate Range Lake, Alkali Flat, Borax Lake, Borax Marsh, Borax Flat, and Searles Marsh. The name Borax Lake has caused confusion in geologic litera ture because it is commonly not distinguished from Borax Lake in Lake County, Calif., the site of the earliest borax mining in the State.

INTRODUCTION
peaks in the southwestern Basin Ranges and Mojave Desert of California and unspecified parts of Nevada and Arizona to the east. Bailey further postulated that on partial desiccation, this large lake became frag mented into more modest-sized lakes, and these too are shown on his map (Bailey, 1902, facing p. 32). One of these lakes includes China Lake and Searles Lake, joined as one, and the text (Bailey, 1902, p. 94) indi cates this body as the destination of the overflow from Owens Lake, a relation now known to be true. Bailey does not cite the evidence for these smaller lakes to say nothing of the larger one and it is not possible to tell whether his correct conclusion regarding the Owens-China-Searles chain was a result of observa tion or serendipity.
The attempt to commercially extract soda ash (so dium carbonate) from Searles Lake in 1908, and its recognition in 1912 as a domestic supply of potash to replace the European supply being threatened by the events preliminary to World War I stimulated another series of geologic and engineering studies. Reports that include geologic descriptions and interpretations were published by Hamman (1912a, b, c), C. E. Dol- bear (1913), Gale (1913b; 1914), S. H. Dolbear (1914), Free (1914, p. 38-40), and Young (1914, p. 48-53). By the time these investigations were made, Searles Lake seems to have been generally recognized as a member of the chain of lakes that received water from the Owens River. Hamman (1912a, p. 373) was the first to clearly state that the salines in Searles Lake were de rived from the desiccation of a long-term overflow from Owens Lake, but both Gale (1913b, p. 886; 1914, p. 251, 252) and Free (1914, p. 39), whose fieldwork in the area was started around 1912, also indicated this interrelation.
Of these papers, Gale's report (1914) was the most complete. It is primarily a discussion of the strati graphy, chemistry, and mineralogy of the Searles Lake deposit but it also presents the factual data on Owens, China, and Panamint Basins that support the geologic history of Searles Lake described herein. This factual support consists chiefly of a systematic record of the shorelines in the several basins as related to the elevations of their spillways. Except for descriptions of the tufas, the lake deposits exposed around the edge of Searles Valley were not described; the possible correlations between the subsurface deposits in Searles Valley and those of other basins or glaciated areas were discussed only indirectly.
At the time of Gale's investigations (1914), about 65 shallow core holes (mostly 15-25 m deep) and one deep hole had been drilled by private organizations, and his knowledge of the stratigraphy of the deposit was based on the results of their work. The shallower
holes penetrated only those layers now known as the Overburden Mud and Upper Salt. Chemical analyses of core samples from these units were included in Gale's report, but detailed lithologic and mineralogic logs were not made during drilling. The log of the deep hole, called the "old Searles deep well" and drilled near the west edge of the saline body (see fig. 3), is so generalized that little can be said of the deeper saline and mud layers in the deposit.
Between 1914 and 1952, in the course of commercial development, a wealth of data accumulated. Several new minerals were discovered and new analyses of brines and salines became available. Continued core drilling provided more and better information on the parts of the lake fill investigated by H. S. Gale and has revealed the presence of the deeper saline and mud layers (see Dyer, 1950, p. 41; Ryan, 1951, p. 447 and fig. 2).
In 1952, as part of a study of borates, a new study of Searles Lake was started by the U.S. Geological Sur vey. The core and analytical data previously obtained by the companies operating on the lake (then the American Potash & Chemical Corp. and the West End Chemical Co.) were made available to the Survey and were used as a basis for a program of core drilling that was carried out between 1953 and 1955. Core logs were later published (Smith and Pratt, 1957; Haines, 1957, 1959).
In 1958, Flint and Gale described the subsurface stratigraphy of the Searles Lake evaporites on the ba sis of the many cores obtained by the American Pot ash & Chemical Corp. and the deep core obtained during the Geological Survey's program (Smith and Pratt, 1957). The names used in that paper for the ma jor subsurface units were informal names that had been in use for some years by company geologists and engineers working on the deposit, and those names are used in the present report.
Later, after logs of 41 cores from the upper part of the deposit had been published by Haines (1957, 1959), subdivisions of two of the stratigraphic units described by Flint and Gale (1958) seemed justified and were proposed by Smith (1962). A description of the nonclastic mineral components and a summary of their distribution within these stratigraphic layers was later published by Smith and Haines (1964).
The stratigraphic framework established by Flint and Gale (1958) provided the basis for their own inter pretations of 14C ages of the sediments and for the lat er study by Stuiver (1964). The mineral associations described by Smith and Pratt (1957) and Haines (1959) were used by Eugster and Smith (1965) in a study of chemical equilibrium relations in the deposit. Samples of the cores obtained by the Survey were

8 SUBSURFACE STRATIGRAPHY AND GEOCHEMISTRY, QUATERNARY EVAPORITES, SEARLES LAKE, CALIF.
used in studies by Droste (1961) on clays, Hay and Moiola (1963) on authigenic silicates, and Leopold (1965) on fossil pollen. The stratigraphy and mineral ogy described in these papers was later used to inter pret the geologic history of the lake and its climatic implications (Smith, 1968,1976). The deuterium con centration in hydrated minerals of this suite allows es timates of the temperatures of salt crystallization to be made (Smith, Friedman, and Matsuo, 1970).
The ground water in Searles Valley was first studied by Thompson (1929, p. 177-182), who noted the un usually low gradient of the water table near Searles Lake. Moyle (1969) subsequently compiled the much larger volume of well and spring data now available from the valley and confirmed Thompson's earlier observations. These data led to the conclusions pre sented in a report by Hardt, Moyle, and Dutcher (1972, fig. 10) that even before the activities of the chemical companies on Searles Lake, the hydrostatic head of the high-density brines in the salt body was greater than in the less saline waters in the surround ing parts of the valley. This head means that for much or most of the time since Searles Lake desiccated, brine has migrated, though very slowly, from the cen tral surface of the lake downward and toward its edges, thereby allowing surface waters to move down ward and mix with the brines.
ACKNOWLEDGMENTS
This report would not have been possible without the complete cooperation of the companies holding land on the Searles Lake deposit. All gave permission for the Geological Survey to drill core holes on their holdings and to publish the factual results of its find ings. Data from the past drilling and analytical re cords of the American Potash and Chemical Corp. and the Stauffer Chemical Co. (and their successor, the Kerr-McGee Chemical Corp.) were made available to me, and written permission was granted to publish those data necessary for this report.
Many individuals associated with those companies participated in helpful discussions and aided in com piling data from Searles Lake. Special thanks are due D. S. Arnold, R. L. Cremer-Bornemann, L. J. Czel, F. J. Dluzak, H. S. Eastman, W. A. Gale, D. E. Garrett, F. C. Hohne, D. A. Holmes, J. F. Phillips, and F. J. Weishaupl, all then on the staff of the American Pot ash and Chemical Corporation or the Kerr-McGee Chemical Corp., and P. Cortessis, C. F. Cowie, and L. E. Mannion, all then of the Stauffer Chemical Co.
Colleagues with the Geological Survey who pro vided special help in compiling this report include
P. F. Irish, R. J. McLaughlin, J. D. O'Sullivan, and S. Walsh, who did many of the compilations and cal culations; R. D. Alien, R. C. Erd, and Beth Madsen, who helped identify some of the uncommon minerals; and the USGS chemists cited in the tables of analyses. Company chemists were not identified on the records of their analyses. D. V. Haines helped compile a pre liminary version of this report.
This report is in part the result of a cooperative agreement with the State of California, Department of Natural Resources, Division of Mines and Geology.
STRATIGRAPHY OF THE EVAPORITE DEPOSITS
The term Searles Lake evaporites4 is used in this re port as an informal term for the sequence of salines and muds beneath the surface of Searles Lake. The stratigraphy of the Searles Lake evaporites described here, with the emphasis on the mineral composition, extent, and stratigraphic arrangement of the units, comes chiefly from published core logs (Smith and Pratt, 1957; Haines, 1957, 1959). Logs and chemical analyses of the Kerr-McGee Chemical Corp. (then the American Potash & Chemical Corp.) were examined as a check on the extent to which the published data apply to other parts of the deposit. With the permis sion of the company, some of those data are included in this report.
Knowledge of the Searles Lake evaporites is based on samples and logs of cores (fig. 3). The stratigraphy of the upper 120-150 ft (35-45 m) 5 of the deposit was initially determined from 30 logs of cores obtained for the Geological Survey (Haines, 1959), and subse quently applied to about 70 core logs made by the American Potash & Chemical Corp. Samples from several other cores were later obtained from the Kerr- McGee Chemical Corp. for special studies. The strati graphy of the deeper deposits is determined mostly from the log of the core L-W-D (Smith and Pratt, 1957); six other cores have sampled parts of this inter-
'Throughout this report the term "evaporites" is used as a nearly all-inclusive word for chemical sediments that precipitated initially from natural bodies of water. It in cludes minerals such as calcite, aragonite, and dolomite that precipitated from nearly "fresh" waters, and minerals such as borax, trona, and halite that precipitated from "saline" waters. Solutions containing 1 percent dissolved solids fall near the boundary between "fresh" and "saline" waters as the term is used in this report. The terms "salt," "salts," and "salines" refer to mixtures of solid minerals that crystalized from saline waters; mono-mineralic bodies of halite, though called "salt" in many reports, are re ferred to as "halite".
sln this report, the English system of units (inches, in.; feet, ft; miles, mi; pounds, Ibs) has been used in some instances where the data being discussed are directly or indirect ly derived from core logs, contour maps, or older publications that use these units; this facilitates relating this report to the original sources of data. When these data are gener alized or used in calculations, they are converted and expressed in metric units (milli meters, mm; centimeters, cm; meters, m; kilometers, km; kilograms, kg).

O
o o § CO a
3'
co Q g d a Kj o w ts § I— I
H
IS G
IS
"•0 g
NA
VA
L R
ESE
RV
AT
ION
BO
UN
DA
RY

10 SUBSURFACE STRATIGRAPHY AND GEOCHEMISTRY, QUATERNARY EVAPORITES, SEARLES LAKE, CALIF.
val: core L-30, described in this report, extends to 160 ft (49 m); core 254, described here with permission of Kerr-McGee Chemical Corp., extends to about 260 ft (80 m); cores KK, SL-34, and S-2 (Flint and Gale, 1958, figs. 3, 4) extend to about 300 ft (90 m); a core described by Gale (1914, p 289-290) extends to 628 ft (191 m).
Flint and Gale (1958) described the major stratigra- phic units of the deposit and applied the following in formal names: Overburden Mud, Upper Salt, Parting Mud, Lower Salt, Bottom Mud, and Mixed Layer. Smith (1962) subdivided the Lower Salt into 13 units and the Mixed Layer into 6 units (fig. 4).
The stratigraphic subdivisions of the Mixed Layer are thick units distinguished by changes in evaporite mineral content that indicate significant differences in the chemical nature of the lake in which they were deposited. The Bottom Mud, Lower Salt, Parting Mud, and Upper Salt are relatively homogeneous units defined on the basis of lithology. Contacts be tween them are sharp and considered to be about the same age throughout the deposit. The Overburden Mud, which is more heterogeneous, consists of inter- bedded mud and saline layers. In the central part of the deposit, its basal contact is gradational and con sists of a zone having an upward increase in the per centage of clastic-rich mud layers and a decrease in saline layers; around the edges, the contact is at the base of a zone of solid mud that includes near-shore equivalents of horizons in the Upper Salt as well as in the Overburden Mud.
In studying cores, it is generally easy to separate the mud units from the saline units. The muds6 are mostly dark green to brown, soft, and appear nonporous. They consist chiefly of chemical precipitates made up of Ca, Na, and Mg combined with C03 . The major minerals are fine-grained aragonite and dolomite and fine- or coarse-grained gaylussite and pirssonite (the names and chemical compositions of the nonclastic minerals in the Searles Lake evaporites are given in table 1). A few mud layers have large percentages of clay-sized halite, or small percentages of fine- or coarse-grained borax or northupite. Galeite, schairer- ite, and tychite occur in traces. Authigenic silicates
The term "muds" is used throughout this report for the layers having the physical properties listed here. By most conventional sediment terminologies, these muds would be designated as marls rich in organic material. The term "mud" is preferred, however, because it conveys the concept of moist plasticity, one of the striking properties of these materials, better than the conventional sediment term, and because it is an established part of the local terminology for both the sediment itself and the stratigraphic units composed of it.
such as K-feldspar, analcime, phillipsite, and searle- site are locally abundant. Clastic silt and clay, and partially decomposed organic material, are always present but subordinate. Almost all mineral identifi cations of fine-grained components in the muds are by X-ray diffraction techniques.
The salines are mostly white to dark gray, hard, and porous. They consist chiefly of precipitates made up of Na, K, and Mg combined with C03, HC03, S04 , Cl, or B407 . The major minerals are coarse-grained halite, trona, hanksite, burkeite, borax, nahcolite, mirabilite, thenardite, northupite, and aphthitalite (glaserite). Small quantities of sulfohalite, teepleite, and tincal- conite occur locally. Mineral identifications of saline minerals are by visual inspection (of large crystals) and X-ray diffraction methods.
The identification and correlation of mud and sa line units in cores is based upon multiple criteria. Thickness is the most reliable single parameter, but mineralogy, crystal size and habit, bedding character, and the number and positions of thin layers of muds in salines (or, rarely, salines in muds) provide sup porting evidence. The Upper Salt, Parting Mud, and units within the Lower Salt generally maintain similar thickness over an extent of a kilometer or so, and these thicknesses form a pattern that can be matched with confidence in nearby cores. The mud beds in these se-
TABLE 1. Nonclastic minerals in the Searles Lake evaporites
Mineral Composition
Adularia ________Analcime ________Aphthitalite (glaserite) Aragonite _______Borax __________Burkeite ________Calcite _________Dolomite ________Galeite _________Gaylussite _______Halite _________Hanksite ________Mirabilite _______Nahcolite _______Northupite ______Phillipsite_ _______Pirssonite _______Schairerite _______Searlesite _______Sulfohalite _______Teepleite ________Thenardite ______Tincalconite ______Trona _________Tychite _________
KAlSi308NaAlSiA H20
. K3Na(S04 ) 2CaC03Na2B407 1QH 20
. 2Na2S04 Na2C03CaC03CaMg(C03 ) 2
. Na2S04 Na(F,Cl)CaC03 Na2C03 5H20
.NaCl
. 9Na2S04 2Na2C03 KC1Na2S04 10H20NaHC03
. Na2C03 MgC03 NaClKCa(Al3Si5016) 6H20CaC03 Na2C03 2H20
. Na»S04 Na(F,Cl)NaBSi206 H20
. 2Na2S04 NaCl NaFNa2B204 2NaCl 4H20Na2S04Na2B 4 07Na,C03 2Na2C03
5H20NaHC03 2H20 2MgC03 Na2S04

STRATIGRAPHY OF THE EVAPORITE DEPOSITS 11
UNITDEPTH,
IN METERS 4.ITHOLOGY
Overburden Mud
Upper Salt
Parting Mud
M-7-
M-6-S-6
S-5
i_ower Salt M-5- M-4 S-4
M-2 S-2_S-1
Bottom Mud
Mixed Layer
— 5
— 10
— 15
— 20
25
— 30
— 35
— 40
— 45
— 50
— 100
— 150
— 200
— 250
Interbedded halite and brown mud in central facies grading edgeward to brown nru'd
Halite, trona, hanksite, and borax grading downward and edgeward to trona
Green mud containing gaylussite and pirssonite
Interbedded green muds containing gaylussite, pirssonite, borax, and northupite, and salines consisting of trona, halite, burkeite, and borax
Green mud containing gaylussite
Trona and nahcolite, some interbedded brown mud containing gaylussite
Trona, nahcolite, and halite, some interbedded brown mud containing gaylussite
Halite and trona, some interbedded brown mud containing pirssonite
Brown mud containing pirssonite, some interbedded trona, halite, and nahcolite
Green to brown muds containing pirssonite, some interbedded halite
Green mud containing pirssonite
267
FIGURE 4.—Summary of stratigraphic units in Searles Lake evaporite sequence.

12 SUBSURFACE STRATIGRAPHY AND GEOCHEMISTRY, QUATERNARY EVAPORITES, SEARLES LAKE, CALIF.
quences are more constant in thickness than the saline beds, and for this reason provide more reliable mark ers; toward the edges of the deposit, the saline beds pinch out, and the overlying and underlying mud beds are not separable. Detailed correlations have not been attempted between sections of the Bottom Mud and Mixed Layer. Very few cores penetrate complete sec tions of the Bottom Mud; only one has been examined carefully during this study.
A schematic cross section of the fill in Searles basin is shown in figure 5. The bedrock profile is based on Mabey (1956). The top 45 m of the fill shown in this diagram is based on the data of Haines (1959), Smith (1962), Smith and Haines (1964), and this report. The section between 45 m and 267 m is based on the core log L-W-D from the central part of the basin (Smith and Pratt, 1957) and the "old Searles deep well" from near the west edge (Gale, 1914, p. 275, 289-290); these two logs are so different that correlations are not pos sible, although the older log reports saline minerals
from enough horizons to indicate that some saline lay ers extend at least that far west.
The cross sections of the upper part of the Searles Lake evaporites, plate 1, are based on core holes de scribed by Haines (1959) and on subsurface data adapted from the isopach maps presented in the fol lowing sections (figs. 8-20). Most contacts are drawn at the boundaries between mud and saline material; the base of the Overburden Mud is drawn at the lowermost thick lens of mud in the part of the core considered to represent the Overburden Mud.
The mud layers that can be correlated with the greatest confidence are those near the center of the deposit where the saline layers that separate them are the most distinct and thickest. Near the edges, some saline layers are missing and successive mud layers are combined. Since most of the saline layers have about the same areal extent and position, both the saline units and the mud layers they separate can be recog nized over about the same area.
w4000 —
2000 —SEA
LEVEL 2000 —
4000 —
Argus Range Slate Range
NO VERTICAL EXAGGERATION
,— 1500
— 1000
— 500SEA
LEVEL— 500
— 1000— 1500
^1500
7 4000 —i
3000 —
2000 —
1000 —
SEA LEVEL
1000 —
2000VERTICAL EXAGGERATION x 5
— 1000
— 500
SEA LEVEL
— 500
FIGURE 5.—Cross-section of Searles Valley showing bedrock profile (dashed where position uncertain; after Mabey, 1956, fig. 6) and stratigraphy of upper part (top 45 m) of Cenozoic fill (from data of Haines, 1959; Smith, 1962; Smith and Haines 1964; and this report). Profile is east-west and through central part of lake, along section line one mile north of boundary between T. 25 S. and T. 26 S. (see fig. 3). Two deep core holes are projected to this section: "old Searles deep well" (Gale, 1914, p. 289, 290) is 2 km north of this section line, L-W-D (Smith and Pratt, 1957, p. 25-51) 0.8 km north of it.

MIXED LAYER 13
MIXED LAYER
All the interbedded salines and lake muds below the Bottom Mud were included in a single stratigraphic unit by Flint and Gale (1958, p. 694) and designated the Mixed Layer. The explored part of this unit, 219 ft-875 ft (66.8-266.7 m) in core L-W-D, was previ ously inferred by Smith (1962) to be of Illinoian and Sangamon age, but the present paper tentatively re vises this correlation, making the Mixed Layer of Yar mouth age and possibly Kansan. Saline layers have an aggregate thickness estimated to be near 280 ft (85 m). This thickness is slightly less than half the entire se quence, but as most of the salines are in the upper 60 percent of it, that part is dominated by them. The sa lines are mostly trona, nahcolite, and halite that form individual beds several meters thick; small to trace amounts of burkeite, northupite, sulfohalite, thenar- dite, and tychite are also found. The muds consist of a variable percentage of megascopic crystals of gaylus- site or pirssonite, embedded in a silt- to clay-sized ma trix of gaylussite, pirssonite, dolomite, calcite, northupite, K-feldspar, analcime, searlesite, clastic silicates, and organic material.
The Mixed Layer has been divided into six strati- graphic units (Smith, 1962) whose boundaries sepa rate deposits characterized by different suites of evaporite minerals that indicate significant changes in the chemical nature of the depositing lake. Relative to the overlying units of the Searles Lake evaporites, these Mixed Layer units are thicker and the contacts between them less sharp because the long periods of distinctive chemical sedimentation that they record changed gradually over a long period of time.
AREAL EXTENT AND THICKNESSThe interbedded sequence of salines and lake muds
that constitute the Mixed Layer grade laterally into alluvial deposits that crop out on the valley sides, but the transition zone between them is not exposed and has not been observed in cores; the areal extent of the lacustrine facies therefore can only be estimated. The three deep cores described by Flint and Gale (1958) and the L-W-D core (Smith and Pratt, 1957) are all in the central part of the basin, and it is clear that all four cores are composed entirely of lake deposits. The log of the "old Searles deep well" (Gale, 1914), near the west edge of the present lake (fig. 5), notes halite, thenardite, trona, and northupite at several horizons within the 628 ft (191 m) of fill tested; although saline layers are apparently few and mud layers predomi nate, the lower part of that log describes nothing that could be interpreted as the toe of an alluvial fan. The lacustrine deposits of the Mixed Layer appear to be at
least as extensive as the present playa lake (100 km2), but outcrops of subaerial gravels considered to be contemporaneous with the Mixed Layer limit the pos sible extent of most lacustrine deposits to less than 400 km2 .
The total thickness of the Mixed Layer has not been determined. Core L-W-D includes 655 ft (200 m) of section assigned to this unit. Three other core holes in the central part of. the deposit (Flint and Gale, 1958) penetrate the top 65,100, and 135 ft (20, 30, and 41 m) of this layer. The "old Searles deep well" penetrated the lateral equivalent of the unit, and, because of its position on the flanks of the bedrock basin (fig. 5), may have included the lateral equivalent of deeper ho rizons than did L-W-D in the center of the basin. The deepest samples in the old well consist mostly of clay containing halite and calcite; these lithologies indicate that the base of the lake deposits were not reached.
MINERAL COMPOSITION AND LITHOLOGY
The entire known thickness of the Mixed Layer consists of deposits formed in a moderately to highly saline lake. These have been divided into six zones on the basis of evaporite mineralogy, each zone repre senting a period when the lake waters, on the average, had a characteristic salinity or composition. The zones of highest salinity are represented by saline layers. Decreases in salinity correspond to increases in the percentage of material logged as mud, but the mud layers themselves are actually composed mostly of evaporite minerals that indicate something of the lake's salinity and composition.
The estimated volume percentages of the main components in the Mixed Layer of core L-W-D (Smith and Pratt, 1957) are plotted quantitatively (pi. 2A) such that the horizontal sum of all percentages to tals 100. The core that was lost (52 percent) is graphi cally interpolated by diagonal lines that connect the lithologies plotted for recovered core above and below.
The clastic minerals in the mud (col. 1) and the few beds of sand (col. 2) are mostly quartz, feldspar, and clay, although biotite and amphibole are common. The clastic quartz and feldspar have not been studied in detail, but X-ray patterns of bulk core samples in dicate that they are commonly present in about equal quantities. Hay and Moiola (1963, p. 315-320) note that the grains are generally subround to round and pitted or frosted. Cementing materials include calcite, halite, and searlesite. The heavy minerals in the clas tic fraction were studied by Gan (1961, table 3). In the Mixed Layer, he found a small but generally persis tent percentage of amphibole, opaque mineral, mica,

14 SUBSURFACE STRATIGRAPHY AND GEOCHEMISTRY, QUATERNARY EVAPORITES, SEARLES LAKE, CALIF.
epidote, apatite, sphene, pyroxene, zircon, and topaz fragments; in a few samples he found rutile, cassiter- ite, olivine, anatase, corundum, tourmaline, and spinel fragments.
The clay minerals in the Mixed Layer were studied by Droste (1961) who shows (fig. 3) that the illite:- montmorillonite:chlorite or kaolinite ratios average about 6:3:1. Estimates by Hay and Moiola (1963, table 1) confirm this ratio. Droste (1961) used the pattern of stratigraphic variation in these ratios to correlate the deposits in Searles Lake with those in the other basins that once contained lakes in the same chain. The field evidence now shows that much of the clastic sediment in each basin was derived locally, the observed vari ations are likelier to be the result of local factors such as the position of the shoreline of the lake, the pattern of streams relative to the site of the core hole, the cir culation pattern of strong currents within the lake, or the nature of local rock-weathering processes.
Of the fine-grained authigenic silica minerals found in the Mixed Layer, and the searlesite(?) reported at 248 ft (75.6 m) by Smith and Pratt (1957), plotted in column 4, K-feldspar is by far the most common; it is estimated by Hay and Moiola (1963) to make up 10- 20 percent of many layers and as much as 50 percent of some. Analcime may be slightly more common that K-feldspar in units A and B, but the reverse is clearly true in units C, D, E, and F. Searlesite was reported by Smith and Pratt (1957) from the middle of unit A at 248 ft (75.6 m) and by Hay and Moiola (1963) from units E and F. These three authigenic silicates occur in the overlying Bottom Mud, but only analcime and phillipsite are found in the younger units above it. This stratigraphic distribution suggests either that less time is needed for the formation of analcime and phillipsite than for searlesite and K-feldspar, or that analcime and phillipsite are here precursors to K-feld spar and possibly searlesite as is found elsewhere (Sheppard and Gude, 1968, p. 35, 36).
Eighteen of the X-ray determinations of the fine grained carbonates (col. 5) were made by Hay and Moiola (1963; R.L. Hay, written commun., 1964) on samples selected for study of authigenic silicates; the rest were made during the present study. Although the samples studied by X-ray are widely spaced, the following observations are probably applicable to the unstudied segments of this unit: northupite, dolomite, pirssonite, and calcite are the only carbonates detect ed in this fraction; dolomite is more common than cal cite; and northupite is most common in zones containing saline layers. Gaylussite and aragonite,7
"The light-colored laminae in this unit reported by Smith and Haines (1964) to be aragonite are now known to consist of other carbonate minerals.
though common in overlying units, were not found in the fine-grained fraction of the Mixed Layer.
The percentages of coarse-grained evaporite miner als are plotted in columns 6 to 10 of plate 2A. Gaylus site and pirssonite are relatively insoluble Na-Ca carbonates, and their percentages are shown in col umns 6 and 7. The percentages of more soluble eva porite minerals—the salines—are plotted in columns 8, 9, and 10. About 45 beds of trona and nahcolite are shown, and these total about 45 ft (14 m) thick. Nearly the same number of beds of halite are shown, but they total about 95 ft (29 m). As about half the core was not recovered, actual thickness of salt beds are likely to be about twice these figures, meaning that a total of about 280 ft (86 m) of salts occur in the Mixed Layer. In terms of the overall composition of the 655-foot (200 m) section of the Mixed Layer discussed here, a little less than 15 percent is trona plus nahcolite and 30 percent is halite.
Chemical analyses of the water-soluble fraction of seven samples of the Mixed Layer are given in table 2. Six of these samples are of salines. These analyses confirm that trona, nahcolite, and halite make up most of the saline portions of the core as reported in the log of L-W-D; they also show that saline minerals containing K and B4O7 are nearly absent,8 and sulfate minerals are subordinate to rare. The seventh sample is composed of silt, and the analysis of its water-solu ble fraction indicates the presence of small quantities of carbonates, chlorides, and sulfates. Generalized de scriptions of the individual stratigraphic units follow:
Unit A.—Saline layers composed of trona and nah colite predominate in unit A. Halite is missing (except near the basal contact), and this characteristic distin guishes unit A from unit B. The mud layers are mostly dark yellowish brown and contain megascopic gaylus- site and smaller quantities of pirssonite. Locally there are detectable quantities of megascopic northupite and tychite and microscopic analcime, searlesite(?), and dolomite. A thin bed of basaltic or andesitic vol canic ash lies near the top.
Unit B.—Saline layers again predominate in unit B; they consist of both trona and halite with smaller quanitites of nahcolite. Some of the mud layers are dark yellowish brown, others dark olive green. They contain megascopic gaylussite, traces of megascopic pirssonite, sulfohalite, and northupite, and local con centrations of microscopic crystals of analcime, dolo mite, K-feldspar, and northupite.
'Core drilling was done with hrine pumped from the top of hole W; table 16 shows the uppermost sample of brine to contain 0.70 percent B,0, and 1.39 percent K. Some of the components in this brine must have adhered to the cores that were later analyzed, and some or all of the detected B,0, and K could have come from this source.

BOTTOM MUD 15
TABLE 2.—Chemical analyses of core samples from the Mixed Layer[Analyses, by Henry Kramer and Sol Berman, are of material dissolved in boiling water. Samples from core L-W-D described by Smith and Pratt (1957)]
Depth (ft)
464.0-465.3
580.0-583.0
594.0-597.6640.3-650.0
707.0-710.0722.8-730.0
865.0-868.0
Weight percent
Unit Lithology
____C _____ Trona with halite,some burkeite.
____C _____ Halite, trona,and thenardite.
____C _____ Trona and mud.____D______ Halite, some trona
and pirssonitemud.
____E _____ Halite and mud.____E _____ Halite and
pirssonite mud.____F _____ Silt cemented by
pirssonite andsearlesite.
Na
32.2
38.2
30.038.8
33.238.3
4.1
K
0.09
.17
.30
.02
.06
.04
.19
Cl
11.9
47.4
5.356.9
47.956.5
1.05
so,3.4
8.9
2.0.5
.4
.3
1.2
C03
18.6
2.4
21.3.9
2.01.0
3.7
HCO3
20.1
1.0
23.21.4
.08
.08
.08
B,0,
0.08
.12
.23
.02
.06
.02
.21
Total water soluble
86.4
98.2
82.398.5
83.796.2
10.5
Unit C.—Unit C consists mostly of halite beds, but contains some relatively thin beds of trona. The pre ponderance of halite over other saline minerals and the virtual lack of gaylussite distinguish this unit from units A and B above it. Traces of nahcolite, burkeite, sulfohalite, and thenardite occur locally. The subordi nate mud layers are mostly yellowish to orange brown; they contain megascopic and microscopic crystals of pirssonite and traces of gaylussite, northupite, K-feld- spar, analcime, and dolomite.
Unit D.—In unit D, pirssonite-bearing yellowish- or greenish-brown mud layers are more common than sa line layers, and this distinguishes these deposits from those of unit C above. Most mud layers contain only pirssonite; some contain a little northupite, calcite, and dolomite. Gaylussite is absent from the muds of this and all deeper units. The saline layers consist of about equal percentages of halite and trona, and traces of nahcolite, sulfohalite, and tychite. A 1-cm bed of devitrified glass or andesitic tuff lies near the middle of this unit.
Unit E.—About two-thirds of unit E consists of yel lowish-green mud containing megascopic crystals of pirssonite and locally northupite and sulfohalite. The saline layers are composed of halite that locally con tains traces of included northupite and sulfohalite; trona and nahcolite are absent from the saline layers, and this distinguishes this unit from unit D above it. A thin bed of devitrified andesitic(?) volcanic ash that has been partly altered to K-feldspar, analcime, and searlesite, occurs near the upper contact. Microscopic crystals of analcime, K-feldspar, searlesite, northu pite, dolomite, and calcite make up small to major percentages of some beds in the unit.
Unit F.—Unit F consists chiefly of mud containing pirssonite. Megascopic crystals of northupite and mi croscopic crystals of K-feldspar and dolomite are com
mon to abundant, crystals of analcime, searlesite, and calcite less common. A few thin beds of fibrous trona and cubic halite are found, but the rarity of such beds distinguishes unit F from other units in the Mixed Layer.
Brine samples from the Mixed Layer were not col lected for analysis during the drilling of core hole L-W-D because they were contaminated during cor ing by the surface brines forced down into these deep layers. However, the general composition of the brines that permeate the saline bodies of the Mixed Layer can be inferred from the mineral phases present. The saline layers are composed predominantly of minerals made up of Na, CO3, HCO3 , and Cl. Minerals contain ing Mg and SO4 are rare. Saline minerals containing B and K have not been noted although the authigenic silicates searlesite and K-feldspar do contain these components. As the brines in contact with these min erals appear to be in equilibrium, limits can be placed on their chemical compositions by use of phase dia grams (Smith and Haines, 1964, fig. 14) or relative chemical activity diagrams (Eugster and Smith, 1965). Estimates based on these data indicate, in qualitative terms, that the brines in the Mixed Layer have high percentages of Na, low to high percentages of Cl, HCO3, and CO3 , (with the ratio of HCO3/CO3 mostly low), and very low percentages of K, SO4, and B. The chemical activity of H2O is higher in unit A, and possi bly in unit B, than in older units; the activity of CO2 varies but may be higher in units B, C, and the upper part of D than in other units.
BOTTOM MUD
The Bottom Mud is a unit deposited by a series of perennial lakes that occupied Searles Valley through out most of early Wisconsin, Sangamon, and Illinoian

16 SUBSURFACE STRATIGRAPHY AND GEOCHEMISTRY, QUATERNARY EVAPORITES, SEARLES LAKE, CALIF.
times. It consists largely of dark-green to black mud that contains megascopic crystals of gaylussite. The muds consist of fine-grained carbonates and other evaporite minerals, authigenic silicates, clastic sili cates, and partially decomposed organic debris. Thin lenticular beds of nahcolite and mirabilite are found at several horizons, and a few thin layers of trona, thenardite, and borax have been noted near the top. These represent low stands of the lake but not desic cation.
AREAL EXTENT AND THICKNESS
The Bottom Mud has been penetrated by only a few test holes. Core hole L-W and its downward extension L-W-D (Smith and Pratt, 1957, p. 25-51) is in the east-central part of the deposit. Core holes S-2, KK, and SL-34, which extend to depths of about 300 ft (90 m), penetrated the entire unit (Flint and Gale, 1958, figs. 2, 3, and 4); their core logs are not published, but two were examined during this study. The "old Searles deep well," drilled near the west edge of the deposit (Gale, 1914, p. 289), penetrated the Bottom Mud, but its upper and lower limits cannot be identi fied in the log. Core hole 254, drilled in the southeast part of the lake by the Kerr-McGee Chemical Corp., is described here with their written permission.
In most parts of the deposit, the thickness of the Bottom Mud is about 30 m. Flint and Gale (1958, figs. 3 and 4) show Bottom Mud thicknesses in cores SL- 34, S-2, and KK ranging from about 65 to 90 ft (20-27 m), but application of the criteria used by Smith (1962) to the original logs of SL-34 and S-2 indicates Bottom Mud thicknesses in these cores of about 94 and 100 ft (28 and 30 m) respectively. In core L-W-D, the Bottom Mud is 101 ft (31 m) thick; in core 254, 97 ft (29 m) thick. Near the edge of the lake and outside of it, the areal variation in thickness cannot be mea sured; unpublished mapping shows that the layer was at one time continuous with sections of coarser lake sediments now preserved as remnants around the sides of the valley.
MINERAL COMPOSITION AND LITHOLOGY
The Bottom Mud consists mostly of mud that con tains megascopic gaylussite crystals. About a quarter of the unit has faint or widely spaced laminae or thin beds, but most of it is massive. The mud is clay- to silt- sized material that is moist and plastic. It is com posed, in major to minor percentages, of micro- crystalline gaylussite, dolomite, aragonite, calcite, an- alcime, searlesite, authigenic K-feldspar, halite, and clastic minerals plus a few percent organic material. Thin lenticular beds of nahcolite and mirabilite are found at several horizons, and small amounts of trona, burkeite, and borax occur locally. The mirabilite and
borax dehydrated to thenardite and tincalconite prior to logging and X-ray identification.
Plate 2B shows graphically the distribution of saline layers in three cores of the Bottom Mud, and the min eral composition of the mud fraction. Core 254 repre sents samples collected from the entire thickness of Bottom Mud, core L-30 and core L-W-D samples from the upper third and lower two thirds. The strati- graphic intervals represented by the two partial cores probably overlap slightly, and the beds of nahcolite at about 152 ft (46.3 m) in both are probably correlative and equivalent to the one at 155 ft (47.2 m) in core 254. The bed of nahcolite at 134 ft (40.8 m) in core 254 may be equivalent to one or both of the beds of mira bilite9 reported in core L-W. The other nahcolite beds are not found in the correlative cores, either because not present or not recovered during coring.
The top of the Bottom Mud is at 123.4, 116.8, and 120.7 ft (37.61,35.60, and 36.79 m) in the cores plotted (pi. 2B). The base of the Bottom Mud in core 254 is at 226.8 ft (69.13 m) and in L-W-D at 219.3 ft (66.84 m). The top of the unit is placed at the base of the salts that make up unit S-l of the Lower Salt, and the base at the top of the uppermost saline layer in unit A of the Mixed Layer, a closely spaced series of nahcolite beds.
The Bottom Mud, as represented by the cores plot ted, consists mostly of mud containing as much as 70 percent gaylussite crystals. The crystals are subhedral to anhedral, and generally cut across bedding, demon strating that they grew after burial (see Smith and Haines, 1964, fig. 15; Eugster and Smith, 1965, pi. 1). Crystal sizes range from a fraction of a millimeter to 20 mm, and inclusions of mud similar to the host ma terial occur in most crystals. The largest crystals com monly are found in the top few meters.
Beds and lenses of highly soluble saline minerals are critical in reconstructing the history of the lake inas much as they represent periods of low lake levels. A thin bed of borax occurs about 3 ft (1 m) below the top of the Bottom Mud in the core L-30, and thin discon tinuous beds and pods of northupite, borax, trona, nahcolite, and thenardite are found in this zone in cores GS-8, 10, 11, 15, 16, 17, 18, 19, and 27 (Haines, 1957,1959). Beds of mirabilite were reported 10-20 ft (3-6 m) below the top contact in core L-W (Smith and Pratt, 1957, p. 30) and traces of mirabilite and borax were found in core 254 although none were detected in this zone in core L-30. In cores shown in figure 9, nah-
"Samples of the mirabilite reported in the log of core L-W were not available for con firmation by X-ray diffraction. However, chemical analyses and descriptions in other logs of the rapid dehydration character of the minerals that constitute saline layers in the Bottom Mud show that mirabilite is probably present in some parts of the unit.

BOTTOM MUD 17
colite forms prominent beds 35-45 ft (10-14 m) below the top, and traces of mirabilite and borax were found in core 254. Core 254 penetrated several beds of nah- colite at depths 60-70 ft (18-21 m) below the top, and core L-W-D contained nodules of trona and borax at this depth. Two thin beds of nahcolite occur near the base of the unit in core L-W-D, 1-4 ft (0.3-1.2 m) above several thicker beds of nahcolite assigned to the Mixed Layer.
The mineralogy of the fine-grained fraction of the segments logged as mud in cores 254, L-30, and L-W-D was studied by X-ray diffraction and found to consist chiefly of carbonate minerals, halite, and auth- igenic silicates. Clastic minerals are generally subordi nate. Figure 9 shows the mineral composition of the samples studied. Determinations on 10 of the X-rayed samples from core L-W-D are by Hay and Moiola (1963, table 1, R. L. Hay, written commun., 1964); the remaining determinations from L-W-D and all the de terminations from cores 254 and L-30 are products of this study. Although the abundances of mineral com ponents are only relative, their presence or near-ab sence is generally certain, and the indicated changes in relative concentrations for any component in a giv en core are probably reliable.
Gaylussite (G, on pi. 2B) is a component in about 90 percent of the samples. Except for the top few meters, its abundance tends to be less in the upper third of the unit, the zone containing the largest amount of calcite (C). Dolomite (D) is a component in half to two-thirds of the unit, but it may be slightly less abundant in the zones containing salines. Aragonite (A) is found in samples from the upper 20 ft (6 m), but it has not been detected below those depths in this unit or in underly ing deposits. Analcime (An) is concentrated in two zones, one about 40 ft (12 m) thick near the middle of the unit and one about 10 ft (3 m) thick at the base. A concentration of another zeolite, phillipsite, is reported by Hay and Moiola (1963, table 1) from a tuff bed 8 ft (2.4 m) below the top of the Bottom Mud in core GS-2. Searlesite (SI) is detected in significant amounts in a 10-ft (3 m) zone a little below the middle of the unit. Monoclinic K-feldspar (K) that is pre sumed to be authigenic is present in detectable con centrations in three zones that lie above the main saline beds, and its abundance is roughly proportional to the percentage of clastic minerals (Cm); possibly some of the monoclinic feldspar is clastic rather than authigenic, but its diffraction patterns resemble those described by Hay and Moiola (1963, fig. 3) and by Sheppard and Gude (1968, fig. 2; 1969, fig. 2) from authigenic material. The halite (H) concentration may partially reflect the amount of NaCl-saturated interstitial brines in the core sample which dried be
fore X-raying rather than crystalline material in the original core, but crystalline material can be shown to exist in the Parting Mud and may be present in these samples also; its concentration may increase toward the top of the unit. The small amounts of other saline materials (Sx) may also come from the dried brines, but where shown present in minor amounts, the min erals were observed as crystals. The concentration of clastic minerals (Cm) seems highest in the zones de posited immediately after the main saline layers were deposited, a time when the lakes were smaller and the shores nearer the center of the basin.
Traces of microscopic crystals of pyrite were found in greenish-gray silts from a depth of 152.3 ft (46.4 m) in core L-W-D. None were found in four other sam ples of similar-appearing mud from cores L-30 and L-W-D, which were studied in comparable detail.
CHEMICAL COMPOSITION OF THE BOTTOM MUD
Complete chemical analyses of samples from the Bottom Mud are not available. Determinations of the acid-insoluble percentage of 41 samples from the Bot tom Mud (fig. 6) range from 11 to 65; the average of all determinations is 31. The acid-insoluble fraction in cludes clastic and authigenic silicates (plus the much smaller organic fraction); the fraction that dissolved in the acid or water consists of Na, Ca, and Mg carbon ates plus any salts. As each portion contains several components, the variations cannot be attributed to in creases or decreases in any one. Comparing these data with the X-ray data plotted for this core (pi. 2B) shows that the zones containing the highest percent ages of acid-insoluble material are those containing the highest percentages of authigenic silicates, chiefly analcime (138-176 ft, 219-227 ft) and K-feldspar (176-196 ft). Clastic mineral percentages tend to be high in these zones, which presumably originally in cluded much higher concentrations of clastic silicates that provided the Si and Al now contained in the authigenic minerals. In the parts of the core that do not contain authigenic silicates in abundance, the per centages of acid-insoluble material are mostly be tween 10 and 30 and average about 20.
The mineral components plotted in figure 9 provide a more detailed estimate of the chemical composi tion of the unit. Megascopic crystals of gaylussite (Na2C03 • CaC03 • 5H20) were estimated visually to constitute about 10 percent of core L-30 and 55 per cent of L-W-D. The finely crystalline gaylussite in the mud determined from the X-ray data appears to be more abundant and consistently present than any other component. Finely crystalline dolomite (CaC03 •
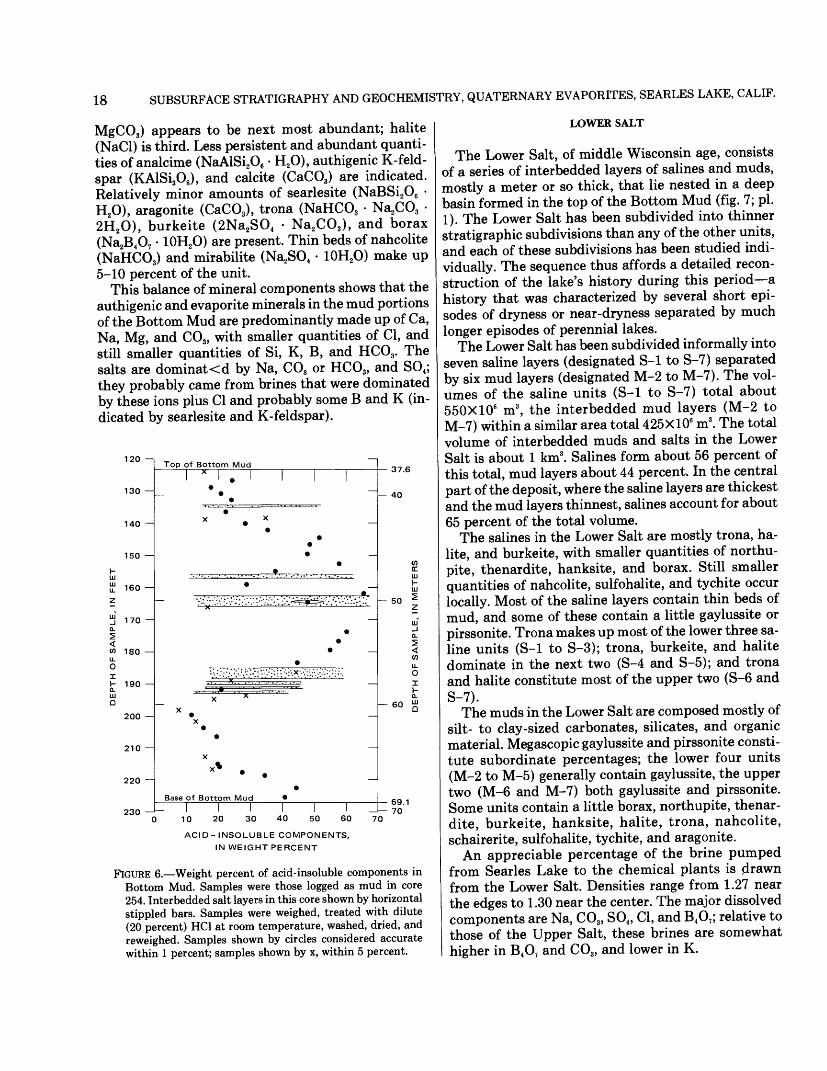
18 SUBSURFACE STRATIGRAPHY AND GEOCHEMISTRY, QUATERNARY EVAPORITES, SEARLES LAKE, CALIF.
MgCO3 ) appears to be next most abundant; halite (NaCl) is third. Less persistent and abundant quanti ties of analcime (NaAlSi2O6 • H2O), authigenic K-feld- spar (KAlSi3O8), and calcite (CaCO3 ) are indicated. Relatively minor amounts of searlesite (NaBSi2O6 • H2O), aragonite (CaCO3 ), trona (NaHCO3 • Na2CO3 • 2H 2 O), burkeite (2Na2 SO4 • Na2 CO3 ), and borax (Na,B4O7 • 10H2O) are present. Thin beds of nahcolite (NaHCO3) and mirabilite (Na2SO4 • 10H2O) make up 5-10 percent of the unit.
This balance of mineral components shows that the authigenic and evaporite minerals in the mud portions of the Bottom Mud are predominantly made up of Ca, Na, Mg, and CO3, with smaller quantities of Cl, and still smaller quantities of Si, K, B, and HCO3 . The salts are dominat<d by Na, CO3 or HCO3, and S04 ; they probably came from brines that were dominated by these ions plus Cl and probably some B and K (in dicated by searlesite and K-feldspar).
120 —i
130 —
140 —
150 —
160
170 —
W 180 —u.OII- 190 —
200 —
210 —
220 —
230 —*— 0
Top of Bottom Mudx
X * * 1
f•
— ':'•'• '•'••// : v:OV-VV.'V-\:X':«¥3ic=r.v ;•.'••'•'•'::..':'.•
.•'
V:-V> :: ;Av.;O:'-':M^:'^-\:^:^v^;-
' x ' * "
x
x
Base of Bottom Mud •L ii i i J
0-7 ft
— 40
— 50
— 60
— 69.1— 70
10 20 30 40 50 60 70
ACID- INSOLUBLE COMPONENTS, IN WEIGHT PERCENT
FIGURE 6. — Weight percent of acid-insoluble components in Bottom Mud. Samples were those logged as mud in core 254. Interbedded salt layers in this core shown by horizontal stippled bars. Samples were weighed, treated with dilute (20 percent) HC1 at room temperature, washed, dried, and reweighed. Samples shown by circles considered accurate within 1 percent; samples shown by x, within 5 percent.
LOWER SALT
The Lower Salt, of middle Wisconsin age, consists of a series of interbedded layers of salines and muds, mostly a meter or so thick, that lie nested in a deep basin formed in the top of the Bottom Mud (fig. 7; pi. 1). The Lower Salt has been subdivided into thinner stratigraphic subdivisions than any of the other units, and each of these subdivisions has been studied indi vidually. The sequence thus affords a detailed recon struction of the lake's history during this period—a history that was characterized by several short epi sodes of dryness or near-dryness separated by much longer episodes of perennial lakes.
The Lower Salt has been subdivided informally into seven saline layers (designated S-l to S-7) separated by six mud layers (designated M-2 to M-7). The vol umes of the saline units (S-l to S-7) total about 550X106 m3 , the interbedded mud layers (M-2 to M-7) within a similar area total 425XlO6 m3 . The total volume of interbedded muds and salts in the Lower Salt is about 1 km3 . Salines form about 56 percent of this total, mud layers about 44 percent. In the central part of the deposit, where the saline layers are thickest and the mud layers thinnest, salines account for about 65 percent of the total volume.
The salines in the Lower Salt are mostly trona, ha lite, and burkeite, with smaller quantities of northu- pite, thenardite, hanksite, and borax. Still smaller quantities of nahcolite, sulfohalite, and tychite occur locally. Most of the saline layers contain thin beds of mud, and some of these contain a little gaylussite or pirssonite. Trona makes up most of the lower three sa line units (S-l to S-3); trona, burkeite, and halite dominate in the next two (S-4 and S-5); and trona and halite constitute most of the upper two (S-6 and S-7).
The muds in the Lower Salt are composed mostly of silt- to clay-sized carbonates, silicates, and organic material. Megascopic gaylussite and pirssonite consti tute subordinate percentages; the lower four units (M-2 to M-5) generally contain gaylussite, the upper two (M-6 and M-7) both gaylussite and pirssonite. Some units contain a little borax, northupite, thenar dite, burkeite, hanksite, halite, trona, nahcolite, schairerite, sulfohalite, tychite, and aragonite.
An appreciable percentage of the brine pumped from Searles Lake to the chemical plants is drawn from the Lower Salt. Densities range from 1.27 near the edges to 1.30 near the center. The major dissolved components are Na, CO3 , SO4 , Cl, and B4 O7 ; relative to those of the Upper Salt, these brines are somewhat higher in B4 O7 and CO3 , and lower in K.

O o 3 3 03 •o o 3 o- CO 03 tr* 03
tr* O
H

20 SUBSURFACE STRATIGRAPHY AND GEOCHEMISTRY, QUATERNARY EVAPORITES, SEARLES LAKE, CALIF.
AREAL EXTENT AND VOLUME
SALINE UNITSThe seven saline layers included in the Lower Salt
underlie about 114 km2 of the present play a. No single bed covers more than 103 km2 (table 3), but as the lay ers are not perfectly superimposed, some of the small er beds extend beyond the edge of the largest.
Isopach maps of units S-l, S-2, S-3, S-4, S-5, S-6, and S-7 (figs. 8-14) are based on interpretations of the core data presented by Haines (1957, 1959) and the records of the American Potash & Chemical Corp., which were generously made available for study. The combined sources furnish thickness data from about a hundred core holes scattered around the deposit, or an average of about one per square kilometer. The iso- pach map of each unit was constructed by plotting the thicknesses of the unit (in ft) at each core-hole site, then contouring the data. The zero line represents the estimated edge of the salt layer and always falls inside, not on, points plotted as having zero thickness.
TABLE 3.—Area and volume of units in the Lower Salt[Based on isopach maps (figs. 11-17 and 18-23). Mud unit volumes
measured within arbitrary boundary shown on maps ]
Volume
Stratigraphic unit
Area (km2 ) m3xl06
Percent of total volume
Saline unitsS-7S-6S-5S-4S-3S-2S-lTotal ______
102.8 102.8 99.2 94.3 92.7 95.8 93.0
62 133 215 40 28 40 45
563
1124 38
7 5 7 8
100Mud units
M-7M-6 ______ M-5 _M-4M-3M-2Total
>100 >100 >100 >100 >100 >100
93 116
28 5957 74
427
22 27
7 14 13 17
100
The contouring of these data is a subjective process, and in some areas the actual distribution of thick nesses may be quite different from that shown. This is most likely to be true near the edges, where control points are few. Furthermore, compaction of material or core losses during drilling makes some reported thicknesses uncertain over a range of several tenths of a foot. Many parts of the deposit have closely spaced control points that are fairly consistent; it seems prob able that the thicknesses represented by the contours in these areas are essentially correct.
The volumes of saline units were calculated from these isopach maps. Planimeter measurements were first made of the areas bounded by successive con tours. The area between each of the crudely concen tric contours was then calculated, the volume of the vertical zone beneath each area was computed, and the volumes of all zones were added together. This cal culation, expressed as a formula, is as follows:
V = where
, -A2 ) (A2 - A,)
V is total volume,A0, A 1? A2 , and A3 are areas bounded by the zero,
first, second, and third contours, and hl3 h2, and hs are the midpoints between the zero and first, first and second, and second and third contours (so that maps with a 1-ft contour interval thus have /ij = 0.5, h2 = 1.5A = 2.5, etc.).
The volumes obtained in this way, given in table 3, are a few percent larger than if calculated from formulas for the prismoid or frustrum of a cone10 , but this tech nique is preferred because the volume of each vertical zone is subsequently used to estimate mineral zona- tion and bulk mineral composition of the unit.
MUD UNITSThe six mud units that separate the salt layers in
the Lower Salt extend beyond the edges of those lay ers. Their lateral equivalents crop out in some parts of the valley, mostly a kilometer or more outside of the limits of the salts. Within the cored area, though, the individual mud layers can be identified in virtually every core, and their variations in thickness plotted as isopach maps (figs. 15-20). The contours are terminated at an arbitrary boundary which approxi mates the limits of the salt layers. Volume measure ments have been made in the same manner as the measurements on the salt layers; the results are given in table 3.
'"For example, the volume of unit S-7 by the technique used is calculated to be 62.3X10⁶ m3 . Applying the formula for the prismoid in the form:
[A0 + 4(A0+A, — C
[A, + 4(A1 +A*
where
C = contour, interval, andA0 , A,, A2, etc. = total areas bounded by each contour,
the volume of S-7 is calculated to be 60.3X10⁶ m3 .Applying the formula for the frustrum of a cone:
V = '/3C[A0 + A, (AA)'/2 ] + '/3C[A,+A where symbols are as above, the volume of S-7 is calculated to be 60.0X10⁶ m3 ,

I—1
CO <D 5T CO fT
r o 3 M » CO
NA
VA
L R
ESE
RV
AT
ION
BO
UN
DA
RY
to

22 SUBSURFACE STRATIGRAPHY AND GEOCHEMISTRY, QUATERNARY EVAPORITES, SEARLES LAKE, CALIF.
- R. 43 E. 117°20' R - 44 E-
IsopachHachured in areas of thinning.
Contour interval 1 foot
Core-hole location Thickness of unit S - 2, in feet
0123 KILOMETERS
FIGURE 9.—Isopach map of unit S-2, Searles Lake.

M i—1
O CO
fti ^.
co -
NA
VA
L R
ESE
RV
AT
ION
BO
UN
DA
RY

24 SUBSURFACE STRATIGRAPHY AND GEOCHEMISTRY, QUATERNARY EVAPORITES, SEARLES LAKE, CALIF.
™ D«m ^E » / R. 43 E. 117°20' R - 44 E-
IsopachHachured in areas of thinning.
Contour interval 1 foot
Core-hole location Thickness of unit S -4, in feet
0123 KILOMETERS
FIGURE 11.—Isopach map of unit S-4, Searles Lake.

3 -,
-
CO CO

26 SUBSURFACE STRATIGRAPHY AND GEOCHEMISTRY, QUATERNARY EVAPORITES, SEARLES LAKE, CALIF.
,,««, f R. 43 E. 117° 20' R - 44 E-
IsopachHachured in areas of thinning.
Contour interval 2 feet
Core-hole location Thickness of unit S - 6, in feet
0123 KILOMETERS
FIGURE 13.—Isopach map of unit S-6, Searles Lake.

r I er £0 ts o l-tl 3 03
I 9 03
NA
VA
L R
ES
ER
VA
TIO
N B
OU
ND
AR
Yto

28 SUBSURFACE STRATIGRAPHY AND GEOCHEMISTRY, QUATERNARY EVAPORITES, SEARLES LAKE, CALIF.
R. 43 E. 117°20' R - 44 E-
35°45'
IsopachHachured in areas of thinning.
Contour interval 1 foot.1.8
Core-hole location Thickness of unit M-2, in feet
0123 KILOMETERS
FIGURE 15.—Isopach map of unit M-2, Searles Lake.

LOWER SALT
R. 43 E. 117° 20'
29R. 44 E.
IsopachHachured in areas of thinning.
Contour interval 1 foot .2.7
Core-hole location Thickness of unit M-3, in feet
0 1 2 3 KILOMETERS
FIGURE 16.—Isopach map of unit M-3, Searles Lake.

30 SUBSURFACE STRATIGRAPHY AND GEOCHEMISTRY, QUATERNARY EVAPORITES, SEARLES LAKE, CALIF.
,«r«™^ / R. 43 E. 117° 20' R. 4 4 E.
IsopachHachured in areas of thinning.
Contour interval 1 foot
Core-hole location Thickness of unit M-4, in feet
0123 KILOMETERS
FIGURE 17.—Isopach map of unit M-4, Searles Lake.

CO
NA
VA
L R
ES
ER
VA
TIO
N B
OU
ND
AR
Y
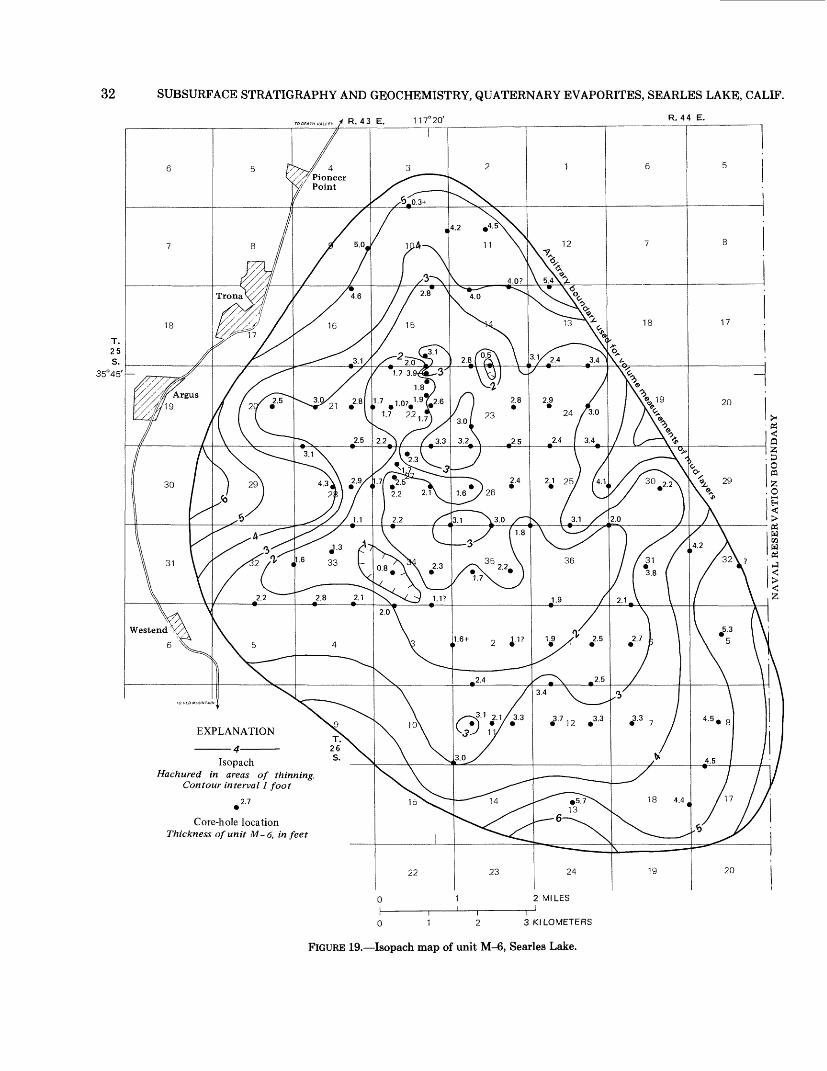
32 SUBSURFACE STRATIGRAPHY AND GEOCHEMISTRY, QUATERNARY EVAPORITES, SEARLES LAKE, CALIF.
ro D«r««tlf , / R. 43 E. 117°20' R ' 44 E'
IsopachHachured in areas of thinning.
Contour interval 1 foot
Core-hole location Thickness of unit M-6, in feet
1 2 3 KILOMETERS
FIGURE 19.—Isopach map of unit M-6, Searles Lake.

NA
VA
L R
ES
ER
VA
TIO
N B
OU
ND
AR
Y
1 s 00 00

34 SUBSURFACE STRATIGRAPHY AND GEOCHEMISTRY, QUATERNARY EVAPORITES, SEARLES LAKE, CALIF.
MINERAL COMPOSITION AND LITHOLOGY
The Lower Salt is composed of alternating saline layers and mud layers. The salines are mostly hard, white or light gray, porous, and composed of megasco pic crystals. The muds are generally soft, black to dark greenish gray, impervious, and composed mostly of microscopic or submicroscopic components that form a matrix for megascopic crystals of gaylussite, pirsson- ite, borax, and northupite. Thin discontinuous beds of mud occur locally in the saline units, and lenses and small clusters of saline minerals occur in the mud units, but they do not make up significant percentages and generally the horizons containing them cannot be traced throughout the deposit.
SALINE UNITS
The main mineral components of the saline units in the Lower Salt are, in approximate order of decreasing abundance, trona, halite, burkeite, northupite, borax, and thenardite. Small amounts of hanksite, nahcolite, sulfohalite, tychite, and tincalconite are found mixed with the other salines, and gaylussite and pirssonite are found in some of the thin interbeds of mud.
The volume percentages of megascopic minerals in the saline units given in table 4 are based on visual estimates of mineral percentages (Haines, 1957,1959). As described later, these estimates have systematic but moderately sized errors; on the average, they over estimate trona by about 14 percent and underestimate halite by 8 percent, burkeite and hanksite by 5 per cent, borax by 2 percent, and gaylussite and pirssonite by 1 to 2 percent.
The volume percentage estimates of the mineral content are made as follows: The isopach map of each stratigraphic unit is considered to represent a solid body that has a base that is flat and a top that is di vided into "steps" of different heights along the con tours. It is treated as if the steps are a series of nested and crudely concentric rings that have rectangular cross sections. The inner and outer edges of each irreg ular ring are vertical and defined by successive iso pach contours, and the top and base are flat with the height of the top surface being midway between the thicknesses represented by the bounding contours. The area of each of these concentric bodies is calcu lated from planimeter measurements as described in the previous section, and the volume computed on the basis of their height. The relative volume percentages of the saline minerals in each of these concentric bo dies are then calculated. First, the volume percentages
of all minerals in that particular stratigraphic unit in each core are computed. These data are then grouped according to the isopach contours the core falls be tween and averaged. Where there are no core holes be tween a given pair of contours, a reasonable value is interpolated or extrapolated (shown in table 4 in par entheses). The average composition of each of the rings making up the isopach map body is then weighted according to the percentage of the unit's to tal volume it accounted for, and then all are added.
The data in table 4 clearly show two types of compo sitional variation, lateral and vertical. Lateral vari ation of the minerals trona, halite, and burkeite is marked; borax, thenardite, and nahcolite also appear to change systematically. The minerals halite and burkeite are clearly concentrated in the thicker cen tral parts of the units, and trona, nahcolite, and then ardite are concentrated near the thinner edges. This distribution, a function of the relative solubilities of these minerals, is discussed in a later section.
Vertical variation in composition is evident from the data in this table. The most marked vertical changes are as follows: the lower three units (S-l, S-2, and S-3) consist almost entirely of trona; the next unit (S-4) is mostly trona and burkeite; the next (S-5), the thickest, consists of trona and halite with some bur keite; the upper two (S-6 and S-7) contain large per centages of both trona and halite but are relatively low in burkeite. Several other vertical changes are evident. Northupite is most abundant in S-2, S-3, and S-4. Borax becomes gradually more abundant from S-l to S-5 and is notably abundant in S-7. Nahcolite is restricted to S-l and S-7. More complete descrip tions of the saline units, based on the above data and on the mineralogical and textural details presented by Haines (1959) and Smith and Haines (1964), follow.
S-l.—Unit S-l consists chiefly of bladed and fine grained trona with subordinate amounts of the fibrous form. In the central and thicker parts of the body, few other minerals are associated with this bed except for some massive northupite in the interstices of trona blades in GS-11 and 12. Toward the thinner marginal areas, there are local pockets of borax crystals (in GS- 18 and 21) and nahcolite (in GS-9,27, and 41). Tincal conite is reported from this layer (Pabst and Sawyer, 1948; see also Smith and Haines, 1964). Visible halite is absent. Mud as impurities in the trona and as thin beds is common, especially near the lower and upper contacts; in the central areas, mud rarely forms as much as 10 percent of the unit, but nearer the edges it commonly forms more than 20 percent.

LOWER SALT
TABLE 4.—Estimated mineral compositions of saline layers in the Lower Salt[Numbers in parentheses either interpolated or extrapolated, t = trace)
35
Stratigraphic Mineral unit
S-7 HaliteTronaBoraxThenarditeSulfohalitePirssoniteBurkeiteNahcoliteMud
Number of cores between contours _ _ _ _ Percentage of unit volume
lying between indicated contours
S-6 HaliteTronaBoraxBurkeiteSulfohaliteMud
Number of cores between contours Percentage of unit volume
lying between indicated contours
S-5 HaliteTronaHanksiteBoraxBurkeiteThenarditeSulfohaliteNorthupiteTwhitpPirssoniteMud
Number of cores between contours Percentage of unit volume
lying between indicated contours
Contour lines
S-4 TronaHanksiteBoraxBurkeiteNorthupitePirssoniteHaliteSulfohaliteMud
Number of cores between contours Percentage of unit volume
lying between indicated contours
Composition (in volume percent) indicated between contour lines
0-2
84 3.5 1.7
.1
t 11 21
35
92
7.5 2
5 9.5
79.9
1.5 .2 .3
8.67
20-1
49
5.3 32
3.5
.3
.2 9.6
15
14
2-4
13 80
3.7
.8
2.7 7
27 5.4
93 .8
t .6
18
34 17 71
0.4
124
61-2
82 1.7 1.2
12 .6 .2
2.2 9
46
4-6
35 58
.1
.15.7
.8 2
18 30 68
1.2
.3 8
49 40 50
.1 8.0
t t t .3
2.0 3
82-3
45
.2 52
.3
2.5 5
36
6-8
38 61
.2
.2
.41
15 36 64
1
10 66 31
1.5
t t t
2.0 3
133-4
72
116.2 2.5
7.5 1
3
8-10
(40) (60)
--
0
3 (40) (59)
(1.0) 0
1 43 33
2.2 20
t
.1 1.1 5
164-5
(60)
(1.0) (35)
(1.0)
(3.0) 0
1
10-12 12-14 14+
(40)(60)
--
--
0
2 (40)(59)
n o)o
i61 49 (50) 31 35 (35)
t t .8 (1.0)
5.3 12 (13)
.3 .8 1.8 3.1 (1.0) 720
38 14 35+
— — —
Weighted total
percent
18 73 2.2
.6
.05
.3 1.1 t
4.6
2177
.3
.6t.7
51 37
t .5
8.1 .03 t .03 t .3
2.6
64 8 1.7
29 1.0
.1
.03 .03
3.5

36 SUBSURFACE STRATIGRAPHY AND GEOCHEMISTRY, QUATERNARY EVAPORITES, SEARLES LAKE, CALIF.
TABLE 4.—Estimated mineral compositions of saline layers in the Lower Salt—Continued
Stratigraphic unit
Composition (in volume percent) indicated between contour linesMineral
0-2 2-4 4-6 6-8 8-10 10-12 12-14 14+
Weightedtotal
percent
S-3 _________Trona ____Hanksite Borax _ _ _ _Northupite _ Gaylussite __ Burkeite ___ Mud _____
Number of cores between contoursPercentage of unit volume
lying between indicated contours ______________
S-2 _________Trona ____Borax _ _ _ _Burkeite ___ Thenardite _ Northupite _ Mud ___ _
Number of cores between contoursPercentage of unit volume
lying between indicated contours ______________
S-l __________Trona ____Borax _ _ _ _Northupite _ Tychite Nahcolite _ _ Pirssonite _ _ Mud _____
Number of cores between contoursPercentage of unit volume
lying between indicated contours ______________
88
3.7 .8 .3
7.119
2798
.5
.8
.9____ 11
1271
.3
.4t
4.5
2416
86 (86)2.0 (2.0)1.1 (1.0)1.5 (2.0)
.6 (2.0)8.8 (7.0)
14 0
6593
.1
.7
.6 5.2
11
4392
1.2
889
2.21.31.31.4 4.5 6
4097
14 24
t .3
.4 2.5 5
23
91
.3 8.8 3
598 85 (100)
1.9 3
29
141
87 1.5 1.8 1.3
.08
.5 8.2
92 .9 .9 .5 .9
4.6
92 .3 .1 t .6 .2
7.1
S-2.—Unit S-2 is in many respects similar to S-l; they are similar in area and volume and both consist largely of trona in the fine-grained and bladed forms, but the fibrous form is subordinate. Locally S-2 has pockets containing major percentages of burkeite (in the central facies, GS-15 and 16), borax (in the east edge facies, GS-2 and 27), and thenardite (in GS-6). In about a third of the cores, small quantities of fine grained northupite form beds or interstitial fillings. Visible halite is absent. Impurities of mud are less common than in S-l and seem to be concentrated in the central areas.
S-3.—Like the underlying two saline beds, unit S-3 consists primarily of trona, although it is slightly smaller in volume and covers less area. Local pockets contain uncommonly high percentages of burkeite (in GS-15), hanksite (in GS-10), and borax (in GS-15,19, 22, and 27). Northupite occurs in about a quarter of the cores. Visible halite is absent. Thin beds and im purities of mud make up several percent of the unit in most cores; their distribution does not seem to be re lated to areal position.
S-4.—In bulk composition, unit S-4 is largely trona plus major amounts of burkeite; their relative per centages do not seem related to the thickness of the unit. Halite is present but in very small quantities (in GS-10 and 18). Hanksite (in GS-2 and 27) is present but in smaller quantities than in S-3. Borax (in GS-2, 8,15,17, 20, and 26) and northupite (in GS-23, 24, 26, 27, 39, and 41) are commonly found in percentages similar to those of the two underlying units. Mud lay ers are generally subordinate, especially in the central areas, and most of them contain neither pirssonite nor gaylussite.
S-5.—Unit S-5 has the largest volume of saline lay ers in the Lower Salt, although its areal extent is about the same as the other units. Halite is the chief component, but trona approaches the same concen tration. Burkeite is subordinate to halite. Borax forms about half a percent. Minor amounts of hanksite, thenardite, sulfohalite, and northupite occur sporadi cally. In many areas, burkeite and halite show a ten dency to be more abundant in the lower three- quarters of the bed, trona to be more abundant in the

LOWER SALT 37
upper one-quarter, but the layering within the unit is not consistent. With respect to thickness, trona per centages show a clear tendency to diminish toward the thick parts of the saline body, whereas halite percent ages complement this trend. Both burkeite and borax are clearly concentrated near the central part of the deposit. A 2- 3-cm mud layer is generally present about half a meter above the base of the unit, and a small percentage of mud, much of which contains pirs- sonite, occurs throughout.
S-6.—Trona is clearly the predominant mineral in S-6. The relative percentage of halite is less than half that of the underlying saline unit. The percentages of borax and burkeite are small. In the thicker central facies, the lower two-thirds of the layer contains high percentages of halite that is mixed with trona, and the upper third of this layer is mostly trona; the thinner edge facies are almost exclusively trona. A little borax is found near the edges (GS-6, 19, and 20), burkeite near the center (GS-15). Very small quantities of sul- fohalite and mud occur in this unit.
S-7.—The preponderant mineral in unit S-7 is trona. As in S-6, halite is concentrated in the lower part of the central thicker facies, whereas trona forms the upper part; trona becomes very common toward the edges. Borax is found locally in the west, central, and eastern parts of the body. A little nahcolite (GS- 40), burkeite (GS-15), thenardite (GS-3), sulfohalite (GS-16), and aphthitalite (GS-15) are noted. Mud beds, some of which contain pirssonite, are more abundant in this unit than in S-6 and become more predominent toward the edges.
MUD UNITS
The six mud units in the Lower Salt are dark organic-rich marls in which megascopic carbonate minerals are embedded. Quantitative estimates of the megascopic mineralogy of these mud layers (within the area sampled by cores) given in table 5, have been made by the same techniques used for the saline lay ers. These data clearly show that the percentages of these minerals vary according to stratigraphic posi tion. In units M-2 - M-5, megascopic crystals of gay- lussite are uniformly distributed and form percentages diminishing from about 18 to 2; small quantities of pirssonite occur in M-4 and M-5. In M-6 and M-7, gaylussite forms 30-40 percent of cores from the edge facies but is subordinate to pirssonite in the central facies. Crystals of borax locally form pockets in most of these layers, but are most abundant in M-4, M-5, and M-6. Northupite forms a small amount of all units but is most concentrated in M-3. Schairerite, tychite, and sulfohalite form fractions of a percent of some units. In addition, some layers have lenses or
small pods of megascopic saline minerals such as ha lite, trona, nahcolite, burkeite, thenardite, or hanksite that were probably formed by postdepositional cry stallization of migrating brine.
The microscopic size fraction of these muds consists predominantly of smaller crystals of most of these same minerals plus aragonite, analcime, clastic sili cates, and partly decomposed organic material. An X- ray study by R. C. Erd (written commun., 1958) of eight samples of muds from the Lower Salt in GS-14 is summarized in table 6. Gaylussite, pirssonite, northupite, and halite are the major evaporite compo nents of the microscopic fraction. These data show that fine-grained gaylussite and pirssonite coexist; northupite is a prominant component of some units; dolomite is not detected; and halite is present in only minor amounts. Studies of the fine-grained fraction of mud samples from GS-2 by Hay and Moiola (1963, ta ble 1) report small quantities of analcime in units M-6 and M-7. The small percentages of saline minerals found in many of these samples may come from the evaporation of brine that was in the pores or entered the core during drilling.
The mineralogy of these mud layers differs from that of the underlying Bottom Mud and the overlying Parting Mud, which contain larger percentages of ara gonite, dolomite, and halite, smaller percentages of clastic minerals, and almost no northupite.
Summaries of the megascopic lithology of the mud layers follow.
M-2.—Unit M-2 is the lowest mud layer within the Lower Salt sequence. It most commonly consists of mud that contains 15-20 percent gaylussite crystals. Fine laminar bedding is well-developed in most cores. A few parts of the bed contain disseminated crystals of trona, but halite is not reported. Other minerals found are nodules and thin beds of northupite (in about a third of the cores), disseminated crystals of borax (in GS-8 and 21), and small pockets of crystal line galeite (in GS-17,22, and 41) (misidentified in original logs as schairerite; see Smith and Haines, 1964, p. P32), tychite (in GS-1, 3, and 24), thenardite (in GS-6 and 10), hanksite (in GS-26), and sulfohalite (in GS-11). The northupite is concentrated around the edges of the deposit; thenardite may be also. Unit M-2 is generally 1-3 ft (0.3-1 m) thick and is thinnest near the south end of the deposit (fig. 15); the only marked thickening is to the southeast and southwest, and this thickening is probably a reflection of the clas tic contribution coming from the large drainages of these areas.
M-3.—Unit M-3 is similar to M-2, consisting chiefly of euhedral gaylussite in mud, although the average percentage of gaylussite is slightly lower. Lam-

38 SUBSURFACE STRATIGRAPHY AND GEOCHEMISTRY, QUATERNARY EVAPORITES, SEARLES LAKE, CALIF.
TABLE 5.—Estimated mineral compositions of mud layers in the Lower Salt[Compositions, in volume percent, estimated within arbitrary boundaries shown in figs. 15-20]
Stratigraphic M unit
M-7 MudGaylussitePirssonite Northupite BoraxTronaSulfohalite
Number of cores between contoursPercentage of unit volume,
within arbitrary boundary shown on map, lying between indicated contours
M-6 MudGaylussitePirssonite Northupite BoraxHaliteTrona
Number of cores between countoursPercentage of unit volume,
within arbitrary boundary shown on map, lying between indicated contours
M-5 MudGaylussitePirssonite Northupite BoraxTronaTychite _Sulfohalite
Number of cores between contours
Composition (in volume percent) between indicated contour linesmeral
0-1
(62)(18)
_______ (20)
0
1(56)
(2.0)(39)
(i.o)(1.0)(1.0)0
186
2.6________ 1.5 ________ 4.2
3.32.3
.1
.125
1-2
62 21 16
.1
7
11 59
3.5 34
1.0 1.0 1.1 5
6 95
2.5
2.5
2
2-3
63 19 15
t .6
2.6 t
20
41 62 16 21
.1
.8
9
21 (98)
(2.0)
0
3-4
67 33
.1
5
18 65
9.8 23
t 1.9
8
23 (98)
(2.0)
0
4-5
62 38
1
24 69 26
4.2 .2 .6
.2 9
25
--
_ _
5-6 6-7
60 60 40 40
0 0
4 2 66 (65) 33 (34.0)
.4
.9 (1.0)
3 0
18 6
— — — —
_ _ _ _
Weighted total
percent
63 28 8.0 t .2
1.1 t
65 20 13
.1 1.1
.1
.1
92 2.4
.7 1.9 1.5 1.7 0.5
.05
Percentage of unit volume, within arbitrary boundary shown on map, lying between indicated contours __________________ 46 26 18 10
M-4 ____________ Mud ___________ 85 85 84 83Gaylussite ________ 11 11 11 13Pirssonite ________ -- .1 .2 --Northupite ________ 3.0 1.1 1.9 1.6Borax ___________ .2 .9 1.4 1.2Trona ___________ .5 2.0 1.9Burkeite __________ -- t -- 1.3Tychite __________ -- tHanksite _________ -- .5 -- --
Number of cores between contours __________ 3 19 7 3Percentage of unit volume,
within arbitrary boundary shown on map, lying between indicated contours __________________ 2 53 34 11
84 11
.1 1.5 1.1 1.7
.1 t .3
inar bedding is well-developed in most cores, and, after partial drying, the beds separate into paper-thin layers that have a marked flexibility. Laminae near the base are commonly contorted. Northupite forms
massive white nodules or thin beds in more than half the cores, and averages about 2 percent of the unit. A few crystals of trona are found in many cores; crystals of halite are not found. Tychite crystals have been

LOWER SALT
TABLE 5.—Estimated mineral compositions of mud layers in the Lower Salt—Continued
39
Stratigraphic unit
M-3
Number of cores between
Mineral
MudGaylussiteNorthupite ________
TronaTychitecontours __________
Composition (in volume percent)
0-1
84 13
1.5
2.1 .2
16
1-2
83 14
1.2 t
2.3
6
2-3
84 9.2 2.9
2.4 1.1 5
3-4
82 11 5.9
1.4
2
4-5
83 17
1
5-6
83 15 2.0
0
6-7
83 15 2.0
0
Weighted total
percent
83 13 2.2 t
1.5 .2
Percentage of unit volume, within arbitrary boundary shown on map, lying between indicated contours _____________
M-2 ____________ Mud ____.Gaylussite _ _ _. Northupite __. Trona ______Tychite _____Galeite ______Thenardite __. Borax ______Sulfohalite __.Hanksite _ _ _.
Number of cores between contours _ _ _ _.Percentage of unit volume,
within arbitrary boundary shown on map, lying between indicated contours _____________
118217
308217
188118
1.3
.4
.4 t .1
157621
2.2.6.2
14 69.2 13.6
t 14
3.6
11
16
12
54
79 18
.6 1.6
.1
.05
.4
.1tt
18
found only in the southeast part of the deposit (in GS- 3 and 4). A trace of borax is reported from GS-27. Current marks were noted in GS-17. Generally, this unit has a thickness of a foot or less (fig. 16), but it thickens rapidly toward the edges of the contoured area.
M-4.—Like the underlying two mud units, M-4 consists of dark mud containing gaylussite, but the gaylussite percentage has fallen to about 10 percent. Small euhedral crystals of pirssonite occur locally (in GS-20 and 41). Faint laminar bedding is noted in most cores. Northupite, as white massive nodules or thin beds, forms about 1.5 percent, the maximum con centration in any mud layer in the Lower Salt; its dis tribution is probably random but it may be more concentrated in the thin central facies. Euhedral, sub- hedral, anhedral, and massive borax crystals lie in an irregular east-west belt through the center of the de posit. Crystals of trona are embedded in the muds of this unit in about a third of the cores. A little tychite (GS-3), hanksite (GS-26), and burkeite (GS-18 and 22) are noted. The thickness of this unit is commonly between 1 and 2 ft (0.3-0.6 m), but the areal pattern of the variations in thickness is erratic (fig. 17); the unit
thickens toward the west and southwest edges but maintains a nearly uniform thickness to the other edges of the drilled area.
M-5.—Unit M-5 is normally the thinnest mud unit in the Lower Salt. Faint to indistinct laminar bedding is noted in most cores. Gaylussite crystals, generally much smaller than in other units, are reported from only about a third of the cores studied by Haines (1959) and are estimated here to constitute only 2-3 percent of the unit. Pirssonite crystals are reported from less than half as many cores. Northupite was found in three cores (GS-20, 21, and 26). A little trona (in GS-5,15, 23, and 39), tychite (in GS-26), and sul- fohalite (in GS-26) are reported, but halite is not found. Borax reaches a higher concentration in this mud unit than in any other, most of it being in the elongate prismatic form (see Smith and Haines, 1964, p. P10-P12 and fig. 5); much of the borax is concen trated near the base of the unit and in the central part of the deposit. Ripplemarks were noted in the mud at GS-16. The thickness of this unit is generally less than 1 ft (0.3 m) (fig. 18); except for an anomalous area in the northwest-central part, greater thicknesses are found only very near the west and south edges of the evaporite body.

40 SUBSURFACE STRATIGRAPHY AND GEOCHEMISTRY, QUATERNARY EVAPORITES, SEARLES LAKE, CALIF.
TABLE 6.—Mineral abundance in mud units of the Lower Salt, core GS-14, determined for total sample and acid-soluble fraction ofsample
[Semiquantitative determination from X-ray diffraction charts; M = major, I = intermediate to minor, t = trace, ? = determination uncertain, - = not detected. Determinationsby R. C. Erd, R. J. McLaughlin, G. I. Smith]
Total Sample Acid-soluble fractionAcid
Depth (ft) Unit Halite Gaylussite Pirssonite Northupite Calcite Aragonite insoluble Quartz Feldspar Mica Clay Amphiboleminerals
86.193.094.4
108.0110.0110.6112.6114.3115.3
M-7M-6M-6M-5M-4M-4M-3M-2M-2
M 1IIt
MIIII
I__M
MM_M
IM
____-
I
t_M_ _-
It? I
MIII
_ tMI
_tIt?___t?
MMMMI
MMMM
IIII tMMMII
MII____-
'Sample also contains intermediate amounts of trona.
M-6.—About two-thirds of unit M-6 consists of mud, one-third of gaylussite or pirssonite. Laminar bedding is almost nonexistent. In 11 cores, gaylussite exists alone; in 13, pirssonite exists alone; and in 5, both exist in the same unit. The cores that contain megascopic gaylussite in this unit are mostly from the edge facies, whereas the pirssonite-bearing cores are from the more central facies, and the cores containing both come from a transitional zone between them. These zones, though distinctly concentric, do not fol low closely the isopachous patterns of the unit; they do, however, approximately follow the present-day depth contours on the top of the mud layer (which are similar to those on the base of the Parting Mud shown in fig. 25). Disseminated crystals of euhedral borax are found in about half of the cores described by Haines (1959), most of which are from the central and eastern parts of the deposit. Northupite is found in this layer in six cores, all from areas near the edges. The total volume of unit M-6 (within the boundary used for measurements) is about 1.2 X 10⁸m3 ; this volume makes it the largest of any mud unit in the Lower Salt. Its pattern of thickness variation, shown in figure 19, is notable because it varies more symmetrically around a central thin area than the other mud units, probably because the surface on which it was depos ited was nearly flat (see p. 97), whereas the other mud units were deposited on irregular surfaces. Typical thicknesses are mostly between 1 and 3 ft (0.3-0.9 m), but some are nearly 6 ft (almost 2 m).
M-7.—In most respects, unit M-7 is similar to M-6. Indistinct laminar bedding is found in this unit in about half the cores. Mud, gaylussite, and pirssonite form most of the layer. The percentage of gaylussite is slightly higher than in M-6 and the areal distribution slightly wider, the average percentage of pirssonite correspondingly lower and the distribution more re stricted. The pattern of mineral zonation is broadly the same. Borax is found sporadically along the east and west edges of the deposit. Northupite is almost
nonexistent. A little trona (in GS-7,14, and 17), sulfo- halite (in GS-8), and nahcolite (in GS-40) are noted. The volume of this unit (table 3) is a little less than unit M-6 but still greater than any of the lower four mud units of the Lower Salt. The thickness of the unit is commonly between 1 and 3 ft (0.3-0.9 m) (fig. 20), somewhat less than M-6, and it shows only a slight thickening toward the west and south.
CHEMICAL COMPOSITION
CHEMICAL ANALYSES OF THE SOLIDS
Chemical analyses were made of 34 samples from four cores of the Lower Salt (table 7). The 11 samples from GS-16 are representative of the area near the central part of the deposit, the 6 samples from GS-21 of the parts near the edge, and the 9 samples from GS- 11 and the 8 from GS-12 of facies between the edges and center. At the time these samples were taken for chemical analyses, the stratigraphic subdivisions of the Lower Salt had not been established. The inter vals chosen for sampling and analysis thus bear no re lation to them.
The samples were taken from large-diameter cores (Haines, 1959, p. 147-148, pis. 9 and 10) by sawing a uniform wedge from one side of the core. This entire sample, which represented approximately 5 percent of the volume of the core, was then crushed and split to get a representative sample for analysis.
Table 7 lists both chemical and X-ray analyses. The X-ray data are not quantitative, but when combined with the chemical analyses, allow one to verify and semiquantify the stratigraphic trends in mineral com position inferred from the visual estimates and sum marized in table 4. The dominant trends verified are the tendencies for the lower saline units (S-l, S-2, and S-3) to contain larger amounts of CO2 in the form of trona; for the middle units (S-4 and S-5) to contain larger amounts of SO3 in the form of burkeite and Cl in

TABL
E 7.
—An
alys
es o
f sol
ids
in th
e Lo
wer
Salt
[Che
mic
al a
naly
ses
by L
. B. S
chlo
cker
, H. C
. Whi
tebr
ead,
and
W. W
. Bra
nnoc
k. A
naly
tical
tech
niqu
es:
(1) C
aO, M
gO, N
a20,
K20
, and
Bz0
3 wer
e de
term
ined
in s
olut
ions
pre
pare
d by
boi
ling
porti
ons
of sa
mpl
es in
1+
9HC1
; (2)
Cl s
olut
ions
pre
pare
d by
boi
ling
porti
ons
of sa
mpl
es in
dis
tille
d w
ater
; (3)
S03
by
X-r
ay fl
uore
scen
ce o
f who
le s
ampl
es; (
4) a
cid
inso
lubl
e w
as re
sidu
e ob
tain
ed b
y bo
iling
por
tions
of s
ampl
es in
1+9
HC1
, dr
ied
at 1
10°C
; (5)
H20
was
det
erm
ined
by
mea
surin
g w
eigh
t of H
exp
elle
d du
ring
com
bust
ion.
X-r
ay a
naly
ses
of to
tal u
ntre
ated
sam
ple
by R
. J. M
cLau
ghlin
and
G. I
. Sm
ith]
Sam
ple
No.
GS
11 F G H I J K L M N
GS
12-E F G H I J K L
GS-
16-F G H I J K L M N 0 p
G 21
D E F _
G -
H
_I
Dep
th in
cor
e(f
t)83
.5-
87.5
87.5
- 92
.0
92.0
- 94
.294
.2-1
00.0
100.
0-10
4.8
104.
8-10
9.7
109.
7-11
3.4
113.
4-11
6.8
116.
8-12
0.8
86.9
- 88
.188
.1-
94.9
94.9
- 98
.098
.0-1
02.4
102.
4-11
0.0
110.
0-11
4.3
114.
3-11
9.3
119.
3-12
1.9
81.1
- 83
.7
83.7
86
.886
.8-
91.4
91.4
- 92
.692
.6-
97.1
97.1
101
.910
1.9-
105.
610
5.6-
111.
311
1.3-
113.
8
113.
8-11
7.8
117.
8-11
9.8
53.0
- 56
.856
.8-
61.2
61.2
- 65
.965
.9-
69.9
69.9
- 74
.274
.2-
77.8
Stra
tigra
phic
un
its
incl
uded
S7
M7
+ S6
S6 +
M6
M6
+ S5
S5
S5
+ M
5 +
S4
M4
+ S3
S2
+ M
2 +
Si
Si +
Bot
. Mud
S7
S7 +
M7
+ S6
S6
M
6 +
S5
S5
S5 +
M5
+ S4
+
M4
M4
+ S3
+ M
3 +
S2 +
M2
M2
+ S1
Part
ing
Mud
+ S7
S7
S7
+ M
7 M
7 +
S6
S6
M6
+ S5
S5
S5
+ M
5 S4
+ M
4
M4
+ S3
+ M
3
M3
+ S2
+ M
2S6
S6
+ M
6 +
S5
S5
S5 +
M5
+ S4
+
M4
+ S3
S3
+ M
3 M
3 +
S2 +
M2
+ S1
CaO
1.2
3.8
6.4
2.9 .0
5 1.5
6.
0 4.
7 .51 .37
3.2 .3
4 7.
2 .16
2.1 6.3
4.0
4.8 .2
0 5.
3 3.
5 .16
7.0 .22
.4
6 4.
0
4.3
2.5 .3
2 6.
5 .40
4.7
9.4
7.3
MgO
0.64
2.
1 1.6
1.0 .03 .40
1.0
1.6 .4
6.1
7 .9
2 .44
2.0 0.4 .58
2.0 1.5 1.8 .08
1.8 .7
8 .1
2 2.
2 .08 .14
2.0
1.5
1.1 0.8
2.3 .2
2 1.
6
4.0
2.0
Na2
047
.5
36.9
35.8
41
.0
50.7
46
.2
29.4
31
.8
39.5
30.5
38
.8
47.2
33
.6
48.6
42
.5
29.6
33.4
28.3
43.5
35
.8
35.2
48
.7
31.6
47
.4
46.2
35
.8
29.9
36.2
39.2
28
.6
40.5
31
.3
20.4
26
.7
K20
0.43
1.
0
1.1 .89
.27 .44
1.2 .87
.51 .17
.72
.33
.95
.20
.33 .49
.35
.90
.38
.99
1.2 .35
1.3 .2
5 .2
3 .55
.57
.50
.53 .92
.55 .83
1.06
.8
4
C02
10.4
16
.3
18.7
14
.2
3.8
9.4
26.6
28
.9
35.6
18.9
20
.1
11.3
17
.0
7.6
12.4
25.6
31.2
23.0
26.2
13
.2
32.7
9.
8 17
.1
11.0
9.
8 16
.7
27.2
30.2
35.2
25
.8
35.4
27
.8
24.6
25
.9
S03
1.0 1.3 3.7
5.3
6.2 9.2 1.9
3.2 3.7 .3
3 10
.0
3.3
6.5
8.3
14.6 5.2 2.6
1.3
1.6
3.4
2.0
1.0
2.3
13.0
16
.2
19.2 1.5
4.6 1.5
2.1
2.
6 2.
2
2.8
2.0
BA 0.19
2.
0 .85
.78
.41
.29
1.3 .32
.20
22.8
.3
4 .1
8 1.
5 1.5
1.1 .4
9
.28
10.2 .1
5 1.
3 .38
.10
1.5
1.7
2.2 1.8
5.3 .2
8.2
3 .43
.24
.40
1.4 .8
4
Cl40
.5
26.0
21.5
27
.3
46.5
33
.2
4.0
3.6
2.7 .9
3 12
.4
39.1
15
.3
37.1
20
.4 3.3 2.2
3.5
17.1
25
.3
4.9
44.0
18
.6
26.9
24
.6
4.3
2.5
2.7
3.4 5.4
3.6 5.3
5.0
4.5
H20 5.7
9.6
10.1
7.
6 1.7
5.1
20.0
17
.9
17.8
24.5
10
.0
5.8
9.6
4.0
7.0
18.2
19.4
18.8
13.4
9.
6 15
.7
4.8
10.2
5.
2 4.
8 9.
7
18.6
17.3
18.3
17
.5
17.7
17
.5
15.1
18
.8
Aci
d in
solu
bl
e1.
5 5.
9
5.8
4.8 .0
8 1.
6 8.
1 6.
1 .50
.26
3.8
3.4
8.3 .1
2 2.1 6.
7
4.2
6.0 .2
3 6.
6 5.
0 .09
10.0
.1
8 .2
0 4.
1
6.0
2.6 .9
7 8.
8 .31
6.3
13.7
9.
2
(Oxy
gen
equi
va
lent
of C
l)(9
.14)
(5
.87)
(4.8
5)
(6.1
6)
(10.
49)
(7.4
9)
(.90)
(.8
1)
(.61)
(.21)
(2
.80)
(8
.82)
(3
.45)
(8
.37)
(4
.60)
(.74)
(.50)
(.79)
(3.8
6)
(5.7
1)
(1.1
1)
(9.9
3)
(4.2
0)
(6.0
7)
(5.5
5)
(.97)
(.56)
(.61)
(.76)
(1
.22)
(.8
1)
(1.2
0)
(1.1
3)
(1.0
1)
Sum
99.9
99
.0
100.
7 99
.6
99.2
99
.8
98.6
98
.2
100.
998
.7
97.5
10
2.6
98.5
99
.2
98.5
97.1
98.6
97.8
99.0
97
.6
100.
2 99
.2
97.6
99
.9
99.3
97
.2
96.8
97.4
99.0
97
.1
100.
7 96
.7
96.3
97
.1
Min
eral
s id
entif
ied
by X
-ray
(in
app
roxi
mat
e or
der
of d
ecre
asin
g ab
unda
nce)
Hal
ite, t
rona
, pirs
soni
te?
Hal
ite, t
rona
, gay
luss
ite, n
orth
upite
, pi
rsso
nite
. H
alite
, tro
na, p
irsso
nite
, gay
luss
ite, h
anks
ite?
Hal
ite, t
rona
, bur
keite
, pirs
soni
te?
Hal
ite, t
rona
, bur
keite
. H
alite
, tro
na, b
urke
ite, g
aylu
ssite
. Tr
ona,
gay
luss
ite, n
orth
upite
, hal
ite.
Tron
a, g
aylu
ssite
, nor
thup
ite, h
alite
, tyc
hite
? Tr
ona,
hal
ite, n
orth
upite
?, ty
chite
?Ti
ncal
coni
te,1
trona
, hal
ite.
Tron
a, h
alite
, bur
keite
, pirs
soni
te?
Hal
ite, t
rona
, nor
thup
ite?
Hal
ite, p
irsso
nite
, tro
na.
Hal
ite, t
rona
, bur
keite
. H
alite
, bur
keite
, tro
na, g
aylu
ssite
.
Tron
a, g
aylu
ssite
, nor
thup
ite?,
hal
ite.
Tron
a, g
aylu
ssite
, nor
thup
ite?,
hal
ite.
Tron
a, ti
ncal
coni
te,1
gayl
ussi
te, h
alite
, no
rthup
ite?
Tron
a, h
alite
. H
alite
, tro
na, g
aylu
ssite
, the
nard
ite?
Tron
a, h
alite
, pirs
sonn
ite.
Hal
ite, t
rona
. Pi
rsso
nite
, hal
ite, t
rona
, tin
calc
onite
?1
Hal
ite, t
rona
, bur
keite
, tin
calc
onite
?1
Hal
ite, b
urke
ite, t
rona
, tin
calc
onite
.1 B
urke
ite, g
aylu
ssite
, nor
thup
ite, t
rona
, ha
lite.
Tr
ona,
gay
luss
ite, t
inca
lcon
ite,1
north
upite
, hal
ite.
Tron
a, g
aylu
ssite
, nor
thup
ite, h
alite
.Tr
ona,
hal
ite, g
aylu
ssite
. Tr
ona,
gay
luss
ite, n
orth
upite
?, h
alite
. Tr
ona,
hal
ite.
Tron
a, g
aylu
ssite
, hal
ite, n
orth
upite
.
Gay
luss
ite, t
inca
lcon
ite,1
halit
e, tr
ona.
Tr
ona,
gay
luss
ite, n
orth
upite
, hal
ite.
CO > 5
•Occ
urre
nces
of t
inca
lcon
ite r
epre
sent
bor
ax b
efor
e de
hydr
atio
n in
atm
osph
ere.

42 SUBSURFACE STRATIGRAPHY AND GEOCHEMISTRY, QUATERNARY EVAPORITES, SEARLES LAKE, CALIF.
the form of halite (as well as C02 in the form of trona); and for the upper units (S-6 and S-7) to contain Cl and CO2 in the forms of halite and trona. The analyt ical data also confirm that the edge facies (exempli fied by GS-21) are low in Cl- and SO3 -bearing minerals relative to central (GS-16) and intermediate (GS-11 and GS-12) facies. It is difficult to assess the vertical variations in CaO, MgO, K2O, and B2O3 be cause the statigraphic composition of the analyzed in tervals is so variable. Horizontal variations are more marked; the central and intermediate facies appear to have about three times as much B2O3 as the edge fa cies, about half as much CaO and MgO, and about the same K20. The acid-insoluble material averages about 4 percent; because about 45 percent of the Lower Salt consists of material logged as mud, more than 90 per cent of most mud layers is soluble in acid.
The chemical analyses provide a way to check the reliability of the visually estimated mineral composi tions. Table 8 compares the visual estimates of min eral volume percentages (converted to weight percent ages of major element oxides) with the chemical anal yses of the same intervals. In compiling table 8, the chemical analyses of cores from both the Lower Salt and Upper Salt, given in tables 7 and 15, were com bined into a single list and the analysis percentages compared with the modal percentages calculated from the estimated mineral composition of the same inter vals cited in the published logs (Haines, 1959). Differ ences were tabulated, with a positive sign used for differences where the chemical analyses gave higher values, and a negative sign used for those where the
chemical analyses gave lower values. To test for sys tematic errors in visual estimates, these positive and negative values were added algebraically, and the sum divided by the number of analyses. Results of these computations are shown in table 8 both for the four individual cores and for all 51 analyses for Lower and Upper Salt combined. Also listed are mean deviations and standard deviations. _
Although the analyses provide a more accurate measure of the composition of the cores, not all differ ences are attributable to errors in the visual estimates. The chemical analyses are of a relatively small wedge cut from one side, whereas the visual estimates were based on the surface area of the entire core. Because of crystal sizes and the lateral variability in composition found in most cores, the large surface is likely to pro vide a different, and possibly better, sample of the layer than the small wedge. The chemical analyses were of samples that included the fractured material logged as "probably cuttings, not core," whereas the modal estimates omit these segments. And the analy ses include the components that were in the brine en trapped in the pores and were not actually present as salts.
Nevertheless, it is clear that the visual estimates have small but consistent errors which should be taken into account when evaluating the bulk mineral compositions of the saline units given in table 4. The 5.0 percent negative error in CO2 and negative error in H2O probably means that trona was overestimated in the cores by about 14 percent (assuming that some of the analyzed CO2 came from underestimated or unde-
TABLE 8—Comparison of chemical analyses with composition indicated by visual estimates of mineral percentages[Positive values indicate components for which chemical analyses were higher, negative values indicate chemical analyses lower. All values in weight percent. Data for chemical
analyses from tables 7 and 15, visual estimates of mineral percentages from Haines (1959)]
Average error1 GS-11GS-12GS-16GS-21
All samplesMean deviation3Standard deviation4
CaO
+0.40.0
+0.6+1.1+0.5
1.22.0
MgO
+0.7+0.8+0.7+1.3+0.8
0.81.2
Na2O
-0.8+0.3-1.8-2.2-1.1
2.43.1
K2O
+0.6+0.5+0.9+0.9+0.7
0.81.0
C02
-4.6-5.7-3.8-6.5-5.0
5.96.9
S03
+0.8+3.3+1.6+3.8+2.2
4.05.5
BA
+0.5+0.6+1.1+0.6+0.7
0.91.7
Cl
+5.2+4.7+2.2+5.1+4.8
6.48.2
H2O
-1.6-3.2-1.1-3.0-2.1
3.03.9
Oxygen equivalent
ofCl
(-1.7)(-1.1)(-0.5)(-1.2)(-1.1)
Sum2
-0.5-0.2-0.1-0.1-0.4
2 d where d = difference between chemical analysis value and visual estimates value,sign retained
N N = number of analyzed samples; 14 in GS-11, 12 in GS-12, 16 in GS-16, and 9 in GS-21, total of 51.
2 Algebraic Sums are negative because sums of chemical analyses (tables 8 and 15) are mostly less than 100.
3 ——— Id I = same but sign ignored.N'
1/2
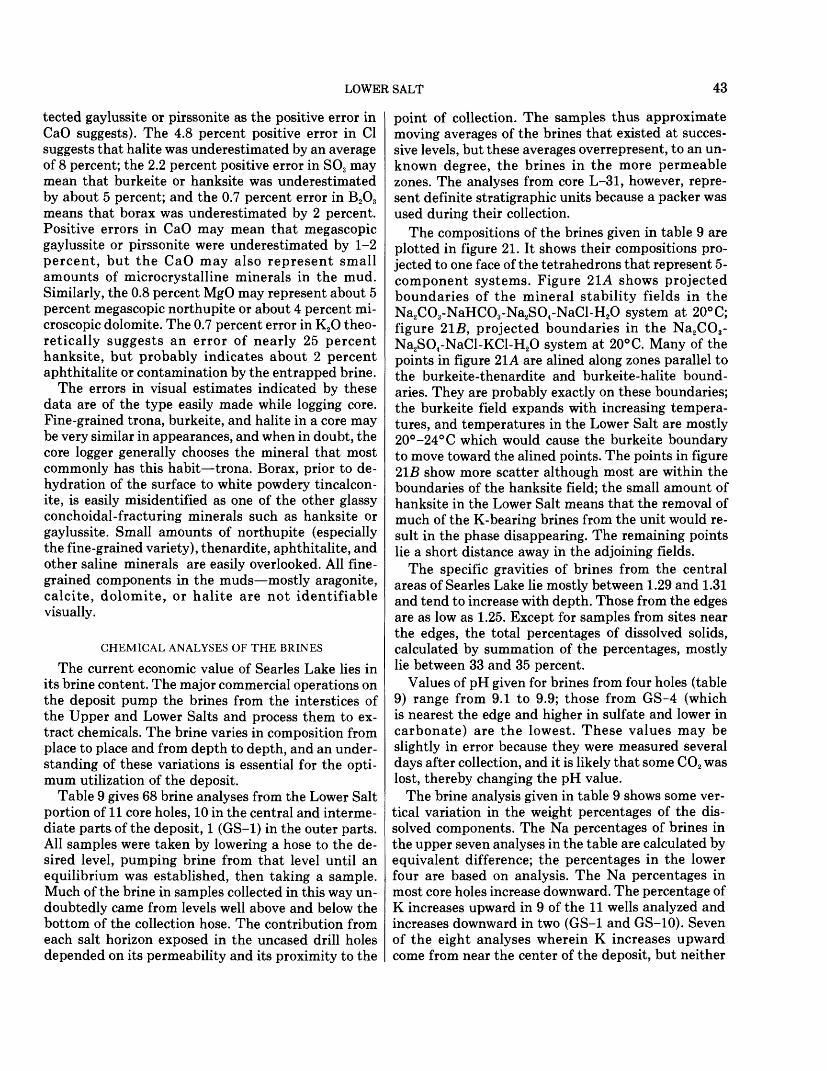
LOWER SALT 43
tected gaylussite or pirssonite as the positive error in CaO suggests). The 4.8 percent positive error in Cl suggests that halite was underestimated by an average of 8 percent; the 2.2 percent positive error in SO3 may mean that burkeite or hanksite was underestimated by about 5 percent; and the 0.7 percent error in B2O3 means that borax was underestimated by 2 percent. Positive errors in CaO may mean that megascopic gaylussite or pirssonite were underestimated by 1-2 percent, but the CaO may also represent small amounts of microcrystalline minerals in the mud. Similarly, the 0.8 percent MgO may represent about 5 percent megascopic northupite or about 4 percent mi croscopic dolomite. The 0.7 percent error in K2O theo retically suggests an error of nearly 25 percent hanksite, but probably indicates about 2 percent aphthitalite or contamination by the entrapped brine.
The errors in visual estimates indicated by these data are of the type easily made while logging core. Fine-grained trona, burkeite, and halite in a core may be very similar in appearances, and when in doubt, the core logger generally chooses the mineral that most commonly has this habit—trona. Borax, prior to de hydration of the surface to white powdery tincalcon- ite, is easily misidentified as one of the other glassy conchoidal-fracturing minerals such as hanksite or gaylussite. Small amounts of northupite (especially the fine-grained variety), thenardite, aphthitalite, and other saline minerals are easily overlooked. All fine grained components in the muds—mostly aragonite, calcite, dolomite, or halite are not identifiable visually.
CHEMICAL ANALYSES OF THE BRINES
The current economic value of Searles Lake lies in its brine content. The major commercial operations on the deposit pump the brines from the interstices of the Upper and Lower Salts and process them to ex tract chemicals. The brine varies in composition from place to place and from depth to depth, and an under standing of these variations is essential for the opti mum utilization of the deposit.
Table 9 gives 68 brine analyses from the Lower Salt portion of 11 core holes, 10 in the central and interme diate parts of the deposit, 1 (GS-1) in the outer parts. All samples were taken by lowering a hose to the de sired level, pumping brine from that level until an equilibrium was established, then taking a sample. Much of the brine in samples collected in this way un doubtedly came from levels well above and below the bottom of the collection hose. The contribution from each salt horizon exposed in the uncased drill holes depended on its permeability and its proximity to the
point of collection. The samples thus approximate moving averages of the brines that existed at succes sive levels, but these averages overrepresent, to an un known degree, the brines in the more permeable zones. The analyses from core L-31, however, repre sent definite stratigraphic units because a packer was used during their collection.
The compositions of the brines given in table 9 are plotted in figure 21. It shows their compositions pro jected to one face of the tetrahedrons that represent 5- component systems. Figure 21A shows projected boundaries of the mineral stability fields in the Na2CO3-NaHCO3 -Na2SO4 -NaCl-H2O system at 20° C; figure 21B, projected boundaries in the Na2 CO3 - Na2SO4-NaCl-KCl-H2O system at 20° C. Many of the points in figure 21A are alined along zones parallel to the burkeite-thenardite and burkeite-halite bound aries. They are probably exactly on these boundaries; the burkeite field expands with increasing tempera tures, and temperatures in the Lower Salt are mostly 20°-24°C which would cause the burkeite boundary to move toward the alined points. The points in figure 2 IB show more scatter although most are within the boundaries of the hanksite field; the small amount of hanksite in the Lower Salt means that the removal of much of the K-bearing brines from the unit would re sult in the phase disappearing. The remaining points lie a short distance away in the adjoining fields.
The specific gravities of brines from the central areas of Searles Lake lie mostly between 1.29 and 1.31 and tend to increase with depth. Those from the edges are as low as 1.25. Except for samples from sites near the edges, the total percentages of dissolved solids, calculated by summation of the percentages, mostly lie between 33 and 35 percent.
Values of pH given for brines from four holes (table 9) range from 9.1 to 9.9; those from GS-4 (which is nearest the edge and higher in sulfate and lower in carbonate) are the lowest. These values may be slightly in error because they were measured several days after collection, and it is likely that some CO2 was lost, thereby changing the pH value.
The brine analysis given in table 9 shows some ver tical variation in the weight percentages of the dis solved components. The Na percentages of brines in the upper seven analyses in the table are calculated by equivalent difference; the percentages in the lower four are based on analysis. The Na percentages in most core holes increase downward. The percentage of K increases upward in 9 of the 11 wells analyzed and increases downward in two (GS-1 and GS-10). Seven of the eight analyses wherein K increases upward come from near the center of the deposit, but neither

44 SUBSURFACE STRATIGRAPHY AND GEOCHEMISTRY, QUATERNARY EVAPORITES, SEARLES LAKE, CALIF.
TABLE 9.—Chemical analyses of brines in the Lower Salt[Analyses of core holes HH, MM, U, W, X, S-28 and S-31, by chemists of American Potash & Chemical Corp., published with permission of company. Analyses of GS-1, GS-4,
and GS-10 by Henry Kramer and Sol Berman, U.S. Geological Survey, of L-31 by Shirley L. Rettig, U.S. Geological Survey. Compositions in weight percent except where indicated as parts per million (ppm)]
Core hole (depths in feet to top and base of Lower Salt)
Date of SamplingHH
(90.7-129.8) November 1949
MM(66.5-98.3)
November 1949
U (78.4-114.6)
December 1949
W (85.0-120.1) March 1950
X(89.2-127.2) March 1950
S-28 (77.4-102.1)
September 1950
S-31 (84.0-117.1)
December 1950
GS-1 (65.0-88.6) July 1954
GS-4 (64.6-89.5)
September 1954
GS-10 (83.1-114.5)
January 1955
L-312 (91.5-129.1)
November 1964
Brine sample depth (feet)
95 100 105 '110 115 120 12570 75 '80 85 90 9580 85 '90 95
100 105 11085 90 95
'100 105 110 115 12090 95
100 '105 110 115 120 12580 85 '90 95
10085 90 '95
100 105 110 11568 70 75 '80 85 8664.6 70 75 '80 85 8685 90 '95
100 105 110102 127
Specific gravity1.300 1.310 1.310 1.311 1.314 1.317 1.3201.297 1.299 1.300 1.301 1.301 1.3011.292 1.294 1.294 1.299 1.300 1.300 1.3001.301 1.304 1.304 1.304 1.303 1.303 1.302 1.3021.304 1.304 1.305 1.305 1.305 1.306 1.306 1.3061.289 1.290 1.293 1.295 1.2951.297 1.297 1.298 1.303 1.305 1.305 1.3051.253 1.255 1.253 1.265 1.264 1.2631.275 1.274 1.274 1.276 1.274 1.2721.280 1.281 1.288 1.288 1.288 1.2861.299 1.302
Total dissolved solids (by summation)
34.75 34.98 34.99 35.02 35.12 35.33 35.4034.37 34.46 34.52 34.57 34.64 34.6033.95 34.22 34.11 34.45 34.42 34.47 34.4734.84 35.99 34.85 34.91 34.86 34.76 34.57 34.5935.00 35.04 35.00 35.01 35.05 34.97 34.94 34.9133.50 33.50 33.94 34.11 33.9734.27 34.23 34.29 34.50 34.48 34.50 34.6229.8 30.1 30.5 31.3 31.6 31.731.8 31.9 31.8 31.5 32.0 31.333.0 33.3 34.6 33.7 33.6 34.033.0 32.2
pH Na11.05 12.04 12.0112.04 12.1812.31 12.3411.34 11.4611.47 11.49 11.51
_ __ 11.4811.23 11.35 11.3311.58 11.59 11.62
___ 11.6511.37 11.52 11.5011.52 11.49 11.43 11.39 11.3811.4711.48 11.45 11.4611.47 11.50 11.4911.5211.51 11.54 11.7411.80 11.7511.72 11.7411.81 12.0412.07 12.09 12.12
9.3 10.2 9.3 10.3 9.3 10.7 9.3 10.6 9.3 10.8 9.3 10.7
9.15 11.2 9.19 11.1 9.12 11.1 9.18 10.8 9.15 11.1 9.10 11.09.32 10.7 9.41 10.9 9.37 11.8 9.39 11.0 9.42 11.0 9.38 11.09.75 11.1 9.90 11.1
K2.40 1.69 1.74 1.73 1.61 1.56 1.542.08 1.96 1.96 1.95 1.96 1.962.03 2.01 1.99 1.85 1.82 1.80 1.772.10 1.92 1.89 1.89 1.89 1.92 1.89 1.902.13 2.13 2.14 2.14 2.14 2.10 2.10 2.051.46 1.43 1.39 1.35 1.341.60 1.55 1.52 1.39 1.35 1.33 1.350.95
.96 1.06 1.36 1.36 1.420.93 1.01
.94
.90
.92
.581.70 1.85 1.95 2.00 1.95 2.022.39 1.77
Li (ppm)
____
———
____
____
____
____
———
____
----
———
~ll~ 11 32
~ 32~
8.8 8.8
12 21 22 2011 11 11 11 11 7
23 23 51 51 52 50
____
C032.39 4.53 4.57 4.66 4.93 5.24 5.522.76 2.88 2.91 2.95 2.97 2.972.43 2.55 2.60 3.09 3.17 3.24 3.252.81 2.91 2.91 2.92 2.92 2.93 2.93 2.933.07 3.07 3.07 3.07 3.07 3.23 3.24 3.412.39 2.51 2.72 2.88 2.892.89 2.93 3.08 3.66 3.89 3.92 3.933.98 4.12 3.72 3.14 3.12 3.292.96 3.00 2.81 3.11 3.11 3.912.58 2.70 2.66 2.58 2.56 2.693.23 4.32
SO,4.98 3.22 3.20 3.15 3.04 2.91 2.834.50 4.50 4.52 4.53 4.52 4.524.35 4.44 4.39 4.11 4.05 4.03 4.105.31 5.76 5.73 5.76 5.81 5.84 5.87 5.874.58 4.58 4.56 4.56 4.60 4.43 4.43 4.624.58 4.58 4.60 4.70 4.704.43 4.42 4.25 3.81 3.68 3.67 3.675.34 5.44 5.37 5.11 5.14 5.195.94 5.81 5.90 6.30 6.36 8.204.53 4.49 4.73 4.70 4.71 4.713.78 4.08
Cl12.20 11.26 11.19 11.14 10.95 10.78 10.5312.06 11.95 11.88 11.84 11.84 11.8412.24 12.16 12.09 11.84 11.77 11.74 11.6611.52 11.12 11.07 11.07 10.99 10.89 10.77 10.7711.84 11.84 11.84 11.84 11.84 11.74 11.70 11.0112.06 11.93 11.93 11.67 11.5811.95 11.88 11.88 11.63 11.42 11.42 11.458.50 8.48 8.84
10.14 10.20 10.1910.16 10.41 10.39 9.82 9.91 7.17
12.34 12.24 12.24 12.20 12.22 12.2211.70
9.82
BA1.06 1.83 1.85 1.88 1.99 2.12 2.241.13 1.20 1.23 1.24 1.26 1.261.13 1.17 1.16 1.42 1.46 1.48 1.471.11 1.13 1.12 1.13 1.13 1.13 1.12 1.121.29 1.30 1.30 1.30 1.29 1.33 1.35 1.381.03 1.04 1.08 1.16 1.161.21 1.23 1.29 1.48 1.57 1.58 1.590.79
.79
.81
.95
.95
.910.59
.59
.61
.57
.57
.451.10 1.16 1.19 1.22 1.20 1.381.23 1.45
PO, F (ppm) (ppm)960 400 400 400 400 380 360580 580 660 700 700 700580 580 600 600 600 620 620860 860 860 840 860 820 800 820840 860 860 860 860 860 840 820500 480 520 620 660500 500 460 500 500 500 520
536 357
20~16~
23 13 18 23
----
____
_ ___
----
____
____
----
----
____
———
____
----
———
23 35
Br (ppm)910 550 550 540 520 510 460840 780 810 810 810 810800 780 760 690 660 650 660770 770 790 790 770 790 790 770870 890 890 890 890 870 850 810560 550 530 520 520630 630 600 570 570 570 550
704 449
S (ppm)
200 1300 1300 1300 1400 1300 1300980
1080 1060 1050 1110 10401400 1400 1400 1600 1600 1600 1600700 800 800 800 800 900 800 900700 800 800 800 800 800 900 9001400 1500 1400 1600 14001400 1500 1500 1600 1700 1600 1600
----
As Si I (ppm) (ppm) (ppm)
102 40 27 98 33 22
'Uppermost brine sample used to calculate composition of brine in units SI + S2 + S3 + S4 + S5.2Sample from depth of 102 feet represents brine from unit S7; sample from 127 feet represents brine from Si, S2, and S3.
the areal position in the deposit nor the total thick ness of the Lower Salt bears a consistent relation to the K content. Ryan (1951, p. 449) reports 1.5 percent K as typical of brine pumped from the central part of Lower Salt; Dyer (1950, p. 41) reports 1.4 percent K as typical.
In most wells in the central part of the deposit, total
carbonate in the Lower Salt brines, expressed in the analyses as C03 percentage, increases downward; to ward the edges, the vertical variation is small, reflect ing the more nearly monomineralic composition of this zone. The percentages of S04 are generally be tween 3 and 6. The percentages of S04 in the brines increase toward the top in four core holes, increase to-

LOWER SALT 45
ward the bottom in five, and are nearly constant in two. 11 Brines in core holes GS-4 have abnormally high percentages of SO4 although the associated salines are not high in sulfate minerals. This high SO4 content in the brine may result from the relatively large quanti ties of sulfate that were contained by the waters drain ing from the gypsum-bearing lake deposits near the south end of the Slate Range, and the gypsiferous gouge of the Sand Canyon thrust fault along the nearby edge of the Slate Range (Smith and others, 1968, p. 14, 21). The percentages of Cl mostly fall be tween 10.5 and 12 except near the edges, where the brines have a lower total salinity. The Cl content of the brines generally increases upward. The B4O7 per centage normally increases downward; most percent ages lie between 1 and 2 except near some parts of the edge, where they are substantially less.
Analyses of minor elements are available for some sets of samples. The brine wells for which PO4 analy ses are available come from the central part of the de posit. Although there is appreciable variation in PO4 content of brines from different wells, the percentages in brine from a single well are relatively uniform. Ryan (1951, p. 449) reports an average of 590 ppm PO4 and W. A. Gale (written commun., 1952) reports 535 ppm in brines from the central part of the Lower Salt. The analyses for F and Br are all of brines from the central parts of the deposit. The amount of F shows no clear trend; Br tends to increase toward the base of the layer. Ryan reports 30 ppm Li and 540 ppm Br, and Gale estimates 30 ppm Li and 580 ppm Br in the brines pumped by the American Potash and Chemical Corp. The amounts of S may increase downward, al though the total range of variation is small. The values are mostly between 1,000 and 1,500 ppm. Ryan and Gale report average quantities of about 1,500 and 1,800 ppm S, respectively. Data on the As, Si, and I content are given in table 9 for core hole L-31. Esti mates by Ryan and Gale of the I content of brines pumped from the central part of the Lower Salt are the 20 ppm and 25 ppm. The Sr content of a brine sample from the top part of the Lower Salt in GS-26 is 1.5 ppm (J. D. Hem, analyst, written commun., 1960). The W content of brine in the Lower Salt is reported by Ryan and W. A. Gale to be about 32 ppm. Samples from GS-1, GS-4, GS-10, and L-31 were analyzed for Ca and Mg, but the concentrations were below the limit of detection.
"Analyses showing higher percentages of SO, in the upper part of the Lower Salt may be of brines that were largely or entirely drawn from units S-4 and S-5, as those units are more porous and were not blocked off during sampling of most cores. Analysis of a brine from core L-31, which was collected when that layer was blocked off from other layers, show lower S04 values for brine from S-7 than from units S-l through S-3 in that core; although not sampled, units S-4 and S-5 are almost certainly higher in SO, than S-l, S-2, and S-3.
The vertical variations in brine composition follow a broad pattern but do not bear a close relation to the mineral composition of the surrounding solids. The inconsistency of relations result in part from post-de- positional changes in the brines caused by the follow ing processes: (1) fresh waters from the surface and the ground water of surrounding valley sediments have encroached on the salt bodies, probably affecting each salt layer somewhat differently; (2) the brines were allowed to mix when the mud layers that sepa rated the Lower Salt salt layers were perforated by drill holes; (3) additional mixing occurred when these brines were pumped for processing by the chemical companies; and (4) the brine sampling procedure pro vides a sample for analysis that is still more mixed be cause it draws brines into the sample from porous zones above and below the sampled depth in the un cased hole.
Of the brines represented by analyses in table 9, those from S-31 are probably least affected by post- depositional changes as that core hole is well away from the edges of the body, and is in the southern part of the deposit, which, at the time of sampling and analysis, was not so extensively drilled nor as heavily pumped as other areas represented by analysis. In S-31, the depths sampled for brine lie near or within the following salt units:
85 ft (25.9 m) ____________ S-790ft __________________ S-695ft ________------_--- S-5
100ft ___________------_ S-5105ft ________------_-_- S-4110ft ________--_---_--- S-3115 ft (35.1 m) ------------- S-l
The brines in S-31 show their greatest change above and below the sample from 95 ft. This change is as ex pected because, as noted in earlier papers (Smith and Haines, 1964, p. 47-50, 54; Smith, 1968, fig. 4), the only dry-lake stage inferred during deposition of the Lower Salt is represented by the top of unit S-5. The two samples representing S-7 and S-6 have greater percentages of K, SO4 , Cl and Br. The five samples re presenting S-5, S-4, S-3, S-2, and S-l have greater percentages of Na, CO3 , B407 , Li, S, and total dissolved solids. Of these lower five samples, the lowest three (representing S-l, S-2, S-3, and S-4) have the great est concentrations of these components, and the two above them (representing S-5) have intermediate concentrations.
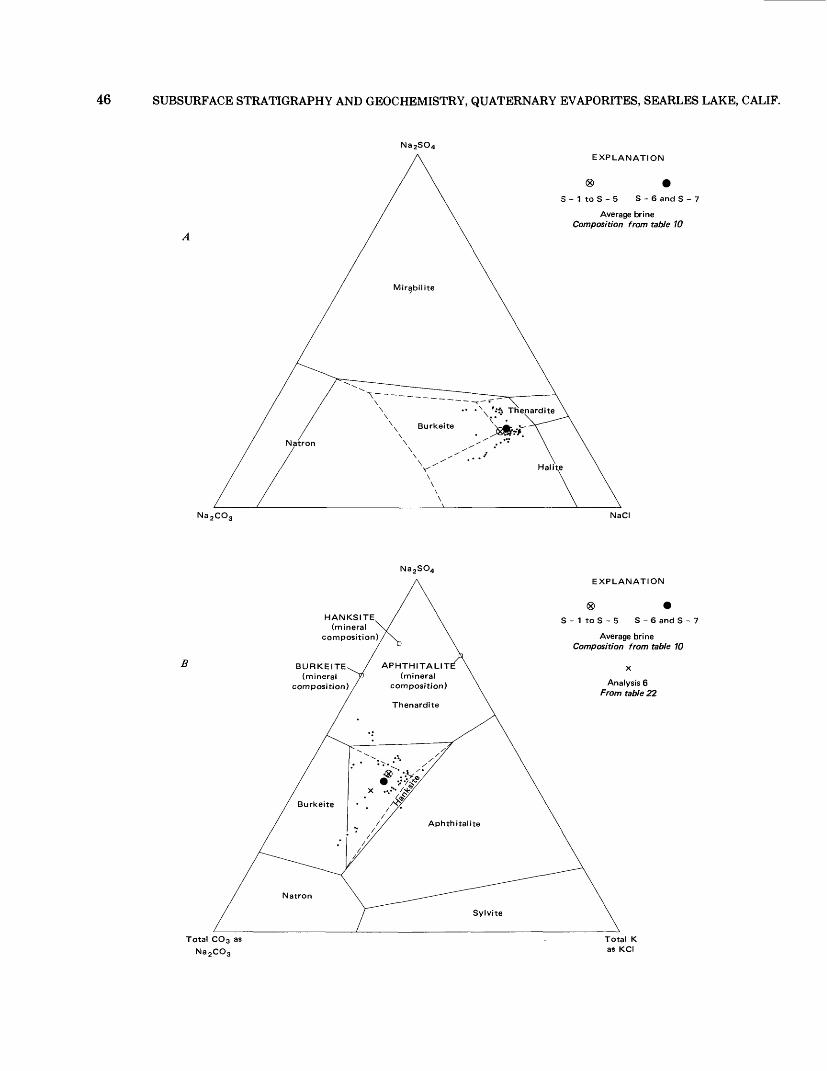
46 SUBSURFACE STRATIGRAPHY AND GEOCHEMISTRY, QUATERNARY EVAPORITES, SEARLES LAKE, CALIF.
Na 2SO 4EXPLANATION
S - 1 to S - 5 S-6 and S - 7
Average brine Composition from table 10
Na 2 CO3 NaCI
Na 2 SO4
B
Total COa as Na 2 CO3
HANKSITE(mineral
composition)
BURKEITE(mineral
composition)
EXPLANATION
S - 1 to S - 5 S-6 and S - 7
Average brine Composition from table 10
Analysis 6 From table 22
Total K as KCI

PARTING MUD 47
ESTIMATED BULK COMPOSITION OF THE UNIT
The estimates of mineral composition of the salt layers (table 4), the measure of the probable error in those visual estimates (table 8), and analyses of the brines (table 9) provide a basis for calculating the rela tive percentage and total quantity of the major water- soluble components in the Lower Salt. Because the top of S-5 represents a depositional break, the per centage and total quantities are calculated for the lay ers above and below this level. Table 10 tabulates the steps followed in the calculation. Combining these data and weighting them according to the volumes they represent yields these totals for the Lower Salt:
Na _____K ______Mg _____C03 _ _ _ _HCO3 _ _ _ S04 ____Cl _____
Total quantity (grams X lO™)
23493
998356
17111
312
Relative amounts (percent, water-free)
35.11.40.4
14.912.48.4
25.71.7
In a much more extensive study of the boron in Searles Lake, D. V. Haines, (unpub., 1956) estimated the total amount of B4 O7 in the Lower Salt to be 17.1 X 10¹² g. That amount, based on chemical analyses of brines from 155 wells and cores from 86 core holes, in cludes the B4O7 that was in borax in the interbedded mud layers of the Lower Salt and is predictably larger. Calculations based on tables 3, 4, and 5 show that about 63 percent of the solid borax observed in the Lower Salt is in salt layers and 37 percent in mud lay ers. As about 8.6 X 10¹² of the 11 X 1012 g of B4O7 listed in table 10 comes from solid crystals in the salt layers, the amount of additional B4O7 in borax crystals em bedded in M-2 to M-7 is estimated to be near 5.0 X 10¹² g. The resulting total of 16 X 1012 g B4 O7 in the salt
•« FIGURE 21—Composition of brines given in table 9 plotted on dia grams that indicate phase relations in two 5-component sys tems. A, Shows phase boundaries in, and projected from, Na2C03-Na2S04-NaCl-NaHC03-H2Osystem.B,Those bound aries in, and projected from, Na2C03-Na2S04-KCl-NaCl-H20 system. Brines are plotted on the basis of their compositions as projected to plane of diagram; some points represent more than one analysis. See figures 35 and 39 and associated text for explanation of phase boundaries and method of plotting.
and mud layers in the Lower Salt can be compared with Haines' 17.1 X 10¹² g to give a measure of the probable accuracy of the amounts given here.
PARTING MUD
The Parting Mud, of late Wisconsin age, is a layer generally 12-14 ft (3.7-4.3m) thick that rests on the top of the Lower Salt. It is composed chiefly of mud that contains megascopic crystals of gaylussite, pirs- sonite, and a little borax. Gaylussite is found in almost every core hole, commonly forming 5-15 percent of the unit. Pirssonite is less abundant, commonly 2-5 percent of the unit. In about half the core holes, a layer of megascopic crystals of borax is present near the top or bottom of the unit. The mud matrix con sists of a dark-green to black mixture of microscopic crystals of halite, dolomite, clastic silicates, authigenic silicates, organic debris, and entrapped brine. In the upper one- to two-thirds of the unit, thin laminae of white aragonite are numerous.
The Parting Mud has for many years been recog nized as a stratigraphic unit by members of the chemi cal companies operating on the deposit. This unit separates the Lower Salt and the Upper Salt, which differ chemically, and the Parting Mud helps main tain those differences so that they can be utilized in the commercial operations.
AREAL EXTENT AND VOLUME
The outer limits of the Parting Mud are well beyond the limits of the area sampled by cores; mapping in progress shows that its lateral equivalents once ex tended over an area of about 1,000 km2 . Scattered remnants of it crop out around the edges of the basin, and it forms a persistent and unbroken layer in sub surface sections.
The Parting Mud is easily identified in almost all cores from Searles Lake. Its top is most commonly 15- 25 m below the present lake surface, its thickness gen erally 3-4 m. Variations in the depth to the base and top of the unit are shown by contour maps (figs. 22 and 26); variations in its thickness are shown by an isopach map (fig. 23). The isopach contours show that the unit has a large area of relatively uniform thick ness in the center and a zone of rapid thickening around the edges. Toward the southwest, a zone of thickening is shown, despite the lack of core evidence, because the outcropping equivalent of the Parting Mud is abnormally thick southwest of the lake.
48 SUBSURFACE STRATIGRAPHY AND GEOCHEMISTRY, QUATERNARY EVAPORITES, SEARLES LAKE, CALIF.
TABLE 10.—Estimated percentages and total quantities of water soluble components in the upper two and lower five units of the LowerSalt
Units S-l + S-2 + S-3 + S-4 + S-5 Units S-6 + S-7
Chemical composition of solids inferred from visual estimate'
Average error of visual estimates2 Chemical composition of solids,
weight percent adjusted for
Chemical composition of combined
Total quantity of component in included salt layers, (Trams X 1012 8E f
Na
33.7 -0.8
19 Q11.5
24.3
1 Cl
K
trace +0.6
n c1.7
1.0
Mg
trace +0.5
n ^0n i
2
C03 1
17.1 -3.4
1171 1
9.5
HCO3
15.7 3-3.4
19160
49
SO, Cl
5.0 18.8 +2.6 +4.8
•7 £ OO £4.6 11.3
C A 1 Q 1
43 124
B,O,0.2
+0.8
1.0i i
1.1
7
H20
9.5 -4 1.6
7 9cc o
11 1
207
Na
32.2 -0.8
111
23.4
71
K
0 +0.6
t\ a1.7
1.0
0
Mg
0 +0.5
0.50n o
i
CO3
20.7 -3.4
1711 1
11C
1C
HC03
21.0 3 -3.4
1 7 C60
1 f\ C
O i
so,0.7
+2.6
o o
q Q
1^
Cl
12.3 +4.8
17.11 1 q
1 A Q
B,0,
0.3 +0.8
1.11.1
1.1
4
H20
12.8 '1.6
11.2£•£• n
105
'Data in table 4, converted to weight percent.2Based on comparison of visual estimates and chemical analyses of cores (converted to ions), data from table 8, average of all samples; table 8 also lists error in Ca of +0.4,
reducing totals in this and underlying columns to 99.6. 'Error in CO2 listed in table 8 divided equally between CO3 amd HCO3 . 'Reduced by amount of H in HC03.'Arithmetic average of brine analyses given in table 9; averages exclude nalyses from core hole L-31. "Percentage of HC03 is low, assumed to be 0. 'In weight percent, assumed porosity, 40 percent. "Assumed specific gravity of salt plus brine-filled pores, 1.80; volumes from table 3.
The volume of the unit, calculated within the arbi trary boundary by the methods described previously, is about 480X106 m3 , about 10 percent more than the combined volumes of the mud layers M-2 to M-7 in the Lower Salt.
MINERAL COMPOSITION AND LITHOLOGYThe chief megascopic components of the Parting
Mud are mud, gaylussite, pirssonite, and borax, in de creasing order of abundance. Thin beds and isolated crystals of trona, halite, and northupite are found lo cally. Prominent laminar beds of microscopic argonite crystals characterize the upper one- to two-thirds of the layer. The weighted average composition of the megascopic minerals, based on the visual estimates of mineral percentages and calculated by the method de scribed in the section on the Lower Salt, is given in table 11.
The data in table 11 indicate a tendency for the per centage of megascopic gaylussite to increase laterally toward the thinner (more central) areas and the per centages of pirssonite to remain nearly constant. Bo rax has its highest percentages in the edge and central facies, its lowest percentages in the intermediate zone. Trona and northupite, which occur as thin beds and isolated pods of crystals, are mostly in the intermedi ate zones. Megascopic crystals of halite occur sporadi cally in the central zones. In general, though, areal variations in the megascopic mineralogy of this unit are not great because the area sampled by cores repre sents only the most central facies of the entire unit which originally covered much of the floor of Searles Valley.
Although there is local variation within and be tween cores, megascopic gaylussite and pirssonite
commonly form a higher percentage in the top and bottom meter of the Parting Mud, lower percentages in the middle. In more than half of the pirssonite- bearing cores, this mineral is concentrated near the upper or lower contact, possibly indicating the pene tration of more saline waters from the enclosing saline layers which would tend to alter gaylussite to pirsson ite (Eugster and Smith, 1965, p. 478-483). Borax is concentrated in the top few centimeters of the unit, but some occurs 20-60 cm up from the base. Arago- nite, mostly in the form of white laminar beds com posed of microscopic crystals, is common in the upper 55-60 percent of the section except for the uppermost 30-50 cm of the unit.
Variations in the color, abundance of gaylussite and pirssonite, the spacing and color (mineralogy) of la minae, and the chemical composition of the organic components were used by Mankiewicz (1975, p. 7-8) to subdivide the Parting Mud into five parts. In his core B, which came from the northwest part of the lake, the Parting Mud had a thickness of 5.4 m, and changes in lithology were noted at levels 0.30, 0.75, 1.65, and 2.70 m below the top of the unit. The top unit (0.30 m thick) is characterized by laminae and abundant large gaylussite and pirssonite crystals; the next (0.45 m) contains fewer crystals but is finely laminated; the third (0.90 m) is finely laminated but contains more widely spaced yellowish-white (dolo mite?) laminae and also contains two rhyolitic tuff beds; the fourth (1.05 m) contains more abundant and closely spaced dolomite(?) layers and some gaylussite (or borax?) vugs, and it is lighter colored, and the fifth (2.70 m) which is light gray and faintly laminated, is characterized by an absence of yellowish and white la minae and the presence of numerous reddish-orange

PARTING MUD
R. 43 E. 11 7° 20'
49
R. 44 E.
Structure contour Drawn on base of Parting Mud,
Contours show depth below pre sent surface, in feet. Interval 10 feet
0123 KILOMETERS
FIGURE 22. —Contour map on base of Parting Mud, Searles Lake.

50 SUBSURFACE STRATIGRAPHY AND GEOCHEMISTRY, QUATERNARY EVAPORITES, SEARLES LAKE, CALIF.
ATH*MU, X R. 43 E. 117°20' R - 44 E-
35°45' —
IsopachHachured in areas of thinning
Contour interval 2 feet .12.7
Core-hole location Thickness of unit, in feet
3 KILOMETERS
FIGURE 23.—Isopach map of Parting Mud, Searles Lake.

PARTING MUD 51
TABLE 11.—Megascopic mineral composition of the Parting Mud[Based on visual estimates of Haines (1959), compositions in volume percent; estimated for intervals without cores shown in parentheses; calculated for contours and within
boundary shown in figure 23; t = trace]
Mineral
MudGaylussitePirssoniteNorthupiteBoraxHaliteTronaNumber of cores
between contoursPercentage of
volume between contours
Between contours
24+
(90)(6.0)(3-0)
(1.0)
0
1
24-22
7914 3.2
3.2
1
5
22-20
91 5.6 3.6
2
8
20-18
89 5.9 3.4
1.1
.3
2
11
18-16
907.5 2.6
.1
.1
4
14
16-14
88 9.0 3.3
.1
.1
6
14
14-12
86 9.5 3.3 t .4 .1 .3
9
32
12-10
88 9.8 1.7
.6
7
14
10-8
(76) (20) (3.0)
(1.0)
0
1
8-6
68 25 4.2
3.1
1
t
Weightedtotal
percent88
8.7 3.0 t .5 .03 .2
laminae. These units can be identified in most logs of the Parting Mud cores described by Haines (1959), and a sixth unit, composed of about 0.5 m of faintly laminated green mud, is found above the other five in cores from many parts of the lake.
Hand-specimen and thin-section studies of these muds indicate that most of the megascopic gaylussite and pirssonite crystals grew after burial. Large crys tals generally cut directly across bedding planes. Where such crystals cut aragonite laminae, the la minae are not bent (Smith and Haines, 1964, fig. 15; Eugster and Smith, 1965, pi. 1); this shows that most of the mud's compaction occurred prior to crystal growth, and that the growth was by volume-for-vol- ume replacement.
Thin-section studies of the textural characteristics of muds are useful in the laminated segments of the Parting Mud. Sections show that the aragonite la minae are thin bands produced by variations in the purity of calcium carbonate. Where laminae pairs are closely spaced, thickest beds may be either pure or im pure. Where laminae pairs are thicker, the dark im pure beds are thicker and the light beds of nearly pure calcium carbonate are thinner, rarely exceeding 1 mm. The top and bottom contacts of the laminae are usually sharp, even on a microscopic scale. Laminae defined by slight differences in carbonate percentage are commonly lenticular, and most laminae cannot be traced more than a few millimeters before pinching out. Beds of nearly pure carbonate tend to be continu ous at least over the width of the core, and distinctive sequences of them could probably be recognized in cores from an area of several square kilometers.
The thickness of calcium carbonate laminae ranges from several hundredths of a millimeter to about a millimeter. Several series of measurements give aver age thicknesses for pairs of beds (one light bed and one associated dark bed) ranging from an average of 3.5 mm per pair in zones that represent sections of
widely spaced types of laminar beds to an average of 0.75 mm per pair for zones that typify sections of fine laminar bedding. The finest laminae are in beds that average 0.35 mm per pair. If these laminae are inter preted as annual cycles, sedimentation rates repre sented by these three sets of measurements would be about 3, 13, and 29 yrs/cm, respectively. Sedimenta tion rates implied for these muds by 14C dating average 38 yrs/cm. Presumably the discrepancy results from the lack of distinct episodes of rapid calcium carbon ate deposition during some years.
The mineralogy of the fine-grained muds of this unit cannot be determined satisfactorily with a petro- graphic microscope. Study with immersion oils per mits identification of some crystals of carbonates, halite, clay, and silicates, but most of these minerals are coated with submicroscopic crystals of carbonates making consistent identifications impossible.
The abundance of minerals in Parting Mud samples from L-12 and KM-3, as determined by X-ray dif- fractometer studies, is schematically represented in figure 24. Comparable data for the analyzed core GS- 16 are given in table 13. The amounts of gaylussite and pirssonite are variable, but they tend to be more con centrated near the top and base. In core L-12, micro scopic gaylussite and pirssonite crystals occur in beds also containing microscopic crystals of the same spe cies. Dolomite is found in major or intermediate amounts at the top of two cores and at the base of all three, but it is also found in detectable amounts in other parts of the core. Aragonite is most abundant in the middle and upper parts; it is mixed with calcite in many samples. Halite, as microscopic and submicros copic crystals, is a major constituent throughout most of the section in all three cores. The origin of this solu ble salt is problematical, but the lower abundances near the top and base of the Parting Mud (at its con tacts with salt bodies containing sodium chloride-rich brines) is the opposite of what should be found if the

52 SUBSURFACE STRATIGRAPHY AND GEOCHEMISTRY, QUATERNARY EVAPORITES, SEARLES LAKE, CALIF.
0 1 .»
84 -
86 -
88 -
90 -
92 -
en T
/
/
/
/
^
:
/ 28.44
/o.u
76 -
78 -
80 -
82 -
84 -
86 -
87 d
/ ( [
, L\, 1
- 25 :\C
. IK. R-l
Segments of core recovered
gaylussitepirssonitedolomitearagonitecalcitehalite
CORE L-12
G P D A C H Sx Cm
?\ Tr, "Bx
-Tr
—Np
CORE KM -3
G P DA C H Sx Cm
EXPLANATION
Estimated abundance from X- ray charts
Trace to doubtful component — Minor to trace component
Intermediate to minor component — Major component
Abbreviations
Sx salts in minoramounts — Tr, trona; Bx , borax; Np, northupite
Cm clastic minerals —mostly quartz, feldspar, mica, and clay
halite formed after burial from brines that migrated into the mud layer. The smaller amounts of trona and borax occurring sporadically in core L-12 may come from the desiccation of entrapped brines. The quanti ty of northupite at the base of the unit in L-12 is nota ble and is similar to the quantities noted by Mankiewicz (1975, p. 87) in the top centimeter of the Parting Mud. Clastic silicates form minor to interme diate amounts of the muds in the middle and upper middle parts of the section.
Authigenic silicates are not so abundant in the Parting Mud as in underlying layers. Hay and Moiola (1963, table 1) report traces of analcime from the low er part of the Parting Mud in GS-2, and a thin zone of tuff altered to phillipsite from 1-2 ft (0.3-0.6 m) below the top of the Parting Mud in GS-14 and 17.
The acid-insoluble fraction of these muds is largely composed of clastic fragments plus organic material that is amorphous to X-rays. The mineralogy of this fraction of a sample from the interval between 86.7 and 87.3 ft (26.43 and 26.61 m) in core hole L-12 was studied by R. C. Erd (written commun., 1957). The clay minerals were found to be mostly mont- morillonite with a little hydrous mica. About 10-15 percent of the sample was composed of the following, in the approximate order of abundance: biotite (subangular to subrounded grains, dark green), chlo- rite, feldspar (fresh subangular grains of albite-oligo- clase and some fresh subangular microcline), quartz (subangular), hornblende (angular, blue green), glass shards (n below 1.51), zircon (traces, subround, pris matic, colorless), sphene (traces, subround), epidote (traces, subround), magnetite (traces).
Four Parting Mud samples from core L-12 were studied by Paul D. Blackmon, of the Geological Sur vey, for grain-size distribution of the clastic minerals; the results are shown in table 12. Coarse sand and gravel grains are absent. Except for the uppermost sample, medium sand grains are nearly absent. Fine sand and very fine sand consistently form about 15 percent of the total, but most of the clastic material is silt or clay sized.
The quantities of sand seem greater than would be transported by lake waters to this location. Core L-12 is in Parting Mud sediments that were mostly deposit-
24.—Mineral abundance in samples from two cores of Parting Mud. Samples from core L-12 represent only silt- and clay-sized components; samples from KM-3 include both mega scopic and microscopic components. Determinations for L-12 by R. C. Erd; for KM-3 by R. J. McLaughlin and G. I. Smith.

PARTING MUD 53
TABLE 12.—Size distribution of acid-insoluble material in four samples of the Parting Mud, core L-12[Original 350 g samples digested in cold diluted (4:1) HCI; washed in cold water by decanting; dried on a steam bath. Each residue was then treated as follows: the sample was
quartered to an appropriate size and stirred vigorously in distilled water for 15 minutes utilizing a milkshake-type stirrer. Sodium metaphosphate was added as a dispersing agent. After stirring, each sample was further dispersed in an ultrasonic separator for approximately V4 hour. Sand-sized particles were then removed by wet seiving, dried, and seived using screen sizes of Wentworth's scale. Percentages of silt and clay were determined by standard pipette analyses. Analyses by P. D. Blackmon. All values are in weight percent]
Size distribution (sizes in mm)Interval sampled (ft below ground
surface)82.2-82.6 86.7-87.3 89.4-89.9 91.1-91.7
Percent acid
insoluble_ _ _ _ 20.7 ____28.9 ----23.9 ____22.9
Coarse sand to gravel (>0.5)0.0
.0
.0
.0
Medium sand
(0.25-0.5)4.2
.5
.8
.0
Fine sand
(0.10-0.25)10.5 4.8 4.7 2.9
Very fine sand
(0.0625-0.10)8.2
11.2 10.3 5.4
Silt (0.002-0.0625)
50.2 61.4 55.0 66.5
Clay(<0.002)
27.0 22.0 29.2 25.1
ed in 100 m or more of water, 5 km from the nearest shore, and several times that distance from the inlet for most of the water that flowed into the basin during high stands of the lake. It seems unlikely that fine and very fine sand grains could have been transported by current to that area. Transport by wind seems likelier, and the common occurrence of frosted sand grains (Hay and Moiola, 1963, p. 320, 322) supports this premise. If all the fine and very fine sand is wind blown, that depositional process accounts for 3.8 per cent of the Parting Mud volume in L-12. The Parting Mud in this core is about 3.44 m thick and accumulat ed during a period of about 13,500 years; this indicates an average depositional rate for sand that was air borne for a distance of several kilometers—to the mid dle of the basin—of about 1 cm per 1,000 years. As finer material was undoubtedly also introduced dur ing wind storms, aeolian deposition was actually more rapid. If all the acid-insoluble material was transport ed by wind, aeolian deposits accumulated at the rate of about 6 cm per 1,000 years.
The types of clay included in the clastic fraction of the Parting Mud were studied by Droste (1961, fig. 5) and reported to be predominantly illite, with much smaller percentages of montmorillonite; chlorite or kaolinite were detected only in samples from the edge facies where chlorite was introduced from the adja cent mountain ranges (especially by the Slate Range on the east, where large areas of chlorite-bearing rocks and fault gouge are exposed). R. C. Erd (written com- mun., 1957) and Hay and Moiola (1963, table 1), how ever, report montmorillonite as the dominant clay mineral and illite as subordinate.
Organic material in samples from the lower middle part of the Parting Mud in GS-12 was studied by Val- lentyne (1957), who reported several types of caro tenes and xanthophylls. Samples for depths of 1.46- 1.65 m below the top of the Parting Mud in the same core were studied by R. C. Erd (written commun., 1957). In the acid insoluble residue, he noted abun
dant fragments of chitinous material, apparently de rived from the brine shrimp Artemia, closely associated with the montmorillonitic (and possibly the aragonitic) mud was an orange-yellow compound that was clearly organic and thought probably a carot- enoid. Green stains on some mineral grains suggested algae as a source.
Mankiewicz (1957), in a more recent study, extract ed and identified by chromatographic techniques a large number of hydrocarbons, terpenes, and sterols in four cores of the Parting Mud. Green algae, blue-green algae, and vascular plants were the dominant sources of organic components. Their abundances varied in response to changes in stream inflow, lake salinity, and the degree of anaerobic conditions that affect preservation. Zones containing concentrations of vas cular plant debris, as indicated primarily by increases in the amounts of straight chain saturated hydrocar bons (n-alkanes) that have odd-carbon numbers in the C23-C36 range, are interpreted to represent periods of strong inflow which introduced plant remains from other basins. Zones containing high percentages of al gal remains, as indicated by concentrations of hydro carbons that have odd-carbon numbers in the C15-C19 range, are interpreted as resulting from times of re duced inflow and high algal production within the lake. The extent of diagenetic reaction of original or ganic compounds to related compounds is used as a measure of the development of anaerobic conditions on the lake floor.
The Patting Mud contains enough brine in its inter stices to give the material a moderate plasticity. The percentage of brine in this mud was estimated by re cording the weight of water lost when samples were heated to about 60° C12 for several hours. Amounts of water range from about 10-42 weight percent (fig. 25).
12 Gaylussite (and presumably pirssonite) is dehydrated to Na2Ca(CO3) 2 at tempera tures approaching 100°C. At 60°C, no dehydration was noted in test samples.

54 SUBSURFACE STRATIGRAPHY AND GEOCHEMISTRY, QUATERNARY EVAPORITES, SEARLES LAKE, CALIF.
75Top of Parting Mud
80 —
85 —
— 23
— 24
Base of Parting Mud
— 25
26
10 20 30 40
PORE WATER, IN WEIGHT PERCENT
50
FIGURE 25.—Weight percent of pore water in samples of Parting Mud. Samples from core KM-3; values obtained by measuring weight loss from fresh moist sample during 17 hours of heating at 60°-65°C.
All this evaporated water, though, was in the form of brine that probably had a density of about 1.25 con sidering the amounts of halite that exist in the sample. For this reason, 10 weight percent water would indi cate 12.5 weight percent of entrapped brine, and 42 percent water 52.5 percent brine. The highest per centages are about 1 meter below the top of the unit; distinctly lower percentages are at the top and in the basal zones. The greatest changes occur between units of massive and laminated lithologies; the top three and lower three samples were massive, and the middle six samples were distinctly laminated. These litholo- gic changes coincide with changes in the amounts of aragonite and calcite in the solids and clearly reflect shifts in the character of deposition. It is likely that the higher percentages of pore water in the middle six samples are products of these changes.
CHEMICAL COMPOSITION
Nine samples from core GS-16 were partially ana lyzed to determine their major element composition. Table 13 gives those analyses and lists X-ray diffrac tion data for the minerals in the same samples. The analyses list the evaporite constituents as "water- and acid-soluble components", and the clastic constitu
ents as "acid-insoluble components."In making the major element analyses, difficulties
were discovered that introduced small errors into the results, and insufficient amounts of the samples re mained to complete the analyses or repeat the deter minations. For example, one portion of all the samples was heated to 500° C before treatment with acid in an attempt to quantify the percentage of dolomite in the sample. Under correct conditions, dolomite' decom poses at this temperature to CaC03 , MgO, and C02, but the results showed that this reaction was incom plete, possibly because of interference from other components in the mixture. When heated, however, some of the clastic silicate minerals apparently fused with the Na-jCOg or Na2B407 in these samples and their components subsequently dissolved in acid. This ap pears to be the reason that about 65 percent of the total A1203 and 90 percent of the total Fe203 were found in the acid-soluble fraction. Inasmuch as Si02 was not determined on this fraction and A1203 was de termined by difference, all Si02 in this fraction was reported as A1203 making the total alumina in the acid-insoluble fraction too high. The acid-soluble CaO, MgO, Na-jO, and K20 percentages were deter mined from this heated fraction. Although the report ed amounts of these components seem consistent with the observed evaporite suites, they may be slightly high if they include contributions from the clastic minerals. For the same reason, reported amounts of Si02 and other elements in the clastic fraction may be low because they represent the concentrations that re mained in the acid-insoluble residue after the treat ment described above. Total H 20 could not be determined accurately. The samples were first ana lyzed by heating to about 800° C and the weight loss determined, but the loss was found to include some C02 , organic H, and possibly organic C, as well as H20 and OH; subsequent analyses on the three samples for H20+ and H20- are given in a footnote to table 13.
The analyses of table 13 show the approximate ma jor-element content of each fraction. On the average, about 20 percent of each sample consists of clastic ma terial, nearly 80 percent is evaporite, and about 1-2 percent is organic. Combining this information with the X-ray diffraction data verifies that the water- and acid-soluble evaporites are clearly dominated by gay- lussite, pirssonite, dolomite, calcite, aragonite, and halite.
The acid-insoluble clastic minerals are composed mostly of Si02 , although the X-ray identifications show chlorite, feldspar, mica, and clay to be more abundant than quartz in most samples. The combined percentages of acid-insoluble components (exclusive of organic C) show that the greatest amounts of clastic

PARTING MUD 55
TABLE 13.—Partial chemical analyses of samples from core GS-16 in Parting Mud
[Major-element analyses by M. J. Cremer, L. B. Schlocker, H. N. Elsheimer, and F. O. Simon; minor-element analyses by Harry Bastron. Analytical techniques: (1) Except for CO2 analysis, water- and acid-soluble components were separated from insoluble components by igniting sample at 500°C for 48 hours, immersing sample in dilute (2N) HC1 (ca. 80°C) until CO2 evolution ceased, then filtering. (2) The filtrate included some components that presumably would have remained in the acid-insoluble fraction if the sample had not been heated sufficiently to cause limited Na2CO3 fusion. Of these, the R2O3 group was precipitated as hydroxide and total Fe determined as Fe2O3 by potentiometric titration methods, TiO2 and MnO determined by colorimetric methods, and A12O3 by difference. The AL2O3 and Fe2O3 percentages were added to the percentages of these components determined on the insoluble fraction. (3) CaO and MgO were determined in this filtrate by gravimetric methods, and Na2O and K2O by flame photometer methods. (4) SO3 and B2O3 were determined on separate samples; they were immersed in boiling water for about 1 hour, SO3 determined on the filtrate by X-ray fluorescence and B2O3 by volumetric methods. (5) Cl was determined on separate samples by two methods: five samples were immersed in water at 80°C for several hours, filtered, and Cl determined gravimetrically in the filtrate; four samples (values followed by a "?" because considered less reliable) were fused in LiBO2 and total Cl determined by a colorimetric method. (6) Total carbonate determined on dried but unheated sample by adding H3PO4 and trapping the evolved CO2 in a train. (7) The acid insoluble portion represented by the heated residue after filtering, washing, and drying was fused with LiBO2 , dissolved in HNO3 , and from this solution, the A12O3 ; total Fe and Fe2O3 , CaO, and MgO determined by atomic absorption methods, the Na2O and K..O by flame photometric methods, and the SiO2 by difference. (8) Organic carbon determined by igniting dry sample at 1,000°C, determining evolved CO2 in a train, and subtracting the CO2 present as carbonate from this quantity. (9) Minor elements determined by emission spectrographic techniques on the acid insoluble portion; the results are semiquantitative and are assigned to geometric brackets reported as their midpoints (such as 1, 0.7, 0.5, 0.3, etc.) with their one standard deviation precision estimated at plus or minus one bracket; n.d., not detected. (10) X-ray diffraction analyses of total untreated samples by R. J. McLaughlin and G. I. Smith]
Major elements (percent of total sample)Water- and acid-soluble components
SampleNo.
PM13PM2PM3PM4PM5PM6PM83PM93PM 10
Depth in CaO MgOcore (ft)'
70.6-71.5 13.3 8.671.5-72.5 14.7 5.072.5-73.3 12.2 5.373.3-74.2 6.2 4.774.2-75.1 10.7 3.975.1-77.0 19.6 4.378.0-79.0 17.1 4.879.0-80.0 12.9 5.380.0-81.1 11.2 6.8
Na2O
14.419.019.820.717.614.613.615.817.2
K2O TotalCarbonate
asCO2
2.9 20.12.9 18.93.0 13.24.1 8.04.3 10.83.0 17.63.4 16.42.9 18.42.9 18.2
S03 B203
1.9 0.82.2 0.9n 1.1') 1.5h .61.3 .91.2 .61.5 .81.5 .8
Cl
9.911.918.8
15.9?19.6?12.0?11.57.3
12.0?
SiO2 2
13.212.515.419.819.915.117.315.214.0
Acid-insoluble componentsA12O3 Total Fe
as Fe2O3
2.8 1.42.3 1.13.1 1.44.5 1.84.3 2.02.2 1.33.6 1.63.8 1.63.1 1.5
CaO MgO
0.1 0.040.1 0.04.2 .5.3 .1.3 .09.2 .06.2 .05
.03 .01.1 .04
Na2O
0.20.02
.3
.5
.7
.3
.3
.02
.3
K2O
0.20.02
.3
.5
.5
.4
.2
.02
.4
Organiccarbon,
asC
1.71.61.61.81.6(4 )2.21.30.7
Minor elements (parts per million of acid-insoluble portion)Sample
No.
PM1PM2PM3PM4PM5PM6PM8PM9PM10
B Ba Cr
300 500 15300 500 20300 500 15500 500 15500 500 15300 500 15100 300 15100 50 3500 500 15
Cu
1.5221.51.51.50.7n.d.0.7
Ga Mn
5 505 1507 707 707 707 705 70
n.d. 305 70
Mo
375555
n.d.n.d.n.d.
Nb
77777
n.d.555
Sc
3335553
n.d.3
Sr Ti
200 2000200 2000200 2000200 3000200 3000200 2000200 2000
10 700200 2000
Yb
0.7.7.7
110.7n.d.n.d.0.7
V
15152050503015
720
Y
777
1010
7n.d.n.d.
7
Zr
15020015015015015070
100100
Minerals identified by X-ray in untreated sample (in approximate order of decreasing abundance)
PM 1 . PM2 . PM3 . PM4 . PM5 . PM6 PM8 . PM9 PM 10
. Dolomite, halite mica, chlorite; clay, calcite(?).
. Pirssonite, dolomite, halite, mica, clay, chlorite, aragonite, feldspar, calcite.
. Halite, aragonite, mica, chlorite, clay, dolomite, feldspar, quartz, cacite.
. Dolomite halite, mica, clay, chlorite, feldspar, quartz, calcite.
. Halite, aragonite, calcite, mica, chlorite, clay, feldspar, dolomite, quartz(?).
. Aragonite, dolomite, mica, chlorite, clay, halite, feldspar, quartz, calcite.
. Aragonite, halite, dolomite, calcite, mica, chtonte, clay, feldspar, quartz.
. Gaylussite, dolomite, mica, clay, chlorite, halite, calcite, feldspar(?).
. Dolomite, gaylussite, mica, clay, chlorite, halite, amphibole(?).
'Parting Mud in GS-16 lies between 70.6 and 82.2 ft (21.52 and 25.05 m). "Percentage possibly low because of loss during original heating and acid treatment.'Analyses for H2O~ (weight lost on heating at 100°C) as follows: PM 1 = 6.7, PM 8 = 3.1, PM 9 = 11.1. Analyses for H2O+ (weight percent of H lost during heating from 100° to
800°C, expressed as H2O) as follows: PM 1 = 1.7, PM 8 = 2.8, PM 9 = 2; percentages may be high because H may have been derived from both H2O and organic compounds. 'Not analyzed because of insufficient sample.
minerals are in a zone just above the middle of the Parting Mud. A high concentration of elastics in these horizons is consistent with the data on sediment sizes in table 12. Slightly increased concentrations of Ga, Sc, Ti, Yb, V, and Y in this zone may also reflect this distribution. Unpublished field observations of the lake sediments exposed in the surrounding valley show that there was a lake recession during this part of its history that would have allowed more and coarser clastic material to be transported into the ba
sin center.Analyses for U in 29 samples of the Parting Mud by
Mankiewicz (1975, table 2-1) shows an average value of 12 ppm with a range from 1 to 42 ppm. The higher values occur near and below the middle of the Parting Mud, a zone he interprets on the basis of the organic content to have been deposited during a period of maximum lake size and inflow.
The analyses of MgO give values that average 5.4 percent but are as high as 8.6 percent; if all the MgO

56 SUBSURFACE STRATIGRAPHY AND GEOCHEMISTRY, QUATERNARY EVAPORITES, SEARLES LAKE, CALIF.
was contained in dolomite, the dolomite percentage would average 25 percent and be as high as 40 percent. The analyses for carbonate, expressed as CO2 , average 15.7 percent. If all the CO2 was in dolomite, the aver age dolomite percentage would be 33; if it was in cal- cite or aragonite, their combined average percentage would be 35; if in pirssonite, its average percentage 43; and if in gaylussite, 53. The actual percentages of each are much less because most samples contain two or more of these minerals, but these values provide up per limits. The average SO3 content is 1.6 percent, the B2O3 content 0.9 percent. These values imply a thenar- dite content in the analyzed samples of 2.8 percent and a borax content of 2.5 percent. Using the average brine values in table 17, combined with an estimated interstitial brine content in the Parting Mud (fig. 25) of about 25 percent, it appears that desiccation of the entrapped brine could account for all but 1.1 percent of the thenardite and 1.9 percent of the borax. Al though borax is commonly observed, thenardite and other sulfate minerals have not been observed in the Parting Mud; some or all of the reported SO3 may have been produced during analysis by oxidation of pyrite, a mineral that has been observed in trace amounts in the Bottom Mud. The Cl content averages 13.1 percent and is as high as 19.6 percent; the implied average halite content is 22 percent with a maximum of 32 percent. As the Cl content of the average brine in the Upper Salt (table 17) is 12.2 percent, the Cl con tent in the Parting Mud clearly reflects the presence of crystalline halite in the mud.
The CaO content is of special significance in recon structing the nature of the depositing lake. If the aver age value of 13.1 percent CaO is not inflated greatly by contribution from the clastic material, it virtually re quires the lake to have been stratified with a fresh layer at the surface that introduced additional cal cium each year; details of this reasoning are given in the section on the processes of sedimentation of the mud layers.
The average organic C content of 1.6 percent indi cates an average content of organic compounds that probably exceeds 2 percent. The Parting Mud in core GS-16 is 12.2 ft (273 cm) thick and has an approxi mate density of 2.2. If the average organic content is 2 percent, each square centimeter of the Parting Mud represents a column of sediment that contains 16.4 g of organic matter. As the unit was deposited in about 13,500 years, the minimum rate of organic production and accumulation was about 1.3 X 10 ~ 3 g/cm2/yr. Ac tual rates were higher because some of the organic ma terial has decomposed and been lost as CO2 and CH4 .
These data show that the Parting Mud is a marl
dominated by carbonate minerals but containing ap preciable quantities of halite and subordinate amounts of clastic components and other evaporites. The organic percentage is low but contributes dispro portionately to the physical properties of the mud.
UPPER SALT
The Upper Salt is the largest of the commercially worked saline layers in the Searles Lake deposit. It ex tends over an area of about 110 km2 and has typical thicknesses near its center of about 15 m. This unit was the first to be exploited as a source of commercial brine; from it have come the bulk of the industrial chemicals produced from Searles Lake. The salt body is lens shaped; its upper contact with the Overburden Mud is gradational but generally concave downward, and its lower contact is concave upward as it rests in the symmetrically shaped basin formed by the top of the Parting Mud (fig. 26).
Most of the Upper Salt layer is composed of salines. The most abundant minerals are halite, trona, and hanksite. Minerals occurring in smaller quantities are borax, burkeite, pirssonite, thenardite, aphthitalite, sulfohalite, and mud.
Compared with the Lower Salt, the solids of this layer contain more halite and hanksite, about the same amount of borax, and less trona, burkeite, then ardite, and mud. The brine is higher in K and Cl and lower in total CO3 and B4 O7 .
AREAL EXTENT AND VOLUME
The areal limits of the Upper Salt, are about the same as those given for the saline layers within the Lower Salt (114 km2 ).
The variations in thickness of the Upper Salt are shown by the isopach map (fig. 27). In making this map, deciding on the position of the contact between the Upper Salt and the Overburden Mud was found to be a very subjective matter. In general, the contact was placed at the top of the uppermost zone in which the salt beds dominate.
According to the isopach map, the configuration of the Upper Salt is symmetrical; it has a zone of rapid thickening near the edges and a large area of more gradual thickening near the center. This distribution of thickness is similar to that of S-5, the largest saline layer in the Lower Salt, but it appears more regular than the other saline layers within that unit. This reg ularity is partly due to the large contour interval used for the map of the Upper Salt which minimizes the small variations introduced artificially by differences in the measuring techniques used during coring and logging.

UPPER SALT
R. 43 E. 11 7°20'
57
R. 44 E.
Structure contour Drawn on base of Upper Salt.
Contours show depth below pre sent surface, in feet. Interval 10 feet
0123 KILOMETERS
FIGURE 26.—Contour map on base of Upper Salt, Searles Lake.

58 SUBSURFACE STRATIGRAPHY AND GEOCHEMISTRY, QUATERNARY EVAPORITES, SEARLES LAKE, CALIF.
R. 43 E. 117° 20' R - 44 E-
35°45' —
IsopachHachured in areas of thinning.
Contour interval 10 feet.20.1
Core-hole location Thickness of unit, in feet
0123 KILOMETERS
FIGURE 27.—Isopach map of Upper Salt, Searles Lake, Calif.

UPPER SALT 59
Using the isopach map of the Upper Salt (fig. 27), the volume is calculated to be about 1,050 X 106 m3 , or about 1 km3 , about twice the total volume of the saline layers in the Lower Salt. More than half the total vol ume of the Upper Salt lies within those parts of the unit that are more than 12 m (40 ft) thick.
MINERAL COMPOSITION AND LITHOLOGY
Trona and halite are the major mineral components of the Upper Salt, together forming more than three- fourths of the total volume. Hanksite is the third most abundant mineral, borax the forth. Smaller amounts of mud, burkeite, pirssonite, thenardite, aphthitalite, and sulfohalite occur.
Quantitative estimates of the mineral composition of the Upper Salt were made in the same manner as for the saline layers in the Lower Salt. The results of these calculations, given in table 14, illustrate an areal mineral zonation that can be correlated with the unit's thickness. Some of the mineral percentages in individ ual cores vary markedly. The averaged values indicate the following trends. Trona reaches its maximum per centage in the thinner parts of the layer and dimin ishes toward the thicker parts. 13 Halite follows the op posite trend. Hanksite, the predominant sulfate min eral in the Upper Salt, is slightly more abundant in the intermediate thickness zones. The highest per centages of borax are normally in the thicker zones. Aphthitalite is concentrated in the thicker parts of the deposits. Thin beds of mud occur sporadically throughout the Upper Salt. Pirssonite is in the mud layers.
Other areal concentrations noted are unrelated to"The one core within the 0-10 contour area, GS-25, is not representative of that
facies; it consists of an unusually large amount of borax that is associated with halite, whereas most cores obtained by the chemical companies from that facies mostly con tain only trona.
thickness. Hanksite is most abundant in the western, central and eastern parts of the unit, and is deficient to the north and south. Burkeite and thenardite are higher than average along the south and southeast edges of the deposit, apparently because of the source of nearby sulfate in the Slate Range (Smith and oth ers, 1968, p.14). Borax is more common in the western, central, and eastern parts of the Upper Salt body.
The vertical distribution of minerals varies some what from one area to the next. A few centimeters of borax occurs at the base of the Upper Salt (or in the top of the Parting Mud) in about half of the GS series of cores, most are from the central part of the deposit. Almost all cores of the Upper Salt have a 1- to 3-m layer of trona at the base. The basal few centimeters of this bed contains major amounts of northupite as a fine-grained interstitial material. This trona layer maintains its thickness toward the edges of the de posit and constitutes the entire Upper Salt in most of the outermost facies. Above the bed of trona, except in the outermost facies, halite is the predominant com ponent. Its percentage increases in an irregular man ner toward the top of the Upper Salt. In some parts of the deposit, the halite-rich zone extends to the top of the Upper Salt; in others, in particular in the central facies, it is overlain by a layer 2-5 m thick composed largely of hanksite and borax.
The stratigraphic position of hanksite concentra tions in the Upper Salt is variable but is generally re lated to areal position. In the central part of the deposit, the largest concentrations of hanksite are generally at the top of the Upper Salt, as in GS-15 and GS-16. In the edge facies of the deposit, hanksite is more commonly concentrated just above the basal lay er of trona, and may be nearly pure or mixed with ha lite and trona, a distribution pattern found in GS-10, GS-12, and GS-17. Other cores have distributions of
TABLE 14.—Mineral composition of salines in the Upper Salt by contour interval[Based on visual estimates of Haines (1959), compositions in volume percent; calculated for contour shown in figure 27; t = trace]
HaliteTronaHanksiteBoraxBurkeitePirssoniteThenarditeAphthitaliteSulfohaliteMudNumber of cores between contours _ _ _ _ Percentage of total volume between contours
Between isopach contours
0-10
61
39
.3 1
2
10-20
33 55
6.1 .8 .4
1.4 .8
t2.7 7
7
20-30
31 43 22
1.0 .8 .1 .3
t 2.0 9
14
30-40
46 33 19
.8
.1
t
1.04
20
40-50
48 27 18 4.6
.3
t 2.2 4
31
50-60
43 33 19
1.4 .8 .1
t t 2.6 4
20
60+
46 39 10
2.8
.5
.1 1.3 1
6
Weighted total
percent
43 34 17
3.1 .3 .2 .1 .03 .01
2.0
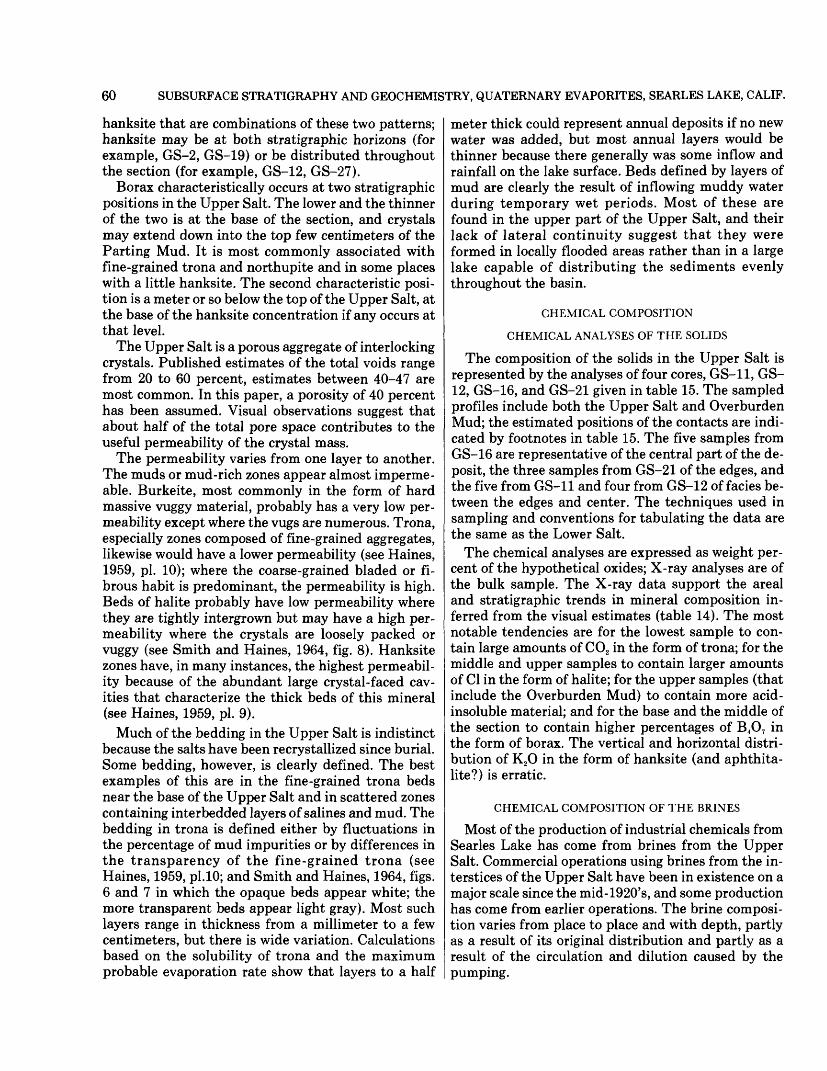
60 SUBSURFACE STRATIGRAPHY AND GEOCHEMISTRY, QUATERNARY EVAPORITES, SEARLES LAKE, CALIF.
hanksite that are combinations of these two patterns; hanksite may be at both stratigraphic horizons (for example, GS-2, GS-19) or be distributed throughout the section (for example, GS-12, GS-27).
Borax characteristically occurs at two stratigraphic positions in the Upper Salt. The lower and the thinner of the two is at the base of the section, and crystals may extend down into the top few centimeters of the Parting Mud. It is most commonly associated with fine-grained trona and northupite and in some places with a little hanksite. The second characteristic posi tion is a meter or so below the top of the Upper Salt, at the base of the hanksite concentration if any occurs at that level.
The Upper Salt is a porous aggregate of interlocking crystals. Published estimates of the total voids range from 20 to 60 percent, estimates between 40-47 are most common. In this paper, a porosity of 40 percent has been assumed. Visual observations suggest that about half of the total pore space contributes to the useful permeability of the crystal mass.
The permeability varies from one layer to another. The muds or mud-rich zones appear almost imperme able. Burkeite, most commonly in the form of hard massive vuggy material, probably has a very low per meability except where the vugs are numerous. Trona, especially zones composed of fine-grained aggregates, likewise would have a lower permeability (see Haines, 1959, pi. 10); where the coarse-grained bladed or fi brous habit is predominant, the permeability is high. Beds of halite probably have low permeability where they are tightly intergrown but may have a high per meability where the crystals are loosely packed or vuggy (see Smith and Haines, 1964, fig. 8). Hanksite zones have, in many instances, the highest permeabil ity because of the abundant large crystal-faced cav ities that characterize the thick beds of this mineral (see Haines, 1959, pi. 9).
Much of the bedding in the Upper Salt is indistinct because the salts have been recrystallized since burial. Some bedding, however, is clearly defined. The best examples of this are in the fine-grained trona beds near the base of the Upper Salt and in scattered zones containing interbedded layers of salines and mud. The bedding in trona is defined either by fluctuations in the percentage of mud impurities or by differences in the transparency of the fine-grained trona (see Haines, 1959, pi.10; and Smith and Haines, 1964, figs. 6 and 7 in which the opaque beds appear white; the more transparent beds appear light gray). Most such layers range in thickness from a millimeter to a few centimeters, but there is wide variation. Calculations based on the solubility of trona and the maximum probable evaporation rate show that layers to a half
meter thick could represent annual deposits if no new water was added, but most annual layers would be thinner because there generally was some inflow and rainfall on the lake surface. Beds defined by layers of mud are clearly the result of inflowing muddy water during temporary wet periods. Most of these are found in the upper part of the Upper Salt, and their lack of lateral continuity suggest that they were formed in locally flooded areas rather than in a large lake capable of distributing the sediments evenly throughout the basin.
CHEMICAL COMPOSITION
CHEMICAL ANALYSES OF THE SOLIDS
The composition of the solids in the Upper Salt is represented by the analyses of four cores, GS-11, GS- 12, GS-16, and GS-21 given in table 15. The sampled profiles include both the Upper Salt and Overburden Mud; the estimated positions of the contacts are indi cated by footnotes in table 15. The five samples from GS-16 are representative of the central part of the de posit, the three samples from GS-21 of the edges, and the five from GS-11 and four from GS-12 of facies be tween the edges and center. The techniques used in sampling and conventions for tabulating the data are the same as the Lower Salt.
The chemical analyses are expressed as weight per cent of the hypothetical oxides; X-ray analyses are of the bulk sample. The X-ray data support the areal and stratigraphic trends in mineral composition in ferred from the visual estimates (table 14). The most notable tendencies are for the lowest sample to con tain large amounts of C02 in the form of trona; for the middle and upper samples to contain larger amounts of Cl in the form of halite; for the upper samples (that include the Overburden Mud) to contain more acid- insoluble material; and for the base and the middle of the section to contain higher percentages of B407 in the form of borax. The vertical and horizontal distri bution of K20 in the form of hanksite (and aphthita- lite?) is erratic.
CHEMICAL COMPOSITION OF THE BRINES
Most of the production of industrial chemicals from Searles Lake has come from brines from the Upper Salt. Commercial operations using brines from the in terstices of the Upper Salt have been in existence on a major scale since the mid-1920's, and some production has come from earlier operations. The brine composi tion varies from place to place and with depth, partly as a result of its original distribution and partly as a result of the circulation and dilution caused by the pumping.

UPPER SALT 61
TABLE 15.—Chemical analyses of cores from the Upper Salt and Overburden Mud
[Chemical analyses by L. B. Schlocker, H. C. Whitebread, and W. W. Brannock. Analytical techniques: (1) CaO, MgO, NazO, K..O, and B2O3 were determined in solutions prepared by boiling portions of samples in 1+9HC1; (2) Cl was determined in solutions prepared by boiling portions of samples in distilled water; (3) SO3 was determined by X-ray fluorescence of whole samples; (4) acid insoluble was residue obtained by boiling portions of samples in 1+9HC1, dried at 110°C; (5) H.,0 was determined by measuring weight of H expelled during combustion. X-ray analyses of total untreated sample by R. J. McLaughlin and G. I. Smith]
Sample No.Depth in core
(ft) CaO MgO Na20 K20Acid (Oxygen Minerals identified by X-ray
CO.. SO3 B2O3 Cl H2O insoluble equivalent Sum (in approximate order of decreasing abundance)ofCl)
GS-ll A
C - —— -__ D
r*c 10 ABQD
GS 16-A
QD ------- E
r*a 91 A
B _______ C -------
0 -17.1-30.7- 55.6£fi £
cya Q
33.3-
7fl ft
01 O Q
9^ °.45.8- 64.0-
<\ 4
10.9- 30.6-
'17.1on 7
55.6 68.672.7300 0<
60.77fi fi
7C Q
13.85OC O
64.0 70.610 9630.6 35.5
1.41.5
.55
.09on
5.4.63.107°.
1.41.5
cn
.13
.191.4.11 .15
49OC
.16 04on
1.116
.03fi4
091 £
.20
.06
.22
.59
.44
.54
45.646.3 49 042.740.447.845.2Q7 ft
43.4
45.244.5 40.307 £40.7 40.7
1.11.11.2.47
1Q
352.01.1101.41.44.6
781.21.7 1.5
Q, 9
5.27.8 76
OO C
Q 9
8?,Q Q,
24.7o 9
0 c
6.7 31 41 0 ft
14.8 28.3
£ Q
9.6 8.3
1 Q G.
.719,6
90 Q
5.09 4
20.211.010.8
2.7eye ft
24.0 4.2
9°.
1.2 08
2.2.1510
.10
12.07
.44 1 62.4
.85
.57
41.2Oft ft
36.1 40.6
a Q
07 Q
38.41 ft o
38.3on o°.1 1
37.2 79
2.29.4
10.2
2.59 Q
4.4Q. Q.
11C
5.13.4Q £
2.01.45.03.6
16.8ft fi
6.8 15.6
7 £
.84 22
.55f; 4
.51fifioc
7.61.2
.44
.22
.140 C
2.0 .51
/Q ofi\/O ris*\
(8.15)fQ 1 (*\
(1.56)/Q Cfi\
(8.67)(4.24)(1.67)/Q /;r\
(7.02)(8.40) (1.78)(0.50)(2.12) (2.30)
990QQ fi
100.0 100.5i no. 7
100.5QQ Q
QQ fi
98.1QQ fi
Qfi Q
99.8 100.2
Qfi f\
98.7 100.0
Halite, hanksite, trona, tincalconite?2
Halite, trona, hanksite. Trona, halite, tincalconite2 .
Hanksite, trona, halite. Trona, halite, northupite?
' Contact of Overburden Mud at 16.3 ft.'• Occurrences of tincalconite represent borax before dehydration in atmosphere.1 Includes 0.2 ft of Parting Mud.
' Contact of Overburden Mud at 31.3 ft. ' Contact of Overburden Mud at 13.8 ft. ' Contact of Overburden Mud at 6.3 ft.
The 104 brines analyzed (table 16) are from the Up per Salt portion of 10 core holes, 5 (HH, U, W, X and S-31) in the central part of the deposit, 1 (GS-4) in the outer part, and 4 (MM, S-28, GS-1, and GS-10) in intermediate facies. The samples were collected in the same manner as those from the Lower Salt.
The compositions of the brines listed in table 16 were projected to one face of the tetrahedrons used to represent the two pertinent 5-component systems (fig. 28). Projected boundaries of the mineral stability fields in the Na2CO3-NaHCO3-Na2SO4 -NaCl-H2O sys tem at 20° C are shown in figure 28A; projected bound aries in the Na2CO3-Na2SO4 -NaCl-KCl-H2O system at 20°C in figure 28B. The points in figure 28A are closely grouped and confirm the equilibrium assem blage in the Upper Salt of trona, halite, and thenar- dite without burkeite. The points in figure 2SB are mostly within the boundaries of hanksite field; few are on the hanksite-aphthitalite boundary or in the aphthitalite field, confirming the equilibrium pres ence of that mineral in the assemblage at the time the analyses were made.
The specific gravities of brines from the central areas are mostly near 1.26 at the top and 1.30 at the base. Those from the edges of the deposit are as low as 1.25. Except for GS-1 and GS-4, which lie nearer the edges than the others, the total percentages of dis solved solids are between 33 and 35 percent. Values of pH from three holes range from 9.1 to 9.4.
The percentage of Na fluctuates over a small range but not systematically. The average is near 11 percent. The K content of the brine increases downward in al
most every well. Most of this increase occurs in the top 5-10 m, but further increases generally occur below this zone. Near the top of the sampled profiles, in the Overburden Mud, the percentage of K is generally be tween 1 and 2 percent; at the base, it is generally about 2.5 percent in the central areas and under 2 percent nearer the edges. Teeple (1929, p. 18), Gale (1938, p. 869), and Ryan (1951, p. 449) list average percentages of K in the brine pumped from the Upper Salt as 2.53, 2.46, and 2.63, respectively.
The analyses list total carbonate expressed as CO3 , and in brines having these pH values, almost all the carbonate must actually be in this form. In most core holes, the CO3 percentage shows a marked increase downward. The percentages of SO4 are generally be tween 4 and 5. The brines in six core holes have in creasing percentages of SO4 toward the bottom, in three increase toward the top, and in one SO4 is nearly constant. The percentages of Cl mostly fall between 12 and 13. The Cl content of the brines generally in creases upward. Most B4 O7 percentages, which lie near 1, increase downward.
Analyses of minor elements in Upper Salt brines are available for some sets of samples. The phosphate analyses are from brine wells in the intermediate and central parts of the deposit. Although areal position seems to be unrelated to the values, there is consider able variation in PO4 content of brines within and be tween different wells. Ryan (1951, p. 449) reports an average of 940 ppm PO4 and W. A. Gale (written com- mun., 1952) reports 920 ppm PO4 in brines from the central part of the Upper Salt. As is reported only for

62 SUBSURFACE STRATIGRAPHY AND GEOCHEMISTRY, QUATERNARY EVAPORITES, SEARLES LAKE, CALIF.
TABLE 16.—Chemical analyses of brines from Upper Salt and Overburden Mud[Analyses of cores HH, MM, U, W, X, S-28, and S-31 by chemists of American Potash & Chemcial Corp., published with permission of company. Analyses of GS-1, GS-4, and GS-
10 by Henry Kramer and Sol Herman, U.S. Geological Survey. Composition in weight percent except where indicated as parts per million (ppm)]
Sample depth
(ft)
Total dissolved Specific solids gravity (by summation) pH Na K
Total carbonate
ascoa SO, Cl B407PO, ppm
As Li ppm ppm
Br S F ppm ppm ppm
Core HH, 1 June 19485
10 15 20 25 30 35 40 45 50 55 60 65 70 75
1.276 1.278 1.279 1.280 1.287 1.301 1.301 1.301 1.301 1.301 1.301 1.301 1.301 1.301 1.301
39 33
32.3735.6032.6633 97
34.3634.2534.3434.3134 31
34 34
34.3734.4234 4634.38
10.8110.8010.891 (\ ftQ
11.0311.0711.041 1 f\£i
11.0611.0511.0611.0511.0511.0611.03
1.95 1.98 1.98 1.99 2.03 2.49 2.48 2.48 2.48 2.48 2.49 2.47 2.49 2.50 2.49
1.74 1.83 1.89 1.92 1.98 2.45 2.45 2.46 2.45 2.45 2.45 2.45 2.45 2.46 2.46
4.02 4.05 4.10 4.18 4.87 5.09 5.03 5.10 5.08 5.10 5.10 5.08 5.08 5.08 5.05
13.02 12.88 14.33 12.82 12.50 12.10 12.09 12.08 12.08 12.07 12.09 12.06 12.09 12.09 12.08
0.72 .76 .77 .79 .79
1.07 1.07 1.07 1.07 1.07 1.06 1.06 1.06 1.07 1.07
700 13700 10700 13700 13700 13900 13900 13900 13900 16900 15900 15900 16900 1900 15900 15
Core MM, 1 October 19485
10 15 20 25 30 35 40 45 50
5 10 15 20 25 30 35 40 45 50 55 60 65
5 10 15 20 25 30 35 40 45 50 55 60 65 70
1.2844 1.286 1.287 1.288 1.292 1.295 1.295 1.292 1.297 1.298
1.278 1.279 1.286 1.293 1.297 1.297 1.297 1.297 1.297 1.297 1.299 1.301 1.303
1.256 1.277 1.284 1.291 1.292 1.293 1.293 1.294 1.296 1.298 1.298 1.298 1.298 1.298
32.3932.6032.5732.6934.2633.4033.3733 3Q
33.9034.01
32.6832.6033.1534.4034.1034.1034.1134.1134.1134.4234 3Q
34.7634.75
32.6234.9035.6536.0936.2536.493R 34
36.7236.8237.0237.1937.3337.5037.42
11.341 1 3Q
11.3811 4211.4211 4911.4711.461 1 CO
11.42
11.3011.2911.4011.0811.381 1 O7
11 <_*
11.3511 3411.1210.9911.0511.06
10.7111.0411.0411.1411.1211.1411.0511.0210.931 A Q9
10 9010.9110.9810.98
1.06 1.09 1.06 1.06 1.30 1.30 1.27 1.31 1.47 1.65
1.31 1.28 1.33 1.73 1.73 1.73 1.76 1.77 1.78 2.17 2.37 2.46 2.45
1.39 1.65 1.83 1.88 1.96 1.99 2.06 2.28 2.42 2.51 2.62 2.63 2.60 2.60
2.20 2.21 2.21 2.22 2.50 2.55 2.54 2.52 2.64 2.72
Core U, 12.23 2.25 2.34 2.03 2.52 2.52 2.52 2.52 2.52 2.51 2.51 2.73 2.73
Core W, 11.66 2.18 2.38 2.41 2.55 2.59 2.57 2.56 2.58 2.62 2.66 2.72 2.74 2.71
4.55 4.56 4.55 4.52 4.64 4.60 4.66 4.68 4.79 4.69
12.06 12.16 12.13 12.20 11.90 11.96 11.91 11.88 11.90 11.86
0.82 .82 .82 .81
1.03 1.04 1.04 1.03 1.04 1.07
540 540 660 700 700 700 740 800 860 940
_ ——— —— __
;;;;; ;;;;;650 _ __ _ _____ 670 __ __ _____ 6506707^n740 _____ __ __ 740 _____ _____ 740790
790
December 19494.00 4.00 4.41 4.88 4.95 4.96 4.96 4.96 4.96 4.96 4.96 4.82 4.82
12.62 12.55 12.38 12.16 11.91 11.91 11.91 11.91 11.91 11.91 11.91 11.89 11.88
0.75 .76 .78 .96
1.04 1.04 1.04 1.04 1.04 1.07 1.09 1.21 1.21
740 740 800 900 900 900 900 880 880 880 880 920 920
— — _— —— —— —— _____
630630 _____ _____ 670680750 _____ _____ 750760760 _____ _____ 760760 _____ _____ 770870880
February 19352.64 3.69 4.00 4.25 4.24 4.30 4.29 4.48 4.52 4.52 4.46 4.48 4.54 4.51
13.53 12.76 12.52 12.32 12.26 12.27 12.17 12.21 12.18 12.19 12.19 12.15 12.17 12.19
0.700 .950 .988
1.067 1.061 1.082 1.097 1.101 1.094 1.099 1.129 1.139 1.143 1.140
588 752 830 858 868 896 900 856 872 920 950 988 996 986
708192 863232 ___ _39
54 _____ 65 __ __ 599286 _ __ _ 92 _ __ - 92
40140180220270280280270270250200180180190
Footnotes on page 64.

UPPER SALT 63
TABLE 16— Chemical analyses of brines from Upper Salt and Overburden Mud—Continued
Sample depth
(ft)
5 10 15 20 25 30 35 40 45 50 55 60 65 70 72
Specific gravity
1.264 1.265 1.265 1.283 1.294 1.299 1.300 1.301 1.301 1.301 1.301 1.301 1.300 1.301 1.302
Total dissolved solids
(by summation) pH
OA 07
31.59^i finqo Q7
33.8834 3Q
34 4Q
34.6034.5434.5934.6234 fi9
34.6034.6234.50
Na
11.16 11.17 11.18 11.48 11.35 11.25 11.24 11.17 11.17 11.18 11.19 11.19 11.17 11.18 11.13
K
1.05 1.04 1.04 1.13 1.66 2.05 2.11 2.23 2.23 2.23 2.23 2.23 2.23 2.24 2.24
Total carbonate
as C03
Core X, 11.96 1.96 1.96 2.04 2.36 2.47 2.47 2.41 2.41 2.41 2.41 2.41 2.41 2.47 2.46
SO,
March3.36 3.37 3.37 5.14 5.00 5.10 5.18 5.30 5.26 5.28 5.33 5.33 5.33 5.23 5.10
Cl
195013.05 13.05 13.05 12.16 12.06 12.02 12.02 12.02 12.02 12.02 11.99 11.99 11.99 11.99 11.99
BA
0.57 .57 .57 .60 .98
1.03 1.01 1.01 1.01 1.01 1.01 1.01 1.01 1.04 1.06
PO, ppm
660 660 660 620 720 720 700 700 680 700 700 700 700 700 760
As Li Br ppm ppm ppm
510520520520610650650630610fi3fl
630630fi3fl
720750
S F ppm ppm
1002002003fin100100100100100100100100100100200
Core S-28, 1 August 195030 35 40 45 50 55 60 64
25 30 35 40 45 50 55 60 65 70
1.290 1.291 1.297 1.301 1.301 1.301 1.302 1.302
1.285 1.285 1.291 1.306 1.306 1.307 1.307 1.307 1.307 1.307
33.5733.5334.4034.7834.6734.8134.8134.85
32.9933 f>9
34.6235.2031.1335.2635.2735.1935.1731.25
11.34 11.35 11.32 11.26 11.20 11.24 11.21 11.23
11.49 11.51 11.44 11.16 11.11 11.13 11.13 11.10 11.10 11.16
1.70 1.72 2.15 2.38 2.42 2.42 2.44 2.44
1.30 1.28 2.06 2.62 2.66 2.68 2.70 2.71 2.70 2.67
2.71 2.73 2.99 3.14 3.14 3.16 3.15 3.15
Core S-31, 12.51 2.55 2.97 3.09 3.08 3.11 3.14 3.12 3.12 3.12
4.22 4.22 4.16 4.03 4.00 4.05 4.02 4.05
12.19 12.18 12.09 12.06 12.00 12.01 12.02 12.02
0.98 1.00 1.21 1.35 1.36 1.37 1.39 1.38
560 560 640 720 700 720 780 780
630640740760770770840840
500500600800800800700700
December 19504.23 4.25 4.31 4.21 4.21 422 4.21 4.20 4.22 4.23
12.33 12.30 12.12 12.11 12.06 12.09 12.06 12.06 12.04 12.09
0.76 .76
1.20 1.33 1.34 1.36 1.37 1.37 1.36 1.36
500 500 720 980 960 960 940 900 900 880
570590740930940Q3D
930940930930
400400500500500500500500500500
brines from core hole W in the central segment of the lake; values range from 32 to 92 ppm with no clear ver tical trend. Li was analyzed in brines from intermedi ate and edge facies but no areal or vertical trend is evident; Ryan (1951, p. 449) reports 70 ppm in pumped brines. The analyses for Br are all brines from the intermediate and central parts of the depos it; Br tends to increase in concentration toward the base of the layer. Ryan reports 810 ppm Br, and Gale estimates 860 ppm Br in brines pumped for commer cial use. The amounts of S are variable and tend to increase downward. Ryan and Gale report average amounts of S as 330 and 390 ppm, respectively. Amounts of F in core hole HH are mostly between 10 and 15 ppm; Ryan and Gale estimate 20 and 15 ppm F, respectively. Ryan and Gale estimate the I content of brines pumped from the central part of the Upper Salt
to be 30 and 29 ppm. They and Carpenter and Garrett (1959), report W in average amounts near 55 ppm. Hem (written commun., 1960) reports Sr in two sam ples from 60 and 70 ft (18.3 and 21.3 m) in GS-14 as 4.5 and 3.2 ppm, and in samples from 25 and 30 ft (7.6 and 9.1 m) in GS-26 as 3.7 and 2.2 ppm. The brines from GS-1, GS-4, and GS-10 were analyzed for Ca and Mg but their quantities were found to be below limits of detection.
Vertical variations in brine composition bear a spo radic relation to the mineral composition of the salts although there is a marked increase in the total dis solved solids below the zone immediately below the Overburden Mud. Percentages of CO3 and B4 O7 in crease downward in accord with the downward in crease of trona and borax, percentages of Cl increase upward as does the percentage of halite. Percentages

64 SUBSURFACE STRATIGRAPHY AND GEOCHEMISTRY, QUATERNARY EVAPORITES, SEARLES LAKE, CALIF.
TABLE 16 . —Chemical analyses of brines from Upper Salt and Overburden Mud—Continued
Sample depth Specific
(ft) gravity
Total dissolved solids
(by summation) PH Na
Total carbonate
as K C03 SO, Cl
P04 As B407 ppm ppm
Li Br S F ppm ppm ppm ppm
Core GS-1, 1 July 195430 35 40 45 45.8
24.8 30.0 35.0 40.0 45.0 48.9
1.264 1.277 1.281 1.276 1.277
1.274 1.278 1.277 1.282 1.284 1.287
32.4 33.5 34.2 34.4 33.8
32.0 32.3 34.0 33.0 33.0 32.9
9.2 9.2 9.3 9.3 9.3
9.12 9.18 9.23 9.28 9.31 9.32
10.9 11.3 11.3 11.3 10.9
11.0 10.9 12.8 11.3 10.9 10.7
1.52 1.80 2.10 2.02 2.10
1.07 1.19 1.20 1.22 1.78 1.79
2.54 2.56 2.71 3.04 2.72
Core GS-4, 12.45 2.62 2.50 3.03 2.81 2.97
3.91 4.62 4.68 4.64 4.67
12.64 12.30 12.36 12.33 12.35
0.84 _____ _____ .966
1.081.07 _____ _____ 1.07
2831•}<;i<;
35
September 19544.56 4.62 4.72 4.73 4.42 4.38
12.14 12.08 11.99 11.81 12.01 11.92
0.78 _____ _____ .85 _____ _____ 83.86
1.111.10 _____ _____
424342437269
Core GS-10, 1 January 195536.3 40 45 50 55 60 65 70
1.285 1.283 1.285 1.284 1.285 1.282 1.289 1.280
33.6 33.6 33.5 33.4 33.6 33.7 33.6 33.4
9.30 9.30 9.30 9.26 9.24 9.25 9.38 9.31
10.9 10.9 10.7 10.9 10.9 10.9 10.8 11.3
1.98 1.98 1.93 1.95 1.93 1.95 2.05 1.75
2.37 2.33 2.32 2.24 2.39 2.40 2.48 2.48
5.09 5.12 5.11 5.10 5.12 5.19 4.84 4.54
'Depth to top and base of Upper Salt; HH: 13-78.7 feet. MM: 6-53.4 feet. U: 12(?)-65.0 feet W: 22-71.3 feet. X: 19-76.7 feet.
12.32 12.30 12.28 12.30 12.26 12.28 12.32 12.26
0.94 _____ _____ .94Q<;
Q<;
.95
.951.10 _____ _____ 1.10 _____ _____
5858585757585922
S-28: 28.6-64.7 feet S-31: 23.0-72.0 feet. GS-1: 28.9-46.0 feet GS-4: 24.8-48.9 feet. GS-10: 32.4-70.2 feet
of SO4 do not show any clear trend, and percentages of K increase downward. Both patterns are in contrast with the general tendency for hanksite, the principal mineral in these cores containing these components, to be more abundant near the top of the Upper Salt. The effect of pumping by chemical companies cannot be inferred from data in table 16 because the samples come from widely spaced sites and represent a wide range in dates of collection.
ESTIMATED BULK COMPOSITION OF THE UNIT
The estimates of mineral composition of the Upper Salt (table 14), the measure of the probable error in the visual estimates (table 8), and analyses of the brines (table 16) provide a basis for calculating the to tal quantity of the major water-soluble components in the Upper Salt. The total is about 1,330 X 1012 g of salts. Table 17 gives the quantity of each component and tabulates the steps followed in the calculation. A more detailed study of the boron in Searles Lake (D. V. Haines, unpub. report, 1956) estimates a total of 23
X 1012 g of BO in the Upper Salt, whereas table 17 indi cates 28 X 1012 g; this discrepancy indicates the ap proximate accuracy of these estimates. The relative percentages of components, calculated water-free, are:
NaKMgrnHC03S04ClB c\ 4 U7 ___________
34.82.1
47.54.9
14.533.7
2 1
FIGURE 28.—Compositions of analyzed brines from the Upper Salt (table 16), plotted on diagrams that indicate phase relations in two 5-component systems. A Phases in Na2C03-Na2S04-NaCl -NaHC03-H20 system, B, Phases in Na2C03-Na2S04-KCl- NaCl-H20 system. Brines plotted on the basis of their compo sitions projected to plane of diagram; some points represent more than one analysis. See figures 35 and 39 and associated text for explanation of phase boundaries and method of plotting.

UPPER SALT
Na 2 SO4
65
\ \ Thenardite
EXPLANATION
Average brine Composition from table 17
Na 2 CO3 NaCI
Burkeite(mineral
composition)
Na 2 SO 4
,Aphthitalite'Hanksita Sf (mineral (mineral \composition)
composition)
EXPLANATION
Average brine Composition from table 17
Analysis 1 and 4 From table 22
Total CO 3 as Na 2 CO 3
Total K as KCI

66 SUBSURFACE STRATIGRAPHY AND GEOCHEMISTRY, QUATERNARY EVAPORITES, SEARLES LAKE, CALIF.
TABLE 17.—Estimated percentages and total quantities of water-soluble components in the Upper Salt
Na Mg C03 HC03 S04 Cl
1 Data in table 14 converted to weight percent.2 Based on comparison of visual estimates and chemcial analyses of cores (converted
to ions), data from table 8, average of all samples. Table 8 also lists error in Ca of +0.4, reducing totals in this and underlying columns to 99.6
1 Error in CO3 listed in table 8 divided equally between CO3 and HCO3 .
H20
Chemical composition of solids inferred from visual estimate1
Average error of visual estimates2Chemical composition of solids, in weight per cent, adjusted for probable error
Chemical composition of brine5Chemical composition of combined solids and brines7
Total quantity of component in Upper Salt8 , grams X 1012
34.2-0.8
33.411.2
24.5
462
0.5+0.6
1.12.0
1.5
28
0+0.5
0.50
0.3
5
10.5-3.4
7.12.5
5.3
100
9.13 -3.4
5.760
3.4
64
11.4+2.6
14.04.6
10.2
192
26.8+4.8
31.612.2
23.8
448
1.0+0.8
1.81.0
1.5
28
6.54-1.6
4.966.5
29.5
556
4 Reduced by amount of H in HCO3 .5 Arithmetic average of brine analyses listed in table 16, in weight percent.6 Percentage of HCO3 is low, assumed to be 0.7 In weight percent, assumed porosity 40 percent.8 Assumed specific gravity of salt plus brine filled pores, 1.80; volume from text.
OVERBURDEN MUD
The Overburden Mud, commonly about 7 m thick in the center of the deposit, is composed of a succes sion of discontinuous beds of mud and salts. Most of the salt is halite, some as partially dissolved and rounded crystals; locally beds of hanksite, trona, bo rax, and thenardite are found. Toward the edges of the lake, the Overburden Mud is characteristically a black or dark-gray pirssonite-bearing mud that grades up ward into greenish or olive-colored clay and silt; at the surface, when dry, it is a light-tan or pinkish-tan silt. In many parts of the Searles Lake deposit, the subsur face contact between the Overburden Mud and the upper part of the Upper Salt is gradational and not easily identified. Stratigraphic criteria used to place the contact in cores are described in the section on the Upper Salt. Outside the area covered by the Upper Salt, the base of the Overburden Mud is in contact with a sand layer that is the lateral equivalent of the Upper Salt. In most areas, the outcrop of this contact is known or interpreted to be a kilometer or more out side the salt body limits. Along the southwest part of the body, southeast of Westend, this contact is much closer to the inferred edge of the Upper Salt body be cause the chemical and clastic sediments carried into the basin from upstream formed a delta in this area, steepening the slopes upon which both salt and mud layers were deposited.
AREAL EXTENT AND VOLUME
The Overburden Mud covers the entire surface of Searles Lake within the area underlain by the Upper Salt (fig. 27), and in most areas extends a kilometer or more beyond this limit. The average thickness of the Overburden Mud in the 88 cores in which it could be measured is 7 m (23 ft). It is only 2-5 m thick in an area of about 10 km2 that lies within a kilometer or two
of the northwest edge of the lake, but elsewhere, it is mostly 6-9 m thick. Thickness greater than 9 m were noted only in cores that are near the north, south, and southwest edges of the Upper Salt unit; the unit thins to zero about a kilometer outside this edge.
These thickness data were plotted on an isopach map and the volume of the unit calculated. This infor mation was used in making the very general calcula tions of the mineral composition of the Overburden Mud. The map is not included in this report because the position of the basal contact of the Overburden Mud, owing to its gradational nature, is chosen by means of a set of arbitrary criteria. As a result, the trends in thickness indicated by subsurface data are relatively unsystematic, and the changes in thickness near the edge of the deposit are too abrupt to allow meaningful extrapolation in areas of no data. The to tal volume of the unit, calculated from the isopach map and within the arbitrary boundary described pre viously, is 380 X 106 m3 .
MINERAL COMPOSITION AND LITHOLOGY
The composition of the Overburden Mud is dis tinctly different from the other mud layers in this de posit. Clastic fragments are commonly larger and make up higher percentages of this layer. Sand is abundant in parts of the Overburden Mud, whereas clastic fragments larger than silt size make up less than 20 percent of the Parting Mud and older mud units. In the outer parts of the deposit, the Overbur den Mud is composed almost entirely of mud and this grades into interbedded mud and salt layers in the center. In contrast, the Parting Mud and Bottom Mud are nearly constant in composition between their edge and central facies.
The megascopic composition of the Overburden Mud was estimated by the methods used for older units, although the results are not as reliable for rea-

OVERBURDEN MUD 67
sons described below. The calculated mean composi tion (in volume percent) is as follows:
Mud (clastic and other fine-grained minerals) _ _ _ _ 83Halite ___________________________ 13Pirssonite _________________________ 2Hanksite _________________________ 1Trona ____________________________ 1Gaylussite ______________________ TraceBorax _________________________ TraceThenardite ______________________ TraceSulfohalite_______________________ Trace
Near the edge of the deposit, evaporite components are generally reported only from the bottom meter, but this is probably not an accurate record of their dis tribution. Most test holes in those areas did not take cores in the upper part of the Overburden Mud, and the composition of that segment was inferred to be pure mud. Pirssonite and halite are the minerals likely to have been underestimated as a result of this prac tice. In the central segment of the deposit, evaporite minerals are about evenly distributed vertically throughout the unit.
X-ray diffraction studies of samples from this unit (tables 15 and 18) confirm the megascopic mineral identifications and show that halite, pirssonite, and hanksite are the most common evaporite minerals, and that little dolomite and no aragonite are present. The clastic minerals are mostly quartz, feldspar, mica, and clay. The clay fraction of surface samples, studied by Droste (1961, p. 1,717-1,719), consists mostly of montmorillonite and illite; there is a marked increase in chlorite in the east part of the deposit which re ceives sediment from the several chlorite-rich zones of fault gouge in the Slate Range.
In the central part of the deposit (Haines, 1959, fig. 6), the surface of the Overburden Mud is generally pure halite. Much of this material is firm enough to support a car or truck, even when covered with water. The cubic crystals of halite are several millimeters to a few centimeters across and are intergrown in a ran dom orientation. As a result of microorganisms that live in the near-surface brine, some of the salt has a light pinkish color. In a few areas where the surface has been modified by the evaporation of waters re turned from the chemical plants and towns to the lake, the surface crust includes more thenardite and a number of introduced impurities.
The surface crusts commonly form a pattern of po lygonal cracks and ridges (fig. 29). The center of each polygon is saucer shaped, and the edges turn up to form ridges a few millimeters to more than half a me ter high. These polygons appear to grow from the cen ter outward, and edges are thrust outward over the adjacent polygon. The zone between polygons is a cha otic zone of slabs broken off when they met crusts growing from the opposing side.
FIGURE 29.—The Polygonal cracks and ridges on surface of north ern part of Searles Lake (sec. 11, T. 25 S., R. 43 E.). Metal clipboard is 20 cm long.
A remarkably linear zone of saline crusts and ef florescences known as the "trona reef occurs along the northeast edge of the lake surface (Gale, 1914, p. 275,294-296). The efflorescences range from a surface powder to crusts several centimeters thick. Saline minerals constitute the bulk of this material; the per centages of minerals vary from place to place. Gale (1914, p. 294) reports an analysis of a composite sam ple of crusts that suggests their content to be about 54 percent trona,14 20 percent halite, 5 percent thenar dite, nearly 3 percent borax, a few percent a K-bearing mineral, and the remainder a material that is insolu ble in water. X-ray diffraction analysis of a sample of crust from the northern part of the zone (NW J/4 sec. 12) shows it to be composed of halite, a smaller amount of trona, and minor quantities of burkeite and gaylussite(?).
Gale (1914, p. 295) attributed the trona reef to evapora tion of saline ground water that rose to the surface at the edge of the playa as a result of the impermeability of the sediments that characterize the playa floor. This does not explain the absence of similar zones around other parts of the playa where ground water is encroaching. Seismic re fraction data (Mabey, 1956, p. 846), however, show a ve locity discontinuity beneath the trona reef that could be a fault having upward displacement on the east side. It seems likely that this fault extends to the surface, where it acts as a linear barrier to eastward-moving brine.15 The
" The published analysis reports components that total 89.20, not 100 as indicated. However, the percentage of H2O that would accompany 54.04 percent Na2CO3 - NaHCO3 as trona and 1.52 percent Na2B4O, as borax brings the total to 100.77.
15 As noted by Hardt, Moyle, and Butcher (1972, fig. 10), as the hydrostatic head of the brines in the center of the valley is greater than in the surrounding areas, brine migrates from the lake into the surrounding ground water reservoir areas.

68 SUBSURFACE STRATIGRAPHY AND GEOCHEMISTRY, QUATERNARY EVAPORITES, SEARLES LAKE, CALIF.
TABLE 18.—Partial chemical analyses of core GS-40 from the Overburden Mud[Analysts and analytical techniques as listed in table 13]
Major elements (percent of total sample)Water-and acid-soluble components
Depth in core CaO MgO Na2O K2O1.0 __ 4.2 1.2 5.0 4.0
230.3 __ 9.2 6.8 14.5 2.6
Total carbo nate
as CO2 SO31.2 0.22
15.3 1.8
BA0.19
.64
Cl1.5 7.9
'SiO261.3 26.9
A12O311.7 3.0
Acid-insoluble components
Total Fe as Fe2O3 Cao MgO Na2O K2O0.9 1.9 0.5 2.9 2.7
.3 .5 .1 .8 .6
Organic carbon inC0.04
.5Minor Elements
Depth in core B Ba Cr
1.0 _ __ 200 700 15 30.3 _ _ _ 100 500 15
Depth in core1.0
30.3
Cu Ga0.7 15 0.7 10
Mn150 150
Nb57
Sc107
Sr700 300
Ti Yb V Y3000 1.5 50 10 3000 1.5 30 10
Zr150 150
Minerals identified by X-ray of untreated sample (in approximate order of decreasing abundance)
DolFeldspar,
omite, pirssquartz, mica, amphibole, clay, halite icnite, gaylussite, halite, mica, clay, calcite
'Percentage possibly low because of loss during original heating and acid treatment. "Base of Overburden Mud in GS-40 at 31.9 feet.
brine is thus forced to the surface and, on evaporation, produces an elongate strip of efflorescences. This ex planation accounts for the notable linearity of the fea ture, and for the absence of similar features along other parts of the lake periphery.
CHEMICAL COMPOSITION
Analyses of the Overburden Mud segment of four cores are included in the analyses of Upper Salt given in table 15, analyses of individual specimens logged as pure mud in core GS-40 in table 18. Two of the sam ples given in table 15 (GS-ll-A and GS-16-A) are al most entirely Overburden Mud, but samples from GS-12 and GS-21 include only a small part of the unit. The GS-11 and GS-16 cores, from the central segment of the deposit, contain ony 7.6 percent acid- insoluble material. Most of the remaining portions of these cores are halite (as shown by X-ray data com bined with the high Na and Cl percentages) with some hanksite (as shown by X-ray data combined with the high SO3 and low CO2 percentages). Some pirssonite is present. The sample from near the top of the unit in core hole GS-40 (table 18) contains 81.8 percent acid- insoluble material, the rest being mostly halite with small amounts of other saline minerals forming the balance.16 The mud sample from near the basal con tact of core GS-40 contains only 32.4 percent acid-in soluble material and larger amounts of dolomite, pirssonite, gaylussite, and halite.
16 The percentages of acid-soluble K2O appear too high. The discussion of analytical problems encountered in making analyses of samples from the Parting Mud (p. 54) applies to the two analyses in table 18.
RADIOCARBON AGES OF STRATIGRAPHIC UNITS
By MlNZE STUIVER17 and GEORGE I. SMITH
INTRODUCTION
Radiocarbon ages, together with the stratigraphy and mineralogy, provide a basis for reconstructing the climatically controlled history of Searles Lake. The large number of published 14C dates that have been de termined on core samples from Searles Lake (fig. 30) are taken from publications by Flint and Gale (1958), Rubin and Berthold (1961), Ives, Levin, Robinson and Rubin (1964), and Stuiver (1964). Of the 74 dates shown in figure 30, 40 are based on carbon from inor ganic carbonate minerals, and 2 are on wood frag ments.
Fourteen previously unpublished dates on dissemi nated organic carbon from the Lower Salt and the top of the Bottom Mud are given in table 19.18 These sam ples were collected in November 1964 from core L-31 in order to obtain a detailed chronology of the wet-dry episodes in the Lower Salt deposits.
The dated samples plotted in figure 30 are grouped according to the stratigraphic unit from which they came. Stratigraphic assignments were based on the re ported sample depths and logs of the sampled cores. The relative positions of samples from the Parting
" Quaternary Research Center, University of Washington, Seattle, Wash. 98195. 18 Support of the "C work was through N. S. F. grant GS-36762 to M. Stuiver.

RADIOCARBON AGES OF STRATIGRAPHIC UNITS 69
UNIT
Overburden Mud
Upper Salt
Parting Mud
Lower Salt
Bottom Mud
AGE, IN YEARS BEFORE PRESENT (STUIVER, 1964)
I
\
f (6,890 ± 140) I/ / I 6,630 ± 390 I / | 3,520 ± 190 (wood)/ [(9,700 ± 180) -^^
r (11,100 + 180) l__— ——— - 11,010 ± 150 F
(10,600 + 100) -~-^^ (10,460 ±170) I ^~^^^ 11, 510 ±150 l\^ (9,720 ± 200) v ^\ (9,850 ± 18O) \ ^ (9,840 ± 80) \\
1 0,680 ±90 * \\\ 10,900 ±90 \\\\ 10,230 ±80 A\\\ 10,060 + 90 \\V\\\ 10,410 ±120 \\V\\
(10,630 ±80) \V^V\\ (11,470 ±100) \\^^\
10^590 + 110 r^~-^^(10,440 + 90) l__—— —11, 800 ±130 I
(13,100 ±230) l^^^^ 13,710 + 270 I .^
(17,710 + 280) \^^ / 18,800 ±240 I .//
(19,380 + 250) L/// 19,970 ±280 I / //
(21 ,380 ± 340) I/ // 22,300 ± 280 I //
(20,650 ±210) Y/ 24,630 ± 460 I /
(22,450 ± 380) I/ / [_ 23,710 ± 320 I /
" 24,600 ± 400 ^//^ 27,500 + 800 '/'
(25,800 ± 500)* ' (24.400 ± 400)*28,000 ± 600 f32,000 ± 1,000 -—- _________
(32,300 ± 900) Y 32,700 + 800 I
LITHOLOGY
^••v^--5W:\ft$
m?•••':.:•'• :• v>
• •. ;'; M — ~7-'-':'.\ \ '• '
' . .'\> . lyi — 6'..'. ..•/
•'. '. • '*M — 5 •.'.*'•'.•.
•':'.-:'-.--M -4V;:::v
.-: -.-.'M - 3. •••••-.
•;..••. -,-M - 2-: :.-;: /
fr-v^Xiv^/.;:.:/.
;':•'•.'.• _ •'.''• '. ;;'. •.;"•';'.
AGE, IN YEARS BEFORE PRESENT (FLINT AND GALE, 1958;
RUBIN AND BERTHOLD, 1961; AND IVES AND OTHERS, 1964)
^^ 11,800 ± 1,000\ ^--^^^ 12,390 + 400 J
^\ ^ 1 0,270 ± 450 1 ^U 11,400 + 600
1 ( 9,900 ± 500) >
, (8,550 ± 250)1
/ / 1 0,494 ± 560 v /\ 10,700 ±130 //I (11,810± 140)
// / 15,089 ± 1,000 // / \ (12,420 ± 160)
,/ /A 12, 730 ±210X// 18,000 + 730
/X Xj 16,620 + 320 ///""I (16,890 + 210)
X/\^^ 22,600 ±1,400 ^^^^ \ 21, 200 ±2, 170 ^^\ 23,923 ± 1,800
^^ I (23,610 ± 1,750) ^-^^^l 24,690 + 1,070 \^\^ 22,800+1,400 \ ^ 22,400 ± 1,000 J
\\ (22,620 + 200)* \ (25,600 ± 230)
I 26,700 ± 2,000 (wood) > \ 29,500 ± 2,000
/[ (23,000 ± 1,400) // (31, 750 ±600) / /. 32,300 + 400 / /// (31,100 + 400)*
~~~~~~ —— 46,350 ±1,500
UNIT
Overburden Mud
Upper Salt
Parting Mud
Lower Salt
Bottom Mud
FIGURE 30.—Summary of published 14C dates on subsurface samples from Searles Lake. Dates in parentheses are on carbon in inorganic carbonates and are considered relatively unreliable; dates followed by asterisks (*) were sus pected by Stuiver (1964) of being contaminated; remaining dates, except for two on wood, are on organic carbon disseminated in lake mud.

70 SUBSURFACE STRATIGRAPHY AND GEOCHEMISTRY, QUATERNARY EVAPORITES, SEARLES LAKE, CAIIF.
TABLE 19.—New 14C dates on disseminated organic carbon in mud layers of Lower Salt and top of the Bottom Mud, core L-31
Sample Depth Years B.P.
Y-2230' ______ Top 5 cm of M-7 23,750 ± 300Y-2231 ______ Bottom 5 cm of M-7 26,350 ± 350Y-2232 ______ Top 5 cm of M-6 24,760 ± 300Y-2233 ______ Bottom 5 cm of M-6 28,880 ± 500Y-2234 ______ 5 cm thick layer near
base S-5 27,550 ± 400Y-2235 ______ Top 5 cm of M-5 28,380 ± 350Y-2236 ______ Bottom 5 cm of M-5 29,040 ± 350Y-2237 ______ Top 5 cm of M-4 28,620 ± 350Y-2238 ______ Bottom 5 cm of M-4 30,160 ± 400Y-2239 ______ Top 5 cm of M-3 30,510 ± 400Y-2240 ______ Bottom 5 cm of M-3 30,270 ± 500Y-2241 ______ Top 5 cm of M-2 30,280 ± 300Y-2242 _ __ _ _ Bottom 5 cm of M-2 32,620 ± 500Y-2243 ______Top5cmofBottomMud 32,800 ± 600
Mud are approximate; dated samples came from many cores, and the level within the unit was esti mated and plotted on the basis of its proportionate position between the base and top of the Parting Mud in that particular core hole.
RELIABILITY OF SAMPLED MATERIALSDates on wood are considered to be the most reli
able. Dates on disseminated organic carbon are con sidered less reliable because most are probably somewhat too "old." Dates on carbonate minerals may be either a little too "old" or too "young" and are therefore the least useful. The reasons leading to this ranking of reliabilities are given below.
The dates on wood are considered best because they are on material that is relatively unsusceptible to re placement by younger carbon, and because they pre sumably derived carbon from atmospheric CO2 rather than from the lake. The only predictable discrepan cies between 14C dates and true dates are produced by the variation in the atmospheric 14C through geologic time which is known for the past 7,400 years from comparison of 14C dates with tree-ring dates, and the minor discrepancies that result from fractionation of 14C by some plants and trees during their growth. The 14C date of 3,520 ± 190 on wood corresponds to a tree- ring age of 3,720-3,800 years (Ralph and others, 1973, p. 11; Stuiver and Suess, 1966, p. 539). The 14C date on wood of 26,000 ± 2,000 years is too old for comparison with tree-ring chronologies. Carbon isotope fractiona tion during plant growth can be calculated by measur ing "C/^C ratios. When 13C measurements are lacking, age errors of a few hundred years may be introduced.
Dates derived from disseminated organic carbon form the main basis for the time scale used to inter pret and correlate the stratigraphic section in Searles Lake. These dates had to be used because wood frag ments are rare in the sediments, and a few hundred grams of almost any subsurface sample of mud pro
vides enough disseminated organic carbon for datmg. Most mud samples contain several percent carbon in the acid-insoluble fraction that commonly makes up 15-25 percent of the total sample (Stuiver, 1964, table 4; this report, table 13). A sample adequate for dating may therefore be obtained from normal-sized cores by a horizontal slice 1-2 cm thick that probably repre sents less than 100 years of sedimentation. The or ganic compounds in these muds do not seem to have changed their composition greatly since deposition (Vallentyne, 1957) although some change is indicated by the secondary organic components noted by Man- kiewicz (1975).
Broecker and Kaufman (1965, p. 554) suggest that dates on such material from Searles Lake are likely to be about 2,200 years too "old." An error in this direc tion is anticipated because the original 14C/12C ratios i in most lacustrine organisms reflects the ratios in l;he lake waters, and those ratios were probably not ,i;he same as in the contemporaneous atmosphere because of the slow rate at which atmospheric CO2 exchanges with water. The suggested magnitude of error is based on a calculation of the amount of CO2 in solution end the probable exchange rate that indicates that the ra tio of 14C in the CO2 dissolved in the original lake was only 77 percent that of the atmosphere, giving an ap parent age of 2,200 years. The lake area of 250 km2 assumed by them is about correct when the lake stood at a level near 1,750 ft (530 m), and this is reasonable for the lakes that existed during the time the Lower Salt was being deposited (Smith, 1968, fig. 4). At she time the Parting Mud was deposited, however, :he average elevation of the lake surface was near 2,000 ft (610 m) and its area about 400 km2 . Using their for mula and revised values for the average lake area dur ing its expanded stages of 400 km2 and for the number of moles of Na2CO3 of 2.7X10¹² (table 17), the percent age of 14C in the lake relative to that of the atmosphere becomes 83, indicating an original apparent age of 1,500 years. Broecker and Kaufman (1965) found that modern organic material from Mono and Pyramid Lakes gives apparent ages of 1,800 and 800 years, re spectively.
Some confirmation of this magnitude and direction of error predicted by Broecker and Kaufman (1965) results from comparison of two dates from unit M-3 of the Lower Salt (fig. 30). The date of 29,500 ± 2,000 on disseminated organic carbon is 2,800 years older than the date on wood from the same horizon, but the large experimental uncertainty on both samples must be considered in drawing conclusions from this compari son. A similar comparison can be made with the date on wood from the Overburden Mud where one date on disseminated organic carbon from a slightly greater

RADIOCARBON AGES OF STRATIGRAPHIC UNITS 71
depth is about 3,000 years older than the dated wood. An age difference twice as large results if other dates on disseminated organic carbon from nearby horizons are compared with the wood date.
It is difficult to assess the extent of disequilibrium between atmospheric and lacustrine CO2 during var ious stages in the history of Searles Lake. One reason is that some of the lakes appear to have been density stratified (Smith and Haines, 1964, p.52; Smith, 1966, p. 174-176). In such lakes, most organisms live in the less saline and less dense surface layer where photo- synthetic activity is greatest. The volume of such a surface layer is only a fraction of the total volume of the lake, and the proportion of total carbonate in it even less because of its lower salinity. The CO2 in the surface layer of a stratified lake, must therefore be more nearly at equilibrium with the atmosphere than is the near-surface concentration of CO2 in an unstra- tified lake having the same total salinity (Deevey and Stuiver, 1964, p. 6). During the times represented by organic-rich mud layers in Searles Lake, both strati fied and unstratified lakes probably existed, but it is not possible to reconstruct the physical and organic regime of the lake at all stages represented by samples.
Additional sources of error come from the fact that during most stages of deposition, older lake deposits were undergoing erosion. They contributed both de- trital organic carbon and older CO2 as their carbonate was dissolved. Pre-Quaternary carbonate rocks in Searles Valley are virtually restricted to the north quarter of the Slate Range. Broecker and Walton (1959, p. 24) consider the effects of this process to be negligible in lacustrine environments. Oana and Dee vey (1960, p. 265) found evidence based on 13C ratios in Searles Lake muds that the process was potentially a major source of error, but with a larger number of samples, Stuiver (1964, p. 389-390) was unable to de tect the trend on which their conclusion was based. The many pairs of dates on coexisting carbonate and organic carbon have differences that range from insig nificant to 6,500 years. Such differences may be pro- duced in part by variations in the ratio of contaminating carbon introduced in the two forms; dates on both carbonate and organic carbon would re flect the CO2 dissolved from older carbonates, but only the dates on organic carbon would reflect the de- trital older carbon.
These diverse sources of error lead to diverse possi ble combinations. For example, the quantity of car bonate dissolved from older lake sediments and transported as dissolved CO2 into the existing lake was partly a function of the area of sediments preserved and exposed around the lake; the CO2 derived from
this source affected both organic carbon and inorganic carbonate in the new lake sediments. The quantity of detrital carbon was influenced by the area of expo sure, but it affected only the organic carbon fraction of the new sediments. The rate of new organic carbon production in the lake changed as the concentrations of nutrients and other salts varied, and this variation in productivity affected the ratio of new to reworked organic carbon in the sediments. Moreover, precipita tion of CaCO3 was the result of two mechanisms, an nual evaporation and mixing with the underlying saline water; the relative importance of the two mechanisms determined how much carbon came from the CO2 in the surface layer of fresh water (and was thus nearly modern) and how much came from the CO3 in the underlying layer (which was less equili brated and therefore not so modern).
As dates on carbonate minerals involve uncertain ties as to the original 14C ratio of the CO2 in solution and other factors, neither the direction nor the magni tude of displacement of 14C ages on carbonate minerals can be evaluated. Like the organisms that produced the organic carbon in muds, they reflect the 14C con tent of the carbonate and CO2 dissolved in the water, and this ratio was contemporaneous only to the extent that it was equilibrated with the atmosphere. Many of the dated carbonate minerals (such as gaylussite and pirssonite) were formed from moderately saline brines and others (such as trona) came from highly saline brines. Brines represent periods when the lake area was smallest and the rate at which CO2 was equili brated with the atmosphere at its lowest. Most car bonate minerals formed, therefore, at times when equilibration with the atmosphere was less complete than during periods when the lake contained rela tively fresh water and the deposits consisted of organic muds.
Additional change can occur after burial if either younger or older carbon is introduced during recrys- tallization of the carbonate minerals. Older carbon from deeper horizons may be introduced by carbonate brines that migrate upward during compaction. Car bon from older zones may have come from upward moving CO2 produced by microorganisms that contin ued to assimilate organic matter after burial (although it is uncertain how long CO2 can avoid being converted to methane in the reducing environment provided by these muds). At some time during the history of Searles Lake, when the hydrostatic brine level became like that of the present, carbon from younger horizons began to be introduced into deeper levels because of the downward movement of brines (Hardt and others, 1972, fig. 10). The hydrogen-deuterium ratios of the interstitial brines and hydrated salts in the mud units

72 SUBSURFACE STRATIGRAPHY AND GEOCHEMISTRY, QUATERNARY EVAPORITES, SEARLES LAKE, CALIF.
suggest, according to unpublished data, that most of the gaylussite crystallized from brines that had mi grated from above; dates on those crystals are there fore expected to be too young.
Many trona layers are bedded and fine grained, and their crystals appear to have stopped recrystallizing soon after the layer was deposited. If the brines in which they grew or recrystallized were near equilib rium with the atmosphere, they are correspondingly reliable carbonate minerals for dating purposes. Whether the brines had reached the required state of near-equilibrium is difficult to determine by an inde pendent method.
All gaylussite and pirssonite crystals in the mud layers were crystallized after the muds in that horizon were deposited and largely compacted (Smith and Haines, 1964, fig. 15; Eugster and Smith, 1965, pi. 1), and all dates on those minerals are suspect. Stratigra- phic unit M-3, the unit that provided wood and dis seminated organic carbon for dating, contains gaylussite crystals that yielded a 14C date (fig. 30) of 23,000 ± 1,400 years. This is 3,700 years younger than the wood. If the date on wood is correct, the gaylussite contains about 2.1 percent more modern 14C than the wood and may represent contamination to that ex tent. A liklier mechanism is that the gaylussite formed by the reaction between aragonite or calcite and Na2CO3-rich brines from above:
CaCO3 +2Na + +COr+5H2O = CaCO3 -Na2CO3 -5H2OIf the original 14C content of the aragonite was the same as the wood, 3.6 percent modern, and the gaylus site is 5.7 percent modern, then by the above equation, the CO3 = added from brine must have had a 14C con tent of 7.8 percent modern, or an apparent age of 20,500 years.
Most other pairs of carbonate-organic carbon dates do not differ by this much, and about a third differ in the opposite direction. Of the 22 paired dates on car bon and carbonate listed by Flint and Gale (1958, ta ble 2) and Stuiver (1964, tables 1, 2, and 3), 14 of the carbonate ages are younger than the organic carbon (average difference = 1,710 years), and 8 are older (average difference = 520 years).
It seems, therefore, that carbon exchange mecha nisms that operate during recrystallization of carbon ate minerals are not predictable in terms of either direction or amount. Even when dates on carbonate and organic carbon are determined in pairs, their rela tive ages cannot be used to indicate whether "old" or "young" carbon was introduced during carbonate re- crystallization because the amount of "old" carbon in the organic sample cannot be independently determined.
An opportunity to make a detailed study of paired dates is provided by the 10 pairs listed by Stuiver (1964, table 2) obtained from samples of three cores from the Parting Mud. The three secondary carbonate samples from the top 10 percent of the unit are 200- 1,410 years "older" than the organic carbon in the sur rounding muds, and the seven samples that lie in the lower 90 percent of the unit are 590-3,980 years "younger". The relation between dates appears too consistent in direction to be accidental.
Stuiver (1964, p. 384-387) suggested that this rela tion could be explained by the downward diffusion of 14C from the top part of the unit, as this isotope had a higher concentration in the brine in that part of the unit and substantial diffusion could have taken place during the 10,000-year period that followed its deposi tion. Those calculations however, required the top of the Parting Mud to be sealed off by the Upper Salt against post-depositional diffusion of any 14C from above, which we now consider unlikely. It seems liklier that the porous carbonate salts at the base of the Up per Salt provide a poor seal, and that the brines in the Upper Salt constitute an available source of carbonate brine having a greater concentration of 14C available for diffusion. If this is so, the mechanism is removed by which the carbon as CO3 near the top could have become depleted in 14C by downward diffusion while the underlying deposits became enriched and thereby appear younger; downward diffusion of 14C from the Upper Salt would instead have maintained or in creased the amount of 14C in the carbonate of the top part so that its apparent age remained the same or be came younger.
It is unlikely that this relation between dates can be entirely explained by the diffusion of high carbonate brines into the Parting Mud. Postdepositional move ment of such brines was probably responsible for the recrystallization of aragonite and calcite to form the gaylussite or pirssonite crystals that were dated. This mechanism would have required the migration of car bonate-bearing brines in opposing directions; the car bonate minerals in the top 10 percent of the Parting Mud would have had to incorporate CO3 from older brine that migrated upward from underlying horizons, the carbonate in the lower 90 percent to incorporate CO3 from brine that migrated downward from overly ing horizons.
An alternative explanation stems from the possi bilities that (1) during deposition, all the original 14C ages were too old and that successive 14C ages on both carbonates and organic carbon differed from the cor rect age and from each other by varying amounts, (2) that during diagenesis, all apparent dates on carbon ate minerals decreased by a relatively uniform

RADIOCARBON AGES OF STRATIGRAPHIC UNITS 73
amount as they incorporated CO3 from downward-mi grating brines. The upper 10 percent of the Parting Mud appears to represent a period when the lake was strongly stratified. In those thin and relatively fresh surface layers, organic carbon was probably generated with apparent 14 C ages that were nearly modern, whereas the submerged and unequilibrated CO3 -rich brines of the lower zone (which supplied the carbon for most of the crystallizing CaCO3 ) was producing ap parent 14C ages that were substantially old. If those apparent ages were too old for the subsequent recrys- tallization of carbonate minerals to reverse, the pre sent deposits would have organic carbon dates "younger" than the carbonates—the relation we now see. The lower 90 percent of the Parting Mud, on the other hand, appears to represent a time when the lake was unstratified or less frequently stratified so that most of the organic carbon and carbonate was produced in the same layer and probably slightly old. When more modern carbon was later introduced dur ing diagenesis of the carbonate minerals, it caused the apparent 14C age of the minerals to appear less than the organic carbon.
A change in the structure of the lake according to this pattern is reasonable in view of its history during Parting Mud time as deduced from surface mapping (Smith, 1968, fig. 4). The last brief episode of lake ex pansion (and mud deposition) required introduction of a large amount of new water each year into a basin that had contained smaller and more saline lakes for several thousand years. The new and relatively fresh water introduced by streams was probably nearly in equilibrium with the CO2 of the atmosphere (Broecker and Walton, 1959, p. 32). Carbon in the underlying body of saline water probably would have been "older" because incompletely equilibrated and possibly be cause large areas of older lake deposits were exposed to erosion so that their carbon and carbonate were added to the lake. Earlier stands of the lake during Parting Mud time were mostly lower and changed less rapidly; new water had more time to mix and form an unstratified lake that was less completely equilibrated and thus depositing both organic and inorganic car bon that was slightly old.
Considering the possible sources of error in most 14C dates from Searles Lake, the agreement between dates obtained from different materials and determined in different laboratories is surprisingly good. What the discussion shows is that the dates must be considered individually. The nature of the material, the lake his tory at the time the sample material was deposited, the subsequent history of the layer, and the size of the experimental uncertainty all must be considered.
The discussion here shows that 14C dates on wood
samples are best although wood samples from the Searles Lake deposits are rare. They can be used with out a correction and with confidence, especially if the experimental uncertainty is doubled, increasing the liklihood from two-out-of-three- to nineteen-out-of- twenty that the correct date lies in this range. Dates on disseminated organic carbon and carbonate are much more abundant, but several factors other than age influence their 14C content. Most factors tend to make the disseminated organic carbon samples ap pear old relative to their true 14C age. Present-day ana logs and calculations of reasonable models show that this error may range in size from several hundred to a few thousand years. The age assignments that follow are mostly based on disseminated organic carbon; the "corrected" 14C ages assume that the reported dates are 500-2,500 years too old. Carbonate mineral sam ples may have an error of comparable size but either young or old, and these samples provide only a supple mentary basis for estimating the ages of units in Searles Lake. With these considerations in mind, the contacts of the mud units are interpreted to have un- corrected and corrected 14C ages as follows.
PROBABLE TRUE AGES OF STRATIGRAPHICUNITS
In the Overburden Mud, only the one date on wood is regarded as reliable. The wood was recovered from a depth of 2.4 m, about one-third of the depth to the base of this unit, and its age was 3,520 ± 190 years (Stuiver, 1964, p.381). The unit was deposited in a much smaller lake than most other mud units (Smith, 1968, fig. 4), and large amounts of older lake beds con taining carbon and carbonate minerals were exposed to erosion. Possibly it was contamination from these widespread deposits that accounts for the extreme discrepancy between the date on wood from this unit and the dates on both detrital carbon and carbonate from nearby horizons. The 14C age of the basal contact of the Overburden Mud is more than 3,500 ± 400 years and less than the age of the Parting Mud.
The seven 14C dates from organic carbon derived from the top of the Parting Mud are within a few hun dred years of each other (fig. 30). Their average is about 10,500 ± 165 years. An earlier estimate of the 14C age of this contact was 10,200 years (Stuiver, 1964, p. 382). Quite likely all the dates are too "old" because of the unequilibrated older CO2 that existed in the lake water. The corrected 14C age of this contact is therefore likely to be between 8,000 and 10,000 years B.P. The minimum correction leading to the older date is favored because Searles Lake was apparently stratified and the 14C that became photosynthetically fixed in the upper layer was therefore more nearly contemporaneous.

74 SUBSURFACE STRATIGRAPHY AND GEOCHEMISTRY, QUATERNARY EVAPORITES, SEARLES LAKE, CALIF.
The base of the Parting Mud is represented by several dates on organic carbon (fig. 30). The two nearest the base average about 23,000 ±900 years. The seven dates on the lowest 0.5 m average 23,300 ± 1,175 years. Stuiver (1964, p. 382) estimated the 14C age of the basal contact to be about 24,200 years old, the rounded average of the two most reliable dates from the base of the unit. An age of 24,000 years is used here, but the discussion shows that ages spanning more than 1,000 years can be derived. Again, there is reason to suspect that most of the organic carbon was too "old" when deposited the corrected 14C age of the base of this unit probably lies between 21,500 and 23,500 years.
Published dates on units within the Lower Salt in clude six dates on disseminated organic carbon and one on wood (fig. 30). In addition, 13 dates are now available on disseminated organic carbon from core L-31. (table 19). Where possible, samples were col lected from the top and bottom sections of the mud layers in the Lower Salt. The ages increase downward from 23,750 ± 300 at the top of M-7 to 32,800 ± 600 at the top of the Bottom Mud, a range of 9,050 years. A minor reversal is represented by the age for the top of M-6 (24,760 ±300), although it is consistent with the age of 24,600 ± 400 years previously determined on a sample from the upper part of M-6 (Stuiver, 1964 and fig. 30). Plotting this series of 14C ages against depth (fig. 31) points up the relatively long periods repre sented by the muds and the short intervals represented by the salts. For instance, units M-7, M- 6, and M-2 together account for approximately 6,500 years of the 9,000 year long Lower Salt episode. The top of unit S-5 represents the only period of desicca tion in this unit. It is bracketed by ages of 27,550 ± 400 and 28,880 ± 500 years; its 14C age is thus near 28,000 years B.P.
The lake history during Lower Salt time was com plex and changed rapidly (Smith, 1968, fig. 4). It is thus difficult to evaluate the probable degree of CO2 equilibration between the atmosphere and the lake waters that contained the majority of organisms or the amount of older carbon and carbonate that was washed into the lake from the surrounding slopes. The difference between dates from unit M-3 on dissemi- nated carbon (29,500 + 2,000) and wood (26,000 + 2,000) suggests a 2,800-year lag in the ex change of CO2 in the lake with the atmosphere, but the large experimental uncertainty in both dates makes it unwise to use the size of this difference rigorously. The top of M-6 may represent a time when the CO2 in the lake was close to equilibrium with atmospheric CO2, and its age, 1,500 years younger than the pro jected age of this horizon in figure 31, may be the ones
PARTING MUD
h< 0 D Lj
C
M-7
M-6
J ( I S-5j>)
M -5
M -4
M-3
M-2
BOTTOM MUD
ff*«
14 C AGE, IN YEARS
24,OOO 26,000 28,000 30,000 32,000 34,000
i*"1T
i • iiFIGURE 31.—Relation between depth and new 14C ages of mud
layers in Lower Salt.
that are too old by 500-2,500 years. The corrected 14C age of the period of major dessication (S-5) is there fore interpreted to be between 25,500 and 27,500 years, and the age of other mud units to be corre spondingly less than reported.
The two 14C dates on organic carbon from the top part of the Bottom Mud give ages of 32,700 ± 800 years (fig. 30) and 32,800 ±600 years (table 19). These ages are interpreted to mean that the uncorrected and rounded age of the contact is about 32,500 ± 700 years, and that the deposition of the Bottom Mud actually ceased some time between 30,000 and 32,000 years ago.
The base of the Bottom Mud is too old for radio carbon dating. The period of time required for its de position is inferred by extrapolation of sedimentation rates determined from the Parting Mud (table 20) and from the top 3 m of the Bottom Mud. This period is then added to the age of its top contact, which is ap proximately 32,500 years. This calculation is not greatly affected by uncertainties about the degree of CO2 equilibration in a lake because the sedimentation

RATES OF DEPOSITION 75
rates are based on the differences between dates on disseminated organic carbon which are subject to comparable errors. As discussed in the next section, it probably should be corrrected on the basis of the per centage of acid-insoluble material, which is higher in the Bottom Mud than in the Parting Mud.
An unpublished study by Goddard (1970) compares dates on salts obtained by ^"Th/234!! techniques with dates obtained by 14C techniques. 19 Twenty samples from two cores of the Lower Salt and two samples from the Upper Salt were dated by both methods and found to be in general agreement. Better agreement among dates on the Lower Salt was found when the 14C age was reduced by 1,900 years to account for the lag in isotopic equilibrium of lake waters with the atmo sphere. He concludes that the absolute ages of salt units in the Lower Salt are as follows:
Unit Age (xio3 years)S-7 _____________ 23.0±1.0S-6 _____________ 23.9±1.0S-5 _____________ 26.1 ±1.0S-4 _____________ 26.3±1.0S-3 _____________ 28.5±1.0S-2 _____________ 29.8±1.0S-l _____________ 31.3±1.0
Samples from depths of 7.6 and 21.5 m in the Upper Salt gave 23°Th/234 U dates of 13.8±1.2X10³ and 10.0±0.2X10³ years, respectively.
Using the average sedimentation rates for mud (ta ble 20) without any correction, the base of the Bottom Mud is calculated to have an age of 143,000 ± 6,000 years. (In calculating these numbers, the age of the top contact of the Bottom Mud was rounded to 33,000 years.) (In calculating these numbers, the age of the top contract of the Bottom Mud was rounded to 33,000 years.) The faster and slower sedimentation rates given for cores 129 and X-20 in table 20 indicate ages of 132,000 ±12,000 and 155,000 ±9,000 years. Correcting the sedimentation rates on the assumption that the sedimentation rate of acid-insoluble compo nents increased so that they accounted for 30 percent of the sample (while the carbonate sedimentation rate remained constant), the base of the Bottom Mud is calculated to have an age of 129,000 years, with the corrected faster and slower sedimentation rates indi cating ages of 119,000 and 139,000 years. Correcting the sedimentation rate on the assumption that the carbonate sedimentation rate decreased enough for the percentage of acid-soluble material to increase to 30 percent indicates the base of the Bottom Mud to be about 195,000 years old. In this paper, an age of 130,000 years, a rounded value based on the corrected"Data later included in : Peng, T.-H., Goddard, J. G., and Broecker, W. S., 1978, A direct comparison of UC and 230Th ages at Searles Lake, Calif: Quaternary Research, v. 9, no. 3, p. 319-329.
average sedimentaion rate, is used for the base of the Bottom Mud, but the above discussion indicates the level of uncertainty.
RATES OF DEPOSITIONA knowledge of approximate rates at which salts
and muds were deposited in Searles Lake helps inter pret the depositional history in the basin. The deposi- tional rates of salts and muds can differ by about three orders of magnitude. Estimates of the rates for each follow.
Salts crystallize from a body of brine at a maximum rate that is determined by the annual evaporation. Some salts (such as natron and mirabilite) crystallize at an accelerated rate during winter because their solubility is markedly reduced by low temperatures, whereas others (such as halite) are virtually un affected by temperature change. The net accumula tion in a year, though, reflects the amount of water lost by evaporation in the preceding year reduced by the amount of new water that was added to the lake during the year. The maximum rate of saline deposi tion is thus determined by the annual evaporation when no new water is added during the year. Unless the lake begins to expand, the minimum rate is deter mined by the amount of new dissolved material that is introduced during the year because the water that brought it in must be evaporated and the dissolved salt crystallized out.
Evaporation rates of brines can be derived in two ways: (1) by calculations based on evaporation rates from standard evaporation measurement pans, or (2) by comparison of measured evaporation rates from natural brine bodies. The results, derived below, sug gest maximum rates of accumulation of porous salt layers to be between 25 and 40 cm per year. These rates mean that all the salt layers in the Bottom Mud, and all but one of the layers in the Lower Salt could be the result of less than 5 years of crystallization. Unit S-5 of the Lower Salt might represent only a quarter of a century. The Upper Salt might represent half a century.
Rates based on evaporation pan data must first be multiplied by a factor approximated in a desert envi ronment by 0.6 to adjust for the differences in the heat distribution, surface character, circulation, and size of large natural bodies of water relative to small shallow test pans (Blaney, 1955, 1957). The result of this cal culation must then be multiplied by a factor that nor mally lies somewhere between 0.6 and 0.8, depending on the species and concentrations of ions in the solu tion,20 as well as the evaporation rate, humidity, and temperature of the brine (Harbeck, 1955). Using rea-
1 This factor is applicable to most solutions whose anions are dominated by Na and

76 SUBSURFACE STRATIGRAPHY AND GEOCHEMISTRY, QUATERNARY EVAPORITES, SEARLES LAKE, CALIF.
sonable values for these factors and applying them to the saline lakes that existed in Searles Valley during the periods represented by salt layers suggests maxi mum depositional rates about 15-25 cm of solid salts per year, or 25-40 cm of porous salts.
A series of measurements on evaporating brine from Owens Lake allows a second means of estimating maximum salt crystallization rates. That lake, 100 km northwest of Searles Lake, is 600 m higher, so there fore has a slightly less arid climate. Owens Lake is nor mally almost dry, but becomes flooded whenever run off in Owens Valley greatly exceeds the capacity of the Owens Valley aqueduct, which carries water to Los Angeles. In the winter of 1937-38, Owens Lake flooded, and between mid-April 1939 and mid-April 1940, evaporation lowered the level of Owens Lake by 46.9 inches (119 cm) (Dub, 1947, table 3). During the same period, 6.69 inches (17 cm) of rain fell on the lake, meaning that total evaporation from its surface was 53.6 inches (136 cm). The brine had a Na2CO3 + Na^A + Na2SO4 + NaCl content of 154,000 ppm at the beginning of this period and a content of 310,000 ppm at the end. Saturation with sodium carbonate probably occurred during July 1939 when a salinity of about 220,000 ppm was reached. Approximately 29 inches (73 cm) of net evaporation occurred during the 9-month period that followed. A brine body, 73 cm deep and containing 220,000 ppm solids (about 245,000 mg/L), would precipitate 9 cm of solids (as suming a specific gravity of 2.1) or about 15 cm of po rous salts containing 40 percent brine. Extrapolating linearly from 9 months to a full year indicates nearly 19 cm of porous salts as an annual accumulation rate, but the actual rate might be nearer 25 cm because the three unrepresented months are May, June, and July, when about 40 percent of the annual evaporation takes place (Lee, 1912, table 50).
Work by Friedman, Smith, and Hardcastle (1976) on Owens Lake following another period of flooding in the spring of 1969 permits another estimate. A maxi mum water depth of about 2.4 m was reached in Au gust 1969, and this water had virtually all evaporated by September 1971; the net evaporation rate was therefore about 120 cm per year. Sodium carbonate salts began to crystallize in mid-August 1970 from 168 cm of brine. Since the salinity of the brine at that time was near 250,000 mg/L, about 20 cm of nonporous salts (density = 2.1) should have accumulated upon desiccation, which took place a year later. This would be increased to nearly 33 cm if its porosity was 40 per-
K. Solutions containing much Mg have their evaporation rates much more strongly af fected by increased salinities because of the very large hydration energy of that ion. Turk (1970) studied the evaporation rate of MgCl2-rich brines from the Bonneville Salt Flats and found that the most concentrated solutions reduced the evaporation rate to as little as 9.5 percent of the freshwater rate. Brines dominated by CaCl2 would exhibit intermediate effects.
cent. 21Unless the saline lake begins to expand, the mini
mum rate of salt deposition is controlled by the amount of dissolved material introduced into the ba sin each year. If one assumes that the Owens River was the source of all solids that entered Searles Valley during a given year and that the quantity was the same as at present, an estimate can be made of the rate salts would have to be crystallized annually to maintain a steady state. In 1908, at a station in the lower Owens River, the water contained an average of 339 ppm solids and had an annual flow of 218,000 acre feet (269X106 m3 ) (Gale, 1914, p. 263). This flow car ried, therefore, about 9X10¹⁰ g of solids in solution, which, if crystallized in Searles Valley over the area of the Upper Salt (110 km2 ), would amount to an annual layer of porous salts about 0.06 cm thick (17 yrs/cm). This rate is about three orders of magnitude less than the maximum estimated rate for salts and is compara ble to the estimate of depositional rate for muds. Bradley and Eugster (1969, p. B35) used a deposi tional rate of 0.2 cm/yr (5 yrs/cm) in their calculations of saline depositional rates of trona beds in the Green River Formation. This rate was taken from Fahey's (1962, table 17) estimate based on the percentage of acid insoluble material in the saline beds.
Alternating light and dark beds of trona at the base of the Upper Salt and elsewhere have thicknesses ranging from about 1 to 30 cm (Haines, 1959, pi. 10; Smith and Haines, 1964, p. P22 and figs. 6, 7). These were formerly considered to be annual layers and thus were a means of estimating the rate of saline accumu lation. However, the salines deposited in Owens Lake in 1970 and 1971 have many similar layers that appar ently reflect weather cycles of a few days or weeks. Similar beds in the Searles Lake saline layers may also represent much less than a year.
Mud layers are deposited at much slower rates. Us ing thicknesses of the material compacted to its pre sent form, the rate near the middle of the basin is probably near 0.025 cm/yr or 40 yrs/cm. Table 20 gives all of the 14C dates from the Parting Mud that used organic carbon and represent a sequence of two or more from the same core. Rates implied by many of the 17 pair are meaningless because the differences between sample ages have large experimental uncer tainties, or the intervals in the core were too close to allow the differences in 14C dates to be significant. The differences between the uppermost and lowermost samples in cores X-20, X-23, L-U-1, and 129 are con sidered the most meaningful. They average 38 ±2 yrs/crn and range from 34 ±4 to 42 ±3 yrs/cm. The
21 Actually, by January 1971, a substantially greater amount of salt had accumulated at the Owens Lake sample site. The discrepancy is apparently caused by wind, which drove crystals growing on the surface of other parts of the lake to the sample site where they sank to the bottom.

RATES OF DEPOSITION 77
TABLE 20.—Depositional rates in Parting Mud[Based on "C dates in Flint and Gale (1958, table 2) and Stuiver (1964, table 2). Only dates on organic carbon are used, and only cores with two or more such dates are listed]
Core
X-16X-20
X-231 ____
L-U-13 ___
129
Midpoint of sample WQ
(ft below top of age Parting Mud) (years)
9.35 13.75
.35 1.63 3.20 3.40 6.90 7.28
11.45 .16 .77
5.45 9.05
11.63 .02 .08 .15
12.25 .50
3.50 7.00
12.00
22,600 ±1,400 22,800 ±1,400 10,700 ± 130 11,800 ± 130 12,730 ± 210 13,710 ± 270 16,620 ± 320 19,970 ± 280 24,690 ±1,070
2 10,235± 105 10,590 ± 110 18,800 ± 240 22,300 ± 280 24,630 ± 460 10,680 ± 90 10,900 ± 90 10,230 ± 80 23,710 ± 320 10,494 ± 560 15,089 ±1,000 18,000 ± 730
222,562± 1,285
Difference between Difference between sample depths sample ages
(feet) (years)
4.40
1.28 1.57
.20 3.50
.38 4.17
.61 4.68 3.60 2.58
.06
.07 12.10
3.00 3.50 5.00
200 ±1,980
100 ± 184 930 ± 247 980 ± 342
2,910 ± 419 3,350+ 425 4,720 ±1,107
355 ± 152 8,210 ± 264 3,500 ± 369 2,330 ± 538
220 ± 127 -670 ± 120
13,480+ 330
4,595 ±1,146 2,911 ±1,238 4,562 ±1,478
Depositional rates between between intervals
yrs/ft
45
78 592
4,900 831
8,816 1,132
582 1,754
972 903
3,666
1,114
1,532 832 912
yrs/cm
1.5
2.6 \ 19
161 I 27 (
28937 ;19 \ 58 I 32 I 30 J
120 }37 I50 } 27 | 30 1
Avg.
Depositional rates, uppermost to lowermost
sample in coreyrs/ft yrs/cm
1,260 + 97 42 + 3
1,255 ±41 41 + 1
1,065 ±27 35 + 1
1,049 ±122 34 + 4
1,157 ±72 38 + 2'Parting Mud assumed to be 12 feet thick."Average of two dates.'Parting Mud in L-U-1 is 12.3 feet thick.
date of 17,100 ± 700 from a level 2.75 m below the top of the Parting Mud in core B (Mankiewicz, 1975, p. 10) suggests that the depositional rate of mud near the edge of the deposit (fig. 3) was near 24 yrs/cm (assum ing the top of the Parting Mud in that area to be 10,500 yrs old).
The 14C dates on organic carbon in two samples from the Bottom Mud (fig. 30) indicate a depositional rate of about 46 ± 6 yrs/cm. The upper date of 32,700 ± 800 represents the top 0.1 ft (.03 m) of the unit; the lower date of 46,350 ± 1,500 represents material at about 9.9 ft (3.0 m) depth.
There is a strong lithologic similarity between the dated sediments from the Parting Mud and the sedi ments in the Bottom Mud. Most of the Bottom Mud is too old for 14C dating, but extrapolation by use of these sedimentation rates provides an approximation. The 30 m of sediments in the Bottom Mud contains 3-6 percent bedded salts (mostly nahcolite and mirabi- lite), probably deposited in very brief periods of time as a result of chilling the lake waters when they were moderately saline. Excluding these salts leaves the equivalent of about 29 m of mud. The average sedimentation rate calculated from dates in the Parting Mud (38 ±2 yrs/cm) suggests that the Bottom Mud represents a period of deposition about 110,000 ± 6,000 years long. The fastest (34 ± 4 yrs/cm) and slowest (42 ± 3 yrs/cm) rates indicate depositional periods about 99,000 ±12,000 and 122,000 ±9,000 years long. The slower sedimentation rate indicated by the two dates at the top of the Bottom Mud (46 ± 6
yrs/cm) suggests a period of deposition about 133,000 ± 17,000 years long.
The variable percentage of acid-insoluble material in the Bottom Mud (fig. 6) shows that the relative im portance of various sedimentation processes during Bottom Mud time was not constant. The increases in the percentage of insoluble material may have re sulted from an increase in the rate at which water- or air-suspended clastic material was introduced, a very large increase in the rate of organic productivity, or a decrease in the rate of nonclastic precipitation while other rates remained constant. The average of the acid-insoluble percentages plotted in figure 6 is about 30, the average of the percentages given in table 13 for the Parting Mud about 20.
Starting with the balance of nonclastic, clastic, and organic sediments found in Parting Mud, an increase of 70 percent in the depositional rate of acid-insoluble clastic sediments, for example, would increase the to tal sedimentation rate 14 percent (assuming weight and volume percents are interchangeable) and pro duce a sediment containing 30 percent acid-insoluble material. An increase of 14 percent above the average sedimentation rate determined for the Parting Mud would change the average sedimentation rate for the Bottom Mud to about 33 yrs/cm. A 500 percent in crease in clastic material would double the sedimenta tion rate and produce a sediment containing the observed maximum of 60 percent acid-insoluble mate rial. Its sedimentation rate would be 19 yrs/cm. An average sedimentation rate of 33 yrs/cm for the 29 m

78 SUBSURFACE STRATIGRAPHY AND GEOCHEMISTRY, QUATERNARY EVAPORITES, SEARLES LAKE, CALIF.
of mud in the Bottom Mud indicates a depositional Parting Mud and the 46 yrs/cm rate determined for interval that was about 96,000 years long. the top 3 m of the Bottom Mud.
The increase in the amount of organic material re quired to change the percentage of acid-insoluble ma terial from 20 to 30 is too large to be a likely mechanism. The average sample of Parting Mud con tains about 2 percent organic material, and this would have to increase 3,500 percent to produce the required 70 percent increase in acid-insoluble material.
The observed variation in the percentage of acid- insoluble material in the Bottom Mud might also be caused by a decrease in the sedimentation rate of the nonclastics (mostly carbonates). Again, starting with the balance of sedimentation processes found in the Parting Mud, a reduction of about 40 percent in the depositional rate of carbonate would produce a sedi ment containing about 30 percent acid-insoluble ma terial. Its sedimentation rate would be about 68 percent that of the Parting Mud, or about 56 yrs/cm. This rate suggests a depositional interval that was more than 160,000 years long.
A final uncertainty in estimating the duration of the period represented by the Bottom Mud by using rates derived from the Parting Mud comes from lack of data on their relative densities and thus the relative extent of compaction. Core samples obtained from fresh water Lake Biwa, Japan, have mud densities at depths of 22-26 m (equivalent to the typical depth of the Parting Mud, although about twice as old) that aver age about 1.45 g/cm3, whereas samples from depths of 38 m and 68 m (equivalent to depths of the top and base of the Bottom Mud) average about 1.50 g/cm3 and 1.58 g/cm3, respectively (Yamamoto and others 1974, fig. 1). These densities imply a compaction of the deeper samples that increases with depth from 3.5 to 9.0 percent above the value found for the shallower samples. The slope of their age/depth curve (fig. 3) in dicates an apparent accumulation rate (after compac tion) for the shallower zone of 25 yrs/cm, and rates for the deeper zone that average 28 yrs/cm, an increase of about 12 percent. A similar curve for sediments in Clear Lake, Calif. (Sims and Rymer, 1975, fig. 4) indi cates apparent accumulation rates for the same depth zones of about 12.5 yrs/cm and 14 yrs/cm, a 12 percent difference. These data indicate that because of the greater compaction of the Bottom Mud sediments, a correction factor of 3-12 percent is probably required when estimating the period represented by its deposi tion. Such corrections would increase the age of the base of the Bottom Mud by 5,000-20,000 years and would partially or totally offset the corrections made on the basis of the increased clastic sedimentation rate; it would also explain some of the difference be tween the 38 yrs/cm average rate determined for the
GEOCHEMISTRY OF SEDIMENTATIONAll the late Quaternary lakes that existed in Searles
Valley contained an appreciable percentage of dis solved solids (fig. 32). Even at its highest levels, salini ties may have exceeded 1.5 percent and pH values probably exceeded 9. Chemical sediments deposited under these conditions consisted mostly of aragonite, calcite, or dolomite. These minerals probably con tained most of the calcium, much of the magnesium, and some of the carbonate that was dissolved in those lakes. When the lakes shrank as a result of evapora tion, salinities increased and some primary gaylussite may have crystallized. Eventually, saline layers com posed of trona, halite, and related minerals formed, and they contain most of the other components origin ally dissolved in the lake. Only the quantities of those components required for phase equilibrium and the most highly soluble ions remained in solution.
The stratigraphic sequence of mud and salt layers beneath the surface of Searles Lake reflects the gross changes in chemical sedimentation and thus provides a first approximation of the chemical history of the
VOLUME, IN CUBIC METERS x 10 9
20 30 40 50 60 70 80 90 1001102300
Base of Lower Salt
1400 -
200
- 150
V) litcc olit <I- IL1U CC
100 HI
- 50
I——I——I——I——I——T
0 5 10 15 20 25 30 35 40 SALINITY, WEIGHT PERCENT
200 400 600 800 1000100 300 500 700 900 1100
AREA, IN SQUARE KILOMETERS
FIGURE 32.—Relation between elevation, area, and volume of the Pleistocine lake surface and approximate salinities of its wa ters. Based on USGS 15-minute topographic maps, measure ments of area enclosed by each contour taken by planimeter, volumes between pairs of contours calculated using the pris- moidal formula (V = Vs C [A, + A2 + (Al A2 ) 1/2 ]) where C is the contour interval, and AI and A2 are areas enclosed by succes sive contours. Solid lines indicate volume and areas above base of Upper Salt (elev. 1,560 ft, 475 m); dotted portions indicate quantities above base of Lower Salt (elev. 1,500 ft, 457 m). Present surface is about 1,616 ft (493 m) above sea level. Salin ity of waters that desiccated to form Upper Salt plotted on a curve based on the assumption that the total quantity of salts (given in table 17) was dissolved in a homogeneous lake having the indicated volume.

GEOCHEMISTRY OF SEDIMENTATION 79
lake. Mineral variations within the mud and salt lay ers mostly indicate variations in the chemistry of the lake waters. When the mineral, chemical, and other lithologic criteria are combined, the lake history and many of the processes of chemical sedimentation can be reconstructed from the chemical sediments now found. In an earlier paper, Smith and Haines (1964) approximated these processes on the basis of mineral assemblages and crystal habits. The data presented here allow a more detailed reconstruction because they include both the relative percentages and the to tal volumes of minerals that constitute these assem blages.
Mud layers are discussed first because their evapor- ite composition represents the first components to precipitate from the lake waters. Salt layers represent the components that survived earlier precipitation and were eventually crystallized. Some components in the original lake never crystallized; most of these re mained in the brines that filled the interstices of the salts (prior to extensive pumping by the chemical companies that extract chemicals from them) al though some were incorporated into the waters of later lakes and lost by overflow. The chemistry of these brines is implicitly considered during discussion of the crystallization of the salts.
MUD LAYERS
The mud layers beneath the surface of Searles Lake represent deposits formed in relatively fresh lakes that covered much of the floor of Searles Valley. At their maximum size, these lakes covered about 1,000 km2 ; geologic mapping of the valley floor around the present dry lake shows that carbonate-rich muds were deposited in almost all parts of those expanded lakes. The muds below the present dry lake surface have been affected by diagenesis, but their lateral equiv alents exposed around the edge of the valley com monly have similar lithologies, yet do not contain the minerals attributed to diagenesis and thus serve as samples of the original deposits. Their original simi larity is not surprising; the chemical compositions of lake waters tend to be uniform over large areas, and primary chemical sediments deposited from them are comparably uniform.
Many of the deposits that crop out are light green, fine-grained, and locally laminated, and most of the samples from the deposits contain high percentages of aragonite, calcite, and (or) dolomite. Halite is com monly present in fresh samples, but not in quantities like those found in subsurface deposits. Analcime, searlesite, K-feldspar, and phillipsite—minerals thought to be produced by authigenesis in the subsur face deposits—have not been found in outcrops. Gay-
lussite and pirssonite are rarely found in outcrops, and there is no textural evidence in the exposed sedi ments that large quantities of megascopic crystals like those in subsurface muds ever existed; both minerals are soluble in water, and subaerial leaching normally produces some form of textural expression.
Of the nonclastic minerals in the subsurface mud layers, only aragonite, calcite, dolomite, and northu- pite are considered primary. Aragonite is most com monly an abundant mineral in the Parting Mud and upper part of the Bottom Mud (pi. 2B); the mineral is thermodynamically metastable, and the oldest occur rence is in the Bottom Mud, in sediments estimated to be about 50,000 years old.22 Possible traces were found in the Lower Salt (table 6); but it is not found in the Overburden Mud (table 18) and Mixed Layer (pi. 2A). Calcite is locally abundant in the upper part of the Bottom Mud but is subordinate in the Parting Mud and nearly absent in the Overburden Mud, Lower Salt, and Mixed Layer. It is the only form of calcium carbonate found in sediments older than 50,000 years, and some of the calcite in older sediments may have been produced by diagenetic alteration of primary aragonite. Dolomite is abundant in the Bottom Mud, in some parts of the Overburden Mud, Parting Mud, and Mixed Layer, but it is absent from mud layers in the Lower Salt. Northupite is fairly common in most mud layers of the Lower Salt and apparently is the Mg-bearing mineral in those layers that contain no dolomite. The mineral is found in the top of the Bot tom Mud and occurs sporadically throughout the Mixed Layer, but it is absent from the Overburden Mud and Parting Mud.
The amount of Ca that reached the center of the ba sin virtually required transportation to that area by relatively fresh water (Smith, 1966, p. 173-174). This conclusion results from evidence like the following. The average CaO content of the Parting Mud in core GS-16 is 13.1 percent (table 13). The unit in this core is 12.2 ft (3.72 m) thick and has an average density near 2.0. Each square centimeter of the surface of the Parting Mud in this part of the deposit, therefore, re presents a column of mud that weighs 744 g and con tains 97 g of CaO. As the Parting Mud was deposited in about 13,500 years, about 7.2X10 3 g of CaO was de posited each year over each square centimeter of this part of the lake floor. And as most or all of this was originally deposited as calcite or aragonite, the least- soluble Ca-bearing minerals in the mud, about 12.9X10'3 g/cm2/yr of CaC03was precipitated. Evapo ration from the lake surface determines the minimum amount of CaC03 precipitated each year, and if annu-
22 Reported occurrences of aragonite in the Mixed Layer (Smith and Haines, 1964, p. P25) were not verified by X-ray diffraction.

80 SUBSURFACE STRATIGRAPHY AND GEOCHEMISTRY, QUATERNARY EVAPORITES, SEARLES LAKE, CALIF.
al evaporation was 200 cm/yr, each cubic centimeter of evaporated water would have had to contain about 64 ppm CaCO3 , or 26 ppm Ca.
This is a reasonable quantity to expect from a fresh water lake in this climate. Pure water in equilibrium with CO2 in the atmosphere (about 0.033 volume per cent CO2) at a temperature of 16° C is saturated with CaCO3 at this concentration (Hutchinson, 1957, table 84). With increasing alkalinity, however, smaller con centrations represent equilibrium amounts. Calculat ing equilibrium quantities of Ca in alkaline brines is difficult, but analyses of comparable natural waters suggest limits. Jones (1965, table 7) cites numerous analyses of stream, spring, and lake waters from Deep Springs Valley, Calif., that have a composition and pH similar to the waters that probably existed in Searles Lake at various stages. Almost all are in contact with CaCO3 or more soluble carbonate minerals. Only a few waters that contain more than 26 ppm Ca have a total dissolved solid content of more than about 1,000 ppm; the few that do have pH values less than 9 and small to unmeasurable amounts of CO3 relative to HCO3 . The waters that desiccated to form the salts now in Searles Lake are very unlikely to have had these properties once concentration began.
As noted in the section in diagenesis, mi- crocrystalline halite is found in large quantities in many of the mud layers and is considered the product of diagenesis from highly saline pore waters incorpo rated in the sediment at the time of deposition. This proposed mechanism conflicts with the evidence for fresh lake waters which was derived from the CaO content of the muds. This enigma can be resolved if one postulates that (1) cool fresh Ca-bearing water flowed into the basin during part of the year and spread as a layer over highly saline waters that occu pied the basin during the remaining seasons, and (2) that the calcium in the fresh waters precipitated as aragonite, calcite, or dolomite as a result of both evap oration and mixing in the zone along the interface be tween the pre-existing saline water and the new fresh water. Salinity stratification seems unavoidable whenever a highly saline lake receives a small supply of new water on a markedly seasonal basis, and it can persist for very long periods with large or uniform in flow volumes because salinity stratification is very stable. The presence of Ca-carbonates in mud layers in the middle of the basin, therefore, is interpreted as an indicator that fresh water flowed into a lake that was chemically stratified.
Aragonite is commonly formed when CaCO3 is pre cipitated rapidly from solutions with high pH and sa linity (Zeller and Wray, 1956; Ingerson, 1962, p. 827- 829). Jones (1965, p. A45) reported aragonite "varves"
in the older strata of Deep Springs Lake and attribu ted the crystallization of aragonite to the results of seasonal changes in the lake combined with inflow from fresh springs, possibly as a stratified surface lay er. The darker layers were composed of dolomite, cal cite, and clastic minerals attributed to deposition during summer periods of high evaporation. Arago nite, along with gypsum and calcite, was also reported by Neev and Emery (1967, p. 82-94) from laminated sediments from the Dead Sea. The white laminae there are composed mostly of gypsum and aragonite, and they form during summer "whitenings" which oc cur at irregular intervals of several years; necessary conditions are the combined result of several seasons of evaporation followed by a summer warming of the surface waters. The dark laminae are composed of gypsum, calcite, and other components deposited more evenly throughout the intervening periods.
In the Na-carbonate-rich waters that constituted Searles Lake even during its high stands, aragonite was most likely to have been formed when Ca-bearing fresh waters flowed into the basin as a surface layer. Where the aragonite is in the form of distinct laminae, the inflow is interpreted to have been seasonal and to have formed a thin layer so that most of its calcium was precipitated during a small part of the year by a combination of warming, evaporation, and mixing. Where aragonite is disseminated, or calcite is the dominant mineral, the introduction of calcium and crystallization of CaCO3 is interpreted to have been a process that occurred uniformly throughout the year because the surface layer was thick enough to prolong mixing and minimize the importance of seasonal warming and evaporation.
Support for the suggestion that aragonite laminae represent times when the lake was stratified comes from the study by Mankiewicz (1975, p. 115-117). La minae are most abundant in the Parting Mud above the level dated by him as 17,000 ± 700 years B.P. That segment also contains a higher percentage of macer ated organics and chlorophyll pigments. Mankiewicz interprets this as being partly a matter of preservation and suggests as its cause that a more stable chemical stratification resulted from an increase in the salinity contrast between the upper and lower water layers, and that this reduced the amount of oxygen that could reach the bottom waters and sediments. However, he also attributes the higher percentages of long-chain hydrocarbons (derived from higher plants), aragonite, and uranium in most parts of this zone to vigorous epi sodes of inflow which brought plant debris, Ca, and U from upstream. The inflow of large volumes of waters into basins containing more saline and unoxygenated waters virtually requires a density stratification.

GEOCHEMISTRY OF SEDIMENTATION 81
The dolomite in Searles Lake muds is considered most likely to be primary, or nearly so, although a dia- genetic origin at a much later time cannot be dis proved. The primary origin seems probable because (1) the mineral occurs chiefly in microcrystalline form; (2) it is found in outcropping lake sediments where other minerals known to be of diagenetic origin are missing; (3) it is concentrated in certain stratigra- phic zones as if reflecting episodes when the chemistry of the lake was favorable, (4) dolomite is abundant in samples that apparently had very small percentages of minerals that would have provided Mg during diagen- esis (the Mg content of interstitial brines is also very low), and (5) dolomite is absent in zones that contain minerals that could react diagenetically to form dolo mite (for example, when the Mg-bearing minerals northupite and tychite occur with calcite, gaylussite, and pirssonite; see Eugster and Smith (1965, p. 497- 504)).
Reasoning like that applied here to explain the CaO content of the muds can also be applied to their MgO content. The average percentage of acid-soluble MgO shown in table 13 is 5.4, this percentage implies a de- positional rate of 3.0 X 10 " 3 g/cm2/yr from waters con taining at least 15 ppm MgO. Since this quantity can be contained in alkaline brines having total salities as high as 300,000 ppm (Jones, 1965, table 7), transport of MgO into Searles Valley by highly saline waters was possible. Solutions containing 15 ppm MgO, however, would also have to contain 21 ppm CaO (15 ppm Ca) to form primary dolomite, and dolomite commonly co exists with other Ca-bearing minerals meaning that the amount introduced by solutions was substantially higher. If twice as much CaO was introduced, Jones' data (1965, table 7) suggest that waters having a total salinity of more than a few percent would be inad equate.
The conditions under which dolomite forms are im perfectly known. In the Overburden Mud and Parting Mud, the mineral commonly occurs in the largest quantities near contacts with salines; in the Bottom Mud and Mixed Layer, though, no correlation is evi dent. Observations by other workers (Alderman and Skinner, 1957, p. 566; Graf and others, 1961, p. 221; Jones, 1961, p. 201; Jones, 1965, p. 44-45; Peterson and others, 1963; Clayton, Jones, and Berner, 1968; Clayton, Kninner, Berner, and Rubinson, 1968; Barnes and O'Neil, 1971, p. 702-705; Barnes and oth ers, 1973, table 1) present valid reasons for consider ing dolomite as both primary precipitates and diagenetic products. The studies by Peterson, Bien, and Berner (1963) and by Clayton, Jones, and Berner (1968), though, indicated dolomite to be forming in, or just below the surface of, the muds of Deep Spring
Lake, California. That lake represents an environ ment that is chemically very similar to Searles Lake (Jones, 1965), and the muds that contain dolomite seem to be modern analogs of the muds in Searles Lake that were deposited during times of major inflow and large lakes. In Deep Spring Lake, dolomite is abundant in the area flooded seasonally as the lake rises and falls, and along the side where lake waters mix with perennial, nearly fresh springs (Jones, 1965, p. A44; Clayton, Jones, and Berner, 1968, p. 417). These relations make it additionally plausible to infer that much of the dolomite in the Searles Lake deposit was formed in an environment in which Mg- and Ca- bearing waters mixed with lake waters that had a high pH and total salinity.
The presence of northupite as a primary mineral in the mud layers of Searles Lake has been interpreted as a result of introducing Mg-bearing waters into solu tions having relatively high concentrations of sodium carbonate and chloride (Smith and Haines, 1964, p. P51). The mineral has been formed synthetically (Wilson and Ch'iu, 1934, table 4), but the required percentages of carbonate and chloride, relative to magnesium, are not typical of those created by evapo ration of normal waters. A likely explanation, there fore, for the occurrence of primary northupite in Searles Lake muds is that there was mixing along the interface between inflowing low density Mg-bearing waters and pre-existing high density saline waters. The mud horizons that contain northupite may indi cate times at which the pre-existing saline waters were much more concentrated than those that existed in the basin at the times aragonite, calcite, and dolomite formed by mixing along the interface of a chemically stratified lake.
Thickness variations in the mud units also reflect processes that occurred during deposition. Areal vari ations were caused by areal differences in the volumes of clastic and chemically precipitated minerals. More than three-quarters of the mud in most units is com posed of chemically precipated (acid-soluble) miner als in both subsurface samples and in samples exposed around the edges of Searles Valley. The variations in mud-layer thickness shown on the isopach maps are attributed largely to areal variations in the geochemis try of sedimentation. Chemical sedimentation pat terns are influenced by proximity of shorelines, water depth, current patterns, wind directions, and the vol ume, chemistry, proximity, and entrance point of in flowing water. To some extent, of course, clastic sedimentation patterns also contributed to the thick ness variations; they are chiefly influenced by the shape of the preexisting surface of deposition, the to tal volume and size distribution of clastic material in-

82 SUBSURFACE STRATIGRAPHY AND GEOCHEMISTRY, QUATERNARY EVAPORITES, SEARLES LAKE, CALIF.
troduced from different directions, the proximity of the shoreline, the depth of water, and the wave energy produced by wind.
Both chemical and clastic sedimentation are influ enced by the proximity of the shoreline. The basal and top zones of the mud layers (and possibly some zones in the middle) were deposited immediately after and just prior to saline deposition; therefore, they are de posits formed in lakes that had shorelines only slightly beyond the edges of the salt beds (approximated by the arbitrary boundary line on the isopach maps). The middle zones of the mud layers, however, were mostly deposited in larger lakes in which the areas plotted in the isopach maps represent only the centermost por tions. In general, thin mud layers are interpreted to have a higher proportion of material deposited in shallow lakes with nearby shorelines, and thick layers are interpreted to be composed mostly of deep lake deposits.
Isopach maps of the six mud units in the Lower Salt, figures 15-20, seem to show changes in the areal distribution of material, although the lack of many data points near the edges makes contouring and in terpretation of these areas very subjective. Unit M-2, the lowermost mud, has evenly spaced isopach con tours indicating that the unit thins gradually toward its area of minimum thickness in the central and southern part. Units M-3 and M-5, in contrast, thin abruptly near the edges and have large central areas that are fairly uniform. Unit M-4 is somewhat similar to M-2 except for an anomalous area in the west-cen tral part of the contoured area. Units M-6 and M-7, the upper two mud units in the Lower Salt, again thin uniformly from their edges toward a small central area. In all mud units, those that have the greatest rel ative volumes (table 3), and therefore probably repre sent the greatest periods of time, are those that most clearly thin gradually toward the center of the basin. This configuration may be the natural form of deep lake sediments. The layers with smaller relative vol umes may have their distribution of thicknesses domi nated by the shallower stages at the beginning and end of deposition.
The distribution of sediment in the Parting Mud re vealed by the isopach map (fig. 23) shows that the unit tends to have zones of greater thickness near the north, southeast, and south edges, and to be more uni form throughout the middle (although a small thinner area is present near the very center). The thick zone shown by unsubstantiated contours along the south west edge is based on the assumption that chemical and clastic sedimentation from the southwest—the area receiving most of the inflow—was more rapid than elsewhere. The thick zones near some of the oth
er edges are possibly products of inflowing waters from those directions or of periods where the deposit ing lakes were relatively small. However, the history of lake fluctuations during the time this unit was depos ited was complex (Smith, 1968, fig. 4), and too many episodes are superimposed to make meaningful inter pretations.
The pattern of thickness variation in the Overbur den Mud was found to be so uncertain that the iso pach map used to approximate its volume is not included in this report. Part of the difficulty is in con structing an isopach map from the gradational lower contact of the unit, and part comes from the erosion of this and older units from surrounding areas (deter mined by geologic mapping of the exposed units) and redeposition of the eroded sediments on the original top surface of the Overburden Mud.
SALINE LAYERS
The saline layers in the Searles Lake evaporites are composed of relatively soluble salts that crystallized from saline solutions. During the deposition of layers of this type, the minerals that originally crystallize are mostly determined by the compositions and tempera tures of the solutions at the surface of the saline lake where they form. Most minerals form on the surface of the lake and float until the crystals founder and sink to the bottom. Although some dissolve at the surface if conditions change before they sink, others do sink and become part of a mineralogically heterogeneous layer that is accumulating on the bottom. Conditions at the surface are changeable, and rapid shifts in tempera ture, salinity, and C02 content occur on an hourly, daily, monthly, and seasonal basis. As a result, several different minerals form at the surface from similar so lutions. On the bottom, all are exposed to the more uniform environment provided by the accumulating layers of salts on the floor of the lake, and the changes that take place tend to make the mineral assemblage more uniform. Many of these changes occur within the first few hours or days after deposition.
In this section, the present mineral assemblages are used to reconstruct the geochemical environment that existed during their deposition. Many of the following reconstructions, though, apply principally to condi tions within the accumulating salt layer, not to the lake that first precipitated them. This is in some ways fortunate because the temperatures in the accumulat ing salt layer have more meaning; depending on the depth of lake water, they approximate monthly or yearly averages of the lake temperatures and thus can be interpreted more easily as a measure of the climate that prevailed during salt deposition. However, some conclusions regarding the chemistry of the lake waters

GEOCHEMISTRY OF SEDIMENTATION 83
can also be made.The conclusions regarding which temperatures are
recorded by saline mineral assemblages are based largely on unpublished observations of salt crystalli zation processes that occurred in Owens Lake, Calif, during 1970 and 1971. These observations showed (1) that most saline minerals originally crystallized at the water surface and that their geochemical significance was limited to this zone; (2) that some of the crystals that formed at the surface subsequently dissolved whereas others sank to bottom within hours; and (3) that within days to months, most of the carbonate (and sulfate?) minerals that sank to the bottom were altered to another species without any textural or ob vious chemical evidence of the change. Had crystals not been collected as they formed or within days thereafter, it would have been virtually impossible to reconstruct the mineralogy of the very first crystals and thus the chemistry of the lake waters in which they formed.
Most of the minerals that recrystallized in Owens Lake without leaving obvious evidence were those sensitive to Pco2- Both nahcolite and natron were pri mary crystalline phases, and both converted to fine grained and primary-appearing trona within weeks or months after being deposited on the lake bottom. As explained in more detail by Milton and Eugster (1959), Eugster and Smith (1965), Bradley and Eug ster (1969), and later in this section, the changes in Pco2 indicated by these reactions are opposites. Alter ing nahcolite to trona requires a lowered PCOZ to allow loss of one-third mole of CO2 for each mole of reacting nahcolite; altering natron to trona requires an in creased PCOZ to allow the addition of one-third mole of CO2 for each mole of reacting natron. It appeared that the final species of mineral in Owens Lake was deter mined by the PCOZ m the environment provided by the accumulating layer rather than by the solutions responsible for the primary crystallization. The PCOZ in that environment was partly determined by the ex tent of organic decomposition within the salt layer and in the salt and mud layers immediately below, partly by the buffering effect of other saline minerals, and partly by the amount of CO2 that was able to mi grate between the saline layer pore waters, the overly ing waters in the lake, and the atmosphere.
The only sulfate mineral observed in the salines ac cumulating in Owens Lake was burkeite, but several lines of evidence suggest that mirabilite was originally deposited during the winter. When accompanied by sodium carbonate minerals, the stability fields of mir abilite and burkeite are influenced by acoa > aH2O» and temperature (Eugster and Smith, 1965, p. 489-497), and it appears that postdepositional reaction of sul
fate minerals also occurs in response to the different conditions found in the accumulating sediments.
PHASE RELATIONS APPLICABLE TO SEARLES LAKESALTS
The Searles Lake saline layers are composed chiefly of minerals that represent phases in the sodium bicar bonate, carbonate, sulfate, chloride system (fig. 33). Trona, burkeite, mirabilite, thenardite, and halite are now present in the Searles Lake deposit; natron is not. In that system, at 20°C, the field of trona occupies a wedge-shaped volume above all the burkeite and part of the natron, mirabilite, thenardite, and halite fields. The top of the trona field is shown shaded, and the field of nahcolite occupies all the area above both it and the underlying fields that extend outside the edges of the trona field. At temperatures above 20° C, the trona, burkeite, and thenardite fields expand at the expense of the halite, mirabilite, nahcolite, and natron fields. At temperatures below 20°C, the re-
NaHC0 3
Na 2 SO4NaCI
Na 2 CO 3
FIGURE 33.—Three dimensional view of phase system NaHCO3 - Na2CO3-Na2SO4 -NaCl-H2O at 20°C. Solid phases indicated as follows: B, burkeite (2Na2S04-Na2CO3); H, halite (NaCI); M, mirabilite (Na2 SO4 -10H 20); Na, natron (Na2 CO3 -10H2 O); Nh, nahcolite (NaHCO3); Th, thenardite (Na2SO4); Tr, trona (Na2CO3-NaHCO3-2H2O). Shaded area represents top of trona field which occupies a wedge-shaped volume between overly ing nahcolite field and parts of underlying natron, mirabilite, thenardite, halite, and burkeite fields. Boundaries of stability fields plotted in terms of weight percent of solid components in equilibrium solutions. Arrows show slopes of boundaries to ward base of tetrahedron. Compositions of double salts bur keite (b) and trona (tr) are shown on edges of tetrahedron. Data from Teeple (1929); diagram from Smith and Haines (1964, fig. 16).

84 SUBSURFACE STRATIGRAPHY AND GEOCHEMISTRY, QUATERNARY EVAPORITES, SEARLES LAKE, CALIF.
verse happens. The thenardite field does not exist be low about 17°C; the burkeite field does not exist below 14.4° C. The data in this report show that of the re lated minerals in figure 33, only trona, halite, bur keite, and thenardite coexist in appreciable quanti ties; nahcolite is sparsely represented in a few layers, and mirabilite is found only in the Bottom Mud.
The changing composition of the brine during depo sition of the salt layers can be theoretically recon structed from phase diagrams representing the Na2 C03-NaHC03-Na2S04 -NaCl-H20 system. When data are not available for the 5-component system, the 4- component systems Na2C03-NaHC03 -NaCl-H20 and Na2C03 -Na2S04 -NaCl-H20 are used. Although the laboratory determination of points in a 5-component system is not experimentally difficult, plotting the re sults in a quantitative manner requires at least four dimensions—which is difficult. However, by limiting boundaries to those in which the H20 component is saturated, specifying saturation of one or more solid components, and projecting the field boundaries of the saturated solid components onto a two dimen sional triangular diagram, all five components can be related.230ther components that exist in natural solu tions can generally be ignored with only minor uncer tainties introduced.
The changing ratios of these components in the lake brines as crystallization and rapid diagenesis pro ceeded are indicated by the crystallization path. This path represents a greatly simplified version of the chemical events that occurred in the lake because nei ther the seasonal changes nor the alteration of the ini tial crystallization products is indicated. The path does show, however, the compositional changes that ultimately occurred when equilibrium was reached as a result of postdepositional interaction between the lake brines and the minerals in the accumulating salt layer. When interaction ceased, the bulk composition of the buried salt layer became largely fixed, and fur ther changes involved only phases allowed by that fixed composition.
23 A small uncertainty about the precise relations between stability field boundaries and the compositions of the brines comes from the lack of a satisfactory method for plotting more than one cation percentage in this system. Two major cations (Na and K) were present in the crystallizing solutions in mole ratios of about 10:1, and the diagram dimensions relate hypothetical salts (Na2C03, NaCl, etc.) that contain only one. Consid ering the average brine compositions in table 17 as an example, the anion equivalent sum of C03 , SO,, and Cl is 0.5284 per 100 g of solution, whereas the cation equivalent of Na is only 0.4870, meaning that about 80 percent of the 0.0512 equivalents of K are required to electrically balance the three anions in solution. In this paper, relative per centages in these 4- and 5-component systems have been calculated by converting total C03 , SO,, and Cl to Na2C03, Na2SO,, and NaCl. This overstates the amount of one or more of the hypothetical salts in the reacting solutions by maximum of a few percent. In the example using the average brine given in table 17, if all the K is calculated as KC1 and removed from the system, and the amount of NaCl is calculated from the amount of Cl that remains, the point representing the brine composition in the Na2C03-Na2S04 - NaCl-H20 diagram is shifted by 3 percent directly away from the NaCl corner of the diagram.
The general direction and extent of the crystalliza tion path in a given phase diagram is deduced from the stratigraphic order of the primary minerals24 that crystallized; its exact path is dictated by the geometry of the stability fields and their boundaries. By com bining the stratigraphy of the observed mineral as semblages with the requirements of the phase relations, the composition of primary salt assemblage and the composition of the interstitial brine can be ap proximately reconstructed. This places limits on the physical conditions under which crystallization took place, and defines both the solids and brines that con stituted the starting point for subsequent diagenetic change.
SALINES IN THE MIXED LAYER
The primary salts in the Mixed Layer apparently represent chemically simple waters. The saline miner als in the Mixed Layers are mostly trona, nahcolite, or halite, meaning that the saline lake waters were domi nated by Na, C03 , HC03 , and Cl, and that the brines at the time crystallization began were very close to the NaHC03-Na2C03-NaCl face of the tetrahedron shown in figure 33. The small percentages of burkeite, north - upite, sulfohalite, thenardite, and tychite (pi. 2A) may indicate brief changes in the chemical composition of the lake waters, but they do not occur in a pattern that seems significant.
Changes in the compositions of the brines that oc cupied Searles Lake at the times the Mixed Layer was deposited can be inferred from the saline minerals (pi. 2A). A few thin beds of trona and a little halite are in unit F, but unit E is the oldest unit that contains thick beds of salt. Units E, D, and C are similar in that they contain much more halite than trona and no nahco lite. In the NaHC03 -Na2C03 -NaCl-H20 system at 20°C (fig. 33), the halite field is small; it becomes even smaller above 25° and below 15° C. Many saline beds in units C, D, and E, however, are composed solely of halite. These show that crystallization started from brine represented by a point very close to the NaCl corner, and even though crystallization of halite forced the composition of the remaining brine toward the Na2C03 -NaHC03 edge of the phase diagram, it never reached the boundary of the adjoining field. Other saline beds in these units, however, contain both trona and halite. These beds show that the initial brines were represented by points in the trona or ha-
24 For the sake of simplicity in this paper, the term "primary" is used for minerals that appear to have ultimately become the stable phase in the accumulating salt layer even though they may have actually been products of rapid diagenesis from other species. The term "secondary" is reserved for minerals that are thought to have formed many years after deposition and as a result of diagenetic processes not directly related to the geochemistry of the depositing lake.

GEOCHEMISTRY OF SEDIMENTATION 85
lite field but near the phase boundary, so that crystal lization of the first mineral moved the composition of the remaining brines into the other field before cry stallization ceased. It is evident, therefore, that the brines that produced salines in units C, D, and E of the Mixed Layer had initial compositions that were near or inside the boundary of the halite field in the Na2C03 -NaHC03 -NaCl-H20 system. Temperature changes and small compositional variations allowed crystallization of other minerals at times, but the bulk composition of the brines was at all times dominated by NaCl.
The composition of salines in units A and B in the Mixed Layer indicate that there was a major change in the composition of water flowing into Searles Valley relative to the waters that desiccated to produce sa lines in units C, D, and E. In unit B, trona and nahco- lite are much more abundant than halite, and in unit A, they are virtually the only saline minerals found. The saline composition of the unit shows that the brines that produce salts in unit B had shifted in com position toward the Na2C03-NaHC03 edge of the dia gram shown in figure 33, although extensive crys- stallization of carbonate minerals still shifted the composition of the remaining brine into the halite field. The brines that produced salts in unit A were either so dominated by Na carbonates that no degree of desiccation could shift the brine composition to the halite field, the brines of unit A were desiccated less extensively than those that produced unit B, or those that crystallized salts did so at lower temperatures.
Evidence of a different type of change in brine com position during deposition of the Mixed Layer comes from the Br content of halite (Holser, 1970, p. 309- 315). It abruptly rises and falls in the middle of unit E; more gradually increases to a high level in the lower part of unit C and then decreases. Holser (1970, p. 311) concludes that the gradual rise in Br in the base of unit C represents a gradual net increase in the ex tent of evaporation, and that the decrease represents a relatively large inflow of new water. The presence of about 13 ft (4 m) of clay and silt in the zone of change (Smith and Pratt, 1957, p. A39) supports this conclu sion and might indicate more than 10,000 years of in flow that produced a large lake. The new water in the lake apparently had a high Cl/Br ratio as indicated by their ratio when deposition of salts resumed.
The stratigraphic distribution of nahcolite and trona is a function of the chemical activities of C02 (aCO2 ) and water (aH2o)- The relation between these controls and minerals has been discussed by Milton and Eugster (1959), Eugster and Smith (1965), Eug- ster (1966), and Bradley and Eugster (1969). Applica tion of these principles to salts in the Mixed Layer
(Eugster and Smith, 1965, fig. 22) demonstrates a gradual but erratic upward increase in aco2 > and an abrupt increase in ctH 2O * n units B and A. Both changes are consistent with the other evidence of a major change in the chemistry and character of depo sition in late Mixed Layer time.
The existence of nahcolite in units A and B indi cates values of aco2 above those provided by equilibri um with the atmosphere. They may be interpreted as a measure of the extent of bacterial production of C02 at the time deposition was taking place. Observations like those of Siever, Garrels, Kanwisher, and Berner (1961), Siever and Garrels (1962, p. 54), and Jones (1965, p. A48) show that C02 from bacterial decompo sition can increase the aco2 in uncompacted sedi ments to a level much above that needed to change any sodium carbonate mineral to nahcolite. Evidence is not available as to whether greater production of C02 during deposition of the upper part of the Mixed Layer might have resulted from more intense bacte rial activity or from a larger amount of organic materi al available for decomposition. The amount of organic material in the mud layers in units A and B was prob ably high. This quantity was initially controlled by the chemistry of the lake waters that determined the or ganic productivity of the lake and thus the organic material that can become available for decomposition. The study of Owens Lake (Friedman, Smith, and Hardcastle, 1976) showed that an alkaline lake con centrated to levels both below and above those neces sary to form Na-carbonate salts can have a very high productivity; at salinities ranging from 136,200 mg/L to 387,500 mg/L, the phytoplankton population limit ed downward visibility to 5 or 10 cm.
SALINES IN THE BOTTOM MUD
The several layers of salines in the Bottom Mud (pi. 2B) are mostly nahcolite or mirabilite; only the zone of salts about a meter below the top of the unit contains other minerals. These salt beds commonly contain more mud than the others do, and the lack of clear correlation between saline layers in the three cores plotted on plate 2B suggest that the beds are lenticu lar. These characteristics indicate that these layers were probably the result of winter cooling of the lake during periods when its salinity had increased to the proper levels.
Deposition in this manner accounts for the mono- mineralic composition of the beds, the high mud con tent in some, and the lenticularity of the layers. The original Na2C03 -minerals were probably natron or nahcolite and the Na2S04 -mineral was mirabilite. The solubilities of these minerals are markedly sensitive to temperature, and when cooled, solutions containing

86 SUBSURFACE STRATIGRAPHY AND GEOCHEMISTRY, QUATERNARY EVAPORITES, SEARLES LAKE, CALIF.
mixtures of dissolved salts crystallize these minerals exclusive of the others. Except for borax, which was initially a relatively minor ingredient,25 no other salts in the applicable systems are similarly affected by chilling. In pure Na-carbonate and Na-sulfate solu tions, natron, nahcolite, and mirabilite crystallize at temperatures near 0°C from brines having total salini ties between 3 and 7 percent (Makarov and Bliden, 1938, tables 1 and 4; Freeth, 1923, tables 1 and 17); at 15°C, these salts crystallize from solutions having sa linities between 8 and 15 percent. Addition of NaCl raises the salinity but lowers the percentage of these components necessary for their crystallization (Ma karov and Bliden, 1938, table 8).
The tendency for the salts that are preserved to be mixed with mud and form lenticular beds is inter preted to be a result of a mechanism that allows salts to survive the warmer seasons that follow crystalliza tion. Initially, each salt layer probably covered the floor of the lake, but currents in the relatively shallow lake probably mixed the salts in some parts of the lake with mud, a mixture that would have been relatively impervious. During the following warmer seasons, this property would have protected the salts in these areas from being infiltrated by lake waters and dissolved.
These saline layers, therefore, are considered indic ative of crystallization during winter from an interme diate-sized lake. Salinity of the lake water was probably in the range 5-15 percent, the exact value depending on the species and amounts of the other components in solution which depress the saturation point. The data in figure 32 show that lakes having these salinities could have had areas of 400-600 km2 and depths of 70-120 m.
The discontinuous layer about 1 m below the top of the Bottom Mud that contains borax, northupite, trona, nahcolite, and thenardite may also be a result of winter crystallization inasmuch as these minerals are reasonable products of winter crystallization if modi fied by diagenesis. If the layer was initially composed of salts crystallized during winter, the most likely pri mary minerals were borax, natron or nahcolite, and mirabilite. The diagenesis that produced the present suite could have been caused solely by a post- depositional decrease in an2o- Saline brines having a lower aH2o exist in the overlying Lower Salt, and downward migration of brines from that layer would have mixed with the original interstitial brines and lowered the an2o- This, with or without a change in aC02 > could have produced the present mineral suite. Remembering that the meter of intervening mud con tains dolomite and gaylussite, and using OCQ -°H 0
" When the brines that formed the Upper Salt were concentrated to 5 percent, Na2B4O7 constituted about 0.15 percent.
diagrams of Eugster and Smith (1965, fig. 19), a de crease in an2o °f brine would have caused minerals of stability field 15 (mirabilite, natron, gaylussite, halite, dolomite, aphthitalite) to alter to those of field 6 (thenardite, nahcolite, gaylussite, halite, dolomite, aphthitalite) or field 18 (thenardite, northupite, trona, gaylussite, halite or dolomite, and hanksite), depending on the aco2 - Note that gaylussite, northu pite, and nahcolite do not coexist in any field of those °CO ~°H20 diagrams and that they do not coexist in the salt layers being described; gaylussite exists in the muds of all cores, but nahcolite exists in this zone only in cores GS-15 and GS-16, and northupite exists only in cores GS-18 and GS-27.
SALINES IN THE LOWER SALT, UPPER SALT, AND OVERBURDEN MUD
The starting compositions of the solutions that pro duced the Lower Salt and Upper Salt in Searles Lake are now best approximated by the present bulk chemical composition of each salt unit or group of re lated units. Their compositions are summarized in ta bles 10 and 17. These calculated compositions are weighted averages of analyses and include the compo nents in both the present salts and the residual brines that fill their interstices. There is the possibility that small quantities of soluble components remained in the surface brines at the time salt crystallization ceased and these components were incorporated into younger saline units or removed from the basin by subsequent overflow. The only evidence of this hap pening to an appreciable extent is in the deposition of unit S-7.
In the following discussion, the salt layers of the Lower Salt are divided into two groups which repre sent sequences of crystallization that are interrelated and can be treated almost as if they were continuous. The first is composed of units S-l to S-5, and the sec ond of units S-6 and S-7. This grouping is emphasized when viewed as a histogram (fig. 34). Crystallization of the Upper Salt is considered as a single continuous event. The crystallization paths followed by the brines during these three episodes are plotted on the phase diagrams shown in figures 35, 36, and 38. The salines in the Overburden Mud were formed by a crystalliza tion sequence similar to the one that formed the Up per Salt.
LOWER SALT
The phase diagrams shown in figure 35 allow the crystallization of units S-l through S-5 to be recon structed. Field boundaries in the 5-component system with all points and boundaries saturated in both H2O and NaHCO3 are shown in figure 35A. To portray this

GEOCHEMISTRY OF SEDIMENTATION 87IVHNERAL COMPOSITION, IN VOLUME PERCENT
n n n n n0 1000 1000 1000 100 0505050505
Upper Salt d34 I <1 CH 43 017 10.1 It
S-7
S-6 dHI 77 |1
S-5 CH37 | 8
S-4 I I 64S-3 I———I87K1
S-2
S-1 I———192
Q18
D21
CH51 |t
It l<|2
00.6
I 0.5
D3.1
It D2.2
I 0.3
10.5 |t
Di-7 D 1 -oQ1.8 D1.3
D0.9 00.9Q0.6 | 0.3 | 0.1
Na 2SO4
Burkeite(mineral
composition)
Na 2 CO 3 NaCI
NaHCO3
B
82 percent Na 2 CO 3 18 percent NaCI
b-2 Burkeite 72 percent NaCI S-5 28 percent Na2 SO 4
^FIGURE 34.—Visually estimated volume percentages of major min erals in salt units of Lower Salt and Upper Salt. Data from tables 4 and 14. Percentages rounded, <1 = 0.1 to 1.0 percent, t (trace) = <0.1 percent.
in two dimensions, they are projected from the NaHCO3 corner of the tetrahedron shown in figure 33 to the Na2CO3-Na2SO4 -NaCl face. The diagram is con structed for a temperature of 20° C, because the posi tions of the field boundaries at this temperature best satisfy the mineral assemblages found in units S-4 and S-5. The boundaries of fields are probably curved but are drawn straight because of the lack of experi mental data.
The boundaries shown in this projection are those of the trona field and those mineral stability fields that lie below and outside of it. Boundaries and triple points within the limits of the trona field, shown with dashed lines because they underlie the trona field as viewed from the NaHCO3 corner of the tetrahedron, represent solutions that are in equilibrium with trona and the two or three adjoining labeled phases. Bound aries outside the limits of the trona field represent so lutions that are in equilibrium with nahcolite and the two adjoining labeled phases. The boundaries in this phase diagram are univariant and the triple points are invariant. The composition of burkeite is shown on the Na2CO3 -Na2SO4 edge; the composition of trona lies on the Na2CO3-NaHCO3 boundary and is represented by the Na2CO3 corner of this diagram.
Data on water-soluble components of units S-1 to S-5 (table 10) have been used to determine the com position of the original brine at the time deposition of unit S-1 began. To do this, the percentages of SO4 , Cl,
^FIGURE 35.—Selected mineral stability fields in system NaHC03 - Na2C03 -Na2S04 -NaCl-H20 at 20°C. A, Projection from the NaHC03 corner of tetrahedron toward Na2Co3-NaCl-Na2S04 face. Boundaries represent equilibrium between labeled fields and trona (dashed lines inside limits of trona field) or nahcolite. Arrows show direction of increasing salinity. Starting composition of brine that produced S-1, S-2, S-3, S-4, and S-5 shown by point b-1; final composition of brine by point 6-2; present composition of brine by point b-3. Heavy line and arrow indicate changing composition of the brine as units crystallized, with segments of line labeled to indicate units. Arrows labeled 82 and 72 show location of base of section shown in B. B, Section through a tetrahedron representing NaHC03-Na2C03 -Na2S04 -NaCl-H20 system in a plane having its base along line between points represent ing 82 percent Na2C03 (18 percent NaCI) and 72 percent NaCI (28 percent Na2S04 ) in diagram A and its top at NaHC03 corner. Boundaries indicate equilibrium between labeled fields. Points b-1, b-2 and b-3 and crystallization path shown in A plotted in this plane. Data from Freeth (1923) and Teeple (1929) as compiled by Smith and Haines (1964, fig. 16A) in the form of a 4-component tetrahedron, with all points in equilibrium with H20. Boundaries plotted in terms of weight percent.

88 SUBSURFACE STRATIGRAPHY AND GEOCHEMISTRY, QUATERNARY EVAPORITES, SEARLES LAKE, CALIF.
CO3, and HCO3 indicated for the "Chemical composi tion of combined solids and brines" (line 5 of table 10) were converted to Na2SO4 , NaCl, and total carbonate as Na2CO3 . The result is plotted in figure 35A as a point labeled b-1. A sufficient supply of Na was as sumed. From the same table and by the same method, the "Chemical composition of the present brine" (line 4) was determined and plotted as a point labeled 6-3. Point 6-2 represents the estimated composition of the final brine at the time primary crystallization ceased. The brine composition moved from point 6-2 to 6-3 as a result of post depositional processes.
The path representing the changing composition of the brine during crystallization of units S-l through S-5 is plotted between points b-1 and 6-2 (fig. 35A). These points lie approximately along a line that inter cepts the edges of the triangle at 72 percent NaCl and at 82 percent Na2CO3 . This line is the base of a scalene triangle that represents a section through the tetrahe dron representing the 5-component system (fig. 33). This section is plotted as figure 35B, and the changing composition of the brine as it progressed from point b-1 to 6-2 is plotted on it. This representation is graphic but not precise. Experimental data showing the exact stability fields in these planes are not avail able; the relations shown are based on linear projec tions from the 4-component diagrams that make up the faces of the tetrahedron and on scattered control points for the 5-component system within the tetrahe dron. Also, the crystallization path curves out of the plane of the diagram and all points must be projected to it.
Point b-1 (fig. 35B) is plotted on the trona-nahco- lite boundary because unit S-l is composed mostly of trona but contains a little nahcolite. As the actual Na2CO3/NaHCO3 ratio in the original brines is not known, and the position of that boundary changes rapidly with temperature, the point in figure 35B is more representative of the brine and phase relations that existed in the accumulating salt layer. (In Owens Lake, nahcolite and natron were commonly the first sodium carbonate crystals to form, but they altered to trona a few weeks or months after accumulating on the floor of the lake.) Isotopic evidence (Smith, Fried- man, and Matsuo, 1970) suggests that crystallization of units S-l and S-2 took place at lower temperatures than crystallization of units S-3, S-4, and S-5, so dur ing deposition of the earlier two salt units, the trona field may have been smaller and the nahcolite field may have been larger than shown in figure 35. The phase boundaries are drawn for temperatures near 20°C because their positions best satisfy the relations between brine composition and mineralogy found in units S-4 and S-5.
Units S-l, S-2, and S-3 now consist almost solely of trona (fig. 34), although the first crystals could have been natron, trona, or nahcolite. However, all three sodium carbonate minerals lie on the Na2 CO 3 - NaHCO3 edge of the 5-component system, and the path representing brine composition during crystalli zation followed a track that moved away from that edge. Therefore, in figure 33A (which projects the Na2CO3 -NaHCO3 edge to the Na2C03 corner), units S- 1, S-2, and S-3 are plotted along the straight portion of the crystallization path that begins at b-1 and mi grates directly away from the Na2CO3 corner of the diagram.26 In figure 35B, the path is plotted moving away from the point representing the composition of trona but remaining in the trona field. Other minerals may have been precursors, but trona was the final phase. By the time S-3 was fully crystallized, the com position of the crystallizing brine was very close to the trona-burkeite boundary (fig. 35B). That it first touched the trona-burkeite boundary instead of the trona-halite boundary (fig. 35A) is indicated by the mineral composition of unit S-4 (fig. 32) in which trona is accompanied by major percentages of bur- keite but not halite.
Unit S-4, a thin unit, is mostly trona and burkeite (fig. 33). The composition of brine that was in equilib rium with this assemblage is represented in figure 35A by a short curved line that moves along the trona-bur keite boundary and away from a series of bivariant points that lie on the Na2CO3 -Na2SO4 edge. These points represent mixtures of trona and burkeite and thus lie between the points that define the composi tions of pure trona and burkeite. (Pure trona and its precursor sodium carbonate minerals are all repre sented in figure 35A by the Na2CO3 corner of the dia gram, and the composition of pure burkeite is plotted.) The path is curved because the proportions changed. The path representing S-4 stopped at or just prior to reaching the boundary of the halite field. In figure 35B, the S-4 segment of the crystallization path follows the trona-burkeite boundary which is plotted straight. In three dimensions, though, its path curves upward from the plane of figure 35B and toward the halite field which lies a very short distance "above" the burkeite field in this part of the diagram.
Unit S-5 is represented in both figures 33A and 33B by a crystallization path that represents a series of un- ivariant points along the trona-burkeite-halite bound-
16 In detail, the composition of the brine should be plotted with a sawtooth shape; partial reversals in its composition must have occurred during the time represented by the interbedded mud units inasmuch as they represent hundreds or a few thousand years of inflowing water that contained a significant amount of dissolved solids. The reversals would be plotted as short segments traveling back toward point b-1, their length being proportional to the amount of solids that were introduced. Space on the diagrams does not allow this detail to be shown.

GEOCHEMISTRY OF SEDIMENTATION 89
ary. The direction is toward the invariant point at the junction of the natron, burkeite, halite, and trona fields. This is the assemblage that is in equilibrium with the most concentrated brine, and the crystalliza tion path of S-5 toward it is the only direction that allows the components of trona, halite and burkeite to be removed from solution. Point b-2 is plotted at the invariant point because most cores from the middle of Searles Lake have some trona in the uppermost part of unit S-5 which is the relation that would be pro duced by crystallization at this point.
The average composition of the present brine, cal culated from table 10, is indicated by point b-3. It lies exactly on the trona-burkeite-halite-thenardite invar iant point of the fields that are plotted at 20° C. Not all individual brine samples lie at this point (fig. 21 A), but none remain at the invariant point where crystal lization initially ceased. The change in composition from points b-2 to b-3 requires the addition of H2O as well as partial solution of some original phases, and this is discussed in the section on diagenesis.
Changes in brine composition during the crystalli zation of units S-6 and S-7 are reconstructed by a dia gram representing the 4-component system Na2C03 - Na2SO4-NaCl-H2O at 15° C (fig. 36) (data for the 5- component system at this temperature are not avail able). The trona field would occupy less area than at 20° C (fig. 35) but would probably cover an area that included point b-2 and the burkeite field. However, the base of the trona field is close to the base of the tetrahedral model of this system (fig. 33) and little er ror in the position of the burkeite field is introduced by omitting NaHCO3 ; the difference between the posi tions of field boundaries in 4-component and 5-com- ponent systems at 20°C is illustrated in figure 37. At 15° C, the difference would be even less.
The starting composition of the brine (b-1), calcu lated from data in table 10, is closer to the Na2CO3 cor ner of figure 36 than is the starting composition of the brine responsible for the underlying units (b-1 in fig. 35A). The first crystals to form may have been natron (as shown in fig. 36), trona, nahcolite, or a mixture of any pair of phases which are represented by the boundaries and fields above trona. As the carbonate mineral crystallized, the composition of the solution, represented by points lying along the line connected to point b-1 (in figure 36), moved away from the Na2CO3 corner of the diagram. As soon as it touched the halite field, it coprecipitated trona or natron (but not nahcolite) and halite, the crystallization path fol lowing the boundary that separates their fields. The near-lack of sulfate minerals in units S-6 and S-7 shows that crystallization stopped before the crystalli zation path reached the burkeite (or other sulfate
mineral) field and that desiccation was not complete. The low percentage of sulfate minerals in units S-6
and S-7 is why point b-2 in figure 36 is likely to repre sent the brine compositions at the time crystallization of S-6 and S-7 ceased, and why the prevailing tem perature of crystallization was at or very near 15°C. At temperatures more than a few degrees above 15°C, the
Na 2 SO 4
Burkeite(mineral
composition)
Na 2 CO 3 NaCI
FIGURE 36.—Mineral stability fields in system Na2C03 - Na2S04 -NaCl-H20 at 15°C. Starting composition of brine that produced units S-6 and S-7 shown by point b-1; final composition of brines shown by point b-2; present composition of brine by point b-3. Points b-1 and b-3 based on data from table 10. Point b-3 (?) re presents total C03 , S04 , and Cl from analysis of brine from S-7, core hole L-31 (see explanation in text). Heavy line indicates changing composition of brine as salt units S-6 and S-7 crystallized. Arrows show direc tion ofincreasing salinity. Data from Makarov and Bli- den (1938). All boundaries plotted in terms of weight percent.
Na 2 SO4
Na 2 CO 3 NaCI
FIGURE 37.—Superimposed stability field boundaries of sys tems Na2C03 -Na2S04 -NaCl-H20 (dashed lines) and NaHC03 -Na2C03 -Na2S04 -NaCl-H20 (solid lines) at 20°C. Five-component system projected as in figure 35A; 4-component system plotted in normal manner. All boundaries plotted in terms of weight percent. Data from Freeth (1923) and Teeple (1929).

90 SUBSURFACE STRATIGRAPHY AND GEOCHEMISTRY, QUATERNARY EVAPORITES, SEARLES LAKE, CALIF.
burkeite field expanded into the area that would have been reached by solutions precipitating a Na-carbon- ate mineral before crystallizing halite (as did occur during crystallization of units S-l to S-5); at tempera tures slightly below 15°C, the mirabilite field expands into this zone (Makarov and Bliden, 1938).
The quantity of dissolved solids introduced by fresh water during the times represented by units M-6 and M-7 were probably comparable inasmuch as M-6 and M-7 have similar volumes. Unit S-5 represents desic cation, and the solids in the brine that deposited S-6 resulted from inflow during M-6 time plus those so lids dissolved by it from the top of unit S-5. Units S-6 and S-7 have similar percentages of trona and halite suggesting that both crystallized from brines and un der conditions that were quite similar. Thus the initial brines that produced units S-6 and S-7 are both ap proximated by point b-1 in figure 36, and the paths representing crystallization of units S-6 and S-7 are virtually the same. The sulfates not deposited in unit S-6 because of incomplete desiccation may have been added to the brine that produced unit S-7 and be the cause of the slightly higher percentages of bur keite and thenardite in that unit (fig. 34).
A feature of units S-6 and S-7 unexplained by the inferred crystallization sequence is the present con centration of halite at the base of these units. Initial crystallization in the halite field seems precluded by their present bulk composition. Possibly, the basal layer of each unit represents times when winter cry stallization of natron was followed by summer crystal lization of halite and solution of all or most of the underlying natron; this sequence would have left a zone of residual halite as the basal layer. During sub sequent years, natron crystallized during winter would have converted to trona during the summer warming because of the increased concentration of Na carbonate in the brines. This process would have pro duced the mixture of halite and trona found in the up per parts of these two units.
Phase data for borax show that cool temperatures strongly favor its crystallization (Teeple, 1929, p. 128- 130; Bowser, 1965). The position of borax in the cry stallization sequence, therefore, is markedly depen dent on temperature as well as the concentration of its components. Borax zones in or near mud layers which indicate deposition in relatively dilute waters thus suggest marked chilling; zones in the middle of saline layers may indicate either chilling or a high total salin ity.
The borax content of units S-l to S-5 of the Lower Salt shows a progressive increase in the lower three
units and then a decrease. Previously discussed phase data show that the salinity of the solutions that depos ited those five salt units consistently increased. The increase from S-l to S-3 therefore seems to indicate an environment that was sufficiently cool to allow so dium borate to be crystallized in amounts approxi mately proportionate to the increasing salinity of the brine. The similar quantities of borax in units S-3 and S-4—a time when the salinities had increased from levels that only crystallized trona to levels where trona and burkeite cocrystallized—indicates a warming trend that increased the solubility of borax about the same amount as its concentration increased in the brines. The sharp decrease in the quantity of borax in unit S-5 probably indicates a more pronounced warm ing of the lake and the crystals accumulating on its floor.
In units S-6 and S-7, the borax concentration in creases upward. The previously discussed phase data for the other components indicate consistently lower crystallization temperatures for these two units than for units S-4 and S-5. The small quantity of borax in S-6 is interpreted as the result of a low concentration of borate in the lake waters, and thus a small quantity of crystals formed in spite of cool conditions (about the same percentage as in S-l). The larger quantity of borax in S-7 is interpreted as the result of the higher borate concentration in the parent brines which re sulted from the combination of the quantities not pre cipitated in S-6 plus those introduced during the long period represented by muds of unit M-7.
Northupite, a common though not abundant mineral, is not represented in any of the phase sys tems discussed previously. Eugster and Smith (1965, fig. 19) show that northupite may coexist with almost every mineral found in Searles Lake except aphthita- lite. It has been synthesized in the laboratory by de Schulten (1896), Watanabe (1933), and Wilson and Ch'iu (1934, table 4). Wilson and Ch'iu added magne sium carbonate to a solution containing much higher amounts of sodium carbonate, sodium bicarbonate, and sodium chloride, and under CO2 pressure about 420 times greater than its pressure in the atmosphere. They synthesized the mineral at temperatures be tween 100° C and 20° C and noted that high tempera tures accelerate the mineral's crystallization, but they did not determine the lower temperature limit of the stability field. In their diagram, the stability field of the synthesized mineral adjoins nahcolite, halite, and a basic magnesium carbonate. However, the required amount of magnesium (100-930 ppm MgCO3 ) is much higher than in present brines from Searles Lake. In

GEOCHEMISTRY OF SEDIMENTATION 91
natural environments, the required concentrations might be attained either by mixing of "fresh" magne sium-bearing waters with saline waters or by evapora tion of waters having a low enough pH to permit enough magnesium to stay in solution until the neces sary concentrations of other components were at tained.
Northupite was reported by Haines (1957, 1959) from units S-l to S-5 of the Lower Salt but not from units S-6 and S-7. Its percentages in units S-l to S-5 change systematically with stratigraphy (table 4, fig. 34) and in a pattern similar to that followed by borax. The controls of the northupite percentage, however, can not be the same as for borax if northupite crystal lization is promoted by warm temperatures. More likely, controls included the amount of Mg that could be transported to the central part of the basin, and the salinity of the water with which it mixed because this would have affected the proportion of the introduced amount that was crystallized. Eugster and Smith (1965, p. 497-500) show that in the presence of dolo mite muds, northupite is not stable at high aco2 val ues. The mechanism most likely to explain the presence and progressive change in the amount of northupite in the Lower Salt units is similar to that proposed to explain northupite and Ca-bearing min erals in the muds; that mechanism required a strati fied lake with Mg introduced by fresh waters that transported Mg to the center of the basin in a low den sity fresh layer superimposed on a dense brine, and crystallization by mixing of water from the two layers. Salt layers are inherently the result of climates char acterized by more evaporation than inflow, but a sea sonal inflow of some fresh water into a salt lake is possible. The increasing percentages of northupite in units S-l to S-3 are interpreted as the result of spo radic inflow of Mg waters into lakes that had succes sively greater salinities, and the decrease in units S-4 and S-5 is interpreted as a decrease in the quantity of water introduced by sporadic inflow as final desicca tion was approached.
UPPER SALTThe path representing the changes in brine compo
sition during the crystallization of the Upper Salt is plotted on a phase diagram that shows the bounda ries of the stability fields of minerals in the Na2CO3 -NaHCO3 -Na2 SO4 -NaCl-H2O system at 20°C (fig. 38). Figure 38A projects this system to the base of the tetrahedron, and figure 38B is a section through the tetrahedron. A line that represents the changing composition of the brine as crystallization
Na 2 SO4
Burkeite(mineral
composition)
\ _ ^~.~~-\ThenerditeA 73
Na 2 CO 3 NaCI
NaHCO3
Na 2 CO3
Trona(mineral
composition)
Burkeite 73 percent NaCI 27 percent Ne 2 SO4
FIGURE 38.—Selected mineral stability fields in system NaHC03-Na2C03-Na2-S04-NaCl-H20 at 20°C. A, Same pro jection as in figures 35A and 36. Boundaries represent equilib rium between labeled fields and trona (inside limits of trona field) or nahcolite. Starting composition of brine that produced Upper Salt shown by point b-1; final composition of brine shown by point 6-2; present composition of brine shown by point 6-3. Points b-1 and 6-2 based on data in table 17. Heavy line indicates changing composition of brine as unit crystal lized. Arrows labeled 73 and 100 show location of base of sec tion in B. B, Section through tetrahedron representing NaHC03-Na2C03-Na2S04-NaCl-H20 system is a plane having its base along line between points representing 100 percent Na2C03 and 73 percent NaCI (27 percent Na2SOJ in diagram A and its top at NaHC03 corner. Boundaries plotted in terms of weight percent indicate equilibrium between labeled fields. Phase data from Freeth (1923) and Teeple (1929).

92 SUBSURFACE STRATIGRAPHY AND GEOCHEMISTRY, QUATERNARY EVAPORITES, SEARLES LAKE, CALIF.
proceeded connects points b-1 and b-2. As the layer of trona at the base of the Upper Salt shows that a so dium carbonate mineral was the dominant species formed during early stages of crystallization, the ini tial crystallization path (fig. 38A) followed a straight line that started at point b-1 and led directly away from the Na2CO3 corner that represents the composi tion of all sodium carbonate minerals in this system. As noted below, the path probably first touched the boundary of the underlying field about at the bound ary between the thenardite and burkeite fields, and trona, thenardite, and burkeite cocrystallized. The path then became a curved line that moved away from a series of points that represent the crystallized mix tures of those minerals plotted along the Na2CO3 — NajjSCX edge of the diagram. For the path to move from the trona-thenardite-burkeite-halite invariant point toward the point of maximum salinity under equilibrium conditions, all the thenardite would have to be dissolved. As indicated in the discussion of hank- site that follows, the brines in the central facies may have done so; point b-2 (fig. 38A) is plotted on the as sumption that they did, and the final salt assemblage was composed of trona, halite, and burkeite.
The path of crystallization was projected to a plane that cuts a section through the tetrahedron represent ing the NaHCO3 -Na2CO3 -Na2SO4 -NaCl-H2O sys tem (fig. 38B). It intercepts the boundaries of all fields except halite. Point b-1 is plotted on the nahcolite- trona boundary. Although any of three Na-carbonate minerals may have first crystallized from the lake, trona was the final product after rapid diagenesis, and the net effect of its crystallizations was to move the crystallization path directly away from the point that represents its composition on the edge of the diagram. This results in the crystallization path touching the base of the trona field in the diagram at the top of the boundary between the burkeite and thenardite fields. The next phases to crystallize, therefore, probably in cluded both of those minerals. As most of the thenar dite dissolved before the brine moved to point b-2, and both burkeite and thenardite apparently became the metastable precursors of the mineral hanksite, their initial ratios had no permanent significance.
The third most abundant mineral in the Upper Salt is hanksite which is not included in the 5-component system plotted in figure 38. A plot of the system Na2CO3-Na2SO4-NaCl-KCl-H2O at 20°C (Teeple, 1929, p. 100-103) illustrates the relation between hanksite and the other sulfate minerals being dis cussed and shows the inferred path of crystallization in this system followed during deposition of the Upper
Salt (fig. 39). Hanksite is stable in a triangular field within the diagram. The ratios of Na2CO3 to Na^CX that allow hanksite to form, when the solution is satu rated in halite and contains the correct percentage of K, are shown by projection from the KC1 corner of fig ure 39A to the edge representing those components. However, the slow crystallization rate of hanksite al lows minerals from surrounding fields—burkeite, thenardite, and aphthitalite—to form as metastable assemblages controlled by the dashed boundaries, then later react with each other and brine to form hanksite (Gale, 1938, p. 869). For this reason, the crys tallization path is shown following the metastable boundaries.
Experimental data for the 6-component system in cluding NaHCO3 are not available. However, the rela tions shown by Eugster and Smith (1965, fig. 19b) show that increasing percentages of NaHCO3 (propor tional to aco2 in that figure) would cause the thenar dite field to encroach on the burkeite field, and the aphthitalite and thenardite fields to encroach on the hanksite field. This means that the burkeite-thenar- dite boundary and the metastable triple point in the hanksite field (fig. 39A) probably are shifted toward the Na2CO3 corner of the diagram in the 6-component system. The diagrams compiled by Eugster and Smith (1965) show that some combinations of aco2 and OH20 allow the boundaries between the hanksite and the burkeite, thenardite, and aphthitalite fields to lie both inside and outside the boundary of the trona field.
Crystallization during deposition of the Upper Salt started at point b-1 (fig. 39). The crystallization path is plotted in figure 39A as if in the 6-component sys tem which included the trona field, and deposition of trona moved the crystallization path away from the Na2CO3 corner of the diagram. The crystallization path reached the thenardite or burkeite field approxi mately at the boundary that separates them (then moved along it to the boundary of the halite field, see fig. 38A). Trona, thenardite, burkeite, (and halite) then crystallized together until the path reached the aphthitalite field, forming a metastable triple point. Further increase in salinity required solution of the previously crystallized thenardite prior to following the metastable burkeite-aphthitalite boundary. Thenardite is still found in the outermost parts of the deposit (cores GS-5 and GS-23), meaning that crys tallization ceased in that area before the phase was de stroyed. It is probable, however, that the central facies crystallized further, and that burkeite and aphthita lite crystallized simultaneously until brine concentra tion ceased. At that time, the composition of the brine
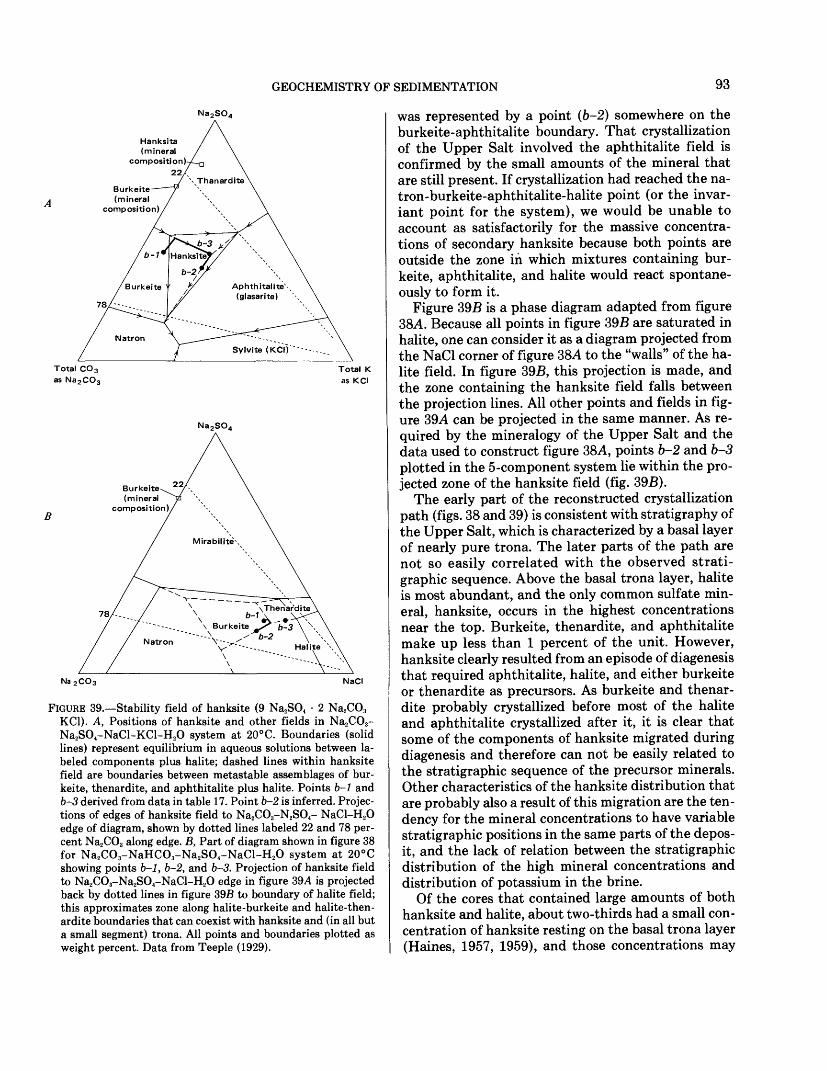
GEOCHEMISTRY OF SEDIMENTATION 93
Na 2 SO4
Hanksita (mineral
composition) 22
Burkeite(mineral
composition)
Total CO 3 as Na 2 CO3
Total Kas KCI
Na 2 SO4
Burkeite(mineral
composition)
Na 2 C0 3 NaCI
FIGURE 39.—Stability field of hanksite (9 Na2S04 • 2 Na2C03 KCI). A, Positions of hanksite and other fields in Na2C03- Na2S04-NaCl-KCl-H20 system at 20°C. Boundaries (solid lines) represent equilibrium in aqueous solutions between la beled components plus halite; dashed lines within hanksite field are boundaries between metastable assemblages of bur- keite, thenardite, and aphthitalite plus halite. Points b-1 and 6-3 derived from data in table 17. Point b-2 is inferred. Projec tions of edges of hanksite field to Na2C03-N2S04- NaCl-H20 edge of diagram, shown by dotted lines labeled 22 and 78 per cent Na2C03 along edge. B, Part of diagram shown in figure 38 for Na2C0 3-NaHC03-Na2S04-NaCl-H20 system at 20°C showing points b-1, b-2, and 6-3. Projection of hanksite field to Na2C03-Na2S04-NaCl-H20 edge in figure 39A is projected back by dotted lines in figure 39B to boundary of halite field; this approximates zone along halite-burkeite and halite-then- ardite boundaries that can coexist with hanksite and (in all but a small segment) trona. All points and boundaries plotted as weight percent. Data from Teeple (1929).
was represented by a point (b-2) somewhere on the burkeite-aphthitalite boundary. That crystallization of the Upper Salt involved the aphthitalite field is confirmed by the small amounts of the mineral that are still present. If crystallization had reached the na tron-burkeite-aphthitalite-halite point (or the invar iant point for the system), we would be unable to account as satisfactorily for the massive concentra tions of secondary hanksite because both points are outside the zone in which mixtures containing bur- keite, aphthitalite, and halite would react spontane ously to form it.
Figure 39B is a phase diagram adapted from figure 38A. Because all points in figure 39B are saturated in halite, one can consider it as a diagram projected from the NaCI corner of figure 38A to the "walls" of the ha lite field. In figure 39B, this projection is made, and the zone containing the hanksite field falls between the projection lines. All other points and fields in fig ure 39A can be projected in the same manner. As re quired by the mineralogy of the Upper Salt and the data used to construct figure 38A, points b-2 and b-3 plotted in the 5-component system lie within the pro jected zone of the hanksite field (fig. 39B).
The early part of the reconstructed crystallization path (figs. 38 and 39) is consistent with stratigraphy of the Upper Salt, which is characterized by a basal layer of nearly pure trona. The later parts of the path are not so easily correlated with the observed strati- graphic sequence. Above the basal trona layer, halite is most abundant, and the only common sulfate min eral, hanksite, occurs in the highest concentrations near the top. Burkeite, thenardite, and aphthitalite make up less than 1 percent of the unit. However, hanksite clearly resulted from an episode of diagenesis that required aphthitalite, halite, and either burkeite or thenardite as precursors. As burkeite and thenar dite probably crystallized before most of the halite and aphthitalite crystallized after it, it is clear that some of the components of hanksite migrated during diagenesis and therefore can not be easily related to the stratigraphic sequence of the precursor minerals. Other characteristics of the hanksite distribution that are probably also a result of this migration are the ten dency for the mineral concentrations to have variable stratigraphic positions in the same parts of the depos it, and the lack of relation between the stratigraphic distribution of the high mineral concentrations and distribution of potassium in the brine.
Of the cores that contained large amounts of both hanksite and halite, about two-thirds had a small con centration of hanksite resting on the basal trona layer (Haines, 1957, 1959), and those concentrations may

94 SUBSURFACE STRATIGRAPHY AND GEOCHEMISTRY, QUATERNARY EVAPORITES, SEARLES LAKE, CALIF.
represent the original stratigraphic position of aphthi- talite. The hanksite crystals in the middle and lower horizons of the Upper Salt (and in units S-3, S-4, and S-5 of the Lower Salt) tend to have dominant basal pinacoid faces whereas crystals in the upper parts of the Upper Salt tend to have prominent pyramidal and prismatic faces (Smith and Haines, 1964, p. 17-18). Possibly the pinacoid form is favored by crys tallization in high-sulfate environments (solid thenar- dite or burkeite reacting with K-bearing brine) and the pyramid form is favored by high potassium envi ronments (solid aphthitalite reacting with C03-bear- ing brine).
The change of the metastable assemblage composed of thenardite, aphthitalite, burkeite, and halite to hanksite is a form of diagenesis. It would normally be discussed in the discussion of diagenesis but the pro cess consumed some minerals and produced others, and these changes should be considered when com paring the inferred phase relations with present stra tigraphy. The reaction of aphthitalite (Ap), thenardite (Tn), and halite (H) to form hanksite (Hk) also consumes trona (Tr) and produces C02 and H20 according to the following reaction:
4Tr + Ap + 3H + 25Tn = 3Hk + 10H20 + 2C02 .
Substituting burkeite (B) for thenardite, however, re sults in a reaction that has the opposite requirements:
6Ap + 18H + 75B + 65H20 + 13C02 = 18Hk + 26Tr.
Both reactions produce and consume H20 and C02 in the same ratios, so the two reactions can offset each other as follows:
Ap + 3H + 13Tn + 6B = 3Hk.
These relations mean that thenardite and burkeite must be initially present in mole ratios of 13:6 to avoid the involvement of H20, C02 , and trona in their con version to hanksite.
The zone immediately above the trona layer at the base of the Upper Salt is inferred to represent the stage when primary sulfate minerals should have started to crystallize (see figs. 38 and 39), yet thenar dite and burkeite are almost absent. Haines (1957, 1959) found neither of these minerals at this horizon except for one core, GS-11, which contains burkeite in beds 5-10 ft (1.5-3 m) above the top of the trona layer. Conversely, no K-bearing mineral should have cry stallized at this level (fig. 39A), yet hanksite is com mon. It seems clear that the original suite of minerals recrystallized to form hanksite, deriving the required
amounts of potassium from the ionic K+ in the inter stitial brines and consuming all the primary sulfates. The production of hanksite (Hk) from burkeite (B) or thenardite (Th), halite (H), and K+-bearing intersti tial brine also involves trona (Tr), H20, C02, and H+ (ionic hydrogen) according to the following relations:
6K+ + 6H + 27B + 33H20 + 9CO, = 6Hk + 12 Tr + 6H+or
K+ + H + Tn + Tr = Hk + 2H20 + H+
and with mixtures of burkeite and thenardite as fol lows:
7K+ + 7H + 27B + Tn + 31H20 + 9C02 =7Hk + UTr + 7H+
All reactions release H+ which would have reduced the pH of the remaining brine and promoted partial solution of carbonate-bearing phases. The salinity of present brine in this zone is as great or greater than other brines in the Upper Salt, and this salinity is con sistent with the possibility of water being extracted from it during diagenesis according to the reactions that involve chiefly burkeite. At the time of reaction, trona and halite were certainly present to excess in this zone, and the reaction was limited by the amount of sulfate mineral of K-rich brine. As K-bearing brine is still present and sulfates are absent, the reaction ap parently ceased because the original sulfate minerals were exhausted.
The upper part of the Upper Salt is the zone in ferred to have been deposited when the crystallization path reached the metastable triple point (fig. 39A). It should have originally consisted of aphthitalite, bur keite, halite, and possibly thenardite; some or all of these must have converted to hanksite during diagen esis. The central parts of the deposit now have thick beds of vuggy hanksite and no other sulfate mineral; however, a few areas near the edge of the deposit have small amounts of thenardite (cores GS-5 and GS-23) and burkeite (cores GS-3, GS-4, and GS-5). This dis tribution seems to indicate that aphthitalite was ex hausted in the edge facies before all of the original burkeite or thenardite and that both of those minerals were exhausted in the central facies before the aphthi talite. In the central facies, some trona occurs in or near the hanksite concentrations, and these zones ap pear to be products of reaction from a suite that in cluded enough burkeite for trona to be produced. This reaction also requires sources of H20 and C02 ; addi tional H20 was undoubtedly available at the time the Overburden Mud was deposited, and C02 may have

GEOCHEMISTRY OF SEDIMENTATION 95
been available from the same waters or from C02 re leased by bacterial action on underlying units.
Hanksite is abundant and aphthitalite is locally common in the Upper Salt, whereas hanksite is rare and aphthitalite missing in the Lower Salt. The con centration of potassium and sulfate in the brines that formed the Lower Salt was apparently high enough for some aphthitalite to form because that mineral was necessary for the formation of the local concentra tion of hanksite that are observed. The quantities of both components were higher in the brines that pro duced the Upper Salt. The increase may have oc curred because the Upper Salt brines inherited a substantial amount of the sulfate and all the potas sium that remained after crystallization of S-6 and S-7 of the Lower Salt. Those two Lower Salt units are nearly free of potassium- and sulfate-bearing miner als, and the brines that remained when crystallization ceased were correspondingly enriched. The enriched brines probably would have been preserved if the dense layer of brine that had formed during deposi tion of S-7 continued to occupy the lowermost levels in the series of the enlarged but stratified lakes that deposited the Parting Mud. In this way, all the potas sium and sulfate would have stayed in Searles Lake rather than being partly lost during overflow. Those components would then have been added to the brines that ultimately desiccated to form the Upper Salt.
Borax is concentrated at the base of the Upper Salt and near the top, where it is associated with the large amounts of hanksite. The basal layer is interpreted as the result of chilling just prior to and coincident with the first deposition of a Na-carbonate mineral; the marked effect of low temperatures on solubility of bo rax was noted in the previous section. Its concentra tion in the zone now occupied by hanksite is interpreted as the result of crystallization of those ho rizons at high temperatures when borax solubility in creased to levels that allowed it to remain in solution until very late stages in the sequence.
OVERBURDEN MUD
The saline components in the Overburden Mud came from two sources. Some were dissolved from the top of the Upper Salt; and others were introduced by the inflowing waters that formed the lake. The ex posed surface of the Upper Salt was largely halite and hanksite, and since hanksite dissolves very slowly in solutions saturated with halite, the components added to the lake waters from this source were dominated by Na and Cl. The components introduced by the inflow ing waters were presumably similar to those of earlier episodes.
Extensive solution of the exposed surface of the Up per Salt and the tendency for hanksite to dissolve slowly could also explain the notably irregular and concave-downward contact between the Overburden Mud and Upper Salt. The thickest layers of hanksite were probably near the surface of the central facies of the Upper Salt. These hanksite zones may have re tarded the solution rate of the Upper Salt in these fa cies, and their absence in the edge facies would have allowed more extensive solution in those areas. In the central facies, this would have produced a hummocky and irregular lake floor that was little lower than the original surface, and the floor would have been cov ered by concentrations of disaggregated, subhedral to anhedral, hanksite crystals. This is a lithology that is commonly found near the contact between the units in the central facies (Haines, 1959, see logs of GS-14 and GS-16). More extensive solution of the edge fa cies would have produced a concave-downward shape to the overall surface. Clastic sediments from nearby shorelines would probably have quickly filled in this deep trough around the edge of the partially dissolved salt body, producing the wedge of abnormally clastic- rich sediments we now see in this zone (pi. 1).
Evidence from cores and outcrops suggests that the lake that was responsible for deposition of the Over burden Mud was quite different from previous lakes. It was a perennial lake, yet small and highly saline, and contained more suspended sediment. The hydro- logic details and climatic cause of this different type of lake are not understood. Beneath the outer parts of the present dry lake surface, most of the Overburden Mud consists of sand- and silt-sized clastic material, and even near the center, discontinuous beds of elas tics make up 10-50 percent of the unit. Clearly, large quantities of the older lake sediments that cropped out around the edges of the relatively small lake were washed into it. Halite crystals eroded from the ex posed surface of the Upper Salt are commonly found embedded in mud. The crystals are rounded as if par tially dissolved, and this could mean that the lake wa ters were so near saturation in NaCl that the amount dissolved from those crystal edges brought the solu tions to the saturation point. Many outcrops of sedi ments deposited at the same time are solidly cemented by halite; this characteristic further sug gests a highly saline lake.
The mineral composition of salts in the Overburden Mud suggests that the composition of the brines that formed the salts would have plotted well inside the halite field in the phase diagrams (figs. 38 and 39B). Initial crystallization of halite is consistent with the geologic evidence showing that all the saline layers in this unit include halite, and that the clastic sediments

96 SUBSURFACE STRATIGRAPHY AND GEOCHEMISTRY, QUATERNARY EVAPORITES, SEARLES LAKE, CALIF.
exposed around the edges of the lake are cemented by halite in a manner suggesting that they were permeat ed by saturated brine at the time of deposition. Prob ably there were several episodes of saline deposition that alternated with clastic deposition caused by re newed inflows of sediment-laden water. Each episode that started with the crystallization of halite would have moved the point representing the composition of the remaining brine toward other fields (figs. 38 and 39). The areal distribution of saline minerals in cores from the Overburden Mud (Haines, 1957, 1959) sug gests that the trona and thenardite fields were touched first, and the fields of the other minerals that were precursors to hanksite touched last. Trona is most common, and thenardite is found only in cores near the edge of the deposit; hanksite is most abun dant in the center. This distribution seems best ex plained if trona an thenardite were deposited during an earlier stage, when the lake covered a larger area, and the other precursor minerals for hanksite and K- rich brines were products of a later lake that covered a smaller central area. Most of the previously formed trona and thenardite in the center should have been consumed by the reaction of halite and aphthitalite to form hanksite, H2O, and CO2 . Borax in this unit is dis tributed similarly to trona.GEOCHEMICAL INFLUENCE ON SHAPE AND THICKNESS
OF SALT BODIESThe shapes of the saline layers as indicated by iso-
pach maps are largely products of conditions that ex isted at the time chemical sedimentation was taking place. They can be interpreted on the basis of exam ples provided by present-day saline lakes and evapor ating ponds constructed for commercial production. In the zone around the edges of saline lakes and ponds that are crystallizing salt but not evaporating to dry- ness, saline layers tend to be thin and uneven; the edges are more affected by seasonally fluctuating brine levels and wave erosion, and the salts that cry stallize from dilute brines are controlled more by sea sonal fluctuations in temperatures. The zone in the middle, however, is characterized by saline layers that have more uniform thickness because the salts are af fected less by these variables and the crystal layers tend to be draped over topographic irregularities of the underlying mud.
Some small-scale relief in both zones is probably produced initially by winds. On Owens Lake, an irreg ular surface having a relief of half a meter seemed to be largely a result of wind-generated currents which were observed moving clumps of crystals on the brine surface into certain parts of the lake. Where these crystals foundered and sank, apparently because of turbulence caused by irregularities on the lake floor,
they "piled up" to make the mounds even larger, and eventually made "islands." These processes were most active during mid-winter when rapid crystallization occurred with nighttime chilling, and during the final stages of desiccation when mid-day evaporation pro duced massive crops of crystals.
Saline lakes and ponds that eventually become dry most of the year produce saline layers that are nearly flat on top. This is because when the lake floods or when rain falls on the exposed salts, the water dis solves and transports salts from the higher areas to the lowest areas, eventually filling them in. As almost all the thickness variation in a desiccated saline layer is attributable to its lower surface, its shape as depict ed by an isopach map is that of an inverted mold of the mud surface on which it rests.
After deposition, other processes may alter the original shape and thickness of saline units. If the sa line lake receives an inflow of fresh water and becomes larger and fresher, erosion and solution of the salines probably creates new variations in thickness. Even after a protective layer of mud has been deposited, further volume and thickness changes may result from postburial recrystallization of salines under new tem peratures and pressures and from solution by en croaching groundwater or undersaturated brines from other horizons. In Searles Lake, solution and volume change caused by the removal of interstitial brines by the chemical companies may have created new vari ation in thickness.
The most critical control of the shape of thick saline layers that resulted from desiccation is the topograph ic surface provided by the underlying muds. This is partly a result of the depositional pattern in the pre ceding lake and partly a result of compaction of the underlying deposits. Variation in the distribution of thickness in mud units is indicated by the isopach maps (figs. 15-20 and 23). The effect of post- depositional compaction is demonstrated by the pre sent shape of the top of unit S-5 that was almost cer tainly flat at the end of its desiccation. The cross sections shown on plate 1 show more than 40 ft(12 m) of relief on this surface between the center and edge of the unit, and more than 10 ft(3 m) of relief in the cen tral area between adjacent cores. Both local and over all relief seem best attributed to differential compaction of underlying material since deposition of the unit.
All saline units in the Lower Salt except S-5 were deposited on the floors of incompletely evaporated brine bodies rather than in lakes that desiccated. Iso pach maps of the saline beds in the Lower Salt show that unit S-l (fig. 8) has relatively small area near the center of the layer in which intermediate to maximum

GEOCHEMISTRY OF SEDIMENTATION 97
unit thicknesses are attained and a wide peripheral zone in which the bed is less than 1 ft (0.3 m) thick; relief in the central part is irregular and commonly amounts to half a meter. Units S-2, S-3, and S-4 (figs. 9, 10, and 11) have near-maximum thicknesses over larger areas; local relief appears less in units S-2 and S-3 but is pronounced in some part of S-4. The dimin ishing amount of local relief, and increasing tendency toward uniform distribution of salts as units S-l to S-3 were deposited may reflect the decreasing proportion of the total crystallization that occurred rapidly because of night-time chilling. Units S-4 (and S-5) crystallized more during the summer, when mas sive crops of crystals are produced during mid-day, causing the bottom topographic irregularities to grow rapidly. Units S-l, S-2, and S-4 have thin areas that trend from the southwest edge northeastward. Salt units in this area may be thin because they were par tially dissolved by inflowing fresh waters which en tered Searles Valley from China Lake via Poison Canyon (Salt Wells Canyon on old maps) which lies to the southwest.
The thickest of the saline units in the Lower Salt is S-5. It has a more symmetrical shape than any of the other units in the Lower Salt (fig. 12); its sides thicken rapidly and uniformly near the edge toward a large central area of irregular thickness. Unit S-5 was a product of complete desiccation; the major features of its isopach map reflect the topographic surface that preceded it, a basin with sloping sides and a flat cen tral area. The marked local relief in the central area is likely to be the result of irregularities produced by so lution of the flat surface during the initial stages of flooding that produced M-6.
Units S-6 and S-7 (figs. 13 and 14) have differences in their thickness distributions comparable to the dif ferences between units S-2 and S-l. Thicknesses near average extend over much of the total extent of units S-6 and S-2; thicknesses below average characterize a wide area around the edge of units S-7 and S-l. These units represent the first two and last two periods of salt deposition in the Lower Salt sequence, and the ex planation for their shapes may be the same. Thick concentrations of salts near the center suggest that most of the deposits formed after the lakes had shrunk to their minimal sizes because their brines were less concentrated or because the depositional ba sins had nearly flat edges and central depressions. Uniform distribution of thickness suggests opposite conditions. Neither possibility appears reasonable for these pairs of units. Possibly wind erosion of near- shore facies was more active during S-l and S-7 times as a result of the major transition in climate that was taking place at that time. Solution by inflowing fresh
water appears inadequate as an explanation because there is no relation between the sizes of thin areas and major sources of inflow.
The pattern of thickness distribution of the Upper Salt (fig. 27) is similar to that of S-5. The sides of the saline body thicken uniformly and rapidly toward a large central area of near-maximum thickness. The re lief in this central area also is pronounced (although less obvious because fig. 27 has a 10-ft contour inter val). Most of the overall shape of the Upper Salt is attributed to the shape of the basin at the time deposi tion of the Parting Mud ceased. Some of the overall shape and much of the irregular relief was apparently produced by the solution of the upper surface that oc curred when the Overburden Mud was deposited. As plate 1 shows, though, relief along the basal contact of the Upper Salt is substantial, and some of the irregu larities in the top contact seem to be reflections of ir regularities in the basal contact (for example, note cores GS-12, GS-15, GS-18 on pi. IA, and cores EE and N on pi. IB). These irregularities partially cancel out each other and reduce the variation shown in the isopach map (fig. 27); this probably means that some of the irregularity now present in the basal contact was produced by differential compaction since the Upper Salt and Overburden Mud were deposited.
The areal extent and position in the basin of the seven saline units in the Lower Salt as plotted in fig ures 8-14 are notably similar. Their zero contours lie within about half a kilometer of each other in most places. The zero contour of the Upper Salt also lies within these limits. There is no systematic shifting of position with age, and each unit covers within 10 per cent of the same area, regardless of thickness (table 3). Although in many areas the zero contour is not brack eted by data points, possible changes are mostly limit ed to those that increase the extent indicated.
It seems likely that the area of each salt layer was about the same as the area of the lake toward the end of crystallization. Lakes that shrank to the point of desiccation must have had early salt deposition in areas that became exposed to weathering. The ex posed salts were presumably dissolved by surface run off and their components recrystallized in the upper parts of the desiccating body. This process would have produced an inverted chemical stratigraphy for some of the dissolved components; those crystallized early from the larger lake were dissolved and redeposited with (or above) the components that crystallized last from the smallest lake (Smith and Friedman, 1975, p. 138). The final areal extent of the salt unit, therefore, is considered to be approximately the area of the lake that followed maximum concentration of the brine and solution of all exposed salts.

98 SUBSURFACE STRATIGRAPHY AND GEOCHEMISTRY, QUATERNARY EVAPORITES, SEARLES LAKE, CALIF.
Deposition of the Upper Salt apparently followed this process. When Searles Lake began to shrink just prior to depositing the Upper Salt, salinities of 5 per cent (that would allow deposition of salts during win ter) were reached when the lake level was about 110 m deep (90 m above the present surface) and covered an area 3.5 times the present extent of the Upper Salt body (fig. 32). Salinities of 25 percent (that would have allowed trona to form all year from a Na2C03- NaHC03 solution at 25°) were reached when the lake was about 40 m deep (20 m above the present lake sur face) and covered an area almost 2.5 times the present extent of that body. A salinity of 35 percent, which is equivalent to the present brine, was reached when the lake was 33 m deep (13 m above the present surface), and this was apparently the original extent of the Up per Salt. As no salt beds are now exposed at these lev els, they must have dissolved prior to, and during, deposition of the Overburden Mud. At present, the zone between the present lake surface and a level about 13m above it is nearly free of vegetation except along washes; the Upper Salt, deposited initially over this larger area of the lake floor, apparently "poi soned" the soil, thereby preventing most plant growth since its solution and redeposition.
The differences in the reconstructed maximum sa linities of units S-l to S-3 relative to S-4 and S-5 sug gest that the areas of saline deposits should decrease. As table 3 demonstrates, however, there is no change. Apparently, as successive layers of salts crystallized, they filled and flattened the central depression in the basin such that the area-to-volume ratio changed. In this way, the lakes that crystallized units S-4 and S-5 were shallower and more saline but occupied about the same area as the lake that deposited S-l. Some support for this model comes from calcu lating the quantity of salt in unit S-5 and applying it to the area-to-volume curve shown in figure 32 for the Upper Salt.27 The present shape of the base of the Lower Salt cannot be used because as much as 10 m of compaction has occurred since deposition of units S-5 which must have been originally almost flat (pi. 1).
A similar calculation of units S-6 and S-7 shows that they should have crystallized from a 30-percent brine that had a volume of about 0.6X10⁹ m3 and cov ered an area of only about 30 km2 . Their actual area is about 100 km2 . Part of the discrepancy results from the flattening of the basin caused by deposition of units S-l to S-5. A larger factor may be that more salts were dissolved in those lakes'than table 10 in-
r When the dissolved solids in units S-l to S-5 were in a brine that had a salinity of 20 percent (the approximate salinity of multicomponent solutions at 10°C when they precipitate sodium carbonate minerals but not halite), it occupied about 2.0X10⁹ m3 . The curves for volume extrapolated to the base of the Upper Salt in figure 32 show that these volumes occupied about 100 km2.
dicates—the sodium, potassium, sulfate, and chloride that were retained in the brine and ultimately incor porated in the Upper Salt.
SOURCE OF SALT COMPONENTS
The large volume of components in the salt bodies of Searles Lake were clearly introduced into the valley by water. Many of the components are found in al most all waters draining from bedrock terrane, among them Ca, Na, K, and Mg. All natural waters also con tain C03 and HC03 contributed by the atmosphere. Many natural waters in the Great Basin drain areas underlain by Cenozoic lacustrine sediments that con tain halite and gypsum, and those waters contain higher-than-average amounts of Cl and S04 . The un usual components in Searles Lake—many of them the components that make the brines so unusual and valuable—must have come from sources that occur only infrequently in the headwaters of streams in the Great Basin. Thermal springs, mostly in the Long Val ley area near Mammoth, apparently provided that source. The reasons leading to this conclusion are de scribed in another paper (Smith, 1976); a summary of that information follows.
The Owens River and its headwaters probably con tributed most of the dissolved solids because they ac count for most of the volume of water, and their drainage includes geologically favorable areas. Most of the uncommon components probably came from thermal springs, and the quantities of elements now issuing from those springs, plus those derived by the Owens River from other sources, are adequate to ac count for the amounts of most components now in Searles Lake. Data available for seven components — Na, K, C03 , S04 , Cl, B, Li—allow comparison of the total quantity of dissolved solids that would be carried by the present Owens River in 24,000 years, and the amounts estimated to have accumulated in Owens Lake and Searles Lake during the same period (table 21). From the concentrations of those components now present in the Owens River where it enters the Los Angeles aqueduct (or Owens Lake), the approxi mate amounts that would be contributed annually to a system of closed lakes today are estimated. It is rea sonable to assume that the total amounts dissolved in the river during the Pleistocene were comparable or greater, and that since deposition of the Lower Salt in Searles Lake ceased 24,000 years ago, most of those components crystallized as salts in the Upper Salt of Searles Lake or were trapped in Owens Lake. Over flow of Searles Lake during Parting Mud time appar ently carried few dissolved solids, for on desiccation, neither borates nor potassium salts crystallized in

GEOCHEMISTRY OF SEDIMENTATION 99
TABLE 21.—Comparison of amount of selected components carried by Owens River in 24,000 years with amount now in Owens Lake andUpper Salt of Searles Lake
[Quantities expressed as parts per million (ppm) and grams (g)]
Component
NaKTotal CO3SO,Cl
B
Li
Presentconcentration
in Owens River 1(ppm)
263.4
1371714
5 .77
.11
Amount carriedannually2 by
Owens River (x 109g)
10.91.4
57.57.15.9
57.8.325 .23.046
Amount carriedby Owens River in
24,000 years (x 1012g)
26234
1,380170142187
7.75.51.1
Amount now inUpper Salt,
Searles Lake (x 1012g) 3
46228
163192448
7.966.4
'.06
Amount inOwens Lake in1912 (x 1012g)'
543
301538
.8
'.0005
Total amount nowfound in Searlesand Owens Lakes
(x 1012g)
51631
193207486
8.77.2.06+
'Friedman, Smith, and Hardcastle (1976) except value for B.2Average annual flow of river 4.2X10¹¹ g/yr (calculated for period before irrigation in Owens Valley, using data of Gale, 1914, p. 254-261). 3Values from table 17 except as indicated.'Recalculated from Gale (1914, p. 259); he incorrectly calculated quantities in this report but corrected them in later reports (Gale, 1919).5Data from Wilcox (1946); value for concentration, from his table 12, is mean for the years 1929-1945 at the inlet to the aqueduct near Aberdeen. Values of amounts of Cl and B
carried annually compiled by methods described by Smith (1976)."Data from unpublished administrative report by D. V. Haines, entitled "Borate reserves of Searles Lake, San Bernardino County, Calif.", U.S. Geological Survey, July 1956. 'Calculation assumes average value 60 ppm Li in brine and 20 ppm in salts.
Panamint Valley, whereas they are abundant in Searles Valley (Smith and Pratt, 1957). Such a comparison shows that three of the seven com ponents are now present in Owens and Searles Lakes in quantities close to those expected to be carried by the Owens River in 24,000 years. The quantity of K in the two lakes is within 10 percent of that expected, and the quantity of B now found may be as close (de pending on which combinations of the amounts listed in table 21 are used). The quantity of SO, is about 20 percent greater than predicted.
In the Upper Salt, only about 15 percent of the pre dicted amount of C03 and 5 percent of the Li are ac counted for. Large quantities of calcite precipitated in Owens and China Lakes (Smith and Pratt, 1957) and the carbonates in the mud layers of Searles Lake ac count for additional quantities. Some of the lost C03 was probably restored as the lakes and streams dis solved atmospheric C02 , but the original quantities were never fully replaced. The amount of Li now found in Searles Lake indicates even more loss, pre sumably by adsorption on clays. The amounts of Na and Cl now in Searles Lake are two to three times greater than the present Owens River seems likely to have supplied. The excess of Na in the Upper Salt is less because part of the quantity in the brine reacted after burial to form gaylussite and pirssonite in the in- terbedded mud layers. The excess of Cl came from erosion of older lake beds as well as from springs and atmospheric sources.
Calculations like those in table 21 can also be made for the quantities of P04 and F. The amounts of P04 and F in the Owens River are at least 0.11 ppm and 0.5 ppm (Smith, 1976, table 41). The quantity of P04 con
tributed by the river to Searles and Owens Lakes in 24,000 years is about 1.1 X 10¹² g, whereas, the amount present is near 0.5 X 10¹² g. The discrepancy seems sig nificant but its cause uncertain because downstream movement of P04 was affected by biological factors in each lake of the chain. The quantity of F now found in the Owens River is very large. The analysis cited by Friedman, Smith, and Hardcastle (1976) indicates the amount to be about 1 percent of the total solids, al though data from the Los Angeles Department of Wa ter and Power suggest 0.25 percent as a more typical content. This amount, nevertheless, means that 5 X 10 12 g of F should be present in the Upper Salt of Searles Lake, yet only about 14 X 109 g is present. Those brines contain 8 X 10⁹ g of F, and the salts would have to be composed of about 8 percent sulfo- halite to account for the remaining quantity of F. That is three orders of magnitude greater than the amount estimated (table 14), and clearly a large amount of F is unaccounted for.
The quantity of W in the brines of Searles Lake has been attributed to the combined influence of springs and drainage from the many tungsten deposits in the Owens River drainage (Carpenter and Garrett, 1959). They estimated a total of 6 X 10¹⁰ g of W in the Upper and Lower Salts of Searles Lake; data from this pre sent report suggest about 3 X 10¹⁰ g in the Upper Salt. One analysis of Owens river water reports 0.07 mg/L of W (Smith, 1976, table 41), and this would provide about 7 X 10" g in 24,000 years to Searles Lake. Only a small portion of this came from drainage of tungsten- bearing bedrock. A water sample collected November 8, 1958, from Morgan Creek, 28 km west of Bishop, Calif., at a point below the Pine Creek tungsten mine

100 SUBSURFACE STRATIGRAPHY AND GEOCHEMISTRY, QUATERNARY EVAPORITES, SEARLES LAKE, CALIF.
(in one of the largest scheelite-bearing pendants in the Owens River drainage), contained 0.003 ppm W and 0.08 ppm Mo (F. S. Grimaldi, analyst, May , 1960). The flow was not measured, but an estimate made during a comparable season (December 12, 1975, by W. Hobbs of the Los Angeles Department of Water & Power, Independence, Calif.) suggests the flow in Morgan Creek at this time of year to be about 9 cfs (8 X 101Z g/yr) with most of that coming from one or more of the tungsten mine adits. That flow, for 24,000 years, would contribute about 6 X 10⁸ g of W to the Owens River. About 1.5 X 10¹⁰ g of Mo would be transported in the same period. The quantity of W from Morgan Creek would account for less than 0.1 percent of the total in the Owens River.
The amount of W issuing from springs in the Long Valley area can be estimated on the basis of two un published neutron activation analyses for W in water samples from Hot Creek and Little Hot Creek (L. A. Eccles, written commun., March 1976). These samples contained 0.035 and 0.9 mg/L of W, respectively, and average flow rates for those streams are estimated to be 3.2 X 10¹³ and 3.6 X 10¹¹ g/yr. In 24,000 years, those two sources would contribute a total of 3.4 X 10¹⁰ g of W, which is 5 percent of the calculated contribution by the the Owens River for that period but slightly more than is present in the Upper Salt of Searles Lake. Carpenter and Garrett (1959, p. 302) reported that W in water from Keough Hot Spring (on the west side of Owens Valley) averages 0.2 mg/L but no dis charge data are available.
GEOCHEMISTRY OF DIAGENESISBoth salts and muds in Searles Lake have under
gone change since first deposited. In both, new miner als have developed, and some original minerals have recrystallized into larger euhedral crystals of the same mineral. It is difficult to identify the times of most diagenetic changes; many could have taken place within weeks or months of first deposition although some clearly followed long periods of burial.
In theory, diagenesis of primary sediments takes place as a result of one or both of the following: (1) when postburial changes in the pressure, temperature, or composition of the interstitial fluids create condi tions that favor the creation of new phases, or (2) when the original crystals or phases are ther- modynamically metastable so that time alone results in spontaneous changes to form larger crystals or new phases.
Changes in pressure are proportional to changes in depth of burial plus the depth of the overlying lake, and in the Searles Lake sediments described here, they were relatively minor. The deepest samples ob
tained in core L-W-D come from 875 feet. Considering only the sediments, confined load pressures are about 60 bars, the unconfined hydrostatic pressures about 35 bars (Eugster and Smith, 1965, p. 480,485). During times the basin was filled by a large lake, loads would have been about 30 bars greater. Pressures of this magnitude have been shown to have little effect on the mineral pair mirabilite-thenardite (Gibson, 1942, p. 195). The great contrast in density between mirabilite and thenardite suggests that they are likely to be as sensitive to change in pressure as any mineral pair found in Searles Lake. Pressure, therefore, is virtually neglected as a possible cause of changes described in this report.
Changes in temperature were probably more impor tant as a cause of diagenesis. Temperatures at the time of original crystallization and for a short time after deposition probably varied over a range of 30° C or more, depending on the contrast between seasons, the depth of water, the salinity of the water, and the continentality of the climate. After deposition, tem peratures within the accumulating layers fluctuated less and converged toward a level approximated by the mean annual air temperature in the basin during that period. As burial continued, these temperatures slowly changed to conform to the geothermal gradient. As the geothermal gradient is about three times nor mal—29° C/l,000 ft or 95° C/km—reactions caused by increased temperatures are likelier to occur in the Searles Lake evaporites than at similar depths in other deposits. A plot of the measurements in one core hole (fig. 40) shows that the projected mean tempera ture at the surface of the lake is about 20° C (the mean annual temperature today at Trona is about 19° C) and the base of the Bottom Mud a temperature of about 26° C. Projecting this trend downward suggests that the base of core L-W-D (875 ft, 267 m) is at a temperature of about 45° C, and the base of the sedi mentary fill in the deepest part of the basin (3,300 ft, 1,000 m) about 115°C.
Changes in the composition of the interstitial solu tions probably account for the most diagenetic changes. Several processes led to these compositional changes, some almost immediately after deposition, others much later. As most of the processes operative in the mud layers were not operative in the saline lay ers and vice versa, generalizations about them are giv en separately in the sections that follow.
MUD LAYERS
Diagenetic reactions appear to have occurred in the mud layers as a result of several factors. Most of the diagenetic changes are attributed to disequilibrium between the original minerals and the brines that sur-

GEOCHEMISTRY OF DIAGENESIS 101
20 —
40 —
60
80
100
120
140
160
180
200
220
240
260
I ••
Mean annual temperature, Trona, 19.1 C
Average thermal gradient 2.78° C/100feet 9.12° C/100 meters 5.32° F/100 feet
18 20° 22° 24° 26°
TEMPERATURE, IN DEGREES CELSIUS
28
FIGURE 40.—Relation between temperature and depth in Searles Lake. Measured in core hole KM-8 with thermistor probe on in sulated cable, on April 8,1970, by G. I. Smith, W. J. Mapel, and R. L. Bornemann. Estimated accuracy ±0.2°C.
round them after burial. Others are attributed to chemical disequilibrium that resulted when tempera tures within the mud layers changed significantly after burial. Still others are attributed to the fact that some of the initial precipitates were ther- modynamically metastable and thus subsequently al tered spontaneously to stable forms.
Some of the states of disequilibrium between the original minerals and brine occurred almost immedi ately after the original minerals were formed. Some minerals probably crystallized originally in stratified lakes along the zone of mixing and then sank to the bottom where they were surrounded by interstitial so lutions of a different composition. Other states of dis- equilibrium occurred much later when brines migrating through the mud layer changed the compo sition of the previous interstitial brines or replenished the components that had been exhausted from them. Others occurred when organic decomposition altered the partial pressures of confined CO2 and thus the quantities of dissolved HCO3 and CO3 in the intersti tial solutions. Still others probably occurred during compaction when pore waters were eliminated more rapidly than were the salts dissolved in them, result ing in an increase in the relative percentage of dis solved ions. Changes may have occurred whenever major differences in the chemical compositions of con tiguous brine zones caused ionic diffusion to occur.
Nearly all gaylussite and pirssonite crystals in the muds of Searles Lake appear to be diagenetic pro ducts of reactions between primary calcium carbonate minerals and sodium- and carbonate-rich solutions according to the equation (for gaylussite):
CaC03(s) + 2Na+ + CO 3= + 5H20 = Na2Ca(CO3) 2 - 5H2OThis process was inferred by Jones (1965, p. A45) to explain gaylussite crystals in Deep Springs Lake, Calif., because of the tendencies for calcite and gay lussite to have inverse abundances and for gaylussite to be more abundant in older deposits. Both types of evidence for this reaction are found in Searles Lake. Aragonite occurs most prominently as laminae in these deposits, and although the number or thickness of the laminae does not seem to determine the zones that contain a high percentage of gaylussite or pirs sonite, the percentage of aragonite obviously de creases in the gaylussite- and pirssonite-rich zones as segments of the aragonite laminae are replaced by the larger crystals during their volume-for-volume growth (see Smith and Haines, 1964, fig. 15). In the Bottom Mud, the percentage of aragonite and calcite de creases downward whereas the percentage of gaylus site increases (pl,2B); in the underlying Mixed Layer, calcium carbonate minerals are virtually nonexistent

102 SUBSURFACE STRATIGRAPHY AND GEOCHEMISTRY, QUATERNARY EVAPORITES, SEARLES LAKE, CALIF.
whereas gaylussite and pirssonite are common.Several diagenetic processes were probably in
volved in the formation of those minerals. Textural evidence shows that the most of the gaylussite and pirssonite crystal growth occurred after the muds had been compacted to their present state (Smith and Haines, 1964, fig. 15; Eugster and Smith, 1965, pi. 1), but other evidence suggests that some growth started immediately after the aragonite (or calcite) was de posited on the bottom. As described earlier (p. 79), much of the aragonite was apparently crystallized in the zone of mixing between a layer of calcium-bearing fresh water at the surface and a more saline layer be low it. Crystals of aragonite formed in this way must have then settled to the bottom in a mud layer that had interstitial solutions of a higher salinity than the solution they formed in. If the sodium carbonate con centration in the solution was sufficient (between 14 and 22 percent Na2C03 in the 3-component system) and the temperature high enough (between 15° and 40°C), a spontaneous diagenetic reaction to form gay lussite would have started (Bury and Redd, 1933, p. 1162). Higher salinities and temperatures would have produced pirssonite. Inasmuch as evidence derived from the existence of halite in the muds (described be low) suggests that the initial salinity of some intersti tial brines was nearly high enough to form halite, those brines probably also had concentrations greater than the minimum required to initiate the alteration of aragonite to gaylussite.
Most of the gaylussite and pirssonite crystallized after burial. The supply of CaC03 was generally more than adequate, for some is still preserved in most mud layers. Therefore, limits on the rate of gaylussite growth were imposed by the rate at which Na-bearing brines were able to migrate through the muds to the site of crystal growth and the availability of C03 from the same solutions or from nearby bacterial produc tion of C02 .
The rate at which Na in the solution that surround the growing crystal was able to reach the site of crystal growth must have been retarded by the low porosity of the muds. The quantity of Na in the original intersti tial solutions should have been adequate. In the brines that permeate the salt layers (tables 9 and 16), the number of moles of Na is an order of magnitude greater than of C03 although about half the Na in so lution was electrically balanced by S04 , Cl, or B407 ions; K-, Mg-, and Ca-salts of those ions are not now found in the muds showing that the quantities of Na required to balance these anions were not extracted, and calculations outlined below show that only about a third of the total Na appears to be in gaylussite and pirssonite.
If the ionic ratios in the salts are representative of the pore brines in the mud layers, C03 ions in solution seem likely to have been exhausted first. Once the C03 was exhausted, the rate at which gaylussite crystalli zation could proceed probably depended in part on the rate at which C02 was formed by postburial de composition of organic matter in the sediments so it could react with water and replenish the C03 in the interstitial solutions. Production of C02 by this pro cess is effective but not necessarily rapid. Siever, Gar- rels, Kanwisher, and Berner (1961) and Siever and Garrels (1962, p. 54) report that in recent marine muds, there may be an order of magnitude increase in the partial pressure of C0 2 (Pco 2 ) over solutions equilibrated with the atmosphere. Jones (1965, p. A466, A48) noted that fetid organic muds and C02 - bearing gas from vents accompanied some occurrences of nahcolite, a mineral that requires the Pco 2 to be at least four times that of solutions in equilibrium with the atmosphere (Eugster, 1966, fig. 3).
The crystallization of gaylussite and pirssonite from calcium carbonate and dissolved ions depleted the in terstitial solutions in Na, C03 , and H20. The average of Na values reported in analyses of the Parting Mud (table 13) is 12.6 percent (17.0 percent Na20); after subtracting 8.6 percent of the Na which is combined with the average of 13.2 percent Cl to form 21.8 per cent halite, 4.0 percent of the muds consists of Na which is in gaylussite and pirssonite. The volume of the Parting Mud within the areal limits used for iso- pach plotting (fig. 23) is about 480xl06 m3 . Assuming an average density of the Parting Mud of 2.0, about SOxlO12 g of Na is in halite and 35xl012 g of Na is in gaylussite and pirssonite. This is about 20 percent of the amount of Na now found in the Upper Salt. Al though the crystallization of this amount of Na caused a relative increase in the amount of dissolved K in the brines, it is probably not great enough to account for the exceptional concentration of K in the Upper Salt. At greater depths, where so much Na has been ex tracted from interstitial solutions to form gaylus site and pirssonite that CaC0 3 is almost non existent, this process might explain the creation of authigenic K-silicate phases in the muds, a mecha nism suggested as the cause of these phases in the Green River Formation (Goodwin, 1973, p. 103).
Gaylussite and pirssonite in the Parting Mud are more abundant near the top and bottom contacts than in the middle (Haines, 1959, pis. 7, 8), and there is a tendency for the pirssonite that is found in the Part ing Mud to be concentrated in these zones (Eugster and Smith, 1965, p. 519). Concentrations of more than a few percent of diagenetic gaylussite or pirssonite re quired additional Na, C02 , and H20 from nearby sa-

GEOCHEMISTRY OF DIAGENESIS 103
line layers because the quantities of these components in the original interstitial brines were small. Concen trations of either pure gaylussite or pure pirssonite had to form in an open system. This is because the reaction responsible for diagenetic gaylussite removes five moles of H2O from the surrounding brines for each three moles of dissolved components, and if this process occurred in a closed system, it would raise the salinity, lower the chemical activity of water, and eventually result in the cocrystallization of pirssonite. Reactions of brine with aragonite to form pirssonite removed only two moles of water for each three moles of dissolved components, so its crystallization in a closed system would have decreased the salinity, in creased the aH2o, and promoted the cocrystallization of gaylussite.
In most other mud layers that are shallower than 545 ft (166 m), though, the distribution of gaylussite and pirssonite seems to be controlled by the original salinities of the interstitial solutions and thus aH2o (below 166 m it seems controlled by temperature, see below). Individual mud units (such as those in the Lower Salt) characteristically contain gaylussite, pirs sonite, or a mixture without regard to the proximity or composition of the brine in the overlying and underly ing saline layers. It seems likely that the salinities of the interstitial solutions at the time crystal growth oc curred reflect the variations in the original bottom wa ters to a larger extent than waters introduced later by diffusion. Possibly seed crystals that grew in the origi nal bottom waters determined which phase would later become abundant during diagenesis.
The maximum depth at which diagenetic gaylussite has been preserved is apparently controlled by tem perature. In the Na2CO3 -CaCO3 -H20 system, pirsson ite is stable within a certain range of compositions above a boundary that lies between 37.3° and 40°C and gaylussite is stable within a similar range of com positions below these temperatures (Bury and Redd, 1933, p. 1162). Additional components in the solution will lower the chemical activity of water (OH.O) and thus lower the temperature range of this boundary (Eugster and Smith, 1965, p. 478-480). In core L-W- D, at levels above 545 ft (166 m), both gaylussite and pirssonite exist, apparently because of local variations in aH2o Below 166 m only pirssonite is found. Project ing the geothermal gradient shown in figure 40 to 166 m indicates 35° C as the approximate temperature at that depth. Although this is 2°-5° below the range containing the gaylussite-pirssonite stability field boundary in the three component system, other com ponents exist in the interstitial solutions, and the lower aH2o resulting from their presence probably de presses the temperature range of the field boundary to
about 35° C. At greater depths, temperatures would be above this point and only pirssonite would be stable.
Several other diagenetic minerals in the muds seem best explained by postburial changes in the partial pressure of CO2 (Pco2 ) as a result of fluctuations in the biologically generated CO2 from organic rich mud. A postdepositional increase of Pco2 in muds that contain sodium-rich pore brines seems the most likely expla nation of rosettes and isolated clumps of nahcolite and trona in the muds of Searles Lake; this mecha nism was proposed by, and supported by data of, Bradley and Eugster (1969, p. B9, B43) to explain similar features in the Green River Formation. In fact, the preservation of nahcolite in contact with brine re quires the postdepositional addition of C02 such that the Pco, is raised and maintained above that provided by equilibrium with the atmosphere. A postburial de crease in Pco, in the mud layers of Searles Lake is pos sibly indicated by octahedra and nodules of finely crystalline northupite and tychite that cut bedding and are inferred to be diagenetic (Smith and Haines,1964. p. P30-P33). These minerals can result from the interaction of brines and dolomite (or other minerals containing the necessary ingredients) when the PCO, is lowered, although it is equally possible that the criti cal change in environment consisted of a decrease in the chemical activity of H2O (Eugster and Smith,1965. p. 497-504; Bradley and Eugster, 1969, p. B60).
Microcrystalline halite, identified by X-ray diffrac tion techniques, is present in many of the mud units. This is one of the diagenetic products that seems most likely a result of postdepositional increases in the sa linity of the interstitial brine during compaction (Smith and Haines, 1964, p. P39). Some of the ob served halite in the muds may have crystallized from the interstitial brines that were evaporated to dryness prior to X-ray diffraction, but crystalline NaCl must also exist in the undried muds. The Parting Mud is the most carefully studied mud unit that contains ma jor quantities of halite in most samples, and the con clusion that halite exists as a solid phase in the fresh moist samples is virtually unavoidable; the maximum brine content in the samples of this unit from core KM-3 was about 50 percent (fig. 25), and assuming that the unit in core GS-16 had a similar porosity, and the interstices were filled with brine that was satu rated with NaCl, the maximum amount of Cl in the analyzed samples (table 13) should be only about 8 percent. All but one contain more than this amount and some contain more than twice as much.
Dissolved solids are commonly concentrated by sev eral percent after they are deeply buried in sediments (White, Hem, and Waring, 1963, p. F9). Many work-

104 SUBSURFACE STRATIGRAPHY AND GEOCHEMISTRY, QUATERNARY EVAPORITES, SEARLES LAKE, CALIF.
ers—DeSitter (1947, p. 2039-2040), Wyllie (1955, p. 288-301), Bredehoeft, Blyth, White, and Maxey (1963), and Von Engelhardt and Gaida (1963)—con sider the postdepositional concentration of NaCl solu tions in deeply buried marine sediments a probable result of the salt-filtering effect of compacting clay, which acts as a membrane that allows H2O to escape during compaction more rapidly than the salts dis solved in it. Bradley and Eugster (1969, p. B65) add the suggestion that the organic content may enhance the filtering effectiveness of sediments. Emery and Rittenberg (1952, p. 788-789) found no change in the NaCl concentration of brines of very shallowly buried (5-10 ft) muds, although Siever, Garrels, Kanwisher, and Berner (1961) and Siever and Garrels (1962) note a slight tendency for such concentration. Jones, Van Denburgh, Truesdell, and Rettig (1969, p. 257- 258) report a downward increase in dissolved solids in muds from the bottom of Abert Lake, Oreg., and attri bute it to the entrapment of more saline waters during an earlier period when the lake was more saline; Van Denburgh (1975, p. C24-C27, table 9) reports similar data from the muds beneath Abert Lake but no trend (or a weak trend in the opposite direction) in muds from nearby Summer Lake. Neev and Emery (1967, fig. 50, p. 96) noted the presence of halite crystals up to 10 cm in size that grew beneath the sediment sur face in muds from the Dead Sea, but no explanation of their origin is suggested.
While the above observations show that increases in the salinities of interstitial brines do occur during compaction, they do not indicate increases of more than a few percent. The inference that halite in the mud layers of Searles Lake is product of this mecha nism is therefore tenable only if the salinity of the pore brines from which halite crystallized was high. This is part of the reason for concluding that the lake was chemically stratified during some stages (see p. 54) with the densest and most saline waters, pro duced during previous episodes of near-desiccation or by solution of underlying salts, forming a layer on the bottom of the lake. The concentration of halite in the upper-middle part of the Parting Mud (table 13) is reasonably correlated with the episode of partial des iccation that geologic mapping indicates for this part of the lake's history (Smith, 1968, fig. 4) but it cannot be correlated with the present stratigraphic proximity of saline layers.
It is difficult to conceive of a mechanism other than diagenesis that could explain halite in the Parting Mud which was deposited on the bottom of a lake 100- 200 m deep (Smith, 1968, fig. 4). If the lake was un- stratified, and assuming that it contained the quanti ty of dissolved salts that later crystallized to become
the Upper Salt, its average salinity while standing at these levels would have been at most only 5 percent— 20 percent of that necessary to precipitate halite. If the lake was stratified, much denser brines near satu ration could have existed on the floor of the lake. There is, however, no mechanism that allows a dense brine in this position to become supersaturated with halite. Further concentration could not occur as a re sult of evaporation because the lower brine layer did not have an exposed surface; supersaturation could not occur as a result of mixing along the interface be tween the brine and the overlying water layer because halite is one of the last minerals to precipitate from waters of these compositions, so both of its compo nents would be concentrated in the denser lower layer.
In addition to diagenesis that is attributable to changes in the composition of the interstitial solutions and the temperature, some changes occurred because the original phases were thermodynamically metasta- ble. The most common reaction of this type was prob ably the conversion of aragonite to calcite. Aragonite is a metastable compound, and if in contact with fluids, converts spontaneously to calcite (Berner, 1971, p. 138-147). In Searles Lake, aragonite in con tact with interstitial solutions is in the Parting Mud, possibly in some mud layers in the Lower Salt and in the upper part of the Bottom Mud.28 The oldest arago nite occurrences confirmed by X-ray are in muds from core L-30 at 136 ft (41 m), about 5 m below the top of the Bottom Mud and in deposits estimated to be about 50,000 years old. The similarity of laminae in older layers to those composed of aragonite in the younger layers suggests that they were originally ara gonite but that the mineral converted spontaneously to calcite as a result of its thermodynamic meta- stability. If this is so, the conversion appears to re quire about 50,000 years under conditions of pressure and temperature found in these deposits.
Another diagenetic process related to thermody namic forces is the long-term growth of large crystals of a given mineral species at the expense of very small crystals of the same species. This is promoted by the fact that the free energy of large crystals is slightly less than crystals less than a few microns in size (see Berner, 1971, p. 27-34). In a deposit containing very small crystals composed of moderately soluble phases, this thermodynamic drive probably results in some change. Most large crystals in the mud layers presum ably contain some ions that become available by this process. Most of their postdepositional growth, how ever, was probably the result of the other processes
"Smith and Haines (1964, p. P25) reported laminae—presumed to be aragonite—in the lower part of the Bottom Mud, but these laminae were subsequently found by X-ray diffraction to be composed of other minerals.

GEOCHEMISTRY OF DIAGENESIS 105
that have been discussed.Much slower diagenetic reactions between brines
and (or) clastic silicates have produced a suite of auth- igenic silicate minerals. All these reactions were caused by disequilibrium between the interstitial brines and the silicates in the muds, although some were probably accelerated by the thermodynamic me- tastability of the amorphous silicates—tuffs—that lie at several horizons. Monoclinic K-feldspar, two types of searlesite, and two zeolites—analcime and phillip- site—occur in the subsurface deposits of Searles Lake. Hay and Moiola (1963) studied 72 carefully selected samples from cores GS-2, GS-14, GS-17, and L-W-D and found authigenic silicates in 54. None of the five samples they collected from the Overburden Mud contained authigenic silicate minerals. Two of the nine samples from the Parting Mud were from a 2 1/2 mm tuff bed that is about half a meter below the top of the unit; the tuff was almost entirely converted to phillipsite. R. L. Hay reports (written commun., June 1964) that two tuff laminae at a level 1 m below the top of the Parting Mud in core GS-27, possibly repre senting the same ash fall, were altered to phillipsite. One clayey dolomite sample from near the base of the Parting Mud contained a trace of analcime. Three of the six samples from the mud beds in the Lower Salt contained traces of analcime (their sample from GS-2 at 99 ft (30 m) is probably from the Bottom Mud rath er than the Lower Salt as indicated in their table 1); the three containing analcime came from M-7 and M-6(?), and the three remaining samples came from M-6(?) and M-4. All but one of the 12 samples from the Bottom Mud contained authigenic minerals. A thin tuff bed 8.3 ft (2.5 m) below the top of the Bottom Mud consisted almost totally of phillipsite, but a tuff of similar thickness at the base of the Bottom Mud was altered to analcime. Analcime was detected in clayey samples from the upper and lower parts of this unit; authigenic K-feldspar was found mostly in the middle; and what Hay and Moiola (1963, p. 324-325) call "type B" searlesite was found in the lower part of that middle zone. Samples from the Mixed Layer con tained analcime, both their "A" and "B" types of sear lesite, and authigenic K-feldspar (data on Mixed Layer samples from table 1 of Hay and Moiola are summarized here on pi. 2A). Analcime appears to de crease in abundance downward through the Mixed Layer; K-feldspar clearly increases in abundance. Oc currences of both types of searlesite seem random. Two relatively thick (40 mm and 150 mm) tuff beds in the Mixed Layer were altered to analcime, "type B" searlesite, and (or) K-feldspar.
In the study described by this present report, authi genic silicates were sought systematically only in sam
ples from the Bottom Mud. They have been confirmed to be present in the Parting Mud and in mud layers of the Lower Salt, as reported by Hay and Moiola (1963), but their percentages are commonly too low to allow detection by X-ray diffraction unless especially favorable sample material is selected. Auth igenic silicates are common in the Mixed Layer, but very few samples from that unit were studied, as Hay and Moiola had thoroughly studied the only available core.
The authigenic silicates in the Bottom Mud of cores L-30, L-W-D, and 254 were sampled, X-rayed, and their distribution plotted on plate 2B. Few or no auth igenic silicates are in the top 20 ft (6 m). Analcime is a prominent component in a 10 m zone below that, with authigenic(?) K-feldspar coexisting with analcime in the lower 3-6 m of this zone. Authigenic K-feldspar is found as a component in the underlying 5 m of sedi ments, and in part of this zone, it coexists with "type B" searlesite of Hay and Moiola (1963, p. 324-325). Except for a basal zone, authigenic silicates are not detected in the bottom 10 m. This zonation is similar to that reported by Hay and Moiola (1963, table 1).
The phases present in the clastic silicate fraction of Searles Lake muds are presumably about the same throughout the section, even though the original per centages of clastic minerals may have varied by a fac tor of three. The distinct zonation of authigenic silicate minerals in the Bottom Mud would therefore seem to be most likely a result of differences in the chemistry of the pore waters. Differences in the com position of interacting solutions that would be critical can be inferred from the compositions of the new phases. Analcime (NaAlSi206 -H20) and searlesite (NaBSi208-H20) require environments that have high chemical activities of Na and H20, but searlesite envi ronments require a higher activity of B or a lower ac tivity of Al than analcime. Zones of K-feldspar (KAlSi208 ) indicate higher ratios of K/Na activities than zones composed solely of analcime and searlesite. In the Bottom Mud (pi. 2B), authigenic K-feldspar oc curs alone and also coexists with analcime and with searlesite; analcime and searlesite rarely coexist with each other, and only analcime occurs alone. This shows that the K/Na activity ratios in the reacting in terstitial solutions are those required by the K-feld spar or analcime fields, or by the boundaries between the K-feldspar/analcime and K-feldspar/searlesite fields. The activites of Al apparently are those re quired by the K-feldspar and analcime fields and the K-feldspar/searlesite boundary, but not the searlesite field or the analcime/searlesite boundary. Variations in the chemical activity of B partially control the dis tribution of searlesite, but the necessary combination

106 SUBSURFACE STRATIGRAPHY AND GEOCHEMISTRY, QUATERNARY EVAPORITES, SEARLES LAKE, CALIF.
of high Na and B, combined with low values of Al, that would allow searlesite and analcime to coexist, are rarely present. Conditions that allow searlesite to oc cur alone apparently are never present.
Pyrite was noted (and confirmed by X-ray diffrac tion) in one sample from the Bottom Mud as a cluster approximately 0.1 mm in diameter of intergrown eu- hedral crystals. It is surprising that it was undetected in nine other samples subjected to similar study from the Parting Mud, Lower Salt, and other parts of the Bottom Mud. Pyrite in these sediments is almost cer tainly the product of diagenesis by reaction of Fe com pounds in the clastic sediments with hydrogen sulfide produced by sulfate-reducing bacteria that consumed S04 from the salts or brines. Neev and Emery (1967, p. 86, 94) infer that this process is responsible for the py- rite found in almost all dark laminae in sediments from the bottom of the Dead Sea.
SALT LAYERS
The most obvious result of diagenesis in the salt lay ers is the postdepositional increase in the size of some crystals. This increase may be due partly to the ther- modynamic drive supplied by the small difference in the free energy of large crystals relative to small ones, but this factor is probably negligible. The energy dif ference is a result of the larger surf ace-to-volume area of small crystals, but the differential is minute when the crystals are more than a few microns in size. Even with geologic spans of time involved, it does not seem likely that the typical "primary" crystals in the salt layers, most of which are 1,000 microns (1 mm) or more in size, would be affected.
It seems likely that the solution of small crystals and recrystallization of their ingredients on the sur faces of larger crystals is a result of cycles that first cause slight undersaturation and then super- saturation. Periods of slight undersaturation would result in some solution of all crystals, but smaller cry stals would tend to be destroyed while larger crystals would tend to be partially preserved. Because super- saturation is required to start new nuclei, most of the ions from the destroyed crystals would recrystallize on the surfaces of the remnants of the larger crystals (along with the ions that had been previously dis solved from those crystals). The net effect would be for the large crystals to grow larger and small crystals to disappear. Cycles of this type can be created by daily or seasonal changes in temperature (while the salt layer is still near the surface), by the long-term changes in temperatures that occurred during the Pleistocene, or by cyclic changes in brine chemistry (caused, for example, by cycles in the Pco2 related to
fluctuations in the rate of biological decomposition). The addition of brines having different composition or of fresher waters would also cause changes in the degree of saturation, but as changes caused by these mechanisms are inherently irreversible, their effects would have to be counteracted by other processes to complete the cycle.
Evidence of other forms of diagenesis of the salt lay ers in Searles Lake is rare, although most of the pro cesses that created diagenesis in the mud layers were active in the salt layers. There are no convincing ex amples of one mineral being pseudomorphous after another. There is evidence that one suite of original minerals was thermodynamically metastable and that it recrystallized later to form a new mineral—hank- site. There are, however, only isolated examples of evi dence indicating changes in mineralogy caused by postdepositional disequilibrium between the original minerals and new interstitial brines or by changes in temperature. However, as noted earlier (see section on "Saline Layers"), studies at Owens Lake show that the recrystallization that occurs immediately after some of the crystals first sink to the bottom leaves almost no physical evidence, so the lack of evidence of later change in salines of this type is not very significant.
The convincing example of diagenesis caused by a thermodynamically metastable suite of primary min erals that recrystallized spontaneously into a new mineral phase is provided by large crystals of hank- site. These crystals occur commonly as vuggy clusters, beds, and as relatively isolated euhedral crystals in several parts of the Upper Salt, less commonly as iso lated crystals in units S-3, S-4, and S-5 of the Lower Salt (Smith and Haines, 1964, p. P16-P18). Hanksite crystals grow very slowly, and solutions that have compositions within its stability field commonly pre cipitate metastable assemblages of burkeite, aphthi- talite (glaserite), and thenardite (Gale, 1938, p. 869) . Hanksite crystals in Searles Lake are almost all large and euhedral and occur in vuggy configurations that are virtually impossible to relate to conditions pro vided by the bottom of a saline lake. Recrystallization may have taken place within a relatively short time of the original deposition of the precursor minerals; some crystals contain inclusions of orange micro-or ganisms likely to have been most abundant during and immediately after salt deposition. The earliest core logs and descriptions of salts from Searles Lake (Hidden, 1885; Hidden and Mackintosh, 1888; Gale, 1914, p. 304; and company data made available to the author) report hanksite crystals in the form in which they now occur; their distribution and habit cannot be related to changes resulting from commercial oper ations on the lake.

GEOCHEMISTRY OF DIAGENESIS 107
Small percentages of anomalous minerals are mostly interpreted here as products of diagenesis rather than original depositional conditions. Some may have resulted from changes in bulk composition that can occur after deposition when brines from over lying or underlying sediments migrate into a layer. Others may have been caused by differences in tem perature that occured between the time the initial lay er was deposited and the present. New phases created because of postdepositional changes in temperature, however, were crystallized only to the extent that their components were available in the brines. Since about 15 percent of the evaporite components are esti mated to be in the brines (tables 10 and 17, footnote 7), new phases containing components that were ini tially only in brines cannot exceed this percentage and are likely to contribute much lower percentages. Ex amples of diagenetic minerals probably formed in this way are indicated by analyses of Lower Salt cores (ta ble 7). In most cores, units S-l, S-2, S-3, S-6, and S-7 do not contain sulfate minerals that are detected visu ally or by X-ray (fig. 34), yet the analyzed samples do contain a few percent S04 indicating the presence of a small percentage of such minerals. It seems likely that these sulfate minerals, present consistently but in small amounts, are products of post-burial diagenesis.
The C02 that was organically generated in muds after burial may have locally changed the species of carbonate minerals in overlying saline layers because C02 (and methane) tends to escape upward. Changes in the rate at which C02 is produced could change the Pco2 in those solutions, and, as indicated by Eugster and Smith (1965, p. 486-512), numerous reactions are promoted by such changes. For example, assuming reasonable assemblages of Searles Lake minerals, in creasing the PCOZ (which is nearly proportional to aco2 ) may promote reactions that will change thermonatrite to trona, burkeite to mirabilite, or natron to trona (Eugster and Smith, 1965, figs. 19A, B). Decreasing the Pco2 could have the opposite effect. Since all these reactions are also promoted by changes in OH,,O evi dence of alteration is not necessarily a sign of change in the C02 in the postdepositional environment, there fore, the conclusions may be ambiguous.
It is difficult to evaluate the importance of this mechanism. There is very little physical evidence in the saline layers of the Searles Lake deposits of dia genetic changes caused by changes in Pco2 > yfit as noted previously, such evidence is sometimes missing even where reactions are known to have taken place. Coarsely crystalline aggregates of some sensitive min erals are clearly recrystallized after burial, but they do not appear to be replacing or growing at the expense of another species of mineral; in many instances, in fact,
they coexist with finely crystalline layers of the same mineral (Smith and Haines, 1964, p. P45).
Any diagenesis of the salt layers must cause corre sponding changes in the brines. The present brines, indicated by point 6-3 in figures 35, 36, 38 and 39, are all different from the brines as they existed at the end of crystallization (point b-2 in those figures). All the points labelled b-3 lie on a phase boundary or triple point for the applicable system at 20° C (which is within 3°C the present temperature of the salt bo dies), but in a position that requires that they have a slightly lower percentage of dissolved solids than when crystallization ceased at point b-2. Clearly, wa ter has been added to the brines since deposition of the salt bodies, and partial solution of the original salts has produced brines whose compositions are con trolled by the boundaries of the remaining phases.
The deuterium-hydrogen content of the salts and present interstitial brines in Searles Lake (Smith, Friedman, and Matsuo, 1970, p. 258) confirms the fact that water has been added to the saline units since their deposition. The question is: Did the addition of water cause diagenesis or did diagenesis produce the additional water? It is clear that some water was added as the present hydrostatic head (Hardt and others, 1972, fig. 10) is forcing relatively dilute brines from near the surface of the lake into the underlying layers, thus producing an increase in the aHao of the interstitial brines. Diagenetic reactions that require water would be favored by this change. Two of the post-depositional reactions that probably occurred have this requirement. Nahcolite (Nh) reacts to form trona (Tr) as follows:
3Nh + H20 = Tr + C02
and burkeite (B), aphthitalite (Ap), and halite (H) react to form hanksite (Hk) and trona as follows:
75B + 6Ap + 18H + 65H20 + 13C02 = 18Hk + 26Tr
However, other post-depositional reactions that prob ably occurred release water; they would have pro duced a more dilute brine but might have been inhibited by the dilution of the brine by other pro cesses. Natron (Na) reacts to form trona as follows:
3Na + C02 = 2Tr +«25H20;and thernadite (Tn) and other minerals react to form hanksite as follows:
25Tn + 4Tr + Ap + 3H = 3Hk + 10H20 + 2C02
At this time, there is no clear way to tell which pro cesses were most active. The net result, though, was

108 SUBSURFACE STRATIGRAPHY AND GEOCHEMISTRY, QUATERNARY EVAPORITES, SEARLES LAKE, CALIF.
that the brines were diluted after initially being formed and that their present compositions are con trolled by the phase relations between the surviving mineral species at about 20° C.
The position of point b-3 in figure 39A is almost ex actly on the metastable triple point of that system. This is probably coincidence. Once the metastable suite of minerals has altered to hanksite, the triple point has no meaning. Moreover, the actual position of the triple point in the system that contains NaHCO3 and thus trona was inferred (p. 92) to be po sitioned more toward the Na2CO3 corner of that dia gram. It is more likely the Upper Salt brines are on the aphthitalite-thenardite-trona-halite boundary in the 6-component system at 20°C. Burkeite, therefore, would not be expected to exist in the Upper Salt, but a few pockets remain. Point b-3 represents an average, however, and the scatter of brine compositions indi cated by figures 21 and 28 means that local assem blages may exist that are not in equilibrium with a brine having this average composition.
RECONSTRUCTED DEPOSITIONAL HISTORY
The history of lakes in Searles Valley is partially documented by the sequence and nature of the sedi ments beneath the present dry-lake surface. The mud layers represent large, relatively deep lakes that were fresh or brackish, and variations in the lithology and mineralogy of those layers reveal changes in the com position, concentration, and distribution of dissolved solids in those lake waters. The salt layers represent either small, relatively shallow lakes that were highly saline or dry lakes. Some saline lakes crystallized salts during part of the year only; others crystallized salts all year; still others desiccated. Beds of monomineralic salt of a type that probably crystallized as a result of winter cooling indicate a moderately saline lake (ap proximately 3-15 percent salinity); beds of mono mineralic or bimineralic salts that probably crystal lized during much of the year but did not include the most soluble species indicate a shallower(?) more saline lake (approximately 15-30 percent); and beds of salts that include the most soluble species of salts indicate a highly saline lake that approached or reached desiccation (more than about 30 percent).
In the following reconstruction of Searles Lake his tory, the ages of the inferred events are mostly based on the ages discussed in the section on 14C dates. The positions of salt layers in the Bottom Mud are based on core 254 (pi. 2JB), and the period of time represent ed by that unit is based on the depositional rate deter mined for the Parting Mud, as corrected for the greater amount of acid-insoluble material found in the Bottom Mud.
The Mixed Layer represents a long period during which there was a gradual shift from nearly continu ous mud sedimentation to salts, and from a NaCl- to a Na2CO3-dominated water chemistry. Nearly continu ous mud sedimentation is represented by unit F (pi. 2A). Salt deposition started as a mixture of mud and halite (unit E), then progressed to alternating beds of mud, halite, and trona (unit D), then to beds of nearly pure trona and halite that grade up to halite (unit C), and finally shifted to beds dominated by trona and nahcolite (units B and A).
Although the mud layers in the units F and E repre sent perennial lakes, the salinities of the interstitial waters appear to have been high inasmuch as they contain large amounts of authigenic K-feldspar, anal- cime, and searlesite. These minerals occur more con sistently and in larger amounts than in younger salt- bearing units, either because the mud in units E and F provided more adequate sources of silica and alumina for diagenesis, or because their greater age allowed diagenesis to progress further. The other minerals present in fine-grained form in the muds of the Mixed Layer seem to indicate no trends in sedimentation his tory that are not evident from the megascopic litho logy of the mud and salt units.
Several mud layers in the Mixed Layer are charac terized by mottled coloration that includes reddish hues. Mottled zones are inferred to represent times when the lake was dry and the sediments were ex posed to oxidation by the atmosphere. The surface was probably dry at many other times when oxidation of the clastic sediments was prevented by an overlying layer of salt that contained entrapped brine. However, salts exposed at the surface of modern salt flats tend to become tan to pink as they are mixed with or cov ered by silt of these colors that is introduced by winds and seasonal floodings. Salt surfaces that have been dry for more than a few thousand years are likely to be identifiable in cores by the intermixed clastic sedi ments that have these colors.
Sands, silts, and clays exposed on the present sur face of Searles Lake have hues in the 5YR to 10YR category of standard rock-color charts. These colors do not characterize any layers of muds or salts in the units above the Mixed Layer (Smith and Pratt, 1957, p. 25-33; Haines, 1959) but do occur at six horizons in core L-W-D. One horizon (534 ft, 163 m) is in unit C, five (at approximate depths of 715, 722, 763, 768, and 783 ft, or 218, 220, 233, 234, and 239 m) are in unit E. None occur in units A, B, D or F. These data combined with those described above suggest that the center of Searles Valley contained a deep lake during much of the time unit F was deposited, a fluctuating lake that desiccated several times and remained dry for long

RECONSTRUCTED DEPOSITIONAL HISTORY 109
periods while units C, D, and E were deposited, and a shallow saline lake that commonly produced salts but dessicated rarely or only for relatively brief periods during the times units B and A were being deposited.
Calculations described by Smith (1976, table 1) show (1) that Searles Lake was likely to have been dry only when it received no overflow from Owens Lake meaning that the flow of the Owens River did not ex ceed about 3 times that of the present, (2) that it was likely to have been a small saline lake when the Owens River flow into Owens Lake was approximately 4 times that of the present, and (3) that it was likely to have been a maximum-sized or overflowing lake when the river was flowing at a rate 7 to 10 times that of the present. Using these categories of relative flow of the Owens River, the lithology of unit C of the Mixed Layer represents an episode that was dominantly like category 1 (interpluvial), the lithology of unit F repre sent an episode that was clearly like category 3 (plu vial), and units A, B, D, and E represent episodes that were mostly intermediate between these extremes.
The period of time represented by the Mixed Layer can only be approximated on the basis of sedimenta tion rates. In core L-W-D (Smith and Pratt, 1957), the Mixed Layer is about 200 m thick of which about half was recovered as core. As the cumulative thickness of mud recovered from the Mixed Layer was about 45 m, about 90 m of mud may occur in this part of the sec tion. The sedimentation rate derived for the Bottom Mud (about 33 yrs/cm) suggests that 90 m of mud re presents about 300,000 years. As the top of the Mixed Layer is about 130,000 years old, the age of the base of unit F might be about 430,000 years plus whatever time was required to deposit 110 m of salts. Reason able guesses of the age of that horizon probably lie be
tween 500,000 and 1,000,000 years.The larger amounts of data pertaining to the Bot
tom Mud and younger deposits allow more details of their depositional processes to be reconstructed. The curve shown in figure 41 indicates the inferred lake history during the past 150,000 years. The levels la beled C, D, E, and F are represented in cores by saline layers, with each level representing a range of salini ties that would result in deposition of the observed suites. The levels labeled A and B represent large pe rennial lakes that had a wide range of depths, and some probably had relative depths which were the op posite of those implied by the curve because the choice of levels is based on criteria that are only sug gestive of depth. Segments of lake history plotted at level B are based on the presence in cores of authi- genic silicates (indicative of higher salinities in the bottom waters and presumably also those of the entire lake), or aragonite laminae (indicative of pronounced chemical stratification and thus probably a more sa line lower layer and a smaller total lake volume). The segments plotted at level A are mostly based on the absence of these suggestions of moderate salinity. Some portions of lake history are plotted at levels be tween the labeled horizons because the available data do not allow a clear choice.
The Bottom Mud mostly consists of mud that was deposited in deep lakes, although several low stands are documented by salt layers. The deep lakes are re presented by mud. A plot of its fine-grained com ponents (pi. 2B) shows marked variations in the amounts of the four Ca-bearing minerals, aragonite, calcite, dolomite, and gaylussite, but these variations are not used as a primary basis for inferring a succes sion of lacustrine environments. The amount of Ca
A —i
10 20 301————————T50 60 70 80 90 100 110
AGE, IN THOUSANDS OF YEARS BEFORE PRESENT
120 130 140 150
FIGURE 41.—Inferred history of fluctuations in Searles Lake, 0-150,000 years ago. A, Deep lake, unstratified or stratified with thick surface layer; B, Deep lake, stratified with thin surface layer; C, Intermediate-depth lake, salinity of interstitial brine 3-15 percent; D, Shallow lake, salinity 15-30 percent; E, Very shallow lake, salinity 30-35 percent; F, Dry lake, salt surface exposed part of year, salinity of interstitial brine mostly greater than 35 percent.

110 SUBSURFACE STRATIGRAPHY AND GEOCHEMISTRY, QUATERNARY EVAPORITES, SEARLES LAKE, CALIF.
that was transported into the lake basin and pre cipitated theoretically provides a measure of the vol ume of inflow, but the percentages of Ca in those min erals (40, 40, 22, and 14, respectively) vary so much that it is almost impossible to estimate the total amount from the semiquantitative estimates of min eral abundance, and chemical analyses that report to tal Ca are not available.
In younger units, the existence of a stratified lake is inferred from the abundance of aragonite laminae or the dominance of aragonite over calcite. Aragonite laminae are found in the upper few meters of the Bot tom Mud, but calcite is the more abundant of the two minerals. These proportions suggest that the lake in which the upper part of the Bottom Mud was deposi ted was occasionally stratified but that conditions favorable for slow crystallization of CaCO3 as calcite existed during most of the year; presumably this required a large, relatively fresh lake. Calcite percent ages diminish downward in the Bottom Mud, but it is not clear if this is because its original percentage was low or because the extent of its reaction to form gay- lussite is more nearly complete.
The distribution of dolomite and gaylussite in the Bottom Mud apparently also reflects too many proc esses to make it useful for reconstruction. In the Part ing Mud, the distribution of dolomite suggests that it is favored by brines that are intermediate in salinity, but its coexistence in the Bottom Mud with gaylussite, calcite, and aragonite, combined with its proximity to saline layers, means that there is either broad overlap of stability fields, that there were rapid fluctuations between environments, or that some is diagenetic. The quantity of gaylussite must partly reflect the original amount of calcite (or aragonite) and partly in dicate the amount of Na in the original or introduced interstitial brines. In the lower part of the Bottom Mud, there is a fair correlation between the large per centages of gaylussite (pi. 2B) and the high stands of the lake inferred from other data (fig. 41). In the up per part of core 254 (pi. 2J3), a zone containing abun dant calcite approximately coincides with a zone low in gaylussite, and this suggests a deficiency in the amount of Na-bearing brine that was required for the diagenetic reaction. This interval also contains trace amounts of Na-bearing saline minerals meaning that the Na percentages in the interstitial brines must be high. Inconsistencies like this make interpretations of the original depositional condition based on gaylussite percentages seem tenuous.
Lake levels plotted at or below the horizon labeled B in figure 41 are mostly those represented by mud containing analcime, searlesite, or authigenic K-feld- spar. Exceptions to this are the three queried intervals
between 55,000 and 85,000 years which are tentatively plotted at horizon A, even though the sediments con tain authigenic K-feldspar and analcime, on the basis of correlations with unpublished geologic mapping; this shows that greater thicknesses of sediments were deposited at the highest lake levels in the period that followed a low stand (presumed to be the one plotted at 95,000 years) than before it.
Analcime in the Bottom Mud is clearly concen trated in certain zones (fig. 41). They are interpreted as of diagenesis resulting from times when the original lake and resultant pore waters had higher chemical activities of Na and H2O. The tendency for these zones to characterize the mud layers above and below nah- colite layers suggests that the lakes at these times had Na-rich brines in contact with the accumulating mud layers for long periods of time, either because the lake was stratified or because it was shallow and uniformly saline. The lack of frequent zones of winter-crystal lized salines throughout the analcime zones argues against shallow saline lakes.
Changes in the abundance of searlesite in the Bot tom Mud must in part indicate variations in the abun dance of B in the interstitial waters. The one searlesite zone in the interval plotted (fig. 41) between 85,000 and 105,000 years probably reflects a period of abnor mally high B in the inflowing waters. A high B content might also result from concentration by evaporation of lake waters, but searlesite is missing from other zones known to have been deposited in lakes having high salinities.
Concentrations of authigenic K-feldspar occur in the Bottom Mud in two or three distinct zones (fig. 41), that probably indicate higher K/Na ratios in the pore waters than zones containing only analcime or searlesite. As K-feldspar occurs with analcime and searlesite as well as without either of these minerals, these zones probably indicate periods characterized by both intermediate and high K/Na ratios in the pore waters.
Several times the lakes that deposited the Bottom Mud decreased in size and deposited salts during part of each year. Zones in the Bottom Mud that contain disseminated salines appear to represent lakes that were too deep for salt crystallization during normal winters, but which deposited small quantities of salts during exceptionally cold winters or dry years. Zones that are composed of more nearly pure salines are in terpreted to represent the culmination of those per iods when the lakes were a little shallower and more saline so that salts crystallized out during most win ters. Periods represented by these nearly pure saline layers are plotted in figure 41 at level C. The promi nent saline layers are mostly composed of mirabilite

RECONSTRUCTED DEPOSITIONAL HISTORY 111
or of nahcolite that was probably altered from prim ary natron. They are mostly overlain and underlain by zones of mud that is mixed with minor amounts of similar salts that are detected only by X-ray (pi. 2B, column Sx), and these are shown in figure 41 at a level slightly above C. For example, in core 254, mirabilite occurs as a minor component in muds above and be low the layer of salines at 134 ft (41 m); these and other saline minerals are intermixed with muds that are interbedded with the thin layers of salines near 164 ft (50 m) and 190 ft (58 m). Similar zones occur in core L-W-D at depths of 150 ft (46 m) and 216 ft (66 m), and they provide the only evidence of the saline layers that probably lie at depths near 190 ft (58 m).
The depositional history of the Lower Salt is one of conditions that alternated between large perennial lakes that deposited muds and small saline lakes that either deposited salts or dried up to form salt flats. The details come largely from the mineralogy of the layers. The successively greater degrees of desiccation indicated by the mineralogy of saline units S-l to S-5 and the partial desiccations indicated by units S-6 and S-7 allow the salinities and relative levels of the small highly saline lakes to be approximated. The pro gressive changes in the volume of inflow into the per ennial lakes are indicated by the quantities of gaylus- site plus pirssonite. Their percentages decrease gradu ally from units M-2 to M-5 and increase markedly in units M-6 and M-7. Because there are virtually no other Ca-bearing minerals in these layers, these percentages are interpreted as being proportional to the volumes of Ca-bearing water that annually flowed into the lakes.
The presence or absence of laminar bedding also in dicates progressive changes in the character of the larger lakes during Lower Salt time. Well developed laminar bedding occurs in units M-2 and M-3, less well developed laminar bedding occurs in units M-4 and M-5, and massive bedding occurs in units M-6 and M-7. Distinctly laminated muds are interpreted as the products of stratified lakes that periodically (seasonally?) received influxes of Ca-bearing fresh water that formed thin surface layers that quickly warmed, evaporated, or mixed with the underlying dense saline layers; this would have resulted in most of the CaCO3 being crystallized rapidly during a small part of the depositional year. Unlaminated mud layers are interpreted as products of unstratified lakes or stratified lakes that received Ca-bearing waters throughout the year or had thicker surface layers; this would have resulted in CaCO3 being crystallized more uniformly throughout the year.
These criteria suggest that the mud units in the Lower Salt were deposited under the following condi
tions. Units M-2 and M-3 are interpreted to have been deposited in stratified lakes that seasonally re ceived moderate volumes of Ca-bearing water which formed thin layers over the brine bodies that devel oped during the preceding salt deposition episodes (S-l and S-2). Units M-4 and M-5 were deposited in stratified lakes that received less fresh water each year but received it more evenly throughout the year. Unit M-6 was presumably deposited in a lake that annually received large volumes of water but was unstratified because no residual brine layer existed at the close of S-5 time. Unit M-7 was probably deposited in a lake that was stratified but received such a large annual in flow that the surface layer was too thick to pre cipitate its CaCO3 during only part of the year.
The Parting Mud represents a long period of depo sition in fluctuating but perennial lakes. Variations in the lithologic details of the unit indicate the nature and approximate duration of the fluctuations. The lower 40 percent of the unit consists mostly of massive black mud. The upper 60 percent of the unit consists of prominently laminated aragonitic mud, and an in terval low in CaCO3 and high in acid-insoluble compo nents occurs near the middle of this zone. The change from unlaminated to laminated sediments occurs at a horizon dated as about 17,100 years (Mankiewicz, 1975, p. 10). Interpreting the presence or absence of laminar bedding, as in the Lower Salt muds, it ap pears that during the period that lasted from about 24,000 to 17,100 14C years ago (uncorrected), deposi tion took place in a lake that generally was either un stratified or stratified with a thick zone of fresher water forming the upper layer, and that during the pe riod that lasted from 17,100 to 10,500 MC years ago, deposition took place in a stratified lake that pro duced laminae.
Contacts between the four subdivisions of the lami nated zone described by Mankiewicz (1975, p. 7-8) lie at levels whose estimated ages (using the sedimenta tion rate in his core "B" of 24 yrs/cm) are 14,460 years, 12,300 years, and 11,220 years. The unit deposited be tween 17,100 and 14,460 years ago is interpreted, on the basis of mud lithology plus evidence from out crops, to represent the waning stages of the lake which had reached its maximum expansion slightly before that time. The unit deposited between 14,460 and 12,300 years may represent a persistent period of low stands during which no salts were deposited but widely spaced dolomite(?) laminae resulted from the decreased frequency of inflow and increased salinity. In outcrops, deposits correlated with this stage, or its end, consist of lag gravels and a characteristic soil (Smith, 1968, figs. 4 and 7). The two units above that horizon, covering the age range of 12,300 to 11,220 and

Searles Lake, Celif. (this report)
Tulare Lake, Calif. (Croft, 1968)
Mono Lake, Calif.(Lajoie, 1968 end
unpub. data)i i i i i \ ii i i i r iii i i i i
Lake Lahontan, Nev. (Morrison and Frye, 1965)
i i i i i i r i i i
Lake Bonneville, Utah (Morrison and Frye, 1965)
112 SUBSURFACE STRATIGRAPHY AND GEOCHEMISTRY, QUATERNARY EVAPORITES, SEARLES LAKE, CALIF.
11,200 to 10,500 years, are probably correlative with the two high stands shown by Smith (1968, fig. 4) for this period. A brief final lake expansion, represented by about 50 cm of unlaminated mud in most cores (but not in core B of Mankiewicz) and by similar deposits in outcrop, occurred after these events; its duration is unknown but must have been small.
The Upper Salt records an almost uninterrupted desiccation. The succession of minerals follows that expected from crystallization of a brine having its bulk composition. Crystallization temperatures were initially low when winter chilling produced borax and probably natron (now trona), and temperatures rose when the lake became shallower and summer evapora tion accounted for most of the salts. A few thin discon tinuous mud layers in the Upper Salt indicate temporary floodings that covered part of the lake with sediments, but there is no evidence of a significant break in salt deposition within the unit.
The lithology and mineral composition of the Over burden Mud show that much of it was deposited in a shallow saline lake. Clastic fragments in some samples from the edge facies constitute more than 80 percent of the Overburden Mud, although in the central facies they make up less than 10 percent of most samples. In samples from all but the basal layer, fine-grained car bonate minerals are missing and pirssonite and gay- lussite are rare. The organic carbon fraction is lower than in any of the other mud layers studied in detail. Halite is abundant, especially in the central facies, and partially dissolved crystals characterize some ho rizons. All indications are that relative to the lakes that deposited other mud layers, the lake responsible for the Overburden Mud was smaller, more saline, lower in organic productivity, and characterized by deposition of more clastic material relative to chemi cal sediments. Geologic mapping of outcrops suggests that the lake that deposited the Overburden Mud never reached levels greater than about 45 m above the present surface.
CORRELATIONS WITH DEPOSITS IN OTHERAREAS
The subsurface stratigraphic units of Searles Lake reflect distinct climatic episodes. Major climatic changes are widespread; they certainly affected areas comparable in size to several western states and are likely to have been recorded over areas the size of a continent, a hemisphere, or throughout the world. In-
—i—i—i—i—i—i—i—iLake Bonneville, Utah
(Eerdley and others, 1973)
n i i r
Dead Sea(Modified from
Neev and Emery, 1967)
1 I I I i I I I I I I I I \\ I I I I 1
Sierra Nevade, Calif. (Modified from Sharp and Birman, 1963; Smith, 1968; Birke- land and others, 1971; Birkeland and Janda, 1971; Sharp, 1972)
i i i r i i i i r
Puget-Fraser Lowland,Wash. - B. C., Ceneda
(Porter, 1971)
West Yellowstone, Wy (Pierce and others,
i i r150 200
AGE, IN THOUSANDS OF YEARS BEFORE PRESENT
FIGURE 42.—Comparison of lake-fluctuation curve for Searles Lake (fig. 41) and other lacustrine and glacial chronologies that extend over much or all of the past 150,000 years. Data from sources indicated. Lettered points are inferred correl ative events.

CORRELATIONS WITH DEPOSITS IN OTHER AREAS 113
dividual stratigraphic units in Searles Lake are there fore expected to be correlative with deposits that reflect climatic events in many other areas.
Possible correlation between the fluctuations of Searles Lake over the past 150,000 years and the his tories reconstructed for 16 other areas (figs. 42 and 43) are based on various criteria of climatic change. Figure 42 compares it with other Pleistocene lake fluctu ations and glacial advances and retreats; figure 43 with records of variations in atmospheric tempera tures, pollen, sea-surface temperatures, and sea levels. Lake expansions, glacial advances, cooling trends, and sea-level lowering are considered most likely to occur in phase, and the curves are drawn so as to have simi lar shapes when this relation exists. A summary of these correlations was presented in another paper (Smith, 1976). Other and more complete discussions of possible correlations between deposits of this age in western North America are presented by Porter (1971) and Birkeland, Crandell, and Richmond (1971).
The curve for Searles Lake shows six low stands, la belled A through F. Low stands are more reliably do cumented by subsurface data of the type presented here, so are used as points of correlation. Most records from other areas, however, are least reliable for these times. Lacustrine records are based mostly on sedi ments exposed on the valley sides, and a low stand is recorded as a period of erosion, alluvial deposition, or soil formation; glacial records are mostly based on evi dence of extensive or maximum advances, and a re treat is indicated by different degrees of weathering and erosion on successive deposits. None of these cri teria indicate the time of the lake's lowest level or the glacier's maximum retreat. Points in the fluctuation curves from other areas that are considered reason ably correlative with the selected Searles Lake low stands are labelled with the same letters. A similarity in assigned ages was sought but not used as a basis for correlation—partly because almost all age estimates older than about 45,000 years are based on assump tions and projections, and partly because some gla ciers and lakes probably did not respond syn chronously owing to their size, hydrologic setting, or latitude.
A similarity is evident between Searles Lake fluctu ations and several of the other curves in figure 42.
FIGURE 43.—Comparison of lake-fluctuation curve for Searles Lake (fig. 41) and other climatically sensitive geologic indica tors; included are criteria that are sensitive to fluctuations in air temperature, sea temperature, and sea level. Lettered points indicate inferred correlative events.
Searles Lake, Calif, (this report)
Speleothems, New Zealand (Hendy and Wilson, 1968)
Pollen data, Netherlands (Van der Hammen and others, 1967)
Greenland ice sheet (Dansgaard and others, 1971)
(Emiliani, 1971) "I——I——I——I——T
B?
Planktonic fossils.Gulf of Mexico
(Kennett and Huddlestun,1972)
100 -i Sea - level fluctuations.New Guinea
(Bloom and others, 1974)
150 -i
100
50 -
Sea - level fluctuations,Bering Sea
(Hopkins, 1973)
niiiiiiiiiipiiiiTV0 50 100 150
AGE, IN THOUSANDS OF YEARS BEFORE PRESENT

114 SUBSURFACE STRATIGRAPHY AND GEOCHEMISTRY, QUATERNARY EVAPORITES, SEARLES LAKE, CALIF.
Points labelled A and B are assigned to every curve, and many curves show a similarity in their detailed shapes between these two points. Point A (base of Up per Salt) lies between 5,000 and 10,000 years in all but the Lake Bonneville curve by Eardley and others (1973), and their lithic log (fig. 1) shows a soil at the top that suggests an extensive closing period of nonde- position. Point B (top of unit S-5) lies between 20,000 and 35,000 years in all but the curve for the Dead Sea, which may be too distant for detailed correlation of climatic cycles. Points C, D, and E represent three sets of salt beds in the Bottom Mud. The three are corre lated with comparable recessions of Lakes Bonneville and Lahontan, and one or more of them are correlated with recessions shown in the three glacial records. Correlation between point E in the Searles Lake curve and the curves for Lake Bonneville, Lake Lahontan, and the glacial deposits in the Sierra Nevada29 is based on the stratigraphic position of a prominent fossil soil on the deposits of this age around Searles Lake and in the other three areas.
Point F in (fig. 42) represents the base of the Bot tom Mud and of the first of the late Pleistocene lacus trine rises in Searles Valley that followed a very long period that was lacking these events. The Lake Bonneville curve by Eardley and others (1973) shows a period preceding point F during which there were moderate to large lakes, but their lithic log (fig. 1) shows coarse sand deposits and a succession of soils that seem to indicate more strongly a period of rela tive aridity. The curve (fig. 42) for the Dead Sea was modified from the version published by Neev and Em ery (1967, fig. 16) such that the lake history at the time marked by point F is placed at about 140,000 years instead of 75,000 years; this modification was made because they suggested the possibility of a greater age for this event (p. 26), and recalculation of sedimenta tion rates from their data (p. 25) suggested the age plotted here. The significance of the position of point F in the curve representing glacial advances in the West Yellowstone area is discussed below.
The curves of figure 43 compare the history of Searles Lake for the past 150,000 years with other cri teria of climatic change. Speleothems, pollen data, and the isotopic composition of ice sheets reflect at mospheric temperature changes; planktonic fossils re flect sea-surface temperature change; and sea levels reflect the partitioning of the earth's water between the major ice caps and the oceans. The points labelled
"Almost no "C dates from glacial deposits in the Sierra Nevada are available. The ages of glaciation shown for the Sierra Nevada were adjusted to fit the chronology of the Searles Lake curve.
A to F on the curve for Searles Lake are the same as in figure 42. Points A and B can be correlated with rea sonable confidence to most of the other curves at times that are within a few thousand years of each other. Points C, D, and E seem reasonably correlated as shown, although the prominence of the correlated events differs between curves. The best correlations appear to be between Searles Lake and the pollen data from the Netherlands and the two records of sea-level change.
Point F on the curve of figure 43 is correlated with the warmest points in the two sea-surface tempera ture curves and the highest stands in the two sea-level curves that are of similar age. In figure 42, it is corre lated with the maximum recession of the West Yel lowstone glacier. These curves, however, show cooler temperatures, lower sea level, and advancing glaciers during the preceding period, and these histories are inconsistent with the climate that seems likely to ex plain the history inferred for Searles Lake prior to 130,000 years. It is possible that the time scale used for the Searles Lake diagram (and the Sierra Nevada glacier diagram which has its time scale based on the Searles scale) is too short, or that the scales used for the other curves are too long; alteration of these scales might allow the point labelled E in the Searles and Si erra Nevada diagrams to be correlated with the points labelled F in the other five curves. However, changes of 50,000 years or more would be necessary to allow the curves to have this relation, and it seems unlikely that any of the scales are in error by this amount. Ad mittedly, the subsurface and outcrop data in Searles Valley do not entirely eliminate the possibility of lakes of moderate salinity and depth in the valley dur ing part of the time prior to point F, but they do make it clear that the period that preceded point F was con spicuously less pluvial than the 100,000-year period that followed it. If the correlations in figures 42 and 43 are correct, the growth of major ice sheets during the period prior to point F required a different climatic regime than during the several glacial periods that fol lowed. Relative to the later periods, that earlier re gime would have required glacial growth to be caused more by lower temperatures than by increased pre cipitation.
The record of fluctuations in Searles Lake and the North American (Laurentide) ice sheet is very similar for the last 45,000 years, but problems arise in corre lating events before that time (fig. 44). Points in the fluctuation curves that seem correlative in terms of their magnitude and character, and their positions among other events, are labeled the same. The single

CORRELATIONS WITH DEPOSITS IN OTHER AREAS 115
Searles Lake, Calif (this report)
,B-2,4
A-
Range of "C dates
Ohio, Pennsylvania,and Ontario
(Goldthwait and others,1965, fig. 6)
C-3
D-1•nJU
Wisconsin 4 Sang.
iA-2 B-4Illinois and Wisconsin
(Frye and others, 1965,fig. 5)
-1UB-3 C
H. A-3Wisconsinan Sang.
CD
CD
IDCIDO O0I
IDU><0<rtn3v)
C<0CD•0
(D
ID Ultowo3WC(0
IDCDOO §H
0) D) (D
n_MC<D
T3
T30 O
0)o>(DMQ3WC(0
15TJE(D
LL
IDU>(Dwo3wjc(D'E0
^
Wisconsinan Stage
c g(0o(DD)0)C
c0Ec(0
I10 20 30 40 50 60 70 AGE, IN THOUSANDS OF YEARS BEFORE PRESENT
80
FIGURE 44.—Correlation of fluctuations in Searles Lake during the past 80,000 years with those of Laurentide ice sheet and with time-stratigraphic units commonly used in those areas (Frye, Willman, Rubin, and Black, 1968). Ranges of 14C dates available in each area also shown. Lettered points indicate inferred correl ative events; single letters placed at same points in Searles Lake diagram as in figures 42 and 43.
letters have the same position as in figures 42 and 43, and the letter-number pairs indicate additional points of correlation. Correlation points between A and C all lie within five thousand years of each other and most are closer. For most of the time shown, a close coinci dence of glacial and lacustrine events is evident. Sev eral fluctuations in Searles Lake probably represent climatic episodes that were too short for the larger ice sheet to reflect but were widespread, and tentatively they should be considered part of the North American Pleistocene climate chronology.
There is less similarity between the shapes of the older parts of these curves, and there are larger dis crepancies in the ages of points between C-1 and D. A major discrepancy exists between, the ages of the points labelled E in in the Searles Lake and Lauren tide ice sheet curves. Point E in the Searles Lake dia gram (figs. 42 and 43) is plotted at 93,000 years, where the Laurentide ice sheet diagrams (fig. 44) have the correlated event—the end of the Sangamon Intergla- ciation—plotted at about 75,000 years. The oldest 14C date in the Laurentide chronology, on deposits in On tario at the horizon labelled D, is 67,000 years (Goldthwait and others, 1965, p. 92), and glacial till correlated with the Wisconsin sequence underlies that horizon. This means that the age of the Sangamon- Wisconsin boundary is significantly older, and it seems quite possible that it should be nearer the 93,000 years age estimated for point E in the Searles Lake chronology.
If this correlation is correct, it requires revision of an earlier suggestion (Smith, 1968, fig. 5, p. 307, 308) that tentatively equated the Sangamon Interglacia- tion with the Mixed Layer of Searles Lake. The re vised correlation in figures 42 and 43 would now place the Sangamon Interglaciation near point E, the Yar mouth Interglaciation prior to point F, and the Illin- oian Glaciation between them. Future dating of deposits in the Laurentide area may confirm or refute this revised correlation, but the age estimated for point F in the Searles Lake chronology shown in fig ures 42 and 43 seems too old to correlate with the San gamon if it ended less than 100,000 years ago.
The Pleistocene chronology of northeast North America is commonly expressed in terms of time- stratigraphic units. The stages, substages, and ages recommended by Frye, Willman, Rubin, and Black (1968) are plotted along the base of figure 44. The sub- stages (Altonian, 75,000 to 28,000 years B.P.; Wood- fordian, 22,000 to 12,500 years B.P., and Valderan, 11,000 to 7,000 years B.P.) correlate clearly with major periods of lake expansion in Searles Lake (except for

116 SUBSURFACE STRATIGRAPHY AND GEOCHEMISTRY, QUATERNARY EVAPORITES, SEARLES LAKE, CALIF.
the age of the Sangamon-Wisconsinan boundary which was discussed earlier). The substages that sepa rate them (Farmdalian and Twocreekan) correspond closely to identifiable episodes of recession in Searles Lake.
Such close correlations raise the question of wheth er the amount of water stored in glaciers in the Pleis tocene Searles Lake drainage area should have been enough to significantly delay the shrinking of Searles Lake as the glaciers retreated in response to regional climatic change. Calculations show that the delay could amount to only a few hundred years. Topo graphic and geologic maps of the Sierra Nevada show that the areal extent of glaciers in that part of the Si erra Nevada that drained into Searles Lake was about 1,000 km2—the same as the maximum area of the lake. For purposes of an example we can postulate that evaporation from Searles Lake was 1.5 m/yr and that glaciers in the Sierra Nevada system had vertical walls and averaged 300 m in thickness. This would mean that the entire volume of water produced by the com plete melting of the glaciers could be evaporated from Searles Lake in 200 years. Retreat of Searles Lake from a high stand, relative to when the glaciers started their retreat, could be delayed only by that much.
Correlation of the deposits in the Mixed Layer of Searles Lake with other areas is not attempted in any detail because of the lack of time control. The esti mate that the base of the Mixed Layer in core L-W-D is probably 500,000-1,000,000 years old permits the tentative correlation of the pluvial deposits in the low er 25 m or more of the Mixed Layer with the Sherwin Glaciation in the Sierra Nevada. Sharp (1968, p. 361) considers them to be about 750,000 years old and cor relative with the Kansan Glaciation in northeast North America. He and several other workers infer a relatively long interval between the Sherwin and the younger Mono Basin and Tahoe Glaciation, and the long period of relatively nonpluvial deposition repre sented by the salts in units A to E in the Mixed Layer of Searles Lake represents a compatible climatic his tory. In figure 42, point F is plotted at the base of the Mono Basin Till in the Sierra Nevada diagram, and the long interglacial period that appears to have pre ceded that point, and the succession of glaciations that followed it, is the major reason for correlating events in the Sierra Nevada and Searles Lake in this way. As noted earlier, though, there are several valid reasons for concluding that points E and F in figures 42 and 43 should be correlated in other ways. The de cision revolves around the reliability of ages, the qual ity of the geologic evidence indicative of glacial and pluvial climates, and the likelihood that the sequence of climatically controlled events was similar in differ
ent areas. Several alternative correlations are almost equally reasonable.
ECONOMIC GEOLOGY
The chemicals produced each year at Searles Lake, valued at $30 million, come from the brines. The origi nal and post-diagenesis compositions of the brines and salts have been discussed in this paper. Since the beginning of commercial operations on the deposit, however, the average brine compositions have under gone some change, for the chemical companies pump large quantities of it and the volume occupied by the pumped brine is mostly replaced by groundwater, sur face runoff, and plant effluent. Those waters, which range from nearly fresh to brines having various salin ities and compositions, react with the salts. The re sulting new brines (called "replacement brines" in this paper) have compositions controlled by the phase re lations discussed.
The post-diagenesis compositions of the brines plotted as points b-3 in figures 35, 36, 38, and 39 are averages of brines analyzed in the late 1940's and early 1950's, and are actually intermediate between the brines present in the lake prior to any commercial pro duction and present-day replacement brines. Older analyses of brines (Gale, 1914, p. 6276-277) do not ap pear to be sufficiently reliable; when plotted on the above diagrams, some of the points lie near points b-3, whereas others lie in positions relative to the more modern analyses that are highly improbable. The brines on which points b-3 are based, probably did not differ greatly from the original brines because less than a quarter of the total amount of brine pumped by 1974 had then been extracted. Hardt, Moyle, and Butcher report 1972 pumping rates of 19.2X10¹² g of brine (density about 1.3) per year. Dyer reports 1950 pumping rates of 10.0X10¹² g of brine per year from the lake, of which the plant at Trona (Ryan, 1951) used about 8X10¹² g. Assuming that brine pumping in creased linearly from 1926 to 1974, and that pumping extracted 10X1012 g per year by 1950 (24 years after it began) and 20X1012 g by 1974 (48 years after), a total of about 120X1012 g of brine had been pumped by 1950 (approximately when the analyses used for points b-3 were made) and 480X1012 g of brine had been pumped by 1974.
Simple extrapolation of the historical increase in pumping rates would suggest that the original brine would be entirely exhausted shortly after the year 2000. However, this is not a valid approach to estimat ing the commerical life of the salt body for four rea sons—three of which tend to extend it and one to shorten it. One factor that extends it is that continued

ECONOMIC GEOLOGY 117
improvements in technology allow lower grade brines to be utilized. The second is that as pumping contin ues, the remaining brine becomes a mixture of original brine and replacement brine, and the proportion of original brine decreases such that the rate of its deple tion is slower than assumed in this extrapolation. The third is that pumping rates are presently limited by the U.S. Geological Survey to the amount of fluid available to replace the pumped brines; the present pumping rate nearly equals the recharge rate from natural sources and present plant effluent (Hardt and others 1972, p. 34-48), and large increases would re quire modified plant processes and/or increased amounts of water imported from other nearby valleys. The factor that decreases the commercial life expec tancy of this body is that the brines preferred by the chemical companies have compositions that are found only in some parts of the deposit, and a significant proportion of the brines included in the preceding cal culations are not considered adequate by present standards.
The total quantity of chemicals that have been ex tracted from the brines of Searles Lake, valued at more than $1 billion, has been estimated at about 57X1012 g (Hardt and others, 1972, p. 50). This is about 3 percent of the total quantity of salts in the Upper and Lower Salt bodies (table 10 and 17) and may represent substantially less than half of the po tential production from the salt bodies. Since existing plant processes use only brine, and it contains only about 15 percent of the total components in the salt bodies, approximately 20 percent of the original quan tity of dissolved solids has been extracted. As about half of the dissolved solids are NaCl, not now consid ered a commercial product, so the salts extracted to date account for about 40 percent of the commercially extractable salts that were in the original brine. Some, possibly a large part, of the extracted salts have been replaced as a result of solution of solid salts by the wa ters that form the replacement brine, and the extract- able salts in these bodies have theoretically been increased by this amount. How much of the replace ment brine can be used for commercial purposes de pends on future refinements in extraction technology and the proportions of components in the brines re quired for it.
Three complete and three partial analyses of the brines considered by the companies to be of commer cial grade during and prior to 1950 are given in table 22. Analyses 1 and 4 are plotted in the Na2 C0 3 - Na2S04-KCl-NaCl-H20 system at 20°C in figure 28B and analysis 6 is plotted in figure 2IB. The brines of the Upper Salt used at that time are represented by points that are on (or near) the hanksite-aphthitalite
TABLE 22.—Analyses of brines pumped to chemical plants,1938-51
[Analyses of major components expressed as weight percent, minor components (Li, S, PO(, F, Br, and I) as parts per million. Sodium not listed for partial analyses because original analyses expressed as hypothetical salts. Sources of data noted below]
Upper Salt Lower Salt
NaK _ ________ LiC03 ________ S04ClBA _______ sP04F _________ BrI _________ WSpecific gravity _ pH
i11.07 2.46
2.66 4.71
12.16 1.16
930 40
1.30 9.4
2
2.63
2.70 4.58
1.22
1.30
3
2.73
2.84
1.32
___
4
11.00 2.63
70 2.71 4.56
12.13 1.26
330 940
20 810
30 55
5
1.44
3.82
1.54
6
11.86 1.54
30 3.84 4.43
10.81 1.51
1560 590
20 540
20 32
NOTE.—1. Gale, 1938, p. 869.2. Dyer, 1950, p. 41, "pumped brine."3. Dyer, 1950, p. 41, typical analysis, Upper zone, 35-70 ft. depth.4. Ryan, 1951, p. 449.5. Dyer, 1950, p. 41, typical analysis, Lower zone, 85-125 ft. depth.6. Ryan, 1951, p. 449.
boundary (fig. 2SB), but it is evident that many of the individual brine samples from the Upper Salt body contained different ratios of those ions. The commer cially attractive brines from the Lower Salt (table 22) are represented by a point within the hanksite field, (fig. 2IB) and many of the other brines in that unit contain different ratios of those ions.
The amount of scatter in the 1950 brine composi tions shown in figures 21 and 28 shows that despite the constraints imposed by the phase relations, con siderable variation in composition does occur. Part of this variation is a result of the areal difference in the solid phases present in the Lower Salt and Upper Salt; the relative percentages of minerals vary in a broadly concentric pattern (tables 4 and 14), and the edge fa- cies appear devoid of many minerals. As a reduction in the number of minerals removes constraints on possi ble brine compositions, brines from the edge facies (which apparently lack some phases present in the central facies) are likely to be more variable.
Implicit in this conclusion is the suggestion that brines in the salt bodies do not mix freely. The density and compositional profiles in the Upper Salt brines support this suggestion, but two other lines of evi dence suggest that the brines have mixed over periods of time that are unknown but could be short. The first consists of isotopic data (G. I. Smith, S. Matsuo, and I. Friedman, unpub. data) showing that the deuterium- hydrogen ratios of the brines from the Upper Salt are nearly uniform from the top to base of the unit despite

118 SUBSURFACE STRATIGRAPHY AND GEOCHEMISTRY, QUATERNARY EVAPORITES, SEARLES LAKE, CALIF.
a marked density and compositional contrasts over the same range. Significant lateral variation in deuter ium percentages do exist, but vertical variations do not. The present brines in a given area are clearly re placements of the original brines and are evidently made from similar mixtures of original and replace ment waters. The second line of evidence, which sug gests that the brines move freely and that the migration and mixing times might be short, comes from the records of brine levels in wells which re sponded in periods of several weeks or a few months to the onset of heavy pumping several kilometers away (Hardt and others, 1972, p. 45-48).
Several lines of study need to be pursued to test the possibility that brines in the Upper Salt migrate over periods of less than a year in response to manmade or natural changes in the hydraulic regime of the lake. If found valid, the areal variations in the brines must be largely inherited from the assemblage of salts that ex ist in the various parts of the lake. Properly used, this property could become the basis for extracting much greater quantities of chemicals from the lake than simple reliance on original brines would allow.
The scatter of brine compositions found in the Low er Salt (fig. 21) is greater than in the Upper Salt. This difference is largely a result of the effect of the mud units, M-2 to M-7, which isolate each of the interbed- ded salt layers from the others, originally allowing seven slightly different salt deposits to coexist. After drilling and pumping of the Lower Salt commenced in the mid-1940's, though, some mixing of their brines occurred because most of the pumped wells were un cased from the top of unit S-7 to the base of S-l. Iso- topic investigations in progress show that the H20 contained by the brines in the Lower Salt is isotopical- ly nearly homogeneous from the top of the unit to the base, and that it is also different from the brines that crystallized some of the salts. The present isotopic ra tios of the H20 seem, partly at least, to be the result of geologic processes that occurred before pumping be gan, but some of the change may have been the result of pumping.
Despite this mixing, however, distinct composi tional differences still exist between the brines of each salt unit in the Lower Salt. Selective pumping and mixing of them would allow relatively precise control of the ratios of ions in the brines reaching the plants. Solution mining of individual layers in this unit would allow more controlled and restricted leaching than in the Upper Salt.
The overall shapes of the Upper Salt and Lower Salt result in marked differences in the probable re sponse to the addition of low-density water. The up per contact of the Upper Salt has a shape that is
crudely concave-downward (pi. 1), and any low densi ty waters and brines introduced to produce replace ment brines will, if they do not mix, migrate or remain in the higher part of the body, which is near the mid dle of the lake. The salts of the Lower Salt, however, have lens shapes with upturned edges (pi. 1), and com parable low-density waters and brines will migrate or remain in the higher parts of those bodies that are at the edges. Fluids entering the Lower Salt and Upper Salt brine bodies as natural and artificial recharge therefore probably migrate in opposite directions.
Pumping of brines and production of soda ash from the trona and nahcolite bodies in units A and B of the Mixed Layer are planned and construction of a new plant to process them is now underway (1977). Deeper units seem to present no commercial prospects.
REFERENCES CITED
Alderman, A. R., and Skinner, H.C.W., 1957, Dolomite sedimenta tion in the southeast of south Australia; Am. Jour. Sci., v. 255, p. 561-567.
Bailey, G. E., 1902, The saline deposits of California: California State Mining Bur. Bull. 24, 216 p.
Barnes, Ivan, and O'Neil, J. R., 1971, Calcium-magnesium carbon ate solid solutions from Holocene conglomerate cements and travertines in the Coast Range of California: Geochim. et Cos- mochim. Acta, v. 35, p. 699-718.
Barnes, Ivan, O'Neil, J. R., Rapp, J. B., and White, D. E., 1973, Silica-carbonate alteration of serpentine—Wall rock alter ation in mercury deposits of the California Coast Ranges: Econ. Geology, v. 68, no. 3, p. 388-390.
Berner, R. A., 1971, Principles of chemical sedimentology: New York, McGraw-Hill, p. 240.
Birkeland, P. W., Crandell, D. R., and Richmond, G. M., 1971, Sta tus of correlation of Quaternary stratigraphic units in the western conterminous United States: Quaternary Research, v. 1, no. 2, p. 208-227.
Birkeland, P. W., and Janda, R. J., 1971, Clay mineralogy of soils developed from Quaternary deposits of the eastern Sierra Nevada, California: Geol. Soc. America Bull., v. 82, no. 9, p. 2495-2514.
Bixler, G. H., and Sawyer, D. L., 1957, Boron chemicals from Searles Lake brines: Indus, and Eng. Chemistry, v. 49, p. 322.
Blaney, H. F., 1955, Evaporation from and stabilization of Salton Sea water surface: Am. Geophys. Union Trans., v. 36, no. 4, p. 633-640.
___1957, Evaporation study at Silver Lake in the Mojave De sert, California: Am. Geophys. Union Trans., v. 38, no. 2, p. 209-215.
Bloom, A. L., Broecker, W. S., Chappell, J.M.A., Matthews, R. K., and Mesolella, K. J., 1974, Quaternary sea level fluctuations on a tectonic coast—New 230Th/234U dates from the Huon Pen insula, New Guinea: Quaternary Research, v. 4, no. 2, p. 185- 205.
Bowser, C. J., 1965, Geochemistry and petrology of the sodium bor- ates in the nonmarine evaporite environment: California Univ. at Los Angeles, Ph.D. thesis, p. 282
Bradley, W. H., and Eugster, H. P., 1969, Geochemistry and paleo- limnology of the trona deposits and associated authigenic min erals of the Green River Formation of Wyoming: U.S. Geol.

REFERENCES CITED 119
Survey Prof. Paper 496-B, 71 p.Bredehoeft, J. D., Blyth, C. R., White, W. A., and Maxey, G. B.,
1963, Possible mechanism for concentration of brines in sub surface formations: Am. Assoc. Petroleum Geologists Bull., v. 47, no. 2, p. 257-269.
Broecker, W. S., and Kaufman, Aaron, 1965, Radiocarbon chro nology of Lake Lahontan and Lake Bonneville II, Great Basin: Geol. Soc. America Bull., v. 76, no. 5, p. 537-566.
Broecker, W. S., and Walton, A., 1959, The geochemistry of C 14 in fresh-water systems: Geochim. et Cosmochim. Acta, v. 16, nos. 1-3, p. 15-38, 200.
Bury, C. R., and Redd, R., 1933, The system sodium carbonate— calcium-carbonate—water: Chem. Soc. Jour. [London], p. 1160-1162.
California Geology, 1972, Salt—San Bernardino County: Califor nia Geology, v. 25, no. 10, p. 233.
Carpenter, L. G., and Garrett, D. E., 1959, Tungsten in Searles Lake [Calif.]: Mining Eng., v. 11, no. 3, p. 301-303.
Chilton, C. H., 1958, Crystallization—Key step in sodium sulfate process: Chem. Engineering, p. 116-119.
Clayton, R. N., Jones, B. F., and Berner, R. A., 1968, Isotope stud ies of dolomite formation under sedimentary conditions: Geo chim. et Cosmochim. Acta, v. 32, p. 415-432.
Clayton, R. N., Kninner, H.C.W., Berner, R. A., and Rubinson, M., 1968, Isotopic compositions of recent south Australian la- goonal carbonates: Geochim. et Cosmochim. Acta, v. 32, p. 983-988.
Croft, M. G., 1968, Geology and radiocarbon ages of Late Pleisto cene lacustrine clay deposits, southern part of San Joaquin Valley, California, in Geological Survey research 1968: U.S. Geol. Survey Prof. Paper 600-B, p. B151-B155.
Dansgaard, W., Johnsen, S. J., Clausen, H. B., and Langway, C. C., Jr., 1971, Climatic record revealed by the Camp Century Ice Core, in Turekian, K. K., ed., The late Cenozoic glacial ages: New Haven and London, Yale Univ. Press, p.37-56.
Deevey, E. S., and Stuiver, Minze, 1964, Distribution of natural isotopes of carbon in Crinsley Pond and other New England lakes: Limnology and Oceanography, v. 9, no. 11, p. 1-11.
De Groot, Henry, 1890, The Searles borax marsh: California State Mining Bur., 10th Ann. Rept., p. 534-539.
De Sitter, L. U., 1947, Diagenesis of oil-field brines: Am. Assoc. Pe troleum Geologists Bull., v. 31, no. 11, p. 2030-2040.
Dolbear, C. E., 1913, The Searles Lake potash deposit: Eng. and Mining Jour., v. 95, p. 259-261.
Dolbear, S. H., 1914, The saline deposits of Searles Lake, Califor nia: Mining and Eng. World, v. 41, p. 797-800.
Droste, J. B., 1961, Clay minerals in sediments of Owens, China, Searles, Panamint, Bristol, Cadiz, and Danby lake basin, Cali fornia: Geol. Soc. America Bull., v. 72, p. 1713-1722.
Dub, G. D., 1947, Owens Lake, source of sodium minerals: Mining Technology, v. 11, no. 5, 13 p.
Dyer, B. W., 1950, Searles Lake development: Colo rado School Mines Quart., v. 45, no. 4B, p. 39-44.
Eardley, A. J., Shuey, R. T., Gvosdetsky, V., Nash, W. P., Dane Pichard, M., Gray, D. C., and Kukla, G. J., 1973, Lake cycles in the Bonneville Basin, Utah: Geol. Soc. America Bull., v. 84, no. 1, p. 211-216.
Emery, K. 0., and Rittenberg, S. C., 1952, Early diagenesis of Cali fornia basin sediments in relation to origin of oil: Am. Assoc. Petroleum Geologists Bull., v. 36, no. 5, p. 735-806.
Emiliani, C., 1971, The last interglacial—Paleotemperatures and chronology: Science, v. 171, p. 571-573.
Eugster, H. P., 1966, Sodium carbonate-bicarbonate minerals as indicators of Pco2 : Jour. Geophys. Research, v. 71, no. 14, p. 3369-3377.
Eugster, H. P., and Smith, G. L, 1965, Mineral equilibria in the Searles Lake evaporites, California: Jour. Petrology, v. 6, pt. 3, p. 473-522.
Fahey, J. J., 1962, Saline minerals of the Green River Formation: U.S. Geol. Survey Prof. Paper 405, p. 50.
Fairbanks, H. W., 1896, Notes on the geology of eastern California: Am. Geologist, v. 17, p. 63-74.
Flint, R. F., and Gale, W. A., 1958, Stratigraphy and radiocarbon dates at Searles Lake, California: Am. Jour. Sci., v. 256, no. 10, p. 689-714.
Free, E. E., 1914, The topographic features of the Desert Basin of the U.S. with reference to the possible occurrence of potash: U.S. Dept. Ag. Bull. 54, 68 p.
Freeth, F. A., 1923, The system—Na20-C02 -NaCl-H20, consid ered as two four-component systems: Philos. Trans. Royal Soc. London, ser. A, v. 223, p. 35-87.
Friedman, L, Smith, G. L, and Hardcastle, K., 1976, Studies of Quaternary saline lakes—II. Isotopic and compositional changes during desiccation of the brines in Owens Lake, Cali fornia, 1969-71: Geochim. et Cosmochim. Acta v. 40, p. 501-511.
Frye, J. C., Willman, H. B., and Black, R. F., 1965, Outline of gla cial geology of Illinois and Wisconsin in Wright, H. E., Jr., and Frey, D. G., eds, The Quaternary of the United States—A re view volume for the 7th Cong. Internat. Assoc. for Quaternary Research: Princeton, N.J., Princeton Univ., p. 43-62.
Frye, J. C., Willman, H. B., Rubin, Meyer, and Black, R. F., 1968, Definition of Wisconsinan stage: U.S. Geol. Survey Bull. 1274-E, p. E1-E22.
Gale, H. S., 1913a, Papers on potash and other salines: U.S. Geol. Survey Bull, 540-N, p. Nl-37.
___1913b, Searles Lake, California [potash]: U.S. Geol. Survey Mineral Research, pt. 2, p. 884-890.
___1914, Salines in the Owens, Searles, and Panamint basins, southeastern California: U.S. Geol. Survey Bull. 580-L, p. 251-323.
.1919, Searles Lake, in Salt Resources of the United States,by Phalen, W. C.: U.S. Geol. Survey Bull. 669, p. 164-174.
Gale, W. A., 1938, Chemistry of the trona process (from the stand point of the phase rule): Indus. Eng. Chemistry, v. 30, no. 8, p. 867-871.
___1945, Lithium from Searles Lake: Jour. Chem. Industries, v. 57, p. 442-446.
Gan, T. L., 1961, Heavy minerals in sediments from Owens, China, Searles, and Panamint basins, southern California: Indiana Univ., Bloomington, Ph.D. dissert., 95 p.
Garrett, D. E., 1960, Borax processing at Searles Lake, in Industri al minerals and rocks: New York, Am. Inst. Mining, Metall., and Petroleum Engineers, p. 119-122.
Garrett, D. E., and Phillips, J. F., 1960, Sodium carbonate from natural sources in the United States, in Industrial minerals and rocks (Nonmetallics other than fuels), Seeley W. Mudd Series: New York, Am. Inst. of Mining, Metall., and Petroleum Engineers, p. 799-808.
Gibson, R. E., 1942, Effect of pressure on phase equilibria in binary condensed systems: Geol. Soc. America Spec. Paper 36, p. 187-202.
Gilbert, G. K., 1875, The glacial epoch: Explor. and Surveys West 100th Meridian, (Wheeler) Rept. v. 3, chap. 3, p. 86-104.
Goddard, J. G., 1970, Th230/!)234 dating of saline deposits from Searles Lake, California: Queens College, City Univ. New York, New York, M.A. thesis, 50 p.
Goldthwait, R. P., Dreimanis, Aleksis, Forsyth, J. L., Karrow, P. F., and White, G. W., 1965, Pleistocene deposits of the Erie Lobe in Wright, H. E., Jr., and Frey, D. G., eds., The Quaternary of

120 SUBSURFACE STRATIGRAPHY AND GEOCHEMISTRY, QUATERNARY EVAPORITES, SEARLES LAKE, CALIF.
the United States—A review volume for the 7th Cong. Inter- nat. Assoc. for Quaternary Research: Princeton, N. J., Prince- ton Univ. Press, p. 85-98.
Goodwin, J. H., 1973, Analcime and K-feldspar in tuffs of the Green River Formation, Wyo: Am. Mineralogist, v. 58, p. 93-105.
Goudge, M. F., and Tomkins, R. V., 1960, Sodium sulfate from nat ural sources, in Industrial minerals and rocks (Nonmetallics other than fuels), Seeley W. Mudd Series: New York, Am. Inst. of Mining, Metall., and Petroleum Engineers, p. 809-814.
Graf, D. L., Eardley, A. J., and Shimp, N. F., 1961, A preliminary report on magnesium carbonate formation in glacial Lake Bonneville: Jour. Geology, v. 69, no. 2, p. 219-223.
Haines, D. V., 1957, Core logs from Searles Lake, San Bernardino County, California: U.S. Geol. Survey open-file report.
____1959, Core logs from Searles Lake, San Bernardino County, California: U.S. Geol. Survey Bull. 1045-E, p. E139-E317.
Hamman, W. D., 1912a, Potash solutions in the Searles Lake re gion: Mining Sci., v. 65, p. 372-373.
____1912b, Potash solutions in the Searles Lake region—II: Mining Sci., v. 65, p. 391-392.
-1912c, The Searles Lake potash deposit: Eng. and MiningJour., v. 93, p. 975-978.
Hanks, H. G., 1883, Report of the borax deposits of California and Nevada: California State Mining Bur., 3rd Ann. Rept. State Mineralogist for the year ending June 1, 1883, 111 p.
____1889, On the occurrence of hanksite in California: Am. Jour. Sci., ser. 3, v. 37, p. 63-66.
Harbeck, G. E., Jr., 1955, The effect of salinity on evaporation: U.S. Geol. Survey Prof. Paper 272-A, 5 p.
Hardt, W. F., Moyle, R. W., Jr., and Butcher, L. C., 1972, Proposed water-resources study of Searles Valley, Calif.: U.S. Geol. Sur vey open-file report. 69 p.
Hay, R. L., and Moiola, R. J., 1963, Authigenic silicate minerals in Searles Lake, California: Sedimentology, v. 2, no. 4, p. 312-332.
Hellmers, H. S., 1938, Borax, soda ash, lime hydrate—Their recov ery by West End Chemical Co., Searles Lake, California: Pa cific Chem. and Metall. Industries, v. 2, no. 9, p. 3-11.
Hendy, C. H., and Wilson, A. T., 1968, Paleoclimatic data fromspeleothems: Nature (London), v. 219, p. 48-51.
Hidden, W. E., 1885, On Hanksite, a new anhydrous sulphato-car-bonate of sodium from San Bernadino County, California:New York Acad. Sci., Annals 3, p. 238-241.
Hidden, W. E., and Mackintosh, J. B., 1888, On a new sodium sul-phato-chloride, sulphohalite: Am. Jour. Sci., 3d ser., v. 36, no.216, p. 463-464.
Hightower, J. V., 1951, New carbonation technique—more naturalsoda ash: Chem. Engineering, v. 58, p. 162-169.
Holser, W. T., 1970, Bromide geochemistry of some non-marinesalt deposits in the southern Great Basin: Mineralog. Soc.America Spec. Paper 3, p. 307-319.
Hopkins, D. M., 1973, Sea level history in Beringia during the past250,000 years: Quaternary Research, v. 3, no. 4, p. 520-540.
Hutchinson, E. G., ed., 1957, A treatise on limnology; V. 1, Geogra phy, Physics and Chemistry; New York, John Wiley & Sons, 1015 p.
Industrial Minerals, 1971, Occidental's Searles Lake Borax, p. 35.Ingerson, E., 1962, Problems of the geochemistry of sedimentary
carbonate rocks: Geochim. et Cosmochim. Acta, v. 26, p. 815-847.
Ives, P. C., Levin, Betsy, Robinson, R. D., and Rubin, Meyer, 1964, U.S. Geological Survey radiocarbon dates VII: Radiocarbon, v. 6, p. 37-76.
Jennings, C. W., Burnett, J. L., and Troxel, B. W., 1962, Geologic map of California, Olaf P. Jenkins edition, Trona sheet: Cali fornia Div. Mines and Geology Map Sheet.
Jones, B. F., 1961, Zoning of saline minerals at Deep Spring Lake, California; in Geological Survey research 1961: U.S. Geol. Sur vey Prof. Paper 424-B, p. B199-B202.
____1965, The hydrology and mineralogy of Deep Spring Lake, Inyo County, California: U.S. Geol. Survey Prof. Paper 502-A, 56 p.
Jones, B. F., Van Denburgh, A. S., Truesdell, A. H., and Rettig, S. L., 1969, Interstitial brines in playa sediments: Chem. Geolo gy, v. 4, p. 253-262.
Kallerud, M. J., 1966, Advances in solar salt—Solar evaporation in multicomponents processes, in Rau, J. L., and Dellwig, L. F., eds., 3rd Symposium on Salt, Vol. 2: Cleveland, Ohio, North ern Ohio Geol. Soc., p. 41-46.
Kennett, J. P., and Huddlestun, Paul, 1972, Late Pleistocene pa- leoclimatology, foraminiferal biostratigraphy and tephro- chronology, Western Gulf of Mexico: Quaternary Research, v. 2, no. 1, p. 38-69.
Lajoie, K. R., 1968, Quaternary stratigraphy and geologic history of Mono Basin, eastern California: California Univ. (Berkeley), Ph.D. thesis, 271 p.
Lee, C. H., 1912, Water resources of a part of Owens Valley , Cali fornia: U.S. Geol. Survey Water-Supply Paper 294, 135 p.
Leonardi, M. L., 1954, American Potash and Chemical Corp., main plant cycle: Am. Inst. Mining Engineers Tech. Pub. 3728-H, v. 199.
Leopold, E. B., 1965, Late Quaternary and modern pollen rain at Searles Lake, California [abs.]: Internat. Assoc. Quaternary Research, 7th Internat. Cong., Boulder and Denver, Colo., 1965, p. 289.
Mabey, D. R., 1956, Geophysical studies in southern California ba sins: Geophysics, v. 21, no. 3, p. 839-853.
Makarov, S. Z., Bliden, V. P., 1938, The polytherm of the Quater nary system Na2CO3-Na2SO4 -NaCl-H2O and solid solutions of the burkeite type: Akad. Nauk SSSR Izv., Otdeleniyle, Mat. i Yestestven. Nauk ser. chem. p. 865-890. [In Russian, with English Summary.]
Mankiewicz, P. J., 1975, An organic geochemical investigation of a glacial sequence at Searles Lake, California: California Univ. at Los Angeles, M.S. thesis, 122 p.
Milton, C., and Eugster, H. P., 1959, Mineral assemblages of the Green River Formation, in P. H. Abelson, ed., Researches in geochemistry: New York, John Wiley and Sons, p. 118-150.
Morrison, R. B., and Frye, J. C., 1965, Correlation of the Middle and Late Quaternary successions of the Lake Lahontan, Lake Bonneville, Rocky Mountain (Wasatch Range), Southern Great Plains, and Eastern Midwest areas: Nevada Bur. Mines Rept. 9, 45 p.
Moyle, R. W., Jr., 1969, Water wells and springs in Panamint, Searles, and [Pilot] Knob valleys, San Bernardino and Inyo Counties, Calif.: California Dept. Water Resources Bull. 91- 17, 110 p.
Neev, David, and Emery, K. O., 1967, The Dead Sea—Depositional processes and environments of evaporites: Israel Ministry De velopment Geol. Survey Bull. 41, 147 p.
Norman, L. A., Jr., and Stewart, R. M., 1951, Mines and mineralresources of Inyo County: California Jour. Mines and Geology,v. 47, no. 1, p. 17-223.
Oana, Shinya, and Deevey, E. S., 1960, Carbon 13 in lake waters,and its possible bearing on paleolimnology: Am. Jour. Sci.,Bradley Volume, v. 258-A, p. 253-272.
Pabst, A., and Sawyer, D. L., 1948, Tincalconite crystals from

REFERENCES CITED 121
Searles Lake, San Bernardino County, California: Am. Miner alogist, v. 33, p. 472-481.
Peterson, M.N.A., Bien, G. S., and Berner, R. A., 1963, Radiocar bon studies of recent dolomite from Deep Spring Lake, Cali fornia: Jour. Geophys. Research, v. 68, no. 24, p. 6493-6505.
Phosphorus and Potassium, 1971, Company Reports: Phosphorus and Potassium, no. 56, p. 50.
Pierce, K. L., Obradovich, J. D., and Friedman, Irving, 1976, Obsi dian hydration dating and correlation of Bull Lake and Pine- dale glaciations near West Yellowstone, Montana: Geol. Soc. America v. 87, Bull., p. 703-710.
Porter, S. C., 1971, Fluctuations of Late Pleistocene alpine glaciers in western North America, in Turekian, K. K., ed., The late Cenozoic glacial ages: New Haven and London, Yale Univ. Press, p. 307-330.
Ralph, E. K., Michael, H. N., and Han, M. C., 1973, Radiocarbon dates and reality: MASCA Newsletter Applied Sci. Center for Archeology, Pennsylvania Univ., Philadelphia, v. G, no. 1, 20 p.
Rubin, Meyer, and Berthold, S. M., 1961, U.S. Geological Survey radiocarbon dates VI: Radiocarbon, v. 3, p. 86-98.
Ryan, J. E., 1951, Industrial salts—Production at Searles Lake: Mining Eng., v. 3, p. 447-451.
Schulten, M. A., 1896, Production artificielle du chlorocarbonate de sodium et de magnesium: Soc. Francaise Mineralogie [Paris] Bull., v. 19, p. 164-169.
Sharp, R. P., 1968, Sherwin till-Bishop tuff geological relation ships, Sierra Nevada, California: Geol. Soc. America Bull., v. 79, no. 3, p. 351-364.
———1972, Pleistocene glaciation, Bridgeport Basin, California: Geol. Soc. America Bull., v. 83, no. 8, p. 2233-2260.
Sharp, R. P., and Birman, J. F., 1963, Additions to classical se quence of Pleistocene glaciations, Sierra Nevada, California: Geol. Soc. America Bull, v. 74, no. 8, p. 1079-1086.
Sheppard, R. A., and Gude, A. J., 3d, 1968, Distribution and gen esis of authigenic silicate minerals in tuffs of Pleistocene Lake Tecopa, Inyo County, California: U.S. Geol. Survey Prof. Pa per 597, 38 p.
___1969, Diagenesis of tuffs in the Barstow Formation, Mud Hills, San Bernardino County, California: U.S. Geol. Survey Prof. Paper 634, 35 p.
Siever, Raymond, and Garrels, R. M., 1962, Early diagenesis— Composition of interstitial waters of recent marine muds: Am. Assoc. Petroleum Geologist-Soc. Econ. Paleontologists and Mineralogists Mtg., San Francisco, Calif., 1962, Program, p. 54-55.
Siever, Raymond, Garrels, R. M., Kanwisher, John, and Berner, R. A., 1961, Interstitial waters of recent marine muds off Cape Cod: Science, v. 134, p. 1071-1072.
Sims, J. D., and Rymer, Michael, 1975, Preliminary description and interpretation of cores and radiographs from Clear Lake, Lake County, California; Core 4: U.S. Geol. Survey open-file report.
Smith, G. I., 1962, Subsurface stratigraphy of late Quaternary de posits, Searles Lake, Califonia—A summary; in Geological Survey research 1962: U.S. Geol. Survey Prof. Paper 450-C, p. C65-C69.
___1964, Geology and volcanic petrology of the Lava Moun tains, San Bernardino County, California: U.S. Geol. Survey Prof. Paper 457, 97 p.
___1966, Geology of Searles Lake—A guide to pros pecting for buried continental salines, in Symposium on salt, 2d—v. 1, Geology, geochemistry, mining: Cleveland, Ohio, Northern Ohio Geol. Soc., p. 167-180.
_1968, Late Quaternary geologic and climatic history of Searles Lake, southeastern California: Internat. Quaternary Cong., 8th, Proc. 7, p. 293-310.
__1976, Origin of lithium and other components in the Searles Lake evaporites, California, in Vine, J. D., ed., Lithium re sources and requirements by the year 2000: U.S. Geol. Survey Prof. Paper, 1005, p. 92-103.
., 1976, Paleoclimatic record in the upper Quaternary sediments of Searles Lake, Calif., U.S.A., in Horie, S., ed., Paleo- limnology of Lake Biwa and the Japanese Pleistocene; v. 4, Kyoto Univ., Kyoto, Japan, p. 577-604.
Smith, G. I., and Friedman, Irving, 1975, Chemical sedimentation and diagenesis of Pleistocene evaporites in Searles Lake, Cali fornia, U.S.A., in Theme 2—Les divers aspects geochimiques de la sedimentation continentale: Congres Internat. de Sedi- mentologie, 9th, Nice 1975, p. 137-140.
Smith, G. I., Friedman, Irving, and Matsuo, Sadao, 1970, Salt cry stallization temperatures in Searles Lake, California: Minera- log. Soc. America Spec. Paper 3, p. 257-259.
Smith, G. L, and Haines, D. V., 1964, Character and distribution of nonclastic minerals in the Searles Lake evaporite deposit, California: U.S. Geol. Survey Bull. 1181-P, 58 p.
Smith, G. L, and Pratt, W. P., 1957, Core logs from Owens, China, Searles, and Panamint basins, California: U.S. Geol. Survey Bull. 1045-A, 62 p.
Smith, G. L, Troxel, B. W., Gray, C. H., Jr., and von Huene, Ro land, 1968, Geologic reconnaissance of the Slate Range, San Bernardino and Inyo Counties, California: California Div. Mines and Geology Spec. Rept. 96, 33 p.
Stuiver, Minze, 1964, Carbon isotopic distribution and correlated chronology of Searles Lake sediments: Am. Jour. Sci., v. 262, no. 3, p. 377-392.
Stuiver, Minze, and Suess, H. E., 1966, On the relationship be tween radiocarbon dates and true sample ages: Radiocarbon, v. 8, p. 534-540.
Teeple, J. E., 1921, The American potash industry and its prob lems: Ind. and Eng. Chemistry, v. 13, p. 249.
___1929, The industrial development of Searles Lake brines with equilibrium data: Am. Chem. Soc., Mon. Ser., no. 49, 182 p.
Thompson, D. G., 1929, The Mohave Desert region, California, a geographic, geologic, and hydrologic reconnaissance: U.S. Geol. Survey Water-Supply Paper 578, 759 p.
Turk, L. J., 1970, Evaporation of brine: A field study on the Bonne- ville Salt Flats, Utah: Water Resources Research, 6, no. 4, p. 1209-1215.
Vallentyne, J. R., 1957, Carotenoids in a 20,000-year-old sediment from Searles Lake, California: Archives Biochemistry and Bio physics, v. 70, p. 29-34.
Van Denburgh, A. S., 1975, Solute balance at Abert and Summer Lakes, south-central Oregon; Closed-basin investigations: U.S. Geol. Survey Prof. Paper 502-C, 29 p.
Van der Hammen, T., Maarleveld, G. C., Vogel, J. C., and Zagwijn, W. H., 1967, Stratigraphy, climatic succession and radiocar bon dating of the last glacial in the Netherlands: Geologie en Mijnbouw, v. 46, no. 3, p. 79-95.
Ver Planck, W. E., 1957, Salines, in Wright, L. A., ed., Mineral commodities of California: California Div. Mines Bull. 176, p. 475-582.
Von Engelhardt, Wolf, and Gaida, K. H., 1963, Concentration changes of pore solutions during the compaction of clay sedi ments: Jour. Sed. Petrology, v. 33, no. 4, p. 919-930.
Watanabe, Tokunosuke, 1933, Synthese de la northupite, de la ty- chite et de nouveaus mineraux artificiels du meme groupe:

122 SUBSURFACE STRATIGRAPHY AND GEOCHEMISTRY, QUATERNARY EVAPORITES, SEARLES LAKE, CALIF.
Inst. Phys. and Chem. Research Sci. Papers [Tokyo], v. 21, p. 35-39.
White, D. E., Hem, J. D., and Waring, G. A., 1963, Chemical com position of subsurface waters: U.S. Geol. Survey Prof. Paper 440-F, 67 p.
Wilcox, L. V., 1946, Boron in the Los Angeles (Owens River) aque duct: U.S. Dept. Agr., Bur. Plant Research Dept. 78, 66 p.
Wilson, E. 0., and Ch'iu, Yu-ch'ih, 1934, Brine purification: Indus, and Eng. Chemistry, v. 26, no. 10, p. 1099-1104.
Wyllie, M. R. J., 1955, Role of clay in well-log interpretation, in Pask and Turner, eds., Clays and clay technology: California Div. Mines Bull. 169, p. 282-305.
Yamamoto, Atsuyuki, Kanari, Seiichi, Fukuo, Yoshiaki, and Horie, Shoji, 1974, Consolidation and dating of the sediments in core samples from Lake Biwa, in Horie, Shoji, ed., Paleolimnology of Lake Biwa and the Japanese Pleistocene (2d issue; Contr. Paleolimnolgoy of Lake Biwa and Japanese Pleistocene), no. 43, p. 135-144.
Young, G. J., 1914, Potash salts and other salines in the Great Ba sin region: U.S. Dept. Agri. Bull. 61, 96 p.
Zeller, E. J., and Wray, J. L., 1956, Factors influencing precipita tion of calcium carbonate: Am. Assoc. Petroleum Geologists Bull., v. 40, no. 1, p. 140-152.

INDEX[Italic page numbers indicate major references]
Page A
Albert Lake. Oreg., muds, dissolved solids————104a co.————————————— 83 - 85- 86 - 92
Algae————————————————————————————53American Potash and Chemical Corp ———— 5, 8, 20
brines pumped —————————————————————45American Trona Co ———————————————————— 5Analcime ———————————— 10, 18, 14, 15, 16, 17, 18
37, 52, 79, 105, 108formation ———————————————————————105Mixed Layer —————————————————— 105, 108tuff ——————————————————————————105
Apatite ———————————————————————————14Aphthitalite ——————— 10, 37, 43, 56, 59, 90, 92, 93,
94, 95, 106, 107phase diagrams———————————————————92Upper Salt———————————————————————92
Aragonite——————————— 10, 14, 16, 17, 18, 37, 43,47, 51, 54. 72, 78, 79, 80, 102, 104. 110
alteration ——————————————————————— 102beds————————————————————————————48Bottom Mud ———————————— 79, 101, 104, 110conversion to calcite ———————————————104crystallization ————————————————————80formation———————————————————— 81, 102laminae————————————————————————110
significance———————————————————109Lower Salt —————————————————————— 79Mixed Layer —————————————————————79oldest occurence————————————————————79Overburden Mud ——————————————————— 79Parting Mud —————————————————————104precipitation —————————————————————80primary——————————————————————————79recrystallization ———————————————————72varves ——————————————————————————80
Argus Range————————————————————————— 3Artemia ————————————————————————————53Ash, volcanic ————————————————————— 14, 15Atmospheric temperature changes——————————114Atriplex hymenelytra ———————————————————3
B
Bacteria, sulfate-reducing ———————————————106Bacterial production, COj, measure——————————85Bedding laminar, significance————————————111Berthold, S.M.,cited ————————————————————68Biotite —————————————————————————— 13,52Blackmon, P. I) , cited——————————————————52Blue-green algae ——————————————————————53Borate Playas, Nevada———————————————————4Borates —————————————————————————— 98,99Borax-4, 5. 10. 16, 17, 18, 34, 36, 37, 39. 40, 43. 47, 48,
51, 56, 59, 60, 64, 66, 67, 86. 90, 95. 96, 112beds ————————————————————————————16crystals————————————————34, 37, 39, 40, 17crystallization —————————————————— 90, 95Lower Salt————————————————————— 47, 90Overburden Mud ——————————————————— 96zones ———————————————————————————90
Boron. Lower Salt—————————————————————47Searles Lake——————————————————— 47. 64
Bottom Mud ————————————————— 10, 12, /o. 79acid-insoluble material, percentage———————77
Page Bottom Mud—Continued
analcime, zones ———————————————————110aragonite ———————————————————— 79, 104
laminae—————————————————————110percentage ———————————————————101
areal extent —————————————————————— 16authigenic K-feldspar ————————————105,110authigenic minerals———————————— 14,18,105base ——————————————————————————16
age————————————————————... 74, 78temperature———————————————————110
B content ———————————————————————100brines, salinities ———————————————————86
Ca-bearing minerals ——————————————————109calcite ———————————————————————— 79, 101
chemical composition ——————————————— 17clastic, sedimentation, ———————————————78core, logs ———————————————————————16core L-W-D ——————————————————————16dated sediments———————————————————— 77deposition ————————————————————— 74,110depositional history ——————————————109,110depositional interval ————————————————78depositional processes———————————————109depositional rate ———————————————————77diagenesis ———————————————————————86disseminated salines, zones ———————————110dolomite——————————————————79, 81, 110evaporite minerals —————————————————18gaylussite, crystals——————————————————16
distribution ———————————————————110quantity —————————————————————110
lithology —————————————————————————16mineral composition ———————————— 16, 37, 86minerals, alteration —————————————————86mud densities —————————————————————78nahcolite ———————————————————————86northupite ——————————————————————86organic carbon, dates ————————————— 74, 77pyrite——————————————————————— 10, 56saline layers——————————————————— 16, 85salines————————————————————————— 85salt layers, accumulation rate——————————75
correlation ————————————————————114depositional process——————————— 85, 86formation—————————————————————85mineral composition ——————————————85positions—————————————————————108
searlesite ———————————————————— 105, 110sedimentation rates———————————75, 77. 109sediments————————————————————————77silicate minerals, authigenic————————————14thickness ———————————————————————— lf>top —————————————————————————— 16,78tuff, analcime —————————————————————105
Bradley, W. H.. cited ————————————————— 83. 85Brine———————————————————————————— 8. 18
carbonate ——————————————————————— 71total————————————————————————44
changing ratios of components —————————— 84chemical composition ———————————————— fiOchemistry ———————————————————————— 79commercial grade——————————————— 56, 117composition, changes ———————————————197
post-diagenesis————————————————— 116depletion rate —————————————————————117economic value ————————————————— 43. 98interstitial, hydrogen-deuterium ratios ————— 71evaporation, rates———————————————————75
salinities———— -————————————————104
PageBrine—Continued
major elements ————————— —————————— 43 minor elements ———————————————————45 original, exhausted—————————————————116
extractable salts ———————————————117 Owens Lake —————————————————————76 Parting Mud ————————————————— 53, 56, 72 post-depositional changes —————————————45 pumping rates ————————————————————116 shrimp——————————————————————————53 test pumping——————————————————————— 5
Broecker, W. S., cited———————————————————70Burkeite ————— 10, 13, 15, 16, 18, 34, 36, 37, 39, 40,
43, 56, 59, 60, 67, 83, 84, 92, 93, 94, 106, 107, 108 Lower Salt —————————————————————— 89 mineral percentages—————————————————34 phase diagrams————————————————— 89, 92 stability fields —————————————————————83 Upper Salt———————————————————— 92, 94
Burro-bush———————————————————————————3
C
Calcite—— 13, 14, 15. 16, 17, 18, 43, 51. 54, 72, 78, 79,80, 81, 110
Bottom Mud —————————————————— 79, 101diagenetic alteration ————————————————79formation————————————————————————81Lower Salt ——————————————————————— 79Mixed Layer —————————————————————79Overburden Mud ——————————————————— 79Owens Lake —————————————————————99precipitation, significance————————— 109, 110Parting Mud —————————————————————79recrystallization ————————————— —————72
Carbon, detrital, "C age ————————————————73Carbon exchange mechanisms ————————————72Carbonate, wood samples, "C dates—————————73Carbonate minerals ———————————————————17
dates ———————————————————————— 70, 71diagenesis ———————————————————————73recrystallization ———————————————— 71, 72
Carbonates —————————————————————— 18, 78X-ray determinations—————————————————14
Carotenes——————————————————————————53Carpenter, L. G., cited———————————————————63Chemicals, industrial ——————————————— 56, 60Chemicals, potential production———————————117Chemistry, lake waters——————————————————85China Lake—————————————————————— 97, 99Chlorite———————————————————————52, 53, 54Chlorophyll pigments —L———————————————80Chronology, Searles Lake———————————————115Clastic minerals —————————————— 16, 17, 37, 56Clastic silicates——————————————— 13, 37, 47, 52Clay minerals, Mixed layer———————————————14
Parting Mud ————————————————————— 51days—————————————————————8. 13, 53, 54, 67Clear Lake, Calif., sediments, accumulation rates-78Climate chronology, North American,
Pleistocene———————————————————————— 115Climatic- change, criteria———————————— 113, 114COj, bacterial decomposition —————————————— 85Core L-W-1)————————————————————14, 16, 105
authigenic silicate minerals ———————————105base, temperature ——————————————————100gaylussite——————————————— ————————103pirssonite ———————————————————————103saline layers ——————————— —————————— 111
123

124 INDEX
PageCore samples, mineral composition ——————————17Correlation, Dead Sea ——————————————————114
glaciers ———— ————————————————————113lake fluctuations. Pleistocene ——————————113mud and saline units—————————————————10pollen—————————————————————————— 113sea levels ————————————————————————113sea-surface temperatures —————————— 113, 114West Yellowstone glacier —————————————114
Creosote bush———————————————————————— 3Current marks ————————————————————————39
D
Dead Sea, correlation —————————————————114fluctuation curve ———————————————————114mineral composition —————————————————80muds —————————————————————————104pyrite—————————————————————————106sediments, laminated ————————————————80
Death Valley —————————————————————————3Deep Spring Lake—————————————————— 80. 81
gaylussite crystals —————————————————101muds ——————————————————————————81similarity to Searles Lake —————————————81
Deposition rates ——————————————————————75Depositional history, reconstructed————————— 108Deposits, correlations with other areas —————— 112Desert holly—————————————————————————— 3Diagenesis, geochemistry ——————————————— 100
Lower Salt———————————————————————88primary sediments —————————————————100temperature, changes ———————————————100
Diagenetic minerals———————————————————107Diagenetic processes, mud layers ——————————100
salt layers ———————————————————————106Dissolved solids, quantity extracted ————————117Dolomite————— 10. 13, 14, 15, 16, 17, 37, 43, 47. 51,
54, 67, 68, 78, 79, 81, 86, 110Bottom Mud ————————————————79, 81, 110coexistence —————————————————————— 110diagenetic origin ———————————————————81distribution. Bottom Mud —————————————110formation ———————————————————————— 81Lower Salt ——————————————————————— 79Mixed Layer——————————————————— 79, 81Overburden Mud————————————————— 79, 81Parting Mud——————————————————— 79, 81primary origin —————————————————————81
Droste, J. B., cited ————————————— 8, 14, 53, 67Dutcher, L. C., cited————————————————— 8, 116Dyer, B. W., cited —————————————————————44
E, F
Economic development, Searles Lake ————————— 4 Economic geology————————————————————— 116 Emery, K. O., cited——————————————80, 106, 114 Erd. R. C., cited——————————————————— 37, 53 Eugster. H. P., cited—————————7, 83. 85, 86, 90, 92 Evaporation pan. rates——————————————————75 Evaporation ponds—————————————————————5 Evaporite content. Parting Mud————————————54 Kvaporite deposits —————————————————————56
Mixed Layer —————————————————————— 13stratigraphy ——————————————————————— 8
Evaporite mineralogy ———————————————————13 Evaporite minerals, Overburden Mud————————67 Evapontes, Lower Salt —————————————————— 37
Searles Lake——————————————— 4, 8, 82, 100 Fahey. J. J., cited—————————————————————76 Feldspar———————————————————— 13, 52, 54, H7 Flint R. F., cited —————————————————7. 16. 68 Flora, surrounding area —————————————————— 3 Flourine, Owens Lake ——————————————————— 99
Searles Lake ————————————————————— 99 Fossil soil——————————————————————————114 Franscria dumosa------------------------------- ;jFriedman, I., cited ————————————————— 76, 99
Page
Gale, H. S., cited ————————————————— 7, 13, 67W. A., cited ————————————— 7, 16, 45, 61, 68
Galeite————————————————————————— 10, 37Garrett, D. E., cited ———————————————————63Gaylussite———— 10, 13, 14, 15, 16, 17, 18, 34, 37, 39,
40, 43. 47, 48, 51, 54, 67, 68,72, 78,79, 81, 86, 101. 102, 103, 110, 111, 112
Bottom Mud ——————————————————— 16, 110cocrystallization ———————————————————103composition, stability ———————————————103crystallization ————————————————— 72, 110
rate—————————————————————————102crystals————— 16, 34, 37, 39, 40, 47, 48, 72, 101diagenetic ———————————————————————103
maximum depth ————————————————103formation ———————————————————————— 72mineral percentages————————————————— 34Mixed Layer—————————————————— 101, 102Parting Mud —————————————————————102pirssonite stability field boundary ———————103quantities———————————————————————111quantity, significance ———————————————110
Geochemistry, diagenesis ——————————————— 100sedimentation————————————————————— 78
Geologic environment, Searles Lake——————————5Geologic studies, previous, Searles Lake——————— 6Glacial advances—————————————————— 113, 114Glacial retreats —————————————————— 113, 114Glacial deposits, correlation——————————————114Glacial records——————————————————— 113, 114Glaciation, Illinoian ———————————————————115
Mono Basin——————————————————————116Glacier, West Yellowstone ———————————————114Glacier diagram, time scale —————————————114Galciers, Pleistocene, Searles Lake drainage area 116Glaserite——————————————————————— 10, 106Glass, devitrified——————————————————————15Glass shards————————————————————————52Goddard, J. G.. cited ———————————————————75Grayia spinosa ————————————————————————3Great Basin, streams, headwaters ——————————98Green algae——————————————————————————53Green River Formation, authigenic K-silicate
phases ———————————————————————————102nahcolite, rosettes——————————————————103trona beds, saline depositional rates —————— 76
Ground water, Searles Valley ——————————————8Gude, A. J., cited—————————————————————17Gypsum ——————————————————————45, 80, 98Gypsum-bearing fault gouge ———————————————6
H
Haines, D. V., cited — 7, 12, 20, 34, 39, 40, 47. 51, 95Halite ——————————— 10, 13, 14. 15, 16, 17, 18. 34,
36, 37. 42, 43, 47, 48, 51. 54, 56, 59,60, 61. 64, 66, 67, 68, 75, 78, 79, 80,
83, 84, 85. 90, 93, 94, 95, 96, 98, 103,104, 107, 108, 112
beds ——————————————————————— 60. 108 crystallization ——————————— 75, 84, 90, 95, 96 crystals ——————————————— 47, 48, 51, 84, 104 cubic ——————————————————————————15 diagenesis ———————————————————————80 Lower Salt ——————————————————————— 90 Mixed Layer —————————————————————108 microcrystalhne————————————————— 80, 103 mineral percentages—————————————————34 Overburden Mud————————————————67, 112 Parting Mud—————————————————— 103, 104 phase diagrams ———————————————————— 95 Upper Salt ——————————————————————— 95
Hanksite—————— 10, 18. 34, 36, 37, 39, 43, 56, 59, 60, 64. 66, 67, 68, 92. 93. 94, 95, 96, 106, 107. 108
crystallization rate —————————————————— 92 crystals ———————————————————— 94, 95, 106 diagenesis ———————————————————————94
Page H anksite—Continued
formation——————————————— 92, 93, 106, 107Lower Salt ———————————————————————106mineral percentages—————————————————34Overburden Mud———————————————————96phase diagrams————————————————— 92, 93recry stallization ——————————————————106secondary————————————————————————93Upper Salt—————————— 60, 92, 93, 94, 95, 106
Hardcastle, K., cited ———————————————— 76, 99Hardt. W. F., cited ————————————————— 8. 116Hay, R. L., cited ————————— 8, 14, 17, 52, 53, 105Hem, J. D., cited——————————————————— 45, 63Hop Sage ———————————————————————————— 3Hot Creek—————————————————————————100
flow rate ———————————————————————— 100tungsten, amounts —————————————————100
Hydrocarbons———————————————————————53
I, J, KIce sheet, Laurentide——————————————— 114, 115Ice sheets, isotopic composition————————————114
major, growth————————————————————114Illinoian Glaciation ———————————————————115Interstitial solutions, composition, changes————100Introduction —————————————————————————— 2Isopach map, Overburden Mud ————————————— 82Isopach maps, Lower Salt————————————— 82, 96
mud units———————————————————————20saline units ———————————————————————20
Ives, P. C., cited——————————————————————68Joshua trees —————————————————————————3Kaufman, Aaron, cited —————————————————— 70Keough Hot Spring ———————————————————100
tungsten, amount ——————————————————100Kerr-McGee Chemical Corp ———————————————16
chemical analyses ———————————————————8cited ————————————————————————————10logs—————————————————————————————8
K-feldspar ——————————— 10, 13, 14, 15, 17, 18, 79authigenic —————————— 16, 102, 105, 108, 110
Lacustrine facies, areal extent—————————————13Lacustrine records ————————————————————113Lacustrine sediments, Cenozoic ————————————98Lake, chemical stratification ——————————————80
mud, deposition ———————————————————82organic productivity ————————————————85saline——————————————————————————108stand, low, definition———————————————113stratified————————————————————— 110. Ill
Lake basin, inflow, volume ———————————————110Lake surface, saline minerals —————————————67Lake Biwa, Japan —————————————————————78Lake Bonneville —————————————————————114
lake-fluctuation curve ———————————————114recessions, correlated————————————————114
Lake brines, crystallization path ———————————84Lake deposits, gypsum-bearing————————————45Lake efflorescences ————————————————————67Lake fluctuations. Pleistocene —————————————113Lake Lahontan, recessions, correlated———————114Lake levels, related to sediments, thickness ———110Lake salinity, stratification ———————————————80Lake waters, chemistry ————————————83, 84, 85Lakes, deposition. Bottom Mud ————————————110
larger. Lower Salt——————————————————111perennial ———————————————————— 108, 111saline, deposition ———————————————————96
formation ————————————————————— 96layers————————————————————————96recry stallization —————————————————96solution———————————————————————96volume changes—————————————————96zones ————————————————————————96
stratified————————————————————————101unstratified —————————————————————— 111

INDEX 125Page
Laminar bedding, significance ———————————111 Larrea tridentata ————————————————— 3Laurentide chronology —————————————————115Laurentide ice sheet, correlation with Searles Lakell4
fluctuations—————————————————— 114, 115Leopold, E. B., cited ———————————————————— 8Levin, Betsy, cited ————————————————————68Little Hot Creek—————————————————————100
flow rate———————————————————————100tungsten, amounts —————————————————100
Long Valley area, springs, thermal ————————— 98tungsten, amount —————————————————100
Los Angeles aqueduct —————————————————— 98Lower Salt—————————————————————10, 18, 75
age———————————————————————— 18, 74aragonite occurrences ———————————— 79, 104areal extent ——————————————————————20authigenic silicate minerals ———————————105borax——————————————————————————47brine, densities————————————————————18brine composition ———————————————————45
average——————————————————————89variation —————————————————117, 118
brines, analyses———————————————————43commercial grade———————————————117mixing——————————————————————118post-depositional changes ——————————45saline———————————————————————86total carbonate————————————————— 44
calcite ————————————————————————— 79chemical analyses —————————————————43chemical composition ————————————— 40, 86core samples, chemical analyses—————————40
X-ray analyses ————————————————— 40deposition ———————————————————————98
dry-lake stage——————————————————45salinity ——————————————————————90wet-dry episodes —————————————————68
depositional history ———————————————— 111deposits, volumes ——————————————————18diagenesis ———————————————————— 88, 90dolomite ————————————————————————79estimated bulk composition ———————————47hanksite crystals———————————————————94inferred environment————————————————90lake history —————————————————————— 74lakes, large —————————————————————111lithology———————————————————————— 34mineral compositon ————————————————— 34mineral distribution————————————————— 34mud beds, analcime ————————————————105mud deposits—————————————————————18mud layers———————————————————— 18, 47mud units————————————————————— 20, 37
depositional conditions ————————————111evaporites ————————————————————37isopach maps ——————————————————82mineral composition —————————————37relative volumes ————————————————82
M-2 ———————————————————————— 37, 82deposition, inferred ——————————————111laminar bedding ———————————————111
M-3 ———————————————————————— 37, 81dates, different—————————————————74deposition, inferred —————————————111laminar bedding ———————————————111
M-4 ———————————————————————— 39, 82deposition, inferred ——— —————————— 111laminar bedding ———————————————111
M-5 ———————————————————————— 39, 82deposition, inferred ——————————————111laminar bedding ———————————————111
M-6 ———————————————————————— 40, 82age ————————————————————————— 74deposition, inferred ——————————————111dissolved solids —————————————————90laminar bedding ———————————————111
M-7 ———————————————————————— 40. 82age ————————————————————————74deposition, inferred ——————————————111
Page Lower Salt, M-7—Continued
dissolved solids —————————————————90laminar bedding ———————————————111
muds, laminar bedding——————————————111northupite ——————————————————————— 79organic carbon, dates ———————————————74Parting Mud ————————————————————— 47phase diagram, burkeite field———————————89
trona field ————————————————— 87, 894-component system——————————————895-component system——————————— 86, 88
pumped wells ————————————————————118pyrite —————————————————————————105saline beds, isopach maps—————————————96saline deposits ————————————————————18saline layers —————————————————————18saline units——————————————————- 20, 34
areal extent———————————————————97basin position——————————————————97deposition ————————————————————96mineral content, volume percentage ———34
salines————————————————————————— 86salt depositional sequence ————————————— 97salt layers ———————————————————————47
accumulation rate———————————————75borax———————————————————————47crystallization sequences ———————————86
salt units, absolute ages——————————————75•^ '"Th • - "U age —————————————————75
samples—————————————————————————68selective pumping —————————————————118shapes —————————————————————————118sodium carbonate minerals————————————88solids, chemical analyses————————————— 40solutions, initial compositions ——————————86stratigraphic subdivisions—————————————18S-l ————————————————————————— 16, 34
borax content —————————————————— 90brine, composition ———————————————88
crystallization ————————————————97crystallization, path—————————————88crystallization, temperature ———————88
deposition, final—————————————————88original brine —————————————————87
mineral assemblage——————————————88mineralogy ———————————————————111northupite, percentage ————————————91phase diagrams—————————————————86thickness distribution —————————————97trona ———————————————————————88
S-2——————————————————————————— 36borax content —————————————————— 90brine, composition ———————————————88
crystallization ————————————————97crystallization, path—————————————88crystallization, temperature ———————88
mineralogy ————————————————88, 111northupite, percentage —————————————91phase diagrams ————————————————— 86thickness distribution —————————————97trona ———————————————————————88
S-3——————————————————————————— 36borax content ——————————————————90brine, composition ———————————————88
crystallization ————————————————97crystallization, path—————————————88crystallization, temperature ———————88
hanksite, crystals ———————————————106mineralogy ————————————————— 88, 111northupite, percentage —————————————91phase diagrams—————————————————86thickness distribution —————————————97trona ————————————————————————88
S-4——————————————————————————— 36borax content ——————————————————— 90brine, composition ———————————————88
crystallization —————————————————97crystallization, path—————————————88crystallization, temperature ———————88
hanksite, crystals ———————————————106
Lower Salt, S-4—Continuedmineral assemblage——————————————88mineralogy ——————————————————— 111northupite, percentage ————————————91phase diagram, field boundaries——————87phase diagrams ————————————————— 86thickness distribution —————————————97
S-5 ———————————————————————— 36, 56accum ulation rate——————————————— 75age—————————————————————————74borax content —————————————————— 90brine, composition ———————————— 88, 89
crystallization ————————————————97crystallization, path—————————————88crystallization, temperature ———————88
compaction, post-depositional ———————96desiccation————————————————— 90, 97dessication period ——————————————— 74hanksite, crystals ———————————————106mineral assemblage——————————————89mineralogy ———————————————————111northupite, percentage ————————————91phase diagram, field boundaries——————87phase diagrams ————————————————— 86thickness —————————————————————97
S-6———————————————-——————————— 37borax concentration——————————————90brine, composition ———————————————89
crystallization, summer ——————————90crystallization, temperature ————— 89, 90crystallization, winter———————————90crystallization sequence——————— 89, 90final———————————————————————89original—————————————————— 89, 90
halite———-—————————-————————90mineralogy ———————————————————111natron, crystallization ————————————90sulfate minerals—————————————————89thickness distribution —————————————97trona ———————————————————————90
S-7 ——————————————————————————— 3 7borax concentration ————————————————— 90
brine, composition ———————————————89crystallization, summer ——————————90crystallization, temperature ————— 89, 90crystallization, winter———————————90crystallization sequence——————— 89, 90final———————————-——————————89original—————————————————— 89, 90
halite ——————————————————————— 90mineralogy ———————————————————111natron, crystallization ————————————90sulfate minerals————————————————— 89thickness distribution —————————————97trona ———————————————————————90
water-soluble components, major————————47wood, date ——————————————————————74units———————————————————————— 10, 12
solution mining —————————————————118upper contact ————————————————————118visual estimates, percent error——————————42volume ———————————————————————— 20water, isotopically homogeneous ————————118
M
Mabey, D.R., cited ———————————————————— 12Magnesium ———————————————————————— 78Mankiewicz, core B, age ————————————— 111, 112
P. J., cited —————————— 48, 52, 53, 55, 80, 111Manly party ————————————————————————— 4Marine muds, recent —————————————————— 102Marine sediments, NaCl solutions, postdepositional
concentration ————————————————————— 104Marl 56Marls, organic-rich ———————————————————— 37 Megascopic minerals, volume percentages ————— 34 Methane —————————————————————————— 71 Microorganisms ——————————————————— 71, 106 Milton, C., cited ——————————————————— 83, 85

126 INDEX
Page Mineral assemblages, geochemical environment
of deposition —————————————————————— 82saline, temperatures—————————————————83
Mineral species, crystals, large, growth——————104Minerals —————————————————————————— 17
anomalous, formation ———————————————107diagenetic ——————————————————————107related, coexistence —————————————————84sulfate ————————————————————————107
Mining, solution, Lower Salt —————————————118Mirahilite—————10, 16, 17, 18, 77, 83, 100, 107, 111
beds ————————————————————————————16Bottom Mud —————————————————————85crystallization —————————————————— 75, 86layers—————————————————————— 110, 111stability fields ————————————————————83
Mixed Layer—————————————————————— 10. 12age———————————————————————— 13, 109analcime———————————————————————108
abundance———————————————————105aragonite ——————————————————————— 79areal extent —————————————————————— 13authigenic K-feldspar ———————————————108authigenic silicate minerals ———————————105base, age ———————————————————————116brines ——————————————————————————84
composition————————————————— 15, 85initial———————————————————————84
calcite —————————————————————————79chemical analyses, water-soluble fraction ———14chemistry, major change ————————————— 85clay minerals ————————————————————14coreL-W-D ———————————————————————13
thickness —————————————————————109correlated with Sherwin Glaciation ——————116correlation, revised—————————————————115deposition ———————————————————————84
change —————————————————————— 85nonpluvial———————————————————116
dolomite ————————————————————— 79, 81evaporite deposits —————————————————— 13evaporite minerals, coarse-grained———————14gaylussite——————————————————— 101, 102lacustrine deposits —————————————————13lithology ————————————————————————— 13mineral composition ————————————— 13, 14minerals, stratigraphic distribution———————14mud, sedimentation —————————————————108muds, color ——————————————————————108north upite ——————————————————————— 79pirssonite——————————————————— 101, 102saline layers ——————————————————— 13, 15salines————————————————————————— 84salt deposition ———————————————————108salts, color ——————————————————————— 108
primary———————————————————————84searlesite ——————————————————————108sedimentation history ———————————————108sedimentation rates ————————————————109silicate minerals, authigenic———————————14stratigraphic units——————————————— 13, 14thickness ———————————————————————13tuff beds, analcime—————————————————105
K-feldspar ————————————————————105type B searlesite ————————————————105
unit A ————————————————————————— 14brine composition ————————————————85brines, pumping ————————————————118nahcolite —————————————————————85nahcolite beds —————————————— 108, 118organic material ————————————————85saline composition ———————————————85trona beds ————————————————— 108, 118
unit B —————————————————————————14brine composition ———————————————85nahcolite —————————————————————85nahcolite beds ————————————— 108, 118organic material —————————————————85saline composition ——————————————--85soda ash production——————————————118trona beds————————————————— 108, 118
Page Mixed Layer—Continued
unit C ————————————————————— 15, 84, 85horizons, color —————————————————108interpluvial ———————————————————109halite beds ———————————————————108trona beds ———————————————————108
unit D ———————————————————— 15. 84, 85halite deposition ———————————————108mud deposition —————————————————108trona deposition ————————————————108
unitE ————————————————————— 15, 84, 85brine composition, change——————————85horizons, color —————————————————108mud ————————————————————————108
unit F —————————————————————— 15, 84base, age ————————————————————109mud sedimentation——————————————108pluvial——————————————————————109
units——————————————————————————10volume percentages —————————————————13zones ——————————————————————————13
mottled —————————————————————108Moiola, R. J., cited ———————— 8, 14, 17, 52, 53, 105Mono Basin Glaciation—————————————————116Mono Basin Till —————————————————————116Mono Lake, age——————————————————————70Monomineralic salt, beds———————————————108Morgan Creek, flow, rate ———————————————100
water analysis, tungsten —————————— 99, 100Moyle, R. W., cited————————————————— 8, 116Mud————————————————————————48, 56, 59Mud deposition, rates ———————————————————76
unit E, halite ————————————————————108Mud layer, aragonite, formation ———————————102
pirssonite, formation ————————————————102Mud layers ——————————————————————————13
authigenic K-silicate phases ———————————102borax zones, significance—————————————90brine, interstitial, salinity—————————————103brines, disequilibrium ———————————————101
ionic ratios ———————————————————102chemical disequilibrium ——————————————101COj, rate of formation ——————————— 102, 103compaction —————————————————————103diagenetic changes————————————————— 100disequilibrium between original
minerals and brines———————————————100dissolved solids, concentration —————————103gaylussite, concentrations —————————————103
distribution ———————————————————103formation, limits ———————————————102
halite, microcrystalline———————————————103interstitial solutions, salinities —————————103ionic diffusion ———————————————————101large crystals, growth———————————————104lithology ————————————————————————— 34organic decomposition, partial pressures———101pirssonite, concentrations ————————————103
distribution ———————————————————103pore water elimination ——————————————101
Mud samples, dating ——————————————————— 70Mud units, areal extent —————————————————20
areal variations————————————————————81bedding character———————————————————12brines, interstitial, H D ratios——————————71crystal habit ————————————————————— 12crystal size ———————————————————————12depositional processes————————————————81hydra ted salts, H D ratios ————————————71isopach maps —————————————————————20mineralogy ———————————————————— 10, 12minerals, quantitative analyses —————————37saline minerals ————————————————————37thickness ————————————————————— 12, 20
distribution, variation—————————————96variations ————————————————————81
volume ——————————————————————————20Muds, CaO content ———————————————————81
laminated, significance ——————————————111marine, recent ————————————————————102MgO content——————————————————————81
PageMuds, CaO content—Continued
unlaminated, significance ———————————— 111M-2, megascopic lithology ———————————————37
nodules —————————————————————————37 thickness ——————————————————————-37
M-3, current marks ———————————————————39 megascopic lithology ———————————————— 37 thickness ——————————————————————— 39
M-4, megascopic lithology ———————————————39 thickness ——————————————————————— 39
M-5, megascopic lithology ———————————————39 ripple marks —————————————————————39 thickness ——————————————————————— 39
M-6, megascopic lithology ———————————————40 thickness ———————————————————————40 total volume —————————————————————40
M-7, megascopic lithology ———————————————40 thickness ——————————————————————— 40 total volume —————————————————————40
N
Nahcolite—————————10, 13, 14, 15, 16, 18, 34, 37,40, 77, 83, 84, 85, 86, 103, 107, 108, 118
alteration to trona —————————————————83beds—————————————————— 16, 17, 108, 118Bottom Mud ——————————————————— 85, 86crystallization ————————————————————86crystalline phases, primary ———————————83formation ————————————————————————102layers—————————————————————— 110, 111Mixed Layer———————————————85, 108, 118preservation, brine —————————————————103rosettes, Green River Formation ————————103stratigraphic distribution —————————————85
Natron —————————————————— 83, 90, 107, 112alteration to trona —————————————————83crystalline phases, primary ———————————83crystallization ——————————————— 75, 86, 90Lower Salt ——————————————————————— 90
Neev, David, cited ——————————————80, 106, 114North American ice sheet, correlation with Searles
Lake———————————————————————————114fluctuations —————————————————————114
North American Pleistocene climate chronology -115Northupite———————10, 13, 14, 15, 18, 34, 36, 37, 39,
40, 43, 52, 59, 79, 81, 84, 86, 90, 91, 103beds ————————————————— 16, 37, 38, 39, 48Bottom Mud ——————————————————— 79, 86crystallization ————————————————————91crystals—————————————————————— 34, 48Lower Salt———————————————————— 79, 91Mixed Layer —————————————————————79nodules ——————————————————————— 38, 39Overburden Mud ——————————————————— 79Parting Mud ————————————————————— 79primary material———————————————————81stability field —————————————————————90synthesis ———————————————————————90synthetic formation —————————————————81
O
Old Searles deep well —————————————12, 13, 16Organic carbon, disseminated, dates ————————70
disseminated. Lower Salt—————————————74wood samples, ' 'C dates———————————73
production, rate ———————————————————— 71Organic compounds, muds, composition ——————70Organic material———————————— 10, 13, 16, 18, 37
decomposition ————————————————————85Organic productivity, lake———————————————85Overburden Mud—————————————————10, 66. 95
aragonite ——————————————————————— 79areal extent—————————————————————— 66basal contact, "C age ——————————————— 73borax, distribution ——————————————————96brines, composition —————————————————95

INDEX 127
PageOverburden Mud—Continued
calcite ————————————————————————— 79 chemical composition ——————————————— 68 clastic minerals ———————————————————67 composition, megascopic —————————————66
megascopic, mean, calculated ———————67 contact —————————————————————————95 crystallization sequence——————————————86 deposition ——————————————— 66, 95, 97, 98
lake ———————————————————————— 95 dissolved solids, total ———————————————64 dolomite ————————————————————— 79, 81 evaporite minerals —————————————————67 halite, abundant ——————————————————112
surficial —————————————————————67 hanksite, distribution ———————————————96 isopach map —————————————————————82 lake, levels——————————————————————112 lake, perennial ————————————————————95 lithology ———————————————————————— 66 mineral composition ———————————————— 66 northupite ——————————————————————— 79 polygons————————————————————————67 saline components, sources————————————95 saline minerals, areal distribution ———————96 salines————————————————————————— 86 salts, mineral composition ————————————95 sand——————————————————————————66 stratigraphic contact————————————— 56, 66 thenardite, distribution——————————————— 96 thickness, average —————————————————66
variation —————————————————————82 trona, distribution ——————————————————96 volume ————————————————————————— 66 wood sample, reliable date ————————————73
Owens Lake ———————————————————85, 88, 98 accumulation rate, annual ————————————76 brine, evaporation rate ——————————————— 76 brine content —————————————————————76 calcite precipitation —————————————————99 crystallization process ———————————————96 dissolved solids, total quantity —————————98 evaporation rate, net ———————————————— 76 fluorine, amount ———————————————————99 minerals, recrystallized ——————————————83 overflow ———————————————————————109 PCQ environment—————————————————83 PO i, "amounts—————————————————————99 phytoplankton population—————————————85 recrystallization ——————————————————106 salinities————————————————————————85 salt crystallization —--———————————————83 surface, irregular——————————————————— 96 water depth —————————————————————— 76
Owens River————————————————————— 76, 99components, compared to Searles Lake ————99
concentrations ——————————————————98sources ———————————————————————98
dissolved solids, total quantity —————————98flow, Pleistocene ———————————————————109fluorine, amounts ———————————————————99headwaters, dissolved solids———————————98PO,, amounts—————————————————————99
contributed to Owens Lake—————————99contributed to Searles Lake —————————99
water analysis, tungsten —————————————99Owens Valley aqueduct —————————————————76Owens Valley, runoff ———————————————————76
Panamint Valley——————————————————— 3, 98 Parting Mud ———————————————————10, 12, 79
age ——————————————————————————— 47 algae —————————————————————————— 53 aragonite ———————————————————————104 areal extent——————————————————————— 47 authigenic silicate minerals ———————————105 base, organic carbon, dates————————————74 brine ———————————————————————————53
desiccation————————————————————56
Page Parting Mud—Continued
brines, diffusion ———————————————————72 calcite ————————————————————————— 79 CaO content ——————————————————— 56, 79 carbonate minerals —————————————————56 chemical composition ——————————————— 54 chemical stratification ———————————————80 chlorine content——————————————————— 56 chlorophyll pigments————————————————80 clastic content ————————————————————54 clastic minerals, distribution ———————————55
grain-size distribution —————————————51 clay minerals —————————————————— 51, 53 core B —————————————————————————48 core samples, dated —————————————————70 crystallization ————————————————————51 dated sediments, lithologic similarity ————— 77 density, average ——————————————————102
lake water stratification———————————80 deposition —————————————————— 79, 95, 97
aeolian ——————————————————————53 depositional rate ——————————————————108 deposits correlated with outcrops———————111 dolomite—————————————54, 79, 81, 105, 110
decomposition —————————————————54distribution ———————————————————110
dolomite sample, analcime ———————————105 evaporite content ——————————————————54 gaylussite, abundance———————————————102 halite —————————————————————————103
concentration —————————————————104diagenesis ———————————————————104
interstitial brine content —————————————56 laminae—————————————————————— 51, 80
calcium carbonate, thickness————————51 laminated zone, subdivisions —————————— 111 lateral equivalents ——————————————— 1, 47 lithology———————————————————————— 48 Lower Salt Contact ————————————————— 47 major element analyses ——————————————54 marl —————————————————————————— 56 MgO analyses ————————————————————55 mineral composition ——————————— 37, 47, 48 mineral distribution ————————————————— 48 minerals————————————————————————51 mud, densities ————————————————————78
depositional rate ———————————————— 77matrix———————————————————————47
northupite ——————————————————————— 79 organic carbon, 14 C dates —————————— 73, 76
content ——————————————————————56 organic content———————————————53, 54, 80
average——————————————————————56 organic material ———————————————— 51, 78 organic production rate ——————————————56 paired dates —————————————————————72 prissonite, abundance ———————————————102 pore water, percentages ——————————————54 pyrite—————————————————————————105 sand grains, frosted—————————————————53 sediment, distribution ———————————————82 sedimentation rate —————————————————51
average——————————————————————77 sediments, laminated ———————————————111
unlaminated ——————————————————111silicates, authigenic ————————————————— 51sodium content average—————————————102stratified lakes————————————————————95stratigraphy —————————————————————47textural characteristics———————————————51thickness ———————————————————————47tuff bed ————————————————————————105uranium ————————————————————— 55, 80volume ————————————————————— 47, 102
PCO2———————————————— 83, 102, 103, 106, 107Perennial lakes, Searles Valley ————————————15Phase diagram, crystallization path, extent————84
crystallization path, direction ——————————84Phase diagrams———————— 84, 86, 87, 91, 92, 93, 95
4- component system————————————————845-component system———————————— 84, 92, 93
Phase diagrams—Continued Page6-component system—————————————————92halite field———————————————————————95Lower Salt———————————————————— 86, 87
pH, brine —————————————— 43, 61, 78, 80, 81, 94Phillipsite ————————————— 10, 14, 17, 52, 79, 105Phytoplankton, Owens Lake —————————————85Pine Creek tungsten mine———————————————99Pinyon Pine ————————————————————————3Pirssonite———————10, 13, 14, 15, 18, 34, 37, 39, 40,
43, 47, 48, 51, 54, 56, 59, 67, 68, 72, 79,81, 101, 102, 103, 112
cocry stallization ——————————————————103composition, stablility———————————————103crystallization ————————————————— 72, 102crystals———————————————34, 39, 47, 48, 72diagenetic ——————————————————————102mineral percentages—————————————————34Mixed Layer ————————————————— 101, 102Parting Mud ————————————————————102
Planktonic fossils ————————————————————114Plant growth, carbon isotope fractionation ————70Plants, lower Sonoran zone ———————————————3
vascular ———————————————————————— 53Playa lake —————————————————————————13Pleistocene, temperature, long-term changes———106Pleistocene climate chronology———————————115Pleistocene lake fluctuations, correlation —————113Pollen, correlation ———————————————— 113, 114
data __________________________114fossil __________________________ 8
Ponds, evaporation ————————————————————5saline, deposition ——————————————————96
Potassium salts —————————————————— 5, 98, 99Pratt, W. P., cited—————————————————————7Pumping, selective, Lower Salt———————————118Pyramid Lake, age————————————————————70Pyrite, Bottom Mud ————————————————— 10, 56
crystals————————————————————— 17, 106Dead Sea ——————————————————————106diagenesis ——————————————————————106Lower Salt—————————•————————————105Parting Mud ————————————————————105
Quaternary lakes, chemical sediments———————78pH values——————————————————————— 78salinities————————————————————————78Searles Valley ————————————————————78
Radiocarbon dates, carbonate minerals———————68carbonate vs. organic carbon ——————————— 71error——————————————————————————70organic carbon, disseminated ——————————68reliability ——————————————————————— 70sources of error ———————————————————73wood fragments———————————————————68wood vs. disseminated organic carbon ————— 70
Ripple marks ———————————————————————39Robinson, R. D., cited ——————————————————68Rubin, M., cited——————————————————————68Ryan J.E., cited——————————————— 44, 45, 61, 63
Saline crust, X-ray diffraction analysis ———————67Saline crusts————————————————————————67Saline deposition, rate —————————————————76
rate, maximum ———————————————————75minimum ————————————————————— 75
Saline deposits———————————————————————18Saline lakes————————————————————————108
deposition ———————————————————————96erosion ————————————————————————96formation———————————————————————96solution—————————————————————————96zones ——————————————————————————96
Saline layers, borax, significance———————————90burkeite—————————————————————————83distribution ——————————————————————16

128 INDEX
Page Saline layers—Continued
evaporites ————————————————————————82geochemical environment of deposition————82lithology ———————————————————————— 34Lower Salt———————————————————————18mirabilite———————————————————————83Mixed Layer——————————————————— 13, 15shape affected by underlying muds ——————— 96sulfate mineral———————————————————— 83water-soluble fraction, analysis—————————14zones ——————————————————————————13
Saline mineral assemblages——————————————83Saline minerals, crystallization————————————83
lake surface———————————————————————67Mixed Layer —————————————————————84mud units, formation————————————————37Overburden Mud———————————————————96relative volume percentages ———————————34
Saline units, areal extent———————————————— 20bedding character——————————————————— 12crystal habit ————————————————————— 12crystal size ——————————————————————12isopach maps —————————————————————20Lower Salt——————————————— 20, 34, 96, 97megascopic minerals, volume percentages ——34mineral components ————————————————34mineralogy ——————————————————— 10, 12minerals, volume percentage, method—————34mud layers————————————————————————12thickness ————————————————————— 12, 20volume ————————————————————————— 20
Salines, in Bottom Mud ————————————————— 85Lower Salt——————————————————————— 86Mixed Layer —————————————————————— 84Overburden Mud ——————————————————— 86pure, zones——————————————————————110Upper Salt———————————————————————— 86
Salt, surfaces ————————————————————————108Salt bodies, geochemical influence, shape—————96
geochemical influence, thickness ————————96Salt components, source————————————————— 98Salt deposition, Mixed Layer —————————————108Salt depositional rate ———————————————————75Salt depositional sequence, Lower Salt ———————97Salt flats, modern ————————————————————108Salt layers, accumulation, rates ————————————75
crystals, large, growth ———————————————106primary—————————————————————106size, postdepositional increase———————106
deposition, brine, changing composition ———84diagenetic changes————————————————— 106Lower Salt——————————————————47, 75, 86significance—————————————————————108
Salt units, areal extent, final—————————————97Lower Salt———————————————————————75Upper Salt——————————————————————— 75
Salt Wells Canyon ————————————————————97Salts—————————————————————————————18
crystallization, winter———————————————110rates—————————————————————————75
phase relations ——————————————————— 83Sampled materials, reliability of dates——————— 70Sand Canyon thrust fault ————————————————45Sangamon Interglaciation ——————————————115Sangamon-Wisconsin boundary, age ———————115Schairerite—————————————————————10, 18, 37Sea levels —————————————————————————114Sea-level curves, correlation—————————— 113, 114Sea surface temperature, correlation————— 113, 114Searles basin ———————————————————————12Searles Lake———————————————————— 105, 114
aragonite ———————————————————————104laminae—————————————————————101
assigned ages, similarity —————————————113atmospheric and lacustrine CO disequilibrium 71boron ——————————————————————— 47, 64brine ——————————————————————————18
borate concentration —————————————90Cl/Br ratio ———————————————————85compositions——————————— 79, 84, 85, 108
Page Searles Lake, brine—Continued
dilution —————————————————————108economic value —————————————————43interstitial, present——————————————107magnesium ———————————————————90pH——-————————————————————43phases ——————————————————————107present —————————————————————107replacement———————————————————116specific gravities ————————————————— 43tungsten —————————————————————99valuable——————————————————————98
burkeite field——————————————————— 83, 84chemical sedimentation, changes————————78chemical stratification ———————————————81chemicals, total quantity —————————————117
value ———————————————————————116chronology———————————————————————115climatic episodes, fluctuations —————————115components compared to Owens River—————99confined load pressures ——————————————100core L-W-D, depth —————————————————100correlated with pollen data, Netherlands ——114correlated with sea-level change ————————114correlation with events in
Sierra Nevada ——————————————————116correlation with Laurentide ice sheet —————114density, stratified ——————————————————71deposition, episodes —————————————————96desiccation———————————————————————74diagram, time scale —————————————————114discovery ———————————————————————— 4dissolved solids, total quantity —————————98dolomite ————————————————————————81drainage area, Pleistocene glaciers ——————116dry surface, present —————————————————95economic development ——————————————— 4evaporation ——————————————————————116evaporite deposit, value ——————————————— 4evaporites, extent ——————————————————— 8
logs of cores ———————————————————8mineral composition ——————————————8saline layers ——————————————————— 82samples————————————————————————8temperature effects——————————————100
expansion, correlation with Pleistocenechronology, northeast North America —115,116
fluorine, amount —————————————————99fluctuation curves —————————————————115fluctuations, correlation —————————————113
correlation with Laurentide ice sheet ——114fossil soil, stratigraphic position————————114geologic environment ————————————————5geologic studies, previous —————————————6halite crystallization —————————————————84halite field —————————————————— 83, 84, 85hanksite, crystals ——————————————————106history—————————————————————5, 68, 114
chemical —————————————————————— 78inferred—————————————————— 108, 109
industrial chemicals —————————————————56production ————————————————————60
low stands ——————————————————————113Lower Salt, deposition ———————————————98micro-organisms, orange —————————————106mirabilite field ———————————————————— 83Mixed Layer, correlation —————————————116
correlation, revised——————————————115deposition ————————————————————84
mud, depositional rate ———————————————75mud deposition —————————————————73
mud layers—————————————————79, 81, 108carbonates—————————————————————99halite ———————————————————————104
muds, diagenetic changes ————————————100gaylussite—————————————————————101northupite —————————————————————81pirssonite, crystals ———————————————101
mud units, contacts, ' 'C ages———————————73Na-carbonate-rich waters—————————————— 80
Page Searles Lake—Continued
nahcolite field ————————————————————83 nahcolite, rosettes—————————————————103 natron field ——————————————————————'83 organic carbon, production rate —————————71 overflow ————————————————————— 98, 109 phases, muds ————————————————————105
original —————————————————————104 PpOr alteration minerals—————————————107 PO 4 , amount—————————————————————99 post-depositional reactions ———————————107 Quaternary lakes ———————————————————78 recession, correlation, northeast North
America ——————————————————————116reducing environment———————————————71saline layers —————————————————— 76, 108
changes in PcOj ———————————————107crystallizaion conditions ———————————82mineral composition —————————————83
salinity—————————————————————— 98, 109average——————————————————————194
salt, depositional rate———————————————75salt components, source —————————————— 98salt layers deuterium-hydrogen content ———107
diagenesis ———————————————————106salts, diagenetic changes —————————————100
phase relations ————————————————— 83sediments, pressure, changes ——————————100seismic refraction data ——————————————— 67solution, change ———————————————————96stratification—————————————————————104
chemical —————————————————————105stratigraphic section —————————————————70stratigraphic sequence ———————————————78stratigraphic units, subsurface —————————112structure change ——————————————————— 73surface, clays, color—————————————————108
elevations, average——————————————— 70temperature———————————————————100present —————————————————————108projected mean temperature————————100sands, color ———————————————————108silts, color ————————————————————108
thenardite field ————————————————— 83, 84trona, rosettes ————————————————————103trona field ———————————————————— 83, 84unstratified lake water———————————————73Upper Salt, tungsten—————————————————99volume, change ———————————————————96water, depth —————————————————————98
salinity ———————————————————————86source ———————————————————————98
Searles Lake basin, depositional history —————— 75Searles Lake deposits, correlation ——————————14
old, erosion ——————————————————————71Overburden Mud———————————————————66Upper Salt ——————————————————————— 56
Searles Valley ———————————————————76, 79, 99climate ————————————————————————— 2deposits, subsurface ————————————————— 79
surface ——————————————————————79drainage area —————————————————————— 2fresh lakes, maximum size ————————————79fresh water, inflowing————————————————97
Searles Valley, ground water ——————————————— 8lacustrine rises, late Pleistocene ————————114lakes, history —————————————————————108muds, diagenesis——————————————————— 79
lateral equivalents ———————————————79saline deposition, rate ———————————————— 76water composition, change ————————————85
Searlesite——— 10, 13, 14, 15, 16, 17, 18, 79, 105, 108Bottom Mud ————————————————— 105, 110Mixed Layer —————————————————————108type B ——————————————————————————105
Sea-surface temperature —————————————————114Sedimentation, geochemistry —————————————— 78Sedimentation history, Mixed Layer————————108Sedimentation patterns, chemical ———————— 81, 82
clastic ——————————————————————— 81 82

INDEX 129Page
Sedimentation patterns—Continuedacid-insoluble components————————————— 75ages, estimated ———————————————————111Bottom Mud ————————————————75, 77, 109carbonate components ———————————————75Clear Lake, Calif———————————————————78Mixed Layer —————————————————————109Parting Mud—————————————————————51
Sediments, varved ————————————————————80Sheppard, R.A , cited ———————————————————17Sherwin Glaciation, Sierra Nevada —————————116Sierra Nevada, glacial deposits, correlation ———114
glaciers, areal extent ———————————————116Silicates ———————————————————————— 10, 18
authigenic——— 14, 17, 47, 51, 102, 105, 109. 195Slate Range——————————————————————— 3, 45
chlorite-bearing rocks ———————————————53fault gouge ——————————————————— 53, 67sulfate source —————————————————————59
Smith, G. I., cited —————————————— 7, 12, 34, 76Soda ash ———————————————————————————5
production ——————————————————————118Sodium bicarbonate system ——————————————83Sodium carbonate salts, crystallization———————76Sodium sulfate, production techniques ———————— 5Speleothems ———————————————————————114Springs, thermal —————————————————————98Sterols————————————————————————————53Stratigraphic units, probable true ages ——————— 73Strontium, Lower Salt——————————————————45Stuiver, M., cited—————————————————7, 72, 74Sulfate minerals, formation —————————————107
Lower Salt———————————————————————89postdepositional reaction —————————————83
Sulfate system ———————————————————————83SulfohalitelO, 13, 14, 15, 18. 34, 36, 37, 39, 40, 56. 59, 84Summer Lake, dissolved solids ———————————104S-l, mineral composition————————————————34
mud ———————————————————————————34salinity, maximum, reconstructed ———————98
S-2, mineral composition ———————————————— 36mud ——————————————————————————— 36salinity, maximum, reconstructed ———————98
S-3, mineral composition ———————————————— 36mud ———————————————————————————36salinity, maximum, reconstructed ———————98
S-4, mineral composition————————————————36mud ———————————————————————————36salinity, maximum, reconstructed ———————98
S-5, mineral composition ———————————————— 36mud ——————————————————————————37salinity, maximum, reconstructed ———————98
S-6, mineral composition————————————————37mud —————————————————————————— 37
S-7, mineral composition ———————————————— 37mud ——————————————————————————37
Tahoe Glaciation ————————————————————116Teepleite————————————————————————————10Temperature, postdepositional changes ——————107Temperatures, crystallization, original———————100
geothermal gradient ————————————————100Terpenes——————————————————————————53Thenardite——10, 13. 15, 16, 18, 34, 36, 37. 56, 59, 61.
66. 67, 83, 84. 86, 93, 94, 96, 106, 107beds ——————T-———————————————————16cocrystalli/.ation ———————————————————92density —————————————————— -——————100Overburden Mud ——————————————————— 96phase diagram —————————————————————92Upper Salt ——————————————————————— 92
Thermal springs. Long Valley area——————————98Thermonatrite ———————————————————————107Thompson, 1). G. , cited ——————————————————8Till, Mono Basin —————————————————————116Tincalconite ————————————————— 10. 16, 34. 43Tree-ring dates ——————————————————————— 70
PageTrona——————— 10, 13, 14, 15, 16, 18, 34, 36, 37, 39,
40, 42, 52, 56, 59, 60, 61, 64, 66, 67, 78,83, 84, 85, 86, 88, 90, 93, 94, 96, 103, 107,
108, 112, 118beds ———————————15, 16, 48, 60, 76, 108, 118
deposition ———————————————————— 72Green River Formation————————————76Upper Salt————————————————— 60, 76
cocrystallization ———————————————————92crystallization ————————————————————72crystals—————————————————— 38, 39, 48, 72fibrous——————————————————————— 15, 36formation ———————————————————————107Lower Salt——————————————— 87, 88, 89, 90mineral percentages—————————————————34Mixed Layer————————————————— 108, 118Overburden Mud———————————————————96phase diagrams ——————————————— 87, 89, 92plant ————————————————————————— 116stratigraphic distribution —————————————85Upper Salt———————————————————————92
Trona reef, formation ——————————————————67Tuff, altered to phillipsite ———————————————52
andesitic————————————————————————15Tuff beds —————————————————————— 17, 105
analcime———————————————————————105K-feldspar ——————————————————————105rhyolitic —————————————————————————48searlesite, type B, —————————————————105
Tungsten, Hot Creek ——————————————————100Keough Hot Spring ————————————————100Little Hot Creek———————————————————100Long Valley area —————————————————100Morgan Creek ————————————————— 99, 100neutron activation analyses ———————————100Owens River ————————————————————— 99Pine Creek mine ——————————————— 99, 100Searles Lake ————————————————————— 99sources, compared——————————————————100Upper Salt ——————————————————————— 99
Tychite———————10, 13, 14, 15, 18, 34, 37, 39, 81, 84crystals————————————————————— 38, 103
U
Unit A, deposition, saline lake ———————————109 lake, perennial ————————————————————109 mud layers———————————————————————14 nahcolite beds ———————————————————108 saline layers ——————————————————————14 trona beds ——————————————————————108
Unit B, deposition, saline lake————————————109 lake, perennial ———————————————————109 mud layers————————————————————————14 nahcolite beds ————————————————————108 saline layers —————————————————————— 14 trona beds ———————————————————————108
Unit C, deposition, saline lake————————————109 halite beds ———————————————————————15 mud layers————————————————————————15 salinity, range ———————————————————109 trona beds ———————————————————————15
Unit D, tuff bed ——————————————————————15 mud layers———————————————————————15 saline layers ——————————————————————15 salinity, range ————————————————————109 tuff bed ——————————————————————————15
Unit E, deposition, fluctuating lake—————————109 saline layers ——————————————————————15 salinity, range ———————————————————109 volcanic ash bed ———————————————————15
Unit F, deposition, deep lake —————————————108 halite ——————————————————————————15 mud layers————————————————————————15 saline layers ——————————————————————15 salinity, range ————————————————————109 trona beds ————————————————————————15
Unit S-5, top, correlation————————————————114Upper Salt————————————— 10, 12. 56, 59, 75, 91
Page Upper Salt—Continued
aphthitalite —————————————————————95 areal extent—————————————————————— 56 areal mineral zonation, correlated with
thickness ——————————————————————59base, correlation ——————————————————114bedding—————————————————————————60borax, concentration ————————————————95
distribution pattern —————————60, 64, 95brine ——————————————————————————56
composition, variation ———————————117vertical variations —————————————64
salinity ——————————————————————94brines, areal variations —————————————118
boron ———————————————————————63carbonate source ———————————————— 72carbonate total—————————————————61chemical composition ————————————— 60chloride———————————————————————61commercial grade ———————————————117compositions—————————————61, 93, 117density profile —————————————————117deuterium-hydrogen ratios —————————117dissolved solids, total percentages—————61fluoride——————————————————————63iodide———————————————————————63lithium ——————————————————————63major elements, analyses———————————61migration————————————————————118pH values—————————————————————61phosphate ————————————————————61sulfide———————————————————————63sampling —————————————————————616-component system——————————————108sulfate———————————————————————61specific gravities ————————————————61strontium—————————————————————63tungsten —————————————————————63
burkeite—————————————————————— 92, 94central facies —————————————————————95chemical composition ————————————— 60, 86compared to Lower Salt——————————————95contact, base—————————————————————97
upper———————————————————————97core samples, chemical analyses—————————42crystallization sequence——————— 86, 92, 93, 98deposition ——————————————— 56, 92, 98, 112diagenesis ——————————————————92, 93, 94distribution ——————————————————————56equilibrium assemblage ——————————————61estimated bulk composition ——————————— 64flourine amount———————————————————99halite——————————————————————————95hanksite————————————————————— 92, 95
beds————————————————————————94concentration ——————————————————93crystals——————————————————— 94, 106distribution———————————————60, 93, 95secondary—————————————————————93permeability ———————————————————60
lateral equivalent ——————————————————66lithology————————————————————————— 59metastable assemblage———————————————94mineral assemblage, recrystallization —————94mineral composition ———————————————— 59
estimates ———————————————————— 64minerals—————————————————————————56
vertical distribution ——————————————59minor elements ————————————————————61mud ——————————————————————————59mud layers, discontinuous—————————————112
formation ————————————————————— 60original extent ————————————————————98overall shapes ———————————————————118permeability ——————————————————————60phase diagram ———————————————————— 91
burkeite field———————————————————92aphthitalite field ————————————————925-component system——————————— 92, 93

130 INDEX
Page Upper Salt, phase diagram—Continued
halite—————————————————————95hanksite field ——————————————— 92, 936-component system——————————————92thenardite field —————————————————92trona field ————————————————————92
porosity—————————————————————————60potassium amount —————————————————102salines————————————————————————— 86salt layers, accumulation rate ——————————75
salt units, 21 " Th/ 2M U—————————————————75shape related to basin———————————————97sodium amount ———————————————————102sodium carbonate mineral, dominant species -92solids, chemical analyses————————————— 60
composition———————————————————60solutions, initial compositions ——————————86stratigraphic contacts ——————————— 56, 60, 66
Page Upper Salt—Continued
sulfate minerals, primary —————————————94 temperatures, crystallization ——————————112 thickness ——————————————————————— 56 thickness distribution ———————————————97 trona beds ———————————————————— 60, 76 trona layer———————————————————— 93, 94 upper zone ———————————————————————94 volume —————————————————————— 56, 59 water-soluble components, major, total ————64
X-ray analyses———————————————————————60 Uranium———————————————————————— 55, 80
V, W
Vallentyne, J. R.,cited——————————————————53Volcanic ash, andesitic——————————————— 14, 15
basaltic———————————————————————14
Page
Volume, computation method —————————————20 Waters, calcium, total dissolved solid content ——— 80
natural, components ————————————————98 Great Basin———————————————————98
pH values———————————————————————80 Well, Old Searles—————————————————12, 13, 16 Wells, pumped, Lower Salt ——————————————118 West End Chemical Co. —————————————————5 West Yellowstone area, glacial advances —————114 West Yellowstone glacier, recession, maximum —114 Wood, dates————————————————————————— 73
X,Y, ZXanthophylls ———————————————————————53 Yarmouth Interglaciation ———————————————115 Zeolite———————————————————————— 17, 105 Zones, salines, pure———————————————————110
GPO 689-035
Copyright © 2022 FDOKUMEN