Organic geochemistry and petrology of subsurface Paleocene–Eocene Wilcox and Claiborne Group coal...
17
Organic geochemistry and petrology of subsurface Paleocene–Eocene Wilcox and Claiborne Group coal beds, Zavala County, Maverick Basin, Texas, USA Paul C. Hackley a,⇑ , Peter D. Warwick a , Robert W. Hook b , Hossein Alimi c , Maria Mastalerz d , Sharon M. Swanson a a US Geological Survey, 956 National Center, Reston, VA 20192, USA b Vertebrate Paleontology Laboratory, The University of Texas at Austin, Austin, TX 78758, USA c Weatherford Laboratories, 143 Vision Park Blvd., Shenandoah, TX 77384, USA d Indiana Geological Survey, Indiana University, 611 N. Walnut Grove, Bloomington, IN 47405, USA article info Article history: Received 19 August 2011 Received in revised form 21 February 2012 Accepted 21 February 2012 Available online 1 March 2012 abstract Coal samples from a coalbed methane exploration well in northern Zavala County, Maverick Basin, Texas, were characterized through an integrated analytical program. The well was drilled in February, 2006 and shut in after coal core desorption indicated negligible gas content. Cuttings samples from two levels in the Eocene Claiborne Group were evaluated by way of petrographic techniques and Rock–Eval pyrolysis. Core samples from the Paleocene–Eocene Indio Formation (Wilcox Group) were characterized via proximate– ultimate analysis in addition to petrography and pyrolysis. Two Indio Formation coal samples were selected for detailed evaluation via gas chromatography, and Fourier transform infrared (FTIR) and 13 C CPMAS NMR spectroscopy. Samples are subbituminous rank as determined from multiple thermal matu- rity parameters. Elevated rank (relative to similar age coal beds elsewhere in the Gulf Coast Basin) in the study area is interpreted to be a result of stratigraphic and/or structural thickening related to Laramide compression and construction of the Sierra Madre Oriental to the southwest. Vitrinite reflectance data, along with extant data, suggest the presence of an erosional unconformity or change in regional heat flow between the Cretaceous and Tertiary sections and erosion of up to >5 km over the Cretaceous. The pres- ence of liptinite-rich coals in the Claiborne at the well site may indicate moderately persistent or recurring coal-forming paleoenvironments, interpreted as perennially submerged peat in shallow ephemeral lakes with herbaceous and/or flotant vegetation. However, significant continuity of individual Eocene coal beds in the subsurface is not suggested. Indio Formation coal samples contain abundant telovitrinite interpreted to be preserved from arborescent, above-ground woody vegetation that developed during the middle portion of mire development in forested swamps. Other petrographic criteria suggest enhanced biological, chemical and physical degradation at the beginning and end of Indio mire develop- ment. Fluorescence spectra of sporinite and resinite are consistent and distinctly different from each other, attributed to the presence of a greater proportion of complex asphaltene and polar molecules in resinite. Gas chromatography of resinite-rich coal shows sesquiterpenoid and diterpenoid peaks in the C 14–17 range, which are not present in resinite-poor coal. Quantities of extracts suggest bitumen concentration below the threshold for effective source rocks [30–50 mg hydrocarbon/g total organic carbon (HC/g TOC)]. Saturate/aromatic and pristane/phytane (Pr/Ph) ratios are different from values for nearby Tertiary-reservoired crude oil, suggesting that the Indio coals are too immature to source liquid hydrocar- bons in the area. However, moderately high HI values (200–400 mg HC/g rock) may suggest some poten- tial for naphthenic–paraffinic oil generation where buried more deeply down stratigraphic/structural dip. Extractable phenols and C 20+ alkanes are suggested as possible intermediates for acetate fermentation in microbial methanogenesis which may, however, be limited by poor nutrient supply related to low rainfall and meteoric recharge rate or high local sulfate concentration. Published by Elsevier Ltd. 0146-6380/$ - see front matter Published by Elsevier Ltd. doi:10.1016/j.orggeochem.2012.02.008 ⇑ Corresponding author. Tel.: +1 703 648 6458; fax: +1 703 648 6419. E-mail address: [email protected] (P.C. Hackley). Organic Geochemistry 46 (2012) 137–153 Contents lists available at SciVerse ScienceDirect Organic Geochemistry journal homepage: www.elsevier.com/locate/orggeochem
Transcript of Organic geochemistry and petrology of subsurface Paleocene–Eocene Wilcox and Claiborne Group coal...

Organic Geochemistry 46 (2012) 137–153
Contents lists available at SciVerse ScienceDirect
Organic Geochemistry
journal homepage: www.elsevier .com/locate /orggeochem
Organic geochemistry and petrology of subsurface Paleocene–Eocene Wilcoxand Claiborne Group coal beds, Zavala County, Maverick Basin, Texas, USA
Paul C. Hackley a,⇑, Peter D. Warwick a, Robert W. Hook b, Hossein Alimi c, Maria Mastalerz d,Sharon M. Swanson a
a US Geological Survey, 956 National Center, Reston, VA 20192, USAb Vertebrate Paleontology Laboratory, The University of Texas at Austin, Austin, TX 78758, USAc Weatherford Laboratories, 143 Vision Park Blvd., Shenandoah, TX 77384, USAd Indiana Geological Survey, Indiana University, 611 N. Walnut Grove, Bloomington, IN 47405, USA
a r t i c l e i n f o a b s t r a c t
Article history:Received 19 August 2011Received in revised form 21 February 2012Accepted 21 February 2012Available online 1 March 2012
0146-6380/$ - see front matter Published by Elsevierdoi:10.1016/j.orggeochem.2012.02.008
⇑ Corresponding author. Tel.: +1 703 648 6458; faxE-mail address: [email protected] (P.C. Hackley).
Coal samples from a coalbed methane exploration well in northern Zavala County, Maverick Basin, Texas,were characterized through an integrated analytical program. The well was drilled in February, 2006 andshut in after coal core desorption indicated negligible gas content. Cuttings samples from two levels in theEocene Claiborne Group were evaluated by way of petrographic techniques and Rock–Eval pyrolysis. Coresamples from the Paleocene–Eocene Indio Formation (Wilcox Group) were characterized via proximate–ultimate analysis in addition to petrography and pyrolysis. Two Indio Formation coal samples wereselected for detailed evaluation via gas chromatography, and Fourier transform infrared (FTIR) and 13CCPMAS NMR spectroscopy. Samples are subbituminous rank as determined from multiple thermal matu-rity parameters. Elevated rank (relative to similar age coal beds elsewhere in the Gulf Coast Basin) in thestudy area is interpreted to be a result of stratigraphic and/or structural thickening related to Laramidecompression and construction of the Sierra Madre Oriental to the southwest. Vitrinite reflectance data,along with extant data, suggest the presence of an erosional unconformity or change in regional heat flowbetween the Cretaceous and Tertiary sections and erosion of up to >5 km over the Cretaceous. The pres-ence of liptinite-rich coals in the Claiborne at the well site may indicate moderately persistent or recurringcoal-forming paleoenvironments, interpreted as perennially submerged peat in shallow ephemeral lakeswith herbaceous and/or flotant vegetation. However, significant continuity of individual Eocene coal bedsin the subsurface is not suggested. Indio Formation coal samples contain abundant telovitriniteinterpreted to be preserved from arborescent, above-ground woody vegetation that developed duringthe middle portion of mire development in forested swamps. Other petrographic criteria suggestenhanced biological, chemical and physical degradation at the beginning and end of Indio mire develop-ment. Fluorescence spectra of sporinite and resinite are consistent and distinctly different from each other,attributed to the presence of a greater proportion of complex asphaltene and polar molecules in resinite.Gas chromatography of resinite-rich coal shows sesquiterpenoid and diterpenoid peaks in the C14–17
range, which are not present in resinite-poor coal. Quantities of extracts suggest bitumen concentrationbelow the threshold for effective source rocks [30–50 mg hydrocarbon/g total organic carbon (HC/gTOC)]. Saturate/aromatic and pristane/phytane (Pr/Ph) ratios are different from values for nearbyTertiary-reservoired crude oil, suggesting that the Indio coals are too immature to source liquid hydrocar-bons in the area. However, moderately high HI values (200–400 mg HC/g rock) may suggest some poten-tial for naphthenic–paraffinic oil generation where buried more deeply down stratigraphic/structural dip.Extractable phenols and C20+ alkanes are suggested as possible intermediates for acetate fermentation inmicrobial methanogenesis which may, however, be limited by poor nutrient supply related to low rainfalland meteoric recharge rate or high local sulfate concentration.
Published by Elsevier Ltd.
Ltd.
: +1 703 648 6419.

138 P.C. Hackley et al. / Organic Geochemistry 46 (2012) 137–153
1. Introduction
To evaluate the quality and quantity of US domestic energy re-sources, the US Geological Survey (USGS) has been involved ininvestigations of coalbed natural gas resources in the Gulf CoastalPlain since 1999 (e.g. SanFilipo, 1999; Barker et al., 2000; Hackleyet al., 2007; Warwick et al., 2008; Jones et al., 2008, 2010;McIntosh et al., 2010, among others). Undiscovered coalbed gas re-sources in the regionally occurring Paleocene–Eocene WilcoxGroup were estimated at a mean value of c. 4 trillion cubic feetof gas (Warwick et al., 2007a), illustrating the potential importanceof this unconventional energy resource in the Gulf Coast area.
In order to better understand the hydrocarbon habitat of coal-bed gas resources in Tertiary Gulf Coast strata, the USGS drilledand cored the Arroyo Roble No. 1 (API No. 42507326780000) coal-bed methane exploration well (total depth 357 m; 1171 ft) innorth-central Zavala County, Texas (Fig. 1), in February, 2006, incooperation with industry partner Genesis Gas and Oil, LLC. A totalof 5.1 m of coal core was collected from three Paleocene–EoceneIndio Formation (Wilcox Group) coal beds, and cuttings were col-lected from two overlying Eocene Claiborne Group coal beds. Be-cause desorption of the cored Indio samples indicated negligiblegas content (Warwick et al., 2007b), the well was temporarilyabandoned and shut in.
Gulf Coast coalbed gas is thought to be primarily biogenic in ori-gin via CO2 reduction (Warwick et al., 2008; McIntosh et al., 2010)and gas storage appears to be a function of coal rank and moisturecontent as determined from present burial depth (Hackley et al.,2007). However, the environmental conditions that promotemicrobial methanogenesis are poorly known and several GulfCoast coalbed exploration efforts have encountered beds that con-tain negligible gas (Warwick et al., 2005; this study) despite labo-ratory experiments that demonstrated samples of these same coalsto be suitable substrates for production of biogenic methane (Joneset al., 2008, 2010; Orem et al., 2010). The potential for artificialstimulation of methanogens and resultant enhanced biogenic gasgeneration in coal-bearing areas (Shimizu et al., 2007; Greenet al., 2008) clearly emphasizes the need for detailed informationon the chemical composition of the coal substrate (Strapoc et al.,2007), which is the intention of this study.
This study summarizes the petrologic and organic geochemicaldata from Wilcox and Claiborne Group coal core and cuttings sam-ples from the Arroyo Roble No. 1 coalbed methane explorationwell. We briefly discuss the implications of these data with respectto maturity and burial history in the Maverick Basin, the paleoen-vironments of coal deposition, coalbed methane exploration andthe potential for Indio coals to source liquid hydrocarbons (HCs).
2. Geologic setting of Maverick Basin
2.1. Depositional and tectonic history
The Maverick Basin of south Texas (Fig. 1) is defined by thicken-ing of Cretaceous strata into the axis of the Rio Grande Embaymentadjacent to regional structural highs (Rose, 1986; Scott, 2003). Thebasin developed over a pronounced northwest–southeast trendingrift zone or significant crustal discontinuity, possibly beginning asearly as the Jurassic (Ewing, 2003). Seismic imaging clearly definesnorthwest–southeast oriented fault-bounded half-graben featuresthat controlled Mesozoic sediment accumulation (Scott, 2003).
In the Upper Cretaceous, the primarily fluvial-deltaic OlmosFormation (Fig. 2) formed from sediment influx to the western Gulfalong the axis of the Rio Grande Embayment due to Laramide upliftto the west (Barker et al., 2003). Influx of Laramide-derived clasticsediment to the Rio Grande Embayment continued during the
Paleocene–Eocene, causing progradation of Wilcox delta systemsover the Cretaceous shelf edge by as much as 160 km (100 miles)into the western Gulf of Mexico (Galloway et al., 2000). The coalbeds of this study were deposited in upper deltaic to fluvial set-tings in the Paleocene–Eocene Wilcox delta systems (Fisher,1963) and in the overlying Eocene Claiborne Group (Eargle, 1968).
Laramide deformation produced several broad amplitudenorthwest-trending folds in the Maverick Basin (Ewing, 1991).Folding and increased depth of burial in proximity to Laramideorogenesis increased maturity in the Maverick Basin area vs.time-correlative strata elsewhere in the greater Gulf Basin (Barkeret al., 2000). Gray et al. (2001) demonstrated by way of thermo-chronological techniques that 5–7 km of post-Laramide uplift oc-curred in the Parras–La Popa Basins in Mexico ca. 320 km (200miles) to the south. Similar amounts of exhumation may haveoccurred to the north in the Sabinas and Maverick Basin areas(Ewing, 2003).
2.2. Previous Maverick Basin coal studies
Coal beds of bituminous rank are present in the Maverick Basinin the Upper Cretaceous Olmos Formation (Mapel, 1967; Evans,1974; Barker et al., 2003; Scott, 2003) and in the Eocene ClaiborneGroup (Mukhopadhyay, 1989; Warwick and Hook, 1995). Beds oflignite-subbituminous rank occur in the Paleocene–Eocene WilcoxGroup (Breyer and McCabe, 1986) and in the Eocene Jackson Group(Warwick et al., 1996). The lower rank of lignite-subbituminousWilcox beds relative to overlying bituminous Claiborne beds ispuzzling if depth of burial is the only agent of metamorphism (San-Filipo, 1999). However, more recent work suggests that subbitumi-nous Wilcox coal beds are widespread in the subsurface (Hackleyet al., 2005) and that natural variability and analytical uncertaintymay explain rank differences. Moreover, Claiborne Group coals areliptinite-rich, such that they have been described as cannel (Mapel,1967; Evans, 1974) or non-banded coals (Warwick and Hook,1995), and this character may contribute to their anomalously highrank (Warwick and Hook, 1995; SanFilipo, 1999).
3. Methods
3.1. Vitrinite reflectance, spectral fluorescence and maceral analyses
After canister desorption (ASTM, 2011a), core samples wereprepared for petrographic analysis (ASTM, 2011b) and analyzedfor random vitrinite reflectance (ASTM, 2011c) with a Leica DMRXmicroscope at the USGS. Per ASTM protocol, the mean random vitr-inite reflectance measurement is representative of all vitrinitetypes in a sample. Spectral epi-fluorescence measurements wereconducted with a Zeiss AxioImager microscope with a metal halideilluminator according to the calibration and methods described byBaranger et al. (1991). For each sample, ten measurements of thefluorescence spectrum of the targeted macerals (sporinite and res-inite) were collected using ultraviolet (356 nm) excitation. Fluores-cence data were determined to be accurate and reproduciblethrough interlaboratory exercises in 2008–2010 on blind samples(Mendonça Filho et al., 2010). Quantitative maceral compositiondata were collected from the core samples using a modificationof ASTM (2011d) wherein 1000 points were counted in white lightand 1000 counted in blue light fluorescence (450–490 nm) illumi-nation for each sample (e.g. Hackley et al., 2007).
3.2. Proximate–ultimate and Rock–Eval analyses
Indio (Fig. 2) core samples were analyzed for proximate–ulti-mate quality parameters in a commercial laboratory (Geochemical

Fig. 1. Study area and sample locations (modified from Hackley et al., 2005; surface geology from Warwick et al., 2002, as compiled from Barnes, 1992). Data for wells otherthan Arroyo Roble No. 1 are presented in Table 2. Speculative coal rank isograds from SanFilipo (1999). Approximate outline of Maverick Basin area shown in inset (called RioEscondido Basin in northern Mexico). Abbreviations: Qal, alluvium; Qt, terrace deposits; Qle, Leona Fm.; QTu, Uvalde Gravel; Ey, Yegua Fm.; Ecm, Cook Mountain Fm.; El,Laredo Fm.; Es, Sparta Sand; Eep, El Pico Clay; Ew, Weches Fm.; Eqc, Queen City Sand; Er, Reklaw Fm.; Ec, Carrizo Sand; Eb, Bigford Fm.; EPawi, Wilcox Grp., undiv.; EPain,Indio Fm.; Pami, Midway Grp., undiv.; Pak, Kincaid Fm.; Kes, Escondido Fm.; Kol, Olmos Fm.; Kac, Anacacho Limestone; Ki, Balcones igneous rocks; Kau, Austin Chalk; Ksm,San Miguel Fm.; Kuc, Upson Clay; Ksa, Salmon Peak Limestone; Kdv, Devils River Limestone; Kmk, McKnight Fm.; Ked, Edwards Limestone.
P.C. Hackley et al. / Organic Geochemistry 46 (2012) 137–153 139
Testing) according to ASTM methods (ASTM, 2011e). Core samplesand selected cuttings samples also were analyzed using Rock–EvalII pyrolysis and for total organic carbon (TOC) content with a Leco
instrument in a commercial laboratory (Weatherford Laboratories)according to the methods described by Barker (1974) and Espitaliéet al. (1977).

Fig. 2. Stratigraphic column showing position of important Maverick Basin coals (modified from SanFilipo, 1999). Abbreviations: Ej, Jackson Grp.; other abbreviations as inFig. 1.
140 P.C. Hackley et al. / Organic Geochemistry 46 (2012) 137–153
3.3. Gas chromatography (GC), carbon isotope, Fourier transforminfrared (FTIR), and 13C nuclear magnetic resonance (NMR) analyses
Two Indio samples (B3-2 and B3-12) were selected for detailedanalysis based on their contrasting petrographic composition (seebelow). Ca. 20 g of each sample were ground prior to Soxhletextraction with CH2Cl2 and the extract quantitatively fractionatedby way of medium pressure liquid chromatography in a commer-cial laboratory (Weatherford Laboratories) after precipitation ofasphaltenes. The extract, saturate and aromatic fractions were ana-lyzed for carbon isotopes and the extracts analyzed using GC withan Agilent 6890 gas chromatograph at Weatherford. Sample B3-12was also analyzed at Weatherford via pyrolysis GC to evaluate the
light HCs (free HCs) which may have been lost during solventextraction and evaporation. Pyrolysis GC used inlet settings of320–620 �C (held 1 min) at 65 �C/min, with nitrogen cooled trapat �170 �C and oven programmed for 0 �C for 8 min, 5 �C/min rampto 320 �C (held 20 min).
The two samples were analyzed by way of FTIR spectroscopywith a Nicolet 6700 instrument with DTGS detector using ca.2 mg of sample prepared as a KBr pellet (Mastalerz and Bustin,1995) at the Indiana Geological Survey. Spectra (300 scans,4 cm�1 resolution) were normalized to 1 mg of sample. Areas un-der selected bands were integrated to calculate individual band ra-tios and aliphatic stretching was deconvoluted to calculate CH2/CH3. 13C cross-polarization magic angle spinning (CPMAS NMR)

Table 1Sample information and mean random reflectance of vitrinite (Ro) in oil for Arroyo Roble No. 1 samples (Fm, Formation; Grp, Group).
Samplea Type Depth from (m) Depth to (m) Thickness (m) Description and lithologic unit Ro (%)b
140–150 Cuttings 42.7 45.7 3.05 Coal, Claiborne Grp 0.41150–160 Cuttings 45.7 48.8 3.05 Coal, Claiborne Grp 0.44210–220 Cuttings 64.0 67.1 3.05 Coal, Claiborne Grp 0.48540–550 Cuttings 164.6 167.6 3.05 Coal, carbonaceous shale, Indio Fm, Wilcox Grp 0.51660–670 Cuttings 201.2 204.2 3.05 Coal, carbonaceous shale, Indio Fm, Wilcox Grp 0.43670–680 Cuttings 204.2 207.3 3.05 Coal, carbonaceous shale, Indio Fm, Wilcox Grp 0.42B3-1 Core 274.2 274.2 0.06 Coal, shaley, solid and broken pieces, Indio Fm, Wilcox Grp 0.41B3-2 Core 284.8 285.1 0.30 Coal, shaley, solid and broken pieces, Indio Fm, Wilcox Grp 0.44B3-3 Core 285.1 285.4 0.30 Coal, shaley, solid and broken pieces, Indio Fm, Wilcox Grp 0.47B3-4 Core 285.4 285.7 0.30 Coal, shaley, solid and broken pieces, Indio Fm, Wilcox Grp 0.45B3-5 Core 285.8 286.1 0.30 Coal, shaley, solid and broken pieces, Indio Fm, Wilcox Grp 0.47B3-6 Core 286.1 286.4 0.30 Coal, shaley, solid and broken pieces, Indio Fm, Wilcox Grp 0.45B3-7 Core 328.4 328.5 0.15 Coal, cleated, solid, Indio Fm, Wilcox Grp 0.40B3-8 Core 328.7 329.0 0.30 Coal, cleated, solid, Indio Fm, Wilcox Grp 0.40B3-9 Core 329.3 329.6 0.30 Coal, cleated, solid, Indio Fm, Wilcox Grp 0.46B3-10 Core 329.6 329.9 0.30 Coal, cleated, solid, Indio Fm, Wilcox Grp 0.42B3-11 Core 330.3 330.6 0.30 Coal, shaley, Indio Fm, Wilcox Grp 0.46CB3-11 Core 331.6 331.7 0.14 Coal, Indio Fm, Wilcox Grp 0.43B3-12 Core 331.8 332.1 0.30 Coal, cleated, solid, Indio Fm, Wilcox Grp 0.46B3-13 Core 332.1 332.2 0.12 Coal, cleated, solid, Indio Fm, Wilcox Grp 0.44B3-14 Core 332.6 332.9 0.30 Coal, carbonaceous, Indio Fm, Wilcox Grp 0.42
a The sample used for the Jones et al. (2008, 2010) study was collected stratigraphically between samples B3-10 and B3-11.b Ro measured via ASTM D2798 (ASTM, 2011c); note that vitrinite <0.5% reflectance is called huminite according to the ICCP (ICCP, 1998); however, for subbituminous coal,
the ICCP specifies that the vitrinite nomenclature is to be used (Sykorová et al., 2005).
P.C. Hackley et al. / Organic Geochemistry 46 (2012) 137–153 141
was performed at Spectral Data Services, Inc., using ca. 500 mg ofsample and a 360 MHz instrument with 1 ms contact time and3 s delay.
4. Results and discussion
4.1. Petrographic analysis
Mean random vitrinite reflectance values (Ro) for samples fromthe Arroyo Roble No. 1 well range from 0.40–0.51% (Table 1, usingnomenclature of ICCP, 1998), consistent with previous work (Ta-ble 2; Ro, 0.38–0.44%) for Zavala County (Hackley et al., 2005)and indicate subbituminous rank (Teichmüller, 1987). Values dis-play no relationship with depth, presumably because the samplesspan only 290.2 m (952 ft).
Table 2Mean random vitrinite reflectance values for cuttings samples, Zavala and DimmitCounties, Texas (from Hackley et al., 2005).
Well Depth (m) Unit Ro (%) s.d.a nb
Lora Lyles No. 1 55–65 Wilcox 0.39 0.04 50Gilliam No. 6 360–363 Wilcox 0.38 0.03 25Gillaim No. 3 360–363 Wilcox 0.41 0.06 45Kincaid No. 1 170–190 Wilcox 0.40 0.04 50Kincaid No. 1 311–314 Wilcox 0.41 0.04 50Voight No. 1 360–366 Wilcox 0.38 0.03 50Voight No. 1 384–387 Wilcox 0.39 0.04 30Voight No. 1 396–399 Wilcox 0.40 0.03 15Boykin No. 1 494–500 Wilcox 0.43 0.04 30A A Story No. 2 445–454 Wilcox 0.41 0.03 40A A Story No. 1 497–500 Wilcox 0.40 0.03 50C A Maedgen No. 1 329–339 Wilcox 0.41 0.05 50W D Glasscock No. 1 754–763 Wilcox 0.43 0.04 30W D Glasscock No. 1 763–772 Wilcox 0.42 0.04 35W D Glasscock No. 1 772–782 Wilcox 0.41 0.05 30Bartlett Elizabeth C No. 1 488–497 Wilcox 0.38 0.03 50Kothman–Barnard 188 Wilcox 0.44 0.03 25Munger Ranch No. 1 738–741 Olmos 0.41 0.04 30Rosa Wolf No. 1 863–866 Olmos 0.44 0.03 50
a Standard deviation.b Number of measurements [ASTM D2798 (ASTM, 2011c) specifies 100].
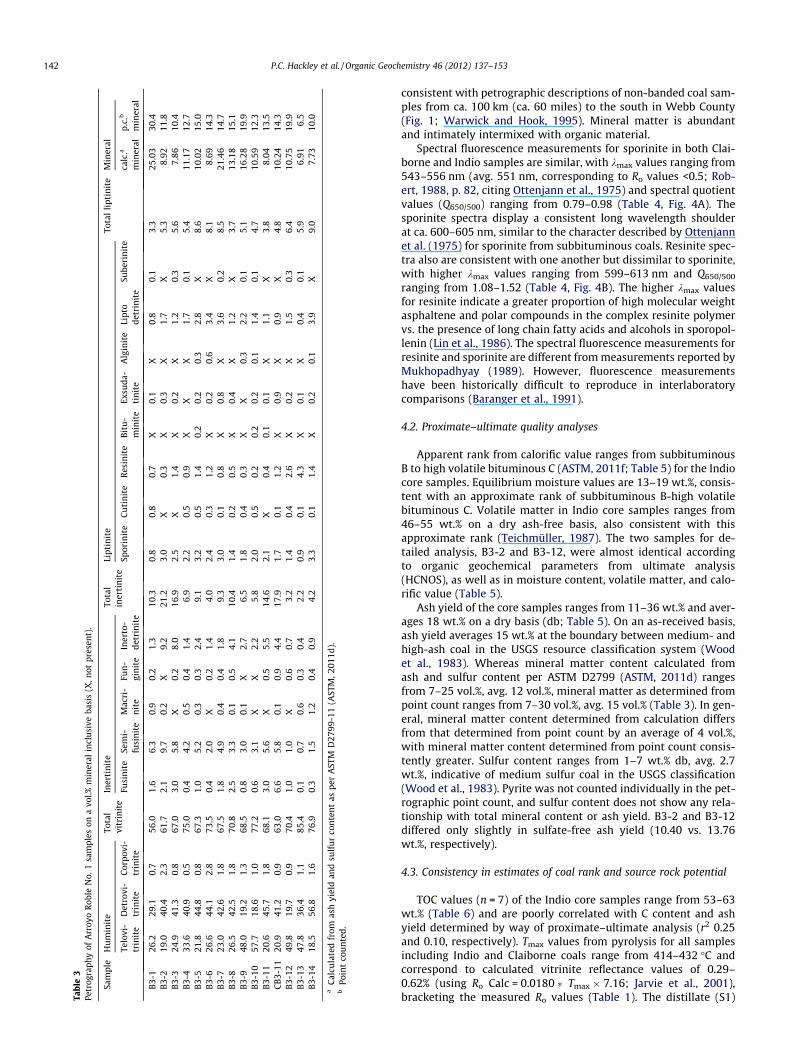
The Indio core samples contain 56–85 vol.% vitrinite maceralson a mineral inclusive basis and average 70 vol.% vitrinite (Table 3,using nomenclature of ICCP, 1998). Detrovitrinite (Fig. 3A and B) ismore abundant than telovitrinite (Fig. 3C and D) in 11 of the 15point counted samples. This character is similar to Wilcox coalsfrom east-central Texas and dissimilar to more distant Wilcoxcoals from northeast Texas (Mukhopadhyay, 1989). Inertinite con-tent ranges from 2–21 vol.% and averages 10 vol.%, while liptinitecontent ranges from 3–9 vol.% and averages 6 vol.%. Micrinite is ab-sent, consistent with subbituminous rank [summarized by Tayloret al. (1998)] based on vitrinite reflectance. The absence of micri-nite is inconsistent with data presented by Mukhopadhyay(1989), who noted micrinite abundance up to 2.2 vol.%, but whichmay have been misidentified as granular mineral particles or fine-grained inertodetrinite. Lumen-filling (Fig. 3E and F) and isolatedglobular resinite are present in all the Indio core samples. Void-filling exsudatinite (Fig. 3G and H) is present in 13 of the 15samples. Some vitrinite, in particular attrital detrovitrinite, dis-plays weak orange-brown fluorescence. Telovitrinite frequentlycontains reddish internal reflections (Fig. 3C and D).
The two Indio core samples (B3-2 and B3-12) with detailed or-ganic analysis are identical in rank as determined from vitrinitereflectance (0.44% vs. 0.46%, Table 1; 4.4% difference). However,they have starkly contrasting maceral composition (Table 3). B3-2 contains high total inertinite (21.2 vol.%) and attrital detrovitri-nite is more abundant than telovitrinite. Resinite is sparse at 0.3vol.%. Conversely, B3-12 contains only 3.2 vol.% inertinite maceralsbut 2.6 vol.% resinite, most of which occurs as in situ cell filling(Fig. 3E and F), and telovitrinite dominates detrovitrinite. In addi-tion to the contrasting organic composition, B3-12 contains moremineral matter based on the petrographic point count (19.9 vs.11.8 vol.%).
The Claiborne Group cuttings samples (Table 1; samples 140–150, 150–160, 210–220) were not quantitatively point counted,but reconnaissance petrography suggests that attrital detrovitri-nite (Fig. 3I) was the most abundant maceral, followed by veryminor telinite (Fig. 3J). Inertinite macerals are rare or absent (ex-cept funginite; Fig. 3I). Liptinite macerals constitute a significantportion of the organic matter. In particular, the presence of greenalgal fructifications (?) resembling cutinite (Fig. 3K and L) is
Tabl
e3
Petr
ogra
phy
ofA
rroy
oRo
ble
No.
1sa
mpl
eson
avo
l.%m
iner
alin
clus
ive
basi
s(X
,not
pres
ent)
.
Sam
ple
Hu
min
ite
Tota
lvi
trin
ite
Iner
tin
ite
Tota
lin
erti
nit
eLi
ptin
ite
Tota
lli
ptin
ite
Min
eral
Telo
vi-
trin
ite
Det
rovi
-tr
init
eC
orpo
vi-
trin
ite
Fusi
nit
eSe
mi-
fusi
nit
eM
acri
-n
ite
Fun
-gi
nit
eIn
erto
-de
trin
ite
Spor
init
eC
uti
nit
eR
esin
ite
Bit
u-
min
ite
Exsu
da-
tin
ite
Alg
init
eLi
pto
detr
init
eSu
beri
nit
eca
lc.a
min
eral
p.c.
b
min
eral
B3-
126
.229
.10.
756
.01.
66.
30.
90.
21.
310
.30.
80.
80.
7X
0.1
X0.
80.
13.
325
.03
30.4
B3-
219
.040
.42.
361
.72.
19.
70.
2X
9.2
21.2
3.0
X0.
3X
0.3
X1.
7X
5.3
8.92
11.8
B3-
324
.941
.30.
867
.03.
05.
8X
0.2
8.0
16.9
2.5
X1.
4X
0.2
X1.
20.
35.
67.
8610
.4B
3-4
33.6
40.9
0.5
75.0
0.4
4.2
0.5
0.4
1.4
6.9
2.2
0.5
0.9
XX
X1.
70.
15.
411
.17
12.7
B3-
521
.844
.80.
867
.31.
05.
20.
30.
32.
49.
13.
20.
51.
40.
20.
20.
32.
8X
8.6
10.0
215
.0B
3-6
26.6
44.1
2.8
73.5
0.4
2.0
X0.
21.
44.
02.
40.
31.
2X
0.2
0.6
3.4
X8.
18.
6914
.3B
3-7
23.0
42.6
1.8
67.5
1.8
4.9
0.4
0.4
1.8
9.3
3.0
0.1
0.8
X0.
8X
3.6
0.2
8.5
21.4
614
.7B
3-8
26.5
42.5
1.8
70.8
2.5
3.3
0.1
0.5
4.1
10.4
1.4
0.2
0.5
X0.
4X
1.2
X3.
713
.18
15.1
B3-
948
.019
.21.
368
.50.
83.
00.
1X
2.7
6.5
1.8
0.4
0.3
XX
0.3
2.2
0.1
5.1
16.2
819
.9B
3-10
57.7
18.6
1.0
77.2
0.6
3.1
XX
2.2
5.8
2.0
0.5
0.2
0.2
0.2
0.1
1.4
0.1
4.7
10.5
912
.3B
3-11
20.6
45.7
1.8
68.1
3.0
5.6
X0.
55.
514
.62.
1X
0.4
0.1
0.1
X1.
1X
3.8
8.04
13.5
CB
3-11
20.9
41.2
0.9
63.0
6.6
5.8
0.1
0.9
4.4
17.9
1.7
0.1
1.2
X0.
9X
0.9
X4.
810
.24
14.3
B3-
1249
.819
.70.
970
.41.
01.
0X
0.6
0.7
3.2
1.4
0.4
2.6
X0.
2X
1.5
0.3
6.4
10.7
519
.9B
3-13
47.8
36.4
1.1
85.4
0.1
0.7
0.6
0.3
0.4
2.2
0.9
0.1
4.3
X0.
1X
0.4
0.1
5.9
6.91
6.5
B3-
1418
.556
.81.
676
.90.
31.
51.
20.
40.
94.
23.
30.
11.
4X
0.2
0.1
3.9
X9.
07.
7310
.0
aC
alcu
late
dfr
omas
hyi
eld
and
sulf
ur
con
ten
tas
per
AST
MD
2799
-11
(AST
M,2
011d
).b
Poin
tco
un
ted.
142 P.C. Hackley et al. / Organic Geochemistry 46 (2012) 137–153
consistent with petrographic descriptions of non-banded coal sam-ples from ca. 100 km (ca. 60 miles) to the south in Webb County(Fig. 1; Warwick and Hook, 1995). Mineral matter is abundantand intimately intermixed with organic material.
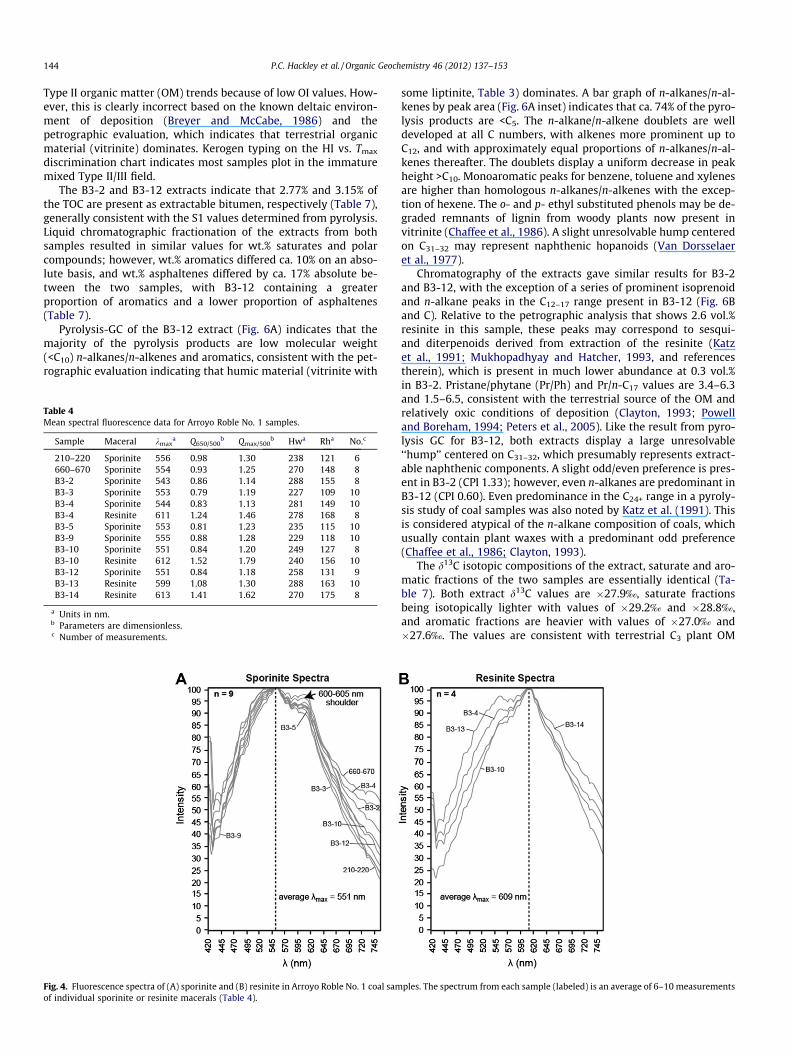
Spectral fluorescence measurements for sporinite in both Clai-borne and Indio samples are similar, with kmax values ranging from543–556 nm (avg. 551 nm, corresponding to Ro values <0.5; Rob-ert, 1988, p. 82, citing Ottenjann et al., 1975) and spectral quotientvalues (Q650/500) ranging from 0.79–0.98 (Table 4, Fig. 4A). Thesporinite spectra display a consistent long wavelength shoulderat ca. 600–605 nm, similar to the character described by Ottenjannet al. (1975) for sporinite from subbituminous coals. Resinite spec-tra also are consistent with one another but dissimilar to sporinite,with higher kmax values ranging from 599–613 nm and Q650/500
ranging from 1.08–1.52 (Table 4, Fig. 4B). The higher kmax valuesfor resinite indicate a greater proportion of high molecular weightasphaltene and polar compounds in the complex resinite polymervs. the presence of long chain fatty acids and alcohols in sporopol-lenin (Lin et al., 1986). The spectral fluorescence measurements forresinite and sporinite are different from measurements reported byMukhopadhyay (1989). However, fluorescence measurementshave been historically difficult to reproduce in interlaboratorycomparisons (Baranger et al., 1991).
4.2. Proximate–ultimate quality analyses
Apparent rank from calorific value ranges from subbituminousB to high volatile bituminous C (ASTM, 2011f; Table 5) for the Indiocore samples. Equilibrium moisture values are 13–19 wt.%, consis-tent with an approximate rank of subbituminous B-high volatilebituminous C. Volatile matter in Indio core samples ranges from46–55 wt.% on a dry ash-free basis, also consistent with thisapproximate rank (Teichmüller, 1987). The two samples for de-tailed analysis, B3-2 and B3-12, were almost identical accordingto organic geochemical parameters from ultimate analysis(HCNOS), as well as in moisture content, volatile matter, and calo-rific value (Table 5).
Ash yield of the core samples ranges from 11–36 wt.% and aver-ages 18 wt.% on a dry basis (db; Table 5). On an as-received basis,ash yield averages 15 wt.% at the boundary between medium- andhigh-ash coal in the USGS resource classification system (Woodet al., 1983). Whereas mineral matter content calculated fromash and sulfur content per ASTM D2799 (ASTM, 2011d) rangesfrom 7–25 vol.%, avg. 12 vol.%, mineral matter as determined frompoint count ranges from 7–30 vol.%, avg. 15 vol.% (Table 3). In gen-eral, mineral matter content determined from calculation differsfrom that determined from point count by an average of 4 vol.%,with mineral matter content determined from point count consis-tently greater. Sulfur content ranges from 1–7 wt.% db, avg. 2.7wt.%, indicative of medium sulfur coal in the USGS classification(Wood et al., 1983). Pyrite was not counted individually in the pet-rographic point count, and sulfur content does not show any rela-tionship with total mineral content or ash yield. B3-2 and B3-12differed only slightly in sulfate-free ash yield (10.40 vs. 13.76wt.%, respectively).
4.3. Consistency in estimates of coal rank and source rock potential
TOC values (n = 7) of the Indio core samples range from 53–63wt.% (Table 6) and are poorly correlated with C content and ashyield determined by way of proximate–ultimate analysis (r2 0.25and 0.10, respectively). Tmax values from pyrolysis for all samplesincluding Indio and Claiborne coals range from 414–432 �C andcorrespond to calculated vitrinite reflectance values of 0.29–0.62% (using Ro Calc = 0.0180 � Tmax � 7.16; Jarvie et al., 2001),bracketing the measured Ro values (Table 1). The distillate (S1)
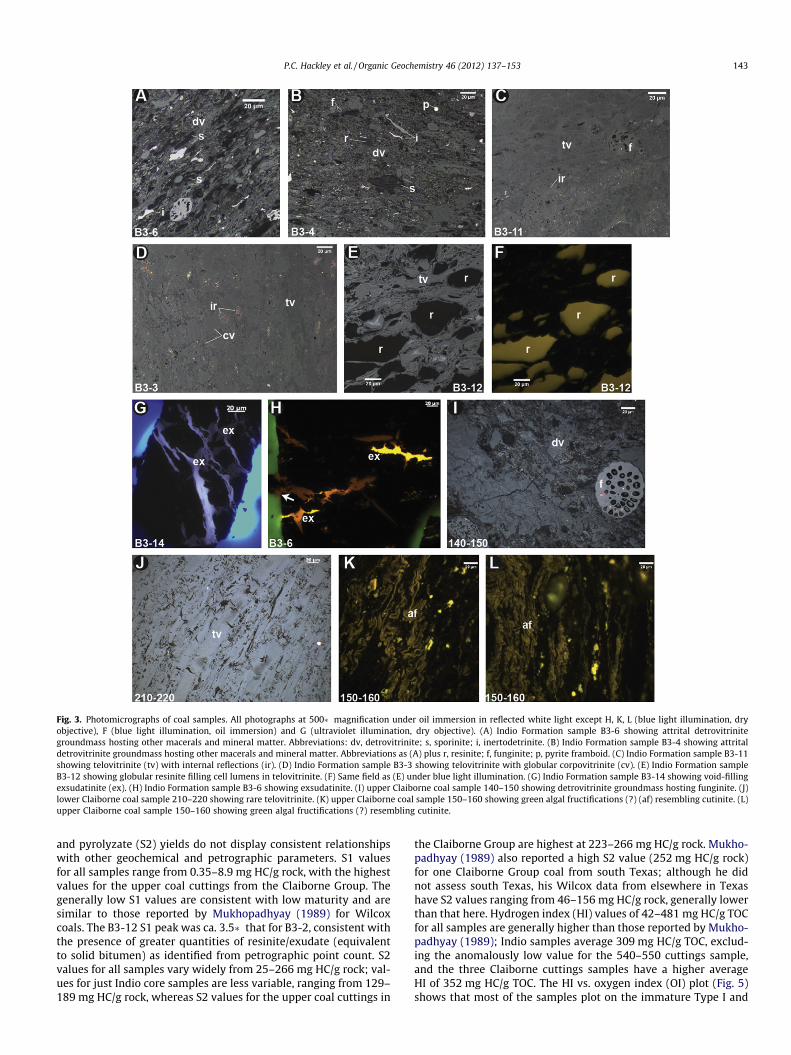
Fig. 3. Photomicrographs of coal samples. All photographs at 500� magnification under oil immersion in reflected white light except H, K, L (blue light illumination, dryobjective), F (blue light illumination, oil immersion) and G (ultraviolet illumination, dry objective). (A) Indio Formation sample B3-6 showing attrital detrovitrinitegroundmass hosting other macerals and mineral matter. Abbreviations: dv, detrovitrinite; s, sporinite; i, inertodetrinite. (B) Indio Formation sample B3-4 showing attritaldetrovitrinite groundmass hosting other macerals and mineral matter. Abbreviations as (A) plus r, resinite; f, funginite; p, pyrite framboid. (C) Indio Formation sample B3-11showing telovitrinite (tv) with internal reflections (ir). (D) Indio Formation sample B3-3 showing telovitrinite with globular corpovitrinite (cv). (E) Indio Formation sampleB3-12 showing globular resinite filling cell lumens in telovitrinite. (F) Same field as (E) under blue light illumination. (G) Indio Formation sample B3-14 showing void-fillingexsudatinite (ex). (H) Indio Formation sample B3-6 showing exsudatinite. (I) upper Claiborne coal sample 140–150 showing detrovitrinite groundmass hosting funginite. (J)lower Claiborne coal sample 210–220 showing rare telovitrinite. (K) upper Claiborne coal sample 150–160 showing green algal fructifications (?) (af) resembling cutinite. (L)upper Claiborne coal sample 150–160 showing green algal fructifications (?) resembling cutinite.
P.C. Hackley et al. / Organic Geochemistry 46 (2012) 137–153 143
and pyrolyzate (S2) yields do not display consistent relationshipswith other geochemical and petrographic parameters. S1 valuesfor all samples range from 0.35–8.9 mg HC/g rock, with the highestvalues for the upper coal cuttings from the Claiborne Group. Thegenerally low S1 values are consistent with low maturity and aresimilar to those reported by Mukhopadhyay (1989) for Wilcoxcoals. The B3-12 S1 peak was ca. 3.5� that for B3-2, consistent withthe presence of greater quantities of resinite/exudate (equivalentto solid bitumen) as identified from petrographic point count. S2values for all samples vary widely from 25–266 mg HC/g rock; val-ues for just Indio core samples are less variable, ranging from 129–189 mg HC/g rock, whereas S2 values for the upper coal cuttings in
the Claiborne Group are highest at 223–266 mg HC/g rock. Mukho-padhyay (1989) also reported a high S2 value (252 mg HC/g rock)for one Claiborne Group coal from south Texas; although he didnot assess south Texas, his Wilcox data from elsewhere in Texashave S2 values ranging from 46–156 mg HC/g rock, generally lowerthan that here. Hydrogen index (HI) values of 42–481 mg HC/g TOCfor all samples are generally higher than those reported by Mukho-padhyay (1989); Indio samples average 309 mg HC/g TOC, exclud-ing the anomalously low value for the 540–550 cuttings sample,and the three Claiborne cuttings samples have a higher averageHI of 352 mg HC/g TOC. The HI vs. oxygen index (OI) plot (Fig. 5)shows that most of the samples plot on the immature Type I and
144 P.C. Hackley et al. / Organic Geochemistry 46 (2012) 137–153
Type II organic matter (OM) trends because of low OI values. How-ever, this is clearly incorrect based on the known deltaic environ-ment of deposition (Breyer and McCabe, 1986) and thepetrographic evaluation, which indicates that terrestrial organicmaterial (vitrinite) dominates. Kerogen typing on the HI vs. Tmax
discrimination chart indicates most samples plot in the immaturemixed Type II/III field.
The B3-2 and B3-12 extracts indicate that 2.77% and 3.15% ofthe TOC are present as extractable bitumen, respectively (Table 7),generally consistent with the S1 values determined from pyrolysis.Liquid chromatographic fractionation of the extracts from bothsamples resulted in similar values for wt.% saturates and polarcompounds; however, wt.% aromatics differed ca. 10% on an abso-lute basis, and wt.% asphaltenes differed by ca. 17% absolute be-tween the two samples, with B3-12 containing a greaterproportion of aromatics and a lower proportion of asphaltenes(Table 7).
Pyrolysis-GC of the B3-12 extract (Fig. 6A) indicates that themajority of the pyrolysis products are low molecular weight(<C10) n-alkanes/n-alkenes and aromatics, consistent with the pet-rographic evaluation indicating that humic material (vitrinite with
Table 4Mean spectral fluorescence data for Arroyo Roble No. 1 samples.
Sample Maceral kmaxa Q650/500
b Qmax/500b Hwa Rha No.c
210–220 Sporinite 556 0.98 1.30 238 121 6660–670 Sporinite 554 0.93 1.25 270 148 8B3-2 Sporinite 543 0.86 1.14 288 155 8B3-3 Sporinite 553 0.79 1.19 227 109 10B3-4 Sporinite 544 0.83 1.13 281 149 10B3-4 Resinite 611 1.24 1.46 278 168 8B3-5 Sporinite 553 0.81 1.23 235 115 10B3-9 Sporinite 555 0.88 1.28 229 118 10B3-10 Sporinite 551 0.84 1.20 249 127 8B3-10 Resinite 612 1.52 1.79 240 156 10B3-12 Sporinite 551 0.84 1.18 258 131 9B3-13 Resinite 599 1.08 1.30 288 163 10B3-14 Resinite 613 1.41 1.62 270 175 8
a Units in nm.b Parameters are dimensionless.c Number of measurements.
Fig. 4. Fluorescence spectra of (A) sporinite and (B) resinite in Arroyo Roble No. 1 coal samof individual sporinite or resinite macerals (Table 4).
some liptinite, Table 3) dominates. A bar graph of n-alkanes/n-al-kenes by peak area (Fig. 6A inset) indicates that ca. 74% of the pyro-lysis products are <C5. The n-alkane/n-alkene doublets are welldeveloped at all C numbers, with alkenes more prominent up toC12, and with approximately equal proportions of n-alkanes/n-al-kenes thereafter. The doublets display a uniform decrease in peakheight >C10. Monoaromatic peaks for benzene, toluene and xylenesare higher than homologous n-alkanes/n-alkenes with the excep-tion of hexene. The o- and p- ethyl substituted phenols may be de-graded remnants of lignin from woody plants now present invitrinite (Chaffee et al., 1986). A slight unresolvable hump centeredon C31–32 may represent naphthenic hopanoids (Van Dorsselaeret al., 1977).
Chromatography of the extracts gave similar results for B3-2and B3-12, with the exception of a series of prominent isoprenoidand n-alkane peaks in the C12–17 range present in B3-12 (Fig. 6Band C). Relative to the petrographic analysis that shows 2.6 vol.%resinite in this sample, these peaks may correspond to sesqui-and diterpenoids derived from extraction of the resinite (Katzet al., 1991; Mukhopadhyay and Hatcher, 1993, and referencestherein), which is present in much lower abundance at 0.3 vol.%in B3-2. Pristane/phytane (Pr/Ph) and Pr/n-C17 values are 3.4–6.3and 1.5–6.5, consistent with the terrestrial source of the OM andrelatively oxic conditions of deposition (Clayton, 1993; Powelland Boreham, 1994; Peters et al., 2005). Like the result from pyro-lysis GC for B3-12, both extracts display a large unresolvable‘‘hump’’ centered on C31–32, which presumably represents extract-able naphthenic components. A slight odd/even preference is pres-ent in B3-2 (CPI 1.33); however, even n-alkanes are predominant inB3-12 (CPI 0.60). Even predominance in the C24+ range in a pyroly-sis study of coal samples was also noted by Katz et al. (1991). Thisis considered atypical of the n-alkane composition of coals, whichusually contain plant waxes with a predominant odd preference(Chaffee et al., 1986; Clayton, 1993).
The d13C isotopic compositions of the extract, saturate and aro-matic fractions of the two samples are essentially identical (Ta-ble 7). Both extract d13C values are �27.9‰, saturate fractionsbeing isotopically lighter with values of �29.2‰ and �28.8‰,and aromatic fractions are heavier with values of �27.0‰ and�27.6‰. The values are consistent with terrestrial C3 plant OM
ples. The spectrum from each sample (labeled) is an average of 6–10 measurements

Table 5Proximate–ultimate and calorific value data for Arroyo Roble No. 1 coal samples. Dry basis calculations were made using equilibrium moisture content as the samples were submitted for analysis with excess moisture from immersion indesorption canisters. SO3 in ash on an as-determined basis. SO3-free corrected ash on an equilibrium moisture basis. Calorific value also reported on a moist, mineral-matter-free basis according to ASTM D388-05 (ASTM, 2011f; � coalwas non-agglomerating).
Sample ID RMa ADLb Moistc EMd EMe dry SO3 SO3-free EM drye EM drye EM drye EM drye EM drye EM drye EM drye m,mmfh ASTMwt.% wt.% wt.% wt.% Ash wt.% wt.% Ash wt.% VM fwt.% H wt.% C wt.% N wt.% S wt.% O wt.% BTU/lbg Btu/lbg Appi rank
B3-1 2.28 13.58 15.55 14.29 36.30 2.32 30.39 34.61 3.75 46.14 1.06 2.03 9.25 8460 11,064 subAj
B3-2 3.46 16.49 19.38 17.06 14.05 10.70 10.40 40.40 4.61 63.05 1.40 2.27 11.84 11,242 10,867 subAj
B3-3 3.05 18.40 20.89 17.81 12.53 12.00 9.06 39.92 4.66 63.78 1.42 1.70 12.15 11,316 10,772 subAj
B3-4 3.30 20.62 23.24 17.50 15.04 6.34 11.62 38.96 4.36 56.88 1.21 5.47 10.07 10,417 10,728 subAj
B3-5 2.79 16.41 18.74 14.79 15.63 7.28 12.35 41.34 4.80 60.08 1.35 1.83 11.68 10,926 11,375 subAj
B3-6 2.88 15.89 18.31 14.73 13.76 7.58 10.84 43.65 5.15 61.77 1.41 1.71 12.01 11,301 11,480 subAj
B3-7 2.67 14.79 17.07 14.79 30.88 5.10 24.97 37.48 4.10 48.90 1.10 3.36 8.99 9113 11,081 subAj
B3-8 2.50 17.41 19.47 17.77 20.81 14.30 14.66 43.68 4.35 56.29 1.30 1.78 13.40 9897 9921 subBj
B3-9 3.40 14.31 17.22 15.11 22.35 4.48 18.12 37.04 4.19 53.59 1.30 7.07 9.02 9880 10,834 subAj
B3-10 2.96 17.77 20.20 18.58 15.21 5.28 11.73 40.05 4.59 60.40 1.52 5.29 10.99 11,039 10,572 subAj
B3-11 3.39 15.12 18.00 16.37 12.95 6.88 10.08 41.96 4.96 64.88 1.48 1.94 11.84 11,649 11,199 subAj
CB3-11 3.00 14.71 17.27 12.67 15.96 5.54 13.17 41.43 4.91 60.31 1.12 1.59 10.83 11,052 12,017 hvCbk⁄
B3-12 3.65 15.23 18.32 16.21 17.23 4.69 13.76 40.28 4.86 61.20 1.30 1.60 11.29 11,044 11,220 subAj
B3-13 3.22 19.75 22.33 17.53 11.01 7.09 8.44 43.83 5.06 63.22 1.46 1.21 12.22 11,408 11,073 subAj
B3-14 3.53 13.22 16.28 13.64 12.66 6.28 10.24 46.67 5.51 64.36 1.44 1.25 11.73 11,887 11,973 hvCbk⁄
a Residual moisture.b Air-dried loss.c Total moisture.d Equilibrium moisture.e On a dry basis calculated using equilibrium moisture content.f Volatile matter.g British thermal units per pound.h Moist, mineral-matter-free.i Apparent.j Subbituminous A.k High volatile C bituminous.
P.C.Hackley
etal./O
rganicG
eochemistry
46(2012)
137–153
145

Table 6TOC and Rock–Eval pyrolysis data for Arroyo Roble No. 1 coal samples.
Sample TOCa S1b S2b S3c Tmaxd HIe OIf S2/S3 S1/TOC � 100 PIg
140–150 60.98 8.86 223.00 6.33 425 366 10 35.2 15 0.04150–160 57.42 5.87 265.67 5.67 432 463 10 46.9 10 0.02210–220 18.68 1.32 42.36 4.03 431 227 22 10.5 7 0.03540–550 59.69 0.81 25.23 22.06 414 42 37 1.1 1 0.03660–670 45.96 4.96 221.00 3.84 428 481 8 57.6 11 0.02B3-2 63.10 1.30 139.01 11.54 418 220 18 12.0 2 0.01B3-3 57.91 0.83 166.89 8.45 425 288 15 19.8 1 0.00B3-6 58.27 0.35 189.41 9.49 421 325 16 20.0 1 0.00B3-10 52.84 3.32 128.93 6.33 421 244 12 20.4 6 0.03B3-11 57.27 0.64 170.73 9.58 420 298 17 17.8 1 0.00B3-12 56.13 4.75 163.76 5.14 423 292 9 31.9 8 0.03B3-13 58.06 0.48 186.23 11.02 425 321 19 16.9 1 0.00
a Total organic carbon wt.%.b mg Hydrocarbons/g rock.c mg CO2/g rock.d In �C.e HI, hydrogen Index (S2 � 100/TOC).f OI, oxygen index (S3 � 100/TOC).g Production index [S1/(S1 + S2)].
146 P.C. Hackley et al. / Organic Geochemistry 46 (2012) 137–153
(Galimov, 1980) or, more precisely, with angiosperm precursorvegetation (Widodo et al., 2009).
FTIR spectroscopy also indicates very similar results for the twocore samples, with sharp peaks at 3600–3800 cm�1, which repre-sent water bound in clay minerals (Geng et al., 2009), and a broadabsorbance band at 3400 cm�1, representing OAH stretching inwater, phenols and lignin alcohols (Fig. 7). B3-2 shows lower OHabsorbance and greater aromatic C@C absorbance at 1610 cm�1.Sample B3-2 displayed a high-wave number shoulder on the aro-matic peak at 1690 cm�1 that may represent C@O stretching in ke-tones. Both samples show strong aliphatic CAH absorbance at2850–2920 cm�1 and 1370–1450 cm�1. Prominent peaks in the1100–1200 cm�1 region are probably related to oxygenated func-tional groups in lignin (Mastalerz and Bustin, 1994; Yang et al.,2007; Petersen et al., 2008 and references therein). Minor differ-ences in the spectra of the two samples may be related to interfer-
Fig. 5. HI vs. OI plot for Arroyo Roble No. 1 coal samples. Lines labeled I (lacustrine),II (marine), III (terrestrial) and IV (inert) correspond to maturation pathways fordifferent kerogen types.
ence caused by contributions from minerals or to relativeabundances of OM types.
CP-MAS 13C NMR spectra for the two samples have a somewhatbroad peak in the aromatic C region (110–160 ppm), a subordinatephenolic peak and a small, broad spinning side-band aromatic peakat 220–190 ppm (Fig. 8). A sharp and intense peak is present in thealiphatic region (10–50 ppm) for both samples. Integration of thespectra provides a qualitative comparison of aliphatic vs. aromaticC, indicating higher aromaticity in sample B3-2 consistent with theliquid chromatography data (Table 7) and petrographic analysisthat indicates a higher concentration of aromatic inertinite in B3-2 (Table 3). The spectra are similar to those of similar rank coalsamples (Ro 0.47–0.56%) from Mastalerz and Bustin (1994), withthe exception of a 175 ppm carboxyl peak absent from the ArroyoRoble samples.
4.4. Burial history and thermal maturity in the Maverick Basin
South Texas contains the only shallow coals of elevated rankwithin the overall lignitic Gulf Coast coal province. Mukhopadhyay(1989) speculated that elevated rank in the Eocene cannel coalsmay have been the result of locally increased heat flow or oxida-tion during early diagenesis, whereas SanFilipo (1999) attributedthe rank elevation to residual heat associated with local emplace-ment of Cretaceous Balcones igneous rocks (Figs. 1 and 2) and/orTertiary volcanic rocks in northern Mexico. Barker et al. (2003)attributed the rank anomaly to increased depth of burial on the ba-sis of mapped thickness of the Paleocene to upper Oligocene sec-tion in the Rio Grande Embayment (Barnes, 1992) andreflectance vs. depth data compiled from throughout the Gulf prov-ince. Ewing (2003) proposed that subsidence and increased depthof burial in south Texas were caused by foreland basin develop-ment in the Late Cretaceous to Eocene related to Laramide SierraMadre orogenic compression. The interpretations of Barker et al.(2003) and Ewing (2003) are supported by maturity data fromLower Cretaceous rocks from the Sabinas Basin (Mexico), whererank isolines parallel Laramide fold axes and the trend of the SierraMadre orogenic front (Rodriguez and Sinuta, 2003). In summary,the observations suggest that foreland basin subsidence, leadingto a thicker stratigraphic section, and later tectonic thickeningfrom southwest–northeast directed Laramide compression mayhave contributed to the coal rank anomaly in the Maverick Basin.
Our previous work on Wilcox coals from Zavala County indi-cated subbituminous rank, with Ro values ranging from 0.38–

Table 7Liquid and gas chromatography results and d13C composition of two Arroyo Roble No. 1 samples.
Sample EOM (% of TOC)a Sat (%)b Aro (%)c NSO (%)d Asph (%)e mg HC/g TOCf
B3-2 2.77 6.98 15.78 55.69 21.55 27.74B3-12 3.15 7.57 26.60 61.50 4.33 32.22
Pr/Phg Pr/n-C17 Ph/n-C18 n-C18/(n-C18 + n-C19) n-C17/(n-C17 + n-C29) CPIh
B3-2 6.31 6.54 0.71 0.50 0.16 1.33B3-12 3.69 1.50 0.38 0.60 0.21 0.60
d13C extract d13C Sat d13C Aro
B3-2 �27.9 �29.2 �27.0B3-12 �27.9 �28.8 �27.6
a Extractable organic matter.b Saturate.c Aromatic.d Polars.e Asphaltenes.f mg extractable hydrocarbons/gram of total organic carbon.g Pristane:phytane.h Carbon preference index.
P.C. Hackley et al. / Organic Geochemistry 46 (2012) 137–153 147
0.44% (Hackley et al., 2005), consistent with the data here (Table 1).Vitrinite reflectance data plotted vs. present burial depth (Fig. 9) donot show any correlation for shallow Tertiary coal samples. Thedata in Fig. 9 are from a limited geographic area within the Maver-ick Basin and we assume that no differential uplift has occurred. Acorrelation (r2 0.68) is observed for Lower Cretaceous samples;Upper Cretaceous samples display lower maturity at similar depths(strata dip gently towards the Gulf of Mexico) and also do not cor-relate with depth (r2 0.49). This may suggest the influence of a timecomponent on the maturation kinetics of vitrinite or that a steepergeothermal gradient prevailed during the Lower Cretaceous (e.g.Dow and O’Connor, 1982). Projection of the vitrinite reflectancetrends results in surface intercepts of ca. 1.0% for the Lower Creta-ceous and ca. 0.7% for the Upper Cretaceous, indicating that signif-icant post-Mesozoic uplift and exhumation occurred, consistentwith the observations of previous workers (e.g. Gray et al., 2001).Extrapolation to 0.2% vitrinite reflectance at the surface (e.g. Dowand O’Connor, 1982) would suggest that up to 5.5–9.5 km (3.5–6.0 miles) of strata overlying the Cretaceous have been removed.This is significant but of the same order of magnitude as in the Par-ras–La Popa Basins in Mexico where Gray et al. (2001) estimated5–7 km of uplift.
The Ro data could suggest the presence of an erosional uncon-formity between the Cretaceous and Tertiary sections (Fig. 9) be-cause the Tertiary coal samples are so far removed from the Ro
vs. depth trends for the Cretaceous. Local unconformable relation-ships have been noted at updip outcrops of Maverick Basin strata(e.g. Rose, 1972); however, such observations are generally absentfrom the subsurface (e.g. Salvador, 1991). Nonetheless, the reflec-tance data support the presence of an unconformity or change inregional heat flow between the Upper Cretaceous and Paleogenesections in the Maverick Basin.
Broad folding of Paleogene strata in the basin (Fig. 1) indicatesthat Laramide orogenesis continued to affect the area after deposi-tion of the Wilcox and Claiborne coals. We suggest that tectonicburial is at least partly responsible for the rank anomaly in thePaleogene, in concurrence with Barker et al. (2003). Based on thedata available at the time, SanFilipo (1999) proposed hypotheticalcoal rank isograds indicating a westward rank increase from lignitethrough bituminous in the Zavala County area (Fig. 1). Based on thedata presented here, coals of subbituminous rank (as determinedfrom reflectance) are present in a much wider area than originallyproposed by SanFilipo (1999). However, the general northwest–southeast orientation of his isograds is consistent with orientation
of the structural front of the Sierra Madre Oriental orogenic belt,rank isolines in Lower Cretaceous rocks of the Sabinas Basin (Rodri-guez and Sinuta, 2003) and Laramide fold axes. Overall, the coalvitrinite reflectance data indicate significant stratigraphic and/orstructural thickening of the post-Olmos section towards the south-west into the Maverick and Sabinas basins, where coals were ex-humed from deeper burial under the Sierra Madre Orientalpiedmont than in strata farther to the northeast.
4.5. Paleoenvironment of deposition
The sporinite- and mineral-rich, semi-canneloid ClaiborneGroup coal cuttings from this study are identical to coal samplesof shallow subaqueous deposition ca. 100 km (60 miles) to thesouth in Webb County (Warwick and Hook, 1995), and are inter-preted to indicate recurrence of similar coal-forming environmentsin the Eocene. In particular, the presence of thin (5–25 lm), fluo-rescing membranes of varying morphology and length (Fig. 3Kand L) is suggestive of the up to 2 mm long spindle-shaped struc-tures observed by Warwick and Hook (1995), which were inter-preted as oogonium septa from green algae reproduction. Thealmost complete absence of inertinite macerals (except funginite)from the Claiborne cuttings implies that the peat surface wasperennially submerged, prohibiting charring or desiccation of theprecursor vegetation. In addition, the scarcity or absence of struc-tured (telo)vitrinite indicative of arborescent plant material andthe presence of abundant mineral matter also implies subaqueousaccumulation. These observations are consistent with peat deposi-tion in shallow aquatic environments with primarily herbaceous orflotant vegetation, such as an ephemeral lake (Warwick and Hook,1995), and would correspond to the lower delta plain environmentof Mukhopadhyay (1989).
Despite the presence of Claiborne coal in the cuttings and iden-tification of coal beds in electric logs from the Arroyo Roble No. 1well, extensive evaluation of geophysical logs, drillers logs andcompletion cards from Zavala, Dimmit and Webb Counties on filewith the Texas Railroad Commission and the Texas Bureau ofEconomic Geology indicates that the economically importantnon-banded coal beds at the southern Webb County mines arenot laterally extensive in the subsurface. Therefore, although sim-ilar coal-forming environments were present in north-centralZavala County in the area of the Arroyo Roble No. 1 well, it doesnot appear that individual subsurface Claiborne coal beds are

Fig. 6. (A) Pyrolysis gas chromatogram for Indio Formation sample B3-12. Labels: 1–32, n-alkane/n-alkene doublets; X, m- and p-xylene; Ph, o- and p-ethylphenol. Bar graphshows relative proportions of C compounds by peak area. (B) Gas chromatogram for extract of sample B3-2. Labels: 10–33, n-alkanes, IP8, isoprenoids. (C) Gas chromatogramfor extract of sample B3-12. Insert above (B) and (C) shows expanded n-17, Pr, n-18, Ph region.
148 P.C. Hackley et al. / Organic Geochemistry 46 (2012) 137–153
significantly laterally continuous, possibly due to deposition inephemeral lakes.
Facies analysis of Wilcox coal measures in south Texas has re-sulted in competing hypotheses for the primary paleoenviron-ments of deposition, including (as outlined by Mukhopadhyay,1989): association with barrier bar, bay and lagoon settings (Fisherand McGowen, 1967), deltaic and barrier bar settings (Kaiser et al.,1980) and tidal settings (Breyer and McCabe, 1986). Mukhopadhy-ay (1989) used a variety of graphical maceral indices to assign coal
samples to upper or lower deltaic settings. While rigorous assign-ment of the depositional environment of the Indio coals in theArroyo Roble No. 1 well is outside the scope of this paper, severalobservations can be made. The 15 desorbed Indio core samplesconstituted 5.1 m total thickness of coal, occurring in three beds(Fig. 10; Table 1). The coals are readily distinguished on electriclogs by way of low density and high porosity curves, as are theoverlying Claiborne coal beds (not shown). However, in contrastto the overlying Claiborne coal beds, Indio samples contain a high

Fig. 7. FTIR spectra for Indio Formation coal samples B3-2 and B3-12.
Fig. 8. CP-MAS 13C NMR spectra for Indio Formation coal samples B3-2 and B3-12.For comparison, the spectra are not shown on the same baseline; B3-2 is elevatedrelative to B3-12. Qualitative aromatic/aliphatic ratio calculated from integratedspectral areas: aromatic, 2 � (area 210 ppm SSB) + area 125 ppm, aliphatic, area30 ppm – area 210 ppm SSB, SSB, spinning side band.
Fig. 9. Vitrinite reflectance plotted vs. depth for Tertiary coal samples, UpperCretaceous Eagle Ford Formation, and Lower Cretaceous mudstones and wacke-stones in the Maverick Basin. Data contained herein, from Hackley et al. (2005,2009) and Hackley, unpublished data. All data points shown for Upper Cretaceousshale (n = 23) and Lower Cretaceous shale (n = 60) were used to calculate the r2
values, 0.49 and 0.68 respectively; the linear trend lines shown were generated inMicrosoft Excel and consider all data points.
P.C. Hackley et al. / Organic Geochemistry 46 (2012) 137–153 149
percentage of telovitrinite, particularly in the central benches ofthe lower coal beds. This feature suggests preservation of abundantarborescent, above-ground woody vegetation during the middle ofeach mire development (e.g. Hackley et al., 2007). Conversely,detrovitrinite dominates the upper and lower portions of each coalbed, consistent with primarily herbaceous vegetation and/or en-hanced biological, chemical and physical degradation at the begin-ning and end of mire development. Inertinite concentration ishighest in the upper benches of each coal bed (Table 3), consistentwith increasing moisture stress towards the end of each mirephase (Mukhopadhyay, 1989), possibly as a result of decreasedsubsidence rate. Therefore, the petrographic characteristics of theIndio coals, in particular the presence of abundant telovitriniteand high mineral matter, are consistent with deposition in
topogenous forested swamp environments of the Paleocene–Eo-cene Texas coast and would correspond to the alluvial plain orupper delta plain environment of Mukhopadhyay (1989).
4.6. Implications for coalbed methane exploration
Gas content of the desorbed Indio coal core samples was negli-gible, a characteristic that could be caused by several processes:groundwater flushing, an unfavorable environment for microbialmethanogenesis, a lack of extant thermogenic gas generation or
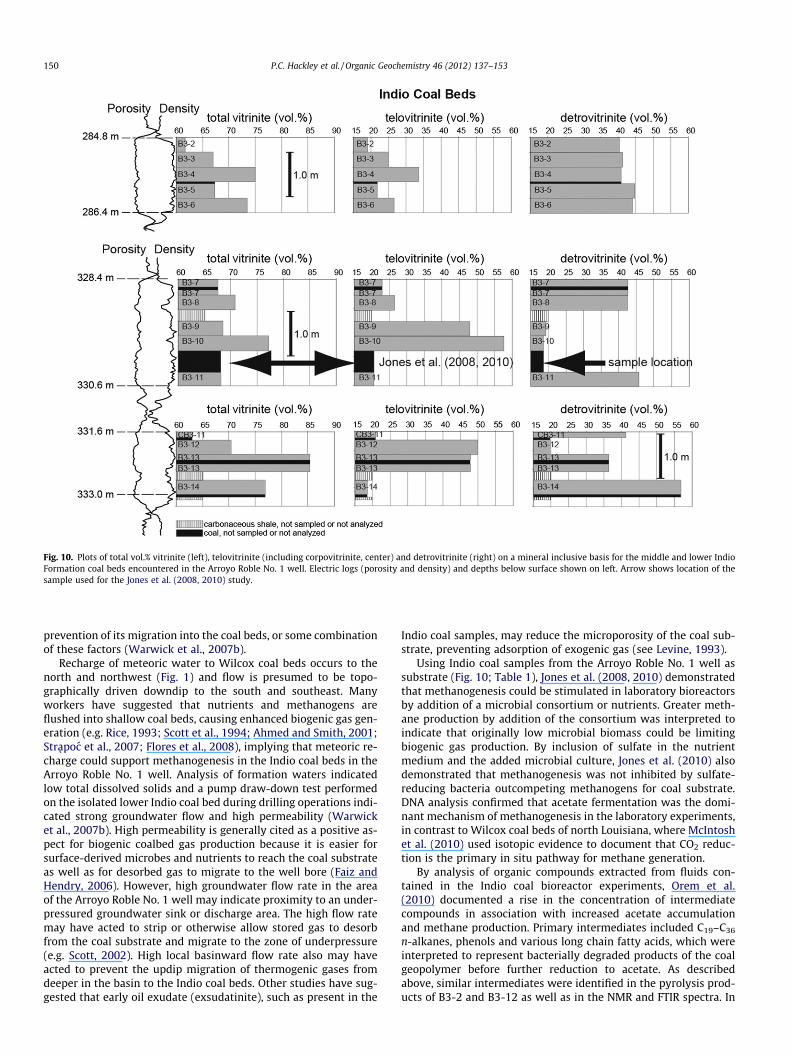
Fig. 10. Plots of total vol.% vitrinite (left), telovitrinite (including corpovitrinite, center) and detrovitrinite (right) on a mineral inclusive basis for the middle and lower IndioFormation coal beds encountered in the Arroyo Roble No. 1 well. Electric logs (porosity and density) and depths below surface shown on left. Arrow shows location of thesample used for the Jones et al. (2008, 2010) study.
150 P.C. Hackley et al. / Organic Geochemistry 46 (2012) 137–153
prevention of its migration into the coal beds, or some combinationof these factors (Warwick et al., 2007b).
Recharge of meteoric water to Wilcox coal beds occurs to thenorth and northwest (Fig. 1) and flow is presumed to be topo-graphically driven downdip to the south and southeast. Manyworkers have suggested that nutrients and methanogens areflushed into shallow coal beds, causing enhanced biogenic gas gen-eration (e.g. Rice, 1993; Scott et al., 1994; Ahmed and Smith, 2001;Strapoc et al., 2007; Flores et al., 2008), implying that meteoric re-charge could support methanogenesis in the Indio coal beds in theArroyo Roble No. 1 well. Analysis of formation waters indicatedlow total dissolved solids and a pump draw-down test performedon the isolated lower Indio coal bed during drilling operations indi-cated strong groundwater flow and high permeability (Warwicket al., 2007b). High permeability is generally cited as a positive as-pect for biogenic coalbed gas production because it is easier forsurface-derived microbes and nutrients to reach the coal substrateas well as for desorbed gas to migrate to the well bore (Faiz andHendry, 2006). However, high groundwater flow rate in the areaof the Arroyo Roble No. 1 well may indicate proximity to an under-pressured groundwater sink or discharge area. The high flow ratemay have acted to strip or otherwise allow stored gas to desorbfrom the coal substrate and migrate to the zone of underpressure(e.g. Scott, 2002). High local basinward flow rate also may haveacted to prevent the updip migration of thermogenic gases fromdeeper in the basin to the Indio coal beds. Other studies have sug-gested that early oil exudate (exsudatinite), such as present in the
Indio coal samples, may reduce the microporosity of the coal sub-strate, preventing adsorption of exogenic gas (see Levine, 1993).
Using Indio coal samples from the Arroyo Roble No. 1 well assubstrate (Fig. 10; Table 1), Jones et al. (2008, 2010) demonstratedthat methanogenesis could be stimulated in laboratory bioreactorsby addition of a microbial consortium or nutrients. Greater meth-ane production by addition of the consortium was interpreted toindicate that originally low microbial biomass could be limitingbiogenic gas production. By inclusion of sulfate in the nutrientmedium and the added microbial culture, Jones et al. (2010) alsodemonstrated that methanogenesis was not inhibited by sulfate-reducing bacteria outcompeting methanogens for coal substrate.DNA analysis confirmed that acetate fermentation was the domi-nant mechanism of methanogenesis in the laboratory experiments,in contrast to Wilcox coal beds of north Louisiana, where McIntoshet al. (2010) used isotopic evidence to document that CO2 reduc-tion is the primary in situ pathway for methane generation.
By analysis of organic compounds extracted from fluids con-tained in the Indio coal bioreactor experiments, Orem et al.(2010) documented a rise in the concentration of intermediatecompounds in association with increased acetate accumulationand methane production. Primary intermediates included C19–C36
n-alkanes, phenols and various long chain fatty acids, which wereinterpreted to represent bacterially degraded products of the coalgeopolymer before further reduction to acetate. As describedabove, similar intermediates were identified in the pyrolysis prod-ucts of B3-2 and B3-12 as well as in the NMR and FTIR spectra. In

P.C. Hackley et al. / Organic Geochemistry 46 (2012) 137–153 151
particular, phenols were present in the pyrolysis-GC trace for B3-12, and phenolic C was present in the NMR spectra of both sam-ples. Readily accessible long chain n-alkanes (C20+) were also abun-dant, as evidenced in the extract GC traces, and oxygenatedfunctional groups from lignin were identified from the FTIR spec-tra. Confirmation herein of the presence of readily available inter-mediates for acetate fermentation suggests that an environmentalfactor inhibited growth of microbial biomass and in situ methano-genesis in coals from the Arroyo Roble No. 1 well, consistent withthe findings of Jones et al. (2010). In northern Louisiana, where an-nual present-day rainfall rate is ca. 2� that of south Texas (Na-tional Oceanic and Atmospheric Administration, 2010), microbialmethanogenesis via CO2 reduction in Wilcox coal beds of similarcomposition and rank is robust (Warwick et al., 2008; McIntoshet al., 2010). Despite the high groundwater flow rate at the ArroyoRoble No. 1 site, limited recharge due to the present low annualrainfall in south Texas may limit the delivery of a meteoric-derivednutrient supply, thus inhibiting bacterial growth. Alternatively,high local groundwater sulfate concentration in the Indio coal bedsmay inhibit methanogens (Warwick et al., 2007b).
4.7. Coal as a source rock for oil
Mukhopadhyay (1989) suggested, on the basis of hydrous pyro-lysis, that the liptinite-rich (HI >225) Wilcox coals could poten-tially generate petroleum, where buried more deeply. Despite thepresence of modal exsudatinite, the limited extract data containedhere (Table 7) indicate that Indio coal samples B3-2 and B3-12 con-tain only ca. 30 mg HC/g TOC. This is at the lower margin of theempirical threshold of 30–50 mg HC/g TOC cited by Snowdon(1991) for effective source rocks. However, the low HC content inthe extracts can be explained by low maturity and high Rock–EvalHI and S2 values (Table 6) suggest that Indio coals could potentiallygenerate petroleum at higher maturity (e.g. Wilkins and George,2002; Petersen, 2006). Although little is known about the presenceof coal deeper in the subsurface of the Maverick Basin and in thegreater Rio Grande Embayment, Galloway et al. (2000) indicatedeastward Laramide progradation of Wilcox delta systems by asmuch as 160 km (100 miles) from the relict Lower Cretaceous shelfedge, suggesting that coal beds similar to those in the Arroyo Roblewell may be present downdip at higher maturity.
The hydrocarbon systems analysis of Hood et al. (2002) indi-cated that Cretaceous source rocks are the main source of oil inthe Maverick Basin and oil generated from lower Tertiary (Wilcox)sediments is present farther downdip towards the Texas coast.However, little data are publicly available on the composition ofcrude oil from the area of the Arroyo Roble No. 1 well. Carbon iso-tope analysis of six crude oils in Paleocene–Eocene strata fromnearby Atascosa and La Salle Counties indicate d13C saturate frac-tion values of 27.5–28.3‰ and d13C aromatic fraction values of26.9–27.6‰ (USGS, 2009), very similar to the d13C isotope datahere for Indio coal extracts (Table 7) and suggestive of a geneticrelationship (e.g. Ahmed et al., 2009). However, Peters et al.(1986) cautioned against classifying oil sources on the basis of car-bon isotopes without supporting data. Saturate/aromatic valuesare much higher in the reservoired crudes (4.5–11.3; USGS,2009), which could be evidence against a coal source, but thismay be a function of higher maturity of the oils. Finally, Pr/Ph val-ues of 1.4–2.0 for the reservoired crude oils suggest that morereducing environments were present in the source rock. On the ba-sis of the available data, it does not appear that Indio coals areeffective source rocks for oils in the area of the Arroyo Roble No.1 well. Additional investigation such as GC–mass spectrometry(MS) biomarker analysis and/or compound-specific isotope analy-sis of oils and coal extracts or pyrolyzates would be required tomake this statement definitively.
5. Summary and conclusions
The Arroyo Roble No. 1 well in Zavala County, Texas, penetratedPaleocene–Eocene coal beds in the Claiborne and Wilcox Groups,which were sampled for integrated petrologic and geochemicalcharacterization. Negligible coalbed gas was measured in canisterdesorption of the Wilcox Group (Indio Formation) coal samples,and the well was shut in. The coal samples are subbituminous inrank, which is locally elevated in the study area, a characteristicattributed to increased relative depth of burial as a result offoreland basin subsidence and tectonic thickening from nearbyLaramide compression. Ro data suggest that an erosional unconfor-mity or change in regional heat flow is present between theTertiary coal-bearing section and underlying Cretaceous strata,which may have been uplifted by as much as >5 km. The presenceof canneloid coal-forming environments, i.e. shallow ephemerallakes, may have been significant during the Eocene based on thesimilarity of liptinite-rich coal beds to Claiborne Group coal bedsca. 100 km to the south. However, these coal beds are not laterallycontinuous in the subsurface. Paleocene–Eocene Indio coal bedswere formed in forested swamp environments and exhibit zona-tion in composition that corresponds to mire development, growthand drowning. Geochemical measurements of solvent extracts donot correlate with nearby crude oils in Tertiary age reservoirs. Thissuggests that Indio coal beds were not effective oil source rocks inthe study area. Organic intermediates for acetate fermentation arepresent in extracts of the coals. However, microbial methanogene-sis may be limited by poor nutrient supply as a result of low re-charge rate.
Acknowledgments
The work was supported by the USGS Energy Resources Pro-gram. R. Gesserman assisted with petrographic analysis. Drillingefforts were led by A. Clark (USGS). Discussions with E. Rowan(USGS) were helpful in understanding thermal maturity and burialhistory in the study area. Comments from R. Burruss and M. Var-onka of USGS and journal reviewers H. Petersen and J. Francu im-proved the manuscript. The questions of the late R.W. Stanton(USGS, Reston) regarding coal-rank data reported for south Texascontributed to the USGS’s early work in the region. Any use oftrade, product, or firm names herein is for descriptive purposesonly and does not imply endorsement by the US Government.
Associate Editor—C.C. Walters
References
Ahmed, M., Smith, J.W., 2001. Biogenic methane generation in the degradation ofeastern Australian Permian coals. Organic Geochemistry 32, 809–816.
Ahmed, M., Volk, H., George, S.C., Faiz, M., Stalker, L., 2009. Generation andexpulsion of oils from Permian coals of the Sydney Basin, Australia. OrganicGeochemistry 40, 810–831.
ASTM, 2011a. D7569-10 Standard practice for determination of gas content of coal-direct desorption method. Annual Book of ASTM Standards: PetroleumProducts, Lubricants, and Fossil Fuels; Gaseous Fuels; Coal and Coke, sec. 5, v.5.06. ASTM International, West Conshohocken, PA, pp. 802–813.
ASTM, 2011b. D2797/D2797M-11a Standard practice for preparing coal samples formicroscopical analysis by reflected light. Annual Book of ASTM Standards:Petroleum Products, Lubricants, and Fossil Fuels; Gaseous Fuels; Coal and Coke,sec. 5, v. 5.06. ASTM International, West Conshohocken, PA, pp. 454–458.
ASTM, 2011c. D2798-11a Standard test method for microscopical determination ofthe vitrinite reflectance of coal. Annual Book of ASTM Standards: PetroleumProducts, Lubricants, and Fossil Fuels; Gaseous Fuels; Coal and Coke, sec. 5, v.5.06. ASTM International, West Conshohocken, PA, pp. 459–463.
ASTM, 2011d. D2799-11 Standard test method for microscopical determination ofthe maceral composition of coal. Annual Book of ASTM Standards: PetroleumProducts, Lubricants, and Fossil Fuels; Gaseous Fuels; Coal and Coke, sec. 5, v.5.06. ASTM International, West Conshohocken, PA, pp. 464–469.
ASTM, 2011e. D3172-07a Standard practice for proximate analysis of coal and coke(pp. 477–478); D3176-09 Standard practice for ultimate analysis of coal and

152 P.C. Hackley et al. / Organic Geochemistry 46 (2012) 137–153
coke (pp. 495–497); D1412-07 Standard test method for equilibrium moistureof coal at 96–97 percent relative humidity and 30�C (pp. 406–410); D5865-10aStandard test method for gross calorific value of coal and coke (pp. 633–646).Annual Book of ASTM Standards: Petroleum Products, Lubricants, and FossilFuels; Gaseous Fuels; Coal and Coke, sec. 5, v. 5.06. ASTM International, WestConshohocken, PA, 856 pp.
ASTM, 2011f. D388-05 Standard classification of coals by rank. Annual Book ofASTM Standards: Petroleum Products, Lubricants, and Fossil Fuels; GaseousFuels; Coal and Coke, sec. 5, v. 5.06. ASTM International, West Conshohocken,PA, pp. 372–378.
Baranger, R., Martinez, L., Pittion, J.-L., Pouleau, J., 1991. A new calibration procedurefor fluorescence measurements of sedimentary organic matter. OrganicGeochemistry 17, 467–475.
Barker, C., 1974. Pyrolysis techniques for source rock evaluation. AmericanAssociation of Petroleum Geologists Bulletin 58, 2349–2361.
Barker, C.E., Biewick, L.R., Warwick, P.D., SanFilipo, J.R., 2000. Preliminary Gulf Coastcoalbed methane exploration maps; depth to Wilcox, apparent Wilcoxthickness and vitrinite reflectance. US Geological Survey Open-File Report 00-113. <http://pubs.usgs.gov/of/2000/ofr-00-0113/>.
Barker, C.E., Warwick, P.D., Gose, M., Scott, R.J., 2003. Olmos coal, Maverick Basin,South Texas: from prospect to production. In: Silverman, M.R. (Ed.), EmergingCoalbed Methane Plays of North America. IHS Energy Petroleum Frontiers, vol.18, pp. 1–10.
Barnes, V.E., compiler, 1992. Geologic map of Texas. The University of Texas atAustin, Bureau of Economic Geology, scale 1:500,000, 4 sheets.
Breyer, J.A., McCabe, P.J., 1986. Coals associated with tidal sediments in the WilcoxGroup (Paleogene), south Texas. Journal of Sedimentary Petrology 56, 510–519.
Chaffee, A.L., Hoover, D.S., Johns, R.B., Schweighhardt, F.K., 1986. Biological markersextractable from coal. In: Johns, R.B. (Ed.), Biological Markers in theSedimentary Record. Methods in Geochemistry and Geophysics, vol. 24.Elsevier, Amsterdam, pp. 311–345.
Clayton, J.L., 1993. Composition of crude oils generated from coals and coaly organicmatter in shales. In: Law, B.E., Rice, D.D. (Eds.), Hydrocarbons from Coal.American Association of Petroleum Geologists Studies in Geology No. 38, pp.185–201.
Dow, W.G., O’Connor, D.I., 1982. Kerogen maturity and type by reflected lightmicroscopy applied to petroleum exploration. In: Staplin, F.L., et al. (Eds.), Howto Assess Maturation and Paleotemperatures. Society of EconomicPaleontologists and Mineralogists Short Course, vol. 7, pp. 133–157.
Eargle, D.H., 1968. Nomenclature of formations of Claiborne Group, Middle Eocenecoastal plain of Texas. US Geological Survey Bulletin 1251-D, 25 pp.
Espitalié, J., Laporte, J.L., Madec, M., Marquis, F., Leplat, P., Paulet, J., 1977. Méthoderapide de caractérisation des rochès, de leur potential pétrolier et de leur degreed’évolution. Revue de L’Institut Français du Pétrole 32, 23–43.
Evans, T.J., 1974. Bituminous coal in Texas. The University of Texas at Austin, Bureauof Economic Geology Handbook, vol. 4, 65 pp.
Ewing, T.E., 1991. Structural framework. In: Salvador, A. (Ed.), The Gulf of MexicoBasin. Boulder, Colorado, Geological Society of America, The Geology of NorthAmerica, v. J, pp. 31–52.
Ewing, T.E., 2003. Review of the tectonic history of the lower Rio Grande borderregion, south Texas and Mexico, and implications for hydrocarbon exploration.In: Rosen N.C. (Ed.), Structure and Stratigraphy of South Texas and NortheastMexico, Applications to Exploration. Society of Economic Paleontologists andMineralogists, Gulf Coast Section Foundation, and South Texas GeologicalSociety, CD-ROM, pp. 7–21.
Faiz, M., Hendry, P., 2006. Significance of microbial activity in Australian coal bedmethane reservoirs – A review. Bulletin of Canadian Petroleum Geology 54,261–272.
Fisher, W.L., 1963. Lignites of the Texas Gulf Coastal Plain. University of Texas atAustin, Bureau of Economic Geology Report of Investigations No. 50, 164 pp.
Fisher, W.L., McGowen, J.H., 1967. Depositional systems in the Wilcox Group ofTexas and their relationship to occurrence of oil and gas. Gulf Coast Associationof Geological Societies Transactions 17, 105–125.
Flores, R.M., Stricker, G.D., Rice, C.A., Warden, A., Ellis, M.S., 2008. Methanogenicpathways in the Powder River Basin: the geologic factor. International Journalof Coal Geology 76, 52–75.
Galimov, E.M., 1980. C13/C12 in kerogen. In: Durand, B. (Ed.), Kerogen: InsolubleOrganic Matter from Sedimentary Rocks. Éditions Technip, Paris, pp. 271–299.
Galloway, W.E., Ganey-Curry, P.E., Li, Xiang, Buffler, R.T., 2000. Cenozoicdepositional history of the Gulf of Mexico basin. American Association ofPetroleum Geologists Bulletin 84, 1743–1774.
Geng, W., Nakajima, T., Takanashi, H., Ohki, A., 2009. Analysis of carboxyl group incoal and coal aromaticity by Fourier transform infrared (FT-IR) spectrometry.Fuel 88, 139–144.
Gray, G.G., Pottorf, R.J., Yurewicz, D.A., Mahon, K.I., Pevear, D.R., Chuchla, R.J., 2001.Thermal and chronological record of syn- to post-Laramide burial andexhumation, Sierra Madre Oriental, Mexico. In: Bartolini, C., Buffler, R.T.,Cantú-Chapa, A. (Eds.), The Western Gulf of Mexico Basin: Tectonics,Sedimentary Basins and Petroleum Systems. American Association ofPetroleum Geologists Memoir 75, pp. 159–181.
Green, M.S., Flanegan, K.C., Gilcrease, P.C., 2008. Characterization of a methanogenicconsortium enriched from a coalbed methane well in the Powder River Basin,USA. International Journal of Coal Geology 76, 34–45.
Hackley, P.C., Dennen, K.O., Gesserman, R.M., Ridgley, J.L., 2009. Preliminaryvitrinite and bitumen reflectance, total organic carbon, and pyrolysis data forsamples from Upper and Lower Cretaceous strata, Maverick Basin, south Texas.
US Geological Survey Open-File Report 2009-1220, 3 pp. <http://pubs.usgs.gov/of/2009/1220/>.
Hackley, P.C., Hook, R.W., Warwick, P.D., 2005. Huminite reflectance measurementsof Paleocene and Upper Cretaceous coals from borehole cuttings, Zavala andDimmit Counties, South Texas. US Geological Survey Open-File Report 2005-1144, 13 pp. http://pubs.usgs.gov/of/2005/1144/.
Hackley, P.C., Warwick, P.D., Breland Jr., F.C., 2007. Organic petrology and coalbedgas content, Wilcox Group, northern Louisiana. International Journal of CoalGeology 71, 54–71.
Hood, K.C., Wenger, L.M., Gross, O.P., Harrison, S.C., 2002. Hydrocarbon systemsanalysis of the northern Gulf of Mexico: delineation of hydrocarbon migrationpathways using seeps and seismic imaging. In, Schumacher, D., LeSchack, L.A.(Eds.), Surface Exploration Case Histories: Applications of Geochemistry,Magnetics, and Remote Sensing. American Association of PetroleumGeologists Studies in Geology 48 and SEG Geophysical Reference Series, vol.11, pp. 25–40.
ICCP, 1998. The new vitrinite classification (ICCP system 1994). Fuel 77, 349–358.Jarvie, D.M., Claxton, B.L., Henk, F., Breyer, J.T., 2001. Oil and shale gas from the
Barnett Shale, Fort Worth Basin, Texas. American Association of PetroleumGeologists Annual Meeting Program 10, p. A100.
Jones, E.P., Voytek, M.A., Corum, M.D., Orem, W.H., 2010. Stimulation of methanegeneration from nonproductive coal by addition of nutrients or a microbialconsortium. Applied and Environmental Microbiology 76, 7013–7022.
Jones, E.P., Voytek, M.A., Warwick, P.D., Corum, M.D., Cohn, A., Bunnell, J.E., Clark,A.C., Orem, W.H., 2008. Bioassay for estimating the biogenic methane-generating potential of coal samples. International Journal of Coal Geology 76,138–150.
Kaiser,W.R., Ayers, W.B., Jr., LaBrie, L.W., 1980. Lignite Resources in Texas.University of Texas at Austin, Bureau of Economic Geology Report ofInvestigations 104, 52 pp.
Katz, B.J., Kelley, P.A., Royle, R.A., Jorjorian, T., 1991. Hydrocarbon products of coalsas revealed by pyrolysis-gas chromatography. Organic Geochemistry 17, 711–722.
Levine, J.R., 1993. Coalification: the evolution of coal as source rock and reservoirrock for oil and gas. In: Law, B.E., Rice, D.D., (Eds.), Hydrocarbons from Coal.American Association of Petroleum Geologists Studies in Geology, vol. 38, pp.39–77.
Lin, R., Davis, A., Bensley, D.F., Derbyshire, F.J., 1986. Vitrinite secondaryfluorescence: its chemistry and relation to the development of a mobilephase and thermoplasticity in coals. International Journal of Coal Geology 6,215–228.
Mapel, W.J., 1967, Bituminous Coal Resources of Texas. US Geological SurveyBulletin 1242-D, 28 pp.
Mastalerz, M., Bustin, R.M., 1994. Variation in reflectance and chemistry of vitriniteand vitrinite precursors in a series of Tertiary coals, arctic Canada. OrganicGeochemistry 22, 921–933.
Mastalerz, M., Bustin, R.M., 1995. Application of reflectance micro-Fouriertransform infrared spectrometry in studying coal macerals: comparison withother Fourier transform infrared techniques. Fuel 74, 536–542.
McIntosh, J.C., Warwick, P.D., Martini, A.M., Osborn, S.G., 2010. Coupled hydrologyand biogeochemistry of Paleocene–Eocene coal beds, northern Gulf of Mexico.Geological Society of America Bulletin 122, 1248–1264.
Mendonça Filho, J.G., Araujo, C.V., Borrego, A.G., Cook, A., Flores, D., Hackley, P.C.,Hower, J., Kern, M.L., Kommeren, K., Kus, J., Mastalerz, M., Mendonça, J.O.,Menezes, T.R., Newman, J., Ranasinghe, P., Souza, I.V.A.F., Suarez-Ruiz, I., Ujiié,Y., 2010. Effect of concentration of dispersed organic matter on opticalmaturity parameters: interlaboratory results of the organic matterconcentration working group of the ICCP. International Journal of CoalGeology 84, 154–165.
Mukhopadhyay, P.K., 1989. Organic Petrography and Organic Geochemistry ofTexas Tertiary Coals in Relation to Depositional Environment and HydrocarbonGeneration. Bureau of Economic Geology, The University of Texas at Austin,Report of Investigations No. 188, 118 pp.
Mukhopadhyay, P.K., Hatcher, P.G., 1993. Composition of coal. In: Law, B.E., Rice,D.D. (Eds.), Hydrocarbons from Coal. American Association of PetroleumGeologists Studies in Geology 38, pp. 79–118.
National Oceanic and Atmospheric Administration, 2010. United States interactiveclimate pages. National Oceanic and Atmospheric Administration, Earth SystemResearch Laboratory, Physical Sciences Division web page at http://www.esrl.noaa.gov/psd/data/usclimate/ (accessed 12.12.2010).
Orem, W.H., Voytek, M.A., Jones, E.J., Lerch, H.E., Bates, A.L., Corum, M.D., Warwick,P.D., Clark, A.C., 2010. Organic intermediates in the anaerobic biodegradation ofcoal to methane under laboratory conditions. Organic Geochemistry 41, 997–1000.
Ottenjann, K., Teichmüller, M., Wolf, M., 1975. Spectral fluorescence measurementsof sporinites in reflected light and their applicability for coalification studies. In:Alpern, B. (Ed.), Petrographie de la Matiere Organique des Sediments, Relationsavec la Paleotemperature et le Potentiel Petrolier. CNRS, Paris, France, pp. 49–65.
Peters, K.E., Moldowan, J.M., Schoell, M., Hempkins, W.B., 1986. Petroleum isotopicand biomarker composition related to source rock organic matter anddepositional environment. In: Leythaeuser, D., Rullkötter, J. (Eds.), Advancesin Organic Geochemistry 1985. Organic Geochemistry 10, 17–27.
Peters, K.E., Walters, C.C., Moldowan, J.M., 2005. The Biomarker Guide. Biomarkersand Isotopes in Petroleum Exploration and Earth history, vol. 2, second ed..Cambridge University Press, New York, 1155 pp.

P.C. Hackley et al. / Organic Geochemistry 46 (2012) 137–153 153
Petersen, H.I., 2006. The petroleum generation potential and effective oil window ofhumic coals related to coal composition and age. International Journal of CoalGeology 67, 221–248.
Petersen, H.I., Rosenberg, P., Nytoft, H.P., 2008. Oxygen groups in coal and alginite-rich kerogen revisited. International Journal of Coal Geology 74, 93–113.
Powell, T.G., Boreham, C.J., 1994. Terrestrially sourced oils: where do they exist andwhat are our limits of knowledge? In: Scott, A.C., Fleet, A.J. (Eds.), Coal and Coal-Bearing Strata as Oil-Prone Source Rocks? Geological Society of London SpecialPublication 77, pp. 11–30.
Rice, D.D., 1993. Composition and origins of coalbed gas. In: Law, B.E., Rice, D.D.(Eds.), Hydrocarbons from Coal. American Association of Petroleum GeologistsStudies in Geology 38, pp. 159–184.
Robert, P., 1988. Organic Metamorphism and Geothermal History: MicroscopicStudy of Organic Matter and Thermal Evolution of Sedimentary Basins. Elf-Aquitaine and D. Reidel Publishing Company, Dordrecht, 311 pp.
Rodriguez, G.Z., Sinuta, A.P., 2003. Gas potential of the Sabinas Basin and PiedrasNegras areas, northeastern Mexico. In: Rosen, N.C. (Ed.), Structure andStratigraphy of South Texas and Northeast Mexico, Applications toExploration. Society of Economic Paleontologists and Mineralogists, GulfCoast Section Foundation, and South Texas Geological Society, CD-ROM, pp.27–64.
Rose, P.R., 1972. Edwards Group, Surface and Subsurface Central Texas. Universityof Texas at Austin, Bureau of Economic Geology Report of Investigations 74, 198pp.
Rose, P. R., 1986. Oil and gas occurrence in Lower Cretaceous rocks, Maverick basinarea, southwest Texas. In: Stapp, W.E. (Ed.), Contributions to the Geology ofSouth Texas 1986. South Texas Geological Society, pp. 408–421.
Salvador, A., 1991. Origin and development of the Gulf of Mexico basin. In: Salvador,A. (Ed.), The Gulf of Mexico Basin. Boulder, Colorado, Geological Society ofAmerica, The Geology of North America, vol. J, pp. 389–443.
SanFilipo, J.R., 1999. Some speculations on coal-rank anomalies of the South TexasGulf Province and adjacent areas of Mexico and their impact on coal-bedmethane and source rock potential. In: Warwick, P.D., Aubourg, C.E., Willett, J.C.(Eds.), Tertiary Coals in South Texas: Anomalous Cannel Like Coals of WebbCounty (Claiborne Group, Eocene) and Lignites of Atascosa County (JacksonGroup, Eocene), Geologic Setting, Character, Source Rock and Coal Bed MethanePotential. US Geological Open-File Report 99-301, pp. 37–47. <http://pubs.usgs.gov/pdf/of/ofr99301/chapter4.pdf>.
Scott, A.R., 2002. Hydrogeologic factors affecting gas content distribution in coalbeds. International Journal of Coal Geology 50, 363–387.
Scott, A.R., Kaiser, W.R., Ayers Jr., W.B., 1994. Thermogenic and secondary biogenicgases, San Juan Basin, Colorado and New Mexico-implications for coalbed gasproducibility. American Association of Petroleum Geologists Bulletin 78, 1186–1209.
Scott, R.J., 2003. The Maverick basin: new technology, new success. In: Rosen N.C.(Ed.), Structure and Stratigraphy of South Texas and Northeast Mexico,Applications to Exploration. Society of Economic Paleontologists andMineralogists, Gulf Coast Section Foundation, and South Texas GeologicalSociety, CD-ROM, pp. 84–121.
Shimizu, S., Akiyama, M., Naganuma, T., Fujioka, M., Nako, M., Ishijima, Y., 2007.Molecular characterization of microbial communities in deep coal seamgroundwater of northern Japan. Geobiology 5, 423–433.
Snowdon, L.R., 1991. Oil from type III organic matter: resinite revisited. OrganicGeochemistry 17, 743–747.
Strapoc, D., Mastalerz, M., Eble, C., Schimmelmann, A., 2007. Characterization of theorigin of coalbed gases in southeastern Illinois Basin by compound-specificcarbon and hydrogen stable isotope ratios. Organic Geochemistry 38, 267–287.
Sykorová, I., Pickel, W., Christanis, K., Wolf, M., Taylor, G.H., Flores, D., 2005.Classification of huminite-ICCP System 1994. International Journal of CoalGeology 62, 85–106.
Taylor, G.H., Teichmüller, M., Davis, A., Diessel, C.F.K., Littke, R., Robert, P., 1998.Organic Petrology. Gerbrüder Borntraeger, Berlin, 704 pp.
Teichmüller, M., 1987. Organic material and very low-grade metamorphism. In:Frey, M. (Ed.), Low Temperature Metamorphism. Blackie, Glasgow, pp. 114–161.
USGS, 2009. US Geological Survey Energy Program Geochemistry Database.Microsoft Access file format. <http://energy.cr.usgs.gov/prov/og/index.htm>.
Van Dorsselaer, A., Albrecht, P., Ourisson, G., 1977. Identification of novel 17a(H)-hopanes in shales, coals, lignites, sediments and petroleum. Bulletin de laSociétè Chimique de France 1–2, 165–170.
Warwick, P.D., Aubourg, C.A., Hook, R.W., SanFilipo, J.R. (compilers), Morrissey, E.C.,Schultz, A.C., Karlsen, A.W., Watt, C.S., Podwysocki, S.M., Mercier, T.J., Wallace,W.C., Tully, J.K., Sun, Zhuang, Newton, M. (digital compilers), 2002. Geology andLand Use in the Western Part of the Gulf Coast Coal-Bearing region. Bureau ofEconomic Geology, The University of Texas at Austin Miscellaneous Maps 41, 2sheets 1:500,000 scale, CD-ROM.
Warwick, P.D., Breland Jr., F.C., Hackley, P.C., 2008. Biogenic origin of coalbed gas inthe northern Gulf of Mexico Coastal Plain, USA. International Journal of CoalGeology 76, 119–137.
Warwick, P.D., Charpentier, R., Cook, T.A., Klett, T.R., Pollastro, R.M., Schenck, C.J.,2007a. Assessment of Undiscovered Oil and Gas Resources in Cretaceous-Tertiary Coal Beds of the Gulf Coast Region, 2007. US Geological Survey FactSheet FS-2007-3039, 2 pp. <http://pubs.usgs.gov/fs/2007/3039/>.
Warwick, P.D., Crowley, S.S., Ruppert, L.F., Pontilillo, J., 1996. Petrography andgeochemistry of the San Miguel lignite, Jackson Group (Eocene), South Texas.Organic Geochemistry 24, 197–217.
Warwick, P.D., Hook, R.W., 1995. Petrography, geochemistry, and depositionalsetting of the San Pedro and Santo Tomas coal zones: anomalous algae-richcoals in the middle part of the Claiborne Group (Eocene) of Webb County, Texas.International Journal of Coal Geology 28, 303–342.
Warwick, P.D., Hook, R.W., Clark, A.C., Corum, M.D., McIntosh, J.C., Burr, C.R.,Hackley, P.C., Jensen, D.B., 2007b. Coal bed methane exploration in ZavalaCounty, Texas: American Association of Petroleum Geologists Annual MeetingProgram, Long Beach, California, April 1–4, 2007, vol. 16, p. 147.
Warwick, P.D., SanFilipo, J.R., Karlsen, A.W., Barker, C.E., 2005. Results of coalbedmethane drilling in Panola County, Texas. US Geological Survey Open FileReport 2005 1046, 153 pp. <http://pubs.usgs.gov/of/2005/1046/>.
Widodo, S., Bechtel, A., Anggayana, K., Püttmann, W., 2009. Reconstruction of floralchanges during deposition of the Miocene Embalut coal from Kutai Basin,Mahakam Delta, East Kalimantan, Indonesia by use of aromatic hydrocarboncomposition and stable carbon isotope ratios of organic matter. OrganicGeochemistry 40, 206–218.
Wilkins, R.W.T., George, S.C., 2002. Coal as a source rock for oil: a review.International Journal of Coal Geology 50, 317–361.
Wood, G.H., Jr., Kehn, T.M., Carter, M.D., Culbertson, W.C., 1983. Coal ResourceClassification System of the US Geological Survey. US Geological Survey Circular891, 65 pp.
Yang, H., Yan, R., Chen, H., Lee, D.H., Zheng, C., 2007. Characteristics ofhemicellulose, cellulose, and lignin pyrolysis. Fuel 86, 1781–1788.