geochemistry and resonance ionization
232
GEOCHEMISTRY AND RESONANCE IONIZATION OF PLATINUM-GROUP ELEMENTS Thesis by Joel David Blum In Partial Fulfillment of the Requirements for the Degree of Doctor of Philosophy California Institute of Technology Pasadena, California 1990 (Submitted May 23, 1990)
-
Upload
khangminh22 -
Category
Documents
-
view
3 -
download
0
Transcript of geochemistry and resonance ionization
GEOCHEMISTRY AND RESONANCE IONIZATION
OF PLATINUM-GROUP ELEMENTS
Thesis by
Joel David Blum
In Partial Fulfillment of the Requirements
for the Degree of
Doctor of Philosophy
California Institute of Technology
Pasadena, California
1990
(Submitted May 23, 1990)

ii
ACKNOWLEDGEMENTS
I thank Professor G.J. Wasserburg for having the insight to steer me in the right directions
and for sharing with me his infectious enthusiasm for science. He has tutored me in the
principles of scientific experimentation and interpretation, and bas taught me the art of
effectively communicating the results of my research. Professors E .M . Stolper, G.R.
Rossman, D.S. Burnett, T.J . Ahrens and G.A. Blake are thanked for their continued interest
and helpful comments on my research, and willingness to let me use their laboratory facilities .
Drs . I.D. Hutcheon, J.T. Armstrong, D.A. Papanastassiou, J.R. Beckett, G.S. Mattioli , A.E .
Blum, M.J. Pellin and D .M. Gruen taught me a wide variety of experimental techniques and
spent countless hours discussing all aspects of my research. I thank my fellow graduate
students for companionship and for creating an environment highly conducive to scholarship.
Finally, I thank my wife Cynthia for her continuous support (both spiritual and financial ) and
our daughter Hazel Claire for making the last year so rewarding.

lll
ABSTRACT
Experimental studies were conducted with the goals of 1) determining the origin of Pt
group element (PGE) alloys and associated mineral assemblages in refractory inclusions from
meteorites and 2) developing a new ultrasensitive method for the in situ chemical and isotopic
analysis of PGE. A general review of the geochemistry and cosmochemistry of the PGE is
given, and specific research contributions are presented within the context of this broad
framework.
An important step toward understanding the cosmochemistry of the PGE is the
determination of the origin of POE-rich metallic phases (most commonly ERu-Fe) that are
found in Ca, AJ-rich refractory inclusions (CAl) in C3V meteorites. These metals occur
along with ')'Ni-Fe metals, Ni-Fe sulfides and Fe oxides in multiphase opaque assemblages.
Laboratory experiments were used to show that the mineral assemblages and textures observed
in opaque assemblages could be produced by sulfidation and oxidation of once homogeneous
Ni-Fe-PGE metals . Phase equilibria, partitioning and diffusion kinetics were studied in the
Ni-Fe-Ru system in order to quantify the conditions of opaque assemblage formation. Phase
boundaries and tie lines in the Ni-Fe-Ru system were determined at 1273, 1073 and 873K
using an experimental technique that allowed the investigation of a large portion of the Ni-Fe
Ru system with a single experiment at each temperature by establishing a concentration
gradient within which local equilibrium between coexisting phases was maintained. A wide
miscibility gap was found to be present at each temperature, separating a hexagonal
close-packed ERu-Fe phase from a face-centered cubic ')'Ni-Fe phase. Phase equilibria
determined here for the Ni-Fe-Ru system, and phase equilibria from the literature for the
Ni-Fe-S and Ni-Fe-0 systems, were compared with analyses of minerals from opaque
assemblages to estimate the temperature and chemical conditions of opaque assemblage

IV
formation. It was determined that opaque assemblages equilibrated at a temperature of
-770K, a sulfur fugacity 10 times higher than an equilibrium solar gas, and an oxygen
fugacity 1()6 times higher than an equilibrium solar gas.
Diffusion rates between -yNi-Fe and ERu-Fe metal play a critical role in determining the
time (with respect to CAl petrogenesis) and duration of the opaque assemblage equilibration
process. The diffusion coefficient for Ru in Ni (D~i) was determined as an analog for the Ni
Fe-Ru system by the thin-film diffusion method in the temperature range of 1073 to 1673K
and is given by the expression:
D~i (cm2 sec-1) = 5.0(±0.7) x 10·3 exp(-2.3(±0.1) x 1012 erg mole-1/RT)
where R is the gas constant and T is the temperature in K. Based on the rates of dissolution
and exsolution of metallic phases in the Ni-Fe-Ru system it is suggested that opaque
assemblages equilibrated after the melting and crystallization of host CAl during a
metamorphic event of 2: 1 Q3 years duration. It is inferred that opaque assemblages originated
as immiscible metallic liquid droplets in the CAl silicate liquid. The bulk compositions of
PGE in these precursor alloys reflects an early stage of condensation from the solar nebula
and the partitioning of V between the precursor alloys and CAl silicate liquid reflects the
reducing nebular conditions under which CAl were melted. The individual mineral phases
now observed in opaque assemblages do not preserve an independent history prior to CAl
melting and crystallization, but instead provide important information on the post-accretionary
history of C3V meteorites and allow the quantification of the temperature, sulfur fugacity and
oxygen fugacity of cooling planetary environments . This contrasts with previous models that
called upon the formation of opaque assemblages by aggregation of phases that formed
independently under highly variable conditions in the solar nebula prior to the crystallization
of CAl.

v
Analytical studies were carried out on PGE-rich phases from meteorites and the products
of synthetic experiments using traditional electron microprobe x-ray analytical techniques.
The concentrations of PGE in common minerals from meteorites and terrestrial rocks are far
below the -100 ppm detection limit of the electron microprobe. This has limited the scope
of analytical studies to the very few cases where PGE are unusually enriched. To study the
distribution of PGE in common minerals will require an in situ analytical technique with much
lower detection limits than any methods currently in use. To overcome this limitation,
resonance ionization of sputtered atoms was investigated for use as an ultrasensitive in situ
analytical technique for the analysis of PGE. The mass spectrometric analysis of Os and Re
was investigated using a pulsed primary Ar+ ion beam to provide sputtered atoms for
resonance ionization mass spectrometry. An ionization scheme for Os that utilizes three
resonant energy levels (including an autoionizing energy level) was investigated and found to
have superior sensitivity and selectivity compared to nonresonant and one and two energy
level resonant ionization schemes. An elemental selectivity for Os over Re of ~ 1()3 was
demonstrated . It was found that detuning the ionizing laser from the autoionizing energy level
to an arbitrary region in the ionization continuum resulted in a five-fold decrease in signal
intensity and a ten-fold decrease in elemental selectivity. Osmium concentrations in synthetic
metals and iron meteorites were measured to demonstrate the analytical capabilities of the
technique. A linear correlation between Os+ signal intensity and the known Os concentration
was observed over a range of nearly 10'' in Os concentration with an accuracy of - ± 10% , a
millimum detection limit of 7 parts per billion atomic, and a useful yield of 1% . Resonance
ionization of sputtered atoms samples the dominant neutral-fraction of sputtered atoms and
utilizes multiphoton resonance ionization to achieve high sensitivity and to eliminate atomic
and molecular interferences. Matrix effects should be small compared to secondary ion mass

VI
spectrometry because ionization occurs in the gas phase and is largely independent of the
physical properties of the matrix material . Resonance ionization of sputtered atoms can be
applied to in situ chemical analysis of most high ionization potential elements (including all of
the PGE) in a wide range of natural and synthetic materials. The high useful yield and
elemental selectivity of this method should eventually allow the in situ measurement of Os
isotope ratios in some natural samples and in sample extracts enriched in PGE by fire assay
fusion.
Phase equilibria and diffusion experiments have provided the basis for a reinterpretation of
the origin of opaque assemblages in CAl and have yielded quantitative information on
conditions in the primitive solar nebula and cooling planetary environments. Development of
the method of resonance ionization of sputtered atoms for the analysis of Os has shown that
this technique has wide applications in geochemistry and will for the first time allow in situ
studies of the distribution of PGE at the low concentration levels at which they occur in
common minerals .
Vll
PREFACE
This thesis draws together the results and implications of the research projects that I have
completed in the course of my doctoral work. The six chapters represent a general review of
the geochemistry and resonance ionization of Pt-group elements, and include reference to my
research as well as the research of others. Appendices I through VI are original research
articles addressing the details of the specific experiments that I have completed and their
imp! ications .

Vlll
TABLE OF CONTENTS
Acknowledgements
Abstract
Preface
Chapter 1. Introduction
Chapter 2. Chemistry and natural abundances
2 .1 Alloys
2 .2 Sulfides
2 .3 Oxides
2.4 Partition coefficients
2 .5 Cosmic abundances and condensation temperatures
2 .6 Meteoritic and terrestrial abundances
Chapter 3. Cosmochemistry
3 .1 Refractory meteorite inclusions
3.2 Kinetics of grain condensation
3.3 Composition of condensate alloys
3.4 Condensate alloys during meteorite petrogenesis
3 .5 Re-Os cosmochronometer
Chapter 4. Geochemistry of Pt-group elements in CAl
4.1 Description of opaque assemblages
4.2 Condensation and melting in the nebula
4 .3 Exsolution of metallic phases
4.4 Oxidation and sulfidation of metals
4.5 Comparison with previous models
ii
iii
vii
8
8
30
34
36
37
39
45
45
50
52
64
66
68
69
81
86
87
101

Chapter 5 . Terrestrial fractionation
5 . 1 Core formation
5.2 Origin of the moon
5.3 Mantle partial melting
5.4 Magmatic crystallization
5.5 Re-Os geochronometer
IX
Chapter 6. Resonance ionization of sputtered atoms
6 .1 Traditional ionization techniques
6.2 Laser resonance ionization
6.3 Resonance ionization coupled with sputtering
6 .4 Multiphoton ionization schemes
6.5 Analytical capabilities
6.6 Potential applications
References
Appendix I. Diffusion, phase equilibria and partitioning experiments in the
Ni-Fe-Ru system. (co-authored with G.J. Wasserburg, I.D. Hutcheon,
1 .R. Beckett and E.M. Stolper), 1989, Geochimica et Cosmochimica Acta 53,
483-489.
Appendix II. 'Domestic' origin of opaque assemblages in refractory inclusions
in meteorites. (co-authored with G.J . Wasserburg, I.D. Hutcheon,
J.R. Beckett and E.M. Stolper), 1988, Nature 331, 405-409.
106
109
113
114
118
123
127
128
130
136
141
142
150
154
166
173

X
Appendix ill. Origin of opaque assemblages in C3V meteorites : Implication for
nebular and planetary processes. (co,authored with G.J . Wasserburg,
J.D. Hutcheon, J.R. Beckett and E.M. Stolper), 1989, Geochimica et
Cosmochimica Acta 53, 543,556.
Appendix N. Preliminary experimental investigation of the origin of
Ir,rich alloys in chromites .
Appendix V. Resonance ionization mass spectrometry of sputtered osmium and
rhenium atoms. (co,authored with M.J. Pellin, W .F. Calaway, C.E. Young,
D.M. Gruen, J.D . Hutcheon and G.J . Wasserburg), 1990, Analytical
Chemistry 62, 209,214.
Appendix VI. In situ measurement of osmium concentrations in iron meteorites
by resonance ionization of sputtered atoms. (co-authored with M.J.
Pellin, W.F. Calaway, C.E. Young, D .M. Gruen, I.D . Hutcheon and G.J.
Wasserburg), 1990, Geochimica et Cosmochimica Acta 54, 875-881.
178
192
210
216

C~Rl. ~ODUCTION
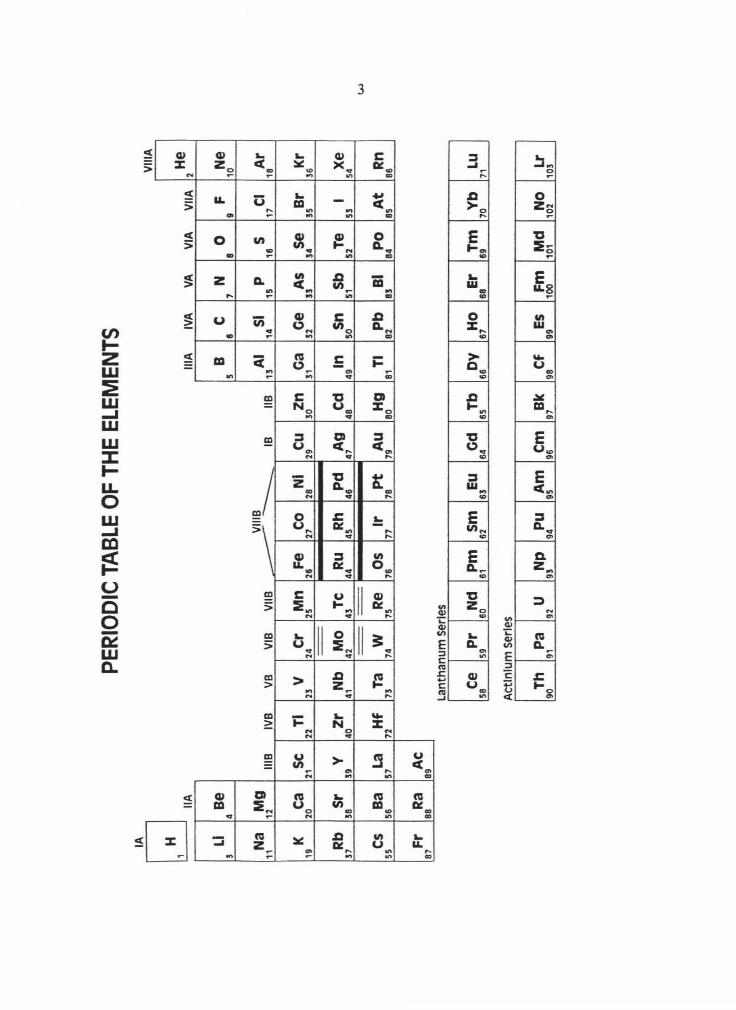
The Pt-group elements (PGE: Ru, Rh, Pd, Os, Ir and Pt) include the six group VIII
transition metals that lie in the second and third rows of the periodic table below Fe, Co and
Ni (Fig. 1.1). In their metallic form, the PGE (along with their periodic table neighbors Mo,
W and Re) are among the most refractory materials known, and yield important information
on high temperature solar nebular processes . Re is a group vn transition metal that has many
chemical similarities to the PGE (particularly under reducing conditions) and will, therefore,
be included with them in many of the following discussions. The PGE are generally
classified as siderophile elements because they tend to associate with the common transition
elements Ni, Co and Fe in iron meteorites and presumably in the earth's core. However, at
the elevated sulfur fugacities prevalent in the earth's crust and upper mantle the PGE also
become concentrated into sulfides, and are useful as tracers of the separation of metallic
and/or sulfide phases during geologic processes.
The PGE are of considerable economic importance and have a wide range of industrial
uses. They are "noble" metals in the sense that the massive metal resists oxidation and are
used as corrosion-resistent coatings, in dental applications, and in jewelry. When frnely
divided, the PGE are chemically reactive and are used as catalysts in the chemical and
petroleum refining industries and in automotive exhaust systems. The high melting
temperatures of the PGE also make them widely useful in high temperature electronic and
industrial applications. World demand for the PGE exceeded 2.5xl01 g in 1987 (Loebenstein,
1989).
PGE are mined primarily from magmatic sulfide ore deposits associated with mafic and
ultramafic igneous rocks. Minor production of PGE also comes from alluvial deposits

2
Fig. 1. Periodic table of the elements with Groups listed at the top of each column. The
platinum-group elements are in the second and third rows of Group VlliB and are designated
by thick solid lines. The other refractory siderophile elements are designated by thin double
lines .
PER
IOD
IC T
ABLE
OF
THE
ELEM
ENTS
lA
[;]
VIll
A
IIA
lilA
IV
A
VA
V
IA
VIlA
2
He
Ll
Be
B
c N
0
F N
e 3
4 5
' 7
a •
10
Na
Mg
______.YIII~
AI
Sl
p s
Cl
Ar
11
12
IIIB
IVB
VB
VIB
VIIB
IB
liB
13
14
15
18
17
18
K
ca
sc
Tl
v cr
M
n Fe
co
Nl
cu
zn
ca
ce
AS
se
B
r K
r 19
20
21
22
23
24
25
28
27
28
29
30
31
32
35
34
35
36
Rb
sr
v zr
N
b M
O TC
RU
Rh
Pd
A
g Cd
In
Sn
Sb
Te
I
xe
37
38
39
40
41
42
43
44
45
48
47
48
49
50
51
52
53
54
w
cs
Ba
La
Hf
Ta
w
Re
OS
lr p
t AU
H
g Tl
Pb
Bl
Po
A
t Rn
55
56
57
72
73
74
75
76
77
78
79
80
81
82
83
84
85
86
Fr
Ra
AC
87
88
89
La
nth
an
um
Ser
ies
ce
Pr
Nd
Pm
sm
EU
Cd
Tb
Dy
Ho
Er
Tm
Vb
I LU
58
59
60
61
62
63
64
65
66
67
68
69
70
71
Act
iniu
m s
erie
s
Th
Pa
u N
p Pu
A
m
em
Bk
Cf
Es
Fm
Md
No
Lr
90
91
92
93
94
95
96
97
98
99
100
101
102
103

4
derived from the weathering of mafic and ultramafic igneous rocks and concentration of native
alloys from them. Detailed statistics on the supply and demand for PGE can be found in
Loebenstein (1989). Approximately 48% of PGE production comes from the Republic of
South Africa (primarily from the Merensky Reef in the Bushveld Complex), -43% of
production comes from the U.S.S.R. (primarily from the Noril'sk-Talnakh region of Siberia)
and -5% of production comes from Canada (primarily from the Sudbury District)
(Loebenstein, 1989; Naldrett, 1981). Mining of the J-M Reef in the Stillwater Complex of
Montana, U.S .A., began in 1977 but is not yet a major source of PGE. The J-M Reef grades
as high in Pt and four times as high in Pd as the Merensky Reef over a mining width twice as
great but has a more complex structure due to extensive faulting .
Methods of isolating, separating and analyzing the PGE are presented in a series of papers
published by Beamish and coworkers, mainly in the journal Talanta. The papers provide the
basis for the book, The Analytical Chemistry of the Noble Metals (Beamish, 1966). Two
subsequent books (Beamish and Van Loon, 1972, 1977) provide updated information on
analytical methodologies. Crockett and Cabri (1981) provide a brief review of the various
analytical techniques for the PGE. Cabri (1988) summarized the status of in situ microbeam
analytical techniques for the PGE.
By studying the distribution and chemical behavior of the PGE in geological materials,
several important problems in geochemistry can uniquely be addressed including 1) the
condensation of refractory solids from the solar nebula, 2) the mechanisms by which trace
metals are concentrated during magmatic differentiation and planetary metamorphism and 3)
core formation in planetesimals, the moon and the earth. Numerous analytical and
petrographic studies of the PGE have been carried out in order to address each of these

5
problem areas. However, due to a lack of diffusion, phase equilibria and partitioning data in
PGE-rich systems and the severe limitations of available analytical methods, there are still
many basic unanswered questions in PGE geochemistry .
In this thesis, a few key research areas where chosen in which experimental data could
potentially elucidate uncertain, yet important, aspects of the geochemistry of PGE.
Experimental studies were used to address specific problems including 1) the origin of POE
rich alloys which occur in meteorites and have been proposed to be the earliest nebular
condensates, 2) the behavior of PGE-rich alloys during planetary metamorphism and 3) the
role of PGE-rich phases and chromite in the partitioning of PGE during mantle partial melting
and crustal magmatic differentiation .
Analytical studies were carried out on PGE-rich phases from meteorites and the products
of synthetic experiments using traditional electron microprobe x-ray analytical techniques .
The high detection limits for PGE ( -100 ppm) relative to the concentrations usually observed
in typical rocks ( < 6 ppb) have, however, limited the scope of analytical studies to the very
few cases where PGE are unusually enriched. To study the behavior of PGE during the more
common geologic processes that largely control their terrestrial distribution will require an in
situ analytical technique with much lower detection limits than any methods currently in use.
To overcome this limitation, resonance ionization of sputtered atoms was investigated for use
as a new ultrasensitive in situ analytical technique for the analysis of PGE in natural samples
and experimentally synthesized phases.
Details of specific research projects completed during my thesis studies are presented as
original research articles in Appendices I through VI. Appendix I presents diffusion, phase
equilibria and PGE partitioning experiments in the Ni-Fe-Ru system. This work: demonstrates

6
that PGE-rich metallic phases can be formed by subsolidus exsolution reactions from an
initially homogeneous Ni-Fe-PGE metal. Appendices n and Ill present analytical studies of
PGE-rich metallic phases from refractory meteorite inclusions. The conditions under which
the inclusions and their host meteorites were melted and subsequently metamorphosed are
quantified by comparison with experimental data from the Ni-Fe-Ru, Ni-Fe-0-V and Ni-Fe-S
systems. Appendix IV presents a preliminary experimental investigation of the solubility and
diffusion of the PGE in iron sulfide and chromite at magmatic temperatures, and a discussion
of the possible importance of these phases in the terrestrial fractionation of PGE.
Appendices V and VI diverge from the theme of PGE geochemistry to the theme of PGE
analytical chemistry. They describe the development of resonance ionization of sputtered
atoms as a new method for in situ analysis of the PGE. It is demonstrated that this method is
capable of quantitative PGE analyses at concentrations many orders of magnitude lower than
the minimum detection limits of the electron microprobe. With this method we now have the
potential to explore many aspects of PGE geochemistry that were previously inaccessible to
analytical study. Appendix VI also includes a discussion of the application of resonance
ionization of sputtered atoms as a new type of highly efficient and elementally selective ion
source for an isotope ratio mass spectrometer.
The chapters of this thesis represent a general review of the geochemistry and resonance
ionization of PGE emphasizing those areas in which I have made a contribution. Chapter 2
draws together some basic information on the chemistry and natural abundances of PGE.
Chapter 3 summarizes the cosmochemistry of PGE and Chapter 4 discusses the geochemical
behavior of PGE in refractory meteorite inclusions. Chapter 5 considers the available data on
the terrestrial fractionation of PGE and the applications of the Re-Os geochronometer.

7
Finally, Chapter 6 reviews the use of resonance ionization of sputtered atoms for the chemical
and isotopic analysis of PGE.

8
CHAPTER 2. CHEMISTRY AND NATURAL ABUNDANCE'S
This chapter summarizes some of the basic features of Pt-group element chemistry, and
presents data on their cosmic and terrestrial abundances. It is not meant to be a
comprehensive review, but rather to provide background information and references that are
pertinent to the specific discussions of PGE geochemistry in the chapters and appendices that
follow. PGE have a remarkable tendency to form their own alloy and sulfide phases in nature
rather than dissolving as trace constituents in major minerals. These PGE alloys and
compounds typically occur as minute particles ( ~ 1 J.Lm) containing two or more of the PGE
and variable amounts of Fe and Ni. The binary phase equilibria of pairs of PGE and of each
PGE with Fe and Ni are reviewed below and provide a basis for understanding the separation
of PGE into the variety of phases observed in nature. Clues to the concentration mechanisms
for PGE in meteorites and terrestrial rocks come from consideration of basic chemical
stability data, as well as meteoritic and terrestrial abundance patterns.
2.1 ALWYS
Among the elements, the most notable feature of the PGE is their high melting
temperatures, which range from 3045°C for Os to 1554 oc for Pd (fable 2 .1). Os is the third
most refractory element following only W (3410°C) andRe (3170°C). As can be seen on
Table 2. 1, the melting and boiling points as well as the hardness of the PGE decrease with
increasing atomic number along both the second and third rows of the periodic table. Thus,
Ru and Os are the most refractory and the hardest, whereas Pd and Pt are the least refractory
and the softest.
The binary phase equilibria for pairs of PGE have been determined to varying degrees of
completeness. A compilation of all available binary phase diagrams is provided by Massalski

9
Table 2.1 Some chemical properties of the PGE and Re.
Ru Rh Pd Os Ir Pt Re
Atomic number 44 45 46 76 77 78 75
Atomic wt (AMU) 101.1 102.9 106.4 190.2 192.2 195.1 186.2
Melting point (0 C) 2310 1963 1554 3045 2447 1772 3170
Boiling point ( 0 C) 4080 3700 2900 5020 4500 3800 5630
Crystal structure HCP FCC FCC HCP FCC FCC HCP
Atomic radius (A) 1.33 1.35 1.38 1.34 1.36 1.37 1.37
Valence electrons 4<F5s 4d85s 4d10 5d66s2 5d76s2 5d96s 5d56s2
Oxidation 2,3,4 1,3,4 2,4 2,3,4 1,2,3 2,4 2,3,4 states 6,8 5 6,8 4,6 5,6,7
Ionization pot. (eV) 7.4 7.5 8.3 8.6 9.0 9.0 7.9
Density (g/cm3
) 12.5 12.4 12.0 22.6 22.7 21.5 21.0
Hardness 200- 100- 40- 300- 200- 40- -250 (vickers) 350 120 42 670 240 42
HCP=hexagonal close-packed, FCC=face-centered cubic.

10
(1986). Many of the PGE pairs have only been studied at temperatures close to their melting
points, and there are no studies of PGE systems containing three or more components.
Nevertheless, it is clear that the crystal structures of the metals play a dominant role in the
phase equilibria, and rules relating the binary mixing properties to crystal structure can be
stated. Ru and Os (which lie below Fe on the periodic table) and Re (which lies below Mn)
have a hexagonal close-packed structure, whereas Rh, Pd, Ir and Pt (which lie below Co and
Ni) have a face-centered cubic structure (fable 2.1). The common crystal structure between
Ru, Os and Re results in a complete solid solution between these elements at near-liquidus
temperatures; the behavior at lower temperatures has not been determined experimentally.
Similarly, complete solid solution at high temperature is observed in binary mixtures of the
elements Rh, Pd, Ir and Pt. Miscibility gaps are known to occur in each of these binary
systems at temperatures below - 1000°C. The Pt-Ir phase diagram is shown in Fig. 2 .1 as a
general example of phase equilibria between two PGE with the same crystal structure.
Binary mixtures between the hexagonal close-packed and face-centered cubic PGE display
limited solid solution and always have a miscibility gap that extends from lower temperatures
( < 1000°C) up to the liquidus. The solubilities of each of the end-member elements in the
other element of the binary pair vary from < 5% in the Os-Pd system to > 30% in the Os-Ir
system. The Pt-Ru phase diagram is shown in Fig. 2.2 as an example of phase equilibria
between two PGE with differing crystal structure. No ordered intermetallic compounds are
known in any of the binary PGE systems.
Binary phase equilibria in PGE-Fe and PGE-Ni systems have been determined to varying
degrees of completeness and are compiled by Massalski (1986). Although some of the binary
phase diagrams are unknown or only poorly constrained, they too appear to obey simple rules

11
Fig. 2.1 Pt-Ir phase diagram as compiled by Massalski (1986). The following notation is
used in Figs. 2.1 through 2.7. Dashed lines are used for uncertain or speculative phase
boundaries, liquid phases are designated by L, complete solid solutions are designated by
(A,B) and terminal solid solutions are designated by (A) or (B). Ordered phases are
designated by AxBv and Greek letters are used to designate high- and low-temperature forms .

12
"" § {,) ,• §
) \ , , ,
I I
i I i I
I I I I I I
i I I I I I I I I
0 \
0 \ ,... \ ...
E \ s \
§ \
::J I .2 \
-a \ -a g ~ \ s ·-\
"" CIS \ - "" \
"" Q \ \ - _, _, \ - -c: ~ \
"" c: Q,) ~
\ - + ~ ~ Ill \ (.) \ .J ""
CIS \ "" .c: \ Q.. - ~ Q,) Q.. \ - .. (:I. (:I. \ Q..
\ -_, 0 ... \ 0 .~ - \
.c. .. ~
\ • s QD \ c.. \
\ 0 Q,) \ _,
:c: \ < I
~ \
~ I I I • I
• ~
I I I I I I I I I
2 I I
_, 0 0 (:I.
~ ~ 8 ~ ~ !
::>a a.Jnl~.Jadwa~

13
Fig. 2.2 Pt-Ru phase diagram compiled by Massalski (1986). Nomenclature as in Fig. 2.1 .

Wc
1g
ht
Pe
rcen
t H
uth
cn
1u
m
0 10
20
30
4
0 :'lO
6
0
?0
80
9
0
100
24
00
----r-·,
)~~~~~~~~~~~~~~~~~~~
~
22
00
2000
u 0
t 18
00
=' .... CIS
I.. 8.
1000
E
Q
l
E-
14
00
1200
##
••
...
Pt-
Ru
Ph
ase
Dia
gra
m
------
------
--~~::
::-;
----
--::
::::
::::
::: .
.. ::::~-
~~~~~~~:-:~:
::~~:-··;··
· ---
.~~~~~~~
::::--
--7
9
L
z:::J
34 "c
(Pt)
(R
u)
woo
l 1
1 1
• 1
, ~ I
. .
1 18
0
1 t
o w
~
~
~
:'lO
60
m
oo
P
t A
tom
ic
Perc
en
t R
uth
en
ium
9
0
10
0
Ru
...... ~

15
based upon the crystal structures of the various PGE. The crystal structure of
Fe is face-centered cubic at T>912°C and body centered cubic at T<91rC. The crystal
structvre of Ni is face-centered cubic. The hexagonal close-packed PGE (Ru, Os and Re)
display limited solid solution and miscibility gaps at all temperatures when alloyed with either
Fe or Ni . The Fe-Ru and Ni-Ru diagrams are shown in Figs. 2.3 and 2.4 as examples of the
forms of these binary diagrams.
The face-centered cubic PGE (Rh, Pd, lr and Pt) display complete solid solution with both
Fe and Ni at high temperatures and develop miscibility gaps only at temperatures below 600
to 1300°C for alloys with Fe, and temperatures below 200 to 700°C for alloys with Ni. The
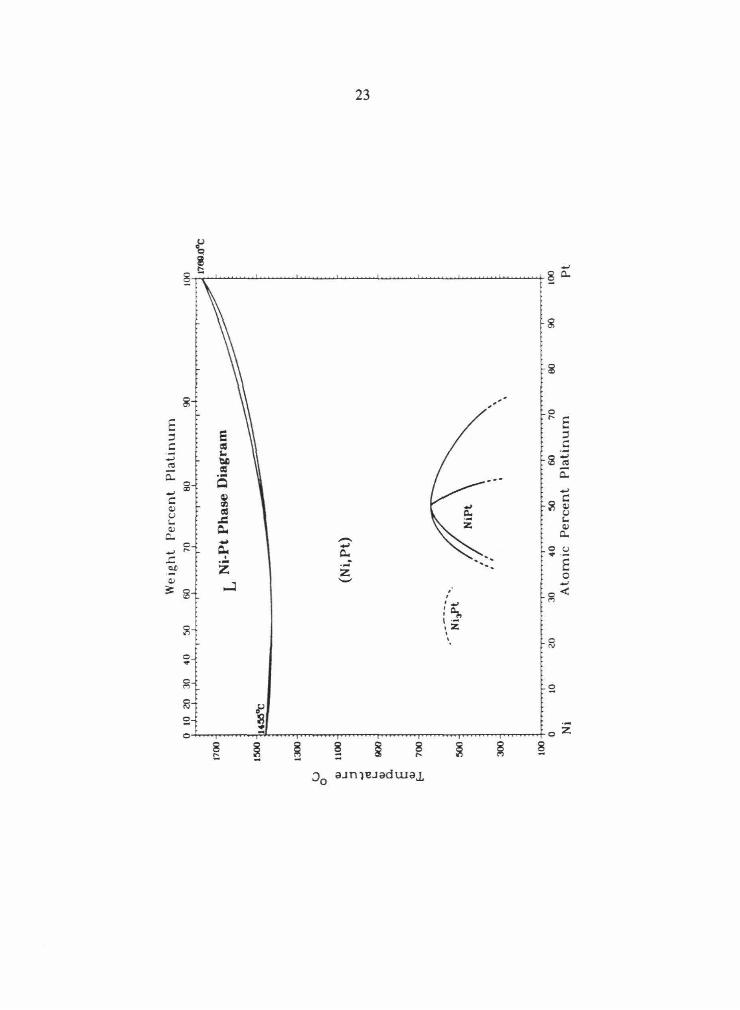
only ordered intermetallic phases reported are in the Fe-Pd (FePd, FePd3), Fe-Pt (F~Pt. FePt,
Fe~) and Ni-Pt (Ni3Pt, NiPt) systems. The Fe-Pt and Ni-Pt diagrams are shown in Figs. 2.5
and 2 .6 as examples of the general forms of these diagrams.
Naturally occurring PGE alloys usually also contain both Fe and Ni and therefore Fe-Ni
PGE ternary systems must be considered. The Fe-Ni binary, which bounds these ternary
systems, is shown in Fig. 2.7 for reference. Fe and Ni display complete solid solution at
high temperatures and develop miscibility gaps and intermetallic compounds at lower
temperatures. Ternary Fe-Ni-PGE phase equilibria have been studied previously only in the
Fe-Ni-Pt system and then only at 600°C (Stevens et al. , 1978). As can be seen in Fig. 2 .8, a
continuous tetragonal solid solution forms between the ordered phases FePt and NiPt, and
cubic solid solutions extend from the ordered phases F~Pt and FePt3 toward more Ni rich
compositions. Disordered face-centered cubic and body-centered cubic solid solutions are also
observed (Fig. 2.8). Ternary phase equilibria in the Fe-Ni-Ru system were determined in this
study between 600 to 1000°C and are discussed in detail in App. I. The 600°C section is
shown in Fig . 2.9 for comparison with the Fe-Ni-Pt system. Whereas the traditional phase

16
Fig. 2.3 Fe-Ru phase diagram compiled by Massalski (1986). Nomenclature as in Fig. 2.1.

u 0 (I
) I.
. ::l .....
(Q
I.. ~ E
(I)
f-
Wet
gh
t P
erce
nt
Hu
then
ium
0
10
20
JO
40
::>
a 60
7
0
80
90
10
0 2400~~~~~--~~~~-r~~~~~~~~~------~~~~-r~~~~~~+
2.20
0 F
e-R
u P
has
e Di
agra
f!l~
~~~~
~~~~~~
::.:.:
.~··
L ~~~~~
-~~
,,
,."
~~~~~~
-~~--
--------
,.,,
,.
,'
---
,. .... ""
,,
' ,,
''
,,'"
,,''
,,''
,'
,'
20
00
1800
i[
--_-
' J~o~
_-'
16
00
I .-I
----
--('-
~
' .
1400
1200
1000
80
0
600
.»4
•c
('yF
e)
, , , , , , , , , , , , ,
, ,
, ,
, ,
, ,
, lZ
"c
, ,'
. ,/
,'
': ... ,
/
,/
'...
, '
\ ...
, '
~ ",,
,'
-ff
!J/J
oC
/ ~--
-::. .. __
____
___ (
, '
I '
(Ru)
----
----
-Z3
34l>c
~aPe
) \
. \
40011::~~~~~~~~~~~~~~~~~~~~~~~
0 10
0
0
20
JO
40
::>
a 6
0
70
Ato
mic
Per
cen
t R
uth
en
ium
8
0
100 Ru
Fe
--1

18
Fig. 2.4 Ni-Ru phase diagram compiled by Massalski (1986). Nomenclature as in Fig. 2.1.

19
~ ~ ~+-~.~~~~~~~~~~~~~~~~~~~~ ~
E 0-
... "' ! c: c:> ..c: -' 0 ::l .... c:: -' c: Q)
s (.) I-Q)
0..
-'
~~ Q)
~ 0 ....
~
0 'J
~ t _ _. -. J
8 .., N
" •' •' ,. '\ ' ' ' ' ' ' ' ' ' ' ' ' ' ' ' ' ' ' ' \
' '
E = "" b.o
= Q ~ 'l)
= .c c..
::::s c=
0
z
' ' ' ' ' ' ' ' ' ' ' ' ' ' ' ' ' ' ' ' ' ' ' \ \
' \ '
..-. ::::s IX ......
~ E ::l c Q)
s ..c: -' ;:l c:: -'
~ ~ c: Q) (.)
~ I-Q)
0.. 0 ... .... (.) ·-E
0
~<
..-. z ......
z
~ ~ ~ Jo aJnreJadWaJ.

20
Fig . 2.5 Fe-Pt phase diagram compiled by Massalski (1986). Nomenclature as in Fig. 2.1.
Note the existence of three ordered phases.

u 0 v .... :l
,.j
Wei
ght
Perc
en
t P
lati
nu
m
0 10
2
0
30
4
0
~0
60
7
0
60
11
0 10
0
1800
&7
ee.o
-c
UIO
O
,,
Fe-
Pt
Ph
ase
Dia
gra
m ~,,,''
. .
----
----
----
----
----
----
~1:118·~-----------------------
L
14
00
..., 13
11••c
-13~•c
-.:--
-~~·c
<0
1200
....
()'F
e,P
l)
_,l .. :.
oo\1,.
I I
f I
'/
. : v a.
E
v E-
1000
111z
ec
80
0
I I • I • I • • • • ' • ' ' ' ' /'-
1: ,
\ :
,'
\ :
I
, ' . '
/ (P
'e,P
t)
~ :
: (F
ePl)
I
tl
I (F
ePt.
J :
.. : .
800
1 ,,
.. 1
-1 }•
I I
t 1
4 I
I I
\I
I •
i •
i r
0 10
2
0
30
4
0
50
6
0
70
Fe
A
tom
ic
Perc
en
t P
lati
nu
m
60
11
0 10
0 Pl
tv -

22
Fig. 2.6 Ni-Pt phase diagram compiled by Massalski (1986). Nomenclature as in Fig. 2.1 .
Note the existence of two ordered phases.
23
8 ---- 0
E .... E
::l e ::l c: = c: ·- 1... ·-~ ~ ~~ «:! = c.. Q --- c.. ~
g ~
c: ~ ~ ~ Cl) ~ = (.,) u L.. ..c: I-Q,) c.. Q,)
c.. ... - c.. 0 c.. -~ ,....
0.. 0 (.,)
.c ' ..r ·-·- E QJ) z .... z
~ - 0
3: .....J ~
g ' o< ' .... ("')
:c, ' ·-~ ,:z: ' ' 0
N
0 ....
0 ("') ~
~
~ ~
0 oZ
8 ~ ~ § § 8 § c ....
::>a <unreJadwaJ,
24
Fig. 2.7 Fe-Ni phase diagram compiled by Massalski (1986). Nomenclature as in Fig. 2 .1.
Note the existence of three ordered phases.

Fe-
Ni
Ph
ase
Dia
gra
m
Wei
gh
t P
erc
en
t N
ick
el
0 10
20
3
0
40
~0
60
70
80
110
100
16
00
J
I I I I
II
I I
I I
I I
I I
II
I I
1 L
(6F
e)
I .a&
""'j,.,.,
t42
&•c
1200
u 0 Q
J [
IV
s...
(/'F
e,N
i)
:I
1000
1 v.
.. «
l 8~C
s...
QJ 0. E
800
QJ
f-
1100
400-
i I
3411
•c
-........
........ _
?--
r'\
?
200
1 : +
-Fe
1N
l I
I •,
•
I I
0 10
20
30
40
50
60
70
11
0 80
10
0
Fe
Ato
mic
P
erc
en
t N
ick
el
Ni

26
Fig. 2.8 Fe-Ni-Pt phase diagram at 600°C from Stevens et al. (1978). All solid solution
fields are labeled. Tetragonal and cubic fields are ordered phases whereas face-centered cubic
(fcc) and base-centered cubic (bee) fields are disordered phases. Unlabeled fields are two and
three phase regions.

Fe
-Ni-
Pt
syst
em
AT
OM
IC 0
/o I
'~
60
0 °
C
ttlr
ogon
ol
"~
10
2
0
30
4
0
50
AT
OM
IC
0/o
N
i 60
7
0
80
AT
OM
IC
0/o
P
t Nl
90
1
00
N
-J

28
Fig 2.9 Ni-Fe-Ru phase diagram at 600°C from App. I. Hexagonal close-packed tRu-Fe and
face-centered cubic -yNi-Fe solid solutions fields are labeled. Two-phase (2¢) and three-phase
(3¢) regions are designated. Tie-lines are drawn in two-phase regions.

u 0 0 0 (0
29
I I I I I ICl> u...
/I• / lz
/ ' >--/ "'6-/ C'-J I
l _...I
----- l __... I I I
0 o-u ~ 0 .... <

30
equilibria methodology used in the study of the Fe-Ni-Pt system required the preparation and
annealing of many different alloy compositions, a large portion of the Ni-Fe-Ru system was
investigated in this study with a single experiment at each temperature by establishing a
concentration gradient within which local equilibrium between coexisting phases was
maintained. A wide miscibility gap is present in the Fe-Ni-Ru system at each temperature
studied and separates a hexagonal close-packed Ru-Fe phase from a face-centered cubic Ni-Fe
phase.
2.2 SULFIDES
The sulfur fugacity (Js;) of a given geologic environment has a strong influence on the
chemical behavior of the PGE and determines whether they exist as alloy or sulfide minerals.
Therefore, it is important to summarize the thermodynamic data for metal-sulfide stabilities of
PGE. Metal-sulfide stability curves were calculated as a function of temperature using
thermodynamic data from Barton and Skinner (1979), Svendsen (1979), Hultgren et al. (1973)
and Mills (1974). The curves are plotted on a log.fs2 versus 1rr diagram in Figure 2.10.
The .fsz necessary to form a PGE sulfide is considerably higher than needed to form FeS and
increases in the order Ru~~~s. There are insufficient data to include Rb and Pd within
this ordering.
A wide variety of PGE sulfide compounds have been synthesized and are listed on Table
2.2. The experimental data are reported in the materials science and chemistry literature and
have been compiled in several binary phase diagram reference volumes (Hansen and Anderko,
1958; Elliot, 1965; Shunk, 1969; Moffatt, 1979). Naturally occurring sulfide minerals
include laurite (RuS2; Leonard et al., 1969), prassoite (Rh17S15; Geller, 1962), vysotskite
(PdS; Cabri et al., 1978), erlichmanite (OsS2; Snetsinger, 1971), xingzbongite [(Ir,Cu)S;

31
Fig. 2 .10 Plot of logjS2 versus reciprocal temperature with metal-sulfide stability curves for
Fe, Ru, Pt, Ir and Os. Calculated using data from Barton and Skinner (1979), Svendsen
(1979), Hultgren et al. (1973) and Mills (1974).

N
~ 0> 0
0
2
10
32
Temp (°C)
1200 1000 800 600
7 9 1 1 1 0 4 /Temp (K_,)

33
Table 2.2 Synthetic oxide and sulfide compounds of the PGE and Re.
Ru Rh Pd Os Ir Pt Re
Oxide formed by Ru02 Rh203 PdO oso. Ir02 Pt02 R~07 heating in air
Other known oxides Ru20 3 Rh02 ~03 lr20 3 PtO Re02
Ru20 s Rh205 Os02 lr03 ~04 Re03 Ru03 Os03 Ruo.
Known sulfides RuS2 Rhl~IS Pd4S OsS2 IrS Pt3S ReS2
Rh3S4 Pd3S lr2S3 PtS R~S7 Rh2S3 Pdl6s 7 IrS2 PtS2
RhS3 PdS lr3S8
Rh6S7 PdS2 IrS3

34
Peng et al., 1978], braggite [(Pt,Pd)S; Cabri et al., 1978], cooperite (PtS2 ; Cabri et al. ,
1978), and malanite [(Pt,Ir)2CuS4; Peng et al., 1978]. Naturally occurring alloys, tellurides
and arsenides are also observed for many of the PGE; a comprehensive glossary of the
chemical and mineralogical properties of these minerals is given by Cabri ( 1981).
2.3 OXIDES
The PGE display a wide range of oxidation states in their chemical compounds (Table _
2.1). In Table 2 .2 the oxide compound that forms by heating each metal in air is given as
well as other known oxides. Os04, which forms by the oxidation of Os metal powder in air
at room temperature, is by far the most volatile of the PGE oxides. It forms a colorless solid
which melts at 40oc and boils at 101 oc. It has a characteristic chlorine-like odor and is
extremely toxic (McLaughlin, 1946; Sax, 1968). It is reduced to a black dioxide when it
comes in contact with organic matter and can cause severe damage to the eyes and respiratory
system. In contrast, Pt can be heated in air to its melting point with only a slight loss of Pt as
the volatile Pt02•
Several PGE-bearing spinel compounds that contain PGE as major cations have been
synthesized at high temperatures under very oxidizing conditions, and are reported in the
materials science literature (K.rutzsch and Kemmler-Sack, 1983; Greenwood, 1968; Muller
and Roy, 1969, 1971). Most of the compounds combine one or two first row transition
metals with a PGE. Spinels synthesized with the )(2+¥1+ 20 4 structure include (Ni ,Ru)F~04,
(Mg,Ru)F~04, RuCo20 4 and IrCo20 4 • Spinels synthesized with the )(2+ 2 Y4+0 4 structure
(inverse spinels) include Mg2Pd04 , Mg2Pt04, Cd2Pt04 and Zn2Pt04 .
Recently, Capobianco and Drake (1990) crystallized geologically important MgA120 4
spinels at 1450°C in an air atmosphere in the presence of silicate liquid and Ru, Rh and Pd.
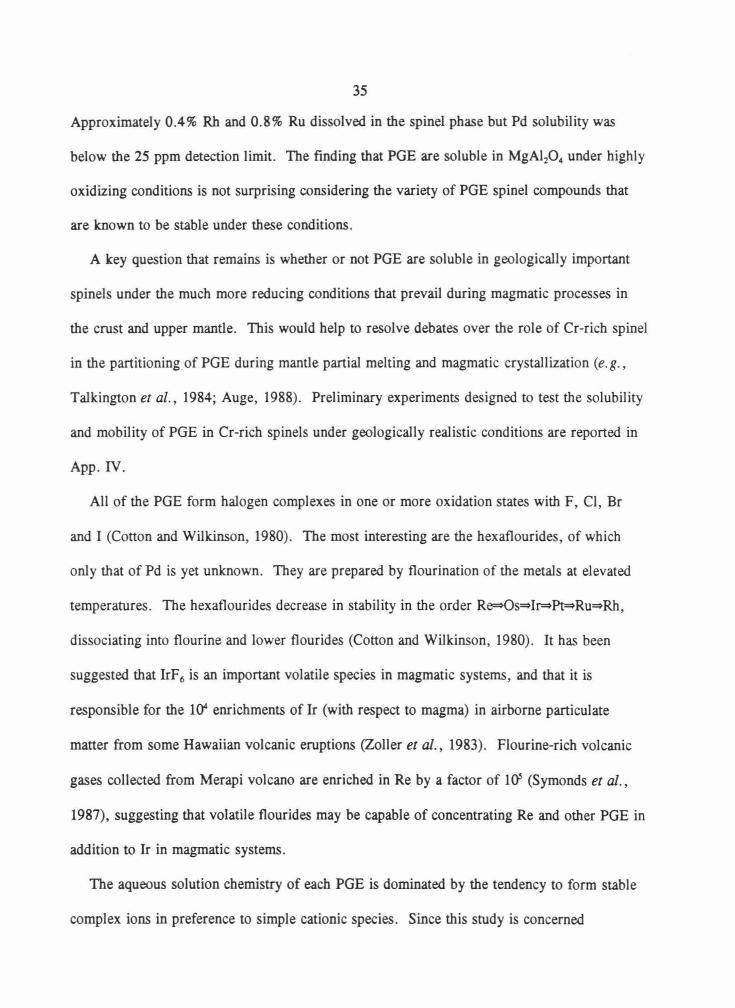
35
Approximately 0.4% Rh and 0 .8% Ru dissolved in the spinel phase but Pd solubility was
below the 25 ppm detection limit. The finding that PGE are soluble in MgAl20• under highly
oxidizing conditions is not surprising considering the variety of PGE spinel compounds that
are known to be stable under these conditions.
A key question that remains is whether or not PGE are soluble in geologically important
spinels under the much more reducing conditions that prevail during magmatic processes in
the crust and upper mantle. This would help to resolve debates over the role of Cr-rich spinel
in the partitioning of PGE during mantle partial melting and magmatic crystallization (e.g.,
Talkington et al., 1984; Auge, 1988). Preliminary experiments designed to test the solubility
and mobility of PGE in Cr-rich spinels under geologically realistic conditions are reported in
App. IV.
All of the PGE form halogen complexes in one or more oxidation states with F, Cl, Br
and I (Cotton and Wilkinson, 1980). The most interesting are the hexaflourides, of which
only that of Pd is yet unknown. They are prepared by flourination of the metals at elevated
temperatures. The hexaflourides decrease in stability in the order R~os~Ir=>Pt==>Ru~Rh,
dissociating into flourine and lower flourides (Cotton and Wilkinson, 1980). It has been
suggested that IrF 6 is an important volatile species in magmatic systems, and that it is
responsible for the 10'' enrichments of Ir (with respect to magma) in airborne particulate
matter from some Hawaiian volcanic eruptions (Zoller et al., 1983). Flourine-rich volcanic
gases collected from Merapi volcano are enriched in Re by a factor of 105 (Symonds et al.,
1987), suggesting that volatile flourides may be capable of concentrating Re and other PGE in
addition to Ir in magmatic systems.
The aqueous solution chemistry of each PGE is dominated by the tendency to form stable
complex ions in preference to simple cationic species. Since this study is concerned

36
exclusively with the high temperature behavior of PGE, the details of PGE complexes will not
be discussed. There is an extensive literature on the low temperature chemistry of PGE
complexes which has been reviewed by Griffith (1967), Hartley (1973) and Crockett (1981).
The limited data on the marine chemistry of PGE has recently been reviewed by Goldberg et
a1.(1988).
2.4 PARTITION COEFFICIENTS
Very little is known about the partitioning of PGE between mineral phases under conditions
relevant to geochemical systems. Partitioning of PGE as a function of temperature, .fo2 and
A is not well understood. Analyses of iron meteorites, magmatic sulfides and chromitites has
established that the PGE are compatible with metallic iron, iron-sulfides and chromite relative
to silicate liquids. However, experimental studies have been so limited in scope that they
have done little more than to confirm these general observations.
The partitioning of Ir and Re between iron metal containing 22% S and basaltic glass was
measured by Jones and Drake (1986) at 1270°C and log.fo2 = -13. The silicate/metal
partition coefficient (DSJ~ for Ir was determined to be 5x10"" to 5x10~ and DSJM for Re was
determined to be 5x1Q-3 to 5x10"5• It is not known how much these values vary for the other
PGE or the effect of S content, temperature or jo2• Silicate/sulfide partition coefficients for
PGE have not been studied experimentally; empirical estimates based on the study of ore
deposits range from 10"2 (Ross and Keays, 1979) to 10"5 (Campbell and Barnes, 1984).
A study of the partitioning of Ru, Rh and Pd between MgA120 4 spinel and a
CaO+ MgO+ Al20 3+Si02 liquid in an air atmosphere at 1450°C has yielded silicate/spinel
partition coefficients of 0.04, 0 .01 and >50, respectively (Capobianco and Drake, 1990). It
is not clear whether these experiments, which were run under highly oxidizing conditions, are

37
directly relevant to partitioning under the much more reducing conditions prevalent in the
crust and upper mantle. They do, however, suggest that spinel compatibility might play a
role in the fractionation of PGE during magmatic processes .
The partitioning of Os and Re was measured between chromian diopsidic pyroxene and a
Fe-free basaltic liquid contained in aPt crucible in an air atmosphere (Watson et al., 1987).
Silicate melt/pyroxene partition coefficients of -10 and -20 were determined for Os and Re,
respectively. However, due to the oxidizing conditions and presence of Pt metal, the
relevance of this experiment to equilibrium or to natural conditions is questionable.
2.5 COSMIC ABUNDANCES AND CONDENSATION TE:MPERATURES
The concentrations of most PGE andRe have been measured in C1 chondrite meteorites
using neutron activation analysis. Rh has not been measured but has been estimated based on
analyses of H-chondrites assuming that the relative abundances of the PGE are constant in H
chondrites and C1 chondrites. The first measurements of the PGE (except Rh) were made by
Crockett et al. (1967), and the first measurements of Re were made by Morgan and Lovering
(1967) . The original values, averages compiled by Cameron (1972), averages compiled by
Anders and Grevesse (1989), and estimates based on abundances in the solar photosphere
(Anders and Grevesse, 1989) all agree to - ± 15%. The average cosmic abundances of each
of the PGE relative to Si are given in Table 2.3 and vary by a factor of five from 0.344 Rh
atoms/leY' Si to 1.86 Ru atoms/1()6 Si.
Following the approach of Larimer (1967), Scott (1972) first calculated the temperatures at
which each of the PGE (and other refractory metals) become stable solid phases relative to an
equilibrium gas of solar composition at a total pressure of 1~ atm (Table 2.3). Grossman
(1973) repeated the calculation for a few of the PGE at a total pressure of 10·3 atm

38
Table 2.3 Cosmic abundances and nebular condensation temperatures (in K) for the PGE and Re.
Ru Rh Pd Os Ir Pt Re
Cosmic abundance (atoms/1()6 Si) [1] 1.86 0 .344 1.39 0 .675 0 .661 1.34 0.0517
Condensation temp pure metals (PT = 10-4 atm) [2] 1540 1285 940 1840 1550 1325 1775
Condensation temp pure metals (PT = 10·3 atrn) [3] 1613 1346 1050 1917 1636 1415 1838
50% condensation temp into alloy with complete solid solution (PT = 10·3 atm) [3] 1642 1475 1415 1897 1683 1490 1905
[1] Anders and Grevesse (1989); [2] Scott (1972); [3] Palme and Wlotzka (1976).

39
and Palme and Wlotzka (1976) repeated the calculation for all of the PGE under these
conditions (fable 2.3). Palme and Wlotzka (1976) also calculated the condensation
temperature for each of the PGE for 50% condensation of each element into an alloy
containing 13 metals assuming ideal solid solution (fable 2.3). The 50% condensation
temperatures for the PGE range from -1900°C for Os to -1400°C for Pd, following a
trend similar to the relative melting and boiling temperatures of the PGE given in Table 2.1.
The compositions of possible condensate alloys are discussed further in Chapter 3.
2.6 METEORITIC AND TERRESTRIAL ABUNDANCES
Average abundances of PGE (andRe) in several types of meteoritic and terrestrial
materials are given along with the sources of data in Table 2.4. In many cases averages were
taken from review papers in which all available data were compiled. When such sources
were not available, data were taken from analytical studies in which the maximum number of
PGE were analyzed . C1 chondrites were included because they are the best estimates of the
PGE content of the bulk earth. Ca, Al-rich refractory inclusions from C3 meteorites (CAl)
were included because they may be representative of high-temperature nebular condensates .
The PGE contents of samples of iron meteorites vary by as much as 1 Q4 within meteorite
groups (e.g., Scott and Wasson, 1975; Pemicka and Wasson, 1987). This variation has been
attributed to fractional crystallization of metallic iron during the crystallization of the cores of
asteroid size bodies (Scott, 1972). The average values for IIIAB iron meteorites given in
Table 2.4 are an estimate of the bulk composition of the metallic parent melt from which the
IllAB iron meteorites crystallized that was calculated using a fractional crystallization model
(Willis, 1980; Willis and Goldstein, 1982).
Abundances of the PGE in terrestrial rocks are not well known because the concentrations

40
Table 2.4 Average PGE (andRe) concentrations in some representative rock-types in ppb.
Rock-type Ru Rh Pd Os Ir Pt Re
Cl chondrite [1] 710 130 560 490 480 990 37
CAl [2] 10450 1240 1160 6920 7510 10740 780 lliAB Fe-meteoritet [3,4] 710 450 530 530 1100 48
Spinel lherzolite xenoliths [5] 5.5 3.3 3.4 0.17
Ophiolite complexes Peridotites [6,7] 6.1 3.0 6.7 5.1 3.8 9 .1 2.4 Chromitites [8] 180 11 4.8 91 17
Komatiites [6,9] 8.6 1.6 1.2 14 1.1
Oceanic basalts [6,10] :::;; 1.8 ~0.025 ::::;0.037-- 0.93 Continental basalts [6] 8.3 0.092 -Granitic rocks [6, 7] ::::;0.4 ::::;0.06 0.03 ::::;0.5 0.6 K-T boundary sed. [11] 110 46 57 131 2.7 (3 mm basal clay layer)
-- indicates no data available. 1based on model-dependent calculation. [1] Anders and Grevesse (1989); [2] Mason and Taylor, 1982; [3] Willis (1980); [4] Willis and Goldstein, 1982; [5] Morgan (1986); [6] Crockett (1981); [7] Morgan and Lovering (1967); [8] Page eta/. (1982); [9] Walker et al. (1988); [10] Hertogen et al. (1980) [11] Kyte et al. (1985).

41
in almost all rocks are very low and thus difficult to measure. Pd and lr are the most
commonly analyzed PGE in terrestrial samples because these elements are the most sensitive
of the PGE to neutron activation analysis. Os andRe have also been analyzed in a variety of
rocks because of interest in Re-Os isotope systematics. The concentrations of Ru, Rh and Pt
in many rock-types are largely unknown. An exception to the general lack of data on PGE
concentrations are mafic/ultramafic layered intrusions such as the Stillwater Complex which
host PGE ore deposits and have been extensively analyzed for all of the PGE. The
concentrations of PGE in layered intrusions is discussed in section 5.4.
The data from Table 2.4 were normalized to C1 chondrite values and plotted on Figs . 2.11
for comparison. The PGE are plotted in the order of decreasing melting temperature, which
seems to correlate with their behavior during terrestrial fractionation . Re is plotted last (after
Pd) because it behaves much more similarly to Pd than it does to Os during terrestrial
fractionation.
The concentrations in CAl of the highly refractory elements Os, Ir, Ru, Rh, Pt andRe are
10 to 20 x chondritic (Fig. 2.11). Pd is considerably lower at -2 x chondritic, reflecting its
lower condensation temperature. The estimated group IIIAB iron meteorite parent liquid is
approximately chondritic in composition indicating that all of the PGE partition strongly into
metallic liquids during core formation on planetesimals preserving chondritic ratios (Fig.
2.11).
The normalized concentrations of each of the PGE (and Re) in spinel lherzolite xenoliths
and ophiolitic peridotites are relatively constant at -10-2 x chondritic (Fig. 2.11). This
suggests that the sub-continental and sub-oceanic upper mantle has approximately the same
PGE (andRe) content. Komatiites, which are generally believed to be magmas produced by
high degrees of partial melting in the mantle, also have - 10·2 x chondritic concentrations but

42
Fig. 2.11 Average concentrations of PGE andRe from Table 2.4 normalized to Cl chondrite
concentrations in representative meteoritic and terrestrial materials. The PGE are plotted in
order of decreasing melting point. Re is plotted after Pd because it behaves more similarly to
Pd than any of the other PGE during terrestrial fractionation. Lines connecting the elements
are dashed where data for a particular element are unavailable. Arrows ( +) attached to
symbols designate maximum values. Data sources are given in Table 2.4. See text for
discussion.

(1) .... ·.: -g 1 o-, 0
.J::. u -u -~ 1 o-2
0 u
1 o-3
43
IIIAB Fe Met. 0 0-- ~ ---<)~-
K-T Bdry Sed. \
Spin. Lher~ ~
~mat. ~ean. Bas.
/// Cont. Bas./ /
'c( /
Os lr Ru Rh Pt Pd Re

44
are slightly depleted in Os and Ir relative to Pd and Re. The depletion of Os and Ir relative
to Pd and Re is far more pronounced in magmas formed by lower degrees of mantle partial
melting including continental basalts, oceanic basalts and granitic rocks (Fig. 2.11).
Chrornitites from ophiolitic complexes have a pattern that is complementary to crustal rocks
with large enrichments in Ir and Ru relative to Pt and Pd (Fig. 2.11). The patterns suggest
that Os, Ir and Ru are compatible in the mantle in chromitites, whereas Rh, Pt, Pd and Re are
less compatible and are extracted from the mantle to a much greater extent during crust
formation.
Since the initial discovery of high concentrations of Ir in Cretaceous-Tertiary (K-T)
boundary sediments and the proposition that the massive terminal Cretaceous extinctions
resulted from an asteroidal impact (Alvarez et al., 1980), many workers have investigated the
relative concentrations of PGE in K-T boundary sediments. The measured concentrations of
Os, lr, Pt andRe in a basal clay layer 0 to 0 .3 em above the K-T boundary from Caravaca,
Spain, are plotted on Fig. 2.11; relative concentrations from other K-T boundary sections are
very similar. The flat chondrite normalized pattern is similar to patterns in C 1 chondrites, Fe
meteorites and mantle peridotites but distinct from the steeply sloped patterns of crustal
materials including continental and oceanic basalts. Although this does not resolve the dispute
over whether the PGE were derived from asteroids (Alvarez et al., 1980) or the earth's
mantle (Officer and Drake, 1985), it does argue against an origin from basaltic volcanics or
crustal sediments.
45
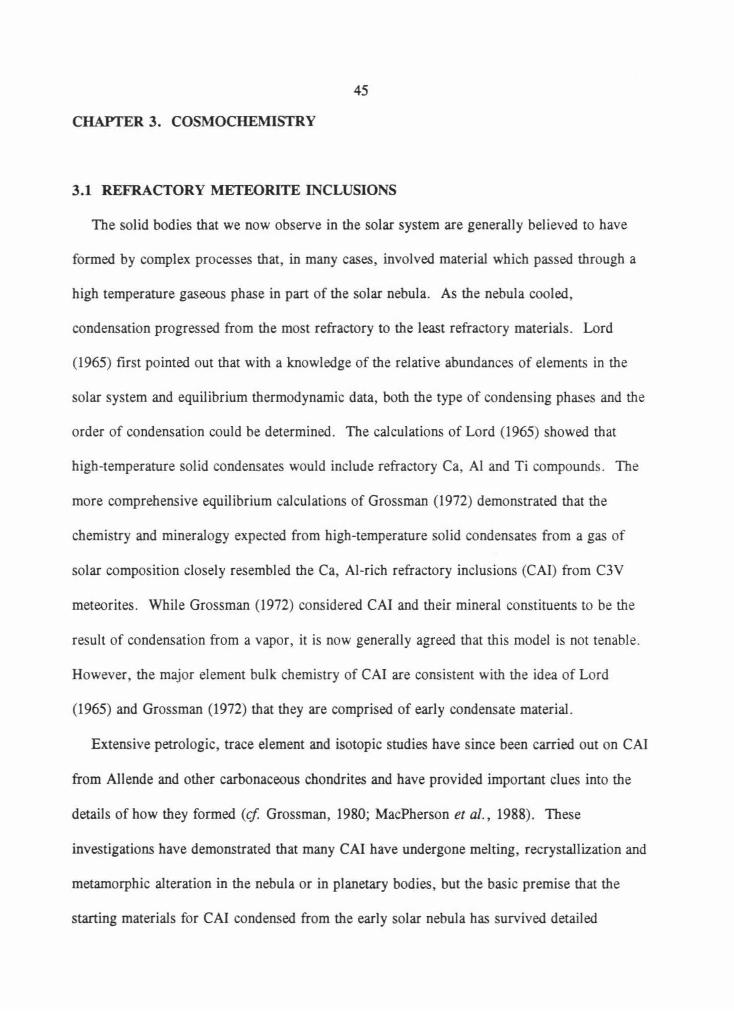
CHAPTER 3. COSMOCHEMISTRY
3.1 REFRACTORY METEORITE INCLUSIONS
The solid bodies that we now observe in the solar system are generally believed to have
formed by complex processes that, in many cases, involved material which passed through a
high temperature gaseous phase in part of the solar nebula. As the nebula cooled,
condensation progressed from the most refractory to the least refractory materials. Lord
(1965) first pointed out that with a knowledge of the relative abundances of elements in the
solar system and equilibrium thermodynamic data, both the type of condensing phases and the
order of condensation could be determined . The calculations of Lord (1965) showed that
high-temperature solid condensates would include refractory Ca, AI and Ti compounds. The
more comprehensive equilibrium calculations of Grossman (1972) demonstrated that the
chemistry and mineralogy expected from high-temperature solid condensates from a gas of
solar composition closely resembled the Ca, Al-rich refractory inclusions (CAI) from C3V
meteorites. While Grossman (1972) considered CAl and their mineral constituents to be the
result of condensation from a vapor, it is now generally agreed that this model is not tenable.
However, the major element bulk chemistry of CAl are consistent with the idea of Lord
(1965) and Grossman (1972) that they are comprised of early condensate material.
Extensive petrologic, trace element and isotopic studies have since been carried out on CAl
from Allende and other carbonaceous chondrites and have provided important clues into the
details of how they formed (cf. Grossman, 1980; MacPherson et al., 1988). These
investigations have demonstrated that many CAl have undergone melting, recrystallization and
metamorphic alteration in the nebula or in planetary bodies, but the basic premise that the
starting materials for CAl condensed from the early solar nebula has survived detailed

46
scrutiny. Although the condensate origin for CAl has become a well accepted hypothesis, it
must be remembered that the thermodynamic equilibrium between a nebular gas and
condensed phases is equivalent for partial condensation and partial evaporation (Kurat et al.,
1975; Hashimoto et al. , 1979). Therefore, an origin for CAl as volatilization residues of
chondritic material is a viable alternative to condensation.
Trace element analyses of CAl have demonstrated that they are enriched relative to cosmic
proportions in the elements that are most refractory in a gas of solar composition. Reflecting
this trend is a 10 to 20 x enrichment of the PGE in CAl (with the exception of the less
refractory PGE Pd) relative to C1 chondrites (Grossman and Ganapathy, 1976; Mason and
Taylor, 1982; Fig. 2. 11). This is consistent with the high condensation temperatures of all of
the PGE (except Pd) in a gas of solar composition (Table 2 .3).
An important observation is that although the PGE (except Pd) are uniformly enriched in
most CAl, they are highly fractionated into a variety of compositions of J.Lm-sized alloy
grains, each containing only a few of the PGE. These PGE alloys most commonly occur in
10-1000 JLm multiphase opaque assemblages which also contain Ni-Fe alloys, sulfides and
oxides . PGE alloys are also sometimes found as small (0.5-5 J.Lm) grains isolated in the
silicate phases of CAl (Wark, 1986; Bischoff and Palme, 1987).
The pattern of PGE fractionation in CAl is demonstrated by the neutron activation data of
Bischoff and Palme (1987) for a bulk CAl and individual opaque assemblages separated from
the same CAl. The data were normalized to C1 chondrites and are plotted on Fig. 3.1 . Two
large (20-50 J.Lm) opaque assemblages that were each mechanically separated have highly
fractionated PGE patterns with -10" x chondritic W, Re Os and Ir, but only -1Q3 x
chondritic Mo, Ru and Pt. However, when an aggregate of five "tiny" opaque assemblages
along with adhering silicate material were analyzed together, they averaged out to a flat

47
Fig. 3.1 Chondrite normalized concentrations of refractory elements in one bulk sample, one
aggregate of five opaque assemblages and two mechanically separated opaque assemblages
from Allende CAl A37 (data from Bischoff and Palme, 1987). See text for discussion.

48
Allende CAl A37
10'- Individual opaque assemblages
{/) Q) -~ -o c:: 0
103 ~ () Aggregate of 5
- opaque assemblages ()
.......... Q)
Q
E 10
2 ro (/)
: Bulk CAl
::::: ~ • W Re Os lr Mo Ru Pt

49
chondritic pattern (at somewhat lower concentration due to dilution by silicate). This
indicates that some opaque assemblages have abundance patterns that are complimentary to the
patterns of the two individual opaque assemblages on Fig. 3 .1. Finally, when the bulk CAl
was analyzed the contributions from all of the opaque assemblages in it averaged to a
relatively "flat" chondrite normalized pattern at the 10 to 20 x chondritic level (Fig. 3.1).
Any explanation for the origin of PGE-rich alloys in CAl must explain why such
compositionally diverse grains tend to average to a composition for each bulk CAl that is
uniformly enriched in PGE relative to chondritic.
Owing in part to the extremely refractory nature of the PGE alloys observed, early
workers suggested that the individual metal grains in opaque assemblages were the oldest solid
materials in the Solar System and had formed either as condensates in expanding supernova
envelopes (outside the Solar System) or as the earliest high-temperature nebular condensates
(El Goresy et al. , 1978). The opaque assemblages in which PGE alloys are found were also
assumed to be exotic and to have formed by condensation of metals, sulfides and oxides from
the solar nebula before the crystallization of host CAl (El Goresy et al. , 1978; Armstrong et
al., 1985, 1987). If this were the case it would require a wide range in temperature, A and
A in the solar nebula, and that the nebula was turbulent enough to mix together grains
formed under highly variable conditions.
It was implied that PGE-rich alloys in opaque assemblages might have an extraordinary
isotopic composition, as they would reflect a single pre-solar stellar source. To test this
possibility, Hutcheon et al. (1987) measured Ru isotope ratios of PGE alloys from opaque
assemblages and isolated PGE alloy grains to a precision of ± 8° I oo using the ion microprobe.
Poths et al. (1987) measured Ru isotopes in magnetic and nonmagnetic fractions of refractory
meteorite inclusions to a precision of ± 1 o I oo by thermal ionization mass spectrometry. In

50
both studies Ru was found to be isotopically normal within the resolution of each of the
analytical techniques, suggesting that PGE alloys are not composed of isotopically exotic
material from extra-solar sources, but instead contain the normal solar mixture of isotopic
abundances homogenized from various nucleosynthetic sources .
As a result of the exotic history originally proposed for opaque assemblages, they are often
referred to in the literature as "Fremdlinge," which is German for strangers or foreigners.
The term "Fremdlinge" carries an inappropriate genetic connotation. Instead, I will refer to
these multiphase objects by the simple descriptive name "opaque assemblages. "
3.2 KINETICS OF GRAIN CONDENSATION
Several workers have considered the question of whether the PGE in CAl could have
condensed directly from the solar nebula. For the purpose of this discussion one must
differentiate between condensation of the individual metallic phases in opaque assemblages,
condensation of each opaque assemblages as a single precursor alloy, and condensation of the
bulk PGE content of entire CAL Palme and Wlotzka (1976) assumed that individual metallic
phases in opaque assemblages condensed directly from the nebula and used the kinetic theory
of gases to calculate whether J.Lm-sized PGE alloy grains, such as those rich in Os which are
often observed in opaque assemblages, could grow by condensation from a nebular gas in a
reasonable time period. Based on the number density and mean velocity of Os atoms in the
nebula at a total pressure of 1 0'3 atm and at a temperature of 2000K, they derived the
following expression for the minimum time needed to grow a cluster of N atoms (;N):
N
TN(sec) = (2.5xlQ10) (flo.)"1 f 11;'213 dll; = (7.5xlQ1~ (flo.)"1 (N)113
Il;o

51
where no. is the Os atom density in atoms/em) in the original nebular gas and 11;0 is the
number of Os atoms in the first Os cluster formed (11;0 < < N).
From this expression one can calculate that at least 1()3 years are needed to grow a typical
1 J.liD grain of Os (101s atoms) in the nebula. It would take approximately the same amount of
time to condense these 101s Os atoms into a 5 11m a1loy grain containing 1% Os. At a total
nebular pressure of 10·3 atm, 11o. is lOS atoms/cm3 and, therefore, for each lJ.lm Os grain that
condensed a to-' m3 volume of nebular gas would have to be entirely depleted of Os.
One can use the timescale necessary to grow Os grains by condensation to explore whether
the metallic phases in opaque assemblages were more likely to have formed in the solar
nebula or in a supernova envelope. Estimates for the "cooling time" for various portions of
the solar nebula are very uncertain but are generally much shorter than the calculated lOl
years. For instance, cooling between 1500K and 1700K is believed to have occurred in a
time on the order of 1 year (Cameron, 1962; Larimer and Anders, 1967). Supernovae,
however, cool at even faster rates and because of their low density are much less appropriate
environments for condensation of PGE than the solar nebula. According to the grain growth
equation of Palme and Wlotzka (1976) and the supernova density and thermal history
suggested by Lattimer et al. (1978), an average Os atom will have only 10'12 collisions with
another Os atom during the entire cooling history of a supernova envelope (Anders, 1987).
Abundant elements such as Mg or Al can yield J.tm-sized condensates in the few months
available for condensation (Lattimer et al., 1978), but rare elements such as the PGE cannot.
If the PGE alloys observed in opaque assemblages did form by condensation from the solar
nebula, it must have been under conditions highly conducive to nucleation and at low
supersaturation, so that atoms could chose their preferred condensation sites and form a
variety of PGE-rich phases rather than forming a single alloy (Blander and Katz, 1967) . As

52
pointed out by Anders (1987), it is difficult to imagine how the required high temperatures
were sustained in the nebula for so long ( > 1o:' years), and it is even more difficult to see
how the nebular composition could have been regulated to maintain low supersaturation. If
the condensate grains contained only 1()6 Os atoms, the equation above indicates that
condensation could take place on a - 1 year timescale. In this case, the observed
1 JLm PGE-rich alloy grains would have had to form out of billions of tiny particles by some
secondary collection process. Therefore, it would be the bulk PGE content of CAl that
reflects the nebular condensation process rather than the individual metallic phases or bulk
opaque assemblages that are presently observed in CAl.
3.3 COMPOSITION OF CONDENSATE ALLOYS
Palme and Wlotzka (1976) calculated the composition of a single homogeneous equilibrium
condensate alloy as a function of temperature at a total nebular pressure of 10·3 atm. The
result of this calculation is shown graphically on Figs. 3.2 and 3.3 (modified from Palme and
Wlotzka, 1976). The fractions of each element condensed as a function of temperature are
plotted on Fig. 3.2 for condensation of 13 siderophile metals into an alloy containing all 13
metals, assuming ideal solid solution. The temperatures at which 50% of each metal is
condensed (see Table 2.3) decreases in the order:
w~R~s~lr==>M~Ru~~Rh~~Ni~F~Pd~r.
The total condensate composition is shown as a function of temperature in Fig. 3.3. The
initial equilibrium condensate is an alloy of mostly Os, W and Re. As the temperature
decreases, significant fractions of the other metals condense in the condensation order given
above. Once a solid alloy has condensed, each metal will dissolve in the grain at a
composition level that balances the partial pressure of each element in the nebular gas. Since

53
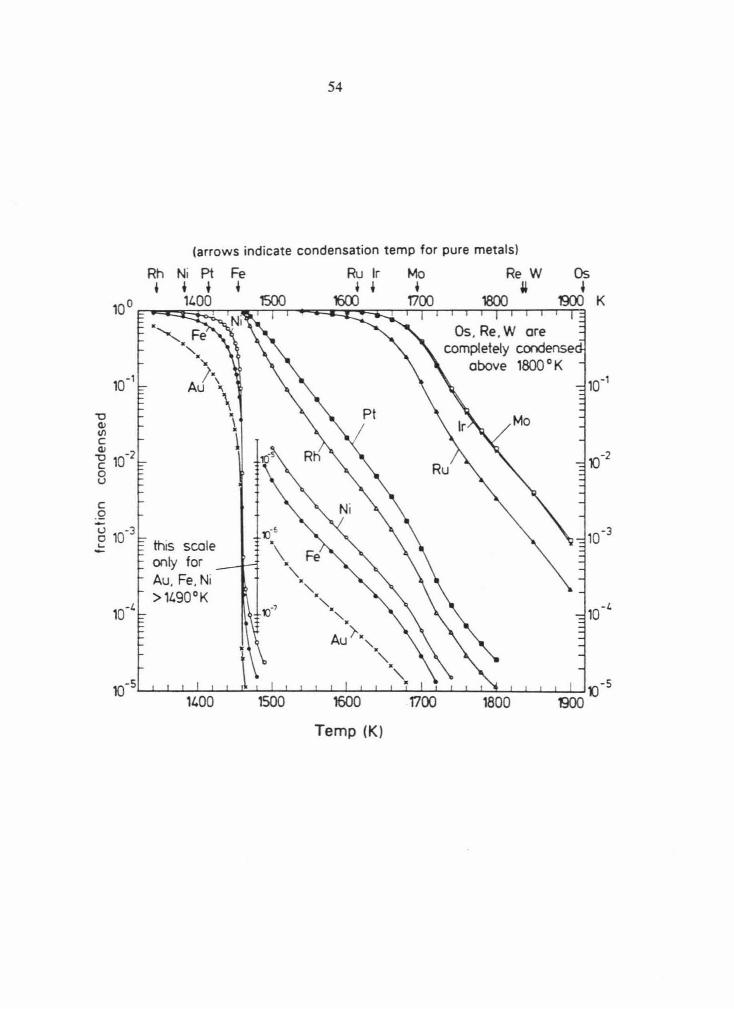
Fig. 3.2 Calculated condensation curves for Mo, lr, Ru, Rh, Pt, Ni, Fe, and Au condensing
from a solar gas with total pressure of I0-3 atm into an alloy of 13 metals (Os, Re, W, Mo,
Ir, Ru, Rh, Pt, Ni, Fe, Co, Pd and Au). Ideal solid solution was assumed for all metals.
Modified from Palme and Wlotzka (1976). See text for discussion.
c .Q
10°
54
(arrows indicate condensation temp for pure metals)
Rh Ni Pt
• t t 11.00
this scale only for Au. Fe. Ni > 11.90°K
Fe Ru lr t t t
1500 1600
Mo Re W Os
• i ~ TlOO 1800 00)
Os. Re . W are completely condense
above 1800 ° K
~-5~~~~~~~~~~~~~~~~~~~~~~~ 11.00 1500 1600 1700 1800
Temp (K)
K

55
Fig. 3.3 The condensation curves from Fig. 3.2 renormalized to weight fractions. The
composition of an alloy in equilibrium with a solar gas at a given temperature can be read
from this diagram. Modified from Palme and Wlotzka (1976). See text for discussion.

c .Q -u 0 ~
~ 0.1% · ~
~
0.01% (100~
0.001% (10ppm)
u.oo
56
1600
Mo --·-·-·-·-·-·-· Ru
1600
Temp {K)
0.01% 100ppm)

57
Fe and Ni are highly abundant elements, they have high partial pressures in the nebula.
Therefore, even a small fraction condensed leads to substantial concentrations of Fe and Ni in
even the highest temperature condensates. As the temperature decreases, the concentration of
Fe and Ni in the refractory alloys increases until the alloys are nearly 100% Fe+ Ni, at a
temperature just above the condensation temperature of pure Fe. Thus, the amount of Fe+ Ni
relative to PGE in a condensate alloy indicates the temperature at which it ceased to be in
equilibrium with the solar nebula. As can be seen on Fig . 3.2, at all temperatures below
1466K W, Re, Mo and all of the PGE (except Pd) are fully condensed and would be found in
a condensate alloy in cosmic relative abundances. Since Pd condenses at a lower temperature
than Fe and Ni it will be depleted relative to cosmic abundances in all high temperature
condensates . At temperatures above -1500K depletions of Rh and Pt relative to their cosmic
abundances would be observed, and at temperatures above -1600K depletions of Ru would
also be observed.
The average abundances of all of the PGE in bulk CAl are plotted on Fig. 2. 11 normalized
to Cl chondrites and show that Pd is depleted by a factor of -10 relative to the other PGE
and Rh and Pt are depleted by a factor of -2. The depletion of Pt by a factor of -2 is also
illustrated on the bulk CAl pattern from Fig. 3.1. Thus, the relative abundances of PGE in
bulk CAl are consistent with alloy condensation at a temperature ~ 1500K but ~ 1600K.
However, to explain the highly variable refractory siderophile patterns in individual opaque
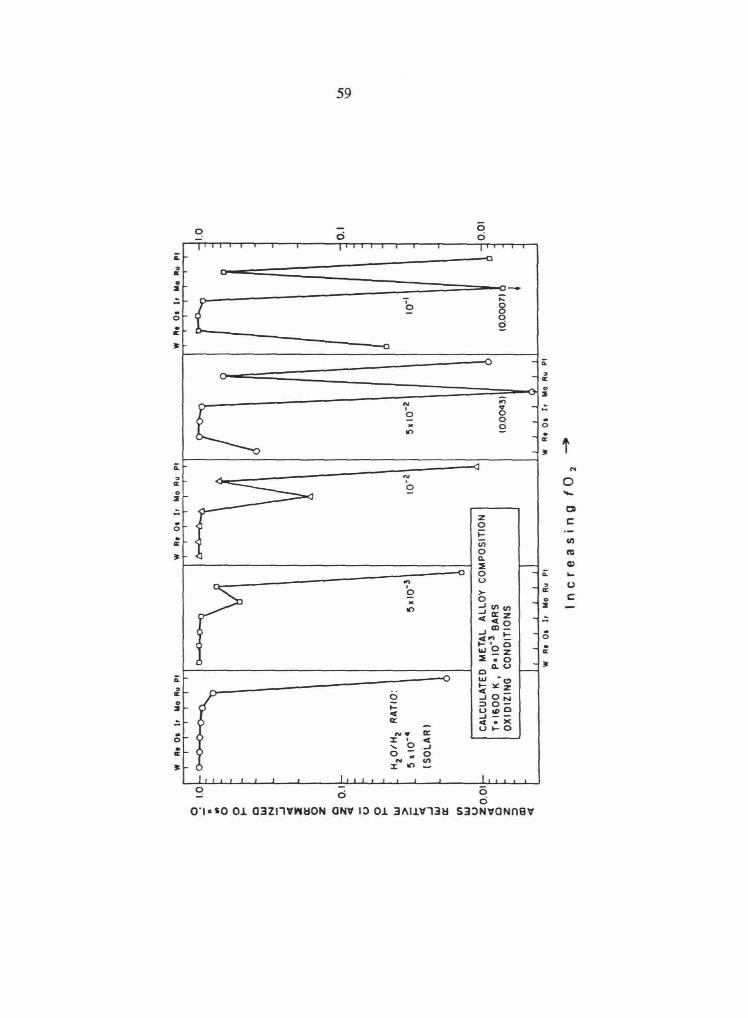
assemblages by condensation is far more difficult. Fegley and Palme (1985) attempted to do
this by calculating the abundance patterns of condensate alloys atjo2's more oxidizing than an
equilibrium solar gas . Fig. 3.4 shows the relative abundances of W, Re, Os, lr, Mo, Ru and
Pt in a condensate alloy at 1600K for increasing values of H20/H2 (which corresponds to
increasingfoz) . The pattern on the far left is for a solar gas and shows depletions in Pt and

58
Fig. 3.4 The calculated ratios ofW, Re, lr, Mo, Ru, and Pt to Os in a condensate alloy in
equilibrium with a solar gas at 1600K (from Fegley and Palme, 1985). The assumptions
made in this calculation are the same as in Figs 3.2 and 3.3 except that the calculation is
repeated at increasingly higher values of }02• See text for discussion.
~
1.0
• ... 0 0 .....
0 laJ
N
..J
c :1
a:
0 z ~ 0
. c (.
)
0 .....
laJ > ~ ..J
laJ a:
If)
laJ
(.) ~0
.0
0 z ;:)
Cl) c
I I
W
!It
01
lr
M
o R
u P
I W
R
t O
a lr
M
o ll
u
PI
H20
1H~ ~ATIO:
5.
10
"4 5
a10"
3 10
-~
(SO
LA
RI CA
LCU
LAT
ED
M
ET
AL
ALL
OY
C
OM
PO
SIT
ION
T
• 1
60
0 K
, P
•I0
"3 B
AR
S
OX
IDIZ
ING
C
ON
DIT
ION
S
W
Rt
Ot
lr
Mo
Ru
PI
Incre
asin
g f0
2
W lit
Ot
lr
Mo
llu
PI
5a10
-~
10"1
10.0
04
3)
10.0
0071
l
W
Rt
Ot
lr
Mo
Ru
PI
~
. - - . - - - - - - - - - - -
.0
0.1
0.0
1
VI
\0

60
Ru at 1600K similar to those calculated by Palme and Wlotzka (1976; Fig. 3.3). With
increasing H20/H2 (andfi:>J depletions in Mo and W develop as a result of the greater
stability of Mo and W oxides relative to the PGE oxides (Fig. 3.4). Fegley and Palme (1985)
matched the compositions of calculated condensate alloys to the compositions of some opaque
assemblages that display depletions in W and Mo relative to cosmic values. This was done by
allowing both the temperature of removal of the alloy from the nebular gas and the H20/H2
ratio of the nebular gas to vary during condensation. They argued that the non-solar
refractory siderophile patterns that are sometimes observed for opaque assemblages were the
result of condensation atfi:>2's 1Q3 to 1Q4 times more oxidizing than an equilibrium solar gas .
For example, to match the refractory siderophile element composition of the LE0-1 opaque
assemblage reported by Palme et al. (1982), Fegley and Palme required condensation to cease
at 1620K and for the nebular gas H20/H2 ratio to be considerably higher than solar value of
2xl0·2 (Fig. 3.5). The depletions of the less refractory elements Ru and Pt are roughly
matched in Fig. 3.5 by ending condensation at a temperature high enough that they have not
fully condensed. The depletions in W and Mo are roughly matched in Fig. 3.5 by
condensation under oxidizing conditions which results in W and Mo remaining in the vapor
phase as volatile oxides.
Although the model of Fegley and Palme (1985) successfully reproduces refractory
siderophile abundance patterns of individual opaque assemblages, there are alternate
explanations for these non-solar patterns which include 1) redistribution of W and Mo as
gaseous hydroxides during low-temperature alteration (e.g. , Beckett et al., 1988) and 2)
redistribution of W, Mo, Ru and Pt (which form sulfides at lower A's than Re, Os or Ir) by
low-temperature sulfidation of alloys during planetary metamorphism (App. ill). Each of the
alternate explanations could result in W, Mo, Ru and Pt redistribution from individual opaque

61
Fig. 3.5 Measured and calculated relative refractory siderophile element abundances in an
opaque assemblage from the Leoville meteorite (LE0-1) (from Fegley and Palme, 1985).
Solid lines connect the neutron activation analyses of the opaque assemblage from Palme et
al. (1982). Dashed lines connect points calculated for an alloy condensed from the nebula
under non-solar oxidizing conditions at 1620K. See text for discussion.

62
Os
0 1.0 ~
• .. 0
~ 0 w N ' _, \ 4 I ~
' a:: 0 .1 I 0 z \ 0 ' z I 4 ' u I
' 0 \I
' ...... 0 w CALCULATED/I >
' ...... 0 .0 1 1620 K
' 4 _, IH20/H2l= 2110-2 I w ' a:: ' "' 0
w u METAL ALLOY z 4 OXIDIZ ING CONDITIONS, 10-3 BARS 0 z :::> lD 4 0 .001
w Re Os Ir Mo Pt
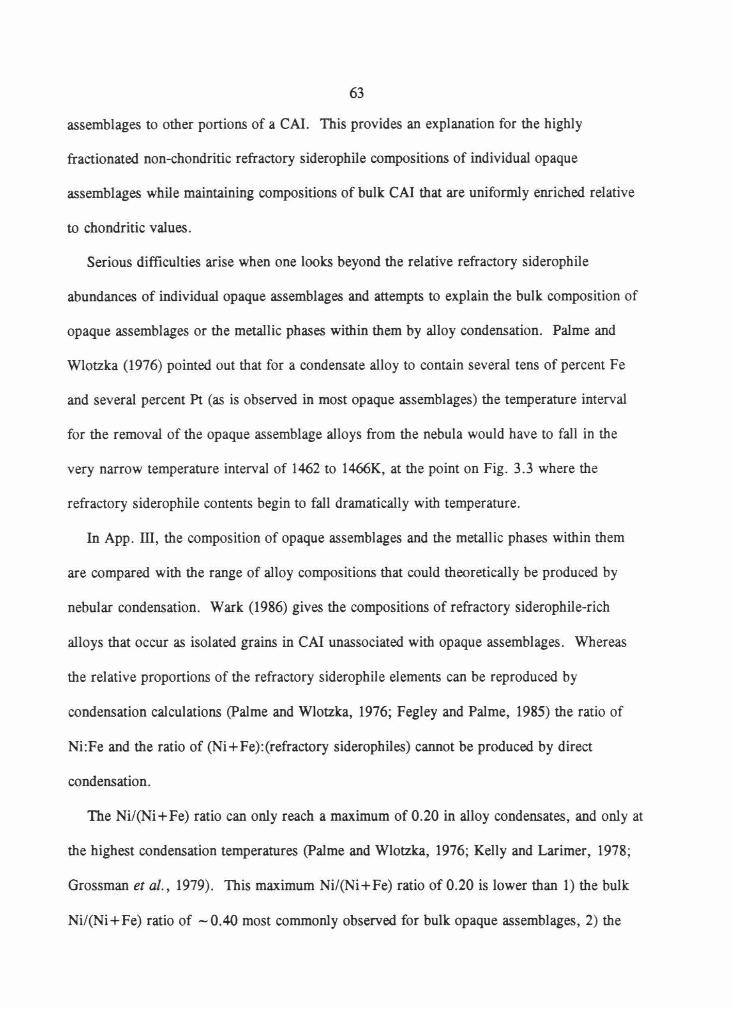
63
assemblages to other portions of a CAl. This provides an explanation for the highly
fractionated non-chondritic refractory siderophile compositions of individual opaque
assemblages while maintaining compositions of bulk CAl that are uniformly enriched relative
to chondritic values.
Serious difficulties arise when one looks beyond the relative refractory siderophile
abundances of individual opaque assemblages and attempts to explain the bulk composition of
opaque assemblages or the metallic phases within them by alloy condensation. Palme and
Wlotzka (1976) pointed out that for a condensate alloy to contain several tens of percent Fe
and several percent Pt (as is observed in most opaque assemblages) the temperature interval
for the removal of the opaque assemblage alloys from the nebula would have to fall in the
very narrow temperature interval of 1462 to 1466K, at the point on Fig. 3.3 where the
refractory siderophile contents begin to fall dramatically with temperature.
In App. III, the composition of opaque assemblages and the metallic phases within them
are compared with the range of alloy compositions that could theoretically be produced by
nebular condensation. Wark (1986) gives the compositions of refractory siderophile-rich
alloys that occur as isolated grains in CAl unassociated with opaque assemblages. Whereas
the relative proportions of the refractory siderophile elements can be reproduced by
condensation calculations (Palme and Wlotzka, 1976; Fegley and Palme, 1985) the ratio of
Ni:Fe and the ratio of (Ni + Fe):(refractory siderophiles) cannot be produced by direct
condensation.
The Ni/(Ni +Fe) ratio can only reach a maximum of 0.20 in alloy condensates, and only at
the highest condensation temperatures (Palme and Wlotzka, 1976; Kelly and Larimer, 1978;
Grossman eta/. , 1979). This maximum Ni/(Ni+Fe) ratio of0.20 is lower than 1) the bulk
Ni/(Ni +Fe) ratio of -0.40 most commonly observed for bulk opaque assemblages, 2) the

64
Ni/(Ni +Fe) ratio of 0.67 most commonly observed in alloys from opaque assemblages, and
3) the Ni/(Ni +Fe) ratio of most of the isolated alloy grains which ranges from 0.10 to 0.67
(Wark, 1986). With decreasing temperature, the Ni/(Ni +Fe) ratio is expected to decrease
from 0.20 to the cosmic value of 0.06 at temperatures below the condensation temperature of
pure Fe.
The concentration of each refractory siderophile element in a condensing alloy is expected
to drop rapidly from the 1 to 10% level at high temperatures to the 10 ppm level below the
condensation temperature of Fe (Fig. 3.3). Therefore, even the unusually Fe-rich alloys from
opaque assemblages in the Leoville meteorite (described in App. III), which have nearly
cosmic Ni/(Ni +Fe), could not have formed by condensation. The low condensation
temperature necessary to produce the cosmic Ni/(Ni +Fe) refractory siderophile contents
would result in an alloy with only -10 ppm of each PGE, much lower than the 1 to 5%
levels observed. It appears that the only way the composition of metal from the Leoville
opaque assemblages could have formed by condensation is if it represents a mixture of alloys
formed during two intervals of condensation; i.e., a mixture of a high-temperature condensate
(high refractory siderophiles) and a lower-temperature condensate (low Ni/(Ni +Fe)).
3.4 CONDENSATE ALLOYS DURING METEORITE PETROGENESIS
Sharp phase boundaries are found between metallic Ni-Fe phases and PGE-Fe phases in
opaque assemblages in CAl. Following a report of such contacts between Pt-rich metal and
Ni-rich metal by El Goresy et al. (1978), Arrhenius and Raub (1978) calculated the
constraints that these contacts placed on the cooling history of CAl. Arrhenius and Raub
assumed that these metals were early nebular condensates and that they had been aggregated
before the melting of refractory inclusions, as suggested by El Goresy et al. (1978). Using

65
the diffusion coefficient for Pt in Ni, Arrhenius and Raub (1978) calculated that the sharp
phase boundaries could not have existed at CAl liquidus or condensation temperatures
(1600-1700K) for more than a fraction of a second, and could not have existed at 900K for
more than one day without developing measurable diffusion gradients due to the dissolution of
Pt in the -yNi-Fe phase. They concluded that CAl must have melted and recrystallized during
extremely short thermal pulses.
Recent studies of opaque assemblages in CAl (Armstrong et al., 1985, 1987) have not
confirmed the original report (El Goresy et al., 1978) of Pt-rich metallic phases in contact
with Ni-Fe-rich metallic phases (as a rule, Pt-rich metallic phases are surrounded by sulfide);
however, the approach taken by Arrhenius and Raub (1978) is stiJJ useful and can be used to
interpret the commonly observed boundaries between €Ru-Fe and -yNi-Fe in opaque
assemblages. Using diffusion coefficients for Ru in Ni as a function of temperature from
App. 1 as a simplified analog for the diffusion of Ru in Ni-Fe in opaque assemblages, I have
calculated isothermal survival times for sharp boundaries between ERu-Fe grains and
surrounding -yNi-Fe. Details of the calculations are given in App. ill . The main conclusion
is that once ERu-Fe and -yNi-Fe are juxtaposed, the sharp metallic phase boundaries observed
between these phase can only be maintained for < 4 seconds at 1673K, < 28 seconds at
1473K or <2 weeks at 873K. This result is similar to that of Arrhenius and Raub (1978) and
suggests that if ERu-Fe and -yNi-Fe formed separately by condensation and were later
juxtaposed, the host CAl must have melted and cooled during extremely short thermal pulses.
It has been inferred based on experimental studies that during the melting and
crystallization of the silicate minerals in CAl that host opaque assemblages, a maximum
temperature between 1700 and 1550K was reached (Stolper, 1982), and crystallization
occurred during slow cooling at a rate of 0.5-20Khr·1 (Stolper and Paque, 1986). For even
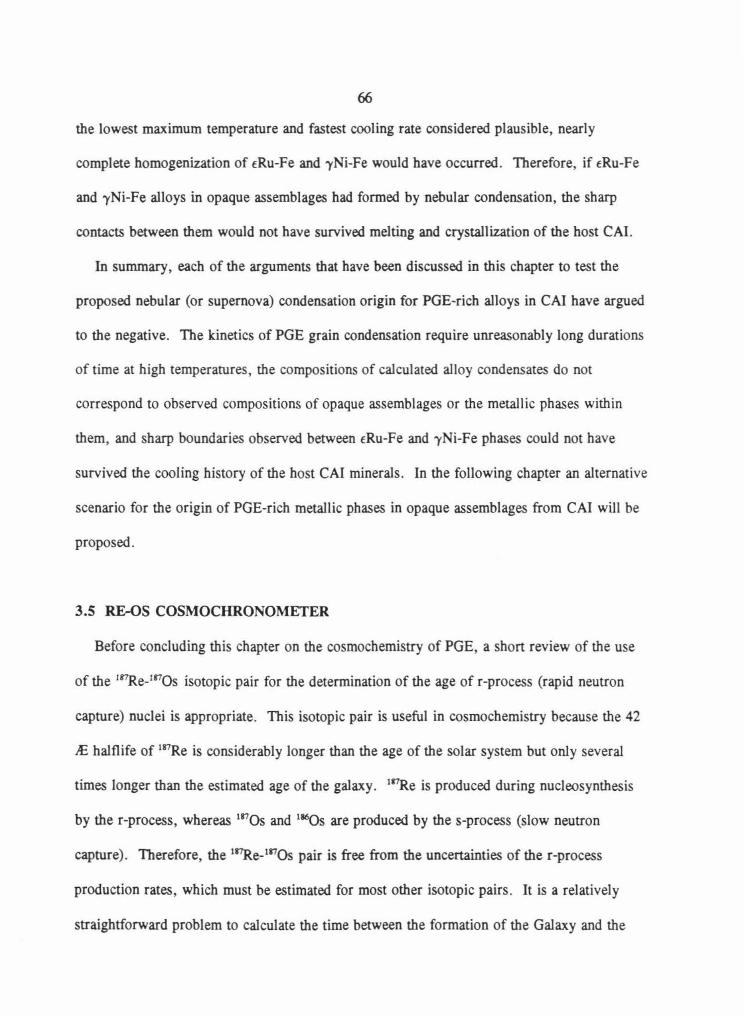
66
the lowest maximum temperature and fastest cooling rate considered plausible, nearly
complete homogenization of ERu-Fe and -yNi-Fe would have occurred. Therefore, if ERu-Fe
and -yNi-Fe alloys in opaque assemblages had formed by nebular condensation, the sharp
contacts between them would not have survived melting and crystallization of the host CAL
In summary, each of the arguments that have been discussed in this chapter to test the
proposed nebular (or supernova) condensation origin for PGE-rich alloys in CAl have argued
to the negative. The kinetics of PGE grain condensation require unreasonably long durations
of time at high temperatures, the compositions of calculated alloy condensates do not
correspond to observed compositions of opaque assemblages or the metallic phases within
them, and sharp boundaries observed between ERu-Fe and -yNi-Fe phases could not have
survived the cooling history of the host CAl minerals. In the following chapter an alternative
scenario for the origin of PGE-rich metallic phases in opaque assemblages from CAl will be
proposed.
3.5 RFA)S COSMOCHRONOMETER
Before concluding this chapter on the cosmochemistry of PGE, a short review of the use
of the 1B7Re-1170s isotopic pair for the determination of the age of r-process (rapid neutron
capture) nuclei is appropriate. This isotopic pair is useful in cosmochemistry because the 42
JE halflife of 187Re is considerably longer than the age of the solar system but only several
times longer than the estimated age of the galaxy. 1~e is produced during nucleosynthesis
by the r-process, whereas 1870s and 1116Qs are produced by the s-process (slow neutron
capture). Therefore, the 1~e-1810s pair is free from the uncertainties of the r-process
production rates, which must be estimated for most other isotopic pairs. It is a relatively
straightforward problem to calculate the time between the formation of the Galaxy and the

67
formation of the Solar System for the limiting cases of sudden and steady-state
nucleosynthesis if one knows 1) the ratio of 1170s to '16Qs produced during nucleosynthesis, 2)
the decay rate of '~e. and 3) the Re/Os and 1170si'I6Qs ratios at the time of formation of the
Solar System (Clayton, 1964). Luck and Allegre (1983) most recently determined parameters
2 and 3 above from isotopic measurements of meteorites, and estimated parameter 1 from the
neutron capture cross-sections of 1170s and '16Qs as a function of temperature after including
the contributions from a -9.8 keV excited state of 1170s. Based on these data Luck and
Allegre calculated the extreme limits on the age of the Galaxy as 10.6 and 16.8 JE for sudden
and steady-state nucleosynthesis, respectively. Yokai et al. (1983) pointed out that there are
additional uncertainties in this calculation because at the extreme temperatures of a stellar
environment 1) the s· decay rate of '~e may be substantially greater than in the laboratory,
2) '~e may be produced from 1170s by electron capture, and 3) there may be previously
unrecognized s-process branchings in the W-Os region. Nevertheless, a treatment of these
additional factors by Yokai et al. (1983) results in an age for the Galaxy of 11 to 15 JE, in
agreement with previous results but with somewhat greater uncertainty.

68
CHAPTER 4. GEOCHEMISTRY OF PT -GROUP ELEMENTS IN CAl
Pt-group elements inCa, Al-rich refractory inclusions (CAl) are highly concentrated into
metallic phases which occur along with sulfides and oxides in multiphase opaque assemblages .
The opaque assemblages occur as inclusions in the major silicate minerals including melilite,
fassaite and anorthite. Based on the extremely high melting and condensation temperatures of
the PGE, many workers have assumed that PGE-rich metals found in CAl are primordial in
origin and formed by high temperature condensation in supernovae or in the solar nebular
(e.g., El Goresy et al., 1978; Blander et al., 1980; Armstrong et al., 1985). However, as
discussed in the previous chapter, direct condensation from a supernova or the solar nebular
does not appear to be a likely explanation for the origin of these PGE-rich metallic phases.
Since little was known previously about subsolidus phase equilibria or diffusion kinetics in
PGE-rich metallic systems it was difficult to assess the plausibility of forming PGE-rich
metallic phases by processes other than condensation. To test whether PGE-rich metallic
phases observed in CAl could have formed by subsolidus reactions I have 1) conducted
diffusion and phase equilibria studies in Ni-Fe-PGE systems, and 2) performed detailed
analytical studies of PGE-rich phases in CAl for comparison with the experimental results.
The experimental methods and results are presented in App . I, and the analytical data for
PGE-rich phases in opaque assemblages are presented in App. Ill. In this chapter, I will first
describe the opaque assemblages from CAl that were studied in App. ill and provide
reproductions of scanning electron micrographs that are of higher quality than was possible in
published articles. The reader should note that I will not reiterate the contents of App. I, II
and ill but will instead summarize the predicted geochemical behavior of PGE during the
multistage evolution of CAl based on the model for the origin of opaque assemblages
developed in App. n and ill . The constraints that this model places on the conditions under

69
which CAl were melted and subsequently equilibrated will be reviewed, and previous models
will be compared with the model presented here.
4.1 DESCRIPTION OF OPAQUE ASSEMBLAGES
Opaque assemblages in CAl are generally spheroidal, 10-1000 J.Lm in diameter and
consist primarily of ')'Ni-Fe, magnetite (F~04), pentlandite [(Fe,Ni)~8] , pyrrhotite (Fe1 • .$)
and apatite [Ca~(P04)3 (F,OH,Cl)] . They also contain minor amounts of phases rich in
refractory siderophile elements which include Pt-group element-rich metallic phases (most
commonly t:Ru-Fe), molybdenite (MoS~ and scheelite-powellite solid solution [Ca(W,Mo)04] .
Five opaque assemblages from Type B CAl in C3V chondrites were chosen for detailed
study. Type B inclusions contain melilite, fassaite, anorthite and spinel as the major mineral
phases (e.g., Grossman, 1980). They are from Allende samples JIM (Brandstatter and Kurat,
1983), USNM 5241 ("WILLY" and "F3"; Armstrong et al. , 1985) and EGG3 (Meeker et al.,
1983), and from Leoville sample UNM 575 (Kracher et al., 1985).
The individual opaque assemblages will be referred to as "JIM-OA1," "WILLY," "F3,"
"EGG3-0A1" and "LE0575-0A1" respectively. The Allende meteorite belongs to the
"oxidized subgroup" of C3V meteorites, which generally contains Ni-rich ')'Ni-Fe alloys,
whereas the Leoville meteorite belongs to the "reduced subgroup," which generally contains
Fe-rich 'Y and a Ni-Fe alloys (McSween, 1977). The a, f and 'Y designations for the metallic
solid solution fields in the Ni-Fe-Ru-rich system are based on compositional data rather than
direct determination of crystal structure.
JIM-OA1 has a cross-sectional diameter of -30 J.Lm and consists of the phases ')'Ni-Fe,
pyrrhotite, t:Ru-Fe, apatite, molybdenite and magnetite in order of decreasing abundance.
The t:Ru-Fe phase occurs within ')'Ni-Fe, pyrrhotite and magnetite, but not within apatite or

70
molybdenite (Fig. 4.1). Typically, €Ru-Fe grains within yNi-Fe range in size from 0.3 to 1.0
JLm, whereas those within pyrrhotite range from 0.1 to 0.3 JLm. One unusually large (3 x5
JLm) €Ru-Fe grain occurs in JIM-CAl adjacent to yNi-Fe, pyrrhotite and magnetite (Fig. 4 .1).
Willy has a cross-sectional diameter of - 150 JLm and consists of the phases magnetite,
yNi-Fe, pyrrhotite, scheelite, apatite, €Ru-Fe and molybdenite in order of decreasing
abundance (Armstrong et al., 1985). Magnetite and yNi-Fe are the two main phases and each
account for -45% of the cross-sectional area. €Ru-Fe grains are typically -1 11m in
diameter and occur surrounded by yNi-Fe and magnetite. A portion of Willy which shows
the magnetite outer rim and intergrown magnetite, -yNi-Fe, pyrrhotite and €Ru-Fe is shown in
Fig. 4.2.
F3 has a cross-sectional diameter of -30 J.Lm and consists of the phases magnetite, yNi
Fe, apatite and €Ru-Fe in order of decreasing abundance (Fig. 4.3). €Ru-Fe grains are
typically - 1 11m in diameter and occur in contact with both yNi-Fe and magnetite.
EGG3-0A1 has an irregular shape and is 5 x 15 11m in cross-section (Fig. 4.4). The Ni
rich mineralogy of EGG3-0A 1 is typical of opaque assemblages in the CAI EGG3 and
consists of very Ni-rich yNi-Fe, heazlewoodite (Ni3SJ, apatite, molybdenite and €Ru-Fe.
LE0575-0A1 has a cross-sectional diameter of about 15 11m and has a Fe-rich mineralogy
typical of opaque assemblages from the Leoville meteorite. It consists of the phases V -rich
magnetite, aFe (kamacite), €Ru-Fe and yNi-Fe (taenite) (Fig. 4.5). The €Ru-Fe and yNi-Fe
phases occur as -1 J.Lm wide lamellae in the aFe phase and V-rich magnetite occurs as a
partial rim around all of the metallic phases.

71
Fig. 4.1 Scanning electron microscope backscattered electron image of JIM-OAl. ru = tRu-
Fe, ni = -yNi-Fe, po = pyrrhotite, mo = molybdenite, ap = apatite and mt = magnetite.
Scale bar is 10 J.LID.

72

73
Fig. 4.2 Scanning electron microscope backscattered electron image of Willy . ru = t:Ru-Fe,
ni = )'Ni-Fe, po = pyrrhotite and mt = magnetite. Scale bar is 10 J.LID.

74
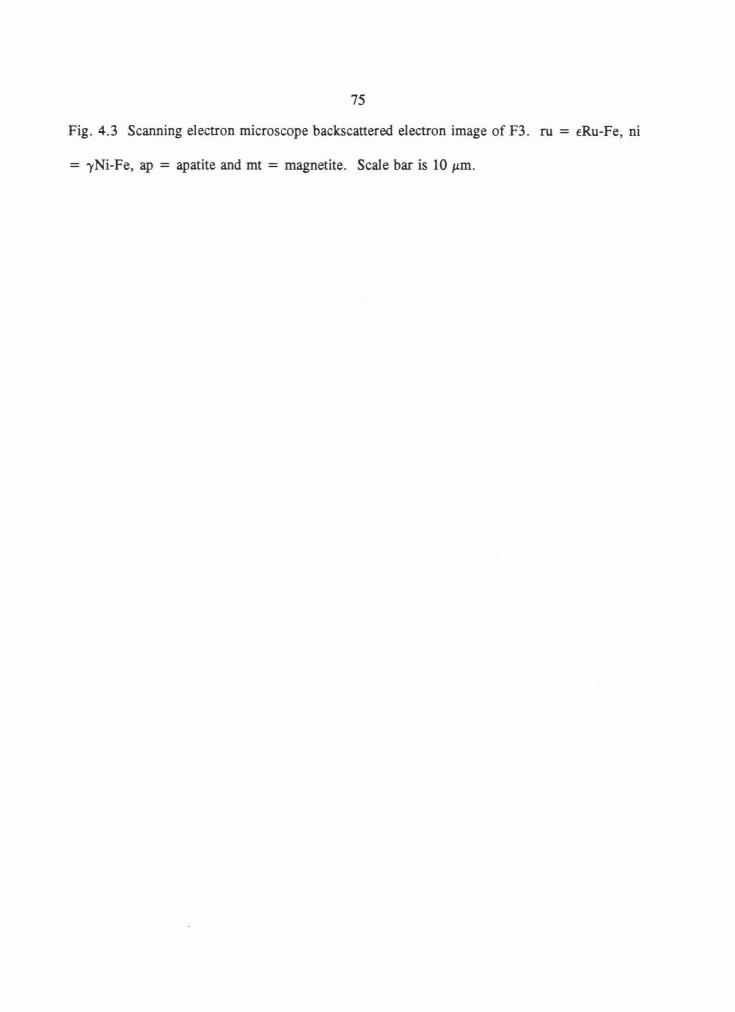
75
Fig. 4 .3 Scanning electron microscope backscattered electron image of F3. ru = eRu-Fe, ni
= -yNi-Fe, ap = apatite and mt = magnetite. Scale bar is 10 J.Lffi .

76

77
Fig. 4.4 Scanning electron microscope backscattered electron image of EGG3-0A1. ru =
eRu-Fe, ni = -yNi-Fe, hz = heazlewoodite, mo = molybdenite, ap = apatite and mt =
magnetite. Scale bar is 1 JLm.

78
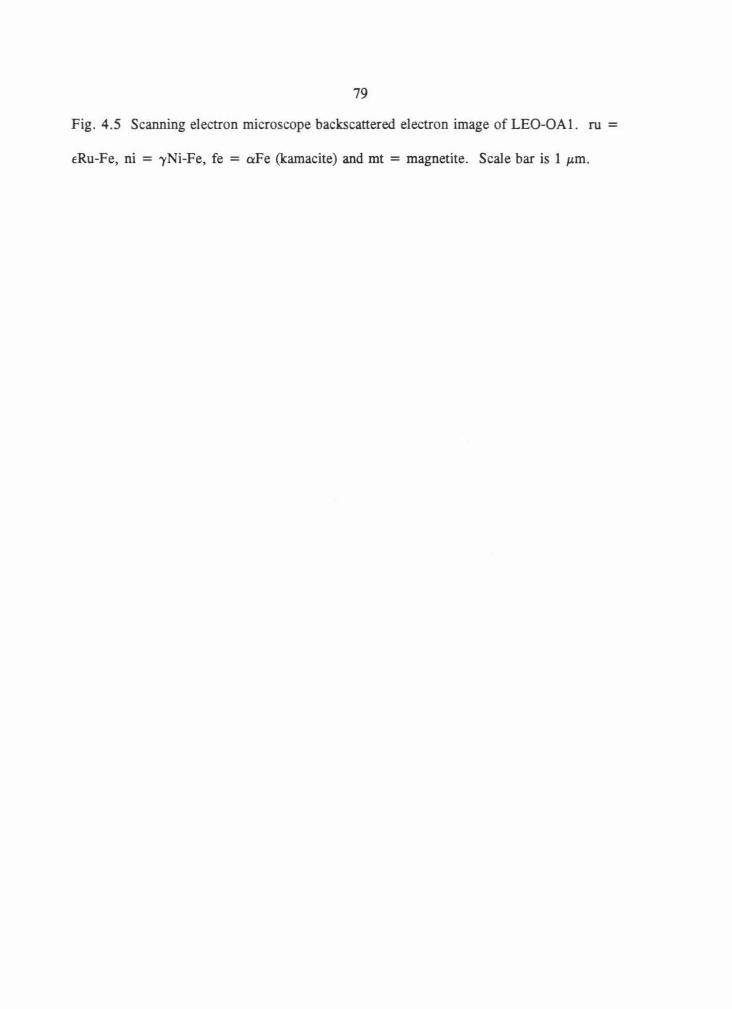
79
Fig. 4.5 Scanning electron microscope backscattered electron image of LEO-OAl. ru =
eRu-Fe, ni = -yNi-Fe, fe = aFe (kamacite) and mt = magnetite. Scale bar is 1 ILm.

80

81
4.2 CONDENSATION AND MELTING IN THE NEBULA
Condensation calculations presented by Palme and Wlotzka (1976) and discussed in the
previous chapter indicate that in a nebular environment the PGE would most likely condense
along with Fe and Ni as alloys. Unless the alloys were removed from the nebular gas at a
temperature above 1466K, the composition of the alloy would be predominantly F~N~ with
the PGE homogeneously dissolved at ppm concentration levels. These alloys would contain
approximately chondritic proportions of all of the PGE (except Pd) and would condense in the
same temperature interval as the refractory silicate and oxide phases from which CAl were
formed (Grossman, 1972) . Subsequent to condensation, many CAl melted in the solar nebula
forming rounded silicate droplets that slowly cooled and crystallized. Comparisons of CAl
silicate mineral textures, crystallization sequences, and major element zoning patterns indicate
that maximum temperatures of about 1670 to 1770K were reached, and that cooling during
crystallization proceeded at a relatively slow rate of about 0.5 to 20K per hour (Stolper and
Paque, 1986). Spinel would have been the only major phase in CAl not to have completely
melted under these conditions (Stolper, 1982). Thej02 in the solar nebula during the
crystallization of CAl is believed to have been very reducing and has been quantified from the
TP+ ffi4+ ratios in fassaites (Beckett et al., 1988) and the }02 calculated for an equilibrium
solar gas composition (Grossman, 1972). At the estimated temperature andj02 during CAl
melting, an immiscible Fe-Ni liquid phase would be expected to separate from the silicate
liquid . This immiscibility can be predicted because the./02 was far more reducing than the
iron-wiistite buffer, and has also been demonstrated experimentally in solar furnace
experiments in which Allende meteorite powders were melted under reducing conditions and
Fe-rich metal droplets were formed by reduction (King, 1983).
During the stage when CAI were partially molten, Fe and Ni would form the major

82
constituents of molten alloys. All other elements that are siderophile at a reducing ambient
.f02 would be expected to partition strongly into the metallic liquid. If opaque assemblages
acquired their bulk compositions from precursor metal droplets, then one would expect
opaque assemblages to be enriched in all of the siderophile elements. Consistent with this
idea is the observation that refractory siderophiles such as PGE, Mo, W and Re are highly
concentrated in opaque assemblages from CAl to -10" x chondritic values. The
concentration of refractory siderophiles into metal droplets in CAl is somewhat analogous to
planetary core formation on a smaller scale. Silicate/metal partition coefficients (D51~ have
been determined experimentally for a few refractory siderophile elements as a function ofj02
and are known to decrease linearly with decreasingj02 on a plot of logj02 versus log DstM
(Schmitt et al., 1989). Although experiments have not been performed atj02's as low as a
solar gas, extrapolation of data from higher j02's indicates that values of DstM are < 10-4 for
Ir andRe (Jones and Drake, 1986) as well as for Wand Mo (Schmitt et al. , 1989). The low
DstM values for the four elements that have been studied are consistent with the extreme
concentration of PGE, Re, Mo and W into opaque assemblages in CAL
Elements that are only moderately siderophile (such as V) would partition more equally
between metal droplets and silicate melt atj02's close to that of a solar gas . Based on
thermodynamic data one can estimate the partition coefficient for V between silicate and metal
liquids. To a first order, partitioning of V between alloy and silicate at conditions of CAl
melting would be determined by the reaction V + 1h02 ~ VO. The equilibrium constant can
be calculated for the VNO reaction from thermodynamic data (Chase et al. , 1985). By
fixing the j02 equal to that of a solar gas, a silicate/metal partition coefficient of 20 for V at
1600K is calculated (App. ill).
Two opaque assemblages from CAl have been analyzed by analytical SEM in detail to

83
determine total V concentrations (Armstrong et al., 1987), and one bulk opaque assemblage
has been analyzed for V by neutron activation (Grossman et al., 1986). If these three opaque
assemblages originated as alloys, their initial V contents would have been 1.1, 2.6 and 5.5
wt% respectively. The V content of the host CAl silicate minerals (and spinel) has not been
determined, but the average bulk CAl V content is -620 ppm (Wanke et al., 1974). We can
estimate the V content of the host silicates by difference using the estimate of Armstrong et
al. (1985), which suggests that opaque assemblages originally comprised about 0.1 wt% of
CAI. In this case, the average silicate host concentration of V is -590 ppm and the apparent
silicate/metal partition coefficient for V in CAl is 20 to 100, in agreement with the prediction
of 20 calculated above. Thus, the partitioning behavior of V and refractory siderophiles is
consistent with silicate-metal equilibration in CAI at an~ equal to an equilibrium solar gas.
During cooling of CAI, Ni-Fe metal droplets and spinel would be the first phases to
crystallize. The common occurrence of opaque assemblages in embayments in spinel (Fig.
4.6) suggests that some spinel crystallized after the formation of metallic droplets. Many CAI
have coarse-grained melilite rims that have very few inclusions of spinel or opaque
assemblages. If crystallization proceeded from the outside of CAl inward, advancing melilite
crystal faces might have pushed early crystallized spinel and metal toward the center of the
inclusion where melilite, fassaite and anorthite subsequently crystallized around them,
resulting in the textures observed in CAl. If CAl continued to cool at a solar gas~ V
dissolved in the metallic phase would be expected to oxidize and diffuse out of the metal due
to the difference in the slopes of the V NO buffer and the solar gas curve (App. ill). This
may explain the observations of Armstrong et al. (1985, 1989) that many opaque assemblages
have rims of V-rich fassaite (Fig. 4.6) and that V is often highly enriched in spinels in the
vicinity of opaque assemblages.

84
Fig. 4.6 Scanning electron microscope backscattered electron image of F3 (large bright
object) and a smaller unnamed opaque assemblage both of which occur in embayments in a
spinel (sp) crystal. A vanadium-rich fassaite (vfs) rim can be seen surrounding F3. vfs rims
a common feature of opaque assemblages and suggests that vanadium was oxidized from the
opaque assemblage metal and reacted with surrounding fassaite to form the vfs rim. Scale bar
is 10 p.m.

85
86
As indicated above, many compositional and textural aspects of opaque assemblages can be
explained if they formed from metallic Ni-Fe droplets. However, since most opaque
assemblages observed in CAI contain Ni-Fe oxides, Ni-Fe sulfides and PGE-rich metals in
addition to Ni-Fe metals, previous workers have assumed the opaque assemblages formed
independently from host CAI and acquired their bulk compositions by accretion of grains in
the solar nebula prior to the melting of CAI. Contrary to this scenario is the thermodynamic
prediction that during the melting and crystallization of CAI the low j02 andjS2 of the solar
nebula would not have allowed the stabilization of any of the oxides or sulfides observed in
opaque assemblages. Preexisting sulfur would have been vaporized into the nebular gas and
preexisting Fe-oxides would have been reduced to metallic iron. Additionally, the various
metallic phases would have been homogenized by solid state diffusion as discussed in Chapter
3. However, if one is to argue that opaque assemblages originated as metallic droplets during
CAI melting, it must be demonstrated that the complex metal-oxide-sulfide mineralogy that
now characterizes opaque assemblages can be formed by the reequilibration of metallic
droplets.
4.3 EXSOLUTION OF METALLIC PHASES
To form a data base with which to compare experimental phase equilibria, detailed
analyses were made of coexisting metal, oxide and sulfide phases from the five opaque
assemblages contained within CAI that were described above. The compositions of coexisting
phases are tabulated in App. ill. Particular emphasis was placed on the determination of the
origin of refractory PGE-rich alloys because it has previously been argued that these phases
provide evidence for the primitive nature of opaque assemblages, since it was supposed that
they could form only by extremely high temperature condensation processes (El Goresy et a/.,

87
1978; Blander eta/., 1980; Armstrong eta/., 1985).
To address the problem of whether PGE-rich alloys could be formed by a process other
than condensation, homogeneous Ni-Fe-PGE alloys were synthesized and then annealed at
subsolidus temperatures under both oxidizing and reducing conditions (App. I). Even in the
most preliminary experiments (App. II) PGE-rich metal of the appropriate composition
formed by exsolution, and the intergrown textures of PGE-rich metal, Ni-Fe metal and
magnetite that are characteristic of opaque assemblages were reproduced experimentally (Fig.
4.7). More refined experiments allowed the determination of phase boundaries and tie-lines
in the Ni-Fe-Ru phase diagram as a function of temperature as well as the partitioning
behavior of lr and Pt between phases in this system (App. 1). Isothermal sections of the Ni
Fe-Ru phase diagram at 1070K, 870K and 770K are shown in Fig. 4.8 with the compositions
of metallic phases from the five opaque assemblages studied projected onto this plane for
comparison. Metallic phases in the opaque assemblage from the Leoville meteorite appear to
have exsolved at a temperature of - 870 K, and that metallic phases in four opaque
assemblages from the Allende meteorite exsolved at a temperature of -770 K (Fig. 4.8; App.
ill).
Diffusion rates determined for Ru diffusion in Ni (App. I) were used to calculate the
timescale for diffusion limited exsolution of PGE-rich metallic phases from a homogeneous
alloy. The calculation is presented in App. ill and indicates that ~ 1()3 years would be needed
for diffusion-limited exsolution of the observed fRu-Fe grains from surrounding -yNi-Fe at a
temperature of 770 K (App. III).
4.4 OXIDATION AND SULFIDATION OF METALS
Phase compositions of coexisting Ni-Fe metal and Ni-Fe sulfide can also be used to

88
Fig. 4 .7 Scanning electron microscope backscattered electron image of an experimental run-
product from the experiments described in App. I. mt = magnetite, ni = -yNi-Fe and ru =
t:Ru-Fe. Note the striking similarity in texture between this sample and the opaque
assemblage Willy shown in Fig. 4.2. Both images display a mt rim surrounding intergrown
mt, ni and ru . Scale bar is 10 JLm.

89

90
Fig. 4.8 Compositional regions of metallic phases in opaque assemblages from App. ill
plotted on isothermal sections of the Ni-Fe-Ru plane along with phase equilibria from App . I.
at a) 1073K, b) 873K and c) 773K. Phase boundaries and tie-lines are solid near regions
where there is experimental data; dashed phase boundaries and tie lines are estimated or
schematic. The 773K diagram is speculative and is intended to be diagrammatic only. Two
and three-phase regions are denoted by 2cp and 3cp respectively and three-phase regions are
also stippled. Single-phase solid-solution regions include face-centered cubic -yNi-Fe,
hexagonal close-packed ERu-Fe and base-centered cubic aFe. Asterisks represent bulk alloy
compositions for each opaque assemblage estimated from point-counting. The oxidation
arrow in (c) connects the approximate total bulk compositions (including alloys, sulfides and
oxides) of JIM-OAI , WILLY and F3 (diamond) with the approximate bulk alloy
compositions.

Fe
I I I I I «._
fL I
~
I 2~
Cc
, I
I /
I
//
\ /0
13 K
/
I -_
../1
I
a
I 1
I ~~
1 I
;'
_J_ _
__
_ ~-----~
LE
0575
-0A
1
* •
YN
i-Fe
JIM-
OA1~
~.-1
WILL
Y6F3
'tE
GG
3-0A
1
~.
Ni
\0 -

92

93
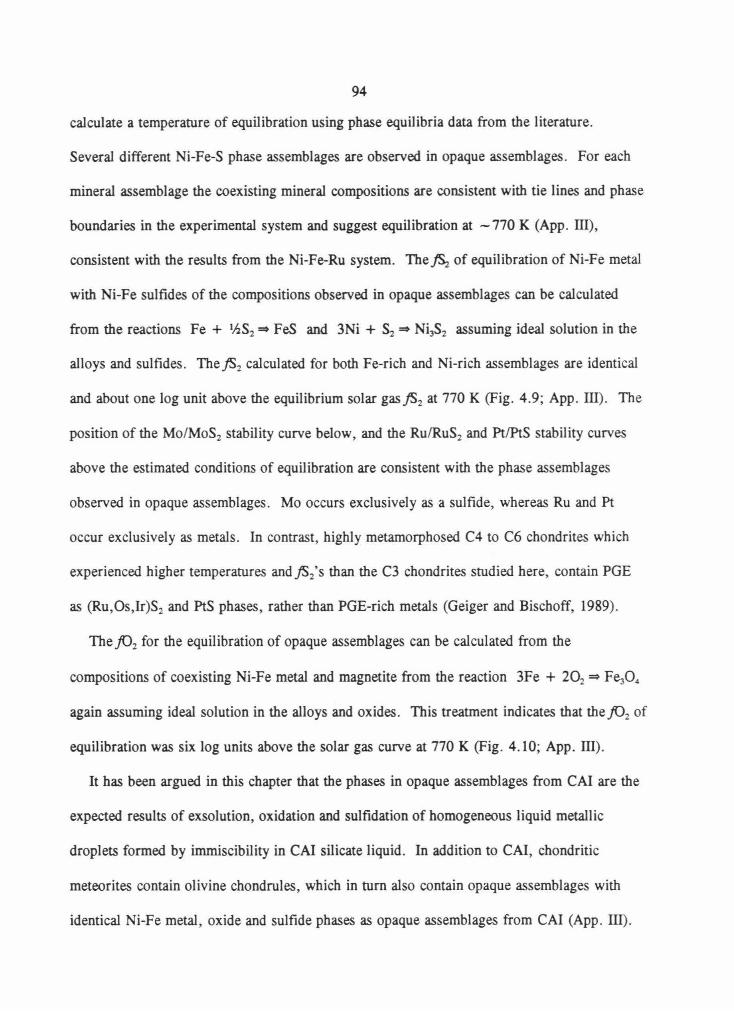
94
calculate a temperature of equilibration using phase equilibria data from the literature.
Several different Ni-Fe-S phase assemblages are observed in opaque assemblages . For each
mineral assemblage the coexisting mineral compositions are consistent with tie lines and phase
boundaries in the experimental system and suggest equilibration at -770 K (App. Ill),
consistent with the results from the Ni-Fe-Ru system. The A of equilibration of Ni-Fe metal
with Ni-Fe sulfides of the compositions observed in opaque assemblages can be calculated
from the reactions Fe + 1hS2 ~ FeS and 3Ni + ~ ~ Ni3S2 assuming ideal solution in the
alloys and sulfides. The jS2 calculated for both Fe-rich and Ni-rich assemblages are identical
and about one log unit above the equilibrium solar gasjS2 at 770 K (Fig. 4 .9; App . Ill) . The
position of the Mo/MoS2 stability curve below, and the Ru/RuS2 and Pt/PtS stability curves
above the estimated conditions of equilibration are consistent with the phase assemblages
observed in opaque assemblages . Mo occurs exclusively as a sulfide, whereas Ru and Pt
occur exclusively as metals. In contrast, highly metamorphosed C4 to C6 chondrites which
experienced higher temperatures and jS2's than the C3 chondrites studied here, contain PGE
as (Ru,Os,lr)S2 and PtS phases, rather than PGE-rich metals (Geiger and Bischoff, 1989) .
The .f02 for the equilibration of opaque assemblages can be calculated from the
compositions of coexisting Ni-Fe metal and magnetite from the reaction 3Fe + 202 ~ Fe30 4
again assuming ideal solution in the alloys and oxides. This treatment indicates that the ./02 of
equilibration was six log units above the solar gas curve at 770 K (Fig. 4.10; App. Ill).
It has been argued in this chapter that the phases in opaque assemblages from CAl are the
expected results of exsolution, oxidation and sulfidation of homogeneous liquid metallic
droplets formed by immiscibility in CAl silicate liquid. In addition to CAl, chondritic
meteorites contain olivine chondrules, which in turn also contain opaque assemblages with
identical Ni-Fe metal , oxide and sulfide phases as opaque assemblages from CAl (App. Ill).

95
Fig. 4.9 Plot of logarithm of jS2 versus reciprocal temperature for equilibria relevant to
opaque assemblage origin. Solar gas curve is from Fuchs and Blander (1977). Stability
curves are calculated from thermodynamic data compiled by Bartoo and Skinner (1979) except
for the Ru/RuS2 curve, which is from Svendsen (1979). The curve labeled Ni-Fe alloy/Ni-Fe
sulfide is broken into four segments (A-D) based on Ni-Fe-S phase equilibria from the
compilation of Hsieh et al. (1982) at T ~ 973K and from Misra and Fleet (1973) at T ~ 873K.
For each line segment, a different alloy assemblage of sulfides may be in equilibrium with Ni
Fe alloy: A: FeS, Ni-S melt; B: FeS, Ni3S2, Ni-S melt; C: FeS, Ni3S2; and D: FeS, Ni3S2,
(Fe,Ni)~8• The position of the Ni alloy/Ni-Fe sulfide curve is calculated from the
compositions of phases in opaque assemblages (see text). Region I is the .f02 - T space for
equilibration of opaque assemblages determined in App. ill .
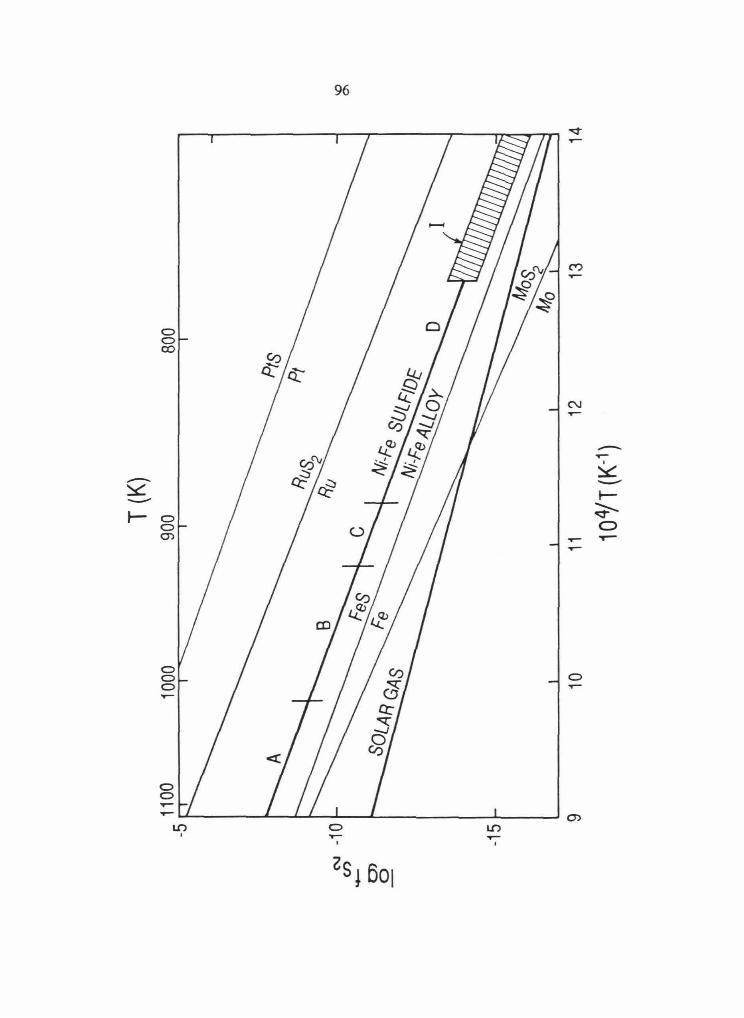
- 0> 0
-5 1
100
-15 9
10
T (K
) 90
0
11 1 Q
4/T
(K-1 )
800
14
\0
0\

97
Fig. 4.10 Plot of the logarithm of .f02 versus reciprocal temperature for equilibria relevant to
opaque assemblage origin. The solar gas curve is at PT = 10·3 atm (Grossman, 1972) and the
VNO and Ni/NiO curves are calculated from thermodynamic data (Chase et al. , 1985).
Curve (a) is Fe/Fe,04, curve (b) is Ni67Fe,3 /Fe,04, and curve (c) is Niasfe 15/Fe,04 (McMahon
and Haggerty, 1980). Lines (a), (b) and (c) end at the highest temperature at which the alloys
are stable with magnetite. Region I is the .f02 - T space for partitioning of V between alloy
and silicate liquids as calculated in App. ill. Region II is the.f02 - T space for the
crystallization of fassaite in CAl based on reactions involving TP+ ffi 4- ratios in fassaites
(Beckett et al., 1988). Region III is the.f02 - T space determined in App. III for equilibration
of opaque assemblages.

T {K
) -1
0 IV
VV
IV
VV
IO
VV
IL
VV
10
00
800
%~n
- -35 s
L...
---.-
-'-6 -
---'7
--..l-8
----
'9-~
1.}.
_.0 -
---L
.,,-
-1.}
._.2
---'-13~~,4
104/
T {K
-1 )
\0
00

99
Fig. 4 .11 Scanning electron microscope backscattered electron image of an opaque
assemblage from an Allende olivine chondrule. ni = -yNi-Fe, pn = pentlandite, ap = apatite
and mt = magnetite. Scale bar is 100 J.Lffi.

100
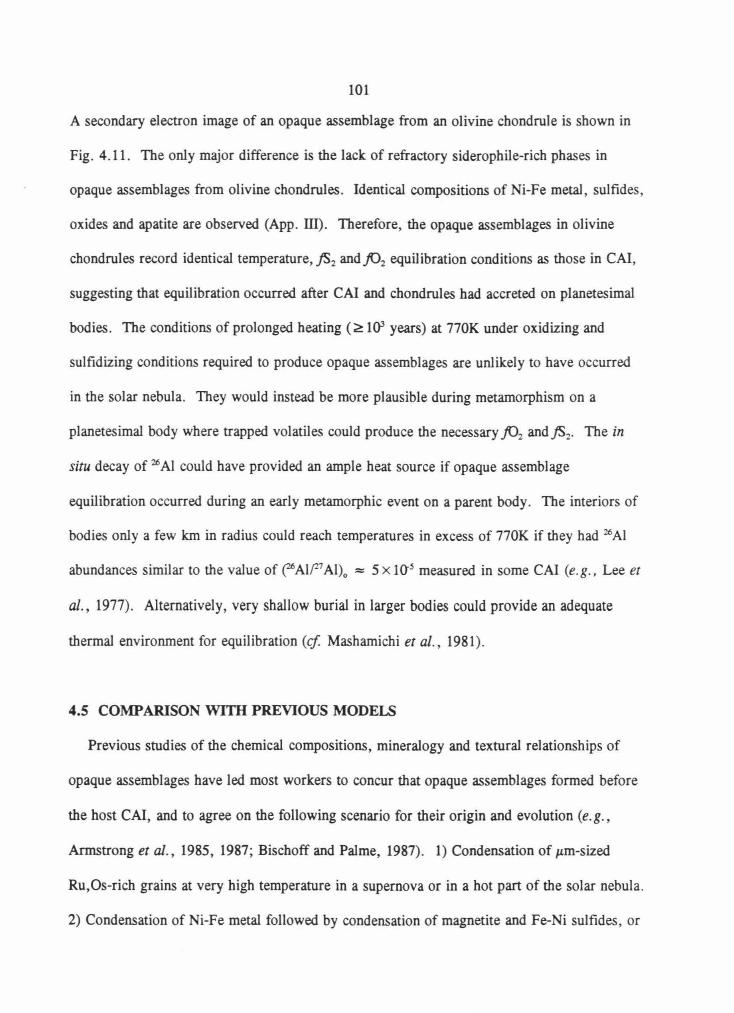
101
A secondary electron image of an opaque assemblage from an olivine chondrule is shown in
Fig. 4.11. The only major difference is the lack of refractory siderophile-rich phases in
opaque assemblages from olivine chondrules. Identical compositions of Ni-Fe metal, sulfides,
oxides and apatite are observed (App. III). Therefore, the opaque assemblages in olivine
chondrules record identical temperature, }S2 and ./02 equilibration conditions as those in CAl,
suggesting that equilibration occurred after CAl and chondrules had accreted on planetesimal
bodies. The conditions of prolonged heating(~ HY years) at 770K under oxidizing and
sulfidizing conditions required to produce opaque assemblages are unlikely to have occurred
in the solar nebula. They would instead be more plausible during metamorphism on a
planetesimal body where trapped volatiles could produce the necessary }02 and}S2• The in
situ decay of 26 AI could have provided an ample heat source if opaque assemblage
equilibration occurred during an early metamorphic event on a parent body. The interiors of
bodies only a few km in radius could reach temperatures in excess of 770K if they had 26 AI
abundances similar to the value of ~Aif27 Al)0
z 5 x w-s measured in some CAl (e .g. , Lee et
al., 1977). Alternatively, very shallow burial in larger bodies could provide an adequate
thermal environment for equilibration (cf. Mashamichi et al., 1981).
4.5 COMPARISON WITII PREVIOUS MODELS
Previous studies of the chemical compositions, mineralogy and textural relationships of
opaque assemblages have led most workers to concur that opaque assemblages formed before
the host CAl, and to agree on the following scenario for their origin and evolution (e.g.,
Armstrong et al. , 1985, 1987; Bischoff and Palme, 1987). 1) Condensation of ~tm-sized
Ru,Os-rich grains at very high temperature in a supernova or in a hot part of the solar nebula.
2) Condensation of Ni-Fe metal followed by condensation of magnetite and Fe-Ni sulfides, or

102
reaction of Ni-Fe metal in the nebula to form magnetite and Fe-Ni sulfides . 3) Aggregation
of these and other phases in the solar nebula to form opaque assemblages. 4) Mixture of
opaque assemblages with proto-CAl silicates before (or during) a brief high-temperature
(- 1700K) event, during which the silicate portion of the CAl melted or partially melted,
followed by rapid cooling.
The high-temperature CAl melting event was postulated to have been so brief, and cooling
so rapid, that the delicate textures and mineral intergrowths in opaque assemblages were
preserved as they existed before CAl melting. According to this model, the phase
assemblages in opaque assemblages look through the CAl melting event and record highly
sulfidizing and oxidizing conditions during condensation very early in the history of the solar
nebula. Since some silicate minerals in the host CAl preserve evidence for crystallization
under reducing conditions in the solar nebula (Beckett et al. , 1988), this view of opaque
assemblage origin implies that the condensing nebula was heterogeneous, with local variations
in temperature of hundreds of degrees and in j02 of many orders of magnitude. It further
implies turbulence within the nebula capable of mixing the various phases formed under these
conditions.
The new model proposed in this chapter and in App. ll and III contrasts markedly with the
previous model. The two models are compared in cartoon form in Fig. 4.12. The new
model suggests that all of the siderophile elements condensed as alloys under reducing solar
gas conditions in contrast to the previous idea that each phase condensing in its own
microenvironment at variable j02 and }02 and then aggregating in the nebula to form opaque
assemblages. After aggregation of alloys with proto-CAl silicates, the silicate melting event
resulted in the formation of immiscible metallic liquid droplets which scavenged siderophile
elements (e.g., PGE, Re, W and Mo) from the silicate melt. The complex mineralogy that

103
Fig. 4.12 Cartoon depicting models for the multistage origin proposed for opaque
assemblages by previous authors (e.g., Armstrong et al. , 1985; Bischoff and Palme, 1987)
contrasted with the new model proposed in this study. See text for discussion.

Condensation of small particles
Aggregation w lth silicates to form I ncl us Ions
Silicate melting
Silicate crystallization and cooling
AccretIon on planetesimal
Low temp equilibration
104
ORIGIN OF OPAQUE ASSEMBLAGES
PREVIOUS MODEL
~~~ ~ ·.o 11 (I « o·.· :o ~ •' PGE. alloy sulfide oxide Fe-N1 alloy VARIABLE: fs2, fo2, temp
//,o--!0~ -~D-<:5 o-- , I ' 7 \ 'D'0 \1 0- • . L\l I 'c:Jc:::J \:I . U' "o __ n_ i}!t:::::J Q f -~t,
----
~ ~
OA unchanged
fast
no information
NEW MODEL
0 0 0
\] 0
Fe-Ni-PGE alloy
solar gas conditions
metallic liquid immiscibility <solar gas fo2 partitioning)
slow or fast
exsolution, sulfidation and oxidation of metal
Planetary metamorphism 073 K for~ 1000 years f 02 1 o6 above so 1 ar gas fs2 10 I above solar gas

105
now characterizes opaque assemblages is believed to have formed from these proto-opaque
assemblage alloy droplets by sulfidation, oxidation, and exsolution. This could have occurred
during metamorphism for ~ 1()3 yr at 770K and at anjS2 one log unit above, and anj02 six
log units above, a solar gas composition. The two-stage evolution proposed in the new
model , which includes homogeneous alloy formation at high temperature followed by
reequilibration and redistribution of elements during metamorphic reactions at lower
temperature, provides a general explanation of the approximately solar refractory siderophile
element ratios in all CAl in spite of the highly fractionated compositions of individual opaque
assemblages and the mineral phases found within them.
The alternative scenario for the origin of opaque assemblages, which suggests that they
formed in the solar nebula before CAl melting and were subsequently captured in the CAl and
rapidly cooled (Armstrong et al., 1985, 1987; Bischoff and Palme, 1987), is considered by
this author to be unlikely because the low temperature mineral assemblages could not have
survived melting and subsequent cooling of the bulk CAl for any plausible cooling rates. The
previous model also does not provide an explanation for the solar refractory siderophile
element ratios in CAl.
The conditions that were estimated for the temperature, jS2 and }02 of equilibration for
opaque assemblages from both CAl and chondrules are very similar and suggest that these
two components of C3V meteorites share a common, late low-temperature history, perhaps on
a planetesimal body. Studies of opaque assemblages may therefore provide quantitative
constraints on the post-accretionary equilibration conditions of C3V meteorites .

106
CHAPfER 5. TERRESTRIAL FRACTIONATION
The geochemical behavior of Pt-group elements is strongly influenced by the presence or
absence of metallic iron. During planetary differentiation core-forming metallic iron liquid is
believed to remove virtually all of the PGE in a planet to the planet's core. A small
proportion of the PGE, however, remains in the silicate fraction of the planet where the
geochemical behavior becomes much more complex and poorly understood. At the sulfur and
oxygen fugacities prevalent in the earth's crust and upper mantle a metallic iron phase is
absent, and sulfides and oxides become important in fractionating the PGE with respect to one
another.
The general trends of terrestrial PGE fractionation were introduced in section 2.6. The
average concentrations of PGE and Re in representative terrestrial materials were given in
Table 2.4 and are plotted relative to C1 chondrite concentrations on Fig . 5.1. Ratios are
plotted in order of decreasing melting temperature for the PGE, with Re following Pd. Fig.
5. 1 includes ophiolitic peridotites and spinel lherzolite xenoliths as samples of suboceanic and
subcontinental mantle respectively. The average patterns for these two rock-types are
virtually flat at the 10-2 x chondritic level. The data for oceanic basalts and granitic roclcs are
included as samples of the differentiated oceanic and continental crust. These crustal patterns
have steep positive slopes . Relative to the mantle samples, Os and Ru are depleted by a
factor of -100, Pt and Pd are depleted by a factor of -10, andRe is enriched by a factor of
-2. Because of the low concentrations of PGE and Re in crustal rocks and the small mass of
the crust relative to the mantle ( < 1%) crustal extraction from the mantle does not
significantly effect mantle PGE contents. The data for ophiolitic chromitites are also included
since these samples may represent a residuum of a high degree of mantle partial melting. The
pattern has a steep negative slope which is complementary to the crustal samples. Ir and Ru

107
Fig. 5.1 Average concentrations of PGE andRe from Table 2.4 normalized to Cl chondrite
concentrations in representative terrestrial materials. Data sources are given on Table 2.4.
The PGE are plotted in order of decreasing melting temperature. Re is plotted after Pd
because it behaves more similarly to Pd during terrestrial fractionation than any of the other
PGE. Lines connecting the elements are dashed where data for a particular element are
unavailable. Arrows ( +) connected to data points designate maximum values . See text for
discussion.
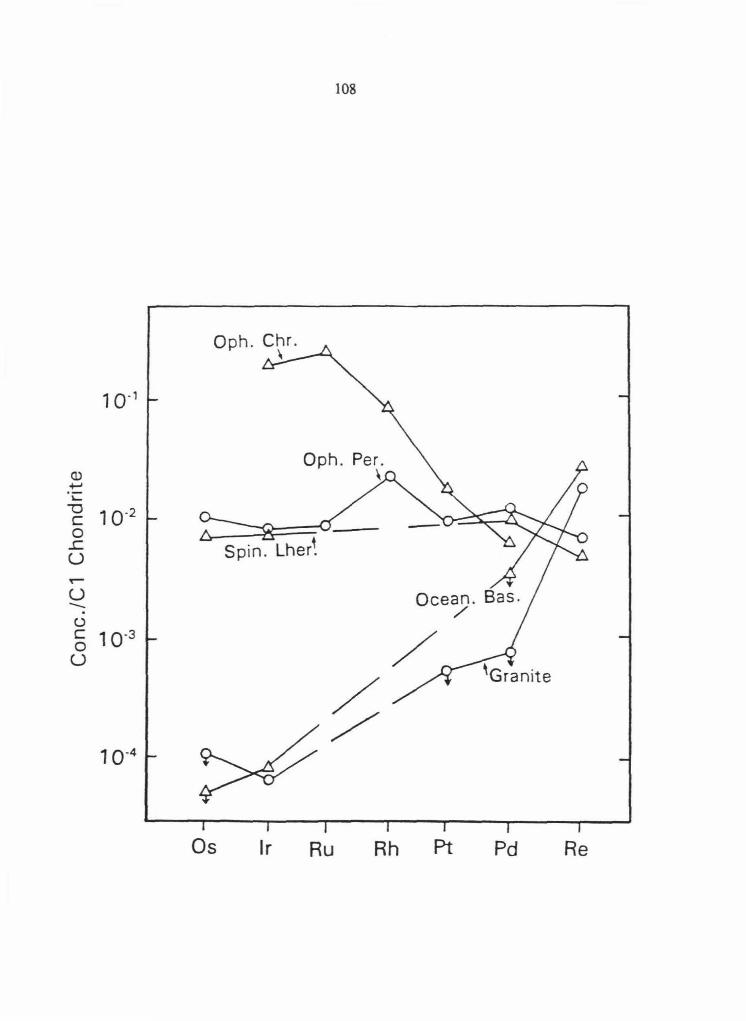
1 o-,
Cl) +-' ·~ -o 1 o-2 c 0 .!: u or-
u -. ()
c 1 o-3 0 u
1 o-4
Oph . Chr. \
Os lr
108
:: Ru Rh Pt Pd Re

109
are enriched relative to the mantle samples by a factor of 20, Rh is enriched by a factor of
10, and Pt and Pd are approximately equal to mantle values. Re concentrations have not been
measured in ophiolitic cbromitites.
It is well known that some of the PGE can become highly concentrated into trace phases in
peridotites. However, the solubility of PGE in major silicate and oxide phases and the
mechanisms by which they are concentrated into trace phases in the mantle and crust are not
well understood. It is important to investigate the mechanisms which result in the tremendous
fractionations of this chemically similar group of elements so that the PGE can be used as
petrogenetic indicators and as a tool for mineral deposit exploration. A fundamental problem
in PGE geochemistry is the role of Os-Ir-Ru alloys in the fractionation of PGE. These alloys
occur as inclusions in cbromite crystals in virtually all PGE-ricb rocks. Although their origin
bas been widely debated, no previous experimental studies have been undertaken to clarify
their origin.
In App. IV a preliminary experimental investigation designed to determine the origin of
Os-Ir-Ru alloy inclusions in chromites and their role in PGE fractionation is presented. This
chapter is largely a summary of the literature on terrestrial PGE fractionation with some
discussion of the results of the experiments presented in App. IV. The geochemical behavior
of the PGE are explored during the processes of core formation, mantle partial melting, and
the magmatic differentiation of layered mafic-ultramafic intrusions. The final section of this
chapter summarizes the application of the Re-Os geochronometer.
5.1 CORE FORMATION
The most direct evidence that we have for the behavior of PGE during core formation in
planetary bodies comes from the study of iron meteorites. These samples are widely believed

110
to be the product of melting and gravitational segregation of metallic Fe in asteroid size
bodies. Wasson and colleagues (e.g., Scott and Wasson, 1975) have classified about 500 iron
meteorites into 12 chemical groups (each believed to be from a separate parent body) based
on their Ga, Ge, Ir and Ni contents. Chemical fractionations between groups are generally
believed to have occurred in the solar nebula (Scott, 1972; Kelly and Larimer, 1977), whereas
chemical variations within most groups reflect fractional crystallization of molten metal during
the solidification of the cores of planetary bodies (Scott, 1972). PGE are enriched in early
crystallizing Fe-Ni metal to -100 x cbondritic and the concentrations decrease by - IQ4 with
decreasing Ni content in magmatic groups (Pernicka and Wasson, 1987). The PGE content of
the parental metallic liquids from which each iron meteorite group crystallized can be roughly
estimated using a fractional crystallization model and estimates of the liquid metal/solid metal
partition coefficients for the PGE (Willis and Goldstein, 1982). For example, the PGE
pattern for the estimated parental liquid from which the group illAB iron meteorites
crystallized is plotted on Fig. 2.11 (Willis, 1980). The PGE occur in chondritic proportions
at 1 to 2 x Cl chondrite values consistent with an origin by removal of virtually all of the
PGE into cores of approximately chondritic composition parent bodies.
The partitioning of Ir and Re between iron metal containing 22% S and basaltic glass was
measured at 1270°C and logj02 = -13 by Jones and Drake (1986). The silicate/metal
partition coefficients (DSIM) for Ir andRe are -5x1o-5 and -5x10_. respectively. Under these
conditions, equilibration between the mantle and core of a planet would result in nearly
complete removal of Ir and Re (and presumably the rest of the PGE) to the core.
In most models for core formation in the earth it is assumed that the earth bas a chondritic
bulk composition. The earth's composition may have been established by 1) homogeneous
accretion of chondritic material or 2) heterogeneous accretion of a mixture of refractory-rich

111
and refractory-poor material that condensed from the nebula at various temperatures. Recent
accretionary models suggest that the earth accreted from km-sized planetesimals containing
roughly chondritic abundances of the elements (e.g., Stevenson, 1981).
If core formation in the earth was a simple equilibrium process, one would expect the
earth's mantle to have concentrations of "highly siderophile" elements (PGE andRe) at the
10-4 to 10·5 x chondritic level based on the available partitioning data. Many workers have
argued that the siderophile element content of the upper mantle is we11 represented by spinel
lherwlite xenoliths (e.g. , Jagoutz et al., 1979). Spinel lherzolite xenoliths have "highly
siderophile" element contents of -10·2 x chondritic in conflict with much lower
concentrations expected for mantle-core equil ibration. As a result, many models have been
developed to explain the high concentrations of "highly siderophile" elements in the mantle.
The models must also explain the partitioning of the "moderately siderophile" elements (e.g.,
Co, Ni and Mo) which, according to partitioning data (Jones and Drake, 1986), should be
depleted by 10·3 to 10""' x chondritic by equilibrium core formation but are instead 0.1 to 0.2
x chondritic in spinel lherzolite xenoliths (J agoutz et al. , 1979).
The proposed models have been reviewed by Jones and Drake (1986) and can be classified
into four categories 1) incomplete core formation leaving a small quantity of metal in the
mantle to be subsequently oxidized (Jones and Drake, 1986), 2) equilibration between mantle
silicates and an Fe-S-0 metallic liquid (rather than Fe-S liquids as in the partitioning
experiments) (Brett, 1984), 3) heterogeneous accretion involving a late 'veneer' of chondritic
material that did not separate to the core (e.g. Kimura et al., 1974; Chou, 1978) and 4)
establishment of highly siderophile element concentrations by partitioning at megabar
pressures, perhaps at the core-mantle boundary (cf. Ringwood, 1977). It must be emphasized
that partitioning data are limited to only a narrow range of pressure, temperature, jo2, and A .

112
Considering the data that do exist, none of the first three models quantitatively predicts the
"highly" and "moderately" siderophile element abundances inferred for the upper mantle
(Jones and Drake, 1986). The fourth model is presently untestable because high pressure
partition coefficients are entirely unknown. Recently Schmitt et al. (1989) suggested a model
of late accretion of a volatile-rich chondritic 'veneer' followed by removal of a sulfide liquid
to the core. They suggest that sulfide removal may be capable of depleting the highly
siderophile elements but not the moderately siderophile elements. This is an interesting
explanation of the observations, but more experimental data on the partitioning of siderophiles
between metal, sulfide and silicate are needed to test the model.
Most investigators accept the idea that the relatively constant PGE content of spinel
lherzolite xenoliths are representative of the bulk upper mantle, but this assumption may not
be entirely valid . Garnet lherzolite PGE abundances are much more highly variable and
appear to have been affected by introduction of S-hearing metasomatic fluids (Mitchell and
Keays, 1981). Neutron activation studies of phases separated from garnet and spinel
lherzolite xenoliths indicate that intergranular sulfides contain the bulk of the PGE in these
rocks (Mitchell and Keays, 1981; Jagoutz et al., 1979). Since these sulfides would be
intergranular liquids under mantle conditions, the PGE may have considerable mobility . It is
also possible that the intergranular sulfides could have originated by liquid immiscibility from
sulfide-saturated basic magmas. Partial melts of undepleted mantle are probably sulfide
saturated as indicated by the ubiquitous presence of sulfides in mantle xenoliths. Since the
solubility of S decreases with decreasing pressure (Wendlandt, 1982), melts migrating through
the mantle could deposit intergranular sulfides genetically unrelated to the host lherzolites.
This could conceivably lead to large-scale redistributions of PGE within the mantle during
successive melting and metasomatic episodes and may be responsible for the highly variable

113
PGE contents in garnet lherzolites. Although spinel lherzolite xenoliths are presently our best
estimate of the siderophile content of the upper mantle, much more work needs to be done to
fully understand the mobility of mantle sulfides and their influence on PGE distributions in the
mantle.
5.2 ORIGIN OF THE MOON
Determination of the PGE content of the lunar mantle is a more difficult exercise than for
the earth's mantle because there are no lunar mantle samples available. Estimates of mantle
abundances have been surmised from the study of volcanic rocks presumably derived from the
moon's mantle. This is not a straightforward exercise in the case of PGE because of the vital
importance of trace phases and jo2 and A to their partitioning behavior. If one could
estimate with some confidence the bulk PGE contents of the mantles of the earth and moon,
then in principle one could gain insight into whether or not they formed from the same
material. However, the difficulty in interpreting lunar mantle PGE abundances based on the
study of lunar volcanic rocks has led to considerable controversy concerning the origin of the
moon (cf. Delano and Ringwood, 1978; Anders, 1978).
Some workers have compared the low PGE content of volcanic rocks from the moon with
the high PGE content of mantle xenoliths from the earth and concluded that the mantles of the
moon and earth have highly contrasting abundances of PGE (Newsom and Taylor, 1989).
This is a rather tenuous approach considering the complexities and magnitude of PGE
partitioning during crustal genesis. Drake (1987) estimated theIr and Re contents of the
moon's mantle from Ir andRe concentrations in lunar basalts by attempting to correct for the
fractionations observed between mantle xenoliths and basalts on earth. While this is a better
approach than that of Newsom and Taylor (1989), it is still unreliable because the partitioning

114
of PGE during partial melting depends on intensive variables such as fo2 and .fs.z and the
presence or absence of certain phases in the residuum (discussed below) which are unlikely to
be the same in the moon and earth.
In summary, the data are insufficient for a reliable estimation of the PGE contents in the
bulk mantle of the moon. Therefore, tests of whether the moon originated from the earth's
mantle, based on comparisons between terrestrial and lunar PGE contents, are premature.
Even if the PGE contents of the mantles of the moon and earth were precisely known, the
comparison would be inconclusive since the relative PGE contents could easily be changed by
further core formation or further accretion of Sun-orbiting debris after the formation of the
moon (Stevenson, 1987).
5.3 MANTLE PARTIAL MELTING
The representative analytical data for PGE in terrestrial mantle and crustal rocks presented
in Table 2.4 and Fig. 5.1 suggest that Os, Ir and Ru behave as highly compatible elements
whereas Rh, Pd, Pt and Re behave as only slightly compatible elements during mantle partial
melting. While this idea has become generally accepted, the reason for this behavior and the
phase(s) that accommodate these elements in the mantle are the subject of debate. Suggested
host phases for Os, Ir and Ru include olivine, FeS, Os-Ir-Ru alloys and chromite. Brugmann
et al. (1987), citing experimentally determined partition coefficients of Malvin et al. (1986),
argued that olivine is the host phase for Os, Ir and Ru during fractionation of komatiites
which do not contain sulfides or spinel. The compatibility of Os, Ir and Ru in olivine has
been drawn into question by the work of Capobianco and Drake (1990), who showed the
results of Malvin et al. (1986) to be invalid based on further analyses of the experimental run
products.

115
Unlike the komatiites studied by Brugmann et al. (1987), mantle peridotites contain spinel
and sulfide, and these phases dominate the partitioning of PGE (Mitchell and Keays, 1981).
Most workers have attributed the highly fractionated PGE patterns of mantle-derived melts to
the presence of an Os-Ir-Ru-rich alloy in the mantle source region (Bird and Basset, 1980;
Keays, 1982; Campbell and Barnes, 1984; Barnes et al. , 1985). Given this assumption,
Keays (1982) suggested that mantle partial melts were saturated with Ir. The ubiquitous
presence of Os-lr-Ru-rich alloys in ophiolitic peridotites has been cited as evidence in favor of
this hypothesis. A role for spinel in the fractionation of PGE has largely been discounted due
to the lack of conclusive evidence that PGE are compatible in the spinel structure. However,
the widespread occurrence of Os-Ir-Ru-rich alloys as inclusions in Cr-rich spinels from
ophiolitic peridotites and layered intrusions suggests that chromite plays some role in the
fractionation of PGE. The relationship between Or-Ir-Ru-rich alloys and chromites is
unquestionably one of the least understood aspects of PGE geochemistry .
In several early studies it was proposed that Os, Ir and Ru could be accommodated in solid
solution in the chromite lattice at magmatic temperatures (e.g . , Gijbels eta/., 1974; Morgan
eta/., 1976; Naldrett and Cabri, 1976). More recently, petrographic studies have identified
discrete 1 to 20 J..Lffi diameter inclusions of alloys and sulfides in chromite from nearly every
major ophiolite and layered intrusion (e.g . , Talkington et al., 1984; Auge, 1988). Alloy
compositions range from - 80% Ir to - 80% Os with Ru contents up to -50% (Legendre
and Auge, 1986; Talkington and Lipin, 1986). These compositions correspond to the
minerals osmiridium, iridosmine and rutheniridosmine according to the nomenclature of
Harris and Cabri, (1973). Sulfide compositions span the solid solution between laurite and
erlichmanite (Ru,Os)S2 with up to -20% Ir (Legendre and Auge, 1986; Talkington and
Lipin, 1986). Several petrographic features of the inclusions have been used to argue that

116
they did not form by exsolution from chromite including: 1) euhedral and anhedral habits, 2)
non-crystallographic orientation, and 3) compositional diversity. Based on these types of
features, virtually every petrographic investigator has suggested that alloys and sulfides
precipitate directly from magmatic liquids creating nucleation sites for chromite crystals,
which crystallize around the small particles and mechanically remove them to chromitite
layers (e.g., Talkington et al., 1984; Auge, 1988).
I have experimentally studied several aspects of the origin of Ir-rich alloys in chromite.
The details of this preliminary investigation are presented in App. IV. In summary, the
solubility of Ir in FeS liquid in equilibrium with Ir metal at 1250°C was determined to be
-4% . The solubility of Ir in synthetic and natural chromites in equilibrium with Ir metal at
1450°C was investigated and found to be below the electron microprobe detection limit of
-80 ppm. It was, however, demonstrated that Ir is mobile in chrornite at magmatic
temperatures and probably diffuses though chromite at a rate similar to the diffusion of major
cations (App. IV).
If Ir-rich alloys were stable in mantle peridotites, the high solubility of Ir in FeS indicates
that Ir concentrations in coexisting FeS liquid should be -4%. The concentration of Ir in
sulfides from spinel lherzolite xenoliths are many orders of magnitude lower at ~ 10 ppm
(Jagoutz et al., 1979). Additionally, recent experimental data on the solubility of Ir in
basaltic melt (Amosse et al. , 1990) indicates that melts saturated with Ir atjo2' s andftz's in
the range estimated for mantle partial melting would have concentrations of -100 ppb, which
is over three orders of magnitude higher than observed in basalts (~0.04 ppb; Table 2.4) .
The high Ir solubilities in FeS liquid and basalt suggest that Ir-rich alloys would not be stable
in mantle peridotites which contain FeS liquid or have had a silicate liquid fraction removed
by partial melting. Instead, one would predict that Ir resides in the mantle dissolved in FeS

117
liquid or another major phase. Mitchell and Keays (1981) analyzed mineral separates from
mantle xenoliths for lr and Pd and found that spinel was enriched in PGE relative to olivine,
clinopyroxene and orthopyroxene but that 60 to 80% of the PGE of the xenoliths was
contained in the minor intergranular FeS component. It is unclear how much of the 20 to
40% of the PGE that reside in the major phases is dissolved in them or is due to inclusions of
sulfides or other trace phases in the major phases.
Silicate/sulfide partition coefficients for PGE have not been determined experimentally and
estimates in the literature vary widely from 10·2 (Ross and Keays, 1979) to 10·5 (Campbell and
Barnes, 1984). If the positively sloped PGE patterns for oceanic basalts (Fig. 5 .1) were
controlled by simple silicate/sulfide partitioning during mantle partial melting then Os, Ir and
Ru would have to be much more compatible than Rh, Pt and Pd in FeS liquid. This is not
consistent with the patterns that would be expected from the relative thermodynamic stabilities
of PGE sulfides which decrease in the order Ru~Pt=Ir==>Os (Fig. 2.10). This pattern is also
not consistent with the more chalcophile nature of Rh, Pt and Pd compared to Os, Ir and Ru
in layered intrusions such as the Stillwater Complex (see section 5 .4). Instead, an additional
residual phase in the mantle other than FeS, in which Os, Ir and Ru are more compatible than
Rh, Pt and Pd seems to be indicated.
In spite of the textural arguments made in favor of Os-lr-Ru alloy inclusions having
formed as liquidus phases and having been trapped by crystallizing chromite, the limited
experimental data summarized in App. IV suggest that these alloys would not be stable in the
presence of either FeS or basaltic liquid at magmatic temperatures, even if trapped in
chromite crystals. The stability of Os-lr-Ru alloys in the presence of chromite at magmatic
temperatures is still unknown, but the apparent mobility of lr in chromite and the ability of Ir
and Ru to substitute into compounds with the spinel structure under highly oxidizing

118
conditions (e.g., Krutzsch and Kernmler-Sack, 1983; Capobianco and Drake, 1990) suggests
that ppm level solubility of Os, Ir and Ru in the chromite structure at high temperatures is at
least plausible. It has been suggested by several authors that Ir, Os and Ru substitute for C~"'"
in the spinel lattice (Agiorgitis and Wolf, 1978; Morgan et al. , 1976). The solubility of these
elements in chromite is presently unknown but almost certainly decreases with temperature.
Thus, it is possible that exsolution is responsible for forming Os-lr-Ru alloys during cooling
of magmatic chromite after it crystallized with ppm level concentrations of Os-Ir-Ru in solid
solution. This would provide an explanation for the fractionation of Os-Ir-Ru from Rh-Pt-Pd
during the process of mantle partial melting without having to resort to a metallic Os-Ir-Ru
alloy phase in the mantle. The possible compatibility of Os, Ir and Ru in chromite suggests
that the presence or absence of spinel (in addition to FeS) in the mantle of the earth and the
moon could play a major role in determining the PGE abundances of crustal rocks formed by
partial melting.
5.4 MAGMATIC CRYSTALLIZATION
The magmatic process that results in the concentration of PGE from parental magmas with
< 100 ppb total PGE into -1 m thick PGE-rich sulfide and chromite horizons with > 10 ppm
total PGE is a remarkable feature of layered intrusions. The PGE-rich sulfide and chromite
layers concentrate trace elements from very large volumes of magma. The mechanisms by
which Rh, Pt and Pd are collected by immiscible iron-sulfide liquids has been extensively
studied and was recently reviewed by Naldrett et al. (1987). The concentration mechanism
for Os, Ir and Ru has not been given much attention, but there is clearly a link with the
crystallization of chromite. As stated by Naldrett et al. (1987) "these metals [Os, Ir and Ru]
may well have been scavenged by chromite in an as yet not-understood way."

119
The Stillwater Complex in Montana provides a good example for discussion of the
fractionation of PGE in layered mafic-ultramafic intrusions. The principles are the same in
other intrusions such as the Bushveld Complex in South Africa, the Great Dyke in Zimbabwe
and the Bird River Sill in Manitoba. Average PGE (andRe) abundances for several different
rock-types from the Stillwater Complex are given in Table 5.1 (along with data sources) and
plotted normalized to C1 chondrite values in Fig. 5.2. Basal norites are believed to be the
best estimates of the parental magma composition of the Stillwater Complex. The PGE
contents of the Stillwater basal norites are also virtually the same as the chilled margin rocks
from the Bushveld complex (cf Naldrett et al., 1987). Comparison of Fig. 5.2 with Fig. 5.1
shows that the steep positively sloped PGE pattern for the basal norites is very similar to the
patterns for basalts and granites, except that the norites are enriched in all of the PGE by a
factor of -10. TheRe content of the basal norites is unknown, but based on the patterns fo r
basalts and granites their chondrite normalized Re content is probably somewhat higher than
the Pd content. Equilibration and settling of immiscible iron-sulfide into a -2 m layer called
the "J-M Reef' resulted in 101 to > 102 enrichments in PGE, while retaining the steep positive
slope (Fig. 5 .2) . Crystallization and settling of chromitite layers that do not have high
concentrations of accompanying iron-sulfide (chromitites B-K) resulted in -1Q2 enrichments
of Os, Ir and Ru, but ~ 101 enrichments in Rh, Pt and Pd, resulting in an overall flat PGE
pattern (Fig . 5.2). Re is not enriched in the J-M Reef sulfides or in the chromitites
suggesting that it is more compatible with silicate liquid than with sulfide or chromite. The
pattern for the A chromitite is more complex because it also contains considerable
concentrations of iron-sulfide. Chromite has enriched this layer in Os, Ir and Ru, and iron
sulfide has enriched this layer in Rh, Pt and Pt. The resulting pattern is enriched in all of the
PGE by > 102 compared to the basal norites (Fig. 5.2). In summary, all of the PGE appear

120
Table 5.1 Average PGE (andRe) concentrations in some representative rock-types from the Stillwater Complex, Montana, USA (in ppb) .
Rock-type Ru Rh Pd Os Ir Pt Re
Stillwater Complex Basal zone [ 1 ,2] ~6.0 45 0.82 0.90 21 J-M Reef [3,4] 50 150 17300 22 19 5000 6.5 B-K Chromitites [1,2] 199 62 66 48 36 89 0.65 A Chromitites [ 1] 510 93 8130 303 4100
-- indicates no data available. [1] Page eta/. (1976); [2] Lambert eta/. (1989); [3] Barnes eta/. (1985); [4] Manin (1989).

121
Fig. 5 .2 Average concentrations of PGE normalized to C1 chondrites from various layers of
the Stillwater Complex, Montana, USA. Data sources are given on Table 5.1. Data are
plotted in the same order as in Fig. 5.1. See text for discussion.

122
STILLWATER COMPLEX J-M Reef
Q) +-' A Chromit ite '- 10° ""0 c 0 .c u or-
u -. u 1 o-, c 0 u
1 o-2
Basal norites
Os lr Ru Rh Pt Pd Re

123
to be compatible in iron-sulfide, but Rh, Pt and Pd are more compatible than Os, Ir and Ru.
In contrast, only Os, Ir and Ru appear to be compatible in chromite.
As in the case of ophiolitic peridotites, Os-Ir-Ru-rich alloy and sulfide phases are found
included in chromite crystals from layered intrusions. The most common Os-Ir-Ru mineral
found in layered intrusions is laurite-erlichmanite solid solution (Ru,Os,Ir)S2 (e.g. , Talkington
and Lipin, 1986), although Os-Ir-Ru alloys have also been observed (e.g., Cabri and
Laflamme, 1988). Extensive subsolidus exsolution and reequilibration of Rh, Pd and Pt-rich
sulfides and alloys is known to have taken place in sulfide-rich horizons such as the J-M Reef.
It is likely that preexisting Os-Ir-Ru alloys would have been sulfidized during cooling or
metamorphism to form laurite at the high ambient A's. Therefore, the origin of laurite
inclusions in chromite from layered intrusions is basically the same problem as the origin of
Os-Ir-Ru alloys in ophiolitic chromites that was discussed in section 5.3.
During the growth and settling of chromite crystals at magmatic temperatures, Cr and Os
Ir-Ru were efficiently scavenged from large volumes of magma. Most workers have
concluded that laurite and Os-Ir-Ru alloys crystallized directly from the silicate magma
providing nucleation sites for chromite crystals which grew around them and then settled into
chromitite layers. However, as discussed in App. IV and section 5.3 this mechanism does not
seem likely. Instead, it is possible that Os, Ir and Ru were accommodated in solid solution as
oxides in the chromite lattice and later exsolved as Os-Ir-Ru alloys or laurite at subsolidus
temperatures.
5.5 RE.QS GEOCHRONOMETER
117Re decays to 1870s by B- emission with a halflife of -40 A!. The usefulness of this
isotopic system as a geochronometer has long been recognized (e.g., Herr et al., 1961) but

124
due to the analytical difficulties in measuring Os isotope ratios it has not been widely utilized.
Hirt et al. (1963) first determined the 187Re halflife to be 43 ±5 A:: by measuring 1870s in
molybdenites of known age which contain abundant Re but no common Os. A more accurate
determination of the 1~e halflife was determined by Luck and Allegre (1983) from analyses
of iron meteorites. Fractionations of Re and Os are observed between iron meteorite groups;
when 1860s is used as a reference isotope and 1870sfl86Qs is plotted versus 1~efl86 0s, a linear
array is established. From the slope of this line and the age of chondritic and achondritic
meteorites determined by the Rb-Sr and U-Pb isotopic systems a halflife of 45.6 ± 1.2 A:: was
calculated (Luck and Allegre, 1983). A direct laboratory measurement of the 1~e halflife
suggests that it has a significantly lower value of 42.3 ± 1.3 A:: (Lindner et al., 1989). This
has caused considerable confusion because if the laboratory value is accepted, the age of iron
meteorites based on the data of Luck and Allegre (1983) is 4.17 ±0.16 ..£, suggesting that
iron meteorites are 0.38 ±0.16 A:: younger than chondrites. This conflicts with iron
meteorite ages inferred from the 107 Ag-107pd system (Kaiser and Wasserburg, 1983; Chen and
Wasserburg, 1990) that suggest a much shorter timescale between late nucleosynthesis and
iron meteorite formation.
Under the reducing conditions of iron and chondritic meteorite genesis, both Re and Os
behave as siderophile elements and partition strongly into the metallic phase. Magmatic
crystallization of metallic liquids results in fractionations in the Re/Os ratio which range from
0.05 to 0.2 in both the IIAB and IllAB iron meteorite groups (Pemicka and Wasson, 1987).
Under the more oxidizing conditions of terrestrial magmatism Re behaves more like a
lithophile element and Os more like a siderophile element, resulting in dramatic fractionations
in the Re/Os ratio (Fig. 5.1). The Re/Os ratio of mantle peridotite xenoliths is a nearly
chondritic value of - 0.08, whereas the Re/Os ratio of basalts is - 35 (Hertogen et al.,

125
1980). The fractionation arises because Re concentrations of basalts generated by partial
melting are close to peridotite values ( -1 ppb) but Os concentrations are lower than
peridotites by more than a factor of 102 ( -0.03 ppb) (fable 2.4).
The Re/Os fractionation results in enormous variations in the 1170sfl86Qs ratio between the
mantle (- 1.0) and average continental crust (- 30) (Palmer and Turekian, 1986). Allegre
and Luck (1980) measured the 1170s/1860s ratio of osmiridium alloys from alluvial deposits
associated with ultramafic rocks of known age. They found that these data define a straight
line when plotted against age, implying that the mantle source region for all of the
osmiridiums has a present Re/Os ratio of 0.085 (the same ratio measured in peridotites) and
has changed through time only as a result of the decay of 117Re. The Os isotopic composition
at the time of crystallization of the Stillwater intrusion is also consistent with the osmiridium
mantle evolution trend (Martin, 1989; Lambert et al., 1989). Some mantle peridotite
xenoliths have lower than predicted 1170sJ1860s suggesting that parts of the sub-continental
mantle may have been depleted in Re relative to Os at least 2 JE ago (Walker et al. , 1989).
Future studies of Os isotopes from a variety of mantle-derived rocks will test whether there is
mantle heterogeneity with respect to the time integrated Re/Os ratio due to processes such as
1) Re depletion from partial melt extraction, 2) radiogenic Os introduction from subduction of
oceanic crust, and 3) heterogeneity remaining from incomplete core formation or meteoritic
input to the mantle.
The Re-Ds isotopic system may prove useful as a geochronometer in certain geological
situations where other isotopic systems are inappropriate. For example, iron meteorites,
Alaska-type ultramafics, chromitites and sulfides often lack sufficient concentrations or exhibit
sufficient fractionations of Rb-Sr, Sm-Nd, K-Ar or U-Pb for dating. Each of these rock-types
has high concentrations of Re and Os and is a potential candidate for dating using the Re-Os

126
system. Basic studies to determine the concentrations, fractionations and mobility of Re and
Os in these types of rocks must be done to determine the feasibility of utilizing the Re-Os
system. A recent study of Re-Os systematics in organic-rich black shales indicates that Re is
concentrated in black shales by reduction from seawater, and that Re/Os ratios vary enough to
allow isochron dating (Ravizza and Turekian, 1989). The data indicate that some mobility of
Re and/or Os occurs during diagenesis but that the disturbance is less than that which affects
the U-Th-Pb and Rb-Sr systems, and may be small enough to allow direct dating of
depositional ages.

127
CHAPTER 6. RESONANCE IONIZATION OF SPUITERED ATOMS
Geochemical studies of the distribution of Pt-group elements in rocks and minerals have
been primarily limited to bulk chemical methods. Radiochemical neutron activation has
played the dominant role in establishing the geochemical data base for PGE because it is the
only method capable of measuring the sub-ppba (parts per billion atomic) concentrations of
PGE that occur in most geological materials (Crockett and Cabri, 1981) . The distribution of
the PGE among the major rock-forming minerals and their influence on the fractionation of
PGE during magmatic processes is virtually unknown and is an important analytical goal in
geochemistry . Attempts to determine the concentrations of PGE in minerals using bulk
analyses of mineral separates have been ambiguous because of the prevalence of PGE-rich
sulfide inclusions and interstitial sulfides (Mitchell and Keays, 1981). Only in unusual cases,
where PGE are highly concentrated into sulfides in ore deposits , have in situ analytical
techniques such as electron microprobe x-ray analysis , synchrotron x-ray fluorescence or
particle-induced x-ray emission of PGE been possible (Cabri, 1988). The measurement of the
isotopic composition of small quantities of Os is also an important analytical goal in
geochemistry because of the geochemical applications of the radioactive decay of 187Re to
1870s (section 5.5).
Resonance ionization mass spectrometry (RIMS) is a newly developing field in chemistry
and physics (Hurst and Payne, 1988) that may provide the basis for a new method of
ultrasensitive in situ geochemical analysis. RIMS has already been successfully utilized for
isotopic analysis of Re, Os and Kr in geological materials following chemical separation (e.g. ,
Walker eta/., 1988; Thonnard eta/. , 1987). Several research groups have coupled RIMS
with primary ion beam sputtering for use as an in situ analytical technique. They have

128
achieved ultrasensitive detection of impurities such as Fe, In and Si in synthetic industrial
materials (Pellin et al., 1988; Parks et al., 1988; Pappas et al. , 1989).
The purpose of this work was to investigate the potential application of resonance
ionization coupled with ion sputtering (or resonance ionization of sputtered atoms) as a new
tool in analytical geochemistry. This method holds great promise and should eventually allow
the in situ measurement of extremely low concentrations of PGE in most minerals, and the
measurement of Os isotope ratios on very small sample sizes. The experimental work was
carried out at Argonne National Laboratory using a modified version of the SARISA (surface
analysis by resonance ionization of atoms) apparatus developed by Pellin et al. (1988). A
detailed description of the apparatus and the ionization schemes that were evaluated for Os
and Re are given in App. V. The analytical procedures and capabilities of the technique for
quantitative analyses of Os are given in App. VI. In this chapter a general introduction to
resonance ionization of sputtered atoms is given, some highlights of the experimental results
presented in Apps. V and VI are summarized, and the future applications of this technique for
in situ PGE analysis and Os isotope ratio measurement are discussed.
6.1 TRADmONAL IONIZATION TECHNIQUES
The mass spectrometric analysis of matter is a three step process of ionization, mass
separation and ion detection. The methods of mass separation and detection are common to
all elements and have been extensively developed. A recent review of mass spectrometry is
provided by Duckworth et al. (1986). The limitation for elements that are presently difficult
to analyze by mass spectrometry (such as the PGE) is in the ionization step. My work has
emphasized the development of a new laser-based method for the ionization of PGE, which
can be coupled with traditional mass separation and detection systems. The ionization of

129
solids is itself a two part process which involves vaporizing the species to be analyzed and
then removing or adding an electron to produce a charged particle that can be manipulated by
electromagnetic fields.
Most isotope ratio measurements of solids are done by thermal ionization, in which the
sample is deposited onto a refractory metal filament and heated in the mass spectrometer
producing a cloud of vaporized ions and neutrals. By loading samples onto filaments along
with a variety of materials such as silica gel and graphite (e.g., Cameron et al. , 1969), most
elements can now be ionized efficiently by thermal ionization. Some elements, however,
evaporate from the filament almost entirely as neutral species and thus cannot be analyzed by
thermal ionization. Several of the PGE (including Os) fall into this category. Due to the
failure of thermal ionization for Os analysis, a wide variety of alternate methods have been
evaluated for Os ionization including electron bombardment of volatile Os04 molecules (Herr
et al., 1961), laser ablation (Simmons, 1983), inductively coupled plasma ionization (Russ et
al., 1987), accelerator mass spectrometry (Teng et al., 1987) and secondary ionization (Luck
and Allegre, 1983).
The most successful Os ionization method has been secondary ionization, in which a
focused beam of energetic primary ions (usually o ·) is used to bombard the sample and
sputter material from it as both ions and neutral atoms. The ratio of sputtered ions to neutrals
is difficult to predict a priori, and is a complex function of the primary ion used for
sputtering, the element being analyzed, the matrix or substrate from which the element is
being sputtered, and surface properties such as the extent of oxygen coverage (e.g.,
Benninghoven, 1975; Williams, 1983). Elements with low ionization energies generally form
secondary ions with high efficiency, allowing the ultrasensitive in situ analyses for which
secondary ionization mass spectrometry has been so successful. Some elements, particularly
130
those with high ionization energies (including PGE), are sputtered predominantly as neutrals
thus precluding the use of secondary ionization for ultrasensitive analyses. Although the
ionization efficiency for Os is quite low with secondary ionization ( ~ 1 Q-4; App. V), this is
still the most efficient of the available methods and has been used extensively to measure the
isotopic composition of Os after chemical separation from geologic materials (e.g., Luck and
Allegre, 1983). The low ionization efficiency necessitates large sample sizes (> 1 ng of Os)
and limits the precision ( < ± 1%) due to ion counting statistics . Due to the isobaric
interference between 1870s and 1B"7Re, lengthy chemical separation procedures are required to
quantitatively separate Re from Os prior to analysis by secondary ionization.
6.2 LASER RESONANCE IONIZATION
Resonance ionization is a multistep photon absorption process in which the final state is the
ionization continuum of the atom. The individual photons that are used generally do not have
sufficient energy to ionize atoms. Instead, their wavelengths are tuned to excite electronic
energy levels that are characteristic for each element. First a photon excites an atom from its
ground state to a resonant energy level . Then additional photons excite the atom further to
other energy levels or to the ionization continuum. Ionization schemes ranging from one to
three stepwise resonances have been utilized for this process. In general, the greater the
number of resonant steps that are involved in an ionization scheme, the greater the elemental
selectivity. To demonstrate the wide applicability of resonance ionization, Hurst et al. (1979)
compiled a list of the simplest resonance ionization scheme that could be utilized for each
element using either one or two lasers. They assumed that the fundamental wavelength of
tunable dye lasers, which have sufficient power to saturate photoionization, is 380-750 run
(5.25-1.65 eV). They further assumed that dye lasers can be frequency doubled over the

131
wavelength range of 217-360 nm (5.71-3.44 eV). The five ionization schemes that they
considered are given in Fig. 6.1 and are numbered 1-5 in order of increasing complexity.
Using tabulated values for the energy levels of each element they showed that 57 elements
could be ionized with one laser, 44 elements could be resonantly ionized with two lasers and
only two elements (He and Ne) could not be ionized by these simple schemes (Fig. 6.2).
In order to saturate the resonance ionization levels a high power density on the order of
108 Wcm·2 in the ultraviolet region is usually required (Hurst and Payne, 1988). Therefore,
continuous wave lasers, which have maximum ultraviolet power densities of - 102 Wcm·2 in a
1 mm spot, cannot be used efficiently. Ionization must instead be achieved by pulsed lasers.
Pulsed lasers can produce ~ 1 Jcm·2 per -10 nsec pulse resulting in a ~ 108 Wcm·2 power
density in a 1 mm diameter spot. Modern pulsed lasers operate at maximum repetition rates
of 30Hz (Nd-YAG lasers) to 200Hz (excimer lasers).
Walker and Fassett (1986) were the first to demonstrate that photons from a pulsed dye
laser could be used to enhance the ionization of Os in a mass spectrometer. They thermally
vaporized neutral Os atoms from a filament and resonantly ionized them by shining a laser
through the atomic vapor cloud. Walker and Fassett used a 10Hz Nd-YAG laser, which
resulted in a 10·7 efficiency for the detection of Os atoms loaded onto the filament due to the
large differences in the duty cycle of the laser versus the continuously heated filament. To
help alleviate this problem they minimized the size of the filament and thermally pulsed it as
quickly as possible in synchronization with the laser. Because thermal diffusion in the
filament limited the narrowness of the vaporization pulse width, this approach only improved
the ionization efficiency by a factor of 102. With the duty cycle mismatch reduced to 10·5 for
the pulsed experiment, and a mass spectrometer transmission efficiency of -10·2, Walker and
Fassett detected 1 out of each 107 Os atoms that were vaporized.

132
Fig. 6. 1 Classification of resonance ionization schemes using either one or two tunable dye
lasers from Hurst et al. (1979). The vertical scale is in arbitrary units of energy . The
hachured region indicates the ionization continuum. Wide arrows indicate resonant transitions
and narrow arrows indicate ionization to an arbitrary position in the ionization continuum. w1
and w2 designate the frequencies of the dye lasers; 2w indicates that the dye laser fundamental
is frequency doubled; and the two arrows in scheme 5 without a resonant transition between
them indicates a two photon absorption process.
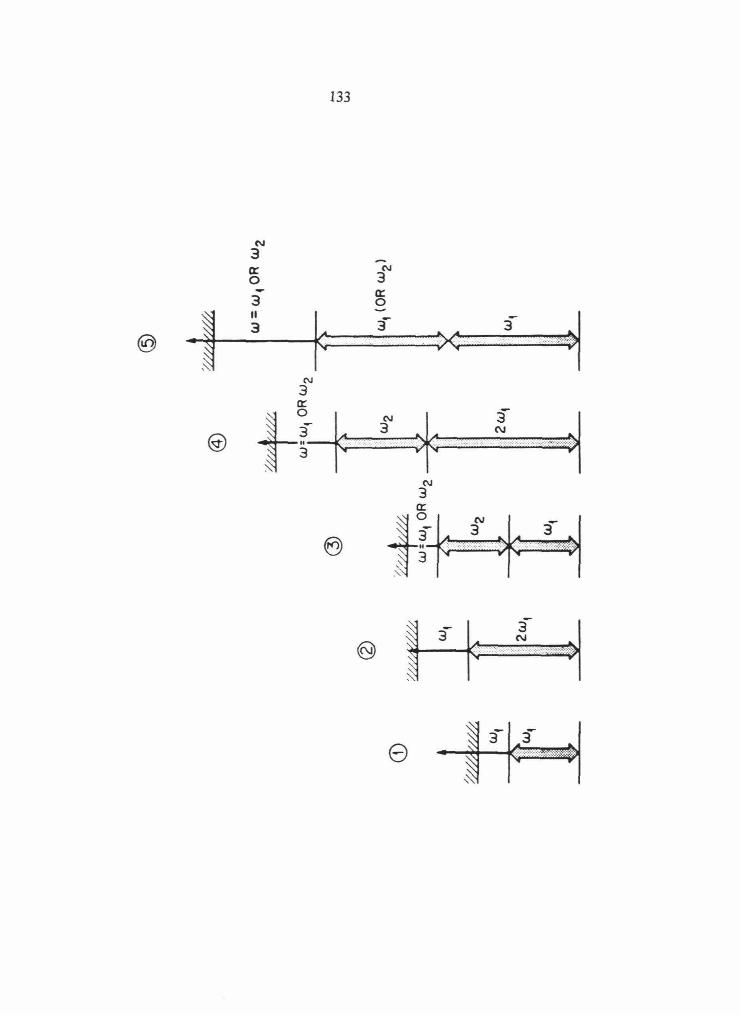
133
N
3 0: -o.... 3N
3 0: I II 9 @ • ; 3 J;:=:==3===· >< . . . 3 ...... '~
a:
@ ti-f ~

134
Fig. 6.2 Periodic table of the elements indicating the simplest resonance ionization scheme
possible using two dye lasers (from Hurst et al., 1979). The definition of the ionization
schemes (1-5) is given in Fig. 6.1. It was assumed that the fundamental wavelength of
tunable dye lasers is 380-750 nm and the dye lasers can be frequency doubled over the
wavelength range 217-360 nm (Hurst et al., 1979).

(;R
OU
, I•
H
G)
1J
6 10
.2
lo 0
5.
31
No
0 S
I 3
.1
K
0 •
3 3
I
Rb
0 4
2
30
Co
0 3
9
27
fo
e •
,
II•
a.
10
0 1
.3
5,3
Mt
5.1
0 7.
1 2.
7 ll
lb
Co
Sc
G)
0 I
I 4
S
1.6
4.7
So
v 5
0
0 0
5.7
43
1.
4 3
.0
8•
Lo
0 0
52
3.
1 5
1
30
Ro
Ac
' 0
) ®
5
.3
3.1
1.9
21
SEC
ON
O
SYM
BO
L a
!XC
IIIO
C
l S
fAT
(
17
\ R
IS
~
SC
H!M
£
39
27
FI
RST
IO
Nil
AT
IO
N
[XC
II E
O
PO
HN
TIA
L
ST
AlE
... 0
Ill.
'•
Vh
\'
II,
206
8 7.
2 c
N
0 ,
"' 0
0 0
0 0
0 1.
3 5.
0 11
.3
I. I
us
12.0
1
31
11
.0
17 .•
IU
21
6
AI
So
7.1
, s
Cl
"' \'
Ill
0 0
0 0
0 G
) -
IVb
V
b V
lh
\'ll
o
,. ll
h 1.
0 3
I 1.
1 •••
10.1
1.
3 10
.•
1t
13.0
10
.3
15.1
12
.1
V.)
V
I To
v
Co
Mn
,,
Co
N
o C
u
1.2
Z
n 1
.9
c.
c.
1.1
A
o S
t 8
· "'
0 0
0 0
0 0
0 0
0 0
0 G
) 0
'0
G)
1.1
4.7
1.7
4.5
II
5.2
7 .•
5.7
7.
1 5
.3
7.9
54
7.
1 s
.4
7.7
31
u
4.0
1.0
3 I
7.9
... 1
.1
7.5
1.1
7.
3 11
.1
1.3
uo
11
3
Zo
u N
b M
o T
c 5
5
Ru
R
h
Pd
7.2
... 1
.0
Cd
••• In
Sn
S
b 7.
2 T
t 7.
9 I
x.
0 0
0 0
0 0
0 0
0 0
0 0
0 0
G)
1.1
1.1
1.1
4,7
7.1
4.1
7.3
u 7.
4 4
.9
7.5
6.0
1.3
s.o
71
3
1
90
3
1
Sl
3.0
73
5
.4
... s.
• 9
0
5.5
10.5
1
0
12.1
u
HI
' "
5.3
w
5
5
Rt
Oo
5.9
" 1.
5 "'
1.5
A
u
7.7
... 7.
9 Tl
P
b 6.
4 Bo
1.
2 P
o 7 .
• A
I R
n
@
0 0
0 0
0 0
0 0
0 0
0 0
@
G)
7 3.
1 7.
9 2.
7 1.
0 3.
2 7.
1 5.
3 1.
7 2.
1 9
3.3
9
0
40
9.2
... 10
4 ..•
I I
3.3
,. 4 .
• 7.
3 4
0 1
4
.. 9.5
, 10
1
I 2
I c.~
0 I Po
~ 0 I~
~ 0 I Pm
~
@
I~~
0 I [u
~
0 I Cd
~
0 I Tb
~
0 I Uy
~
0 I"
"~
0 I£·~ 0
I Tm ~
0 I Yb
~
0 llu
~
0 I
5.5
2.1
I a.
• 2.
1 I
s.s
2.1
I s.
l 5
.1
2.1
I 5.
7 4.
2 I
1.2
3.1
I S.
l 3.
2 I
5.1
3 1
I 1
.0
3.1
I 1.
1 3.
2 I
1.2
3.2
I 1.
3 4.
7 I
s.•
3 o
Th
.. u
Np
""
Am
C
m
Bk
Ct
Eo
fm
Md
N
o
L•
@
@
0 0
0 0
0 0
®
0 @
®
e
@
1.1
u 1.
2 u
I 1.
3 3
.2 I
5.1
U
I
1.0
4.2
I 1.
2 3.
1 I
1.2
3.2
I 1
.3
1.4
Ul
U
1.1
••

136
6.3 RESONANCE IONIZATION COUPLED WITH SPUTIERING
The resonance ionization method that I have investigated, utilizes a primary ion beam to
sputter neutral atoms instead of a filament to thermally vaporize them. In principle, this
method should be capable of much higher efficiency than thermal vaporization. The major
advantage is that by utilizing electrostatic deflection the ion beam can be precisely pulsed to
more closely match the duty cycles of vaporization and ionization. The method has the added
advantage that the element being analyzed does not have to be chemically separated from the
geologic sample and loaded onto a filament for analysis. Instead, analyses can be made
directly on sample specimens (in situ) or on chemically concentrated solid fractions.
A schematic diagram of the resonance ionization of sputtered atoms apparatus is shown in
Fig. 6.3. It consists of three main subunits: a pulsed primary ion source, three tunable dye
lasers pumped by a pulsed XeCl excimer laser and an energy- and angle- refocusing time-of
flight mass spectrometer. A 5 keV primary Ar+ ion beam with an average current of 2.0 JLA
and a diameter of -70 JLm is used for sputtering. During analyses, the primary ion beam is
chopped into pulses of 200 nsec width by electrostatic deflection at a 40 to 200 Hz repetition
rate. The sputtering rate in the 40 Hz pulsed mode is - 10 minutes per monolayer of target.
Sputtered species fill a volume above the target during and after the arrival of the primary
Ar+ ion pulse. Approximately 300 nsec after the end of each primary ion pulse, a XeCI
excimer laser is fired producing a - 10 nsec ultraviolet pulse which is used to pump the three
tunable dye lasers to produce three beams of light. The three laser beams are spatially and
temporally overlapped in a volume that extends from about 0.5 to 1.5 nun above the target
surface and has a diameter of -1 nun (Fig. 6.4). Photoionization of sputtered neutral Os
atoms occurs within this volume. The time delay between the end of the primary ion pulse
and the laser firing is precisely adjusted to maximize the number of sputtered atoms in the
137
Fig. 6.3 Schematic diagram of the laser resonance ionization of sputtered atoms apparatus
used in this study. The wavelength and energy per pulse are given for the XeCI excimer
pump laser as is the partitioning of the energy to the three dye lasers for ionization scheme E .
The type of dye used for each tunable dye laser in scheme E is given as well as the
fundamental or frequency doubled energy produced by each dye laser. The components of
the primary ion gun and time~f-flight mass spectrometer are labeled.

Hig
h
Vo
lta
ge
E
lnze
l le
ns
Ve
rtic
al
de
fle
cti
on
Eln
zet
Le
ns
/ P
uls
ed
P
rim
ary
rh
lon
B
ea
m
Pri
ma
ry
ton
B
ea
m
De
fle
cti
on
P
late
s
Ph
oto
-to
n
Flig
ht
Pa
th
• S
am
ple
Ph
oto
-to
n
Flig
ht
Ho
rizo
nta
l D
efl
ecti
on
Pri
ma
ry
ton
...
.__
Be
am
T
urn
ing
P
late
s
Re
sis
tive
D
isk
An
aly
ze
r
t
Pa
th
475
nm
640
nm
(2 m
J/P)
(4
mJ/
P)
~ --
I C
-480
, D
ye
'DC
M'
Dye
,A
-590
D
ye
I 15
%
25
%
60%
" "
J "
; ,
, r
r 1
308
nm
X
eC
I E
xcim
er
(200
mJ/
P)
Eln
zel
Le
ns
a= ¥@
M
icro
._
Ch
an
ne
l P
late
s
Re
sis
tive
D
isk
An
aly
ze
r ~
Co
ll•c
lor
.....
w
00

139
Fig . 6.4 Schematic diagram of the photoionization region in the apparatus used in this study.
Neutral Os atoms are sputtered during the 200 nsec primary Ar+ ion pulse. Approximately
300 nsec after the end of each primary ion pulse the lasers are frred producing Os+ photoions
in the region 0 .5 to 1.5 mm from the sample. The ions are accelerated into the mass
spectrometer for detection.

140
(/)
~ <( w [C
a: w (/)
::5 + (fJ en w 0 () w
w CL
......J (fJ
(L 0 +
~ w ~-a:
<( w (/) ~
::::> CL + (fJ en
0

141
ionization volume, which depends on the velocity distribution of the sputtered atoms of
interest. Positively charged Os • photoions are accelerated away from the target and are
focussed in the time-of-flight mass spectrometer by a series of einzel lenses, deflection plates,
and two hemispherical resistive disk analyzers. Ions are detected with a chevron-type
microchannel plate electron multiplier and arrival times are recorded in 5 nsec windows by a
pulse-counting system at low signal levels or by a transient charge digitizer at higher signal
levels.
6.4 MULTIPHOTON IONIZATION SCHEMES
One of the most powerful features of resonance ionization is that the ionization process can
be elementally selective. In principle this should allow the in situ isotopic analysis of both
parent and daughter isotopes (such as 187Re and 1870s) without chemical separation, and reduce
isobaric and molecular interferences in trace element analyses to levels that will allow
ultrasensitive measurements. Walker and Fassett (1986) demonstrated that they could load
equal amounts of Re and Os onto a single fllament and consecutively analyze Re and then Os
with an ionization selectivity of l<P for each element with respect to the other. Re was first
ionized with a single unfocused laser beam (- 3 mrn diameter) tuned to excite Re from the
ground state to a single resonance level and then to the ionization continuum. The laser was
then tuned to ionize Os from a thermally excited state (containing -8% of the Os atoms) to a
single resonance and then to the ionization continuum. Fassett and Walker found that if the
laser beam was tightly focused there was a broadening of resonant transitions and a large
increase in nonresonance background, both of which degraded elemental selectivity.
In the experiments reported here, resonance ionization of sputtered atoms was used to
analyze samples with equal amounts of Re and Os dissolved in the same Fe-Ni matrix. Since

142
Re and Os are vaporized simultaneously and with the same efficiency, it is possible to
quantitatively evaluate the selectivity of various resonance ionization schemes. Five different
classes of ionization schemes (designated A-E) were studied and are shown in Fig . 6.5.
Scheme Cis equivalent to scheme 1 on Fig. 6.1, schemeD is equivalent to scheme 4 on Fig .
6 . 1 and scheme E utilizes three lasers and is therefore more complex that any of the
ionization schemes on Fig 6 .1 from Hurst et al. (1979). Measurements of the selectivity of
Os ionization relative toRe are reported on Fig. 6.6 for each of the ionization schemes (A-E)
that I investigated. Under the experimental conditions reported in App . V the single
resonance two-photon Os ionization scheme (scheme C), which is similar to that used by
Walker and Fassett (1986), was found to be -30 x more selective for Os than for Re.
SchemeD was -100 x more selective for Os than for Re. By utilizing three resonance
energy levels (scheme E) a maximum selectivity for Os relative to Re of > 1()3 was
demonstrated. The final resonance energy level in this three level scheme (E) is at an energy
higher than the ionization potential and is therefore autoionizing. The autoionizing energy
level was found by scanning the ionizing laser energy from the ionization potential up in
energy while monitoring the signal intensity. Utilization of this previously unknown
autoionizing energy level enhanced the signal intensity 10 x relative to scheme C and 5 x
relative to scheme D .
6.5 ANALYTICAL CAPABILmES
To test the efficiency and quantitative capabilities of resonance ionization of sputtered
atoms for PGE analyses, synthetic metal standards and metallic phases from iron meteorites
that have known Os concentrations were analyzed. The analytical procedures and
experimental results are given in App. VI. When the Os+ signal intensity is plotted versus

143
Fig. 6.5 Generalized ionization schemes evaluated for Os. Asterisks denote broadband
excimer radiation. I.P. indicates the ionization potential for Os.
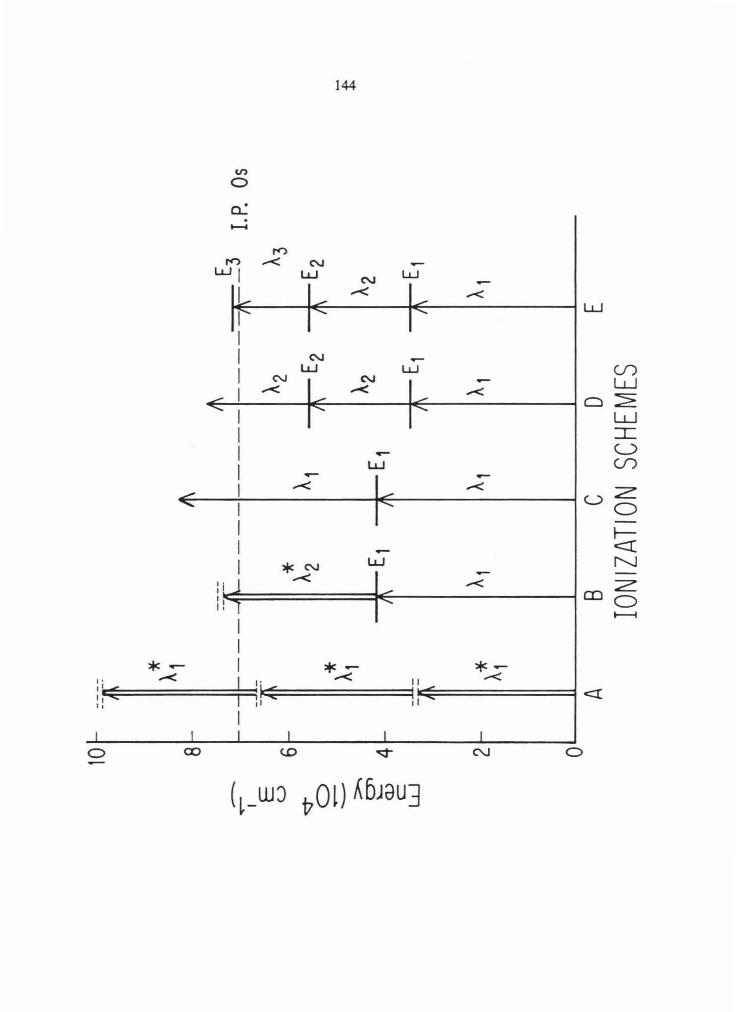
10 ._
----
~~
8 A*
1 1
-II
\
-~
I E
u 6
~
0 -- - >-.
CT
l 4
\,..
.
a..>
c w
----
II\
E
---
1--
-1--
----
-o"-----------------~~--
3 I.
-=..-
r=:
~ A2
A3
I-
* A2
A1
[\ E2
I[
\ E
2 A*
I
1 f-
E1
E1
A2
A2
II\
I[\
--
--
E1
E1
II\
~~
~~
P. Os
..... t
2 1
-
Af
A1
A1
A1
A1
0 L
.
A
8 C
D
E
IO
NIZA
TIO
N SC
HEM
ES

145
Fig. 6.6 Relative selectivity for ionization of Os compared to Re measured as the logarithm
of the ratio of the observed to the true '92()s+ fl85Re + ratio for ionization schemes A-E.

146
3
w 2 r x X'i'X"J (/) :::> CD a::: 0 I--- --(l) (l)
0::: 0::: l() l() CD CD
.:::::.... ........ ..............
V> V> 0 0
N N 0"> 0"> - -I - -, rXX'iXSI
0' 0 0
A 8 C 0 E
IONIZATION SCHEME
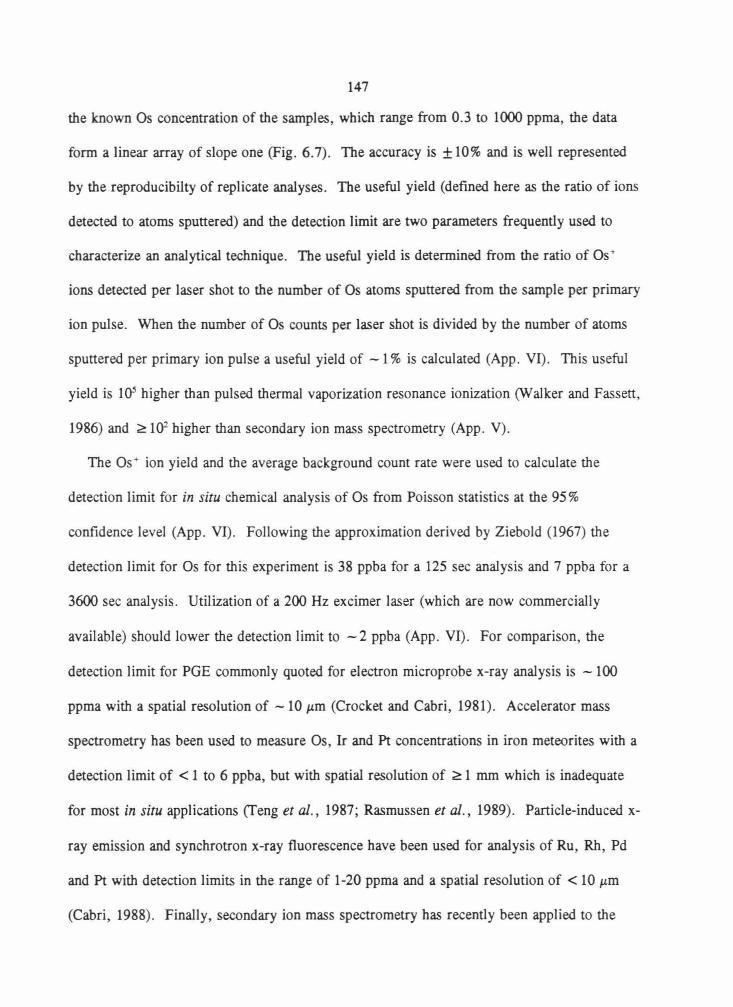
147
the known Os concentration of the samples, which range from 0.3 to 1000 ppma, the data
form a linear array of slope one (Fig. 6.7). The accuracy is ± 10% and is well represented
by the reproducibilty of replicate analyses. The useful yield (defined here as the ratio of ions
detected to atoms sputtered) and the detection limit are two parameters frequently used to
characterize an analytical technique. The useful yield is determined from the ratio of Os+
ions detected per laser shot to the number of Os atoms sputtered from the sample per primary
ion pulse. When the number of Os counts per laser shot is divided by the number of atoms
sputtered per primary ion pulse a useful yield of -1% is calculated (App. VI). This useful
yield is lOS higher than pulsed thermal vaporization resonance ionization (Walker and Fassett,
1986) and ~ 102 higher than secondary ion mass spectrometry (App. V).
The Os + ion yield and the average background count rate were used to calculate the
detection limit for in situ chemical analysis of Os from Poisson statistics at the 95%
confidence level (App. VI). Following the approximation derived by Ziebold (1967) the
detection limit for Os for this experiment is 38 ppba for a 125 sec analysis and 7 ppba for a
3600 sec analysis . Utilization of a 200Hz excimer laser (which are now commercially
available) should lower the detection limit to -2 ppba (App. VI) . For comparison, the
detection limit for PGE commonly quoted for electron microprobe x-ray analysis is - 100
ppma with a spatial resolution of - 10 J.Lm (Crocket and Cabri, 1981). Accelerator mass
spectrometry has been used to measure Os, Ir and Pt concentrations in iron meteorites with a
detection limit of < 1 to 6 ppba, but with spatial resolution of ~ 1 mrn which is inadequate
for most in situ applications (feng eta/. , 1987; Rasmussen eta/., 1989). Particle-induced x
ray emission and synchrotron x-ray fluorescence have been used for analysis of Ru, Rh, Pd
and Pt with detection limits in the range of 1-20 ppma and a spatial resolution of < 10 J.Lm
(Cabri, 1988). Finally, secondary ion mass spectrometry has recently been applied to the

148
Fig. 6.7 Logarithmic plot of normalized Os+ signal intensity in ppma versus Os concentration
determined gravimetrically for synthetic samples or by radiochemical neutron activation for
iron meteorite samples by Pernicka and Wasson (1987) and Davis (1977). Circles are
synthetic metal standards and triangles and diamonds are iron meteorites. Signal intensities
were normalized to the 1000 ppma standard. The minimum detection limit of 7 ppba is
calculated for a 3600 sec analysis.

0 0 0 0 0
149
0 q 0
(owdd) OH\10N\11S 01 3/\ll\1l3H AllSN31Nl l\1N9l S +so
h....
~ -....;::: -........J
~ ~ ~ ' ~ ~ ~ ~ ~
~ 0 d
0 0 0
0 0
0 E a. a.
::z 00
I<! n:: 1-z: w (_)
oz __: 0
(_)
0 c)

150
analysis of Pd, Rh, lr and Pt with detection limits in the range of 30-200 ppba and a spatial
resolution of 60 ILm (Chryssoulis et al., 1989).
Resonance ionization of sputtered atoms samples the large neutral fraction of atoms that
are sputtered, rather than the much smaller secondary ion fraction sampled by secondary ion
mass spectrometry. Matrix-dependent variations in sensitivity should be smaller for
photoionization than for sputter-initiated secondary ionization because ionization occurs in the
gas phase and is largely independent of the physical properties of the sample. Variations in
relative ion yield of several orders of magnitude are common for secondary ion mass
spectrometry (e.g. Williams, 1983) but appear to be much less than a factor of 10 for
resonance ionization of sputtered atoms (Parks et al. , 1988). The yield of photo ions using
resonance ionization of sputtered atoms should depend only on 1) the sputtering rate of the
sample, 2) the relative sputter yield of neutral atoms, ions and molecules, and 3) the extent of
surface segregation and/or contamination during an analysis .
6.6 POTENTIAL APPLICATIONS
The high useful yield and elemental selectivity of resonance ionization of sputtered atoms
allows chemical and isotopic analyses to be made on small numbers of Os (or other PGE)
atoms without the need for chemical separation. As discussed in App . V, the time-of-flight
mass spectrometer used in these experiments is adequate for concentration measurements but
not appropriate for high precision ( < ± 1%) isotope ratio measurements of Os due to its low
mass resolution. Resonance ionization of sputtered atoms can, in principle, be coupled with a
magnetic sector, quadrupole, or high resolution time-of-flight mass spectrometer for high
precision isotope measurements . In this case, the precision of Os measurements would be
limited primarily by ion counting statistics. Os occurs in geological materials dissolved at low

151
concentrations in sulfides, silicates, and spinels and as a major constituent in JLm-sized PGE-
rich sulfides and alloys. Os measurements of geochemical interest can be grouped into the
following categories: 1) in situ chemical analyses of Os (and other PGE) at low (sub-ppma)
concentrations, 2) in situ isotopic analyses of Os at low concentrations, 3) in situ isotopic
analyses of Os in JLm-sized PGE-rich sulfides and alloys, and 4) isotopic analyses of Os
chemically concentrated from geological materials.
Simple counting statistics can be used to calculate the approximate precision of Os
concentration and 1870sl'860s isotope ratio measurements that are potentially possible using
this method. In App . VI a useful yield of 1% is demonstrated , which corresponds to 0 .069
Os+ counts per laser shot per ppma of Os in a sample. The experiments reported here were
run at a 40 Hz repetition rate, but excimer lasers are available which operate at repetition
rates of up to 200 Hz. For a 1 hour analysis at 200 Hz one can calculate that there would be
5x1Q4 Os+ counts per ppma of Os in a sample. Based on the calculated count rates and
counting statistics, it should be possible to measure Os concentrations in situ with a precision
of ± 10% down to 2 ppba, and with a precision of ± 1% down to 200 ppba. These detection
limits will allow the investigation of Os partitioning and solubilities in mineral phases from
iron meteorites, terrestrial mafic and ultramafic rocks, and in phases synthesized in laboratory
experiments.
Most geological applications of Os isotope studies require the measurement of 1170sl'860s
ratios with < ± 1% precision (Allegre and Luck, 1980). My calculations indicate that this
should be possible for in situ measurements of samples with ~ 15 ppma Os. This is a
considerably higher concentration than needed for Os concentration measurements because
1170s and 1860s are minor isotopes ( -1.6% abundance) of Os. As a result, in situ Os isotope

152
investigations will be limited to materials that are enriched in Os such as iron meteorites and
Ni-Fe sulfides in peridotites and mafic-ultramafic layered intrusions.
Os is a major constituent in PGE-rich alloys and sulfides that are commonly found as
inclusions in spinels associated with ophiolites and layered mafic-ultramafic intrusions. These
inclusions range in size from 1 to 20 JLm in diameter and have Os concentrations of up to
-20% (e.g., Stockman and Hlava, 1984; Talkington et al., 1984). Although the primary
Ar+ ion beam used in the resonance ionization of sputtered atoms apparatus bas a - 70 JLm
fwbm diameter, small inclusions can still be analyzed for 1870s/1860s with a precision of
< ± 1% if they have high Os concentrations. For example, a 1JLm diameter inclusion with
5% Os or a 5JLm diameter inclusion with 0 .2% Os should be adequate for such an analysis.
Thus, the Os isotope systematics of PGE-rich alloys and sulfides from most ophiolites and
layered mafic-ultramafic intrusives should be amenable to in situ Os isotope studies.
Finally, resonance ionization of sputtered atoms can be used to measure the isotopic
composition of extremely small samples of Os that have been chemically concentrated from
geological materials. Following separation of Os from rocks by acid dissolution and
distillation (cf. Luck and Allegre, 1983), samples with as little as 10"15 grams of Os could
theoretically be used for 1870s/1860s ratio measurements with < ± 1% precision if they were
deposited as thin films onto a substrate for sputtering. Chemical separation of Os would
allow Os isotope analyses of mg-size samples of virtually all rock-types including felsic
crustal rocks which have Os concentrations as low as -0.01 ppba (Table 2.4). Os can quite
easily be concentrated by a factor of - 10 from bulk rocks into NiS or Ni metal by fire assay
fusion (Hoffman et al., 1978). Alternatively, Os can be concentrated by - l<f by NiS fire
assay fusion followed by acid dissolution and filtration of acid insoluble residues (Teng et al. ,
1987). These residues could then be sputtered directly or fused with NiS or Ni metal for

153
sputtering. Fire assay concentration of Os would allow Os isotopic analysis of ultramafic
rocks which generally contain 1 to 10 ppba Os.
It has been shown that resonance ionization of sputtered atoms can be used for quantitative
analysis of trace levels of Os in metallic phases with a spatial resolution of -70 1-Lm. This
technique can be adapted to trace analysis of most high ionization potential elements
(including all of the PGE) in a wide variety of natural and synthetic materials by determining
the appropriate ionization scheme for each element and tuning the dye laser wavelengths
accordingly. To obtain multielement analyses in a single spot, dye laser wavelengths will
have to be rapidly tuned to the ionization scheme for each element. The high useful yield and
elemental selectivity of resonance ionization of sputtered atoms should eventually allow in situ
measurement of PGE concentrations down to 2 ppba and the in situ measurement of Os
isotope ratios down to concentrations of - 15 ppma without chemical separation.

154
REFERENCES
Agioritis G. and Wolf R. (1978) Aspects of osmium, ruthenium and iridium contents in some Greek chromites. Chem. Geol. 23, 267-272.
Allegre C.J. and Luck J.M. (1980) Osmium isotopes as petrogenetic and geologic tracers. Earth and Planet. Sci. Lett. 48, 148-154.
Alvarez L.W., Alvarez W., Asaro F . , and Michel H.V. (1980) Extraterrestrial cause for the Cretaceous-Tertiary extinction. Science 108, 1095-1108.
Amosse J., Allibert M., Fischer W. and Peboule M. (1990) Experimental study of the solubility of platinum and iridium in basic silicate melts - Implications for the differentiation of platinum-group elements during magmatic processes. Chem. Geol. 81, 45-53 .
Anders E . (1978) Procustean science: Indigenous siderophiles in the lunar highlands, according to Delano and Ringwood. Pro. Lunar Planet. Sci. Conf. 9th, 161-184.
Anders E. (1987) Local and exotic components of primitive meteorites, and their origin. Phil. Trans. Royal Soc. Lond. [A] 323, 287-304.
Anders E. and Grevesse N. (1989) Abundances of the elements: Meteoritic and solar. Geochim. Cosmochim. Acta 53, 197-214.
Armstrong J. T., El Goresy A. and Wasserburg G. J. (1985) Willy: A prize noble Ur-Fremdling - Its history and implications for the formation of Fremdlinge and CAl. Geochim. Cosmochim. Acta 49, 1001-1022.
Armstrong J. T., Hutcheon I. D. and Wasserburg G. J. (1987) Zelda and company: Petrogenesis of sulfide-rich Fremdlinge and constraints on solar nebular processes. Geochim. Cosmochim. Acta 51, 3155-3173.
Arrhenius G. and Raub C. J. (1978) Thermal history of primordial metal grains. J. Less-common Metals 62, 417-430.
Auge T. (1988) Platinum-group minerals in the Tiebaghi and Vourinos ophiolitic complexes: genetic implications. Can. Mineral. 26, 177-192.
Barnes S.J. and Naldrett A.J . (1985) Geochemistry of the J-M (Howland) reef of the Stillwater complex, Minneapolis adit area. I. Sulfide chemistry and sulfide-olivine equilibrium. Econ. Geol. 80, 627-645.
Barnes S.J. , Naldrett A.J. and Gorton M.P. (1985) The origin of the fractionation of platinumgroup elements in terrestrial magmas. Chem. Geol. 53, 303-323.
Barton P. B. and Skinner B. J. (1979) Sulfide mineral stabilities. In Geochemistry of Hydrothermal Ore Deposits (ed. H. L. Barnes), pp. 278-403. Wiley and Sons.
Beamish F .E. (1966) The Analytical Chemistry of the Noble Metals. Pergamon ,Oxford. 609 p.

155
Beamish F.E. and Van Loon J.C . (1972) Recent Advances in the Analytical Chemistry of the Noble Metals. Pergamon, Oxford. 511 p.
Beamish F.E. and Van Loon J.C. (1977) Analysis of Noble Metals, Overview and Selected Methods. Academic Press, New York. 327 p.
Beckett J. R., Live D., Tsay F., Grossman L. and Stolper E. M. (1988) TP+ in meteoritic and synthetic hibonite. Geochim. Cosmochim. Acta 52, 1479-1496.
Benninghoven A. (1975) Developments in secondary ion mass spectroscopy and applications to surface studies. Surf Sci. 53, 5~25.
Bird J.M. and Bassett W.A. (1980) Evidence of a deep mantle history in terrestrial osmiumiridium-ruthenium aiioys. J. Geophys. Res. 85, 5461-5470.
Bischoff A. and Palme H. (1987) Composition and mineralogy of refractory-metal-rich assemblages from a Ca,AI-rich inclusion in the Allende meteorite. Geochim. Cosmochim. Acta 51, 2733-2748.
Blander M., Fuchs L. H., Horowitz C. and Land R. (1980) Primordial refractory metal particles in the Allende meteorite. Geochim. Cosmochim. Acta 44, 217-223 .
Blander M. and Katz J.L. (1967) Condensation of primordial dust. Geochim. Cosmochim. Acta 31' 1025-1034.
Brandstatter F. and Kurat G. (1983) All-Jim: A large Ca-AI-rich chondrule from Allende (C3). (abstr.) Meteoritics 18, 272.
Brett R. (1984) Chemical equilibration of the Earth's core and upper mantle. Geochim. Cosmochim. Acta 48, 1183-1188.
Brugmann G.E., Arndt N.T., Hofmann A.W. and Tobschaii H.J. (1987) Noble metal abundances in komatiite suites from Alexo, Ontario, and Gorgona Island, Columbia. Geochim. Cosmochim. Acta 51, 2159-2169.
Cabri L.J. (1981) The platinum-group minerals. In Platinum-group elements: Mineralogy, geology. recovery (ed. Cabri, L.J.) Canad. Inst. Mining Metaii. Spec. Vol. 23, pp. 83-150.
Cabri L.J. (1988) Applications of proton and nuclear microprobes in ore deposit mineralogy and metallurgy. Nucl. Insr. and Merh. in Phys. Res. B30, 459-465.
Cabri L.J., LaFlamme J.H.G., Stewart J.M., Turner K. and Skinner B.J. (1978) On cooperite, braggite and vysotskite. Amer. Mineral. 63, 832-839.
Cabri L.J. and Laflamme J.H.G. (1988) Mineralogical study of the Platinum-group element distribution and associated minerals from three stratigraphic layers, Bird River sill , Manitoba. CANMET Repon CM88-1E, Canadian Govt. Publ. Center, 33 p.

156
Cameron A. E., Smith D.H. and Walker R.H. (1969) Mass spectrometry of nanogram-size samples of lead. Anal. Chern. 41, 525.
Cameron A.G.W. (1973) Abundances of the elements in the solar system Space Sci. Rev. 15, 121-146.
Cameron A.G.W. (1962) Formation of the Sun and Planets. Icarus 1, 13.
Campbell I.H. and Barnes S.J. (1984) A model for the geochemistry of the platinum-group elements in magmatic sulfide deposits. Can. Mineral. 22, 151-160.
Capobianco C.J. and Drake M.J. (1990) Partitioning of ruthenium, rhodium and palladium between spinel and silicate melt. Geochim. Cosmochim. Acta 54, 869-874.
Chase M .W.Jr., Davies C.A., Downey J.R.Jr. , Frurip D.J. , McDonald R.A. and Syverud A.N. (1985) JANAF thermochemical tables, 3rd ed. J. Phys. Chern. Ref DaJa 14, Supp. 1.
Chen J.H. and Wasserburg G.J. (1990) The presence of 107Pd in the early solar system Lunar Planet. Sci. Conf. XXI, 184-185.
Chou C.L. (1978) Fractionation of siderophile elements in the earth's upper mantle. Proc. Lunar Planet. Sci. Conf. 9th, 219-230.
Chryssoulis S .L., Alcock R.A. , Sizgoric M.B. and Cabri L.J. (1989) Quantitative trace PGE analyses of phyrrhotite, pentlandite and millerite (abstr) . 5th International Platinum Symposium. Geol. Soc. of Finland Bull. 61, 56.
Clayton D.D. (1964) Cosmoradiogenic chronologies of nucleosynthesis. Astrophys. J. 137, 637-663.
Cotton F.A. and Wilkinson G. (1980) Advanced ilwrganic chemistry. Wiley and Sons, 1396 pp.
Crockett J .H. (1981) Geochemistry of the platinum-group elements. In Platinum-group elements: Mineralogy, geology, recovery (ed. Cabri , L.J.) Canad. Inst. Mining Metall. Spec. Vol. 23, pp. 47-64.
Crockett J .H., Keays R.R. and Hsieh S. (1967) Precious metal abundances in some carbonaceous and enstatite chondrites. Geochim. Cosmochim. Acta 31, 1615-1623.
Crockett J .H . and Cabri L.J. (1981) Analytical methods for the platinum-group elements. In Platinum-Group Elements: Mineralogy. Geology, Recovery. (ed. Cabri L.J.), pp 71-82. The Canad. lnst. of Mining and Metall.
Davis A.M. (1977) The cosmochemical history of the pallasites. Ph.D. DissenaJion, Yale University.
Delano J.W. and Ringwood A.E . (1978) Siderophile lements in the lunar highlands: nature of indigenous component and implications for the origin of the moon. Proc. Lunar Planet. Sci. Conf. 9th, 111-159.

157
Drake M.J. (1987) Geochemical constraints on the origin of the moon. Geochim. Cosmochim. Acta 47, 1759-1767.
Duckworth H .E., Barber R.C. and Venkatasubramanian V.S. (1986) Mass Spectrometry, Cambridge University Press, 337 p.
El Goresy A., Nagel K. and Ramdohr P. (1978) Fremdlinge and their noble relatives. Proc. Lunar Planet. Sci. Conf. 9th, 1279-1303.
Elliott R.P. (1965) Constitution of Binary Alloys, 1st SupplemenJ. McGraw Hill, New York, 877 p.
Fegley B. and Palme H . (1985) Evidence for oxidizing conditions in the solar nebula from Mo and W depletions in refractory inclusions in carbonaceous chondrites. Earth and Planet. Sci. Lett. 12, 311-326.
Fuchs L. H. and Blander M. (1977) Molybdenite in calcium-aluminum-rich inclusions in the Allende meteorite. Geochim. Cosmochim. Acta 41, 117~1175 .
Geiger T. and Bischoff A. (1989) Mineralogy of metamorphosed carbonaceous chondrites (abstr). Meteoritics 24, 269.
Geller S. (1962) The crystal structure of the superconductor Rh1~15 • Acta. Cryst. 15, 1198-1201.
Gijbels R.H. , Millard H .T., Desborough G.A. and Bartel A.J . (1974) Osmium, ruthenium, iridium and uranium in silicates and chromite from the eastern Bushveld Complex, South Africa. Geochim. Cosmochim. Acta 38, 319-337.
Goldberg E .D. , Koide M. , Yang J.S. and Bertine K.K. (1988) Comparative marine chemistries of platinum group metals and their periodic table neighbors. In Metal speciation: Theory, analysis and applications. (eds. J .R. Kramer and H .E. Allen), pp. 201-217, Lewis Publishers.
Greenwood N .N. (1968) Ionic Crystals, Lanice Defects and Nonstoichiometry . Butterworth & Co. Ltd.
Griffith W.P. (1967) The Chemistry of the Rarer Platinum Metals (Os, Ru, Ir, and Rh). Interscience, London. 491 p .
Grossman L. (1972) Condensation in the primitive solar nebula. Geochim. Cosmochim. Acta 36, 597-619.
Grossman L. (1973) Refractory trace elements in Ca-Al-rich inclusions in the Allende meteorite. Geochim. Cosmochim. Acta 37, 1119-1140.
Grossman L. (1980) Refractory inclusions in the Allende meteorite. Ann. Rev. Earth Planet. Sci. 8, 559-6)8.

158
Grossman L., Olsen E. and Lattimer J. M. (1979) Silicon in carbonaceous chondrite metal: Relic of high temperature condensation. Science 206, 449-451.
Grossman L. and Ganapathy R . (1976) Trace elements in the Allende meteorite-!. coarsegrained, Ca-rich inclusions. Geochim. Cosmochim. Acta 40, 331-344.
Grossman L., Davis A.M., Ekambaram V., Armstrong J. T., Hutcheon I. D. and Wasserburg G. J . (1986) Bulk chemical composition of a Fremdling from an Allende Type B inclusion. (abstr.) Lunar Planet. Sci. XVII, 295-296.
Hansen M. and Anderko K. (1958) Constitution of Binary Alloys. McGraw Hill, New York. 1305 p .
Harris D.C. and Cabri L.J . (1973) The nomenclature of the natural alloys of osmium, iridium and ruthenium based on new compositional data of alloys from world-wide occurences. Can. Mineral. 12, 28~284.
Hartley F .R. (1973) Chemistry of Platinum and Palkuiium. Wiley, New York. 544 p .
Hashimoto A., Kumazawa M. and Onuma N. (1979) Evaporation metamorphism of primitive dust material in the early solar system. Eanh Planet. Sci. Len. 43 , 13-21.
Herr W. , Hoffmeister W., Hirt B., Geiss J. and Houtermans F .G. (1961) Versuch zur datierung von eisenmeteoriten nach der rhenium-osmium-methode. Z. Naturforsch. 16a, 1053-1058.
Hertogen J., Janssens M.-J. and Palme H. (1980) Trace elements in ocean ridge basalt glasses: implications for fractionations during mantle evolution and petrogenesis. Geochim. Cosmochim. Acta 44, 2125-2143.
Hirt B., Tilton G.R., Herr W. and Hoffmeister W. (1963) The halflife of 1~e. In Eanh Sciences and Meteoritics (eds. J . Geiss and E .D. Goldberg), pp. 273-280. North Holland Publishing Co., Amsterdam.
Hoffman E .L., Naldrett A.J. , Van Loon J .C . , Hancock R.G.V. and Manson A. (1978) The determination of all of the platinum group elements and gold in rocks and ore by neutron activation analysis after preconcentration by a nickel sulfide fire-assay technique on large samples. Analytica Chimica Acta 102, 157-166.
Hsieh K., Chang Y. A. and Zhang T. (1982) The Fe-Ni-S system above 700 C . Bull. Alloy Phase Equil. 3, 165-172.
Hultgren R ., Desai P .O ., Hawkins D.T., Gleiser M., Kelley K.K. and Wagman D.O. (1973) Selected Values of the Thermodynamic Propenies of the Elements. American Society for Metals, Metals Park, Ohio.
Hurst G.S., Payne M.G., Kramer S.D. and Young J .P . (1979) Resonance ionization spectroscopy and one-atom detection. Rev. Mod. Phys. 51, 767-819.

159
Hurst G. S. and Payne M.G. ( 1988) Principles and applications of resonance ionization spectroscopy. lOP Publishing Ltd, 417 p.
Hutcheon I.D., Armstrong J.T. and Wasserburg G.J. (1987) Isotopic studies of Mg, Fe,Mo,Ru and W in Fremdlinge from Allende refractory inclusions. Geochim. Cosmochim. Acta 51, 3175-3192.
Jagoutz E., Palme H., Baddeohausen H., Blum K., Cendales M., Dreibus G., Spettel V., Lorenz V. and Wanke H. (1979) The abundances of major, minor and trace elements in the earth's mantle as derived from primitive ultramafic nodules. Proc. Lunar Planet. Sci. Conf. lOth 2031-2050.
Jones J .H. and Drake M.J . (1986) Geochemical constraints on core formation in the Earth. Nature 322, 221-228.
Kaiser T. and Wasserburg G. J. (1983) The isotopic composition and concentration of Ag in iron meteorites and the origin of exotic silver. Geochim. Cosmochim. Acta 47, 43-58 .
Keays R.R. (1982) Palladium and iridium in komatiites and associated rocks: Application to petrogenetic problems. In Komatiites (eds. N.T. Arndt and E.G. Nisbet) pp. 435-458, Allen Unwin, London.
Kelly W . R . and Larimer J. W. (1977) Chemical fractionations in meteorites--Vlll. Iron meteorites and the cosmochemical history of the metal phase. Geochim. Cosmochim. Acta 41, 93-111.
Kimura K., Lewis R.S. and Anders E. (1974) Distribution of gold and rhenium between nickeliron and silicate melts: implications for the abundances of siderophile elements on the earth and moon. Geochim. Cosmochim. Acta 38, 683-701.
King E.A. (1983) Reduction, partial evaporation, and spattering: Possible chemical and physical processes in fluid drop chondrule formation. Pro. Lunar Planet. Sci. Conf. 14th, 180-187.
Kracher A. , Keil K., Kallemeyn G. W., Wasson J. T ., Clayton R. N. and Russ G. I. (1985). The Leoville (CV3) accretionary breccia. J. Geophys. Res. 90, D123-Dl35 .
Krutzch B. and Kemmler-Sack S. (1983) Sauerstoff-spinelle mit ruthenium und iridium. Mat. Sci. Bull. 18, 647-652.
Kurat G., Hoinkes G. and Fredriksson K. (1975) Zoned Ca-Al-rich chondrule in Bali: New evidence against the primordial condensation model. Earth and Planet. Sci. Lett. 26, 140-144.
Kyte F.T., Smit J. and Wasson J.T. (1985) Siderophile interelement variations in the Cretaceous-Tertiary boundary sediments from Caravaca, Spain. Earth Planet. Sci. Lett. 73, 183-195.
160
Lambert D.O. , Morgan J .W., Walker R.J., Shirey S.B., Carlson R.W., Zientek M .L. and Koski M.S. (1989) Rhenium-osmium and samarium-neodymium isotopic systematics of the Stillwater complex. Science 244, 1169-1174.
Larimer J .W. (1967) Chemical fractionations in meteorites- I . Condensation of the elements. Geochim. CosTTWchim. Acta 31, 1215-1238.
Larimer J.W. and Anders E. (1967) Chemical fractionations in meteorites-ll . Abundance patterns and their interpretation. Geochim. CosTTWchim Acta. 31, 1239-1270.
Lattimer J.M., Schramm D.N. and Grossman L. (1978) Condensation in supernova ejecta and isotopic anomalies in meteorites. Astrophys. J. 219, 230-249.
Lee T. , Papanastassiou D.A. and Wasserburg G.J. (1977) Alurninum-26 in the early solar system: Fossil or fuel? Astrophys. J. 211, L107-Lll0.
Legendre 0. and Auge T. (1986) Mineralogy of platinum-group-mineral inclusions in cbromitites from different ophiolitic complexes. In Metallogeny of Basic and Ul!rabasic Rocks (eds. Gallagher M.J., lxer R.A., Neary C.R. and Prichard H.M.), pp 361-372. lnst. Mining Metall., London.
Leonard B.F. , Desborough G.A. and Page N.J. (1969) Ore microscopy and chemical compositions of some laurites. Amer. Mineral. 54, 1330-1346.
Lindner M., Leich D .A., Russ G.P., Bazan J.M. and Borg R.J . (1989) Direct determination of the halflife of 1ii7Re. Geochim. Cosmochim. Acta 53, 1597-1606.
Loebenstein J.R. (1989) Platinum-group metals. Minerals Yearbook, 1987. U.S . Govt. Printing Office, 689-700.
Lord H.C. III (1965) Molecular equilibria and condensation in a soar nebula and cool stellar atmospheres. Icarus 4, 279-288.
Luck J.M. and Allegre C.J. (1983) 11'7Re-1870s systematics in meteorites and cosmochemical consequences. Nature 302, 130-132.
MacPherson G.J . , Wark D.A. and Armstrong J.T. (1988) Prirnative material surviving in chondrites: Refractory inclusions. In MeteoriJes and the early solar system. (eds.
Kerridge J.F. and Matthews M.S.), pp 746-807. Univ. of Arizona Press, Tucson.
Malvin D.J., Drake M.J. , Benjamin T.M., Duffy C.J., Hollander M. and Rogers P.S.Z. (1986) Experimental partitioning studies of siderophile elements amongst lithophile phases: Preliminary results using PIXE microprobe analysis. Pro. Lunar Planet. Sci. Conf. 17th, 514-515.
Martin C .E . (1989) Re-Os isotopic investigation of the Stillwater complex, Montana. Eanh and Planet. Sci. Lett. 93, 336-344.

161
Mashamichi M., Fujii N. and Takeda H. (1981) Ordinary chondrite parent body: An internal heating model. Proc. Lurulr Sci. Conf. 12th, 1145-1152.
Mason B. and Taylor S.R. (1982) Inclusions in the Allende meteorite. SmiJhsonian Comrib. Earth ScL 25, 1-30.
Massalski T. B. (1986) Binary Alloy Phase Diagrams. Amer. Soc. Metals. 2208p.
McLaughlin A.I.G. (1946) Toxic Manifestations of osmium tetroxide. British Journal of Industrial Medicine 3, 183-186.
McMahon B. M. and Haggerty S. E . (1980) Experimental swdies bearing on the magnetite-alloy-sulfide association in the Allende meteorite: Constraints on the conditions of chond.rule formation. Proc. Lurulr Planet. Sci. Conf. 11th, 1003-1025.
McSween H. Y. Jr. (1977) Petrographic variations among carbonaceous chondrites of the Vigarano type. Geochim. Cosmochim. Acta 41, 1777-1790.
Meeker G. P . , Wasserburg G. J. and Armstrong J . T. (1983) Replacement textures in CAl and implications regarding planetary metamorphism. Geochim. Cosmochim. Acta 41, 707-721.
Mills K.C. (1974) Thermodynamic Data for Inorganic Sulfides, Tellurides, and Selenides. Butterworths, London. 845 p.
Misra K. C. and Fleet M. E. (1973) The chemical compositions of synthetic and natural pentlandite assemblages. Econ. Geol. 68, 518-539.
Mitchell R.H. and Keays R.R. (1981) Abundance and distribution of Au,Pd, and Ir in some spinel and garnet lherzolites: Implication for the nature and origin of precious metal-rich intergranular components in the upper mantle. Geochim. Cosmochim. Acta 45, 2425-2442.
Moffatt W.G. (1979) The Handbook of Binary Phase Diagrams. General Electric, Schenectady.
Morgan J.W. (1986) Ultramafic xenoliths: clues to Earth's late accretionary history. J. Geophys. Res. 91, 12375-12387.
Morgan J.W. and Lovering J.F. (1967) Rhenium and Osmium abundances in chondritic meteorites. Geochim. Cosmochim. Acta 31, 1893-1909.
Morgan J.W. and Lovering J.F. (1967) Rhenium and Osmium abundances in some igneous and metamorphic rocks. Earth and Planet. Sci. Len. 3, 219-224.
Morgan J.W., Ganapathy R., Higuchi H. and Krahenbuhl U. (1976) Volatile and siderophile trace elements in anorthositic rocks from Fiskenaesset, West Greenland: comparison with lunar and meteoritic analogues. Geochim. Cosmochim. Acta 40, 861-888.

162
Muller 0 . and Roy R. (1969) Synthesis and crystal structure of Mg2Pt04 and ZnJ>t04• Mat. Res. Bull. 4, 3943.
Muller 0. and Roy R. (1971) Synthesis and crystal structure of some new complex palladium oxides. In Platinum Group Metals and Compounds (ed. R.F. Gould). American Chemical Society.
Naldrett A.J. (1981) Platinum-group element deposits . In Platinum-Group Elements: Mineralogy, Geology, Recovery. (ed. Cabri L.J.), pp 197-232. The Canad. lnst. of Mining and Metall.
Naldrett A.J. and Cabri L.J. (1976) Ultramafic and related mafic rocks: Their classification and genesis with special reference to the concentration of nickel sulfides and platinum-group elements. Econ. Geo/. 71, 1131-1158.
Naldrett A.J . , Cameron G. , von Gruenewaldt G. and Sharpe M.R. (1987) The formation of stratiform PGE deposits in layered intrusions. In Origins of igneous layering. Ed. I . Parsons, pp. 313-397, Reidel Publishing Company.
Newsom H.E. and Taylor S.R. (1989) Geochemical implications of the formation of the moon from a giant impact. Nature 338, 29-34.
Officer C.B. and Drake C .L. (1985) Terminal Cretaceous environmental events. Science 227, 1161-1167.
Page N.J. , Rowe J .J . and Haffty J. (1976) Platinum metals in the Stillwater Complex, Montana. Econ. Geol. 71, 1352-1363.
Page N.J., Cassard D. and Haffty J . (1982) Pd, Pt, Rh, Ru and Ir in chromitites from the Massif du Sud and Tiebaghi Massif, New Caledonia. Econ. Geol. 11, 1571-1577.
Page N .J. , Zientek M .L. , Czamanske G.K. and Foose M .P . (1985) Sulfide mineralization in the Stillwater Complex and underlying rocks. In Stillwater Complex. Eds. G .K. Czamanske and M .L. Zientek, pp. 147-210, Montana Bureau of Mines and Geology Spec. Pub. 92.
Palme H . and Wlotzka F . (1976) A metal particle from a Ca,Al-rich inclusion from the meteorite Allende, and condensation of refractory siderophile elements. Earth Planet. Sci. Len. 33, 45-60.
Palme H., Wlotzka F., Nagel K. and El Goresy A. (1982) An ultra-refractory inclusion from the Ornans carbonaceous chondrite. Earth. Planet. Sci. Len. 61, 1-12.
Palmer M.R. and Turekian K.K. (1986) 1110sf116Qs in marine manganese nodules and the constraints on the crustal geochemistries of rhenium and osmium. Nature 319, 216-220.
Pappas D .L., Hrubowchak D .M., Ervin M.H. and Winograd N. (1989) Atom counting at surfaces. Science 243, ~-

163
Parks J.E . , Spaar M.T. and Cressman P.J. (1988) Analysis of high purity solids by resonance ionization spectroscopy. J. Crystal Growth 89, 4-15.
Pellin M.J. , Young C .E . , and Gruen D.M. (1988) Multiphoton ionization followed by time-offlight mass spectroscopy of sputtered neutrals. Scanning Microscopy 2, 1353-1364.
Peng Z . , Chang C. and Ximen L. (1978) Discussion of published articles in the research of new minerals of the platinum-group discoverd in China in recent years. Acta. Geol. Sin. 4 , 326-336.
Pemicka E . and Wasson J.T. (1987) Ru, Re, Os, Pt and Au in iron meteorites. Geochim. Cosmochim. Acta 51, 1717-1726.
Poths H., Schmitt-Strecker S. and Begemann F. (1987) On the isotopic composition of ruthenium in the Allende and Leoville carbonaceous chondrites. Geochim. Cosmochim Acta 51, 1143-1149.
Rasmussen K.L., Greenway T.J.L. and Gwozdz R. (1989) The composition of kamacite in iron meteorites investigated by accelerator mass spectrometry, neutron activation analysis and analytical electron microscopy. Nucl. lnstr. and Meth. in Phys. Res. B36, 43-52.
Ravizza G. and Turekian K.K. (1989) Application of the 11'7Re-1870s system to black shale geochronometry. Geochim. Cosmochim. Acta 53, 3257-3262.
Ringwood A.E. (1977) Composition of the core and implications for the origin of the earth. Geochim. J. 11, 111-135.
Ross J.R. and Keays R.R. (1979) Precious metals in volcanic-type nickel sulfide deposits in Western Australia, I. Relationship with the composition of the ores and their host rocks. Can. Mineral. 17, 417-435.
Russ G.P . , Bazan J.M. and Date A.R. (1987) Osmium isotopic ratio measurements by inductively coupled plasma source mass spectrometry. Anal. Chem 59, 984-989.
Sax N.l. (1968) Dangerous Properties of Industrial Materials. Van Nostrand Reinhold, New York.
Schmitt W ., Palme H. and Wanke H. (1989) Experimental determination of metal/silicate partition coefficients for P,Co,Ni,Cu,Ga,Ge,Mo, and Wand some implications for the early evolution of the Earth. Geochim. Cosmochim Acta 53, 173-185.
Scott E.R.D. (1972) Chemical fractionation in iron meteorites and its interpretation. Geochim Cosmochim Acta 36, 1205-1236.
Scott E .R.D. and Wasson J .T. (1975) Classification and properties of iron meteorites. Rev. Geophys. Space Sci. 13, 527-546.
Shunk F.A. (1969) Constitution of Binary Alloys, 2nd Supplement. McGraw-Hill , New York. 720 p.

164
Simmonc; D.S. (1983) Isotopic analysis with the laser microprobe mass analyzer. Internal. Jour. Mass Spec. Ion Proc. 55, 15-30.
Snetsinger K.G. (1971) Erlichmanite (~,a new mineral. Amer. Mineral. 56, 1501-1506.
Stevenc; G.T., Hatherly M. and Bowles J.S. (1978) The ordered phase fields of the iron-nickelplatinum equilibrium diagram. J. Mater. Sci. 13, 499-504.
Stevenson D .J. (1981) Models of the Earth' s core. Science 214, 611-619.
Stevenson D .J. (1987) Origin of the moon- the collision hypothesis. Ann. Rev. Earth. Planet. Sci. 15, 271-315.
Stockman H .W. and Hlava P .F . (1984) Platinum-group minerals in alpine chromitites from southwestern Oregon. Econ. Geol. 79, 491-508.
Stolper E. M. (1982) Crystallization sequences of Ca,Al-rich inclusionc; from Allende: An experimental study. Geochim. Cosmochim. Acta 46, 2159-2180.
Stolper E. M. and Paque J. M. (1986) Crystallization sequences of Ca-Al-rich inclusionc; from Allende: The effects of cooling rate and maximum temperature. Geochim. Cosmochim. Acta 50, 1785-1806.
Svendsen S. R. (1979) High energy enthalphy and decomposition pressures of RuS2. Acta Chem. Scandinavica A33, 601-607.
Symonds R.B., Rose W.I., Reed M.H., Lichte F .E. and Finnegan D.L. (1987) Volatilization, transport and sublimation of metallic and non-metallic elements in high temperature gases at Merapi Volcano, Indonesia. Geochim. Cosmochim. Acta 51, 2083-2101.
Talkington R.W. and Lipin B.R. (1986) Platinum-group minerals in chromite seams of the Stillwater complex, Montana. Econ. Geol. 81, 1179-1186.
Talkington R.W. , Watkinson D .H. , Whittaker P .J . and Jones P .C . (1984) Platinum-group minerals and other solid inclusionc; in chromite of ophiolitic complexes: occurrence and petrological significance. TMPM Tschermaks Min. Petr. Mitt. 32, 285-301.
Teng R.T.D . , Fehn U . , Elmore D. , Hemmick T.K. , Kubik P.W. and Gove H.E. (1987) Determination of Os isotopes and Re/Os ratios using AMS. Nucl. Instr. and Meth. in Phys. Res. B29, 281-285.
Thonnard N., Willis R.D. , Wright M .C. and Davis W.A. (1987) Resonance ionization spectroscopy and the detection of 11Kr. Nucl. Instr. and Meth. in Phys. Res. B29, 398-406.
Walker R.J. and Fassett J.D. (1986) Isotopic measurement of subnaoogram quantities of rhenium and osmium by resonance ionization mass spectrometry. Anal. Chern. 58, 2923-2927.

165
Walker R.J., Shirey S.B. and Stecher 0 . (1988) Comparative Re-Os, Sm-Nd and Rb-Sr isotope and trace element systematics for Archean komatiite flows from Munro Township, Abitibi Belt, Ontario. Earth and Planet. Sci. Le". 87, 1-12.
Walker R.J., Carlson R.W., Shirey S.B. and Boyd F .R . (1989) Os, Sr, Nd, and Pb isotope systematics of southern African peridotite xenoliths: Implications for the chemical evolution of subcontinental mantle. Geochim. Cosmochim. Acta 53, 1583-1595.
Wanke H. , Baddenhausen H. , Palme H. and Spettel B. (1974) On the chemistry of the Allende inclusions and their origin as high temperature condensates. Earth Planet. Sci. Le". 23 , 1-7.
Wark D . A. (1986) Evidence for successive episodes of condensation at high temperature in a part of the solar nebula. Earth Planet. Sci. Le". 77, 129-148.
Watson E.B., Ben Othman D. , Luck J .M. and Hofmann A.W. (1987) Partitioning of U, Pb, Cs, Yb, Hf, Re and Os between chromian diopside pyroxene and haplobasaltic liquid. Chern. Geol. 62, 191-208.
Wendlandt R.F. (1982) Sulphur saturation of basalt and andesite melts at high pressures and temperatures. Am. Mineral. 61, 877-885.
Williams P. (1983) Secondary ion mass spectrometry. In Applied Atomic Collision Physics 4 (ed . Datz S.), pp 327-377, Academic Press.
Willis J . (1980) The bulk composition of iron meteorite parent bodies. Ph.D. Dissertation , Univ. of California, Los Angeles.
Willis J. and Goldstein J.l. (1982) The effects of C, P, and Son trace element partitioning during solidification in Fe-Ni alloys. J. Geophys. Res. 87, A435-A445.
Yokai K. , Takahashi K. and Arnould M. (1983) The 1~e-1870s chronology and chemical evolution of the galaxy. Astronom. and Astrophys. 117, 65-82.
Zeibold T.O. (1967) Precision and sensitivity in electron microprobe analysis. Anal. Chern. 39, 858-861.
Zoller W.H., Parrington J .R. and Phelan Kotra J.M. (1983) Iridium enrichment in airborne particles from Kilauea Volcano: January 1983. Science 222, 1118-1121.

Gft111t1mKV f'f CriSIPkri,,tNW An" Vol S3 ~ 41.).....&&9 Copvna.ht C 19fq Papmon P'rea pit Pnnled an U...s..A
166
001~ 1017/19/U .OO + .00
Diffusion, phase equilibria and partitioning experiments in the Ni-Fe-Ru system
JOEL D. BLUM0, G. J. WASSERBURG", I. 0 . HUTO!EON°, J. R. BEO<.m and E. M . STOLPER
Division ofGeolocical and Planetary Sciences. California liiStitute ofTcchnolocY. Pasadena. CA 9 11 25. U.S.A.
(R«.~ived Jul), 21, 1988; oeapud in rroimlform Nov~ 18, 1988)
A '-tract-The diffusion coefficient for Ru in Ni (~) was determined by the thin-fllm diffusion method in the tempentlll"t ranae of 1073 to 1673 K and is pven by the expression:
~ (cm2 sec- 1)- 5.0 (±0.7)· lo-• cxp(-2.3 (±0.1)· 1011 el'l mole-'/R7l
wbere R is the ps ronsta.nt and Tis the tempenturc in K. !'base boundaries and tie lines in a Ni-Fe-Ru-ricb system were determined at 1273, 1073 and 873 K. A wide miscibility pp is present at each tempenturc, ~tin& a closepacked bexqonal rRu-Fe p~ from a face.«ntered cubic ,.Ni-Fe ~. The p&rtiuoning behavior of Pt and lr betwttn phases in a Ni-Fe-Ru-ricb system and V between phases in a Ni-Fe~rich system was detmnined at 873 K. Pt partitions preferentially into the ,.Ni-Fe ~. wbereas lr prcfm the <Ru-Fe ~. V partitions strongly into Fe oxides reLative to ,.Ni-Fe. The experimental results have applications in the fields of meteoritics. ~eposit aeo!O&Y and materials science.
Il'o'TRODUcnON
M ETALLIC PHASES CONT AI:-IING hi&h concentrations of the PI-group elements (PGEs) Ru, Rh, Os, lr and Pt occur associated with metallic Ni-Fe phases in refractory inclusions in C3V chondritic meteorites (e.g. PALME and WLOTZKA, 1976) and in leTreSlrial ultramafic rocks (lEGENDRE and AUG~ 1986; MOCHALOV et a/., 198.5). Studies of PGE-rich alloys in meteorites have played an imponant role in the formulation of recent theories of the early condensation and chemical and thermal evolution of the solar nebula (ARM· STRO:-IG eta/., 198.5; BISCHOfF and PALME, 1987; BLUM et
a/., 1988). In addition, the extent of intmlilfusion between PGE-rich phases and Ni-Fe phases bas been used to constrain the thermal histories of meteorites in which these phases occur (ARRHENIUS and RAUB, 1978; BLUI\4 eta/., 1988). Studies of PGE-rich alloys in leTreSlrial ultramafic rocks have contributed to the understanding of the behavior of PGEs in silicate systems and to the thermal and chemical history of oertain PGE-rich ore deposits (DISTLER et a/., 1986). The behavior of PGE-ricb alloys is also of interest in the field of super-alloy development and coatings technology because the addition of PGEs to Ni-rich alloys Rlduces oxidation and corrosion at hi&h temperatures without adversely alfectill& other mechanical properties (cf. CoRn et a/ .• 1980).
In this study, we describe 1 series of experiments desianed primarily to constrain pbue equilibria in Ni-Fe-Ru-rich systems at temperatures of 1273, 1073 and 873 K and to determine the rate of Ru diffusion in Ni as 1 function of temperature. We also investipted Pt and lr panitionill& between ptwes in a Ni-Fe-Ru-rich S)'llem and V panitioninc between plwes in a Ni·F~rich system at 873 K. Phase equilibria and panitionina was investipted by analyzina alloys within a macroscopic compositional lfadient. This procedure assumes local equilibrium on 1 microscopic ICale between ~ existing plwcs. Provided that local equilibrium is 8cbieved, 1arze portions of compositional 1J*e can be inYeltipted from a sinaJe experiment at each temperature. Dilfusion studies
0 Also: Lunatic Asylum of the Cbarle5 Arms Laboratory.
483
were done by the tbin-6.1m method (cf. CRANK, 1975). The diffusion of Ru in Ni was chosen for study because it provides 1 good analogue for the more compositionally complex NiFe-Ru-rich alloy system found in refractory inclusions in meteorites. In a companion paper (BLUM et a/., 1989), we present analyses of PGE-rich alloys in meteorites and utilize the experimental data presented here to constrain models for the or\iin of opaque assemblages in chondritic meteorites. The data presented here may also be of value in the study of PGE-rich alloys in terrestrial ultramafic roclcs and in materials lcience research. Preliminary results have been published previously (BLUM eta/., 1988).
EXPERIMENTAL MEllfODS
Diffusion apmmt'fiL!
Thin-film diffusion experiments were c:onducted to determine the diffusion coefficient for Ruin Ni (~~)as a function of temperature. A fiat surface of a 5 mm thic.k disk of polycrystalline >99.6'i> purity Ni metal was polished with diamond pam. The sample was lightly etched electrolytically with a 30% HO solution. and a -I I'ID Layer of Ni was elearoplated onto the surface to enbance the surface adhesion of Ru. A VI ,.m layer of Ru was electropLated onto the surface from a sulfamate solution (WEtsBURG, I 988) and the sample was then cut into several pieces. For the experiments at 1073 and 1273 K. samples were IC&Ied into evacuated silica tubes with >99.999% purity paphite, and for the experiments at 1473 and 1673 K. samples were placed in alumina aucibles suspended by Pt wire. The sample c:ontaioen were plutlled into the bot rqions of fumaoes at I 073, 1273, 1473 and 1673 K. annealed for times indicated on F"t&- I (ran&i.Da from 20 minut.es to 5.7 days) and then quenched in water. The experiments at 1273 and 1073 K were carried out in a borizontal tube JlDdber& SB furnace open to the ambient atmospb=; the .,.apbite included in the silica tubes prevented the oxidation of the samples, The experiments at 1673 and 1473 K were carried out in a .-mica! tube Dehech VT-31 furnace. To prevent oxidation of the samples, the OX)'IIen fupcity (fo,) was maintained 2 lo& units more reclucina than the Fe-Fe,-..0 buffer by a ftowina roro, ps mixture c:ontainina 6 volume'k CO,. Tempentures were monitored with a PI/PI I ORb thermocoupk adjacent to the sampk. The thermocouples were calibrated at the meltin& point of Au (1337 K) and found to be ec:curate within ±2 K. After quenc:bina. each silica tube experiment was c:hecked with a spark roil to ensure that it bad remained under vacuum before the sample was removed from the silica tube. AU samples were then cut in balf, and each balf was polished with diamond pam perpendicular to the ofilinal electroplated surface: one

167
J . D. Blum~ a/
IO IO!J K ':1 4 9? o10°sec e:., ~
(d)
o::" • 4 •t~0.1) o10·11c.,l m ·
100 200 300 400
816lJ~· &' 1l0 o1011fc ~ 7 w ... 6 --' ,.. o:: • i6(~0.2h to-10""1 ...--
~~~~.~00~~~2~00~~-300~~--4~00
x2 (~mJ2
Flo. L Dilfusion profiles for Ru-Ni thin-film experiments. l1le natural loprithm of the Ru concentration in atom~ ([Ru)) is ploned &pJDSI the square of the distance from the Ru-Ni diffusion interface Analyncal un=u.intJes art approximately equal to the symbol size. The temperature and duration of anncalina are IJYen for each e..periment. The diJfusJ.oo coefficients ~~~) and associated erron are calculated from the slope of the hoes fined to the data.
half was C-coated for Ru analysis and the other balf was Plkoated for C analysis.
ph.aJ, ~ilibna and partilion111g upmmmu
Homoceneous alloys were synthesized from 6.~ metallic powden of Ni. Fe, Ru, Pt, lr and V of >99.99'ro purity. For each composition, pure metals were wei&hed in appr-oprUte ratios and bomocenizcd by sbalcina in plastic conwnen with a SPEX vibrational mixer. l1le powdm wer-e then placed in alumina aucibles suspeodcd by PI wire, and pluQFd into a De.ltu:b VT-31 f'uroace at 1823 K with the same ps mixture as in the dilfusion experiments., to~~ the oxidation of the samples. 1bc powdcn melted within a few minutes and were kept molten for at least two bows. 1bc lemperature was reduced to 1673 K (wbicb is below the soliclus for all of the alloys) for at least one bour to allow the alloys to crysWlize, and they were then quencbcd in water. 1bc cryslalliM alloys were annealed usina the u.me ps mixture at 1673 K for at least an additional 2<4 boun to I.IIUJ'e bomoceneity, and they wer-e ipio queDCbed in water. Slanina materials for e..periments were obtai1lcd by cuttina each alloy into -2 mm cubes usina a diamond saw. lbe above procedure - Uled to synthesize the followina alloy comPQiitioas liven in atom percent: (I) N' .... .Fe,.,.Ru..,.oPtu: (2) Ni.. 1Fe,,.Ru19..,Pt1_.1r,_.; and (3) Ni.ufe,..>Vo.s-
Homoceneous mixtures of Ni and NiO powder (Ni-N'.O buft'er) were plaoed in silica tubina with one eDd c:l<*d and the other eDd collapsed to -1 mm. Pieces of cacb alloy were iDdividually tealcd into 1arJrr diameter evxuated silica tubes alon& with a Ni-Ni~i.na silica tube so that interaction between alloys and the bull'er could
take place only via the ps phase. Pieces of alloy (I) were also sealed into evacuated silica tubes with >99.~ purity JT&phite to prevent oxidation. The samples were annealed in a lindbera SB furnace at 1273, 1073 and 873 K for I, <40 and lOS days. respectively. and then quenched in water. Samples were prepared for analysis following the procedure outlined above for the difu.slon experiments.
(}uanliiQJiv~ analyus
Experimenw Slanina materials and run produc:u were inveslipted by tec:Ondary and back-scanercd dectron irnaaina usina a JEOL JSM 35 analytical IC&Dnina electron microlcope (SEM); quantitauve analyses were made usi.na a TN 5500 tneiiY dispmive analyzer system (EDS) on the SEM and a waveleDJth dispersive system (WDS) on a IEOl 733 electron microprobe. AD analyses were made at IS ktV ea:eleratina volta&e with a beam cutTeDt of 7 S pA on the SEM and SO nA on the electron probe, acept for C analyses wbicb were made at60 nA.
Peak deconvolution and bacqround subtraction procedures were employed followina ScHAMBER ~ a/ (1980). Pure metals were used as standards and data were reduced USID& the ZAF correction procedure (cf AltM5nONG, 198<4). The analytical 8CC11racy was determined from analyses of secondary standards to be about :t:S'l. of the values reported for EDS analyses and about :3'l. of the values reported for WDS analyses. Detection limits were about 0 .1 atom~ for EDS analyses and about 0 .0 I atom'l. for WDS analyses, e..oept for Canalyses which had a detection limit of about 0.<4 atom'l.. EDS analyses of low concentrations close to the detection limit (0.1 to 0.3%) have hi&her erron of up to ±25% of the values reported .
The size of the X -ray production J'elion was calculated usina the Monte Carlo simulation method of Joy ( 198<4) as modified by AltMsno-.o ( 1988). The calculation was performed for ·~ compositions of both the -yNi-Fe pbue and the tRu-Fe phase. The diameter of the J'elion (wbicb was nearly spberical) in wbicb 99.~ of the X-rays were produced for EDS analyses on the SEM was fouod to vary from O.S to 0.7 ,.m for the elements Si, Fe. Co, N i, Ru. Re, Os, lr and Pt. lbe diameter of the X-ray production J'elion for WDS analyses on the elccuon probe was approximate!) dislo:-sbapcd., with a diameter of about 2.5 to 2.7 ,.m and a deplh of O.S to 0.7 ,.m because of the-211m diameter electron beam.
Quantitative analyses of phase equilibria and partitionin& e.. perimen I run products were made usina the EDS on the SEM in order to talo:e advantaae of the small X-ray production J'elion wben analyzina smaD plwcs. Quantitative analyses of the diJfusion experiments were made usin& the WDS on the electron probe because of the necessity of measurina Ru concentrations as low as -0.01 atom'l.. Concentrations of R u and Ni were measured at I 11m intervals in a linear profile perpendicular to the diJfusion interface by automaticall~ steppina the staae- The individual analyses overlap since the X-ray production J'elion was about 2.1 11m in diameter.
HomD~tDeity of IWtina materials for the dill'usion and phase equilibria experiments was determined by bacbcattered dectron im-.in& and by EDS-SEM analyses alona profiles 11 I ,.m l!*inasSwtin& materials and aperi.Inental run products were c:bcded for the presence of impurities, includin& C, Si, Cr, Fe and Co. In all caes, concentrations were below the WDS-dectron miaoprobe detection limits. A.Jtbouab tbeae impurities were DOt praent, the analytical toW for WDS-elecuon microprobe analyses of the Ni .w:.rate utcd in the dill'usion aperimen!l ranaed from 96 to 98'l., sugestina that the N i contained 2 to <4'l. of an undetected impurity, wbicb was ~Y OXYJCD.
EXPEJUMENTAL RESULTS
Diffusion c«jficinus
Thin-film di.ft'usion experiments were wed to determine the value of~~ at each of the four annealiD& temperatures by plotti.n& the natural loprithm of the Ru concentration v~sus the square of the distance from the Ru-Ni di.ft'usion intnfaoe (FJi- Ia~). 'These plots yield approximately linear amays; the slopes of lines lined to these data are equal to

168
Dift'uslon in the Ni-fe.Ru symm 485
(4~~t)-1, foUowin& the thin-film diffusion approximation (cf. CRANK, 1975). ~~ increases with temperature from 3.9 (±0.2)· 10-14 em, sec-• at 1073 K to 3.6 (±0.2)· 10- •o em, tee-• at 1673 K (F'11- Ia~). Two experiments were rooducted at 1273 K with different annealin& times (1.66 • Ia-' and 1.85 • I <r seconds) as a test of the reproducibility of the method. The calculated value of~ for the Jon,er annealina time was 2.8 (±0.2) · 10- 12 em1 sec-•, in close .,reement with the value of 2.6 (±0.1)·10_1
, em1 tee-• obtained for the shoner annealina time (Fia. I b, c).
The four analyses closest to the interface (from 3 to 6 microns) on the 1473 and 1673 K profiles CF!i- Jd, e) deviate from linearity and were excluded from the linear regressions. The deviation from linearit)• may be due to more rapid dif. fusion in a surface layer at the hi&her temperatures, resulting from hi&h porosities or organic or oxide impurities typical of electroplated deposits. Alternatively, the nonlinearity rould be caused by evaporation of Ni from the sample surface during annealina in the ps-mixing furnace. In either case, by excluding the data points near the interfaces for the 1473 and 1673 K experiments, we believe that we have avoided the problem and determined accurate values for~~.
The experimentally determined values of -In ~~ are ploned versus 10'/ Tin Fia. 2. The equation of the line fined to these data yields ~~ (em1 sec- 1
) a 5.0 (±0.7)· 10-) exp(-2.3 · 1012/RT), wbere R is the ps ronstant, Tis the temperature inK, and the activation eneJiY is 2.3 (±0. 1) · 1012
erg mole-•. The activation energy determined bere for Ru diffusion in Ni is similar to the activation energy for Pt dif. fusion in Ni ( 1.8 · 1012 erg mole- •; KUBASCHEWSKI and EBERT, 1944). The linearity of the data shown in Fig. 2 supports our procedure of excluding anomalous near-surface data points in the hi&her temperature experiments and sua&ests that a single diffusion mechanism dominates at eacb temperature. The diffusion mechanism is probably lattice dif. fusion, whicb has been shown to dominate over grainboundary diffusion in alloys at temperatures above about 900 K (cf. SHEWMON, 1963).
Phase ~ilibria and partition coefficients
Pbase equilibrium experiments were performed in two ways: Ni-Fe-Ru-Pt ± lr alloys were annealed with araphite
T (K)
~~~~--~.--~~.--L-~~
1rf'/r IK' 1J
AG. 2. Tbe variation of the dilfusioo cocfticieDt for Ru in Ni (~) with temperature en in K. Tbe oatlnl loprithm of~ is pi Oiled qaill$1 I 0' IT. uncmaintiel are smaller th&n the symbol siz.c. An expression for Dr: as 1 fuoaion of T was calculated from the equation for the line 6tted 10 the data and is liven in the text.
("araPhite experiments") or with Ni-NiO ("Ni-NiO experiments"). Run products from araphite experiments either remained as bomoseneous alloys or exsolvcd into two ooex.isting phases, dependin& on the annealin& temperature. Run products from Ni-NiO experiments are more romplicatcd because of partial oxidation of the initially bomoseneous alloys under the oxidizing ronditions imposed by the Ni-NiO buffer. In eacb of these samples, oxidation of the oriainal alloys produced a rind of Fe-ricb oxide surrounding a z.one of Fe-ricb oxide intergrown with Ni-Fc-Ru-Pt ± lr alloys (F'11- 3). Near regions wbere the Fe-ricb oxide formed, the alloys were enriched in Ni-Ru-Pt ± lr because these elements are excluded from the oxide. A rompositional ~ent was thus established in the alloy from the z.one of oxide-alloy int.erarowths extending inward from this z.one; where the romposition became sufficiently enriched in Ni and Ru, a cRu-Fe and -yNiFe phase exsolved. The a , « and 'Y designations used in this paper for the metallic solid-solution fields in the Ni-Fe-Ruricb system are based on rompositioral data rather than direct determination of crystal structure.
The graphite experiments provide information about phase equilibria based on the presence or absence of multiple phases and the rom positions of ooex.isting phases in the run products. In addition, if the tRu-Fe phase produced in the Ni-NiO experiments is assumed to be in local equilibrium with the -yNi-Fe phase with which it is in rontaet (within 2 to 3 pm). then the rompositions of ooexistin& phases in the Ni-NiO experiments also ronstrain the phase m.uam. Analyses of ooexistin& phases in both sets of experiments with alloy romposition N~.Fel,_oRu10oPt,. are listed in Table I. The data are projected from Pt onto the Ni-Fe-Ru plane and shown as isothermal sections at 1273, 1073 and 873 Kin FJ&. 4. At 1273 K (FJ&. 4a), the alloy romposition falls in a one-phase region, and, therefore, exsolution occurred only in the NiNiO experiment. At 1073 K (F'll- 4b) and 873 K (FJ&. 4c), exsolution occurred in both types of experiments, and the results from the araPhite and Ni-NiO experiments are in close .,reement, supponin& our assumption of local equilibrium on a 2 to 3 pm scale in eacb of the Ni-NiO experiments. The binary joins of the diqrams in FJ&. 4a~ were taken from previously determined binary m.uam rompilations for NiRu (NASH, 1986), Ru-Fe (SWARTZENDRUBER and SUNDMAN,
1983) and Ni-Fe (KUBASCHEWSKJ, 1983). Also plotted on the 1273 K m.uam (F'11- 4a) are results of experiments on 12 of the 25 alloy rompositions in the Ni-Fc-Ru system studied by AXOPYAN er al. (1974). Tbe exact rompositions of exsolved plwes were not determined in that study, but the presence or ab!ence of euolution in all of the alloy rompositions throuahout the m.uam is aeneraJiy ronsistent with our experiments.
Tbe ronsistency of our data with the Ni-Ru binary system (NASH, 1986) at eacb temperature and with the ternary data of AXOPYAN n al. (1974) at 1273 K sugestS that the presence of 1.6% Pt in our samples does not have a major effect on the pbue relations. Mcnover, when the exsolvcd pbues from the lr-bearin& experiments delcribcd below are projected from lr + Pt onto the Ni-Fe-Ru plane, phue boundaries and tie lines are nearly identical to those for theIr-free experiments, lhowin& that the addition of 5% Ir to the Ni-Fc-Ru system also does not ligniftcantly affect phase relations.

169
486 J . D. Blum n al.
FIG. 3. SEM imaFs of experimenw run produru U!ed to determi~ ~equilibria in the Ni-Fe-Ru systtm at (a) 1273 K and (b) 873 K. White rqions are the tRu-Fe phase, p-ay rqions arc the -yNi-Fe ~ and dark rqions (includina the ricin ed&t of each imace) are Fe-rich o:Ude. Scale ban are 10 and I microns in (a) and (b) respectively.
At each tempenture studied {FJi- 4a-<), the data define two solvi bouodin& a IarKe miscibility pp that separates a close-pa.clced hexagonal (cpb) tRu-Fe phase (SWARTZ£
DRUBER and SUNDMAN, 1983) from a face-centered cubic (fcc) 'YNi-Fe phase (KUBASCHEWSKJ, 1983). ln the Fe-poor pan of the system, tie lines are approximately parallel to the Ru-Ni ed&e of the trianaJe, and there is no sianificant cbanae in their orientation with temperature. With deaQsina temperature, the ~plwe rqion expands, with the tRu-Fe and 'YNi-Fe pbues movina closer to the binaries. An exception to this trend is the near overlap in compositions for a few of the analyxs of the tRu-Fe pbDe at 1073 and 873 K. However, this is probably due to an analytical contribution to analyses of the tRu-Fe plwe by the JWTOundina "f Ni-Fe plwe in the 873 K experimenu. Alloys annealed at 1213 and 1073 K developed lamellae and p-ains of tRu-Fe that were sufficiently large (I-S ~tm) to easily analyu bySEM {FJi- 3a). The much slower diJrusion rates at 873 K resulted in narrow (~.8 ~tm)
exsolution lamellae (Fie. 3b). Althouab care was taken to
T•bl~ 1. Ana l•••• Jn a to. ~ru•at of mcahuna pM• •• lr p.huf' ~~,otllt.rh a nt p.rt ltiol'ltnJ ••perl• nts.
Start ina .U loy
1273 K ~
107) ~ ca;:;;
813 , (iU-"f;
Sta re ina 4 110)'
1 7) It a;-:,;
,,
Ia ),4t 2a 2.14 J. l].()6
•• )4.4) ).a 1),,.
N U .SL 7a ).tl)
a. 11.11
lb 4.&e 2b ) . 94 )b 11 .9C, 4b 2~ - ltlb 21.)t 6b 22.66 1b 6. )!b 11.19
.. 2. 1C Z. 7.U la l9 . 7G 4b 12. JS ~ J) . b)
ba 9. 24 ,. 2. 7; a. ~. J7
.,. 2•.9"
lb •• s, 2b J4 .2S )b 27.46 4b )0.11 )b 21.21 6b lb-21 7b 4. 7) lb ... )b .,b 31 .06
)2.0
ll.U ll.IO ta.ta 2 1.)4 11.)2 2 1. ), J) .U
16.74
12.61 l) • .t;J
18 . 16 20. 0) 2C.2S 19.t9 13. 4 b ll.b~
b. ·' 10 . 73 12.PI Jl,4{'
I:'. IS II. OE: 6.60 b.9Z
14.76
,,
0. )1 0 . 11 0. 44 0. 41 0.)0 0.4)
o.zs 0 .)2
2. 89 ).0)
2.37 1.9:' 1.61 1.90 2.82 2.09
0.14 C.IJ C.:!l' c .•• o.n 0-19 C.IC ~-11 0 .2C
h 2).99 U.49 S!.tt' Q,6o)
la 2~-1! JS. SS Sl.9! O.:'e )a lt.. 19 16.1) ) 7. )) 0.32 h J9,M: Jtt.Oi tl.ec o.n ~ l).!f; 12.!t 72.9! o.x W :!'-.IC :~.Zl 6C.4(' O.:o 7• 2a.l- n.•-: ss . 1e o.z .. a. 21 . 0. U. 'fo 66- CS C:.Jl •• 21 . s• n. zc ''·'t o.JO
lOa 10.6) 14.4! 64.S<! Q,4J lh 2S.91 li . Sl )0.0) 0.~2
•u. lL•l t7 .s, so.n o .• , • ••• )0.74 11.02 S0.7b 0. 48
l b 2). 71 h.)) lb 29.2! u.n 4b lh-62 6t. . Mt S\1 2S. ' ' 6b.fl lb 27. 9t- t). 26 9b 27. ~ flo6,2'fl
12b 14.2t .,.n llb 16.81 7:'.0) 14b U.il' 7!.41
• Jsb n.Je, 64. 17 . 16b 29.)1 fll,Je
).b) 2.09 b. l) 2. 12 4 .)9 2.19 4.1~ 2- lb 4.~l 2 . 1) 4,4(' 2.U s. 1! 1.0) ).4) 2-" ).84 2.Sl 4 . 4f I.H ).II 2.:!1
44. 1 30.4 19.0 J.S ).0
111 22.6S 12.74 S..ttt O.le a.oe. )a 21.4) Jl,4) ~.4) o.u 7.)4. U U.06 14.12 SI . )O 0.41 1,40 .. 2). 7) 14.03 )2.46 o.zs 7.)1 1a 23.04 12.31 !tl.u o.n 7.t.s a. n .» 20.s9 u.n o . ao •·•s
lb 24.90 6).4) ..... 2-11 4 .92 2b 2b.7) 60. )) ).66 2 . 26 ).02 4b 29.7) S..)) 6. 79 2 . ]) · ·~ Sb 26.)9 62.3) 4.S7 2. 4 1 4 ,01 6b 10.2) )4.76 1. 21 1.97 ... , 7b 28.02 )9.91 ).)7 2-12 4 .)7
Jktt e : • lrt4lc•tu eape r 1• nu aaM:• ld v ilh cuphhe ; all oc.bcu --•1•4 with li>.J-111 0 lllufhr . • • fill! fll; n prut:nt anaiJu• of M j a cent •••·uu tn a alqh u per-l • •n. AN; }Jttc.al tou h table~ fro. ttl to IO.t a MI -.u IIIDru lf ull to 100:. - tacUuus M !ov 0.1: 4e tut10ft ll • ll - AulJtl u l ua.cutdatln au t.S1 of t~ val~o~.u .-.porte4.

170
Dilfusioo in !be Nt-Fe-Ru system 487
FIG. 4. Isothermal sections (io atom%) projccled from PI onto the Ni-Fe-Ru plane. Astmsks represent !be SWtin& alloy composiuoos used in !be expmmeoiS. Cirdes art analyses of !be expmmeotal run productS; open circles art exJXriments run with a Ni-NiO buffer and filled circles art expmments run with sraphite. Solid tie lines connect analyses of adjacent plwcs (wilhin 2-3 jtlll). inverted triao&les are plwe bouodaries from compilations of the Ni-Fe (KUIASCHEWSKJ, 1983), Ru-Fe (SwARTZENDRUBER and SUNOMAN, 1983) and Ni-Ru (NASH, 1986) plwe diqrarns. Squares art alloy compositions studied by AXOPYA.N ~a/ (1974) for which euolution into two phases was either ~ to occur (filled squares) or not occur (open IQIW'es). Phase boundaries and tie lines are solid near rqioM wbeTt there isexpmmeotal data; dashed plwe bolll>dariesand tie I.Jnesare estinuled or schematic. The n3 K c!iasram is speeu.lative and intended to be cfiaamnatic only. SinJ)e-plwe solid-iOiution rqions ioclude a foe -yNi-Fe phase, a c:pb tRu-Fe plwe and a boc aFe plwe. T~pbaK and three-plwe rqions are denoted by 2• and ~ respecnvely and three-pbaJc rqions are stippled.
analyze the centen of only the widest lamellae ( -0.8 "m), we cannot rule out the possibility that these analyses contain an analytical contribution from the surroundina .,.Ni-Fe, especially since the lamellae are almost c:ena.inly not perpendicular to the polished surface and the X-ray production reJion penetrated O.S to 0 . 7 ~ into the sample. Analyses of ')'Ni-Fe in the 873 K experiments are more reliable si.nce lamellae are sometimes cpuat.ed by 0!::. I "m, aJiowin& analysis without analytical contribution from the adjacent tRu-Fe lamellae.
We studied the putitionin& of PI and lr between ooexistina tRu-Fe and ')'Ni-Fe in the 873 K Ni-NiO experiments with alloy composition Ni.. ,FelO . .Ru.,.oPt,.Jrso. 1be compositions of ERu-Fe and ')'Ni-Fe in this experiment are listed in Table I. PI concentrations are lower and lr concentrations hi&her in ERu-Fe compared with ')'Ni-Fe, and there are only
small variations in PI and lr concentrations within each phase <Ft&- S). By talcina the avera&e PI and lr concentration for the tRu-Fe phase and the ')'Ni-Fe phase, we calculate (tRuFe)/(')'Ni-Fe) partition coefficients for PI (K"') and lr (K1')
between these two phases of 0 .16 and 1.6, respectively. Althouab pure PI and lr both have fcc crystal structures, PI is more compatible with fcc ')'Ni-Fe, whereas lr is more compatible with cpb tRu-Fe.
Experiments with alloy composition Ni.1 ~e,.2 Yo.s annealed with Ni-NiO were uaed to constrain the partitioning ofV between ')'Ni-Fe and F~xide at 873 K. The alloy was partially oxidized and developed Fe-V oxide rims and interpowth.s similar to the Fe-rich oxides in the Ni-NiO experiments described above. Near reJions where Fe-V oxide formed, the removal of Fe and V from the alloy resulted in Ni-enricbed alloys that contained no detectable V (sO. I %).
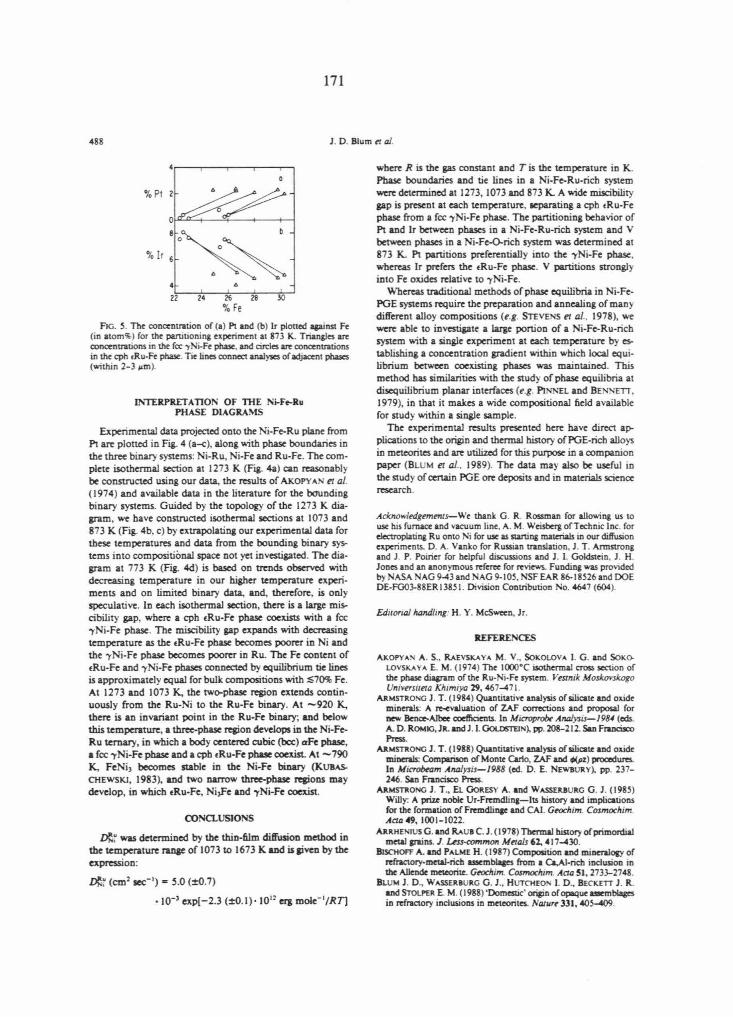
171
488 J. D. Blum D a/.
.. 4 u-~--~z.~~~~~~*---~~~
"'o Fe
FIG. S. The conccntntion of (a) PI and (b) lr plotted apinst Fe (in atom%) for the panitionin& experiment at 87 3 K. TrianiJes an concentrations in the fcc -yNi-Fe phase. and circles an concentrations in the cph tRu-Fe phase. Tie lines connect anal)'$es of adjacent phases (within 2-3 ,.m).
INTEIU'RETATIOI'i OF 1lfE NI-F~Ru PHASE DiAGRAMS
Experimental data projected onto the Ni-Fe-Ru plane from Pt are plotted in F~g. 4 (a-<), along with phase boundaries in the three binary systems: Ni-Ru, Ni-Fe and Ru-Fe. The complete isothermal section at 1273 K {FJ&. 4a) can reasonably ~ constructed using our data, the results of AKOPYAN n a/. (1974) and available data in the literature for the bounding binary systems. Guided by the topology of the 1273 K diagram, we have constructed isothermal sections at I 07 3 and 873 K (Fig. 4b, c) by extrapolating our experimental data for these temperatures and data from the bounding binary systems into compositional space not yet investigated. The diagram at 773 K {FJ&. 4d) is based on trends observed with decreasing temperature in our higher temperature experiments and on limited binary data, and, therefore, is only speculative. In each isothermal section, there is a large miscibility gap, where a cph tRu-Fe phase coexists with a fcc 'YNi-Fe phase. The miscibility gap expands with decreasing temperature as the tRu-Fe phase becomes poorer in Ni and the 'YNi-Fe phase becomes poorer in Ru. The Fe content of tRu-Fe and -yNi-Fe phases connected by equilibrium tie liocs is approximately equal for bulk compositions with S70% Fe. At 1273 and 1073 K, the two-phase region extends continuously from the Ru-Ni to the Ru-Fe binary. At -920 K, there is an invariant point in the Ru-Fe binary; and ~low this temperature, a three-phase region develops in the Ni-FeRu ternary, in which a body centered cubic (bee) aFe phase, a fcc 'YNi-Fe phase and a cph •Ru-Fe pbue coexist. At -790 K, FeNh becomes stable in the Ni-Fe binary (KtJBAS.
CHEWSKJ, 1983), and two narrow three-phase regions may develop, in which tRu-Fe, Ni,Fe and 'YNi-Fe coexist.
CONCLUSJONS
~~ was determined by the thin-film dilfusion method in the temperature ranae of I 073 to 16 73 K and is Jiven by the expression:
~~ (cm2 sec-') .. S.O (±0.7)
• 10- 3 exp[- 2.3 (±0.1) · JO" era mole- 1/RT)
where R is the gas constant and Tis the temperature in K. Phase boundaries and tie lines in a Ni-Fe-Ru-rich system were determined at 1273, 1073 and 873 K. A wide miscibility gap is present at each temperature, separating a cph tRu-Fe phase from a fcc 'YNi-Fe phase. The partitioning ~havior of Pt and lr between phases in a Ni-Fe-Ru-rich System and V between phases in a Ni-Fe-0-rich System was determined at 873 K. Pt partitions preferentially into the 'YNi-Fe phase, whereas Ir prefers the tRu-Fe phase. V partitions strongly into Fe oxides relative to 'YNi-Fe .
Whereas traditional methods of phase equilibria in Ni-FePGE systems require the preparation and annealing of many different alloy compositions (e.g. STEVENS et a/ .. 1978), we were able to investigate a large portion of a Ni-Fe-Ru-rich System with a single experiment at each tempcrature by establishing a concentration gradient within which local equilibrium between coexisting phases was maintained. This method has similarities with the stud) of phase equilibria at disequilibrium planar interfaces (e.g. PtNNEL and BENNETT, 1979), in that it makes a wide compositional field available for study within a single sample.
The experimental results presented here have direct aJ> plications to the origin and thennal history ofPGE-rich alloys in meteorites and are utilized for this purpose in a companion paper (BLUM n al .. 1989). The data may also~ useful in the study of certain PGE ore deposits and in materials science research.
Acknow/Ngnnnus-Wt tha.nk G. R. Rossman for allowin& us to use his furnace and vacuum line, A. M WeisberJ of Technic Inc. for elecuoplatinc Ru onto Ni for use as swtina materials in our diffusion experimtnts. D. A. Vanko for Russian translation, J. T. Armstrong and J. P. Pouitr for helpful discussions and J. l. Goldstein. J. H. Jones and an anonymous referee for ~views. Funding was proVIded by NASA NAG9-43 and NAG 9-IOS, NSFEAR 86-18S26 and OOE DE-FG03-88ER138Sl. Division Conuibution No. 4647 (604).
Eduor~a/ handling: H. Y. McSween, Jr.
R£FER£NO:S
Alc.OPYAN A. S .. RI.IVS.KAYA M. V., S0KOLOVA I. G. and SOK~ LOVSKAYA E. M. (1974) The 1ooo•c isothermal cross section of the phase ~m oftht Ru-Ni-Ft system. Vestnik Mosicovskogo U" i•"sima Khrmiya 29, 467-471.
ARMSTRONG J. T. ( 1984) Quantiativt analysis ofsilicatt and oxidt minerals: A re-evaluation of ZAF corrections and proposal for - Ben<r-Aibee c:oefficients. In Microprobe Atlaiysis- 1984 (eels. A. D. ROMJG,JJLandJ. I.Gol.DsmN), pp. 208-212. San Franc:iJco Press.
ARMSTRONG J. T. (1988) Quantitative analysis ofsilicatt and oxide minerals: Comparison of Montt Carlo, ZAF and f(pz) proadun:s. ln Mit:roheam Atlaiysis- 1988 (ed. D. E. NEWBURY), pp. 237-246. San Francisco Press.
MMSTRONG J. T., El GoRESY A. and WASSEitBUJtG G. J. (198S) Willy: A priu noble Ur-Fmndlina-Its history and implications for the formation of Fremdlinat and CAl. Grochim. Cosmochim ACID 49, 1001-1022.
ARRHENIUS G. and RAUII C. J. (1978) Tbmnal history of primordial metal p-ains. J. Lns-awrrm0t1 Mftab 61,417-430.
BIScHOFF A. and PALME H. (1987) Composition and mioeraJoay of refractory-mclal-ricb UK.mbiqes from a Ca,.AJ-ricb iodusion in the Allende meseorite. G~m. Comtodtim. ACID Sl, 2733--2748.
BLUM J. D., WASSERBURG G. J., HUTCHEON I. D., B ECKETT J. R. and SToLPER E. M. ( 1988) 'Domestic' qn of opequt aaembl.qo:s in refractory inclusions in meteorites. N01urr 331, 40S-409.
172
Oilfusion in th~ Ni-Fe-Ru system
BLUM J . D .. WASSERBURG G. J .. H l!TCHEO'< I. D., BECKm J. R . and STOLPER E. M . (1989) Origin ofopaqu~ as:scmbJaae$ on C3V meteorites: Implications for nebular and planetary processes. G~ chim. Cosmochom. Acta 53, S45-558 (this issue).
CoRn C. W., CouPLAND D. R . and SELMAN G . L. (1980) Platinumenriched superalloys. Enhanced oxidation and corrosion resiswK:e for industrial and aerospace applications. Pllllinum Mnal Rn-. ~. 2-11.
OIA"K J . (1975) Th~ Mlllhmuuics ofDiffu.sion Oxford Univ. Press. 414p.
DISTLER V. V., KRYACH KO V. V. and l.APUTINA I. P. (1986) Eve>lution of platinum-group par-ageneses in Alpone-type ult.rama1ics. Jrul G~. Rn-. 28, 1068-1085.
Joy D. C. ( 1984) Beam interactions, contrut and resolutio n in th~ SEM. J. Mocrosc 136, 241-258.
K UBASCHEWSKI 0 . ( 1983) /ron-Bmary Phas' Dwgrams SprinaerVertaa. Bertin.
K UBASCHEWSKI 0 . and EBERT H . (1944) Oilfusion measurements in aold and platinum alloys. Z £/dctrochm~. 50, 138-144.
UGE'IDR£ 0 . and AUGt T. (1986) MinenlOC) of platinum-group minenl inclusions in cbromitites from dilfercn1 ophiolitic compl~xes. In Mnallog~y of Basic and Ultrabasoc Roclcs (eds. M . J. GALLAGHER, R . A. IXER, C. R. NEARY and H. M. PRICHARD), pp. 361-372. lnst. of Mining and Metallurgy.
MOCHALOV A. G .. DMITRENKO G . G ., ZHERNOVSKII I. V. and RUDASHEVSKII N . S. (1985) New iridium-osmium-ruthenium type
(solid solutions of ran: platinum-group elements with iron) of platinum-group mincraliz.auon in chromium spinel-group minenlls in alpine-type ultramafic rocks of the Koryak HiJhland. lilpiski V.st'S. MiMral Obshch 114, S44-5S4 (in Russian).
NASH P. (1986) lbe Ni-Ru (nickel-ruthenium) system. Bull. Alloy Phas' Diagrams 1, 1»-133.
PALME H . and WLOTZKA F. (1976) A metal particle from a Ca.Alricb inclu.sio.n from the meteorite Allende, and coodensation of refractory siderophile elements. £4nh P/ann. Sci. lAo 33, 45-60.
I'INNEL M . R. and BENNm J . E. ( 1979) On the formation of the orc:lmd phases CuAu and CU,Au at a copper/lOki planar in~. Mnallurg. Trans lOA, 741-747.
SCHAMBER F. H., WODKE N. F . and MCCARTHY J . J . (1980) Least .:juares fit with diailal filter. lbe method and its application to EDS spectra. In Proc 8th Jm/ Corif on X-ra}' Optics and X-ray Microt1J141 (eel. D. R. BEAMAN, R. E. OGILVIE and D. B. WrrntY). pp. 124-132. Pendell Publ. Co.
SH£WMON P. G. (1963) Dijfu.sion in Solids McGraw-Hill. 203p. STEVENS G . T ., HATHERLY M . and BoWLESJ. S. (1 978) lbe ordered
phase fields of the iron-nickel-platinum equilibria diaaram. J. Ma· trrials Sco. 13, 499-504.
SWARTZENDRUBER L. J . and SUNDMAN B. (1983) lbe Fe-Ru (ironruthenium) system. Bull Alloy Phas' Dwgrams 4, 155-160.
WEISBURG A. M . ( 1988) Ruthenium platina. In Mna/ Fmishmg (eel. M. M URPHY), p. 286. Metals and Plastics Publ., lnc.

173
lteprinted from Nature, Vol. 331. No. 61~~ . pp . .OS~. 4 FebruaT) 1988 <S Macmilltm Magazmn Ltd., 1988
'Domestic' origin of opaque assemblages in refractory inclusi9ns in meteorites Joel D. Blum, G. J. Wasserburg, Ian D. Hutcheon, John R. Beckett & Edward M. Stolper Division or Geo1ozjcal and Planetary Sciences, California Institute or Technology, Pa5adena. Califomoa 91125, USA
Experimental studies indicate that opaque assemblages rich in refractory siderophile elements were formed ~·ithin host calcium- and aluminium-rich inclusions ( CAis ) by exsolution, oxidation and sulphidization of homogeneous alloys, rather than by aggregation of materials in the solar nebula before the formation of CAis. These opaque assemblages are thus not the oldest known solid materials, as ~·as once thought, and they do not constrain processes in the early solar nebula before CAl formation. Instead, the assemblages record the changing oxygen fugacity experienced by CAls during slo~<·
cooling in nebular and/ or planetary environments.
C ALCIUM· and aluminium-rich inclusions (CAls) in C2 and C3 chondri tic m~teorit~s ar~ g~n~rally believ~d to be repr~sentativ~ of the ~arliest solids form~d in the primitive solar n~bula '·'. They are ~nrich~d relativ~ to cosmic proponions in th~ elem~nts that are most refractory in a gas of solar composition. R~ll~cting this tr~nd is an ~nricbment ( - 20xCl chondrit~) in the refractor) siderophil~ ~l~ments ( Ru, Os, Re, Pl, lr, Wand Mo )1
"5
, which ar~ concentrat~d in multi-phase opaque ass~mblages6-1. The bulk chemistry o f thes~ ass~mblages has strong affinities with the calculated ~arli~st cond~nsat~s from a hot ponion of the solar n~bulau.u. Extensive inv~stigations hav~ shown that many of the ass~mblag~s are compos~d of d iscrete microm~tre-sized refract.ory sid~rophile m~tal nugg~ts surrounded by Ni-Fe m~tal , V-rich magn~tit~ and Fe-Ni sulphides with associated molybd~nite, molybdate, tungstate and phosphat~•-". The opaqu~ ass~mblag~s are rypically spheroidal and 1-1,000 .,_m in diam~ter. They occur as inclusions in all of the major silicat~ phases of CAls, are sometimes found in ~mbayments in spinel , and are often rimm~d by a thin (:520 ~.~-m) rind of V-rich fassaite 9
·"·" (se~ Fig. I ). In addition to the opaqu~ assemblages descri~d abov~. there exist other small (0.5-3.0 .,.m) refractory siderophile metal nug~ets not associated with Ni- Fe metal , magnetite or sulphide ·' 0·'1.1'. The net refractory siderophile element content of CAls is controlled by the combination of these smaller obj~cts and the opaque assemblages descri~d here. We will focus here on the origin of the opaque assemblages.
Owing in pan to the presumption that refractory sid~rophile m~ nugaets formed eith~r as cond~nsates in ~xpanding supernova envelopes (outside the Solar System) or as the earliest high-temperature nebular condensates, early workers postulated that th~ opaqu~ as~mblages w~r~ ~xotic and form~d ~fore CAls1"9• As a result, th~ opaque ass~mblag~s are often ref~rred to by th~ genwc name "Fremdlinge" 1
•9
, which is G~rman for strangers or foreign~rs. w~ p refer to refer to the objects, previously called " Fremdlinge", by th~ simple descriptiv~ nam~ " opaque as~mblages".
Recent studies of the chemical compositions, mineralogy and textural relationships of opaqu~ assemblages hav~ led most workers to concur that opaque assemblages formed ~for~ the host CAls, and to ~ on th~ following ~eenario for their origin and evolution' -u: (I) condensation of Ru,Os-rich nuggets at very high t~mpcrature ( -1,500-2,000 K) in a supernova envelope or in a hot pan of the solar nebula; (2) condensation of Ni-Fe metal followed ~ither by oxidation of Fe and reaa.ion with V in a nebula.r aas to produce V -rich magnetite or by direct c:ond~nsation ofV-rich magnetite; (3) agaregation of Ru,Os-rich nuggets, Ni-Fe metal, V-rich magnetit~ and associat~d phases in the nebula at low temperature ( -870 K) to form opaque
fl&. I Baekscan=d-eleetron images of opaque assemblaaes from CAJs. a, Two opaque usemblages {round bright objeru) which occur in e.mbaymenu in a spinel crystal in Allende sa.mple USNM ~241. The surrounding silicate is melilite and the rim around the 1al'ler opaque usemblaae is V-rich fassaite. b, An opaque assemblace in Allende JIM analys~ in this stud) , which includes Ru,Osrich nu&&eU, Ni-Fe mml, V-rich macnetite and sulphides. Scale
bars, 10 .,.m.
ass~mblages; and { 4 ) mixture of opaque assemblag~s with protoCAl material ~fo~ (or during) a bri~f high-t~mperatur~ ( -1,700 K) event, during which th~ silicat~ ponion o f th~ host CAl melted o.r partially m~lt~d . followed by rapid cooling. The bigh-temperatu~ CAl melting ~vent was post ulated to hav~ ~n so brief, and cooling so rapid, that the delicate t~xtur~s and mineral int~rgrowths in opaque ass~mblages were pres~rved as th~y exist~d befo~ CAJ m~lting. Thus, opaqu~ assemblages have ~en inferr~d to record conditions in the solar nebula before CAl crystallization, providing imponant constraints on the temperature, composition and d~gr~e of mixing in the early nebula"·" -13
·".
To test experim~ntally mod~ls for the format ion of opaque

2
174
·: 28
~~ ,_
«QZ
s 24
..a'l T UC'l
f"l&· 2 Summary of the ~ult.s of Ru- Ni thin·film dillusion ex peri· ment.s at four diflerent tempcra111rcs, yielding a reliable estimate of the diffusion coefficient ( D~:l as a function of temperature ( T), based on the fined line. The equation of the line is o~: = 0.005 exp{ - 2.3 x JO"/ RT); the activation energy thu.s determined is (~ .3 :: 0.1) x JO" erg mol- 1
, and R is the gas constant in c.g.s. units.
assemblages, we have determined the diffusion coefficient for Ru in Ni ( D~~) as a function of temperature, studied phase equilibria in the system Ni-Fe- Ru-0, and studied the partitioning of minor amounts of Pl., lr and V between coexisting phases in systems dominated by Ni, Fe, Ru and 0 . Based on our experiments, we propose a new model for the origin of opaque assemblages that is in sharp contrast with the prevailing scenario"·"- We suggest that opaque assemblages originated as homogeneous metallic droplets in CAl silicate liquids and that, after crystallization and subsequent cooling to a temperature of :s 870 K., these once homogeneous alloys ex solved into immiscible metallic phases as they were partially oxidized and sulphidized to form the multi-phase opaque assemblages now observed in CAls. The possibility that some refractory siderophile metal nuggets in opaque assemblages might have formed by exsolution was suggested previously•-•o ... , but this view was subsequently rejected by most workers in favour of the formation of these nuggets as primary condensates9
•11
-'3
·",
and has therefore received linle serious attention until now. The implications of our model are that opaque assemblages do not constrain the high-temperature thermal histories of CA!s or conditions in the solar nebula before CAl melting, as suggested previously. Instead, they provide important con.straints on the low-temperature thermal histories of CAls and on the changing oxygen fugacity (/ 0 ,) in cooling nebular and/ or planetary environments.
Experiments and analyses Thin-film diffusion experiments were conducted by electroplating a O.J . ,_.m film of Ru onto a slab of polycrystalline Ni. Pieces of this material were annealed at1 ,673, 1,473, 1,273 and 1,073 K in evacuated silica tubes with graphite for times ranging from 0.3 to 137 h. The samples were sectioned and Ru concentration ([ Ru]) profiles measured at 1-,_.m intervals perpendicular to the interface, using a JEOL 733 electron microprobe following procedure$ given in ref. 11. The value of ~~ was determined at each temperature ( T) from the approximately linear slope of -ln[Ru] versus the square of the distance, following the thinfilm approximation". The values of~~ determined in this way are shown planed against 1/ Tin Fig. 2 and yield the expression for D~~( T) given in the Fig. 2 legend.
To study Ni-Fe-Ru-0 phase equilibria and PI and lr partitioning, we first produced a powdered metal mixture with the composition Ni,.Fe..,PI2 (in atomic proportions). To aliquots of this mixture, we added 10% Ru, 20% Ru, 10°-'o Ru + S% lr, and 20"-'> Ru + S% lr. The powders were melted and homogenized. Pieces of this material were then sealed in evacuated silica
F"11. J Secondary~lectron images comparin& a typical experi mental run product (a ) and a ponion or the opaque assemblage --w;ny--11 from Allende USNM 5241 (b). Note the textural and chemical similarities, whieh include: (I ) a magnetite rim and inter&rowtbs; (2) Ni- Fe metal with d issolved Pt and lr; and (3)
Ru., (Os. lr)-ricb nuggets. Scale ban, IO~~om.
tubes witb a Ni-NiO bufier and annealed at 1.273 and 1,073 K for I and 9 days respectively. Reaction of oxygen with each of the synthetic alloys produced an outer rind of magnetite and a zone of magnetite (or in some instances wiistite) intergrown with Ni-Fe-PI-Ru( ± lr) alloys just inside the rind (Fig. 3). The removal of Fe from metal to form magnetite produced metal enriched in Ni, PI, Ru, ±lr near regions where magnetite had formed, because these metals have very low solubilities in magnetite. A compositional gradient was thus established, and where the metal composition became sufficiently enriched in Ni and Ru, a Ru-rich metall ic phase (nuggets) exsolved. Coexisting Ru-rich nuggets and Ni-Fe-rich metals in synthetic samples were analysed using a JEOL JSM 35 analytical scanning electron microscope (ASEM ) following procedures given in ref. 11. Only exsolved nuggets larger than the -0.8-jl.m X-ray interaction volume were analysed, to minimize interference from surrounding phases. PI was concentrated in the Ni-Fe metal , whereas lr partitioned into both the Ni-Fe metal and the exsolved Ru-rich nuggets. The positions of pltase boundaries and tie-lines at 1,273 and 1,073 K in the Ni-Fe-Ru pltase diagram were determined by analysing the compositions of coexisting Ru-rich nuggets and Ni-Fe metals and assuming local equilibrium on a 2-3-ji.!Tl 5Cale. The experimentally determined 1,273- and 1,073-K phase diagrams, and the 873-K diagram inferred from the three binary systems, are shown projected from the PI apex in Fig. 4.
To study V partitioning between Ni-Fe metal and magnetite. we dissolved V into Ni-Fe under /o, conditions one log unit more oxidizing than the solar gas curve (Fig. S) to form a NinF~t V 1 alloy. We annealed this alloy under the same experimental conditions as the Ni-Fe-PI-Ru(±lr) alloys. Essentially all of the V initially in the metal alloy partitioned into the magnetite rim and intef11owths, resulting in V-free ( < 0.1 %) Ni-Fe metal and V-rich magnetite.
To compare the experimental run products with naturally occurring opaque assemblages in CAls, three opaque assemblages from Allende sample JIM" (Fig. 1b), Allende USN'M

175
3
fla. 4 h.othermaJ sections for the sub-solidus phase diagram in the Ni -Fe- Ru system (projeaed from Pt) Experimentally determined phase boundaries (including data from the three binary systems 19
•1,.
0) art shown as dark sohd lines; dark dashed lines art phase boundanes
extrapolated into compositional re&ions not yet investigated. Phase diagrams an incomplete (denoted b) ""?"") tn the Fe-rich ngion at 1.273 and 1.073 K.. where several constructions art possible. Single-phase reJions are shaded Tie-hnes are shown in two-phase regions as hght solid lines; they wert determined experimental!) where they connea solid phase boundanes and were estimated where they connea dashed phase boundaries. For comparison. analyses of metal phases (open symbols ) from three opaque assemblages in CAis (Allende JIM (0). Allende USNM S241 ""Willy""" (0) and Leoville UNM S7S (.0 ) art shown. The reaangular region near the N1-Fe edge of the triangle encloses 42 analyses of Ni-Fe metal from both Allende opaque assemblages. The approximate bulk metal composition or the two Allende opaque
assemblages (e ) and the Leoville opaque assemblage (.l ) are also shown.
5241 ("'Willy'') 11 (Fig. 3b ) and uoville UNM 57511 were studied. Each comprises mostl) Ni-Fe metal, V-rich magnetite and Ru,Os-rich nuggets. The opaque assemblage from uoville UNM 575 has a 2x 10-ILm Ru,Os-rich lamella ratherthan discrete nuggets. Most Ru,Os-rich nuggets in the two Allende opaque assemblages are 0.1-1 11-m in diameter, allowing no more than a single analysis of the largest nuggets. One unusually large 3x5-1Lm Ru,Os-rich nugget was found in the opaque assemblage from Allende JIM and four non-overlapping analyses were made on this nugget. Compositions of Ru,Os-rich nuggets and the lamella, and adjacent Ni-Fe metal, were measured by ASEM and bulk opaque-assemblage metal compositions were calcu· lated from point-counts. Pt occurs only in the N i-Fe metal ; Ru,Os and Re occur almost entirely in the Ru,Os-rich nuggets ; and lr occurs in both Ni-Fe metal and Ru,Os-rich nuggets. We have represented the sum of the three chemically similar hexagonal-close-packed noble metals (Ru + Os + Re) as the Ru apex in Fig. 4, so that the compositions of Ru,Os-rich nuggets from opaque assemblages can be compared with the Ni-Fe-Ru phase diagrams. The compositions of Ru,Os-rich nuggets from the two Allende opaque assemblages (open circles and squares) spread along a linear trend of constant Ni concentration ,.;th variable proportions of Ru and Fe, whereas the Ni-Fe metal (open rectangle ) has a fairly constant Nio7Fe13 composition. The Ru,Os-rich nugget compositions are lower in Ni than the composition that would be predicted to be in equilibrium with Ni- Fe metal at 1,073 K. based on our experimentally determined phase boundaries in the 1,073-K diagram (Fig. 4). However, inspection of the 1,273- and 1,073-K. diagrams shows that equilibrium nugget compositions contain progressively Jess Ni with decreasing temperature. Based on this trend and the inferred 873-K d iap-a.m, we suggest that Ru,Os-rich nuggets equilibrated with Ni-Fe metal at :S873 K. The nearly constant Ni-Fe metal composition could not have been in equilibrium with most of the Ru,Os-rich nugget compositions. We attribute this to homoaenization of Ni- Fe metal after equilibration with Ru,Os· rich nuggets, as discussed below.
A &ood test of the applicability of the inferred phase diagram is the composition of the two coexistioa metals in the opaque assemblage from the uoviUe CAl, because the bulk metal composition is extremely Ni-poor and lies close to the previously determined Fe-Ru binary system". If the two metal phases were once in equilibrium, their compositions should plot at the ends of a tie-line crossing the bulk metal composition at a particular temperature. As can be seen in Fig. 4, the uoviUe opaque
assemblage metal compositions (open triangles) agree closely with equilibrium at 873 K.
Diffusion constraints Arrhenius and Raub20 first pointed out that the existence of sharp contaCts between Ru,Os-rich or PI-rich nuggets and N i-Fe metal in opaque assemblages pro\ides an important constraint on the cooling history of opaque assemblages and host CAis. This argument was largely ignored, however, because ~~ was not known20 and although Dl:!, was known. the existence of primary contacts between PI-rich nuggets and Ni- Fe metal has never been confirmed''. The expression for ~~( T ) determined bere now permits a calculation of the initial cooling rate ( r0 )
required to preserve contacts between Ru,Os-rich nuggets and Ni-Fe metal. Using the maximum Ru concentrations in Ni-Fe metal measured 0.5 and 1.0 ILm from Ru,Os-rich nuggets. and the equation for diffusion from a 1-ILm-diameter sphere•• , we first calculated the value for the time integral of ~~( T ) (or T(<e)) that would produce the observed gradients21 . Equating this to the approximation for T(<e) given by Kaiser and Wasserburg22 ( T(CO)- D ( T0 )RTi,J Er0 , where R is the gas constant and E is the activation energy), and assuming that the maximum temperature of melting ( T0 ) was-1,700 K, we calculate r0~ 1~ K h- 1
• Although this r0 is possible for CA!s in a radiative environmentu, it is unreasonably rapid in light of experimental studies of textures and phase chemistries of the silicate portion of CAis, which imply much slower cooling ( r0 - 0.5-20 K h- 1
;
refs 23-27). On the other hand, we calculate from D~~( T) that the diffusion of Ru in Ni is sufficiently rapid for exsolution of typical 1-ILm Ru,Os-rich nuggets (at 10-~LM spacings) to occur on a reasonable timescale of about 10 days or 10 years, depending on whether exsolution beg~n at 1,073 or. 873 K.
Origin of opaque assemblages ln our phase equilibrium and partitioning experiments, we began with homogeneous Ni-Fe-V alloys and produced V-ricb maanetite as rims and intergrowths within V-poor Ni-Fe metal. We also bepn with Ni-Fe-Pt-Ru( ± lr) alloys and produced magnetite as rims and intergrowths within Ni-Fe metal enriched in Ni and Ru. Ru-rich nuggets were produced by exsolution, and we observed that most Pt remained in the Ni-Fe phase, whereas lr partitioned into both phases. The textures and mineral chemistries that we produced in the laboratory show li remarkable resemblance to natural opaque assemblages (Fig. 3), and lead us to suggest a new model for their origin. Following previous

176
4
T IKl
-~·~s--~--~~--~--~,~~~~~~~__J
~/T IK"1l
workers, we assume that proto-CAls are refractory, early nebular condensates or evaporative residues. We propose that when the silicate ponions of CAJs melted, refractory siderophile elements which had previously condensed as refractory metal alloys•·•·u panitioned into homogeneous metallic droplets: At the temperature of CAl melting ( - 1,700 K), Ni-Fe metal would occur as molten droplets, consistent with the spheroidal shapes of many opaque assemblages. At this temperature, the only solid phase in most CAis would be spinet••. Subsequent crystalliz.ation of spinel could result in the occurrence of opaque assemblages in embayments in spinel crystals {Fig. I a ). As CAts cooled from - I, 700 to- 1,500 K., the metallic droplets crystallized as homogeneous alloys and silicate minerals crystallized around them. At the still lower sub-solidus temperature of s 870 K., the homogeneous alloys exsolved into iznmiscible metallic phases (such as Ru,Os-rich nuggets and Ni-Fe metal) as they were panially oxidized and sulphidized to form magnetite and associated phases, completing the formation of opaque assemblages.
An imponant requirement of this model is that there must be a substantial change in /o. during the formation of the opaque assemblages within the host CAJs. This change is required to explain several basic features of the opaque assemblages, including the oxidation of Ni-Fe metal to magnetite and the initial panitioning of substantial amounts of V into the metal phase at high temperature, followed by subsequent oxidation and diffusion into magnetite . In the remaining discussion, we address the origin of some of the detailed characteristics of opaque assemblages in the context of this model.
Ru,Os-rich nuggets Ru.Os-rich nuuets from individual opaque assemblages show a large variability in {Ru + Os + Re)/Fe ratios. The compositions spread along the inferred 873-K phase boundary in the Ni-FeRu diagram (Fig. 4). This behaviour is consistent with the e:uolution of the Ru,Os-rich nuuets in stages during the removal nf Fe from Ni-Fe metal to form magnetite and Fe sulphide, so that a variety of nuuet compositions formed as the bulk metal composition became more Ni-rich. If the Ru,Os· rich nuueu were the product of siznple equilibrium exsolution, there would be a single nuuet composition falling on a common tie-line crossing the bulk metal composition. Only one Ru,Osricb nuuet was large enough to permit multiple analyses; analyaes nf four separate areas indicate that this nuuet is beteroaeneous in composition21 . lt is possible that all nuueu are some· what wned, and we expect that the edaes of each nuuet have a constant composition in equilibrium with adjacent Ni.7Fen .
Ni-Fe metal The Ni-Fe metal compositions of opaque assemblages in most Allende CAls are fairly constant {Ni.7Fen ), in contrast to the variable compositions of Ru,Os-rich nuueu. We consider Ni.7Feu to reflect the Ni-Fe metal composition in equilibrium
fla.! Plot ofloa/o- versus I / Twith relevant equilibrium curves. The conditions of equilibrium for opaque assemblaaes (OA) are from ref. II and this work; the solar ps curve;. at P • IO-' bar" ; the V/ V20, curve is calculated from thermodynamic dauo•'; the N;..Fe,,/Fe,O. curve ;. from ref. 30, the fUS&Jte crysalltuuon conditions are based on n'--n- (ref 36); the o~n circle giV« the u~rimental conditions for synthesis of the Ni-Fe- V alloy
... ed as saruna material in our V partitionina ex~riment.s
with magnetite at the /o, of the local CAl environment, and thus to be the endpoint of the oxidat:on process. We suggest that the Ni-Fe metal homogenized during oxidation and e:uolution, whereas the isolated Ru,Os-rich nuggets were k.ineti· cally inhibited from re-equilibratinl, with each other. This is consistent with the lower value of D,..~ at 873 K determined here (- 2x I o-••cm• s- • ), compared to the value of ~:-F. at 873 K determined by Hirano~~ aL21 (-3 x 10- "cm' s- 1
). We note that N~1Fen alloy also coexists with magnetite and sulphide in opaque spheroids in olivine-rich cbondrules from Allende29
· :10,
suuesting that both cbondrules and CAJs in this meteorite were exposed to the same ambient fo. and that the opaque assemblages in the cbondrules also ~present an oxidation endpoint.
There is a substantial discrepancy berween the predictions of equilibrium condensation from a cooling gas of solar composi· lion and the composition of Ni-Fe metal observed in Allende, as models predict a maximum Ni content of about Ni20Fe10 ,
whereas N~,Fen is observed".l'. This discrepancy can be pan!) accounted for by the enrichment of opaque-assemblage metal in Ni caused by the removal of Fe during oxidation. But adding the Fe contribution from magnetite and Fe sulphide in Allende opaque assemblages back into the bulk metal composition only brings the composition back to a miniznum Ni content of about Ni33Fe6 7 , which is still somewhat more Ni-rich than the Ni20Fe10
condensate composition. If metal condensation occurred under conditions more oxidizing than a solar gas, condensation of more Ni-rich metal is theoretically possible".
V -rich phases The V-rich fassa.ite rims that frequently surround opaque assem· blages can also be understood in the context of our model. We suuest that metallic V was present in molten Ni-Fe alloy droplets at high temperature, in contrast to previous models that assume that V was always present as V20>, which is the oxidized form of V known to occur in silicate and oxide pbases11
•12
• ln our view, metallic V condensed from the solar nebula either as a metal, or as an oxide which was subsequently reduced during the melting of CAJs. Consider a plot of log /o, versus 1/ T that includes both the solar gas curve (at P = JO-> bar) and the equilibrium curve for the reaction 2V+i02 - V20 , (Fig. S). The rwo curves anss at T-1,770 K and lo&/o,- - IS, so that fnr Tc:: 1,770 K metallic Vis stable at the /o, of a solar gas. A detailed calculation of the log/o, versus 1/ T curve along which an opaque-assemblage alloy with metallic V would be in equilibrium with a CAl silicate liquid containing oxidized V, indicates that this curve would be displaced somewhat to the right of the V/ V20> curve. The shin would lower the temperature at which V would be stable in a Ni-Fe metal droplet immersed in CAl silicate liquid at the /0; of a solar gas to - 1,670 K. This calculation uses 1\'a.ilable estimates of V activities in metal33
and silicatel4, V concentrations in opaque assemblages and bulk

177
CAls11, and an estimate of the fraction of atoms in CAis once
contained in opaque assemblages" . As CAis cooled along the solar l!as curve, V in refractory siderophile alloys would be expected to oxidize progressively and diftuse out of the metal because of the difterence in the slopes of the solar J!as and V / V20 1 curves ( Fig. 5). The oxidized V could have difiused into surrounding fassaite, resulting in the V-rich fassaite rims. The oxidized V in the silicates may b.ave been present as VO rather than V20 1 at high temperatures. But as the V/ VO curve is only -1 log unit more reducing than the V/ V20 , curve, the change in speciation would not significantly affect the above argument.
All of these phases in opaque assemblages cannot be produced simply by cooling of a solar gas, because the N~1Fen metal and V-ricb magnetite must have equilibrated at an /o, that is - 6 log units more oxidizing than the solar gas curve at a temperature of :S870 K (Fig. 5). The deviation from the solar gas curve that led to the formation ofV-rich magnetite at -870 K could also have influenced the oxidation of V at intermediate temperatures. Nevertheless, in the context of our model for the origin and evolution of opaque assemblages, the /o, of the early high-temperature solar nebula must have been at least as reducing as the solar gas curve during CAl melting because of the necessity for V to occur in the alloy. This fo. is consistent with estimates of the / 0 , during CAl crystallization based on Ti'" Ti•- in fassaites».l6 (Fig. 5 ). In these reducing conditions, the siderophile elements Mo, W and P would also have been in a reduced state in the opaque-assemblage alloy. By the time CAts cooled to -870 K. however, the fo, must have deviated from the solar gas curve and increased dramatically to form the V-rich magnetite and possibly the molybdate, tungstate and phosphate found in opaque assemblaJ!es.
Other phases In addition to the coexistence of Ru,Os-rich nuggets and Ni-Fe metal, there are other intergrown phases in opaque assemblages that indicate equilibrium at :S:870 K (for example, N4, FenFe10.-FeNiS, Fe-FeS-MoS2 and Fe-Fe, O.-FeA1 20.)11
•
Although we have not explored diftusion within these phases experimentally, we consider it unlikely that intergrowths of these phases could have survived CAl melting and slow cooling. Instead, we also interpret these assemblages as the produCts of low-temperature re-equilibration.
Our model for opaque assemblages predicts that the refractory siderophiles that arc soluble in Ni-Fe metal at low temperature (such as Pt and lr) should occur dissolved in Ni- Fe metal in opaque assemblages. This is generally the case, but occasionally Pt,lr-ricb nuggets arc observed in sulphide-rich opaque assemblages. It has been shown 11
•12 that these nuggets formed during
low-temperature sulphidization of Ni-Fc-Pt-lr metaL The ocx:urrences of small (O.S-3 .,.m) refractory siderophile
........, "~~>• o...ba 1m.
I. o.-.._ LA a.., &nil,...... 5c l. l,.__ (1910) 1. w~ o. J a...,......_..,._ o A. a. ED-,. .. - AnNp~o,.... 1ec1o ..,_,
c. A.. a.,..... o. o. a-...... o. N.l n-1.o ~~ u.. .... ;,y ,.,_, ...,. Yoft. IKll
J. o.-... L ~-. "-n. ll19-u.o o,,,_ 4. W'uk<, H, .-M..,._H,N-. H. a~J. f.Mdo,._Sclnt.ll,l-1(1"•1 s. FcPY. a. a ~A. s. EMfA ,.__.so. Ua.-. 111·1" ll"'l-'- ,.._, H. a -._ F. Unl< ,.__ So. LftL D.·~ 11"6~ l . Wart.. D. A.. A l.4wt:na&. J F t..wrt Sa. l , JU-914 (tt76t a. El Clono)'. A.. Naed. K.. o..uw., 1 a a..c~o~w. r. -..... U.21~216 om> ' - EIGooay,A.. ,....._La Raadolu. P hec. '-fi-t. So. C.V:I.1719-IJ0l(l"ll
10. wam.. o. A. a ............ J. F ,_.so. 1. lll"-1217 omJ. 11. -J.T. EIGooay,A.aW~G. J."--_..._ .. ,1001-IOll
(lfll). U. --.LT. H-1. O. a W~G.J. "---..._(ill !II< ,....,_ II. --A. a~-H.~- A<M 51. IDl-11 .. (ln71 1• F..a.. L H a llluda, M hec. U... ,.__So. c-{ II. 929-.._. (19101. ll . ...-.H..-._ K.. N ..... K. a EJ Cloray, A. E.onl ,-... s.< L#f1 •t. 1-n omJ 16. c:...i.. J. 1lw Me-.a of r;v.- (o.tord UW.....ty ,__ ..... Yoft. l"ll 11. ~-F. a Karu. o. M..-. 11. m tln lJ 11. Kncb<r. A. .. e1 ,__ "- ,.__ .sa. c-t. 10. om-om onsJ 19. s-ba. LJ.a-1- Allo1 -..o.o,-o,u~I60 0nlJ
s
metal nuggets in silicate or oxide phases in CAis with no associated Ni-Fe metal, magnetite or sulphidc'·' 0·1l--'
1 are not specifically addressed by our model. These nuggets may be either primary condensate grains that did not come in contact with Ni-Fe metal droplets, remnants of digested opaque assemblages, or metals precipitated directly from the CAl silicate liquid.
Finally. it should be noted that isotopic studies of opaque assemblages and isolated refractory siderophile metal nuggets have found no evidence of large isotopic anomalies in any of the elements studied (Mg, Fe, Ru, Mo, W)ll. These results suggest that opaque assemblages, including Ru,Os-rich nuggets, were most probably formed within the solar nebula rather than outside the Solar System.
Conclusion We have reproduced the basic assemblage of Ru,Os-rich nuggets, Ni-Fe metal and V-rich magnetite, characteristic of opaque assemblages, by oxidation of a homogeneous alloy a t low temperature in the laboratory. We infer that opaque assemblages originated in CAl silicate liquid as homogeneous, probabl~ molten, metal alloy droplets which mcluded the clements Ru, Os, Rc, Pt, lr, W, Mo, P and V in the reduced state. The proto-CAl material most plausibly represents refractory ca rl~ nebular condensates or evaporative residues. We propose that the complex mineralogy that now characterizes opaque assemblages formed from the alloy droplets by cxsolution during progressive oxidation and sulphidization. This process probably occurred during the slow cooling of CAis at a temperature of s870 K. The alternative scenario, that opaque assemblages formed in the solar nebula before CAl melting and were subsequent)) captured in the CAJs9
·11
-13
· '5
, is not tenable because the low-temperature mineral assemblages could not have su rvived the CAl melting event for any plausible cooling rate. In our view, opaque assemblages do not contain much information on the high-temperature thermal h istories of CAts or record an independent history before CAl formation ; they are not ' foreigners' to CAts in the sense implied by the name " Fremdlingc". Instead, they are 'domestic' and pro,-idc equall) important constraints on the lower-temperature thermal histories of CA!s and on the changing oxygen fugacity in cooling nebular and/ or planetary environments.
We acknowledge the careful analytical and petrographic studies of "Fremdlinge" by J. T. Armstrong and A. El Gores) which set the framework for this study. We thank G . R. Rossman for making his laboratory available to us and H. Palmc, K. Kei l and the U.S. Museum of Natural History for loaning us the meteorite specimens used in this study, and H. Palmc for a careful review. Funding was provided by grants from NASA and NSF, and by Caltech's Caroline Dobbins Fellowship to J .D.B. J.D .B., GJ.W. and I.D.H. are at the Lunatic Asylum of the Charles Arms Laboratory (No. •537/ 591 ).
20 At'rbauua.,. G A a.. .. b. C. J J. ~ Mtf&h Q, 4l1-0 0 fi971 J ll. II\UD, J D. "'-"'"'a- J T. H•c:DeoA. I 0 a-..-.._ G J. ,_,fi-t. Sn 11.
, _,. (1917)
n .:...... T. a,.,_,._ G J. o--.--. ..,.. n. o-ll llflll 23. NacPt.m.oft. G. J .. hqwc. J M .. S.olpc.r, E. M. A <.iroumaA. L J Grot n, 219-~ t l91o&l lA.. S&ofpn, E.. N A Paq~. J M Grodulft. ~ Ade .. lliS-1106 11916J 25. Wart.. 0 A. A l..o'tomft&. J. F Groc:lu"'-~ Ana 46. Ull-~ t 19tlJ 16. llo<tm.J. IL a Growun, L ,_,...,.., Sn U . ll·l2 119121 11. -. O.J. Man.._ P. M.aH..-.I. 0.~- ....... 169-11lll ... l ll HtrUO, L. Coht:a., N . A A~ B. L A.cM Nnd. t . .WO,....W~ C 1961 1 lf. ~- S. £.a M<Ma!Joo. I M l'roc. ,_,. ,.¥-. 5c c-{ II.ISI-110 119191 JO. M<Wa!Joo. I M a H_.,, S. £. hec. ,_,. ,w..._ 5c C../ 11. 100l-10ll119101 11 IWI) . .. JLa 1..aruoc-t. J .. . ClnldoooL--.. ...,. . 1. 9!-111 um1 J1. "'-e. L. Olon. L a .......,_,_ J M S....- ..,._.,I 119'191 l3 ~.,..u.J A.Ountr, W N. J.Irln.ls,lto' Y. lfl, 1li- 11S I I9SI1 l4. N-. H a Sdloom.. W t- ,.__ So. C.V: 11, W-61• 1 1m1 l l . Soolpn. L M. """'· I M. a ........_ G. IL ,_,. ,._ Sn ll, n2-17J (19CI J6 llo<tm. J. IL a Cin>um&o. L ~ ,..,..._ 5<. 11. l4-l7 119161 11 wam.. o. A. &n~< ,._ Sn u.. n . 129-1 .. 119161 Jl. H .. c:beoa. I D .. ~ J. T. A W~ G J <Md-. ~"" A tu: 51.
311~)192 (19111 39. Null. P . ... Aloy -.. no.,.. ... 7. llO-Ill (19161 tO. K•bMchtwt.la, 0 J,_......,.. l'twut- .t.:Jrwro""' (Spnqc-r, Nn Yor\.., 191)) • 1. CiroMmaa, L a....~ At1o ... 591-619 119,1. U. Qw.c, N 9t Jr n .J J ,;ry.s dwa Atf D11o 14,. Suppl 1 I l91~ 1

Gw•ill"'"",., ( •~•'1\,m,.-o .4tTCJ \-ol 53 pp S41-SS6 C~na,nt ~ 191fi Papmon f'rtsl pk PnnY!d 1n U.S o\
178
00 16-'1017/19/U OO + i1J
Origin of opaque assemblages in C3V meteorites: Implications for nebular and planetary processes
JOEl D . BLUM•, G . J. WASSERBURG• , I. D. HUTCHEO~, J. R. BECKETT and E. M. STOLPER
Division ofGeoiOiical and Planetary Sciences, California I!Utitutt of Technology, Pasadena. CA 91125. U.S.A .
(Rrceived July 27, 1988; oa:ep~ed in revised form November 18, 1988)
Allwtract-Minenal phases from opaque IIS!Ctnbiaal:s (0As) inCa, AJ.ricb refractory inclusions (CA!s), cbondrules and matrix in C3V meteorites wen: chemica!Jy analyzed and compared with experiment.ally determined phase equilibria and partitionina data in the Ni-Fe-Ru, Ni-Fe-S and Ni-Fe-0 systems to cstimatt the temperature, sulfur fupoty U,l and oxyaen fupcity (}0,) of OA formation. The kinetics of dissolution and exsolution of metallic phases in the Ni-Fe--Ru system wen: used to constrain the thermal history of OAs that occur in CAis. Based on this work. we suaaest that OAs fonned after the crystallization of host CAis by exsolution. sullidation and oxidation of precunor alloys at low temperatures (- 770 K) and higher than solar gas /s, and /o, . Our model contrasts with Jnvious models that call upon the formation of CAl OAs by agregation of ~ously formed phases in the solar nebula prior to the aystallization of CAis. Opaque assembJa&es in CA!s and cbondrules probably originated as bomoseneous alloys during melting of the silicatt portions of CAts and cbondrules. The compositions of the:K precunor alloys rellect high-temperature and lo"'·/o, conditions in the early solar nebula. The similarities in the ttmperaturt. /s, and /o, of ~uilibration for OAs that occur in CAis. cbondrules and matrix sugest that these three component> of C3V meteontes share a common. latt low-temperature history. The mineral phases in OAs do not preserve an Independent history prior to CAl and cbondrule melting and crystallization. but instead provide important information on the post-acxmionat)· history of C3V meteorites and allow us to quantify the temperature./., and ./0, of coolina planetary environment>.
INTRODUcnON
C3V CHOSDRITIC METEORITES consist predominantly of refractory Ca.AI-rich inclusions (CAls) and olivine-pyroxene chondrules (and mineral fragments), embedded in ·a finegrained silicate matrix. CAls are panicularly impon.ant to our understanding of nebular processes because they are widely believed to be representative of refractory materials formed by condensation early in the history of the primitive solar nebula (cf. GROSSMAN, 1980). Olivine·pyroxene chondrules are less refractory than CAJs and are believed to be mixtures of materials condensed from the nebula (RUBIN and WASSON, 1987). The origin of the matrix is uncertain, but compositional similarities with chondrules suggest an origin involving nebular condensation (RUBIN and WASSON, 1987) and/or alteration of preexisting chondrules (HOUSLEY and ORUN, 1983). Alth.ough CAls, chondrules and matrix in C3V chondrites are quite different in bulle composition, they all contain similar multiphase assembla&es of alloys, sulfides and oxides that we term O/)Qi/Ue assemblages (OAs).
Opaque assembla&es in CAJs and cbondrules are generally spheroidal, 10 to I 000 11m in diameter and consist primarily of 'YNi-Fe, ma&netite (Fe10.), pentlandite ((Fe,Ni),S.), PYT· rbotite (Fe1 • .S) and Ca-phosphate (CaJ(PO.), or Ca,(PO.h (F,OH,O)) {FJ&S. 1-4). CAl OAs (previously called " Fremdlinge"; t'.g. El. GoRESY n al .. 1978) additionally contain phases rich in refractory siderophile elements {FJ&S. 1-3), including Pt-goup element-rich metallic phases (most commonly eRu-Fe), molybdenite (M~) and scheelite-powellite solid solution [Ca(W,Mo)O.). refiec:tins the large bulk<bemical enrichments in refractory elements in CAls compared to cbondrules. Matrix OAs are .,enerally i.rrqular in shape, 5 to 25 p.m IIClOSS and consist mainly of 'YNi-Fe and pent-
• Jtlso: Lunatic Asylum of the Owies Arml Laboratory.
543
landite with minor pyrrhotite, ma&netite and Ca-phosphate (Fis. S).
The major mineral phases and textural relationships in OAs from CAJs, chondrules and matrix have many similarities, suggestins that they could have formed by similar processes. However, several diverse scenarios have been proposed in the literature for the formation of these three types ofOAs:
OpaqUP assemblages in CA/s have been hypothesized by most recent workers 10 have formed by the nebular condensation of Pt-goup dement-rich metallic phases, Ni-Fe alloys, sulfides and oxides that were mechanically mixed at low temperaturt (<1000 K) in the solar nebula. Subsequently, OAs are believed 10 have been incorporated into proto-CAl material before (or durins) a brief high temperature ( -1700 K) event, durins which the silicate portion of the host CAis partially melted and crystallized (ARMSTRONG et a/., J98Sa, 1987; BISCHOFF and PALME, !987). Aocording to this model, the phase assembla&es in CAJ OAs look through the CAl melting event and record highly sulfidizing and oxidizing conditions durins condensation very early in the history of the solar nebula. Since some silicate minerals in the host CAJs preserve evidence for crystalliz.ation under reducing conditions in the solar nebula (BECKETT n al.. 1988), this view of CAl OA ori&in implies that the condensina nebula was het.eroaeneous, with local variations in temperature of hundreds of decrees and in ox)'ltn fupcity {fo,) of many orders of JDa&D.itude. It funher implies turbulence within the nebula capable of mixins the various phases formed under these conditions. An alternative hypothesis is that the phase assemblB&CS within CAl OAs are not relicts of nebular condensation and instead evolved during a low temperature reequilibntion event(s) after CAl c:rystallization (BLUM n al .. 1988).
0/)Qi/Ue assmlh/ages in chondrvlt's have been proposed to have formed either by sulfidation and oxidation of Ni-Fe alloys in cbondrules (HAGGERTY and MCMAHON, 1979) or
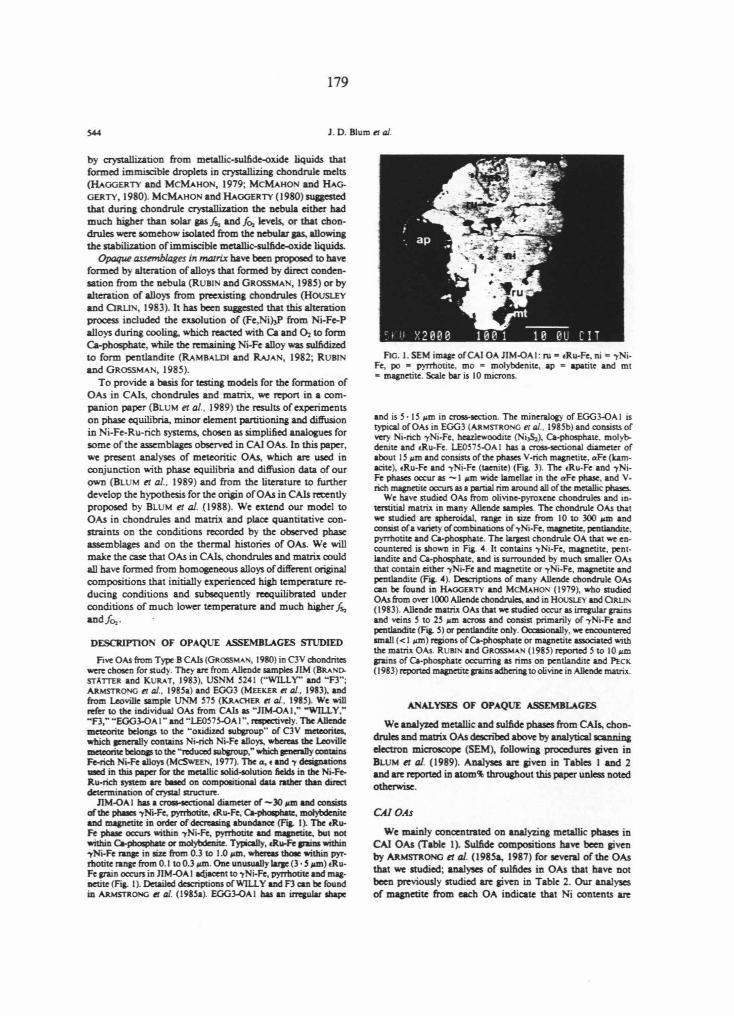
179
J. D. Blum rr a/.
by aystallization from metallic-sulfide-oxide liquids that formed immiscible droplets in crystallizina chondrule melts (HAGGERTY and McMAHON, 1979; MCMAHON and HAGGERTY, 1980). MCMAHON and HAGGERTY ( 1980) sugested that durin& chondrule crystallization the nebula eitber bad much hiaber than solar psIs, and /o, levels, or that chondrules -...ere somehow isolated from the nebular ps, allowina the subiliz.ation of immiscible metallic-sulfide-oxide liquids.
0J1DIIUL assemblag~ in maJrix have been proposed to have formed by alteration of alloys that formed by direct condensation from the nebula (RUBIN and GROSSMAN, 1985) or by alteration of alloys from preexistins cbondrules (HousLEY and 0RUN, 1983). It has been sugested that this alteration process included the exsolution of (Fe,Ni)JP from Ni-Fe-P alloys durins coolin&. which reacted with Ca and 0, to form Ca-pbosphate, while the remaining Ni-Fe alloy was sulfidizcd to form pentlandite (RAMBALDI and RA.JAN, 1982; RUBIN and GROSSMAN, 1985).
To provide a basis for t.cstins models for the formation of OAs in CAls, cbondrules and matrix, we ~rt in a companion paper (BLUM et al., 1989) the results of experiments on phase equilibria, minor element pertitionin& and diffusion in Ni-Fe-Ru-rich systems, chosen as simplified analocues for some of the assembla&es observed in CAl OAs..ln this paper, we present analyses of meteoritic OAs, which arc used in conjunction with phase equilibria and diffusion data of our own (BLUM et al., 1989) and from the literature to further develop the hypothesis for the origin of OAs in CAls m:ently proposed by BLUM et al. (1988). We extend our model to OAs in chondrules and matrix and plac:e quantitative constraints on the conditions recorded by the observed phase assembla&es and on the thermal histories of OAs. We will make the case that OAs in CAls, chondrules and matrix could all have formed from bomoseneous alloys of different original compositions that initially experienced hish temperature reducing conditions and subsequently reequilibrated under conditions of much lower temperature and much hiaber /s, and/o,.
DESCJUPTJON OF OPAQUE ASSEMBLAGES STUDIED
Fi~ OAs from Type B CA1s (GROSSMAN, 1980) in C3V c:boodrites were chosen for study. They are from Allende samples JIM (BRAN!). ST.J.Trnt and KURAT, 1983), USNM S241 ("WILLY" and "F3"; AltMSTl!.oNG n a/., 198Sa) and EGG3 (MEEK£R eta/., 1983). and from Leoville sampk UNM S7S (KRAotER eta/., 198S). We will n:fer 10 !be individual OAs from CA1s as "JlM-OAI," "WILLY," "F3, M "EGG3-0A I" and "LEOS 7S-OA I", respectively. The AlleDde meteorite bclonas 10 !be "oxidized subp'Oup" of C3V meteorites, which teneral~Y contains Ni-ricb Ni-Fe allo)'5. wbcftas the Leoville ~ beloap 10the "reduced subp'Oup," wbicb~contaim Fe-ricb N'rfe alloys (McSwEEN, 1977). The «, • and ,.. clesicJWions aed in this paper for !be metallic solid-talution fields in the Ni-FeRu-rich S)'lleiD are bMed on comi)Oiitional data rather tban direct detennination of c:rysW structure.
IIM-OA I bas a cn.wectional diameter af-30 1'111 and consists of !be pbaes 'YNi-Fe, pyrrbotite, <Ru-Fe, ~molybdenite and mqnelite in order of clccTQsjna abuodanoe <F~&- I). The <RuFe pbue occurs within ,..Ni-Fe, pynbotite and m.apetite, but DOt within ~ or molybdeMe. Typically, <Ru-Fe paiDS within ,..Ni-Fe ranar in size from 0.3 to 1.0 ~'~~~ · wbcftas thoK within pyrmotit.e ranae from 0.1 to 0.3 jiJil. ODe u.nusu.ally t.uwe (3 • S jiJil) <RuFe pn oocun in JIM-OA I acljecent 10 ')'Ni-Fe, pyrrbotite and masoetite <FI&- I). Detailed descriptions of WILLY and F3 can be found in AltMSTIIONG n a/. (198Sa). EGG3-0AI bas an iJTecular shape
FlG. I. SEM ima,e of CAl OA JJM-OAI : ru • <Ru-Fe, ni • ,..NiFe, po - pyrrhotite, mo - molybdenite, ap - apatite and mt - masnetite. Scale bar is I 0 microns.
and is S · IS "m in crosHCCtion. The mineralOCY of EGG3-0A I is rypical ofOAs in EGG3 (ARMSTRONG n al .. 198Sb) and consists of very Ni-ricb ,..Ni-Fe, heazlewoodile (Ni..s,), <:a-phosphate, molybdenite and .Ru-Fe. LEOS7S-OA I has a crosHec:tional diameter of about IS "m and consists of the phases V -rich magnetite, afe (kamadte). tRu-Fe and ,..Ni-Fe (taenite) (Fi&- 3). The tRu-Fe and ,..NiFe phases occur as - I 1'111 wide lamellae in the aFe plwr, and Vricb magnetite occurs as a ~ rim uou.nd all of the metallic phues.
We have studied OAs from olivine-pyroxene chondrules and intentitial matrix in many Allende samples. The cbondtule OAs that we Sludied are spheroidal, ranar in size from I 0 10 300 I'ID and consist of a variety af combinations of ,..Ni-Fe, macnetite. pentlandite, pyrrhotite and <:a-phosphate. The llrBest chondrule OA that we encountered is shown in F~&- 4. It contains .,.Ni-Fe, IDI&Detite, pentlandite and <:a-phosphate, and is surrounded by much sna!Jer OAs that contain either ')'Ni-Fe and IDI&Detite or ,..Ni-Fe, macnclite and pentlandit.e <F'I&- 4). Descriptions of many Allende cbondtule OAs can be found in HAGGERTY and McMAHON (1979), who studied OAs from o~ 1000 Allende c:bondrules, and in HOUSL£Y and ORUN (1983). Allende matrix OAs that we studied occur as irTqu1ar p ns and veins S to 2S I'ID across and consist primarily of ,..Ni-Fe and penllandite <F'I&- S) or penllandite only. Ocasionally, we encountered anall (<I jiJil) rqjons ofCa-phosphate or IDI&Detite assoc:dted with the matrix OAs. R U BIN and GROSSMAN (198S) reported S to 10 1'1D pns of <:a-phosphate occurrina as rims on pentlandite and PEcK ( 1983) reported mapetite arains 8dberina 10 olivine in Allende matrix.
ANALYSES OF OPAQUE ASSEMBLAGES
We analyzed metallic and sulfide phases from CAls, chondrules and matrix OAs described above by analyticaliC&D!lini ekctton microscope (SEM), followin& procedures r;iven in BLUM et al. (1989). Analyses arc r;iven in Tables I and 2 and arc~ in atom% throuihout this paper unless noted otherwise.
CUOA.s
We mainly concentrated on analyzin& metallic ptwes in CAl OAs (Table 1). Sulfide compositions have been r;iven by AllMSTRONG et al. (198Sa, 1987) for aeveral of the OAs that we studied; analyses of sulfides in OAs that have not been previously studied arc r;iven in Table 2. Our analyses of mqnetite from each OA indicate that Ni contents arc

180
Op.quc aaemblqes in ClV meteorites S45
AG. 2. SEM i~Da~t of CAl OA F3 (lalJe. round objecl). SU1TOUIIdt:d by V-rich fassaite (vfs) and occurrina in an embayment in a spinel (sp) crystal. The SUIT'OUDC1ina host phase is melilite. Scale bar is 10 microns.
sO.S% and V contents ~ from 0. 1 to -12%, consistent with the data of ARMSTRONG n al. (1985a).
The 'YNi-Fe and fRu-Fe phases contain concentrations measurable by SEM (0!::0.1 %) of the elements Ni, Fe, Co, Ru, Os, Re, lr and Pt. We measured Ru, Os andRe concentrations in 'YNi-Fe 0.5 and 1.0 11m from fRu-Fe grains in each OA to determine whether these metallic phase boundaries were
compositionally sharp within the resolution of our analyses, which has been calculated to be O.S to 0. 7 11m (BLUM n al .. 1989). Ru, Os and Re concentrations do not i.ncrease tov.-ard the boundaries and show the same degree of variability as concentrations measured far from boundaries, indicatina that they are sharp within the analytical resolution. Most fRu-Fe grains are so small that they can only be analyzed at their center. The larJe fRu-Fe grain in JIM-OA I was analyzed in nine nonoverlappin& regions and is compositionally beteroaeneous (Table I, analyses lla-i). The larJe fRu-Fe lamella
AG. 3. SEM iiMfe of CAl OA LEOS7~AI : ~ • aFc; ocher abblniAtions as in F~~o I. Scale t.r is I micron.
AG. 4. SEM imaae of an AUende chondrule OA: pn • penllandite: other abbreviations as in Fia. I. Scale bar is I 00 microns.
in LEOS7S-OA I was analyzed in six nonoverlapping regions and is homoaeneous (Table I, analyses 1~).
Compositional data for metallic phases in CAl OAs are sb~in~k~~anaJysesbm~and~aremalized to 100% and plotted in the Ni-Fe-Ru plane. This representation is used to depict the compositions of metallic phases in CAl OAs because Ni, Fe and Ru comprise ~95% of the composition of 'YNi-Fe and aFe, and -6S to 90% of the composition of fRu-Fe, and because the phase equilibria of compositions near this plane have been studied experimentally (BLUM n a/ .. 1989). An alternative approach, which attempts to account for the influence on phase ~tions of those components not in the Ni-F~Ru system, is to aroup elements that are chemically similar; i.e. Ni and Co are combined at the Ni apex, and Ru, Re and Os are combined at the Ru apex (Fi&. 6b). This approach aroups elements that have the same crystal structures, form complete solid solutions, have similar melting temperatures, and partition sim-
AG. S. SEM imqe of an Allende matrix OA. Abbreviations as in r~&o 1. Scale ..,. is 10 microns.

181
S46 J. D. Blum n a/.
t able 1. ,._ Ir••• 1• ato. ,..rc:ent of eoeaJutna • tdlic: art excluded by both treatments, but these an: minor con-,h.uH 1ft O,a4!-.M aauablale& f ro. CAb.
stituents in the metallic phases, do not mimic the behavior •• Co •• ... .. .. h ... JIM-o41 )1.46 0.40 }.49 ·~-11 lol9 .... of any of the major elements in the metallic phases, and, in ~ 4l.S2 0.67 .... , 4). 18 tt. ta .... any case, appear to have little infiuence on phase equilibria
14.40 0 . 1) 6.S9 4 J,l) S.91 )0.2) o ... 10.44 0.)7 4,!1) Sl.11 ),S) 21.41 1.47 in the Ni-Fe-Ru system at the concentrations found in OAs 14.64 0.10 S. ll u.so
'· }4 2flo-92
(BLUM et al .. 1989). The resulting compositional regions in 11.17 • •• s 4 ),)4 J. 12 u .u 7 • • 71 7.112 n. •.a 2 .JS 24.~ 2.26
F~~o"S- 6a and bart very similar; for convenience, Fig. 6a will • 1'2 .11 S.21 49.SI 1.11 20 .)) .... ' )),0) 0.4) 6 .2} 48.10 JO. U .... be UJed for comparison with the Ni-Fe-Ru phase diagram in
!0 11.S2 7,2) 4). 71 2.6) 27.4 ) t.u !Ia 42 . 06 o.u ] ... 46.0S 4.02 ).42 the foUowin& section. • 40.29 o .• , 4,24 u.u 4 . 1!) ] ...
To evaluate the relationship between the concentrations )1.4) o.n .... .. •. u ~ ... ). 19 4 l.le 0.10 4 . 27 4tt.42 ),1) l.SO of Ru, Os and lr and the Fe content of tRu-Fe grains and 4l .U o.s7 •• 21 n.n '·"" 4 .8) 49.1) o.~ 7.1 1 l7.SS 1.9) ).6) lameUae, we have plotted them versus Fe for JlM-OA I and Sl.JO 1 . 8) ··" 32.64 1.93 5.15 ... ]0
··~ ~ . ., .a. s~ J,61 4.39 LEOS7S-OAI (Fig. 7). Ru concentrations in tRu-Fe grains
1 41.91 1 . 11 41. U U ,)O 0.]4 41 .61 3.0) in HM-OAI (Fig. 7, open circles) are relatively insensitive to J lJ"-()AI l8. 20 o.oo S7.40 1 . 41~ 1.09 o., variations in Fe, whereas Os displays a negative, and lr a T')lt -Fe )8. 11 1. 32 57.09 J,4S .... 0.9S
)6.. ~2 J.Sl 59 . 0) o. 71 o . 19 t.l! o.es positive, correlation with Fe. The ")'Ni-Fe phase in nM-OA I )S.9J t .S7 S,S.6 .. 0.1) 0 . 71 1.2e 1. te ]4 .90
· · ~ 60.80 0.4) 0.16 .... 1.16 (F~g. 7, asterisk) bas a restricted compositional range. Each
)tl.l3 ).29 ~-6! 0. 96 0.12 .... .... of the three phases from LEOS75-0AI (F~g. 7, filled circles) 31.)4 1. 62 .S7. 74 1.43 1.2) 0 . 9 5
)1.4) 1.)) 57.07 l-67 o. n J . OS J,IJ have distinct concentrations of Ru and Os. )7.te t.)) ~- 11 l.47 o. :n 1.07 1.1 1 !0 ]6.~ 1. 49 sa ... 6 1. 00 0 - 19 ).)4 lolS The partitioning of Pt and lr between tRu-Fe and .,.Ni-Fe !! 38 . 16 o.n )f).96 1.25 0.]6 1. 19 1.10 12 )6,)9 t.sz ~.94 0.61 Q,)J ).10 loll can be evaluated for the CAl OAs that we analyzed. Pt and ll 37.20 t .zt. 58.20 J,J1 0.12 J. to 1.01
lr concentrations of ")'Ni-Fe are nearly constant for each OA VlLLY ]0.00 t . 19 6.51 )5.47 s. 29 20 .6' 0 . 69 studied; Ir concentrations are somewhat variable in tRu-Fe c..b.l-h 4J, SS 1.12 ~.]9 32.)a o. 73 1).71 ....
42.&~ o . .. '·'" li.Sf !.00 U .08 J .9S from each OA (Table 1). The (tRu-Fe)/(")'Ni-Fe) partition • 45.29 1.76 6.67 32.)9 11-&6 2.20 coefficients (K1 for element 1) were calculated for Pt and lr
VJLLY ]5.61 2. 16 61.2) 0 . 3) 0.10 0 .)1 o. Jl in each CAl OA usilli the averqe Pt and lr concentrations. ~. )6. l 4 t.67 6 1 .)4 0 . 21 0.10 0.24 o.to
) 5.97 1.98 61.)7 0 . 1! 0 . 12 o.u Q.)l except for the Pt content of tRu-Fe, which was below the )6.&1 2.416 60.62 0 . 12 0. 17
JS.l2 l.lb 61.96 0.21 c .• ~ 0.1% detection limit, allowing us only to calculate an upper JS, 76 2.21 61 ·" 0.2! 0.10 0.1• l S. J9 2. 40 6 t . oe o.u o.a. Q.IS o. u. 0 .2) limit for Krt: JIM-OAI (K"' s 0. 1, K" • 2.4); WILLY (Krt
• 35.27 .... 62 - 16 o . )7 0 . 24 s 0.7, K1
' ~ 2.2); F3 (K"' s 0.2, K " = 2.S); EGG3-0AI (Krt ' )6.]2 2.45 60 . ]9 Q ,)) o.u Q.J2 0 .24 10 JS,)) 2.21 61.9 2 0. 14 0.24 c.J6 s 0.1, K1
' ~ 2.4); and LEOS7S-OAI (.K"' s 0.1, K" = 0.9). !I )6 . 39 2.2 ) 60. 45 0 .26 o. n o. •u These K"' and K" values an: similar to those determined 12 3).)2 2.2) 62 . 26 0.11
!l JS . Ol t .t! 62.44 0. )] 0 . 22 experimentally at 873 K by BLUM et al. (1989) (K"' ~ 0 .16 n 4().19 o.u 7.14 28-81 20 .&4 2. 15 and J<l' • 1.6). ln both the OAs and the experiments of BLUM tiu-h )4,41 0.87 6.U 26 . ~ 1 , ... 18.20 1.76
et al. (I 989), Pt partitions preferentially into face-centered n 3S.Sl t .el 6 J.OS 0.60 o.oo 0. 16 cubic (fcc) ")'Ni-Fe, whereas lr partitions preferentially into lit:-fe )~.67 2.]1 64),4) 0.61 0. 7! 0. 12
) ),64 1.96 6().!2 0 . 72 o.86 close-packed heJl88onal (cph) tRu-Fe. tcCl-OA J ! 1.8) 0 .]1 4. 07 60.11
··~ 28.62 2.37
~·2 ). fl6 .79 • • 71 60 .!2 2-fll 27.)6 ChondnJe OAs
tcG1-0A1 14.21 1.45 !l-02 O. lb O.SI o. • s
~ )4..~2 ),9] 8 2.9! o . sJ Our analyses of metallic phases and sulfides from Allende 14. 01 .... 82.99 0. 49 0.)1
• 1).90 t.6) 8 2.38 0.-418 0. 1) o •• , o .Js chondrule OAs an: given in Table 2 to augment the extensive UOS7S U -29 ··~ 18 .27 0. 2) 4 .91 2. JO analytical data of HAGGERTY and MCMAHON ( 1979). Chon-~ 7J •. U 4. 22 16. 7S •.a ....
drule OAs an: texturally similar to CAl OAs and an: com-~h 72.0& 4. 1) JS,SI 0.)2 s.to 2.47 0 . ]9
70. 8 2 4.)4 Jfl;.l2 0.20 s.zo 2.41 o.1o prised of the same major mineral phases. Tbe compositions 71.49 4.14 ts.ss o.n s. 74 .... 0.40 ... ,. ~.oo 11-16 o. ss .... ). 07 of ")'Ni-Fe, pyrrhotite and pentlandite art similar in most LLOS7S 72. )(1 o.n 10.40 8-Sl o ... 1.76 ).ti l .... chondrule and CAl OAs (Tables I and 2; HAGGERTY and -:oAI 72.90 J2,fl) 7 .67 0.)2 1. 76 2. 2S ....
McMAHON, 1979; AllMSTRONG et al., 198Sa, 1987). Re-lii"='re 7).1(1 10.416 e.sJ o.u },)) z.n 1.)7 ]). 61 10.02 7 ... o.l9 t . as 2 . 91 2.19 &actory siderophile element-rich phases, which are common
LtOS7S 92.47 O.lt 2 ... l . l'to 0. 41 0.15 .... in CAl OAs, bave never been reponed in cbondrule OAs. -:cAl 92.01 0.56 2.11 1.11 0.25 ), 72
··~ ....... 9).04 o.s2 2. 57 . ... ) .. 21 .... Refractory siderophile and V abundances in ")'Ni-Fe, sulfides 91.44 o ... ].]~ 1.41 1.59 1.57
and oxides from cbondrule OAs art sO. I %. Tbe refractory tl.44 o. •~ '·" o ... 0.19 1.71 1.69
tz.os 0 . 41 l.Ol 1.21 .. ., .... siderophile contents of bu.l.k OAs from chondrules ba ve not
lote : - llwU c.at• 1M l 011tr Q. ll 4etecUan lt.a.it . '· lt. ' · s, been detetmined, but the refractory siderophile contents of Tt. er. It! aad J!lo wn au J,...ed llut wn M low • t • ctiOfl u.su. Aul ,.U~l tot all noaH fr• ft. t o 104 ,.rceat a Dd whole chondrules art approximately chondritic (RUBIN and wu M1nMltU:4 t.o lOOt. • i111111C.at·•• t~t CJOepoel tfOfl •• oor..l had to ••d"*' part ial •-ly•h of eurrouDdb& T•t-Fe. WASSON, 1987). 1 Ana l J • • • ll • -1 npre•••c .oe""O .. r lappin& aMl J•h of OIW hrr aratn of c.l:u-h. ,...lJt Jcal uanrtetet t• ere alllout .,. of tlw ••1•• reported.
Mmrix OA.s
ilarly between phases in OAs. Greater than 95% of the com- We analyzed .,.Ni-Fe + pentlandite assembJaaes in matrix position of each major metallic phase is accounted for on the OAs, and give analyses in Table 2; ~or element analyses (Ni + Co}-Fe-(Ru + Re + Os) diagram (Fig. 6b). Pt and lr of phases in matrix OAs have not previously been published.
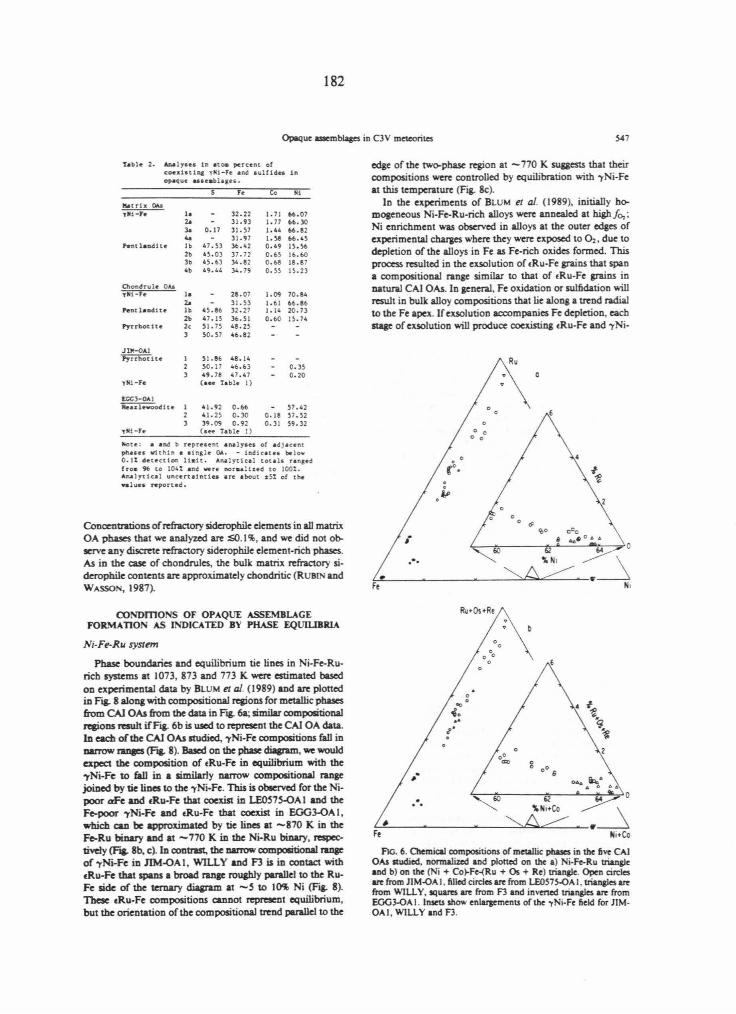
182
Op.que asaembla&es in CJV meteorites 547
h ble 2. AA.a lyu _a iu a t o. percent of e:oeaht i a,c Ttii -h a Dd sulfi des i n op.equt:
I"Ytrh au TIU-Fe
Pentla Ddt t e
O.ondrult: OA.a Ttil-fe
Pe:at l a •cU t t:
Pyrrhotite
JDHI.U Pyrrhotite
h 2o )o .. l b 2b )b 4b
l o 2o l b 2b 2c J
un•bla&U·
r.
)2.22 )1.9)
0.17 ll. S7 )1.97
47. Sl 3&. 42 4S.Ol ) 7. 71 4S. 6l )1. . &2 .,. 44 )4. 79
2&.07 ) I . SJ
4S.a 6 )2 . 27 47 . IS )6 . S I S l . IS 48. 2S SO. S7 46.82
Sl . 86 48. 10 SO. I7 46 . 6 ) 49. 78 47. 47 ( aee Ta ble J)
4 1.92 0.66 4 1. 2S 0 . )0 )9.09 0 .92 (u~ Tabl e I )
Co
1. 71 1. 77 J.U I . S8 o.•9 0 .6S 0 . 6& o. ss
1.09 1. 61 1. 14 0 .60
Ni
61> . 07 66 .)0 66.&2 66.4S I S . ~
16.60 1&.&7 IS . 2)
70 .114 66. &6 20.7) 1) . 74
o. l S 0 . 20
S7. 42 O.JB Sl .S2 O. ll S9.)2
ltlote : • a Dd b rep rese nt a nalyse• of adj acent piulua vithtn a a t.na h CA . - i tld teeua be lov 0.1% dt:Uc:ti on Uatt . ANi ly·ttcal t o t a ls u n&d froc 96 t o 104: and wn ncr a.al1ud to 100: . Ana lyt t c..a l unu rt a i ntiu a n 1bou t t 51 of t he n lves reported.
Concentrations of refractory siderophile elements in all matrix OA pha5es that we analyzed are :SO. 1%, and we did not observe any discrete refractory siderophile element-rich phases. As in the case of chondrules, the bulk matrix refractory siderophile conlents are approximately chondritic (RUBIN and WASSON, 1987).
CONDmONS OF OPAQUE ASSEMBLAGE FORMATION AS INDICATED BY PHASE EQUILIBRIA
Ni-Fe-Ru syston
Phase boUDdaries and equilibrium tie lines in Ni-Fe-Rurich systetns at 1073, 873 and 773 K were estimated based on experimental data by BLUM et al. (1989) and are plotted in FJ&. 8 alona with compositional regions for metallic phases from CAl OAs from the data in FJ&. 6a; similar compositional reaions result ifF~&- 6b is uJed to represent the CAl OA data. In each of the CAl OAs studied, -yNi-Fe compositions fall in narrow raJ1FS {FJ&. 8). Bucci on the phase cfia&ram, -would expect the composition of cRu-Fe in equilibrium with the -yNi-Fe to fall in a similarly narrow compositional ranee joined by tie lines to the -yNi-Fe. This is oblerved for the Nipoor aFe and dtu-Fe that coexist in LEOS7S.OAI and the Fe-poor -yNi-Fe and dlu-Fe that coexist in EGG3-0AI , which c:an be approximated by tie lines at -870 K in the Fe-Ru binary and at -110 Kin the Ni-Ru binary, respec.
tivdy (Fia.. 8b, c). In contrut, the narrow compolitional ranae of-yNi-Fe in 11M-OAI, WILLY and F3 is in contact with dlu-Fe that spans a broad ranae rouahly panllel to the RuFe side of the teTnary diqram at -s to Ia% Ni {FJ&. 8). lbese dlu-Fe compositions cannot represent equilibrium, but the orientation of the compositional trend panllel to the
edge of the ~phase region at -770 K sugests that their compositions were controlled by equilibration with -yNi-Fe at this temperature (Fig. 8c).
In the experiments of BLUM n al. (1989), initially h~ moseneous Ni-Fe-Ru-rich alloys were annealed at hi&h/o, ; Ni enrichment was observed in alloys at the outer edges of experimental clwies where they were exposed to~ . due to depletion of the alloys in Fe as Fe-rich oxides formed. This process resulted in the e.uolution of eRu-Fe grains that span a compositional range similar to that of eRu-Fe grains in natural CAl OAs. In aeneral, Fe oxidation or sulfidation will result in bulk alloy compositions that lie along a trend radial to the Fe apex. If e.uolution accompanies Fe depletion, each stage of e.uolution will produce ooex.isting eRu-Fe and 'Y Ni-
. . -
FIG. 6. Chemical compositions or meullic pbues in the five CA.I OAs studied, normalized and plotted on the a) Ni-fe.Ru t:rianale and b) on the (Ni + Co}-Fe-{Ru + Os + Re) trianaJe. Open circles ~from JJM.()A I. filled circles~ from LEOS7S-OA I. trianaJes are from WILLY, IQu&res ~ from F1 and inVC11ed triafliles are from EGG3-0A I. lnseu show enJaraements of the -yNi-Fe field for JJMOAI , WILLY and F1.

183
S48 J. D. Blum ~a/.
60
,..: a:
% 0 0 0
.o
~It
lll 0 o oe 0
<SIC ~
10
..: at
0 l 0 • 0
0 0.0
lO
0 0~ <t;,
0
: "" aPO
0 0
0~ 0
40 %Fe
60
.. ..
-.. . ~ ..
~ . 10
FIG. 7. Concentration of a) Ru. b) Os and c) lr plotted ipinst Fe for metallic plwes in the two CAl OAs studied for which there is a large variauon in Fe content Open circles represent concentrations in <Ru-Fe from JIM-OA I. asterisks represent the ave~ concentra· tions of yNi-Fe from JIM-OA I, and filled circles represent concen· tr.otions tn the three metallic plwes from LEOS75-0A I.
Fe phases that~ progressively lower in Fe (a schematic path for an initially Fe-ricb alloy is depicted with an arrow in Fig. & ). If the prooess goes to completion, the fmal, homotieneous -yNi-Fe and tRu-Fe phases will be those in equilibrium with magnetite at the /~;>, of the environment in which the oxidation occurred (and/or in equilibrium with Ni-Fe sulfide at the/s, of this environment). If, as in the experiments of BLUM
et al. ( 1989), the process does not go to completion, a gradient in <Ru-Fe and -yNi-Fe compositions, reflecting a gradient in/~;>, (and/or /s,) from the outside to the oenter of the alloy, is expected. To generate the widest range of <Ru-Fe compositions observed in CAl OAs by this kind of process, their cxsolution must have begun from a bulk alloy composition at least as Fe-rich as Ni..,Fe..o .
The wide range of <Ru-Fe compositions in natural CAl OAs could have evolved by exsolution during oxidation (or suliidation) as in the experiments of BLUM n al. (1989). However, if this were the case, we would also expect a wide J'1lii&C of complementary -yNi-Fe phase compositions (ranging from Ni..,Fe..o to N47Fen in the case of JIM-OAI), but this is not observed. Instead, as pointed out earlier, -yNi-Fe in contact with <Ru-Fe covering the full range of oblerved com· positions display a very restricted compositional raDIC around N41Fen . One possibility is that the -yNi-Fe was bomotlenized subsequent to exsolution, whereas the <Ru-Fe arains were lcinetically inhibited from reequilibrating with surroundi.n& -yNi-Fe. This would require that interdilfusion in fcx: -yNi-Fe is much faster than in cph <Ru-Fe. In order to account for the homoseniz;ation of the -yNi-Fe over the -10 I'1D radius of nM-OAI , while retainin& non-equilibrium tRu-Fe compositions over the -1 "m radius of tRu-Fe araim, tbe ratio of interdilfusion constants (D,! D,) must be I ()2 or hiaherTbedetermination of D,/D,at 773 K could, therefore, provide an important test of our model. Altbouah the appropriate diB'usion dau are not available for this test, di1fusion in the
Ni-Fe system bas been studied at low temperatures and may be somewhat analogous. DEAN and GoLOSTEJI'I ( 1986) studied interdiffusion in fcx: -yNi-Fe and body-oentered cubic (bee)
aNi-Fe and found that at 773 K, D,!D. "" 5 · JQ2, suggesting that differenoes in crystal structure can account for 1arJc differenoes in iJ at low temperature. In addition, both the pas.. sible presence of low concentrations of P in CAl OA Ni-Fe alloys and the importance of arain·boundary diffusion at lower temperatures (OEAI'I and GoLDSTEII'I, 1986) may have enhanced the rate of homogenization of -yNi-Fe compared to tRu-Fe.
The bulk compositions of alloys in the five CAl OAs that we studied were estimated by point-counting (Fig. 8). The bul.k compositions enter two-phase (or three-phase) regions in the Ni-Fe-Ru diagram at ::6870 K (Fag. 8b). The compositional range of tRu-Fe grains from JIM-OA I, WILLY and F3 fall in a linear trend with constant Ni content along an estimated two-phase boundary at -770 K (Fag.&). Tbe -yNiFe phase from JIM-OA I, WILLY and F3 (Fl&S. 6a and 8c) also lies near a two-phase boundary estimated for -110 K. A lower temperature limit of 740 K can be inferred because the -yNi-Fe compositions in these OAs would be expected to exsolve into two phases (-yNi-Fe and FeNi1) below 740 K according to a recent compilation of the Fe-Ni binary system (KUBASCHEWSKI, 1983), suggesting that equilibration OC·
curred at > 740 K. The coexisting tRu-Fe and -yNi-Fe in EGG3-0A I are close in composition to the Ni-Ru binary and indicate equilibration at -770 K (Fag. 8c).
LEOS15-0A I contains three distinct metallic phases (Fig. 8). The aFe and <Ru-Fe compositions fall very close to the Ru-Fe binary and indicate equilibration temperarures of -870 K. The coexisting -yNi-Fe is more difficult to interpret because the composition does not lie near one of the binaries. but we have inferred from binary data that a three-phase region exists in that region at temperatures of ::6870 K, and the -yNi-Fe phase along with the aFe and <Ru-Fe phases may deii.ne a three-phase triangle at -870 K (BLUM n al., 1989; Fig. 8b).
Ni-Fe-S syst~m
A schematic represenution of the S.poor portion of the Ni-Fe-S phase diagram at 773 K is given in Fag. 9a based on the data of MISRA and FllET (1973) and KUBASCHEWSKI
(1983); the approximate positions of the pentlandite + pyrrbotite + -yNi-Fe three-phase region at 773 and 558 K are given in FIJ. 9b. Pentlandite is a stable phase only below 883 K (MlsRA and FUET, 1973). With dec:reasin& temperature, tbe compositions ofpentlandite and -yNi-Fe coexistina with pyrrhotite become procressively IOW'Cr in N i, varying from 20 to 14'1. Ni in pcntlandite and 64 to 27'1. Ni in -yNi-Fe as 1empcrature varies from 873 to 558 K (FIJ. 9b; MisRA and .ft.E.ET, 1973).
Four aaemblaaes in the Ni-Fe-S system occur in OAs (F~g.
9a): the usemblqr -yNi-Fe + bearlewoodite ocx:un in CAl OAs from EGG3; the aaemblaaes pyrrhotite+ -yNi-Fe and pyrrhotite + pcntlandite + -yNi-Fe are common in both CAl and chondrule OAs; and the assembllae pentlandite + -yNiFe is sometimes found in CAl and cbondrule OAs and is the exclusive assemblaae in matrix OAs. For any given assem-

184
Opaque assemblageo in C3Y meteorites S49
AG. 8. Compositional regions of metallic phases in CAl OAs from F11- 6a plotted on isothermal sections of the Ni-Fe-Ru piaM along with phast eqwlibria from BLUM ('t a/. (1989) II a) 1013 K, b) 813
blagc, the compositions of individual phases in all OAs studied from CAls, chondrules and matrix are similar (Ftg. 9b ). The -yNi-Fe and pentlandite compositions vary systematically depending on the a.ssembla&e, consistent with general trends of tie lines on the Ni-Fe-S phase diagram (Fig. 9a). The composition of -yNi-Fe coexisting with pentlandite and pynbotite suuests equilibration at -770 K., but the composition of pentlandite in this a.ssembla&e suggests equilibrium at -560 K (MISRA and FLEET, 1973). One possibility is that the closure temperature for -yNi-Fe equilibration with pentlandite and pynbotite was -770 K in the OAs, but pentlandite and pyrrhotite continued to react and reequilibrate upon cooling to -560 )(_
The variety of sulfide phases present in OAs gives an indication of the /s., during equilibration. Stability curves for Mo, Fe, Ni-Fe, Ru and Pt sulfides are shown in Ftg. 10, as is the equilibrium solar gas curve. The curve labeled Ni-Fe alloy/Ni-Fe sulfide shows the conditions under which OA sulfide and alloys could coexist; it is calculated from the reaction Fe + 'hS2 - FeS, assuming ideal solution in the alloy and sulfide and an alloy composition of N4,Fen. The conditions of equilibration between NiuFeu and Ni1~ . calculated from the reaction 3Ni + S2 - Ni~, falls within 0.2 log units of the curve shown. Thus the /s, of equilibrium for the assemblage Ni,, Few FeS {found in most CAl and chondrule OAs) and the assembla&e Ni15FewNi~2 {found in CAl OA EGG3-0A I) are nearly identical. The /s., and temperature constraints {discussed above) are combined and shown as region I in Fig. I 0 . The position of region I with respect
to the Mo/MoS, Ru/R~ and Pt/PtS curves is consistent with the observation that Mo in CAl OAs occurs as Mo~ . whereas Ru and Pt occur in met.allic phases but not as sulfides. The /s., of equilibration is higher than the /s, of a solar gas at temperatures above about 700 K.
Ni-Fe-0 system
The conditions of !o, and temperature at which Ni-Fe alloys are in equilibrium with Ni-poor magnetite for several alloy compositions relevant to OAs are shown in Fig. I I , based on McMAHON and HAGGERTY {I 980). Curve (a} shows the conditions of equilibrium for aFe metal and Fe,0 4 , and curves (b) and {c) show the conditions of equilibrium for Ni,,Fe" and Niasfe u alloy with Fe,o • .
Magnetites from CAl OAs {ARMSTRONG n al.. 1985a, I987) and chondrule 0As (HAGGERTY and MCMAHON, I979)contain !50.5% Ni, and those that are low in V {!50.1%) are therefore close in composition to Fe10 • . From Ftg. II, we see that the Ni,,Fe" alloy that occurs in most CAl OAs,
K and c) 773 K. Phase boundaries and tie-lines are solid near rqions where there is experimental data; dasbed phase boundaries and tie lines are estimated or ICbematic. The 713 K cfiacram is speculative and is intended to be cfiacramatic only. T~ and three-phax rqions are denoted by 2• and 3• respectively and thrtle-phast rqions are also stippled. Si~phast solid-solution rqions include fcx -,Ni-Fe, c:ph tRu-Fe and bee aFe. Asterisks represent bulk alloy compositions for each OA estimated from point-counting. The oxidation arrow in (c) connects the approximate total bulk compositions (induding alloys, sulfides and oxides) of JIM.OA I, WlLL Y and F3 (diamond) with the approximatt bulk alloy compositions.

185
sso J . D. Blum rt a/.
'r.S ~ ~ s
"'17 ............ po ~~. -~,~---,C.'.
I I I
' I ' I
/, 558K \
1 I I II
" :: I Hl
'r.So~•~~ 60 " 68 n 'r.N1
FIG. 9. a) A schematic representation of the sulfur-poor portion of the Ni-Fe-S phase diaaram at 773 K and b) the position of the pentlandite + pyrrhotite + ,.Ni-Fe three-phase rqion at two tem· pen.tures from our interpretation of the data of MISRA and fU:ET (1973) and KUBASCHEWSKJ (1983). The inteneetions of phase fields within the Ni-Fe binary contrast somewhat with those of MISRA and fU:ET ( 1973) because these authors assumed the Ni-Fe binary phase relations of OwEN and l.Ju ( 1949) that have been sbown 10 be incomplete (sec compilation by KUBASCHEWSKJ, 1983). mss • mon~ sulfide solid solution, po • pynbotite, pn • pentlandite, ml • mil· lerite, JS • aodlevslcite and bz • beazlewoodite. In (a), dart< lines on the Ni-Fe binary indicate ranaes ofNi-Fe solid solutions, dark sappled rqions indicate ranaes of monosullide an~ pentlandite solid .~ution and tie Jines are shown in two-phase TCIJODS. Tbe compos~bons of su11ides and ,.Ni-Fe from OAs wa-c normaliz.ed 10 adude Co and are sbown in (b) for comparison; ovals are from matrix OAs (Table 2), aquares are from cbondrule OAs (Table 2; HAOGERlY and MCMAHON, 1979), circles are from CAl OA JIM..OAI (Tables I and 2), inverted triaDa1es are from CAl OA EGG3..QA I (Tables I and 2), triaDales are from CAl OA WILLY (.AAMSTRONG rt a/., 198Sa; Table I ), and diamonds are from CAl OA ZELDA (.AAMSTRONG rt aJ .. 1987). Open symbols are individual analyses. and tilled symbols within elliptical rqions represent the mean and ..._. of multiple analyses. lDJets sbow m!arFments of the 'l'Ni-Fe, pentlandite and pyrrhotite fidds.
and in all chondrule and matrix OAs in Allende, would be in equilibrium with Fe30. only along curve (b) (at temperatures below -1100 K). The crFe alloy in CAl LE0575..0A I (:S3~ Ni) equilibrates with Fe,o. alona curve (a) (tempera·
T (K)
1CWT {l('1)
FlG. 10. Plot of the lopritbm ofls, vm-us Tfor equilibria relevant 10 OA ori&in. Solar ps curve is from F\JcHS and Bu.NDER (1977). Buffer curves are c:alculated from thermodynamic data compiled by BARTON and SKINNER ( 1979) except for the Ru{RuS, curve, .....tUch is from SVENDSEN ( 1979). Tbe C\ln'e labeled Ni-Fe alloy/Ni·Fe sulfide is broken into four qments (A-0) bucd on Ni-Fe-S pbax equilibria from the compilation of HsiEH rt a/ ( 1982) at T ~ 97 3 K and from MISRA and fU:ET (1973) at T S 873 K. For each line qment, a different assemblaae of sullides may be in equilibrium with Ni-Fe alloy: A: FeS, Ni-S melt; B: FeS, Ni,S, , Ni-S melt; C: FeS, Ni,S, ; and D: FeS, Ni,S,, (Fe,Ni),S. . The position of the Ni-Fe alloy IN•· Fe sulfide curve is calculated from the reactions Fe + ¥.5, - FeS and 3Ni + S, - Ni,S, (sec text). Reaion I is the fo, - T space for equilibration of CAl, cbondrule and matrix OAs determined in this 11\ldy; the region brackets the Ni-Fe alloy/Ni-Fe sul1ide curve to display the approximate unetrtainties due 10 non-ideal solution. compositional variability of phases and thermodynamic parameters.
T(K)
FIG. II. Plot of the 1opritbm of/o, M':S1U Tforequilibria rekvant 10 OA ori&in. Tbe IOlar ps ~ is at P • 10· > t.r (GROSSMAN, 1972) and the V /VO and Ni/NiO curves are cakulated from thermodynamic data (CHASE eta/., 1985). CUrve (a) is Fe{Fe,O., ~ (b) is N;.,Fe,,{Fe,O. , and curve (c) is Nia,Fe,,{Fe,o. (McMAHON and HAGGERTY, 1980). Lines a, band c end at the hi&best temper· atures at....rucb the alloys are liable with macnetitt (McMAHON and HAGGERTY, 1980). Reaion I is the lo, - T ~PM% for panitioniaa of V between alloy and lilic:ate liquids as calculated in the text. Rqjon D is the /o, - T ~PM% for crystalliz:ation of fassaite in CAls bucd on ractions .involviDJ Ti>+ {fi•· ratios in fassaites (BECKETT and GROSSMAN, 1986). Relion Ill is the/o,- TIPM% detmniDed in this 11\ldy for equilibration of CAl, cbondrule and matri.x OAs. Tbe sizes of n!lions I, 11 and W display the approximate uncertainties due 10 non-ideal solution, c:ompositi.onal variability of phases and thermodynamic parameters.

186
Op.que uxmblqes in C3V meteorites SS J
tures below -870 K), and the Nia~eu alloy in CAl EGG3-0A I equilibrates with FelO• alo111 curve (c) (temperatures below -1330 K). If Fe-rich Ni-Fe alloys are exposed to an !o, more oxid.i.zin& thaD the Fe-FelO• buffer at :S870 K (curve (a)], ma&netite will form, enrichill& the remainina alloy in Ni as demonstrated by BRETT (1967) and MCMAHON and HAGGERTY (1980). I fie& fo, were -1 unit more oxidizina than the Fe-Fe30. buffer (i.t'. on curve (b)], maanctite formation would proceed until the alloy was enriched in Ni to the Ni,.1Fe33 alloy composition. If log /o, were -1.5 units more oxidizi.n& thaD the Fe-Fe30. buffer (curve (c)], oxidation would proceed until the Nia~e" alloy composition was reached. It is clear that oxidation of an initially Fe-rich alloy within a small ranac of OXYiefl fuaacity near the Fe-Fe30. buffer can result in large variation in Ni-Fe alloy compositions.
Magnetites from CAl OAs sometimes contain up to 12% V as V 20 3 (ARMSTRONG t1 a/., 1987) which coexists with Ni-Fe alloys that contain :SO. I% V. This can be explained by the experiments of BLUM t1 a/. (1989) which showed that, while O.S% V can dissolve in Ni-Fe alloys atfo,'s sliahtly lo~ thaD the Fc-FcO buffer, when these alloys are exposed tofo,'s above the Fc-FcO buffer, V will oxidize from the alloy and partition strongly into maanetite rims as they form.
ALLOY DIFFUSION IN CAl OPAQUE ASSEMBLAGES
Prt'servaJion of sharp phase boundarit's
AR.RHENIUS and RAUB (1978) showed that the reported existence of sharp boundaries between Pt-rich metallic phases and Ni-Fc-ricb metallic phases (El. GoRESY t1 a/., 1978) in CAl OAs could provide important constraints on the cooling history of these OAs and their host CAis if Pt-ricb phases were early nebular condensates that agregated with Ni-Ferich phases before the melting of CAis, as suagested by EL GoRESY t1 a/. (1978). Using the diffusion coefficient (D) for Pt in Ni, AR.RHENIUS and RAUB (1978) calculated that the sharp phase boundaries could not have existed at CAl liquidus or condensation temperatures ( 1600-1700 K) for more thaD 1 fraction of 1 second or at 900 K for more thaD one day without developing measurable diffusion aradients due to the dissolution of Pt in the Ni-Fe phase. They concluded that CAls must have formed during extremely shon thermal pubes.
Recent studies of CAl OAs (ARMSTRONG t1 a/., 198Sa, 1987) have not confirmed the oriainal repon (EL GoRESY n a/., 1978) of Pt-ricb metallic pbues in contact with Ni-Ferich metallic phases (as a rule, Pt-rich metallic pbues are surrounded by sulfide); h~er. the approach taken by ARRHENIUS and RAUB (1978) is potentially powerful and can be u.ed to interpret the commonly observed boundaries between tRu-Fe and ')'Ni-Fe in CAl OAs that we have described above. Usina the ~nt determination by BLUM t1 a/. ( 1989) of the diffusion coefficient for Ru in ')'Ni as a function of temperature ~~~(DJ as a simplified analog for the diffusion ofRu in ')'Ni-Fe in CAl OAs, we have calculated isothermal survival times for sharp boundaries between tRu-Fe &rains and surroundi111 .,.Ni-Fe. Using the equation for radial diffusion from a sphere (if. CRANK, 1975), we first calculated
the maximum Ru lf'ldient in ')'Ni-Fe that could be hidden within the -0.7 ,.m resolution of our analyses. This aradient corresponds to 1 Ru concentration of -O.S% at a distance ofO.S ,.m from 1 typical 1.0 ,.m diameter tRu-Fe Jrain and a value of Dt- 2.s x 10- 10 cm2
• Usina ~~en and the radial diffusion equation, we calculate that Ru(+Os + Re) padients would be detectable in our analyses if I ,.m tRu-Fe spheres were suddenly juxtaposed against Ni and held isothermally for 01;4 seconds at 1673 K, 01;28 seconds at 1473 K or 01;2 weeks at 873 K; I result similar to that of AR.RHENIUS and RAUB (1978).
Another approach to this problem is to calculate the coolill& rate (To) required to form Ru(+Os + Re) aradients that would be dctectlble in our analyses, rather thaD calculating the ~ thermal diffusion times. ln this calculation, we replace Dt with fo .. D(t)dJ -. D(To)RT~/ET0, where R is the ps constant, E is the activation energy, To is the maximum temperature and To is the COOlill& rate (KAISER and WASSERBURG, 1983). For the identical Ru(+Os + Re) Jfldient used in the ~ thermal case, the integral is equal to 2.S X 10- 10 cm2
, and we can calculate To for any Biven T0 • During CAl melting, the value of To reached was probably - 1700 K (STOLPER, 1982), for which we calculate To ;;:; lOs K hr- 1
• For a T0 of ISSO K (which is a reasonable lo~ limit), we calculate To ;;:; I 0" K hr- 1
• Althouah these coolina rates are possible for CAis in a radiative environment (if. MAcPHERSON t1 a/., 1984), they are at odds with inferences based on experimental studies of the silicate portion of Type B CAis, which imply much slo~ coolill& at To "" O.S-20 K hr-1 (SToLPER and PAQUE, 1986). Even the lowest To (lSSO K) and highest To (200 K hr- 1
) values considered plausible by STOLPER and PAQUE (1986) for Type B CAis would produce nearly complete homogenization of I ,.m tRu-Fe srains in -yNi-Fe. We therefore consider it unlikely that sharp boundaries between tRu-Fe and ')'Ni-Fe could have survived the crystallization ofCAis.
Exsollllion of tRu-Fe grains
Althouah sharp boundaries between tRu-Fe and .,.Ni-Fe in CAis would be difficult to preserve during CAl melting, they could instead have formed by exsolution of tRu-Fe from Ni-Fe-Ru alloys durina coolina ofCAls below the solidus, as sugested by BLUM t1 a/. (1988). Usina the diffusion coefficient for lattice diffusion of Ru in Ni (D~~) from BLUM t1
a/. ( 1989), we can estimate the time ICalc necessary for exsolution of tRu-Fe from a homQ~eneous Ni-Fe-Ru(+Os+Re) alloy at various temperatures. We have applied the treatment of diffusion-limited exsolution Biven by HAM ( 1958) for this purpose. We assume that at t • 0, tRu-Fe nuclei capable of powth were prexnt in Ni-Fc-Ru alloy and that the nuclei were ~eP~Bted by 1 constant specilli of 2A, where A is the radius of influence of each nucleus. We funher assume powth of spherical &rains by diffusion of Ru( +Os + Re), thus dea-easing the averqe concentration (c) ofRu(+Os + Re) in the sunoundina .,.Ni-Fe with time. The initial concentration of Ru(+Os + Re) in the Ni-Fe-Ru alloy is eo, the Ru(+Os + Re) concentration in ')'Ni-Fe in equilibrium with exsolved tRu-Fe is c', and the Ru( +Os + Re) concentration in exsolved

187
552 J . D. Blum ~ a/
tRu-Fe is c,.. The exsolvcd fraction at any given time is defined as Y(t)- (Co - f)/( Co - c' ). HAM (1958) showed that for Y(t)
> '12:
Y(t) ""' I - 2 expC1) ;
We calculated the time necessary for diffusion-limited exsolution of •Ru-Fe grains in CAl OAs, using the value for ~~<nand estimating A, c. eo. c' and c,.. We use the maximum value of A - 4 ,.m from the spacings between tRu-Fe grains in JIM.OA I, WILLY and F3. The other parameter values arc estimated from our analyses of metallic phases and estimates of bullc alloy compositions for nM.OAI , WILLY and F3, and arc given in Table 3. The calculated exsolution times arc given in Table 4. It was shown above that exsolution was initiated be.low 870 K and probabl) oc· curred at -770 K. Ac:cording to our calculation, exsolution would require le Ia-' years at 773 K.
We also calculated the coolin& rate (r0) if the diffusion· limited exsolution process described above occurred during continuous cooling rather than isothermally. We have cal· culated r0 for the CAJ OAs JlM.QA I, WILLY and F3 using data given in Table 3. We use the equation.s given by HAM (1958), replacing Dr with the approximauon for J: D(t}dt from KAISER and WASSERBURG (1 983) given above. Values for r0 were calculated at temperatures for the onset of exsolution (T0) equal to 873, 773 and 673 K (see Table 4). If ellSOlution began at 773 K, a cooling rate of SIO_. K br-• is required. The formation of tRu-Fe grains by exsolution (controlled by lattice diffusion) is thus kinetically feasible with thermal metamorphism at constant temperature (- 770 K) for at least I()-' yean or during slow cooling at rates less than 10-• K br- 1 through the 770 K tempe.rature range. If the grain size of ")'Ni-Fe was very small relative to the spacing of •Ru-Fe nuclei, grain-boundary diffusion could have played an important role in the diffusion-limited exsolution process below about 900 K (SHEWMON, 1963). We consider this unlikely, but if it were the case, the thermal metamorphism time scale could have been shoner and/or cooling rates faster than the \'alues we have calculated based on lattice diffusion rates.
ORJGJI'i OF OPAQUE ASSEMBUGES
We showed above that phase assemblages in all Allende OAs, whether from CAls, cbondrules or matrix, appear to have equilibnted at temperatures of -770 K or lower, and at similar, relatively b.i&h levels of /s, and /o, (F'JIS. 8-11 ). We also showed that it is unlikely that CAl OAs arc prese:rwd aareptes of phases formed before the crystalliz.ation of their host CAls and cbondrules. Based on these observations, we propose the followina model for the ori&in ofOAs. Following
T•t.h ). lu( ..O.•b ) coacent ratloaa ta • t oe perc-ent ou·t l n dtff ~o~-don-liaJ ted cuoh-ctoe c .tcuh t lon. s.. , •• , for ••p lautlOB.
' 'o ,. '•
Jlllf-QAI J , )O ... 0 . ) ~· o.a
\fiLLY o.u '·' 0.) ~· o ••• n o.u ).) 0.) ~) o.u
t. •h '· ho1Mru.: GHfuuor ..... ,, ... c:ooluc: ,.,._. ho> u lc: .. ! • t •e w aet eft t!fth• • t-·lt• 1t ee euolt.Uo,. .,C,p } . ... L•at ... ••Flaa.at l on •
(Jr) .. u. ,,-.,
1:0 . To • To • To • To • To • Dl (c:-• 1 ) an r ll) ' •n ' 1 7] , Hl II' 67) J:
JlM~I '1• 10-· ' ) • 101 )• 10"' 9• 10 ... S• UI_, t.• JO·t VlU.T 1• 10- · 10 >Oo !o' 10.10'" ) • JC:- .. •·•o·• l • l(l- . F) .. ,o·• ' t •lC1 ) • 10"' ) • 10-.. l • lo-• h ac·•
previous worken, we assume that proto-CAl, proto-cllondrule and proto-matrix material formed as condensates (or evaJ>orative residues) in the solar nebula. When the silicate por· tions ofCAJs and cbondrules melted or parti.ally melted under highly reducing conditions, siderophile elements that had previously condensed as alloys and/or oxides partitioned into molten, proto-OA alloy droplets. As CA1s and chondrules cooled, the alloy droplets cryst.alliud to homogeneous solids which were included in the major silicate minerals ( + spinel) as they crystalliz.ed. At still lower wmperatures of -770 K. the homogeneous, proto-OA alloysexsolved into immiscible metallic phases as Fe was removed from them by panial ox· idation and sulfidation, thus completing the formation of CAl and cbondrule OAs. Uncenainty concerning the origin of the silicate ponion of the matrix material prevents us from proposing a detailed model for matrix OAs, but we note that the common assemblaae ofpentlandite surrounding ")'Ni-Fe in matrix OAs is consistent with the reequilibration of ")'NiFe at conditions of temperature, /s, and /o, similar to those experienced by CAJ and cbondrule OAs.
Nebular condfflSazion
Our model contrasts with the suagestions of many previous workers that the metallic phases in CAl OAs arc the direct products of equilibrium condensation from a gas of solar composition (e.g. PALME and WLOTZKA, 1976; BLANDER n al .. 1980; ARMSTRONG n a/., 1985a). Neither the compositions of individual •Ru-Fe &rains and ")'Ni-Fe nor the bulk alloy compositions of CAJ OAs that we studied arc close to calculated condensates. Alloys condensed between 1700 and 1500 K are predicted to have about I to I 0'*. of each refractory siderophile element and relatively low Ni (0. 1-3%) and Fe (0.3-20'*.) concentrations (PALME and WLOTZKA, 1976). The ntio of Ni/(Ni + Fe) could only reach a maximum of 0.20 i.n these very b.i&h·temperature condensates (PALME and WLOTZXA, 1976; KELLY and LARIMER, 1977; GROSSMAN er al .. 1979), far lower than the value of 0.67 in alloys in most CAJ, cbondrule and matrix OAs. Below about 1460 K, refractory siderophile concentrations arc predicted to drop rapidly to the 10 ppm level, and Ni/(Ni +Fe) is predicted to npidly approach the cosmic value of -0.06 (GROSSMAN, 1972; PALME and WLOTZKA, 1976). To condense alloys with refractory siderophile contents close to those of CAl OA bullc alloy compositions, PALM£ and WLOTZXA (1976) argued that the temperature interval for the condensation of these &rains would have to be in the very narrow nnge of 1462 to 1466 K, but even these conderuates would be far too poor in Ni to match observed OA alloy compositions. BISCHOFF and PALME (1987) sugested that ")'Ni-Fe in CAl OAs condensed along with magnetite directly from the nebula at an /o, far b.i&her than a solar ps to ac:count for the high values of Nil

188
Op.qu~ asaembla&es in C3V meteorites SS3
(Ni + Fe) observed; although alloys with high Ni/(Ni + Fe) could condense under these conditions, we deem it unlikely that magnetite (or Fe sulfide) could have survived CAl melting without being convened to metallic Fe under the very reducing solar ps conditions of CAl melting.
The model proposed here for OAs sugests that all of the Ni and Fe currently in alloys, oxides and sulfides in each OA was originally in a bomoeeneous, proto-OA alloy. Ac:oording to this view, it is the Ni and Fe contents of the bulk OA (rather than the present bulk alloy composition) that give us an estimate of the proto-OA alloy compositions. Our model does not require that proto-OA alloy compositions were controlled by condensation proce55es, but it is interesting to consider whether this could be the case. The majority of CAl, cbondrule and matrix OAs [Ni/(Ni + Fe) = 0.25 to 0 .50) could have ofi&inated as condensate alloys [Ni/(Ni + Fe) :5 0.20) that were oxidized and/or sul6dized, provided that some Fe was lost from the bulk OAs to neighboring spinel and silicates. Even EGG3-0AI [Ni/(Ni +Fe)= 0.90) could have formed in this way if a large enough amount of Fe was lost to the surroundings. We have found petrographic evidence for the loss of Fe from OAs in both CAis and chondrules. As shown by ARMSTRONG et a/. ( 1987), most spinels are enriched in Fe within -100 pm of CAl OAs with Fe concentration gradients increasing toward OAs, and as shown by H UA et al. (1988), olivine is sometimes enriched in Fe adjacent to OAs in chondrules.
LE0575-0AI [Ni/(Ni + Fe) ""' 0 .05 to 0 .06) and other OAs from meteorites of the C3V "reduced subgroup" cannot have formed from alloys whose compositions approximate a nebular condensate by the simple scenario of oxidation and/or sul6dation with subsequent loss of Fe. The bulk Ni/ (Ni + Fe) ratio ofLE0575-0A I could match lower temperature condensates (<1400 K), but such condensates would contain <100 ppm total refractory siderophiles (PALME and WLOTZKA, I 976), whereas LEOS 7 5-0A I bas a total refrac1ory siderophile content of about 10%. Possibly, the LE0575-0A I bulk composition represents a mixture of alloys formed during two intervals of condensation; i.e. a mixture of a hightemperature condensate (high refractory siderophiles) and a lower-temperature condensate [low Ni/(Ni + Fe)].
Constraints on fo, during CAl and chondrule melting lllld crystalliuuion
CAis and cbondrules are widely beli~ w have melted and recrystallized in the nebula subsequent to condensation. The composition of the cooling solar ps defines nearly a strai&ht line on a plot ofloa/o, versus 1/T("solar p.s" curve, Ftg. I I). Studies of Ti:~-t /Ti•• in fassaites in CAis (SToLPER et al., 1982; BECKETT and GROSSMAN, 1986) indicate that fassaites in most CAis crystalliz.ed in a narrow ranae of lot~ /o, within about one unit of the solar ps curve (~« FJ&. II). Fassaites are believed to preserve a record of the /o, during CAl aysWJ.iz.ation, whereas the compositions of other plwes 111cb as ma&netite, bibonite and melilite have been reset by hi&hiY oxidized 111bsolidus conditions (BECK£TT et al., I 988).
JOHNSON (1986) studied cbondrules from C2 and unequilibrated ordinary chondrites and suaested that the lowest Fe content of the cores of olivines and pyroxenes oould be
used Ul calculate limiting /o, values for cbondrule crystallization. Following the arguments given by JOHNSON (1986), we calculate that the low Fe oontents of the cores of some olivines and pyroxenes from Allende chondrules (:51% fayalite, :S I% ferrosilite; RUBIN and WASSON, I 987) could indicate ori&inal aysWJ.iz.ation at an /o, within -2 orders of magnitude of the solar ps curve, with 111bsequent sutHolidus 8ddition of Fe Ul the rims under more oxidizing conditions.
Melting of the silicate portions of CAis and cbondrules at a solar p.s /o, would result in the partitioning of siderophile elements, oriainaUy condensed as either alloys or oxides, into immiscible alloy liquids. The estimated maximum temperature experienced during CAl melting is 1700 1D 1800 K; the only major phase expected not to have oompletely melted is spinel (STOLPER, I 982). At temperatures of 1700 to 1725 K. most Ni-Fe alloys would melt (KUBASCHEWSKJ, 1983) and the presenoe of dissolved P (MAssALSKJ, 1986) or other elements oould cause them to melt a\ even lower temperatures. During cooling.. Ni-Fe alloy droplets and spinel would be the 6m phases to c:rysta)liu. The oommon occurre.nce of CAl OAs in embayments in spinel CF!i- 2) sugest.s that some spinel c:rystallized after the formation of proUl-OA alloys. Many Type B CAis have coarse-grained meWite rims that have very few inclusions of spinel and OAs. If crys:taii.ization proceeded from the outside ofCAls inward, advancing melilite crystal faces might have pushed early crystallized spinel and proto-OAs toward the center of the inclusion where melilite, fassaite and anorthite subsequently crystallized around them, resulting in textures observed in many CAls. Cbondrules are believed to have crystallized from maximum temperatures of 1670 to 1870 K (HEWINS, 1983), indicating that olivine and pyroxene in chondrules probably crystallized before or simultaneously with chondrule proUl-OA alloy liquids.
Durina the sta&e when CAJs and chondrules were partially molten, Fe and Ni, if present, would form the major oonstituents of molten alloys. AU other elements that are siderophile at the very reducing ambient/a, would be expected to partition strongly inUl the alloy liquid. As expected., common siderophiles, such as Co and P, are abundant in OAs from both CAis and cbondiUles. Refrac1ory sideropbiles such as Mo, W, Re, Ru, Os, Pt and lr occur in much higher concentrations in CAl OAs than in OAs from chondrules or matrix, reflecting the Jarae enrichment of refractory siderophiles in the parental material for CAis oompared to the parental material for cbondrules and matrix. Although it is expected that each individual proto-OA alloy droplet was h<> moseneous. oompo5itiooal differences between alloy droplets within a given CAl or chondrule, inherited from alloys present in the initial unmelted proto-CAl and proto-<:bondrule agareptes, were probably preserved.
The partitioning ofV between proto-OA alloys and silicate melt may be particularly lenSitive to /o, for values of !o, near those of a solar p.s because the V-YO buffer curve crosses the solar p.s curve at a temperature near the range of CAl and chondrule meltilli CFI&. I I). If OAs originated as molten alloy droplets in silicate liquid, then we can estimate the /o, required to explain the observed partitioning of V between OAs and enclosilli silicates. Since we require an estimate of the V content of the proposed precursor OA alloy droplets, we restrict our anention to CAl OAs due to insufficient data

189
J. D. Blum n a/
on Y contents of choodrule or matiD. OAs. Most Y is currently present in CAl OAs IS Y 20 3 in magnetite in concentrations ranging up to 12% Y (ARMSTRONG et al., 1987). Two CAl OAs bave been analyz.cd by SEM in detail to determine total Y concentrations (ARMSTRONG et al.. 1987), and one bulle CAl OA bas been analyz.cd by neutron activation (GROSSMAN et al., 1986). If these three OAs originated IS alloys, the initial Y content would have been 1.1 , 2.6 and 5.5 ~. respectively; we will use the averaae of 3. 1 ~ in our calculations. TheY content of the host CAl silicate mine:rals (and spinel) bas not been detennioed, but the averaae bulle CAl Y content is -620 ppm (WANKE et al., 1974). We can estimate the Y content of the host silicates (and spinel) by difference using the estimate of ARMSTRONG t'l al. ( 1985a), which suagests that OAs originally comprised about 0.1 ~ of CAls. In thi.s case, the averaae silicate (and spinel) host concentration ofY would be about 590 ppm (note that most of the Y in CAls is in the silicate + spinel fraction). Partitioning between alloy and silicate at conditions of CAl melting would be determined by the reactions Y + 1/,0, -+ YO and 2Y + lt,02 -+ Y20 3 • Although our calculation is based on YO. the presence of dissolved V ,03 would not JfC&tly affect the foUo.,.ing discussion. The equilibrium con.stant (K) can be calculated for the V {VO reaction from thermodynamic data (CHASE t'l al., 1985), yielding:
'Y..,o.,n-~• o K(T) • .,.~xf''flf; = exp(50995 r - 9.72)
where y{ is the activity coefficient (of 1 in j), X~ is the mole fraction (of i in j) and Tis the temperature in K. Lacking data on activity coefficients, - assume that their ratio is unity. We further assume that the fraction of the total Y in CAls that is now associated ....;th OAs cr."') was once in a proto-OA alloy in the metallic state and that the remaining Y in CAls (.,n-~1) was in the coexisting silicate melt. For any measured partitioning behavior, the equation can be solved for /o, . yielding an equilibration line on a plot of log /o, versus l / T. The line defined by the estimated averaae value of n~'/..n-"' • 0.05 is plotted in Fig_ II bounded by dashed curves calculated for n~'/n"' greater and smaller than the averaae value by a factor of 3, which is a reasonable estimate of the accuracy of the value chosen for the ratio ofY in OAs versus the silicate + spinel fraction of CAis. The line for the averaae n~·/..n-"' value is displaced 310&/o, units above the pure Y-YO buffer, which is shown for reference. In the temperature range of 1550 to 1700 K, the inferred Joc/o, from Y partitioning lies ...;thin one unit of the solar ps curve. This result is consistent ....;th a proto-OA alloy in equilibrium with a silicate melt and a ps of solar composition at the temperature of CAl partial melting and with /o, estimates of BECKETT and GROSSMAN ( 1986) from Ti:.. /Ti•• in CAl fasuite Cfi&- II). lfCAls cooled along the solar ps curve CFl&-11 ), Y would oxidiu proeressively and diffuse out of the alloy into surrounding silicate (or spinel). This process may explain the observations of ARMSTRONG n al. ( 1985&, 1987) that many CAl OAs bave rims (~20 ,.m) ofY-ricb f&S1aite (fi&.- 2) and that Y is often hi&bJy enriched in spinels in the vicinity of OAs.
0ptJ~~UP assmtblage rquilibration
According to our model, the final equilibration of OAs in CAls, cbondrules and matrix occurred during metamorphism or slow cooling under sulfidizing!oxidizing conditions. In an earlier section, we quantified the temperature, /r., and /o, for the formation of OA phase assemb)aaes by comparison ....;th experimentally determined phase equilibria. In general , equilibration conditions for OAs from CAis, cbondrules and matiD. are similar even though relative modal abundances of alloy, sulfide and oxide sometimes vary ....;dely in adjacent OAs within single CAJs or chondrules. One possible explanation for this is that sulfidizing and oxidizing gases gained -= to protcH)A alloys selective!) via cracks. In the remainder of this section, - speculate upon the origin of Caphosphate (present in most CAl, chondrule and matrix OAs) and scbeelite-poweUite [Ca(W,Mo)O. ; present in some CAl OAs) ...;thin the context of our model, and then discuss the possible environment for OA equilibration.
At the /o, and Is, of a solar gas, P, w and Mo are highly siderophile and would partition into a Ni-Fe alloy liquid if it was present. These elements are soluble in solid -yNi-Fe at high temperatures, but at lower temperatures (~1000 K ) and high enough concentrations, they would probably exsolve into phases such as (Fe,Nih P, Fe,w and Fe,Mo (cf MASSALSKJ, 1986). This type of concentration by exsolution would facilitate reaction of P, W and Mo ....;th 0 2 and a volatile species ofCa (HAsHIMOTO and Wooo, 1986) to form Capbosphate and scheelite-powellite under oxidizing a:mditions at 10"' temperature. This view contrasts ....;th that of BISCHOFF
and PALME (1987), who suggested that scbeelite-powellite condensed under extreme)) oxidizing conditions (/ o, > 4 log units above a solar gas) and from a gas ....;th high nonsolar partial pressures of Ca and/ or W and Mo in the solar nebula at temperatures of> 1672 K before the formation of OAs or CAJs.
C3V meteorites are generally believed to have been brought together IS accretionary breccias that wert: buried within planetesimal bodies (if KRACHER eta/., 1985). Since OAs in CAls, cbondrules and matrix from C3Y meteorites all equilibrated at similar temperature, /s, and /o, , one possibility is that the equilibration occurred after these three major components bad accreted into a common parent body. The slow cooling rates of :5101 K hr- 1 required to account for observed alloy exsolution in CAl OAs are consistent ....;th such an environment., IS are the sulfidizing and oxidizing conditions that we infer (HOUSLEY and ORU , 1983). The in situ decay of 1•Al provides an ample beat so= if OA equilibration occurred during an early metamorphic event on a parent body. The interiors of bodies only a few km in radius could reach temperatures in excess of770 K for (16Al/ 77 Al)o ... 5 • to·'. or, alternatively, very sballow burial in larger bodies could provide an adequate thermal environment for equilibration (cf MASHAMICHI ~I a/., 1981).
Distribwion ofr(fractory siderophil~s in CA/s
The refractory siderophile elements Ru, Os, Re, lr and Pt are, in general, uniformly enriched to - 20X chondri tic in bulk ~ned CAls, whereas Wand Mo are also enriched but sometimes not to this extent (GROSSMAN, 1973;

190
()plqut usemblqes in C3V meteOrites sss
FEGLEY and PALME, 1985). The m~r host of the refractory siderophile elements in CAls are OAs and in some cases refractory metal nugets (RMNs; WARK, 1986). Refractory metal nugets are small (0.5-5 ,.m) alloy grains which are distinguishable from the Laraer multipbase OAs.. They usually occur in CAls that do not contain OAs (WARK., 1986), but they are also occasioilally found in OA-bearing CAis (EL GoRE.SY et al., 1978; BISCHOFF and PALME, 1987). The composition of some RMNs could plausibly have been produced by direct nebular condensation (PALME and Wl.OTZKA, 1976; W ARK, 1986). The preservation of condensate RMN compositions in some CAls could reflect (I) the fact that some CAls were never mehed; (2) that some CAl melting events were of sufficiently Ilion duration that RMNs did not have time to dissolve in proto-OA alloy droplets; or (3) that the host CA!s contained so little Ni + Fe that molten alloy droplets did not form during CAl melting. RMNs that are relicts of condensation might be expected to display a range of concentration of refractory siderophile elements due to the different volatilities of these elements; such a correlation appean to have been observed in the CAl studied by WARK (1986). Alternatively, RMNs could be remnants ofOAs from which sulfide and oxide phases were removed by secondary p~ cesses.
The relative proportions of refractory sideropbile elements in bulk coane-grained CAls sugest a role for nebular condensation (PALME and WLOTZX.A, 1976; FEGLEY and PALME, 1985), yet the relative proportions of these elements in individual OAs and RMNs from single CAls are sometimes bighly variable (BISCHOFF and PALME, 1987). We prefer to explain these variations by processes that occurred during melting and equilibration of the CAls rather than by a process that sampled diverse grains formed under variable conditions in the nebula, and averaged them to approximately chondritic ratios for each CAl.
CONCLUSIONS
We have shown by comparison ofOA phase compositions with experimentally de'termined phase equilibria and panitioning behavior that alloy, sulfide and oxide assemblages in OAs from CAls, chondrules and matrix could have been~ duced by the exposure of homogeneous alloys to high values of A, and /o, at low temperature. We infer that CAl and chondrule OAs ori&inated at low /o, in CAl and chondrule silicate liquids as homogeneous Ni-Fe alloy droplets that contained other siderophile elements (t.g. P, Co, V, W, Mo, Re, Ru, Os, Pt and lr) in the reduced state. The complex mineralogy that now characterizes OAs formed from these proto-OA alloy droplets by IU16dation, oxidation, and exsolution. This occurred during slow cooling (:Sl01 K br- 1
) or metamorphism for lii::IO' yr at -770 K and at anh, one los unit above, and an /o, six Joe units above, a solar ps composition. The two-stqe evolution proposed bere, which includes bomoseneous alloy formation at hiab temperature foUowed by reequilibration at lower temperature, provides a aeneral explanation of the approximately solar refractory element ratios in bulk CAls, chondrules and matrix, as weD as the complex compositions of individual phases now ~ lerVed in OAs.
We consider alternative acenarios for the ofi&in of CAl OAs, which suaest that they formed in the solar Debula before CAl melting and were subsequently captured in the CAls and rapidly cooled (ARMSTRONG et aJ., I 985a, 1987; BISCHOFF and PALME, 1987), to be unlikely because tbe low tem· perature minerai851CmbJaaes could not have survived melting and subsequent cooling of tbe bulk CAl for any plausible oooling rates. The scenario for the ofi&in ofOAs in chondrules that suggests they formed by crystallization of metalli<Xlxidesulfide liquid droplets (HAGGERTY and MCMAHON, 1979; McMAHON and HAGGERTY, 1980) is not likely because sulfur would probably have been vaporized and Fe oxide reduced to metallic Fe under tbe relatively reducing conditions of chondrule melting in the nebula. On tbe otber band, tbe acenario of ofi&in by oxidation of preexisting alloys (HAGGERTY and McMAHON, I 979) is consistent with our fm~.
Similarly, a scenario proposed for the ofi&in ofOAs in matrix involving alteration of alloys (HOUSLEY and 0RUN, I 983; RUBIN and GROSSMAN, I 985) is supponed by our findings.
The conditions that we estimate for tbe temperature, Is, and /o, of equilibration for CAl, cbondrule and matriJt OAs are very similar and suagest that tbese three components of CJV meteorites share a common, late low-temperature history, perhaps on a planetesimal body. Stodies ofOAs may therefore provide quantitative constraints on the post-accretionary equilibration conditions of C3V meteorites.
AclcnowlNgnnnus-Wt thank H. Palmt and J. T. Armstron& for helpful discussions, S. E. H~&&ert)'. K. C. Misra and an anonymous referee for rtviews, and H. Palme. K. Keilaod the U.S. MUStum of Natural History for loaninc us tht meteorite specimens used in this RUdy. Funding was provided by NASA Grants NAG ~3 and NAG 9-1 OS and NSF Grant EAR 86-18526. Division Contribuuon No. 4664 (631 ).
Edirorial luuldlmg: H . Y. McSv.un, Jr.
JlE.FEitENCES
ARMSTRONG J. T., El. GoRESY A. and WASSERBURG G. J. (198Sa) Will)~ A prize noblt Ur-Frtmdlinc-lu history and implications for tht formation ofFrtmdlinae and CAl. Gtoclrim. Com.odrim. ACU149, 1001-1022.
ARMSTRONG J. T ~ Hl!TCHEON I. D. and WASSflUIURG G. J. (198Sb) Ni-Pt.{;e-ric:h Fremdlin&e: Indicators of a turbulent early solar nebula (abstr.). Mnromrcs 10, 60~.
ARr.tSTRONG J. T., HUTCHEON I. D. and WASSERIIURG G. J. (1987) Zdda and company: Petrotleoesis of sulfide-rich Fremdlinse and consmiots oo solar oebular ~ Gtodum. Cosmoclrim Aaa 51, JISS-3173.
ARRHENIUS G. and RAUII C. J . (1978) Tbermal history of primordial metallf8ios. J. ias-contm(NI Mnals 62,417--430.
8ArtTON P. B. and SluNNER B. J. (1979) Sulfide minenlllabilities. In G«x::tmmi.rlry ofHydrot~ Ort Dtposil.s (ed. H. L BAANf:s). pp. 278---403. J . Wtley &. Sons.
BEcKm J. R. and GROSSr.tAN L (1986) Oxyten fupcities in tht solar nebula durin& c:rysWlization of fasaitt in Allende iDdusioos (abllr.). LwrDr Phllln. Sci. Con/ XVII. 36-37.
Bu:xm J. R., lJVE D., TSAY F., GltOSSI<otAN L and Sro!.PE.R E. M. (1988) Ti>+ in meteoritic and synthetic hibonite. Gtochim Cosmoclrim. ACU15l, 1479-1496.
BlscHOF1' A. and PALME H . (1987) Compocition and truneraloey of rd'ractory-mctal-rich .-mblqes from a Ca.Al-rich inclusion in tbe Allende meuorile. GrocJtim_ Cosmodrim. Aao 51, 2733-2748.
BlANDER M., F\JcHS L H., HOROWITZ c. and lAND R .. (1980) Primordial refractory metal panicles in the Allende meteOrite. Gtochim. Cosmodrim. Aao ~. 2 I 7-223.

191
556 J . D. Blum et a/.
BLUM J . D., WASSERBURG G. J., HllTCHEON I. D., BECXETT J. R. and STOLPER E. M. ( 1988) "Domestic" ori&in of OJ*!Ue assemblaacs in reh-.ctory inclusions in melCOrites. NaJw~ 331, 405-"09.
BLUM J . D., WASSERBURG G. J ., HUTCHEON). D., BECKETT J. R. and STOLPEII E. M. (1989) Diffusion, plwt equilibria and partitionin& experiments in the Ni-Fc-Ru system. G«>clum. Cosmocllim. Acta 53, •8S-491 (this issue).
BIIA~'DST~rmt F. and KullA T G. (1983) All-Jim: A iar1C Ca-AIrich choodrule from Allen& (C3) (abstr.). Met~lics 18, 272.
BR£TT R. ( 1967) Meullic spberules in impectitt and telctitt aJasscs. Amn. M1Mral. 51,721-733.
CHASE M. W. JJL, DAVIES C. A., DoWNEY J. R. JR., f)t.UIIIP D. J., Mc0oi'ALD R. A. and SVVERUD A. N. (1985) JANAF thermochemical ~bles, 3rd edn. J. Phys. Chnn Rtf Da/a J4, Supp. I.
CllANK J . (1975) TMMaJMmiJucso/Diffusion. Oxford Univ. Press. 414p.
DEAN D . C. and GoLDSTEIN J. I. (1986) Detemtination ofinterdjffusioo coefficients in the Fc-Ni and Fe-Ni-P syuems below 900"C. Met. Tran.s. 17A, 1131-1138.
EL GotlESY A., NAGEL K. and RAMDOHR P. (1978) Fremdlin&e and their noble relatives. Proc. Lunar Planet Sci. Corif. 9th, 1279-1303.
fWLEY B. JR. and PALME H. (1985) Evidence for olUdiziD& conditions in the solar nebula from Mo and W depletions in refnlctory inclusions in c:arilooaceous chondrites. Earth P/ann. Sci. Uti. 71, 311-326.
FUCHS L. H. and BLANDER M. (1977) Molybdenite in calcium-alu· minum-rich inclusions in the Allende m=ritt. Gtoehim . Cos· rnochim. Acta •1, 1170-1175.
GROSSMAN L. ( 1972) Condensation in the primitive solaJ nebula. G~lum Cosmoclrim. Acta 36, 597-619.
GROSSMA"J L. (1973) Refractory IJ1IOe elements in Ca-AI-rich inclusions in the Allende meteorite. G~1m Cosmoch1m. Acta 37, 11 19- 1140.
GROSSMAN L ( 1980) Refractory inclusions in the Allende meteorite. Ann. R"·· Earth Planer. Sci. 8, 559-608.
GROSSMA" L , Ol.SEt-1 E. and LATTIMER J. M. (1 979) Silicon in c:arilonaceous cboodrite metal: Relic ofhiah ttmperature condensation. Scm•a l06, 449-451.
GROSSMAN L., DAVIS A. M., EKAMBAilAM V., ARMSTRONG J. T., HUTCHEON I. D. and WASSERBURG G. J. (1986) Bulk chemical composition of a FremdliD& from an Allen& Type B inclusion (abstr.). Lunar Planer Sci. XVII. 295-296.
HACGERTY S. E. and MCMAHON B. M. (1979) Mqnelite-sullidcmetal complexes in the Allende m=ritt. Proc. Lunar P/ann Sci. lOth, 851-870.
HAM F. S. ( 1958) Theory of dilfusion-limited precipitation. J. Phys. Chmt. Solids 6, 335-351.
HASHIMOTO A. and WooD J. A. (1986) Enhanced volatility of CaO in H,O.rich ps environments as a faclor in the alteration ofCa.AIrich inclusions (abstr.). Merl'Orirics 21, 391-392.
HEwiNS R. H. (1983) Dynamic CT)'Stlllizatioo experiments as conlltaints on choodrule aenesis. In Clrondnd~s and Th~ir Origins (ed. E. A. KING). pp. 122-133. Lunas and Planewy lnst.
HOUS1£Y R. M_ and CIRuN E. H. ( 1983) On the Utemion of Allende cbondrulcs and the formation of matrix. In CltONirvles and TMir Origins (ed. E. A .. KING). pp. J·S-161. Lu!W' and Planewy lost.
HsiEH~ CHANG Y . A. and ZHANG T. (1982) The ~NhS rys1m> above 700"C. Bwll. Alloy Pitt= £qui/. 3, 165-172.
HUA X., ADAM J_, PALME H. and EL GotlESY A. (1988) Fayaliterieb rims, veins, and balos aroWKI and in fonteritic oliviDes in CA!s and chondrulel in c:arbonllceous choDdriu:s: Types, compositional pro& and c:onsuaints on their formation. ~m. Cosmodlim. Acta 51, 1389-1408.
JOHNSON M. C. (1986) The solaJ nebula redox aat.e a recorded by the~ reduced cbondtules of five primitive c:boadritea. Gtodlim. Cosrnochim. Acta 50, 1497-1502.
KAISER T. and W ASSERBURG G. J. ( 1983) The ilolopic CX)IftpoaitiOn and COIIOeDtntion of A& in iron meteorites and the orilin of uotic ailver. G«>chim. Cosmochim. Acta 47, •3-S8.
Kf.u.Y W. R. and LARIMER J . W. (1 977) OxmicaJ fractionations in meteorites-Vlll. Iron meteorites and the cocmoc:bcmical hislory of the metal phase. G~h1m. Cosmochim. Acta 41, 93-111.
k.RACHER A., K.EIL K., k.ALLEMEYN G. W., WASSON J. T., CLAYTON R. N. and Huss G. 1. ( 1985). The l.eoville (CV3) acc:retiooary breccia. J. Gtophys R~s. ~. DI23-DI3S.
KUBASCHEWSKI 0 . ( 1983) /ron· Binary PIIIJS~ Dilzgram.s. SprioaerV erla&. Berlin.
MACPHERSO~ G. J., PAQUE J . M., STOlPER E. M. and GROSSMAN L (1984) The ori&in and sipificance ofrevene wnina in melilitt from Allende Type B inclusions. J. Gtol. 91, 289-305.
MAsltAMK:HJ M., F\JJII N. and T AIW>A H. (1981) Ordinary c:bondritt parent body: An internal beatin& model. Proc. Lunar Sci. Con/ J}llr, 1145-1152.
MAssALSKI T. B. ( 1986) Binary Alloy Plw~ Dilzgram.s. Amer. Soc. Metals. 2208p.
McMAHON B. M. and HACGERTY S. E. ( 1980) Experimental studies beariD& on the map~etite-alloy-sulfide association in tbe Allende meteoritt: Constraints on the condiuoos of choodrule formation. Proc. Lunar Planet. Sci Corif. 1/lh, IOOJ-1025.
McSwEEN H. Y. JR. (1977) J>etrocraphic variations &mOD& c:azbo. naceous chondrites of the Viprano type. G«>clrim . Cosmochim. Acta 41, 1777-1790.
M£E.KER G. P., WASSERBURG G . J . and ARMSTRONG J. T. (1983) Repla=nenl texlures in CAl and implications reprdin& pl.anewy metamorphism. G~h1m. Cosmoch1m. Acta 47, 707-721.
MISilA K. C. and FUET M. E. (1973) The chemical compositions of synthetic and natural peotlandite assembla&es. Econ. Gtol. 68, 518-539.
0W£N E. A. and I.Ju Y. H. (19 .. 9) Further X-ray study oftbe equi· librium diagram of the iron-nickel system. Iron and Surl fiiSI. J. 163, 132-137.
PALME H. and WLOTZKA F. (1976) A metal particle from a~rich inclusion from the m=ritt Allende, and condensation of refnlctory siderophile elements. Earth Planet. Sci. Uti. 33, 45-60.
PEcK J. A. (1983) An SEM J)etr'Oirapbic study ofC3(V) meteorite matrix (abstr.). LWIIJT P/ann. Sci. Conf. XIV. 598-599.
RAMBALDI E. R. and RAJAN R. S. (1982) Evidenoe for primitive pbosphates in hiahJy unequilibrated chondrites (abstr.). Met~IICS 17,271 -272.
RUBI'I A. E. and GIIOSSMAN J . N. (198S) Phosphate-Sulfide assemblages and AI/C. ratios in type-3 choDdrites. Mettorilia 20, 479-489.
RUBI>; A. E. and WASSON J . T. ( 1987) Chondrules, matrix and coanevaincd cbondrule rims in the Allende meteorite: Origin, interrelationships and )X)Gible precursor components. G~him. Cos· mochim. Acta 51, 1923-1937.
SliEWMON P. G. ( 1963) Diffu.sion in Solids. McGraw-Hill. 203p. STOLPER E. M. ( 1982) Crystallization Jequeoces of ~-rich inclu
sions from Alleock: An experimental study. Gtochim Cosmocllim. Aaa~ 2 159-2180.
STOLPER E. M. and PAQUE J. M. (1986) Crystallization leQUtnces of Ca-AI-ricb inclusions from Allende: The effects of coolin& rate and maximum tcmpentwe. Gtocltim. Cosmodtim. Acta 50, 1785-1806.
STolPER E. M., PAQUE J. M. and ROSSMAN G. R. (1982) The influence of OXYieD fupcity and coolin& rate on tbe crystallization of Ca-AI-rich inclusions from Allende (abstr.). Lunar PIDNt. Sci. CD'~/ XJ/1, 772-773.
SvENDSEI" S. R. (1979) Free ene!JY, enthalpy and decomposition presiW'e5 of RuS,. Acta Chrm. Sautd1naviaz A33, 601-607.
WmKE H., BADDENHAUSEN H., PALME H. and SPETTEL B. (1974) On the chemistry of the Allende inclusions and their ori&in as hiah temperature colldensates. Earth PlaMt. Sci. Uti. 23, 1- 7.
W ARX D. A. ( 1986) E videDcc for suc:casive qUoclcs of c:oodeosation at hi&b temperature in • ~ of the aolar nebula. Earth Planet. Sci. Uti. 71, 129-148.

192
APPENDIX IV. PRELIMINARY EXPERIMENTAL INVESTIGATION OF THE
ORIGIN OF IR-RICH ALLOYS IN CHROMITE
INTRODUCTION
Chromite-rich rocks worldwide share the common feature of high concentrations of three
of the PGE (Ir, Os and Ru) whether they occur in ophiolitic sequences or in layered
intrusions. While it has been well documented that Ir, Os and Ru are strongly concentrated
by the mineral chromite in most ultramafic occurrences (e.g., Crocket, 1981), the reason for
this association has not been well established. Interest in the origin of Ir, Os and Ru in
cbromite has increased as chromitites have become PGE mineral exploration targets (e.g. ,
Constantinides et al. , 1980; Page et al., 1986; Naldrett and von Gruenewaldt, 1989).
In several early studies it was proposed that Ir, Os and Ru could be accommodated in solid
solution in the chromite lattice at magmatic temperatures (e.g., Gijbels et al., 1974; Morgan
et al., 1976; Naldrett and Cabri, 1976). More recently petrographic studies have identified
discrete 1 to 20 ~tm diameter inclusions of Ir-Os-Ru alloys and sulfides in chromite from
nearly every major ophiolite and layered intrusion (e.g., Talkington et al., 1984; Auge,
1988). Alloy compositions range from -80% Ir to -80% Os with Ru contents up to -50%
(Legendre and Auge, 1986; Talkington and Lipin, 1986) (all concentrations given in this
Appendix are in weight fractions). These compositions correspond to the minerals
osmiridium, iridosmine and rutheniridosmine according to the nomenclature of Harris and
Cabri, (1973). Sulfide compositions span the solid solution between laurite and erlichmanite
(Ru,Os)S2 with up to -20% Ir (Legendre and Auge, 1986; Talkington and Lipin, 1986).
If the high Os, Ir and Ru contents of chromites were established by partitioning of PGE
between chromite and silicate liquid, then the Os-Ir-Ru alloy and sulfide inclusions must have

193
formed by exsolution from originally homogeneous chromite crystals. However, several
petrographic features of these inclusions have been used to argue against exsolution from
chromite including: 1) euhedral and anhedral habits, 2) non-crystallographic orientation, and
3) compositional diversity. Based on these types of features, virtually every petrographic
investigator has suggested that lr-Os-Ru alloys and sulfides precipitate directly from magmatic
liquids creating nucleation sites for chromite crystals, which crystallize around the small
particles and mechanically remove them to chromitite layers (e.g. , Talkington et al., 1984,
1986; Auge, 1988). Although Ir-Os-Ru-rich inclusions are observed as both alloys and
sulfides, the discussion in this Appendix will concentrate on the relationship between alloys
and chromite because most ophiolites and layered intrusions have cooled slowly, allowing the
subsolidus reequilibration of alloys to sulfides or vice versa, depending on the ambient A
(Stockman and Hlava, 1984; Legendre and Johan, 1981).
The origin of Ir-Os-Ru-rich inclusions in chromite is important to the understanding of
PGE fractionation during mantle partial melting and crustal magmatic differentiation.
Experimental data reported herein and in the literature will be used to discuss the plausibility
of the two competing hypotheses for the origin of the inclusions, i.e., 1) solid solution of lr
Os-Ru in chromite followed by exsolution of alloys or 2) crystallization of lr-Os-Ru alloys
from silicate liquid followed by chromite nucleation and growth. It will be argued that the
available data suggest that the first alternative is more plausible than the second. However,
interpretation of the experiments reported here are somewhat ambiguous and a conclusive test
of these hypotheses must await further experimentation.

EXPERIMENTAL METHODS
PGE-FeS liquid
194
Synthetic pyrrhotite (Fe1.xS) was prepared by weighing pieces of pure Fe rod and S
powder and sealing them in an evacuated silica glass tube. The tube was heated to 600°C for
24 hours to react the S and Fe. The FeS was then melted at 1250°C for 5 minutes and
annealed at l000°C for 24 hours to homogenize the sample. The sample tube was quenched
in water and the sample was ground in an agate mortar under ethyl alcohol. A 50:50 mixture
of Fe1.xS with Ir wire and a 50:50 mixture of Fe1.xS with Pt wire were sealed in evacuated
silica tubes. The samples were melted in a vertical quench furnace at 1300oc for 1 hour and
quenched into liquid nitrogen. They were then cut with a diamond saw, mounted in epoxy,
polished with diamond paste, and carbon coated for electron beam analysis.
PGE-chromite
Synthetic chromite (FeCr20 4) was prepared by weighing and grinding pure FeO and Cr20 3
powder in an agate mortar under ethyl alcohol. The powdered mixture was pressed into a 10
mm diameter pellet using polyvinyl alcohol as a binding agent and hung by a 100 Jlm
diameter Pt wire at 1500°C in a vertical quench gas-mixing furnace. The jo2 was maintained
midway between the iron-wiistite and wiistite-magnetite buffers using a flowing gas mixture of
CO and C02• The pellet was quenched in distilled water and dried in an oven at l00°C. The
grinding and annealing process were then repeated to increase homogeneity. Natural
chromite (Fe,Mg)(Cr,Al,Fe)20 4 from the G-zone chromitite of the Stillwater Complex,
Montana (for compositional data see Talkington et al. , 1986), was prepared by crushing the
chromitite, handpicking chromite grains with minimum adhering silicate, and then grinding
the chromite in an agate mortar under ethyl alcohol.
Pure Ir and Pt powders were weighed and added to splits of the synthetic and natural

195
chromite powders at the 1% level. The grain size of both theIr and Pt was 0.3 to 2 JLm.
The samples were ground in an agate mortar under ethyl alcohol for 1 hour to evenly disperse
the PGE and they were then split, diluted with pure chromite and reground to produce
samples that contained 100, 500 and 1000 ppm of both Ir and Pt. These will be referred to as
the "100 ppm," "500 ppm," and "1000 ppm" samples. Doped and undoped powders were
pressed into pellets with a 3 mm diameter and 1 mm thickness. The pellets were hung with
25 JLm diameter Pt wire in a vertical quench furnace at an A midway between the iron
wiistite and wiistite-magnetite buffers and annealed for 2 weeks at 1450°C. TheA was
chosen because it corresponds to the intrinsic /02 measured for chromitite samples from the
Stillwater and Bushveld Complexes by Elliot et al. (1982). The pellets and Pt hanging wires
were quenched, dried, cut into sections with a diamond saw, mounted in epoxy, polished with
diamond paste and carbon coated for electron beam analysis.
Electron beam analysis
Quantitative analyses were made with an energy dispersive detector on a Camscan electron
microscope (SEM) and wavelength dispersive detectors on a JEOL electron microprobe
(EMP). Pure metals were used for standards, except for Fe1.xS which was used as the
standard for S. All analyses were made at an accelerating voltage of 20 KeV with counting
times of 100 sec. A beam current of 0.1 nAmp was used for energy dispersive analyses and a
beam current of 500 nAmp was used for wavelength dispersive analyses. X-ray lines used for
analyses were L .. for Pt and Ir, and K .. for Fe, Cr and S. The ZAF correction procedure was
used for quantification of X-ray intensities.

EXPERIMENTAL RESULTS
PGE-FeS
196
SEM analyses of the PGE-FeS experiments indicate that both Ir and Pt are soluble in
saturated FeS melt at the percent level but that in each case an interstitial metallic phase
exsolves at grain boundaries upon quenching. In the Ir-FeS experiment, analyses of rastered
areas (which included both FeS and the interstitial metallic grains that exsolved upon
quenching) indicate that 3.9% Ir dissolved in the FeS liquid. The bulk of theIr remained in
the adjacent Ir wire. The quenched FeS retained 3 .6% Ir and the intergranular metal grains,
which range in size from 0.1 to 0.5 JLm, are 88% Ir and 12% Fe.
In the Pt-FeS experiment, analyses of rastered areas (which included both FeS and the
interstitial metallic grains that exsolved upon quenching) indicate that 14.9% Pt dissolved in
the FeS liquid. As in the case of Ir, the bulk of the Pt remained in the attached Pt wire. The
quenched FeS in this experiment retained only 0.3% Pt and the intergranular Pt metal grains
were much larger, ranging in size from 1 to 5 JLffi. The composition of the exsolved metallic
phase was 87% Pt and 13% Fe.
PGE-Chromite
The PGE-chromite experiments were designed to test whether the solubility of Ir in
chromite was above or below the minimum detection limit for EMP analysis. Thus, the first
problem was to determine the minimum detection limit for Ir and Pt in a chromite matrix .
Synthetic and natural chromite samples that were not annealed were analyzed for Ir and Pt in
15 individual spots. The mean count rates correspond to concentrations of 105 ±53 ppm Ir
and 66 ±51 ppm Pt (all uncertainties are given as ± lo). These values are considered
background intensities for a chromite with no Ir or Pt and were subtracted from all chromite
analyses. The typical uncertainty of the individual analyses due to counting statistics is ±45

197
ppm. Analyses of a secondary standard which contains 325 ppm Ir and 325 ppm Pt in a Ni
matrix were used to calculate the detection limit from Poisson statistics at the 95% confidence
level following the approximation of Ziebold (1967). The detection limit calculated for Ir is
81 ppm and for Pt is 110 ppm.
The three synthetic and three natural chromites that were annealed with Pt and Ir powder
dispersed within them were next analyzed by EMP. The analyzed spots were verified not to
contain metal grains using the backscattered electron detector on the EMP. The mean
concentrations for 21 analyses from the six samples (after background and ZAF corrections)
are 18 ±42 ppm Ir and 17 ±47 ppm Pt. These mean values are well below the minimum
detection limits. Each of the six samples were also analyzed in two to four separate areas (in
the interiors of the pellets) in a 400x400 llm raster pattern which included both chromite and
the dispersed Ir and Pt grains. The mean of seven analyses of the two "100 ppm" samples
are 114 ±38 ppm Ir and 132 ±77 ppm Pt [(lr/(Pt+lr)= 0.46]; the mean of five analyses of
the two "500 ppm" samples are 236 ±45 ppm Ir and 297 ± 125 ppm Pt [(lr/(Pt+ Ir)= 0.44];
and the mean of five analyses of the two "1000 ppm" samples are 642 ± 106 ppm Ir and 764
±68 ppm Pt [(lr/ (Pt+ lr)= 0.46].
The concentrations of Ir and Pt in the "500 and 1000 ppm" samples are lower than
expected indicating that either the homogenization and dilution procedure was not quantitative
or that Ir and Pt were lost from the samples during annealing either by diffusion into the Pt
hanging wires or by volatilization. The Pt hanging wires were analyzed to see if they had
gained Ir during annealing. Unfortunately, the sample pellets fell out of the Pt wire loops
during quenching making it impossible to match the wires with individual samples. Two
pieces of Pt wire that had not been annealed and eleven random pieces of Pt hanging wire
from the experimental runs were analyzed. Both unannealed Pt wires analyzed contain

198
0.786% Fe and 0.070% Ir. The mean concentrations of the Pt hanging wire are 15.3 ±2.2%
Fe and 0.248 ±0.071% Ir. The mass of Pt hanging wire used for each sample was -1 mg
and the mass of each sample was -25 mg. Thus, the mean Ir added to the Pt hanging wire
corresponds to an average of 70 ppm Ir from each of the 10 samples annealed. If most of
theIr was contributed by the four "500 and 1000 ppm" samples, as much as 175 ppm Ir
could have been lost from each of these samples. This could at least partially explain the 200
to 350 ppm apparent loss of Ir from the "500 and 1000 ppm" samples. However, there were
nearly equal losses of Ir and Pt which suggests that Pt was also lost from the sample to the
hanging wire or both metals were volatilized during annealing.
The SEM was used to determine the Ir/(lr+ Pt) content of the individual metal grains in
the samples after annealing. Each of theIr and Pt alloy grains gained -10% Fe from the
surrounding chrornite. Many of the grains were smaller than the -1 JLm x-ray interaction
volume and thus also contain Fe and Cr in the analyses from the surrounding chromite.
However, this does not effect the determination of the Ir/(lr + Pt) ratio in the alloys. The
natural chromite samples recrystallized during annealing (perhaps due to the presence of
-2% interstitial silicate glass that may have acted as a flux) and formed dense pellets which
formed smooth surfaces when polished. The synthetic chromite samples remained porous
after annealing and these samples (plus all of the unannealed samples) formed pitted surfaces
when polished with only 10-20 JLm diameter islands of well polished material .
The Ir and Pt grains were evenly dispersed throughout the chromite in the unannealed
starting materials and no metal grains were observed adhering to one another. The sizes of
30 Ir grains that were measured with the SEM in unannealed samples ranged from 0.3 to 2.0
JLm and averaged 0.8 JLm, and the sizes of 25 Pt grains ranged from 0.3 to 1.5 JLm and
averaged 0.7 JLffi. The average spacings of Ir and Pt grains were calculated assuming a
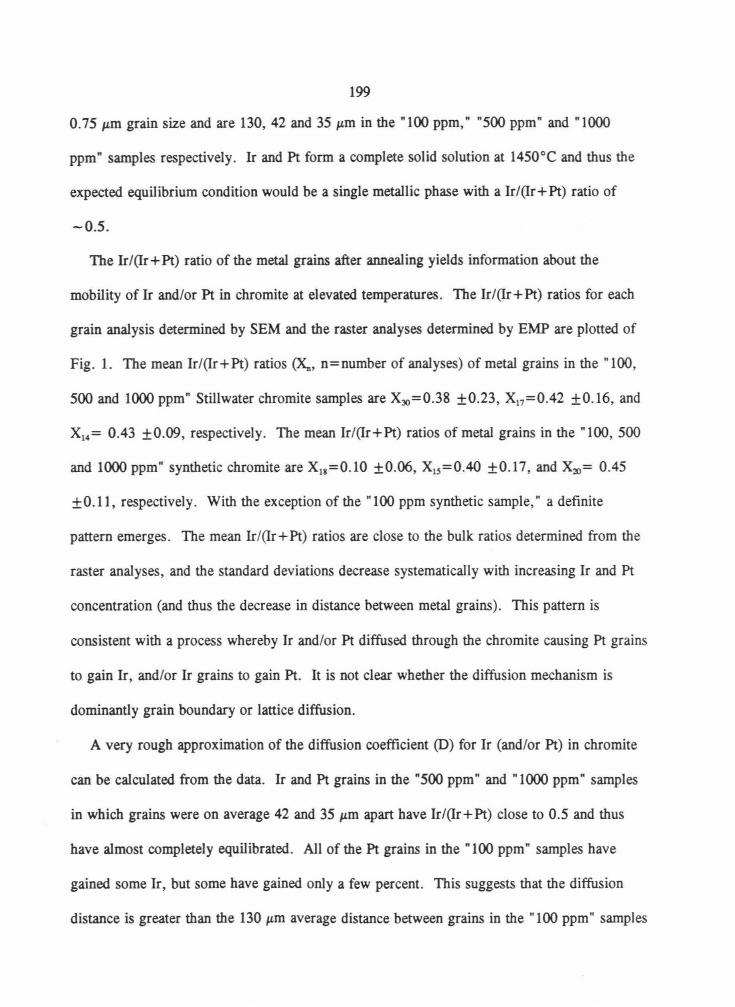
199
0.75 ~tm grain size and are 130,42 and 35 ~tm in the "100 ppm," "500 ppm" and "1000
ppm" samples respectively. Ir and Pt form a complete solid solution at 1450°C and thus the
expected equilibrium condition would be a single metallic phase with a lr/(Ir+ Pt) ratio of
-0.5.
The lr/(Ir+ Pt) ratio of the metal grains after annealing yields information about the
mobility of Ir and/or Pt in chromite at elevated temperatures. The lr/(Ir+ Pt) ratios for each
grain analysis determined by SEM and the raster analyses determined by EMP are plotted of
Fig. 1. The mean lr/(Ir+ Pt) ratios (X,, n=number of analyses) of metal grains in the "100,
500 and 1000 ppm" Stillwater chromite samples are X30=0.38 ±0.23, X17=0.42 ±0.16, and
X14 = 0.43 ±0.09, respectively. The mean lr/(Ir+Pt) ratios of metal grains in the "100, 500
and 1000 ppm" synthetic chromite are X11=0.10 ±0.06, X15=0.40 ±0.17, and X20 = 0.45
±0.11, respectively. With the exception of the "100 ppm synthetic sample," a definite
pattern emerges. The mean Ir/(Ir+ Pt) ratios are close to the bulk ratios determined from the
raster analyses, and the standard deviations decrease systematically with increasing Ir and Pt
concentration (and thus the decrease in distance between metal grains). This pattern is
consistent with a process whereby Ir and/or Pt diffused through the chromite causing Pt grains
to gain Ir, and/or Ir grains to gain Pt. It is not clear whether the diffusion mechanism is
dominantly grain boundary or lattice diffusion.
A very rough approximation of the diffusion coefficient (D) for Ir (and/or Pt) in chromite
can be calculated from the data. Ir and Pt grains in the "500 ppm" and "1000 ppm" samples
in which grains were on average 42 and 35 ~tm apart have lr/(Ir+ Pt) close to 0.5 and thus
have almost completely equilibrated. All of the Pt grains in the "100 ppm" samples have
gained some Ir, but some have gained only a few percent. This suggests that the diffusion
distance is greater than the 130 ~tm average distance between grains in the " 100 ppm" sam pies

200
Fig. 1 lr/(lr+ Pt) ratio from SEM spot analyses of alloy grains (open circles) and EMP
raster analyses (400x400 J.Lm) of chromite with included alloy grains (solid bars) in chromite
samples annealed with Ir and Pt powder. "100 ppm, 500 ppm and 1000 ppm" indicate the
concentration of Ir and Pt powder mixed into the chromite starting material. The dashed line
indicates Ir=Pt which is the expected equilibrium condition. Raster analyses indicate that
roughly equal concentrations of Ir and Pt are present in all of the bulk materials. The scatter
in the 100 ppm raster analyses is probably due to poor counting statistics since the -100 ppm
measured concentrations are only slightly higher than the 80 ppm detection limit. Note that in
the Stillwater chromite the higher the concentration of metal grains (and thus the closer their
spacings) the closer the alloy compositions are to lr=Pt. The reason for the lack of Ir-rich
alloys in the "100 ppm" synthetic sample is uncertain. See text for further discussion.

201
I UJ o<Jf>oro o pro 0 1- 0 0 E ~ 0 c. ..- c. 0 a: I I u
l<mo: loo a: 0 000 00 0 E UJ 0 c. 1- It) c. <t I ~ I ...J to o axxl~ ool ...J
CID 0 GX&D <ID <IIl oE ~ Oc. CJ) .-c.
UJ 0 0 @1>~0 0 0 0 gE
!::: Oc. ~
..- c.
0 I a: I I u
00 14 am 0 00 0 0 CD o E u Oc.
~ It> C.
UJ I 1-
t: z 0 E >- CID <mamDCXID<OOOD CJ) 0 c.
c.
I I I I I I I co <0 - ~ N 0 0 -0 Cl. 0 0
+ ..... --.....

202
and approximately equal to the maximum spacings between grains. A reasonable guess at this
maximum distance based on observations of the unannealed samples is twice the average grain
spacing, which is -260 I-'m. Following a rough approximation that the characteristic
diffusion distance (X) is equal to ../(Dt), a value of D =6xHt10 cm2/sec is calculated for Ir
and/or Pt diffusion in chromite at 1450°C. This calculation is intended only as an order of
magnitude estimate. As indicated above, the diffusion mechanism is unknown.
Freer and O'Reilly (1980) studied Fe-Mg interdiffusion in pressed spinel powders between
800 and 1034°C in FeAl20 4-MgA120 4 and F~GeO.-Mg2Ge04 couples as a function of
composition. When their data are extrapolated to 1450°C, the interdiffusion rates in each
system vary by several orders of magnitude depending on composition. With a Fe content of
-25%, the Fe-Mg interdiffusion rates in both couples are equal to the diffusion rate for Ir
(and/or Pt) in FeCr20 4 that was estimated above. This comparison is intended only to point
out that Ir (and/or Pt) mobility in sintered spinel is within the range of values measured for
major cation diffusion in sintered spinels.
The lack of identifiable metal grains rich in Ir in the "1 00 ppm" synthetic sample is
difficult to understand. Three possible explanations are 1) theIr grains (which have greater
hardness than Pt) are plucked from the polished surface during polishing, 2) the Ir grains are
smaller than -0.1 I-'m and were thus not identifiable with the SEM, or 3) the Ir grains have
dissolved in the chromite at a concentration level below the - 80 ppm detection limit of the
EMP. The first explanation seems unlikely because the Ir/(Ir+Pt) ratio was 0.3 to 0.7 in the
raster analyses, and because the lack of Ir grains is not observed in any of the unannealed
samples, or in the annealed "500 ppm" or "1000 ppm" samples. The second explanation also
seems unlikely because theIr grains in the starting materials were all larger than 0.3 I-'m and
easily identifiable with the SEM. Annealing should have the opposite effect of increasing

203
grain sizes in order to lower the surface free energy of the system. Thus, the third
explanation which calls upon the dissolution of lr in chromite at the < 80 ppm level seems to
be the most likely. If this is the case, the solubility of lr in the Stillwater chromite is
probably lower than in the synthetic chromite. Additional experiments will clearly be
necessary to draw firm conclusions concerning the solubility of lr in chromite.
DISCUSSION
From the limited experimental data available we can gain some insight into the question of
whether Ir-Os-Ru alloys in chromites originated by 1) exsolution from chromite or 2)
crystallization from silicate liquids followed by chromite nucleation and growth. In the
following discussion the stability of lr-Os-Ru metallic phases coexisting with FeS liquid,
chromite and silicate liquid will be considered.
PGE-sulfide
During magmatic crystallization of layered intrusions and the partial melting of mantle
peridotite there is abundant evidence for sulfur oversaturation and the formation of immiscible
FeS liquids (e.g., Naldrett et al. , 1979; Mitchell and Keays, 1981). The high affinity of three
of the PGE (Pd, Pt and Rh) for sulfides results in their strong partitioning into sulfide liquids
and removal from the silicate fraction of a magma. This results in the formation of Pd, Pt
and Rh-rich sulfide layers (commonly known as reefs) in layered intrusions such as the
Bushveld and Stillwater Complexes. Similarly, Pd, Pt and Rh-rich sulfides are found in some
mantle peridotite xenoliths and discrete Pd and Pt sulfides have even been observed (Mitchell
and Keays, 1981). The other three PGE (lr, Os and Ru) also have high affinities for sulfur
relative to silicate liquid, but are concentrated both in sulfide and in chromite in layered
intrusions and in peridotites (e.g., Mitchell and Keays, 1981; Page and Talkington, 1984;

204
Naldrett et al., 1987).
The presence of an immiscible FeS liquid phase has a strong effect on the partitioning of
PGE. All of the PGE, including lr, Os and Ru, have strong chalcophile affinities and
dissolve in FeS in the presence of PGE alloys. The solubility of lr in FeS liquid was
determined in this study to be 3.9% . The solubility of Ru in solid FeS at 900°C has been
determined to be 3.6 wt% in the presence of either RuS2 or Ru metal (Makovicky et al.,
1986). Therefore, if lr-Os-Ru alloys or sulfides coexisted with the FeS sulfides in peridotites
or layered intrusions, the equilibrium concentration of these elements in the sulfides would be
expected to be - 4% , several orders of magnitude higher than the - 10 ppm total PGE
concentrations observed in magmatic sulfides from peridotite xenoliths and layered intrusions.
This strongly suggests that Ir-Os-Ru-rich alloys were not present in the mantle during partial
melting and were also not present in layered intrusions during magmatic crystallization.
PGE-chromite
If Ir partitions into chromite during chromite crystallization, then the solubility of lr in
chromite at magmatic temperatures must be at least as high as the bulk concentration of lr in
chromites which contain lr-Os-Ru alloy and sulfide inclusions. Estimates of the lr content of
chromitites that contain lr-Os-Ru alloys indicate that the total lr content of chromite crystals
and their inclusions do not exceed -1 ppm. This has been determined in two ways: 1) from
the composition, size and frequency of occurrence of inclusions (e.g., Cocherie et al., 1989)
and 2) from the bulk lr content of chromite crystals plus inclusions (e.g., Stockman and
mava, 1984; Page et al., 1986). Experiments reported above suggest that the lr solubility in
chromite at magmatic temperatures is below - 80 ppm but that lr can diffuse through
chromite either by grain boundary or lattice diffusion. This result does not provide the
necessary test of whether the solubility of Ir in chromite is ~ 1 ppm. It does, however,

205
suggest that if Ir-Os-Ru alloys were trapped within chromite crystals as has been suggested,
they might be able to diffuse into surrounding interstitial FeS liquid at magmatic temperatures.
For example, using the diffusion coefficient for Ir in chromite estimated above, it would take
only - 1h year for Ir to diffuse out of a typical 1 mm chromite grain, or -50 years to diffuse
out of a 1 em grain. The mobility of Ir in chromite also suggests that if chromite were
supersaturated with Ir at magmatic temperatures, Ir-Os-Ru alloys might be able to form by a
diffusive exsolution mechanism at subsolidus temperatures. However, if theIr diffusion
mechanism is strictly grain boundary diffusion, one could argue that Ir-Os-Ru alloy inclusions
in single chromite crystals might be isolated from surrounding phases.
PGE-silicate melts
Another test of the two hypotheses for the origin of Ir-Os-Ru alloy inclusions in chromite
could come from a knowledge of the solubility of these elements in saturated silicate liquids.
If Ir-Os-Ru alloys precipitate directly from silicate liquids as has been proposed, they must be
saturated with Ir-Os-Ru. Investigations of the bulk composition of chilled margins from the
Bushveld Complex and basal norites from the and Stillwater Complex give an indication of
the PGE content of layered intrusion parental magmas. Estimates of Ir contents range from
0.1 to 0.4 ppb, while Ru contents range from 1 to 6 ppb (Davies and Tredoux, 1985; Page et
al. , 1976). For comparison, the Ir and Os contents of basalts and granites that have been
analyzed for PGE range from 0.001 to 0.4 ppb (Crockett, 1981; Morgan and Lovering, 1967;
Hertogen et al., 1980).
Amoss~ et al. (1990) measured the solubility of Ir in a basaltic liquid at 1430°C as a
function ofjo2 andftz and report that the solubility is -100 ppb within the range of
reasonable/02 andftz conditions for mantle partial melting and the crystallization of layered
intrusions. Although the data available on Ir-Os-Ru concentrations and solubilities in silicate

206
magmas is very limited and the nature of the dissolved PGE species is unknown, the low
concentrations of Ir (by two orders of magnitude) relative to the apparent saturation level
make it appear unlikely that silicate liquids became oversaturated with Ir (or Os and Ru) and
precipitated Ir-Os-Ru alloys as liquidus phases.
Origin of Ir-rich alloys in chromite
In spite of textural arguments made in favor of Ir-Os-Ru alloys having formed as liquidus
phases and having been trapped by crystallizing chromite, the limited experimental data
summarized above suggest that these alloys would not be stable in the presence of either FeS
or basaltic liquid at magmatic temperatures, perhaps even if trapped in chromite crystals . The
stability of Ir-Os-Ru in the presence of chromite at magmatic temperatures andj02's is still
unknown, but the apparent mobility of Ir in chromite and the ability of Ir and Ru to form
compounds with the spinel structure under highly oxidizing conditions (e.g. , Krutzch and
Kemmler-Sack, 1983; Capobianco and Drake, 1990) suggests that sub-ppm level solubility of
Ir-Os-Ru in the chromite structure at high temperatures is at least plausible. It has been
suggested by several authors that Ir, Os and Ru substitute for Cr+ in the spinel lattice
(Agiorgitis and Wolf, 1978; Morgan et al., 1976). The solubility of these elements in
chromite is presently unknown but almost certainly decreases with temperature. Thus, it is
possible that exsolution is responsible for forming Ir-Os-Ru alloys during cooling of magmatic
chromite after it crystallized with sub-ppm concentrations of Ir-Os-Ru in solid solution.
Alteration and metamorphism of most peridotites and layered intrusions is indicative of slow
cooling and may allow time for diffusion controlled exsolution. The textural features of Ir
Os-Ru alloy and sulfide inclusions in chromite that have been used by many authors to argue
against the origin of these inclusions by exsolution are inherently inconclusive, particularly
since it is likely that extensive subsolidus reequilibration has taken place.

207
REFERENCFS
Agioritis G. and Wolf R. (1978) Aspects of osmium, ruthenium and iridium contents in some Greek chromites. Chern. Geol. 23, 267-272.
Amoss~ J., Allibert M., Fischer W. and Peboule M. (1990) Experimental study of the solubility of platinum and iridium in basic silicate melts - Implications for the differentiation of platinum-group elements during magmatic processes. Chem. Geol. 81, 45-53.
Auge T. (1988) Platinum-group minerals in the Tiebaghi and Vourinos ophiolitic complexes: genetic implications. Can. Mineral. 26, 177-192.
Capobianco C.J. and Drake M.J. (1990) Partitioning of ruthenium, rhodium and palladium between spinel and silicate melt. Geochim. Cosmochim. Acta 54, 869-874.
Cocherie A., Auge T. and Meyer G. (1989) Geochemistry of the platinum-group elements in various types of spinels from the Vourinos ophiolitic complex, Greece. Chern. Geol. 77, 27-39.
Constantinides C. C., Kingston G.A. and Fisher P.C. (1980) The occurrence of platinum group minerals in the chromitites of the Kokkinorotsos chrome mine, Cyprus. In Proc. Int. Ophiolite Symp. Cyprus (ed. Panayiotou A.), pp 93-101. Geol. Surv. Dep. , Nicosia.
Crockett J.H. (1981) Geochemistry of the platinum-group elements. In Platinum-group elements: Mineralogy, geology, recovery (ed. Cabri, L.J .) Canad. lnst. Mining Metal!. Spec. Vol. 23, pp. 47-64.
Davies G. and Tredoux M. (1985) The platinum group element and gold contents of the marginal rocks and sills of the Bushveld Complex. Econ. Geo/. 80, 838-848.
Elliott W.C., Grandstaff D.£., Ulmer G.C., Buntin T. and Gold D.P. (1982) An intrinsic oxygen fugacity study of platinum-carbon associations in layered intrusions. Econ. Geo/. 77, 1493-1510.
Freer R. and O'Reilly W. (1980) The diffusion of Fe2 + ions in spinels with relevance to the process of maghemitization. Mineral. Mag. 43, 889-899.
Gijbels R.H., Millard H.T. , Desborough G.A. and Bartel A.J . (1974) Osmium, ruthenium, iridium and uranium in silicates and chromite from the eastern Bushveld Complex, South Africa. Geochim. Cosmochim. Acta 38, 319-337.
Harris D.C. and Cabri L.J. (1973) The nomenclature of the natural alloys of osmium, iridium and ruthenium based on new compositional data of alloys from world-wide occurrences. Can. Mineral. 12, 104-112.

208
Hertogen J. , Janssens M.-J. and Palme H. (1980) Trace elements in ocean ridge basalt glasses: implications for fractionations during mantle evolution and petrogenesis. Geochim. Cosmochim. Acta 44, 2125-2143.
Krutzch B. and Kemmler-Sack S. (1983) Sauerstoff-spinelle mit ruthenium und iridium. Mat. Sci. Bull. 18, 647-652.
Legendre 0 . and Auge T . (1986) Mineralogy of platinum-group-mineral inclusions in chromitites from different ophiolitic complexes. In Metallogeny of Basic and Ultrabasic Rocks (eds. Gallagher M.J., Ixer R.A., Neary C.R. and Prichard H.M.), pp 361-372. lost. Mining Metall., London.
Legendre 0. and Johan Z. (1981) Mineralogie des platinoides dans les chromites massives de series ophiolitiques. France, Centre National Recherche Scienti.fique, Rap. Ann. d 'Activite, Juillet 1981 , 32-33.
Makoviclcy M., Makoviclcy E . and Rose-Hansen J. (1986) Experimental studies on the solubility and distribution of platinum group elements in base-metal sulphides in platinum deposits. In Metallogeny of basic and ultrabasic rocks. (eds . Gallagher M.J ., Ixer R.A., Neary C.R. and Prichard H.M.), pp 415-425. lost. Mining Metall. , London.
Mitchell R.H. and Keays R.R. (1981) Abundance and distribution of Au,Pd, and Ir in some spinel and garnet lherzolites: Implication for the nature and origin of precious metalrich intergranular components in the upper mantle. Geochim. Cosmochim. Acta 45, 2425-2442.
Morgan J.W., Ganapathy R., Higuchi H. and Krahenbuhl U. (1976) Volatile and siderophile trace elements in anorthositic rocks from Fiskenaesset, West Greenland: comparison with lunar and meteoritic analogues. Geochim. Cosmochim. Acta 40, 861-888.
Morgan J .W. and Lovering J.F. (1967) Rhenium and Osmium abundances in some igneous and metamorphic rocks . Eanh Planet. Sci. Lett. 3, 219-224.
Naldrett A.J . and Cabri L.J . (1976) Ultramafic and related mafic rocks: Their classification and genesis with special reference to the concentration of nickel sulfides and platinumgroup elements. Econ. Geol. 71, 1131-1158.
Naldrett A.J., Cameron G., von Gruenewaldt G. and Sharpe M.R. (1987) The formation of stratiform PGE deposits in layered intrusions. In Origins of igneous layering. (ed . Parsons I.), pp. 313-397, Reidel Publishing Company.
Naldrett A.J . , Hoffman E .L ., Green A.H., Chou C.L . and Naldrett S.R. (1979) The composition of Ni-sulfide ores, with particular reference to their content of PGE and Au. Can. Mineral. 17, 403-415.
Naldrett A.J. and von Gruenewaldt G. (1989) Association of platinum-group elements with

209
chromite in layered intrusions and ophiolite complexes. Econ. Geol. 84, 180-187.
Page N.J ., Rowe J.J. and Haffty J . (1976) Platinum metals in the Stillwater Complex, Montana. Econ. Geol. 71, 1352-1263.
Page N.J ., Singer D.A., Moring B.C., Carlson C.A., McDade J.M. and Wilson S.A. (1986) Platinum-group element resources in podiform chromitites from California and Oregon. Econ. Geol. 81, 1261-1271.
Page N.J. and Talkington R.W. (1984) Palladium, platinum, ruthenium and iridium in peridotites and chromitites from ophiolite complexes in Newfoundland. Can. Mineral. 22, 137-149.
Stockman H .W. and Hlava P.F. (1984) Platinum-group minerals in alpine chromitites from southwestern Oregon. Econ. Geol. 79, 491-508.
Talkington R.W. and Lipin B.R. (1986) Platinum-group minerals in chromite seams of the Stillwater complex, Montana. Econ. Geol. 81, 1179-1186.
Talkington R.W. , Watkinson D.H., Whittaker P.J. and Jones P.C. (1984) Platinum-group minerals and other solid inclusions in chromite of ophiolitic complexes: occurrence and petrological significance. TMPM Tschenruzks Min. Petr. Mitt. 32, 285-301 .
Talkington R.W., Watkinson D.H. , Whittaker P.J. and Jones P.C. (1986) Platinum-group element bearing minerals and other solid inclusions in chromite of mafic and ultramafic complexes: Chemical compositions and comparisons. In Metallogeny of basic and ultrabasic rocks (regional presentations) (eds. Carter B., Chowdhury M.K.R., Jankovic S., Maralcushev A.A. , Morten L. , Onikhimovsky V .V., Raade G. , Rocci G. and Augustithis S.S.), pp 223-249. Theopbrastus Publishing, Athens.
Zeibold T.O. (1967) Precision and sensitivity in electron microprobe analysis. Anal. Chern. 39, 858-861.

210
RepriDled from AAalytical Chemistry, lt90, U , 209. Copyrlcht @ tt90 by the Am~rie&D Cbem.ical Society ud repriDled by perm.iasioD of the eopyrlcbt oWller.
Resonance Ionization Mass Spectrometry of Sputtered Osmium and Rhenium Atoms
Joel D . Blum,• ·' M . J . Pellin, W. F . Calaway, C. E . Young. and D . M. Gruen
Mat erials Science, Chemistry , and Chemical Technolog) Divisions, Argonne National Laboratory, Argonne, 1/linois 60439
I . D. Hutcheon and G. J . Wanerburg
Lunlltic Asjlum of the Charles Arms Laboratory, Dwision of Geological and Planetary Sciences, California Institute of Technolog), Pa.sadeTUI , California 91125
The rnua apectrometric enalysil of Ot end Ae was lnvestiIJIIted by UN of • puiNd pnnary Ar+ lon b .. m to prowlcle .,tiered etom. t« r-.enc:. lonlutlon meea ~onletly. A UMful yield of 10- 2 and e detection lln1lt of I ppb were demonltreted for Ot conc:entretlon measur.ment. In eltu measurement• of 0t conc:entretlon ere obtainable by tNI method •t the aub1>•rt..per~ level In conducting and ~ meten•la wt1t1 • ful wkfth •t hell mulmum bum cleme4er of - 70 ""'· An 1on1ut1on .a- f« 01 tNt utllz• ltrH r--.t -vr ....- (lnc:Uing en~ -vJ level) was lnvestlg•ted llfiCI found to have euperior --'tlvtty and Mlectlvtty c:ompered to nonreeonent end -.nd two energy level reeonent lonlz•tlon echemel. An element.~ NlectMty f« 01 over Re of ~ 1D' •• demorwtreted. It was found th•t detunlng the Ionizing lasef from the •~ to6onlzlng energy level to en erbltrery region In the lonlzetlon contlnaun ,...ad In. S-lofd ~In..,.,~ end • 10-fold deere ... In elementel Mlec1Mty.
INTRODUCTION
The mass spectrometric analysis of small quantities of Os and Re is an important analytical goal in geochemistry with two main applications: (1) the in situ measurement of Os and Re ooncentrations at very low levels in geologic materials and in phases ayntheaiz.ed in laboratory experiments; (2) the measurement of Os isotope ratios both in situ and on small &IIIIIples of Os chemically separated from geologic materials. In both instances the number of Os and Re atoms evailable for measurement is quite low. Therefore, it is of interest to develop • masa apectrometric measurement technique with • high ratio oC ions detected to etoms preeent in the ioo IOOl'Oe
(uaeful yield). The technique must alao be able to di8crim.inete against molecular interferences in the cue of ooncentretion meuure.ments and di8crim.inete between uno. and II7Re etoma in the cue of Os isotope ratio measurements.
At Argonne National lAboratory we heve developed a resonance ionization mass spectrometer for ultrasensitive aurface analysis of aemiconductors with monoleyer depth resolution. Surface analysis by resonance ionization of lp\ltteed atoms (SARlSAJ hu • high Uleful yield (2::10"2) and a demonstreted sensitivity et the parte-per-billion (ppb) level for Fe ooncentretion measurements in a Si matrix (1-3). It employs a pulsed primary ion beam to create • cloud of sputtered neutrals that efficiently fill the ionif.ing volume of
• Author to whom corre.pondence ahould be addreued. 1 Praent addnu: Diviaion of <l«>loci<:al and Planetary Science,
Celifomia Inatitute of TecbnolOC}', Puadena, CA 91125.
pulsed lasers and an energy and angular refocusing tim~of· flight mass spectrometer to maximize photoion detection. SARISA appears to be well suited for in situ determinations of Os and Re ooncentrations.
A major obst.acle that must be addressed in order to demonstrate the utility of resonance ionization of sputtered ato.ms for Os and Re analyses is the identification of suitable ionization schemes for these elements. T o this end, we have investigated a series of multi photon ionization schemes for Os and Re with the goal of mu.i.m.iz.ing the 0s photoion yield and minimizing the isobaric interference between Os and Re at mass 187. In this study we have evaluated the useful yield, detection limit, and selectivity of SARISA for the measurement of Os ooncentrations. This information is abo imponant in evaluating the potential of the SARISA photoion source as a prototype of an elementally selective and highly efficient ion source for an isotope ratio mass spectrometer.
EXPERIMENTAL SECTION Apparatus. The erperiments were performed by use of the
SARISA apparatus, d-nbed in detail by Pellin et al. (2). The inmument consists of three main subunits: a pulsed primary ion aource, three pulaed tunable Iuers, and an energy and angular refocusing time-of-flight mass spectrometer (Figure 1).
A mass analyzed 5 ke V AI+ a puttering beam with a current of 2.0 i<A and a full width at half m.uimum (fwbm) diameter of - 70 11m i5 produced by a Calutron ion gun. Durin& analyses, the primary ion beam is chopped into pulses of 200 ns width by electrO&tatic deflection and is synchroniud with the Iuers operetinc at a 40-H.z repetition rate. The AI+ ion pulses strike the target in a chamber pumped to the low 1~ Torr preuure range. The sputtering rate in the pu)&ed mode is -10 min per monolayer ol target. Spu~ apeci• fill a volume~ the target during and afW the arrival of the primary ion pube. Durin& aputtering, the target ia beld at a l.G-kV potential; incomin& AI+ ions are decelerated to 3.5 keV and poaitive llt.COndary ions produced by IJ)Uttering are eccelerated to 1.5 keV. The aecondary ions are DOt transmitted throucb the mag spec:Uometer which is deaicned to accept ions with 1.0 :t 0.1 keV energy.
Three hundred nanoseconds after the end of eech ion pulae • XeCI escimer Liller is fired produc:ing a -l().ns, 250-mJ UV pulse with a bandwidth of 0.3 to 0.5 nm centered about 307.9 nm. The excimer output is aplit into three be&n:IS which either are uaed to pump tuneble dye Luen (loaded with Rhodamine, Coumarin, or OCM dye) or, for aome experiments, are fOCIIAed directly into the ioniz.etion region. When oeceuary, the visible fundameotal dye laKr output is frequency doubled in a nonlinear crystal to produce UV pu.leea. 'Ibe Luer beams are apetially and temporally OYerlepped in a volume that extends from about 0.5 to 1.5 mm above the WJet aurfece and hu • diameter of -1 m.m. Pbotoioniz.etion of aputt.ered neutrals OCCW'I within this volume and the photoions are accel~rated away from the target and into the mass spectrometer. The target poteotial ia lowered at the becinninc al MCh I..r &hot, 10 that ions produced by pholoionization are transmitted through the mass apectrometer, and i5 then
000$.2700/t0/0312-420ti02.50/0 C 1HO Amertc:an o.mc.J Soc.ly

211
210 • ANALYTICAL CtEMISTRY, VOL 112. NO. 2, JN«JAP.Y 15, 1i90
- ..__ SaMple
Vertical
Pulsed Pflml r y ton Beam Primary ton Beam
Deflection Ptataa
£1Nal Lens
LeMr eaame
~"'OIO ·Ion Flight Plath
Primary ton ......._. ... ,. TUmlf\9
Plat•• .......... Disk A nalyJar
• ll lcro · Channel ,,., ..
...... 1. Sc:t.nalic clllgwn of fie SARISA expet~IMillll ~IUS from ~ Ill el. (2).
twitched back to 1.5 k V before the arrival of the nut primary ion pulae to again 1Upp-. the deleetion oC aputtued aecondary ions.
The photoion beam ia (~ and ahaped in the time-oC-Ilicht masa apectrometrr by a eeries of einullen.es, ddlec:t.ion plates, and two hemispherical enerp- analyun, after which it atrikea a chevron-type microcbannel plate electron multiplier (Figure 1). The resulting electron pulae is meuured by a transient cbarJe digitizer at high aicnaJieYela « by a pulle-cauntinc l)'ltem at~ aiinaJlevela. The maximum ion tranamiaaion of the maaa apectrometer is -70~ (3).
Sam plea. Four aamplee oC metallic aolid aolutiona were uaed u tarteta in thia uudy. Two aamplee were ayntheaized from pure metala (4) and two aamplee are from me~ta Synthetic aample 1 contain& 95.2~ Ni, 2.5~ Os, and 2.3~ Re. Synthetic aample 2 contain& 99.8~ Ni, 0.1 ~ Oa, and 0.1 ~ Re. The ~tea are the N'lriJ.Ioa and eo.buila type IIAB beubedrite iron meteorite~, which are -ntially compriaed of a bomogeneoua mixture of 9-6 .2~ Fe, 5.4~ Ni, and 0.4~ Co with many other metala includin& Os, Re, lr, Pt, and Au u pvta-per-million level tnce impurities. Radiochemical neutron activation anal~ by Ptmicka and Wueon (5) indicate that the NecrilJoa meteorite contain& 25 ppm 0a and 1.4 ppm Re (*12~) and that the Co.bulla meteorite contain& 3.4 ppm Oa and 0.4 ppm Re (*12,.). All c:oncentntiona are liven in etomic proportiona.
loalsadoa Se~ Oamium - ionized by liYe different acbemea to evaluate their relative eenaitivitiea and aelectivitiea. Rhenium wu ionized by only the two aimpleet ecbtmee. The iooization acbemea all oricinate from the crowwl elec:tronic ttate and can be IJ'OUP8(i into liYe aeneral typee ~ A tbrouch E (Fipre 2). We report wawJenct.ba u IWIOmetrn in air and eDei'JY levela u invene centimeten in vacuum. Sc::beme A ia DO~t and requirea the aimuJtmeoua aJ.orptioo of two (in the cue of Re) or three (in the c:ue of Oa) pbotona from the broed-band 307.9-nm ucimer !Mer to rucb the ionization COD·
tinuum. Scheme B-ooe -w. err -300-nm UV pbot.oc from a d~ !Mer (>.1) to rae Oa or Re atoml to • IWOII&Dt -.:y leYel <Etl and one 307.9-nm uci.mer pbocon to ioDize the etoma. Scheme C.._ one -24G- or -300-nm UV photon from a dye l.uer (>.1) to raiae atoma to a r.onant eDei'JY level <Et> and one additional photon (when -24G-nm pbotona are UMd) or two 8dditioDal pbotma (when -300-nm pbotma are~) of the aeme
I E v
..,. Q
10
8
OL-~A----~8----~C----~0----~E---
JONIZATION SCHEMES ...... 2 . Generalzed lonlz.allcn ~ ...U..ted for Os (A-£) and Re (A-8). Asterisks denote broeO-band exc*ner radiation.
Table I. ilHoD..IIlt EAerc Lnela Enl~~atecl iA tllia Stad,.
ioniution acbeme
c D
E
41557 41313 41876 41726 41232 41225 40362 34365
b 41726 41232 40362 34365 34365
enercY level, =-•
68175 56729 56222 55402 55402
• ~ and E, levela are from ref 18. • Same u Bor 71032
eDergy to ionize them. SchemeD~ one -24(}. or -300-nm UV photon (>.1) from a dye IMe.r to rajae atoms to a fuat reiOIWlt eoergy leYel (E,), ooe - ~ or - 600-nm visible photon (>.,) from • aeccod d~ luer to rajae at.oma to a aec:ood .--nt eoergy leYel (EJ, and a aecond viaible photon (>.,) from the aec:ond dye l.uer to produce pbotoiona. In acbemee A throu(h D atoma are raiaed to an arbitrary enti'JY above the ionization continuum by the ioDizinc photon. Scheme E ia the aame • acbeme D ucept that the ionizing photon (>.a) is cenerated from a dye !Mer tuned to r.cb an autoionizinc reeonant eDei'J)' level (EJ above the ionisation pot.rntial (IP). The apecific eDei'JY levela evaluated for each acbeme are liven in Table L
Scbeme E waa found to be moat favorable Cor Oa ionization (folloorinc criteria dila..! below) and will therefore be cBcribed in more detail (Fipre 3). UV pbotona from the fuat dye l.uer are tuned to 290.906 nm to populate the~ level [E1 • 34365 an-1;
ancu1ar IIIOIIltDtum quantum number (J) • 5) from the cround .tate (J • 4). Visible pbotonaat 475.216 nm then pump ato.IDI froat Et to the E, level (E, • 55 402 em -I; J • 5). Finally, the third dye !Mer ia tuned to pump atoma from E, over the IP (?;69000 cm-1) to the ma.t favorable autoiocizinc E, eDei'JY level (E, - 71032 = -·>that could be a~ by acanninc the third dye luer acrwa the 6$- to 665-nm repon.
The meliY ~ per puiae to aatwate -=h of the tbJw leYela ... inveaticated by monitorin& the aa• lilnal in the maa& apectrometer while aequentially plac:inc a eeriea of partially tnnlmittinc filten into each of the luer bea.IDI aepar~~tely. The important parameter Cor aaturation ia the enti'JY denaity, which can be controlled by the aize, ahape, and poaition of the l.uer

212
8
~~ LP.E3 1/0Jl
69()(}()
LP. 6
Ez ~Ol J'5 -' E
u
E, .. 0
J' liz 4= =-
E, ~ "' J ' 5 c:
""" ~ ,240.560 ~'290.906
0
Figure 3. Specillc loniz.ation schemes used lor Re and Os analyses.
I mJ/ pulse
Figure 4. ~!lYe Os sq,aJ n.ns~ty as a fln:llcn of .._ .-gy per pulse tor Ionization ac:heme E as eech of the line .._ beems was attenuated eeparetely. while the Olhet two beams -• held at lui .-gy. Enor bers are nc:t.ded where 881n'eted ~ex~ 8Y"t>ofllze. Satl.ntion wu not r-.ched lor >., at a rTaxi'Tun .-gy of -1 mJtP~M <~> tu wu ,..d'led lor >.,at -o.s mJtP<AM (crc:lel) and >., at -1.5 mJ/ pUie (lriangles).
beams u well u by the amount of incomin& enelJY. By t:ichtly fOCUIUlc the l.er '-mi. we were able to aetume -=b ~the three energy Ieveli, but in thia configuration only a amall portion of the cloud~ apuUered atom&- ionized. Under normal operating conditiona, we def~ the luen to a diameter of -1 mm in order to acoeu a larte portion of the cloud of aputtered atoma. With two of the three luer beams kept at full eDei'JY and one beam artenuated, Et was found not to be completely aaturated with a maximum energy af -1 mJ{puJ.e for >.,. Et -aaturated at an enerCY of -0.5 mJ / pulae for >-t, and Es wu aaturated at an eDei'JY of -1.5 mJ f pulae for >.1 (Ficure 4). Subeequent experiments we~ run with an &Dei'JY of -1 mJ{pul.e, -2 mJ{pulae, and -4 mJ{pulae at >.1, >-t, and>.., reapectively.
Rhenium atoms were ionized by ICbemea A and B ooly (Ficure 2). In IICbeme B (Ficure 3), UV photooa at 240.560 nm populated theE, level (E1 • 41557 =-•; J • 1/ a) from the around atate (J • 'fa). The broed-band 307.9-nm excimer photona then rw..iaed the atoma from the excited enei'IY level to the IP (~63530 =-1).
ANALYTICAL Ct£MIS'TRY, VOL 62, NO. 2, JAMJAAY 15, 1990 • 211
~
eml! o~~~~~~~~~
A B C 0 E IONIZATION SCHEME
RESULTS AND DISCUSSION Seuitivity ud Selectivity of Ionization Schemes.
Synthetic sample 1 was used to investigate the relative sen· aitivity and selectivity of the ionization achemes for Os. We wi.l..l use the Os+ signal intensity fox nonresonant ionization by acheme A as a reference value and diacuss the Os• signal levels for the resonant schemes relative to this value (Figure 5). Iooization by acheme B was -3 times mo~ efficient than echeme A., showing the enhancement of ionization probability from the addition of a resonant atep to the broad-band 307.9-nm laaer beam. The ionization energy in acheme A aignificant.ly overshoots the IP, whereas the ionization energy in acheme 8 places the atom only alight.ly above the IP (Figure 2). The increaaed ionization of acheme 8 over A B\lggeStS that the broad-band laser in acheme 8 overlaps an aut.oionizing reaonance or that the ionization croes aection in the continuum decreases at energies much higher than the IP.
Ionization by acheme C was - 50% lea& efficient than by acheme A. This probably arises because the -1 mJ{pulse UV dye laaer does not have enough energy to saturate the ionization process. In scheme D the addition of a second resonana! level allows the ionization step to be pumped by the visible dye laser fundamentals which have higher energy (-2 mJ / pulae) than the frequency doubled UV pulaes. The increaae in energy mo~ nearly aaturates the ionization step and results in a -50% higher efficiency than by acheme C (about the aame efficiency as acheme A). Scheme E is identical with acheme D except that the visible ionizing photons are tuned to match an aut.oioniz:ing energy level, producing a llignaJ enhancement of a factor of -5 over schemeD and suggesting that the ionization step is only saturated at the autoionizing resonana!. Similar ionization enhana!menta have been ob.erved for Gd (6) and U (7) when dye laaen we~ tuned to match aut.oionizing energy Ieveli.
The in aitu meuurement of the iaotopic composition of Os in aamples that aJao contain Re would require that the I87Re peak (62.6'Jo abundance iaot.ope) be auppr.aed to eliminate iaobaric interference with the 1170s peak ( -1.6'Jo abundance ilotope). A. a~ of the eelectivity of each as• ionization Kheme, we meuured the lJ20s+/ U6Re+ ratio without cor· rection for inatrumental fractionation (to an accuracy of -lO'Jo) for each sch.eme and normalized it to the true ratio of theBe stable iaot.opea in the synthetic sample calculated from the 0. and Re cxmceutntions and natural illotopic abundances. Since there WUIO!De variability in the ..aos•;•&• ratio for different enef1Y levels following a given ionization acheme, we have plotted in Fi(ure 6 the 1120s• ; •&• ratio for the energy levels with the maximum .electivity for each ecbeme. NODnliOD8Ilt ionization by 307.9-nm pbotona (scheme A) was alightJy mo~ efficient for Re than for Os and ahowed a -30'Jo Re enbancemenL The addition of an Os reaonant atep to the excimer photoDJ (scheme B) enhanced Os ionization by 88
much 88 3-fold. For resonance ionization uaing narrow band
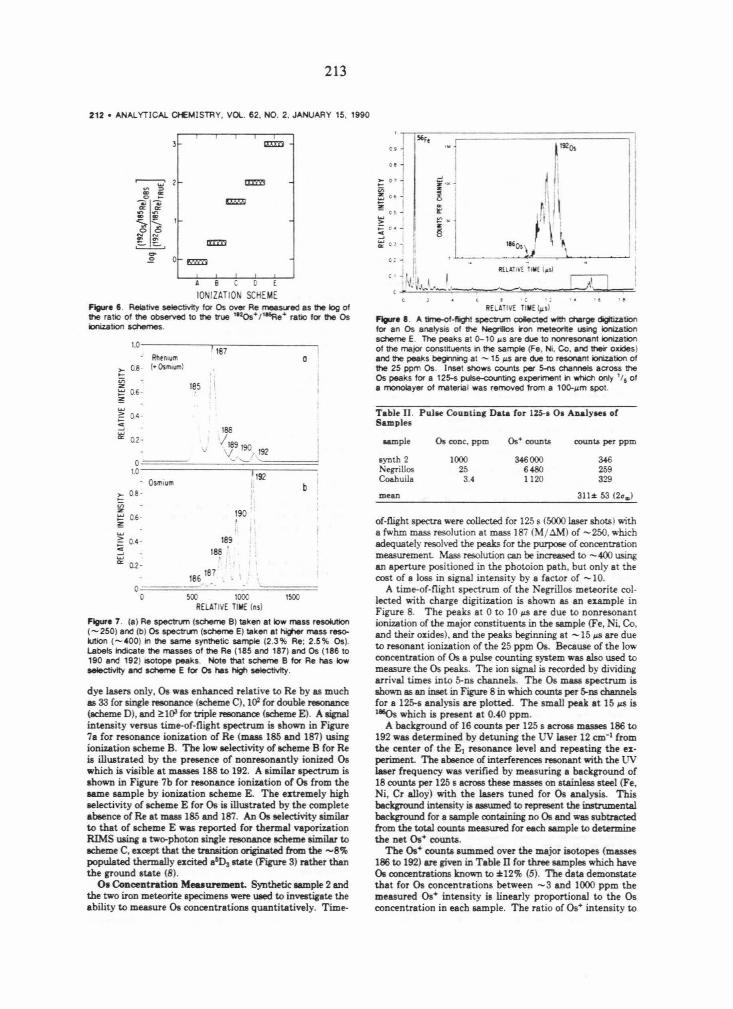
213
212 • ANALYTICAL CHEMISmY, VOL. 62, NO. 2. JANUAAY 15, 1990
B C D l
IONIZATION SCHEME Figura 6. Relative selectivtly for Os ov. Re ~ed as !he log of !he ratio of !he observed to !he true "'Os• t'"'Re+ ratio for !he Os ionization schemes.
I.0------.-,:::8::-7-------Rhtnlum
>- 0.6 (• Osnwum) .... u; z 185 ~ 0.6 -;!0
.... ~ 0.' ~ ~ 0.24
~ 08-u; z ~ 0.6 · ;;!; .... ~ 0 4-
~ "' 0.2·
Osmoum
189 188 •
190 I
192 I.
0
b
186 18_7
o========~----~~====== 0 ~ IOOC ,~
RELATIVE Tl lo!E (nsl
Figura 7. (a) Re spectn.m (scheme B) taken at low mess resolution (-250) and (b) Os spectn.m (scheme E) taken at hlg>er mass resolution ( -400) In !he same synlhetic sample (2.3% Re; 2.5% Os). labels Indicate !he masses of !he Re ( 185 and 187) and Os ( 186 to 190 and 192) Isotope peaks. Note thai scheme B for Re has low Mle<:tivlty and ~Cherne E for Os has high selectivtly.
dye lasers only, Os was enhanced relative toRe by as much as 33 for single reeonance (scheme C), 10:Z for double~ (echeme D), and ~1()3 for triple reeonance (echeme E). A signal intensity ve1'11us time-of-flight spectrum is shown in Figure 7a for resonance io.nization of Re (mass 185 and 187) using ionization echeme B. The low selectivity of echeme B for Re is illustrated by the presence of nonreaonantly ionized Os which is visible at IJlllllaeS 188 to 192. A similar spectrum is shown in Figure 7b for resonance ionization of Os from the u.me sample by ionization &Cheme E. The e:rtremely high selectivity of echeme E for Os is illustrated by the complete absence of Re at mass 185 and 187. An Os selectivity aimilar to that of echeme E was reported for thermal vaporization RIMS using a two-photon single reeonance scheme aimilar to acheme C, except that the tl'anaition originated frool the -8% populated thermally excited a6D3 state (Figure 3) rather than the ground state (8).
0. Coaceatratioa MeullJ"elDeelt. Synthetic umple 2 and the two iron meteorite specimens were ~ to investigate the ability to measure Os concentrations quantitatively. Time-
192as
oel !··- I I ~ 0) 1
!li1 c. -
.1\ i\ ~ ' iS
c ~ - ~ .... I r] "'as\ t I \ ~~ > ;:. ' . -1 ... -'
f.
~ n -,
c.; -,1 '.
lt[LAJ.V[ liW[ lp l
'· -tv ' 1 IT' ( •lJ.,.. _, •' ----t . , :
RELATIVE TillE (jlsl Figura a. A tim&-of-fight spectn.m cole<:ted wtth cnarge c19tization for an Os analysis of the Negrilos Iron meleorite using Ionization SCheme E. The peaks at 0-10 ILS are due to nonresonant ionization of !he major constiluents in !he sample (Fe, Nl Co, and 1helr oxides) and !he peaks beginning a1 -15 1L5 are due to resonant ionization of !he 25 ppm Os. Inset shows CO\XIts per 5-ns Channels across !he Os peaks for a 125-s putse..eounting experiment In which only 1/ 5 of a monolaye< of material was removed !rom a 100-,~-~m spot.
Table II . Pube Counling Data for 125-• Oa Alla.lysea of Sample•
aampl• Os cone, ppm 0s• counu counu per ppm
synth 2 ) ()()() 346000 346 Neg-riUos 25 6480 259 Coahuila 3.4 1120 329
mean 311 ± 53 (2a.)
of-flight Spectl'll were collected for 125 s (5000 laser shots) with a fwhm mass resolution at mass 187 (M / ~) of -250, which adequately resolved the peaks for the purpose of concentration measurement. Mass resolution can be increased to -400 using an apen.ure positioned in the photoion path, but only at the cost of a loss in signal intensity by a factor of -10.
A time-of-flight spectrum of the Negrillos meteorite collected with charge digitization is shown as an example in Figure 8. The peaks at 0 to 10 ,.s are due to nonresonant ionization of the major constituents in the sample (Fe, Ni, Co, and their oxides), and the peaks beginning at -15 ,.s are due to resonant ionization of the 25 ppm Os. Because of the low concentration of Os a pulse counting system was also used to measure the Os peaks. The ion signal is recorded by dividing arrival times into 5-ns channels. The Os m81& spectrum is shown as an inset in Figure 8 in which counts per 5-ns channels for a 125-s analysis are plotted. The small peak at 15 ,.sis 1"0s which is present at 0.40 ppm.
A background of 16 counts per 125 s acr016 masses 186 to 192 was determined by detuning the UV laser 12 cm-1 from the center of the Et resonance level and repeating the experiment. The abeence of interferences reeonant with the UV laser frequency was verified by measuring a background of 18 counts per 125 s aCl06S these masses on stainless steel (Fe, Ni, Cr alloy) with the lasers tuned for Os analysis. This background intensity is aaaumed to represent the instrumental background for a sample containing no Os and was subtracted from the total counts measured for each sample to determine the net es• counts.
The es• counts aummed over the major isotopes (masses 186 to 192) are given in Table ll for three samples which have Os concentrations known to :i: 12% (5). The data demonstate that for Os concentrations between -3 and 1000 ppm the measured es• intensity is linearly proportional to the Os concentration in each sample. The ratio of es• intensity to

214
Os concentration (relative ion yield) is constant to within -20% for all three samples and the data defme a linear calibration curve whose slope, 311 * 53 (2"• ) es• count& per ppm Os, can be used to determine Os concentrations in samples of similar bulk composition.
The mean relative ion yield and background count rate were used to calculate the minimum detection limit for Os in metallic Ni-Fe phases. Following the treatment of Ziebold (9) we calculate from Poisson statistics that the detection limit for Os at the 95% confidence level is 41 ppb for a 125-s analysis and 7.7 ppb for a 3600-s analysis. We note that a 3600-s analysis would consume only ca. six monolayers of the sample.
Variations in the relative ion yield due to matrU effect& should depend primarily on the sputtering rate of the sample as long as the dominant sputtered species are neutral atoms. Therefore, sputtering rates must be determined for each target material analyzed. Considerable data exist for pure elements which indicate variations of up to a factor of -3 (10). Sputtering rates of most multielement matrix materials are unknown and will have to be measured. If large populations of ions or molecules are produced during sputtering, the population of sputtered neutral atoms available for photoionization will be diminished and will cause shifts in the relative ion yield.
U~~eful Yield. The useful yield is defmed as the ratio of ions detected to atoms present in the ion source. The useful yield is determined from the ratio of es• ions detected per laser shot to the number of Os atoms sputtered from the sample per primary ion pulse. The mean relative es• ion yield corresponds to 0.062 count per ppm per laser shot. The amount of target material sputtered per primary ion pulse can be estimated from the sputter yield of pure Fe and Os under bombardment by 3.5-keV PJ• ions, which for both Fe and Os is 2.5 atoms per PJ• ion (10). With a primary ion current of -2.0 p.A and a pulse width of 0.20 p.s, 2.5 x 1()6 ions strike the target per pulse and, therefore, approximately 6 .3 X 1()6 Fe atoms are sputtered per pulse. Assuming that trace levels of Os are sputtered at the same rate as the Fe matrix, 6.3 Os atoms v.-ill be sputtered during each pulse per ppm of Os in the sample. Dividing the mean os• counts per laser shot by the number of sputtered Os atoms per primary ion pulse gives a useful yield of 10· 2• The Os mass spectrum for the 25 ppm Os sample shown in Figure 8 was collected during 5000 primary ion pulses (125 s) by sputtering 7.8 x 1~ Os atoms (1 j 6 of a monolayer in a 100-p.m spot) and detecting 6 .5 X 10' 0s• ions.
The useful yield of the experiment described here appear!i to be considerably higher than that reported for other m888 spectrometric techniques for Os analyais. However, in making such a co.mparison one must consider that the typical operating conditions (for instance, the mass resolution and the required sample preparation) of the various techniques differ markedly. The useful yield for resonance ionization mass spectrometry of chemically separated Os vaporized from a thermally pulaed filament baa been reported at -10·7 (8) and the useful yield of inductively coupled plasma mass spectrometry of chemically separated Os baa been reported at 1~ to 1(/6 (11) . We have determined the useful yield for 0s analysis by ~ndary ion m8ll6 spectlOmetry to be -1~ uaing the Caltech Cameca IMS 3-F ionprobe with a o- primary ion beam and a metallic Oa target. Osmium analyses have also previously been made by thermal ionization of oxide species (12,13), ~ndary ion mass spectrometry (14, 15), accelerator mass spectrometry {16), and laaer ablation maaa spectrometry (17), but useful yields have been been reported.
Applications. In situ Oa and Re concentrations can now be measured at the aub-part-per-million level in conducting
ANALYTICAL Ct£MIS"ffiY, VOL. 62, NO. 2, J1.NUARY 15, 1990 • 213
and semiconducting materials with a fwhm beam diameter of -70 p.m using SARISA. The linear dependence of the es• signal on Os concentration allows the use of synthetic and well-cl!aracterized natural standards for quantitative analysis. Minor changes in the experimental conflgUIIltion should allow analyses of most high IP element& including all of the Pt-group elements. These measurement& may be applied to geochemical studies related to chemical fractionation and diffusion in metallic and sulfide phases in meteorites and terrestrial rocks and ore deposit& as well as in phases synthesized in laboratory nperiments.
The SARISA apparatus used in this study use6 a low-resolution mass spectrometer (see mass spectra in Figures 7 and 8) and is therefore not appropriate for Oa iaotope ratio measuremenL However, the high useful yield and,aelectivity for Oa demonstrated here suggest that the SARISA photoion source may be superior to thermal vaporization as the ion source for Os iaotope ratio measurement& by resonance ionization. An important issue that remains to be resolved is whether the pulsed photoion source described here can be coupled with a mass spectrometer wtth sufficient mass resolution and abundance sensitivity for the measurement of Os iaotopic ratios with :!::1 % precision. If this can be accomplished, it will be possible to measure the isotopic composition of Os using much smaller sample sizes than needed for thermal vaporization resonance ionization. If measurement& can be precisely calibrated by using standards, in situ iaotopic analyses may eventually be possible.
ACKNOWLEDGMENT
We thank three anonymous reviewers, J . Whitten for technical assistance, J. Wasson for providing meteorite specimens, J. Blake for comments, and E . Stolper and G. Rossman for the use of furnaces.
Registry No. Os, 7~-2; Rh, 7440-15-5.
LITERATURE CITED (1 ) - · M. J .; Yeu>g. C. E.; Calaway. W. F.; &<.nett. J. W.; ~.
B.: Schweitzer. E. L: ~. 0 . M. M;x:t . lnstrurn. _1 .. 7. 818, 4-46451.
(2) Pearl. M. J.; Yeu>g. C. E.; ~. 0 . M . .5<:lomt1p .wraosc. 1111. 2 . 1353-1364.
(3) - · M. J .; ttahoky. W.; Calaway. W. F.; lk6nel1. J . W.; Schweitzer. E. L ; Yeu>g. C. E.; Jcr~ B.;~ 0 . M. J . V.c. Sci. T«:McJ/ . 1117. 85. 1·77-1.81.
<•> BUn. J . 0 .; Wauert><rg. G. J .; ~c:t.on. I. 0 .; Beci<e!1. J . R.; SU>Iper. E. M. Geoc:nm. Cosrnoc:Nrn . AC1a 1lat, 53 . ~9.
(5) Pemid<a. E.; Wasson. J . T. a.ocnm. Cosrnoc:Nrn . Ac:IIO 1117, 51. 1717-1726.
(8) RWn<e. H.; - · P.; Sa~. P.; Trautmam, N.; IWmnam. G.; -... W.; ""-· F.;~. H. J .; Ollen. E. W. In.....,.,.. lonlulfon 5p«trost:cpy ; Hln1. G. S .. Morgan. C. G.. Eds.; 1,._ of flhr*a eom.r.- s.n.o No. II'; I,_. of Physics: llrto1ol, 1887; pp 235-238.
(7) Janes. G. S.; IM"Ig. 1.; Pita. C. T.; t.vy. R. H.; ~. L IEEE J . a..tmm~. 1171. OE-12 . 111-120.
(8) Wal<er. R. J .; F-. J. 0 .; Travll. J . C. ln .....,.,.. lonlullon ~y; Luca1Drto. T. B .• Paries. J . E., Eds.; I~ of Physics Conference s.n.o No. e.; 1..- o1 Physics: 11rto1o1. 1889: pp 337-3-42.
(8) ZiM>ot!. T. 0 . AMI. Olam. 1H7, 36 . asa-M1. (10) ""'~ N.; Y.,.,..,.. Y.; lll<awa. Y.; Itch. N.; l<az\mala. Y.;
Myegawa. S.; - · K.; Sl*nizu. R.; Tawara. H. Enrgy Dependence t1l,.,. Y"- <>f lon-lrdlt:«J Sputlettlp <>f M>nolllml: SOII:II ; 1-ol ~ Physk:a: Hegoya. Japan. 1813.
(11) R..u. G. P.; Bazan. J. M. A/W. Olam. 1 .. 7, 51 . 884-819. (12) Hlr1. B.: Tllon. G.; Han-. W.; Hollmall1e<. W. In Ew1h Sc:ianot M>d ~; Goiu. J .• Golcl>erg. E .• Eds.; Nor1h Holand: ~. 11163: pp 273-280.
(13) Han-. W.; Wallie. R.; ~ P.; Kopp. E. In ~caw Olftlp M>d ~ aiLDw~CouminQ ; IAEA: Vlanna. 1867; pp U8-S08.
(14) Uld<. J . M.; ~e. C. J . Alliin 1113. 3C2. 130-132. (15) W::1<. J . M.; ~e. C. J . EOS 11M. 57. 383. (18) Tang, R. T. 0 .; Fehn. U.: Emono. 0 .; Hanwric1<. T. K.; Kl.tll<. P. W.;
Gow. H. E. Mx:IMt IMinln . ~. "'rys . lies . 1 .. 7. 829 . 281-285.
(17) smons. o. s. 1m. J . Allul ~. ion ,.,..._ ttU. 55. 1S-30.
(18) loleggers. W. F.: Corlu. C. H.; Sc:tbw. B. F. T- <>f NBS Sj»ccral Li>e 1- Part I . 2nd ad. U.S. ~ of c:omn.ca. Na-

214
215
tloniJ lkneu of Slanclorca lolor'q'aph 145: U.S. CkNwnrTWII Pr'rlllng omce: WUIWIQton. DC. 1875.
R!x::ErvED for review May 9, 1989. Aooepted October 24, 1989. This study was performed as part of a doctoral dissertation by the senior author at the California Institute of Technology
(Caltech). Work was supported by the U.S. Department of Energy through BES-Material Sciences Contract W-31-109-ENG-38 to Argonne National Laboratory and BES-EngiDeering and ~iences Grant DE-FG03-88ER13851 to CaJtech. Caltech Division of Geological aDd PlaDetary ScieDC81 Contribution Number 4759 (675).

GtodUift.ICIJ ~ ~ .AcU Val )4. pp. l 'lS-111 ~• C 1990.........,,.,_111<-_•o U.S.A
216
001 .. '1031190/13.00 • .00
LElTER
/11 sit11 measurement of osmium concentrations in iron meteorites by resonance ionization of sputtered atoms
JOEl D. BLUM,1.2.oo M . J. PauN,' W . F. CALAWAY,' C. E . YOUNG,' D . M. GRUEN,' I. D. HUTOiEON,2 and G . J . WASSERBURG2
'Materials Science. O>emisuy. and Chemical TccltnolocY Divisions. AIJonne National Laborat~ . A"lonne. IL 60439, USA 'Lunatic Asylum of the Charles Arms Laboratory. Division of GeoiQ~Jcal and Pia new)· Scien=.
Califonua lnstitutt ofTechnoiOCY. Pasadena, CA 91125, USA
(Rrcrived D«mtber I, 1989; accqxrd in l'n'ised/onro FmrutJry 2, 1990)
Abstract-Resonance ionization of sputtered atoms followed by time-of-flight mass spectrometry was used for in silu quantitative measurement of Os with a spatial resolution of -70 ~o~m . Osmium concentrations in synthetic mews and iron meteorites~ measured to demonstrate the analytical capabilities of the technique. A linear correlation between 0s• signal intensity and the known Os concentration was observed over a range of nearly 10" in Os concentration with an accuracy of- ±10%, a minimum delCCtion limit of 7 pans per billion atomic, and a useful yield of I%. Resonance ionization of spunered atoms samples the dominant neutral-fraction of spunered atoms and utiliz.es multipboton resonance ionization to achieve high sensitivity and to eliminate atomic and molecular interferences. Matrix effects should be small compared to secondary ion mass spectrometry because ionization occurs in the gas pba.se and is largely independent of the physical properties of the matrix material. Resonance ionization of sputtered atoms can be applied to in situ chemical analysis of most high ionization-potential elements (including all of the PI-group elements) in a wide range of natural and synthetic materials. The high useful yield and elemenw selectivity of this method should eventually allow the in situ measurement of Os isotope ratios in some natural samples and in sample extracts enriched in PI-group elements by fire assay fusion .
INlllODUCJlON
ADVANCES IN THE understanding of trace element geochemistry are often limited by the sensitivity and spatial resolution of available analytical techniques. Resonance ionization mass spectrom~ (RIMS) is developing a.s an analytical method with important applications in isotope geochemistry (e.g., W Al.KER et al., 1988; THONNARD et al., 1987) and may~ vide the basis for a new method of in situ trace element and isotopic analysis. We have recently established a RIMS technique that takes advantage of the high efficiency and elemental selectivity of multiphoton ionization. allowing in situ detection of su~pan per million atomic (ppma) concentrations of Os (BLUM et al., 1990). The experiments, which couple RIMS with ion sputtering. ~ carried out using the SARISA (surface analysis by resonanc:e ionization of spuuered atoms) apparatus developed at Al)onne National Laboratory (PEu.IN et al., 1988). Several ocher JrOU1)S ba-..e U!ed a similar approach to achieve ultrasensitive detection of impurities in synthetic materials (PAJlKS et al., 1988; PAPPAS et al., 1989).
Geocbcmical lllldies of the platinum JI'OUP elements (PGE: R.u, Rh. Pd, Os. lr, PI). which are present in most rocks and minerals at the su~ppma level, bave been mostly limited to bulk chemical methods such as radiochemical oeutron activation analysis or isotope dilution. Electron miaoprobe X-
• Prrsml Dddress: l...wJatic Asylum o(the a.ries Arms Laboratory, Division of GeoiQiical &Del Pla.oewy ScieDca. Califomia I.Dititutc ofTechnoioiY. Paadeoa. CA 91125, USA.
175
ray analysis is the most widely used in silu analytical technique in geochemistry, but the detection limits for PGE (- I 00 ppma; CROCXET and CABRl. 198 I) are not low enough for most applications. Interest in the distribution of PGE at low concentrations in sulfide ore minerals and in meteorite phases has led to the recent evaluation of several new techniques for in situ measurement of these precious m~s. Accelerator mass spectrometry has been used to measure Os, lr, and PI concentrations in iron meteorites with a detection limit of <I to 6 ppba. but with a spatial resolution of only -1 mm (TENG et al., 1987; RASMUSSEN eta!., 1989). Particleinduced X-ray emission and synchroton X-ray Ouorescence bave been used for analysis of Ru, Rh, Pd, and PI with detection limits in the range of 1-20 ppma and a spatial~ lution of <10 jllD (CAliRI et al ., 1988). Finally, !leCOodary ion mass spectrometry bas recently been applied to the analysis of Pd, Rh. lr, and PI with detection limits in the ranac of 20-300 ppba (CHRYSSOUUS et al., 1990).
Tbe measurement of the isotopic composition of small quantities of Os bas long been recognized as an imponant analytical JOal in ~CQChemistry because of the aeochemical IIPJIIications of the radioactive decay of 111Re to 1110s (halflife • <t.2 x 1010 a; I...INDNER et al., 1989). Tbe high ionization potential (IP) ofOs (8.6 eV; 69,000 cm- 1
) precludes the use of conventional thennal ionization mass spectrometry. Osmium isotope ratios bave been measured by electron impact Mmization mass spectrometry of the volatile OsO. species using MlarJe~ ~Csamples ofOs (HEJUt et al., 1967). Secondary

217
876 J. D. Blum et &1.
ion mass spectrometry (SIMS) has been used succ:essfully to measure 05 and Re isotopic ratios to a precision of -1" aft.erchcmic:al separation of~ ln&of05 (l...ucK and Allh:iRE, 1983). Seven! other methods including accelerator mass spectrometry (TENG et al., 1987), laser ablation mass spectrometry (SIMMONS, 1983), and inductively coupled plasma mass spectrometry {Russ et al., 1987) ha~ been explored for 05 isotopic measurements but presently either require ~er sample sizes or have inferior precision of SIMS.
Resonance ionization mass spectrometry foUowina pulsed thmnaJ vaporization has recently been shown to have similar capabilities as SIMS with respect to sample size and precision for 05 and Re isotope natio measurements (WALX£R and FASSETT, 1986). This technique, however, is limited by the low 05 ionization efficiency due to the large mismatch between the duration of the ionizing laser pulse and the thermal vaporization pulse. By closely matching the duty cycle between a pulsed primary ion beam and ionizing lasers.~ nance ionization of spunered atoms has the potential for an -10' increase in ionization efficiency compared to thermal vaporization RIMS and an -1()2 increase compared to SlMS (BLUM et al., 1990).
In this study we report our progr= toward examining the capabilities of resonance ionization of spunered atoms for quantitative geochemic:al analysis of one of the PGE (05) in natural materials. Synthetic metals were used to establish a
calibnation curve for Os.. and a suite of iron meteorites with known bulk 05 concentrations were analyzed to test tbe linearity of tbe 05• signal with concentration. We will exhibit data which show that resonance ionization of sputtered atoms can be easily c:alibnated and may be used for in situ cbemic:al analyses of PGE in a wide ra.nae of natural and synthetic materiah. We also discuss the potential of this technique for the hi&h efliciency measurement of 05 isotope natios.
EXPEIUMENT AL METHODS
SDmp/n
Synthetic and meleOritic samples o( metallic IDiid solutions were analyzed. The synthetic samples consist of Os and Re dissoi\'Cd in a Ni matrix. They were produocd by wei&hin& ~ powders and then meJtina. crystallizina. and anDCalinc the meuls in alumina crucible$ in a vmical..quencb controiJed..atmospben furnaot (BLUM et al., 1989). Th~ synthetic samples were DOl oriaina!Jy inlended for usc as analytical standards. and some have weiahina unoe:ruintics introduced durin& sample ~tion thai could readily be reduced. The synthetic sam pi~ wed as a IWI<brd in lhis study conwns 1000 ppma Os and Re ( :::4'1. ). Two other syntbetk samples thai wm: analyzed contain Os and R~ at the 100 pp~ (±25'l) and 10 ppma (:.35%) levels. Th~ meteoritic samples are the metallic Fe-Ni bmacitt plwoe &om three fYJX !lAB iron meteorites which contain bmaci~e as the only metallic phase. one type lAB and o~ fYJX lliAB iron meteori~e. both of which contain two Fe·Ni meW!ic phases (bmaci~e and raeDirt). and one pallasite wbicb also contains kamacite and 1aeru1e. Samples were cut into wafus. poli.sbed with diamond pas~e and mounlt:d on1o su.inless steel stubs with conductin& e-poxy. The bulk
Sample 'Oo CXliiC. 'Oo cax. '0& cax. VWV· ppma RNAA ppma lD ppma
SYN'THE11CS (lalioo I) NHA-Re 1000 tOOO 1.04110'
Ni.O..Re 100 17.3 ~0.()()
1.78110'
Ni.O..Re 10 12..5 ~0. 18) ~10'
WUB)
METeORITES (lalioo 2) NHA-Rc 1000 1000 3.46110'
NtJnllal 25.3 14.8 ~0.2A)
1&.7 6.Aa<IO'
EaJIC SlaUCll 4..50 4.85 ~0.20)
1.611110' ~0.26)
Coabuila 3.41 3.19 1.1 1.110' (±0.()()
Nonb Chile O.lol 0.38 0.40 1.40110' ~0.26)
WElEORrTCS (11011100 3) No.O..Re 1000 tOOO 1.46110'
(±0.12) HCIIbwy 4.811 3.90 4.00 5.112110'
Eack SWian 4.50 4.01 ~0.92)
5.861110' ~0.58)
c.a,a. Dlobm 0.6$ o.61 o.60 II.IIS%10' ~1.70)
~ dounDiDed Fll•iiilttliallly duriDc ~ ~ ~ detcrmiDod by RNM (Petni<b and W.an, 1!1117; OM&. t977). 'Canaonlt8IIOD dactmiaod by iootope diluUCll (Herr., Ill. , 1961~ 'SARlSA Oo CXliiCallntJCID llllr1mlized lO 1000 ppma aand8n1. 'Man d 1101 Oo • COlllll per 125 oet ..r,.a b Cllbcr 2 or 4 .....,..,. ~~~~~ Mltc.:led~

218
Nev. metbod 10 measu"' Os in silu 177
CODCaltration of 05 ill dlt meteoritic am pies bas been prrviousl) da.ermiDed by radiodlemical oeutron ecuvauon analy51s (RNAA) with a rcporud precision of: 12~ for 1M iron mncorius CPE:RNICKA aDd WASSOt., 1987)ud :14'll· fortM pallasitt(DAVIS. 1977). Com· ..,Doll oftbele RNAA dala with poTYious RNAA and isotope dilution (ID) detrrmiD&tions iadicaleS ~ ip'Cimltnt within - :20'1-(PBHJKA &Del WASSON, 1987. and rdereoas tberein). Tbt 011ly li&· 8ificaut clilcrepancy i5 (or NEGRJUOS where dlt ID valut or HEitR n al. (1961) is -40'7. ~than the RNAA valut ofPE:RNICKA and WASSON (1987). Tbe umes of each ortM samples anal)'led and thc 05 aJDCniJ'atioas in ppma delermilled by RNAA and 10 art si~n ill T.tllr I.
Appauuw
Tbe aprrimntts ~ performed usin& tM SARJSA apparatus (PE:u.J,.; et al .• 1988: 8UJto4 n al_ 1990) which oonsisu ofthret main Slbuniu: a pulled primary ion toun::c. thret pulsed tunabk 1astrs. aDd 1.11 ~· &Del aocular rd'ocusin& tirM4-IIi&ht IIIlA spcarom· eser. A mass aoal)'led ~ kcV ,.,. spuneri111 beam with an averagt cunnt o( 2.0 ,.A and a full width at half mwmum (fwbm) diamncr o(-70 ,.m is produced by a Colutroo ion JUn. Durin& analyses. the primary ion beam is c:boppcd into puhes or 200 mec width b~ el«lrOSUitic ddltoctioo at a 40 Hz repetition rate. Tbt Ar' ions suikc the WJet in an ultra·biJh VK'UUm chamber pumped to a bast pressu"' o( ~ X 10' 10 torr &Del opented I I a pressu"' of -I X IO' 'torr dunn& ualyses. Tbe spunerin& rat< in tM 40 Hz pulsed mod< is -10 min per IIIODOiayer of WJe1. Sputi<T'ed species lill a YOiume abo~ thc WJel durin& &Del after the arrival or the pri~ ion p~. Durin& spunmac. tM ~is held at a I . ~ kV pocential; inoom•111 Ar' ions ~decelerated 10 3.~ keY and positi~ leCODdary ions produced b) spuncrin&art aa:deTaled to I.S keV. Tbt unwanted econdary ions ~ DOt IJ'aDSIDitled tbrou&h the IIIISii spcctrOmCU:r, 'Wbicb IS dcsi&ned 10 accq~~ ions with 1.0 ± 0. 1 keV ~·
Approximately 300 115« aftCT tM end or cad! primary ion ,pulse a XeCJ n cimer laser is 6red produciJllan -10 IIKC. 200 mJ ultra· violet (UV) pulse with a bandwidth of0.3to O.S om emitted about 307.9 om. Tbe nc:imer output is split into thret beams which art used 10 pump three tunabk dyt Jasen (loaded •ith Rhodamine 590. Coumarin 480. &Del OCM dyes. respeai~l~ ) 10 prod~>C"r three beams o( visibk baht. Tbe Rbodamine dye laser's visiblc Iicht our.put is freq~~e~~cy doubled in a non-linear cryst.al to produce UV pulses. The thret IIIIer beams art spatially and tCTDporally CMrlapped in a volume that ntmds from about 0.5 10 I.S mm abo~ the 11tJct surfaot and bas a diameter of -1 mm. Pbotoionization of sputi<T'ed neutral Os atoms occurs •ilhin this volume followioa a three merJY Je,.eJ resoa.ancc ionization tchetM which utilizes raonant etltl'l)' ~vets for 05 at 34365 and SS402 em· • and an autoionizin& raonao~ merJY ~I at 71032 em· • (rta. 1 ). This ionization scheme bas an elemental aelectivitv for 05 rdative 10 Re and OlhCT PGE or> I 0' (BlUM n al .. 1990). The time dday berwern the end or the primary ion pulx and the 1uer 6rina is prccixly adjusted to muimi.u the number or sput· !<red atoms in tM ionization volume. which depends on tM velocity 11istribution of the sputtered atoms or interest. Positively clwJed 0s· ptaocoioas art aa:oeleralal away from the WJe1 &Del art focu.ed in the tim«JJ'-Giaht mass IP«bOmetcr by a aeries or eioz.eJ lemr$. delec:tioe plates. &Del two bemispheric:al eoerJ)' analyzer~ Ions are de· l«1ed with a c:heYroo-typt miaodlaDnd plate dectroct muhiplier. and arrival times art I'IICIOI'ded in S a.r wiDdc7wl by a puie<:owltin& ay11aD at low lipallr..as (S I 0 aJUDIS per laer lbol) or by a tmiSient dlafF diliti= at Jaicbc:r lipalie..as (> 10 COUDts per luCT lbot).
AMI}fial/~~
Prior 10 ext~...,._ a 2.0""' direct curmn Ar• tam-Jallerlld ~ dlt ample for 2 min in a 2.S x 2.S mm .. nem 10 remove -40 IDODOia)'en oftM laf'IC\ and npo~e a deaD surfacr for analysis. Ead! aoa/yli5 allllisled olwmtnin& the counts io ad! S ma: dlannel for 1 period o/125 ec at a repetition mr of 40 Hz (5000 pulws). Tbe 1000 ppma ample p~ a 0s• aJUDt 1'111: hilh aiOIIIh 10 aturate dlt puilr-<~DW~tiD& sys1m1 for the- abundant Os ilolopes. Tbmfcft. tlliiiUDple - aoalyJled .... boUI tmiSient c:huJr dilitilation and puile<ountiac. It - 6nl analyzed by dlai'Jfl dilitization with a DOf1llal primary ioa pu11r width or 200 11111t and - dlto analyzed wi1b a 1t1orur pullr widlh of 20 a.:. Tbt ill~ Os' 1i1naJs
• f!OJ? &Jm:l
MfO/ .::-. ~
• 0 4 = -E, ""' ~
J · ~ .... 1•290.906
FIG. 1. EnerJ>· ~vel di.q:ram for Os raoD&DCe ionization ICb~me. Resonant eDefD ~ (£ 1• £ 1 • £,) and tM ionization potenual (J.P.) arc Jivcn as em·• in vacuum. and laser wavelcoJI)u are si~n as om in air. Electronic oonfiauration and IDJUiar momentum quantum numbers (J) art also si~n.
_,., used to calculate a oon-.enion factor for the roduction in pulse width. The I 000 pprna am pic was tMD analyzed with the pu~x. oountina system &Del a 20 ~~~a: primary ion pulx. and tM oouo1 rate was multiplied by tM oon-.enioo factor 10 Jive the equivalent count mr with a 200 nsec primary ion pulx width. All 0\bcr samples were analyzed with the pulx-countiD& S)'Siml and a 200 DSeC pri~ IOn pulse width.
For Os isotopes. unit mass raolution corTeSPOnded to a difference ill pbotoion arrival time of approumately 120 a.r (24 cbanoru). Since the mass spectrOmC\t'r was operated at low IDIS5 raohinc power (M/tl.M - 250. at fwbm). oei&hborin& Os isotopes were not fuU~ resolved &Del tM toW ion lipal was mcasurod by summin& the total Dum~r of counts in tM channels between mas.tes 185.5 and 192.5. The net 0s• intensit)' for cacb sample was calculated by subtracti!ll the average bacll&round inttnsity from tM total. Each samplc was anal)ozed at least twice and tM total number or counts_,. 1~. Tbt t.cqround was determined b) collcctiD& analyx:s in trvmal ways: I ) tM UV d~ luer was dctuned 12 em·• from the ~ntCT of 1M 6nt raonaot mctJY ~vel and an a-. or 16 counts per 12S ICC were measured; 2) tM UV dyt laser beam- blocked and an average of IS counts per 12S ICC_,. masured: and 3) all three of tile luCT beams were blocked and an a-. or 4 COUDts per 125 ICC
MrC masured. Tbt abltnct or iotcrfermces reiOIWII with the UV hqumcy was -mec~ by aDIIyzioa lllillles Sled fi:tr 0s and re::ordioa ooly 18 counts per 12S ICC. Tbt bacqrouod data iDdic:ate that oonlributiolls 10 tbe t.cqrouod lienal art from two IIIIIJ'Ca: I ) dcotuocic _,. and/or ICCOIIdary ions 'Wbicb CODtributt -4 counts per I 25 IIIC, &Del 2) pbotoioos produced by DOnl't:IOIWit ionization &Del/or .._ablation from tbt Yilibk d~ luCT beams wllicll contribute -12 COUnts per 125 ICC. For tM aperimetlts reponed .,.,.,_ tilt average t.cqround o/16 counts per 12S ICC i111111med to ftl)l'l!llmt iDSU'll· ma~tal beckpound for a ample cootaioina no 05. Tbt bacqround CIOmlCliOII i5 ooly Jilni6c:aDI for analytes or amples CODtainiD& subppma Os CODCCDtrations.
EXPEJUMENTAL RESULTS
ANllyrical data
The analytical data for synthetic and meteoritic samples are Jivm in Table I, divided illto thnoe sroups which repraent
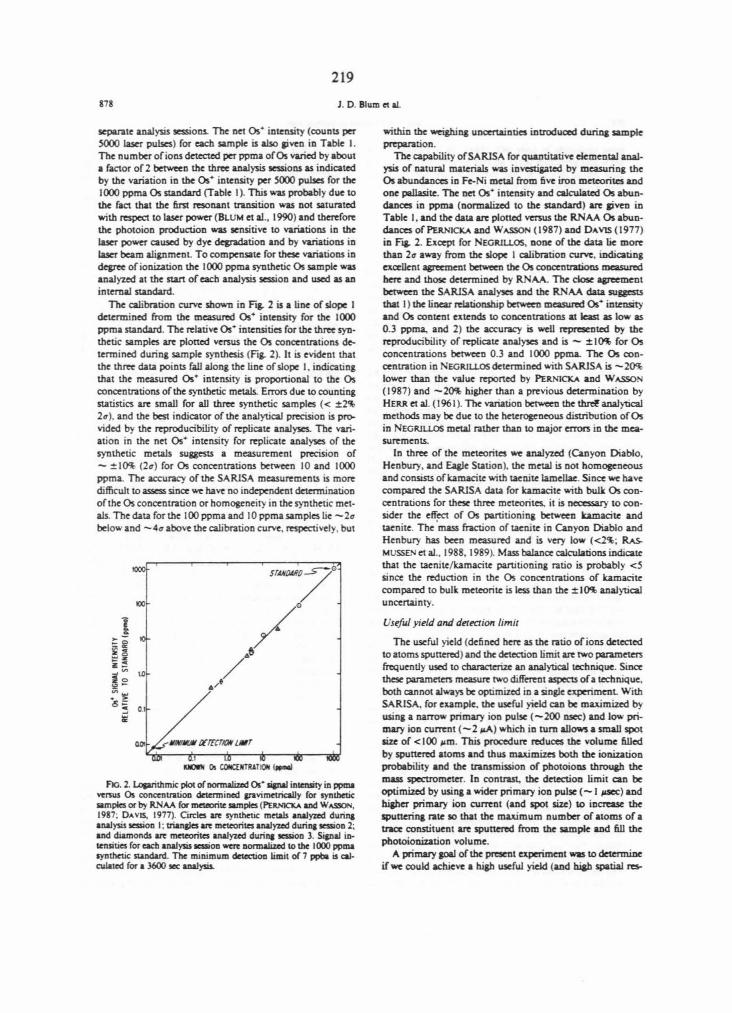
219
878 J. D. Blum et aJ.
separate analysis sessions. The net 05• intensity (counts per 5000 laser pulses) for each sample is also Jiven in Table I. The number of ions detected per ppma of05 varied by about a factor of 2 between the three analysis sessions as indicated by the variation in the 05• intensity per 5000 pulses for the 1000 ppma 05 standard (Table 1). This was probably due to the fact that the 6m resonant transition was not satunated with respect to laser power (BLUM et al., 1990) a.nd therefo~ the photoion production was tensitive to variations in the laser power caused by dye dqradation and by variations in laser beam alignment. To compensate for these variations in dqree of ioniution the 1000 ppma synthetic 05 sample was analyzed at the start of each analysis session and used as an internal standard.
The calibration curve shown in F11- 2 is a line of slope I determined from the measured 05• intensity for the 1000 ppma standard. The ~lative 05• intensities for the three synthetic samples ~ ploned versus the 05 concentrations detcnnined durin& sample synthesis (Fi&- 2). It is evident that the th~ data points fall alons the line of slope I , indicatins that the measured 05• intensity is proportional to the 05 concentrations of the synthetic metals.. Errors due to countina statistics ~ small for all three synthetic samples ( < ±2% 2a). and the best indicator of the analytical precision is p~ vided by the reproducibility of replicate analyses. The variation in the net 05• intensity for replicate analyses of the synthetic metals susgests a measu~ment p~sion of - :tiO% (2a) for 05 concentrations between 10 and 1000 ppma. The accuracy of the SARJSA measu~ments is mo~ difficult to assess since we have no independent determination of the 05 concentnation or homogeneity in the synthetic metals. The data for the I 00 ppma and I 0 ppma samples lie - 2a below and -4a abo\'e the calibration curve, respectively, but
1000
100
Flo. 2. Loprithmic plot of oonnaJ.ized Os. siplal intensity in ppma venus Os concentration drtermined sravimetrically for synthetic am pies or by RNAA for meteorite am pies (PEJU«XA &DC! W AS:SON, 1987; OA viS, 1977). Circles art synthetic mculs analyz.ed dwina analysis session I; trianaJes art meteOrites analyzed dwiD&te!liOn 2; &DC! diamonds art !Miearites analyzed dwina .Son 3. Si10aJ intensities for each analysis .Son were normaliud to the I 000 ppm.a synthetic SWidard. The minimum dcuction limit of 7 ppba is calcvlat.cd for a 3600 tee analysis.
within the wei&hin& UllOel"tainties introduced dwina sample preparation.
The capability ofSARJSA for qiWititative elemental analysis of natural materials was investipted by measurins the 05 abundances in Fe-Ni metal from live iron meteorites and one pallasite. The Det 05• intensity and calculated 05 abundances in ppma (normalized to the standard) ~ a:iven in Table I , and the data~ ploned venus the RNAA 05 abundances of PER.NicKA and WASSON ( 1987) and DAVIS (1977) in rJi. 2. Except for NEGRJllOS, none of the data lie mo~ than 2a away from the slope I calibration curve, indicatins excellent agreement between the 05 conoentr21ions measun:d heTe and those determined by RNAA. The dose aveement between the SARISA analyses and the RNAA data sugcst.s
that I) the linear relationship between measured 05• intensity and 05 content extends to concentrations at least as low as 0.3 ppma, and 2) the accuracy is well represented by the reproducibility of replicate analyses and is - :t I 0% for 05 concentrations ber:ween 0.3 and I 000 ppma. The 05 concentration in NEGRJU.OSdetermined with SARJSA is -20% lower than the value ~ned by PE.IlNICKA and WASSON (1987) and -20% bi&ber than a p~vious determination by HERR et al. ( 1961 ). The variation between the tbrcl analytical metbnds may be due to the heterogeneous distribution of05 in NEGRJLLOS metal rather than to major errors in the mcasu~ments.
In ~ of the meteorites we analyzed (Canyon Diablo, Henbury, and Ea&Je Station), the metal is not homogeneous and consists ofkamacite with taenite lamel.l.ac. Since we have compared the SARJSA data for kamacite with bulk 05 concentrations for these th~ meteorites. it is nec::essary to consider the effect of 05 partitionins between kamacite and taenite. The "mass fraction of taenite in Canyon Diablo and Hen bury has been measured and is very low ( <2%; RAsMUSSEN et al .. , 1988, 1989). Mass balance calculations indicate that the taenite/kamacite panitioning ratio is probably <5 since the reduction in the 05 concentrations of kamacite compared to bulk meteorite is less than the :t 10% analytical uncenainty.
Useful yield and d~«tion limit
The useful yield (defined here as the ritio of ions detected to atoms spu~) and the detection limit~ two panmeters frequently used to <:hancterize an analytical technique. Since these parameters meas~ two different aspectS of a technique. both cannot always be optimized in a sinsJe experiment. With SARJSA. for example. the useful yield can be maximized by using a narrow primary ion pulse (-200 nsec) and low primary ion current ( - 2 ,.A) which in turn allows a small spot size of <100 ~m. This procedu~ reduces the volume filled by sputtered atoms and thus maximizes both the ioniution probability and the transmission of pbotoioos throuab the mass spectrometer. In contrast, the detection limit can be optimized by usins a wider primary ion pulse ( -1 ,.sec) and hiaber primary ion current (and spot size) to increase the spunerins rate so that the maximum number of atoms of a trace constituent~ sputtered from the sample and fill the pbotoionization volume.
A primary pi of the prexnt experiment was to determine if we could achieve a high useful yield (and hi&h spatial res-

220
New method \0 mc:asurt 0s Ill Silll 179
olution) for hi&b ionization potential elements such as Os. Accordingly, a IWTOW pulse width and low CWTCDI of Ar• primary ions were wed, and no attempt was made to obtain lbe best possible delec:tion limit for Os. For some applications maximum useful yield and b.igJI spatial resolution are not as imponant as tbc optimization of delection limits. lD one such case it was possible to detect In in a Si matrix at the parts per trillion asomic level by usiD& a wide primary ion pulse (5.6 jlSeC), a hi&h ion current (-100 ,.A}, and alarae spot size (3000 ,.m) (PAPPAS et al., 1989).
The useful yie.ld is determined from the ntio of 0s· ions detccu:d per la!er shot to the number ofOs atoms sputtered from the sample per primary ion pulse. The 0s· ion yield per ppma for analysis session 2 (Table I ) oorrespoods to 0.069 counts per ppma per laser sboL The amount of WJet matcria.l spunered per primary ion pulse can be estimated from the spuner yield of pure Fe and Os under bombardment by 3.5 keY Ar• ions. which for both Fe and Os is 2.5 atoms per Ar• ion ( M ATSUNAMI et al .• 1984). With a primar) ion current of -2.0 ,.A and a pulse width of 0.20 jlSeC, 2.5 X I 0' ions strike the target per pulse and. therefore, appro~matdy 6.3 X t<f Fe atoms are spunered. We assume that trace levels of Os are spunered at the same r.ue as the Fe matrix, which is the expected equilibrium condition (LAM and WIEDER.ISC1i, 1987). In this case, 6.3 Os atoms will be spunered per ppma of Os in the sample during a single primary ion pulse. Dividing the Os counts per laser shot by the number of spunered Os morns per primary ion pulse gives a useful yield.of 1%. For cumple. the Os mass spcctiUm for the 0.34 ppma Os North Chile sample was coUccted during 5000 primary ion pulses (125 sec) by sputtering 1.1 X 10" Osatoms (1/sofa monolayer in a 100 11m spot) and detecting 140 0s· ions.
The 0s· ion yidd for analysis session 2 (Table I ) and the •venae background count rate ( 16 counts per 125 sec) were Uled to calculate the detection limit for Os from Poisson llatistics at the 95% confidence levd . FoUowiD& the approximation derived by ZlEBOLD (1 967) we calculate that the detection limit for Os for this experiment is 38 pans per billion atomic (ppba) for a 125 sec analysis and 7 ppba for a 3600 sec analysis. Increasing the UV dye laser power to saturate the fim J'C$0nant ttansition would increase the 0s• siJ!lal and reduce the minimum detection limiL For fuUy saturated transitions the useful yield would be expected to increase to -5%, as was adUevcd for Fe: analyses using SARISA (PEu.JN c:t al., 1988), and the minimum detection limit lbould be reduced to -2 ppba.
DISCUSSION
RQOnance ionization of sputtered atoms samples the larJe DeUtral fraction of moms that are sputtered, rather than the much smaller m:ondary ion fraction sampled by teoondary ioD mass spectrOmetry. Matrix-dependent variations in ~enlitivity lbould be smaller for pbotoionization than for spunerinitiated ICCOndary ionization because ionization occurs in the aas phase and is J.araely iodepc:odent of the physical Pf'OI>enies oftbc sample. Variations in relative ion yield ofeevenl arden of macnitw:k are common for ICCOndary ion mass lpeCU'Ometry (e.J., WIUJAMS, 1983) but appear to be much ka than a factor of 10 for J'C$OIWICC ionization oflputtered
atoms (PARX.S et al., 1988). The yield of pbotoions using SARISA should depend onl) on I ) the spunering rate of the IUI'Iple, 2) the relative spunc:r yield of neutral atoms. ion.s, and molecules, and 3) the extent of surface segrqation and/ or contamination during an analysis.
The Ar• ion spuner yields for most dements have been measured as a function o f projectile eneT'IY and vary by up lOa factor of -3 at3.S keY (MATS\.INAMI et al., 1984). Spuner yields for more complex multielement matrices are largely unknown and will have to be determined by weight loss or by profilomeuy of sputtered craters. We have used nonr-esonant excimer laser ionization to saturate the ionization of atoms and molecules in order to pin a qualitative underlland!D& of the ratio of sputtered atoms to spunered molecules. For samples of Fe-Ni metal. sulfides, and oxides. we have found that molecules make up <10% of the total sputaered species.
The relativr yidd of spunered secondary ions is strongly affected by surface properties such as the extent of oxygen coverage: (e.g.., H USINSKY et al., 1987). Secondar) ion yid ds can be higher than I 0% for low ionization potenual elements but are generally much lower than 10% for b.igJI ionization potential elements under ultra-high vacuum conditions (8ENNJNGHOVEN, 1975). Tbaefore. the yield of spunered molecules and secondary ions will not significant!)' deplete the population of spunered neutral atoms of Os (or other PGE) that are available for pbotoionization.
The high useful yield and elemental selectiviTy of resonance ionization of spunered atoms allo~ chemical and isotopic analyses to be made on small numbers of Os (or other PGE) atoms without the need for c:bemicaJ tepamjon. As discus5ed b) BLUM et al . (1990), the time-of-flight mass spectrometer used in these experiments is ~equate for concentration measurements but not appropriate for high precision ( < ±I 'i-) isotope ratio measurements of Os due to its low mass resolution. Resonance ionization of sputtered atoms can. in principle, be coupled with a magnetic leCtOr, quadrupole, or high resolution time-of-fli&ht mass specttometer for b.igJI precision isotope measurements. In this case, the precision of Os mc:a~ments would be limited primarily by ion counting statistics. Osmium occurs in acological materials diSsolved at low concentrations in sulfides, silicates, and spinels and as a major constituent in 11m-sized PGE-ricb sulfides and alloys. Osmium measurements of aeocbemical inte:rest can be srouped into the foUowing cateaoric:s: I ) in situ chemical anai)'ICS of Os (and other PGE) at low (sub-ppma) concentntioos, 2) in silu isotopic anai)'ICS of Os at low concentrations, 3) in si/11 isotopic anai)'ICS of Os in "m-sized PGE-rich aulfides and alloys. and •> isotopic anai)'ICS ofOs chemically concentratedfromaeo!Qiicalmaterials.
We can ux simple countiD& statistics to c:akuJate the approximate precision of05 concentration and 1110s!'"'s ~ tope ratio measurements that are potentially possible using this method. In an earlier section we demonstrated a useful yield of l'l>, whi<:b c::onaponds to 0.069 0s• counts per laser lbot per ppma of Os in a sample. Tbe experiments reported bere were run at a 40 Hz re:petition ntc:, but XeCI excimer Iuers are available whi<:b opente at repetition ntes of up to 200 Hz. For a I h analysis at 200 Hz we calculate that there would be 5 X 10' 0s• counts per ppma of Os in a sample.
221
880 J . D. Blum et al..
Based on the calculated count rates and countina statistics, we expect to be able to measure 05 concentrations in situ with a pre::ision of± I O'fo down to 2 ppba. and with a precision of±,._, down to 200 ppba. Tbe5e detection limits will allow the investiption of 05 partitionin& and solubilities in mineral phases from iron meteorites, teTTcstrial mafic and ultramafic rocks, and in phases synthesiud in laboratory experiments.
Most aeoloeical applications of 05 isotope studies require the measurement of 1170s/1"0s ratios with < ± ,.., precision (ALUGJt£ and l.uc'K, 1980). Our calcu1ations indicate that this should be possible for in situ measurements of samples with ~IS ppma Os. This is a considerably higher concentration than Deeded for 05 concentration mc:asurements because '"Os and '"'s are minor isotopes ( - 1.6.., abundance) or Os. As a result, in suu 05 isotope investiptions will be limiud to materials that are enriched in 05 such as iron meteorites and Ni-Fe sulfides in peridotites and mafic-ultramafic intrusions.
Osmium is a major constituent in POE-rich alloys and sulfides that are commonly found as inclusions in spinels associated with ophiolites and layered mafic-ultramafic intrusions. These inclusions ranae in size from I to 20 I'm in diameter and have 05 concentrations of up to -20'fo (e.g., STOCKMAN and tiu.VA, 1984; TAJ..XJNGTON et al., 1984). Although the primary Ar• ion beam used in our apparatus has a -70 I'm fwhm diameter, small inclusions can still be analyzed for '"Os/11605 with a precision of < ± ,.., if they have higb 05 concentrations. For example. a I ,.m diameter inclusion with s-.. 05 or a 5 I'm diameter inclusion with 0.2-.. 05 should be adequate for such an analysis. Thus. the 05 isotope systematics of POE-rich alloys and sulfides from most ophiolites and layered mafic-ultramafic intruSives should be amenable to in situ 05 isotope studies.
Finally, resonance ionization of spunered atoms can be used to measure the isotopic composition of extremely small samples of 05 that have been chemically concentrated from aeological mat.erials.. FoUowi ng separation of Os from rocks by acid dissolution and distillation (c{ Lucx and All..tGR£, 1983), samples with as little as 10" 11 g ofOs could theoretically be used for 11705/ '"'0s ratio measurements with<± 1-., precision if they were deposited U thin fllrm onto a substrate for spunering. Chemical se~tion of 05 would allow 05 isotope analyses of mg-size samples of vinually all rock-types including felsic crustal rocks which have Os concentrations as low as -0.01 ppba (MORGAN and LoVERING, 1967).
Osmium can quite easily be concentrated by a factor of -10 from bulk rocks into NiS or Ni metal by fire assay fusion (H<>FFMAN et al., 1978). Alternatively, 05 can be concentrated by -10" by NiS fire assay fusion followed by acid dissolution and 6.Jtratioo of acid insoluble residues (T£NG et
al., 1987 ). Tbe5e residues could then be sputtered directly or fused with NiS or Ni metal for sputterin&. rlrt assay concentration ofOs would allow 05 isotopic analysis of ultramafic rocks which generally contain I to 10 ppt. Os.
We have shown that resonance ionization of sputtered atoms can be used for quantitative analysis of trace levels of 05 in Ni-rich and F~rich metal with a spatial resolution of - 70 I'm. This technique can be adapted to trace analysis of most higb ionization potential elements (includioa aU of the POE) in a wide variery of natural and synthetiC materials by
determiniD& the appropriate ionization ~heme for each element and tuni111 the dye laser wavelengths accordingly. To obtain multielement analyses in a single spoL dye laser wav~ kocths will have to be rapidly tu.oed to the ionization scheme for each elemenL The hi&h useful yield and elemental selectivity of resonance ionization of spunered atorm should eventually allow in siru measurement of 05 isotope ratios down to concentrations of -1 S ppma without chemical sqr aration.
Adatowlrdgmm~s-We thank J. Whitten for t.edlnicaJ assistance. J . T . Wusoo for providJna meteorite specimens. G. R. Ros.sman and E. M. Stolper for the USt of furnaces. and L. Brown, G. P. RIW. K. K. Tw-eban, and an anonymous refmoe for revkws. This Slud) was performed as pan of a doctoral dlssenaoon by the tenior author at the California Institute ofT ecbnoJocy. (Caltecb). won: was supported by the US Dept. of Enerzy lhrou&h DES-Material Sciences conuact W-31-109-ENG-38 10 AtJonne National lAboratory and BES-Enajnemna and Geosciences Grant DE-FG03-88ER 13851 to Calteeh. Calteeb O.vaion ofGeolocJcal and PLa.newy Sciences Cootribution Number 4817 (687).
EditoriJJI hDndlmg. G. Faure
R.EFER£NCTS
AWGIU C. J. and llJCl( J. M. (1 980) Omuum isotopes u petroatnetic and~ =n. £anh Plann Set U!t 48, 148-154.
BENNINGHOVEN A. (1975) tkvdopmeD\S in secondary IOU 11\aS$
spcctr05COpy and applications 10 sutfaa srudJes. Sruf Sc1 SJ, 5~ 625.
BLUM J. D .. WASSEUUltG G. J.. HUTCHEON I. D .. BECKETT J. R., and STOLPER, E. M. ( 1989) Diffusion. plwr equilibria and partitiooin& expenments in the N1-Fe-Ru system. Grochtm. Cosm~; dum Acta SJ. 483--489.
BLUM J. D .. I'EWl'> M. J.. CALAWAY W. F .. YOlNG C. E .. GRUES D. M .. HllTCliEOS I. D .. and WA.SSE.UURG G. J. ( 1990) Rcsonancr ionization mass spcctrornetr)' of sputteTed osnuum and rberuum atoms. AfiQ/ ChnntStry 62. 209-214.
CAIRJ L. J. ( 1988) Applications of proton and nuclear microprobes in ore deposn mineraJocy and metallurgy. NJJCI IIISI ML'Ih. Ph)-s Rn 830. 459...-165.
CHRYSSOUUS S. l.. ALCOCK R. A .• SIZGOIUC M. B., and CABRJ l. J. ( 1990) Quanuuti~ uaa PGE anal)'5CS of phyrrbotite. pent· landite and millente. Sth !ttl Pla1111ll111 Symp G~ Soc Firtkuui Bull (ab5tr.) (ID press).
CROCKETT J . H. and CAliRI l. J. ( 1981) Analytical methods for the platinum-sroup elements. In PlaJmll111-Group £/nnn11s Mm" · alorY. G~orY- R«ovny(ed. L.J . CABRJ). pp. 71-82. TbeCanad. lnst. of Minina and MeW!.
DAVIS A. M. (1977) The cosmochemical b.istor) of the ~tes. Ph.D. dimcrution. Yale UniversJty.
KERR W .. H()ffl.IE.ISTER W., HtRT 8 ., GEISS J .. and HOVTUlMANS f . G. (1961) Venucb zur da.tieNna von risenme\eori\en nacb <let rhenium-owium-methode. Z. NaJru[orsdt. 16&. IOH-1058.
HERA W., WOUU R.. EBERHARDT P., and KOI'I' E. (1967) De~l
opment and recent applications of the Re/Os Datin& Method. In RDdioaat>r Daltfll and Mnhods of Low-I.Lvrl COUIIlmg. lAE.A Vienna. pp. 499-508.
HOFniAN E. L . NALDilETT A. J., VA." LOON J. C .. HANCOCK R. G. V., and MANSON A. (1978) The detmnJDauon of all of the platinum II'OUP dements and aold in rocks and ort by neutron activation anai)'SU after precooa:ntratioo by a rude! sulfide flre.. -y technique on larp: samples. Anal. Chimu::tz A C1D 101, 15 7-166.
HUZINSKY W .. WuRZ P ~ Sni.HL B .. and BETZ G. (1987) Cr atoms sputteTed from dilferent matnc:es. NJJCL /lut Mnlt. PIJys R.n . Ill. 452-'457.
1.-Uc N. Q. and WIEDERSIOf (1987) Bombardment-i.Dduoed sqre-

222
New method 10 meas~ Os in situ 881
ption and ftldislribution. Nud IM M~lt Ph>>s Rn 811,471-485.
ln-'DNU M., Lao! D. A., Russ G. P~ BAZAN J. M .. and BoRG R. J . (1989) DU-ec:t dettnnination of the ba!Jlife of '"Re. Grochim Cosmochm1. ACID 53, 1597-1606.
lvcK J. M. I.Dd All.tGilf C. J. (1983) 111Rc-11'0s systematics in metcoritts and cumoc:bemical COIIXIQuenoe5. NQJurr l02, I 30-132.
MA TSUNIVo(l N ~ Y AMANUllA Y ~ ITlXA WA Y., ITOH N~ KAzul,u, TA Y., MlGAYAWA S., MORITA K., SHIMIZU R., and TAWAilA H. (1984) EnetJY depende.ooe of the ion-induced spuneria& yields of mona1omic solids. Atom. Dtuo Nud. Tobl~s 31.
MORGAN J. W. and LeVElliNG J. F. (1967) Rhenium I.Dd Osmium abu.ndanoes in some iencous and mewnorphic rodcs.. E4nh PiaMI. Sci. Uu 3, 219-224.
PAPPAS D. L , HRUBOWCHAK D. M., ERVIN M. H .. I.Dd WINOGUD N. (1989) A 10m countin& &I surfaces. Scima lO, 64-06.
PARKS J. E.. SPAAR M. T ~ I.Dd Ciu:ssMAN P. J . (1988) Analysis of hi&h purity solids by resonanct ioniution speclrOSalpy. J. Crystal GrOv.fh 89. 4-15.
PnuN M. J .• YOUNG C. ~and GRUDJ D. M. (l988) Multipholon ionization followed by ti.mc-of-fb&ln mass spectii&Opy of spunend DeUtrals. Sctznning Mlf:rOSCOPJ' 2, 1353-1364.
I'ERNICKA E. I.Dd WASSON J . T. (1987) Ru. Re, Os., PI and Au in iron meteori~a. Grochmt. Cosmochim Acto 51, 1717-1726.
RASMIJssEN K. L , MAl.. YIN D. J ., and WASSON J. T. (1988) Tratt deme:nl partitioni~~& between txnitc and lwnacitc; Relationship 10 the c:ooun& rates of iron meteOritts. Mt'lroritics 13, 107-112.
RAsMt.JSSEN K. L , GR£El';-....'A v T. J. L . and Gwozoz R. ( 1989) The composition of lwnacite in iron meteoritts investiptcd b) ..:ttl· enator mass spectrometry, neutron activation analysis and analytical clcclron microscopy. Nucl. lnstr. Mnh. Ph)'J. Rrs. 1136, 43-52.
Russ G. P .• BAZAN J. M .• and DATE A. R. (1987) Osmium iso10pic ratio measurements b) inducuvely coupled plasma sourct mass spectroliiC"!I) . A111ll Chmustry 59. 984-989.
Suo! MONS D. S. ( 1983) l.sotopic analysis with the We1 microprobe mas anal)'ttf. IN/ J. Mass Sp«. lort !'roc 55, I ~30.
SToc:JcMAN H . W . and HLA VA P. F. (1984) Platinum'lfOup minerals in alpine dlromiotts from IOUth-.ern Orqon. £con Grology 79,491-508.
TALJUNG"TON R. W~ WATKINSON D. H., WHTTTAUit P. J ., and JoNES P. C. (1984) Platinum'lfOup minerals and other aolid indusions in chromitc of ophiolitic compiCJ.cs: occurrenct and pet· rolocical lipibcanoe. TMPM TscMmuJks Mm. Ptrr. Mill. 32, 285-301.
fiNo R. T. D., FDiN U., El.MOilf D., HEMioOCK T. K., KUBIK P. W., and GoVE H. E. (1987) Detmnination ofOs isot.opes and Re/Os ratios usin& AMS. Nud lnstr Ml!lh PhJ>s. Rn. 829, 281-285.
ntoNNAJU> N., WIUJS R. D .. WJUGKT M. C~ and DAVlS W . A. ( 1987) Resonanct ionization llj)CCtrOSCOpy and the detection of 1 'Kr. Nucl lnsrr Mnh Ph)'J Rn 829, 39~.
WALXEJt R. J. I.Dd FASSETT J. D. (1986) l.sotopic measurement of subnanocrun quantities of rbe:nium and osmJum by resonanct ioniution aws spectrometr) . AIIQ/ Chmustry 58, 2923-2927.
WALXEJt R. J .• SHIItEY S. B., and<STEotu 0 . (1988) Companu~ RHA. Sm-Nd and Rb-Sr isotopt and tract ekmtnt syslt'mltics for A1cbean komatiitc flows from Munro Township. Abitibt BelL Ontario. E4nh Plant'l. Sci Ll'lt. l1, l-12.
Wll..LIAMS P. (1983) Sec:ondar) ion aws spectrometry. In Applitd Atomtc Collis to" Ph}'JiCJ 4 (ed. S. DA TZ). pp. 327-377. Academic Pr=.
.l.EnlolD T. 0 . (1967) Pm:ision and !e:DSitivity in dcclron ~ analysis. AIIQ/ Chrmistry 39, 858-861.