Geology and Volcanic Petrology of the Lava Mountains, San ...
Upload
khangminh22Category
view
0download
0
HAL Id: tel-01232279https://tel.archives-ouvertes.fr/tel-01232279
Submitted on 23 Nov 2015
HAL is a multi-disciplinary open accessarchive for the deposit and dissemination of sci-entific research documents, whether they are pub-lished or not. The documents may come fromteaching and research institutions in France orabroad, or from public or private research centers.
L’archive ouverte pluridisciplinaire HAL, estdestinée au dépôt et à la diffusion de documentsscientifiques de niveau recherche, publiés ou non,émanant des établissements d’enseignement et derecherche français ou étrangers, des laboratoirespublics ou privés.
The Deccan Plume : geochemistry, petrology coupledwith high-resolution paleomagnetic data - geodynamicaland environmental consequences at the K-Pg boundary
Karim Malamoud
To cite this version:Karim Malamoud. The Deccan Plume : geochemistry, petrology coupled with high-resolution paleo-magnetic data - geodynamical and environmental consequences at the K-Pg boundary. Geochemistry.Université de Grenoble, 2014. English. �NNT : 2014GRENU055�. �tel-01232279�

Université Joseph Fourier / Université Pierre Mendès France / Université Stendhal / Université de Savoie / Grenoble INP
THÈSE Pour obtenir le grade de
DOCTEUR DE L’UNIVERSITÉ DE GRENOBLE Spécialité : Sciences de la Terre, de l’Univers, et de l’Environnement Arrêté ministériel : 7 août 2006 Présentée par
Karim Malamoud Thèse dirigée par Alexander V. Sobolev préparée au sein de L’Institut des Sciences de la Terre de Grenoble (ISTerre) et de l’Ecole Doctorales Terre, Univers, Environnement (TUE)
Des Traps du Deccan à la Réunion : Couplage de données géochimiques, pétrologiques et paléomagnétiques – Conséquences géodynamiques à la limite Crétacé-Paléocène
Thèse soutenue publiquement le 29 Septembre 2014 devant le jury composé de :
M, Dominique, Gasquet Professeur, Université de Savoie, Président du jury M, Andy, Saunders Professeur, University of Leicester, Rapporteur M, Mike, Widdowson Professeur, The Open University, Rapporteur M, Frédéric, Fluteau Maître de Conférence, Institut de Physique du Globe de Paris, Examinateur M, Nicholas, Arndt Professeur, Université de Grenoble, Examinateur M, Alexander V., Sobolev Professeur, Université de Grenoble, Directeur de thèse

I
Université de Grenoble
Institut des Sciences de la Terre de Grenoble (ISTerre)
Thèse présentée à
l’Université de Grenoble pour obtenir le grade de
Docteur de l’Université de Grenoble spécialité « Sciences de la Terre, de l’Univers, et de l’Environnement »
par
Karim Malamoud
Des Traps du Deccan à la Réunion : Couplage de données géochimiques, pétrologiques et
paléomagnétiques – Conséquences géodynamiques à la limite Crétacé-Paléocène
Soutenance prévue le 29 Septembre 2014 devant un jury composé de :
M. Andy Saunders M. Mike Widdowson M. Frédéric Fluteau M. Dominique Gasquet M. Nicholas T. Arndt M. Alexander V. Sobolev
Professeur, University of Leicester Professeur, The Open University Maître de conférence, IPGP Paris VI Professeur, Université de Savoie Professeur, Université de Grenoble Professeur, Université de Grenoble
(Rapporteur) (Rapporteur) (Examinateur) (Examinateur) (Examinateur) (Directeur de thèse)

II
R e m e r c i e m e n t s
III
Je tiens tout d’abord tout d’abord remercier mon directeur de thèse, Alexander V. Sobolev,
pour m’avoir confié ce sujet et pour m’avoir encadré pendant ces trois années et demie.
Ma gratitude va à Stéphane Guillot, Jean Braun, Etienne Jaillard, Christine Bigot, Carole
Cordier, Catherine Chauvel, Valentina Batanova, Valérie Magnin et l’ensemble de l’équipe
Géochimie4D à ISTerre Grenoble, ainsi qu’à Olga et Dmitry Kuzmin à l’Institut Max Planck de
Mayence, Allemagne, dont l’aide précieuse m’a permis d’achever ce travail.
Un grand merci également à Frédéric Fluteau de l’Institut de Physique du Globe de Paris et à
Ivan Vlastelic de l’Université Blaise Pascal de Clermont Ferrand, pour m’avoir très généreusement
confié les échantillons nécessaires à l’élaboration de mon travail.
Je remercie aussi Jacky Larnould et Lionel Cachoulet de JEOL Europe SAS pour le partage
de leurs expériences et de leurs connaissances en microscopie électronique.
Je tiens à remercier les membres du jury, Andy Saunders, Mike Widdowson, Nicholas Arndt,
Frédéric Fluteau et Dominique Gasquet, pour m’avoir aidé à améliorer ce travail en acceptant de
l’évaluer.
Je souhaite vivement adresser mes remerciements les plus chaleureux à tous ceux qui m’ont
encouragé et soutenu durant ces trois années et demi : ma famille, mes amis, dont ceux des autres
bouts du monde, et bien sûr Anne-Sophie.
Mes remerciements vont enfin à mes collègues de promo, amis, anciens et récents. Pour moi,
ces six années grenobloises, depuis le master, même si je n’ai pas été aussi présent que je le souhaitais,
c’était vous. Merci pour ces moments précieux et inoubliables, parfois trop rares mais toujours
chaleureux, passés en votre compagnie. Je ne les oublierai pas. Je vous souhaite la meilleure des
chances. Merci.
En contribuant ainsi à l’étude pétrologique et géochimique des provinces magmatiques et de la
Terre interne, j’espère que cette thèse saura apporter quelque(s) pierre(s) à l’édifice de la connaissance
de ce domaine des sciences de la Terre.
Karim, le 4/08/2014
Longtemps, j’ai voulu être breton. Longtemps, j’ai voulu être corse, ou basque ou serbe ou bosniaque ou tchétchène. Avoir une origine forte, une identité forte. Etre quelque chose, être lié à une terre, un terroir, avoir
des racines. Très important les racines… Et puis un jour j’ai trouvé un petit vers de Bertolt Brecht qui disait « Je n’ai pas de racines, j’ai des jambes »
Daniel Mermet 23/01/2014

IV

R é s u m é
V
Les Traps du Deccan (70/67-65Ma) (Courtillot et al., 1986, Basu et al., 1993, Chenet et al.,
2007), les Seychelles 65-62 Ma (Collier et al., 2008) et les iles Mascareignes 60-0 Ma
(Mahoney et al., 2002, Murthy, 2002) sont interprétées comme faisant partie d’une série
magmatique représentant l’évolution complète d’un panache mantellique, depuis un stade
initial, sous une lithosphère continentale – en l’occurrence celle de l’Inde à la fin du Crétacé –
jusqu’à un stade final, sous une lithosphère océanique (iles Mascareignes) (Duncan, 1990).
L’importance de l’étude des provinces magmatiques telles que celle des Trappes du Deccan,
est de deux ordres. D’une part, il y a toujours débat quant aux processus magmatiques
capables de générer de l’ordre d’un million de kilomètres cubes de laves en un temps très
court (typiquement, moins d’un million d’années) (Anderson, 1994, 2000a, Courtillot et al.,
2003, Foulger et al., 2005, Sheth, 2005, 2007, Sobolev et al., 2011). D’autre part, si les
éruptions de provinces magmatiques ont été corrélées aux phénomènes d’extinctions de
masses aux cours des temps géologiques, les processus par lesquels ces éruptions ont
contribué – ou déclenché – de tels évènements ne sont, à ce jour, toujours pas clairement
établis (Wignall, 2001, Courtillot & Renne, 2003, Saunders, 2005).
Cette thèse s’appuie sur de précédents travaux par le groupe de travail d’Alexander V.
Sobolev sur le recyclage de matériel crustal dans le manteau terrestre en lien avec les
processus de mise en place des provinces magmatiques et des iles océaniques (Sobolev et al.,
2005, 2007, 2011). Il s’agit d’utiliser des outils pétrologiques et géochimiques (Sobolev et al.,
2005, 2007) couplés à des données de paléomagnétisme haute résolution (Chenet et al., 2008,
2009), et à de la modélisation thermomécanique (Sobolev et al., 2011) dans le but de
contraindre les processus profonds à l’origine des Traps du Deccan et leurs conséquences au
niveau planétaire (extinction de masse).
A plus long terme, une comparaison précise des données relatives aux conséquences
environnementales des Traps du Deccan, avec celles correspondant à l’impacte de la
météorite de Chicxulub (Alvarez et al., 1980, Schulte et al., 2010), devrait permettre de
conclure quant à la contribution respective de ces deux évènements à l’extinction de masse de
la fin de Crétacé.
Dans un premier temps, cette thèse propose une réinterprétation des diverses contraintes
temporelles sur la durée de l’éruption des Traps du Deccan (datations radiochronologiques,
paleomagnétisme, profiles d’altérations, et données paléo-environnementales) et suggère un
scénario temporel pour la mise en place de cette province magmatique, le tout principalement
R é s u m é
VI
basé sur des données paléomagnétiques de hautes résolution de Chenet et al (2008, 2009). Ce
scénario implique que la phase principale de l’éruption des Traps du Deccan s’est produite
peu de temps avant la limite Crétacé-Paléogène (Chenet et al., 2007, Keller et al., 2008a,
2012) et qu’elle correspond à la mise en place d’environ 1.106km3 de laves en 50ka. Ces
chiffres sont équivalents à 150-200 fois le taux d’éruption actuel de l’ile volcanique d’Hawaii
(Courtillot et al., 1986).
Ce scénario temporel a ensuite été couplé à des données géochimiques élémentaires qui ont
permis de mettre en évidence plusieurs caractéristiques particulières de la composition des
laves des Traps du Deccan (Western Ghats). D’abord, les laves des Western Ghats portent une
forte signature du grenat (appauvrissement en terres rares lourdes), ce qui indique une origine
profonde pour la grande majorité des liquides primaires. Ensuite, ces laves peuvent être
globalement divisées en deux catégories, principalement fondées sur l’intensité de
l’assimilation crustale qu’elles ont endurée. Cette classification est, dans l’ensemble,
comparable aux différences entre « lower formations » et « upper formations » visibles dans
les diagrammes isotopiques (Peng et al., 1994). Une observation plus poussée de l’évolution
des éléments traces au cours du temps révèle l’existence de plusieurs excursions de courte
durée vers des valeurs compatibles avec une très forte assimilation crustale et une absence de
signature du grenat. Ces excursions se sont produites juste avant la limite Crétacé-Paléogène
et n’ont, d’après notre scénario temporel, pas duré plus de 10-20ka chacune. Il est probable
que ces phénomènes correspondent à un unique épisode d’érosion lithosphérique de la plaque
indienne par les processus magmatiques dans le manteau sous-jacent. Cette proposition est en
accord avec les variations d’épaisseur actuelles de la plaque indienne. Enfin, il est très
probable que ces épisodes d’intense assimilation crustale coïncident avec un dégazage
magmatique important qu’il serait important de contraindre afin de mieux quantifier le
dégazage global lié aux Trappes du Deccan.
Les données relatives aux Traps du Deccan peuvent être comparées à celles des Traps de
Sibérie et révèlent d’importantes différences géodynamiques. Il apparaît notamment que
l’importante érosion lithosphérique identifiée dans les Traps de Sibérie (Sobolev et al., 2011)
n’ait pas eu lieu dans le cas des Traps du Deccan malgré des caractéristiques mantelliques
similaires. Cette différence peut être attribuée à la plus grande épaisseur de la plaque
indienne, ainsi qu’à l’existence de zones de faiblesses, liées à l’héritage tectonique du bouclier

R é s u m é
VII
indien (Murthy, 2002, Biwas, 2005). Ces zones de faiblesses auraient facilité le passage des
magmas à travers la plaque de manière à ce qu’une faible proportion d’entre eux seulement ait
été impliquée dans les processus de délamination lithosphérique.
Un ensemble de données géochimiques sur olivine ainsi que de modélisation des liquides
magmatiques primaires et de leur source (Sobolev et al., 2005, 2007) pour les Traps du
Deccan nous ont permis de montrer 1) l’importante contribution d’une source pyroxenitique à
la composition des liquide magmatiques primaires (65%), 2) que la gamme de températures
potentielles de ces mêmes sources avait due être de l’ordre de 1600°C et 3) que ces dernières
contenaient environ 15% de matériel crustal recyclé. Des mesures et calculs similaires
appliquées aux laves de la Réunion ont, par ailleurs, montrés des résultats très différents :
50% de liquides pyroxenitiques dans les liquides magmatiques primaires, une température
potentielle mantellique de l’ordre de 1500°C et une teneur des sources magmatiques en
matériel crustal recyclé de l’ordre de 7%.
Ces résultats sont compatibles avec le modèle de panache mantellique pour la mise en place
des provinces magmatiques et des iles océaniques (Morgan, 1971, White & McKenzie, 1989,
Coffin & Eldholm, 1994, White & McKenzie, 1995, Courtillot et al., 2003) ainsi qu’avec
l’hypothèse du refroidissement séculaire de ces mêmes panaches (Herzberg & Gazel, 2009).
Nous en concluons que l’éruption des Traps du Deccan fut un événement d’une rapidité
exceptionnelle et que son implication dans la crise biologique de la fin du Crétacé fut sans
doute particulièrement importante. La mise en place des Traps du Deccan a été déclenchée par
l’arrivée d’un large panache mantellique sous la lithosphère indienne. L’activité de ce
panache mantellique a ensuite participé à la formation de la « Chagos-Laccadive ridge » et
des iles Mascareignes. L’activité actuelle du panache du Deccan est localisée sous l’ile de la
Réunion. L’épaisseur lithosphérique, relativement comparable à celle de la plaque indienne,
permet une comparaison directe entre le stade initial (Deccan) et le stade final (Réunion) du
panache du Deccan. Enfin, il apparaît que ce dernier s’est affaiblit (baisse de température
d’environ 100°C) et nous en concluons que cette affaiblissement a pour conséquence une plus
faible concentration en matériel crustal recyclé.

VIII

A b s t r a c t
IX
The Deccan Traps – or Deccan Flood Basalts – 70/67-65Ma (Courtillot et al., 1986, Basu et
al., 1993, Chenet et al., 2007), Seychelles 65-62 Ma (Collier et al., 2008) and Mascarene
Islands 60-0 Ma (Mahoney et al., 2002, Murthy, 2002) are believed to trace the evolution of a
single mantle plume from its initial plume-head stage, under continental lithosphere (India in
the Cretaceous and early Palaeogene), to the recent hot spot or ocean island (plume-tail) stage
under oceanic lithosphere (Mascarene Islands) (Duncan, 1990). The relevance of Continental
Flood Basalts (CFBs), or continental Large Igneous Provinces (LIPs), such as the Deccan
Traps is twofold. Firstly, there is on-going debate on the processes capable of generating large
volumes of lava (>1 million km3) in a relatively short time (<1Ma) (Anderson, 1994, 2000a,
Courtillot et al., 2003, Foulger et al., 2005, Sheth, 2005, 2007, Sobolev et al., 2011).
Secondly, the timing and occurrence of Continental Flood Basalts has been coincident with
the mass extinctions of species throughout the history of our planet. There are suggestions that
the eruptions of CFBs might have contributed to, or induced such tragedies, however the
mechanism for such extinctions has not yet been fully clarified (Wignall, 2001, Courtillot &
Renne, 2003, Saunders, 2005). This PhD aims to build on the previous work by Alexander V.
Sobolev and colleagues on crustal recycling within the Earth mantle and LIPs/ocean island
magmatism (Sobolev et al., 2005, 2007, 2011). The PhD focus will be to apply petrology and
geochemistry (Sobolev et al., 2005, 2007) coupled with high-resolution paleomagnetism
(Chenet et al., 2008, 2009), and thermo-mechanical modelling (Sobolev et al., 2011) in order
to constrain the deep processes behind the Deccan Traps (mantle melting and crustal
recycling) as well as the consequences at the surface of the Earth (eruption rates and related
degassing). This analysis should provide an idea of the intensity of the Deccan Traps eruption
at the Cretaceous-Palaeogene boundary. The environmental consequences that would result
from eruptions of this magnitude can be contrasted with the speculated environmental
consequences of the Chicxulub impact (Alvarez et al., 1980, Schulte et al., 2010) to make
inferences at the respective contribution of the two catastrophic events to the mass extinctions
of the end-Cretaceous.
Upon revisiting published time constraints on the Deccan eruptions (radiometric dating,
paleomagnetism, inter-flow weathering profiles and paleoenvironmental data), we propose a
new, paleomagnetism-based (Chenet et al., 2008, 2009) eruption scenario for the Main
Deccan Province (Western Ghats). We suggest that the main phase of volcanic activity
occurred just before and ended at the Cretaceous-Palaeogene boundary (Chenet et al., 2007,

A b s t r a c t
X
Keller et al., 2008a, 2012) and was responsible for the emplacement of about 1.106km3 of
lavas in ~50kyr. This is equivalent to 150 to 200 times present-day eruption rates in Hawaii
(Courtillot et al., 1986).
Coupling of the paleomagnetism-based timeframe with bulk-rock trace element
concentrations revealed that Western Ghats lavas feature a strong garnet signature (Heavy
Rare Earth Element depletion), indicative of a deep origin. These lavas have two different
trace element signatures that correspond to differences in the intensity of crustal assimilation
undergone by their rising melts. This classification resembles the general trend between upper
and lower formations seen on radiogenic isotope diagrams (Peng et al., 1994). A closer look
at the variations of trace element proxies for garnet signature and crustal assimilation through
time reveals several transient excursions of combined strong crustal assimilation and absence
of the garnet signature. These excursions occurred before the Cretaceous-Palaeogene
boundary and are not believed to have lasted more than 10-20ka each. We suggest that these
excursions are part of a single and localized plume-induced lithospheric erosion event of the
Indian lithosphere by the Deccan plume. This observation is in agreement with present-day
estimates for the thickness of the Indian lithosphere. The probability that these short-lived
severe crustal assimilation events coincided with catastrophic magmatic degassing is very
likely and should be investigated in detail.
A comparison of the Deccan Traps with the Siberian Traps exposes significant geodynamical
differences. Most notably, the widespread and extensive lithospheric erosion observed in the
Siberian Traps (Sobolev et al., 2011) did not take place in the Deccan Traps, despite similar
mantle characteristics. This difference is attributed to 1) a thicker Indian lithosphere and 2) to
the existence of weaknesses in the form of pre-existing structural lineaments (Murthy, 2002,
Biwas, 2005). These pre-existing structures facilitated the passage of deep mantle-derived
magmas and thus precluded or limited their involvement in a freezing-delamination process.
Olivine geochemistry and olivine-based primary melt and source modelling (Sobolev et al.,
2005, 2007) in Deccan Traps lavas showed 1) large contributions of pyroxenite-derived melts
(65%) to the primary melts, 2) high potential temperatures of the mantle sources (~1590-
1600°C) and 3) that the mantle sources of Deccan Traps magmas contained ~15% of recycled
crustal material. These observations contrast with those obtained from Réunion Island lavas

A b s t r a c t
XI
(50% of pyroxenite-derived melts, mantle potential temperatures of 1490-1500°C and 7% of
recycled crustal material in the sources of Réunion Island magmas.
Our results are compatible with the plume model for LIPs and ocean island magmatism
(Morgan, 1971, White & McKenzie, 1989, Coffin & Eldholm, 1994, White & McKenzie,
1995, Courtillot et al., 2003) as well as with a secular cooling of mantle plumes (Herzberg &
Gazel, 2009).
We conclude, along with many authors, that the emplacement of the Deccan Traps was a
remarkably swift and catastrophic event at the end of the Cretaceous and that it likely played a
significant role in the end-Cretaceous mass extinction. These eruptions have been triggered by
the arrival of a large hot and enriched plume-head at the base of the India lithosphere,
carrying large amounts of recycled crustal material. Subsequent activity of the Deccan plume
resulted in the Chagos-Laccadive ridge, the Mascarene Plateau and Islands. The present
manifestation of the plume at Réunion Island occurs at a comparable depth, which allows
direct comparison with its passed activity in India. The plume has become significantly cooler
(plume-tail). We speculate that the lower concentrations of recycled crustal material measured
for the sources of Réunion Island lavas are a consequence of the colder temperatures of the
final, ocean-island stage of the Deccan plume.

XII

Table of contents
XIII
1. INTRODUCTION ......................................................................................................................... 17
1.1. LARGE IGNEOUS PROVINCES AND THE PLUME MODEL ........................................................... 18 1.2. LIPS, MASS EXTINCTIONS AND THE DECCAN CASE .................................................................. 22 1.3. THE DECCAN TRAPS, CHICXULUB, AND THE END-CRETACEOUS EXTINCTION – AN ATTEMPT FOR RECONCILIATION ........................................................................................................................... 26 1.4. LAYOUT AND GOALS OF THE PHD PROJECT ............................................................................. 30
2. GEOLOGICAL SETTING .......................................................................................................... 33
2.1. INDIA IN THE LATE CRETACEOUS .............................................................................................. 34 2.2. THE STRUCTURE AND GEOLOGICAL UNITS OF THE INDIAN PLATE ......................................... 35 2.3. THE STRATIGRAPHY OF THE DECCAN TRAPS ........................................................................... 36 2.3.1. THE MAIN DECCAN PROVINCE, THE WESTERN GHATS AND RELATED OUTCROPS .................. 37 2.3.2. PERIPHERAL DECCAN VOLCANISM AND MINOR FORMATIONS .................................................. 41 2.3.2.1. Kutch and Saurashtra (Gujarat) .............................................................................................. 41 2.3.2.2. Mount Pavagadh .................................................................................................................... 42 2.3.2.3. Narmada-Tapti rift ................................................................................................................. 42 2.3.2.4. Behradi Kodomali kimberlite ................................................................................................. 42 2.3.2.5. Mumbai volcanics .................................................................................................................. 43 2.3.2.6. The Seychelles and the Laxmi Ridge ..................................................................................... 44 2.4. THE INDIAN LITHOSPHERE AND THE DECCAN PLUME ............................................................. 46 2.5. REUNION ISLAND ........................................................................................................................ 50
3. RE-VISITING THE ERUPTION TIMING OF THE DECCAN TRAPS ............................... 53
3.1. RADIOMETRIC DATING OF THE DECCAN TRAPS ...................................................................... 54 3.2. HIGH-RESOLUTION PALEOMAGNETISM .................................................................................... 55 3.3. BOLE BEDS AND/OR RED BOLES ................................................................................................ 56 3.4. GIANT PLAGIOCLASE BASALTS ................................................................................................. 58 3.5. PALEOENVIRONMENTAL DATA .................................................................................................. 59 3.5.1. INTERTRAPPEAN SEDIMENTS ..................................................................................................... 59 3.5.2. STRONTIUM AND OSMIUM ISOTOPES ......................................................................................... 61 3.6. FURTHER SPECULATIONS ON THE EMPLACEMENT OF THE DECCAN TRAPS NEAR THE K-PG BOUNDARY ............................................................................................................................................. 63 3.6.1. CONTINUOUS DECCAN ERUPTION SCENARIO ............................................................................ 63 3.6.2. CUMULATIVE VOLUME AND ERUPTION RATES .......................................................................... 67 3.6.3. RED BOLES AND QUIESCENCE TIME ........................................................................................... 67 3.6.4. COUPLING WITH PALEOENVIRONMENTAL INDICATORS ............................................................ 68 3.7. SUMMARY AND PRELIMINARY INTERPRETATIONS ................................................................... 71
4. SAMPLES AND METHODS ....................................................................................................... 77
4.1. SAMPLES ...................................................................................................................................... 78 4.2. METHODS .................................................................................................................................... 78 4.2.1. BULK-ROCK MAJOR AND TRACE ELEMENTS .............................................................................. 79 4.2.2. OLIVINES, SPINELS AND MELT INCLUSIONS .............................................................................. 80
5. BULK-ROCK GEOCHEMISTRY THROUGH TIME ............................................................ 85
5.1. SAMPLE COMPOSITION AND CLASSIFICATION .......................................................................... 86 5.2. MAJOR ELEMENTS CLASSIFICATION ......................................................................................... 89 5.3. PROXIES FOR SOURCE DEPTH AND CRUSTAL ASSIMILATION ................................................... 90
Table of contents
XIV
5.4. EVIDENCE FOR A RAPID CHANGE IN CRUSTAL CONTAMINATION AT CONSTANT GARNET SIGNATURE DURING THE MAIN VOLCANIC PHASE OF THE DECCAN TRAPS ...................................... 95 5.5. SUMMARY AND PRELIMINARY INTERPRETATIONS ................................................................... 98
6. OLIVINE PETROLOGY IN THE DECCAN TRAPS AND REUNION ISLAND .............. 103
6.1. SAMPLES .................................................................................................................................... 104 6.2. THE THAKURVADI FORMATION ............................................................................................... 108 6.3. OLIVINE MAJOR AND TRACE ELEMENT COMPOSITION .......................................................... 109 6.4. PYROXENITIC COMPONENT IN THE SOURCE OF DECCAN (THAKURVADI FORMATION) AND REUNION ISLAND (PDN AND PDF) LAVAS .......................................................................................... 115 6.5. OLIVINE-HOSTED MELT INCLUSIONS ...................................................................................... 117 6.6. SPINEL INCLUSIONS IN OLIVINE ............................................................................................... 121 6.6.1. SPINEL COMPOSITION AND FERROUS-FERRIC IRON RATIOS .................................................... 122 6.6.2. OLIVINE-SPINEL THERMOMETRY ............................................................................................ 125 6.7. SUMMARY AND PRELIMINARY INTERPRETATIONS ................................................................. 128
7. PRIMARY MELT RECONSTRUCTION AND SOURCE MODELLING .......................... 131
7.1. PRIMARY MELT RECONSTRUCTION ......................................................................................... 133 7.1.1. MELT INCLUSION RE-EQUILIBRATION ..................................................................................... 134 7.1.2. MELT INCLUSION BACK-FRACTIONATION ............................................................................... 135 7.1.3. TRACE ELEMENT COMPOSITION OF PRIMARY MELTS .............................................................. 139 7.2. SOURCE MODELLING ................................................................................................................ 142 7.2.1. GEODYNAMICAL FRAMEWORK ............................................................................................... 142 7.2.2. GEOCHEMICAL MODELLING .................................................................................................... 145 7.2.2.1. Model parameterization ....................................................................................................... 145 7.2.2.2. Geochemical modelling results ............................................................................................ 148 7.2.3. HYDROUS MANTLE MELTING .................................................................................................. 153 7.2.3.1. Model description ................................................................................................................ 154 7.2.3.2. Hydrous melting and model coupling results ...................................................................... 155 7.2.4. SUMMARY OF SOURCE MODELLING RESULTS ......................................................................... 159 7.3. DISCUSSION AND LIMITS ........................................................................................................... 161 7.3.1. PRIMARY MELT RECONSTRUCTION ......................................................................................... 163 7.3.1.1. K2O, H2O and temperature correction .................................................................................. 163 7.3.1.2. H2O and Ce .......................................................................................................................... 166 7.3.1.3. Primary melt FeO*, spinel olivine temperature and melt inclusion re-equilibration ........... 167 7.3.1.4. Melt inclusion back-fractionation and Fomax ........................................................................ 168 7.3.1.5. Melt decompression and temperature correction ................................................................. 169 7.3.1.6. Trace element concentrations in primary melts ................................................................... 171 7.3.2. SOURCE MODELLING ............................................................................................................... 172 7.3.2.1. Partition coefficient variations ............................................................................................. 176 7.3.2.2. Effects of primitive versus depleted composition of the mantle .......................................... 179
8. CONCLUSION CHAPTER ....................................................................................................... 183
8.1. GENERAL CONCLUSIONS .......................................................................................................... 184 8.2. PROSPECTS ................................................................................................................................ 189
9. APPENDIX .................................................................................................................................. 193
I. Stratigraphic nomenclature of the western Deccan basalt formations (Western Ghats) after Peng et al (1994) ................................................................................................................................................ 195 II. Conceptual timeframe for the emplacement of the Deccan Traps ............................................... 197

Table of contents
XV
III. Electron Probe Micro Analyser (EPMA) – Basic principles and high-precision analysis ......... 203 III.1. Electron-Probe Micro Analysis – From electrons to X-ray ..................................................... 204 III.2. Electron Probe Micro Analysis – quantification ...................................................................... 213 III.3. High-precision EPMA for olivines .......................................................................................... 216 III.4. EPMA protocols for specimens other than olivines ................................................................. 226 III.5. Specifications of the JEOL JXA-8230 at ISTerre, Grenoble (France) .................................... 227 III.6. Historical references ................................................................................................................. 228 IV. Résumé en français ..................................................................................................................... 231 IV.1. Objectifs de la thèse ................................................................................................................. 233 IV.2. Scénario temporel continu de l’éruption des Trapps du Deccan et couplage à la géochimie roche totale ........................................................................................................................................... 234 IV.3. Analyse pétrologique des olivines des Trapps du Deccan et de l’île de la Réunion ............... 243 IV.4. Reconstitution des magmas primaires et des sources magmatiques des Trapps du Deccan et de l’île de la Réunion ................................................................................................................................ 245 IV.5. Conclusions .............................................................................................................................. 247 IV.6. Perspectives ............................................................................................................................. 252
10. REFERENCES .......................................................................................................................... 256


17
1. Introduction

1. Introduction
18
1.1. Large Igneous Provinces and the plume model
The occurrence of basaltic rocks at the surface of the Earth’s crust is related to the activity of
the mantle underneath it. Three different geological settings can result in such occurrence,
two of which are directly related to plate tectonics, namely island arc volcanism (convergent
margins), and mid-ocean ridges and intra-plate rifts (extensional tectonics). The third
circumstance under which basaltic rocks may be emplaced at the surface of the Earth in large
amounts is not related to plate tectonics and yet remains of the utmost importance to the
history of this planet (and certainly others, e.g. Lee et al., 2009). Large outpourings of basaltic
rocks (and sometimes more evolved volcanic products) have long been reported under the
term Large Igneous Provinces and hotspots (Coffin & Eldholm, 1994). Figure 1.1.
Figure 1.1 – Present-day plate boundaries and tomographic models of shear wave velocity anomalies (∂Vs) at the core-mantle
boundary or CMB (note that the tomographic model is different in A and B) and superimposed Large Igneous Provinces or
LIPs (black) and hotspots (dots: white, 44 hotspots from Steinberger (2000), red, green and yellow for hotspots argued to
have a deep origin according to Courtillot et al (2003) and Ritsema and Allen (2003) at A) present day and B) reconstructed
eruption locations back in time. From Burke and Torsvik (2004).

1. Introduction
19
Large Igneous Provinces (LIPs) are defined as large (>1.106km3) outpourings of primarily
mafic lithologies (e.g. tholeiites) emplaced over short periods of time (<1Ma) by processes
unrelated to “normal” seafloor spreading or subduction. LIPs include continental flood basalts
(e.g. the Deccan and Siberian Traps), oceanic plateaus (e.g. the Ontong Java plateau),
volcanic rifted margins and aseismic ridges (e.g. the Chagos-Laccadive Ridge), (Coffin &
Eldholm, 1994, Saunders, 2005).
No single mechanism or model seems capable of explaining all LIPs in detail. However, the
plume model, that states instabilities at the core mantle boundary or CMB (Figure 1.1b) set
off plumes (Figure 1.2) that rise towards the overlying lithosphere (Morgan, 1971, White &
McKenzie, 1989, 1995), does explain LIPs as a whole.
Figure 1.2 –Schematic cross section of the Earth. Three different kinds of mantle plumes as proposed by Courtillot et al: 1)
primary plumes, directly originating at the CMB, 2) secondary plumes, derived from larger domes (superswells, Cazenave et
al., 1989) near the mantle transition zones and 3) tertiary hotspots with superficial origin (tensile stresses in the lithosphere
and decompression melting, Anderson, 2000b). From Courtillot et al (2003).
Mantle plumes have originally been understood as instabilities of purely thermal nature,
caused by heat transfer from the outer core (several hundred degrees higher than the lower
mantle, Boehler, 1993) to the lower mantle at the CMB. It was not long however, before
mantle plume began to be interpreted as part of a crustal and lithospheric recycling scheme
1. Introduction
20
wherein subducting lithosphere is entrained to the CMB by density difference. This subducted
lithosphere is stored and heated, and then travels back up, dynamically, by mantle plumes
(Chase, 1981, Hofmann & White, 1982, Allègre & Turcotte, 1986, Kogiso et al., 1998).
Finally, the consideration that mantle plumes take part in a lithospheric recycling process
within the mantle led to the conclusion that they may not be anomalies of purely thermal
nature. Instead, the presence of crustal material within plumes result in a chemical anomaly
and thus, the idea of thermochemical plumes emerged (Farnetani & Samuel, 2005, Sen &
Chandrasekharam, 2011, Sobolev et al., 2011).
The plume model thus stems from:
1) The application of a physical behaviour that was expected for the Earth interior: The Earth
mantle lies between two thermal boundary layers, namely the CMB at the bottom and the
lithosphere (which involves part of the upper mantle but does not take part in convection)
above it, and is likely to be convecting
2) The absence of a relationship between hotspot volcanism and plate tectonics (deep-seated
processes, beyond its reach). Several lines of evidence corroborate the existence of mantle
plumes:
- Convection plumes are expected to form a large flattened head (~1000km in diameter
or more) once they impinge upon the base of the lithosphere (Campbell & Griffiths,
1990). The large plume-head stage is capable of generating very large volumes of
melts. This stage corresponds to LIPs emplacement (White & McKenzie, 1995). Once
the plume-head has dissipated its energy, a plume-tail or hotspot-stage ensues
(Richards et al., 1989a, Campbell & Griffiths, 1990) with much lower rates of melt
production and yet much more sustained activity through geological times. This stage
then results in a series of seamounts or aseismic ridge, as a result of plate motion
above the plume tail or hotspot (Wilson, 1963, Morgan, 1972). Present-day hotspots
have indeed been associated with LIPs, e.g. the Chagos-Laccadive Ridge and the
Mascarene Islands are associated with the Deccan Traps, (White & McKenzie, 1989,
Duncan, 1990, Duncan & Richards, 1991)
- Mantle plumes are anomalies of both thermal and chemical nature that contrast with
the physical characteristics of the mantle around it. This contrast is expected to
translate in seismic velocity anomalies that can be observed by means of geophysical
models (e.g. Kennett & Widiyantoro, 1999, Li et al., 2000, Hammond et al., 2012). It
1. Introduction
21
is nevertheless likely that the scale of plume-tails in the present day mantle is often
beyond the reach of geophysical models (Anderson, 2006). Large plume scars have
however been reported in the mantle (e.g. Hammond et al., 2012), and large-scale
seismic velocity anomalies at the CMB (Large Low Shear Wave Velocity Provinces or
LLSVP) have undoubtedly been resolved and do provide sound evidence for the
relationship between hotspot volcanism and heterogeneities in the lower mantle
(Burke & Torsvik, 2004, Torsvik & Cocks, 2004, Abouchami et al., 2005, Torsvik et
al., 2010, Huang et al., 2011, Weis et al., 2011, Payne et al., 2012), Figure 1.1
- Plumes tap deep mantle reservoirs that are more primordial than the upper mantle.
This primordial material has undergone far less degassing than shallower parts of the
Earth and thus bears typical isotopic signatures of high (>30 Ra) 3He/4He (Class &
Goldstein, 2005, Herzberg et al., 2013). Similar signatures are also seen in other
isotopic systems (Hart et al., 1992)
- The existence of plumes is suggested by the occurrence of primitive lava compositions
and/or high-Mg olivine phenocrysts that are indicative of anomalously hot (melt MgO
increases with mantle temperature as ~1%/25°C) sources (Campbell & Griffiths, 1990,
Sobolev & Nikogosian, 1994, Herzberg & O'Hara, 2002, Campbell, 2005, Herzberg et
al., 2007)
- Furthermore, high nickel and low calcium and manganese contents of LIPs and
hotspot lavas (Herzberg, 2011) and magnesium-rich olivine phenocrysts (Sobolev et
al., 2005, 2007) have been ascribed to the presence of olivine-free lithologies in
plumes (pyroxenite and eclogite). Pyroxenite is argued to result from the reaction
between eclogite melts (i.e. recycled crust) with the surrounding mantle peridotite.
(Yaxley & Green, 1998, Yaxley, 2000, Kogiso et al., 2003, 2004, Sobolev et al.,
2005). Eclogite has a low solidus and therefore melts significantly deeper than
peridotite in mantle upwelling (Yasuda et al., 1994). The existence of recycled
material in plumes has also been suggested by isotopic data, especially osmium
(Allègre & Luck, 1980, Roy-Barman & Allègre, 1995, Sobolev et al., 2008)
A number of authors disagree with the plume model, or at least with particular applications of
it (e.g. Anderson, 1994, Anderson, 2000a, Sheth, 2005). A comprehensive compilation of
non-plume models for the formation of LIPs can be found here: Foulger et al (2005).

1. Introduction
22
The main objection to the plume model comes from the predicted lithospheric response to the
arrival of a hot plume. If a plume is regarded as a purely thermal anomaly (thermal plume),
the light (because hot) peridotite it contains is expected to induce significant regional uplift of
the lithosphere above it, in the order of 0.8-2.5km for a 100 to 300°C temperature excess
before any major volcanic activity (Campbell & Griffiths, 1990, Farnetani & Richards, 1994).
Such pre-magmatic uplift has been reported for the North Atlantic and Columbia River LIPs
(Saunders et al., 2007) yet convincing evidence is still lacking in most other cases: the
Siberian Traps (Czamanske et al., 1998), the Emeishan Traps (Peate & Bryan, 2008), the
Ontong Java oceanic plateau (Korenaga, 2011), and of course the Deccan Traps (Sheth,
2007).
It has been shown however, that a plume of both thermal (~ 200°C excess temperature) and
chemical (carrying 15% of recycled crust) nature (or thermo-chemical plume) is expected to
produce only negligible (100-200m) pre-magmatic uplift (Sobolev et al., 2011).
If it is true that no simple unified mechanism is likely to explain all LIPs on the Earth, anti-
plume arguments have thus far failed to bring compelling evidence against the plume model.
It is therefore likely that the plume model is capable of explaining LIPs on the whole, even
though unravelling their every detail may require a number of case-related adaptations.
Nevertheless, this PhD does not take a particular geodynamical model for granted but rather
consists of a compilation of evidence (uplift, temperature) that consistently rule out the non-
plume origin of the Deccan Traps.
1.2. LIPs, mass extinctions and the Deccan case
Mass extinction events (Figure 1.3) correspond to periods in geological times during which
the continuous extinction of species and the appearance of new ones was disrupted to such an
extent that extinction rates far surpassed speciation rates. Such events have punctuated the
history of the Earth and have been observed in the paleontological record for many decades
(e.g. Raup & Sepkoski, 1982).

1. Introduction
23
Figure 1.3 –Biodiversity versus time for the past 600Ma and the five most dramatic (the “big five”) mass extinctions of the
Phanerozoic: End-Ordovician (445Ma), Late-Devonian (375Ma), End-Permian (250Ma), End-Triassic (200Ma) and the
Cretaceous-Tertiary (66Ma). From White (2002).
A wealth of potential mass killers have been suggested in the literature, from extra-terrestrial
impacts (Alvarez et al., 1980) to LIPs (Courtillot & Renne, 2003, Saunders, 2005), including
cosmic rays (Rohde & Muller, 2005, Medvedev & Melott, 2007), Milankovitch cycles (Raup,
1987, Bennett, 1990) and supercontinent formation and break-up (Santosh, 2010).
As in the case of the plume model with respect to LIPs (section 1.1), it is reasonable to
contend that no simple and unique mechanism is likely to explain all mass extinction events
throughout geological times. Nevertheless, among all possible players, extra-terrestrial
impacts and LIPs eruption, for their capacity to release vast amounts of climate-affecting
gases over short time periods have dominated the debate for the past thirty years (Alvarez et
al., 1980, Courtillot et al., 1986, 1988, Wignall, 2001, Alvarez, 2003, Courtillot & Renne,
2003, Keller, 2005, Saunders, 2005, White & Saunders, 2005, Saunders et al., 2007,
Courtillot & Fluteau, 2010).
The strongest historical argument in favour of LIPs as a main trigger of mass extinction
events comes from the close-to-perfect correlation through time between the two (Courtillot
& Renne, 2003), Figure 1.4.

1. Introduction
24
Figure 1.4 –But see also Rampino and Stothers (1988). Correlation between the age of LIPs and mass extinction and ocean
anoxia events. From Courtillot and Renne (2003).
The end-Cretaceous (also referred to as KT or K-Pg) extinction is the most recent of the “big
five” (Figure 1.3) and appears to correlate rather perfectly with the emplacement of the
Deccan Traps (Figure 1.4). This association of the Deccan Traps and the K-Pg extinction has
been reported in the literature for the past forty years (Vogt, 1972, Courtillot et al., 1986,
1988, Courtillot & Renne, 2003, Keller et al., 2012). However, and like most other extinction
events, the K-Pg crisis has at least one serious alternative scenario: the possibility that the ~65
million years old and 200km-wide impact crater roughly centred on the town of Chicxulub
(Yucatan, Mexico) is evidence of a catastrophic extra-terrestrial impact that may well have
been sufficient to wipe the dinosaurs out of the Mesozoic world (Alvarez et al., 1980, Schulte
et al., 2010). Akin to the debate between pro- and anti-plume proponents, a debate as to which
of the extra-terrestrial impact or the large volcanic eruption (Deccan Traps) is to blame for the
K-Pg mass extinction, has been raging on for more than thirty years. Both scenarios have
been assessed for 1) their age with respect to the Cretaceous-Palaeogene (K-Pg) boundary
(Keller et al., 1995) with reports that the Chicxulub impact predated the K-Pg boundary (e.g.
Keller et al., 2004a, 2004b, 2007, 2008) or was contemporaneous with it (e.g. Alvarez et al.,
1980, Krogh et al., 1993, Norris et al., 2000, Smit, 2004, Schulte et al., 2008, Robinson et al.,
2009, Schulte et al., 2010) and conversely for the Deccan Traps (e.g. Courtillot et al., 1986,

1. Introduction
25
1988, Venkatesan et al., 1993, Raju et al., 1995, Allègre et al., 1999, Widdowson et al., 2000,
Pande, 2002, Chenet et al., 2007, Keller et al., 2008a, Robinson et al., 2009, Hooper et al.,
2010, Keller et al., 2011, 2012) and 2) their respective devastating power with authors
arguing that the Chicxulub impact had been able to affect the Earth’s troposphere fast enough
to trigger an extinction while the eruption of the Deccan Traps certainly spanned several Ma
and was thus too slow to bear significant consequences on the global ecosystem (e.g. Pierazzo
et al., 2003, Abramov & Kring, 2007, Schulte et al., 2008, 2010). Others argue that the
Chicxulub impact was indeed instantaneous but that the sheer size of the Deccan Traps
combined with emplacement times much shorter than 1Ma implied that its effect on the
climate (through magmatic degassing mostly) would have been orders of magnitude higher
than that of the Chicxulub impact (e.g. Sen, 2002, Self et al., 2006, Sen et al., 2006, Chenet et
al., 2008, Self et al., 2008a, Chenet et al., 2009, Courtillot & Fluteau, 2010, Keller et al.,
2012). The next and final section to this introduction is a modest attempt to untangle and
reconcile both sides of this debate. There is nonetheless one last and peculiar aspect to the K-
Pg crisis that ought to be kept in mind and that summarizes particularly well the fascinating
character of this end-Cretaceous early-Tertiary period. Early in the Jurassic, there was a major
shift in the chemistry of the oceans, from a Neritan mode wherein no buffer existed against
global acidification, to a Cretan state in which deep-sea unlithified carbonate acted as a buffer
against acidification (Ridgwell, 2005). This turning point in geological history correlates with
a transition from extremely severe mass extinction events, such as the end-Permian (250Ma)
and the end-Triassic (200Ma), themselves associated with particularly voluminous LIPs (the
Siberian Traps and the Central Atlantic Magmatic Province) to far less severe crises despite
the emplacement of LIPs comparable in size (e.g. the Ontong Java Plateau, the Caribbean
Plateau and the North Atlantic Magmatic Province). This transition in the intensity of mass
extinction events holds true for all crises since the Jurassic with one notable exception. This
exception also happens to be the only such event where a clear combination of intense
volcanism and extra-terrestrial impact exists: the K-Pg extinction and the Deccan Traps,
Figure 1.5.
1. Introduction
26
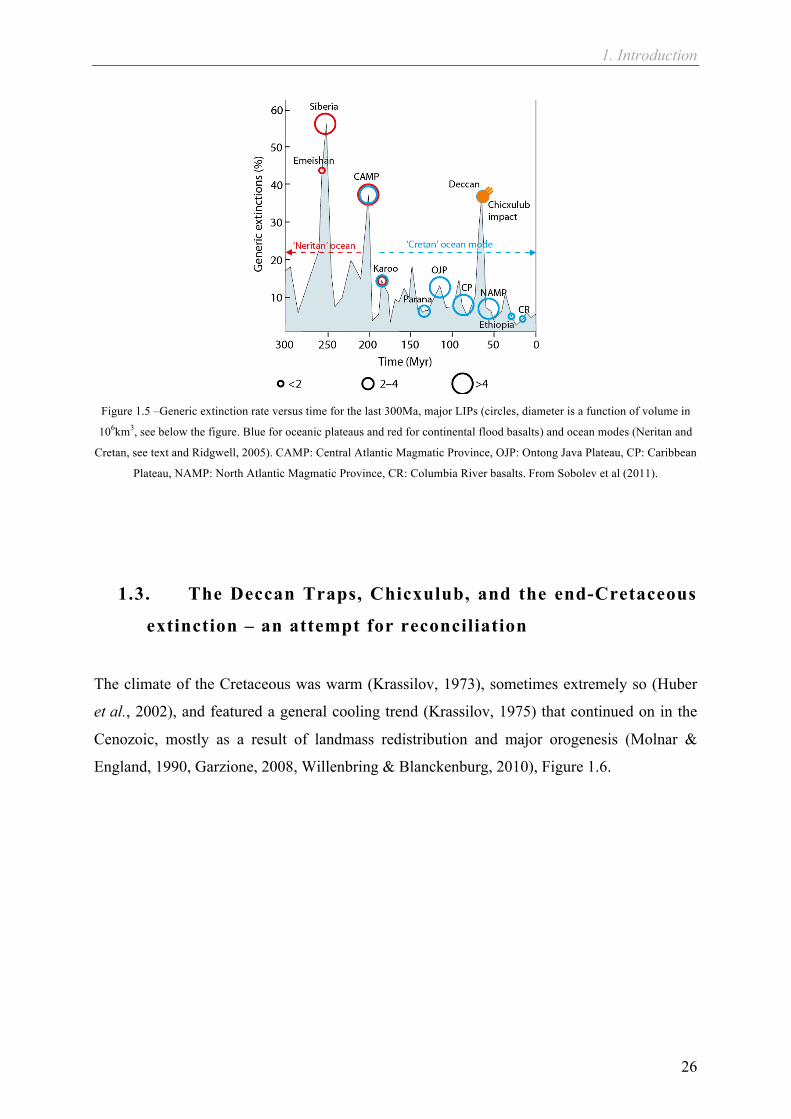
Figure 1.5 –Generic extinction rate versus time for the last 300Ma, major LIPs (circles, diameter is a function of volume in
106km3, see below the figure. Blue for oceanic plateaus and red for continental flood basalts) and ocean modes (Neritan and
Cretan, see text and Ridgwell, 2005). CAMP: Central Atlantic Magmatic Province, OJP: Ontong Java Plateau, CP: Caribbean
Plateau, NAMP: North Atlantic Magmatic Province, CR: Columbia River basalts. From Sobolev et al (2011).
1.3. The Deccan Traps, Chicxulub, and the end-Cretaceous
extinction – an attempt for reconciliation
The climate of the Cretaceous was warm (Krassilov, 1973), sometimes extremely so (Huber
et al., 2002), and featured a general cooling trend (Krassilov, 1975) that continued on in the
Cenozoic, mostly as a result of landmass redistribution and major orogenesis (Molnar &
England, 1990, Garzione, 2008, Willenbring & Blanckenburg, 2010), Figure 1.6.

1. Introduction
27
Figure 1.6 – Bottom water temperature and sea level trend since the early Cretaceous from Kent and Muttoni (2013) and
Cramer et al (2011). CTM: Cretaceous thermal maximum, EECO: early Eocene climatic optimum, MMCO: middle Miocene
climatic optimum. Sea-level drop: AA, inception of Antarctic ice cap and NH inception of the Northern Hemisphere ice
sheets.
The paleoclimate of the K-Pg transition has proved more difficult to resolve in detail. The
terrestrial record shows opposing trends with reports of cooling (Krassilov, 1975), warming
(Wolfe, 1990, Nordt et al., 2002) or a brief low-temperature excursion with recovery early in
the Palaeocene (Wolfe & Upchurch-Jr, 1986). The marine record nevertheless provides a
better picture (Wilf et al., 2003). Oxygen and carbon (Li & Keller, 1998) as well as strontium
(Vonhof & Smit, 1997, MacLeod et al., 2001) and osmium (Ravizza & Peucker-Ehrenbrink,
2003, Robinson et al., 2009) isotopic ratios in marine sediments consistently show a late-
Maastrichtian warm event followed by a rapid cooling ending at the K-Pg boundary and
further global cooling in the Cenozoic (Burke et al., 1982). Both the extra-terrestrial impact
(MacLeod et al., 2001, Wilf et al., 2003, Robinson et al., 2009) and intense volcanism (Li &
Keller, 1998, Ravizza & Peucker-Ehrenbrink, 2003, Robinson et al., 2009, Keller et al., 2012)
have been proposed as the cause of this global climate change.
The consequences of volcanic eruptions on the climate depends on the composition of the
erupted products as well as on their amount and height of ejection (e.g. Robock, 2000). In the
case of Continental Flood Basalts, and especially in the case of the Deccan Traps, where both
volcanism and/or an extra-terrestrial impact may have contributed to the K-Pg extinction, the
average rate of eruption over the entire duration of the flood basalt volcanism is critical (e.g.
Self et al., 2006). Indeed, the fact that the Chicxulub impact took only seconds to release a
noticeable fraction (Pierazzo et al., 2003) of the harmful volatiles (e.g. SO2, CO2, NOx) while
1. Introduction
28
the Deccan Traps released in potentially several millions of years has been in favour of the
impact hypothesis (Alvarez et al., 1980, Schulte et al., 2010). On the other hand, if one was to
argue that 80% of the Deccan Traps had been emplaced in a few thousands of years and thus
released orders of magnitudes more harmful gasses to the atmosphere than an extra-terrestrial
impact like Chicxulub – in a timeframe the global environment could not bear – Figure 1 in
Schulte et al (2010) would look somewhat different (Chenet et al., 2008, 2009, Courtillot &
Fluteau, 2010). In addition, large outpourings of basaltic rocks onto vast areas of continents
would also act as a carbon sink through weathering and erosion (Dessert et al., 2001, 2003).
Therefore, the surface and volume of Continent Flood Basalts may also be an important
variable in assessing the longer-term environmental consequences of volcanism. Finally, an
interesting feature of the end-Cretaceous extinction is that it occurred after a major change –
during the Mesozoic – in the global ocean chemistry from a ‘Neritan’ to a ‘Cretan’ mode
wherein deep-sea unlithified carbonates act as buffers against acidification (Ridgwell, 2005,
Payne et al., 2010), Figure 1.5. This would make mass-extinction more difficult, at least in the
marine realm, whereas it is precisely from the marine record that the end-Cretaceous mass
extinction is globally seen. Furthermore, while the major extinction events that preceded the
end-Cretaceous, namely end-Permian and end-Triassic, occurred under a Neritan ocean
chemistry mode and were indeed intense, reaching 60 and 40% species extinction, all mass-
extinction events have been below 20% of generic extinction ever since, except the end-
Cretaceous and despite the buffering by deep-sea carbonates (White & Saunders, 2005,
Sobolev et al., 2011).
Attempting to untangle the environmental effects of flood basalt volcanism from those of an
extra-terrestrial impact seems difficult since the global environmental consequences – as seen
in the geological record – of extra-terrestrial impacts and those of large volcanic eruptions are
roughly similar: global climate change (warming or cooling), acid rains, increased rainfall,
decreased sunlight (Haywood & Boucher, 2000, Robock, 2000, Chenet, 2006, Self et al.,
2006). Speculated asteroid-specific consequences would be 1) extensive wildfires (Wolbach
et al., 1985, Vonhof & Smit, 1997) although evidence of their occurrence seems to be lacking
(Belcher et al., 2003, Cripps et al., 2005) and 2) slope failure as a result of seismicity (Olsson
et al., 1997, Klaus et al., 2000, Norris et al., 2000) even though not all slope failures near
North America match this postulate despite being in the vicinity of the impact zone (MacLeod
et al., 2003).

1. Introduction
29
These global environmental consequences have been transferred to the geological record
mostly as isotopic and chemical excursions in sedimentary deposits and changes in fossil
species richness, especially among foraminifera. Yet, the time lag between the actual event
taking place (i.e. a huge volcanic eruption or an asteroid impact) and its environmental
consequences being recorded in sedimentary rocks can be significant (kyr). For instance, the
global ocean mixing time is in the order of thousands of years (MacLeod et al., 2001)
potentially averaging many eruptions in the Deccan Traps with one asteroid impact in
Yucatan.
High-pressure (e.g. shocked-quartz, fullerene) and PGE-enriched materials intercalated within
the sedimentary record suggest the occurrence of an extra-terrestrial impact event (Alvarez et
al., 1980, Alvarez, 2003, Parthasarathy et al., 2008). It has been proposed that high-pressure
features such as shocked quartz could have been of volcanic origin (Morgan et al., 2004).
However, the PGE concentrations in the sources of the Deccan Traps would have been too
low (Chalapathi Rao et al., 2013) to explain the K-Pg Ir-anomaly. Therefore, impact signal
can be considered as unambiguous in the late-Cretaceous. But this does not help in trying to
decipher the consequence of one event versus the other. Adding to the confusion is the fact
that the Chicxulub impact has been described as predating the mass extinction (Keller et al.,
2004a, 2004b).
Among the frenzy for possible scenarios - and not to mention the possible causes such as
several impacts (Hartnady, 1986, Damuth & Johnson, 1989, Chatterjee et al., 2006), sea level
change (Hallam & Wignall, 1999) or ecosystem instabilities (McElwain & Punyasena, 2007)
– it remains that both events must have occurred close enough to one another to create
ambiguous signatures in the sedimentary record, which typically means that the Chicxulub
asteroid must have impacted the Earth within a time window of (much) less than a million
years (typical resolution of global stratigraphic correlations) around the main phase of
volcanism in the Deccan Traps, which immediately precedes the K-Pg boundary. It is also
clear that an asteroid the size of Chicxulub (i.e. about 10km in diameter) must have had at
least catastrophic regional consequences (Campbell et al., 2008, Schulte et al., 2010). The
same goes for the Deccan Traps (Self et al., 2006, Keller et al., 2012). Furthermore, the sheer
size of the Deccan Traps compared to the rather discreet Chicxulub crater should not be
mistaken as a subliminal indication that the Deccan Traps did more damage to Earth than the
impact (Alvarez, 2003).

1. Introduction
30
In order to fully grasp the severity of the Deccan Traps eruption and then compare it with
models of extra-terrestrial impacts, it is required to 1) better constrain the eruption of the
Deccan Traps through time, 2) better constrain the composition of the magmatic sources of
these eruptions in order to gain insights as to the geodynamical processes capable of releasing
several million cubic kilometres of lavas as well as gigatons of climate-modifying gasses over
a relatively short time, and 3) quantify the consequences on the climate – and life.
1.4. Layout and goals of the PhD project
The ultimate goal of this PhD is to re-assess the role of the Deccan Traps as a contributing
factor to K-Pg mass extinction event. I aim to understand the deep-Earth processes and
magmatism: By reconstructing the composition and physical conditions of the magmatic
sources of the Deccan Traps through time, new constraints to melt production and related
degassing will be obtained and may be assessed in view of the available literature in order to
estimate potential environmental consequences.
This PhD may be considered as a continuation of the work undertaken by Sobolev and co-
workers on the Siberian Traps (Sobolev et al., 2011) but in a wholly different setting. While
the Siberian Traps have been erupted under a compressive tectonic regime at a time where the
world oceans were vulnerable to acidification, the Deccan Traps have been emplaced under
extensional tectonic regimes with extremely fast plate motion at a time were the world oceans
were buffered against acidification by deep-see unlithified carbonates. An additional
difference is the unambiguous simultaneous occurrence of a catastrophic extra-terrestrial
impact (Figure 1.5).
A brief introduction on the geological and geodynamic setting of the Indian plate and the
Deccan Traps will be followed by four sections, each of them attempting to address on
particular and crucial aspect of the Deccan Traps (note however, that the modelling of LIPs-
related climate effects is not tackled in this manuscript. An on-going PhD project at the IPGP,
Paris (France) is currently attempting to address this issue in the case of the Deccan Traps):
- The duration of the Deccan Traps emplacement and its rate are of the utmost
importance to assess the capacity of such an event to affect the global ecosystem. A
new timing scenario entirely based on a re-interpretation of the extensive work of
Chenet and colleague on paleomagnetic measurements and radiometric dating in the

1. Introduction
31
Western Ghats (Chenet, 2006, Chenet et al., 2007, 2008, 2009) as well as on literature
review will be proposed
- The timing scenario will be coupled to bulk-rock major and trace element data
(Bonnefoy, 2005). This step will allow for source depths and crustal assimilation to be
assessed through time, with implications on melt productivity and degassing
- Olivine phenocrysts in picritic samples from both the Deccan Traps (plume-head
stage) and Réunion Island (plume-tail stage) will be investigated for 1) the existence
of an olivine-free lithology in the source of the Deccan Traps magmas, with
implications on melt productivity, plume-lithosphere interactions and degassing, 2) the
volatile (K2O, H2O, Cl, SO2) contents of those magmas and 3) their primary melt
composition and temperature
- In the final section, olivine phenocryst data will be integrated to a modelling
framework based on observations from the previous sections (e.g. lithospheric
thickness, source pressure, crustal assimilation) that will allow for the sources of the
Deccan Traps and Réunion Island to be reconstructed and conclusions to be drawn as
to the deep origin of the Deccan magmas

32

33
2. Geological Setting
2. Geological setting
34
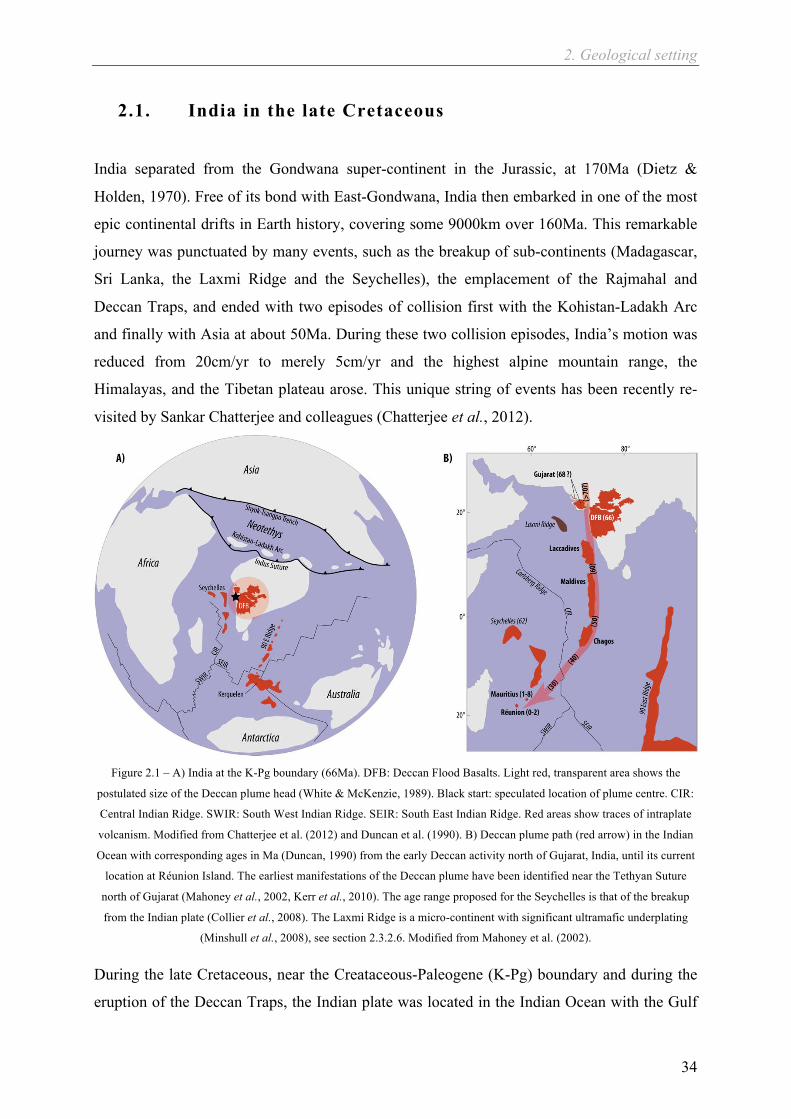
2.1. India in the late Cretaceous
India separated from the Gondwana super-continent in the Jurassic, at 170Ma (Dietz &
Holden, 1970). Free of its bond with East-Gondwana, India then embarked in one of the most
epic continental drifts in Earth history, covering some 9000km over 160Ma. This remarkable
journey was punctuated by many events, such as the breakup of sub-continents (Madagascar,
Sri Lanka, the Laxmi Ridge and the Seychelles), the emplacement of the Rajmahal and
Deccan Traps, and ended with two episodes of collision first with the Kohistan-Ladakh Arc
and finally with Asia at about 50Ma. During these two collision episodes, India’s motion was
reduced from 20cm/yr to merely 5cm/yr and the highest alpine mountain range, the
Himalayas, and the Tibetan plateau arose. This unique string of events has been recently re-
visited by Sankar Chatterjee and colleagues (Chatterjee et al., 2012).
Figure 2.1 – A) India at the K-Pg boundary (66Ma). DFB: Deccan Flood Basalts. Light red, transparent area shows the
postulated size of the Deccan plume head (White & McKenzie, 1989). Black start: speculated location of plume centre. CIR:
Central Indian Ridge. SWIR: South West Indian Ridge. SEIR: South East Indian Ridge. Red areas show traces of intraplate
volcanism. Modified from Chatterjee et al. (2012) and Duncan et al. (1990). B) Deccan plume path (red arrow) in the Indian
Ocean with corresponding ages in Ma (Duncan, 1990) from the early Deccan activity north of Gujarat, India, until its current
location at Réunion Island. The earliest manifestations of the Deccan plume have been identified near the Tethyan Suture
north of Gujarat (Mahoney et al., 2002, Kerr et al., 2010). The age range proposed for the Seychelles is that of the breakup
from the Indian plate (Collier et al., 2008). The Laxmi Ridge is a micro-continent with significant ultramafic underplating
(Minshull et al., 2008), see section 2.3.2.6. Modified from Mahoney et al. (2002).
During the late Cretaceous, near the Creataceous-Paleogene (K-Pg) boundary and during the
eruption of the Deccan Traps, the Indian plate was located in the Indian Ocean with the Gulf

2. Geological setting
35
of Cambay (between the Gujarat peninsula and the Konkan coast) roughly centred on today’s
Réunion Island (Chatterjee et al., 2012) (Figure 2.1a). At this time, the Indian plate motion
was in the order of 20cm/yr, which converts into 200km/Ma. This figure is an important one
to consider when investigated volcanic phenomena that have spanned several Ma, such as the
emplacement of the Deccan Traps.
Subsequent traces of the Deccan plume are to be found in the Seychelles micro-continent that
separated from the Laxmi Ridge (Minshull et al., 2008) and Indian plate at about ~62Ma
(Collier et al., 2008), and further resulted in the formation of the Chagos-Laccadive ridge (60-
40Ma), the Mascarene plateau (30Ma), Mauritius (1-8Ma) and Réunion Island (0-2Ma)
(Duncan, 1990, Mahoney et al., 2002), Figure 2.1b.
The generally accepted plume model for the origin of the Deccan Traps and subsequent traces
of intraplate volcanism have been heavily criticized by proponents of a rifting model (e.g.
Sheth, 2005). According to this model, part of the age progression of Figure 2.1b would not
be valid or explained by the plume model. For example, the Chagos-Laccadive ridge have
been created by large scale crack propagation, which would result in a similar age progression
(Sheth, 2005).
2.2. The structure and geological units of the Indian plate
The Indian plate consists of several Archean to late-Precambrian cratonic units and fold belts
forming what is commonly referred to in the literature as the Indian Shield. A number of rifts
have also developed at different times along inherited Precambrian structures. (Murthy, 2002,
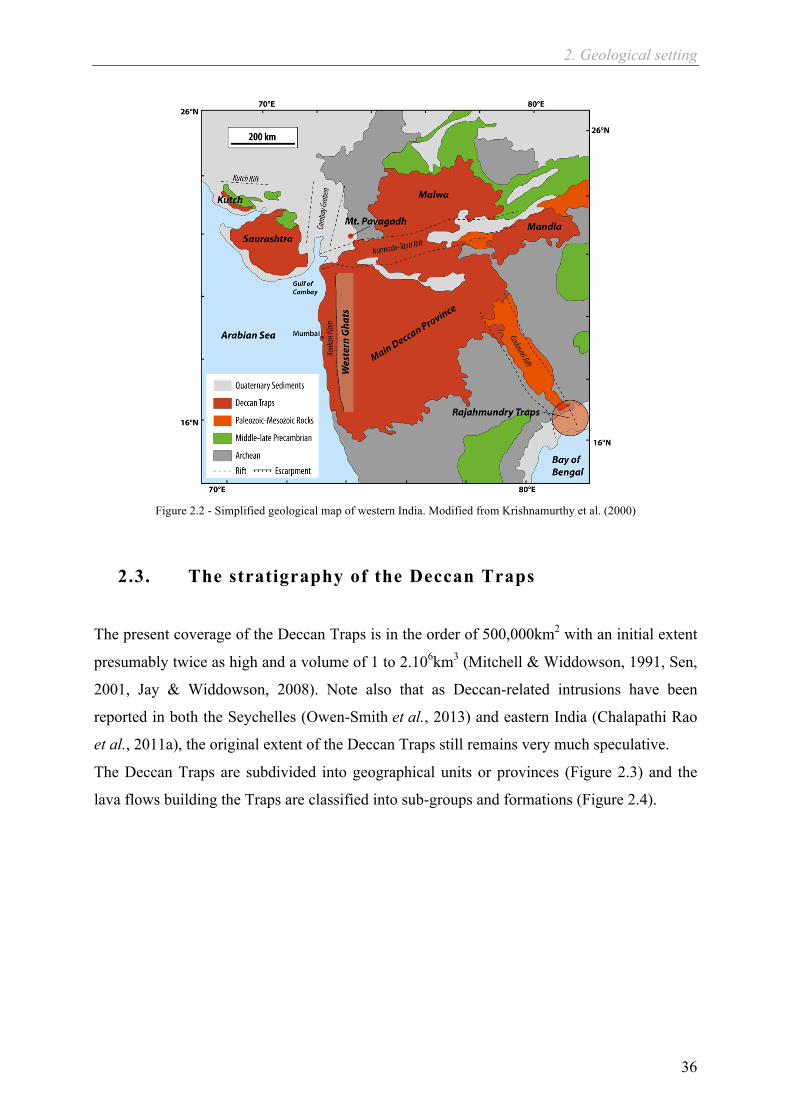
Ray et al., 2008). The Indian Shield is blanketed by Palaeozoic and Mesozoic deposits,
Cretaceous to Palaeogene basalts resulting from the eruption of the Deccan Traps, and
Quaternary, mostly detrital, sediments (Figure 2.2).
2. Geological setting
36
Figure 2.2 - Simplified geological map of western India. Modified from Krishnamurthy et al. (2000)
2.3. The stratigraphy of the Deccan Traps
The present coverage of the Deccan Traps is in the order of 500,000km2 with an initial extent
presumably twice as high and a volume of 1 to 2.106km3 (Mitchell & Widdowson, 1991, Sen,
2001, Jay & Widdowson, 2008). Note also that as Deccan-related intrusions have been
reported in both the Seychelles (Owen-Smith et al., 2013) and eastern India (Chalapathi Rao
et al., 2011a), the original extent of the Deccan Traps still remains very much speculative.
The Deccan Traps are subdivided into geographical units or provinces (Figure 2.3) and the
lava flows building the Traps are classified into sub-groups and formations (Figure 2.4).

2. Geological setting
37
Figure 2.3 - Structure and provinces of the Deccan Traps. Alkali complexes, carbonatites and kimberlite occurrences related
the Deccan Traps (Subba Rao, 1972, Woolley & Kjarsgaard, 2008, Vanderkluysen et al., 2011). General structure or the lava
flows (simple or compound flows) (Sen, 2001). Main dike swarms (white: Narmada-Tapti swarm, green: Nasik-Pune swarm,
grey: Coastal swarm). Rajahmundry Traps, Krishna-Godavari Basin (Baksi et al., 1994, Baksi, 2001, Self et al., 2008b).
2.3.1. The Main Deccan Province, the Western Ghats and
related outcrops
The Main Deccan Province (Figure 2.4) is the most extensive and voluminous lava sequence
in the Deccan Traps. The maximum thickness of the Main Province is reached along the
Indian west coast, at the Western Ghats escarpment. It has a general shield-like structure
centred on the Nasik-Pune dyke swarm that gradually thins towards the east and south
forming a ~3° slope. Along this trend compound flows gradually transition to simple flows
about 200km from the Nasik-Pune swarm. The average length or extent of lava flows is
unclear yet larger than 100km. However, Pahoehoe-to-aa flow type transitions that would
drastically limit flow propagation have been reported (Duraiswami et al., 2004, Duraiswami

2. Geological setting
38
et al., 2013). The shield-like structure of the Main Province is also seen in the general
prograde structure of the lava flows: the youngest formations are to be found away to the east
and south on the Nasik-Pune swarm, (Figure 2.4). The lava flows of Malwa, Mandla and
those of the Rajahmundry Traps are similar to those of the Main Province. The outcrops of
Rajahmundry have been linked to the Ambenali and Mahabaleshwar formations (Baksi et al.,
1994, Baksi, 2001, Self et al., 2008b) and would have originated from eruption centres in the
Western Ghats (coastal dyke swarm, Figure 2.3) thereby forming the longest (>1000km) lava
flows ever reported on Earth (Self et al., 2008b).
Figure 2.4 – Structure of the Main Deccan Province and associated areas (Malwa, Mandla and the Rajahmundray Traps). A)
Present-day extent of the Deccan Traps, location of the cross section (C), and stratigraphic columns for various locations of
the Main Deccan Province (Vanderkluysen et al., 2011), colour codes as of B). B) Full stratigraphic column, subgroups and
formations (with corresponding thickness) of the Main Deccan Province (Chenet et al., 2009). C) Schematic north-south
cross section of the Western Ghats (A) form Chenet et al. (2009).
2. Geological setting
39
The Main Deccan Province mostly consists of differentiated tholeiites with minor occurrences
of alkaline (Narmada: Subba Rao, 1972, Central Main Province: Talusani, 2010) and felsic
products (Mumbai area: Melluso et al., 2002, although these clearly postdate the emplacement
of the Main Deccan Province, Hooper et al., 2010). The tholeiites have been divided into
three sub-groups and twelve formations originally recognized upon simple field observations,
later confirmed and slightly modified using isotopes, major and trace element compositions
(e.g. Mahoney, 1984, Lightfoot, 1985, Beane et al., 1986, Devey, 1986, Mitchell &
Widdowson, 1991, Peng et al., 1994), Figure 2.4b and appendix I.
The following brief description of the subgroups is taken from Beane et al. (1986):
The first five formations (Kalsubai subgroup) are also referred to in the literature as lower
formations. They consist of massive amygdaloidal compound flows that make up for more
than 50% (~2000m) of the total composite thickness of the Main Deccan Province or Western
Ghats. They have higher average Mg# than the above-lying formations and a wide range of
compositions from picritic flows (Mg# > 60) to evolved lavas featuring large (>cm)
plagioclase phenocryst, the Giant Plagioclase Basalts (Mg# < 45).
The Lonavala subgroup (~15% of total thickness) consists of only two formations (Khandala
and Bushe) that are easily recognized in the field by their simpler and less massive structure
(especially Khandala) than that of the Kalsubai subgroup. The Lonavala subgroup has a lower
average Mg# than the Kalsubai formations. Bushe has the highest (87Sr/86Sr)t of all Deccan
Traps formations (Figure 2.5) despite two picritic flows. Its large compound flows are also
much more massive than those of Khandala and allow for easy identification in the field.
The Wai subgroup (35% of total thickness) is the final subgroup and comprises five
formations (Poladpur, Ambenali, Mahabaleshwar, Panhala and Desur). Panhala and Desur are
very poorly preserved and Desur has been virtually eroded away. The Bushe-Poladpur
transition is readily noticed in the field by a transition from massive amygdaloidal flows
(Bushe) to simple flows (Poladpur and above). Poladpur appears to be the most extensive
formation of the Deccan Traps (Figure 2.4) (Mahoney et al., 2000). The composition of the
Wai subgroup is on average the most evolved of the Main Province although it contains no
Giant Plagioclase Basalts. Wai also lacks major picritic flows and is thus evolved and more
homogeneous than the flows of Kalsubai and Lonavala. Ambenali has the lowest (87Sr/86Sr)t
and δ18O, and the highest εNd(t) of all Main Province tholeiites (Peng et al., 1994), Figure 2.5.

2. Geological setting
40
Finally, the Mahabaleshwar formation recorded the C29r-C29n geomagnetic reversal (Chenet
et al., 2008).
The location of the Main Deccan Province formation in Nd, Sr and Pb isotopic spaces reveals
a hidden diversity of the Deccan Traps tholeiites (Mahoney, 1984, Lightfoot, 1985, Peng et
al., 1994), Figure 2.5.
Figure 2.5 – Isotope diagrams from Peng et al. (1994). A) Location of the Main Deccan Province formations in the Nd-Sr
isotope space. Réunion (Fisk et al., 1988) and Central Indian Ridge (CIR, Mahoney et al., 1989) shown for comparison. B)
Similar to A) for the Nd-Pb isotopic space. All lower formations (Jawhar-Igatpuri to Bushe) converge towards a Common
Signature (Peng et al., 1994) suggesting several stages of contamination and evolution of the magmas as well as source
different from those of the Ambenali-Mahabaleshwar-Panhala trend.
Figure 2.5 shows that Ambenali is the least contaminated formation of the Deccan Traps with
the lowest (87Sr/86Sr)t and the highest εNd(t) of all Deccan formation. Ambenali has been
described as a mixture of MORB- and Réunion-like mantle and considered as a common
parental for the other formations of the Main Province (Lightfoot & Hawkesworth, 1988,
Mahoney, 1988, Lightfoot et al., 1990). Subsequent contamination would result from at least
two stages of contamination by 1) the lower crust, responsible for the common signature and
2) several upper crustal end-members resulting in radiating trends from the common signature
towards lower εNd(t) and 206Pb/204Pb (Peng et al., 1994). Peripheral Deccan-related lavas
however do not all fall within this framework (e.g. Melluso et al., 2006). The details of the
isotopic evolution of the Deccan Traps formations are however much less straightforward
(Chatterjee & Bhattacharji, 2008, and references therein, Bhattacharya et al., 2013) and
beyond the scope of this introduction.
2. Geological setting
41
2.3.2. Peripheral Deccan volcanism and minor formations
A number of volcanic products have been reported in the literature as the result of peripheral
and/or early activity of the Deccan Traps. Despite their rather minor character, these
observations are important in order fully to apprehend the extent and dynamics of the Deccan
Traps in both space and time. These manifestations are common to all continental flood basalt
provinces (Jerram & Widdowson, 2005) and mostly consist of alkaline magmatism (e.g.
Subba Rao, 1972 and references therein). Figure 2.3 shows the location of peripheral alkaline
magmatism associated with the Deccan Traps.
2.3.2.1. Kutch and Saurashtra (Gujarat)
The lavas of Kutch and Saurashtra have partly preceded, in C30n, and accompanied the
emplacement of the Main Deccan Province (C29n) (Basu et al., 1993, Courtillot et al., 2000,
Mahoney et al., 2002, Melluso et al., 2006, Paul et al., 2008, Sen et al., 2009). However, the
lava flows of Gujarat are not the earliest manifestation of the Deccan plume. Volcanic rocks
with isotopic signatures similar to present-day Réunion have been identified further north in
Pakistan (south Tethyan suture zone, Figure 2.1). These outcrops predate those of Gujarat
lavas by about 2Ma (Kerr et al., 2010) and the possibility of even older manifestations of the
Deccan plume has been evoked (Mahoney et al., 2002). In Gujarat, the sedimentary sequence
intercalated between both periods of volcanic activity bears evidence of the K-Pg boundary
(Courtillot et al., 2000). The lava pile of Gujarat is much thinner than in the Western Ghats
and in the order of hundreds of meters, increasing to about 1.5km in the south (e.g. Kaila et
al., 1985, Melluso et al., 1995, Peng & Mahoney, 1995). It is discontinuous and affected by
faulting (Biwas, 2005, Guha et al., 2005). Despite the faults and rifts, the outcrops are now
extremely limited due to the extensive blanketing of the area by quaternary sediments (Figure
2.2). The composition of the lavas of Kutch and Saurashtra differs markedly from the Main
Province Tholeiites. Alkali and magnesium contents are generally higher and picritic basalts
are common (Krishnamurthy & Cox, 1977, Melluso et al., 1995, Peng & Mahoney, 1995,
Krishnamurthy et al., 2000, Melluso et al., 2006). Carbonatites have also been reported on
several locations in Gujarat and in the Narmada-Tapti rift (Gwalani et al., 1993, Simonetti et
al., 1995, Viladkar & Schidlowski, 2000, Paul et al., 2008 and references therein). Tholeiites
do occur in both Kutch and Saurashtra yet no corresponding feeder system has been reported
2. Geological setting
42
thus far. It is likely that they have been emitted further south by the feeder dykes of the
Western Ghats (Sen et al., 2009).
2.3.2.2. Mount Pavagadh
Mount Pavagadh (Figure 2.3) is an isolated outcrop consisting in a ~500m-thick section (5km
across) made of syn-Deccan (Kaneoka & Haramura, 1973), flat-lying lava flow remnants. The
section of Mt. Pavagadh is bimodal with alkaline basalt (sometimes picritic) building most of
its structure while the upper third is felsic (dacite and rhyolite). No connection of this section
with any other Deccan outcrop has yet been established (Sheth & Melluso, 2008).
2.3.2.3. Narmada-Tapti rift
The Narmada-Tapti rift is a complex area in many respects. First, it is an intraplate rift
wherein ubiquitous and intense normal faulting syn- and, to a lesser extent, post-Deccan
(Kaila et al., 1985, Ju et al., 2013) renders flow correlation – with the rest of the Deccan
Traps as well as within the rift itself – much more difficult than for the Main Province
(Subbarao et al., 1999, Shrivastava & Pattanayak, 2002). In addition, Deccan volcanism has
resulted in large-scale partial remagnetization of many sections (Prasad et al., 1998). A third
complication comes from the fact that both Western Ghats-like tholeiites (Peng et al., 1998,
Chandrasekharam et al., 1999, Shrivastava & Pattanayak, 2002, Vanderkluysen et al., 2011)
and alkali products (Subba Rao, 1972, Gwalani et al., 1993, Simonetti et al., 1995, 1998,
Chalapathi Rao et al., 2012) have been emplaced in this area.
Amongst the variety of alkaline rocks of the Narmada-Tapti area, the Abma Dongar
carbonatites is certainly the most studied one (e.g. Gwalani et al., 1993, Simonetti et al., 1995,
Viladkar & Schidlowski, 2000, Ray et al., 2003) for their geodynamic implications (mantle
volatile content: Ray et al., 2003, temperature, amount of melting: Ernst & Bell, 2010).
2.3.2.4. Behradi Kodomali kimberlite
Although other instances of kimberlites have been reported in Indian (e.g. Gregory et al.,
2006, Lehmann et al., 2010), the Behradi Kodomali kimberlite is the only such rock that has
an end-Cretaceous age (Chalapathi Rao & Lehmann, 2011, Chalapathi Rao et al., 2011b). The
2. Geological setting
43
occurrence of kimberlites associated with the eruption of the Deccan Traps is an important
geodynamic indicator suggesting that 1) significant heat transfer from the plume the
surrounding cratonic root and 2) the Indian lithosphere was thick at the time and location of
the Behradi Kodomali kimberlitic intrusion (Chalapathi Rao & Lehmann, 2011, Chalapathi
Rao et al., 2011b). See section 2.4 for a discussion of the lithospheric thickness beneath the
Indian plate.
2.3.2.5. Mumbai volcanics
Mumbai is located some 80km to the west of the Western Ghats on the coastline (Konkan
plain (Figure 2.2 and Figure 2.3). In this area, the lava sequence of the Main Deccan Province
(Figure 2.4) is brought to sea-level by a weak north-south anticline structure parallel to the
Western Ghats and resulting in a low angle westward dip of the lava flows towards the
Arabian Sea: the Panvel Flexure (Hooper, 1990, Dessai & Bertrand, 1995, Sheth, 1998). The
area of Mumbai and especially Salsette Island feature alkaline felsic rocks that contrast
drastically with the underlying Deccan tholeiites: the Salsette subgroup (Sethna, 1999).
Although the latter clearly postdate the main volcanic phase of the Deccan Traps by about 2-
3Ma (Lightfoot et al., 1987, Sethna, 1999, Cripps et al., 2005, Hooper et al., 2010, Sheth &
Pande, 2013), isotopic signatures resemble those of the Main Deccan Province tholeiites
(Lightfoot et al., 1987, Sheth et al., 2013). The Salsette subgroup has thus been interpreted as
resulting from the foundering of earlier, underlying grabbroic intrusions related to the
ubiquitous Main Deccan Province tholeiites (Lightfoot et al., 1987). Several intrusions related
to Main Deccan Province formations (Figure 2.4) have also been reported in this area. Hooper
et al. (2010) identified three distinct sets of dykes in the Mumbai area based on chemistry and
orientation (Group1: Wai-like composition, random trends; Group2: Kalsubai-like
composition, clear north-south trend; Group3: Salsette-like composition, clear north-south
trend, cross cut Group1 and 2) and argued for a post-Deccan extension (Laxmi Ridge and
Seychelles breakup) of the Indian west coast and a syn-Deccan formation of the Panvel
Flexure (see also Hooper, 1990). However, this interpretation has recently been challenged by
the discovery of a new 62-63Ma sedimentary sequence within the Salsette subgroup (Sheth &
Pande, 2013), casting doubts as to a syn-Deccan formation of the Panvel Flexure.
2. Geological setting
44
2.3.2.6. The Seychelles and the Laxmi Ridge
The Seychelles are made of Precambrian granitic terrains and Cretaceous-Tertiary alkaline to
tholeiitic intrusions (Devey & Stephens, 1992). Similarities between the latter and the Deccan
Traps have been reported (Devey & Stephens, 1991, 1992, Owen-Smith et al., 2013). The
tholeiitic dykes of the Seychelles share similarities with the Bushe formation in the Deccan
(Devey & Stephens, 1992). In the same way, it has been suggested that the Seychelles
tholeiitic and alkaline intrusions correspond to the culmination of volcanic activity in the
Deccan (Owen-Smith et al., 2013). However, the published 40Ar/39Ar and U-Pb ages reported
for these intrusions (63-63.5Ma, Ganerød et al., 2011) may not coincide with the actual
culmination of the volcanism in the Deccan Traps (Chenet et al., 2007) but rather to post-
Main Province activity (Hooper et al., 2010).
An important unknown regarding the end-Cretaceous early-Palaeogene geodynamics of the
Seychelles with respect to the Indian plate stems from the existence of a ~500km-long
negative gravity anomaly (Sandwell & Smith, 1997) associated with evidences of pre-
geomagnetic chron C28 (Gradstein et al., 2004) of a an early spreading centre: respectively,
the Laxmi Ridge and the Gop Rift (Bhattacharya et al., 1994, Malod et al., 1997), Figure 2.1.
The Laxmi Ridge is generally described as a micro continent (Talwani & Reif, 1998, Dietmar
Müller et al., 2002) with significant ultramafic underplating that became separated from 1- the
Indian plate by transient, presumably syn-Deccan, extensional regime (Gop Rift) and 2-
(later) from the Seychelles by the onset of the Carlsberg Ridge, which then accommodated all
subsequent seafloor spreading in the Arabian Sea (Minshull et al., 2008, Eagles & Hoang,
2014), Figure 2.6. See also Huismans and Beaumont (2011) for two-stage breakup modelling.
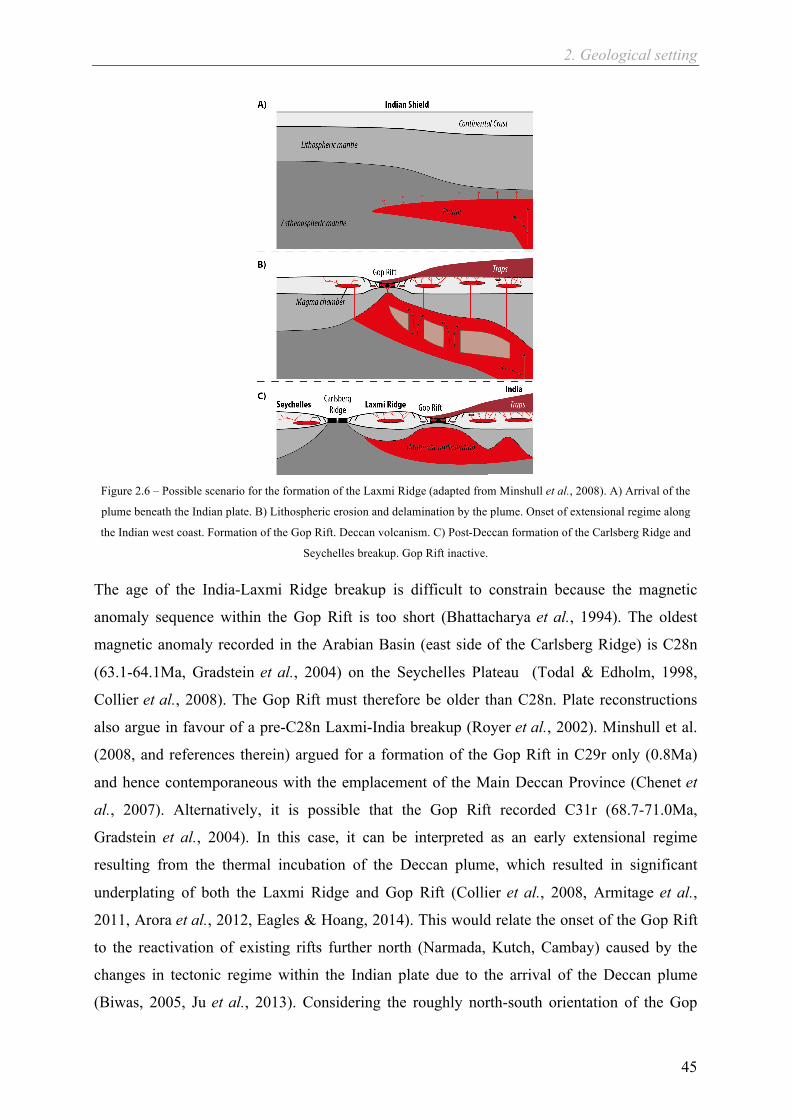
2. Geological setting
45
Figure 2.6 – Possible scenario for the formation of the Laxmi Ridge (adapted from Minshull et al., 2008). A) Arrival of the
plume beneath the Indian plate. B) Lithospheric erosion and delamination by the plume. Onset of extensional regime along
the Indian west coast. Formation of the Gop Rift. Deccan volcanism. C) Post-Deccan formation of the Carlsberg Ridge and
Seychelles breakup. Gop Rift inactive.
The age of the India-Laxmi Ridge breakup is difficult to constrain because the magnetic
anomaly sequence within the Gop Rift is too short (Bhattacharya et al., 1994). The oldest
magnetic anomaly recorded in the Arabian Basin (east side of the Carlsberg Ridge) is C28n
(63.1-64.1Ma, Gradstein et al., 2004) on the Seychelles Plateau (Todal & Edholm, 1998,
Collier et al., 2008). The Gop Rift must therefore be older than C28n. Plate reconstructions
also argue in favour of a pre-C28n Laxmi-India breakup (Royer et al., 2002). Minshull et al.
(2008, and references therein) argued for a formation of the Gop Rift in C29r only (0.8Ma)
and hence contemporaneous with the emplacement of the Main Deccan Province (Chenet et
al., 2007). Alternatively, it is possible that the Gop Rift recorded C31r (68.7-71.0Ma,
Gradstein et al., 2004). In this case, it can be interpreted as an early extensional regime
resulting from the thermal incubation of the Deccan plume, which resulted in significant
underplating of both the Laxmi Ridge and Gop Rift (Collier et al., 2008, Armitage et al.,
2011, Arora et al., 2012, Eagles & Hoang, 2014). This would relate the onset of the Gop Rift
to the reactivation of existing rifts further north (Narmada, Kutch, Cambay) caused by the
changes in tectonic regime within the Indian plate due to the arrival of the Deccan plume
(Biwas, 2005, Ju et al., 2013). Considering the roughly north-south orientation of the Gop
2. Geological setting
46
Rift, it is reasonable to speculate speculate that the Gop Rift could also be contemporaneous
with the early extension episode that resulted in the coastal dyke swarm (Vanderkluysen et
al., 2011, Ju et al., 2013), Figure 2.3, and indeed contemporaneous with the emplacement of
the Main Deccan Province. However, the early extensional regime responsible for the Gop
Rift could also date back to the separation of Madagascar (90Ma, Chatterjee et al., 2012 and
references therein), even though further extension as well as significant ultramafic
underplating were caused by the Deccan plume in the late-Crataceous and the Seychelles
breakup in the early Palaeogene (Arora et al., 2012).
2.4. The Indian lithosphere and the Deccan plume
The lithosphere-asthenosphere transition is boundary layer of both thermal and mechanical
nature that constitutes the sole of mechanically coherent tectonic plates (Artemieva, 2009).
The interactions between this boundary layer and an impinging mantle plume are of critical
importance in understanding Large Igneous Provinces (Saunders et al., 2007). The
impingement of a plume on the lithosphere-asthenosphere boundary creates large anomalies
of thermal (Morgan, 1971) and chemical (Hofmann & White, 1982) nature that will affect the
above-lying plate in a variety of ways and that will ultimately result in thermal anomalies,
thinned lithosphere, extension and chemical variations in lavas after the onset of volcanism.
These traces of plume activity will remain and can thus be investigated as means to
reconstruct plume-related processes (e.g. Saunders et al., 2007, Sobolev et al., 2011). The
thickness of the lithosphere directly determines the depth at which primary magmas will be
released from their source – however, the actual depth of melting may be slightly different
from the lithosphere-asthenosphere boundary (~10km deeper) due to the existence of a plume
freezing zone beneath the lithosphere (Watson & McKenzie, 1991). Plume-induced
lithospheric erosion will thus affect the depth and amount of melting of primary melt sources,
and consequently induce variations in the composition of lavas (Sobolev et al., 2007, 2011). It
is also believed to affect plate motion (thinner lithosphere = faster continental drift, e.g.
Kumar et al., 2007). The thickness of the Indian lithosphere is therefore a parameter of prime
importance in trying to understand the magmatic activity responsible for the Deccan Traps.
The Indian plate is a craton (Figure 2.2). Lithosphere thicknesses of cratons are usually large
(≥ 200km) (James et al., 2001, Carlson et al., 2005, Artemieva, 2006, 2009, Eaton et al.,

2. Geological setting
47
2009, Griffin et al., 2009). Artemieva (2006) proposed that the Precambrian units of Indian
Shield were 140 to 200km thick while the Narmada-Tapti area (Figure 2.2) would reach only
80 to 110km. Lehmann et al. (2010) suggested an average thickness of 164km for India.
Arora et al. (2012) identified a thickness gradient along the Indian west coast: 120km in the
Mumbai area, smoothly decreasing to 95km towards the Laxmi Ridge (west) before
transitioning to true oceanic lithosphere west of the Laxmi Ridge. Interestingly, Arora and
colleagues also noted a significant thickening 450km southeast of Mumbai (160km). In this
area (450km southeast of Mumbai and farther in this direction), there is a steep east-west
lithospheric thickness gradient with 165km beneath onshore India decreasing to 65km to the
west at the Laccadive Islands (oceanic lithosphere) close to the hypothetical plume path
(Arora et al., 2012), Figure 2.7.
Petrological data, to some extent, argue in favour of a generally thick, yet locally thinner
Indian lithosphere. Both Precambrian and late Cretaceous diamond-bearing Kimberlites have
been reported in India (Lehmann et al., 2010 and references therein), section 2.3.2.4, which
implies a lithospheric thickness greater than 140km (Chalapathi Rao & Lehmann, 2011). In
the same way, alkali volcanics (Subba Rao, 1972) and (e.g. Sen, 2001, Karmalkar et al., 2005,
Talusani, 2010) and garnet-bearing mantle sources also hint at lithospheric thicknesses greater
than 80km (Walter, 2014). At the same time, magmatic source rocks in the spinel stability
field have also bee reported, especially in Saurashtra, Kutch and in the Cambay-Narmada
Tapti junction area (e.g. Sen, 2001, Melluso et al., 2006, Sen et al., 2009), implying shallow
lithosphere-asthenosphere boundary (<80km).
Kumar et al. (2007) proposed a very different scenario wherein the Indian lithosphere would
have been thinned to about 100km by a large plume before or immediately after (no later than
130Ma) breakup with Gondwana (167Ma). Kumar and co-workers proposed that the very thin
Indian lithosphere was directly responsible for the very fast drift of the Indian plate towards
Asia. However, this proposition is at odd with several key observations: 1) It fails to explain
the existence of Deccan-related kimberlites, lamprophyres, carbonatites and related alkaline
lavas. 2) Present-day observations clearly indicate that, except along the Indian west coast, the
lithosphere is thicker than 120km. 3) Plumes are known to erode and rejuvenate the
continental lithosphere (e.g. Foley, 2008, Sobolev et al., 2011), which implies that the
present-day Indian lithosphere must be thinner than it was prior to the impingement of the
Deccan plume. Therefore, unless large scale underplating can account for the difference
between the Cretaceous lithosphere thickness range proposed by Kumar et al. (2007) and the

2. Geological setting
48
range proposed by the various authors quoted in the earlier paragraphs, the proposition that
the Indian lithosphere was thin prior to the arrival of the Deccan plume may be considered
incorrect. It has also been proposed that the Deccan plume itself was responsible for faster
divergence rates of the Indian plate (Eagles & Hoang, 2014).
Sobolev et al (2011) suggested – on the basis of thermo-mechanical modelling of plume-
lithosphere interactions – that no lithosphere erosion and subsequent LIPs magmatism would
occur if the initial lithospheric thickness was greater than 140-150km.
In this manuscript, it is argued that the Cretaceous lithospheric thickness of the Indian shield
was similar to present-day in its central part – i.e. 160-200km (Artemieva, 2006, Priestley &
McKenzie, 2006) – and that there was an westward thickness gradient from there so that the
Deccan Plume impinged upon a 140km-thick lithosphere beneath the Nasik-Pune dyke swarm
(Figure 2.3), and even shallower lithosphere-asthenosphere boundary in Gujarat where spinel-
facies mantle sources have been reported (Sen et al., 2009). The cratonic Indian lithosphere
has subsequently been eroded and underplated by the Deccan plume, very much in the manner
described by Foley (2008) and Sobolev et al. (2011), see also Figure 2.6 of this manuscript,
see also Sen and Chandrasekharam (2011). The present-day Indian lithospheric thickness
speculated in this PhD thesis is assumed to be very close to a combination of the observations
made by Arora et al. (2012), Artemieva (2006) and Priestley and McKenzie (2006). Figure
2.7.

2. Geological setting
49
Figure 2.7 – Present-day lithosphere thickness beneath India and the Deccan Traps (based on: Artemieva, 2006, Priestley &
McKenzie, 2006, Arora et al., 2012), main rift systems (Figure 2.2), Continent-Ocean Boundary (Arora et al., 2012) major
dyke swarms (Figure 2.3), speculated size and location of the Deccan plume at 66Ma (White & McKenzie, 1989) and
Deccan-related Kimberlite occurrences: Behradi Kodomali (63-65Ma, Chalapathi Rao & Lehmann, 2011).
The scenario proposed on Figure 2.7 accounts for most of the field observations discussed
above:
- The present-day Indian lithosphere is thinner towards centre of the speculated end-
Cretaceous location of the Deccan plume centre (White & McKenzie, 1989)
- It is thinner beneath the main feeder dyke swarms (Vanderkluysen et al., 2011, Ju et
al., 2013) and intraplate rifts (Murthy, 2002, Bhattacharji et al., 2004, Meert et al.,
2010). The postulated thickness beneath Narmada-Tapti and Gujarat (100-125km)
fails to explain the occurrence of spinel-facies mantle source rocks in those areas (e.g.
Sen, 2001, Melluso et al., 2006, Sen et al., 2009). However, the possibility of large
and localized variations of the lithospheric thickness due to erosion by the Deccan
plume and/or subsequent thickening due to ultramafic underplating (Foley, 2008,
Sobolev et al., 2011) would easily explain that locally mantle source rocks were at
depths <80km
- A locally thinned lithosphere would also account for the occurrence of very different
volcanic products in relatively small areas of the Deccan Traps: e.g. Lamprophyres
(Chalapathi Rao et al., 2012), carbonatites (Gwalani et al., 1993, Ray et al., 2003) and
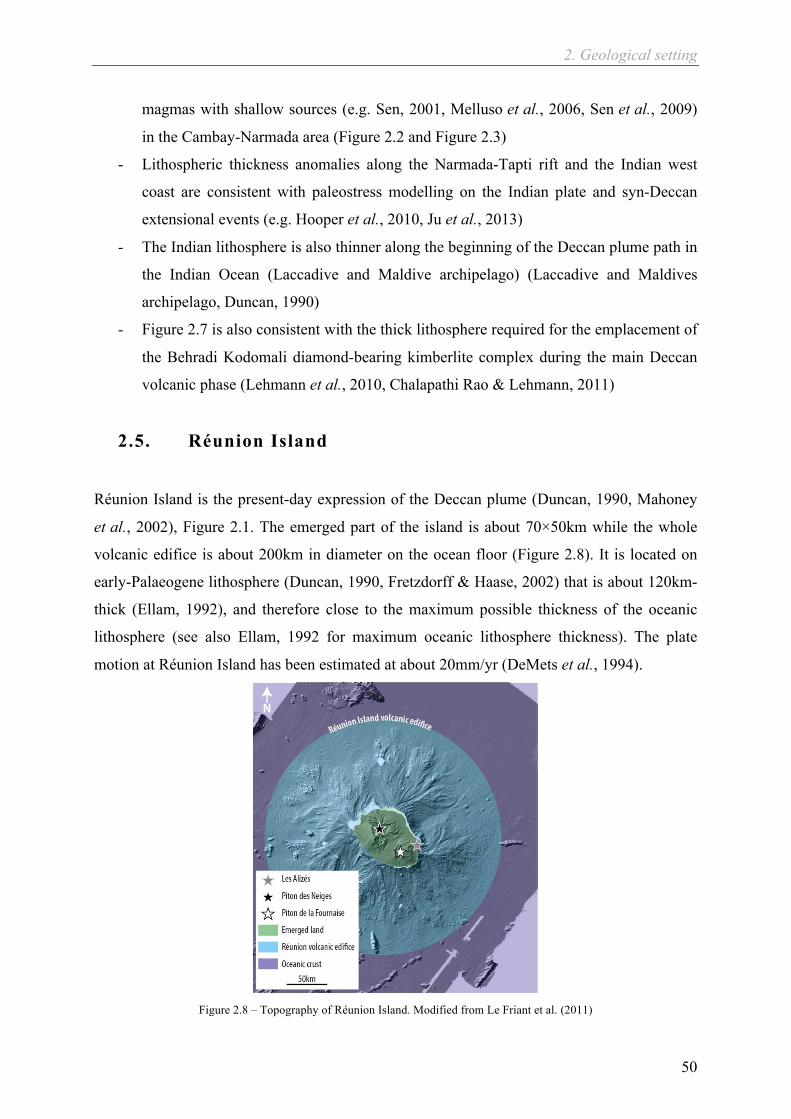
2. Geological setting
50
magmas with shallow sources (e.g. Sen, 2001, Melluso et al., 2006, Sen et al., 2009)
in the Cambay-Narmada area (Figure 2.2 and Figure 2.3)
- Lithospheric thickness anomalies along the Narmada-Tapti rift and the Indian west
coast are consistent with paleostress modelling on the Indian plate and syn-Deccan
extensional events (e.g. Hooper et al., 2010, Ju et al., 2013)
- The Indian lithosphere is also thinner along the beginning of the Deccan plume path in
the Indian Ocean (Laccadive and Maldive archipelago) (Laccadive and Maldives
archipelago, Duncan, 1990)
- Figure 2.7 is also consistent with the thick lithosphere required for the emplacement of
the Behradi Kodomali diamond-bearing kimberlite complex during the main Deccan
volcanic phase (Lehmann et al., 2010, Chalapathi Rao & Lehmann, 2011)
2.5. Réunion Island
Réunion Island is the present-day expression of the Deccan plume (Duncan, 1990, Mahoney
et al., 2002), Figure 2.1. The emerged part of the island is about 70×50km while the whole
volcanic edifice is about 200km in diameter on the ocean floor (Figure 2.8). It is located on
early-Palaeogene lithosphere (Duncan, 1990, Fretzdorff & Haase, 2002) that is about 120km-
thick (Ellam, 1992), and therefore close to the maximum possible thickness of the oceanic
lithosphere (see also Ellam, 1992 for maximum oceanic lithosphere thickness). The plate
motion at Réunion Island has been estimated at about 20mm/yr (DeMets et al., 1994).
Figure 2.8 – Topography of Réunion Island. Modified from Le Friant et al. (2011)
2. Geological setting
51
The Réunion Island includes two or three different volcanoes:
Les Alizés volcano would be the oldest (>4Ma: Smietana, 2011) but its existence is being
debated (e.g. Le Friant et al., 2011). It woud have ceased its activity at about 400ka
(Smietana, 2011, and references therein).
Piton des Neiges volcano was established shortly after Les Alizés (Upton & Wadsworth,
1965, Gillot et al., 1994). Its latest period of activity was dated at 12ka (Deniel et al., 1992).
Piton de la Fournaise volcano is the current active centre of eruption. It became active around
400ka (Oehler et al., 2008). Proponents of the existence of Les Alizés volcano argue that
Piton de la Fournaise was built after the collapse of the previous (Lénat et al., 2001, Oehler et
al., 2008).
Réunion Island is an oceanic island similar to Hawaii (Moore & Clague, 1992) in the sense
that it is related to a hotspot (the tail stage of the Deccan plume, Duncan, 1990). Nevertheless,
if the Hawaiian model of Moore and Clague (alkalic pre-shield, tholeiitic shield building and
alkalic post-shield stages) holds for Piton des Neiges (e.g. Upton & Wadsworth, 1965), it has
been challenged by reports of differentiated alkaline rock corresponding in age and location
with the earliest activity of Piton de la Fournaise (Albarède et al., 1997). These observations
may nevertheless be reconciled with the standard Hawaiian ocean island model if the
differentiated lavas previously attributed to Piton de la Fournaise belonged instead to an older
edifice, namely Les Alizés volcano (see Smietana, 2011 and related publications for a
thorough discussion of the structure and evolution of Réunion Island).

52

53
3. Re-visiting the
eruption timing of the
Deccan Traps

3. Re-visiting the eruption timing of the Deccan Traps
54
It has been known for some time that the main eruptions of Deccan Traps occurred in the late
Cretaceous to early Danian. This first age estimation of the onset of Deccan volcanism was
based on paleontological studies of underlying sedimentary deposits beneath and in contact
with Deccan lavas: the Lameta Formation (Courtillot et al., 1986, Buffetaut, 1987, Salil et al.,
1997). An early-Tertiary age had been assigned to intertrappean deposits of the Mumbai area
(top of the Deccan Traps section) as early as the late nineteenth century (Blanford, 1867), and
still earlier activity of the Deccan Plume (up to 99Ma) has been reported in present day
Pakistan (Mahoney et al., 2002). However, such an early trace of Deccan plume activity is
somewhat inconsistent with paleogeographic reconstructions (Roddaz et al., 2011, Chatterjee
et al., 2012).
A more detailed chronology of the eruptions is difficult to establish. The required resolution is
at the order of centuries to millennia. At this level traditional radiochronology is of little use
and the marine sedimentary record is often too coarse. Despite these rather stringent
constraints, very valuable information as to the relative timing can be obtained from high-
resolution paleomagnetism, weathered basalt horizons (Bole Beds), Giant Plagioclase Basalt
flows, biostratigraphic and pelagic carbonate Os isotopic ratios.
3.1. Radiometric dating of the Deccan Traps
Although radiometric dating is of limited use when trying to obtain the details of the
remarkably swift events that occurred in the late Cretaceous to early Danian, the method did
provide the first absolute time constraints to this series of events by showing that the eruption
of the Deccan Traps started prior to and straddled the K-Pg boundary. See Chenet et al. (2007,
Figure 4) and Courtillot et al. (1986, Figure 4) for a compilation of radiometric dating for the
Deccan Traps.
Moreover, recent 40K-40Ar dating (Chenet et al., 2007) shed new lights on the Deccan Traps
by showing that the eruption occurred in three different phases: Phase 1 predates the K-Pg
boundary by about 2Ma, Phase 2 occurred just before and ended at the K-Pg boundary and
Phase 3 happened ~2-300ka later in the Danian and therefore post-dates the K-Pg boundary.

3. Re-visiting the eruption timing of the Deccan Traps
55
3.2. High-resolution paleomagnetism
The main eruptions of the Deccan Traps are known to straddle three to four geomagnetic
chrons, namely C30r, C30n, C29r and C29n (Courtillot et al., 1986), the most intense ones
having occurred in C29r.
Recently, Chenet and co-workers (Chenet, 2006, Chenet et al., 2007, 2008, 2009) carried out
an extensive field campaign during which they sampled every lava flow in the Western Ghats
resulting in an almost complete, 3.5km-thick composite section of the main Deccan province
(Figure 2.4), from the north near Igatpuri, to Mahabaleshwar in the south. The unique spatial
resolution of their dataset paved the way for a new interpretation of paleomagnetic data that is
based on variations of the paleomagnetic mean site directions: Applying today’s magnetic
secular variations of 2-3° per century, and assuming it was similar in the Cretaceous, they
were able to identify directional groups wherein a sequence of lava flows feature magnetic
directions that are statistically similar, thereby suggesting they erupted during a period of less
than a century. Moreover, no thick weathered horizons (Bole Beds, see section 3.3) were
found within directional groups, which further supports a rapid emplacement.
Thirty such directional groups (or single eruptive events) have been identified in this manner,
implying a total eruption time of 300 to 3000 years. Lava flows outside directional groups (41
in all) cannot be temporally constrained in the same way, as pole wander paths cannot be
predicted over several hundreds of years. By assuming a total time of emplacement of 10 to
100 years – based on volcanological observations at the Roza flow field, Columbia River
Basalt (Thordarson & Self, 1998) and the frequent lack of weathering features – for each of
the 41 individual flows, their total time of emplacement varies between 410 and 4100 years.
Hence, the combined eruption time of the Western Ghats lava pile would have been between
1000 and 7000 years, plus an unknown intervening quiescence time. It should nevertheless be
stressed that faster emplacement rates for both directional groups and/or individual flows
cannot be ruled out as instances of extremely fast (days to months) variations the geomagnetic
field have been identified elsewhere on Earth from both sedimentary (Valet et al., 1986,
Channell & Lehman, 1997) and volcanic (Coe et al., 1995, Bogue & Glen, 2010) formations.
Chenet et al. (2008) and Gérard et al. (2006) attempted to evaluate the extent of these
quiescence periods and proposed that thin (cm-thick) weathered horizons (thin red boles) may
have formed over a few years (typically 10) while thicker ones (m-thick) would have required
several thousands of years. Thin red boles (38 in all) being negligible compared to the 6 thick
3. Re-visiting the eruption timing of the Deccan Traps
56
ones reported, Chenet and co-workers arrived at an estimated 300,000 years of quiescence
time based on red boles only, plus an unknown duration where time gaps have not been
recorded. This is an order of magnitude larger than the eruption time proposed above.
Nonetheless, the possibility that red boles or bole beds may not necessarily imply long
volcanic quiescence, however thick they may be, will be discussed in section 3.3.
This high-resolution paleomagnetic data agrees with the episodic character of the Deccan
Traps eruption seen at coarser timescales in geochronological (Chenet et al., 2007),
petrological (Self et al., 2008b) and paleontological (Keller et al., 2008a) data with a first and
minor phase in early C30n, followed by a second and most intense phase in mid-C29r, which
is believed to contain – or to have ended at – the K-Pg boundary and, finally, a third phase
beginning early in C29n and followed by minor volcanic events and rifting for a few millions
of years on (Hooper et al., 2010, Sheth & Pande, 2013). This high-resolution paleomagnetic
dataset also, and most importantly, shows that the three main phases are themselves made of
shorter ones of extreme intensities (directional groups). It provides a very high precision in
the relative timing to within the uncertainties regarding the quiescence time, which now
becomes the most important unknown.
Similar observations of discontinuous activity with large pulses, and intervening but difficult-
to-measure quiescence periods, have been reported using the same method in Siberia (Pavlov
et al., 2011) and Karoo (Moulin et al., 2011).
3.3. Bole Beds and/or Red Boles
Bole beds are weathered basalt horizons intercalated in a lava flow sequence. They are also
referred to in the literature as intrabasaltic layers or flood basalt hosted paleosols. Their colour
varies according their oxidation state, composition and grain size distribution from grey-blue
to green or red. Sayyed (2013) provides an extensive review on bole beds and their potential
use as palaeoclimatic indicators of environmental changes.
In the Deccan Traps, bole beds are mostly red and thick (m-thick) or thin (cm-thick). Green
boles also occur but are far rarer. Overall, bole beds are more numerous towards the top of the
Western Ghats composite section (Sen, 2001, Chenet et al., 2008, 2009). They have been
reported in the literature ever since the early publications on the Deccan Traps and their
interpretation has remained controversial. They have been argued to be sediments, weathered
basalts or pyroclastites (e.g. water pools filling topographical lows), paleosols, or basalts
3. Re-visiting the eruption timing of the Deccan Traps
57
metasomatized by hydrothermal alteration. See Chenet et al. (2008), Sen (2001) and
references therein.
Green boles feature contacts with both under- and over-lying flows, which are sharper than
those of red boles. Their colour is due to the presence of Mg in the form of chlorite. Overall,
there seem to be a general consensus that green boles are altered ash deposits, probably
equivalent to today’s andosols or volcanic ash soil. High concentrations of K and Rb also
argue in favour of aeolian ash transportation. (Ghosh et al., 2006). However, F. Fluteau
(IPGP, personal communication) observed a green bole continuous with a red bole in the
field.
In the case of red boles, the boundary with the underlying lava appears interstratified and
amygdaloidal while the contact with the overlying flow is generally sharp. Their colour
results from the presence of Fe3+ in the form of geothite. Their chemical composition clearly
indicates that red boles are the result of basalt weathering (Ghosh et al., 2006). Furthermore,
Ghosh and co-workers argued that red boles had clear characteristics of developing soils, such
as shrinkage cracks, clay and secondary minerals as well as partially dissolved plagioclase
grains (Sayyed, 2013). Paedogenesis from fresh basalt is known to take several thousands of
years (Patino et al., 2003) and this observation supports the idea that red boles took a long
time to form. Nevertheless, concentrations in immobile elements (e.g. Al, Fe3+) differ from
that of laterites, which suggests processes different and probably shorter than paedogenesis
(Widdowson et al., 1997). In the same way, Sayyed and Hundekari (2006) compared red
boles to modern Deccan soils and concluded that the bole beds have not undergone intense
chemical weathering or paedogenesis. Srivastava et al. (2012) recently proposed that
recycling and redeposition by surface runoff, infiltration and ponding was the most likely
process of bole bed formation in the Deccan Traps. In other words, most bole beds are
interpreted by Srivastava and colleagues as detrital deposits governed by shallow streams.
Moreover, Srivastava et al also stress that signs of paedogenesis or lateritization in Deccan
bole beds are in fact seldom unequivocal.
In the field, red boles also appear to be associated with Giant Plagioclase Basalt flows (Sen,
2001, Higgins & Chandrasekharam, 2007). See section 3.4.
3. Re-visiting the eruption timing of the Deccan Traps
58
3.4. Giant Plagioclase Basalts
Giant Plagioclase Basalts (GPB) differ from any other Deccan lavas in that they contain
plagioclase phenocrysts that are abundant (up to 25mod%) and large (up to 30mm in length)
whilst most other Deccan products only contain very low amounts of small phyric
plagioclase. GPBs are the most evolved lavas of the Main Deccan Province. They occur as 5-
to-10m-thick flows at the top of the lowest formations of the Western Ghats (Kalsubai sub-
group (Figure 2.4), although their occurrence in Wai subject to debate (Deshmukh et al.,
1977)) and have therefore been of great help in mapping this part of the lava section (Hooper
et al., 1988, Subbarao et al., 2000). Many GPBs have also been emplaced directly on red
boles (Deshmukh et al., 1977, Beane, 1988, Sen, 2001). Although uncommon, GPBs have
been observed in other volcanic settings (Naslund, 1984, Cullen et al., 1989, Furman et al.,
1991).
The relevance of GPBs in understanding the rate of the Deccan Traps eruption stems from the
fact that the large plagioclase phenocrysts are believed to have formed over the entire life-
span of a magma chamber. Therefore, the time taken by the large phenocrysts to grow is
believed to be equal to the eruption time of the formation they belong to (Hooper et al., 1988,
Sen, 2001, Borges, 2007, Higgins & Chandrasekharam, 2007, Borges et al., 2013).
Plagioclase phenocrysts would have crystallized in convecting, upper crustal magna
chambers. Being buoyant, they would accumulate near the top of the chamber and increased
in size in response to the continuous supply of magma. After the end of an eruption cycle, a
new magma pulse – of a new formation – would eject the Giant Plagioclase magma,
sometimes on top of red boles, after a period of dormancy (Sen, 2001, Higgins &
Chandrasekharam, 2007). Thus, finding out how long the phenocrysts took to reach their large
size is similar to measuring the eruption time of an entire formation. This has been made
possible by the application of diffusion/relaxation modelling of 87Sr/86Sr zoning in the
plagioclase phenocrysts (Borges, 2007, Borges et al., 2013). Such studies yielded maximum
residence times of 780 years for 5cm crystals and suggest that the peak of volcanic activity
lasted a minimum of 21,000 years, including some periods of dormancy as several GPBs have
been erupted onto red boles. These observations also mostly preclude the possibility of
(upper) crustal assimilation in the Deccan Traps and argue in favour of large volumes of melts
being extracted from an enriched source with low solidus temperatures (e.g. eclogite, Borges,
2007, Borges et al., 2013). Yet, as Borges and co-workers duly noted, high bulk-rock 87Sr/86Sr

3. Re-visiting the eruption timing of the Deccan Traps
59
ratios indicative of crustal contamination occur in the Deccan Traps, especially in Mg-rich
units (e.g. Bushe formation). Such a pattern may be explained by either rapid and turbulent
melt transport through cracks that can efficiently assimilate fragments of wall-rock (Huppert
& Sparks, 1985) or by lower crustal assimilation. In the Deccan case, turbulent transport
through the crust may also explain the rare yet sometimes extremely abundant xenoliths of in
some dykes (Ray et al., 2008).
3.5. Paleoenvironmental data
Paleoenvironmental temporal constraints stem from various proxies in the sedimentary
record: high-resolution biostratigraphy and isotopic ratios in marine sediments. Unfortunately,
this valuable information can only be pinpointed in time by means of assumptions and
models. These include sedimentation rates and chemical precipitation models (Kyte et al.,
1993), inter-correlation with other sections that have been precisely dated (e.g. by
radiochronology, magnetostratigraphy, biostratigraphic age determination, Coccioni et al.,
2004), correlation with astronomical cycles (Boulila et al., 2011) and magnetostratigraphy
itself (Cande & Kent, 1995, Gradstein et al., 2004, Robinson et al., 2009, Keller et al., 2011).
The uncertainties inherent to these models generally limit the resolution to greater than a few
tens or hundreds of thousands – if not millions – of years (Burke et al., 1982, Pegram et al.,
1992, Peucker-Ehrenbrink & Ravizza, 2000, Nordt et al., 2002, Wilf et al., 2003, Keller et al.,
2011). This is true for both absolute and relative timeframes. Nevertheless, the importance of
paleoenvironmental data remains twofold: 1- it provides a tool for tracking climatic variables
such as paleotemperatures (oxygen and carbon isotopes), proxies for erosion rates and sources
(osmium isotopes) and species diversity (foraminifera) over several hundreds of thousands of
years and thereby provides useful information as to Deccan-induced climate/environmental
change. 2- it is especially useful in trying to untangle the footprint of the Chicxulub impact
versus that of Deccan volcanism because the rate at which both of these events occurred is
extremely different (seconds versus tens to hundreds of millennia).
3.5.1. Intertrappean sediments
There are several instances of intertrappean sediments in the Deccan Traps, including some
that were of great help to the first attempts to determine the age of the Deccan Traps
3. Re-visiting the eruption timing of the Deccan Traps
60
(Blanford, 1867, Bajpai & Prasad, 2000, Khosla & Sahni, 2003, Cripps et al., 2005, Singh et
al., 2007, Bajpai et al., 2013). Unfortunately, most of these sediments comprise freshwater to
estuarine facies and may thus not be correlated to global sedimentary and paleontological
data. Such material may be used to monitor relative and local environmental and faunal
changes yet they are of no use when it comes to biostratigraphic age determination, or more
generally to tracing the global consequences of the emplacement of the Deccan Traps and the
role it played with respect to the end-Cretaceous mass extinction (Jaiprakash et al., 1993,
Raju et al., 1995, 1996).
The Krishna-Godavari Basin of southeast India is very promising in this respect. It contains
marine deposits that are intercalated with lava flows in the Rajahmundry area (Baksi et al.,
1994, Raju et al., 1995, 1996, Keller et al., 2008a, 2011). These lava flows have long been
recognized as being part of the Deccan Traps (Venkaya, 1949), thereby forming what has
been recognized as the longest (~1000km) lava flows so far known on Earth (Self et al.,
2008b). The association of the Rajahmundry Traps with the main Deccan province was
confirmed on a variety of grounds, mainly magnetostratigraphic and geochemical (Duncan &
Pyle, 1988, Lightfoot et al., 1990, Subbarao & Pathak, 1993, Banerjee et al., 1996, Baksi,
2001, Jay & Widdowson, 2008). Furthermore, the lava flows of the Rajahmundry Traps have
been identified as members of the Ambenali and Mahabaleshwar formations (Self et al.,
2008b).
Keller and co-workers (Keller et al., 2008a, 2009c, 2011) carried out intensive
biostratigraphic and magnetostratigraphic fieldwork in the Rajahmundry Traps. They were
able to bring new valuable insights as to the age and timing of the Rajahmundry traps – and
therefore of the final stages of volcanism in the main Deccan province – as well as on the
faunal changes during their emplacement. First and foremost, the Rajahmundry Traps
encompass the end of C29r (Maastrichtian) and the beginning of C29n (Danian) and hence
straddle the K-Pg boundary, which is located in C29r (Courtillot et al., 1986, Renne et al.,
2013). Moreover, it appears that the mass extinction was underway in C29r prior to the
eruption of the first so-called mega-flow found in the Krishna-Godavari basin as planktic
foraminiferal species richness had already suffered a 50% loss (Keller et al., 2012). The
eruption of the first mega-flow was followed (or accompanied) by a further 50% drop in
species richness and the extinction was complete by the end of phase 2 (Chenet et al., 2007)
after the eruption of the next three to four pre-K-Pg boundary mega-flows of reversed
3. Re-visiting the eruption timing of the Deccan Traps
61
polarities (C29r). No recovery of species diversity has been observed in between both sets of
mega-flows. Phase 3 (Chenet et al., 2007) started near the C29r-C29n reversal and is
expressed in the Rajahmundry area by four other mega-flows of normal polarity (C29n). At
this time, no major faunal diversity loss have been recorded, which suggests a lower intensity
of volcanism and/or that post-phase 2 species had adapted to high stress conditions. Finally,
full recovery took place only after phase 3. (Keller et al., 2011, 2012). These observations
suggest that phase 2 of Deccan volcanism (i.e. Jawhar to lower-Ambenali, Figure 2.4) alone
might have been responsible for the K-Pg mass extinction. In addition, paleomagnetic data
and biozone ages require that 260 to 380ka elapsed between phase 2 and phase 3 mega-flows.
Nevertheless, it has been suggested that pahoehoe to a’a flow type transition has recently been
advocated as a possible limiting factor to the development of very extensive lava flows
(Duraiswami et al., 2003, 2013). As a result, Duraiswami and colleagues have proposed
multicentre eruptions in order to explain the similarities of the Rajahmundry Traps with the
Western Ghats lavas.
3.5.2. Strontium and osmium isotopes
The variations of 87Sr/86Sr (Burke et al., 1982) and 187Os/186Os (Pegram et al., 1992) in
sedimentary marine carbonates over geological times provides a unique record of the origin of
the detrital material supplied to the ocean: the erosion of mantle-derived rocks (e.g. oceanic
islands or ridges) gives isotopic signatures significantly different from that of continental
crust weathering products (DePaolo & Ingram, 1985, Hess et al., 1986, Hodell et al., 1989).
Both seawater Sr and Os isotopic records show similar patterns throughout the Cenozoic
(Pegram et al., 1992). However, these isotopic systems are fundamentally different (Peucker-
Ehrenbrink & Ravizza, 2000) and these differences are extremely relevant in the case of the
end Cretaceous extinction. First, an extra-terrestrial impact could reset the 187Os/188Os to non-
radiogenic values while not affecting the marine Sr record. Several authors have attempted to
use Sr isotopes in order to constrain the origin (impact versus volcanism) of the end-
Cretaceous extinction (Vonhof & Smit, 1997, MacLeod et al., 2001). However, most of them
used Sr as a proxy for continental weathering and argued that impact-induced climate change
was to blame for changes in weathering intensities, even though acid rains and wetter climate
could have been caused by intense volcanism (Self et al., 2006, Self et al., 2008a, Ganino &
Arndt, 2009, Sobolev et al., 2011). Secondly, the residence time of Os in seawater (10-40ka)
3. Re-visiting the eruption timing of the Deccan Traps
62
is shorter than that of Sr (2-4Ma) (Pegram et al., 1992, Hodell, 1994, McArthur et al., 1998,
Peucker-Ehrenbrink & Ravizza, 2000). Such a short residence time – which nevertheless
remains longer than ocean mixing times (~103yr) (MacLeod et al., 2001) – could prevent a
complete homogenization of the seawater 187Os/186Os in isolated ocean basins (Robinson et
al., 2009). At the same time, it offers a much higher resolution record of the global
paleoclimate by keeping traces of short-periodic fluctuations such as glacial-interglacial
cycles (Oxburgh, 1998) that would otherwise be buffered in the Sr isotopic system wherein
only long-term forcing, such as tectonics, may be seen (Burke et al., 1982, Hodell et al., 1989,
Hodell, 1994).
Os isotopes have been used in the past to trace the onset and the environmental consequences
of Large Igneous Provinces (Cohen & Coe, 2002, Turgeon & Creaser, 2008) but these
findings lacked independent validation of their timing (Robinson et al., 2009).
Robinson et al. (2009) recently published high-resolution marine 187Os/188Os data coupled
with PGE concentrations from late-Cretaceous pelagic carbonate sections at Deep Sea
Drilling Program (DSDP) site 525 in the Atlantic, DSDP site 577 in western Pacific and
Ocean Drilling Program (ODP) site 690 in the Weddell Sea as well as a the subaerial
Bottaccione section in Italy (Premoli-Silva & Sliter, 1995). Using appropriate age models,
Robinson and colleagues were able to increase the temporal resolution of their sampling to
40-100ka and as much as 15ka for special interest samples. Furthermore, coupling with PGE
concentrations and published isotopic and paleomagnetic data produces a very coherent 187Os/186Os dataset between the four sampling sites. Two 187Os/186Os excursions, one early in
C29r and the second just before the K-Pg boundary lasting between 100 and 200ka, have been
identified from this record (Robinson et al., 2009, Figure 5). It has been suggested that the
outpouring of the Deccan basalts on the Dharwar Craton would have removed a source of
radiogenic Os by preventing the felsic rocks of the craton from being eroded away (Ravizza
& Peucker-Ehrenbrink, 2003). Moreover Ravizza and co-workers proposed that the Os
inventory of the Deccan basalts was too low (Allègre et al., 1999) to account for the changes
observed in seawater composition. Nevertheless, the Os inventory of Deccan may not be so
straightforward because high Os concentrations have been observed in Deccan laterites
(Wimpenny et al., 2007). As to the role of the Deccan Traps with respect to the K-Pg
extinction, Robinson et al. (2009) point out that that despite its duration (~0.3Ma), the initial
decrease in 187Os/188Os in C29r seems to have had no consequences on the environment. On
the other hand, paleontological (Keller et al., 2011, 2012), paleomagnetic (Chenet et al.,
3. Re-visiting the eruption timing of the Deccan Traps
63
2008, 2009) and 40K-40Ar (Chenet et al., 2007) data show that the actual first Deccan phase
(<10% of total volume) occurred in C30n or C30r and that the second and main Deccan phase
– responsible for 80% of the total volume – occurred in C29r and led to the K-Pg extinction
while a third phase (20% of total volume) took place after the extinction in C29n. It is thus
likely that the decline in 187Os/186Os seen by (Robinson et al., 2009) in early C29r was a
consequence of the early Deccan eruptions and its associated background activity while the
second and sharper 187Os/186Os excursion was the consequence of the actual second –
according to (Chenet et al., 2007) – and main phase of Deccan volcanism (80% of total
volume) that ultimately led to the extinction (Keller et al., 2012). However, the fact that no 187Os/186Os excursion is seen earlier in C30n casts significant doubt as to either the age, and
intensity of the earliest activity of the Deccan Traps, or the sedimentary age models.
Finally, PGE concentrations and 187Os/186Os excursions in marine pelagic carbonates show no
trace of an extra-terrestrial impact (Robinson et al., 2009).
3.6. Further speculations on the emplacement of the
Deccan Traps near the K-Pg boundary
By pulling together the information provided by the various proxies mentioned above, as well
as by adding hypotheses to those proposed by Chenet and co-workers (Chenet et al., 2007,
2008, 2009), a new interpretation of the timing of the Deccan Traps eruption and the end-
Cretaceous extinction has been developed. First, high-resolution paleomagnetic datasets were
re-interpreted in order to construct a continuous composite section of all Deccan lava flows
and assess the consequences in terms of cumulative erupted volume, quiescence time and
magma fluxes. This timeframe – very similar to that of Chenet and co-workers – will later
(section 5) be coupled with bulk-rock trace element geochemical signatures. Possible
correlations between this hypothetical scenario and paleoenvironmental proxies and
observations will then be assessed.
3.6.1. Continuous Deccan eruption scenario
This section is dedicated to a re-interpretation of the high-resolution paleomagnetic dataset of
Chenet and co-workers (Chenet et al., 2008, 2009) presented in section 3.2.

3. Re-visiting the eruption timing of the Deccan Traps
64
The continuous composite section of the main province of the Deccan Traps is derived from
the following observations and assumptions:
- Sample order and red bole locations have been taken from Chenet et al. (2008, Figure
7) and Chenet et al. (2009, Figure 9). Directional groups (DGs) are from Table 1 of
Chenet et al. (2008) and Table 4 of Chenet et al. (2009). Erupted volumes come from
Chenet et al. (2009) Table 5. These have been changed to fractions as their data
explains only 10 to 25% of the original volume of the Deccan Traps (e.g. Sen, 2001,
and references therein)
- SI20 is the oldest (transitional) sample (bottom of the sequence in the field). The
possibility that SI13 and SI22, which belong to the Latifwadi formation, could be
older than SI20 has been ruled out. SI20 has thus been thought to have the age of the
C30r-C30n magnetic transition, 67.61Ma (Cande & Kent, 1995), corrected to the
latest age estimate of the K-Pg boundary of 66.043±0.043Ma (Renne et al., 2013):
Cande and colleagues assumed a K-Pg age of 65.0Ma, which implies a 1.043Ma
correction to the age of 67.61Ma for the C30r-C30n transition (67.61 + 1.043 =
68.653Ma). The possibility that the lower Western Ghats sequence might have in fact
recorded the C31n-C30r transition at 67.735 + 1.043 = 68.778Ma (Chenet et al., 2009)
was not considered here
- The K-Pg boundary has been identified in the Rajahmundry traps/Krishna-Godavari
Basin of southeastern India as being contained within the early Ambenali formation
(Knight et al., 2003, Baksi, 2005, Keller et al., 2008a). Cande and Kent (1995) noted
that the K-Pg boundary is expected to have occurred 250ka after the C29r-C29n
reversal. This constraint is accounted for by assigning the age of the K-Pg to sample
MB22 (i.e. first sample of the oldest directional group in Ambenali)
- Thin red boles form over 10 years while thick ones do so over 50ka (Chenet et al.,
2008, 2009) and they have all been reported. Note that this probably is incorrect. On
the other hand red boles appear hard to trace over long distances in the field and may
instead correspond to local topographical infill. This suggests that the eruption might
have continued as well as stopped completely during times of red bole formation. See
section 3.3
- Single Eruptive Events (SEE), last for 100 years (Chenet et al., 2008, 2009). On the
other hand, the time between single flows outside SEE and/or between SEEs
themselves has been assumed to be equal to 1ka. This is likely too long as 1) thin red
3. Re-visiting the eruption timing of the Deccan Traps
65
boles form within 10 years and were not systematically observed above or below
single flows, and 2) most contacts between flows, even outside directional groups, are
perfectly preserved and show no trace of alteration. Nevertheless, provided that
today’s 3° secular variation of the magnetic pole applies to K-Pg times, differences in
paleomagnetic directions in excess of 3° requires that any pair of event with such a
difference be separated by more than a century. Yet very fast excursion in the order of
several degrees per month have been identified in the geological record (Coe et al.,
1995, Bogue & Glen, 2010)
- Early and peripheral Deccan products (Subba Rao, 1972), the Panhala and Desur
formations (Peng et al., 1994) above Mahabaleshwar and the Mumbai volcanics
(Salsette subgroup) (Hooper et al., 2010, Sheth et al., 2013) have not been sampled by
Chenet and colleagues and were excluded in this scenario
- In the same way, the absence of erosion hiatuses along is assumed
- Finally, this section does not consider the possibility of unreported lava flows. In other
words, the sample set of Chenet and co-workers is assumed to be exhaustive – and
non-redundant
The resulting composite section is illustrated on Figure 3.1 below.
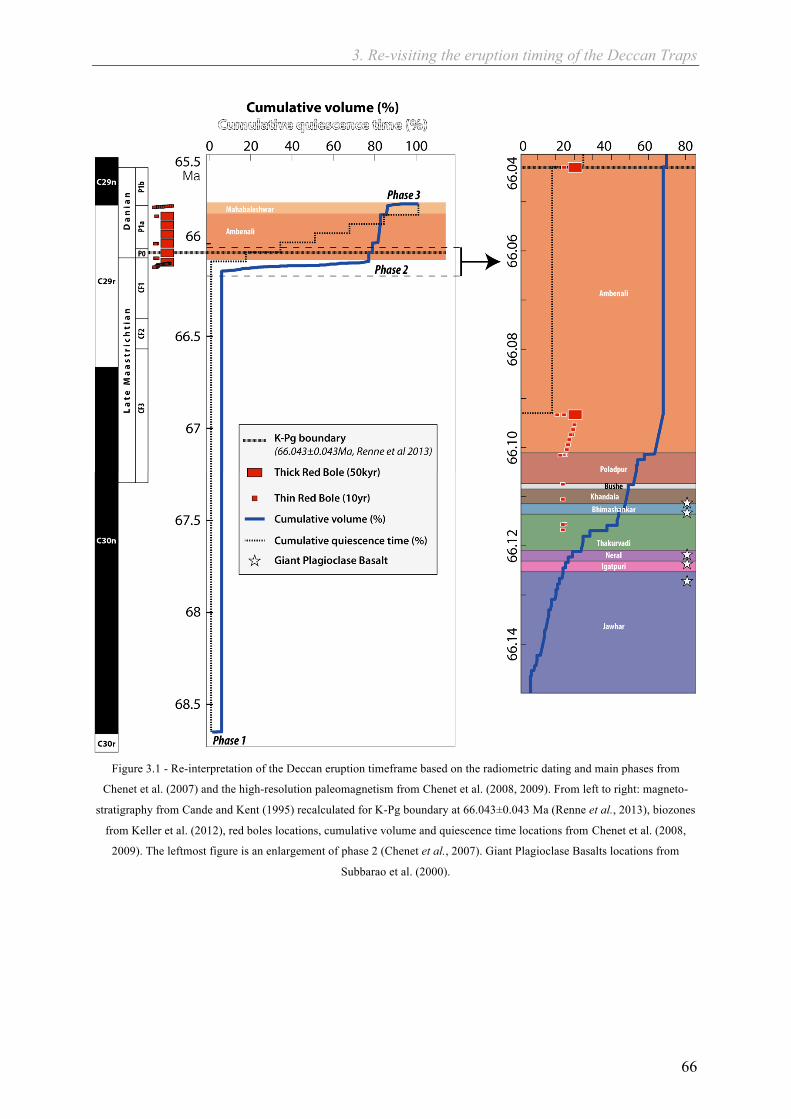
3. Re-visiting the eruption timing of the Deccan Traps
66
Figure 3.1 - Re-interpretation of the Deccan eruption timeframe based on the radiometric dating and main phases from
Chenet et al. (2007) and the high-resolution paleomagnetism from Chenet et al. (2008, 2009). From left to right: magneto-
stratigraphy from Cande and Kent (1995) recalculated for K-Pg boundary at 66.043±0.043 Ma (Renne et al., 2013), biozones
from Keller et al. (2012), red boles locations, cumulative volume and quiescence time locations from Chenet et al. (2008,
2009). The leftmost figure is an enlargement of phase 2 (Chenet et al., 2007). Giant Plagioclase Basalts locations from
Subbarao et al. (2000).

3. Re-visiting the eruption timing of the Deccan Traps
67
3.6.2. Cumulative volume and eruption rates
Figure 3.1 shows a very discontinuous picture wherein phase 1, responsible for merely less
than 10% of the total volume of the Western Ghats occurred at the C30r-C30n reversal, more
than 2Ma before the main eruption (phase 2 and 3) and the K-Pg boundary. Phase 2 is
responsible for 70-80% of the total volume and spans 50 to 100ka and ends with the K-Pg
boundary (hypothesis) in early-Ambenali. Phase 3 accounts for 10-20% of the total volume
and is represented by the Mahabaleshwar formation (Panhala and Desur are excluded). Note
that the GPB strontium isotopes diffusion and relaxation models mentioned in section 3.4
(Borges et al., 2013) were not integrated to this framework.
Phase 2 would have been responsible for the emplacement of 8.105 km3 of lavas over about
50ka. If the total volume of the Western Ghats was in the order of 1.106 km3 (Sen, 2001,
Courtillot & Renne, 2003), the average eruption rate of phase 2 (and in fact for any of the
three phases when considered individually) would be in the order of 16km3/yr. This is
equivalent to 160 times the eruption rates of today’s Hawaii: 0.1km3/yr (Courtillot et al.,
1986). The average rate over the full emplacement of the Western Ghats (1.106km3 over about
3Ma) looks somewhat different: 0.3km3/yr.
3.6.3. Red boles and quiescence time
Figure 3.1 shows the occurrence of red boles along the section and the corresponding
cumulative quiescence time considering that thick red boles take 50ka to form while thinner
ones do so over only a decade. It is clear that thin red boles are negligible in this timeframe
(Chenet et al., 2008, 2009). However, it is important to keep in mind that bole beds in general
are difficult to trace over large distances in the field and could thus be of limited lateral extent
(F. Fluteau, personal communication). Moreover, GPBs have been described as being
associated with red boles in the field (Sen, 2001, Higgins & Chandrasekharam, 2007) whereas
red boles were not systematically reported at GPB locations by Chenet and co-workers
(Figure 3.1). This indicates that some red boles have likely not been reported.
Figure 3.1 shows a rather surprising relationship between cumulative quiescence time and
cumulative erupted volume: the occurrence of large eruptions identified by the existence of
directional groups is coeval with the appearance of red boles in the field. This surprising
relationship is primarily due to the fact red boles develop on the lava flows themselves.

3. Re-visiting the eruption timing of the Deccan Traps
68
Therefore, if no flow is reported, e.g. between phase 1 and 2, no red bole will be observed and
the cumulative quiescence time will not increase. It is nevertheless noteworthy that neither
bole bed nor any sign of erosion seems to have been observed between phase 1 and 2.
Phase 2 contains a significant number of thin red boles, especially towards its end in
Ambenali and the occurrence of the first thick red bole of the section. This thick red bole
predates the first directional group of Ambenali and the K-Pg since it was hypothesized that
the latter was located at the first sample of the first directional group in Ambenali following
its proper identification in the Rajahmundry traps, Krishna-Godavari basin, in intertrappean
sediments surrounded by Ambenali lavas (Knight et al., 2003, Baksi, 2005, Keller et al.,
2008a). Therefore, in this scenario, the K-Pg boundary occurs 50ka after the end of the
paroxysmal emplacement of phase 2. This seems in agreement with the fact that the K-Pg
boundary is contained within intertrappean sediments in the Rajahmundry traps that are
surrounded by sets of mega flows (Self et al., 2008b, Keller et al., 2011, 2012), suggesting
lower volcanic intensities at this time.
Phase 3 happens about 300ka after the end of Phase 2. This time constraint again hinges upon
the occurrence of thick red boles (6 in all). This duration of 300ka is in agreement with
biozones in the oceanic sedimentary record: P0 + P1a ≈ 300ka (Keller et al., 2012). Finally,
Phase 3 recorded the C29r-C29n reversal with 7 flows with transitional polarities and 10 with
normal polarities.
The Panhala and Desur formation were not included in this section and do not constitute a
large body of lava flows.
3.6.4. Coupling with paleoenvironmental indicators
The interpretation of high-resolution paleomagnetic data has been taken one step further by
attempting a coupling with paleoenvironmental proxies (Figure 3.2). Amongst the variety of
available proxies, only two were considered for the following reasons:
- Paleotemperatures of seawater is a good indicator of the global warming and cooling
that might have been caused by intense volcanism and/or extra-terrestrial impact, both
presumed causes of the K-Pg extinction
- High-resolution 187Os/188Os in deep-sea unlithified carbonates decreases with
increasing erosion, increasing rainfall and decreasing cratonic surface exposed to
erosion (granitic rocks have a high 187Os/188Os). Coupled with PGE abundances,
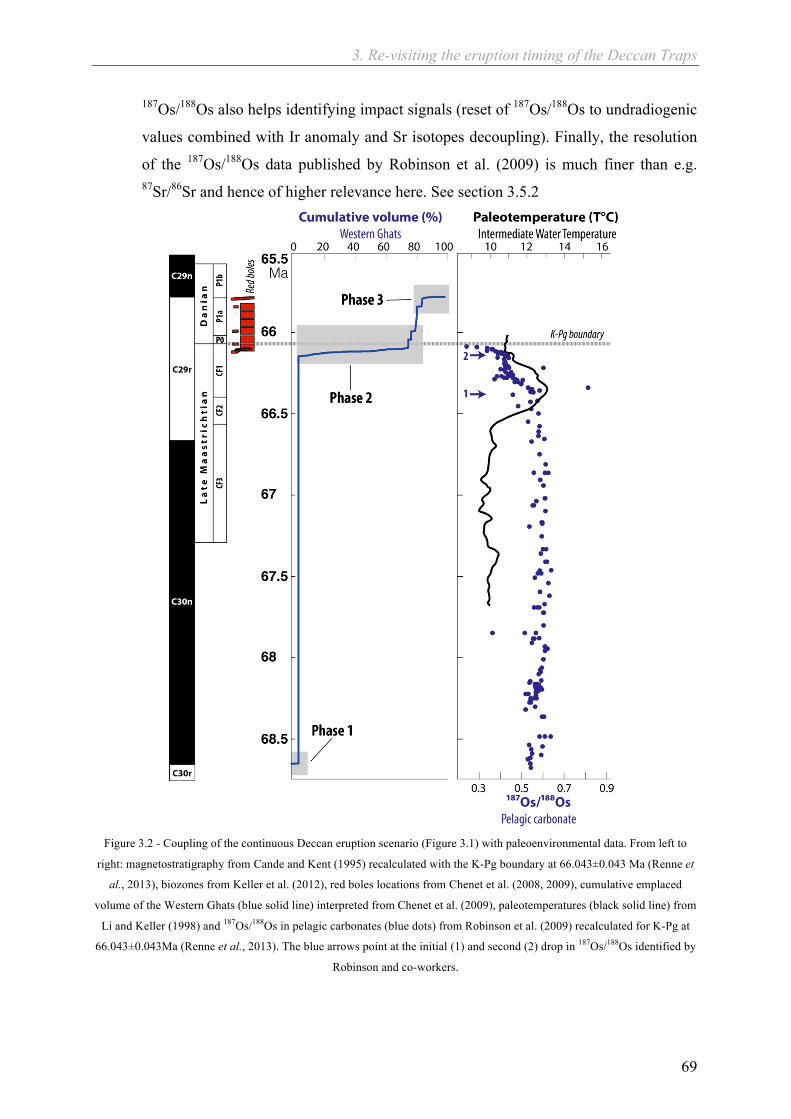
3. Re-visiting the eruption timing of the Deccan Traps
69
187Os/188Os also helps identifying impact signals (reset of 187Os/188Os to undradiogenic
values combined with Ir anomaly and Sr isotopes decoupling). Finally, the resolution
of the 187Os/188Os data published by Robinson et al. (2009) is much finer than e.g. 87Sr/86Sr and hence of higher relevance here. See section 3.5.2
Figure 3.2 - Coupling of the continuous Deccan eruption scenario (Figure 3.1) with paleoenvironmental data. From left to
right: magnetostratigraphy from Cande and Kent (1995) recalculated with the K-Pg boundary at 66.043±0.043 Ma (Renne et
al., 2013), biozones from Keller et al. (2012), red boles locations from Chenet et al. (2008, 2009), cumulative emplaced
volume of the Western Ghats (blue solid line) interpreted from Chenet et al. (2009), paleotemperatures (black solid line) from
Li and Keller (1998) and 187Os/188Os in pelagic carbonates (blue dots) from Robinson et al. (2009) recalculated for K-Pg at
66.043±0.043Ma (Renne et al., 2013). The blue arrows point at the initial (1) and second (2) drop in 187Os/188Os identified by
Robinson and co-workers.

3. Re-visiting the eruption timing of the Deccan Traps
70
The reader should be aware of potential age discrepancies between the biozones (Keller et al.,
2012), the cumulative Deccan volume estimate based on Chenet et al. (2008, 2009), the
evolution of intermediate seawater temperatures (Li & Keller, 1998) and the high-resolution 187Os/188Os (Robinson et al., 2009). All three variables have been re-adjusted to the
magnetostratigraphy of Cande and Kent (1995) and latest K-Pg age estimation of
66.043±0.043Ma (Renne et al., 2013). It thus seems reasonable to argue that the K-Pg
boundary is properly located in all three datasets. However, any data lying in between polarity
reversals and before the K-Pg boundary may suffer from uncertainties pertaining to
sedimentation rates and global distribution and evolution of foraminiferal fauna, which
homogenization is not instantaneous contrary to geomagnetic reversals. Despite these
inconvenience, several important observation can be done and double-checked in the
available literature.
Paleotemperatures (Li & Keller, 1998) show evidences of a late Maastrichtian warming (~
66.5 – 66.3Ma) followed by a cooling near the K-Pg boundary (Vonhof & Smit, 1997,
MacLeod et al., 2001, Ravizza & Peucker-Ehrenbrink, 2003, Robinson et al., 2009). The 187Os/188Os record does not fluctuate throughout C30n (0.5 – 0.6) with the exception of one
point (0.35 at 67.8Ma). It then starts to decrease towards 0.4 at 66.4Ma. This first drop is
followed by a second, sharper excursion down to 0.35 starting a few tens of thousands of
years before the K-Pg. The dataset does not continue into the Danian. There are also two
outsiders at 0.6 and 0.8 between the first and second decrease. Note that the details of the
fluctuations in paleotemperatures should not be over-interpreted with respect to the osmium
isotope data due to the potential discrepancies mentioned above. Nevertheless, it seems that
either of the following proposition is true: 1) The onset of the late-Cretaceous cooling is
coeval with the initial drop (1) in 187Os/188Os. 2) The onset of the late-Cretaceous temperature
variations (warming and cooling) is coeval with the general decreasing trend in 187Os/188Os.
Robinson and colleagues (Robinson et al., 2009) also measured PGE abundances along the
sections sampled for osmium isotopes and found no evidence of extra-terrestrial impact.
Another mismatch appearing on Figure 3.2 concerns the onset of the warming event at
66.5Ma – which has been attributed to volcanism (Li & Keller, 1998) – with respect to the
beginning of phase 2 (66.15Ma) in the Deccan. The Western Ghats composite section of
Chenet et al (2008, 2009) does not include the earliest and peripheral formations of the
Deccan Traps, namely, the Latifwadi formation and the mostly alkali outcrops of Gujarat.
However, the Latifwadi formation has been assigned to phase 1 (Chenet et al., 2007) while

3. Re-visiting the eruption timing of the Deccan Traps
71
the Gujarat (Saurashtra and Kutch) lavas are considered older than any Deccan tholeiites, and
therefore the Latifwadi formation (Sen et al., 2009).
In the same way, phase 1 – which clearly occurred ~2Ma before Phase 2 (Chenet et al., 2007)
– is not seen in the osmium isotope record.
These mismatches emphasize that Figure 3.2 must be handled with care.
Finally, the species richness at the El Kef section (the stratotype of the K-Pg boundary)
swiftly drop by 50% between biozones CF1 and P0 and then further decreases into the early-
Danian (Keller et al., 1995, 2008a). This catastrophic change is too instantaneous to be
coupled to the Deccan eruption model presented here, with the exception of phase 2 of the
Deccan Traps emplacement, which might have been shorter than speculated here (e.g. shorter
red bole formation – see section 3.3 – shorter time gaps between individual flows and during
the emplacement of directional groups – see sections 3.2 and 3.4).
3.7. Summary and preliminary interpretations
The emplacement of the Western Ghats occurred in three different phases (Figure 3.1)
(Chenet et al., 2007):
- Phase 1 (10% of total volume) at the C30r-C30n reversal (~68.65Ma)
- Phase 2 (70-80% of total volume in 50ka) in C29r (~66.10Ma). Phase 2 ends at the K-
Pg boundary
- Phase 3 (10-20% of total volume) after the K-Pg boundary at the C29r-C29n reversal
and continued on in early C29n (~65.8Ma). It is represented by the Mahabaleshwar
formation in this section
- Earlier Deccan products (Gujarat), peripheral volcanics (Subba Rao, 1972) and the
formations above Mahabaleshwar (Panhala, Desur and the Salsette subgroup) where
not considered here. Their contribution to the total volume of the Deccan Traps is
however believed to be in the order of 10% or less (Paul et al., 2008, Hooper et al.,
2010)
Phase 2 alone would be responsible for the end-Cretaceous extinction (Keller et al., 2012). It
would have released about 8.105 km3 (Sen, 2001, Courtillot & Renne, 2003) of lavas in 50ka
(Figure 3.1), which corresponds to about 160 the current eruption rate of today’s Hawaii:
0.1km3/yr (Courtillot et al., 1986). Furthermore, phase 2 contains 25 paleomagnetic
directional groups corresponding to 25 paroxysmal eruptions (Chenet et al., 2009). The

3. Re-visiting the eruption timing of the Deccan Traps
72
maximum eruption rate reached during these extreme events has been estimated at 160km3/yr
(Thakurvadi formation, Chenet et al., 2009). Note that even using such a high rate, Chenet et
al did not match the final volume of 1.106km3 proposed for the Deccan Traps (e.g. Sen, 2001,
and references therein). These extremely high rates are in agreement with recently published
strontium isotope diffusion and relaxation models in Giant Plagioclase Basalts, which suggest
that entire formations (i.e. Jawhar, Igatpuri, Neral, Thakurvadi and Bhimashankar) could have
been emplaced in less than 1ka (Borges et al., 2013).
Red boles start to appear and become more numerous towards the end of phase 2 (Ambenali).
The first thick red bole in early Ambenali combined with the hypotheses as to the location of
the K-Pg boundary (see 3.6.1) imply that the latter could have occurred up to 50ka after the
end of phase 2. It is also interesting to note that when thick red boles are reported, thin red
boles seem to be less so and conversely: the last thick red bole is in early Mahabaleshwar and
is followed by many thin red boles. In other words, the occurrence of red boles in the field
seems compatible with the observation of paleomagnetic directional groups: no thick red bole
has been reported inside directional groups or within any of the main volcanic phases (1, 2
and 3). However, thin red boles have been reported within lava sequences belonging to a
directional group, which further support a fast alteration/formation process.
Upon comparing this scenario to seawater paleotemperatures and osmium isotopic ratios in
pelagic carbonates (Figure 3.2) the following interpretation can be proposed:
The increasing occurrence of red boles in phase 2 is weakly correlated with the cumulative
erupted volume. At the same time, osmium isotopic ratios decrease and seawater
paleotemperatures vary (Figure 3.2). This could be tentatively interpreted as the result of
volcanism-induced climate change: large volumes of CO2 and SO2 are released to the
atmosphere leading to climate change (warming and/or cooling of seawater
paleotemperatures). Large amounts of SO2 would also affect the climate by making it wetter
(Chenet, 2006). Increased erosion would decrease osmium isotopic ratios and even more so as
large amounts of basalts (low 187Os/188Os) are blanketing a craton (high 187Os/188Os).
Moreover, basalts are much more prone to erosion than cratonic rocks. (Robinson et al.,
2009). The details of this scenario are however not so straightforward.
First, phase 1 is not seen in the high-resolution osmium isotopic record despite the C30r-C30n
reversal being recorded in both Deccan lavas and osmium isotope sections (Chenet et al.,
2007, Robinson et al., 2009). It is speculated that the low intensities of this initial volcanism
were not sufficient to affect the global oceanic osmium budget. The Western Ghats tholeiitic
3. Re-visiting the eruption timing of the Deccan Traps
73
eruptions were preceded and probably accompanied by alkali basalt (Subba Rao, 1972, Sen et
al., 2009), carbonatites (e.g. Ray et al., 2003, and references therein) and kimberlites
(Chalapathi Rao & Lehmann, 2011, and references therein) in the north, northwest and
northeast (Figure 2.3). These volcanic events were of much lower intensities than those of the
main province, and therefore might have had limited consequences on the environment.
Furthermore, in this scenario (Figure 3.1 and Figure 3.2), the onset of the well-documented
late-Cretaceous warming and cooling events, that are roughly coeval with the osmium isotope
excursions of Robinson et al and biozones CF2 and CF1 of Keller and colleagues (Figure
3.2), happen 0.5Ma before the onset of phase 2. However, both temperature variations (Li &
Keller, 1998) and isotope excursions (Vonhof & Smit, 1997, MacLeod et al., 2001, Ravizza
& Peucker-Ehrenbrink, 2003, Robinson et al., 2009) have been interpreted as being caused by
the eruption of the Deccan Traps. The re-interpretation proposed in this section concur with
the fact that late-Cretaceous warming and the first 187Os/188Os excursion of Robinson et al
(Figure 3.2) – which is also seen in other isotopic systems (Li & Keller, 1998, Ravizza &
Peucker-Ehrenbrink, 2003) – was certainly caused by volcanism (outpouring of large volumes
of basalts on a craton and important contribution of the eruptions to the atmospheric pCO2).
Nevertheless, the timescale of the first 187Os/188Os excursion of Robinson et al (~0.3Ma),
which is similar to that of the late-Cretaceous warming, is incompatible with both the duration
of phase 2 (Chenet et al., 2007) and the fact that it contains the K-Pg boundary (Keller et al.,
2011). Moreover, Robinson and co-workers point out that no major damage to the
environment had been observed by the end of the first 187Os/188Os excursion and concluded
that the Deccan Traps must have contributed little to the end-Cretaceous extinction. Yet this is
again inconsistent with the observations made in the Krishna-Godavari basin wherein 1- the
Deccan Traps appear clearly associated with the loss in species richness in biozone CF1 and
2- phase 2 appear to contain or end at the K-Pg boundary (Keller et al., 2011, Keller et al.,
2012). In the same way, the duration and intensity of the initial 187Os/188Os excursion seems
inconsistent with the existence of paroxysmal eruption seen as paleomagnetic directional
groups or Giant Plagioclase Basalt flows. Nor is it consistent with the fact that the most
voluminous of these paroxysmal eruptions occurred in mid-phase 2 (160km3/yr in the
Thakurvadi formation, Chenet et al., 2009). Finally, the very limited number of red boles in
the first half of phase 2 indicates that volcanic repose was extremely limited. None of the
above argues in favour of phase 2 being responsible for the first 187Os/188Os excursion.
3. Re-visiting the eruption timing of the Deccan Traps
74
The sharper second 187Os/188Os excursion (Figure 3.2) is more compatible with phase 2 of the
eruption although it has been attributed to the Chicxulub impact (Robinson et al., 2009). The
final cooling is also compatible with volcanism (SO2).
At this stage, major discrepancies in age models cannot be ruled out. For example, Ravizza
and Peucker-Ehrenbrink (2003) place the main phase of Deccan volcanism at C30n-C29r,
which is very different to what Chenet and co-workers proposed (Chenet et al., 2009).
If the second 187Os/188Os excursion indeed corresponds to phase 2 – which would then match
all other observations: directional groups, Giant Plagioclase Basalts, biozones and red bole
frequencies – one has to find an explanation for the first 187Os/188Os excursion (Figure 3.2).
The latter has been measured in samples featuring a reverse paleomagnetic orientation. If it is
a trace of early Deccan activity, this reverse polarity would be that of C30r and therefore
imply a mismatch greater than 2Ma in either sedimentary age models or in the radiometric
dating of Chenet et al. (2007). 2Ma is twice greater than the average error bars of Chenet et al
and such a mismatch in sedimentary age models coupled to paleomagnetic measures
(Robinson et al., 2009) is highly unlikely. Moreover, as mentioned above, several authors
have reported excursions in isotopic systems at this time and over similar periods. It may
therefore be asserted that the pre-K-Pg 187Os/188Os decrease in pelagic carbonates (first +
second excursions) did happen in C29r in the last 0.5Ma of the Cretaceous.
How is it possible to accommodate the gap between phase 1 and 2 (>2Ma) and the existence
of pre-phase 2 187Os/188Os excursion (~0.5Ma before the K-Pg while phase 2 seems to have
lasted 50ka and ended at the K-Pg)? It has been suggested that the Chicxulub impact could
have predated the K-Pg boundary by as much as 0.3Ma (Keller et al., 2004a, 2004b, Schulte
et al., 2008). However, Alvarez (2003) pointed out that if there was a time interval greater
than 0.1Ma between the main phase of the Deccan Traps and the Chicxulub impact it would
be easily seen in K-Pg sections. Alternatively, the possibility of several extra-terrestrial
impacts in the late Cretaceous has been suggested (Keller et al., 2003). However, it is
reasonable to expect that isotope excursions resulting from impact would be sharper that the
first excursion of Robinson et al. Not to mention that the observation of similar excursions in
strontium isotopes rules out the implications of extra-terrestrial impact as a possible
explanation for this early 187Os/188Os excursion (see references above and section 3.5.2).
A different scenario would involve the Deccan plume. Sobolev et al. (2011) have shown that
the incubation of a plume beneath the lithosphere could generate a very significant degassing
of the volatiles contained in the plume itself thereby causing significant damage to the
3. Re-visiting the eruption timing of the Deccan Traps
75
environment before any magma has actually been erupted. Such a scenario requires
knowledge of the volatile content of the magmas. This aspect will be dealt with in a later
section 6.5. It also implies that the degassing alone is capable of creating an excursion in
volcanism-sensitive isotopic systems. It is reasonable to assert that injecting large amounts of
CO2, SO2 or HCl to the atmosphere would affect the climate (e.g. temperature variations,
higher rainfall). Nevertheless, the new source of low 187Os/188Os and 87Sr/86Sr material
available to the erosion that freshly outpoured basalts represent and the combined loss of
material with high isotopic osmium and strontium ratios (cratonic rocks being covered by
Deccan basalts) remain unaccounted for.
At last, incompleteness of the sampling cannot be ruled out. Considering the large volume and
extent of the main Deccan province, it is possible that that flows – or red boles, for that matter
– have been missed between phase 1 and 2 or during phase 2 itself. For instance, the Bushe-
Poladpur transition section of Chenet et al is not complete (Chenet et al., 2009, Figure 1).
Moreover, the volume estimation proposed by Chenet and co-workers merely accounts for
less than 30% of the published estimations for total Deccan Traps volumes (e.g. Sen, 2001,
and references therein). A significant missing volume may lie to the west, in the Laxmi Ridge
(Minshull et al., 2008) or on the Seychelles micro-continent (Owen-Smith et al., 2013). In
addition, dyke swarms and paleo-stress modelling on the Indian plate (Vanderkluysen et al.,
2011, Ju et al., 2013) combined with paleotopography (Hooper et al., 2010, Sheth & Pande,
2013) argue for a symmetrical emplacement of the main Deccan province (i.e. on either sides
of today’s Indian west coast). In that case, the underestimated volume calculated by Chenet et
al (2009) would pertain to an underestimated lateral extent and not to unreported flows that
would instead add to the overall thickness of the Western Ghats. It thus seems unlikely that
missing flows in this composite section would account for significant volumes with respect to
phase 2, which also limits, if not preclude, the role of potentially unreported flows in
explaining the first 187Os/188Os excursion.

76

77
4. Samples and
methods

4. Samples and methods
78
4.1. Samples The samples used in this project were assembled in an attempt to constitute a time-lapsed
picture of the Deccan plume, from its initial stage beneath the Indian plate until today at Piton
de la Fournaise, Réunion Island, in the Indian Ocean. However, no fieldwork was carried out
during this project. This work is therefore solely based on existing samples obtained from the
Institut de Physique du Globe de Paris (IPGP, France), the Université Blaise Pascal (Clermont
Ferrand, France) and previous projects of Alexander V. Sobolev at the Max Plank Institute,
Mainz (Germany).
The main sample set has been collected at the IPGP in Paris, France, with the invaluable help
of Frédéric Fluteau and consists in 219 unheated drill cores collected in the Western Ghats for
paleomagnetism during Anne-Lise Chenet’s Ph.D project in the mid-2000s (Chenet, 2006,
Chenet et al., 2007, 2008, 2009)
A second, more limited, set has been collected at the Université Blaise Pascal in Clermont
Ferrand (France) with the help of Ivan Vlastelic. It covers the most recent activity of the
Deccan Plume: Piton de la Fournaise, Réunion Island. It contains both picritic basalts (MgO >
20wt%) and steady-state basalts (MgO < 10wt%). A.V. Sobolev also provided one sample for
Piton de la Fournaise (OPF) and another for Piton des Neiges (RU11), both picritic in
composition.
A third, minor, set consists in 5 samples (MgO = 5-14%) from northwest Deccan (Gujarat)
collected by A.V. Sobolev’s team in the late 2000s. This set has been lost at some point
during the project. Its contribution to this project is therefore very limited.
4.2. Methods
This project uses the above-mentioned sample sets in two different ways. First, bulk-rock
trace element data are coupled with existing high-resolution paleomagnetic measurements
(Chenet et al., 2008, 2009), (section 5.4). This allows for observing the evolution of trace
element signatures at the resolution offered by high-resolution paleomagnetism (ca. 100
years) and enables to draw new conclusions as to the big picture of the Deccan eruption.
Secondly, in-situ analysis of olivine phenocrysts and their inclusions (spinel and melt
4. Samples and methods
79
inclusions) were carried out in order to have access to the primary melt compositions, source
lithologies and pressure-temperature environment.
4.2.1. Bulk-rock major and trace elements The IPGP provided bulk-rock major and trace element analyses for 144 drill cores (out of 175
used for paleomagnetic measurements) from the Western Ghats. They were processed at the
CRPG (Nancy, France) by Inductively-Coupled Plasma Mass-Spectrometry (ICP-MS). This
dataset has been acquired during an MSc project at the IPGP (Bonnefoy, 2005) but were
never published. I have been offered to re-visit and publish this data on the occasion of this
Ph.D project.
In order to confirm the quality of the dataset a number of randomly selected samples have
been re-analysed at the Max Planck Institute for Chemistry (Mainz, Germany) by LA-ICP-
MS and yielded positive results.

4. Samples and methods
80
Table 4–1 Comparison of trace element concentrations (ppm) for a selection of samples from the CRPG database of
Bonnefoy (2005) with LA-ICP-MS results obtained for the same samples at the Max Planck Insitute for Chemistry (Mainz,
Germany). ∆% is the relative error. Large errors for Pb concentration are due to the LA-ICP-MS method: Pb is volatized by
the laser spot.
Sample: KD04 KD04 VT08 VT09
Mainz CRPG ∆% Mainz CRPG ∆% Mainz CRPG ∆% Mainz CRPG ∆%
Rb 3.06 2.79 4.6 2.64 2.40 4.7 11.27 18.71 24.8 22.64 21.67 2.2 Ba 116.53 113.36 1.4 102.15 107.12 2.4 189.01 190.95 0.5 108.05 120.18 5.3 Th 1.85 1.85 0.1 1.78 1.86 2.4 2.39 2.35 0.9 3.07 2.89 3.0 U 0.52 0.44 8.5 0.43 0.46 2.6 0.42 0.50 8.0 0.63 0.70 5.4 Nb 8.60 6.94 10.7 8.53 7.26 8.0 10.41 8.06 12.7 5.85 5.56 2.6 Ta 0.54 0.56 1.5 0.52 0.56 3.8 0.66 0.63 1.8 0.41 0.47 6.1 La 10.85 11.17 1.5 11.11 11.20 0.4 15.56 15.55 0.0 10.39 10.55 0.7 Ce 27.08 25.21 3.6 26.27 25.19 2.1 32.60 32.96 0.6 22.23 23.52 2.8 Pb 1.51 2.58 26.3 0.89 2.65 49.7 1.76 2.51 17.5 1.76 2.15 10.0 Pr 3.32 3.34 0.3 3.30 3.38 1.2 4.23 4.43 2.3 3.11 3.38 4.2 Nd 15.38 14.86 1.7 15.18 14.98 0.7 19.51 19.03 1.2 15.57 15.35 0.7 Sr 211.78 211.24 0.1 219.66 208.43 2.6 250.24 227.50 4.8 184.21 194.85 2.8 Sm 3.61 3.84 3.0 3.90 3.88 0.2 4.96 4.89 0.7 4.35 4.40 0.6 Zr 86.68 93.02 3.5 94.20 94.50 0.2 147.57 139.79 2.7 117.55 116.38 0.5 Hf 2.26 2.56 6.1 2.29 2.58 6.0 3.61 3.74 1.8 3.17 3.25 1.2 Eu 1.30 1.33 0.9 1.28 1.38 3.7 1.57 1.60 0.9 1.40 1.51 3.8 Ti 10492.57 8779.86 8.9 10631.83 8553.20 10.8 12478.85 9250.46 14.9 9300.65 8772.78 2.9 Gd 3.56 4.11 7.1 3.80 4.17 4.6 4.92 5.22 2.9 4.82 4.84 0.2 Tb 0.56 0.63 5.8 0.59 0.64 4.3 0.78 0.81 1.4 0.81 0.76 3.1 Dy 3.44 3.65 3.0 3.80 3.68 1.6 5.17 4.75 4.2 5.00 4.56 4.6 Ho 0.66 0.72 4.4 0.72 0.70 1.2 0.98 0.92 3.2 1.02 0.87 7.9 Y 15.95 18.93 8.5 17.40 19.30 5.2 24.21 25.65 2.9 24.22 24.30 0.2 Er 1.87 1.89 0.6 1.90 1.85 1.5 2.64 2.43 4.2 2.75 2.30 9.0 Tm 0.26 0.26 1.8 0.28 0.26 4.0 0.36 0.35 1.2 0.37 0.33 5.1 Yb 1.66 1.66 0.1 1.65 1.68 0.7 2.41 2.23 3.8 2.38 2.06 7.2 Lu 0.21 0.25 7.1 0.24 0.25 2.0 0.35 0.34 1.9 0.35 0.31 6.0
This dataset is available on demand from the PhD candidate.
4.2.2. Olivines, spinels and melt inclusions In order to apply olivine petrology (major and trace element analysis of olivine phenocrysts
and their melt and spinel inclusions), samples with MgO > 6-7wt% (olivine field) have been
investigated for olivine phenocryst occurrence by simple observation with a magnifying glass.
In addition, phyric samples have all been hand crushed and observed with traditional
microscopy in an attempt to separate olivine phenocrysts for further processing. This part of
the project has been carried out at the Max Plank Institute for Chemistry in Mainz (Germany)

4. Samples and methods
81
under the supervision of Olga and Dmitry Kuzmin. Despite the significant number of Deccan
samples (>200), only 8 turned out to be olivine-phyric: KUR1, NAK1 and NAK2 (Kutch,
Gujarat); VT02 and VT08 (Jawhar formation); VT09 (Igatpuri formation); KD04 and KD06
(Thakurvadi formation). On the other hand, all Réunion samples provided by Ivan Vlastelic at
the University of Clermont Ferrand, France, proved olivine-phyric, despite sometimes low
MgO contents (<7wt%).
Table 4–2 summarizes the content of the sample set used in this PhD project.
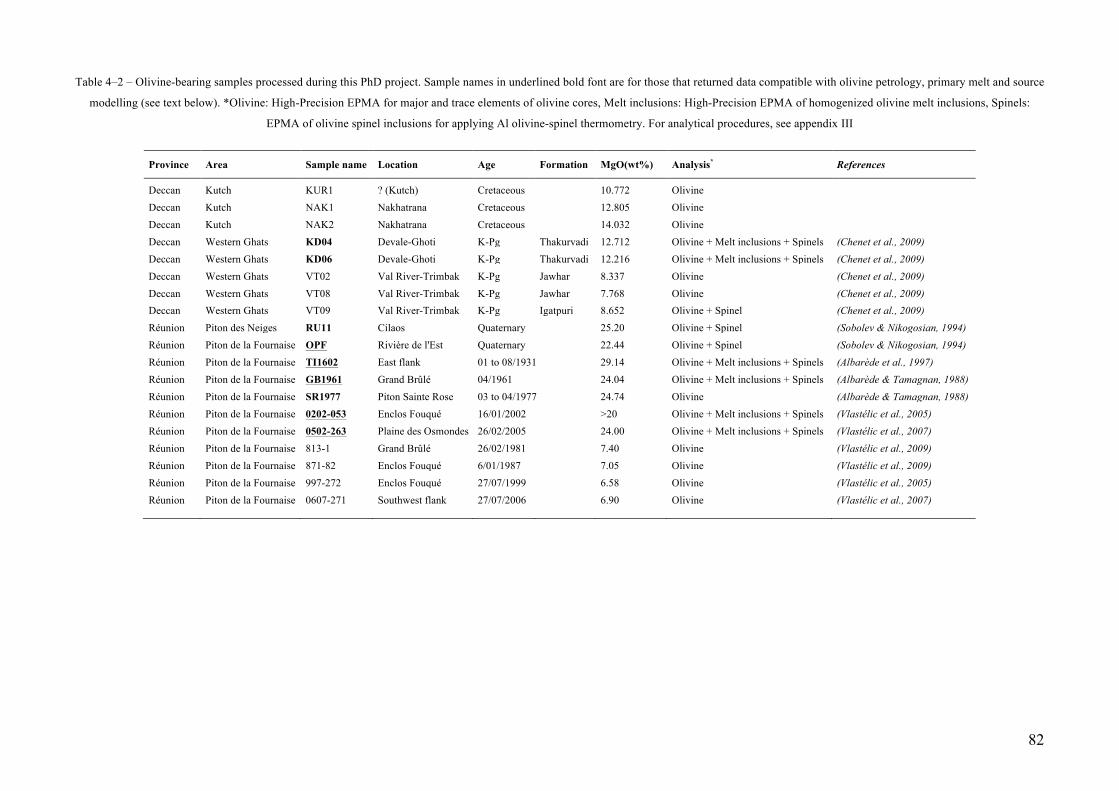
82
Table 4–2 – Olivine-bearing samples processed during this PhD project. Sample names in underlined bold font are for those that returned data compatible with olivine petrology, primary melt and source
modelling (see text below). *Olivine: High-Precision EPMA for major and trace elements of olivine cores, Melt inclusions: High-Precision EPMA of homogenized olivine melt inclusions, Spinels:
EPMA of olivine spinel inclusions for applying Al olivine-spinel thermometry. For analytical procedures, see appendix III
Province Area Sample name Location Age Formation MgO(wt%) Analysis* References
Deccan Kutch KUR1 ? (Kutch) Cretaceous
10.772 Olivine Deccan Kutch NAK1 Nakhatrana Cretaceous
12.805 Olivine
Deccan Kutch NAK2 Nakhatrana Cretaceous
14.032 Olivine Deccan Western Ghats KD04 Devale-Ghoti K-Pg Thakurvadi 12.712 Olivine + Melt inclusions + Spinels (Chenet et al., 2009) Deccan Western Ghats KD06 Devale-Ghoti K-Pg Thakurvadi 12.216 Olivine + Melt inclusions + Spinels (Chenet et al., 2009) Deccan Western Ghats VT02 Val River-Trimbak K-Pg Jawhar 8.337 Olivine (Chenet et al., 2009) Deccan Western Ghats VT08 Val River-Trimbak K-Pg Jawhar 7.768 Olivine (Chenet et al., 2009) Deccan Western Ghats VT09 Val River-Trimbak K-Pg Igatpuri 8.652 Olivine + Spinel (Chenet et al., 2009) Réunion Piton des Neiges RU11 Cilaos Quaternary 25.20 Olivine + Spinel (Sobolev & Nikogosian, 1994) Réunion Piton de la Fournaise OPF Rivière de l'Est Quaternary
22.44 Olivine + Spinel (Sobolev & Nikogosian, 1994)
Réunion Piton de la Fournaise TI1602 East flank 01 to 08/1931 29.14 Olivine + Melt inclusions + Spinels (Albarède et al., 1997) Réunion Piton de la Fournaise GB1961 Grand Brûlé 04/1961
24.04 Olivine + Melt inclusions + Spinels (Albarède & Tamagnan, 1988)
Réunion Piton de la Fournaise SR1977 Piton Sainte Rose 03 to 04/1977 24.74 Olivine (Albarède & Tamagnan, 1988) Réunion Piton de la Fournaise 0202-053 Enclos Fouqué 16/01/2002
>20 Olivine + Melt inclusions + Spinels (Vlastélic et al., 2005)
Réunion Piton de la Fournaise 0502-263 Plaine des Osmondes 26/02/2005
24.00 Olivine + Melt inclusions + Spinels (Vlastélic et al., 2007) Réunion Piton de la Fournaise 813-1 Grand Brûlé 26/02/1981
7.40 Olivine (Vlastélic et al., 2009)
Réunion Piton de la Fournaise 871-82 Enclos Fouqué 6/01/1987
7.05 Olivine (Vlastélic et al., 2009) Réunion Piton de la Fournaise 997-272 Enclos Fouqué 27/07/1999
6.58 Olivine (Vlastélic et al., 2005)
Réunion Piton de la Fournaise 0607-271 Southwest flank 27/07/2006
6.90 Olivine (Vlastélic et al., 2007)
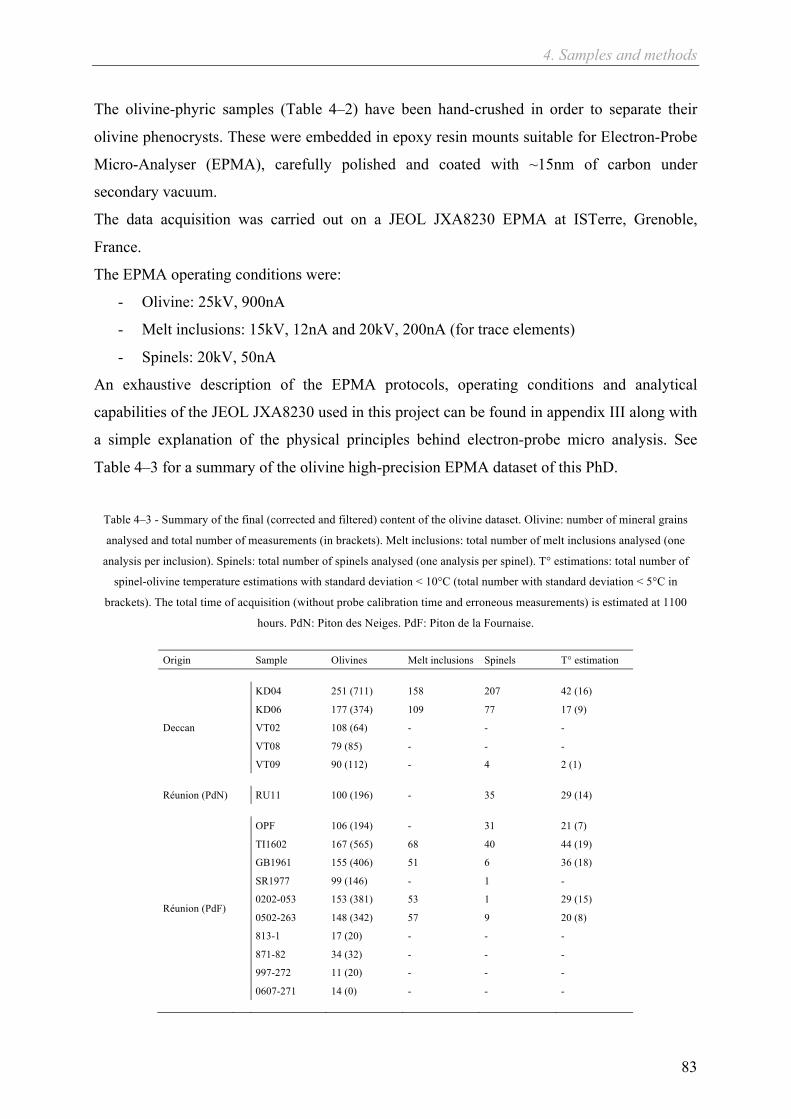
4. Samples and methods
83
The olivine-phyric samples (Table 4–2) have been hand-crushed in order to separate their
olivine phenocrysts. These were embedded in epoxy resin mounts suitable for Electron-Probe
Micro-Analyser (EPMA), carefully polished and coated with ~15nm of carbon under
secondary vacuum.
The data acquisition was carried out on a JEOL JXA8230 EPMA at ISTerre, Grenoble,
France.
The EPMA operating conditions were:
- Olivine: 25kV, 900nA
- Melt inclusions: 15kV, 12nA and 20kV, 200nA (for trace elements)
- Spinels: 20kV, 50nA
An exhaustive description of the EPMA protocols, operating conditions and analytical
capabilities of the JEOL JXA8230 used in this project can be found in appendix III along with
a simple explanation of the physical principles behind electron-probe micro analysis. See
Table 4–3 for a summary of the olivine high-precision EPMA dataset of this PhD.
Table 4–3 - Summary of the final (corrected and filtered) content of the olivine dataset. Olivine: number of mineral grains
analysed and total number of measurements (in brackets). Melt inclusions: total number of melt inclusions analysed (one
analysis per inclusion). Spinels: total number of spinels analysed (one analysis per spinel). T° estimations: total number of
spinel-olivine temperature estimations with standard deviation < 10°C (total number with standard deviation < 5°C in
brackets). The total time of acquisition (without probe calibration time and erroneous measurements) is estimated at 1100
hours. PdN: Piton des Neiges. PdF: Piton de la Fournaise.
Origin Sample Olivines Melt inclusions Spinels T° estimation
Deccan
KD04 251 (711) 158 207 42 (16)
KD06 177 (374) 109 77 17 (9)
VT02 108 (64) - - -
VT08 79 (85) - - -
VT09 90 (112) - 4 2 (1) Réunion (PdN) RU11 100 (196) - 35 29 (14)
Réunion (PdF)
OPF 106 (194) - 31 21 (7)
TI1602 167 (565) 68 40 44 (19)
GB1961 155 (406) 51 6 36 (18)
SR1977 99 (146) - 1 -
0202-053 153 (381) 53 1 29 (15)
0502-263 148 (342) 57 9 20 (8)
813-1 17 (20) - - -
871-82 34 (32) - - -
997-272 11 (20) - - -
0607-271 14 (0) - - -

4. Samples and methods
84
The olivine (Table 4–3) and the Deccan bulk-rock (section 4.2.1) datasets are available on
demand from the PhD candidate. Please note that the bulk-rock compositions of all Réunion
samples is already published and available from the GEOROC online database (corresponding
references in Table 4–2).
In sections 6 and 7 on olivine petrology and olivine-based source modelling, only high-MgO
samples that returned data compatible with olivine petrology, primary melt and source
modelling (bold, underlined in Table 4–2, MgO > 12wt%) will be described.
The lower-MgO samples of Table 4–2 (regular font, MgO < 12wt%) and the Kutch samples
(lost during this project) have nonetheless been integrated to the database of this PhD and are
available as Excel files along with the other datasets produced during this PhD. The poor
quality of the data with respect to the goals of this project pertains to 1) low MgO contents
(8wt% or lower), implying that olivine was not the only silicate phase in equilibrium with the
solidifying lava and 2) the presence of sulphides and varying oxidation state of Fe in the
Gujarat (Kutch) samples with MgO > 10wt%, which resulted in large variations in olivine
trace elements.
The Deccan samples KD04 and KD06 are to be compared with RU11, OPF, TI1602,
GB1961, SR1977, 0202-053 and 0502-263 from Réunion Island. Both sets are regarded as
early, plume head stage and late, plume tail stage of the Deccan plume respectively. The
emphasis will be on the consequences of the new observations on the emplacement of the
Deccan Traps in the late-Cretaceous. The implications of these observations on the
geodynamics of Réunion Island will be discussed as well, although the contribution of this
work to the understanding of Réunion Island is somewhat limited. In this context, the latter is
rather considered as a present-day end-member used for comparison.

85
5. Bulk-rock
geochemistry through
time
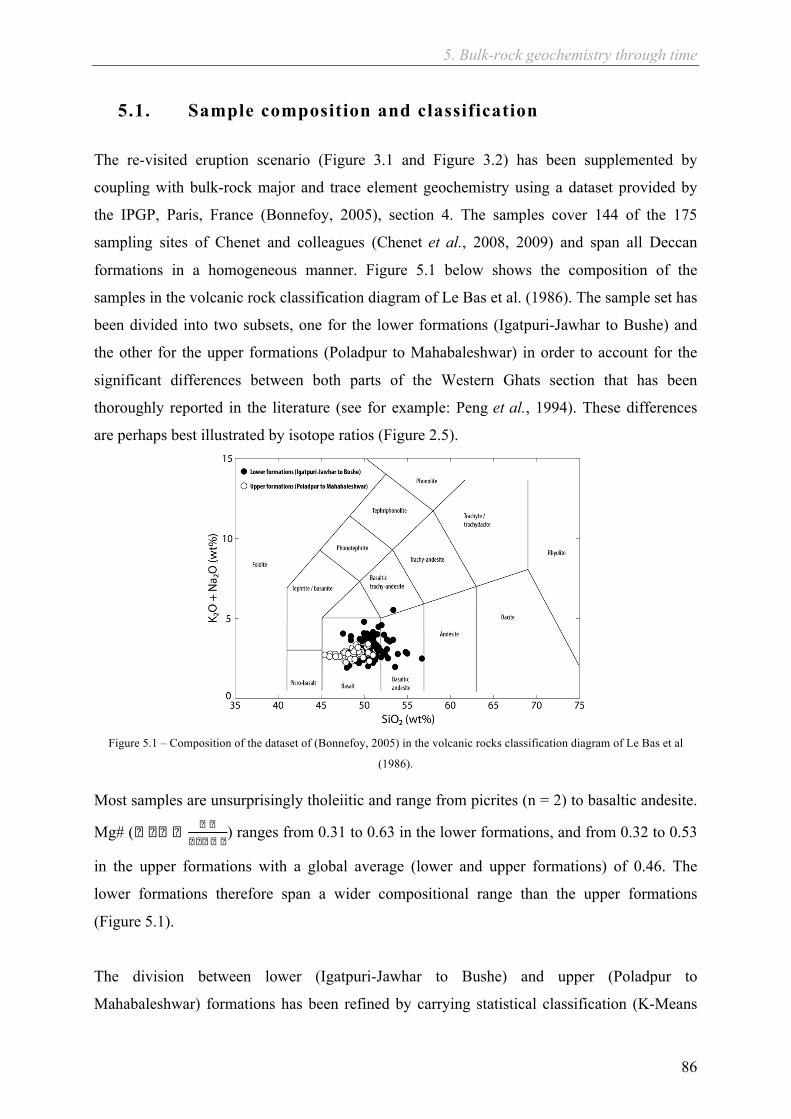
5. Bulk-rock geochemistry through time
86
5.1. Sample composition and classification The re-visited eruption scenario (Figure 3.1 and Figure 3.2) has been supplemented by
coupling with bulk-rock major and trace element geochemistry using a dataset provided by
the IPGP, Paris, France (Bonnefoy, 2005), section 4. The samples cover 144 of the 175
sampling sites of Chenet and colleagues (Chenet et al., 2008, 2009) and span all Deccan
formations in a homogeneous manner. Figure 5.1 below shows the composition of the
samples in the volcanic rock classification diagram of Le Bas et al. (1986). The sample set has
been divided into two subsets, one for the lower formations (Igatpuri-Jawhar to Bushe) and
the other for the upper formations (Poladpur to Mahabaleshwar) in order to account for the
significant differences between both parts of the Western Ghats section that has been
thoroughly reported in the literature (see for example: Peng et al., 1994). These differences
are perhaps best illustrated by isotope ratios (Figure 2.5).
Figure 5.1 – Composition of the dataset of (Bonnefoy, 2005) in the volcanic rocks classification diagram of Le Bas et al
(1986).
Most samples are unsurprisingly tholeiitic and range from picrites (n = 2) to basaltic andesite.
Mg# (� � � � � �� � � � �
) ranges from 0.31 to 0.63 in the lower formations, and from 0.32 to 0.53
in the upper formations with a global average (lower and upper formations) of 0.46. The
lower formations therefore span a wider compositional range than the upper formations
(Figure 5.1).
The division between lower (Igatpuri-Jawhar to Bushe) and upper (Poladpur to
Mahabaleshwar) formations has been refined by carrying statistical classification (K-Means

5. Bulk-rock geochemistry through time
87
clustering) based on the trace element concentrations of the sample set as a whole. The result
of the trace element-based classification (Figure 5.2) is similar to the division between lower
and upper formations overall, with a limited number of exceptions: three samples of Poladpur
and three more from Mahabaleshwar appear to be more compatible with lower formations
trace element concentrations and one sample from Bhimashankar is more compatible with the
upper formations.
Figure 5.2 – A) Western Ghats stratigraphy modified from Chenet et al (2009). B) Differences between the division in lower
(Igatpuri-Jawhar to Bushe) and upper formations (Poladpur to Mahabaleshwar), e.g. Peng et al (1994) and the Deccan1 and
Deccan2 subsets identified from trace element-based statistical analysis (K-Means clustering), Figure 5.3.
Two classes thus replace the division between lower and upper formations: Deccan1,
corresponding to the lower formations with limited exceptions in the upper formations and
Deccan2, which is mostly represented by the upper formations with one exception in
Bhimashankar. Figure 5.2 and Figure 5.3. Both classes mostly differ in trace element
concentrations indicative of crustal contamination and will be described and interpreted
further in this section.
Extended trace element spectra are shown in Figure 5.3a.
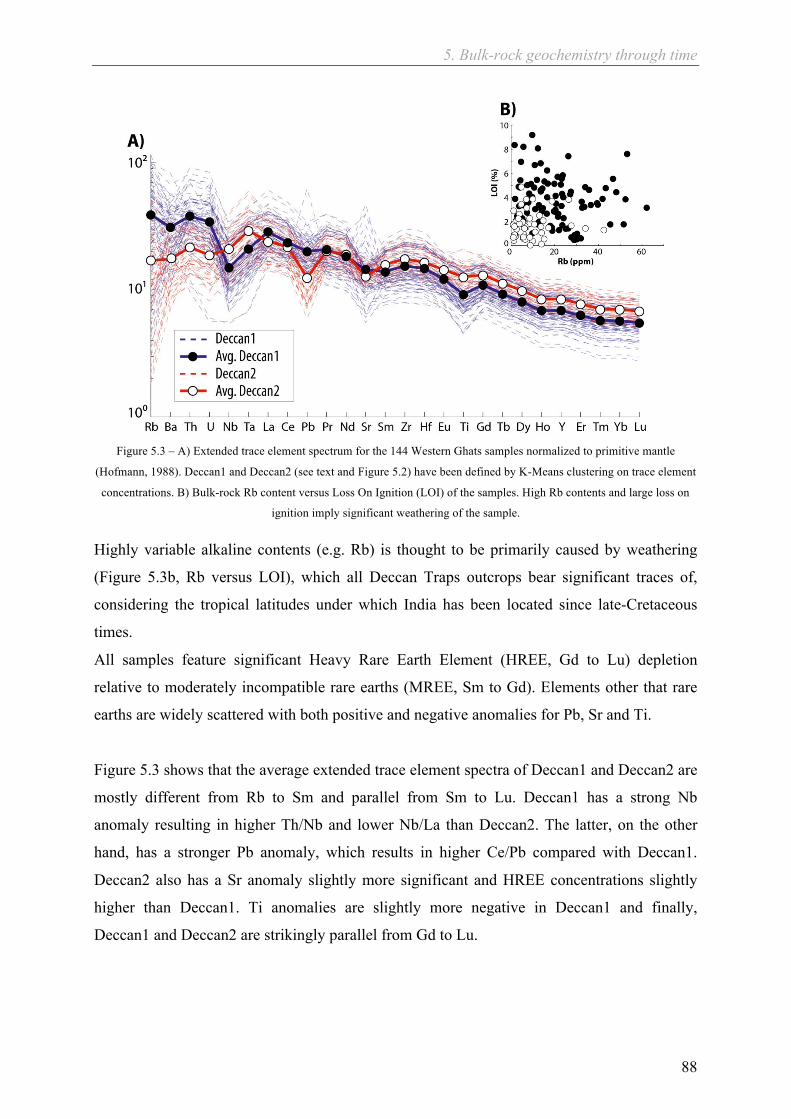
5. Bulk-rock geochemistry through time
88
Figure 5.3 – A) Extended trace element spectrum for the 144 Western Ghats samples normalized to primitive mantle
(Hofmann, 1988). Deccan1 and Deccan2 (see text and Figure 5.2) have been defined by K-Means clustering on trace element
concentrations. B) Bulk-rock Rb content versus Loss On Ignition (LOI) of the samples. High Rb contents and large loss on
ignition imply significant weathering of the sample.
Highly variable alkaline contents (e.g. Rb) is thought to be primarily caused by weathering
(Figure 5.3b, Rb versus LOI), which all Deccan Traps outcrops bear significant traces of,
considering the tropical latitudes under which India has been located since late-Cretaceous
times.
All samples feature significant Heavy Rare Earth Element (HREE, Gd to Lu) depletion
relative to moderately incompatible rare earths (MREE, Sm to Gd). Elements other that rare
earths are widely scattered with both positive and negative anomalies for Pb, Sr and Ti.
Figure 5.3 shows that the average extended trace element spectra of Deccan1 and Deccan2 are
mostly different from Rb to Sm and parallel from Sm to Lu. Deccan1 has a strong Nb
anomaly resulting in higher Th/Nb and lower Nb/La than Deccan2. The latter, on the other
hand, has a stronger Pb anomaly, which results in higher Ce/Pb compared with Deccan1.
Deccan2 also has a Sr anomaly slightly more significant and HREE concentrations slightly
higher than Deccan1. Ti anomalies are slightly more negative in Deccan1 and finally,
Deccan1 and Deccan2 are strikingly parallel from Gd to Lu.
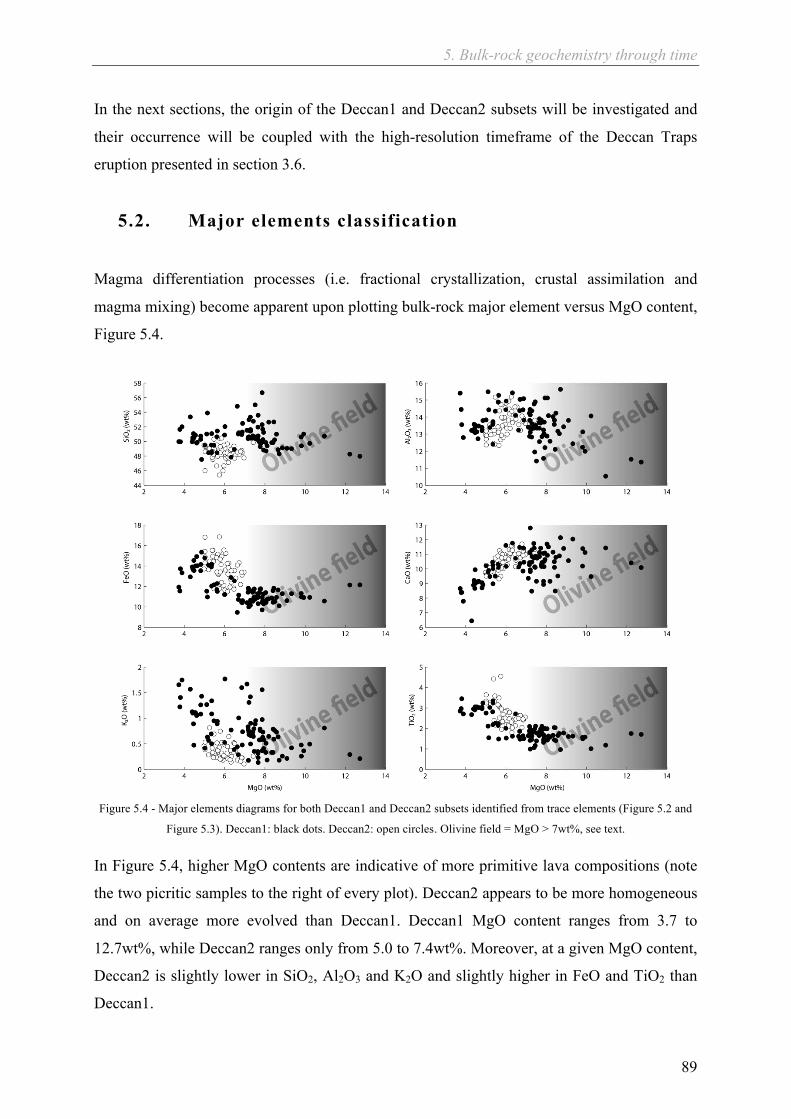
5. Bulk-rock geochemistry through time
89
In the next sections, the origin of the Deccan1 and Deccan2 subsets will be investigated and
their occurrence will be coupled with the high-resolution timeframe of the Deccan Traps
eruption presented in section 3.6.
5.2. Major elements classification
Magma differentiation processes (i.e. fractional crystallization, crustal assimilation and
magma mixing) become apparent upon plotting bulk-rock major element versus MgO content,
Figure 5.4.
Figure 5.4 - Major elements diagrams for both Deccan1 and Deccan2 subsets identified from trace elements (Figure 5.2 and
Figure 5.3). Deccan1: black dots. Deccan2: open circles. Olivine field = MgO > 7wt%, see text.
In Figure 5.4, higher MgO contents are indicative of more primitive lava compositions (note
the two picritic samples to the right of every plot). Deccan2 appears to be more homogeneous
and on average more evolved than Deccan1. Deccan1 MgO content ranges from 3.7 to
12.7wt%, while Deccan2 ranges only from 5.0 to 7.4wt%. Moreover, at a given MgO content,
Deccan2 is slightly lower in SiO2, Al2O3 and K2O and slightly higher in FeO and TiO2 than
Deccan1.

5. Bulk-rock geochemistry through time
90
Each plot on Figure 5.4 feature a general trend shift in the vicinity of MgO = 7wt%. This kink
shows the boundary between the olivine stability field (towards higher MgO contents), and
further fractional crystallization and/or cumulation of other minerals, such as pyroxenes and
feldspars (towards lower MgO contents). The dispersion away from this fractionation trend
indicates that other processes occurred during magma differentiation (e.g. crustal
assimilation). These processes will be investigated using trace elements.
5.3. Proxies for source depth and crustal assimilation
The depth of magmatic sources and the existence of crustal contamination are two important
parameters to consider in understanding the emplacement of a Large Igneous Province (LIP)
(Arndt et al., 1993, Sobolev et al., 2011). Major element concentrations (Figure 5.4) suggest
that Deccan Traps magmas have suffered significant amounts of fractional crystallization that
was likely coupled with crustal assimilation. Therefore, their composition cannot be regarded
as representative of the primary melt from which they derive, which makes it considerably
more difficult to infer about their origin in the mantle.
The depth of magma sources is indicative of the thickness of the lithosphere beneath the
eruption centre. This has implications in calculating the pressure-temperature conditions of a
magmatic source as well as its amount of melting (section 7). When examined through time, it
shows whether significant erosion of the lithosphere by the plume head – or thinning due to
tectonic extension – has occurred during the emplacement of the LIP. This will in turn affect
the LIP’s late-stage pressure-temperature-melting source conditions (P,T,f). The depth of the
magmatic sources is usually estimated from the fractionation between MREE and HREE.
Gd/Ybn (MREE/HREE, normalized to primitive mantle) increases with the steepness of the
HREE pattern (Figure 5.3). HREE are extremely compatible with garnet and hence, steep
HREE patterns, or high Gd/Ybn (>1.6, Sobolev et al., 2011) suggest 1) a garnet-bearing
source, 2) that garnet remained in the restite after melting occurred, and 3) that the source did
not melt sufficiently to exhaust the garnet it contains. Similarly, higher Gd/Ybn may not be
entirely due to higher source pressure, but can also be related to lower amounts of melting (or
both…). Alternatively, low Gd/Ybn (<1.6, Sobolev et al., 2011) means that either all garnet
has been exhausted from the magmatic source by high degrees of melting or because of low
garnet content, or that the source was not in the garnet stability field (P > 1.5-2GPa for
5. Bulk-rock geochemistry through time
91
pyroxenite: Lambart et al., 2009, Lambart et al., 2013, P > 2.4GPa for peridotite: Walter,
2014).
The relevance of crustal contamination (or assimilation) is twofold. First and foremost, crustal
contamination modifies the composition of the rising magmas and blurs the source signal they
contained. It renders the reconstruction of primary melts more difficult, if not impossible,
which precludes proper estimation of the sources P,T,f conditions. On the other hand, crustal
contamination returns valuable information as to the processes occurring between the source
and the eruption centre (fractionation and assimilation in magma chamber, simple
fractionation and low degrees of wall rock assimilation in large magma chambers or large
assimilation and limited fractionation upon fast and turbulent transport). In the absence of
radiogenic isotope data, crustal assimilation can be assessed using ratios of trace elements that
have distinct concentrations in mantle melts and in the crust. Assimilation Fractional
Crystallization (AFC: DePaolo, 1981) was not used during this PhD project. See Bhattacharya
et al (2013) and Chatterjee and Bhattacharji (2008) for recently published applications of AFC
to the Deccan Traps.
Nb/Lan and Th/Nbn are proxies for crustal contamination. Nb/Lan increases with decreasing
contamination because of the general negative Nb anomaly of the continental crust (Rudnick
& Gao, 2003). Th/Nbn varies in the opposite way, as Th/Nb ratios are much higher in the crust
than in the mantle. In addition, La concentrations being higher in the upper crust and Th being
more abundant in the lower crust, these trace element ratios also help decipher whether one of
the other crustal component was preferentially involved in the contamination process
(Rudnick & Gao, 2003).
The subsets Deccan1 and Deccan2 identified in the preceding paragraph (section 5.1) mostly
differ by their light incompatible trace element contents and feature a remarkably similar
HREE pattern (Figure 5.3). This dichotomy is further investigated by considering ratios of
elements that vary with incompatible element patterns or HREE steepness: Nb/Lan, Th/Nbn,
Ce/Pb and Gd/Ybn (Figure 5.5).

5. Bulk-rock geochemistry through time
92
Figure 5.5 - Incompatible trace element ratios for the Deccan1 and Deccan2 subsets (Figure 5.2 and Figure 5.3). Gujarat
high-Ti picrites (Melluso et al., 2006) and Réunion lavas (GEOROC database). A) Nb/Lan reflects lithophile elements
enrichment. Gd/Ybn shows variations in Heavy Rare Earth Elements (HREE) patterns that are a proxy for garnet signature in
the source of magmas. Values above 1.6 (Sobolev et al., 2011) suggest a source in the garnet stability field (P > 1.5-2GPa for
pyroxenite: Lambart et al., 2009, Lambart et al., 2013, P > 2.4GPa for peridotite: Walter, 2014). Trace element abundances
normalized to primitive mantle (Hofmann, 1988) B) Th/Nbn and Ce/Pb variations are another way of illustrating the
enrichment of magmas in incompatible elements with respect to average mantle and crustal values. Grey area “DM”:
Depleted Mantle values (Workman & Hart, 2005). For crustal values, see (Rudnick & Gao, 2003). C) Nb/Lan versus Mg#.
Deccan2 tends to be more evolved and less contaminated than Deccan1, see text.
Figure 5.5a and b return the following ranges in trace element ratios:
Deccan1: Nb/Lan = 0.31 to 0.83 (average: 0.51); Th/Nbn = 0.95 to 6.15 (average: 2.77); Ce/Pb
= 2.68 to 15.92 (average: 11.26); Gd/Ybn = 1.38 to 2.24 (average: 1.92)
Deccan2: Nb/Lan = 0.65 to 1.05 (average: 0.86); Th/Nbn = 0.77 to 1.91 (average: 1.07); Ce/Pb
= 11.46 to 26.20 (average: 16.86); Gd/Ybn = 1.63 to 2.10 (average: 1.87)

5. Bulk-rock geochemistry through time
93
Nb/Lan, Th/Nbn and Ce/Pb unambiguously indicate that Deccan1 underwent significant
crustal assimilation and that both lower (low Nd/Lan) and upper (high Th/Nbn) crustal
components were involved. Deccan2 on the other hand, appears to have assimilated
significantly less crustal material and seems to include almost uncontaminated end-members
(Nb/Lan = 1.05, Th/Nbn = 0.77, Ce/Pb = 26.20). Figure 5.5a and b.
Upon considering Figure 5.5a and b together with Figure 5.4 (major element concentrations)
and Figure 5.5c (Nb/Lan versus Mg#), a rather non-trivial relationship arises: Deccan2 is more
homogeneous and on average more evolved (lower Mg#) than Deccan1 and yet it is less
contaminated by crustal material (lower Th/Nbn and higher Ce/Pb and Nb/Lan) both at a given
Mg# and with respect to the highest Mg# end-members of Deccan1. Such a correlation of
ratios that decrease with crustal contamination (e.g. Nb/Lan) and Mg# had already been noted
in early publications on the Deccan Traps (Cox & Hawkesworth, 1985, Devey & Cox, 1987)
and is an important observation to consider in interpreting the dynamics of magma transport
in the Deccan Traps. It should be noted however, that the incompatible trace elements ratios
presented in Figure 5.5 merely provide qualitative estimates and must not be used as direct
indicators for quantifying the amount of crustal assimilation undergone by the magmas as the
characteristics of both the contaminants and the sources may have varied through time (Peng
et al., 1994, Chatterjee & Bhattacharji, 2008).
The HREE patterns of both Deccan1 and Deccan2 subsets are compared using Gd/Ybn
(Figure 5.5a). Deccan1 (Gd/Ybn = 1.38 to 2.24, average: 1.92) covers a wider range of
Gd/Ybn than Deccan2 (Gd/Ybn = 1.63 to 2.10, average: 1.87) and reaches slightly higher
values (2.24) than the latter (2.10). Both subsets clearly bear significant garnet signature:
Gd/Ybn > 1.6 (Sobolev et al., 2011). Moreover, this signature seems unaffected by the
varying crustal assimilation suggested by Th/Nbn, Ce/Pb and Nb/Lan. Alternatively, higher
absolute concentrations of HREE in Deccan2 (Figure 5.3) imply that these magmas could
have been formed by lower degrees of melting (a comparable range of Mg# between Deccan1
and Deccan2 (Figure 5.4) rules out the role of fractionation).
Figure 5.6 allows comparison of Western Ghats with the Gujarat high-Ti picrites, Réunion
Island and the Siberian Traps (Norilsk).
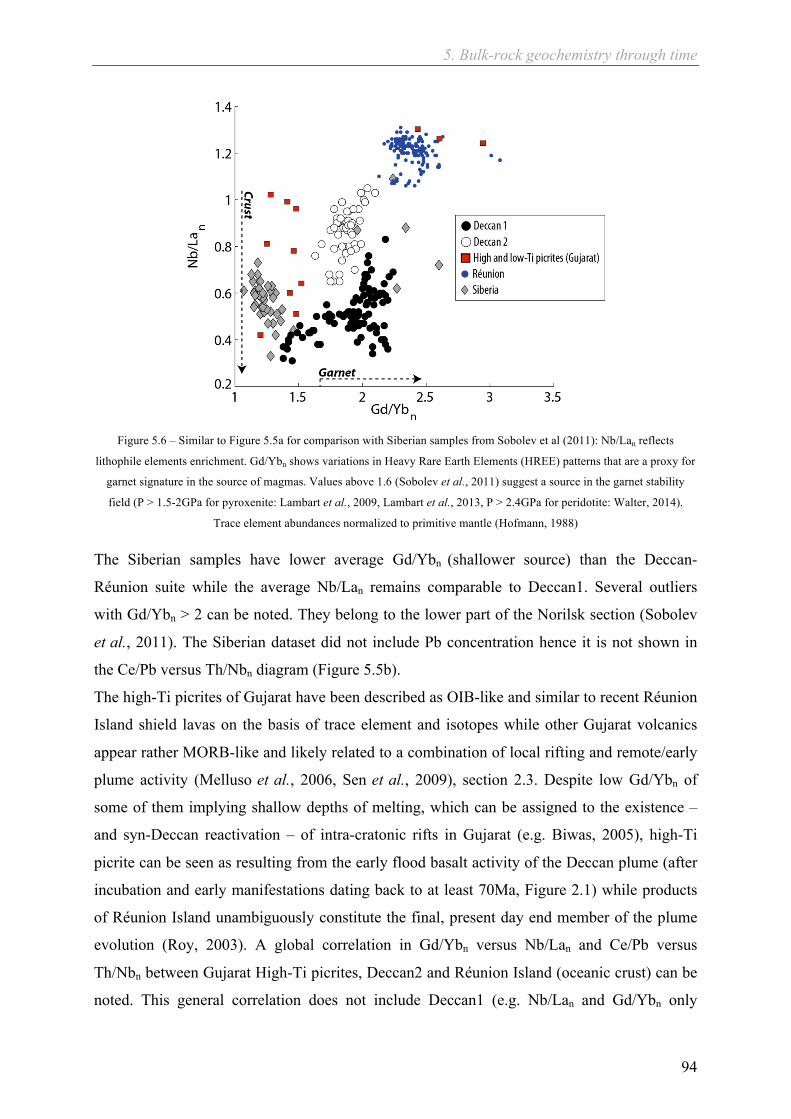
5. Bulk-rock geochemistry through time
94
Figure 5.6 – Similar to Figure 5.5a for comparison with Siberian samples from Sobolev et al (2011): Nb/Lan reflects
lithophile elements enrichment. Gd/Ybn shows variations in Heavy Rare Earth Elements (HREE) patterns that are a proxy for
garnet signature in the source of magmas. Values above 1.6 (Sobolev et al., 2011) suggest a source in the garnet stability
field (P > 1.5-2GPa for pyroxenite: Lambart et al., 2009, Lambart et al., 2013, P > 2.4GPa for peridotite: Walter, 2014).
Trace element abundances normalized to primitive mantle (Hofmann, 1988)
The Siberian samples have lower average Gd/Ybn (shallower source) than the Deccan-
Réunion suite while the average Nb/Lan remains comparable to Deccan1. Several outliers
with Gd/Ybn > 2 can be noted. They belong to the lower part of the Norilsk section (Sobolev
et al., 2011). The Siberian dataset did not include Pb concentration hence it is not shown in
the Ce/Pb versus Th/Nbn diagram (Figure 5.5b).
The high-Ti picrites of Gujarat have been described as OIB-like and similar to recent Réunion
Island shield lavas on the basis of trace element and isotopes while other Gujarat volcanics
appear rather MORB-like and likely related to a combination of local rifting and remote/early
plume activity (Melluso et al., 2006, Sen et al., 2009), section 2.3. Despite low Gd/Ybn of
some of them implying shallow depths of melting, which can be assigned to the existence –
and syn-Deccan reactivation – of intra-cratonic rifts in Gujarat (e.g. Biwas, 2005), high-Ti
picrite can be seen as resulting from the early flood basalt activity of the Deccan plume (after
incubation and early manifestations dating back to at least 70Ma, Figure 2.1) while products
of Réunion Island unambiguously constitute the final, present day end member of the plume
evolution (Roy, 2003). A global correlation in Gd/Ybn versus Nb/Lan and Ce/Pb versus
Th/Nbn between Gujarat High-Ti picrites, Deccan2 and Réunion Island (oceanic crust) can be
noted. This general correlation does not include Deccan1 (e.g. Nb/Lan and Gd/Ybn only

5. Bulk-rock geochemistry through time
95
appear correlated at Gd/Ybn < 1.6. Above this threshold, the correlation disappears and the
scattering is large). It is therefore possible that the assimilation processes of Deccan1 were
specific to this subset and not representative of the Deccan system as a whole (Gujarat –
Western Ghats – Réunion Island).
5.4. Evidence for a rapid change in crustal contamination
at constant garnet signature during the main volcanic
phase of the Deccan Traps The samples used for paleomagnetic observations and those used in bulk-rock major and trace
element analysis have been collected at the same locations (section 4). Therefore, the subsets
of Western Ghats lavas identified earlier (Deccan1 and 2, Figure 5.3a) can be assigned a
relative age by using the re-visited Western Ghats eruption timeframe of Figure 3.1 (section
3.6). Figure 5.7 combines Figure 3.1 with incompatible trace element ratios that increase with
garnet signature (Gd/Ybn) and that decrease with crustal contamination (Nb/Lan) from Figure
5.5a.
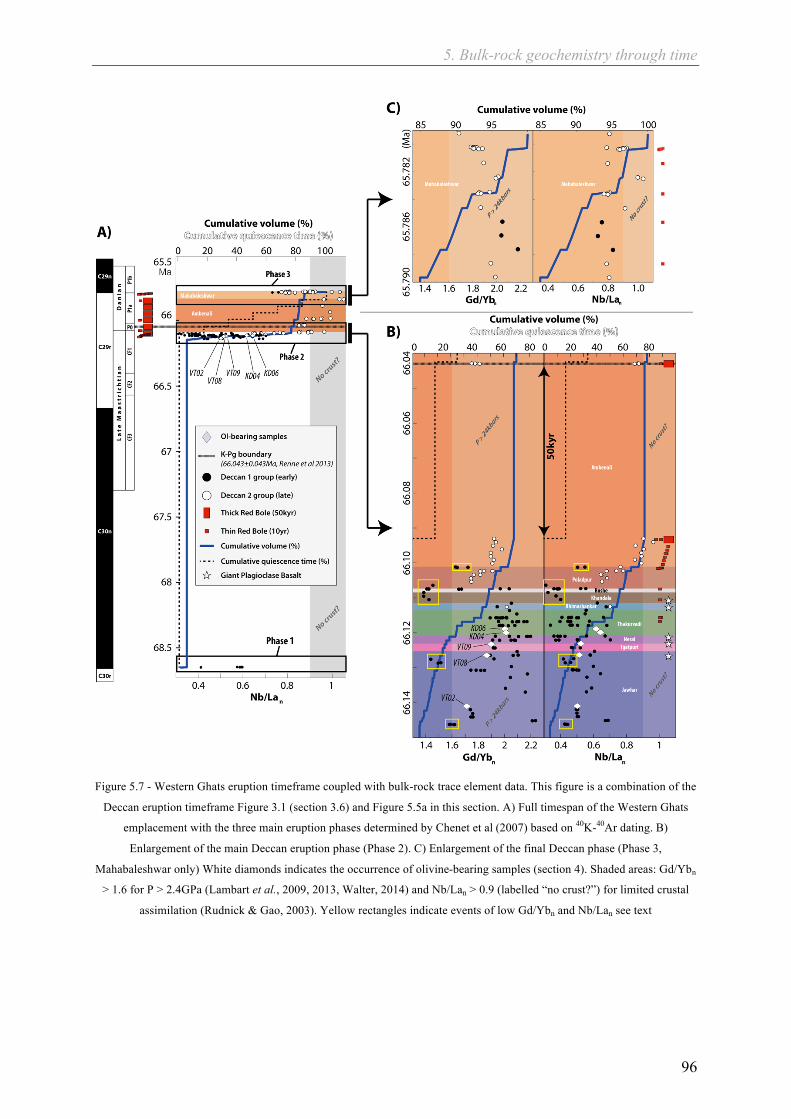
5. Bulk-rock geochemistry through time
96
Figure 5.7 - Western Ghats eruption timeframe coupled with bulk-rock trace element data. This figure is a combination of the
Deccan eruption timeframe Figure 3.1 (section 3.6) and Figure 5.5a in this section. A) Full timespan of the Western Ghats
emplacement with the three main eruption phases determined by Chenet et al (2007) based on 40K-40Ar dating. B)
Enlargement of the main Deccan eruption phase (Phase 2). C) Enlargement of the final Deccan phase (Phase 3,
Mahabaleshwar only) White diamonds indicates the occurrence of olivine-bearing samples (section 4). Shaded areas: Gd/Ybn
> 1.6 for P > 2.4GPa (Lambart et al., 2009, 2013, Walter, 2014) and Nb/Lan > 0.9 (labelled “no crust?”) for limited crustal
assimilation (Rudnick & Gao, 2003). Yellow rectangles indicate events of low Gd/Ybn and Nb/Lan see text
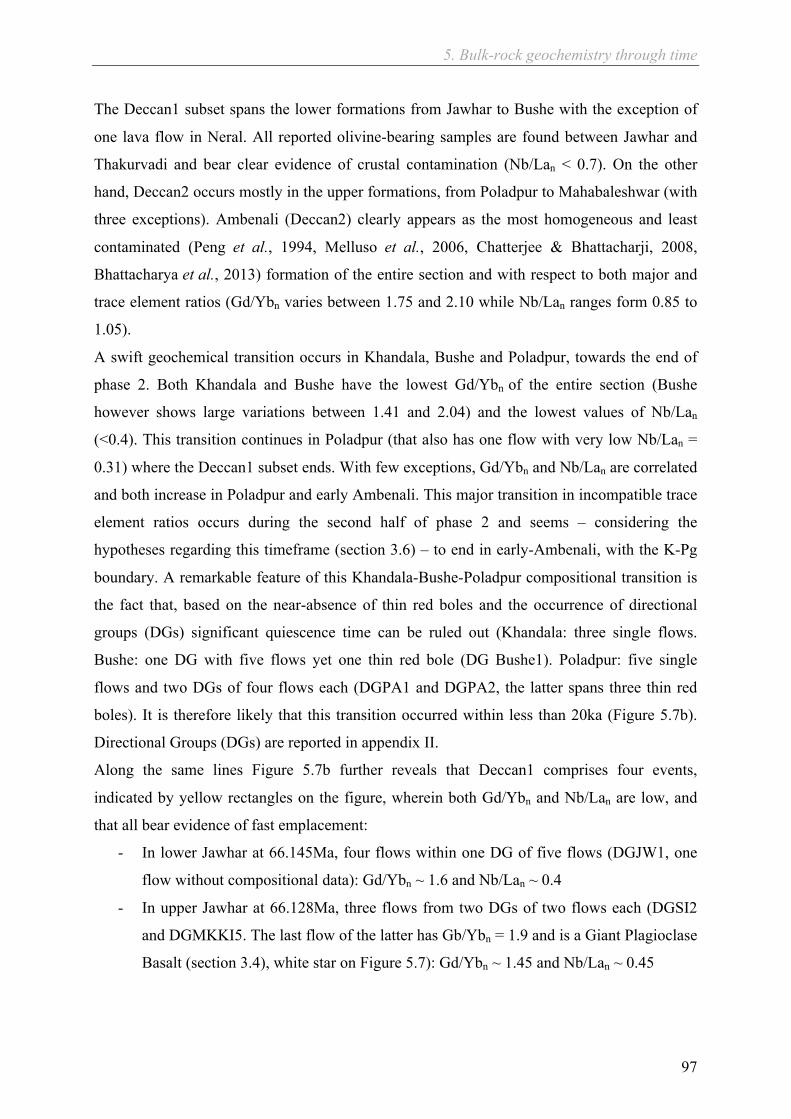
5. Bulk-rock geochemistry through time
97
The Deccan1 subset spans the lower formations from Jawhar to Bushe with the exception of
one lava flow in Neral. All reported olivine-bearing samples are found between Jawhar and
Thakurvadi and bear clear evidence of crustal contamination (Nb/Lan < 0.7). On the other
hand, Deccan2 occurs mostly in the upper formations, from Poladpur to Mahabaleshwar (with
three exceptions). Ambenali (Deccan2) clearly appears as the most homogeneous and least
contaminated (Peng et al., 1994, Melluso et al., 2006, Chatterjee & Bhattacharji, 2008,
Bhattacharya et al., 2013) formation of the entire section and with respect to both major and
trace element ratios (Gd/Ybn varies between 1.75 and 2.10 while Nb/Lan ranges form 0.85 to
1.05).
A swift geochemical transition occurs in Khandala, Bushe and Poladpur, towards the end of
phase 2. Both Khandala and Bushe have the lowest Gd/Ybn of the entire section (Bushe
however shows large variations between 1.41 and 2.04) and the lowest values of Nb/Lan
(<0.4). This transition continues in Poladpur (that also has one flow with very low Nb/Lan =
0.31) where the Deccan1 subset ends. With few exceptions, Gd/Ybn and Nb/Lan are correlated
and both increase in Poladpur and early Ambenali. This major transition in incompatible trace
element ratios occurs during the second half of phase 2 and seems – considering the
hypotheses regarding this timeframe (section 3.6) – to end in early-Ambenali, with the K-Pg
boundary. A remarkable feature of this Khandala-Bushe-Poladpur compositional transition is
the fact that, based on the near-absence of thin red boles and the occurrence of directional
groups (DGs) significant quiescence time can be ruled out (Khandala: three single flows.
Bushe: one DG with five flows yet one thin red bole (DG Bushe1). Poladpur: five single
flows and two DGs of four flows each (DGPA1 and DGPA2, the latter spans three thin red
boles). It is therefore likely that this transition occurred within less than 20ka (Figure 5.7b).
Directional Groups (DGs) are reported in appendix II.
Along the same lines Figure 5.7b further reveals that Deccan1 comprises four events,
indicated by yellow rectangles on the figure, wherein both Gd/Ybn and Nb/Lan are low, and
that all bear evidence of fast emplacement:
- In lower Jawhar at 66.145Ma, four flows within one DG of five flows (DGJW1, one
flow without compositional data): Gd/Ybn ~ 1.6 and Nb/Lan ~ 0.4
- In upper Jawhar at 66.128Ma, three flows from two DGs of two flows each (DGSI2
and DGMKKI5. The last flow of the latter has Gb/Ybn = 1.9 and is a Giant Plagioclase
Basalt (section 3.4), white star on Figure 5.7): Gd/Ybn ~ 1.45 and Nb/Lan ~ 0.45

5. Bulk-rock geochemistry through time
98
- In Khandala, Bushe, early-Poladpur between 66.110 and 66.105Ma, with respect to
Bhimashankar and late Poladpur-Ambenali. This event is made of three single flows
of Khandala, one DG with five flows and one thin red bole (DG Bushe1) of Bushe and
one single flow of Poladpur: Gd/Ybn ~ 1.45 and Nb/Lan ~ 0.3-0.4. This event
corresponds to the Khandala-Bushe-Poladpur transition described in the preceding
paragraph, late-Poladpur excepted
- In late-Poladpur at 66.101Ma, three flows from one DG (DG PA2) with three thin red
boles. Gd/Ybn = 1.63 to 1.72 and Nb/Lan 0.50 to 0.77. This excursion is separated
from the main Khandala-Bushe-Poladpur transition mentioned above by four single
flows and one DG of four flows (DG PA1)
Directional Groups (DGs) are reported in appendix II.
Phase 3 (Mahabaleshwar, Figure 5.7c) is more heterogeneous than Ambenali yet less than
phase 2. Gd/Ybn (1.7 – 2.2), which is on average higher than phase 2 (1.4 – 2.2) while Nb/Lan
is clearly higher (0.7 – 1.0). Two phase 3 samples have been classified as Deccan1 due to
their lower Nb/Lan (Figure 5.3 and Figure 5.7c).
5.5. Summary and preliminary interpretations
Section 3.6, based on previous work from Chenet and colleagues (Chenet et al., 2007, 2008,
2009) and further literature review, exposed a very hectic unwinding of the Deccan Traps
emplacement with three main phases separated by 2.5Ma (phase 1 to phase 2) and 0.3Ma
(phase 2 to phase 3) and eruption rates that would have been close to 20km3/yr on average and
potentially skyrocketing to 160km3/yr within some directional groups (Thakurvadi formation,
DG TH2, Chenet et al., 2009). This somewhat heterogeneous picture is now complemented
by bulk-rock major and incompatible trace elements.
There appear to be a clear chemical dichotomy along the Western Ghats section. This
difference has been identified using bulk-rock incompatible trace elements (Figure 5.5) and
also affects major element compositions (Figure 5.4). Figure 5.3 shows this dichotomy in
terms of trace element signatures that differ to the left of Sm (incompatible elements) while
the HREE signatures (to the right) are strikingly parallel (Ti-anomaly excepted). Two subsets
of Western Ghats lavas were thereby proposed: Deccan1 has lower average Nb/Lan and is
slightly more enriched in incompatible elements than Deccan2 (Figure 5.3 and Figure 5.5).
Furthermore, indices that vary with crustal contamination (e.g. Nb/Lan) are on the whole

5. Bulk-rock geochemistry through time
99
reversely correlated with indices showing the primitiveness of lava compositions (e.g. Mg#,
Figure 5.5 and Figure 5.4) (Cox & Hawkesworth, 1985, Devey & Cox, 1987). Deccan1
therefore seems more primitive (higher average Mg#) and yet more contaminated (lower
average Nb/Lan) than Deccan2.
Upon plotting the incompatible trace element ratios of Figure 5.5 through time (Figure 5.7), it
appears that a clear transition from the Deccan1 to Deccan2 occurred in late phase 2 (Chenet
et al., 2007) in the Khandala, Bushe and Poladpur formations. Within these formations,
Nb/Lan increases from ~ 0.4 to > 0.8 and Gd/Ybn increases from ~ 1.4 to > 1.9, implying that
magmatic sources were not in the garnet stability field early in this transition (Khandala and
Bushe) but that they indeed were by the end of it (Ambenali), and that crustal assimilation
almost stopped at the same time. The relative timeframe suggests that this transition has
occurred in less than 20ka and remained until the end of the Deccan Traps eruptions (Figure
5.7).
In addition to the Khandala-Bushe-Poladpur transition, there appear to be occasional
excursions of both low Gd/Ybn and Nb/Lan that also bear evidence of remarkable swiftness in
lower (1 DG = 100 years) and upper (2 DGs = 200 years) Jawhar, in Khandala-Bushe with
respect to Bhimashankar and Poladpur-Ambenali (4 single flows (4000 years) + 1 DG (100
years) + 2 thin red boles (20 years) = 4200 years based on section 3.6) and late-Poladpur (1Dg
and three thin red boles = 130 years) (yellow rectangles Figure 5.7). On these occasions,
Gd/Ybn and Nb/Lan are correlated and low (Gd/Ybn < 1.7 and Nb/Lan < 0.5, Figure 5.6)
implying both shallow sources and significant crustal contamination. No such excursion is
reported for Ambenali and Mahabaleshwar (Figure 5.7c)
Except for these excursions, Gd/Ybn and Nb/Lan are not correlated: both Deccan1 and
Deccan2 have an average Gd/Ybn ~ 2 despite average Nb/Lan of ~ 0.5 and ~ 0.9 respectively
(Figure 5.5a). Therefore, both Deccan1 and Deccan2 mostly differ by the extent to which they
have assimilated crustal components. This is also clearly seen in the trace element patterns
(Figure 5.3) and in Ce/Pb and Th/Nbn (Figure 5.5b).
Figure 5.6 shows a comparison of the Deccan Traps and the Siberian Traps (Sobolev et al.,
2011). It appears that garnet signature is absent from most Siberian lava flows, except early
ones, which contrasts with the almost ubiquitous Gd/Ybn > 1.6 in the Deccan Traps.
Sobolev et al (2011) have shown that a plume can significantly erode the lithosphere and
reduce its thickness (e.g. by more than 50% in about 50ka). Sobolev and colleagues further

5. Bulk-rock geochemistry through time
100
argued that in the Siberian case, widespread lithospheric erosion resulted in a sharp drop in
Gd/Ybn (from > 1.6 to <1.5, Figure 5.6) clearly suggesting that the magmatic sources were no
longer in the garnet stability field and that the depth of the lithosphere-asthenosphere
boundary had been reduced to < 80km. However, Sobolev et al. also contended that the
widespread lithospheric thickness reduction caused by the Siberian plume would not have
been of the same magnitude if the lithosphere had been thicker (> 130km).
The trace element variations in Deccan Traps lavas reported in this manuscript are compatible
with what Sobolev et al (2011) expected for 1) plumes impinging upon thick lithosphere (e.g.
140km) and 2) early release of mantle melts via pre-existing weaknesses within the
lithosphere (Murthy, 2002, Biwas, 2005). In this situation, plume-induced lithospheric erosion
would be more limited and localized than in the case a thinner and less permeable lithosphere.
In the Siberian Traps Sobolev and colleagues (Sobolev et al., 2011) noted that the erosion of
the Siberian craton by magmatic processes (melt freezing and delamination) had been very
large due to the absence of pre-existing potential pathways for melt transport towards the
surface. However localized, the erosion of the Indian lithosphere may still result in hot plume
material being brought very close to the crust, inducing decompression melting and crustal
assimilation due to heat advection beneath the crust as well as within conduits by turbulent
melt transport (Huppert & Sparks, 1985). The typical timescale required for this lithospheric
erosion process to be completed has been shown, by numerical modelling, to be in the order
of 50ka. This is compatible with the duration of phase 2 of the Deccan Traps eruption (~ 70-
80% of the total speculated volume of the Main Deccan Province in ~ 50ka, Figure 5.7b). It is
speculated that the 3 or 4 Gd/Ybn and Nb/Lan excursions could belong to the same erosion
event. The sudden “rebound” of Gd/Ybn and Nb/Lan in Poladpur may be accounted for by the
fact that fertile peridotite is denser than e.g. harzburgite. Thus, it is possible that the pathway
created by lithospheric erosion became sufficiently clogged by light restite for Gd/Ybn to
increase again significantly (> 1.6). The coeval decrease in crustal assimilation would be due
to coating and exhaustion of the conduits wall rock by previous melts.
The upper formations (Wai subgroup) were erupted under this same final regime (deep
source, low contamination) as suggested by the quiescence periods (thick red boles) and
comparatively lower emplaced volumes (Figure 5.7a), despite the significant extent of the
Wai subgroup on the field (Self et al., 2008b, Vanderkluysen et al., 2011).
Bhattacharya et al (2013) identified spikes of high δ 18O, low εNd(t) and high 87Sr/86Sr(t)
compatible with isolated yet significant crustal inputs in late-Poladpur and early-

5. Bulk-rock geochemistry through time
101
Mahabaleshwar (no data available for the lower formations). Note that these contamination
events are not seen on Figure 5.7c in Gd/Ybn and Nb/Lan and are thus likely to have been of
much lower intensity than those of the lower formations (Figure 5.7b). Bhattacharya et al.
proposed that only two phenomena could explain their observations: 1) A different plumbing
system is used for each new formation (with the exception of Ambenali) and crustal
contamination drops once this new feeder system has been coated by rising magmas. 2) All
magmas come from the same chamber. This chamber is fed by magmas that may have had
different sources and/or crustal contamination histories. The erupted lavas are the products of
various degrees of mixing within this common chamber.
It is likely that their first proposition is incorrect, as it has been shown that all three major
Deccan dike swarms have been active almost simultaneously during the emplacement of the
Main Deccan Province (Vanderkluysen et al., 2011). However, the second proposition fits
two important features of the upper formations and is likely to by more realistic. First, the
composition of Deccan2 lavas is on average more evolved and less heterogeneous than that of
Deccan1 (Figure 5.4), suggesting that Deccan2 melts were stored in order for them to have
homogeneous and evolved compositions. Secondly, the isotopic trends of the Mahabaleshwar
and Poladpur formations are different (higher 87Sr/86Sr(t) in Poladpur lavas, Figure 2.5).
Therefore, the contamination history could have been different.
Finally, the localized lithospheric erosion scenario proposed in the above is in agreement with
the present-day Indian lithospheric thickness (localized thinning in the vicinity of the Nasik-
Pune swarm and along the west coast but preservation of the Indian Shield to the east, Figure
2.7), with paleostress field modelling on the Indian plate at the time of the Deccan Traps (Ju
et al., 2013) as well as with the broad shield-like structure and compound flows centred on
Nasik-Pune swarm (Subbarao et al., 2000) (Figure 2.3).

102

103
6. Olivine Petrology
in the Deccan Traps
and Réunion Island

6. Olivine petrology in the Deccan Traps and Réunion Island
104
Olivine are used as a mean to access deep magmatic processes. The minor and trace element
composition of high-forsterite olivines allows elemental signatures to be related to olivine-
free material in the source of primary magmas (Sobolev et al., 2005, 2007). The composition
of host olivine and spinel inclusions is used to calculate aluminium partitioning between
them, which has been related to magmatic temperatures (Wan et al., 2008, Sobolev et al.,
2013, Coogan et al., 2014). Finally, the composition of olivine-hosted melt inclusions is a
proxy for primary melt major element composition (Sobolev, 1996, Sobolev et al., 2005),
primary melt water content (e.g. Dixon et al., 2002, Almeev et al., 2007, Médard & Grove,
2008) and magmatic temperatures (Sobolev & Nikogosian, 1994, Bureau et al., 1998b,
Danyushevsky, 2001, 2002a, Schiano, 2003, Danyushevsky & Plechov, 2011).
All olivine phenocrysts and inclusions have been analysed by Electron-Probe MicroAnalyser
at ISTerre, Grenoble, France. Details as to the analytical protocols used during this project are
presented in appendix III.
Examples of olivine compositions are listed in Table 6–3 and full datasets are available from
the corresponding author.
This section begins with a brief presentation of the samples and reminder on the Thakurvadi
formation of the Main Deccan Province (for a reminder on the geological setting of Réunion
Island, see 2.5). It will then be dedicated to olivine and inclusions (spinel and melt)
compositional data. Their use for primary melt reconstruction and source modelling will be
dealt with in section 7.
6.1. Samples
The olivine-bearing samples collected for this PhD project are all reported in Table 4–2
(section 4). However, this section only considers those that fell within the compositional
range required for the application of the methods of Sobolev et al (2005, 2007). In other
words, this section is based of samples bearing olivine with forsterite content above ~80.
The sample set used for olivine analysis is described consists of 2 samples from the
Thakurvadi formation in the Main Deccan Province (KD04 and KD06), 6 samples from Piton
de la Fournaise (PdF), Réunion Island (OPF, TI1602, GB1961, SR1977, 0202-053 and 0502-

6. Olivine petrology in the Deccan Traps and Réunion Island
105
263) and 1 sample from Piton des Neiges (PdN), Réunion Island (RU11). The Deccan
samples will be systematically compared to the Réunion Island samples as early and present-
day stages of the Deccan plume respectively.
The major and trace element composition of the selected picritic, olivine-phyric samples is
given on Table 6–1 below and their normalized trace element patterns are shown on Figure
6.1.
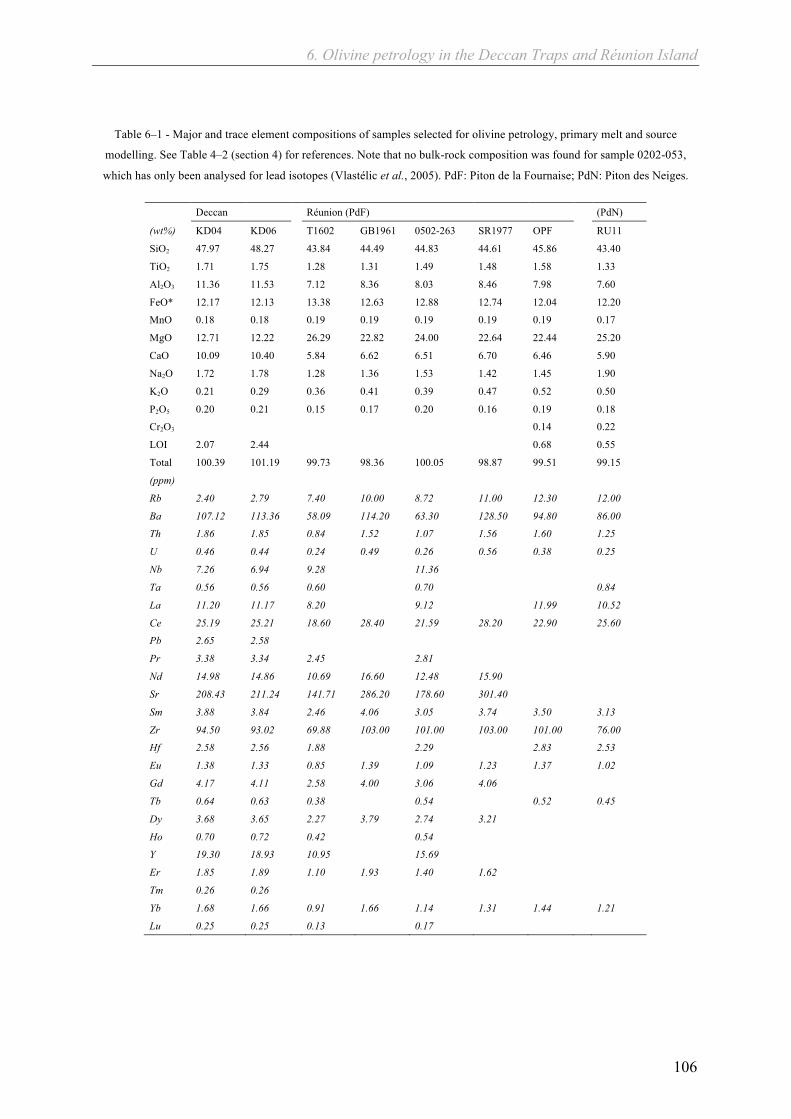
6. Olivine petrology in the Deccan Traps and Réunion Island
106
Table 6–1 - Major and trace element compositions of samples selected for olivine petrology, primary melt and source
modelling. See Table 4–2 (section 4) for references. Note that no bulk-rock composition was found for sample 0202-053,
which has only been analysed for lead isotopes (Vlastélic et al., 2005). PdF: Piton de la Fournaise; PdN: Piton des Neiges.
Deccan Réunion (PdF) (PdN)
(wt%) KD04 KD06 T1602 GB1961 0502-263 SR1977 OPF RU11
SiO2 47.97 48.27 43.84 44.49 44.83 44.61 45.86 43.40
TiO2 1.71 1.75 1.28 1.31 1.49 1.48 1.58 1.33
Al2O3 11.36 11.53 7.12 8.36 8.03 8.46 7.98 7.60
FeO* 12.17 12.13 13.38 12.63 12.88 12.74 12.04 12.20
MnO 0.18 0.18 0.19 0.19 0.19 0.19 0.19 0.17
MgO 12.71 12.22 26.29 22.82 24.00 22.64 22.44 25.20
CaO 10.09 10.40 5.84 6.62 6.51 6.70 6.46 5.90
Na2O 1.72 1.78 1.28 1.36 1.53 1.42 1.45 1.90
K2O 0.21 0.29 0.36 0.41 0.39 0.47 0.52 0.50
P2O5 0.20 0.21 0.15 0.17 0.20 0.16 0.19 0.18
Cr2O3 0.14 0.22
LOI 2.07 2.44 0.68 0.55
Total 100.39 101.19 99.73 98.36 100.05 98.87 99.51 99.15
(ppm) Rb 2.40 2.79 7.40 10.00 8.72 11.00 12.30 12.00
Ba 107.12 113.36 58.09 114.20 63.30 128.50 94.80 86.00
Th 1.86 1.85 0.84 1.52 1.07 1.56 1.60 1.25
U 0.46 0.44 0.24 0.49 0.26 0.56 0.38 0.25
Nb 7.26 6.94 9.28 11.36 Ta 0.56 0.56 0.60 0.70 0.84
La 11.20 11.17 8.20 9.12 11.99 10.52
Ce 25.19 25.21 18.60 28.40 21.59 28.20 22.90 25.60
Pb 2.65 2.58 Pr 3.38 3.34 2.45 2.81 Nd 14.98 14.86 10.69 16.60 12.48 15.90 Sr 208.43 211.24 141.71 286.20 178.60 301.40 Sm 3.88 3.84 2.46 4.06 3.05 3.74 3.50 3.13
Zr 94.50 93.02 69.88 103.00 101.00 103.00 101.00 76.00
Hf 2.58 2.56 1.88 2.29 2.83 2.53
Eu 1.38 1.33 0.85 1.39 1.09 1.23 1.37 1.02
Gd 4.17 4.11 2.58 4.00 3.06 4.06 Tb 0.64 0.63 0.38 0.54 0.52 0.45
Dy 3.68 3.65 2.27 3.79 2.74 3.21 Ho 0.70 0.72 0.42 0.54 Y 19.30 18.93 10.95 15.69 Er 1.85 1.89 1.10 1.93 1.40 1.62 Tm 0.26 0.26 Yb 1.68 1.66 0.91 1.66 1.14 1.31 1.44 1.21
Lu 0.25 0.25 0.13 0.17
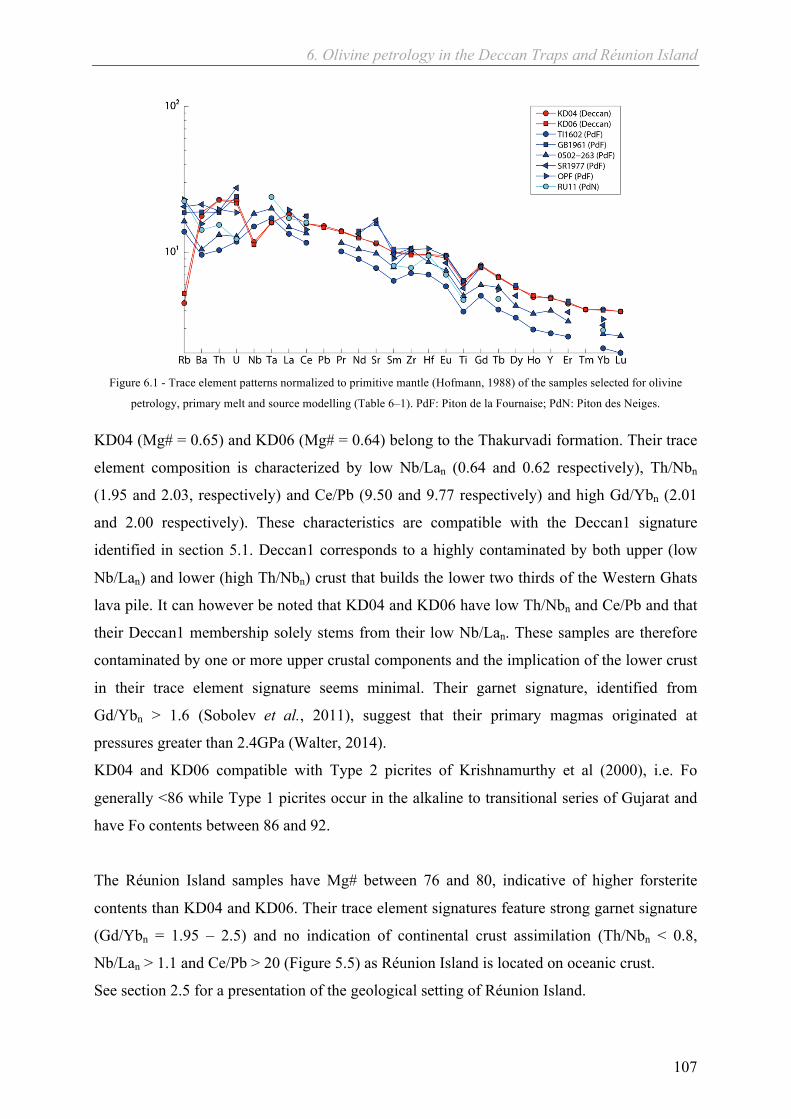
6. Olivine petrology in the Deccan Traps and Réunion Island
107
Figure 6.1 - Trace element patterns normalized to primitive mantle (Hofmann, 1988) of the samples selected for olivine
petrology, primary melt and source modelling (Table 6–1). PdF: Piton de la Fournaise; PdN: Piton des Neiges.
KD04 (Mg# = 0.65) and KD06 (Mg# = 0.64) belong to the Thakurvadi formation. Their trace
element composition is characterized by low Nb/Lan (0.64 and 0.62 respectively), Th/Nbn
(1.95 and 2.03, respectively) and Ce/Pb (9.50 and 9.77 respectively) and high Gd/Ybn (2.01
and 2.00 respectively). These characteristics are compatible with the Deccan1 signature
identified in section 5.1. Deccan1 corresponds to a highly contaminated by both upper (low
Nb/Lan) and lower (high Th/Nbn) crust that builds the lower two thirds of the Western Ghats
lava pile. It can however be noted that KD04 and KD06 have low Th/Nbn and Ce/Pb and that
their Deccan1 membership solely stems from their low Nb/Lan. These samples are therefore
contaminated by one or more upper crustal components and the implication of the lower crust
in their trace element signature seems minimal. Their garnet signature, identified from
Gd/Ybn > 1.6 (Sobolev et al., 2011), suggest that their primary magmas originated at
pressures greater than 2.4GPa (Walter, 2014).
KD04 and KD06 compatible with Type 2 picrites of Krishnamurthy et al (2000), i.e. Fo
generally <86 while Type 1 picrites occur in the alkaline to transitional series of Gujarat and
have Fo contents between 86 and 92.
The Réunion Island samples have Mg# between 76 and 80, indicative of higher forsterite
contents than KD04 and KD06. Their trace element signatures feature strong garnet signature
(Gd/Ybn = 1.95 – 2.5) and no indication of continental crust assimilation (Th/Nbn < 0.8,
Nb/Lan > 1.1 and Ce/Pb > 20 (Figure 5.5) as Réunion Island is located on oceanic crust.
See section 2.5 for a presentation of the geological setting of Réunion Island.

6. Olivine petrology in the Deccan Traps and Réunion Island
108
6.2. The Thakurvadi formation
The Thakurvadi formation is the second last formation of the Kalsubai subgroup (Figure 6.2).
Figure 6.2 - A) Western Ghats stratigraphy modified from Chenet et al (2009). Yellow star indicates the location of the KD04
and KD06 olivine-bearing samples analysed during this project. B) Differences between the division in lower (Igatpuri-
Jawhar to Bushe) and upper formations (Poladpur to Mahabaleshwar), e.g. Peng et al (1994) and the Deccan1 and Deccan2
subsets identified from trace element-based statistical analysis (K-Means clustering), section 5.1
Most of its outcrops are located in the Western Ghats. Nevertheless, the chemical signature of
the Thakurvadi formation has been identified in all three main feeder dyke systems of the
Deccan Traps (Vanderkluysen et al., 2011), Figure 2.3 (section 2.2). The chemical
characteristics of the Thakurvadi formation after Peng et al (1994, and references therein) are
given in Table 6–2.
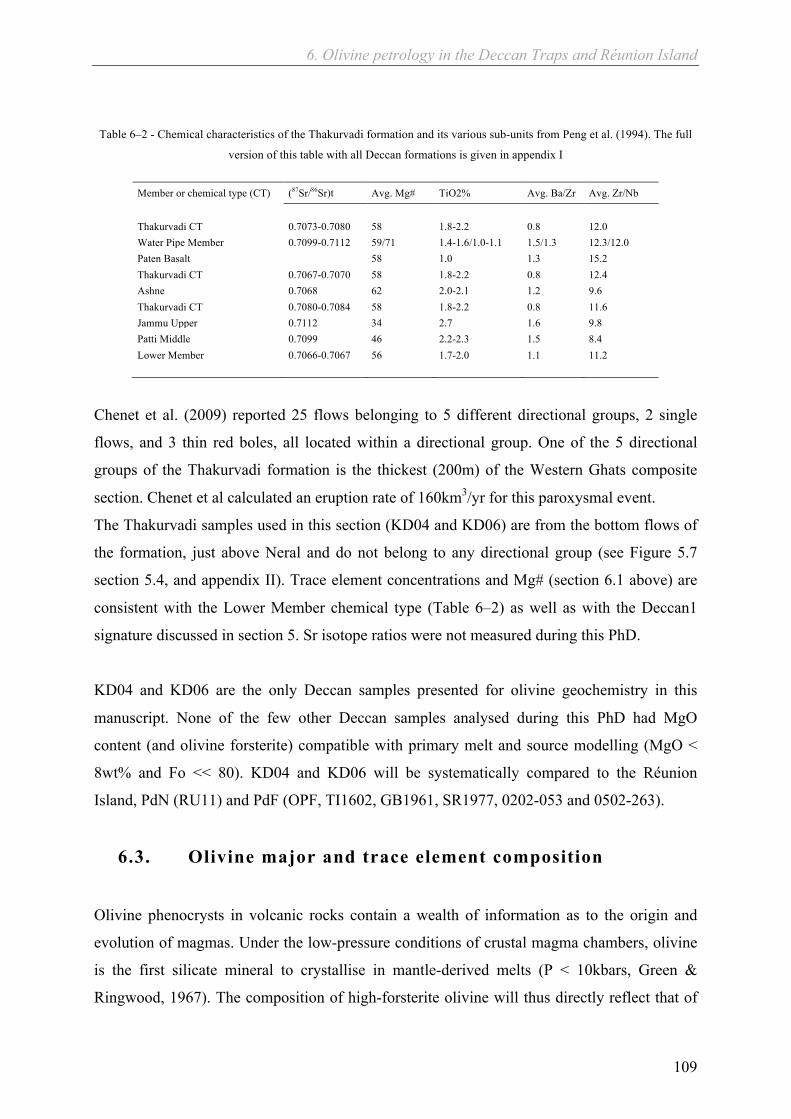
6. Olivine petrology in the Deccan Traps and Réunion Island
109
Table 6–2 - Chemical characteristics of the Thakurvadi formation and its various sub-units from Peng et al. (1994). The full
version of this table with all Deccan formations is given in appendix I
Member or chemical type (CT) (87Sr/86Sr)t Avg. Mg# TiO2% Avg. Ba/Zr Avg. Zr/Nb Thakurvadi CT 0.7073-0.7080 58 1.8-2.2 0.8 12.0 Water Pipe Member 0.7099-0.7112 59/71 1.4-1.6/1.0-1.1 1.5/1.3 12.3/12.0 Paten Basalt
58 1.0 1.3 15.2
Thakurvadi CT 0.7067-0.7070 58 1.8-2.2 0.8 12.4 Ashne 0.7068 62 2.0-2.1 1.2 9.6 Thakurvadi CT 0.7080-0.7084 58 1.8-2.2 0.8 11.6 Jammu Upper 0.7112 34 2.7 1.6 9.8 Patti Middle 0.7099 46 2.2-2.3 1.5 8.4 Lower Member 0.7066-0.7067 56 1.7-2.0 1.1 11.2
Chenet et al. (2009) reported 25 flows belonging to 5 different directional groups, 2 single
flows, and 3 thin red boles, all located within a directional group. One of the 5 directional
groups of the Thakurvadi formation is the thickest (200m) of the Western Ghats composite
section. Chenet et al calculated an eruption rate of 160km3/yr for this paroxysmal event.
The Thakurvadi samples used in this section (KD04 and KD06) are from the bottom flows of
the formation, just above Neral and do not belong to any directional group (see Figure 5.7
section 5.4, and appendix II). Trace element concentrations and Mg# (section 6.1 above) are
consistent with the Lower Member chemical type (Table 6–2) as well as with the Deccan1
signature discussed in section 5. Sr isotope ratios were not measured during this PhD.
KD04 and KD06 are the only Deccan samples presented for olivine geochemistry in this
manuscript. None of the few other Deccan samples analysed during this PhD had MgO
content (and olivine forsterite) compatible with primary melt and source modelling (MgO <
8wt% and Fo << 80). KD04 and KD06 will be systematically compared to the Réunion
Island, PdN (RU11) and PdF (OPF, TI1602, GB1961, SR1977, 0202-053 and 0502-263).
6.3. Olivine major and trace element composition
Olivine phenocrysts in volcanic rocks contain a wealth of information as to the origin and
evolution of magmas. Under the low-pressure conditions of crustal magma chambers, olivine
is the first silicate mineral to crystallise in mantle-derived melts (P < 10kbars, Green &
Ringwood, 1967). The composition of high-forsterite olivine will thus directly reflect that of
6. Olivine petrology in the Deccan Traps and Réunion Island
110
the primary melt. In addition, during their growth, olivine crystals trap a number of valuable
indicators of primary melt compositions and temperature. Spinel inclusions and the
partitioning of aluminium with the host olivine carry information as to the magmatic
temperatures at the time of olivine crystallisation (Wan et al., 2008, Sobolev et al., 2013,
Coogan et al., 2014). In the same way, olivine growth sometimes results in small volumes of
magma being trapped within the phenocrysts. Such melt inclusions carry information as to the
composition and temperature of the surrounding magma.
Sections 6.3 and 6.4 deal with olivine phenocryst compositions. Melt and spinel inclusions
will be considered in sections 6.5 and 6.6.
Examples of olivine compositions from all samples investigated in this section are presented
in Table 6–3, below.
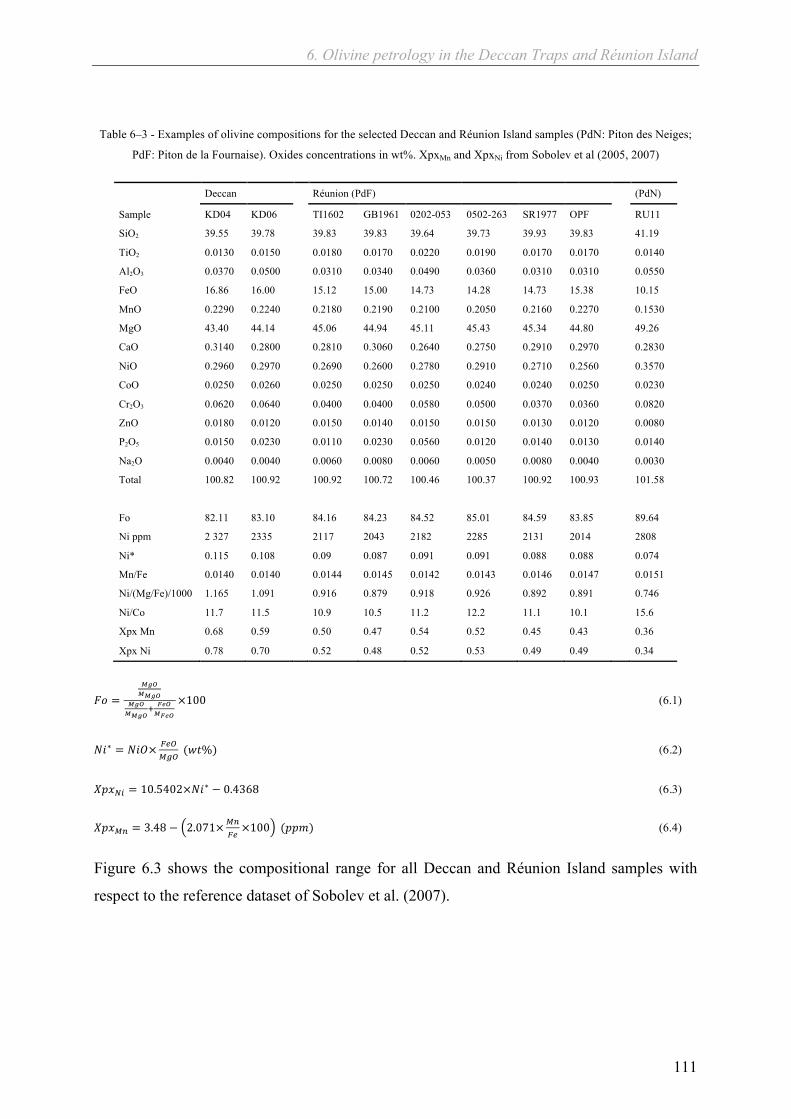
6. Olivine petrology in the Deccan Traps and Réunion Island
111
Table 6–3 - Examples of olivine compositions for the selected Deccan and Réunion Island samples (PdN: Piton des Neiges;
PdF: Piton de la Fournaise). Oxides concentrations in wt%. XpxMn and XpxNi from Sobolev et al (2005, 2007)
Deccan Réunion (PdF) (PdN)
Sample KD04 KD06
TI1602 GB1961 0202-053 0502-263 SR1977 OPF RU11
SiO2 39.55 39.78
39.83 39.83 39.64 39.73 39.93 39.83 41.19
TiO2 0.0130 0.0150
0.0180 0.0170 0.0220 0.0190 0.0170 0.0170 0.0140
Al2O3 0.0370 0.0500
0.0310 0.0340 0.0490 0.0360 0.0310 0.0310 0.0550
FeO 16.86 16.00
15.12 15.00 14.73 14.28 14.73 15.38 10.15
MnO 0.2290 0.2240
0.2180 0.2190 0.2100 0.2050 0.2160 0.2270 0.1530
MgO 43.40 44.14
45.06 44.94 45.11 45.43 45.34 44.80 49.26
CaO 0.3140 0.2800
0.2810 0.3060 0.2640 0.2750 0.2910 0.2970 0.2830
NiO 0.2960 0.2970
0.2690 0.2600 0.2780 0.2910 0.2710 0.2560 0.3570
CoO 0.0250 0.0260
0.0250 0.0250 0.0250 0.0240 0.0240 0.0250 0.0230
Cr2O3 0.0620 0.0640
0.0400 0.0400 0.0580 0.0500 0.0370 0.0360 0.0820
ZnO 0.0180 0.0120
0.0150 0.0140 0.0150 0.0150 0.0130 0.0120 0.0080
P2O5 0.0150 0.0230
0.0110 0.0230 0.0560 0.0120 0.0140 0.0130 0.0140
Na2O 0.0040 0.0040
0.0060 0.0080 0.0060 0.0050 0.0080 0.0040 0.0030
Total 100.82 100.92
100.92 100.72 100.46 100.37 100.92 100.93 101.58
Fo 82.11 83.10
84.16 84.23 84.52 85.01 84.59 83.85 89.64
Ni ppm 2 327 2335
2117 2043 2182 2285 2131 2014 2808
Ni* 0.115 0.108
0.09 0.087 0.091 0.091 0.088 0.088 0.074
Mn/Fe 0.0140 0.0140
0.0144 0.0145 0.0142 0.0143 0.0146 0.0147 0.0151
Ni/(Mg/Fe)/1000 1.165 1.091
0.916 0.879 0.918 0.926 0.892 0.891 0.746
Ni/Co 11.7 11.5
10.9 10.5 11.2 12.2 11.1 10.1 15.6
Xpx Mn 0.68 0.59
0.50 0.47 0.54 0.52 0.45 0.43 0.36
Xpx Ni 0.78 0.70 0.52 0.48 0.52 0.53 0.49 0.49 0.34
!" =!"#!!"#
!"#!!"#
! !"#!!"#
×100 (6.1)
!"∗ = !"#× !"#!"#
(!"%) (6.2)
!"#!" = 10.5402×!"∗ − 0.4368 (6.3)
!"#!" = 3.48 − 2.071×!"!"×100 (!!") (6.4)
Figure 6.3 shows the compositional range for all Deccan and Réunion Island samples with
respect to the reference dataset of Sobolev et al. (2007).
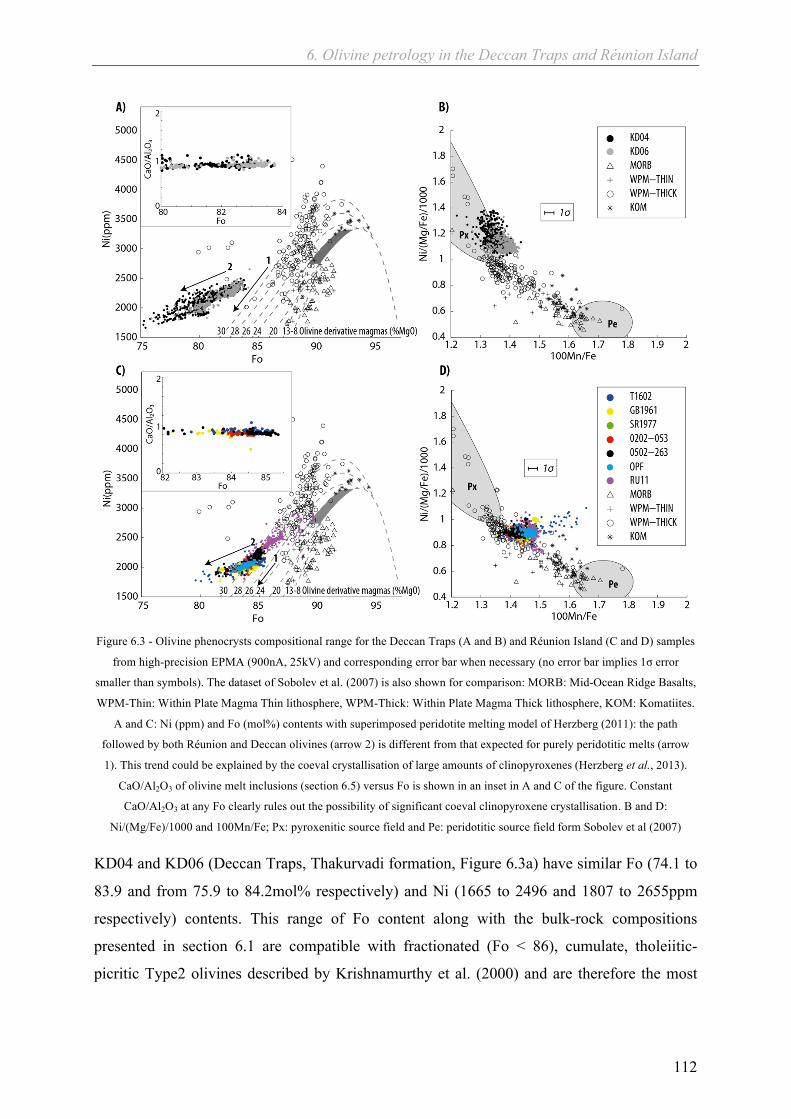
6. Olivine petrology in the Deccan Traps and Réunion Island
112
Figure 6.3 - Olivine phenocrysts compositional range for the Deccan Traps (A and B) and Réunion Island (C and D) samples
from high-precision EPMA (900nA, 25kV) and corresponding error bar when necessary (no error bar implies 1σ error
smaller than symbols). The dataset of Sobolev et al. (2007) is also shown for comparison: MORB: Mid-Ocean Ridge Basalts,
WPM-Thin: Within Plate Magma Thin lithosphere, WPM-Thick: Within Plate Magma Thick lithosphere, KOM: Komatiites.
A and C: Ni (ppm) and Fo (mol%) contents with superimposed peridotite melting model of Herzberg (2011): the path
followed by both Réunion and Deccan olivines (arrow 2) is different from that expected for purely peridotitic melts (arrow
1). This trend could be explained by the coeval crystallisation of large amounts of clinopyroxenes (Herzberg et al., 2013).
CaO/Al2O3 of olivine melt inclusions (section 6.5) versus Fo is shown in an inset in A and C of the figure. Constant
CaO/Al2O3 at any Fo clearly rules out the possibility of significant coeval clinopyroxene crystallisation. B and D:
Ni/(Mg/Fe)/1000 and 100Mn/Fe; Px: pyroxenitic source field and Pe: peridotitic source field form Sobolev et al (2007)
KD04 and KD06 (Deccan Traps, Thakurvadi formation, Figure 6.3a) have similar Fo (74.1 to
83.9 and from 75.9 to 84.2mol% respectively) and Ni (1665 to 2496 and 1807 to 2655ppm
respectively) contents. This range of Fo content along with the bulk-rock compositions
presented in section 6.1 are compatible with fractionated (Fo < 86), cumulate, tholeiitic-
picritic Type2 olivines described by Krishnamurthy et al. (2000) and are therefore the most
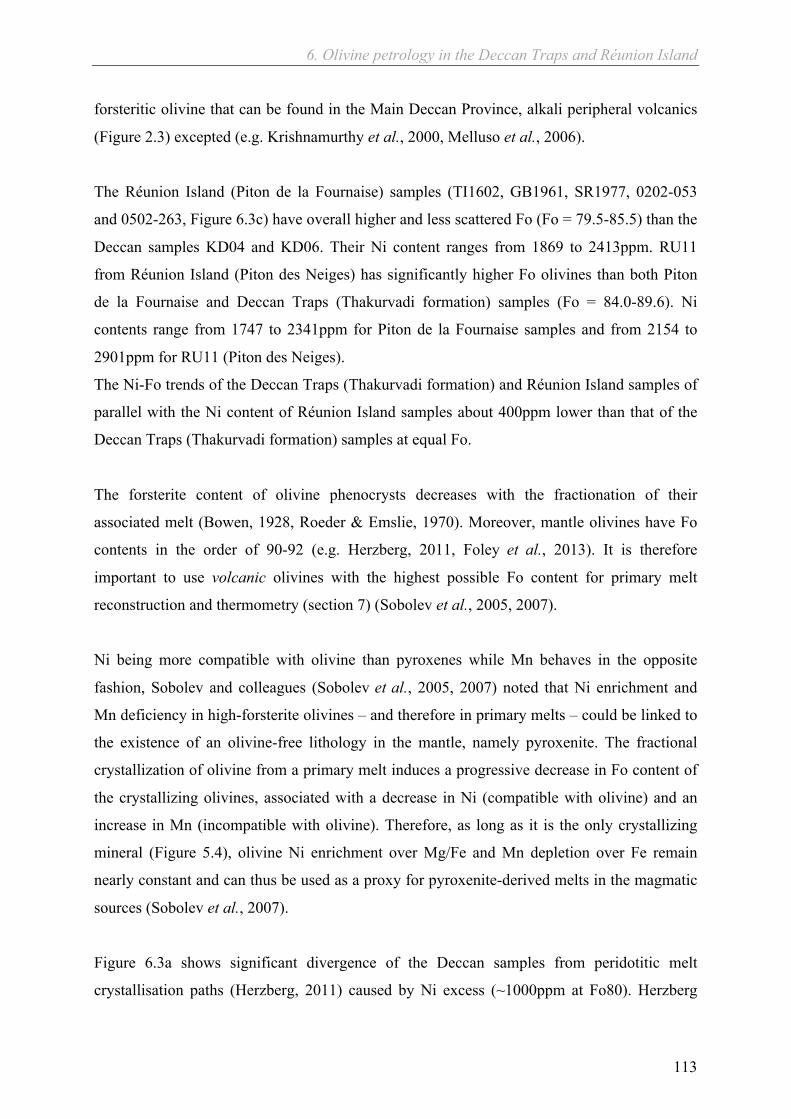
6. Olivine petrology in the Deccan Traps and Réunion Island
113
forsteritic olivine that can be found in the Main Deccan Province, alkali peripheral volcanics
(Figure 2.3) excepted (e.g. Krishnamurthy et al., 2000, Melluso et al., 2006).
The Réunion Island (Piton de la Fournaise) samples (TI1602, GB1961, SR1977, 0202-053
and 0502-263, Figure 6.3c) have overall higher and less scattered Fo (Fo = 79.5-85.5) than the
Deccan samples KD04 and KD06. Their Ni content ranges from 1869 to 2413ppm. RU11
from Réunion Island (Piton des Neiges) has significantly higher Fo olivines than both Piton
de la Fournaise and Deccan Traps (Thakurvadi formation) samples (Fo = 84.0-89.6). Ni
contents range from 1747 to 2341ppm for Piton de la Fournaise samples and from 2154 to
2901ppm for RU11 (Piton des Neiges).
The Ni-Fo trends of the Deccan Traps (Thakurvadi formation) and Réunion Island samples of
parallel with the Ni content of Réunion Island samples about 400ppm lower than that of the
Deccan Traps (Thakurvadi formation) samples at equal Fo.
The forsterite content of olivine phenocrysts decreases with the fractionation of their
associated melt (Bowen, 1928, Roeder & Emslie, 1970). Moreover, mantle olivines have Fo
contents in the order of 90-92 (e.g. Herzberg, 2011, Foley et al., 2013). It is therefore
important to use volcanic olivines with the highest possible Fo content for primary melt
reconstruction and thermometry (section 7) (Sobolev et al., 2005, 2007).
Ni being more compatible with olivine than pyroxenes while Mn behaves in the opposite
fashion, Sobolev and colleagues (Sobolev et al., 2005, 2007) noted that Ni enrichment and
Mn deficiency in high-forsterite olivines – and therefore in primary melts – could be linked to
the existence of an olivine-free lithology in the mantle, namely pyroxenite. The fractional
crystallization of olivine from a primary melt induces a progressive decrease in Fo content of
the crystallizing olivines, associated with a decrease in Ni (compatible with olivine) and an
increase in Mn (incompatible with olivine). Therefore, as long as it is the only crystallizing
mineral (Figure 5.4), olivine Ni enrichment over Mg/Fe and Mn depletion over Fe remain
nearly constant and can thus be used as a proxy for pyroxenite-derived melts in the magmatic
sources (Sobolev et al., 2007).
Figure 6.3a shows significant divergence of the Deccan samples from peridotitic melt
crystallisation paths (Herzberg, 2011) caused by Ni excess (~1000ppm at Fo80). Herzberg
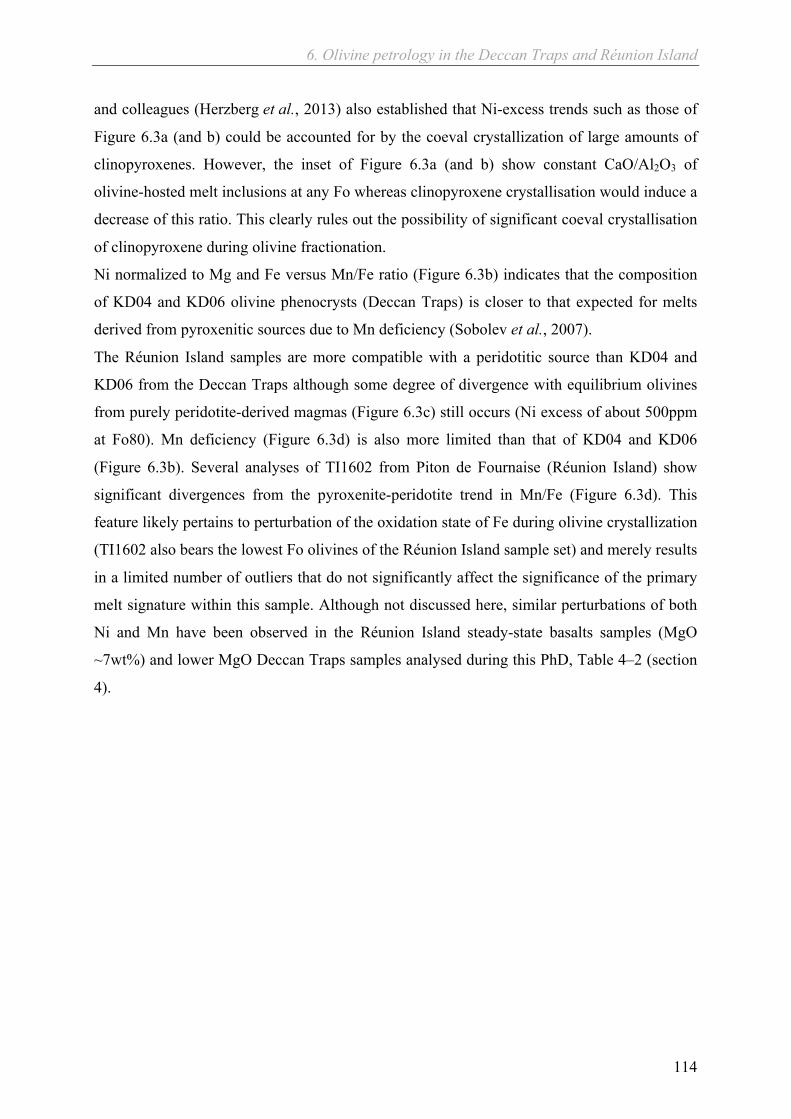
6. Olivine petrology in the Deccan Traps and Réunion Island
114
and colleagues (Herzberg et al., 2013) also established that Ni-excess trends such as those of
Figure 6.3a (and b) could be accounted for by the coeval crystallization of large amounts of
clinopyroxenes. However, the inset of Figure 6.3a (and b) show constant CaO/Al2O3 of
olivine-hosted melt inclusions at any Fo whereas clinopyroxene crystallisation would induce a
decrease of this ratio. This clearly rules out the possibility of significant coeval crystallisation
of clinopyroxene during olivine fractionation.
Ni normalized to Mg and Fe versus Mn/Fe ratio (Figure 6.3b) indicates that the composition
of KD04 and KD06 olivine phenocrysts (Deccan Traps) is closer to that expected for melts
derived from pyroxenitic sources due to Mn deficiency (Sobolev et al., 2007).
The Réunion Island samples are more compatible with a peridotitic source than KD04 and
KD06 from the Deccan Traps although some degree of divergence with equilibrium olivines
from purely peridotite-derived magmas (Figure 6.3c) still occurs (Ni excess of about 500ppm
at Fo80). Mn deficiency (Figure 6.3d) is also more limited than that of KD04 and KD06
(Figure 6.3b). Several analyses of TI1602 from Piton de Fournaise (Réunion Island) show
significant divergences from the pyroxenite-peridotite trend in Mn/Fe (Figure 6.3d). This
feature likely pertains to perturbation of the oxidation state of Fe during olivine crystallization
(TI1602 also bears the lowest Fo olivines of the Réunion Island sample set) and merely results
in a limited number of outliers that do not significantly affect the significance of the primary
melt signature within this sample. Although not discussed here, similar perturbations of both
Ni and Mn have been observed in the Réunion Island steady-state basalts samples (MgO
~7wt%) and lower MgO Deccan Traps samples analysed during this PhD, Table 4–2 (section
4).
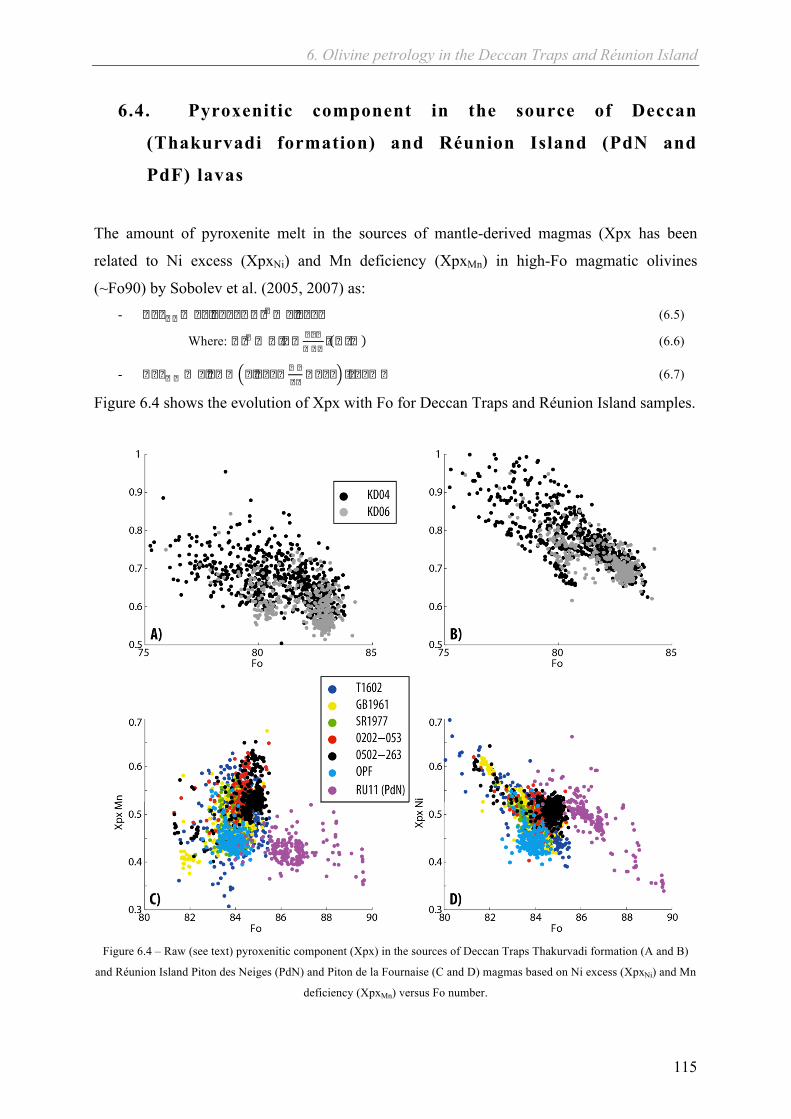
6. Olivine petrology in the Deccan Traps and Réunion Island
115
6.4. Pyroxenitic component in the source of Deccan
(Thakurvadi formation) and Réunion Island (PdN and
PdF) lavas
The amount of pyroxenite melt in the sources of mantle-derived magmas (Xpx has been
related to Ni excess (XpxNi) and Mn deficiency (XpxMn) in high-Fo magmatic olivines
(~Fo90) by Sobolev et al. (2005, 2007) as: - � � � � � � � � � � � � � � � � � � � � � � � � (6.5)
Where: � � � � � � � � � � �� � �
� � � � (6.6)
- � � � � � � � � � � � � � � � � � � �� �� � � � � � � � � � (6.7)
Figure 6.4 shows the evolution of Xpx with Fo for Deccan Traps and Réunion Island samples.
Figure 6.4 – Raw (see text) pyroxenitic component (Xpx) in the sources of Deccan Traps Thakurvadi formation (A and B)
and Réunion Island Piton des Neiges (PdN) and Piton de la Fournaise (C and D) magmas based on Ni excess (XpxNi) and Mn
deficiency (XpxMn) versus Fo number.

6. Olivine petrology in the Deccan Traps and Réunion Island
116
All samples exhibit variations of Xpx > 10% at any Fo value while the overall ranges of Xpx,
irrespective of the Fo content, varies by more than 40% (Figure 6.4). The Deccan Traps
samples (Figure 6.4a-b) feature a reverse correlation of Xpx and Fo that converges towards
Xpx = 0.55-0.65 at maximum Fo. This relationship also exists yet is less clear for the Réunion
Island samples (Xpx = 0.4-0.5, Figure 6.4c-d). Olivines from RU11 (Piton des Neiges) clearly
have distinct Xpx in both Ni and Mn spaces with respect to Piton de la Fournaise samples.
This implies a slightly different source composition for Piton des Neiges with a more limited
involvement of pyroxenitic components. However, the relatively low pyroxenitic component
of RU11 at high Fo (Xpx ~ 0.35 at Fo ~ 90) should be handled with care as most (>80%) Xpx
estimates for this sample are in the order of 0.40-0.45. It is possible that high-Fo (>88)
olivines from RU11 are different from those with lower Fo~86 (e.g. metasomatized peridotite
xenocrysts?).
The few wild variations of Xpx seen on Figure 6.5 are not observed on Figure 6.4 and yet
correlate, to some extent at least, with a fractionation trend (decreasing Fo). It is likely that the
perturbations of the Xpx indices of Figure 6.5 is the result of processes related to magmatic
fractionation and cumulate formation, such as varying oxidation state of Fe and the
crystallisation of other (non-silicate) phases (e.g. sulphides) (Krivolutskaya et al., 2012).
These effects can be filtered out by finding the best correlation of XpxNi and XpxMn (largest
population at the highest Fo), Figure 6.5.
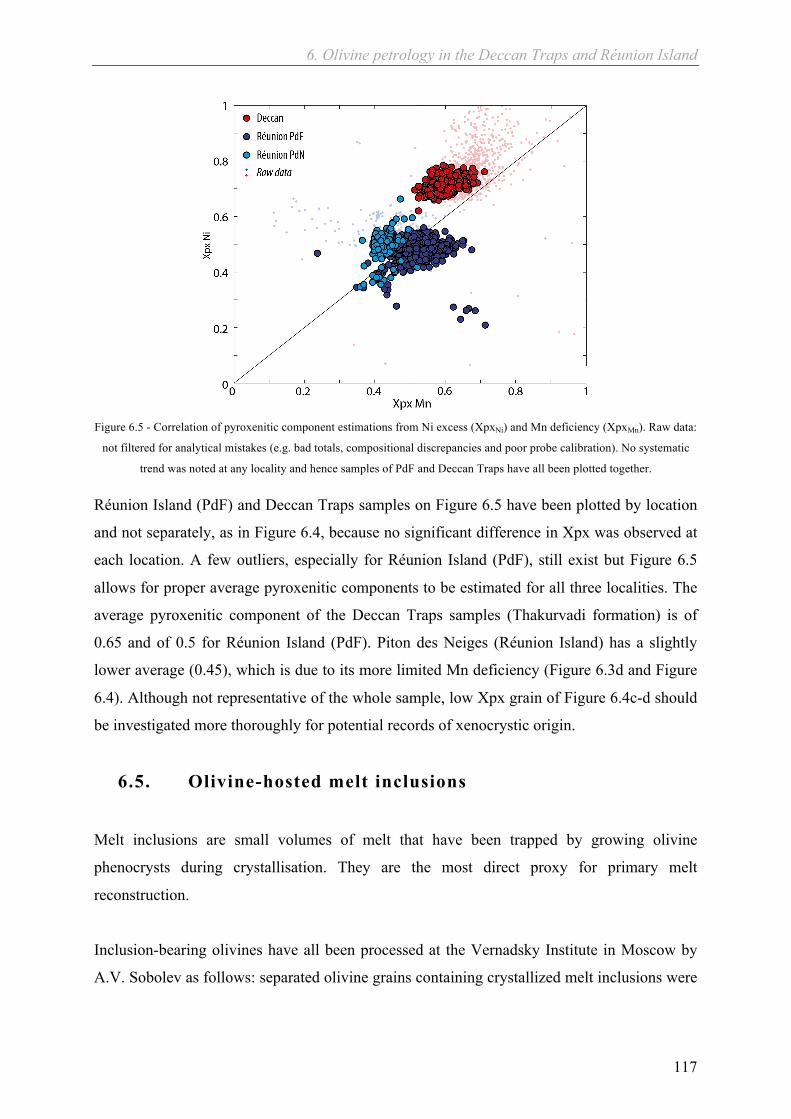
6. Olivine petrology in the Deccan Traps and Réunion Island
117
Figure 6.5 - Correlation of pyroxenitic component estimations from Ni excess (XpxNi) and Mn deficiency (XpxMn). Raw data:
not filtered for analytical mistakes (e.g. bad totals, compositional discrepancies and poor probe calibration). No systematic
trend was noted at any locality and hence samples of PdF and Deccan Traps have all been plotted together.
Réunion Island (PdF) and Deccan Traps samples on Figure 6.5 have been plotted by location
and not separately, as in Figure 6.4, because no significant difference in Xpx was observed at
each location. A few outliers, especially for Réunion Island (PdF), still exist but Figure 6.5
allows for proper average pyroxenitic components to be estimated for all three localities. The
average pyroxenitic component of the Deccan Traps samples (Thakurvadi formation) is of
0.65 and of 0.5 for Réunion Island (PdF). Piton des Neiges (Réunion Island) has a slightly
lower average (0.45), which is due to its more limited Mn deficiency (Figure 6.3d and Figure
6.4). Although not representative of the whole sample, low Xpx grain of Figure 6.4c-d should
be investigated more thoroughly for potential records of xenocrystic origin.
6.5. Olivine-hosted melt inclusions
Melt inclusions are small volumes of melt that have been trapped by growing olivine
phenocrysts during crystallisation. They are the most direct proxy for primary melt
reconstruction.
Inclusion-bearing olivines have all been processed at the Vernadsky Institute in Moscow by
A.V. Sobolev as follows: separated olivine grains containing crystallized melt inclusions were

6. Olivine petrology in the Deccan Traps and Réunion Island
118
heated to 1180-1220°C in a vertical furnace for 30 minutes and quenched under controlled
oxygen fugacity, corresponding to the QFM buffer.
All the melt inclusions analysed by EPMA during this project are larger than 8µm in diameter
in order to allow for large excitation volumes of high-current EPMA analysis (appendix III).
Figure 6.6 is an overview of measured (non-equilibrated) olivine melt inclusions and
examples of compositions are given on Table 6–4.
Figure 6.6 – Measured compositions of non-equilibrated (Danyushevsky et al., 2000a) olivine melt inclusions for Deccan
Traps (red) and Réunion Island Piton de la Fournaise (bleu, except TI1602 which is in grey) samples.

6. Olivine petrology in the Deccan Traps and Réunion Island
119
Table 6–4 - Examples of melt inclusion compositions for the selected Deccan Traps and Réunion Island samples (RU11 from
Piton des Neiges was not analysed for melt inclusions). Oxides concentrations in wt%.
Deccan Réunion (PdF)
Sample KD04 KD06
TI1602 GB1961 0202-053 0502-263
SiO2 51.87 51.78
50.61 48.41 49.03 48.64
Al2O3 14.24 14.58
14.6 14.12 14.06 13.79
FeOtot 8.08 8.79
7.15 11.87 11.2 11.5
MgO 8.82 7.9
8.58 8.04 7.98 8.7
CaO 12.07 11.99
11.78 11.76 11.18 11.07
TiO2 2.09 1.89
3.25 2.61 2.67 2.62
MnO 0.12 0.13
0.12 0.19 0.19 0.19
Na2O 2.17 2.31
2.77 2.44 2.36 2.34
K2O 0.44 0.44
1.08 0.67 0.73 0.65
Cl 0.02 0.02
0.03 0.02 0.02 0.02
S 0.03 0.05
0.04 0.11 0.07 0.12
P2O5 0.23 0.18
0.42 0.26 0.41 0.27
Total 100.22 100.06
100.58 100.72 99.89 99.95
Host Olivine
SiO2 40.03 39.79
40.14 39.78 40.04 40.17
Al2O3 0.0550 0.0290
0.0350 0.0370 0.0340 0.0320
FeO 16.31 18.41
14.93 16.08 14.72 14.29
MgO 43.70 42.37
45.87 44.58 45.05 45.58
CaO 0.2930 0.3190
0.2940 0.2790 0.2670 0.2760
TiO2 0.0290 0.0160
0.0110 0.0100 0.0100 0.0080
MnO 0.2210 0.2490
0.2120 0.2330 0.2090 0.2050
Cr2O3 0.0640 0.0470
0.0350 0.0340 0.0420 0.0440
NiO 0.2860 0.2550
0.2600 0.2500 0.2720 0.2890
CoO - -
0.0230 0.0220 0.0220 0.0200
ZnO 0.0140 0.0140
0.0150 0.0140 0.0150 0.0160
P2O5 - -
0.0150 0.0170 0.0200 0.0180
Total 101.00 101.49
101.85 101.34 100.64 100.90
Fo 82.69 80.41 84.56 83.17 84.51 85.04
Melt inclusions of the Deccan Traps samples tend to have slightly higher SiO2 and lower
FeOtot, MnO and TiO2 for the same MgO than those of PdF. However, TI1602 (Réunion
Island, grey on Figure 6.6) has higher SiO2, Al2O3 and CaO and lower FeO and MnO than its
counterparts from the same location. Several olivine core measurements of TI1602 returned
higher Mn/Fe than the other samples from the same locality (Figure 6.3d) and differences in
melt inclusion composition could therefore be ascribed to olivine and magmatic compositions.
However, no such difference is observed for any other element including volatiles (Figure

6. Olivine petrology in the Deccan Traps and Réunion Island
120
6.4c-d and Figure 6.7). It is likely that Fe-loss from the inclusion occurred due to equilibration
of the melt and the host olivine at low temperature (Sobolev & Danyushevsky, 1994)
The volatile contents of melt inclusions are given on Figure 6.7.
Figure 6.7 - Volatile contents of Deccan and Réunion (Piton de la Fournaise only) melt inclusions and published data for the
Deccan Traps (Self et al., 2008a), the Siberian Traps (Sobolev et al., 2009a) and Hawaii, Mauna Loa (Sobolev, 1996). K2O is
not a volatile but it is a proxy for water concentrations in the primary melts (e.g. Sobolev & Chaussidon, 1996, Dixon et al.,
2002). The relationship between K2O and water content is discussed in section 7.3.1.1
The average volatile (K2O, Cl and S) contents of the Deccan Traps and Réunion Island, PdF
melt inclusions are given in Table 6–5.
Table 6–5 – Average volatile contents of melt inclusions and average Fo of the host olivines for the Deccan Traps
(Thakurvadi formation) and Réunion Island (Piton de la Fournaise) samples analysed in this section
Thakurvadi Formation Réunion Island (Piton de la Fournaise)
KD04 KD06 Avg. TI1602 0202-053 0502-263 GB1961 Avg.
K2O(wt%) 0.48 0.48 0.48 0.78 0.66 0.64 0.72 0.70
Cl(wt%) 0.02 0.02 0.02 0.02 0.02 0.02 0.02 0.02
S(wt%) 0.04 0.05 0.05 0.07 0.10 0.09 0.10 0.09
Fo 82 82 84 84 84 84
Self and colleagues (Self et al., 2008a) reported 4 olivine-hosted (Fo 81) melt inclusions and
glasses volatile contents for three formations of the Deccan Traps Kalsubai subgroup: Jawhar,
Thakurvadi and Neral (Figure 6.2). Their estimations returned similar concentrations of S and
Cl, to the most K2O-rich inclusions of Figure 6.7, with S = 0.07-0.10wt%, Cl = 0.03 wt% and
K2O = 0.4-0.7wt% (Fo = 81).
6. Olivine petrology in the Deccan Traps and Réunion Island
121
KD04 and KD06 come from two successive lava flows at the beginning of the Thakurvadi
formation (section 6.2). It is therefore likely that both samples shared a similar degassing
history. The difference in volatile concentrations between the many inclusions from two
closely similar samples of the same formation (KD04 and KD06) analysed during this project
and the few inclusions from three different formations of the Kalsubai subgroup published by
Self et al cannot be interpreted. On the whole, both datasets are compatible and no conclusion
may be drawn as to the evolution of magma degassing during the emplacement of the
Kaulsubai subgroup due to limited data.
Matrix glass volatile measurements similar to Self et al (2008a) were carried out on none of
the Deccan Traps (Thakurvadi formation) or Réunion Island (Piton de la Fournaise) samples,
which precludes magma degassing calculations similar to those of Self and colleagues. It is
nevertheless proposed that the degassing of lavas is generally complete and that the amount of
volatiles remaining in the rocks is negligible. Thus, volatile concentrations in matrix glasses
are not necessarily representative of the amount of undegassed volatiles. (Sobolev, 2014,
personal communication).
Réunion Island (Piton de la Fournaise) melt inclusions (Figure 6.7) are also compatible with
estimates of Sobolev and Nikogosian (1994, K2O only) as well as Bureau and colleagues
(Bureau et al., 1998a, 1998b) for PdF, Réunion Island.
Both Deccan Traps and Réunion Island melt inclusions follow a markedly different trend than
the Siberian samples shown on Figure 6.7a for comparison (Sobolev et al., 2009b) and appear
closer to Hawaiian and MORB concentrations (Sobolev, 1996, Sobolev et al., 2009a). Figure
6.7b and the difference in Cl/K2O may hint at different magma degassing processes between
the Deccan Traps (Thakurvadi formation) and Réunion Island (Piton de la Fournaise).
6.6. Spinel inclusions in olivine
Spinel inclusions in olivine are used to constrain the oxidation state of Fe and the oxygen
fugacity of the melt with respect to the QFM and Ni-NiO oxygen buffers, which has
implications for the reconstruction of primary melt compositions from melt inclusions, and
the calculation of magmatic temperatures (Borisov & Shapkin, 1990, Nikolaev et al., 1996).
In additions, spinel inclusions are used to estimate magmatic temperatures in an way that is
independent from petrological models (thereby allowing for independent validation) and that
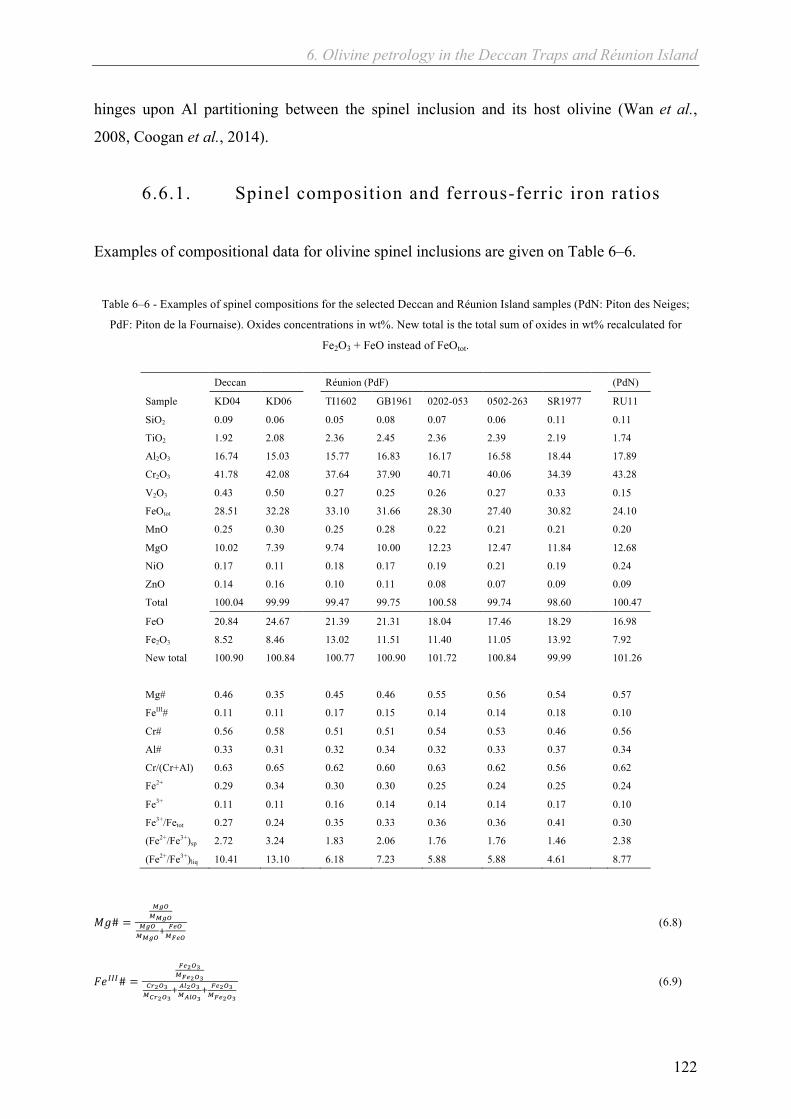
6. Olivine petrology in the Deccan Traps and Réunion Island
122
hinges upon Al partitioning between the spinel inclusion and its host olivine (Wan et al.,
2008, Coogan et al., 2014).
6.6.1. Spinel composition and ferrous-ferric iron ratios
Examples of compositional data for olivine spinel inclusions are given on Table 6–6.
Table 6–6 - Examples of spinel compositions for the selected Deccan and Réunion Island samples (PdN: Piton des Neiges;
PdF: Piton de la Fournaise). Oxides concentrations in wt%. New total is the total sum of oxides in wt% recalculated for
Fe2O3 + FeO instead of FeOtot.
Deccan Réunion (PdF) (PdN)
Sample KD04 KD06 TI1602 GB1961 0202-053 0502-263 SR1977 RU11
SiO2 0.09 0.06 0.05 0.08 0.07 0.06 0.11 0.11
TiO2 1.92 2.08 2.36 2.45 2.36 2.39 2.19 1.74
Al2O3 16.74 15.03 15.77 16.83 16.17 16.58 18.44 17.89
Cr2O3 41.78 42.08 37.64 37.90 40.71 40.06 34.39 43.28
V2O3 0.43 0.50 0.27 0.25 0.26 0.27 0.33 0.15
FeOtot 28.51 32.28 33.10 31.66 28.30 27.40 30.82 24.10
MnO 0.25 0.30 0.25 0.28 0.22 0.21 0.21 0.20
MgO 10.02 7.39 9.74 10.00 12.23 12.47 11.84 12.68
NiO 0.17 0.11 0.18 0.17 0.19 0.21 0.19 0.24
ZnO 0.14 0.16 0.10 0.11 0.08 0.07 0.09 0.09
Total 100.04 99.99 99.47 99.75 100.58 99.74 98.60 100.47
FeO 20.84 24.67 21.39 21.31 18.04 17.46 18.29 16.98
Fe2O3 8.52 8.46 13.02 11.51 11.40 11.05 13.92 7.92
New total 100.90 100.84 100.77 100.90 101.72 100.84 99.99 101.26
Mg# 0.46 0.35 0.45 0.46 0.55 0.56 0.54 0.57
FeIII# 0.11 0.11 0.17 0.15 0.14 0.14 0.18 0.10
Cr# 0.56 0.58 0.51 0.51 0.54 0.53 0.46 0.56
Al# 0.33 0.31 0.32 0.34 0.32 0.33 0.37 0.34
Cr/(Cr+Al) 0.63 0.65 0.62 0.60 0.63 0.62 0.56 0.62
Fe2+ 0.29 0.34 0.30 0.30 0.25 0.24 0.25 0.24
Fe3+ 0.11 0.11 0.16 0.14 0.14 0.14 0.17 0.10
Fe3+/Fetot 0.27 0.24 0.35 0.33 0.36 0.36 0.41 0.30
(Fe2+/Fe3+)sp 2.72 3.24 1.83 2.06 1.76 1.76 1.46 2.38
(Fe2+/Fe3+)liq 10.41 13.10 6.18 7.23 5.88 5.88 4.61 8.77
!"# =!"#!!"#
!"#!!"#
! !"#!!"#
(6.8)
!"!!!# =!"!!!!!"!!!
!"!!!!!"!!!
!!"!!!!!"!!
! !"!!!!!"!!!
(6.9)
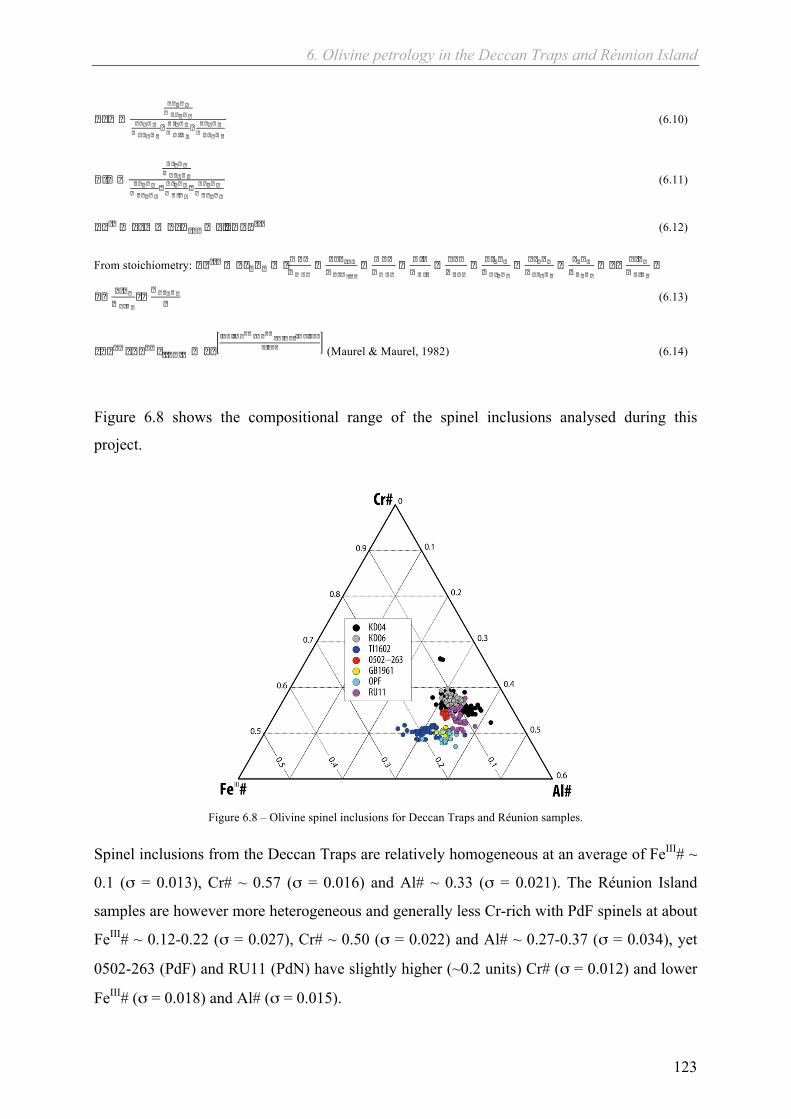
6. Olivine petrology in the Deccan Traps and Réunion Island
123
� � � �� � � � �� � � � � �
� � � � �� � � � � �
� � � � � �� � � � �
� � � � � �� � � � � �
(6.10)
� � � �� � � � �� � � � � �
� � � � �� � � � � �
� � � � � �� � � � �
� � � � � �� � � � � �
(6.11)
� � � � � � � � � � � � � � � � � � � � � � � � � (6.12)
From stoichiometry: � � � � � � � � � � � � � � � �� � � �
� � � � � � �� � � � � � �
� � � �� � � �
� � � �� � � �
� � � �� � � �
� � � � � �� � � � � �
� � � � � �� � � � � �
� � � � �� � � � �
� � � � � � �� � � � �
�
� � � � � �� � � � �
� �� � � � � �
� (6.13)
� � � � � � � � � � � � � � � � � � � �� � � � � � � � � � � � � � � � � � � � � � � � � � �
� � � � � (Maurel & Maurel, 1982) (6.14)
Figure 6.8 shows the compositional range of the spinel inclusions analysed during this
project.
Figure 6.8 – Olivine spinel inclusions for Deccan Traps and Réunion samples.
Spinel inclusions from the Deccan Traps are relatively homogeneous at an average of FeIII# ~
0.1 (σ = 0.013), Cr# ~ 0.57 (σ = 0.016) and Al# ~ 0.33 (σ = 0.021). The Réunion Island
samples are however more heterogeneous and generally less Cr-rich with PdF spinels at about
FeIII# ~ 0.12-0.22 (σ = 0.027), Cr# ~ 0.50 (σ = 0.022) and Al# ~ 0.27-0.37 (σ = 0.034), yet
0502-263 (PdF) and RU11 (PdN) have slightly higher (~0.2 units) Cr# (σ = 0.012) and lower
FeIII# (σ = 0.018) and Al# (σ = 0.015).

6. Olivine petrology in the Deccan Traps and Réunion Island
124
The ferrous-ferric partitioning (Fe2+/Fe3+) of spinel inclusions and the Fo content of the host
olivines can be compared with the fractionation paths of published high-Mg glasses and
primary melts in order to find the most appropriate oxygen fugacity buffer for melt inclusion-
based petrological modelling (section 7.1). Figure 6.9 shows Fe2+/Fe3+liquid versus Fo of the
host olivine for spinels in samples where melt inclusions have been analysed: KD04, KD06,
TI1602, GB1961 and 0502-263. RU11 from PdN, Réunion Island, is shown for comparison.
Data are represented by location for clarity and because no significant difference in
Fe2+/Fe3+liquid was noticed among Deccan Traps or PdF samples.
Figure 6.9 – Fe2+/Fe3+
liq recalculated from Fe2+/Fe3+ of spinel inclusions (Table 6–6) (Maurel & Maurel, 1982) and Fo of the
host olivine compared with the evolution of Fe2+/Fe3+liq for the QFM and NNO oxygen fugacity buffers (Borisov & Shapkin,
1990, Danyushevsky & Sobolev, 1996) during the crystallisation of high-MgO glasses and primary melt estimates for the
Deccan Traps (grey field: Sen, 1995, Sen & Chandrasekharam, 2011. NNO not in the plot area) and Réunion Island (arrows:
Ludden, 1978, Sobolev & Nikogosian, 1994, Famin et al., 2009, Villemant et al., 2009, Salaün et al., 2010). Fe2+/Fe3+liq
preferred ratios used for back-fractionation of melt inclusions (section 7) are Fe2+/Fe3+liq = 6 for Piton de la Fournaise and
Fe2+/Fe3+liq = 11.5 for the Deccan Thakurvadi samples. PdN: Piton des Neiges. PdF: Piton de la Fournaise. Fractionation
carried out using Petrolog (Danyushevsky & Plechov, 2011), P = 1atm, crystallization models: Ford et al (1983) for olivine,
Danyushevsky (2001) for clinopyroxene, orthopyroxene and plagioclase.
Figure 6.9 shows that Fe2+/Fe3+liq at PdF is compatible with the Ni-NiO oxygen fugacity
buffer while PdN is closer to QFM. In order to apply the most appropriate Fe2+/Fe3+liq in the
petrological models presented in section 7, the average Fe2+/Fe3+liq of PdF melts (Fe2+/Fe3+
liq =
6) is used. From Figure 6.9, it also appears that there is a linear relationship between
Fe2+/Fe3+liq and Fo (in the form Fe2+/Fe3+
liq = a×Fo + b) between PdF and PdN. However, this
6. Olivine petrology in the Deccan Traps and Réunion Island
125
relationship was not considered because 1) in this particular case, the use of a fixed ratio as
opposed to a linear equation has very limited consequences (logarithm) on the oxygen
fugacity (Borisov & Shapkin, 1990, Nikolaev et al., 1996) and 2) the linear relationship
between PdF and PdN would induce negative values of Fe2+/Fe3+liq at Fo < 78 and thus
preclude its use for petrological modelling at low Fo (e.g. melt-liquidus associations and
fractionation).
The Deccan Traps spinel inclusions, Figure 6.9, have markedly higher Fe2+/Fe3+liq than both
PdF and PdN samples (average Fe2+/Fe3+liq = 11.5). It is also higher than calculated Fe
oxidation state versus Fo based on the QFM oxygen fugacity buffer.
Overall, the oxidation state of magmas strongly increases between the Deccan Traps
(Thakurvadi formation) and Réunion Island. Moreover, at Réunion Island, the oxidation state
seems related to fractionation as Piton de la Fournaise and Piton des Neiges form a single
trend of increasing oxidation during fractionation. Figure 6.9.
6.6.2. Olivine-spinel thermometry
Aluminium partitioning between spinel inclusions and their host olivine has been used as an
igneous thermometer by Wan et al. (2008) and more recently by Coogan et al. (2014). The
olivine-spinel thermometer is expressed as:
! °! = !" !!!!.!"#!!.!"#!!"!!.!"#$ (!!)
− 273 (6.15)
Where:
!!" =!"!!!!!"!!!
!"!!!!!"!!!
! !"!!!!!"!!!
!"# !! =(!"!!!)!"#$#%&(!"!!!)!"#$%&
(6.16)
This thermometer is valid within the following range (Wan et al., 2008):
- 0.07 < YCr < 0.69
- Fe3+ < 0.1
- Ti < 0.025
These bounds preclude proper application of the thermometer to the Deccan Traps and
Réunion Island samples investigated in this manuscript as most of these have Fe3+ and Ti
contents beyond the recommendations of Wan et al. (Figure 6.10).
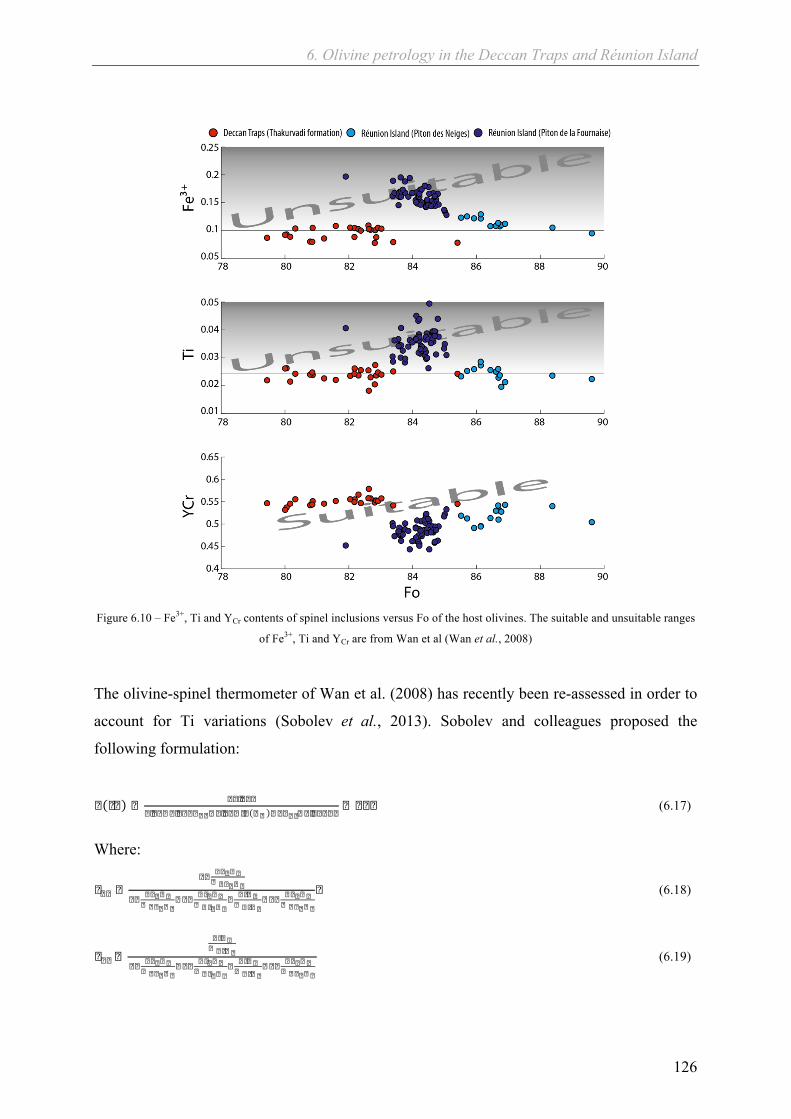
6. Olivine petrology in the Deccan Traps and Réunion Island
126
Figure 6.10 – Fe3+, Ti and YCr contents of spinel inclusions versus Fo of the host olivines. The suitable and unsuitable ranges
of Fe3+, Ti and YCr are from Wan et al (Wan et al., 2008)
The olivine-spinel thermometer of Wan et al. (2008) has recently been re-assessed in order to
account for Ti variations (Sobolev et al., 2013). Sobolev and colleagues proposed the
following formulation:
� � � � � � � � � �� � � � � � � � � � � � � � � � � � � � � � � � � � � � � � � � � � � �
� � � � (6.17)
Where:
� � � �� � � � � � �
� � � � � �
� � � � � � �� � � � � �
� � � � � � � �� � � � � �
� � � � �� � � � �
� � � � � � � �� � � � � �
� (6.18)
� � � �� � � �� � � � �
� � � � � � �� � � � � �
� � � � � � � �� � � � � �
� � � � �� � � � �
� � � � � � � �� � � � � �
(6.19)
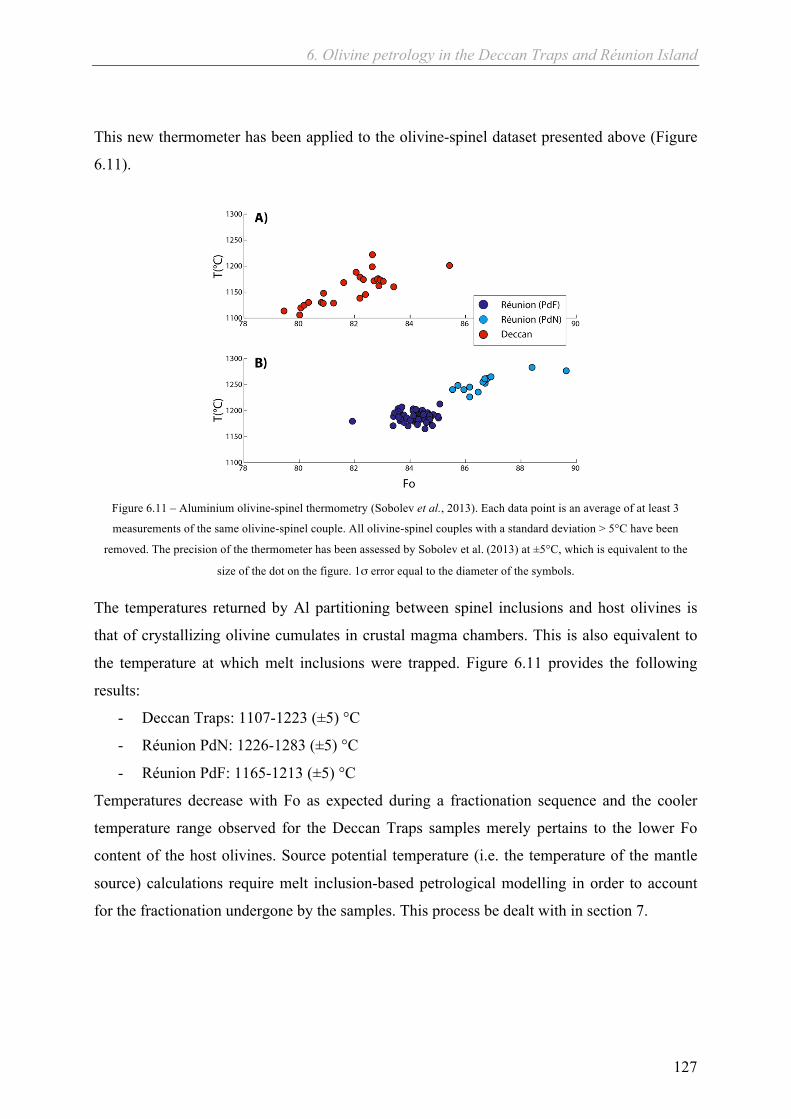
6. Olivine petrology in the Deccan Traps and Réunion Island
127
This new thermometer has been applied to the olivine-spinel dataset presented above (Figure
6.11).
Figure 6.11 – Aluminium olivine-spinel thermometry (Sobolev et al., 2013). Each data point is an average of at least 3
measurements of the same olivine-spinel couple. All olivine-spinel couples with a standard deviation > 5°C have been
removed. The precision of the thermometer has been assessed by Sobolev et al. (2013) at ±5°C, which is equivalent to the
size of the dot on the figure. 1σ error equal to the diameter of the symbols.
The temperatures returned by Al partitioning between spinel inclusions and host olivines is
that of crystallizing olivine cumulates in crustal magma chambers. This is also equivalent to
the temperature at which melt inclusions were trapped. Figure 6.11 provides the following
results:
- Deccan Traps: 1107-1223 (±5) °C
- Réunion PdN: 1226-1283 (±5) °C
- Réunion PdF: 1165-1213 (±5) °C
Temperatures decrease with Fo as expected during a fractionation sequence and the cooler
temperature range observed for the Deccan Traps samples merely pertains to the lower Fo
content of the host olivines. Source potential temperature (i.e. the temperature of the mantle
source) calculations require melt inclusion-based petrological modelling in order to account
for the fractionation undergone by the samples. This process be dealt with in section 7.

6. Olivine petrology in the Deccan Traps and Réunion Island
128
6.7. Summary and preliminary interpretations
The olivine dataset presented in this section is the first step towards assembling a reasonable
picture of the deep magmatic processes that generated the Deccan Traps and Réunion Island
volcanics:
- The primary magmas from which lavas of both localities originated are mixture of
peridotite- and pyroxenite-derived (olivine-free) melts. The contribution of pyroxenite
to the generation of primary magmas result in Ni excess and Mn deficiency in the
composition of the olivine phenocrysts. Based on Sobolev et al. (2005, 2007) it has
been estimated that the Deccan Traps (Thakurvadi formation only) high-Fo olivines
crystallized from a primary melt made of pyroxenite-derived melt at 65%. In the same
way, Réunion Island high-Fo olivine of Piton de la Fournaise (PdF) crystallized from a
primary melt composed of 50% of pyroxenite melt. Piton des Neiges returned slightly
lower pyroxenitic component (40-45%) while its maximum Fo olivines (Fo ~ 90)
suggest even lower involvement of an olivine-free lithology in the formation of
primary magmas (Xpx ~ 0.35). This observation requires further investigation and
may result from metasomatism of mantle olivines (Foley et al., 2013). Figure 6.3,
Figure 6.4 and Figure 6.5
- Homogenized olivine melt inclusions will be used for primary melt reconstruction at
Réunion Island (Piton de la Fournaise) and for the Deccan Traps (Thakurvadi
formation only) in the next section (7.1). Figure 6.6
- The volatile (S and Cl) contents of melt inclusions (Figure 6.7) are compatible with
previous measurements from both localities (Sobolev & Nikogosian, 1994, Sobolev,
1996, Bureau et al., 1998a, 1998b, Self et al., 2008a) and form a trend that is markedly
different from that of the Siberian Traps inclusions and similar to MORBs and
Hawaiian inclusions (Sobolev et al., 2009a). A significant difference in Cl/K2O
between Deccan Traps and Réunion Island (Piton de la Fournaise) inclusions may
imply different degassing processes of magmatic sources between the plume-head
stage and the tail stage of the Deccan Plume. No magma degassing calculations can be
carried out due to the lack of bulk-rock volatile measurements. It is nonetheless argued
that the figure proposed by Self et al (2008a) still hold true (S = 3.5Tg/km3 and Cl =
1Tg/km3). However, the very high chlorine concentrations found in Siberian melt
inclusions (up to 0.2wt%, Sobolev et al., 2009a) are in stark contrast with those
6. Olivine petrology in the Deccan Traps and Réunion Island
129
reported here for the Deccan Traps and Réunion Island. The differences in volatile
concentrations between the Siberian and the Deccan Traps should be assessed in
details in order to re-evaluate the potential environmental consequence of both LIPs
- Olivine spinel inclusions provided valuable information as to the oxidation state of Fe
(Réunion Island Piton de la Fournaise Fe2+/Fe3+liq = 6; Deccan Traps Thakurvadi
formation Fe2+/Fe3+liq = 11.5) and oxygen fugacity in the primary magmas of both
localities. There is a significant difference between the oxidation state of the Deccan
Traps (Thakurvadi formation) magmas (Fe2+/Fe3+liq ~ 11.5) and those of Réunion
Island (Piton des Neiges and Piton de la Fournaise, Fe2+/Fe3+liq = 6). In addition, there
is a clear correlation of Fe2+/Fe3+liq and Fo between Piton de la Fournaise and Piton
des Neiges suggesting that the oxidation state of Réunion Island magmas is related to
their degree of fractionation. These trends will be integrated to melt inclusion-based
petrological modelling of primary melt (section 7.1). Figure 6.9
- In addition, olivine-spinel aluminium partitioning was used as a magmatic
thermometer (Sobolev et al., 2013) and returned the following temperature ranges for
crustal magma chambers (Figure 6.11):
Deccan Traps (Thakurvadi formation only): 1107 – 1223°C
Réunion Island (Piton des Neiges): 1226 – 1283°C
Réunion Island (Piton de la Fournaise): 1165 – 1213°C
- The temperature under which spinel inclusions formed is equal to that of melt
inclusions trapping by the growing olivine crystals (cumulate formation in crustal
magma chambers) and hence, olivine-spinel-based temperature estimates will be used
as an independent constrain for melt inclusion re-equilibration and ensuing primary
melt modelling (section 7.1)

130

131
7. Primary melt
reconstruction and
source modelling

7. Primary melt reconstruction and source modelling
132
The purpose of the olivine dataset presented in the preceding section (6) is to be used as a
proxy for understanding the deep mantle processes that generated the lavas exposed in the
Deccan Traps and at Réunion Island. However, the olivine phenocrysts that have been
described earlier crystallized in shallow crustal magma chambers (Figure 7.1) (Sobolev &
Nikogosian, 1994, Bureau et al., 1998b) and the information they convey therefore
corresponds to the conditions applicable at this pre-eruption stage of magmatic evolution. The
path that led to this stage thus has to be unveiled in order for the origin of the magmas to be
reconstructed. Such a forward modelling process requires the use of proxies, namely the
olivine dataset presented in the preceding section but also bulk-rock trace element
composition. It also involves assumptions that may have critical implications and that
therefore sometimes represent strong limitations or imply large uncertainties that will be
discussed.
Figure 7.1 – Histograms of the last equilibrium pressure of the olivine-clinopyroxene assemblage for Deccan Traps (Loss on
Ignition, LOI, < 2wt%) and Réunion Island lavas with MgO < 7wt%. This result is compatible with independent estimates by
Bureau and colleagues (Bureau et al., 1998b). Calculation carried out using the Petrolog software (Danyushevsky & Plechov,
2011)
This section begins with the reconstruction of primary melt compositions, that is, the
composition of the magmas after it departed from its source in the mantle and before any
other magmatic process such as crustal assimilation or fractionation occurred. This first step is
achieved upon re-equilibration and back-fractionation of melt inclusions (section 7.1).
In a second phase, the sources of primary magmas will be modelled and mantle potential
temperatures will be calculated.
Finally, the limits of the models used in this section will be briefly discussed.
7. Primary melt reconstruction and source modelling
133
7.1. Primary melt reconstruction
The composition of primary melts is recalculated from melt inclusion (major and minor
elements) and bulk rock (trace element) composition. Melt inclusions were analysed in KD04
and KD06 from the Deccan Traps (Thakurvadi formation) and TI1602, GB1961, SR1977,
0502-263 from Réunion Island (Piton de la Fournaise, PdF). Therefore, the primary melt
compositions calculated here are valid for these volcanics only. However, since the
composition of the samples used in this PhD are representative of their respective localities
(sections 4 and 5), it is reasonable to argue that the primary melt compositions proposed here
for Piton de la Fournaise at Réunion Island and for the Thakurvadi formation of the Deccan
Traps are applicable to Réunion Island as a whole and to the lower formations of the Deccan
Traps (Igatpuri-Jawhar to Bushe) respectively. In the case of the Deccan Traps, it is even
possible that primary melt compositions could have been roughly constant for all formations
of the Main Deccan Province, as Ambenali-like signatures have been recognized in most of
them (Peng et al., 1994), section 5. Nevertheless, if HREE slopes (e.g. Gd/Ybn) are roughly
constant throughout the Western Ghats (Deccan Traps) section, trace element signatures that
are indicative of source composition as well as crustal contamination (e.g. Th/Nbn) indicate
strong variations along this same section (Figure 5.5).
The composition of primary melts is recalculated in the following manner and the different
steps to this process are detailed in the next sections. 1) Melt inclusion compositions are re-
equilibrated with their host olivine for Fe-loss (Danyushevsky et al., 2000a, 2002b). 2) Re-
equilibrated melt inclusions are back-fractionated to mantle Fo values (Herzberg, 2011). 3)
Primary melt water contents are calculated using K2O as a proxy and primary melt
temperatures are corrected for water content based on Almeev et al. (2007) and Médard and
Grove (2008), section 7.3.1.1. 4) Primary melt trace elements are recalculated using their
concentration in the bulk rock. TiO2 and Al2O3 are assumed to behave like trace elements
during primary melt fractionation. The evolution of TiO2 and Al2O3 during melt inclusion
back-fractionation can thus be directly liked to the trace element concentrations in the primary
melt by simple cross multiplication using bulk rock trace element concentrations.
All calculations have been carried out using the Petrolog software (Danyushevsky &
Plechov, 2011) and Ford et al. (1983). The oxygen fugacity buffer used was a fixed Fe2+/Fe3+
7. Primary melt reconstruction and source modelling
134
chosen according to Figure 6.9 (Fe2+/Fe3+ = 6 for Réunion PdF and Fe2+/Fe3+ = 11.5 for
Deccan Traps Thakurvadi formation samples).
7.1.1. Melt inclusion re-equilibration
Olivine-hosted melt inclusions are trapped during olivine crystallisation. Subsequent cooling
will result in magmatic fractionation within the inclusions themselves. As any low-pressure
crystallisation sequence, olivine first appears and crystallizes on the walls of the inclusion. As
fractionation proceeds, olivine compositions on the inclusion walls become increasingly Fe-
rich. If sufficient volumes of similarly fractionating melt surrounded the host olivine, the
latter would also progressively become more Fe-rich. However, within olivine cumulates,
from which high-Fo volcanic olivines are extracted, the amount of fractionating melt is not
large enough to affect the composition of the olivines phenocrysts. Host olivines in cumulate
layers will therefore keep Mg-rich compositions despite decreasing temperatures. The
chemical gradient between the increasingly Fe-rich olivine rim crystallizing within the
inclusions and the constant high-Mg composition of the host olivine will result in Fe-loss
from the inclusion to the host olivine. The small volume of melt inclusions is not sufficient to
affect the composition of the host but the composition of the melt inclusion is indeed strongly
affected. Melt inclusion re-equilibration consists in adding Fe to measured melt inclusion
compositions in order to reconstruct their composition at the time of melt inclusion
entrapment during host olivine crystallisation. The amount of Fe that has to be added to the
melt inclusions depends of the original Fe content of the primary melt (FeO*) from which the
host olivine crystallised. (Danyushevsky et al., 2000a, 2002b). In the present case, FeO* is an
unknown and increases with melting pressure. The temperature at which melt inclusions were
trapped (i.e. the crystallisation temperature of the host olivine) is the same as that of spinel
inclusion formation (i.e. the crystallization temperature of the host olivine). The issue of
guessing the right FeO* is addressed by re-equilibrating the melt inclusions for a range of
FeO* that covers the temperature range returned by the olivine-spinel thermometer (section
6.6.2). Figure 7.2.

7. Primary melt reconstruction and source modelling
135
Figure 7.2 - Melt inclusion re-equilibration (Danyushevsky et al., 2000a, 2002b) for different Fe contents of the primary melt
(FeO* wt%). Spinel-olivine temperatures (Figure 6.11) used as framework for melt inclusion FeO* estimation. A) Deccan
Traps (Thakurvadi formation), B) Réunion Island (Piton de la Fournaise and Piton des Neiges for spinel-olivine thermometry
only)
Melt inclusion re-equilibration matches the olivine-spinel thermometer for FeO* = 9 – 12wt%
for the Deccan Traps (Thakurvadi formation) samples and FeO* = 9.5 – 12wt% for the
Réunion Island (PdF) samples. Although no melt inclusions were analysed in RU11 from
PdN, Figure 7.2b shows that FeO* = 9.5 – 12wt% also matches the trend of PdN olivine-
spinel temperatures.
7.1.2. Melt inclusion back-fractionation The re-equilibrated melt inclusions (section 7.1.1) have the composition of the magma
surrounding the crystallizing olivines within which they are hosted. In order to access the
composition of the primary melt – that of the magma before crystallisation of olivine, which
is the first silicate mineral to crystallize in mantle-derived melts at pressure < 10kbars (Green
& Ringwood, 1967) – olivine must be added to the composition of the re-equilibrated melt
inclusions until equilibrium with Fo contents equal to that of the initial mantle source of the
primary melt (Herzberg & O'Hara, 2002). This process is called back-fractionation or reverse-
crystallisation. Figure 7.3.

7. Primary melt reconstruction and source modelling
136
Figure 7.3 - Back-fractionation paths of re-equilibrated melt inclusions (grey arrows) to mantle Fo values (Fomax) for different
FeO* (wt%) of primary melts. Spinel-olivine temperature data (Figure 6.11). A) Deccan Traps (Thakurvadi formation)
samples. The inset shows bulk-rock (Figure 5.4) melt-liquidus associations and the pressure (kbars) required for the melt
inclusion crystallisation paths to match the bulk-rock melt-liquidus associations. B) Réunion Island (Piton de la Fournaise
and Piton des Neiges for spinel-olivine thermometry only) samples. The inset shows melt-liquidus associations of glasses
(Famin et al., 2009, Villemant et al., 2009, Salaün et al., 2010) and the pressure (kbars) required for them to be matched by
the melt inclusion crystallisation paths. Background: compilation of melt-liquidus associations of MORB glasses from
GEOROC.
The back-fractionation paths of Figure 7.3 match the spinel-olivine data because the FeO*
used in the re-equilibration stage (section 7.1.1) was chosen accordingly. These paths are
further validated with bulk-rock compositions (Deccan Traps, Figure 7.3a) and volcanic
glasses (Réunion Island, Figure 7.3b) compositions: the melt-liquidus associations of volcanic
glasses and bulk-rock compositions (with low loss on ignition) return pressures, temperatures
and equilibrium olivine Fo contents that must be matched by fractionation (or crystallisation)
of the re-equilibrated melt inclusions at the same pressure (upper crustal magma chamber). In
other words, all potential products of the back-fractionated melt inclusions (or primary melts)
must be explained by the crystallisation paths of the latter.
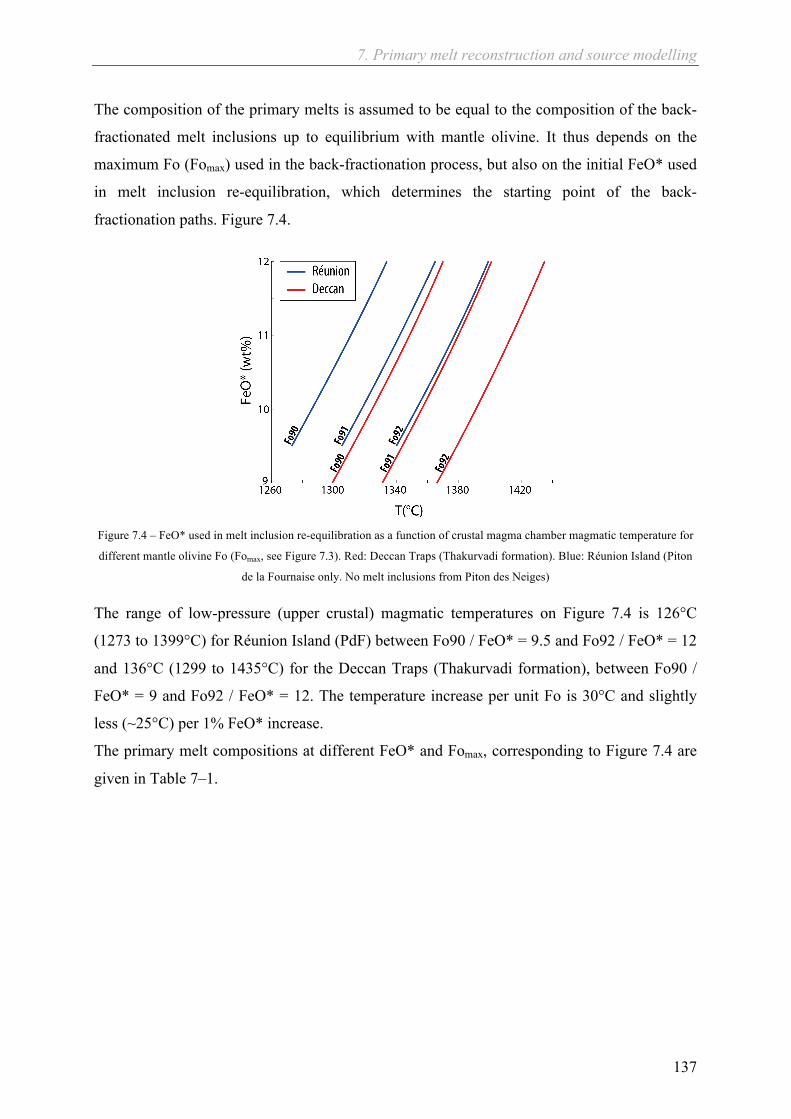
7. Primary melt reconstruction and source modelling
137
The composition of the primary melts is assumed to be equal to the composition of the back-
fractionated melt inclusions up to equilibrium with mantle olivine. It thus depends on the
maximum Fo (Fomax) used in the back-fractionation process, but also on the initial FeO* used
in melt inclusion re-equilibration, which determines the starting point of the back-
fractionation paths. Figure 7.4.
Figure 7.4 – FeO* used in melt inclusion re-equilibration as a function of crustal magma chamber magmatic temperature for
different mantle olivine Fo (Fomax, see Figure 7.3). Red: Deccan Traps (Thakurvadi formation). Blue: Réunion Island (Piton
de la Fournaise only. No melt inclusions from Piton des Neiges)
The range of low-pressure (upper crustal) magmatic temperatures on Figure 7.4 is 126°C
(1273 to 1399°C) for Réunion Island (PdF) between Fo90 / FeO* = 9.5 and Fo92 / FeO* = 12
and 136°C (1299 to 1435°C) for the Deccan Traps (Thakurvadi formation), between Fo90 /
FeO* = 9 and Fo92 / FeO* = 12. The temperature increase per unit Fo is 30°C and slightly
less (~25°C) per 1% FeO* increase.
The primary melt compositions at different FeO* and Fomax, corresponding to Figure 7.4 are
given in Table 7–1.
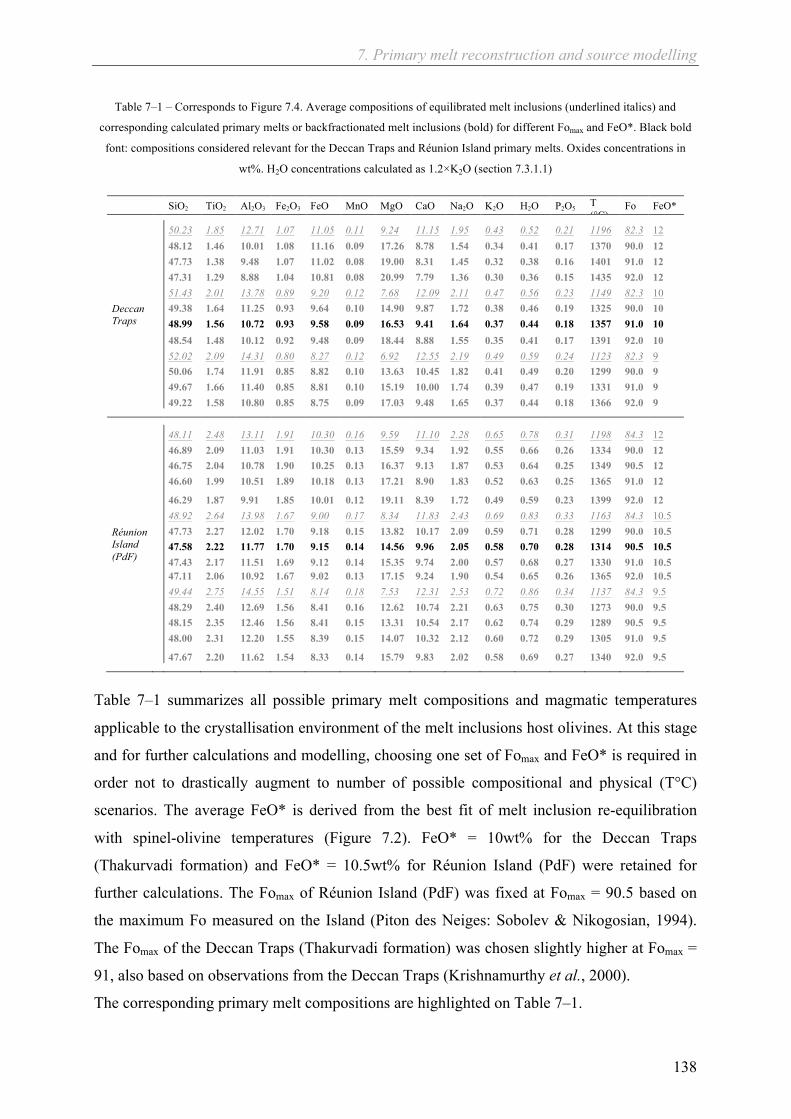
7. Primary melt reconstruction and source modelling
138
Table 7–1 – Corresponds to Figure 7.4. Average compositions of equilibrated melt inclusions (underlined italics) and
corresponding calculated primary melts or backfractionated melt inclusions (bold) for different Fomax and FeO*. Black bold
font: compositions considered relevant for the Deccan Traps and Réunion Island primary melts. Oxides concentrations in
wt%. H2O concentrations calculated as 1.2×K2O (section 7.3.1.1)
SiO2 TiO2 Al2O3 Fe2O3 FeO MnO MgO CaO Na2O K2O H2O P2O5 T (°C)
Fo FeO*
Deccan Traps
50.23 1.85 12.71 1.07 11.05 0.11 9.24 11.15 1.95 0.43 0.52 0.21 1196 82.3 12 48.12 1.46 10.01 1.08 11.16 0.09 17.26 8.78 1.54 0.34 0.41 0.17 1370 90.0 12 47.73 1.38 9.48 1.07 11.02 0.08 19.00 8.31 1.45 0.32 0.38 0.16 1401 91.0 12 47.31 1.29 8.88 1.04 10.81 0.08 20.99 7.79 1.36 0.30 0.36 0.15 1435 92.0 12 51.43 2.01 13.78 0.89 9.20 0.12 7.68 12.09 2.11 0.47 0.56 0.23 1149 82.3 10 49.38 1.64 11.25 0.93 9.64 0.10 14.90 9.87 1.72 0.38 0.46 0.19 1325 90.0 10 48.99 1.56 10.72 0.93 9.58 0.09 16.53 9.41 1.64 0.37 0.44 0.18 1357 91.0 10 48.54 1.48 10.12 0.92 9.48 0.09 18.44 8.88 1.55 0.35 0.41 0.17 1391 92.0 10 52.02 2.09 14.31 0.80 8.27 0.12 6.92 12.55 2.19 0.49 0.59 0.24 1123 82.3 9 50.06 1.74 11.91 0.85 8.82 0.10 13.63 10.45 1.82 0.41 0.49 0.20 1299 90.0 9 49.67 1.66 11.40 0.85 8.81 0.10 15.19 10.00 1.74 0.39 0.47 0.19 1331 91.0 9 49.22 1.58 10.80 0.85 8.75 0.09 17.03 9.48 1.65 0.37 0.44 0.18 1366 92.0 9
Réunion Island (PdF)
48.11 2.48 13.11 1.91 10.30 0.16 9.59 11.10 2.28 0.65 0.78 0.31 1198 84.3 12 46.89 2.09 11.03 1.91 10.30 0.13 15.59 9.34 1.92 0.55 0.66 0.26 1334 90.0 12 46.75 2.04 10.78 1.90 10.25 0.13 16.37 9.13 1.87 0.53 0.64 0.25 1349 90.5 12 46.60 1.99 10.51 1.89 10.18 0.13 17.21 8.90 1.83 0.52 0.63 0.25 1365 91.0 12 46.29 1.87 9.91 1.85 10.01 0.12 19.11 8.39 1.72 0.49 0.59 0.23 1399 92.0 12 48.92 2.64 13.98 1.67 9.00 0.17 8.34 11.83 2.43 0.69 0.83 0.33 1163 84.3 10.5 47.73 2.27 12.02 1.70 9.18 0.15 13.82 10.17 2.09 0.59 0.71 0.28 1299 90.0 10.5 47.58 2.22 11.77 1.70 9.15 0.14 14.56 9.96 2.05 0.58 0.70 0.28 1314 90.5 10.5 47.43 2.17 11.51 1.69 9.12 0.14 15.35 9.74 2.00 0.57 0.68 0.27 1330 91.0 10.5 47.11 2.06 10.92 1.67 9.02 0.13 17.15 9.24 1.90 0.54 0.65 0.26 1365 92.0 10.5 49.44 2.75 14.55 1.51 8.14 0.18 7.53 12.31 2.53 0.72 0.86 0.34 1137 84.3 9.5 48.29 2.40 12.69 1.56 8.41 0.16 12.62 10.74 2.21 0.63 0.75 0.30 1273 90.0 9.5 48.15 2.35 12.46 1.56 8.41 0.15 13.31 10.54 2.17 0.62 0.74 0.29 1289 90.5 9.5 48.00 2.31 12.20 1.55 8.39 0.15 14.07 10.32 2.12 0.60 0.72 0.29 1305 91.0 9.5 47.67 2.20 11.62 1.54 8.33 0.14 15.79 9.83 2.02 0.58 0.69 0.27 1340 92.0 9.5
Table 7–1 summarizes all possible primary melt compositions and magmatic temperatures
applicable to the crystallisation environment of the melt inclusions host olivines. At this stage
and for further calculations and modelling, choosing one set of Fomax and FeO* is required in
order not to drastically augment to number of possible compositional and physical (T°C)
scenarios. The average FeO* is derived from the best fit of melt inclusion re-equilibration
with spinel-olivine temperatures (Figure 7.2). FeO* = 10wt% for the Deccan Traps
(Thakurvadi formation) and FeO* = 10.5wt% for Réunion Island (PdF) were retained for
further calculations. The Fomax of Réunion Island (PdF) was fixed at Fomax = 90.5 based on
the maximum Fo measured on the Island (Piton des Neiges: Sobolev & Nikogosian, 1994).
The Fomax of the Deccan Traps (Thakurvadi formation) was chosen slightly higher at Fomax =
91, also based on observations from the Deccan Traps (Krishnamurthy et al., 2000).
The corresponding primary melt compositions are highlighted on Table 7–1.

7. Primary melt reconstruction and source modelling
139
7.1.3. Trace element composition of primary melts
Melt inclusion trace element concentrations are not accessible to EPMA and were not
measured during this project. However, the use of proxies for trace element behaviour during
melt inclusion back-fractionation helps circumvent this limitation. TiO2 and Al2O3 were
assumed to behave in a similar way to trace elements and have been used to calculate the
trace element concentrations of primary melts from the bulk-rock compositions of the samples
analysed for olivines and melt inclusions (Table 6–1). The concentration of a trace element x
in the primary melt (PM) is assumed to be related to its concentration in the bulk-rock (BR) in
the following way:
! !" = ! !"×!"#! !"!"#! !"
(7.1)
or: ! !" = ! !"×
!"!!! !"!"!!! !"
(7.2)
!"#! !"!"#! !"
and !"!!! !"!"!!! !"
used for the estimation of primary melt trace element concentrations for
the Deccan Traps and Réunion Island are given in Table 7–2 below.
Table 7–2 – Primary melt (Table 7–1)-to-bulk rock (Table 6–1) Al2O3 and TiO2 ratios. Samples from the Deccan Traps are
KD04 and KD06 and those from Réunion Island are TI 1602, GB1961, SR1977 and 0502-263
!"!!! !"
!"!!! !"
!"#! !"
!"#! !"
KD06 0.93 0.89
KD04 0.94 0.91
TI1602 1.65 1.73
GB1961 1.41 1.69
SR1977 1.39 1.50
0502-263 1.47 1.49
The trace element concentrations in the primary melt of Réunion Island (PdF) have been
calculated using the same samples processed earlier for olivine-hosted melt inclusions
(section 6.5) and used for the reconstruction of primary melts major element concentrations
(Table 7–1): TI1602, GB1961, SR1977 and 0502-263. These samples are from Piton de la
Fournaise and contain average Fo84 olivines. Note that these are not the highest Fo olivines
reported at Réunion Island (Sobolev & Nikogosian, 1994). However their compositions
correspond to average olivine-rich basalt of Piton de la Fournaise (Albarède et al., 1997). In
7. Primary melt reconstruction and source modelling
140
addition, Réunion Island being emplaced onto an oceanic lithosphere, the trace element
patterns of these samples is unaffected by (continental) crustal assimilation (Figure 5.6).
On the other hand, crustal assimilation has long been recognized in the Deccan Traps,
especially for high-MgO lavas (Figure 2.5 and Figure 5.5) and both of the olivine-bearing
samples presented here (KD04 and KD06) are clearly affected by this process (Figure 6.1).
This feature of the Deccan Traps lavas, i.e. the most primitive lavas being on average the
most contaminated and vice versa, has been evoked in section 5. Several adaptations are
therefore required in order to avoid crustal assimilation effects in the reconstruction of the
trace element patterns of Deccan Traps primary melts.
Firstly, only a limited set of trace elements has been considered: Th, Nb, La, Ce, Nd, Sm, Gd,
Dy, Er and Yb. This set is deemed sufficient to account for incompatible trace element
variations due to low amounts of fractional melting as well as to preserve Heavy Rare-Earth
Elements (HREE) depletion (garnet signature), which is an important feature of both Réunion
Island and Deccan Traps lavas.
Secondly, the compositions of KD04 and KD06 cannot be used as is because of the crustal
assimilation they have undergone. Considering the difficulty of properly inferring about the
composition of the various crustal components involved in the crustal contamination of
Deccan Traps lavas (Peng et al., 1994, Chatterjee & Bhattacharji, 2008, Ray et al., 2008,
Bhattacharya et al., 2013), the quantification and correction of crustal assimilation effects in
high-MgO lavas was not carried out. Instead, it is assumed that the primary melts of Deccan
Traps lavas have had a constant composition throughout the emplacement of the Western
Ghats formations and that the trends in radiogenic isotope ratios are entirely due to the
variable assimilation of various crustal components (Figure 2.5), (e.g. Peng et al., 1994,
Chatterjee & Bhattacharji, 2008). Following this assumption, the trace element concentrations
of primary melts were calculated using the TiO2 and Al2O3 contents of backfractionated,
olivine-hosted melt inclusion as proxies (Table 7–2). This process is therefore similar to the
calculation of Réunion Island primary melts explained above. Nevertheless, the starting trace
element composition has to be less affected by crustal contamination than those of KD04 and
KD06. It was deemed reasonable to replace the trace element concentrations of KD04 and
KD06 by that of the least contaminated (e.g. highest Nb/Lan, lowest Th/Nbn) sample with an
MgO content close-enough to the olivine stability field (MgO > 7wt%, Figure 5.4) so as to
restrict magmatic fractionation effects. Among the bulk-rock dataset presented in section 5,
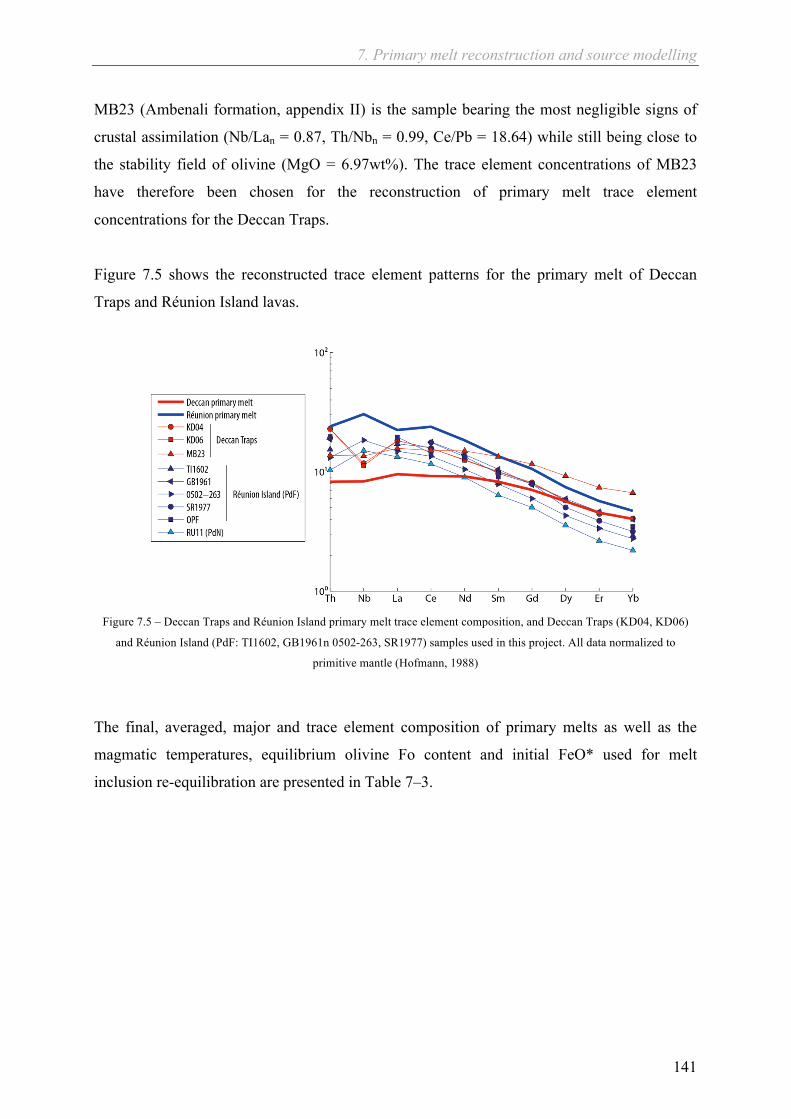
7. Primary melt reconstruction and source modelling
141
MB23 (Ambenali formation, appendix II) is the sample bearing the most negligible signs of
crustal assimilation (Nb/Lan = 0.87, Th/Nbn = 0.99, Ce/Pb = 18.64) while still being close to
the stability field of olivine (MgO = 6.97wt%). The trace element concentrations of MB23
have therefore been chosen for the reconstruction of primary melt trace element
concentrations for the Deccan Traps.
Figure 7.5 shows the reconstructed trace element patterns for the primary melt of Deccan
Traps and Réunion Island lavas.
Figure 7.5 – Deccan Traps and Réunion Island primary melt trace element composition, and Deccan Traps (KD04, KD06)
and Réunion Island (PdF: TI1602, GB1961n 0502-263, SR1977) samples used in this project. All data normalized to
primitive mantle (Hofmann, 1988)
The final, averaged, major and trace element composition of primary melts as well as the
magmatic temperatures, equilibrium olivine Fo content and initial FeO* used for melt
inclusion re-equilibration are presented in Table 7–3.
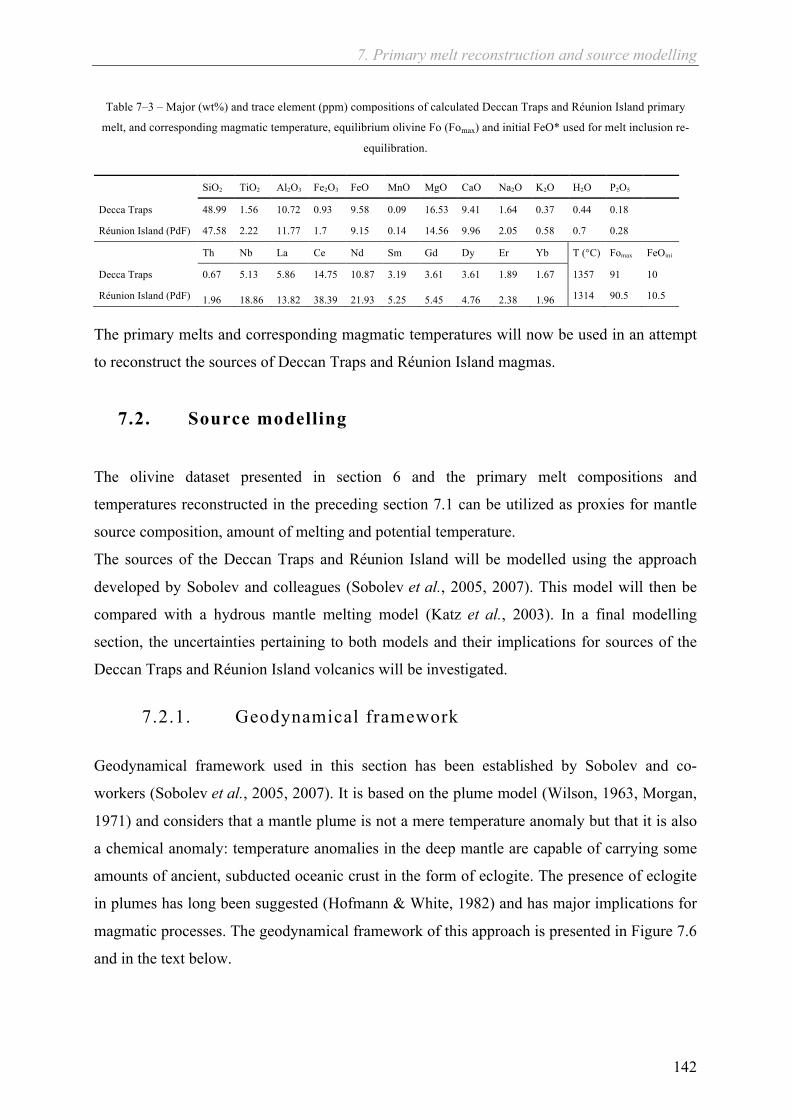
7. Primary melt reconstruction and source modelling
142
Table 7–3 – Major (wt%) and trace element (ppm) compositions of calculated Deccan Traps and Réunion Island primary
melt, and corresponding magmatic temperature, equilibrium olivine Fo (Fomax) and initial FeO* used for melt inclusion re-
equilibration.
SiO2 TiO2 Al2O3 Fe2O3 FeO MnO MgO CaO Na2O K2O H2O P2O5
Decca Traps 48.99 1.56 10.72 0.93 9.58 0.09 16.53 9.41 1.64 0.37 0.44 0.18
Réunion Island (PdF) 47.58 2.22 11.77 1.7 9.15 0.14 14.56 9.96 2.05 0.58 0.7 0.28
Th Nb La Ce Nd Sm Gd Dy Er Yb T (°C) Fomax FeOini
Decca Traps 0.67 5.13 5.86 14.75 10.87 3.19 3.61 3.61 1.89 1.67 1357 91 10
Réunion Island (PdF) 1.96 18.86 13.82 38.39 21.93 5.25 5.45 4.76 2.38 1.96 1314 90.5 10.5
The primary melts and corresponding magmatic temperatures will now be used in an attempt
to reconstruct the sources of Deccan Traps and Réunion Island magmas.
7.2. Source modelling
The olivine dataset presented in section 6 and the primary melt compositions and
temperatures reconstructed in the preceding section 7.1 can be utilized as proxies for mantle
source composition, amount of melting and potential temperature.
The sources of the Deccan Traps and Réunion Island will be modelled using the approach
developed by Sobolev and colleagues (Sobolev et al., 2005, 2007). This model will then be
compared with a hydrous mantle melting model (Katz et al., 2003). In a final modelling
section, the uncertainties pertaining to both models and their implications for sources of the
Deccan Traps and Réunion Island volcanics will be investigated.
7.2.1. Geodynamical framework
Geodynamical framework used in this section has been established by Sobolev and co-
workers (Sobolev et al., 2005, 2007). It is based on the plume model (Wilson, 1963, Morgan,
1971) and considers that a mantle plume is not a mere temperature anomaly but that it is also
a chemical anomaly: temperature anomalies in the deep mantle are capable of carrying some
amounts of ancient, subducted oceanic crust in the form of eclogite. The presence of eclogite
in plumes has long been suggested (Hofmann & White, 1982) and has major implications for
magmatic processes. The geodynamical framework of this approach is presented in Figure 7.6
and in the text below.
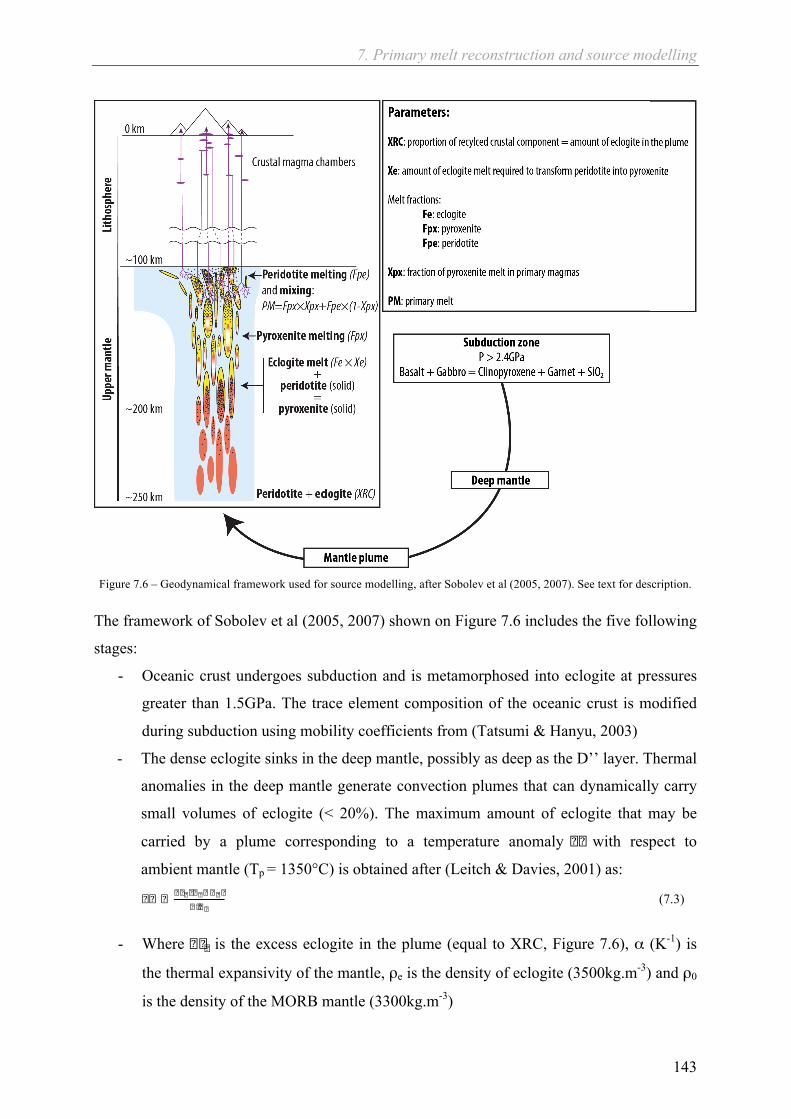
7. Primary melt reconstruction and source modelling
143
Figure 7.6 – Geodynamical framework used for source modelling, after Sobolev et al (2005, 2007). See text for description.
The framework of Sobolev et al (2005, 2007) shown on Figure 7.6 includes the five following
stages:
- Oceanic crust undergoes subduction and is metamorphosed into eclogite at pressures
greater than 1.5GPa. The trace element composition of the oceanic crust is modified
during subduction using mobility coefficients from (Tatsumi & Hanyu, 2003)
- The dense eclogite sinks in the deep mantle, possibly as deep as the D’’ layer. Thermal
anomalies in the deep mantle generate convection plumes that can dynamically carry
small volumes of eclogite (< 20%). The maximum amount of eclogite that may be
carried by a plume corresponding to a temperature anomaly � � with respect to
ambient mantle (Tp = 1350°C) is obtained after (Leitch & Davies, 2001) as:
� � � � � � � � � � � � �� � � �
(7.3)
- Where � � � is the excess eclogite in the plume (equal to XRC, Figure 7.6), α (K-1) is
the thermal expansivity of the mantle, ρe is the density of eclogite (3500kg.m-3) and ρ0
is the density of the MORB mantle (3300kg.m-3)

7. Primary melt reconstruction and source modelling
144
- Eclogite has a lower solidus than peridotite and thus starts melting at deeper depths
than peridotite (~180km) and melt by 40 to 60% (Fe, Figure 7.6) so that only a dense
eclogite refractory restite remains and probably delaminates. (Yasuda et al., 1994,
Yaxley, 2000, and references therein). The eclogite high-Si melt reacts with the
olivine of the surrounding peridotite to produce secondary pyroxenite until all the
olivine is exhausted (Rapp et al., 1999, Sobolev et al., 2005). The weight fraction of
reacting eclogite melt Xe (Figure 7.6) is considered equal to the olivine mode in the
peridotite (Sobolev et al., 2005). The mineral modes in the pyroxenite are calculated
as a function of Xe (Table 7–5)
- The secondary pyroxenite also has a lower solidus than peridotite (yet higher that
eclogite: Yaxley, 2000, and references therein) and starts melting deeper than
peridotite. It also melts by 40 to 60% (Fpx, Figure 7.6). (Yaxley & Green, 1998,
Sobolev et al., 2007, 2011)
- Both Fe and Fpx are therefore buffered within 40-60%. As explained, the lower bound
of this range is due to low solidi compared with peridotite. The upper bound is the
result of melting-induced exhaustion causing the eclogite and pyroxenite to become
refractory beyond 60% melting (Na exhaustion: Kogiso & Hirschmann, 2006)
- Finally, the proportion of pyroxenite-derived melt that mix with peridotite-derived
melts (Fpe, Figure 7.6) is given by Xpx (Figure 7.6), which is measured in volcanic
olivine phenocrysts (Figure 6.5). This mixture of pyroxenite- and peridotite-derived
melt forms the primary melt that will travel to the surface and undergo fractionation
and contamination within the crust. The olivine phenocrysts analysed for Ni excess
and Mn deficiency in order to characterize the pyroxenitic component Xpx have
crystallized at shallow depth in crustal magma chambers (Marsh, 2007) and must
therefore be chosen among the highest forsterite contents in order to exclude the
chemical effects of fractionation and contamination
- The amount of recycled oceanic crust in the form of eclogite in the plume (XRC) can
be calculated from the melt fractions of eclogite (Fe), pyroxenite (Fpx) and peridotite
(Fpe), the fraction of reacting eclogite melt Xe and the pyroxenitic component Xpx as:
!"# = !"
!!!!"(!!!"#)!"# !!"
!!!!!!!!!!!
(7.4)
And the proportions of each lithology in the plume head are obtained from:
!! = !"# 1 − !! (7.5)

7. Primary melt reconstruction and source modelling
145
!!" =!"# !!!!
(7.6)
!!" = 1 − !! − !!" (7.7)
- The total amount of melting of the hybrid source (pyroxenite + peridotite) is:
!"# !"#$% = !!"!!"
!!"!!!"!!!+ !!"
!!"!!"!!!"!!!
(7.8)
7.2.2. Geochemical modelling
7.2.2.1. Model parameterization
The first modelling approach used in this project consists in calculating the evolution of trace
element concentrations through the five stages of mantle convection and magma production
described above (section 7.2.1) so that the final primary melt modelled matches the primary
melt composition reconstructed from melt inclusion back-fractionation (sections 7.1.2 and
7.1.3).
Mantle and oceanic crust composition
The compositions of the major lithologies upon which this model is based are given in Table
7–4. Table 7–4 – Compositions of the starting lithologies of the trace element model. PM: Primitive Mantle from Hofmann
(1988), DMM: Depleted MORB Mantle from Workman and Hart (2005), OC: average Oceanic Crust from White and Klein
(2014). The oceanic crust (OC) is modified during subduction by fluid circulation. This process is implemented here by
applying Mobility coefficients (Tatsumi & Hanyu, 2003) to the original oceanic crust composition (OC) thereby creating
Eclogite
PM DMM OC Mobility Eclogite
Th 0.08 0.01 0.21 0.38 0.13
Nb 0.62 0.15 2.77 0.04 2.67
La 0.61 0.19 2.13 0.56 0.94
Ce 1.60 0.55 5.81 0.51 2.86
Nd 1.19 0.58 4.90 0.31 3.39
Sm 0.39 0.24 1.70 0.14 1.47
Gd 0.51 0.36 2.25 0.06 2.12
Dy 0.64 0.51 2.84 0.04 2.74
Er 0.42 0.35 1.85 0.01 1.84
Yb 0.41 0.37 1.85 0.01 1.82
Subduction

7. Primary melt reconstruction and source modelling
146
The peridotite composition is considered to be equivalent to 80% PM and 20% DMM
throughout the model (White & McKenzie, 1995). The initial composition of the peridotite
that is metamorphosed by eclogite melts and the composition of the peridotite that melts with
the pyroxenite are assumed to be equal.
The trace element mobility coefficients of Tatsumi et al (2003) are used to simulate the
compositional changes affecting the oceanic crust during subduction. It is possible that trace
element mobility during subduction only concerns secondary altered minerals. In this case,
the final composition of the processed altered crust could be equal to its original composition
before alteration.
Rock and melt modes for eclogite, pyroxenite and peridotite The rock and melting modes of the lithologies that will undergo melting (i.e. eclogite,
pyroxenite and peridotite) are given in Table 7–5.
Table 7–5 – Modes of the peridotite (Walter, 1998, Donnelly et al., 2004), eclogite and pyroxenite (Sobolev et al., 2005)
used in the trace element model. m: rock modes, p melting modes for non-modal melting, (see text below), f: coefficients
used to calculate the mineral modes of the pyroxenite from those of the original peridotite before metasomatism by eclogite
melt:
!!"!"#$#%& = !!"
!"#$#%& − !" and is therefore equal to zero
!!"!"# = !!"
!"# + !!"#.!" where !!"# ∈ −!.! ; −!.!
!!"!"# = !!"
!"# + !!"#.!" where !!"# ∈ !.!";!
!!"!"# = !!"
!"# + !!"#.!" where !!"# ∈ !.!";!.!"
!!"! and !!"
! are the modes of mineral i in the peridotite and pyroxenite respectively.
Opx: orthopyroxene, Cpx: clinopyroxene, Grt: garnet
Peridotite m p Eclogite m p Pyroxenite m f p
Ol 0.57 0.08 Coesite 0.1 0.2 Opx 0.064 -0.1 0.1
Opx 0.14 0.14 Opx 0 0 Cpx 0.83 1 0.75
Cpx 0.27 0.53 Cpx 0.55 0.5 Grt 0.106 0.1 0.15
Grt 0.02 0.25 Grt 0.35 0.3
Sp 0 0 Sp 0 0
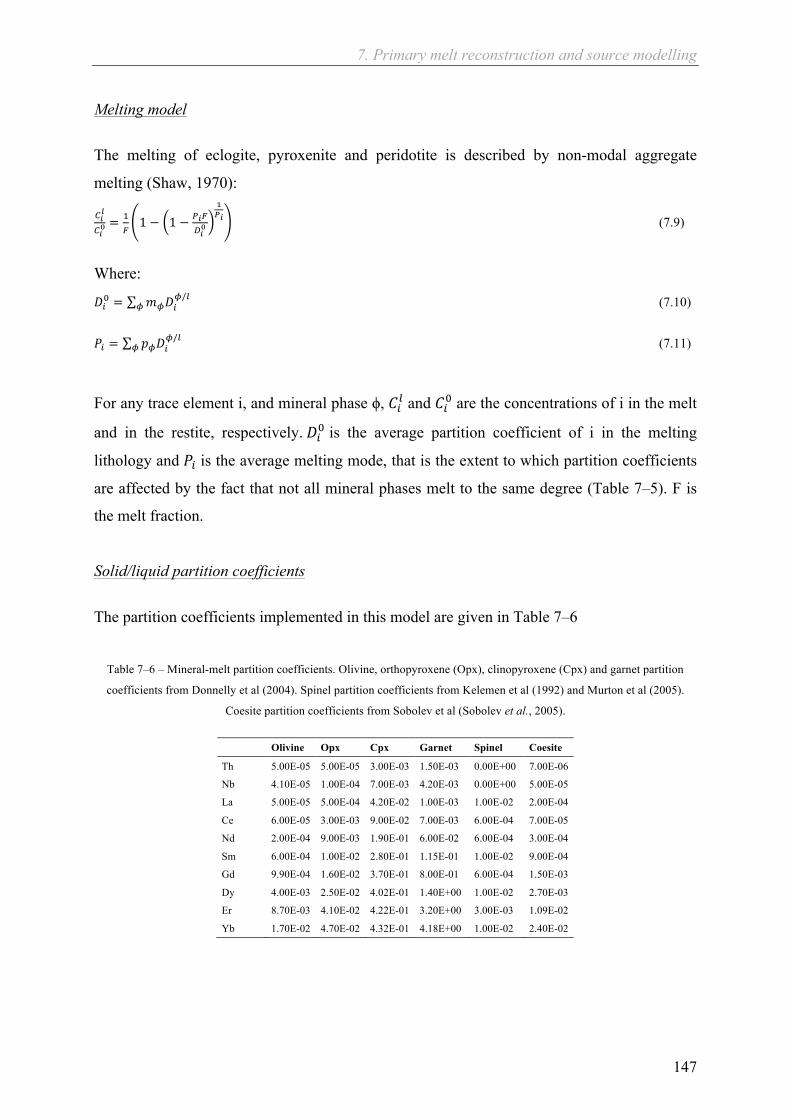
7. Primary melt reconstruction and source modelling
147
Melting model
The melting of eclogite, pyroxenite and peridotite is described by non-modal aggregate
melting (Shaw, 1970):
!!!
!!! =
!!1 − 1 − !!!
!!!
!!! (7.9)
Where:
!!! = !!!!!/!
! (7.10)
!! = !!!!!/!
! (7.11)
For any trace element i, and mineral phase ϕ, !!! and !!! are the concentrations of i in the melt
and in the restite, respectively. !!! is the average partition coefficient of i in the melting
lithology and !! is the average melting mode, that is the extent to which partition coefficients
are affected by the fact that not all mineral phases melt to the same degree (Table 7–5). F is
the melt fraction.
Solid/liquid partition coefficients
The partition coefficients implemented in this model are given in Table 7–6
Table 7–6 – Mineral-melt partition coefficients. Olivine, orthopyroxene (Opx), clinopyroxene (Cpx) and garnet partition
coefficients from Donnelly et al (2004). Spinel partition coefficients from Kelemen et al (1992) and Murton et al (2005).
Coesite partition coefficients from Sobolev et al (Sobolev et al., 2005).
Olivine Opx Cpx Garnet Spinel Coesite
Th 5.00E-05 5.00E-05 3.00E-03 1.50E-03 0.00E+00 7.00E-06
Nb 4.10E-05 1.00E-04 7.00E-03 4.20E-03 0.00E+00 5.00E-05
La 5.00E-05 5.00E-04 4.20E-02 1.00E-03 1.00E-02 2.00E-04
Ce 6.00E-05 3.00E-03 9.00E-02 7.00E-03 6.00E-04 7.00E-05
Nd 2.00E-04 9.00E-03 1.90E-01 6.00E-02 6.00E-04 3.00E-04
Sm 6.00E-04 1.00E-02 2.80E-01 1.15E-01 1.00E-02 9.00E-04
Gd 9.90E-04 1.60E-02 3.70E-01 8.00E-01 6.00E-04 1.50E-03
Dy 4.00E-03 2.50E-02 4.02E-01 1.40E+00 1.00E-02 2.70E-03
Er 8.70E-03 4.10E-02 4.22E-01 3.20E+00 3.00E-03 1.09E-02
Yb 1.70E-02 4.70E-02 4.32E-01 4.18E+00 1.00E-02 2.40E-02
7. Primary melt reconstruction and source modelling
148
Potential temperature
Finally, the source potential temperature is calculated from the total amount of melting of the
hybrid source (Equation 7.8) as in (Herzberg et al., 2007):
!! = !"# !"#$% ∆!×!!!
− ! (7.12)
Where ∆S is the entropy difference between solid and liquid (300 J kg-1 K-1), CP is the
specific heat at constant pressure (1200 J kg-1 K-1), T (°K) is the magmatic temperature
obtained from spinel-olivine and melt inclusion thermometry (sections 7.1.1 and 6.6.2)
recalculated at the pressure of the source after (Ford et al., 1983) as ! = !!"#$%&/!"#$%&!'" +
49!!"#. Finally, P is the postulated source pressure (P (GPa) = depth (km) / 33). (Katz et al.,
2003).
It is therefore critical to estimate pressure appropriately in order to calculate realistic potential
temperatures (Tp).
The depth at which primary magmas will be released from their source is thought to be that of
the lithosphere-asthenosphere boundary. This depth may be increased by about 10km due to
the existence of a plume-head freezing zone (Watson & McKenzie, 1991).
The depth of the lithosphere-asthenosphere boundary beneath India both today and at the K-
Pg boundary is a matter of debate (section 2.4). Based on section 2.4 and Figure 5.5 as well as
on the stratigraphy of the Deccan Traps (section 2.3), the depth of the lithosphere
asthenosphere boundary during the emplacement of the Thakurvadi formation (fourth lowest
formation of the Deccan Traps) is estimated to have been in the order of 140km. The depth of
the Thakurvadi formation sources is thereafter considered to be in the order of 150km,
including the plume-head freezing zone (Sobolev et al., 2005). The pressure corresponding to
this depth is 4.5GPa and will be used to calculate potential temperatures in later sections.
Réunion Island is located on early-Palaeogene lithosphere (Duncan, 1990, Fretzdorff &
Haase, 2002) that is 110 to 120km-thick (Ellam, 1992). The pressure of primary magma
generation at Réunion Island is estimated at 3.5GPa.
7.2.2.2. Geochemical modelling results
The geochemical model was implemented as a simple Excel spreadsheet, which is available
from the PhD candidate.
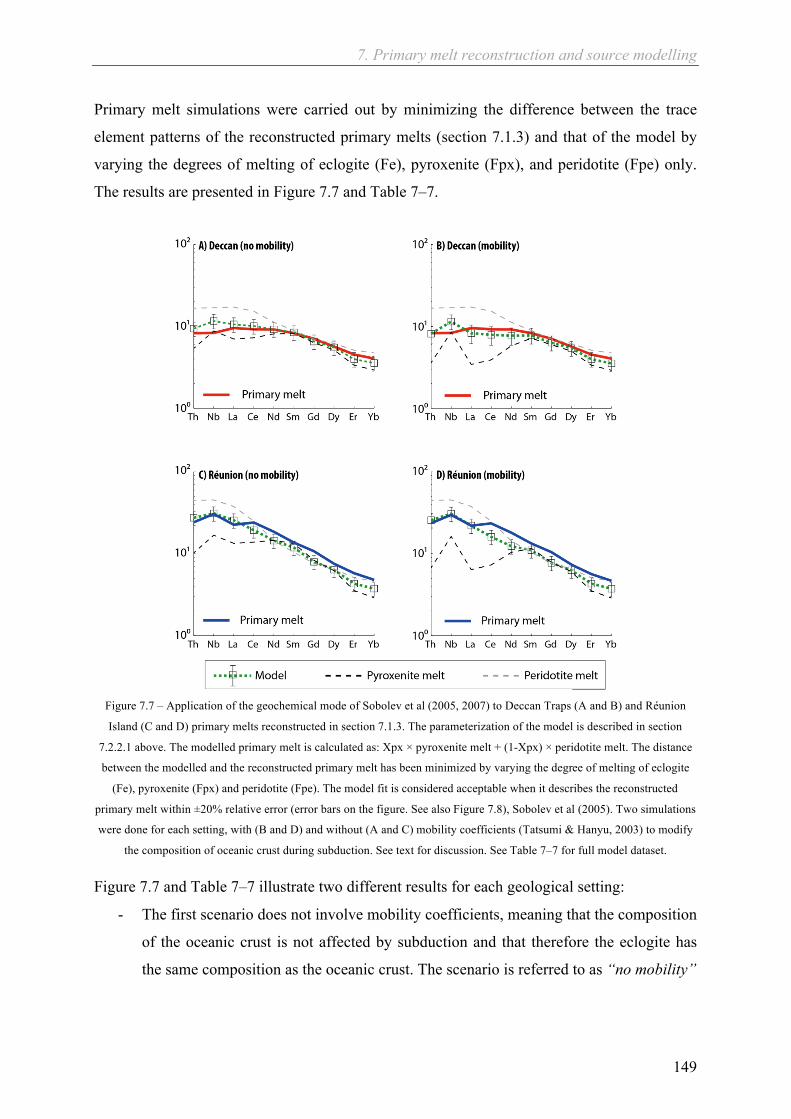
7. Primary melt reconstruction and source modelling
149
Primary melt simulations were carried out by minimizing the difference between the trace
element patterns of the reconstructed primary melts (section 7.1.3) and that of the model by
varying the degrees of melting of eclogite (Fe), pyroxenite (Fpx), and peridotite (Fpe) only.
The results are presented in Figure 7.7 and Table 7–7.
Figure 7.7 – Application of the geochemical mode of Sobolev et al (2005, 2007) to Deccan Traps (A and B) and Réunion
Island (C and D) primary melts reconstructed in section 7.1.3. The parameterization of the model is described in section
7.2.2.1 above. The modelled primary melt is calculated as: Xpx × pyroxenite melt + (1-Xpx) × peridotite melt. The distance
between the modelled and the reconstructed primary melt has been minimized by varying the degree of melting of eclogite
(Fe), pyroxenite (Fpx) and peridotite (Fpe). The model fit is considered acceptable when it describes the reconstructed
primary melt within ±20% relative error (error bars on the figure. See also Figure 7.8), Sobolev et al (2005). Two simulations
were done for each setting, with (B and D) and without (A and C) mobility coefficients (Tatsumi & Hanyu, 2003) to modify
the composition of oceanic crust during subduction. See text for discussion. See Table 7–7 for full model dataset.
Figure 7.7 and Table 7–7 illustrate two different results for each geological setting:
- The first scenario does not involve mobility coefficients, meaning that the composition
of the oceanic crust is not affected by subduction and that therefore the eclogite has
the same composition as the oceanic crust. The scenario is referred to as “no mobility”

7. Primary melt reconstruction and source modelling
150
- The second scenario uses the mobility coefficients of Tatsumi and Hanyu (2003) in
order to simulate oceanic crust elemental loss upon fluid migration during subduction
As mentioned earlier, it is possible that the mobility of trace elements during subduction does
not affect the entire crust and is only limited to weathered mineral. It is therefore hypothesised
that the mobility and no mobility scenarios (Figure 7.7) can be considered as two
compositional end-members for the recycled component.
For either scenario, the minimum residuals are met for the same set of values of Fe, Fpx and
Fpe.
The mobility coefficients of Tatsumi and Hanyu (2003) have been used by Sobolev et al
(2005). Nevertheless, the reason for proposing a simulation without them is that these
coefficients are very poorly constrained (limited number of publications) and are likely to
vary from one setting to another. Furthermore, the large Nb anomaly in the eclogite and
pyroxenite induced by the low mobility of Nb compared to that of Th, La, Ce, Nd, and Sm
suggested by Tatsumi and Hanyu (2003) (0.04, Table 7–4) seems unrealistically large. It is
nonetheless interesting to note that positive Nb anomalies are a common feature of Ocean
Island Basalts (Sun & McDonough, 1989), which may carry small amounts of recycled crust
(Sobolev et al., 2007).
The relative errors of each scenario (with and without mobility coefficients) for both the
Deccan Traps and Réunion Islands are shown on Figure 7.8.
Figure 7.8 – Relative error between reconstructed and modelled primary melts – with and without the mobility coefficients of
Tatsumi and Hanyu (2003) – for the Deccan Traps and Réunion Island as in Figure 7.7. Acceptable error range of ±20% as in
Sobolev et al (Sobolev et al., 2005)
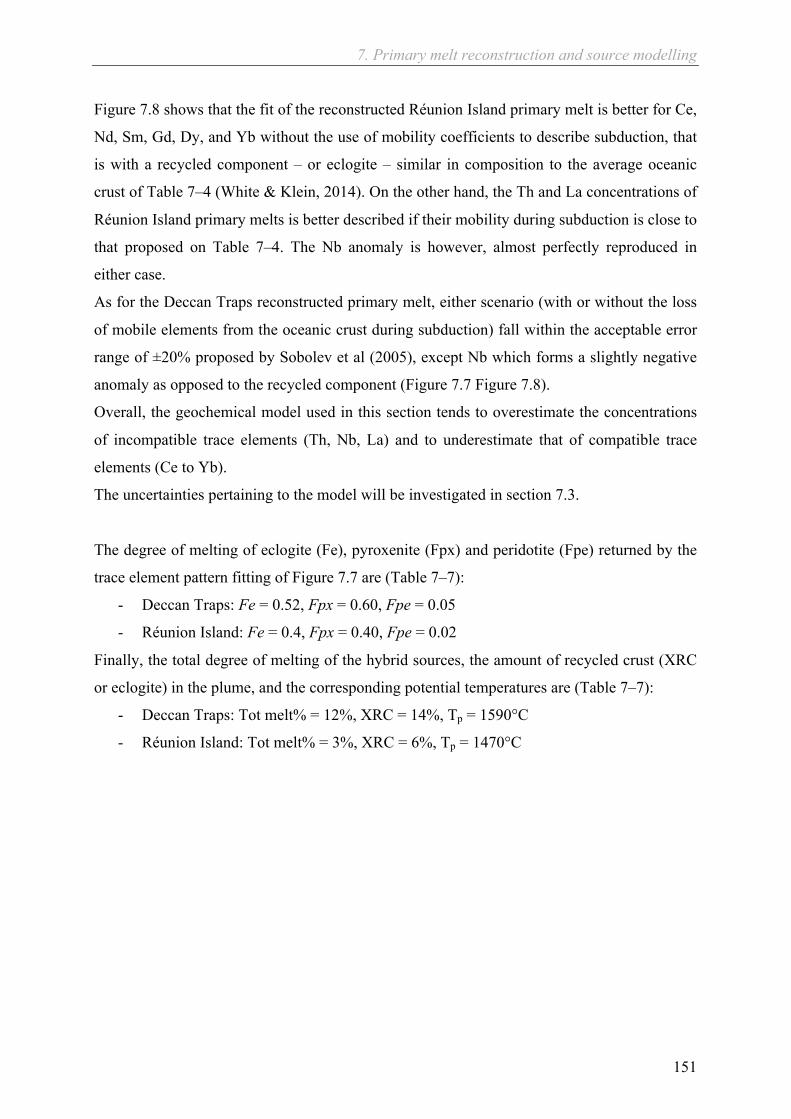
7. Primary melt reconstruction and source modelling
151
Figure 7.8 shows that the fit of the reconstructed Réunion Island primary melt is better for Ce,
Nd, Sm, Gd, Dy, and Yb without the use of mobility coefficients to describe subduction, that
is with a recycled component – or eclogite – similar in composition to the average oceanic
crust of Table 7–4 (White & Klein, 2014). On the other hand, the Th and La concentrations of
Réunion Island primary melts is better described if their mobility during subduction is close to
that proposed on Table 7–4. The Nb anomaly is however, almost perfectly reproduced in
either case.
As for the Deccan Traps reconstructed primary melt, either scenario (with or without the loss
of mobile elements from the oceanic crust during subduction) fall within the acceptable error
range of ±20% proposed by Sobolev et al (2005), except Nb which forms a slightly negative
anomaly as opposed to the recycled component (Figure 7.7 Figure 7.8).
Overall, the geochemical model used in this section tends to overestimate the concentrations
of incompatible trace elements (Th, Nb, La) and to underestimate that of compatible trace
elements (Ce to Yb).
The uncertainties pertaining to the model will be investigated in section 7.3.
The degree of melting of eclogite (Fe), pyroxenite (Fpx) and peridotite (Fpe) returned by the
trace element pattern fitting of Figure 7.7 are (Table 7–7):
- Deccan Traps: Fe = 0.52, Fpx = 0.60, Fpe = 0.05
- Réunion Island: Fe = 0.4, Fpx = 0.40, Fpe = 0.02
Finally, the total degree of melting of the hybrid sources, the amount of recycled crust (XRC
or eclogite) in the plume, and the corresponding potential temperatures are (Table 7–7):
- Deccan Traps: Tot melt% = 12%, XRC = 14%, Tp = 1590°C
- Réunion Island: Tot melt% = 3%, XRC = 6%, Tp = 1470°C
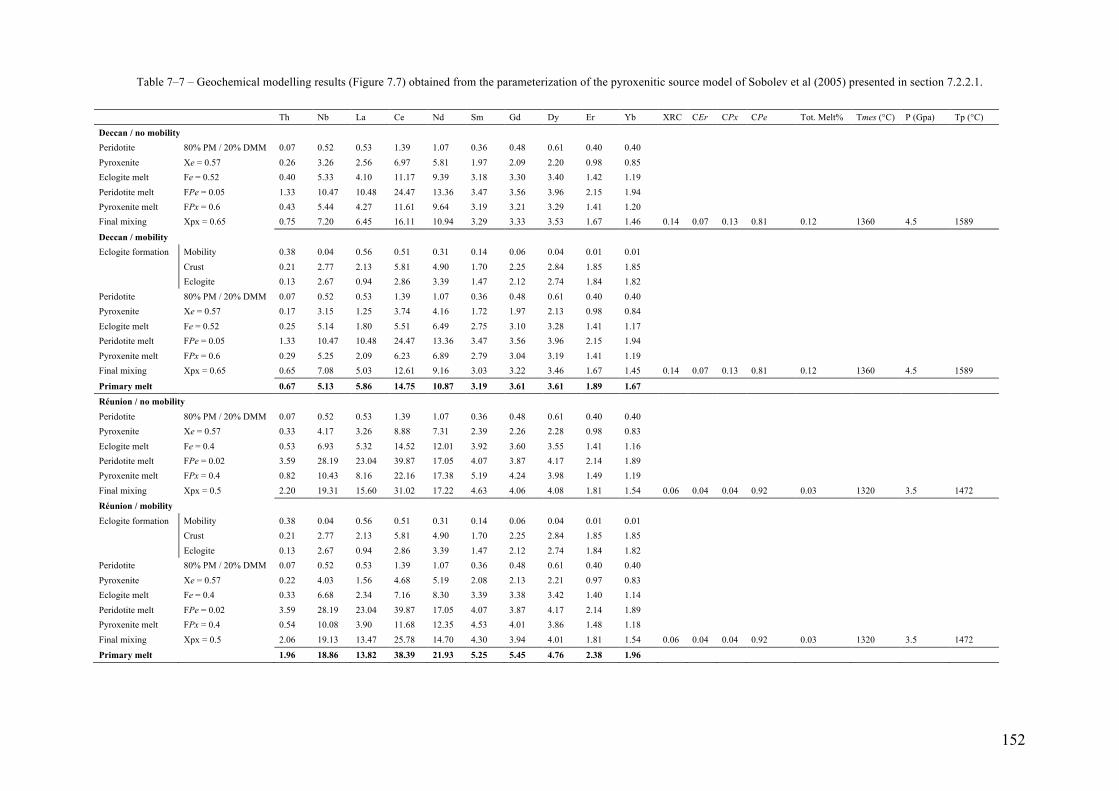
152
Table 7–7 – Geochemical modelling results (Figure 7.7) obtained from the parameterization of the pyroxenitic source model of Sobolev et al (2005) presented in section 7.2.2.1.
Th Nb La Ce Nd Sm Gd Dy Er Yb XRC CEr CPx CPe Tot. Melt% Tmes (°C) P (Gpa) Tp (°C)
Deccan / no mobility Peridotite 80% PM / 20% DMM 0.07 0.52 0.53 1.39 1.07 0.36 0.48 0.61 0.40 0.40 Pyroxenite Xe = 0.57 0.26 3.26 2.56 6.97 5.81 1.97 2.09 2.20 0.98 0.85 Eclogite melt Fe = 0.52 0.40 5.33 4.10 11.17 9.39 3.18 3.30 3.40 1.42 1.19 Peridotite melt FPe = 0.05 1.33 10.47 10.48 24.47 13.36 3.47 3.56 3.96 2.15 1.94 Pyroxenite melt FPx = 0.6 0.43 5.44 4.27 11.61 9.64 3.19 3.21 3.29 1.41 1.20 Final mixing Xpx = 0.65 0.75 7.20 6.45 16.11 10.94 3.29 3.33 3.53 1.67 1.46 0.14 0.07 0.13 0.81 0.12 1360 4.5 1589
Deccan / mobility Eclogite formation Mobility 0.38 0.04 0.56 0.51 0.31 0.14 0.06 0.04 0.01 0.01 Crust 0.21 2.77 2.13 5.81 4.90 1.70 2.25 2.84 1.85 1.85 Eclogite 0.13 2.67 0.94 2.86 3.39 1.47 2.12 2.74 1.84 1.82 Peridotite 80% PM / 20% DMM 0.07 0.52 0.53 1.39 1.07 0.36 0.48 0.61 0.40 0.40 Pyroxenite Xe = 0.57 0.17 3.15 1.25 3.74 4.16 1.72 1.97 2.13 0.98 0.84 Eclogite melt Fe = 0.52 0.25 5.14 1.80 5.51 6.49 2.75 3.10 3.28 1.41 1.17 Peridotite melt FPe = 0.05 1.33 10.47 10.48 24.47 13.36 3.47 3.56 3.96 2.15 1.94 Pyroxenite melt FPx = 0.6 0.29 5.25 2.09 6.23 6.89 2.79 3.04 3.19 1.41 1.19 Final mixing Xpx = 0.65 0.65 7.08 5.03 12.61 9.16 3.03 3.22 3.46 1.67 1.45 0.14 0.07 0.13 0.81 0.12 1360 4.5 1589
Primary melt 0.67 5.13 5.86 14.75 10.87 3.19 3.61 3.61 1.89 1.67
Réunion / no mobility Peridotite 80% PM / 20% DMM 0.07 0.52 0.53 1.39 1.07 0.36 0.48 0.61 0.40 0.40 Pyroxenite Xe = 0.57 0.33 4.17 3.26 8.88 7.31 2.39 2.26 2.28 0.98 0.83 Eclogite melt Fe = 0.4 0.53 6.93 5.32 14.52 12.01 3.92 3.60 3.55 1.41 1.16 Peridotite melt FPe = 0.02 3.59 28.19 23.04 39.87 17.05 4.07 3.87 4.17 2.14 1.89 Pyroxenite melt FPx = 0.4 0.82 10.43 8.16 22.16 17.38 5.19 4.24 3.98 1.49 1.19 Final mixing Xpx = 0.5 2.20 19.31 15.60 31.02 17.22 4.63 4.06 4.08 1.81 1.54 0.06 0.04 0.04 0.92 0.03 1320 3.5 1472
Réunion / mobility Eclogite formation Mobility 0.38 0.04 0.56 0.51 0.31 0.14 0.06 0.04 0.01 0.01 Crust 0.21 2.77 2.13 5.81 4.90 1.70 2.25 2.84 1.85 1.85 Eclogite 0.13 2.67 0.94 2.86 3.39 1.47 2.12 2.74 1.84 1.82 Peridotite 80% PM / 20% DMM 0.07 0.52 0.53 1.39 1.07 0.36 0.48 0.61 0.40 0.40 Pyroxenite Xe = 0.57 0.22 4.03 1.56 4.68 5.19 2.08 2.13 2.21 0.97 0.83 Eclogite melt Fe = 0.4 0.33 6.68 2.34 7.16 8.30 3.39 3.38 3.42 1.40 1.14 Peridotite melt FPe = 0.02 3.59 28.19 23.04 39.87 17.05 4.07 3.87 4.17 2.14 1.89 Pyroxenite melt FPx = 0.4 0.54 10.08 3.90 11.68 12.35 4.53 4.01 3.86 1.48 1.18 Final mixing Xpx = 0.5 2.06 19.13 13.47 25.78 14.70 4.30 3.94 4.01 1.81 1.54 0.06 0.04 0.04 0.92 0.03 1320 3.5 1472
Primary melt 1.96 18.86 13.82 38.39 21.93 5.25 5.45 4.76 2.38 1.96

7. Primary melt reconstruction and source modelling
153
7.2.3. Hydrous mantle melting
The geochemical model used in the preceding section 7.2.2 hinges upon the minimization of
differences in trace element concentrations between the model and the measured primary
melts by varying the melt fraction of eclogite (Fe), pyroxenite (Fpx) and peridotite (Fpe).
Because of their low solidus, the melt fractions of eclogite (Fe) and pyroxenite (Fpx) are
expected to be large (>40%: Yasuda et al., 1994, Yaxley & Green, 1998) and fairly constant
because extensive fractional melting renders the source rock refractory by exhausting Na
(Kogiso & Hirschmann, 2006). The combination of low solidus and extensive fractional
melting is therefore believed to buffer the melt fraction of both eclogite and pyroxenite within
40-60% (Sobolev et al., 2005). On the other hand, the melt fraction of peridotite is much
lower (<10%, Table 7–7) and will depend on the intensity of the temperature anomaly of the
plume. In addition, peridotite is the main lithology of the plume head (Deccan Traps ~81%
and Réunion Island ~92%, Table 7–7). The melt fraction of peridotite will therefore have
considerable implication on the trace element pattern generated by the model as well as on the
total amount of melting of the hybrid source (peridotite + pyroxenite).
The hydrous mantle melting parameterization of Katz et al (2003) is combined to the
estimates of Fe and Fpx from the geochemical model of Table 7–7. Furthermore, total melt
fractions will be calculated for different pressures in order to assess the consequences of the
poorly constrained lithospheric thickness of pre-Deccan Traps India on the modelling results
(total melt fraction, potential temperature and recycled component in the plume).
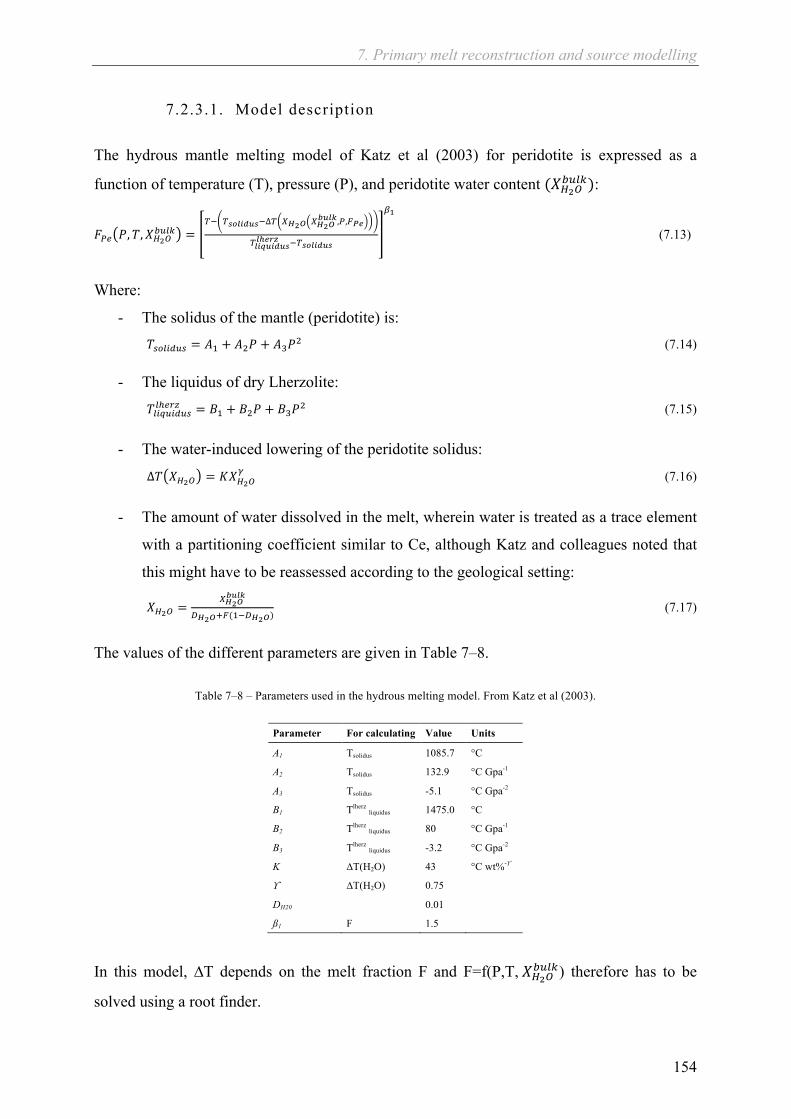
7. Primary melt reconstruction and source modelling
154
7.2.3.1. Model description
The hydrous mantle melting model of Katz et al (2003) for peridotite is expressed as a
function of temperature (T), pressure (P), and peridotite water content (!!!!!"#$):
!!" !,!,!!!!!"#$ =
!! !!"#$%&!!∆! !!!! !!!!!"#$,!,!!"
!!"#$"%$&!!!"# !!!"#$%&!
!!
(7.13)
Where:
- The solidus of the mantle (peridotite) is: !!"#$%&! = !! + !!! + !!!! (7.14)
- The liquidus of dry Lherzolite: !!"#$"%$&!!!"# = !! + !!! + !!!! (7.15)
- The water-induced lowering of the peridotite solidus:
∆! !!!! = !!!!!! (7.16)
- The amount of water dissolved in the melt, wherein water is treated as a trace element
with a partitioning coefficient similar to Ce, although Katz and colleagues noted that
this might have to be reassessed according to the geological setting:
!!!! =!!!!!"#$
!!!!!!(!!!!!!) (7.17)
The values of the different parameters are given in Table 7–8.
Table 7–8 – Parameters used in the hydrous melting model. From Katz et al (2003).
Parameter For calculating Value Units
A1 Tsolidus 1085.7 °C
A2 Tsolidus 132.9 °C Gpa-1
A3 Tsolidus -5.1 °C Gpa-2
B1 Tlherz liquidus 1475.0 °C
B2 Tlherz liquidus 80 °C Gpa-1
B3 Tlherz liquidus -3.2 °C Gpa-2
K ∆T(H2O) 43 °C wt%-ϒ
ϒ ∆T(H2O) 0.75 DH20 0.01 ß1 F 1.5
In this model, ∆T depends on the melt fraction F and F=f(P,T, !!!!!"#$) therefore has to be
solved using a root finder.
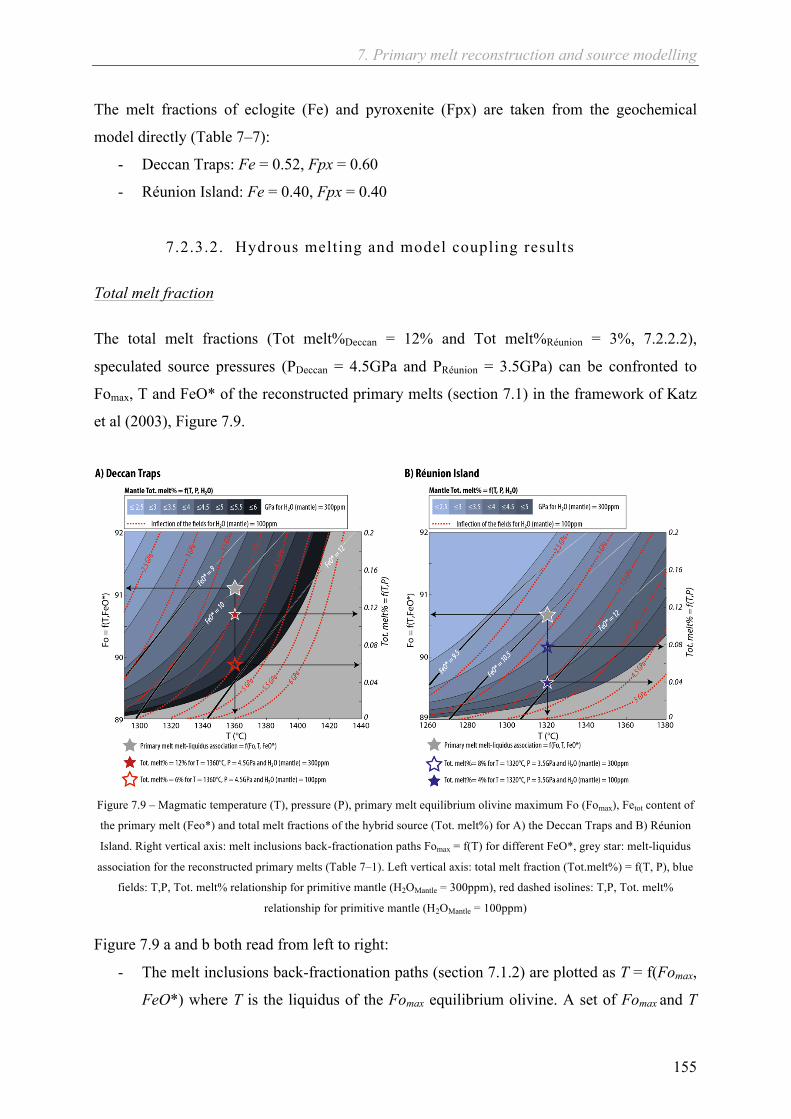
7. Primary melt reconstruction and source modelling
155
The melt fractions of eclogite (Fe) and pyroxenite (Fpx) are taken from the geochemical
model directly (Table 7–7):
- Deccan Traps: Fe = 0.52, Fpx = 0.60
- Réunion Island: Fe = 0.40, Fpx = 0.40
7.2.3.2. Hydrous melting and model coupling results
Total melt fraction
The total melt fractions (Tot melt%Deccan = 12% and Tot melt%Réunion = 3%, 7.2.2.2),
speculated source pressures (PDeccan = 4.5GPa and PRéunion = 3.5GPa) can be confronted to
Fomax, T and FeO* of the reconstructed primary melts (section 7.1) in the framework of Katz
et al (2003), Figure 7.9.
Figure 7.9 – Magmatic temperature (T), pressure (P), primary melt equilibrium olivine maximum Fo (Fomax), Fetot content of
the primary melt (Feo*) and total melt fractions of the hybrid source (Tot. melt%) for A) the Deccan Traps and B) Réunion
Island. Right vertical axis: melt inclusions back-fractionation paths Fomax = f(T) for different FeO*, grey star: melt-liquidus
association for the reconstructed primary melts (Table 7–1). Left vertical axis: total melt fraction (Tot.melt%) = f(T, P), blue
fields: T,P, Tot. melt% relationship for primitive mantle (H2OMantle = 300ppm), red dashed isolines: T,P, Tot. melt%
relationship for primitive mantle (H2OMantle = 100ppm)
Figure 7.9 a and b both read from left to right:
- The melt inclusions back-fractionation paths (section 7.1.2) are plotted as T = f(Fomax,
FeO*) where T is the liquidus of the Fomax equilibrium olivine. A set of Fomax and T

7. Primary melt reconstruction and source modelling
156
correspond to a FeO* content and conversely. The average FeO* values of the
reconstructed primary melt (section 7.1.1) have been estimated at FeO*Deccan = 10wt%
and FeO*Réunion = 10.5wt% and correspond to magmatic temperatures of TDeccan =
1360°C and TRéunion = 1320°C at Fomax (Deccan) = 91 and Fomax (Réunion) = 90.5. The
possible range of FeO* for both localities has also been reported on both Figure 7.9a
and b: FeO*Deccan = 9-12wt%, FeO*Réunion = 9.5-12wt%
- The hydrous melting model T, P, total melt fraction (equation 7.8, see section 7.2.2.1)
for Primitive and Depleted Mantle water content (300 and 100ppm, respectively) are
linked to the T = f(Fomax, FeO*) relationship by the magmatic temperature T: a set of
Fomax and FeO* correspond to a given T (TDeccan = 1360°C and TRéunion = 1320°C) and
this temperature also corresponds to a total melt fraction at a given pressure and
mantle water content.
Figure 7.9a shows that at P = 4.5GPa and for Primitive Mantle water content (300ppm), the
Deccan Traps melt fractions are: Fpe = 0.05 and Tot. melt% = 12%, which is similar to
estimates of the geochemical model (Table 7–7). If the mantle water content is lower and
closer to Depleted Mantle content (100ppm), the total melt fraction at P = 4.5GPa would be of
6%. This possibility may be considered less likely as mantle plumes are generally not made of
depleted material (White & McKenzie, 1995). Moreover, hot plumes are expected to melt by
more than 6% (Herzberg & O'Hara, 2002, Sobolev et al., 2007). Alternatively, similar total
melt fractions of ~12% with mantle water contents of 100ppm would nonetheless be achieved
at P = 4GPa.
Figure 7.9b on the other hand, shows that Réunion Island total melt fractions of 3% estimated
from geochemical modelling (Table 7–7) are matched by the hydrous melting model only for
low mantle water content, similar to Depleted Mantle values (100ppm) at P = 3.5 GPa.
Primitive Mantle water content (300ppm) of the Réunion Island source peridotite would
require P > 4GPa to match the total melt fractions returned by the geochemical model. The
thickness of the lithosphere beneath Réunion Island seem well established (~110km, Ellam,
1992) and it is therefore unlikely that pressures higher than 3.5GPa would be compatible with
the sources of Réunion Island magmas.

7. Primary melt reconstruction and source modelling
157
Potential Temperatures
As explained is section 7.2.2.1, the potential temperature (Tp) of the source can be calculated
from total melt fractions (Tot. melt%), magmatic temperature (T) and pressure (P) following
Herzberg et al (2007). In much the same way as Figure 7.9, Tp can thus be represented as a
function of Tot.Melt%, T, P and mantle water content (Figure 7.10).
Figure 7.10 –Total melt fractions (Tot. melt%), magmatic temperature (T), pressure (P), mantle water content (H2OMantle) and
potential temperature (Tp) of the Deccan plume for A) the Deccan Traps and B) Réunion Island. Blue fields: Tp = f(Tot.
melt%) for Primitive Mantle water content (300ppm). Thick red dotted lines: Tp = f(Tot. melt%) for Depleted Mantle water
content (100ppm). Thin black solid lines: isolines for magmatic temeratures (T) for Primitive Mantle water content. Thin red
dotted line: isolines for magmatic temperatures (T) for Depleted Mantle water content. Thick solid red and black lines:
isolines for primary melt magmatic temperature (TDeccan = 1360°C and TRéunion = 1320°C, see Table 7–3. Red and blue stars
similar to Figure 7.9.
Figure 7.10 illustrates the relationship between total melt fractions of the hybrid source (Tot.
melt%), magmatic temperatures (T), pressure (P) and mantle water content for both localities
(Deccan Traps and Réunion Island). The total melt fractions of Figure 7.9 for Primitive
Mantle water content (300ppm) Tot melt%Deccan = 12% and Tot melt%Réunion = 8% and for
Depleted Mantle water content (100ppm) Tot melt%Deccan = 6% and Tot melt%Réunion = 4% are
also reported (red and blue stars). The corresponding potential temperatures (Tp) are:
- Deccan Traps: 1587°C for H2OMantle = 300ppm and 1561°C for H2OMantle = 100ppm
- Réunion Island: 1491°C for H2OMantle = 300ppm and 1474°C for H2OMantle = 100ppm

7. Primary melt reconstruction and source modelling
158
In DMM water content is indeed 100ppm, Figure 7.9 suggests that the mantle beneath
Réunion Island is more depleted than that of the Deccan Traps because the total melt fractions
returned by the geochemical model and those of the hydrous melting model converge for this
scenario. It is therefore speculated that the potential temperature of the plume was as high as
1587°C for the Deccan Traps and is 110°C lower at 1474°C beneath Réunion Island.
Recycled component The amount of recycled crust carried by the plume in the form of eclogite is expressed as
equation 7.4 () from the melt fractions of eclogite (Fe), pyroxenite (Fpx) and peridotite (Fpe),
the fraction of reacting eclogite melt Xe and the pyroxenitic component Xpx (section 7.2.1).
XRC depends on the melt fractions of the three lithologies involved in the plume and will
therefore decrease with pressure (P) and increase with magmatic temperature (T). In other
words, at a given Xpx, XRC is correlated with potential temperature (Tp).
Furthermore, eclogite is denser than peridotite: ρe ~ 3500km.m-3 and ρpe ~ 3300km.m-3
respectively. The plume does thus not carry eclogite because it is buoyant but rather because
the plume is vigorous enough to dynamically drag small eclogite bodies towards the upper
mantle (sufficient temperature anomaly with respect to the surrounding mantle). There is
therefore a maximum amount of eclogite that a given plume can carry and this amount
depends directly on its potential temperature. As a first approximation (Figure 7.11), the
maximum amount of eclogite that can be carried by a plume (XRCmax) can be related to the
temperature anomaly of the plume with respect to MORB mantle (∆T = Tp – TpMORB where
TpMORB = 1350°C) and the density difference between eclogite (ρe) and peridotite (ρpe) as
!"#!"# < ! ∆!!!"!!!!!"
where α is the coefficient of thermal expansivity of the plume. (Leitch &
Davies, 2001).

7. Primary melt reconstruction and source modelling
159
Figure 7.11 – Recycled component carried by the plume (XRC) as a function of potential temperature (Tp), pressure (P), and
mantle water content (blue fields: H2OMantle = 300ppm, red dotted lines: H2OMantle = 100ppm) for A) the Deccan Traps and B)
Réunion Island. Red and blue stars from Figure 7.9 and Figure 7.10. Superimposed XRCmax = f(Tp) for mantle thermal
expansivity ranging from 2.10-5 to 5.10-5 from Leitch and Davies (2001), section 7.2.1.
From Figure 7.11, TpDeccan = 1587°C, XRCDeccan = 12% at H2OMantle = 300ppm and TpRéunion =
1474°C, XRCRéunion = 7% at H2OMantle = 100ppm return similar thermal expansivity
coefficients of ~ 3.10-5. On the other hand, H2OMantle = 100ppm for the Deccan Traps and
H2OMantle = 300ppm for Réunion Island would require significantly different thermal
expansivity coefficients of 2.10-5 and 5.10-5 respectively.
7.2.4. Summary of source modelling results
The application of the geochemical model of Sobolev et al (2005, 2007) (7.2.2), the
combination of hydrous mantle melting (Katz et al., 2003) and the calculation of mantle
potential temperature based on Herzberg et al (2007), allowed for constraining several
characteristics of the mantle sources of the Deccan Traps and Réunion Island, Table 7–9.
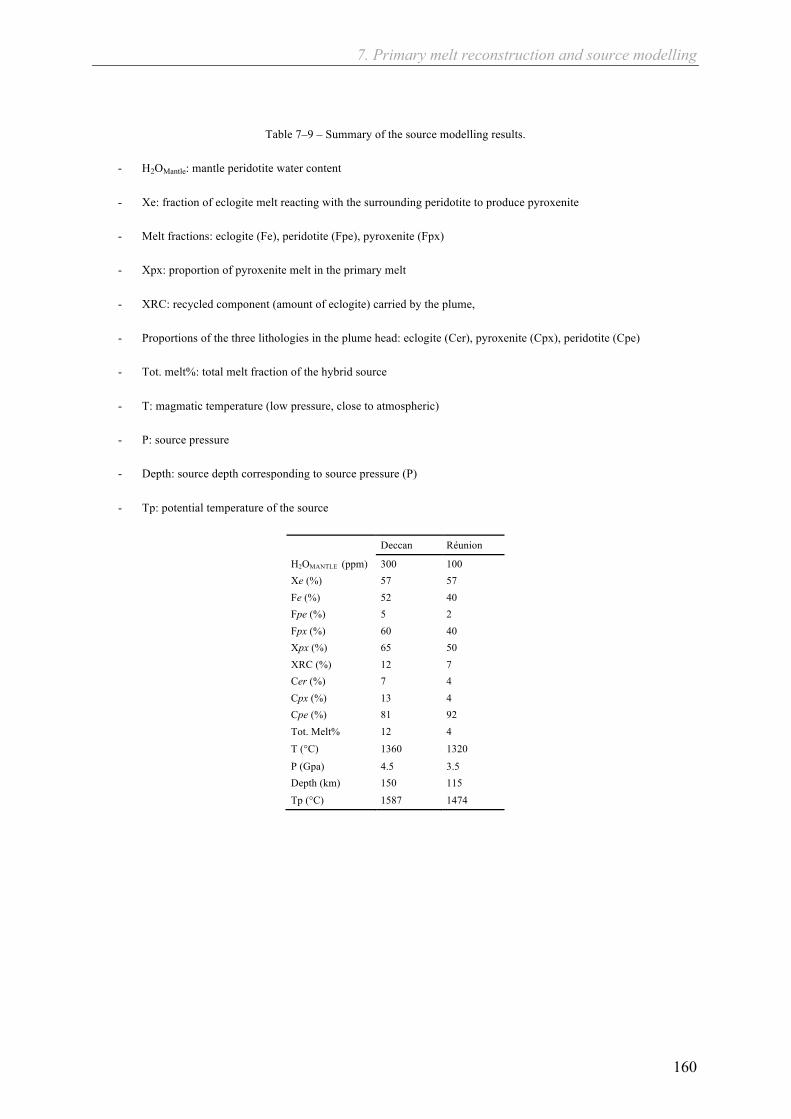
7. Primary melt reconstruction and source modelling
160
Table 7–9 – Summary of the source modelling results.
- H2OMantle: mantle peridotite water content
- Xe: fraction of eclogite melt reacting with the surrounding peridotite to produce pyroxenite
- Melt fractions: eclogite (Fe), peridotite (Fpe), pyroxenite (Fpx)
- Xpx: proportion of pyroxenite melt in the primary melt
- XRC: recycled component (amount of eclogite) carried by the plume,
- Proportions of the three lithologies in the plume head: eclogite (Cer), pyroxenite (Cpx), peridotite (Cpe)
- Tot. melt%: total melt fraction of the hybrid source
- T: magmatic temperature (low pressure, close to atmospheric)
- P: source pressure
- Depth: source depth corresponding to source pressure (P)
- Tp: potential temperature of the source
Deccan Réunion
H2OMANTLE (ppm) 300 100 Xe (%) 57 57 Fe (%) 52 40 Fpe (%) 5 2 Fpx (%) 60 40 Xpx (%) 65 50 XRC (%) 12 7 Cer (%) 7 4 Cpx (%) 13 4 Cpe (%) 81 92 Tot. Melt% 12 4 T (°C) 1360 1320
P (Gpa) 4.5 3.5 Depth (km) 150 115 Tp (°C) 1587 1474

7. Primary melt reconstruction and source modelling
161
7.3. Discussion and limits
The final results of the source modelling undertaken in the above sections are summarized in
Table 7–7 and Table 7–9 (section 7.2.4). These results are compatible with the following
scenario:
The Deccan Traps magmas were generated by a vigorous mantle plume (Tp ~ 1600°C) of
primitive composition (DMM component < 20% and H2O = 300ppm) and carrying recycled
oceanic crust in the form of eclogite (XRC ~ 10 – 15%). The Deccan plume reached the thick
Indian cratonic lithosphere (thickness ~ 140 – 250km) a few million years before the K-Pg
boundary (70 - 68Ma, e.g. Mahoney et al., 2002, Chenet et al., 2007). The multi-level melting
of the hybrid (eclogite, pyroxenite, peridotite) source resulted in a total average melt fraction
of 10 – 15% (involving 65% of pyroxenite-derived melt, Xpx) considering a depth of melt
generation of 150km (4.5GPa). These numbers are compatible with a plume head diameter of
> 1000km as suggested by White and McKenzie (1995) in order to generated the sheer 1-
3.106km3 of lavas proposed throughout the literature (e.g. Sen, 2001, and references therein).
The potential temperature (1600°C), recycled component (XRC = 10-15%) and the
pyroxenitic component in mantle derived melts (Xpx = 65%) also comply with the WPM-
THICK (Within-Plate Magmas – Thick lithosphere) classification of Sobolev et al (2007).
Plume-lithosphere interactions resulted in a significant – yet heterogeneous – thinning of the
Indian cratonic lithosphere (section 2.4). Lithospheric thinning is observed in HREE trace
element signatures at four different times along the Western Ghats composite section in lower
and upper Jawhar, Khandala-Bushe and upper-Poladpur (Figure 5.7). Altogether the four
transient episodes of thinning are compatible with one single and localized event of
lithospheric erosion (50ka, Sobolev et al., 2011) and periodic clogging by peridotite restite
inducing increased source depths thereafter (section 5.5). Nonetheless, the trace element
signature of Thakurvadi formation lavas undoubtedly bears evidence of deep origin (Gd/Ybn
> 1.6, Figure 5.7), despite the occurrence of paroxysmal eruption rates (160km3/yr, Chenet et
al., 2009). Overall, the average eruption rate of the main province of the Deccan Traps might
have been close to 200 times that of today’s Hawaii over 50 000 years (section 3.6). It is
tempting to associate lithospheric thinning, at least to some extent, with extensional tectonics
related to the rifting of 1) the Laxmi Rigde and 2) the Seychelles after the emplacement of the
main Deccan lava pile (Figure 2.1 and Figure 2.6). However, Hooper et al (2010) consistently
observed that extension along the Indian West Coast post-dated the emplacement of the

7. Primary melt reconstruction and source modelling
162
Western Ghats. Moreover, Sobolev et al (2011), indicated that extensional tectonics were not
required for plume-induced lithospheric erosion to take place.
More than 60Ma after the emplacement of the Deccan Traps, the Deccan plume was still
active and resulted in the building of Réunion Island onto 115km-thick Indian Ocean
lithosphere (Ellam, 1992). Piton de la Fournaise is therefore the present day remnant of the
Deccan plume. Olivine-based geochemical modelling reveals important changes between the
early stage of the Deccan plume and its present-day state at Réunion Island. Potential
temperature estimations suggest that it is now cooler by about 50-150°C (Tp ~ 1450-1500°C)
and is therefore far less vigorous than at the K-Pg boundary. In the same way, it carries less
recycled crustal material (XRC ~ 7%), the total melt fraction of the hybrid source is lower by
10% (Tot. melt% ~ 3-5%) and the contribution of pyroxenite-derived melts to the magmas is
lower by about 15% (Xpx = 50%) compared with K-Pg times.
The above scenario supports the proposition that mantle plumes related to Palaeocene Large
Igneous Provinces were hotter and melted more extensively than those of modern-day Ocean
Islands (Herzberg & Gazel, 2009). Herzberg and Gazel attributed this general temperature
change to lower mantle compositional heterogeneities. The outcomes of the geochemical
modelling carried out in during this PhD is thus in overall agreement with the current
understanding of deep-Earth processes. Nevertheless, several aspects of this modelling could
be improved and benefit to the meaning and clarity of the big-picture exposed above.
The different stages of chemical analysis and calculations presented in the previous sections
of this PhD, from olivine and inclusions data (section 6) to the application of geochemical
models (section 7), all aim at reconstructing the mantle processes, which have their surface
manifestation as intraplate volcanics (here, the Deccan Traps and Réunion Island). In a very
final stage, these results can be integrated to a 2- or 3D numerical modelling framework in
order to infer about the deep processes of the Earth (mantle convection, mantle structure,
crustal recycling time and the like), (Sobolev et al., 2011).
Throughout this manuscript, the prime sources of information and proxies for deep-Earth
processes are olivine phenocrysts found in lavas that have been erupted onto the surface of the
Earth. These olivines crystallized as cumulates in crustal magma chamber that are distant
from the processes they are meant to be probes of (mantle melting and crustal recycling) in
both space (>100km) and chemical evolution terms (e.g. fractionation, crustal assimilation,
7. Primary melt reconstruction and source modelling
163
magma mixing). Like any indirect approach and model, the methods used in this PhD project
therefore suffer from a number of limitations that must be assessed in order for conclusions to
be meaningful.
The all-important aspect of any modelling approach that assessing limitations represents, was
only touched upon due to limited time. A first subsection of this discussion is dedicated to
uncertainties in the reconstruction of primary melts. It is followed by a brief assessment of the
uncertainties and sensitivities in the geochemical models.
7.3.1. Primary melt reconstruction
7.3.1.1. K2O, H2O and temperature correction
Electron Micro-Probe Analyser (EPMA) is the only analytical tool used during this PhD
project (see appendix III for technical description and analytical protocols). EPMA does not
allow for water contents to be directly measured. Yet, the effect of water content on magmatic
processes is significant. Most importantly in the present case, H2O affects melting processes
and magmatic temperature estimations in petrological models by lowering the melting points
of rocks and minerals (e.g. Danyushevsky, 2001, Katz et al., 2003, Almeev et al., 2007,
Médard & Grove, 2008) that have been used in sections 7.1 and 7.2. Note however, that H2O
does not affect the temperature obtained by aluminium-based olivine-spinel thermometry
(section 6.6.2). Indeed, these estimates are solely based on the partitioning of Al between
olivines and their spinel inclusions and do not depend on liquidus temperatures (Wan et al.,
2008, Coogan et al., 2014).
One can circumvent this limitation of EPMA by using K2O as a proxy for H2O
concentrations. It has indeed been observed that, in magmatic rocks with low (<2%) loss on
ignition, both elements are correlated to one another (e.g. Danyushevsky et al., 2000b, Dixon
et al., 2002), Figure 7.12.
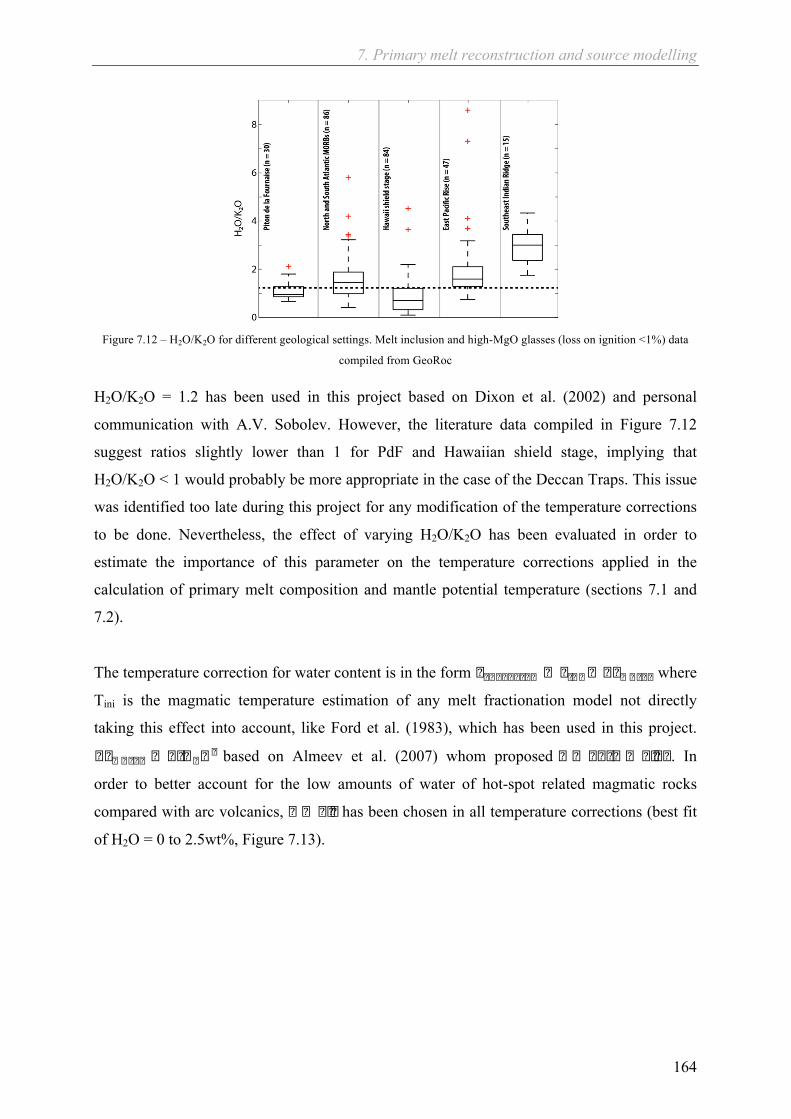
7. Primary melt reconstruction and source modelling
164
Figure 7.12 – H2O/K2O for different geological settings. Melt inclusion and high-MgO glasses (loss on ignition <1%) data
compiled from GeoRoc
H2O/K2O = 1.2 has been used in this project based on Dixon et al. (2002) and personal
communication with A.V. Sobolev. However, the literature data compiled in Figure 7.12
suggest ratios slightly lower than 1 for PdF and Hawaiian shield stage, implying that
H2O/K2O < 1 would probably be more appropriate in the case of the Deccan Traps. This issue
was identified too late during this project for any modification of the temperature corrections
to be done. Nevertheless, the effect of varying H2O/K2O has been evaluated in order to
estimate the importance of this parameter on the temperature corrections applied in the
calculation of primary melt composition and mantle potential temperature (sections 7.1 and
7.2).
The temperature correction for water content is in the form � � � � � � � � � � � � � � � � � � � � � � � where
Tini is the magmatic temperature estimation of any melt fractionation model not directly
taking this effect into account, like Ford et al. (1983), which has been used in this project.
� � � � � � � � � � � � � � based on Almeev et al. (2007) whom proposed � � � � � � � � � � � . In
order to better account for the low amounts of water of hot-spot related magmatic rocks
compared with arc volcanics, � � � � � has been chosen in all temperature corrections (best fit
of H2O = 0 to 2.5wt%, Figure 7.13).
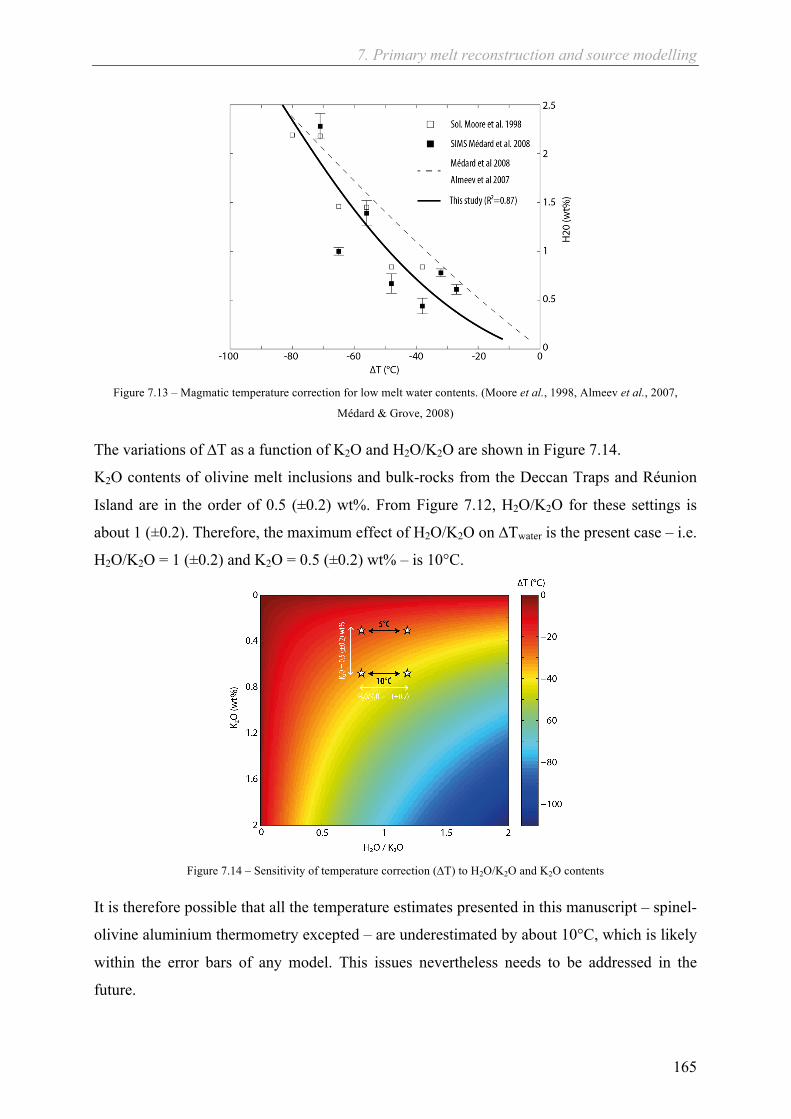
7. Primary melt reconstruction and source modelling
165
Figure 7.13 – Magmatic temperature correction for low melt water contents. (Moore et al., 1998, Almeev et al., 2007,
Médard & Grove, 2008)
The variations of ∆T as a function of K2O and H2O/K2O are shown in Figure 7.14.
K2O contents of olivine melt inclusions and bulk-rocks from the Deccan Traps and Réunion
Island are in the order of 0.5 (±0.2) wt%. From Figure 7.12, H2O/K2O for these settings is
about 1 (±0.2). Therefore, the maximum effect of H2O/K2O on ∆Twater is the present case – i.e.
H2O/K2O = 1 (±0.2) and K2O = 0.5 (±0.2) wt% – is 10°C.
Figure 7.14 – Sensitivity of temperature correction (∆T) to H2O/K2O and K2O contents
It is therefore possible that all the temperature estimates presented in this manuscript – spinel-
olivine aluminium thermometry excepted – are underestimated by about 10°C, which is likely
within the error bars of any model. This issues nevertheless needs to be addressed in the
future.

7. Primary melt reconstruction and source modelling
166
7.3.1.2. H2O and Ce
Cerium can also been used as a proxy to water concentrations in fresh volcanic and mantle
rocks (e.g. Dixon et al., 2002). Rare earths were not measured in the olivine-hosted melt
inclusions of the Deccan Traps and Réunion Island samples analysed during this PhD.
Therefore, no direct relationship between Ce and water was used during this project.
Literature and modelled Ce/H2O are nevertheless proposed in Table 7–10.
Table 7–10 – H2O and Ce concentrations and ratios in the inputs and results of the application of the geochemical model of
Sobolev et al (2005, 2007).
Inputs: Primitive mantle (PM) from Hofmann (1988), Depleted MORB Mantle (DMM) from Workman and Hart (2005),
eclogite from Dixon et al (2002). Pe: starting peridotite composition 80% PM and 20% DMM (section 7.2.2).
Outputs: H2O concentrations in the melts of eclogite, pyroxenite and peridotite were estimated by integrating water to the
geochemical model of Sobolev et al (2005, 2007) as a moderately incompatible trace element with DH2O = 0.01 as in Katz et
al (2003). Uncertainties of ±10ppm on H2O concentrations are arbitrary and meant to show the consequences on Ce/H2O (±5
units). The final H2O contents are those of the reconstructed primary melts (section 7.1) and were determined using K2O
from back-fractionated melt inclusions as a proxy, see above (section 7.3.1.1). Outputs in brackets are for the application of
the geochemical model of Sobolev et al (2005, 2007) without the coefficients of Tatsumi et al (2003) for the mobility of trace
elements during subduction.
Deccan Réunion
H2O (ppm) Ce (ppm) H2O/Ce
H2O (ppm) Ce (ppm) H2O/Ce Inputs DMM 100 0.55 182 100 0.55 182 PM 300 1.60 187 300 1.60 187 Eclogite 600 6.00 100 600 6.00 100 Pe = PM+DMM 260 1.39 186 260 1.39 186 Outputs Eclogite melt 1140 ±10 11 (6) 104 (190) ±5 1480 ±10 15 (7) 99 (211) ±5 Pyroxenite 765 ±10 7 (4) 109 (191) ±5 960 ±10 9 (5) 107 (192) ±5 Pyroxenite melt 1265 ±10 12 (6) 105 (211) ±5 2300 ±10 22 (12) 105 (192) ±5 Peridotite melt 4380 ±10 24 183 ±5 9200 ±10 40 230 ±5 Final 2400 ±10 16 (13) 150 (185) ±5 5800 ±10 31 (26) 187 (223) ±5
Table 7–10 shows that the H2O/Ce ratios in the final modelled melts (150 or 185 for the
Deccan Traps and 187 or 223 for Réunion Island depending on the effect of subduction on the
recycled oceanic crust Ce content) are compatible with published estimates for magmatic
glasses: H2O/Ce ~ 200±50 (e.g. Dixon et al., 2002).
The combined study of H2O, K2O and Ce in rocks and inclusions may prove useful both in
terms of having simple proxies to magmatic and mantle water concentrations as well as for
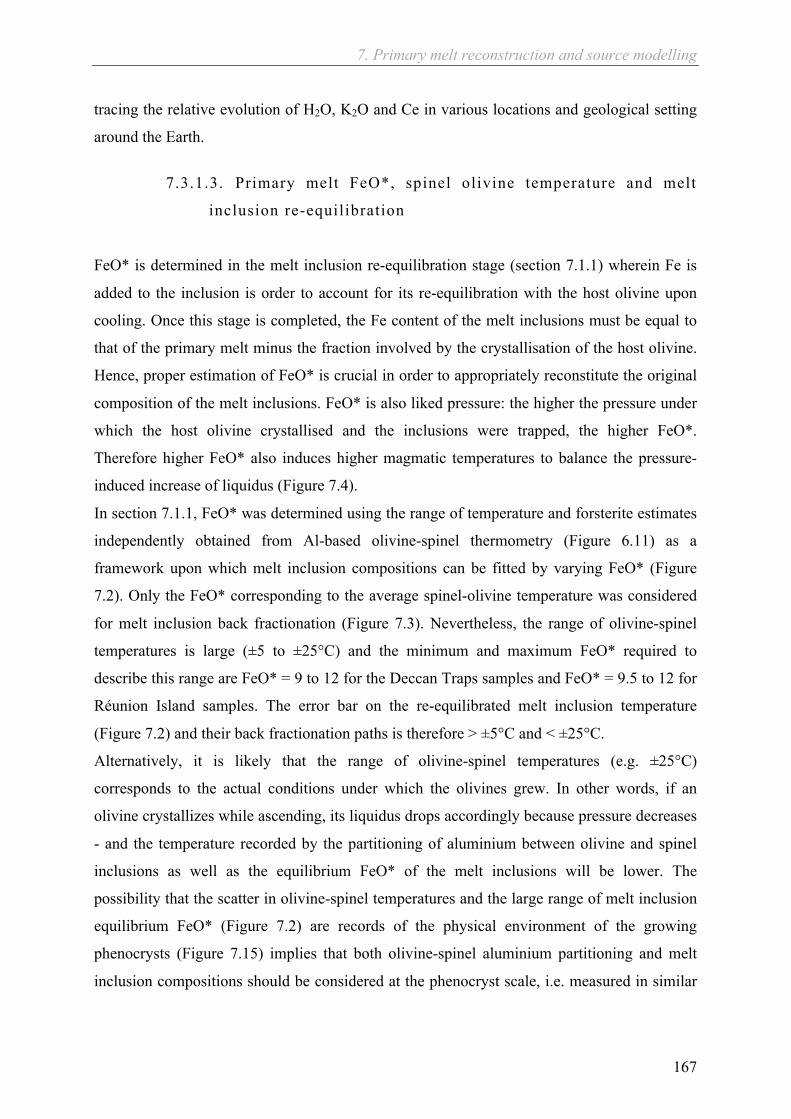
7. Primary melt reconstruction and source modelling
167
tracing the relative evolution of H2O, K2O and Ce in various locations and geological setting
around the Earth.
7.3.1.3. Primary melt FeO*, spinel olivine temperature and melt
inclusion re-equilibration
FeO* is determined in the melt inclusion re-equilibration stage (section 7.1.1) wherein Fe is
added to the inclusion is order to account for its re-equilibration with the host olivine upon
cooling. Once this stage is completed, the Fe content of the melt inclusions must be equal to
that of the primary melt minus the fraction involved by the crystallisation of the host olivine.
Hence, proper estimation of FeO* is crucial in order to appropriately reconstitute the original
composition of the melt inclusions. FeO* is also liked pressure: the higher the pressure under
which the host olivine crystallised and the inclusions were trapped, the higher FeO*.
Therefore higher FeO* also induces higher magmatic temperatures to balance the pressure-
induced increase of liquidus (Figure 7.4).
In section 7.1.1, FeO* was determined using the range of temperature and forsterite estimates
independently obtained from Al-based olivine-spinel thermometry (Figure 6.11) as a
framework upon which melt inclusion compositions can be fitted by varying FeO* (Figure
7.2). Only the FeO* corresponding to the average spinel-olivine temperature was considered
for melt inclusion back fractionation (Figure 7.3). Nevertheless, the range of olivine-spinel
temperatures is large (±5 to ±25°C) and the minimum and maximum FeO* required to
describe this range are FeO* = 9 to 12 for the Deccan Traps samples and FeO* = 9.5 to 12 for
Réunion Island samples. The error bar on the re-equilibrated melt inclusion temperature
(Figure 7.2) and their back fractionation paths is therefore > ±5°C and < ±25°C.
Alternatively, it is likely that the range of olivine-spinel temperatures (e.g. ±25°C)
corresponds to the actual conditions under which the olivines grew. In other words, if an
olivine crystallizes while ascending, its liquidus drops accordingly because pressure decreases
- and the temperature recorded by the partitioning of aluminium between olivine and spinel
inclusions as well as the equilibrium FeO* of the melt inclusions will be lower. The
possibility that the scatter in olivine-spinel temperatures and the large range of melt inclusion
equilibrium FeO* (Figure 7.2) are records of the physical environment of the growing
phenocrysts (Figure 7.15) implies that both olivine-spinel aluminium partitioning and melt
inclusion compositions should be considered at the phenocryst scale, i.e. measured in similar
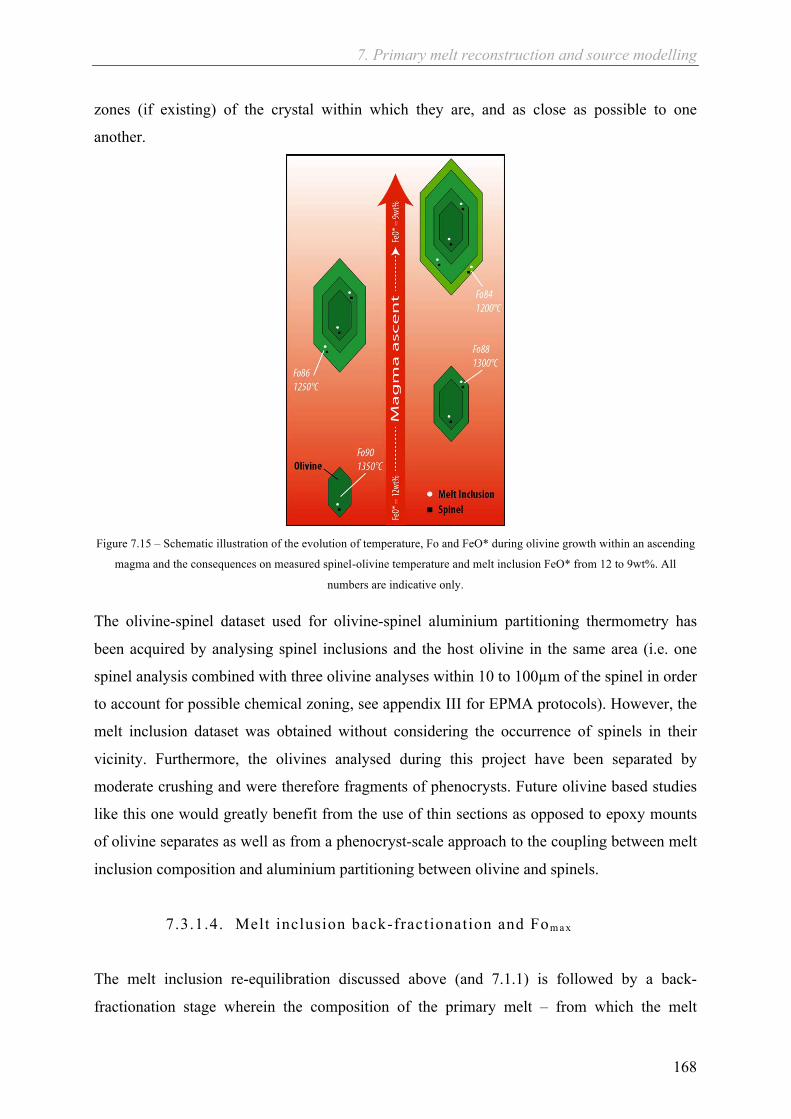
7. Primary melt reconstruction and source modelling
168
zones (if existing) of the crystal within which they are, and as close as possible to one
another.
Figure 7.15 – Schematic illustration of the evolution of temperature, Fo and FeO* during olivine growth within an ascending
magma and the consequences on measured spinel-olivine temperature and melt inclusion FeO* from 12 to 9wt%. All
numbers are indicative only.
The olivine-spinel dataset used for olivine-spinel aluminium partitioning thermometry has
been acquired by analysing spinel inclusions and the host olivine in the same area (i.e. one
spinel analysis combined with three olivine analyses within 10 to 100µm of the spinel in order
to account for possible chemical zoning, see appendix III for EPMA protocols). However, the
melt inclusion dataset was obtained without considering the occurrence of spinels in their
vicinity. Furthermore, the olivines analysed during this project have been separated by
moderate crushing and were therefore fragments of phenocrysts. Future olivine based studies
like this one would greatly benefit from the use of thin sections as opposed to epoxy mounts
of olivine separates as well as from a phenocryst-scale approach to the coupling between melt
inclusion composition and aluminium partitioning between olivine and spinels.
7.3.1.4. Melt inclusion back-fractionation and Fom a x
The melt inclusion re-equilibration discussed above (and 7.1.1) is followed by a back-
fractionation stage wherein the composition of the primary melt – from which the melt
7. Primary melt reconstruction and source modelling
169
inclusions and their host olivines were derived – is reconstructed by simply adding (or
melting) olivine back into melt inclusions. The resulting melt composition is assumed to be
that of the primary melt that was extracted from the mantle/plume-head source. The
equilibrium Fo for this melt must therefore be equal to that of the source (Fo = 90-92, e.g.
Sobolev et al., 2005, Herzberg, 2011). The equilibrium Fo of the source is thus guessed. This
guess can by comforted by making it equal to the maximum Fo olivine observed in the sample
or in the province where the samples came from. The Fo of both the Deccan (Thakurvadi
formation, Fo ~ 80-86) and Réunion Island (Piton de la Fournaise, Fo ~ 81-86) samples is too
low to be in equilibrium with a mantle source (e.g. Herzberg, 2011). It entails that 1) the
picritic samples analysed during this PhD are fractionated and 2) this fractionation took place
in the olivine stability field (bulk rock MgO > 7wt%, Figure 5.4) and hence simple back-
fractionation to higher equilibrium Fo is still possible even though the maximum equilibrium
Fo (Fomax), which is that of the source, is unknown (but lies within Fo ~ 91 ±1). The
calculations of section 7.1 assume Fomax (Deccan) = 91 and Fomax (Réunion) = 90.5 based on
the highest Fo olivine reported in the literature for lava samples from the Deccan Traps (Fo =
91: Krishnamurthy et al., 2000) and Réunion Island (Fo = 90.5: Sobolev & Nikogosian,
1994). If these estimates were incorrect, to uncertainty on magmatic temperature resulting
from a Fo range of Fo = 91±1 is ±40°C. Combined with the possible range of FeO* the total
uncertainty on temperature in the reconstruction of the primary melt composition by re-
equilibration and back-fractionation of melt inclusions is in the order of ±60°C. The
consequence of this temperature range on the composition of the primary melts is ±4% Mg#.
The full range of possible primary melt compositions is presented in Table 7–1.
7.3.1.5. Melt decompression and temperature correction
The temperature and equilibrium olivine Fo of the primary melt reconstructed upon re-
equilibration and back-fractionation of melt inclusions is valid only for shallow depth, where
the cumulate they were extracted from crystallised (Ford et al., 1983). The evolution of this
primary melt between the magma chamber and the source need to be reconstructed in order to
characterize the temperature of the mantle source, Tp (section 7.2.1). Melt transport from the
mantle through the lithosphere to the upper crust is believed to take place in dunite or
pyroxenite channels in the sub-lithospheric mantle (Kelemen et al., 1995, 1997, Batanova et
al., 2011) and in cracks (dykes) in the rigid lithosphere (Marsh, 2007, Maimon et al., 2012).

7. Primary melt reconstruction and source modelling
170
Nevertheless, these processes are swift enough to leave no record of the occurrence behind so
that the actual path followed by the primary melts from their source to the crustal magma
chambers where olivine cumulates crystallised cannot be known with absolute certainty. The
hypothesis upon which the calculation of potential temperature hinges in the modelling
presented above (section 7.2) is shown on Figure 7.16.
Figure 7.16 – Hypothesis on the temperature evolution of the primary melts upon ascent from their source through the
lithosphere towards the crustal magma chambers wherein the analysed olivine cumulates are assumed to have crystallized. 1)
Primary melts are extracted from their source at high pressure (lithosphere-asthenosphere boundary) and temperature
(potential temperature, Tp). During transport in the lithosphere, melts will be decompressed and cooled. Two different paths
can be taken: 2) The primary melt can follow an adiabatic path along which it will cool by ~3°C/kb and arrive in the crustal
magma chamber in an overheated state. In this scenario, the overheated melt will cool until it reaches the olivine liquidus and
olivine cumulates will begin to crystallise. 3) The primary melt follows the olivine liquidus at about 5°C/kb. In this case,
fractionation in the olivine stability field can occur during the ascent of the melt through the lithosphere. The cumulate
composition will thus be more evolved than that of the original primary melt and needs to be back-fractionated to a
composition in equilibrium with its source. Based on Ford et al (1983).
According to Figure 7.16, once it has been extracted from its source, a primary melt can either
be transferred via an adiabatic process or follow the olivine liquidus. If it follows an adiabat
(~3°C/kb), the primary melt will arrive overheated (i.e. significantly hotter than the olivine
liquidus) in the crustal chamber. Once the melt liquidus is reached, olivine cumulates will
crystallize. The Fo content of these olivines will be high and close to the source equilibrium
Fo. On the other hand, if the extracted melt exchanges some amount of heat with the
surrounding rocks during ascent, it can follow a trajectory below the olivine liquidus
(~5°C/kb) and olivine fractionation – although limited – will take place during melt transport.
7. Primary melt reconstruction and source modelling
171
Therefore, the composition of the melt that subsequently enters the crustal chamber will be
further away from the source equilibrium composition. In order for this composition to be
reconstructed, back-fractionation to mantle source equilibrium olivine (Fomax) is required. The
maximum Fo reported in the melt inclusion host olivines from the Deccan Traps (Thakurvadi
formation) and Réunion (Piton de la Fournaise) analysed during this PhD is ~86, which is
lower than mantle olivines (Fo90-92: e.g. Herzberg & O'Hara, 2002, Herzberg, 2011). It is
thus clear that the primary melt was fractionated in the olivine stability field upon ascent and
that the decompression from the source to the crustal chamber was not adiabatic. The actual
evolution of a primary melt from its source to the crystallisation of olivine cumulates remains
unknown. Nevertheless, most of the olivine fractionation generally occurs in crustal magma
chambers as cumulate and allows for high-Fo olivines to be preserved. Occasionally, little
fractionation occurs before cumulate formation and results in olivine close to mantle Fo
contents being preserved, e.g. Fo90.5 have been reported at Piton des Neiges, Réunion Island
(Sobolev & Nikogosian, 1994).
7.3.1.6. Trace element concentrations in primary melts
The concentrations of trace elements in reconstructed primary melts were not measured in
olivine-hosted melt inclusions because ppm-level concentrations or rare-earth elements in
micrometre-sized glassy inclusions are not accessible to EPMA analysis. Instead, primary
melts trace element compositions have been calculated from bulk-rock trace element
concentrations measured by Inductively Coupled Plasma Mass Spectrometer (ICP-MS) and
from the evolution of EPMA-measured minor elements that behave similarly to trace
elements during back fractionation, i.e. Ti and Al. This method is uncertain for two main
reasons: 1) Ti and Al and merely proxies. Trace element concentrations in melt inclusions can
be measured and directly integrated to the back-fractionation calculations. 2) Deccan Traps
magmas are known for (Peng et al., 1994, Sen, 2001, Chatterjee & Bhattacharji, 2008, e.g.
Bhattacharya et al., 2013) and were described above (section 5) as bearing signs of crustal
contamination, which significantly affect trace element patterns (DePaolo, 1981). The issue
was partly circumvented by using only a limited set of trace elements that are less subject to
contamination-induced variations. Nevertheless, crustal contamination effects cannot be ruled
out and indeed, one may notice for instance that a slight negative Nb anomaly still exists in
the Deccan Traps reconstructed primary melt trace element pattern (Figure 7.5). Since this

7. Primary melt reconstruction and source modelling
172
particular trace element pattern is used in the application of the geochemical model of
Sobolev et al (2005, 2007), potential crustal assimilation effects will have consequences on
the melt fractions and potential temperatures returned by the model.
7.3.2. Source modelling
The geochemical model of Sobolev et al (2005, 2007) consists in a fit of a primary melt
composition that is recalculated from olivine melt inclusions (section 7.1.2) and bulk-rock
compositions (section 7.1.3), by a modelled primary melt composition that results from the
melting, reaction and mixing of three lithologies: eclogite, reaction pyroxenite and peridotite
(section 7.2.1). The main parameters of this model are given in Table 7–11a and Table 7–11b
for the coupling with the hydrous melting model of Katz et al (2003). The following
observations are proposed:
Only two parameters are directly measured: the pyroxenitic component Xpx and the
magmatic temperature at which the olivines of the sample crystallized. The variables used in
fitting the reconstructed primary melt composition are the melt fractions of each of the three
lithologies: eclogite (Fe), pyroxenite (Fpx) and peridotite (Fpe) (underlined in Table 7–11a
and b). The other parameters of the model are averages: the composition of the mantle
(peridotite), of the recycled component (eclogite) and their mineral modes. For example, the
composition of the mantle could change between the early stage of a mantle plume and its
final tail stage by involving progressively more depleted mantle components (White &
McKenzie, 1995). This possibility is seen in the second stage of modelling (section 7.2.3.2)
using the hydrous melting approach of Katz et al (2003) wherein the Réunion Island (Piton de
la Fournaise) case is better described by low, DMM-like mantle water contents. Alternatively,
the composition of the recycled component can be affected to various degrees by subduction
processes (Dixon et al., 2002, Tatsumi & Hanyu, 2003), average crustal compositions (White
& Klein, 2014) or even by metasomatism in the deep mantle (e.g. Foley et al., 2013, and
references therein). These parameters will have considerable implication on the final trace
element pattern generated by the model. The amount of eclogite melt required to transform
peridotite into pyroxenite (Xe) is reasonably well constrained from experiments (Yasuda et
al., 1994, Yaxley, 2000, Wang & Gaetani, 2008) but the mineral modes of all three lithologies
can be different, particularly the amount of garnet, which strongly modifies the trace element
patterns. In the same way, the ranges coefficients given by Sobolev et al (2005) for
7. Primary melt reconstruction and source modelling
173
calculating the mineral modes in the reaction pyroxenite from those of the original peridotite
have sufficiently loose bounds to significantly affect the final trace element signatures.
Finally, this model is essentially a melting and mixing model and hence depends greatly on
proper estimations of mineral-melt trace element partition coefficients (Table 7–6) and rock
melting modes (Table 7–5). Rare Earths partition coefficients are known to depend on mineral
chemistry, pressure and temperature (Sun & Liang, 2013). Mineral and melting modes are
also expected to vary with at least pressure and temperature (e.g. Walter, 1998). In the end, it
is clear that finding the appropriate partition coefficients and compositions for the starting
lithologies is the most crucial stage in the application of a model such as that of Sobolev et al
(2005, 2007).
Some of the observations exposed above are currently being tested yet full integration of the
model sensitivities into the modelling framework by means of e.g. Monte Carlo simulations,
was not attempted due to lack of time.
Table 7–11 – Variables and their dependence in A) the model of Sobolev et al (2005, 2007) and B) the coupling of the
hydrous mantle melting model of Katz et al (2003). Abbreviations:
- Pe compo, m pe, Fpe: chemical composition of mantle peridotite, mineral modes and melt fraction, respectively
- OC: composition of the average oceanic crust
- m e, Xe, Fe: eclogite mineral modes, fraction of eclogite melt reacting with peridotite to form pyroxenite, eclogite
melt fraction, respectively
- m px, Fpx, Xpx: pyroxenite mineral modes, melt fraction and melt fraction involved in the primary melts
- XRC: amount of eclogite (recycled component) in the plume head
- Tot melt: total melt fraction of the hybrid (peridotite + pyroxenite + eclogite restite)
- P: source pressure
- T: magmatic temperature in crustal magma chamber
- Tp: potential temperature of the source

174
A) Sobolev et al (2005, 2007)
Dependencies
Pe Compo m pe Fpe OC m e Xe Fe m px Fpx Xpx XRC Tot melt P T Tp Va
riab
les
Peridotite Pe Compo Var
m Pe Var
Fpe Var
Eclogite OC compo Var
m e Var Xe + Calc
Fe Var
Pyroxenite
m px + Calc
Fpx Var
Xpx Measured
XRC + + + + + Calc
Tot melt + + + Calc
P Var
T Measured
Tp + + + Calc

175
B) Katz et al (2003)
Dependencies Fpe H2Omantle Xe Fe Fpx Xpx XRC Tot melt P T Tp
Vari
able
s
Peridotite Fpe Calc H2Omantle Var
Eclogite Xe Var Fe Var
Pyroxenite Fpx Var Xpx Measured
XRC + + + + + Calc Melt% + + + Calc P Var T Measured Tp + + + Calc

7. Primary melt reconstruction and source modelling
176
7.3.2.1. Partition coefficient variations
The partitioning of elements between minerals and melts varies with temperature, pressure
and chemistry (e.g. Sun & Liang, 2013). The effect of partition coefficient variations on the
trace element pattern generated by the geochemical model of Figure 7.7 (section 7.2.2) was
assessed using a compilation of partition coefficients for Th, Nb, La, Ce, Nd, Sm, Gd, Dy, Er
and Yb in mafic lithologies from the Geochemical Earth Reference Model (GERM) database.
The behaviour of trace elements during melting is mainly controlled by garnet and
clinopyroxene (Table 7–6) and hence the trace element compilation from GERM only
includes these two phases (Figure 7.17).
Figure 7.17 – Comparison of the partition coefficients from Donnelly et al (2004) as used in Table 7–6 with a compilation of
partitioning coefficients from mafic lithologies and experiments from the Geochemical Earth Reference Model (GERM)
represented as a boxplot: black and white dot, median; blue rectangle, inter-quartile; whiskers (blue line), 1th and 99th
percentile; blue circles, outliers.
The dataset corresponding to Figure 7.17 is summarized in Table 7–12

7. Primary melt reconstruction and source modelling
177
Table 7–12 - Partition coefficients for garnet and clinopyroxene from Donnelly et al (2004) as in the application of the
geochemical model of Sobolev et al (2005) of section 7.2.2 of the manuscript and a compilation from the Geochemical Earth
Reference Model (GERM): compilation of partition coefficients for mafic rock and experiments summarized by statistical
indexes: 25th percentile, average, median and 75th percentile
Donnelly et al 2004 GERM Garnet 25th percentile Average. Median 75th percentile
Th 1.50E-03 1.00E-03 1.47E-03 1.37E-03 1.70E-03
Nb 4.20E-03 7.10E-03 6.13E-02 5.00E-02 6.19E-02
La 1.00E-03 4.75E-04 2.90E-02 5.80E-03 2.70E-02
Ce 7.00E-03 5.10E-03 2.85E-02 8.00E-03 4.00E-02
Nd 6.00E-02 2.98E-02 1.06E-01 5.20E-02 1.44E-01
Sm 1.15E-01 1.33E-01 3.69E-01 2.09E-01 4.93E-01
Gd 8.00E-01 4.23E-01 7.63E-01 5.54E-01 8.08E-01
Dy 1.40E+00 1.63E+00 2.42E+00 2.20E+00 2.88E+00
Er 3.20E+00 3.48E+00 4.10E+00 3.60E+00 4.47E+00
Yb 4.18E+00 4.05E+00 7.23E+00 6.07E+00 7.36E+00
Donnelly et al 2004 GERM Cpx 25th percentile Average. Median 75th percentile
Th 3.00E-03 8.73E-03 3.48E-02 1.35E-02 4.50E-02
Nb 7.00E-03 4.00E-03 2.05E-02 7.70E-03 2.00E-02
La 4.20E-02 3.40E-02 8.46E-02 5.26E-02 9.29E-02
Ce 9.00E-02 5.70E-02 1.14E-01 8.43E-02 1.08E-01
Nd 1.90E-01 1.68E-01 2.95E-01 1.99E-01 3.45E-01
Sm 2.80E-01 2.82E-01 4.74E-01 3.20E-01 5.39E-01
Gd 3.70E-01 3.73E-01 7.10E-01 5.21E-01 7.55E-01
Dy 4.02E-01 3.24E-01 5.93E-01 4.42E-01 7.74E-01
Er 4.22E-01 2.99E-01 5.17E-01 3.87E-01 6.80E-01
Yb 4.32E-01 3.11E-01 5.81E-01 4.31E-01 6.35E-01

7. Primary melt reconstruction and source modelling
178
This basic assessment of partitioning-induced sensitivity was carried out by simply changing
the original coefficients used in the geochemical model (Table 7–6) from those of Donnelly et
al (2004) to extreme cases based on the compilation from GERM. The 25th and 75th
percentiles of the GERM compilation (Table 7–12) were considered to be sufficiently further
apart to constitute an upper and lower bound of possible mineral/melt partitioning in mantle
sources. All other model parameters were unchanged and similar to the simulation of Figure
7.7, including the melt fractions of eclogite (Fe), pyroxenite (Fpx) and peridotite (Fpe).
Figure 7.18 presents the effect of such mineral/melt partitioning variations
Figure 7.18 - Consequences of partitioning coefficients modification in the application of the geochemical model of Sobolev
et al (2005) of section 7.2.2: the minimization of the melt fractions of eclogite, pyroxenite and peridotite where done using
the partitioning coefficients of Donnelly et al (2004). The coefficients have then been changed to correspond to the 25th and
75th percentile of the partition coefficient compilation from the Geochemical Earth Reference Model (Table 7–12) and the
relative error is reported in the figure for two scenarios: A) mobility coefficients of Katz et al (2003) are applied to the
oceanic crust –eclogite transition B) the composition of the eclogite is equal to that of the oceanic crust.
Changes in trace element partitioning mostly affects elements heavier than Nd and the effect
on incompatible elements is less significant, as one may expect for low-degree melts (< 20%)
of garnet-bearing source.
The patterns corresponding to the 25th percentile of the GERM compilation allows for
Réunion Island primary melts to be reproduced within the acceptable error range of ±20%
(Sobolev et al., 2005), except for Nd in the mobility case (Figure 7.18a).
It is reasonable to argue that lower partition coefficients are more likely to apply to high-
temperature sources such as those of Réunion Island and Deccan Traps magmas. In this case,
the difference between the coefficients originally used in the model (Donnelly et al., 2004)
and those corresponding to the 25th percentile of the GERM compilation suggest that the
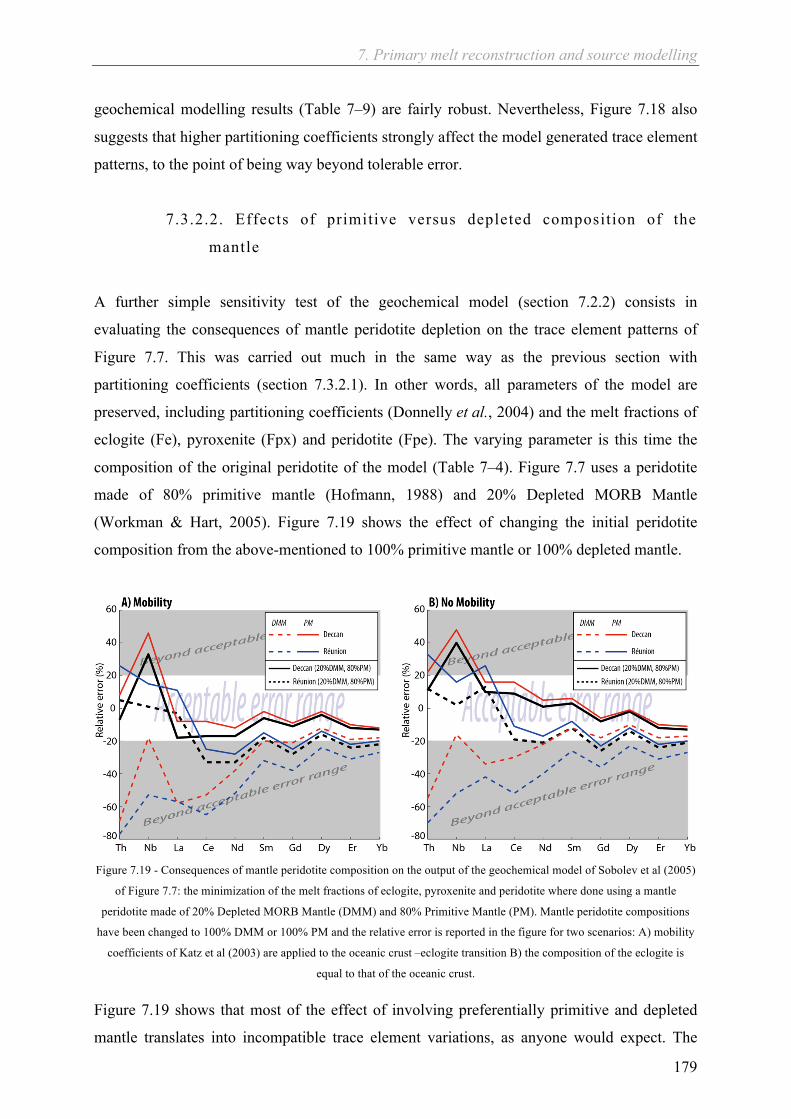
7. Primary melt reconstruction and source modelling
179
geochemical modelling results (Table 7–9) are fairly robust. Nevertheless, Figure 7.18 also
suggests that higher partitioning coefficients strongly affect the model generated trace element
patterns, to the point of being way beyond tolerable error.
7.3.2.2. Effects of primitive versus depleted composition of the
mantle
A further simple sensitivity test of the geochemical model (section 7.2.2) consists in
evaluating the consequences of mantle peridotite depletion on the trace element patterns of
Figure 7.7. This was carried out much in the same way as the previous section with
partitioning coefficients (section 7.3.2.1). In other words, all parameters of the model are
preserved, including partitioning coefficients (Donnelly et al., 2004) and the melt fractions of
eclogite (Fe), pyroxenite (Fpx) and peridotite (Fpe). The varying parameter is this time the
composition of the original peridotite of the model (Table 7–4). Figure 7.7 uses a peridotite
made of 80% primitive mantle (Hofmann, 1988) and 20% Depleted MORB Mantle
(Workman & Hart, 2005). Figure 7.19 shows the effect of changing the initial peridotite
composition from the above-mentioned to 100% primitive mantle or 100% depleted mantle.
Figure 7.19 - Consequences of mantle peridotite composition on the output of the geochemical model of Sobolev et al (2005)
of Figure 7.7: the minimization of the melt fractions of eclogite, pyroxenite and peridotite where done using a mantle
peridotite made of 20% Depleted MORB Mantle (DMM) and 80% Primitive Mantle (PM). Mantle peridotite compositions
have been changed to 100% DMM or 100% PM and the relative error is reported in the figure for two scenarios: A) mobility
coefficients of Katz et al (2003) are applied to the oceanic crust –eclogite transition B) the composition of the eclogite is
equal to that of the oceanic crust.
Figure 7.19 shows that most of the effect of involving preferentially primitive and depleted
mantle translates into incompatible trace element variations, as anyone would expect. The

7. Primary melt reconstruction and source modelling
180
model-generated trace element patterns better describe the calculated primary melts when the
contribution of primitive mantle in large or exclusive. Nevertheless, if a depleted MORB
mantle component happened to be involved at more than 20% at any locality, the
incompatible trace element patterns of the model would easily reach beyond the acceptable
error range of ±20% (Sobolev et al., 2005). Fortunately, significant (e.g. > 20%) involvement
of depleted MORB mantle is unlikely for both the Deccan Traps (Sen, 2001, and references
therein) and Réuion Island (e.g. Füri et al., 2011).

181

182

183
8. Conclusion chapter
8. Conclusion chapter
184
8.1. General conclusions
This PhD brings new insights as to the emplacement of the Deccan Traps at the K-Pg
boundary and the evolution through time of the Deccan Plume, between its early (plume head)
stage beneath India and its present-day (plume tail) stage, at Réunion Island in the Indian
Ocean.
Based on previous work by Anne-Lise Chenet and colleagues, it has been consistently shown
that the eruption of the Deccan Traps at the Cretaceous-Palaeogene transition was fast and
that a paroxysmal volcanic event ends at the K-Pg boundary.
Chenet and colleagues brought exceptional constrains as to the duration and dynamics of the
emplacement of the Deccan Traps. First, Chenet et al (2007) identified three main phases of
volcanism based on 40K-40Ar radiometric dating: Phase 1 predates the K-Pg boundary by
about 2Ma, Phase 2 occurred just before and ended at the K-Pg boundary (Keller et al., 2012)
and Phase 3 happened ~2-300ka later in the Danian and therefore post-dates the K-Pg
boundary. Secondly, Chenet et al (2008, 2009) used paleomagnetism on a comprehensive
sample set of the entire Western Ghats section and were able to identify Directional Groups
corresponding to sequences of lavas with statistically similar magnetic orientations, implying
that any of these sequences must have been emplaced in a century or less. Chenet et al
identified 30 Directional Groups (or Single Eruptive Events) and 41 lava flows unrelated to
directional groups, suggesting a total eruption time of 300 to 3000 years for the Directional
Groups alone and 1000 to 7000 years for all the formations of the Western Ghats. Very fast
eruption rates have recently been independently confirmed from diffusion/relaxation
modelling of 87Sr/86Sr zoning in giant plagioclase phenocrysts (A few hundred years for the
emplacement of entire formations, Borges et al., 2013). Chenet et al thus argued that
quantifying the intervening quiescence time within the eruption sequence was the most
critical issue in order for the rates, total duration and environmental effects of the Deccan
Traps eruption to be fully understood. Chenet et al (2008) and Gérard et al (2006) attempted
to quantify the span of volcanic quiescence periods along the Western Ghats section from the
occurrence and extent of intertrappean weathered horizons (red boles or bole beds, Sayyed,
2013). Upon assuming that centimetre-thick red boles formed over 10 years while meter-thick
did so over 50,000 years, Chenet et al proposed that the 38 thin- and 6 thick-red boles

8. Conclusion chapter
185
reported in the Western Ghats implied a total cumulated volcanic quiescence time of 300,000
years.
The extensive work of Chenet and colleagues has been re-interpreted in order to implement a
continuous timeframe of the Western Ghats section (Figure 3.1) that could be compared with
paleoenvironmental data (Figure 3.2) and coupled to bulk-rock geochemistry (Figure 5.7).
Considering the uncertainties on volcanic quiescence (section 3.6.3) and magmatic degassing
processes (Self et al., 2006, Sobolev et al., 2011) the continuous eruption timeframe of the
Western Ghats shows good correlation with intermediate water paleotemperatures (Li &
Keller, 1998) and recent high-resolution 187Os/188Os records in pelagic carbonates (Robinson
et al., 2009). It is thus argued that phase 2 of the Deccan Traps emplacement (Chenet et al.,
2007) corresponds to a cataclysmic volcanic event corresponding to the eruption of ~
8.105km3 of lavas in ~ 50ka. The average eruption rate during this event would have been
close to 20km3/yr (~ 200 times present-day Hawaii, Courtillot et al., 1986) and occasionally
skyrocketing to 160km3/yr (Chenet et al., 2009). This catastrophic event is well correlated
with at least the late-Cretaceous cooling as well as both of the strong 187Os/188Os negative
anomalies reported by Robinson et al (2009). Furthermore, it clearly appears that phase 2
(Chenet et al., 2007) ends with the Poladpur formation (onset of the Wai sub-group) at the K-
Pg boundary (Keller et al., 2012) and is followed by significant volcanic quiescence periods,
suggested by the occurrences of thick red boles between phase 2 and 3. The occurrence of 6
thick red boles in Ambenali-Mahabaleshwar implies 300ka of volcanic quiescence before the
onset of phase 3 in Mahabaleshwar. Interestingly, this estimate of 300ka is similar to those
proposed on the basis of radiometric dating (Chenet et al., 2007) and paleontological
observations (biozone P1a, Keller et al., 2012). It is also speculated that the formation of thick
red boles could have been favoured by a wetter and cooler climate as a result of a volcanically
induced late-Cretaceous cooling (Figure 3.2 and section 1.3).
The continuous timeframe of the Western Ghats eruption (section 3.6.1) has been coupled
with the bulk-rock major and trace element dataset of Bonnefoy (2005). Two different
incompatible trace element signatures have been identified along the Western Ghats section.
Deccan1 corresponds mostly to the lower formations (Jawhar to Bushe) and features clear
evidence of strong crustal assimilation whereas Deccan2 (Wai subgroup: Poladpur to
Mahabaleshwar) shows less or no evidence of crustal contamination and a more evolved and
homogeneous composition than Deccan1. The transition between Deccan1 and Deccan2 takes
8. Conclusion chapter
186
place during the emplacement of Poladpur and is therefore correlated with the end of phase 2
(Chenet et al., 2007).
The average trace element signature of both Deccan1 and Deccan2 is indicative of deep,
garnet bearing sources (Gd/Ybn > 1.6, Figure 5.6), which is at odd with the widespread and
significant plume induced lithospheric erosion postulated for LIPs emplacement (Sobolev et
al., 2011). Nevertheless, Deccan1 features four transient Gd/Ybn and Nb/Lan excursions in
lower- and upper-Jawhar, Khandala-Bushe and upper-Poladpur compatible with suddenly
shallower (Gd/Ybn < 1.8) sources and heavily contaminated melts (Nb/Lan ~ 0.5) (Figure 5.7).
The fleeting character of these excursions is confirmed by their systematic association with
directional groups thereby suggesting that these compositional excursions did not last for
more than a few hundred years. It is argued that transient excursions of both low Gd/Ybn and
low Nb/Lan correspond to a localized, plume-induced lithospheric thinning event. The sudden
onset of erosional pathways in the Indian lithosphere would lead to extensive decompression
melting (Gd/Ybn < 1.8) and large crustal assimilation (Nb/Lan < 0.6) caused by the Deccan
plume being locally brought close to the crust. The erosional pathways would subsequently
become clogged by large amounts of light peridotite restite, causing melts to be again released
in the garnet stability field (Gd/Ybn). Crustal contamination would drop as a result of the
previous extensive assimilation. In other words, the magmatic conduits would probably
become too refractory for large crustal assimilation to happen. The four excursions reported in
Jawhar, Khandala-Bushe and Poladpur altogether span ~ 50ka, which is compatible with the
model-based estimation of Sobolev et al (2011). The localized lithospheric erosion in both
space and time is also compatible with what Sobolev and colleagues expected for lithospheric
thicknesses in the order of 140km (in agreement with the Indian case, section 2.4). It is also
compatible with the location of the feeder dykes of the Deccan Traps (Vanderkluysen et al.,
2011), Figure 2.3. In addition, it seems reasonable to argue that severe crustal assimilation
results in severe magma degassing (Self et al., 2008a, Ganino & Arndt, 2009, Sobolev et al.,
2011). All four Gd/Ybn and Nb/Lan transient negative excursions occurred during phase 2,
which ended at the K-Pg boundary. It is thus likely that catastrophic amounts of magmatic
gasses were released on these occasions and contributed to the end-Cretaceous extinction.
High-MgO, olivine-phyric samples from the Deccan Traps and Réunion Island have been
investigated in order to reconstruct the primary melts and magmatic sources for both localities
8. Conclusion chapter
187
– themselves representative of the (early) plume-head and (final) plume-tail stage of the
Deccan plume.
High-forsterite olivines (>80) from the Thakurvadi formation of the Deccan Traps, and Piton
des Neiges and Piton de la Fournaise (Réunion Island) were processed for high-precision
EPMA analysis olivine phenocrysts as well as olivine-hosted melt and spinel inclusions.
The olivine phenocrysts composition from the Deccan Traps and Réunion Island revealed Ni
excess and Mn deficiency corresponding to a hybrid mantle source (pyroxenite + peridotite ,
Sobolev et al., 2005) (Figure 6.3) and with a large contribution of pyroxenite melts to the
primary melt compositions: Xpx (Deccan) = 65%, Xpx (Réunion) = 50% (Figure 6.5).
Olivine-hosted melt inclusions from Deccan Traps lavas recorded volatile contents similar to
those published by Self et al (2008a) (averages: K2O = 0.48wt%, Cl = 0.02wt%, S =
0.05wt%) yet much lower in chlorine than the Siberian Traps (Sobolev et al., 2009a). It is
however likely that the amount and rate of magmatic degassing were much higher during (or
just before: Sobolev et al., 2011) the episodes of strong crustal contamination mentioned
earlier (transient Gd/Ybn and Nb/Lan negative excursions, Figure 5.7). Olivine-hosted melt
inclusions from Réunion Island revealed slightly different volatile contents (averages: K2O =
0.70wt%, Cl = 0.02wt%, S = 0.09wt%). Most notably, Cl/K2O of Réunion Island inclusions
was significantly lower than for the Thakurvadi melt inclusions (Cl/K2O = 0.30 and 0.40,
respectively. But Cl/K2O is twice higher in Deccan Traps than in Réunion Island olivine-
hosted inclusions at a given S content, Figure 6.7b), suggesting slightly different
compositions of the magmas either due to crustal assimilation (Figure 5.7) or due to the larger
amounts of pyroxenite-derived melts involved in the primary melts of the Deccan Traps lavas
(the recycled crustal component could be responsible for chlorine enrichment: Sobolev et al.,
2009a, 2011).
Olivine-hosted melt and spinel inclusions have been used to reconstitute the primary melts of
the Deccan Traps and Réunion Island lavas (section 7.1). This result has subsequently been
integrated into a modelling framework based on geochemistry (Sobolev et al., 2005) and
thermodynamics (Katz et al., 2003) allowing for reconstructing the temperature, pressure and
composition of the mantle sources of Réunion Island and Deccan Traps lavas (section 7.2).
Modelling results revealed clear changes between the plume-head (Deccan Trap) and the
plume-tail (Réunion Island) stage of the Deccan plume.
8. Conclusion chapter
188
During the emplacement of the Deccan Traps, the Deccan plume was hot (Tp ~ 1590-1600°C)
and carried large amounts of recycled crustal material (XRC ~ 14%) compared with other
settings (Sobolev et al., 2007). The large recycled component of the Deccan plume at this
time precludes significant surface uplift (Sobolev et al., 2011) and thus reconciles the
observations of several authors with the plume model (e.g. Saunders et al., 2007, Sheth,
2007). The hybrid source (eclogite + reaction pyroxenite + peridotite) in the plume melted at
4.5GPa by about 12% with a contribution of pyroxenite melts at 65% (Table 7–9). The strong
garnet signature of most Deccan Traps lavas (Figure 5.6) suggests that the Indian lithosphere
was little affected by plume-related magmatism and thus remained thick throughout the
plume-head stage of the Deccan Plume. This feature is most directly explained by 1) the
initially deep lithosphere-asthenosphere boundary (140km, section 2.4) and 2) by the limited
involvement of magmas in the lithosphere erosion process due to their early escape (before
freezing and delamination) towards the surface (Sobolev et al., 2011), probably facilitated by
pre-existing weaknesses within the Indian lithosphere itself (e.g. Murthy, 2002).
Some 66Ma later, the Deccan plume remains active beneath Réunion Island in the Indian
Ocean. It is now cooler by about 100±50°C (Tp ~ 1490-1500°C) and therefore carries less
recycled crustal material (XRC ~ 7%) than at its younger state in the Deccan Traps. The
mantle source of Réunion Island lavas is argued to melt by 4% at 3.5 GPa with a contribution
of pyroxenite melts at 50% (Table 7–9).
Figure 8.1, is an illustration of speculated plume-lithosphere interactions for the Deccan
plume during the Deccan Traps eruption and at present-day Réunion Island. A comparison
with the Siberian plume is also included.

8. Conclusion chapter
189
Figure 8.1 – Schematic illustration of the plume-lithosphere interactions based on Sobolev et al (2011) for A) the Deccan
Traps (plume-head stage of the Deccan plume), B) Réunion Island (plume-tail stage of the Deccan plume) and C) the
Siberian Traps. Colorscale: potential temperature (°C). Model time of the snapshot: 1Myr. Note that this is not an actual
simulation of the Deccan plume but a simple modification of a figure from Sobolev et al (2011). A proper thermomechanical
model of the Deccan plume is being implemented by S.V. Sobolev at GFZ, Germany
8.2. Prospects
In the concluding paragraphs of her Ph.D, Anne-Lise Chenet (Chenet, 2006) suggested that
the immediate prospects of her work be to address the following items:
- Confirm that the Deccan eruption took place in two separate phases by dating the
transitional polarity samples of the Latifwadi plateau and investigating the Tapti River
area where thick sections have not yet been accurately dated
- Re-sample the Khandala-Bushe and Bushe-Poladpur transitions since the poor
outcrops of the Bushe formation did not allow for a fully comprehensive sampling
during this project

8. Conclusion chapter
190
- Investigate the lower formations, especially in the Narmada River/Rift area in order to
better constrain the early phases of Deccan volcanism. However, the Narmada rift has
been active post-Deccan making flow-to-flow correlations much more difficult than in
the case of the Western Ghats
- Numerical models used in assessing the environmental consequences of the Deccan
Traps should be tested on a global – planetary – scale and account for the chemistry
and physics of the stratosphere
- Finally, comparing the Deccan Traps with the Karoo province (southeast Africa,
180Ma), where signs of a major extinction are absent despite similar erupted volumes
This new Ph.D project undertaken in January 2011 originally aimed at bringing together
geochemistry, petrology and geodynamics in the implementation of a thermo-mechanical
numerical model of the Deccan plume through time similar to Sobolev et al (2011). As such,
this new project would have been able to address the first three items above-mentioned as part
of a Ph.D. fieldwork and would have used the high-resolution paleomagnetic data of Anne-
Lise Chenet’s Ph.D. as time constraints for the entire main volcanic phase.
Nevertheless, difficulties in the early stages of this project mostly pertaining to the installation
of a new JEOL JXA 8230 Electron Microprobe Analyser at ISTerre as well as to the
unsuccessful quest for local contacts in India precluded the organisation of a proper field trip.
However, full access, granted by Frédéric Fluteau and Vincent Courtillot at the Institut de
Physique du Globe (IPGP, Paris, France), to the Western Ghats samples collected and used
during Anne-Lise Chenet’s PhD (Chenet, 2006), as well as their bulk-rock major and trace
element compositional data (Bonnefoy, 2005) enabled us to participate in the study of the
Deccan Traps by:
- Revisiting the high-resolution paleomagnetic data and 39Ar/40Ar ages of (Chenet,
2006, 2007, 2008, 2009) and reconstructing a continuous timing scenario for the
emplacement of the Western Ghats that fits paleao-environmental indicators such as
high-resolution 187Os/188Os record in pelagic carbonates (Robinson et al., 2009) and
global seawater temperatures (Li & Keller, 1998) (section 3.6)
- Coupling this timeframe with bulk-rock compositional variations, allowing for the
depth of mantle sources and the assimilation of crustal material to be traced in time
throughout the emplacement of the Western Ghats
8. Conclusion chapter
191
- Carrying olivine petrology and source modelling (Sobolev et al., 2005, 2007) olivine-
phyric, picritic samples from both the Deccan Traps and Réunion Island in order to
bring new insights as to the magma sources, their melting conditions, the primary
melts generated, and the amounts of volatiles they carried
- Ultimately, the catastrophic eruption rates speculated upon interpretation of these data
(70% of the Western Ghats formations in 50,000 years) and the clear correlations with
paleoenvironmental proxies, lead the author to conclude that the emplacement of the
Deccan Traps must have had cataclysmic consequences on the environment of the
late-Cretaceous
The author hopes this manuscript still provides some degree of novelty and advancement to
the community despite the extensive use and re-interpretation of published data and the
absence of actual fieldwork.
This work would greatly benefit from addressing the following items:
- Fieldwork would allow addressing the first three items of Anne-Lise Chenet’s
proposed prospects (Chenet, 2006). It would also allow for more olivine-phyric
samples to be collected both in the Main Deccan Province and in the peripheral areas
of the Deccan Traps (e.g. Gujarat, section 2.3.2). A more coherent dataset would
enable for far better constraints on the dynamics of the Deccan Plume
- More specifically, the transient Gd/Ybn and Nb/Lan negative excursion (Figure 5.7)
should be investigated on the field for olivine-phyric samples and olivine-hosted melt
inclusions as they may represent periods of catastrophic degassing due to large crustal
assimilation and extensive decompression melting
- Fieldwork should be carried out in the Seychelles as Bushe-like compositions have
been reported there (Owen-Smith et al., 2013) and may thus correspond to the
culmination of the Deccan Traps activity, shortly pre-dating the K-Pg extinction
- The results of source modelling (as in section 7.2) should be implemented in the
thermo-mechanical modelling framework of Sobolev et al (2011), in order for the
Deccan plume to be compared with other settings, such as the Siberian Traps or the
Ontong Java plateau.

192
193
9. Appendix

194
195
I. Stratigraphic nomenclature of the
western Deccan basalt formations
(Western Ghats) after Peng et al (1994)

Appendix I. Stratigraphic nomenclature of the Deccan basalt formation (Peng et al. 1994)
196
Subgroup Formation (Max. thickness)
Member or chemical type (CT) (87Sr/86Sr)t Avg.
Mg# TiO2% Avg. Ba/Zr
Avg. Zr/Nb
Wai
Desur (100m)
0.7072-0.7080 48 1.6-1.9 1.2 11.4
Panhala (>175m)
0.7046-0.7055 52 1.6-2.3 0.5 14.8
Mahabaleshwar (280m)
0.7040-0.7055 47 2.5-4.3 0.5 11.4
Ambenali (500m)
Ambenali CT 0.7038-0.7044 49 1.9-3.1 0.3 14.4
Poladpur (375m)
Upper 0.7061-0.7083 52 1.8-2.3 0.4 12.7
Lower 0.7053-0.7110 56 1.5-2.0 0.7 14
Sambarkada
43 2.2-2.3 0.9 12.6
Valvhan 0.7068 42 2.5-2.6 0.9 12.3
Ambavne
45 2.0-2.1 0.4 14.0
Lon
aval
a
Bushe (325m)
Pingalvadi
61 1.1-1.2 0.8 17.2
Bushe CT 0.713-0.720 55 1.0-1.3 1.1 15.3
Shingi Hill 0.718 49 1.3-1.4 2.0 16.2
Hari 0.7078-0.7079 46 2.0-2.1 1.0 12.9
Karla Picrite 0.7147 68 1.1-1.2 0.8 19.7
Bhaja 0.712 58 1.3-1.5 0.6 18.2
Khandala (140m)
Rajmachi 0.7102 44 2.1-2.5 1.2 14.6
Khandala Phyric CT
41 2.4-2.8 1.3 13.6
KA3 0.7107 49 1.7 3.1 12.9
Madh
58 1.6 2.8 14.0
Boyhare 0.7102 63 1.2-1.3 2.1 13.7
KA2 0.7124 57 1.2 3.9 13.5
Khandala Phyric CT 0.7077 41 2.5-2.8 1.3 13.6
KA1 0.7094 61 1.0-1.1 1.8 15.4
Dhak Dongar 0.7071-0.7072 40 2.9-3.1 1.0 13.1
KCG 0.7098 48 1.4-1.6 1.5 18.7
Monkey Hill GPB 0.7073 41 3.1-3.4 1.1 12.2
Girvali GPB 0.7068-0.7074 45 2.8-3.1 0.8 12.1
Kal
suba
i
Bhimashankar (140m)
Bhimashankar CT 0.7067-0.7076 47 1.9-2.6 0.8 11.7
Manchar GPB
42 2.9-3.1 0.5 13.2
Thakurvadi (650m)
Thakurvadi CT 0.7073-0.7080 58 1.8-2.2 0.8 12.0
Water Pipe Member 0.7099-0.7112 59/71 1.4-1.6/1.0-1.1 1.5/1.3 12.3/12.0
Paten Basalt
58 1.0 1.3 15.2
Thakurvadi CT 0.7067-0.7070 58 1.8-2.2 0.8 12.4
Ashne 0.7068 62 2.0-2.1 1.2 9.6
Thakurvadi CT 0.7080-0.7084 58 1.8-2.2 0.8 11.6
Jammu Upper 0.7112 34 2.7 1.6 9.8
Patti Middle 0.7099 46 2.2-2.3 1.5 8.4
Lower Member 0.7066-0.7067 56 1.7-2.0 1.1 11.2
Neral (100m)
Tunnel Five GPB 0.7082-0.7083 36 3.3-3.5 1.0 10.8
Tembre Basalt
43 2.8-3.0 1.1 10.6
Neral CT 0.7062-0.7073 62 1.5-1.7 1.2 12.3
Ambivli Picrite 0.7104 67 1.4-1.5 1.7 18.6
Igatpuri - Jawhar (>700m)
Kashele GPB 0.7102-0.7122 40 2.6-3.1 1.1 11.5
Mg-rich Igatpuri
59 1.4-1.9 1.0 13.3
Igatpuri phyric 0.7107-0.7124 49 1.9-2.2 1.1 14.3
Thal Ghat GPB 0.7108 36 3.6 0.9 10.7
HFS-poor Jawhar
51 1.3-1.6 1.5 13.0
Plag. Phyric 0.7085 38 3.0 1.0 11.7
Mg-rich Jawhar 0.7128 59 1.4-1.9 1.0 12.7
Kasara phyric 0.7091 39 2.8-3.0 1.0 10.8

197
II. Conceptual timeframe for the
emplacement of the Deccan Traps

Appendix II. Conceptual timeframe for the emplacement of the Deccan Traps
198
Synthesis of the Western Ghats cross-section (sections 3.6 and 5.4). (Chenet et al., 2008,
Chenet et al., 2009).
SEE (Single Eruptive Events) may be seen at the formation or field section level, which
induces slightly different interpretations. “Deccan Group” refers to trace element
classification. Conceptual timeframe (in Ma) based on the hypotheses explained in section
3.6. Gd/Ybn: garnet signature, normalized to Hofmann (1988). Nb/Lan: crustal signature,
normalized to Hofmann (1988). Blue sample names are for duplicates, red for missing bulk-
rock data, underlined bold fonts for olivine-bearing samples. Light and dark grey lines
highlight directional groups. K-Pg boundary (Renne et al., 2013) at MB22. Finally, the first
two letters of sample names correspond to their section, the next two digit to the sampling site
and the last two are for the drill core ID as several drill cores have been collected at each
sampling site. For a graphical representation of this table, see Figure 5.7. Bulk-rock
compositional data obtained at the SARM Nancy, France. Only two Giant Plagioclase Basalts
were identified in the sample set among at least 5 such flows reported in the Deccan Traps
(Sen, 2001, and references therein), section 3.4.
Sample (Red boles)
Formation
SEE (section)
SEE (formation)
Deccan Group
Magneto-stratigraphy
40K-40Ar age (Ma)
Timeframe (Ma)
Gd/Ybn Nb/Lan Cumulative volume (%)
MB0203 Mahabaleshwar
(280m)
2
C29n
64.1 ± 0.9 65.779260 1.684 0.809 100 MB0407 DG_PA6 2 65.780260 1.785 0.791 99 MB0503 DG_PA6 2 65.780272 1.820 0.923 91 MB0608 DG_PA6 2 65.780285 1.802 0.924 91 MB0702 DG_PA6 2 65.780297 1.833 0.910 91 (thin)
MB0807 DG_PA6 2 65.780320 1.812 0.897 91 (thin)
MB1104 DG_PA6 2 65.780342 1.799 0.901 91 (thin)
MB1202 DG_PA6 2 65.780365 1.808 0.873 91 MB1701 DG_PA6 2 65.780377 1.880 0.870 91 (thin)
MB0905 DG_PA6 2 65.780400 1.849 0.879 91 (thin)
MB2705
2 C29r / C29n
65.781410 1.890 0.797 91 WA0405 DG_WA2 2 65.782410 2.012 0.998 91 WA0306 DG_WA2 2 65.782510 1.992 1.034 90 MB2805 DG_PA5 2 C29r / C29n 65.783510 1.941 0.811 90 MB1005 DG_PA5 2 C29r / C29n 65.783543 1.854 0.800 88 (thin)
(thin)
(thin)
MB1811 DG_PA5 2 C29r / C29n 65.783607 1.868 0.773 88 MB1901 DG_PA5 2 C29r / C29n 65.783640 1.843 0.799 88 WA0708
2
65.784640 1.866 0.913 88
(thin)
WA0801
1
65.785650 2.046 0.759 87
WA0503
1
65.786650 2.038 0.732 87 WA0902
1
65.787650 2.175 0.833 86
(thin)
WA0607
2
65.788660 1.950 0.791 86
MB2901
2
C29r
65.789660 1.987 0.807 85
(thick)
MB3002 Ambenali
(500m) DG_PA4 2 65.839660 2.037 1.051 85
MB2009 DG_PA4 2 65.839710 2.096 1.032 82 (thin)
MB1407 DG_PA4 2 65.839770 1.777 0.962 82 (thick)
WA1001
2
65.889770 1.966 0.956 82 (thick)
WA1102
2
65.939770 2.018 0.990 81
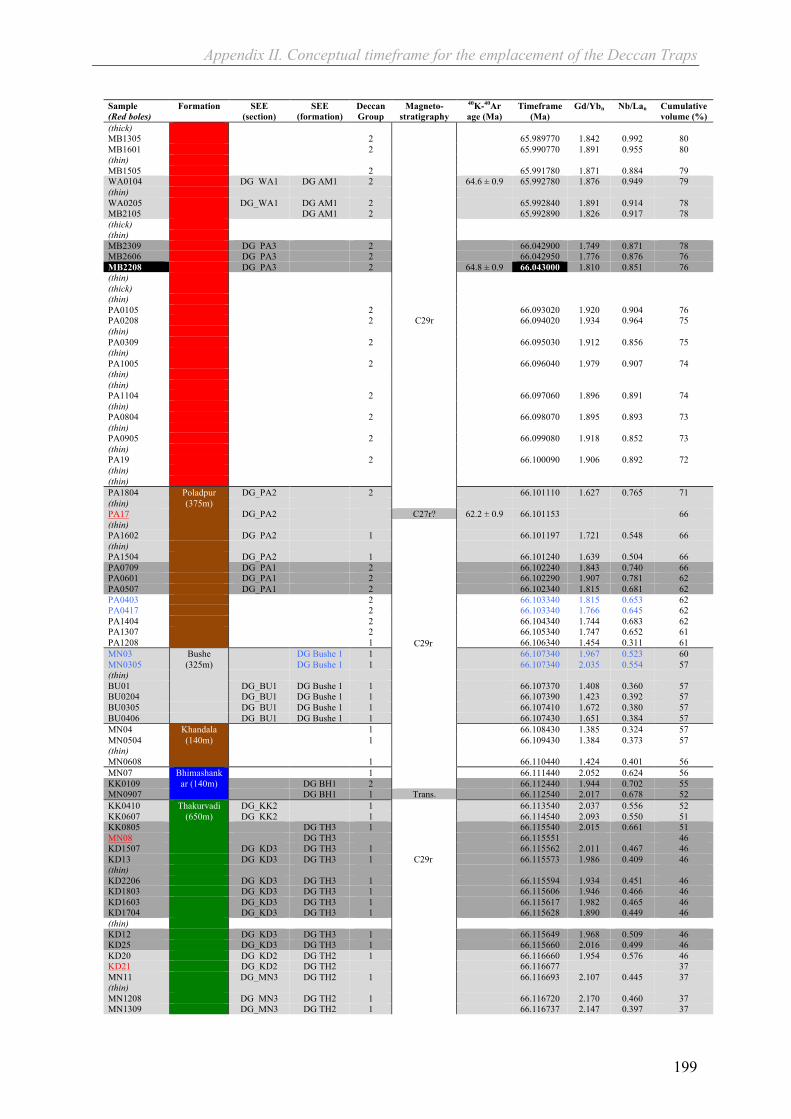
Appendix II. Conceptual timeframe for the emplacement of the Deccan Traps
199
Sample (Red boles)
Formation
SEE (section)
SEE (formation)
Deccan Group
Magneto-stratigraphy
40K-40Ar age (Ma)
Timeframe (Ma)
Gd/Ybn Nb/Lan Cumulative volume (%)
(thick)
MB1305
2
65.989770 1.842 0.992 80
MB1601
2
65.990770 1.891 0.955 80 (thin)
MB1505
2
65.991780 1.871 0.884 79 WA0104 DG_WA1 DG AM1 2 64.6 ± 0.9 65.992780 1.876 0.949 79 (thin)
WA0205 DG_WA1 DG AM1 2 65.992840 1.891 0.914 78 MB2105 DG AM1 2 65.992890 1.826 0.917 78 (thick)
(thin)
MB2309 DG_PA3 2 66.042900 1.749 0.871 78 MB2606 DG_PA3 2 66.042950 1.776 0.876 76 MB2208 DG_PA3 2 64.8 ± 0.9 66.043000 1.810 0.851 76 (thin)
(thick)
(thin)
PA0105
2
66.093020 1.920 0.904 76 PA0208
2 C29r
66.094020 1.934 0.964 75
(thin)
PA0309
2
66.095030 1.912 0.856 75 (thin)
PA1005
2
66.096040 1.979 0.907 74 (thin)
(thin)
PA1104
2
66.097060 1.896 0.891 74
(thin)
PA0804
2
66.098070 1.895 0.893 73
(thin)
PA0905
2
66.099080 1.918 0.852 73
(thin)
PA19
2
66.100090 1.906 0.892 72
(thin)
(thin)
PA1804 Poladpur (375m)
DG_PA2 2 66.101110 1.627 0.765 71 (thin)
PA17 DG_PA2 C27r? 62.2 ± 0.9 66.101153 66 (thin)
PA1602 DG_PA2 1 66.101197 1.721 0.548 66 (thin)
PA1504 DG_PA2 1 66.101240 1.639 0.504 66 PA0709 DG_PA1 2 66.102240 1.843 0.740 66 PA0601 DG_PA1 2 66.102290 1.907 0.781 62 PA0507 DG_PA1 2 66.102340 1.815 0.681 62 PA0403
2
66.103340 1.815 0.653 62
PA0417
2
C29r
66.103340 1.766 0.645 62
PA1404
2
66.104340 1.744 0.683 62 PA1307
2
66.105340 1.747 0.652 61
PA1208 1 66.106340 1.454 0.311 61 MN03 Bushe
(325m)
DG Bushe 1 1 66.107340 1.967 0.523 60 MN0305 DG Bushe 1 1 66.107340 2.035 0.554 57 (thin)
BU01 DG_BU1 DG Bushe 1 1 66.107370 1.408 0.360 57 BU0204 DG_BU1 DG Bushe 1 1 66.107390 1.423 0.392 57 BU0305 DG_BU1 DG Bushe 1 1 66.107410 1.672 0.380 57 BU0406 DG_BU1 DG Bushe 1 1 66.107430 1.651 0.384 57 MN04 Khandala
(140m) 1
66.108430 1.385 0.324 57
MN0504
1
66.109430 1.384 0.373 57 (thin)
MN0608
1
66.110440 1.424 0.401 56 MN07 Bhimashank
ar (140m) 1
66.111440 2.052 0.624 56
KK0109 DG BH1 2 66.112440 1.944 0.702 55 MN0907 DG BH1 1 Trans. 66.112540 2.017 0.678 52 KK0410 Thakurvadi
(650m) DG_KK2 1 66.113540 2.037 0.556 52
KK0607 DG_KK2 1 66.114540 2.093 0.550 51 KK0805 DG TH3 1 66.115540 2.015 0.661 51 MN08 DG TH3 66.115551 46 KD1507 DG_KD3 DG TH3 1
C29r
66.115562 2.011 0.467 46 KD13 DG_KD3 DG TH3 1 66.115573 1.986 0.409 46 (thin)
KD2206 DG_KD3 DG TH3 1 66.115594 1.934 0.451 46 KD1803 DG_KD3 DG TH3 1 66.115606 1.946 0.466 46 KD1603 DG_KD3 DG TH3 1 66.115617 1.982 0.465 46 KD1704 DG_KD3 DG TH3 1 66.115628 1.890 0.449 46 (thin)
KD12 DG_KD3 DG TH3 1 66.115649 1.968 0.509 46 KD25 DG_KD3 DG TH3 1 66.115660 2.016 0.499 46 KD20 DG_KD2 DG TH2 1 66.116660 1.954 0.576 46 KD21 DG_KD2 DG TH2 66.116677 37 MN11 DG_MN3 DG TH2 1 66.116693 2.107 0.445 37 (thin)
MN1208 DG_MN3 DG TH2 1 66.116720 2.170 0.460 37 MN1309 DG_MN3 DG TH2 1 66.116737 2.147 0.397 37
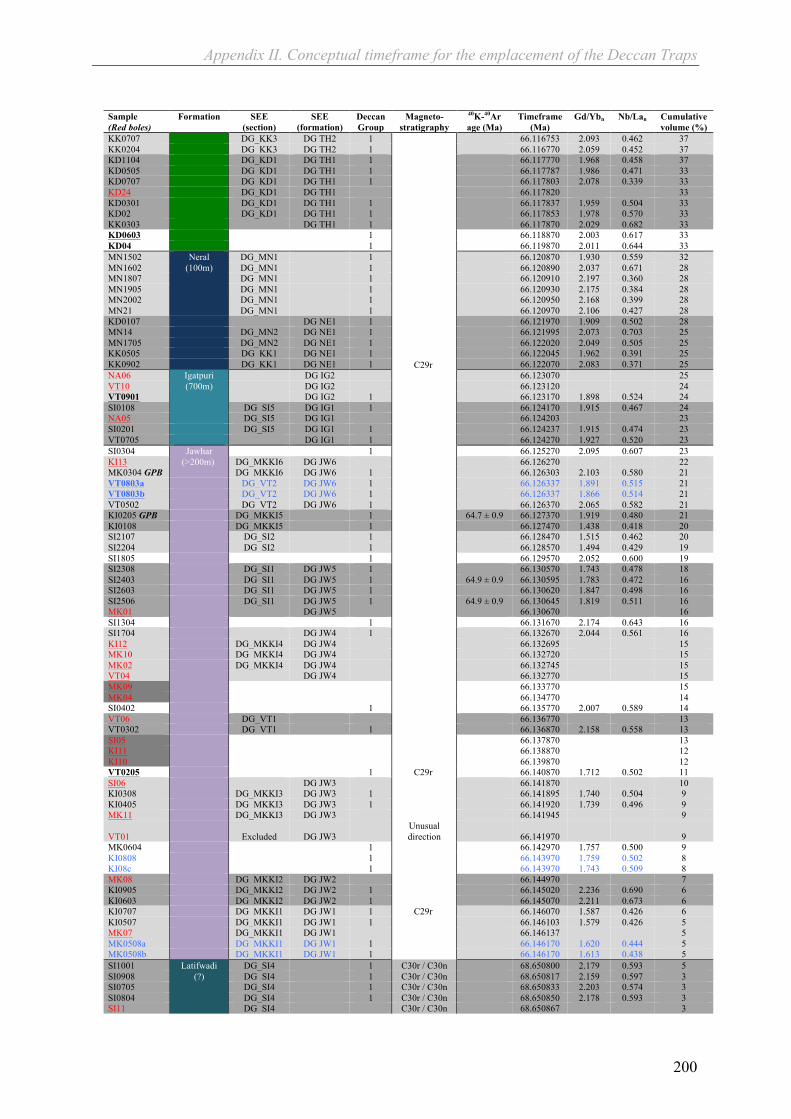
Appendix II. Conceptual timeframe for the emplacement of the Deccan Traps
200
Sample (Red boles)
Formation
SEE (section)
SEE (formation)
Deccan Group
Magneto-stratigraphy
40K-40Ar age (Ma)
Timeframe (Ma)
Gd/Ybn Nb/Lan Cumulative volume (%)
KK0707 DG_KK3 DG TH2 1 66.116753 2.093 0.462 37 KK0204 DG_KK3 DG TH2 1 66.116770 2.059 0.452 37 KD1104 DG_KD1 DG TH1 1
66.117770 1.968 0.458 37
KD0505 DG_KD1 DG TH1 1 66.117787 1.986 0.471 33 KD0707 DG_KD1 DG TH1 1 66.117803 2.078 0.339 33 KD24 DG_KD1 DG TH1 66.117820 33 KD0301 DG_KD1 DG TH1 1 66.117837 1.959 0.504 33 KD02 DG_KD1 DG TH1 1 66.117853 1.978 0.570 33 KK0303 DG TH1 1 66.117870 2.029 0.682 33 KD0603
1
66.118870 2.003 0.617 33
KD04
1
66.119870 2.011 0.644 33 MN1502 Neral
(100m) DG_MN1 1 66.120870 1.930 0.559 32
MN1602 DG_MN1 1 66.120890 2.037 0.671 28 MN1807 DG_MN1 1 66.120910 2.197 0.360 28 MN1905 DG_MN1 1 66.120930 2.175 0.384 28 MN2002 DG_MN1 1 66.120950 2.168 0.399 28 MN21 DG_MN1 1 66.120970 2.106 0.427 28 KD0107 DG NE1 1 66.121970 1.909 0.502 28 MN14 DG_MN2 DG NE1 1
C29r
66.121995 2.073 0.703 25 MN1705 DG_MN2 DG NE1 1 66.122020 2.049 0.505 25 KK0505 DG_KK1 DG NE1 1 66.122045 1.962 0.391 25 KK0902 DG_KK1 DG NE1 1 66.122070 2.083 0.371 25 NA06 Igatpuri
(700m) DG IG2 66.123070 25
VT10 DG IG2 66.123120 24 VT0901 DG IG2 1 66.123170 1.898 0.524 24 SI0108 DG_SI5 DG IG1 1 66.124170 1.915 0.467 24 NA05 DG_SI5 DG IG1 66.124203 23 SI0201 DG_SI5 DG IG1 1 66.124237 1.915 0.474 23 VT0705 DG IG1 1 66.124270 1.927 0.520 23 SI0304 Jawhar
(>200m) 1
66.125270 2.095 0.607 23
KI13 DG_MKKI6 DG JW6 66.126270 22 MK0304 GPB DG_MKKI6 DG JW6 1 66.126303 2.103 0.580 21 VT0803a DG_VT2 DG JW6 1 66.126337 1.891 0.515 21 VT0803b DG_VT2 DG JW6 1 66.126337 1.866 0.514 21 VT0502 DG_VT2 DG JW6 1 66.126370 2.065 0.582 21 KI0205 GPB DG_MKKI5 1 64.7 ± 0.9 66.127370 1.919 0.480 21 KI0108 DG_MKKI5 1 66.127470 1.438 0.418 20 SI2107 DG_SI2 1 66.128470 1.515 0.462 20 SI2204 DG_SI2 1 66.128570 1.494 0.429 19 SI1805
1
66.129570 2.052 0.600 19
SI2308 DG_SI1 DG JW5 1 66.130570 1.743 0.478 18 SI2403 DG_SI1 DG JW5 1 64.9 ± 0.9 66.130595 1.783 0.472 16 SI2603 DG_SI1 DG JW5 1 66.130620 1.847 0.498 16 SI2506 DG_SI1 DG JW5 1 64.9 ± 0.9 66.130645 1.819 0.511 16 MK01 DG JW5 66.130670 16 SI1304
1
66.131670 2.174 0.643 16
SI1704 DG JW4 1 66.132670 2.044 0.561 16 KI12 DG_MKKI4 DG JW4 66.132695 15 MK10 DG_MKKI4 DG JW4 66.132720 15 MK02 DG_MKKI4 DG JW4 66.132745 15 VT04 DG JW4 66.132770 15 MK09
66.133770
15
MK04
66.134770
14 SI0402
1
66.135770 2.007 0.589 14
VT06 DG_VT1 66.136770 13 VT0302 DG_VT1 1 66.136870 2.158 0.558 13 SI05
66.137870
13
KI11
C29r
66.138870
12
KI10
66.139870
12 VT0205
1
66.140870 1.712 0.502 11
SI06 DG JW3 66.141870 10 KI0308 DG_MKKI3 DG JW3 1 66.141895 1.740 0.504 9 KI0405 DG_MKKI3 DG JW3 1 66.141920 1.739 0.496 9 MK11 DG_MKKI3 DG JW3 66.141945 9
VT01 Excluded DG JW3 Unusual
direction 66.141970 9 MK0604
1
66.142970 1.757 0.500 9
KI0808
1
66.143970 1.759 0.502 8 KI08c
1
66.143970 1.743 0.509 8
MK08 DG_MKKI2 DG JW2 66.144970 7 KI0905 DG_MKKI2 DG JW2 1
C29r
66.145020 2.236 0.690 6 KI0603 DG_MKKI2 DG JW2 1 66.145070 2.211 0.673 6 KI0707 DG_MKKI1 DG JW1 1 66.146070 1.587 0.426 6 KI0507 DG_MKKI1 DG JW1 1 66.146103 1.579 0.426 5 MK07 DG_MKKI1 DG JW1 66.146137 5 MK0508a DG_MKKI1 DG JW1 1 66.146170 1.620 0.444 5 MK0508b DG_MKKI1 DG JW1 1 66.146170 1.613 0.438 5 SI1001 Latifwadi
(?) DG_SI4 1 C30r / C30n 68.650800 2.179 0.593 5
SI0908 DG_SI4 1 C30r / C30n 68.650817 2.159 0.597 3 SI0705 DG_SI4 1 C30r / C30n 68.650833 2.203 0.574 3 SI0804 DG_SI4 1 C30r / C30n 68.650850 2.178 0.593 3 SI11 DG_SI4 C30r / C30n 68.650867 3

Appendix II. Conceptual timeframe for the emplacement of the Deccan Traps
201
Sample (Red boles)
Formation
SEE (section)
SEE (formation)
Deccan Group
Magneto-stratigraphy
40K-40Ar age (Ma)
Timeframe (Ma)
Gd/Ybn Nb/Lan Cumulative volume (%)
SI12
DG_SI4 C30r / C30n 68.650883 3 NA03 DG_SI4 C30r / C30n 67.4 ± 1.0 68.650900 3 SI1403a DG_SI3 1 C30r / C30n 68.651900 2.126 0.587 3 SI1403b DG_SI3 1 C30r / C30n 68.651900 2.161 0.597 1 NA04 DG_SI3 C30r / C30n 68.651933 1 SI1508 DG_SI3 1 C30r / C30n 68.651967 2.122 0.586 1 SI1602 DG_SI3 1 C30r / C30n 68.652000 2.140 0.596 1 SI2001 1 C30r / C30n 68.653000 1.529 0.412 1

202

203
III. Electron Probe Micro Analyser (EPMA)
– Basic principles and high-precision
analysis
Appendix III. EPMA – basic principles and high-precision analysis
204
Most of the dataset presented in this thesis has been acquired on a JEOL JXA-8230 EPMA at
ISTerre (Grenoble, France) using combined Energy Dispersive Spectroscopy (EDS) and
Wavelength Dispersive Spectroscopy (WDS) at high current, acceleration voltage and
counting times.
After providing the reader with the basics of electron microscopy and electron-probe
microanalysis, the high-precision EPMA analysis method will be described in details.
III.1. Electron-Probe Micro Analysis – From electrons to X-ray
EPMA is a technique of electron microscopy allowing in-situ elemental analysis for elements
ranging from 4Be to 92U (this range of atomic numbers results from the capacity of an element
to emit x-rays and on how easily it can be detected. See further in the text) at concentrations
down to ~10ppm (depending on the analysed specimen and the operating conditions) and
spatial resolution of about 1µm (also depending on the specimen and the operating
conditions).
Electron microscopy is one of the most versatile sets of techniques for analysing
(composition) and/or observing (shape/morphology) fine structures. It stems from the
multitude of signals emanating from the interaction of an electron beam with matter. Electron
microscopy is a mostly non-destructive technique insofar as it does not require any ablation of
material from the analysed specimen. However, the stability (i.e. capacity to withstand the
energy of the electron beam) of the latter depends on its composition and structure. Figure 1.1
shows some of the signals that arise from the interaction of an electron beam with matter.
These emissions or signals convey compositional as well as morphological and structural
information about the specimen under observation. For example, the latter may be used to
create images up to very high magnification powers (up to ca. two million) or to find out the
structure and orientation of a crystal lattice if the specimen happens to be in a crystallized
state (Secondary Electrons Image (SEI), CathodoLuminescence (CL), Electron BackScatter
Diffraction (EBSD), respectively). On the other hand, the compositional information can be
used to resolve the chemical composition of a sample in various ways: in-situ point analysis,
mapping (as a series of points or as a raster scan) or atomic number contrast (Energy and
Wavelength Dispersive Spectroscopy (EDS/WDS), BackScattered Electron image (BSE),
respectively). Note that electron microscopy cannot be used for acquiring isotopic data.
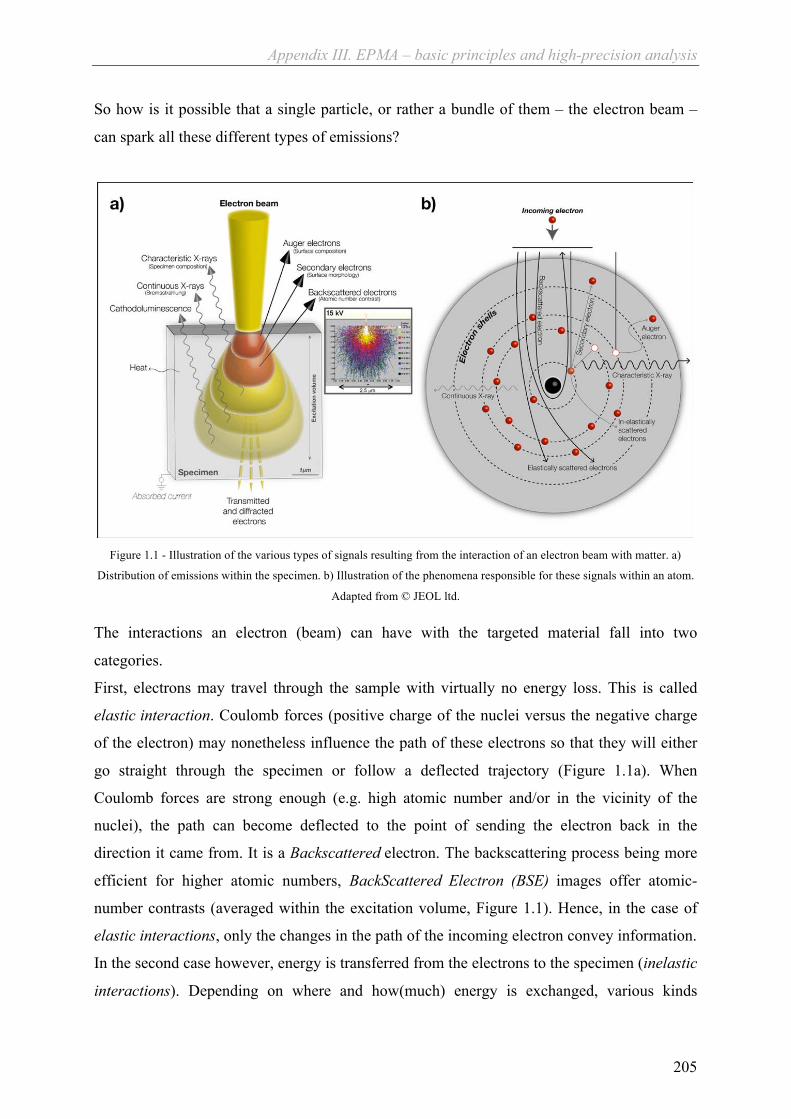
Appendix III. EPMA – basic principles and high-precision analysis
205
So how is it possible that a single particle, or rather a bundle of them – the electron beam –
can spark all these different types of emissions?
Figure 1.1 - Illustration of the various types of signals resulting from the interaction of an electron beam with matter. a)
Distribution of emissions within the specimen. b) Illustration of the phenomena responsible for these signals within an atom.
Adapted from © JEOL ltd.
The interactions an electron (beam) can have with the targeted material fall into two
categories.
First, electrons may travel through the sample with virtually no energy loss. This is called
elastic interaction. Coulomb forces (positive charge of the nuclei versus the negative charge
of the electron) may nonetheless influence the path of these electrons so that they will either
go straight through the specimen or follow a deflected trajectory (Figure 1.1a). When
Coulomb forces are strong enough (e.g. high atomic number and/or in the vicinity of the
nuclei), the path can become deflected to the point of sending the electron back in the
direction it came from. It is a Backscattered electron. The backscattering process being more
efficient for higher atomic numbers, BackScattered Electron (BSE) images offer atomic-
number contrasts (averaged within the excitation volume, Figure 1.1). Hence, in the case of
elastic interactions, only the changes in the path of the incoming electron convey information.
In the second case however, energy is transferred from the electrons to the specimen (inelastic
interactions). Depending on where and how(much) energy is exchanged, various kinds
Appendix III. EPMA – basic principles and high-precision analysis
206
secondary signals will be emitted (Figure 1.1). For example, an electron can collide with
another one to the point of removing it from its shell. The removed electron becomes a
secondary electron. Subsequently, another electron from another shell of the same atom will
replace the missing one (vacancy). Transitions always occur from outer shells towards inner,
higher-energy ones. During this substitution process, characteristic X-ray fluorescence will be
emitted. Furthermore, secondary electrons may still be strong enough to spark further
fluorescence either belonging to the X-ray continuum (Background, Continous X-ray or
Bremsstrahlung) or triggering other characteristic X-ray emissions of lower energies
(secondary fluorescence). Removal of outer shell electrons will not spark characteristic X-ray
emission. Instead, this will merely modify the overall electronic charge of the atom, a
phenomenon that will easily be compensated for by electrons wandering in the surroundings.
Outer shell electrons nonetheless do carry some compositional information (Auger electron).
Finally, at lower energies and for luminescent materials, interactions with the atomic nuclei
will result in cathodoluminscence.
It is important to keep in mind that the electrons (transmitted or scattered, elastically or
inelastically) and the photons emitted whether they be infra-red (heat), visible light
(cathodoluminscence), or X-rays (characteristic or background) do not all come from the
same depth/volume of the specimen and hence in electron microscopy, one does not analyse a
2D-point on the surface of a sample but rather a small volume (µm3) of it. This volume is
generally referred to as excitation volume (Figure 1.1). The size of this volume depends 1 – on
the signal or emission considered (e.g. secondary electrons will only provide the user with
information on the surface of the specimen whereas characteristic X-rays will be emitted from
a much larger volume) and 2 – the overall excitation volume varies with the acceleration
voltage of the electron beam as well as with the average atomic number or density of the
specimen (Figure 1.2). Although generally illustrated as a pear-like structure, the excitation
volume is rather messier in reality. A Monte Carlo simulation of electron trajectories within a
given specimen is presented in the inset of (Figure 1.1a). The beam current on the other hand
has consequences solely on the intensity of what happens within the excitation volume, but
not on its dimensions.
It therefore appears that the observation or analysis of a specimen by electron microscopy
cannot be undertaken without considering what the previous is made of as well as what the
latter is used for. In other words, if one wishes to obtain high-resolution images of the surface
of a sample (secondary electrons), low acceleration voltages should be used (smaller
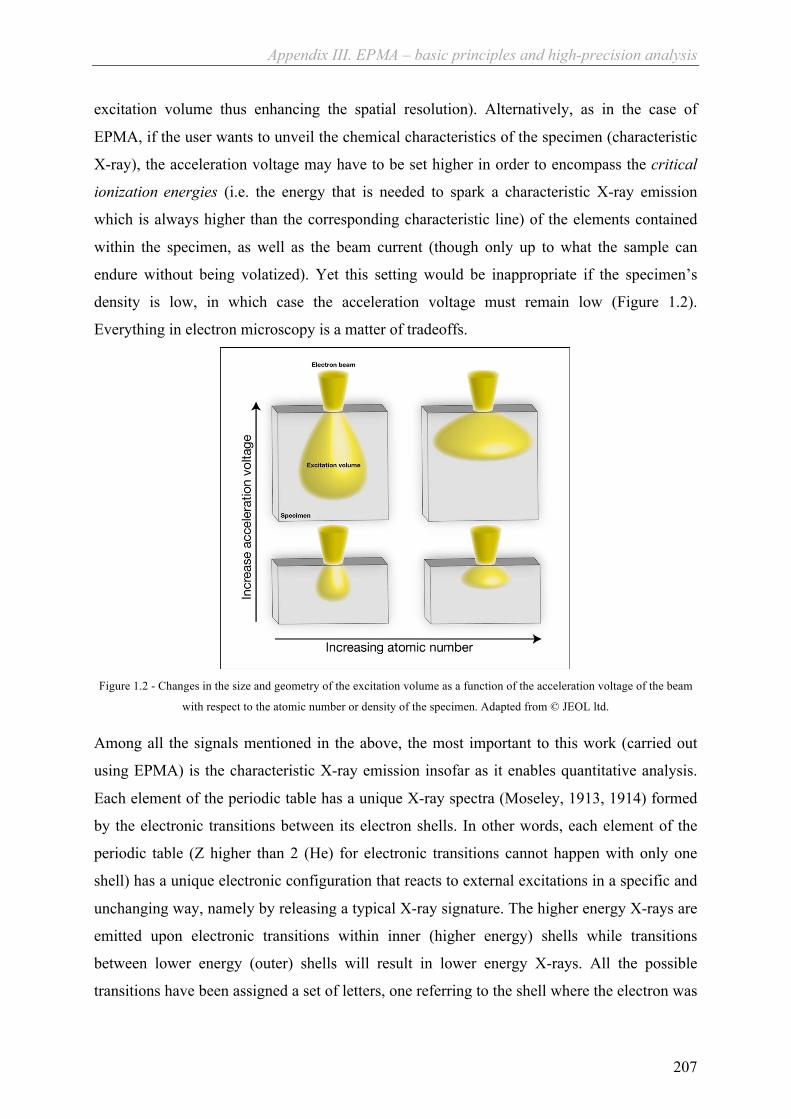
Appendix III. EPMA – basic principles and high-precision analysis
207
excitation volume thus enhancing the spatial resolution). Alternatively, as in the case of
EPMA, if the user wants to unveil the chemical characteristics of the specimen (characteristic
X-ray), the acceleration voltage may have to be set higher in order to encompass the critical
ionization energies (i.e. the energy that is needed to spark a characteristic X-ray emission
which is always higher than the corresponding characteristic line) of the elements contained
within the specimen, as well as the beam current (though only up to what the sample can
endure without being volatized). Yet this setting would be inappropriate if the specimen’s
density is low, in which case the acceleration voltage must remain low (Figure 1.2).
Everything in electron microscopy is a matter of tradeoffs.
Figure 1.2 - Changes in the size and geometry of the excitation volume as a function of the acceleration voltage of the beam
with respect to the atomic number or density of the specimen. Adapted from © JEOL ltd.
Among all the signals mentioned in the above, the most important to this work (carried out
using EPMA) is the characteristic X-ray emission insofar as it enables quantitative analysis.
Each element of the periodic table has a unique X-ray spectra (Moseley, 1913, 1914) formed
by the electronic transitions between its electron shells. In other words, each element of the
periodic table (Z higher than 2 (He) for electronic transitions cannot happen with only one
shell) has a unique electronic configuration that reacts to external excitations in a specific and
unchanging way, namely by releasing a typical X-ray signature. The higher energy X-rays are
emitted upon electronic transitions within inner (higher energy) shells while transitions
between lower energy (outer) shells will result in lower energy X-rays. All the possible
transitions have been assigned a set of letters, one referring to the shell where the electron was

Appendix III. EPMA – basic principles and high-precision analysis
208
removed from and the other, a Greek character often accompanied by an index, indicates
where the replacing electron comes form (Figure 1.3).
Figure 1.3 – Some of the electronic transitions giving rise to emission lines (Thompson et al., 2009)
However, a specimen is not made of a single atom so that many will be excited in the fashion
described above (Figure 1.1 and Figure 1.2). Moreover, the actual characteristic X-ray
signature will be superimposed to the continuous X-ray or background emission (Figure 1.1
and Figure 1.4).
Figure 1.4 - Example of an X-ray fluorescence (EDS) spectra superimposed to the continuous X-ray. The inset shows the first
emission lines (K) of Mn, Fe and Ni in details
There are two important aspects of Figure 1.4: First, the X-ray lines or peaks do not all have
the same height (in counts per s or X-ray photon per s). This is not directly indicative of the
element concentration in the sample but it is a place to start. Secondly, some lines overlap
(see, for example around 5 and 2.5 keV on Figure 1.4). This phenomenon renders both the
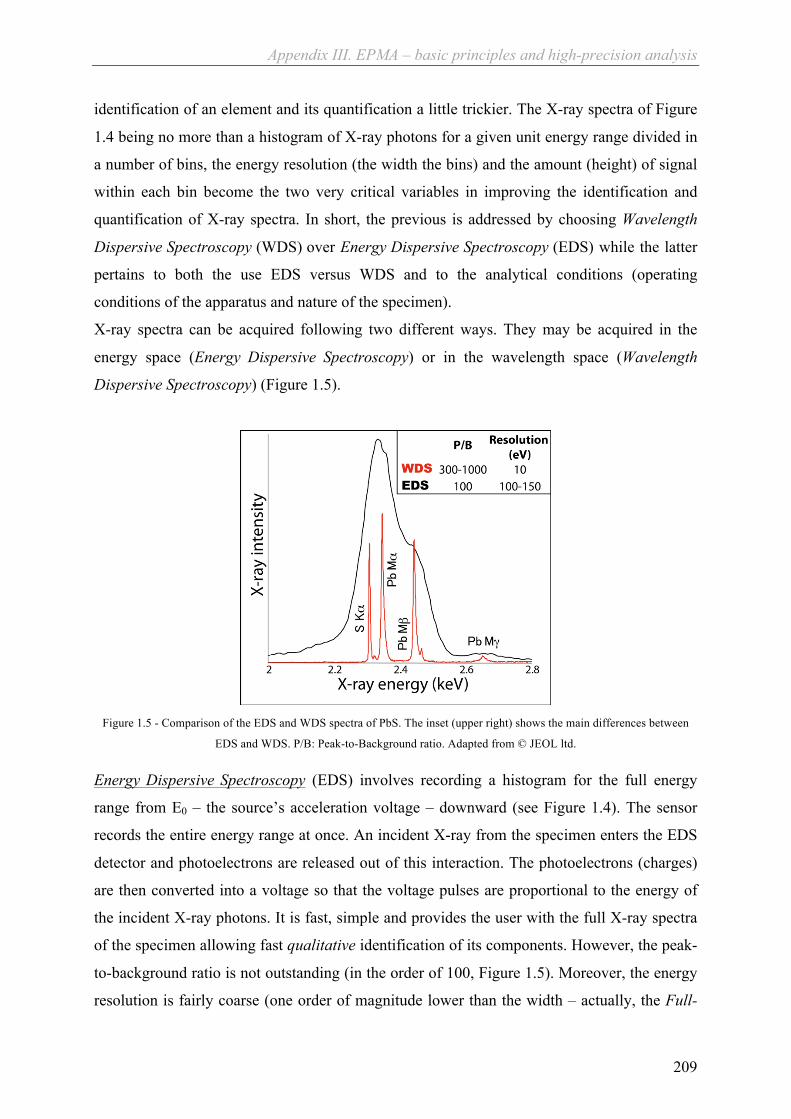
Appendix III. EPMA – basic principles and high-precision analysis
209
identification of an element and its quantification a little trickier. The X-ray spectra of Figure
1.4 being no more than a histogram of X-ray photons for a given unit energy range divided in
a number of bins, the energy resolution (the width the bins) and the amount (height) of signal
within each bin become the two very critical variables in improving the identification and
quantification of X-ray spectra. In short, the previous is addressed by choosing Wavelength
Dispersive Spectroscopy (WDS) over Energy Dispersive Spectroscopy (EDS) while the latter
pertains to both the use EDS versus WDS and to the analytical conditions (operating
conditions of the apparatus and nature of the specimen).
X-ray spectra can be acquired following two different ways. They may be acquired in the
energy space (Energy Dispersive Spectroscopy) or in the wavelength space (Wavelength
Dispersive Spectroscopy) (Figure 1.5).
Figure 1.5 - Comparison of the EDS and WDS spectra of PbS. The inset (upper right) shows the main differences between
EDS and WDS. P/B: Peak-to-Background ratio. Adapted from © JEOL ltd.
Energy Dispersive Spectroscopy (EDS) involves recording a histogram for the full energy
range from E0 – the source’s acceleration voltage – downward (see Figure 1.4). The sensor
records the entire energy range at once. An incident X-ray from the specimen enters the EDS
detector and photoelectrons are released out of this interaction. The photoelectrons (charges)
are then converted into a voltage so that the voltage pulses are proportional to the energy of
the incident X-ray photons. It is fast, simple and provides the user with the full X-ray spectra
of the specimen allowing fast qualitative identification of its components. However, the peak-
to-background ratio is not outstanding (in the order of 100, Figure 1.5). Moreover, the energy
resolution is fairly coarse (one order of magnitude lower than the width – actually, the Full-

Appendix III. EPMA – basic principles and high-precision analysis
210
Width-Half-Maximum of a peak intensity – of an actual X-ray line, which is typically 10eV
wide or less) so that EDS often fails to single out peaks that are close to one another (Figure
1.4, Figure 1.5, Table 1–1). Finally, the user must be aware of some artefacts. These include
peak broadening; peak distortion; escape peak; absorption edges; sum peak and system peak.
Peak broadening results from the convolution of a detector system response with a natural
peak. The natural peak appears wider and the quantification is biased. In brief:
- Peak distortion: the collection of charge carriers (photoelectrons) from some regions
(edges) of the detector is not perfect and results in a deviation from the Gaussian shape
of the low-energy side of a peak
- Escape peak is an artificial peaks that can appear close to any natural one as a result of
K X-ray photons being released within the sensor (e.g. silicon K-lines for a detector
made of silicon. In this case escape peaks could occur at E - KαSi)
- Absorption edge: an EDS detector is isolated from the specimen chamber by a thin
layer or window (typically made of beryllium). Absorption takes place for low energy
photons (the lower energy, the more absorption) and reduces the number of photons
reaching the detector but not their energies. Hence, peak-to-background ratios can
become extremely poor at low energies
- Sum peak occurs during pre-amplification in the detector and results from several
pulses being fully or partially processed at the same time. This is directly linked to the
frequency or counting rate at which the sensor’s pre-amplifier operates
- Finally, system peak is due to the X-ray fluorescence of the detector itself. If it is made
of silicon, KαSi may be detected. This is also true of X-ray tubes (source) used in X-
ray fluorescence instruments – another way of generating EDS spectra is to excite the
specimen with X-rays instead of electrons. For example, Figure 1.4 was recorded on
an Eagle III X-ray fluorescence apparatus that uses a rhodium X-ray tube as a source.
Therefore in the final spectrum rhodium lines will occur (around 20 and 22 keV, not
seen on Figure 1.4)
An exhaustive and accurate review of the mechanisms by which these artefacts are generated
is beyond the scope of this chapter. It is nonetheless critical that the user be aware of these.
Finally, note that EDS and/or Electron Energy Loss Spectroscopy (EELS) are the only options
in the case of Transmission Electron Microscopy (small area of interest) and high-resolution
Scanning Electron Microscopy (low beam current). EELS is based on measuring the energy
lost by the electron beam upon elastic and inelastic interactions while travelling through the

Appendix III. EPMA – basic principles and high-precision analysis
211
specimen. In addition to very high energy resolutions (~1eV) EELS also provides information
as to the state of the material analysed (e.g. EELS can make the difference between two
crystalized polymorphs).
Table 1–1 – Common peak overlaps in X-ray microanalysis
S Kα Mo Lα Pb Mα
Na Kα Zn Lα
Ni Lα La Mα
Zr Lα Pt Mα P kα Ir Mα
Nb Lα Hg Mα
Si Kα W Mα Ta Mα Rb Lα
Al Kα Br Lα
Y Lα Os Mα
O Kα V Lα
Mn Lα Fe Lα F kα
Wavelength Dispersive Spectroscopy (WDS) was proposed for the first time in the very
comprehensive PhD thesis of Raymond Castaing (Castaing, 1951) and aims at increasing both
the peak-to-background ratios and the spectral resolution. It is more complex than EDS and
does not provide the user with a full X-ray spectrum as seen on Figure 1.4. On the other hand,
it enables very accurate quantitative analysis.
With WDS, one looks at X-rays from a wavelength point of view. Energy and wavelength are
related following:
! = ℎ!! (1)
Where E is the energy in J (1eV = 1.602.10-19 J), h the Planck constant (6.63 10-34 m2 kg/s), c
the speed of light in vacuum in (2.99 108 m.s-1) and λ the wavelength in m.
The reason for considering wavelengths instead of energies is that they can be filtered (or
analysed) upon diffraction by crystallized matter following Bragg’s law:
2! sin! = !" (2)
Where d is the lattice spacing of the analysing crystal, θ is the angle of the incident X-ray
with respect to the crystal’s surface, n is an integer and λ the wavelength of the characteristic
X-ray (Figure 1.6). Therefore, by diffracting X-ray using specific crystals with appropriate d
it becomes possible to analyse one specific peak at a time. The spectral resolution becomes
very high (Figure 1.5)
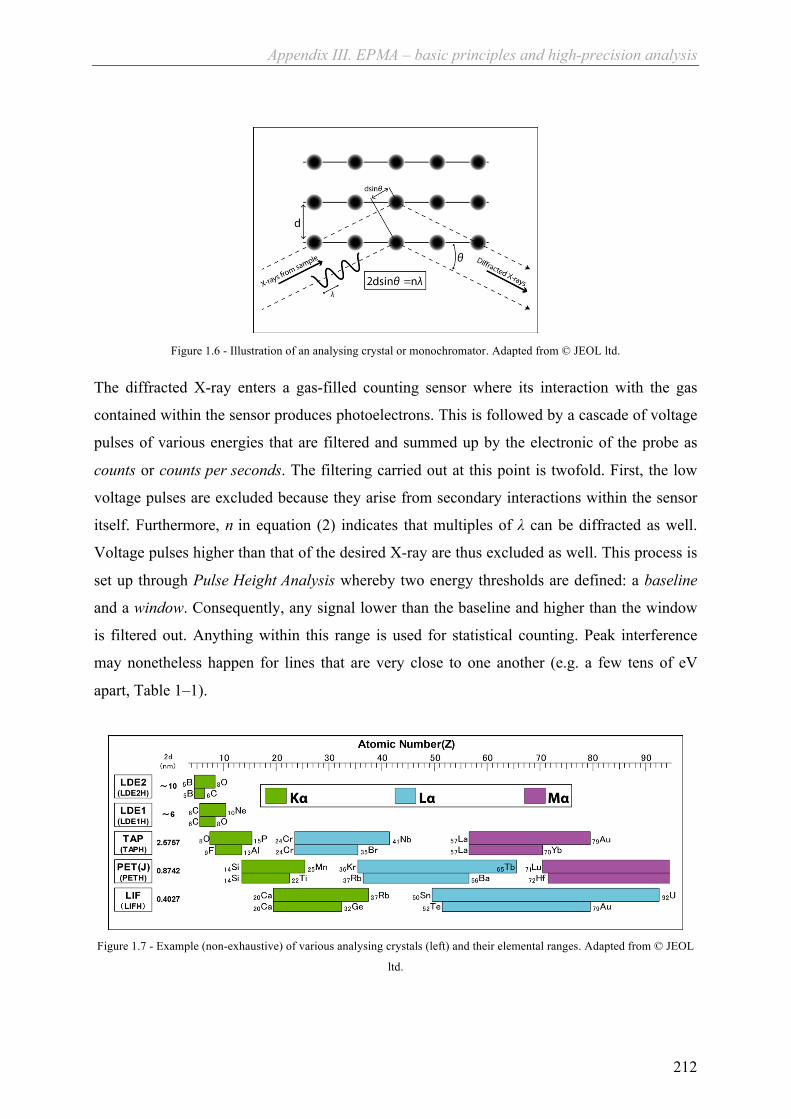
Appendix III. EPMA – basic principles and high-precision analysis
212
Figure 1.6 - Illustration of an analysing crystal or monochromator. Adapted from © JEOL ltd.
The diffracted X-ray enters a gas-filled counting sensor where its interaction with the gas
contained within the sensor produces photoelectrons. This is followed by a cascade of voltage
pulses of various energies that are filtered and summed up by the electronic of the probe as
counts or counts per seconds. The filtering carried out at this point is twofold. First, the low
voltage pulses are excluded because they arise from secondary interactions within the sensor
itself. Furthermore, n in equation (2) indicates that multiples of λ can be diffracted as well.
Voltage pulses higher than that of the desired X-ray are thus excluded as well. This process is
set up through Pulse Height Analysis whereby two energy thresholds are defined: a baseline
and a window. Consequently, any signal lower than the baseline and higher than the window
is filtered out. Anything within this range is used for statistical counting. Peak interference
may nonetheless happen for lines that are very close to one another (e.g. a few tens of eV
apart, Table 1–1).
Figure 1.7 - Example (non-exhaustive) of various analysing crystals (left) and their elemental ranges. Adapted from © JEOL
ltd.

Appendix III. EPMA – basic principles and high-precision analysis
213
An analysing crystal with its own d will only allow a certain range of wavelength (λ) to be
diffracted, θ being the limiting variable. Several crystals with different d are required to cover
most of the periodic table in terms of characteristic X-ray (Figure 1.7). Moreover, while more
than one crystal type may diffract the same given wavelength, they may not all provide an
output signal of equal quality (Figure 1.8).
Figure 1.8 - Ti K � for 200ppm of Ti in olivine analysed by 4 different PET crystals (PET = Pentaerythritol) and 2 kinds of
counters (Ar flow-through vs. Xe sealed). Adatped from (Batanova & Sobolev, 2013)
Finally, lithium is not within the range of elements accessible to WDS for two reasons. First,
its ionization energy is low meaning that the peak-to-background ratio of Li Kα would be very
poor. But most importantly, there exist no crystal for analysing Li Kα X-ray as the lattice
spacing required would be too large. This shortcoming may nonetheless be compensated for
by the use of a Soft X-ray Emission Spectrometer (SXES). SXES uses diffraction gratings and
a CCD camera instead of analysing crystals and gas counters. It works exclusively at low
energies with resolutions of less than 1eV and detection limits comparable or better than that
of high-precision EPMA (a few ppm and sub-ppm level in some cases). SXES may be
coupled to TEM as well as EPMA and used for lights elements K lines (Li to F) or low energy
L lines (Mg to P). (© JEOL ltd.).
III.2. Electron Probe Micro Analysis – quantification
This section is intended as an introduction to how quantitative data can be extracted from the
X-ray line intensities.
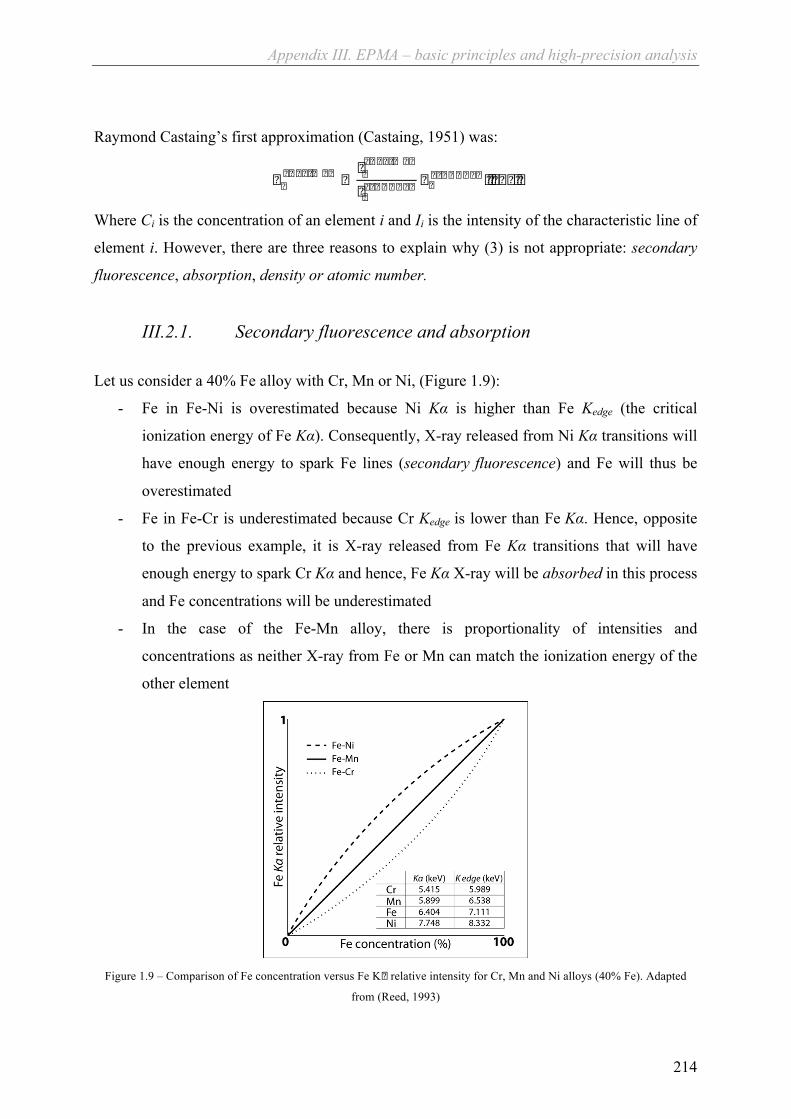
Appendix III. EPMA – basic principles and high-precision analysis
214
Raymond Castaing’s first approximation (Castaing, 1951) was:
� �� � � � � � � � �
� �� � � � � � � �
� � � � � � � � � �� � � � � � � � � � � � � � � � �
Where Ci is the concentration of an element i and Ii is the intensity of the characteristic line of
element i. However, there are three reasons to explain why (3) is not appropriate: secondary
fluorescence, absorption, density or atomic number.
III.2.1. Secondary fluorescence and absorption Let us consider a 40% Fe alloy with Cr, Mn or Ni, (Figure 1.9):
- Fe in Fe-Ni is overestimated because Ni Kα is higher than Fe Kedge (the critical
ionization energy of Fe Kα). Consequently, X-ray released from Ni Kα transitions will
have enough energy to spark Fe lines (secondary fluorescence) and Fe will thus be
overestimated
- Fe in Fe-Cr is underestimated because Cr Kedge is lower than Fe Kα. Hence, opposite
to the previous example, it is X-ray released from Fe Kα transitions that will have
enough energy to spark Cr Kα and hence, Fe Kα X-ray will be absorbed in this process
and Fe concentrations will be underestimated
- In the case of the Fe-Mn alloy, there is proportionality of intensities and
concentrations as neither X-ray from Fe or Mn can match the ionization energy of the
other element
Figure 1.9 – Comparison of Fe concentration versus Fe K� relative intensity for Cr, Mn and Ni alloys (40% Fe). Adapted
from (Reed, 1993)

Appendix III. EPMA – basic principles and high-precision analysis
215
III.2.2. Density or atomic number Figure 1.10 is a simplified illustration of what happens within a specimen made of atoms of
different atomic weights under given observation conditions. One can see that within the
binary compound (middle), the amount of high-Z atoms (grey) in the excitation volume (red)
is equal to that of the pure high-Z compound (right). On the other hand, low-Z atoms (white)
are under-represented in this same binary material compared to the excitation volume of the
pure low-Z material (left).
Figure 1.10 - Excitation volume (red) for a low Z material (left), a higher Z material (right) and an alloy of both (middle).
Modified from (Reed, 1993)
This induces a disproportionality of the characteristic X-ray: the intensity of the high-Z lines
will be similar for the alloy and the pure high-Z specimen while that of the lower-Z lines will
appear smaller even though low-Z are actually more concentrated. Furthermore, it could be
that one of those elements has a characteristic X-ray close to the ionization energy of the other
(secondary fluorescence/absorption). Not to mention that electron backscattering is more
efficient at high Z and beam penetration at low Z. In the end, one can see that proportionality
between intensities and concentrations (3) almost never occurs. A correction based atomic
number and specimen composition is therefore needed.
Equation (3) thus becomes:
� �� � � � � � � � �
� �� � � � � � � � � � � � �
� � � � � � � �
� � � � � � � � � � � � � � � � � � � � � � �� � � � � � � � � � � � � � � � �
Where ZAF is a compound correction coefficient that accounts for the atomic number through
electron penetration and backscattering (Z), absorption (A) and secondary fluorescence (F)
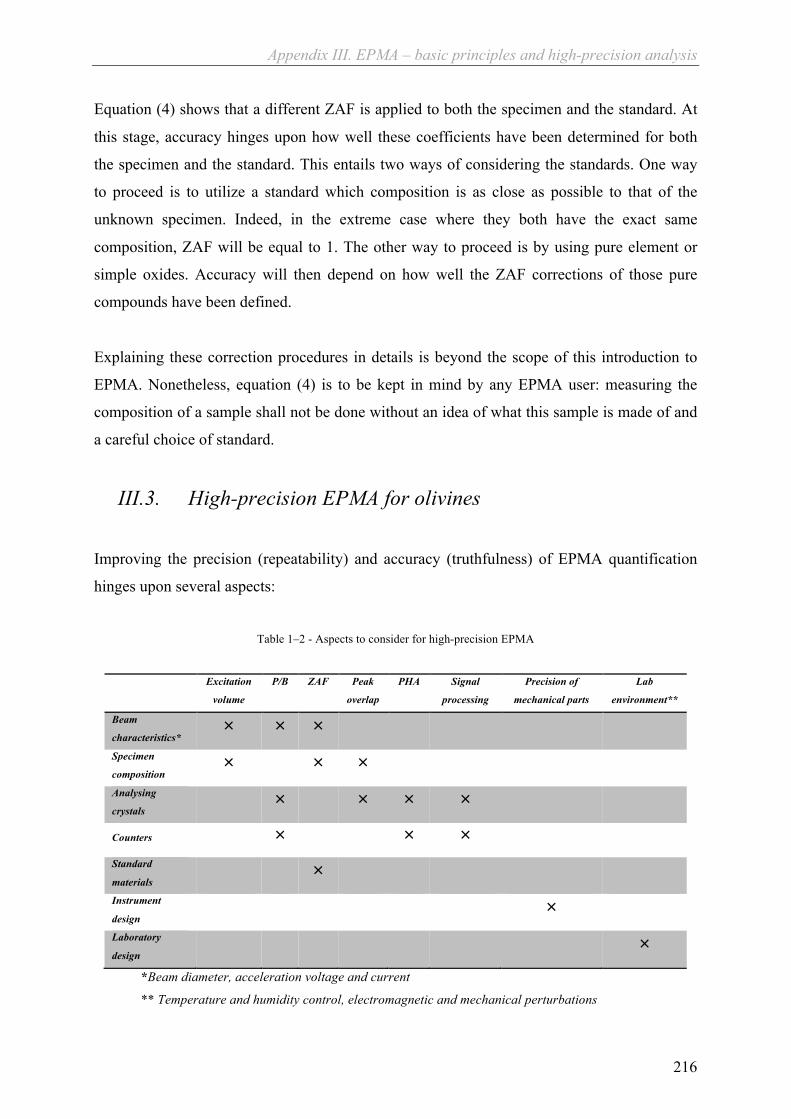
Appendix III. EPMA – basic principles and high-precision analysis
216
Equation (4) shows that a different ZAF is applied to both the specimen and the standard. At
this stage, accuracy hinges upon how well these coefficients have been determined for both
the specimen and the standard. This entails two ways of considering the standards. One way
to proceed is to utilize a standard which composition is as close as possible to that of the
unknown specimen. Indeed, in the extreme case where they both have the exact same
composition, ZAF will be equal to 1. The other way to proceed is by using pure element or
simple oxides. Accuracy will then depend on how well the ZAF corrections of those pure
compounds have been defined.
Explaining these correction procedures in details is beyond the scope of this introduction to
EPMA. Nonetheless, equation (4) is to be kept in mind by any EPMA user: measuring the
composition of a sample shall not be done without an idea of what this sample is made of and
a careful choice of standard.
III.3. High-precision EPMA for olivines
Improving the precision (repeatability) and accuracy (truthfulness) of EPMA quantification
hinges upon several aspects:
Table 1–2 - Aspects to consider for high-precision EPMA
*Beam diameter, acceleration voltage and current
** Temperature and humidity control, electromagnetic and mechanical perturbations
Excitation
volume
P/B ZAF Peak
overlap
PHA Signal
processing
Precision of
mechanical parts
Lab
environment**
Beam
characteristics* × × ×
Specimen
composition ×
× ×
Analysing
crystals ×
× × ×
Counters
×
× ×
Standard
materials ×
Instrument
design ×
Laboratory
design ×
Appendix III. EPMA – basic principles and high-precision analysis
217
All of these aspects are not equally important and more often than not appear in tradeoffs. For
example, high current and acceleration voltage can dramatically improve the peak-to-
background ratios and the counting statistics whilst the size of the excitation volume will
increase, the spatial resolution decrease and the specimen may be damaged. Moreover,
increasing the beam power (power = current × voltage) may simply decrease the precision for
low-density samples, as the energy from the beam would simply be dispersed within a large
volume thereby decreasing the net intensities of characteristic lines (Figure 1.2, Figure 1.10
and Figure 1.12). The same is true of alkali elements like sodium and potassium. They are
volatized by the electron beam and must therefore be measured before any other element, at
low current and acceleration voltages with a defocalized beam (large diameter).
The high-precision method used to analyse olivines in this PhD project is based on a
combination of optimized lab design, probe operating conditions, analysing crystals and well-
known standards.
III.3.1. Lab design The lab is fitted with a high-performance air-conditioning system keeping the room
temperature within ±0.5°C and ±4%RH (Relative Humidity). Maintaining a stable
temperature is important, especially for the analysing crystals as temperature variations may
imply small changes (dilation) in the lattice spacing which is directly linked to the diffracted
wavelength (equation 2).
Along with temperature and humidity controls, low electromagnetic and mechanic
perturbations help the stability of the electron beam.
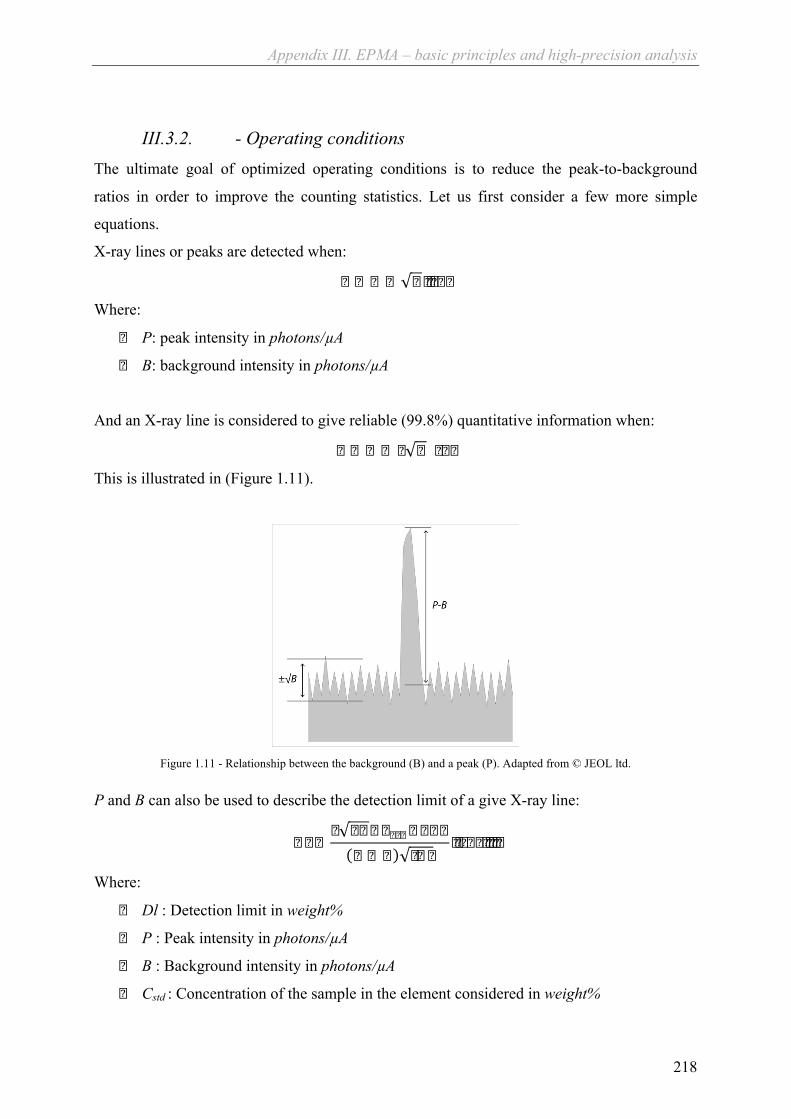
Appendix III. EPMA – basic principles and high-precision analysis
218
III.3.2. - Operating conditions The ultimate goal of optimized operating conditions is to reduce the peak-to-background
ratios in order to improve the counting statistics. Let us first consider a few more simple
equations.
X-ray lines or peaks are detected when:
� � � � � � � � � �
Where:
� P: peak intensity in photons/µA
� B: background intensity in photons/µA
And an X-ray line is considered to give reliable (99.8%) quantitative information when:
� � � � � � � � �
This is illustrated in (Figure 1.11).
Figure 1.11 - Relationship between the background (B) and a peak (P). Adapted from © JEOL ltd.
P and B can also be used to describe the detection limit of a give X-ray line:
� � �� � � � � � � � � � � �
� � � � � �� � � � � � � � � �
Where:
� Dl : Detection limit in weight%
� P : Peak intensity in photons/µA
� B : Background intensity in photons/µA
� Cstd : Concentration of the sample in the element considered in weight%

Appendix III. EPMA – basic principles and high-precision analysis
219
� ZAF : Matrix correction factor(s)
� i : Probe current in µA
� t : Counting time in s
Finally, equation (7) can be reformulated as follows:
� � �� � � � � � � � � � �
� � �� � �� � � � �
Equations (7) and (8) show that the easiest way to decrease Dl is to reduce the peak-to-
background ratio (P2/B) and that this is best achieved by increasing i and t, namely, the probe
current and the counting time. P/B is also enhanced by higher acceleration voltage although
this depends on the atomic number of the atoms targeted. For light elements (Z<10), the
acceleration voltage should not be higher than about 10kV (Figure 1.12).

Appendix III. EPMA – basic principles and high-precision analysis
220
Figure 1.12 - X-ray intensities as a function of the accelerating voltage and atomic number (Z>10 and Z<10). Adapted from
© JEOL ltd.
Olivine turns out to be resistant to high beam power. Moreover, it is not a low-density
material and it is made of elements which atomic numbers are generally higher than 10.
Therefore, the acceleration voltage it set to 25kV and the probe current to several hundreds of
nano-amperes with counting times of several minutes.
The early version of this high-precision method has been explained in (Sobolev et al., 2007).
In this paper, Sobolev and co-workers explained the capabilities of high-precision EPMA and
published the first high-precision dataset for olivines form various geological settings. They
illustrated the strength of high-precision EPMA in the following figure (Figure 1.13).
Figure 1.13 - The detection limits of olivine high-precision EPMA confronted to those of routine analysis. Modified from
(Sobolev et al., 2007)
Figure 1.13 shows that Sobolev and co-workers did not increase the probe current higher than
300nA yet most of the olivine dataset presented in this thesis has been acquired at 900nA.
This improvement was made possible by combining EDS and WDS. While this was not
possible on the probe used by Sobolev and colleagues in 2007, the new EPMA (JEOL JXA
8230) installed at ISTerre in 2011 is fully capable of combining both types spectrometers. The
reason behind this technical aspect is that at beam currents higher than 300nA X-ray lines of
major elements (Si, Fe and Mg) are so intense they overshoot the saturation point of the WDS
counters and cannot be measured at all. Upon combining WDS and EDS however, one can
analyse those major elements with EDS which saturation level is much higher than that of
WDS spectrometers. The low spectral resolution and peak-to-background ratios are partially
compensated for by high counting statistics. Minor and trace elements on the other hand, are

Appendix III. EPMA – basic principles and high-precision analysis
221
measured by WDS. This allows to move farther towards the bottom right of Figure 1.13
thereby reaching detection limits of a few (<10) ppm for Mn and other elements.
Under these conditions, the spatial resolution (max diameter of the excitation volume) is
about 2µm3. Upon comparing this value to the resolution capabilities of another analytical
tool capable of similar accuracies and precisions, namely that of Laser Ablation-Inductively
Coupled Mass Spectrometry (LA-ICP MS, Figure 1.14), the advantages of EPMA become
obvious. In the case of Figure 1.14, not only does LA-ICP MS fail to resolve the fine zoning
of this olivine grain, and will not return meaningful and reproducible (precise) compositional
data either. Finally, note that Figure 1.14 was acquired at 300nA, not 900nA. Indeed, it is a
qualitative (i.e. not quantitative) specimen map were counting statistics do not really matter as
soon as a significant peak can be detected above the background (equation 6). Moreover, in
order to obtain such a map, the high-current beam stays on the same specimen grain for
several hours and over-heating is an issue (melting of the epoxy resin holding the specimen).
Therefore, it has been decided to lower the beam current for this acquisition.
Figure 1.14 - WDS map of phosphorus K � (PETH analysing crystal) at 300nA and 25kV with a 2ms dwell time for a San
Carlos olivine grain and comparison of the resolution power of EPMA (1 pixel) versus that of Laser Ablation Inductively
Coupled Mass Spectrometer (LA-ICP MS, black laser pit indicated on the image). Modified from (Batanova & Sobolev,
2013)

Appendix III. EPMA – basic principles and high-precision analysis
222
III.3.3. Standards The high-precision EPMA protocol for olivine uses standard specimens in two different ways.
First and foremost, a combination of natural and pure oxide standards is used in the
calibration of the apparatus whereby both the spectrometers and the statistical processing are
adjusted for all the elements analysed (Table 1–3).
Table 1–3 - List of standard specimens for high-precision olivine analysis
Element Standard
Si Olivine San Carlos (USNM111312-44)
Mg Olivine San Carlos (USNM111312-44)
Fe Olivine San Carlos (USNM111312-44)
Al Pure Al2O3
Na Albite
Ca Wollastonite
P Apatite Durango
Co Pure CoO
Zn ZnS
Ti Pure TiO2
Ni Pure NiO
Mn Rhodonite
Cr Pure Cr2O3
All these reference specimens are internationally recognized and their respective
compositions are either simple (pure oxides) or well established (i.e. analysed many times by
different techniques). Major elements (Si, Fe and Mg) are calibrated using a natural olivine
standard (San Carlos olivine, (DeHoog et al., 2010)) as the matrix corrections (ZAF) will be
close to that of the unknown sample being processed, namely olivine. Additionally, the matrix
corrections of major elements have more consequences on the final quantitative result than
minor and trace elements. It is therefore important to use natural specimens at this stage.
Minor and trace elements on the other hand are calibrated using either pure oxides or natural
samples (for those which are not easily synthesised as simple compounds). Matrix effects of
minor and trace elements have much less effects on the overall quantification simply because
of their lower concentrations.

Appendix III. EPMA – basic principles and high-precision analysis
223
In addition to this calibration stage, standard specimens are used during the quantitative
analysis sequence by intercalating three San Carlos olivine standards every forty unknown
specimens. By doing so the user is able to closely monitor changes in the repeatability of the
measurements (precision) and adjust the final results accordingly.
III.3.4. - Summary of the high-precision protocol Table 1–4 is a summary of the high-precision EPMA protocol for olivine. Table 1–4 also
mentions that olivine being non-conductive specimens must be coated with conductive matter
in order to drain away the beam current (otherwise the specimen would turn into a capacitor).
A thin carbon film of about 15nm deposited by sputtering under high vacuum takes on this
task. It is worth noting that all the standard specimens must have a coating thickness similar to
that of the specimen. Indeed this thin layer at the surface of the sample absorbs some of the
signals from both the beam and the analysed material. It is therefore important that this
absorption be equal everywhere. As for the choice of carbon over other coating materials like
gold, it appears carbon is easy to use, fairly cheap and absorbs far less signal than e.g. gold.
Table 1–4 - Summary of the olivine high-precision EPMA protocol
Element Dwell time
(s)
Standard Crystal Counter Detection limit
(ppm)
1σ error
(ppm)
Si 500 Olivine San Carlos (USNM111312-44) EDS (SDD) 800
Mg 500 Olivine San Carlos (USNM111312-44) EDS (SDD) 90
Fe 500 Olivine San Carlos (USNM111312-44) EDS (SDD) 100
Al 180 Pure Al2O3 TAPJ Ar gas flow 5 8 - 10
Na 160 Albite TAPJ Ar gas flow 9 10
Ca 160 Wollastonite TAPH Ar gas flow 4 3 - 5
P 180 Apatite Durango PETH Ar gas flow 5 6 - 10
Co 160 Pure CoO LIFL Xe sealed 5 4 - 6
Zn 180 ZnS LIFL Xe sealed 6 4 - 7
Ti 180 Pure TiO2 PETH Xe sealed 3 2 - 4
Ni 160 Pure NiO LIFH Xe sealed 4 8 - 10
Mn 180 Rhodonite LIFH Xe sealed 3 2 - 4
Cr 160 Pure Cr2O3 LIFH Xe sealed 4 2 - 4
Operating conditions: 25kV, 900nA
Carbon coating by sputtering in high-vacuum: 15 ±3 nm
Appendix III. EPMA – basic principles and high-precision analysis
224
III.3.5. Comparison with LA-ICP MS data LA-ICP MS is an in-situ adaptation of ICP MS (Inductively Coupled Plasma Mass
Spectrometry, whereby elements are separated according to their mass (instead of there X-ray
signature as in EPMA) upon laser ablation (LA). This paragraph is intended to show that LA-
ICP MS has limitations that may be counterbalanced by the advantages of EPMA and vice
versa. In short, combining EPMA and LA-ICP MS may prove to be the most efficient set of
analytical techniques for petrology and geochemistry.
While EPMA probes the composition of a specimen by analysing its response to an external
excitation (non-destructive), mass spectrometry is fundamentally different in that it measures
concentrations by sampling a tiny fraction of the analysed specimen, turning it into plasma
and then separating and counting the various elements in presence according to their mass.
This technique is therefore destructive: a tiny fraction of the original specimen has to be
removed and destroyed. Moreover, the integrated signal received by the counters of an ICP
MS depends on the number of atoms of a given element it receives. Therefore, the lower the
concentration of this element in the specimen, the more material needed and, in the case of
LA-ICP MS, the larger the laser spot and the lower the spatial resolution. It has indeed been
shown (Figure 1.14) that EPMA has a much higher (about one order of magnitude higher)
spatial resolution than LA-ICP MS. This is a drawback since the fine phosphorus zoning
(linked to the crystal’s growth rate) of the olivine grain presented in this figure is not
accounted for. Not being able to resolve this, or any other zoning for that matter, not only
prevents the user to access this information – which may prove critical – it also decreases the
precision (repeatability) of the measurement: analysing the grain of Figure 1.14 with laser
ablation mass spectroscopy several times on several locations means not having an equal
proportion of P-rich and P-poor zones in all these locations and hence, precision will
decrease.
Figure 1.15 shows the error bars (precision) of high-precision EPMA versus LA-ICP MS for a
large range of minor and trace elements in olivine. It appears that the precision of EPMA is
better than that of LA-ICP MS down to concentrations of about 100ppm where the both
precisions are similar. At lower concentrations, LA-ICP MS turns out to be more precise
(Figure 1.15 a and b). Nonetheless, Figure 1.15c shows that in some cases, EPMA may have
precisions similar to LA-ICP MS down to 60ppm. The reasons behind these changes in
precisions with concentrations from one instrument to the other are as follows: First LA-ICP
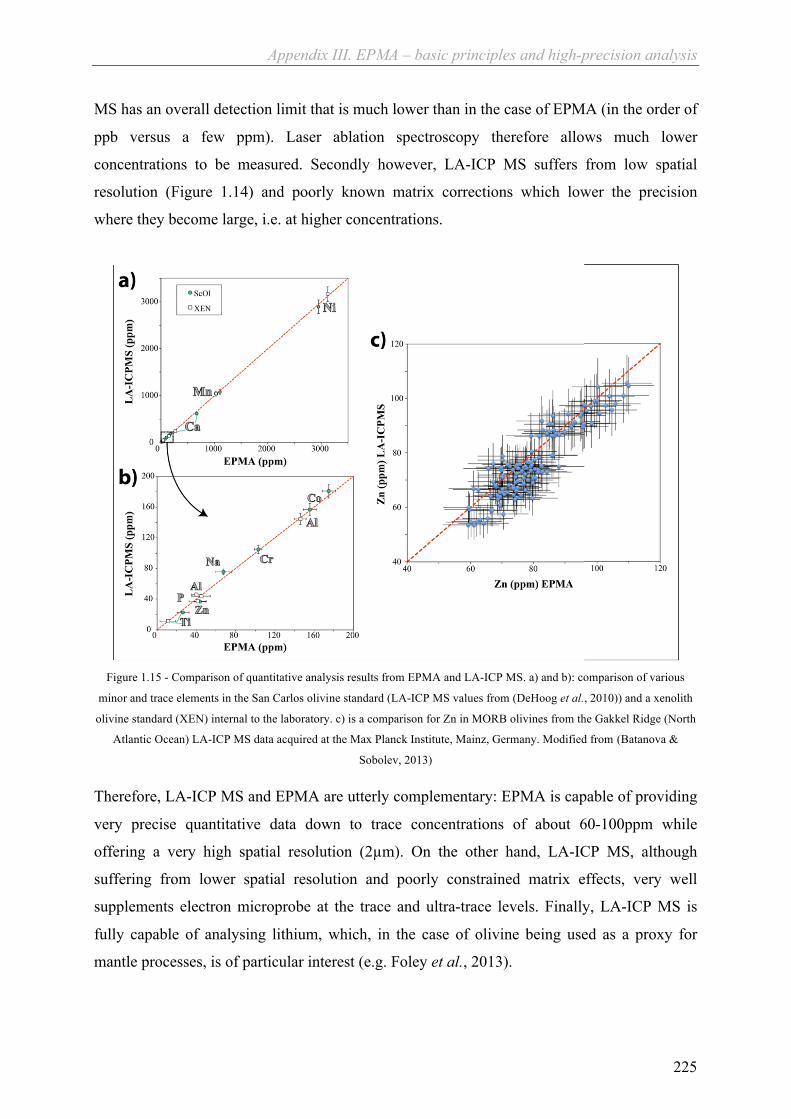
Appendix III. EPMA – basic principles and high-precision analysis
225
MS has an overall detection limit that is much lower than in the case of EPMA (in the order of
ppb versus a few ppm). Laser ablation spectroscopy therefore allows much lower
concentrations to be measured. Secondly however, LA-ICP MS suffers from low spatial
resolution (Figure 1.14) and poorly known matrix corrections which lower the precision
where they become large, i.e. at higher concentrations.
Figure 1.15 - Comparison of quantitative analysis results from EPMA and LA-ICP MS. a) and b): comparison of various
minor and trace elements in the San Carlos olivine standard (LA-ICP MS values from (DeHoog et al., 2010)) and a xenolith
olivine standard (XEN) internal to the laboratory. c) is a comparison for Zn in MORB olivines from the Gakkel Ridge (North
Atlantic Ocean) LA-ICP MS data acquired at the Max Planck Institute, Mainz, Germany. Modified from (Batanova &
Sobolev, 2013)
Therefore, LA-ICP MS and EPMA are utterly complementary: EPMA is capable of providing
very precise quantitative data down to trace concentrations of about 60-100ppm while
offering a very high spatial resolution (2µm). On the other hand, LA-ICP MS, although
suffering from lower spatial resolution and poorly constrained matrix effects, very well
supplements electron microprobe at the trace and ultra-trace levels. Finally, LA-ICP MS is
fully capable of analysing lithium, which, in the case of olivine being used as a proxy for
mantle processes, is of particular interest (e.g. Foley et al., 2013).

Appendix III. EPMA – basic principles and high-precision analysis
226
III.4. EPMA protocols for specimens other than olivines
Not only has EPMA been used in this project for high-precision olivine analysis, important
proxies within the olivine itself, namely spinels and melt inclusions, have also been analysed
this way. Olivine spinel inclusions afford information about the crystallisation temperatures
and the oxygen fugacity and melt inclusions are proxies for both magmatic temperatures and
primary melt compositions (section 7). None of these inclusions may be analysed at high
current and acceleration voltage for they are not stable under such conditions (i.e. they would
be volatized).
Table 1–5 gathers the analytical conditions and standard specimens used for analysing melt
inclusions. All elements are analysed at low current first. This allows for good estimates of
the average composition. Moreover, alkalis are not volatized under these conditions. The
same inclusions are then processed one more time at higher current for better quantification of
volatiles (S and Cl are proxies for SO2 and HCl contents and K2O is assumed to be close to
the water content of the parental magma). Mn and Fe are re-analysed for correlating high and
low current datasets. Fe is also critical in correcting the melt inclusion composition for
crystallisation and inter-diffusion with olivine (section 7.1.1).
Table 1–5 - Summary of the analytical protocol for melt inclusions
Melt inclusions - low current Melt inclusions - high current
Element Dwell time
(s)
Crystal Standard Element Dwell time
(s)
Crystal Standard
(20kV / 20nA)
Si 60 TAP VG-2 glass K 120 PETJ Orthoclase
Al 60 TAP VG-2 glass Cl 120 PETL Cancrinite
Cl 40 PETL Cancrinite S 120 PETH ZnS
S 40 PETL ZnS Fe 120 LIFH VG-2 glass
P 40 PETL Apatite Mn 120 LIFH Rhodonite
Na 30 TAPH Albite Operating conditions: 20kV, 200nA
Mg 60 TAPH VG-2 glass
Ca 60 PETH VG-2 glass
K 40 PETH Orthoclase
Ti 60 PETH TiO2 (rutile)
Fe 60 LIFH VG-2 glass
Mn 60 LIFH Rhodonite
Operating conditions: 15kV, 12nA
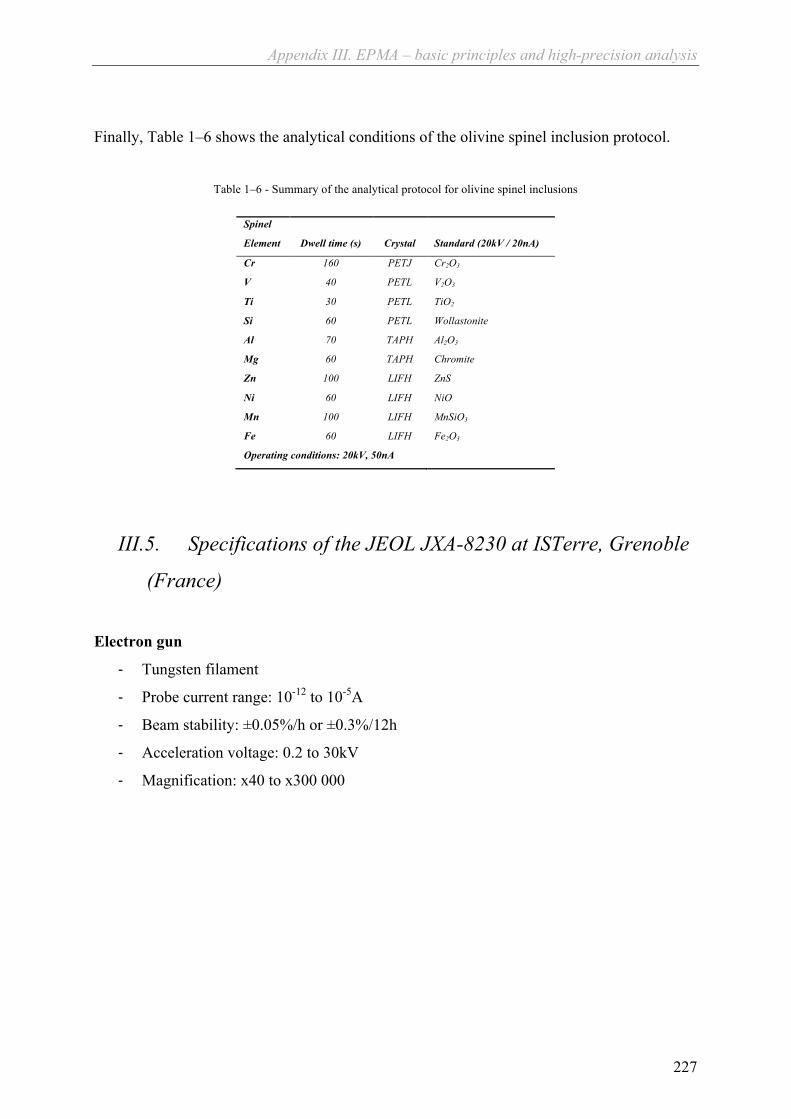
Appendix III. EPMA – basic principles and high-precision analysis
227
Finally, Table 1–6 shows the analytical conditions of the olivine spinel inclusion protocol.
Table 1–6 - Summary of the analytical protocol for olivine spinel inclusions
Spinel
Element Dwell time (s) Crystal Standard (20kV / 20nA)
Cr 160 PETJ Cr2O3
V 40 PETL V2O3
Ti 30 PETL TiO2
Si 60 PETL Wollastonite
Al 70 TAPH Al2O3
Mg 60 TAPH Chromite
Zn 100 LIFH ZnS
Ni 60 LIFH NiO
Mn 100 LIFH MnSiO3
Fe 60 LIFH Fe2O3
Operating conditions: 20kV, 50nA
III.5. Specifications of the JEOL JXA-8230 at ISTerre, Grenoble
(France)
Electron gun
-‐ Tungsten filament
-‐ Probe current range: 10-12 to 10-5A
-‐ Beam stability: ±0.05%/h or ±0.3%/12h
-‐ Acceleration voltage: 0.2 to 30kV
-‐ Magnification: x40 to x300 000
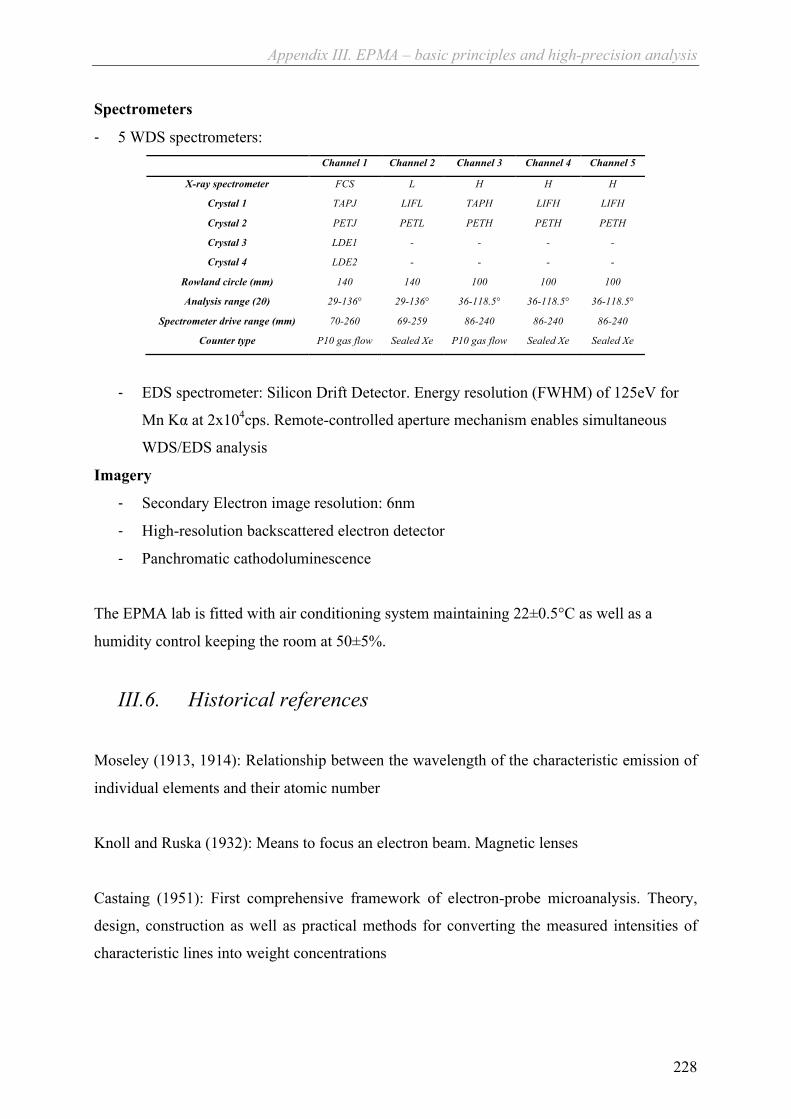
Appendix III. EPMA – basic principles and high-precision analysis
228
Spectrometers
-‐ 5 WDS spectrometers: Channel 1 Channel 2 Channel 3 Channel 4 Channel 5
X-ray spectrometer FCS L H H H
Crystal 1 TAPJ LIFL TAPH LIFH LIFH
Crystal 2 PETJ PETL PETH PETH PETH
Crystal 3 LDE1 - - - -
Crystal 4 LDE2 - - - -
Rowland circle (mm) 140 140 100 100 100
Analysis range (2θ) 29-136° 29-136° 36-118.5° 36-118.5° 36-118.5°
Spectrometer drive range (mm) 70-260 69-259 86-240 86-240 86-240
Counter type P10 gas flow Sealed Xe P10 gas flow Sealed Xe Sealed Xe
-‐ EDS spectrometer: Silicon Drift Detector. Energy resolution (FWHM) of 125eV for
Mn Kα at 2x10⁴cps. Remote-controlled aperture mechanism enables simultaneous
WDS/EDS analysis
Imagery
-‐ Secondary Electron image resolution: 6nm
-‐ High-resolution backscattered electron detector
-‐ Panchromatic cathodoluminescence
The EPMA lab is fitted with air conditioning system maintaining 22±0.5°C as well as a
humidity control keeping the room at 50±5%.
III.6. Historical references
Moseley (1913, 1914): Relationship between the wavelength of the characteristic emission of
individual elements and their atomic number
Knoll and Ruska (1932): Means to focus an electron beam. Magnetic lenses
Castaing (1951): First comprehensive framework of electron-probe microanalysis. Theory,
design, construction as well as practical methods for converting the measured intensities of
characteristic lines into weight concentrations

Appendix III. EPMA – basic principles and high-precision analysis
229
First commercial microprobe built by Cameca (France) in 1958
McMullen (1953): First electron micrograph using secondary electrons (surface image).
Prototype of many commercial instruments for the next 40 years
Duncumb and Melford (1957): Scanning technique applies to microanalysis
Long (1958) and Agrell and Long (1960): First application to geological samples
Mulvey (1960): first commercial instrument designed specifically for geological applications
“Geoscan”

230
231
IV. Résumé en français

232

Appendix IV Résumé en français
233
IV.1. Objectifs de la thèse
L’objectif général de cette thèse est de participer à l’étude du rôle des Trapps du Deccan vis-
à-vis de l’extinction de masse de la limite Crétacé-Paléogène (K-Pg). Plus précisément, il
s’agit de comprendre les processus magmatiques capables de générer des provinces
magmatiques telles que les Trapps du Deccan et d’en évaluer les conséquences à la surface de
la Terre : en reconstruisant la composition et l’environnement physique des sources
magmatiques des Trapps du Deccan au cours du temps, de nouvelles contraintes peuvent être
obtenues quant à la fusion de ces dernières et au dégazage des magmas. Ces données peuvent
ensuite être confrontées à la littérature existante afin d’estimer les conséquences
environnementales de telles éruptions.
Cette thèse est une application des travaux d’Alexander V. Sobolev sur les Trapps de Sibérie
(Sobolev et al., 2011) à un contexte radicalement différent. En effet, les Trapps de Sibérie ont
été mises en place dans un contexte tectonique compressif à une époque au cours de laquelle
l’océan mondial était vulnérable à l’acidification par les retombées volcaniques. A l’inverse,
les Trapps du Deccan ont été mises en place dans un contexte tectonique extensif, lors d’une
des plus rapide dérive continentale de l’histoire de la Terre (celle de l’Inde à travers l’Océan
Indien), alors que la chimie des océans était relativement plus stable et moins vulnérable à
l’acidification. La combinaison de l’éruption des Trapps du Deccan avec l’impact de
Chicxulub (Alvarez et al., 1980) à la limite Crétacé-Paleogène, et l’absence d’impact majeur
connu à la limite Permien-Trias (Trapps de Sibérie), constituent une différence
supplémentaire entre les deux évènements.
Cette thèse aborde la formation des Trapps du Deccan en quatre chapitres (la modélisation des
conséquences climatiques de la mise en place des provinces magmatiques n’y est cependant
pas abordé. Cette thématique fait l’objet d’une thèse en cours à l’Institut de Physique du
Globe de Paris) :
- La durée et l’intensité de l’éruption des Trapps du Deccan sont des paramètres
essentiels à l’évaluation des conséquences environnementales du volcanisme. Un
nouveau scénario temporel, exclusivement basé sur la réinterprétation des travaux de
thèse d’Anne-Lise Chenet et collaborateurs en radiochronologie et paléomagnétisme
dans les Western Ghats (Chenet et al., 2007, 2008, 2009), ainsi que sur une synthèse
de la littérature existante est proposé.

Appendix IV Résumé en français
234
- Ce scénario temporel est ensuite couplé à des données de chimie roche totale en
éléments majeurs et traces (Bonnefoy, 2005). Cette étape permet de mettre en
évidence les variations de profondeur des sources et de contamination crustale des
magmas au cours du temps. Elle permet aussi d’évaluer les conséquences en terme de
productivité magmatique et de dégazage.
- Des échantillons picritiques à phénocristaux d’olivines provenant du Deccan (stade
précoce du panache mantellique) et de la Réunion (stade final de ce même panache)
ont permis de mettre en évidence : 1) L’existence d’une lithologie ne contenant pas
d’olivine dans les sources des Trapps du Deccan et de l’île de la Réunion, ce qui a des
répercussions importantes sur la productivité magmatique, les interactions lithosphère-
panache et sur le dégazage. 2) La composition en volatiles (K2O, H2O, Cl, SO2) des
magmas et 3) la composition et la température des liquides primaires à l’origine des
magmas.
- Enfin, les données obtenues par analyse des phénocristaux d’olivines sont combinées
aux observations des sections précédentes (épaisseur lithosphérique, pression,
contamination crustale) et utilisées pour reconstituer les sources magmatiques des
Trapps du Deccan (tête de panache) et de l’île de la Réunion (queue de panache).
IV.2. Scénario temporel continu de l’éruption des Trapps du
Deccan et couplage à la géochimie roche totale
IV.2.1. Scénario temporel continu de l’éruption des Trapps du
Deccan
Les données de paléomagnétisme haute résolution de Chenet et al (2008, 2009) et les
datations radiochronologiques de Chenet et al (2007) on été réinterprétées et comparées à
diverses études en liens avec la durée de mise en place des Trapps du Deccan (horizons
d’altération ou red boles, Giant Plagioclase Basalts et données paléoenvironnementales), dans
le but d’obtenir un scénario continu de l’éruption de cette province magmatique (Figure 3.1).
La mise en place des Trapps du Deccan – ou tout au moins de la province principale – s’est
déroulée en trois étapes (Chenet et al., 2007) :

Appendix IV Résumé en français
235
- La première phase (phase 1) correspond à environ 10 % du volume total des Trapps et
s’est produite à la transition C30r-C30n, il y a environ 68.65 Ma
- La seconde (phase 2) implique la mise en place de 70 à 80 % du volume de la
province principale des Trapps du Deccan en environ 50 ka il y a environ 66.10 Ma
(C29r). La fin de cette phase éruptive principale semble coïncider avec la limite
Crétacé-Paléogène
- La phase finale (phase 3) représente 10 à 20 % du volume totale quelques 300 ka après
la limite Crétacé Paléogène, de transition C29r-C29n et se prolongeant dans C29n
(~65.8 Ma)
Les épisodes éruptifs précoces (Gujarat), périphériques (Subba Rao, 1972), ou tardifs
(formations plus récentes que Mahabaleshwar) ne sont pas intégrés au scénario présenté ici.
Le volume de ces épisodes volcaniques n’est généralement pas considéré comme supérieur à
10% du volume total des Trapps du Deccan (Paul et al., 2008, Hooper et al., 2010).
A elle seule, la seconde et principale phase éruptive (phase 2) pourrait avoir été responsable
de l’extinction de masse de la fin du Crétacé (Keller et al., 2012). Cette phase représenterait la
mise en place de 8.105 km3 de laves (Sen, 2001, Courtillot & Renne, 2003) en 50 ka (Figure
3.1). Ceci correspond à environ 160 fois le flux de lave actuel de l’archipel volcanique
d’Hawaii (Courtillot et al., 1986). De plus, la phase 2 est constituée de 25 épisodes de très
courte durée (~100 ans) identifiés grace aux données paléomagnétiques (Directional Groups)
Le plus important Directional Groupd identifié aurait pu correspondre à un flux moyen
d’environ 160km3/an (formation Thakurvadi : Chenet et al., 2009). Ce résultat est en accord
avec des données récentes de diffusion isotopique du strontium dans les Giant Plagioclase
Basalts, impliquant la mise en place de formations entières des Trapps du Deccan en moins de
1 ka (Borges et al., 2013).
Les horizons d’altérations, ou red boles (les red bole d’épaisseur centimétrique, ou thin red
boles se forment en une dizaine d’années alors que leurs homologues d’épaisseurs métriques
nécessiteraient 50 ka pour se former : Chenet et al., 2008, 2009), apparaissent à la fin de la
phase principale (phase 2, Ambenali). Il est intéressant de noter que d’une part les red bole
centimétriques (thin red boles) sont les premiers à apparaître dans Thakurvadi. Ils semblent
ensuite être remplacés par des red boles métriques (thick red boles) dans Ambenali et
Mahabaleshwar, puis à nouveau remplacés par des red boles centimétriques dans
Appendix IV Résumé en français
236
Mahabaleshwar. D’autre part, aucun « red bole » métrique (thick) n’est inclus dans un des 25
courts épisodes volcaniques (Directional Group : Chenet et al., 2008, 2009) identifiés grace
au paléomagnétisme. En revanche, des « red boles » centimétriques (thin), décrits comme
pouvant se former en quelques années (Chenet et al., 2008, 2009, Sayyed, 2013) ont été
observés au sein de ces groupes directionnels ou directional groups, ce qui atteste d’un
processus d’altération rapide.
Le scénario éruptif proposé en Figure 3.1 est ensuite comparé aux paléotempératures des
océans (Li & Keller, 1998) ainsi qu’à l’évolution du rapport 187Os/188Os dans les carbonates
pélagiques (Robinson et al., 2009) (Figure 3.2).
Figure 3.1 montre que l’augmentation de la fréquence des red boles et de leur épaisseur est
associée à un épisode éruptif cataclysmique (phase 2). Figure 3.2 indique que cette phase
éruptive majeure est aussi associée à une baisse du rapport 187Os/188Os, et à des variations de
température dans les eaux intermédiaires de l’océan global. Il est possible que ces variations
puissent avoir été causées par un changement climatique, lui-même induit par une intense
activité volcanique (relargage dans l’atmosphère de grandes quantités de CO2 et SO2 durant la
phase 2). Ce changement climatique aurait affecté l’intensité moyenne des précipitations et
accéléré les processus d’érosion. Une forte érosion tend à réduire le rapport 187Os/188Os dans
les carbonates pélagiques. Ce même rapport isotopique aurait aussi baissé grâce à la
couverture d’un craton (le craton indien dont le rapport 187Os/188Os est haut) par des basaltes
(bas 187Os/188Os), eux mêmes très sensibles à l’érosion. (Robinson et al., 2009).
L'interprétation de la Figure 3.2 n’est néanmoins pas si simple.
D’abord, bien que la transition C30r-C30n ait été enregistrée à la fois par les Trapps du
Deccan et par la section composite dans les carbonates pélagiques (Chenet et al., 2007,
Robinson et al., 2009), la phase 1 n’est pas visible dans l’enregistrement du rapport 187Os/188Os (Figure 3.2). Il est proposé que la faible intensité de la phase 1 n’a pas été
suffisante pour affecté le climat global.
D’autre part, le début du refroidissement général de la fin du Crétacé (Late-Cretaceous
Cooling, ex : Li & Keller, 1998), contemporain de l’excursion en 187Os/188Os rapportée par
Robinson et al, ainsi que des biozones CF2 et CF1 (Keller et al., 2012), semble s’être produit
environ 0.5 Ma avant le début de la phase 2 de l’éruption des Trapps du Deccan. Or les

Appendix IV Résumé en français
237
excursions de températures (Li & Keller, 1998) et de rapports isotopiques (Vonhof & Smit,
1997, MacLeod et al., 2001, Ravizza & Peucker-Ehrenbrink, 2003, Robinson et al., 2009) ont
aussi été interprétés comme des conséquences de l’intense volcanisme du Deccan. La
réinterprétation des évènements liés aux Trapps du Deccan proposée dans cette section est en
accord avec un scénario dans lequel le réchauffement de la fin du Crétacé et la première
excursion de 187Os/188Os observée par Robinson et al – laquelle est aussi observée dans
d’autres systèmes isotopiques (Li & Keller, 1998, Ravizza & Peucker-Ehrenbrink, 2003) –
aurait été la conséquence d’une intense activité volcanique. Cependant, la durée de la
première excursion en 187Os/188Os notée par Robinson et al (~0.3 Ma), elle-même similaire à
celle du réchauffement tardif de la fin du Crétacé, n’est compatible ni avec la durée de la
phase 2 de l’éruption du Deccan (Chenet et al., 2007), ni avec la survenue de la limite K-Pg à
la fin de cette dernière (Keller et al., 2011). De plus, Robinson et al ont souligné que la
première excursion en 187Os/188Os n’est associée à aucune conséquence environnementale
majeure et en concluent que la mise en place des Trapps du Deccan n’a probablement pas eu
de rôle majeur dans l’extinction de la fin du Crétacé. Cette conclusion est en contradiction
avec ce qui est observé dans le bassin Krishna-Godavari, à l’Est du Deccan. D’une part, les
Trapps du Deccan sont clairement associées à une perte de biodiversité dans le biozone CF1.
D’autre part, la phase 2 du Deccan (phase principale) apparaît clairement contenir la limite K-
Pg (Keller et al., 2011, 2012). Parallèlement, la durée et l’intensité de la première excursion
en 187Os/188Os de Robinson et al ne paraît pas non plus en accord avec l’existence d’éruptions
paroxysmales indiquées par les groupes directionnels observés en paléomagnétisme et par les
« Giant Plagioclase Basalt flows ». Enfin, le faible nombre de « red boles » observés dans la
première moitié de la phase 2 indique que l’activité volcanique y était très soutenue. Par
conséquent, l’hypothèse selon laquelle la première excursion en 187Os/188Os aurait été causée
par la phase éruptive principale des Trapps du Deccan paraît très incertaine.
La seconde excursion en 187Os/188Os décrite par Robinson et al (2009) (Figure 3.2) semble
d’avantage compatible avec la phase 2 de l’éruption des Trapps du Deccan.
A ce stade, il est important de garder en tête que l’existence d’importantes divergences dans
les modèles d’âges utilisés en sédimentologie, ne peut être écartée. Par exemple, Ravizza et
Peucker-Ehrenbrink (2003) placent la phase principale de l’éruption des Trapps du Deccan à
la transition C30n-C29r alors que Chenet et al (2009) la place dans C29r.
Appendix IV Résumé en français
238
Si la seconde éruption en 187Os/188Os de Robinson et al correspond effectivement à la phase 2
des Trapps du Deccan (ce qui serait alors en accord avec un grand nombre d’observations
indépendantes, telles que les groupes directionnels paléomagnétiques, les « Giant Plagioclase
Basalts », les biozones, et les « red boles »), il reste à trouver une explication pour l’existence
de le première excursion en 187Os/188Os (Figure 3.2). Cette excursion a été mesurée dans des
échantillons montrant une orientation paléomagnétique inverse. Si cette excursion est une
trace de l’activité précoce des Trapps du Deccan, cette polarité inverse devrait être celle de
C30r. Ceci impliquerait une discordance de plus de 2 Ma soit entre les âges modèles
sédimentologiques, soit dans les données radiométriques (Chenet et al., 2007). Un intervalle
de 2 Ma représente deux fois la barre d’erreur moyenne des résultats de Chenet et al. Il est
également peu probable qu’une telle erreur soit possible alors que les âges sédimentaires sont
couplés à des données paléomagnétiques (Robinson et al., 2009). D’autre part, comme il a été
dit plus haut, plusieurs auteurs ont observé des excursions isotopiques sur des périodes
similaires. Il est donc probable qu’une baisse en 187Os/188Os dans les carbonates pélagiques se
soit produite dans C29r, au cours des derniers 0.5 Ma du Crétacé.
Dès lors, comment est-il possible d’accommoder l’intervalle entre les phases 1 et 2 du Deccan
(>2 Ma) et l’existence d’une excursion en 187Os/188Os avant la phase éruptive principale
(phase 2)? Il a été suggéré que l’impact de Chicxulub pourrait être plus âgé que la limite K-Pg
d’environ 0.3 Ma (Keller et al., 2004a, 2004b, Schulte et al., 2008). Cependant, Alvarez
(2003) souligne qu’un intervalle d’une durée supérieure à 0.1 Ma entre la phase principale de
l’éruption du Deccan et l’impact de Chicxulub serait facilement identifiable dans les sections
sédimentaires contenant la limite K-Pg. Il est aussi possible que plusieurs impacts
météoritiques aient pu se produire aux alentours de la limite K-Pg (Keller et al., 2003).
Pourtant, de multiples impacts auraient certainement résulté en d’importantes excursions
isotopiques, plus importantes que celles présentées par Robinson et al (2009). Sans oublier
que l’observation conjointe d’excursion en 187Os/188Os ainsi que dans le système isotopique
du Strontium exclue l’implication de matériel extraterrestre (voir section 3.5.2 du manuscrit).
Une autre possibilité consisterait à attribuer les excursions isotopiques au panache du Deccan.
Sobolev et al (2011) ont montré que l’incubation d’un panache mantellique sous la lithosphère
pouvait être à l’origine d’un dégazage significatif et suffisant pour créer d’importants
dommages à l’environnement, avant même qu’une quelconque éruption se soit produite.
Tester la validité d’une telle hypothèse nécessite de connaître la concentration des magmas en
Appendix IV Résumé en français
239
éléments volatiles. Cet aspect est traité en section 6.5. Ce scénario implique aussi qu’un
simple dégazage serait capable d’affecter les systèmes isotopiques sensibles au volcanisme. Si
il est raisonnable de penser que l’injection de grandes quantités de CO2, SO2 et HCl dans
l’atmosphère affecterait profondément le climat global, l’apparition d’une source de bas 187Os/188Os et 87Sr/86Sr (telle que des basaltes) disponible au processus d’érosion et/ou la
disparition d’une autre source de haut 187Os/188Os et 87Sr/86Sr (telles que le craton indien,
recouvert par les basaltes des Trapps du Deccan) demeure inexpliquée.
Enfin, la non-exhaustivité de l’échantillonnage ne peut pas être exclue. Au vu de l’étendue et
du volume des Trapps du Deccan, il est possible que des coulées (ou des « red boles ») aient
pu être omises entre phase 1 et 2, ou même dans la phase 2 elle même. Par exemple, la
transition Bushe-Poladpur de Chenet et al n’est pas complète (Chenet et al., 2009). De plus,
les calculs de volume proposés par Chenet et al ne permettent d’expliquer que moins de 30%
du volume totale des Trapps du Deccan (Sen, 2001). Une part importante de ce volume
manquant pourrait se trouver à l’ouest de l’Inde (Minshull et al., 2008, Owen-Smith et al.,
2013). Par ailleurs, les essaims de dykes et des études de modélisation des paléo-stresses dans
la plaque indienne (Vanderkluysen et al., 2011, Ju et al., 2013) combinées à des données de
paléo-topographie (Hooper et al., 2010, Sheth & Pande, 2013) indiquent que l’emplacement
des Trapps du Deccan aurait du être symétrique de part et d’autre de l’escarpement des
« Western Ghats ». Dans ce cas, la sous-estimation du volume de Chenet et al (2009) serait
entièrement due à une sous-estimation de l’étendue latérale de la province magmatique, et non
pas à la non-exhaustivité potentielle de l’échantillonnage. Il apparaît donc peu probable que
l’existence de coulées cachées sous les Trapps pourrait expliquer l’important volume
manquant ainsi que l’excursion précoce en 187Os/188Os.
IV.2.2. Couplage à la géochimie roche totale
Le scénario temporel de la mise en place des Trapps du Deccan présenté dans la section
précédente a été couplé aux compositions en éléments majeurs et traces des échantillons
utilisés en paléomagnétisme de haute résolution par Chenet et al (2008, 2009). Ces données
géochimiques ont été acquises à l’occasion du stage de master de Benjamin Bonnefoy à
l’IPGP, Paris (Bonnefoy, 2005).

Appendix IV Résumé en français
240
Il apparaît que la composition de ces échantillons, notamment en terme d’éléments traces,
n’est pas homogène (Figure 5.3).
Les échantillons ont été divisés en deux classes, Deccan1 et Deccan2. Celles-ci diffèrent par
leurs enrichissements en éléments incompatibles et leurs anomalies en Nb, Pd, Sr et Ti.
Malgré ces différences, les signatures en éléments compatibles sont remarquablement
parallèles. Deccan1 montre par exemple, un Nb/Lan moyen plus bas et un enrichissement en
éléments incompatibles plus fort, que Deccan2. Ces deux sous ensembles partagent cependant
un enrichissement en éléments compatibles comparable et par conséquent, un rapport Gd/Ybn
moyen relativement identique. De manière plus générale, les indices de contamination
crustale (ex : Nb/Lan) semblent anti-corrélés avec ceux qui indiquent une composition
primitive des laves (ex : Mg#, Figure 5.5). Une telle observation a déjà été rapportée dans la
littérature au sujet des Trapps du Deccan (Cox & Hawkesworth, 1985, Devey & Cox, 1987).
Deccan1 semble ainsi plus primitive (et beaucoup plus hétérogène) que Deccan2 malgré des
indices montrant une contamination crustale plus importante.
Les données roche totale et, plus particulièrement, des rapports élémentaires témoignant de
paramètres géodynamiques importants tels que la contamination crustale (Nb/Lan) et la
profondeur de la source (Gd/Ybn), peuvent à présent être ajoutés à la Figure 3.1 pour donner
la Figure 5.7. Cette figure permet d’observer que les signatures Deccan1 et Deccan2 sont
séparées le long de la séquence de Trapps du Deccan. Deccan1 constitue principalement les
formations inférieures, jusqu’à Poladpur, alors que Deccan2 n’est exprimée que dans les
formations supérieures. La transition entre Deccan1 et Deccan2 s’opère entre les formations
Khandala et Poladpur. Nb/Lan augmente alors d’environ 0.4 à plus de 0.8. Gd/Ybn augmente
aussi d’environ 1.4 à plus de 1.9 mais la valeur moyenne de ce rapport entre Deccan1 et
Deccan2 reste comparable (Figure 5.5). Ceci implique une diminution importante de la
contamination crustale entre Deccan1 et 2. Les variations importantes de Gd/Ybn durant la
mise en place des formations Khandala, Bushe et Poladpur implique que les sources
mantelliques des Trapps du Deccan se sont, au moins momentanément, retrouvées à des
profondeurs suffisamment faibles pour être en dehors du champ de stabilité du Grenat (P <
2.4 GPa). De plus, si le scénario temporel est correct, cette transition entre Deccan 1 et 2
n’aurait duré que 20 ka.
L’excursion négative de Gd/Ybn et Nb/Lan des formations Khandala, Bushe et Poladpur n’est
pas unique dans les Trapps du Deccan. En effet, plusieurs excursions similaires, quoi que de

Appendix IV Résumé en français
241
moins forte intensité, peuvent être remarquées en Figure 5.7 dans les formations Jawhar
(inférieure et supérieure) et Poladpur (supérieure).
Toutes les coulées faisant partie de ces excursions ne portent aucun signe d’érosion ou
d’altération et contiennent des groupes directionnels paléomagnétiques. Ceci indique avec une
quasi-certitude que les excursions négatives en Gd/Ybn et Nb/Lan se sont produites sur de très
courts intervalles de temps.
Les rapports élémentaires présentés ici peuvent être comparés à d’autres provinces
magmatiques, telles que les Trapps de Sibérie (Figure 5.6).
Il peut être noté qu’à l’exception de quelques coulées appartenant à la base de la section de
Norislk, l’ensemble des laves sibériennes ne montre aucun signe de signature du grenat
(Gd/Ybn > 1.6). Il s’agit d’une différence majeure entre les Trapps du Deccan et celles de
Sibérie.
Sobolev et al (2011) ont montré qu’un panache mantellique était capable d’éroder la
lithosphère et de réduire son épaisseur d’environ 50 % en 50 Ma. De plus, Sobolev et al ont
proposé que, dans le cas de Trapps de Sibérie, l’érosion intense et généralisée de la
lithosphère explique la forte baisse du rapport Gd/Ybn (depuis des valeurs supérieures à 1.6 à
inférieures à 1.5), laquelle implique que les sources magmatiques ne se trouvaient plus dans le
champ de stabilité du grenat après cet épisode d’érosion. Enfin, Sobolev et al notent qu’une
telle réduction de l’épaisseur de la lithosphère n’aurait pu avoir lieu si cette dernière avait eu
une épaisseur initiale plus importante.
Les variations de rapports d’éléments traces dans les laves du Deccan sont compatibles avec
les propositions de Sobolev et al (2011) : le panache du Deccan est entré en contact avec une
lithosphère épaisse (~140 km) et les premiers magmas ont été émis de manière plus précoce
que dans le cas sibérien, en empruntant des zones de faiblesses préexistantes à travers le
craton indien (Murthy, 2002, Biwas, 2005). Dans ce contexte, l’érosion de la lithosphère
induite par l’activité du panache mantellique doit être plus limitée et plus localisée que dans le
cas d’une lithosphère moins épaisse et plus imperméable aux magmas émis pas le panache
(Trapps de Sibérie). Dans le cas Sibérien, il a effectivement été noté que l’érosion généralisée
du craton sibérien n’avait été possible que parce que la lithosphère était notablement
imperméable aux magmas produits par le panache. A l’inverse, l’érosion localisée de la
lithosphère indienne aurait tout de même pu favoriser la remontée de matériel mantellique
proche de la croute. L’importante advection thermique aurait alors participé à une
accentuation de la fusion par décompression et de l’assimilation crustale par assimilation et
Appendix IV Résumé en français
242
transport turbulent (Huppert & Sparks, 1985). L’échelle de temps nécessaire à ces
phénomènes a été estimée, sur la base de calculs numériques, aux alentours de 50 ka. Cette
durée est parfaitement compatible avec la durée de la phase 2 de l’éruption des Trapps du
Deccan (~70 % du volume total en 50 ka, Figure 5.7). Il est proposé ici que les trois ou quatre
excursions de faible Gd/Ybn et Nb/Lan pourraient témoigner d’un unique épisode d’érosion
lithosphérique. Le retour rapide à des valeurs moyennes de ces deux rapports dans la
formation Poladpur peut être expliqué par la formation d’un bouchon de restite (ex
Harzburgite), plus légère que la péridotite fertile et la pyroxenite du panache et/ou du manteau
environnant. La formation d’un tel bouchon entrainerait une augmentation de la profondeur de
fusion de la tête du panache. Parallèlement, la baisse associée des indices de contamination
crustale serait expliquée par la maturation des conduits magmatiques causée par le passage
des précédents magmas.
Les formations supérieures (Wai) ont été mises en place suivant ce même régime final (source
profonde, faible contamination crustale), comme le suggèrent les périodes de quiescence
volcanique (« red boles ») et les volumes de lave plus faibles. Il doit cependant être noté que
le sous-groupe Wai a une extension spatiale considérable sur le terrain (Self et al., 2008b,
Vanderkluysen et al., 2011).
Bhattacharya et al (2013) ont identifié de fortes valeurs de δ18O et de 87Sr/86Sr(t) combinées à
des faibles εNd(t), compatibles avec des épisodes isolés de forte contamination crustale dans
les formations Poladpur supérieure et Mahabaleshwar inférieure. Figure 5.7 suggère que ces
événements sont sans commune mesure avec ceux des formations inférieures (bas Gd/Ybn et
Nb/Lan simultanés). Bhattacharya et al ont proposé que seuls deux phénomènes pourraient
expliquer ces mesures : 1) Les systèmes de conduits magmatiques sont propres à chaque
formation (sauf pour Ambenali). De fait, la contamination crustale baisse une fois que le
nouveau système de conduits est à maturation (réaction complète avec les magmas
ascendants). 2) Tous les magmas proviennent de la même chambre magmatique. Cette
chambre est approvisionnée par des magmas de différentes sources et/ou ayant subis des
processus de contamination crustale variables. Les laves mises en place à la surface sont
issues de mélanges de degrés variables des ces différents magmas dans la chambre
magmatique commune.
Il est probable que la première proposition soit incorrecte dans la mesure où il a été montré
que les trois principaux essaims de dykes ont été actifs à peu près simultanément au cours de
l’emplacement de la province principale des Trapps du Deccan (Vanderkluysen et al., 2011).

Appendix IV Résumé en français
243
La deuxième proposition semble, quand à elle, plus appropriée. D’une part, la composition du
groupe Deccan2 est, en moyenne, plus évoluée et plus homogène que celle de Deccan1
(Figure 5.5). Ceci indique qu’il est probable que les magmas à l’origine de Deccan2 aient été
stockés suffisamment longtemps pour acquérir cette composition. D’autre part, les tendances
des rapports isotopiques des formations Mahabaleshwar et Poladpur sont différentes
(Poladpur possède un rapport 87Sr/86Sr(t) plus élevé). Les épisodes de contamination que ces
magmas ont subi doivent dès lors être différents.
Enfin, l’idée selon laquelle l’érosion de la lithosphère aurait été seulement localisée dans le
Deccan est en accord avec les mesures de l’épaisseur actuelle de la lithosphère indienne
(Artemieva, 2006, Priestley & McKenzie, 2006, Arora et al., 2012), les modélisations de
paléo-contraintes dans la plaque indienne (Ju et al., 2013), ainsi qu’avec la structure en
bouclier et les coulées complexes centrées sur l’essaim Nasik-Pune (Subbarao et al., 2000).
IV.3. Analyse pétrologique des olivines des Trapps du Deccan et
de l’île de la Réunion
Les données pétrologiques sur olivines présentées dans ce manuscrit constituent la base de
données nécessaire à la reconstitution des processus magmatiques profonds liés à la mise en
place des Trapps du Deccan et de l’île de la Réunion. Les principales caractéristiques de cette
base de données peuvent être résumées de la manière suivante :
- Les magmas primaires à partir desquels les laves du Deccan et de la Réunion ont été
fractionnées sont issus d’un mélange de produits de fusions de péridotite et de
pyroxenite. La contribution de la pyroxenite à la génération des magmas peut être
mesurée par l’intermédiaire de l’enrichissement en éléments compatibles (ex : Ni) et
de l’appauvrissement en éléments incompatibles (ex : Mn, compatible avec le
pyroxène) avec l’olivine (Sobolev et al., 2005, 2007). Il a été estimé que les olivines
riches en Mg des Trapps du Deccan ont cristallisé à partir d’un magma primaire lui-
même composé de liquide pyroxénitique à 65%. Les olivines de la Réunion, quant à
elles, ont été produites à partir d’un magma composé à 50% de liquides
pyroxénitiques. Cependant, il semble que cette contribution de la pyroxénite ait été
légèrement moins importante dans le cas du Piton des Neiges (35-45 %). Cette
Appendix IV Résumé en français
244
observation nécessitera une analyse plus précise afin de déterminer les causes de cette
différence. Figure 6.5.
- La composition des inclusions vitreuses des olivines est utilisée pour reconstituer les
magmas primaires des Trapps du Deccan et de l’île de la Réunion ainsi que les
caractéristiques de leurs sources.
- Les concentrations en éléments volatiles (S, Cl) dans les inclusions vitreuses sont
compatibles avec les données publiées (Sobolev & Nikogosian, 1994, Sobolev, 1996,
Bureau et al., 1998a, 1998b, Self et al., 2008a). Ces nouvelles données forment une
tendance similaire à celle des MORB et des laves hawaiiennes, clairement différente
de celle des Trapps de Sibérie (Sobolev et al., 2009a). Une différence significative en
Cl/K2O entre les inclusions du Deccan et celles de la Réunion (Piton de la Fournaise)
peut être notée et implique probablement une variation des processus de dégazage
magmatique entre les deux stades d’évolution du panache du Deccan. Cette variation
pourrait aussi s’expliquer par une contribution différente de la pyroxénite et du
matériel recyclé à la génération des magmas primaires. Figure 6.7.
- L’absence de données sur les concentrations en volatiles des roches totales n’a pas
permis de quantifier le dégazage des magmas du Deccan et de la Réunion. Il est
néanmoins possible de proposer que ces nouvelles données sont en accord avec celles
de Self et al (2008a) et que, par conséquent, les estimations publiées par ces auteurs
sont valables pour le cas présent (S = 3.5 Tg/km3 et Cl = 1 Tg/km3). Cependant, les
très fortes concentrations de chlore mesurées dans les inclusions sibériennes (jusqu’à
0.2 wt.% Sobolev et al., 2009a) sont sans commune mesure avec celles du Deccan et
de la Réunion. Cette différence importante devra être étudiée en détail afin de
réévaluer les conséquences environnementales de la mise en place des Trapps du
Deccan à la fin du Crétacé. Figure 6.7.
- L’analyse des inclusions de spinels dans les olivines magnésiennes a permis de
déterminer l’état d’oxydation du fer dans les laves étudiées (Réunion, Piton de la
Fournaise : Fe2+/Fe3+liq = 6, Trapps du Deccan : Fe2+/Fe3+
liq = 11.5). Ce paramètre est
important pour l’application des modèles pétrologiques nécessaires à la reconstruction
des magmas primaires et des sources des deux localités. De plus, il apparaît que
Fe2+/Fe3+liq et Fo sont corrélés entre le Piton de la Fournaise et le Piton des Neiges.
Ceci suggère que le degré d’oxydation des magmas est corrélé avec leur
fractionnement. Figure 6.9.
Appendix IV Résumé en français
245
- Les inclusions spinels ont aussi été utilisées pour appliquer le thermomètre de Sobolev
et al (2013) basé sur le partitionnement de l’aluminium entre le spinel en inclusion et
l’olivine encaissante (Figure 6.11). Les températures magmatiques obtenues sont les
suivantes :
Trapps du Deccan : 1107 – 1223 °C
Réunion (Piton des Neiges): 1226 – 1283 °C
Réunion (Piton de la Fournaise): 1165 – 1213 °C
- La température à laquelle les inclusions spinels se sont formées est égale à la
température d’emprisonnement des inclusions vitreuses et de croissance des olivines
(cumulât) qui les contiennent. Les températures dérivées de l’application de
thermomètre olivine-spinels (Sobolev et al., 2013) seront donc utilisées comme
contraintes indépendantes sur la rééquilibration de la composition des inclusions
vitreuses.
IV.4. Reconstitution des magmas primaires et des sources
magmatiques des Trapps du Deccan et de l’île de la Réunion
Les résultats des modélisations pétrologiques entreprises dans le Chapitre 7 du manuscrit sont
résumés dans les tableaux suivants : Table 7–7 et Table 7–9. Ces données sont compatibles
avec l’interprétation suivante :
Les magmas des Trapps du Deccan ont été produits par un panache mantellique chaud (Tp
~1600 °C), composé de matériel primitif (moins de 20 % de DMM et 300 ppm d’eau) et
contenant de 10 à 15% de matériel crustale recyclé (XRC). Le panache du Deccan est entré en
contact avec la lithosphère indienne (épaisseur 140 à 250 km) quelques Ma avant la limite K-
Pg, probablement aux alentours de 68-70 Ma (Mahoney et al., 2002, Chenet et al., 2007). La
source hybride (éclogite + pyroxénite + péridotite) est entrée en fusion à hauteur de 10 à 15 %
à une profondeur de 150 km (4.5GPa). Enfin, les magmas primaires sont issus d’une mixture
de 65 % de liquides d’origine pyroxénitiques (Xpx).
Ces chiffres sont en accord avec un diamètre de la tête de panache supérieur à 1000 km
(White & McKenzie, 1995) et un volume initial des Trapps du Deccan de l’ordre de 1 à
3.106km3 (Sen, 2001). La température potentielle (1600 °C), la composante de matériel
Appendix IV Résumé en français
246
crustale recyclé (XRC = 10-15 %) et la contribution de la pyroxénite (Xpx = 65 %)
correspondent au contexte « WPM-THICK » de la classification de Sobolev et al (2007).
L’interaction de la tête de panache avec la lithosphère a engendré une réduction partielle et
hétérogène de l’épaisseur de la lithosphère indienne (2.4). Cette réduction d’épaisseur est
observée dans les signatures en éléments traces sur roche totale (Gd/Ybn et Nb/Lan) à quatre
reprises le long de la section des Trapps du Deccan (Jawhar inférieur et supérieur, Khandala-
Bushe et Bushe-Poladpur, Figure 5.7). Ces quatre excursions correspondent probablement à
un seul et unique épisode d’érosion/délamination lithosphérique (50 ka, Sobolev et al., 2011)
périodiquement interrompu par la formation de bouchons de restite (5.5).
En moyenne, le taux d’éruption de la province principale des Trapps du Deccan aurait pu être
équivalent à environ deux cent fois le taux d’éruption actuel de l’île volcanique d’Hawaii.
Une telle activité magmatique aurait perduré environ 50 ka (3.6).
Il est tentant d’associer l’érosion de la plaque indienne à un contexte tectonique extensif et/ou
au rifting le long de la côte ouest de l’Inde. Pourtant, il a été observé que l’extension le long
de cette côte (séparation de la Laxmi Ridge et, plus tard, de Seychelles) était clairement
postérieure à l’emplacement du Deccan (Hooper et al., 2010). De plus, Sobolev et al (2011)
ont montré qu’un régime tectonique extensif n’était pas nécessaire à la mise en place des
processus d’érosion lithosphérique par un panache mantellique.
Quelques 60 Ma après l’éruption des Trapps du Deccan, le panache du même nom est
toujours actif et s’exprime sous l’île de la Réunion, dont il est l’origine. A partir des données
compositionnelles sur olivines, les différentes étapes de modélisation pétrologique ont permis
de mettre en évidence d’importants changements entre le stade initial (Deccan) et final
(Réunion) de l’activité du panache du Deccan. Les calculs de températures potentielles
révèlent que le panache s’est refroidit de 50 à 150 °C au cours des soixante derniers millions
d’années (TpRéunion ~ 1450-1500 °C). Il s’avère aussi que la proportion de matériel recyclé
transporté est moins importante (XRCRéunion ~ 7 %), que le taux de fusion des sources
magmatiques est moins élevé d’une dizaine de pourcents (FRéunion = 3 à 5 %) et que la
contribution des liquides pyroxénitiques à la formation des magmas primaires est moins forte
d’environ 15 % (Xpx = 50 %). Cette interprétation va dans le sens de la proposition
d’Herzberg & Gazel (2009) selon laquelle les panaches mantelliques liés à l’épanchement des
provinces magmatiques paléocènes étaient plus chauds et ont fondu davantage que ceux qui
sont à l’origine de la formation des îles volcaniques modernes. Herzberg & Gazel ont attribué

Appendix IV Résumé en français
247
ce changement général de régime thermique à des variations compositionnelles des
hétérogénéités du manteau inférieur.
Les conclusions de cette thèse sont en accord général avec les connaissances actuelles sur les
processus géodynamiques internes de la Terre. Plusieurs aspects de ce travail de modélisation
gagneraient néanmoins à être affinés. Les phénocristaux d’olivines magnésiennes sont la
principale source d’information utilisée dans cette étude. Ces olivines ont été cristallisées dans
des chambres magmatiques crustale et ont été collectées à la surface de la Terre. Le principale
proxy utilisé ici (les olivines) est donc très éloigné, aussi bien dans l’espace (>100 km) qu’en
terme d’évolution chimique (fractionnement, contamination crustale), de l’objet qu’il aide à
décrire (le manteau terrestre). Il est donc particulièrement important de considérer et
d’examiner chaque hypothèse et chaque source d’incertitude de cette approche. Ce travail de
validation et de test des différentes sources d’incertitudes est abordé dans la dernière partie du
chapitre 7 (7.3).
IV.5. Conclusions
Cette thèse apporte de nouveaux éléments quant à la mise en place des Trapps du Deccan à la
limite Crétacé-Paléocène (K-Pg) d’une part, et quant à l’évolution au cours du temps du
panache du Deccan d’autre part, depuis un stade initial de tête de panache durant la fin du
Crétacé et l’éruption des Trapps du Deccan, jusqu’à un stade final actuel de « queue de
panache », sous l’île de la Réunion dans l’Océan Indien.
En s’appuyant sur les précédents travaux d’Anne-Lise Chenet à l’IPGP, Paris (Chenet, 2006,
2007, 2008, 2009), il a été montré que la mise en place des Trapps du Deccan à la fin du
Crétacé s’est traduite par un épisode d’activité volcanique paroxysmal dont la phase éruptive
principale s’est achevée précisément à la transition K-Pg. Chenet et al ont apporté des
contraintes exceptionnelles sur la durée et la dynamique de mise en place des Trapps du
Deccan. D’une part, Chenet et al (2007) ont identifié trois phases volcaniques principales à
partir de datation 40K-40Ar : Phase 1 précède la limite K-Pg de 2 Ma, phase 2 s’est produite
juste avant, et s’est achevée à, la limite K-Pg (Keller et al., 2012) et phase 3 a eu lieu quelques
2-300 ka plus tard, dans le Danien inférieur. D’autre part, Chenet et al (2008, 2009) ont publié
une base de données quasi-exhaustive de paléomagnétisme de haute résolution pour les
« Western Ghats » (Province principale des Trapps du Deccan). Ces données ont permis

Appendix IV Résumé en français
248
l’identification de groupes directionnels correspondant à des séquences de coulées de laves
portant des orientations paléomagnétiques similaires. Cette similarité dans les orientations
paléomagnétiques implique une mise en place de chacunes de ces séquences de coulées en
une centaine d’années au plus. 30 directionnels et 41 coulées individuelles (n’appartenant à
aucun groupe directionnel) ont été observées le long de la séquence éruptive complète de la
province principale du Deccan. Ceci suggère un temps d’éruption de 300 à 3000 ans pour les
groupes directionnels uniquement, et 1000 à 7000 ans pour la mise en place complète de la
province magmatique principale du Deccan. Récemment, des durées d’éruptions très courtes
et compatibles avec les résultats de Chenet et al ont été obtenus indépendamment par
modélisation de la diffusion/relaxation du rapport 87Sr/86Sr dans les phénocristaux de
plagioclase des « Giant Plagioclase Basalts » (Borges et al., 2013). Chenet et al en concluent
que la quantification des épisodes de quiescence volcanique devenait dès lors, l’enjeu
principal de la détermination de la durée totale de l’éruption des Trapps du Deccan. Chenet et
al (2008) et Gérard et al (2006) ont tenté d’adresser ce problème en se basant sur les horizons
altérés et autres paléosols (Sayyed, 2013) intercalés dans la séquence des Trapps du Deccan.
En faisant l’hypothèse que les « thin red boles » pouvaient se former en une dizaine d’années
alors que les « thick red boles » impliquaient une quiescence d’environ 50 ka, ces auteurs ont
proposés que les 38 « thin red boles » et les 6 « thick red boles » observés dans les « Western
Ghats » correspondaient à un temps de quiescence total d’environ 300 ka.
Le travail de Chenet et al a été réinterprété au cours de cette thèse de manière à produire un
scénario continu de mise en place des Trapps du Deccan (Figure 3.1). Ce scénario continu a
ensuite été comparé à des données paléo-environnementales de la littérature (Figure 3.2) et
couplé à des données en éléments majeurs et traces sur roche totale (Bonnefoy, 2005) (Figure
5.7). Ce nouveau scénario continu montre une bonne corrélation avec les indicateurs paléo-
environnementaux tels que les paléo-températures marines (Li & Keller, 1998) et les données
récentes en 187Os/188Os dans les carbonates pélagiques (Robinson et al., 2009), malgré les
incertitudes importantes quand à l’étendue et la durée des périodes de quiescence volcanique.
Il en est conclu que la phase 2 de l’éruption des Trapps du Deccan (Chenet et al., 2007) fut un
événement cataclysmique correspondant à la mise en place d’environ 8.105 km3 de laves en 50
ka. Le taux d’épanchement moyen correspondant aurait été équivalent à 20 km3/yr, soit 200
fois le taux d’éruption actuel de l’île d’Hawaii (Courtillot et al., 1986). Occasionnellement, ce
taux d’éruption aurait pu atteindre la valeur impressionnante de 160 km3/yr (Chenet et al.,
2009). Cet évènement catastrophique (phase 2) apparaît aussi correspondre à une forte
Appendix IV Résumé en français
249
anomalie négative en 187Os/188Os dans les carbonates pélagiques (Robinson et al., 2009). La
phase 2 fut probablement suivie d’une période d’activité volcanique de moindre intensité,
comme en témoigne le grand nombre « thick red bole » observé entre les formations Poladpur
et Mahabaleshwar (Figure 3.1). Les « thick red boles » suggèrent environ 300 ka de
volcanisme de faible intensité précédant la phase 3 (Chenet et al., 2007). Il est intéressant de
noter que cette durée est équivalente à celle suggérée par les observations paléontologiques
(Biozone P1a, Keller et al., 2012). Enfin, il est aussi proposé ici que la formation des « thick
red boles » aurait pu être favorisée par un climat plus humide et plus frais, lui-même
conséquence de l’intense activité volcanique de la phase 2 (Figure 3.2).
Le scénario continu de l’éruption des « Western Ghats » a ensuite été couplé à des données
géochimiques élémentaires (majeurs et traces) (Bonnefoy, 2005).
Deux signatures élémentaires distinctes ont pu être identifiées le long de cette section.
Deccan1 correspond aux formations inférieures (Jawhar à Bushe) et montre une implication
claire de la croûte continentale (contamination/assimilation). Deccan2 (Poladpur à
Mahabaleshwar) apparaît, à l’inverse, moins contaminée par la croûte continentale, plus
homogène et plus évolué que Deccan1 (Figure 5.5). La transition entre Deccan1 et 2 s’est
produite au cours de l’éruption de la formation Poladpur (Figure 5.7) et correspond à la fin de
la phase 2 (Chenet et al., 2007).
Les signatures élémentaires de Deccan 1 et 2 indiquent une origine en moyenne profonde,
dans le champ de stabilité du grenat (Gd/Ybn > 1.6, Figure 5.6). Néanmoins, Deccan1 montre
quatre excursions de bas Gd/Ybn et Nb/Lan dans les formations Jawhar inférieure et
supérieure, Khandala-Bushe et Poladpur supérieure compatibles avec des sources
magmatiques à plus faible profondeur, hors du champ de stabilité du grenat (Gd/Ybn < 1.8), et
avec d’intenses épisodes d’assimilation crustale (Nb/Lan ~ 0.5) (Figure 5.7). Le caractère
ponctuel de ces excursions est confirmé par leur association systématique avec des groupes
directionnels (Chenet et al., 2009) impliquant une durée de l’ordre de quelques centaines
d’années. Il est proposé ici que ces excursions correspondent à des processus
d’érosion/délamination lithosphériques localisés. En effet, la mise en place localisée
d’intenses réactions panache-lithosphère aurait résulté, à ces endroits, en une forte production
magmatique par décompression (Gd/Ybn < 1.8). De plus, la proximité locale du matériel
mantellique (panache) avec la croûte continentale aurait engendré des épisodes de forte
assimilation crustale (Nb/Lan < 0.6). Ces chenaux d’érosion lithosphérique localisée auraient
Appendix IV Résumé en français
250
ensuite été simplement bouchés par les restites issues de la fusion par décompression. Ce
phénomène aurait artificiellement augmenté la profondeur des sources magmatiques au point
de revenir dans le champ de stabilité du grenat (Gd/Ybn > 1.6). L’épuisement des conduits
magmatiques par ces épisodes de forte assimilation crustale aurait, parallèlement, résulté en
l’augmentation du rapport Nb/Lan. Ces excursions sont réparties au cours de la phase 2 (50
ka), ce qui correspond aux résultats numériques de Sobolev et al (2011). Outre la contrainte
temporelle apportée par ces derniers, Sobolev et al ont aussi montré, numériquement, que
l’interaction entre un panache mantellique et une lithosphère de 140 km d’épaisseur (2.4) ne
pouvait résulter qu’en une érosion/délamination localisée de la lithosphère. L’érosion
localisée de la lithosphère indienne est aussi confirmée par des mesures actuelles (Figure 2.7),
ainsi que par la localisation des principaux essaims de dykes (Vanderkluysen et al., 2011).
Enfin, il est probable que l’importante assimilation crustale indiquée par les excursions en
Gd/Ybn et Nb/Lan – lesquelles précèdent la limite K-Pg – ait eu une répercussion majeure sur
le dégazage magmatique (Self et al., 2008a, Ganino & Arndt, 2009, Sobolev et al., 2011).
L’analyse par microsonde électronique d’olivines magnésiennes des Trapps du Deccan et de
l’île de la Réunion a permis de reconstruire les magmas primaires et les sources magmatiques
de pour ces deux localités, elles-mêmes respectivement représentatives des stades précoce
(tête de panache) et tardif (queue de panache) du panache mantellique du Deccan.
La composition des phénocristaux d’olivine de la formation Thakurvadi des Trapps du
Deccan et de l’île de la Réunion montre un excès de nickel (Ni) et un appauvrissement en
manganèse (Mn) (Figure 6.3). Ce type d’anomalie compositionnelle (par rapport à des
olivines issues d’un produit de fusion de la péridotite) est caractéristique de la présence d’une
source hybride (pyroxenite + péridotite) dans la tête du panache du Deccan. Il est possible de
relier ces anomalies en Ni en Mn à la fraction (Xpx) de liquide pyroxénitique dans les
magmas primaires (Sobolev et al., 2005) : Xpx (Deccan) = 65%, Xpx (Réunion) = 50% (Fig.
6.5).
Les inclusions vitreuses de ces olivines ont été analysées. Celles du Deccan (formation
Thakurvadi) montrent des concentrations en volatiles comparables à celles publiées par Self et
al (2008a) (valeurs moyennes : K2O = 0.48 wt%, Cl = 0.02 wt%, S = 0.05 wt%, Figure 6.7).
Ces concentrations sont beaucoup plus basses que celles rapportées pour les Trapps de Sibérie
(Sobolev et al., 2009a). Il est néanmoins possible et probable que, lors de la mise en place des
Trapps du Deccan, le dégazage magmatique ait été beaucoup plus important pendant, ou juste
Appendix IV Résumé en français
251
avant (Sobolev et al., 2011), les épisodes de forte assimilation crustale mentionnés plus haut
(excursions en Gd/Ybn et Nb/Lan, Figure 5.7). Les inclusions vitreuses de la Réunion
montrent une composition en volatiles légèrement différente de celles du Deccan (valeurs
moyennes : K2O=0.70 wt%, Cl = 0.02 wt%, S = 0.09 wt%). Il est intéressant de noter que le
rapport Cl/K2O varie entre le Deccan et la Réunion (0.40 et 0.30, respectivement). Plus
précisément, pour une concentration de S donnée, Cl/K2O est deux fois plus élevé dans les
inclusions vitreuses du Deccan que dans celles de la Réunion (Figure 6.7). Cette observation
suggère soit une influence de la contamination crustale (Figure 5.7), soit une influence du
matériel crustale recyclé dans le panache du Deccan (Sobolev et al., 2009b, 2011).
Les inclusions de spinels (dans ces mêmes olivines) ont été analysées afin de contraindre
certains paramètres magmatiques importants tels que la température et l’état d’oxydation des
magmas. Ces résultats ont ensuite été utilisés pour reconstituer les magmas primaires à
l’origine des olivines du Deccan et de la Réunion (7.1). Puis les compositions et les
paramètres physiques de ces magmas primaires ont été intégrés à deux modèles pétrologiques
indépendants permettant de reconstituer les sources magmatiques des deux localités (Deccan
et Réunion). L’un de ces modèles repose entièrement sur la géochimie (Sobolev et al., 2005),
l’autre repose sur la thermodynamique (Katz et al., 2003) (7.2).
Les résultats de ces diverses étapes de modélisation convergent et révèlent des différences
notables entre le stade « tête de panache » du Deccan et le stade tardif (« queue de panache »)
de la Réunion. Durant la mise en place des Trapps du Deccan, le panache était chaud (Tp
~1590-1600 °C) et transportait, en comparaison avec d’autres localités (Sobolev et al., 2007),
une importante quantité de matériel crustale recyclé (XRC ~ 14%). Cette importante
composante recyclée dans les sources des Trapps du Deccan exclue la possibilité d’une
surrection syn-volcanique importante (Sobolev et al., 2011), et, de fait, réconcilie les
observations contradictoires de plusieurs auteurs (ex : Saunders et al., 2007, Sheth, 2007). Les
sources magmatiques hybrides (éclogite + pyroxénite + péridotite) des laves du Deccan ont
endurées un taux de fusion de l’ordre de 12% à 4.5 GPa et la contribution des produits de
fusion de la pyroxénite à la génération des magmas primaires fut de 65% (Table 7–9). La forte
signature du grenat dans la plupart des laves du Deccan (Figure 5.6) implique que la
lithosphère indienne n’ait été que peu affectée par l’activité du panache. Cette particularité est
expliquée par 1) l’importante épaisseur initiale de la lithosphère indienne (140 km, 2.4) et 2)
par l’étendue limitée des processus d’érosion/délamination due à l’existence de zones de

Appendix IV Résumé en français
252
faiblesses préexistantes dans la plaque indienne (Murthy, 2002) permettant l’évacuation
rapide des produits de fusion (Sobolev et al., 2011).
Quelques 66 Ma plus tard, le panache du Deccan est toujours actif (île de la Réunion). Il est à
présent plus froid d’une centaine de degrés (Tp ~1490-1450 °C) et transporte de plus faibles
quantités de matériel crustale recyclé (XRC ~7 %). Les sources magmatiques de la Réunion
entrent actuellement en fusion à hauteur de 4 % à 3.5 GPa et la contribution des produits de
fusion de la pyroxénite à la génération des magmas primaires de la Réunion s’élève à 50 %
(Table 7–9).
Figure 8.1 est une illustration, basée sur les résultats numériques de Sobolev et al (2011), de la
différence entre les Trapps du Deccan et l’île de la Réunion. Cette figure inclut aussi une
comparaison avec les Trapps de Sibérie.
IV.6. Perspectives
Dans les conclusions de sa thèse, Anne-Lise Chenet (Chenet, 2006) propose les perspectives
suivantes :
- Confirmer que l’éruption des Trapps du Deccan s’est produite en deux phases
distinctes en datant les échantillons à polarité transitionnelle de la formation Latifwadi
et en étudiant la zone nord de la province principale du Deccan (Rivière Tapti), qui n’a
pas encore été datée
- Ré-échantillonner la transition entre les formations Khandala et Bushe ainsi que Bushe
et Poladpur dans la mesure ou les affleurements de Bushe sont de piètre qualité et
n’ont par permis, pour l’instant, de construire une section continue à cet endroit
- Etudier les formations inférieures, spécialement dans la région nord (Narmada) pour
contraindre les phases d’activité précoce du Deccan
- Les conséquences environnementales de l’éruption des Trapps du Deccan devraient
être examinées à l’aide de modèles numériques d’étendue globale (planétaire) prenant
en compte la chimie et la physique de la stratosphère
- Enfin, il serait intéressant de comparer les Trapps du Deccan avec la province
magmatique de Karoo (Afrique su Sud, 180 Ma), pour laquelle les signes d’extinction
de masse associés sont absents, malgré des volumes éruptés similaires

Appendix IV Résumé en français
253
La présente thèse a été commencée en janvier 2011 et avait pour objectif initial de combiner
les approches géochimiques, pétrologiques et géodynamiques en construisant un modèle
numérique précis du panache du Deccan au cours du temps, similaire à celui de Sobolev et al
(2011) pour les Trapps de Sibérie. Ce projet aurait donc pu adresser les trois premiers points
des perspectives d’Anne-Lise Chenet mentionnées ci-dessus. Néanmoins, des difficultés et
retards dans l’avancement de ce projet, dus à la mise en place d’une nouvelle microsonde
électronique JEOL JXA 8230 à ISTerre ainsi qu’à la difficulté d’obtenir des contacts sur le
terrain en Inde n’ont pas permis de mener à bien le travail de terrain nécessaire. Cependant,
l’aide précieuse de Frédéric Fluteau et Vincent Courtillot de l’Insitut de Physique du Globe de
Paris (IPGP), l’accès à leur collection d’échantillon (Chenet et al., 2008, 2009), et à leur base
de données à permis de participer à l’étude des Trapps du Deccan de la manière suivante :
- Réinterprétation des données de paléomagnétisme de haute résolution et des âges 39Ar/40Ar de Chenet et al (2007, 2008, 2009) par la mise en place d’un scénario
continu de la mise en place des Trapps du Deccan
- Couplage de ce scénario continu avec des données paléoenvironnementales (Li &
Keller, 1998, Robinson et al., 2009) ainsi qu’avec des données géochimiques en
éléments majeurs et traces sur roche totale (Bonnefoy, 2005)
- Application des méthode pétrologiques sur olivine (Sobolev et al., 2005, 2007) et
reconstitution des magmas primaires à l’origine des laves des Trapps du Deccan et de
l’île de la Réunion ainsi que de leur sources
L’auteur de ce manuscrit espère fournir quelques éléments nouveaux permettant l’avancement
de la compréhension de la mise en place des Trapps du Deccan.
Ce travail bénéficierait largement de l’approfondissement des points suivants :
- Des travaux de terrain permettraient de répondre aux trois premiers points des
perspectives proposées dans la thèse d’Anne-Lise Chenet (Chenet, 2006). Ils
permettraient également de collecter d’avantage de basaltes picritiques, aussi bien
dans la province principale du Deccan que dans les régions périphériques (ex :
Gujarat, 2.3.2)
- De manière plus spécifique, les excursions de bas Gd/Ybn et Nb/Lan (Figure 5.7)
devraient être étudiées en détail afin de mieux contraindre leurs durées, leurs origines
et le dégazage magmatique associé
Appendix IV Résumé en français
254
- Des travaux de terrains seraient aussi nécessaires aux Seychelles où des intrusions de
compositions similaires à celles de la formation Bushe ont été observées (Owen-Smith
et al., 2013).
- Les résultats des modèles pétrologiques (7.2) devraient être intégrés dans un modèle
numérique similaire à celui de Sobolev et al (2011) et comparés à d’autres contextes,
tels que celui des Trapps de Sibérie.

255
10. References
10. References
256
Abouchami, W., Hofmann, A. W., Galer, S. J. G., Frey, F. A., Eisele, J. & Feigenson,
M. D. (2005). Lead isotopes reveal bilateral asymetry and vertical continuity in the Hawaiian mantle plume. Nature 434, 851-856.
Abramov, O. & Kring, D. K. (2007). Numerical modelling of impact-induced hydrothermal activity at the Chicxulub crater. Meteoritics & Planetary Science 42, 93-112.
Agrell, S. O. & Long, J. V. P. (1960). The application of the scanning X-ray microanalyser to mineralogy. In: Engström, A., Cosslett, V. E. & Pattee, H. H. (eds.) X-ray Microscopy and Microanalysis. Amsterdam: Elsevier, 391-400.
Albarède, F., Luais, B., Fitton, G., Semet, M., Kaminski, E., Upton, B. G. J., Bachlèlery, B. & Cheminée, J.-L. (1997). The Geochemical Regimes of Piton de la Fournaise Volcano (Réunion) During the Last 530 000 Years. Journal of Petrology 38, 171-201.
Albarède, F. & Tamagnan, V. (1988). Modelling the recent geochemical evolution of the Piton de la Fournaise volcano, Réunion Island, 1931-1986. Journal of Petrology 29, 997-1030.
Allègre, C. J., Brick, J. L., Capmas, F. & Courtillot, V. (1999). Age of the Deccan traps using 187Re-187Os systematics. Earth and Planetary Science Letters 170, 197-204.
Allègre, C. J. & Luck, J. M. (1980). Osmium isotopes as petrogenetic and geological tracers. Earth and Planetary Science Letters 48, 148-154.
Allègre, C. J. & Turcotte, D. L. (1986). Implications of a two-component marble-cake mantle. Nature 323, 123-127.
Almeev, R. R., Holtz, F., Koepke, J., Parat, F. & Botcharnikov, R. E. (2007). The effect of H2O on olivine crystallization in MORB: Experimental calibration at 200 MPa. American Mineralogist 92, 670-674.
Alvarez, L. W., Alvarez, W., Asaro, F. & Michel, H. V. (1980). Extraterrestrial Cause for the Cretaceous-Tertiary Extinction. Science 208, 1095-1108.
Alvarez, W. (2003). Comparing the Evidence Relevant to Impact and Flood Basalt at Times of Major Mass Extinctions. Astrobiology 3, 153-161.
Anderson, D. L. (1994). The sublithospheric mantle as a source of continental flood basalts; the case against the continental lithosphere and plume head reservoirs. Earth and Planetary Science Letters 123, 269-280.
Anderson, D. L. (2000a). The Thermal State of the Upper Mantle; No Role for Mantle Plumes. Geophysical Research Letters 27, 3623-3626.
10. References
257
Anderson, D. L. (2000b). The thermal state of the upper mantle: no role for mantle plumes. Geophysical Research Letters 27, 3623-3626.
Anderson, D. L. (2006). Speculations on the nature and cause of mantle heterogeneity. Tectonophysics 416, 7-22.
Armitage, J. J., Collier, J. S., Minshull, T. A. & Henstock, T. J. (2011). Thin oceanic crust and flood basalts: India-Seychelles breakup. Geochemistry Geophysics Geosystems 12, 25pp.
Arndt, N. T., Czamanske, G. K., Wooden, J. L. & Fedorenko, V. A. (1993). Mantle and crustal contributions to continental flood volcanism. Tectonophysics 223, 39-52.
Arora, K., Tiwari, V. M., Singh, B., Mishra, D. C. & Grevemeyer, I. (2012). Three dimensional lithospheric structure of the western continental margin of India constrained from gravity modelling: implications for tectonic evolution. Geophysical Journal International 190, 131-150.
Artemieva, I. M. (2006). Global 1° x 1° thermal moodel TC1 for the continental lithosphere: Implications for lithosphere secular evolution. Tectonophysics 416, 245-277.
Artemieva, I. M. (2009). The continental lithosphere: Reconciling thermal, seismic, and petrologic data. Lithos 109, 23-46.
Bajpai, S., Holmes, J., Bennett, C., Mandal, N. & Khosla, A. (2013). Palaeoenvironement of Northwestern India during the late-Cretaceous Deccan volcanic episode from trace-element and stable-isotope geochemistry of intertrappean ostracod shells. Global and Planetary Change 107, 82-90.
Bajpai, S. & Prasad, G. V. R. (2000). Cretaceous age for Ir-rich Deccan intertrappean deposits: palaeontological evidence from Anjar, western India. Journal of the Geological Society, London 157, 257-260.
Baksi, A. K. (2001). The Rajahmundry Traps, Andhra Pradesh: Evaluation of their petrogenesis relative to the Deccan Traps. Proceedings of the Indian Academy of Sciences 110, 397-407.
Baksi, A. K. (2005). Comment on "40Ar/39Ar dating of the Rajahmundry Traps, eastern India and their relationship to the Deccan Traps" by Knight et al. Earth and Planetary Science Letters 239, 368-373.
Baksi, A. K., Byerly, G. R., Chan, L. H. & Farrar, E. (1994). Intracanyon flows in the Deccan province, India: case history of the Rajahmundry Traps. Geology 22, 605-608.

10. References
258
Banerjee, P. K., Ghose, N. C., Ravikumar, V. & Chacko, S. (1996). Petrography, geomagnetism, and rare-earth element abundances of the Rajahmundry lavas, eastern India. Journal of Southeast Asian Earth Sciences 13, 139-143.
Basu, A. R., Renne, P. R., DasGupta, D. K., Teichmann, F. & Poreda, R. J. (1993). Early and Late Alkali Igneous Pulses and a High-3He Plume Origin for the Deccan Flood Basalts. Science 261, 902-906.
Batanova, V. & Sobolev, A. V. (2013). A new analytical protocol for high precision EPMA of olivine. Goldschmidt conference.
Batanova, V. G., Belousov, I. A., Savelieva, G. N. & Sobolev, A. V. (2011). Consequences of Channelized and Diffuse Melt Transport in Supra-subduction Zone Mantle: Evidence from the Voykar Ophiolite (Polar Urals). Journal of Petrology 52, 2483-2521.
Beane, J. E. (1988). Flow stratigraphy, chemical variation and petrogenesis of Deccan flood basalts from the Western Ghats, India. Washington State University.
Beane, J. E., Turner, C. A., Hooper, P. R., Subbarao, K. V. & Walsh, J. N. (1986). Stratigraphy, composition and form of the Deccan Basalts, Western Ghats, India. Bulletin of Volcanology 48, 61-83.
Belcher, C. M., Collinson, M. E., Sweet, A. R., Hildebrand, A. R. & Scott, A. C. (2003). Fireball passes and nothgin burns - The role of thermal radiation in the Cretaceous-Tertiary event: Evidence from the charcoal record of North America. Geology 31, 1061-1064.
Bennett, K. D. (1990). Milankovitch cycles and their effects on species in ecological and evolutionary time. Paleobiology 16, 11-21.
Bhattacharji, S., Sharma, R. & Chatterjee, N. (2004). Two- and three-dimensional gravity modeling along western continental margin and intraplate Narmada-Tapti rifts: Its relevance to Deccan flood basalt volcanism. Proceedings of the Indian Academy of Sciences 113, 771-784.
Bhattacharya, G. C., Chaubey, A. K., Murty, G. P. S., Srinivas, K., Sarma, K. V. L. N. S., Subrahmanyam, V. & Krishna, K. S. (1994). Evidence for seafloor spreading in the Laxmi Basin, northeastern Arabian Sea. Earth and Planetary Science Letters 125, 211-220.
Bhattacharya, S. K., Ma, G. S.-K. & Matsuhisa, Y. (2013). Oxygen isotope evidence for crustal contamination in Deccan Basalts. Chemie der Erde 73.
Biwas, S. K. (2005). A review of structure and tectonics of Kutch basin, western India, with special reference to earthquakes. Current Science 88, 1592-1600.
Blanford, W. T. (1867). On the Traps and intertrappean beds of western and central India. Memoir - Geological Survey of India 6, 137-162.
10. References
259
Boehler, R. (1993). Temperatures in the Eath's core from melting-point measurements of iron at high static pressures. Nature 363, 534-536.
Bogue, S. W. & Glen, J. M. G. (2010). Very rapid geomagnetic field change recorded by the partial remagnetization of a lava flow. Geophysical Research Letters 37.
Bonnefoy, B. (2005). Evolution géochimique des laves des trapps du Deccan et détermination des concentrations en S, F et Cl dans des inclusions vitreuses de Rajahmundry. Institut de Physique du Globe de Paris. Paris: Université Paris VI.
Borges, M. R. (2007). Life Cycle of Deccan Trap Magma Chambers: A Crystal Scale Elemental and Strontium Isotopic Investigation. FIU Electronic Theses and Dissertations Paper 10.
Borges, M. R., Sen, G., Hart, G. L., Wolff, J. A. & Chandrasekharam, D. (2013). Plagioclase as recorder of magma chamber processes in the Deccan Traps: Sr-isotope zoning and implications for Deccan eruptive event. Journal of Asian Earth Sciences in press.
Borisov, A. A. & Shapkin, A. I. (1990). A new empirical equation rating Fe3+/Fe2+ in magmas to their composition, oxygen fugacity, and temperature. Geochemistry International 27, 111-116.
Boulila, S., Galbrun, B., Miller, K. G., Pekar, S. F., Browning, J. V., Laskar, J. & Wright, J. D. (2011). On the origin of Cenozoic and Mesozoic "third-order" eustatic sequences. Earth-Science Reviews 109, 94-112.
Bowen, N. L. (1928). The evolution of igneous rocks: Princeton University Press.
Buffetaut, E. (1987). On the age of dinosaur fauna from Lameta Formation; Upper Cretaceous of Central India. Newsletter on Stratigraphy 18, 1-6.
Bureau, H., Métrich, N., Pineau, F. & Semet, M. P. (1998a). Magma-conduit interaction at Piton de la Fournaise volcano (Réunion Island): a melt and fluid inclusion study. Journal of Volcanology and Geothermal Research 84, 39-60.
Bureau, H., Pineau, F., Métrich, N., Semet, M. P. & Javoy, M. (1998b). A melt and fluid inclusion study of the gas phase at Piton de la Fournaise volcano (Réunion Island). Chemical Geology 147, 115-130.
Burke, K. & Torsvik, T. H. (2004). Derivation of Large Igneous Provinces of the past 200 million years from long-term heterogeneities in the deep mantle. Earth and Planetary Science Letters 227, 531-538.
Burke, W. H., Denison, R. E., Hetherington, E. A., Koepnick, R. B., Nelson, H. F. & Otto, J. B. (1982). Variation of seawater 87Sr/86Sr throughout Phanerozoic time. Geology 10, 516-519.
10. References
260
Campbell, C. E., Oboh-Ikuenobe, F. E. & Eifert, T. L. (2008). Chapter 11: Megatsunami deposit in Cretaceous-Paleogene boundary interval of southeastern Missouri. In: Evans, K. R., Horton-Jr, J. W., King-Jr, D. T. & Morrow, J. R. (eds.) SPE437: The Sedimentary Record of Meteorite Impacts. Boulrder: The Geological Society of America, 189-198.
Campbell, I. H. (2005). Large Igneous Provinces and the Mantle Plume Hypothesis. Elements 1, 265-269.
Campbell, I. H. & Griffiths, R. W. (1990). Implications of mantle plume structure for the evolution of flood basalts. Earth and Planetary Science Letters 99, 79-93.
Cande, S. C. & Kent, D. V. (1995). Revised calibration of the geomagnetic polarity timescale for the Late Cretaceous and Cenozoic. Journal of Geophysical Research 100, 6093-6095.
Carlson, R. W., Graham-Pearson, D. & James, D. E. (2005). Physical, chemical, and chronological characteristics of continental mantle. Reviews of Geophysics 43.
Castaing, R. (1951). Applications des sondes électroniques à une méthode d'analyse ponctuelle chimique et cristallographique. Université de Paris.
Cazenave, A., Souriau, A. & Dominh, K. (1989). Global coupling of Earth surface topography with hotspots, geoid and mantle heterogeneities. Nature 340, 54-57.
Chalapathi Rao, N. V., Burgess, R., Lehmann, B., Mainkar, D., Pande, S. K., Hari, K. R. & Bodhankar, N. (2011a). 40Ar/39Ar ages of mafic dykes from the Mesoproterozoic Chhattisgarh basin, Bastar craton, Central India: Implications for the origin and spatial extent of the Deccan Large Igneous Province. Lithos 125, 994-1005.
Chalapathi Rao, N. V. & Lehmann, B. (2011). Kimberlites, flood basalts and mantle plumes: New insights from the Deccan Large Igneous Province. Earth-Science Reviews 107, 315-324.
Chalapathi Rao, N. V., Lehmann, B. & Balaram, V. (2013). Platinum-group element (PGE) geochemistry of Deccan orangeites, Bastar craton, central India: Implication for a non-terrestrial origin for iridium enrichment at the K_Pg boundary. Journal of Asian Earth Sciences in press.
Chalapathi Rao, N. V., Lehmann, B., Mainkar, D. & Belyatski, B. (2011b). Pretogenesis of the end-Cretaceous diamondiferous Behradih orangeite pipe: implication for mantle plume-lithosphere interaction in the Bastar craton, Central India. Contribution to Mineralogy and Petrology 161, 721-742.
10. References
261
Chalapathi Rao, N. V., Rao, C. V. D. & Das, S. (2012). Petrogenesis of Lamprophyres from Chhota Udepur area, Narmada rift zone, and its relation to Deccan magmatism. Journal of Asian Earth Sciences 45, 24-39.
Chandrasekharam, D., Mahoney, J. J., Sheth, H. C. & Duncan, R. A. (1999). Elemental and Nd-Sr-Pb isotope geochemistry of flows and dikes from the Tapi rift, Deccan flood basalt province, India. Journal of Volcanology and Geothermal Research 93, 111-123.
Channell, J. E. T. & Lehman, B. (1997). The last two geomagnetic polarity reversals recorded in high-deposition-rate sediment drifts. Nature 389, 712-715.
Chase, C. G. (1981). Oceanic island Pb: two-stage histories and mantle evolution. Earth and Planetary Science Letters 52, 277-284.
Chatterjee, N. & Bhattacharji, S. (2008). Trace Element Variations in Deccan Basalts: Roles of Mantle Melting, Fractional Crystallization and Crustal Assimilation. Journal Geological Society of India 71, 171-188.
Chatterjee, S., Goswami, A. & Scotese, C. R. (2012). The longest voyage: Tectonic, magmatic, and paleoclimatic evolution of the Indian plate during its northward flight from Gondwana to Asia. Gondwana Research 23, 238-267.
Chatterjee, S., Guven, N., Yoshinobu, A. & Donofrio, R. (2006). Shiva Structure: a possible KT boundary impact crater on the western shelf of India. Museum of Texas Tech University Special Publications 50, 39pp.
Chenet, A.-L. (2006). Reconstruction de la structure de la séquence éruptive des Traps du Deccan, Inde : conséquences climatiques et environnementales. Equipe de Paléomagnétisme. Paris: Institut de Physique du Globe de Paris, 359.
Chenet, A.-L., Courtillot, V., Fluteau, F., Gérard, M., Quidelleur, X., Khadri, S. F. R., Subbarao, K. V. & Thordarson, T. (2009). Determination of rapid Deccan eruptions across the Cretaceous-Tertiary boundary using paleomagnetic secular variation: 2. Constraints from analysis of eight new sections and synthesis for a 3500-m-thick composite section. Journal of Geophysical Research 114.
Chenet, A.-L., Fluteau, F., Courtillot, V., Gérard, M. & Subbarao, K. V. (2008). Determination of rapid Deccan eruptions across the Cretaceous-Tertiary boundary using paleomagnetic secular variation: Results frim a 1200-m-thick section in the Mahabaleshwar escarpment. Journal of Geophysical Research 113.
Chenet, A.-L., Quidelleur, X., Fluteau, F., Courtillot, V. & Bajpai, S. (2007). 40K-40Ar dating of the Main Deccan large igneous province: Further evidence of KTB age and short duration. Earth and Planetary Science Letters 263, 1-15.

10. References
262
Class, C. & Goldstein, S. L. (2005). Evolution of helium isotopes in the Earth's mantle. Nature 436, 1107-1112.
Coccioni, R., Ferraro, E., Lirer, L., Luciani, F., Marsili, V. & Spezzaferri, S. (2004). New Insights on the Late Cretaceous-Eocene Foraminiferal Record from the Classical Bottaccione and Contessa Pelagic Tethyan Sections (Gubbio, Central Italy): Results from High Resolution Study and a New Sample Preparation Technique. 32nd IGC, 340.
Coe, R. S., Prévot, M. & Camps, P. (1995). New evidence for extraordinarily rapid change of the geomagnetic field during a reversal. Nature 374, 687-692.
Coffin, M. F. & Eldholm, O. (1994). Large Igneous Provinces: Crustal Structure, Dimensions, and External Consequences. Reviews of Geophysics 32, 1-36.
Cohen, A. S. & Coe, A. L. (2002). New geochemical evidence for the onset of volcanism in the Central Altantic magmatic province and environmental change at the Triassic-Jurassis boundary. Geology 30, 267-270.
Collier, J. S., Sansom, V., Ishizuka, O., Taylor, R. N., Minshull, T. A. & Whitmarsh, R. B. (2008). Age of Seychelles-India break-up. Earth and Planetary Science Letters 272, 264-277.
Coogan, L. A., Saunders, A. D. & Wilson, R. N. (2014). Aluminium-in-olivine thermometry of primitive basalts: Evidence of an anomalously hot mantle source for large igneous provinces. Chemical Geology in press.
Courtillot, V., Besse, J., Vandamme, D., Montigny, R., Jaeger, J.-J. & Cappetta, H. (1986). Deccan flood basalts at the Cretaceous/Tertiary boundary? Earth and Planetary Science Letters 80, 361-374.
Courtillot, V., Davaille, A., Besse, J. & Stock, J. (2003). Three dstinct types of hotspots in the Earth's mantle. Earth and Planetary Science Letters 205.
Courtillot, V., Féraud, G., Maluski, H., Vandamme, D., Moreau, M. G. & Besse, J. (1988). Deccan flood basalts and the Cretaceous/Tertiary boundary. Nature 333.
Courtillot, V. & Fluteau, F. (2010). Cretaceous Extinctions: The Volcanic Hypothesis. Science 328, 973-974.
Courtillot, V., Gallet, Y., Rocchia, R., Féraud, G., Robin, E., Hofmann, C., Bhandari, N. & Ghevariya, Z. G. (2000). Cosmic markers, 40Ar/39Ar dating and paleomagnetism of the KT sections in the Anjar Area of the Deccan large igneous province. Earth and Planetary Science Letters 182, 137-156.
Courtillot, V. E. & Renne, P. R. (2003). On the ages of flood basalt events - Sur l'âge des trapps basaltiques. Comptes Rendus de l'Académie des Sciences 335, 113-140.
10. References
263
Cox, K. G. & Hawkesworth, J. (1985). Geochemical Stratigraphy of the Deccan Traps at Mahabaleshwar, Western Ghats, India, with Implications for Open System Magmatic Processes. Journal of Petrology 26, 355-377.
Cramer, B. S., Miller, K. G., Barrett, P. J. & Wright, J. D. (2011). Late Cretaceous-Neogene trends in deep ocean temperature and continental ice volume: Reconciling records of benthic foraminiferal geochemistry (d18O and Mg/Ca) with sea level history. Journal of Geophysical Research 116.
Cripps, J. A., Widdowson, M., Spicer, R. A. & Jolley, D. W. (2005). Coastal ecosystem responses lo late stage Deccan Trap volcanism: the post K-T boundary (Danian) palynofacies of Mumbai (Bombay), west India. Palaeogeography, Palaeoclimatology, Palaeoecology 216, 303-332.
Cullen, A., Vicenzi, E. & McBirney, A. R. (1989). Plagioclase-ultraphyric basalts of the Galapagos archipelago. Journal of Volcanology and Geothermal Research 37, 325-337.
Czamanske, G. K., Gurevitch, A. B., Fedorenko, V. & Simonov, O. (1998). Demise of the Siberian plume: Paleogeographic and paleotectonic reconstruction from the prevolcanic and volcanic record, north-central Siberia. International Geology Review 40, 95-115.
Damuth, J. E. & Johnson, D. A. (1989). Morphology, sediments and structure of the Amirante Trench, Western Indian Ocean: implications for trench origin. Marine and Petroleum Geology 6, 232-242.
Danyushevsky, L. V. (2001). The effect of small amounts of H2O on crystallisation of mid-ocean ridge and backarc basin magmas. Journal of Volcanology and Geothermal Research 110, 265-280.
Danyushevsky, L. V., Della-Pasqua, F. N. & Sokolov, S. (2000a). Re-equilibration of melt inclusions trapped by magnesian olivine phenocrysts from subduction-related magmas: petrological implications. Contribution to Mineralogy and Petrology 138, 68-83.
Danyushevsky, L. V., Eggins, S. M., Falloon, T. J. & Christie, D. M. (2000b). H2O Abundance in Depleted to Moderately Enriched Mid-ocean Ridge Magmas; Part I: Incompatible Behaviour, Implications for Mantle Storage, and Origin of Regional Variations. Journal of Petrology 41, 1329-1364.
Danyushevsky, L. V., McNeill, A. W. & Sobolev, A. (2002a). Experimental and petrological studies of melt inclusions in phenocrysts from mantle-derived magmas: an overview of techniques, advantages and complications. Chemical Geology 183, 5-24.
Danyushevsky, L. V. & Plechov, P. (2011). Petrolog3: Integrated software for modeling crystallization processes. Geochemistry Geophysics Geosystems 12, Q07021.

10. References
264
Danyushevsky, L. V. & Sobolev, A. V. (1996). Ferric-ferrous ratio and oxygen fugacity calculations for primitive mantle-derived melts: calibration of an empirical technique. Mineralogy and Petrology 57, 229-241.
Danyushevsky, L. V., Sokolov, S. & Falloon, T. J. (2002b). Melt inclusions in olivine phenocrysts: using diffusive re-equilibration to determine the cooling history of a crystal, with implications for the origin of olivine-phyric volcanic rocks. Journal of Petrology 43, 1651-1671.
DeHoog, J. C. M., Gall, L. & Cornell, D. H. (2010). Trace-element geochemistry of mantle olivine and application to mantle petrogenesis and geothermobarometry. Chemical Geology 270, 196-215.
DeMets, C., Gordon, R., Argus, D. & Stein, S. (1994). Effect of recent revisions to the geomagnetic reversal time scale on estimates of current plate motion. Geophysical Research Letters 21.
Deniel, C., Kieffer, G. & Lecointre, J. (1992). New 230th-238U and 14C age determinations from Piton des Neiges volcano, Réunion - A revised chronology for the Differentiated Series. Journal of Volcanology and Geothermal Research 51, 253-267.
DePaolo, D. J. (1981). Trace element and isotopic effects of combined wallrock assimilation and fractional crystallization. Earth and Planetary Science Letters 53, 189-202.
DePaolo, D. J. & Ingram, B. L. (1985). High-resolution stratigraphy with strontium isotopes. Science 227, 938-941.
Deshmukh, S. S., Aramaki, S., Shimizu, N., Kurasawa, N. & Konda, T. (1977). Petrography of the basalt flows exposed along Mahabaleshwar and Amboli sections in Western Ghats, India. Records of the Geological Survey of India 108, 81-103.
Dessai, A. G. & Bertrand, H. (1995). The "Panvel Flexure" along the Western Indian continental margin: an extensional fault structure related to Deccan magmatism. Tectonophysics 241, 165-178.
Dessert, C., Dupré, B., François, L. M., Schott, J., Gaillardet, J., Chakrapani, G. & Bajpai, S. (2001). Erosion of Deccan Traps determined by river geochemistry: impact on the global climate and the 87Sr/86Sr ratio of seawater. Earth and Planetary Science Letters 188, 459-474.
Dessert, C., Dupré, B., Gaillardet, J., François, L. M. & Allègre, C. J. (2003). Basalt weathering laws and the impact of basalt weathering on the global carbon cycle. Chemical Geology 202, 257-273.
Devey, C. W. (1986). Stratigraphy and geochemistry of the Deccan Traps lavas, Western India. University of Oxford.
10. References
265
Devey, C. W. & Cox, K. G. (1987). Relationship between crustal contamination and crystallisation in continental flood basalt magmas with special reference to the Deccan Traps of the Western Ghats, India. Earth and Planetary Science Letters 84, 59-68.
Devey, C. W. & Stephens, W. E. (1991). Tholeiitic dykes in the Seychelles and the original spatial extent of the Deccan. Journal of the Geological Society, London 148, 979-983.
Devey, C. W. & Stephens, W. E. (1992). Deccan-related magmatism west of the Seychelles-India rift. In: Storey, B. C., Alabaster, T. & Pankhurst, R. J. (eds.) Magmatism and Causes of Continental Break-up: Geological Society Special Publication, 271-291.
Dietmar Müller, R., Gaina, C., Roest, W. R. & Lundbek Hansen, D. (2002). A recipe for microcontinent formation. Geology 29, 203-206.
Dietz, R. S. & Holden, J. C. (1970). Reconstruction of Pangea: Breakup and dispersion of continents, Permian to Present. Journal of Geophysical Research 75, 4939-4956.
Dixon, J. E., Leist, L., Langmuir, C. H. & Schilling, J.-G. (2002). Recycled dehydrated lithosphere observed in plume-influenced mid-ocean-ridge basalt. Nature 420, 385-389.
Donnelly, K. E., Goldstein, S. L., Langmuir, C. H. & Spiegelman, M. (2004). Origin of enriched ocean ridge basalts and implications for mantle dynamics. Earth and Planetary Science Letters 226, 347-366.
Duncan, R. A. (1990). The volcanic record of the Réunion hotspot. In: Duncan, R. A., Backman, J., Peterson, L. C. & et.al. (eds.) Proceedings of the Ocean Drilling Program, Scientific Restuls 115. College Station, TX: Ocean Drilling Program, 3-10.
Duncan, R. A. & Pyle, D. G. (1988). Rapid eruption of the Deccan flood basalt at the Cretaceous/Tertiary boundary. Nature 333, 841-844.
Duncan, R. A. & Richards, M. A. (1991). Hot spots, mantle plumes, flood basalts, and true polar wander. Reviews of Geophysics 29, 31-50.
Duncumb, P. & Melford, D. A. (1957). A scanning microscope for X-ray emission pictures. In: Cosslett, V. E., Engström, A. & Pattee, H. H. (eds.) X-ray microscopy and microradiography. New York: Academic Press, 374-380.
Duraiswami, R. A., Bondre, N. R. & Dole, G. (2004). Possible lava tube system in a hummocky lava flow at Daund, western Deccan Volcanic Province, India. Proceedings of the Indian Academy of Sciences 113, 819-829.
Duraiswami, R. A., Dole, G. & Bondre, N. (2003). Slabby pahoehoe from the western Deccan Volcanic Province: evidence for incipient pahoehoe-aa transitions. Journal of Volcanology and Geothermal Research 121, 195-217.
10. References
266
Duraiswami, R. A., Gadpallu, P., Shaikh, T. N. & Cardin, N. (2013). Pahoehoe-a'a transitions in the lava flow fields of the western Deccan Traps, India-implications for emplacement dynamics, flood basalt architecture and volcanic stratigraphy. Journal of Asian Earth Sciences in press.
Eagles, G. & Hoang, H. H. (2014). Cretaceous to present kinematics on the Indian, African and Seychelles plates. Geophysical Journal International 196, 1-14.
Eaton, D. W., Darbyshire, F., Evans, R. L., Grütter, H., Jones, A. G. & Yuan, X. (2009). The elusive lithosphere-asthenosphere boundary (LAB) beneath cratons. Lithos 109, 1-22.
Ellam, R. M. (1992). Lithospheric thickness as a control on basalt geochemistry. Geology 20, 153-156.
Ernst, R. E. & Bell, K. (2010). Large igneous provinces (LIPs) and carbonatites. Mineralogy and Petrology 98, 55-76.
Famin, V., Welsch, B., Okumura, S., Bachèlery, P. & Nakashima, S. (2009). Three differentiation stages of a single magma at Piton de la Fournaise volcano (Reunion hot spot). Geochemistry Geophysics Geosystems 10.
Farnetani, C. G. & Richards, M. A. (1994). Numerical investigations of the mantle plume initiation model for flood-basalt events. Journal of Geophysical Research-Solid Earth 99, 13813-13833.
Farnetani, C. G. & Samuel, H. (2005). Beyond the thermal plume paradigm. Geophysical Research Letters L03711.
Fisk, M. R., Upton, B. G. J. & Ford, C. E. (1988). Geochemical and Experimental Study of the Genesis of Magmas of Reunion Island, Indian Ocean. Journal of Geophysical Research 93, 4933-4950.
Foley, S. F. (2008). Rejuvenation and erosion of the cratonic lithosphere. Nature Geoscience 1, 503-510.
Foley, S. F., Prelevic, D., Rehfeldt, T. & Jacob, D. E. (2013). Minor and trace elements in olivines as probes into early igneous and mantle melting processes. Earth and Planetary Science Letters 363, 181-191.
Ford, C. E., Russell, D. G., Craven, J. A. & Fisk, M. R. (1983). Olivine-Liquid Equilibira: Temperature, Pressure and Composition Dependence of the Crystal/Liquid Cation Partition Coefficients for Mg, Fe2+n Ca and Mn. Journal of Petrology 24, 256-266.
Foulger, G. R., Natland, J. H., Prescall, D. C. & Anderson, D. L. (2005). Plates, plumes and paradigms. Boulder, Colorado: The Geological Survey of America Inc.

10. References
267
Fretzdorff, S. & Haase, K. M. (2002). Geochemistry and petrology of lavas from the submarine flanks of Réunion Island (western Indian Ocean): implications for magma genesis and the mantle source. Mineralogy and Petrology 75, 153-184.
Füri, E., Hilton, D. R., Bramley, J. M., Hémond, C., Dyment, J. & Day, J. M. D. (2011). Helium isotope variations between Réunion Island and the Central Indian Ridge (17°-21°S), New evidence for ridge-hot spot interaction. Journal of Geophysical Research 116.
Furman, T., Frey, F. A. & Park, J.-H. (1991). Chemical constraints on the petrogenesis of mildly alkaline lavas from Vestmannaeyjar, Iceland: the Eldfell (1973) and Surtsey (1963-1967) eruptions. Contribution to Mineralogy and Petrology 109, 19-37.
Ganerød, M., Torsvik, T. H., Hinsbergen, D. J. J. v., Gaina, C., Corfu, F., Werner, S., Owen-Smith, T. M., Ashwal, L. D., Webb, S. J. & Hendriks, B. W. H. (2011). Palaeoposition of the Seychelles microcontinent in relation to the Deccan Traps and the Plume Generation Zone in Late Cretaceous-Early Palaeogene time. Geological Society, London, Special Publications 357, 229-252.
Ganino, C. & Arndt, N. T. (2009). Climate changes caused by degassing of sediments during the emplacement of large igneous provinces. Geology 37, 323-326.
Garzione, C. N. (2008). Surface uplift of Tibet and Cenozoic global cooling. Geology 36, 1003-1004.
Gérard, M., Caquineau, S., Chenet, A.-L., Fluteau, F., Courtillot, V. & Subbarao, K. V. (2006). Red Boles in the Deccan traps: Time constraints from alteration processes. In: Abstracts, G. R. (ed.) European Geosciences Union.
Ghosh, P., Sayeed, M. R. G., Islam, R. & Hundekari, S. M. (2006). Inter-basaltic clay (bole bed) horizons from Deccan traps of India: Implications for palaeo-weathering and palaeo-climate during Deccan volcanism. Palaeogeography, Palaeoclimatology, Palaeoecology 242, 90-109.
Gillot, P.-Y., Lefèvre, J.-C. & Nativel, P. E. (1994). Model for the structural evolution of the volcanoes of Réunion island. Earth and Planetary Science Letters 122, 291-302.
Gradstein, F., Ogg, J. & Smith, A. (2004). A Geologic Time Scale. Cambridge, UK: Cambridge University Press.
Green, D. H. & Ringwood, A. E. (1967). The genesis of basaltic magmas. Contribution to Mineralogy and Petrology 15, 103-190.
Gregory, L. C., Meert, J. G., Pradhan, V., Pandit, M. K., Tamrat, E. & Malone, S. J. (2006). A paleomagnetic and geochronologic stury of the Majhgawan kimberlite, India: Implications for the age of the Uppper Vindhyan Supergroup. Precambrian Research 149, 65-75.
10. References
268
Griffin, W. L., O'Reilly, S. Y., Afonso, J. C. & Begg, G. C. (2009). The Composition and Evolution of Lithospheric Mantle: a Re-evaluation and its Tectonic Implications. Journal of Petrology 50, 1185-1204.
Guha, D., Das, S., Srikarni, C. & Chakraborty, S. K. (2005). Alkali Basalt of Kachchh: Its Implication in the Tectonic Framework of Mesozoic of Western India. Journal Geological Society of India 66, 599-608.
Gwalani, L. G., Rock, N. M. S., Chang, W.-J., Fernandez, S., Allègre, C. J. & Prinzhofer, A. (1993). Alkaline Rocks and Carbonatites of Amba Dongar and Adjacent Areas, Deccan Igneous Province, Gujarat, India: 1. Geology, Petrography and Petrochemistry. Mineralogy and Petrology 47, 219-253.
Hallam, A. & Wignall, P. B. (1999). Mass extinctions and sea-level changes. Earth-Science Reviews 48, 217-250.
Hammond, J. O. S., Collier, J. S., Kendall, J.-M., Helffrich, G. & Rümpker, G. (2012). Plume scar in the mantle lithosphere beneath the Seychelles revealed by seismic imaging. Earth and Planetary Science Letters 355-356, 20-31.
Hart, S. R., Hauri, E. H., Oschmann, L. A. & Whitehead, J. A. (1992). Mantle Plumes and Entrainement: Isotopic Evidence. Science 256, 517-520.
Hartnady, C. J. H. (1986). Amirante Basin, western Indian Ocean: Possible impact site of the Cretaceous/Tertiary extinction bolide? Geology 14, 423-426.
Haywood, J. & Boucher, O. (2000). Estimates of the direct and indirect radiative forcing due to tropospheric aerosols: a review. Reviews of Geophysics 38, 513-543.
Herzberg, C. (2011). Identification of Source Lithology in the Hawaiian and Canary Islands: Implications for Origins. Journal of Petrology 52, 113-146.
Herzberg, C., Asimow, P. D., Arndt, N. T., Niu, Y., Lesher, C. M., Fitton, J. G., Cheadle, M. J. & Saunders, A. D. (2007). Temperature in ambient mantle and plumes: Constraints from basalts, picrites, and komatiites. Geochemistry Geophysics Geosystems 8.
Herzberg, C., Asimow, P. D., Ionov, D. A., Vidito, C., Jackson, M. G. & Geist, D. (2013). Nickel and helium evidence for melt above the core-mantle boundary. Nature 493, 393-397.
Herzberg, C. & Gazel, E. (2009). Petrological evidence for secular coolig in mantle plumes. Nature 458, 619-622.
Herzberg, C. & O'Hara, M. J. (2002). Plume-Associated Ultramafic Magmas of Phanerozoic Age. Journal of Petrology 43, 1857-1883.
10. References
269
Hess, J., Bender, M. & Schilling, J.-G. (1986). Seawater 87Sr/86Sr evolution from Cretaceous to present. Science 231, 979-984.
Higgins, M. D. & Chandrasekharam, D. (2007). Nature of Sub-volcanic Magma Chambers, Deccan Province, India: Evidence from Quantitative Textural Analysis of Plagioclase Megacrysts in the Giant Plagioclase Basalts. Journal of Petrology 48, 885-900.
Hodell, D. A. (1994). Editorial: Progress and paradox in strontium isotope stratigraphy. Paleoceanography 9, 395-398.
Hodell, D. A., Mueller, P. A., McKenzie, J. A. & Mend, G. A. (1989). Strontium isotope stratigraphy and geochemistry of the late Neogene ocean. Earth and Planetary Science Letters 92, 165-178.
Hofmann, A. W. (1988). Chemical differentiation of the Earth: the relationship between mantle, continental crust, and oceanic crust. Earth and Planetary Science Letters 90, 297-314.
Hofmann, A. W. & White, W. M. (1982). Mantle plumes from ancient oceanic crust. Earth and Planetary Science Letters 57, 421-436.
Hooper, P., Widdowson, M. & Kelley, S. (2010). Tectonic setting and timing of the final Deccan flood basalt eruptions. Geology 38, 839-842.
Hooper, P. R. (1990). The timing of crustal extension and the eruption of continental flood basalts Nature 349, 246-249.
Hooper, P. R., Subbarao, K. V., Beane, J. E. & Subbarao, K. V. (1988). The giant plagioclase basalts (GPBs) of the Western Ghats, Deccan Traps. Memoir - Geological Society of India 10, 135-144.
Huang, S., Hall, P. S. & Jackson, M. G. (2011). Geochemical zoning of volcanic chains associated with Pacific hotspots. Nature Geoscience 4, 874-878.
Huber, B. T., Norris, R. D. & MacLeod, K. G. (2002). Deep-sea paleotemperature record of extreme warmth during the Cretaceous. Geology 30, 123-126.
Huismans, R. & Beaumont, C. (2011). Depth-dependent extension, two-stage breakup and cratonic underplating at rifted margins. Nature 473, 74-78.
Huppert, H. E. & Sparks, S. J. (1985). Cooling and contamination of mafic and ultramafic magmas during ascent through continental crust. Earth and Planetary Science Letters 74, 371-386.
10. References
270
Jaiprakash, B. C., Sungh, J. & Raju, D. S. N. (1993). Foraminiferal events across the K/T boundary and age of Deccan volcanism in Palakollu area, Krishna-Godavari Basin, India. Journal of the Geological Society of India 41, 105-117.
James, D. E., Fouch, M. J., VanDecar, J. C. & Lee, S. v. d. (2001). Tectospheric structure beneath southern Africa. Geophysical Research Letters 28.
Jay, A. E. & Widdowson, M. (2008). Stratigraphy, structure and volcanology of the south-easts Deccan continental flood basalt province: implications for eruptive extent and volumes. Journal of the Geological Society, London 165, 177-188.
Jerram, D. A. & Widdowson, M. (2005). The anatomy of Continental Flood Basalt Provinces: geological constraints on the processes and products of flood volcanism. Lithos 79, 385-405.
Ju, W., Hou, G. & Hari, K. R. (2013). Mechanics of mafic dyke swarms in the Deccan Large Igneous Province: Palaeostress field modelling. Journal of Geodynamics 66, 79-91.
Kaila, K. L., Reddy, P. R., Dixit, M. M. & Koteswara-Rao, P. (1985). Crustal structure across the Narmada-Son lineament, Central India from deep seismic soundings. Journal of the Geological Society of India 26, 465-480.
Kaneoka, I. & Haramura, H. (1973). K/Ar ages of successive lava flows from the Deccan Traps, India. Earth and Planetary Science Letters 18, 229-236.
Karmalkar, N. R., Rege, S., Griffin, W. L. & O'Reilly, S. Y. (2005). Alkaline magmatism from Kutch, NW India: Implications for plume-lithosphere interaction. Lithos 81, 101-119.
Katz, R. F., Spiegelman, M. & Langmuir, C. H. (2003). A new parameterization of hydrous mantle melting. Geochemistry Geophysics Geosystems 4.
Kelemen, P. B., Dick, H. J. B. & Quick, J. E. (1992). Formation of harzburgite by pervasive melt/rock reaction in the upper mantle. Nature 358, 635-641.
Kelemen, P. B., Hirth, G., Shimizu, N., Spiegelman, M. & Dick, H. J. (1997). A review of melt migration processes in the adiabatically upwelling mantle beneath oceanic spreading ridges. Philosophical Transactions of the Royal Society, London A 355, 283-318.
Kelemen, P. B., Whitehead, J. A., Aharonov, E. & Jordahl, K. A. (1995). Experiments on flow focusing in soluble porous media, with applications to melt extraction from the mantle. Journal of Geophysical Research 100, 475-496.
Keller, G. (2005). Impacts, volcanism and mass extinction: random coincidence or cause and effect? Australian Journal of Earth Sciences 52, 725-757.
10. References
271
Keller, G., Adatte, T., Baum, G. & Berner, Z. (2008). Reply to 'Chicxulub impact predates K-T boundary: New evidence from Brazos, Texas' Comment by Schulte et al. Earth and Planetary Science Letters 269, 621-629.
Keller, G., Adatte, T., Berner, Z., Harting, M., Baum, G., Prauss, M., Tantawy, A. & Stueben, D. (2007). Chicxulub impact predates K-T boundary: New evidence from Brazos, Texas. Earth and Planetary Science Letters 255, 339-356.
Keller, G., Adatte, T., Bhowmick, P. K., Upadhyay, H., Dave, A., Reddy, A. N. & Jaiprakash, B. C. (2012). Nature and timing of extinctions in Cretaceous-Tertiary planktic foraminifera preserved in Deccan intertrappean sediments of the Krishna-Godavari Basin, India. Earth and Planetary Science Letters 341-344, 211-221.
Keller, G., Adatte, T., Gardin, S., Bartolini, A. & Bajpai, S. (2008a). Main Deccan volcanism phase ends near the K-T boundary: Evidence from the Krishna-Godavari Basin, SE India. Earth and Planetary Science Letters 268, 293-311.
Keller, G., Adatte, T., Stinnesbeck, W., Rebolledo-Vieyra, M., Fucugauchi, J. U., Kramar, U. & Stüben, D. (2004a). Chicxulub impact predates the K-T boundary mass extinction. PNAS 101, 3753-3758.
Keller, G., Adatte, T., Stinnesbeck, W., Stüben, D., Berner, Z., Kramar, U. & Harting, M. (2004b). More evidence that the Chicxulub impact predates the K/T mass extinction. Meteoritics & Planetary Science 39, 1127-1144.
Keller, G., Bhowmick, P. K., Upadhyay, H., Dave, A., Reddy, A. N., Jaiprakash, B. C. & Adatte, T. (2011). Deccan Volcanism Linked to the Cretaceous-Tertiary Boundary Mass Extinction: New Evidence from ONGC Wells in the Krishna-Godavari Basin. Journal Geological Society of India 78, 399-428.
Keller, G., Li, L. & MacLeod, N. (1995). The Cretaceous/Tertiary boundary stratotype section at El Kef, Tunisia: how catastrophic was the mass extinction? Palaeogeography, Palaeoclimatology, Palaeoecology 119, 221-254.
Keller, G., Sahni, A. & Bajpai, S. (2009c). Deccan volcanism, the KT mass extinction and dinosaurs. Journal of Biosciences 34, 709-728.
Keller, G., Stinnesbeck, W., Adatte, T. & Stüben, D. (2003). Multiple impacts across the Cretaceous-Tertiary boundary. Earth Science Reviews 62, 327-363.
Kennett, B. L. N. & Widiyantoro, S. (1999). A low seismic wavespeed anomaly beneath northwestern India: a seismic signature of the Deccan plume? Earth and Planetary Science Letters 165, 145-155.

10. References
272
Kent, D. V. & Muttoni, G. (2013). Modulation of Late Cretaceous and Cenozoic climate by variable drawdown of atmospheric pCO2 from weathering of basaltic provinces on continents drifting through the equatorial humid belt. Climate of the Past 9, 525-546.
Kerr, A. C., Khan, M., Mahoney, J. J., Nicholson, K. N. & Hall, C. M. (2010). Late Cretaceous alkaline sills of the south Tethyan suture zone, Pakistan: Initial melts of the Réunion hotspot? Lithos 117, 161-171.
Khosla, A. & Sahni, A. (2003). Biodiversity during the Deccan volcanic eruptive episode. Journal of Asian Earth Sciences 21, 895-908.
Klaus, A., Norris, R. D., Kroon, D. & Smit, J. (2000). Impact-induced mass wasting at the K-T boundary: Blake-Nose, western North Atlantic. Geology 28, 319-322.
Knight, K. B., Renne, P. R., Halkett, A. & White, N. (2003). 40Ar/39Ar dating of the Rajahmundry Traps, Eastern India and their relationship to the Deccan Traps. Earth and Planetary Science Letters 208, 85-99.
Knoll, M. & Ruska, E. (1932). Das Elektronenmikroskop. Zeitschrift für physik 78, 318-339.
Kogiso, T., Hirose, K. & Takahashi, E. (1998). Melting experiments on homogeneous mixtures of peridotite and basalt: application to the genesis of ocean island basalts. Earth and Planetary Science Letters 162, 45-61.
Kogiso, T. & Hirschmann, M. M. (2006). Partial melting experiments of bimineralic eclogite and the role of recylcled mafic oceanic crust in the genesis of ocean island basalts. Earth and Planetary Science Letters 249, 188-199.
Kogiso, T., Hirschmann, M. M. & Frost, D. J. (2003). High-pressure partial melting of garnet pyroxenite: possible mafic lithologies in the source of ocean island basalts. Earth and Planetary Science Letters 216, 603-617.
Kogiso, T., Hirschmann, M. M. & Pertermenn, M. (2004). High-pressure Partial Melting of Mafic Lithologies in the Mantle. Journal of Petrology 45, 2407-2422.
Korenaga, J. (2011). Velocity-depth ambiguity and the seismic structure of large igneous provinces: a case study from the Ontong Java Plateau. Geophysical Journal International 185, 1022-1036.
Krassilov, V. A. (1973). Climatic changes in eastern Asia as indicated by fossil floras. I. Early Cretaceous. Palaeogeography, Palaeoclimatology, Palaeoecology 13, 261-273.
Krassilov, V. A. (1975). Climatic changes in eastern Asia as indicated by fossil floras. II. Late Cretaceous and Danian. Palaeogeography, Palaeoclimatology, Palaeoecology 17.

10. References
273
Krishnamurthy, P. & Cox, K. G. (1977). Picrite Basalts and Related Lavas from the Deccan Traps of Western India. Contribution to Mineralogy and Petrology 62, 53-75.
Krishnamurthy, P., Gopalan, K. & Macdougall, J. D. (2000). Olivine Compositions in Picrite Basalts and the Deccan Volcanic Cycle. Journal of Petrology 41, 1057-1069.
Krivolutskaya, N. A., Sobolev, A. V., Mikhailov, V. N., Plechova, A. A., Kostitsyn, Y. A., Roschina, I. A. & Fekiacova, Z. (2012). Parental melt of the Nadezhdinsky Formation: Geochemistry, petrology and connection with Cu-Ni deposits (Noril'sk area, Russia). Chemical Geology 302-303, 87-105.
Krogh, T. E., Kamo, S. L., Sharpton, V. L., Marin, L. E. & Hildebrand, A. R. (1993). U-Pb ages of single shocked zircons linking distal K/T ejecta to the Chicxulub crater. Nature 366, 731-734.
Kumar, P., Yuan, X., Kumar, M. R., Kind, R., Li, X. & Chadha, R. K. (2007). The rapid drift of the Indian tectonic plate. Nature 449, 894-897.
Kyte, F. T., Leinen, M., Heath, G. R. & Zhou, L. (1993). Cenozoic sedimentation history of the central North Pacific: Inferences from the elemental geochemistry of core LL44-GPC3. Geochimica et Cosmochimica Acta 57, 1719-1740.
Lambart, S., Laporte, D. & Schiano, P. (2009). An experimental study of pyroxenite partial melts at 1 and 1.5 GPa: Implications for the major-element composition of Mid-Ocean Ridge Basalts. Earth and Planetary Science Letters 288, 225-347.
Lambart, S., Laporte, D. & Schiano, P. (2013). Markers of the pyroxenite contribution in the major-element compositions of oceanic basalts: Review of the experimental constraints. Lithos 160-161, 14-36.
Le Bas, M. J., Le Maitre, R. W., Streckeisen, A. & Zanettin, B. (1986). A Chemical Classification of Volcanic Rocks Based on the Total Alkali-Silica Diagram. Journal of Petrology 27, 745-750.
Le Friant, A., Lebas, E., Clément, V., Boudon, G., Deplus, C., De Voogd, B. & Bachèlery, P. (2011). A new model for the evolution of La Réunion volcanic complex from complete marine geophysical surveys. Geophysical Research Letters 38.
Lee, C.-T. A., Luffi, P., Plank, T., Dalton, H. & Leeman, W. P. (2009). Constraints on the depths and temperatures of basaltic magma generation on Earth and other terrestrial planets using new thermobarometers for mafic magmas. Earth and Planetary Science Letters 279, 20-33.
Lehmann, B., Burgess, R., Frei, D., Belyatski, B., Mainkar, D., Rao, N. V. C. & Heaman, L. M. (2010). Diamondiferous kimberlites in central India synchronous with Deccan flood basalts. Earth and Planetary Science Letters 290, 142-149.
10. References
274
Leitch, A. M. & Davies, G. F. (2001). Mantle plumes and flood basalts: Enhanced melting from plume ascent and an eclogite component. Journal of Geophysical Research 106, 2047-2059.
Lénat, J.-F., Gibert-Malengreau, B. & Galdéano, A. (2001). A new model for the evolution of the volcanic island of Réunion (Indian Ocean). Journal of Geophysical Research 184, 1-13.
Li, L. & Keller, G. (1998). Abrupt deep-sea warming at the end of the Cretaceous. Geology 26, 995-998.
Li, X., Kind, R., Priestley, K., Sobolev, S. V., Tilmann, F., Yuan, X. & Weber, M. (2000). Mapping the Hawaiian plume conduit with converted seismic waves. Nature 405, 938-941.
Lightfoot, P. (1985). Isotope and trace element geochemistry of the South Deccan lavas, India. The Open University.
Lightfoot, P. & Hawkesworth, C. (1988). Origin of the Deccan Trap lavas: evidence from combined trace element and Sr- Nd- and Pb-isotope studies. Earth and Planetary Science Letters 91, 89-104.
Lightfoot, P., Hawkesworth, C., Devey, C. W., Rogers, N. W. & Calsteren, P. W. C. v. (1990). Source and differentiation of Deccan Trap lavas: implications of geochemical and mineral chemical variations. Journal of Petrology 31, 1165-1200.
Lightfoot, P. C., Hawkesworth, C. J. & Sethna, S. F. (1987). Petrogenesis of rhyolites and trachytes from the Deccan Trap: Sr, Nd, and Pb isotope and trace element evidence. Contribution to Mineralogy and Petrology 95, 44-54.
Long, J. V. P. (1958). Microanalysis with X-rays. University of Cambridge.
Ludden, J. N. (1978). Magmatic evolution of the basaltic shield volcanoes of Reunion island. Journal of Volcanology and Geothermal Research 7, 171-198.
MacLeod, K. G., Fullagar, P. D. & Huber, B. T. (2003). 87Sr/86Sr test of the degree of impact-induced slope failure in the Maastrichtian of the western North Atlantic. Geology 31, 311-314.
MacLeod, K. G., Huber, B. T. & Fullagar, P. D. (2001). Evidence for a small (~0.000030) but resolvable increase in seawater 87Sr/86Sr ratios across the Cretaceous-Tertiary boundary. Geology 29, 303-306.
Mahoney, J. J. (1984). Isotopic and chemical studies of the Deccan and Rajmahal traps, India: mantle sources and petrogenesis. University of California, San Diego.
10. References
275
Mahoney, J. J. (1988). Deccan Traps. In: Macdougall, J. D. (ed.) Continental flood basalts: (Dorrecht: Kluwer-Academic), 151-194.
Mahoney, J. J., Duncan, R. A., Khan, W., Gnos, E. & McCormick, G. R. (2002). Cretaceous volcanic rocks of the South Tethyan suture zone, Pakistan: implications for the Réunion hotspot and Deccan Traps. Earth and Planetary Science Letters 203, 295-310.
Mahoney, J. J., Natland, J. H., White, W. M., Poreda, R. J., Bloomer, S. H., Fisher, R. L. & Baxter, A. N. (1989). Isotopic and Geochemical Provinces of the Western indian Ocean Spreading Centers. Journal of Geophysical Research 94, 4033-4052.
Mahoney, J. J., Sheth, H. C., Chandrasekharam, D. & Peng, Z. X. (2000). Geochemistry of Flood Basalts of the Toranmal Section, Northern Deccan Traps, India: Implications for Regional Deccan Stratigraphy. Journal of Petrology 41, 1099-1120.
Maimon, O., Lyakhovsky, V., Melnik, O. & Navon, O. (2012). The propagation of a dyke driven by gas-saturated magma. Geophysical Journal International 189, 956-966.
Malod, J. A., Droz, L., Mustafa Kemal, B. & Patriat, P. (1997). Early sreading and continental to oceanic basement transition beneath the Indus deep-sea fan: northeastern Arabian Sea. Marine Geology 141, 221-235.
Marsh, B. D. (2007). Magmatism, Magma, and Magma Chambers. Treatise on Geophysics Volume 6: Crust and Lithosphere Dynamics: Elsevier, 275-333.
Maurel, C. & Maurel, P. (1982). Etude experimentale de l’equilibre Fe2+-Fe3+ dans les spinelles chromiferes et les liquides silicates basiques coexistants à 1atm. Comptes Rendus de l'Académie des Sciences 285, 209-215.
McArthur, J. M., Thirlwall, M. F., Engkilde, M., Zinsmeister, W. J. & Howarth, R. J. (1998). Strontium isotope profiles across K/T boundary sequences in Denmark and Antarctica. Earth and Planetary Science Letters 160, 179-192.
McElwain, J. C. & Punyasena, S. W. (2007). Mass extinction events and the plant fossil record. TRENDS in Ecology and Evolution 22, 548-557.
McMullen, D. (1953). An improved scanning electron microscope for opaque specimens Proceedings of the IEE 100, 254-256.
Médard, E. & Grove, T. L. (2008). The effect of H2O on the olivine liquidus of basaltic melts: experiments and thermodynamic models. Contribution to Mineralogy and Petrology 155, 417-432.
Medvedev, M. V. & Melott, A. L. (2007). Do extragalactic cosmic rays induce cycles in fossil diversity? The Astrophysical Journal 664, 879-889.
10. References
276
Meert, J. G., Pandit, M. K., Pradhan, V. R., Banks, J., Sirianni, R., Stroud, M., Newstead, B. & Gifford, J. (2010). Precambrian crustal evolution of Peninsular India: A 3.0 billion year odyssey. Journal of Asian Earth Sciences 39, 483-515.
Melluso, L., Beccaluva, L., Brotzu, P., Gregnanin, A., Gupta, A. K., Morbidelli, L. & Traversa, G. (1995). Constraints on the Mantle Sources of the Deccan Traps from the Petrology and Geochemistry of the Basalts of Gujarat State (Western India). Journal of Petrology 36, 1393-1432.
Melluso, L., Mahoney, J. J. & Dallai, L. (2006). Mantle sources and crustal input as recorded in high-Mg Deccan Traps basalts of Gujarat (India). Lithos 89, 259-274.
Melluso, L., Sethna, S. F., D'Antonio, M., Javeri, P. & Bennio, L. (2002). Geochemistry and petrogenesis of sodic and potassic mafic alkaline rocks in the Deccan Volcanic Province, Mumbai Area (India). Mineralogy and Petrology 74, 323-342.
Minshull, T. A., Lane, C. I., Collier, J. S. & Whitmarsh, R. B. (2008). The relationship between rifting and magmatism in the northeastern Arabian Sea. Nature Geoscience 1, 463-467.
Mitchell, C. & Widdowson, M. (1991). A geological map of the southern Deccan Traps, India and its structural implications. Journal of the Geological Society, London 148, 495-505.
Molnar, P. & England, P. (1990). Late Cenozoic uplift of mountain ranges and global climate change: chicken or egg? Nature 346, 29-34.
Moore, G., Vennemann, T. & Charmichael, I. S. E. (1998). An empirical model for the solubility of H2O in magmas to 3 kilobars. American Mineralogist 83, 36-42.
Moore, J. G. & Clague, D. (1992). Volcano growth and evolution of island of Hawaii. Geological Society of America Bulletin 104, 1471-1484.
Morgan, J. P., Reston, T. J. & Ranero, C. R. (2004). Contemporaneous mass extinctions, continental flood basalts, and 'impact signals': are mantle plume-induced lithospheric gas explosions the causal link? Earth and Planetary Science Letters 217, 263-284.
Morgan, W. J. (1971). Convection plumes in the lower mantle. Nature 230, 42-43.
Morgan, W. J. (1972). Deep Mantle Convection Plumes and Plate Motions. The American Association of Petroleum Geologists Bulletin 56, 203-213.
Moseley, H. J. G. (1913). The high-frequency spectra of the elements. Philosophical Magazine 26, 1024-1034.

10. References
277
Moseley, H. J. G. (1914). The high-frequency spectra of the elements; part II. Philosophical Magazine 27, 703-713.
Moulin, M., Fluteau, F., Courtillot, V., Marsh, J., Delpech, G., Quidelleur, X., Gérard, M. & Jay, A. E. (2011). An attempt to constrain the age, duration, and eruptive history of the Karoo flood basalt: Naude's Nek section (South Africa). Journal of Geophysical Research 116.
Mulvey, T. (1960). A new microanalyser. In: Engström, A., Cosslett, V. E. & Pattee, H. H. (eds.) X-ray Microscopy and Microanalysis. Amsterdam: Elsevier, 372-378.
Murthy, Y. S. (2002). On the correlation of seismicity with geophysical lineaments over the Indian subcontinent. Current Science 83, 760-766.
Murton, B. J., Tindle, A. G., Milton, J. A. & Sauter, D. (2005). Heterogeneity in southern Central India Ridge MORB: Implications for ridge-hot spot interaction. Geochemistry Geophysics Geosystems 6.
Naslund, H. R. (1984). Petrology of the Upper Border Series of the Skaergaard Intrusion. Journal of Petrology 25, 185-212.
Nikolaev, G. S., Borisov, A. A. & Ariskin, A. A. (1996). Calculation of the Ferric-Ferrous Ratio in Magmatic Melts: Testing and Additional Calibration of Empirical Equations for Various Magmatic Series. Geochemistry International 34, 641-649.
Nordt, L., Atchley, S. & Dworkin, S. I. (2002). Paleosol barometer indicates extreme fluctuations in atmospheric CO2 across the Cretaceous-Tertiary boundary. Geology 30, 703-706.
Norris, R. D., Firth, J., Blusztajn, J. S. & Ravizza, G. (2000). Mass failure of the North Atlantic margin triggered by the Cretaceous-Paleogene bolide impact. Geology 28, 1119-1122.
Oehler, J.-F., Lénat, J.-F. & Labazuy, P. (2008). Growth and collapse of the Reunion Island volcanoes. Bulletin of Volcanology 70, 717-742.
Olsson, R. K., Miller, K. G., Browning, J. V., Habib, D. & Sugarman, P. J. (1997). Ejecta layer at the Cretaceous-Tertiary boundary, Bass River, New Jersey (Ocean Drilling Program Leg 174AX. Geology 25, 759-762.
Owen-Smith, T. M., Ashwal, L. D., Torsvik, T. H., Ganerød, M., Nebel, O., Webb, S. J. & Werner, S. C. (2013). Seychelles alkaline suite records the culmination of Deccan Traps continental flood volcanism. Lithos 182-183, 33-47.
Oxburgh, R. (1998). Variations in the osmium isotope composition of sea water over the past 200,000 years. Earth and Planetary Science Letters 159, 183-191.

10. References
278
Pande, K. (2002). Age and duration of the Deccan Traps, India: A review of radiometric and paleomagnetic constraints. Proceedings of the Indian Academy of Sciences 111, 115-123.
Parthasarathy, G., Bhandari, N., Vairamani, M. & Kunwar, A. C. (2008). High-pressure phase of natural fullerene C60 in iridium-rich Cretaceous-Tertiary boundary layers of Deccan intertrappean deposits, Anjar, Kutch, India. Geochimica et Cosmochimica Acta 72.
Patino, L. C., Velbel, M. A., Price, J. R. & Wade, J. A. (2003). Trace element mobility during spheroidal weathering of basalts and andesites in Hawaii and Guatemala. Chemical Geology 202, 343-364.
Paul, D. K., Ray, A., Das, B., Patil, S. K. & Biswas, S. K. (2008). Petrology, geochemistry and paleomagnetism of the earliest magmatic rocks of Deccan Volcanic Province, Kutch, Northwest India. Lithos 102, 237-259.
Pavlov, V., Fluteau, F., Veselovskiy, R., Fetisova, A. M. & Latyshev, A. V. (2011). Secular Geomagnetic Variations and Volcanic Pulses in the Permian-Triassic Traps of the Norilsk and Maimecha-Kotui Provinces. Physics of the Solid Earth 47, 402-417.
Payne, J. A., Jackson, M. G. & Hall, P. S. (2012). Parallel volcano trends and geochemical asymetry of the Society Islands hotspot track. Geology 41, 19-22.
Payne, J. L., Turchyn, A. V., Paytan, A., DePaolo, D. J., Lehrmann, D. J., Yu, M. & Wei, J. (2010). Calcium isotope constraints on the end-Permian mass extinction. Proceedings of the National Academy of Sciences, USA 107, 8543-8548.
Peate, I. U. & Bryan, S. E. (2008). Re-evaluating plume-induced uplift in the Emeishan large igneous province. Nature Geoscience 1, 625-629.
Pegram, W. J., Krishnaswami, S., Ravizza, G. E. & Turekian, K. K. (1992). The record of seawater 187Os/186Os variation through the Cenozoic. Earth and Planetary Science Letters 113, 569-576.
Peng, Z. X. & Mahoney, J. J. (1995). Drillhole lavas from the northwestern Deccan Traps, and the evolution of Réunion hotspot mantle. Earth and Planetary Science Letters 134, 169-185.
Peng, Z. X., Mahoney, J. J., Hooper, P. R., Harris, C. & Beane, J. E. (1994). A role for lower continental crust in flood basalt genesis? Isotopic and incompatible element study of the lower six formations of the western Deccan traps. Geochimica et Cosmochimica Acta 58, 267-288.
Peng, Z. X., Mahoney, J. J., Hooper, P. R., Macdougall, J. D. & Krishnamurthy, P. (1998). Basalts of the northeastern Deccan Traps, India: Isotopic and elemental geochemistry
10. References
279
and relation to southwestern Deccan stratigraphy. Journal of Geophysical Research 103, 29,843-829,865.
Peucker-Ehrenbrink, B. & Ravizza, G. (2000). The marine osmium isotope record. Terra Nova 12, 205-219.
Pierazzo, E., Hahmann, A. N. & Sloan, L. C. (2003). Chicxulub and Climate: Radiative Perturbations of Impact-Produced S-Bearing Gases. Astrobiology - Rubey Colloquium Paper 3, 99-118.
Prasad, J. N., Patil, S. K., Venkateshwarlu, M., Saraf, P. D., Tripathi, S. C. & Rao, D. R. K. (1998). Palaeomagnetic results from the Cretaceous Bagh Group in the Narmada Basin, central India: evidence of pervasive Deccan remagnetization and its implications for Deccan volcanism. Geophysical Journal International 133, 519-528.
Premoli-Silva, I. & Sliter, W. (1995). Cretaceous planktonic foraminiferal biostratigraphy and evolutionary trends from the Bottaccione section, Gubbio, Italy. Palaeontogr. Ital. 82, 1-89.
Priestley, K. & McKenzie, D. (2006). The thermal structure of the lithosphere from shear wave velocities. Earth and Planetary Science Letters 244, 285-301.
Raju, D. S. N., Jaiprakash, B. C. & Kumar, A. (1996). Paleoenvironmental set-up and age of basin floor just prior to the spread of Deccan volcanism in the Krishna-Godavari Basin, India. Memoir - Geological Society of India 37, 285-295.
Raju, D. S. N., Jaiprakash, B. C., Kumar, A., Saxena, R. K., Dave, A., Chatterjee, T. K. & Mishra, C. M. (1995). Age of Deccan volcanism across KTB in Krishna-Godavari Basin: new evidences. Journal of the Geological Society of India 45, 229-233.
Rampino, M. R. & Stothers, R. (1988). Flood basalt volcanism during the past 250 million years. Science 241, 663-668.
Rapp, R. P., Shimizu, N., Norman, M. D. & Applegate, G. S. (1999). Reaction between slab-derived melts and peridotite in the mantle wedge: experimental constraints at 3.8 GPa. Chemical Geology 160, 335-356.
Raup, D. M. (1987). Mass extinction: A commentary. Palaeontology 30, 1-13.
Raup, D. M. & Sepkoski, J. J. (1982). Mass Extinction in the Marine Fossil Record. Science 215, 1501-1503.
Ravizza, G. & Peucker-Ehrenbrink, B. (2003). Chemostratigraphic Evidence of Deccan Volcanism from the Marine Osmium isotope Record. Science 302, 1392-1395.

10. References
280
Ray, J. S., Pande, K. & Pattanayak, S. K. (2003). Evolution of the Amba Dongar Carbonatite Complex: Constraints from 40Ar–39Ar Chronologies of the Inner Basalt and an Alkaline Plug. International Geology Review 45, 857-862.
Ray, R., Shukla, A. D., Sheth, H. C., Ray, J. S., Duraiswami, R. A., Vanderkluysen, L., Rautela, C. S. & Mallik, J. (2008). Highly heterogenous Precambrian basement under the central Deccan Traps, India: Direct evidence from xenoliths in dykes. Gondwana Research 13, 375-385.
Reed, S. J. B. (1993). Electron Probe Analysis. Cambridge: Cambridge University Press.
Renne, P. R., Deino, A. L., Hilgen, F. J., Kuiper, K. F., Mark, D. F., Mitchell, W. S., Morgan, L. E., Mundil, R. & Smit, J. (2013). Time Scales of Critical Events Around the Cretaceous-Paleogene Boundary. Science 339, 684-687.
Richards, M. A., Duncan, R. A. & Courtillot, V. E. (1989a). Flood Basalts and Hot-Spot Tracks: Plume Heads and Tails. Science 246, 103-107.
Ridgwell, A. (2005). A Mid Mesozoic Revolution in the regulation of ocean chemistry. Marine Geology 217, 339-357.
Ritsema, J. & Allen, R. M. (2003). The elusive mantle plume. Earth and Planetary Science Letters 207, 1-12.
Robinson, N., Ravizza, G., Coccioni, R., Peucker-Ehrenbrink, B. & Norris, R. (2009). A high-resolution marin 187OS/188Os record for the late Maastrichtian: Distinguishing the chemical fingerprints of Deccan volcanism and the KP impact event. Earth and Planetary Science Letters 281, 159-168.
Robock, A. (2000). Volcanic eruptions and climate. Reviews of Geophysics 38, 191-219.
Roddaz, M., Said, A., Guillot, S., Antoine, P.-O., Montel, J.-M., Martin, F. & Darrozes, J. (2011). Provenance of Cenozoic sedimentary rocks from the Sulaiman fold and thrust belt, Pakistan: implications for the palaeogeography of the Indus drainage system. Journal of the Geological Society, London 168, 499-516.
Roeder, P. L. & Emslie, R. F. (1970). Olivine-Liquid Equilibrium. Contribution to Mineralogy and Petrology 29, 275-289.
Rohde, R. A. & Muller, R. A. (2005). Cycles in fossil diversity. Nature 434, 208-210.
Roy, A. B. (2003). Geological and Geophysical Manifestations of the Reunion Plume-Indian Lithosphere Interactions - Evidence from Northwest India. Gondwana Research 6, 487-500.

10. References
281
Roy-Barman, M. & Allègre, C. J. (1995). 187Os/186Os in oceanic island basalts: tracing crust recycling in the mantle. Earth and Planetary Science Letters 129, 145-161.
Royer, J.-Y., Chaubey, A. K., Dyment, J., Bhattacharya, G. C., Srinivas, K., Yatheesh, V. & Ramprasad, T. (2002). Paleogene plate tectonic evolution of the Arabian and Eastern Somali basins. Geological Society, London, Special Publications 195, 7-23.
Rudnick, R. L. & Gao, S. (2003). 3.01 Composition of the Continental Crust. Treatise on Geochemistry 3, 1-64.
Salaün, A., Villemant, B., Semet, M. & Staudacher, T. (2010). Cannibalism of olivine-rich cumulate xenoliths during the 1998 eruption of Piton de la Fournaise (La Réunion hotspot): Implications for the generation of magma diversity. Journal of Volcanology and Geothermal Research 198, 187-204.
Salil, M. S., Shrivastava, J. P. & Pattanayak, S. K. (1997). Similarities in the mineralogical and geochemical attributes of detrital clays of Maastrichtian Lameta Beds and weathered Deccan basalt, Central India. Chemical Geology 136, 25-32.
Sandwell, D. T. & Smith, W. H. F. (1997). Marine gravity anomaly from Geosat and ERS-1 altimetry. Journal of Geophysical Research 102, 10,039-010,054.
Santosh, M. (2010). A synopsis of recent conceptual models on supercontinent tectonics in relation to mantle dynamics, life evolution and surface environment. Journal of Geodynamics 50, 116-133.
Saunders, A. D. (2005). Large Igneous Provinces: Origin and Environmental Consequences. Elements 1, 259-263.
Saunders, A. D., Jones, S. M., Morgan, L. A., Pierce, K. L., Widdowson, M. & Xu, Y. G. (2007). Regional uplift associated with continental large igneous provinces: The roles of mantle plumes and the lithosphere. Chemical Geology 241, 282-318.
Sayyed, M. R. G. (2013). Flood basalt hosted palaeosols: Potential palaeoclimatic indicators of global climate change. Geoscience Frontiers in press.
Sayyed, M. R. G. & Hundekari, S. M. (2006). Preliminary comparison of ancient bole beds and modern soils developed upon the Deccan Volcanic Basalts around Pune (India): Potential for Palaeoenvironmental Reconstruction. Quaternary International 156-157, 189-199.
Schiano, P. (2003). Primitive mantle magmas recorded as silicate melt inclusions in igneous minerals. Earth Science Reviews 63, 121-144.
Schulte, P., Alegret, L., Arenillas, I., Arz, J. A., Barton, P. J., Bown, P. R., Bralower, T. J., Christeson, G. L., Claeys, P., Cockell, C. S., Collins, G. S., Deutsch, A., Goldin, T. J.,

10. References
282
Goto, K., Grajales-Nishimura, J. M., Grieve, R. A. F., Gulick, S. P. S., Johnson, K. R., Kiessling, W., Koeberl, C., Kring, D. A., MacLeod, K. G., Matsui, T., Melosh, J., Montanari, A., Morgan, J. V., Neal, C. R., Nichols, D. J., Norris, R. D., Pierazzo, E., Ravizza, G., Rebolledo-Vieyra, M., Reimold, W. U., Robin, E., Salge, T., Speijer, R. P., Sweet, A. R., Urrutia-Fucugauchi, J., Vajda, V., Whalen, M. T. & Willumsen, P. S. (2010). The Chicxulub Asteroid Impact and Mas Extinction at the Cretaceous-Paleogene Boundary. Science 327, 1214-1218.
Schulte, P., Speijer, R. P., Brinkhuis, H., Kontny, A., Claeys, P., Galeotti, S. & Smit, J. (2008). Comment on the paper "Chicxulub impact predates K-T boundary: New evidence from Brazos, Texas" by Keller et al. (2007). Earth and Planetary Science Letters 269, 614-620.
Self, S., Blake, S., Sharma, K., Widdowson, M. & Sephton, S. (2008a). Sulfur and Chlorine in Late Cretaceous Deccan Magmas and Eruptive Gas Release. Science 319, 1654-1657.
Self, S., Jay, A. E., Widdowson, M. & Keszthelyi, L. P. (2008b). Correlation of the Deccan and Rajahmundry Trap lavas: Are these the longestand the largest lava flows on Earth? Journal of Volcanology and Geothermal Research 172, 3-19.
Self, S., Widdowson, M., Thordarson, T. & Jay, A. E. (2006). Volatile fluxes during flood basalt eruptions and potential effects on the global environment: A Deccan perspective Earth and Planetary Science Letters 248, 518-532.
Sen, G. (1995). A simple petrologic model for the generation of Deccan Traps magmas. International Geology Review 37, 825-850.
Sen, G. (2001). Generation of Deccan Trap magmas Proceedings of the Indian National Science Academy 110, 409-431.
Sen, G. (2002). Giant Plagioclase Basalts, eruption rate versus time. Response to Sheth's comments and some additional thoughts. Proceedings of the Indian Academy of Sciences 111, 487-488.
Sen, G., Bizimis, M., Das, R., Paul, D. K., Ray, A. & Biswas, S. (2009). Deccan plume, lithosphere rifting, and volcanism in Kutch, India. Earth and Planetary Science Letters 277, 101-111.
Sen, G., Borges, M. R. & Marsh, B. (2006). A case for short durtaion of Deccan Traps eruption. EOS Transactions, American Geophysical Union 87, 197-198.
Sen, G. & Chandrasekharam, D. (2011). Chapter 2: Deccan Traps Flood Basalt Province: An Evaluation of the Thermochemical Plume Model. In: Ray, J., Sen, G. & Ghosh, B. (eds.) Topics in Igneous Petrology: Springer Science.

10. References
283
Sethna, S. F. (1999). Geology of Mumbai and Surrounding Areas and its Position in the Deccan Volcanic Stratigraphy, India. Journal Geological Society of India 53, 359-365.
Shaw, D. M. (1970). Trace element fractionation during anatexis. Geochimica et Cosmochimica Acta 34, 237-243.
Sheth, H. C. (1998). A reappraisal of the coastal Panvel fl exure, Deccan Traps, as a listricfault–controlled reverse drag structure. Tectonophysics 294, 143-149.
Sheth, H. C. (2005). From Deccan to Réunion: No trace of a mantle plume. In: G.R., F., J.H., N., D.C., P. & D.L., A. (eds.) Plates, Plumes and Paradigms: Geological Society of America Special Paper, 477-501.
Sheth, H. C. (2007). Plume-related regional prevolcanic uplift in the Deccan Traps: Absence of evidence, evidence of absence. The Geological Society of America Special Paper 430, 785-813.
Sheth, H. C. & Melluso, L. (2008). The Mount Pavagadh volcanic suite, Deccan Traps: Geochemical stratigraphy and magmatic evolution. Journal of Asian Earth Sciences 32, 5-21.
Sheth, H. C. & Pande, K. (2013). Geological and 40Ar/39Ar age contraints on late-stage Deccan rhyolitic volcanism, inter-volcanic sedimentation, and the Panvel flexure from the Dongri area, Mumbai. Journal of Asian Earth Sciences in press.
Sheth, H. C., Zellmer, G. F., Demonterova, E. I., Ivanov, A. V., Kumar, R. & Patel, R. K. (2013). The Deccan tholeiite lavas and dykes of ghatkopar-Powai area, Mumbai, Panvel flexure zone: Geochemistry, stratigraphic status, and tectonic significance. Journal of Asian Earth Sciences in press.
Shrivastava, J. P. & Pattanayak, S. K. (2002). Basalts of the Eastern Deccan Volcanic Province, India. Gondwana Research 5, 649-665.
Simonetti, A., Bell, K. & Viladkar, S. G. (1995). Isotopic data from the Amba Dongar Carbonatite Complex, west-central India: Evidence for an enriched mantle source. Chemical Geology 122, 185-198.
Simonetti, A., Goldstein, S. L., Schmidberger, S. S. & Viladkar, S. G. (1998). Geochemical and Nd, Pb, and Sr Isotope Data from Deccan Alkaline Complexes - Inferences for Mantle Sources and Plume - Lithosphere interaction. Journal of Petrology 39, 1847-1864.
Singh, R. S., Stoermer, E. F. & Kar, R. (2007). Earliest freshwater diatoms from the Deccan Intertrappean (Maastrichtian) sediments of India. Micropaleontology 52, 545-551.
Smietana, M. (2011). Pétrologie, geochronologie (K-Ar) et géochimie élémentaire et isotopique (Sr, Nd, Hf, Pb) de laves anciennes de la Réunion : Implications sur la construction
10. References
284
de l'édifice volcanique. Université de la Réunion - Laboratoire GéoSciences Réunion, Université de Brest - Laboratoire Domaines Océaniques, 371.
Smit, J. (2004). The section of the Barranco del Gredero (Caravaca, SE Spain): a crucial section for the Cretaceous/Tertiary boundary impact extinction hypothesis. Journal of Iberian Geology 31, 181-193.
Sobolev, A. V. (1996). Melt Inclusions in Minerals as a Source of Principle Petrological Information. Petrology 4, 209-220.
Sobolev, A. V., Batanova, V., Krasheninnikov, V. G., Borisov, A. A., Arndt, N. T., Kuzmin, D. V., Krivolutskaya, N. A. & Sushchevskaya, N. M. (2013). Potential Temperatures of Sources of MORB, OIB and LIPs based on Al Partitioning Between Olivine and Spinel. AGU, Fall Meeting 2013 V11C-06.
Sobolev, A. V. & Chaussidon, M. (1996). H2O concentrations in primary melts from supra-subduction and mid-ocean ridges: Implications for H20 storage and recycling in the mantle. Earth and Planetary Science Letters 137, 45-55.
Sobolev, A. V. & Danyushevsky, L. V. (1994). Petrology and Geochemistry of Boninites from the North Termination of the Tonga Trench: Constraints on the Generation Conditions of Primary High-Ca Boninite Magmas. Journal of Petrology 35, 1183-1211.
Sobolev, A. V., Hofmann, A., Sobolev, A. V. & Nikogosian, I. K. (2005). An olivine-free mantle source of Hawaiian shield basalts. Nature 434, 590-597.
Sobolev, A. V., Hofmann, A. W., Brügmann, G., Batanova, V. G. & Kuzmin, D. V. (2008). A Quantitative Link Between Recycling and Osmium Isotopes. Science 321, 536.
Sobolev, A. V., Hofmann, A. W., Kuzmin, D. V., Yaxley, G. M., Arndt, N. T., Chung, S.-L., Danyushevsky, L. V., Elliott, T., Frey, F. A., Garcia, M. O., Gurenko, A. A., Kamenetsky, V. S., Kerr, A. C., Krivolutskaya, N. A., Matvienkov, V. V., Nikogosian, I. K., Rocholl, A., Sigurdsson, I. A., Sushchevskaya, N. M. & Teklay, M. (2007). The Amount of Recycled Crust in Sources of Mantle-Derived Melts. Science 316, 412-417.
Sobolev, A. V., Krivolutskaya, N. A. & Kuzmin, D. V. (2009a). Petrology of the Parental Melts an Mantle Sources of Siberian Trap Magmatism. Petrology 17, 253-286.
Sobolev, A. V. & Nikogosian, I. K. (1994). Petrology of Long-Lived Mantle Plume Magmatism: Hawaii, Pacific, and Reunion Island, Indian Ocean. Petrology 2, 131-168.
Sobolev, A. V., Sobolev, S. V., Kuzmin, D. V., Malitch, K. N. & Petrunin, A. G. (2009b). Siberian meimechites: origin and relation to flood basalts and kimberlites. Russian Geology and Geophysics 50, 999-1033.

10. References
285
Sobolev, S. V., Sobolev, A. V., Kuzmin, D. V., Krivolutskaya, N. A., Petrunin, A. G., Arndt, N. T., Radko, V. A. & Vasiliev, Y. R. (2011). Linking mantle plumes, large igneous provinces and environmental catastrophes. Nature 477, 312-316.
Srivastava, P., Sangode, S. J., Meshram, D. C., Gudadhe, S. S., Nagaraju, E., Kumar, A. & Venkateshwarlu, M. (2012). Paleoweathering and depositional conditions in the inter-flow sediments units (bole beds) of Deccan Volcanic Province, India: A mineral magnetic approach. Geoderma 177-178, 90-109.
Steinberger, B. (2000). Plumes in a convecting mantle: models and observations for individual hotspots. Journal of Geophysical Research 105, 11127-11152.
Subba Rao, S. (1972). Alkaline Rock of the Deccan Traps. Bulletin Volcanologie 35, 983-997.
Subbarao, K. V., Bodas, M. S., Khadri, S. F. R., Beane, J. E., Kale, V., Widdowson, M., Hooper, P. R. & Walsh, J. N. (2000). Penrose Deccan 2000 - Field Excursion Guide to the Western Deccan Basalt Province. Geological Society of India & Geological Society of America.
Subbarao, K. V., Hooper, P. R., Dayal, A. M., Walsh, J. N. & Gopalan, K. (1999). Narmada dykes. Geological Society of India, Memoirs 43, 891-902.
Subbarao, K. V. & Pathak, S. (1993). Reversly magnetized flows, Rajahmundry, Andhra Pradesh. Journal Geological Society of India 41, 71-72.
Sun, C. & Liang, Y. (2013). The importance of crystal chemistry on REE partitioning between mantle minerals (garnet, clinopyroxene, orthopyroxene, and olivine) and basaltic melts. Chemical Geology 358, 23-36.
Sun, S. & McDonough, W. F. (1989). Chemical and isotopic systematics of oceanic basalts: implications for mantle composition and processes. In: Saunders, A. D. & Norry, M. J. (eds.) Magmatism in the Ocean Basins. London: Geological Society Special Publication, 313-345.
Talusani, R. V. R. (2010). Bimodal tholeiitic and midly alkalic basalts from Bhir area, central Deccan Volcanic Province, India: Geochemistry and petrogenesis. Journal of Volcanology and Geothermal Research 189, 278-290.
Talwani, M. & Reif, C. (1998). Laxmi Ridge - A continental sliver in the Arabian Sea. Marine Geophysical Researches 20, 259-271.
Tatsumi, Y. & Hanyu, T. (2003). Geochemical modeling of dehydration and partial melting of subducting lithosphere: Toward a comprehensive understanding of high-Mg andesite formation in the Setouchi volcanic belt, SW Japan. Geochemistry Geophysics Geosystems 4.
10. References
286
Thompson, A., Attwood, D., Gullikson, E., Howells, M., Kim, K.-J., Kirz, J., Kortright, J., Lindau, I., Liu, Y., Pianetta, P., Robinson, A., Scofield, J., Underwood, J., Williams, G. & Winick, H. (2009). X-ray data booklet. Berkeley: Lawrence Berkeley National Laboratory - University of California.
Thordarson, T. & Self, S. (1998). The Roza Member, Columbia River Basalt Group: A gigantic pahoehoe lava flow field formed by endogenous processes? Journal of Geophysical Research 103, 27,411-427,447.
Todal, A. & Edholm, O. (1998). Continental margin off Western India and Deccan Large Igneous Province. Marine Geophysical Researches 20, 273-291.
Torsvik, T. H., Burke, K., Steinberger, B., Webb, S. J. & Ashwal, L. D. (2010). Diamonds sampled by plumes from the core-mantle boundary. Nature 466, 352-355.
Torsvik, T. H. & Cocks, L. R. M. (2004). Earth Geography from 400 to 250 Ma: a palaeomagnetic, faunal and facies review. Journal of the Geological Society 61, 555-572.
Turgeon, S. C. & Creaser, R. A. (2008). Cretaceous anoxic event 2 triggered by a massive magmatic episode. Nature 454, 323-326.
Upton, B. G. J. & Wadsworth, W. J. (1965). Geology of Réunion Island, Indian Ocean. Nature 207, 151-154.
Valet, J.-P., Laj, C. & Tucholka, P. (1986). High-resolution sedimentary record of a geomagnetic reversal. Nature 322, 27-32.
Vanderkluysen, L., Mahoney, J. J., Hooper, P. R., Sheth, H. C. & Ray, R. (2011). The Feeder System of the Deccan Traps (India): Insights from Dike Geochemistry. Journal of Petrology 52, 315-343.
Venkatesan, T. R., Pande, K. & Gopalan, K. (1993). Did Deccan volcanism pre-date the Cretaceous/Tertiary transition? Earth and Planetary Science Letters 119, 181-189.
Venkaya, E. (1949). Deccan trap outliers of the Godavari districts. Proceedings of the Indian Academy of Sciences 29, 431-441.
Viladkar, S. G. & Schidlowski, M. (2000). Carbon and Oxygen Isotope Geochemistry of the Amba Dongar Carbonatite Complex, Gujarat, India. Gondwana Research 3, 415-424.
Villemant, B., Salaün, A. & Staudacher, T. (2009). Evidence for a homogeneous primary magma at Piton de la Fournaise (La Réunion): A geochemical study of matrix glass, melt inclusions and Pélé's hairs of the 1998-2008 eruptive activity. Journal of Volcanology and Geothermal Research 184, 79-92.

10. References
287
Vlastélic, I., Deniel, C., Bosq, C., Télouk, P., Boivin, P., Bachèlery, P., Famin, V. & Staudacher, T. (2009). Pb isotope geochemistry of Piton de la Fournaise historical lavas. Journal of Volcanology and Geothermal Research 184, 63-78.
Vlastélic, I., Peltier, A. & Staudacher, T. (2007). Short-term (1998-2006) fluctuations of Pb isotopes at Piton de la Fournaise volcano (Réunion Island): Origins and constraints on the size and shape of the magma reservoir. Chemical Geology 244, 202-220.
Vlastélic, I., Staudacher, T. & Semet, M. (2005). Rapid Change of Lava Composition from 1998 to 2002 at Piton de la Fournaise (Réunion) Inferred from Pb Isotopes and Trace Elements: Evidence for Variable Crustal Contamination. Journal of Petrology 46, 79-107.
Vogt, P. R. (1972). Evidence for a global synchronism in mantle plume convection, and possible significance for geology. Nature 240, 338-342.
Vonhof, H. B. & Smit, J. (1997). High-resolution late Maastrichtian-early Danian oceanic 87Sr/86Sr record: Implications for Cretaceous-Tertiary boundary events. Geology 25, 347-350.
Walter, M. J. (1998). Melting of Garnet Peridotite and the Origin of Komatiite and Depleted Lithosphere. Journal of Petrology 39, 29-60.
Walter, M. J. (2014). 3.10 - Melt Extraction and Compositional Variability in Mantle Lithosphere. Treatise on Geochemistry (Second Edition) 3, 393-419.
Wan, Z., Coogan, L. A. & Canil, D. (2008). Experimental calibration of aluminium partitioning between olivine and spinel as a geothermometer. American Mineralogist 93, 1142-1147.
Wang, Z. & Gaetani, G. A. (2008). Partitioning of Ni between olivine and siliceous eclogite partial melt: experimental constraints on the mantle source of Hawaiian basalts. Contribution to Mineralogy and Petrology 156, 661-678.
Watson, S. & McKenzie, D. (1991). Melt Generation by Plumes - a Study of Hawaiian Volcanism. Journal of Petrology 32, 501-537.
Weis, D., Garcia, M. O., Rhodes, J. M., Jellinek, A. M. & Scoates, J. S. (2011). Role of the deep mantle in generating the compositional asymetry of the Hawaiian mantle plume. Nature Geoscience 4, 831-838.
White, R. & McKenzie, D. (1989). Magmatism at Rift Zones: The Generation of Volcanic Continental Margins and Flood Basalts. Journal of Geophysical Research 94, 7685-7729.
White, R. S. & McKenzie, D. (1995). Mantle plumes and flood basalts. Journal of Geophysical Research 100, 17543-17585.
10. References
288
White, R. V. (2002). Earth's biggest 'whodunnit': unravelling the clues in the case of the end-Permian mass extinction. Philosophical Transactions of the Royal Society, London A 360, 2963-2985.
White, R. V. & Saunders, A. D. (2005). Volcanism, impact and mass extinctions: incredible or credible coincidences? Lithos 79, 299-316.
White, W. M. & Klein, E. M. (2014). 4.13 Composition of the Oceanic Crust. Treatise on Geochemistry (Second Edition), 457-496.
Widdowson, M., Pringle, M. S. & Fernandez, O. A. (2000). A Post K-T Boundary (Early Palaeocene) Age for Deccan-type Feeder Dykes, Goa, India. Journal of Petrology 41, 1177-1194.
Widdowson, M., Walsh, J. N. & Subbarao, K. V. (1997). The geochemistry of Indian bole horizons: palaeoenvironmental implications of Deccan intravolcanic palaeo surfaces. Geological Society, London, Special Publications 120, 269-281.
Wignall, P. B. (2001). Large igneous provinces and mass extinctions. Earth Science Reviews 53, 1-33.
Wilf, P., Johnson, K. R. & Huber, B. T. (2003). Correlated terrestrial and marine evidence for global climate changes before mass extinction at the Cretaceous-Paleogene boundary. Proceedings of the National Academy of Sciences, USA 100, 599-604.
Willenbring, J. K. & Blanckenburg, F. v. (2010). Long-term stability of global erosion rates and weathering during late-Cenozoic cooling. Nature 211-214.
Wilson, J. T. (1963). A possible origin of the Hawaian Islands. Canadian Journal of Physics 41, 863-870.
Wimpenny, J., Gannoun, A., Burton, K. W., Widdowson, M., James, R. H. & Gislason, S. R. (2007). Rhenium and osmium isotope and elemental behaviour accompanying laterite formation in the Deccan region of India. Earth and Planetary Science Letters 261, 239-258.
Wolbach, W. S., Lewis, R. S. & Anders, E. (1985). Cretaceous Extinctions: Evidence for Wildfires and Search for Mateoritic Material. Science 230, 167-170.
Wolfe, J. A. (1990). Palaeobotanical evidence for a temperature increase following the Cretaceous/Tertiary boundary. Nature 343, 153-156.
Wolfe, J. A. & Upchurch-Jr, G. R. (1986). Vegetation, climatic and floral changes at the Cretaceous-Tertiary boundary. Nature 324, 148-152.
10. References
289
Woolley, A. R. & Kjarsgaard, B. A. (2008). Carbonatite occurrences of the world: map and database: map and database. Geological Survey of Canada, Open File 5796.
Workman, R. K. & Hart, S. R. (2005). Major and trace element composition of the depleted MAROB mantle. Earth and Planetary Science Letters 231, 53-72.
Yasuda, A., Fujii, T. & Kurita, K. (1994). Melting phase relations of an anhydrous mid-ocean ridge basalt from 3 to 20 GPa: Implications for the behavior of subducted oceanic crust in the mantle. Journal of Geophysical Research 99, 9401-9414.
Yaxley, G. M. (2000). Experimental study of the phase and melting relations of homogeneous basalt + peridotite mixtures and implications for the petrogenesis of flood basalts. Contribution to Mineralogy and Petrology 139, 326-338.
Yaxley, G. M. & Green, D. H. (1998). Reactions between eclogite and peridotite: mantle refertilisation by subduction of oceanic crust. Schweizer Mineralogische und Petrographische Mitteilungen 78, 243-255.
Copyright © 2022 FDOKUMEN