West Slope Lion Plan - Colorado Parks and Wildlife
132
West Slope Mountain Lion Plan: Sept 2, 2020 1 Colorado Parks and Wildlife COLORADO WEST SLOPE MOUNTAIN LION (Puma concolor) MANAGEMENT PLAN Northwest and Southwest Regions September 2020 Colorado Parks and Wildlife Approved by the Parks and Wildlife Commission on September 2, 2020
-
Upload
khangminh22 -
Category
Documents
-
view
1 -
download
0
Transcript of West Slope Lion Plan - Colorado Parks and Wildlife

West Slope Mountain Lion Plan: Sept 2, 2020
1
Colorado Parks and Wildlife
COLORADO WEST SLOPE MOUNTAIN LION
(Puma concolor) MANAGEMENT PLAN
Northwest and Southwest Regions
September 2020
Colorado Parks and Wildlife
Approved by the Parks and Wildlife Commission on September 2, 2020
West Slope Mountain Lion Plan: Sept 2, 2020
2
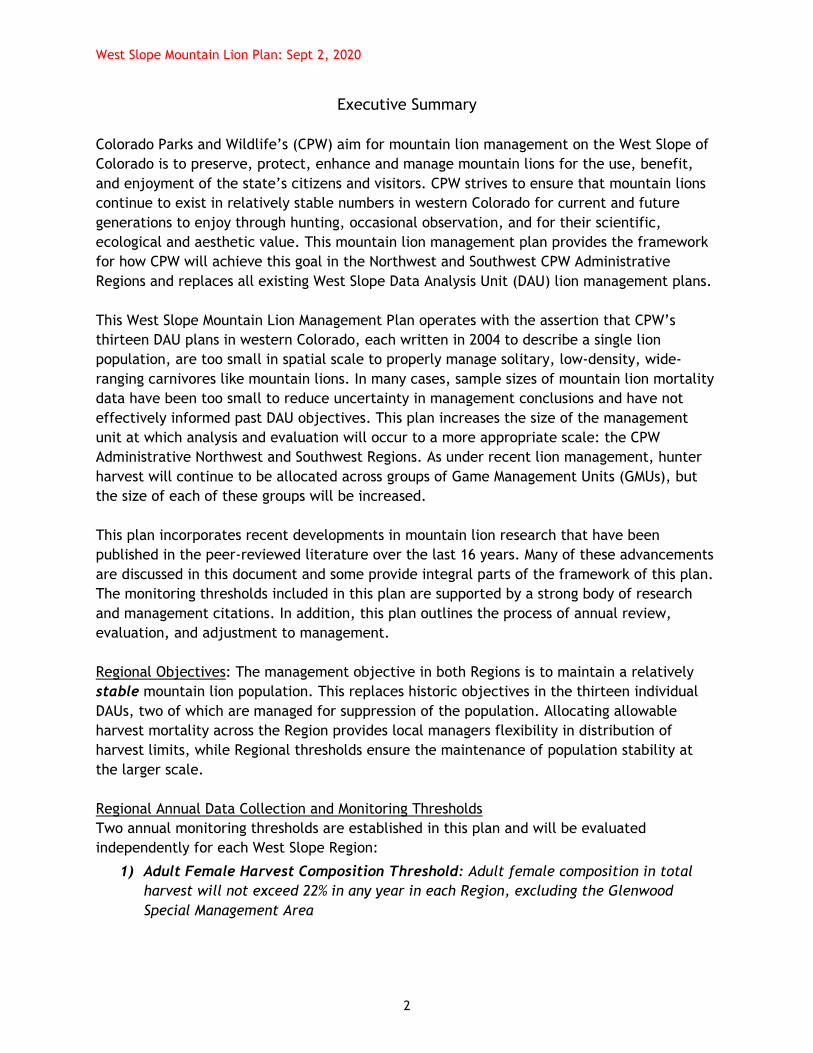
Executive Summary
Colorado Parks and Wildlife’s (CPW) aim for mountain lion management on the West Slope of
Colorado is to preserve, protect, enhance and manage mountain lions for the use, benefit,
and enjoyment of the state’s citizens and visitors. CPW strives to ensure that mountain lions
continue to exist in relatively stable numbers in western Colorado for current and future
generations to enjoy through hunting, occasional observation, and for their scientific,
ecological and aesthetic value. This mountain lion management plan provides the framework
for how CPW will achieve this goal in the Northwest and Southwest CPW Administrative
Regions and replaces all existing West Slope Data Analysis Unit (DAU) lion management plans.
This West Slope Mountain Lion Management Plan operates with the assertion that CPW’s
thirteen DAU plans in western Colorado, each written in 2004 to describe a single lion
population, are too small in spatial scale to properly manage solitary, low-density, wide-
ranging carnivores like mountain lions. In many cases, sample sizes of mountain lion mortality
data have been too small to reduce uncertainty in management conclusions and have not
effectively informed past DAU objectives. This plan increases the size of the management
unit at which analysis and evaluation will occur to a more appropriate scale: the CPW
Administrative Northwest and Southwest Regions. As under recent lion management, hunter
harvest will continue to be allocated across groups of Game Management Units (GMUs), but
the size of each of these groups will be increased.
This plan incorporates recent developments in mountain lion research that have been
published in the peer-reviewed literature over the last 16 years. Many of these advancements
are discussed in this document and some provide integral parts of the framework of this plan.
The monitoring thresholds included in this plan are supported by a strong body of research
and management citations. In addition, this plan outlines the process of annual review,
evaluation, and adjustment to management.
Regional Objectives: The management objective in both Regions is to maintain a relatively
stable mountain lion population. This replaces historic objectives in the thirteen individual
DAUs, two of which are managed for suppression of the population. Allocating allowable
harvest mortality across the Region provides local managers flexibility in distribution of
harvest limits, while Regional thresholds ensure the maintenance of population stability at
the larger scale.
Regional Annual Data Collection and Monitoring Thresholds
Two annual monitoring thresholds are established in this plan and will be evaluated
independently for each West Slope Region:
1) Adult Female Harvest Composition Threshold: Adult female composition in total
harvest will not exceed 22% in any year in each Region, excluding the Glenwood
Special Management Area

West Slope Mountain Lion Plan: Sept 2, 2020
3
2) Total Human-Caused Mortality: The 3-year average of total human-caused
mortality will not exceed 17% of the extrapolated abundance index from the
resource selection function for each Region, excluding the Glenwood Special
Management Area
The following totals do not include the Glenwood Special Management Area
Northwest Region total human-caused mortality threshold: 269 lions
Southwest Region total human-caused mortality threshold: 284 lions
Proposed 2021-2022 Northwest Region harvest objective: 243
Proposed 2021-2022 Southwest Region harvest objective: 185
Historic 2018-2019 Northwest Region harvest limits: 317
Historic 2018-2019 Southwest Region harvest limits: 194
Annual evaluation of adult female harvest composition allows assessment of what the
population trajectory might be based on the selective nature of hound hunting and the
proportional abundance of each age/sex class on the landscape. Limiting adult female
harvest also acts to protect the component of the population responsible for reproduction.
Use of a total human-caused mortality threshold acknowledges the biological importance
of other human-caused lion mortality factors beyond harvest and sets a ceiling for that
maximum acceptable mortality that interacts with information derived from adult female
composition evaluations.
By complementing different aspects of our understanding of mountain lion population
performance in each Region, these monitoring thresholds are designed to interact and
modulate each other during annual analysis. If either threshold is exceeded, this plan lays
out clear and supportable steps that will be taken with harvest management to return the
population trajectory to a stable one. Additionally, as part of the West Slope plan, CPW
will begin the initiation of a mark-resight lion density monitoring program. Survey areas on
the West Slope would be used to confirm and align observed lion densities with abundance
index projections generated from Regional resource selection function output.
Exceptions to Monitoring Thresholds: Retaining viable mountain lion populations for future
generations, like with any other big game species, does not require populations to exist at
their maximum potential. In GMUs 43, 44, 45 and 444 near Glenwood Springs, human safety
and social tolerance levels is a higher management priority than lion abundance. This is
balanced with the overarching goal at the much larger Northwest Regional scale, of
maintaining a stable lion population. Consequently, this plan establishes the Glenwood
Special Management Area (SMA) with its own management objectives and where the Regional
monitoring thresholds will not be applied. Evaluation of techniques and efficacy of reducing
human-lion conflicts in the SMA will be conducted under an adaptive management framework.

West Slope Mountain Lion Plan: Sept 2, 2020
4
Management Plan Public Involvement:
In developing this plan, CPW gathered input from the public in various ways. To inform
elements of the plan specific to the Northwest and Southwest Regions, CPW held 12 public
meetings on the West Slope as well as a virtual Facebook event designed for any interested
member of the public that couldn’t attend the in-person meetings. This draft plan was posted
on the CPW webpage along with a comment link for 6 weeks to collect additional public
input. Outreach was also conducted directly to impacted land management agencies, county
commissions, Habitat Partnership Program committees and stakeholder groups interested in
lion management.
Appendices to this plan should be referenced for comprehensive explanations on the following
topics:
Appendix A: Mountain Lion Life History, Ecology and Monitoring
Appendix B: Mountain Lion Management History in Colorado and the West Slope
Appendix C: Mountain Lion Resource Selection Function model
Appendix D: Literature Cited and References
Appendix E: Mountain Lion Plan Public Process and Results
Acknowledgments: The development of this West Slope Mountain Lion Management Plan
involved the active participation of many people, whose professional expertise, knowledge,
experience, and perspectives were invaluable for critical review and numerous suggestions to
improve the content including Area Wildlife Managers, District Wildlife Managers, Terrestrial
Biologists, Regional Managers, Terrestrial Section Staff, Researchers and Human Dimensions
Specialists, and many others too numerous to individually mention here. We also thank the
Oregon Department of Fish and Wildlife for their independent review and comments on this
plan. All of the above professionals had many other projects and activities that were shuffled,
juggled, shifted and some, perhaps, remained unfinished for the time everyone applied to
reviewing and improving this plan. Colorado Parks and Wildlife thanks all of you.

West Slope Mountain Lion Plan: Sept 2, 2020
5
Colorado West Slope Mountain Lion Management Plan
Table of Contents
West Slope Mountain Lion Management Plan Goal and Strategy --------------------------------- 6
Lion Harvest Terminology, Regulations Process and Hunting Seasons -------------------------- 6
Harvest Limit Groups ................................................................................ 6
Regional Harvest Objectives and Harvest Limit ................................................. 7
Annual Lion Regulations Process................................................................... 7
Lion Hunting Seasons ................................................................................ 8
Methods of Take ..................................................................................... 8
Regional Data Collection Scales and Monitoring Thresholds -------------------------------------- 9
West Slope Mule Deer Strategy and Lion Plan Relationship ................................... 9
Regional Data Analysis Units ...................................................................... 10
Annual Data Collection ............................................................................. 11
Adult Female Composition Threshold ............................................................ 12
Total Human-Caused Mortality Threshold ....................................................... 15
Annual Management Thresholds ----------------------------------------------------------------------- 17
Voluntary Female Harvest Reduction Outreach ................................................ 18
Harvest Limit Reductions .......................................................................... 19
Lion Population Resiliency ------------------------------------------------------------------------------ 20
Resiliency to High Mortality ....................................................................... 20
Source Population Refuges ........................................................................ 20
Zone Management .................................................................................. 22
West Slope Regional Summaries ----------------------------------------------------------------------- 23
Northwest Regional Summary ..................................................................... 23
Southwest Regional Summary ..................................................................... 30
Management Plan Update & Revision Process ------------------------------------------------------- 35
Public Planning Process --------------------------------------------------------------------------------- 35
Lion Density Monitoring and Future Research Needs ---------------------------------------------- 36
Lion Density Monitoring ............................................................................ 36
Future Research Needs ............................................................................ 36
Appendix A….Mountain Lion Life History, Ecology, and Monitoring
Appendix B….History of Mountain Lion Management in Colorado
Appendix C….Colorado Resource Selection Function
Appendix D….Literature Cited and References
Appendix E….Mountain Lion Plan Public Process and Results

West Slope Mountain Lion Plan: Sept 2, 2020
6
West Slope Mountain Lion Management Plan Goal and Strategy
On the West Slope of Colorado, Colorado Parks and Wildlife’s (CPW) aim for lion management
is to preserve, protect, enhance, and manage mountain lions for the use, benefit, and
enjoyment of the citizens of Colorado and its visitors. The broad goal laid forth in this plan by
CPW in both the Northwest and Southwest Administrative Regions is to manage for relatively
stable mountain lion populations, while allowing for management flexibility at smaller
scales.
This plan puts forth a strategy to allow management flexibility at the harvest limit group
scale while regulating lion mortality with thresholds designed to maintain stable lion numbers
at the larger Regional geographic scale. At small scales, lions experience great variation in
rates of abundance, survival, mortality, immigration, and emigration and therefore while
management assumptions about those parameters are quite important, they can be
inaccurate. At larger scales however, it is more likely that differences in initial population
density assumptions result in relatively small changes in population growth rate, and
uncertainty about dispersal may not be as influential (Robinson et al. 2015). A review of these
and other aspects of lion biology and ecology is provided in Appendix A. With implementation
of this plan, we will transition from the 13 historic lion Data Analysis Units (DAUs) on the West
Slope to the CPW Administrative Regions (Southwest and Northwest) as the management unit
of interest, analysis and reporting.
The need for this West Slope plan is demonstrated as follows:
Larger management scales (such as Regions) are most relevant to lion biology and most appropriately support management inferences from mortality and composition data
Significant advancements in geographic information systems (GIS) modeling, lion
monitoring metrics, density estimation and population trajectory information have
been published in the realm of peer-reviewed literature over the last 15 years, and
need to be incorporated into current and future management
Existing lion management plans are outdated as all but one West Slope lion DAU have
plans over 15 years old and this plan will leverage updates into one plan
Without updated West Slope lion management plans, managers setting annual harvest
limits are challenged with aligning metrics and objectives in historic plans against
concerns over various aspects of plans that many have deemed to have lost relevance
Lion Harvest Terminology, Regulations Process and Hunting Seasons
Harvest Limit Groups: The term to describe the pool or grouping of West Slope Game
Management Units (GMUs) that are joined together under one harvest limit will be called a
“harvest limit group”. In the past, harvest limit groups have been as small as one GMU or up
to 5 or 6 GMUs. Under this plan, the size of harvest limit groups will increase, as each group
will include more GMUs than under past plans.

West Slope Mountain Lion Plan: Sept 2, 2020
7
Regional Harvest Objectives and Harvest Limit: CPW will establish annual “Regional
harvest objectives” for the Northwest and Southwest Regions independently. However, the
term harvest objective makes less sense and could create confusion at the smaller harvest
limit group scale. Therefore, at the harvest limit group scale, we will continue to use the
term “harvest limit” to describe the distribution of the Regional harvest objective across
smaller geographic areas of the Region on an annual basis. In this context, the sum of the
harvest limits within each Region is equal to the Regional harvest objective. Regional
summaries included later in this plan provide further discussion on specific recommendations
for the first 3 years of the plan.
As with current lion regulations, the annual harvest limit accounting will begin on April 1 and
ends on March 31 (license year). Only hunter harvest (lions associated with take on a lion
license) will be counted and deducted from the harvest limit. During the Regional harvest
objective and harvest limit setting process, wildlife managers consider the estimated amount
of non-harvest mortality that contributes to total human-caused mortality. While Regional
harvest limits and harvest limit group composition are reviewed annually, it is CPW’s intent
that both will be largely static for the first 3 years of this plan on the West Slope. An
exception to this stability in harvest limits would be if management thresholds are exceeded
and management action is needed. Maintaining these new lion harvest limits for periods of ≥3
years will allow sufficient time for any management efforts to yield results. For example, if
efforts are applied to decrease lion abundance in a local zone, Anderson and Lindzey (2005)
suggest that a 3-year period is necessary to detect results. Other studies suggest that a time
period between 3 and 5 years is the minimum time for recovery of previously suppressed
populations (Logan and Sweanor 2001, Anderson and Lindzey 2005, Stoner et al. 2006,
Robinson and DeSimone 2011).
Annual Lion Regulations Process: This West Slope Lion Management Plan continues to follow
CPW’s current regulatory process and timeline. The annual regulatory cycle for mountain
lions occurs in two stages. The first stage includes regulations related to season dates, open
GMUs or harvest limit groups, method of take, and harvest reporting requirements. The
second stage involves the establishment of annual harvest limits by harvest limit groups.
Mountain Lion Regulation Development Process for Seasons, Method of Take, Other
Provisions:
July-September: internal considerations, conceptual development, regional review
meetings
October: issues considered at internal regulation review meetings
November: issues/draft regulations presented for consideration at the Parks and Wildlife
Commission meeting
December: regulation language modified pursuant to November meeting outcomes
January: final adoption action by the Parks and Wildlife Commission

West Slope Mountain Lion Plan: Sept 2, 2020
8
Mountain Lion Regulation Development Process for Harvest Limits:
June-July: analysis of harvest and total mortality, adult female harvest composition and
Glenwood SMA lion management objectives
September-November: internal development of harvest limit recommendations, regional
review meetings, harvest limits by harvest limit group considered at internal regulation
review meetings
January: final adoption action by the Parks and Wildlife Commission on harvest limits
along with final approval of all other lion provisions
February: publication of online mountain lion brochure
Every 5 years, CPW’s big game season structure is re-evaluated. During this structural review
process, public input is solicited, with three hearing stages that include issue identification
and examination, drafting of regulations, and final structure and approval by the Parks and
Wildlife Commission. The approved 2020-2024 big game season structure is compatible with
all aspects of this West Slope Mountain Lion Management Plan.
Lion Hunting Seasons: Currently, two distinct seasons occur during the April 1- March 31
license year. Both seasons will be maintained in this plan, but use of an April season won’t
initially be employed in either Region outside of the Glenwood Special Management Area. The
two seasons have different purposes, but each will operate within the context of a harvest
limit system.
1. April Lion Season: The season will run from April 1-30, annually. The use of dogs as a
hunting aid is allowed. This is primarily an additional opportunity season in locations
where harvest limits may not be routinely achieved during the regular season. If
conflicts with other resource management issues are anticipated or if harvest
opportunity is not compatible with other management considerations, then an April
season will not be initiated. The utilization of an April season is determined annually
for each harvest limit group.
2. Regular Lion Season: Begins the day after the close of 4th rifle deer and elk season
through March 31, annually. The use of dogs as a hunting aid is allowed. The bulk of
lion harvest is expected during this time and the majority of hunter days will occur in
this season. Lion hunting opportunity is unlimited during each license year until
harvest limits are reached in each harvest limit group, at which point that harvest
limit group will be closed for the remainder of the license year.
Methods of Take: The use of dogs shall be allowed as an aid to take lions as prescribed
within the foregoing April and Regular seasons. The use of mouth-operated predator calls is
allowed. Legal rifles, shotguns, crossbows, handguns, and archery weapons are allowed.
Under specific circumstances, as outlined in the SW and NW Regional summary sections,
electronic calls will be legal in certain harvest limit groups.

West Slope Mountain Lion Plan: Sept 2, 2020
9
Regional Data Collection Scales and Monitoring Thresholds
Lions occupy large spatial scales in terms of home ranges and dispersal patterns. They
regularly live, move, and disperse across previously used DAU boundaries, CPW Administrative
Region boundaries and even state lines. Consequently, monitoring mortality and female
composition at small scales is hampered by small sample sizes and large amounts of annual
variation. As noted by Logan and Runge (2020), larger regions for puma management are more
appropriate to the scale of puma movements and demographics. At the historic DAU scales on
the West Slope, the difference between a few animals of different gender or age classes
could alter harvest composition and conclusions about management trajectory in some units.
For example, from 2016-2018, annual total lion mortality was less than 40 animals for 9 out of
13 previous West Slope DAUs. When samples of each individual DAU’s harvest were divided
among the four age/gender classes (adult female, subadult female, adult male, and subadult
male) the composition of any one class often would be represented by only 4 or 5 individual
lions, causing year to year compositional proportions to commonly vary by 20-30%. This
amount of variation in harvest composition confounds data interpretation, making it difficult
for wildlife managers to evaluate the effects of different harvest levels on mountain lion
population trajectories at the previous DAU scale.
Many lion biologists across the West suggest managing lion populations with respect to source-
sink dynamics (CMGWG 2005, Cooley et al. 2009a, Robinson and DeSimone 2011, Jenks et al.
2011, Logan 2019). Source areas are managed for the production of dispersers that move to
other source areas and into sink areas where management objectives call for greater lion
mortality. Thus, source areas retain a capacity for population resiliency region-wide. This
approach allows for considerable flexibility in applying variable harvest rates spatially and
temporally. This would be in contrast to a management framework with little flexibility
where harvest is attempted to be apportioned evenly across the landscape as outlined by
Beausoleil et al. (2013). The West Slope plan incorporates source-sink dynamics by allocating
lion harvest mortality across the Northwest and Southwest Administrative Regions at a level
appropriate for a stable population objective, while allowing harvest pressure to vary within
more local areas defined by harvest limit groups.
West Slope Mule Deer Strategy and Lion Plan Relationship
Due to recent declines in mule deer populations across the West Slope, CPW embarked on a
comprehensive public engagement and planning effort in 2014 to develop a West Slope Mule
Deer Strategy to guide future management actions to help western deer herds increase
towards objectives. The goal of the West Slope Mule Deer Strategy states that together with
the public and stakeholders, CPW will work to stabilize, sustain and increase mule deer
populations in western Colorado and, in turn, increase hunting and wildlife-related
recreational opportunities. Relative to mountain lions, one of the seven strategies outlined in
the Mule Deer Strategy is to implement lion reductions where predation has been shown to be
limiting deer survival. This West Slope lion plan provides the flexibility, if needed, to allocate
lion harvest at the harvest limit group scale within a Region to implement higher local harvest

West Slope Mountain Lion Plan: Sept 2, 2020
10
rates consistent with the priorities of the Strategy, while still managing to the Regional
objective.
Regional Data Analysis Units
The history of mountain lion management in Colorado, and more specifically on the West
Slope, is provided in Appendix B. This appendix includes an overview of harvest management,
methods of hunting, game damage, and a human-lion conflict discussion all within the
historical DAU-specific management structure. A map showing the 13 historic mountain lion
DAUs is also included in Appendix B.
Under this new plan, the West Slope will be comprised of two Data Analysis Units,
corresponding to the CPW Northwest (NW DAU) and Southwest (SW DAU) Administrative
Regional boundaries instead of the historic DAU scale (Figure 1). The Northwest (NW) Region
lion DAU is comprised of the previous lion DAUs of L-1, L-2, L-3, L-5, L-6, L-7 along with GMU
40 (previously in L-22) and GMUs 41, 42 and 421 (previously in L-9). The Southwest (SW)
Region lion DAU is comprised of the previous lion DAUs of L-20, L-21, L-23, L-24, L-25 along
with GMUs 52, 53, 63, 411 and 521 (previously in L-9), GMUs 60, 61, 62, 64, 65 (previously in
L-22), GMU 82 (previously in L-16) and GMU 83 (previously in L-19).
The 13 historic DAUs have existing management plans that were written in 2004, with the
exception of L-3, which was originally written in 2004 but amended in 2012. Eleven of the 13
plans have DAU population objectives of maintaining a “stable” lion population. Two of the
plans, DAUs L-7 (White River) and L-9 (Grand Mesa/ North Fork), have “suppression”
objectives that were largely implemented to reduce lion populations due to high rates of
game damage (livestock depredation). The new NW and SW Regional management objectives
will replace all historic DAU objectives in the areas governed by those 13 historic plans.

West Slope Mountain Lion Plan: Sept 2, 2020
11
Figure 1. The location of the two West Slope Regional monitoring areas within Colorado.
Annual Data Collection
All known lion mortalities in Colorado are recorded during a mandatory check process. In the
case of harvest mortalities, every hunter is required to report their harvest within 48 hours
and present the hide and head for inspection within 5 days. During this mandatory check,
biological data is collected including sex, evidence of past nursing/breeding status, and age
information, including extraction of a premolar for cementum aging (Table 1).
Table 1. Cementum (premolar tooth) aging guidelines
Cementum Age Age Class
0-12 months Kitten
1 year or 2 years old Subadult
3 years and older Adult
Female of any age that shows evidence of past nursing Adult
Lion mortality data are used to evaluate age and sex composition of harvest, distribution of
harvest and non-harvest lion mortalities, indices of population trajectory, and to account for
and set harvest limits. Due to standard time delays in cementum analysis, the current harvest
composition analysis is always retrospective information, lagging one harvest year behind
regulatory cycles.

West Slope Mountain Lion Plan: Sept 2, 2020
12
Harvest data can be used in many different ways. The age of reproductive females can be
useful to examine the reproductive potential of lion populations (Stoner 2004, Anderson and
Lindzey 2005). Populations maintaining older-age females have higher reproductive potential,
and thus resiliency, than populations where adult female survival is lower. Additionally,
recording the distribution of lion harvest and other human-caused mortalities allows
assessment of potential source areas where little or no lion mortality occurs, and sink areas
where lion mortalities may be relatively high. This kind of spatial analysis may be used to
help inform harvest limits that are established by harvest limit groups.
As recommended by Beausoleil (2017), we approached all demographic metrics referenced in
this management plan with standardization in mind. Since most recent literature focuses on
metrics defined by “independent” lions, that is the common standard we have used in all
data, thresholds, and models presented in this plan. Independent lions are defined as animals
that are not dependent on their mother; this includes subadult lions and adult lions. See
Appendix A for details on mountain lion life history. Kittens are considered dependent lions,
and as such are not legal for harvest and are not included in demographic metrics and
thresholds.
Adult Female Composition Threshold
Both the survival rate and relative abundance of adult female lions, as the reproductive
component of a population, are important considerations for managers. For instance, in the
Garnet Mountains of Montana during an un-hunted period, 71% of the growth rate in the
population was related to reproduction (maternity and kitten survival), while adult female
survival accounted for only 22% of the population growth rate. When hunting was added, only
17% of the growth rate in the population was related to reproduction, while adult female
survival became more influential and accounted for 40% of the population growth rate.
Monitoring and population modeling efforts in this population indicated that when accounting
for all forms of known human-caused mortality, adult female annual survival needs to be at
least 80% to prevent a decrease in the resident lion population level (Robinson and DeSimone
2011) and therefore limits on adult female harvest mortality would be needed to prevent
declines.
Recent research findings are presented below reviewing adult female harvest composition and
population trajectory.
Wildlife managers, through the use of hunting harvest, have the ability to limit lion
population growth (Robinson and DeSimone 2011). On the Uncompahgre Plateau, Colorado,
during the 5-year lion hunting phase of a research project, adult females comprised 23% of
the total cumulative harvest. In this study, lion harvest was considered additive mortality and
lion survival rates and independent lion abundance declined when compared to the preceding
reference phase with no lion hunting (Logan 2015, Logan and Runge 2020).

West Slope Mountain Lion Plan: Sept 2, 2020
13
In southern Idaho and northern Utah, Laundre et al. (2007) tested the effects of changes in
prey abundance on lion population dynamics. Through their monitoring of the change in
population size and social-age class structure, they suggest that an annual harvest of 15 to
20% of resident (adult) females would not reduce a population.
Anderson and Lindzey (2005) conducted an experimental population reduction and recovery in
the Snowy Range of Wyoming to examine how various gender and age classes are exposed in
hunter harvest when a population is increasingly exploited. Because of the differences in daily
movement distances it was assumed that under equal gender ratios, males are more
vulnerable to hound hunting, which relies on discovery of tracks in snow. Increasing hunting
pressure exposes different genders and age classes until they are relatively less available,
subsequently exposing the next most vulnerable age class. Sex and age classes of lions exhibit
different and relatively predictable movement patterns, where males move longer distances
than females and subadults generally move longer distances than adults (Barnhurst 1986,
Anderson 2003). Conceptually, the likelihood of a specific sex or age class of lion being
harvested would reflect its relative abundance in the population and its relative vulnerability
based on daily movement patterns. The least vulnerable individuals (adult females) should
become prominent in the harvest only after the population has been reduced in size by
removal of more vulnerable/available lions. Harvest progression of a higher density
population would be expected to shift from subadults to adult males and finally to adult
females as more vulnerable or targeted individuals are removed and the population is reduced
in size (Anderson and Lindzey 2005). Selectivity in harvest where hunters select males over
females or perhaps subadults is possible from experienced hunters using hounds by examining
track characteristics or live animals prior to harvest. Selective harvests may delay or change
the order of expected harvest progression, but this relationship should still hold as larger
males are removed and the least vulnerable and most biologically important compositional
class (adult females) becomes exposed as abundance of other more selected age/sex classes
decline. Anderson and Lindzey (2005) tested these predictions by applying varying levels of
hunter harvest and found harvest composition to be predominantly subadults for a high-
density population with low harvest levels, shifting to adult males as harvest levels increased,
and then a shift from adult males to adult females with continued high harvest as the
population declined. Likewise, Cooley et al. (2009b) noted that adult females increased in
harvest composition when hunting increasingly removed other age/sex classes in a population.
When harvest levels were reduced, the composition of the harvest returned to primarily
subadults. The male segment of the reduced population recovered within 2 years, primarily
due to male immigration from other populations and the female segment within 3 years from
an increased number of females producing young within the population (Anderson and Lindzey
2005). They concluded that the population appeared to support a harvest composed of 10-15%
adult females. When adult female composition in hunter harvest reached approximately 25%,
the population declined.
The results of these studies suggesting that setting Regional composition thresholds of
between 20-25% adult females in hunter harvest will maintain the Region goals of managing

West Slope Mountain Lion Plan: Sept 2, 2020
14
for a stable population. A threshold of 22% adult female harvest composition was selected
because it represents a mid-range value based on these independent research efforts. Using
cementum data and breeding status to classify adult females, we can infer that if our
threshold is exceeded, the population in question would likely begin a decline. Because the
goal is to not exceed this threshold and risk moving into a decline phase, adult female harvest
composition will be examined annually and management actions will be enacted to reduce
female and/or overall harvest if this threshold is exceeded in any single year.
Applying our new Regional monitoring scales to historic data, the composition of adult
females in total harvest over the last 6 years has ranged from 9-20% in the NW Region and 14-
18% in the SW Region (Table 2). These statistics suggest that even under increasing harvest
levels over this period, neither Regional population has undergone a decline. In accordance
with this plan, data will be evaluated annually to inform Regional management, but voluntary
female and overall harvest reduction steps will be required only if the monitoring threshold of
22% is exceeded. The Glenwood SMA, described in greater detail in the NW Summary section,
is the only area excluded from the annual harvest composition analysis in either Region.
Table 2. Northwest and Southwest Regional adult female harvest composition and sample size of interpreted age class (N) for the last 6 years (2013-2018). Data include all legal harvest mortalities for lions of known sex/age for all GMUs in each region.
2013 2014 2015 2016 2017 2018
Northwest Region
Adult Female Composition in Total
Harvest 20% 9% 16% 17% 19% 17%
N 172 163 172 201 203 205
Southwest Region
Adult Female Composition in Total
Harvest 14% 14% 18% 17% 16% 16%
N 107 118 115 141 125 131
It should also be noted that less selective methods of harvest are likely to result in harvest
composition that reflects the relative abundance of the 4 age-gender classes. Consequently,
significant use of non-selective methods at any broad scale will confound harvest composition
analysis. Hound harvest relies on a portion of hunters selecting against taking females based
on track size or identification while bayed, but non-selective methods take lions of each
compositional class in the same relative abundance that they are encountered, so much
higher rates of female harvest would be expected. Because of this, we conclude that any
other season or method of take besides hound hunting, such as electronic calls, that is largely
non-selective of age-gender classes should be reserved only for areas where substantially
increased harvest and population impact is desired. This would include the Glenwood SMA or
areas where control removals are high but hound hunter harvest has not been successful due
to limited snow. Non-selective hunting methods have been shown in Oregon and Washington
to have higher female harvest rates when compared to hound hunting. A further discussion on
these implications is presented in the “Methods of mountain lion hunting” section in Appendix

West Slope Mountain Lion Plan: Sept 2, 2020
15
B, but electronic calls, as a non-selective method of harvest, would only be allowed in the
areas prescribed in this plan.
Total Human-Caused Mortality Threshold
Clarification of terminology is an important precursor to the discussion of the total human-
caused mortality threshold. Natural forms of mortality (drowning, starvation, disease,
intraspecific strife, injury etc.) are sometimes documented by our mandatory check system,
but such natural mortality will not be included in the total human-caused mortality analysis.
The primary human-caused mortality factors includes hunter harvest, removal of depredating
lions by CPW, landowner, and federal Animal and Plant Health Inspections Service/Wildlife
Services agents (APHIS/WS), and lions killed by vehicles. The only exception of human-caused
mortality sources that is not included in the mortality analysis is for lions that are killed
because they are determined to be dangerous lions pursuant to CPW Administrative Directive
W-20. Our reasoning for not including these kills in our calculations related to mortality
thresholds is that regardless of lion population trajectory or any other management condition,
CPW as a matter of policy would always take lethal action on lions that are determined to be
a threat to public safety. Therefore, including them in calculations of total mortality
thresholds is irrelevant. Additionally, the number of lions that are killed because they are
determined to be dangerous is typically a very small number. For example, from 2016-2018
less than 10 lions annually were reported killed statewide as a result of having attacked or
exhibited threatening behavior towards people. Lions removed in accordance with
Administrative Directive W-20 are specifically documented as such to ensure conflict lion
mortalities with this classification are clearly enumerated, as they will be excluded from
analysis in all mortality totals.
Comparing the rate of population growth against population reduction from harvest can give
managers information on what mortality levels would maintain a stable population. Recent
research findings are presented below that helped inform CPW’s total human-caused
mortality threshold.
The growth rate for a population, or intrinsic rate of population growth, can be described as
the rate biologists expect a population to grow in the absence of additive human-caused
mortality. In Washington, the intrinsic growth rate for 3 different lion populations (Selkirk
Mountains, Kettle Falls, and Cle Elum) was 14% (+-2%) (Beausoleil et al. 2013). In Montana,
the expected intrinsic growth rate of a modeled population through 2 years was 15% when
the results from a protected area and an adjacent hunted area were combined (Robinson and
DiSimone 2011). Laundre et al. (2007) observed a lion population increase 7% during a growth
phase that correlated with an increasing deer population on the border of Idaho and Utah. In
New Mexico, Logan and Sweanor (2001) observed population growth rates of 5% and 17% for
two 4-year periods, averaging 11% for the entire 7-year period for a lion population segment
protected from hunting. Furthermore, Logan and Sweanor observed higher growth rates of
21% to 28% for an experimentally manipulated population segment that was substantially
reduced in abundance and then protected to allow it to increase. Their research indicates

West Slope Mountain Lion Plan: Sept 2, 2020
16
that lion population growth rates are highly variable and most likely density dependent
(Logan and Sweanor 2001).
Examined differently in Wyoming, experimental control and recovery of a population
determined that a harvest rate of 18% of independent lions allowed recovery of the
population that had been intensively harvested in two previous years (Anderson and Lindzey,
2005). On the Uncompahgre Plateau in Colorado, a lion population that was protected from
hunting for five years and subsequently subjected to regulated hunting for five years yielded
evidence that the marked lion population grew during the non-hunting period when total
human-caused annual mortality was 7% or less and began to decline when total human-caused
annual mortality was 27% and continued to decline at rates of 24-29% (Logan and Runge
2020). The discrete threshold at which population decline began could not be measured. The
authors do note that inference should be made to population-scale harvest and human-caused
mortality rates, as rates observed at a smaller scale are biased and represent underestimates
(Logan and Runge 2020).
Although growth rates and mortality or harvest rates in expanding populations may act as
surrogates for determining maximum sustained yield (the highest sustainable annual rate of
removal), caution should be applied in this comparison. Stochastic events can change the
assumed population size and may result in over-harvest, and thus are falsely assumed to be
supported over the longer term (Caughley and Sinclair 1994).
Whether one looks specifically at Colorado data or examines the span of the 6 reported
population growth rates and 3 reported mortality thresholds, a 16-17% annual total mortality
rate is an appropriate range to manage for population stability. Therefore, this plan will use a
maximum human-caused mortality threshold of 17% of Colorado’s projection of possible lion
abundance. This extrapolated lion abundance index is based on a resource selection function
(RSF) model that was applied to each Region to generate an initial representation of how
many lions could be in the population and the corresponding maximum mortality threshold
(Table 3).
For more information about the abundance index extrapolation and the supporting RSF model
as applied to the NW and SW Regions, see Appendix C. The RSF model developed for
Colorado’s lion population provides a probability of lion presence across areas of each Region
and allows application of various densities to those probability classes to generate a
projection of possible lion abundance. The RSF extrapolation that is generated is not a
representation of actual lion population size, but rather the relative probability of resource
selection by a lion population. It provides a method to derive a maximum mortality threshold
at a given scale, which if exceeded, would lead to the reasonable conclusion that lion
populations are experiencing a declining trend. The numerical value that is derived as a
threshold from this analysis will not be exceeded on a 3-year running average in either
Region. While not necessarily a management target, the total mortality threshold represents
the maximum acceptable amount of annual human-caused mortality in each Region.

West Slope Mountain Lion Plan: Sept 2, 2020
17
Table 3. Regional total human-caused mortality thresholds in relation to 2016-2018 total human-caused mortality data. The Regional mortality threshold for the NW Region does not include lion population or mortality contributions from the Glenwood Special Management Area (GMUs 43, 44, 45, 444). Historic mortality data for the SMA is provided on a separate line.
Monitoring Area
17% Annual Total
Human-Caused
Mortality Threshold
2016 Total
Human-Caused
Mortality
2017 Total Human-Caused
Mortality
2018 Total Human-Caused
Mortality
3-year Total
Human-Caused
Mortality Average
Northwest Region 269 228 232 245 235
Glenwood SMA NA 27 11 22 20
Southwest Region 284 180 168 184 177
The total mortality thresholds in Table 3 may or may not change over the lifespan of this
West Slope Mountain Lion Management Plan. Thresholds may change during the course of
revisions based upon new scientific evidence, density estimates that refine the RSF, or
related updates that may occur during periodic plan review. Colorado Parks and Wildlife will
prioritize lion density estimation in future work planning to allow validation and refinement
of densities applied to the RSF. The Glenwood SMA, which is described in greater detail in the
Northwest Region Summary section, will be the only area excluded from annual threshold
requirements in either Region. More specific historic data on harvest and non-harvest
mortality is available in the Regional Summary sections of this document and in Appendix B;
History of Mountain Lion Management in Colorado.
Adjustments to this human-caused mortality threshold is informed by the adult female
compositional threshold. Direction of population trajectory as indicated by annual
compositional evaluation provides a feedback mechanism to modify the common currency of
human-caused lion mortality, which are harvest limits.
Annual Management Thresholds
The West Slope Lion Management Plan initiates a new management framework that evaluates
annual lion mortality data against selected thresholds that are scientifically supportive of a
stable lion population. The NW and SW Administrative Regions will be independently
managed, and the Glenwood Special Management Area is excluded from evaluation against
the NW thresholds. The two following mortality monitoring thresholds will be evaluated in an
interactive manner.
1. Proportion of adult female (cementum age of 3 years or older, or any age with
evidence of nursing) composition of total hunter harvest will not exceed 22% in any
single year.

West Slope Mountain Lion Plan: Sept 2, 2020
18
2. Total human-caused mortality will not exceed 17% of the extrapolated abundance
index (see RSF in Appendix C and Table 3) based on a 3-year running average.
The adult female harvest composition threshold and total human-caused mortality threshold
are intended to interact and inform each other. Therefore, if either threshold is exceeded, a
management response to reduce mortality will be required and implemented in Regional
harvest objective setting the following year.
If the 22% adult female threshold is exceeded in any single year (suggesting a decline in the
population) the following actions will be taken:
Regional harvest objective (and mortality threshold) used in that year will be reduced
by 1% of the extrapolated abundance index. This represents a decrease from 17% to
16% of the RSF and would create a lower harvest rate and lower mortality threshold.
CPW will also enact a voluntary female harvest reduction outreach process that
includes:
i. Publishing a request for hunters to voluntarily reduce female harvest in
the CPW Mountain Lion Hunting brochure
ii. Notifying hunters using the online Available Harvest Limit Report to
identify harvest limit groups where CPW is voluntarily asking for
reductions in female harvest
iii. Contacting lion hunters directly to inform them of the voluntary request
If the total human-caused mortality threshold is exceeded or the 22% compositional threshold
continues to be exceeded past one year, then a 5% reduction of the Regional harvest
objective (and mortality threshold) will be implemented the following year. The human-
caused mortality threshold continues to be independent of the female composition threshold.
Each time a reduction in Regional harvest objective is triggered by exceeding thresholds, the
broad intention is that this reduction will be maintained using the recalculated Regional
harvest objective for a minimum of 3 years. In some cases, if the annual female composition
or 3-year average total mortality return to levels below the thresholds before that time,
increases in Regional harvest objectives may be considered.
Annual Regional harvest objectives, outlined further in the West Slope Regional Summaries
section of this plan, incorporate non-harvest mortality rates in development of acceptable
harvest mortality levels so as not to exceed the total human-caused mortality threshold. As
such, Regional harvest objectives will always be lower than total human-caused mortality
thresholds and will likely fall in or near the annual harvest range of 12-16%, bracketing the
14% harvest off-take level as recommended by Beausoleil et al. (2013).
Voluntary Female Harvest Reduction Outreach
If the adult female composition threshold of 22% is exceeded, the first action should be to
reduce adult female harvest. While differentiating subadult females from adult females before

West Slope Mountain Lion Plan: Sept 2, 2020
19
harvest may be difficult, Colorado’s lion hunters have a proven track record of being able to
decrease harvest pressure on females when requested by CPW.
From 2005-2007, CPW, in collaboration with hound hunting groups, conducted training
workshops about the biology and life history of mountain lion as well as the importance of
females to sustaining populations. The lion regulation brochure also provided similar written
information. In the 2007-2008 lion season, CPW implemented a mandatory mountain lion hunter
education requirement. This course provides training information to hunters about mountain
lion ecology and hunters must pass an exam demonstrating the ability to identify lion gender
characteristics. Subsequently, the average total female composition in harvest declined from
about 44% in the 10 years before 2005 to about 37% in the 14 years since. It is important to note
this was a reduction in all female age classes, not just adults. As part of this West Slope plan,
CPW intends to engage with lion hunters via the brochure, the online harvest limit report, and
make informal field contacts to request voluntary reductions in female harvest if and when
Regional annual adult female composition exceeds the 22% threshold. It would not be practical
to ask for reductions just in adult females since age class determination in the field is much
more challenging than gender determination. This outreach would likely decrease overall
female harvest (all ages), but adult females would be part of that reduction, and we expect
this to move composition trajectory in the desired direction.
Harvest Limit Reductions
Harvest limit reductions of 5% will be applied to the Regional harvest objective total in the
regulatory cycle immediately following management thresholds being exceeded, as outlined
above. Any such reduction in Regional harvest objective due to exceeding either threshold,
outside of the Glenwood SMA, is mandatory and is a reduction minimum. Each time a reduction
is applied to the Regional harvest objective, it will generally be maintained for 3 years. There
may be cases where the 3-year total mortality or annual adult female compositional proportion
returns below the management threshold before that time where increases in Regional harvest
objectives will be considered. Nothing precludes managers from implementing larger reductions
of Regional harvest objectives and harvest limits that are determined desirable or necessary to
accelerate the lion population response.
The management steps CPW will take are based on empirical data in previously observed
populations and on models developed in Colorado. The following section presents an
evaluation quantifying Regional areas of minimal lion mortality and outlining the extent of
source areas (Figure 2) and large-scale lion resiliency to harvest. Further, the application of
monitoring thresholds is appropriate to guard against longer term impacts to populations on
the West Slope and ensure population stability at that scale.

West Slope Mountain Lion Plan: Sept 2, 2020
20
Lion Population Resiliency
Resiliency to High Mortality
Upon reaching age of independence, mountain lions disperse to maximize genetic
interchange, which also serve to make populations resilient against high exploitation or rates
of removal as vacated ranges are continuously being re-occupied by immigrants. Natural
replacement of mortalities or otherwise vacated home ranges occurs differently between
male and female lions. Vacated ranges of resident females are typically re-occupied by their
independent-age daughters, adjacent resident females, and some immigrant females (Laing
and Lindzey 1993, Logan and Sweanor 2001). In contrast, male dispersal from natal areas
appears to occur regardless of resident adult male densities (Hemker et al. 1984).
Consequently, vacated ranges of resident males are typically re-occupied by immigrant males,
some coming from long distances. Logan and Sweanor (2001) documented this in New Mexico
and numerous studies have recorded the long distances moved by dispersing lions as well as
the sex bias in dispersal distance (Anderson et al. 1992, Ken Logan, CPW, personal
communication 2018).
Source Population Refuges
In several studies, lion populations subjected to temporary intensive exploitation by > 40%
over 1 to 6 year periods have been demonstrated to recover within 3 to 5 years (Ashman
1976, Logan and Sweanor 2001, Anderson and Lindzey 2005, Robinson et al. 2008, Logan
2015). In two such studies, the lion populations were completely protected from hunting
(Logan and Sweanor 2001, Logan 2015). It is also important to understand that in addition to
reductions in human-caused mortality, recovery was facilitated by immigrants coming from
proximal source areas (Logan and Sweanor 2001, Anderson and Lindzey 2005, Robinson et al.
2008, Cooley et al. 2011). These results confirm that with adequate source populations in
sufficient proximity to provide dispersal immigration combined with native recruitment, lion
populations can be resilient when localized harvest rates exceed recruitment (Anderson and
Lindzey 2005, Robinson et al. 2008, Cooley et al. 2009a, Cooley et al. 2011). These
observations about lion resiliency and ability to rely on adjacent source populations are
derived from research areas that range in size from the average GMU in Colorado (~1,500 km2)
to the largest GMU at about 7,500 km2. The management thresholds of this plan will be
monitored at a large, regional scale; therefore, if the thresholds are exceeded and are
unmitigated, then longer-lasting negative impacts to the lion population should be expected.
At this scale, male immigration is likely to be capable of re-occupying vacant habitat. In
contrast, female immigration would likely occur initially along the boundary with adjacent
Regions or adjacent states if intensive lion mortality is not also occurring in those locations.
Some amount of female immigration may occur also from refuge areas within Regions (i.e.,
areas of high quality lion habitat with limited harvest as a result of land ownership or other
restrictions of access), but this alone may not be sufficient to support continued mortality in
excess of sustainable levels.
West Slope Mountain Lion Plan: Sept 2, 2020
21
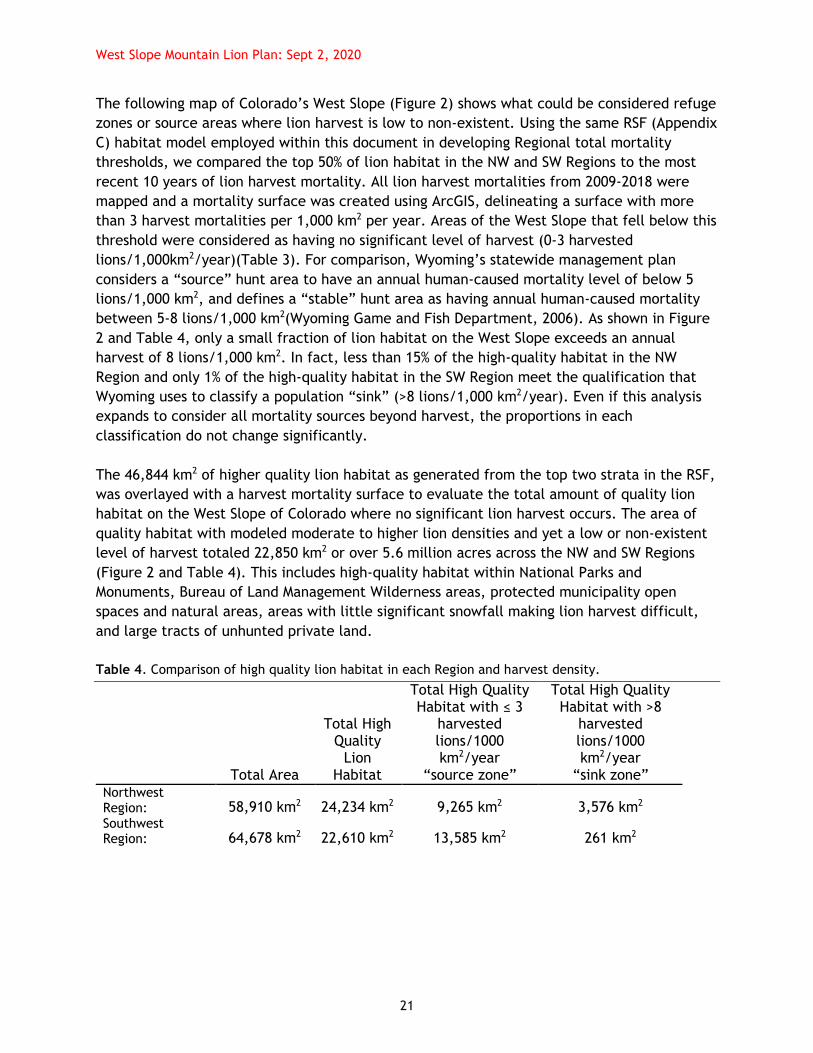
The following map of Colorado’s West Slope (Figure 2) shows what could be considered refuge
zones or source areas where lion harvest is low to non-existent. Using the same RSF (Appendix
C) habitat model employed within this document in developing Regional total mortality
thresholds, we compared the top 50% of lion habitat in the NW and SW Regions to the most
recent 10 years of lion harvest mortality. All lion harvest mortalities from 2009-2018 were
mapped and a mortality surface was created using ArcGIS, delineating a surface with more
than 3 harvest mortalities per 1,000 km2 per year. Areas of the West Slope that fell below this
threshold were considered as having no significant level of harvest (0-3 harvested
lions/1,000km2/year)(Table 3). For comparison, Wyoming’s statewide management plan
considers a “source” hunt area to have an annual human-caused mortality level of below 5
lions/1,000 km2, and defines a “stable” hunt area as having annual human-caused mortality
between 5-8 lions/1,000 km2(Wyoming Game and Fish Department, 2006). As shown in Figure
2 and Table 4, only a small fraction of lion habitat on the West Slope exceeds an annual
harvest of 8 lions/1,000 km2. In fact, less than 15% of the high-quality habitat in the NW
Region and only 1% of the high-quality habitat in the SW Region meet the qualification that
Wyoming uses to classify a population “sink” (>8 lions/1,000 km2/year). Even if this analysis
expands to consider all mortality sources beyond harvest, the proportions in each
classification do not change significantly.
The 46,844 km2 of higher quality lion habitat as generated from the top two strata in the RSF,
was overlayed with a harvest mortality surface to evaluate the total amount of quality lion
habitat on the West Slope of Colorado where no significant lion harvest occurs. The area of
quality habitat with modeled moderate to higher lion densities and yet a low or non-existent
level of harvest totaled 22,850 km2 or over 5.6 million acres across the NW and SW Regions
(Figure 2 and Table 4). This includes high-quality habitat within National Parks and
Monuments, Bureau of Land Management Wilderness areas, protected municipality open
spaces and natural areas, areas with little significant snowfall making lion harvest difficult,
and large tracts of unhunted private land.
Table 4. Comparison of high quality lion habitat in each Region and harvest density.
Total High Quality
Lion Habitat
Total High Quality Habitat with ≤ 3
harvested lions/1000 km2/year
“source zone”
Total High Quality Habitat with >8
harvested lions/1000 km2/year
“sink zone” Total Area Northwest Region: 58,910 km2 24,234 km2 9,265 km2 3,576 km2 Southwest Region: 64,678 km2 22,610 km2 13,585 km2 261 km2

West Slope Mountain Lion Plan: Sept 2, 2020
22
Figure 2. Upper 50%-100% percentile quality lion habitat from Colorado resource selection function
model and 2009-2018 lion harvest mortality surface from the West Slope.
Zone Management
While the West Slope lion plan is not explicitly managing for defined source and sink areas or
employing “zone” management across the two Regions (Logan 2019), the exercise described
above is illuminating. It shows that in addition to monitoring mortality and harvest
composition thresholds to ensure viability of Regional lion populations, Colorado’s West Slope
lions benefit from 49% of the Northwest and Southwest Regions highest-quality lion habitat
having virtually no lion harvest. These zones are functioning as refuges from harvest
mortality. The fact that these robust source areas exist in abundance at large spatial scales
and are well distributed across the West Slope affirms an additional safeguard in CPW’s lion
management strategy. The source areas promote a supply of immigrant lions and bolster
recruitment, supporting population viability and resiliency across the entire landscape. The
functional impact of having 49% of the West Slope’s best habitat as a refuge zone, even if
those areas are not explicitly defined by this plan or in regulations, cannot be overstated.
Significant portions of both Regions are available to lions as “source” zones that offset any
“sink” zones that are implemented through management or occur due to hunter harvest

West Slope Mountain Lion Plan: Sept 2, 2020
23
patterns. As an example, Robinson and DeSimone’s (2011) initial analysis of the Blackfoot
watershed in Montana suggested that an area as small as 12% of a larger landscape that was
without hunting mortality could act as a viable source with increased survival rates and ability
to produce emigrants to other, more heavily harvested areas.
West Slope Regional Summaries
Northwest Regional Summary
Introduction and History
The Northwest Region contains large areas of highly productive mountain lion habitat. The
highest quality mountain lion habitat occurs in western and southern portions of the Region,
particularly in areas around Dinosaur National Monument in Moffat County, in the Piceance
Basin in Rio Blanco and Garfield Counties, in the Bookcliffs and Roan Plateau in Rio Blanco,
Garfield and Mesa Counties, and east into Eagle County. These areas are characterized by
rocky terrain and pinyon-juniper woodland vegetation. They overlap the largest, and
historically most productive, mule deer herds in Colorado. Lion habitat becomes less
productive at higher elevations in the central and northeastern portions of the Region.
Mountain lion management plans completed in 2004 call for a management strategy of stable
mountain lion numbers throughout most of the Region, with the exception of the White River
and Grand Mesa areas, which were previously managed to suppress mountain lion numbers.
The Northwest Region has annually accounted for approximately 40% of statewide mountain
lion mortality, with most of that mortality occurring as hunter harvest. Hunter harvest across
the entire Northwest Region averaged 228 mountain lions annually in the 2016-2018 time
period. Total human-caused mountain lion mortality over the same period averaged 258 lions
annually. These recent rates of mountain lion harvest and total human-caused mortality
represent historic highs. Non-livestock related lion conflict calls have increased in several
areas of the Region within the past several years, particularly in Steamboat Springs, Eagle
County and the Roaring Fork Valley (including Aspen). Conflicts include prolonged trail
closures due to lion activity, depredation of pets and hobby livestock, and the June, 2016
mauling of a young child by a younger lion near Aspen.
Northwest Regional Monitoring Metrics
Lion populations will be managed for a Regional objective of a stable population. CPW will
monitor total human-caused mortality and adult female composition in harvest annually. The
two monitoring thresholds are:
1) The adult female composition in total hunter harvest at the Regional scale will not
exceed 22% in any given year, excluding the Glenwood SMA.
2) The total human-caused mortality at the Regional scale will not exceed 17% of the RSF
extrapolation, excluding the Glenwood SMA, on a 3 year average. In the Northwest
Region, this equates to a Regional total human-caused mortality threshold of 269
lions.

West Slope Mountain Lion Plan: Sept 2, 2020
24
Regional Harvest Objective
Evaluation of both monitoring metrics indicates that there is room for a modest increase in
mountain lion harvest in the Northwest Region while continuing to manage for a stable
mountain lion population consistent with the provisions of the West Slope Mountain Lion
Management Plan.
Excluding the Glenwood SMA, mountain lion harvest in the Northwest Region between 2016
and 2018 averaged 212 lions annually. Given the flexibility to achieve a slightly higher harvest
rate within the framework on the West Slope plan, the Northwest Region intends to increase
the harvest rate of mountain lions above levels achieved in 2016-2018.
It is CPW’s intent to maximize the use of licensed hunters in achieving lion management
objectives within the Northwest Region. Mountain lion mortality attributed to control actions
and other non-harvest events within the Region comprises a small portion of total annual
human-caused mortality. Lion management conducted pursuant to this Northwest Regional
plan will strive to maintain non-harvest lion mortality at a low level, with the remaining
mortality directed toward harvest.
The Northwest Region harvest objective for 2021-2022 in GMUs excluding the Glenwood SMA
will equal 243 lions annually (approximately 15% of the lion abundance index in those GMUs in
the RSF). This Regional harvest objective will be divided among four harvest limit groups, as
shown in Table 4. The NW Region harvest objective projects average non-harvest mortality as
being similar to the most recent 3-year average.
Human Safety and Conflict
Human populations and lion populations show direct overlap in much of Colorado. In some
instances, this overlap occurs in areas of relatively high human densities and development.
Lions typically avoid people and are primarily active at times when humans are not.
Nevertheless, co-occupancy of habitats may result in conflicts between people and lions.
These human-lion incidents vary and run a continuum from mere sightings, depredation of or
altercations with pets or hobby livestock, to human attack and injury or fatality. Given the
current human population in Colorado and the anticipated population growth in the future,
lion conflict levels will likely increase, especially in those areas where people continue
expansion of human developments into occupied lion habitat. In addition, as this expansion
occurs, the opportunity to effectively harvest lions is reduced because the traditional form of
lion hunting (use of hounds) is largely incompatible with increasing human occupancy.
Opinions vary on appropriate lion abundance in suburban and ex-urban communities.
Considerable agency effort is directed toward providing people information for managed
coexistence with lions and these efforts will be continued for the foreseeable future.
Nevertheless, CPW places human safety above lion occupancy, especially in areas of human
residential development, where conflict has, or is expected to occur. In areas where conflicts
between humans and lions are of increasing concern, special management may be necessary
to find an appropriate level of tolerance for lions. CPW proposes the use of a Special

West Slope Mountain Lion Plan: Sept 2, 2020
25
Management Area (SMA) to address primarily non-agricultural issues in ex-urban areas where
an increasingly robust lion population is coming in conflict with increasingly high rates of
human occupancy and land use. Appendix B provides a broader discussion on human-lion
conflicts and human safety. In this plan, only one area has been identified on the West Slope
for needing a SMA, and that is the community surrounding Glenwood Springs in the NW
Region. The need, objectives and monitoring goals in the Glenwood SMA are described later in
the NW Regional Summary.
Harvest Limits
Until now, mountain lion seasons and harvest in the Northwest Region was distributed at small
scales, predominantly, to individual GMUs. For example, in 2017 and 2018, 33 separate
mountain lion hunting harvest limit groups were used. All GMUs in the Northwest Region have
been open for mountain lion hunting, except GMU 471, although that unit will be open in the
2020-2021 hunting season. Recent harvest distribution is presented in Table 5. This West
Slope Mountain Lion Management Plan aggregates harvest limits into four harvest limit groups
that include all GMUs within the Region, except those included within the Glenwood SMA
(Figure 3, Table 6).
Figure 3. NW Region harvest limit groups for 2021-2022 lion season.
West Slope Mountain Lion Plan: Sept 2, 2020
26
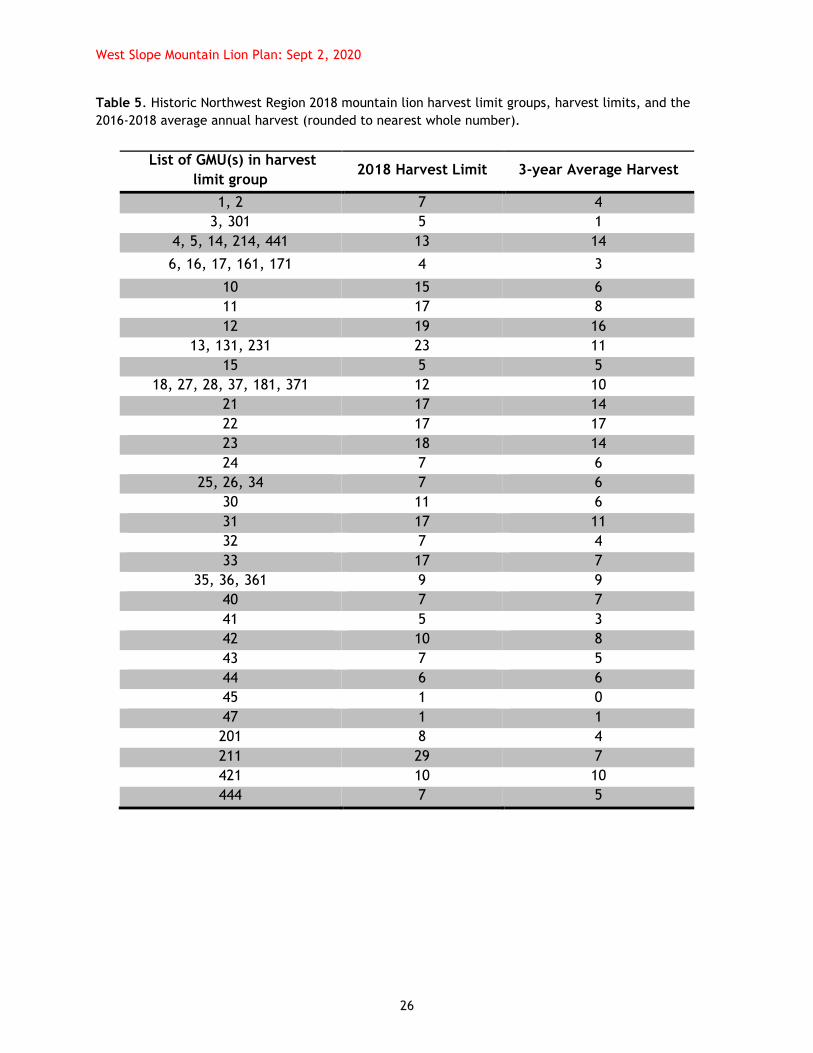
Table 5. Historic Northwest Region 2018 mountain lion harvest limit groups, harvest limits, and the
2016-2018 average annual harvest (rounded to nearest whole number).
List of GMU(s) in harvest
limit group 2018 Harvest Limit 3-year Average Harvest
1, 2 7 4
3, 301 5 1
4, 5, 14, 214, 441 13 14
6, 16, 17, 161, 171 4 3
10 15 6
11 17 8
12 19 16
13, 131, 231 23 11
15 5 5
18, 27, 28, 37, 181, 371 12 10
21 17 14
22 17 17
23 18 14
24 7 6
25, 26, 34 7 6
30 11 6
31 17 11
32 7 4
33 17 7
35, 36, 361 9 9
40 7 7
41 5 3
42 10 8
43 7 5
44 6 6
45 1 0
47 1 1
201 8 4
211 29 7
421 10 10
444 7 5

West Slope Mountain Lion Plan: Sept 2, 2020
27
Table 6. Northwest Region mountain lion harvest limit group name, GMUs and harvest limit for 2021-
2022.
Harvest Limit Group Name GMUs Harvest Limit
L-30
West Hwy 13
1, 2, 3, 10, 11, 21, 22, 30,
31, 32, 201, 211, 301 91
L-31
East Hwy 13
4, 5, 12, 13, 14, 23, 24, 33,
131, 214, 231, 441 80
L-32
Upper Colorado River
6, 15, 16, 17, 18, 25, 26,
27, 28, 34, 35, 36, 37, 161,
171, 181, 361, 371
38
L-33
Lower Colorado River 40, 41, 42, 47, 421, 471 34
Glenwood Special
Management Area (SMA) 43, 44, 45, 444 33
April Season
Historically, the Northwest Region has had very limited lion hunting opportunities during the
month of April. Typically, most harvest limits were filled during the regular lion season from
late November through March. In some areas, April seasons haven’t been utilized to minimize
impacts on other wildlife such as breeding and nesting sage-grouse and sharp-tailed grouse.
The NW Region will initially implement this plan with all April seasons closed, with the
exception of the Glenwood SMA harvest limit group. Opening April seasons could be an option
for other harvest limit groups in the future if there is a need.
Electronic Calls
CPW will create regulations to make electronic calls legal for mountain lion hunting within
the Glenwood SMA (GMUs 43, 44, 45, and 444). Electronic calls have proven to be an effective
means in attracting lions to a hunter’s location, although harvest from this method is less
selective than with hound hunting. By bringing the lion to the hunter through the use of calls,
hunters can control where the lion is harvested, thereby allowing hunters to hunt small pieces
of private or public property. Electronic calls would also enable hunters who do not have
access to hounds the opportunity to harvest a lion. Additionally, the use of electronic calls
would better enable CPW to address conflict lions near residential areas and reach harvest
goals.
Glenwood Special Management Area
The Glenwood SMA is comprised of GMUs 43, 44, 45 and 444 (Figure 3). This area encompasses
most of the Roaring Fork valley and portions of the Eagle valley south of Interstate
70. Mountain lions have historically existed in these areas; however field observations and
reported incidents over the past decade have all indicated a significant increase in both the
number and severity of human-lion conflicts. Managers have become concerned that the

West Slope Mountain Lion Plan: Sept 2, 2020
28
frequency of these conflicts is likely to result in human injuries or fatalities. Conflicts are
likely high in the Glenwood SMA because local winter ranges occupied by mule deer within
these GMUs are located in close proximity to urban and suburban areas, with additional areas
containing substantial exurban housing development. Human activity levels within mountain
lion habitats are high year-around. The combination of small parcel private land ownership,
relatively dense human housing, and high degree of winter recreation all make the GMUs
within this SMA difficult to hunt with hounds, which limits the impact that lion harvest can
have on management. Lion management within this area will be governed by the management
needs, objectives and monitoring metrics stated below.
The NW Regional goal of managing for a stable lion population is compatible with the
independent objective of reducing human-lion conflict in these 4 GMUs. Harvest, total
mortality and adult female composition levels within the Glenwood SMA are exempt from
both NW Regional monitoring thresholds. However, the RSF extrapolated abundance index
within GMUs 43, 44, 45 and 444 will also be excluded from calculations of the total human-
caused mortality threshold for the Region (Table 2). In other words, both lion mortality and
contributions to projected Regional abundance index from the Glenwood SMA will be
excluded from any calculations or analysis of the Regional monitoring thresholds.
Glenwood SMA Need and Rationale:
Public reports of mountain lions in the Glenwood SMA were rare 10-20 years ago. Now reports
number in the hundreds annually and come from a variety of groups and members of the
community. Mountain lion reports have also changed in nature during this period from
occasional sightings in the backcountry to videos and photos of lions basking on front porches
in neighborhoods, roaming between vehicles on highways, and casually walking in the middle
of the day down sidewalks. Reports of lions generally increased in winter and early spring
when snow concentrated prey species in lower elevations nearer human development, more
recently however, reports are now received year-round.
Changes in lion habituation to humans have been reported as well. Many calls report
mountain lions that appear to have lost their fear of humans when confronted and exhibit
behaviors consistent with being “habituated” to humans. The duration of time that lions have
tolerated being close to urban and suburban settings has also increased, now lasting upwards
of several weeks in some cases. Hazing efforts by CPW staff, landowners and other agencies
have been largely unsuccessful in displacing lions from these settings in most cases, similar to
the results of research documented by Alldredge et al. (2019).
Colorado Parks and Wildlife is statutorily liable for damage to livestock and has historically
incorporated game damage objectives in lion management plans. Recorded game damage in
and around the SMA has increased in the last 10 years when compared to the previous
decade. From 1998 to 2008, there were 11 mountain lion damage claims paid in the local
area, at a cost of $3,936. From 2009 to 2019, there were 21 mountain lion damage claims
paid for a cost of $38,870. During these same 10 years however, the number of commercial
livestock producers has decreased while hobby livestock owners appear to have increased.

West Slope Mountain Lion Plan: Sept 2, 2020
29
Agency staff has increased public awareness to help reduce incidents through posting signs in
residential areas, presenting information at homeowners association meetings, coordinating
responses with local law enforcement agencies, providing recommendations to planners and
developers with measures aimed at protecting residents and pets, providing information
through traditional media, posting information on social media and teaching lion safety
principles in annual school programs. Despite these efforts, CPW has needed to increase the
frequency of use of hazing techniques, in addition to more efforts targeting individual conflict
mountain lions for removal.
Glenwood SMA Goals and Objectives:
The goal of the SMA is to address human safety concerns by reducing human-lion conflicts,
reduce lion occupancy in developed areas of high human use and to provide maximum hunting
opportunity. Hunter harvest will be the primary tool for addressing an increasing mountain
lion population and associated increasing conflicts. Harvest management tools such as longer
and additional hunting seasons and permitting the use of electronic calls will help increase
harvest and may allow for targeted harvest in areas of high conflict. Management tools will
also include public education and strategic removal of individual lions that are dangerous by
location or behavior. This SMA approach will be evaluated in an adaptive management
framework to allow testing of some of the questions surrounding mitigating tools, including
high harvest, heightened public education and management of individual animals in conflict
situations, that will be used to reduce human-lion conflicts (Appendix B).
Harvest: The harvest limit in the four GMUs that comprise the SMA will be established at a
level high enough that this SMA harvest limit group offers maximum hunting opportunity
throughout the regular and April lion seasons(>25% harvest mortality, no human-caused
mortality threshold and no adult female threshold).
Public Education: Public education on human wildlife coexistence remains paramount. CPW
will continue to build and rely on partnerships with local governments, municipalities and
organizations to find additional means of reducing conflicts. CPW continues to use various
public information resources to provide information to communities and highlight the
importance of living responsibly with wildlife. Common CPW recommendations include
bringing pets in at night, not leaving pets unattended or tethered in yards, using fully
enclosed outdoor kennels, use of outdoor lights, removing brush and grasses when
landscaping, securing hobby livestock in enclosed barns/sheds and removing deer and elk food
sources near homes that may attract prey species.
Individual Conflict: CPW continues to consider removal or translocation of individual lions,
based on case-by-case specifics, as a main tool to mitigate human-lion conflict. This is
particularly true in developed areas of the SMA where using a licensed hunter to harvest the
individual lion is not practical.

West Slope Mountain Lion Plan: Sept 2, 2020
30
SMA Objective Monitoring and Adaptive Management
Managing for a sustained reduction in human-lion conflicts will be monitored by various
mechanisms. Information will be assessed over time to account for variations in external
conditions, such as weather, which may alter the number of conflicts but cannot be
controlled or replicated by staff. CPW staff collects human-lion incidents and records them in
a system that can be referenced to evaluate progress towards the goal of reducing conflicts.
CPW will use these records to measure increasing or decreasing trends in mountain lion
conflict reports within the SMA.
To further evaluate that CPW is accomplishing the goal of reducing conflicts, staff will
monitor the amount of time spent by officers in response to calls specific to lions and
measure for increasing or decreasing trends. Management direction will continue towards a
decreasing population until social metrics show a multi-year reduction in human mountain
lion conflicts.
Given that the West Slope plan and Glenwood SMA strategy will guide management for at
least the next 10 years, evaluation of success at reaching goals and objectives related to
decreased human-lion conflict in the SMA will occur at an interim point, approximately 5
years into plan implementation. This formal evaluation will assess whether the number of
recorded annual human-lion conflicts have been on a trend of reduction over that time. If this
evaluation shows that the approach used in the first 5 years did not successfully produce a
declining trend in conflicts, then adaptively, a different strategy with reduced levels of
harvest will be employed for the second 5 years. Additionally, harvest limit fulfillment will be
evaluated annually, with a particular focus on the success of each method and season in
reaching harvest goals. The use of electronic calls will be a novel management tool, so
assessing its efficacy in contributing to harvest will also be considered.
Southwest Regional Summary
Introduction and History
The Southwest Region has a variety of habitat and mountain lion prey abundance, and
therefore a variety of lion densities likely ranging from marginal to very high. The Southwest
Region has the lowest human population of CPW’s four administrative regions. Much of the
Southwest Region is public, agricultural or rural residential land. However, population
clusters in the Uncompahgre, Gunnison, Dolores, San Juan and Animas river valleys overlap
lion habitat and do experience occasional human-lion conflicts. Urban and exurban
developments may provide attractants to lions such as residential deer, dogs at-large, and
hobby livestock, as well as refuge areas where traditional hunter harvest is difficult.
Human-mountain lion interactions can vary from sightings of lions, to depredation incidents
on pets or livestock to human attacks. Lions involved in these interactions are categorized in
agency Directive W-20 as nuisance lions, which are frequently seen near people, kill and
cache prey near homes, or as depredating lions which kill livestock, or dangerous lions. Lions

West Slope Mountain Lion Plan: Sept 2, 2020
31
may be considered dangerous due to their location or their behavior. The Southwest Region
will prioritize human safety when handling potentially dangerous human-lion interactions.
Number and locations of nuisance, depredating, or dangerous lions are highly variable from
year to year and are unpredictable.
Southwest Regional Monitoring Metrics
Lion populations will be managed for a Regional objective of a stable population. This will
maintain viable lion populations and sustainable harvest compatible into the future. We will
manage for a relatively stable Regional mountain lion population, and quality hunting
opportunities with a diverse age and sex distribution in the harvest. The two monitoring
thresholds are:
1) The adult female composition in total hunter harvest at the Regional scale will not
exceed 22% in any given year.
2) The total human-caused mortality at the Regional scale will not exceed 17% of the RSF
extrapolation on a 3-year average. In the Southwest Region, this equates to a Regional
total human-caused mortality threshold of 284 lions.
Regional Harvest Objective
For the first three years of the Regional plan, the SW Regional hunter harvest objective will
be set as approximately 11% of the RSF extrapolated abundance. Using this approach, the
Regional annual harvest objective is calculated to be 185 lions, and total human-caused
mortality is projected to be 219 lions. This is well below the mortality monitoring threshold.
This Regional harvest objective is a decrease from the pooled harvest limit of 194 (Table 7)
that existed prior to the development of the West Slope Lion Management Plan. However, due
to the great flexibility afforded to hunters by the large geographic harvest limit groups (as
opposed to many small GMU-level limits, many of which were never achieved), we expect
annual hunter harvest to increase from 147 lions to approximately 185 lions. Harvest limit
changes are likely to occur in harvest limit groups that consistently reach harvest limits. In
addition, this Regional harvest objective is substantially below the SW maximum total human-
caused mortality threshold of 284 lions. This Regional harvest objective may incrementally
increase and decrease as the adult female proportion and total human-caused mortality
thresholds are monitored after the initial 3 years of implementing this plan.
Hunting opportunity in the Southwest Region is allocated to harvest limit groups (Figure 4 and
Table 8) that differ from historic harvest limit groups (Table 7). Harvest limit allocations will
be manipulated to create a balance between maintaining a viable lion population and staying
below acceptable levels of conflicts with humans and livestock. On the large landscape level
of the Southwest Region, harvest limits will be set to provide a broad spectrum of lion ages
and densities on the landscape, as well as addressing hunter opportunity and satisfaction.

West Slope Mountain Lion Plan: Sept 2, 2020
32
Harvest Limit
Mountain lion harvest limit groups were delineated according to the need to distribute
harvest geographically while recognizing the landscape scale of mountain lion movements.
The units are large enough to manage mountain lions on a landscape scale, group Game
Management Units with similar geography, habitat, human cultural use, and regulation
(method of take, April season, hunter harvest vs non-harvest mortality). This led to the
creation of seven harvest limit groups in the Southwest Region loosely identified as the
Dolores Canyon, Uncompahgre, North Fork, Gunnison Basin, San Luis Valley North, San Juan,
and San Luis Valley South. Each harvest limit group will initially have a harvest limit greater
than the current 3-year average harvest mortality. When summed across the Region, harvest
is expected to increase approximately one-third of the difference between the 2019-2020
total harvest and the human-caused mortality threshold. This strategy will be evaluated for
several years, at which time harvest limits may be adjusted to remain below the adult female
monitoring thresholds while strategically maximizing harvest. As necessary, harvest limit
groups and harvest limits may be adjusted at any time during the life of this management
plan.
Figure 4. SW Region harvest limit groups for 2021-2022 lion season.
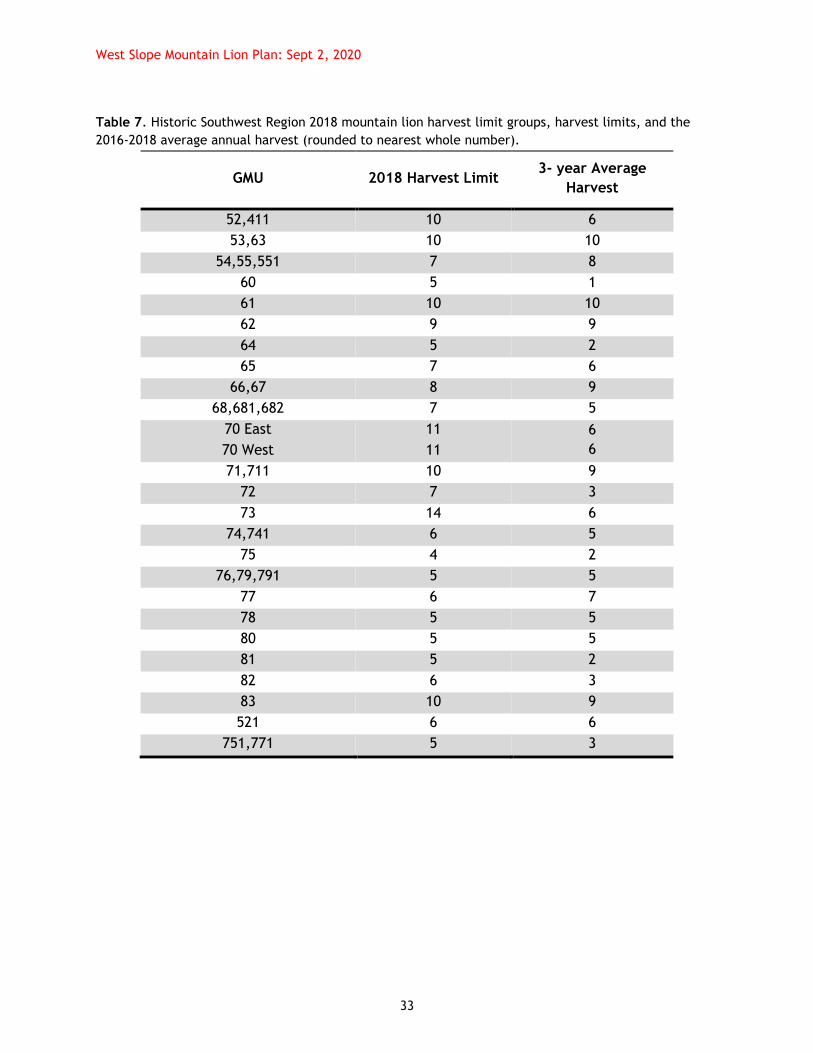
West Slope Mountain Lion Plan: Sept 2, 2020
33
Table 7. Historic Southwest Region 2018 mountain lion harvest limit groups, harvest limits, and the
2016-2018 average annual harvest (rounded to nearest whole number).
GMU 2018 Harvest Limit 3- year Average
Harvest
52,411 10 6
53,63 10 10
54,55,551 7 8
60 5 1
61 10 10
62 9 9
64 5 2
65 7 6
66,67 8 9
68,681,682 7 5
70 East 11 6
6 70 West 11
71,711 10 9
72 7 3
73 14 6
74,741 6 5
75 4 2
76,79,791 5 5
77 6 7
78 5 5
80 5 5
81 5 2
82 6 3
83 10 9
521 6 6
751,771 5 3

West Slope Mountain Lion Plan: Sept 2, 2020
34
Table 8. Southwest Region mountain lion harvest limit group name, GMUs and harvest limits for 2021-
2022.
Harvest Limit Group Name GMUs Harvest Limit
L-50
Dolores Canyon 60, 61, 70W, 72, 73 31
L-51
Uncompahgre 62, 64, 65, 70E, 71, 711 48
L-52
North Fork 411, 52, 53, 63, 521 31
L-53
Gunnison Basin 54, 55 ,66, 67, 551 18
L-54
San Luis Valley North 68, 76, 79, 82, 681, 682, 791 16
L-55
San Juan 74, 75, 77, 78, 741, 751, 771 23
L-56
San Luis Valley South 80, 81, 83 18
April Season
Under this plan, the Southwest Region will initially close all harvest limit groups during the
April hunting season each year. In the recent past, there have been several GMUs open for
hunting in April including 70, 71, 72, 73, and 711. Several of these are proposed to have
expanded opportunity via electronic calls (see below), while others are included in L-51,
which has typically achieved harvest limits during the November-March period. The remaining
GMUs in the Southwest Region have traditionally not had an April season because the units
have met the harvest objective in the November-March time period or wildlife managers
recognize potential conflict with Gunnison sage-grouse during a critical period of their
breeding season.
Electronic Calls
Colorado Parks and Wildlife will create regulations to make electronic calls legal for mountain
lion hunting in harvest limit group L-50 (GMUs 60, 61, 70W, 72, and 73). Although large
portions of the Region are comprised of public property, mountain lion hunting with hounds is
difficult in areas of small property ownership patterns in Montezuma, Dolores, and Montrose
Counties. Much of the low elevation deer and elk winter range in this area has poor or non-
existent snow-tracking conditions in most winters and is therefore difficult to hunt with
hounds, though it is still excellent lion habitat. L-50 is made up of a checkerboard pattern of
public and private land; this can make accessing some of the public land difficult without
permission from a landowner. Keeping hound pursuits only on the property that hunters have
permission to hunt can also become quite challenging due to the smaller parcel size of both
private and public property. Consequently, there is a limited amount of opportunity for lion
hound hunting in these areas. Most of these GMUs rarely, if ever, meet their harvest limit.
The result has been an increase in lion sightings and conflicts. The hunting public has an

West Slope Mountain Lion Plan: Sept 2, 2020
35
interest in harvesting lions in these area; hunters just need a method that would give them an
opportunity that currently does not exist.
Electronic calls have proven to be an effective means in attracting mountain lions to a
hunter’s location, although harvest from this method is less selective than with hound
hunting. By bringing the lion to the hunter through the use of calls, hunters can control where
the lion is harvested, thereby allowing hunters to hunt small pieces of private or public
property. Electronic calls would also enable hunters who do not have access to hounds the
opportunity to harvest a lion. Additionally, the use of electronic calls would better enable
CPW to address conflict lions near residential areas and reach harvest objectives. We can
measure success by identifying electronic call-assisted harvest locations closer to
suburban/urban areas, increased harvest, and a reduction in conflicts. Adult female harvest
composition in these units will be monitored to see if harvest proportions increase above 22%
in any year; harvest limits and methods will be reevaluated if this threshold is exceeded.
Management Plan Update & Revision Process
As is appropriate with lions, this plan initiates a long-term management framework for the
entire West Slope. Colorado Parks and Wildlife’s management plans should be based on
credible scientific information, informed by and responsive to the diversity of public interests
and concerns, and readily available to the public. Management plans provide an
accountability mechanism for agencies that manage lions as a public trust resource. However,
management plans that persist over long time periods risk becoming unresponsive to new
scientific evidence or may outlast changing perspectives of citizens or resource management
demands. A common criticism of management plans is that they are overly restrictive and
unresponsive to either changing management conditions or to newer information. The
challenge is to create guidance that is firm enough to truly guide management but that is also
adaptive to new scientific information, new opportunities to test management applications,
and new demands placed upon the agency. Periodic review and examination of new scientific
information relevant to the management assumptions contained in this plan should be
conducted as needed.
Public Planning Process
A more complete description of the public process and summaries of feedback received on
the West Slope lion plan are included in Appendix E. Public outreach efforts, designed to
inform the public of the proposed planning process and collect input, began in January of
2020. Twelve in-person public meetings were hosted across the by CPW staff beginning in
February 2020. Approximately 584 individuals attended the in-person presentations with 360
attendees providing written survey feedback. The agency also conducted a Facebook Premier
event featured a recording of the same presentation given at West Slope in-person meetings
and included a recorded question and answer session to common themes we heard from
earlier meetings. Over 32,000 views were recorded in the first full day of the video being

West Slope Mountain Lion Plan: Sept 2, 2020
36
posted. The draft West Slope lion management plan and associated appendices were posted
to the CPW mountain lion webpage on CPW’s website on March 12, 2020 and closed on April
30, 2020 (~ 6 weeks) for public review and commenting. During this draft plan review period,
1,855 formal public comments were received.
Lion Density Monitoring and Future Research Needs
Lion Density Monitoring
Developing robust estimates of current lion density in survey areas on the West Slope will help
improve and refine assumptions made in the RSF model. Empirically-derived estimates will
also serve to confirm projected cumulative Regional abundances in the range of 2-3
independent lions/100 km2 that are being applied as part of the West Slope plan to generate
the total human-caused mortality threshold.
Beginning in 2020-2021, CPW will identify two survey areas on the West Slope that are
representative of quality lion habitat and that reflect a gradient of lion hunting pressure. A
spatial mark-resight density estimation approach will be used, which produces more precise
estimates of lion numbers than mark-recapture efforts used in the past (Alldredge et al. 2019,
Murphy et al. 2019). This survey technique relies on remote game cameras distributed across
the survey area to “resight” lions from repeated photos over time. A proportion of lions in the
population are “marked” using GPS collars labeled with unique visual identifiers. The
proportion and capture pattern of known marked lions versus unmarked individuals allows
estimation of density. Spatial data acquired from GPS collars addresses geographic closure
and improves density estimates based on the proportion of time each collared lion spent on
the survey area (Alldredge et al. 2019, Murphy et al. 2019). This correction tends to reduce
overall density estimates, but results in a more accurate estimate. To achieve a desired
precision so the estimates are meaningful in the context of evaluating the RSF, each survey
area would likely be around ~2,000 km2 and will require handling and marking approximately
20-25 independent lions. Each study area will be divided into around eighty 25 km2 cells and a
remote game camera and call will be installed in each cell. Resight sampling will occur for a
minimum of 8 weeks during February and March. This time period was chosen because bears
will not be active at this time and most of the cougar harvest will be completed at this time.
Therefore, estimated lion densities will represent a post-hunt estimate on winter range,
similar to the techniques and procedures currently being employed in CPW’s Upper Arkansas
research project. These West Slope survey area densities will serve to support and align
CPW’s RSF modeling process and its’ resulting abundance projection outputs to accurately
reflect lion population status currently in the field.
Future Research Needs
Numerous avenues of potential research exist into the future in Colorado. Some are already
underway, others require commitment of significant resources that are outside the framework
of this plan, and others may be best evaluated after several years of implementing this West

West Slope Mountain Lion Plan: Sept 2, 2020
37
Slope Mountain Lion Management Plan. Below are several topics that have been identified as
future research needs.
Investigate and update research on public perceptions and opinions about lion
management in Colorado.
Further evaluate the hypothesis that the social disruption caused by intensive lion
harvest or removal of adult males is related to increases in human-lion conflicts.
Evaluate presumed source and sink locations to determine if predictions reflect
functionality.

Appendix A: Sept 2, 2020
1
Colorado West Slope Mountain Lion Management Plan
APPENDIX A
MOUNTAIN LION LIFE HISTORY, ECOLOGY, AND MONITORING
Introduction: This review of current scientific literature begins by briefly describing where and
how lions live in Colorado, including a review of lion densities, and predator-prey relationships.
Specific attention is devoted to lion predation on mule deer because of a high level of interest
in these relationships and how they might relate to recent declines in mule deer populations.
Lastly, a summary is provided of both commonly used field and harvest index-driven methods
to monitor lion populations.
Distribution
The historic range of the mountain lion (Puma concolor) was the largest of any terrestrial
mammal in the Western Hemisphere, with the exception of humans (Logan and Sweanor
2001). The lion continues to range from the southern tip of South America to northern British
Columbia (Logan and Sweanor 2001) but was apparently extirpated from the eastern US and
Canada, with the exception of southern Florida, by the late 1800s to early 1900s. Between
the mid-1960s and the early 1990s, lion populations increased in many western states and
they expanded their distribution into Nebraska, South Dakota, and North Dakota. In Alberta,
Canada, lion distribution has expanded to the north and east during the past two decades
(Knopff et al. 2010). The Cougar Management Guidelines Working Group [CMGWG] (2005) and
Fecske et al. (2011) suggest that population recovery and expansion may be due in part to
reclassifying lions from unregulated predator status to game animal (which has regulated
human off-take since 1965), science-based management practices, increases in prey
abundance, restricted uses of predicides since the 1970s, and increased human tolerance for
large carnivores.
On the West Slope of Colorado, lions occupy most timbered and tall shrub covered habitats. In
comparison to other Rocky Mountain States, western Colorado possesses high-quality, well-
connected lion habitat with the capacity to support high lion abundance. The relatively high-
quality habitat on the West Slope is due in part to an abundance and diversity of lion prey
species, coupled with optimal vegetation and topographic structure.
Dispersal patterns and genetic evidence suggest that lion populations throughout most of the
western US are well connected (Culver et al. 2000, Sinclair et al. 2001, Anderson et al. 2004).
Extreme movements of male lions in excess of 1,000 km have been documented (Thompson
and Jenks 2005). These long-range movements provide a very effective means of genetic
transfer and population maintenance to lion populations in distant regions. Gene flow among
lion populations in the Central Rocky Mountains suggests this region exists as one large lion
population with rapid genetic exchange among suitable habitat patches throughout the region

Appendix A: Sept 2, 2020
2
(Anderson et al. 2004). Consequently, little or no genetic population structuring has been
found in Colorado (Sinclair et al. 2001, McRae 2004).
Habitat Use
The broad geographic distribution of the lion in North America attests to its ability to persist
in natural habitats wherever there is adequate prey and cover (CMGWG 2005). Previous lion
habitat studies in the western US suggest lions select conifer, deciduous timber, riparian, and
tall shrub habitat types at mid-high elevations in steep or rugged terrain (Logan and Irwin
1985, Laing 1988, Koehler and Hornocker 1991, Williams et al. 1995, Dickson and Beier 2002).
Tall vegetation or rugged terrain sufficient for concealment provides the necessary hiding and
stalking cover for securing prey and raising young (CMGWG 2005). Lions may be found in
climates ranging from arid regions of desert environments to temperate rainforests of the
Pacific Coast. Vast, open areas with little hiding cover and severely cold winter temperatures
of northern climates may restrict lion use (Pierce and Bleich 2003). It may be that the basin
bottom of a few mountain “parks” on the West Slope meet this description.
Despite the lion’s broad distribution and adaptability, habitat fragmentation that is
associated with human development can negatively impact lion populations (Beier 1993,
Vickers et al. 2015). In southern California, major highways were implicated in restricting the
size and arrangement of lion home ranges and restrict gene flow in populations by
constraining dispersal patterns (Riley et al. 2006). Genetic analysis and Global Positioning
Systems (GPS) location data for a monitored lion population in northern Colorado did not
demonstrate any similar results as Riley et al. (2006) found in California (Alldredge 2015). The
magnitude of the human population in the Greater Los Angeles Area (>20,000,000) may
explain the differences in observations. Nevertheless, increased construction of roads and
homes in lion habitat may reduce the amount and quality of habitat available to lions and
their primary prey [e.g., deer and elk], but may increase the number of alternative prey
sources [raccoon, fox, domestic pets and hobby livestock]. Moreover, medium to low density
ex-urban development in parts of Colorado serve as refugia for mule deer and can experience
higher densities of mule deer than those found in similar public land habitats (Colorado Parks
and Wildlife (CPW) Terrestrial Section unpublished data).
Lion Social Structure and Reproduction
Social behavior of lions likely evolved to maximize individual survival and reproductive
success (Logan and Sweanor 2001). Lions are solitary carnivores exhibiting a polygynous
breeding strategy where dominant males typically breed with females that reside within their
home range (Murphy 1998). Resident males aggressively defend their territories against male
intruders, whereas females allow more overlap, but express mutual avoidance (Lindzey et al.
1989, Ross and Jalkotzy 1992, Logan and Sweanor 2001). Size of female home ranges tend to
be large enough to provide sufficient prey for themselves and their young (~50-100 km2, 20-40
mi2), while male home ranges tend to be larger (~150-300 km2, 60-120 mi2), overlapping
several females, apparently to maximize their reproductive success (Murphy 1998). Home
ranges found in Colorado vary widely; from 309 km2 for females and 503 km2 for males on the
Uncompahgre Plateau (Anderson et al. 1992) to 188 km2 for females and 253 km2 for males on

Appendix A: Sept 2, 2020
3
the Southern Ute Indian Nation in southwestern Colorado (Koloski 2002). In recently
completed research on the Uncompahgre Plateau and along the Front Range northwest of
Denver, Colorado home range sizes are similar to, if not slightly larger than, those reported
by Murphy (1998)(Ken Logan, CPW, personal communication 2015, Mat Alldredge, CPW,
personal communication 2020). Young females commonly express philopatric behavior
(remain in their natal range) upon independence, but males typically disperse from their
natal range (Anderson et al. 1992, Ross and Jalkotzy 1992, Lindzey et al. 1994, Logan and
Sweanor 2001).
Lion densities are low relative to other large mammals ranging from about 1 independent
(>12-18 months old and self-sufficient) lion/100 km2
(38.6 mi2) in arid climates (Ashman 1976,
Lindzey et al. 1994) to nearly 5 independent lions/100 km2
in generally more mesic areas
(Currier et al. 1977, Hopkins 1989, Ross and Jalkotzy 1992, Robinson et al. 2008, Cooley et al.
2009b, Proffitt et al. 2015) (Table 1). Whittaker and Wolfe (2011) point out that density
estimates are strongly influenced by the methods used to assess the population size in a given
area. This may help explain why in some cases, more recent non-invasive techniques and
spatially-explicit models have yielded density estimates on the higher end of the previously-
observed range.

Appendix A: Sept 2, 2020
4
Table 1. Mountain lion densities reported or derived from surveyed areas in the western United States and Canada, 1977-2019. All densities reported as the number of lions per 100 km2.
Location Vicinity
Survey Area Size (km2)
Independent Mountain Lion Density
Total Mountain Lion Density
Number Survey Years Notes Reference
Washington NE- Wash. 2878 2.2 2.1-2.6 9 Hunted Beausoleil et al. 2016
Colorado Boulder 800 4.1 3 Lightly hunted Alldredge et al. 2019
Colorado Canon City 1950 4.8 (1.8-7.7) 1 Hunted Currier et al. 1977
Utah Monroe Mts 1300 1.2-3.2 9 Hunted
Stoner et al. 2006 Oquirrh Mts 480 2.5-2.9 8 Unhunted
Wyoming Snowy Mts
383 2.4 1 Pre-treatment. Then thru 2
treatment yrs followed by 3 recovery yrs.
Anderson and Lindzey 2005
439 3.4
1700 1.2-3.2 5
Wyoming Bighorn Mts 741 1.8-2.3 3.5-4.6 2 Hunted. Kittens defined as <24mos comprised 50% of the pop.
Logan et al. 1986
Montana Bitterroot Mts 2625 4.5-5.2 1 Hunted Proffitt et al. 2015
Washington NE-Wash. 735 5.0 6 Hunted, Kittens <12mos = 30% of the population
Robinson et al. 2008
Montana Blackfoot drainage
7908 3.7 (2.3-5.7) 6.7 (3.1-11.0)
1 Hunted Russell et al. 2012
Montana Garnet Mts. 915
4.0
11
Yr 1 Unhunted, Kittens <12mos = 30% of population across all years of study Robinson and
DeSimone 2011 2.2 After 3 yrs Hunted
3.6 After 3 yrs Hunted w/refugia in part of area
New Mexico San Andreas Mts
2059 1.5-2.1 1.7-4.3 7 Simulated hunting effect Logan and Sweanor 2001
Washington West-central 655 3.6 (3.0-4.2) 5 Lightly hunted
Cooley et al. 2009b NE 772 3.5 (2.8-4.2) 5 Heavily hunted
Oregon NE Oregon 225 4.2-5.0 1 Hunted Davidson et al. 2014
Utah South-central 1900 0.4-0.9 0.6-1.4 9 Unhunted Lindzey et al. 1994
Utah/Idaho SE-ID & NW-UT 1700 1.0-2.1 1.6-2.8 15 Hunted Laundre et al. 2007
Alberta Sheep River 780 2.6 2.7-4.7 8
Hunted. Kittens/“juveniles” defined as <24 mos. are not included in the average independent density
Ross and Jalkotzy 1992
British Columbia
SE-BC 540 1.5-1.7 3.5-3.7 2
Unhunted, but hunted prior to study. Kittens/“juveniles” defined as <24 mos. = 50-58% of population and are not included in the independent density
Spreadbury et al. 1996
Idaho Idaho Primitive Area
520 1.7-3.5 8 Hunted, Kittens/“juveniles” defined as <24 mos.
Seidensticker et al. 1973

Appendix A: Sept 2, 2020
5
Female lions typically produce their first litter at 2-3 years old (Anderson 1983, Ashman et al.
1983, Logan and Sweanor 2001) and may breed at any time of the year, but exhibit seasonal
birth pulses. Data from 7 lion studies in western North America indicate that May through
October are the peak months for lion parturition (CMGWG 2005). Gestation lasts 82-96 days
and lions typically produce 2 to 4 young (Logan et al. 1986, Ross and Jalkotzy 1992, Logan and
Sweanor 2001). Kittens are usually weaned at 2–3 months and typically remain with the
female for 12–18 months before becoming independent (Pierce and Bleich 2003).
Food Habits and Prey Relationships
Lion diets consist primarily of large vertebrate prey species. Throughout much of North
America, deer comprise the majority of lion diets (Pierce and Bleich 2003), but other large
ungulates such as elk (Cervus canadensis), bighorn sheep (Ovis canadensis), moose (Alces
alces), and pronghorn (Antilocapra americana) may also be consumed (Ross and Jalkotzy
1996, Ross et al. 1997, Murphy 1998, Anderson and Lindzey 2003). Although lions primarily
subsist on large ungulates, small mammals including porcupines (Erethizon dorsatum),
raccoons (Procyon lotor), lagomorphs (hares and rabbits), ground squirrels (Spermophilus
spp.), and beavers (Castor canadensis) may also supplement lion diets. Lions also occasionally
prey on domestic livestock and pets. Sheep and goats are the most commonly killed domestic
livestock, but lions also kill cattle, horses, and pets including dogs and cats (CMGWG 2005).
Scavenging is also a more important contribution in lion diets than was believed 20-30 years
ago (Knopf et al. 2010, Blecha et al. 2015).
Scientific efforts reveal the complexity of predator-prey relationships, yet many people are
not well versed in this understanding (Murphy et al. 2011). A fundamental understanding of
predation consequences is required in order to meet societal goals for prey and predator
populations (Gassaway et al. 1992). Failure to correctly apply the key principles of predator-
prey interactions invites management mistakes, can misspend money (Kie et al. 2003) and
may erode public confidence in management agencies. These points stress the importance of
reviewing and incorporating into management the most current and relevant scientific
information regarding predator-prey relationships.
In single prey systems, predation by cougars and other predators is not believed to widely
trigger declines of prey or depress prey populations for extended (>15 years) time periods
(Ballard and Van Ballenberghe 1997, Ballard et al. 2001). However, if extreme weather or
other perturbations significantly lower prey numbers below maximum sustained yield (Figure
1) predation may delay the prey’s density-dependent response and prolong low numbers. This
effect may occur if the expected drop in cougar numbers naturally lags behind that of the
primary prey (Logan and Sweanor 2001, CMGWG 2005, Laundré et al. 2006), as is common for
population cycles of Canada lynx (Lynx canadensis) and snowshoe hares (Lepus americanus) in
Canada and Alaska. The density dependence model of mortality should be one that is highly
familiar to hunters in North America because it is a foundational principle for hunting many
game populations. Under this paradigm of wildlife management, hunters take animals that
may die from other causes (“compensatory” mortality), but they are only removing this
surplus of animals from the population. It is only when wildlife agencies determine that

Appendix A: Sept 2, 2020
6
additional mortality is necessary to manage wildlife populations that harvest and license
levels are increased to allow hunters to take more animals. This regulated increase in harvest
to reduce population size is then considered “additive” mortality (NFRTC 2001, CPW Hunter
Education 2014).
Figure 1. Density dependence: the relationship between the number of prey recruited and the density
of the prey population. At low prey numbers mortality tends to be additive. At high prey numbers
mortality tends to be compensatory. (Murphy et al. [2011] derived from McCullough [1979], Bailey
[1984], and Bowyer et al. [2005])
Under some circumstances, in multiple prey systems, cougars may have sustained limiting
effects on their large or mid-sized prey (Berger and Wehausen 1991, Sweitzer et al. 1997,
Krausman and Shackleton 2000, Ballard et al. 2001, Kinley and Apps 2001, Novaro and Walker
2005, Wittmer et al. 2005). At the extreme, cougar predation, often acting in concert with
other factors, also may reduce the viability of small or declining prey populations and
mammalian diversity (Sweitzer et al. 1997, Ernest et al. 2002, Wittmer et al. 2005). These
situations often involve a mix of primary and alternate prey (wild or exotic) as well as human-
induced changes in plant communities that collectively help maintain cougar numbers. In
these situations, predator populations that would normally decrease as their prey populations
are reduced are supported by other, more numerous prey populations (Pierce and Bleich
2003). In most of Colorado, it is likely that lion predation functions primarily within the
multiple prey model; on the Uncompahgre Plateau and the northern Front Range areas lions
preyed on mule deer and elk, and in the northern Front Range small prey played a significant
role in lion diet (Blecha et al. 2015, Moss et al. 2016).
The potential impacts of lions on prey populations are largely dependent on the condition of
the prey and their habitat. In areas where prey habitat is in good condition, prey body
condition will also be greater. Thus, more individuals in the prey population are likely to
survive in the absence of predation. However, in prey populations where individuals are in
poor condition due to poor forage quality, those individuals are more likely to die regardless
of predation. Therefore, lion predation on ungulates in good physical condition is more likely

Appendix A: Sept 2, 2020
7
to be additive to other causes of mortality. Conversely, lion predation on ungulates in poor
physical condition (that is, ungulates in populations that exceed Kecol [ecological carrying
capacity]) is more likely to be compensatory (Logan and Sweanor 2001)(Figure 1). In addition,
healthy prey populations likely exhibit higher reproductive rates and are more likely to offset
predatory regulation by producing more young than are consumed by predators. Ungulate
populations exhibiting the characteristics of limitation by predation (Table 2) may benefit
from increased lion harvest. Prey populations limited mainly by habitat conditions will not
likely benefit from increases in local lion harvest except during the initial phases of habitat
recovery allowing more rapid response of the prey population to improved forage conditions.
Additionally, in situations where abundant alternate prey are lacking, a decline in lion
numbers will naturally follow the decrease in the ungulate population regardless of lion
harvest levels (CMGWG 2005).
Table 2. Characteristics of ungulate-prey populations regulated by predation and populations regulated by forage conditions (CMGWG 2005, page 15).
Life history characteristic Population size mainly affected by predationb
Population size mainly affected by forage
Physical condition of adult females better poorer
Pregnancy rate of adult females higher lower
Pause in annual production by adult females less likely more likely
Yearlings pregnanta usually seldom
Corpora lutea counts of adult femalesa higher lower
Litter sizea higher lower
Age at first reproduction for females younger older
Weight of neonates heavier lighter
Mortality of young additive compensatory
Age at extensive tooth wear older younger
Diet quality higher lower
aSome species of ungulates may show limited variability in these characteristics. bThese traits will be evident in any population far below carrying capacity, even if it experiences no predation. The manager should have evidence that predation is a limiting factor before concluding that reducing predation would increase ungulate recruitment.
The extent to which lion predation influences the abundance of ungulate populations seems
to depend upon the ungulate population size, its productivity, the quality of its habitat, the
presence of alternate prey, and lion abundance. Most notably, lion predation can suppress the
growth of small, island-like populations of bighorn sheep (Ross et al. 1997, Kamler et al.
2002, Rominger et al. 2004a, Rominger et al. 2004b). In addition, the effect that lion
predation can have on a small population of bighorn sheep can be influenced by the presence
of more abundant prey, such as mule deer, that is more important to provisioning the lions on
the same range (Johnson et al. 2013).
Lions have annually removed an estimated 15-20% of a mule deer population on the Kaibab
Plateau, Arizona (Shaw 1980), 8-12% of a mule deer population on the Uncompahgre Plateau,

Appendix A: Sept 2, 2020
8
Colorado (Anderson et al. 1992), and 2-3% of elk and 3-5% of mule deer in the northern
Yellowstone Ecosystem (Murphy 1998). Yet, the mere presence of predation does not
necessarily indicate that an ungulate population is limited by predators. Nor does lion
predation necessarily indicate suppression or regulation of the prey population (Ballard et al.
2001). For example, in the Chihuahua desert of southern New Mexico where neither the lions
nor the mule deer were hunted, Logan and Sweanor (2001) revealed that the effect of lion
predation on a population of deer was conditional upon deer habitat quality as influenced by
weather. Lion predation apparently slowed the rate of growth of the deer population, but did
not stop it from growing during good habitat years. The data indicated that lion predation was
partially additive and partially compensatory as the deer population grew, but it was strongly
compensatory as the deer population declined during the drought. In California, Pierce et al.
(2012) examined the relative strengths of predation, mostly by lions, and habitat quality on a
mule deer population and found that predation slowed but did not prevent deer population
growth when food was not limiting the deer. They concluded that deer mortality during a
time that the deer population declined and was at (or near) winter range carrying capacity,
was mostly compensatory. However, during the time when the deer population was
rebounding from a low phase and not limited by food, lion predation was likely additive
mortality.
Researchers in the New Mexico and California studies identified a period when lion abundance
lagged behind the deer population decline, and that it was during this time that lion
predation had the strongest affect. Evidence indicates that the lag period for lion numbers
following deer declines could be 4 to 8 years (Laundre et al. 2007, Pierce et al. 2012).
Other investigations of mule deer population trends have demonstrated population expansion
and contraction highly correlated with the availability and quality of forage (Clements and
Young 1996, Peek at al. 2002). Winter severity of the current and previous year’s winters
were the most influential predictors of deer population growth rates in Idaho. In that study,
lion control was able to increase fawn:doe ratios, but did not affect deer population growth
(Hurley et al. 2011). A number of recent studies support a conclusion that the potential
abundance of mule deer is determined mainly by the nutritional quality and availability of
forage and not by lion predation (Bishop et al. 2005, Bender et al. 2007, Hurley et al. 2011,
Pierce et al. 2012, Montieth et al. 2014). Monteith et al. (2014) suggested a path forward
through a model that predicts expected population demographic rates through measuring
nutritional carrying capacity (NCC). Their approach focuses on the capacity of the habitat and
reduces the need to estimate population abundance. The degree that predation is
compensatory or additive can be assessed by comparing the estimated nutritional capacity for
survival and recruitment of young based on the predictive model developed by Monteith et al.
(2014) to those same demographic rates measured empirically in that system. This would be
useful for quantifying the effects of predation and provides a basis for determining the likely
efficacy of predator control to enhance ungulate populations.
Bergman et al. (2015) examined the published evidence about mule deer population
management and concluded that herds in Colorado are most likely limited by the quality of

Appendix A: Sept 2, 2020
9
available winter range habitat and that the influence that lion predation may have on mule
deer population dynamics (that is, variation in growth rates) is poorly understood. Considering
the abundance of lion habitat in Colorado and the conservative approach to lion harvest
strategies, they posit that lion predation on mule deer is probably weakly additive.
Even in a system when lion predation is primarily compensatory, hunters may be in
competition with lions for preferred prey (i.e. mule deer). If demand for mule deer is high
(hunter interest) and access to the resource is constrained (limited licenses), then deer dying
from other means can be seen, at least by some, as lost hunting opportunity. Lion predation
can be viewed as competition for access to the resource. The conflict here results from the
tension between a short-term desire for hunting opportunity and a long-term view of
population management of both lions and mule deer. Ultimately this isn’t a matter of
biological capacity or ecological function; these considerations are outside the bounds of
what must ultimately be a value-driven decision regarding mule deer and lion management. If
lions are perceived as competitors for a limited resource such as mule deer, some may seek
reductions in lion numbers to lessen this competition. Determination of how much deer
mortality from hunters and how much deer mortality from predation is acceptable is not a
decision that science can make. It is a value-based decision, which must be left to evaluation
in the social, and not biological, realm.
The body of evidence suggests that in most cases, efforts to reduce lion predation impacts to
mule deer are likely to be expensive and the effect, if any, is likely to be relatively short-
lived. Such efforts are also likely to be unpopular with some non-hunting segments of the
human population.
Mountain Lion Population Monitoring
Although lion populations have previously been monitored with intensive capture efforts over
relatively small areas, reliable and affordable techniques to monitor lion populations for
large-scale management programs are lacking. The two main approaches to lion population
monitoring are field methods and harvest data analysis. Field methods may obtain information
directly about lion abundance, demographics and vital rates and/or population trend,
whereas harvest data analysis can provide indications of population trends.
Field Methods
Field methods pertain to efforts by biologists to gather data on lions directly or indirectly via
evidence they leave in the environment. Some methods are used to estimate lion numbers,
while others are indices to relative lion abundance.
Complete Enumeration: Very intensive field efforts to capture, tag and radio-collar lions
along with GPS/radio-tracking to discern movements of unique individuals to combine with
ground-tracking and harvest information have provided the most reliable estimates of lion
abundance in specified study areas (CMGWG 2005). This method produces high-quality data on
Appendix A: Sept 2, 2020
10
sex and age structure, survival, agent-specific mortality, reproduction, emigration, and other
animal movements that generally cannot be obtained with the other methods. This method is
the most expensive and is impractical for lion management on a broader landscape scale,
where only abundance estimates are of focal interest, such as the historic Data Analysis Unit
(DAU) or Regional scale on the West Slope of Colorado.
Mark-Recapture: Chapman’s 1951 modification of the Lincoln-Peterson (L-P) estimator
(Pollock et al. 1990) was used in an effort to estimate lion numbers in Wyoming (Anderson
and Lindzey 2005) and Utah (Choate et al. 2006). The Wyoming effort used a captured and
marked sample of lions at the beginning of each sampling period and used lions killed by
hunters and observed by researchers after the hunting season as the recaptured sample.
Population estimates had 95% confidence intervals ±19-37% of the estimates (n = 5). The Utah
study derived population estimates by determining the identity of lions that they detected
from their tracks on snow as either marked or unmarked by using radio-telemetry or by
pursuing the animal to capture and observe it. The estimates tended to adequately track the
changes in the reference population. But, estimates were on average negatively biased by 17
± 14%, and 95% confidence intervals were widely variable from ± 0 to 50% of the estimates (n
= 7, Monroe Mts., Choate et al. 2006). Multiple capture occasions can be designed into the
mark-recapture field operations with the intent to achieve greater precision in population
estimates and allow more mark-recapture-type models to be applied in terms of modeling the
data (e.g., variations in capture probability by animal type, time, observer, and incorporation
of covariates) (Amstrup et al. 2005). These methods are suitable for intensive research on a
specified study area, especially to establish a reference for local population abundance and
attendant effects of manipulation and experimentation.
Russell et al. (2012) gathered genetic samples from lions one winter in a management unit-
size area (7,908 km2) in Montana. They used a combination of a non-invasive method (back-
tracking to collect hair samples) and treeing and biopsy darting lions to genotype individuals,
and used spatial capture-recapture models to estimate abundance. Their lion density
estimates, including all lions (i.e., adults, subadults, and kittens) varied by model structure,
ranging from 3.7 lions/100 km2 (95% CI=3.6, 5.7) from a base model (including an effect of
distance on detection probability) to 6.7 lions/100 km2 (95% CI=3.1, 11.0) from a full model
(including effects of distance, sex, survey effort, and distance x sex on detection probability).
Proffitt et al. (2015) also gathered genetic samples from lions one winter in a 2,625 km2 area
spanning two lion management units in Montana. They treed and biopsy darted lions to
genotype individuals to estimate abundance using spatial capture-recapture models and
predicted habitat use as a covariate. They estimated median density of independent lions
(i.e., adults and subadults only) from 4.5 lions/100 km2 (95% CI= 2.9-7.7) to 5.2 lions/100 km2
(95% CI=3.4, 9.1). In northeastern Washington, biopsy dart sampling of the population when
integrated with hunter harvest data was able to detect a population decline across multiple
years that was noted in independent mark-recapture efforts in the same research area
(Beausoleil et al. 2016). Wyoming and South Dakota have applied this technique for
estimating annual lion abundance. Their experience suggests that it can be effective if a

Appendix A: Sept 2, 2020
11
sufficiently high number of marks and recaptures can be obtained on a multi-year basis
(Daniel Thompson, Wyoming Game and Fish, personal communication 2015).
Davidson et al. (2014) surveyed a 220 km2 area with scat detection dogs over a 4-week period
in Oregon. The dogs found lion scats that were used in DNA analysis to genotype individuals.
Individual capture histories were used in 4 capture-recapture models to estimate total lion
abundance. Density estimates including all lions (adults, subadults, and kittens) were: 4.6
lions/100 km2 (95% CI=3.8, 8.3) for the Huggins model, 4.8 lions/100 km2 (95% CI=4.2, 7.8) for
the Multiple Detection Poisson model, 4.2 lions/100 km2 (95% CI=3.3, 5.3) for the CAPWIRE
model, and 5.0 lions/100 km2 (95% CI=3.2, 7.7) for the Spatially Explicit Capture-Recapture
model.
Colorado Parks and Wildlife research staff have been experimenting with a non-invasive mark-
resight population sampling method that holds promise for abundance estimation (Mat
Alldredge, CPW, personal communication 2020). Initial work demonstrates that results are
valid, have acceptable confidence intervals on estimates, and can be conducted at a
reasonable cost. Therefore, this mark-resight methodology using “marked” GPS-collared lions
and remote game cameras is currently being implemented on a management scale as part of
CPW’s Upper Arkansas research project. This technique can provide reference densities in a
variety of locations with diverse habitat quality and also will allow testing of resource
selection function models. This non-invasive approach uses a call to lure lions to a site where
a game camera records photos of the animal. A portion of the lion population in the study
area is “marked” with GPS radiocollars before the camera deployment, so both capture
probabilities and rigorous density estimates are obtained (Mat Alldredge, CPW, personal
communication 2020).
This recent advances in Colorado using the spatially-explicit method described above will be
fundamental in generating site-specific abundance or density estimates. Given the
importance of numerical density assumptions in the existing resource selection function
model, CPW commits to conducting robust estimates of density in multiple survey areas of
western Colorado. These will be used in addition to existing estimates from recent Colorado
research to further align and improve our understanding of lion populations in the state.
Helicopter-Based Track Probability Sampling: This method involves detecting and following
lion tracks in ideal snow conditions along transects from a low-flying helicopter to estimate
lion numbers. It is intended for general lion management purposes in representative areas,
but still requires field validation for estimator precision. Results of this approach applied to
lions in the wild have been reported twice in the literature and with mixed results. Field
operations and data quality (i.e., bias) are limited by the difficulty in meeting conditions to
observe lion tracks from a helicopter, including: 1-2 nights after snowfall with no wind to
cover tracks or crust snow, dense vegetation canopy, helicopter availability, and avoidance of
unstable weather and physical obstacles that makes such low-flying dangerous (Van Sickle and
Lindzey 1991, Anderson 2003, Choate et al. 2006). One study in Utah used this method in one
survey and reported an accurate but imprecise lion population estimate when compared to a

Appendix A: Sept 2, 2020
12
reference population (i.e., 14.2 ± 6.3 standard error, Van Sickle and Lindzey 1991). In another
Utah study, investigators observed poor accuracy, poor precision, and inconsistent biases.
Some estimates of the lion population were grossly overestimated by 120 to 284% (using the
Becker 1991 method) and exhibited poor precision with standard errors of 25 to 55% of the
reference density (Choate et al. 2006). Adjusted population estimates using Anderson’s (2003)
correction for low movement lengths derived from computer simulations resulted in
underestimates of 26 to 88% of the reference population. In addition, the application of
Anderson’s (2003) modification using random track lengths resulted in inconsistent biases of
±22-59% of the reference population (Choate et al. 2006).
Ground-Based Track Surveys: This method is intended for use as a trend indicator in
representative areas for general lion management purposes. Track surveys have been used to
monitor lion populations in California (Smallwood 1994, Smallwood and Fitzhugh 1995) and
Arizona (Cunningham et al. 1995). This method requires transect sampling areas where lion
tracks are detectable and provides presence-absence data with confidence interval estimates.
Beier and Cunningham (1996) reported that sampling 140 and 110 8-km-long transects would
be required to detect 30% and 50% population declines, respectively (80% power, α = 0.05).
The difficulty in implementing track surveys is ensuring that transects are well distributed
throughout the population in areas where access may be limited and also the unpredictability
of favorable tracking conditions. The level of effort required to detect useful population
changes likely limits the application of this method to once every few to several years.
Researchers in Utah applied summer track surveys and found statistically significant
relationships (P<0.03) between winter lion density and summer-time track-finding frequency
(i.e., no. track sets/km searched). The investigators concluded that ground-based track
surveys are the least expensive and might be the most efficient method, and offered 2
suggestions for improvement. First, winter track counts would be more efficient than summer
track counts because the tracking substrate is superior and should increase track detection
rates. Second, because removal of lions during a hunting season may bias survey results, track
surveys should be conducted prior to a hunting season to more closely relate the index to the
population of interest (Choate et al. 2006).
Photographic Rates as an Index to Lion Abundance: Photographic rates of mountain lions
might provide a noninvasive index for assessing trends in lion abundance. Such an approach
has been used with tigers and showed camera days per tiger photo correlates with
independent estimates of tiger density (Carbone et al. 2001). In addition, photographic rates
(i.e., leopard photos/100 trap-nights) were an index to snow leopard abundance (McCarthy et
al. 2008). This method has yet to be fully evaluated for lions, where individual identification
without the use of “marks” is not possible as lions don’t possess uniquely identifying coats or
spotting patterns.
Harvest Data
Harvest data pertains to information gathered on hunter-killed lions and hunters by the
managing agency. Methods based on these data are intended for general lion management as
an indicator of population trends.

Appendix A: Sept 2, 2020
13
Relationships of Lion Harvest to Population Abundance: Researchers in Wyoming developed
and validated this method on an experimentally manipulated reference lion population
(Anderson and Lindzey 2005). The researchers found that the sex and age composition of the
harvest varied predictably with lion population size because the likelihood of a specific sex or
age class of lion being harvested (with the use of hounds) was a product of the relative
abundance of particular sex and age classes in the population and their relative vulnerability
to harvest. Wolfe et al. (2015) revealed other potentially useful indices to abundance. The
percent of permits filled and the minimum abundance index were positively correlated. The
percent of individuals in the harvest >6 years old was positively correlated with annual
survival, annual adult male survival, and annual female survival. There was a negative
relationship between the annual number of female lions in the harvest and annual lion
survival rate. Likewise, there was a negative relationship between the annual proportion of
females in the harvest and annual lion survival rate.
Catch-Per-Unit Effort: Researchers in Utah quantified catch-per-unit-effort (CPUE) of their
research teams and hunters for each year as the number of days to capture a lion. In each
case, they found that CPUE was a poor predictor of lion population size (Choate et al. 2006).
However using a data set over a longer period of time, Wolfe et al. (2016) found a strong
relationship between the number of cougars treed per day during the pursuit season and the
index of minimum annual lion abundance.

Appendix B: Sept 2, 2020
1
Colorado West Slope Mountain Lion Management Plan
APPENDIX B
MOUNTAIN LION MANAGEMENT HISTORY IN COLORADO AND THE WEST SLOPE
Historical Management, Game Damage and Conflicts: This section provides a description of the
history of lion management in Colorado. This appendix also provides a review of recent game damage
and human-lion conflict information.
Mountain Lion Management History
Lion management throughout the range of this species is challenging because of the secretive
nature and naturally low densities typical of this solitary large carnivore, and the rugged terrain it
typically inhabits. Consequently, no statewide “census” of lion populations has ever been
attempted in Colorado or the West Slope. Lion research in Colorado has focused on relatively small
geographic areas involving population segments where intensive, expensive studies have revealed
information for reference values on abundance, sex and age structure, fecundity, survival,
mortality factors, predation, depredation, behavioral patterns, movements, dispersal, and effects
of sport-hunting. Current research in the Upper Arkansas study area on Colorado’s Eastern Slope
using newly validated techniques will provide data types described previously, but at much larger
scales and with the ability to draw more rigorous conclusions due to the strengths of the study
design.
Agencies charged with lion management attempt to address the desires of the public, whose values
vary and sometimes compete between maintaining abundant populations, providing hunting
opportunity, and minimizing the potential for human-lion conflicts. Lions have been classified as a
big game species since 1965 in Colorado. Prior to 2000, Colorado had not formulated any plans for
lion management. In 1999, the Executive Director of the Department of Natural Resources (DNR)
formed the Predator Management Advisory Committee, for the purpose of providing policy advice to
DNR and its subordinate agency, Colorado Parks and Wildlife (CPW). This group helped develop
brief plans that set annual hunter harvest and total mortality objectives based on the preceding 3-
year average levels in 25 distinct geographic areas called Data Analysis Units (DAUs). By 2003 these
plans were deemed too generic, inflexible and lacking a credible basis. During 2004, a new
planning effort was completed producing 19 separate DAU plans for the state. This more
comprehensive planning effort provided statewide direction and management sideboards related to
habitat models, population extrapolations, and mortality off-take rates. The plans mentioned
game damage caused by lions and human conflicts associated with lions, but management
objectives were firmly focused on supportable mortality amounts.
The long-term increase in Colorado’s lion population likely resulted from a combination of
regulating human-caused mortality of lions since 1965 and increases in mule deer and elk
populations. Consequently, lion harvest limit allocations and the amount of harvest have increased
since 1980 (Figures. 1) both across the state and in more recent years in the two West Slope
Regions (Figures 2 and 3). The 2004 DAU management plans and analysis suggested that similar

Appendix B: Sept 2, 2020
2
harvest could be obtained with substantially lower harvest limits. An emphasis of these plans was
to reduce hunter harvest of females in select DAUs. Therefore, in 2007 a mandatory lion hunter
education course was instituted to help increase the focus of harvest on male lions. As a result,
female lion harvest composition declined and the combined effect of the reduced harvest limits
and the emphasis on reducing female mortality caused an initial decrease in the total amount of
hunter harvest. Recent research has revealed the importance of focusing on adult female harvest
composition, as opposed to the overall female harvest mortality. The compositional monitoring
threshold incorporated in this West Slope Mountain Lion Management Plan focuses on adult female
proportions versus the total female proportion that was previously a standard objective in the 2004
lion DAU management plans.
Figure 1. Annual mountain lion harvest by gender, total mortality, and total harvest limit in Colorado from
1980-2018. Note transition from calendar year to winter year in 2007.
0
100
200
300
400
500
600
700
800
900 Statewide Lion Harvest, Total Mortality, and Harvest Limit 1980 -'18/'19
Hunter Harvest - Male Hunter Harvest - Female Harvest Limit Total Mortality
Hunting Season Transition - Calendar
to Winter

Appendix B: Sept 2, 2020
3
Figure 2. Historic Northwest Region harvest by gender, total mortality and proportion of females (adult and
subadult) in harvest. This includes all historic GMUs in the NW Region, including those now in the Glenwood
SMA.
Figure 3. Historic Southwest Region harvest by gender, total mortality and proportion of females (adult and
subadult) in harvest.
Non-harvest, human-caused mortality has also increased statewide since the late 1980s (Figure 1)
and in more recent years on the West Slope (Figures 2 and 3). Some have attributed this to
increasing lion populations. However during the past 30+ years the human population, related

Appendix B: Sept 2, 2020
4
development, volume of automobile traffic, and the amount of outdoor recreation in Colorado have
also increased considerably. It is likely that a combination of factors contribute to the increases in
non-harvest lion mortality, including better documentation of these forms of mortality in more
recent decades.
Figure 4. Non-harvest human-caused mountain lion mortality in the Northwest Region from 2000-2018.
Figure 5. Non-harvest human-caused mountain lion mortality in the Southwest Region from 2000-2018.
0
5
10
15
20
25
30
35
2000 2001 2002 2003 2004 2005 2006 2007 2008 2009 2010 2011 2012 2013 2014 2015 2016 2017 2018
NW Region Human-caused Mountain Lion Mortality2000-2018
NW Other Human-caused
NW Roadkill
NW Landowner
NW CPW
NW APHIS
0
5
10
15
20
25
30
35
40
2000 2001 2002 2003 2004 2005 2006 2007 2008 2009 2010 2011 2012 2013 2014 2015 2016 2017 2018
SW Region Human-caused Mountain Lion Mortality2000-2018
SW Human-caused
SW Roadkill
SW Landowner
SW CPW
SW APHIS

Appendix B: Sept 2, 2020
5
The 2004 lion DAU management plans were based on a series of assumptions about lion population
size and the population responses to varying levels of mortality. The plans noted that information
about how populations actually responded to these assumptions was lacking, as was the ability to
collect valid information that could detect population changes in a timely and effective manner.
This led to implementation of two long-term research projects in Colorado designed to evaluate
lion management assumptions, inform management decisions, and quantify actual population
responses to management actions. On the Uncompahgre Plateau, research activities were
completed in 2014. Subsequent data analysis and evaluation have concluded, and CPW Technical
Publication Number 54 reports final project findings which are incorporated into this plan (Logan
and Runge 2020). On the northern Front Range, research has concluded on estimating abundance,
diet composition, and age class from non-invasive sampling. Additionally, this research evaluated
lion demographic and behavioral characteristics in a significantly human altered environment.
Colorado Parks and Wildlife is currently in the third year of a 9-year lion research project in the
Upper Arkansas area of southeastern Colorado. This project will build knowledge of predator-prey
dynamics, improved density estimates, evaluate lion population composition structure under
different harvest regimes and shed light on the relationship of human-lion conflicts under varying
lion harvest and abundance scenarios. Within this plan, provisions are made to allow for future
periodic evaluation and updating so that the plan can incorporate knowledge gained from this and
other research that may be conducted in the future.
Harvest Management
Regulation of hunting for lions in the western states typically follows 1 of 3 harvest strategies
including general seasons, limited entry, and harvest limit/quota systems (CMGWG 2005).
1) General seasons allow unlimited hunting of lions of either sex, and the only restrictions include
the number of licenses issued and/or bag limit allowed per hunter (typically 1 per season), and
timing and length of the hunting season. General seasons provide the highest hunting
opportunity, but likely result in uneven hunting pressure (i.e., accessible areas are heavily
hunted and inaccessible areas are not), which limits control over the amount, composition, and
distribution of the harvest.
2) Limited entry programs restrict the number of hunters per hunt area through a limited license
allocation, using either first come first serve or lottery license sales. This approach is most
restrictive in terms of hunter opportunity, but can be useful to disperse hunting pressure,
control harvest levels, and may increase the opportunity for hunters to be selective (increasing
male harvest) in areas where hunting pressure is low.
3) Harvest limit/quota management limits the total harvest and/or number of female lions
harvested from defined areas. The hunting season closes in an area once the harvest limit has
been met. Hunters are required to monitor status of the hunting season by checking a website
prior to hunting to determine if an area is open or closed to hunting. Advantages to this
approach are that hunting opportunity remains high and the amount and distribution of harvest
can be regulated. Potential disadvantages of harvest limit/quota management include the
number of hunters per hunt area is unlimited until harvest limits are filled and desired harvest

Appendix B: Sept 2, 2020
6
may be exceeded if more than 1 lion is harvested the same day the limit is reached. Also, a
high amount of competition among hunters/outfitters for the lions available under the harvest
limit can result in decreased harvest selection, increasing the amount of females in harvest.
Female sub-quotas can be used to support a management objective of maintaining harvest
levels with reduced impact on the lion population. Advantages include the ability to stop
harvest based on a female objective, while problems include illegal non-reporting of harvested
females to avoid closing units and sacrificing hunter opportunity to pursue males once the
smaller female sub-quota is achieved.
Colorado has managed lion hunting recreation with a harvest limit or quota system since before
1980. As originally conceived, the “quota” is the maximum amount of harvest allowable within a
specific geographic area. Once the “quota” is met, the hunting season for that area is closed for
that year. Lion hunting licenses are available in unlimited numbers, but hunters must check an
online harvest limit report to determine if the harvest limit group of game management units
(GMUs) they wish to hunt remains open to hunting. The harvest limit/quota system optimizes
hunting opportunity while limiting hunting harvest to acceptable levels on an annual basis. In most
DAUs in Colorado, historic “quotas” have historically been set higher than actual harvest
objectives, because the full quota may not be achieved each year. This has occurred because of
several factors: hunting conditions are not always conducive to harvest, the behavior of hound
hunters not filling the quota to facilitate the opportunity to pursue lions and train their dogs
throughout the entire season, and in some areas the constraints of guided hunts as the primary
mechanism to obtain harvest. Using the name “harvest limit” instead of “quota” gives a more
accurate description of how this term functions within a harvest limit group.
Historic “quotas” in Colorado have not been synonymous with the harvest objective, though the
term has been mistakenly believed to be one and the same. When quotas went unfilled it created
an erroneous perception for some that management was failing to achieve the desired harvest. The
upper end of harvest objectives and the total mortality limits codified in the 2004 lion DAU
management plans were intended to be the maximum amount of acceptable annual mortality; a
value not to be exceeded. The contrast of perception and intention surrounding these terms has
contributed to some of the debate about lion management today.
In 2013, an April lion season (April 1-30) was implemented to provide hunting opportunity in
locations where harvest objectives were not being achieved during the regular season. In these
areas, an additional season provides extra hunting opportunity and hunter harvest within the
previous lion DAU management plan objectives. In its original design, the April season was
intended to be a simple extension of the existing lion season structure. The “regular” lion season
opens after the last day of the 4th deer and elk season; typically around the middle of November
through March 31. However, because Colorado’s license year is April 1 – March 31, administrative
and logistical requirements resulted in establishment of a regular and an April season harvest limit,
which has caused confusion in when, where, and why seasons would be open in April and what the
objectives would be. Prior to 2019, CPW used the 3-year running average of residual harvest limit
from the regular season and set that amount on an annual basis as the harvest limit for the April
season in order to function as an extension of the regular season. Harvest during 2016-2018 April

Appendix B: Sept 2, 2020
7
seasons averaged less than 10 lions in each year. Beginning in 2019, to more efficiently manage the
lion regulatory cycle and remove confusion over how April harvest limits were set, CPW combined
the numeric harvest limits from the April season and regular season into one single annual harvest
limit.
All hunter harvest of lions must be reported as part of a mandatory check process required in some
form since before 1980. In 1989, the agency included a requirement that all discovered non-hunt
mortality must also be documented through the mandatory check process. Data collected at the
mandatory check include: harvest date, location (legal description, Universal Transverse Mercator
location, and hunt area), sex, lactation history (whether or not females have ever nursed young
based on nipple characteristics; Anderson and Lindzey 2000), estimated age from tooth wear and
degree of staining, collection of teeth for cementum annuli aging, number of days spent hunting,
and hunting method. Trainer and Golly (1992) reported 76% agreement ≤1 year of annuli ages
compared using blind tests of 2 premolars from the same lion (n = 426; 92% agreement for lions <4
years old), and annuli age comparisons of known age lions were 95% accurate (within 1 year;
Trainer and Golly 1992, Anderson 2003). In 2019, the recording system used for these mortality
reports was overhauled and data are now collected on a computer or mobile application as opposed
to a paper form.
This mandatory reporting system is the most accurate way of accounting for human-caused
mortality, so while time consuming for staff to implement, it attains quality data. Lion carcasses or
pelts harvested by hunters may be frozen, which can reduce the collection of teeth or the ability to
inspect evidence of the gender. Washington noted that hound hunters correctly determined the
gender of lions at bay about 70% (57-88%) of the time, whereas agency personnel correctly
determined the gender of lions during mandatory checks 87% (71-90%) of the time (Beausoleil and
Warheit 2014). They recommended better training of agency staff and education with hunters to
improve the credibility of data that is important to management purposes. In Colorado, hunter
education on gender identification is part of the mandatory mountain lion hunter education course.
Agency staff is trained annually on the data collection process from mandatory inspections. In
addition to mortality data, CPW compiles data on human-lion conflicts and game damage claims,
and gauges social concerns through public meetings, contacts with the public, hunter surveys, and
public attitude surveys.
Methods of Mountain Lion Hunting
Lion hunting in Colorado is accomplished primarily by tracking and baying lions using trained
hunting dogs (i.e., hunting with hounds). However, during lion seasons, harvest may also occur
through opportunistic encounters (spot and stalk) or by calling lions using predator calls (mouth
calls). The majority of lions harvested annually in Colorado are taken by hunting with hounds
(typically >95%). Compared to 20-35 years ago, recent advancements in technologies has
dramatically changed the manner of guided hound hunting, which is the primary way most lions are
harvested in Colorado. Collar technology on pursuit hounds allow an outfitter to release hounds
and track them on a computer or hand held GPS device. Collars may be equipped to detect when
the dogs have a lion at bay. This allows for examination of the closest or easiest path for the
hunter and guide to approach the bayed lion without actually engaging in foot pursuit from the
Appendix B: Sept 2, 2020
8
release of hounds to the point of bay. All-terrain vehicles (ATVs), snowmobiles, cell phones, and
digital radios all combine to make hound hunting lions more efficient than in past decades.
Some groups and individuals are concerned about the use of dogs as a hunting method for lions, and
some states have banned hunting with hounds (e.g., Oregon, Washington). In 2005, CPW hired
Corona Research to survey attitudes of Coloradans about issues related to lions. Some key
elements related to lion hunting include: a) An overwhelming majority of Coloradans thought it was
important for lions to exist, even if they never saw one, and it was important for them and future
generations to have lions; b) Coloradans were split about hunting lions, with 47 percent in support
of legal and regulated hunting and 41 percent opposed; and c) 46 percent disagreed that lion
hunting should be banned, while 34 percent agreed with a ban. These results provide a broader
representation of attitudes of Coloradans about lion conservation and hunting, well beyond the
traditional constituents that agency personnel more frequently contact during the process of
structuring hunting management. As we recommend in the Research Needs portion of the planning
document, a more updated survey in the near future would be useful to evaluate if those
sentiments reported above have changed among citizens.
In states where hunting with hounds has been prohibited, opportunistic lion hunting (during big
game seasons or predator calling) is capable of obtaining similar or higher harvest levels as before
the bans. States in which lion hunting with hounds has been prohibited typically compensate for
substantially decreased success rates by reducing the price of a license, increasing the number of
licenses, and easing mechanisms by which licenses can be obtained. Results from Washington
(Martorello and Beausoleil 2003) revealed that opportunistic lion hunting is less selective of sex and
age class than hunting with hounds and female lions are more vulnerable to harvest from
opportunistic hunting than from hound hunting. Relative female harvest levels increased from 42%
to 59% when hunting with hounds was banned in Washington (mean annual harvest before hound
hunting ban = 157 and after hound hunting ban = 199). In Oregon, similar increases in the
proportion of females in harvest were observed, and within 7 years, total harvest amounts regularly
exceeded harvest amounts prior to the ban on hound hunting (Don Whittaker, Oregon Dept. of Fish
and Wildlife, personal communication 2015).
Lion harvest data from Colorado suggest that hunters using the services of an outfitter are more
selective in the harvest of females (36% F) than hunters not using an outfitter (44% F). In
comparing the methods of hunting lions in Colorado, the use of hounds appears to improve hunter
selectivity regarding females (37% F hound hunters compared with 55% F for opportunistic hunting).
This suggests that applying mechanisms to expand hunting seasons absent the use of hounds is likely
to result in an increase in the absolute amount of and composition of females in harvest. In
addition, if opportunistic hunting harvest increased and hunting with hounds was reduced, we
would expect an increase in the number of dependent young being orphaned due to hunting
because of the apparent increased vulnerability and the higher proportion of females harvested
with non-selective methods (Martorello and Beausoleil 2003).
Differences in the composition and amount of females in hunter harvest are likely a combination of
a hunter’s ability to determine gender (while a lion is treed or at bay), but are also related to
differences in lion vulnerability between hunting methods. Anderson (2003) observed that nightly

Appendix B: Sept 2, 2020
9
movement distances from GPS data averaged over 3 times longer for male lions than for females
(mean end-point distance = 4.6 km versus 1.5 km, 2.9 mi versus 0.9 mi). These longer distance
movements expose males more than females to hunting methods where tracking is involved (i.e.,
hunting with hounds). Opportunistic hunters who do not track lions while hunting are more likely to
harvest the more abundant sex, typically females, because relative abundance and chance
encounters drives harvest vulnerability.
Mountain Lion Conflicts
There are two broad categories of human-lion conflicts: game damage and human safety. Game
damage primarily refers to the economic costs of lion depredation on domestic livestock. Human
safety primarily refers to the concerns about and the real or perceived risks to human safety that
may be posed by lions. State law provides allowance for the public to kill a lion that is considered
a threat to people’s safety or to livestock [Colorado Revised Statute §33-3-106(3): Nothing in this
section shall make it unlawful to trap, kill, or otherwise dispose of bears, mountain lions, or dogs
without a permit in situations when it is necessary to prevent them from inflicting death, damage,
or injury to livestock, real property, a motor vehicle, or human life]. Animals killed under the
authority of this provision must still be reported within 5 days of its death to CPW and the state of
Colorado retains legal possession of such animals; consequently, CPW is able to obtain information
on the number of such losses. If lions are killed in the summer and/or in remote locations or are
too badly decomposed, obtaining gender or tooth samples is difficult and less data are generally
collected on such animals.
The broadest tool CPW uses regularly to address mountain lion conflicts is public education.
Providing the public educational resources will continue to be a prominent agency tool under the
West Slope lion plan. Education is done both proactively, as a staple when the staff interact with
the public in lion habitat or on lion-related issues, and reactively in contacts with the public after a
specific human-lion conflict. There are a number of pamphlets, brochures, videos and educational
tools that CPW produces to educate the public on actions they can take to reduce human-lion
conflicts. These steps include improved animal husbandry practices for livestock producers,
employing guard animals and removing vegetation from near homes that attract deer and elk or
provide cover for lions. This agency education also focuses on how to recreate in lion habitat and
steps to take if you encounter a lion. Temporary signage is often used to inform the public about
areas where lions have been recently seen to further educate about the need to take commonsense
precautions, particularly with pets and children in these areas.
Immediate agency responses to game damage and human safety conflicts in Colorado are primarily
aimed at individual animals involved in the conflict. The actions that can be applied to an
individual lion involved in either conflict behavior are broad and are usually determined on a case-
by–case basis. Intervention techniques include capture and translocation, lethal removal, and on-
site hazing. Hazing can involve harassment with trained dogs and non-lethal projectiles fired at the
animal. This does not preclude the agency from applying larger scale management efforts to
address such conflicts. Colorado Parks and Wildlife previously identified 2 West Slope management
areas in which the objective was increased harvest to suppress the lion population (DAUs L-7 and L-
9). Figure 6 shows the location of current mountain lion DAUs in Colorado.

Appendix B: Sept 2, 2020
10
Figure 6. Current mountain lion Data Analysis Units for 2020 season.
Some recent research suggests that management targeting an area for increased harvest (rather
than an individual conflict animal) may not be effective because of rapid immigration from
adjacent source populations (Robinson et al. 2008, Cooley et al. 2009b). These authors postulate
that it is possible that the increased presence of younger immigrant animals, social disruption of
lion populations, and spatial changes in use patterns of immigrants that result from increased
harvest may all contribute to increases in human conflicts and game damage (Peebles et al. 2013).
A correlative study in British Columbia found that when accounting for human density and habitat
productivity, harvest levels comprised the most correlated variable to conflict numbers (Teichman
et al. 2016). Unfortunately, this study did not account for underlying lion densities, which could
strongly relate to harvest levels and defined conflict in very broad terms, including roadkill,
livestock depredation and perceived risks from sightings. Similar to Peebles et al. (2013) the
authors of this study looked at the relationship between conflicts and mortality at very large scales
and collapsed data from large spatial scales for purposes of the analysis.
In contrast, an Oregon lion population study found an inverse relationship between conflict lion
mortalities and lion harvest (Hiller et al. 2015). The authors present an analysis showing that under
high lion population densities, the number of lions killed due to livestock conflicts decreased as
harvest density increased. Their results indicated that hunter harvest may be a useful tool in
managing livestock conflicts in circumstances when agency managers can increase prey populations,
increase hunter harvest on lions, and reduce vulnerability of livestock. To date, the scientific
evidence regarding the effectiveness of population scale management to effect reductions in
conflicts is equivocal. In fact, data from Colorado do not suggest a relationship between high lion
harvest and increased conflicts, but rather just the opposite. Areas of highest harvest removal as

Appendix B: Sept 2, 2020
11
shown in Figure 2 of the West Slope Lion Management Plan document do not correlate with highest
non-agricultural conflicts and many areas of high conflict in Colorado have, in fact, very little or no
harvest.
Laundre and Papouchis (2020) used the example of California, a state without a legal lion hunting
season, to test various assumptions that some might make about the role harvest plays in managing
conflict, depredations and deer numbers. As in some other studies, the issue of scale of analysis is
important. Pooling data on lion population size, human population size, conflicts and harvest
across entire states for comparison, as done in this study, ignores other significant differences
between states, and more importantly, does not account for context of those data categories
within each state. Research in Colorado regarding the effects of harvest and lion population
density suggest management to reduce conflict has varied results and is not solely linked to
harvest. Few, if any studies, have been able to look at the value of small-scale, localized harvest
or agency removals of lions involved in human-lion conflicts, and then make conclusions about that
impact on quantifiable reporting of human-lion conflicts. Monitoring goals in the Glenwood SMA,
should allow evaluation of the full suite of management tools and their efficacy in reducing
conflicts. Both the ongoing research project in the Upper Arkansas area and the proposal for the
Glenwood SMA are manipulative treatments, and as such, will allow stronger inferences on
relationships between harvest and overall mortality to conflict levels.
Game Damage
Colorado has been liable for monetary losses caused by lions to livestock since the 1920s. However,
it wasn’t until the 1970s that game damage laws and liability were first codified in statute.
Liability for damage caused by wildlife is governed by Colorado Revised Statute §33-3-103.
Regulations that establish the process for submitting a claim and the process whereby a stock
producer can prove their claim and value of the stock were first established in the mid-1970s.
Consequently, CPW has a long history of damage payments related to lion depredation on livestock.
However, records were not accurately maintained regarding claim numbers, location, dates, and
amounts until the 1990s.
In 1996 the Colorado Department of Agriculture (CDA) was granted “exclusive jurisdiction over the
control of depredating animals that pose a threat to an agricultural product or resource.” Thus,
CDA has exclusive authority to determine the disposition of an individual lion if it is depredating on
livestock, while the CPW retains authority to manage lion populations, body parts, and all forms of
recreational or scientific use. A Memorandum of Agreement between the CDA and CPW provides
operational guidance for both agencies. This aids both agencies in implementing their management
authority and helps assure documentation of agriculture-related lion deaths and the legal
disposition of carcasses. As a matter of policy, any lion that is involved in a depredation incident
shall be destroyed if it can be captured or identified.
In 2002, the Colorado legislature limited the State’s liability for damage caused by lions to livestock
or personal property used in the production of raw agricultural products and further limited liability
to not more than $5,000 per head of livestock. As a consequence of this change, non-agricultural
personal property claim payments have been eliminated.

Appendix B: Sept 2, 2020
12
Over the last 15 years on the West Slope, the annual number of lion damage claims submitted to
CPW has ranged from 18 to 65. In the 5 most recent years, claims have averaged 44 per year.
Domestic sheep depredation accounts for the largest share of monetary compensation paid annually
over the past 5 years, averaging just over 50% of all claim payments on the West Slope (Figure 6
and Table 1). Other stock account for just over 40% of annual claim payments over the past 5
years, but involve relatively few numbers of animals, outside of goats (Table 1). The exotic stock
classification includes llama, alpaca, guanaco, angora goats, and other livestock that typically are
considered hobby stock animals. Because they are often highly valuable, damage claim amounts for
exotic stock are often higher on a per claim basis compared to other livestock. The total monetary
amount of damage paid on Colorado’s West Slope has been less than $100,000 in 14 of the last 15
years (Figure. 6). Using the last 15 years of data, West Slope lion damage payments average less
than $61,000 per year; during the most recent 5 years damage payments have averaged $65,000 per
year.
Nearly two thirds of all lion game damage occurs from May through September. This largely
coincides with the time that domestic sheep are on Bureau of Land Management and United States
Forest Service summer grazing allotments and may also be the time that hobby stock are more
commonly allowed to remain outside at night instead of held within barns as during winter months.
On open range and even in pastures outside of homes, stock such as sheep or hobby animals would
be more vulnerable to lion depredation during milder seasons.
Figure 6. West Slope compensation paid for mountain lion damage in Colorado from 2004 through 2018.
$0
$15,000
$30,000
$45,000
$60,000
$75,000
$90,000
$105,000
$120,000
Total Paid Lion Game Damage Claims on Colorado's West Slope (indexed to 2018 dollars)
Cattle Other Stock Sheep

Appendix B: Sept 2, 2020
13
Table 1. Number of animals submitted in mountain lion damage claims to CPW from 2004-2018 by Region and
animal type.
REGION 2004 2005 2006 2007 2008 2009 2010 2011 2012 2013 2014 2015 2016 2017 2018
Northwest Captive Wildlife 0 0 0 0 0 0 0 0 0 0 0 0 0 0 3
Cattle 1 1 0 3 5 8 4 3 2 0 4 5 1 2 2
Exotic Stock 0 0 2 1 0 0 1 0 1 0 3 0 3 0 5
Goats 0 0 0 11 8 1 29 15 4 4 0 8 6 3 29
Horses 0 1 0 0 0 1 1 1 0 1 0 0 1 0 2
Other Animals 0 0 0 0 1 0 0 1 0 0 0 0 0 0 0
Poultry 0 0 0 0 0 0 0 22 0 0 0 0 0 0 0
Sheep 132 26 126 192 333 279 116 111 35 84 197 155 17 5 127
Swine 0 0 0 0 0 0 0 0 0 0 0 0 2 0 0
Grand Total 133 28 128 207 347 289 151 153 42 89 204 168 30 10 168
Southwest Captive Wildlife 0 0 0 1 0 3 0 1 0 0 3 1 3 0 0
Cattle 1 2 0 1 5 9 2 2 2 11 4 0 1 2 1
Exotic Stock 0 0 0 0 0 0 0 0 0 0 0 0 0 0 0
Goats 5 15 36 3 13 12 16 48 24 32 20 40 20 45
Horses 0 2 1 2 0 0 1 1 0 5 0 0 0 0 0
Other Animals 0 0 0 0 0 0 0 1 1 0 0 0 0 0 0
Poultry 0 0 0 25 0 9 6 60 27 0 30 74 0 35 62
Sheep 33 27 15 50 89 101 63 17 68 86 68 40 9 42 47
Swine 0 0 0 12 2 0 0 3 0 1 0 0 2 0 6
Grand Total 39 46 16 127 99 135 84 101 146 127 137 135 55 99 161

Appendix B: Sept 2, 2020
14
Human Safety
Lion attacks on humans across North America are rare, but their frequency has increased in
recent decades (Beier 1991, Torres et al. 1996, CMGWG 2005). This has also been found in
Colorado. Lion attacks on humans occur primarily in the summer season (June-August), which
likely correlates with the amount of outdoor recreation activity that occurs in Colorado lion
habitat (Figure. 7). Mattson et al. (2011) evaluated 386 human-lion encounters, including 29
fatal and 171 non-fatal injury attacks on humans, documented in the U.S. and Canada to
determine the important risk factors in such encounters. They found that young females
(≤2.5 years) were more likely to be involved in an attack on people than adult lions. Their
examinations show that attacks on people are extraordinarily low-frequency, but high
consequence events that are difficult to anticipate or prevent. They noted that aggressive
behavior (yelling, throwing objects, charging, or discharging firearms) by people involved in
close encounters with lions lessens the likelihood that the lion will attack. Unfortunately,
several states have documented their first fatal human attacks over the last several years.
Figure 7. Seasonality of mountain lion attacks on humans in Colorado.
CPW Administrative Directive W-20 Human-Mountain Lion Interactions, establishes the agency
procedures for dealing with general conflicts that may develop between humans and lions.
This policy directs that agency management responses to a specific conflict between people
and a lion or lions will be directed at the individual lion(s) involved and not at the population
management scale. Administrative Directive OW-2 Predator Attacks on Human(s), details the
manner in which the agency will respond to an attack by a lion (and any other predator) on a
person. Both of these administrative directives allow for lion relocation under certain
circumstances and provide direction for when that may happen. However, it is also the policy
of CPW per these administrative directives that a lion will be euthanized when it’s
determined to be dangerous because of its behavior, whereas a lion that is dangerous because

Appendix B: Sept 2, 2020
15
of its location may be euthanized or relocated. The determination on relative risk due to
location or behavior presented by the individual lion will be made by the Regional staff
involved with addressing the incident.
Per these administrative directives, CPW employees are required to document human-lion
conflicts via a conflict recording system. Lions lethally removed under Administrative
Directive W-20 will be recorded as such on the conflict report. These reports document
essential information about the date, time, location, type of conflict, number of people, and
animals involved, and the circumstances of the conflict. Along with the mortality recording
system, this human-lion conflict recording system was overhauled in April 2019 to provide an
electronic recording system that is consistent, standardized and used across the state to
record each human-lion interaction reported to CPW. Due to the previous recording system
using hardcopy paper forms across the state to record incidents, developing historically
accurate precise enumerations of conflicts is difficult. The new web and mobile-based
application currently in use is expected to provide much more consistent and precise data.
Two separate public opinion surveys in Colorado have revealed that the majority of Colorado
citizens prefer that the agency apply non-lethal conflict management tools, except in the
case of attacks on people (Zinn and Manfredo 1996, Corona Research 2005). However, when
considering the location of an attack on a person, respondents equivocate; 49% opposed
destroying a lion involved in an attack if the person was recreating in lion habitat (Corona
Research 2005). These results and those previously mentioned regarding public opinions
about lion hunting suggest that the public is quite divided in their perspectives about lions.
Nevertheless, the Corona survey indicates that the public strongly supports active
management of lions as well as encouraging responsible behavior by people to manage
human-lion conflicts.

Appendix C: Sept 2, 2020
1
Colorado West Slope Mountain Lion Management Plan
APPENDIX C
Mountain Lion Resource Selection Function Model
Colorado Parks and Wildlife (CPW) modeled lion winter habitat using a resource selection
function (RSF) approach, which compares where species are present to habitat that is
available in the landscape. The winter period is defined as December-February and all lion
locations used in our model correspond to those dates. We used 2,470 male and 1,603 female
mortality locations documented through mandatory checks from 2000-2013 as our presence
sample in the model. We created a list of 18 variables considered important to how lions
choose habitat in Colorado (Table 1). We then removed variables that were highly correlated
with each other, like distance to deer and elk winter range. This resulted in 6 variables
chosen for model development, including distance to mule deer winter range, elevation, low
vegetation, short shrub, tall shrub, and slope (highlighted in Table 1). We generated an equal
number of random locations (n= 4,100) within lion habitat documented within CPWs species
activity maps (http://gisweb/webmaps/sam/sam.html) and used these as the “available”
sample.
Table 1. Variables originally considered for development of the 2020 Colorado winter mountain lion habitat resource selection function (RSF) model.
Using ArcMap 10.1 (ArcGIS 10.1; Environmental Systems Research Institute, Redlands, CA), a
continuous predictive surface was created that represented the relative probability of lion
presence in winter across Colorado. However, with a goal of projecting a potential lion
abundance across the West Slope, a probability of lion presence surface has limited practical
use. Harvest rates and mortality thresholds are based on projections of lion numbers or
population projections, so we needed to take steps to convert from relative probability of lion
presence into projected lion abundance. Therefore, we elected to stratify the prediction
Variable Keep or Remove Why Removed
NE aspect Remove Correlation with another aspect
SE aspect Remove Correlation with another aspect
SW aspect Remove Correlation with another aspect
NW aspect Remove Correlation with another aspect
Distance to mule deer winter range Keep
Distance to elk winter range Remove Correlation with mule deer distance
Distance to bighorn winter range Remove No contribution to model
Elevation Keep
Urban Remove Less than 1% of landscape
Suburban Remove Less than 1% of landscape
Bare Remove Less than 1% of landscape
Low vegetation Keep
Short shrub Keep
Tall shrub Keep
Forest Remove Correlated with elevation and TRI
Water Remove Less than 1% of landscape
Slope Keep
TRI (roughness) Remove Correlated with slope and elevation

Appendix C: Sept 2, 2020
2
surface into 4 categories: strata 1 was where the probability of lion winter presence = 1-25%,
strata 2 probability of lion winter presence 26-50%, strata 3 probability 51-75%, strata 4
probability 76-100% (Figure 1).
Figure 1. Modeled mountain lion winter habitat with the probability of presence stratified into four
categories of increasing probability.
In a final step, three independent datasets were used for model validation: 164 winter lion
predation sites on mule deer documented through CPW mule deer survival monitoring, 14,793
GPS locations from 33 female and 9 male lions researched on the Uncompahgre Plateau from
2004-2015, and 58,593 GPS locations from 45 female and 32 male lions researched in the
Northern Front Range west of Denver-Longmont, CO from 2007-2015. For each validation set,
we assigned each validation point to one of the 4 categories of the relative probability
surface and determined the percentage of those points that were within the two highest
stratas which correspond to > 50% relative probability of presence. We found that 86% of the
Uncompahgre GPS locations were within stratas 3 and 4 of our model, 82% of northern Front
Range GPS locations were within stratas 3 and 4, and 73% of the deer predation sites were
within stratas 3 and 4.

Appendix C: Sept 2, 2020
3
Results from the modeling effort indicate that lions are closer to mule deer winter range, at
lower elevations, within steeper slopes, and within tall shrub habitats compared to the
habitat available. Lions were less likely to be located within low vegetation or short shrub
habitats compared to the habitat available in the landscape.
We stratified the model results into 4 strata related to the probability of lion presence in
winter. We assumed that lions exist in greater density in strata with high probability of
presence and assigned decreasingly lower densities in the two strata with lower probability of
winter lion occurrence. The top two strata of the RSF model represent “high quality” winter
lion habitat for the purposes of the West Slope management plan source population analysis.
There are several alternate approaches to deriving a lion abundance index extrapolation. One
would be to assume that at some low level of habitat selection probability these areas are
functionally not lion habitat; or, alternatively predetermine that some portions of Colorado
are not winter habitat and exclude them from the model. Then one has to assign some
assumed density smoothed over the remaining area. This approach has two problems; there
will always be some debate about what is excluded and if a lion is ever observed in excluded
habitat then the model is deemed a failure. Applying some even density in all the remaining
habitat fails at regional scales because it is likely to result in too many lions in low probability
locations (e.g. eastern plains areas or high altitudes) and too few in high probability locations
(e.g. deer winter range, in tall shrubland/forested areas, with high topographic relief).
Another approach is to apply a continuous range of lion density from near zero to some upper
limit which corresponds with the RSF model prediction surface of 0.2% to 99.7%. The
challenge with this approach is selecting what the lower and upper density should be and this
seemed no better than the stratification approach that we selected.
We calculated the amount of habitat by strata in each of the monitoring scales (NW and SW
Regions (Table 2)). Ultimately, we applied assumed independent lion densities to each
stratum to generate an extrapolated abundance index from which we calculated 17% to
determine the maximum Regional total human-caused mortality thresholds presented in the
West Slope plan. An interdisciplinary team of managers and biologists in CPW examined lion
densities reported in literature (Table 1 in Appendix A) and considered habitat quality, prey
base, abundance of alternative prey, vegetation characteristics, and the RSF model outputs.
The winter-range independent lion densities listed below and applied in each strata were
selected based on observed lion densities in the literature (Table 1, Appendix A) with
particular weight given to density estimates from the most recent study in Colorado
(Alldredge et al. 2019), and projects that used more modern and rigorous estimation methods
including mark-recapture (Proffitt et al. 2015, Beausoleil et al. 2016). These newer
techniques estimate capture probabilities and address study area closure while past methods
of radio-collaring what was assumed to be all the lions in a study area could never account for
these issues and were less statistically robust. As part of the West Slope plan, CPW will begin

Appendix C: Sept 2, 2020
4
to conduct mark-resight lion density surveys in representative habitats in western Colorado to
allow further refinement of RSF assumptions, densities and projections.
The following densities were applied to each RSF stratum:
Strata 1: 1.0 independent lions/100 km2. This strata represents lower-quality winter-range.
While some lower lion density is documented in these areas from harvest and other mortality
locations as well as visual observations, lion use is low and densities are well below average
levels from studies in better habitat.
Strata 2: 2.5 independent lions/100 km2. This strata represents a mid-level quality of habitat
where lion densities are expected to exist in moderate numbers due to variables like slope,
elevation and distance to deer winter range. This is the largest strata, in terms of area, on
the West Slope.
Strata 3 and Strata 4: 4.2 independent lions/100 km2. These two strata represent better lion
habitat on the West Slope and as such, each represent a relatively small portion of each
Region. Prey densities are very high in these strata as they largely include deer winter range
and high-quality habitat. The relatively high density applied in these strata is supported by
recent work in quality lion habitat both in Colorado (4.1 independent lions/100 km2,
Alldredge et al. 2019) and in other western Rocky Mountain states (4.5-5.2 independent
lions/100 km2, Proffitt et al. 2015).
The NW and SW cumulative Region-wide average independent lion densities generated from
the RSF after strata densities were applied are 2.9 lions/100 km2 and 2.6 lions/100 km2,
respectively. This range of 2.6-2.9 independent lions/100 km2 as an extrapolated density
across all of the West Slope is strongly supported by numerous studies reporting lion densities.
Viewing lion densities as a numeric range is important, as point estimates from lion density
studies are often the focus for management applications, but these values should be
evaluated in the context of the variability shown by the confidence intervals.
Any GMU or landscape on the West Slope has contributions from all 4 strata and therefore will
always have a total projected density well below the density of 4.2 lions applied in only
the highest quality habitat. The independent lion densities derived from this extrapolation
process in 12 GMUs in Colorado, which represent a range of medium to high winter lion
habitat quality, mostly ranged from 2.5 to 3.5 lions/100 km2; a few were as low as 2.2
lions/100 km2 and one was 3.8 lions/100 km2. As expected from any model, some projected
RSF densities are higher and some are lower than empirically-derived densities in study areas
of the same geographic area. However, when evaluated across all GMUs in each region, the
average densities of independent lions projected from the RSF are supported by Colorado
projects and densities from similar habitats in other states (see Table 1 in Appendix A). For
instance, Alldredge et al. (2019) documented a density of 4.1 lions/100 km2 in a study area on
the Front Range, while the RSF extrapolation density in the GMU encompassing the study area
only projected a density of 2.6 lions/100 km2.

Appendix C: Sept 2, 2020
5
An RSF model provides a temporal snapshot of what populations could be using densities and
model variables applied at that time. That is why a commitment to obtain temporally and
spatially relevant density estimates throughout the duration of the West Slope plan is
important. An even more comprehensive modeling approach could be considered by
developing an Integrated Population Model (IPM) for lions on the West Slope or Colorado.
Given that Regional lion populations likely are best modeled at a statewide level, our future
intention to revise Front Range lion plans, and the current limitations on West Slope
demographic data needed to populate an IPM, we believe an IPM could become a useful tool
in later years but only after we have obtained density estimates and ancillary data from
radio-collared animals.
Table 2. Amount of area (in km2) within each strata, delineated by existing DAUs on the West Slope.
Only the portions of the existing DAUs that are within each Region are displayed.
REGION LIONDAU Strata 1 W of I-25 Strata 2 Strata 3 Strata 4
L-1 Total 60 2389 1000 599
NW L-2 Total 1957 4073 1068 193
L-22 Total 80 426 588 833
L-3 Total 2121 1848 220 3
L-5 Total 1688 3447 1008 44
L-6 Total 2476 3974 2428 1506
L-7 Total 2644 5888 5613 6912
L-9 Total 630 956 865 1369
NW Total 11655 23000 12791 11460
L-16 Total 1441 749 492 137
SW L-19 Total 1179 1423 564 74
L-20 Total 6695 4771 1663 358
L-21 Total 2836 4661 1662 137
L-22 Total 1306 2238 2791 2679
L-23 Total 1452 2157 1929 1850
L-24 Total 1705 1156 1042 943
L-25 Total 2880 3034 2610 1511
L-9 Total 868 1490 1175 1046
SW Total 20363 21679 13929 8734

Appendix D: Sept 2, 2020
1
Colorado West Slope Mountain Lion Management Plan
APPENDIX D
LITERATURE CITED AND REFERENCES
LITERATURE CITED
Alldredge, M. 2015. Cougar demographics and human interactions along the urban-exurban
Front Range of Colorado. Federal Aid Report 204-W-R4, Colorado Parks and Wildlife, Fort Collins, Colorado, USA.
Alldredge, M. W., T. Blecha, and J.H. Lewis. 2019. Less invasive monitoring of cougars in
Colorado’s Front Range. Wildlife Society Bulletin 43(2):222–230.
Alldredge, M. W., F. E. Buderman, and K. A. Blecha. 2019. Human–cougar interactions in the wildland–urban interface of Colorado's front range. Ecology and Evolution. 00:1–17. Amstrup, S. C., T. L. McDonald, and B. F. J. Manly. 2005. Handbook of capture-recapture
analysis. Princeton University Press, Princeton, New Jersey. Anderson, A. E. 1983. A critical review of literature on puma (Felis concolor). Special Report
No. 54. Colorado Division of Wildlife, Fort Collins, USA. Anderson, A. E., D. C. Bowden, and D. M. Kattner. 1992. The puma on Uncompahgre Plateau,
Colorado. Colorado Division of Wildlife Technical Publication No. 40. Anderson, C. R., Jr. 2003. Cougar ecology, management, and population genetics in Wyoming.
Dissertation, University of Wyoming, Laramie, USA. Anderson, C. R., Jr., and F. G. Lindzey. 2000. A photographic guide to estimating mountain
lion age classes. Wyoming Cooperative Fish and Wildlife Research Unit, Laramie, USA. Anderson, C. R., Jr., and F. G. Lindzey. 2003. Estimating cougar predation rates from GPS
location clusters. Journal of Wildlife Management 67:307-316. Anderson, C. R., Jr., and F. G. Lindzey. 2005. Experimental evaluation of population trend
and harvest composition in a Wyoming cougar population. Wildlife Society Bulletin 33:179-188.
Anderson, C. R., Jr., F. G. Lindzey, and D. B. McDonald. 2004. Genetic structure of cougar
populaions across the Wyoming Basin: metapopulation or megapopulation. Journal of Mammalogy 85:1207-1214.
Ashman, D. L. 1976. Mountain lion investigations. Perf. Rep., P-R Proj. W-48-7, Study S&I, Job
5 and Study R-V, Job 1. Nevada Fish and Game Department, Reno, NV, USA. 19pp. reported in Anderson, A. E. 1983. A critical review of literature on puma (Felis concolor). Special Report No. 54. Colorado Division of Wildlife, Fort Collins, USA.

Appendix D: Sept 2, 2020
2
Ashman, D., G. C. Christensen, M. L. Hess, G. K. Tsukamoto, and M. S. Wickersham. 1983. The mountain lion in Nevada. Nevada Game and Fish Department, Federal Aid in Wildlife Restoration Project W-14-15, Final Report.
Bailey, J. A. 1984. Principles of wildlife management. John Wiley & Sons, New York, New York, USA.
Ballard, W. B., and V. Van Ballenberghe. 1997. Predator-prey relationships. Pages 247-273
in A. W. Fransmann and C. C. Schwartz, editors. Ecology and Management of the North
American Moose. Smithsonian Institution, Washington, D.C., USA.
Ballard, W. B., D. Lutz, T. W. Keegan, L. H. Carpenter, and J. C. de Vos. 2001. Deer–
predator relationships: a review of recent North American studies with emphasis on
mule and black-tailed deer. Wildlife Society Bulletin 29:99-115.
Barnhurst, D. 1986. Vulnerability of cougars to hunting. Thesis, Utah State University, Logan, USA.
Beausoleil, R. A., G. M. Koehler, B. T. Maletzke, B. N. Kertson, and R. B. Wielgus. 2013.
Research to regulation: Cougar social behavior as a guide for management. Wildlife Society Bulletin 37:680-688.
Beausoleil, R. A. and K. I. Warheit. 2014. Using DNA to evaluate field identification of cougar
sex by agency staff and hunters using trained dogs. Wildlife Society Bulletin 39:203-209. Beausoleil, R. A., J. Clark., and B. T. Maletzke. 2016. A long-term evaluation of biopsy darts
and DNA to estimate cougar density: an agency-citizen science collaboration. Wildlife
Society Bulletin 40:583-592.
Beausoleil, R. A. 2017. Standardization of cougar population metrics. Page 35 in McLaughlin, C. R. and M. Vieira, editors. Proceedings of the 12th Mountain Lion Workshop. May 15-18, 2017. Estes Park, Colorado, USA.
Beier, P. 1991. Cougar attacks on humans in the United States and Canada. Wildlife Society
Bulletin 19:403-412. Beier, P. 1993. Determining minimum habitat areas and habitat corridors for cougars.
Conservation Biology 7:94-108. Beier, P., and S. C. Cunningham. 1996. Power of track surveys to detect changes in cougar
populations. Wildlife Society Bulletin 24:540-546. Becker, E. F. 1991. A terrestrial furbearer estimator based on probability sampling. Journal
of Wildlife Management 55:730-737. Bender, L. C., L. A. Lomas, and J. Browning. 2007. Condition, survival, and cause-specific
mortality of adult female mule deer in north-central New Mexico. Journal of Wildlife Management 71:1118-1124.

Appendix D: Sept 2, 2020
3
Berger, J., and J. D. Wehausen. 1991. Consequences of a mammalian predator-prey disequilibrium in the Great Basin Desert. Conservation Biology 5:244-248.
Bergman, E. J., P. F. Doherty, G. C. White, and A. A. Holland. 2015. Density dependence in
mule deer: a review of evidence. Wildlife Biology 21:18-29. Bishop, C. J., J. W. Unsworth, and E. O. Garton. 2005. Mule deer survival among adjacent
populations in southwest Idaho. Journal of Wildlife Management 69:311-321. Blecha, K., R. Boone, and M. Alldredge. 2015. Puma foraging in an urban to rural landscape.
Federal Aid Report W-204-R4 Cougar Demographics and Human Interactions Along the Urban-Exurban Front Range of Colorado, Appendix IV. Colorado Parks and Wildlife, Fort Collins, Colorado, USA.
Bowyer, T. B., D. K. Person, and B. M. Pierce. 2005. Detecting top-down versus bottom-up
regulation of ungulates by large carnivores: implication for conservation of biodiversity. Pages 342-361 in J. C. Ray, K. H. Redford, R. S. Steneck, and J. Berger, editors, Large carnivores and the conservation of biodiversity. Island Press, Washington D.C., USA.
Carbone, C., S. Christie, T. Coulson, N. Franklin, J. R. Ginsberg, M. Griffiths, J. Holden, K.
Kawanishi, M. F. Kinnaird, R. Laidlaw, A. Lynam, D. W. Macdonald, D. Martyr, C. McDougal, L. Nath, T. Obrien, J. Seidensticker, D. J. L. Smith, M. Sunquist, R. Tilson, and W. N. Wan Shahruddin. 2001. The use of photographic rates to estimate densities of tigers and other cryptic mammals. Animal Conservation 4:75-79.
Caughley, G., and A. R. E. Sinclair. 1994. Wildlife ecology and management. Blackwell
Science, Malden, Massachusetts, USA. CPW [Colorado Parks and Wildlife]. 2014. Colorado hunter education manual. Kalkomey
Enterprises, Inc. Dallas, Texas, USA. Choate, D. M., M. L. Wolfe, and D. C. Stoner. 2006. Evaluation of cougar population
estimators in Utah. Wildlife Society Bulletin 34: 782–799. Clements, C. D., and J. A. Young. 1996. A viewpoint: rangeland health and mule deer habitat.
Journal of Range Management 50:129-138. Cooley, H. S., R. B. Wielgus, G. M. Koehler, and B. T. Maletzke. 2009a. Source populations in
carnivore management: cougar demography and emigration in a lightly hunted population. Animal Conservation 12:321–328.
Cooley, H. S., R. B. Wielgus, G. M. Koehler, H. S. Robinson, and B. T. Maletzke. 2009b. Does
hunting regulate cougar populations? A test of the compensatory mortality hypothesis. Ecology 90:2913-2921.
Cooley, H. S., K. D. Bunnell, D. C. Stoner, and M. L. Wolfe. 2011. Population management:
Cougar hunting. Pages 111-134. in J. A. Jenks, editor. Managing cougars in North America. Jack H. Berryman Institute, Utah State University, Logan, Utah, USA.
Corona Research, Inc. 2005. Public opinions and perceptions of mountain lion issues. Report
to the Colorado Division of Wildlife, Denver, Colorado, USA.

Appendix D: Sept 2, 2020
4
Cougar Management Guidelines Working Group. 2005. Cougar management guidelines.
WildFutures, Bainbridge Island, Washington, USA.
Culver, M., W. E. Johnson, J. Pecon-Slattery, and S. J. O’Brien. 2000. Genomic ancestry of
the puma (Puma concolor). Journal of Heredity 91:186-197. Cunningham, S. C., L. A. Haynes, C. Gustavson, and D. D. Haywood. 1995. Evaluation of the
interaction between mountain lions and cattle in the Aravaipa-Klondyke region of southeast Arizona. Arizona Game and Fish Department Technical Report No. 17.
Currier, M. J. P., S. L. Sheriff, and K. R. Russell. 1977. Mountain lion population and harvest
near Canon City, Colorado. Colorado Division of Wildlife Spec. Rep. No. 42. CDOW, Fort Collins, CO, USA. 12pp.
Davidson, G. A., D. A. Clark, B. K. Johnson, L. P. Watts, and J. R. Adams. 2014. Estimating
cougar densities in northeast Oregon using conservation detection dogs. Journal of Wildlife Management 78:1104-1114.
Dickson, B. G., and P. Beier. 2002. Home-range and habitat selection by adult cougars in
southern California. Journal of Wildlife Management 66:1235-1245. Ernest, H. B., E. S. Rubin, and W. M. Boyce. 2002. Fecal DNA analysis and risk assessment of
mountain lion predation of bighorn sheep. Journal of Wildlife Management 66:75-85. Fecske, D. M., D. J. Thompson, and J. A. Jenks. 2011. Cougar ecology and natural history.
Pages 15-40 in J. A. Jenks, editor. Managing cougars in North America. Jack H. Berryman Institute, Utah State University, Logan, Utah, USA.
Gassaway, W. C., R. D. Boertje, D. V. Grangard, D. G. Kelleyhouse, R. O. Stephenson, and D.
G. Larsen. 1992. The role of predation in limiting moose at low densities in Alaska and
Yukon and implications for conservation. Wildlife Monographs No. 120. Hemker, T. P., F. G. Lindzey, and B. B. Ackerman. 1984. Population characteristics and
movement patterns of cougars in southern Utah. Journal of Wildlife Management 48:1275-1284.
Hiller, T. L., J. E. McFadden-Hiller, S. R. Jenkins, J. L. Belant, and A. J. Tyre. 2015.
Demography, prey abundance, and management affect number of cougar mortalities associated with livestock conflicts. Journal of Wildlife Management 79:978-988.
Hopkins, R. A. 1989. Ecology of the puma in the Diablo Range. Dissertation, University of
California, Berkeley, USA. Hurley, M. A., J. W. Unsworth, P. Zager, M. Hebblewhite, E. O. Garton, D. M. Montgomery, J.
R. Skalski, and C. L. Maycock. 2011. Demographic response of mule deer to experimental reduction of coyotes and mountain lions in Southeastern Idaho. Wildlife Monographs No. 178.
Jenks, J. A., editor. 2011. Managing cougars in North America. Jack H. Berryman Institute,
Utah State University, Logan, Utah, USA.

Appendix D: Sept 2, 2020
5
Johnson, H. E., M. Hebblewhite, T. R. Stephenson, D. W. German, B. M. Pierce, and V. C.
Bleich. 2013. Evaluating apparent competition in limiting the recovery of an endangered ungulate. Oecologia 171:295-307.
Kamler, J. F., R. M. Lee, J. C. deVos, Jr., W. B. Ballard, and H. A. Whitlaw. 2002. Survival
and cougar predation of translocated bighorn sheep in Arizona. Journal of Wildlife Management 66:1267-1272.
Kie, J. G., R. T. Bowyer, and K. M. Stewart. 2003. Ungulates in western forests: habitat
requirements, population dynamics, and ecosystem processes. Pages 296-340 in C. Zabel and R. Anthony, editors. Mammal community dynamics: management and conservation in the coniferous forest of western North America. Cambridge University Press, New York, New York, USA.
Kinley, T. A., and C. D. Apps. 2001. Mortality patterns in a subpopulation of endangered
mountain caribou. Wildlife Society Bulletin 29:158-164. Knopff, K. H., A. A. Knopff, and M. S. Boyce. 2010. Scavenging makes cougars susceptible to
snaring at wolf bait stations. Journal of Wildlife Management 74:644-653. Koehler, G. M., and M. G. Hornocker. 1991. Seasonal resource use among mountain lions,
bobcats, and coyotes. Journal of Mammalogy 72:391-396. Koloski, J. H. 2002. Mountain lion ecology and management on the Southern Ute Indian
Reservation. M. S. Thesis. Department of Zoology and Physiology, University of Wyoming, Laramie.
Krausman, P. R., and D. M. Shackleton. 2000. Bighorn sheep. Pages 517-544 in S. Demarais,
and P. R. Krausman, editors, Ecology and management of large mammals in North America. Prentice Hall, Upper Saddle River, New Jersey, USA.
Laing, S. P. 1988. Cougar habitat selection and spatial use patterns in southern Utah. Thesis,
University of Wyoming, Laramie, USA. Laing, S. P. and F. G. Lindzey. 1993. Patterns of replacement of resident cougars in southern
Utah. Journal of Mammalogy 74:1056-1058 Laundré, J. W., L. Hernandez, and S. G. Clark. 2007. Numerical and demographic responses of
pumas to changes in prey abundance: Testing current predictions. Journal of Wildlife Management 71:345-355.
Laundré, J. W. and C. Papouchis. 2020. The Elephant in the room: What can we learn from
California regarding the use of sport hunting of pumas (Puma concolor) as a management tool? PLoS ONE 15(2): e0224638.
Lindzey, F. G., B. B. Ackerman, D. Barnhurst, T. Becker, T. P. Hemker, S. P. Laing, C.
Mecham, and W. D. Van Sickle. 1989. Boulder-Escalante cougar project. Final Report. Utah Division of Wildlife Research, Salt Lake City, USA.

Appendix D: Sept 2, 2020
6
Lindzey, F. G., W. D. Van Sickle, B. B. Ackerman, D. Barnhurst, T. P. Hemker, and S. P. Laing. 1994. Cougar population dynamics in southern Utah. Journal of Wildlife Management 58:619-624.
Logan, K. A., and L. L. Irwin. 1985. Mountain lion habitats in the Big Horn Mountains,
Wyoming. Wildlife Society Bulletin 13:257-262. Logan, K. A., L. L. Irwin, and R. Skinner. 1986. Characteristics of a hunted mountain lion
population in Wyoming. Journal of Wildlife Management 50:648–654. Logan, K. A., and L. L. Sweanor. 2001. Desert puma: evolutionary ecology and conservation of
an enduring carnivore. Island Press, Washington, D. C., USA. Logan, K. A. 2010. Puma population structure and vital rates on the Uncompahgre Plateau,
Colorado. Federal Aid Project W-204-R1 report. Colorado Parks and Wildlife. Fort Collins, Colorado, USA.
Logan, K. A. 2015. Assessing the effects of hunting on a puma population on the Uncompahgre
Plateau, Colorado. Federal Aid Project W-204-R4 report. Colorado Parks and Wildlife. Fort Collins, Colorado, USA.
Logan, K. A. 2019. Puma Population Limitation and Regulation: What Matters in Puma
Management? Journal of Wildlife Management 83:1652-1666. Logan, K. A., and J. P. Runge. 2020. Effects of hunting on a puma population in Colorado.
Technical Publication Number 54. Colorado Parks and Wildlife. Fort Collins, Colorado, USA.
Martorello, D. A., and R. A. Beausoliel. 2003. Cougar harvest characteristics with and
without the use of hounds. Pages 129-135 in S. A. Becker, D. D. Bjornlie, F. G. Lindzey, and D. S. Moody, editors. Proceedings of the 7th Mountain Lion Workshop. Wyoming Game and Fish Department, Lander, USA.
Mattson, D., K. Logan, and L. Sweanor. 2011. Factors governing risk of cougar attacks on
humans. Human-Wildlife Interactions 5:135-158. McAlpine, C. A., J. R. Rhodes, M. E. Bowen, D. Lunney, J. G. Callaghan, D. L. Mitchell, and
H. P. Possingham. 2008. Can multiscale models of species’ distribution be generalized from region to region? A case study of koala. Journal of Applied Ecology 45:558-567.
McCarthy, K. P., T. K. Fuller, M. Ming, T. M. McCarthy, L. Waits, and K. Jumabaev. 2008.
Assessing estimators of snow leopard abundance. Journal of Wildlife Management 72:1826–1833.
McCullough, D. R. 1979. The George Reserve deer herd: population ecology of a K-selected
species. University of Michigan Press, Ann Arbor, Michigan, USA.
McRae, B. H. 2004. Integrating landscape ecology and population genetics: conventional
tools and a new model. Ph.D. Dissertation, Northern Arizona University, Flagstaff,
Arizona, USA.

Appendix D: Sept 2, 2020
7
Monteith, K. L., V. C. Bleich, T. R. Stephenson, B. M. Pierce, M. M. Conner, J. G. Kie, and R.
T. Bowyer. 2014. Life-history characteristics of mule deer: effects of nutrition in a variable environment. Wildlife Monographs No.186.
Moss, W. E, M. W. Alldredge, and J. N. Pauli. 2016. Quantifying risk and resource use for a
large carnivore in an expanding urban–wildland interface. Journal of Applied Ecology 53:371–378.
Murphy, K. M. 1998. The ecology of the cougar (Puma concolor) in the northern Yellowstone
ecosystem: Interactions with prey, bears, and humans. Dissertation, University of Idaho, Moscow, USA.
Murphy, K. M., M. S. Nadeau, and T. K. Ruth. 2011. Cougar-prey relationships. Pages 41-70
in J. A. Jenks, editor. Managing cougars in North America. Jack H. Berryman Institute, Utah State University, Logan, Utah, USA.
Murphy, S. M., D. T. Wilckens, B. C. Augustine, M. A. Peyton and G. C. Harper. 2019.
Improving estimation of puma (Puma concolor) population density: clustered camera-trapping, telemetry data, and generalized spatial mark-resight models. Scientific Reports 9:4590. https://doi.org/10.1038/s41598-019-40926-7
Novaro, A. J., and R. S. Walker. 2005. Human-induced changes in the effect of top carnivores
on biodiversity in the Patagonian Steppe. Pages 268-288 in J. C. Ray, K. H. Redford, R. S. Steneck, and J. Berger, editors, Large carnivores and the conservation of biodiversity. Island Press, Washington, D.C., USA.
Peebles, K. A., R. B. Wielgus, B.T. Maletzke, and M. E. Swanson. 2013. Effects of remedial
sport hunting on cougar complaints and livestock depredations. PLoS ONE 8(11): e79713.
Peek, J. M., B. Dennis, and T. Hershey. 2002. Population trends of mule deer. Journal of
Wildlife Management 66:729-736.
Pierce, B .M. and V. C. Bleich. 2003. Mountain Lion. Pages 744–757 in G.A. Feldhamer, B.C.
Thompson, and J.A. Chapman, editors. Wild mammals of North America: biology,
management, and conservation. 2nd edition. The Johns Hopkins University Press,
Baltimore, Maryland, USA.
Pierce, B. M., V. C. Bleich, K. L. Monteith, R. T. Bowyer, and W. P. Smith. 2012. Top-down
versus bottom-up forcing: evidence from mountain lions and mule deer. Journal of
Mammalogy 93:977-988.
Pollock, K. H., J. D. Nichols, C. Brownie, and J. E. Hines. 1990. Statistical inference for
capture-recapture experiments. Wildlife Monographs 107:3–97.
Proffitt, K. M., J. F. Goldberg, M. Hebblewhite, R. Russell, B. S. Jimenez, H. S. Robinson, K.
Pilgrim, and M. K. Schwartz. 2015. Integrating resource selection into spatial capture-
recapture models for large carnivores. Ecosphere 6(11): 239.

Appendix D: Sept 2, 2020
8
Riley, S. P. D., J. P. Pollinger, R. M. Sauvajot, E. C. York, C. Bromley, T. K. Fuller, and R. K.
Wayne. 2006. A southern California freeway is a physical and social barrier to gene flow in
carnivores. Molecular Ecology 15:1733–1741.
Robinson, H. S., R. B. Wielgus, H. S. Cooley, and S. W. Cooley. 2008. Sink populations in
carnivore management: cougar demography and immigration in a hunted population.
Ecological Applications 18:1028–1037.
Robinson, H. S. and R. M. DeSimone. 2011. The Garnet Range mountain lion study:
characteristics of a hunted population in west-central Montana. Final Report, Montana
Department of Fish, Wildlife and Parks, Wildlife Bureau, Helena, MT. 102 pp.
Robinson, H. S., T. Ruth, J. A. Gude, D. Choate, R. M. DeSimone, M. Hebblewhite, K. Kunkel,
M. R. Matchett, M. S. Mitchell, K. Murphy, and J. Williams. 2015. Linking resource
selection and mortality modeling for population estimation of mountain lions in Montana.
Ecological Modelling 312:11–25.
Rominger, E. M., H. A. Whitlaw, D. L. Weybright, W. C. Dunn, and W. B. Ballard. 2004a. The influence of mountain lion predation on bighorn sheep translocations. Journal of Wildlife Management 68:993-999.
Rominger, E. M., R. S. Winslow, E. J. Goldstein, D. L. Weybright, and W. C. Dunn. 2004b. Cascading effects of subsidized mountain lion populations in the Chihuahuan Desert. Page 103 in Carnivores 2004: expanding partnerships in carnivore conservation. Defenders of Wildlife 2004 Carnivore Conference, Santa Fe, New Mexico, USA.
Ross, I. P., and M. G. Jalkotzy. 1992. Characteristics of a hunted population of cougars in
southwestern Alberta. Journal of Wildlife Management 56:417–426. Ross, I. P., and M. G. Jalkotzy. 1996. Cougar predation on moose in southwestern Alberta.
Alces 32:1-8. Ross, I. P., M. G. Jalkotzy, and M. Festa-Bianchet. 1997. Cougar predation on bighorn sheep in
southwestern Alberta during winter. Canadian Journal of Zoology 74:771–775. Russell, R. E., J. A. Royle, R. DeSimone, M. K. Schwartz, V. I. Edwards, K. P. Pilgrim, and K.
S. McKelvey. 2012. Estimating abundance of mountain lions from unstructured spatial sampling. Journal of Wildlife Management 76:1551-1561.
Seidensticker, J. C., and M. G. Hornocker, W. V. Wiles, and J. P. Messick. 1973. Mountain lion social organization in the Idaho Primitive Area. Wildlife Monographs No. 35.
Shaw, H. G. 1980. Ecology of the mountain lion in Arizona. Final Report, Federal Aid in
Wildlife Restoration Project W-78-R, Work Plan 2, Job 13. Arizona Game and Fish Department, Phoenix, USA.

Appendix D: Sept 2, 2020
9
Sinclair, E. A., E. L. Swenson, M. L. Wolfe, D. C. Choate, B. Gates, and K. A. Crandall. 2001. Gene flow estimates in Utah cougars imply management beyond Utah. Animal Conservation 4:257-264.
Smallwood, K. S. 1994. Trends in California mountain lion populations. Southwest Naturalist
39:67-72. Smallwood, K. S., and E. L. Fitzhugh. 1995. A track count for estimating mountain lion, Felis
concolor californica, population trend. Biological Conservation 71:251-259. Spreadbury, B. R., K. Musil, J. Musil, C. Kaisner, and J. Kovak. 1996. Cougar population
characteristics in southeastern British Columbia. Journal of Wildlife Management 60:962-969.
Stoner, D. C. 2004. Cougar exploitation levels in Utah: implications for demographic
structure, metapopulation dynamics, and population recovery. Thesis, University of Utah, Logan, USA.
Stoner, D. C., M. L. Wolfe, and D. M. Choate. 2006. Cougar exploitation levels in Utah:
Implications for demographic structure, population recovery, and metapopulation dynamics. Journal of Wildlife Management 70:1588-1600.
Sweitzer, R. A., S. H. Jenkins, and J. Berger. 1997. Near-extinction of porcupines by mountain
lions and consequences for ecosystem change in the Great Basin Desert. Conservation Biology 11:1407-1417.
Teichman, K.J., B. Cristescu, and C. T. Darimont. 2016. Hunting as a management tool?
Cougar-human conflict is positively related to trophy hunting. BMC Ecology 16:44. Thompson, D. J., and J. Jenks. 2005. Long-distance dispersal by a sub-adult male cougar
from the Black Hills, South Dakota. Journal of Wildlife Management 69:818-820. Torres, S. G., T. M. Mansfield, J. E. Foley, T. Lupo, and A. Brinkhus. 1996. Mountain lion and
human activity in California: testing speculations. Wildlife Society Bulletin 24:451-460. Trainer, C. E., and N. E. Golly. 1992. Cougar age and reproduction. Oregon Department of
Fish and Wildlife, Corvallis, USA. Van Sickle, W. D., and F. G. Lindzey. 1991. Evaluation of a cougar population estimator based
on probability sampling. Journal of Wildlife Management 55:738-743. Vickers T.W., J. N. Sanchez, C. K. Johnson, S. A. Morrison, R. Botta,T. Smith, B. S. Cohen, P.
R. Huber, H. B. Ernest, and W. M. Boyce. 2015. Survival and mortality of pumas (Puma concolor) in a fragmented, urbanizing landscape. PLoS ONE 10(7): e0131490.
Whittaker, D. and M. L. Wolfe. 2011. Assessing and monitoring cougar populations. Pages 71-
110 in J. A. Jenks, editor. Managing cougars in North America. Jack H. Berryman Institute, Utah State University, Logan, Utah, USA.
Williams, J. S., J. J. McCarthy, and H. D. Picton. 1995. Mountain lion habitat use and food
habits on the Montana Rocky Mountain front. Intermountain Journal of Sciences 1:16-28.

Appendix D: Sept 2, 2020
10
Wittmer, H. U., B. N. McLellan, D. R. Seip, J. A. Young, T. A. Kinley, G. S. Watts, and D.
Hamilton. 2005. Population dynamics of the endangered mountain ecotype of woodland caribou (Rangifer tarandus caribou) in British Columbia, Canada. Canadian Journal of Zoology 83:407-418.
Wyoming Game and Fish Department Mountain Lion Management Plan. 2006. Trophy Game
Section (Management/Research Branch), Wyoming Game & Fish Department, Lander, Wyoming.
Wolfe, M. L., E. M. Gese, P. Terletzky, D. C. Stoner, and L. M. Aubry. 2016. Evaluation of
harvest indices for monitoring cougar survival and abundance. Journal of Wildlife Management. 80:27-36.
Zinn, H. C. and M. J. Manfredo. 1996. Societal preferences for mountain lion management
along Colorado’s Front Range. Project report No. 28. Report for the Colorado Division of Wildlife. Colorado State University, Human Dimensions in Natural Resources Unit. Fort Collins, Colorado, USA.

Appendix D: Sept 2, 2020
11
REFERENCES
Cougar: Ecology and Conservation. 2010. M. Hornocker and S. Negri, editors. University of
Chicago Press, Chicago, Illinois, USA.
Cougar, the American lion. 1992. K. Hansen. Northland Publishing, Flagstaff, Arizona, USA.
Mountain Lion. 1987. M. Novak, J. A. Baker, M. E. Obbard, and B. Malloch, editors. Wild
Furbearer Management and Conservation in North America. Ontario Ministry of Natural Resources and Ontario Trappers Association, Toronto, Canada.
Mountain lion field guide. 1983. H. G. Shaw. Arizona Game and Fish Department Special
Report No. 9. Arizona Game and Fish Department, Phoenix, USA.
Proceedings of the 4th Mountain Lion Workshop. 1991. C. E. Braun, editor. Colorado Division of Wildlife, Denver, USA.
Proceedings of the 7th Mountain Lion Workshop. 2003. A. Becker, D. D. Bjornlie, F. G.
Lindzey, and D. S. Moody, editors. Wyoming Game and Fish Department, Jackson, USA.

Appendix E: Sept 2, 2020
1
Colorado West Slope Mountain Lion Management Plan
APPENDIX E
WEST SLOPE MOUNTAIN LION PLAN PUBLIC PROCESS AND RESULTS
Summary of Outreach Efforts
The West Slope Mountain Lion Management Plan went through an extensive public outreach
process, which was designed to inform the public of the proposed plan and collect input. Our
outreach included a series of in person public meetings, a Facebook premier event, the
posting of the plan on the CPW website for a 6 week review period, and outreach to local
governments and interest groups. A list and timeline of these outreach efforts can be found in
Table 1.
Outreach for the draft plan began in January of 2020 with 12 in-person public meetings
hosted by CPW across the Western Slope. Approximately 584 individuals attended the in-
person presentations. The audiences were encouraged to complete surveys after the session.
Surveys from the West Slope meetings were completed by 360 members of the public.
Three in-person public meetings were planned on the Front Range; however, COVID-19
gathering limitations prevented these meetings from occurring. Therefore, to reach broader
audiences geographically, CPW hosted a Facebook Premier event on April 16, 2020. The
Facebook Premier event featured a pre-recorded presentation that was consistent with the
presentation given at West Slope in-person meetings and a recorded question and answer
session. The question and answer recording was developed from common themes identified
during the West Slope public meeting process. Staff remained online to engage with viewers
for a 5-hour window after the video premiered. Over 32,000 views were recorded in the first
twenty-two hours of the video being posted.
The draft management plan and associated appendices were posted to the CPW mountain lion
webpage on March 12, 2020 for public review. The formal public comment period opened on
CPW’s website on March 12, 2020 and closed at midnight on April 30, 2020 (~ 6 weeks). CPW’s
standard for posting draft management plans on the web is 30 days, but this extended posting
was offered to ensure that the draft plan was available to review and comment after the
Facebook Premier event occurred. During the draft plan review period, 1,855 formal public
comments were received. Of the formal comments from within Colorado, 80% were associated
with zip codes from the East Slope and 20% from the West Slope.
The formal public comment period also made accommodations for communities and
individuals who do not use the internet by providing the option for those communities to
submit their feedback via paper forms. CPW made direct outreach contacts to Boards of
County Commissioners, the Habitat Partnership Program, federal agencies, and other
stakeholder groups from January through April 2020. In total, seven press releases were
produced by CPW Public Information Officers to highlight all public input opportunities. The

Appendix E: Sept 2, 2020
2
cumulative press releases were successfully delivered 4,081 times to media outlets and public
members who signed up to receive CPW press releases directly.
Table 1. Stakeholder Outreach Efforts
Location or Audience Description Notes
1/9/2020
Mesa County Board of County
Commissioners Proposal Discussion
USFS Grand Mesa Ranger District,
USFS Rifle Ranger District, BLM
Grand Junction Field Office
Present
1/20/2020 Colorado Cattlemen's Association Proposal Discussion
Reid DeWalt spoke at the mid-
winter convention
2/1/2020
USFS Holy Cross & Sopris Ranger
Districts Proposal Discussion
2/1/2020 BLM Lower Colorado River Office Proposal Discussion
2/10/2020 Steamboat Springs West Slope Public Meeting
2/10/2020 Gunnison West Slope Public Meeting
2/11/2020 Kremmling West Slope Public Meeting
2/11/2020 Norwood West Slope Public Meeting
2/12/2020 Glenwood Springs West Slope Public Meeting
2/13/2020 Delta West Slope Public Meeting
2/18/2020 Gypsum West Slope Public Meeting
2/19/2020 Meeker West Slope Public Meeting
2/19/2020 Grand Junction West Slope Public Meeting
BLM Grand Junction Field Office
staff present
2/20/2020 Rifle West Slope Public Meeting
2/20/2020 Durango West Slope Public Meeting
2/20/2020
Grand Mesa Habitat Partnership
Program Committee Proposal Discussion
2/21/2020 Alamosa West Slope Public Meeting
3/1/2020
Garfield County Board of County
Commissioners Requests for Discussions
Several requests were sent in
March & April
3/4/2020 BLM Grand Junction Field Office
Coordination Meeting -
Proposal Discussion
CPW & proposed plan listed as an
agenda item
3/23/2020
Summit County Board of County
Commissioners
Emailed Press Release &
Public Comment Period Info
Emailed reminder of comment
period close on 4/28/2020
3/23/2020
Grand County Board of County
Commissioners
Emailed Press Release &
Public Comment Period Info
Emailed reminder of comment
period close on 4/28/2020
3/23/2020 BLM Kremmling Field Office
Emailed Press Release &
Public Comment Period Info
3/23/2020 USFS
Emailed Press Release &
Public Comment Period Info
Verifying which offices Lyle
contacted

Appendix E: Sept 2, 2020
3
3/25/2020
BLM Grand Junction & Silt Field
Offices
CPW Formally Requested
Input
3/25/2020
USFS Grand Mesa & Rifle Ranger
Districts
CPW Formally Requested
Input
4/3/2020
Virtual meeting with special interest
groups that included Humane
Society of the United States, Wild
Earth Guardians, and the Sierra Club
Meeting was to discuss the
contents of the draft plan and
take feedback from these
groups. The groups followed
with a formal comment
letter.
4/8/2020 Montezuma County BOCC
Email with link to plan and
requesting input
4/8/2020
Backcountry Hunters and Anglers-
SW Colorado
Email with link to plan and
requesting input
4/8/2020
Southwest Livestock Growers
Association
Email with link to plan and
requesting input
4/8/2020 San Juan Citizens Alliance
Email with link to plan and
requesting input
4/8/2020
La Plata County Living with Wildlife
Advisory Board
Email with link to plan and
requesting input
4/10/2020 Montrose County BOCC
email plan and invite to
Facebook event
Email presented plan to BOCC and
asked to reach out with
comments or concerns
4/14/2020
Eagle County Board of County
Commissioners Proposal Presentation
4/14/2020
Pitkin County Board of County
Commissioners Proposal Presentation
4/14/2020 BLM Kremmling Field Office Proposal Discussion Personal call to Bill Mills
4/14/2020
La Plata County Living with Wildlife
Advisory Board Proposal Discussion
4/16/2020 Facebook Event
Online Proposal Presentation,
Live Q&A
Replaced front range meetings
due to COVID19
4/21/2020 Colorado Outfitters Association
Email with link to plan and
requesting input All mailing list
4/21/2020 USFS Aspen-Sopris Ranger District Proposal Discussion
4/22/2020
Mesa County Board of County
Commissioners Proposal Presentation
4/22/2020 USFS Sulphur Ranger District
Coordination Meeting -
Proposal Discussion
4/22/2020 La Plata County BOCC Discussion with BOCC
4/23/2020 BLM Kremmling Field Office Proposal Discussion Personal call to Bill Mills
4/27/2020
Hinsdale, Mineral, Rio Grande,
Alamosa, Costilla, Conejos and
Saguache Board of County
Commissioners
Emailed Links to all relevant
information along with a
reminder to comment and
provide support letters.

Appendix E: Sept 2, 2020
4
4/27/2020 USFS Divide Ranger District
Emailed Links to all relevant
information along with a
reminder to comment and
provide support letters.
4/27/2020 BLM San Luis Valley Field Office
Emailed Links to all relevant
information along with a
reminder to comment and
provide support letters.
4/27/2020 San Luis Valley Ecosystem Council
Emailed Links to all relevant
information along with a
reminder to comment and
provide support letters.
4/27/2020
Gunnison Board of County
Commissioners Chair
Phone discussion on lion
management plan and
support
Personal call with Jonathan
Houck-BOCC supports CPW as
wildlife mgmt professionals in CO
4/27/2020
Hinsdale County Board of County
Commissioners
Email exchange with BOCC
chair
4/27/2020 Gunnison Wildlife Association
Phone discussion on lion
mgmt plan and support
Call with GWA President Cody
Dyce, they will submit letter of
support
4/27/2020
Dolores County Board of County
Commissioners
Emailed Links to all relevant
information along with a
reminder to comment and
provide support letters.
4/27/2020
Archuleta County Board of County
Commissioners
Emailed Links to all relevant
information along with a
reminder to comment and
provide support letters.

Appendix E: Sept 2, 2020
5
West Slope Public Meeting Details
Beginning in February 2020, CPW hosted twelve in-person public meetings across the West
Slope. Over 584 individuals attended these meetings. A PowerPoint presentation was given at
each meeting, after which CPW answered questions and circulated a survey to capture
feedback. A total of 360 surveys were submitted at the end of the discussions across all
meetings. Attendees who provided usable email addresses were provided a follow-up email
when the formal comment period opened online. The most commonly asked questions
answered by staff in these in-person meetings are listed below.
1. How was the percent adult female threshold determined? Why only adult females?
2. Why is a female sub-quota not recommended in this plan?
3. Why aren’t gender-specific lion tags issued?
4. Will pursuit tags ever be available?
5. Will private land vouchers be considered, that don’t contribute to hunter harvest?
6. What if the population estimates projected by the Resource Selection Function are
not accurate?
7. Is the current population ideal for maintaining at a stable level?
8. With these larger Harvest Limit Groups, aren’t wildlife managers concerned that
specific game management units may experience over-harvest or under-harvest?
9. Is CPW aware of the British Columbia & Washington peer-reviewed mountain lion
research papers that describe social chaos in hunted mountain lion populations?
10. Why aren’t non-lethal methods used to manage problem mountain lions?

Appendix E: Sept 2, 2020
6
West Slope Public Meeting Survey & Results
The five questions posed on the survey, with results, are as follows.
1. How do you interact with mountain lions? Choose your primary interest.
a. Lion Hunter
b. Deer/Elk Hunter
c. Landowner
d. Agricultural Producers
e. Wildlife Enthusiast
f. Other: ________
Figure 1. Proportion of Responses to Survey Question 1
2. Managing mountain lions on a landscape scale is appropriate for the species.
a. Scale of 1-5. 1: Strongly Disagree 5: Strongly Agree
Figure 2. Proportion of Responses to Survey Question 2

Appendix E: Sept 2, 2020
7
3. This plan allows wildlife managers more flexibility to manage lions.
a. Scale of 1-5. 1: Strongly Disagree 5: Strongly Agree.
Figure 3. Proportion of Responses to Survey Question 3
4. This plan allocates harvest limits to meet local needs while maintaining a stable
mountain lion population across the West Slope of Colorado.
a. Scale of 1-5. 1: Strongly Disagree 5: Strongly Agree
Figure 4. Proportion of Responses to Survey Question 4
5. Do you have any comments or concerns on mountain lion management to relay to
wildlife managers?
a. Open for written responses.

Appendix E: Sept 2, 2020
8
Facebook Premier Event Details
CPW’s Facebook Premier went live on April 16, 2020, at 3 p.m. Colorado Parks and Wildlife
staff pre-recorded the same presentation provided to West Slope Public Meeting attendees
along with responses to common questions identified from the West Slope meetings. After the
event premiered at 3 p.m., staff were available until 8 p.m. for live responses to all
comments with questions pertaining to mountain lion management. This event was hosted in
lieu of in-person Front Range meetings (which were canceled due to COVID-19 gathering
restrictions).
Analytics of the Facebook Premier event were evaluated when the video had been posted for
twenty-two hours. In total, 3,767 engagements with the materials were recorded. A total of
427 comments were on the post at hour twenty-two, which included the responses from CPW.
Formal Online Public Comment Period Details
The draft West Slope Mountain Lion Management Plan and Appendices were posted to the
CPW lion webpage on March 12, 2020 for formal comments and closed at midnight on April 30,
2020. A Google Form was used to capture all comments. Each respondent’s zip code was a
required component for all comments. No formal questions were asked of those that had
reviewed the plan; space was provided for open-ended feedback on elements of the
management plan. A total of 1,855 comments were submitted during this review period.
The public comment period garnered worldwide attention. The intent of this comment period
was to collect input on elements of the proposed West Slope Mountain Lion Plan. Many of the
comments received did not comment on the plan itself; rather, they were philosophical
comments about the ethics of mountain lion hunting. Mountain lion hunting in Colorado is
regulated per Chapter W-02, Article VI of CPW’s Regulations. The question of whether or not
hunting mountain lions in Colorado should continue was not posed to the public and should be
addressed through other channels. Comments to this effect were put into the “N/A”
category. Some comments did mention specific lion plan elements while expressing that the
commenter was against mountain lion hunting; these comments were included in the
comment statistics & common themes below.
Comment Statistics
35% of the online comments either had no text attached, were incoherent, or
did not relate to the management plan itself
Of the comments associated with Colorado zip codes, approximately 80% were
from the East Slope
Of the comments associated with Colorado zip codes, approximately 20% were
from the West Slope
Approximately 14% of the online public review comments had “form letter” elements
identified, which indicates that the proposed management plan came to their attention
through a mailing list with prompts, or was cut and pasted from a common source.

Appendix E: Sept 2, 2020
9
Common Themes
CPW staff examined all of these comments to identify commonality between comments
and general themes. The top themes are listed below. Of additional note was the
widespread request for robust mountain lion community education programs. The word
“education” was mentioned 128 times in comments received.
1. Not Applicable, Incoherent, or blank: 652 comments or 35%
2. Form elements identified (indicating the comment period came to their
attention through a mailing list): 259 comments or 14%
3. Against trophy hunting, against mountain lion hunting, or against all
hunting: 475 comments or 25%
4. Against suppression or mountain lions, against harvest increases, or
against the Glenwood Springs SMA: 406 comments or 22%
5. Against the use of electronic calls: 323 comments or 17%
6. Against April mountain lion harvest, concurrent seasons, or extended
seasons: 184 comments or 10%
7. Supportive of this plan & lion hunting: 139 comments or 7%
8. Supportive of increased mountain lion harvest, mountain lion population
reduction, or the Glenwood Springs SMA: 61 comments or 3%
9. Requested more research on mountain lions on the West Slope of
Colorado: 101 comments or 5%

Appendix E: Sept 2, 2020
10
Analysis of Public Feedback
Feedback from the in-person West Slope public meetings contrasted with the feedback
received during the online comment period. A range of stakeholders attended the in-person
meetings outside of the sportsmen community; 16% identified as primarily “wildlife
enthusiasts” over options including hunters, agricultural producers, or others. The West Slope
Public Meeting section provides an analysis of audience identification and complete
percentages of survey answers compiled. More than half of all attendees agreed or strongly
agreed with the following statements:
1. Managing mountain lions on a landscape scale is appropriate for the species. (57%
agree & strongly agree)
2. This plan allows wildlife managers more flexibility to manage lions. (69% agree &
strongly agree)
3. This plan allocates harvest limits to meet local needs while maintaining a stable
mountain lion population across the West Slope of Colorado. (67% agree & strongly
agree)
Of the 1,855 comments received during the formal online comment period, 318 were from zip
codes associated with West Slope addresses (living within the proposed management plan
boundary). A total of 1,324 comments were from zip codes associated with East Slope
addresses and an additional 213 comments were either out of state or invalid for mapping
(perhaps submitted incorrectly and some comments in this category were international).
Sociological differences were detected based on the location of the commenter. Those who
don’t live within the plan boundary tended toward protectionist mindsets. Those who live
with the mountain lions that are managed within this plan boundary offered different
feedback that generally trended toward a management mindset.
Local Support for the Glenwood Springs Special Management Area (SMA)
While some members of the communities surrounding the Glenwood Springs SMA have
expressed concerns, the majority of local opinions received regarding the management
practices proposed in the Glenwood Springs SMA were supportive. The surveys circulated at
the public meetings held in Glenwood Springs and Gypsum indicate that residents generally
agree with the goals of this proposed lion management plan. Concepts proposed in the
management of the SMA were strongly driven by input from residents and local governments
that have expressed concerns both in the number and severity of human-lion conflicts in this
area over the past decade. This was demonstrated and supported by the many written
comments on these surveys that referenced increased human-lion interactions and the need
for increased mountain lion management efforts. Letters of support for this special
management area have been collected from individual residents, homeowner associations,
Boards of County Commissioners, and stakeholder groups that focus on landscapes in or
adjacent to the Glenwood Springs SMA.

Appendix E: Sept 2, 2020
11
CPW’s Response to Public Input
During the formal comment period, some stakeholders expressed a desire for this draft plan
to be peer-reviewed by a professional wildlife management agency. To accommodate this
request, the draft West Slope Mountain Lion Management Plan was shared with technical staff
involved with lion management and research at the Oregon Department of Fish & Wildlife.
Derek Broman formally commented that “as a wildlife biologist, large carnivore manager, and
representative of a state wildlife agency, I’m very pleased to see that this draft plan
incorporates all relevant components of contemporary lion conservation and management.”
This review is included, in full, in Figure 5 on page 12 of this appendix.
Respondents also requested surveys that produced more solid mountain lion density estimates
for the West Slope. In response, CPW has committed to beginning lion density surveys in 2021.
Developing robust estimates of current lion density in survey areas on the West Slope will help
improve and refine assumptions made in the RSF model (Appendix C). A further explanation
of this proposed density monitoring approach is provided on page 36 of the draft West Slope
Mountain Lion Management Plan.
The strategy proposed in the Glenwood SMA to reach of the objective of reducing human-lion
conflicts was also modified to fit an adaptive management framework. Currently-proposed
tools would be employed for the first half of the West Slope Mountain Lion Management Plan,
followed by an evaluation. This review would assess success of management actions, including
higher harvest limits, to reach objectives of reduced conflicts. However, following an
adaptive management framework evaluation, if data suggest that higher harvest, along with
other tools, haven’t been successful in reducing conflicts, then a different management
scenario will be employed after the evaluation.
CPW will also increase public education programs across West Slope communities to better
educate residents who live in mountain lion habitat on how to decrease the chances of
negative interactions. These educational programs will be developed through collaboration
between CPW’s NW & SW Region Staff, CPW’s Creative Services and Marketing Department,
and CPW’s Education Department. The educational media & materials produced by this
collaboration will be distributed to West Slope schools, boards of county commissioners, home
owner associations, and other avenues as identified by the above team. Local field staff will
continue to engage with communities at every opportunity (providing school programs,
working with partner organizations on educational programming, etc.).
It is worth noting that mountain lion advocacy groups agreed with the metrics proposed in this
plan. While the Humane Society and their partners are “generally opposed to the hunting of
mountain lions in Colorado and beyond,” they “support CPW’s efforts to improve management
of mountain lions, as well as implementing mortality thresholds, including a 17% total human-
caused mortality limit and a 22% adult female mortality limit.” The letter is included, in full,
on page 40 of this appendix.

Appendix E: Sept 2, 2020
12
Figure 5. Agency Peer Review of the draft West Slope Mountain Lion Management Plan

Appendix E: Sept 2, 2020
13

Appendix E: Sept 2, 2020
14

Appendix E: Sept 2, 2020
15
Letters Received Independently of the Formal Public Comment Period
The letters listed below are included, in full, after Table 2.
Table 2.
Name Region Agency/Group/Board
USFS Rio Grande SW Agency
USFS Sulphur RD NW Agency
USFS White River NF Super. NW Agency
BLM NW District NW Agency
Mesa County BOCC NW Board
Montezuma County BOCC SW Board
La Plata County BOCC SW Board
Rio Blanco County BOCC NW Board
Archuleta County BOCC SW Board
Eagle County BOCC NW Board
Minturn Town Council NW Board
Red Sky Ranch HOA NW Board
Single Tree Property Owners Association NW Board
Eagle Ranch Wildlife Committee NW Board
Back Country Hunters & Anglers NW Group
RMEF - Eagle County NW Group
Safari Club International N/A Group
Human Society of the United States & Partners N/A Group

Appendix E: Sept 2, 2020
16

Appendix E: Sept 2, 2020
17

Appendix E: Sept 2, 2020
18

Appendix E: Sept 2, 2020
19

Appendix E: Sept 2, 2020
20

Appendix E: Sept 2, 2020
21

Appendix E: Sept 2, 2020
22

Appendix E: Sept 2, 2020
23

Appendix E: Sept 2, 2020
24

Appendix E: Sept 2, 2020
25
Appendix E: Sept 2, 2020
26

Appendix E: Sept 2, 2020
27

Appendix E: Sept 2, 2020
28

Appendix E: Sept 2, 2020
29
Appendix E: Sept 2, 2020
30

Appendix E: Sept 2, 2020
31
Appendix E: Sept 2, 2020
32

Appendix E: Sept 2, 2020
33

Appendix E: Sept 2, 2020
34

Appendix E: Sept 2, 2020
35

Appendix E: Sept 2, 2020
36

Appendix E: Sept 2, 2020
37

Appendix E: Sept 2, 2020
38

Appendix E: Sept 2, 2020
39

Appendix E: Sept 2, 2020
40
Appendix E: Sept 2, 2020
41

Appendix E: Sept 2, 2020
42

Appendix E: Sept 2, 2020
43

Appendix E: Sept 2, 2020
44

Appendix E: Sept 2, 2020
45

Appendix E: Sept 2, 2020
46

Appendix E: Sept 2, 2020
47

Appendix E: Sept 2, 2020
48

Appendix E: Sept 2, 2020
49

Appendix E: Sept 2, 2020
50

Appendix E: Sept 2, 2020
51