The Halogen Geochemistry of the Bushveld Complex ...
23
JOURNAL OF PETROLOGY VOLUME 41 NUMBER 10 PAGES 1517–1539 2000 The Halogen Geochemistry of the Bushveld Complex, Republic of South Africa: Implications for Chalcophile Element Distribution in the Lower and Critical Zones C. C. WILLMORE 1 , A. E. BOUDREAU 1 ∗ AND F. J. KRUGER 2 1 DIVISION OF EARTH AND OCEAN SCIENCES, BOX 90227, DUKE UNIVERSITY, DURHAM, NC 27708, USA 2 HUGH ALLSOPP LABORATORY, UNIVERSITY OF THE WITWATERSRAND, WITS 2050, REPUBLIC OF SOUTH AFRICA RECEIVED OCTOBER 20, 1999; REVISED TYPESCRIPT ACCEPTED MARCH 24, 2000 solidification of the interstitial liquid. The stratigraphic distribution Halogen-bearing minerals, especially apatite, are minor but ubi- of S, Cu and the PGE in the Critical Zone cannot readily be quitous phases throughout the Bushveld Complex. Interstitial apatite explained either by precipitation of sulfide as a cotectic phase or as is near end-member chlorapatite below the Merensky reef (Lower a function of trapped liquid abundance. Evidence from potholes and and Critical Zones) and has increasingly fluorian compositions with the PGE-rich Driekop pipe of the Bushveld Complex imply that increasing structural height above the reef (Main and Upper Zones). migrating Cl-rich fluids mobilized the base and precious metal Cl/F variations in biotite are more limited owing to crystal-chemical sulfides. We suggest that the distribution of sulfide minerals and controls on halogen substitution, but are also consistent with a the chalcophile elements in the Lower and Critical Zones reflects a decrease in the Cl/F ratio with structural height in the complex. general process of vapor refining and chromatographic separation of A detailed section of the upper Lower Zone to the Critical Zone is these elements during the evolution and migration of a metalliferous, characterized by an upward decrease in sulfide mode from 0·01– Cl-rich fluid phase. 0·1% to trace–0·001%. Cu tends to correlate with other in- compatible elements in most samples, whereas the platinum-group elements (PGE) can behave independently, particularly in the Critical Zone. The decrease in the Cl/F ratio of apatite in the KEY WORDS: Bushveld Complex; chlorine; platinum-group elements; Main Zone is associated with a shift to more radiogenic Sr isotopic layered intrusions signature, implying that the unusually Cl-rich Lower and Critical Zones are not due to assimilation of crustal rocks. Nor is the Main Zone more Cl rich where it onlaps the country rocks of the floor, suggesting little if any Cl was introduced by infiltrating country rock fluids. Instead, the results are consistent with other studies that INTRODUCTION suggest Bushveld volatile components are largely magmatic. This is The effects of volatile components in igneous systems are also supported by apatite–biotite geothermometry, which gives typical well documented. During partial melting, the addition equilibrium temperatures of 750°C. The increasingly fluorian apatite of water lowers the solidus of the source rock (e.g. with height in the Upper Zone can be explained by volatile saturation Burnham & Davis, 1974), which can change both the and exsolved a Cl-rich volatile phase. The high Cl/F ratio inferred major and trace element chemistry of the partial melt for the Lower and Critical Zone magma(s) and the evidence for (e.g. Hickey & Frey, 1982; Iwanori, 1998). Further, volatile saturation during crystallization of the Upper Zone indicate volatile elements can alter the anhydrous crystallization the Lower and Critical Zones magma(s) were unusually volatile sequence and result in features such as pegmatites by suppressing crystal nucleation (e.g. Hort, 1998). rich and could easily have separated a Cl-rich fluid phase during ∗Corresponding author. e-mail: [email protected] Oxford University Press 2000
-
Upload
khangminh22 -
Category
Documents
-
view
0 -
download
0
Transcript of The Halogen Geochemistry of the Bushveld Complex ...

JOURNAL OF PETROLOGY VOLUME 41 NUMBER 10 PAGES 1517–1539 2000
The Halogen Geochemistry of the BushveldComplex, Republic of South Africa:Implications for Chalcophile ElementDistribution in the Lower and Critical Zones
C. C. WILLMORE1, A. E. BOUDREAU1∗ AND F. J. KRUGER2
1DIVISION OF EARTH AND OCEAN SCIENCES, BOX 90227, DUKE UNIVERSITY, DURHAM, NC 27708, USA2HUGH ALLSOPP LABORATORY, UNIVERSITY OF THE WITWATERSRAND, WITS 2050, REPUBLIC OF SOUTH AFRICA
RECEIVED OCTOBER 20, 1999; REVISED TYPESCRIPT ACCEPTED MARCH 24, 2000
solidification of the interstitial liquid. The stratigraphic distributionHalogen-bearing minerals, especially apatite, are minor but ubi-of S, Cu and the PGE in the Critical Zone cannot readily bequitous phases throughout the Bushveld Complex. Interstitial apatiteexplained either by precipitation of sulfide as a cotectic phase or asis near end-member chlorapatite below the Merensky reef (Lowera function of trapped liquid abundance. Evidence from potholes andand Critical Zones) and has increasingly fluorian compositions withthe PGE-rich Driekop pipe of the Bushveld Complex imply thatincreasing structural height above the reef (Main and Upper Zones).migrating Cl-rich fluids mobilized the base and precious metalCl/F variations in biotite are more limited owing to crystal-chemicalsulfides. We suggest that the distribution of sulfide minerals andcontrols on halogen substitution, but are also consistent with athe chalcophile elements in the Lower and Critical Zones reflects adecrease in the Cl/F ratio with structural height in the complex.general process of vapor refining and chromatographic separation ofA detailed section of the upper Lower Zone to the Critical Zone isthese elements during the evolution and migration of a metalliferous,characterized by an upward decrease in sulfide mode from 0·01–Cl-rich fluid phase.0·1% to trace–0·001%. Cu tends to correlate with other in-
compatible elements in most samples, whereas the platinum-groupelements (PGE) can behave independently, particularly in theCritical Zone. The decrease in the Cl/F ratio of apatite in the
KEY WORDS: Bushveld Complex; chlorine; platinum-group elements;Main Zone is associated with a shift to more radiogenic Sr isotopiclayered intrusionssignature, implying that the unusually Cl-rich Lower and Critical
Zones are not due to assimilation of crustal rocks. Nor is the MainZone more Cl rich where it onlaps the country rocks of the floor,suggesting little if any Cl was introduced by infiltrating countryrock fluids. Instead, the results are consistent with other studies that INTRODUCTIONsuggest Bushveld volatile components are largely magmatic. This is The effects of volatile components in igneous systems arealso supported by apatite–biotite geothermometry, which gives typical well documented. During partial melting, the additionequilibrium temperatures of 750°C. The increasingly fluorian apatite of water lowers the solidus of the source rock (e.g.with height in the Upper Zone can be explained by volatile saturation Burnham & Davis, 1974), which can change both theand exsolved a Cl-rich volatile phase. The high Cl/F ratio inferred major and trace element chemistry of the partial meltfor the Lower and Critical Zone magma(s) and the evidence for (e.g. Hickey & Frey, 1982; Iwanori, 1998). Further,volatile saturation during crystallization of the Upper Zone indicate volatile elements can alter the anhydrous crystallizationthe Lower and Critical Zones magma(s) were unusually volatile sequence and result in features such as pegmatites by
suppressing crystal nucleation (e.g. Hort, 1998).rich and could easily have separated a Cl-rich fluid phase during
∗Corresponding author. e-mail: [email protected] Oxford University Press 2000

JOURNAL OF PETROLOGY VOLUME 41 NUMBER 10 OCTOBER 2000
In layered intrusions, the separation of a volatile-rich the half-graben Transvaal basin between c. 2·3 and 2·1phase (or fluid) from evolved magma in the interstices Ga (Schreiber et al., 1992b) in a lacustrine environment.between primary crystals (the interstitial or trapped liquid) Fresh-water deposition of the Pretoria group is inferredcan also have dramatic effects on the resultant chemistry from sedimentary structures (Eriksson et al., 1991) and theand textures of the rocks. For example, separation and boron content of shale (Schreiber et al., 1992a; Eriksson etmigration of a fluid phase can alter the primary igneous al., 1996).chemistry by metasomatism and the promotion of re- The eruption and intrusion of the units of the Bushveldcrystallization of the primary igneous assemblage (e.g. magmatic province [which includes the Bushveld Com-Mathez, 1995; Meurer & Boudreau, 1998a, 1998b; plex (Coetzee & Kruger, 1989)] are not fully understood.Meurer et al., 1999), and form features such as discordant, However, it is known that the igneous suite is the resultpegmatoidal replacement bodies (e.g. Schiffries, 1982) of at least three distinct episodes of magmatism. The firstand potholes (e.g. Ballhaus, 1988; Boudreau, 1992). In was the eruption of the 2061 ± 2 Ma Rooiberg felsitesaddition, if the fluid phase contains a strong complexing [(Walraven, 1997) zircon evaporation data]. These areagent such as Cl, it can redistribute and concentrate base composed of >300 000 km3 of silicic ash flows and py-and precious metal sulfides (e.g. Schiffries, 1982; Candela roclastic deposits (Twist, 1985). The felsic volcanic rocks& Holland, 1984; Ballhaus & Stumpfl, 1986; Boudreau that form the roof of the Bushveld Complex are thought& McCallum, 1992; Boudreau & Meurer, 1999). to be genetically related to the calc-alkaline Dullstroom
Previous work has suggested that the Bushveld volcanic rocks overlying the Pretoria group (Cheney &magma(s) parental to the Lower and Critical Zones Twist, 1991).contained significant Cl and that the Cl-bearing fluids The second major igneous event was the intrusion ofcould have been an important means of redistribution the mafic Bushveld magmas along the interface betweenof precious metal sulfides. Boudreau & Kruger (1990) the Pretoria group and the Rooiberg felsites to form thepresented analyses of a short stratigraphic section that Bushveld Complex. There were at least three and possiblyindicate that the Critical Zone contained Cl-rich inter- four identifiable mafic liquids that crystallized to formstitial apatite. Further, Schiffries (1982) has shown that the Bushveld Complex, based upon a Sr isotopic shiftCl-rich fluids were involved in the anomalous con- between the Critical and Main Zones and the Main andcentration of the platinum-group elements (PGE), and Upper Zones (Kruger & Marsh, 1982; Kruger et al.,particularly Pt and Pd, in the Driekop iron-rich ultramafic 1986).pegmatite. This study adds to these previous studies by The third and final event was the intrusion of the 2040addressing two major questions: (1) what is the halogen ± 8 Ma Bushveld (Nebo) granite (Walraven, 1988). Thecomposition of hydrous minerals throughout the Bushveld granite was intruded through the mafic complex and intoComplex? (2) Is there evidence of fluid interaction with and along the boundary between the Upper Zone andeither the crystal pile or resident magma that could have the overlying Rooiberg felsic volcanic and granophyricredistributed base and precious metals and sulfides in the rocks. These three Bushveld magmatic events are clearlyLower and Critical Zone rocks as suggested by Boudreau temporally and spatially related, but their genetic relations& Meurer (1999) and contribute to the formation of are speculative.the PGE-rich upper Group 2 (UG-2) chromitite, theMerensky reef, and anomalous enrichments in otherchromitites of the Critical Zone (e.g. Scoon & Teigler,
Stratigraphy1994)?The rocks of the Bushveld Complex form a funnel-shaped sill, which crosscuts the Pretoria group along theboundary noted above. The intrusion is >7 km thick,
GEOLOGY AND PETROLOGY although the thickness varies laterally. The layered seriesGeologic setting is divided into a stratigraphy based largely on modal
mineralogy. The primary divisions are the Lower Zone,The Bushveld Complex is a 2060 ± 3 Ma (Kruger etCritical Zone, Main Zone, and the Upper Zone.al., 1986) layered mafic–ultramafic intrusion that covers
The Lower Zone is a succession of chemically relatively>66 000 km2 of the northern Kaapvaal craton of thehomogeneous dunite, harzburgite, and orthopyroxenite,Republic of South Africa (Fig. 1). The magmas formingwith grain sizes on the order of 1 mm. The intersticesthe Bushveld Complex were intruded into the Pretoriaare dominated by pyroxene and minor plagioclase, butgroup, a succession of quartzitic to arkosic sandstone andapatite, biotite and sulfides are also present. The base ofmudstone with interlayered andesitic lavas and vol-the overlying Critical Zone is marked by a increase incanoclastic sediments (Eriksson et al., 1991), broadly alongthe modal abundance of interstitial plagioclase from <1the interface with the overlying Rooiberg group felsic
volcanic rocks. The Pretoria group was deposited within to >4%.
1518

WILLMORE et al. HALOGEN GEOCHEMISTRY, BUSHVELD COMPLEX
Fig. 1. Simplified geologic map of the Bushveld Complex, Republic of South Africa. The line labeled ‘Cameron section’ is the Lower andCritical Zone section location of the detailed sampling of this study. After Hatton & Sharpe (1989).
The Lower Critical Zone is composed largely of felds- typically sandwiched between thin (1–2 cm) lower andupper chromitite layers. The crystals of the pegmatoidpathic orthopyroxenites, with some harzburgite, whereas
the Upper Critical Zone is composed of feldspathic are considerably coarser than the 1 mm typical of mostof the complex, being commonly greater than 1–2 cm inorthopyroxenite, melano- and leuconorite and anor-
thosite. Chromitite layers occur in both subzones and long dimension, and typically subhedral to anhedral. Theinterstitial areas contain abundant PGE-bearing sulfides,range between 20 cm and 2 m in thickness, and may
contain economic concentrations of base and precious biotite, and apatite. The top chromitite stringer is laterallyinconsistent, and chromite is in places disseminated. Themetals. Apatite and biotite continue to be interstitial
phases, quartz becomes more abundant, but sulfides are Merensky orthopyroxenite overlies the chromitite layer,and grades into the Merensky norite, which is itselfless abundant. Visual estimates suggest an increase in
the abundance of accessory rutile in the Critical Zone, capped by the Merensky anorthosite. The Merenskycyclic unit is overlain by the Bastard cyclic unit, whichboth as an interstitial mineral and included in primocryst
minerals. has much the same character as the Merensky unit, butis poorer in PGE and is usually much thicker, andThe Merensky cyclic unit has been described in great
detail by other workers (e.g. Cousins, 1969; Vermaak, pegmatoid is seldom developed.The boundary between the Critical and Main Zones1976; Kruger & Marsh, 1985; Mathez, 1995; Wilson et
al., 1999). The base of the cyclic unit is the Merensky is conventionally taken as the top of the Giant MottledAnorthosite, which caps the Bastard cyclic unit (e.g. Ealespegmatoid (Merensky reef ). The pegmatoid itself is a
pegmatitic feldspathic pyroxenite of 0–50 cm thickness, & Cawthorn, 1996). However, based upon Sr-isotope
1519

JOURNAL OF PETROLOGY VOLUME 41 NUMBER 10 OCTOBER 2000
changes and other evidence, including a major un- Sample location and selectionconformity (see, e.g. Carr et al., 1999), Kruger (1990) Most samples of this study are typical rocks from thesuggested placing the boundary at the base of the Mer- layered suite, with the addition of a Lower Zone ‘chilled’ensky cyclic unit, and this convention is adopted here. marginal sample (No. 1581), and two samples from theAbove the Bastard cyclic unit the Main Zone is generally heterogeneous Marginal Zone where the lower Mainuniform, composed of equigranular gabbronorite with Zone transgresses the floor (Nos 1544 and 1548). Theanorthositic horizons. The interstitial areas, unlike those latter two are both nominally B2 (Critical Zone equi-of the Lower and Critical Zones, contain only rare biotite valents) as defined by Sharpe (1981), although G. Caw-and apatite, the interstitial areas being filled dominantly thorn (personal communication, 1996) believes they areby minor quartz. The Main Zone is also characterized more likely to be related to the Main Zone, based onby a more radiogenic initial 87Sr/86Sr ratio (0·7085) than texture, low Cr contents, and proximity of Main Zonethe underlying rocks (0·7064). However, a shift back to cumulates.less radiogenic initial 87Sr/86Sr ratios (Sharpe, 1985) and An extensive set of samples were taken from the
‘Cameron section’ of the Eastern Bushveld (Cameron,an associated Mg/Fe reversal at the pyroxenite marker1978) (Fig. 1) for additional whole-rock analysis. Theat the top of the Main Zone imply a major unconformitysamples cover a stratigraphic interval of 1900 m fromor replenishment event at this level (Kruger et al., 1986).above the lowest orthopyroxenite layer to the anorthositeThe base of the Upper Zone is conventionally definedbelow the Merensky reef. Merensky pegmatoid samplesby the first appearance of euhedral (cumulus) magnetite,were taken from drill core provided by the Rustenburgbut, as shown by Kruger (1990), the pyroxenite markerPlatinum Mines. All field samples were taken from loc-is the petrological base of the Upper Zone and is alsoations away from obvious fractures and alteration veins,associated with an unconformity related to magma in-and were selected based on apparent freshness in handjection [see Cawthorn et al. (1991)]. Hence, the sectionspecimen.between the pyroxenite marker and the appearance of
magnetite is included in Subzone A of the Upper Zone.The overlying stratigraphy is a series of gabbronorite,magnetite gabbronorite and economic (vanadiferous)magnetitite layers. Biotite returns as a relatively abundant Petrology of late-crystallizing mineralsinterstitial phase, and apatite becomes a cumulus phase Chromite, plagioclase, quartz, and clinopyroxene (cpx)in Upper Zone C and is particularly abundant in the are the most common minor and interstitial phases inlower part of this subzone. Although variable, apatite the Lower and Critical Zones. Except for chromite, thesemode decreases in abundance toward the top of the minerals are typically anhedral to subhedral with crystalintrusion, consistent with a decrease in the bulk P con- shapes controlled by the primocryst minerals.tents, which may exceed 4 wt % P2O5 near the base of Apatite is the principal mineral of interest as it is theUpper Zone C, to typically <0·4% just under the roof most commonly occurring halogen-bearing mineral and,[compare summary of Eales & Cawthorn (1996)]. unlike the micas and amphiboles, halogen substitution is
The stratigraphic units of the layered series can have ideal at high temperatures (e.g. Volfinger et al., 1985;a complex association of marginal rocks and sills (the Tacker & Stormer, 1989). Apatite is a minor but relativelyMarginal Zone) where the layered series onlaps the common interstitial and chadocrystic mineral even in thecountry rocks along the floor of the intrusion. For ex- Lower and Critical Zones. Its low modal abundance (aample, the B1 and B2 sills intrude into the floor rocks few small grains observed in a typical thin section) isadjacent to the Lower and Critical Zones, respectively. consistent with low whole-rock P2O5 concentrations ofThe sills vary greatly in thickness, from tens of meters 0·01–0·02 wt % that are characteristic of much of theto >800 m, and range in composition from homogeneous lower 80% of the complex below the Upper Zone (e.g.peridotite to differentiated bodies of peridotite, harz- Cawthorn, 1983). As noted above, where apatite firstburgite, orthopyroxenite and norite (Sharpe & Hulbert, appears as a primocryst mineral in Upper Zone C, apatite1985). There are also a small number of quench-textured mode is observed to locally exceed 6%, but then decreasesmicropyroxenites. Many of the sills have quenched mar- in abundance irregularly with structural height until it isgins that contain devitrified glass, and smaller sills can again only a minor to trace mineral in a ferrodioritehave devitrified glass throughout (Sharpe & Hulbert, sample from the top of the complex.1985). For additional description of the Marginal Zone The majority of apatite grains analyzed in this studyrocks, the reader is referred to Cawthorn et al. (1981) are interstitial to the primocrysts, and many are associatedand Harmer & Sharpe (1985). Sill equivalents to the with late crystallized phases such as quartz and biotiteMain Zone magmas have not yet been unequivocally (Fig. 2a and b). Apatite grains in this environment
are typically subhedral to anhedral with crystal facesidentified.
1520
WILLMORE et al. HALOGEN GEOCHEMISTRY, BUSHVELD COMPLEX
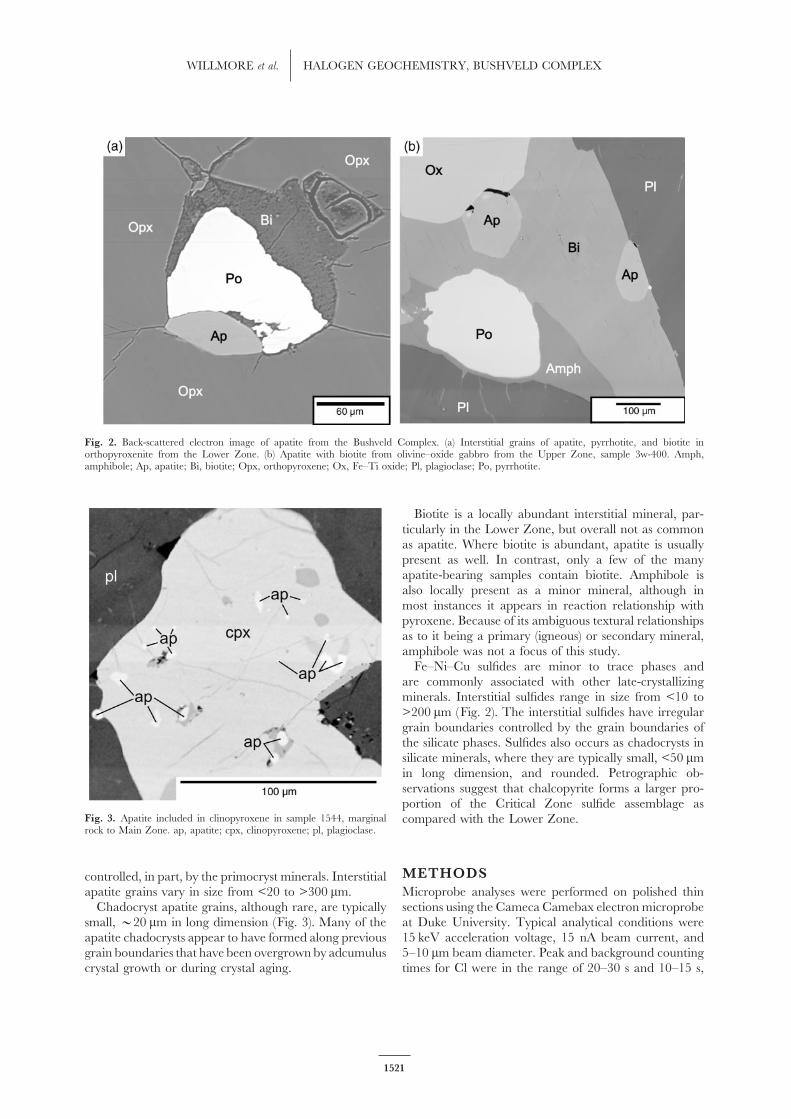
Fig. 2. Back-scattered electron image of apatite from the Bushveld Complex. (a) Interstitial grains of apatite, pyrrhotite, and biotite inorthopyroxenite from the Lower Zone. (b) Apatite with biotite from olivine–oxide gabbro from the Upper Zone, sample 3w-400. Amph,amphibole; Ap, apatite; Bi, biotite; Opx, orthopyroxene; Ox, Fe–Ti oxide; Pl, plagioclase; Po, pyrrhotite.
Biotite is a locally abundant interstitial mineral, par-ticularly in the Lower Zone, but overall not as commonas apatite. Where biotite is abundant, apatite is usuallypresent as well. In contrast, only a few of the manyapatite-bearing samples contain biotite. Amphibole isalso locally present as a minor mineral, although inmost instances it appears in reaction relationship withpyroxene. Because of its ambiguous textural relationshipsas to it being a primary (igneous) or secondary mineral,amphibole was not a focus of this study.
Fe–Ni–Cu sulfides are minor to trace phases andare commonly associated with other late-crystallizingminerals. Interstitial sulfides range in size from <10 to>200 �m (Fig. 2). The interstitial sulfides have irregulargrain boundaries controlled by the grain boundaries ofthe silicate phases. Sulfides also occurs as chadocrysts insilicate minerals, where they are typically small, <50 �min long dimension, and rounded. Petrographic ob-servations suggest that chalcopyrite forms a larger pro-portion of the Critical Zone sulfide assemblage as
Fig. 3. Apatite included in clinopyroxene in sample 1544, marginal compared with the Lower Zone.rock to Main Zone. ap, apatite; cpx, clinopyroxene; pl, plagioclase.
METHODScontrolled, in part, by the primocryst minerals. Interstitialapatite grains vary in size from <20 to >300 �m. Microprobe analyses were performed on polished thin
sections using the Cameca Camebax electron microprobeChadocryst apatite grains, although rare, are typicallysmall, >20 �m in long dimension (Fig. 3). Many of the at Duke University. Typical analytical conditions were
15 keV acceleration voltage, 15 nA beam current, andapatite chadocrysts appear to have formed along previousgrain boundaries that have been overgrown by adcumulus 5–10 �m beam diameter. Peak and background counting
times for Cl were in the range of 20–30 s and 10–15 s,crystal growth or during crystal aging.
1521

JOURNAL OF PETROLOGY VOLUME 41 NUMBER 10 OCTOBER 2000
On a few later analyses, a software upgrade to theCameca microprobe operating system allowed extra-polation of Cl and F count rate to zero time by fitting aline to 10 consecutive 3 s counting periods. Results usingthis technique in most cases were within error of thoseobtained by integrating over a 30 s counting period.
Whole-rock major element compositions were de-termined by direct-current-plasma optical emission spec-troscopy (DCP). The sample preparation and analysisconditions are as described by Klein et al. (1991). Samplesolutions were run along with an in-house drift monitor,a procedural blank, and known standards on the ARLFisons Spectrospan 7 instrument at Duke University.Drift was corrected by forcing the blank analyses to zeroand the drift monitor to a constant composition.
Whole-rock trace element compositions were de-Fig. 4. Variations in F and Cl analyses of primocryst apatite grains
termined by inductively coupled plasma mass spec-cut parallel and normal to the c-axis. Sample 1w-1428 from the UpperZone of the Bushveld Complex. trometry (ICP-MS) on powdered samples using a VG-
Elemental Quadrapole-3 instrument at Duke University.One-step digestion (Meurer et al., 1999) did not dissolve
respectively. Other elements were counted on the peak chromite in the samples. Therefore, 40 mg of sample wasfor 30 s and background for 15 s. Standards included dissolved by a two-step digestion in a sealed Teflon vial.natural chlorapatite (RM-1, Morton & Catanzaro, 1964) The powder was initially digested in 1:1:1 solution ofand fluorapatite (Wilburforce) for Ca, P and the halogens, HF, HNO3, and HCl. The products of the first digestionallanite (102522, No. 42; Frondel, 1964) for the rare were dried and taken up in a 3:10 mixture of HF–HNO3.earth elements (REE), and a variety of silicate mineral The products of the final digestion were dried and takenstandards. F and Cl in the apatite standards were checked up in a 4:1 mixture of H2O–HNO3. Dilutions of 1:against fluorite, topaz and halite. Fluorine was analyzed 1000 and 1:10 000 were analyzed. Machine operatingusing a synthetic Si–W layered diffracting crystal. OH−
conditions and data manipulations are as reported byand H2O were calculated by difference based on hydroxyl Meurer et al. (1999).site occupancy. The abundance of sulfide was determined as follows:
Potential problems associated with electron microprobe sulfide grains were located in back-scattered electronanalyses of F and Cl in apatite have been documented images and their setting relative to the cumulus phasesby Stormer et al. (1993). Specifically, F and Cl counts
was determined, i.e. either interstitial or as chadocrystsare affected by grain orientation, with grains cut parallelin other minerals. The areas of the sulfide grains wereto the c-axis showing significant variations with time.then measured from the back-scattered images using theStandards are mounted such that count rates on freshlyimage processing program NIH IMAGE.polished surfaces remain approximately constant, and
restandardization over the course of 1–2 weeks of a typicalanalysis run shows no significant change in standard countrates with time.
To test the effect of grain orientation on analyzed F RESULTSand Cl abundance, 17 grains from an apatite-rich sample
Apatite composition and stratigraphicfrom the Upper Zone of the Bushveld Complex, ninetrendscut perpendicular to the c-axis and eight cut parallel toThe composition of apatite with respect to stratigraphicthe c-axis, were analyzed by the methods describedheight in the intrusion is shown in Fig. 5. This plotabove. Analysis of nine c-normal grains had an averageillustrates the trend of increasing F/Cl from Lower,composition of 2·66 ± 0·14 wt % F and 0·55 ±through Critical and Main, to Upper Zone apatite.0·05 wt % Cl, and eight c-parallel grains had an averageCalculated OH is generally low (<0·35 mol %) through-composition of 2·52 ± 0·09 wt % F and 0·53 ±out the intrusion. The calculated OH end-member com-0·04 wt % Cl (Fig. 4). Assuming that the grains areponent is negligible where apatite approaches end-homogeneous (see Discussion), these results suggest thatmember chlorapatite in the lower third of the complexthe errors associated with all causes (volatile loss, machineor where apatite is essentially end-member fluorapatitedrift, and counting statistics) are approximately twice the
expected counting statistic error alone. at the top of the complex (Fig. 6).
1522

WILLMORE et al. HALOGEN GEOCHEMISTRY, BUSHVELD COMPLEX
Fig. 5. The halogen geochemistry of apatite as a function of stratigraphic position. The horizontal bars represent the range of compositions forapatite from a single thin section. The filled circles (labeled ‘a’ in the OH column) are analyses of visibly altered apatite crystals. Also shown isa plot of the initial 87Sr/86Sr ratio against structural height from the western Bushveld [after Kruger (1994)].
fluorian compositions (Boudreau & Kruger, 1990). TheIn general, apatite below the level of the Merenskyoffset in the trends in halogens across the Critical Zone–unit is uniformly rich in Cl with compositions ap-Main Zone boundary parallels changes observed in majorproaching end-member chlorapatite. The data clusterelement and Sr isotopic compositions across this bound-near 1·0 mole fraction Cl and extend to 0·4 mole fractionary (e.g. Kruger & Marsh, 1982; Sharpe, 1985; Kruger,OH and 0·6 mole fraction F, with the more F-rich1994). Apatite composition in the Main Zone is nearlycompositions preferentially occurring in the Criticalconstant, which mimics the relatively homogeneous char-Zone. Because of the variations seen in different grainsacter of the gabbronorite and norite that make up muchin individual samples, suggestions of trends in halogensof the Main Zone (von Gruenewaldt, 1973; Molyneux,on any finer scale within the Lower and Critical Zones1974). This isotopic break associated with the pyroxenitewith height need a more detailed sampling interval tomarker at the top of the Main Zone is not stronglybe confirmed.reflected in a change in apatite compositional trends, ifWithin the Main Zone, Cl contents of apatite areat all.highest in the pegmatoidal rocks of both the Merensky
In the Upper Zone, the highest Cl concentrationsand Bastard units at the base of the zone. Above theseunits the Cl/F ratio of apatite falls sharply to more occur in interstitial apatite in troctolite of Upper Zone
1523

JOURNAL OF PETROLOGY VOLUME 41 NUMBER 10 OCTOBER 2000
Apatite in marginal rocks has compositions broadlysimilar to those in the immediately associated layeredrocks. Thus, apatite grains from the Lower Zone chillsample are rich in Cl, as is typical of apatite from theLower and Critical Zones (compare analyses 1 and 2 ofTable 1). Apatite grains from the Marginal Zone wherethe Main Zone onlaps the floor are similar to the moreintermediate compositions typical of the Main Zone(compare analyses 3 and 10 of Table 1).
The higher values for the REE (specifically Ce) inapatite are associated with the most evolved rocks thatoccur in the uppermost parts of Upper Zone C (Table1, analysis 9). In contrast, there are modestly highervalues for the interstitial apatite from the Lower andLower Critical Zones as compared with those from theUpper Critical and Main Zones. REE are most variablein REE-rich fluorapatite from ferrodiorite just beneath
Fig. 6. Halogen composition of apatite from the Bushveld Complex. the roof of the complex, and REE–Si correlation (Fig.Also shown are the compositional fields for the Skaergaard intrusion 8) is consistent with the coupled substitution ofand the Great Dyke [after Boudreau (1995)]. REE3+–Si4+ for Ca2+–P5+ as suggested by Rønsbo (1989).
B (Table 1, analysis 7). Once apatite becomes a cumulus Biotite compositions and apatite–biotitephase in the Upper Zone C, Cl begins to decrease and geothermometryF increases sharply such that the most F-rich, Cl-poor Biotite compositions tend to be uniformly poor in bothapatite occurs in the apatite-poor ferrodiorite just beneath Cl and F throughout the complex, containing <10 mol %the roof of the intrusion (Table 1, analysis 9). Indeed, in of these two components combined (Table 2 and Fig.these rocks there is generally no detectable Cl. 9). This is attributed to the strong Fe–F and Mg–Cl
Single apatite crystals tend to be homogeneous and exclusions that characterize the micas and amphibolesunzoned. However, different grains in a sample may in general (Munoz & Swenson, 1981; Volfinger et al.,show a range in composition, typically expressed as 1985). Thus, in the Lower and Critical Zones, whereinverse variations in F and Cl (an extreme example is the solids assemblages are relatively Mg rich and theshown in Fig. 7). In these and other rocks, apatite associated apatite is characterized by a high Cl con-compositions do not appear to be noticeably affected by centration, phlogopitic biotite contains only modestthe presence or absence of biotite, either within individual amounts of Cl. Similarly, in the more iron-rich rockssamples or comparing nearby biotite-bearing and biotite- near the top of the intrusion, where apatite approachesabsent samples. end-member fluorapatite compositions, the locally as-
Although the rocks used in this study would be generally sociated annite-rich biotite contains only modest amountsdescribed as fresh, some patches of alteration are observed of F.in some samples. Apatite analyses were generally per- Although strongly damped by these avoidance rules,formed on crystals without obvious evidence of alteration biotite compositional trends nonetheless mimic the de-such as a mottled appearance in back-scattered electron creasing Cl/F ratio with structural position observed inimages, ragged grain boundaries or alteration in adjacent the apatite trends. Thus, biotite associated with chlor-silicates (e.g. epidote or chlorite). However, a few analyses apatite from a marginal sample from the Lower Zone iswere carried out on obviously affected grains and com- the most Cl rich observed, even though the mole fractionpared with an analysis of an optically fresh region of the of Cl is only 0·06 (Table 2, analysis 1). Biotite com-same crystal. In most cases the altered regions have a positions from the Lower and Critical Zones are similarlower Cl concentration and elevated calculated water to those reported from the Ultramafic series of thecontent compared with the optically fresh region, a Stillwater Complex (Page & Zientek, 1987). Finally, bi-feature also observed in analyses of altered Stillwater otite from individual samples may contain widely variableapatite (Boudreau & McCallum, 1990). An exception is amounts of Ti (Table 2, analyses 5 and 6).a single, partially altered grain from the Upper Zone, A formulation of the apatite–biotite F–OH geo-which was anomalously enriched in Cl (Table 1, analysis thermometer that takes account of the Mg/Fe
dependence on the incorporation of fluorine in biotite6).
1524

WILLMORE et al. HALOGEN GEOCHEMISTRY, BUSHVELD COMPLEX
Table 1: Selected microprobe analyses of apatite from the Bushveld Complex
Analysis: 1 2 3 4 5 6 7 8 9 10
Sample: 1581 1598 MG7-1207 14 2w484 3W1015 17 1W422 18 1544
Zone: LZ LZ MZa MZb MZc UZb UZb UZc UZc Marginal∗
Height (m): 0 1000 3210 6250 6300 6300 7017 8314 8350 —
Rock type: Quartz Orthopyr- Gabbro- Norite Gabbro- Oxide–olivine Troctolite Olivine Ferro- Gabbro-
norite oxenite norite norite gabbro† gabbro diorite norite
CaO 53·2 53·6 54·2 54·4 55·0 54·6 53·6 55·7 53·2 55·1
P2O5 41·5 40·9 40·8 41·3 41·2 39·7 40·2 41·1 39·7 40·9
F n.d. n.d. 1·42 1·52 2·36 0·12 1·18 3·43 3·61 1·66
Cl 6·33 6·05 2·65 2·15 1·52 7·49 2·63 0·04 0·03 1·38
H2O‡ 0·11 0·19 0·39 0·48 0·26 0·00 0·49 0·15 0·00 0·63
La3O3 0·26 0·18 0·14 0·07 0·08 0·09 0·00 0·18 0·39 0·06
Ce2O3 0·34 0·27 0·30 0·26 0·18 0·16 0·20 0·31 0·91 0·45
SiO2 0·38 0·26 0·25 0·17 0·17 0·23 0·77 0·28 0·86 0·34
Na2O 0·11 0·02 0·04 0·06 0·04 0·08 0·10 0·04 0·12 n.d.
SrO n.a. n.d. 0·01 0·03 0·05 0·04 0·02 0·03 0·02 0·04
Total 102·2 101·5 100·2 100·4 100·9 102·5 99·2 101·2 98·9§ 100·5
OoF,Cl 1·43 1·37 1·20 1·13 1·34 1·74 1·09 1·45 1·53 1·01
Total 100·8 100·1 99·0 99·3 99·6 100·8 98·1 99·8 97·3 99·5
XCl 0·94 0·89 0·39 0·31 0·22 1·09 0·39 0·01 0·00 0·20
XF 0·06 0·00 0·39 0·41 0·63 0·03 0·33 0·91 1·00 0·44
XOH‡ 0·00 0·11 0·23 0·28 0·15 −0·12 0·29 0·08 0·00 0·36
n.d., not detected; n.a., not analyzed.∗Marginal Zone where Main Zone abuts against floor in eastern limb—B2 of Sharpe & Hulbert (1981).†3W1015: ragged-edged grain associated with sulfide and oxides in locally altered area.‡H2O and OH calculated on the bases of Cl + F + OH = 1 per formula unit.§Low total of sample 18 a function of incomplete REE analysis.
Fig. 8. Ce2O3 vs SiO2 concentrations in apatite from ferrodiorite frombelow the roof of the Bushveld Complex.
was presented by Zhu & Sverjensky (1992). F–OHexchange between apatite and the phlogopite end-member of biotite can be expressed in the followingFig. 7. Grain-to-grain variations in Cl, F and Ce in apatite from
sample 1581, marginal rock to the Lower Zone. exchange reaction:
1525

JOURNAL OF PETROLOGY VOLUME 41 NUMBER 10 OCTOBER 2000
Table 2: Selected microprobe analyses of biotite from the Bushveld Complex
Analysis: 1 2 3 4 5 6 7 8
Sample: 1581 1462 14 17 1w1428 1w862 1w422 1w422
Zone: LZ CZ MZb UZb UZc UZc UZc UZc
Height (m): 0 1400 6250 7017 7392 7910 8314 8314
Rock type: Quartz Harz- Norite Troct- Magnetite Olivine Olivine Olivine
norite burgite olite gabbro gabbro gabbro gabbro
SiO2 37·6 38·8 37·6 36·5 35·3 36·0 33·6 31·9
TiO2 4·20 4·01 3·78 4·50 4·29 3·79 3·23 0·00
Al2O3 14·2 15·1 12·9 14·6 14·9 14·6 14·8 15·2
FeO 13·8 3·75 19·2 14·1 17·5 20·8 33·1 38·0
MnO 0·05 0·03 0·09 0·04 0·10 0·06 0·15 0·14
MgO 16·2 22·9 14·1 16·0 14·4 11·7 2·13 2·16
CaO 0·05 0·03 0·17 0·02 0·11 0·07 0·17 0·02
BaO 0·27 0·33 0·23 0·30 0·47 0·23 0·36 0·05
Na2O 0·04 0·56 0·05 0·28 0·16 0·23 0·20 0·04
K2O 9·14 10·3 7·82 9·99 9·02 9·85 8·96 8·10
F n.d. 0·25 0·46 0·42 0·55 0·49 0·34 0·40
Cl 0·93 0·16 0·35 0·21 0·23 0·30 0·02 0·02
H2O∗ 3·58 3·82 3·50 3·55 3·40 3·40 3·28 3·13
Total 100·2 100·1 100·3 100·5 100·3 101·4 100·3 99·2
OoF,Cl 0·21 0·14 0·27 0·22 0·28 0·27 0·15 0·17
Total 99·9 100·0 100·0 100·3 100·1 101·1 100·2 99·0
XCl 0·06 0·01 0·02 0·01 0·01 0·02 0·00 0·00
XF 0·00 0·03 0·06 0·05 0·07 0·06 0·05 0·06
XOH∗ 0·94 0·96 0·92 0·94 0·92 0·92 0·95 0·94
Si + Al 3·83 3·81 3·78 3·78 3·77 3·83 3·93 3·95
Ti + Fe +
Mn + Mg 3·06 3·04 3·18 3·08 3·17 3·05 2·90 3·16
Ba + Ca +
Na + K 0·93 1·09 0·82 1·06 0·97 1·05 1·05 0·94
Xfe 0·30 0·08 0·40 0·30 0·37 0·34 0·83 0·91
Abbreviations as for Table 1.∗H2O and OH calculated on the bases of Cl + F + OH = 2 per formula unit.
12 KMg3AlSi3O10F2 + Ca5(PO4)3(OH) = the graphical geothermometer shown in Fig. 10. It should
be noted that even with a wide range in halogen com-Fphl Hap12 KMg3AlSi3O10(OH)2 + Ca5(PO4)3F. (1) positions in apatite and Fe/Mg ratio of biotite, most
samples cluster around 750°C.Phl Fap
The partition coefficient for the exchange reaction isdefined as follows:
Whole-rock geochemistry of the Lower andCritical Zones
KD=� X F
X OH�apatite
�� X F
X OH�biotite
Whole-rock analyses, pyroxene analyses, and sulfideabundance for the upper part of the Lower Zone andthrough the Critical Zone to just below the Merenskywhere X is the mole fraction of the superscripted com-
ponent in apatite or biotite. The partition coefficient and reef are listed in Table 3 and plotted in Fig. 11. Figure11a shows the mg-number [molar MgO/(MgO+ FeO)]the mole fraction of Fe in the biotite have been empirically
calibrated and compiled by Zhu & Sverjensky (1992) into trend with height of orthopyroxene primocryst from this
1526

WILLMORE et al. HALOGEN GEOCHEMISTRY, BUSHVELD COMPLEX
Fig. 9. Compositions of apatite–biotite pairs from the Bushveld Complex. Shown in inset is detail of the biotite compositions as well as typicalbiotite composition from the Great Dyke, Zimbabwe (Boudreau et al., 1995).
incompatible element concentrations are correlated (Fig.13), only the concentration of P with height is shown inFig. 11. The concentrations of P and other incompatibleelements are low in the Lower Zone and uniformly higherin the Critical Zone.
Sulfide and the chalcophile elements in theLower and Critical ZonesSulfide abundance is highest in the upper Lower Zoneand the base of the Critical Zone, and decreases to tracelevels through the remainder of the Critical Zone (Fig.11d). This is consistent with the findings of Maier et al.(1996) and Maier & Barnes (1999), who looked at a morecomplete section for the Lower Zone from the westernFig. 10. Apatite–biotite equilibration temperatures calculated usingBushveld (Fig. 14). In addition, the data of Maier et al.the Zhu & Sverjensky (1992) geothermometer. The field for the Great
Dyke is taken from Boudreau et al. (1995). The sample with the highest and Lee & Tredoux (1986) (from a section in the easternequilibration temperature was from a Marginal Zone sample in which Bushveld, 50 km south of the Cameron section of thisF concentrations were near the detection limit.
study) show an increase by several orders of magnitudein the background concentration of Pd and Pt withstratigraphic height, the highest values occurring in thesection. In the Critical Zone, the mg-number generally
decreases from >0·75 at the base of the Critical Zone upper parts of the Critical Zone. No noticeable Pt–Pdenrichment is associated with the S-rich sections of theto 0·65 below the Merensky reef.
Most of the major and compatible trace element data lower half of the Lower Zone from either the eastern orwestern Bushveld sections (Fig. 14).correlate positively with the modal mineralogy of the
Lower and Critical Zones (Fig. 12). However, P, U, Pb, There is not a strong correlation between the modalabundance of sulfide minerals and the concentration ofTh, Cs, Ba, Zr and Y are incompatible elements in the
major Bushveld silicate minerals, and as such, are not Cu in the section covered in this study. Qualitatively, thisis supported by visual modal estimates that chalcopyrite isstrongly controlled by the silicate mineralogy. Because
1527

JOURNAL OF PETROLOGY VOLUME 41 NUMBER 10 OCTOBER 2000
Tab
le3
:M
ajor
(wt
%)
and
trac
eel
emen
t(p
pm)
com
posi
tion
ofL
ower
and
Cri
tica
lZ
one
sam
ples
Low
erZ
on
eC
riti
cal
Zo
ne
Sam
ple
:C
-2C
-3C
-4C
-6C
-7C
-8C
-9C
-10
C-1
1C
CZ
-15
CC
Z-1
3C
CZ
-11
CC
Z-1
0C
CZ
-9C
CZ
-8C
CZ
-7C
CZ
-6C
CZ
-5C
CZ
-4C
CZ
-3C
CZ
-1
Hei
gh
t(m
):73
480
080
982
287
493
599
210
2911
1712
7514
5516
4717
3818
2319
0819
9320
3521
2021
6323
3324
60
Ro
ckty
pe:
oliv
.p
y-h
arzb
ur-
har
zbu
r-o
liv.
py-
har
zbu
r-o
liv.
py-
pyr
ox-
pyr
ox-
oliv
.p
y-le
uco
-py-
no
rite
leu
co-p
y-n
ori
ten
ori
tele
uco
-m
ela-
no
rite
no
rite
ano
rth
o-
no
rite
pyr
ox-
roxe
nit
eg
ite
git
ero
xen
ite
git
ero
xen
ite
enit
een
ite
roxe
nit
ero
xen
ite
roxe
nit
en
ori
ten
ori
tesi
teen
ite
SiO
252
·52
55·6
455
·16
51·9
854
·26
53·3
256
·10
54·8
655
·22
54·7
854
·27
52·3
652
·87
51·5
151
·95
52·9
251
·34
51·1
853
·89
51·0
253
·65
TiO
20·
080·
090·
090·
080·
090·
090·
090·
110·
100·
160·
190·
160·
160·
120·
110·
160·
130·
110·
100·
110·
15
Al 2
O3
1·19
1·28
1·53
1·41
1·58
1·47
1·51
1·67
1·35
4·60
4·36
9·87
9·65
16·1
320
·84
9·64
20·6
917
·64
24·0
316
·86
3·23
Fe2O
39·
759·
359·
3310
·11
9·20
9·72
9·38
9·49
9·59
9·73
11·0
110
·29
10·5
37·
345·
5410
·39
5·63
6·30
4·20
6·92
13·5
4
Mn
O0·
170·
180·
180·
180·
180·
180·
190·
190·
190·
180·
200·
180·
190·
130·
100·
190·
100·
110·
070·
130·
25
Mg
O32
·74
31·7
631
·46
34·2
832
·16
32·2
131
·02
30·9
530
·95
25·0
825
·18
20·0
020
·34
13·9
78·
8420
·31
9·06
12·1
56·
1213
·57
25·6
8
CaO
1·26
1·37
1·47
1·32
1·52
1·34
1·38
1·53
1·36
3·44
3·34
5·65
5·59
8·49
10·6
75·
4410
·63
9·11
11·7
09·
042·
87
Na 2
O0·
060·
07n
.d.
0·12
n.d
.0·
070·
12n
.d.
0·04
0·73
0·47
0·76
0·74
1·31
1·97
0·76
1·89
1·46
2·41
1·29
0·27
K2O
0·00
0·02
0·03
0·05
0·02
0·02
0·02
0·04
0·03
0·14
0·12
0·10
0·12
0·12
0·20
0·12
0·18
0·14
0·24
0·11
0·02
LOI
0·17
0·07
0·00
0·32
0·15
0·43
0·00
0·55
0·03
0·07
0·07
0·25
0·19
0·18
0·40
0·00
0·35
0·00
0·03
0·06
0·47
Tota
l97
·94
99·8
399
·25
99·8
599
·16
98·8
599
·81
99·3
998
·86
98·9
199
·21
99·6
210
0·38
99·3
010
0·62
99·9
310
0·00
98·2
010
2·79
99·1
110
0·13
Sr
4·02
3·22
6·09
5·60
8·18
5·19
8·09
8·50
2·18
63·7
049
·91
133·
0012
0·87
231·
0031
9·00
126·
6932
0·00
283·
0036
9·00
281·
0036
·37
Ba
7·70
6·00
12·5
96·
7314
·43
7·72
12·9
512
·56
5·19
65·5
957
·11
47·1
442
·15
46·1
464
·92
44·8
164
·42
52·9
770
·34
52·2
615
·60
Rb
0·53
0·41
0·82
0·75
1·37
0·89
1·07
1·05
0·50
3·06
3·68
1·56
1·86
1·79
3·39
2·34
2·99
1·78
3·29
1·74
0·60
Ga
1·72
1·73
1·97
1·80
2·03
1·91
2·11
2·14
1·82
5·72
5·61
8·44
7·70
11·1
914
·05
7·90
15·2
812
·68
16·6
112
·17
4·15
Ta0·
040·
040·
040·
030·
040·
030·
050·
030·
070·
070·
080·
040·
050·
040·
090·
040·
050·
040·
090·
060·
04
Nb
0·16
0·10
0·16
0·14
0·29
0·18
0·19
0·19
0·10
0·36
0·51
0·31
0·37
0·28
0·43
0·25
0·46
0·29
0·62
0·23
0·11
Zr
2·56
1·90
3·70
2·83
6·09
3·82
6·21
5·22
2·09
9·67
15·6
28·
5210
·41
6·79
11·5
59·
4910
·99
6·29
11·0
07·
494·
93
Y1·
111·
171·
351·
281·
511·
261·
481·
631·
304·
404·
793·
163·
052·
342·
223·
202·
522·
112·
052·
183·
06
Th
0·07
0·05
0·13
0·08
0·20
0·11
0·15
0·15
0·05
0·38
0·46
0·26
0·26
0·22
0·38
0·21
0·27
0·19
0·35
0·21
0·06
U0·
020·
010·
030·
020·
050·
030·
040·
030·
010·
110·
170·
050·
060·
040·
080·
040·
070·
040·
090·
040·
01
Cr
3462
2987
2835
3372
2743
3571
2892
2721
2628
2323
2294
3218
3335
2060
655
2805
714
1045
491
1072
2538
Ni
782
566
554
711
573
594
505
473
517
356
404
369
357
272
163
352
173
250
122
247
482
Co
100
8581
9383
9092
8099
8792
8183
5957
7948
5348
6010
8
1528

WILLMORE et al. HALOGEN GEOCHEMISTRY, BUSHVELD COMPLEX
Low
erZ
on
eC
riti
cal
Zo
ne
Sam
ple
:C
-2C
-3C
-4C
-6C
-7C
-8C
-9C
-10
C-1
1C
CZ
-15
CC
Z-1
3C
CZ
-11
CC
Z-1
0C
CZ
-9C
CZ
-8C
CZ
-7C
CZ
-6C
CZ
-5C
CZ
-4C
CZ
-3C
CZ
-1
Hei
gh
t(m
):73
480
080
982
287
493
599
210
2911
1712
7514
5516
4717
3818
2319
0819
9320
3521
2021
6323
3324
60
Ro
ckty
pe:
oliv
.p
y-h
arzb
ur-
har
zbu
r-o
liv.
py-
har
zbu
r-o
liv.
py-
pyr
ox-
pyr
ox-
oliv
.p
y-le
uco
-py-
no
rite
leu
co-p
y-n
ori
ten
ori
tele
uco
-m
ela-
no
rite
no
rite
ano
rth
o-
no
rite
pyr
ox-
roxe
nit
eg
ite
git
ero
xen
ite
git
ero
xen
ite
enit
een
ite
roxe
nit
ero
xen
ite
roxe
nit
en
ori
ten
ori
tesi
teen
ite
Cu
3·33
2·82
1·87
3·50
3·88
3·60
3·02
3·62
1·73
20·8
919
·81
8·61
6·61
6·39
6·45
4·99
6·00
3·68
6·39
5·54
6·07
Sc
1415
1514
1815
1817
1921
2623
2317
1123
1214
814
32
V43
4850
4638
5060
5857
8392
119
120
9067
111
7466
4867
150
Zn
6058
5866
5867
6371
5681
7171
6742
3465
3541
3644
93
Li2·
692·
182·
452·
831·
802·
633·
152·
962·
343·
954·
013·
374·
923·
893·
363·
053·
913·
953·
383·
603·
89
P14
24
1726
1934
142
6754
4331
3649
3854
4250
3622
As
0·18
0·15
0·19
0·15
0·17
0·20
0·19
0·21
0·15
0·31
0·30
0·43
0·42
0·53
0·51
0·43
0·63
0·58
0·47
0·53
0·30
Ag
0·01
0·01
0·01
0·01
0·01
0·01
0·01
0·01
0·01
0·01
0·01
0·01
0·01
0·01
0·02
0·01
0·02
0·01
0·02
0·01
0·01
Sb
0·05
0·01
0·02
0·02
0·03
0·03
0·03
0·04
0·01
0·05
0·04
0·02
0·03
0·02
0·04
0·02
0·03
0·03
0·04
0·02
0·02
Cs
0·03
0·03
0·06
0·04
0·07
0·04
0·06
0·07
0·02
0·14
0·15
0·05
0·08
0·08
0·09
0·11
0·08
0·05
0·08
0·05
0·02
Pb
0·29
0·21
0·35
0·27
0·37
0·29
0·29
0·36
0·12
1·22
1·68
0·95
0·81
0·81
1·06
0·91
1·08
0·78
1·26
0·89
0·31
La0·
240·
180·
390·
340·
680·
400·
550·
610·
282·
512·
971·
881·
851·
762·
432·
102·
461·
702·
501·
770·
66
Ce
0·59
0·43
0·95
0·78
1·47
0·90
1·21
1·35
0·43
5·08
5·81
3·59
3·62
3·29
4·56
3·91
4·58
3·10
4·60
3·23
1·19
Pr
0·09
0·07
0·13
0·11
0·20
0·12
0·16
0·17
0·09
0·64
0·72
0·43
0·43
0·40
0·54
0·47
0·55
0·36
0·53
0·38
0·18
Nd
0·36
0·28
0·51
0·45
0·76
0·48
0·61
0·68
0·38
2·59
2·87
1·63
1·64
1·46
1·99
1·77
2·06
1·33
1·86
1·41
0·79
Sm
0·08
0·08
0·12
0·12
0·17
0·11
0·14
0·16
0·10
0·56
0·62
0·34
0·35
0·29
0·36
0·36
0·41
0·26
0·31
0·27
0·23
Eu
0·02
0·02
0·03
0·03
0·04
0·03
0·04
0·04
0·03
0·22
0·21
0·22
0·19
0·27
0·40
0·20
0·43
0·30
0·47
0·30
0·09
Gd
0·16
0·14
0·20
0·18
0·24
0·18
0·21
0·22
0·17
0·72
0·75
0·46
0·46
0·38
0·44
0·47
0·50
0·35
0·40
0·35
0·33
Dy
0·16
0·17
0·21
0·19
0·23
0·19
0·22
0·24
0·20
0·69
0·75
0·47
0·48
0·34
0·35
0·48
0·39
0·30
0·26
0·32
0·44
Er
0·13
0·13
0·15
0·14
0·17
0·14
0·17
0·18
0·16
0·44
0·49
0·34
0·34
0·24
0·22
0·34
0·24
0·21
0·17
0·22
0·34
Yb
0·16
0·17
0·19
0·17
0·21
0·18
0·22
0·22
0·19
0·47
0·55
0·42
0·41
0·27
0·22
0·40
0·26
0·25
0·18
0·27
0·43
Lu0·
030·
030·
030·
030·
040·
030·
040·
040·
030·
080·
090·
070·
070·
050·
040·
070·
040·
040·
030·
040·
08
Hf
0·08
0·06
0·11
0·09
0·17
0·11
0·17
0·15
0·08
0·27
0·40
0·25
0·30
0·18
0·28
0·27
0·28
0·18
0·26
0·20
0·16
1529

JOURNAL OF PETROLOGY VOLUME 41 NUMBER 10 OCTOBER 2000
Fig. 11. Plots of orthopyroxene mg-number, whole-rock P, whole-rock Cu, area percent sulfide minerals and Cl/(Cl + F) ratio of apatite asfunctions of structural height in the Lower and Critical Zones. The bold gray lines on the P and Cu plots assume the trend of the Lower Zonecontinues through the Critical Zone, with a modest (10%) increase for fractional crystallization. The fine gray lines assume two and four timesthe concentration. LZ, Lower Zone; CZ, Critical Zone.
Fig. 12. Examples of compatible trace element correlation with mineral norms for whole-rock analyses from the Lower and Critical Zones.
1530

WILLMORE et al. HALOGEN GEOCHEMISTRY, BUSHVELD COMPLEX
as a function of structural height. We attribute thelocal scale compositional variation in late crystallizinginterstitial minerals to be a function of both the result ofsmall pockets of differentially evolved interstitial liquidproduced once the interstitial liquid became saturated ina halogen-bearing phase and a later, local re-equilibrationduring cooling. The grain-to-grain variability seen inindividual samples in halogens and REE concentrationscan arise if the interstitial liquid did not crystallize as abulk equilibrium system but instead underwent significantmicro-scale fractionation as individual grains of apatiteare isolated from remaining pore liquid at different times.
For example, the Cl–F–Ce correlation seen in Fig. 7illustrates this process on the thin-section scale. In thiscase, pore-scale fractionation is interpreted to have ledto increases in Cl and the REE as apatite preferentiallyincorporated the smaller F ion. (It is also noted that ifthis evolved liquid is displaced upward, perhaps as aresult of compaction, or by migration of Cl-rich fluidsdegassed from these evolved liquids, it will result in evenhigher Cl/F ratios of overlying rocks. This can explainwhy the Lower and Critical Zones typically show amore restricted compositional range than is seen in theMarginal Zone apatite of Fig. 7.) In contrast, thosesamples with relatively abundant apatite primocryst nearthe base of Upper Zone C are more uniform in com-position, consistent with crystallization from a much morehomogeneous environment.
The typical temperature calculated by the Zhu &Sverjensky geothermometer, 750°C, is lower than es-timated crystallization temperatures of 1000–1050°C forFig. 13. Incompatible trace element plots of (a) Pb, Th and U and (b)
Y and Zr against P for whole-rock analyses from the Lower and Critical liquidus temperatures at apatite saturation in the UpperZones. Zone (Cawthorn & Walsh, 1988). This implies that that
there has been some degree of sub-solidus mobility ofthe halogens, and also suggests that any compositionala much more abundant fraction of the Critical Zonezoning, if initially present, could have been lost duringsulfide assemblage than in the upper half of the Lowerre-equilibration.Zone. However, this contrasts with the findings of Maier
However, halogen exchange with other halogen-bear-et al. (1996), who showed that the lower half of the Lowering phases during cooling is not the primary control onZone has a higher Cu concentration than the upperapatite compositions for several reasons. First, as notedLower and Critical Zones and that Cu and S correlatepreviously, apatite compositional trends do not appearpositively (Fig. 14) in this part of the section.to be a strong function of the presence or absence ofThe distribution of Cu with height in the Lower andbiotite either within individual samples or comparingCritical Zones (Fig. 11c) has a trend similar to thebiotite-bearing and biotite-absent samples from the samelithophile incompatible trace elements; the Critical Zoneunit. This is consistent with the observation that apatitesamples are modestly enriched in Cu relative to theis the only mineral that accepts significant F and Cl.Lower Zone. In most samples, there is a good correlationSecond, apatite compositions are not random but cor-between Cu abundance and incompatible element con-relate with the major rock types or stratigraphic unitscentration (Fig. 15).of the complex. Third, for temperatures in the rangeobserved, minor adjustment of the F–OH partitioning cangive significant variation in the calculated equilibration
DISCUSSION temperature (although the effect on either mineral isPossible causes of halogen variations strongly affected by modal proportions).
Equilibration temperatures in the range of 750°C in-Bushveld apatite and biotite show compositional vari-ations both on the scale of an individual thin section and dicate that Bushveld apatite grains were not significantly
1531

JOURNAL OF PETROLOGY VOLUME 41 NUMBER 10 OCTOBER 2000
Fig. 14. Whole-rock (a) Pd, (b) S and (c) Cu as functions of stratigraphic position. Data from Lee & Tredoux (1986) and Maier et al. (1996).The gray line in the Pd panel is an expected concentration for 40% trapped liquid assuming initial Pd concentrations equivalent to the B1 sills(17 ppb) of Davies & Tredoux (1985). LZ, Lower Zone; CZ, Critical Zone; MR, Merensky Reef.
affected by low-temperature (<>750°C) fluids, except chemistry similar to the inferred high-silica, high-mag-nesian magma that formed the Lower and Critical Zones,those closely associated with local patches of alteration
noted previously. This and the broad correlation of this magma was probably enriched in volatile componentsand had a Cl/F ratio of >1·0 (Sharpe & Hulbert, 1985;halogen compositions with the major stratigraphic units
of the Bushveld Complex imply that halogen contents Hatton & Sharpe, 1989; Hickey & Frey, 1989; Sobolev& Chaussidon, 1996; Boudreau et al., 1997).are a primary (igneous) feature of the Bushveld system.
Furthermore, the observation that the Main Zone as- It is generally agreed that the Main Zone representsa chemically distinct magma from the Lower and Criticalsemblage is not more Cl rich where it onlaps the country
rock implies little, if any, Cl was introduced by infiltrating Zone, probably involving some interaction with crustalrocks. The coincidence of the jump in initial 87Sr/86Srcountry fluids. This is also consistent with previous studies
(e.g. Reid et al., 1993; Mathez et al., 1994) and Cl isotopic ratio (e.g. Kruger & Marsh, 1982) with an abrupt decreasein the mole fraction chlorapatite end-member from andata (Boudreau et al., 1999) that imply that Bushveld
volatile components are largely magmatic. average of 0·8 to 0·4 across the Merensky unit suggeststhat the Main Zone magma had a low Cl/F ratio. ThisGiven that the apatite is indeed magmatic, the most
prominent features of the Bushveld apatite data are the Cl/F ratio is still high compared with many intrusions.For example, apatite analyses from the Munni Munni andunusually high Cl/F ratios in the Lower and Critical
Zones and the decreasing Cl/F ratio with height above Great Dyke typically do not contain >10% chlorapatitecomponent (Boudreau et al., 1993, 1995). Also, a no-the Merensky reef. Whereas a trend of decreasing Cl/F
is common to many intrusions, such as the Munni Munni ticeable decrease in the abundance of hydrous mineralsin the Main Zone as compared with the Lower andComplex, Western Australia (Boudreau et al., 1993), Cl-
rich apatite is typical of only a few intrusions, including the Critical Zones is consistent with a lower volatile con-centration in the Main Zone magma.Stillwater Complex, Montana (Boudreau & McCallum,
1989) (see Fig. 6). Modern magmas with high Cl/F ratios The association of lower Cl/F ratios in the Main Zonewith a more radiogenic Sr isotopic signature implies thatare typically rich in other volatile components such as
water (see summary by Boudreau et al. (1997)]. On the jump to more F-rich compositions in the Main Zonecould have been the result of assimilation of F-rich crustalthe basis of analogy to modern boninitic magmas with
1532

WILLMORE et al. HALOGEN GEOCHEMISTRY, BUSHVELD COMPLEX
decreasing Cl/F trend in the Upper Zone by this modelwould imply that the proportion of cumulus apatite tointerstitial liquid increases toward the top. Further, theeffect must also counter the expected fractionation tomore Cl-rich compositions as explained above. However,apatite mode decreases from a significant modal com-ponent of the rocks toward the top of the intrusions untilit is only a minor phase in the most fractionated rocksat the top of the intrusion.
In addition, the estimated trapped liquid componenttends to be uniformly low in these rocks (1–6%, Cawthorn& Walsh, 1988). If closed-system equilibration were theonly significant mechanism controlling apatite com-position, one would expect the most F-rich compositionsto occur at the base of Upper Zone C where apatitemode may exceed 5% and effects of any trapped liquidshift would be lowest. This is not observed.
In other intrusions, we have suggested that a decreasein Cl/F ratio can result from preferential loss of Clto a separating fluid phase during crystallization (e.g.Boudreau & McCallum, 1989). This is supported bythe virtual absence of Cl in both apatite and biotitein the most evolved rocks of the complex, implying acomplete loss of Cl at the end stages of crystallization.If true, this implies that the Upper Zone magmabecame fluid saturated at least by the point of apatitesaturation.
In summary, compositional trends from the UpperZone imply that the magma was fluid saturated atFig. 15. Plot of whole-rock (a) Cu and (b) As and Sb as a function ofleast by the time apatite became a cotectic phase andP concentration from the Lower and Critical Zone samples.suggest that an igneous fluid separated at a hightemperature (>1000°C). For the more volatile-rich
rocks at source. This also implies that the unusually high Lower and Critical Zones, fluid separation may haveCl/F ratio seen in the Lower and Critical Zone apatite begun even earlier. The lower equilibration temperaturecompositions are not simply the result of assimilation of and non-uniform range of apatite compositions seenCl-rich crustal rocks. However, given that the Main Zone in most samples are interpreted to reflect both pore-is not as primitive as the Lower and Critical Zones, it scale fractionation and migration of interstitial liquidmay be that the Main Zone magma degassed and lost (concurrent with fluid saturation) and a later (possiblyCl before emplacement. subsolidus) modest redistribution of halogens down
The gradual decrease of the Cl/F ratio through the to 750°C.Upper Zone is not associated with evidence for magmamixing events involving isotopically distinct magmas (e.g.Kruger et al., 1987). The trend of decreasing Cl/F ratio
The problem of PGE and S distribution incontinues once apatite becomes a cotectic phase in Upperthe Lower and Critical ZonesZone C. This trend is the opposite of the expected trend
if apatite were the only phase fractionating the halogens The problem of PGE concentration mechanism inlayered intrusions in general and the Bushveld Complexfrom the magma owing to the preferential incorporation
of the smaller F ion relative to Cl (e.g. Boudreau & in particular has been discussed by a number of workers,most recently by Cawthorn (1999). As summarized byMcCallum, 1989; Cawthorn, 1994).
Cawthorn (1994) suggested that significant Cl/F vari- Cawthorn, precipitation of an immiscible sulfide liquidcan act as a collector for the PGE and is the mostability of apatite can result if cumulus apatite evolves in
closed systems with different volumes of interstitial liquid. conventionally accepted model, but there is very littlepreserved evidence that the magma was saturated inThis model is similar to the way in which mafic minerals
can become more iron rich through interactions with a sulfide phase. It contains no basal sulfide ores, and(as shown in Fig. 14) background sulfur contents belowtrapped liquid (e.g. Barnes, 1986). To explain the
1533

JOURNAL OF PETROLOGY VOLUME 41 NUMBER 10 OCTOBER 2000
the Merensky reef are typically <200 ppm in the Lower sulfide abundance of the Lower and especially the CriticalZone.Zone and less than 50–100 ppm for much of the Critical
Zone. As noted by Cawthorn, these values are well below In a later work, Maier & Barnes (1999) plotted S againsta computed ‘trapped liquid’ fraction [based on La contentexpected S-saturation concentrations.
The generally good correlation between incompatible of rock as compared with La contents of the B1 sills ofHarmer & Sharpe (1985)]. They suggested that sulfur andtrace elements and Cu in most samples would suggest that
most sulfides can be readily explained as having pre- metal contents that exceed the expected trapped liquidfraction have a cumulus sulfide component. However, notcipitated from the residual (trapped) liquid. The as-
sociation of sulfide with other late crystallizing minerals discussed by them is the fact that S concentrations are stillbelow most estimates of what sulfide-saturated as-supports this. On the basis of an average P concentration
of 0·07 wt % for the B1 sills (Sharpe & Hulbert, 1985), the semblages should contain (e.g. Cawthorn, 1999). Further,a significant number of the analyses reported by Maier &Lower Zone contains 2–5% crystallized interstitial liquid
and the Critical Zone roughly twice this amount. Similarly, Barnes have S contents that are markedly lower than thatexpected from a trapped melt component alone. Thisthe typical Cu concentrations of 5–10 ppm generally are
not higher than expected from a trapped liquid component would suggest a loss of sulfur from these rocks.None of these existing models take more than a passingalone, assuming an initial magma concentration of 56 ppm
Cu [equal to the average B1 quench textured mi- look at the possibility that chalcophile elements may havebeen affected by degassing during crystallization, despitecropyroxenite composition from Sharpe & Hulbert
(1985)]. These low residual liquid fractions are broadly in strong field, petrographic and geochemical evidence. Asnoted in the Introduction, a number of workers includingline with other estimates (e.g. Maier & Barnes, 1999).
In contrast, the PGE concentrations are too high, espe- Schiffries (1982) have presented evidence from the pla-tiniferous Driekop pipe from the eastern Bushveld Com-cially in the Critical Zone, to be simply a function of
trapped liquid fraction. For example, estimated parent plex, which indicates that the focused flow of a Cl-richfluid altered the original norite to a hortonolite–dunite andmagmas contain only>30 ppb Pt+ Pd (Davies & Tre-
doux, 1985). The whole-rock Pt+ Pd concentrations in strongly enriched the core of the pipe in PGE–Fe alloys.Also, whereas normal Merensky reef is composed of PGE–silicate rocks from the Lower and Critical Zones exceed
the expected trapped liquid proportion by a factor of from sulfides, it has long been recognized that PGE–Fe alloyscommonly characterize ‘pothole’ reef. This has been at-two to 100 (Maier & Barnes, 1999), with higher values
occurring in rocks of the Critical Zone, in which there may tributed to sulfur loss to fluids fluxing through the potholeregions (e.g. Kinloch, 1982; Kinloch & Peyerl, 1990). Bothbe either no or very little increase in bulk S concentration.
McCarthy et al. (1984) suggested that the Bushveld features imply the significant redistribution of chalcophileelementsduringdegassingof theLowerandCriticalZones.magma was sulfide saturated throughout the Lower and
Critical Zones. They explained the decrease in the modal In the Stillwater complex of Montana, we have pre-viously noted the presence of discordant podiform andamount of S with height as a result of increased S solubility
in the liquid as it fractionates. However, most existing work pipelike bodies containing several percent disseminatedsulfide in the Middle Banded Zone (Boudreau & McCal-suggests that sulfur saturation should actually decrease, not
increase with fractionation [see the summary by Naldrett lum, 1986). Here, the association of the sulfide with otherlate-crystallizing minerals such as apatite and quartz was(1989)]. In this case, the amount of ‘cumulus’ sulfide should
actually increase with height as the resident magma in the interpreted to imply that mineralizing fluids migrated up-ward through the crystal pile via pockets of residual inter-chamber precipitates excess sulfide in response to lower
saturation levels. Further, one should expect the highest Pd stitial liquid. Similarly, associated with the platiniferous J-M reef of the Stillwater complex are half-meter-sized bod-concentrations to occur in the Lower Zone, where sulfide
mode is highest, not the Critical Zone. To produce the ies of massive sulfide bodies composed of pyrrhotite–chalcopyrite–pentlandite that form the core of discordantobserved trend, the bulk distribution for Pd would be re-
quired to increase significantly even as the modal amount silicate pegmatoids (Boudreau, 1999). Again, this stronglysuggests concentration of the chalcophile elements by flu-of sulfide decreases with stratigraphic height.
Maier et al. (1996) also explained metal ratios as a result ids.A number of workers have discussed the possible role ofof cumulus sulfide precipitation, with variations largely
resulting from changing silicate liquid/sulfide liquid mass fluids in both influencing crystallization of the magma andbeing a possible transport agent for the PGE (e.g. Ballhausratio [the ‘R factor’ of Campbell & Naldrett (1979)]. This
requires that the magma be saturated in sulfide at least & Stumpfl, 1986; Nicholson & Mathez, 1991). We havepreviously suggested that degassing of interstitial liquidsduring crystallization of the Critical Zone. Although Maier
et al. suggested that the metal ratios are consistent with can influence PGE, sulfur and base metals in a numberof ways (e.g. Boudreau & McCallum, 1989; Boudreau &sulfide saturation, they did not address the low Cu and
1534

WILLMORE et al. HALOGEN GEOCHEMISTRY, BUSHVELD COMPLEX
Meurer, 1999). These models are illustrated in Fig. 16 and in the magma and induces S saturation and PGE col-are discussed below. lection in addition to whatever may be carried by the
fluid itself (Boudreau, 1999; Boudreau & Meurer, 1999).The model is similar to magma mixing schemes but usesan S-bearing fluid to induce sulfide saturation. PotholesVapor refining modelhave been suggested as channelways by which such fluidsA process of vapor refining of the crystal pile can occurmay have entered the chamber (e.g. Ballhaus, 1988).as interstitial liquid reaches fluid saturation and transports
The interaction of S-bearing fluids with residentsulfur, base metals and the PGE (the chalcophile elements)magma at the top of the crystal pile can induce sporadicupward. The actual behavior of metal transport duringsulfide saturation in the magma that may have beendegassing of a solidifying and compacting crystal pile canotherwise far from sulfide saturation (e.g. Boudreau &be complex. For example, the crystal pile can act as aMeurer, 1999). Because only part of the magma nearchromatographic column to separate the PGE from sulfurthe floor need reach sulfide saturation, only small amountsand the base metals during fluid migration (Boudreau &of sulfide need be produced. This sulfide precipitationMeurer, 1999; Meurer et al., 1999).could then collect the PGE of the resident magma (plusIn numeric models such as those of Boudreau & Meurerore metals transported by the fluid), with much of the(1999), degassing can lead to 100% loss of ore elements.sulfur eventually lost to later degassing as the crystal pileHowever, in natural systems, some sulfide grains maycontinues to grow. This could explain the generally highbecome isolated as the interstitial liquid crystallizes andPGE but overall low S content of the Critical Zone.small residual pockets of sulfide and silicate liquid become
There have been a number of objections to fluidisolated. The observation that PGE enrichments of thetransport models, most of which focus on rather restrictedCritical Zone occur above the Lower Zone would bepossibilities of how such models must operate. For ex-consistent with this, the Lower Zone being the source ofample, it is often claimed that the rocks below the variousfluids and some of the metals now present in the Criticalreefs cannot be a source for the PGE because the trappedZone.liquid fraction does not contain enough PGE (e.g. Maier &Because there is little evidence for the significant inputBarnes, 1999). These arguments make two unwarrantedof fluids from underlying country rocks, the fluids thatsimplifications. First, the amount of interstitial liquid canmoved through the Lower Zone must have separatedbe substantially reduced by compaction by an order ofwithin the Lower Zone. Low in the complex the interstitial
liquid would contain approximately the volatile content magnitude or more (e.g. Shirley, 1986). If metals are lostof the parent magma. As a consequence, the Lower Zone from the interstitial liquid before significant compaction,should have evolved a relatively small volume of fluid then this must be considered in any mass balance.phase. A more significant problem is that these simple mass
The Critical Zone, however, experienced chalcophile balance arguments assume that all PGE were initiallyand especially volatile element enrichment from degassing only in the interstitial liquid. It is observed that the rocksof the underlying Lower Zone. An upward enrichment below the reef contain much more that expected trappedin the volatile content of the interstitial liquid would lead liquid proportions of the PGE (e.g. Maier & Barnes,to earlier and more extensive degassing. The lower whole- 1999). As noted by Boudreau & Meurer (1999), therock S of the Critical Zone is consistent with more remobilization of the PGE originally preconcentratedextensive sulfur loss. Overall, one would expect an upward (relative to concentrations in the magma) in a minordisplacement in the ore elements by such a vapor refining cotectic sulfide fraction is particularly effective in pro-process. ducing chromatographic zones of high PGE con-
centration.Using an isotopic argument against fluid concentration
of the PGE, Schoenberg et al. (1999) noted that the OsFluid-induced sulfide saturation modelisotopes of chromite and interstitial sulfide in chromititeIn a variation of the above model, the degassing oflayers are similar. This implies that the two phasesinterstitial liquids leads to fluid migration up into over-scavenged their osmium from the same or similar sources,lying hotter, less evolved interstitial liquids. This leadswhich Schoenberg et al. then suggested is not consistentto a progressive increase in the volatile concentrationwith a fluid transport model. However, given the ease(including sulfur) of the overlying interstitial liquids, caus-with which chromite can re-equilibrate and recrystallizeing them to degas earlier in their crystallization. Even-(e.g. Hatton & Von Gruenewald, 1985), it would appeartually, fluid may actually escape the crystal pile and mixthat one can say no more than that chromite and sulfidewith fluid-undersaturated magma in the chamber. Theare in isotopic equilibrium, regardless of the concentrationmixing of an S-bearing fluid into a fluid-undersaturated
silicate magma leads to an increase in the S concentration mechanism.
1535

JOURNAL OF PETROLOGY VOLUME 41 NUMBER 10 OCTOBER 2000
Fig. 16. Schematic representation of fluid behavior and possible consequences for the concentration of the PGE. (a) Vapor refining model. Theinitial crystallization of crystal pile leads to a preconcentration of the PGE in a minor sulfide component. Degassing of underlying cumulatesleads to resorption of this early sulfide and upwards transport of the chalcophile elements. Some of the PGE, being less soluble than S and thebase metals, lag behind. (b) Fluid-induced sulfide saturation model. As the pile grows, interstitial liquid becomes saturated in fluid at earlier andearlier times as fluid separating from underlying cumulates enriches overlying interstitial liquid in volatile components. Eventually fluids interactwith resident magma to induce sulfide saturation near the floor, resulting in collection of the PGE by immiscible sulfide liquid.
We do not presume to understand fully how PGE can ore components and the influence of volatile componentson crystallization, in mafic systems. However, we dobe transported and concentrated in layered intrusions,
which is clearly complex, but our data suggest that volatile find that many of the objections to fluid concentrationmechanisms rest on rather narrow interpretations of whatcomponents played a significant role. In part, this reflects
ignorance of volatile behavior, including the solubility of is possible in a crystallizing magma.
1536

WILLMORE et al. HALOGEN GEOCHEMISTRY, BUSHVELD COMPLEX
Boudreau, A. E. & McCallum, I. S. (1986). Investigations of theCONCLUSIONSStillwater Complex: III. The Pick Pin Pt/Pd deposit. Economic Geology
The magma(s) that crystallized to form the Lower and 81, 1953–1975.Boudreau, A. E. & McCallum, I. S. (1989). Investigations of theCritical Zones had a relatively high Cl/F ratio and
Stillwater Complex: part 4. Apatites as indicators of evolving fluidhigh Cl concentration. Further, the distributions of thecomposition. Contributions to Mineralogy and Petrology 102, 138–153.incompatible trace elements, Cu, PGE, and sulfide min-
Boudreau, A. E. & McCallum, I. S. (1990). Low temperature alterationerals indicate that conventional models involving sulfideof REE-rich chlorapatite from the Stillwater Complex, Montana.
saturation or a trapped liquid component cannot readily American Mineralogist 75, 687–693.explain sulfur and the chalcophile elements. At the very Boudreau, A. E. & McCallum, I. S. (1992). Concentration of platinum-least, one must consider the possibility of redistribution of group elements by magmatic fluids in layered intrusions. Economic
Geology 87, 1830–1848.chalcophile elements during degassing when interpretingBoudreau, A. E. & Meurer, W. P. (1999). Chromatographic separationbulk compositional features of cumulate rocks. Indeed,
of the platinum-group elements, gold, base metals and sulfur duringit is suggested the chalcophile elements of the Lower anddegassing of a compacting and solidifying crystal pile. ContributionsCritical Zones of the Bushveld Complex must haveto Mineralogy and Petrology 134, 174–185.
undergone extensive mobilization during the separation Boudreau, A. E., Love, C. & Hoatson, D. M. (1993). Variation in theand migration of a Cl-rich fluid phase. More complex composition of apatite in the Munni Munni Complex and associated
intrusions of the West Pilbara Block, Western Australia. Geochimicamodels of metal transport during degassing ac-et Cosmochimica Acta 57, 4467–4477.companying crystallization and compaction (e.g. Bou-
Boudreau, A. E., Love, C. & Prendergast, M. D. (1995). Halogendreau & Meurer, 1999) are needed to explain the generalgeochemistry of the Great Dyke, Zimbabwe. Contributions to Mineralogyfeatures of chalcophile element distribution.and Petrology 122, 289–300.
Boudreau, A. E., Stewart, M. A. & Spivack, A. J. (1997). Stable chlorineisotopes and the origin of high-Cl magmas of the Stillwater Complex,Montana. Geology 25, 791–794.
ACKNOWLEDGEMENTS Boudreau, A. E., Willmore, C. C. & Spivack, A. (1999). The halogengeochemistry and stable Cl isotopic ratios of the Bushveld Complex,We would like to thank Rustenburg Platinum Mines forRepublic of South Africa (abstract). EOS Transactions, American Geo-providing some samples used in this study, and R. G.physical Union 80(Supplement), F1199.Cawthorn for drill core samples from the Upper Zone.
Burnham, C. W. & Davis, N. F. (1974). The role of H2O in silicateCareful reviews by E. A. Mathez, E. M. Ripley, J. Bedard melts II, thermodynamic and phase relations in the system NaAl-and W. D. Maier led to considerable improvement of Si3O8–H2O to 10 kilobars, 700 degrees to 1100 degrees C. Americanthe manuscript. Their efforts are very much appreciated. Journal of Science 274(8), 902–940.
Cameron, E. N. (1978). The Lower Zone of the eastern BushveldThis work was supported by NSF grants EAR-9705507Complex in the Olifants river trough. Journal of Petrology 19, 437–462.and EAR-9902183.
Campbell, I. H. & Naldrett, A. J. (1979). The influence of silicate:sulfide ratios on the geochemistry of magmatic sulfides. Economic
Geology 74, 1503–1505.Candela, P. A. & Holland, H. D. (1984). The partitioning of copper andREFERENCES molybdenum between silicate melts and aqueous fluids. Geochimica et
Ballhaus, C. G. (1988). Potholes of the Merensky reef at Brakspruit Cosmochimica Acta 48, 373–380.shaft, Rustenburg Platinum Mines: primary disturbances in the Carr, H. W., Kruger, F. J., Groves, D. I. & Cawthorn, R. G. (1999).magmatic stratigraphy. Economic Geology 83, 1140–1158. The petrogenesis of Merensky Reef potholes at the Western Platinum
Ballhaus, C. G. & Stumpfl, E. F. (1986). Sulfide and platinum min- Mine, Bushveld Complex: Sr-isotopic evidence for synmagmaticeralization in the Merensky reef; evidence from hydrous silicates deformation. Mineralium Deposita 34(4), 335–347.and fluid inclusions. Contributions to Mineralogy and Petrology 94, 193–204. Cawthorn, R. G. (1983). Magma addition and possible decoupling of
Barnes, S. J. (1986). The effect of trapped liquid crystallization on major- and trace-element behaviour in the Bushveld Complex, Southcumulus mineral compositions in layered intrusions. Contributions to Africa. Chemical Geology 39, 335–345.Mineralogy and Petrology 93, 524–531. Cawthorn, R. G. (1994). Formation of chlor- and fluor-apatite in
Boudreau, A. E. (1992). Volatile fluid overpressure in layered intrusions layered intrusions. Mineralogical Magazine 58, 299–306.and the formation of potholes. Australian Journal of Earth Sciences 39, Cawthorn, R. G. (1999). Platinum-group element mineralization in the277–287. Bushveld Complex—a critical reassessment of geochemical models.
Boudreau, A. E. (1995). Fluid evolution in layered intrusions: evidence South African Journal of Geology 102, 268–281.from the chemistry of the halogen-bearing minerals. In: Thompson, Cawthorn, R. G. & Walsh, K. L. (1988). The use of phosphorusJ. F. H. (ed.) Magmas, Fluids and Ore Deposits. Geological Society of Canada contents in yielding estimates of the proportion of trapped liquid inShort Course Series 23, 25–46. cumulates of the Upper Zone of the Bushveld complex. Mineralogical
Boudreau, A. E. (1999). Fluid fluxing of cumulates: the J-M reef and Magazine 52, 81–89.associated rocks of the Stillwater Complex, Montana. Journal of Cawthorn, R. G., Davies, G., Clubley-Armstrong, A. & McCarthy, T.Petrology 40, 755–772. S. (1981). Sills associated with the Bushveld complex, South Africa:
Boudreau, A. E. & Kruger, F. J. (1990). Variation in the composition an estimate of the parental magma composition. Lithos 14, 1–15.of apatite through the Merensky cyclic unit in the western Bushveld Cawthorn, R. G., Meyer, P. S. & Kruger, F. J. (1991). Major additionComplex. Economic Geology and the Bulletin of the Society of Economic of magma at the Pyroxenite Marker in the Western Bushveld
Complex, South Africa. Journal of Petrology 32, 739–763.Geologists 85(4), 737–745.
1537

JOURNAL OF PETROLOGY VOLUME 41 NUMBER 10 OCTOBER 2000
Cheney, E. S. & Twist, D. (1991). The conformable emplacement of Kruger, F. J. & Marsh, J. S. (1985). The mineralogy, petrology, andorigin of the Merensky cyclic unit in the western Bushveld Complex.the Bushveld mafic rocks along a regional unconformity in theEconomic Geology 80, 958–974.Transvaal succession of South Africa. Precambrian Research 52, 115–
Kruger, F. J., Cawthorn, R. G., Meyer, P. S. & Walsh, K. L. (1986). Sr-132.isotopic, chemical and mineralogical variations across the pyroxeniteCoetzee, H. & Kruger, F. J. (1989). The geochronology, Sr- and Pb-marker and in the Upper Zone of the western Bushveld Complex.isotope geochemistry of the Losberg Complex, and the southernIn: Geo-congress ’86. Johannesburg: Geological Society of Southlimit of Bushveld complex magmatism. South African Journal of GeologyAfrica, pp. 609–612.92, 37–41.
Kruger, F. J., Cawthorn, R. G. & Walsh, K. L. (1987). StrontiumCousins, C. A. (1969). The Merensky reef of the Bushveld igneousisotopic evidence against magma addition in the Upper Zone of thecomplex. Economic Geology Monographs 4, 239–251.Bushveld complex. Earth and Planetary Science Letters 84, 51–58.Davies, G. & Tredoux, M. (1985). The platinum-group element and
Lee, C. A. & Tredoux, M. (1986). Platinum-group element abundancesgold contents of the marginal rocks and sills of the Bushveld Complex.in the Lower and the lower Critical Zones of the eastern BushveldEconomic Geology 80, 838–848.Complex. Economic Geology 81, 1087–1095.Eales, H. V. & Cawthorn, R. G. (1996). The Bushveld Complex. In:
Maier, W. D. & Barnes, S. J. (1999). Platinum-group elements inCawthorn, R. G. (ed.) Layered Intrusions. New York: Elsevier, pp.silicate rocks of the Lower, Critical and Main Zones at Union181–229.section, western Bushveld complex. Journal of Petrology 40, 1647–1671.Eriksson, P. G., Schreiber, U. M. & van der Neut, M. (1991). A
Maier, W. D., Barnes, S. J., De Klerk, W. J., Teigler, B. & Mitchell,review of the sedimentology of the early Proterozoic Pretoria group,A. A. (1996). Cu/Pd and Cu/Pt of silicate rocks in the Bushveld
Transvaal sequence, South Africa: implications for tectonic setting.Complex: implications for platinum-group element exploration. Eco-
Journal of African Earth Sciences 13, 107–119.nomic Geology 91, 1151–1158.
Eriksson, P. G., Reczko, B. F. & Piper, D. P. (1996). An interpretation Mathez, E. A. (1995). Magmatic metasomatism and formation of theof boron contents within a Paleoproterozoic volcano-sedimentary Merensky Reef, Bushveld Complex. Contributions to Mineralogy andsuccession: Pretoria group, Transvaal supergroup, South Africa. Petrology 119, 277–286.Precambrian Research 78, 273–287. Mathez, E. A., Agrinier, P. & Hutchinson, R. (1994). Hydrogen isotope
Frondel, J. W. (1964). Variations in some rare earths in allanite. American composition of the Merensky reef and related rocks, Atok section,Mineralogist 49, 1159–1177. Bushveld complex. Economic Geology 89, 791–802.
Harmer, R. E. & Sharpe, M. E. (1985). Field relations and strontium McCarthy, T. S., Lee, C. A., Fesq, H. W., Kable, E. J. & Erasmus,isotope systematics of the marginal rocks of the Eastern Bushveld C. S. (1984). Sulfur saturation in the Lower and Critical Zones ofComplex. Economic Geology 60, 813–837. the eastern Bushveld Complex. Geochimica et Cosmochimica Acta 48,
Hatton, C. J. & Sharpe, M. R. (1989). Significance and origin of 1005–1019.boninite-like rocks associated with the Bushveld complex. In: Craw- Meurer, W. P. & Boudreau, A. E. (1998a). Compaction of igneousford, A. J. (ed.) Boninites and Related Rocks. London: Unwin Hyman, cumulates part I: Geochemical consequences for cumulates andpp. 174–208. liquid fractionation trends. Geology 106, 281–292.
Meurer, W. P. & Boudreau, A. E. (1998b). Compaction of igneousHatton, C. J. & von Gruenewald, G. (1985). Chromite from thecumulates part II: Compaction and the development of igneousSwartkop Chrome Mine—an estimate of the effects of subsolidusfoliations. Geology 106, 293–304.reequilibration. Economic Geology 80, 911–924.
Meurer, W. P., Willmore, C. C. & Boudreau, A. E. (1999). MetalHickey, R. L. & Frey, F. A. (1982). Geochemical characteristics ofredistribution during fluid exsolution and migration in the Middleboninite series volcanics: implications for their source. Geochimica etBanded Series of the Stillwater Complex, Montana. Lithos 47,Cosmochimica Acta 46, 2099–2115.143–156.Hort, M. (1998). Abrupt change in magma liquidus temperature because
Molyneux, T. G. (1974). A geological investigation of the Bushveldof volatile loss or magma mixing; effects on nucleation, crystalComplex in Sekhukhuneland and part of the Steelpoort valley.growth and thermal history of the magma. Journal of Petrology 39,Transactions of the Geological Society of South Africa 77, 321–338.1063–1076.
Morton, R. D. & Catanzaro, E. J. (1964). Stable chlorine isotopesIwamori, H. (1998). Transportation of H2 and melting in subductionabundances in apatite from Odegardens Verk, Norway. Norsk Geologiskzones. Earth and Planetary Science Letters 160, 65–80.Tidsskrift 44, 307–313.Klein, E. M., Langmuir, C. H. & Staudigel, H. (1991). Geochemistry
Munoz, J. L. & Swenson, A. (1981). Chloride–hydroxyl exchange inof basalts from the Southeast Indian Ridge, 115 degrees E–138
biotite and estimation of relative HCl/HF activities in hydrothermaldegrees E. Journal of Geophysical Research 96, 2089–2107.
fluids. Economic Geology 76, 2212–2221.Kinloch, E. D. (1982). Regional trends in the platinum-group min- Naldrett, A. J. (1989). Sulfide melts; crystallization temperatures, sol-
eralogy of the Critical Zone of the Bushveld Complex, South Africa. ubilities in silicate melts, and Fe, Ni, and Cu partitioning betweenEconomic Geology 77, 1328–1347. basaltic magmas and olivine. Reviews in Economic Geology 4, 5–20.
Kinloch, E. D. & Peyerl, W. (1990). Platinum-group mineralogy in Nicholson, D. M. & Mathez, E. A. (1991) Petrogenesis of the Merenskyvarious rock types of the Merensky Reef: genetic implications. Reef in the Rustenburg section of the Bushveld Complex. ContributionsEconomic Geology 85, 537–555. to Mineralogy and Petrology 107, 293–309.
Kruger, F. J. (1990). The stratigraphy of the Bushveld complex: a Page, N. J. & Zientek, M. L. (1987). Composition of primary post-reappraisal and the relocation of the Main Zone boundaries. South cumulus amphibole and phlogopite within an olivine cumulate inAfrican Journal of Geology 93, 376–381. the Stillwater Complex, Montana. US Geological Survey Bulletin 1674A,
Kruger, F. J. (1994). The Sr-isotopic stratigraphy of the western 1–35.Bushveld complex. South African Journal of Geology 97, 393–398. Reid, D. L., Cawthorn, R. G., Kruger, F. J. & Tredoux, M. (1993).
Kruger, F. J. & Marsh, J. S. (1982). Significance of the 87Sr/86Sr ratios Isotope and trace-element patterns below the Merensky Reef, Bush-in the Merensky cyclic unit of the Bushveld Complex. Nature 298, veld complex, South Africa: evidence for fluids. Chemical Geology 106,
171–186.53–55.
1538

WILLMORE et al. HALOGEN GEOCHEMISTRY, BUSHVELD COMPLEX
Rønsbo, J. G. (1989). Coupled substitutions involving REEs and Na implications for H2O storage and recycling in the mantle. Earth and
and Si in apatites in alkaline rocks from the Ilımaussag intrusions, Planetary Science Letters 137, 45–55.South Greenland, and petrological implications. American Mineralogist Stormer, J. C., Pierson, M. L. & Tacker, R. C. (1993). Variation74, 896–901. of F and Cl X-ray intensity due to anisotropic diffusion in apatite
Schiffries, C. M. (1982). The petrogenesis of a platiniferous dunite pipe during electron microprobe analysis. American Mineralogist 78,in the Bushveld Complex: infiltration metasomatism by a chloride 641–648.solution. Economic Geology 77, 1439–1453. Tacker, R. C. & Stormer, J. C. (1989). A thermodynamic model
Schoenberg, R., Kruger, F. J., Nagler, T. F., Meisel, T. & Kramers, for apatite solid solutions, applicable to high-temperature geologicJ. D. (1999). PGE enrichment in chromitite layers and the Merensky problems. American Mineralogist 74, 877–888.Reef of the western Bushveld Complex; a Re–Os and Rb–Sr isotope Twist, D. (1985). Geochemical evolution of the Rooiberg silicic lavasstudy. Earth and Planetary Science Letters 172, 49–64. in the Loskop Dam area, southeastern Bushveld. Economic Geology
Schreiber, U. M., Eriksson, P. G. & Snyman, C. P. (1992a). Mudrock 80, 1153–1165.geochemistry of the Proterozoic Pretoria group, Transvaal sequence Vermaak, C. F. (1976). The Merensky Reef—thoughts on its en-(South Africa): geological implications. Journal of African Earth Sciences vironment and genesis. Economic Geology 71, 1270–1298.14, 393–409. Volfinger, M., Roberts, J.-L., Vielzeuf, D. & Neiva, A. M. R. (1985).
Schreiber, U. M., Ericksson, P. G., van der Neut, M. & Snyman, C. Structural control of the chlorine content of OH-bearing silicatesP. (1992b). Sedimentary petrography of the early Proterozoic Pretoria
(micas and amphiboles). Geochimica et Cosmochimica Acta 49, 37–48.group, Transvaal sequence, South Africa: implications for tectonic
Von Gruenewaldt, G. (1973). The Main and Upper Zones of thesetting. Sedimentary Geology 80, 89–103.
Bushveld complex in the Roosenekal area, eastern Transvaal. Trans-Scoon, R. N. & Teigler, B. (1994). Platinum-group element min-actions of the Geological Society of South Africa 76, 53–61.eralization in the Critical Zone of the western Bushveld complex.
Walraven, F. (1988). Notes on the age and genetic relationships of theEconomic Geology 89, 1094–1121.
Makhutso granite, Bushveld Complex, South Africa. Chemical GeologySharpe, M. R. (1985). Strontium isotope evidence for preserved density72, 17–28.stratification in the Main Zone of the Bushveld Complex, South
Walraven, F. (1997). Geochronology of the Rooiberg Group, TransvaalAfrica. Nature 316, 119–126.Supergroup, South Africa. Economic Geology Research Unit, InformationSharpe, M. R. & Hulbert, L. J. (1985). Ultramafic sills beneath theCircular 316, 21 pp.eastern Bushveld Complex: mobilized suspensions of early Lower
Wilson, A. H., Lee, C. A. & Brown, R. T. (1999). Geochemistry ofZone cumulates in a parental magma with boninitic affinities.the Merensky reef, Rustenburg section, Bushveld Complex: controlsEconomic Geology 80, 849–871.on silicate framework and distribution of trace elements. MineraliumShirley, D. N. (1986). Compaction of igneous cumulates. Journal ofDeposita 34, 657–672.Geology 94, 795–809.
Zhu, C. & Sverjensky, D. A. (1992). F–Cl–OH partitioning betweenSobolev, A. V. & Chaussidon, M. (1996). H2O concentrations inprimary melts from supra-subduction zones and mid-ocean ridges; biotite and apatite. Geochimica et Cosmochimica Acta 56, 3435–3467.
1539