Geochemistry of three contrasting British peatlands: Complex patterns of cation availability and...
9
Geochemistry of three contrasting British peatlands: Complex patterns of cation availability and implications for microbial metabolism S. Gogo 1 , T.G. Shreeve, D.M.E. Pearce ⁎ School of Life Sciences, Oxford Brookes University, Gipsy Lane Campus, Headington, OX3 0BP Oxford, United Kingdom abstract article info Article history: Received 6 November 2009 Received in revised form 9 April 2010 Accepted 30 April 2010 Available online 9 June 2010 Keywords: Cation Exchange Capacity Adsorption Decomposition Wetland Organic matter Trace element mobilization Cation availability in peat may limit CH 4 production and microbial activity and thereby impact on rates of organic matter accumulation and the chemical character of the peat. We quantify total, soluble, and exchangeable cation concentrations, Exchange Site Saturation Levels (ESSLs) and organic fractions in bog- peat profiles and compare these with fen peat. Total and soluble cation concentrations are not correlated and these and exchangeable cation concentrations are lower in bog than fen peat. In all sites these vary with depth and the distribution patterns of individual cations are unique. This is explained by variation in ESSL, which is negatively correlated with Cation Exchange Capacity (CEC). Total cation concentrations in bog peat are higher in the top and bottom fractions than in the middle. Soluble concentrations in surface bog peat are low, because cations are trapped due to low ESSL. This does not occur in fen peat, with lower CEC and higher ESSL. CEC is related to total organic matter content, not just to Sphagnum, which has been invoked as the explanatory variable of high CEC in peat bogs. There is a complexity in the mechanisms controlling cation availability in peat and we suggest that total, soluble and exchangeable cation fractions need to be taken into account in studies of cation limitation of microbial activity in organic soils. CEC may also chelate exo- enzymes, further inhibiting decay processes. © 2010 Elsevier B.V. All rights reserved. 1. Introduction Organic matter decay is a key process in peatland functioning (Clymo, 1983). The control of microbial activity is only partly understood, but involves cations (Williams and Crawford, 1984; Gonzalez-Gil et al., 1999; Basiliko and Yavitt, 2001; Thomas and Pearce, 2004), anions (Basiliko and Yavitt, 2001; Dise and Verry, 2001), a carbon source (Martin and Holding, 1978; Thomas and Pearce, 2004), and Cation Exchange Capacity (Thomas and Pearce, 2004) at least. Comparisons between studies and conclusions about the relative roles of different rate-limiting factors are difficult to draw because different indicators of decay rates, combined with different controlling factors have been investigated. For example, Coulson and Butterfield (1978) used mass loss whereas Yavitt et al. (2005) used CO 2 and CH 4 production whilst measuring ion concentrations in peat samples and correlating these to microbial activity. Experimental approaches have used anion and cation amendments to peat and measured microbial activities (e.g. Williams and Crawford, 1984; Basiliko and Yavitt, 2001; Thomas and Pearce, 2004). Other cation treatments have also included carbon sources (Martin and Holding, 1978) and mineral nutrients such as N and P (Williams and Crawford, 1984). Cations have also been added with different anions (e.g. Williams and Crawford, 1984; Basiliko and Yavitt, 2001; Thomas and Pearce, 2004), without necessarily factoring out the effects of the anions. There is further inconsistency about the cation fraction estimated to be available to the microbial community. Soluble and exchangeable cation fractions are those available to plants and microbial commu- nities (Chapin et al., 2002), but are also linked by geochemical processes to total cation concentration. Basiliko and Yavitt (2001) used soluble cation concentration, Yavitt et al. (2005) used the total content and Martin and Holding (1978) based their arguments on exchangeable cations. The ratios of the different fractions vary within and between sites (Gore and Allen, 1956; Waughman, 1980; Kyziol, 2002) and are influenced by ion exchange processes. Cations in solutions (ionic form) can react with exchange sites on organic matter or clay material (Tummavuori and Aho, 1980; Summer et al., 1991). The strength of adsorption can be increased by, (1) increased cation valency, (2) smaller hydrated size of the cation, and (3) increase of the strength of the site's negative charge (Miller and Donahue, 1990). Also, Cation Exchange Capacity (CEC) increases with organic matter content (Puustjärvi, 1956) and Sphagnum species. The latter dominate the partially decomposed bulk and living layer of many northern bogs and have a high CEC (Puustjärvi, 1956; Clymo, 1963) possibly higher than any other species (Painter, 1995). Therefore, in studies of the role of cations, the effects of CEC must also be carefully considered. Geoderma 158 (2010) 207–215 ⁎ Corresponding author. Tel.: + 44 1865 483965; fax: + 44 1865 483242. E-mail address: [email protected] (D.M.E. Pearce). 1 Present address: Institut des Sciences de la Terre d'Orléans-Tours, Université d'Orléans-Université de Tours-CNRS Bâtiment ISTE, 45000 Orléans, France. 0016-7061/$ – see front matter © 2010 Elsevier B.V. All rights reserved. doi:10.1016/j.geoderma.2010.04.031 Contents lists available at ScienceDirect Geoderma journal homepage: www.elsevier.com/locate/geoderma
-
Upload
independent -
Category
Documents
-
view
1 -
download
0
Transcript of Geochemistry of three contrasting British peatlands: Complex patterns of cation availability and...

Geoderma 158 (2010) 207–215
Contents lists available at ScienceDirect
Geoderma
j ourna l homepage: www.e lsev ie r.com/ locate /geoderma
Geochemistry of three contrasting British peatlands: Complex patterns of cationavailability and implications for microbial metabolism
S. Gogo 1, T.G. Shreeve, D.M.E. Pearce ⁎School of Life Sciences, Oxford Brookes University, Gipsy Lane Campus, Headington, OX3 0BP Oxford, United Kingdom
⁎ Corresponding author. Tel.: +44 1865 483965; fax:E-mail address: [email protected] (D.M.E. Pear
1 Present address: Institut des Sciences de la Terrd'Orléans-Université de Tours-CNRS Bâtiment ISTE, 450
0016-7061/$ – see front matter © 2010 Elsevier B.V. Aldoi:10.1016/j.geoderma.2010.04.031
a b s t r a c t
a r t i c l e i n f oArticle history:Received 6 November 2009Received in revised form 9 April 2010Accepted 30 April 2010Available online 9 June 2010
Keywords:Cation Exchange CapacityAdsorptionDecompositionWetlandOrganic matterTrace element mobilization
Cation availability in peat may limit CH4 production and microbial activity and thereby impact on rates oforganic matter accumulation and the chemical character of the peat. We quantify total, soluble, andexchangeable cation concentrations, Exchange Site Saturation Levels (ESSLs) and organic fractions in bog-peat profiles and compare these with fen peat. Total and soluble cation concentrations are not correlated andthese and exchangeable cation concentrations are lower in bog than fen peat. In all sites these vary withdepth and the distribution patterns of individual cations are unique. This is explained by variation in ESSL,which is negatively correlated with Cation Exchange Capacity (CEC). Total cation concentrations in bog peatare higher in the top and bottom fractions than in the middle. Soluble concentrations in surface bog peat arelow, because cations are trapped due to low ESSL. This does not occur in fen peat, with lower CEC and higherESSL. CEC is related to total organic matter content, not just to Sphagnum, which has been invoked as theexplanatory variable of high CEC in peat bogs. There is a complexity in the mechanisms controlling cationavailability in peat and we suggest that total, soluble and exchangeable cation fractions need to be taken intoaccount in studies of cation limitation of microbial activity in organic soils. CEC may also chelate exo-enzymes, further inhibiting decay processes.
+44 1865 483242.ce).e d'Orléans-Tours, Université00 Orléans, France.
l rights reserved.
© 2010 Elsevier B.V. All rights reserved.
1. Introduction
Organic matter decay is a key process in peatland functioning(Clymo, 1983). The control of microbial activity is only partlyunderstood, but involves cations (Williams and Crawford, 1984;Gonzalez-Gil et al., 1999; Basiliko and Yavitt, 2001; Thomas andPearce, 2004), anions (Basiliko and Yavitt, 2001; Dise and Verry,2001), a carbon source (Martin and Holding, 1978; Thomas andPearce, 2004), and Cation Exchange Capacity (Thomas and Pearce,2004) at least. Comparisons between studies and conclusions aboutthe relative roles of different rate-limiting factors are difficult to drawbecause different indicators of decay rates, combined with differentcontrolling factors have been investigated. For example, Coulson andButterfield (1978) used mass loss whereas Yavitt et al. (2005) usedCO2 and CH4 production whilst measuring ion concentrations in peatsamples and correlating these to microbial activity. Experimentalapproaches have used anion and cation amendments to peat andmeasured microbial activities (e.g. Williams and Crawford, 1984;Basiliko and Yavitt, 2001; Thomas and Pearce, 2004). Other cationtreatments have also included carbon sources (Martin and Holding,
1978) and mineral nutrients such as N and P (Williams and Crawford,1984). Cations have also been added with different anions (e.g.Williams and Crawford, 1984; Basiliko and Yavitt, 2001; Thomas andPearce, 2004), without necessarily factoring out the effects of theanions.
There is further inconsistency about the cation fraction estimatedto be available to the microbial community. Soluble and exchangeablecation fractions are those available to plants and microbial commu-nities (Chapin et al., 2002), but are also linked by geochemicalprocesses to total cation concentration. Basiliko and Yavitt (2001)used soluble cation concentration, Yavitt et al. (2005) used the totalcontent and Martin and Holding (1978) based their arguments onexchangeable cations. The ratios of the different fractions vary withinand between sites (Gore and Allen, 1956; Waughman, 1980; Kyziol,2002) and are influenced by ion exchange processes. Cations insolutions (ionic form) can react with exchange sites on organic matteror clay material (Tummavuori and Aho, 1980; Summer et al., 1991).The strength of adsorption can be increased by, (1) increased cationvalency, (2) smaller hydrated size of the cation, and (3) increase of thestrength of the site's negative charge (Miller and Donahue, 1990).Also, Cation Exchange Capacity (CEC) increases with organic mattercontent (Puustjärvi, 1956) and Sphagnum species. The latter dominatethe partially decomposed bulk and living layer of many northern bogsand have a high CEC (Puustjärvi, 1956; Clymo, 1963) possibly higherthan any other species (Painter, 1995). Therefore, in studies of the roleof cations, the effects of CEC must also be carefully considered.
208 S. Gogo et al. / Geoderma 158 (2010) 207–215
Previous studies have shown that applied soluble cations canstimulate methanogenic activity in peat (Basiliko and Yavitt, 2001;Thomas and Pearce, 2004; Gogo and Pearce, 2009), and thatmicroorganisms (in planktonic and aggregated states) use nutrientsin solution (Teitzel and Parsek, 2003; Hall-Stoodley et al., 2004). Themechanisms of cation stimulation may be via direct nutrientstimulation, and be indirect, via release of limiting cations fromexchange site reactions. Cation application can also alter carbonavailability, as positively charged molecules, for example exo-enzymes, can be bound to exchange sites (Painter, 1995). CEC canplay an important role in the occurrence and solubility of nutrientsthrough the amount of cation exchange sites and their level ofsaturation. If exchange sites are in excess compared to cations,remaining sites may chelate and inhibit exo-enzymes. Understandingthe state of cations in peat and how the state of individual elementsvaries in relation to internal and external mechanisms is important tounderstanding the control of decay processes and the role ofpeatlands to act as carbon sinks or sources.
Here, we quantify cation concentrations in different fractions fromthree sites of differing CEC. We examine the interaction of cationswith the CEC of peat to demonstrate the dynamic nature of cationavailability in soluble form and further demonstrate variation insoluble to total cation concentration in relation to CEC.
2. Materials and methods
2.1. Study sites, collection and preparation of samples
Peat cores were collected from each of three sites with a Russian or“D shape”corer (50 cm long; Jowsey, 1966) in January 2003. The firstsite, EllergowerMoss, is an undisturbed raised bog approximately 6 mdeep in its centre, situated near New Galloway, south-west Scotland.The surface is dominated by Sphagnum capillifolium, Sphagnumpapillosum and S. cuspidatum and the bulk of the peat comprisespartially decomposed Sphagnum. Cores were taken close to the centreof the bog in an area dominated by S. papillosum. The second site,Cothill Fen is a disturbed minerotrophic calcareous fen about 2 mdeep, situated near Oxford, south-central England. It is dominated byPhragmites with Sphagnum species (S. palustre and S. plumulosum)only present in very low abundance. The third site, Snelsmore ValleyMire, near Newbury, south-central England is a transitional valleymire about 2 m deep. The vegetation is composed predominantly ofS. papillosum, S. palustre and Eriophorum angustifolium.
At each site, cores were taken for each depth; four depths for Cothilland Snelsmoreandeleven forEllergowerMoss. In thefield, thedepthsofthe profiles were not always the same (±10 cm). In Cothill andSnelsmore, 4 core depths of 50 cm long were collected and the deepestdepth (when the corer could be pushed no further) noted as N1.5 m(Table 1). In Ellergower Moss, 11 core depths of 50 cm long werecollected and the deepest depth (when the corer could be pushed no
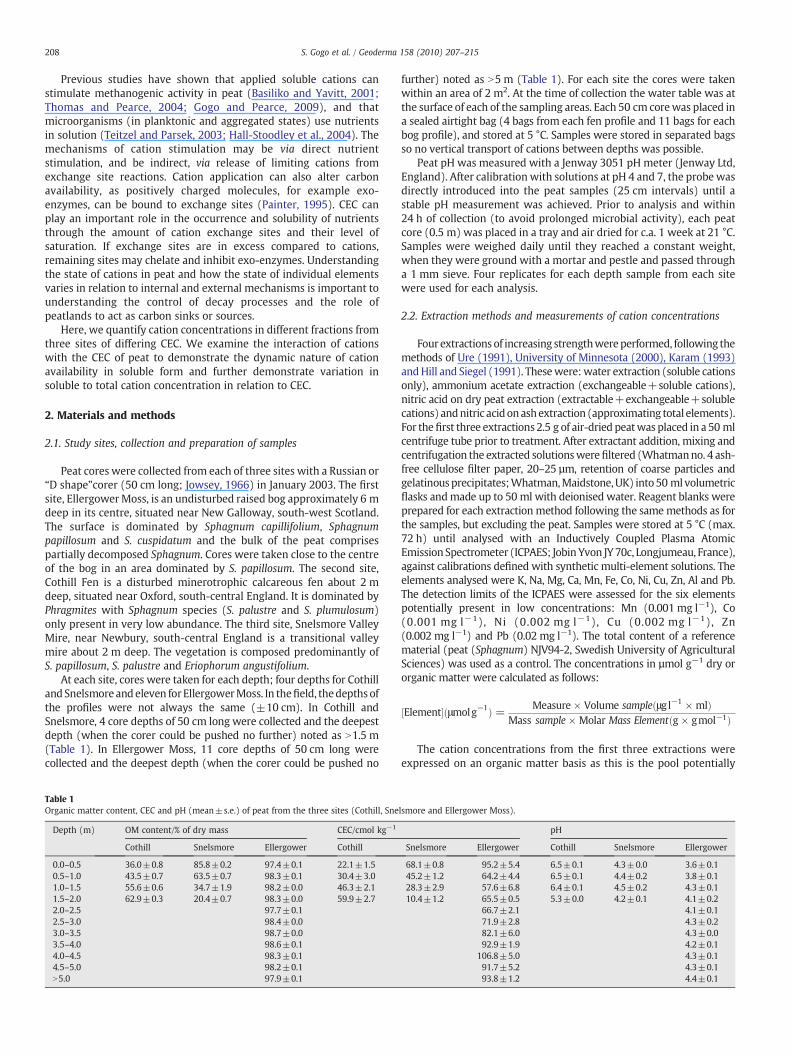
Table 1Organic matter content, CEC and pH (mean±s.e.) of peat from the three sites (Cothill, Sne
Depth (m) OM content/% of dry mass CEC/cmol kg−1
Cothill Snelsmore Ellergower Cothill
0.0–0.5 36.0±0.8 85.8±0.2 97.4±0.1 22.1±1.50.5–1.0 43.5±0.7 63.5±0.7 98.3±0.1 30.4±3.01.0–1.5 55.6±0.6 34.7±1.9 98.2±0.0 46.3±2.11.5–2.0 62.9±0.3 20.4±0.7 98.3±0.0 59.9±2.72.0–2.5 97.7±0.12.5–3.0 98.4±0.03.0–3.5 98.7±0.03.5–4.0 98.6±0.14.0–4.5 98.3±0.14.5–5.0 98.2±0.1N5.0 97.9±0.1
further) noted as N5 m (Table 1). For each site the cores were takenwithin an area of 2 m2. At the time of collection the water table was atthe surface of each of the sampling areas. Each 50 cm corewas placed ina sealed airtight bag (4 bags from each fen profile and 11 bags for eachbog profile), and stored at 5 °C. Samples were stored in separated bagsso no vertical transport of cations between depths was possible.
Peat pH was measured with a Jenway 3051 pH meter (Jenway Ltd,England). After calibration with solutions at pH 4 and 7, the probewasdirectly introduced into the peat samples (25 cm intervals) until astable pH measurement was achieved. Prior to analysis and within24 h of collection (to avoid prolonged microbial activity), each peatcore (0.5 m) was placed in a tray and air dried for c.a. 1 week at 21 °C.Samples were weighed daily until they reached a constant weight,when they were ground with a mortar and pestle and passed througha 1 mm sieve. Four replicates for each depth sample from each sitewere used for each analysis.
2.2. Extraction methods and measurements of cation concentrations
Four extractions of increasing strengthwereperformed, following themethods of Ure (1991), University of Minnesota (2000), Karam (1993)andHill and Siegel (1991). Thesewere:water extraction (soluble cationsonly), ammonium acetate extraction (exchangeable+soluble cations),nitric acid on dry peat extraction (extractable+exchangeable+solublecations) andnitric acidonashextraction (approximating total elements).For thefirst three extractions 2.5 g of air-dried peatwas placed in a 50 mlcentrifuge tube prior to treatment. After extractant addition, mixing andcentrifugation the extracted solutionswerefiltered (Whatmanno. 4 ash-free cellulose filter paper, 20–25 µm, retention of coarse particles andgelatinousprecipitates;Whatman,Maidstone,UK) into50 mlvolumetricflasks andmade up to 50 ml with deionised water. Reagent blanks wereprepared for each extraction method following the samemethods as forthe samples, but excluding the peat. Samples were stored at 5 °C (max.72 h) until analysed with an Inductively Coupled Plasma AtomicEmission Spectrometer (ICPAES; JobinYvon JY70c, Longjumeau, France),against calibrations defined with synthetic multi-element solutions. Theelements analysed were K, Na, Mg, Ca, Mn, Fe, Co, Ni, Cu, Zn, Al and Pb.The detection limits of the ICPAES were assessed for the six elementspotentially present in low concentrations: Mn (0.001 mg l−1), Co(0.001 mg l−1), Ni (0.002 mg l−1), Cu (0.002 mg l−1), Zn(0.002 mg l−1) and Pb (0.02 mg l−1). The total content of a referencematerial (peat (Sphagnum) NJV94-2, Swedish University of AgriculturalSciences) was used as a control. The concentrations in µmol g−1 dry ororganic matter were calculated as follows:
Element½ �ðμmolg−1Þ = Measure × Volume sampleðμgl−1 × mlÞMass sample × Molar Mass Elementðg × gmol−1Þ
The cation concentrations from the first three extractions wereexpressed on an organic matter basis as this is the pool potentially
lsmore and Ellergower Moss).
pH
Snelsmore Ellergower Cothill Snelsmore Ellergower
68.1±0.8 95.2±5.4 6.5±0.1 4.3±0.0 3.6±0.145.2±1.2 64.2±4.4 6.5±0.1 4.4±0.2 3.8±0.128.3±2.9 57.6±6.8 6.4±0.1 4.5±0.2 4.3±0.110.4±1.2 65.5±0.5 5.3±0.0 4.2±0.1 4.1±0.2
66.7±2.1 4.1±0.171.9±2.8 4.3±0.282.1±6.0 4.3±0.092.9±1.9 4.2±0.1
106.8±5.0 4.3±0.191.7±5.2 4.3±0.193.8±1.2 4.4±0.1

209S. Gogo et al. / Geoderma 158 (2010) 207–215
degradable by microbes. To assess the organic content, peat of eachdepth (50 cm intervals) was oven dried (80 °C), and placed in amufflefurnace for 4 h at 550 °C. The ash was weighed immediately and thepercentage of the organic content was calculated as follows:
%organic content= oven dryweight−ashweightð Þ=oven dry weight½ � × 100
The cation concentrations for the “total” content were expressedon a soil dry weight basis as cations from mineral particles as well asthose bound to organic matter were measured.
To assess chelating strength, the quotients of water extractablecations to ammonium acetate extractable ones were calculated.Because ammonium acetate extracts only soluble cations andexchangeable K, Na, Mg and Ca (Karam, 1993; University ofMinnesota, 2000), the analyses of water to ammonium acetatequotient were only conducted on K, Na, Mg and Ca.
2.3. Cation Exchange Capacity (CEC) and assessment of Exchange SiteSaturation Level (ESSL)
The technique used for this study was the method of displacementof cations by 1 M NH4OAc buffered at pH 7 (Karam, 1993). Air-drypeat (0.5 g) was shaken with 20 ml of NH4OAc and centrifuged at5000 rpm for 15 min in a 50 ml centrifuge tube. The supernatant wasdiscarded and the extraction repeated. The sample was then washedtwice with 10 ml methanol to remove the remaining ammoniumpresent. Samples were thenmixed with 20 ml of 0.5 M CaCl2 to returnto solution the ammonium held on the exchange sites, centrifuged at5000 rpm for 10 min and the supernatant poured into a 100 mlvolumetric flask. This extraction was repeated and the volume madeup with deionised water to 100 ml. The ammonium concentrationwas finally measured with an ammonium electrode (Jenway 3045 IonAnalyser, Jenway Ltd, England), the assumption being that theamount of NH4
+ corresponds to the amount of negative chargeoccupied previously by K+, Na+, Mg2+, Ca2+ and H+.
Exchange Site Saturation Levels (ESSLs) by macronutrient cations(K, Na, Mg and Ca), micronutrient cations (Mn, Fe, Ni, Co, Cu and Zn,)and Al and Pb are the quotient of ammonium acetate and nitric acidextractable cations versus CEC (modified from Hill and Siegel, 1991;each expressed as cmol of positive or negative charge per gram ofOM). A value less than 1 represents unsaturated exchange sites,whereas a value greater than 1 represents saturated sites. Ammoniumdisplacesmainly K+, Na+, Mg2+, Ca2+ and H+. Cations (such as Pb, Cuand Al) strongly bound to organic matter may not be fully displacedby NH4
+. Calculating the ESSL with the nitric acid extraction assesseshow much of these strongly bound cations were not displaced by theammonium acetate treatment. At the pH of Ellergower Moss andSnelsmore all cations would have been in their most reduced form,whereas for Cothill cations e.g. Fe, Al and Mn may have been inchemical forms other than ionically bound to exchange sites.
2.4. Data analysis
All experimental designs were one- or two-way ANOVAs. Theresponse variables for all experimental designs were all the solubleand total cations taken separately, the soluble and total sum ofpositive charge frommacro- andmicronutrients, soluble to exchange-able quotient (chelating strength) and CEC.
The depth effect on response variables in Ellergower Moss was aone-way ANOVA design. However, because the residuals werenormally distributed, but the variances were unequal, the Welchtest was performed followed by a Tamhane post-hoc test (SPSS,2004).
For each response variable, the three sites were compared usingthe first four depths (max depth of Cothill and Snelsmore=2 m)using a two-way factorial ANOVA (with site and depth as the main
effects). The null hypotheses were: (a) there are no differences inresponse variable between sites (pooling depths), (b) there are nodifferences in response variable between depths (pooling sites) and(c) there are no interactions between site and depth. When the datadid not fulfil the ANOVA assumptions, the Aligned Rank Transforma-tion (ART) method was performed (Richter and Payton, 1999),followed by a post-hoc Tukey test, using Statistica (Statsoft, 2001).Because the ART method is non-parametric, the results are presentedas medians with ranges.
3. Results
3.1. Peat pH
Peat samples from Ellergower Moss (pH from 3.6 to 4.4; Table 1)and Snelsmore valleymire (pH from4.2 to 4.6)were acidic confirmingcations would be in their most reduced form (e.g. Al3+) and solublecation concentrations controlled by cation exchange. At such low pHvalues other chemical forms are absent. In Cothill some of the cationsmay be in non-exchangeable forms because of higher pH (pH from 5.3to 6.5).
3.2. Cation concentrations in Ellergower Moss
In Ellergower Moss, the total concentration of each cation changedwith depth (Figs. 1 and 2; Welch one-way ANOVA, all Pb0.0001).Soluble cation concentrations, other than Ni, Co, Cu and Pb, individuallyor summed, also changed with depth (Figs. 1–4; Welch one-wayANOVA, all Pb0.003). For the total concentrations in the bog peat, twodistinct patterns were observed. Total Na and Mg (Fig. 1) formed “D”shaped profiles (Shotyk, 1988), with concentrations being lower at 0–0.5 m than at 2.5–3 m (Tamhane all Pb0.0001). Total Ca (Fig. 1c)Mn, Fe,Ni, Co, and Cu (Fig. 2a–e) and Al (Fig. 3) presented a “C” shaped profile,with lower content at 3–3.5 m than at 0–0.5 m and N5 m (Tamhane allPb0.025).
Very different patterns were observed for soluble concentrations ofcations. In the EllergowerMoss peat, for Na, K Ca (Fig. 1) and the sum ofmacronutrients (Fig. 4), there were some significant differencesbetween depths, but soluble concentrations remained fairly constantthroughout the profile. There was no significant difference for thesoluble Zn concentrationswhereas total Zn at 0–0.5 mwas significantlyhigher than at all the other depths (Tamhane, all Pb0.001). Soluble MgandMn (Figs. 1 and 2) decreasedwith depth (0–0.5 m to 1.5–2 m versus2–2.5 m to N5 m for Mg, and 0–0.5 m versus 1–1.5 m to 4–4.5 m,Tamhane all Pb0.05).
3.3. Between-site comparisons
In between-site concentration comparisons of soluble cations,sums of soluble cations, total cations and sums of total cations differedbetween sites and depths with a significant site×depth interaction(all Pb0.05). Some soluble cation concentrations were very low,which explains the high variability observed.
3.3.1. MacronutrientsBoth soluble and total Na in Cothill, especially at 0–0.5 m, was
higher than for Snelsmore and Ellergower Moss (Tukey all Pb0.005),and higher for Snelsmore than Ellergower Moss (Fig. 1; Tukey allPb0.005). At each depth, soluble Mg in Ellergower Moss was at least 4times lower than in the other two sites (Fig. 1; Tukey all Pb0.0002).However, total Mg was measured in higher concentrations for alldepths at Ellergower Moss peat than in the other two sites (Fig. 1).Soluble and total Ca was about 80 and 200 times higher in Cothill thanin Snelsmore and Ellergower Moss respectively, and higher inSnelsmore than in Ellergower Moss (Tukey all Pb0.05; Fig. 5).
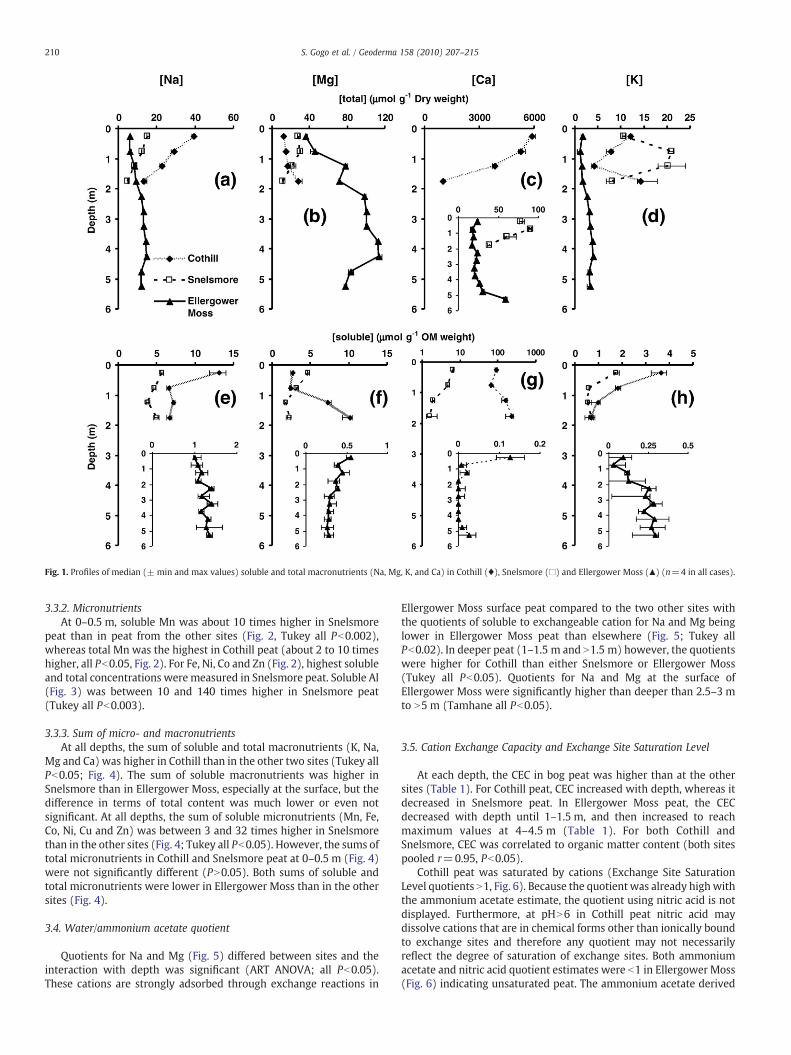
Fig. 1. Profiles of median (± min and max values) soluble and total macronutrients (Na, Mg, K, and Ca) in Cothill (♦), Snelsmore (□) and Ellergower Moss (▲) (n=4 in all cases).
210 S. Gogo et al. / Geoderma 158 (2010) 207–215
3.3.2. MicronutrientsAt 0–0.5 m, soluble Mn was about 10 times higher in Snelsmore
peat than in peat from the other sites (Fig. 2, Tukey all Pb0.002),whereas total Mn was the highest in Cothill peat (about 2 to 10 timeshigher, all Pb0.05, Fig. 2). For Fe, Ni, Co and Zn (Fig. 2), highest solubleand total concentrations were measured in Snelsmore peat. Soluble Al(Fig. 3) was between 10 and 140 times higher in Snelsmore peat(Tukey all Pb0.003).
3.3.3. Sum of micro- and macronutrientsAt all depths, the sum of soluble and total macronutrients (K, Na,
Mg and Ca) was higher in Cothill than in the other two sites (Tukey allPb0.05; Fig. 4). The sum of soluble macronutrients was higher inSnelsmore than in Ellergower Moss, especially at the surface, but thedifference in terms of total content was much lower or even notsignificant. At all depths, the sum of soluble micronutrients (Mn, Fe,Co, Ni, Cu and Zn) was between 3 and 32 times higher in Snelsmorethan in the other sites (Fig. 4; Tukey all Pb0.05). However, the sums oftotal micronutrients in Cothill and Snelsmore peat at 0–0.5 m (Fig. 4)were not significantly different (PN0.05). Both sums of soluble andtotal micronutrients were lower in Ellergower Moss than in the othersites (Fig. 4).
3.4. Water/ammonium acetate quotient
Quotients for Na and Mg (Fig. 5) differed between sites and theinteraction with depth was significant (ART ANOVA; all Pb0.05).These cations are strongly adsorbed through exchange reactions in
Ellergower Moss surface peat compared to the two other sites withthe quotients of soluble to exchangeable cation for Na and Mg beinglower in Ellergower Moss peat than elsewhere (Fig. 5; Tukey allPb0.02). In deeper peat (1–1.5 m and N1.5 m) however, the quotientswere higher for Cothill than either Snelsmore or Ellergower Moss(Tukey all Pb0.05). Quotients for Na and Mg at the surface ofEllergower Moss were significantly higher than deeper than 2.5–3 mto N5 m (Tamhane all Pb0.05).
3.5. Cation Exchange Capacity and Exchange Site Saturation Level
At each depth, the CEC in bog peat was higher than at the othersites (Table 1). For Cothill peat, CEC increased with depth, whereas itdecreased in Snelsmore peat. In Ellergower Moss peat, the CECdecreased with depth until 1–1.5 m, and then increased to reachmaximum values at 4–4.5 m (Table 1). For both Cothill andSnelsmore, CEC was correlated to organic matter content (both sitespooled r=0.95, Pb0.05).
Cothill peat was saturated by cations (Exchange Site SaturationLevel quotients N1, Fig. 6). Because the quotientwas already highwiththe ammonium acetate estimate, the quotient using nitric acid is notdisplayed. Furthermore, at pHN6 in Cothill peat nitric acid maydissolve cations that are in chemical forms other than ionically boundto exchange sites and therefore any quotient may not necessarilyreflect the degree of saturation of exchange sites. Both ammoniumacetate and nitric acid quotient estimates were b1 in Ellergower Moss(Fig. 6) indicating unsaturated peat. The ammonium acetate derived
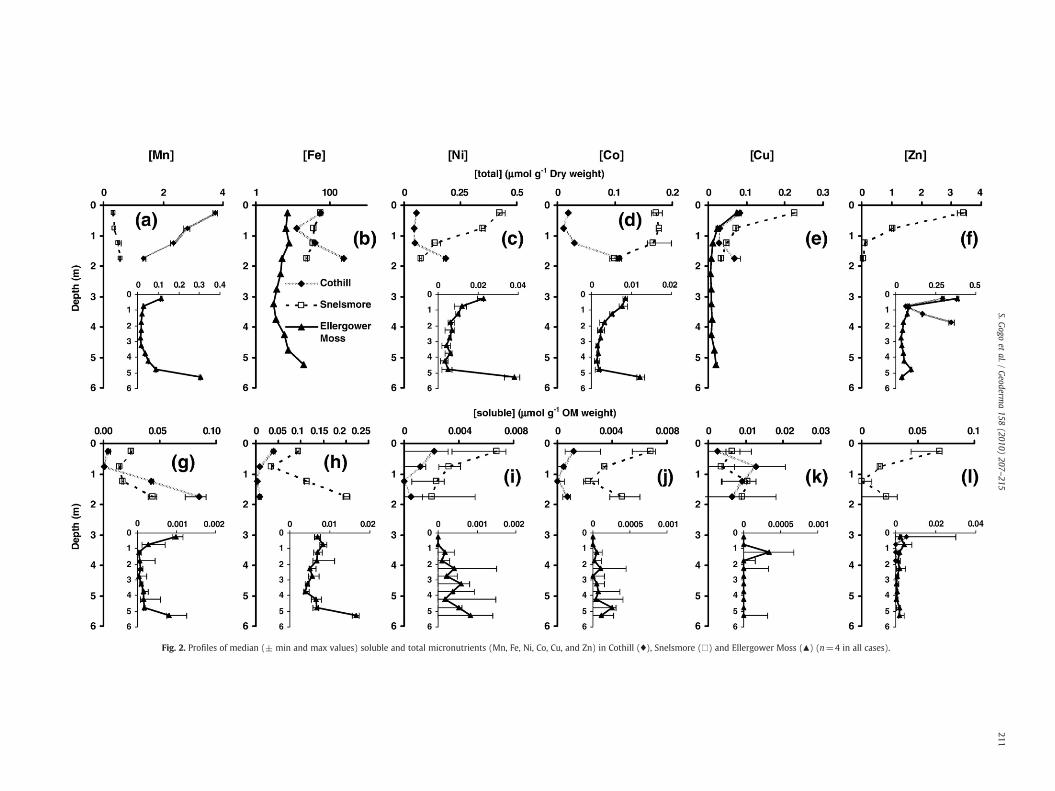
Fig. 2. Profiles of median (± min and max values) soluble and total micronutrients (Mn, Fe, Ni, Co, Cu, and Zn) in Cothill (♦), Snelsmore (□) and Ellergower Moss (▲) (n=4 in all cases).
211S.G
ogoet
al./Geoderm
a158
(2010)207
–215

Fig. 3. Profiles of median soluble and total Pb and Al (± min and max values) in Cothill(♦), Snelsmore (□) and Ellergower Moss (▲) (n=4 in all cases).
Fig. 4. Profiles of median soluble and total sum of micronutrients and macronutrients(±min andmax values) in Cothill (♦), Snelsmore (□) and Ellergower Moss (▲) (n=4 inall cases).
212 S. Gogo et al. / Geoderma 158 (2010) 207–215
quotient was b1 for Snelsmore peat but the nitric acid derivedquotients was N1 (Fig. 6).
4. Discussion and conclusions
We have found that the totals and ratios of total, extractable,exchangeable and soluble cations, Cation Exchange Capacity andExchange Site Saturation Levels differ with depth through peatprofiles and differ between peat from an acid bog, a mesotrophiccalcareous fen and a transitional valley mire. Although between-sitedifferences are not surprising, cross-site comparisons can be used toelucidate control mechanisms. Within site (depth) differences mayalso indicate that cation-related limits to microbial activity may differwithin a peat profile.
Concentrations of cations in bog peat were compared to the twofen sites. At all depths, the sum of soluble and total macronutrients (K,Na, Mg and Ca) was higher in Cothill than in the other two sites,because of the high Ca concentrations. The sum of soluble macro-nutrients was higher in Snelsmore than in EllergowerMoss, especiallyat the surface, but the difference in terms of total content was eitherlower or not significantly different. At all depths, the sum of solublemicronutrients (Mn, Fe, Co, Ni, Cu and Zn) was between 3 and 32times higher and Al was between 10 and 140 times higher inSnelsmore than in the other two sites. These micronutrients werepossibly high in Snelsmore peat due to the surrounding area beingused as an ammunition dump during the Second World War (Evans,2006; West Berkshire Council, 2006). However, the sums of total
micronutrients in Cothill and Snelsmore peat at 0–0.5 m were notsignificantly different. Both sums of soluble and total micronutrientswere lower in the bog peat than in the fen peats. SolubleMg in the bogwas at least 4 times lower than in the fens but total Mg was measuredin higher concentrations in Ellergower Moss peat due to its proximityto the sea and being exclusively rain-fed.
Total cation concentrations varied between sites and with depth ateach site. This variation can be explained by site geomorphology,current internal and external processes and historical factors. Mgconcentrations were greater than those of Ca at all depths inEllergower Moss peat but Ca tended to increase towards the bottomof the profile and Mg tended to decrease, indicating a groundwatereffect at the start of peat formation and dominance of rainfall as peataccumulates. For Cothill and Snelsmore, Ca concentrations werehigher than Mg concentrations throughout, indicating the dominanceof groundwater in these shallower peats within basins.
Total Mn, Co, Zn, Fe, Ni and Cu concentrations profiles fromEllergower Moss had C shapes typical of those described in theliterature (e.g. Mattson and Koutler-Andersson, 1955; Shotyk, 1988;Hill and Siegel, 1991). The upward decrease in the profiles for all thesecations from the bottom can be explained by the progressiveindependence of the system from the ground water as peataccumulates. The high concentrations at the bottommay also indicatea continuing influence of mineral-rich water at the base of the bog,though this can only be resolved by hydrological study. The increasein Ellergower Moss of soluble Co and Ni with depth may be explained

Fig. 5. Quotient of water soluble to ammonium acetate exchangeable Na and Mg concentrations (± min and max values) in Cothill (♦), Snelsmore (□) and Ellergower Moss (▲)(n=4 in all cases).
213S. Gogo et al. / Geoderma 158 (2010) 207–215
by weathering over time (Schlesinger, 1997; Kelly et al., 1998).Anthropogenic input, mineral uptake and plant/decomposer cyclingare likely to dominate at the surface.
Cu, Pb and Zn surface concentrations from ash and dry peat acidextractions are even higher than the bottom concentrations. Peatprofiles act as archives for a wide variety of atmospheric constituents(Clymo et al., 1990; Shotyk, 1995). Anthropogenic releases of Pb, Cu,Zn and other metals are greater than from natural sources (Benjaminand Honeyman, 1994; Zaccone et al., 2007a) and produce heavymetalenrichment in peatlands through long-range transport (Mattson andKoutler-Andersson, 1955; Livett et al., 1979; Santelmann and Gorham,1988; Zoltai, 1988; Steinnes, 1997). This may explain some of theupper part of the “C” shaped profiles. The high capacity of EllergowerMoss peat to conserve anthropogenic metallic cation inputs, throughexchange reactions, could also explain why the total content of Zn andPb are higher in Ellergower Moss than in Cothill.
Very different patterns were observed for soluble concentrationsof cations with some significant differences between depths, butsoluble concentrations remained fairly constant throughout theprofile. High total cations do therefore not infer high soluble cations.The lack of correlation between the two may be due to variation inExchange Site Saturation Levels and Cation Exchange Capacity.
At the surface, the quotients of soluble to exchangeable cation for NaandMgwere lower in bog peat than in the fen peats. This indicates thatthese cations are strongly adsorbed through exchange reactions inEllergower Moss peat compared to the peat from the two fen sites. Ateach depth, the CEC in bog peat was higher than in peat from the othersites. Calculations of quotients of Exchange Site Saturation Level (ESSL)indicate that Cothill peat was saturated by cations (quotient N1). By
Fig. 6. Exchange Site Saturation Level by cations as expressed by the quotient of the
contrast, Ellergower Moss peat is unsaturated (quotient b1). From thequotient calculated using the ammonium acetate extraction, Snelsmorepeat is not saturated throughout the profile. However, when nitric acidextractable cation concentrations are used, the peat is saturated at alldepths. While this can be explained by the difference in Al concentra-tions yielded by the two types of extraction it also indicates thatSnelsmore peat is saturated with a relatively large Al fraction.
Despite the highest total and exchangeable Mg concentrationsamong sites being measured in Ellergower Moss, soluble Mg waslowest in this site. Thus, in Ellergower Moss peat there was a greaternegative charge compared to peat from the two fen sites (Miller andDonahue, 1990). Andersen et al. (1987) demonstrated with Sphagnumspecies that, when exchange sites are less saturated with Mg, moreheavy metals are adsorbed. Bunzl et al. (1976) demonstrated thatwhen soluble cation concentrations are low in Sphagnum peat, thecations are more adsorbed on exchange sites. The extent ofhumification determines which peat fraction binds the solublecations. As the peat gets increasingly humified with depth, theproportion of many cations bound to humic acids increases (Zacconeet al., 2007b). In Ellergower Moss, the peat is highly unsaturated bycations, as indicated by the Exchange Site Saturation Level (ESSL),thus there are low concentrations of soluble cations. In the fen sites,ESSL were higher than in the bog. Exchange sites are probablycompletely saturated because of high Ca concentrations in Cothill andAl concentrations in Snelsmore. Because the peat is saturated withcations, the CEC in these sites is unlikely to reduce the amount ofsoluble cations. Soluble Na, Mg, Mn and Co concentrations weresignificantly positively correlated (Spearman correlation, all Pb0.05)with ESSL (assessed with nitric acid). When the peat exchange sites
sum of charges extracted with ammonium acetate (♦) or nitric acid (□) on CEC.
214 S. Gogo et al. / Geoderma 158 (2010) 207–215
are unsaturated (low ESSL), soluble cation concentrations are low.Thus, unsaturation of the Ellergower Moss peat explains whyquotients were lower in the bog than in the fen sites and whyEllergower Moss was the poorest site in soluble Mg (despite highexchangeable concentrations of Mg).
It is known that Sphagnum (Clymo, 1963) and Sphagnum peat(Bunzl et al., 1976) have a high capacity to bind cations and this link isso strong that heavy metals such as Pb and Al are not necessarilyexchangeable (ammonium acetate extractable). In addition, Bunzl(1974) showed that as peat becomes more saturated with Pb, theexchange reaction rate decreases. As soon as Zn and Pb are releasedinto the system (soluble) from the relatively high total pool of thesurface, they are instantaneously adsorbed because of the increasedstrength of adsorption (low quotient) found at the surface. WithinSphagnum species, CEC depends on their relative position to the watertable: species of wet habitats have a relatively low CEC, whereashummock forming species have a higher CEC (Spearing, 1972; Hájekand Adamec, 2009). Thus, as the system changes from fen to bog, theSphagnum community may change towards a community that has anoverall higher adsorption capacity. In this succession, the low amountof soluble nutrients would be determined first by the increasingindependence of the system to the local groundwater, but also by theincreased adsorption of the Sphagnum community.
The bog, because of its ombrotrophic nature, has a low cation input(other than Mg) and due to the high CEC of the peat this furtherdecreases the soluble amount of nutrients. This supports the view ofPainter (1991) that bog peat has unsaturated exchange sites that bindcations to organic matter and may make them unavailable formicrobial activity. However, microbes can release in the media exo-enzymes that would attack the organic matter and mobilize mineralnutrients (Sinsabaugh et al., 2009). These exo-enzymes can also beadsorbed onto exchange sites (Painter, 1995). This could occurespecially in the bog where a lot of exchange sites were available toreact with exo-enzymes (Fig. 6). Such enzymatic inhibition issuspected to be of importance in the C storage in peat (Freemanet al., 2001) and the availability of peat exchange sites could be apowerful tool to achieve such enzymatic inhibition in bog peat.
CEC may affect not only soluble cations, but also their total contentby adsorbing cations and thus preventing losses through leaching. TheD shape of total and exchangeable K, Na and Mg profiles in the bogfollows the overall shape of the organic matter content. Damman(1978) reported the same pattern for Mg from Scandinavian bogs.Malmer (1988) demonstrated that the CEC of Sphagnum, whichdominate Ellergower Moss, determines the total concentrations of Naand Mg. The capacity of Sphagnum species to retain macronutrientcations liberated from the decomposed peat combined with a loss ofpeat mass could explain the “D” shape distribution. Compared to thesurface, at the bottom the CEC was lower, which would retain less Mg.This demonstrates the essential role of the CEC of the Sphagnum itselfand the peat formed from the partial decay of Sphagnum on thedistribution of these elements. The high CEC of Ellergower Moss is notentirely due to the presence of Sphagnum. The work here demon-strates that when expressed on a per organic matter basis the CECs ofthe different peats were very similar. However, the CEC of EllergowerMoss was high, simply because of the relatively high concentration oforganic matter at this site compared to the other two.
We have demonstrated that at Ellergower Moss, an undisturbedpeat bog, CEC is an important factor in determining the size of eachcation pool. With a high CEC, cations are not in solution due to thelarge number of free exchange sites. They may be more available atthe other sites due to a lack of availability of exchange sites. Theexchange sites of Snelsmore peat are saturated by macro- andmicronutrient cations and such a “mopping up” of cations is unlikely.Al is a determinant cation affecting the ESSL: because this element isprobably in its Al3+ form (acidic conditions), it may occupy manyexchange sites. Overall, the highest soluble cation concentrations
were found at Snelsmore and Cothill. However, as peat is building inSnelsmore, the CEC will be increasing at the surface and the exchangesites may becomes less and less saturated. The exchange capacity ofSphagnum peat compared to Carex peat is less sensitive to varying pH,at least for Cu (Ringqvist and Öborn, 2002). As the peat water becomesmore acidic with peatland development, the exchange capacity ofSphagnum peat would remain the same along the succession from fento bog despite the change in pH. This would ensure the high exchangecapacity of Sphagnum peat, and hence the high ESSL, even at very lowpH. As peat becomes unsaturated, exo-enzymes are likely to beincreasingly inhibited. If CEC does decrease the availability of cationsand inhibits exo-enzymes activity, a positive feedback may existwhich reduces microbial activity, which in turn increases overall CECas the organic fraction increases. If this is the case then a suddenchange in the rate of peat accumulation may occur. This change maybe reinforced by Sphagnum, which grows in low nutrient conditionsand has a high number of exchange sites when both living and dead.For other plant species (like Phragmites), it is only the peat derivedfrom them that has a high number of exchange sites (Moorhead et al.,2000).We suggest that the changes of soluble cation concentrations atthe bottom of the Ellergower Moss profile demonstrate this suddentransition from one state to another. In Cothill, the high concentrationof Ca saturates all the exchange sites, leading them to play only aminor role in the distribution of cations.
There are few studies in the literature on the availability of cationsin peat (Williams and Crawford, 1984; Thomas and Pearce, 2004) andnone on the effect of Pb or Al. We demonstrate that patterns of solubleand total cations are not equivalent. This may lead to misinterpreta-tions in the literature with some authors using soluble and otherstotal cation concentrations when interpreting microbial mineralnutrition studies. There is a need to determine which cation fractionis available to microbes in other studies to fully understand microbialactivity and care needs to be taken in cross-site comparisons.
Although only one site of each type of peatland was studied here,they were representative of their own type. Similar investigations ondifferent types of peatlands are needed to confirm the conclusions.We also encourage the study of enzymatic activity in relation toexchange site saturation, as a large amount of available sites may havean inhibitory effect that would enhance the lack of soluble cations bypreventing mineralization. We further demonstrate that CEC is moreclosely related to organic matter content than Sphagnum per se.
Acknowledgments
This work was funded by the Oxford Brookes University. We thankEnglish Nature (now Natural England), Scottish Natural Heritage andForest Enterprise Scotland (South) for allowing access to the sites andsampling of peat. We thank Dr Mike Fowler for helping with theICPAES.
References
Andersen, K., Grasdalen, H., Holsen, K.A., Painter, T.J., 1987. Structure, properties, andpotential applications of Sphagnum holocellulose. In: Stivala, S.S., Crescenzi, V., Dea,I.C.M. (Eds.), Industrial Polysaccharides: The Impact of Biotechnology andAdvanced Methodologies. Gordon and Breach, New York, pp. 15–34.
Basiliko, N., Yavitt, J.B., 2001. Influence of Ni, Co, Fe and Na additions on CH4 productionin Sphagnum-dominated Northern American peatlands. Biogeochemistry 52,133–153.
Benjamin, M.M., Honeyman, B.D., 1994. Trace metals. In: Butcher, S.S., Charlson, R.J.,Orians, G.H., Wolfe, G.V. (Eds.), Global Biogeochemical Cycles. Academic Press,London, pp. 317–352.
Bunzl, K., 1974. Kinetics of ion exchange in soil organic matter. II. Ion exchange duringcontinuous addition of Pb2+ ions to humic acid and peat. Journal of Soil Science 25,32–41.
Bunzl, K., Schmidt, W., Sansoni, B., 1976. Kinetics of ion exchange in soil organic matter.IV. Adsorption and desorption of Pb2+, Cu2+, Cd2+, Zn2+ and Ca2+ by peat. Journalof Soil Science 27, 32–41.
Chapin III, F.S., Matson, P.A., Mooney, H.A., 2002. Principles of Terrestrial EcosystemEcology. Springer Verlag, New York.

215S. Gogo et al. / Geoderma 158 (2010) 207–215
Clymo, R.S., 1963. Ion exchange in Sphagnum and its relation to bog ecology. Annals ofBotany 27, 309–324.
Clymo, R.S., 1983. Peat. In: Gore, A.J.P. (Ed.), Ecosystems of the World, Vol. 4A. : Mires:Swamp, Bog, Fen and Moor. Elsvier, Amsterdam, pp. 159–224.
Clymo, R.S., Oldfield, F., Appleby, P.G., Pearson, G.W., Ratnesar, P., Richardson, N., 1990.The record of atmospheric deposition on a rainwater-dependent peatland.Philosophical Transactions of the Royal Society, London B327, 331–338.
Coulson, J.C., Butterfield, J., 1978. An investigation of the biotic factors determining therates of plant decomposition on blanket bog. Journal of Ecology 66, 631–650.
Damman, A.W.H., 1978. Distribution and movement of elements in ombrotrophic peatbogs. Oikos 30, 480–495.
Dise, N.B., Verry, E.S., 2001. Suppression of peatland methane emission by cumulativesulfate deposition in simulated acid rain. Biogeochemistry 53, 143–160.
Evans, N.F., 2006. British Artillery in World War 2. . Retrieved on October 2006 fromhttp://members.tripod.com/~nigelef/ammo.htm.
Freeman, C., Ostle, N., Kang, H., 2001. An enzymic “latch” on a global carbon store.Nature 409, 149.
Gogo, S., Pearce, D.M.E., 2009. Saturation of raised bog peat exchange sites by Pb2+ andAl3+ stimulates CH4 production. Soil Biology & Biochemistry 41, 2025–2028.
Gonzalez-Gil, G., Kleerebezem, R., Lettinga, G., 1999. Effects of nickel and cobalt onkinetics of methanol conversion by methanogenic sludge as assessed by on-linemonitoring. Applied and Environmental Microbiology 65, 1789–1793.
Gore, A.J.P., Allen, S.E., 1956. Measurement of exchangeable and total cation content forH+, Na+, K+, Mg2+, Ca2+ and iron, in high level blanket peat. Oikos 7, 48–55.
Hájek, T., Adamec, L., 2009. Mineral nutrient economy in competing species ofSphagnum mosses. Ecological Research 24, 291–302.
Hall-Stoodley, L., Costerton, J.W., Stoodley, P., 2004. Bacterial biofilms: from the naturalenvironment to infectious diseases. Nature 2, 95–108.
Hill, B.M., Siegel, D.I., 1991. Groundwater flow and the metal content of peat. Journal ofHydrology 123, 211–224.
Jowsey, P.C., 1966. An improved peat sampler. New Phytologist 65, 245–248.Karam, A., 1993. Chapter 44: chemical properties of organic soils. In: Carter, M.R. (Ed.),
Soil Sampling and Methods of Analysis, Canadian Society of Soil Science. LewisPublishers, pp. 459–471.
Kelly, E.F., Chadwick, O.A., Hilinski, T.E., 1998. The effect of plants on mineralweathering. Biogeochemistry 42, 21–53.
Kyziol, J., 2002. Effect of physical properties and Cation Exchange Capacity on sorptionof heavy metals onto peats. Polish Journal of Environmental Studies 11, 713–718.
Livett, E.A., Lee, J.A., Tallis, J.H., 1979. Lead, zinc, and copper analyses of British blanketpeats. Journal of Ecology 67, 865–891.
Malmer,N., 1988. Patterns in the growth and the accumulationof inorganic constituents inthe Sphagnum cover on ombrotrophic bogs in Scandinavia. Oikos 53, 105–120.
Martin, N.J., Holding, A.J., 1978. Nutrient availability and other factors limiting microbialactivity in the blanket peat. In: Heal, O.W., Perkins, D.F. (Eds.), The Ecology of BritishMoors and Mountain Grassland. Springer Verlag, New York, pp. 113–135.
Mattson, S., Koutler-Andersson, E., 1955. Geochemistry of a raised bog. Annals of theRoyal Agricultural College of Sweden 21, 321–366.
Miller, R.W., Donahue, R.L., 1990. Soils, an Introduction to Soils and Plants Growth.Prentice-Hall International Editions, USA.
Moorhead, K.K., Moynihan, R.E., Simpson, S.L., 2000. Soil characteristics of four southernAppalachian fens in North Carolina, USA. Wetlands 20, 560–564.
Painter, T.J., 1991. Lindow man, Tollund man and other peat-bog bodies: thepreservative and antimicrobial action of sphagnan, a reactive glycuronoglycanwith tanning and sequestering properties. Carbohydrate Polymers 15, 123–142.
Painter, T.J., 1995. Chemical and microbiological aspects of the preservation processesin Sphagnum peat. In: Turner, R.C., Scaife, R.G. (Eds.), Bog Bodies— New Discoveriesand New Perspectives. British Museum Press, London, pp. 88–100.
Puustjärvi, V., 1956. On the cation exchange capacity of peats and on factors of influenceupon its formation. Acta Agriculturae Scandinavica 6, 410–449.
Richter, S.J., Payton, M.E., 1999. Nearly exact tests in factorial experiments using thealigned rank transform. Journal of Applied Statistics 26, 203–217.
Ringqvist, L., Öborn, I., 2002. Copper and zinc adsorption onto poorly humifiedSphagnum and Carex peat. Water Research 36, 2233–2242.
Santelmann, M.V., Gorham, E., 1988. The influence of airborne road dust on thechemistry of Sphagnum mosses. Journal of Ecology 76, 1219–1231.
Schlesinger, W.H., 1997. Biogeochemistry: An Analysis of Global Change. AcademicPress, San Diego.
Shotyk, W., 1988. Review of the inorganic chemistry of peats and peatlands waters.Earth Science Reviews 25, 95–176.
Shotyk, W., 1995. Peat bog archives of atmospheric metal deposition: geochemicalevaluation of peat profiles, natural variations in metal concentrations and metalenrichment factors. Environmental Review 4, 149–183.
Sinsabaugh, R.L., Hill, B.H., Follstad Shah, J.J., 2009. Ecoenzymatic stoichiometry ofmicrobial organic nutrient acquisition in soil and sediment. Nature 462, 795–798.
Spearing, A.M., 1972. Cation-exchange capacity and galacturonic acid content of severalspecies of Sphagnum in Sandy Ridge bog, central New York State. Bryologist 75,154–158.
SPSS, Inc, 2004. SPSS for Windows Version 13.0. Chicago Illinois, SPSS Inc.Statsoft, Inc, 2001. STATISTICA for Windows Version 6.0. Tulsa Oklahoma, Statsoft, Inc.Steinnes, E., 1997. Trace elements in ombrogenous peat profiles fromNorway: evidence
of long-range atmospheric transport. Water and Air Soil Pollution 100, 405–413.Summer, M.E., Fey, M.V., Noble, A.D., 1991. Nutrient status and toxicity problems in acid
soils. In: Ulrich, B., Summer, M.E. (Eds.), Soil Acidity. Springer Verlag, New York, pp.149–182.
Teitzel, G.M., Parsek, M.R., 2003. Heavy metal resistance of biofilm and planktonicPseudomonas aeruginosa. Applied and Environmental Microbiology 69, 2313–2320.
Thomas, P.A., Pearce, D.M.E., 2004. Role of cation exchange in preventing the decay ofanoxic deep bog peat. Soil Biology and Biochemistry 36, 23–32.
Tummavuori, J., Aho, M., 1980. On the ion-exchange properties of peat part I: on theadsorption of some divalent metal ions (Mn2+, Co2+, Ni2+, Cu2+, Zn2+, Cd2+ andPb2+) on the peat. Suo 2–3, 45–51.
University of Minnesota, 2000. Research Analytical Laboratory. . Retrieved on January2002 from http://ral.coafes.umn.edu/soil.htm.
Ure, A.M., 1991. Methods of analysis for heavy metals in soils. In: Alloway, B.J. (Ed.),Heavy Metals in Soils. Blackie Academic and Professional, London, pp. 58–104.
Waughman, G.J., 1980. Chemical aspects of the ecology of some south Germanpeatlands. Journal of Ecology 68, 1025–1046.
West Berkshire Council, 2006. Snelsmore Common. . Retrieved on October 2006 fromhttp://www.westberks.gov.uk/media/doc/1/5/Snelsmore_Common.doc.
Williams, R.T., Crawford, R.L., 1984. Methane production in Minnesota peatland.Applied and Environmental Microbiology 29, 1266–1271.
Yavitt, J.B., Williams, C.J., Wieder, R.K., 2005. Soil chemistry versus environmentalcontrols on production of CH4 and CO2 in northern peatlands. European Journal ofSoil Science 56, 169–178.
Zaccone, C., Cocozza, C., Cheburkin, A.K., Shotyk, W., Miano, T.M., 2007a. Highly organicsoils as “witnesses” of anthropogenic Pb, Cu, Zn and 137Cs inputs during centuries.Water, Air and Soil Pollution 186, 263–271.
Zaccone, C., Cocozza, C., Cheburkin, A.K., Shotyk, W., Miano, T.M., 2007b. Enrichmentand depletion of major and trace elements, and radionuclides in ombrotrophic rawpeat and corresponding humic acids. Geoderma 141, 235–246.
Zoltai, S.C., 1988. Distribution of base metals in peat near a smelter at Flin Flon,Manitoba. Water, Air, and Soil Pollution 37, 217–228.