Identi cation of a Novel PPAR Signature for Predicting ...
29
Page 1/29 Identication of a Novel PPAR Signature for Predicting Prognosis and Immune Microenvironment in Hepatocellular Carcinoma Qiuming Su The Aliated Calmette Hospital of Kunming Medical University Shengning Zhang The Aliated Calmette Hospital of Kunming Medical University Jianghua Ran ( [email protected] ) The Aliated Calmette Hospital of Kunming Medical University Article Keywords: hepatocellular carcinoma, PPAR, gene signature, prognosis, immune microenvironment Posted Date: August 12th, 2022 DOI: https://doi.org/10.21203/rs.3.rs-1943906/v1 License: This work is licensed under a Creative Commons Attribution 4.0 International License. Read Full License
-
Upload
khangminh22 -
Category
Documents
-
view
0 -
download
0
Transcript of Identi cation of a Novel PPAR Signature for Predicting ...

Page 1/29
Identi�cation of a Novel PPAR Signature forPredicting Prognosis and ImmuneMicroenvironment in Hepatocellular CarcinomaQiuming Su
The A�liated Calmette Hospital of Kunming Medical UniversityShengning Zhang
The A�liated Calmette Hospital of Kunming Medical UniversityJianghua Ran ( [email protected] )
The A�liated Calmette Hospital of Kunming Medical University
Article
Keywords: hepatocellular carcinoma, PPAR, gene signature, prognosis, immune microenvironment
Posted Date: August 12th, 2022
DOI: https://doi.org/10.21203/rs.3.rs-1943906/v1
License: This work is licensed under a Creative Commons Attribution 4.0 International License. Read Full License

Page 2/29
Abstract
BackgroundHepatocellular carcinoma (HCC) is the most common primary malignancy of the liver, which the 5-yearsurvival rate has not substantially improved in the past few decades. We aimed to explore the potentialrole of peroxisome proliferator activated receptors (PPARs) in HCC progression and diagnosis.
MethodsThe clinical information and corresponding gene expression matrix of HCC patients were obtained fromThe Cancer Genome Atlas and International Cancer Genome Consortium databases (ICGC). Consensuscluster analysis was used to identify novel molecular subgroups. ESTMATE, Microenvironment CellPopulations-counter and single sample Gene Set Enrichment Analysis were used to determine the tumorimmune microenvironment (TIME) and immune status of the identi�ed molecular subtypes. Functionalanalyses were used to elucidate the underlying mechanisms, including Gene Ontology, KyotoEncyclopedia of Genes and Genomes, Gene Set Enrichment Analysis and Gene Set Variation Analysis.The prognostic risk model was constructed by LASSO analysis and multivariate Cox regression analysis,and validated by ICGC datasets. A nomogram was constructed to predict the prognosis of HCC patientsby integrating risk scores and clinical characteristics.
ResultsSigni�cant differences in survival for the identi�ed two molecular subgroups. The subgroup with poorerprognosis was associated with higher immune score, higher abundance of immune cell in�ltration andcorrespondingly higher immune status. DEGs between the two molecular subgroups were mainlyenriched in the metabolic- and PPAR-pathways. The abnormal expression pattern of PPAR genes(PPARGs) may alter the metabolic activity, affecting the function of the immune system. Moreover, therisk model based on 4 PPARGs (TTC33, TMEM135, TALDO1, and TXNIP) exhibited excellent ability ofpredictive prognostic. Finally, A nomogram integrating risk scores and clinical features could accuratelypredict the prognosis of HCC patients.
ConclusionWe constructed and validated a novel PPAR signature associated with the TIME, which exhibitedextremely excellent performance in predicting the prognosis of HCC patients.
Introduction

Page 3/29
Liver cancer is the second most common cause of cancer-related death after lung cancer, accounting formore than 800,000 deaths annually[1, 2]. Hepatocellular carcinoma (HCC) is the most common primarymalignancy of the liver, accounting for approximately 75% of all liver cancers[3]. The morbidity andmortality of HCC are steadily increasing worldwide in recent years[3, 4]. The risk factors for HCC arechronic infection of hepatitis B virus and hepatitis C virus, alcoholic liver disease and nonalcoholic fattyliver disease[5]. Because the early symptoms of HCC are insidious and the sensitivity of early screeningmethods is low, most patients are already in the advanced stage when they are diagnosed[3, 4]. In fact,the prognosis of advanced HCC is poor, the median survival time is less than 1 year, and the 5-yearsurvival rate is only about 7%[3–6]. The poor prognosis of HCC is associated with high tumorheterogeneity due to signi�cant genomic instability[7]. Therefore, it is necessary to identify a riskstrati�cation method for HCC patients and screen out gene targets for individualized therapy.
Transcription factors peroxisome proliferator activated receptors (PPARs) belong to the nuclear hormonereceptor superfamily[8]. Meanwhile, PPARs are also the most well-studied fatty acid-activated nuclearreceptors, including the following three subtypes: PPAR-α, PPAR-γ, and PPAR-δ/β[8]. The three isoforms ofPPARs are highly biologically identical but differ for biological functions, tissue distribution and liganda�nity[9]. PPAR-α is mainly expressed in liver, heart, brown adipose tissue, kidney, and intestine, whichregulates energy homeostasis by activating fatty acid catabolism and stimulating gluconeogenesis[8,10]. PPAR-δ/β are ubiquitous in various cells and are mainly engaged in fatty acid oxidation andregulated the blood sugar balance[8, 11]. PPAR-γ is mainly expressed in white and brown adipose tissue,intestinal, and immune cells, which promotes lipogenesis and lipid synthesis by promoting adipogenesisto store energy[8, 12]. Take into account their expression in speci�c cell types or tissues, PPARs playcritical roles in regulating a variety of cellular functions (proliferation, death, and differentiation),in�ammatory processes, angiogenesis, and immune responses[8]. Due to the abundant physiologicalfunctions of PPARs, the role of PPARs in tumor development and progression has attracted great interestin the scienti�c community. Maggiora et al. demonstrated that in human hepatoma cells, the speci�cPPAR-α agonist clo�brate-induced apoptosis in a time- and concentration-dependent manner, and thePPAR-α ligand PGJ2 could inhibit cell proliferation[13]. However, PPARα activation may drivehepatocarcinogenesis through multiple mechanisms in rodents, including activation of c-Myc and cyclinsto increase cell proliferation, decrease susceptibility to apoptosis, and upregulate cellular oxidativestress[14]. Savic et al. found that PPAR-γ activation increased lipid peroxidation in human colon cancercells, inhibiting tumor cell proliferation[15]. Moreover, Montagner et al. identi�ed that UV-induced PPAR-δ/β activity directly stimulated SRC expression in mice, thus promoting skin cancer progression byactivating of EGFR/Erk1/2 signaling pathway[16]. Zuo et al. found that PPAR-δ/β activators (L165041and GW501516) can induce IL-8 overexpression in vascular endothelial cells of colon cancer, whichpromoted tumor angiogenesis and increased lung metastasis[17]. Although the functions of PPARs innumerous tumors are gradually being unraveled, the role of PPARs in HCC is still unknown.
In the present study, we comprehensively analyzed PPAR genes (PPARGs) using the bioinformaticsanalysis to identify the role of PPARs in TIME and survival of HCC. Furthermore, we constructed aprognostic risk model based on PPARGs to evaluate the prognostic value of PPARs in HCC patients. Our

Page 4/29
work provides a new perspective for exploring the molecular mechanism and targeted therapy strategiesof HCC, and promotes the implementation of personalized therapy for HCC patients.
ResultsIdenti�cation of Two Molecular subtypes based on PPARGs
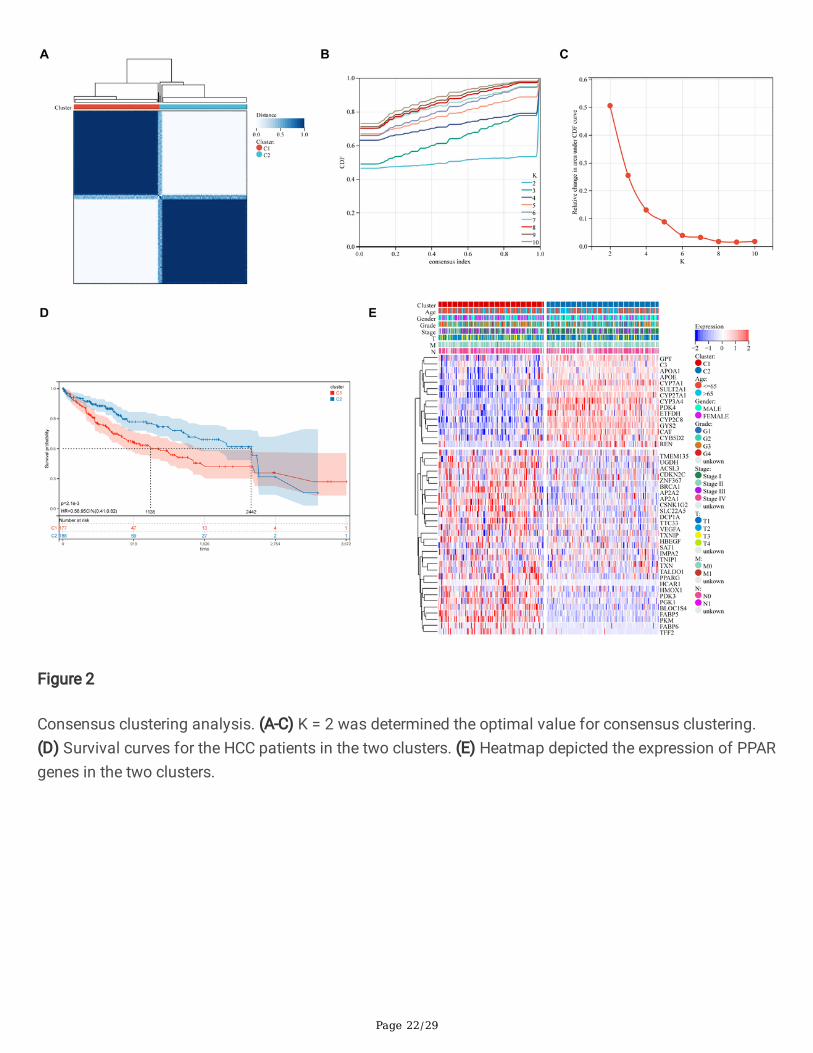
We combined with PPAR-targeted genes and HCC database from the TCGA database according to theresults of univariate Cox survival analysis, and generated a total of 45 PPARGs associated with prognosis(Table 2). In this study, we used the consensus clustering approach to classify HCC patients into differentsubgroups based on the expression levels of PPARGs, with the highest mean concordance within theclustering group when k = 2 (Figure 2A-C). Therefore, we divided the HCC patients from the training cohortinto 2 subgroups: cluster 1 (n = 177), cluster 2 (n = 188). Meanwhile, KM analysis showed that the clinicaloutcome of cluster 1 was signi�cantly worse than cluster 2 (P = 2.1e-03; Figure 2D). Furthermore, theheatmap visualized that the expression patterns of PPARGs were different in cluster 1 and cluster 2, andthe two subgroups of HCC patients also differed in age, gender, tumor grade, T stage, M stage, and Nstage (Figure 2E). The above �ndings suggest that HCC patients can be divided into two molecularsubtypes with different overall survival.
Two molecular subtypes of HCC Exhibited Different TIME and Immune Status
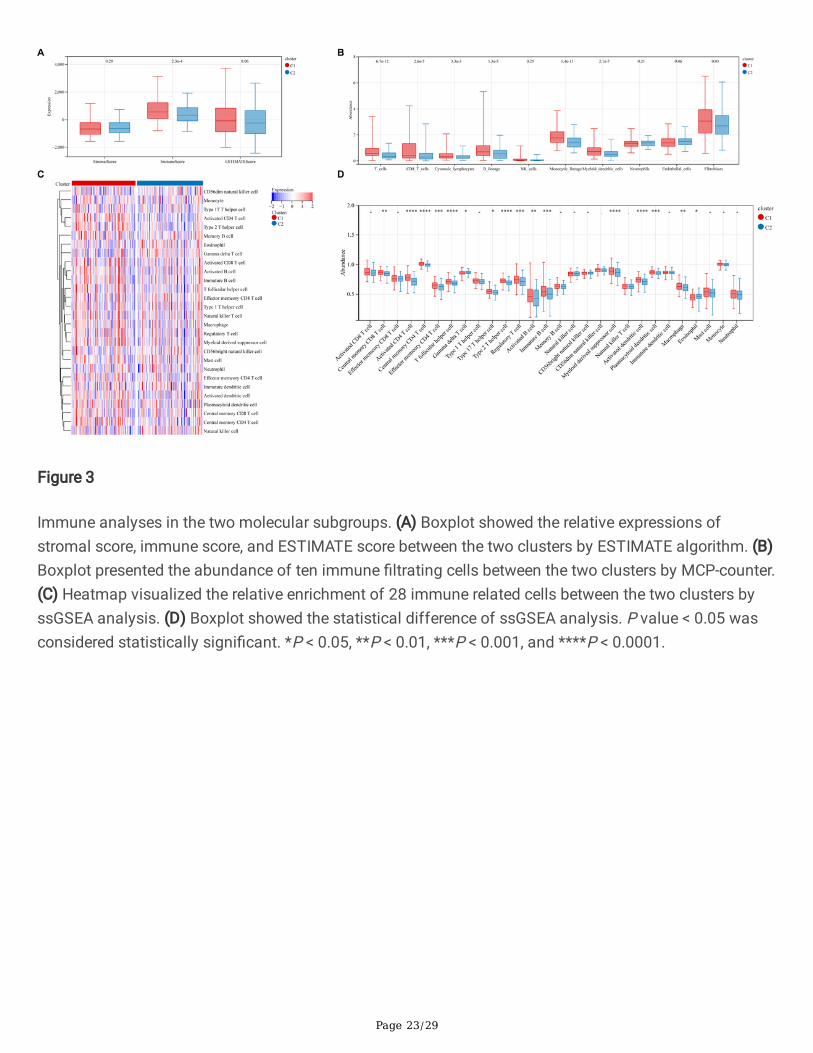
We then explored the immunological differences between the two molecular subtypes. The ESTIMATEalgorithm found that HCC patients in cluster 1 had higher immune score (P = 2.3e-04), while stromalscore (P = 0.29) and ESTIMATE score (P = 0.06; Figure 3A) were no statistical difference. Furthermore, theMCP-counter analysis revealed T cells (P = 6.7e-12), CD8 T cells (P = 2.6e-05), Cytotoxic lymphocytes (P =3.3e-03), B lineage (P = 1.3e-05), Monocytic lineage (P = 1.4e-11), Myeloid dendritic cells (P = 2.1e-07),and Fibroblasts (P = 0.03) were signi�cantly higher in cluster 1 than cluster 2, and no statisticalsigni�cance was detected with respect to in NK cells (P = 0.25), Neutrophils (P = 0.21), and Endothelialcells (P = 0.06; Figure 3B). In addition, we compared the immune landscape of cluster 1 and cluster 2 byssGSEA algorithm. The results were presented in Figure 3C, the immune landscape between the twogroups was signi�cantly different, and the immune status of cluster 2 was relatively lower than cluster 1.Besides, the statistical results demonstrated that 16 immune cells were signi�cantly increased in cluster 1compared with cluster 2 (Figure 3D), including Central memory CD8 T cell, Activated CD4 T cell, Centralmemory CD4 T cell, Effector memory CD4 T cell, T follicular helper cell, Gamma delta T cell, Type 17 Thelper cell, Type 2 T helper cell, Regulatory T cell, Activated B cell, Immature B cell, Myeloid derivedsuppress cell, Activated dendritic cell, Plasmacytoid dendritic cell, Macrophage , and Eosinophil, the other12 immune cells showed no difference. These results suggest that the two molecular subtypes of HCCpatients have signi�cant differences in TIME and immune status.
Identi�ed DEGs and functional analysis
Page 5/29
We identi�ed DEGs of two molecular subgroups via the limma tool, and performed in-depth functionalanalysis to explore the underlying signaling mechanisms. Here, a total of 485 DEGs were screened, ofwhich 151 genes were up-regulated and 334 genes were down-regulated in cluster 1 (Figure 4A), ascompared with cluster 2. GO enrichment analysis revealed that DEGs were mainly involved in metabolicbiological process, including small molecule metabolic process, carboxylic acid metabolic process,organic acid metabolic process, oxoacid metabolic process, oxidation-reduction process, monocarboxylicacid metabolic process. Moreover, some cellular component such as extracellular exosome, extracellularvesicle, and extracellular organelle were also enriched (Figure 4B). Similarly, KEGG analysis also identi�edsome signaling pathways related to metabolism and tumorigenesis, including metabolic pathways,metabolism of xenobiotics by cytochrome P450, drug metabolism-cytochrome P450, retinol metabolism,chemical carcinogenesis, PPAR signaling pathway, and Drug metabolism-other enzymes (Figure 4C).Meanwhile, Metascape tool analysis also reached consistent conclusions (Figure 4D). Then, we found 14submodules by protein-protein interaction (PPI) analysis, all of which were closely related to metabolism,tumor development and immune regulation. The results indicate that changes in metabolic activity maybe associated with the PPAR-targeted genes contribute to HCC (Figure 4E). To further explore therelationship between the enriched pathways and prognosis of HCC patients, we used GSVA and GSEAanalyses to evaluate the relative expression differences of signaling pathways in two molecularsubgroups. GSEA analysis enriched a large number of differentially expressed pathways. In compared tocluster 2, the expression of PPAR and metabolism-related pathways was considerably lower in cluster 1(Figure 4F). Correspondingly, GSVA analysis also revealed that the expression of metabolism-relatedpathways was signi�cantly lower in cluster 1 (Figure 4G). All these results demonstrate that theexpression of PPAR is closely related to immune and metabolic dysregulation, affecting the clinicaloutcomes of HCC patients.
Construction of a risk model based on PPAR-associated genes in a training cohort
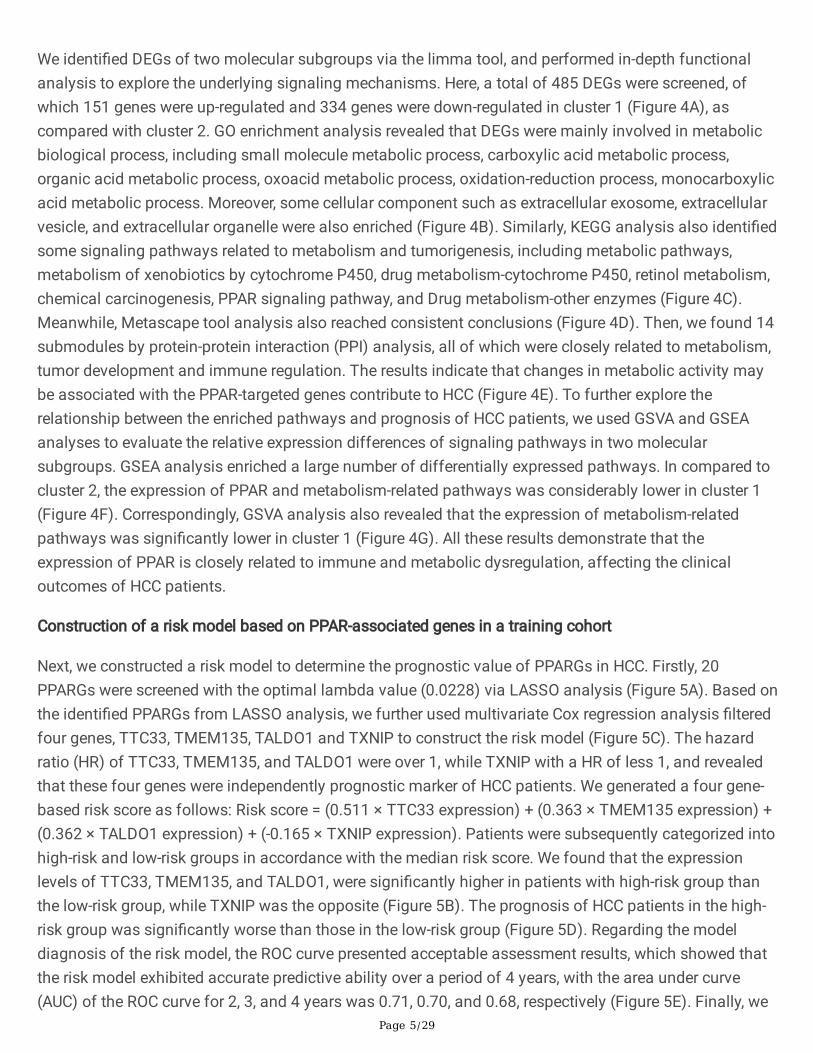
Next, we constructed a risk model to determine the prognostic value of PPARGs in HCC. Firstly, 20PPARGs were screened with the optimal lambda value (0.0228) via LASSO analysis (Figure 5A). Based onthe identi�ed PPARGs from LASSO analysis, we further used multivariate Cox regression analysis �lteredfour genes, TTC33, TMEM135, TALDO1 and TXNIP to construct the risk model (Figure 5C). The hazardratio (HR) of TTC33, TMEM135, and TALDO1 were over 1, while TXNIP with a HR of less 1, and revealedthat these four genes were independently prognostic marker of HCC patients. We generated a four gene-based risk score as follows: Risk score = (0.511 × TTC33 expression) + (0.363 × TMEM135 expression) +(0.362 × TALDO1 expression) + (-0.165 × TXNIP expression). Patients were subsequently categorized intohigh-risk and low-risk groups in accordance with the median risk score. We found that the expressionlevels of TTC33, TMEM135, and TALDO1, were signi�cantly higher in patients with high-risk group thanthe low-risk group, while TXNIP was the opposite (Figure 5B). The prognosis of HCC patients in the high-risk group was signi�cantly worse than those in the low-risk group (Figure 5D). Regarding the modeldiagnosis of the risk model, the ROC curve presented acceptable assessment results, which showed thatthe risk model exhibited accurate predictive ability over a period of 4 years, with the area under curve(AUC) of the ROC curve for 2, 3, and 4 years was 0.71, 0.70, and 0.68, respectively (Figure 5E). Finally, we

Page 6/29
applied the ESTIMATE algorithm to evaluate TIME between the two groups, and demonstrated that thestromal score (P = 4.9e-03) and ESTIMATE score (P = 0.02) were signi�cantly higher in the low-risk groupthan high-risk group, while there was no statistical difference in immune score (P = 0.07; Figure 5F).These results demonstrate that the identi�ed risk model has potential ability for prognostic prediction ofHCC patients, and it is signi�cantly associated with TIME.
Independence of the Risk Model
We further explored the relationship between risk score and clinicopathological characteristics, andassessed the independence of the constructed risk model via subgroup analysis and Cox regressionanalysis. The heatmap presented the distribution of clinical characteristics between the two groups,including age, gender, tumor grade, TNM stage, T stage, M stage, and N stage. Signi�cant differenceswere observed in gender, tumor grade, tumor stage, and T stage between the high- and low-risk groups(Figure 6A). Box plots further presented the signi�cant correlation between higher risk score and poorerclinical features (Figure 6B-H). Moreover, the results of subgroup analysis strati�ed by various clinicalcharacteristics showed that the survival time of HCC patients in the high-risk group was signi�cantlyshorter except the female and T1-T2 subgroups (Figure 7). Meanwhile, multivariate Cox regressionanalysis identi�ed that the constructed risk model was an independent prognostic marker for HCCpatients (Figure 6I). These results indicate that the risk model presents excellent independence inpredicting the prognosis of HCC.
Validation of the Risk Model
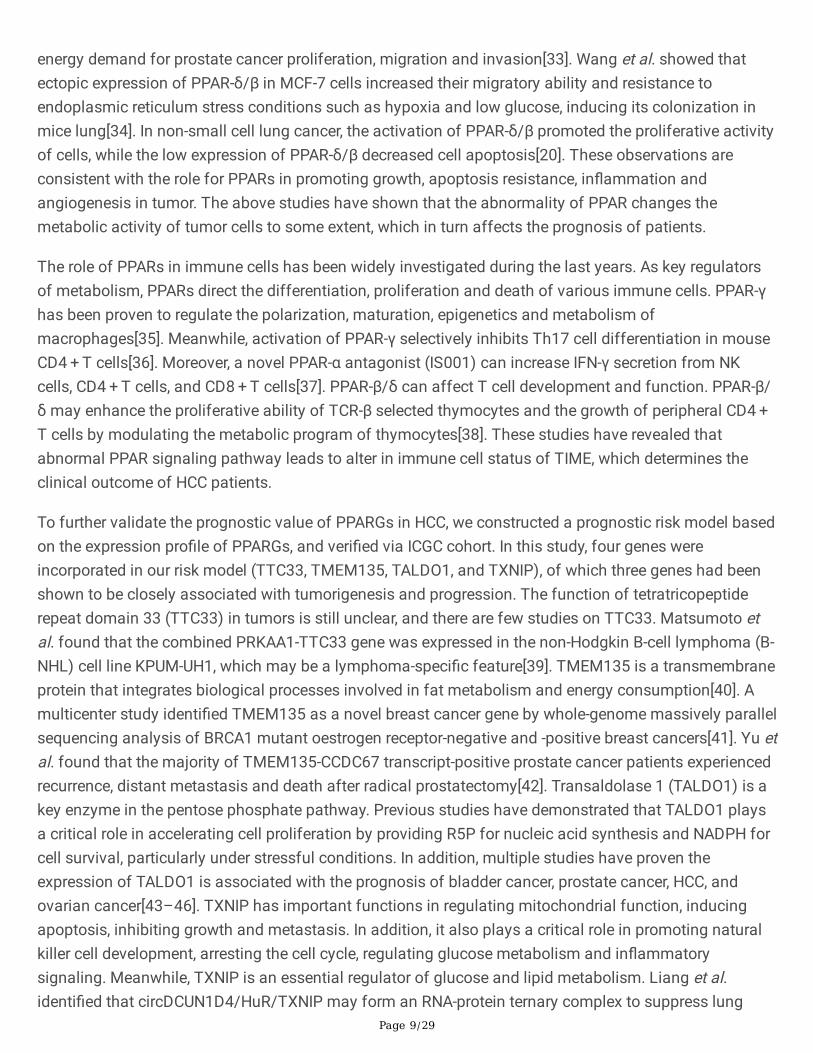
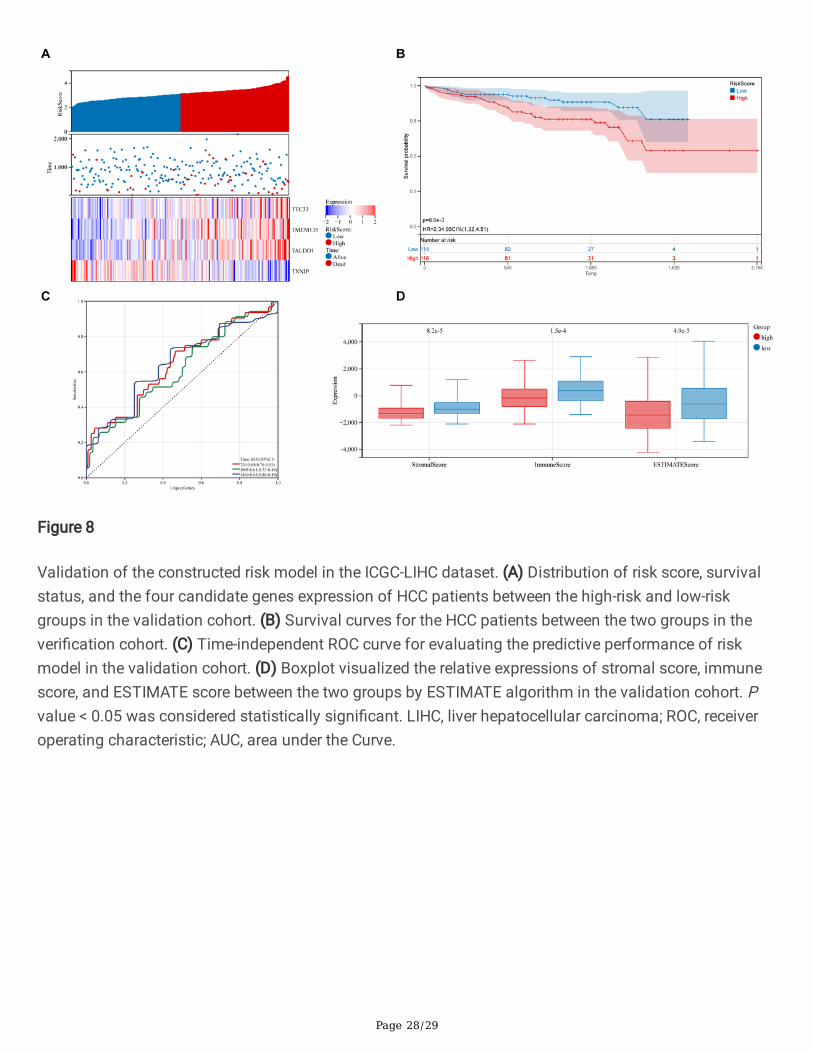
Subsequently, we validated the established risk model via HCC samples from the ICGC cohort. Based onthe formula of the risk score, we divided HCC patients into the high-risk and low-risk groups (Figure 8A).We observed that the distribution of expression levels of the four PPARGs in the validation cohortbetween the two groups was consistent with the training cohort (Figure 8A). Survival analysisdemonstrated that HCC patients in the high-risk group had a worse prognosis than the low-risk group (HR= 2.34, P = 8.6e-03; Figure 8B). ROC analysis showed that the risk model presented excellent predictiveaccuracy in predicting 3- and 4-year survival (Figure 8C). We also explored the relationship between riskmodel and TIME. Consistent with the results of the training cohort, the stromal score (P = 8.2e-05),immune score (P = 1.5e-04), and ESTIMATE score (P = 4.9e- 05) of low-risk group was signi�cantly higherthan the high-risk group (Figure 8D). These results indicate that the risk model is associated with TIMEand prognosis of HCC in the validation cohort.
Construction of an Integrated Nomogram
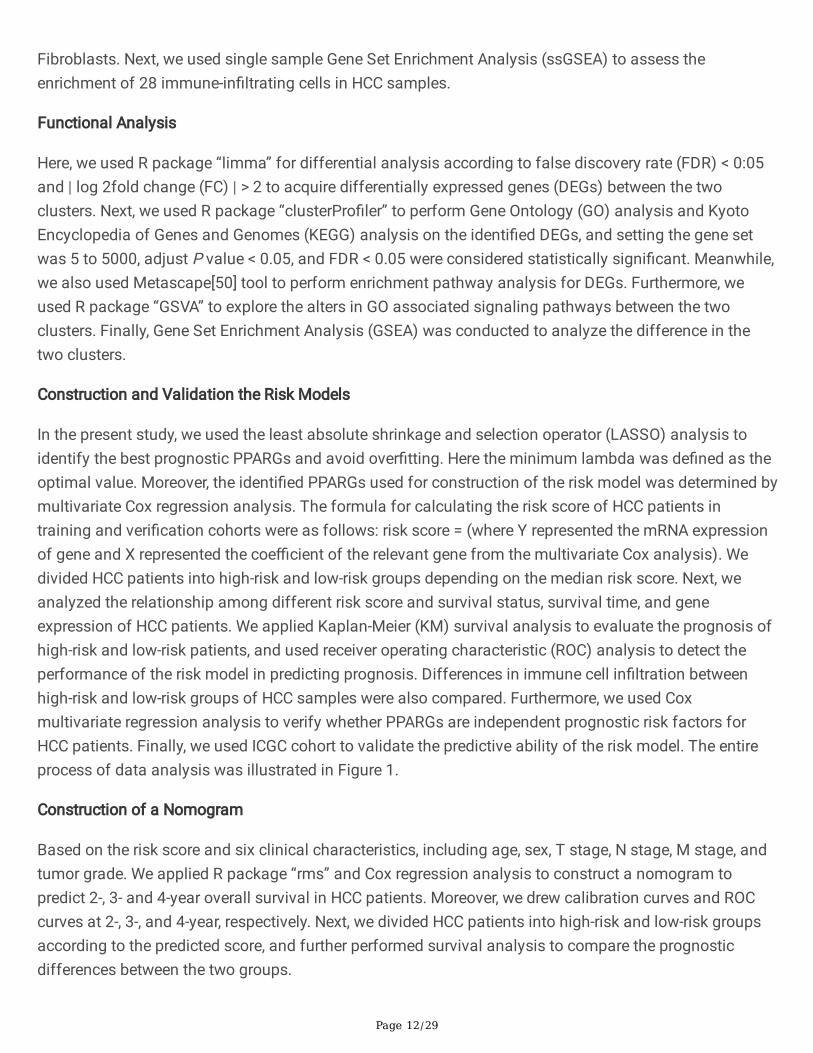
Ultimately, we constructed a nomogram integrating the risk model and clinical features, which could helpto more accurately predict the prognosis of HCC patients. The constructed nomogram was visualized inFigure 9A, and the risk score and clinicopathological features were assigned speci�c score according totheir degree of in�uence on the prognosis of HCC. Next, we further examined the nomogram. The C-indexand calibration curves showed acceptable accuracy of the nomogram for model diagnosis (Figure 9B-D).

Page 7/29
The C-index of the nomogram in the training cohort reached 0.7023 (95%CI: 0.6542-0.7507). It wasobserved that the overall survival of HCC patients was in well agreement with the actual survival at 2, 3and 4 years in the training cohort (Figure 9B-D). Survival analysis demonstrated that HCC patients withhigh predictive score in the nomogram had a worse prognosis than low predictive score (HR = 2.75, P =3.3e-08; Figure 9E). ROC analysis identi�ed that the constructed nomogram exhibited excellent predictiveability in predicting 4-year survival (Figure 9F).
DiscussionHCC is the most common primary malignancy of the liver[3]. In recent years, scientists have madesigni�cant efforts to uncover the etiology and mechanism of HCC, and a large number of detectionmethods and treatment strategies have emerged, but the 5-year survival rate of HCC patients is stilllow[4]. Therefore, it is necessary to develop effective risk strati�cation and individualized treatment plan.Numerous studies have shown that abnormal PPARs are involved in the tumorigenesis and progressionof various tumors, including skin cancer, colon cancer, breast cancer, and lung adenocarcinoma[15, 16,18–20]. Despite the important roles of PPARs in HCC, studies on the association between PPARs andpatient prognosis are still scarce. In the present study, we divided HCC patients into two molecularsubtypes based on the expression levels of PPARGs, which had signi�cant differences in prognosis andmetabolic activity. Immune analysis indicated that HCC patients in cluster 1 had disordered immunestatus, higher immune score and higher proportion of immune cell in�ltration than cluster 2. Furtherfunctional analyses demonstrated that abnormal expression of PPARs affects metabolic activity andtumor immunity. Moreover, we constructed a prognostic risk model based on four PPARGs (TTC33,TMEM135, TALDO1, and TXNIP), which could accurately predict the prognosis of HCC patients. Finally,we integrated clinical features and risk score to establish a nomogram, which further improved theaccuracy of predicting the prognosis of HCC patients. Our �ndings may facilitate the development oftargeted therapy for HCC and guide the formulation of rational clinical treatment decisions.
In this study, we �rstly divided HCC patients into two molecular subgroups via consensus clusteringanalysis based on the PPARGs expression matrix of TCGA-LIHC, with distinct differences in tumorprogression and clinical outcomes. Subsequently, we explored the function of PPARs in HCC byimmunological and functional analyses of two molecular subgroups. Tumor progression is associatedwith changes in surrounding stroma, since TIME determines the prognosis of patients to a certain extent,with immune cells are the key components of TIME[21, 22]. The ESTIMATE algorithm can infer theproportion of immune and stromal cells in tumors according to gene expression values. The immunescore obtained via the ESTIMATE algorithm shows the immune components of each tumor sample,which can re�ect TIME more objectively[23]. A previous study by Xiang and Hu et al. identi�ed that higherimmune/stromal/estimate scores were signi�cantly associated with better survival bene�t in HCCpatients[24, 25]. However, some studies had also pointed out that the immune score was higher in thesubgroup with poor prognosis of HCC[26]. Therefore, we cannot judge the prognosis of HCC patientssimply based on the immune score, it can only indicate that the immune status of HCC patients isdisordered. In this study, we used the ESTIMATE algorithm to assess the difference in TIME between the

Page 8/29
identi�ed molecular subgroup. Our results presented that HCC patients in cluster 1 had faster diseaseprogression and higher immune score than cluster 2. In addition, we applied the other methods, MCP-counter and ssGSEA, to assess the immune status of two molecular subgroups. The results of MCP-counter analysis showed that the number of seven out of ten immune cells was signi�cantly increased incluster 1, which was consistent with the results of ESTIMATE analysis. These results indicated that theimmune status of cluster 1 was up-regulated. The ssGSEA analysis summarized the proportion of 28immune cells in HCC samples, and we found that the proportion of 16 immune in�ltrating cells wassigni�cantly increased, indicating that cluster 1 was in a correspondingly high immune state, furtherproving the reliability of the ESTIMATE and TIMER results. Taken together, we can reasonably assumethat the disturbance of the immune system is closely related to the prognosis of HCC patients.
Next, we explored the underlying biological mechanisms of the two molecular subgroups by functionalanalysis. GO, KEGG and PPI analyses synergistically suggested that aberrant metabolic regulation maymediate the function of PPARs in HCC formation and progression based on the identi�ed DEGs. However,the exact relationship between PPARs and metabolic dysregulation remains unknown. Therefore, we usedGSEA and GSVA analyses to further research the in-depth mechanisms. GSVA analysis calculates theactivity of signaling pathways in each sample based on gene expression matrix and can estimatedifferences between groups. The results of GSVA analysis identi�ed that various metabolic pathwayswere signi�cantly inhibited in cluster 1. GSEA analysis is able to integrate gene expression information todirectly elucidate the expression trends of signaling pathway gene sets in different groups. In the presentstudy, the GSEA results also indicated that the corresponding metabolic level was low in cluster 1. Theseresults explain that the abnormality of PPARs signi�cantly alters the metabolic level of HCC patients,affecting the clinical outcomes of patients.
Based on the above research results, we can reasonably infer that the abnormality of PPARs will causethe disorder of metabolic level and TIME in patients, and ultimately lead to the poor prognosis of HCC. Aspreviously mentioned, PPAR is important mediator closely related to tumor metabolism[27]. AberrantPPAR signaling pathway in tumors has gained widespread attention over the past few decades. ThePPAR pathway regulates energy metabolism and in�ammatory response in the body, which exerts anti-�brotic and anti-in�ammatory effects in various diseases, including tumors, autoimmune diseases,hepatic steatosis, and type 2 diabetes (T2D)[28]. Activation of PPAR-α can induce apoptosis and tumorcell death, preventing uncontrolled tumor expansion and in�ammatory responses. Meanwhile, PPAR-αacts as an inhibitor of colon carcinogenesis in mouse, which expression is downregulated in tumors[29].PPAR-α de�cient mice promote methylation of tumor suppressor genes P21 and p27 by improving theexpression of DNMT1 and PRMT6[30]. Moreover, Rajarajan et al. demonstrated that PPAR-α knockdowndown-regulated the proliferative potential of leptin-induced breast cancer cells[18]. In a breast cancerstudy, PPAR-γ activation induced terminal differentiation of cancer cells into adipocytes and promotedtheir apoptosis accompanied by up-regulation of C/EBP-β expression, inhibiting tumor cellproliferation[31]. In addition, PPAR-γ activation signi�cantly reduces the invasive and metastatic abilitiesof human gastric adenocarcinoma by down-regulating the ERK-signaling pathway[32]. In terms ofmetabolism, activation of PPAR-γ can improve glucose and fat metabolism, demonstrating the high
Page 9/29
energy demand for prostate cancer proliferation, migration and invasion[33]. Wang et al. showed thatectopic expression of PPAR-δ/β in MCF-7 cells increased their migratory ability and resistance toendoplasmic reticulum stress conditions such as hypoxia and low glucose, inducing its colonization inmice lung[34]. In non-small cell lung cancer, the activation of PPAR-δ/β promoted the proliferative activityof cells, while the low expression of PPAR-δ/β decreased cell apoptosis[20]. These observations areconsistent with the role for PPARs in promoting growth, apoptosis resistance, in�ammation andangiogenesis in tumor. The above studies have shown that the abnormality of PPAR changes themetabolic activity of tumor cells to some extent, which in turn affects the prognosis of patients.
The role of PPARs in immune cells has been widely investigated during the last years. As key regulatorsof metabolism, PPARs direct the differentiation, proliferation and death of various immune cells. PPAR-γhas been proven to regulate the polarization, maturation, epigenetics and metabolism ofmacrophages[35]. Meanwhile, activation of PPAR-γ selectively inhibits Th17 cell differentiation in mouseCD4 + T cells[36]. Moreover, a novel PPAR-α antagonist (IS001) can increase IFN-γ secretion from NKcells, CD4 + T cells, and CD8 + T cells[37]. PPAR-β/δ can affect T cell development and function. PPAR-β/δ may enhance the proliferative ability of TCR-β selected thymocytes and the growth of peripheral CD4 + T cells by modulating the metabolic program of thymocytes[38]. These studies have revealed thatabnormal PPAR signaling pathway leads to alter in immune cell status of TIME, which determines theclinical outcome of HCC patients.
To further validate the prognostic value of PPARGs in HCC, we constructed a prognostic risk model basedon the expression pro�le of PPARGs, and veri�ed via ICGC cohort. In this study, four genes wereincorporated in our risk model (TTC33, TMEM135, TALDO1, and TXNIP), of which three genes had beenshown to be closely associated with tumorigenesis and progression. The function of tetratricopeptiderepeat domain 33 (TTC33) in tumors is still unclear, and there are few studies on TTC33. Matsumoto etal. found that the combined PRKAA1-TTC33 gene was expressed in the non-Hodgkin B-cell lymphoma (B-NHL) cell line KPUM-UH1, which may be a lymphoma-speci�c feature[39]. TMEM135 is a transmembraneprotein that integrates biological processes involved in fat metabolism and energy consumption[40]. Amulticenter study identi�ed TMEM135 as a novel breast cancer gene by whole-genome massively parallelsequencing analysis of BRCA1 mutant oestrogen receptor-negative and -positive breast cancers[41]. Yu etal. found that the majority of TMEM135-CCDC67 transcript-positive prostate cancer patients experiencedrecurrence, distant metastasis and death after radical prostatectomy[42]. Transaldolase 1 (TALDO1) is akey enzyme in the pentose phosphate pathway. Previous studies have demonstrated that TALDO1 playsa critical role in accelerating cell proliferation by providing R5P for nucleic acid synthesis and NADPH forcell survival, particularly under stressful conditions. In addition, multiple studies have proven theexpression of TALDO1 is associated with the prognosis of bladder cancer, prostate cancer, HCC, andovarian cancer[43–46]. TXNIP has important functions in regulating mitochondrial function, inducingapoptosis, inhibiting growth and metastasis. In addition, it also plays a critical role in promoting naturalkiller cell development, arresting the cell cycle, regulating glucose metabolism and in�ammatorysignaling. Meanwhile, TXNIP is an essential regulator of glucose and lipid metabolism. Liang et al.identi�ed that circDCUN1D4/HuR/TXNIP may form an RNA-protein ternary complex to suppress lung

Page 10/29
adenocarcinoma metastasis and glucose metabolism[47]. Numerous studies have shown that TXNIP is apotent tumor suppressor gene in breast, kidney, prostate and thyroid cancers, which is involved inmetabolic reprogramming and oxidative stress of tumor cells[48]. Moreover, in our study, KM survivalanalysis and ROC analysis identi�ed that the established risk model exhibited effective predictiveprognostic performance for HCC patients, both in the training cohort and the validation cohort.Signi�cantly lower stromal score, immune score and estimate score were associated with poorerprognosis. Furthermore, multivariate Cox survival analysis and subgroup analysis showed that the riskmodel could independently predict the prognosis of HCC regardless of the interference of confoundingfactors such as age, gender, tumor grade, TNM stage, T stage, N stage, and M stage. Ultimately, anomogram that integrating risk score and clinical characteristics was constructed and calibrated, whichpresented excellent properties in predicting survival of HCC patients. All results suggest that PPARGshave a signi�cant role in predicting prognosis of HCC, which are associated with abnormal metabolismand TIME.
In recent years, chemotherapy, molecular targeted therapy and immunotherapy of tumors have achievedsigni�cant advancement, but the prognosis of HCC patients is still poor. Therefore, it is extremelyimportant to �nd an effective method that divides patients into different subgroups according to theirprognostic risk score, and to formulate reasonable individualized and targeted treatment plans.Bioinformatics analysis based on RNA sequence is a feasible method for risk strati�cation and targetidenti�cation. Although many scholars have constructed HCC risk models based on glucose metabolism,ferroptosis, tumor microenvironment, immune cell in�ltration, and apoptosis, our study shows uniqueadvantages compared with previous studies. First, our work focused on abnormal PPARs in HCC patients,and identi�ed two molecular subgroups with different prognosis and immune status via consensusclustering approach. Subsequently, we explored the biological mechanisms of HCC based on the resultsof consensus clustering, and partially elucidated the underlying mechanisms. Meanwhile, we alsodemonstrated the effects of PPARs on metabolism, TIME and prognosis. Furthermore, our studyincorporates the TCGA and ICGC databases, which contains more samples than previous studies. Ourwork will provide excellent theoretical guidance for in-depth research on the mechanism of HCC. Not onlythat, the results of this study can promote the research progress of HCC targeted therapy and helpclinicians to formulate more rational treatment strategies.
Of course, there were still some �aws in our study, which should be addressed when generalizing theconclusions. First of all, our results were obtained via bioinformatics analysis, and had not been furtherveri�ed by in vitro and in vivo experiments. Second, the data we used were available from public opendatabases and were not validated with our own research cohort. The low-level of evidence nature ofretrospective studies still remained, and more prospective studies were needed to further con�rm theprognostic value of PPARGs in HCC.
Conclusion

Page 11/29
In conclusion, in this study, two molecular subtypes were identi�ed via consensus clustering methodbased on PPARGs in HCC. Immune analysis and functional analyses identi�ed that abnormal PPARs canaffect the immune system and metabolic activity of the body, resulting in poor prognosis in HCC patients.Our work may provide a novel perspective for developing new targeted drugs for HCC, providingtheoretical support for individualized treatment, and promoting risk strati�cation.
Materials And MethodsData Acquisition
We obtained RNA-sequence and clinical characteristics information of HCC patients from The CancerGenome Atlas database (TCGA, https://portal.gdc.cancer.gov/repository) and International CancerGenome Consortium (ICGC, https://dcc.icgc.org/projects/LIRI-JP) database. The inclusion criteria were asfollows: (a) the sample was diagnosed with HCC; (b) clinical information and expression matrix ofsamples were complete; (c) only one sample was included if there were paired sample. The exclusioncriteria were as follows: (a) normal hepatic tissue samples; (b) samples with missing clinical informationor more than half of the gene expression values. Finally, 365 HCC samples obtained from TCGA databasewere served as training cohort. 231 HCC samples acquired from ICGC database were de�ned asvalidation cohort. Demographic and clinical characteristics of the training and validation cohorts werepresented in Table 1. 128 PPAR-targeted genes were available from the PPARgene database(http://www.ppargene.org/).
Identify Molecular Subgroups
We used R package “survival” to assess the prognostic signi�cance of each gene in the TCGA-LIHCdatabase by integrating survival time, survival status, and gene expression data. PPARGs thatsigni�cantly associated with HCC prognosis were screened. Next, we performed cluster analysis using Rpackage “ConsensusClusterPlus”, and determined the optimal number of clusters through the empiricalcumulative distribution function. We then analyzed the prognostic difference between the molecularsubgroups and drew the survival curve by using the surv�t function of R package “survival”, and used thelog rank test to evaluate the signi�cance between these subgroups. In addition, we use R package“pheatmap” to draw the distribution of PPARGs expression and clinicopathological features between themolecular subgroups.
TIME Evaluation and Immune Analysis
In this study, we used the Estimation of Stromal and Immune cells in Malignant Tumor tissues usingExpression data (ESTIMATE) algorithm[23] to calculate the stromal score, immune score, and estimatescore of stromal cells and immune cells in HCC tissues. Microenvironment Cell Populations-counter(MCP-counter) analysis[49] was used to calculate T cells, CD8 T cells, Cytotoxic lymphocytes, B lineageNumber of NK cells, Monocytic lineage, Myeloid dendritic cells, Neutrophils, Endothelial cells, and
Page 12/29
Fibroblasts. Next, we used single sample Gene Set Enrichment Analysis (ssGSEA) to assess theenrichment of 28 immune-in�ltrating cells in HCC samples.
Functional Analysis
Here, we used R package “limma” for differential analysis according to false discovery rate (FDR) < 0:05and ∣ log 2fold change (FC) ∣ > 2 to acquire differentially expressed genes (DEGs) between the twoclusters. Next, we used R package “clusterPro�ler” to perform Gene Ontology (GO) analysis and KyotoEncyclopedia of Genes and Genomes (KEGG) analysis on the identi�ed DEGs, and setting the gene setwas 5 to 5000, adjust P value < 0.05, and FDR < 0.05 were considered statistically signi�cant. Meanwhile,we also used Metascape[50] tool to perform enrichment pathway analysis for DEGs. Furthermore, weused R package “GSVA” to explore the alters in GO associated signaling pathways between the twoclusters. Finally, Gene Set Enrichment Analysis (GSEA) was conducted to analyze the difference in thetwo clusters.
Construction and Validation the Risk Models
In the present study, we used the least absolute shrinkage and selection operator (LASSO) analysis toidentify the best prognostic PPARGs and avoid over�tting. Here the minimum lambda was de�ned as theoptimal value. Moreover, the identi�ed PPARGs used for construction of the risk model was determined bymultivariate Cox regression analysis. The formula for calculating the risk score of HCC patients intraining and veri�cation cohorts were as follows: risk score = (where Y represented the mRNA expressionof gene and X represented the coe�cient of the relevant gene from the multivariate Cox analysis). Wedivided HCC patients into high-risk and low-risk groups depending on the median risk score. Next, weanalyzed the relationship among different risk score and survival status, survival time, and geneexpression of HCC patients. We applied Kaplan-Meier (KM) survival analysis to evaluate the prognosis ofhigh-risk and low-risk patients, and used receiver operating characteristic (ROC) analysis to detect theperformance of the risk model in predicting prognosis. Differences in immune cell in�ltration betweenhigh-risk and low-risk groups of HCC samples were also compared. Furthermore, we used Coxmultivariate regression analysis to verify whether PPARGs are independent prognostic risk factors forHCC patients. Finally, we used ICGC cohort to validate the predictive ability of the risk model. The entireprocess of data analysis was illustrated in Figure 1.
Construction of a Nomogram
Based on the risk score and six clinical characteristics, including age, sex, T stage, N stage, M stage, andtumor grade. We applied R package “rms” and Cox regression analysis to construct a nomogram topredict 2-, 3- and 4-year overall survival in HCC patients. Moreover, we drew calibration curves and ROCcurves at 2-, 3-, and 4-year, respectively. Next, we divided HCC patients into high-risk and low-risk groupsaccording to the predicted score, and further performed survival analysis to compare the prognosticdifferences between the two groups.
Page 13/29
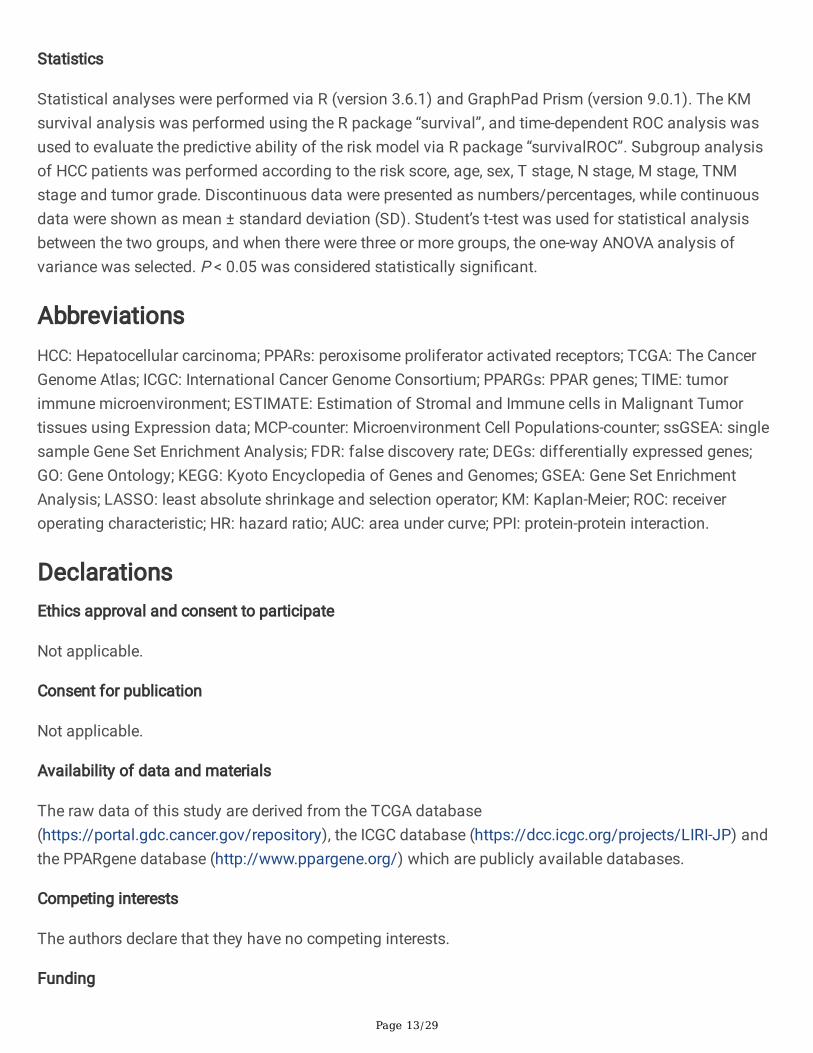
Statistics
Statistical analyses were performed via R (version 3.6.1) and GraphPad Prism (version 9.0.1). The KMsurvival analysis was performed using the R package “survival”, and time-dependent ROC analysis wasused to evaluate the predictive ability of the risk model via R package “survivalROC”. Subgroup analysisof HCC patients was performed according to the risk score, age, sex, T stage, N stage, M stage, TNMstage and tumor grade. Discontinuous data were presented as numbers/percentages, while continuousdata were shown as mean ± standard deviation (SD). Student’s t-test was used for statistical analysisbetween the two groups, and when there were three or more groups, the one-way ANOVA analysis ofvariance was selected. P < 0.05 was considered statistically signi�cant.
AbbreviationsHCC: Hepatocellular carcinoma; PPARs: peroxisome proliferator activated receptors; TCGA: The CancerGenome Atlas; ICGC: International Cancer Genome Consortium; PPARGs: PPAR genes; TIME: tumorimmune microenvironment; ESTIMATE: Estimation of Stromal and Immune cells in Malignant Tumortissues using Expression data; MCP-counter: Microenvironment Cell Populations-counter; ssGSEA: singlesample Gene Set Enrichment Analysis; FDR: false discovery rate; DEGs: differentially expressed genes;GO: Gene Ontology; KEGG: Kyoto Encyclopedia of Genes and Genomes; GSEA: Gene Set EnrichmentAnalysis; LASSO: least absolute shrinkage and selection operator; KM: Kaplan-Meier; ROC: receiveroperating characteristic; HR: hazard ratio; AUC: area under curve; PPI: protein-protein interaction.
DeclarationsEthics approval and consent to participate
Not applicable.
Consent for publication
Not applicable.
Availability of data and materials
The raw data of this study are derived from the TCGA database(https://portal.gdc.cancer.gov/repository), the ICGC database (https://dcc.icgc.org/projects/LIRI-JP) andthe PPARgene database (http://www.ppargene.org/) which are publicly available databases.
Competing interests
The authors declare that they have no competing interests.
Funding
Page 14/29
This research was supported by the National Natural Science Foundation of China [Grant No.NSF82060127]; the Yunnan Provincial Organ Transplantation Clinical Medical Center [Grant No.2020SYZ-Z-044]; and the Postgraduate Innovation Fund of Kunming Medical University under the grant[Grant No. 2022B16].
Authors’ contributions
QS and JR conceived and designed the study. QS, SN and JR performed the data curation and analysis.QS, SN and JR analyzed and interpreted the results. QS and JR drafted and reviewed the manuscript. Allauthors reviewed and approved the �nal manuscript.
Acknowledgements
The authors gratefully acknowledge the TCGA, ICGC, PPARgene, and Metascape database, which madethe data available.
References1. Nguyen T, Le A: The Metabolism of Renal Cell Carcinomas and Liver Cancer. Adv Exp Med Biol 2018,
1063:107–118.
2. Sia D, Villanueva A, Friedman SL, Llovet JM: Liver Cancer Cell of Origin, Molecular Class, and Effectson Patient Prognosis. Gastroenterology 2017, 152(4):745–761.
3. Couri T, Pillai A: Goals and targets for personalized therapy for HCC. Hepatol Int 2019, 13(2):125–137.
4. Chen Z, Xie H, Hu M, Huang T, Hu Y, Sang N, Zhao Y: Recent progress in treatment of hepatocellularcarcinoma. Am J Cancer Res 2020, 10(9):2993–3036.
5. Yamashita T, Kaneko S: [Liver Cancer]. Rinsho Byori 2016, 64(7):787–796.
�. Buendia MA, Neuveut C: Hepatocellular carcinoma. Cold Spring Harb Perspect Med 2015,5(2):a021444.
7. Feo F, De Miglio MR, Simile MM, Muroni MR, Calvisi DF, Frau M, Pascale RM: Hepatocellularcarcinoma as a complex polygenic disease. Interpretive analysis of recent developments on geneticpredisposition. Biochim Biophys Acta 2006, 1765(2):126–147.
�. Christo�des A, Konstantinidou E, Jani C, Boussiotis VA: The role of peroxisome proliferator-activatedreceptors (PPAR) in immune responses. Metabolism 2021, 114:154338.
9. Wang Y, Nakajima T, Gonzalez FJ, Tanaka N: PPARs as Metabolic Regulators in the Liver: Lessonsfrom Liver-Speci�c PPAR-Null Mice. Int J Mol Sci 2020, 21(6).
10. Grabacka M, Pierzchalska M, Plonka PM, Pierzchalski P: The Role of PPAR Alpha in the Modulationof Innate Immunity. Int J Mol Sci 2021, 22(19).
11. Wagner N, Wagner KD: PPAR Beta/Delta and the Hallmarks of Cancer. Cells 2020, 9(5).

Page 15/29
12. Janani C, Ranjitha Kumari BD: PPAR gamma gene–a review. Diabetes Metab Syndr 2015, 9(1):46–50.
13. Muzio G, Martinasso G, Trombetta A, Di Simone D, Canuto RA, Maggiora M: HMG-CoA reductase andPPARalpha are involved in clo�brate-induced apoptosis in human keratinocytes. Apoptosis 2006,11(2):265–275.
14. Corton JC, Peters JM, Klaunig JE: The PPARalpha-dependent rodent liver tumor response is notrelevant to humans: addressing misconceptions. Arch Toxicol 2018, 92(1):83–119.
15. Savic D, Ramaker RC, Roberts BS, Dean EC, Burwell TC, Meadows SK, Cooper SJ, Garabedian MJ,Gertz J, Myers RM: Distinct gene regulatory programs de�ne the inhibitory effects of liver X receptorsand PPARG on cancer cell proliferation. Genome Med 2016, 8(1):74.
1�. Montagner A, Delgado MB, Tallichet-Blanc C, Chan JS, Sng MK, Mottaz H, Degueurce G, Lippi Y,Moret C, Baruchet M et al: Src is activated by the nuclear receptor peroxisome proliferator-activatedreceptor beta/delta in ultraviolet radiation-induced skin cancer. EMBO Mol Med 2014, 6(1):80–98.
17. Zuo X, Xu W, Xu M, Tian R, Moussalli MJ, Mao F, Zheng X, Wang J, Morris JS, Gagea M et al:Metastasis regulation by PPARD expression in cancer cells. JCI Insight 2017, 2(1):e91419.
1�. Rajarajan D, Natesh J, Penta D, Meeran SM: Dietary Piperine Suppresses Obesity-Associated BreastCancer Growth and Metastasis by Regulating the miR-181c-3p/PPARalpha Axis. J Agric Food Chem2021, 69(51):15562–15574.
19. Xu YY, Liu H, Su L, Xu N, Xu DH, Liu HY, Spaner D, Bed-David Y, Li YJ: PPARgamma inhibits breastcancer progression by upregulating PTPRF expression. Eur Rev Med Pharmacol Sci 2019,23(22):9965–9977.
20. Genini D, Garcia-Escudero R, Carbone GM, Catapano CV: Transcriptional and Non-TranscriptionalFunctions of PPARbeta/delta in Non-Small Cell Lung Cancer. PLoS One 2012, 7(9):e46009.
21. Hinshaw DC, Shevde LA: The Tumor Microenvironment Innately Modulates Cancer Progression.Cancer Res 2019, 79(18):4557–4566.
22. Ren X, Zhang L, Zhang Y, Li Z, Siemers N, Zhang Z: Insights Gained from Single-Cell Analysis ofImmune Cells in the Tumor Microenvironment. Annu Rev Immunol 2021, 39:583–609.
23. Yoshihara K, Shahmoradgoli M, Martinez E, Vegesna R, Kim H, Torres-Garcia W, Trevino V, Shen H,Laird PW, Levine DA et al: Inferring tumour purity and stromal and immune cell admixture fromexpression data. Nat Commun 2013, 4:2612.
24. Xiang S, Li J, Shen J, Zhao Y, Wu X, Li M, Yang X, Kaboli PJ, Du F, Zheng Y et al: Identi�cation ofPrognostic Genes in the Tumor Microenvironment of Hepatocellular Carcinoma. Front Immunol 2021,12:653836.
25. Hu B, Yang XB, Sang XT: Molecular subtypes based on immune-related genes predict the prognosisfor hepatocellular carcinoma patients. Int Immunopharmacol 2021, 90:107164.
2�. Xu D, Wang Y, Wu J, Lin S, Chen Y, Zheng J: Identi�cation and clinical validation of EMT-associatedprognostic features based on hepatocellular carcinoma. Cancer Cell Int 2021, 21(1):621.

Page 16/29
27. Bahrambeigi S, Molaparast M, Sohrabi F, Sei� L, Faraji A, Fani S, Sha�ei-Irannejad V: Targeting PPARligands as possible approaches for metabolic reprogramming of T cells in cancer immunotherapy.Immunol Lett 2020, 220:32–37.
2�. Wagner N, Wagner KD: The Role of PPARs in Disease. Cells 2020, 9(11).
29. Yaghoubizadeh M, Pishkar L, Basati G: Aberrant Expression of Peroxisome Proliferator-ActivatedReceptors in Colorectal Cancer and Their Association with Cancer Progression and Prognosis.Gastrointest Tumors 2020, 7(1–2):11–20.
30. Luo Y, Xie C, Brocker CN, Fan J, Wu X, Feng L, Wang Q, Zhao J, Lu D, Tandon M et al: IntestinalPPARalpha Protects Against Colon Carcinogenesis via Regulation of Methyltransferases DNMT1 andPRMT6. Gastroenterology 2019, 157(3):744–759 e744.
31. Li H, Wang Q, Dong L, Liu C, Sun Z, Gao L, Wang X: Morusin suppresses breast cancer cell growth invitro and in vivo through C/EBPbeta and PPARgamma mediated lipoapoptosis. J Exp Clin CancerRes 2015, 34:137.
32. Elrod HA, Sun SY: PPARgamma and Apoptosis in Cancer. PPAR Res 2008, 2008:704165.
33. Ha X, Wang J, Chen K, Deng Y, Zhang X, Feng J, Li X, Zhu J, Ma Y, Qiu T et al: Free Fatty AcidsPromote the Development of Prostate Cancer by Upregulating Peroxisome Proliferator-ActivatedReceptor Gamma. Cancer Manag Res 2020, 12:1355–1369.
34. Wang X, Wang G, Shi Y, Sun L, Gorczynski R, Li YJ, Xu Z, Spaner DE: PPAR-delta promotes survival ofbreast cancer cells in harsh metabolic conditions. Oncogenesis 2016, 5(6):e232.
35. Stafeev YS, Michurina SS, Zubkova ES, Beloglazova IB, Ratner EI, Parfenova EV, Men'shikov MY:Modulation of the In�ammatory Status of Macrophages and Their Paracrine Effect on the Sensitivityof Adipocytes to Insulin with Sirtuin and PPARgamma Receptor Activators. Bull Exp Biol Med 2018,165(4):429–433.
3�. Klotz L, Burgdorf S, Dani I, Saijo K, Flossdorf J, Hucke S, Alferink J, Nowak N, Beyer M, Mayer G et al:The nuclear receptor PPAR gamma selectively inhibits Th17 differentiation in a T cell-intrinsicfashion and suppresses CNS autoimmunity. J Exp Med 2009, 206(10):2079–2089.
37. Zhang MA, Ahn JJ, Zhao FL, Selvanantham T, Mallevaey T, Stock N, Correa L, Clark R, Spaner D,Dunn SE: Antagonizing Peroxisome Proliferator-Activated Receptor alpha Activity SelectivelyEnhances Th1 Immunity in Male Mice. J Immunol 2015, 195(11):5189–5202.
3�. Zhao FL, Ahn JJ, Chen ELY, Yi TJ, Stickle NH, Spaner D, Zuniga-P�ucker JC, Dunn SE: PeroxisomeProliferator-Activated Receptor-delta Supports the Metabolic Requirements of Cell Growth inTCRbeta-Selected Thymocytes and Peripheral CD4(+) T Cells. J Immunol 2018, 201(9):2664–2682.
39. Matsumoto Y, Tsukamoto T, Chinen Y, Shimura Y, Sasaki N, Nagoshi H, Sato R, Adachi H, Nakano M,Horiike S et al: Detection of novel and recurrent conjoined genes in non-Hodgkin B-cell lymphoma. JClin Exp Hematop 2021, 61(2):71–77.
40. Exil VJ, Silva Avila D, Benedetto A, Exil EA, Adams MR, Au C, Aschner M: Stressed-induced TMEM135protein is part of a conserved genetic network involved in fat storage and longevity regulation inCaenorhabditis elegans. PLoS One 2010, 5(12):e14228.

Page 17/29
41. Natrajan R, Mackay A, Lambros MB, Weigelt B, Wilkerson PM, Manie E, Grigoriadis A, A'Hern R, vander Groep P, Kozarewa I et al: A whole-genome massively parallel sequencing analysis of BRCA1mutant oestrogen receptor-negative and -positive breast cancers. J Pathol 2012, 227(1):29–41.
42. Yu YP, Ding Y, Chen Z, Liu S, Michalopoulos A, Chen R, Gulzar ZG, Yang B, Cieply KM, Luvison A et al:Novel fusion transcripts associate with progressive prostate cancer. Am J Pathol 2014,184(10):2840–2849.
43. Silvers CR, Miyamoto H, Messing EM, Netto GJ, Lee YF: Characterization of urinary extracellularvesicle proteins in muscle-invasive bladder cancer. Oncotarget 2017, 8(53):91199–91208.
44. Leduc CA, Crouch EE, Wilson A, Lefkowitch J, Wamelink MM, Jakobs C, Salomons GS, Sun X, Shen Y,Chung WK: Novel association of early onset hepatocellular carcinoma with transaldolase de�ciency.JIMD Rep 2014, 12:121–127.
45. Yi H, Zheng X, Song J, Shen R, Su Y, Lin D: Exosomes mediated pentose phosphate pathway inovarian cancer metastasis: a proteomics analysis. Int J Clin Exp Pathol 2015, 8(12):15719–15728.
4�. Wu YR, Lee YC, Li WM, Hsu WC, Lin HH, Chang LL, Huang AM, Jhan JH, Wu WJ, Li CC et al: HighTransaldolase 1 expression predicts poor survival of patients with upper tract urothelial carcinoma.Pathol Int 2021, 71(7):463–470.
47. Liang Y, Wang H, Chen B, Mao Q, Xia W, Zhang T, Song X, Zhang Z, Xu L, Dong G et al: circDCUN1D4suppresses tumor metastasis and glycolysis in lung adenocarcinoma by stabilizing TXNIPexpression. Mol Ther Nucleic Acids 2021, 23:355–368.
4�. Chen Y, Ning J, Cao W, Wang S, Du T, Jiang J, Feng X, Zhang B: Research Progress of TXNIP as aTumor Suppressor Gene Participating in the Metabolic Reprogramming and Oxidative Stress ofCancer Cells in Various Cancers. Front Oncol 2020, 10:568574.
49. Becht E, Giraldo NA, Lacroix L, Buttard B, Elarouci N, Petitprez F, Selves J, Laurent-Puig P, Sautes-Fridman C, Fridman WH et al: Estimating the population abundance of tissue-in�ltrating immune andstromal cell populations using gene expression. Genome Biol 2016, 17(1):218.
50. Zhou Y, Zhou B, Pache L, Chang M, Khodabakhshi AH, Tanaseichuk O, Benner C, Chanda SK:Metascape provides a biologist-oriented resource for the analysis of systems-level datasets. NatCommun 2019, 10(1):1523.
TablesTable 1 The baseline clinical characteristics of the HCC patients in this study.

Page 18/29
Parameter Training cohort (n=365) Validation cohort (n = 231)
n / % n / %
Age
< = 65 227(62.2%) 89(38.5%)
> 65 138(37.8%) 142(61.5%)
Sex
Female 119(32.6%) 61(26.4%)
Male 246(67.4%) 170(73.6%)
Survival status
Alive 235(64.4%) 189(81.8%)
Dead 130(35.6%) 42(18.2%)
Grade
G1 55(15.1%) 20(8.7%)
G2 175(47.9%) 121(52.4%)
G3 118(32.3%) 22(9.5%)
G4 12(3.3%) 1(0.4%)
Unknown 5(1.4%) 67(29.0%)
Stage
I 170(46.6%) 37(16.0%)
II 84(23.0%) 104(45.0%)
III 83(22.7%) 71(30.7%)
IV 4(1.1%) 19(8.2%)
Unknown 24(6.6%)
Table 2 Signi�cant genes generated in Univariate Cox regression analysis.

Page 19/29
Genes HR HR 95%CI (lower) HR 95%CI (upper) P-value
GYS2 0.858002507 0.779909239 0.94391535 0.00152169
HMOX1 1.222802023 1.06792305 1.400142817 0.003614367
FABP6 1.48436144 1.221486968 1.803808753 3.50215E-05
APOA1 0.922260784 0.867517781 0.980458236 0.009043234
UGDH 1.272337703 1.081453782 1.496913929 0.003560814
GPT 0.839311469 0.74739459 0.942532568 0.003035657
C3 0.878325113 0.792120965 0.973910599 0.012799364
CYP7A1 0.895343833 0.827652436 0.968571521 0.005588522
TXN 1.237713328 1.021331084 1.499938957 0.029445108
SULT2A1 0.91175855 0.851711111 0.976039461 0.007493962
AP2A2 2.101137205 1.345902392 3.280161757 0.001059511
CYP3A4 0.9418248 0.894371222 0.991796171 0.022505666
CYB5D2 0.639373098 0.493730588 0.827977787 0.000693004
IMPA2 1.279267833 1.026029359 1.595009123 0.028898231
PPARG 1.26729359 1.058246696 1.517635774 0.010085694
TTC33 1.491029247 1.107703473 2.007006631 0.00848503
ZNF367 1.258337712 1.029757182 1.537657445 0.02436015
AP2A1 1.413421092 1.004962696 1.987893869 0.046853219
ETFDH 0.779248934 0.628576322 0.966038457 0.022736336
PDK4 0.863975675 0.771845768 0.967102493 0.011011998
TMEM135 1.392907894 1.013477557 1.914391084 0.040960865
CDKN2C 1.300079197 1.105533862 1.528859474 0.001425417
BLOC1S4 1.59993271 1.199748509 2.133601048 0.001347636
CSNK1G2 1.530801625 1.103750241 2.12308322 0.010735274
DCP1A 1.809492568 1.221881343 2.679690114 0.00298392
TALDO1 1.428101349 1.165909786 1.749254949 0.000535936
PDK3 1.604062371 1.218076948 2.112359234 0.000721476
HBEGF 1.389011923 1.061010726 1.818411516 0.016975843

Page 20/29
FABP5 1.357411846 1.139356179 1.617200094 0.0006182
ACSL3 1.453406054 1.142560859 1.848819816 0.002330774
HCAR1 2.721464687 1.137354333 6.511928454 0.021960138
TFF2 1.140968122 1.026577727 1.26810491 0.013272959
PGK1 1.404128453 1.144511947 1.722635328 0.001207521
PKM 1.205911832 1.089002552 1.335371845 0.000290603
APOE 0.853108842 0.750006121 0.970385008 0.015851236
BRCA1 1.777446913 1.300525599 2.429262086 0.000279504
SAT1 0.744648994 0.574931419 0.964466553 0.025553656
CYP27A1 0.832393708 0.744205015 0.931032808 0.001266128
VEGFA 1.372385139 1.103813793 1.706303166 0.004394401
TXNIP 0.871569954 0.766679355 0.990810799 0.035451048
REN 0.819419222 0.676900509 0.991944683 0.039950485
CAT 0.835508834 0.709019493 0.984563919 0.03174238
SLC22A5 1.674661163 1.074210611 2.610745029 0.022716091
TNIP1 1.331322409 1.020155203 1.737401673 0.035222113
CYP2C8 0.91542608 0.852263675 0.983269535 0.014992217
HR, hazard ratio; CI, con�dence interval.
Figures

Page 21/29
Figure 1
Flow chart of the study design. LIHC, liver hepatocellular carcinoma.
Page 22/29
Figure 2
Consensus clustering analysis. (A-C) K = 2 was determined the optimal value for consensus clustering.(D) Survival curves for the HCC patients in the two clusters. (E) Heatmap depicted the expression of PPARgenes in the two clusters.
Page 23/29
Figure 3
Immune analyses in the two molecular subgroups. (A) Boxplot showed the relative expressions ofstromal score, immune score, and ESTIMATE score between the two clusters by ESTIMATE algorithm. (B)Boxplot presented the abundance of ten immune �ltrating cells between the two clusters by MCP-counter.(C) Heatmap visualized the relative enrichment of 28 immune related cells between the two clusters byssGSEA analysis. (D) Boxplot showed the statistical difference of ssGSEA analysis. P value < 0.05 wasconsidered statistically signi�cant. *P < 0.05, **P < 0.01, ***P < 0.001, and ****P < 0.0001.

Page 24/29
Figure 4
Identi�ed differential expression genes and functional analyses. (A) Volcano plot showed the DEGsbetween the two molecular subgroups. (B) Circle plot visualized the biological processes enriched by GOanalysis. (C) Bubble graph showed the signaling pathways enriched by KEGG analysis. (D-E) GO and PPIanalyses of DEGs by Metascape tool. (F) GSEA plots visualized the result of GSEA analysis. (G) Heatmapdemonstrated the result of GSVA analysis. DEGs, differential expression genes; GO, gene ontology; KEGG,kyoto encyclopedia of genes and genomes; PPI, protein-protein interaction; GSEA, gene set enrichmentanalysis; ES, enrichment score; FDR, false discovery rate.

Page 25/29
Figure 5
Construction of risk model based on PPARGs in the TCGA-LIHC dataset. (A) Coe�cient pro�le and tenfoldcross-validation of 45 PPARGs by LASSO analysis. (B) Identi�cation of 4 prognostic PPARGs bymultivariate Cox regression analysis. (C) Distribution of risk score, survival status, and the four candidategenes expression of HCC patients between the high-risk and low-risk groups. (D) Survival curves for theHCC patients between the two groups. (E) Time-independent ROC curve for evaluating the predictiveperformance of risk model. (F) Boxplot visualized the relative expressions of stromal score, immunescore, and ESTIMATE score between the two groups by ESTIMATE algorithm. P value < 0.05 was

Page 26/29
considered statistically signi�cant. LIHC, liver hepatocellular carcinoma; ROC, receiver operatingcharacteristic; AUC, area under the Curve.
Figure 6
Correlation between risk score and clinicopathological features. (A) Heatmap visualized the risk score inHCC patients at multiple clinical parameters, including age, gender, tumor grade, TNM stage, T stage, Mstage, and N stage. (B-H) Boxplot showed the risk score in HCC patients at subgroups strati�ed by age,gender, tumor grade, TNM stage, T stage, M stage, and N stage. P value < 0.05 was consideredstatistically signi�cant. *P < 0.05, **P < 0.01, and ***P < 0.001.

Page 27/29
Figure 7
Survival analysis. Kaplan-Meier curve showed the OS strati�ed by age (A, D), gender (B, E), tumor grade(C, F), TNM stage (G, J), T stage (H, K), M stage (I), and N stage (L) between the high-risk and low-riskgroups. P value < 0.05 was considered statistically signi�cant. OS, overall survival.
Page 28/29
Figure 8
Validation of the constructed risk model in the ICGC-LIHC dataset. (A) Distribution of risk score, survivalstatus, and the four candidate genes expression of HCC patients between the high-risk and low-riskgroups in the validation cohort. (B) Survival curves for the HCC patients between the two groups in theveri�cation cohort. (C) Time-independent ROC curve for evaluating the predictive performance of riskmodel in the validation cohort. (D) Boxplot visualized the relative expressions of stromal score, immunescore, and ESTIMATE score between the two groups by ESTIMATE algorithm in the validation cohort. Pvalue < 0.05 was considered statistically signi�cant. LIHC, liver hepatocellular carcinoma; ROC, receiveroperating characteristic; AUC, area under the Curve.

Page 29/29
Figure 9
Establishment of a nomogram in the TCGA-LIHC dataset. (A) Nomogram based on the risk score and sixclinical features, including age, sex, T stage, N stage, M stage, and tumor grade. (B-D) the 2-, 3-, 4-yearcalibration plot for the nomogram. (E) Survival curves for the HCC patients between the high predictivescore and low predictive score groups. (F) Time-independent ROC curve for evaluating the predictiveperformance of the nomogram. LIHC, liver hepatocellular carcinoma; ROC, receiver operatingcharacteristic; AUC, area under the Curve.