Sucrose Biotransformation to Fructooligosaccharides by Aspergillus sp. N74 Free Cells
Upload
independentCategory
view
1download
0
A
K
I
dhTtc
Ts
6
0d
Basic nutritional investigation
Pan-PPAR agonist beneficial effects in overweight mice fed a high-fathigh-sucrose diet
Caroline Fernandes-Santos, B.Sc., M.Sc.,Rafael Evangelista Carneiro, R.D., Leonardo de Souza Mendonca, B.Sc., M.Sc.,
Marcia Barbosa Aguila, R.D., Ph.D., and Carlos Alberto Mandarim-de-Lacerda, M.D., Ph.D.*Laboratory of Morphometry and Cardiovascular Morphology, Biomedical Center, Institute of Biology, State University of Rio de Janeiro,
Rio de Janeiro, Brazil
Manuscript received March 28, 2008; accepted December 11, 2008.
bstract Objective: We analyzed the effect of peroxisome proliferator-activated receptor (PPAR) agonistson adipose tissue morphology, adiponectin expression, and its relation to glucose and insulin levelsin C57BL/6 mice fed a high-fat high-sucrose (HFHS) diet.Methods: Male C57BL/6 mice received one of five diets: standard chow, HFHS chow, or HFHSplus rosiglitazone (PPAR-� agonist), fenofibrate (PPAR-� agonist), or bezafibrate (pan-PPARagonist). Diets were administered for 11 wk and medications from week 6 to week 11. Glucoseintolerance (GI) and insulin resistance were evaluated by oral glucose tolerance testing andhomeostasis model assessment for insulin resistance, respectively. Adipocyte diameter was analyzedin epididymal, inguinal, and retroperitoneal fat pads and by adiponectin immunostain.Results: Mice fed the HFHS chow had hyperglycemia, GI, insulin resistance, increased fat padweight, adipocyte hypertrophy, and decreased adiponectin immunostaining. Rosiglitazone improved GI,insulin sensitiveness, and adiponectin immunostaining, but it resulted in body weight gain, hyperphagia,and adipocyte and heart hypertrophy. Fenofibrate improved all parameters except for fasting glucose andGI. Bezafibrate was the most efficient in decreasing body weight and glucose intolerance.Conclusion: Activation of PPAR-�, -�, and -� together is better than the activation of PPAR-�or -� alone, because bezafibrate showed a wider range of action on metabolic, morphologic, andbiometric alterations due to an HFHS diet in mice. © 2009 Published by Elsevier Inc.
Nutrition 25 (2009) 818–827www.nutritionjrnl.com
eywords: Peroxisome proliferator-activated receptor; Fibrates; Thiazolidinediones; Adipocyte; Adiponectin
fccPbawi
(Piai
ntroduction
Common diseases of modern society such as obesity,iabetes, and cardiovascular disease are associated withigh-fat Western diets combined with a sedentary lifestyle.his alimentary habit goes against the “thrifty genotype”
hat promotes energy storage as triacylglycerol in adiposeells to meet demand in times of need [1].
This work was supported by the Brazilian Council of Science andechnology and the Rio de Janeiro State Foundation for Scientific Re-earch.
* Corresponding author. Tel.: �55-21-2587-6416; fax: �55-21-2587-133.
aE-mail address: [email protected] (C. A. Mandarim-de-Lacerda).
899-9007/09/$ – see front matter © 2009 Published by Elsevier Inc.oi:10.1016/j.nut.2008.12.010
Peroxisome proliferator-activated receptor (PPAR) is aamily of transcription factors intimately connected to theellular metabolism of lipids, carbohydrates, proteins, andell differentiation. They exist in three isoforms: PPAR-�,PAR-�, and PPAR-� [2]. PPAR-� is expressed in meta-olically active tissues including the liver, heart, kidney,nd skeletal muscle; PPAR-� is ubiquitously expressed,hereas PPAR-� expression is found predominantly in ad-
pose tissue, macrophages, the colon, and the placenta [3].The PPAR-modulating drugs such as thiazolidinediones
TZDs) and fibrates are well known by clinicians. TZDs arePAR-� activators and help to increase tissue sensitivity to
nsulin action in diabetic patients. Fibrates are PPAR-�gonists and decrease hepatic triacylglycerol production byncreasing fatty acid oxidation. PPAR-� activators are not
vailable as medicine, but there is strong evidence showing
tm
�dimt
oadMp
lbbsa(bo
M
A
plw(Mmk2mdoc7a((hSArgtHtwz
F
meiodi3
M
caecnpAwofam6cgccmc(Bl[m2
H
rahathH
B
f
819C. Fernandes-Santos et al. / Nutrition 25 (2009) 818–827
hat they can decrease adipocyte size and whole-body fatass [4,5].Although there is potential helpfulness of dual-PPAR-
/� agonists or pan-PPAR-�/�/� agonists to treat metaboliciseases, some of these drugs have side effects such asncreased adverse cardiovascular events (muraglitazar,yocardial infarction, stroke, and transient ischemic attack;
esaglitazar; increased serum creatinine) [6,7].Bezafibrate, a PPAR-� agonist, is a high-affinity ligand
f PPAR-� and PPAR-�, being considered a pan-PPARgonist [8,9]. Bezafibrate has been widely used to treatyslipidemia in humans with a good safety profile [10].oreover, clinical trials have highlighted its antidiabetic
roperties [11,12].The actions of TZDs and fibrates on carbohydrate and
ipid metabolism are well known, but a comparison of theeneficial effects on body fat and adipocyte behavior in vivoetween pan-PPAR agonists and single-PPAR agonists de-erves evaluation. Thus, this study aimed to investigate thections of bezafibrate (pan-PPAR agonist), rosiglitazonePPAR-� agonist), and fenofibrate (PPAR-� agonist) onody fat behavior in an animal model of type 2 diabetes andverweight induced by a high-fat high-sucrose (HFHS) diet.
aterials and methods
nimals and treatments
The handling and experimentation protocols were ap-roved by the local ethics committee on the care and use ofaboratory animals. The study was performed in accordanceith the guideline Care and Use of Laboratory Animals
U.S. National Institutes of Health 85-23, revised 1996).ale C57BL/6 mice 2 mo old were obtained from coloniesaintained at the State University of Rio de Janeiro and
ept under standard conditions (12-h light/dark cycles, 21 �°C, humidity 60 � 10%, and air exhaustion cycle 15in/h). Mice were randomly divided into two groups: stan-
ard chow (SC) for rodents (SC group, 3.81 kcal/g of chow)r HFHS chow (HFHS group, 4.71 kcal/g of chow). The SConsisted of 15% protein (casein), 9% fat (soybean oil), and6% carbohydrate (65% as corn starch and 11% as sucrose),nd the HFHS consisted of 14% protein (casein), 42% fat9% as soybean oil and 33% as lard), and 44% carbohydrate19% as corn starch and 25% as sucrose). Diets were en-anced with purified nutrients by Rhoster (Ribeirao Preto,P, Brazil, www.rhoster.com.br), in accordance withIN-93 recommendations [13]. After 6 wk, animals that
eceived HFHS chow were randomly allocated into fourroups: untreated HFHS group (HFHS), HFHS plus rosigli-azone (HFHS-Ro), HFHS plus fenofibrate (HFHS-Fe), andFHS plus bezafibrate (HFHS-Bz). Drugs were adminis-
ered by mixing with the chow for 5 wk (from week 6 toeek 11) at the following concentrations (w/w): rosiglita-
one 0.01%, fenofibrate 0.18%, and bezafibrate 0.40%. a
ood, energy, and water
Food and water were freely allowed and their intake wasonitored daily. Food intake was multiplied by chow en-
rgy (kilocalories per gram of chow) to obtain daily energyntake per mouse. Body mass was monitored weekly. Basedn daily food consumption and body mass, medicationoses corresponded to 9.4 � 0.09 mg · kg�1 · d�1 for ros-glitazone, 163.0 � 3.0 mg · kg�1 · d�1 for fenofibrate, and82.0 � 7.0 mg · kg�1 · d�1 for bezafibrate.
etabolic measurements
Before medications (week 6, pretreatment), blood wasollected after a 6-h fast by submandibular plexus bleedingnd used to measure plasma glucose concentration (glucom-ter; Accu-Chek, Roche, Sao Paulo, Brazil) and insulinoncentration (insulin ImmuChem-coated tube radioimmu-oassay kit, MP Biomedicals, Solon, OH, USA) afterlasma separation by centrifugation (120 � g for 15 min).t week 10, oral glucose tolerance testing was performedith 25% glucose in sterile saline (0.9% NaCl) at the dosef 1 g/kg, administered by orogastric gavage after a 6-hasting period. Blood was obtained by milking the tail afterlittle incision of its tip. Plasma glucose concentration waseasured before glucose administration and at 15, 30, and
0 min after glucose administration. The area under theurve was calculated using the trapezoid rule to assesslucose intolerance. At week 11 (post-treatment), blood wasollected at the moment of euthanasia after a 6-h fast andentrifuged at 120 � g for 15 min. Plasma insulin waseasured by radioimmunoassay and total cholesterol, tria-
ylglycerols, and high-density lipoprotein cholesterolHDL-C) were measured by a calorimetric assay (Bioclin,elo Horizonte, MG, Brazil). Low-density lipoprotein cho-
esterol (LDL-C) was calculated with the Friedewald equation14]. Insulin resistance (IR) was estimated by the homeostasisodel assessment index as HOMA-IR � (insulin � glucose)/
2.5 [15].
eart
At week 11, animals were deeply anesthetized withoutecovery (intraperitoneal sodium pentobarbital 15 mg/kg)nd their hearts were removed and weighed. The mouse leftind leg was removed by disarticulating the femur from thecetabulum at the hip. Tibia length (TL) was measured fromhe condyles to the tip of the medial malleolus to correcteart mass (HM) in relation to animal size, expressed as anM:TL ratio [16].
ody fat
Inguinal (subcutaneous), epididymal, and retroperitonealat pads were carefully dissected out from both sides of the
nimal. All subcutaneous fat between the lower part of the
rTtciyn(w(Sai2dC
I
gatbpmt(wtim
D
DyDwsHtc
R
F
gtobg
H(Aia1D
B
bitigtea5sbbp
P
Hrat
TF
P
P
P
pH
m
820 C. Fernandes-Santos et al. / Nutrition 25 (2009) 818–827
ib cage and the midthigh was considered inguinal fat [17].he fat connected to the posterior abdominal wall, around
he kidneys, and the abdominal part of the ureters wasonsidered retroperitoneal fat, and the abdominal fat locatedn the lower part of the abdomen connected to the epidid-mis was considered epididymal fat. The ratio of subcuta-eous to visceral fat was calculated as (inguinal fat mass)/epididymal � retroperitoneal fat masses). Adipose tissueas fixed in freshly prepared 4% (w/v) buffered formalin
pH 7.2), embedded in Paraplast plus (Sigma-Aldrich Co.,t. Louis, MO, USA), and sectioned at 5 �m of thickness,nd slices were stained with hematoxylin and eosin. Digitalmages were obtained from histologic sections, and at least50 adipocytes per group were randomly analyzed. Celliameters were measured with Image-Pro Plus 5.0 (Mediaybernetics, Silver Spring, MD, USA).
mmunohistochemistry
Paraplast sections (5 �m) from retroperitoneal and in-uinal adipose tissues were incubated with rabbit anti-diponectin antibody (A6354, Sigma-Aldrich Co.) at roomemperature for 2 h and this reaction was amplified by aiotin–streptavidin complex system (K0679; LSAB�Kit,eroxidase; Universal DakoCytomation, Glostrup, Den-ark). The positive immunoreaction was identified af-
er incubation with 3,3= diaminobenzidine tetrachlorideK3466; Universal DakoCytomation) and then sectionsere counterstained with Mayer’s hematoxylin. Adiponec-
in expression was classified using a semiquantitative scor-ng system (0, no expression; �, weak expression; ��,oderate expression; ���, strong expression).
ata analysis
Data are expressed as mean � standard error of the mean.ifferences among groups were analyzed with one-way anal-sis of variance (ANOVA) followed by Tukey’s post hoc test.ifferences in the same group at different times were testedith paired t test. Correlation and linear regression (least
quare method) were calculated to adipocyte diameter againstOMA-IR and area under the curve of oral glucose tolerance
esting (Statistica 7, Statsoft, Tulsa, OK, USA). P � 0.05 wasonsidered statistically significant.
esults
ood, energy, and water intake
Data are presented in Table 1. Until week 6, the HFHSroup ingested 10% less food daily than the SC group, buthey had a higher energetic intake (plus 10%, P � 0.0001,ne-way ANOVA). No difference in water intake was foundetween these two groups. The HFHS-Fe and HFHS-Bz
roups ingested the same amount of food and energy as the PFHS group; however rosiglitazone treatment increased itplus 15% versus the HFHS group, P � 0.0001, one-wayNOVA). Water intake was higher in the HFHS group than
n the SC group (plus 15%, P � 0.05, one-way ANOVA),nd it was decreased by rosiglitazone administration (less0% versus the HFHS group, P � 0.05, one-way ANOVA).iarrhea was not observed in the animals.
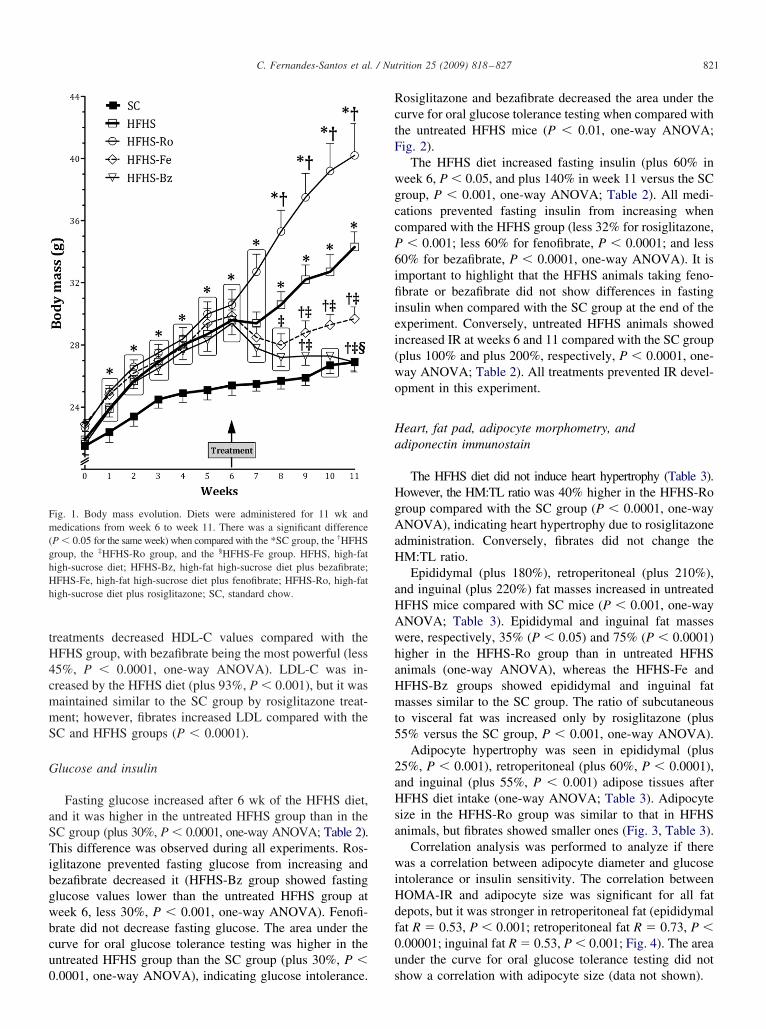
ody mass
Animals started the experiment with no difference inody mass at 22.2 � 0.2 g at 2 mo old. The HFHS chownduced body mass gain after the first week of administra-ion and, at week 6, HFHS animals showed a 17% increasen body mass when compared with the animals from the SCroup (P � 0.0001, one-way ANOVA; Fig. 1). The un-reated HFHS animals continued gaining weight until thend of the experiment, reaching 34.3 � 1.0 g. Rosiglitazonedministration resulted in excessive body mass gain (plus0% and plus 17% versus the SC and HFHS groups, re-pectively, P � 0.01, one-way ANOVA), whereas fenofi-rate prevented body mass gain and bezafibrate-inducedody mass loss (less 10% versus itself at week 6, P � 0.01,aired t test).
lasma lipid concentrations
Total cholesterol increased after the HFHS diet as didDL-C (plus 45%, P � 0.001, and plus 20%, P � 0.05,
espectively, one-way ANOVA; Table 2). The HFHS-Rond HFHS-Bz groups had lower total cholesterol valueshan the HFHS group (less 12%, P � 0.05, and less 15%,
able 1ood, energy, and water intake
arameters Food (g/d permouse)
Energy (kcal/dper mouse)
Water (mL/dper mouse)
retreatmentSC 3.0 � 0.04 11.5 � 0.2 4.5 � 0.2HFHS 2.7 � 0.02† 12.7 � 0.1† 4.5 � 0.1
ost-treatmentSC 2.7 � 0.03† 10.5 � 0.1†‡ 3.5 � 0.1†‡
HFHS 2.7 � 0.05† 12.7 � 0.3†§ 4.0 � 0.1‡§
HFHS-Ro 3.1 � 0.03‡§� 14.5 � 0.2†‡§� 3.6 � 0.1†‡�
HFHS-Fe 2.7 � 0.05†¶ 12.6 � 0.2†§¶ 4.1 � 0.1§¶
HFHS-Bz 2.6 � 0.05†¶ 12.2 � 0.3§¶ 4.3 � 0.1§¶
HFHS, high-fat high-sucrose diet; HFHS-Bz, high-fat high-sucrose dietlus bezafibrate; HFHS-Fe, high-fat high-sucrose diet plus fenofibrate;FHS-Ro, high-fat high-sucrose diet plus rosiglitazone; SC, standard chow† P � 0.05, significant difference versus SC group at pretreatment.‡ P � 0.05, significant difference versus HFHS group at pretreatment.§ P � 0.05, significant difference versus SC group after treatment.� P � 0.05, significant difference versus HFHS group after treatment.¶ P � 0.05, significant difference versus HFHS-Ro group after treat-ent.# P � 0.05, significant difference versus HFHS-Fe group after treatment.
� 0.05, respectively, one-way ANOVA), whereas all
tH4cmmS
G
aSTibgwbcu0
RctF
wgccP6ifiiei(wo
Ha
HgAaH
aHAwhaHmt5
2aHsa
wiHdf0u
Fm(ghHh
821C. Fernandes-Santos et al. / Nutrition 25 (2009) 818–827
reatments decreased HDL-C values compared with theFHS group, with bezafibrate being the most powerful (less5%, P � 0.0001, one-way ANOVA). LDL-C was in-reased by the HFHS diet (plus 93%, P � 0.001), but it wasaintained similar to the SC group by rosiglitazone treat-ent; however, fibrates increased LDL compared with theC and HFHS groups (P � 0.0001).
lucose and insulin
Fasting glucose increased after 6 wk of the HFHS diet,nd it was higher in the untreated HFHS group than in theC group (plus 30%, P � 0.0001, one-way ANOVA; Table 2).his difference was observed during all experiments. Ros-
glitazone prevented fasting glucose from increasing andezafibrate decreased it (HFHS-Bz group showed fastinglucose values lower than the untreated HFHS group ateek 6, less 30%, P � 0.001, one-way ANOVA). Fenofi-rate did not decrease fasting glucose. The area under theurve for oral glucose tolerance testing was higher in thentreated HFHS group than the SC group (plus 30%, P �
ig. 1. Body mass evolution. Diets were administered for 11 wk andedications from week 6 to week 11. There was a significant difference
P � 0.05 for the same week) when compared with the *SC group, the †HFHSroup, the ‡HFHS-Ro group, and the §HFHS-Fe group. HFHS, high-fatigh-sucrose diet; HFHS-Bz, high-fat high-sucrose diet plus bezafibrate;FHS-Fe, high-fat high-sucrose diet plus fenofibrate; HFHS-Ro, high-fatigh-sucrose diet plus rosiglitazone; SC, standard chow.
.0001, one-way ANOVA), indicating glucose intolerance. s
osiglitazone and bezafibrate decreased the area under theurve for oral glucose tolerance testing when compared withhe untreated HFHS mice (P � 0.01, one-way ANOVA;ig. 2).
The HFHS diet increased fasting insulin (plus 60% ineek 6, P � 0.05, and plus 140% in week 11 versus the SCroup, P � 0.001, one-way ANOVA; Table 2). All medi-ations prevented fasting insulin from increasing whenompared with the HFHS group (less 32% for rosiglitazone,� 0.001; less 60% for fenofibrate, P � 0.0001; and less
0% for bezafibrate, P � 0.0001, one-way ANOVA). It ismportant to highlight that the HFHS animals taking feno-brate or bezafibrate did not show differences in fasting
nsulin when compared with the SC group at the end of thexperiment. Conversely, untreated HFHS animals showedncreased IR at weeks 6 and 11 compared with the SC groupplus 100% and plus 200%, respectively, P � 0.0001, one-ay ANOVA; Table 2). All treatments prevented IR devel-pment in this experiment.
eart, fat pad, adipocyte morphometry, anddiponectin immunostain
The HFHS diet did not induce heart hypertrophy (Table 3).owever, the HM:TL ratio was 40% higher in the HFHS-Roroup compared with the SC group (P � 0.0001, one-wayNOVA), indicating heart hypertrophy due to rosiglitazone
dministration. Conversely, fibrates did not change theM:TL ratio.Epididymal (plus 180%), retroperitoneal (plus 210%),
nd inguinal (plus 220%) fat masses increased in untreatedFHS mice compared with SC mice (P � 0.001, one-wayNOVA; Table 3). Epididymal and inguinal fat massesere, respectively, 35% (P � 0.05) and 75% (P � 0.0001)igher in the HFHS-Ro group than in untreated HFHSnimals (one-way ANOVA), whereas the HFHS-Fe andFHS-Bz groups showed epididymal and inguinal fatasses similar to the SC group. The ratio of subcutaneous
o visceral fat was increased only by rosiglitazone (plus5% versus the SC group, P � 0.001, one-way ANOVA).
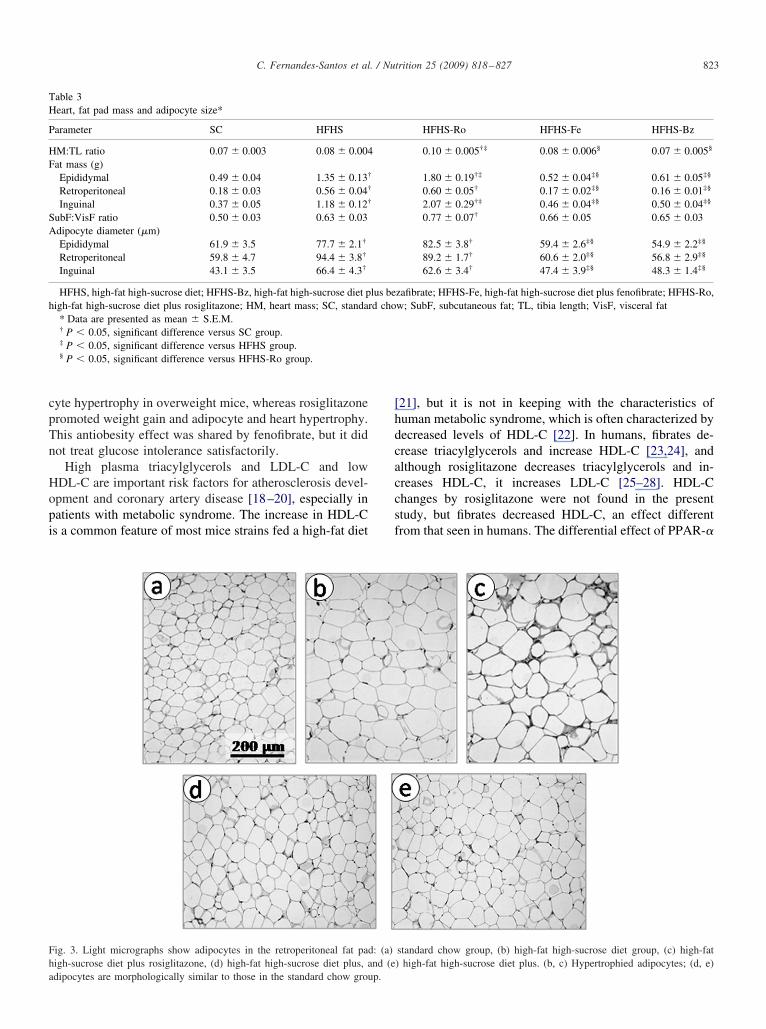
Adipocyte hypertrophy was seen in epididymal (plus5%, P � 0.001), retroperitoneal (plus 60%, P � 0.0001),nd inguinal (plus 55%, P � 0.001) adipose tissues afterFHS diet intake (one-way ANOVA; Table 3). Adipocyte
ize in the HFHS-Ro group was similar to that in HFHSnimals, but fibrates showed smaller ones (Fig. 3, Table 3).
Correlation analysis was performed to analyze if thereas a correlation between adipocyte diameter and glucose
ntolerance or insulin sensitivity. The correlation betweenOMA-IR and adipocyte size was significant for all fatepots, but it was stronger in retroperitoneal fat (epididymalat R � 0.53, P � 0.001; retroperitoneal fat R � 0.73, P �.00001; inguinal fat R � 0.53, P � 0.001; Fig. 4). The areander the curve for oral glucose tolerance testing did not
how a correlation with adipocyte size (data not shown).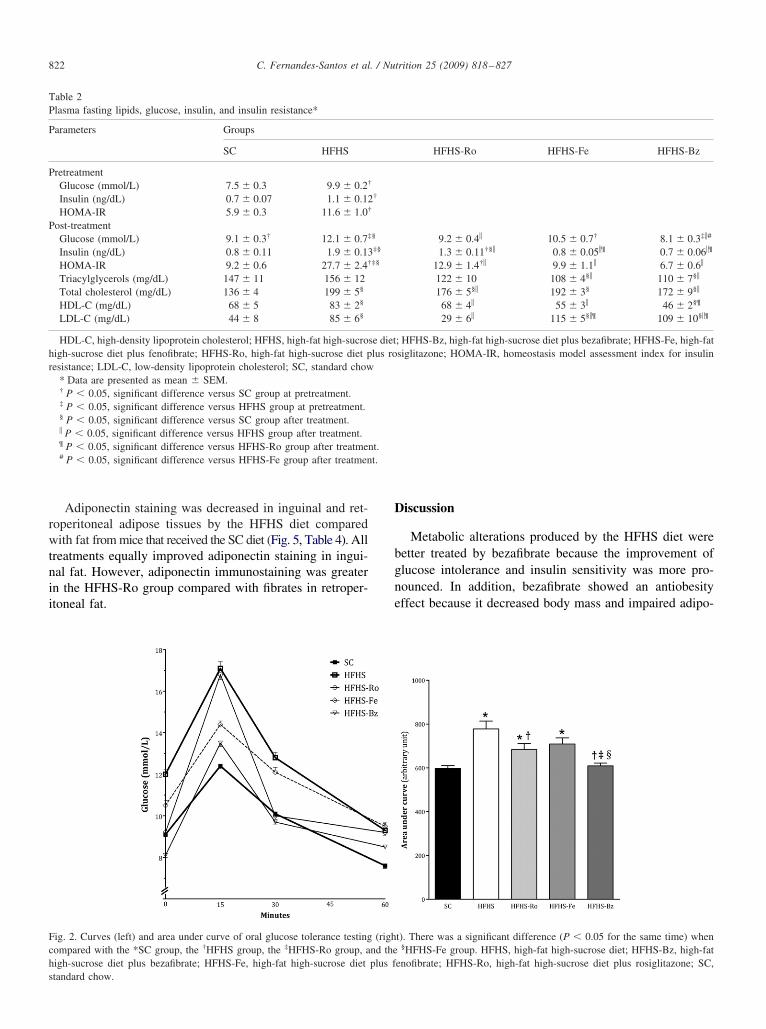
rwtnii
D
bgne
Fchs
TP
P
P
P
hr
t.
822 C. Fernandes-Santos et al. / Nutrition 25 (2009) 818–827
Adiponectin staining was decreased in inguinal and ret-operitoneal adipose tissues by the HFHS diet comparedith fat from mice that received the SC diet (Fig. 5, Table 4). All
reatments equally improved adiponectin staining in ingui-al fat. However, adiponectin immunostaining was greatern the HFHS-Ro group compared with fibrates in retroper-toneal fat.
ig. 2. Curves (left) and area under curve of oral glucose tolerance testingompared with the *SC group, the †HFHS group, the ‡HFHS-Ro group, aigh-sucrose diet plus bezafibrate; HFHS-Fe, high-fat high-sucrose diet
able 2lasma fasting lipids, glucose, insulin, and insulin resistance*
arameters Groups
SC HFHS
retreatmentGlucose (mmol/L) 7.5 � 0.3 9.9 � 0.2†
Insulin (ng/dL) 0.7 � 0.07 1.1 � 0.12HOMA-IR 5.9 � 0.3 11.6 � 1.0†
ost-treatmentGlucose (mmol/L) 9.1 � 0.3† 12.1 � 0.7‡
Insulin (ng/dL) 0.8 � 0.11 1.9 � 0.13HOMA-IR 9.2 � 0.6 27.7 � 2.4†
Triacylglycerols (mg/dL) 147 � 11 156 � 12Total cholesterol (mg/dL) 136 � 4 199 � 5§
HDL-C (mg/dL) 68 � 5 83 � 2§
LDL-C (mg/dL) 44 � 8 85 � 6§
HDL-C, high-density lipoprotein cholesterol; HFHS, high-fat high-sucroigh-sucrose diet plus fenofibrate; HFHS-Ro, high-fat high-sucrose diet pesistance; LDL-C, low-density lipoprotein cholesterol; SC, standard chow
* Data are presented as mean � SEM.† P � 0.05, significant difference versus SC group at pretreatment.‡ P � 0.05, significant difference versus HFHS group at pretreatment.§ P � 0.05, significant difference versus SC group after treatment.� P � 0.05, significant difference versus HFHS group after treatment.¶ P � 0.05, significant difference versus HFHS-Ro group after treatmen# P � 0.05, significant difference versus HFHS-Fe group after treatmen
tandard chow.
iscussion
Metabolic alterations produced by the HFHS diet wereetter treated by bezafibrate because the improvement oflucose intolerance and insulin sensitivity was more pro-ounced. In addition, bezafibrate showed an antiobesityffect because it decreased body mass and impaired adipo-
t). There was a significant difference (P � 0.05 for the same time) when§HFHS-Fe group. HFHS, high-fat high-sucrose diet; HFHS-Bz, high-fat
enofibrate; HFHS-Ro, high-fat high-sucrose diet plus rosiglitazone; SC,
HFHS-Ro HFHS-Fe HFHS-Bz
9.2 � 0.4� 10.5 � 0.7† 8.1 � 0.3‡�#
1.3 � 0.11†§� 0.8 � 0.05�¶ 0.7 � 0.06�¶
12.9 � 1.4†� 9.9 � 1.1� 6.7 � 0.6�
122 � 10 108 � 4§� 110 � 7§�
176 � 5§� 192 � 3§ 172 � 9§�
68 � 4� 55 � 3� 46 � 2§¶
29 � 6� 115 � 5§�¶ 109 � 10§�¶
; HFHS-Bz, high-fat high-sucrose diet plus bezafibrate; HFHS-Fe, high-fatsiglitazone; HOMA-IR, homeostasis model assessment index for insulin
(righnd theplus f
†
§
‡§
‡§
se dietlus ro
t.
cpTn
Hopi
[hdcaccsf
TH
P
HF
SA
h
Fha
823C. Fernandes-Santos et al. / Nutrition 25 (2009) 818–827
yte hypertrophy in overweight mice, whereas rosiglitazoneromoted weight gain and adipocyte and heart hypertrophy.his antiobesity effect was shared by fenofibrate, but it didot treat glucose intolerance satisfactorily.
High plasma triacylglycerols and LDL-C and lowDL-C are important risk factors for atherosclerosis devel-pment and coronary artery disease [18–20], especially inatients with metabolic syndrome. The increase in HDL-Cs a common feature of most mice strains fed a high-fat diet
able 3eart, fat pad mass and adipocyte size*
arameter SC HFHS
M:TL ratio 0.07 � 0.003 0.08 � 0.004at mass (g)Epididymal 0.49 � 0.04 1.35 � 0.13†
Retroperitoneal 0.18 � 0.03 0.56 � 0.04†
Inguinal 0.37 � 0.05 1.18 � 0.12†
ubF:VisF ratio 0.50 � 0.03 0.63 � 0.03dipocyte diameter (�m)Epididymal 61.9 � 3.5 77.7 � 2.1†
Retroperitoneal 59.8 � 4.7 94.4 � 3.8†
Inguinal 43.1 � 3.5 66.4 � 4.3†
HFHS, high-fat high-sucrose diet; HFHS-Bz, high-fat high-sucrose diet pigh-fat high-sucrose diet plus rosiglitazone; HM, heart mass; SC, standa* Data are presented as mean � S.E.M.† P � 0.05, significant difference versus SC group.‡ P � 0.05, significant difference versus HFHS group.§ P � 0.05, significant difference versus HFHS-Ro group.
ig. 3. Light micrographs show adipocytes in the retroperitoneal fat padigh-sucrose diet plus rosiglitazone, (d) high-fat high-sucrose diet plus, a
dipocytes are morphologically similar to those in the standard chow group.21], but it is not in keeping with the characteristics ofuman metabolic syndrome, which is often characterized byecreased levels of HDL-C [22]. In humans, fibrates de-rease triacylglycerols and increase HDL-C [23,24], andlthough rosiglitazone decreases triacylglycerols and in-reases HDL-C, it increases LDL-C [25–28]. HDL-Changes by rosiglitazone were not found in the presenttudy, but fibrates decreased HDL-C, an effect differentrom that seen in humans. The differential effect of PPAR-�
HFHS-Ro HFHS-Fe HFHS-Bz
0.10 � 0.005†‡ 0.08 � 0.006§ 0.07 � 0.005§
1.80 � 0.19†‡ 0.52 � 0.04‡§ 0.61 � 0.05‡§
0.60 � 0.05† 0.17 � 0.02‡§ 0.16 � 0.01‡§
2.07 � 0.29†‡ 0.46 � 0.04‡§ 0.50 � 0.04‡§
0.77 � 0.07† 0.66 � 0.05 0.65 � 0.03
82.5 � 3.8† 59.4 � 2.6‡§ 54.9 � 2.2‡§
89.2 � 1.7† 60.6 � 2.0‡§ 56.8 � 2.9‡§
62.6 � 3.4† 47.4 � 3.9‡§ 48.3 � 1.4‡§
zafibrate; HFHS-Fe, high-fat high-sucrose diet plus fenofibrate; HFHS-Ro,w; SubF, subcutaneous fat; TL, tibia length; VisF, visceral fat
standard chow group, (b) high-fat high-sucrose diet group, (c) high-fat) high-fat high-sucrose diet plus. (b, c) Hypertrophied adipocytes; (d, e)
lus berd cho
: (a)nd (e

alAcaoc
crmt
gi
FhH
Fhhfhap
824 C. Fernandes-Santos et al. / Nutrition 25 (2009) 818–827
ctivation on plasma HDL-C between mice and humans isikely due to species-specific regulation of apolipoprotein-I, the core of HDL-C. Whereas PPAR-� activation in-
reases plasma levels and hepatic mRNA expression ofpolipoprotein A-I in humans [29], the opposite effect isbserved in rodents [30]. In contrast, rosiglitazone de-reased LDL-C in HFHS-fed mice, whereas fibrates in-
ig. 4. Adipocyte diameter versus HOMA-IR in the retroperitoneal fat padigh-fat high-sucrose diet plus bezafibrate; HFHS-Fe, high-fat high-sucrosOMA-IR, homeostasis model assessment index for insulin resistance.
ig. 5. Adiponectin immunostaining (arrows) in retroperitoneal adipose tisigh-fat high-sucrose diet group; (c) high-fat high-sucrose diet plus roigh-sucrose diet plus bezafibrate. Compared with the standard chow grat high-sucrose diet group. Compared with the untreated high-fat high-suigh-fat high-sucrose diet plus rosiglitazone and plus fenofibrate. The gdiponectin immunostaining among the treated groups. (f) Negative contro
rocedure.reased LDL-C, and it is also likely due to species-specificegulation of apolipoproteins. LDL-C and HDL-C wereainly responsible for the lower total cholesterol levels in
he HFHS-Ro and HFHS-Bz groups.It has been shown that rosiglitazone efficiently treats
lucose intolerance and IR. This action is promoted by thencrease in glucose transporter-4 expression in adipose tis-
lation and linear regression). HFHS, high-fat high-sucrose diet; HFHS-Bz,plus fenofibrate; HFHS-Ro, high-fat high-sucrose diet plus rosiglitazone;
ame magnification in all photomicrographs): (a) standard chow group, (b)zone, (d) high-fat high-sucrose diet plus fenofibrate, and (e) high-fateaker adiponectin immunostaining was observed in the untreated high-diet group, stronger immunostaining was observed in the groups fed theed the high-fat high-sucrose diet plus rosiglitazone showed the greatesthich the primary antibody was omitted during the immunohistochemical
(corree diet
sue (ssiglita
oup, wcrose
roup fl, in w
slipttrtrgcabfwsTadcohi
samfdtrimocfbcttHaitc
ctfragctcttpt
ttrhonfhmgbrilcaftgtt
etFcbsbo
TA
IR
hssion.
825C. Fernandes-Santos et al. / Nutrition 25 (2009) 818–827
ue, decreased free fatty acid lipotoxicity in pancreatic is-ets, decreased tumor necrosis factor-� release from fat, andncreased adiponectin secretion [31–33]. Increased adi-onectin immunostaining was found after rosiglitazonereatment in the present study; hence, it likely contributed tohe improvement in IR in HFHS-Ro mice. Conversely,osiglitazone induced weight gain by increasing adiposeissue mass and peripheral edema as a result of renal sodiumetention [34,35]. Thus, it is still a matter of debate if weightain in diabetic patients and associated cardiovascular out-omes and/or obesity during rosiglitazone treatment wouldggravate the situation in the long term. Rosiglitazone haseen reported to promote an approximated doubling in heartailure risk and a 42% increase in myocardial infarction riskithout any effect on cardiovascular mortality [36]. Some
tudies in the literature have indicated that treatment withZDs can cause cardiac hypertrophy [37–39], and this waslso found in the present study. Rosiglitazone-induced car-iac hypertrophy could exert adverse effects on cardiovas-ular function during long-term treatment of type 2 diabetesr hypertension; however, whether induction of cardiacypertrophy occurs in humans after long-term use of TZDss still unknown.
The biological activity of adipocyte changes as its lipidtorage increases. Compared with small adipocytes, largedipocytes are more insulin-resistant, release more inflam-atory cytokines and less adiponectin [40,41], and are more
requently found in people with obesity-related metabolicisorders [42,43]. IR and inflammation in turn may causeype 2 diabetes, cardiovascular disease, increased cancerisk, and other obesity-associated problems [44]. Thus, ad-pose tissue cell composition is the major determinant of theetabolic activity and response to environmental changes
f a specific fat depot [45]. The positive and significantorrelation between IR (HOMA-IR) and adipocyte diameteround in the present study agrees with these affirmativesecause it shows that IR increases as the adipocyte in-reases. A prevalence of small adipocytes was found afterherapy with fibrates in all fat depots analyzed, explaininghe improved insulin sensitivity in the HFHS-Fe andFHS-Bz mice. Increased adiponectin immunostaining by
ll treatments also ratify the decreased IR. Epididymal andnguinal fat pads were heavier in rosiglitazone-treated micehan in untreated HFHS mice, and this finding clearly indi-
able 4diponectin expression: Semiquantitative scoring system* for adiponectin
Groups
SC HFHS
nguinal fat �� �etroperitoneal fat �� �
HFHS, high-fat high-sucrose diet; HFHS-Bz, high-fat high-sucrose diet pigh-fat high-sucrose diet plus rosiglitazone; SC, standard chow* �, Weak expression; ��, moderate expression; ���, strong expre
ates that rosiglitazone induced adipocyte hyperplasia be- p
ause fat cell diameters were not different between thesewo groups. In addition, the ratio of subcutaneous to visceralat indicates a predominant growth in subcutaneous fatather than visceral fat by rosiglitazone. Because of thebundant expression of PPAR-� in adipose tissue, it isenerally thought that the induction of adipogenesis to re-ruit new small adipocytes, and thus to improve adiposeissue lipid accommodation and adiponectin secretion, ac-ounts for most of the credible metabolic outcomes of TZDreatment. However, excessive body fat gain after long-termreatment may have detrimental health consequences,articularly in people who are overweight or obese beforehe treatment [45].
Researchers are now paying attention to body fat loca-ion instead of overall obesity because visceral and subcu-aneous fat depots have distinct functions. Visceral depotselease cytokines that exert major effects on hepatic carbo-ydrate and lipid metabolism and stimulate hepatic releasef inflammatory proteins [46,47]. Cytokines from subcuta-eous fat depots mainly affect adipocyte development andunction locally [40]. Leptin expression and secretion areigher in subcutaneous fat, whereas visceral fat secretesore adiponectin and is more sensitive to insulin-stimulated
lucose uptake [48–50]. In the present work, the correlationetween adipocyte diameter and HOMA-IR was stronger inetroperitoneal fat than in epididymal and inguinal fats,ndicating that fat depots could have different roles in insu-in sensitivity. A crownlike structure, representing multinu-leate giant cells (resulted from macrophage aggregation)round adipocytes indicates adipocyte death [51], and it wasrequently seen in retroperitoneal fat from rosiglitazone-reated mice. In addition, adiponectin immunostaining wasreater in retroperitoneal fat than in inguinal fat by rosigli-azone. Taken together, these specific actions on retroperi-oneal fat reinforce different roles for each fat depot.
Fibrates impaired energy storage as fat independently ofnergy consumption, because daily food intake in fibrate-reated mice was similar to that in untreated HFHS mice.enofibrate can cause hypophagia [52], but it was not thease in the present study; thus, the smaller body mass andody fat were not a result of decreased food intake. Pre-umably, fibrates increased energy expenditure to impairody mass gain. Provided that enhancement of fat acidxidation is the major action of fenofibrate, the decrease in
nostain
HFHS-Ro HFHS-Fe HFHS-Bz
�� �� ����� �� ��
zafibrate; HFHS-Fe, high-fat high-sucrose diet plus fenofibrate; HFHS-Ro,
immu
lus be
rocesses of uptake and synthesis of fatty acids, associated

wefcmaTfitatw[aedi
pmamPrsbaocditom
C
tsa
A
M
R
[
[
[
[
[
[
[
[
[
[
[
[
[
[
826 C. Fernandes-Santos et al. / Nutrition 25 (2009) 818–827
ith increased lipid mobilization in adipose tissue [53], mayxplain the impairment in body mass gain and adiposity byenofibrate therapy. Activation of PPAR-� by bezafibratean also increase the fatty acid burning capacities of skeletaluscle, which is accompanied by a redistribution of fatty
cid flux from adipose tissue toward skeletal muscle [5,54].hus, the sum of PPAR-� and PPAR-� activation by beza-brate likely influenced body mass loss in bezafibrate-
reated mice. In experimental works, fibrates are mainlydministered in the chow, and usually bezafibrate concen-ration ranges from about 0.2% to 0.5% (w/w) [55–58],hereas fenofibrate ranges from about 0.1% to 0.5% (w/w)
59–62]. It is probable that the different responses seenfter fibrate treatment in the present study are due to differ-nces in PPAR modulation by fibrates rather than theiroses, because the doses used in the present study arentermediate compared with doses used by most studies.
Combined treatments with PPAR-� and -� agonists mayotentially improve IR and alleviate atherogenic dyslipide-ia in patients with metabolic syndrome. Furthermore, the
ddition of PPAR-� properties may prevent the develop-ent of overweight, which typically accompanies “pure”PAR-� ligand administration such as rosiglitazone. Cur-ently, promising alternatives to rosiglitazone treatment,uch as bezafibrate treatment, are available, and it allows aalance between the beneficial and harmful effects of PPARctivation. Further research on PPAR biology will increaseur comprehension of their physiologic and pharmacologicharacteristics and provide additional knowledge for theevelopment of superior ligands with improved therapeuticndices. Bezafibrate is a candidate to serve as a model forhe development of more potent pan-PPAR agonists, with-ut the adverse effects seen with dual-PPAR ligands such asuraglitazar and tesaglitazar.
onclusion
Activation of PPAR-�, -�, and -� together is better thanhe activation of PPAR-� or -� alone, because bezafibratehowed a wider range of action on metabolic, morphologic,nd biometric alterations due to an HFHS diet in mice.
cknowledgments
The authors are grateful to Mrs. Thatiany Marinho andr. William Lannes for their technical assistance.
eferences
[1] Prentice AM, Moore SE. Early programming of adult diseases inresource poor countries. Arch Dis Child 2005;90:429–32.
[2] Dreyer C, Krey G, Keller H, Givel F, Helftenbein G, Wahli W.Control of the peroxisomal beta-oxidation pathway by a novel family
of nuclear hormone receptors. Cell 1992;68:879–87.[3] Rosen ED, Spiegelman BM. Molecular regulation of adipogenesis.Annu Rev Cell Dev Biol 2000;16:145–71.
[4] Luquet S, Lopez-Soriano J, Holst D, Fredenrich A, Melki J, Rassou-lzadegan M, et al. Peroxisome proliferator-activated receptor deltacontrols muscle development and oxidative capability. FASEB J2003;17:2299–301.
[5] Wang YX, Lee CH, Tiep S, Yu RT, Ham J, Kang H, et al. Peroxisome-proliferator–activated receptor delta activates fat metabolism to pre-vent obesity. Cell 2003;113:159–70.
[6] Nissen SE, Wolski K, Topol EJ. Effect of muraglitazar on death andmajor adverse cardiovascular events in patients with type 2 diabetesmellitus. JAMA 2005;294:2581–6.
[7] Fagerberg B, Edwards S, Halmos T, Lopatynski J, Schuster H,Stender S, et al. Tesaglitazar, a novel dual peroxisome proliferator-activated receptor alpha/gamma agonist, dose-dependently improvesthe metabolic abnormalities associated with insulin resistance in anon-diabetic population. Diabetologia 2005;48:1716–25.
[8] Krey G, Braissant O, L’Horset F, Kalkhoven E, Perroud M, ParkerMG, et al. Fatty acids, eicosanoids, and hypolipidemic agents iden-tified as ligands of peroxisome proliferator-activated receptors bycoactivator-dependent receptor ligand assay. Mol Endocrinol 1997;11:779–91.
[9] Willson TM, Brown PJ, Sternbach DD, Henke BR. The PPARs: fromorphan receptors to drug discovery. J Med Chem 2000;43:527–50.
10] Goa KL, Barradell LB, Plosker GL. Bezafibrate. An update of itspharmacology and use in the management of dyslipidaemia. Drugs1996;52:725–53.
11] Tenenbaum A, Fisman EZ, Boyko V, Benderly M, Tanne D, Haim M,et al. Attenuation of progression of insulin resistance in patients withcoronary artery disease by bezafibrate. Arch Intern Med 2006;166:737–41.
12] Tenenbaum A, Motro M, Fisman EZ, Adler Y, Shemesh J, Tanne D,et al. Effect of bezafibrate on incidence of type 2 diabetes mellitus inobese patients. Eur Heart J 2005;26:2032–8.
13] Reeves PG, Nielsen FH, Fahey GC Jr. AIN-93 purified diets forlaboratory rodents: final report of the American Institute of Nutritionad hoc writing committee on the reformulation of the AIN-76Arodent diet. J Nut 1993;123:1939–51.
14] Friedwald WT, Levy RS, Fredrickson DS. Estimation of the concen-tration of low-density lipoprotein cholesterol in plasma without use ofthe preparative ultracentrifuge. Clin Chem 1972;18:499–502.
15] Matthews DR, Hosker JP, Rudenski AS, Naylor BA, Treacher DF,Turner RC. Homeostasis model assessment: insulin resistance andbeta-cell function from fasting plasma glucose and insulin concen-trations in man. Diabetologia 1985;28:412–9.
16] Yin FC, Spurgeon HA, Rakusan K, Weisfeldt ML, Lakatta EG. Useof tibial length to quantify cardiac hypertrophy: application in theaging rat. Am J Physiol Heart Circ Physiol 1982;243:H941–7.
17] Surwit RS, Feinglos MN, Rodin J, Sutherland A, Petro AE, OparaEC, et al. Differential effects of fat and sucrose on the developmentof obesity and diabetes in C57BL/6J and A/J mice. Metab Clin Exp1995;44:645–51.
18] Gordon T, Castelli WP, Hjortland MC, Kannel WB, Dawber TR.High density lipoprotein as a protective factor against coronary heartdisease. The Framingham Study. Am J Med 1977;62:707–14.
19] Harper CR, Jacobson TA. New perspectives on the management oflow levels of high-density lipoprotein cholesterol. Arch Intern Med1999;159:1049–57.
20] Brewer HB Jr. Increasing HDL cholesterol levels. N Engl J Med2004;350:1491–4.
21] Paigen B. Genetics of responsiveness to high-fat and high-cholesteroldiets in the mouse. Am J Clin Nutr 1995;62:458S–62.
22] Alberti KG, Zimmet P, Shaw J. Metabolic syndrome—a new world-wide definition. A consensus statement from the International Dia-betes Federation. Diabet Med 2006;23:469–80.
23] Fruchart JC, Staels B, Duriez P. The role of fibric acids in athero-
sclerosis. Curr Atheroscler Rep 2001;3:83–92.
[
[
[
[
[
[
[
[
[
[
[
[
[
[
[
[
[
[
[
[
[[
[
[
[
[
[
[
[
[
[
[
[
[
[
[
[
[
[
827C. Fernandes-Santos et al. / Nutrition 25 (2009) 818–827
24] Fruchart JC, Duriez P. Mode of action of fibrates in the regulation oftriglyceride and HDL-cholesterol metabolism. Drugs Today 2006;42:39–64.
25] Deeg MA, Buse JB, Goldberg RB, Kendall DM, Zagar AJ, JacoberSJ, et al. Pioglitazone and rosiglitazone have different effects onserum lipoprotein particle concentrations and sizes in patients withtype 2 diabetes and dyslipidemia. Diabetes Care 2007;30:2458–64.
26] Gastaldelli A, Ferrannini E, Miyazaki Y, Matsuda M, Mari A, DeFronzoRA. Thiazolidinediones improve beta-cell function in type 2 diabeticpatients. Am J Physiol Endocrinol Metab 2007;292:E871–83.
27] Miyazaki Y, He H, Mandarino LJ, DeFronzo RA. Rosiglitazoneimproves downstream insulin receptor signaling in type 2 diabeticpatients. Diabetes 2003;52:1943–50.
28] Parulkar AA, Pendergrass ML, Granda-Ayala R, Lee TR, FonsecaVA. Nonhypoglycemic effects of thiazolidinediones. Ann Intern Med2001;134:61–71.
29] Berthou L, Duverger N, Emmanuel F, Langouet S, Auwerx J, Guil-louzo A, et al. Opposite regulation of human versus mouse apoli-poprotein A-I by fibrates in human apolipoprotein A-I transgenicmice. J Clin Invest 1996;97:2408–16.
30] Staels B, van Tol A, Andreu T, Auwerx J. Fibrates influence theexpression of genes involved in lipoprotein metabolism in a tissue-selective manner in the rat. Arterioscler Thromb 1992;12:286–94.
31] Olefsky JM. Treatment of insulin resistance with peroxisome proliferator-activated receptor gamma agonists. J Clin Invest 2000;106:467–72.
32] Kramer D, Shapiro R, Adler A, Bush E, Rondinone CM. Insulin-sensitizing effect of rosiglitazone (BRL-49653) by regulation of glu-cose transporters in muscle and fat of Zucker rats. Metab Clin Exp2001;50:1294–300.
33] Kim H, Haluzik M, Gavrilova O, Yakar S, Portas J, Sun H, et al.Thiazolidinediones improve insulin sensitivity in adipose tissue andreduce the hyperlipidaemia without affecting the hyperglycaemia in atransgenic model of type 2 diabetes. Diabetologia 2004;47:2215–25.
34] Mudaliar S, Chang AR, Henry RR. Thiazolidinediones, peripheraledema, and type 2 diabetes: incidence, pathophysiology, and clinicalimplications. Endocr Pract 2003;9:406–16.
35] Fuchtenbusch M, Standl E, Schatz H. Clinical efficacy of new thia-zolidinediones and glinides in the treatment of type 2 diabetes mel-litus. Exp Clin Endocrinol Diabetes 2000;108:151–63.
36] Singh S, Loke YK, Furberg CD. Long-term risk of cardiovascular eventswith rosiglitazone: a meta-analysis. JAMA 2007;298:1189–95.
37] Carley AN, Semeniuk LM, Shimoni Y, Aasum E, Larsen TS, BergerJP, et al. Treatment of type 2 diabetic db/db mice with a novelPPARgamma agonist improves cardiac metabolism but not contrac-tile function. Am J Physiol Endocrinol Metab 2004;286:E449–55.
38] Chang CH, McNamara LA, Wu MS, Muise ES, Tan Y, Wood HB, etal. A novel selective peroxisome proliferator-activator receptor-gamma modulator-SPPARgammaM5 improves insulin sensitivitywith diminished adverse cardiovascular effects. Eur J Pharmacol2008;584:192–201.
39] Wu L, Wang R, De Champlain J, Wilson TW. Beneficial and dele-terious effects of rosiglitazone on hypertension development in spon-taneously hypertensive rats. Am J Hypertens 2004;17:749–56.
40] Sopasakis VR, Sandqvist M, Gustafson B, Hammarstedt A, SchmelzM, Yang X, et al. High local concentrations and effects on differen-tiation implicate interleukin-6 as a paracrine regulator. Obes Res2004;12:454–60.
41] Le Lay S, Krief S, Farnier C, Lefrere I, Le Liepvre X, Bazin R, et al.Cholesterol, a cell size-dependent signal that regulates glucose me-tabolism and gene expression in adipocytes. J Biol Chem 2001;276:16904–10.
42] Krotkiewski M, Bjorntorp P, Sjostrom L, Smith U. Impact of obesityon metabolism in men and women. Importance of regional adiposetissue distribution. J Clin Invest 1983;72:1150–62.
43] Weyer C, Foley JE, Bogardus C, Tataranni PA, Pratley RE. Enlarged
subcutaneous abdominal adipocyte size, but not obesity itself, pre-dicts type II diabetes independent of insulin resistance. Diabetologia2000;43:1498–506.
44] Powell K. Obesity: the two faces of fat. Nature 2007;447:525–7.45] Yang X, Smith U. Adipose tissue distribution and risk of metabolic
disease: does thiazolidinedione-induced adipose tissue redistributionprovide a clue to the answer? Diabetologia 2007;50:1127–39.
46] Baumann H, Gauldie J. Regulation of hepatic acute phase plasmaprotein genes by hepatocyte stimulating factors and other mediatorsof inflammation. Mol Biol Med 1990;7:147–59.
47] Fernandez-Real JM, Vayreda M, Richart C, Gutierrez C, Broch M,Vendrell J, et al. Circulating interleukin 6 levels, blood pressure, andinsulin sensitivity in apparently healthy men and women. J ClinEndocrinol Metabol 2001;86:1154–9.
48] Tritos NA, Mantzoros CS. Leptin: its role in obesity and beyond.Diabetologia 1997;40:1371–9.
49] Lundgren M, Buren J, Ruge T, Myrnas T, Eriksson JW. Glucocorti-coids down-regulate glucose uptake capacity and insulin-signalingproteins in omental but not subcutaneous human adipocytes. J ClinEndocrinol Metabol 2004;89:2989–97.
50] Virtanen KA, Lonnroth P, Parkkola R, Peltoniemi P, Asola M, Vil-janen T, et al. Glucose uptake and perfusion in subcutaneous andvisceral adipose tissue during insulin stimulation in nonobese andobese humans. J Clin Endocrinol Metabol 2002;87:3902–10.
51] Cinti S, Mitchell G, Barbatelli G, Murano I, Ceresi E, Faloia E, et al.Adipocyte death defines macrophage localization and function in adiposetissue of obese mice and humans. J Lipid Res 2005;46:2347–55.
52] Carmona MC, Louche K, Nibbelink M, Prunet B, Bross A, DesbazeilleM, et al. Fenofibrate prevents Rosiglitazone-induced body weight gain inob/ob mice. Int J Obes Relat Metab Disord 2005;29:864–71.
53] Ferreira AVM, Parreira GG, Green A, Botion LM. Effects of feno-fibrate on lipid metabolism in adipose tissue of rats. Metab Clin Exp2006;55:731–5.
54] Fredenrich A, Grimaldi PA. PPAR delta: an uncompletely knownnuclear receptor. Diabetes Metabol 2005;31:23–7.
55] Peters JM, Aoyama T, Burns AM, Gonzalez FJ. Bezafibrate is a dualligand for PPARalpha and PPARbeta: studies using null mice. BiochBiophys Acta 2003;1632:80–9.
56] Kjorholt C, Akerfeldt MC, Biden TJ, Laybutt DR. Chronic hypergly-cemia, independent of plasma lipid levels, is sufficient for the loss ofbeta-cell differentiation and secretory function in the db/db mousemodel of diabetes. Diabetes 2005;54:2755–63.
57] Yoshikawa T, Toda K, Nemoto Y, Ono M, Iwasaki S, Maeda T, et al.Aromatase-deficient (ArKO) mice are retrieved from severe hepaticsteatosis by peroxisome proliferator administration. Hepatol Res2002;22:278–87.
58] Takeda K, Toda K, Saibara T, Nakagawa M, Saika K, Onishi T, et al.Progressive development of insulin resistance phenotype in malemice with complete aromatase (CYP19) deficiency. J Endocrinol2003;176:237–46.
59] Choi KC, Ryu OH, Lee KW, Kim HY, Seo JA, Kim SG, et al. Effectof PPAR-alpha and -gamma agonist on the expression of visfatin,adiponectin, and TNF-alpha in visceral fat of OLETF rats. BiochemBiophys Res Commun 2005;336:747–53.
60] Tsuboyama-Kasaoka N, Takahashi M, Kim H, Ezaki O. Up-regulationof liver uncoupling protein-2 mRNA by either fish oil feeding orfibrate administration in mice. Biochem Biophys Res Commun 1999;257:879–85.
61] Koh EH, Kim MS, Park JY, Kim HS, Youn JY, Park HS, et al.Peroxisome proliferator-activated receptor (PPAR)-alpha activationprevents diabetes in OLETF rats: comparison with PPAR-gammaactivation. Diabetes 2003;52:2331–7.
62] Mancini FP, Lanni A, Sabatino L, Moreno M, Giannino A, ContaldoF, et al. Fenofibrate prevents and reduces body weight gain and
adiposity in diet-induced obese rats. FEBS Lett 2001;491:154–8.Copyright © 2022 FDOKUMEN