Quantification of the morphology of sucrose crystals by image analysis
14
Quantification of the morphology of sucrose crystals by image analysis N. Faria a , M.N. Pons b, * , S. Feyo de Azevedo a , F.A. Rocha a , H. Vivier c a Departamento de Engenharia Quı ´mica, Faculdade de Engenharia, Universidade do Porto, rua Roberto Frias s/n, 4200-465 Oporto, Portugal b Laboratoire des Sciences du Ge ´nie Chimique, CNRS-ENSIC-INPL, 1, rue Grandville, BP 451, F-54001 Nancy cedex, France c Laboratoire de Chimie et Environnement, Faculte ´ des Sciences, 23, rue Paul Michelon, F-42023 Saint-Etienne cedex 2, France Received 15 May 2002; received in revised form 24 February 2003; accepted 27 March 2003 Abstract Automated image analysis procedures combined with discriminant factorial analysis (DFA) have been developed to classify agglomerated sucrose crystals according to their shape. The crystals are observed by optical microscopy. Agreement between manual and automated classifications is 90% in average. Each crystal is characterised by its own degree of agglomeration, calculated from the output of the classification. Mono-crystals are further classified into two types according to the habit of their projected silhouette. The use of these techniques is illustrated on commercial sucrose and batch-crystallised particles obtained in a lab-scale reactor in presence of impurities (dextran, raffinose, glucose, sodium carbonate) known to modify the sucrose crystal habit. D 2003 Elsevier Science B.V. All rights reserved. Keywords: Agglomeration; Growth; Impurities; Discriminant factorial analysis 1. Introduction Industry is more and more required to manufacture powders with defined properties in terms of size and morphology. These characteristics can be related to end- use properties such as filterability of slurry, flowability in storage tanks, bioavailability of pharmaceutical molecules, dissolution rate in a solvent, etc. Many of those powders are produced by precipitation or crystallisation. Although widely studied, the later process is still far from being well understood. Yet, it is used largely from food industry and pure chemical processes to high technology electronic components and arts-related sciences like photography. In the sugar refin- ing process, it is the most important step and, therefore, is worth every attempt to try to better understand it. The purpose is to grow sucrose crystals with a required standard of quality, essentially measured by the purity, by the shape, by the size distribution and by the visual aspect of the grain population. Sucrose is primarily a food but is also included in the formulation of many pharma- ceuticals. Sucrose crystallisation occurs through mechanisms of nucleation, growth and agglomeration that are known to be affected by several operating conditions [1], of which the presence of impurities is mostly relevant. Agglomeration, in particular, is an undesired phenomenon to a large extent not yet understood, which has significant effect on the crystal size distribution and on the crystal aspect, i.e. on the final product quality. On one hand, agglomeration enables to obtain quickly large crystals, on contrary to nucleation, which favours small crystals. But on the other hand, due to the spreading of the size distribution, the separation of crystals from the liquid phase is more difficult. Uniform and well-formed large crystals are pre- ferred, as they are easier to dry by centrifugation [2]. Agglomeration may result in a decrease of purity due to solution entrapment into the agglomerates. Such inclusions of dilute molasses are difficult to remove and increase the risk of bacterial contamination and poor storage behaviour [2]. The search for efficient methods for population char- acterisation, in terms of shape, perfect crystal and agglom- erate contents and size distribution, is thus linked both to the scientific interest of understanding fundamental mech- anisms of the crystallisation process and to the relevant practical interest of daily production requirements. 0032-5910/03/$ - see front matter D 2003 Elsevier Science B.V. All rights reserved. doi:10.1016/S0032-5910(03)00078-0 * Corresponding author. Tel.: +33-3-83-17-52-77; fax: +33-3-83-17- 53-26. E-mail address: [email protected] (M.N. Pons). www.elsevier.com/locate/powtec Powder Technology 133 (2003) 54– 67
-
Upload
independent -
Category
Documents
-
view
1 -
download
0
Transcript of Quantification of the morphology of sucrose crystals by image analysis

Quantification of the morphology of sucrose crystals by image analysis
N. Fariaa, M.N. Ponsb,*, S. Feyo de Azevedoa, F.A. Rochaa, H. Vivierc
aDepartamento de Engenharia Quımica, Faculdade de Engenharia, Universidade do Porto, rua Roberto Frias s/n, 4200-465 Oporto, PortugalbLaboratoire des Sciences du Genie Chimique, CNRS-ENSIC-INPL, 1, rue Grandville, BP 451, F-54001 Nancy cedex, France
cLaboratoire de Chimie et Environnement, Faculte des Sciences, 23, rue Paul Michelon, F-42023 Saint-Etienne cedex 2, France
Received 15 May 2002; received in revised form 24 February 2003; accepted 27 March 2003
Abstract
Automated image analysis procedures combined with discriminant factorial analysis (DFA) have been developed to classify agglomerated
sucrose crystals according to their shape. The crystals are observed by optical microscopy. Agreement between manual and automated
classifications is 90% in average. Each crystal is characterised by its own degree of agglomeration, calculated from the output of the
classification. Mono-crystals are further classified into two types according to the habit of their projected silhouette. The use of these
techniques is illustrated on commercial sucrose and batch-crystallised particles obtained in a lab-scale reactor in presence of impurities
(dextran, raffinose, glucose, sodium carbonate) known to modify the sucrose crystal habit.
D 2003 Elsevier Science B.V. All rights reserved.
Keywords: Agglomeration; Growth; Impurities; Discriminant factorial analysis
1. Introduction
Industry is more and more required to manufacture
powders with defined properties in terms of size and
morphology. These characteristics can be related to end-
use properties such as filterability of slurry, flowability in
storage tanks, bioavailability of pharmaceutical molecules,
dissolution rate in a solvent, etc.
Many of those powders are produced by precipitation
or crystallisation. Although widely studied, the later
process is still far from being well understood. Yet, it is
used largely from food industry and pure chemical
processes to high technology electronic components and
arts-related sciences like photography. In the sugar refin-
ing process, it is the most important step and, therefore, is
worth every attempt to try to better understand it. The
purpose is to grow sucrose crystals with a required
standard of quality, essentially measured by the purity,
by the shape, by the size distribution and by the visual
aspect of the grain population. Sucrose is primarily a food
but is also included in the formulation of many pharma-
ceuticals.
Sucrose crystallisation occurs through mechanisms of
nucleation, growth and agglomeration that are known to be
affected by several operating conditions [1], of which the
presence of impurities is mostly relevant. Agglomeration,
in particular, is an undesired phenomenon to a large extent
not yet understood, which has significant effect on the
crystal size distribution and on the crystal aspect, i.e. on
the final product quality. On one hand, agglomeration
enables to obtain quickly large crystals, on contrary to
nucleation, which favours small crystals. But on the other
hand, due to the spreading of the size distribution, the
separation of crystals from the liquid phase is more
difficult. Uniform and well-formed large crystals are pre-
ferred, as they are easier to dry by centrifugation [2].
Agglomeration may result in a decrease of purity due to
solution entrapment into the agglomerates. Such inclusions
of dilute molasses are difficult to remove and increase the
risk of bacterial contamination and poor storage behaviour
[2]. The search for efficient methods for population char-
acterisation, in terms of shape, perfect crystal and agglom-
erate contents and size distribution, is thus linked both to
the scientific interest of understanding fundamental mech-
anisms of the crystallisation process and to the relevant
practical interest of daily production requirements.
0032-5910/03/$ - see front matter D 2003 Elsevier Science B.V. All rights reserved.
doi:10.1016/S0032-5910(03)00078-0
* Corresponding author. Tel.: +33-3-83-17-52-77; fax: +33-3-83-17-
53-26.
E-mail address: [email protected] (M.N. Pons).
www.elsevier.com/locate/powtec
Powder Technology 133 (2003) 54–67
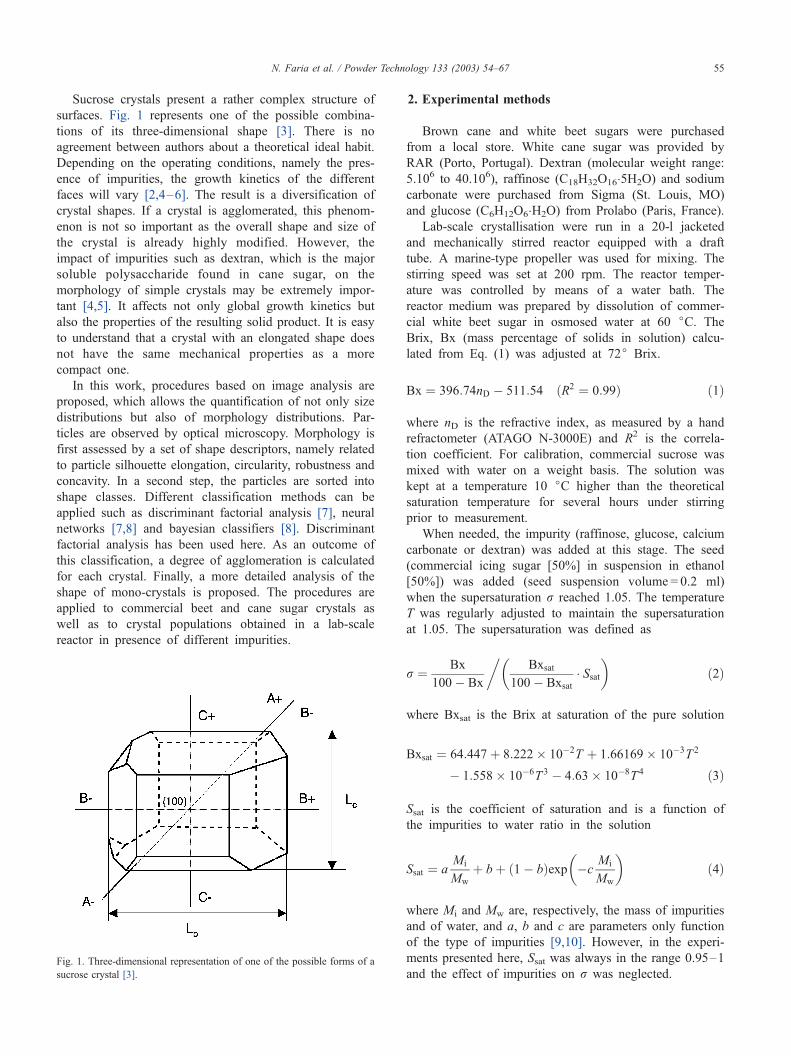
Sucrose crystals present a rather complex structure of
surfaces. Fig. 1 represents one of the possible combina-
tions of its three-dimensional shape [3]. There is no
agreement between authors about a theoretical ideal habit.
Depending on the operating conditions, namely the pres-
ence of impurities, the growth kinetics of the different
faces will vary [2,4–6]. The result is a diversification of
crystal shapes. If a crystal is agglomerated, this phenom-
enon is not so important as the overall shape and size of
the crystal is already highly modified. However, the
impact of impurities such as dextran, which is the major
soluble polysaccharide found in cane sugar, on the
morphology of simple crystals may be extremely impor-
tant [4,5]. It affects not only global growth kinetics but
also the properties of the resulting solid product. It is easy
to understand that a crystal with an elongated shape does
not have the same mechanical properties as a more
compact one.
In this work, procedures based on image analysis are
proposed, which allows the quantification of not only size
distributions but also of morphology distributions. Par-
ticles are observed by optical microscopy. Morphology is
first assessed by a set of shape descriptors, namely related
to particle silhouette elongation, circularity, robustness and
concavity. In a second step, the particles are sorted into
shape classes. Different classification methods can be
applied such as discriminant factorial analysis [7], neural
networks [7,8] and bayesian classifiers [8]. Discriminant
factorial analysis has been used here. As an outcome of
this classification, a degree of agglomeration is calculated
for each crystal. Finally, a more detailed analysis of the
shape of mono-crystals is proposed. The procedures are
applied to commercial beet and cane sugar crystals as
well as to crystal populations obtained in a lab-scale
reactor in presence of different impurities.
2. Experimental methods
Brown cane and white beet sugars were purchased
from a local store. White cane sugar was provided by
RAR (Porto, Portugal). Dextran (molecular weight range:
5.106 to 40.106), raffinose (C18H32O16�5H2O) and sodium
carbonate were purchased from Sigma (St. Louis, MO)
and glucose (C6H12O6�H2O) from Prolabo (Paris, France).
Lab-scale crystallisation were run in a 20-l jacketed
and mechanically stirred reactor equipped with a draft
tube. A marine-type propeller was used for mixing. The
stirring speed was set at 200 rpm. The reactor temper-
ature was controlled by means of a water bath. The
reactor medium was prepared by dissolution of commer-
cial white beet sugar in osmosed water at 60 jC. The
Brix, Bx (mass percentage of solids in solution) calcu-
lated from Eq. (1) was adjusted at 72j Brix.
Bx ¼ 396:74nD � 511:54 ðR2 ¼ 0:99Þ ð1Þ
where nD is the refractive index, as measured by a hand
refractometer (ATAGO N-3000E) and R2 is the correla-
tion coefficient. For calibration, commercial sucrose was
mixed with water on a weight basis. The solution was
kept at a temperature 10 jC higher than the theoretical
saturation temperature for several hours under stirring
prior to measurement.
When needed, the impurity (raffinose, glucose, calcium
carbonate or dextran) was added at this stage. The seed
(commercial icing sugar [50%] in suspension in ethanol
[50%]) was added (seed suspension volume = 0.2 ml)
when the supersaturation r reached 1.05. The temperature
T was regularly adjusted to maintain the supersaturation
at 1.05. The supersaturation was defined as
r ¼ Bx
100� Bx
�Bxsat
100� Bxsat� Ssat
� �ð2Þ
where Bxsat is the Brix at saturation of the pure solution
Bxsat ¼ 64:447þ 8:222� 10�2T þ 1:66169� 10�3T2
� 1:558� 10�6T3 � 4:63� 10�8T 4 ð3Þ
Ssat is the coefficient of saturation and is a function of
the impurities to water ratio in the solution
Ssat ¼ aMi
Mw
þ bþ ð1� bÞexp �cMi
Mw
� �ð4Þ
where Mi and Mw are, respectively, the mass of impurities
and of water, and a, b and c are parameters only function
of the type of impurities [9,10]. However, in the experi-
ments presented here, Ssat was always in the range 0.95–1
and the effect of impurities on r was neglected.Fig. 1. Three-dimensional representation of one of the possible forms of a
sucrose crystal [3].
N. Faria et al. / Powder Technology 133 (2003) 54–67 55

On termination of each run, the crystals are harvested,
separated from the liquid by filtration on paper, washed
twice with pure ethanol and dried.
3. Morphology assessment
3.1. Image analysis
The crystals are deposited on a glass slide and
observed by transmitted light microscopy with a Dialux20
(Leitz, Wetzlar, Germany) microscope equipped with a
monochrome camera (Hitachi ICCTV) connected to a
Matrox Meteor board on PC. Grey-level images (8-bit)
of 768� 576 square pixels are captured. Several slides
can be used to image the required number of crystals.
Images are manually focused to have a good definition of
the crystal contour line and the interior, from the point of
view of the operator. The grabbing of one image takes
about 15 s. These images are then treated, analysed and
several numerical descriptors are extracted for each crys-
tal using Visilogk5 (Noesis, les Ulis, France). There are
two different procedures. The first one refers to the
calculation of the 2D shape parameters that describe the
silhouette of the particles and the second procedure
applies to the calculation of a special pseudo 3D param-
eter.
Before performing the 2D measurements, the images
are transformed through the following set of operations:
� thresholding—the number of grey levels of the image is
reduced from 256 to 2 by an automated procedure based
on the variance of the grey-level histogram [11] (Fig.
2a–b);
� hole filling (Fig. 2b–c);� noise elimination (Fig. 2c–d);� elimination of the objects that contact the board of the
image (Fig. 2d–e);� identification of the particles in the image (Fig. 2e–f).
The 2D size and shape descriptors are silhouette surface
S from which the equivalent diameter ðDeq ¼ 2ffiffiffiffiffiffiffiffiS=p
pÞ is
deduced, Crofton perimeter P [11], Feret diameters distri-
bution, from which the maximal (Fmax) and minimal
(Fmin) diameters are deduced to give size measurements
of the particle, ‘‘length’’ and ‘‘breadth’’, respectively (Fig.
3a). The Feret diameter in orientation a is the distance
between two parallels tangent to the silhouette and making
an angle a with the vertical. When the silhouette convex
bounding polygon Hc (Fig. 3b) is rectangular, Fmax meas-
ures the diagonal length and Fmin the smallest side length.
The following secondary parameters are calculated: circu-
larity (C =P2/4pS), elongation (Fmax/Fmin) and aspect ratio
(Fmax/Deq). The particle silhouette is compared to Hc (Fig.
3c): the particle robustness (X1), its index of largest
concavity (X2), the ratio of the largest concavity to the
total concavity (X3) and its projected surface concavity
index (CI = S/Sc, where Sc is the surface of Hc) are deduced
[12].
The pseudo 3D parameter that is calculated takes
advantage of the transparency of sugar crystals to evaluate
the complexity of its upper face and interior. When light
is transmitted through the crystal, the beam is subject to
phenomena of reflection and refraction at the crystal/air
interfaces but also at the interfaces between two crystal
planes in agglomerates. In the case of a mono-crystal, a
unique zone with high grey levels is visible at the centre
of the crystal (Fig. 4a). In the case of agglomerates, many
Fig. 2. Sequence of operations performed on images before extraction of the measurements.
N. Faria et al. / Powder Technology 133 (2003) 54–6756

internal zones are noticeable (Fig. 4e). The number of
zones (N) can be a criterion for the discrimination
between simple crystals (N = 1) and agglomerates (N>1).
To improve the contrast between the internal zones and
the rest of the crystal, enhancement is performed by
applying morphological transformations. The definition
of morphological transformations is beyond the scope of
this paper, but details can be found in Refs. [11] and [13].
Fig. 3. Measurements on a convex (a) and concave (b) particle; (c) steps for the quantification of concavities.
Fig. 4. Extraction of the pseudo-3D parameter: original image of a simple crystal (a) and an agglomerate (e); inner edges enhancement (b, f); threshold (c, g);
identification of internal zones (d, h).
N. Faria et al. / Powder Technology 133 (2003) 54–67 57
The first step is based on the fact that an image I is
always lying between its eroded E(I) and its dilated D(I):
EðIÞVIVDðIÞ ð4Þ
For each pixel I(n,m) of the initial grey-level image I, the
output grey level value O(n,m) will be the closest value
of I between E(I) and D(I):
Oðn;mÞ ¼DðIðn;mÞÞ if
�DðIðn;mÞÞ � Dðn;mÞ
�<
�EðIðn;mÞÞ � Dðn;mÞ
�
EðIðn;mÞÞ otherwise
8<:
ð5Þ
In the second step, the morphological gradient of O is
calculated, as the difference between its dilated D(O) and its
eroded E(O) thresholded and combined with the silhouette
to produce an image with the internal zones separated into
one or several parts (Fig. 4d,h).
3.2. Crystal classification
Although the goal of the present technique is to automati-
cally classify sugar crystals according to their degree of
agglomeration, several sets of crystals have first been
visually classified. These are used both to train the statistical
method employed and to assess the degree of agreement
between the visual and automated classifications.
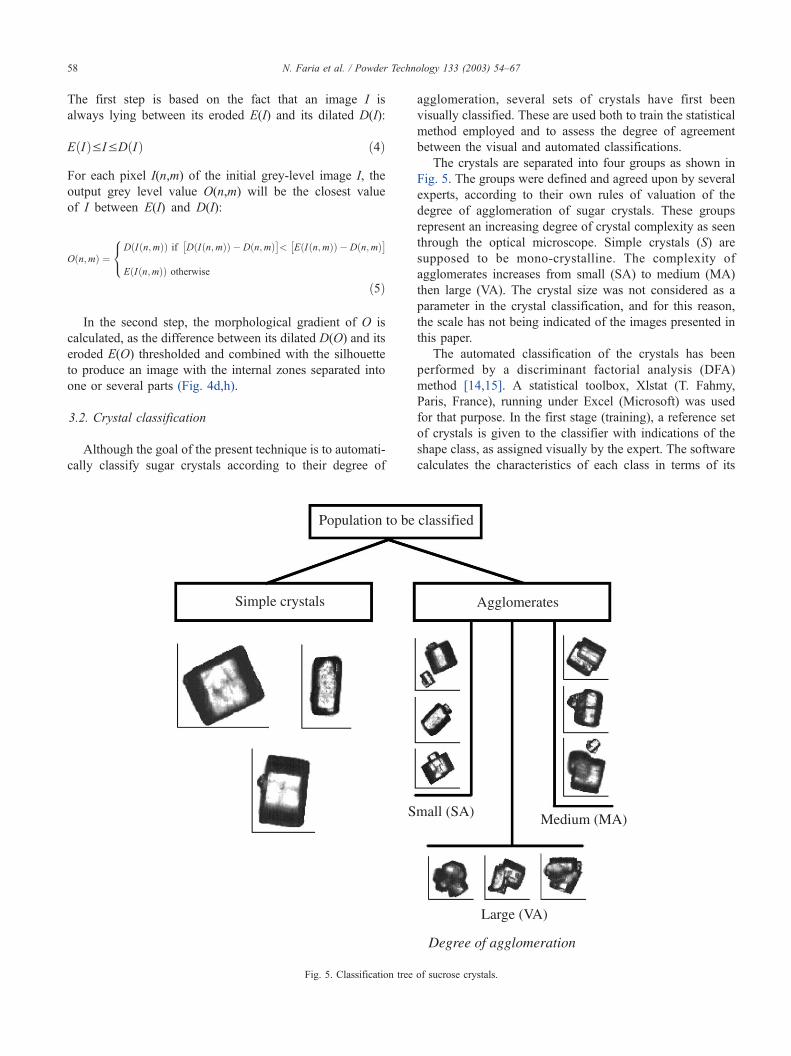
The crystals are separated into four groups as shown in
Fig. 5. The groups were defined and agreed upon by several
experts, according to their own rules of valuation of the
degree of agglomeration of sugar crystals. These groups
represent an increasing degree of crystal complexity as seen
through the optical microscope. Simple crystals (S) are
supposed to be mono-crystalline. The complexity of
agglomerates increases from small (SA) to medium (MA)
then large (VA). The crystal size was not considered as a
parameter in the crystal classification, and for this reason,
the scale has not being indicated of the images presented in
this paper.
The automated classification of the crystals has been
performed by a discriminant factorial analysis (DFA)
method [14,15]. A statistical toolbox, Xlstat (T. Fahmy,
Paris, France), running under Excel (Microsoft) was used
for that purpose. In the first stage (training), a reference set
of crystals is given to the classifier with indications of the
shape class, as assigned visually by the expert. The software
calculates the characteristics of each class in terms of its
Fig. 5. Classification tree of sucrose crystals.
N. Faria et al. / Powder Technology 133 (2003) 54–6758

centroid and variance radius. The operator has not to define
numerically the limits of each class in terms of descriptor
values. The distance of a crystal to the centroid characterises
the probability for a crystal to belong to the class and is used
as classification criterion for the subsequent stage. In this
next stage, a second set (set to be tested) is proposed to the
classifier, which assigns the crystal to the shape class based
on the probability of crystal i to belong to one of the groups
j (Pbi,j), whereP
j Pbi;j ¼ 1. Each crystal is assigned to the
group for which the probability is the highest.
The degree of mismatch (Eq. (6)) is used to grade the
quality of the automated classification.
Performance Index ¼ PIð%Þ
¼ 1� Number of misclassified crystals
Total number of crystals
� �� 100 ð6Þ
Table 1 compares the classification results obtained on a
set of 392 lab-crystallised particles for different descriptor
sets. The information on concavities is extremely valuable
when agglomerates are present: in the particles set under test
these agglomerates represent 90% of the population in
number. Even for simple crystals, a better classification rate
is obtained by considering the full descriptor set. The
increase in computation burden when nonconventional
shape parameters such as X1, X2 and CI are taken into
account has been judged worthwhile. Due to the continuous
improvement in computer speed, it is not reasonable to give
a precise calculation time. It was nevertheless less than 10 s
per image on the computer used throughout this study.
Table 2 presents the results obtained for the binary
classification (simple crystals/agglomerates) with two sets
of white cane sugar crystals from the same initial popula-
tion: P1 (171 agglomerates, 63 simple crystals) and P2 (107
agglomerates, 35 simple crystals). The variables considered
are elongation, aspect ratio, circularity, X1, X2, X3, CI and
N. The performance index decreases when the size of the
reference set decreases: a larger error is obtained when P2 is
the reference set. The use of N improves significantly the
classification. However, it cannot be based solely on this
parameter.
The determination of N is restricted to the case when
crystals are sufficiently transparent: as a matter of fact, N
cannot be obtained on brown cane sugar crystals. Another
restriction comes from the fact that a greater magnification
is required to determine N than the one necessary to obtain
only the silhouette: as a result, to examine the same number
of crystals, the number of images to analyse is larger.
Working with a lower magnification can make the full
automation of the image-grabbing phase much easier. For
those reasons, the subsequent results were obtained without
considering N.
Table 3 presents the results obtained for the complete
classification with two sets of white cane sugar crystals, P3
(224 crystals) and P4 (180 crystals), from the same initial
population. The variables considered are elongation, aspect
ratio, circularity, X1, X2 and CI.
The discrimination between simple and agglomerates is
satisfactory. In any case, the simple crystals are well
recognised. Within the agglomerate group, discrepancies
are high between two adjoining classes (SA and MA, MA
and VA). This was also noticed on the lab-crystallised
particles used to produce the results of Table 1. The
classification made by the expert is based on the initial
grey-level image when the automated classification is based
Table 2
Binary classification performance for white cane sugar crystals
Reference
set
Test set Use
of N
Misclassified
agglomerates
Misclassified
simple crystals
PI (%)
P1 +P2 P1 +P2 Yes 34 5 89.6
P1 +P2 P1 +P2 No 40 6 87.8
P1 P2 Yes 9 5 90.2
P2 P1 Yes 30 1 86.8
P1 P2 No 9 6 89.4
P2 P1 No 33 4 84.2
Table 1
Comparison of classification rates for different shape descriptor sets for lab-
crystallised particles
Descriptor set PI (%) Classification rate
for S crystals (%)
Elongation, aspect ratio,
circularity
84 76
X1, X2, CI 87 95
Elongation, aspect ratio,
circularity, X1, X2, CI
87 92
Table 3
Complete classification performance for white cane sugar crystals
Ref. set Test set PI (%)
S SA MA VA Binary
P3 P3 94.1 65.2 50 61.2 93.9
P3 P4 100 59.3 40 41.3 94.4
Table 4
Morphology distributions for different populations of sugar crystals:
P5 =white beet sugar, P6 = brown cane sugar; visual = as classified by the
expert, auto = automated classifier
Set S (%) SA (%) MA (%) VA (%) Global degree of
agglomeration (%)
P3 (visual) 31.9 21.1 19.3 27.7 68.1
P3 (auto) 35.7 25.8 17.4 21.1 64.3
P4 (visual) 34.4 17.8 22.3 25.5 65.6
P4 (auto) 39.7 26.6 19.6 14.1 60.3
P5 (visual) 41.4 20.4 16.1 22.1 58.6
P5 (auto) 54.3 14.8 21.6 9.3 45.7
P6 (visual) 54.8 14.8 7.8 22.6 45.2
P6 (auto) 55.4 16.8 14.2 13.6 44.6
N. Faria et al. / Powder Technology 133 (2003) 54–67 59

solely on the silhouette, which explained most of the
discrepancies. Furthermore, the classification made by the
experts is not absolute: the performance index between two
experts on the morphology distribution of set P3 was 92%,
which is very similar to the value obtained by automated
classification.
Table 4 gives the morphology distributions obtained
for the different commercial sugars. For P4 and P5, the
reference set was P3. For the brown sugar, as the crystals
do not have the same morphology as the white sugar
crystals, a new and appropriate reference set was
selected. The reference set for the white beet sugar
crystals P5 was P3, which explains the larger difference
in the visual and automated classifications of P5: it could
be seen visually that the beet sugar agglomerates are
slightly different from the white cane sugar ones. This
stresses out the necessity to choose an appropriate refer-
ence set. As it will be shown later, impurities affect the
shape of the crystal. Impurities in cane and beet sucrose
solutions are different. For that reason, it is better to
build a reference set in agreement with the nature of the
raw material.
There is compensation between classes, which explains
why the agreement is better between the visual and the
automated classifications than it could be deduced from the
examination of Table 3. The automated classification
behaves similarly for the commercial and the lab-crystal-
lised particles.
3.3. Degree of agglomeration
Using the results provided by the DFA method, it is
possible to numerically quantify the degree of agglomer-
ation of each crystal, Agi. If the four probabilities are taken
Fig. 6. Some of the frequent shapes observed with sucrose mono-crystals: (a) prototype of type A sucrose crystal (crystal 2), (b) + dextran (crystal 3), (c)
+ raffinose (crystal 4), (d) prototype of type B (crystal 5).
Fig. 7. The two different shapes of mono-crystals identified, A and B.
N. Faria et al. / Powder Technology 133 (2003) 54–6760

into account and not just the largest one, Agi can be
calculated using Eq. (7).
Agi ¼ 100 Pbi;s þ4
3Pbi;SA þ 5
3Pbi;MA þ 2Pbi;VA � 1
� �ð7Þ
This relation is a linear combination of the four proba-
bilities calculated so that
Pbi;S ¼ 1ZAgi ¼ 0%; Pbi;SA ¼ 1ZAgi ¼ 33%; Pbi;MA
¼ 1ZAgi ¼ 67%; Pbi;VA: ¼ 1ZAgi ¼ 100%:
3.4. Habit of mono-crystals
Once the crystals have been classified as simple or
agglomerates, it would be interesting to further characterise
mono-crystals according to their shape. It is a challenge
because, as stated previously, the number of observed
shapes is high and the projected silhouettes of the simple
crystals have many axes of symmetry. Fig. 6a presents one
of the most frequent habits in commercial sugar. Elongation
of the C-axis by dextran and of the B-axis by raffinose gives
rise to the shapes of Fig. 6b,c, respectively [2]. These three
crystals lay on one of their faces parallel to the BC plane.
When the crystals are deposited on a glass surface to be
observed under the optical microscope, they tend to land
on their largest face so as to attain the highest mechan-
ical stability. The crystal depicted in Fig. 6d was also
largely observed in our experiments and lays on a face
Fig. 8. Calculation of the Boxratio parameter.
Fig. 9. Variation of the normalised Feret diameters in function of orientation
for crystals 1 (n), 2 (5), 3 ( w ), 4 (.) and 5 (o).
Table 5
Characteristics of sucrose mono-crystals
Crystal Lb/Lc La/Lb Sbox/S Fmax/Fmin
1 (Fig. 1) 0.79 – 1.06 1.44
2 (Type A) 0.84 – 1.03 1.45
3 ( +Dextran) 0.49 – 1.05 2.16
4 ( +Raffinose) 1.52 – 1.02 1.73
5 (Type B) – 0.44 1.30 2.27
Fig. 10. Variation of the reduced confidence interval at 95% (U) and the
coefficient of variation (- - -) in function of the number of particles for (a)
Deq, (b) circularity C and (c) Fmax/Fmin.
N. Faria et al. / Powder Technology 133 (2003) 54–67 61

parallel to the AB plane. The recognition of the crystal
shape based on the analysis of the contour was initially
thought of. However, due to the high number of potential
shapes to identify, it demands a well-defined contour with
a large magnification of each crystal. This would be very
time-consuming for an industrial application. A simpler
procedure was developed with the aim to classify the
crystals as of type A (Fig. 7a) or type B (Fig. 7b). In
order to distinguish between these two different shapes,
some additional parameters have been introduced.
From Fig. 4d, it is possible to calculate the surface
occupied by the central and transparent part of the crystal
Sin. The ratio between the surface of the crystal and this
interior part (Arearatio = S/Sin) tends to be larger for
crystals of type B.
It can be seen in Fig. 6 that one of the characteristic
lengths of the simple crystal can be obtained directly from
Fmin. It is not so with Fmax. Due to shape of the convex
bounding polygons of the crystals depicted in Fig. 6, the
Feret diameter at a = amin + 90j (Fmin + 90j), where amin is
the tangent orientation corresponding to Fmin, gives a
second characteristic length. However, it should be noticed
that without any additional information, it is not possible to
determine to which length (La, Lb or Lc) Fmin and Fmin + 90j
correspond, respectively. Types A and B crystals can be
included in a rectangle of surface Sbox =Fmin�Fmin + 90j (Fig.
Fig. 11. Crystallisation of pure sucrose: Brix (—) and supersaturation (– – –) (a) and solution temperature (b) in function of time; (c) size distribution;
(d) degree of agglomeration in function of size; (e) elongation of simple crystals.
N. Faria et al. / Powder Technology 133 (2003) 54–6762

8). The ratio between this surface and the surface of the
crystal (Boxratio = Sbox/S) is higher for type B crystals, as
they do not fit so well within the rectangular box.
Besides these two parameters, the particle elongation
(Fmax/Fmin) and a set of Feret diameters calculated at 20
different angles between 0j and 180j, with an angular step
of 9j, are used to distinguish between the two types of
simple crystals. In order to make the Feret diameters
independent of the crystal size, they are normalised by Fmin.
Fig. 9 represents the variation of the normalised Feret
diameters (F(aV)/Fmin) with respect to aV= a� amin for the
different crystals of Figs. 1 and 6, while the shape ratios are
given in Table 5. Crystal 5 (Type B) has a F(aV)/Fmin curve
that presents a different pattern from the ones of crystals
1–4 (type A). As expected, Boxratio for crystal 5 is much
higher than for the other crystals. Using the DFA method
based on the value of these parameters for each simple
crystal, it is possible to automatically assign it in one of
the two groups, A or B. It should be noticed again that the
size is not here again a criterion for shape classification.
In order to evaluate the success of the automated classi-
fication, a set of 305 simple crystals were visually and
automatically classified. These crystals were isolated from
the images of four different populations. The DFA method
was trained using two of these populations (170 crystals)
and the other two were used to validate the classification.
The total number of misclassified crystals was seven, that is
the degree of agreement between the visual and automatic
classification (PI) was 98%. As previously, the operator
does not have to select the limit values of the descriptors for
A and B groups.
3.5. Number of particles
The choice of the number of particles to examine is
always a key issue with image analysis. On one hand, a
large number of particles increase the accuracy of the
morphological characteristics of the sample. On the other
hand, the larger the number, the longer the time necessary
for visualisation, image capture and treatment, especially
when the microscope stage is not automated [16].
To test the effect of the particle number on the results, a
test has been performed on a set of 770 crystals. Fig. 10
presents the variations of the reduced confidence interval at
a level of significance of 5% (i.e. 100� confidence interval
at 95%/average value, where the confidence interval of the
mean is based on the Student law with a significance level
of 5%) and the coefficient of variation (i.e. 100� standard
deviation/mean value) for three parameters: Deq, C and
Fmax/Fmin. A minimum of 500 particles should be analysed
Fig. 12. Crystallisation of sucrose in presence of dextran: (a) Brix in function of time; (b) size distribution; (c) degree of agglomeration in function of size; (d)
elongation of simple crystals.
N. Faria et al. / Powder Technology 133 (2003) 54–67 63
to insure a reduced confidence interval smaller than 5% for
Deq and 2% for the shape descriptors and an acceptable
stability of the coefficients of variation, i.e. of the parame-
ters distributions. The stabilisation of the coefficients of
variation is obtained with a larger number of particles than
the one of the mean values. In Fig. 10, the effect of the
change of slide around 150 particles can be seen on the
coefficients of variation.
4. Experimental results
The previously described procedures have been used to
investigate the effect of impurities on the quality of sugar
crystals.
The first experiment was performed with a pure
sucrose solution. The other six runs contain a certain
amount of a given pure chemical species that are dextran
(0.5 wt.% and 1 wt.%), raffinose (0.5 wt.% and 1 wt.%),
glucose (1 wt.%) and sodium carbonate (0.1 wt.%). The
image analysis procedure is applied to 150–250 images
for each experiment, resulting in the study of more than
500 particles.
4.1. Crystallising from a pure sucrose solution
The results obtained for the pure sucrose solution are
summarised in Fig. 11. The control of supersaturation by
manual adjustment of the bath temperature is delicate, but
the Brix decreases regularly (Fig. 11a). As seen in Fig.
11d, the agglomeration degree increases with the size of
the crystal. It is important to remember that large crystals
have spent a longer time in the solution than smaller
ones, thus increasing the probability of becoming agglom-
erates. The average elongation parameter for simple
crystals is 1.60, which is a little larger than the value
found for the ‘‘ideal’’ crystal 1. Sixty percent of the simple
crystals are of type A. The average degree of agglomer-
ation is 48%.
4.2. Influence of dextran
Dextran is a polymer present in the sugar cane. Its main
consequence to the sugar refining process is the increase of
the viscosity of the solutions. Slower rates of crystallisation
are observed as seen in Fig. 12a. An enlargement of the
overall size distribution can be seen in Fig. 12b in presence
Fig. 13. Crystallisation of sucrose in presence of raffinose: (a) Brix in function of time; (b) size distribution; (c) degree of agglomeration in function of size; (d)
elongation of simple crystals.
N. Faria et al. / Powder Technology 133 (2003) 54–6764

of dextran. The average degree of agglomeration increases
with the impurity concentration: 53% for 0.5% and 56% for
1%, which is higher than with the pure sucrose solution
(Fig. 12c). There is no evident relationship between the
concentration of dextran and the percentage of simple
crystals of type A: 53% with 0.5% but 67% with 1%, when
it is 60% with 0% dextran. Elongated crystals were expected
with this impurity according to Chen [2]. On the contrary, as
shown in Fig. 12e, the average elongation is smaller than
with the pure solution: 1.52 (for 0.5%) and 1.44 (1%).
However, some very elongated crystals can be spotted: 2%
and 5% of the simple crystals exhibit elongation values
larger than 2.9 with 0.5% and 1% dextran, respectively. This
reduced effect could be due to the fact that the dextran
present in the solution is not native and that its concentration
is low [4,5].
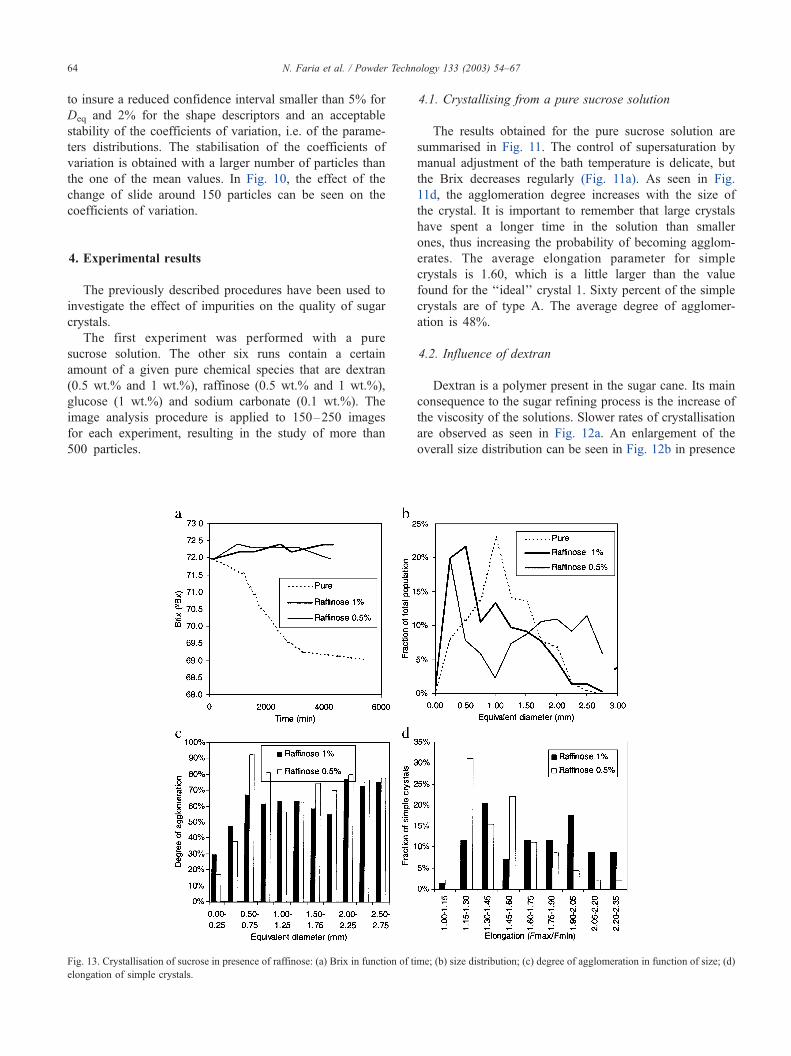
4.3. Influence of raffinose
A rapid inspection of Fig. 13a immediately reveals a very
strange behaviour: in presence of raffinose, the solution Brix
did not decrease as expected but increased. It will be shown
later that raffinose is a very strong inhibitor of sucrose
growth kinetics. Considering that a solution at 72j Bx
contains practically 72% of sucrose and 28% of water, a
small change in the sugar content does not change much its
Brix. On the other hand, a small amount of evaporated water
(the experiments lasted for 3 days) provokes an increase of
the Brix.
Fig. 13b reveals a crystal size distribution for the
raffinose systems rich in small crystals when compared to
the results obtained with a pure solution. This means that
either the nucleation kinetics is higher or the growth kinetics
is lower than in the pure sucrose system. As the total amount
of crystallised sucrose is very low, it is reasonable to assume
that raffinose is a strong sucrose growth inhibitor.
The average degree of agglomeration is similar to the one
obtained with dextran: 62% and 51% with 0.5% and 1%
raffinose, respectively. The variation of the degree of
agglomeration with respect to size (Fig. 13c) is different,
however, it seems to be more homogeneous over the size
distribution.
Raffinose also changes the crystal habit. Simple crystals
are more elongated in its presence than those obtained with
a pure sucrose solution, and they are predominantly of type
B (60–65%). As indicated by Chen [2], raffinose induces an
Fig. 14. Crystallisation of sucrose in presence of glucose and sodium carbonate: (a) Brix in function of time; (b) size distribution; (c) degree of agglomeration in
function of size; (d) elongation of simple crystals.
N. Faria et al. / Powder Technology 133 (2003) 54–67 65

elongation of the B-axis. However, it is delicate to draw
deeper conclusions, as the number of simple crystals was
limited in these experiments.
4.4. Influence of glucose and sodium carbonate
Glucose is a by-product of sucrose. It results from its
decomposition and is present in all sucrose-water systems.
Sodium carbonate is introduced in the system during the
refining process. Although most of it is separated before the
crystallisation stage, a significant amount may still reach
this phase. It is important to note that the amount of sodium
carbonate used in this experiment is only 0.1%. All other
experiments have been carried out with concentrations of
impurities of 0.5% and 1%. Sodium carbonate is a very
strong inhibitor of sucrose crystallisation kinetics (Fig. 14a),
and with a higher concentration of this salt, it was impos-
sible to obtain enough crystals. Glucose is also an inhibitor
of sucrose crystallisation kinetics, although not as strong as
sodium carbonate.
Both glucose and sodium carbonate provoked a spread of
the crystal size distribution (Fig. 14b). In the case of
glucose, this may be due to a decrease in the growth kinetics
as the degree of agglomeration is high even for small
crystals, as with raffinose. Crystal growth would then be
due to agglomeration and not to sucrose transfer from the
solution to the crystals.
In the case of sodium carbonate, the same cannot be said,
as the degree of agglomeration is lower than in the pure
sucrose system for almost all crystal size classes. The
conclusion is that sodium carbonate blocks all crystallisation
mechanisms, including agglomeration.
Glucose produces mostly type A simple crystals (57%)
with an average elongation of 1.57, similar to the value
obtained for pure sucrose (Fig. 14d). Even a very small
amount of sodium carbonate causes a strong elongation of
the simple crystals that are mostly of type A (72%).
5. Conclusions and perspectives
Using image analysis techniques, it is possible to obtain
valuable information on the size and morphology of sucrose
crystals. The information collected is not easily accessible
through any other technique, namely the evaluation of the
degree of agglomeration and the shape descriptors. The
quantification of crystal size is also more reliable as it is
done by a direct ‘‘visual’’ measurement on crystals. The
procedures have been kept as simple as possible to promote
their use in an industrial environment: the crystals are
visualised by optical microscopy and the image analysis is
fully automated.
The chemical species used as impurities in the system
have various effects on the crystallisation kinetics and on the
properties of the crystal populations. Dextran presented the
lowest impact and sodium carbonate the highest. Even at a
concentration 5 to 10 times lower than the other impurities
tested, sodium carbonate practically stopped the crystallisa-
tion process and the crystals that did manage to appear had
the most abnormal shapes. All tested impurities caused a
slowdown of the kinetic rate of one or another of the
crystallisation mechanisms. Dextran showed a slight impact
on the nucleation rate, raffinose strongly reduced the growth
rate, glucose and sodium carbonate reduced both nucleation
and growth rates although the effect of sodium carbonate
was much stronger. Although not dramatic, an effect of
impurities on agglomeration was noticed. It is not so much
the average degree of agglomeration that was modified, but
mostly the variation of the agglomeration with respect to the
size that presents different patterns.
The classification of mono-crystals according to their
shape produced puzzling results, which might have several
explanations. A more detailed classification might be neces-
sary, which is difficult because the number of possible shapes
is high and because the contour of real crystals is not as
perfectly defined as in theory. The number of mono-crystals
is probably not sufficient to draw full conclusions. If a limit of
500 particles is sufficient to have a global view of the size and
shape distribution of a sample, a larger number should in fact
be analysed in order to have a meaningful number of
individuals in the different shape classes.
In future work, this aspect will be considered. The
introduction of newly measured variables such as the degree
of agglomeration should allow a better understanding of the
crystallisation phenomena and of their implication for
designing particles presenting specific end-use properties.
Symbols
a, b, c coefficients
Agi degree of agglomeration of crystal i
Arearatio ratio of the crystal surface to its interior trans-
parent part
Boxratio ratio of the Feret box surface to the crystal
projected surface
Bx Brix
C circularity
CI concavity index
D(I) image resulting from the morphological dilation of I
Deq equivalent diameter
E(I) image resulting from the morphological erosion of I
Fmax maximal Feret diameter
Fmin minimal Feret diameter
Fmin + 90j Feret diameter perpendicular to Fmin
Hc convex bounding polygon
I grey-level image
La, Lb, Lc reference crystal side lengths
Mi mass of impurity
Mw mass of water
N number of internal zones
(n,m) pixel position with respect to line m and row n in
an image
nD refractive index
N. Faria et al. / Powder Technology 133 (2003) 54–6766

O grey-level image, output from a morphological
transformation
P Crofton perimeter
Pbi,j probability for crystal i to belong to shape group j
PI performance index
R2 correlation coefficient
S projected surface
Sbox Feret box surface
Sc surface of Hc
Sin surface of transparent zone
Ssat coefficient of saturation
T temperature
a tangent orientation
r supersaturation
X1 robustness
X2 largest concavity index
X3 concavity ratio
Acknowledgements
This work was partially financed by the Ambassade de
France au Portugal, program reference 98/B4/065, by
program PRAXIS XXI/BD/5491/95 and by the Portuguese
Foundation for Science and Technology—contract POCTI/
1999/EQU/33131.
References
[1] L.J. Kuijvenhoven, L.M. De Pree, E.J. De Jong, Conglomerate for-
mation in sugar crystallization: Part I. Effect of process conditions,
Int. Sugar J. 85 (1983) 201–207.
[2] J.C.P. Chen, Raw sugar quality criteria, Cane Sugar Handbook, Wiley,
New York, 1993, pp. 343–374.
[3] Z. Bubnık, P. Kadlec, Sucrose crystal shape factors, Zuckerindustrie
117 (1992) 345–350.
[4] D.N. Sutherland, Dextran and crystal elongation, Int. Sugar J. 70
(1968) 355–358.
[5] D.N. Sutherland, N. Paton, Dextran and crystal elongation: further
experiments, Int. Sugar J. 71 (1969) 131–135.
[6] M. Saska, Calculated form of the sucrose crystal, Int. Sugar J. 85
(1983) 259–261.
[7] B. Bernard-Michel, S. Rohani, M.N. Pons, H. Vivier, H.S. Hundal,
Classification of crystal shape using Fourier descriptors and mathe-
matical morphology, Part. Part. Syst. Charact. 14 (1997) 193–200.
[8] A. Zaknich, Characterization of aluminium hydroxide particles from
the Bayer process using neural network and Bayesian classifiers,
IEEE trans. Neural Netw. 8 (1997) 919–931.
[9] V. Jesic, Variables affecting saturation coefficient in cane final mo-
lasses, Int. Sugar J. 79 (1977) 274–277.
[10] G. Vavrinecz, Formation and composition of beet molasses: I. The
equation for solubility, Sugar Technol. Rev. 6 (1978) 117–129.
[11] C.R. Russ, The Image Processing Handbook, CRC Press, Boca
Raton, 1995.
[12] M.N. Pons, H. Vivier, J. Dodds, Particle shape characterization
using morphological descriptors, Part. Part. Syst. Charact. 14
(1997) 272–277.
[13] M. Coster, J.L. Chermant, Precis d’analyse d’images, 2nd ed., CNRS,
Paris, 1989.
[14] B.F.J. Manly, Multivariate Statistical Methods, 2nd ed., Chapman &
Hall, 1994.
[15] M. Otto, Chemometrics, Wiley-VCH, Weinheim, 1999.
[16] M.N. Pons, H. Vivier, V. Delcour, J.R. Authelin, L. Pailleres-Hubert,
Morphological analysis of pharmaceutical powders, Powder Technol.
128 (2002) 276–286.
N. Faria et al. / Powder Technology 133 (2003) 54–67 67