Optimisation of phytase production by Aspergillus niger using ...

ORIGINAL PAPER
Sucrose Biotransformation to Fructooligosaccharidesby Aspergillus sp. N74 Free Cells
Oscar Fernando Sánchez & Ana M. Rodriguez &
Edelberto Silva & Luis A. Caicedo
Received: 5 April 2008 /Accepted: 8 July 2008 /Published online: 30 July 2008# Springer Science + Business Media, LLC 2008
Abstract Fructooligosaccharide production with the fructo-syltransferase from free cells of the native strain Aspergillussp. N74 at laboratory level was evaluated. The biomass ofthe native strain Aspergillus sp. N74 was produced in a su-crose fermentation medium and was employed in the enzy-matic reaction in solutions of sucrose and phosphate buffer,where pH, temperature, and initial sucrose concentration ef-fect were evaluated. Fructooligosaccharides and reaction sub-products were identified and quantified by high-performanceliquid chromatography. The enzyme produced by the strainAspergillus sp. N74 possessed hydrolytic and transfructosy-lating activities that changed with process conditions. Thebest transfructosylating condition was obtained at 80 minreaction time at pH 5.5, 60 °C, and initial sucrose concen-trations higher than 550 g L−1, with fructooligosaccharideproduction of about 50% w/w (based on initial sucrose con-centration) and conversion selectivity higher than 90%. Inaddition, the transfructosylating and hydrolytic activities ratiowas of 20. The high transfructosylating activity showed by thefructosyltransferase produced from the native strain Aspergil-lus sp. N74 suggest considering it as an alternative for thescale-up production of fructooligosaccharides by means ofthe whole microorganism at bench and pilot plant levels.
Keywords Fructosyltransferase . Fructooligosaccharides .
Aspergillus sp.
Introduction
Fructooligosaccharides (FOS) are oligosaccharides of fruc-tose containing a single glucose moiety. They are produced bythe action of fructosyltransferase (FTase, E.C. 2.4.1.9) frommany plants and microorganisms (Yun 1996; Hidaka et al.1988). FOS are mainly composed of 1-kestose (GF2), nys-tose (GF3), and 1-β-fructofuranosyl nystose (GF4) in whichfructosyl units (F) are bound at the β(2→1) position ofsucrose molecule (GF) (Sangeetha et al. 2005b; Kaplan andHutkins 2000; Yun 1996; Hidaka et al. 1988).
The reaction mechanism of the FTase depends on theenzyme source. For microorganisms that follow a similar wayto produce FOS like Aureobasidum pullulans, which canproduce GF4 as the biggest FOS molecule, Jung et al. (1989)proposed a reaction mechanism model (Fig. 1). In thismechanism, the enzyme acts on sucrose in a disproportion-ation-type reaction where one molecule of sucrose serves as adonor and another acts as an acceptor. In general, most of themicrobial FTases may catalyze the reactions of a readilyreversible primary step (Eq. 1) and a subsequent irreversiblestep (Eq. 2; Yun 1996).
GFþ Enzyme $ F� Enzymeþ G ð1Þ
F� Enzymeþ Acceptor ! F� Acceptor þ Enzyme ð2ÞFOS with low polymeric grade have better therapeutic
properties than those with a high polymeric degree (Roberfroidand Delzenne 1998). FOS are about 0.4 and 0.6 times assweet as sucrose and have been used in the pharmaceuticalindustry as a functional sweetener (Sangeetha et al. 2005b;Biedrzycka and Bielecka 2004; Heyer and Wendenduerg
Food Bioprocess Technol (2010) 3:662–673DOI 10.1007/s11947-008-0121-7
O. F. Sánchez (*)Department of Chemical Engineering, Universidad De Los Andes,Cra. 1 Este 19A-40, Bogotá, Colombiae-mail: [email protected]
A. M. RodriguezUniversidad De Los Andes, Bogotá, Colombia
E. SilvaDepartment of Pharmacy, Universidad Nacional de Colombia,Bogotá, Colombia
L. A. CaicedoDepartment of Chemical Engineering,Universidad Nacional de Colombia,Bogotá, Colombia

2001; Yun 1996; Kühbauch 1972). FOS exhibited propertiessuch as low caloric values, noncariogenic properties, decreaselevels of phospholipids, triglycerides, and cholesterol, helpgut absorption of calcium and magnesium, are useful fordiabetic products, and are used as prebiotics to stimulate thebifidobacteria growth in the human colon (Sangeetha et al.2005b; Biedrzycka and Bielecka 2004; Roberfroid andDelzenne 1998; Yun 1996; Crittenden and Playne 1996;Yamashita et al. 1984).
FOS are industrially produced from sucrose by microbialenzymes with transfructosylating activity, mainly found infungi such as Aspergillus japonicus, Aspergillus niger,Aspergillus sydowi, Aspergillus foetidus, Aspergillus oryzae,A. pullulans, Penicillium citrinum, Penicillium frequentans,and Fusarium oxysporum, some bacterial like Arthrobactersp., Zymomonas mobilis, and Bacillus macerans, and someyeasts like Kluyveromyces and Candida (Hernalsteens andMaugeri 2008; Sguarezi et al. 2008; Sangeetha et al. 2005b;Yun 1996). The theoretical yield of FOS from sucrose is75% if 1-kestose is the only FOS produced (Yoshikawa et al.2008). Commercial FOS may contain glucose, fructose, andsucrose in more than 500 g per kilogram of total FOS dryweight. Thus, the search of new potent transfructosylatingenzyme producers with their best reaction conditions is desi-rable in order to scale up the process. During the search forenzyme producers with FTase activity in Colombian sugarcane crops, a new strain designated as Aspergillus sp. N74was isolated. In this study, the batch FOS production fromsucrose by whole cells of Aspergillus sp. N74 culture in shookflasks and pH, temperature, and initial sucrose concentrationeffect on the trans-FTase were evaluated in order to establishits potential use for industrial FOS production.
Materials and Methods
Chemicals
1-Kestose, nystose, and 1-β-fructofuranosyl nystose usedas standard in product analysis were purchased from
Wako Pure Chemical Industries (Osaka, Japan). The su-crose was food grade, while other chemicals were analyticalgrade.
Microorganism and Spore Production
From 32 different farms that grow sugar cane in Cundina-marca, a central region of Colombia, soil and sugar canebagasse sampleswere collected. Ten grams of each sample wasadded to 90 mL of peptone water (0.1% w/v). This mixturewas then shaken and diluted to final concentrations of 102,103, and 104. From each dilution, 0.1 mL was spread in tripli-cate on the surface of dichloran–rose bengal–chloramphenicolagar and incubated at 25 °C for 7 days (Necsi et al. 2006).One hundred thirty-six native strains were isolated andidentified by macroscopic and microscopic examination.Fungal colonies that resembled Aspergillus and Penicilliumspecies were subcultured on malt extract agar medium(MEA). Aspergillus species were identified according to thetaxonomic schemes proposed by Pitt and Hocking (1997),Raper and Fennell (1965), Klich and Pitt (1994). Other fungiwere identified according to Samson et al. (2000). Followinga similar procedure as described in this paper for biomassand FOS production, an evaluation of the transfructosylatingactivity of the isolated strains was made. The fungusAspergillus sp. N74, a bagasse isolate from sugar cane(Cundinamarca, Colombia), was obtained as the one with thehighest transfructosylating activity. To prepare spore sus-pensions, spores were scraped down from 7-day-old cul-tures onto MEA plates with a sterilized tensioactive solution(15% w/v glycerol, 0.1% w/v Tween 80, and acetate buffer0.1 M (pH 6.0) q.s.f. 100 mL) and diluted to a concentrationof about 1×10⁷ spores per milliliter with sterilized water(Cruz et al. 1998). The spore suspensions were stored at −20±1 °C and subcultured onto fresh MEA slants once a month.
Biomass Production
Inocula were prepared in 250-mL shake flasks with 100mL ofculture medium (11% sucrose, 0.84% K2HPO4, 0.102%MgSO4·7H2O, 0.088% KCl, 0.007% FeSO4·7H2O, 0.085%NaNO3·4H2O, 2.0% yeast extract, 0.136% CaCO3, adjustedto pH 5.5±0.1 with HNO3; Hernandez 2004). The mediumwas inoculated with 1,000 μL of 1×10⁷ spores per milliliterand incubated for 48 h at 30±1 °C and 200 rpm. (NewBrunswick C76). Cultures were harvested and filtered usingfilter paper (Whatman no. 2) to separate the pellets from theculture fluid. The produced biomass was washed twice with50 mM phosphate buffer, pH 5.5, in order to remove theremnant culture medium. The resulted biomass was con-served at −4 °C during 24 h before being used for the FOSproduction. The biomass weight was determined at the endof the enzymatic reaction, after being washed with 50 mM
2 GF3
1 GF4
4 G
2 GF
GF2
8 GF
4 GF2
Fig. 1 Reaction mechanism forthe FOS production fromsucrose catalyzed by the FTaseproduced from Aureobasidiumpullulans. Nomenclature: GFsucrose, G glucose, GF2
1-kestose, GF3 nystose, GF41-β-fructofuranosyl nystose(Jung et al. 1989)
Food Bioprocess Technol (2010) 3:662–673 663

phosphate buffer, pH 5.50, and dried for 48 h at 105 °C(Dorta et al. 2006; Cruz et al. 1998).
FTase Assay and FOS Production
FTase assay and FOS production were determined from batchstudies done in 250-mL shake flasks containing 100 mL ofsucrose solution and biomass. For each condition of FOSproduction used, the biomass resulted from every 250-mLculture flask, as described above. Effect of initial sucroseconcentration (30, 55, and 80% w/v), pH (5.00, 5.50, and6.00±0.01), and temperature (45, 55 and 65±1 °C) wereevaluated by 320 min with constant agitation (200 rpm in aNew Brunswick C76 shaker). Samples for the analysis ofenzymatic activity and carbohydrates were taken at 0, 5, 10,20, 40, 80, 160, and 320 min. The samples were kept in aboiling water bath for 10 min to stop the reaction. Thereaction was made at sucrose concentrations from 5 to 80%w/v, under the best pH and temperature conditions. For eachcondition of FOS production, a sucrose solution withoutbiomass was used as negative control to check out thetemperature and pH effect on sucrose hydrolysis. Controlsamples were taken and prepared as described above.
The final FOS yield (% w/w) is expressed on the basis ofinitial sucrose concentration. Each reaction condition for FOSproduction was performed by triplicate. Results in the differentprofiles are shown as mean values and standard deviations.
The β-fructofuranosidase activity, transfructosylating ac-tivity, and the hydrolytic activity were determined bymeasuring both the glucose (G) and fructose (F) present inthe reactionmixture. One unit ofβ-fructofuranosidase activitywas defined as the amount of enzyme required to release1 μmol of glucose min−1. One unit of transfructosylatingactivity was defined as the amount of enzyme required totransfer 1 μmol of fructose min−1. One unit of hydrolyticactivity was defined as the amount of enzyme required torelease 1 μmol of free fructose min−1 (Fernández et al. 2004;Nguyen et al. 1999; Hayashi et al. 1990; Hidaka et al. 1988).
The enzymatic productivity (UiE) was calculated as theactivity (Ui) per reaction volume, while the specific activity(UiS) was calculated as the activity (Ui) per unit of biomassdry weight, where i can be the β-fructofuranosidase (Uf),transfructosylating (Ut), or hydrolytic (Uh) activity, whichwere calculated at a time interval by Eqs. 3, 4, and 5,respectively.
Uf ¼mmol Glucosejti�mmol Glucosejt0
ðti � t0Þ ð3Þ
Ut ¼mmol Glucosejti�mmol Glucosejt0
� �� mmol Fructosejti�mmol Fructosejt0� �
ti � t0ð Þ ð4Þ
Uh ¼mmol Fructosejti�mmol Fructosejt0
ti � t0ð Þ ð5Þ
Specific activity and volumetric productivity of the enzymewere evaluated through Eqs. 6 and 7, respectively.
UiS ¼ Ui
mg dried biomassð6Þ
UiE ¼ Ui
Reaction volumeð7Þ
Table 1 Analysis of variance (ANOVA) for the central compositedesign and quadratic regression model
Source df SS MS F P value
ANOVA for the transfructosylating activityTemperature 2 61.99 30.99 4.09 0.025pH 2 2237.12 1118.56 147.72 0.000Sucrose % 2 176.93 88.47 11.68 0.000Error 38 287.74 7.57Total 44 2763.79ANOVA for the hydrolytic activityTemperature 2 9.678 4.830 8.15 0.001pH 2 299.521 149.76 252.16 0.000Sucrose % 2 7.807 3.904 6.57 0.004Error 38 22.569 0.594Total 44 339.574Quadratic regression model ANOVA for the transfructosylatingactivityRegression 9 2458.65 273.184 56.56 0.000Linear 3 115.80 38.599 7.99 0.000Square 3 277.17 92.390 19.13 0.000Interaction 3 37.94 12.640 2.62 0.070Residual error 35 169.05 4.830Lack of fit 5 35.20 7.039 1.54 0.228Pure error 30 137.25 4.575Total 44 2627.70
664 Food Bioprocess Technol (2010) 3:662–673

where the subscript i refers to the β-fructofuranosidase,transfructosylating, or hydrolytic activity.
The selectivity of conversion from sucrose to FOS wascalculated by Eq. 8 (Madlová et al. 1999).
SFOS ¼ 2 GF2½ � þ 3 GF3½ � þ 4 GF4½ �2 GF2½ � þ 3 GF3½ � þ 4 GF4½ � þ F½ � ð8Þ
where, [GF2], [GF3], [GF4], and [F] are the molar con-centrations of 1-kestose, nystose, 1-β-fructofuranosyl nys-tose, and initial sucrose and fructose, respectively.
Fructosyltransferase Enzyme Activityby Recycling Biomass
The biomass harvested from a 48-h-old culture was washedand filtered as described above, then it was transferred to100 mL reaction medium (55% sucrose, with an initial pH of
5.50 adjusted with phosphate buffer 50 mM) in a 250-mLflask. The reaction was carried out at 60±1 °C and 250 rpm.After 180 min of reaction, the biomass was filtered andwashed with 50 mM phosphate buffer (pH 5.50). The se-parated biomass was added to a fresh reaction medium underthe described conditions. Ten recycles were made to observeits effect on the enzyme activity. During each reaction,samples for the analysis of enzymatic activity and carbohy-drates were taken at 0, 5, 10, 20, 40, 80, and 180 min. Thesamples were kept in a boiling water bath for 10 min to stopthe reaction. This assay was carried out in duplicate.
Analysis of Sugars
The analysis of sugars was performed by high-performanceliquid chromatography (HPLC). The HPLC equipment con-tained aWaters 515 pump with on-line degasser, a Waters 410
Fig. 2 Temperature, pH, andinitial sucrose concentrationeffect on transfructosylating(solid line) and hydrolytic(dashed line) activity. Nomen-clature for a: sucrose concentra-tion (% w/v) and pH:30%—5.00 (filled squares),30%—6.00 (filled triangles),55%—5.50 (empty circles),80%—5.00 (empty triangles),and 80%—6.00 (emptysquares); for b: 30% (filledsquares) and 80% (filledtriangles) at 60 °C
Food Bioprocess Technol (2010) 3:662–673 665

refractive index detector, and an injection valve with a 20-μLloop.
A Sugar-Pak™ (Waters) column was used for sucrose,glucose, and fructose identification and quantification. Chro-matographic conditions were as follows: column temperature,84 °C; mobile phase, water at a flow rate of 0.4 cm3 min−1, andrefractive index detector temperature, 40 °C (Sánchez 2006).
A Shodex® (Waters) column was used for 1-kestose,nystose, and 1-β-fructofuranosyl nystose identification andquantification. Chromatographic conditions were as follows:column temperature, 65 °C; mobile phase, water–acetonitrile(72:28) at a flow rate of 1.0 cm3 min−1, and refractive indexdetector temperature, 45 °C (Sánchez 2006).
Experimental Design and Statistics Analysis
To establish the temperature, pH, and initial sucrose concen-tration effect on the transfructosylating and hydrolytic acti-vities, a central composite design with one central point andα=1 was performed up to a full 23 factorial design. Statis-tically significant factors were determined by analysis ofvariance (ANOVA). After that, an unbalance factorial designwas performed by the augmentation of the experimentalmatrix with two temperature (50 and 60 °C) and one pH(6.5) levels to determine the highest transfructosylating acti-vity conditions. The design was analyzed by a general linearmodel ANOVA followed by Tukey’s honestly significant dif-
30 55 8012
15
18
21
24
27
Uts (
µmol
min
-1 g
-1)
1.1
1.6
2.1
2.6
3.1
3.6
45 50 55 60 650
10
20
30
40
50
Temperature (°C)
Uts (
µmol
min
-1 g
-1)
Initial sucrose concentration (%w/v)
0
1.8
3.6
5.4
7.2
9.0
5 5.5 6 6.50
5
10
15
20
25
30
Uts (
µmol
min
-1 g
-1)
Uhs (µ
mol m
in-1 g
-1) U
hs (µm
ol min
-1 g-1)
pH
1.1
1.5
1.9
2.3
2.7
3.1
Uhs (µ
mol m
in-1 g
-1)
Fig. 3 Means and 95.0% Tukeyintervals for the transfructosy-lating (filled diamonds) and hy-drolytic (empty squares)activities
666 Food Bioprocess Technol (2010) 3:662–673

ference multiple comparisons to establish statistically homog-enous level groups inside each factor. A difference with a P<0.05 was considered significant. Calculations were supportedon Minitab® ver. 15.1.
Results and Discussion
The analysis of variance for the central composite designshowed that the effect of pH, temperature, and initial sucroseconcentration on the transfructosylating and hydrolyticactivities of the FTase enzyme from Aspergillus sp. N74were statistically significant (P<0.05; Table 1).
The ANOVA of the regression model for the transfructo-sylating activity showed that two-way interactions were notstatistically significant (P>0.05) but square interactions were(P<0.05; Table 1). The obtained quadratic model (Eq. 9) topredict the transfructosylating activity presented a R2 andadjusted R2 of 0.9461 and 0.9294, respectively. The obtainedcorrelation coefficient R (0.9007) indicates a good agreementbetween the experimental and predicted values.
Y ¼ �250:954þ 145:60x1 � 6:062x2 þ 0:53x3
� 13:407x21 þ 0:062x22 � 0:004x23 ð9Þ
Figure 2a shows the transfructosylating and hydrolyticactivities after 320 min incubation. Under the studied con-
Fig. 4 Sucrose concentrationeffect on specific transfructosy-lating and hydrolytic activityratio (UtSU�1
hS ), at pH 5.50 and60 °C
Fig. 5 Sucrose concentrationeffect on FOS formation rates(1-kestose [empty triangles] andnystose [empty squares]) andsucrose depletion rate (filledsquares), at pH 5.50 and 60 °C.Curves are Michaelis–Mentenmodel whose parameters weredetermined by nonlinear regres-sion. Nomenclature: sucrose(solid line), 1-kestose (dashedline) and nystose (dotted line)
Food Bioprocess Technol (2010) 3:662–673 667

ditions, it was observed that an increment in temperaturefavored both activities but an increment in initial sucroseconcentration only favored the specific transfructosylatingactivity of the enzyme. In the evaluated pH domain, hightransfructosylating activity was observed in the range from5.0 to 6.0. Nevertheless, the major hydrolytic activity wasobserved at pH 5.0 (Fig. 2b). These observations were inagreement with the Tukey’s multiple range test results, ob-tained from the unbalanced factorial design (Fig. 3). Althoughall temperature and pH levels showed statistical difference(P>0.05), for initial sucrose concentrations higher than 55%w/v, no statistical difference was observed. The maximum
transfructosylating activity was obtained at 60 °C and pH 5.50,which went from 46.2±3.3 to 50.2±3.3 μmol min−1 g−1 forinitial sucrose concentrations of 55% and 80%, respectively.While under the same conditions, the hydrolytic activity wentfrom 2.20±0.17 to 2.70±0.24 μmol min−1 g−1 for initial su-crose concentrations of 55% and 80%, respectively. A similarpattern was observed for the volumetric productivity of theenzyme, where the transfructosylation productivity was inthe range of 45.1±3.47 to 180±14.2 μmol min−1 mL−1, andthe hydrolytic productivity was in the range of 2.01±0.11 to15.3±0.85 μmol min−1 mL−1. This performance agrees withreported results for different Aspergillus strains (Sangeetha et
Fig. 6 Carbohydrates profiles at60 °C, pH 5.50, and initialsucrose concentration of 80%(a), 70% (b), 55% (c), 30% (d),and 5% w/v (e). Nomenclature:sucrose (GF, empty triangles),glucose (G, empty squares),fructose (F, empty circles), 1-kestose (GF2, filled triangles),nystose (GF3, filled squares),and FOS total (filled circles)
668 Food Bioprocess Technol (2010) 3:662–673

al. 2005a; Fernández et al. 2004; L’Hocine et al. 2000; Parkand Almeida 1991; Hidaka et al. 1988), although forAspergillus phoenicis, FTase enzyme was reported an optimalpH of 8.0 (van Balken et al. 1991).
Transfructosylating and hydrolytic activities ratio (UtSU�1hS )
was evaluated at 60±1 °C, pH 5.50, 80 min of reaction, andinitial sucrose concentrations between 5% to 80% w/v. As wasexpected, the ratio UtSU�1
hS was increased with increasingsucrose concentration. The plateau of the UtSU�1
hS ratio (20.9±1.47) between initial sucrose concentrations of 55% and 80%w/v represents the maximum UtSU�1
hS ratio of the system(Fig. 4). The plateau could be formed due to the saturation of
β-fructofuranosidase with substrate (Fig. 5). Fernández et al.(2004) reported a similar performance for FOS productionfrom Aspergillus sp. 27 H with sucrose concentrations of 216and 615 g L−1 and obtained a UtSU�1
hS ratio no higher than10.3 at 615 g L−1 of sucrose, at pH 5.50, 55 °C, and 80 minreaction time. While, Hidaka et al. (1988) obtained a UtSU�1
hS
ratio of 14.2 at 50% of sucrose, pH 5.00, 40 °C, and 24 hreaction time. As the UtSU�1
hS ratio is an important factor forindustrial FOS production, these results recommend theAspergillus sp. N74 enzyme for FOS production scale-up.
At the highest transfructosylating condition (pH 5.50 and60 °C) for initial sucrose concentrations between 5% and
Fig. 6 (continued)
Food Bioprocess Technol (2010) 3:662–673 669

80% w/v, the Michaelis–Menten kinetic model was appliedobtaining correlation coefficients (R2) higher than 0.95(Fig. 5). The obtained apparent kinetic constants Kapp
m andV appmax were converted to the same biomass dry weight basis
and expressed on a weight basis. The obtained Michaelis–Menten constants for sucrose (Kapp
m 44.57±2.09 g L−1 andV appmax 68.69±3.22 g L−1 h−1), 1-kestose (Kapp
m 62.59±1.87 gL−1 and V app
max 12.54±0.37 g L−1 h−1), and nystose (Kappm
76.67±3.45 g L−1 and V appmax 1.71±0.07 g L−1 h−1) showed
that increases in fructose units in the molecule resulted indecreased V app
max and increased Kappm values, which implies a
major enzyme affinity for sucrose hydrolysis and 1-kestoseproduction than nystose production. From the second-orderreaction rate constants (V app
maxKapp�1m ), the order of the reaction
rates was as follows: sucrose hydrolysis (1.59 h−1)>for-mation of 1-kestose (0.20 h−1)>nystose (0.022 h−1).These results were in agreement with reported by Jung etal. (1989) and Duan et al. (1994) who studied the FOSproduction kinetic from sucrose. Although further studies
should be made to establish the glucose effect on the reaction,these parameters can be used for preliminary scaling-upevaluations.
Carbohydrate concentration profiles per biomass dry weightobtained at 60±1 °C, pH 5.50, and initial sucrose concentra-tions in the range of 5% to 80% w/v are shown in Fig. 6. Ascan be seen, transformation from sucrose to 1-kestose and from1-kestose to nystose showed expected profiles (Fernández et al.2004; Hidaka et al. 1988). Nevertheless, it was observed thatas sucrose concentration increased, the rate of appearance ofglucose and fructose diminishes, since at lower sucrose con-centrations, hydrolytic activity is favored (Fernández et al.2004). For sucrose concentrations higher than 55% w/v, thehighest FOS production was obtained at about 80 min, whilefor lower sucrose concentrations, the maximum FOS produc-tion was obtained at about 40 min. These results agree withthe transfructosylating activity performing. It was also noticedat higher sucrose concentrations (70 and 80% w/v) that thebiotransformation of nystose from 1-kestose was favored,
Fig. 6 (continued)
Table 2 Sucrose concentration effect on FOS production at 60 °C, pH 5.50, and 320 min of reaction
[S]0 % GF2 (g L−1) GF3 (g L−1) FOS total (g L−1) GF2 (%) GF3 (%) FOS total (%) [S]R (%) SC SD %
80 294.50 117.09 411.59 71.6 28.4 51.4 8.3 90.1 5.4670 214.05 157.84 371.89 57.6 42.4 53.1 5.7 91.7 4.8460 184.37 127.54 311.91 59.1 40.9 52.0 6.9 90.9 5.3455 142.16 143.88 286.04 49.7 50.3 52.0 8.3 93.6 4.3540 85.560 113.89 199.45 42.9 57.1 49.9 7.7 83.5 5.0130 37.470 59.510 96.980 38.6 61.4 32.3 6.3 74.9 4.89
Nomenclature: [S]0 initial sucrose, GF2 1-kestose, GF3 nystose, [S]R remnant sucrose, SC selectivity of conversion, SD standard deviation of totalFOS
670 Food Bioprocess Technol (2010) 3:662–673

causing 1-kestose concentrations to fall rapidly after reachingits maximum value, while total FOS decreased with time.Decreasing FOS concentration could be associated with theping-pong mechanism that has been reported for FTase, wheresucrose can be produced from FOS (Crittenden and Playne1996; Yun 1996). Nevertheless, at concentration of 55% w/vor lower, total FOS production remained constant from 80 to320 min and the 1-kestose/nystose ratio decreased. Because1-kestose has more sweetening power than the other FOS andthe most beneficial properties for health are obtained withFOS of low polymerization grade (Biedrzycka and Bielecka2004; Yun 1996), the reaction should be stopped just asmaximum FOS production is reached. Therefore, reaction timeis an important control parameter in order to get a specific FOScomposition. 1-β-Fructofuranosyl nystose production was notdetected at any of the evaluated conditions.
FOS composition, FOS yield (YFOS), residual sucrose, andconversion selectivity at 60±1 °C, pH 5.50, and differentinitial sucrose concentrations are presented in Table 2. At highsucrose concentrations (≥55% w/v), the conversion selectiv-ity obtained was higher than 90%, remaining sucrose wasabout 8%, and FOS yield was in the range of 51% to 53% w/wwith compositions between 49.7% to 71.6% for 1-kestoseand 50.3% to 28.4% for nystose. Also favored was 1-kestoseproduction, while the nystose proportion was favored at lowsucrose concentration. These results are comparable with sys-tems reported in reaction volumes up to 100 mL where pH,temperature, and sucrose concentration effect were evaluated(Table 3).
The evaluation of the transfructosylating productivity frombiomass recycle showed an almost constant performance duringthe first eight recycles (Fig. 7), 203±11 μmol min−1 mL−1 with
Table 3 FOS yield and composition at different reaction time reported for many microorganisms
Source YFOS [S]0 % GF2 (%) GF3 (%) GF4 (%) Time (h) Reference
Aspergillus oryzae CFR 202 56 63 38 23 0.5 36 Sangeetha et al. (2005a)Aspergillus sp 27H 61.5 39 23 6.0 Fernández et al. (2004)Aureobasidium pullulans CFR 77 60 55 12 Sangeetha et al. (2004)Zymomonas mobilis 24–32 50–60 24 Bekers et al. (2002)Aspergillus japonicus 61 40 6.0 Chien et al. (2001)Aspergillus niger AS0023 54 50 5.0 L’Hocine et al. (2000)Penicillium citrinum 55 70 22 14 11 24 Hayashi et al. (2000)Aureobasidium pullulans sp 70 70 4.0 Madlová et al. (1999)Aspergillus niger ATCC20611 60 50 24 Hidaka et al. (1988)Aspergillus sp. N74 50–53 55–80 71–34 61–28 5.3 This study
Nomenclature: [S]0 initial sucrose, GF2 1-kestose, GF3 nystose, GF4 1-β-fructofuranosyl nystose
Fig. 7 Biomass recycling effecton transfructosylating (squares)and hydrolytic (triangles)volumetric enzyme productivity.Initial sucrose concentration55%, pH 5.5, 60±1 °C, and250 rpm
Food Bioprocess Technol (2010) 3:662–673 671
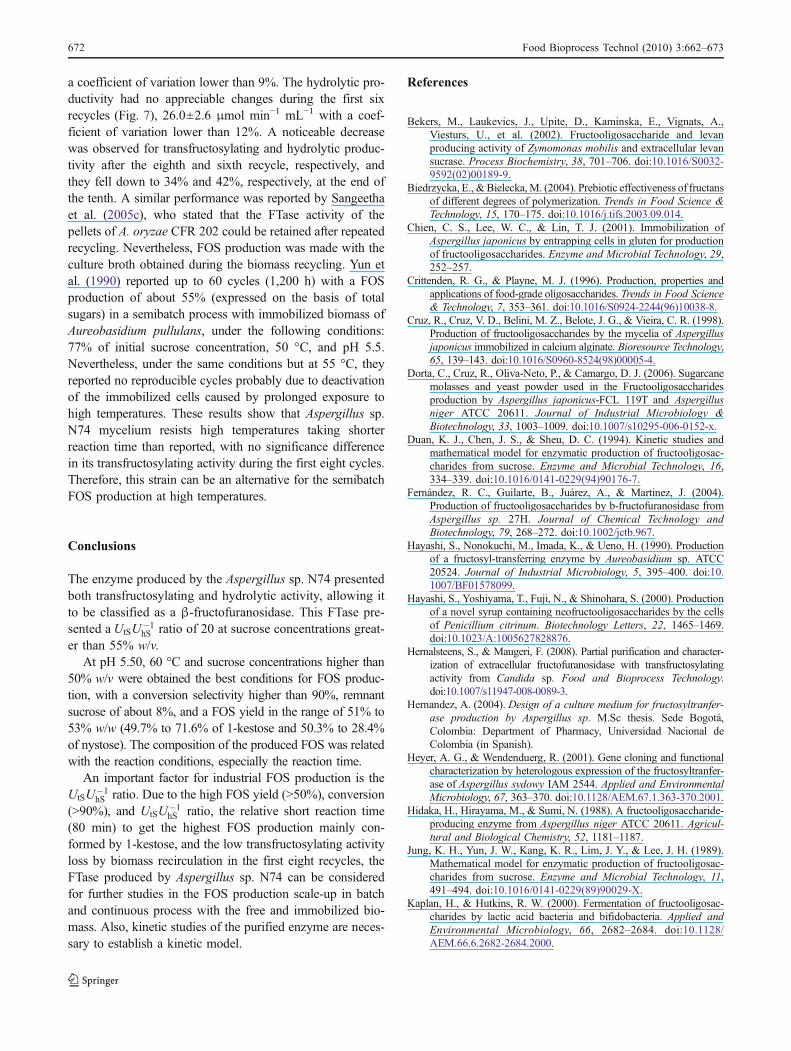
a coefficient of variation lower than 9%. The hydrolytic pro-ductivity had no appreciable changes during the first sixrecycles (Fig. 7), 26.0±2.6 μmol min−1 mL−1 with a coef-ficient of variation lower than 12%. A noticeable decreasewas observed for transfructosylating and hydrolytic produc-tivity after the eighth and sixth recycle, respectively, andthey fell down to 34% and 42%, respectively, at the end ofthe tenth. A similar performance was reported by Sangeethaet al. (2005c), who stated that the FTase activity of thepellets of A. oryzae CFR 202 could be retained after repeatedrecycling. Nevertheless, FOS production was made with theculture broth obtained during the biomass recycling. Yun etal. (1990) reported up to 60 cycles (1,200 h) with a FOSproduction of about 55% (expressed on the basis of totalsugars) in a semibatch process with immobilized biomass ofAureobasidium pullulans, under the following conditions:77% of initial sucrose concentration, 50 °C, and pH 5.5.Nevertheless, under the same conditions but at 55 °C, theyreported no reproducible cycles probably due to deactivationof the immobilized cells caused by prolonged exposure tohigh temperatures. These results show that Aspergillus sp.N74 mycelium resists high temperatures taking shorterreaction time than reported, with no significance differencein its transfructosylating activity during the first eight cycles.Therefore, this strain can be an alternative for the semibatchFOS production at high temperatures.
Conclusions
The enzyme produced by the Aspergillus sp. N74 presentedboth transfructosylating and hydrolytic activity, allowing itto be classified as a β-fructofuranosidase. This FTase pre-sented a UtSU�1
hS ratio of 20 at sucrose concentrations great-er than 55% w/v.
At pH 5.50, 60 °C and sucrose concentrations higher than50% w/v were obtained the best conditions for FOS produc-tion, with a conversion selectivity higher than 90%, remnantsucrose of about 8%, and a FOS yield in the range of 51% to53% w/w (49.7% to 71.6% of 1-kestose and 50.3% to 28.4%of nystose). The composition of the produced FOS was relatedwith the reaction conditions, especially the reaction time.
An important factor for industrial FOS production is theUtSU�1
hS ratio. Due to the high FOS yield (>50%), conversion(>90%), and UtSU�1
hS ratio, the relative short reaction time(80 min) to get the highest FOS production mainly con-formed by 1-kestose, and the low transfructosylating activityloss by biomass recirculation in the first eight recycles, theFTase produced by Aspergillus sp. N74 can be consideredfor further studies in the FOS production scale-up in batchand continuous process with the free and immobilized bio-mass. Also, kinetic studies of the purified enzyme are neces-sary to establish a kinetic model.
References
Bekers, M., Laukevics, J., Upite, D., Kaminska, E., Vignats, A.,Viesturs, U., et al. (2002). Fructooligosaccharide and levanproducing activity of Zymomonas mobilis and extracellular levansucrase. Process Biochemistry, 38, 701–706. doi:10.1016/S0032-9592(02)00189-9.
Biedrzycka, E., & Bielecka,M. (2004). Prebiotic effectiveness of fructansof different degrees of polymerization. Trends in Food Science &Technology, 15, 170–175. doi:10.1016/j.tifs.2003.09.014.
Chien, C. S., Lee, W. C., & Lin, T. J. (2001). Immobilization ofAspergillus japonicus by entrapping cells in gluten for productionof fructooligosaccharides. Enzyme and Microbial Technology, 29,252–257.
Crittenden, R. G., & Playne, M. J. (1996). Production, properties andapplications of food-grade oligosaccharides. Trends in Food Science& Technology, 7, 353–361. doi:10.1016/S0924-2244(96)10038-8.
Cruz, R., Cruz, V. D., Belini, M. Z., Belote, J. G., & Vieira, C. R. (1998).Production of fructooligosaccharides by the mycelia of Aspergillusjaponicus immobilized in calcium alginate. Bioresource Technology,65, 139–143. doi:10.1016/S0960-8524(98)00005-4.
Dorta, C., Cruz, R., Oliva-Neto, P., & Camargo, D. J. (2006). Sugarcanemolasses and yeast powder used in the Fructooligosaccharidesproduction by Aspergillus japonicus-FCL 119T and Aspergillusniger ATCC 20611. Journal of Industrial Microbiology &Biotechnology, 33, 1003–1009. doi:10.1007/s10295-006-0152-x.
Duan, K. J., Chen, J. S., & Sheu, D. C. (1994). Kinetic studies andmathematical model for enzymatic production of fructooligosac-charides from sucrose. Enzyme and Microbial Technology, 16,334–339. doi:10.1016/0141-0229(94)90176-7.
Fernández, R. C., Guilarte, B., Juárez, A., & Martinez, J. (2004).Production of fructooligosaccharides by b-fructofuranosidase fromAspergillus sp. 27H. Journal of Chemical Technology andBiotechnology, 79, 268–272. doi:10.1002/jctb.967.
Hayashi, S., Nonokuchi, M., Imada, K., & Ueno, H. (1990). Productionof a fructosyl-transferring enzyme by Aureobasidium sp. ATCC20524. Journal of Industrial Microbiology, 5, 395–400. doi:10.1007/BF01578099.
Hayashi, S., Yoshiyama, T., Fuji, N., & Shinohara, S. (2000). Productionof a novel syrup containing neofructooligosaccharides by the cellsof Penicillium citrinum. Biotechnology Letters, 22, 1465–1469.doi:10.1023/A:1005627828876.
Hernalsteens, S., & Maugeri, F. (2008). Partial purification and character-ization of extracellular fructofuranosidase with transfructosylatingactivity from Candida sp. Food and Bioprocess Technology.doi:10.1007/s11947-008-0089-3.
Hernandez, A. (2004). Design of a culture medium for fructosyltranfer-ase production by Aspergillus sp. M.Sc thesis. Sede Bogotá,Colombia: Department of Pharmacy, Universidad Nacional deColombia (in Spanish).
Heyer, A. G., & Wendenduerg, R. (2001). Gene cloning and functionalcharacterization by heterologous expression of the fructosyltranfer-ase of Aspergillus sydowy IAM 2544. Applied and EnvironmentalMicrobiology, 67, 363–370. doi:10.1128/AEM.67.1.363-370.2001.
Hidaka, H., Hirayama, M., & Sumi, N. (1988). A fructooligosaccharide-producing enzyme from Aspergillus niger ATCC 20611. Agricul-tural and Biological Chemistry, 52, 1181–1187.
Jung, K. H., Yun, J. W., Kang, K. R., Lim, J. Y., & Lee, J. H. (1989).Mathematical model for enzymatic production of fructooligosac-charides from sucrose. Enzyme and Microbial Technology, 11,491–494. doi:10.1016/0141-0229(89)90029-X.
Kaplan, H., & Hutkins, R. W. (2000). Fermentation of fructooligosac-charides by lactic acid bacteria and bifidobacteria. Applied andEnvironmental Microbiology, 66, 2682–2684. doi:10.1128/AEM.66.6.2682-2684.2000.
672 Food Bioprocess Technol (2010) 3:662–673

Klich, M. A., & Pitt, J. I. (1994). A laboratory guide to commonAspergillus species and their teleomorphs. CSIRO Division ofFood Research Sydney. Australia: Academic.
Kühbauch, W. (1972). Changes of the contents in glucose, fructose,sucrose and fructosans, as well as in the degree of polymerizationof fructosan’s molecules, in small leaves and stems of OrchardGrass during their growth. Landwirtschaftliche Forschung, 26(2),173–181 (in German).
L’Hocine, L., Wang, Z., Jiang, B., & Xu, S. (2000). Purification andpartial characterization of fructosyltransferase and invertase fromAspergillus niger AS0023. Journal of Biotechnology, 81, 73–84.doi:10.1016/S0168-1656(00)00277-7.
Madlová, A., Antosová,M., Baráthová,M., Polakoviè,M., Stefuca, V., &Báles, V. (1999). Screening of microorganisms for transfructosylat-ing activity and optimization of biotransformation of sucrose tofructooligosaccharides. Chemical Papers, 53(6), 366–369.
Nesci, A., Barros, G., Castillo, C., & Etcheverry, M. (2006). Soil fungalpopulation in preharvest maize ecosystem in different tillage prac-tices in Argentina. Soil & Tillage Research, 91, 143–149. doi:10.1016/j.still.2005.11.014.
Nguyen, Q. D., Mattes, F., Hoschke, Á., Rezessy-Szabó, J., & Bhat, M. K.(1999). Production, purification and identification of fructooligosac-charides produced by b-Fructofuranosidase from Aspergillus nigerIMI 303386. Biotechnology Letters, 21, 183–186. doi:10.1023/A:1005429525865.
Park, Y.K., &Almeida,M.M. (1991). Production of fructooligosaccharidesfrom sucrose by a fructosylase from Aspergillus niger. BiotechnologyLetters, 27, 127–130. doi:10.1007/s10529-004-7339-x.
Pitt, J. I., & Hocking, A. D. (1997). Fungi and food spoilage (vol. II).London: Blackie.
Raper, K. B., & Fennell, D. I. (1965). The genus Aspergillus.Baltimore, MD: Williams and Wilkins.
Roberfroid, M. B., & Delzenne, N. M. (1998). Dietary fructans. AnnualReview of Nutrition, 18, 117–143. doi:10.1146/annurev.nutr.18.1.117.
Samson, R. A., van Reenen-Hoekstra, E. S., Frisvad, J. C., & Filtenborg,O. (2000). Introduction to food and airborne fungi. Utrecht, TheNetherlands: Centraalbureau voor Schimmelcultures, Institute ofthe Royal Netherlands Academy of Arts and Sciences.
Sánchez, O. F. (2006). Study of fructosyltransferase production by anAspergilllus sp. native strain from sucrose in a bench-scale membranereactor. M.Sc. thesis. Sede Bogotá, Colombia: Department of Chem-ical Engineering, Universidad Nacional de Colombia (in Spanish).
Sangeetha, P. T., Ramesh, M. N., & Prapulla, S. G. (2004). Pro-duction of fructooligosaccharides by fructosyl transferase fromAspergillus oryzae CFR 202 and Aureobasidium pullulans CFR77. Process Biochemistry, 39, 753–758. doi:10.1016/S0032-9592(03)00186-9.
Sangeetha, P. T., Ramesh, M. N., & Prapulla, S. G. (2005a).Maximization of fructooligosaccharide production by two stagecontinuous process and its scale up. Journal of Food Engineer-ing, 68, 57–64. doi:10.1016/j.jfoodeng.2004.05.022.
Sangeetha, P. T., Ramesh, M. N., & Prapulla, S. G. (2005b). Recenttrends in the microbial production, analysis and application offructooligosaccharides. Trends in Food Science & Technology,16, 442–457. doi:10.1016/j.tifs.2005.05.003.
Sangeetha, P. T., Ramesh, M. N., & Prapulla, S. G. (2005c). Fructooligo-saccharide production using fructosyl transferase obtained fromrecycling culture of Aspergillus oryzae CFR 202. Process Biochem-istry, 40, 1085–1088. doi:10.1016/j.procbio.2004.03.009.
Sguarezi, C., Longo, C., Ceni, G., Boni, G., Silva, M. F., Di Luccio,M. et al. (2008). Inulinase production by agro-industrial residues:optimization of pretreatment of substrates and productionmedium. Food and Bioprocess Technology. doi:10.1007/s11947-007-0042-x.
van Balken, J. A. M., van Dooren, T. J. G. M., van den Tweel, W. J. J.,Kamphuis, J., & Meijer, E. M. (1991). Production of 1-kestose withintact mycelium of Aspergillus phoenicis containing sucrose-1F-fructosyltransferase. Applied Microbiology and Biotechnology, 35,216–221. doi:10.1007/BF00184689.
Yamashita, K., Kawai, K., & Itakura, M. (1984). Effects of fructooligo-saccharides on blood glucose and serum lipids in diabetic subjects.Nutrition Research, 4, 961–966. doi:10.1016/S0271-5317(84)80075-5.
Yoshikawa, J., Amachi, S., Shinoyama, H., & Fujii, T. (2008). Productionof fructooligosaccharides by crude enzyme preparations of b-fructofuranosidase from Aureobasidium pullulans. BiotechnologyLetters, 30, 535–539. doi:10.1007/s10529-007-9568-2.
Yun, J. W., Jung, K. H., Oh, J. W., & Lee, J. H. (1990). Semibatchproduction of fructo-oligosaccharides from sucrose by immobi-lized cells of Aureobasidium pullulans. Applied Biochemistry andBiotechnology, 24/25, 299–308. doi:10.1007/BF02920254.
Yun, J. W. (1996). Fructooligosaccharides—Occurrence, preparation,and application. Enzyme and Microbial Technology, 19, 10–117.doi:10.1016/0141-0229(95)00188-3.
Food Bioprocess Technol (2010) 3:662–673 673
Copyright © 2022 FDOKUMEN