High-Quality Gluten-Free Sponge Cakes Without Sucrose
17
Foods 2020, 9, 1735; doi:10.3390/foods9121735 www.mdpi.com/journal/foods Article High‐Quality Gluten‐Free Sponge Cakes Without Sucrose: Inulin‐Type Fructans as Sugar Alternatives Urszula Krupa‐Kozak 1, *, Natalia Drabińska 1,2 , Cristina M. Rosell 2 , Beata Piłat 3 , Małgorzata Starowicz 1 , Tomasz Jeliński 4 and Beata Szmatowicz 5 1 Department of Chemistry and Biodynamics of Food, Institute of Animal Reproduction and Food Research of Polish Academy of Sciences, 10‐748 Olsztyn, Poland; [email protected] (N.D.); [email protected] (M.S.) 2 Food Science Department, Institute of Agrochemistry and Food Technology (IATA‐CSIC), Paterna, 46980 Valencia, Spain; [email protected] 3 Chair of Food Plant Chemistry and Processing, University of Warmia and Mazury in Olsztyn, 10‐748 Olsztyn, Poland; [email protected] 4 Department of Chemical and Physical Properties of Food, Institute of Animal Reproduction and Food Research of Polish Academy of Sciences, 10‐748 Olsztyn, Poland; [email protected] 5 Sensory Laboratory, Institute of Animal Reproduction and Food Research of Polish Academy of Sciences, 10‐748 Olsztyn, Poland; [email protected] * Correspondence: u.krupa‐[email protected]; Tel.: +48‐89‐523‐46‐18 Received: 16 October 2020; Accepted: 24 November 2020; Published: 25 November 2020 Abstract: Due to its structural and organoleptic functions, sucrose is one of the primary ingredients of many baked confectionery products. In turn, the growing awareness of the association between sugar overconsumption and the development of chronic diseases has prompted the urgent need to reduce the amount of refined sugar in foods. This study aimed to evaluate the effect of complete sucrose replacement with inulin‐type fructans (ITFs), namely fructooligosaccharide (FOS), inulin (INU) or oligofructose‐enriched inulin (SYN), with different degrees of polymerization on the technological parameters and sensory quality of gluten‐free sponge cakes (GFSs). The use of ITFs as the sole sweetening ingredient resulted in the similar appearance of the experimental GFSs to that of the control sample. In addition, all GFSs containing ITFs had similar height, while their baking weight loss was significantly (p < 0.05) lower compared to the control products. The total sugar exchange for long‐chain INU increased the crumb hardness, while the crumb of the GFS with FOS was as soft as of the control products. The sensory analysis showed that the GFS containing FOS obtained the highest scores for the overall quality assessment, similar to the sugar‐containing control sponge cake. The results obtained prove that sucrose is not necessary to produce GFSs with appropriate technological parameters and a high sensory quality. Thus, it can be concluded that sucrose can be successfully replaced with ITF, especially with FOS, in this type of baked confectionery product. Keywords: sucrose replacement; cake; dietary fibre; clean label; texture profile; sensory quality; obesity; celiac disease 1. Introduction Sugar is one of the primary ingredients of many baked confectionery products, including sponge cakes [1]. Due to many functions critical to obtain the desirable structure and organoleptic properties, sucrose is the most commonly used sugar. It imparts a clean, sweet taste appreciated by consumers, and increases the temperature of starch gelatinization and egg protein denaturation, allowing gas
-
Upload
khangminh22 -
Category
Documents
-
view
3 -
download
0
Transcript of High-Quality Gluten-Free Sponge Cakes Without Sucrose

Foods 2020, 9, 1735; doi:10.3390/foods9121735 www.mdpi.com/journal/foods
Article
High‐Quality Gluten‐Free Sponge Cakes Without
Sucrose: Inulin‐Type Fructans as Sugar Alternatives
Urszula Krupa‐Kozak 1,*, Natalia Drabińska 1,2, Cristina M. Rosell 2, Beata Piłat 3,
Małgorzata Starowicz 1, Tomasz Jeliński 4 and Beata Szmatowicz 5
1 Department of Chemistry and Biodynamics of Food, Institute of Animal Reproduction and Food Research
of Polish Academy of Sciences, 10‐748 Olsztyn, Poland; [email protected] (N.D.);
[email protected] (M.S.) 2 Food Science Department, Institute of Agrochemistry and Food Technology (IATA‐CSIC), Paterna,
46980 Valencia, Spain; [email protected] 3 Chair of Food Plant Chemistry and Processing, University of Warmia and Mazury in Olsztyn,
10‐748 Olsztyn, Poland; [email protected] 4 Department of Chemical and Physical Properties of Food, Institute of Animal Reproduction and Food
Research of Polish Academy of Sciences, 10‐748 Olsztyn, Poland; [email protected] 5 Sensory Laboratory, Institute of Animal Reproduction and Food Research of Polish Academy of Sciences,
10‐748 Olsztyn, Poland; [email protected]
* Correspondence: u.krupa‐[email protected]; Tel.: +48‐89‐523‐46‐18
Received: 16 October 2020; Accepted: 24 November 2020; Published: 25 November 2020
Abstract: Due to its structural and organoleptic functions, sucrose is one of the primary ingredients
of many baked confectionery products. In turn, the growing awareness of the association between
sugar overconsumption and the development of chronic diseases has prompted the urgent need to
reduce the amount of refined sugar in foods. This study aimed to evaluate the effect of complete
sucrose replacement with inulin‐type fructans (ITFs), namely fructooligosaccharide (FOS), inulin
(INU) or oligofructose‐enriched inulin (SYN), with different degrees of polymerization on the
technological parameters and sensory quality of gluten‐free sponge cakes (GFSs). The use of ITFs as
the sole sweetening ingredient resulted in the similar appearance of the experimental GFSs to that
of the control sample. In addition, all GFSs containing ITFs had similar height, while their baking
weight loss was significantly (p < 0.05) lower compared to the control products. The total sugar
exchange for long‐chain INU increased the crumb hardness, while the crumb of the GFS with FOS
was as soft as of the control products. The sensory analysis showed that the GFS containing FOS
obtained the highest scores for the overall quality assessment, similar to the sugar‐containing
control sponge cake. The results obtained prove that sucrose is not necessary to produce GFSs with
appropriate technological parameters and a high sensory quality. Thus, it can be concluded that
sucrose can be successfully replaced with ITF, especially with FOS, in this type of baked
confectionery product.
Keywords: sucrose replacement; cake; dietary fibre; clean label; texture profile; sensory quality;
obesity; celiac disease
1. Introduction
Sugar is one of the primary ingredients of many baked confectionery products, including sponge
cakes [1]. Due to many functions critical to obtain the desirable structure and organoleptic properties,
sucrose is the most commonly used sugar. It imparts a clean, sweet taste appreciated by consumers,
and increases the temperature of starch gelatinization and egg protein denaturation, allowing gas

Foods 2020, 9, 1735 2 of 17
bubbles to expand before gel formation [2]. In addition, sucrose provides foam stability and extends
the cake shelf‐life [1]. When exposed to the high temperature, sucrose degrades to fructose and
glucose, which are the reducing sugars participating in the Maillard browning reactions. In turn,
ample studies have provided the evidence for the adverse effects of free sugars overconsumption on
health, in particular on the risk of development of non‐communicable diseases [3], adverse changes
in serum lipids and blood pressure [4], and even cancer [5]. Recently, excessive sugar consumption
has attracted particular attention from researchers and epidemiologists, who perceive this
phenomenon as a major contributor to the rise in obesity prevalence [6–8].
The global prevalence of obesity has increased to pandemic proportions [9]. This worrisome
trend is progressively reported in subjects suffering from celiac disease (CD), which changes the
clinical picture of this disorder. Tucker et al. [10] found that at the time of diagnosis 44% of adult CD
were overweight, 13% were obese, whereas only 3% of them were underweight. Besides, endocrine
autoimmunity, particularly in type 1 diabetes, is prevalent among CD patients, approximating 5–7%
[11]. The strict gluten‐free diet (GFD) is the only available and effective CD therapy. However, health‐
care professionals have problems with the optimal approach to treating CD in type 1 diabetes [12]. A
GFD alleviates the clinical symptoms and improves the health and nutritional status of CD patients
over time. On the other side, it is less clear if the strict adherence to the GFD is similarly important to
asymptomatic CD patients with concomitant type 1 diabetes [13], as there is scarce unbiased evidence
regarding the influence of a GFD in patients with both autoimmune diseases. Compared with a
conventional diet, a GFD is characterised with a lower content of proteins, essential vitamins (B12, D,
and folate), and minerals (iron, calcium, zinc) [14,15]. In turn, numerous studies have provided
evidence for nutrient imbalance resulting from the excessive consumption of hypercaloric and
hyperlipidemic packaged gluten‐free foods [16]. Many gluten‐free products are abundant in simple
sugars and saturated fats [17], which are added to improve their palatability and texture. In contrast,
the GFD has been reported to provide a lower than recommended intake of dietary fibre [18], having
a negative health consequence.
The growing awareness of the association between excessive sucrose intake and development of
chronic diseases has prompted an urgent need to reformulate foods to reduce the amount of refined
sugar. On the other hand, the numerous advantages and favourable functional properties of sucrose
make its total replacement a challenge. The 100% sugar removal caused readily detectable losses in
the appearance, texture, and mouthfeel of baked confectionery products [19]. The synthetic low‐
calorie sweeteners have attracted consumers’ attention and became readily available [20]. However,
apart from the high‐intensity sweetness, they usually do not provide other functionalities of sucrose
necessary to make high‐quality cakes. In addition, their breakdown products have controversial
health and metabolic effects [21,22].
Recently, there has been an increasing consumer interest in foods of superior quality made from
natural ingredients providing functional characteristics while having a reduced sugar content and a
lower energy value. As sucrose—being a principal cake ingredient—cannot be easily substituted only
by intense sweeteners, several studies have explored the application of natural bulking agents,
including dietary fibres, in combination with sweeteners in different cake formulations. Psimouli et
al. [2] investigated whether oligofructose, polydextrose, and polyols can replace sugar in cake
formulations and showed that oligofructose, lactitol, or maltitol exhibited behaviour similar to
sucrose in terms of their influence on batter rheology. To evaluate whether steviol glycosides could
partially replace sucrose in bakery products, Zahn et al. [23] produced muffins where 30% sucrose
was replaced with rebaudioside A together with several fibres and indicated that a mixture of inulin
or polydextrose with steviol glycosides resulted in products with characteristics similar to those of
the control muffins. Similarly, Gao et al. [24] used inulin (Frutafit IQ, DPav 5–7, Sensus, Roosendaal,
The Netherlands) and stevianna as sucrose substitutes in muffin formulation. They pointed out that
the replacement of 50% sugar resulted in muffins having texture, firmness, and springiness similar
to these of the control products, while the increased additions of stevianna or inulin had a negative
effect on muffin firmness.

Foods 2020, 9, 1735 3 of 17
In order to fulfil the demand for healthier sponge cakes, studies on sucrose
replacement/reduction have been carried out and the use of dietary fibres in combination with
sweeteners was proposed. Ronda et al. [19] analysed the effects of total sugar substitution with
polysaccharides, oligofructose, and polydextrose, in combunation with polyols on the quality of
sponge cake. They indicated that the fresh sponge cakes with polyols and oligosaccharides generally
had significantly softer crumb than the control ones; however, the use of oligofructose (Raftilose P‐
95, Orafti Active Food Ingredients, Oreye, Belgium) caused crust darkening and an increase in crumb
firmness during storage. A recent study by Garvey et al. [25] has explored the impact of partial (30%;
w/w) sucrose replacement with natural sweetening ingredients, including oligofructose, in sponge
cakes and showed that in comparison to control sample, the formula with oligofructose was not
significantly different in terms of the liking of colour, odour, flavour, texture, and overall liking.
To successfully exchange sucrose in the already challenging gluten‐free system [26] and obtain
a desirable structure and organoleptic properties, the sugar replacing ingredient must exhibit the
ability to mimic the functionality of sucrose. Due to their sweetness and beneficial technological and
health‐related properties, inulin‐type fructans (ITFs) could be valuable ingredients of gluten‐free
products [27,28]. Inulin‐type fructans are plant natural storage carbohydrates that occur in many
edible fruits and vegetables, and in particularly large amounts in the tubers of Jerusalem artichoke
(Helianthus tuberosus) and chicory (Cichorium intybus). They can be divided into long‐chain inulin and
short‐chain fructooligosaccharides (FOS). The length of the chain determines the physicochemical
properties of ITFs [29]. Short‐chain FOS (DP < 10) are more soluble and sweeter; therefore, they could
be used to improve the mouthfeel of low‐caloric products [30], while inulin (DP > 10), due to its lower
solubility, higher viscosity and thermostability, could be used as a filler and fat‐replacer [31].
Investigations showing the use of ITFs in the baked gluten‐free products are scarce and mainly
focused on gluten‐free bread. To the best of our knowledge, this work represents the first study on
the ITFs application as natural sugar alternatives in the gluten‐free sponge cake formulation. The
study aimed to evaluate the effect of total sucrose replacement with the commercial ITFs of different
sweetness and degrees of polymerization, namely fructooligosaccharide, inulin, or oligofructose‐
enriched inulin, on the mixing and pasting batter behaviour and the quality of gluten‐free mini‐
sponge cakes (GFSs) assessed based on selected technological parameters and sensory descriptors.
2. Materials and Methods
2.1. Ingredients of Gluten‐Free Mini‐Sponge Cakes
The ingredients used to make gluten‐free mini‐sponge cakes (GFSs) are shown in Table 1. Potato
starch (PPZ “Trzemeszno” Sp. Z o.o., Trzemeszno, Poland), corn starch (HORTIMEX, Konin, Poland),
and fresh eggs from the local supermarket were the main components. The remaining ingredients
were rapeseed oil “Kujawski” (ZT “Kruszwica” S.A., Kruszwica, Poland), gluten‐free baking powder
(BEZGLUTEN, Koniusza, Poland), sugar, and salt.
To produce experimental gluten‐free mini‐sponge cakes, sugar in the control GFS composition
was totally replaced with one of the three commercial inulin‐type fructans (ITFs), namely
fructooligosaccharide (FOS) with DPav 2–8 and 30% sweetness compared to sucrose (Orafti® P95,
Beneo, Tienen, Belgium), inulin (INU) with DPav 8–13 and 10% sweetness compared to sucrose
(Frutafit HD, Sensus, Roosendaal, The Netherlands), or oligofructose‐enriched inulin (SYN), which
is a mixture of oligofructose (DPav: 3–9) and inulin (DPav ≥ 10) at a specific ratio of 1:1, and ~25%
sweetness compared to sucrose (Orafti® Synergy 1, Beneo, Tienen, Belgium), according to product
specification.
Foods 2020, 9, 1735 4 of 17
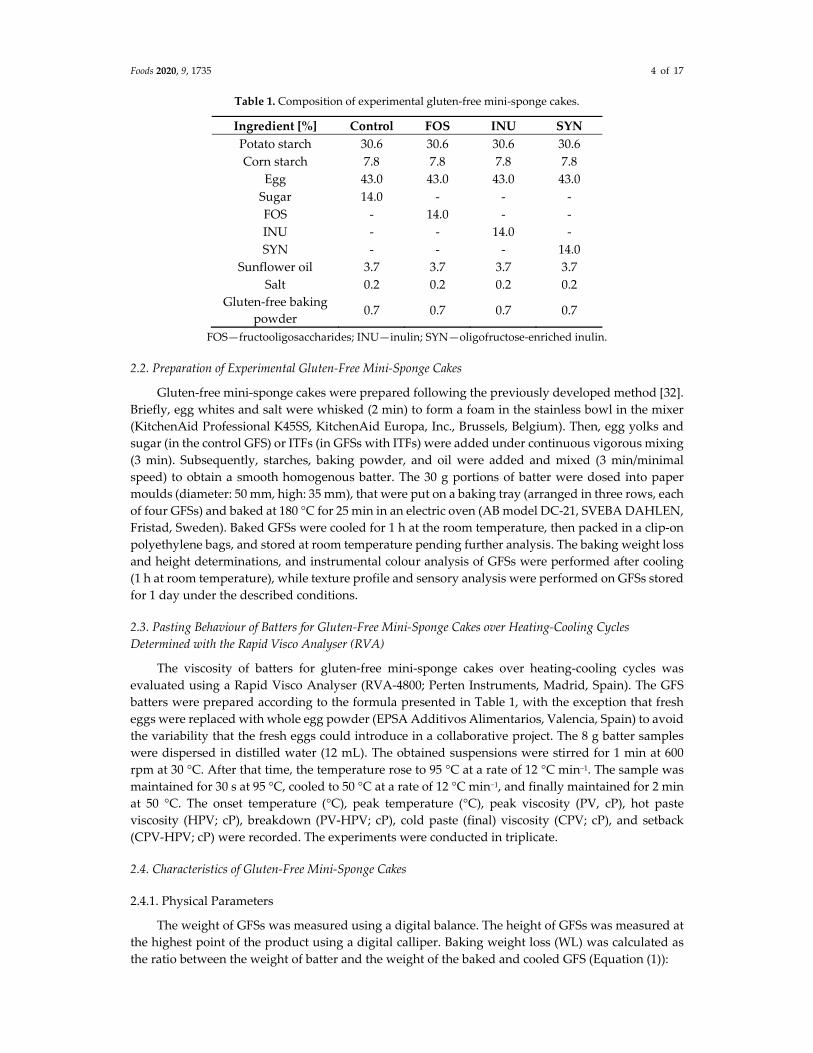
Table 1. Composition of experimental gluten‐free mini‐sponge cakes.
Ingredient [%] Control FOS INU SYN
Potato starch 30.6 30.6 30.6 30.6
Corn starch 7.8 7.8 7.8 7.8
Egg 43.0 43.0 43.0 43.0
Sugar 14.0 ‐ ‐ ‐
FOS ‐ 14.0 ‐ ‐
INU ‐ ‐ 14.0 ‐
SYN ‐ ‐ ‐ 14.0
Sunflower oil 3.7 3.7 3.7 3.7
Salt 0.2 0.2 0.2 0.2
Gluten‐free baking
powder 0.7 0.7 0.7 0.7
FOS—fructooligosaccharides; INU—inulin; SYN—oligofructose‐enriched inulin.
2.2. Preparation of Experimental Gluten‐Free Mini‐Sponge Cakes
Gluten‐free mini‐sponge cakes were prepared following the previously developed method [32].
Briefly, egg whites and salt were whisked (2 min) to form a foam in the stainless bowl in the mixer
(KitchenAid Professional K45SS, KitchenAid Europa, Inc., Brussels, Belgium). Then, egg yolks and
sugar (in the control GFS) or ITFs (in GFSs with ITFs) were added under continuous vigorous mixing
(3 min). Subsequently, starches, baking powder, and oil were added and mixed (3 min/minimal
speed) to obtain a smooth homogenous batter. The 30 g portions of batter were dosed into paper
moulds (diameter: 50 mm, high: 35 mm), that were put on a baking tray (arranged in three rows, each
of four GFSs) and baked at 180 °C for 25 min in an electric oven (AB model DC‐21, SVEBA DAHLEN,
Fristad, Sweden). Baked GFSs were cooled for 1 h at the room temperature, then packed in a clip‐on
polyethylene bags, and stored at room temperature pending further analysis. The baking weight loss
and height determinations, and instrumental colour analysis of GFSs were performed after cooling
(1 h at room temperature), while texture profile and sensory analysis were performed on GFSs stored
for 1 day under the described conditions.
2.3. Pasting Behaviour of Batters for Gluten‐Free Mini‐Sponge Cakes over Heating‐Cooling Cycles
Determined with the Rapid Visco Analyser (RVA)
The viscosity of batters for gluten‐free mini‐sponge cakes over heating‐cooling cycles was
evaluated using a Rapid Visco Analyser (RVA‐4800; Perten Instruments, Madrid, Spain). The GFS
batters were prepared according to the formula presented in Table 1, with the exception that fresh
eggs were replaced with whole egg powder (EPSA Additivos Alimentarios, Valencia, Spain) to avoid
the variability that the fresh eggs could introduce in a collaborative project. The 8 g batter samples
were dispersed in distilled water (12 mL). The obtained suspensions were stirred for 1 min at 600
rpm at 30 °C. After that time, the temperature rose to 95 °C at a rate of 12 °C min−1. The sample was
maintained for 30 s at 95 °C, cooled to 50 °C at a rate of 12 °C min−1, and finally maintained for 2 min
at 50 °C. The onset temperature (°C), peak temperature (°C), peak viscosity (PV, cP), hot paste
viscosity (HPV; cP), breakdown (PV‐HPV; cP), cold paste (final) viscosity (CPV; cP), and setback
(CPV‐HPV; cP) were recorded. The experiments were conducted in triplicate.
2.4. Characteristics of Gluten‐Free Mini‐Sponge Cakes
2.4.1. Physical Parameters
The weight of GFSs was measured using a digital balance. The height of GFSs was measured at
the highest point of the product using a digital calliper. Baking weight loss (WL) was calculated as
the ratio between the weight of batter and the weight of the baked and cooled GFS (Equation (1)):

Foods 2020, 9, 1735 5 of 17
WL % a c 100
a (1)
where:
a—the weight of batter in the mould before baking (g),
c—the weight of baked and cooled GFS (g).
2.4.2. Texture Profile Analysis
Textural properties of experimental GFSs were assessed 24 h after baking. The samples were
removed from clip‐on bags just before testing. Like in the previous study [32], the GFSs were cut
horizontally at the height of the mould to form a flat surface. The texture profile analysis (TPA) was
performed on the 2 cm‐high lower part whereas the upper part was discarded. Hardness, springiness,
gumminess, chewiness, cohesiveness, and resilience were determined using a TA.HD Plus Texture
Analyser (Stable Micro Systems Ltd., Godalming, UK) equipped with a 5‐kg load cell. The sample
was placed centrally under an AACC 36‐mm cylinder probe with radius (P/36R). The GFS sample
was compressed at a constant rate of 1.0 mm s−1 at a distance of 5 mm. The probe holds at this distance
for 30 s and then withdraws from the sample and returns to its starting position. Each type of GFSs
was tested in six replications.
2.4.3. Instrumental Colour Analysis
The instrumental measurements of the crust and crumb colour of GFSs were made using a
HunterLab ColorFlex (Hunter Associates Laboratory, Inc., Reston, VA, USA). The measurements
were performed through a 3‐cm‐diameter diaphragm containing an optical glass. The results were
expressed in accordance with the CIELab system. The parameters determined were L* (L* = 0 (black)
and L* = 100 (white)), a* (+a* = redness and −a* = greenness), and b* (+b* = yellowness and −b* =
blueness). Values were the mean of at least six replicates.
The whiteness index (WI) of the crumb [33] was calculated according to Equation (2):
WI 100 100 𝐿∗ 𝑎∗ 𝑏∗ (2)
The browning index (BI) of the crust [34] was calculated according to Equations (3) and (4):
BI 100 x 0.31
0.17 (3)
where:
x𝑎∗ 1.75𝐿∗
5.645𝐿∗ 𝑎∗ 3.012𝑏∗ (4)
The ΔELab difference between two colours [35] was calculated according to Equation (5):
∆𝐸 ∆𝐿∗ ∆𝑎∗ ∆𝑏∗ (5)
2.4.4. Evaluation of Early, Advanced, and Final Stage of the Maillard Reaction
The content of available lysine, as an indicator of the early stage of the Maillard reaction, was
determined according to the method described by Michalska et al. [36]. Exactly 50 μL of a sample,
100 μL of o‐phthaldialdehyde reagent, and 100 μL of water were added to wells and incubated for 3
min (96‐well microplate; Porvair Sciences, Norfolk, UK). Then, fluorescence was measured at λextinction
= 340 nm and λemmision = 455 nm using a microplate reader (Infinite® M1000 PRO, Tecan, Switzerland).
The quantitative analysis was performed according to the external standard method, employing a
calibration curve of Nα‐acetyl‐L‐lysine ranging from 10 to 250 μM. The content of free intermediate
compounds (FIC) was determined after sample extraction with 6% sodium dodecyl sulfate and then
their fluorescence was recorded in a microplate reader (Infinite® M1000 PRO, Tecan, Switzerland)
setting at λextinction = 347 nm and λemmision = 415 nm. Tryptophan fluorescence (TRP) was measured at
Foods 2020, 9, 1735 6 of 17
λextinction = 290 nm and λemmision = 340 nm. Results are expressed as fluorescence intensity (FI) per mg of
sample dry matter. The FIC and FAST (fluorescence of advanced MRPs and tryptophan) index were
calculated as recently reported by Zieliński et al. [37]. The FAST index data were expressed as a
percentage (%). The formation of brown pigments (melanoidins) was estimated as reported in detail
by Zieliński et al. [37]. Results were expressed as arbitrary absorbance units. All measurements were
performed in triplicate.
2.4.5. Sensory Evaluation
A six‐member expert panel (five women and one men) previously selected and trained
according to ISO guidelines [38] evaluated the sensory characteristics of experimental GFSs 24 h after
baking. The assessors were not CD patients but were familiar with gluten‐free products and have
been aware of tasting starch‐based gluten‐free sponge cake. A quantitative descriptive analysis
(QDA) [39] was applied to assess the sensory characteristics of the experimental GFSs. Before the
analysis, vocabularies of the sensory attributes were developed by the panel in a round‐table session,
using a standardised procedure [40]. Thirteen attributes were evaluated (Table 2). The assessors
evaluated the intensity perceived for each sensory attribute on unstructured graphical scales. The
scales were 10 cm long and verbally anchored at each end, and the results were converted to
numerical values (from 0 to 10 arbitrary units) by a computer. The experimental GFS samples were
coded with a three‐digit number and presented to the assessors all together in a random order in
transparent plastic boxes. The sensory evaluation was carried out in a sensory laboratory room,
which fulfils the requirements of the ISO standards [41], under normal lighting conditions at room
temperature. To minimise residual effects, bottled mineral water was suggested to drink between
each sample evaluation. The results were collected using a computerised system ANALSENS (IAR
& FR PAS, Olsztyn, Poland). GFSs were tested in two replications.
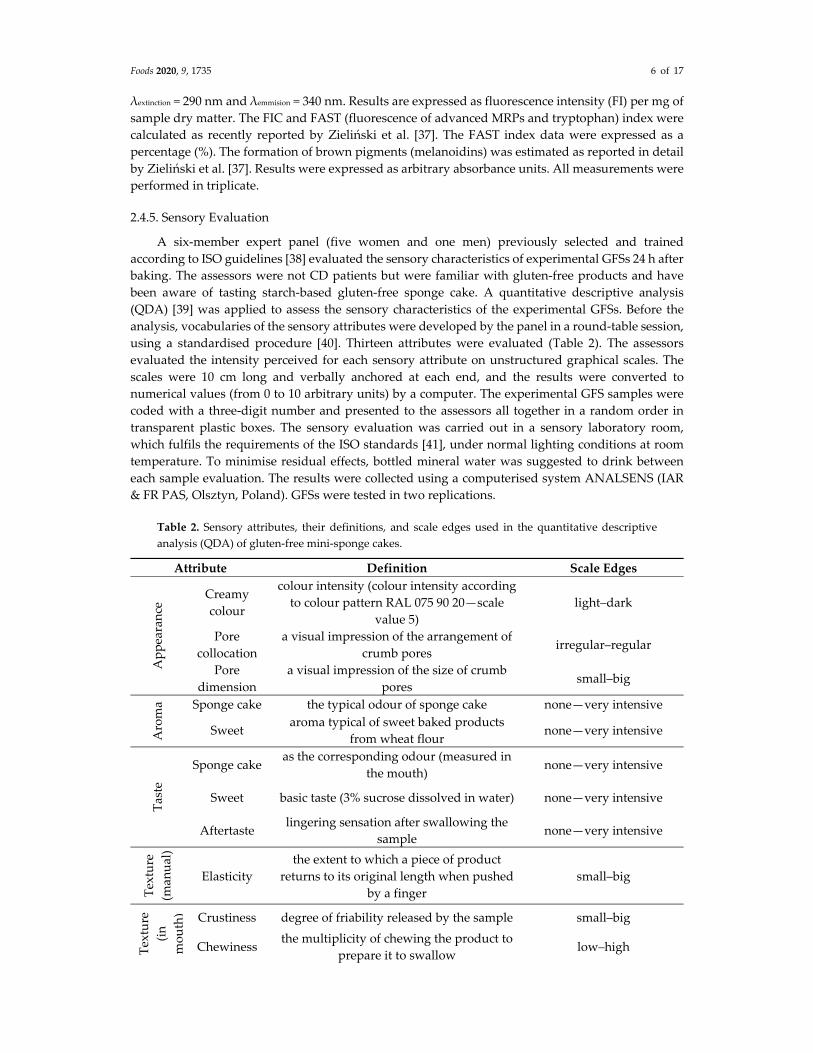
Table 2. Sensory attributes, their definitions, and scale edges used in the quantitative descriptive
analysis (QDA) of gluten‐free mini‐sponge cakes.
Attribute Definition Scale Edges
Appearance Creamy
colour
colour intensity (colour intensity according
to colour pattern RAL 075 90 20—scale
value 5)
light–dark
Pore
collocation
a visual impression of the arrangement of
crumb pores irregular–regular
Pore
dimension
a visual impression of the size of crumb
pores small–big
Aroma Sponge cake the typical odour of sponge cake none—very intensive
Sweet aroma typical of sweet baked products
from wheat flour none—very intensive
Taste
Sponge cake as the corresponding odour (measured in
the mouth) none—very intensive
Sweet basic taste (3% sucrose dissolved in water) none—very intensive
Aftertaste lingering sensation after swallowing the
sample none—very intensive
Texture
(man
ual)
Elasticity
the extent to which a piece of product
returns to its original length when pushed
by a finger
small–big
Texture
(in
mouth) Crustiness degree of friability released by the sample small–big
Chewiness the multiplicity of chewing the product to
prepare it to swallow low–high
Foods 2020, 9, 1735 7 of 17
Adhesiveness degree of adhesiveness perceived while
chewing the sample 10 times low–high
Overall quality overall quality including all attributes and
their harmonisation low–high
2.5. Statistical Analysis
The data reported in all the tables are mean values and standard deviations of triplicate
observations unless otherwise stated. The differences between experimental GFSs were analysed by
a one‐way analysis of variance (ANOVA) with Tukey’s multiple comparison test (p < 0.05) using
GraphPad Prism version 8.0.0 for Windows, GraphPad Software (San Diego, CA, USA).
3. Results and Discussion
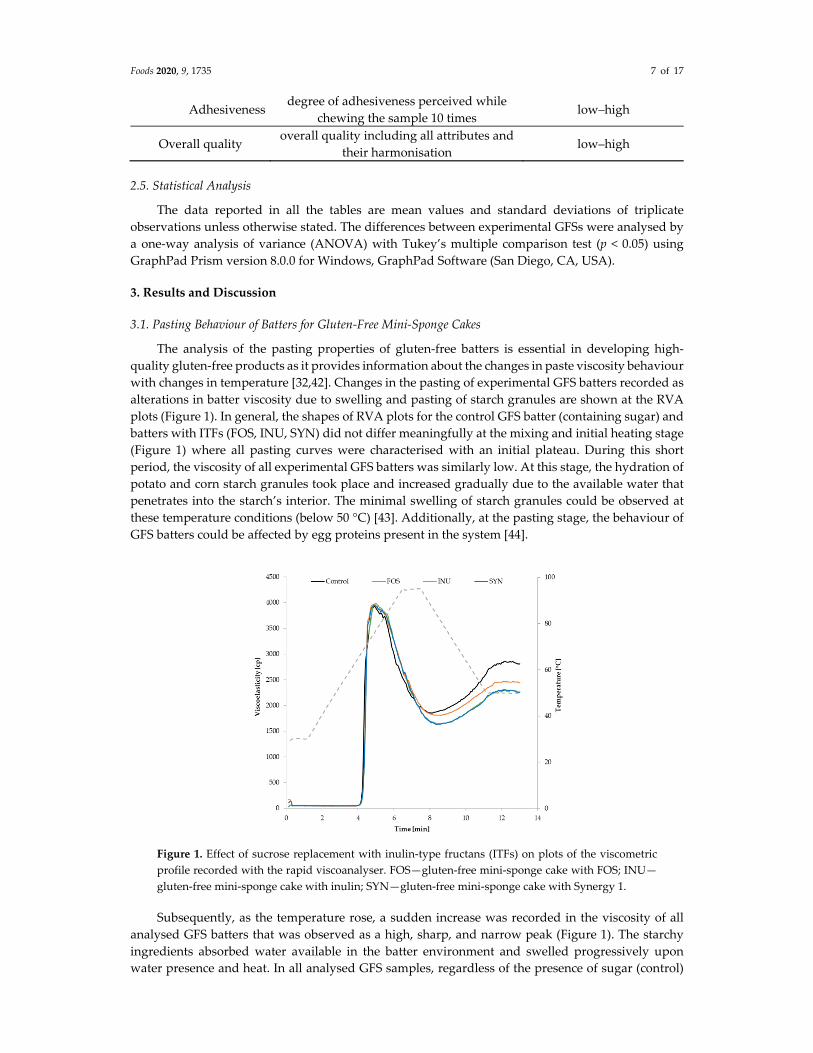
3.1. Pasting Behaviour of Batters for Gluten‐Free Mini‐Sponge Cakes
The analysis of the pasting properties of gluten‐free batters is essential in developing high‐
quality gluten‐free products as it provides information about the changes in paste viscosity behaviour
with changes in temperature [32,42]. Changes in the pasting of experimental GFS batters recorded as
alterations in batter viscosity due to swelling and pasting of starch granules are shown at the RVA
plots (Figure 1). In general, the shapes of RVA plots for the control GFS batter (containing sugar) and
batters with ITFs (FOS, INU, SYN) did not differ meaningfully at the mixing and initial heating stage
(Figure 1) where all pasting curves were characterised with an initial plateau. During this short
period, the viscosity of all experimental GFS batters was similarly low. At this stage, the hydration of
potato and corn starch granules took place and increased gradually due to the available water that
penetrates into the starch’s interior. The minimal swelling of starch granules could be observed at
these temperature conditions (below 50 °C) [43]. Additionally, at the pasting stage, the behaviour of
GFS batters could be affected by egg proteins present in the system [44].
Figure 1. Effect of sucrose replacement with inulin‐type fructans (ITFs) on plots of the viscometric
profile recorded with the rapid viscoanalyser. FOS—gluten‐free mini‐sponge cake with FOS; INU—
gluten‐free mini‐sponge cake with inulin; SYN—gluten‐free mini‐sponge cake with Synergy 1.
Subsequently, as the temperature rose, a sudden increase was recorded in the viscosity of all
analysed GFS batters that was observed as a high, sharp, and narrow peak (Figure 1). The starchy
ingredients absorbed water available in the batter environment and swelled progressively upon
water presence and heat. In all analysed GFS samples, regardless of the presence of sugar (control)

Foods 2020, 9, 1735 8 of 17
or ITFs, excessive expansion of starch granules led to an increase in viscosity up to the maximum
apparent viscosity, the so‐called peak viscosity (PV). The experimental GFS batters achieved the PV
at similar temperature and time (Table 3). Therefore, despite differences in their dextrin chain length,
no significant differences were observed in the peak viscosity between the batters. In the next step,
when the temperature was constant (95 °C) for 30 s, a substantial reduction in the apparent viscosity
of GFS batters was detected (Figure 1) that was determined as the breakdown. Breakdown viscosity
is defined as a difference between PV and hot paste viscosity (HPV) and illustrates the ability of the
starch to withstand shear stress and heating. Generally, the observed changes were a consequence of
the physical breakdown of the starch granules that was accompanied by viscosity decrease. Sugar
substitution with ITFs affected this parameter differently; a significant (p < 0.05) reduction was
determined in HPV (Table 3), particularly when sucrose was exchanged with FOS and Synergy 1.
ITFs with intermediate degrees of polymerization led to the higher breakdown; it is likely that those
dextrins affect the amylose leaching that accompanied the gelanization process. In the last stage of
the RVA analysis, the final viscosity, determined as cold paste viscosity (CPV), and setback were
determined. These parameters reflect the ability of the starch polymers to re‐organise when the
temperature decreases. The setback viscosity of all experimental GFS batters increased (Table 3), that
is commonly related to the crystallisation of the amylose chains, but also to the effect of denatured
protein [44]. In comparison with the control batter, the value of setback recorded for the batters
containing ITFs was significantly (p < 0.05) lower (Table 3), suggesting the lower degree of amylose
chains crystallisation. The applied ITFs are soluble fibres, however, they differ in chain length, with
inulin having the longest chain. That is why the applied ITFs affected the batter pasting characteristics
to a different extent.
Table 3. Effects of sucrose replacement with ITFs on the Rapid Visco Analyser (RVA) parameters of
batter of gluten‐free mini‐sponge cakes.
Control FOS INU SYN
Onset temperature (°C) 1 64 ± 1 ab 64 ± 1 a 63 ± 1 b 64 ± 1 a
Peak temperature (°C) 77 ± 1 77 ± 1 76 ± 1 77 ± 1
Peak viscosity PV (cP) 3937 ± 16 4014 ± 80 3975 ± 122 3973 ± 54
HPV (cP) 1856 ± 15 a 1648 ± 54 b 1808 ± 43 a 1633 ± 61 b
Breakdown (cP) 2080 ± 1 b 2366 ± 26 a 2167 ± 84 b 2339 ± 15 a
Final CPV (cP) 2846 ± 50 a 2253 ± 68 c 2445 ± 67 b 2265 ± 57 c
Setback (cP) 991 ± 64 a 605 ± 14 c 637 ± 30 b 632 ± 5 c 1 Values were presented as mean (n = 3) ± standard deviation. a–c Means with different letters in the
same row are significantly different (p < 0.05), as determined by Tukey’s multiple comparisons test.
HPV—hot paste viscosity; CPV—cold paste viscosity
The study confirmed that the presence of different ITFs in a cake batter modified the pasting
profile, particularly after heating and cooling. It has been reported that soluble and insoluble fibres
affect the performance of gluten‐free layer cakes batter [45], showing that fibres increased the batter
viscosity, except for inulin, which decreased it. The present study results even show that the
behaviour of the inulins was greatly dependent on their degree of polymerization.
3.2. Physical Characteristics and Texture of Gluten‐Free Mini‐Sponge Cakes
The effect of sugar replacement with ITFs on the physical characteristics of GFSs is shown in
Table 4 and Figure 2. The experimental sponge cakes containing ITFs were significantly (p < 0.05)
heavier but similarly high as the control GFS with sugar (Table 4). In the case of foam‐type cakes,
including particulalry sponge cakes, the high volume and fine porosity are desirable features [1]. The
elimination of sucrose did not affect GFSs’ volume. Thus, it appears that ITFs consolidated the
structure of experimental GFSs, supported the height, and prevented GFSs’ collapse after baking
(Figure 2). The height and final volume of foam‐type cakes are mainly determined by gas cell

Foods 2020, 9, 1735 9 of 17
incorporation during mixing and steam production during baking [46]; however, the structure of the
cake is established during baking together with the rise of the temperature when the cake matrix
solidifies as a result of starch gelatinization and protein denaturation.
Figure 2. Exemplary pictures of the appearance and cross‐section of experimental gluten‐free mini‐
sponge cakes with sucrose replaced with ITFs. (A) control gluten‐free sponge cake; (B) gluten‐free
sponge cake with FOS; (C) gluten‐free sponge cake with inulin; (D) gluten‐free sponge cake with
Synergy 1.
All experimental GFSs with ITFs were characterised by significantly (p < 0.05) lower baking
weight loss in comparison with the control cake containing sugar (Table 4). Baking weight loss is one
of the major technological losses and therefore efforts are made to minimise it. Generally, a number
of physical and chemical modifications proceed during baking, such as evaporation of water,
formation of a porous structure, expansion of volume, etc. [47]. The sponge cake baking process can
be divided into the heating up period and crust/crumb period [48]. Baking weight loss results mainly
from the drying process [49]; however, water vaporization during the initial heating up period may
take place as crust does not appear instantaneously. In addition, other ingredients, ITFs in particular,
have a great influence on water retention in baked products. In the case of experimental GFSs without
sugar, the decreased value of baking weight loss could be due to ITFs’ ability to bind water molecules
[50], causing the higher water retention in the cake during baking. The results obtained by Rodriguez‐
Garcia et al. [51], where a highly‐dispersible native inulin (Frutafit HD®, average chain length 8–13,
Sensus, Roosendaal, The Netherlands) and highly‐soluble oligofructose (Frutafit CLR®, average chain
length 7–9, Sensus, Roosendaal, The Netherlands) were used indicated that cakes with 50% of native
Foods 2020, 9, 1735 10 of 17
inulin as fat replacer had significantly (p < 0.05) lower weight loss than the cakes without it,
suggesting that inulins bind water and help to retain moisture during baking.
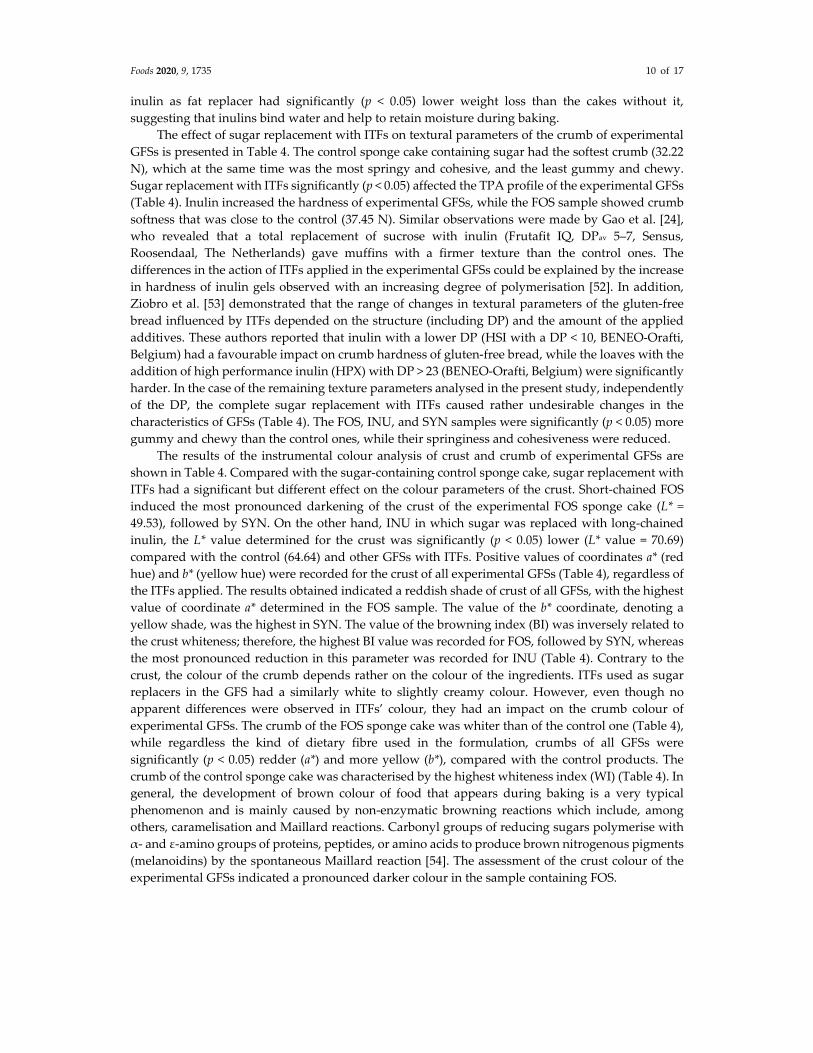
The effect of sugar replacement with ITFs on textural parameters of the crumb of experimental
GFSs is presented in Table 4. The control sponge cake containing sugar had the softest crumb (32.22
N), which at the same time was the most springy and cohesive, and the least gummy and chewy.
Sugar replacement with ITFs significantly (p < 0.05) affected the TPA profile of the experimental GFSs
(Table 4). Inulin increased the hardness of experimental GFSs, while the FOS sample showed crumb
softness that was close to the control (37.45 N). Similar observations were made by Gao et al. [24],
who revealed that a total replacement of sucrose with inulin (Frutafit IQ, DPav 5–7, Sensus,
Roosendaal, The Netherlands) gave muffins with a firmer texture than the control ones. The
differences in the action of ITFs applied in the experimental GFSs could be explained by the increase
in hardness of inulin gels observed with an increasing degree of polymerisation [52]. In addition,
Ziobro et al. [53] demonstrated that the range of changes in textural parameters of the gluten‐free
bread influenced by ITFs depended on the structure (including DP) and the amount of the applied
additives. These authors reported that inulin with a lower DP (HSI with a DP < 10, BENEO‐Orafti,
Belgium) had a favourable impact on crumb hardness of gluten‐free bread, while the loaves with the
addition of high performance inulin (HPX) with DP > 23 (BENEO‐Orafti, Belgium) were significantly
harder. In the case of the remaining texture parameters analysed in the present study, independently
of the DP, the complete sugar replacement with ITFs caused rather undesirable changes in the
characteristics of GFSs (Table 4). The FOS, INU, and SYN samples were significantly (p < 0.05) more
gummy and chewy than the control ones, while their springiness and cohesiveness were reduced.
The results of the instrumental colour analysis of crust and crumb of experimental GFSs are
shown in Table 4. Compared with the sugar‐containing control sponge cake, sugar replacement with
ITFs had a significant but different effect on the colour parameters of the crust. Short‐chained FOS
induced the most pronounced darkening of the crust of the experimental FOS sponge cake (L* =
49.53), followed by SYN. On the other hand, INU in which sugar was replaced with long‐chained
inulin, the L* value determined for the crust was significantly (p < 0.05) lower (L* value = 70.69)
compared with the control (64.64) and other GFSs with ITFs. Positive values of coordinates a* (red
hue) and b* (yellow hue) were recorded for the crust of all experimental GFSs (Table 4), regardless of
the ITFs applied. The results obtained indicated a reddish shade of crust of all GFSs, with the highest
value of coordinate a* determined in the FOS sample. The value of the b* coordinate, denoting a
yellow shade, was the highest in SYN. The value of the browning index (BI) was inversely related to
the crust whiteness; therefore, the highest BI value was recorded for FOS, followed by SYN, whereas
the most pronounced reduction in this parameter was recorded for INU (Table 4). Contrary to the
crust, the colour of the crumb depends rather on the colour of the ingredients. ITFs used as sugar
replacers in the GFS had a similarly white to slightly creamy colour. However, even though no
apparent differences were observed in ITFs’ colour, they had an impact on the crumb colour of
experimental GFSs. The crumb of the FOS sponge cake was whiter than of the control one (Table 4),
while regardless the kind of dietary fibre used in the formulation, crumbs of all GFSs were
significantly (p < 0.05) redder (a*) and more yellow (b*), compared with the control products. The
crumb of the control sponge cake was characterised by the highest whiteness index (WI) (Table 4). In
general, the development of brown colour of food that appears during baking is a very typical
phenomenon and is mainly caused by non‐enzymatic browning reactions which include, among
others, caramelisation and Maillard reactions. Carbonyl groups of reducing sugars polymerise with
α‐ and ε‐amino groups of proteins, peptides, or amino acids to produce brown nitrogenous pigments
(melanoidins) by the spontaneous Maillard reaction [54]. The assessment of the crust colour of the
experimental GFSs indicated a pronounced darker colour in the sample containing FOS.

Foods 2020, 9, 1735 11 of 17
Table 4. Effects of sucrose replacement with ITFs on physical characteristics and texture of gluten‐
free mini‐sponge cakes.
Control FOS INU SYN
Weight (g) 1 22.45 ± 0.57 b 23.13 ± 0.32 a 23.31 ± 0.13 a 23.23 ± 0.11 a
Height (mm) 49.0 ± 0.52 51.3 ± 0.30 51.0 ± 0.36 48.0 ± 0.10
Baking weight loss (%) 25.18 ± 1.92 a 22.89 ± 1.05 b 22.31 ± 0.44 b 22.58 ± 0.37 b
Textural parameters
Hardness (N) 32.22 ± 2.49 c 37.45 ± 2.74 c 62.92 ± 3.473 a 51.54 ± 6.639 b
Springiness (%) 0.87 ± 0.03 a 0.79 ± 0.02 b 0.81 ± 0.02 b 0.81 ± 0.03 b
Cohesiveness 0.49 ± 0.01 a 0.33 ± 0.02 b 0.15 ± 0.02 c 0.17 ± 0.03 c
Gumminess 1.60 ± 0.11 d 12.22 ± 0.63 a 10.43 ± 0.90 b 8.56 ± 0.76 c
Chewiness 1.40 ± 0.10 c 9.67 ± 0.66 a 7.70 ± 0.95 b 6.49 ± 0.96 b
Resilience 0.15 ± 0.01 a 0.08 ± 0.01 b 0.05 ± 0.01 c 0.06 ± 0.01 c
Crust colour
L* 64.64 ± 2.82 b 49.53 ± 0.12 d 70.69 ± 0.95 a 59.71 ± 0.47 c
a* 13.26 ± 0.84 c 17.64 ± 0.20 a 12.09 ± 0.19 d 15.72 ± 0.13 b
b* 35.58 ± 0.95 a 34.14 ± 0.49 bc 33.71 ± 0.54 c 36.09 ± 0.19 a
BI 92.21 ± 5.94 c 133.30 ± 2.56 a 75.66 ± 0.70 d 107.36 ± 1.46 b
ΔE 6.44 15.8 5.53
Crumb colour
L* 82.74 ± 0.58 b 84.01 ± 0.64 a 82.42 ± 0.49 b 81.23 ± 0.92 c
a* 2.01 ± 0.11 d 3.22 ± 0.14 b 2.65 ± 0.14 c 4.59 ± 0.19 a
b* 22.75 ± 0.80 c 24.95 ± 0.64 b 24.15 ± 0.54 b 28.84 ± 0.24 a
WI 71.37 ± 0.65 a 70.18 ± 0.48 b 70.01 ± 0.67 b 65.28 ± 0.62 c
ΔE 1.57 2.82 6.79
1 Values were presented as mean ± standard deviation. a–c Values followed by different letters in the
same row are significantly different (p < 0.05), as determined by Tukey’s multiple comparisons test.
The obtained results of the instrumental colour analysis were consistent with the findings
reported by Zahn et al. [31] and suggested that the rate of the Maillard reaction was more intensive
in FOS than in other GFSs with ITFs. During the baking process, the hydrolysis of FOS to fructans
could occur, thereby increasing the quantity of reducing sugar (especially fructose), promoting the
Maillard reaction. The darkening of the crust of experimental GFSs could be perceived as a desirable
feature because the gluten‐free products generally tend to be paler than their wheat counterparts [26].
In contrast, the light crust of INU may indicate the suppression of the Maillard reaction due to the
dilution of the reaction precursor’s in the presence of inulin, a water‐retaining ingredient, resulting
in a higher water content in the environment [55].
Changes in the contents of the early, advanced, and final stage Maillard reaction products
affected by sugar replacement with ITFs are presented in Table 5. In this study, the available lysine
served as an indicator of the early stage of Maillard reaction, while the fluorescent intermediate
products (FIC) formation was considered as the advanced stage of the reaction, and finally, the
generation of melanoidins was indicative of the final stage. The FOS sponge cake had available lysine
content at the same level as in the control, while that found in INU and SYN was about 20% lower
(Table 5). Therefore, the FIC value for control and FOS was similar, whereas the increased amount of
FIC was determined in the other GFSs with ITFs. It suggested that INU and SYN promoted the
formation of fluorescence compounds, whereas FOS did not. To describe the protein loss in the
experimental GFSs, the FAST index was calculated as a ratio between FIC and tryptophan
fluorescence presented in%. The lowest value of the FAST index was detected in the control sponge
cake (Table 5). Among GFSs with ITFs, a positive effect counteracting proteins loss was noticed in the
sample with short‐chained FOS, determined as a significantly (p < 0.05) lower FAST index percentage.
The FAST index values obtained for GFSs were, however, lower than the obtained by Przygodzka et
al. [56] for rye‐buckwheat cakes enriched with spices. In the GFS containing FOS, an intense form of
brown melanoidins was observed (Table 5) that was 45% and 15% higher than in INU and SYN,
respectively. The results obtained corresponded well to the results of the instrumental colour analysis

Foods 2020, 9, 1735 12 of 17
(Table 4) and proved that melanoidin formation was positively linked to BI. Nevertheless, except for
colour development, many studies demonstrated the health‐promoting properties of melanoidins,
including their antimicrobial, antioxidant, anti‐inflammatory or probiotic effects [57].
Table 5. Effects of sucrose replacement with ITFs on the contents of the early, advanced, and final
stage Maillard reaction products in gluten‐free mini‐sponge cakes.
Control FOS INU SYN
Available lysine (mg/g) 1 12.50 ± 0.42 a 12.51 ± 0.17 a 9.88 ± 0.06 b 9.31 ± 0.09 b
FIC (FI) 28.05 ± 0.60 bc 20.16 ± 0.17 c 50.14 ± 1.94 a 38.56 ± 1.87 b
TRP (FI) 18.00 ± 0.09 d 16.02 ± 0.03 c 20.52 ± 0.78 a 19.44 ± 0.04 b
FAST index (%) 123 ± 5.56 c 175 ± 1.08 b 245 ± 11.28 a 203 ± 19.94 b
Melanoidins (AU) 0.758 ± 0.011 b 0.921 ± 0.012 a 0.504 ± 0.005 c 0.775 ± 0.020 b
FIC—free intermediate compounds; TRP—tryptophan fluorescence; FAST index—fluorescence of
advanced MRPs and tryptophan. 1 Values were presented as mean ± standard deviation. a–c Values
followed by different letters in the same row are significantly different (p < 0.05), as determined by
Tukey’s multiple comparisons test.
The acceptance of the sensory quality is essential when a new product is being developed;
therefore, an important step in the novel product development is to determine and analyse its quality
characteristics, including appearance, aroma, and taste. In the present study, trained experts were
asked to assess the experimental GFSs based on their visual appearance (crumb colour and porosity),
aroma, taste, and texture, both manually (elasticity) and by the mouth (crustiness chewiness and
adhesiveness). The results of QDA are presented in Table 6 and Figure 3. In general, the ITFs used in
the formulation did not influence the visual appearance of the crumb of experimental GFSs (Table 6).
All GFSs with ITFs looked similar like the creamy‐coloured control sponge cake containing sugar.
This indicated that the differences in crumb colour detected by the instrumental colour analysis
(Table 4) were not perceived by the experts panel in QDA analysis (Table 6). This could be explained
by the differences between the methods applied. The instrumental spectrophotometric method
makes it possible to define the colour precisely, expressing it numerically in comparison to the
standard. The main advantage of this instrumental measurement over the sensory QDA analysis is
its higher repeatability resulting from the lower standard deviation due to the lack of variability
caused by psychological, physiological, and environmental factors that affect human sensory
reactions [58]. The experimental GFSs were similar to the control cakes in terms of porosity features,
with both taking into account pore collocation and dimension (Table 6; Figure 2), regardless of the
ITFs used in the sponge cake formulation. The number, size, and distribution of air cells incorporated
during the mixing stage determine the volume and texture of the baked cakes [1]. A larger number
of smaller pores rather than a smaller number of larger ones is a feature of high‐quality sponge cakes
[32,59]. The control sample was characterised by intensive sponge cake aroma and taste, while in
GFSs containing ITFs these features were detected in significantly (p < 0.05) lower range, especially
in FOS (Table 6). In addition, the experimental GFSs containing ITFs were characterised as having
less sweet aroma and taste than the control cakes. Texture evaluation is also an important step in
developing a high‐quality food product or optimising processing variables.
Foods 2020, 9, 1735 13 of 17
Table 6. Effects of sucrose replacement with ITFs on the sensory quality assessed with a quantitative
descriptive analysis (QDA) in gluten‐free mini‐sponge cakes.
Attribute Control FOS INU SYN
Appearance
creamy colour 2.42 ± 0.53 2.59 ± 0.62 2.48 ± 0.54 2.86 ± 0.63
pore collocation 6.59 ± 1.59 7.16 ± 1.87 7.02 ± 0.83 7.56 ± 1.20
pore dimension 2.51 ± 1.34 2.20 ± 1.95 2.18 ± 0.47 2.03 ± 0.72
Aroma sponge cake 8.11 ± 1.07 a 2.26 ± 0.85 d 5.34 ± 2.04 b 3.91 ± 1.32 c
sweet 5.82 ± 1.96 a 1.64 ± 0.92 c 3.69 ± 2.32 b 2.88 ± 1.59 bc
Taste
sponge cake 8.12 ± 0.95 a 4.04 ± 2.31 b 3.34 ± 0.89 b 3.05 ± 1.35 b
sweet 6.26 ± 1.48 a 1.98 ± 1.20 b 1.09 ± 0.76 b 0.99 ± 0.80 b
aftertaste 1.39 ± 0.61 1.59 ± 0.96 1.13 ± 0.68 1.31 ± 0.71
Texture (manual) elasticity 6.18 ± 0.48 a 6.69 ± 1.61 a 3.04 ± 0.92 b 2.92 ± 1.18 b
Texture (in mouth)
crustiness 1.58 ± 0.24 b 1.77 ± 0.53 b 2.72 ± 0.98 a 2.76 ± 0.82 a
chewiness 3.54 ± 0.44 3.58 ± 0.54 3.36 ± 0.82 3.43 ± 0.93
adhesiveness 2.98 ± 0.78 2.67 ± 0.67 2.41 ± 0.76 2.24 ± 0.90
Values were presented as mean ± standard deviation. a–c Values followed by different letters in the
same row are significantly different (p < 0.05), as determined by Tukey’s multiple comparisons test.
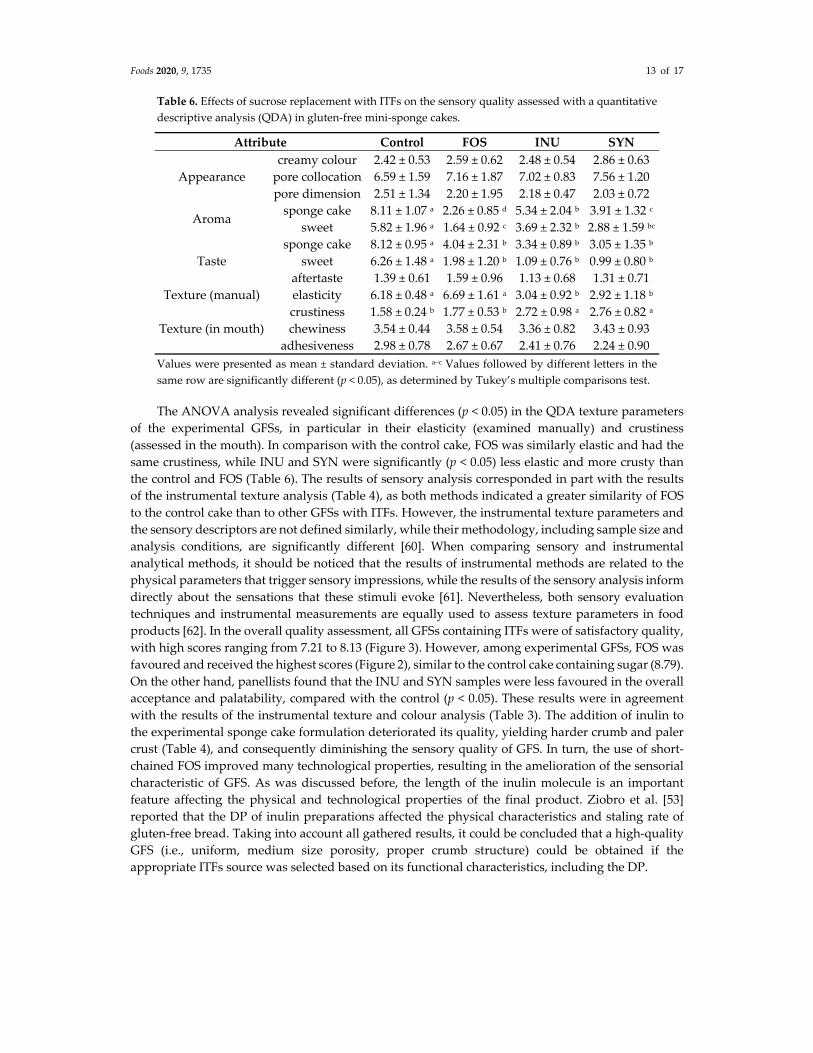
The ANOVA analysis revealed significant differences (p < 0.05) in the QDA texture parameters
of the experimental GFSs, in particular in their elasticity (examined manually) and crustiness
(assessed in the mouth). In comparison with the control cake, FOS was similarly elastic and had the
same crustiness, while INU and SYN were significantly (p < 0.05) less elastic and more crusty than
the control and FOS (Table 6). The results of sensory analysis corresponded in part with the results
of the instrumental texture analysis (Table 4), as both methods indicated a greater similarity of FOS
to the control cake than to other GFSs with ITFs. However, the instrumental texture parameters and
the sensory descriptors are not defined similarly, while their methodology, including sample size and
analysis conditions, are significantly different [60]. When comparing sensory and instrumental
analytical methods, it should be noticed that the results of instrumental methods are related to the
physical parameters that trigger sensory impressions, while the results of the sensory analysis inform
directly about the sensations that these stimuli evoke [61]. Nevertheless, both sensory evaluation
techniques and instrumental measurements are equally used to assess texture parameters in food
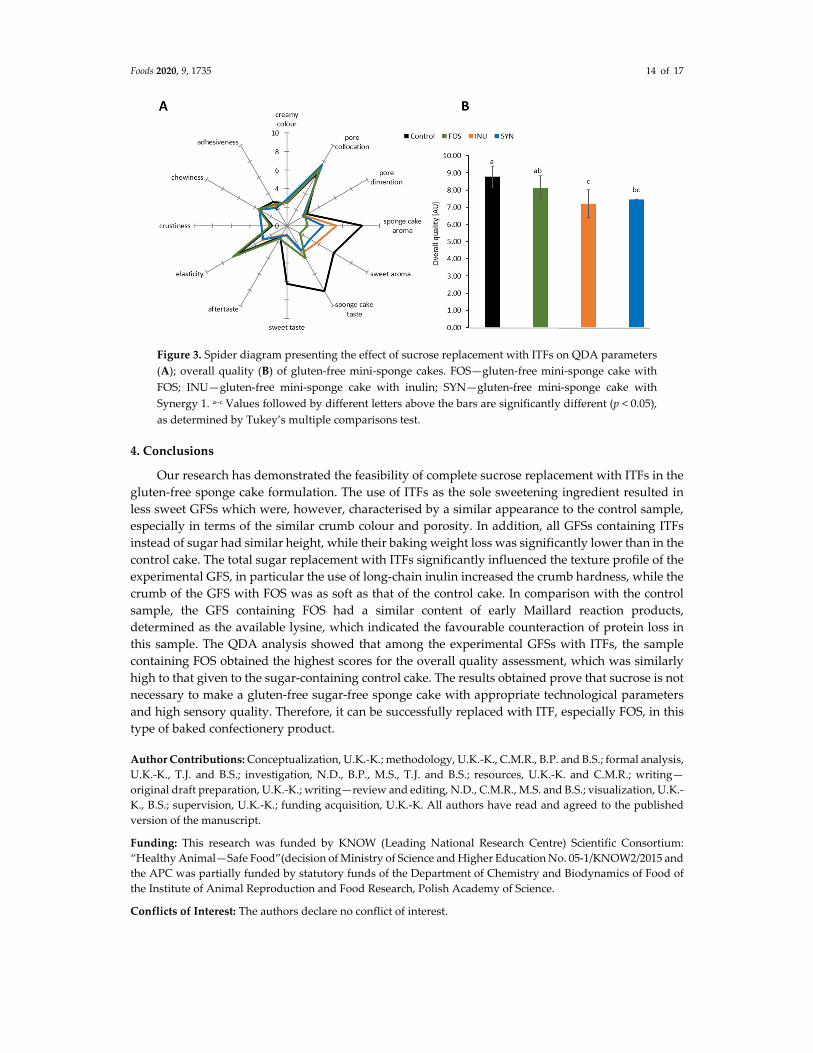
products [62]. In the overall quality assessment, all GFSs containing ITFs were of satisfactory quality,
with high scores ranging from 7.21 to 8.13 (Figure 3). However, among experimental GFSs, FOS was
favoured and received the highest scores (Figure 2), similar to the control cake containing sugar (8.79).
On the other hand, panellists found that the INU and SYN samples were less favoured in the overall
acceptance and palatability, compared with the control (p < 0.05). These results were in agreement
with the results of the instrumental texture and colour analysis (Table 3). The addition of inulin to
the experimental sponge cake formulation deteriorated its quality, yielding harder crumb and paler
crust (Table 4), and consequently diminishing the sensory quality of GFS. In turn, the use of short‐
chained FOS improved many technological properties, resulting in the amelioration of the sensorial
characteristic of GFS. As was discussed before, the length of the inulin molecule is an important
feature affecting the physical and technological properties of the final product. Ziobro et al. [53]
reported that the DP of inulin preparations affected the physical characteristics and staling rate of
gluten‐free bread. Taking into account all gathered results, it could be concluded that a high‐quality
GFS (i.e., uniform, medium size porosity, proper crumb structure) could be obtained if the
appropriate ITFs source was selected based on its functional characteristics, including the DP.
Foods 2020, 9, 1735 14 of 17
Figure 3. Spider diagram presenting the effect of sucrose replacement with ITFs on QDA parameters
(A); overall quality (B) of gluten‐free mini‐sponge cakes. FOS—gluten‐free mini‐sponge cake with
FOS; INU—gluten‐free mini‐sponge cake with inulin; SYN—gluten‐free mini‐sponge cake with
Synergy 1. a–c Values followed by different letters above the bars are significantly different (p < 0.05),
as determined by Tukey’s multiple comparisons test.
4. Conclusions
Our research has demonstrated the feasibility of complete sucrose replacement with ITFs in the
gluten‐free sponge cake formulation. The use of ITFs as the sole sweetening ingredient resulted in
less sweet GFSs which were, however, characterised by a similar appearance to the control sample,
especially in terms of the similar crumb colour and porosity. In addition, all GFSs containing ITFs
instead of sugar had similar height, while their baking weight loss was significantly lower than in the
control cake. The total sugar replacement with ITFs significantly influenced the texture profile of the
experimental GFS, in particular the use of long‐chain inulin increased the crumb hardness, while the
crumb of the GFS with FOS was as soft as that of the control cake. In comparison with the control
sample, the GFS containing FOS had a similar content of early Maillard reaction products,
determined as the available lysine, which indicated the favourable counteraction of protein loss in
this sample. The QDA analysis showed that among the experimental GFSs with ITFs, the sample
containing FOS obtained the highest scores for the overall quality assessment, which was similarly
high to that given to the sugar‐containing control cake. The results obtained prove that sucrose is not
necessary to make a gluten‐free sugar‐free sponge cake with appropriate technological parameters
and high sensory quality. Therefore, it can be successfully replaced with ITF, especially FOS, in this
type of baked confectionery product.
Author Contributions: Conceptualization, U.K.‐K.; methodology, U.K.‐K., C.M.R., B.P. and B.S.; formal analysis,
U.K.‐K., T.J. and B.S.; investigation, N.D., B.P., M.S., T.J. and B.S.; resources, U.K.‐K. and C.M.R.; writing—
original draft preparation, U.K.‐K.; writing—review and editing, N.D., C.M.R., M.S. and B.S.; visualization, U.K.‐
K., B.S.; supervision, U.K.‐K.; funding acquisition, U.K.‐K. All authors have read and agreed to the published
version of the manuscript.
Funding: This research was funded by KNOW (Leading National Research Centre) Scientific Consortium:
“Healthy Animal—Safe Food”(decision of Ministry of Science and Higher Education No. 05‐1/KNOW2/2015 and
the APC was partially funded by statutory funds of the Department of Chemistry and Biodynamics of Food of
the Institute of Animal Reproduction and Food Research, Polish Academy of Science.
Conflicts of Interest: The authors declare no conflict of interest.

Foods 2020, 9, 1735 15 of 17
References
1. Godefroidt, T.; Ooms, N.; Pareyt, B.; Brijs, K.; Delcour, J.A. Ingredient Functionality During Foam‐Type
Cake Making: A Review. Compr. Rev. Food Sci. Food Saf. 2019, 18, 1550–1562.
2. Psimouli, V.; Oreopoulou, V. The effect of alternative sweeteners on batter rheology and cake properties. J.
Sci. Food Agric. 2012, 92, 99–105.
3. Welsh, J.A.; Sharma, A.; Cunningham, S.A.; Vos, M.B. Consumption of added sugars and indicators of
cardiovascular disease risk among US adolescents. Circulation 2011, 123, 249–257.
4. Te Morenga, L.A.; Howatson, A.J.; Jones, R.M.; Mann, J. Dietary sugars and cardiometabolic risk:
Systematic review and meta‐analyses of randomized controlled trials of the effects on blood pressure and
lipids. Am. J. Clin. Nutr. 2014, 100, 65–79.
5. Makarem, N.; Bandera, E.V.; Nicholson, J.M.; Parekh, N. Consumption of sugars, sugary foods, and sugary
beverages in relation to cancer risk: A systematic review of longitudinal studies. Annu. Rev. Nutr. 2018, 38,
17–39.
6. Malik, V.S.; Schulze, M.B.; Hu, F.B. Intake of sugar sweetened beverages and weight gain: A systematic
review. Am. J. Clin. Nutr. 2006, 84, 274–288.
7. Morris, M.J.; Beilharz, J.E.; Maniam, J.; Reichelt, A.C.; Westbrook, R.F. Why is obesity such a problem in the
21st century? The intersection of palatable food, cues and reward pathways, stress, and cognition. Neurosci.
Biobehav. Rev. 2015, 58, 36–45.
8. Faruque, S.; Tong, J.; Lacmanovic, V.; Agbonghae, C.; Minaya, D.M.; Czaja, K. The Dose Makes the Poison:
Sugar and Obesity in the United States. Pol. J. Food Nutr. Sci. 2019, 69, 219–233.
9. Ng, M.; Fleming, T.; Robinson, M.; Thomson, B.; Graetz, N.; Margono, C.; Mullany, E.C.; Biryukov, S.;
Abbafati, C.; Abera, S.F.; et al. Global, regional, and national prevalence of overweight and obesity in
children and adults during 1980–2013: A systematic analysis for the Global Burden of Disease Study 2013.
Lancet 2014, 384, 766–781.
10. Tucker, E.; Rostami, K.; Prabhakaran, S.; Al Dulaimi, D. Patients with Coeliac Disease Are Increasingly
Overweight or Obese on Presentation. J. Gastrointestin. Liver Dis. 2012, 21, 11–15.
11. Mahmud, F.H.; Murray, J.A.; Kudva, Y.C.; Zinsmeister, A.R.; Dierkhising, R.A.; Lahr, B.D.; Dyck, P.J.; Kyle,
R.A.; El‐Youssef, M.; Burgart, L.J.; et al. Celiac Disease in Type 1 Diabetes Mellitus in a North American
Community: Prevalence, Serologic Screening, and Clinical Features. Mayo Clin. Proc. 2005, 80, 1429–1434.
12. Assor, E.; Marcon, M.A.; Hamilton, N.; Fry, M.; Cooper, T.; Mahmud, F.H. Design of a Dietary Intervention
to Assess the Impact of a Gluten‐Free Diet in a Population with Type 1 Diabetes and Celiac Disease. BMC
Gastroenterol. 2015, 15, 181.
13. Krupa‐Kozak, U.; Lange, E. The gluten‐free diet and glycaemic index in the management of coeliac disease
associated with type 1 diabetes. Food Rev. Int. 2019, 35, 587–608.
14. Miranda, J.; Lasa, A.; Bustamante, M.A.; Churruca, I.; Simon, E. Nutritional Differences between a Gluten‐
Free Diet and a Diet Containing Equivalent Products with Gluten. Plant Foods Hum. Nutr. 2014, 69, 182–187.
15. Melini, V.; Melini, F. Gluten‐Free Diet: Gaps and Needs for a Healthier Diet. Nutrients 2019, 11, 170.
16. Kulai, T.; Rashid, M. Assessment of Nutritional Adequacy of Packaged Gluten‐Free Food Products. Can. J.
Diet. Pract. Res. 2014, 75, 186–190.
17. Wild, D.; Robins, G.G.; Burley, V.J.; Howdle, P.D. Evidence of High Sugar Intake, and Low Fibre and
Mineral Intake, in the Gluten‐Free Diet. Aliment. Pharmacol. Ther. 2010, 32, 573–581.
18. Vici, G.; Belli, L.; Biondi, M.; Polzonetti, V. Gluten free diet and nutrient deficiencies: A review. Clin. Nutr.
2016, 35, 1236–1241.
19. Ronda, F.; Gomez, M.; Blanco, C.A.; Caballero, P.A. Effects of polyols and nondigestible oligosaccharides
on the quality of sugar‐free sponge cakes. Food Chem. 2005, 90, 549–555.
20. Carocho, M.; Morales, P.; Ferreira, I.C.F.R. Sweeteners as food additives in the XXI century: A review of
what is known, and what is to come. Food Chem. Toxicol. 2017, 107, 302–317.
21. Chattopadhyay, S.; Raychaudhuri, U.; Chakraborty, R. Artificial sweeteners—A review. J. Food Sci. Technol.
2014, 51, 611–621, doi:10.1007/s13197‐011‐0571‐1.
22. George, V.; Arora, S.; Wadhwa, B.K.; Singh, A.K. Analysis of multiple sweeteners and their degradation products
in lassi by HPLC and HPTLC plates. J. Food Sci. Technol. 2010, 47, 408–413, doi:10.1007/s13197‐010‐0067‐4.
23. Zahn, S.; Forker, A.; Krügel, L.; Rohm, H. Combined use of rebaudioside A and fibres for partial sucrose
replacement in muffins. LWT Food Sci. Technol. 2013, 50, 695–670, doi:10.1016/j.lwt.2012.07.026.

Foods 2020, 9, 1735 16 of 17
24. Gao, J.; Brennan, M.A.; Mason, S.L.; Brennan, C.S. Effect of sugar replacement with stevianna and inulin
on the texture and predictive glycaemic response of muffins. Int. J. Food Sci. Technol. 2016, 51, 1979–1987.
25. Garvey, E.C.; O’Sullivan, M.G.; Kerry, J.P.; Milner, L.; Gallagher, E.; Kilcawley, K.N. Characterising the
sensory quality and volatile aroma profile of clean‐label sucrose reduced sponge cakes. Food Chem. 2020,
doi:10.1016/j.foodchem.2020.128124.
26. Gallagher, E.; Gormley, T.R.; Arendt, E.K. Crust and crumb characteristics of gluten free breads. J. Food Eng.
2003, 56, 153–161.
27. Drabińska, N.; Zieliński, H.; Krupa‐Kozak, U. Technological benefits of inulin‐type fructans application in
gluten‐free products—A review. Trends Food Sci. Technol. 2016, 56, 149–157.
28. Drabińska, N.; Rosell, C.M.; Krupa‐Kozak, U. Inulin‐Type Fructans Application in Gluten‐Free Products:
Functionality and Health Benefits. In Bioactive Molecules in Food. Reference Series in Phytochemistry; Mérillon,
J.M., Ramawat, K., Eds.; Springer: Cham, Switzerland, 2018.
29. Mensink, M.A.; Frijlink, H.W.; Maarschalk, K.V.; Hinrichs, W.L.J. Inulin, a flexible oligosaccharide I:
Review of its physicochemical characteristics. Carbohydr. Polym. 2015, 130, 405–419.
30. Morais, E.C.; Cruz, A.G.; Faria, J.A.F.; Bolini, H.M.A. Prebiotic gluten‐free bread: Sensory profiling and
drivers of liking. Lebensm. Wiss. Technol. 2014, 55, 248–254.
31. Zahn, S.; Pepke, F.; Rohm, H. Effect of inulin as a fat replacer on texture and sensory properties of muffins.
Int. J. Food Sci. Technol. 2010, 45, 2531–2537.
32. Krupa‐Kozak, U.; Drabińska, N.; Rosell, C.M.; Fadda, C.; Anders, A.; Jeliński, T.; Ostaszyk, A. Broccoli leaf
powder as an attractive by‐product ingredient: Effect on batter behaviour, technological properties and
sensory quality of gluten‐free mini sponge cake. Int. J. Food Sci. Technol. 2019, 54, 1121–1129.
33. Hsu, C.L.; Chen, W.; Weng, Y.M.; Tseng, C.Y. Chemical composition, physical properties, and antioxidant
activities of yam flours as affected by different drying methods. Food Chem. 2003, 83, 85–89.
34. Palou, E.; López‐Malo, A.; Barbosa‐Cánovas, G.V.; Welti‐Chanes, J.; Swanson, B.G. Polyphenoloxidase
activity and color of blanched and high hydrostatic pressure treated banana puree. J. Food Sci. 1999, 64, 42–45.
35. Mokrzycki, W.S.; Tatol, M. Color difference Delta E—A survey. Mach. Graph. Vis. 2011, 20, 383–411.
36. Michalska, A.; Amigo‐Benavent, M.; Zielinski, H.; del Castillo, M.D. Effect of bread making on formation
of Maillard reaction products contributing to the overall antioxidant activity of rye bread. J. Cereal Sci. 2008,
48, 123–132.
37. Zieliński, H.; del Castillo, M.D.; Przygodzka, M.; Ciesarova, Z.; Kukurova, K.; Zielińska, D. Changes in
chemical composition and antioxidative properties of rye ginger cakes during their shelf‐life. Food Chem.
2012, 135, 2965–2973.
38. ISO. 8586–1: Sensory Analysis—General Guidance for the Selection, Training and Monitoring of Assessors—Part
1: Selected Assessors; ISO: Geneva, Switzerland, 1993.
39. Lawless, H.T.; Heymann, H. Sensory Evaluation of Food—Principles and Practices; Springer: New York, NY,
USA, 2010; pp 473–478.
40. ISO/DIS. 13299: Sensory Analysis—Methodology—General Guidance for Establishing a Sensory Profile; ISO:
Geneva, Switzerland, 1998.
41. ISO. 8589: Sensory Analysis—General Guidance for the Design of Test Rooms; ISO: Geneva, Switzerland, 1998.
42. Rosell, C.M.; Collar, C. Effect of temperature and consistency on wheat dough performance. Int. J. Food Sci.
Technol. 2009, 44, 493–502.
43. Andrade, F.J.E.T.; Albuquerque, P.B.S.; Moraes, G.M.D.; Farias, M.D.P.; Teixeira‐Sá, D.M.A.; Vicente, A.A.;
Carneiro‐da‐Cunha, M.G. Influence of hydrocolloids (galactomannan and xanthan gum) on the
physicochemical and sensory characteristics of gluten‐free cakes based on fava beans (Phaseolus lunatus).
Food Funct. 2018, 9, 6369–6379, doi:10.1039/c8fo01448e.
44. Marco, C.; Rosell, C.M. Effect of different protein isolates and transglutaminase on rice flour properties. J.
Food Eng. 2008, 84, 132–139.
45. Gularte, M.A.; de la Hera, E.; Gómez, M.; Rosell, C.M. Effect of different fibers on batter and gluten‐free
layer cake properties. Lebensm. Wiss. Technol. 2012, 48, 209–214.
46. Conforti, F.D. Cake manufacture. In Bakery Products: Science and Technology, 2nd ed.; Hui, Y.H., Corke, H.,
De Leyn, I., Nip, W., Cross, N.A., Eds.; Wiley‐Blackwell: Ames, IA, USA, 2014; pp. 565–584.
47. Mondal, A.; Dutta, A.K. Bread baking—A review. J. Food Eng. 2008, 86, 465–474.
48. Mathieu Lostie, Roman Peczalski, Julien Andrieu, Lumped model for sponge cake baking during the ‘‘crust
and crumb’’ period. J. Food Eng. 2004, 65, 281–286, doi:10.1016/j.jfoodeng.2004.01.026.

Foods 2020, 9, 1735 17 of 17
49. Purlis, E.; Salvadori, V.O. Bread baking as a moving boundary problem. Part 1: Mathematical modelling. J.
Food Eng. 2009, 91, 428–433, doi:10.1016/j.jfoodeng.2008.09.037.
50. Dhingra, D.; Michael, M.; Rajput, H.; Patil, R.T. Dietary fibre in foods: A review. J. Food Sci. Technol. 2012,
49, 255–266.
51. Rodríguez‐García. J.; Salvador. A.; Hernando. I. Replacing Fat and Sugar with Inulin in Cakes: Bubble Size
Distribution. Physical and Sensory Properties. Food Bioprocess Technol. 2014, 7, 964–974.
52. Chiavaro, E.; Vittadini, E.; Corradini, C. Physicochemical characterization and stability of inulin gels. Eur.
Food Res. Technol. 2007, 225, 85–94.
53. Ziobro, R.; Korus, J.; Juszczak, L.; Witczak, T. Influence of inulin on physical characteristics and staling rate
of gluten‐free bread. J. Food Eng. 2013, 116, 21–27.
54. Starowicz, M.; Zieliński, H. How Maillard Reaction Influences Sensorial Properties (Color, Flavor and
Texture) of Food Products? Food Rev. Int. 2019, 35, 707–725.
55. Pérez‐Quirce, S.; Collar, C.; Ronda, F. Significance of healthy viscous dietary fibres on the performance of
gluten‐free rice‐based formulated breads. Int. J. Food Sci. Technol. 2014, 49, 1375–1382.
56. Przygodzka, M.; Zieliński, H.; Ciesarová, Z.; Kukurová, K.; Lamparski, G. Effect of selected spices on
chemical and sensory markers in fortified rye‐buckwheat cakes. Food Sci. Nutr. 2016, 4, 651–660.
57. Tamanna, N.; Mahmood, N. Food Processing and Maillard Reaction Products Effect on Human Health and
Nutrition. J. Food Chem. 2015, doi:10.1155/2015/526762.
58. Baryłko‐Pikielna, N. Sensoryczne Badania Żywności: Podstawy, Metody, Zastosowania; Polskie Towarzystwo
Technologii Żywności. Wydawnictwo Naukowe PTTŻ: Kraków, Poland, 2009.
59. Sahi, S.S. Interfacial properties of the aqueous phases of wheat flour doughs. J. Cereal Sci. 1994, 20, 119–127.
60. Meullenet, J.F.; Lyon, B.G.; Carpenter, J.A.; Lyon, C.E. Relation between sensory and instrumental texture
profile attributes. J. Sens. Stud. 1998, 77‐93, doi:10.1111/j.1745‐459X.1998.tb00076.x.
61. Szczesniak, A.S. Texture profile analysis—Methodology interpretation clarified. J. Food Sci. 1995, 6, 60.
62. Lyon, B.G.; Champagne, E.T.; Vinyard, B.T.; Windham, W.R. Sensory and Instrumental Relationships of
Texture of Cooked Rice from Selected Cultivars and Postharvest Handling Practices. Cereal Chem. 2000, 77,
64–69, doi:10.1094/cchem.2000.77.1.64.
Publisher’s Note: MDPI stays neutral with regard to jurisdictional claims in published maps and institutional
affiliations.
© 2020 by the authors. Licensee MDPI, Basel, Switzerland. This article is an open access
article distributed under the terms and conditions of the Creative Commons Attribution
(CC BY) license (http://creativecommons.org/licenses/by/4.0/).