Sucrose metabolism during fruit development in Coffea racemosa
Upload
uniquindioCategory
view
0download
0
TEMPORAL STUDY OF SUCROSE AND FRUCTOSE RELATIVE SWEETNESS
M.C. ZAMORA. F.M. BURATTI and M.E. OTERO-LOSADA
Laboratorio de Investigaciones Sensoriales &IS) CONICET, Facultad de Medicina
Universidad de Buenos Aires Argentina
Received for Publication June 27. 1997
ABSTRACT
Time-Intensity (T-I) and Gustatory Reaction Time (GRT) methodologies were used to study the relative sweetness of sucrose and fructose at 25C. Eleven panelists evaluated nine concentrations (5 to 45 %, w/v) of sucrose and fructose by T-I and seven parameters were determined. Higher values were obtained for fructose at 25, 30 and 35% for Maximum Intensity; at 35, 40 and 45% for the Area Under the Curve; at 40 and 45% for Time to decline the Intensity to half of its maximum value and at 45 % for Rate of Increase. Ten subjects evaluated seven concentrations (3 to 15%, w/v) of sucrose and fructose by the GRTprocedure. Fructose had shorter GRT than sucrose at 3 and 4.5%. Thus, fructose at 25, 30 and 35%, has a more intense and at 40% more persistent sweetness than sucrose and is detected earlier than sucrose at concentrations near gustatory threshold.
INTRODUCTION
Sweetness of fructose is generally accepted to be greater than that of sucrose (Biester et al. 1925; Cameron 1947; Pangborn 1963; Stone and Oliver 1969; Yamaguchi et al. 1970). In this respect, fructose would be the ideal nutritive sweetener because it would give the same texture and sweetness to food as
'Corresponding author: Maria Clara Zamora, LIS-CONICET. CC 53. (1453)-Buenos Aires, Argentina.
Journal of Sensory Studies 13 (1998) 213-228. All Rights Reserved. -Copyright 1998 by Food & Nuiriiion Press, Inc.. Trumbull. Connecticut. 213

214 M. ZAMORA. F. BURATTI and M. OTERO-LOSADA
sucrose but with a lesser energy content. However, when fructose is in solution and according to varying temperature, pH, and concentration, results are much more conflicting. Depending on the physical and chemical characteristics of the solutions, Fontvielle et af. (1989) concluded that fructose has either an equal, higher, or lower relative sweetness compared with sucrose.
No effect of concentration on relative sweetness was first found by Dahlberg and Penczek in 1941. Similar findings were also reported by Cameron (1947). However, Tsuzuki and Yamazaki (1953) found a decrease in relative fructose sweetness from 3% to 20% w/w. Hyvonen et af. (1977) and Schaller and Weiss (1979) again showed that the relative sweetness of fructose over sucrose is lower at higher concentrations when the solutions are tested at room temperature. On the other hand, Cardello et af. (1979) evaluated the relative sweetness of fructose and sucrose at various concentrations (1.4 to 14.3%) in distilled water. They found that the ratio of magnitude estimates for fructose/sucrose sweetness varied with concentration: 1.6-1.9 at lower sugar concentrations (1.4 to 5.7%) and declined with increasing sugar concentration.
Temporal perception of sensory attributes influence responses to many psychophysical tests. The perception of maximum intensity for a specific compound is a function of both time and stimulus concentration (Birch et af. 1980). Sweeteners judged to be identical in total intensity may differ dramatically in their Time-Intensity curves (DuBois et al. 1977; Larson-Powers and Pangborn 1978).
Time-Intensity studies have been used successfully to study practical and theoretical aspects of the sweetness of sugars (Birch and Mylvaganam 1976; Birch and Ogunmoyela 1980; Munton and Birch 1985; Lawless and Skinner 1979; Birch et af. 1980; 1982) and intense sweeteners (DuBois et al. 1977; Birch et af. 1980; Swartz 1980).
Gustatory reaction time (GRT) is defined as the minimum time required by a subject to report any taste changes after onset of taste stimulation (Yamamoto et af. 1985). The stimulated surface and stimulus duration (Bujas and Ostojcic 1939) and concentration (Bujas 1989), are some of the many variables that may modify GRT which can be standardized. However, variables such as fluctuations in the subject’s attention and differences in preparation time are difficult to control.
GRT has been useful in the study of sensory systems (Bonnet 1994; Ehrenstein et af. 1992). It allows one to quantify subjects’ estimations without the need of using numbers or scales. Taste qualities’ respective GRTs allow their different detection, identification and discrimination in mixtures.
The objectives of the present study were to analyze the temporal perception of sucrose and fructose sweetness in a wide range of concentrations by Time- Intensity procedure and by Gustatory Reaction Time in a narrow low concentration range.

TEMPORAL STUDY OF SUGARS’ RELATIVE SWEETNESS 215
MATERIALS AND METHODS
Time-Intensity Measurements
Temporal characteristics were assessed using a computerized data collection system. A mouse was used by panelists to move a cursor along a 500 pixel line, representing a 20 cm unstructured line scale on the monitor (500 pixel = 100% intensity). For each sample and panelist, data were automatically recorded by the computer every 0.28 s.
Eleven panelists (nine female and two male, age 26-40 years; average 31 years) participated in three time-intensity sessions. Subjects were asked not to eat or smoke two hours before the experiment. All subjects had undergone three training sessions on sweetness evaluation prior to this study. First the panelists were instructed to use a mouse and to develop hand-eye coordination for the task as a little training. Then they had to evaluate in triplicate samples of sucrose (food grade) and fructose (RA, Anedra S.A., Argentina) at 5, 10, 15, 20, 25, 30, 35, 40 and 45% w/v. The substances were dissolved in distilled water 24 h before the experiment and kept at 4C.
Samples (5 mL) were served in 30 mL plastic cups with three-digit humbers at room temperature (25 & 1C). The two sample sets (sucrose and fructose) were evaluated in the same session. Samples within each set were presented in a random order except the first one that was a middle concentration (25% w/v) to have a reference value. The subjects were told that maximum intensity of the reference corresponded to about a mid-point on the scale. Subjects rinsed with distilled water prior to the evaluation of each sample. They were instructed to pour the entire sample into their mouths, using their left hand to hold the sample cup, and to ensure that the sample touched all parts of their mouth. During this, as soon as they perceived a taste, they were asked to move the cursor to the right (with the right hand) on the line scale as taste increased until the maximum intensity was reached and to the left as taste decreased until zero intensity or until taste remained constant. Subjects were prompted by a computer sound to expectorate the sample after 10 s.
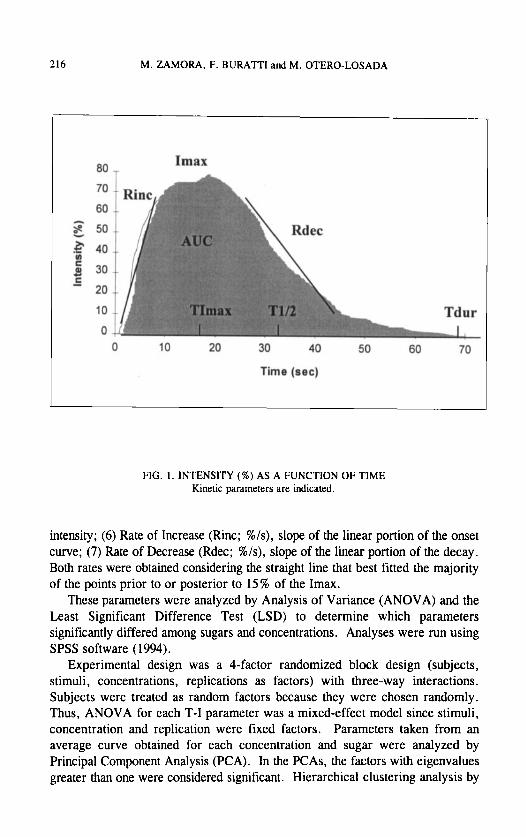
Data Analysis. To compare temporal characteristics of the sugars seven parameters were extracted from T-I curves (Fig. 1) for each sugar, concentration, panelist and replication: (1) Maximum Intensity (Imax; %), the maximum intensity reached between taste onset and taste disappearance; (2) Time to Maximum Intensity (TImax; s) the time spent to reach maximum intensity; (3) Total Duration of the sensation (Tdur, s) the duration of the taste sensation from onset to disappearance; (4) Time for sweetness intensity to decline to half its maximal value (T1/2; s); (5) Area Under the Curve (AUC, %*s), which was calculated by the trapezoidal rule (C(I,+I,)/2*ax) where X is time and I is
216 M. ZAMORA. F. BURATTI and M. OTERO-LOSADA
I I
FIG. 1. INTENSITY (%) AS A FUNCTION OF TIME Kinetic parameters are indicated.
intensity; (6) Rate of Increase (Rinc; %/s), slope of the linear portion of the onset curve; (7) Rate of Decrease (Rdec; %/s), slope of the linear portion of the decay. Both rates were obtained considering the straight line that best fitted the majority of the points prior to or posterior to 15% of the Imax.
These parameters were analyzed by Analysis of Variance (ANOVA) and the Least Significant Difference Test (LSD) to determine which parameters significantly differed among sugars and concentrations. Analyses were run using SPSS software (1994).
Experimental design was a 4-factor randomized block design (subjects, stimuli, concentrations, replications as factors) with three-way interactions. Subjects were treated as random factors because they were chosen randomly. Thus, ANOVA for each T-I parameter was a mixed-effect model since stimuli, concentration and replication were fixed factors. Parameters taken from an average curve obtained for each concentration and sugar were analyzed by Principal Component Analysis (PCA). In the PCAs, the factors with eigenvalues greater than one were considered significant. Hierarchical clustering analysis by

TEMPORAL STUDY OF SUGARS’ RELATIVE SWEETNESS 217
average method based on the degree of similarity among ratings were used to identify groups of observations. Analyses were run using Statgraphics software ( 1987).
Gustatory Reaction Time (GRT) of Sucrose and Fructose
A panel of 10 subjects (six female, four male), 32 years mean age, evaluated the Gustatory Reaction Time (GRT) of sucrose and fructose. The subjects did not eat or smoke for at least 2 h before the experiment. The stimuli were sucrose (food grade) and fructose (RA, Anedra S. A., Argentina). The concentrations used were 3.0, 4.5, 6.8, 8.3, 10.1, 12.0 and 15.0% w/v. Concentrations ranked in a geometric progression of 1.5 (3.0, 4.5, 6.8%) and of 1.2 near the plateau zone where RT became constant.
Solutions were prepared in distilled water 24 h before the experiment and kept at 4C. Solutions and ambient temperature were about 25C when the experiment was carried out. Solutions were randomly pumped and also water was tested in order to discard false values in response to tactile stimuli. Concentrations were replicated 5 times per session and each substance was evaluated in two sessions.
The equipment consisted of a pumping system, an interface between the computer and the pumping system, a software to control the interface and measure the time, and a push button to detect the subject’s reaction.
The subject held the tube and placed it on the middle part of his tongue with his left hand while his’right hand laid on the push button. The subject rinsed with distilled water at 25C just before starting the test and each time before a stimulus was tested. The command for pumping solution was given from the computer. The subject had to push on the button as soon as he felt a stimulus different from water (“go no go” procedure). The computer measured the time interval between onset of pumping and button pushing by the subject. First of all, as a training session, the subject had to push on the button as quickly as possible when he/she recognized touch sensation following application of water on the tongue surface.
Data Analysis. Averaged GRTs were calculated as the mean of 10 replications for each concentration and substance for each panelist and were analyzed by ANOVA. Slopes of the power function were calculated for each panelist and sugar.
RESULTS AND DISCUSSION
Analysis of Variance of the Time-Intensity Parameters
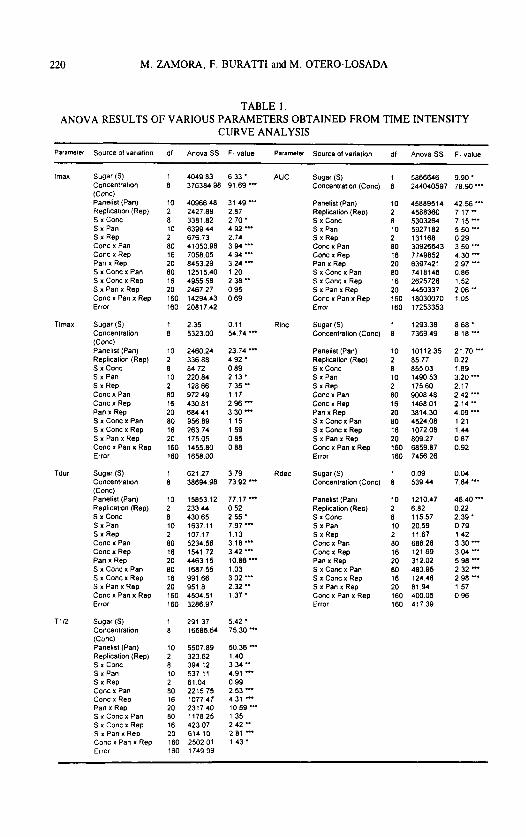
Table 1 shows the ANOVA results of Time-Intensity evaluations obtained from 594 curves (2 sugars x 9 concentrations x 11 panelists x 3 replications).
218 M. ZAMORA. F. BURATTI and M. OTERO-LOSADA
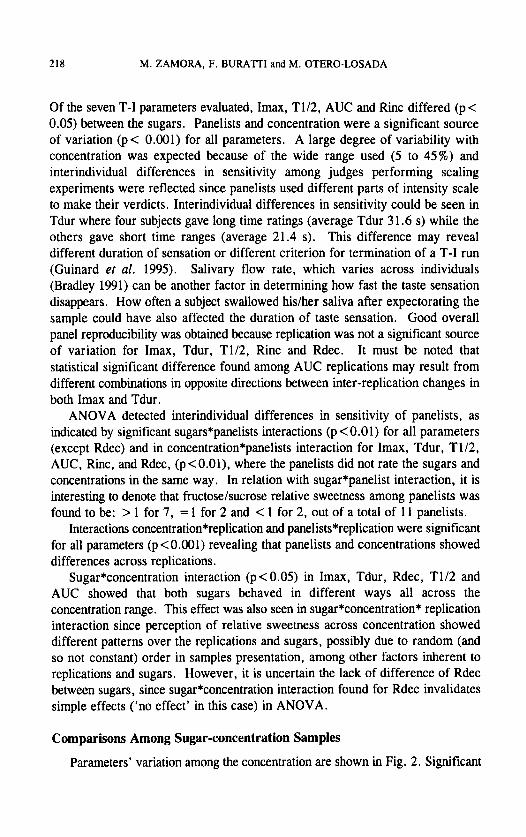
Of the seven T-I parameters evaluated, Imax, T1/2, AUC and Rinc differed (p< 0.05) between the sugars. Panelists and concentration were a significant source of variation (p< 0.001) for all parameters. A large degree of variability with concentration was expected because of the wide range used (5 to 45%) and interindividual differences in sensitivity among judges performing scaling experiments were reflected since panelists used different parts of intensity scale to make their verdicts. Interindividual differences in sensitivity could be seen in Tdur where four subjects gave long time ratings (average Tdur 3 1.6 s) while the others gave short time ranges (average 21.4 s). This difference may reveal different duration of sensation or different criterion for termination of a T-I run (Guinard et al. 1995). Salivary flow rate, which varies across individuals (Bradley 1991) can be another factor in determining how fast the taste sensation disappears. How often a subject swallowed his/her saliva after expectorating the sample could have also affected the duration of taste sensation. Good overall panel reproducibility was obtained because replication was not a significant source of variation for Imax, Tdur, TU2, R im and Rdec. It must be noted that statistical significant difference found among AUC replications may result from different combinations in opposite directions between inter-replication changes in both Imax and Tdur.
ANOVA detected interindividual differences in sensitivity of panelists, as indicated by significant sugars*panelists interactions (p < 0.01) for all parameters (except Rdec) and in concentration*panelists interaction for Imax. Tdur, T1/2, AUC, Rinc, and Rdec, (p<O.Ol), where the panelists did not rate the sugars and concentrations in the same way. In relation with sugar*panelist interaction, it is interesting to denote that fructose/sucrose relative sweetness among panelists was found to be: > 1 for 7, = 1 for 2 and < 1 for 2, out of a total of 11 panelists.
Interactions concentration*replication and panelists*replication were significant for all parameters (p <0.001) revealing that panelists and concentrations showed differences across replications.
Sugar*concentration interaction (p <0.05) in Imax, Tdur, Rdec, T1/2 and AUC showed that both sugars behaved in different ways all across the concentration range. This effect was also seen in sugar*concentration* replication interaction since perception of relative sweetness across concentration showed different patterns over the replications and sugars, possibly due to random (and so not constant) order in samples presentation, among other factors inherent to replications and sugars. However, it is uncertain the lack of difference of Rdec between sugars, since sugar*concentration interaction found for Rdec invalidates simple effects (‘no effect’ in this case) in ANOVA.
Comparisons Among Sugar-concentration Samples
Parameters’ variation among the concentration are shown in Fig. 2. Significant
TEMPORAL STUDY OF SUGARS’ RELATIVE SWEETNESS 219
differences were found (p < 0.05) between sugars for Imax (Fig. 2a, left) at 25, 30 and 35% (44f3, 59k4, 60k4 for sucrose and 52k4, 68k4, 74k3 for fructose, respectively; % + S . E . ) . The two highest levels could not be discriminated by Imax indicating a probable saturation of sweetness perception for these sugars. Also differences were found for T1/2 (Fig. 2d, left) at 40 and 45% (2651, 28+1 for sucrose and 31k1, 32f2 for fructose, respectively, s+S.E. ) and for AUC (Fig. 2e, left) at 35, 40 and 45% (1200f115, 1487f117, 1724k114 for sucrose, 1581k95, 1965k147, 2176k153 for fructose, respectively; s*% 5S.E.). A clear tendency to have higher Rinc (Fig. 2f, left) values was observed for fructose at concentrations higher than 20%, which became significant only at 45% (12f2, 19+2 for sucrose and fructose, respectively; % /s k S. E.).
The relationships of parameters’ kinetic behavior across concentration were calculated in order to make comparisons between sugars.
The increase of Imax, Tdur, T1/2 and AUC with the concentration adjusted to a lineal function. Significant differences (p <0.05) between sucrose and fructose were obtained for the slopes of Imax: 1.81 k0.07, r2=0.99, 2.06k0.13, r2=0.97 (Fig.2a, right); T1/2: 0.35k0.02, r ’ =0.97; 0.46f0.02, r2 =0.99 (Fig.2d, right); AUC: 42.21 k2.05, r2=0.98; 56.23k3.02, r ’ =0.98 (Fig.2e, right), respectively, (s1opekS.E.). TImax had a linear increase up to 25% (0.35f0.04, r’=0.96 for sucrose and 0.38f0.04, r2=0.97 for fructose, Fig.2b, right) and then became constant at about 13 s for both sugars. Rinc adjusted to an exponential function with a value of 0.025+0.003, r2=0.90 for sucrose and 0.034k0.003, r2=0.96 for fructose (Fig.2f, right), (p<0.05). Rdec had a steeper variation for fructose (increase up to 30%) than for sucrose, which only showed a slight tendency to an increase along concentration range. High inter-panelists and replication variability in Rdec might have masked differences between sugars (Fig.2g, right). A lineal equation with a break point at 30% best fitted fructose behavior (0.16k0.02, r2=0.93 from 5 to 30% and -0.11k0.06, r2=0.61 from 30 to 45%) while sucrose’s could be described by a lineal function 0.05k0.01, rz =0.67.
Principal Components Analysis of the T-I Parameters
To summarize overall T-I responses for sweetness, Principal Component Analysis (PCA) (Fig.3) was performed, using each parameter averaged from subjects for each sugar and concentration. The first Principal Component (PC1)
220 M. ZAMORA, F. BURATTI and M. OTERO-LOSADA
TABLE 1. ANOVA RESULTS OF VARIOUS PARAMETERS OBTAINED FROM TIME INTENSITY
CURVE ANALYSIS
Parameter Source of varialion df Anova SS F- value Parametsf Source of vanation df Anova SS F- value
lrnax
Tlrnax
Tdur
T1R
Sugar (S) Concentralion (conc) Panelist (Pan) Replication (Rep) S x Conc S x Pan S x Rep Conc x Pan Conc x Rep Pan x Rep S x Conc x Pan S x Conc x Rep S x Pan x Rep Conc x Pan x Rep Error
Sugar (S) Concentration (Conc) Panelisl (Pan) Replication (Rep) S x Conc S x Pan S x Rep Conc x Pan Conc x Rep Pan x Rep S x Conc x Pan S x Conc x Rep S x Pan x Rep Conc x Pan x Rep Error
Sugar (S) Concenlralion (Conc) Panelist (Pan) Replication (Rep) S x Conc S x Pan S x Rep Conc x Pan Conc x Rep Pan x Rep S x Conc x Pan S x Conc x Rep S x Pan x Rep Conc x Pan x Rep Error
Sugar (S) Concenlralion (Conc) Panelist (Pan) Replicalion (Rep) S x Conc S x Pan S x Rep Conc x Pan Conc x Rep Pan I: Rep S x Conc x Pan S x Conc x Rep S x Pan x Rep Conc x Pan x Rep Error
1 8
10 2 8 10 2 80 16 20 80 16 20 160 160
1 8
10 2 8 10 2 80 16 20 80 16 20 180 160
1 8
10 2 8 10 2 80 16 20 80 16 20 160 160
1 8
10 2 8 10 2 80 16 20 80 16 20 160 160
4049 83 376384 98
40966 48 2427 89 3381 82 6399 44 676 73 41050 98 7058 05 8453 29 1251540 4955 58 2467 27 14294 43 2081 7 42
2 35 5323 00
2460 24 336 86 84 72 220 84 128 66 972 49 430 81 684 41 956 89 263 74 175 05 1455 80 1658 00
621 27 38694 98
15853 12 233 44 430 65 1637 11 107 17 5234 58 1541 72 4463 15 1687 55 991 66 951 8 4524 51 3286 97
291 37 16685 64
5507 89 323 62 394 12 537 11 61 04 2215 75 1077 47 2317 40 117825 423 07 614 10 2502 01 1149 99
6 33 * 91 69 .**
31 49- 2 87 2 70 * 4 92 2 74 3 94 ". 4 94 -* 3 24 *'* 120 2 38 -- 0 95 0 69
0 11 54 74 .**
23 74 *- 4 92 ' 0 89 2 1 3 ' 7 35 ** 117 2 96 .- 3 30 *- 115 1 59 0 85 0 88
3 79 73 92 *-
77 17'" 0 52 2 55 7 97 *- 113 3 18 *- 3 42 ** 10 86 *** 103 3 02 - 2 32 .. 137 '
5 42 * 75 30 **'
50 36 *'* 140 3 34 -* 4 91 .ff 0 99 2 53 --- 4 31 *** 10 59 *'* 1 35 2 42 ** 2 81 **- 143 a
AUC Sugar(S) Concentration (Conc)
Panelist (Pan) Replication (Rep) S x Conc S x Pan S x Rep Conc x Pan Conc x Rep Pan x Rep S x Conc x Pan S x Conc x Rep S x Pan x Rep Conc x Pan x Rep Error
Rinc Sugar (S) Concentration (Conc)
Panelisl (Pan) Replicalion (Rep) S x Conc S x Pan S x Rep Conc x Pan Conc x Rep Pan x Rep S x Conc x Pan S x Conc x Rep S x Pan x Rep Conc x Pan x Rep Error
Rdec Sugar (S) Concentration (Conc)
Panelist (Pan) Replication (Rep) S x Conc S x Pan S x Rep Conc x Pan Conc x Rep Pan x Rep S x Conc x Pan S x Conc x Rep S x Pan x Rep Conc x Pan x Rep Error
1 8
10 2 8 10 2 80 16 20 80 16 20 160 160
1 8
10 2 8 10 2 80 16 20 80 16 20 160 160
1 8
10 2 8 10 2 80 16 20 80 16 20 160 160
5866646 244040597
45889514 4588360 5303264 5927182 131168 30926643 7749852 6397421 741 8146 2625726 4450337 18030070 17253353
1293 38 7389 49
10112 35 85 77 855 03 1490 53 175 60 9008 48 1468 01 3814 30 4524 08 1072 08 809 27 6859 87 7456 26
0 09 539 44
121047 6 82 11557 20 59 11 67 688 28 121 69 312 02 483 95 124 46 81 94 400 05 417 39
9 90 * 78 90 *-.
42 56 ** 7 17" 7 15"' 5 50 *** 0 29 3 59 *.- 4 30 *-- 2 97 ..- 0 86 152 2 06 -* 105
8 68 * a 18 *a*
21 70 *.- 0 22 189 3 20 *-* 2 17 2 42 *-* 2 14" 4 09 I** 121 144 0 87 0 92
OM 7 84 .**
46.40 *** 0 22 2 39 * 0 79 142 3 30 **. 3 04 ..* 5 98 *** 2 32 *** 2 98 *.. 1 57 096
TEMPORAL STUDY OF SUGARS’ RELATIVE SWEETNESS 22 1
accounted for 89.0% of the total variation and was the only one with eigenvalue (6.21) greater than one. Thus PCA showed only one factor as necessary to explain the variation among sugars and concentrations. The seven T-I parameters were positively loaded on PC1. Imax accounted for 15.8%, Tdur 15.776, T1/2 15.6%, AUC 15.376, TImax 13.896, Rinc 13.2% and Rdec 10.5% of the PC1 variation. Imax, Tdur, T1/2 and AUC formed a group of parameters strongly correlated one to another over the sugar and concentrations samples.
This first PC grouped the samples on the basis of sugar concentrations. The samples of 5 % fructose (4.23) and 5 % sucrose (3.70) to the left and 45 % fructose (3.89) to the right side were, respectively, lowest and highest in all parameters. Cluster analysis was applied to confirm delimited categories. Cluster profiles are also shown in Fig. 3, and indicate 3 clusters: one formed by sucrose and fructose 5, 10 and 15%, another at intermediate concentrations, with sucrose 20, 25, 30, 35% and fructose 20, 25% and a third cluster with sucrose 40, 45% and fructose 30, 35, 40 and 45%. If a fourth category was considered, fructose 40 and 45% could form another group.
Same PCA features are observed in the present results (i.e., only one PC accounting for most total variation, concentration-defined clusters for sugar and same directionality for vectors of parameters) were reported for glucose by Cliff and Noble (1990).
Gustatory Reaction Time
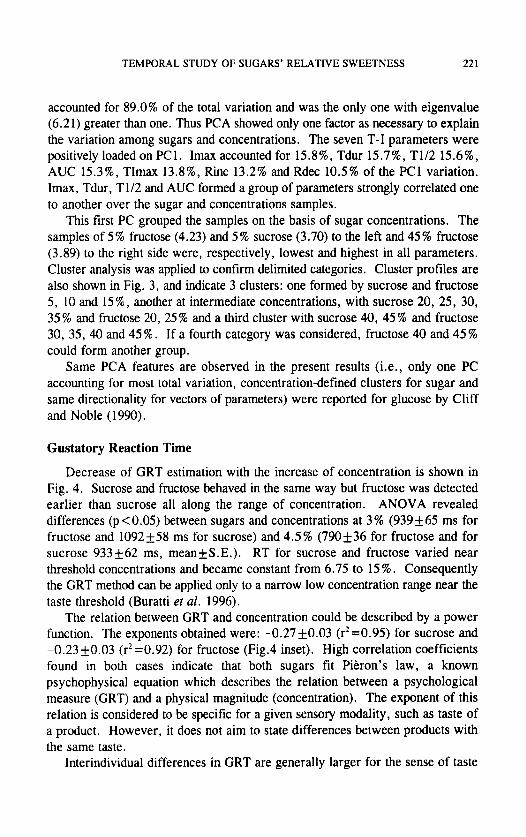
Decrease of GRT estimation with the increase of concentration is shown in Fig. 4. Sucrose and fructose behaved in the same way but fructose was detected earlier than sucrose all along the range of concentration. ANOVA revealed differences (p<O.O5) between sugars and concentrations at 3% (939f65 ms for fructose and 1092+58 ms for sucrose) and 4.5% (790f36 for fructose and for sucrose 933f62 ms, meanfS.E.). RT for sucrose and fructose varied near threshold concentrations and became constant from 6.75 to 15%. Consequently the GRT method can be applied only to a narrow low concentration range near the taste threshold (Buratti et al. 1996).
The relation between GRT and concentration could be described by a power function. The exponents obtained were: -0.27 f0.03 (r2 =0.95) for sucrose and -0.23 f0.03 (r2=0.92) for fructose (Fig.4 inset). High correlation coefficients found in both cases indicate that both sugars fit Pikron’s law, a known psychophysical equation which describes the relation between a psychological measure (GRT) and a physical magnitude (concentration). The exponent of this relation is considered to be specific for a given sensory modality, such as taste of a product. However, it does not aim to state differences between products with the same taste.
Interindividual differences in GRT are generally larger for the sense of taste

222 M. ZAMORA. F. BURA'ITI and M. OTERO-LOSADA
1 1
I Concentration (%)
L=l S W S E 75 E
't .a - FRUCTOSE
3 50 .I 25
0
-
I
IW.
C o n w m n (90
Conwnlration 1%)
Concenkation (%)

TEMPORAL STUDY OF SUGARS' RELATIVE SWEETNESS 223
I Concenbation i%\ I
Concenbabon ( O h )
FIG. 2. T-I PARAMETERS AS A FUNCTION OF CONCENTRATION Inset: slopes for sucrose and fructose. Different small letters mean significant differences (p < 0.05).

224 M. ZAMORA, F. BURATTI and M. OTERO-LOSADA
I
-2.5 2.5 Component 1 (89.0%)
FIG. 3. PRINCIPAL COMPONENT ANALYSIS OF SWEETNESS T-I DATA Projection of T-I parameters loadings (vectors) and sample factor scores on principal components 1 and 2.
Clusters are delimitated. Numbers 1-9 refer to sucrose 5 to 45% and 10-18 to fructose 5 to 45%.
than those observed for other sensory modalities. In the present study interindividual variability was greater than intraindividual variation among replications.
It is interesting to observe that TImax and GRT both vary across concentrations lower than 20% and then both become constant, suggesting that these temporal measures might be related with the same mechanism of sweet taste production. Higher fructose intensity (“more intense”) might also agree with the observation about its higher rate of increase and shortest GRT, even considering that GRT belongs to a much lower concentration.
From a methodological point of view qualitatively different aspects of sweetness perception can be assessed and perceived as differences between sugars depending on different concentration levels regarding methods used among different works. Thus according to the methods used in the present work, sweetness intensity of aqueous solutions of sucrose or fructose at 25C can be

TEMPORAL STUDY OF SUGARS’ RELATIVE SWEETNESS 225
C .o 1000-
a @ a 2 800-
CI g z
% .E 0 % 7J + 600- 3 (3
C 0 SUCROSE
F R UCTOSE e
b @ % .E 7 J + 3 (3
12001 a T
1000-
800-
600-
n b
0
- a
tw 10 I M :
Conuntntlon (X)
a
F R UCTOSE ..
0 5 Ib 15
Concentration (%)
FIG. 4. GUSTATORY REACTION TIME (MS) PLOTTED AGAINST CONCENTRATION (%) FOR SUCROSE AND FRUCTOSE
Inset: slopes for sucrose and fructose. Different small letters mean significant differences (p < 0.05).
perceived as different at 25, 30 and 35%. On the other hand only near threshold sugar concentrations as measured by GRT sweetness reveals differences between sugars.
Our results indirectly demonstrate the lack of sensitivity of the T-I data at low concentration levels for discriminating among samples.
According to the present findings it can be concluded that fructose is sweeter than sucrose at 25, 30 and 35%, and at 40% fructose is more persistent. Near threshold concentrations fructose is detected earlier than sucrose.
ACKNOWLEDGMENT
The authors wish to acknowledge Dr. Javier Alberdi Alonso for his helpful suggestions regarding statistical analyses, Lic. Nestor Racino for the T-I software and Lic. Angeles Baldi and Ing. Olga Sosa for their technical assistance.
226 M. ZAMORA, F. BURATTI and M. OTERO-LOSADA
REFERENCES
BIESTER, A., WOOD, M.W. and WAHLIN, C.S. 1925. Carbohydrate studies. I . The relative sweetness of pure sugars. Am. J. Physiol. 73, 387-396.
BIRCH, G.G., LATYMER, Z. and HOLLAWAY, M. 1980. Intensityhime relationships in sweetness: Evidence for a queue hypothesis in taste chemoreception. Chem. Senses 5, 63-78.
BIRCH, G.G. and MYLVAGANAM, A.R. 1976. Evidence for the proximity of sweet and bitter receptors sites. Nature 260, 632-634.
BIRCH, G.G., O’DONNELL, K. and MUSGRAVE, R. 1982. Intensityhime studies of sweetness: Evidence for localized concentration of stimulus. Food Chem. 9, 223-237.
BIRCH, G.G. and OGUNMOYELA, G. 1980. Taste properties of cocoa drinks with added bitterhweet sugars: Intensity/time effects. J . Food Technol. 15, 549-555.
BONNET, C. 1994. Psicofisica de 10s tiempos de reaccion: teorias y mitodos. Revista Latinoamericana de Psicologia 26(3), 431-444.
BRADLEY, R.M. 1991. Salivary secretion. In Smell and Taste in Health and Disease, (T.V. Getchell, R.L. Doty, L.M. Bartoshuk and J.B. Snow, Jr., eds.) pp. 127-144, Raven Press, New York.
BUJAS, Z. and OSTOJCIC, A. 1939. L’evolution de la sensation gustative en fonction du temps d‘excitation. Acta Instituti Psychologici Universitatis Zagrebensis 3, 1-24.
BUJAS, Z., SZABO, S., AJDUKOVIC, D. andMAYER, D. 1989. Individual gustatory reaction times to various groups of chemicals that provoke basic taste qualities. Perception and Psychophysics 45(4), 385-390.
BURATTI, F., ZAMORA, M.C., OTERO-LOSADA, M. and CALVINO. A. 1996. Tiempo de reaccion al gusto (TRG): su aplicacion para la seleccion de panelistas en analisis sensorial. Libro de resumenes del I Simposio Iberoamericano de Anhlisis Sensorial. “Sensiber 96”.
CAMERON, A.T. 1947. The taste sense and the relative sweetness of sugars and other sweet substances. Sugar Research Foundation Rept. No 9, 1-72. New York.
CARDELLO, A.V., HUNT, D. and MANN, B. 1979. Relative sweetness of fructose and sucrose in model solutions, lemon beverages and white cake. J. Food Sci. 44, 748-75 1.
CLIFF, M. and NOBLE, A.C. 1990. Time-Intensity evaluation of sweetness and fruitiness and their interaction in a model solution. J. Food Sci. 55(2), 450- 454.
DAHLBERG, A.C. and PENCZEK, E.S. 1941. The relative sweetness of sugars as affected by concentration. State Agriculture Expt. Sta., Geneva, N.Y. Tech. Bull, No. 258, 1-12.

TEMPORAL STUDY OF SUGARS’ RELATIVE SWEETNESS 221
DUBOIS, G., CROSBY, G . , STEPHENSON, R. and WINGARD, JR., R. 1977. Dihydrochalcone sweeteners. Synthesis and sensory evaluation of sulfonate derivatives. J. Agric. Food Chem. 25 (4), 763.
EHRENSTEIN, W.H., HAMADA, J., MULLER, M. and CAVONIUS, C.R. 1992. Psychophysics of suprathreshold brightness differences: a comparison of reaction time and rating methods. Fifteenth European Conference on Visual Perception. Pisa, Italy. Perception 21, (supplement 2), 82.
FONTVIELLE, A.M. ef al. 1989. Relative sweetness of fructose compared with sucrose in healthy and diabetic subjects. Diabetes Care 12(7), 481-486.
GUINARD, J.X., HONG, D.Y. and BUDWIG, C. 1995. Time-Intensity properties of sweet and bitter stimuli: implications for sweet and bitter taste chemoreception. J. Sensory Studies 10(1), 45-71.
HYVONEN, L., KURKELA, R., KOIVISTOINEN, P. and MERIMAA, P. 1977. Effects of temperature and concentration on the relative sweetness of fructose, glucose and xylitol. Lebensmittel-Wiss.u. Technol. 10, 316-320.
LARSON-POWERS, N. and PANGBORN, R.M. 1978. Paired comparison and time-intensity measurements of the sensory properties of beverages and gelatins containing sucrose or synthetic sweeteners. J. Food Sci. 43, 41-46.
LAWLESS, H.T. and SKINNER, E.Z. 1979. The duration of perceived intensity and sucrose taste. Perception and Psychophysics 25(3), 180-1 84.
MUNTON, S.L . and BIRCH, G.G. 1985. Accession of sweet stimuli to receptors. I. Absolute dominance of one molecular species in binary mixtures. J . Theor. Biol. 112, 539-551.
PANGBORN, R.M. 1963. Relative taste intensities of selected sugars and organic acids. J. Food Sci. 28, 726-733.
SCHALLER, A. and WEISS, J. 1979. Results of sensory examinations regarding the relative sweetness of fructose compared to saccharose using aqueous solutions. Confructa 24(3/4), 85-93.
SPSS, Statistical Package for the Social Sciences software for Windows, 1994. Base System User’s Guide. SPSS Inc., Chicago, IL.
Statgraphics 1987. Statistical Graphics System by Statistical Graphics Corporation software. User’s Guide. STSC Inc., USA.
STONE, H. and OLIVER, S.M. 1969. Measurement of the relative sweetness of selected sweeteners and sweetener mixtures. J . Food Sci. 34(2), 215-222.
SWARTZ, M. 1980. Sensory screening of synthetic sweeteners using the time- intensity evaluations. J . Food Sci. 45, 577-581.
TSUZUKI, Y. and YAMAZAKI, J. 1953. The sweetness of fructose and some other sugars. J. Chem. SOC. Japan, Pure Chem. Sect. 74, 596-601.
YAMAGUCHI, S . , YOSHIKAWA, T., IKEDA, S. and NINOMIYA, T. 1970. Studies on the taste of some sweet substances. I. Measurement of relative sweetness. Agric. Biol. Chem. 34, 181-186.

228 M. ZAMORA. F. BURATTI and M . OTERO-LOSADA
YAMAMOTO, T . , KATO T . , MATSUO, R . , KAWAMURA, Y . and YOSHIDA, M. 1985. Gustatory reaction time to various sweeteners in human adults. Physiology & Behavior 35, 411-415.
Copyright © 2022 FDOKUMEN