The effect of two energy-restricted diets, a low-fructose diet versus a moderate natural fructose...
9
The effect of two energy-restricted diets, a low-fructose diet versus a moderate natural fructose diet, on weight loss and metabolic syndrome parameters: a randomized controlled trial Magdalena Madero a, ⁎ , Julio C. Arriaga a , Diana Jalal b , Christopher Rivard b , Kim McFann b , Oscar Pérez-Méndez a , Armando Vázquez a , Arturo Ruiz a , Miguel A. Lanaspa b , Carlos Roncal Jimenez b , Richard J. Johnson b , Laura-Gabriela Sánchez Lozada a, b a Division of Nephrology, Department of Medicine, Instituto Nacional de Cardiología Ignacio Chávez, Juan Badiano no 1 Col Seccion XVI Tlalpan, México City, 14080, México b Division of Renal Diseases and Hypertension, University of Colorado, Denver, CO, USA ARTICLE INFO ABSTRACT Article history: Received 20 December 2010 Accepted 4 April 2011 One of the proposed causes of obesity and metabolic syndrome is the excessive intake of products containing added sugars, in particular, fructose. Although the ability of excessive intake of fructose to induce metabolic syndrome is mounting, to date, no study has addressed whether a diet specifically lowering fructose but not total carbohydrates can reduce features of metabolic syndrome. A total of 131 patients were randomized to compare the short-term effects of 2 energy-restricted diets—a low-fructose diet vs a moderate natural fructose diet— on weight loss and metabolic syndrome parameters. Patients were randomized to receive 1500, 1800, or 2000 cal diets according to sex, age, and height. Because natural fructose might be differently absorbed compared with fructose from added sugars, we randomized obese subjects to either a low-fructose diet (<20 g/d) or a moderate-fructose diet with natural fruit supplements (50-70 g/d) and compared the effects of both diets on the primary outcome of weight loss in a 6-week follow-up period. Blood pressure, lipid profile, serum glucose, insulin resistance, uric acid, soluble intercellular adhesion molecule–1, and quality of life scores were included as secondary outcomes. One hundred two (78%) of the 131 participants were women, mean age was 38.8 ± 8.8 years, and the mean body mass index was 32.4 ± 4.5 kg/m 2 . Each intervention diet was associated with significant weight loss compared with baseline. Weight loss was higher in the moderate natural fructose group (4.19 ± 0.30 kg) than the low- fructose group (2.83 ± 0.29 kg) (P = .0016). Compared with baseline, each intervention diet was associated with significant improvement in secondary outcomes. Reduction of energy and added fructose intake may represent an important therapeutic target to reduce the frequency of obesity and diabetes. For weight loss achievement, an energy-restricted moderate natural fructose diet was superior to a low-fructose diet. © 2011 Elsevier Inc. All rights reserved. METABOLISM CLINICAL AND EXPERIMENTAL 60 (2011) 1551 – 1559 Author contributions: Magdalena Madero, Richard Johnson, Diana Jalal, Miguel Lanaspa, Carlos Roncal Jimenez, Armando Vazquez, and Laura-Gabriela Sanchez Lozada were involved in the study design. Julio Arriaga was responsible for recruiting patients and patient follow-up. Kim McFann was the statistician. Christopher Rivard and Arturo Ruiz were involved with the laboratory determinations. Oscar Perez Mendez supported the study with the lipid profile determinations. ClinicalTrials.gov NCT0086873. ⁎ Corresponding author. Tel.: +52 55 73 69 02; fax: +52 55 73 77 16. E-mail address: [email protected] (M. Madero). 0026-0495/$ – see front matter © 2011 Elsevier Inc. All rights reserved. doi:10.1016/j.metabol.2011.04.001 Available at www.sciencedirect.com Metabolism www.metabolismjournal.com
-
Upload
independent -
Category
Documents
-
view
1 -
download
0
Transcript of The effect of two energy-restricted diets, a low-fructose diet versus a moderate natural fructose...

The effect of two energy-restricted diets, a low-fructose dietversus a moderate natural fructose diet, on weight loss andmetabolic syndrome parameters: a randomized controlled trial
Magdalena Maderoa,⁎, Julio C. Arriagaa, Diana Jalalb, Christopher Rivardb, Kim McFannb,Oscar Pérez-Méndeza, Armando Vázqueza, Arturo Ruiza, Miguel A. Lanaspab,Carlos Roncal Jimenezb, Richard J. Johnsonb, Laura-Gabriela Sánchez Lozadaa,b
a Division of Nephrology, Department of Medicine, Instituto Nacional de Cardiología Ignacio Chávez, Juan Badiano no 1 Col Seccion XVITlalpan, México City, 14080, Méxicob Division of Renal Diseases and Hypertension, University of Colorado, Denver, CO, USA
A R T I C L E I N F O A B S T R A C T
Article history:Received 20 December 2010Accepted 4 April 2011
One of the proposed causes of obesity and metabolic syndrome is the excessive intake ofproducts containing added sugars, in particular, fructose. Although the ability of excessiveintakeof fructose to inducemetabolic syndrome ismounting, to date, no studyhas addressedwhether a diet specifically lowering fructose but not total carbohydrates can reduce featuresof metabolic syndrome. A total of 131 patients were randomized to compare the short-termeffects of 2 energy-restricted diets—a low-fructose diet vs amoderate natural fructose diet—on weight loss and metabolic syndrome parameters. Patients were randomized to receive1500, 1800, or 2000 cal diets according to sex, age, and height. Because natural fructosemightbe differently absorbed compared with fructose from added sugars, we randomized obesesubjects to either a low-fructose diet (<20 g/d) or a moderate-fructose diet with natural fruitsupplements (50-70 g/d) and compared the effects of both diets on the primary outcome ofweight loss in a 6-week follow-up period. Blood pressure, lipid profile, serum glucose, insulinresistance, uric acid, soluble intercellular adhesionmolecule–1, andquality of life scoreswereincluded as secondary outcomes. One hundred two (78%) of the 131 participants werewomen, mean age was 38.8 ± 8.8 years, and the mean bodymass index was 32.4 ± 4.5 kg/m2.Each intervention diet was associated with significant weight loss compared with baseline.Weight loss was higher in the moderate natural fructose group (4.19 ± 0.30 kg) than the low-fructose group (2.83 ± 0.29 kg) (P = .0016). Comparedwith baseline, each intervention diet wasassociated with significant improvement in secondary outcomes. Reduction of energy andadded fructose intakemay represent an important therapeutic target to reduce the frequencyof obesity and diabetes. For weight loss achievement, an energy-restricted moderate naturalfructose diet was superior to a low-fructose diet.
© 2011 Elsevier Inc. All rights reserved.
M E T A B O L I S M C L I N I C A L A N D E X P E R I M E N T A L 6 0 ( 2 0 1 1 ) 1 5 5 1 – 1 5 5 9
Author contributions: Magdalena Madero, Richard Johnson, Diana Jalal, Miguel Lanaspa, Carlos Roncal Jimenez, Armando Vazquez,and Laura-Gabriela Sanchez Lozada were involved in the study design. Julio Arriaga was responsible for recruiting patients and patientfollow-up. KimMcFann was the statistician. Christopher Rivard and Arturo Ruiz were involved with the laboratory determinations. OscarPerez Mendez supported the study with the lipid profile determinations.
ClinicalTrials.gov NCT0086873.⁎ Corresponding author. Tel.: +52 55 73 69 02; fax: +52 55 73 77 16.
E-mail address: [email protected] (M. Madero).
0026-0495/$ – see front matter © 2011 Elsevier Inc. All rights reserved.doi:10.1016/j.metabol.2011.04.001
Ava i l ab l e a t www.sc i enced i r ec t . com
Metabolismwww.metabo l i sm jou rna l . com

1. Introduction
One of the proposed causes of obesity and metabolicsyndrome is the excessive intake of products containingadded sugars, in particular, fructose [1-9]. Fructose is asimple sugar that is present in honey and fruits; but thegreatest source is from added sugars, such as table sugar(sucrose, a disaccharide of glucose and fructose) and high-fructose corn syrup (a mixture of free fructose and glucoseusually in a 55:45 ratio). Experimental studies have shownthat excessive concentrations of fructose (but not glucose)can induce all features of metabolic syndrome in rats [1], aneffect that occurs independently of energy intake [1-3].Clinical [4-7] and epidemiologic [8-9] studies also suggestthat excessive fructose intake can cause metabolic syn-drome. In particular, Stanhope et al [4] administeredfructose to 34 healthy adults who subsequently developedpostprandial hypertriglyceridemia, insulin resistance, andintraabdominal fat accumulation; these effects were notobserved with glucose or starch-based diets. Similarly, inhealthy subjects, fructose overconsumption has been asso-ciated with dyslipidemia and ectopic lipid deposition in liverand muscle [5]. In addition, Perez-Pozo et al [7] administered200 g of fructose daily to healthy adult men and notedsignificant increases in ambulatory blood pressure, fastingserum triglycerides, weight, and insulin resistance (assessedby the homeostasis model assessment [HOMA]), with asignificant decrease in high- density lipoprotein (HDL)cholesterol by 2 weeks [7]. Although the ability of excessiveintake of fructose to induce metabolic syndrome in exper-imental animals and humans is mounting, to date, there islimited data regarding whether a diet specifically loweringfructose can reduce features of metabolic syndrome.
There is evidence to suggest that it is primarily thefructose content in added sugars that is important inpromoting hypertension [10], possibly because natural fruitscontain numerous beneficial substances, including antioxi-dants and flavonols. Because most diets that restrictfructose, such as low-carbohydrate–based diets, also reducestarches and high glycemic foods, we tested the hypothesisthat a diet that specifically restricts fructose might reduceweight and features of metabolic syndrome in overweightand obese subjects. We further hypothesized that a diet inwhich the only source of fructose comes from natural fruitsmight be superior to one in which fruits consumption islimited. Therefore, we randomized participants to 2 energy-restricted diets, both of which excluded added sugars, a low-fructose diet allowing a limited consumption of fruits and amoderate-fructose diet in which natural fruits were allowedas the only source of fructose. We also included a modestcaloric restriction in both diets, as this is the cornerstone ofobesity management in clinical practice.
2. Methods
This was a randomized clinical trial to compare the short-term effects on features of themetabolic syndrome of 2 energyreduced diets that differed in their targets for fructose intake.
The trial was conducted between March and October 2009at the Instituto Nacional de Cardiología Ignacio Chávez,México. The study was approved by the human subjectscommittee at the institution (protocol approval no. 09-630,ClinicalTrials.gov NCT0086873). All participants gave writteninformed consent.
2.1. Participants
To participate in the trial, patients had to be 18 years or olderand be overweight (bodymass index [BMI] >25 kg/m2) or obese(BMI >30 kg/m2). Subjects were excluded if they had a historyof diabetes, hypertension, chronic kidney disease, liverdisease, anemia, or malignancy, were taking anymedications,or were pregnant.
A total of 217 patients were screened, and 131 patientswere recruited for the study. Participants were recruited fromthe community and within the Instituto Nacional de Cardio-logía Ignacio Chavez. Sixty-five and 66 patients were random-ized to the low-fructose diet and the natural moderatefructose diet, respectively. A total of 107 (82%) of theparticipants completed the trial (Fig. 1). One hundred two(78%) of the 131 participants were women, mean age was38.8 ± 8.8 years, and the mean BMI was 32.4 ± 4.5 kg/m2. Therewere no differences in the baseline characteristics betweenthe 2 groups (Table 1).
2.2. Weight loss intervention
The nutrient goals for both arms were 55% carbohydrates,15% proteins, and 30% fat. Patients were given a totalkilocalorie dietary plan according to the Harris Benedictformula that takes into account age, sex, and height [11]. Inaddition, the thermal effect of foods and rest energy wereassessed and incorporated in the prescribed diets. The totalcalories that each patient required were rounded to theclosest dietary plan of 1500, 1800, or 2000 kcal. After thiskilocalorie evaluation was prearranged, patients werefurther randomized by using random number tables intoeach diet intervention arm. The low-fructose arm wasassigned to a 2-week period of less than 10 g of fructoseper day followed by a 4-week period of less than 20 g offructose per day (Table 2). The moderate natural fructosediet consisted of 50 to 70 g of fructose consisting of mostlynatural fructose from fruits. Patients were followed for 6weeks. Added sugars from processed fruit juices andpunch; sugar-sweetened soft drinks and beverages; andbakery products such as pies, cakes, strudels, doughnuts,and cookies, in addition to dairy dessert, chocolate, candy,and dried fruits, were excluded in both arms. Beforerandomization, patients completed a self-administeredfood frequency semiquantitative dietary questionnaire of109 items to address their baseline energy consumptionand their intake of nutrients from the major pyramid foodgroups. Food items were categorized into 10 food groups,and each food proportion was presented in units. Thefrequency of consumption of any food item was catego-rized as 1 to 7 days per week, 1 to 2 days per month, ornever. This questionnaire was adapted from food question-naire used for the US National Health and Nutrition
1552 M E T A B O L I S M C L I N I C A L A N D E X P E R I M E N T A L 6 0 ( 2 0 1 1 ) 1 5 5 1 – 1 5 5 9
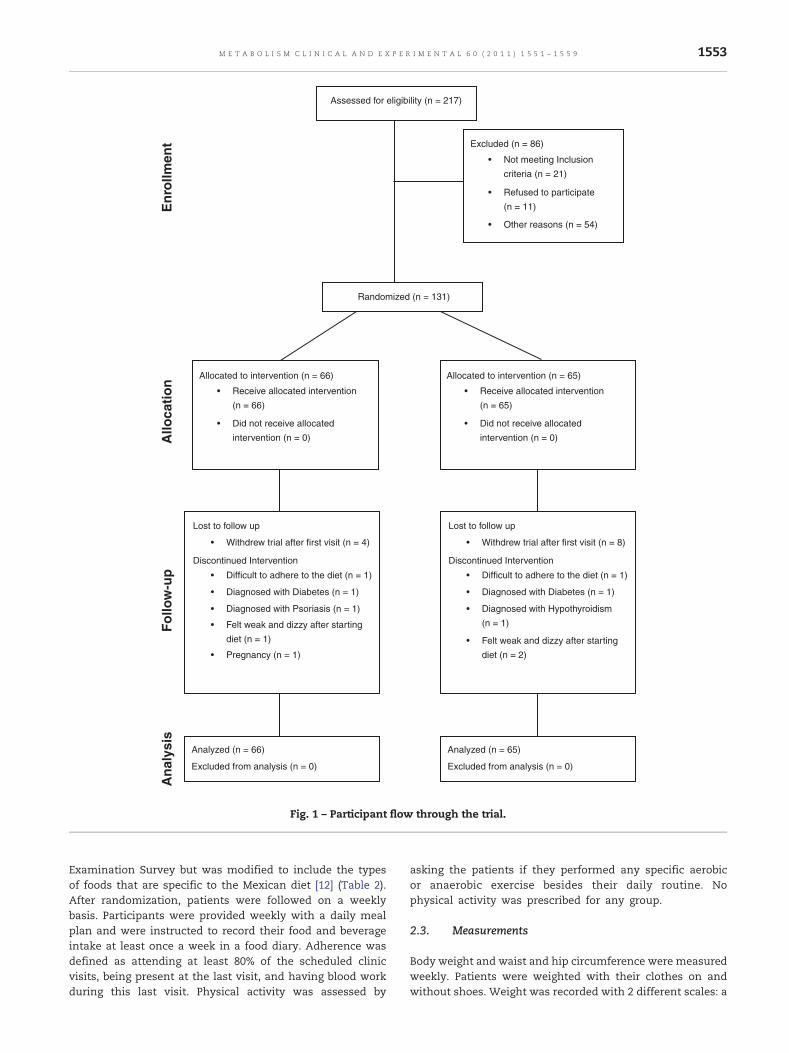
Examination Survey but was modified to include the typesof foods that are specific to the Mexican diet [12] (Table 2).After randomization, patients were followed on a weeklybasis. Participants were provided weekly with a daily mealplan and were instructed to record their food and beverageintake at least once a week in a food diary. Adherence wasdefined as attending at least 80% of the scheduled clinicvisits, being present at the last visit, and having blood workduring this last visit. Physical activity was assessed by
asking the patients if they performed any specific aerobicor anaerobic exercise besides their daily routine. Nophysical activity was prescribed for any group.
2.3. Measurements
Body weight and waist and hip circumference were measuredweekly. Patients were weighted with their clothes on andwithout shoes. Weight was recorded with 2 different scales: a
Assessed for eligibility (n = 217)
Excluded (n = 86)
• Not meeting Inclusion
criteria (n = 21)
• Refused to participate
• Other reasons (n = 54)
Randomized (n = 131)
(n = 11)
Allocated to intervention (n = 66)
• Receive allocated intervention
Lost to follow up
• Withdrew trial after first visit (n = 4)
Discontinued Intervention
• Difficult to adhere to the diet (n = 1)
• Diagnosed with Diabetes (n = 1)
• Diagnosed with Psoriasis (n = 1)
• Pregnancy (n = 1)
Analyzed (n = 66)
Excluded from analysis (n = 0)
Analyzed (n = 65)
Excluded from analysis (n = 0)
(n = 66)
• Did not receive allocated
intervention (n = 0)
• Felt weak and dizzy after starting
diet (n = 1)
Lost to follow up
• Withdrew trial after first visit (n = 8)
Discontinued Intervention
• Difficult to adhere to the diet (n = 1)
• Diagnosed with Diabetes (n = 1)
• Diagnosed with Hypothyroidism
• Felt weak and dizzy after starting
diet (n = 2)
(n = 1)
Allocated to intervention (n = 65)
• Receive allocated intervention
(n = 65)
• Did not receive allocated
intervention (n = 0)
Enr
ollm
ent
Follo
w-u
pA
lloca
tion
Ana
lysi
s
Fig. 1 – Participant flow through the trial.
1553M E T A B O L I S M C L I N I C A L A N D E X P E R I M E N T A L 6 0 ( 2 0 1 1 ) 1 5 5 1 – 1 5 5 9

calibrated mechanical scale and an electric impedancescale (TANITA BF-681, WA, USA) that was used to calculatepercentage of body fat. Body mass index was calculatedwith the formula weight (kilograms)/height (square meters).Waist and hip circumferences were measured by the sameperson with a Gulick glass fiber anthropometric tape. Mea-sures were taken with the patient in a standing position,using the costal edge, iliac crest, and coxofemoral articulationas reference. To evaluate consistency of measurement,randomizedmeasures were done blinded by a person externalto the trial. Blood pressure was measured with a mercurysphygmomanometer (Tycos Welch Allyn, NY, USA) that waspreviously calibrated by the center. Blood pressure wasrecorded weekly with the patient seating. Three blood pres-sure measurements were recorded with 5-minute intervalsafter having the patient at rest for 10 minutes.
Concentration levels of serum glucose, uric acid, totalcholesterol, HDL cholesterol, triglycerides, and microalbuminwere measured at baseline and at the end of follow-up usingthe VetACE analyzer (Alfa Wassermann, West Caldwell, NJ).For triglycerides, an enzymatic glycerol phosphate oxidaseassay was used. Creatinine was determined by the alkalinepicrate (Jaffe reaction).Uric acid was analyzed by the uricasemethod. Cholesterol was analyzed by the esterase/oxidaseassay. The phosphotungstic acid–Mg2+ precipitation proce-dure was used to precipitate apolipoprotein B–containinglipoproteins before quantifying HDL cholesterol. Glucoseanalysis used the hexokinase assay. High-sensitivity micro-albumin for urine was determined by the immunoturbidi-metric assay. Insulin in human serum was measured by asandwich-type immunoassay in a 96-well plate format(ALPCO Diagnostics, Salem NH). Standards and serumsamples were assayed in duplicate as per the manufacturersprotocol. The HOMA, which is an estimate of steady-state !-cell function and insulin sensitivity, was determined using
the online HOMA calculator (www.dtu.ox.ac-uk/index.php?maindoc=/homa/index.php).
Human soluble intercellular adhesion molecule–1 (sICAM-1) was determined by enzyme-linked immunosorbent assay ina 96-well plate format (Invitrogen, Camarillo, CA). Standardsand serum samples were assayed in duplicate as per themanufacturer's protocol.
2.4. Quality of life scores
A validated quality of life questionnaire using 12 questions(SF-12) [13] was applied to all participants before randomi-zation and at the end of follow-up. The main aspectsevaluated by the questionnaire were perception of generalhealth, ability to perform moderate activities, going up a fewflights of stairs, overall productivity and general perfor-mance, physical limitation, ability to concentrate andperform their job thoroughly, feeling of peace and calmness,physical limitation secondary to pain, feeling of sadness anddepression, and overall energy status.
2.5. Statistical analyses
The primary outcome of the study was the change in bodyweight over a period of 6 weeks; and the secondaryoutcomes were the changes in waist circumference, bloodpressure, triglycerides, HDL cholesterol, insulin resistance,uric acid, sICAM-1, and quality of life scores (SF-12).Unadjusted independent-samples t tests were used toexamine baseline characteristics of the low-fructose dietand the moderate natural fructose diet. Baseline data arepresented as mean ± SD. Analysis of covariance (ANCOVA)adjusted for baseline values of each characteristic was usedto compare the change in each variable at 6 weeks
Table 1 – Baseline characteristics of the cohort
Variable (units) Low fructose diet(n = 66)
Moderate naturalfructose diet (n = 65)
P > |t|
Age (y) 37.56 ± 1.14 40.15 ± 1.01 .09Sex (female) 52 (78.79%) 50 (76.92%) .80Weight (kg) 82.74 ± 1.64 79.07 ± 1.66 .12Glucose (mg/dL) 91.30 ± 2.75 89.05 ± 2.77 .56Systolic BP (mm/Hg) 108.9 ± 1.12 109.1 ± 1.13 .92Diastolic BP (mm/Hg) 69.01 ± 0.63 69.64 ± 0.64 .49Fat (%) 41.46 ± 0.90 39.49 ± 0.90 .12Wrist (cm) 15.57 ± 0.14 15.50 ± 0.14 .72Waist to hip ratio 0.87 ± 0.08 1.01 ± 0.08 .23Waist (cm) 97.13 ± 1.29 96.91 ± 1.30 .90BMI (kg/m²) 32.89 ± 0.55 31.81 ± 0.56 .17Insulin (IU) 17.95 ± 1.26 18.07 ± 1.27 .95sICAM (ng/dL) 4.44 ± 0.11 4.37 ± 0.11 .63Urine creatinine (mg/dL) 176.8 ± 11.87 172.1 ± 11.77 .78Urine microalbumin (µg/mg) 1.98 ± 0.42 1.68 ± 0.42 .63Insulin resistance (HOMA) 2.28 ± 0.13 2.15 ± 0.13 .45Uric acid (mg/dL) 5.53 ± 0.14 5.54 ± 0.14 .95Cholesterol (mg/dL) 188.3 ± 4.29 196.2 ± 4.32 .19Triglycerides (mg/dL) 180.6 ± 10.47 174.7 ± 10.55 .69HDL (mg/dL) 40.36 ± 1.47 39.41 ± 1.51 .65
Data reported as least squares means ± SE. BP indicates blood pressure.
1554 M E T A B O L I S M C L I N I C A L A N D E X P E R I M E N T A L 6 0 ( 2 0 1 1 ) 1 5 5 1 – 1 5 5 9

Table 2 – Differences in diet compositions at baseline and among intervention groups
Baselineenergy intake(kcal) total
cohort
% Low-fructose
diet1500 kcal
% Moderate-fructose
diet1500 kcal
% Low-fructose
diet1800 kcal
% Moderate-fructose
diet1800 kcal
% Low-fructose
diet2000 kcal
% Moderate-fructose
diet2000 kcal
%
Pyramid food groupsProtein 416.4 14 264 18 227 15 308 17 272 15 344 17 296 15Fat 764.3 26 427.5 29 441 29 508.5 28 504 28 571.5 29 625.5 32Carbohydrate 1818.9 61 796 54 832 56 971 54 1014 57 1062 54 1104 56Major food groupsDairy products 363.9 13 220 15 220 15 220 12 110 6 220 11 220 11Fruits 528.1 17 60 4 480 32 60 3 540 30 60 3 540 27Animal products 228.3 7 225 15 225 15 225 13 300 17 300 15 300 15Vegetables 178.5 6 100 7 100 7 100 6 50 3 87.5 4 75 4Leguminous products 99.9 3 60 4 60 4 120 7 240 13 120 6 180 9.1Cereals 899.2 30 665 45 280 19 770 43 280 16 875 44 350 18Fat 154.6 6 157.5 11 135 9 292.5 16 270 15 315 16 315 16Candies 71.7 2 0 0.0 0 0.0 0 0.0 0 0.0 0 0.0 0 0.0Juices and soft drinks 263.8 9 0 0.0 0 0.0 0 0.0 0 0.0 0 0.0 0 0.0Snacks 154.8 4 0 0.0 0 0.0 0 0.0 0 0.0 0 0.0 0 0.0Added sugars 56.8 3 0 0.0 0 0.0 0 0.0 0 0.0 0 0.0 0 0.0Average caloric intake 2999.7 100 1487.5 100 1500.0 100 1787.5 100 1790.0 100 1977.5 100 1980.0 100
“%” refers to the percentage of calories from each food group.
1555M
ET
AB
OLISM
CLIN
IC
AL
AN
DEX
PER
IM
EN
TA
L60
(2011)
1551–1559
compared with baseline. Because subjects were assigned todifferent caloric intakes, ANCOVA was then performed,adjusting for baseline and caloric intake. Data from ANCOVAare reported as adjusted least square means ± SE. Paired ttests were used to compare within-group changes frombaseline to 6 weeks. The data were analyzed first forcompleters of the study because those who dropped outtended to drop out after the baseline visit and second asintention to treat. The study was powered to detect an effectsize of 0.5 kg (difference in 1 kg between groups as an effectof the fructose content on each diet with a 2-kg standard
deviation). The number of patients required to have a powerof 80% was 64 patients in each arm.
3. Results
3.1. Participants
A total of 107 (82%) of the 131 subjects recruited into the studycompleted the trial, with baseline characteristics shown inTable 1. Nine patients from the low-fructose arm and 13
Table 3 –Within- and between-group changes in the low-fructose group and themoderate-fructose groupwith natural fruitsupplements
Δ = final ! baseline Low fructose Moderate natural fructose Comparison betweenintervention groups
Δ Mean ± SD P value Δ Mean ± SD P value P value
Weight (kg) !2.94 ± 2.18 <.0001 !4.07 ± 2.39 <.0001 .002Systolic BP (mm/Hg) !9.46 ± 7.77 <.0001 !7.85 ± 8.73 <.0001 .09Diastolic BP (mm/Hg) !5.17 ± 4.69 <.0001 !6.04 ± 5.40 <.0001 .57Fat (%) !2.09 ± 6.32 .02 !2.89 ± 6.33 .002 .10Waist to hip ratio !0.03 ± 0.02 <.0001 !0.18 ± 1.04 .21 .41BMI (kg/m2) !1.18 ± 0.82 <.0001 !1.57 ± 1.08 <.0001 .02Uric acid (mg/dL) !0.24 ± 0.60 .004 !0.22 ± 0.56 .01 .90sICAM (ng/dL) !0.28 ± 0.78 .01 !0.42 ± 0.67 <.0001 .19Urine microalbumin (µg/mg) 0.19 ± 7.70 .85 !0.42 ± 1.84 .11 .32Total cholesterol (mg/dL) !9.75 ± 24.4 .004 !12.76 ± 33.31 .01 .95Triglycerides (mg/dL) !23.50 ± 69.2 .01 !31.76 ± 55.36 <.0001 .48HDL (mg/dL) !0.75 ± 19.67 .79 0.107 ± 12.36 .95 .93Insulin resistance (HOMA) !0.29 ± 0.93 .02 !0.37 ± 0.57 <.0001 .12Blood glucose (mg/dL) !6.14 ± 30.83 .14 !6.96 ± 9.37 <.0001 .07
-7
-6
-5
-4
-3
-2
-1
0
1
2
3
BASELINE FINAL
WE
IGH
T LO
SS
(kilo
gram
s)
LOW FRUCTOSE GROUP
MODERATE NATURAL FRUCTOSE GROUP
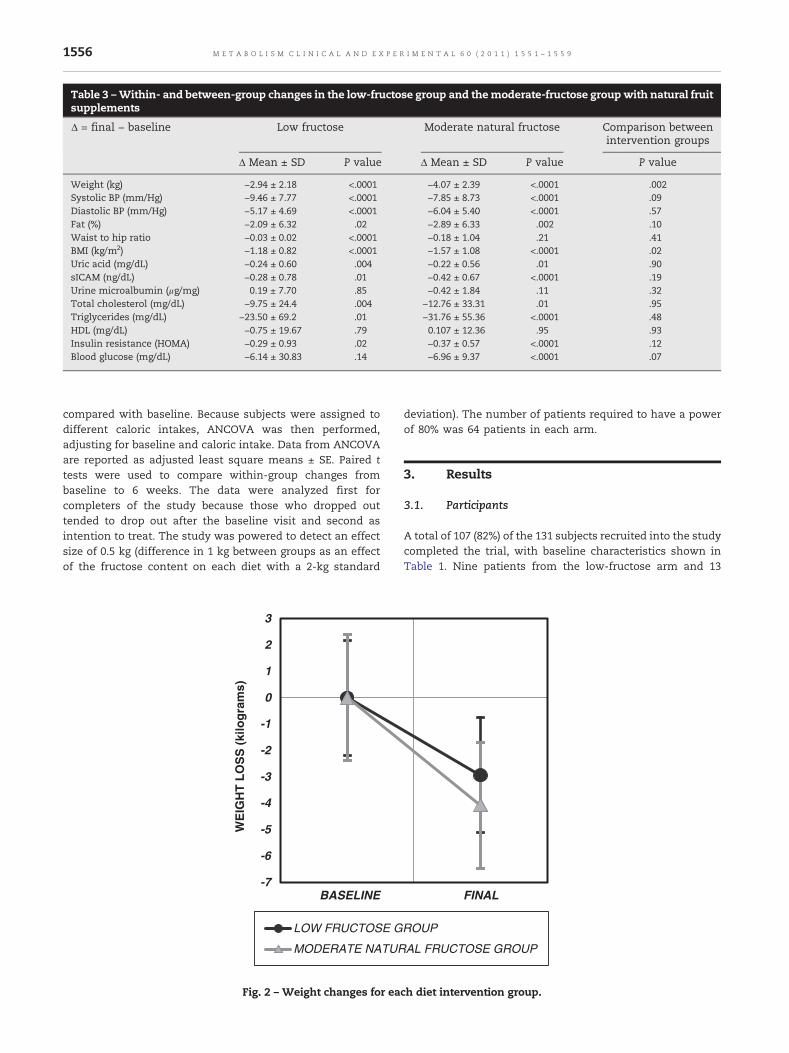
Fig. 2 – Weight changes for each diet intervention group.
1556 M E T A B O L I S M C L I N I C A L A N D E X P E R I M E N T A L 6 0 ( 2 0 1 1 ) 1 5 5 1 – 1 5 5 9

patients from the moderate natural fructose arm did notcomplete the trial. Most of the patients that withdrew fromthe trial were lost to follow-up after the first visit. Twopatients admitted difficulty to adhering to the diet, and 3patients felt weak and dizzy after starting the diet. Twopatients were diagnosed with diabetes, 1 patient was diag-nosed with hypothyroidism, and 1 patient withdrew after thediagnosis of pregnancy during the trial (Fig. 1). Patients thatdid not complete the trial were heavier and had morepercentage of body fat, higher levels of sICAM, and micro-albuminuria (data not shown). There was no difference withregard to adherence between the 2 diet groups.
3.2. Baseline energy intake andmacronutrient composition
The average caloric intake for the cohort before initiating thediet was 3000 ± 2520 kcal/d, the average fructose intake was141 ± 119 g/d, and the average fructose intake from addedsugars (after removing natural fruits) was 77 ± 73 g/d (Table 2).There were no significant differences in the baseline macro-nutrients categories and energy consumption between bothgroups (data not shown).
3.3. Primary outcome: weight loss
The low-fructose diet and the moderate natural fructose dietwere associated with significant weight loss compared withbaseline (Table 3, Fig. 2). Compared with baseline, eachintervention group was associated with a significant changein BMI and fat percentage (Table 3). The change in waist to hipratio was significant only for the moderate natural fructosegroup (P < .001).
When the 2 diets were compared, weight loss was greaterin the moderate natural fructose group (4.19 ± 0.30 kg)compared with the low-fructose group (2.83 ± 0.29 kg) at theend of 6 weeks (Fig. 2, P = .002) (Table 3). When analyzed asintention to treat, weight loss was still greater in themoderatenatural fructose group (3.39 ± 2.51 kg) compared with the low-fructose group (2.54 ± 2.33) (P = .047). The change in BMI wasalso greater in the moderate natural fructose group (P = .02);however, the change in the waist to hip ratio was notsignificant between groups (P = .41).
3.4. Secondary outcomes: metabolic syndrome parameters
Each intervention diet was associated with an improvementin the parameters of metabolic syndrome. Both the low-fructose diet and the moderate natural fructose dietresulted in significant changes in blood pressure, totalcholesterol, triglycerides, insulin resistance (measured byHOMA index), and uric acid (Table 3). There was nosignificant change in HDL cholesterol levels in eithergroup. A trend for a greater reduction of systolic bloodpressure was observed in the subjects on the low-fructosediet compared with the diet with natural fruit supplements,although this did not reach statistical significance (P = .09).There was also a trend towards higher glucose reduction inthe moderate natural fructose group (P = .07). There was nodifference between both diets in relationship to reduction
of total cholesterol, triglycerides, insulin resistance, anduric acid (Table 3).
3.5. Exploratory end points: inflammatory markers
Each diet was also associated with a significant reduction ofsICAM-1 levels (!0.26 ± 0.09 and !0.44 ± 0.09, for the low-fructose and the moderate natural fructose diet, respectively).The absolute reduction of sICAM-1 was not statisticallysignificant between the 2 intervention groups.
3.6. Quality of life scores
There was a substantial percentage of patients from bothgroups that had improvement in their quality of life scores(SF-12), especially in relation to perception of general healthand emotional health. There was no difference in the baselineand follow-up scores between the 2 groups (data not shown).
4. Discussion
We report a pilot study using a low-fructose diet to determineits effects on weight loss and metabolic syndrome. The mainfinding of our study was that both the low-fructose diet andthe moderate natural fructose diet were associated withsignificant weight loss, blood pressure reduction, and changesin the metabolic syndrome parameters, in addition toimproved inflammatory markers and some aspects of qualityof life scores, in a 6-week follow-up period. When both dietswere compared, the moderate natural fructose diet wasassociated with greater weight loss than the low-fructosediet. There was no difference between both diets in relation toany other parameters.
Our primary hypothesis was that restricting fructose in thedietwould result inweight loss and improvement of features ofthe metabolic syndrome. The potential role for fructose as acause of metabolic syndrome is best known from animalmodels [1-3] and is supportedby several clinical studies [4-8,14].Fructose has also been reported to alter satiety responses inhumans [15], to induce leptin resistance in rats [16], and to haveeffects on the hypothalamus in rats that all encourageincreased food intake [17]. Nevertheless, to date, no studieshave been reported on the effect of modifying the fructoseintake in the diet onweight or features ofmetabolic syndrome.Although our main hypothesis was that the lowering offructose in the diet would be beneficial by reducing weightand features of the metabolic syndrome, we also compared 2different fructose diets based on the rationale that the fructosepresent in natural fruitsmight not be as deleterious as fructosepresent in added sugars. First, natural fruits are known tocontain many antioxidants, including vitamin C, resveratrol,and flavonols. Some studies suggest that these antioxidantscan block the effects of fructose to inducemetabolic syndromein animals [14]. In addition, uric acid is a major byproduct offructose metabolism and may be responsible for some of itsmetabolic effects; and vitamin C and antioxidants can alsoblock many of the proinflammatory effects of uric acid onvarious cell types [18]. Thus, the antioxidants in fruits, alongwith the high potassium and fiber content, may outweigh the
1557M E T A B O L I S M C L I N I C A L A N D E X P E R I M E N T A L 6 0 ( 2 0 1 1 ) 1 5 5 1 – 1 5 5 9

negative consequences of having relatively high fructosecontent. The possibility that natural fruits may be a healthysource of fructose is also supported by epidemiological studiesthat show that fructose from added sugars (with the exclusionof natural fruits) is associated with an increased risk forelevated blood pressure [10], whereas in a study in whichsubjects had high natural fruit intake, the association offructose with blood pressure was not observed [19].
A key strength of our study was that the restriction ofcarbohydrate was limited to fructose. Total carbohydratepercentage was not restricted significantly in either diet. Alladded sugars were eliminated from both groups; total calorieintake was equal and contained the same percentage ofmacronutrients. Comparedwithbaseline ingestion, bothgroupshad a total reduction of fructose intake from added sugars.
One of the major findings was that, although both dietswere effective at improving metabolic syndrome, the moder-ate natural fructose diet was actually associated with greaterweight loss. There are few potential hypotheses to explain thisfinding. Asmentioned, themoderate natural fructose diet wasrich in natural fruits that contain many beneficial antioxi-dants. In addition, patients in the very low fructose diet had ahigher glycemic index and glycemic load, as this wasnecessary to maintain equivalent carbohydrate content.Diets with high glycemic load result in higher postprandialinsulin concentration, which has been associated with hungerand overeating [20]. In our study, glycemic loadwas confound-edwithdiet groups and caloric intake; and therefore, it wasnotpossible to discern its specific effects.
A secondmajor finding of the studywas that, in addition toweight loss, both diets were associated with dramaticimprovement in most metabolic syndrome parameters. Astriking finding was that the improvement in metabolicsyndrome parameters was greater than expected for thedegree of weight loss. For example, in comparison to apublished study examining the effect of 4 different diets (ie,low fat–average protein, low fat–high protein, high fat–average protein, and high fat–high protein) [21], we observedan almost 2-fold greater decrease in cholesterol, 3-fold greaterfall in systolic and diastolic blood pressure, and 50% to 2-foldbetter improvement in blood glucose levels despite a meanchange in weight that was only 60% to 70% of the other diets.
Some of the benefits shown in our study from both low-fructose diets are similar nonetheless to those reported withlow-carbohydrate ketogenic diets, especially in relation tochange in triglycerides, glucose levels, and blood pressure [22-24]. However, in contrast to our results, it is recognized thattotal cholesterol and low-density lipoprotein cholesterol donotimprove andmay evenworsen in carbohydrate-restricted diets[25]. In addition, the proportion of patients that can adhere to alow-carbohydrate ketogenic diet is low [21,26]; and there is highpattern of weight loss and regain [26], with only 13% of thesubjects having urinary ketones as a marker of adherencepresent after 48 weeks of enrollment in one randomized study[22]. Our findings raise the possibility that the beneficial effectspreviously reportedwith low-carbohydrate regimensmayhavebeen due to the concomitant restriction of fructose rather thandue to carbohydrate restriction.
One of the other major findings from our trial was thatfructose restriction was able to significantly reduce blood
pressure. Fructose is known to increase blood pressure inrodents, and the mechanism has been reported to be due tothe increase in intracellular and serum uric acid [27,28]. Theadministration of fructose, but not glucose, raises bloodpressure acutely in humans [29]. In a recent clinical study,the administration of fructose to healthy adult men resultedin significant increases in blood pressure, an effect that wasnot observed in a separate group that received the same dietbut with the uric-acid–lowering drug allopurinol [7]. Thesedata suggest that fructose may be a cause of elevated bloodpressure and are consistent with a recent study from theNational Health and Nutrition Examination Survey cohortthat demonstrated that high fructose intake in the form ofadded sugar is independently associated with higher bloodpressure levels in a population with no previous history ofhypertension [10]. In addition, a prospective study thatevaluated the effect of reduction of sugar-sweetened bever-ages on blood pressure found that reducing the intake of onesugar-sweetened beverage serving per day had a significantimpact on blood pressure among healthy adults, an effect thatwas independent of weight loss [30]. Our results are consistentwith these previous studies, as reducing all added sugars inboth diets was reflected in a reduction of !9.66 ± 0.81 and!7.64 ± 0.85mmHg for the low-fructose diet and themoderatenatural fructose diet, respectively, a change that appearssuperior to what is expected with weight loss alone and mayeven be greater to other dietary modifications or the additionof one antihypertensive agent.
Our study has several limitations. First, we recognize thatthe effects of this trial cannot be attributed exclusively to theeffects of fructose reduction and are not fully independent fromenergy restriction. From the ethical standpoint, energy restric-tion was essential for a weight loss trial. Furthermore, we didnot directly compare these diets with standard diets. However,as mentioned above; the changes in the metabolic parametersappear superior when compared with the historical effects ofweight loss alone using other diets that include caloric but notcarbohydrate restriction. In addition, we have a relatively shortperiod of follow-up; and therefore, we cannot be certain thatthese changes inweight loss would be sustained. Nevertheless,the positive changes in blood pressure and other metabolicsyndrome features achieved in such a short-term follow-up arerelevant andpoint out the importance of limiting the consump-tion of fructose. Finally, our population has an unequal sexdistribution; and therefore, we cannot extrapolate our findingsto men. However, because the effects of fructose are almostuniversally greater inmen thanwomen [31], this limitationmayhavebeenmore likely to lead to lesser changes thanwouldhavebeen observed if more men had been included in the study.
In conclusion, diets low in fructose from added sugarsresult in a significant improvement in weight, blood pressure,metabolic syndrome parameters, serum sICAM-1, and qualityof life scores. For weight loss achievement, amoderate naturalfructose diet was superior to a low-fructose diet. Such a dietmay offer greater benefits than other energy-restriction diets,as it does not entail the restriction of total carbohydrate intakeand hence may be more sustainable. Based on the results ofthis pilot study, larger studies in other populationswith longerfollow-up periods are warranted to evaluate the impact oflow-fructose diets on body weight and to explore the potential
1558 M E T A B O L I S M C L I N I C A L A N D E X P E R I M E N T A L 6 0 ( 2 0 1 1 ) 1 5 5 1 – 1 5 5 9

of such diets as a therapeuticmeasure to reduce the frequencyof obesity and metabolic syndrome.
Acknowledgment
This study was supported in part by the Consejo Nacional deCiencia y Tecnologia grant 113960 and by the NationalInstitute of Health HL-68607. We acknowledge Maria delCarmen Gonzalez for her nutritional support.
Conflict of interest
Disclosure statement: Dr R Johnson has patent applicationsrelated to lowering uric acid in the treatment of metabolicsyndrome. Dr Johnson also has a book, The Sugar Fix (Rodale,2008; and Simon and Schuster, 2009), that discusses thepotential role of fructose in the obesity epidemic. None of theother authors have any conflicts of interest.
R E F E R E N C E S
[1] Roncal CA, Reungjui S, Sanchez-Lozada LG, et al.Combination of captopril and allopurinol retards fructose-induced metabolic syndrome. Am J Nephrol 2009;30:399-404.
[2] Reungjui S, Roncal CA, Mu W, et al. Thiazide diureticsexacerbate fructose-induced metabolic syndrome. J Am SocNephrol 2007;18:2724-31.
[3] Nakagawa T, Hu H, Zharikov S, et al. A causal role for uric acidin fructose-induced metabolic syndrome. Am J Physiol2006;290:F625-31.
[4] Stanhope KL, Havel PJ. Endocrine and metabolic effects ofconsuming beverages sweetened with fructose, glucose,sucrose, or high-fructose corn syrup. Am J Clin Nutr 2008;88:1733S-7S.
[5] Stanhope KL, Schwarz JM, Keim NL, et al. Consumingfructose-sweetened, not glucose-sweetened, beveragesincreases visceral adiposity and lipids and decreases insulinsensitivity in overweight/obese humans. J Clin Invest2009;119:1322-34.
[6] Teff KL, Grudziak J, Townsend RR, et al. Endocrine andmetabolic effects of consuming fructose and glucose-sweetened beverages with meals in obese men and women:influence of insulin resistance on plasma triglycerideresponses. J Clin Endocrinol Metab 2009;94:1562-9.
[7] Perez-Pozo SE, Schold J, Nakagawa T, Sánchez-Lozada LG,Johnson RJ, Lillo JL. Excessive fructose intake induces thefeatures of metabolic syndrome in healthy adult men: role ofuric acid in thehypertensive response. Int JObes2010;34:454-61.
[8] Dhingra R, Sullivan L, Jacques PF, et al. Soft drink consumptionand risk of developing cardiometabolic risk factors and themetabolic syndrome inmiddle-aged adults in the community.Circulation 2007:480-8.
[9] Johnson RJ, Segal MS, Sautin Y, et al. Potential role of sugar(fructose) in the epidemic of hypertension, obesity and themetabolic syndrome, diabetes, kidney disease, andcardiovascular disease. Am J Clin Nutr 2007;86:899-906.
[10] Jalal DI, Smits G, Johnson RJ, Chonchol M. Increased fructoseassociates with elevated blood pressure. J Am Soc Nephrol2010;21:1543-9.
[11] Wong WW, Butte NF, Hergenroeder AC, Hill RB, Stuff JE,Smith EO. Are basal metabolic rate prediction equationsappropriate for female children and adolescents? J ApplPhysiol 1996;81:2407-14.
[12] Instituto Nacional de Salud Pública. Snut Sistema deEvaluación de Hábitos Nutricionales y Consumo deNutrimentos. Cuernavaca Mor., México: INSP; 2003.
[13] Jenkinson C, Chandola T, Coulter A, Bruster S. An assessmentof the construct validity of the SF-12 summary scores acrossethnic groups. J Public Health Med 2001;23:187-94.
[14] Johnson RJ, Perez-Pozo SE, Sautin YY, et al. Hypothesis: couldexcessive fructose intake and uric acid cause type 2 diabetes?Endocr Rev 2009;30:96–116.
[15] Teff KL, Elliott SS, Tschop M, et al. Dietary fructose reducescirculating insulin and leptin, attenuates postprandialsuppression of ghrelin, and increases triglycerides in women.J Clin Endocrinol Metab 2004;89:2963-72.
[16] Shapiro A, Mu W, Roncal C, et al. Fructose-induced leptinresistance exacerbates weight gain in response to subsequenthigh-fat feeding. Am J Physiol Regul Integr Comp Physiol2008;295:R1370-5.
[17] Cha SH, Wolfgang M, Tokutake Y, et al. Differential effects ofcentral fructose and glucose on hypothalamic malonyl-CoAand food intake. Proc Natl Acad Sci U S A 2008;105:16871-5.
[18] Gao X, Curhan G, Forman JP, et al. Vitamin C intake andserum uric acid concentration in men. J Rheumatol 2008;35:1853-8.
[19] Forman JP, Choi H, Curhan GC. Fructose and vitamin C intakedo not influence risk for developing hypertension. J Am SocNephrol 2009;20:863-71.
[20] Ludwig DS. The glycemic index: physiological mechanismsrelating to obesity, diabetes, and cardiovascular disease.JAMA 2002;287:2414-23.
[21] Sacks FM, Bray GA, Carey VJ, et al. Comparison of weight-lossdiets with different compositions of fat, protein, andcarbohydrates. N Engl J Med 2009;360:859-73.
[22] YancyWS,Westman EC,McDuffie JR, et al. A randomized trialof a low-carbohydrate diet vs orlistat plus a low-fat diet forweight loss. Arch Intern Med 2010;170:136-45.
[23] Gardner CD, Kiazand A, Alhassan S, et al. Comparison of theAtkins, Zone, Ornish, and LEARN diets for change in weightand related risk factors among overweight premenopausalwomen: the A TO Z Weight Loss Study: a randomized trial.JAMA 2007;297:969-77.
[24] Stern L, Iqbal N, Seshadri P, et al. The effects of low-carbohydrate versus conventional weight loss diets inseverely obese adults: one-year follow-up of a randomizedtrial. Ann Intern Med 2004;140:778-85.
[25] Nordmann AJ, Nordmann A, Briel M, et al. Effects of low-carbohydrate vs low-fat diets on weight loss andcardiovascular risk factors: a meta-analysis of randomizedcontrolled trials. Arch Intern Med 2006;166:285-93.
[26] Shai I, Schwarzfuchs D, Henkin Y, et al. Dietary InterventionRandomized Controlled Trial (DIRECT) Group. Weight losswith a low-carbohydrate, Mediterranean, or low-fat diet.N Engl J Med 2008;359:229-41.
[27] Mazzali M, Hughes J, Kim YG, et al. Elevated uric acidincreases blood pressure in the rat by a novel crystal-independent mechanism. Hypertension 2001;38:1101-6.
[28] Sanchez-Lozada LG, Tapia E, Avila-Casado C, et al. Mildhyperuricemia induces glomerular hypertension in normalrats. Am J Physiol 2002;283:F1105-10.
[29] Brown CM, Dulloo AG, Yepuri G, et al. Fructose ingestionacutely elevates blood pressure in healthy young humans.Am J Physiol 2008;294:R730-7.
[30] Chen L, Caballero B, Mitchell DC, et al. Reducing consumptionof sugar-sweetened beverages is associated with reducedblood pressure: a prospective study among United Statesadults. Circulation 2010;121:2398-406.
[31] Horton TJ, Gayles EC, Prach PA, et al. Female rats do notdevelop sucrose-induced insulin resistance. Am J Physiol1997;272(5 Pt 2):R1571-6.
1559M E T A B O L I S M C L I N I C A L A N D E X P E R I M E N T A L 6 0 ( 2 0 1 1 ) 1 5 5 1 – 1 5 5 9