Absorption capacity of fructose in healthy adults. - Gut
8
Gut, 1986, 27, 1161-1168 Absorption capacity of fructose in healthy adults. Comparison with sucrose and its constituent monosaccharides J J RUMESSEN, AND E GUDMAND-H0YER From the Department of Internal Medicine F, Gentofte University Hospital, Hellerup, Denmark SUMMARY The capacity to absorb fructose in 10 healthy adults was investigated by means of hydrogen breath analysis. Fructose absorption was quantified with lactulose standards. Significant hydrogen production (.20 ppm rise of breath hydrogen) was found after challenge with 10% solutions of 50, 37 5, 25, 20, and 15 g fructose in eight, seven, five, four and one subjects, respectively. One subject showed malabsorption after a 10 g dose and possibly also 5 g fructose. In contrast, no malabsorption could be detected in any of the 10 subjects after ingestion of 100 g, 75 g, or 50 g sucrose or a mixture of 50 g glucose and 50 g fructose. After ingestion of mixtures of 50 g fructose +25 g glucose and 50 g fructose + 12.5 g glucose malabsorption was present in three and seven subjects, respectively. Symptoms during all challenges were mild, or absent. It is concluded that in the healthy state the absorption capacity of fructose given alone ranges from less than 5 g to more than 50 g. The absorption capacity of fructose given as sucrose is much higher. Glucose stimulates fructose uptake in a dose dependent fashion. The possible existence of more than one intestinal transport system for fructose is considered. The elucidation of the clinical relevance of the findings is important. Fructose absorption in man is still poorly under- stood. Fructose is absorbed at a slower rate than galactose and glucose,' but more efficiently than passively transported sugars.2 Fructose is probably not absorbed against a concentration-gradient.3 Thus, although the mechanism may still be con- troversial, fructose absorption in man seems to take place by energy independent facilitated transport. An active carrier mediated mechanism for fructose transport has been found in rat small intestine.45 The subject has recently gained new interest as it has been suggested that the absorption capacity of fructose is limited in health,6 and that glucose may stimulate fructose absorption in children.7 Because systematic studies comparing the total absorption capacity of fructose, sucrose, and fructose/glucose mixtures are not available in the literature, and as malabsorption of fructose may be of clinical relevance as an aetiologic factor in some Address for correspondence: Dr J J Rumessen, Gentofte University Hospital, Department of Internal Medicine F (Gastroenterology), DK-2900 Hellerup, Denmark. Received for publication 4 February 1986. cases of otherwise unexplained chronic gastrointes- tinal distress,810 we carried out a systematic study of these relationships in healthy adults. Methods SUBJECTS Ten healthy adults with no evidence of recurrent or present gastrointestinal or pulmonary disease participated in the study. Their ages ranged from 25-51 years, there were seven men and three women. HYDROGEN BREATH TESTS Breath hydrogen excretion was measured at inter- vals as end-expiratory hydrogen concentrations in ppm. Duplicate samples of expired air were col- lected in 20 ml plastic syringes (Once®) at intervals of 15-30 minutes for three or four hours after ingestion of the test solution, and three times immediately before ingestion. Samples were im- mediately analysed on a GMI (Gas Measurements Instruments Ltd, Renfrew, Scotland) exhaled hydrogen monitor with a sensitivity of 2 ppm and an 1161 on September 12, 2022 by guest. Protected by copyright. http://gut.bmj.com/ Gut: first published as 10.1136/gut.27.10.1161 on 1 October 1986. Downloaded from
-
Upload
khangminh22 -
Category
Documents
-
view
1 -
download
0
Transcript of Absorption capacity of fructose in healthy adults. - Gut

Gut, 1986, 27, 1161-1168
Absorption capacity of fructose in healthy adults.Comparison with sucrose and its constituentmonosaccharidesJ J RUMESSEN, AND E GUDMAND-H0YER
From the Department of Internal Medicine F, Gentofte University Hospital, Hellerup, Denmark
SUMMARY The capacity to absorb fructose in 10 healthy adults was investigated by means ofhydrogen breath analysis. Fructose absorption was quantified with lactulose standards.Significant hydrogen production (.20 ppm rise of breath hydrogen) was found after challengewith 10% solutions of 50, 37 5, 25, 20, and 15 g fructose in eight, seven, five, four and one
subjects, respectively. One subject showed malabsorption after a 10 g dose and possibly also 5 g
fructose. In contrast, no malabsorption could be detected in any of the 10 subjects after ingestionof 100 g, 75 g, or 50 g sucrose or a mixture of 50 g glucose and 50 g fructose. After ingestion ofmixtures of 50 g fructose +25 g glucose and 50 g fructose + 12.5 g glucose malabsorption waspresent in three and seven subjects, respectively. Symptoms during all challenges were mild, orabsent. It is concluded that in the healthy state the absorption capacity of fructose given aloneranges from less than 5 g to more than 50 g. The absorption capacity of fructose given as sucroseis much higher. Glucose stimulates fructose uptake in a dose dependent fashion. The possibleexistence of more than one intestinal transport system for fructose is considered. The elucidationof the clinical relevance of the findings is important.
Fructose absorption in man is still poorly under-stood. Fructose is absorbed at a slower rate thangalactose and glucose,' but more efficiently thanpassively transported sugars.2 Fructose is probablynot absorbed against a concentration-gradient.3Thus, although the mechanism may still be con-troversial, fructose absorption in man seems to takeplace by energy independent facilitated transport.An active carrier mediated mechanism for fructosetransport has been found in rat small intestine.45The subject has recently gained new interest as it hasbeen suggested that the absorption capacity offructose is limited in health,6 and that glucose maystimulate fructose absorption in children.7Because systematic studies comparing the total
absorption capacity of fructose, sucrose, andfructose/glucose mixtures are not available in theliterature, and as malabsorption of fructose may beof clinical relevance as an aetiologic factor in some
Address for correspondence: Dr J J Rumessen, Gentofte University Hospital,Department of Internal Medicine F (Gastroenterology), DK-2900 Hellerup,Denmark.
Received for publication 4 February 1986.
cases of otherwise unexplained chronic gastrointes-tinal distress,810 we carried out a systematic studyof these relationships in healthy adults.
Methods
SUBJECTSTen healthy adults with no evidence of recurrentor present gastrointestinal or pulmonary diseaseparticipated in the study. Their ages ranged from25-51 years, there were seven men and threewomen.
HYDROGEN BREATH TESTSBreath hydrogen excretion was measured at inter-vals as end-expiratory hydrogen concentrations inppm. Duplicate samples of expired air were col-lected in 20 ml plastic syringes (Once®) at intervalsof 15-30 minutes for three or four hours afteringestion of the test solution, and three timesimmediately before ingestion. Samples were im-mediately analysed on a GMI (Gas MeasurementsInstruments Ltd, Renfrew, Scotland) exhaledhydrogen monitor with a sensitivity of 2 ppm and an
1161
on Septem
ber 12, 2022 by guest. Protected by copyright.
http://gut.bmj.com
/G
ut: first published as 10.1136/gut.27.10.1161 on 1 October 1986. D
ownloaded from

1162
accuracy of +/-2%. The subjects fasted for at leastnine hours (overnight) before the study, which tookplace between 8 am and 1 pm. During the studyperiod sleeping and smoking was not allowed, andthe subjects were non-ambulant. None was takingantibiotics, acetylsalicylic acid, laxatives, or othermedication.
Before the study, the subjects were selected onthe basis of their ability to generate a .20 ppm risein breath hydrogen subsequent to ingestion of 20 glactulose as a 20% solution. In subsequent studies arise in breath hydrogen of .20 ppm above thelowest previous values1' was thus considered indica-tive of significant malabsorption. Initial, transienthydrogen peaks (drop off to baseline within the first60-90 min.) were disregarded.12 13
TEST SOLUTIONSAll subjects were tested on a single blind basis withthe sugar solutions shown in Table 1 given with atleast two days intervals between them. The fructose
Table 1 Sugar solutions ingested by all the subjects
Solute Weight Volume Concentration
Sucrose 100 g 500 ml 20%- 75 g 375 ml -
- 50 g 250 ml -
Fructose 50 g 500 ml 10%- 37-5 g 375 ml -
- 25 g 250 ml- 15 g 150 ml
Fructose 50 g+50 g 500 ml 10%+10%+ Glucose 50 g+25 g - 10%+5%
50 g+ 12-5 g - 10%+2-5%
Glucose 50 g 500 ml 10%
Rumessen and Gudmand-H0yer
concentration was kept constant at 10% (550 mM).The temperature of the solutions was in all instancesapprox. 20°C (room-temperature).The conditions of the study only allowed the
sucrose solutions and the three large doses offructose to be given in random order. Five of thesubjects were further challenged with 20 g fructoseas at 10% solutions, and one subject incapable ofcompletely absorbing 15 g fructose was challengedwith 10 g and 5 g as 10% solutions. Hydrogenexcretion after ingestion of 100 g sucrose and themixture of 50 g fructose plus 50 g glucose was
studied for four hours to assure complete gastricemptying of the test substances.14 15 At the end ofthe study, all subjects were rechallenged with 50 gfructose as a 10% solution.
SYMPTOM SCORESDuring all studies the subjects were asked to registerall complaints of abdominal distension, rumbling,flatulence, abdominal pain, diarrhoea, or other sideeffects and to grade each individual symptom intomild, moderate, or severe. The subjects were askedto note any symptom during the 24 hours after eachsugar challenge and report on next occasion. Onlysymptoms quantitatively or qualitatively differentfrom symptoms recorded during the half an hourbefore challenge were considered.
ETHICSInformed written consent was obtained from allsubjects before their participation in the study. Thestudy was carried out in accordance with theHelsinki Declaration II, and the study protocol was
approved by the Copenhagen County MedicalEthics Committee.CALCULATIONS AND EXPRESSION OF RESULTSThe results were expressed as maximal (peak)
Table 2 Absorption offructose in gram (g) as calculated by means of the lactulose standards in all the subjects (n=10).The calculated absorbed dose is equal to the given dose if breath hydrogen production was not significant (<20 ppm rise)
Dose 50 gF+Subject SO gF 37½ gF 25 gF 20 gF 15 gF SO gF+50 gG SO gF+25 gG 12½2 gG
a 11 g 6g* Og Og Og 50g 22g 17gb 26 g* 25 g 17 g 12 g 15 g 50 g 50 g 32 gc 21g 24g 20g 9g 15g 50g 30g 27gd 29 g* 23 g 17 g 14 g 15 g 50 g* 33 g* 35 g*e 38g 29g 21 g 20g 15g 50g* 50g 43gf 37 g* 25 g 25 g ND 15 g 50 g 50 g 50 gg 46 g 30 g 25 g ND 15 g 50 g 50 g 46 gh 34 g 371/2g 25 g ND 15 g 50 g* 50 g 36 g*i 50 g 371/2g 25 g ND 15 g 50 g* 50 g 50 gj 50 g 371/2g 25 g ND 15 g 50 g* 50 g 50 g
ND: Not determined. F: fructose. G: glucose.*Mild flatulence, abdominal rumbling or distension during or after challenge.
on Septem
ber 12, 2022 by guest. Protected by copyright.
http://gut.bmj.com
/G
ut: first published as 10.1136/gut.27.10.1161 on 1 October 1986. D
ownloaded from
Absorption capacity offructose in healthy adults
values in breath hydrogen-concentration (ppm)during the study period with subtraction of thelowest previous values (maximal increase, mean ofduplicate samples).16 The semiquantitative calcula-tions of fructose malabsorption were extrapolatedfrom the areas under the curves (AUC's) withsignificant breath hydrogen production (.20 ppm),and AUC's obtained from the challenge with 20 glactulose.17 18Areas under the curves were calcu-lated according to the trapezoidal rule, and ex-
pressed in arbitrary units (ppmxmin). In all calcula-tions only the AUC's in the initial 90 minutes of thehydrogen-rise were determined.
Statistical evaluation was done non-parametricallyby use of the Mann-Whitney rank sum test. Asignificance level of 0*05 was used.
Results
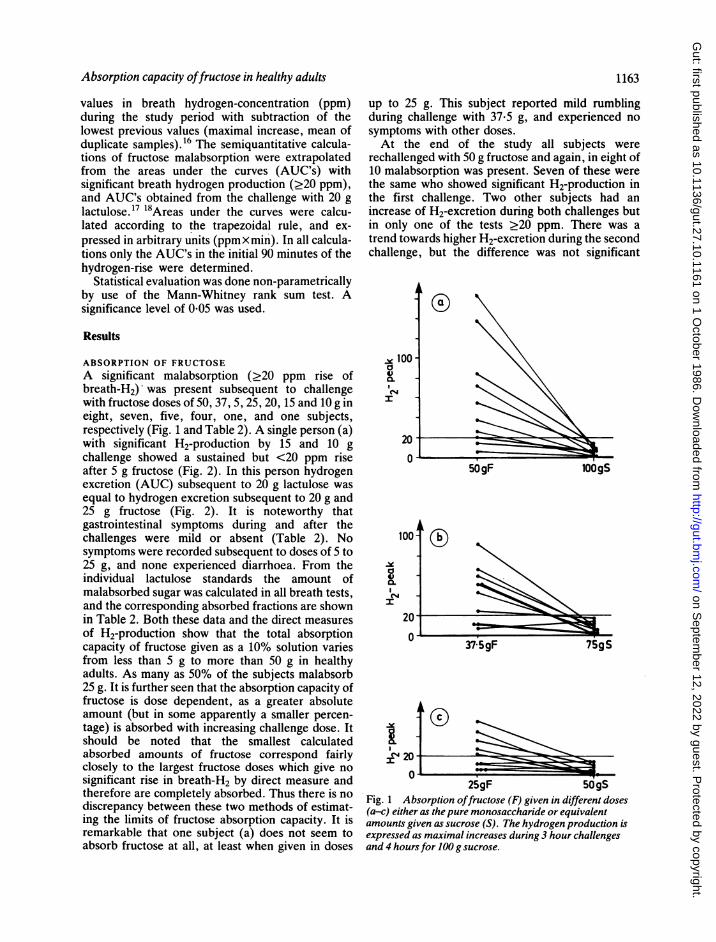
ABSORPTION OF FRUCTOSEA significant malabsorption (.20 ppm rise ofbreath-H2) was present subsequent to challengewith fructose doses of 50, 37, 5, 25, 20, 15 and 10 g ineight, seven, five, four, one, and one subjects,respectively (Fig. 1 and Table 2). A single person (a)with significant H2-production by 15 and 10 gchallenge showed a sustained but <20 ppm riseafter 5 g fructose (Fig. 2). In this person hydrogenexcretion (AUC) subsequent to 20 g lactulose wasequal to hydrogen excretion subsequent to 20 g and25 g fructose (Fig. 2). It is noteworthy thatgastrointestinal symptoms during and after thechallenges were mild or absent (Table 2). Nosymptoms were recorded subsequent to doses of 5 to25 g, and none experienced diarrhoea. From theindividual lactulose standards the amount ofmalabsorbed sugar was calculated in all breath tests,and the corresponding absorbed fractions are shownin Table 2. Both these data and the direct measuresof H2-production show that the total absorptioncapacity of fructose given as a 10% solution variesfrom less than 5 g to more than 50 g in healthyadults. As many as 50% of the subjects malabsorb25 g. It is further seen that the absorption capacity offructose is dose dependent, as a greater absoluteamount (but in some apparently a smaller percen-tage) is absorbed with increasing challenge dose. Itshould be noted that the smallest calculatedabsorbed amounts of fructose correspond fairlyclosely to the largest fructose doses which give nosignificant rise in breath-H2 by direct measure andtherefore are completely absorbed. Thus there is nodiscrepancy between these two methods of estimat-ing the limits of fructose absorption capacity. It isremarkable that one subject (a) does not seem toabsorb fructose at all, at least when given in doses
1163
up to 25 g. This subject reported mild rumblingduring challenge with 37-5 g, and experienced nosymptoms with other doses.At the end of the study all subjects were
rechallenged with 50 g fructose and again, in eight of10 malabsorption was present. Seven of these werethe same who showed significant H2-production inthe first challenge. Two other subjects had anincrease of H2-excretion during both challenges butin only one of the tests >20 ppm. There was atrend towards higher H2-excretion during the secondchallenge, but the difference was not significant
vx 100a4)C4
100-
a4,0.
eC4 -
I
5OgF lOOgS
70
0
37:59F 75gS
.X G)lIr
U -25gF 50gS
Fig. 1 Absorption offructose (F) given in different doses(a-c) either as the pure monosaccharide or equivalentamounts given as sucrose (S). The hydrogen production isexpressed as maximal increases during 3 hour challengesand 4 hoursfor 100 g sucrose.
-- I
O-Z
on Septem
ber 12, 2022 by guest. Protected by copyright.
http://gut.bmj.com
/G
ut: first published as 10.1136/gut.27.10.1161 on 1 October 1986. D
ownloaded from

1164 ~~~~~~~~~~~~~Rumessenand Gudmand-Hoyer
(p>0- 10). There was no relationship between age,sex, or body weight and fructose absorption capacityin this study.
ABSORPTION OF SUCROSENone of the subjects showed significant malabsorp-tion at any dose of sucrose given as 20% solutions.The difference between the absorption capacity of
50-
201
0
-101
100-20 gL fP
2OgF ,/1'50 Fg
0 -x-%
-20
20 60 120 180 20 180 20
fructose given as sucrose and fructose alone isstriking (Figs 1 and 2). The difference between themaximal increases shown in Fig. 1 is highly signifi-cant at all doses studied (p<0.01). Although signifi-cant (.-20 ppm) malabsorption was never seen, thepeak hydrogen production after ingestion of 100 gsucrose was larger compared with the peak hyd-rogen production after ingestion of 50 g glucose
37.5 gF
7gS
~~2.
*.-
log
0
20 180 20 180 2140
pp50.
-20 50g S 75gs 0Xgs20 60120180 20 180 20 180 20 180 20 18021.0
Time (minutes)
Fig. 2 This Figure shows the complete curves of breath test with fructose (F,crosses and unbroken lines), sucrose (S, dots
and stipled lines), and 20 g lactulose (L, triangles and stipled lines) in 3 healthy persons (no. 1-3, correspond to a, b and c in
Table 2), incapable ofcompletely absorbing 20 gfructose. Hydrogen production (ppm) is expressed as absolute
concentrations minus base-line (time 0) concentrations to obtain the same starting point. Hydrogen excretion after 20 glactulose has been shown in the same diagram as 20 gfructose.
PPM
1164
pprr
on Septem
ber 12, 2022 by guest. Protected by copyright.
http://gut.bmj.com
/G
ut: first published as 10.1136/gut.27.10.1161 on 1 October 1986. D
ownloaded from

Absorption capacity offructose in healthy adults
(p<002) (data not shown) suggesting a minormalabsorption of sucrose or its split products. Nodifference in hydrogen production was detectedbetween the 50 g and the 100 g sucrose challenges(p>0- 10). Three subjects (c, d, f) experiencedmild flatulence and distension with 75 g sucrose, butno symptoms with 50 or 100 g. One subject (g)reported mild borborygmi with 100 g sucrose.
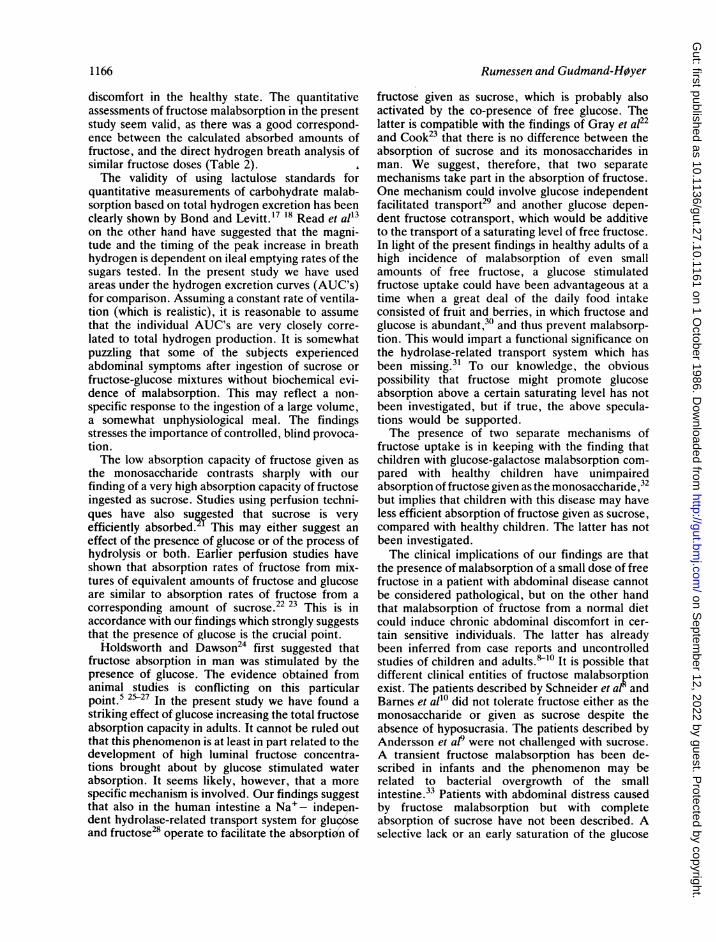
EFFECT OF ADDING GLUCOSEIt is readily apparent from Fig. 3 and Table 2 thatthe absorption capacity of fructose was greatly
I
I
a
cLC4)
1
I
20tULI
50gF
5OgF. 25gG
50gF +12 l/2gGFig. 3 Effect on fructose malabsorption expressed as
maximal increase ofhydrogen production ofaddingdifferent amounts ofglucose (G) to the fructose (F)solution.
1165
enhanced by the addition of glucose to the mixturein a dose dependent fashion. The greatest effect wasseen with equivalent amounts of fructose andglucose, whereas an increasing fraction was malab-sorbed as the amount of glucose added was dimi-nished. The differences between the maximal H2-increases in Fig. 3, a and b are highly significant(p<001 and p<002 respectively). There was nostatistical difference between the H2-peaks subse-quent to ingestion of 50 g fructose +12*5 g glucoseand 37-5 g fructose, and similarly there was nodifference between hydrogen-peaks obtained withmixtures of 50 g fructose +25 g glucose and 25 gfructose. Although not statistically significant ifhydrogen-peaks are compared (p>0-10) (Fig. 3),it is suggested from Table 2 that fructose is moreeffectively absorbed in mixtures containing 50 gfructose + 12-5 g glucose compared with solutions of50 g fructose alone. It was further noted that therewas no statistical difference between the hydrogenpeaks (all <20 ppm) after ingestion of 100 g sucroseor 50 g glucose +50 g fructose (p> 0.10), and thusthere was no measurable effect of sucrose hydroly-sis. Although no H2-peaks were observed duringthis study, as many as five subjects reported mildrumbling or mild flatulence subsequent to challengewith 50 g glucose +50 g fructose (Table 2).
GLUCOSENone of the subjects showed any significant rise inhydrogen production subsequent to ingestion of 50 gglucose as a 10% solution. A small (<20 ppm) initialtransient rise of breath hydrogen was seen in twopersons. None experienced gastrointestinal symp-toms either during or after challenge.
Discussion
In the present study we have shown that in thehealthy state, large individual variations exist in theabsorption capacity of fructose, and that the totalabsorption capacity is even lower than previouslybelieved.6 Some healthy individuals may fail toabsorb as little as a 5 g dose.
Furthermore, we have shown that ingestion offructose as sucrose does not result in appreciablemalabsorption and that the addition of glucose tofructose solutions promote fructose absorption in adose dependent manner. Thus, it seems that malab-sorption of fructose in fructose+glucose mixtures isonly measurable if fructose is present in excess ofglucose. It is now apparent that fructose malabsorp-tion may be considered a normal phenomenon in thehealthy state, in analogy with malabsorption ofwheat starch'9 20 and up to 30-40 g fructose may bemalabsorbed without causing significant abdominal
9
dkl-
on Septem
ber 12, 2022 by guest. Protected by copyright.
http://gut.bmj.com
/G
ut: first published as 10.1136/gut.27.10.1161 on 1 October 1986. D
ownloaded from
Rumessen and Gudmand-H0yer
discomfort in the healthy state. The quantitativeassessments of fructose malabsorption in the presentstudy seem valid, as there was a good correspond-ence between the calculated absorbed amounts offructose, and the direct hydrogen breath analysis ofsimilar fructose doses (Table 2). i
The validity of using lactulose standards forquantitative measurements of carbohydrate malab-sorption based on total hydrogen excretion has beenclearly shown by Bond and Levitt.17 18 Read et alt3on the other hand have suggested that the magni-tude and the timing of the peak increase in breathhydrogen is dependent on ileal emptying rates of thesugars tested. In the present study we have usedareas under the hydrogen excretion curves (AUC's)for comparison. Assuming a constant rate of ventila-tion (which is realistic), it is reasonable to assumethat the individual AUC's are very closely corre-lated to total hydrogen production. It is somewhatpuzzling that some of the subjects experiencedabdominal symptoms after ingestion of sucrose orfructose-glucose mixtures without biochemical evi-dence of malabsorption. This may reflect a non-specific response to the ingestion of a large volume,a somewhat unphysiological meal. The findingsstresses the importance of controlled, blind provoca-tion.The low absorption capacity of fructose given as
the monosaccharide contrasts sharply with ourfinding of a very high absorption capacity of fructoseingested as sucrose. Studies using perfusion techni-ques have also suggested that sucrose is veryefficiently absorbed." This may either suggest aneffect of the presence of glucose or of the process ofhydrolysis or both. Earlier perfusion studies haveshown that absorption rates of fructose from mix-tures of equivalent amounts of fructose and glucoseare similar to absorption rates of fructose from acorresponding amount of sucrose.22 23 This is inaccordance with our findings which strongly suggeststhat the presence of glucose is the crucial point.
Holdsworth and Dawson24 first suggested thatfructose absorption in man was stimulated by thepresence of glucose. The evidence obtained fromanimal studies is conflicting on this particularpoint.5 227 In the present study we have found astriking effect of glucose increasing the total fructoseabsorption capacity in adults. It cannot be ruled outthat this phenomenon is at least in part related to thedevelopment of high luminal fructose concentra-tions brought about by glucose stimulated waterabsorption. It seems likely, however, that a morespecific mechanism is involved. Our findings suggestthat also in the human intestine a Na+- indepen-dent hydrolase-related transport system for gluc,oseand fructose28 operate to facilitate the absorption of
fructose given as sucrose, which is probably alsoactivated by the co-presence of free glucose. Thelatter is compatible with the findings of Gray et at22and Cook23 that there is no difference between theabsorption of sucrose and its monosaccharides inman. We suggest, therefore, that two separatemechanisms take part in the absorption of fructose.One mechanism could involve glucose independentfacilitated transport29 and another glucose depen-dent fructose cotransport, which would be additiveto the transport of a saturating level of free fructose.In light of the present findings in healthy adults of ahigh incidence of malabsorption of even smallamounts of free fructose, a glucose stimulatedfructose uptake could have been advantageous at atime when a great deal of the daily food intakeconsisted of fruit and berries, in which fructose andglucose is abundant,30 and thus prevent malabsorp-tion. This would impart a functional significance onthe hydrolase-related transport system which hasbeen missing.31 To our knowledge, the obviouspossibility that fructose might promote glucoseabsorption above a certain saturating level has notbeen investigated, but if true, the above specula-tions would be supported.The presence of two separate mechanisms of
fructose uptake is in keeping with the finding thatchildren with glucose-galactose malabsorption com-pared with healthy children have unimpairedabsorption of fructose given as the monosaccharide,32but implies that children with this disease may haveless efficient absorption of fructose given as sucrose,compared with healthy children. The latter has notbeen investigated.The clinical implications of our findings are that
the presence of malabsorption of a small dose of freefructose in a patient with abdominal disease cannotbe considered pathological, but on the other handthat malabsorption of fructose from a normal dietcould induce chronic abdominal discomfort in cer-tain sensitive individuals. The latter has alreadybeen inferred from case reports and uncontrolledstudies of children and adults.8-0 It is possible thatdifferent clinical entities of fructose malabsorptionexist. The patients described by Schneider et a! andBarnes et all( did not tolerate fructose either as themonosaccharide or given as sucrose despite theabsence of hyposucrasia. The patients described byAndersson et al9 were not challenged with sucrose.A transient fructose malabsorption has been de-scribed in infants and the phenomenon may berelated to bacterial overgrowth of the smallintestine.33 Patients with abdominal distress causedby fructose malabsorption but with completeabsorption of sucrose have not been described. Aselective lack or an early saturation of the glucose
1166
on Septem
ber 12, 2022 by guest. Protected by copyright.
http://gut.bmj.com
/G
ut: first published as 10.1136/gut.27.10.1161 on 1 October 1986. D
ownloaded from

Absorption capacity offructose in healthy adults 1167
independent fructose uptake mechanism will only beclinically apparent if an adequate daily intake of freefructose is accomplished. This may be of particularrelevance for the use of fructose as a commercial ornutritive sweetener as in the dietary management ofdiabetes mellitus. Furthermore, it seems likely thatthe lower glycaemic effect of fructose as comparedwith glucose34 may be partly due to malabsorptionof fructose.
It is possible that, the individual sensitivity to agiven malabsorbed dose of fructose may be thediscriminative factor between healthy subjects andpatients with chronic abdominal distress. This sug-gestion receives support from the finding of greatindividual sensitivities to lactose malabsorption.35 Itseems highly relevant to further explore the import-ance of the above findings in a clinical setting.
The technical assistance of G Kokholm, ExecutiveScientist, MSc, Radiometer A/S, is gratefully ack-nowledged. The authors also thank Isa Staack,Lotte Meng Hansen, and Gitte Bischoff for under-taking the breath tests, and Lene Krogh for sec-retarial assistance.
References1 Groen J. The absorption of hexoses from the upper
part of the small intestine in man. J Clin Invest 1937;16: 245-55.
2 Holdsworth CD, Dawson AM. Absorption of fructosein man. Proc Soc Exp Biol Med 1965; 118: 142-5.
3 White LW, Landau BR. Sugar transport and fructosemetabolism in human intestine in vitro. J Clin Invest1965; 44: 1200-13.
4 Gracey M, Burke V, Oshin A. Active intestinaltransport of D-fructose. Biochim Biophys Acta 1972;266: 397-406.
5 Macrae AR, Neudoerffer TS. Support for the existenceof an active transport mechanism of fructose in the rat.Biochim Biophys Acta 1972; 288: 137-44.
6 Ravich WJ, Bayless TM, Thomas M. Fructose: Incom-plete intestinal absorption in humans. Gastroenterology1983; 84: 26-9.
7 Kneepkens CMF, Vonk RJ, Fernandes J. Incompleteintestinal absorption of fructose. Arch Dis Child 1984;59: 735-8.
8 Schneider F, Gunther 0. Malabsorption-Syndrom in-folge laktasemangels kombiniert mit fruktoseunver-traglichkeit. Dtsch Zeit Verdauung Stoffwechselkrankh1969; 29: 393-400.
9 Andersson DEH, Nygren A. Four cases of long-standing diarrhoea and colic pains cured by fructose-free diet - A pathogenetic discussion. Acta Med Scand1978; 203: 87-92.
10 Barnes G, McKellar W, Lawrance S. Detection offructose malabsorption by breath hydrogen test in achild with diarrhea. J Pediatr 1983; 103: 575-7.
11 Metz G, Jenkins DJA, Peters TJ, Newman A, BlendisLM. Breath hydrogen as a diagnostic method forhypolactasia. Lancet 1975; 1: 1155-7.
12 Kotler DP, Holt PR, Rosenzweig NS. Modification ofthe breath hydrogen test: Increased sensitivity fordetection of carbohydrate malabsorption. J Lab ClinMed 1982; 100: 798-805.
13 Read NW, Al-Janabi MN, Bates TE et al. Interpreta-tion of the breath hydrogen profile obtained afteringesting a solid meal containing unabsorbable car-bohydrate. Gut 1985; 26: 834-42.
14 Elias E, Gibson GJ, Greenwood LF, Hunt JN, TrippJH. The slowing of gastric emptying by monosacchar-ides and disaccharides in test meals. J Physiol 1968;194: 317-26.
15 Brener W, Hendrix TR, McHugh PR. Regulation ofthe gastric emptying of glucose. Gastroenterology 1983;85: 76-82.
16 Barr RG, Watkins JB, Perman JA. Mucosal functionand breath hydrogen excretion: Comparative studies inthe clinical evaluation of children with nonspecificabdominal complaints. Pediatrics 1981; 68: 526-33.
17 Bond JH, Levitt MD. Use of pulmonary hydrogen (H2)measurements to quantitate carbohydrate absorption. JClin Invest 1972; 51: 1219-25.
18 Bond JH, Levitt MD. Quantitative measurement oflactose absorption. Gastroenterology 1976; 70: 1058-62.
19 Calloway DH, Chenoweth WL. Utilization of nutrientsin milk- and wheat-based diets by men with adequateand reduced abilities to absorb lactose. I. Energy andnitrogen. Am J Clin Nutr 1973; 26: 929-51.
20 Anderson IH, Levine AS, Levitt MD. Incompleteabsorption of the carbohydrate in all-purpose wheatflour. N Engl J Med 1981; 304: 891-2.
21 Gray GM, Ingelfinger FJ. Intestinal absorption ofsucrose in man. The site of hydrolysis and absorption. JClin Invest 1965; 44: 390-8.
22 Gray GM, Ingelfinger FJ. Intestinal absorption ofsucrose in man: Interrelation of hydrolysis and mono-saccaride product absorption. J Clin Invest 1966; 45:388-98.
23 Cook GC. Comparison of the absorption and metabolicproducts of sucrose and its monosaccharides in man.Clin Sci 1970; 38: 687-97.
24 Holdsworth CD, Dawson AM. The absorption ofmonosaccharides in man. Clin Sci 1964; 27: 371-9.
25 Schultz SG, Strecker CK. Fructose influx across thebrush border of rabbit ileum. Biochim Biophys Acta1970; 211: 586-8.
26 Milla PJ, Muller DPR, Harries JT. Glucose stimulatesfructose absorption: clinical implications in health anddisease. Arch Dis Child 1977; 52: 429.
27 Holloway PAH, Parsons DS. Absorption and metabol-ism of fructose by rat jejunum. Biochem J 1984; 222:57-64.
28 Ramaswamy K, Malathi P, Caspary WF, Crane RK.Studies on the transport of glucose from disaccharidesby hamster small intestine in vitro. II. Characteristics ofthe disaccharidase-related transport system. BiochemBiophys Acta 1974; 345: 39-48.
on Septem
ber 12, 2022 by guest. Protected by copyright.
http://gut.bmj.com
/G
ut: first published as 10.1136/gut.27.10.1161 on 1 October 1986. D
ownloaded from

1168 Rumessen and Gudmand-H0yer
29 Ravich WJ, Bayless TM. Carbohydrate absorption andmalabsorption. Clin Gastroenterol 1983; 12: 335-56.
30 Hardinge MG, Swarner JB, Crooks H. Carbohydratesin foods. J Am Diet Assoc 1965; 46: 197-204.
31 Crane RK. 15 years of struggle with the brush border.In: Csaky TZ, ed. Intestinal absorption and malabsorp-tion. Raven Press: New York, 1975: 127-42.
32 Lindquist B, Meeuwisse GW. Intestinal transport ofmonosaccharides in generalized and selective malab-sorption. Acta Paediatr 1963; suppl. 146: 110-15.
33 Gracey M, Burke V, Anderson GM. Association ofmonosaccharide malabsorption with abnormal small-intestinal flora. Lancet 1969; 2: 384-5.
34 Crapo P, Kolterman OG, Olefsky JM. Effects of oralfructose in normal, diabetic, and impaired glucosetolerance subjects. Diabetes Care 1980; 3: 575-82.
35 Gudmand-H0yer E, Simony K. Individual sensitivity tolactose malabsorption. Am J Dig Dis 1977; 22:177-81.
on Septem
ber 12, 2022 by guest. Protected by copyright.
http://gut.bmj.com
/G
ut: first published as 10.1136/gut.27.10.1161 on 1 October 1986. D
ownloaded from