Kidney Function in Rats Treated With a High-Fructose Diet and Streptozotocin
6
International Journal of Food Science, Nutrition and Dietetics, 2014 © 109 Fernanda Teixeira Borges, et al (2014) Kidney Function in Rats Treated With a High-Fructose Diet and Streptozotocin. Int J Food Sci Nutr Diet. 3(4), 109-114. International Journal of Food Science, Nutrition and Dietetics (IJFS) ISSN 2326-3350 Kidney Function in Rats Treated With a High-Fructose Diet and Streptozotocin Review Article Cristina Harumi Tozaki Azevedo 1 , Ellen de Oliveira Narciso Pitlovanciv 1 , Edson Andrade Pessoa 1 , Marcia Bastos Convento 1 , Nestor Schor 1 , Fernanda Teixeira Borges 1,2 . 1 Nephrology Division, Department of Medicine, Universidade Federal de São Paulo (UNIFESP), São Paulo, Brasil. 2 Postgraduate Program, Health Sciences, CBS, Universidade Cruzeiro do Sul. *Corresponding Author: Fernanda Teixeira Borges, Nephrology Division, Department of Medicine, Universidade Federal de São Paulo (UNIFESP), São Paulo, Brasil. Tel: 55(11) 5576-4242; Fax: 55(11) 5573-9652 E-mail: [email protected] Received: February 24, 2014 Accepted: April 05, 2014 Published: April 07, 2014 Citation: Fernanda Teixeira Borges, et al (2014) Kidney Function in Rats Treated With a High-Fructose Diet and Streptozotocin. Int J Food Sci Nutr Diet. 3(4), 109-114. Copyright: Fernanda Teixeira Borges © 2014 This is an open-access article distributed under the terms of the Creative Commons Attribution License, which permits unrestricted use, distribution and reproduction in any medium, provided the original author and source are credited. Introduction High fructose intake has been associated with metabolic syndrome in the United States [1]. Fructose is mainly present in breakfast cereals, high-fructose corn syrup, and soft drinks, which are con- sumed in large amounts by the American population. Metabolic syndrome is characterized by specific signs as abdominal obesity, elevated triglycerides, reduced HDL-C, elevated blood pressure, and hyperglycemia [2, 3]. These signs are risk factors for cardio- vascular disease and chronic kidney disease; they are designated as cardiorenal metabolic syndrome. The link between obesity, insulin resistance, elevated plasma uric acid levels, non-alcoholic fatty liver, and cardiovascular or chronic kidney disease may be oxidative damage [4, 5].Obesity and ele- vated plasma uric acid levels are associated with systemic oxida- tive stress, inflammation, endothelial dysfunction, and pancreatic β-cell injury [5]. Fructose depletes ATP, increases nucleotide turnover and increas- es plasma uric acid levels, impairing the renin-angiotensin-system and inducing oxidative stress [6]. Fructose-induced uric acid syn- thesis in hepatocytes has lipogenic effects such as liver fatty acid accumulation and an increase in plasma triglycerides [7]. A high- fructose diet also induces inflammation in hepatocytes and im- pairment of insulin signaling in the liver [8]. Adherence to a high fructose intake diet (HFID) for long periods is being used to mimic metabolic syndrome in rats. Studies have successfully induced metabolic syndrome in rats or mice using a 60% fructose diet [9], usually during a long period of treatment such as 8 months [10]. Nevertheless, other strategies potentiate or accelerate the development metabolic syndrome signs, such as cardiovascular or kidney diseases associated with this syndrome. A study suggested that a high-fructose and high-fat diet could mimic some of the signs of metabolic syndrome [10]. In addition, another study suggested that fiber-free white flour together with fructose is more effective at triggering metabolic syndrome than only fructose [11]. The goal of the present study was to analyze the association between high fructose intake in rats treated with low doses of streptozotocin, focusing on kidney function and histological al- terations. In our model, the high-fructose diet induced some of the metabolic syndrome signs such as obesity, elevated triglycer- ides, and increased plasma uric acid levels. In the rat kidney, an increased glomerular filtration area, urine volume, and urinary protein excretion, possibly mediated by an increase in kidney oxi- dative stress, were observed. In animals treated with low doses of streptozotocin and fructose, the same effects were observed except oxidative stress. Our work suggests that fructose together with low doses of streptozotocin can potentiate, at least partially, the effects of high fructose intake in the induction of metabolic syndrome and provide new insights into the effect of fructose on metabolic syndrome. Materials and Methods Animal treatment The experimental protocol was approved by the ethics commit- tee of the Universidade Federal de São Paulo (process number 0590/10). Male Wistar rats weighing 200–250 g were divided into three groups. One group was treated with tail injection of streptozo- tocin at low concentration (STZ, Sigma, St. Louis, Mo, USA; 30 mg/kg dissolved in sodium citrate buffer, pH 4.5) and fed with 20% HFID+STZ in drinking water for 90 days. The second group was fed only with a 20% HFID in drinking water for 90 days, and Keywords: Kidney Function; Oxidative Stress; High Fructose Intake Diet.
-
Upload
independent -
Category
Documents
-
view
0 -
download
0
Transcript of Kidney Function in Rats Treated With a High-Fructose Diet and Streptozotocin
International Journal of Food Science, Nutrition and Dietetics, 2014 © 109
Fernanda Teixeira Borges, et al (2014) Kidney Function in Rats Treated With a High-Fructose Diet and Streptozotocin. Int J Food Sci Nutr Diet. 3(4), 109-114.
International Journal of Food Science, Nutrition and Dietetics (IJFS) ISSN 2326-3350
Kidney Function in Rats Treated With a High-Fructose Diet and Streptozotocin
Review Article
Cristina Harumi Tozaki Azevedo1, Ellen de Oliveira Narciso Pitlovanciv1, Edson Andrade Pessoa1, Marcia Bastos Convento1, Nestor Schor1, Fernanda Teixeira Borges1,2.
1 Nephrology Division, Department of Medicine, Universidade Federal de São Paulo (UNIFESP), São Paulo, Brasil.2 Postgraduate Program, Health Sciences, CBS, Universidade Cruzeiro do Sul.
*Corresponding Author: Fernanda Teixeira Borges, Nephrology Division, Department of Medicine, Universidade Federal de São Paulo (UNIFESP), São Paulo, Brasil.Tel: 55(11) 5576-4242; Fax: 55(11) 5573-9652E-mail: [email protected]
Received: February 24, 2014 Accepted: April 05, 2014Published: April 07, 2014
Citation: Fernanda Teixeira Borges, et al (2014) Kidney Function in Rats Treated With a High-Fructose Diet and Streptozotocin. Int J Food Sci Nutr Diet. 3(4), 109-114.
Copyright: Fernanda Teixeira Borges© 2014 This is an open-access article distributed under the terms of the Creative Commons Attribution License, which permits unrestricted use, distribution and reproduction in any medium, provided the original author and source are credited.
Introduction
High fructose intake has been associated with metabolic syndrome in the United States [1]. Fructose is mainly present in breakfast cereals, high-fructose corn syrup, and soft drinks, which are con-sumed in large amounts by the American population. Metabolic syndrome is characterized by specific signs as abdominal obesity, elevated triglycerides, reduced HDL-C, elevated blood pressure, and hyperglycemia [2, 3]. These signs are risk factors for cardio-vascular disease and chronic kidney disease; they are designated as cardiorenal metabolic syndrome.
The link between obesity, insulin resistance, elevated plasma uric acid levels, non-alcoholic fatty liver, and cardiovascular or chronic kidney disease may be oxidative damage [4, 5].Obesity and ele-vated plasma uric acid levels are associated with systemic oxida-tive stress, inflammation, endothelial dysfunction, and pancreatic β-cell injury [5].
Fructose depletes ATP, increases nucleotide turnover and increas-es plasma uric acid levels, impairing the renin-angiotensin-system and inducing oxidative stress [6]. Fructose-induced uric acid syn-thesis in hepatocytes has lipogenic effects such as liver fatty acid accumulation and an increase in plasma triglycerides [7]. A high-fructose diet also induces inflammation in hepatocytes and im-pairment of insulin signaling in the liver [8].
Adherence to a high fructose intake diet (HFID) for long periods is being used to mimic metabolic syndrome in rats. Studies have successfully induced metabolic syndrome in rats or mice using a 60% fructose diet [9], usually during a long period of treatment such as 8 months [10]. Nevertheless, other strategies potentiate or accelerate the development metabolic syndrome signs, such as cardiovascular or kidney diseases associated with this syndrome.
A study suggested that a high-fructose and high-fat diet could mimic some of the signs of metabolic syndrome [10]. In addition, another study suggested that fiber-free white flour together with fructose is more effective at triggering metabolic syndrome than only fructose [11].
The goal of the present study was to analyze the association between high fructose intake in rats treated with low doses of streptozotocin, focusing on kidney function and histological al-terations. In our model, the high-fructose diet induced some of the metabolic syndrome signs such as obesity, elevated triglycer-ides, and increased plasma uric acid levels. In the rat kidney, an increased glomerular filtration area, urine volume, and urinary protein excretion, possibly mediated by an increase in kidney oxi-dative stress, were observed. In animals treated with low doses of streptozotocin and fructose, the same effects were observed except oxidative stress. Our work suggests that fructose together with low doses of streptozotocin can potentiate, at least partially, the effects of high fructose intake in the induction of metabolic syndrome and provide new insights into the effect of fructose on metabolic syndrome.
Materials and Methods
Animal treatment
The experimental protocol was approved by the ethics commit-tee of the Universidade Federal de São Paulo (process number 0590/10).
Male Wistar rats weighing 200–250 g were divided into three groups. One group was treated with tail injection of streptozo-tocin at low concentration (STZ, Sigma, St. Louis, Mo, USA; 30 mg/kg dissolved in sodium citrate buffer, pH 4.5) and fed with 20% HFID+STZ in drinking water for 90 days. The second group was fed only with a 20% HFID in drinking water for 90 days, and
Keywords: Kidney Function; Oxidative Stress; High Fructose Intake Diet.

International Journal of Food Science, Nutrition and Dietetics, 2014 © 110
Fernanda Teixeira Borges, et al (2014) Kidney Function in Rats Treated With a High-Fructose Diet and Streptozotocin. Int J Food Sci Nutr Diet. 3(4), 109-114.
the third group received tap water during the entire period and was used as the control (CTL).
In some experiments, as indicated in the text, the animals were fed during the experimental protocol with a 2% fructose diet. All animals had free access to standard rat chow and tap water during experimental protocol.
At 0 (baseline), 30, 60, and 90 days after the beginning of the experimental protocols, blood samples were collected from the retinal or the tail vein, and the animals were maintained in meta-bolic cages for 24 h for urine collection.
The animals were killed after 90 days and both the right and left kidneys were removed for histological analyses. Biochemical pa-rameters were determined by analyzing plasma and urine samples.
Biochemical analysis
Plasma glucose concentration was determined for all rats by ana-lyzing tail blood samples (Accuchek, Boehringer Mannheim, In-dianapolis, Ind., USA). The levels of blood creatinine, urea, and urinary protein were assayed spectrophotometrically according to standard procedures using commercially available diagnostic kits (Labtest Diagnostica, Minas Gerais, Brazil). Creatinine was deter-mined by using the Jafé reaction [12], and urea was determined by measuring urease activity [13]. Serum uric acid was determined by the uricase enzyme reaction based on the formation of allantoin and hydrogen peroxide [14].
Plasma triglycerides were assessed by measuring hydrolyzation by lipase, which results in the formation of glycerol and fatty ac-ids; glycerol reacts with glycerol kinase followed by oxidase in a system that forms hydrogen peroxide [15]. HDL cholesterol was assessed by precipitation of lipoproteins followed by quantifica-tion of HDL in the supernatant. The samples were hydrolyzed with cholesterol esterase and cholesterol oxidase, forming hydro-gen peroxide [16]. The hydrogen peroxide formed in the reactions described above was analyzed by performing the horseradish per-oxidase reaction in a chromogenic system.
Urinary protein was analyzed by using the pyrogallol red-molyb-date method [17]. The results were expressed in mg/dL for cre-atinine, urea, uric acid, triglycerides, HDL cholesterol, and mg/24 h for urinary protein. Urine volume was expressed in mL, rat weight was expressed in grams, and urinary sodium was analyzed with flame photometry (Micronal B462, São Paulo, Brazil) and expressed in mEq/24 h.
Lipid peroxidation
Lipid peroxidation was determined in urine samples by quanti-fying TBARS (thiobarbituric acid reactive substances). The reac-tive substances combine with thiobarbituric acid, forming a red compound whose concentration can be assessed spectrophoto-metrically at an absorbance of 535nm. The thiobarbituric acid assay was performed as described previously [18]. Malondialde-hyde (MDA) was used to generate a standard curve, and the re-sults were expressed as nM of MDA/mg creatinine. Urine sam-ples were added to a solution of 0.375% thiobarbituric acid, 15% trichloroacetic acid, and 0.25 N HCl (Sigma-Aldrich, St. Louis, USA), after which they were continually agitated while heated to 95°C for 20 min. Subsequently, the samples were allowed to cool to room temperature. Assessment of the creatinine level in urine
samples was performed as previously described and used to nor-malize the results of MDA.
Urinary Hydroperoxide
Urinary levels of hydroperoxides were measured using the ferrous oxidation method with Xylenol Orange called FOX2 assay for lipid hydroperoxide [19]. Briefly, 100-μL aliquots of urine were transferred into microcentrifuge vials followed by the addition of 900 μL FOX2 reagent.
After incubation at room temperature for 30 min, the vials were centrifuged at 12,000 rpm at 25°C for 10 min. The absorbance of the supernatant was then determined at 560 nm. Lipid hydroper-oxide content in urine samples was determined according to the molar coefficient (4.3 104 M-1cm-1). Assessment of the creati-nine level in urine samples was performed as previously described and used to normalize the results of urinary hydroperoxide meas-urements.
Histological analysis
The kidneys were dissected along the nonhilar axis and fixed in 10% phosphate-buffered formalin (Erviegas, São Paulo, Brazil). Kidney sections were fixed with 4% buffered paraformaldehyde and embedded in paraffin (Erviegas, São Paulo, Brazil). Four-mi-crometer thick sections were cut for Masson’s Trichrome (TM; Erviegas, São Paulo, Brazil) and Periodic Acid Schiff (PAS; Ervie-gas, São Paulo, Brazil) staining, and then examined by performing light microscopy in a blinded manner.
The morphometric study was performed in kidney sections stained with PAS and TM in a Leica image analyzer computer sys-tem (Hessen, Germany). The glomerular analyzes is represented by the renal corpuscle area, glomerular tuft area, and the Bowman space, as shown by the difference between them in PAS-stained sections. The fraction of PAS-positive staining areas within theglomerular tuft area was measured in 10 randomly selected glo-meruli to indicate the mesangial matrix expansion.
The kidney sections stained with TM were used to evaluate fibro-sis in the glomeruli. The percentage of the area stained blue was measured per unit tuft area in 15 randomly selected glomeruli per animal.
Statistical Analysis
The results are expressed as a mean ± SE. The data were analyzed by one-way ANOVA followed by Tukey’s test. A value of p < 0.05 was considered statistically significant.
Results and Discussion
Studies have suggested that a fructose diet combined with other stimuli such as a high-fat diet [10, 20] or even a fiber-free white flour diet [11] could mimic metabolic syndrome in animal mod-els. The hypothesis of the present study was that low doses of streptozotocin could accelerate or potentiate the symptoms of metabolic syndrome.
Tables 1 and 2 show the biochemical parameters measured in the CTL, HFID, and HFID+STZ groups. The STZ+HFID animals gained significantly more weight than control or HFID animals after 30 days of treatment (Table 1).

International Journal of Food Science, Nutrition and Dietetics, 2014 © 111
Fernanda Teixeira Borges, et al (2014) Kidney Function in Rats Treated With a High-Fructose Diet and Streptozotocin. Int J Food Sci Nutr Diet. 3(4), 109-114.
No persistent increase in plasma glucose levels was detected in any of the experimental groups in comparison to the control group, and a significant increase was observed in the STZ+HFID animals only at the beginning of the experiment (Table 1).
The fructose diet induced a significant increase in uric acid after 30 days in the HFID group and after 90 days in the STZ+HFID group, and a persistent increase in plasma triglycerides was ob-served in both groups in comparison to the control group after 30 days of diet. The percentage increase was 210% and 251% in plasma triglycerides after 90 days of diet in the HFID and STZ+HFID groups, respectively (Table 2). Nevertheless, a small increase in HDL cholesterol was detected after 30 days of diet in the HFID and STZ+HFID groups.
The same observations were reported in other studies. Animals fed with fructose developed hypertension, hyperuricemia, and hy-pertriglyceridemia, and these effects increased progressively with
an increase in fructose intake from 10 to 60% of fructose [9].
The correlation between these signs may be an increase in uric acid or alterations of the oxidant/antioxidant status. A high-fruc-tose diet induced hypertension, liver steatosis, hyperinsulinemia, and hypertriglyceridemia, and these effects were prevented by al-lopurinol treatment. Uric acid also increased the oxidant status of the animals treated with fructose [21, 22].
The streptozotocin treatment together with the high-fructose diet (20%) potentiated some of the signs of metabolic syndrome in our experimental model, such as body weight, plasma glucose, and triglyceride levels. These results suggest that low doses of streptozotocin can accelerate the development of metabolic syn-drome.
The kidney function analyzes showed that in both groups ana-lyzed, HFID and STZ+HFID, the diuresis increased after 60 days
Table 1: Physiological Parameters
Days Weight(g) Blood Glucosis (mg/dL) Urine Volume (mL)Creatinine serum
(mg/dL) Urea (mg/dL)
Control 0 375±11 83.2±4.8 13.8±1.9 0.50±0.13 34.4±2.3
30 395±10 79.8±2.8 11.8±2.0 0.61±0.07 28.5±4.7
60 437±8 87.0±2.3 9.9±1.8 0.52±0.14 29.2±1.3
90 458±9 95.8±5.3 12.0±2.0 0.63±0.07 28.0±1.3
HFID 0 396±6 82.8±5.1 10.7±0.9 0.36±0.05 35.5±7.2*
30 420±3 90.2±5.3 11.1±3.3 0.35±0.02 46.8±1.8
60 441±3* 103.0±6.6 31.0±3.4* 0.42±0.04 33.6±1.5*
90 442±2 106.6±5.3 36.2±2.8* 0.65±0.09 36.8±0.8
STZ+HFID 0 411±6 93.2±3.0* 9.1±1.3 0.40±0.08 48.5±5.8
30 444±7* 108.0±6.2* 14.6±3.6 0.03±0.06 40.8±0.7
60 468±8* 108.0±4.8 42.8±1.7* 0.40±0.06 28.9±2.4
90 469±9* 106.7±4.8 34.6±2.3* 0.48±0.04 30.1±2.4
Table 2
DaysUrinary Protein
(mg/24h) Uric Acid Serum (mg/dL)Tryglicerydes
(mg/dL) C-HDL (mg/dL)Sodium Urinary
(mEq/24h)
Control 0 6.6 ± 0.5 1.60 ± 0.75 64.6 ± 4.7 52.3 ± 5.3 0.57 ± 0.02
30 4.8 ± 0.4 1.21 ± 0.27 45.5 ± 1.3 46.3 ± 1.5 ND
60 4.1 ± 0.5 0.88 ± 0.01 60.3 ± 2.4 49.2 ± 3.4 ND
90 4.8 ± 0.6 0.83 ± 0.38 55.0 ± 4.5 52.5 ± 4.3 0.63 ± 0.09
HFID 0 5.5 ± 0.9 1.58 ± 0.49 59.6 ± 18.8 55.1 ± 8.1 0.48 ± 0.08
30 3.5 ± 1.0 3.75 ± 0.23* 75.9 ± 26.7 58.4 ± 2.2* ND
60 16.6 ± 2.4* 1.45 ± 0.07* 137.9 ± 2.0* 57.9 ± 4.7 ND
90 10.7 ± 0.5* 1.38 ± 0.31 115.7 ± 5.7* 56.1 ± 0.6 0.39 ± 0.07
STZ+HFID 0 6.5 ± 0.5 1.33 ± 0.07 59.6 ± 18.8 62.6 ± 4.5 0.48 ± 0.07
30 3.7 ± 1.0 1.65 ± 0.32 70.9 ± 6.4* 68.9 ± 4.7* ND
60 25.1 ± 4.8* 1.25 ± 0.13 192.0 ± 18.8* 59.5 ± 6.3 ND
90 12.8 ± 2.8* 2.38 ± 0.19* 149.7 ± 38.1* 64.8 ± 2.7 0.35 ± 0.03*
(*)p< 0.05 vs. CTL Data were expressed as the mean ± SEM. The parameters were analyzed in the CTL (control), HFID (high fructose intake diet, 20%),
STZ+HFID (streptozotocin, 30 mg/mL and high fructose intake diet, 20%) groups at 0, 30, 60, and 90 days of diet.

International Journal of Food Science, Nutrition and Dietetics, 2014 © 112
Fernanda Teixeira Borges, et al (2014) Kidney Function in Rats Treated With a High-Fructose Diet and Streptozotocin. Int J Food Sci Nutr Diet. 3(4), 109-114.
of diet (Table 1). In HFID and STZ+HFID, the increase was 301% and 288%, respectively. Although, no differences in creati-nine or urea were observed in the HFID and STZ+HFID groups in comparison to the control group (Table 1).
Table 2 shows the increase in urinary protein in the HFID and STZ+HFID groups after 30 days of diet and a decrease in urinary sodium only in the STZ+HFID group (45%) after 90 days of diet in comparison to the control group. Interesting in STZ+HFID group the diuresis and the urinary protein were higher than fruc-tose fed animals, suggesting that the effects of fructose in the kidney function were potentiated by streptozotocin treatment.
Figure 1 shows the urinary lipid peroxidation (A) and urinary hy-droperoxides (B) in the HFID and STZ+HFID groups in com-parison to the values in the control group. No difference in uri-
nary hydroperoxides was detected between the groups at baseline (0 time); however, there was a significant increase in urinary hy-droperoxides in the HFID group (107.9 ± 31.9 versus 23.8 ±10.0 nM/mg of creatinine compared with the control) after 90 days (p < 0.05). This increase was related to the high-fructose diet, as in-dicated by the fact that when animals were fed a 2% fructose diet for 90 days (13.6 ± 1.6 nM/mg of creatinine), there was no in-crease in lipid peroxidation. No significant increase was observed in the STZ+HFID, although a tendency towards an increase was observed in lipid peroxidation (63.0 ± 21.7 nM/mg of creatinine) (Figure 1A).
This result was confirmed by quantification of urinary peroxides (Figure 1B). We observed a significant increase in urinary hydrop-eroxides in the HFID group (752 ± 190 versus 87.7 ± 29.8 nM/mg of creatinine compared with control group) after 90 days of
Figure 1. (A) Urinary hydroperoxides (nM/mg creatinine)(B) TBARS levels (nM/mg creatinine) in the control group (CTL) , HFID (high fructose intake diet) and rats treated with streptozotocin and high fructose induced diet (STZ+HFID) at 0 and 90 days.
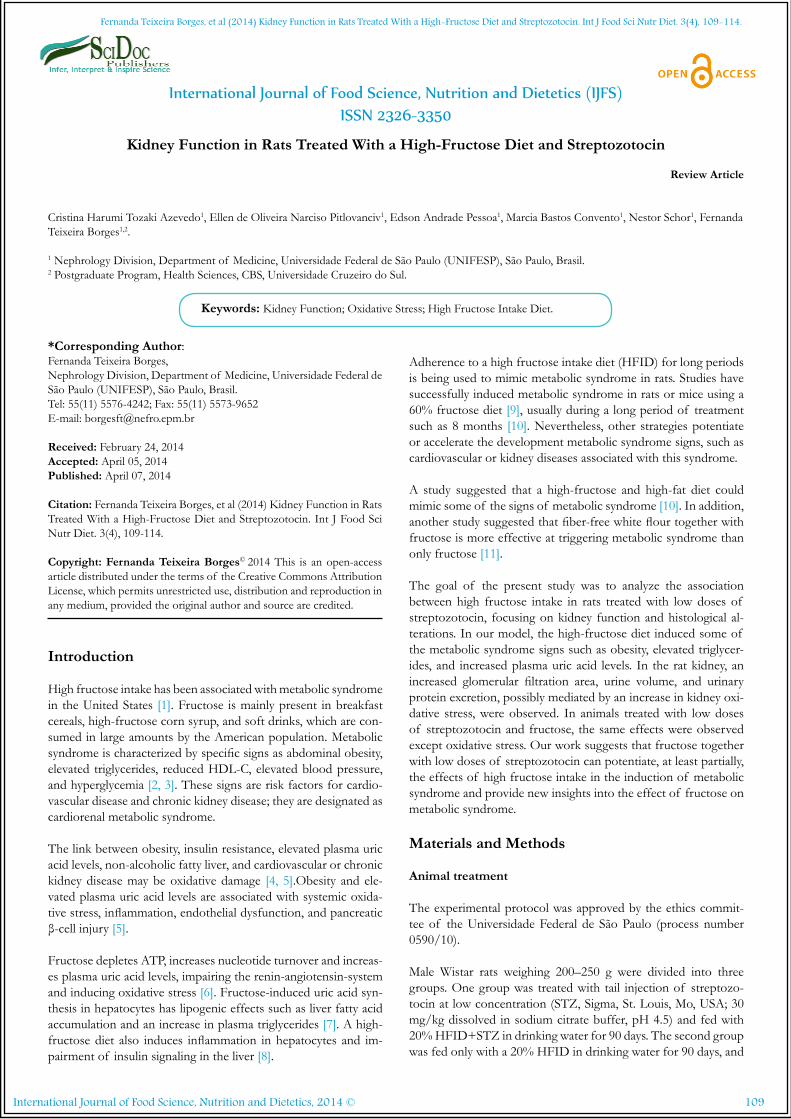
Figure 2. (A) Light microscopy of kidney sections stained with Periodic Acid Schiff (PAS) at 400× and Masson Trichrome stain (TM) at 200× in control rats (CTL), HFID (high fructose intake diet) and rats treated with streptozotocin and high fructose induced diet
(STZ+HFID). (B) Quantification of glomerular tuft, glomerular area, and Bowman’s space expressed in μm2, PAS glomerular stain in counts/μm2 and TM glomerular stain in counts/μm2.
B
A

International Journal of Food Science, Nutrition and Dietetics, 2014 © 113
Fernanda Teixeira Borges, et al (2014) Kidney Function in Rats Treated With a High-Fructose Diet and Streptozotocin. Int J Food Sci Nutr Diet. 3(4), 109-114.
diet, but not in animals fed a 2% fructose diet (175.2 ± 39.1 nM/mg of creatinine) or in the STZ+HFID group (130.7 ± 73.7nM/mg of creatinine).
Taken together these results suggest that a high-fructose diet sig-nificantly increased lipid peroxidation as a consequence of oxida-tive stress and the inhibition of antioxidant defenses, as reported previously [23, 24]. Nevertheless, low doses of streptozotocin together with a high fructose diet attenuates the increase in lipid peroxidation, although the consequences of this effect remain to be determined. One hypothesis is that fructose consumption re-sults in ATP depletion, and the AMP generated enters into the purine degradation pathway and increases uric acid levels, which together with the fructose can result in oxidative stress [25]. In our experimental model, the increase in uric acid plasma concen-tration was delayed in animals treated with streptozotocin and fed with fructose in comparison to the group that only received the carbohydrate.
Figure 2 shows the results of morphometric analyses of kidney sections from HFID and STZ+HFID animals compared to those of the control group after 90 days of high-fructose diet. The re-nal corpuscle area was increased in both groups fed with fruc-tose (HFID: 9062 ± 373 μm2; STZ+HFID: 9248 ± 368 μm2) in comparison to that in the control group (CTL: 8076 ± 328 μm2) (Figure 2A).
Interestingly, in the HFID group, the glomerular tuft area (6802 ± 298 μm2) was increased in comparison to that in the STZ+HFID group (5321 ± 209 μm2) and the control group (5446 ± 230 μm2). Nevertheless, Bowman’s space was increased in the HFID+STZ (3927 ± 244 μm2) in comparison to the control (2630 ± 163 μm2) and HFID (2260 ± 158 μm2) groups (Figure 2 A and B). This result suggests that in both experimental situations, the renal corpuscle was increased, although this increase was related to an increase in Bowman’s space in the STZ+HFID group and to an increase in glomerular filtration area in the HFID group.
It is also important to point out that in the STZ+HFID group, there was a significant increase in PAS stain (11,912 ± 611 count/μm2) in comparison to the control (9,889 ± 636 count/μm2) and HFID (10,893 ± 669) groups, suggesting that the protein glucose residue increased in the glomerular filtration area (Figure 2 A and B). No increase in TM positive staining was observed in the ex-perimental groups when compared to the control group; however, a significant decrease was observed in both experimental groups.
Taken together these results showed that animals treated with streptozotocin and fed a high fructose diet showed an increase in renal corpuscle area, basement membrane thickness, urine volume, and protein excretion, and a decrease in urinary sodium excretion, suggesting impairment in kidney function in animals treated with streptozotocin and fed with fructose. Although in animals fed with high fructose, the kidney analyses showed an increase in glomerular tuft area, a concomitant increase in protein excretion and urine volume also suggested an increase in glomer-ular filtration rate.
Fructose and glucose can glycate the glomerular basement mem-brane and increase its permeability [26]. Additionally, fructose itself can increase tubular sodium reabsorption [27], and this effect appeared to be potentiated in streptozotocin-treated and fructose-fed animals in comparison to the other groups analyzed.
Taken together, the results of the present study suggest that the association of a high fructose diet with low or mild pancreatic lesions promoted by low doses of streptozotocin accelerate, at least partially, the signs of metabolic syndrome. Additionally, our results provide new insights about the effects of prolonged high fructose intake combined or not with low doses of streptozotocin on the kidney.
References
[1]. R. B. Ervin, “Prevalence of metabolic syndrome among adults 20 years of age and over, by sex, age, race and ethnicity, and body mass index: United States, 2003-2006.,” Natl. Health Stat. Report., no. 13, pp. 1–7, 2009.
[2]. Z. Khitan and D. H. Kim, “Fructose: a key factor in the development of metabolic syndrome and hypertension.,” J. Nutr. Metab., vol. 2013, p. 682673, 2013.
[3]. R. J. Johnson, M. S. Segal, Y. Sautin, T. Nakagawa, D. I. Feig, D.-H. Kang, M. S. Gersch, S. Benner, and L. G. Sánchez-Lozada, Potential role of sugar (fructose) in the epidemic of hypertension, obesity and the metabolic syn-drome, diabetes, kidney disease, and cardiovascular disease.,” Am. J. Clin. Nutr., vol. 86, no. 4, pp. 899–906, 2007.
[4]. A. A. Chaudhary K, Malhotra K, Sowers J, “Uric Acid - Key Ingredient in the Recipe for Cardiorenal Metabolic Syndrome,” Cardiorenal Med., vol. 3, no. 3208–220, 2013.
[5]. S. I. Matsuda M, “Increased oxidative stress in obesity: implications for met-abolic syndrome, diabetes, hypertension, dyslipidemia, atherosclerosis, and cancer.,” Obes Res Clin Pr., vol. 7, no. 5, pp. e330–e341, 2013.
[6]. A. Zawiasa and M. Nowicki, “Acute effects of fructose consumption on uric acid and plasma lipids in patients with impaired renal function.,” Metabo-lism., vol. 62, no. 10, pp. 1462–9, 2013.
[7]. M. A. Lanaspa, L. G. Sanchez-Lozada, C. Cicerchi, N. Li, C. A. Roncal-Jimenez, T. Ishimoto, M. Le, G. E. Garcia, J. B. Thomas, C. J. Rivard, A. Andres-Hernando, B. Hunter, G. Schreiner, B. Rodriguez-Iturbe, Y. Y. Sau-tin, and R. J. Johnson, “Uric Acid Stimulates Fructokinase and Accelerates Fructose Metabolism in the Development f Fatty Liver,” PLoS ONE, vol. 7, no. 10. p. e47948, 2012.
[8]. V. N. Vasiljević A, Bursać B, Djordjevic A, Milutinović DV, Nikolić M, Matić G, “Hepatic inflammation induced by high-fructose diet is associated with altered 11βHSD1 expression in the liver of Wistar rats,” Eur J Nutr., 2014.
[9]. L. G. Sánchez-Lozada, E. Tapia, A. Jiménez, P. Bautista, M. Cristóbal, T. Nepomuceno, V. Soto, C. Avila-Casado, T. Nakagawa, R. J. Johnson, J. Herrera-Acosta, and M. Franco, “Fructose-induced metabolic syndrome is associated with glomerular hypertension and renal microvascular damage in rats.,” Am. J. Physiol. Renal Physiol., vol. 292, no. 1, pp.F423–F429, 2007.
[10]. S. J. Dissard R, Klein J, Caubet C, Breuil B, Siwy J, Hoffman J, Sicard L, Ducassé L, Rascalou S, Payre B, Buléon M, Mullen W, Mischak H, Tack I, Bascands JL, Buffin-Meyer B, “Long term metabolic syndrome induced by a high fat high fructose diet leads to minimal renal injury in C57BL/6 mice.,” PLoS One, vol. 8, no. 10, p. e76703, 2013.
[11]. F. Amin and A. H. Gilani, “Fiber-free white flour with fructose offers a bet-ter model of metabolic syndrome.,” Lipids Health Dis., vol. 12, no. 1, p. 44, 2013.
[12]. H. H. TAUSSKY, “A microcolorimetric determination of creatine in urine by the Jaffe reaction.,” J. Biol. Chem., vol. 208, no. 2, pp. 853–61, Jun. 1954.
[13]. Bergmeyer, Methods of Enzymatic Analysis, 9th ed. Florida, 1985, pp. 435–449.
[14]. C. R. Elin RJ, Johnson E, “Four methods for determining uric acid com-pared with a candidate reference method,” Clin Chem, vol. 28, no. 10, pp. 2098–2100, 1982.
[15]. P. L. Fossati P, “Serum triglycerides determined colorimetrically with an en-zyme that produces hydrogen peroxide,” Clin Chem, vol. 28, no. 10, pp. 2077–2080, 1982.
[16]. M. F. Lopes-Virella, P. Stone, S. Ellis, and J. A. Colwell, “Cholesterol de-termination in high-density lipoproteins separated by three different meth-ods.,” Clin. Chem., vol. 23, no.5, pp. 882–884, 1977.
[17]. J. L. Orsonneau, P. Douet, C. Massoubre, P. Lustenberger, and S. Bernard, “An improved pyrogallol red-molybdate method for determining total uri-nary protein.,” Clin. Chem., vol.35, no. 11, pp. 2233–6, Nov. 1989.
[18]. S. Beuge, JA, Aust, “The thiobarbituric acid assay,” Method Enzym., vol. 52, pp. 306–307,1978.
[19]. J. T.-S. J. W. S. Nourooz-Zadeh, “Measurement of plasma hydroperoxide concentrations by the ferrous oxidation–xylenol orange assay in conjunction with triphenylphosphine.,” Anal. Biochem., vol. 220, pp. 403–409, 1994.
[20]. S. T. Briand F, Thiéblemont Q, Muzotte E, “High-fat and fructose intake induces insulin resistance, dyslipidemia, and liver steatosis and alters in vivo

International Journal of Food Science, Nutrition and Dietetics, 2014 © 114
Fernanda Teixeira Borges, et al (2014) Kidney Function in Rats Treated With a High-Fructose Diet and Streptozotocin. Int J Food Sci Nutr Diet. 3(4), 109-114.
macrophage-to-feces reverse cholesterol transport in hamsters.,” J Nutr., vol. 142, no. 4, pp. 704–709, 2012.
[21]. J. R. Nakagawa T, Hu H, Zharikov S, Tuttle KR, Short RA, Glushakova O, Ouyang X, Feig DI, Block ER, Herrera-Acosta J, Patel JM, “A causal role for uric acid in fructoseinduced metabolic syndrome,” Am J Physiol Ren. Physiol, vol. 209, no. 3, pp. F265–F631,2006.
[22]. J. A. Castro GS, Cardoso JF, Vannucchi H, Zucoloto S, “Fructose and NAFLD: metabolic implications and models of induction in rats.,” Acta Cir Bras, vol. 26, no. Suppl 2, pp. 45–50, 2011.
[23]. U. T. Aoyama M, Isshiki K, Kume S, Chin-Kanasaki M, Araki H, Araki S, Koya D,Haneda M, Kashiwagi A, Maegawa H, “Fructose induces tubuloint-erstitial injury in the kidney of mice.,” Biochem Biophys Res Commun, vol. 419, no. 2, pp. 244–249, 2012.
[24]. T. M. Polizio AH, Gonzales S, Muñoz MC, Peña C, “Behaviour of the anti-oxidant defence system and heme oxygenase-1 protein expression in fructose-hypertensive rats,”Clin Exp Pharmacol Physiol, vol. 33, no. 8, pp. 734–739, 2006.
[25]. L. G. Sánchez-Lozada, M. a Lanaspa, M. Cristóbal-García, F. García-Arroyo, V. Soto, D.Cruz-Robles, T. Nakagawa, M. a Yu, D.-H. Kang, and R. J. John-son, “Uric Acid-Induced Endothelial Dysfunction Is Associated with Mi-tochondrial Alterations and Decreased Intracellular ATP Concentrations.,” Nephron. Exp. Nephrol., vol. 121, no. 3–4, pp. e71–e78, 2012.
[26]. R. G. Cochrane SM, “In vitro glycation of glomerular basement membrane alters its permeability: a possible mechanism in diabetic complications,” FEBS Lett, vol. 375, no.1–2, pp. 41–44, 1995.
[27]. M. G. Queiroz-Leite GD, Crajoinas RO, Neri EA, Bezerra CN, Girardi AC, Rebouças NA,“Fructose acutely stimulates NHE3 activity in idney proximal tubule.,” Kidney Blood Press Res, vol. 36, no. 1, pp. 320–334, 2012.