Chapter 12 - The UK Kidney Association |
14
Chapter 12 Clinical, Haematological and Biochemical Parameters in Patients receiving Renal Replacement Therapy in Paediatric Centres in the UK in 2009: national and centre-specific analyses Malcolm Lewis a , Clare Castledine b , Dirk van Schalkwyk b , Manish D Sinha c , Carol Inward d a Manchester Childrens Hospital, Manchester, UK; b UK Renal Registry, Bristol, UK; c Evelina Children’s Hospital, London, UK; d Bristol Royal Hospital for Children, Bristol, UK Key Words Biochemical variables : Children : Dialysis : ERF : Haemo- globin : Height : Quality improvement : Transplant : Weight Summary . Median weight z-score for children on dialysis was ÿ1.0 whereas children with a functioning trans- plant had normal weights. . Median height z-score for children on dialysis was ÿ2.0 and for children with a functioning transplant ÿ1.4. . 73% of transplant patients and 52% of dialysis patients had a systolic blood pressure within the 90th percentile standard. . 44% of transplant patients, 83% of HD patients and 38% of PD patients had a haemoglobin within the age appropriate standard. . Transplant patients with eGFR <45 mls/min/ 1.73 m 2 and those using MMF had significantly worse haemoglobin standard attainment. . 49% of HD patients and 61% of PD patients achieved the audit standard for phosphate. 233
-
Upload
khangminh22 -
Category
Documents
-
view
4 -
download
0
Transcript of Chapter 12 - The UK Kidney Association |

Chapter 12Clinical, Haematological and BiochemicalParameters in Patients receiving RenalReplacement Therapy in PaediatricCentres in the UK in 2009: national andcentre-specific analyses
Malcolm Lewisa, Clare Castledineb, Dirk van Schalkwykb, Manish D Sinhac,
Carol Inwardd
aManchester Childrens Hospital, Manchester, UK; bUK Renal Registry, Bristol, UK; c Evelina Children’s Hospital, London,
UK; dBristol Royal Hospital for Children, Bristol, UK
Key WordsBiochemical variables : Children : Dialysis : ERF : Haemo-globin : Height : Quality improvement : Transplant :Weight
Summary
. Median weight z-score for children on dialysis was�1.0 whereas children with a functioning trans-plant had normal weights.
. Median height z-score for children on dialysis was�2.0 and for children with a functioning transplant�1.4.
. 73% of transplant patients and 52% of dialysispatients had a systolic blood pressure within the90th percentile standard.
. 44% of transplant patients, 83% of HD patients and38% of PD patients had a haemoglobin within theage appropriate standard.
. Transplant patients with eGFR <45mls/min/1.73m2 and those using MMF had significantlyworse haemoglobin standard attainment.
. 49% of HD patients and 61% of PD patientsachieved the audit standard for phosphate.
233

Introduction
The British Association for Paediatric Nephrology(BAPN) registry was established in 1996 in parallelwith the establishment of the UK Renal Registry(UKRR). The data to be collected was agreed by theregistry committee of the BAPN and data collectionforms distributed to each of the participating centres.Data returns have been a mixture of electronic andpaper returns as progress has been made towards amerger of the adult and paediatric registries withpaediatric returns coming from hospital renal informa-tion systems. When complete this will allow moredetailed analysis of laboratory parameters. Currently,only one annual dataset is recorded for each patient.
This year the Paediatric Renal Registry report focuseson the following variables for the prevalent paediatricdialysis and transplantation cohort on 31st December2009:
1. Report on the completeness of data returns to therenal registry
2. Overview of anthropometric characteristics inchildren with established renal failure (ERF)
3. Overview of blood pressure control in children withERF
4. Anaemia5. Key biochemical findings in this population
Analyses of prevalent paediatric patients receivingrenal replacement therapy for the year 2009 and for theperiod 1999–2009 inclusive are reported. Due to lownumbers of patients in each cohort no incident cohortanalyses have been undertaken. Centre specific data foreach paediatric nephrology centre in the UK has alsobeen provided.
Methods
There were 13 centres providing care for children requiringrenal replacement therapy in the UK, 10 of which also providedsurgical renal transplant services. All 13 centres provide out-patient and in-patient follow up for children who have receivedkidney transplants. Centres are listed in table 12.1 and appendix K.
Data collectionThe data presented in this report relate to the annual census
date of 31st December 2009.The paediatric centres with access to renal IT systems
submitted encrypted electronic data directly to the UKRR. The
software routines to extract the data were run with the assistanceof staff at the UKRR.
Paper or electronic returns in the original BAPN databaseformat were sent to the UKRR for entry onto the originalBAPN database as in previous years from those centres withoutaccess to renal IT systems and then data were amalgamated. Com-plete transfer to the UKRR encrypted database is still awaited.
Governance, reporting and standardisationInformation governance, reporting and standardisation were
all performed in an identical manner to previous analyses toallow comparison [1]. As before, with the value of many clinicalparameters in childhood varying with age and size, data arepresented as z-scores.
AnthropometryThe reference range for height (Ht), weight (Wt) and body
mass index (BMI) in childhood varies with gender and age.BMI was calculated using the formula BMI¼Wt (kg)/Ht (m)2.Height, weight and BMI were all adjusted for age and z-scoreswere calculated based on the British 1990 reference data forheight and weight [2].
Blood pressure (BP)The reference range for blood pressure varies with gender, age
and height. The data is therefore presented as z-scores based ondata from the Fourth report of the National High Blood PressureEducation Programme (NHBPEP) working group in the UnitedStates [3].
Laboratory valuesHaemoglobin (Hb), ferritin (Ferr), calcium (Ca) and phos-
phate (Phos) were analysed using age related laboratory referenceranges as in table 12.2. Data analysis is presented for each centreindividually and at a national level for each variable.
Table 12.1. Paediatric renal centres, their abbreviations and ITsystems
Paediatric centre AbbreviationRenal
IT system
Belfast Blfst_P NoneBirmingham Bham_P CCL ProtonBristol Brstl_P CCL ProtonCardiff Cardf_P CCL ProtonGlasgow Glasg_P NoneLeeds Leeds_P CCL ProtonLiverpool Livpl_P NoneLondon Evelina L Eve_P NoneLondon Great Ormond Street L GOSH_P CCL Proton*Manchester Manch_P NoneNewcastle Newc_P CCl clinical
visionNottingham Nottm_P CCL ProtonSouthampton Soton_P Bespoke**
*GOSH has a link to the CCL PROTON system in Bristol but with nolab links**Recent implementation of a bespoke renal IT system has enabledtransmission of a limited dataset from Southampton this year
234
The UK Renal Registry The Thirteenth Annual Report

Statistical analysis
Data were analysed to calculate summary statistics(maximum, minimum, mean and median values inaddition to standard deviation and quartile ranges).Where applicable, the percentage achieving the auditstandard was also calculated. Patients without datawere excluded from that analysis.
Longitudinal analyses of attainment of standards overtime were also performed. This was based on a singledata point per ERF patient per year collected as describedpreviously. Changing audit standards over time andvariable data return for previous years encourages cau-tious interpretation of these analyses. All analyses weredone using SAS 9.2.
Standards
Standards are from the Treatment of Adults andChildren with Renal Failure, Renal Association 2002guidelines unless otherwise stated [4].
Anthropometry‘Height and weight should be monitored at each
clinic visit. Measures of supine length or standinghead circumference should be measured during eachvisit up to two years of age and 6 monthly up to 5
years of age. All measurements should be plotted onEuropean reference growth charts for healthy children.’
Blood Pressure‘Blood pressure varies throughout childhood and
should be maintained within 2 standard deviations ofthe mean for normal children of the same height andsex. Systolic blood pressure during PD or post-HDshould be maintained at <90th percentile for age,gender and height.’
The analyses of blood pressure in this report presentthe achievement of blood pressures at or below the90th percentiles.
AnaemiaGuidance on the management of anaemia in adults
and children with chronic kidney disease was publishedby the National Institute for Clinical Excellence (NICE)in 2006 (Clinical Guideline 39) [5]. The recommenda-tion in this guidance is that in children with chronickidney disease, treatment should maintain stable haemo-globin levels between 10 and 12 g/dl in children below 2years of age and between 10.5 and 12.5 g/dl in childrenabove 2 years of age. For the purposes of this report,the NICE standards have been adopted.
Calcium, phosphate and parathyroid hormone levelsPhosphate and calcium should be kept within the
normal range [4]. For analyses of calcium and phosphate
Table 12.2 Summary of relevant biochemical clinical audit measures
Age
Parameter <1 year 1–5 years 6–12 years >12 years
Haemoglobin (g/dl) in transplant patients –unless eGFR <40 (then as per anaemia – seebelow)
10.5–13.5 12–14 11.5–14.5 13–17.0
Anaemia* (g/dl) (NICE guidelines fordialysis patients only)
<10.0 for <2 yrMaintain 10–12
for <2 yr
<11.0 for >2 yrMaintain 10.5–12.5
for >2 yr
<11.0 for >2 yrMaintain 10.5–12.5
for >2 yr
<11.0 for >2 yrMaintain 10.5–12.5
for >2 yr
eGFR (transplant patients) Estimated GFR (eGFR) as per Schwartz formula: (height� k)/plasma creatinineThe value for k is that in use at the reporting centre
Ferritin (mg/L) 200–500 200–500 200–500 200–500
Corrected calcium (mmol/L) 2.24–2.74 2.19–2.69 2.19–2.69 2.15–2.55
Phosphate (mmol/L) 1.1–1.95 1.05–1.75 1.05–1.75 1.05–1.75
Parathyroid hormone (individual centreunits)
Within twice the normal rangeLevels may be maintained within normal range if growing appropriately
*For transplant patients the reference range used is the normal range for age
235
Chapter 12 Paediatric biochemistry

the age related ranges as described previously have beenused [1].
Results
Data completenessTables 12.3 to 12.6 show the completeness of data
returns for transplant and dialysis patients for 2009and the 1999–2009 period. Each patient was assessedwith regard to the completeness of data for each yearbetween 1999 and 2009. Thus the total does not representthe number of patients treated but the number of patienttreatment years assessed for each modality.
No data was submitted from Southampton in 2008pending the establishment of data extraction routines.
Overall completeness is good, however in 2009,height, weight and blood pressure data from GOSHwere less complete due to problems with the entry oftimeline events without which these parameters cannotbe calculated. The data items shown in these tables arethose used in this chapter to aid interpretation.
Height, weight and BMIFigures 12.1 and 12.4 show that children receiving
renal replacement therapy were short for their age. Theheight deficit was greater in children on dialysis than inthose who had a functioning kidney transplant.
Children with a functioning kidney transplant had anormal weight (figure 12.2). Those on dialysis had a
weight below that of healthy children (figure 12.5) witha UK median z-score of �1.
Body mass index in children with a functioningtransplant in 2009 showed inter-centre variation with amedian UK z-score of 0.8 (figure 12.3). The UKmedian z-score in those on dialysis was 0.2 (figure12.6). The most likely explanation for this is the shortstature seen in this group.
Figure 12.7 shows that the UK average median z-scorefor height and the percentage of children receivinggrowth hormone each year has not changed since 1999.However the group of children who were receivinggrowth hormone appear to have more severe heightrestriction since 2006. More detailed analysis dividingpatients into those on dialysis and those with allografts,together with analysis according to primary diagnosisand comorbidity will be required to establish thereason for this.
Blood pressureAnalyses of blood pressure management have shown
that blood pressure is higher in children receiving renalreplacement therapy than in healthy children (figures12.8 and 12.9). There was wide inter-centre variation insystolic blood pressure, particularly in dialysis patientsin 2009 with a UK median z-score of 0.9 for dialysispatients and 0.5 for transplant patients.
Children receiving peritoneal dialysis had higherblood pressures than children with kidney transplantsor those on haemodialysis (table 12.7). In the UK asa whole in 2009, 75.6% of children on haemodialysis
Table 12.3. Percentage data completeness for transplant patients by centre for each biochemical, blood pressure and growth variableand total number of patients per centre in 2009
Centre
Transplantpatients
N Height Weight BMI Systolic BP Hb eGFR Ferritin
Blfst_P 17 94 94 94 88 100 94 12Bham_P 54 96 96 96 94 98 94 32Brstl_P 38 97 100 97 90 97 92 63Cardf_P 20 95 95 95 95 15 15 10L GOSH_P 138 0 0 0 0 100 0 99Glasg_P 54 98 100 98 98 100 98 82L Eve_P 80 99 100 99 99 100 98 90Leeds_P 61 95 100 95 95 100 95 25Livpl_P 28 100 100 100 100 100 100 89Manch_P 37 100 100 100 100 100 100 19Newc_P 35 97 100 97 97 97 97 74Nottm_P 15 87 93 87 67 87 80 80UK 577 74 75 74 72 96 80 56
236
The UK Renal Registry The Thirteenth Annual Report

Table 12.4. Percentage data completeness for dialysis patients by centre for each variable and total number of patients per centre in2009
Centre
Dialysispatients
N Height Weight BMISystolicBP Hb PTH Ca Phos Ferritin
Blfst_P 10 80 90 80 80 100 70 80 80 80Bham_P 38 95 95 95 95 100 89 100 100 82Brstl_P 7 71 71 86 71 100 86 100 100 71Cardf_P 7 100 100 100 86 29 29 29 29 29L GOSH_P 41 15 15 15 15 100 100 100 100 100Glasg_P 14 86 100 86 86 100 100 100 100 93L Eve_P 21 100 100 100 100 100 100 100 100 100Leeds_P 17 94 100 94 94 100 100 100 100 100Livpl_P 5 100 100 100 100 100 100 100 100 80Manch_P 23 100 100 100 100 100 52 100 100 100Newc_P 6 83 100 83 83 100 100 100 83 100Nottm_P 17 82 88 82 71 100 71 100 100 94UK 206 77 88 85 82 94 83 92 91 86
Table 12.5. Data completeness for each variable for each transplant patient per year from 1999–2009
CentreTransplant patient
years Height WeightSystolicBP Hb eGFR Ferritin
Blfst_P 134 95 95 94 100 95 31Bham_P 398 99 99 99 99 98 23Brstl_P 370 98 98 95 96 95 21Cardf_P 196 88 91 92 89 80 57L GOSH_P 945 74 76 75 96 73 55Glasg_P 386 95 97 97 99 95 49L Eve_P 677 95 98 98 100 94 57Leeds_P 340 94 95 77 95 92 25Livpl_P 287 96 98 99 99 95 52Manch_P 655 98 99 98 99 97 3Newc_P 232 97 98 98 98 97 35Nottm_P 566 92 93 92 97 91 39UK 5,241 93 95 93 97 92 37
*Blood pressure data from Leeds from 2008 was subject to a downloading issue
Table 12.6. Data completeness for each variable and total number of dialysis patients in each centre from 1999–2009
CentreDialysis patient
years Height WeightSystolicBP Hb PTH Ca Phos Ferritin
Blfst_P 71 89 99 94 100 76 96 94 65Bham_P 256 98 98 97 100 82 100 100 74Brstl_P 144 94 98 97 97 92 98 98 63Cardf_P 33 88 97 94 85 73 85 85 76L GOSH_P 304 77 83 82 99 72 99 98 84Glasg_P 122 84 97 95 98 86 98 99 85L Eve_P 113 86 96 90 98 82 86 97 81Leeds_P 143 86 91 78 94 72 92 93 87Livpl_P 73 89 100 99 99 81 96 96 84Manch_P 216 91 93 89 98 56 97 97 74Newc_P 72 92 96 96 99 81 99 97 85Nottm_P 176 76 86 76 98 61 98 98 77UK 1,741 87 94 91 97 76 95 96 78
237
Chapter 12 Paediatric biochemistry
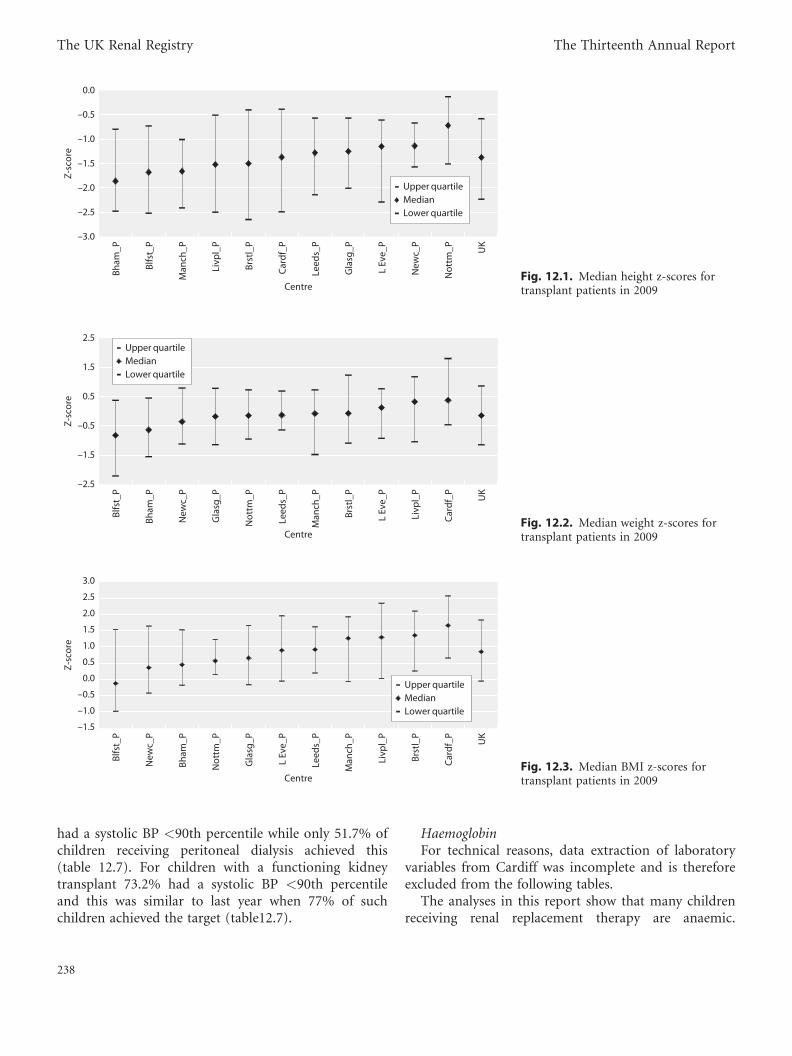
had a systolic BP <90th percentile while only 51.7% ofchildren receiving peritoneal dialysis achieved this(table 12.7). For children with a functioning kidneytransplant 73.2% had a systolic BP <90th percentileand this was similar to last year when 77% of suchchildren achieved the target (table12.7).
HaemoglobinFor technical reasons, data extraction of laboratory
variables from Cardiff was incomplete and is thereforeexcluded from the following tables.
The analyses in this report show that many childrenreceiving renal replacement therapy are anaemic.
–3.0
–2.5
–2.0
–1.5
–1.0
–0.5
0.0
Bham
_P
Blfs
t_P
Man
ch_P
Livp
l_P
Brst
l_P
Car
df_P
Leed
s_P
Gla
sg_P
L Ev
e_P
New
c_P
Not
tm_P U
K
Centre
Z-sc
ore
Upper quartileMedianLower quartile
Fig. 12.1. Median height z-scores fortransplant patients in 2009
Blfs
t_P
Bham
_P
New
c_P
Gla
sg_P
Not
tm_P
Leed
s_P
Man
ch_P
Brst
l_P
L Ev
e_P
Livp
l_P
Car
df_P U
K
Centre
Z-sc
ore
–2.5
–1.5
–0.5
0.5
1.5
2.5Upper quartileMedianLower quartile
Fig. 12.2. Median weight z-scores fortransplant patients in 2009
Blfs
t_P
New
c_P
Bham
_P
Not
tm_P
Gla
sg_P
L Ev
e_P
Leed
s_P
Man
ch_P
Livp
l_P
Brst
l_P
Car
df_P U
K
Centre
Z-sc
ore
–1.5
–1.0
–0.5
0.0
0.5
1.0
1.5
2.0
2.5
3.0
Upper quartileMedianLower quartile
Fig. 12.3. Median BMI z-scores fortransplant patients in 2009
238
The UK Renal Registry The Thirteenth Annual Report

Forty-seven percent (range 33–61%) of children with afunctioning transplant achieved the haemoglobinstandard (table 12.8). However the children with poorgraft function (CKD 3bT or lower) were assessed usingthe same standard as those with well functioning graftsrather than to the standards used for dialysis patientsand so these results may look worse than centres
themselves recognise. This use of different standardsdepending on the graft function will be incorporatedseparately into next year’s report. Fifty-four percent ofhaemodialysis patients and 21% of peritoneal dialysispatients had haemoglobin below the standard. Asignificant percentage of children also had haemoglobinconcentrations above the recommended standard (19%
–5
–4
–3
–2
–1
0
1
Car
df_P
Brst
l_P
New
c_P
Blfs
t_P
Man
ch_P
Leed
s_P
Bham
_P
Livp
l_P
L Ev
e_P
Gla
sg_P
Not
tm_P U
K
Centre
Z-sc
ore
Upper quartileMedianLower quartile
Fig. 12.4. Median height z-scores fordialysis patients in 2009*Centres with less than 50% data completeness
were excluded from the centre specific analysis
but were included in the UK totals
Man
ch_P
New
c_P
Blfs
t_P
Leed
s_P
Bham
_P
L Ev
e_P
Livp
l_P
Brst
l_P
Not
tm_P
Car
df_P
Gla
sg_P U
K
Centre
Z-sc
ore
–5
–4
–3
–2
–1
0
1
2Upper quartileMedianLower quartile
Fig. 12.5. Median weight z-scores fordialysis patients in 2009*Centres with less than 50% data completeness
were excluded from the centre specific analysis
but were included in the UK totals
New
c_P
Man
ch_P
Leed
s_P
Livp
l_P
Bham
_P
Not
tm_P
L Ev
e_P
Gla
sg_P
Blfs
t_P
Brst
l_P
Car
df_P U
K
Centre
Z-sc
ore
–2.2
–1.2
–0.2
0.8
1.8
2.8 Upper quartileMedianLower quartile
Fig. 12.6. Median BMI z-scores fordialysis patients in 2009
239
Chapter 12 Paediatric biochemistry
for HD and 32% for PD). The importance of this in thepaediatric population, with a very different spectrum ofcomorbidity from adults, is not known.
The 10 year trend data suggests some improvementover time with regards to anaemia and ferritin (figure12.10), although with scope for further improvement.
The attainment of the haemoglobin standard in trans-plant patients was assessed for different levels of graftfunction (figure 12.11), in the presence of hyper-parathyroidism (figure 12.12) and with the use of MMFas immunosuppressant therapy (figure 12.13). Figure12.11 demonstrates that haemoglobin standard attainment
–2.8
–2.6
–2.4
–2.2
–2.0
–1.8
–1.6
–1.4
–1.2
–1.0
1999 2000 2001 2002 2003 2004 2005 2006 2007 2008 2009Centre
Z-sc
ore
13 9.8 8.6 7.8 7.2 7.8 6.2 5.2 5.5 7.2 9.1
Median height off GHMedian height on GH
Fig. 12.7. Median height z-scores inpaediatric patients receiving RRT from1999 to 2009, with the percentage ofchildren using growth hormone each yearNumbers represent % patients on GH
–2.0
–1.5
–1.0
–0.5
0.0
0.5
1.0
1.5
2.0
2.5
New
c_P
L Ev
e_P
Gla
sg_P
Livp
l_P
Blfs
t_P
Brst
l_P
Car
df_P
Not
tm_P
Leed
s_P
Bham
_P
Man
ch_P U
K
Centre
Z-sc
ore
Upper quartileMedianLower quartile
Fig. 12.8. Median systolic blood pressurez-scores for transplant patients in 2009Centres with less than 50% data completeness
were excluded from the centres specific analysis
but were included in the UK totals
Livp
l_P
New
c_P
L Ev
e_P
Gla
sg_P
Blfs
t_P
Man
ch_P
Brst
l_P
Not
tm_P
Bham
_P
Leed
s_P
Car
df_P U
K
Centre
Z-sc
ore
–2
–1
0
1
2
3
4Upper quartileMedianLower quartile
Fig. 12.9. Median systolic blood pressurez-scores for dialysis patients in 2009Centres with less than 50% data completeness
were excluded from the centres specific analysis
but were included in the UK totals
240
The UK Renal Registry The Thirteenth Annual Report

Table 12.7. Percentage of patients achieving the standards for systolic blood pressure in 2009
Transplant patients HD patients PD patients
CentrePatients with data
NBelow 90thpercentile
Patients with dataN
Below 90thpercentile
Patients with dataN
Below 90thpercentile
Blfst_P 15 80.0 5 80.0 3 66.7Bham_P 51 51.0 17 29.4 19 31.6Brstl_P 34 70.6 1 100.0 4 75.0Cardf_P 19 73.7 2 100.0 4 0.0Glasg_P 53 94.9 4 75.0 8 62.5L Eve_P 79 79.3 11 72.7 10 90.0Leeds_P 58 58.6 10 50.0 6 0.0Livpl_P 28 92.9 1 100.0 4 100.0Manch_P 37 43.2 2 100.0 21 52.4Newc_P 34 100.0 2 100.0 3 66.7Nottm_P 10 60.0 4 75.0 8 25.0UK 418 73.2 63 75.6 92 51.7
Table 12.8. Percentage of patients achieving the haemoglobin standard in 2009
Transplant patients Haemodialysis patients Peritoneal dialysis patients
Centre
Patients
with dataN
%
achievingstandard
% lower
thanstandard
%
abovestandard
Patients
with dataN
%
achievingstandard
% lower
thanstandard
%
abovestandard
Patients
with dataN
%
achievingstandard
% lower
thanstandard
%
abovestandard
Blfst_P 17 58.8 41.2 0.0 6 33.3 33.3 33.3 4 75.0 0.0 25.0Bham_P 53 35.9 62.3 1.9 18 50.0 33.3 16.7 20 55.0 30.0 15.0
Brstl_P 37 46.0 54.1 0.0 2 0.0 50.0 50.0 5 0.0 40.0 60.0L GOSH_P 138 44.9 54.4 0.7 21 38.1 28.6 33.3 20 50.0 20.0 30.0
Glasg_P 54 46.3 51.9 1.9 4 0.0 75.0 25.0 10 30.0 20.0 50.0L Eve_P 80 50.0 47.5 2.5 11 27.3 36.4 36.4 10 30.0 40.0 30.0
Leeds_P 61 47.5 52.5 0.0 10 20.0 60.0 20.0 7 57.1 28.6 14.3Livpl_P 28 46.4 53.6 0.0 1 0.0 100.0 0.0 4 50.0 0.0 50.0
Manch_P 37 35.1 64.9 0.0 2 0.0 100.0 0.0 21 52.4 28.6 19.1Newc_P 34 58.8 41.2 0.0 2 100.0 0.0 0.0 4 25.0 25.0 50.0
Nottm_P 13 61.5 38.5 0.0 6 50.0 33.3 16.7 11 36.4 18.2 45.5UK 552 44.3 46.8 0.6 83 26.6 45.8 19.3 117 38.4 20.9 32.4
0
10
20
30
40
50
60
70
80
1999 2000 2001 2002 2003 2004 2005 2006 2007 2008 2009Year
Perc
enta
ge o
f pat
ient
s
Hb within or above standardFerritin within or above standard
Fig. 12.10. The percentage of paediatricdialysis patients achieving the treatmentstandards for haemoglobin and ferritinfrom 1999–2009
241
Chapter 12 Paediatric biochemistry

wasworse for patients with transplant dysfunction (29%ofpatients withHb below the standard also had an eGFR<45whilst only 10%of patients with anHbwithin the standardhad an eGFR <45, p< 0.001). PTH concentrationappeared to have little effect on haemoglobin standardattainment in this analysis. However it should be bornein mind that with an observational analysis like this,the true relationship between PTH and haemoglobinconcentration may be masked by unmeasured factors.Figure 12.13 shows that patients using MMF as immuno-suppressant therapy weremore likely to have haemoglobinconcentrations below the standard, p¼ 0.01.
Calcium, phosphate and PTHIn 2009 in the UK as a whole, 49% of haemodialysis
patients and 61% of peritoneal dialysis patients had aphosphate within the target range (table 12.9). The
0
10
20
30
40
50
60
70
80
90
100
Below standard Within standard Above standard
Haemoglobin standard achievement
Perc
enta
ge o
f pat
ient
s
> 60 mls/min45–60 mls/min<45 mls/min
Fig. 12.11. The achievement of haemoglobin treatment standardsin paediatric transplant patients, by the level of graft function*This figures combines all data from 1999–2009
Below standard Within standard Above standard
Haemoglobin standard achievement
Perc
enta
ge o
f pat
ient
s
0
10
20
30
40
50
60
70
80
90
100
PTH above the standardPTH below/within the standard
Fig. 12.12. The achievement of haemoglobin treatment standardsin paediatric transplant patients, by PTH concentration*This figure combines all data from 1999–2009
Below standard Within standard Above standard
Haemoglobin standard achievement
Perc
enta
ge o
f pat
ient
s
0
10
20
30
40
50
60
70
80
90
100
Not on MMFOn MMF
Fig. 12.13. The achievement of haemoglobin treatment standardsin paediatric transplant patients, by use of MMF*This figure combines all data from 1999–2009
Table 12.9. Achievement of the phosphate standard in dialysis patients in 2009
Haemodialysis Peritoneal dialysis
CentrePatients with data
N% withinstandard
% belowstandard
% abovestandard
Patients with dataN
% withinstandard
% belowstandard
% abovestandard
Blfst_P 5 40 20 40 3 100 0 0Bham_P 18 56 0 44 20 60 20 20Brstl_P 2 100 0 0 5 40 40 20L GOSH_P 21 38 10 52 20 55 15 30Glasg_P 4 0 0 100 10 50 0 50L Eve_P 11 55 18 27 10 80 0 10Leeds_P 10 70 0 30 7 43 0 57Livpl_P 1 0 0 100 4 50 0 50Manch_P 2 50 0 50 21 67 5 29Newc_P 2 0 0 100 3 33 33 33Nottm_P 6 83 0 17 11 55 9 36UK 83 49 4 47 115 61 1 28
242
The UK Renal Registry The Thirteenth Annual Report

achievement of the standard for calcium was better with77% of children on haemodialysis and 68% of childrenon peritoneal dialysis having a calcium level within thetarget range (table 12.10). Fifty-six percent of children
on HD and 63% on PD had a PTH within the targetrange with wide inter-centre variation and a medianvalue for the whole UK of 16 pmol/L (table 12.11).Caution should be exercised in the interpretation of
Table 12.10. Achievement of the adjusted calcium standard in dialysis patients in 2009
Haemodialysis Peritoneal dialysis
CentrePatients with data
N% withinstandard
% belowstandard
% abovestandard
Patients with dataN
% withinstandard
% belowstandard
% abovestandard
Blfst_P 3 60 20 20 2 100 0 0Bham_P 18 61 6 33 20 45 0 55Brstl_P 2 100 0 0 5 40 0 60L GOSH_P 21 33 14 52 20 60 0 40Glasg_P 4 75 0 25 10 60 20 20L Eve_P 10 100 0 0 8 90 0 10Leeds_P 10 80 0 20 7 43 14 43Livpl_P 0 100 0 0 4 75 0 25Manch_P 2 50 0 50 21 86 5 10Newc_P 2 100 0 0 2 50 0 50Nottm_P 6 67 0 33 11 73 0 27UK 78 77 3 20 111 68 3 28
Table 12.11. Achievement of the PTH standard in dialysis patients in 2009
Haemodialysis Peritoneal dialysis
CentrePatients with data
N% withinstandard
% abovestandard
Patients with dataN
% withinstandard
% abovestandard
Blfst_P 6 17 83 4 50 50Bham_P 18 33 67 20 50 50Brstl_P 2 100 0 5 80 20L GOSH_P 21 62 38 20 70 30Glasg_P 4 75 25 10 80 20L Eve_P 11 73 27 10 60 40Leeds_P 10 40 60 7 43 57Livpl_P 1 0 100 4 25 75Newc_P 2 100 0 4 100 0Nottm_P 6 50 50 11 64 36UK 84 56 44 99 63 37
0
5
10
15
20
25
30
35
40
45
50
Leed
s_P
GO
SH
Bham
_P
Brst
l_P
Gla
sg_P
L Ev
e_P
Car
df_P
New
c_P
Not
tm_P
Blfs
t_P
Man
ch_P
Livp
l_P
UK
Centre
PTH
con
cent
ratio
n (p
mol
/L)
Upper quartileMedianLower quartile
Fig. 12.14. Median PTH concentration indialysis patients in 2009, by centre
243
Chapter 12 Paediatric biochemistry

these analyses as it was not always possible to identifywhich units were used to measure PTH, for instance, ifbloods were taken at different laboratories and alsosome variation exists between the different PTH assaysavailable.
Discussion
Whilst the move to electronic reporting with multipledata submissions per annum remained incomplete,interpretation of annual census data with regard tohaematological, biochemical and blood pressureparameters, needs to be made with caution. Over thewhole UK there were only a small number of childrenon any specific modality of dialysis at one time pointand within the course of a year parameters such ascalcium, phosphate and PTH may vary greatly withinany individual. The ability to look at annual averagevalues for different parameters in the future will be agreat advance. That said a number of recurring themesare evident from this report.
AnthropometryAs in previous reports the paediatric renal failure
population was shorter than the UK average. This isnot surprising and year by year there is unlikely to beany rapid shift towards normality. Patients requiringdialysis fare worse than transplanted patients. Overall,neither malnutrition nor obesity afflicted the majorityof patients in the populations. Further work needs tobe undertaken to look at the effect of steroid freeimmunosuppression regimes on transplanted patientsas increasing number of centres are using these regimes.Duration of dialysis and height attainment and the use ofgrowth hormone also require analysis in the future –particularly with the paucity of deceased donor kidneysavailable. Some sub-analysis of both the dialysis popula-tions to exclude either primary diseases or comorbidconditions leading to inevitable short stature wouldhelp clarify the situation with regard to those withisolated renal failure at the outset.
Blood pressureAchieving targets for blood pressure remained a
problem. This is one area where there are apparentcentre differences. Further work to assess whether thiswas related to the demography of the patient groupwithin each centre or to the zeal of the team caring for
these patients may be beneficial. Looking at a trend ofblood pressure readings over a year together with anti-hypertensive usage and stratifying according to primarydisease will be considered in future analyses. However,an audit of blood pressure control amongst paediatrictransplant patients carried out for the BAPN foundno relationship between ethnicity or primary renaldisease and achievement of blood pressure targets [6].Cardiovascular disease was a major cause of mortalityand morbidity in patients with renal failure and clinicalteams need to continue to focus on their on-goingefforts to improve overall BP control in this high riskpopulation.
AnaemiaAs with previous reports the management of anaemia
remained imperfect. It appears that ferritin levels areimproving and it is hoped that with time, this will leadto more patients having haemoglobin concentrationswithin the target range. As is already being seen tosome extent, the normal distribution of haemoglobinwill mean that if a shift of the curve to the right to getmore patients with low haemoglobin into range willresult in more patients with relatively higher haemo-globins. Whilst this is a definite risk factor in adultpatients with established cardiovascular disease there isno data to say whether this will be a problem in childrenor not. This subject requires further study whilstaccepting that trials in adult with both pre-dialysis anddialysis dependent CKD, comparing effects of treatmentof anaemia to different targets, have reported higher ratesof adverse events in subjects in whom higher targeted Hblevels was sought [7, 8].
BiochemistryBone disease remained a major problem in children
with ERF. The percentage achieving desired targetsremained too low. Again, more robust analysis will bepossible when annual patient trends rather than isolatedvalues can be reported. The management of renal osteo-dystrophy is changing – particularly with the advent ofnew phosphate binders and calcimimetics which mayin time improve achievement of audit standards.
The data presented in this report provide a snap shotpicture of the care of children receiving renal replace-ment therapy in the UK in 2009. In time, increased useof renal IT systems will enable greater insight to begained by allowing the study of a greater number oftime-points during the year. In addition to this it ishoped that the seamless transfer of this data within
244
The UK Renal Registry The Thirteenth Annual Report

the registry as young patients move to adult centreswill soon allow the long term assessment of whetherthe current goals are the right ones.
Conflicts of interest: none
References
1 UK Renal Registry 12th Annual Report (December 2009): Chapter 12Clinical, Haematological and Biochemical Parameters in Patientsreceiving Renal Replacement Therapy in Paediatric Centres in the UKin 2008: national and centre-specific analyses. Hussain F, Castledine C,Schalkwyk DV, Sinha MD, Lewis MA, Inward C. Nephron Clin Pract2010;115(Suppl 1):c289–c308
2 Freeman JVCT, Chinn S et al. Cross sectional stature and weight referencecurves for the UK, 1990. Arch Dis Child 1995;73:17–24
3 National High Blood Pressure Education Program Working Group onHigh Blood Pressure in Children and Adolescents.The Fourth Reporton the Diagnosis, Evaluation, and Treatment of High Blood Pressure inChildren and Adolescents. Pediatrics 2004;114(2):555–576
4 BAPN clinical standards http://www.bapn.org/clinical_standards.html
5 NICE clinical guideline 39. Anaemia management in people with chronickidney disease. London: National Institute for Health and ClinicalExcellence, 2008
6 Prevalence and management of hypertension in children post renaltransplantation – a report of the British Association for PaediatricNephrology. Sinha MD, Gilg J, Kerecuk L, Reid CJD. Pediatr Nephrol2008;23:1666:P280
7 Besarab A, Bolton WK, Browne JK et al. The effects of normal ascompared with low hematocrit values in patients with cardiac diseasewho are receiving hemodialysis and epoetin. New Engl J Med 1998;339:584–590
8 Singh AK, Szczech L, Tang KL et al. Correction of anemia with epoetinalfa in chronic kidney disease. N Engl J Med 2006;355:2085–2098
245
Chapter 12 Paediatric biochemistry