'Work, Consumption and the Self in the UK Retail Book Trade ...
Upload
khangminh22Category
view
0download
0
© Mediatique Ltd 2020 | This document is confidential and intended solely for the use and information of the addressee
Future audio consumption in the UK
A report for Arqiva, Bauer Radio, the BBC and Global Radio
11th December 2020
2© Mediatique Ltd 2020 |
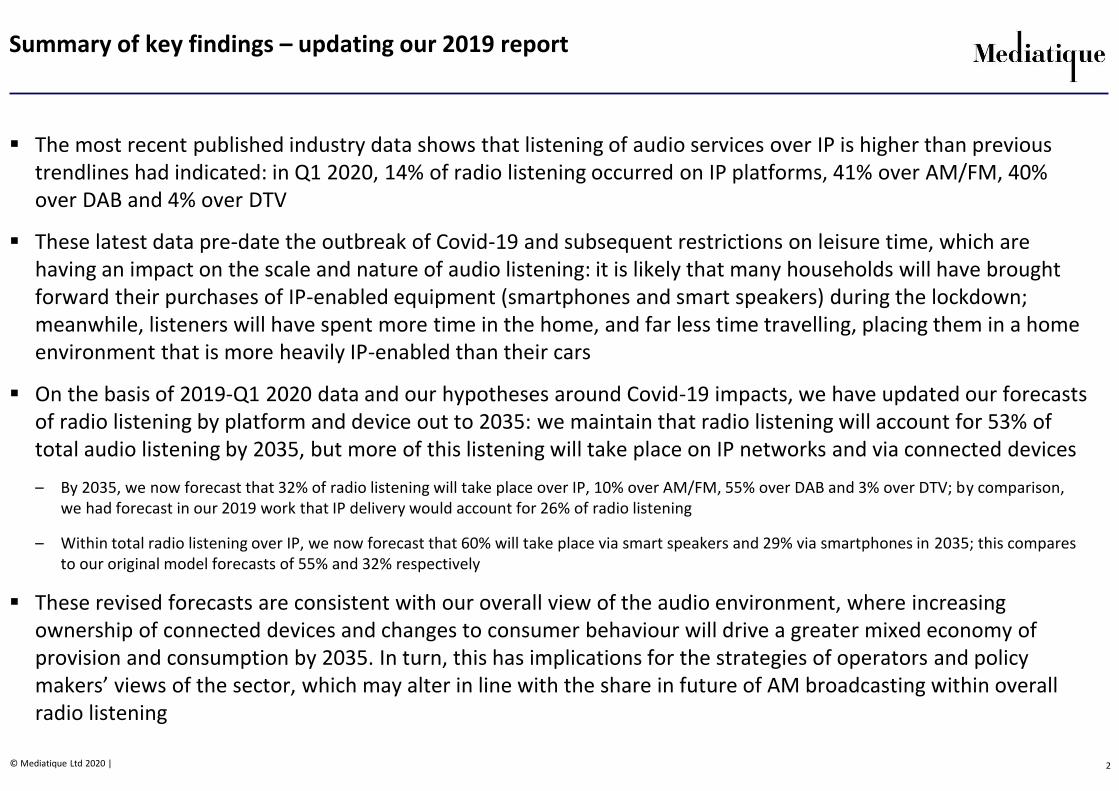
Summary of key findings – updating our 2019 report
� The most recent published industry data shows that listening of audio services over IP is higher than previous trendlines had indicated: in Q1 2020, 14% of radio listening occurred on IP platforms, 41% over AM/FM, 40% over DAB and 4% over DTV
� These latest data pre-date the outbreak of Covid-19 and subsequent restrictions on leisure time, which are having an impact on the scale and nature of audio listening: it is likely that many households will have brought forward their purchases of IP-enabled equipment (smartphones and smart speakers) during the lockdown; meanwhile, listeners will have spent more time in the home, and far less time travelling, placing them in a home environment that is more heavily IP-enabled than their cars
� On the basis of 2019-Q1 2020 data and our hypotheses around Covid-19 impacts, we have updated our forecasts of radio listening by platform and device out to 2035: we maintain that radio listening will account for 53% of total audio listening by 2035, but more of this listening will take place on IP networks and via connected devices
– By 2035, we now forecast that 32% of radio listening will take place over IP, 10% over AM/FM, 55% over DAB and 3% over DTV; by comparison, we had forecast in our 2019 work that IP delivery would account for 26% of radio listening
– Within total radio listening over IP, we now forecast that 60% will take place via smart speakers and 29% via smartphones in 2035; this compares to our original model forecasts of 55% and 32% respectively
� These revised forecasts are consistent with our overall view of the audio environment, where increasing ownership of connected devices and changes to consumer behaviour will drive a greater mixed economy of provision and consumption by 2035. In turn, this has implications for the strategies of operators and policy makers’ views of the sector, which may alter in line with the share in future of AM broadcasting within overall radio listening

3© Mediatique Ltd 2020 |
Mediatique was asked to provide an update to its 2019 audio listening model, to reflect recent changes in market context and listener behaviour
� Mediatique was commissioned in 2019 by a working group of Arqiva, Bauer Media, the BBC and Global Radio to provide a forecast of audio listening in the UK to 2035
� The objective of our work was two-fold:
– To understand how UK audio listening will evolve to 2035 absent any major regulatory or industry intervention; and
– To understand the drivers of changing listening behaviours and identify which will have the greatest impact on usage
� Based on our 2019 work, we concluded that listening behaviours would continue to fragment, leading to a decline in radio listening and a greater reliance on audio listening on new platforms and connected devices
� Since this work, the shift towards digital listening has continued and take-up of connected devices (including smartphones and smart speakers) has increased; we were therefore asked by the working group to update our long-term view of the platform and device elements of our work – specifically, regarding the platforms and devices on which radio listening occurs to 2035
� This short report is structured as follows:
– We provide an update of the current audio market context, including key developments since our last report
– We provide a recap of the primary outputs of our listening model
– We provide an updated view of how radio listening will break down by platform and device over the model period
– We also provide some high-level data analysis on the current scale of AM listening and likely trendlines over the model period
� We have reviewed recent data from RAJAR and MIDAS to inform our update, including listening by service type, age group, device ownership and location (given recent restrictions arising from Covid-19, RAJAR data is only available up to Q1 2020)
� The forecasts and analysis in this report are those of Mediatique and should not be inferred to represent the views of the commissioning clients
4© Mediatique Ltd 2020 |
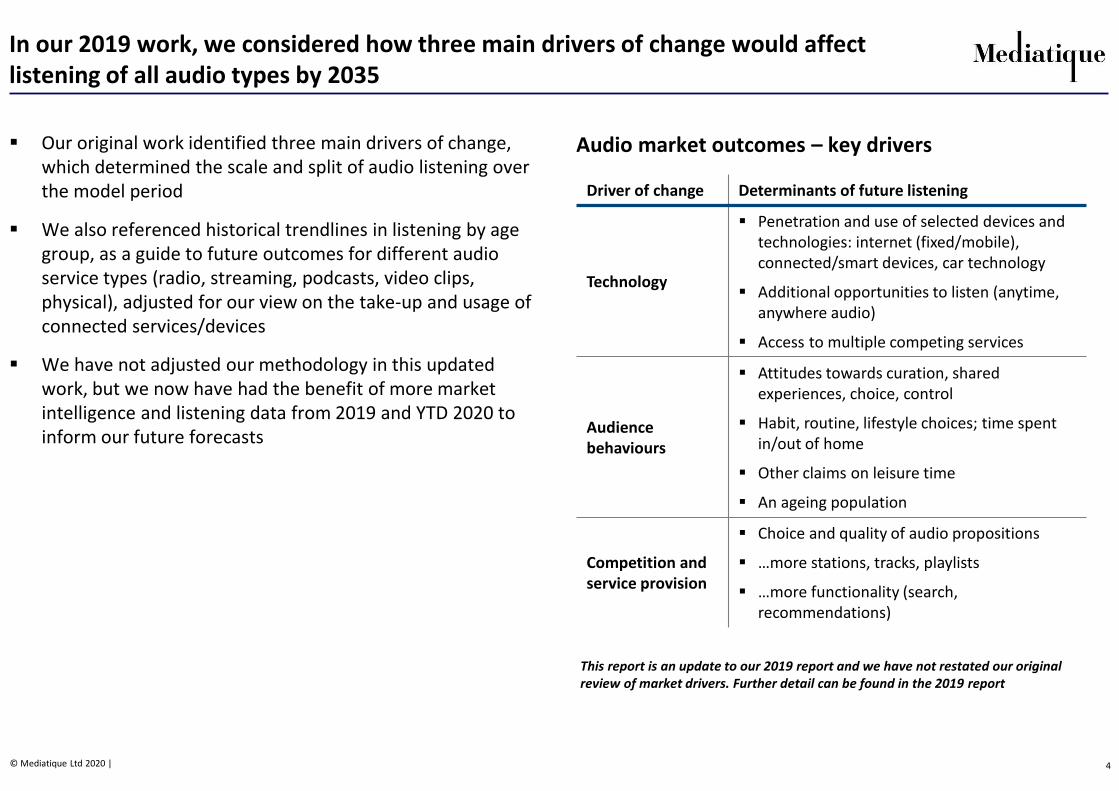
In our 2019 work, we considered how three main drivers of change would affect listening of all audio types by 2035
� Our original work identified three main drivers of change, which determined the scale and split of audio listening over the model period
� We also referenced historical trendlines in listening by age group, as a guide to future outcomes for different audio service types (radio, streaming, podcasts, video clips, physical), adjusted for our view on the take-up and usage of connected services/devices
� We have not adjusted our methodology in this updated work, but we now have had the benefit of more market intelligence and listening data from 2019 and YTD 2020 to inform our future forecasts
Audio market outcomes – key drivers
Driver of change Determinants of future listening
Technology
� Penetration and use of selected devices and technologies: internet (fixed/mobile), connected/smart devices, car technology
� Additional opportunities to listen (anytime, anywhere audio)
� Access to multiple competing services
Audience behaviours
� Attitudes towards curation, shared experiences, choice, control
� Habit, routine, lifestyle choices; time spent in/out of home
� Other claims on leisure time
� An ageing population
Competition and service provision
� Choice and quality of audio propositions
� …more stations, tracks, playlists
� …more functionality (search, recommendations)
This report is an update to our 2019 report and we have not restated our original review of market drivers. Further detail can be found in the 2019 report

5© Mediatique Ltd 2020 |
Since our 2019 report, the UK audio market has continued to evolve and we have identified the main areas of change
Recent themes and developments in the UK audio market
Increased take-up of connected
devices
Changes in consumer
behaviour and preferences
� Restrictions arising from Covid-19 have had significant short-term implications on listening location – greater in-home listening (where IP listening is greatest), reduction in in-car listening (where analogue and DAB listening is greatest)
� Restrictions may have acted as an accelerant of previously observable trends in audio landscape – including bringing forward purchases of connected equipment (even among demos resistant in the recent past) and greater emphasis on home entertainment
� A spike in radio listening (particularly of news during daytime) is unlikely to persist post the end of serial lockdowns
� Live radio continues to make up a large part of UK listeners’ audio diet
� Listening to on-demand services such as podcasts and streaming platforms continues to grow, albeit from a lower base compared to live radio
� Increased familiarity with connected devices across demographics will continue to sustain the pace of behavioural change
Short to medium-term
impacts of Covid-19
� Smart speaker sales have accelerated – even before Covid-19 lockdown
� Increased smart speaker take up is notable particularly in youngest (16-24) and oldest age groups (55+)
� Smartphone penetration has continued to grow (79% Q1 2019 versus 83% Q1 2020)
� Other connected device penetration (tablet, computers) has generally stayed flat

6© Mediatique Ltd 2020 |
Total audio listening – hours/person/week, adults 15+
In 2019 and Q1 2020, live radio continued to account for the majority of audio listening in the UK, although streaming now represents 13% of total listening
Radio average hours/week: Q1 2019 – Q1 2020Source: MIDAS
Source: RAJAR.
� Live radio listening was roughly flat compared to 2018, with average weekly hours down just 30 mins to 20.2 hours in Q1 2020 from Q1 2018
� Live radio accounted for 71% of UK adults’ total audio consumption
� In 2019 and Q1 2020, the location of listening was relatively stable compared to 2018
– 59% at home, 24% in car/van and 16% at work/elsewhere for all radio listening in 2019
– Car/van now accounts for 25% of DAB listening in Q1 2020 (compared to 23% in Q1 2018)
� Outside of live radio, listening to a streaming service was the most significant – and fastest growing – audio category
18.9 19.5 19.5 18.4 17.9
1.0 1.2 1.21.1 1.1
2.7 2.8 3.03.1 3.4
1.0 0.9 1.00.8 0.9
1.4 1.3 1.21.0 1.0
0.7 0.6 0.80.8 0.6
26.2 26.8 27.125.7 25.4
0
5
10
15
20
25
30
Q1 2019 Q2 2019 Q3 2019 Q4 2019 Q1 2020
Vinyl/cassette
CD
Digital owned
Online music clips
Streaming service
Podcast
Catch-up radio
Live radio
20.7
12.9
16.7
19.223.2
25.0 24.4
20.2
12.516.1
18.3
22.424.0 24.5
0
5
10
15
20
25
30
15+ 15-24 25-34 35-44 45-54 55-64 65+
Q4 2018 Q1 2019 Q2 2019 Q3 2019 Q4 2019 Q1 2020

7© Mediatique Ltd 2020 |
Live radio listening – split by source and age
Source: RAJAR
2019-20 data confirms the increasing mixed economy in the delivery of radio, with continued growth in IP listening and migration from AM/FM to DAB
� In 2019/20 AM/FM share of radio listening declined further, as IP and DAB took share
� This is particularly marked in younger demographics, generally in favour of IP listening
51% 48% 43% 41%
35% 37% 40% 40%
5% 5% 5% 4%
8% 9% 12% 14%
0%
20%
40%
60%
80%
100%
2017 2018 2019 Q1 2020
15+
AM/FM DAB DTV IP
50% 48% 42% 42% 49% 46% 39% 40% 46% 43% 36% 35%
26% 29% 32% 31%32% 35%
38% 38%37% 39%
43% 42%
8% 8% 5% 5%5% 5% 5% 4%
5% 4% 4% 3%
17% 15% 20% 22% 13% 14% 18% 18% 12% 14% 17% 21%
0%
20%
40%
60%
80%
100%
2017 2018 2019 Q12020
2017 2018 2019 Q12020
2017 2018 2019 Q12020
15-24 25-34 35-44
AM/FM DAB DTV IP
48% 43% 38% 35%51% 48% 43% 40%
59% 57% 52% 51%
39% 42% 44% 46%
38% 40%42% 42%
34% 35% 37% 38%
5% 4% 4% 4%5% 5% 5% 4%
5% 5% 5% 5%9% 11% 13% 15%
6% 7% 10% 13%2% 4% 5% 6%
0%
20%
40%
60%
80%
100%
2017 2018 2019 Q12020
2017 2018 2019 Q12020
2017 2018 2019 Q12020
45-54 55-64 65+
AM/FM DAB DTV IP
Note: In Q1 2019 RAJAR refined its reporting methodology to more accurately incorporate smart speaker listening to total IP listening; further, in Q4 2019, smart speakers were included in the platform category when respondents are prompted to ‘select your listening platform’.Whilst IP share of radio listening is likely to have grown over the period anyway, RAJAR methodological refinement as described above is likely to have compounded this growth.

8© Mediatique Ltd 2020 |
Our central 2019 model forecast that radio’s share of total audio listening would decline to 53% by 2035
� Our 2019 model forecast that radio listening among Adults 15+ will account for 53% of total audio listening by 2035, down from 72% at the end of 2018; the key area of growth is streaming, which we forecast to account for 27% of all audio listening by 2035
� This forecast averages across the entire population, with younger age groups having a far lower commitment to radio compared to their older counterparts
� RAJAR data from 2019 broadly confirms this original hypothesis, with sustained growth in streaming and a slight decrease in live radio
� Our 2019 forecast of streaming (11% of audio hours) is in line with the 2019 RAJAR data; actual outcomes diverge from our original forecast marginally in owned audio, podcasts and online music – but trendlines remain the same
Adults 15+ share of audio consumption – service type (% of hours): 2018-35 (selected years)
72% 70% 69% 63% 57% 53%
2%3%
3% 3% 4%7%
10% 11%
10% 11% 13% 19% 23% 27%4% 4% 3% 3% 3% 3%7% 6% 5% 3% 2% 2%
0%
10%
20%
30%
40%
50%
60%
70%
80%
90%
100%
2018 2019 2020 2025 2030 2035
Live radio Catch-up radio PodcastStreaming Online music clips Digital ownedCD/cassette Vinyl
Mediatique forecast RAJAR dataLive radio 70% 72%Catch-up radio 2% 2%Podcast 3% 4%Streaming 11% 11%Online music clips 4% 3%Digital owned 6% 5%CD/cassette/vinyl 4% 3%
2019 reconciliation: Mediatique vs RAJAR (actual)

9© Mediatique Ltd 2020 |
Radio listening in 2035 will be made up of a range of platforms and devices, and we used trends within these platforms/devices to amend our forecasts out to 2035
� Our original model considered the platforms and devices on which radio listening would occur by 2035, in light of changes to technology and consumer behaviour
– Our forecasts take into account the impact of increasing connectivity, take-up of DAB and connected devices (which can be used to listen to radio and non-radio services) both in the home and in the car
– The iterated model reflects the impact of two significant factors: greater device reach (i.e., penetration) and consumer behaviour (greater radio listening per smart speaker user)
– Our central hypothesis is that by 2035, those listeners still consuming radio will do so through a mix of platforms, distribution modes and devices
� We updated our original forecasts in light of observed changes to behaviour and the potential impact of Covid-19
� We also conducted a sensitivity analysis on penetration of smart speakers, demonstrating the impact on IP share of live radio listening and IP listening by device
Share of radio hours by platform – notable changes to outcome
IP share of radio hours, by device – notable changes to outcome
Change Determinant and reasoning for change
Smart speaker hours per user
� Smart speaker hours per user significantly up in trailing period (used as foundation for 2035 projection)
Smart speaker radio use
� Subsequently total smart speaker radio use also up (assuming no change to population and/or reach in 2035)
% total radio listening on smart speaker
� Greater share of % total radio listening on a smart speaker – higher speaker hours in context of same audio total
Note: we have not made any changes to original reach and/or penetration assumptions – we expect that any observed increase in the trailing period is a ‘pull forward’ from future growth, and will not materially impact these inputs
Change Determinant and reasoning for change
IP share of radio listening by 2035
� 2019/2020 data confirm that radio listening over IP is higher than our original forecast (14% in Q1 2020, versus 12% in our model for the same year). This compounded with higher user hours lead us to adjust our long-term view of IP-delivered radio, resulting in a 6% point increase in share by the end of the period (2035). It will take greater share from a combination of other modes: analogue, DAB and DTV
Impact ofCovid-19 restrictions
� More leisure time being spent at home (and less time spent in-car) may condition listeners to make greater use of IP as a delivery mechanism
� IP device purchases may be ‘pulled forward’ from future years, although long-term target IP penetration likely to be unaffected
� Slump in 2020 vehicle registrations (DAB-enabled cars) may compound loss of share for DAB listening

10© Mediatique Ltd 2020 |
When included in our model, the impact of recent trailing data increases IP’s eventual share of live radio hours to 32%
Share of live radio hours by platform in 2035 – original 2019
Share of live radio hours by platform in 2035 – revised 2020
59% 56% 53% 49% 44% 41% 38% 35% 32% 29% 25% 22% 20% 17% 15% 14% 12% 11% 11% 10% 10%
28% 31% 34% 37% 40% 40% 42% 44% 46% 47% 49% 50% 52% 52% 53% 53% 53% 54% 54% 55% 55%
5% 5% 5% 5% 5% 4% 4% 4% 4% 4% 4% 4% 4% 4% 4% 4% 4% 3% 3% 3% 3%
7% 8% 8% 9% 11% 14% 15% 16% 18% 20% 22% 23% 25% 26% 28% 29% 31% 31% 32% 32% 32%
0%
20%
40%
60%
80%
100%
2015 2016 2017 2018 2019 2020 2021 2022 2023 2024 2025 2026 2027 2028 2029 2030 2031 2032 2033 2034 2035
AM/FM DAB DTV IP
59% 56% 53% 49% 44% 40% 37% 34% 31% 28% 24% 22% 20% 18% 17% 15% 14% 14% 13% 13% 13%
28% 31% 34% 37% 40% 43% 45% 47% 49% 50% 51% 53% 54% 54% 55% 56% 56% 57% 57% 57% 57%
5% 5% 5% 5% 5% 5% 5% 5% 5% 5% 5% 5% 5% 5% 5% 5% 4% 4% 4% 4% 4%
7% 8% 8% 9% 11% 12% 13% 14% 16% 17% 19% 20% 22% 23% 24% 24% 25% 25% 26% 26% 26%
0%10%20%30%40%50%60%70%80%90%
100%
2015 2016 2017 2018 2019 2020 2021 2022 2023 2024 2025 2026 2027 2028 2029 2030 2031 2032 2033 2034 2035
AM/FM DAB DTV IP
Our forecasts do not assume any change in public policy towards DAB or any move towards analogue switchover
The impact of Covid-19 means share of live radio listening will likely be higher in FY-2020 than evidenced here; reduced time spent in the car and more time in IP-rich homes will favour listening on connected devices
All historic data (to 2020) refers to Q1 only
All historic data (to 2020) refers to Q1 only

11© Mediatique Ltd 2020 |
Device penetration: forecast versus actual (2019)
Device penetration in 2019 was higher than forecast – however, this ‘pull forward’ of device purchases does not change our end point in 2035
2019(forecast)
2019(actual)
% pointchange
Smart speaker 17.6% 24.2% +6.6%
Smartphone 78.2% 80.6% +2.4%
Tablet 63.6% 65.5% +1.9%
Laptop computer 74.4% 77.5% +3.1%
Desktop computer 49.1% 48.5% -0.6%
Device penetration: 2016 – 2035, revised 2020Device penetration: 2016 – 2035, original 2019
18%
50%
78% 88%
64% 63%
74% 72%
49%
30%
0%10%20%30%40%50%60%70%80%90%
100%
2016
2017
2018
2019
2020
2021
2022
2023
2024
2025
2026
2027
2028
2029
2030
2031
2032
2033
2034
2035
Smart speaker Smartphone Tablet
Laptop computer Desktop computer
24%
50%
81% 88%
66% 63%
78%72%
49%
30%
0%10%20%30%40%50%60%70%80%90%
100%
2016
2017
2018
2019
2020
2021
2022
2023
2024
2025
2026
2027
2028
2029
2030
2031
2032
2033
2034
2035
Smart speaker Smartphone Tablet
Laptop computer Desktop computer
� Our 2019 model expected smart speaker penetration to reach 17.6% in 2019 – this figure actually reached 24.2%, an increase of 6.6% points from the original forecast
� Penetration was higher than expected in smartphones, tablets and laptop computers too – desktop computers generally remained on the same trendline as expected
� The trailing data does not change our long-term view on penetration; we expect this to represent a ‘pull forward’ of purchases rather than a fundamental shift
Note: 2020 is YTD and refers to Q1 2020 only; it is likely that the ‘pull forward’ we allude to above has extended to full year 2020, induced by the pandemic. We maintain our belief that even if growth in the period is greater than expected, ‘terminal maturity’ of the market is likely to remain static

12© Mediatique Ltd 2020 |
We expect that 60% of IP radio hours will be represented by smart speakers in 2035, up from 55% in the previous iteration of our report
IP share of radio hours, by device – original 2019
IP share of radio hours, by device – revised 2020
6%23% 28% 30% 31% 33% 35% 36% 38% 40% 41% 43% 45% 46% 48% 50% 51% 53% 55%38%
31%34% 34% 34% 33% 33% 33% 33% 33% 33% 33% 33% 33% 32% 32% 32% 32% 32%
11%9%
9% 8% 8% 8% 7% 7% 7% 6% 6% 6% 6% 5% 5% 5% 4% 4% 4%
46%37% 30% 28% 27% 26% 25% 23% 22% 21% 20% 18% 17% 16% 15% 13% 12% 11% 10%
0%10%20%30%40%50%60%70%80%90%
100%
2017 2018 2019 2020 2021 2022 2023 2024 2025 2026 2027 2028 2029 2030 2031 2032 2033 2034 2035
Smart speaker Smartphone Tablet PC
6%23%
37% 41% 42% 44% 45% 46% 47% 49% 50% 51% 53% 54% 55% 56% 58% 59% 60%38%
31%
29% 24% 24% 24% 25% 25% 25% 26% 26% 26% 27% 27% 27% 28% 28% 28% 29%
11%9%
6% 6% 6% 5% 5% 5% 5% 5% 4% 4% 4% 4% 3% 3% 3% 3% 3%
46%37%
28% 30% 28% 27% 25% 24% 23% 21% 20% 18% 17% 16% 14% 13% 11% 10% 9%
0%10%20%30%40%50%60%70%80%90%
100%
2017 2018 2019 2020 2021 2022 2023 2024 2025 2026 2027 2028 2029 2030 2031 2032 2033 2034 2035
Smart speaker Smartphone Tablet PC

13© Mediatique Ltd 2020 |
If we assume higher levels of smart speaker penetration than in our base case, IP share of live radio hours will grow; so too will smart speaker share of total IP listening
� In addition to providing an updated view of how radio listening will break down by platform and device in 2035, we were asked by the working group to include sensitivities regarding higher smart speaker penetration and how this might affect IP share of live radio listening
– We expect our base case for smart speaker penetration (50%) to contribute to IP taking 32% share of radio listening in 2035. Higher penetration elevates this even further: 35% (60% penetration) and 40% (70% penetration)
– IP listening by device is similarly affected. Our base case suggests that 60% of listening over IP will be represented by a smart speaker in 2035. Higher penetration assumptions grow this share to 64% and 68% respectively
– The implications of this are substitutive loss in share of listening for other modes of delivery (analogue; DAB; DTV) and connected devices (smartphone; tablet; PC)
2035 share of live radio listening – sensitivity analysis, platform
Share of IP listening – sensitivity analysis, listening by deviceDevice 2035 (base case) 2035 (1) 2035 (2)
Smart speaker 60% 64% 68%
Smartphone 29% 26% 23%
Tablet 3% 2% 2%
PC 9% 8% 7%
Assumption – smart speaker penetration AM/FM DAB DTV IP
50% penetration(Base case)
10% 55% 3% 32%
60% penetration(Sensitivity 1)
10% 52% 3% 35%
70% penetration(Sensitivity 2)
9% 49% 3% 40%
For both sensitivities, we have assumed that IP takes share from other distribution modes in proportion to their underlying market share.
Categories may not add up to 100% due to rounding.

14© Mediatique Ltd 2020 |
The following slides provide some high-level insights into the scale of AM listening currently and over the model period. We were not tasked with providing a discrete forecast of AM listening nor to consider the implications of an AM switch off on our market forecasts

15© Mediatique Ltd 2020 |
� RAJAR data does not split out analogue listening between AM and FM modes
� Survey data suggests that radio listeners are reducing their regular listening to AM stations faster than that of FM stations
� Listening data also confirms that AM listening accounts is declining , with listeners migrating to DAB and IP
� We have not undertaken a discrete forecast of AM listening over the model period; however, we would expect the decline in AM listening over time to be greater than that of overall analogue listening
0
10,000
20,000
30,000
40,000
50,000
60,000
Q12010
Q32010
Q12011
Q32011
Q12012
Q32012
Q12013
Q32013
Q12014
Q32014
Q12015
Q32015
Q12016
Q32016
Q12017
Q32017
Q12018
Q32018
Q12019
Q32019
Q12020
Global stations
talkSPORT
Radio 5 Live
15%
11%
4%
4%
8%
13%
3%
7%
Every day
At leastweekly
At leastmonthly
Less thanonce amonth
20102019
How often do you listen to AM/FM radio through a radio set?
AM listening hours – for selected stations (000s)
Ofcom Technology Tracker. Base: those who listen to radio. Question discontinued in 2020
Hours for R5L, talkSPORT and Global’s AM stations only. YoY variations may reflect changes to station names and areas
31%
21%
7%
2%
28%
25%
5%
6%
Every day
At leastweekly
At leastmonthly
Less thanonce amonth
20102019
AM radio FM radio
Evidence suggests a declining role for AM listening within overall analogue listening, although we have not analysed AM’s share of the total over the model period
CAGR: -5%

16© Mediatique Ltd 2020 |
AM reach as % of each station’s total reach (selected stations)
0%
10%
20%
30%
40%
50%
60%
70%
80%
90%
Q1:10
Q3:10
Q1:11
Q3:11
Q1:12
Q3:12
Q1:13
Q3:13
Q1:14
Q3:14
Q1:15
Q3:15
Q1:16
Q3:16
Q1:17
Q3:17
Q1:18
Q3:18
Q1:19
Q3:19
Q1:20
Global stations
Radio 5 Live
talkSPORT
0%
10%
20%
30%
40%
50%
60%
70%
Q1:10
Q3:10
Q1:11
Q3:11
Q1:12
Q3:12
Q1:13
Q3:13
Q1:14
Q3:14
Q1:15
Q3:15
Q1:16
Q3:16
Q1:17
Q3:17
Q1:18
Q3:18
Q1:19
Q3:19
Q1:20
Global stations
Radio 5 Live
talksSPORT
AM hours as % of each station’s total hours (selected stations)
20352035
� In a sample of AM stations, AM listening accounts for 40-50% of their total reach and 35-40% of total hours for these stations –roughly half the levels seen in 2010
� A continuation of this trend would see AM listening continue to decline – for the BBC stations in our sample, a linear regression would see listening reach close to 0% in 2035
� In practice, some residual AM listening will endure as some households resist digital upgrade
� Listening outcomes would also be materially affected if operators stopped AM broadcasts for certain stations
A continuation of the past 10-year decline in AM listening would see a significant reduction in AM listening by 2035
Q1 2020: 40-50% of total reach
Q1 2020: 35-40% of total hours
Source: BBC, Global. YoY variations among Global stations may reflect changes to station names and areas

17© Mediatique Ltd 2020 |
� Some AM services have closed in recent years as alternative routes to market have emerged (DAB and IP) and operators have sought to reduce simulcast costs– BBC local AM stations have been the main services to close over the
last two years, and further closures among the BBC and commercial stations are due in 2020
– New community radio stations have offset declines in the total number of AM services
� As listening to AM stations declines, there are likely to be further closures of AM services at the margins; at some point, policy makers and radio operators may decide to switch off AM broadcasts altogether
� A detailed analysis of the impact of an AM shutdown is outside the scope of our work; further work may be required to consider how an AM shutdown would affect the scale and nature of radio listening
� AM listeners tend to be committed radio listeners and generally older than the average radio (and audio) listener
� The impact may vary by the availability of individual stations –depending on the distribution footprint, listeners may migrate to FM or DAB or, potentially, to IP; the latter option, as we know, may introduce listeners to alternative audio sources over time
AM stations in the UK, by categoryOfcom data (Media Nations/Communications Market Report)
31
53 54 54 54 52 51 51 51 50 50
36
36 36 36 35 35 35 35 26 26
19
4
4 6 6 7 6 6 10
10 12 24
0
20
40
60
80
100
120
2010 2011 2012 2013 2014 2015 2016 2017 2018 2019 2020
Community
National BBC
Local BBC
Nationalcommercial
Localcommercial
Ofcom Media Nations, August 2020“In January 2020, the BBC announced that it would close 18 medium wave transmitters, thereby reducing AM coverage for BBC Radio Wales and BBC Radio Scotland, BBC Radio Norfolk and BBC Radio Cumbria, and close down the AM MW simulcasts of six BBC local radio stations in England. The commercial sector has also continued to reduce AM MW broadcasts. In January 2020 Ofcom approved a request by talkSPORT to reduce its AM MW coverage by 2.4% of the UK population. In May 2020, Bauer surrendered licences used for broadcasting Greatest Hits and Absolute Classic Rock on AM MW in the West Midlands, and also closed Radio City Talk in Liverpool, surrendering its AM MW licence and closing the DAB service”
Lower AM listenership and the closure of stations raises the prospect of an AM switch-off within the period to 2035 – with potential implications for overall analogue listening

18© Mediatique Ltd 2020 |
Mediatique Ltd65 Chandos PlaceLondon WC2N 4HGUNITED KINGDOM
Telephone: +44 (0)20 7836 5050www.mediatique.co.uk
Important informationThe opinions expressed in this report are those of MediatiqueThis document may not be reproduced without the consent of MediatiqueThe information and opinions expressed in this report have been compiled from sources believed to be reliable but neither Mediatique, nor any of its directors, officers, or employees accepts liability from any loss arising from the use hereof or makes any representations as to its accuracy and completeness
Copyright © 2022 FDOKUMEN