Patterns of Audio-Visual Consumption: The Reflection of Objective Divisions in Class Structure
15
European Sociological Review VOLUME 22 NUMBER 4 SEPTEMBER 2006 397–411 397 DOI:10.1093/esr/jcl004, available online at www.esr.oxfordjournals.org Online publication 28 April 2006 © The Author 2006. Published by Oxford University Press. All rights reserved. For permissions, please e-mail: [email protected] Patterns of Audio-Visual Consumption: The Reflection of Objective Divisions in Class Structure Jordi López-Sintas and Ercilia García-Álvarez The heterogeneous behaviour of Spanish audio-visual audiences could be encapsulated into five classes: (1) television fans, (2) occasional film-goers, (3) light film-goers, (4) film fans, and (5) audio-visual fans. When the five clusters of audio-visual consumers were analysed according to a set of sociocultural indicators, they appeared ordered as listed above, from downscale to upscale audiences, giving support to Bourdieu’s homology thesis. Accordingly, the media orientations of each type of audience also differed: upscale audiences used the media for tension release (entertainment) and for integrative-status purposes and downscale audiences, for integrative-social and cognitive reasons (education and information). All in all, the results suggest that the five clusters of audio-visual consumption found reflected the objective divisions in the class structure that the sociology of culture proposes. Introduction In the late 1950s, Katz (1959) suggested a move towards viewing mass communication as something sought by people (active audience) instead of the usual focus on the consumption of media and the production of effects (passive audience). Although many media studies have been conducted following this research strategy, most pieces of research have focused their attention on only one communication channel (one audio-visual medium or device): children’s use of video cassette recorder (VCR) (Cohen et al., 1988), CD-ROM ownership and Internet capability in providing gratifications (Perse and Dunn, 1998), changing patterns of television consump- tion (Robinson, 1981), gratifications sought through television consumption (Becker, 1979; Lee and Lee, 1995), television consumption as a psychological escap- ism (Henning and Vorderer, 2001), clusters of media that explain the gratification sought by audiences (van Rees and van Eijck, 2003), types of readers and televi- sion-viewing behaviour (van Eijck and van Rees, 2000), the role of newspapers in the mass media system (Weibull, 1992). The main drawback of using the gratifi- cations strategy for audience research is that it is a research approach rather than a theoretical framework (Elliot, 1974). Consequently, the results are difficult to interpret and correlate for the purpose of advancing our understanding of the subject. In contrast with earlier research, our analysis also includes audio-visual research by looking at consumers’ audio-visual use (cinema, VCR use—rentals and pur- chases, television-viewing behaviour), degree of use at UNIVERSITAT AUTONOMA DE BARCELONA on September 23, 2014 http://esr.oxfordjournals.org/ Downloaded from
-
Upload
independent -
Category
Documents
-
view
1 -
download
0
Transcript of Patterns of Audio-Visual Consumption: The Reflection of Objective Divisions in Class Structure

European Sociological Review VOLUME 22 NUMBER 4 SEPTEMBER 2006 397–411 397DOI:10.1093/esr/jcl004, available online at www.esr.oxfordjournals.orgOnline publication 28 April 2006
© The Author 2006. Published by Oxford University Press. All rights reserved. For permissions, please e-mail: [email protected]
Patterns of Audio-Visual Consumption: The Reflection of Objective Divisions in Class StructureJordi López-Sintas and Ercilia García-Álvarez
The heterogeneous behaviour of Spanish audio-visual audiences could be encapsulated into five classes: (1) television fans, (2) occasional film-goers, (3) light film-goers, (4) film fans, and (5) audio-visual fans. When the five clusters of audio-visual consumers were analysed according to a set of sociocultural indicators, they appeared ordered as listed above, from downscale to upscale audiences, giving support to Bourdieu’s homology thesis. Accordingly, the media orientations of each type of audience also differed: upscale audiences used the media for tension release (entertainment) and for integrative-status purposes and downscale audiences, for integrative-social and cognitive reasons (education and information). All in all, the results suggest that the five clusters of audio-visual consumption found reflected the objective divisions in the class structure that the sociology of culture proposes.
IntroductionIn the late 1950s, Katz (1959) suggested a move towardsviewing mass communication as something sought bypeople (active audience) instead of the usual focus onthe consumption of media and the production of effects(passive audience). Although many media studies havebeen conducted following this research strategy, mostpieces of research have focused their attention on onlyone communication channel (one audio-visual mediumor device): children’s use of video cassette recorder(VCR) (Cohen et al., 1988), CD-ROM ownership andInternet capability in providing gratifications (Perse andDunn, 1998), changing patterns of television consump-tion (Robinson, 1981), gratifications sought throughtelevision consumption (Becker, 1979; Lee and Lee,
1995), television consumption as a psychological escap-ism (Henning and Vorderer, 2001), clusters of mediathat explain the gratification sought by audiences (vanRees and van Eijck, 2003), types of readers and televi-sion-viewing behaviour (van Eijck and van Rees, 2000),the role of newspapers in the mass media system(Weibull, 1992). The main drawback of using the gratifi-cations strategy for audience research is that it is aresearch approach rather than a theoretical framework(Elliot, 1974). Consequently, the results are difficult tointerpret and correlate for the purpose of advancing ourunderstanding of the subject.
In contrast with earlier research, our analysis alsoincludes audio-visual research by looking at consumers’audio-visual use (cinema, VCR use—rentals and pur-chases, television-viewing behaviour), degree of use
at UN
IVERSITA
T AU
TON
OM
A D
E BARCELO
NA
on September 23, 2014
http://esr.oxfordjournals.org/D
ownloaded from

398 LÓPEZ-SINTAS AND GARCÍA-ÁLVAREZ
(from low to high frequency), sociocultural indicators,and media orientation (the gratifications sought byconsumers) and anchors our analysis in the sociology ofculture. That is, we not only focus our interest on audi-ences’ patterns of media use but also analyse the indica-tors of audiences’ position in the social structureassociated with those patterns of consumption and theindicators of consumers’ media orientation as well—i.e.the media-related schemes in the mind of media usersthat explain why audiences prefer to be exposed to a par-ticular kind of television program or video cassette whenrenting or purchasing.
Our findings suggest that the five clusters of audio-visual consumption found reflected the objective divisionsin class structure that the sociology of culture proposes,i.e. Bourdieu’s homology thesis. Nevertheless, instead offinding a contrasting and univorous patterns of behav-iour, the results suggested that upscale consumers areomnivorous, and the younger the more omnivorousthey are. This suggests that there could be a generationalpath in consumption: older upscale consumers weremore exposed to cinema than younger upscale consum-ers, and vice versa as far as the use of video and televisionsets. Even though we cannot say to what extent the dis-tinction and omnivorous effects were working simulta-neously, we can infer that social standing was beingsymbolized through a high frequency of consumption ofclassical audio-visual channels (cinema) and the mostpopular television and VCR sets as well. The theoreticalbackground of these findings is offered in the next sec-tion, followed by a description of the methodologicalaspects, presentation of the results, and discussion of themain findings and implications. We close the articlewith our main conclusions.
Literature ReviewAudio-Visual Audience Research and the Sociology of Culture
Central to the uses and gratifications research strategy inaudience research is the concept of an active audience.The concept of an active audience suggests (1) differen-tial patterns of audio-visual exposure (Katz, 1959) and(2) that audience appropriate the content of audio-visual communication by actively organizing and inter-preting meaning while in the process of perception(Swanson, 1979). This research strategy views people asactive communicators who are aware of their communi-cation goals, evaluate different communication chan-nels, and select the channels they believe will gratify their
needs (Katz et al., 1974; Katz, 1979). Owing to the factthat the findings about the gratifications sought and thetypes of television program viewing suggest that audi-ences are selective and ritualistic as well, many research-ers have criticized the concept of selective audience(Greenberg, 1974; Lee and Lee, 1995). This fact, accord-ing to Bradley (2002), may be the most controversialaspect of the uses and gratifications approach.
In fact, in his review of the problems scholars facedconducting empirical research on the gratifications thataudiences seek from the media, Becker (1979) revised aset of findings about the gratifications sought by lookingfor a pattern of similarities. He researched differentmedia (television and newspapers) and diverse content(political and general focus content), finding thatalthough gratifications are not entirely consistent acrossstudies (see also the findings of Greenberg, 1974; Katz,1979; Rubin, 1984; Cohen et al., 1988; Finn and Gorr,1988; Swanson, 1992; Lee and Lee, 1995), they do notseem to be media-specific. In fact, the evidence thatBecker presents suggests that people seeking a specificgratification from one medium will seek it from anotheras well, if they perceive that both media can provide it,although probably to differing degrees.
Because of these apparently shocking findings, severalauthors (Elliot, 1974; Becker, 1979; Swanson, 1979) haveproposed that if the measurement of gratificationscauses so many research problems, and they are the res-ult of social and psychological factors, then it would bewise to ‘declare needs redundant and to go back to socialand psychological factors as direct explanations ofbehavior’ (Elliot, 1974: 255). Even Swanson (1979) alsosees a contradiction between the study of meanings andthe proposition that social roles and psychological dis-positions constrain individuals to attribute certainclasses of meaning to certain kinds of mediated messages(Katz, 1979). Nevertheless, because media use can beconsidered a cultural practice, we propose that all thesecontradictions could be solved by grounding mediaresearch on the theoretical developments of the sociol-ogy of culture, especially on the theory of habitus.
According to this theoretical framework, media useand orientation is not objectively determined, nor is itthe outcome of free will, but rather the result of thedialectical relationship between action and structure(Bourdieu, 1989: 3; Ritzer, 1992: 437), between the waypeople construct social reality and the social structurethat ‘constrains’ them. The outcome of this dialecticaldiscourse is the habitus: the ‘mental or cognitive struc-tures through which people deal with the social world’.In fact, we can think of habitus as ‘internalized,
at UN
IVERSITA
T AU
TON
OM
A D
E BARCELO
NA
on September 23, 2014
http://esr.oxfordjournals.org/D
ownloaded from

PATTERNS OF AUDIO-VISUAL CONSUMPTION 399
“embodied” social structures’ (Bourdieu, 1984: 468).They reflect objective divisions in the class structure,such as age group, gender, and social classes (Ritzer,1992: 438).
The habitus is acquired as a result of long-term occu-pation of a position within the social world: it is aninternalized structure that constrains thought andchoice of action, but it does not determine action. Thus,habitus varies depending on the nature of one’s positionin the class structure, and this throws light on the confu-sion about whether the gratifications sought were a psy-chological construct of a structural one (Elliot, 1974:255; Swanson, 1979: 41). Or as Katz (1979: 76–77) putsit, although the social and psychological situation maybe externally constrained, ‘the resultant web of roles andorientations, and the motives arising there from, is theindividual’ (emphasis in the original). If an individualstriving for mobility finds the culture of the upper mid-dle class helpful in climbing in the social ladder, thenKatz says that ‘shall we say that he is externally com-pelled to listen?’ (see also the findings of DiMaggio andUseem, 1978; DiMaggio, 1982).
As a consequence, the principal cause of variation inhabitus (dispositions, taste) is the position in socialspace: cultural practices are related to the position insocial space through habitus, taste (Bourdieu, 1989: 19).Social space is presented itself in the form of agentsendowed with different properties that are systematicallylinked among themselves. When properly perceived,these properties function as signs: ‘differences function asdistinctive signs and signs of distinction, positive or nega-tive, and this happens outside of any intention of dis-tinction’ (emphasis in the original; Bourdieu, 1989: 20).
In this research, we make the distinction betweenaudiences’ social class and audiences’ position in thesocial structure. The former is indicated by the levels andtypes of capital, as suggested by the sociology of culture(DiMaggio and Useem, 1978; Bourdieu, 1984), whereasthe latter includes other audiences’ cultural categories aswell. To judge the symbolic properties of media uses, weought to search for audiences’ patterns of media con-sumption and see how they relate to consumers’ socialclass and position (van Rees et al., 1999). Only then willwe be able to evaluate how consumers use the symbolicproperties of media uses.
From the literature already reviewed, we can infer thatmedia audiences will make a different use (a set ofhomogeneous clusters) of audio-visual channels accord-ing to their position in social space. When clusters ofusers (homogeneity thesis) are associated with the audi-ences’ social class (one pattern of use for upscale audiences
and, another, different one for downscale audiences),then media uses are structured in a similar way to society(the homology thesis), i.e. consumption symbolizesstatus (the distinction effect) through different butunivorous patterns of consumption. Nevertheless, thedistinction effect has been challenged in research con-ducted in diverse symbolic spaces (see Peterson, 2005,for a review of findings about the omnivorous effect in acomparative framework).
According to Bourdieu, social hierarchy is translatedinto, and misrecognized as, cultural symbols and life-styles inherent in individuals through the mediatingstructure of habitus (1984). Nevertheless, DiMaggio(1987: 444) and Douglas and Isherwood (1996: 52–56)have proposed that the variety of cultural products is afunction of his or her socioeconomic status (SES).Therefore, although the upper class clearly has moreknowledge of, and participates more frequently in, highculture, research has too consistently shown that itsmembers participate in the popular culture as well, andoften at levels equivalent to or higher than the lowerclasses (Peterson and Simkus, 1992; Peterson and Kern,1996). Social class status, then, is gained not only byconsuming prestigious forms of art, DiMaggio proposes,but also by showing off one’s cultural knowledge in awide variety of genres. Contrary to the distinction effect,the omnivorous effect proposes that all consumers (or atleast one group of consumers) consume everything butat different levels (higher for upscale consumers).
Media Uses and Their Association to Social Class and Social Position
Most pieces of research have focused their attention ontelevision use or the relationship between televisionusage and other cultural practices. Attempts to explaintelevision-viewing levels have led to several conclusions.It seems that the main relationship found so far isbetween viewing level and social class indicators: formaleducation and income (the less the formal educationand income, the higher the total viewing amount; seeRobinson, 1981). However, in a study done by Robinson(1981) of the 1975 survey, the relationship between edu-cation and television-viewing levels was not linear: mid-dle education and income brackets showed heavierviewing habits than downscale audiences. Age, a genera-tional indicator, is also related to television-viewing lev-els (the older, the higher the total viewing amount; seeHenning and Vorderer, 2001).
Temporal comparisons have reported that marriedpeople had a greater increase in television-viewing
at UN
IVERSITA
T AU
TON
OM
A D
E BARCELO
NA
on September 23, 2014
http://esr.oxfordjournals.org/D
ownloaded from

400 LÓPEZ-SINTAS AND GARCÍA-ÁLVAREZ
amount than unmarried people, particularly when indi-viduals were divorced, although parents showed smallerviewing increases than people without children. Someof the increased time devoted to television viewingobserved between 1965 and 1975 in the United States(43 minutes) appears to have come from time previouslyspent in obligatory activities (Robinson, 1981: 126).Interestingly, as time goes by, television viewing shows aweaker negative relationship with social class indicatorsand highbrow cultural activities.
Henning and Vorderer (2001) tried to explain theamount of television viewing through the concept of‘dislike of thinking’. They gathered a sample of homog-eneous viewers (students) and tested a causal model. Totheir surprise, only 22 per cent of the individual differ-ences are explained with only six variables: need for cog-nition (negative relationship with total amount ofviewing hours), gender (men show a greater amount ofviewing, with almost the larger predictive power), social-ization (parental viewing amount, positive relationship),opportunities to see (work quota, negative relationship),sharing an apartment (negative relationship), and per-sonal television set (positive relationship).
van Eijck and van Rees (2000) analysed the changingpatterns of reading among the Dutch population andhow these patterns were related to television-viewingbehaviour and to a set of sociodemographic indicators.They classified a group of newspapers and magazinesaccording to their content (serious information, lightentertainment, or a mixture of both) and then lookedfor types of readers according to their reading behav-iour. They found five patterns of reading in 1975 and1995 as well: (1) entertainment readers, (2) informationreaders, (3) regional readers, (4) non-readers, and(5) omnivorous readers. Although their data show agreat deal of stability in structure, size of reader typesand reading probability did differ. The most outstandingdifference was the sizeable decrease in entertainmentreaders and the increase observed in omnivorous readers(Weibull, 1992, suggests that audiences’ need for orien-tation and information is one of the causes of Swedes’regular newspaper reading habit). When classes of read-ers were related to sociodemographic indicators andtelevision-viewing behaviour, they brought to light someinteresting findings for this research: (1) fewer differ-ences were observed between the reading behaviour ofmen and women; (2) information readers and omni-vores were older, and the remaining reader classes wereyounger; (3) information readers were less educated (incomparison with 1975, although still the most educatedgroup), but the remaining classes were more educated
(omnivores almost as educated as information readers);(4) information readers were the class least television-minded; and (5) omnivores in 1975 resemble Bourdieu’sautodidacts (1984), whereas in 1995 they are highly edu-cated readers with a broad orientation towards theirmedia consumption (van Eijck and van Rees, 2000: 605).
Media Gratifications and Audiences’ Social Class and Position
Cohen et al. (1988) analysed the gratifications associatedwith home VCR use among Israeli school children, find-ing that although VCR use was high (jointly with televi-sion, cinema, books, papers, radio, and records), it hadnot achieved any special priority in its perceived utilityto gratify various needs. Furthermore, these authorsfound that the space of audio-visual channels could bedivided into four groups: (1) books, (2) newspapers,(3) radio and television, and (4) cinema, records, tapes,and VCRs, suggesting that the VCR had a high degree ofinterchangeability with the other three media, support-ing Becker’s (1979) findings.
In a study applied to the perspective on the uses andgratifications of home computers, especially to explorehow CD-ROM ownership and Internet capability werelinked to computer utility, Perse and Dunn (1998) dis-covered that users found modest utility in home com-puters for entertainment, for escape, for habit, and topass the time. In particular, CD-ROM ownership waslinked to learning and escape utility. Higher levels ofconnectivity were reflected in using computers for enter-tainment and to pass the time. Unfortunately, theseauthors did not relate media uses and gratifications tothe audiences’ position in the social structure.
van Rees and van Eijck (2003) have recentlyresearched the latent factors that relate different mediadevices (specifically 19 kinds of media) in the Dutchpopulation. They found eight factors that accounted for52 per cent of the sample variation: (1) regional andlocal information, (2) serious information, (3) popularnational information, (4) women’s magazines, (5) com-mercial radio and television, (6) hobbies and serious useof Internet, (7) recreational use of Internet, and (8) fic-tion readers and viewers. After relating this findings to aset of cultural indicators, they found that social classindicators were almost never related to the eight factors,casting doubts on the distinction effect (only culturalstatus was negatively related to commercial radio andtelevision; economic status, positively related to hobbiesand serious use of Internet; and education, positivelyrelated to fiction readers and viewers and serious
at UN
IVERSITA
T AU
TON
OM
A D
E BARCELO
NA
on September 23, 2014
http://esr.oxfordjournals.org/D
ownloaded from

PATTERNS OF AUDIO-VISUAL CONSUMPTION 401
information and negatively to popular nationalinformation and commercial radio and television). Thegreatest association, however, was again shown to be age.
Research DesignResearch Question
Nearly all research conducted until now that claim sup-port for or cast doubts on the distinction effect has usedbinary indicators of consumption and then either clus-tered a set of media or clustered audiences’ patterns ofmedia use. Both uses are inaccurate as the former hasforgotten that the distinction effect was formulated aspatterns of consumption and the latter has blurred thefact that the omnivorous effect states that all consumersconsume everything but at different levels, a phenome-non that cannot be captured by binary indicators. Tosolve these shortcomings, we took into account not onlythe breadth of audio-visual use but also the level of useand proposed to answer the following questions:
1. Are there homogeneous patterns of media useamong Spanish audiences?
2. If the answer to the previous questions is affirma-tive, then are they structured in the same way thatsociety is ordered? That is, do data give support tothe homology thesis?
3. If there are homogeneous patterns of media use,then do they differ according to the media contentthey are exposed to?
Sample
Data were obtained from the ‘Habits of Cultural Con-sumption’ survey requested by the Sociedad General deAutores Españoles (SGAE) in 1998. The survey con-ducted home interviews of over 9,000 individuals ofeither sex, 14 years of age or older, living in Spain. Thesurvey launched three waves of about 3,000 intervieweeseach, comprising a representative random sample, strat-ified by autonomous regions and municipalities accord-ing to size. Further technical characteristics aredescribed in SGAE (2000).
Indicators of Audio-Visual Media Consumption
Five ordered categorical audio-visual media use indica-tors were analysed (listed as factor name, short level label,level description): (1) going to the cinema, with six levelsof frequency during the last 12 months: 1, never go to
the films; 2, less than five or six times a year; 3, five or sixtimes a year; 4, once a month; 5, two or three times amonth; and 6, once a week; (2) whether the consumerhad rented video cassettes, with seven levels: 1, never;2, less than five or six times a year; 3, five or six times ayear; 4, once a month; 5, two or three times a month;6, once a week; and 7, several times a week; (3) whetherthe consumer had bought video cassettes, with sevenlevels: 1, never; 2, less than one a year; 3, once a year; 4,two or three times a year; 5, four or five times a year; 6,six–nine times a year; and 7, ten or more times a year;(4) the amount of daily amount of television viewing,with five levels: 1, one or less; 2, two; 3, three; 4, four;and 5, five or more; and (5) the amount of weekly televi-sion viewing, with two levels: 1, less frequently thanevery day; and 2, every day.
To evaluate the content of video cassettes bought orrented by consumers, interviewees were asked the con-tent of the last video cassette bought (children’s,entertainment—feature film, educational, musicals) orrented (action, mystery, adventures, comedy, drama,romantic, psychological, and children’s). Finally, inter-viewees were also asked to grade the following televisionprograms on a scale from one (not interested) to three(very interested): highbrow arts programs, films, plays,sitcoms, drama, romantic, children’s, competitions(contests), magazines, reality shows, books, documenta-ries, modern music, flamenco, football, other sports,bullfighting, television news, weekly report, debate, soci-ety, news on films.
Indicators of Audiences’ Social Position: Sociocultural Categories
To describe audio-visual media audiences’ social class,we selected a set of indicators. First, we used three indi-cators of Spaniards’ social, cultural, and economic cap-ital: SES, educational level, and income level (for economyof space, sample descriptive statistics are displayed inTable 3 along with their association with the patterns ofconsumption in the section of results). SES was esti-mated using the Erikson–Goldthorpe procedure (Eriksonand Goldthorpe, 1992), as it is being used to analyse therelation between social class and cultural consumptionand is considered the most influential conceptualizationand operationalization of social class in European soci-ology (Evans, 1992). We codified the SES indicator withfive categories: employees with a high position in thehierarchy of large firms or government agencies (twoservice categories: service 1, the highest position and ser-vice 2, the second in the social hierarchy); a third designated
at UN
IVERSITA
T AU
TON
OM
A D
E BARCELO
NA
on September 23, 2014
http://esr.oxfordjournals.org/D
ownloaded from

402 LÓPEZ-SINTAS AND GARCÍA-ÁLVAREZ
routine and non-manual workers (non-manual); afourth that included employers and self-employedworkers (entrepreneurs); and, finally, a fifth category forskilled, semiskilled, and unskilled employees with alabour contract (manual workers). Two additional SEScategories were also included: unemployed and not inlabour market (householders, retired persons, and otherunclassified individuals), and a seventh category for stu-dents. The remaining audiences’ social position indica-tors are explained in the same table. Some indicatorsmeasure the opportunities to use audio-visual media(children less than 14 years old or people 14 years or overliving at home, marital status), quality and quantity ofmarket offer (municipality), linguistic resources (French,English), cultural (gender), and a generational indicator(age).
Analytical Procedure
We used an exploratory latent class (LC) model (Lazars-feld and Henry, 1968) to look for support for thehypothesis that people show different patterns of audio-visual consumption and can, therefore, be classifiedaccording to their behaviour. The LC model assumesthat the association between the indicators of audio-visual media use is because of unobserved heterogeneityin the population. To account for consumers’ heteroge-neity in responses, the LC model splits the original sam-ple into T clusters or classes of audio-visual consumers,and then the association between the indicators of audio-visual consumption is completely explained by probabil-istic class membership.
An important difference between standard clusteranalysis techniques (e.g. those reported in Kaufman andRousseeuw, 1990) and LC models for clustering pur-poses is that the latter is model-based; i.e. a statisticalmodel that assumes that the data are generated by amixture of underlying probability distributions. Incomparison with traditional cluster analysis techniquesinstead of minimizing the within-cluster variation and/or maximizing the between-cluster variation, the LCmodel implies maximizing a log-likelihood function.Nevertheless, under very restrictive conditions, bothprocedures produce similar results (Vermunt andMagidson, 2002). As a result, LC models for clusteringturn out to be a more general technique that also solvesadditional classical problems of traditional cluster ana-lysis (Magidson and Vermunt, 2002). For this reason,LC models for clustering have been proposed as theproper way of uncovering consumption patterns (Wedeland Kamakura, 1998).
Exploratory factor analysis was used to classify the setof indicators of interest in television programs. Weexpect that the observed set of indicators could bedescribed as a function of a small number of underlyingcommon factors (k factors Fi, i = 1,...,k) and a set of spe-cific factors (di), Those k fac-tors will help us understand what the consumers’ basicunderlying interests are and how they are achieved byconsuming individual programs. Later, the consumers’factor scores were used to find out whether the clustersof audio-visual consumption differed in the gratifica-tions sought.
FindingsPatterns of Audio-Visual Consumption
The model
Let’s allow y1, y2,..., y5 to denote the five indicators ofaudio-visual consumption, and the bold symbol y forthe entire set of indicators. The LC model estimates a setof parameters that characterize the audio-visual patternsof consumption, f(y): in particular, it will estimatethe number of clusters, T, every cluster size, p(t), andthe indicators’ probabilities conditioned to clustermembership as well, f(yi| t) under the local independ-ence hypothesis, i.e.
As mentioned before, we assumed that the data weregenerated by a mixture of underlying distributions, inparticular from a multinomial distribution parameter-ized by means of a logistic regression model (for furtherdetails, see Magidson and Vermunt, 2001). Theseparameters were transformed into cluster probabilitiesor cluster size as follows,
and the indicators’ probabilities conditioned to clustermembership were modelled as follows,
i i ik k iz a F a F d= + + +1 1 ! .
f y t f y tt
T
ii
( ) = ( ) ( )= =å Õπ
1 1
5
.
πη
η( )
exp
exp
,t t
t
T=( )( )å
1
f y t y ti iy t
y t
i
i
( ) = ( ) = ( )( )å
πη
η
exp
exp1
5
at UN
IVERSITA
T AU
TON
OM
A D
E BARCELO
NA
on September 23, 2014
http://esr.oxfordjournals.org/D
ownloaded from

PATTERNS OF AUDIO-VISUAL CONSUMPTION 403
Nevertheless, contrasting with ordinary LC models,we treated our five audio-visual indicators as ordinalcategorical variables instead of nominal variables.Because of this difference, the ordinary parameters of thestandard logistic regression model, hadto be restricted using fixed scores, for each indica-tor, resulting in (see Vermunt andMagidson, 2000, for technical appendix). These con-straints reduced the number of parameters required forthe estimation and assured that results would have aform consistent with the known ordering of responselevels.
Once the model parameters were obtained, individu-als were classified into clusters. This task was performedusing the posterior class membership probabilities(Magidson and Vermunt, 2001) for each individual andcluster:
Model selection
In Table 1, we report the statistics used to select thenumber of latent clusters (LatentGold3 program wasused to estimate the model). The measures of goodnessof fit used were as follows: the chi-squared (c2) likeli-hood-ratio statistic (L2), the Bayesian information crite-rion (BIC) and Consistent Akaike’s InformationCriterion (CAIC), both based on L2 (Raftery, 1986; Fra-ley and Raftery, 1998). Table 1 summarizes that theaddition of successive LCs reduces the likelihood-ratiostatistic until five classes were added but that furtherclasses had a marginal effect. Unfortunately, because ofthe discrepancy between c2 and likelihood-ratio statist-ics, the likelihood-ratio statistic (L2) should not be
trusted for model selection (Dayton, 1998: 16). There-fore, we used the BIC and CAIC statistics that both indi-cated that model five was the best one (the lower thestatistic, the better the model), as it is the one providingthe most information with the fewest number of param-eters. (To know whether a standard LC model would fitthe data better, we estimated the same model but nowtreated the five indicators as nominal variables. Thisordinary LC model suggested that three clusters wereneeded to explain the heterogeneity in the data; never-theless, the fitted measures were not as good as the onesfor the restricted model.)
Model parameters
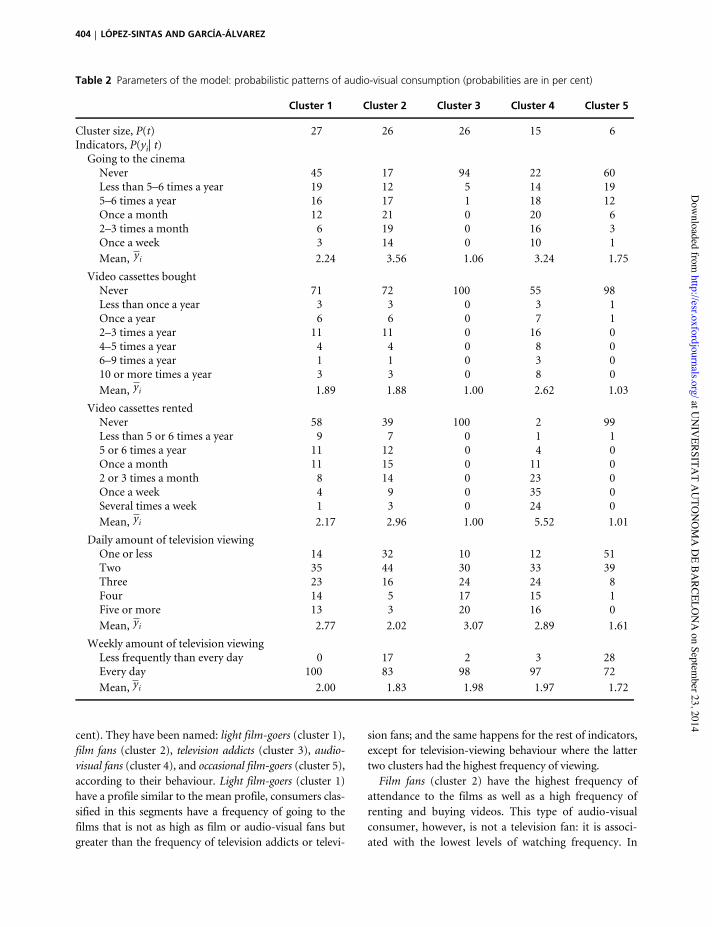
Table 2 summarizes the estimates of the parameters of thefive-cluster model. The first row presents how many indi-viduals have been classified in each cluster, P(t), its rela-tive size [to differentiate the model from the estimatedmodel’s parameters, we use the previous symbol insteadof p(t)], and the following rows indicate the probability ofbehaviour given one’s classification in that cluster, P(yi| t),with all values expressed as percentages. For instance, if aninterviewee has been assigned to cluster one, then he orshe has a probability of 44.57 per cent of never going tothe cinema and a probability of 18.83 per cent of goingless than five or six times a year, and so on, for every levelof the indicator ‘going to the cinema’. On the contrary, ifthe interviewee has been allocated to cluster four, then hisor her probability of never going to the films is expectedto be 22.12 per cent and so on. As the indicators areordered, we also report the mean value for each cluster.On the basis of these conditional probabilities and meanvalues, we can characterize the probabilistic behaviour ofthe Spaniards regarding their audio-visual consumption.
The model estimated suggests that there were threealmost equal segments (cluster 1, 27 per cent; cluster 2,26 per cent; and cluster 3, 26 per cent) and two smallersegments (cluster 4, 15 per cent; and cluster 5, 6 per
η β βy t y tyi i i= +0 1 ,
υ yi,
η β β υy t y ty yi i i i= +0 1 .
ππ
πt y
t f y t
t f y tj
ij
ij
T( ) =( )( )
Õ
Õå
( )
( )
1
5
1
5
1
Table 1 Goodness-of-fit statistics for the restricted model with measurement homogeneity
Underlined values are highly correlated with factors (correlations greater than 0.4).
Cluster models c2 L2 DL2 (M1) (per cent) BIC (L2) CAIC (L2) df Npar
Independence 8547.3 5098.8 -21429.5 -24346.5 2917 22Cluster 2 3470.9 2748.9 46.1 -23724.8 -26635.8 2911 28Cluster 3 3499.3 2512.8 4.6 -23906.4 -26811.3 2905 34Cluster 4 3314.5 2405.4 2.1 -23959.2 -26829.9 2899 40Cluster 5 3251.2 2322.9 1.6 -23987.1 -26880.2 2893 46Cluster 6 3148.5 2297.3 0.5 -23958.2 -26848.3 2887 52Cluster 7 3055.2 2280.9 0.3 -23920.0 -26810.1 2881 58Cluster 8 3019.7 2244.1 0.7 -23902.2 -26778.9 2875 64
at UN
IVERSITA
T AU
TON
OM
A D
E BARCELO
NA
on September 23, 2014
http://esr.oxfordjournals.org/D
ownloaded from
404 LÓPEZ-SINTAS AND GARCÍA-ÁLVAREZ
cent). They have been named: light film-goers (cluster 1),film fans (cluster 2), television addicts (cluster 3), audio-visual fans (cluster 4), and occasional film-goers (cluster 5),according to their behaviour. Light film-goers (cluster 1)have a profile similar to the mean profile, consumers clas-sified in this segments have a frequency of going to thefilms that is not as high as film or audio-visual fans butgreater than the frequency of television addicts or televi-
sion fans; and the same happens for the rest of indicators,except for television-viewing behaviour where the lattertwo clusters had the highest frequency of viewing.
Film fans (cluster 2) have the highest frequency ofattendance to the films as well as a high frequency ofrenting and buying videos. This type of audio-visualconsumer, however, is not a television fan: it is associ-ated with the lowest levels of watching frequency. In
Table 2 Parameters of the model: probabilistic patterns of audio-visual consumption (probabilities are in per cent)
Cluster 1 Cluster 2 Cluster 3 Cluster 4 Cluster 5
Cluster size, P(t) 27 26 26 15 6Indicators, P(yi| t)
Going to the cinemaNever 45 17 94 22 60Less than 5–6 times a year 19 12 5 14 195–6 times a year 16 17 1 18 12Once a month 12 21 0 20 62–3 times a month 6 19 0 16 3Once a week 3 14 0 10 1Mean, 2.24 3.56 1.06 3.24 1.75
Video cassettes boughtNever 71 72 100 55 98Less than once a year 3 3 0 3 1Once a year 6 6 0 7 12–3 times a year 11 11 0 16 04–5 times a year 4 4 0 8 06–9 times a year 1 1 0 3 010 or more times a year 3 3 0 8 0Mean, 1.89 1.88 1.00 2.62 1.03
Video cassettes rentedNever 58 39 100 2 99Less than 5 or 6 times a year 9 7 0 1 15 or 6 times a year 11 12 0 4 0Once a month 11 15 0 11 02 or 3 times a month 8 14 0 23 0Once a week 4 9 0 35 0Several times a week 1 3 0 24 0Mean, 2.17 2.96 1.00 5.52 1.01
Daily amount of television viewingOne or less 14 32 10 12 51Two 35 44 30 33 39Three 23 16 24 24 8Four 14 5 17 15 1Five or more 13 3 20 16 0Mean, 2.77 2.02 3.07 2.89 1.61
Weekly amount of television viewingLess frequently than every day 0 17 2 3 28Every day 100 83 98 97 72Mean, 2.00 1.83 1.98 1.97 1.72
yi
yi
yi
yi
yi
at UN
IVERSITA
T AU
TON
OM
A D
E BARCELO
NA
on September 23, 2014
http://esr.oxfordjournals.org/D
ownloaded from

PATTERNS OF AUDIO-VISUAL CONSUMPTION 405
contrast, audio-visual fans (cluster 4) have a high fre-quency of cinema attendance, but the highest when itcomes to renting or buying a video cassette, in particular,they have an extremely high frequency of renting videos.Unlike film fans, they have a relatively high frequency ofwatching television programs. Television addicts (cluster3) clearly have a univorous taste, as their main culturalpractice is watching television programs. Finally, audi-ences classified as occasional film-goers (cluster 5) have avery peculiar behaviour, as they go to the cinema onlyoccasionally but do not compensate for light film attend-ance by spending more time watching television.
Who are the Consumers Classified in Each Pattern of Audio-Visual Consumption?
Here, we characterize the five clusters found accordingto a set of sociocultural indicators. Table 3 is equivalentto estimating the row profiles in a correspondence ana-lysis when there is no restriction in the estimated LC clus-ter model (Magidson and Vermunt, 2001). In Table 3, foreach class of audio-visual consumers, we have underlinedprobabilities greater than their mean profile (cluster size).
The social class indicators—SES, level of education,and income—are clear in the construction of a social hier-archy related to the patterns of audio-visual consumers.All indicators of the lower social classes (low levels ofincome and education and low prestige occupations) areover-represented in the occasional (cluster 5) and lightfilm-goers (cluster 1). The indicators of a middle class(service 2 and non-manual occupations, high levels ofincome, and middle level of education) are associatedwith the audio-visual class of consumers (cluster 4).Finally, the segment of film fans (cluster 2) is the onemost associated with the higher social class indicators(services 1 and 2, non-manual and entrepreneur occupa-tions, and highest educational and income levels).
As far as the other indicators of consumers’ socialposition were concerned, we can infer that film (cluster2) and audio-visual fans (cluster 4) are younger thanother consumers (till middle age), have children livingwith them, are married (film fans) or single (audio-visual fans) and according to their privileged social posi-tion, have a good command of the French and Englishlanguages, and live in large cities (over 100,000 inhabit-ants) with a higher percentage of men. On the contrary,light film-goers (cluster 1), occasional film-goers (clus-ter 5), and television fans (cluster 3) are older, with thistrend more obvious as we move in the order of the clus-ters listed, do not have children living at home (exceptlight film-goers), do not have a good command of foreign
languages, live in smaller cities (except light film-goers),and have a higher percentage of women.
In fact, the indicators of audience’s social position clas-sify the five patterns of audio-visual consumption into ahierarchy that is ordered as follows: television addicts,occasional audiences, light film-goers, film fans, andaudio-visual fans. A correspondence analysis of the fivetypes of audio-visual media users and the set of sociocul-tural indicators (not reported here) gave support to ourinterpretation: audio-visual fans have the capital (highsocial class: high earnings, education, and SES), have thelinguistic resources, live in big cities, and are younger; filmfans are quite similar to audio-visual fans but a little bitolder and relatively less wealthy; light film-goers have lessresources than the two clusters mentioned above andboth the occasional film-goers (cluster 5) and the televi-sion addicts (cluster 3), who are older and less affluent.
Media Orientations: Gratifications Sought by Video Consumption
In the bottom left panel of Figure 1, we show the profilesof the type of video cassette last rented across segmentsof audiences in the plane defined by the triangle thatjoins the space of audiences. The vertices are the pointsof the triangle that coincide with the extreme profiles[(1,0,0), (0,1,0), and (0,0,1)]. To make it easy to inter-pret the profiles, only the shaded area of the full triangleis plotted (we used the ADE-4 package to display the tri-angles; Thioulouse et al., 1997). Light film-goers rentedalmost 17 per cent of the total amount of videos, fol-lowed by film fans, 38 per cent, and audio-visual fans,45 per cent. Light film-goers mainly rented children’s,adventure, drama, action, and comedy videos. Film fansrented chiefly psychological videos and audio-visualfans, romantic, comedies, drama, and mystery videos. Asfar as video purchases are concerned, light film-goersbought documentary, children’s, and entertainment vid-eos; film fans is a group not characterized by any type ofvideo cassette; and audio-visual fans are characterized byeducational, entertainment, and musical videos.
Media Orientations: Gratifications Sought in Television Programs
We factor-analysed the 22 ´ 22 correlation matrix usingthe principal components procedure and Kaiser’s var-imax rotation (Barlett’s test rejects the null hypothesis ofsphericity: c2 = 37097.84; df = 231; P < 0.0001). A five-factor solution resulted on the basis of the followingcriteria: (1) a significant dip in the screen plot followed
at UN
IVERSITA
T AU
TON
OM
A D
E BARCELO
NA
on September 23, 2014
http://esr.oxfordjournals.org/D
ownloaded from

406 LÓPEZ-SINTAS AND GARCÍA-ÁLVAREZ
Table 3 Patterns of consumption and sociocultural categories (row profiles in per cent)
Indicators Cluster 1 Cluster 2 Cluster 3 Cluster 4 Cluster 5 Sample
Socioeconomic statusService 1 25 46 8 14 7 5Service 2 28 41 9 16 6 6Non-manual 28 34 10 21 6 7Entrepreneurs 28 29 20 13 10 6Manual 29 28 18 18 7 15No in labour market 27 14 43 9 7 46Students 26 42 3 26 3 15
Educational levelPrimary or less 21 7 60 4 8 15Low secondary 29 21 28 15 6 50High secondary 27 39 8 20 5 22College 26 42 9 16 6 7University 25 47 8 15 6 6
Income level<€600 a month 22 10 56 5 7 19€600–€900 29 22 28 14 7 30€900–€1200 29 31 16 18 6 30€1200–€1800 28 37 11 20 5 16>€1800 26 41 9 18 5 5
Children at homeNone 25 25 31 12 7 69Yes 32 30 13 21 5 31
People 14 years or over living at home2 or less persons 27 21 34 11 7 503–4 people 28 30 19 17 6 40More than 4 people 27 32 14 22 5 10
Marital statusSingle 25 39 9 22 5 35Married 29 20 32 12 7 54Widowed 22 8 60 2 8 9Divorced 29 29 24 11 7 3
Municipality (in thousands)<100 27 23 32 12 7 36100–200 26 31 23 14 6 11Other metropolis 28 27 22 18 6 15First metropolis 28 28 23 16 6 38
Level of FrenchSome 27 25 28 14 6 90Good 28 38 10 19 6 10
Level of EnglishSome 28 21 32 13 7 80Good 25 44 5 22 4 20
GenderMale 27 28 23 16 6 46Female 28 24 28 13 6 54
continued
at UN
IVERSITA
T AU
TON
OM
A D
E BARCELO
NA
on September 23, 2014
http://esr.oxfordjournals.org/D
ownloaded from

PATTERNS OF AUDIO-VISUAL CONSUMPTION 407
the five factors; (2) the first five factors were the mostmeaningful, rich, and interpretable, loading each indica-tor high in only one factor; (3) the five-factor solutionexplained a high proportion of the indicators’ variance(49 per cent), given the number of indicators.
Kaiser’s varimax rotation suggested the followinginterpretations of the latent gratifications sought byaudiences (see Table 3 and Discussion): Factor 1, com-panionship, is mainly correlated with interest in sitcomprograms, romantic series, and soap operas, contests,magazines, reality shows, flamenco, and society news;Factor 2, integrative-status, with interest in classic music,opera, ballet, light opera, and interest in plays, bookinformation, interest in modern music and contempo-rary dance programs, and news about the films; Factor 3,cognitive, with interest in documentary programs, televi-sion news bulletin, the weekly report, and debate pro-grams; Factor 4, integrative-social, with interest in
football, other sports, and bullfighting; Factor 5, tensionrelease, with interest in television films and dramaticseries. The five-factor solution accounted for more than40 per cent of the variation in each of the 22 indicators,but interest in films, children’s programs, and documen-taries (version 13 of the SPSS statistical program) wasused to estimate the model parameters and factor scores.
After describing the five factors of interest in televi-sion programs, we analysed whether the factor scoremeans differed among the five patterns of audio-visualconsumers. The means are displayed in the lower part ofTable 4 and the analysis of variance in the last line. Theresults show that light film-goers are interested mainlyin television programs that provide easy tension release(through broadcast films, television films, or series) buthave a medium interest in other programs. Film fans, onthe contrary, are largely interested, firstly, in televisionprograms that provide integrative-status gratifications
Table 3 (continued)
Underlined values are highly correlated with factors (correlations greater than 0.4).
AgeLess 25 26 40 4 28 3 2225–34 28 37 7 22 5 1935–44 33 31 15 15 6 1645–54 31 22 28 9 10 12Over 54 23 8 57 3 8 31
Cluster size 27 26 26 15 6 100
Figure 1 Chart of the cluster association with the type of video rented or bought.
0 0.8
L_movies
0.50.2 M_fan 0.7
0.3
V_fan
Action Mystery
Adventures
Comedy Drama
Romantic
Psychologic
Children's
0.167
0.382
0.452
Audio-visual rented
0.1 0.7
L_movies
0.70.2 M_fan 0.8
0.1
V_fan
Enterainment
Children's
Documentaries
Educational
Musicals
0.321
0.311
0.368
Audio-visual bought
at UN
IVERSITA
T AU
TON
OM
A D
E BARCELO
NA
on September 23, 2014
http://esr.oxfordjournals.org/D
ownloaded from

408 LÓPEZ-SINTAS AND GARCÍA-ÁLVAREZ
Tabl
e 4
Fact
or lo
adin
gs f
or th
e ro
tate
d so
lutio
n an
d fa
ctor
sco
re m
eans
with
in t
he t
ypes
of
cons
umer
s
Und
erlin
ed v
alue
s are
hig
hly
corr
elat
ed w
ith
fact
ors (
corr
elat
ions
gre
ater
than
0.4
).
Un
der
lyin
g f
acto
rs o
f in
tere
stFa
cto
r 1
(co
mp
anio
nsh
ip)
Fact
or
2 (i
nte
gra
tive
-sta
tus)
Fact
or
3 (c
og
nit
ive)
Fact
or
4 (i
nte
gra
tive
-so
cial
)Fa
cto
r 5
(ten
sio
n r
elea
se)
Fact
or lo
adin
gs: i
nter
est i
nH
ighb
row
art
s0.
210.
630.
150.
07-0
.23
Tel
evis
ion
film
s-0
.01
0.00
0.14
0.01
0.56
Play
s0.
380.
470.
23-0
.01
-0.1
0Si
tcom
s0.
440.
090.
010.
140.
43D
ram
atic
and
act
ion
seri
es0.
260.
060.
030.
080.
60R
oman
tic
seri
es, s
oap
oper
as0.
58-0
.02
-0.1
1-0
.21
0.14
Chi
ldre
n’s
prog
ram
s0.
160.
24-0
.10
0.06
0.39
Con
test
s0.
58-0
.04
0.05
0.06
0.27
Mag
azin
es0.
530.
060.
25-0
.10
0.25
Rea
lity
show
s0.
690.
020.
13-0
.01
-0.0
4B
ook
info
rmat
ion
-0.1
10.
740.
22-0
.05
0.15
Doc
umen
tari
es-0
.07
0.30
0.48
0.11
0.18
Mod
ern
mus
ic a
nd b
alle
t0.
170.
52-0
.16
0.08
0.38
Flam
enco
0.65
0.28
0.05
0.19
-0.1
1Fo
otba
ll-0
.14
-0.0
60.
030.
830.
14O
ther
spo
rts
-0.1
50.
090.
130.
790.
22B
ullfi
ghti
ng0.
380.
010.
070.
50-0
.26
Tel
evis
ion
new
s bu
lleti
n0.
10-0
.09
0.71
0.03
-0.1
8W
eekl
y re
port
0.18
0.15
0.76
0.06
0.06
Deb
ates
0.11
0.23
0.64
0.03
0.12
Soci
ety
new
s0.
61-0
.02
0.12
-0.2
50.
20N
ews
abou
t film
s-0
.14
0.70
0.14
-0.0
50.
33
Fact
or s
core
mea
ns w
ithi
n pa
tter
nsLi
ght f
ilm-g
oers
0.01
20.
000
0.02
910.
027
0.16
6Fi
lm fa
ns-0
.496
0.24
8-0
.030
9-0
.086
0.18
0T
elev
isio
n ad
dict
s0.
458
-0.2
560.
0716
0.03
6-0
.422
Aud
io-v
isua
l fan
s-0
.238
0.18
2-0
.152
30.
027
0.53
3O
ccas
iona
l film
-goe
rs-0
.205
0.03
6-0
.026
7-0
.114
-0.6
38
Ana
lysi
s of
var
ianc
e: F
-val
ue a
nd (
P)33
4.38
2 (<
0.00
0001
)90
.375
(<
0.00
0001
)11
.688
(<
0.00
0001
)5.
879
(0.0
001)
303.
209
(<0.
0000
01)
at UN
IVERSITA
T AU
TON
OM
A D
E BARCELO
NA
on September 23, 2014
http://esr.oxfordjournals.org/D
ownloaded from

PATTERNS OF AUDIO-VISUAL CONSUMPTION 409
and, secondly, in tension release. In contrast, televisionaddicts have a greater interest in companionship, cogni-tive, and integrative-social gratifications but are lessinterested than the average consumer as far as integrative-status and tension release are concerned. Audio-visualfans have a pattern similar to film fans but with thehighest interest in programs that offer tension releasegratification and in those that offer integrative-statusenjoyment. Finally, occasional film-goers have almost anaverage profile but with a clear disinterest in tensionrelease and companionship gratifications.
DiscussionWe found support for the thesis of homogeneous clustersof behaviour. The exploratory latent cluster model fittedsuggests that the Spanish audio-visual consumption het-erogeneity could be synthesized into five types of audi-ences: (1) occasional film-goers, (2) light film-goers,(3) film fans, (4) audio-visual fans, and (5) televisionaddicts. Film fans seem to be the snobs of other studies(van Rees et al., 1999; van Eijck and van Rees, 2000), theones who like the seventh art in its original form, andaudio-visual fans seem to be the cultural omnivoresfound in different places and symbolic spaces over the last15 years (see Peterson, 2005, for a review).
When the five types of audiences were analysedaccording to their indicators’ of social status, they wereordered as follows, from the lowest to the highest status:television addicts, occasional film-goers, light film-goers,film fans, and audio-visual fans. The social hierarchyindicators are clearly saying that the objective divisionsin class structure were reflected in the use of audio-visual media: downscale indicators were associated withtelevision addicts, occasional and light film-goer pat-terns of media consumption; upscale indicators, withfilm and audio-visual fans, lending support for the prop-osition that audio-visual uses function as distinctivesigns and signs of distinction, i.e. that audiences make adistinctive use of audio-visual media according to theirposition in social space: downscale audiences showed aunivorous but intensive use of the media, whereasupscale audiences had an omnivorous and intensive useas well. The generational indicators followed the samepattern, as older audiences were associated with low-status audiences and younger ones to upscale audiences.Freedom from caregiver responsibilities was not associ-ated with heavy users of the media, contrary to what wasexpected (Robinson, 1981; van Eijck and van Rees, 2000;Henning and Vorderer, 2001).
On the contrary, DiMaggo (1987) and Douglas andIsherwood (1996) have proposed that social standing issymbolized by consuming prestigious forms of art andshowing off consumer’s cultural knowledge in a widevariety of genres. Here, we generalize their proposition tothe media use research. In this line, our findings suggestthat upscale audiences symbolize their social standingthrough the consumption of a wide variety channels ofmedia and a high frequency of use as well, from originalmedia channels (cinema) to the most popular (television)without forgetting the video format (a new way to deliverfilms). With their use of audio-visual media, upscale audi-ences communicate their social position by showing offthat they have the knowledge and the material means tohave the proper resources for consuming a great variety ofmedia. Nevertheless, the fact that audio-visual fans andfilm fans are so close in the social hierarchy but audio-visual fans are comparatively younger and single suggeststhat there could be a generational technology of con-sumption that is difficult to change even for upscale con-sumers. Our findings suggest that we should expectdifferences in media use according to social class, butwithin social classes, generational differences should alsobe found. This interpretation matches the findings ofPeterson and Kern (1996), in that younger, more omniv-orous consumers are replacing the older upscale snobs.
Rubin’s (1981, 1984) results support our interpreta-tions of the five latent gratifications found, named:(1) companionship, (2) integration-status, (3) cognitive,(4) integration-social, and (5) tension release. Eventhough Rubin did not research the relationship betweenpatterns of audio-visual consumption and gratifications,Rubin analysed the association between a set of gratifica-tions and a set of preferences for television programs pro-viding a framework for interpreting our results. LikeRubin, we found a positive association between cognitivegratifications and age (here television addict audienceswere older and more interested in cognitive, companion-ship, and integrative-social gratifications) but a negativerelationship between age and entertainment [here theyounger audio-visual fans were more interested in tensionrelease (entertainment) than older consumers of themedia]. In fact, upscale audiences (audio-visual and filmfans) were most interested in tension release/entertain-ment and integrative-status gratifications from the televi-sion programs and types of video cassettes bought orrented, a finding that also agrees with the conclusions ofPalmgreen et al. (1988).
It is difficult to compare our findings with all other pre-vious results because research thus far has focused atten-tion directly on motivations (Greenberg, 1974; Finn and
at UN
IVERSITA
T AU
TON
OM
A D
E BARCELO
NA
on September 23, 2014
http://esr.oxfordjournals.org/D
ownloaded from

410 LÓPEZ-SINTAS AND GARCÍA-ÁLVAREZ
Gorr, 1988) or on a large array of media channels (vanRees and van Eijck, 2003) but not on types of televisionprograms and their relations to patterns of audio-visualmedia use. Nevertheless, we can relate our findings also tothose of Finn and Gorr (1988) that summarize the moti-vations for viewing television programs into two generalmotivations: social compensation and mood manage-ment. Thus, we see that downscale audio-visual mediausers seem to look for television programs and videos thatoffer them a social compensation for their meagre socialresources (lack of companionship and social resources;they only bought and rented videos for their children anddocumentaries), whereas upscale audiences were interes-ted in mood management programs (through popularand highbrow entertainment delivered by the televisionbroadcasts and buying and renting motion pictures of dif-ferent genres but related to entertainment).
ConclusionsBy grounding our research on audio-visual uses and ori-entations on the sociology of culture, we were able tofocus our interest on patterns of media consumption andtheir symbolic role. The five patterns of audiences foundwere ordered in the same way as the society was struc-tured. The analysis of the symbolic role of patterns ofmedia uses proposes that upscale individuals use audio-visual consumption to communicate their social positionby showing off that they have the knowledge and thematerial means to consume a great variety of media andto do that more often than downscale consumers. Never-theless, the fact that audio-visual fans and film fans wereso close in the social hierarchy even though audio-visualfans were comparatively younger and more likely to besingle suggests that there could be a generational techno-logy of consumption that is difficult to change even forupscale consumers and could be masking the distinctionversus omnivorous currently under discussion. Accord-ingly, the media orientations of each type of audience sug-gest that each one has a different preference: upscaleaudiences looked for mood management instruments,whereas downscale audiences sought companionship,cognitive, and integrative-social gratifications.
AcknowledgementsThis research was supported by Grant BEC2003-04462from the Spanish Ministry of Science and Technology,Technical Department of the Humanities and Social Sci-ences. We are grateful to Rubén Gutiérrez del Castillo
(SGAE’s Research Department) for providing the data-base and to several anonymous reviewers who kindlycommented on previous versions of this manuscript,one of which was presented at the European Advancesin Consumer Research conference held in Göteborg,Sweden, June 14–18, 2005.
ReferencesBecker, L. B. (1979). Measurement of Gratifications.
Communication Research, 6, 54–73.Bourdieu, P. ([1979] 1984). Distinction: A Social Critique
of the Judgment of Taste. Cambridge: Harvard Uni-versity Press.
Bourdieu, P. (1989). Social Space and Symbolic Power.Sociological Theory, 7, 14–25.
Bradley, R. (2002). I Want My Mass Media: A Review ofthe Uses and Gratifications Approach. San Diego, CA:School of Communication, San Diego State University.
Cohen, A. A., Levy, M. R. and Golden, K. (1988). Chil-dren’s Uses and Gratifications of Home VCRs. Com-munication Research, 15, 772–780.
Dayton, C. M. (1998). Latent Class Scaling Analysis.Thousand Oaks, CA: Sage.
DiMaggio, P. (1982). Cultural Capital and School Suc-cess: The Impact of Status Culture Participation onthe Grades of U.S. High School Students. AmericanSociological Review, 47, 189–204.
DiMaggio, P. (1987). Classification in Art. AmericanSociological Review, 52, 440–455.
DiMaggio, P. and Useem, M. (1978). Social Class andArts Consumption: The Origins and Consequencesof Class Differences in Exposure to the Arts inAmerica. Theory and Society, 5, 141–161.
Douglas, M. and Isherwood, B. ([1979] 1996). TheWorld of Goods. London: Routledge.
Elliot, P. (1974). Uses and Gratifications Research: ACritique and a Sociological Alternative. In Blumler,J. G. and Katz, E. (Eds), The Uses of Mass Communi-cations. Beverly Hills, CA: Sage, pp. 249–268.
Erikson, R. and Goldthorpe, J. H. (1992). The ConstantFlux: A Study of Class Mobility in Industrial Societies.Oxford: Clarendon Press.
Evans, G. (1992). Testing the Validity of the GoldthorpeClass Schema. European Sociological Review, 8, 211–232.
Finn, S. and Gorr, M. B. (1988). Social Isolation andSocial Support as Correlates of Television ViewingMotivations. Communication Research, 15, 135–158.
Fraley, C. and Raftery, A. E. (1998). How Many Clusters?Which Clustering Method? Answers via Model-Based Cluster Analysis. Computer Journal, 41, 578–588.
Greenberg, B. (1974). Gratifications of Television View-ing and Their Correlates for British Children. InBlumler, J. G. and Katz, E. (Eds), The Uses of Mass
at UN
IVERSITA
T AU
TON
OM
A D
E BARCELO
NA
on September 23, 2014
http://esr.oxfordjournals.org/D
ownloaded from

PATTERNS OF AUDIO-VISUAL CONSUMPTION 411
Communications: Current Perspectives on Gratifica-tions Research. Beverly Hills, CA: Sage, pp. 71–92.
Henning, B. and Vorderer, P. (2001). PsychologicalEscapism: Predicting the Amount of TelevisionViewing by Need for Cognition. Journal of Commu-nication, 51, 100–120.
Katz, E. (1959). Mass Communication Research and theStudy of Pop Culture. An Editorial Note on a Possi-ble Future for this Journal. Studies in Public Commu-nication, 6, 1–6.
Katz, E. (1979). The Uses of Becker, Blumler and Swanson.Communication Research, 6, 74–83.
Katz, E., Blumler, J. G. and Gurevitch, M. (1974). Utili-zation of Mass Communication by the Individual. InBlumler, J. G. and Katz, E. (Eds), The Uses of MassCommunications: Current Perspectives on Gratifica-tions Research. Beverly Hills, CA: Sage, pp. 19–32.
Kaufman, L. and Rousseeuw, P. J. (1990). FindingGroups in Data – An Introduction to Cluster Analysis.New York: John Wiley & Sons.
Lazarsfeld, P. F. and Henry, N. W. (1968). Latent StructureAnalysis. Boston, MA: Houghton Mifflin Company.
Lee, B. and Lee, R. S. (1995). How and Why PeopleWatch TV: Implications for the Future of InteractiveTelevision. Journal of Advertising Research, 35, 9–18.
Magidson, J. and Vermunt, J. K. (2001). Latent ClassFactor and Cluster Models, Bi-Plots, and RelatedGraphical Displays. In Sober, M. and Becker, M.(Eds), Sociological Methodology, Vol. 31. Boston,MA: Blackwell Publishers, pp. 223–264.
Magidson, J. and Vermunt, J. K. (2002). Latent ClassModels for Clustering: A Comparison with K-Means.Canadian Journal of Marketing Research, 20, 37–44.
Palmgreen, P., Cook, R., Harvill, J. and Helm, D. (1988).The Motivational Framework of Moviegoing: Usesand Avoidances of Theatrical Films. In Austin, B.(Ed.), Current Research in Film: Audiences, Econom-ics, and Law, Vol. 3. Norwood, NJ: Ablex, pp. 1–23.
Perse, E. M. and Dunn, D. G. (1998). The Utility ofHome Computers and Media Use: Implications ofMultimedia and Connectivity. Journal of Broadcast-ing and Electronic Media, 42, 435–456.
Peterson, R. A. (2005). Problems in Comparative Research.The Example of Omnivorousness. Poetics, 33, 257–282.
Peterson, R. A. and Kern, R. M. (1996). Changing High-brow Taste: From Snob to Omnivore. AmericanSociological Review, 61, 900–907.
Peterson, R. A. and Simkus, A. (1992). How MusicalTastes Mark Occupational Status Groups. In Lamont,M. and Fournier, M. (Eds), Cultivating Differences.Chicago, IL: University of Chicago Press, pp. 152–186.
Raftery, A. E. (1986). Choosing Models for Cross-Classifications. American Sociological Review, 53,145–146.
Ritzer, G. (1992). Contemporary Sociological Practice.New York: McGraw-Hill.
Robinson, J. P. (1981). Television and Leisure Time: A NewScenario. Journal of Communication, 31, 120–130.
Rubin, A. M. (1981). An Examination of TelevisionViewing Motivations. Communication Research, 8,171–165.
Rubin, A. M. (1984). Ritualized and Instrumental Televi-sion Viewing. Journal of Communication, 34, 67–77.
SGAE (2000). Informe SGAE Sobre Hábitos de ConsumoCultural. Madrid, Spain: Fundación Autor.
Swanson, D. L. (1979). Political CommunicationResearch and the Uses and Gratifications Model – ACritique. Communication Research, 6, 37–53.
Swanson, D. L. (1992). Understanding Audiences: Con-tinuing Contribution of Gratifications Research.Poetics, 21, 305–328.
Thioulouse, J., Chessel, D., Dolédec, S. and Olivier, J. M.(1997). ADE-4: A Multivariate Analysis and GraphicalDisplay Software. Statistics and Computing, 7, 75–83.
van Eijck, K. and van Rees, K. (2000). Media Orientationand Media Use: Television Viewing Behavior of Spe-cific Reader Types from 1975 to 1995. Communica-tion Research, 27, 574–616.
van Rees, K. and van Eijck, K. (2003). Media Repertoiresof Selective Audiences: The Impact of Status, Gender,and Age on Media Use. Poetics, 31, 465–490.
van Rees, K., Vermunt, J. and Verboord, M. (1999). Cul-tural Classification Under Discussion – Latent ClassAnalysis of Highbrow and Lowbrow Reading. Poet-ics, 26, 349–365.
Vermunt, J. K. and Magidson, J. (2000). Latentgold:User’s Guide. Belmont, MA: Statistical Innovations.
Vermunt, J. K. and Magidson, J. (2002). Latent ClassCluster Analysis. In Hagenaars, J. and McCutcheon,A. (Eds), Applied Latent Class Models. Cambridge:Cambridge University Press, pp. 89–106.
Wedel, M. and Kamakura, W. A. (1998). Market Seg-mentation: Conceptual and Methodological Founda-tions. Boston, MA: Kluwer Academic.
Weibull, L. (1992). The Status of the Daily Newspaper:What Readership Research Tells us About the Roleof Newspapers in the Mass Media System. Poetics,21, 259–282.
Author’s AddressJordi López Sintas, Department d’Economia de
l’Empresa, Universitat Autònoma de Barcelona, Edi-ficio B, 08193-Bellaterra, Barcelona, Spain. Tel.: +3493 5812270, Fax: +34 93 5812555; email:[email protected]
Ercilia García-Álvarez, Universitat Rovira i Virgili,Department of Management, School of Turisim andLeisure, C/ de Sant Pere, 25, 43480 Vila-Seca I Salou(Tarragona), Spain; email: [email protected]
Manuscript received: August 2005
at UN
IVERSITA
T AU
TON
OM
A D
E BARCELO
NA
on September 23, 2014
http://esr.oxfordjournals.org/D
ownloaded from