8 Wave Reflection - Lab Aids
60
WAVES 79 8 Wave Reflection LABORATORY 2 CLASS SESSIONS ACTIVITY OVERVIEW NGSS CONNECTIONS Students investigate the reflection of sound and light waves. They find that some surfaces are good reflectors of sound, whereas others are good absorbers of sound. These characteristics are applied to acoustic design in an application of the cross- cutting concept of structure and function. Building on their observations of the relationship between the direction of incident and reflected sound waves, students analyze collected data and deduce the law of reflection as applied to light waves. They model the law as they create ray diagrams to represent both regular and diffuse reflection. NGSS CORRELATION Performance Expectation Working towards MS-PS4-2: Develop and use a model to describe that waves are reflected, absorbed, or transmitted through various materials. Disciplinary Core Ideas MS-PS4.B.1 Electromagnetic Radiation: When light shines on an object, it is reflected, absorbed, or transmitted through the object, depending on the object’s material and the frequency (color) of the light. MS-PS4.B.2 Electromagnetic Radiation: The path that light travels can be traced as straight lines, except at surfaces between different transparent materials (e.g., air and water, air and glass) where the light path bends. Science and Engineering Practices Developing and Using Models: Develop a model to describe phenomena.
-
Upload
khangminh22 -
Category
Documents
-
view
2 -
download
0
Transcript of 8 Wave Reflection - Lab Aids

WAVES 79
8 Wave Reflectionl a b o r at o r y
2 c l a s s s e s s i o n s
ACTIVITY OVERVIEWNGSS CONNECTIONS
Students investigate the reflection of sound and light waves. They find that some surfaces are good reflectors of sound, whereas others are good absorbers of sound. These characteristics are applied to acoustic design in an application of the cross-cutting concept of structure and function. Building on their observations of the relationship between the direction of incident and reflected sound waves, students analyze collected data and deduce the law of reflection as applied to light waves. They model the law as they create ray diagrams to represent both regular and diffuse reflection.
NGSS CORRELATION
Performance Expectation
Working towards MS-PS4-2: Develop and use a model to describe that waves are reflected, absorbed, or transmitted through various materials.
Disciplinary Core Ideas
MS-PS4.B.1 Electromagnetic Radiation: When light shines on an object, it is reflected, absorbed, or transmitted through the object, depending on the object’s material and the frequency (color) of the light.
MS-PS4.B.2 Electromagnetic Radiation: The path that light travels can be traced as straight lines, except at surfaces between different transparent materials (e.g., air and water, air and glass) where the light path bends.
Science and Engineering Practices
Developing and Using Models: Develop a model to describe phenomena.

WAVES 80
Planning and Carrying Out Investigations: Plan an investigation individually and collaboratively, and in the design: identify independent and dependent variables and controls, what tools are needed to do the gathering, how measurements will be recorded, and how many data are needed to support a claim.
Planning and Carrying Out Investigations: Conduct an investigation to produce data to serve as the basis for evidence to meet the goals of an investigation.
Analyzing and Interpreting Data: Analyze and interpret data to provide evidence for phenomena.
Using Mathematics and Computational Thinking: Use mathematical representations to describe and/or support scientific conclusions and design solutions.
Connections to the Nature of Science: Scientific knowledge is based on logical and conceptual connections between evidence and explanations.
Crosscutting Concepts
Patterns: Patterns can be used to identify cause and effect relationships.
Structure and Function: Structures can be designed to serve particular functions by taking into account properties of different materials, and how materials can be shaped and used.
Common Core State Standards—Literacy/ELA
RST.6-8.3: Follow precisely a multistep procedure when carrying out experiments, taking measurements, or performing technical tasks.
WHAT STUDENTS DO
The activity begins with students using cardboard tubes to investigate the reflec-tion of sound. They aim a sound through a tube pointed at various angles towards a reflecting surface. Students note the similarity between the angle of that tube and the one that the listener uses to hear the reflected sound. Students also investigate different types of surfaces and determine that some surfaces reflect well while others do not. Groups then apply what they have learned about sound reflection to light. Using a light station, they determine the law of reflection by means of a single ray of light and a plane mirror. Then they investigate other types and shapes of surfaces using multiple rays of light.
ACTIVITY 8 WAVE REFLECTION

WAVES 81
MATERIALS AND ADVANCE PREPARATION
■ For the teacher
1 Scoring Guide: planning and carrying out investigations (pci)
Part A ■ For each group of four students
*2 cardboard tubes
Part B ■ For each group of four students
1 light station 1 single-slit mask 1 triple-slit mask 1 plane mirror 2 plane mirror holders 1 curved mirror 1 curved mirror holder 1 angle card 1 index card 1 beam blocker with holder (optional) *1 protractor (optional) *3 sheets of white paper (optional) 1 Scoring Guide: planning and carrying out investigations (pci)
(optional)
*not included in kit
The cardboard tubes needed for Part A should be about as wide as a student’s ear. Paper towel tubes work well. The room for Part A should contain suitable surfaces that are good reflectors (e.g., smooth wall, whiteboard) and other surfaces that are poor reflectors (e.g., heavy curtains, cork). If you don’t have access to suitable absorbing surfaces (e.g., curtains), try covering a smooth surface with a thick cloth (e.g., a towel).
Determine in advance the optimal setup for the light station, mirrors, and the lighting conditions for your room. A broader beam will be brighter, but using the beam blocker to create a narrower beam can provide more precise and accurate results. Use the flexible mirrors and holders to construct an equal number of concave and convex curved mirrors.
ACTIVITY 8 WAVE REFLECTION

ACTIVITY 8 WAVE REFLECTION
WAVES 82
TEACHING SUMMARY
GET STARTED
1. Discuss echoes and other types of reflection.
a. Ask students if they have ever heard an echo.
b. Ask students to look for the crosscutting concept of patterns at the loca-tions where echoes occur.
c. Ask students to describe locations where echoes would be an unwelcome distraction.
d. Point out that an echo is a reflection of a sound, and ask students to describe other examples of reflection.
DO THE ACTIVITY
2. Students use cardboard tubes to investigate the reflection of sound.
a. Assist groups as necessary with collecting data using a hard surface.
b. Discuss patterns that are evident from the data.
3. Students use a light station to investigate the reflection of light.
a. Assist groups in setting up the light stations.
b. Ask groups to predict the direction of the reflected ray.
c. Discuss the class data.
4. (pci assessment) Students design an investigation to determine the relation-ship between the incident ray and the reflected ray.
a. Approve student experimental designs.
b. Assist students as necessary in conducting their investigations.
c. Review the data collected by students.
5. Students investigate reflection with multiple beams and other reflecting surfaces.
a. Instruct groups to predict what will happen when the three rays hit the plane mirror.
b. Assist groups as they experiment with the triple-slit mask with the plane mirror, the curved mirror, and the white card.

ACTIVITY 8 WAVE REFLECTION
WAVES 83
BUILD UNDERSTANDING
6. Summarize the results of the investigations.
a. Use the Analysis items to guide class discussion of the results of the investigations.
b. Apply the law of reflection to surfaces that are not flat and smooth.
c Use Analysis item 7 to begin a discussion of transmission and absorption.
TEACHING STEPSGET STARTED
1. Discuss echoes and other types of reflection.
a. Ask students if they have ever heard an echo.
It is likely that most, or all, students will have heard an echo, even if only on TV or in a movie. If necessary, play recordings of sounds that have echoes or reverberations.
b. Ask students to look for the crosscutting concept of patterns at the loca-tions where echoes occur.
Students should be able to identify common features, such as large and smooth surfaces and the walls in large spaces (e.g., gym, long hallway, cliff face). Use chart paper, a whiteboard, or a screen to record key informa-tion about the locations.
c. Ask students to describe locations where echoes would be an unwelcome distraction.
Examples might include a concert hall or auditorium, or a music or video recording studio. This is an opportunity to introduce the crosscutting concept of structure and function during a brief discussion of the features found, and avoided, in such spaces (e.g., use of cloth and other absorbent material; no large, smooth surfaces).
d. Point out that an echo is a reflection of a sound, and ask students to describe other examples of reflection.
Responses will likely include reflection of light from mirrors, glass win-dows, and water surfaces. Consider showing images of such reflections before asking students to once again look for patterns in the characteris-tics of surfaces that reflect light. Tell the class that in this activity, they will investigate the reflection of sound and light in more detail.

ACTIVITY 8 WAVE REFLECTION
WAVES 84
DO THE ACTIVITY
2. Students use cardboard tubes to investigate the reflection of sound.129
a. Assist groups as necessary with collecting data using a hard surface.
If necessary, help each group find a suitable location where there is a good reflecting surface. Groups will not need to measure the exact angles of the tubes with respect to the wall, but they will need some way to determine approximate angles. Consider providing pre-drawn lines on a sheet of paper at 30, 45, and 60 degrees to help students position the speaker tube, similar to the diagram below.
b. Discuss patterns that are evident from the data.130
PROCEDURE STEP 6 SAMPLE STUDENT RESPONSE
PROCEDURE STEP 7 SAMPLE STUDENT RESPONSE
The angle of the listener tube from the wall is always at about the same angle as the speaker tube is from the wall.
PROCEDURE STEP 8 SAMPLE STUDENT RESPONSE
The sound did not seem clear no matter at which angle we held the listener tube to the surface.
The data, although approximate, should show that the angle of the listener tube and the angle of the speaker tube with respect to the reflecting surface are closely matched. That is, when the speaker tube is at approximately 60
129 NGSPPI3
130 NGCCPA1
IAPS 3e Waves TEFig. TE 8.8 Legacy Sans Med 10/11.5
Wall or other hard, smooth surface Target spot
Listener tubeSpeaker tube
IAPS 3e Waves TEFig. TE 8.7 Legacy Sans Med 10/11.5
Wall or other hard, smooth surface Target spot

ACTIVITY 8 WAVE REFLECTION
WAVES 85
degrees to the reflecting surface, the listener tube is also at approximately 60 degrees. When the speaker tube is at 45 degrees, the listener tube will also be at 45 degrees, etc. Depending on how much sound is absorbed by the soft surface, there is likely no discernable pattern as the echoes are likely too soft to discern optimum direction.
3. Students use a light station to investigate the reflection of light.
a. Assist groups in setting up the light stations.
Show students how to adjust the light station and single-slit mask to obtain a narrow, sharp beam of light, and how to use the beam blocker to narrow the beam further. Review how to use the angle card in this inves-tigation. For example, clarify that the “L” refers to left and the “R” refers to right. Before students switch on the light station, have them position the plane mirror on the mirror line of the angle card.
b. Ask groups to predict the direction of the reflected ray.
Explain that scientists refer to a beam of light that travels towards and hits a surface as an incident ray, and they refer to the one that bounces off the surface as the reflected ray. Tell the class that they will arrange the light station so that the incident ray travels along line 1L to the mirror. Allow time for groups to discuss where the reflected ray would travel.
c. Discuss the class data.
The reflected ray should have traveled along line 1R. If groups did not get this result, check their setup and technique.
PROCEDURE STEP 12 SAMPLE STUDENT RESPONSE
The light reflected off the mirror along line 1R.
4. (pci assessment) Students design an investigation to determine the relation-ship between the incident ray and the reflected ray.131132
a. Approve student experimental designs.
The investigation can be conducted using the angle card. For a more quantitative approach, a protractor could be provided, and students could be asked to measure the angles of the light beams to the mirror. Procedure Step 13 is an opportunity to assess the science and engineering practice of planning and carrying out investigations using the pci Scoring Guide. Project or distribute the Scoring Guide, and point out the different descriptions for each level. Review the levels as needed. For more infor-mation, see Teacher Resources III, “Assessment.”
131 NGSPPI1
132 SEASPI1

ACTIVITY 8 WAVE REFLECTION
WAVES 86
PROCEDURE STEP 13 SAMPLE LEVEL-4 RESPONSE
1. Place the mirror upright on the mirror line on the angle card.
2. Arrange the light station so that the beam of light travels along line 1L to the mirror.
3. Record the path of the light beam after it reflects from the mirror.
4. Move the angle card and the mirror so that the light beam now travels along line 2L.
5. Record the path of the light beam after it reflects from the mirror.
6. Repeat Steps 3 and 4 for light traveling along lines 3L, 4L, and 5.
b. Assist students as necessary in conducting their investigations.
Procedure Step 14 is an additional opportunity to assess the science and engineering practice of planning and carrying out investigations.
PROCEDURE STEP 14 SAMPLE LEVEL-4 RESPONSE (USING ANGLE CARD)
Light path to the mirror Light path from the mirror
1L 1R
2L 2R
3L 3R
4L 4R
5 5
PROCEDURE STEP 14 SAMPLE LEVEL-4 RESPONSE (USING A PROTRACTOR)
Angle that the light hits the mir-ror (degrees)
Angle that the light reflects from the mirror (degrees)
30 30
40 40
50 50
60 60
70 70
c. Review the data collected by students.
The data should show that a distinct pattern appears in the directions of the incident and reflected rays. Ask the class what statement could be made about the patterns of the angles of the two rays with respect to the mirror. Guide the class to stating that the angle of the reflected ray is equal to the angle of the incident ray.133
133 NGPS4B1

ACTIVITY 8 WAVE REFLECTION
WAVES 87
5. Students investigate reflection with multiple beams and other reflecting surfaces.
a. Instruct groups to predict what will happen when the three rays hit the plane mirror.
PROCEDURE STEP 17 SAMPLE STUDENT RESPONSE
The reflected beams of light should bounce off the mirror at the same angle as they hit it.
b. Assist groups as they experiment with the triple-slit mask with the plane mirror, the curved mirror, and the white card.
Teacher note: When using the triple-slit mask, the three beams of light will diverge slightly and, therefore, will not be parallel to one another. The reflection of each beam will still be predictable in that the angle that it hits the mirror is the angle that it reflects. Multiple reflections may be easier to see if the angle card is replaced by a sheet of white paper.
PROCEDURE STEP 18 SAMPLE STUDENT RESPONSE
IAPS 3e Waves TEFig. TE 8.9 Legacy Sans Med 10/11.5
Mirror
(Student prediction)
IAPS 3e Waves TEFig. TE 8.10 Legacy Sans Med 10/11.5
Mirror
(Student observation)

ACTIVITY 8 WAVE REFLECTION
WAVES 88
PROCEDURE STEP 19 SAMPLE STUDENT RESPONSE
PROCEDURE STEP 20 SAMPLE STUDENT RESPONSE
Student may predict that the rays will reflect off the white card like a mirror. Their observations should not support this.
Our observations were that the three light beams could be seen on the front of the card, but no individual reflected beams could be seen.
BUILD UNDERSTANDING
6. Summarize the results of the investigations.
a. Use the Analysis items to guide class discussion of the results of the investigations.
Analysis items 1 and 2 are opportunities to apply the crosscutting concept of patterns as they are used to formalize student understanding of the law of reflection—that the angle of incidence is equal to the angle of reflection.
b. Apply the law of reflection to surfaces that are not flat and smooth.
Make sure that students realize that the law of reflection was obeyed even with the curved mirror and the white card. The reflected rays were not all in the same direction because they hit the surfaces at different angles. Analysis item 5 provides an opportunity to check for student understand-ing of this concept.
c Use Analysis item 7 to begin a discussion of transmission and absorption.134
Refer students to Procedure Step 8, when they listened for reflections off a soft surface. Students will have noticed that the sound was much softer as it did not reflect well. Ask what might have happened to the sound energy that was not reflected. (It would have been absorbed by the material of the
134 NGPS4B1
IAPS 3e Waves TEFig. TE 8.11 Legacy Sans Med 10/11.5
Mirror
(Note: Rays come to a point)
Mirror
(Note: Rays come from a point)

ACTIVITY 8 WAVE REFLECTION
WAVES 89
soft surface.) Use Analysis item 7 to further the discussion of absorption and to introduce transmission. Tell students that they will be learning more about transmission and absorption in subsequent activities.
SAMPLE RESPONSES
1. What patterns did you notice about the angle of the listener tube compared with the angle of the speaker tube?135
The angles were always about the same.
2. Describe the relationship between the angle that a ray hits a mirror and the angle that the same ray reflects off136137
a. a plane mirror.
The angle that the ray reflects off the plane mirror is the same as the angle that it hits the mirror.
b. a curved mirror.
The angle that the ray reflects off the curved mirror is the same as the angle that it hits the mirror.
3. Was light reflected off the white index card? Explain how you know.
Light must have been reflected off the card because we could see the card.
4. Which surface, a smooth or bumpy one, do you think would be best used for the ceiling of a concert hall? Explain your choice.138
A bumpy surface would be better because it would reflect the sound in different directions. A smooth surface would reflect the sound more in one direction and could cause echoes.
5. The diagram below represents a highly magnified image of the surface of the index card. The five lines with arrows represent rays of light hitting the card. Copy the diagram and then
a. draw the rays of light that are reflected from the card.
135 NGCCPA1
136 NGSPAD3
137 NGSPUM1
138 NGCCSF2 IAPS 3e Waves TEFig. TE 8.12 Legacy Sans Med 10/11.5

ACTIVITY 8 WAVE REFLECTION
WAVES 90
b. explain why the surface of the card does not appear shiny like a mirror.
The surface of the index card looks bumpy when magnified. When rays of light hit the surface, they reflect off at the same angle that they hit. Because the surface is bumpy, different rays hit at different angles. Therefore, they are reflected in many different directions. This means the light is scattered when it reflects off the card.
6. Explain why the ears of some mammals are bowl-shaped.139
The bowl shape helps to reflect sound towards the opening in the ears.
7. If only some of the light that hits an object is reflected, predict what might happen to the rest of the light.140
The light may be absorbed by the material, or maybe it will pass through, like through glass.
REVISIT THE GUIDING QUESTION
What kind of surface makes a good reflector?
A good reflector is a hard, smooth surface. If the surface is soft, it will decrease the amount of reflection because it will absorb some of the energy of the wave. A smooth surface reflects more uniformly than a bumpy surface, because it reflects rays in a more uniform direction rather than scattering the rays in all directions.
ACTIVITY RESOURCESKEY VOCABULARY
reflect, reflection
BACKGROUND INFORMATION
ELECTROMAGNETIC WAVES
Light is an example of an electromagnetic wave. Electromagnetic waves do not require a medium and can, therefore, travel through a vacuum. Electromagnetic waves consist of varying electric and magnetic fields that are perpendicular to one another. For more on electromagnetic waves, see Background Information in Activity 12, “The Electromagnetic Spectrum.”
139 NGCCSF1
140 NGPS4B1

ACTIVITY 8 WAVE REFLECTION
WAVES 91
REFLECTION
When light strikes a flat, shiny surface, such as a mirror, the light will reflect off the surface. The law of reflection determines the exact direction of the reflection. At the point where light strikes a flat surface, we can draw a line perpendicular (or “normal”) to the surface and define two angles measured from this perpendicular line shown in the diagram below.
The angle of incidence is the angle measured from the incoming light path to the perpendicular line (normal), and the angle of reflection is the angle measured from the reflected light path to the same perpendicular line (normal). The law of reflection states that the angle of incidence is always equal to the angle of reflection, q1 = q2.
When a surface is not perfectly smooth, the incident rays will hit at various angles and will, therefore, be reflected at various angles. The law of reflection still applies to each incident and reflected ray, but there is no strong reflection in a single direction. This is referred to as diffuse reflection.
IAPS 3e Waves TEFig. TE 8.13 Legacy Sans Med 10/11.5
Angle of incidence Angle of reflection
Incident ray Reflected ray
�1 �2

WAVES 92
9 Refraction of Lightl a b o r at o r y
1–2 c l a s s s e s s i o n s
ACTIVITY OVERVIEWNGSS CONNECTIONS
Students experiment with the transmission of light rays by planning and carrying out an investigation of the refraction of light through water. Looking for patterns in their data, students search for a qualitative relationship between the angle of incidence, angle of refraction, and index of refraction. Students plan and carry out an investigation that determines the critical angle for total internal reflection. Students identify the crosscutting concept of structure and function as they apply their understanding of total internal reflection as it is used in fiber optics.
NGSS CORRELATION
Performance Expectation
Working towards MS-PS4-2: Develop and use a model to describe that waves are reflected, absorbed, or transmitted through various materials.
Disciplinary Core Ideas
MS-PS-4.B.2 Electromagnetic Radiation: The path that light travels can be traced as straight lines, except at surfaces between different transparent materials (e.g., air and water, air and glass) where the light path bends.
MS-PS-4.B.1 Electromagnetic Radiation: When light shines on an object, it is reflected, absorbed, or transmitted through the object, depending on the object’s material and the frequency (color) of the light.
Science and Engineering Practices
Developing and Using Models: Develop a model to describe phenomena.
Planning and Carrying Out Investigations: Plan an investigation individually and collaboratively, and in the design: identify independent and dependent variables and controls, what tools are needed to do the gathering, how measurements will be recorded, and how many data are needed to support a claim. Conduct an investi-

ACTIVITY 9 REFRACTION OF LIGHT
WAVES 93
gation and evaluate the experimental design to produce data to serve as the basis for evidence that can meet the goals of the investigation.
Connections to the Nature of Science: Scientific Knowledge Is Based on Empirical Evidence: Scientific knowledge is based on logical and conceptual connections between evidence and explanations.
Analyzing and Interpreting Data: Analyze and interpret data to provide evidence for phenomena.
Crosscutting Concepts
Structure and Function: Structures can be designed to serve particular functions by taking into account properties of different materials, and how materials can be shaped and used.
Patterns: Graphs and charts can be used to identify patterns in data.
Common Core State Standards—ELA/Literacy
RST.6-8.3: Follow precisely a multistep procedure when carrying out experiments, taking measurements, or performing technical tasks.
WHAT STUDENTS DO
Students investigate the refraction of light through a translucent object. Students conduct a hands-on investigation to show the redirection of the light ray as it trav-els through the boundary of one medium into another. Then they explore further by investigating total internal reflection in the translucent object.
MATERIALS AND ADVANCE PREPARATION
■ For the teacher
1 Scoring Guide: planning and carrying out investigations (pci) 1 Scoring Guide: analyzing and interpreting data (aid) * milk, fresh or powdered * supply of water *1 gallon container 1 laser pointer 1 semicircular container (optional) * masking tape, 3–5 m

ACTIVITY 9 REFRACTION OF LIGHT
WAVES 94
■ For each group of four students
1 light station 1 single-slit mask 1 beam blocker with stand 1 semicircular container 1 protractor 1 ruler *1 sheet of white paper milky water 1 small cup (optional)
■ For each student
1 Student Sheet 9.1, “Refraction Measurements” 1 Student Sheet 9.2, “Total Internal Reflection Measurements” 1 Scoring Guide: planning and carrying out investigations (pci)
(optional) 1 Scoring Guide: analyzing and interpreting data (aid) (optional) *1 sheet of graph paper
*not included in kit
Make a large batch (1 gallon) of the milky solution to pour into the individual semi-circular containers. Start by stirring a few drops of fresh milk or a pinch of powdered milk into a container of water. Shine the light beam into the solution to see if the beam is visible. If it is not, add more milk, and repeat this process until the path of the light beam is clearly seen. Add only small increments of milk at a time into the water. If too much milk is added to the water, the solution will become too opaque for the path to be easily seen. Consider distributing the milky water in small cups instead of the semicircular containers to minimize spills.
Test the light station with the semicircular container in advance. Make adjust-ments to the setup to achieve optimal results. Depending on the brightness of your room, you may need to have the container very close to the light station. The con-tainer can be placed on top of one or two books in order to better align the path of the beams of light with the liquid in the container. The beam blocker can be used to reduce the width of the light beam. This will help to produce more accurate and precise results but will make the beam dimmer.
Consider the optional demonstration that models refraction (Teaching Step 5b). Find a large area in which to conduct the demonstration.
SAFETY NOTE
This activity includes a teacher demonstration that uses a laser pointer. Be careful not to shine the laser light towards student faces. Do not allow anyone to look into the laser light.

ACTIVITY 9 REFRACTION OF LIGHT
WAVES 95
TEACHING SUMMARY
GET STARTED
1. Review the wave propagation of light.
a. Ask students to identify some characteristics of light.
b. Identify refraction as another wave characteristic.
DO THE ACTIVITY
2. Students design an investigation to show how light refracts in two different media in Part A.
a. Explain the use of milky water in the setup.
b. Describe how to properly set up the equipment.
c. Approve the experimental designs and let groups collect data.
d. (pci assessment) Assess students’ experimental designs.
3. Students consider the patterns found in their results.
a. Review students’ conclusions based on their data.
b. Introduce ray diagrams as a way to model refraction.
4. Students investigate total internal reflection in Part B.
a. Ask students, “What do you think happens when you keep increasing the angle of the incident ray in a more dense medium?”
b. Show how to see the reflection in the milky water.
c. (pci assessment) Let students design and conduct their investigations.
d. Review student results to Part B.
e. Connect the student investigation to the nature of science.
BUILD UNDERSTANDING
5. Conduct demonstrations that illustrate and model refraction.
a. Show refraction and total internal reflection using a laser pointer.
b. Model refraction with students marching at various speeds (optional).
c. Address the mechanism of changing wave speeds when waves enter differ-ent media.
6. Students model refraction and analyze experimental data.
a. Assess students’ abilities to model light through diagrams.

ACTIVITY 9 REFRACTION OF LIGHT
WAVES 96
b. (aid assessment) Assess students’ abilities to analyze critical-angle data.
7. Students consider broader applications of their findings.
a. Revisit total internal reflection and refraction through a lens.
b. Expand the discussion of reflection and refraction to include other types of waves.
TEACHING STEPSGET STARTED
1. Review the wave propagation of light.12
a. Ask students to identify some characteristics of light.
At this point in the unit, students should be able to respond that light is a transverse wave and that it reflects most directly off smooth surfaces. Let students know that in this activity, they will further investigate the char-acteristic of light when it transmits through a transparent or translucent surface.
b. Identify refraction as another wave characteristic.
Let students know that although they will investigate refraction of light, refraction occurs in all types of waves. Review the term refraction, described in the Student Book as a phenomenon that occurs when a wave encounters a boundary between two materials through which the wave can pass. The concept of total internal reflection is presented in Part B and does not need to be defined at this time.
DO THE ACTIVITY
2. Students design an investigation to show how light refracts in two different media in Part A.
a. Explain the use of milky water in the setup.
When reviewing the Procedure, explain to students that the container of milky water does not interfere with the experiment—it is just there to make the path of the light beam visible through the water.
b. Describe how to properly set up the equipment.
Check that students shine the light at the intersection of the surface and the perpendicular (normal) line so the angle is accurately measured. You may want to draw a class diagram that shows the setup and demonstrate exactly where the light should fall on the container in addition to the angle of incidence and the angle of refraction. A ruler may also be helpful
1 NGPS4B1
2 NGPS4B2

ACTIVITY 9 REFRACTION OF LIGHT
WAVES 97
to mark the ray onto the paper and provide a more accurate measurement. If students are having difficulty identifying the refracted beam, suggest they place the beam blocker horizontally across the top of the semicircular container, which helps see only the desired beam.
Teacher’s note: Students may wonder if the plastic container changes their results because that, too, is another medium through which the light trav-els. Fortunately, the plastic container is thin enough that it only slightly changes the results. The effect is small enough to be unnoticed.
c. Approve the experimental designs and let groups collect data.
When students design their investigations, check that they choose appro-priate intervals for the angle of incidence, such as 5–10 degrees, and a range from 20 to 70 degrees.
d. (pci assessment) Assess students’ experimental designs. 34
Both Procedure Parts A and B of this activity can be assessed using the pci Scoring Guide. Project or distribute the Scoring Guide, and point out the different descriptions for each level. Review the levels as needed. For more information, see Teacher Resources III, “Assessment.”
PROCEDURE STEPS 4–7 LEVEL-4 RESPONSE
1. Place the milky water on Student Sheet 9.1 so it lines up with the protractor.
2. Set up the light station so the incident ray hits the center line at 0 degrees, or right down the center line.
3. Check that the light beam goes straight through the milky water on the center line.
4. Set the incident ray so it hits the center line at 10 degrees, as shown below. Measure and record the angle of the refracted ray.
5. Move the angle of the incident ray to 20 degrees and repeat the experiment.
6. Take measurements every 10 degrees up to 90 degrees.
7. Graph the data.
3 NGSPPI1
4 SEASPI1
IAPS 3e Waves TEFig. TE 9_11 MyriadPro Reg 9.5/11
(Change incident angle by moving box)
Light ray
Protractor
Air
Light box Milky water

ACTIVITY 9 REFRACTION OF LIGHT
WAVES 98
LabAids SEPUP IAPS Waves 3eFigure: Waves3e TE9_8MyriadPro Reg 9.5/11
STUDENT SHEET 9.1 SAMPLE RESPONSEREFRACTION MEASUREMENTS

ACTIVITY 9 REFRACTION OF LIGHT
WAVES 99
REFRACTION DATA
Angle of incidence (degrees) Angle of refraction (degrees)
0 0
10 8
20 17
30 23
40 30
50 36
60 41
70 46
80 50
The pattern that we found was that as the angle got bigger, the amount the light refracted increased. There was no refraction at 0 degrees (perpendicular), and it steadily increased to a 30-degree change when the incident ray was at 80 degrees.
3. Students consider the patterns found in their results.5
a. Review students’ conclusions based on their data.
At the end of Part A, students should find that refraction means that the light ray is redirected, or bends, at the boundary between the two surfaces. Explain to students that these results hold for light travelling from less optically dense to a more optically dense media. Let students know that the opposite is also true—that a light ray has larger angle of refraction when it travels from a denser to less dense environment.
5 NGCCPA1
LabAids SEPUP IAPS Waves 3eFigure: Waves3e TE9_9MyriadPro Reg 9.5/11
Ang
le o
f ref
ract
ion
(Deg
rees
) 50
40
30
20
10
0
Angle of incidence (Degrees)402010 50 60 7030 80 90

ACTIVITY 9 REFRACTION OF LIGHT
WAVES 100
b. Introduce ray diagrams as a way to model refraction.6
Remind students of the ray diagrams of reflection that they used in the previous activity. Present the light ray diagrams for refraction, as shown below. This is an opportunity for modeling the phenomena of refraction though the use of diagrams.
Help students relate these ray diagrams to the experiment. Provide diagrams similar to those on Student Sheet 9.1 on which students are recording their data. Look for responses that include the center (normal) line, the incident ray, and a properly refracted angle.
4. Students investigate total internal reflection in Part B.
a. Ask students, “What do you think happens when you keep increasing the angle of the incident ray in a more dense medium?”
Some students may be able to figure out from the ray diagrams that the ray will reflect instead of refract, but if not, allow them to be curious. Let them know that in Part B, they will investigate this further as it is a conse-quence of the phenomenon of refraction.
b. Show how to see the reflection in the milky water.
Using the setup, show how the light ray is not seen when it goes through the air on the other side of the boundary, but the point at which it reflects back into the milky water is visible. Use this exercise to clarify the terms critical angle and total internal reflection.
c. (pci assessment) Let students design and conduct their investigations.78
PROCEDURE STEP 8 LEVEL-4 RESPONSE
1. Place the milky water on the Student Sheet so it lines up with the protractor on the page.
2. Set up the light station so the incident ray goes from the water to the air.
3. Check that the light beam goes straight through the center line.6 NGSPDM1
7 NGSPPI1
8 SEASPI1
IAPS 3e Waves TEFig. TE 9_10 MyriadPro 9.5/11
Material A(Less optically dense)
Material B(More optically dense)
Material A(More optically dense)
Material B(Less optically dense)

ACTIVITY 9 REFRACTION OF LIGHT
WAVES 101
4. Set the incident ray through the water so it hits the center line at 10 degrees, as shown below. Record whether the light is reflected or not.
5. Increase the incident ray every 5 degrees up to 90 degrees. IAPS 3e Waves TEFig. TE 9_11 MyriadPro Reg 9.5/11
(Change incident angle by moving box)
Light ray
Milky water
Air
Light box Protractor
LabAids SEPUP IAPS Waves 3eFigure: Waves3e TE9_12MyriadPro Reg 9.5/11
STUDENT SHEET 9.2 SAMPLE RESPONSETOTAL INTERNAL REFLECTION MEASUREMENTS

ACTIVITY 9 REFRACTION OF LIGHT
WAVES 102
TOTAL INTERNAL REFLECTION DATA
Angle of incidence (degrees)
Reflection?
0 no
10 no
15 no
20 no
25 no
30 no
35 no
40 no
45 no
50 no
55 yes
60 yes
65 yes
70 yes
75 yes
80 yes
85 yes
90 no
The data show that the critical angle was between 50 and 55 degrees.
d. Review student results to Part B.
When students share their results, they should find the critical angle to be somewhere around 50–60 degrees.
e. Connect the student investigation to the nature of science.
Ask students to review how the evidence they collected in this activity led them to a conclusion about how light waves behave. Their work exempli-fies how scientific knowledge is based on logical and conceptual connec-tions between evidence and explanations.9
BUILD UNDERSTANDING
5. Conduct demonstrations that illustrate and model refraction.10
a. Show refraction and total internal reflection using a laser pointer.
Remind students not to look into the laser light. Use a laser pointer to demonstrate refraction through the milky water. Slowly increase the angle of incidence until total internal reflection occurs at the water–air interface. Use the demonstration to reinforce student results.
9 NGCCNS2
10 NGSPDM1

ACTIVITY 9 REFRACTION OF LIGHT
WAVES 103
b. Model refraction with students marching at different speeds (optional).11
This demonstration supports the wave model of light in refraction by modeling the wave front as it encounters a surface. Take a group of students to a large space (e.g., a parking lot, field, or gymnasium). First, show students how to line up next to each other and march in step with a uniform pace, and then have them change to steps half as long with the same frequency. Practice until they are able to march in both ways. Then align the “army” of 4–6 students in each line to represent consecutive wave fronts.
When students are proficient at marching, mark a boundary line on the ground with a long piece of tape or string. Have them march on the road, meeting the boundary at an angle. As soon as each person crosses the boundary, that student must change to steps half as long. This will pro-duce a change in direction of each wave front, demonstrating refraction towards the normal.
Try the demonstration again and model going from an optically slower to faster medium by making the steps twice as long (instead of half) when students reach the boundary. This will show the wave front move away from the normal line.
c. Address the mechanism of changing wave speeds when waves enter a different medium.12
At the end of this activity, students may be well able to predict the direc-tion of a path of light but not fully understand the mechanism. In fact, the explanation of why the light changes direction is complex and likely
11 NGPS4B3
12 NGPS4B3
IAPS 3e Waves TEFig. TE 9_13MyriadPro 9.5/11
ACTIVITY 9 REFRACTION OF LIGHT
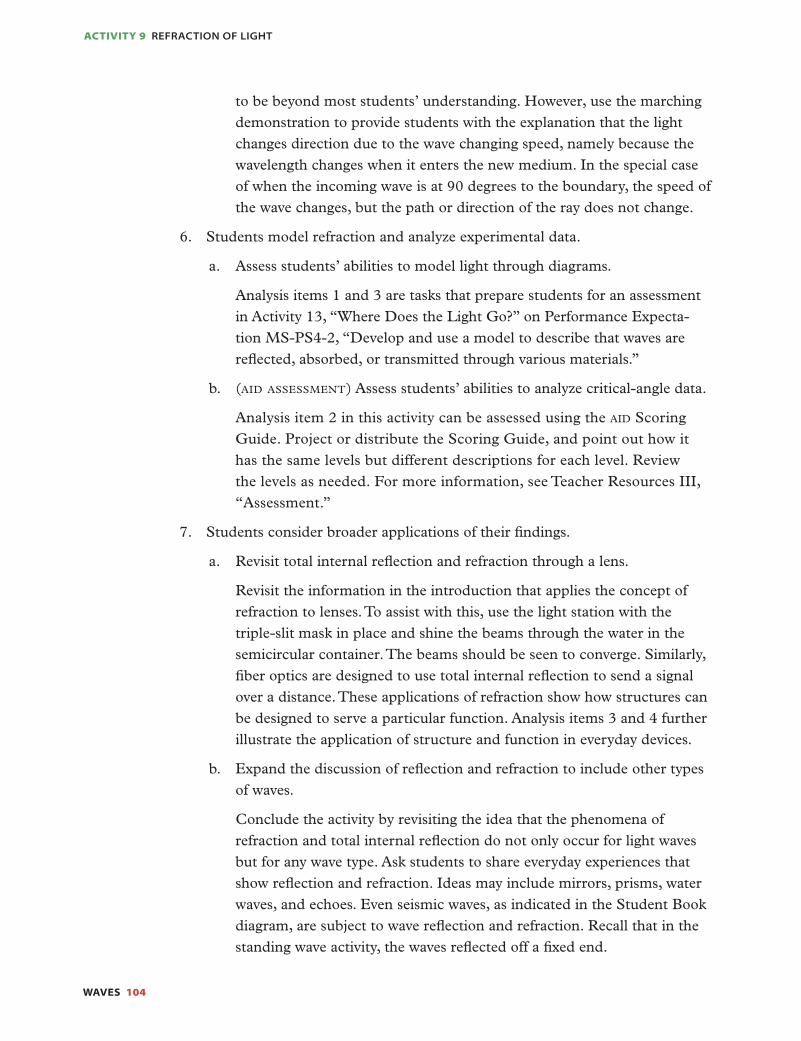
WAVES 104
to be beyond most students’ understanding. However, use the marching demonstration to provide students with the explanation that the light changes direction due to the wave changing speed, namely because the wavelength changes when it enters the new medium. In the special case of when the incoming wave is at 90 degrees to the boundary, the speed of the wave changes, but the path or direction of the ray does not change.
6. Students model refraction and analyze experimental data.
a. Assess students’ abilities to model light through diagrams.
Analysis items 1 and 3 are tasks that prepare students for an assessment in Activity 13, “Where Does the Light Go?” on Performance Expecta-tion MS-PS4-2, “Develop and use a model to describe that waves are reflected, absorbed, or transmitted through various materials.”
b. (aid assessment) Assess students’ abilities to analyze critical-angle data.
Analysis item 2 in this activity can be assessed using the aid Scoring Guide. Project or distribute the Scoring Guide, and point out how it has the same levels but different descriptions for each level. Review the levels as needed. For more information, see Teacher Resources III, “Assessment.”
7. Students consider broader applications of their findings.
a. Revisit total internal reflection and refraction through a lens.
Revisit the information in the introduction that applies the concept of refraction to lenses. To assist with this, use the light station with the triple-slit mask in place and shine the beams through the water in the semicircular container. The beams should be seen to converge. Similarly, fiber optics are designed to use total internal reflection to send a signal over a distance. These applications of refraction show how structures can be designed to serve a particular function. Analysis items 3 and 4 further illustrate the application of structure and function in everyday devices.13
b. Expand the discussion of reflection and refraction to include other types of waves.
Conclude the activity by revisiting the idea that the phenomena of refraction and total internal reflection do not only occur for light waves but for any wave type. Ask students to share everyday experiences that show reflection and refraction. Ideas may include mirrors, prisms, water waves, and echoes. Even seismic waves, as indicated in the Student Book diagram, are subject to wave reflection and refraction. Recall that in the standing wave activity, the waves reflected off a fixed end.
13 NGCCSF2

ACTIVITY 9 REFRACTION OF LIGHT
WAVES 105
SAMPLE RESPONSES
1. Draw a diagram with labels that shows how the light traveled through the milky water when it was
a. directed down the normal line.
b. directed at an angle.
For item 1a, the light is not refracted at all because it is travelling perpendicular to the surface. It passes directly through. For item 1b, the light is redirected when it enters the milky water. It is turned toward the center line by the milky water.
2. (aid assessment) Look at the data below that show the refraction of light from one medium to another for various materials. 1415
Material critical angle (degrees)
Optical Density (index of
refraction, n)
incident angle (degrees)
Refraction angle (degrees)
Water 50 1.3 20 15.2
Sugar solution 46 1.4 20 14.1
Acrylic 42 1.5 20 13.2
Flint glass 39 1.6 20 12.3
Your friend looks at these data and says, “I see a general trend showing that as the optical density of a material increases, the critical angle also increases.” Do you agree or disagree with your friend? Explain your opinion using evidence from the table.
14 NGSPAD4
15 SEASAD1
LabAids SEPUP IAPS Waves 3eFigure: Waves3e TE9_14MyriadPro Reg 9.5/11
Milky water
Incident ray
Center line
LabAids SEPUP IAPS Waves 3eFigure: Waves3e TE9_15MyriadPro Reg 9.5/11
Milky water
Incident ray
Center line
Refracted ray

ACTIVITY 9 REFRACTION OF LIGHT
WAVES 106
SAMPLE LEVEL-4 RESPONSE
I disagree with the statement. The data show that as optical density increases, the critical angle decreases. There is an inverse relationship between the optical density and the critical angle, not a direct relationship. A more optically dense material will refract light more, leading to a smaller critical angle. A less optically dense material will not result in as much refraction, leading to a larger critical angle.
3. The principle of total internal reflection is used in fiber optic technology. A wave signal is sent down a glass tube at the critical angle so that it is reflected off the interior of the tube as it travels. Copy the close-up diagram of a fiber optic cable below. Draw arrow(s) that show a possible ray that is totally inter-nally reflected through the tube.16
4. The functioning of the human eyeball depends on the refraction of light. When light comes into the eye, first the cornea and then the lens refracts the light so that it focuses on the retina. The lens is flexible and is controlled by muscles in the eye. The curvature of the lens changes in order to focus objects at different distances. If the lens does not refract properly, the light rays do not come together at a point on the retina.
When the light focuses past the retina, the person will have blurry vision at close distances. This person would be considered farsighted. Farsightedness can be corrected with eyeglasses or contact lenses that refract the light inwards before it enters the eye. The opposite problem, or nearsightedness, occurs when the light entering the eye comes to a point before it hits the retina. It results in blurry vision at farther distances. This is corrected by refracting the light outwards before it enters the eye. 17
Which one of the following eyeglass lenses can be used to make the light fall on the retina, as shown below? Draw a diagram that shows the lens, the eye, and two rays of light converging on the retina.18
16 NGSPDM1
17 NGCCSF2
18 NGSPDM1
IAPS 3e Waves TEFig. TE 9_16 MyriadPro Reg 9.5/11
25°

ACTIVITY 9 REFRACTION OF LIGHT
WAVES 107
Lens B, concave
REVISIT THE GUIDING QUESTION
How does light behave at the boundary between two different materials?
When light enters a medium with a different optical density, it experiences a change in speed. If the optical density is higher in the refracted medium than in the incident medium, the light will slow down. If the optical density is lower in the refracted medium than in the incident medium, the light will speed up. If the light enters at an angle of incidence greater than 0 degrees, then the light will undergo a change in direction. When traveling from a more optically dense medium to a less optically dense medium, there is a maximum angle beyond which no light refracts out of the more optically dense medium. This angle is called the critical angle for the interface between the two media. When light is reflected in this way, the pro-cess is called total internal reflection.19
ACTIVITY RESOURCESKEY VOCABULARY
angle of incidence
angle of refraction
critical angle
function
refraction
pattern
structure
total internal reflection
transmission, transmit
19 NGPS4B3
IAPS 3e Waves TEFig. TE 9_17 MyriadPro Reg 9.5/11
Convex lens
Retina

ACTIVITY 9 REFRACTION OF LIGHT
WAVES 108
BACKGROUND INFORMATION
SPEED OF LIGHT
The speed of light in a vacuum, c, is 299,792,458 m/s and is a physical constant. It is the maximum speed in the universe for all energy and matter, regardless of the frame of reference. It is the speed at which all electromagnetic radiations, includ-ing those outside the visible spectrum, travel through a vacuum. The speed at which electromagnetic energy propagates through transparent media (e.g., glass or air) is less than c. The ratio between the speed of light in a vacuum and the speed at which it travels in a medium is called the index of refraction. The index of refrac-tion (n) of a material, indicating how much the light slows down in the particular medium, is given as
n = c —v
where c is the speed of light in a vacuum and v is the speed of light through the medium.
For example, the index of refraction for glass is about 1.5, and so the velocity of light in glass (v) travels at
v = c 1.5 m/s
≈ 200,000,000 m/s
SNELL’S LAW
When light travels from one medium into another (e.g., traveling from air into a piece of glass), some or all of the light is transmitted through this new medium. Light does not always travel in the same direction when it enters or leaves a new medium. The law of refraction can be used to determine the new direction in which the light is transmitted. This law, also known as Snell’s Law, describes the ratio between the angles of incidence and refraction for a given pair of media. The angle of incidence, as with reflection, is the angle measured from the incoming light path to the perpendicular line (normal). The angle of refraction is the angle measured from the transmitted (or refracted) light path to the same perpendicular line (nor-mal). A change in direction is a result of a change in speed of the light wave.
Snell’s Law relates the speed of light through the various media to the index of refraction of the materials and to the angles of incidence and refraction, as shown below.
v1 = n1 =
sinθ1
v2 n2 sinθ2
———

ACTIVITY 9 REFRACTION OF LIGHT
WAVES 109
The table below shows a few indices of refraction.
INDEX OF REFRACTION OF COMMON MATERIALS
Medium Index of refraction (n)
vacuum 1 (exactly)
air 1 (approximately)
water 1.33
vegetable oil 1.47
glass (crown) 1.52
diamond 2.42
TOTAL INTERNAL REFLECTION
Total internal reflection occurs when light in a more optically dense medium approaches the boundary with a less optically dense medium, and the angle of incidence is sufficient enough to cause the light to be reflected instead of refracted. The angle of incidence (in the denser medium) that produces an angle of refrac-tion of 90 degrees (in the less dense medium) is called the critical angle. The critical angle for a water–air boundary is 48.6 degrees. For a crown glass–water boundary, the critical angle is 61.0 degrees. The actual value of the critical angle depends on the combination of materials present on either side of the boundary.
The critical angle, c, for a pair of media can be calculated using the formula
c = n1 n2
where n1 is the index of refraction of the less dense medium and n2 is the index of refraction of the denser medium.
IAPS 3e Waves TEFig. TE 9_18 MyriadPro 9.5/11
n1
n2
�1
�2

STUDENT SHEET 9.1
REFRACTION MEASUREMENTS
Name______________________________________________________________ Date____________
LabAids SEPUP IAPS Waves 3eFigure: Waves3e TE9_19SS1MyriadPro Reg 9.5/11
Cent
er li
ne
0°
90°
Light ray
0°
90°
60°
50°
20°10°
30°
40°
80°
70°
60°
50°
20°10°
30°
40°
80°
70°
60°
50°
20°10°
30°
40°
80°
70°
60°
50°
20°10°
30°
40°
80°
70°
Light ray
©20
17 T
he R
egen
ts o
f the
Uni
vers
ity o
f Cal
iforn
ia

STUDENT SHEET 9.2
TOTAL INTERNAL REFLECTION MEASUREMENTS
Name______________________________________________________________ Date____________
LabAids SEPUP IAPS Waves 3eFigure: Waves3e TE9_20SS2MyriadPro Reg 9.5/11
Cent
er li
ne
0°
90°
Light ray
0°
90°
60°
50°
20°10°
30°
40°
80°
70°
60°
50°
20°10°
30°
40°
80°
70°
60°
50°
20°10°
30°
40°
80°
70°
60°
50°
20°10°
30°
40°
80°
70°
Light ray
©20
17 T
he R
egen
ts o
f the
Uni
vers
ity o
f Cal
iforn
ia

WAVES 112
10 Comparing Colorsl a b o r at o r y
1 c l a s s s e s s i o n
ACTIVITY OVERVIEWNGSS CONNECTIONS
Students first observe that visible light can be separated into different colors. Students then conduct an investigation to collect evidence that indicates that different colors of light carry different amounts of energy. In their final analysis, students analyze and interpret light transmission graphs for three different sunglass lenses. They determine which sunglass lens (structure) provides the best protection (function) for the eyes.
NGSS CORRELATION
Performance Expectation
Working towards MS-PS4-2: Develop and use a model to describe that waves are reflected, absorbed, or transmitted through various materials.
Disciplinary Core Ideas
MS-PS4.B.1 Electromagnetic Radiation: When light shines on an object, it is reflected, absorbed, or transmitted through the object, depending on the object’s material and the frequency (color) of the light.
MS-PS4.B.3 Electromagnetic Radiation: A wave model of light is useful for explaining brightness, color, and the frequency-dependent bending of light at a surface between media.
Science and Engineering Practices
Planning and Carrying Out Investigations: Conduct an investigation to produce data to serve as the basis for evidence that meets the goals of an investigation.
Crosscutting Concepts
Structure and Function: Structures can be designed to serve particular functions by taking into account properties of different materials, and how materials can be shaped and used.

ACTIVITY 10 COMPARING COLORS
WAVES 113
Common Core State Standards—ELA/Literacy
RST.6-8.3: Follow precisely a multistep procedure when carrying out experiments, taking measurements, or performing technical tasks.
WHAT STUDENTS DO
Students explore light by investigating the colors of the visible spectrum. They first observe how a white light can be split into its component colors during a teacher demonstration. Then they investigate the energy levels of the different colors of white light through the use of a phosphorescent material.
MATERIALS AND ADVANCE PREPARATION
■ For the teacher
1 Scoring Guide: evidence and trade-offs (e&t) 1 diffraction grating *1 flashlight *1 white surface or wall
■ For each pair of students
1 Phospho-box 1 card with star-shaped cutout 1 colored-film card 1 timer *1 set of colored pencils (red, orange, yellow, green, blue, and purple)
(optional)
■ For each student
1 Scoring Guide: evidence and trade-offs (e&t) (optional)
*Not supplied in kit
Practice using a diffraction grating to diffract white light into the visible spectrum for the demonstration described in Teaching Step 1.
For best results, conduct this activity inside.
TEACHING SUMMARY
GET STARTED
1. Introduce colors of the visible spectrum.
a. Review how a rainbow is formed.
b. Explain how a diffraction grating works.

ACTIVITY 10 COMPARING COLORS
WAVES 114
DO THE ACTIVITY
2. Investigate the frequencies of visible light colors.
a. Conduct a teacher demonstration.
b. Suggest how the waves are separated by the grating.
c. Review student responses to Procedure Part A.20,21
3. Complete Part B of the Procedure where students carry out an investigation.
a. Review the relationship between the amplitude and energy of a wave.
b. Explain how the colored-film card works.
c. Review student responses to Procedure Part B.22
d. Ask students, “Why don’t all of the colors make the strip glow?”
4. If you have not previously done so, introduce scientific evidence in science.
a. Explain how scientists define and use evidence.
b. Distinguish evidence from opinion.
c. Consider the role of evidence in decision making.
BUILD UNDERSTANDING
5. Identify the relationship between color and frequency.
a. Relate the results of the Phospho-box procedure to the story of Tía Ana.
b. Review student responses to Analysis item 5.
6. Discuss the structure and function of selective transmission.
a. Identify selective transmission in Analysis item 6a.
b. Elicit more examples of structure and function.
7. If you have not previously done so, introduce the concept of trade-offs.23
a. Introduce the idea that decisions about solutions to scientific and engi-neering problems often involve trade-offs.
b. Provide an example of trade-offs.
c. Develop some examples of trade-offs in students’ lives.
d. (e&t assessment) Introduce the e&t Scoring Guide.
20 NGSPPI3
21 ELRS683
22 NGSPPI3
23 SEASET1

ACTIVITY 10 COMPARING COLORS
WAVES 115
TEACHING STEPSGET STARTED
1. Introduce colors of the visible spectrum.
a. Review how a rainbow is formed.
Ask, “Who has ever seen a rainbow?” It is likely that all of your students have seen one. Next ask, “What causes the colors of a rainbow?” Record their responses on a white surface or wall (e.g., chart paper, a board, or projector). Make sure students are aware that for a rainbow to form, there must be water droplets in the air and sunlight to pass through the water droplets. This is another example of the phenomenon known as refraction.
b. Explain how a diffraction grating works.24
Hold up the diffraction grating and explain that this film with grating on it can also make a rainbow by splitting up the white light that passes through it. Explain that the grating works by a different mechanism than a prism. While refraction, as explored in a previous activity, is a result of the different frequencies of light being redirected through the glass, diffraction is a result of white light being spread out when it is transmitted through very fine slits.
DO THE ACTIVITY
2. Investigate the frequencies of visible light colors.
a. Conduct a teacher demonstration.
In Part A of the Procedure, display the visible light spectrum to the class by holding the grating about 6 inches in front of a light source (e.g., a flashlight). Move the grating around a bit until the diffracted light is pro-jected onto a white surface (e.g., a wall or paper). When introducing the term visible light spectrum, review that a spectrum does not include starts and stops but, in this case, implies a continuous band of light. Visible light refers to human vision, since some animals and insects can see some light that we cannot. For example, bees can see ultraviolet but not red.
b. Suggest how the waves are separated by the grating.
Observe that the rainbow is not formed directly in front of the grating but is, instead, angled upward or to the side of it. Ask students, “What does this tell you about the light that goes through the grating?” If necessary, explain that this is evidence that the grating splits up the white light. Then use the wave model of light to explain that the incoming white light is
24 NGPS4B3

ACTIVITY 10 COMPARING COLORS
WAVES 116
separated by the structure of the grating into the light’s component colors due to its varying wavelengths.25
c. Review student responses to Procedure Part A.
PROCEDURE STEP 2 SAMPLE STUDENT RESPONSE
In ascending order, the colors are red, orange, yellow, green, blue, violet.
Students might also mention the color indigo. Scientists no longer classify indigo as a color in the visible light spectrum because it is a relatively narrow band of color that is transitional between blue and violet.
In reviewing responses to Procedure Step 2, emphasize that the order of the visible light spectrum always shows in the same order of red, orange, yellow, green, blue, violet or vice versa, regardless of how it is diffracted or refracted. Review the terms frequency and wavelength. Explain that each color of light in the spectrum has a different frequency and wavelength.26
PROCEDURE STEP 3 SAMPLE STUDENT RESPONSE
The colors blend from one to the next with a smooth transition between them.
Explain that the frequencies of the light waves continually increase from the red side of the spectrum to the violet side.
In reviewing responses to Procedure Step 3, reinforce the idea that the visible spectrum is continuous from red to violet. Although students are not familiar with the entire electromagnetic spectrum at this point, the evidence for answering this question foreshadows later activities where students learn about the continuous nature of the electromagnetic spectrum.
PROCEDURE STEP 4 SAMPLE STUDENT RESPONSE
Yellow appears the brightest, with the colors on the outside of it—orange and green—the next brightest. These are closely followed by red, with blue and violet the least bright.
Confirm with students that the yellow and green areas appear the bright-est in the spectrum they observed. There could be several explanations for this observation. For example, it could be because the light arriving on Earth is strongest for those two colors or it could be that our eyes are more sensitive to those colors than to the other colors, or it could be both of these factors.
25
26 NGPS4B3

ACTIVITY 10 COMPARING COLORS
WAVES 117
3. Complete Part B of the procedure where students carry out an investigation.
a. Review the relationship between the amplitude and energy of a wave.
From previous activities, students should know that as the amplitude of a wave increases, so does its energy. With light, the intensity or bright-ness of light is referred to more than amplitude. To informally assess whether students understand how the wave model of light describes the brightness and color (frequency) of light, ask students, “Are microwaves harmful to humans?” Accept all responses, but direct the discussion so that students understand that there is little evidence that long-wavelength microwaves in typical everyday use, such as those used by cell phones, are harmful to people. Ask the class a similar question about X-rays. Some students may suggest that all X-rays are harmful. Others might feel that their everyday experiences with X-rays at dentist and doctor offices show that some X-rays are safe or at least less harmful than others. Now ask students to speculate, from a safety perspective, why exposure to X-rays at the dentist or doctor is kept very short (less than a second) but cell phone conversations can last minutes (or hours!). Conclude the discussion by explaining that for some types of waves, the energy is not only associated with the amplitude or intensity but also the frequency. Students will learn more about this relationship in Part B of this activity and in subsequent activities.27
b. Explain how the colored-film card works.
Each colored film on the card isolates a single color of light. Explain that colored film doesn’t separate white light like a diffraction grating or a water droplet. Instead, it only allows one color to be transmitted through the film and come out the other side. A common student misconception is that color is transferred to the light from the colored film, much like paint is put onto an object. Make it clear to students that the films do not add any color to white light.
In Part B, students engage in the science and engineering practice of carrying out an investigation using the Phospho-box and a card contain-ing various colored films. They should observe that only blue and violet light cause the phosphorescent strip to glow, even when they double the exposure time. Since the phosphorescence in the strip is triggered by a threshold energy, this is evidence that the blue and violet lights have more energy than the other colors. For improved results, students should hold the boxes closer to the light source when exposing them.28
27 NGPS4B3
28 NGPS4B1

ACTIVITY 10 COMPARING COLORS
WAVES 118
c. Review student responses to Procedure Part B.2930
PROCEDURE STEP 10 SAMPLE STUDENT RESPONSE
Violet was the brightest, and then blue. The other colors did not trigger the phosphorescent strip. The violet seemed equally as bright as when the card was not used.
PROCEDURE STEP 15 SAMPLE STUDENT RESPONSE
When the time was doubled, the results were similar. This indicates that the phosphorous strip is sensitive to the frequency of the light and not the total exposure.
d. Ask students, “Why don’t all of the colors make the strip glow?”
Some students may suggest that not all colors of light carry energy. Make it clear that all colors carry energy, but each color carries a different amount. Each color is due to a wave with a slightly different frequency. Only some frequencies carry enough energy to cause the phosphorescent material in the strip to glow. The colors that make the strip glow—blue and violet—are found right next to each other in the visible light spec-trum. This gives some evidence that higher frequencies (and, therefore, energy) of a light wave are related to its position in the spectrum. For vis-ible light, violet has the highest frequency and red has the lowest. The rest of the colors are in between, according to their position in the spectrum. The phosphorescent strip has threshold energy. Any energy equal to or greater than the threshold will make the strip glow. The threshold energy corresponds to the frequency delivered to the strip by blue light.
4. If you have not previously done so, introduce scientific evidence in science.
a. Explain how scientists define and use evidence.
Although the term evidence is used previously in the unit, Analysis item 4 provides an opportunity to review the definition of evidence provided in the Student Book. Explain that scientists collect information (data) with various tools and strategies, including observation and experimentation. Tell students that they will now use the data they collected from the film experiment to decide if it gives information about what is damaging Tea Ana’s eyes. The consideration of evidence is a key step in scientific reasoning and decision making. Throughout this unit, and throughout all SEPUP courses, students will collect and analyze information, which may become evidence to support or refute claims.
29 NGSPPI3
30 ELRS683

ACTIVITY 10 COMPARING COLORS
WAVES 119
b. Distinguish evidence from opinion.
Evidence is information that supports a claim. Opinion is the view someone takes about a certain issue based on their own judgment, often without the support of factual evidence. An informed opinion may be based on evidence; however, another person may have a different opinion based on the same evidence.
c. Consider the role of evidence in decision making.
One must be critical of the source, quality, and quantity of evidence available. Review with students that scientific conclusions are based on evidence, and biased or insufficient evidence compromises the validity of these conclusions. The criteria for quality evidence may vary among the scientific disciplines. However, evidence is generally considered of higher quality if it is obtained through systematic investigation and is reproduc-ible, meaning another investigation under the same set of circumstances obtains similar data. Additionally, the greater the quantity of high-quality evidence that can be provided, the stronger the case is in support or against the claim. Criteria for quantity also vary but might include the sample size or number of trials in the experiment, the number of obser-vations that support a conclusion, or the availability of multiple lines of evidence that lead to the same conclusion. Scientific conclusions should logically follow the evidence collected and should not be overly general-ized beyond the context of the investigation.
BUILD UNDERSTANDING
5. Identify the relationship between color and frequency.
a. Relate the results of the Phospho-box procedure to the story of Tía Ana.
Ask students, “Which color light is more likely to damage eyes due to its higher energy?” Students should respond that the violet light is most likely to be damaging. In fact, it is not the violet light that is damaging but the ultraviolet that exists just beyond the violet frequencies. Students will be introduced to ultraviolet in subsequent activities, and so use this discus-sion of higher and lower energies to explore the frequencies of the various colors. It may be helpful to present a diagram that shows the relative frequencies through the visible spectrum. For the same intensity of light, those light waves with a higher frequency will also have higher energy than light waves of lower frequency. Students’ evidence from the activity supports this idea. For light, scientists use the term intensity to describe the brightness of a light wave in terms of the rate at which energy is delivered by the wave to a surface. Let students know that the energy level

ACTIVITY 10 COMPARING COLORS
WAVES 120
associated with light is dependent on both its brightness and its frequency. Tell them that in the next activity, they will consider waves that are of a frequency higher than violet light, such as those that could damage Tía Ana’s eyes.
b. Review student response to Analysis item 5.
Students have seen in this activity that the frequency of light indicates its energy level. From previous investigations, students should know that its intensity is also related to its energy level. They also should know that both the frequency and intensity (or amplitude) are directly related to the amount of energy transmitted by a wave.31
6. Discuss the structure and function of selective transmission.
a. Identify selective transmission in Analysis item 6a.
In this item, students are asked to identify the lenses that block out high-energy wavelengths. Model how to read one of the graphs, and describe how it shows transmission at different wavelengths and also provides an overall percentage of transmitted sunlight. This question is a good opportunity for assessing students’ abilities to not only read the graphs, but to also apply the concept of selective transmission introduced by the colored films.
b. Elicit more examples of structure and function.
Ask the class to come up with other examples of the crosscutting concept of structure and function involving selective transmission (e.g., sunglasses, windshields, windows, and shades). Selective transmission is further investigated in the next activity. This prepares students for an assessment on Performance Expectation MS-PS4-2, “Develop and use a model to describe that waves are reflected, absorbed, or transmitted through vari-ous materials,” in Activity 13, “Where Does the Light Go?” 3233
7. If you have not previously done so, introduce the concept of trade-offs.34
a. Introduce the idea that decisions about solutions to scientific and engi-neering problems often involve trade-offs.
This unit includes issues that relate to science and/or engineering and that may lead to decisions about the best solutions or designs for solving problems. One goal of this curriculum is to teach students that
• decisions about possible solutions often involve trade-offs
• identifying trade-offs involves analyzing evidence.31 NGPS4B1
32 NGCCSF2
33 NGPS4B3
34 SEASET1

ACTIVITY 10 COMPARING COLORS
WAVES 121
Explain to students that in this unit they will make several decisions about health concerns related to ultraviolet. In this activity, students choose a sunglass lens. In a decision involving trade-offs, something is given up to gain something else. Since many decisions involve trade-offs, students should understand that a perfect choice is often not possible. It is possible, however, to recognize and analyze the trade-offs associated with each decision.
b. Provide an example of trade-offs.
For example, when asked, “Paper or plastic?” at a store checkout counter, most shoppers make the choice quickly. But there are several trade-offs attached to choosing paper or plastic. A shopper who chooses paper over plastic may do so to avoid generating plastic waste. In requesting the paper bag, though, they are contributing to other environmental prob-lems, such as increased water and energy use, and the higher amounts of solid waste and CO2 emissions associated with making paper bags. Nei-ther choice is ideal, and both choices have benefits and risks. Identifying the trade-offs helps clarify the reasoning being applied to make a decision.
c. Develop some examples of trade-offs in students’ lives.
To further explore trade-offs, brainstorm with the class a list of decisions they make every day that involve trade-offs. Choose one, and talk through the associated trade-offs of deciding one way or another. This practice will familiarize students with ways of identifying and considering trade-offs in this and subsequent activities.
d. (e&t assessment) Introduce the e&t Scoring Guide.
Analysis item 6b introduces the concept of a trade-off. This concept is emphasized in the unit’s last activity, Activity 15, “Personal Protection Plan,” but is introduced here as part of the e&t assessment. Provide all students with an e&t Scoring Guide, and ask them to keep it with their science notebooks, as they will refer to it several times in this unit and throughout all SEPUP courses.
Analysis item 6b in this activity is the first use of the e&t Scoring Guide. Project or distribute the Scoring Guide, and point out how it has the same levels but different descriptions for each level. Review the levels as needed. For more information, see Teacher Resources III, “Assessment.”
Note that students could make their choices based on a balance of price and/or ultraviolet protection, but some may be more concerned with

ACTIVITY 10 COMPARING COLORS
WAVES 122
the style and appearance. Encourage students to be clear about what is influencing their choices. Look for responses that specifically identify the trade-offs being made (e.g., higher cost for effectiveness).
SAMPLE RESPONSES
1. What is the purpose of the card with the star-shaped cutout?
The star-shaped cutouts provide a control so that we can see what white light, which contains all of the colors, does to the strip in the Phospho-box. Then we can compare the effects of each color to the effect of white light.
2. How do you think the colored-film card changes the white light into colored light? Describe how you might test your ideas to see if they are correct.
Since the light goes through each film separately, each film is acting as a filter, letting only one color through and blocking the rest of the colors. One way to test my idea is to put one filter in front of another. If each filter only lets one color through, then using two different colored filters should allow little, or no, light through. Another idea is to use a diffraction grating on the light that has passed through a single filter to see if the light can be split into different colors or whether it is a single color.
Teacher’s note: Even though you discussed this earlier, some students will indicate that the color is transferred to the light from the colored film. Although it is hard to provide convincing evidence to the contrary, make clear that this is not what is happening.
3. Why do you think only some colors make the strip on the bottom of the Phospho-box glow? Explain.
I think that the different colors of light carry different amounts of energy. When light is absorbed by a material, that energy is transferred to the material. In the case of the material on the strip on the box, the light has enough energy when it goes through cer-tain films that it glows. The energy is absorbed by the strip and then reemitted as the glowing light. It is like those glow-in-the-dark toys that will glow after being exposed to light but won’t glow unless exposed to light.35
4. Is there enough evidence—information that supports or refutes a claim—that supports the idea that the higher-energy colors of white light are damaging Tía Ana’s eyes? Explain your answer.
There is evidence that a range of energy is carried by white light, with some colors (blue, violet) having more energy than others (red, orange). However, there is no evidence that supports the idea that the relatively higher energy in some colors is enough to damage Tía Ana’s eyes.
35 NGPS4B3

ACTIVITY 10 COMPARING COLORS
WAVES 123
5. Which characteristics of a light wave explored in this activity affects the amount of energy that it carries?
In a previous activity, we learned that energy is related to the amplitude of a wave, and so a brighter light means more energy delivered to a surface. In this investigation, we have seen that the color (frequency) is also related to energy.36
6. Sunglass lenses are an example of a material that blocks some white light and some other short-wavelength light that is harmful to the eyes. Examine the transmission graphs about three pairs of sunglasses below.
a. Which lens has the best protection for the eyes against high-energy waves? Explain how you decided.3738
I think that Lens 1 provides the best protection. This is because the graph goes down close to zero for the ultraviolet wavelengths. Lens 3 is nearly as good because it lets only a little more of the ultraviolet through, and most of the light is transmitted more evenly (except it blocks more blue and violet). All three of the lenses provide a lot of blocking in the ultraviolet frequencies. In fact, both Lenses 1 and 3 transmit only 30% of the light.
b. (e&t assessment) The price for each pair of sunglasses is shown below. Which pair would you buy, Why? Describe any trade-offs you made in your choice. A trade-off is an outcome given up to gain another outcome.39
• Lens 1: $80
• Lens 2: $10
• Lens 3: $20
SAMPLE LEVEL-4 RESPONSE
Although Lens 1 is the best protection, I wouldn’t buy it because it is the most expensive one. Lens 2 provides nearly as much ultraviolet protection and is only 1/8th the cost. I would choose this lens because it is cheaper than both of the other lenses and has similar protection to Lens 1. In fact, the cheaper Lens 2 has better protection than Lens 3. The trade-off is that it is a very light lens with 60% of the light going through it, and I prefer a dark lens. It is a better trade-off than selecting Lens 3, however, because I would not like to wear a red lens at all.
36 NGPS4B3
37 NGPS4B1
38 NGCCSF2
39 SEASET1

ACTIVITY 10 COMPARING COLORS
WAVES 124
REVISIT THE GUIDING QUESTION
How are the colors of the visible light spectrum similar to and different from each other?
The colors of the visible light spectrum are similar in that they are all light waves. They are different in that each color is a different frequency of light. Some fre-quencies carry higher energy than others. Colors of the visible spectrum are selec-tively transmitted depending on the material and the light wave’s frequency.4041
ACTIVITY RESOURCESKEY VOCABULARY
evidence
frequency
trade-off
visible light spectrum
wavelength
BACKGROUND INFORMATION
REFRACTION
Refraction occurs when a wave propagating through one medium (or through a vacuum, in the case of light) encoun-ters the interface of another medium at an angle. This results in a change in the direction of propagation of the wave as it travels across the interface. For example, the frequency of a wave is determined at the source and is fixed after the wave has left the source. However, the speed and the wavelength can change depending on the medium through which the wave travels. There is, as a result, a differential slowing of the wave front that causes the light to refract, or change direc-tion. In the case of white light, different frequencies of the light are redirected at slightly different angles, producing the light spectrum that we observe as a rainbow.
DIFFRACTION GRATING
A diffraction grating is a tool that diffracts the light that passes through it. It has a similar effect on light as a prism that refracts white light into the visible spectrum, although the sequence of the spectrum is different, as shown at left.
40 NGPS4B1
41 NGPS4B1
A diffraction grating (top) and a prism (bottom) will both separate white light into the visible spectrum.

ACTIVITY 10 COMPARING COLORS
WAVES 125
The mechanism for the separation of light into a spectrum via diffraction is dif-ferent from when light is refracted; in diffraction, the light bends around small obstacles that are roughly the same size as the wavelength of the light. A diffraction grating is a film with thin, parallel rulings on it, which cause this bending or dis-persion of light. The change in direction of the light depends on the spacing of the grating and the wavelength of the light. Diffraction gratings are commonly found in spectrometers and monochromators. Likewise, the alternating pits and smooth reflecting surfaces that form closely spaced rows on a CD or DVD are separated by a similar distance to that on an ordinary lab diffraction grating and will produce a separation of white light.
VISIBLE LIGHT SPECTRUM
The visible light spectrum is that portion of the electromagnetic spectrum that is visible to the human eye and is perceived as color. It ranges in wavelength from about 400 nm (violet) to 700 nm (red). The boundaries are somewhat hard to distinguish as the colors blend and the outermost regions blend into ultraviolet and infrared. The table below shows the approximate range for each color. It also shows that the bandwidth for each color is not evenly distributed, with red having the widest wavelength range and yellow the narrowest.
Color Wavelength (nm) Wavelength range (nm)
Violet 380–450 70
Blue 450–495 45
Green 495–570 75
Yellow 570–590 20
Orange 590–620 30
Red 620–750 130
WAVE-PARTICLE DUALITY OF LIGHT
Electromagnetic radiation, such as light, exhibits wave properties including reflec-tion, refraction, diffraction, and interference. However, the behavior of electromag-netic radiation cannot be explained entirely through an analysis of wave properties. In 1900, Max Planck suggested that electromagnetic radiation was not emitted continuously but, rather, intermittently in “packets” of energy. Such packets became known as quanta and photons. The energy of each quantum depends on the frequency of the electromagnetic radiation. Each quantum possesses a discrete amount of energy that is proportional to the frequency of the light. The energy of a quantum of violet light is higher than the energy of a quantum of red light, since violet light has a higher frequency than red light. Fractions of quanta cannot exist.

WAVES 126
In 1905, Albert Einstein theorized that light and other forms of electromagnetic radiation were not only emitted in whole numbers of quanta; they were also absorbed as quanta. In the case of light falling on phosphorescent material, the energy of some of the incident photons is absorbed by the electrons of the atoms in the material. This occurs only if the energy of the photon matches the change in allowable energy states of the electrons in the material. If the energy matches, then the electron temporarily moves to a higher excited state. As the electron drops back to the ground state, it emits photons, causing the material to glow. The energy of the emitted photons will depend on the energy states through which the electron transitioned. Consequently, certain colors of light will make the phospho-rescent material glow while others will not.
ACTIVITY 10 COMPARING COLORS

TEACHER RESOURCES III ASSESSMENT
ASSESSMENT 129
PLANNING AND CARRYING OUT INVESTIGATIONS (PCI)
When to use this scoring guide:This scoring guide is used when students plan and/or carry out scientific investigations.
What to look for:• Response describes the data to be collected• Response describe appropriate tools and methods for collecting the data• Response includes appropriate variables and controls related to the concepts and
ideas being investigated
Level Description
Level 4Complete andcorrect
The student’s plan/investigation is appropriate and includes all essential elements*, with no errors or omissions.
Level 3Almost there
The student’s plan/investigation is appropriate and includes most essential elements*, BUT has one or more minor to moderate omissions and/or errors.
Level 2On the way
The student’s plan/investigation has a basic plan, with two or more elements* appropriate to the goal of the investigation, BUT has one or more significant omissions and/or errors.
Level 1Getting started
The student’s plan/investigation has at least one element* relevant to the goal of the investigations, BUT is generally incorrect or missing multiple components essential to the goal of the investigation.
Level 0 The student’s design or procedure is missing, illegible, or irrelevant to the goal of the investigation.
x The student had no opportunity to respond.
* Based on the prompt, essential elements may include:a) the phenomenon under investigationb) goal of the investigationc) descriptions of the data to be collectedd) how the data relate to the investigatione) the methods and tools used to indicate, collect or measure dataf) identification of tested (independent and dependent) and controlled variablesg) indication of whether the investigation will be conducted individually or
collaborativelyh) systematic collecting and recording of datai) evaluation of the investigationj) revision of the investigation

TEACHER RESOURCES III ASSESSMENT
ASSESSMENT 121
ANALYZING AND INTERPRETING DATA (AID)
When to use this scoring guide:This scoring guide is used when students analyze and interpret data that they have collected or that has been provided to them.
What to look for:• Response describes patterns and trends in data• Response interprets patterns and trends, using relevant concepts and ideas, to
describe possible causal, relationships
Level Description
Level 4Complete andcorrect
The student analyzes the data with appropriate tools, techniques, and reasoning.The student identifies and describes patterns in the data, and interprets them completely and correctly to identify and describe relationships.When appropriate, the student
• makes distinctions between causation and correlation.• states how biases and errors may affect interpretation
of the data.
Level 3Almost there
The student analyzes the data with appropriate tools, techniques, and reasoning.The student identifies and describes patterns in the data BUT incorrectly and/or incompletely interprets them to identify and describe relationships.
Level 2On the way
The student analyzes the data with appropriate tools, techniques, and reasoning.The student identifies and describes, but does not interpret, patterns and relationships.
Level 1Getting started
The student attempts to analyze the data, BUT does not use appropriate tools,techniques and/or reasoning to identify and describe patterns and relationships.
Level 0 The student’s analysis is missing, illegible, or irrelevant to the goal of the investigation.
x The student had no opportunity to respond.

TEACHER RESOURCES III ASSESSMENT
ASSESSMENT 125
EVIDENCE AND TRADE-OFFS (E&T)
When to use this scoring guide:This scoring guide is used when students are making a choice or developing an argument about a socioscientific issue, where arguments may include judgements based on non-scientific factors.
What to look for:• Response uses relevant evidence, ideas and concepts to compare multiple
options in order to make a choice• Response takes a position supported by evidence and describes what is given
up (traded off) for the chosen option
Level Description
Level 4Complete andcorrect
The student provides a clear and relevant choice with appropriate evidence and reasoning, including both of the following: • a thorough description of the trade-offs of the
decision, and • reasons why an alternate choice was rejected.
Level 3Almost there
The student provides a clear and relevant choice with appropriate and sufficient evidence and reasoning, BUT one or both of the following are insufficient: • the description of the trade-offs • reasons why an alternate choice was rejected.
Level 2On the way
The student provides a clear and relevant choice BUT evidence and reasoning are incomplete.
Level 1Getting started
The student provides a clear and relevant choice BUT provides reasons that are subjective, inaccurate, or unscientific.
Level 0 The student’s response is missing, illegible, or irrelevant.
x The student had no opportunity to respond.

TEACHER RESOURCES IV UNIT SPECIFIC RESOURCES
UNIT SPECIFIC RESOURCES 143
UNIT OVERVIEWWAVES
Listed below is a summary of the activities in this unit. The total teaching time as listed is 16–23 periods of approximately 45- to 50-minute periods (approximately 4–5 weeks if you teach the activities as recommended every day).
Activity Description
ContentAdvance
PreparationAssessment
TeachingPeriods
1. Investigation: It’s a Noisy WorldThis activity introduces sound intensityand the decibel scale. Students examinecards that represent the relative intensityof various sounds and learn that an in-crease of 10 dB is equivalent to a 10-foldincrease in sound intensity.
sound intensity, deci-bel, scale
Mathematics
1–2
2. Investigation: Making Sound WavesStudents explore frequency and intensitythrough the pitch of everyday sounds.They use a long metal spring to modelsound waves.
sound intensity, fre-quency,pitch, loudness,audiograms
Gather objects that make different pitches (optional).
MOD A4 1–2
3. Reading: The Nature of SoundStudents read about the propertiesof longitudinal waves, such as sound,including wave speed, transmissionthrough media, and how its energy isrelated to its amplitude.
longitudinal waves, sound transmission, media, speed of sound, energy of sound
Literacy, Mathematics
AID A5 1
4. Investigation: Noise-Induced Hear-ing LossStudents are introduced to the conceptof noise-induced hearing loss. Theyanalyze fictitious profiles and developa list of strategies to reduce the risk ofnoiseinduced hearing loss.
frequency, audiograms,decibel scale, effects of intense sounds on hearing, risk evaluation
Mathematics
Prepare self case study.
ODA Proc. 1
5. Investigation: Telephone ModelStudents investigate a method of soundtransmission through a cord. Using thistelephone model, they compare thetransmission of sound as analog anddigital signals.
Analog wave, digital signal, interference
Construct telephones(optional).
COM A3 1
6. Reading: Analog and Digital Tech-nologyStudents read about the technology ofdigital hearing aids that receive soundwaves and manipulate them for the user.Assessment of PE MS-PS4-3
Analog wave, digital signal, interference,transmission, receiver, recording digitalinformation
Literacy
COM A2 1

TEACHER RESOURCES IV UNIT SPECIFIC RESOURCES
144 UNIT SPECIFIC RESOURCES
WAVES (continued)
Activity Description
ContentAdvance
PreparationAssessment
TeachingPeriods
7. Investigation: Another Kind of WaveUsing a long metal spring, students in-vestigate transverse waves. They examinethe relationship between frequency andwavelength and revisit amplitude andenergy.Assessment of PE MS-PS4-1
Transverse wave, trans-mission, wavelength
MOD A7COM A8ODA A9
1–2
8. Laboratory: Wave Reflection In this activity, students first investi-gate the law of reflection by bouncingsound off a wall. They take what theyhave learned and design an investigationfor light rays. Finally, they explore thereflection of light off a curved mirror.
Sound, light, law of reflection, concavemirrors, communica-tiondishes
PCI Proc. 2
9. Laboratory: Refraction of LightStudents direct a ray of light throughwater and trace its path into and out ofthe water. Then students investigate thespecial case of total internal reflection.
Light refraction, inci-dent ray, refracted ray, total internal reflection
Prepare StudentSheets.
PCI Proc.AID A2
1–2
10. Laboratory: Comparing ColorsStudents explore the nature of light byinvestigation the colors of the visiblespectrum. First they observe how adiffraction grating splits white lightinto its component colors. Then theyinvestigate the frequency of the differentcolors of white light through the use ofa phosphorescent material.
Visible light spectrum, transmission of energy, ultraviolet, evidence
Gather flashlight.
E&T A6b 1
11. Laboratory: Selective Transmission Students learn more about the proper-ties of light by investigating transmis-sion reflection and absorption of wavesoutside the visible spectrum. Studentsinvestigate three thin films that selec-tively transmit light that is not visible,such as ultraviolet.
Selective transmission, reflection, absorption,ultraviolet
Sunshine needed.
AID A2 1–2
12. Reading: The Electromagnetic SpectrumStudents read about the kinds ofelectromagnetic energies emitted fromthe sun that are not visible. The wave-lengths, frequencies, and energy levelsof light are discussed. The discovery andapplications of infrared and ultravioletare introduced.
Electromagneticspectrum, infrared,ultraviolet,
Literacy
COM A5 1

TEACHER RESOURCES IV UNIT SPECIFIC RESOURCES
UNIT SPECIFIC RESOURCES 145
WAVES (continued)
Activity Description
ContentAdvance
PreparationAssessment
TeachingPeriods
13. Laboratory: Where Does the LightGo?Students compare the reflection andabsorption of sunlight off a dark sur-face and reflective surface. Then theyconsider the increased health risks dueto the sunlight that is reflected onto theskin and eyes from sand, snow, or water.Assessment of MS-PS4-2.
Absorption, reflection,refraction, ultraviolet exposure, law of reflec-tion, evidence
Sunshine needed, gather covering cloth.
MOD A2COM A5
1–2
14. Laboratory: Blocking Out Ultravi-oletStudents design an experiment thatcompares the effects of sunblock lotionand moisturizing lotion for their abilityto transmit, reflect, or absorb ultravio-let. They relate the results to the sun’seffects on human health and the use ofsunscreens.
Ultraviolet properties,skin cancer, cataracts,vitamin D deficiency, increased risk
Sunshine needed.
PCI Proc. 1–2
15. Talking It Over: Personal ProtectionPlanStudents analyze a series of fictitiousprofiles to determine the relative risk ofcataracts and skin cancer for each case.After analyzing these narratives, eachstudent determines his or her own rela-tive exposure risk from ultraviolet, andthen creates a personal protection plan.
Health risks of ultra-violetexposure, benefits and trade-offs, risk evaluation
Prepare StudentSheets.
MOD A2COM A5
1–2

TEACHER RESOURCES IV UNIT SPECIFIC RESOURCES
146 UNIT SPECIFIC RESOURCES
UNIT OVERVIEW - NGSSWAVES
Performance Expectation MS-PS4-1: Use mathematical representations to describe a simple model for waves that includes how the amplitude of a wave is related to the energy in a wave.
Performance Expectation MS-PS4-2: Develop and use a model to describe that waves are reflected, absorbed, or transmitted through various materials.
Performance Expectation MS-PS4-3: Integrate qualitative scientific and technical information to support the claim that digitized signals are a more reliable way to encode and transmit information than analog signals.
Activity Description
DisciplinaryCore Ideas
Science and Engineering
Practices
CrosscuttingConcepts
Common Core State Standards
1. Investigation: It’s a Noisy WorldStudents are introduced to the physi-cal properties of waves with a scenariothat engages them in the properties ofsound within the context of hearingloss. Students use mathematical repre-sentations to analyze data and identifypatterns in sound intensity.
MS-PS4.A.1 Using Mathematics and Computational Thinking
Analyzing and In-terpreting Data
Patterns Math: MP.2, MP.4, 6.RP.A.1,7.RP.A.2
Literacy/ELA: RST.6-8.3
2. Investigation: Making SoundWavesStudents experiment with producingnoises of varied intensity and frequen-cy as they begin to build an under-standing of the properties of sound.Students then create a model of asound wave using a metal spring.
MS-PS4.A.1 Developing and Using Models
Structure and Function
Patterns
Math: MP.2
Literacy/ELA: RST.6-8.3
3. Reading: The Nature of SoundStudents learn more about longitu-dinal waves as they obtain, evaluate,and communicate information fromtext, diagrams, and graphs. Studentsengage with the crosscutting conceptof structure and function as they readabout the hearing process and theanatomy of the ear.
MS-PS4.A.1
MS-PS4.A.2
Obtaining, Evaluat-ing, and Communi-cating Information
Analyzing and In-terpreting Data
Using Mathematics and Computational Thinking
Structure and Function
Patterns
Connections to Engineering, Technology, and Applications of Science
Math: MP.2
Literacy/ELA: RST.6-8.1 RST.6-8.9
4. Investigation: Noise-InducedHearing LossStudents use mathematics and com-putational thinking as they analyzeand interpret data related to therisk of noise-induced hearing loss.Students read the profiles of severalindividuals and evaluate the risk ofnoiseinduced hearing loss for eachone. Students examine the structureand function of the protection provid-ed by two kinds of ear protection.
MS-PS4.A.1 Using Mathematics and Computational Thinking
Analyzing and In-terpreting Data
Obtaining, Evaluat-ing, and Communi-cating Information
Structure and Function
Math: MP.4

TEACHER RESOURCES IV UNIT SPECIFIC RESOURCES
UNIT SPECIFIC RESOURCES 147
WAVES (continued)
Activity Description
DisciplinaryCore Ideas
Science and Engineering
Practices
CrosscuttingConcepts
Common Core State Standards
4. Investigation: Noise-Induced Hear-ing LossStudents use mathematics and com-putational thinking as they analyzeand interpret data related to the risk ofnoise-induced hearing loss. Studentsread the profiles of several individualsand evaluate the risk of noiseinducedhearing loss for each one. Studentsexamine the structure and function ofthe protection provided by two kinds ofear protection.
MS-PS4.A.1 Using Mathematics and Computational Thinking
Analyzing and Inter-preting Data
Obtaining, Evaluating, and Communicating Information
Structure and Func-tion
Math: MP.4
5. Investigation: Telephone ModelStudents model how noise interferenceaffects the transmission and receptionof analog and digital signals. They findthat the structure of digitized signals,sent as wave pulses, function as a morereliable way to encode and transmitinformation.
MS-PS4.C.1
Developing and Using Models
Obtaining, Evaluating, and Communicating Information
Structure and Func-tion
Connections to Engineer-ing, Tech-nology, and Applications of Science
ELA/Literacy: RST.6-8.3 WHST.6-8.9
6. Reading: Analog and Digital Tech-nologyStudents clarify the findings of theprevious activity by integrating thoseresults with information in writtentext. Students explore the history ofthe development of hearing aids as anexample of how technology influencesthe progress of science and how sciencehas influenced advances in technology.Students are formally assessed on Per-formance Expectation MSPS4-3.
MS-PS4.C.1 Obtaining, Evaluating, and Communicating Information
Structure and Func-tion
Connec-tions to the Nature of Science
Connections to Engineer-ing, Tech-nology, and Applications of Science
ELA/Literacy: RST.6-8.1 RST.6-8.9 WHST.6-8.9
7. Investigation: Another Kind of WaveStudents use a model to identify pat-terns to deduce the inverse relationshipbetween frequency and wavelength,and the direct relationship between am-plitude and energy. Students performcalculations and make conceptualconnections to make an explanationof the relationships found. Studentsare formally assessed on PerformanceExpectation MS-PS4-1.
MS-PS4.A.1 Developing and Using Models
Using Mathematics and Computational Thinking
Planning and Carrying OutInvestigations
Connections to the Nature of Science
Analyzing and Inter-preting Data
Patterns Math: MP.4
ELA/Literacy: RST.6-8.3

TEACHER RESOURCES IV UNIT SPECIFIC RESOURCES
148 UNIT SPECIFIC RESOURCES
WAVES (continued)
Activity Description
DisciplinaryCore Ideas
Science and Engineering
Practices
CrosscuttingConcepts
Common Core State Standards
8. Laboratory: Wave Reflection Students investigate the reflection ofsound and light waves. Building onobservations of the relationship betweenthe direction of incident and reflectedsound waves, students analyze collecteddata and deduce the law of reflection asapplied to light waves. They model thelaw as they create ray diagrams to repre-sent both regular and diffuse reflection.
MS-PS4.B.1
MS-PS4.B.2
Developing and Us-ing Models
Planning and Carry-ing Out Investigations
Analyzing and Inter-preting Data
Using Mathematics and Computational Thinking
Connections to the Nature of Science
Patterns
Structure and Func-tion
ELA/Literacy: RST.6-8.3
9. Laboratory: Refraction of LightStudents experiment with the transmis-sion of light rays by planning and carry-ing out an investigation of the refractionof light through water. Looking forpatterns in their data, students searchfor a qualitative relationship between theangle of incidence, angle of refraction,and total internal reflection.
MS-PS4.B.2
MS-PS4.B.1
Developing and Us-ing Models
Planning and Carry-ing Out Investigations
Analyzing and Inter-preting Data
Connections to the Nature of Science
Patterns
Structure and Func-tion
ELA/Literacy: RST.6-8.3
10. Laboratory: Comparing ColorsStudents collect evidence that indi-cates that different colors of light carrydifferent amounts of energy. Studentsanalyzing and interpret light transmis-sion graphs for three different sunglasslenses. They determine which sunglasslens (structure) provides the best pro-tection (function) for the eyes.
MS-PS4.B.1
MS-PS4.B.3
Planning and Carry-ing OutInvestigations
Structure and Func-tion
ELA/Literacy: RST.6-8.3
11. Laboratory: Selective Transmission Students conduct an investigation totest how different films affect the trans-mission and absorption of light. As theyanalyze and interpret the data they havecollected, they learn that invisible wavesare present at both ends of the visiblespectrum. Students select and justifywhich structural films would be mostfunctional to use on windows in threedifferent situations.
MS-PS4.B.1 Planning and Carry-ing OutInvestigations
Analyzing and Inter-pretingData
Structure and Func-tion
Math: MP.2
ELA/Literacy: RST.6-8.3

TEACHER RESOURCES IV UNIT SPECIFIC RESOURCES
UNIT SPECIFIC RESOURCES 149
WAVES (continued)
Activity Description
DisciplinaryCore Ideas
Science and Engineering
Practices
CrosscuttingConcepts
Common Core State Standards
12. Reading: The Electromagnetic SpectrumStudents complete a reading that inte-grates textual and visual informationthat extends their understanding of theelectromagnetic spectrum. Through the examples of classic experiments,students see that scientific knowledgeis based on logical and conceptual con-nections between evidence and explana-tions. While reading about applicationsof electromagnetic energy, students areshown how technologies extend thecapabilities of scientific investigation.
MS-PS4.A.2
MS-PS4.B.1
MS-PS4.B.3
MS-PS4.B.4
Obtaining, Evaluat-ing, andCommunicating Information
Connections to the Nature ofScience (empirical evidence)
Connections to the Nature ofScience (new evi-dence)
Connections to Engineer-ing, Tech-nology,and Applica-tions ofScience
ELA/Literacy: RST.6-8.1 RST.6-8.9
13. Laboratory: Where Does the LightGo?Students conduct an investigation of thebehavior of ultraviolet and infrared ondifferent surfaces. Students analyze andinterpret patterns in their data and thenuse the model in the activity to explainhow structures can be designed to mini-mize or maximize reflection or absorp-tion. Students are formally assessed onPerformance Expectation MS-PS4-2.
MS-PS4.B.1 Developing and Us-ing Models
Planning and Carry-ing Out Investigations
Analyzing and Inter-preting Data
Structure andFunction
Patterns
ELA/Literacy: RST.6-8.3
14. Laboratory: Blocking Out Ultravi-oletStudents apply the concepts of trans-mission, reflection, and absorption ofultraviolet while planning and carry-ing out an investigation. Students usemodels to compare the effectiveness ofsunscreen and moisturizing lotion inblocking ultraviolet.
MS-PS4.B.1 Planning and Carry-ing Out Investigations
Analyzing and Inter-preting Data
Connections to the Nature of Science
Developing and Us-ing Models
Structure andFunction
ELA/Literacy: RST.6-8.3
15. Talking It Over: Personal ProtectionPlanStudents integrate scientific andtechnical information in a table withwritten text to evaluate the relative riskof developing cataracts and skin cancerfor several individual profiles. Studentscreate connections between scientificknowledge and society by having stu-dents consider how the consequences ofactions relate to exposure to ultraviolet.
MS-PS4.B.1 Obtaining, Evaluat-ing, andCommunicating Information
Connec-tions to the Nature ofScience
ELA/Literacy: RST.6-8.9 WHST.6-8.9

TEACHER RESOURCES IV UNIT SPECIFIC RESOURCES
UNIT SPECIFIC RESOURCES 153
NGSS CORRELATIONS
WAVES
Activity Appears as...
Crosscutting Concepts Activity number
Patterns 1, 2, 3, 7, 8, 9, 13
Structure and Function 2, 3, 4, 5, 6, 8, 9, 10, 11, 13, 14
Connections to the Nature of Science 6, 9, 15
Connections to Engineering, Technology, and Applications of Science 3, 5, 6, 12
Science and Engineering Practices Activity number
Analyzing and Interpreting Data 1, 3, 4, 7, 8, 9, 11, 13, 14
Developing and Using Models 2, 5, 7, 8, 9, 13, 14
Obtaining, Evaluating, and Communicating Information 3, 4, 5, 6, 12, 15
Planning and Carrying Out Investigations 7, 8, 9, 10, 11, 13, 14
Using Mathematics and Computational Thinking 1, 3, 4, 7, 8
Connections to the Nature of Science 8, 12, 14
Disciplinary Core Ideas (Waves TE) Activity number
Wave Properties (PS4.A)
A simple wave has a repeating pattern with a spe-cific wavelength, frequency, and amplitude. 1, 2, 3, 4, 7
A sound wave needs a medium through which it is transmitted. 3, 12
Electromagnetic Radiation (PS4.B)
When light shines on an object, it is reflected, absorbed, or transmitted through the object, depending on the object’s material and the fre-quency (color) of the light.
8, 9, 10, 11, 12, 13, 14, 15
The path that light travels can be traced as straight lines, except at surfaces between differ-ent transparent materials (e.g., air and water, air and glass) where the light path bends.
8, 9
A wave model of light is useful for explaining brightness, color, and the frequency-dependent bending of light at a surface between media.
9, 10, 12
Because light can travel through space, it cannot be a matter wave, like sound or water waves. 12
Information Technologies and Instrumentation (PS4.C)
Digitized signals (sent as wave pulses) are a more reliable way to encode and transmit information. 5, 6

TEACHER RESOURCES IV UNIT SPECIFIC RESOURCES
154 UNIT SPECIFIC RESOURCES
Performance Expectations (Waves TE) Activity number
Waves and Their Applications in Technologies for Information Transfer (PS4)
Use mathematical representations to describe a simple model for waves that includes how the amplitude of a wave is related to the energy in a wave. (MS-PS4-1)
7
Develop and use a model to describe that waves are reflected, absorbed, or transmitted through various materials. (MS-PS4-2)
13
Integrate qualitative scientific and technical information to support the claim that digitized signals (sent as wave pulses) are a more reliable way to encode and transmit information than analog signals. (MS-PS4-3)
6
COMMON CORE STATE STANDARDS CORRELATIONS
WAVES
Common Core State Standards – English Language Arts (Waves TE) Activity number
Reading in Science and Technical Subjects (RST)
Cite specific textual evidence to support analysis of science and technical texts, attending to the precise details of explanations or descriptions. (RST.6-8.1)
3, 6, 12, 15
Follow precisely a multi-step procedure when carrying out experiments, taking measurements, or performing technical tasks. (RST.6-8.3)
1, 2, 5, 7, 8, 9, 10, 11, 13, 14
Compare and contrast the information gained from experiments, simulations, video, or multi-media sources with that gained from reading a text on the same topic. (RST.6-8.9)
3, 6, 12
Writing in History/ Social Studies, Sci-ence, and Technologi-cal Subjects (WHST)
Draw evidence from informational texts to support analysis, reflection, and research. (WHST.6-8.9)
5, 6, 15
Common Core State Standards – Mathematics (Waves TE) Activity number
Mathematical Practice (MP)
Reason abstractly and quantitatively. (MP.2) 1, 2, 3, 11
Model with mathematics. (MP.4) 1, 3, 4
Ratios and Propor-tional Reasoning (RP)
Understand the concept of a ratio, and use ratio language to describe a ratio between two quanti-ties. (6.RP.A.1)
1
Recognize and represent proportional relation-ships between quantities. (7.RP.A.2) 1