Partitions and Objective Indefiniteness in Quantum Mechanics
Upload
khangminh22Category
view
0download
0
2-1
DEPT. MANAGEMENT & LAW BACHELOR DEGREE IN BUSINESS ADMINISTRATION
Dr. Gabriele Palozzi [email protected]
COURSE of Managerial Accounting
- Basics of Cost Analysis -
2-2
Learning Objective
LO1
Identify and describe fixed, variable, and mixed cost behavior.
Managerial Accounting - Basics of Cost Analysis - A.Y. 17/18

2-3
Cost Classifications for Predicting Cost Behavior
How a cost will react to changes in the level of
activity within the relevant range.
– Total variable costs change when activity changes.
– Total fixed costs remain unchanged when activity changes.
Managerial Accounting - Basics of Cost Analysis - A.Y. 16/17
2-4
Fixed Cost Behavior
Increases Decreases
Total Fixed Cost Remains constant Remains Constant
Fixed Cost Per Unit Decreases Increases
Consider the following concert example where the band will be paid $48,000
regardless of the number of tickets sold.
When activity . . . .
Managerial Accounting - Basics of Cost Analysis - A.Y. 17/18

2-5
Fixed Cost Your monthly basic telephone bill probably
does not change when you make more local calls.
Number of Local Calls
Mon
thly
Bas
ic
Tele
phon
e B
ill
Managerial Accounting - Basics of Cost Analysis - A.Y. 17/18
2-6
Fixed Cost Per Unit
Number of Local Calls
Mon
thly
Bas
ic T
elep
hone
B
ill p
er L
ocal
Cal
l
The average fixed cost per local call decreases as more local calls are made.
Managerial Accounting - Basics of Cost Analysis - A.Y. 17/18
2-7
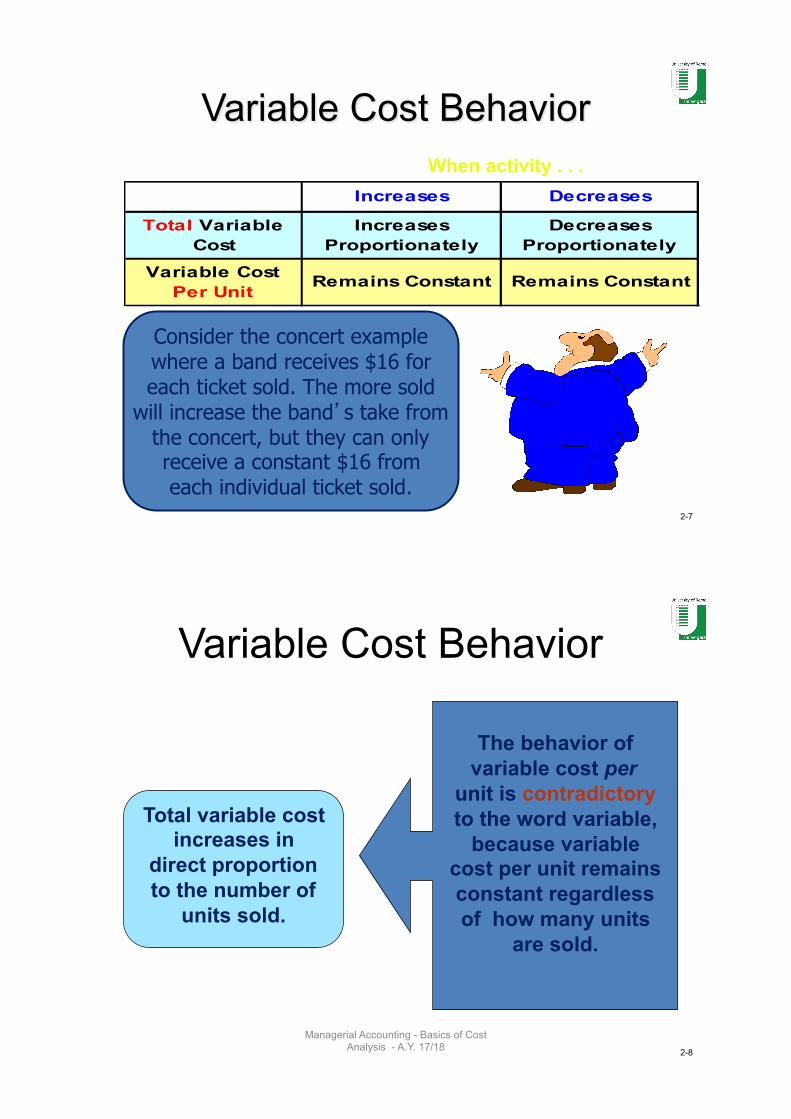
Variable Cost Behavior
Increases Decreases
Total Variable Cost
Increases Proportionately
Decreases Proportionately
Variable Cost Per Unit
Remains Constant Remains Constant
When activity . . .
Consider the concert example where a band receives $16 for each ticket sold. The more sold
will increase the band�s take from the concert, but they can only receive a constant $16 from each individual ticket sold.
2-8
Variable Cost Behavior
Total variable cost increases in
direct proportion to the number of
units sold.
The behavior of
variable cost per unit is contradictory to the word variable,
because variable cost per unit remains constant regardless of how many units
are sold.
Managerial Accounting - Basics of Cost Analysis - A.Y. 17/18

2-9
Variable Cost Your total long distance telephone bill is
based on how many minutes you talk.
Minutes Talked
Tota
l Lon
g D
ista
nce
Tele
phon
e B
ill
Managerial Accounting - Basics of Cost Analysis - A.Y. 17/18
2-10
Variable Cost Per Unit
Minutes Talked
Per
Min
ute
Tele
phon
e C
harg
e
The cost per long distance minute talked is constant. For example, 10 cents per minute.
Managerial Accounting - Basics of Cost Analysis - A.Y. 17/18

2-11
Example: Star Production Inc.
Managerial Accounting - Basics of Cost Analysis - A.Y. 17/18
SPI specializes in promoting rock concerts; it could consider the following alternative structures of costs: 1) It can pay the rock band as fixed cost ($)
irrespective to the number of tickets sold; 2) It can pay the rock band an amount ($) for each
ticket sold.
Let’s see what happened by choosing the different alternatives.
2-12
Fixed Cost Behavior
Tickets sold 2,700 3,000 3,300
Total cost of band 48,000$ 48,000$ 48,000$
Per ticket cost of band 17.78$ 16.00$ 14.55$
$48,000 ÷ 3,000 Tickets = $16.00 per Ticket

2-13
Tickets sold 2,700 3,000 3,300
Band cost per ticket sold 16$ 16$ 16$
Total cost of band 43,200$ 48,000$ 52,800$
The total variable cost increases in direct proportion to the number of tickets sold.
Variable unit cost per ticket remains at $16 regardless of the number of tickets sold.
Variable Cost Behavior
Managerial Accounting - Basics of Cost Analysis - A.Y. 17/18
2-14
Mixed, or Semivariable, Costs Mixed costs (or semivariable costs) include
both fixed and variable components.
For example, Star Productions, Inc., has to pay a janitorial company a base fee of $1,000 plus
$20 per hour required to do each cleanup job. The $1,000 base fee is fixed. The $20 per hour is variable. If 60 hours are required to accomplish a
cleanup, the total mixed cost is: $1,000 + ($20 x 60 hours) = $2,200

2-15
Extent of Variable Costs The proportion of variable costs differs across organizations. For example . . .
Apublicu)litywithlargeinvestmentsinequipmentwilltend
tohavefewervariablecosts.
Amanufacturingcompanywillo;enhavemany
variablecosts.
Amerchandisingcompanyusuallywillhaveahigh
propor/onofvariablecosts,likecostofsales.
Aservicecompanywillnormallyhaveahigh
propor/onofvariablecosts.
2-16
Examples of Variable Costs 1. Merchandising companies – cost of goods sold.
2. Manufacturing companies – direct materials, direct labor, and variable overhead.
3. Merchandising and manufacturing companies – commissions, shipping costs, and clerical costs, such as invoicing.
4. Service companies – supplies, travel, and clerical.
Managerial Accounting - Basics of Cost Analysis - A.Y. 17/18

2-17
Cost Classifications for Predicting Cost Behavior
Behavior of Cost (within the relevant range)
Cost In Total Per Unit
Variable Total variable cost changes Variable cost per unit remainsas activity level changes. the same over wide ranges
of activity.
Fixed Total fixed cost remains Average fixed cost per unit goesthe same even when the down as activity level goes up.
activity level changes.
Managerial Accounting - Basics of Cost Analysis - A.Y. 17/18
2-18
FOCUSONVARIABLECOST
Managerial Accounting - Basics of Cost Analysis - A.Y. 17/18

2-19
Volume
Cos
t
True Variable Cost Direct materials is a true or proportionately variable
cost because the amount used during a period will vary in direct proportion to the level of production
activity.
2-20
Step-Variable Costs
A resource that is obtainable only in large chunks (such as maintenance workers) and whose costs increase or
decrease only in response to fairly wide changes in activity is known as a step-variable cost.
Volume
Cos
t

2-21
Step-Variable Costs
Small changes in the level of production are not likely to have any effect on the number of maintenance workers
employed.
Volume
Cos
t
2-22
Step-Variable Costs
Only fairly wide changes in the activity level will cause a change in the number of maintenance
workers employed
Volume
Cos
t

2-23
Assigning Costs to Cost Objects Direct costs • Costs that can be
easily and conveniently traced to a unit of product or other cost object.
• Examples: direct material and direct labor
Indirect costs • Costs that cannot be
easily and conveniently traced to a unit of product or other cost object.
• Example: manufacturing overhead
Managerial Accounting - Basics of Cost Analysis - A.Y. 17/18
2-24
• Every decision involves a choice between at least two alternatives.
• Only those costs and benefits that differ between alternatives are relevant in a decision. All other costs and benefits can and should be ignored.
Cost Classifications for Decision Making
Managerial Accounting - Basics of Cost Analysis - A.Y. 17/18
2-25
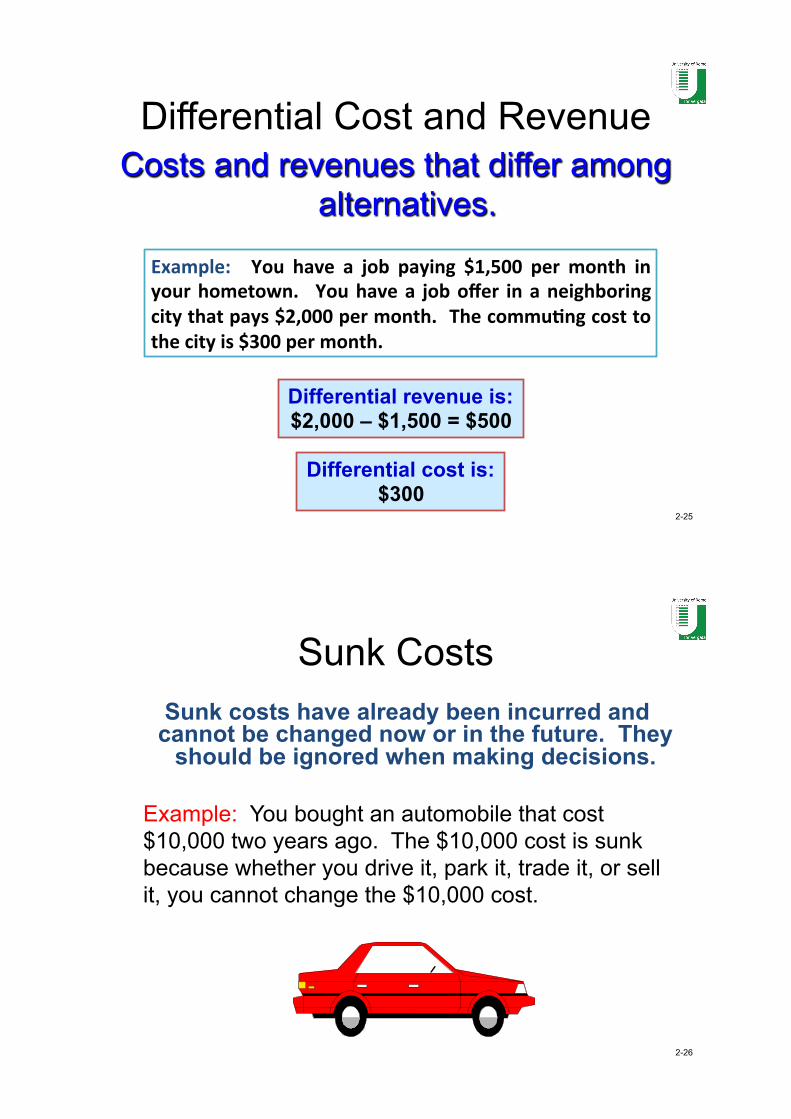
Differential Cost and Revenue Costs and revenues that differ among
alternatives.
Example: You have a job paying $1,500 per month inyourhometown. Youhavea joboffer inaneighboringcitythatpays$2,000permonth. ThecommuCngcosttothecityis$300permonth.
Differential revenue is: $2,000 – $1,500 = $500
Differential cost is: $300
2-26
Sunk Costs Sunk costs have already been incurred and cannot be changed now or in the future. They
should be ignored when making decisions.
Example: You bought an automobile that cost $10,000 two years ago. The $10,000 cost is sunk because whether you drive it, park it, trade it, or sell it, you cannot change the $10,000 cost.

2-27
Opportunity Cost The potential benefit
that is given up when one alternative is
selected over another.
Example: If you were not attending University, you could be earning $15,000 per year. Your opportunity cost of attending it for one year is $15,000.
2-28
Learning Objective
LO2
Demonstrate the effects of
operating leverage on profitability.
Managerial Accounting - Basics of Cost Analysis - A.Y. 17/18

2-29
Basics for Profitability Analysis
Contribution Margin (CM) is the amount remaining from sales revenue after variable
expenses have been deducted.
2-30
CM is used first to cover fixed expenses. Any remaining CM
contributes to net operating income.
Basics for Profitability Analysis

2-31
The Contribution Approach Sales, variable expenses, and contribution margin can be
expressed on a per unit basis. If Racing sells an additional bicycle, $200 additional CM will be generated
to cover fixed expenses and profit.
Managerial Accounting - Basics of Cost Analysis - A.Y. 17/18
2-32
The Contribution Approach Each month, Racing must generate at least $80,000 in total CM to cover fixed expenses.

2-33
Operating Leverage A measure of the extent to which fixed
costs are being used in an organization.
Operating leverage is greatest in companies that have a high proportion of fixed costs in
relation to variable costs.
Consider the following concert example where
all costs are fixed.
Fixed Costs
Small percentage change in revenue
Large percentage change in
profits
Managerial Accounting - Basics of Cost Analysis - A.Y. 17/18
2-34
SPI example: Operating Leverage
Tickets sold 2,700 3,000 3,300
Revenue ($18 per ticket) 48,600$ 54,000$ 59,400$
Cost of band (Fixed) 48,000 48,000 48,000
Gross profit 600$ 6,000$ 11,400$
When all costs are fixed, every additional sales dollar contributes
one dollar to gross profit.
10% Revenue Increase
90% Gross Profit Increase
ContribuConMargin
2-35
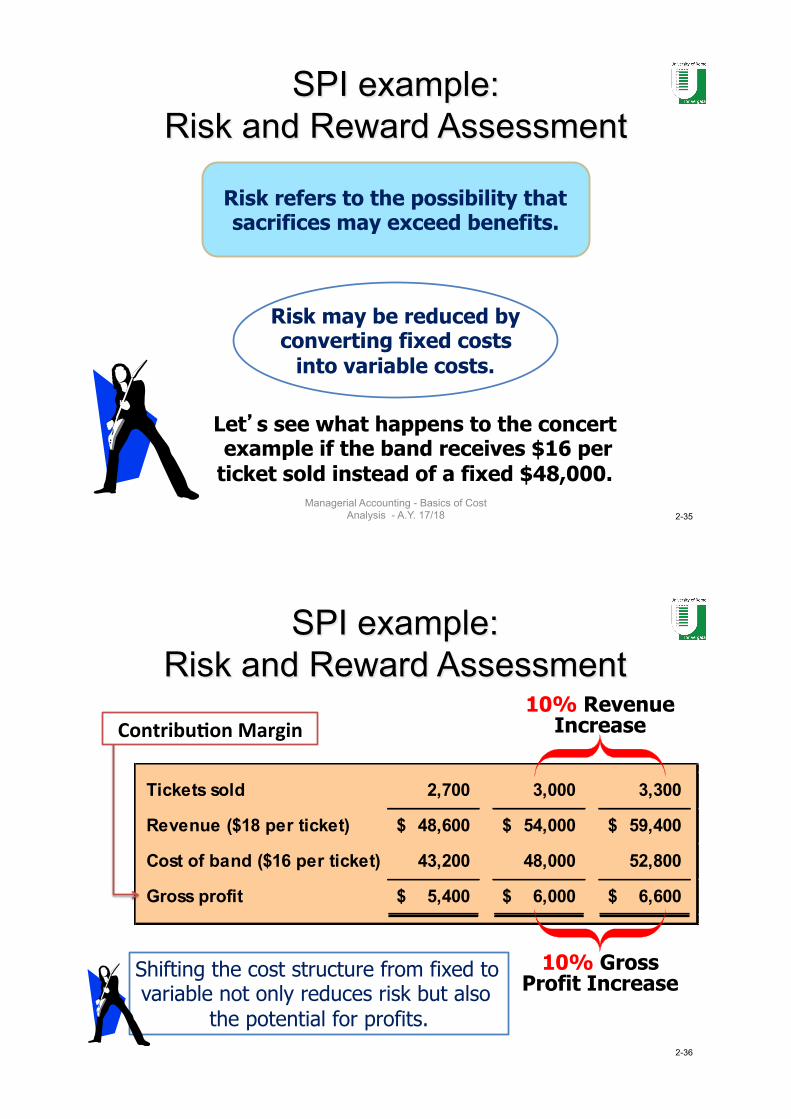
SPI example: Risk and Reward Assessment
Risk refers to the possibility that sacrifices may exceed benefits.
Risk may be reduced by converting fixed costs
into variable costs.
Let�s see what happens to the concert example if the band receives $16 per ticket sold instead of a fixed $48,000.
Managerial Accounting - Basics of Cost Analysis - A.Y. 17/18
2-36
Tickets sold 2,700 3,000 3,300
Revenue ($18 per ticket) 48,600$ 54,000$ 59,400$
Cost of band ($16 per ticket) 43,200 48,000 52,800
Gross profit 5,400$ 6,000$ 6,600$
Shifting the cost structure from fixed to variable not only reduces risk but also
the potential for profits.
SPI example: Risk and Reward Assessment
10% Revenue Increase
10% Gross Profit Increase
ContribuConMargin
2-37
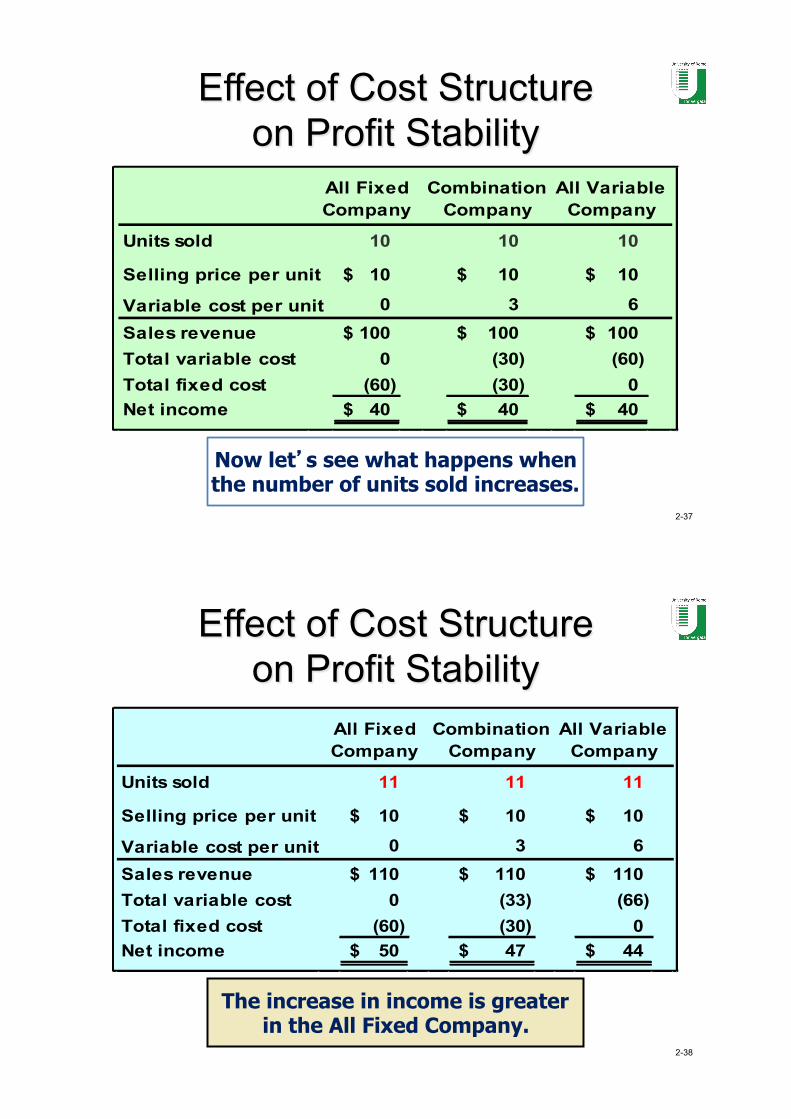
Units sold 10 10 10
Selling price per unit 10$ 10$ 10$
Variable cost per unit 0 3 6
Sales revenue 100$ 100$ 100$ Total variable cost 0 (30) (60) Total fixed cost (60) (30) 0Net income 40$ 40$ 40$
All Fixed Company
Combination Company
All Variable Company
Now let�s see what happens when the number of units sold increases.
Effect of Cost Structure on Profit Stability
2-38
Units sold 11 11 11
Selling price per unit 10$ 10$ 10$
Variable cost per unit 0 3 6
Sales revenue 110$ 110$ 110$ Total variable cost 0 (33) (66) Total fixed cost (60) (30) 0Net income 50$ 47$ 44$
All Fixed Company
Combination Company
All Variable Company
The increase in income is greater in the All Fixed Company.
Effect of Cost Structure on Profit Stability

2-39
Units sold 9 9 9
Selling price per unit 10$ 10$ 10$
Variable cost per unit 0 3 6
Sales revenue 90$ 90$ 90$ Total variable cost 0 (27) (54) Total fixed cost (60) (30) 0Net income 30$ 33$ 36$
All Fixed Company
Combination Company
All Variable Company
Yes, the decrease in income is greater in the All Fixed Company.
Effect of Cost Structure on Profit Stability
2-40
Variable Costs
Fixed Costs
Level of Fixed Cost
Earnings Volatility
High High
Low Low
Effect of Cost Structure on Profit Stability

2-41
EXERCISE:DemonstraConProblem1ArtOnTour,Inc.(AOTI)contractswithar)ststoexhibittheirworktothepublic.AOTIhasagreedtopayawellknownar)sta$20,000commissionfortherighttoexhibithisworkforonemonth.RequiredParta–IdenCfyingCostBehavior1.Determinethetotalcommissioncostandthecommissioncostperpersonif1,000,2,000,or4,000peopleaVendtheexhibi)on.Isthecommissioncostfixedorvariable?2. AOTIsellstopatronsbooksillustra)ngthear)st’swork.ThebookscostAOTI$5each.Determinethetotalcostofbooksandthecostperpersonif1,000,2,000,or4,000peopleaVendtheexhibi)onandwishtopurchasethebooks.Isthebookcostfixedorvariable?
..continue..
2-42
Partb-OperaCngLeverageandRisk/RewardRelaConship1.AOTIpaysanar)sta$20,000commission.Itsells4,000)cketsat$6each.Prepareanincomestatement.Thenpreparerevisedincomestatementsassuming10percentmorethan4,000and10percentfewerthan4,000patronsaVendtheexhibi)on.CalculatethepercentagechangesinrevenueandnetincomeifaVendanceincreasesordecreases10percent.2.Alterna)vely,AOTIpaysthear)stacommissionof$5per)cketsold.Itsells4,000)cketsat$6each.Prepareanincomestatement.Thenpreparerevisedincomestatementsassuming10percentmorethan4,000and10percentfewerthan4,000patronsaVendtheexhibi)on.CalculatethepercentagechangeinrevenueandnetincomeifaVendanceincreasesordecreases10percent.Partc-FixedandVariableCostDefiniConsareContextSensiCve1.AOTIpaysthear)stacommissionof$20,000perexhibi)on.Whatisthetotalcommissioncostandthecommissioncostperpersonif1,000,2,000,or4,000peopleaVendtheexhibi)on?(Sameasparta.1.)2.AOTIpaysthear)stacommissionof$20,000perexhibi)on.Whatisthetotalcommissioncostandthecommissioncostperexhibi)onifAOTIsponsors1,2,or3exhibi)ons?
..continue..

2-43
EXERCISE:DemonstraConProblem2:EffectofCostStructureMyCompanyandYourCompanyprovidera;ingtoursonBigBearRiver.MyCompanypaystourguidesfixedsalaries.Itbudgetssalariesexpenseat$160,000peryear.YourCompanypaystourguides$40perra;erserved.Ra;ersarecharged$50pertour.Bothcompaniesexpecttocarryapproximately4,000ra;ersduringtheyear.Requireda. Preparebudgetedannualincomestatementsforthetwocompanies.b. Inanefforttolurera;ersawayfromYourCompany,MyCompanylowersthepriceperra;erto$39.Preparerevisedincomestatementsforbothcompanies.AssumethatMyCompanyserves6,000ra;erswhoeachpay$39pertour,whileYourCompanyservesonly2,000ra;erswhopay$50pertour.c. AssumeyouarepresidentofYourCompany.Offerdefensivestrategies.d. SupposeYourCompanymatchesthe$39pricesetbyMyCompany.Prepareincomestatementsforbothcompaniesassumingthateachcompanyserves4,000customers.
2-44
Learning Objective
LO3
Prepare an income statement using the contribution
margin approach.
Managerial Accounting - Basics of Cost Analysis - A.Y. 17/18

2-45
An Income Statement under the Contribution Margin Approach
Managerial Accounting - Basics of Cost Analysis - A.Y. 17/18
2-46
Learning Objective
LO4
Calculate the magnitude of
operating leverage.
Managerial Accounting - Basics of Cost Analysis - A.Y. 17/18

2-47
Operating Leverage A measure of how sensitive net operating
income is to percentage changes in sales.
Contribution margin Net operating income
Degree* of operating leverage =
* or simply Operating leverage Managerial Accounting - Basics of Cost
Analysis - A.Y. 17/18
2-48
Operating Leverage
Actual sales 500 Bikes
Sales 250,000$ Less: variable expenses 150,000 Contribution margin 100,000 Less: fixed expenses 80,000 Net income 20,000$
$100,000 $20,000
= 5
At Racing, the degree of operating leverage is 5.

2-49
Operating Leverage With an operating leverage of 5, if Racing increases its sales by 10%, net operating
income would increase by 50%.
Percent increase in sales 10%Degree of operating leverage × 5Percent increase in profits 50%
Here’s the verification!
Managerial Accounting - Basics of Cost Analysis - A.Y. 17/18
2-50
Operating Leverage Actual sales
(500)Increased sales (550)
Sales 250,000$ 275,000$ Less variable expenses 150,000 165,000 Contribution margin 100,000 110,000 Less fixed expenses 80,000 80,000 Net operating income 20,000$ 30,000$
10% increase in sales from $250,000 to $275,000 . . .
. . . results in a 50% increase in income from $20,000 to $30,000.

2-51
Contribution Margin Ratio
The contribution margin ratio is:
For Racing Bicycle Company the ratio is:
Total CM Total sales CM Ratio =
Each $1.00 increase in sales results in a total contribution margin increase of 40¢.
= 40% $80,000 $200,000
2-52
Contribution Margin Ratio Or, in terms of units, the contribution margin ratio is:
For Racing Bicycle Company the ratio is:
$200 $500
= 40%
Unit CM Unit selling price CM Ratio =

2-53
400 Bikes 500 BikesSales 200,000$ 250,000$ Less: variable expenses 120,000 150,000 Contribution margin 80,000 100,000 Less: fixed expenses 80,000 80,000 Net operating income -$ 20,000$
Contribution Margin Ratio
A $50,000 increase in sales revenue results in a $20,000 increase in CM.
($50,000 × 40% = $20,000)
Managerial Accounting - Basics of Cost Analysis - A.Y. 17/18
2-54
Contribution margin Net income
Operating Leverage =
Show me an example.
Measuring Operating Leverage Using Contribution Margin: EXAMPLE

2-55
Actual sales 5,000
HammersSales 50,000$ Less: variable expenses 30,000 Contribution margin 20,000 Less: fixed expenses 15,000 Net income 5,000$
$20,000 $5,000
Operating Leverage = = 4
A measure of how a percentage change in sales will effect profits.
Measuring Operating Leverage Using Contribution Margin
2-56
Current sales 5,000 Hammers
Increased sales 5,500 Hammers
Sales 50,000$ 55,000$ Less: Variable expenses 30,000 33,000 Contribution margin 20,000 22,000 Less: Fixed expenses 15,000 15,000 Net income 5,000$ 7,000$
A 10 percent increase in sales results in a 40 percent increase in net income.
(10% × 4 = 40 %)
Measuring Operating Leverage Using Contribution Margin
Managerial Accounting - Basics of Cost Analysis - A.Y. 17/18

2-57
EXERCISES:DemonstraConProblem3:EffectofOperaCngLeverageSharonVirgilownsadeliveryservicecompany.Shechargescustomers$10perdelivery.Thecompany’svariableexpensesaverage$2perdeliveryandfixedcostsare$600permonth.Ms.Virgilprovided100deliveriesduringthemostrecentmonth.Requireda. Prepareanincomestatementusingacontribu)onmarginformat.b. Determinethemagnitudeofopera)ngleverage.Useyouranswertodeterminethepercentagechangeinnetincomeifsalesincreaseby10%.c. Assumethatsalesincreaseby10%(deliveriesincreaseto110).Prepareacontribu)onmarginformatincomestatementassuming110deliveries.Calculatethepercentagechangeinnetincomeandcompareyouranswerwithyoursolu)ontopartb.
2-58
The Relevant Range
Example: Office space is available at a fixed rental rate of $30,000 per year in increments of 1,000 square feet. As the business grows more space is rented, increasing the total cost.
Continue
Managerial Accounting - Basics of Cost Analysis - A.Y. 17/18

2-59
Ren
t Cos
t in
Thou
sand
s of
Dol
lars
0 1,000 2,000 3,000 Rented Area (Square Feet)
0
30
60
Fixed Costs and Relevant Range
90
Relevant Range
Total cost doesn’t change for a wide
range of activity, and then jumps to a new higher cost for the
next higher range of activity.
Managerial Accounting - Basics of Cost Analysis - A.Y. 17/18
2-60 Activity
To
tal C
ost
Relevant Range
The Relevant Range Our variable cost
assumption (constant unit variable cost)
applies within the relevant range.
Possible Variable Cost Behavior
Our Variable Cost Assumption

2-61
Context Sensitive Definitions of Fixed and Variable
Number of concerts 1 2 3 4 5Cost per concert 48,000$ 48,000$ 48,000$ 48,000$ 48,000$ Total cost 48,000$ 96,000$ 144,000$ 192,000$ 240,000$
Recall the earlier concert example, where the band was paid $48,000 regardless of the number of tickets sold.
The cost of the band is fixed relative to the number of tickets sold for a specific concert.
The cost of the band is variable relative to the number of concerts produced.
2-62
Learning Objective
LO5
Select an appropriate time
period for calculating average
cost per unit.
Managerial Accounting - Basics of Cost Analysis - A.Y. 17/18

2-63
Lake Resorts provides water-skiing lessons for its guests with the following costs:
Equipment rental $80 per day Instructor pay $15 per hour Fuel $ 2 per hour
What is the average cost per one-hour lesson for 2 lessons per day? 5 lessons per day? 10 lessons
per day?
Cost Averaging
2-64
Cost Averaging
Number of lessons 2 10 20
Cost of equipment rental 80$ 80$ 80$ Cost of instruction 30 150 300 Cost of fuel 4 20 40 Total cost 114$ 250$ 420$
Cost per lesson 57$ 25$ 21$
Average costs decline as activity increases when fixed costs such as equipment rental are involved.
Managers must use these average costs with caution as they differ at every level of activity.

2-65
Learning Objective
LO6
Use the high-low method,
scattergraphs, and regression analysis
to estimate fixed and variable costs.
Managerial Accounting - Basics of Cost Analysis - A.Y. 17/18
2-66
The High-Low Method Iris Company recorded the following production
activity and maintenance costs for two months:
Using these two levels of activity, compute:� the variable cost per unit. � the fixed cost.� the total cost.
Units CostHigh activity level 10,000 9,700$ Low activity level 5,000 5,700
Managerial Accounting - Basics of Cost Analysis - A.Y. 17/18

2-67
� Unit variable cost = $4,000 ÷ 5,000 units = $.80 per unit � Fixed cost = Total cost – Total variable cost Fixed cost = $9,700 – ($.80 per unit × 10,000 units) Fixed cost = $9,700 – $8,000 = $1,700 � Total cost = Fixed cost + Variable cost Total cost = $1,700 + $0.80X
The High-Low Method Units Cost
High activity level 10,000 9,700$ Low activity level 5,000 5,700 Change 5,000 4,000$
Managerial Accounting - Basics of Cost Analysis - A.Y. 17/18
2-68
Plot the data points on a graph (total cost vs. activity).
0 1 2 3 4
*
Tota
l Cos
t in
1,00
0�s
of D
olla
rs
$10
$20
$0
* * *
* *
* * *
*
Activity, 1,000�s of Units Produced
X
Y
The Scattergraph Method

2-69
Draw a line through the data points with about an equal numbers of points above and below the line.
0 1 2 3 4
*
Tota
l Cos
t in
1,00
0�s
of D
olla
rs
$10
$20
$0
* * *
* *
* * *
*
Activity, 1,000�s of Units Produced
X
Y
The Scattergraph Method
2-70
0 1 2 3 4
*
Tota
l Cos
t in
1,00
0�s
of D
olla
rs
$10
$20
$0
* * *
* *
* * *
*
Activity, 1,000�s of Units Produced
X
Y
Estimated fixed is $10,000
Thehorizontallineshowsthatthetotalcostof3,000unitsis
approximately$16,000.
Variable cost per unit is represented by the slope of the line.
The Scattergraph Method

2-71
0 1 2 3 4
*
Tota
l Cos
t in
1,00
0�s
of D
olla
rs
$10
$20
$0
* * *
* *
* * *
*
Activity, 1,000�s of Units Produced
X
Y
Total variable cost = Total cost – Total fixed cost Total variable cost = $16,000 – $10,000 = $6,000 Unit variable cost = $6,000 ÷ 3,000 units = $2
The Scattergraph Method
Estimated fixed is $10,000
Thehorizontallineshowsthatthetotalcostof
3,000unitsisapproximately$16,000.
2-72
Regression Method of Cost Estimation
A method used to analyze mixed costs if a scattergraph plot reveals an approximately linear
relationship between the X and Y variables.
Thismethodusesallofthedatapointstoes)matethefixedandvariablecostcomponentsofa
mixedcost. Thegoalofthismethodistofitastraightlinetothedatathatminimizesthesumofthesquarederrors.
Managerial Accounting - Basics of Cost Analysis - A.Y. 17/18

2-73
Regression Method of Cost Estimation
• Software can be used to fit a regression line through the data points.
• The cost analysis objective is the same:
Y = a + bX
Least-squares regression also provides a statistic, called the R2, that is a measure of the goodness
of fit of the regression line to the data points. Managerial Accounting - Basics of Cost
Analysis - A.Y. 17/18
2-74
Regression Method of Cost Estimation
Follow these steps in Excel to perform regression
analysis: 1. Enter the data in
spreadsheet columns. 2. Click Tools. 3. Click Data Analysis. 4. Click Regression and
then OK. 5. Define data ranges and
click Line Fit Plot. 6. Click OK.
0 1 2 3 4
Tota
l Cos
t
10
20
0 Activity
* * * *
* * * **
*
X
Y
The regression function will return an estimate for fixed cost and
variable cost per unit.
Copyright © 2022 FDOKUMEN