
Engineering UK 2014
266
Engineering UK 2014 The state of engineering
-
Upload
khangminh22 -
Category
Documents
-
view
1 -
download
0
Transcript of Engineering UK 2014

Engineering UK 2014 is produced with the support of the members and fellows of the following Professional Engineering Institutions: BCS The Chartered Institute for ITBritish Institute of Non-Destructive TestingChartered Institute of Plumbing & Heating EngineeringChartered Institution of Water & Environmental ManagementEnergy InstituteEngineering CouncilInstitute of AcousticsInstitute of Cast Metals EngineersInstitute of Highway EngineersInstitute of Marine Engineering, Science and TechnologyInstitute of Materials, Minerals & MiningInstitute of Measurement & ControlInstitute of PhysicsInstitute of Physics & Engineering In MedicineInstitute of WaterInstitution of Agricultural EngineersInstitution of Chemical EngineersInstitution of Civil EngineersInstitution of Diesel and Gas Turbine EngineersInstitution of Engineering DesignersInstitution of Fire EngineersInstitution of Gas Engineers & ManagersInstitution of Lighting ProfessionalsInstitution of Mechanical EngineersInstitution of Railway Signal EngineersInstitution of Royal EngineersNuclear InstituteRoyal Aeronautical SocietySociety of Environmental EngineersThe Chartered Institution of Building Services EngineersThe Chartered Institution of Highways & TransportationThe Institute of Healthcare Engineering and Estate ManagementThe Institution of Engineering and TechnologyThe Institution of Structural EngineersThe Royal Academy of EngineeringThe Royal Institution of Naval ArchitectsThe Society of Operations EngineersThe Welding Institute
Engineering UK
2014 The state of engineering
Engineering UK 2014The state of engineering

We gratefully acknowledge contributions and support from…
This Report is printed using an environmentally friendly ECF Paper stock, certified FSC, with a high content of recycled material and is chlorine and acid free.
EngineeringUK EngineeringUK is an independent organisation that promotes the vital contribution of engineers, engineering and technology in our society. EngineeringUK partners business and industry, Government and the wider science and engineering community: producing and sharing evidence on the state of engineering, inspiring young people to choose a career in engineering and matching employers’ demand for skills. EngineeringUK leads two programmes: The Big Bang and Tomorrow’s Engineers.
For more information about EngineeringUK please visit
www.EngineeringUK.com @_EngineeringUK

The state of engineering Authors I
Engineering UK 2014 Authors
The lead authors for Engineering UK 2014 were Dr Anil Kumar, Director Education and Research, Neil Randerson, Senior Researcher and Louisa Kiwana, Research Executive, with support from colleagues at EngineeringUK.
EngineeringUK would also like to thank the following for their valuable contributions:
Prof Michael J. Reiss Pro-Director, Research and Development and Professor of Science Education, Institute of Education, University of London
Dr Tamjid Mujtaba Research Officer, Learning for London@IOE Research Centre
Peter Main Director Education and Science, Institute of Physics
Matthew Harrison Director Education, Royal Academy of Engineering
Barry Brooks Strategic Adviser to the Tribal Board, Tribal PLC
Mark Tully Managing Director, Roevin
Kim Regisford Policy Advisor, Recruitment and Employment Confederation
Grace Breen Policy Advisor, CBI
Tim Thomas Head of Employment and Skills, EEF, the manufacturers’ organisation
Elaine Clark Head of Business Services, National Skills Academy for Railway Engineering
Jon Prichard CEO, Engineering Council

II Foreword The state of engineering
The Engineering UK annual report has established itself as an important source of information to Government and industry on the extent of engineering skills across the country and where the successes and future challenges lie in realising our potential as an engineering nation.
Some positives from this report emerge. I am pleased to note the growth in the turnover of engineering firms, increasing in 2013 by 3.5% to over £1 trillion – this is nearly a quarter of that of all enterprises in the UK.
Another encouraging trend is the increase in numbers of graduates going into engineering careers in 2013 – a rise of over 6% on the previous year. Physics is not an easy subject but its attainment early in life can move a young person’s direction of travel towards a career in engineering. And students are travelling in the right direction, with increases in entrants to GCSE and A level physics.
But there is work to be done. What is imperative, the report makes clear, is significantly to reduce the current gap between the supply of engineering skills and the demands of industry and manufacturing. The main growth sectors that I identified in my Industrial Strategy in
September 2012 need engineers. The UK will need around 87,000 graduate level engineers per year over the next ten years: 2013 was 36,000 short of this.
The skills gap is made worse by the continued inequality in the uptake and progression of women into engineering. Despite being almost equal to boys in physics GCSE, girls’ achievement tapers off as they progress through the system until they form only 14% of the UK cohort with first degrees in engineering. I saw at first hand at The Big Bang UK Young Scientists & Engineers Fair in March 2013 the obvious enthusiasm of both boys and girls for science and engineering. We have to find a way of maintaining and channelling this.
Government has been aware of these challenges and commissioned The Perkins Review to identify potential solutions. Published on 4 November 2013 it anticipates many key themes in this report. It has led directly to the launch of Tomorrow’s Engineers Week, a multi-partner initiative to promote engineering careers. We are investing in a pilot project with the Daphne Jackson Trust to develop a new fellowship to support people returning to professional engineering jobs after a career break to ensure we retain talented engineers within the profession.
This report makes an excellent contribution to the national debate by reminding us of the contribution engineering already makes to our economy and the greater achievements within our grasp if we can develop and increase the skills base.
Rt. Hon Vince Cable MP Secretary of State for Business, Innovation and Skills
Foreword The Rt. Hon Dr Vince Cable MP

The state of engineering About us III
Our aim is to raise awareness of the vital contribution that engineers, engineering and technology make to our society and economy, and inspire people at all levels to pursue careers in engineering and technology.
Britain’s economy needs a vibrant, innovative and successful engineering sector. Our vision is a society that understands the value of engineering and the opportunities that engineering provides. Our goal is to improve the supply of engineers through interventions with learners and those who influence them: their parents, the media, education professionals and policy makers. We work in partnership with business and industry, Government, education and skills providers, the professional engineering institutions, the Engineering Council, the Royal Academy of Engineering and the wider science, technology, engineering and mathematics (STEM) community. Together, we pursue two strategic goals:
• to improve the perception of engineers, engineering and technology
• to improve the supply of engineers
All of our activities are underpinned by thorough research and evaluation. This has helped to establish the not-for-profit organisation as a trusted, authoritative voice for the engineering community with influencers, policy makers and the media. Engineering UK, our annual review of the state of UK engineering, is our flagship
publication, providing the engineering and wider STEM sectors, policy makers and the media with a definitive source of information, analysis and evidence.
You can view Engineering UK by theme on the EngineeringUK website www.engineeringuk.com
We focus our activity on two core programmes:
The Big Bang
The Big Bang programme exists to show young people the range and number of exciting and rewarding opportunities available to them with the right experience and qualifications. A unique collaboration by Government, business and industry, education, professional bodies and the wider STEM community, The Big Bang brings to life the exciting possibilities that exist for young people with science, technology, engineering and mathematics backgrounds. The programme is made up of:
The Big Bang UK Young Scientists and Engineers Fair, the largest celebration of science, technology, engineering and mathematics for young people in the UK. The Fair plays host to the finals of the National Science & Engineering Competition, which recognises the country’s brightest and best young scientists and engineers. Led by EngineeringUK and delivered in partnership with over 200 organisations, with the shared aim of inspiring the next generation of scientists and engineers, The Fair welcomed 65,000 people through its doors in its fourth year.
The Big Bang Near Me events take place across England, Northern Ireland, Scotland and Wales, providing young people across the UK with the opportunity to experience, close to home, the excitement and opportunities available through STEM. In 2013 42,000 young people took part in a Near Me Fair.
We expect 70,000 people to attend The Big Bang Fair in 2014 and our ambition for 2020 is that 100,000 children and young people each year will experience The Big Bang for themselves. Our ultimate goal is that every child in the UK should know someone involved with it.
EngineeringUK About us

IV About us The state of engineering
Tomorrow’s Engineers
Tomorrow’s Engineers is a careers programme led by EngineeringUK and the Royal Academy of Engineering. It is delivered through a broad partnership between business and industry, the engineering profession, activity delivery organisations and schools, working together to inspire learners and their influencers. Our long-term objective is to reach every state-funded secondary school in the UK in order to:
• improve awareness about engineering and what engineers do among pupils, their teachers and parents
• enthuse young people about engineering and the career opportunities available
• encourage young people to make the subject choices that keep open the routes into a career in engineering
In order to help achieve these objectives, Tomorrow’s Engineers:
• funds a variety of experienced delivery partners, who provide a wide range of practical enhancement and enrichment activities delivered to targeted schools
• leads an employer engagement programme to ensure the work of the engineering community in schools is joined-up, effective and sustainable
• implements a common independent evaluation for activities that measures participants’ learning about engineering and engineering careers, the impact on their perceptions, and their likely future subject and career choices
• provides careers information resources that help to engage pupils and teachers in understanding engineering career opportunities and routes into those careers
Careers information and resources are integral to our Big Bang and Tomorrow’s Engineers programmes. We are working with the professional engineering institutions to develop unified, consistent careers messaging across the community for young people and those who influence them.
Our communications strategy ensures that not only those involved in our programmes, but the wider population as a whole, understand that studying science and mathematics subjects at school, college and university can open up a whole range of exciting and rewarding careers opportunities.
At EngineeringUK we believe that working in partnership with stakeholders is the only way to fully embed the engineering agenda in UK society. If you feel the same way, please visit www.engineeringuk.com and follow our activities on twitter.com/_EngineeringUK
Paul Jackson, Chief Executive EngineeringUK

The state of engineering Contents V
Back to Contents
Engineering UK 2014 Contents
Synopsis, recommendations and calls for collaborative action . . . . . XIII
Part 1 Engineering in Context . . . . . . . . . . 1
1.0 Capacity for growth . . . . . . . . . . . . . . . 11.1 Challenges to the delivery of growth . . . . . . 2
1.1.1 Economic . . . . . . . . . . . . . . . . . . . . . . 2
1.1.2 People. . . . . . . . . . . . . . . . . . . . . . . . . 3
1.1.3 Skills challenges . . . . . . . . . . . . . . . . . 4
1.1.4 Teaching quality. . . . . . . . . . . . . . . . . . 4
1.1.5 Maths and physics . . . . . . . . . . . . . . . 5
1.2 Government ambition and intent . . . . . . . . . 6
1.3 UK industry strengths. . . . . . . . . . . . . . . . . . 7
1.3.1 The UK industrial strategy . . . . . . . . . . 8
1.3.2 Strengths and opportunities . . . . . . . . 8
1.3.3 Low carbon – revisited. . . . . . . . . . . . 11
1.4 Miscellaneous but noteworthy . . . . . . . . . . 13
1.4.1 UK universities engineering departments’ ability to double their capacity . . . . . . . . . . . . . . . . . . 13
1.4.2 Leadership and management . . . . . . 13
1.4.3 Food for thought . . . . . . . . . . . . . . . . 13
2.0 Engineering in the UK . . . . . . . . . . . .142.1 Number of engineering enterprises
in the UK . . . . . . . . . . . . . . . . . . . . . . . . . . 14
2.2 Employment in engineering in the UK . . . . 17
2.3 Turnover of engineering enterprises in the UK . . . . . . . . . . . . . . . . . . . . . . . . . . 19
3.0 UK engineering research and innovation . . . . . . . . . . . . . . . . . . . . .21
3.1 Importance of research and innovation . . . 21
3.2 UK Government interventions. . . . . . . . . . . 22
3.3 The international context . . . . . . . . . . . . . . 24
3.4 Research excellence. . . . . . . . . . . . . . . . . . 25
3.4.1 The UK dual funding structure for research . . . . . . . . . . . . . . . . . . . . . . 26
3.4.2 The Research Excellence Framework (REF). . . . . . . . . . . . . . . . . . . . . . . . . 26
3.5 Immigration . . . . . . . . . . . . . . . . . . . . . . . . 26
3.5.1 Migration Advisory Committee (MAC) shortage list: approved engineering job titles . . . . . . . . . . . . . . . . . . . . . . 27
3.6 Predicting the future. . . . . . . . . . . . . . . . . . 28
3.7 Intellectual property rights: a strategic national asset . . . . . . . . . . . . . . . . . . . . . . 28
4.0 Population changes. . . . . . . . . . . . . .29
5.0 Understanding and influencing target audiences . . . . . . . . . . . . . . . .31
5.1 Aspiration and perception . . . . . . . . . . . . . 31
5.1.1 Young people benefit from enriched STEM curriculum . . . . . . . . . . . . . . . . 31
5.1.2 Positively influencing these perceptions. . . . . . . . . . . . . . . . . . . . 32
5.1.3 Female aspiration and perception. . . 33
5.2 Careers information, advice and guidance. . 33
5.3 Bridging the transition from school to work 35
5.3.1 Experience of work . . . . . . . . . . . . . . 36
5.4 Aspiration vs reality: labour market intelligence. . . . . . . . . . . . . . . . . . . . . . . . . 36
6.0 Mining the talent pool – capacity and equity . . . . . . . . . . . . . .37
6.1 Our untapped capacity for growth . . . . . . . 38
6.2 What’s worth restating from the 2013 report? . . . . . . . . . . . . . . . . . . . . . . 41
6.3 What’s new?. . . . . . . . . . . . . . . . . . . . . . . . 42
6.3.1 Free School Meals vs. Non Free School Meals: progression to Higher Education . . . . . . . . . . . . . . . . . . . . . 42
6.3.2 Free School Meals vs. Non Free School Meals: GCSE achievement gap . . . . . 42
6.3.3 Free School Meals: major ethnic groups’ GCSEs attainment. . . . . . . . . 43
6.3.4 High quality teaching is especially important for disadvantaged pupils . . 43
6.3.5 Progression to Higher Education by type of school. . . . . . . . . . . . . . . . 43
6.3.6 Widening access to Higher Education. . . . . . . . . . . . . . . . 44
6.3.7 The importance of careers education and advice . . . . . . . . . . . . 45
6.3.8 It’s not just a matter of ambition or attainment . . . . . . . . . . . . . . . . . . 46
6.3.9 Women . . . . . . . . . . . . . . . . . . . . . . . 47
6.4 Government action. . . . . . . . . . . . . . . . . . . 47
6.5 Cost to the economy . . . . . . . . . . . . . . . . . 48
Part 2 Engineering in Education and Training . . . . . . . . . . . . . . . . .49
7.0 GCSEs. . . . . . . . . . . . . . . . . . . . . . . .497.1 Size of the school sector . . . . . . . . . . . . . . 53
7.2 Funding of the school sector . . . . . . . . . . . 53
7.3 Free School Meals . . . . . . . . . . . . . . . . . . . 54
7.4 GCSE entrant numbers. . . . . . . . . . . . . . . . 54
7.5 A*-C achievement rates. . . . . . . . . . . . . . . 57
7.5.1 A*-C achievement rates by gender . . . 59
7.6 Year 11 diplomas. . . . . . . . . . . . . . . . . . . . 60
7.7 Vocational qualifications . . . . . . . . . . . . . . 60
7.8 Teacher workforce . . . . . . . . . . . . . . . . . . . 63
7.9 Scottish Standards. . . . . . . . . . . . . . . . . . . 65
7.9.1 Standard Grades. . . . . . . . . . . . . . . . 65
7.9.2 Intermediate 1 and Intermediate 2 . . . 66
7.10 How can we get more students to study mathematics or physics? . . . . . . . . . . . . 67
Authored by Prof Michael J. Reiss, Pro-Director, Research and Development and Professor of Science Education, Institute of Education, University of London, and Dr Tamjid Mujtaba, Research Officer at Learning for London@IOE Research Centre
8.0 AS and A levels . . . . . . . . . . . . . . . . .698.1 AS level entrant numbers. . . . . . . . . . . . . . 69
8.2 AS level A-C achievement rates . . . . . . . . . 72
8.3 A level entrant numbers . . . . . . . . . . . . . . . 74
8.4 A level A*-C achievement rates . . . . . . . . . 75
8.5 Vocational qualifications . . . . . . . . . . . . . . 77
8.6 Scottish Highers and Advanced Highers. . . 79
8.6.1 Scottish Highers . . . . . . . . . . . . . . . . 79
8.6.2 Advanced Highers . . . . . . . . . . . . . . . 80
8.7 The next generation . . . . . . . . . . . . . . . . . . 80 Authored by Peter Main, Director Education
and Science, Institute of Physics
9.0 The Further Education sector . . . . . .839.1 Economic benefits of vocational
education. . . . . . . . . . . . . . . . . . . . . . . . . . 85
9.2 Participation in FE . . . . . . . . . . . . . . . . . . . 86
9.3 National Vocational Qualifications . . . . . . . 88
9.4 Vocationally Related Qualifications . . . . . . 90
9.5 Qualifications and Credit Framework . . . . . 91
9.6 STEM and young people aged 16-18 . . . . 93 Authored by Matthew Harrison, Director
Education, Royal Academy of Engineering
9.7 GCSE mathematics: the key to post-16 education reform . . . . . . . . . . . . . . . . . . . . 95
Authored by Barry Brooks, Strategic Adviser to the Tribal Board, Tribal PLC
9.8 FE workforce. . . . . . . . . . . . . . . . . . . . . . . 100
9.8.1 Further Education teaching workforce . . . . . . . . . . . . . . . . . . . . . . . . . 100
9.8.2 Further education staff . . . . . . . . . . 100

VI Contents The state of engineering
Back to Contents
9.8.3 Subject areas taught. . . . . . . . . . . . 101
9.8.4 Gender in engineering Sector Subject Areas . . . . . . . . . . . . . . . . . 101
9.8.5 Salaries in engineering subject areas . . . . . . . . . . . . . . . . . 103
10.0 Apprenticeships . . . . . . . . . . . . . .10410.1 Top ten Apprenticeship Programme
achievements by Sector Framework . . . 107
10.2 Programme starts . . . . . . . . . . . . . . . . . 108
10.3 Framework achievements . . . . . . . . . . . 115
10.4 Success rates . . . . . . . . . . . . . . . . . . . . 122
10.5 Engineering apprenticeships in the devolved nations . . . . . . . . . . . . . . . . . . 122
10.6 The urgent need for more technicians. . 126
11.0 Higher Education . . . . . . . . . . . . .12811.1 HE sector. . . . . . . . . . . . . . . . . . . . . . . . 132
11.2 Participation rates. . . . . . . . . . . . . . . . . 133
11.3 Applicants and accepted applicants to STEM HE courses . . . . . . . . . . . . . . . 136
11.3.1 Applicants to undergraduate STEM HE courses. . . . . . . . . . . 136
11.3.2 Applicants to STEM by gender . . 139
11.3.3 Applicants to engineering by sub-discipline . . . . . . . . . . . . . 141
11.3.4 Female applicants to selected engineering sub-disciplines . . . 144
11.3.5 Educational backgrounds of applicants to full-time undergraduate HE engineering courses . . . . . . . . . . . . . . . . . . 145
11.3.6 Ethnicity of applicants . . . . . . . 146
11.3.7 Widening participation. . . . . . . 149
11.3.8 Accepted applicants to STEM degrees . . . . . . . . . . . . . 151
11.3.9 Accepted applicants by selected engineering sub-discipline . . . . 153
11.3.10 Gender of accepted applicants to selected engineering sub-disciplines. . . . . . . . . . . . . 156
11.4 Engineering students. . . . . . . . . . . . . . . 157
11.4.1 Qualifications of engineering students. . . . . . . . . . . . . . . . . . . 157
11.4.2 Number of engineering students. 157
11.4.3 Sandwich degrees . . . . . . . . . . . 158
11.4.4 Non-continuation rates. . . . . . . . 159
11.5 Qualifications obtained . . . . . . . . . . . . . 160
11.5.1 Domicile status and gender of engineering qualifiers . . . . . . . . . 162
11.5.2 Degrees achieved in selected engineering sub-disciplines . . . . 164
11.5.3 Ethnicity of engineering graduates. . . . . . . . . . . . . . . . . . 168
11.5.4 Geographical location of qualifiers . . . . . . . . . . . . . . . . . . 171
11.6 Foundation degrees, BTec Higher National Certificates (HNCs) and Higher National Diplomas (HNDs). . . . . 173
11.6.1 Foundation degrees, BTec Higher National Certificates (HNCs) and Higher National Diplomas (HNDs) entrants . . . . . . . . . . . . . 173
11.6.2 Foundation degrees, BTec Higher National Certificates (HNCs) and Higher National Diplomas (HNDs) completions. . . . . . . . . . 175
11.7 Higher Education staff. . . . . . . . . . . . . . 178
11.8 International student perspective . . . . . 180
11.8.1 Transnational education . . . . . . . 180
Part 3 Engineering in Employment . . . .181
12.0 Graduate destinations . . . . . . . . .18112.1 Destination of graduates. . . . . . . . . . . . 182
12.2 Destinations of full-time first degree qualifiers . . . . . . . . . . . . . . . . . . 184
12.3 Occupation of engineering and technology graduates . . . . . . . . . . . . . . 186
12.3.1 Occupations by selected engineering sub-disciplines . . . . 187
12.4 Types of industry . . . . . . . . . . . . . . . . . . 187
12.4.1 Engineering and technology graduates going into finance . . . 190
12.5 Industry type by selected engineering sub-disciplines . . . . . . . . . . . . . . . . . . . 190
12.6 Number of non-engineering and technology graduates going to work in engineering and technology . . . . . . . 192
12.7 Destinations for foundation degrees, BTec Higher National Certificates (HNC) and Higher National Diplomas (HND) . . 193
13.0 Graduate recruitment and salaries. . . . . . . . . . . . . . . . . . . . .194
13.1 The graduate premium in the labour market . . . . . . . . . . . . . . . . . . . . 194
13.2 Graduate vacancies. . . . . . . . . . . . . . . . 196
13.3 Graduate starting salaries. . . . . . . . . . . 197
14.0 Earnings in STEM careers . . . . . . .20114.1 Annual mean gross pay for selected
STEM professions . . . . . . . . . . . . . . . . . 201
14.1.1 Annual mean gross pay for selected full-time STEM professions by gender. . . . . . . . . 203
14.1.2 Annual mean gross pay for selected part-time STEM professions by gender. . . . . . . . . 204
14.2 Annual mean gross pay for selected STEM technician and craft careers . . . . 204
14.2.1 Annual mean gross pay for selected full-time STEM technician and craft careers by gender . . . . . . . . . . . . . . . . . . 206
14.2.2 Annual mean gross pay for selected part-time STEM technician and craft careers by gender . . . . . . . . . . . . . . . . . . 207
14.3 2013 Survey of professionally registered engineers and technicians . . 207
14.4 Engineering vacancy and salary trends 2012/13 . . . . . . . . . . . . . . . . . . 210
Authored by Mark Tully, Managing Director, Roevin
14.5 Emerging trends of the future workforce 213 Authored by Kim Regisford, Policy
Advisor, Recruitment and Employment Confederation
15.0 Skills Shortage Vacancies and employment projections . . . . . . . .215
15.1 Business investment in skills. . . . . . . . . 215
15.2 Who engages in further learning . . . . . . 216
15.3 Skill levels in the UK workforce . . . . . . . 217
15.4 Employment by skills level . . . . . . . . . . 218
15.5 Changing qualification requirements. . . 219
15.6 Skills shortages. . . . . . . . . . . . . . . . . . . 219
15.7 Workforce projections for engineering enterprises 2010-2020. . . . . . . . . . . . . 220
15.7.1 Workforce projections in the EU 2010-2020 . . . . . . . . . . . . . 221
16.0 Concerted employer action . . . . . .22216.1 Meeting demand for STEM skills. . . . . . 222 Authored by Grace Breen,
Policy Advisor, CBI
16.2 Manufacturers reap returns by investing in skills . . . . . . . . . . . . . . . . . . 225
Authored by Tim Thomas, Head of Employment and Skills, EEF, the manufacturers’ organisation
16.3 Keeping the UK rail industry on track . . 227 Authored by Elaine Clark, Head of
Business Services, National Skills Academy for Railway Engineering
16.4 Recognising professional excellence in engineering . . . . . . . . . . . . . . . . . . . . 230
Authored by Jon Prichard, CEO, Engineering Council
16.5 The employer activists . . . . . . . . . . . . . . 234
Annex . . . . . . . . . . . . . . . . . . . . . . . . . .237
Back to Contents
The state of engineering Contents of figures VII
Engineering UK 2014 Contents of figures
1.0 Share of world GDP (2010). . . . . . . . . . . . . . . . . . . . . . . . . . . . . . . . . 3
1.1 Ten largest urban agglomerations in the world (2011) . . . . . . . . . . . . 3
1.2 Age pyramids (2010). . . . . . . . . . . . . . . . . . . . . . . . . . . . . . . . . . . . . . 4
1.3 Graduated spectrum of Government sector support . . . . . . . . . . . . . . 8
1.4 Indexed growth in green economy compared with overall economic growth . . . . . . . . . . . . . . . . . . . . . . . . . . . . . . . . . . . . . . . . 12
2.0 Share of VAT and/or PAYE registered engineering enterprises by number of employees and by home nation (2012) – UK . . . . . . . 16
2.1 Share of VAT and/or PAYE registered engineering enterprises by number of employees and by English region (2012) – UK . . . . . . 16
2.2 Share of employment in VAT and/or PAYE registered enterprises by enterprise size and home nation (2012) – UK . . . . . . . . . . . . . . . 18
2.3 Share of employment for VAT and/or PAYE registered enterprises by enterprise size and English region (2012) – UK . . . . . . . . . . . . . . 18
2.4 Share of employment for VAT and/or PAYE registered enterprises by home nation and English region (2012) – UK . . . . . . . . . . . . . . . 18
2.5 Share of turnover of VAT and/or PAYE registered engineering enterprises by home nation and English region (2012) – UK . . . . . . 20
3.0 R&D intensities in 2011 and targets for 2020 . . . . . . . . . . . . . . . . . 24
3.1 The level and distribution of total university research income by funding source (2002/3 and 2010/11) – UK . . . . . . . . . . . . . . . 26
4.0 The proportion of 20- to 64-year-olds and over 65-year-olds as part of the total population (2013-2035) – UK . . . . . . . . . . . . . . 29
4.1 Projected 0- to 29-year-old population in thousands (2013-2035) – UK . . . . . . . . . . . . . . . . . . . . . . . . . . . . . . . . . . . . . . 30
4.2 Projected 18-year-old population in thousands (2013-2035) – UK . . . . . . . . . . . . . . . . . . . . . . . . . . . . . . . . . . . . . . 30
5.0 Elements of a successful STEM engagement activity. . . . . . . . . . . . . 32
5.1 Top factors when recruiting a school leaver for employers with fewer than 20 staff (up to three choices could be made) . . . . . 35
6.0 Global youth unemployment and unemployment rate (1991-2013). . . . . . . . . . . . . . . . . . . . . . . . . . . . . . . . . . . . . . . . . . . 40
6.1 Changes in the attainment gap at GCSE by Free School Meal eligibility (2003–2011) – England. . . . . . . . . . . . . . . . . . . . . . . . . . . 42
6.2 Major ethnic groups: percentage of pupils eligible for Free School Meals attaining five GCSEs at grades A* to C including English and mathematics (2007–12) – UK . . . . . . . . . . . . . . . . . . . . . . . . . . 43
6.3 Higher education participation rates by social class . . . . . . . . . . . . . 44
7.0 GCSE cohort size (2003-2013). . . . . . . . . . . . . . . . . . . . . . . . . . . . . 53
7.1 Percentage of students eligible for FSM and the attainment gap for 5+ A*-C grade GCSEs including English and maths (5EM) – England . . . . . . . . . . . . . . . . . . . . . . . . . . . . . . . . . . . . . . . . 54
7.2 Top ten GCSE subjects as a percentage of total entry (2003-2013) – all UK entrants . . . . . . . . . . . . . . . . . . . . . . . . . . . . . 55
7.3 Proportion of female entrants to separate science GCSEs (2004-2013) – all UK candidates . . . . . . . . . . . . . . . . . . . . . . . . . . . 57
7.4 GCSE A*-C pass rates (2004-2013) – all UK candidates. . . . . . . . . 58
7.5 Vocational awards made by qualification and level of award at Key Stage 4 (2011/12) . . . . . . . . . . . . . . . . . . . . . . . . . . . 60
7.6 Factors that explain 15-year-old students’ aspirations for post-16 physics . . . . . . . . . . . . . . . . . . . . . . . . . . . . . . . . . . . . . . . . . 67
8.1 GCE AS level STEM subject A-C achievement rates (2003-2012) – all UK candidates . . . . . . . . . . . . . . . . . . . . . . . . . . . 72
8.2 Destinations of students with A level physics in 2011. . . . . . . . . . . . 81
8.3 Average increase in progression from GCSE to A level physics 2011-2012 . . . . . . . . . . . . . . . . . . . . . . . . . . . . . . . . . . . . . . . . . . . . 82
8.4 Percentages of girls and boys progressing to A level that took physics A level by school type . . . . . . . . . . . . . . . . . . . . . . . . . . 82
9.0 Vocational Qualification achievements in the UK by qualification type (2006/07-2011/12) . . . . . . . . . . . . . . . . . . . . . . 84
9.1 Overall participation (aims) in FE, all levels, engineering and manufacturing technologies (2005/06-2011/12) – England. . . . . . 87
9.2 Overall participation (aims) in FE, all levels, for construction, planning and the built environment (2004/05-2011/12) – England . . . . . . . . . . . . . . . . . . . . . . . . . . . . . . . . . . . . . . . . . . . . . . . 87
9.3 Overall participation (aims) in FE, all levels, information and communication technology (2005/06-2011/12) – England . . . . . . 88
9.4 Proportions of funded STEM qualifications completed by 16- to 18-year-olds in England in 2010/11 (Total number of qualifications is 1,623,000) . . . . . . . . . . . . . . . . . . . . . . . . . . . . . . . 93
9.5 Proportions of funded qualifications completed in schools (2010/11) – England (Total number qualifications is 1.37 million) . . . . . . . . . . . . . . . . . . . . . . . . . . . . . . . . . . . . . . . . . . . 93
9.6 Proportions of funded qualifications completed in the FE and Skills sector (2010/11) – England (Total number of qualifications is 3.07 million) . . . . . . . . . . . . . . . . . . . . . . . . . . . . . . 94
9.7 Numbers of funded STEM qualifications completed by learners aged 16+ in schools (2010/11) – England . . . . . . . . . . . . . . . . . . . 94
9.8 Numbers of funded STEM qualifications completed by learners aged 16+ in FE and the skills sector (2010/11) – England . . . . . . . . . . . . . . . . . . . . . . . . . . . . . . . . . . . . 95
9.9 Trends in participation in education and training at age 16 (end 1994 – end 2012) – England . . . . . . . . . . . . . . . . . . . . . . . . . . 97
9.10 Employment rate of young people Not in Education or Training by age (end 1994 – end 2012) – England . . . . . . . . . . . . . . . . . . . . 97
9.11 Engineering subjects taught by FE teaching staff by gender (2006/07-2011/12) – England . . . . . . . . . . . . . . . . . . . . . . . . . . . 102
9.12 Average full-time teaching staff pay by subject taught (2011-12) – England. . . . . . . . . . . . . . . . . . . . . . . . . . . . . . . . . . . . 103
10.0 Apprenticeship Programme Starts in engineering and manufacturing technology by age (2002/03-2011/12) – England . . . . . . . . . . . . . . . . . . . . . . . . . . . . . . . . . . . . . . . . . . . . . . 112
10.1 Apprenticeship Programme Starts in construction, planning and the built environment by age (2002/03-2011/12) – England . . . . . . . . . . . . . . . . . . . . . . . . . . . 113

Back to Contents
VIII Contents of figures The state of engineering
10.2 Apprenticeship Programme Starts in information and communication technology by age (2002/03-2011/12) – England . . . . . . . . . . . . . . . . . . . . . . . . . . . . . . . . . . . . . . . . . . . . . . 113
10.3 Apprenticeship Framework Achievements in engineering and manufacturing technology by age (2002/03-2011/12) – England . . . . . . . . . . . . . . . . . . . . . . . . . . . . . . . . . . . . . . . . . . . . . . 119
10.4 Apprenticeship Framework Achievements in construction, planning and the built environment by age (2002/03-2011/12) – England . . . . . . . . . . . . . . . . . . . . . . . . . . . . . . . . . . . . . . . . . . . . . . 120
10.5 Apprenticeship Framework Achievements in information and communication technology by age (2002/03-2011/12) – England . . . . . . . . . . . . . . . . . . . . . . . . . . . . . . . . . . . . . . . . . . . . . . 121
10.6 Apprenticeship success rates by Sector Subject Area (2004/05-2011/12) – England . . . . . . . . . . . . . . . . . . . . . . . . . . . 122
10.7 Engineering technicians view of EngTech registration. . . . . . . . . . . . 127
11.0 HE income and student numbers (1994/95-2009/10) – all non-EU students . . . . . . . . . . . . . . . . . . . . . . . . . . . . . . . . . . . . . 130
11.1 Higher Education participation rates by gender (2006/07-2010/11) – English and Scottish domiciled . . . . . . . . . 134
11.2 Trends in applicants to STEM HE courses as a percentage of all applicants (2002/03-2011/12) – all domiciles . . . . . . . . . . 138
11.3 Applicant numbers in biological sciences by subject and gender (2010/11) – all domiciles. . . . . . . . . . . . . . . . . . . . . . . . . . 139
11.4 Applicant numbers in physical sciences by gender and subject type (2010/11) – all domiciles . . . . . . . . . . . . . . . . . . . . . 139
11.5 Proportion of female applicants in mathematical and computer sciences subjects (2001/02-2010/11) – all domiciles . . . . . . . . . 140
11.6 Applicant numbers in engineering and technology by gender (2002/03-2011/12) – all domiciles . . . . . . . . . . . . . . . . . . . . . . . 140
11.7 Percentage of female applicants by sub-discipline (2002/03-2011/12) – all domiciles . . . . . . . . . . . . . . . . . . . . . . . 144
11.8 Educational background of applicants to engineering undergraduate level full-time HE courses by selected sub-discipline (2011/12) – UK domiciled. . . . . . . . . . . . . . . . . . . . 146
11.9 Breakdown by ethnicity of applicants across HE subject areas (2011/12) – UK domiciled . . . . . . . . . . . . . . . . . . . . . . . . . . . . . . . 147
11.10 Applicants to engineering by ethnic group (2002/03-2011/12) – UK domiciled . . . . . . . . . . . . . . . . . . . . . . . . . . . . . . . . . . . . . . . . . . 148
11.11 Female applicants to engineering by ethnic group (2002/03-2011/12) – UK domiciled . . . . . . . . . . . . . . . . . . . . . . . 149
11.12 Male applicants to engineering by ethnic group (2002/03-2011/12) – UK domiciled . . . . . . . . . . . . . . . . . . . . . . . 149
11.13 Percentage of female accepted applicants to degree courses by engineering discipline (2002/03-2011/12) – all domiciles. . . . . . 156
11.14 Percentage of young entrants to full-time first degree courses in 2010/11 who are no longer in HE in 2011/12 . . . . . . . . . . . . . 160
11.15 Percentage growth in first degrees achieved (2002/03-2011/12) – all domiciles . . . . . . . . . . . . . . . . . . . . . . . 161
11.16 Academic staff (excluding atypical) by cost centre group and salary range (2011/12). . . . . . . . . . . . . . . . . . . . . . . . . . . . . . 179
11.17 Market share in international education by country of destination. . . . . . . . . . . . . . . . . . . . . . . . . . . . . . . . . . . . . . . . . . 180
12.0 Destinations of leavers of HE (all qualifications) in all subjects and engineering and technology (2011/12) – UK domiciled . . . . . 182
12.1 Destinations of leavers of HE (all qualifications) in all subjects and engineering and technology, by gender (2011/12) – UK domiciled . . . . . . . . . . . . . . . . . . . . . . . . . . . . . . . . . . . . . . . . . . 183
12.2 Destinations of engineering and technology graduates (2011/12) – UK domiciled . . . . . . . . . . . . . . . . . . . . . . . . . . . . . . . 184
12.3 Destinations of all full-time first degree graduates (2011/12) – UK domiciled . . . . . . . . . . . . . . . . . . . . . . . . . . . . . . . . . . . . . . . . . . 185
12.4 Occupation of engineering and technology graduates who obtained first degrees (2011/12) – UK domiciled . . . . . . . . . . . . . 186
12.5 Occupation of engineering and technology graduates who obtained first degrees, by gender (2011/12) – UK domiciled . . . . 186
12.6 Occupation of engineering and technology graduates who obtained a postgraduate qualification (2011/12) – UK domiciled . . . . . . . . 186
12.7 Occupation of engineering and technology graduates who obtained a postgraduate qualification, by gender (2010/11) – UK domiciled . . . . . . . . . . . . . . . . . . . . . . . . . . . . . . . . . . . . . . . . . . 187
12.8 Qualifiers who obtained first degrees in engineering by sub-discipline, going into an engineering and technology occupation (2010/11) – UK domiciled. . . . . . . . . . . . . . . . . . . . . . 187
12.9 Employer destinations for engineering and technology subject area leavers who obtained a first degree and entered employment by primary activity of employer (2007/08-2011/12) – UK domiciled . . . . . . . . . . . . . . . . . . . . . . . . . . . . . . . . . . . . . . . . . . 188
12.10 Employer destinations for engineering and technology subject area leavers who obtained a first degree and entered employment by primary activity of employer and by gender (2010/11- 2011/12) – UK domiciled . . . . . . . . . . . . . . . . . . . . . . . . . . . . . . . . 188
12.11 Employer destinations for engineering and technology subject area leavers who obtained a postgraduate degree and entered employment by primary activity of employer (2007/08-2011/12) – UK domiciled. . . . . . . . . . . . . . . . . . . . . . . . . . . . . . . . 189
12.12 Employer destinations for engineering and technology subject area leavers who obtained a postgraduate degree and entered employment by primary activity of employer and by gender (2010/11-2011/12) – UK domiciled . . . . . . . . . . . . . . . . . . . . . . . 189
12.13 Engineering and technology subject area leavers who obtained first degree and went to work for an employer whose primary activity was financial and insurance services (2007/08-2011/12) – UK domiciled . . . . . . . . . . . . . . . . . . . . . . . 190
12.14 Top ten employer destinations for engineering and technology graduates who obtained first degree qualifications, by SIC (2011/12) – UK domiciled . . . . . . . . . . . . . . . . . . . . . . . . . . . . . . . 191
13.0 Median hourly wage for all graduates (4 quarter average) by degree subject studied for those aged 21-64 (2001-2011) – UK . . . . . . . . . . . . . . . . . . . . . . . . . . . . . . . . . . . . . . . . . . . . . . . . . . 195
13.1 Graduate vacancy changes at AGR employers (2000-2013) . . . . . 196
13.2 Changes in median graduate starting salaries at AGR employers (2000-2012). . . . . . . . . . . . . . . . . . . . . . . . . . . . . . . . . . . . . . . . . . 197
13.3 Mean average starting salary for graduates by subject area (2011/12) – UK domiciled . . . . . . . . . . . . . . . . . . . . . . . . . . . . . . . 198
13.4 Salary of full-time foundation degree qualifiers in full-time paid UK employment, by institution type (2010/11) – UK domiciled . . . . . . . . . . . . . . . . . . . . . . . . . . . . . . . . . . . . . . . . . . 200
14.0 Annual mean gross pay for selected STEM professions (2012) – UK . . . . . . . . . . . . . . . . . . . . . . . . . . . . . . . . . . . . . . . . . . . . . . . . . . 202
14.1 Annual mean gross pay for selected STEM technician and craft careers (2012) – UK . . . . . . . . . . . . . . . . . . . . . . . . . . . . . . . . 205
14.2 Median and mean basic income for Chartered Engineers, Incorporated Engineers, Engineering Technicians and ICT Technicians (2010 and 2013). . . . . . . . . . . . . . . . . . . . . . . . . . 208

Back to Contents
The state of engineering Contents of figures IX
14.3 Median and mean overtime, bonus and commission payments for Chartered Engineers, Incorporated Engineers, Engineering Technicians and ICT Technicians (2010 and 2013). . . . . . . . . . . . . 209
14.4 Median and mean total annual earnings for Chartered Engineers, Incorporated Engineers, Engineering Technicians and ICT Technicians (2010 and 2013). . . . . . . . . . . . . . . . . . . . . . . . . . 209
14.5 Vacancies for permanent roles (rolling 12 months). . . . . . . . . . . . . 211
14.6 Vacancies for contract roles (rolling 12 months) . . . . . . . . . . . . . . . 211
14.7 Demand for permanent staff by sector . . . . . . . . . . . . . . . . . . . . . . 213
14.8 Gender profile of the freelance workforce (2008 and 2011) – UK . . . . . . . . . . . . . . . . . . . . . . . . . . . . . . . . . . . . . . . . . . . . . . . . . . 214
14.9 The freelance landscape – I choose to work on a temp/contact/ interim basis . . . . . . . . . . . . . . . . . . . . . . . . . . . . . . . . . . . . . . . . . . 214
14.10 Freelance workforce, occupational structure (2011) – UK. . . . . . . . 214
15.0 Training expenditure by sector (2011) – UK . . . . . . . . . . . . . . . . . . 216
15.1 Highest level of qualification held by adults of working age by economic activity (2011). . . . . . . . . . . . . . . . . . . . . . . . . . . . . . . . . 218
15.2 Unemployment rate by qualification level (2000-2020) – EU27 . . . . . . . . . . . . . . . . . . . . . . . . . . . . . . . . . . . . . . . . . . . . . . . . 218
15.3 Qualifications required (1986-2012) . . . . . . . . . . . . . . . . . . . . . . . 219
16.0 Current difficulties in recruiting individuals with STEM skills and knowledge . . . . . . . . . . . . . . . . . . . . . . . . . . . . . . . . . . . . 223
16.1 Expected difficulties in next three years recruiting individuals with STEM skills and knowledge . . . . . . . . . . . . . . . . . . . . . . . . . . . 223
16.2 Priority action to promote STEM study. . . . . . . . . . . . . . . . . . . . . . . 224
16.3 Barriers to recruiting STEM-skilled staff. . . . . . . . . . . . . . . . . . . . . . 225
16.4 New strategies planned by manufacturers, % of companies reporting planned action in year ahead. . . . . . . . . . . . . . . . . . . . . . 226
16.5 Investment in skills is prioritised by manufacturers, % of companies making a significant investment in areas in past three years . . . . . . . . . . . . . . . . . . . . . . . . . . . . . . . . . . . . . . 226
16.6 Manufacturers are offering training to increase productivity, % of companies saying reasons for offering training . . . . . . . . . . . . 226
16.7 Future programme spend by client . . . . . . . . . . . . . . . . . . . . . . . . . 228
16.8 Workforce age profile. . . . . . . . . . . . . . . . . . . . . . . . . . . . . . . . . . . . 229
16.9 Recruitment: numbers by discipline – Next 5 years . . . . . . . . . . . . . 229
16.10 Total number of registered Incorporated Engineers and Chartered Engineers (1986-2012) . . . . . . . . . . . . . . . . . . . . . . . . . 230
16.11 Age distribution of Engineering Technicians, Incorporated Engineers and Chartered Engineers. . . . . . . . . . . . . . . . . . . . . . . . . 231
16.12 Newly registered Engineering Technicians, Incorporated Engineers and Chartered Engineers (2002–2012) . . . . . . . . . . . . . 231
16.13 Total number of Engineering Technicians (2002-2012). . . . . . . . . . 232
16.14 Total number of female Chartered Engineer registrants (2002-2012). . . . . . . . . . . . . . . . . . . . . . . . . . . . . . . . . . . . . . . . . . 232
16.15 Total number of female Engineering Technician and Incorporated Engineer registrants (2002-2012) . . . . . . . . . . . . . . . 233
16.16 Over the past two years, what steps has your company made in order to improve workforce skills and increase productivity? . . . . . . . . . . . . . . . . . . . . . . . . . . . . . . . . . . . . . . . . . . 235

Back to Contents
X Contents of tables The state of engineering
1.0 Total investment (millions) by UK and foreign-owned companies by sector type (2007-2009) – UK . . . . . . . . . . . . . . . . . . . . . . . . . . . . 2
1.1 Progression from GCSE mathematics and physics to AS/A level mathematics and physics (2012) . . . . . . . . . . . . . . . . . . . . . . . . . . . . 6
2.0 Number of VAT and/or PAYE registered engineering enterprises (2009-2012) – UK . . . . . . . . . . . . . . . . . . . . . . . . . . . . . . . . . . . . . . 15
2.1 Number of VAT and/or PAYE registered enterprises (2009-2012) – UK . . . . . . . . . . . . . . . . . . . . . . . . . . . . . . . . . . . . . . 15
2.2 Number of engineering enterprises by selected industrial groups (2012) – UK . . . . . . . . . . . . . . . . . . . . . . . . . . . . . . . . . . . . . . . . . . . 17
2.3 Employment in VAT and/or PAYE registered engineering enterprises (2009-2012) – UK . . . . . . . . . . . . . . . . . . . . . . . . . . . . . 17
2.4 Employment in VAT and/or PAYE registered engineering enterprises by selected industrial groups (2009-2012) – UK . . . . . . 19
2.5 Turnover (millions) in VAT and/or PAYE registered engineering enterprises (2009-2012) – UK . . . . . . . . . . . . . . . . . . . . . . . . . . . . . 19
2.6 Turnover (millions) in VAT and/or PAYE registered engineering enterprises by selected industrial groups (2009-2012) – UK . . . . . . 20
3.0 Number of academic articles published per year over the past three centuries. . . . . . . . . . . . . . . . . . . . . . . . . . . . . . . . . . . . . . . . . . 21
3.1 Net cash Government expenditure on SET by departments (2002/03-2011/12) – UK . . . . . . . . . . . . . . . . . . . . . . . . . . . . . . . . 23
3.2 Top 20 R&D spend ranking (2010 and 2011) . . . . . . . . . . . . . . . . . 25
5.0 Industrial sector preferences of Year 7 pupils mapped against UK labour force by sector. . . . . . . . . . . . . . . . . . . . . . . . . . . . . . . . . . 36
6.0 Number of young people Not in Employment, Education or Training (2000-2013) – England . . . . . . . . . . . . . . . . . . . . . . . . . . . . 38
6.1 Estimated percentage of maintained school pupils on free school meals at age 15 who entered UK Higher Education Institutions and English Further Education Colleges by age 19 (2005/06-2009/10). . . . . . . . . . . . . . . . . . . . . . . . . . . . . . . . . . 42
6.2 Estimated percentage of maintained school pupils aged 15, by Free School Meal status who entered HE by age 19 Academic UK Higher Education Institutions and English Further Education Colleges (2005/06-2009/10) . . . . . . . . . . . . . . . . . . . . . . . . . . . . . 44
7.0 Number of schools (2012 or 2013) – UK . . . . . . . . . . . . . . . . . . . . . 53
7.1: GCSE full STEM courses entries (2004-2013) – all UK candidates. . . . . . . . . . . . . . . . . . . . . . . . . . . . . . . . . . . . . . . . 56
7.2 Progression from GCSE mathematics and physics to AS/A level mathematics and physics – 2012 . . . . . . . . . . . . . . . . . . . . . . . . . . . 56
7.3 Number of GCSE A*-C passes (2013) – all UK candidates. . . . . . . . 59
7.4 Students achieving five or more A*-C grades at GCSE level or equivalent in all subjects and subjects including English and maths (2011/12) – England . . . . . . . . . . . . . . . . . . . . . . . . . . . 60
7.5 Number of students completing selected BTec subjects at level 2, by gender and age (2004/05-2012/13) – all domiciles . . . . . . . . . 62
7.6 Head count of teachers and number of hours taught by subject and Key Stage to year groups 7-13 in all publicly funded secondary schools (November 2011) – England . . . . . . . . . . . . . . . . 63
7.7 Highest post A level qualifications held by publicly funded secondary school teachers (head count) in the subjects they taught to year groups 7-13 (November 2011) – England . . . . . . . . . 64
7.8 Trends in entries for each STEM subject at Standard Grade (2005-2013) – Scotland. . . . . . . . . . . . . . . . . . . . . . . . . . . . . . . . . . 65
7.9 Proportion of standard Grade entries by gender (2013) – Scotland . . 65
7.10 Trends in entries for each STEM subject at Intermediate 1 and 2 (2005-2013) – Scotland. . . . . . . . . . . . . . . . . . . . . . . . . . . . . . . . . . 66
8.0 GCE AS level STEM subject entrant volumes (2004-2013) – all UK candidates. . . . . . . . . . . . . . . . . . . . . . . . . . . . . . . . . . . . . . . . 70
8.1 Top ten AS level subjects as percentage increase in the number of entrants (2012-2013) – all UK candidates . . . . . . . . . . . 70
8.2 Entries by state-funded students aged 16-18 to GCE A level, as a percentage of all entries, by subject and region (2011/12) – England . . . . . . . . . . . . . . . . . . . . . . . . . . . . . . . . . . . . . . . . . . . . . . . 71
8.3 Number of GCE AS level A-C passes by gender (2013) – all UK candidates. . . . . . . . . . . . . . . . . . . . . . . . . . . . . . . . . . . . . . . . 73
8.4 Percentage of female entrants to GCE AS level subjects (2004-2013) – all UK candidates . . . . . . . . . . . . . . . . . . . . . . . . . . . 73
8.5 GCE A level STEM subject entrant numbers (2004-2013) – all UK candidates. . . . . . . . . . . . . . . . . . . . . . . . . . . . . . . . . . . . . . . . 74
8.6 Top ten AS level subjects as percentage increase in the number of entrants (2012-2013) – all UK candidates . . . . . . . . . . . 75
8.7 Proportion achieving grade A*-C at GCE level (2003-2012) – all UK candidates. . . . . . . . . . . . . . . . . . . . . . . . . . . . . . . . . . . . . . . . 76
8.8 Number of GCE A level A*-C passes by gender (2013) – all UK candidates. . . . . . . . . . . . . . . . . . . . . . . . . . . . . . . . . . . . . . . . 76
8.9 Percentage of female entrants for STEM GCE A level courses (2004-2013) – all UK candidates . . . . . . . . . . . . . . . . . . . . . . . . . . . 77
8.10 Number of students completing selected BTec subjects at level 3 by gender and age (2004/05-2012/13) – all domiciles . . . 78
8.11 Trends in entries for each STEM subject at National Higher and Advanced Higher (2005-2013) – Scotland . . . . . . . . . . . . . . . . 80
8.12 Proportion of National Higher entries by gender (2013) – Scotland . . 80
8.13 Proportion of Advanced Higher entries by gender (2013) – Scotland . . 80
9.0 Number of colleges by college type and home nation (2013) – UK . . . . . . . . . . . . . . . . . . . . . . . . . . . . . . . . . . . . . . . . . . . . . . . . . . . 84
9.1 Funding entitlements (2013/14) . . . . . . . . . . . . . . . . . . . . . . . . . . . 85
9.2 Net Present Value of the FE system for those aged 19+ (2008/09) . . . . . . . . . . . . . . . . . . . . . . . . . . . . . . . . . . . . . . . . . . . . 86
9.3 Overall participation (aims) in FE, all levels, for STEM Sector Subject Areas and all subjects (2005/06-2011/12) – England. . . . 86
9.4 Achievements of NVQs by Sector Subject Area (2001/02-2011/12) – UK . . . . . . . . . . . . . . . . . . . . . . . . . . . . . . . . 89
9.5 N/SVQ achievements by Sector Subject Area and level of award (2011/12) – UK . . . . . . . . . . . . . . . . . . . . . . . . . . . . . . . . . . . . . . . . 89
9.6 N/SVQ achievements by Sector Subject Area and gender (2011/12) – UK . . . . . . . . . . . . . . . . . . . . . . . . . . . . . . . . . . . . . . . . 90
Engineering UK 2014 Contents of tables

Back to Contents
The state of engineering Contents of tables XI
9.7 All VRQ achievements (as reported by participating awarding bodies) by Sector Subject Area and level (2011/12) – UK. . . . . . . . 91
9.8 All VRQ achievements (as reported by participating awarding bodies) by Sector Subject Area and gender (2011/12) – UK. . . . . . 91
9.9 All QCF achievements by Sector Subject Area and level of award (2011/12) – UK . . . . . . . . . . . . . . . . . . . . . . . . . . . . . . . . . . . . . . . . 92
9.10 All QCF achievements by Sector Subject Area and gender (2011/12) – UK . . . . . . . . . . . . . . . . . . . . . . . . . . . . . . . . . . . . . . . . 92
9.11 A level mathematics entries 2001-2013. . . . . . . . . . . . . . . . . . . . . . 96
9.12 GCSE mathematics achievements by age, summer Series 2013. . . . 96
9.13 Alternative mathematics qualifications . . . . . . . . . . . . . . . . . . . . . . . 98
9.14 Mathematics teaching workforce . . . . . . . . . . . . . . . . . . . . . . . . . . . . 98
9.15 Potential mathematics teaching workforce . . . . . . . . . . . . . . . . . . . . 99
9.16 Teaching staff and all Further Education staff by gender and by full-time or part-time (2011/12) – England. . . . . . . . . . . . . . . . 100
9.17 Sector Subject Areas taught by FE teaching staff (2006/07-2011/12) – England . . . . . . . . . . . . . . . . . . . . . . . . . . . 101
10.0 Summary of employers net training costs . . . . . . . . . . . . . . . . . . . . 105
10.1 Payback period by sector. . . . . . . . . . . . . . . . . . . . . . . . . . . . . . . . . 105
10.2 Top ten Apprenticeship Programme achievements by Sector Framework Code, level and gender (2011/12) – England . . . . . . . 108
10.3 Apprenticeship Programme Starts by Sector Subject Area (2002/03-2011/12) – England . . . . . . . . . . . . . . . . . . . . . . . . . . . 109
10.4 Apprenticeship Programme Starts by Sector Subject Area and level (2002/03-2011/12) – England . . . . . . . . . . . . . . . . . . . 110
10.5 Apprenticeship Programme Starts by region and Sector Subject Area (2011/12) – England. . . . . . . . . . . . . . . . . . . . . . . . . 111
10.6 Apprenticeship achievements by Sector Subject Area (2002/03-2011/12) – England . . . . . . . . . . . . . . . . . . . . . . . . . . . 115
10.7 Apprenticeship achievements by Sector Subject Area and level (2002/03-2011/12) – England . . . . . . . . . . . . . . . . . . . . . . . . . . . 117
10.8 Apprenticeship Framework Achievements by region and Sector Subject Area (2011/12) – England . . . . . . . . . . . . . . . . . . . 118
10.9 Engineering-related Modern Apprenticeship starts and achievements by gender (2011/12) – Scotland . . . . . . . . . . . . . . . 123
10.10 Projected Apprenticeship Framework success rates by apprenticeship type and Sector Subject Area (2011/12) – Wales . . . . . . . . . . . . . . . . . . . . . . . . . . . . . . . . . . . . . . . . . . . . . . . . 124
10.11 Apprenticeship occupancy levels (11 March 2013) – Northern Ireland. . . . . . . . . . . . . . . . . . . . . . . . . . . . . . . . . . . . . . . . 125
11.0 Fee arrangements across the UK (2012/13) . . . . . . . . . . . . . . . . . 129
11.1 Overview of the HE sector (August 2011) – UK . . . . . . . . . . . . . . . . 132
11.2 Total income and expenditure by source of income and category of expenditure (2009/10-2010/11) – UK . . . . . . . . . . . . 132
11.3 First time participation rates for 17- to 30-year-old students at UK Higher Education Institutions (2006/07-2011/12) – English domiciled. . . . . . . . . . . . . . . . . . . . . . . . . . . . . . . . . . . . . . . 133
11.4 First time participation rates for 16- to 30-year-old students at UK Higher Education Institutions (2006/07-2011/12) – Scottish domiciled . . . . . . . . . . . . . . . . . . . . . . . . . . . . . . . . . . . . . . 134
11.5 Postgraduate participation rates for 17- to 30-year-old students at UK Higher Education Institutions (2006/07-2011/12) – English domiciled. . . . . . . . . . . . . . . . . . . . . . . . . . . . . . . . . . . . . . . 135
11.6 Applicants to STEM HE courses by domicile (2002/03-2011/12) . . . . . . . . . . . . . . . . . . . . . . . . . . . . . . . . . . . 137
11.7 Applicants to general engineering (2001/02-2010/11) – all domiciles . . . . . . . . . . . . . . . . . . . . . . . . . . . . . . . . . . . . . . . . . . 141
11.8 Applicants to civil engineering (2002/03-2011/12) – all domiciles . . . . . . . . . . . . . . . . . . . . . . . . . . . . . . . . . . . . . . . . . . 142
11.9 Applicants to mechanical engineering (2002/03-2011/12) – all domiciles . . . . . . . . . . . . . . . . . . . . . . . . . . . . . . . . . . . . . . . . . . 142
11.10 Applicants to aerospace engineering (2002/03-2011/12) – all domiciles . . . . . . . . . . . . . . . . . . . . . . . . . . . . . . . . . . . . . . . . . . 142
11.11 Applicants to electronic and electrical engineering (2002/03-2011/12) – all domiciles . . . . . . . . . . . . . . . . . . . . . . . . . . . . . . . . 143
11.12 Applicants to production and manufacturing engineering (2002/03-2011/12) – all domiciles . . . . . . . . . . . . . . . . . . . . . . . 143
11.13 Applicants to chemical, process and energy engineering (2002/03-2011/12) – all domiciles . . . . . . . . . . . . . . . . . . . . . . . 143
11.14 Percentage split of engineering applicants by ethnic group (2002/03-2011/12) – UK domiciled . . . . . . . . . . . . . . . . . . . . . . . 148
11.15 Estimated percentage of maintained school pupils aged 15, by Free School Meal status who entered HE by age 19 Academic UK Higher Education Institutions and English Further Education Colleges (2005/06-2009/10) . . . . . . . . . . . . . . . . . . . . . . . . . . . . 149
11.16 Share of UK regions’ young population within each POLAR3 quintile. . . . . . . . . . . . . . . . . . . . . . . . . . . . . . . . . . . . . . . . 150
11.17 Number of accepted applicants to STEM degrees by subject area and domicile (2002/03-2011/12) . . . . . . . . . . . . . . . . 152-153
11.18 Accepted applicants onto first degrees in general engineering (2002/03-2011/12) . . . . . . . . . . . . . . . . . . . . . . . . . . . . . . . . . . . 154
11.19 Accepted applicants onto first degrees in civil engineering (2002/03-2011/12) . . . . . . . . . . . . . . . . . . . . . . . . . . . . . . . . . . . 154
11.20 Accepted applicants onto first degrees in mechanical engineering (2002/03-2011/12). . . . . . . . . . . . . . . . . . . . . . . . . . 154
11.21 Accepted applicants onto first degrees in aerospace engineering (2002/03-2011/12). . . . . . . . . . . . . . . . . . . . . . . . . . 155
11.22 Accepted applicants onto first degrees in electronic and electrical engineering (2002/03-2011/12) . . . . . . . . . . . . . . . . . . 155
11.23 Accepted applicants onto first degrees in production and manufacturing engineering (2002/03-2011/12). . . . . . . . . . . . . . 155
11.24 Accepted applicants onto first degrees in chemical, process and energy engineering (2002/03-2011/12). . . . . . . . . . 156
11.25 First year undergraduate full-time first degree students by highest qualification on entry (2011/12) – UK domiciled . . . . . . . 157
11.26 Number of STEM students by study level, mode and percentage of all students (2011/12) – all domiciles. . . . . . . . . . . . . . . . . . . . 158
11.27 Proportion of undergraduate first degree students who are on a sandwich course, by gender (2011/12) – all domiciles . . . . . 159
11.28 Top five popular institutions for engineering sandwich courses 2008/09 – all domiciles . . . . . . . . . . . . . . . . . . . . . . . . . . . . . . . . . 159
11.29 Number of first degrees achieved in STEM (2002/03- 2011/12) – all domiciles . . . . . . . . . . . . . . . . . . . . . . . . . . . . . . . . 161
11.30 Classification of undergraduate first degrees by subject area (2011/12) – all domiciles. . . . . . . . . . . . . . . . . . . . . . . . . . . . . . . . 162
11.31 Number of first degrees achieved in engineering (2003/04- 2011/12) – all domiciles . . . . . . . . . . . . . . . . . . . . . . . . . . . . . . . . 162
11.32 Number of postgraduate degrees (excluding doctorates and PGCE) achieved in engineering (2003/04-2011/12) – all domiciles . . . . . . . . . . . . . . . . . . . . . . . . . . . . . . . . . . . . . . . . . . 163
11.33 Number of doctorates achieved in engineering (2003/04- 2011/12) – all domiciles . . . . . . . . . . . . . . . . . . . . . . . . . . . . . . . . 163
11.34 Number of first degrees achieved in engineering subjects (2003/04-2011/12) – UK domiciled . . . . . . . . . . . . . . . . . . . . . . . 165

Back to Contents
XII Contents of tables The state of engineering
11.35 Number of postgraduate degrees (excluding doctorates and PGCE) achieved in engineering sub-disciplines (2003/04-2011/12) – UK domiciled . . . . . . . . . . . . . . . . . . . . . . . . . . . . . . . . . . . . . . . . . . 166
11.36 Number of doctorates achieved in engineering sub-disciplines (2003/04-2011/12) – UK domiciled . . . . . . . . . . . . . . . . . . . . . . . 167
11.37 First degrees achieved in engineering by ethnic origin (2003/04-2011/12) – UK domiciled. . . . . . . . . . . . . . . . . . . . . . . . . . . . . . . . 168
11.38 Percentage breakdown of first degrees achieved by ethnic origin in engineering subjects (2011/12) – UK domiciled . . . . . . . 169
11.39 Percentage breakdown by gender of first degrees achieved by ethnic origin in engineering subjects (2011/12) – UK domiciled . . 170
11.40 Percentage breakdown by ethnic origin of postgraduate degrees (excluding doctorates and PGCE) achieved in engineering subjects (2011/12) – UK domiciled . . . . . . . . . . . . . . . . . . . . . . . . 170
11.41 Location of institution for selected first degree engineering graduates (2011/12) – UK domiciled. . . . . . . . . . . . . . . . . . . . . . . 172
11.42 Location of institution for selected postgraduate degrees (excluding doctorates and PGCE) engineering graduates (2011/12) – UK domiciled . . . . . . . . . . . . . . . . . . . . . . . . . . . . . . . 172
11.43 Entrants to foundation degrees, BTec HNDs and HNCs by broad subject area of study (2011/12) . . . . . . . . . . . . . . . . . . . . . 173
11.44 Entrants to engineering and technology foundation degrees, HNDs and HNCs (2008/09 – 2011/12) . . . . . . . . . . . . . . . . . . . . 174
11.45 Entrants to engineering and technology foundation degrees, HNDs and HNCs by gender (2011/12). . . . . . . . . . . . . . . . . . . . . . 175
11.46 Number of students completing selected STEM BTec HNC and HND subjects, by gender and age (2004/05-2012/13) – all domiciles . . . . . . . . . . . . . . . . . . . . . . . . . . . . . . . . . . . . . . 176-177
11.47 Full-time academic staff (excluding atypical) by cost centre group and gender (2011/12) . . . . . . . . . . . . . . . . . . . . . . . . . . . . . 178
11.48 All academic staff by nationality and cost centre (2011/12) . . . . . 178
11.49 Number of students studying wholly overseas for a UK qualification by region and study level (2011/12) . . . . . . . . . . . . . 180
12.0 Number of non-engineering and technology first degree graduates going into an engineering and technology occupation (2011/12) – UK domiciled . . . . . . . . . . . . . . . . . . . . . . . . . . . . . . . . . . . . . . . . . . 192
12.1 Main engineering occupation destinations for first degree non-engineering and technology graduates going into an engineering and technology occupation (2011/12) – UK domiciled . . . . . . . . . 192
12.2 Destination of engineering and technology qualifiers by foundation degrees, HNDs and HNCs and mode of study (2008/09-2010/11) – UK and EU domiciled. . . . . . . . . . . . . . . . . 193
13.0 Expected percentage changes in number of vacancies by sector (2011/12-2012/13) . . . . . . . . . . . . . . . . . . . . . . . . . . . . . . . . . . . 196
13.1 Median predicted graduate starting salary by sector (2012/13) . . 197
13.2 Median predicted graduate starting salary by career area (2012/13) . . . . . . . . . . . . . . . . . . . . . . . . . . . . . . . . . . . . . . . . . . . 197
13.3 Average starting salaries by subject area (20110/11- 2011/12) – UK domiciled. . . . . . . . . . . . . . . . . . . . . . . . . . . . . . . . 199
13.4 Mean average starting salary for graduates in engineering and technology, by selected sub-discipline and gender (2011/12) – UK domiciled . . . . . . . . . . . . . . . . . . . . . . . . . . . . . . . . . . . . . . . . . . 199
13.5 Mean starting salary for engineering and technology graduates, by primary activity of employer (2011/12) – UK domiciled . . . . . . 200
14.0 Annual mean pay for selected full-time STEM professions by gender (2012) – UK . . . . . . . . . . . . . . . . . . . . . . . . . . . . . . . . . . 203
14.1 Annual mean pay for selected part-time STEM professions by gender (2012) – UK . . . . . . . . . . . . . . . . . . . . . . . . . . . . . . . . . . 204
14.2 Annual mean pay for selected full-time STEM technician and craft careers by gender (2012) – UK . . . . . . . . . . . . . . . . . . . . 206
14.3 Annual mean pay for selected part-time STEM technician and craft careers by gender (2012) – UK. . . . . . . . . . . . . . . . . . . . . . . . 207
14.4 Mean and median basic income for Chartered Engineers, Incorporated Engineers, Engineering Technicians and ICT Technicians . . . . . . . . . . . . . . . . . . . . . . . . . . . . . . . . . . . . . . . . 207
14.5 Percentage of Chartered Engineers, Incorporated Engineers, Engineering Technicians and ICT Technicians who had their institution membership paid for by their employer (2010 and 2013) . . . . . . . . . . . . . . . . . . . . . . . . . . . . . . . . . . . . . . 210
14.6 Ways in which employers offer support for professional development . . . . . . . . . . . . . . . . . . . . . . . . . . . . . . . . . . . . . . . . . . 210
14.7 Jobs in demand (2012-2013). . . . . . . . . . . . . . . . . . . . . . . . . . . . . 212
14.8 Engineering pay (2012-2013). . . . . . . . . . . . . . . . . . . . . . . . . . . . . 212
15.0 Changing distribution of qualifications for those aged 19-64 (2000-2020) – UK . . . . . . . . . . . . . . . . . . . . . . . . . . . . . . . . . . . . . 217
15.1 Share of 16- to 64-year-olds with no qualifications (2011) – UK . . . . . . . . . . . . . . . . . . . . . . . . . . . . . . . . . . . . . . . . . . . . . . . . . . 217
15.2 Changing composition of employment, by occupation in the engineering sector (2010-2020) – UK . . . . . . . . . . . . . . . . . . . . . . 220
15.3 Summary table – changing composition of employment, by occupation in the engineering sector (2010-2020) – UK . . . . . . 221
15.4 Recruitment requirement, in engineering companies, by home nation and English region (2010-2020) – UK . . . . . . . . . 221
16.0 Difficulty recruiting individuals with STEM skills and knowledge by sector (%) . . . . . . . . . . . . . . . . . . . . . . . . . . . . . . . . . 223
16.1 Railway engineering workforce numbers . . . . . . . . . . . . . . . . . . . . . 228
16.2 International comparison of professional engineer and technologist registration. . . . . . . . . . . . . . . . . . . . . . . . . . . . . . . . . . 233

Back to Contents
The state of engineering Synopsis, recommendations and calls for collaborative action XIII
Delivery is the key issue highlighted by this year’s analyses of supply and demand of engineering and engineers. We know from our 2013 analysis that the UK will need approximately 87,000 people per year over the next ten years to meet demand – and that these people will need at least level 4 skills.
Despite a plethora of policies and interventions aimed at growing the economy (which are detailed in our report) the key question remains, do we have the capacity to deliver? Not yet, seems to be the best answer we can currently provide. Although supply has grown over the past year, we still have only 51,000 engineers coming on stream per year. In fact, the number of level 3 engineering-related apprenticeships has actually dropped from 27,000 to 23,500 – falling well short of an annual demand of approximately 69,000.
However, the picture is more optimistic than bare figures might suggest. All the interested stakeholders – business, most policy makers, and key third-sector professional and education organisations in science, technology, engineering and maths (STEM) – are on record in recognising the need to address engineering skills shortages. There is a palpable will and visible evidence for partnerships, collaborations and concerted action across the STEM landscape to deliver the skilled workforce that the UK so vitally needs for to remain globally competitive, economically sustainable and socially cohesive.
While we become engrossed in the details of delivering a re-balanced economy, we mustn’t lose sight of why this aim is so important. The world faces some grand global challenges in coming years. Climate change, ageing populations, and on-going supply of food, clean water and energy all need to be tackled if we are to leave a favourable legacy for future generations. With the supply of new engineers secured, these are all challenges the UK engineering sector is well placed to deliver.
The contribution of engineering and engineers to the UK economy Engineering turnover was £1.1 trillion in the year ending March 2012, a rise of 3.5%. Engineering now accounts for 24.5% of the turnover of all enterprises in the UK, up from 23.9% in 2011. The four-year trend in turnover was also positive, increasing by 2.2%.
In March 2012 there were 565,320 engineering enterprises in the UK, a rise of 4.2% on the previous year. The impact of the recession remains evident, however, as the number of enterprises in the UK is still 0.6% below the number in March 2009. Most of these enterprises (97.9%) are either small or micro. The construction sector accounts for 27.4% of engineering-related enterprises, 27.2% are in information and communication, while manufacturing accounts for just a fifth (21.7%). In 2012, the number of engineering enterprises grew in every region in England, Scotland and Wales, although there was a 1.1% fall in Northern Ireland.
In March 2012, 5.4 million people were working in engineering enterprises – a marginal increase of 0.8% on the previous year. This represents 19.5% of the working population, down from 20.1% last year. Nearly a fifth (17.8%) of all of those working in engineering enterprises work in the South East, with the second largest concentration in London (12.8%). Northern Ireland has the lowest proportion of engineering workers, at just 2.2%.
Turnover-wise, a fifth (20.4%) is generated by those in the South East, closely followed by London (19.5%). At 10.3%, Scotland generates just over a tenth of all engineering turnover, three times as much as Wales (3.1%). Northern Ireland has the lowest share of engineering-related turnover in the UK, at just 1.6%.
Comparing the engineering sector with the retail sector helps to put the scale of its contribution to UK employment and turnover into perspective. The engineering sector turns over 3.2 times more than the retail sector’s £342 billion, and employs 1.8 times more people than retail’s 3.1 million.
Engineering UK 2014 Synopsis, recommendations and calls for collaborative action

Back to Contents
XIV Synopsis, recommendations and calls for collaborative action The state of engineering
The Business Secretary Vince Cable set out the Government’s approach to industrial strategy in September 2012. The Industrial Strategy builds on the Government’s Plan for Growth and the Growth Review, which looked at how the Government is addressing the barriers faced by industry. The Growth Review also highlighted advanced manufacturing, enabling sectors and knowledge services as areas of strength. Advanced manufacturing comprises automotive manufacturing, aerospace, life sciences, and agricultural technologies. The ‘enabling sectors’ cover three energy sectors: offshore wind, civil nuclear, plus oil and gas, and construction. There are three sectors grouped under knowledge services: international education, information economy, and professional and business services. Each sector has been selected for its future growth potential.
Sectors where the UK has proven strength and is demonstrating the capacity for growth and competitiveness are:
Automotive
In recent years, the industry has seen its fortunes transformed. The UK has grown to become the fourth-largest automotive producer in Europe and the 14th-largest globally, making 1.58 million vehicles in 2012. Automotive is one of the UK’s leading export sectors by value, generating £30.7 billion revenue in 2012 and representing around 6.3% of all UK exports. It provides 129,000 jobs in over 2,700 businesses and accounts for 5.2% of manufacturing employment and 7.3% of manufacturing output. Every 20 seconds, a car, van, bus or truck rolls off a UK production line. Over 80% of these are exported to more than 100 countries.
Aerospace
UK aerospace has a 17% global market share, making it the number one aerospace industry in Europe and globally, second only to the United States. The sector creates annual revenues of over £24 billion and exports around 75% of everything it produces. The sector supports more than 3,000 companies distributed across the UK, directly employing 100,000 people and supporting an additional 130,000 jobs indirectly.. The UK aerospace industry is expected to grow at a rate of 6.8% over the next few years, driven by a global increase in air traffic, which is expected to double in the next 15 years.
Construction
Construction accounts for 280,000 businesses and three million jobs: 10% of total UK employment. It contributes £90 billion gross value added to the UK economy – nearly 7% of the total – and 8% to GDP. The sector employs three million workers across a supply chain that accounts for around £124 billion of intermediate consumption, almost all sourced within the UK. In other words, construction spend tends to stay within the UK supply chain. We should also note the Chancellor’s commitment to supporting this important sector: in his June 2013 spending review, he allocated £50 billion pounds of capital investment in 2015 for projects from roads to railways, bridges to broadband and science to schools.
Space
The space industry’s economic contribution to the UK economy is impressive. The 260 companies actively involved in the UK space industry recorded a total space-related turnover of £9.1 billion in 2010/11. This represents a real growth of 15.6% from the £7.5 billion turnover of 2008/09, with an average annual growth rate over the last two years of 7.5%. Employment in the space industry has grown rapidly at almost 15% between 2006/07 and 2008/09, reaching 24,900 in 2008/09.
The UK Space Agency is set to invest £1.2 billion in some of Europe’s biggest and most lucrative space projects, providing the UK with increased leadership in a rapidly growing global sector and further boosting the sector’s contribution to the economy.
Life sciences
The life science industry is truly a jewel in the crown of our economy. There are around 380 pharmaceutical companies based in the UK, employing nearly 70,000 people, with an annual turnover of £30 billion. In addition, the medical technology and medical biotechnology sectors have a combined annual turnover of around £20 billion and employ over 96,000 people. The pharmaceutical sector accounted for almost 39% of total manufacturing business research and development spend in 2011, higher than any other manufacturing sector.
Oil and gas
The 1,100 companies in the UK oil and gas supply chain achieved combined revenues of £27 billion in 2011, meeting almost half of the UK’s total primary energy needs. The oil and gas sector employs over 400,000 people across the UK (45% in Scotland and 55% in England, Wales and Northern Ireland). It is Britain’s largest industrial investor, investing more than ever before in 2012 (£11.5 billion) and forecasting an investment of £14 billion in 2013.
Shale gas
According to The Institute of Directors (IoD), shale gas production could reach peak output by 2030, satisfying one third of the UK’s annual gas demand and creating 74,000 jobs. The business group said the industry could also help to support manufacturers and reduce gas imports. According to a report by PWC, shale oil production could boost the world economy by up to $2.7 trillion (£1.7 trillion) by 2035. The extra supply could account for up to 12% of global oil production, or 14 million barrels a day, and push global oil prices down by up to 40%.

Back to Contents
The state of engineering Synopsis, recommendations and calls for collaborative action XV
Power
The UK’s power sector employs 230,000 people, turns over $50 billion a year and has exports of more than $6 billion per year to over 100 countries. UK energy companies are forecast to generate revenues of $300 billion by 2030, employing one million workers. Analysis by the Carbon Trust forecasts that the UK will capture just under a quarter of the global marine energy market by 2050, creating up to 68,000 jobs and $121 billion revenue. The UK’s solar power market is worth $1.6 billion a year and UK firms and universities number among the world’s leading centres of research into photovoltaics (PV).
Manufacturing
Over the last three decades, manufacturing has weathered four recessions, adapted to a more global operating environment and faced considerable pressure from emerging economies. There is now widespread agreement that a globally-competitive manufacturing sector is a critical component of a better balanced economy.
Manufacturing contributes more than half of our exports, a 2.7 million-strong workforce, has 72% of business R&D expenditure and was responsible for over £12 billion new investment in 2011. Productivity has increased 45% in a decade, contributing a third to growth of the UK’s total productivity. UK goods exports to China are up more than six-fold in a decade. Total exports to the BRICs countries are up 360%.
Mid-sized manufacturing firms
Within the manufacturing sector, mid-sized firms have started to receive significant attention. Over the coming decade, new production technologies and rising costs and regulations will fundamentally change the economics of production, making global product manufacturing unattractive for many sectors. This will mean more products will be made at home and exporting will be replaced with owning or controlling factories in target markets abroad.
A report by the RSA has shown that there are approximately 2,500 mid-sized manufacturing firms in the UK, turning over between £25 million and £500 million and with between 100 and 2,000 employees. It goes on to state that their agility and closeness to their customer-base means mid-sized manufacturing firms will be key to future growth and rebalancing in UK manufacturing.
Low carbon
The UK has a solid stake in the global market, with a market share of 3.7%, and has shown consistent growth since 2007/08. While the UK is the ninth-biggest manufacturing country in the world, it is the sixth-largest producer and provider of low-carbon and environmental goods and services, behind only the US, China, India, Japan and Germany. The UK low carbon sector output £122.2 billion in 2010/11 and employed 940,000 people. Our trade is in surplus, with exports of about £12 billion, which exceeds imports of about £7 billion.
The low carbon sector has shown its resilience. Research by the CBI, the Green Alliance and the UK Government has highlighted that it has been growing despite the recession and that, “over a third of the UK’s economic growth in 2011/12 is likely to have come from green business”.
Globally, it is recognised that countries differ in their ability to prosper in a world moving to limit pollution. The Climate Institute/GE Low-Carbon Competitiveness Index indicates that the United Kingdom – along with France, Japan, China and South Korea – are currently best positioned to prosper in the global low-carbon economy. This bodes well as the global low-carbon market was worth more than £3.3 trillion in 2009/10 and is projected to reach £4 trillion by 2015. The low-carbon market in China alone is around £430 billion (13% of the market).
Nuclear
The Government’s Nuclear Industrial Strategy states that new nuclear power is essential to meeting its objective of delivering a secure, sustainable and low-carbon energy future.
Over the coming decades, the nuclear industry is set for a global expansion. Around £930 billion investment is planned globally to build new reactors, while £250 billion is earmarked for decommissioning those that are coming off-line. Added to this is a significant potential market in extending the life of existing nuclear reactors and enhancing their efficiency.
In the UK, industry has set out plans to deliver around 16GW of new nuclear power by 2030. This broadly translates into at least 12 new nuclear reactors. In parallel, the UK’s strategy to clean up its existing nuclear facilities is being delivered by the Nuclear Decommissioning Authority (NDA) through the established decommissioning supply chain. This is an existing UK market worth around £3 billion a year. The skills, capabilities and capacity needed for this decommissioning work are significant in their own right.
Gas
Alongside low carbon technologies, the Government expects that gas will continue to play a major role in our electricity mix over the coming decades, as the UK decarbonises its electricity system. There are several possible scenarios that could play out, depending on a range of factors. These include fossil fuel prices, carbon prices, demand, and the deployment rates and levels of low marginal cost, low-carbon generation. Including capacity commissioned in 2012, Government predicts the need to invest in up to 26GW of new gas capacity by 2030.
The gas generation strategy therefore sets out the important role that gas generation will play in any future power generation mix, supporting a reliable, secure, low-carbon and affordable electricity system. The policies set out in the strategy aim to deliver an adequate level of overall generation capacity, which includes a significant role for gas (including with carbon capture and storage), to ensure security of supply and an affordable energy mix as we move in to a low-carbon economy.
Wind power
As a result of its exposed location, the UK has the greatest potential for wind power of any European country, both onshore and offshore. This resource, when combined with the UK’s engineering heritage and the right market and policy framework, could be a source of significant economic opportunities. By 2020, the UK Government’s Renewable Energy Roadmap anticipates 18GW of offshore wind capacity will be added, supplying around 55TWh, to take the number of offshore turbines from around 3,000 to 4,000.
Onshore wind is one of the most cost-effective of the low-carbon technologies and, with continuing Government support, the average wind farm may produce power at costs that compete with fossil fuels as soon as 2016.
Offshore wind is more expensive than onshore wind. However, the cost is expected to come down rapidly. It is capable of providing huge amounts of low-carbon electricity for the UK – potentially 45% of the UK’s total electricity needs by 2030 – and can make a major contribution to the 2020 renewables target. It could also generate significant benefits for the economy, contributing £3–10 billion annually between 2010 and 2050.

Back to Contents
XVI Synopsis, recommendations and calls for collaborative action The state of engineering
What does it mean to be an engineer in the UK? – job prospects and salaries
Graduates
Whereas 55.1% of all graduates went into full-time employment in 2011/12, 61.4% of engineering and technology graduates did, with a further 6.8% going into part-time work.
Among male engineering and technology graduates, 61.9% went into full-time employment, 6.6% went into part-time employment and 6.5% went into a combination of work and further study. Although the overall number of female engineering and technology graduates going into employment was similar to that of male graduates, the profile was different. Fewer females (58.8%) went into full-time employment, while a higher proportion (8.1%) went into part-time employment. The proportion going into work and further study was similar to that of male students.
Across all subjects, male graduates had a slightly higher full-time employment rate than female graduates (55.3% compared with 54.9%). By comparison, female graduates were more likely to go into part-time employment than male graduates (14.7% against 10.9%). Female students were also more likely to combine further study with work (7.9% against 6.6%).
Overall, it is worth noting that female engineering and technology graduates were more likely to go into full-time employment (58.8%) than all male graduates (55.3%) or all female graduates (54.9%).
Using data from HESA’s Destination of Leavers in Higher Education (DHLE) survey, it is possible to calculate a mean average starting salary for graduates from different subject areas. Medicine and dentistry graduates had the highest graduate starting salary, at £32,037. Engineering and technology graduates ranked second, with a starting salary of £26,019: this is a fifth (21.8%) more than the mean for all graduates (£21,362). At the other end of the scale, creative arts and design graduates achieved the lowest mean starting salary: a third (33.2%) less than the mean at £14,260. Overall, male engineering and technology graduates have a higher-than-average starting salary of £26,367. By comparison, the average starting salary for female graduates is just £23,858: 90.5% of the male equivalent.
Average starting salaries vary quite widely by engineering sub-disciplines. Overall, the sub-discipline with the highest starting salary is general engineering (£30,648). The other sub-disciplines with an above-average starting salary are:
• chemical, process and energy engineering – £28,492
• production and manufacturing engineering – £26,705
• mechanical engineering – £26,052
The engineering sub-discipline with the lowest average starting salary is electronic and electrical engineering (£24,341), closely followed by civil engineering (£24,392).
The Office for National Statistics (ONS) has published statistics on the median hourly wage for graduates aged between 21 and 64, by their degree subject area. They show that medicine and dentistry graduates are highest paid (£21.29 per hour). Mathematical sciences, engineering, technology and architecture rank joint second, with a median salary of £18.92 per hour (24.6% more than the median for all graduates, which is £15.18). This was followed by physical or environmental sciences on £17.74 (16.9% more than the median). These findings are supported by the Futuretrack research project, which shows that one of the key variables associated with earning a relatively high salary is the subject studied. Finally, research from the Department for Business, Innovation and Skills (BIS) shows that males who graduated in engineering and technology had a lifetime’s earnings premium of around £210,000, compared with the average earnings premium for a male graduate of around £168,000.
The average starting salary for graduates going to work for an engineering or industrial company is £25,000, while those working for energy, water or utility companies earn an average starting salary of £25,500. IT/telecommunications companies pay a starting salary of £26,250. It should be noted that there is a significant wage premium for engineering and technology graduates who work for an employer whose primary activity is engineering. Those working for an engineering employer earn £28,023 on average, compared with £22,284 for those who go to work for a non-engineering employer.
Apprentices
The lifetime benefits of getting an apprenticeship are between £48,000 and £74,000 for a foundation apprenticeship and between £77,000 and £117,000 for an advanced apprenticeship. The average wage for an engineering apprentice is £6.23 – far higher than the minimum rate of £2.65 per hour.
STEM technician and craft careers
The highest paid engineering occupation in this sub-category is engineering technician, with an average salary of £32,647. This is followed by telecommunication engineers at £30,591 average. These are both significantly above the average mean salary for all employees of £26,664.
Chartered engineers
The Engineering Council 2013 Survey of Professionally Registered Engineers and Technicians provides direct comparisons with the 2010 survey and shows that the mean and median salaries have increased for engineers in all sections of the register. The median basic annual income for Chartered Engineers had increased by 14% to £60,000. Incorporated Engineers were earning 9% more at an average £45,000 and the average salary for engineering technicians had risen by 5% to £37,000. The median salary for ICT technicians was £35,000.
Where do graduate engineers work?
There has been a significant rise in the proportion of engineering and technology graduates going to work for an engineering and technology employer, with a five-year high of 67.5% in 2011/12 from 61.4% as the recession hit in 2008/09. By comparison, only 2-3% of engineering and technology graduates went to work for a financial and insurance services company over the last five years, compared with 4-6% of the overall graduate population.
The proportion of male first degree engineering and technology graduates going to work for an employer whose primary activity is engineering increased only slightly between 2010 and 2012, from 68.3% to 69.1%. However, for female graduates the increase was much more significant, rising from 50.0% in 2010/11 to 57.7% in 2011/12.
Engineering vacancy and salary trends
Despite the continued economic fragility of both the UK and European economies, the UK employment market has remained relatively strong. Compared with June 2012, demand for candidates for the engineering and manufacturing market is up by more than 40%. Increased spending on infrastructure projects announced in the 2013 budget is likely to sustain this increased demand.
Although all engineering sectors have fared well recruitment-wise over the past year, it is the automotive, aerospace, oil and gas, and nuclear sectors that have proved to be most successful. A recent increase in car production, fuelled by global demand, has seen demand for candidates with technical expertise increase. And the discovery of large shale gas deposits within the UK means there are various entities getting ready to both survey and extract this valuable resource.

Back to Contents
The state of engineering Synopsis, recommendations and calls for collaborative action XVII
The Association of Graduate Recruiters (AGR) conducts two annual surveys looking at recruitment trends in some of the UK’s largest graduate recruiters. In the most recent of these two surveys, the summer review, the AGR interviewed 209 AGR employers and estimated that they would offer a total of 18,913 graduate vacancies. The sector expected to have the largest percentage increase is consulting (or business services firms), which is predicted to grow by 36.3%. This is closely followed by energy, water or utility companies (30.8%). Engineering and industrial companies are predicting growth of 10.1%. At the other end of the scale, the number of vacancies in banking or financial services is expected to fall by nearly half (45.1%).
Feedback from the Recruitment & Employment Confederation’s report on jobs and recruitment industry trends shows a steady increase in the use of temporary workers – this is linked directly with labour market performance and business culture. A flat-line economy often means employers are reluctant to take the risk of employing permanent staff, resulting in a short-term approach to their resourcing models. In 2011/2012, the temporary market saw a 5.4% increase in placements compared with the previous year. Total permanent placements in the same year were down by 8.9%. Since August 2010, the greatest demand for permanent staff has been in engineering, according to the Report on Jobs index. In June 2013, demand for engineering staff peaked above the overall UK trend: figures showed an index score of 69.4 against average demand across all sectors of 59.1. In the first two quarters of 2013, the engineering sector recorded the strongest demand for permanent staff. This can be interpreted as a sign that confidence is returning to the jobs market, as businesses review the use of long-term resourcing strategies.
Demand – looking forward In 2013, the Manpower Group’s Global Talent Shortage Survey showed that the top two shortages for jobs worldwide were for skilled trades workers and engineers respectively – the same result as in 2012. In particular, mechanical, electrical and civil engineers were found to be in short supply.
The CBI/Pearson Education and Skills Survey 2013 showed that demand for STEM skills at graduate level and below remains high across the economy. It also found that demand continues to outstrip the supply of individuals with these skills. Almost two in five firms (39%) requiring STEM-skilled employees report difficulties in recruiting them. Although this difficulty is gradually reducing at all levels, improvement is not happening fast enough – despite STEM shortages being high on the agenda for both business and Government.
Employers expect these difficulties to continue over the next three years. Two fifths (41%) of firms expect difficulties at some level over this time, with 20% expecting technicians and 17% expecting experienced STEM staff to be hard to recruit.
The difficulties seen in recruiting STEM-skilled individuals vary by sector. It is concerning that these challenges seem most intense in sectors that should be key drivers of the economic recovery. In construction, only 8% of firms currently report difficulties in recruitment at technician level, but 35% anticipate difficulties in the next three years, as the sector begins sustained recovery. Responses from firms in the engineering, high-tech/IT and science areas show the highest proportion of both current and future problems in recruiting STEM-skilled employees, with more than one in four reporting current challenges in recruiting technicians (29%) and STEM graduates (26%). These problems are expected to intensify in the coming three years, with 39% of firms expecting difficulties in recruiting technicians and 32% expecting graduates to be hard to find. As the economy strengthens, difficulties are also expected in recruiting apprentices, with nearly a third (30%) of firms in these sectors foreseeing problems.
Deloitte calls this problem ‘the talent paradox’. This is when there is high unemployment but employers still struggle to fill technical and skilled jobs. According to the Chartered Institute for Personal Development 2011 Talent and Resourcing Survey, three quarters of UK companies experienced recruitment difficulties in the year to April 2011. These were primarily down to applicants lacking technical or specialist skills. Separately, the National Careers Council reported that nearly half (46%) of Hard-to-Fill Vacancies are the result of a low number of
applicants with the right skills, and a further 13% are the result of applicants not having the right qualifications. Skills gaps have increased for mid-sized employers (25-199 staff) since 2009.
In last year’s report we showed that between 2010 and 2020, engineering companies are projected to see 2.74 million job openings, across a diverse range of disciplines. This represents 19.8% of all job openings across all industries by 2020 and is equivalent to 50% of the current workforce in engineering enterprises (5.4 million). Of these 2.74 million jobs, 2.4 million will be to replace workers who are leaving the workforce, while the remaining 350,000 will be new jobs.
Based on our analysis, there is a demand in engineering enterprises for 865,100 people with level 4+ engineering-related qualifications over 10 years. This gives an average demand of approximately 87,000 per year. The UK currently produces only around 51,000 people qualified at level 4+ each year who are able to go into engineering occupations. Similarly, we can expect demand for approximately 690,000 people qualified at level 3 over 10 years, giving an average demand of 69,000 people per year. The supply of level 3 apprentices is also projected to fall short of that demand: the UK currently produces approximately 23,500 apprentices a year qualified at level 3.
It is estimated that by 2020 the UK will need approximately 450,000 more science, engineering and technology (SET) technicians.
It should be noted that the modern engineering footprint (defined using Standard Industrial Classification codes) cuts across a number of different industrial sectors. So in addition to the traditionally recognised areas such as construction, manufacturing, civil, mechanical and electrical engineering, the engineering

Back to Contents
XVIII Synopsis, recommendations and calls for collaborative action The state of engineering
footprint also encompasses engineering enterprises in industrial sectors such as:
• supply of electricity, gas, steam and air conditioning
• information and communication
• water supply, sewerage, waste management and remediation activities
The skills of engineers are sought after by other sectors, increasing demand further. In each of the past five years, around a third of engineering and technology first degree graduates went to work for companies whose primary activity was non-STEM. In 2011/12, the two most common non-STEM industries graduates went to work in were retail trade (8%) and education (3.2%). The top two occupations engineering graduates undertook in non-STEM industries were sales (5.6%) and artistic, literary and media occupations (3.4%).
The pressing need for a buoyant UK engineering and manufacturing sector has been explicitly noted in the Migration Advisory Committee (MAC) shortage list. This includes a statement from BIS, making the point that, “it would benefit the economy to substantially increase the supply and quality of engineers entering the labour market, ensuring they have the right mix of skills as sought by employers”.
In addition, Professor John Perkins, Chief Scientific Adviser for BIS, has looked at the issue of engineering skills in the UK. The Perkins Review starts by endorsing the now widely accepted view that it would benefit the economy to substantially increase the supply of engineers entering the labour market and acknowledging the problems caused by specific skills shortages within engineering. Professor Perkins undertakes an end-to-end analysis of the talent pipeline, from the need to ‘prime’ the pipeline by inspiring
young people about engineering and giving them a strong academic foundation in school, to actions to tackle ‘leakage’ and quality issues throughout the pipeline.
Furthermore, the Government is positioning Local Enterprise Partnerships (LEPs) as a key vehicle for delivering on the UK skills agenda. LEPs are to be given greater freedom and resources in a bid to stimulate local growth through the creation of a Growth Deal, which will form part of an individual LEP’s Strategic Economic Plan. This is essentially a plan for local growth based on a strong rationale, value for money and partnerships for delivery.
As of March 2013, 39 LEPs have been created. To date, £730 million in funding has been allocated by the Department for Communities and Local Government and the Department for Transport specifically to support infrastructure projects that promote the delivery of jobs and housing. The 2012 Autumn Statement announced a new £474 million Local Infrastructure Fund and LEPs were invited to apply for £250,000 annually to draw up their strategic growth plans. Further, following recommendations in Lord Heseltine’s report on growth, a ‘single pot’ funding scheme is expected to be launched in 2015. The pot is intended to include employment and business support, skills, local infrastructure and housing.
The UK education pipeline – keeping the talent flowing If the UK is to meet future demand, there has to be a dramatic increase in the supply of young people studying the STEM subjects needed for a career in engineering. This means influencing their subject choice so that their options remain open for as long as possible. Our research shows that enjoyment of a subject is as significant as attainment in terms of a pupil’s likelihood to pursue it further, and that good teachers make a significant difference to outcomes. We need to improve the conversion rate for STEM subjects – particularly physics – from GCSEs to AS level and from AS to A level. This can be achieved by providing better careers information, work experience, enrichment and enhancement activities, by improving subject enjoyment and by ensuring there are enough trained physics teachers.
An Institute of Education study indicates that young people are more likely to continue with mathematics or physics after they are no longer compulsory (ie after the age of 16 in England) if the following factors are in place:
• they believe that they will benefit from studying the subject in terms of job satisfaction and/or material rewards, such as a bigger salary
• they demonstrate conceptual understanding in the subject, in other words ‘do well at it’ in more than a superficial way
• they have been taught the subject well at school
• they have been encouraged to continue the subject by a key adult: usually someone in their family or one of their teachers at school
In this last case, if the person is a family member, they may not necessarily have been good at maths or physics themselves, but they will be positive about the worth of studying these subjects.
GCSEs
Mathematics had the largest number of entries – 760,170 – accounting for 14.0% of all GCSE entries. This was followed by English with 731,153 entries. Science has dropped from third place in 2012 to fourth place in 2013 with 451,433 entries. Although additional science was in fifth place, the number of entries was around two thirds (62.8%) of that for science (283,391). The other STEM subject to make the top ten was design and technology, slipping from sixth place in 2012 to ninth in 2013 with 219,931 entries.

Back to Contents
The state of engineering Synopsis, recommendations and calls for collaborative action XIX
The growth of the three science subjects within triple science over the last ten years is encouraging: biology has grown by 226.7%, chemistry by 224.2% and physics by 218.9%. All three triple science subjects also showed growth in the last year, with biology rising by 5.0%, chemistry by 4.4% and physics by 2.1%. Disappointingly, none of the individual science subjects made it into the top ten subjects in 2013. However, with 34% of Year 9 students choosing triple science as an option in 2012, biology, chemistry and physics are likely to break into the top ten in 2014.
Maths has been replaced by core science as the STEM subject with the lowest A*-C pass rate. However, only 57.6% of maths entrants achieved an A*-C grade – below the average for all subjects (68.1%). As a compulsory subject, maths may be expected to have a lower A*-C pass rate than optional subjects, but a 10.5 percentage point gap versus all subjects is an area of concern. All three subjects within triple science showed a decline in the pass rate in 2013. Of the subjects within triple science, physics had the highest pass rate for the sixth year in succession, at 90.8%.
For all the GCSE STEM subjects, apart from maths, female students achieve more A*-C passes than males. Females represented 48.6% of all entrants to physics, with a pass rate of 91.1% compared with 90.5% for males.
Post-16 progression
Students who study double science at GCSE attain on average one grade less at A level than those who studied GCSE triple science. What’s more, those who study triple science are more likely to progress to A level science. According to the Department for Education, those studying triple science are three times more likely to study A level physics than those studying core and additional science. Studying maths and physics in combination at A level remains the primary route through to studying engineering at degree level. New research by the Royal Academy of Engineering shows that only half (50%) of 16-year-olds in England pass both GCSE maths and at least two sciences, meaning that effectively half of 16-year-olds are disadvantaged if they wish to pursue engineering after the completion of their compulsory education.
The study of mathematics and physics at A level is a major route into engineering and, to that end, EngineeringUK and the engineering community has called for the doubling of the numbers of young people studying GCSE physics.
Post-16 participation in mathematics and physics relies heavily on prior achievement. The overwhelming majority of those taking A level mathematics have grade A or A* at GCSE level. But even here participation is low – fewer than
50% of students with a grade A go on to study AS level mathematics and only around 1% of those with grade C in GCSE mathematics continue to AS mathematics.
There is a similar but more acute state of affairs for physics, albeit from a low base size. Although the A* pass rate is higher, at 23%, there is much less progression to AS level than there is for maths: 43% compared with 79%. There is also a lower progression to A level: 38% for physics compared with 73% for maths.
In particular, there is a drastic disconnect in the progression of girls to AS and A level physics. In 2013, 71,199 girls achieved grades A*-C in GCSE physics. However, only 8,998 achieved grades A-C at AS level and 5,741 grades A-C at A level.
Over ten years, there has been a 29.5% increase in the numbers of AS level entrants for the various STEM subjects (although entrant numbers declined by 0.4% in 2013). Further maths had the largest percentage increase in entrants over ten years, rising by 467.9%. It also increased by 7.9% in the last year. As a result, in 2013 there were 22,601 entrants to further maths, compared with 3,980 in 2004.
The second largest percentage increase was for maths. Over ten years, entrant numbers have increased by 142.8%, although 2013 saw a more modest increase of 1.5%. In 2013, it was the largest STEM subject, with 150,787 entrants. In fact it has been the largest STEM subject in each year since 2007. Entrants to physics have increased by 66.7% over ten years to reach 61,176.
The overall A-C pass rate at AS level rose from 60.6% in 2012 to 60.8% in 2013, the highest it has been over the ten-year trend period. Only two STEM subjects were above this overall average in 2013: further mathematics, with a
pass rate of 82.3%, and mathematics with a pass rate of 66.5%.
In terms of overall A-C pass rate, female entrants outperformed male entrants by 63.8% to 57.4%. Female entrants also outperformed male entrants in each STEM subject. There has been a decline in the proportion of female entrants for all STEM subjects over the last ten years, with the exception of design and technology, which has increased from 39.0% in 2001 to 40.2% in 2013. Overall, STEM subjects are becoming less gender balanced, although biology (which has a majority of female entrants) and design and technology are moving towards equality.
In 2013, maths was the largest A level STEM subject, with 88,060 entrants. Over the course of ten years, it has grown by 66.8% - 2.7% in the last year. The STEM subject to show the largest percentage increase over ten years was further mathematics. This grew by 141.6% to 13,821, with 4.5% growth in 2013.
Over ten years, entrant numbers to physics have increased by a quarter (23.9%). In 2013, physics had the fifth largest percentage increase, rising by 3.1% to 35,569. It was closely followed by other sciences, which rose by 3.0%.
In 2013, the A*-C pass rate at A level was 77.2% – the highest recorded over the ten-year period. Only three STEM subjects had an above-average pass rate: further mathematics (89.9%), maths (81.3%) and chemistry (79.5%). It is also worth noting that in each of the last ten years, the pass rate for further mathematics has been at least 10 percentage points higher than the pass rate for all subjects. The pass rate for physics in 2013 was 73.9%. Like biology (with a pass rate of 73.7%), physics has had a below-average pass rate in each of the last ten years.

Back to Contents
XX Synopsis, recommendations and calls for collaborative action The state of engineering
Overall, more female entrants (79.4%) achieved an A*-C grade than male entrants (74.5%). Females also outperformed males in all the STEM subjects. The widest variance was for ICT, where there was an 11.4 percentage point gap between female and male entrants.
The Institute of Physics report into the destinations of A level physics students showed that almost everyone with physics A level goes to university, with the vast majority of them studying STEM subjects. The most common destination for people taking A level physics is engineering, with about 40% of the cohort progressing to a university course in some type of engineering. More than 10% follow courses in mechanical engineering alone. These figures are skewed towards boys, with only around 25% of girls who take A level physics following an engineering pathway.
The Further Education (FE) sector plays a critical role in helping to meeting the education and skills demands of UK businesses. In 2011/12, the total number of learners achieving a vocational qualification in the UK was 8.7 million, an increase of 9.6% on the previous year. Of these, 950,000 were achieved by 16- to 18-year-olds in STEM subjects.
The overall rise in numbers achieving a vocational qualification is encouraging. However, over the past seven years participation in engineering-related subjects has declined. Engineering and manufacturing technologies participation is down 22.5%, information and communication technology has fallen by 64%, and there has been only a slight rise (5%) in construction, planning and the built environment. Overall, participation in engineering-related Sector Subject Areas has decreased by half in seven years. This is cause for concern against the forecast demand to 2020 for 69,000 people per year qualified at level 3.
Even so, over the past year, all three engineering-related Sector Subject Areas showed more growth in the number of participants than all subjects (12.8%). Information and communication technology had the highest growth (21.4%), followed by engineering and manufacturing technologies (17.8%) and then construction, planning and the built environment (15.7%).This positive trend needs to be maintained in future.
Over a seven-year period, there has been a steady increase in the overall number of learners aged under 19 in construction, planning and the built environment – from 49,620 in 2005/06 to 72,070 in 2011/12. However, those aged 19+ have declined from 98,430 in 2005/06 to 83,380 in 2011/12.
There are approximately two million workers employed as technicians and skilled operatives in the UK. Apprenticeships are therefore a critical and major route for training future
generations of technicians. In 2013, the Government spent £1.2 billion on the apprenticeship programme and in the same year saw 457,000 apprenticeship starts. The Government is also trying to improve the quality of apprenticeships by specifying that apprenticeships for 16- to 18-year-olds must last at least 12 months, and by reviewing the minimum duration for apprenticeships for those aged 19+. It will therefore be of great concern to the engineering community to note that among under 19s, engineering-related apprenticeship starts at level 3 have declined by 12.5% from 18,550 to 16,230. There was also a decline in 19-year-olds, down 1.4% from 21,030 to 20,730.
Of 49,945 entrants to foundation degrees, a fifth (20.8%) were studying for a STEM qualification and 7.4% (3,720) were studying engineering and technology. Part-time entrants (9.5%) were slightly more likely than full-time entrants (6.2%) to be studying engineering and technology.
The number of students entering HNC (7,995) or HND (9,310) courses is much lower than the number entering foundation degrees (49,945). However, the proportion of those entrants who are specifically studying a STEM subject or engineering and technology is much higher. Nearly two thirds (60.9%) of students entering an HNC course start a STEM course and over half (57.5%) start an engineering and technology course. For HNDs, nearly half (44.7%) of entrants are doing a STEM course and nearly a third (30.8%) are studying engineering and technology.
In the Higher Education sector, applicant numbers for all subjects have risen by 37.2% over ten years, although there was an overall decline of 6.6% last year and a decline in applicant numbers for each STEM subject area. Physical sciences showed the least decline, down by 1.9% in 2011/12. Engineering was down 2.7%, despite a ten-year increase of 41.7%. Females made up 13.0% of all applicants to engineering in 2011/12, a slight improvement on 2002/03 when the comparable figure was 11.2%.
Accepted applicant data is the closest indication of the actual number of starts in a subject area. Overall, there was a 5.5% decline in the number of accepted applicants to all subject areas in 2011/12. Females accounted for 55.2% of all accepted applicants – an increase on the previous year and the joint highest proportion for ten years. Engineering was one of three STEM subject areas to show a below-average decline in the number of accepted applicants in 2011/12, falling by 2.8%. Over the 10-year period, the number of applicants accepted onto engineering courses has increased by 16.4%, with students from the EU and UK showing strong growth (38.7% and 18.6% respectively), compared with a marginal increase of 1.1% from outside the EU.
In 2013, there were nearly 2.5 million students (2,496,625) in UK Higher Education. This is a remarkable increase in provision from the early 1970s, when there were just over 600,000 students. In 2011/12, nearly a quarter (23.8%) of all students were studying for a STEM qualification. Male students were twice as likely as females to be studying for a STEM qualification (34.3% against 15.7%), although females outnumbered their male counterparts (1,406,940 to 1,089,685). Biological sciences was the only STEM subject where female students outnumbered males.
Overall, 162,015 students were studying for a degree in engineering and technology in 2011/12. Of these, 136,525 were male and 25,490 were female. Most of the students were studying at an undergraduate level, with 89,915 studying full-time and 13,035 studying part-time. At postgraduate level, full-time study was again prevalent, with 29,685 full-time students against 12,300 part-time.
In 2011/12, 20,855 students graduated with a first degree in engineering. This was an increase of 4.4% on the previous year. Fourteen percent of these first degree engineering graduates were female. There were also 15,620 qualifiers in engineering at a postgraduate level – a rise of 2.2% on the previous year – of whom 18.9% were female. Finally, 2,410 students qualified with a doctorate in engineering, an increase of 5.1% on the previous year. At 22.1%, the proportion of engineering students was higher for doctorates than for postgraduate and first degrees.
Teaching – quality and quantity
High-quality and well-trained teachers help learners develop the competencies they need in a global labour market based on ever higher skills. The CBI endorses this view, stating that improving educational standards has very positive effects across society. It has also noted that, as global competition increases and our competitors continue to improve absolute performance in their schools, the need to improve our education provision will only grow. In China, for example, a ten-year education reform plan is underway to, “give priority to education and turn China into a country rich in human resources”.
Independent analyses of data from the OECD’s Programme for International Student Assessment (PISA) shows the importance of teacher quality. It found that if teachers are allocated into three equal-sized groups – below-average, average and above-average – students taught by an above-average teacher make 50% more progress, and those taught by a below average teacher make 50% less progress than students taught by average teachers. The most effective teachers are therefore at least three times as effective as the least effective.

Back to Contents
The state of engineering Synopsis, recommendations and calls for collaborative action XXI
This relationship to high-quality teaching is reinforced and quantified by the work of the Sutton Trust, which showed that being taught over a two-year course by a high-quality teacher adds 0.565 of a GCSE point per subject. It also found that, “over a school year, these pupils can gain 1.5 years’ worth of learning with very effective teachers, compared with 0.5 years with poorly performing teachers”. In other words, for poor pupils the difference between a good teacher and a bad teacher is a whole year’s worth of learning. This plainly emphasises that the effects of high-quality teaching are especially significant for pupils from disadvantaged backgrounds.
The total headcount of in-service teachers was 241,500 in 2011. Maths was the STEM subject with the largest number of teachers, at 35,200. Of these, 30,600 taught at Key Stage 3, 27,900 taught at Key Stage 4 and just over a third (12,600) taught at Key Stage 5.
Combined/general science was the STEM subject with the second largest number of teachers, at 34,700. Of these, 30,700 taught Key Stage 3 and 27,800 taught Key Stage 4. Design and technology was the third largest subject with 14,800 teachers. Of these 1,300 taught electronics/systems and control and 4,500 taught resistant materials.
Physics was taught by 5,900 teachers: 1,200 at Key Stage 3, 3,000 at Key Stage 4 and 4,300 at Key Stage 5. The Institute of Physics has estimated a staggering shortfall of between 4,000 and 4,500 specialist physics teachers out of a cohort of 10,000-11,000. We calculated that it would require 15 years of recruitment at 1,000 new teachers a year to redress the balance. At the time (2012), the rate was 300-400 a year.
Just under three quarters (72.9%) of maths teachers have a relevant post A level qualification. However, fewer than half (45.4%) of these teachers have a degree or higher qualification, while only 7.1% have a BEd and 18.2% have a PGCE. For physics, a third (33.7%) of teachers don’t have a relevant STEM post A level qualification at all. Just over half (56.1%) of physics teachers have a degree or higher, while 6.3% have a PGCE and 3.0% have a BEd.
It is gratifying to note the recent targeted recruitment drive through initial teacher training bursaries for mathematics teaching posts in the FE sector. The new bursary scheme, introduced from September, will pay graduates up to £20,000 to train and take up a maths teaching post within a Further Education College. At the same time, a maths conversion course has been developed to help existing teachers to retrain to teach this subject in a college.
In schools, it has long been recognised that there is a need for high quality science, maths and engineering teachers. Here, bursaries are being used to increase the number of good teachers, with up to £20,000 available for graduates who undertake a secondary PGCE. More recently, recruitment shortfalls have forced the Government to lower its bursary thresholds in an attempt to boost the numbers of specialist maths and physics teachers. Graduates with a third-class degree may be offered £9,000 to train as teachers in key subjects, while maths and physics graduates will qualify for a bursary to train as a teacher if they have a ‘relevant degree’ of any classification, and a B or higher in the subject at A level.
The Institute of Physics has been leading on the delivery of some key initiatives, including the Stimulating Physics Network for teachers and the successful Girls in Physics initiative. Together, these initiatives have boosted interest in moving from GCSE to A level physics to twice the comparable national average, with even higher interest among girls.
As we identified in our 2103 report, the UK needs to roughly double its output of students with level 4+ qualifications via universities and colleges of Further Education if we are to meet future demand. But a clear question was whether universities had the capacity to recruit so many engineering students if applicant numbers did double. And if not, how long would it take for departments to build the capacity to be able to accommodate a doubling of numbers? To that end, a poll of members by the Engineering Professors’ Council asked the simple question:
“Over what time period could you accommodate a doubling of your intake of undergraduate (and separately) postgraduate engineering students?”
The poll found that the majority of respondents said that increasing capacity to accommodate twice as many students would take three to five years. Specifically, 51% of those responding said that it would take three to five years to accommodate double the number of undergraduate students. Twenty-five percent said it would take six to ten years, or even longer. For postgraduate students, 34% said it would also take three to five years to accommodate twice as many students, with a further 58% saying that they could do so immediately or within one to two years. There were no significant differences in the pattern of response by engineering discipline or university type.
This clearly indicates a significant time lag that needs to be factored into any policies and/or interventions aimed at significantly increasing the numbers of engineering undergraduates and postgraduates. The recent announcement of a £200 million fund from Government to be matched by universities aimed at boosting the UK’s national university infrastructure and to allow science and engineering departments to provide world-class facilities and teaching for students, is a step in the right direction.
Careers inspiration
A large body of evidence shows that interest in science is formed by age 14 and that those students who had an expectation of science-related careers at age 14 were 3.4 times more likely to earn a physical science and engineering degree than students without this expectation. Research by the University of Warwick has shown that students don’t make links between curriculum knowledge and their future careers and need to know that, for some STEM careers, studying triple science is either desirable or essential. Links between the curriculum and future careers need to be made more explicit to students.

Back to Contents
XXII Synopsis, recommendations and calls for collaborative action The state of engineering
BIS states that good quality and independent information advice and guidance is essential to help young people identify and access the education and training that is right for them. Schools in England now have a statutory duty to provide access to Careers Information, Advice and Guidance (CIAG) to young people from Year 8. It is therefore disturbing to note that a recent research project by Pearson showed that only 12% of educators said they knew a lot about their statutory duty. A recent Ofsted report identified that careers guidance is not working well enough in schools, with few knowing how to provide an effective service: only 12 of 60 schools Ofsted visited were ensuring that all students received sufficient information to consider all career possibilities.
The UK Commission for Employment and Skills looked at the percentage of people employed in different industrial sectors and the percentage of Year 7 students who said they wanted to work in each area. While just over a quarter (27%) of all jobs are in public administration, education and health, over a third (36.2%) of Year 7 students wanted to work in this area. Yet the analysis also shows that while nearly one in nine (10.6%) work in manufacturing, no students wanted to work in this sector.
The essential but often overlooked role of careers education and advice, particularly for young people still in education, is bought into sharp focus through findings from the Education and Employer Taskforce report Nothing in Common. Its research showed that teenagers’ aspirations at age 14, 16 and 18, when mapped against projected labour demand (2010-2020), has almost “nothing in common” with the realities of the UK job market.
In last year’s Engineering UK report we called for the provision of robust face-to-face CIAG and more support for teachers and careers advisors in giving STEM careers advice. The importance of these two elements is strengthened by findings from our annual brand monitor survey, which showed that 11- to 14-year-olds said they were most likely to act on the advice of careers advisors (39%). The research also shows that while three-fifths (57%) of STEM educators had been asked to provide careers advice in the last year, only 31% felt confident about providing careers advice about engineering.
The University of Warwick has shown that students don’t make links between the curriculum and future careers, while the CBI has stated that the highest priority needs to be given to making sure businesses engage more with schools to enthuse and inspire pupils about STEM study. The ‘real world’ perspective that employers can bring to learning can help to open young people’s eyes to the practical value and creative scope of STEM subjects.
However, only two-thirds (61%) of young people surveyed by the Wellcome Trust said they had done work experience and, of these, only a quarter (28%) had done work experience in the STEM field. This means that 83% of young people have no experience of what a STEM career is actually like.
Whilst not providing the same real-life interaction as work experience, STEM enrichment and enhancement events such as fairs, ambassador schemes and activities in schools help give children a greater understanding of what people working in STEM jobs do. For example, the evaluation of the Tomorrow’s Engineers programme shows that 40% of secondary school students met a
working engineer and two-thirds (66%) said they learnt about the different jobs engineers do.
EngineeringUK has identified that well-constructed programmes do positively influence perceptions. Our annual brand monitor survey found that 38% of 11- to 16-year-olds nationally said a career in engineering was desirable. However, when this question was asked of attendees at The Big Bang Fair, 62% agreed. Among those who took part in a Tomorrow’s Engineers activity, the comparable figure was 48% – both well above the corresponding national figure.
Female aspiration and perception
At a fundamental level there is an economic argument to be made: The Women’s Business Council’s report, Maximising Women’s Contribution to Future Economic Growth, makes the point that while women need work, work also needs women. By equalising labour force participation rates between men and women, the UK could increase GDP per capita growth by 0.5 percentage points per year, with potential gains of 10% of GDP by 2030. The Council also states that there are over 2.4 million women who are not in work but want to work, and over 1.3 million women who want to increase the number of hours they work.
Girls also tend to end up concentrated in sectors that offer narrower scope for reward, and are under-represented in areas of skills shortages and high potential, such as science, technology, engineering and maths.
The Wellcome Trust has highlighted that the male-dominated setting of science classrooms can put women off studying science. The Trust also referenced research by the Institute of Physics, which shows that gender stereotyping and a lack of female role models play a role outside of the classroom. EngineeringUK’s own research has highlighted that engineering suffers from being seen as male career. Amongst STEM educators interviewed in the research, 44% of those who said engineering was an undesirable career for their students cited it being seen as a career for men. Even among women who work as engineers, three-quarters believe engineering is regarded as being a “male career”.
In It’s Different for Girls (2012) the IoP demonstrated that almost one half, 49%, of state-funded, coeducational schools sent no girls at all to do A level physics. A girl is four times more likely to take physics A level if she attends a single-sex, independent school than if she attends a state, mixed school.
These results have led to a qualitative shift in IoP thinking on this issue whereby they now take it that their school environment is preventing

Back to Contents
The state of engineering Synopsis, recommendations and calls for collaborative action XXIII
many girls from benefiting from the opportunities that physics A level offers. There is no problem with girls’ academic achievement: generally girls outperform boys in physics, as they do in most subjects. IoP is concerned with addressing two major barriers: overcoming the reinforcement of gender stereotyping that is taking place in many secondary and, crucially, primary schools, and building the girls’ confidence in their capability in what they see as a very challenging subject.
However, the UK is not alone. The OECD has identified that in no OECD country did the proportion of girls who wanted a career in computing or engineering exceed boys, and that on average almost four times as many boys as girls wanted to be employed in these fields.
Perceptions
If the UK is to meet this substantial demand for engineers, we need to ensure that potential current and future workers and their influencers see engineering and the engineering sector as a desirable area to work. Achieving this includes providing positive perceptions of science, technology, engineering and maths, influencing those who can influence future workers, providing valuable work experience, and demonstrating to potential workers that there is a positive career for people in engineering. However, to influence perceptions, we also need to determine what those perceptions are and, over time, be able to monitor the effect of any interventions on them. In 2013, almost two-thirds (64%) of the general public could cite the engineering development of the last 50 years that has had the greatest impact on them. This was significantly up from 38% in 2010.
It should come as no surprise that a vast amount of effort is expended in schools in understanding and trying to positively affect perceptions towards STEM, and engineering in particular. Special effort is needed at those year groups where there are key decision points ie Year 9 and GCSE choices.
As stated at the outset, we need to dramatically increase the supply of young people studying the STEM subjects that are prerequisites for a career in engineering. Therefore, we still need to influence young people’s subject choice.
The encouraging news is that research and practice has shown that through concerted collaborative action we can positively influence young people, their influencers (teachers and parents) and more broadly, the general public.
The National Foundation for Educational Research looked at features of the activities and interventions in schools that were most successful at improving young people’s engagement in STEM. It found that the most beneficial activities were:
• engaging pupils at an early age and at key transition points
• focusing teaching on practical activities, set in real-life contexts and offering good quality enrichment and enhancement activities
• linking teaching to careers in STEM
• making clear links across and between the STEM subjects
• supporting teachers
The impact of concerted action can be seen in the findings from our 2013 brand monitor survey of the general public. This research shows that perceptions of engineering careers have improved among 7- to 11-year-olds, 11- to 16-year-olds, 17- to 19-year-olds and adults over the last 12 months.
The brand monitor also asks how much students know about what people working in engineering do. Overall, 16% of 11- to 16-year-olds said they had some knowledge. However, among 11- to 16-year-olds who participated at The Big Bang Fair, the comparable figure was 62%, and for Tomorrow’s Engineers participants it was 53%. Furthermore, 62% of secondary pupils who attended The Big Bang Fair and nearly half (48%) of secondary pupils who participated in the Tomorrow’s Engineers programme thought that a career in engineering was desirable, compared with 38% of brand monitor respondents. These responses clearly show the positive influence that collaborative programmes can make to young people’s perceptions.
The ability to be able to influence young people is reinforced by qualitative research we did on the Tomorrow’s Engineering programme. It shows that students who took part in the activity gained an increased awareness of the different types of engineering and engineering careers, along with a broader understanding of the role of an engineer and the skills required to become one.
Finally, we mentioned at the outset that influencing the influencers (parents, guardians and teachers) is key to influencing young people. It should therefore be noted that it is equally possible to influence the perceptions of influencers. We know for example that when asked, 79% of parents of 7- to 14-year-old children said they would recommend a career in engineering to a family member. Research with teachers after The Big Bang Fair showed that four out of five (81%) teachers who collected STEM resources while at the fair, intended to use them in their own teaching. In addition, 38% of teachers said they intended to recreate ideas and experiments in the classroom. However, as our brand monitor survey clearly shows, there is more to be done: 18% of all STEM teachers think that a career in engineering is undesirable for their students, rising to 23% for the 25- to 44-year-old STEM teacher group.

Back to Contents
XXIV Synopsis, recommendations and calls for collaborative action The state of engineering
There are two overriding messages from the report. Firstly, that Britain is great at engineering – its skilled engineers are world class and engineering makes a vital and valued contribution to the UK economy, and can help mitigate the grand global challenges of climate change, ageing populations, and supply of food, clean water and energy. Secondly, that the UK at all levels of education does not have either the current capacity or the rate of growth needed to meet the forecast demand for skilled engineers by 2020.
RecommendationsThe evidence and trends presented in this year’s Engineering UK report confirm that the long-term (2020) recommendations remain the same as last year:
• We need a two-fold increase in the number of engineering graduates. This is vital to meet the demand for future engineering graduates and to meet the shortfall in physics teachers and engineering lecturers who will play a vital role in inspiring future generations of talented engineers.
• We need to double the numbers of young people studying GSCE physics as part of triple sciences and grow the numbers of students studying physics A level to match those of maths. There should be a particular focus on increasing take-up and progression by girls.
• We need a two-fold increase in the numbers of under-19s studying vocational level 3 qualifications. In particular, we need to increase numbers studying the Advanced Apprenticeship frameworks in engineering and manufacturing technology, construction planning and the built environment, and information and communications technologies.
• We need to provide careers inspiration for all 11- to 14-year-olds. This should include opportunities to meet technical leaders from across a range of scientific, technological, engineering and business sectors and, where possible, experience the workplace. This inspiration must highlight the value placed on STEM skills and promote the diversity of engineering careers. When required, it should be backed up with consistent, face-to-face careers information advice and guidance that highlights the subjects needed and the variety of routes to those careers.
• We need to support teachers and careers advisors in delivering careers information that helps students understand the range of modern scientific, technological, and engineering career paths - including vocational/technician careers – and recognise the value employers place on STEM subjects. Students also need to have the opportunity to experience a 21st century engineering workplace for themselves.
Calls for collaborative actionIn order to realise these recommendations, the engineering sector makes the following calls for collaborative action across government, engineering businesses, the education sector and the third sector engineering community:
Deliver joined-up education policies that provide simplified academic and vocational pathways for our young people within schools and colleges and ensure the maximum possible throughput in STEM subjects and into engineering careers. (Governments in each of the devolved Nations)
Why is this action needed?
Last year, China committed £7.2 billion of its education budget to achieving world-class status for just 100 of its 3,000+ universities. By 2017, more than £2 billion will have been invested in Germany’s Excellence Initiative. Japan, South Korea, Taiwan, France and Canada are also investing selectively in leading institutions to boost their international competitiveness. It should also be noted that the UK has a lower proportion of apprentices per 1,000 than some of our major competitors: 11 per 1,000 compared with 40 in Germany and 17 in France. In the UK, the engineering sector employed 5.4 million workers and generated a turnover of £1.1 trillion in 2012 – 24.5% of the turnover of all UK enterprises. The current supply of young people studying STEM academic and/or vocational subjects at school, college and university is significantly less than required to meet the forecast demand for engineers and technicians by 2020. In particular, the numbers of young people studying triple science at GCSE currently only stands at 34%. Since these students are three times more likely to study physics A level than those who study core and additional science, and since physics, when combined with maths, is a strong feeder for engineering undergraduate courses, it is crucial that we address this issue.
Improve the co-ordination, quality, reach and impact of engineering outreach activity by the whole engineering community (including business), building on existing programmes to positively influence the perceptions and subject choices of young people and get more young people interested in a career in engineering. (EngineeringUK working with the engineering community)

Back to Contents
The state of engineering Synopsis, recommendations and calls for collaborative action XXV
Why is this action needed?
Young people need to be inspired to take up STEM subjects and thereafter consider an engineering career. Research shows that teenagers’ aspirations at age 14, 16 and 18, when mapped against projected labour demand (2010-2020), has almost nothing in common with the realities of the UK job market. Furthermore, 18% of all STEM teachers think that a career in engineering is undesirable for their students, rising to 23% for the 25- to 44-year-old STEM teacher group. EngineeringUK’s research has found that it is possible to positively influence perceptions through rational, well-constructed programmes. Our annual brand monitor survey found that 38% of 11- to 16-year-olds nationally said a career in engineering was desirable. When this question was asked of those at The Big Bang Fair, 62% agreed, while 48% of those who took part in a Tomorrow’s Engineers activity agreed. Both these figures are well above the corresponding national figure. The research also shows that three-fifths (57%) of STEM educators had been asked to provide careers advice in the last year, yet only 31% felt confident about providing careers advice about engineering.
Ensure the provision of a coordinated, informed and relevant approach to careers inspiration in schools and colleges, particularly aimed at all 11- to 14-year-olds, with advice and guidance available at key decision points throughout their academic careers. Give every child and science teacher an engineering experience that is linked to careers and the curriculum. Hold all schools and colleges to account through the relevant inspection authority against appropriately agreed metrics. (Government working in partnership with business and the education sector)
Why is this action needed?The view held by the engineering community and business that there has been a perennial lack of robust, useful careers education and advice has been independently reinforced by other key stakeholders. The Work Foundation has highlighted the problem in its report on the role of careers education and careers guidance. It concluded that school-to-work transitions are increasingly challenging for young people and that careers education and careers guidance can improve those transitions. Allied to this, we also know from research that students may be making ill-informed career choices. The UK Commission for
Employment and Skills has demonstrated that young people’s career aspirations, “can be said to have nothing in common with the projected demand for labour in the UK between 2010 and 2020”. This is reinforced by research from the National Careers Council who showed that, “young people’s aspirations are often misaligned with the opportunities presented by local labour markets”.
Ensure that there are more appropriately trained, specialist physics teachers in secondary schools. (Government)
Why is this action needed?
The relationship to high quality teaching and pupil achievement is quantified by the work of the Sutton Trust, which showed that being taught over a two-year course by a high-quality teacher adds 0.565 of a GCSE point per subject. The Trust also showed that, “over a school year, these pupils can gain 1.5 years’ worth of learning with very effective teachers, compared with 0.5 years with poorly performing teachers. In other words, for poor pupils the difference between a good teacher and a bad teacher is a whole year’s worth of learning.” This plainly emphasises that the effects of high quality teaching are especially significant for pupils from disadvantaged backgrounds. Moreover, the IoP estimated a shortfall of between 4,000 and 4,500 specialist physics teachers out of a cohort of 10,000 – 11,000. This would require 15 years of recruitment at 1,000 new teachers a year to redress. At the time, the rate was 300-400 a year.
Address the fact that there has been no significant advance in the diversity and make-up of engineering and in particular the gender participation of women into engineering. (The engineering community)
Why is this action needed?
The continued inequality in the uptake and progression of women into engineering only serves to exacerbate the shortfall in the required supply of talented engineers and technicians and is detrimental to the competitiveness of the UK. By equalising labour force participation rates between men and women, the UK could increase GDP per capita growth by 0.5 percentage points per year, with potential gains of 10% of GDP by 2030. The number of girls gaining physics GCSE at A*-C is now almost equal to the number of boys, and the achievement rate for girls is higher than for boys. In 2013, 71,199 girls achieved an A*-C grade, yet only 8,998 achieved an A-C grade at AS level and 5,741 achieved an A*-C grade at A level. At university, 2,925 females achieved a first degree in engineering, which is only 14% of the cohort. Finally, only 4.16% of professionally-registered engineers are female. The UK needs to redress this and improve the progression rate for girls.

1 1.0 Capacity for growth Part 1 – Engineering in Context
Back to Contents
Part 1 – Engineering in Context1.0 Capacity for growth

Part 1 – Engineering in Context Capacity for growth 1.0 2
Back to Contents
1 Source: CIA World Factbook, Rank Order GDP 2 See section 15 for details 3 http://www.telegraph.co.uk/finance/economics/9876267/UK-doubles-exports-to-BRICS-since-crisis.html
Underlying this year’s analyses of supply and demand of engineering and engineers is the issue of delivery: how can we deliver enough engineers to underpin the Government’s clearly stated ambition to grow the economy?
We’ve come some distance since last year’s report, which centred on the need for growth and the Government initiatives designed to support it. This year, intentions are backed by concrete funding. The debate over whether we are still in recession has been laid to rest and work has started in earnest on re-balancing and growing the economy. The economically productive STEM sectors are a particular focus, as exemplified by initiatives including the Plan for Growth, the Industrial Strategy and the Eight Great Technologies. In parallel, there is also a tangible shift towards localism: the emerging Local Enterprise Partnerships (LEPs) are gaining significant economic influence (although we are a long way off knowing if this shift will prove successful).
But the key question remains, do we have the capacity to deliver? We know from our 2013 analysis that over the next decade, the UK will need approximately 87,000 people per year with at least level 4 skills. The level 4+ supply whilst growing over the past year is only 51,000 per year. This is in contrast to the drop in level 3 engineering-related apprenticeships which has fallen from 27,000 to 23,500 against a demand of approximately 69,000 a year. So the best answer we can currently provide appears to be, not yet.2
That’s not to say the picture is gloomy. On the contrary. For once, all the interested stakeholders – business, most policy makers and relevant professional and educational organisations in science, technology, engineering and maths – agree on the need to address engineering skills shortages. Across the STEM landscape, there is visible evidence of partnerships, collaborations and concerted action to deliver the skilled workforce the UK so vitally needs for its global competitiveness, economic sustainability and social cohesion.
The European Union (EU) has the world’s largest economy. In 2012, it produced $15.97 trillion. The US came second with $15.94 trillion followed by China with $12.38 trillion. With a total contribution of $44.29 trillion, these three economies account for more than half of the world’s total GDP. They are also significantly larger than the world’s other notable economies: India at $4.784 trillion, Japan at $4.525 trillion and Germany – the strongest economy in the EU – at $3.123 trillion.1
Table 1.0: Total investment (millions) by UK and foreign-owned companies by sector type (2007-2009) – UK
Source: Department for Business, Innovation and Skills – Regional Economic Performance Indicators 2012
As we rightly remain engrossed in how we can re-balance the UK economy with greater emphasis on knowledge and technology, we shouldn’t lose sight of the need to tackle some even bigger, global challenges. Climate change, ageing populations, food, clean water and energy are challenges we must face if we are to leave a favourable legacy for future generations. And these are challenges the UK engineering sector is well placed to meet.
1.1 Challenges to the delivery of growthThis section highlights key challenges that need to recognised and met if we are to deliver the future skills necessary for sustained economic growth.
1.1.1 Economic
When it comes to economic issues, it’s impossible to look at the UK in isolation. Table 1.0 shows that in the global market place, the UK is heavily and increasingly reliant on foreign investment. This is particularly the case for manufacturing, with foreign investment at 45.1% by 2009.
It is interesting to note that the UK’s exports to Brazil, India, China, Russia and South Africa – the so-called BRICS – jumped from £12.7 billion in 2007, the last full year before the recession, to £27.1 billion in 2012, according to the Office for National Statistics (ONS). The BRICS now account for 5.56% of total UK exports, compared with just 3.34% in 2007.3
Manufacturing investment
(million)
Services investment
(million)
Other investment
(million)
Total investment
(million)
Foreign-owned
2007 4,649 11,674 7,504 23,827
2008 4,817 10,400 9,346 24,563
2009 4,350 9,588 9,391 23,329
UK-owned
2007 7,071 52,774 16,529 76,374
2008 6,515 53,326 18,417 78,258
2009 5,296 44,237 16,730 66,263
Total
2007 11,720 64,448 24,033 100,201
2008 11,332 63,726 27,763 102,821
2009 9,646 53,825 26,121 89,592
Percentage (foreign-owned)
2007 39.7% 18.1% 31.2% 23.8%
2008 42.5% 16.3% 33.7% 23.9%
2009 45.1% 17.8% 36.0% 26.0%

3 1.0 Capacity for growth Part 1 – Engineering in Context
Back to Contents
Additionally, it is becoming more evident that the UK’s success is inextricably linked to that of the EU. This, in turn, makes the position of the EU within the G204 of note, since the G20 was established in recognition of the considerable changes in the international economic landscape, such as the growing importance of emerging economies, or the increasing integration of the global economy and financial markets.
In 2010,5 G20 members covered 60.7% of the world’s land area, homed 65.1% of the world’s population and generated 86.7% of global gross domestic product (GDP). The 86.7% of world GDP, valued at €47,570 billion was 3.0% less than in 2000 (Figure 1.0).
This compares with the EU-27, who accounted for a 25.8% share of world GDP in the same period, the United States at 22.9%, China at 9.1% and Japan at 8.7%. China’s share, however, is growing rapidly. In current price terms, China’s 2010 GDP was €3,038 billion higher than in 2000 – an increase equivalent to the combined GDP of the six smallest G20 economies (South Korea, Turkey, Indonesia, Saudi Arabia, Argentina and South Africa).6
Fig. 1.0: Share of world GDP (2010)
(1) Canada, Russia, Australia, South Korea, Turkey, Indonesia, Saudi Arabia, Argentina and South Africa.
Source: Eurostat
Urban agglomerations are becoming just as important as countries or country groups in shaping the economic landscape.
Nine of the ten largest urban agglomerations in the world in 2011 were in G20 member states: Dhaka in Bangladesh was the only exception (Figure 1.1). Including Dhaka, seven of the ten largest urban agglomerations were in Asia, with Mexico City, New York-Newark (United States) and Sao Paulo (Brazil) completing the list.
Worldwide, there were more than 630 urban agglomerations with a population in excess of 750,000 inhabitants. Together, their population of 1.5 billion people was equivalent to just over one fifth of the world’s population.
1.1.2 People
Population growth is one of the most significant and persistent challenges faced by all economies. The world’s population was approaching 7,000 million at the beginning of 2010 and it continues to grow. In 2010, the most populous countries were China and India, which together accounted for 37.2% of the world’s population. The EU-27’s 501.1 million inhabitants, however, accounted for only 7.3% of the world total.7
Furthermore, an ageing society represents a major demographic challenge for many economies. A range of issues over recent decades may be responsible for ageing populations, including persistently low levels of fertility and significant increases in life expectancy.8 Figure 1.2 shows how different the age structure of the EU-27’s population is from the average for the world. Worldwide, the youngest age classes account for the largest share of population. But in the EU-27, the younger the cohort, the smaller the proportion of people under 44 years old. This reflects falling
fertility rates over several decades and the impact of the baby-boomer cohorts on population structure (resulting from high fertility rates in several European countries up to the mid-1960s). The gender imbalance among older age groups is also more noticeable for the EU-27 than for the world as a whole.
Finally, we have previously reported on findings that the global economy will be driven by the purchasing power of the middle classes, particularly in the BRIC countries and other emerging economies. A brief extract from last year’s report on this phenomenon is provided below.9
As the BRIC and other emerging economies become richer, they will not just fuel competition for low-cost and low-value-added manufacturing. They will also provide a growing consumer market and potential market for exports. McKinsey estimates that between now and 2020, approximately 900 million people in Asia will enter the middle class, with a disposable income that will enable them to look overseas for luxury goods and services.
Today, India and China account for a mere 5% of global middle class consumption, while Japan, the United States, and the European Union account for 60%. By 2025, those numbers are expected to equalise. By 2050, they will be flipped.
Fig. 1.1: Ten largest urban agglomerations in the world (2011)
Source: United Nations, Department of Economic and Social Affairs (World Urbanisation Prospects: the 2011 Revision)
Rest of the world13.3%
Remaining G20countries (1)14.2%
India 2.7%Brazil3.3%
Japan8.7%
China9.1%
United States22.9%
EU-2725.8%
0 5 10 15 20 25 30 35 40
Mexico City (Mexico)
Tokyo (Japan)
Beijing (China)
Delhi (India)
New York-Newark (United States)
Mumbai (India)
Shanghai (China)
Calcutta (India)
Million inhabitants
Dhaka (Bangladesh)
Sao Paulo (Brazil)
˜
4 The G20 first convened in November 2008. It brings together the world’s major advanced and emerging economies, comprising 19 country members and the EU. The country members include four EU Member States (Germany, France, Italy and the United Kingdom), and 15 countries from the rest of the world, namely: Argentina, Australia, Brazil, Canada, China, India, Indonesia, Japan, Mexico, Russia, Saudi Arabia, South Africa, South Korea, Turkey and the United States. 5 The EU in the world 2013, A statistical portrait, Eurostat, 2012, p8 6 Ibid, p17 7 The EU in the world 2013, A statistical portrait, Eurostat, 2012, p30 8 Ibid, p32 9 Engineering UK 2013 The state of engineering, EngineeringUK, December 2013, p7

Part 1 – Engineering in Context Capacity for growth 1.0 4
Back to Contents
10 OECD Local Economic and Employment Development (LEED) Working Papers 2012/08, OECD, 2012, p11 11 Talent Shortage Survey Results, Manpower Group, 2013 12 The relationship between graduates and economic growth across countries, BIS, August 2013, p8 13 First steps, A new approach for our schools, CBI, November 2012, p8 14 This represents the present value (discounted at 3%) of the gains from improving educational achievement to the top performer (Finland) out to 2090. This represents a significant increase in future GDP (about 1/6 higher in present value terms). Source: http://hanushek.stanford.edu/sites/default/files/publications/Hanushek%2BWoessmann%202012%20CESifoEStu%2058%281%29.pdf 15 Skills Taskforce Interim Report: Talent Matters – why England needs a new approach to skills, Labour, May 2013, p1 16 Skills Taskforce Interim Report: Talent Matters – why England needs a new approach to skills, Labour, May 2013, p3-14 17 https://www.gov.uk/government/news/prime-minster-announces-100000-new-engineering-apprentices June 2013 18 Communication from the Commission to the European Parliament, The Council, The European Economic and Social Committee and the Committee of the Regions, Rethinking Education: Investing in skills for better socio-economic outcomes, European Commission, Strasbourg, 20 Nov 2012, p2
1.1.3 Skills challenges
Government has identified that low skill levels are one of the key reasons for the UK’s relatively poor productivity in comparison to other countries. For example, by 1999 around one fifth of the UK’s productivity gap with France and Germany was the result of relatively poor skills at lower and intermediate levels.10 (Low skilled people also have constrained employment chances and are more likely to be marginalised in society.)
Manpower Group’s Global Talent Shortage Survey 201311 showed that the top two job shortages globally were skilled trades workers and engineers: in particular, mechanical, electrical and civil engineers. These results mirror 2012’s findings.
The benefits of skills – and in particular higher education – are evident. Econometric analysis indicates that a 1% increase in the share of the workforce with a university degree raises the level of long-term productivity by 0.2-0.5%. In the UK, the share of the workforce with a university education has increased by 57% between 1994 and 2005. Estimates suggest this will have raised UK long-run productivity by 11-28%. This means that at least one third of the 34% increase in labour productivity recorded between 1994 and 2005 can be attributed to an increase in graduate skills in the labour force.12
Raising standards in schools would bring similar benefits. In the UK, raising educational attainment to match the best in Europe could add one percentage point to growth annually.13 Raising the performance of UK schools to match that of Finland on core subjects could have a
value of more than £8 trillion over the lifetime of a child born today. Few other changes could make such a powerful difference to the UK’s economy.14
Skills do matter. Around the world, governments and employers are addressing urgent questions about how to develop highly skilled, talent-rich economies that can drive high levels of economic growth and enhance social cohesion. The most successful economies of the 21st Century will be those that can ensure their young people maximise their potential, develop skills and knowledge, and contribute to building successful companies. The stakes are high.15
Within the UK, the Skills Taskforce, commissioned by Labour, identified six fundamental problems in our skills system. Putting aside semantics, those that education and skills commentators, practitioners and policy makers could easily agree on were:16
1. The damaging divide between vocational and academic education
2. Low levels of employer involvement in the skills system
3. A fragmented education system
4. The need for a new vision for Further Education
5. The lack of high quality apprenticeships
6. Poor quality advice to navigate the transition between education and work
Ultimately, however, actions speak louder than words, which is why the Government’s scheme to produce 100,000 engineering technicians by 2018 is to be welcomed and applauded.17 The multi-million pound initiative is a national drive to encourage young people to sign up to an engineering apprenticeship. It will create a whole new generation of engineering technicians, giving them structured on-the-job training built upon a recognised academic qualification.
1.1.4 Teaching quality
Making sure there are enough high quality teachers to sustain the supply of young people with the right skills is a challenge shared by all countries.
In Europe, it is recognised that investment in education and training for skills development is essential to boost growth and competitiveness. Skills determine Europe’s capacity to increase productivity. In the long-term, skills can trigger innovation and growth, move production up the value chain, stimulate the concentration of higher level skills in the EU and shape the future labour market.18
5.0%
4.0%
3.0%
2.0%
1.0%
0.0%
1.0%
2.0%
3.0%
4.0%
5.0%
Male (EU-27) Male (World) Female (EU-27) Female (World)
0-4
20-24
15-19
10-14
5-9
40-44
35-39
30-34
25-29
45-49
65-69
60-64
55-59
50-54
85+
80-84
75-79
70-74
Fig. 1.2: Age pyramids (2010)
Source: Eurostat and the United Nations, Department of Economic and Social Affairs (World Population Prospects: the 2010 Revision)

5 1.0 Capacity for growth Part 1 – Engineering in Context
Back to Contents
It has also been noted that Europe must respond to an increase in the quality of education and supply of skills worldwide. However, European education and training systems continue to fall short in providing the right skills for employability. Educators are not working adequately with business or employers to bring the learning experience closer to the reality of the working environment. These skills mismatches are a growing concern for European industry’s competitiveness.19
High-quality and well-trained teachers can help learners develop the competencies they need to compete in a global labour market based on ever higher skills. Evidence20 shows that a primary influence on learners’ performance is the quality of teaching and learning.
Closer to home, the Confederation of British Industry (CBI) has endorsed this view. It notes that improving education standards has a very positive effect across society. Furthermore, global competition is increasing and our competitors continue to improve absolute performance in their schools: the need to improve education in UK schools will only grow.21 In China for example, a ten-year education reform plan is underway to “give priority to education and turn China into a country rich in human resources”.22
As mentioned at the outset, the quality and quantity of our teaching profession underpins the drive to improve the quality of education and skills. In this context, the findings of the Institute for Public Policy Research (IPPR) report on the importance of teaching23 are critical. They find that in most rich countries, as long as you go to school, it doesn’t matter very much which school you go to.24 In fact, in the vast majority of OECD countries, the school attended by an individual accounts for less than 10% of the variation in student achievement.25
Independent analyses of data from the Organisation for Economic Co-operation and Development’s Programme for International Student Assessment (the OECD’s PISA) yields similar results.26 In terms of the progress made by students, differences between schools are small: as long as you go to school, it doesn’t matter very much which school you go to. However, more fine-grained analysis of the relationship between contextualised value added and raw results at GCSE27 shows that while schools might not matter, that it matters very much which teachers are teaching you.28
In fact, the analysis shows that if teachers are allocated into three equal-sized groups – below average, average and above average – then students taught by an above average teacher make 50% more progress, and those taught by a below average teacher make 50% less progress than students taught by average teachers.29 The most effective teachers are therefore at least three times as effective as the least effective.
It is therefore reassuring that a report30 by the National Foundation for Educational Research (NFER), which used data from the most recent Trends in Mathematics and Science Study (TIMSS), showed that in England, 76% of students find their science teacher interesting, compared with 52% in Japan, 53% in Korea, and 54% in Taiwan.
Finally, while we are familiar with initiatives to recruit maths and physics teachers into schools, it is gratifying to note the recent targeted recruitment drive to boost mathematics teaching in the Further Education (FE) sector. The new initial teacher training bursary scheme that was introduced in September 2013 will pay graduates up to £20,000 to train and take up a maths teaching post31 within an FE College. Alongside this, a maths conversion course has been developed to help existing teachers to retrain to teach this subject in a college.
1.1.5 Maths and physics
The study of mathematics and physics at A level is a major route into engineering. To that end, EngineeringUK and the engineering community has called for the doubling of the numbers of young people studying GCSE physics.32 Consequently, the figures in Table 1.1 are cause for distress and should be noted by policy makers and educationalists.
Post-16 participation in mathematics and physics is strongly based on prior achievement. The overwhelming majority of those taking A level mathematics achieved grade A or A* at GCSE. But even here, participation is low: fewer than 50% of students with a grade A GCSE in mathematics go on to study AS level mathematics. By comparison, around 1% of those with grade C in GCSE mathematics continue to AS mathematics.
For physics, the situation is similar but more acute, albeit from a low base size. At 23%, the A* pass rate for physics is higher than maths, but there is much lower progression to AS level. Only 43% of A* GCSE physics students progress to AS level, compared with 79% of maths students. There is also a lower progression to A level, at 38% compared with 73% for mathematics.
19 Industrial Policy Communication Update, COM, 2012, p582 20 Education at a Glance, OECD, 2012 21 First steps, A new approach for our schools, CBI, November 2012, p6 22 China’s National Plan for Medium and Long-term Education Reform and Development, 2010-2020, accessed at https://www.aei.gov.au/news/newsarchive/2010/documents/china_education_reform_pdf.pdf 23 The importance of teaching, Dylan Wiliam, Excellence and Equity, Tackling educational disadvantage in England’s secondary schools, IPPR, June 2013 24 Ibid, p51 25 Programme for International Student Assessment [PISA] (2007) PISA 2006: science competences for tomorrow’s world (Vol 1), Paris: OECD 26 D. Wiliam, “Standardized testing and school accountability” in Educational Psychologist, 45(2), 2010, p107–122 27 A. Ray, School value added measures in England: a paper for the OECD project on the development of value-added models in education systems, Department for Education and Skills, 2006 28 D. Wiliam, “The importance of teaching” in Excellence and Equity, Tackling educational disadvantage in England’s secondary schools, IPPR, June 2013, p52 29 E. A. Hanushek E A, “The economic value of higher teacher quality” in Economics of Education Review, 30(3), 2011 p466–479 30 Science Education – Have We Overlooked What We Are Good At? N. Burdett and H. Weaving, NFER, September 2013 31 https://www.gov.uk/government/publications/vocational-education-reform-matthew-hancock-writes-to-colleges-and-independent-training-providers 32 http://www.engineeringuk.com/View/?con_id=358 or Engineering UK 2013 The state of engineering, EngineeringUK, December 2012, pXV

Part 1 – Engineering in Context Capacity for growth 1.0 6
Back to Contents
33 DfE research report RR195 Subject progression from GCSE to AS level and continuation to A level https://www.education.gov.uk/publications/eOrderingDownload/DFE-RR195.pdf Figures taken from Table B; note that these proportions are based on the number of entries (731,900 for mathematics for the 2007/08 cohort) rather than the number of students attempting (609,700). The former includes attempts by these pupils in previous years, but is relevant in assessing the progression of this cohort. 34 Ibid 35 Ibid, Table 1.1 – based on the progression of the 2007/08 cohort in the following two years 36 Ibid, Table 1.1 37 Ibid, Table 3.1 38 Ibid 39 Engineering UK 2013 The state of engineering, EngineeringUK, December 2012, section 1.1.3, p5; section 7.6, p61,61 and section 8.11, p75. 40 http://www.ifs.org.uk/caytpubs/CAYT_rep03.pdf 41 www.gov.uk/government/publications/plan-for-growth--5 42 www.gov.uk/bis/industrial-strategy 43 http://www.gov.uk/government/publications/engineering-skills-perkins-review
An allied issue is the chronic shortage of maths and physics teachers and lecturers. This was documented in the Engineering UK 2013 report, where we identified a shortage of 4-4,500 physics teachers.39
Finally, the case to encourage more young people to study mathematics, regardless of their career intentions, has been boosted by research published by the Institute for Fiscal Studies (IFS) and funded by the Department for Education (DfE) via the Centre for the Analysis of Youth Transitions (CAYT).40 Their main finding was that children with strong maths skills at age ten earn significantly more in their 30s.
The research used data from the British Cohort Study – a large group of individuals born in April 1970 – to look at the link between reading and maths scores at age ten, and earnings at ages 30, 34 and 38. Analysis showed that a child who scores in the top 15% of maths scores at age ten is likely to earn 7.3% more at age 30 than an otherwise identical child who achieves a middle-ranking maths score – even after controlling for the qualifications that they go on to obtain. This is equivalent to earning around an extra £2,100 per year.
We mentioned in the previous section that there is a positive correlation between teacher quality and young people’s grades. It is therefore disturbing to note the following findings (discussed more fully in section 7.8, Table 7.8):
• Just under three quarters (72.9%) of maths teachers have a relevant post A level qualification. However, fewer than half (45.4%) of teachers have a degree or higher qualification, while 7.1% have a BEd and 18.2% have a PGCE.
• For physics, a third (33.7%) of teachers don’t have a relevant post A level qualification. Just over half (56.1%) of physics teachers have a degree or higher, while 6.3% have a PGCE and 3.0% have a BEd.
1.2 Government ambition and intent“Commitment is what transforms a promise into reality.”
Abraham Lincoln
The Government’s Plan for Growth,41 described in the Engineering UK 2013 report and the chief vehicle for delivering growth, is now well established. All documents relating to the plan are now publically accessible via the internet (links are provided in the footnote).
Two more growth initiatives are worthy of note, since they have been allocated funding. These are the Industrial Strategy,42 described in detail in section 1.3.1, and the much publicised paper, Eight Great Technologies, explained in section 3.6.
In addition, Professor John Perkins, Chief Scientific Adviser for the department of Business, Innovation and Skills (BIS), has looked at the issue of engineering skills in the UK. The Perkins Review43 starts by endorsing the now widely accepted view that it would benefit the economy to substantially increase the supply of engineers entering the labour market and acknowledging the problems caused by specific skills shortages within engineering. Professor Perkins undertakes an end-to-end analysis of the talent pipeline, from the need to “prime” the pipeline by inspiring young people about engineering and giving them a strong academic foundation in school, to actions to tackle “leakage” and quality issues throughout the pipeline. The Review also puts forward actions to enhance the responsiveness of the system to employer needs through the following key recommendations:
(1) Inspiration: Employers, the profession and educators to join with Government to inspire young women (and men) through Tomorrow’s Engineers and a high profile annual campaign. Employers should offer industry experience to teachers as well as students.
(2) Vocational education: Government to build on UTCs to develop elite training facilities for adults. Employers should develop further Trailblazer apprenticeships in engineering and share knowledge eg via Teach Too.
(3) Higher education: Government should ensure universities can continue to deliver high quality engineering programmes. Employers should increase engagement with university students, including work placements, to raise profile of engineering careers.
Table 1.1: Progression from GCSE mathematics and physics to AS/A level mathematics and physics (2012)
Source: DfE, National Pupil Database
A* A B C
Percentage of entries resulting in each GCSE mathematics grade (2007/08)33
5% 11% 17% 26%
Percentage of entries resulting in each GCSE physics grade (2007/08)34
23% 29% 26% 15%
Progression rate from GCSE to AS mathematics by mathematics grade35
79% 48% 15% 1%
Progression rate from GCSE to AS physics by physics grade36
43% 30% 21% 5%
Progression rate from GCSE to A level mathematics37
73% 34% 6% 0%
Progression rate from GCSE to A level physics38
38% 22% 8% 1%

7 1.0 Capacity for growth Part 1 – Engineering in Context
Back to Contents
Several areas of interest essential to growth were allocated funding in the June 2013 Spending Review.44 These were:
• A long term settlement for science capital, maintaining spending in real terms at over £1.1 billion to 2020-21. Along with ring fencing a flat-cash resource funding for science and research, this will help ensure the UK remains at the cutting edge of scientific discovery linked to growth.
• An additional £185 million for the Technology Strategy Board (TSB). A number of programmes supporting the expansion of the network of Catapult Centres45 and innovative companies – particularly SMEs – will help translate scientific excellence into commercial success.
• £800 million additional funding for the UK Green Investment Bank46 for 2015/16. This will enable it to invest in low carbon infrastructure projects including renewable energy, waste management and energy efficiency.
• Funding of £600 million over two years (£300 million in each) for the Regional Growth Fund to support projects and programmes to create economic growth and sustain private sector employment.
• Protection of funding for the Aerospace Technology Institute, the automotive sector and the Advanced Manufacturing Supply Chain Initiative.
• Protection of 19+ apprenticeships in real terms. The Government has also announced that it will consult on a major reform of apprenticeship funding this summer to ensure purchasing power is held in the hands of employers. The consultation will consider options to make payments to employers through the PAYE system.
• Extension of traineeships to young people up to age 24, helping many more to make the transition from education to work.
• Creation of a new £100 million employer ownership fund to co-finance investment in skills in key sectors and new technologies, building on the lessons learnt from the Employer Ownership pilots.
• The creation of a £2 billion Single Local Growth Fund that Local Enterprise
Partnerships can bid for. This will include £500 million of skills funding.
• Continued support for UK Trade and Industry (UKTI), recognising its crucial importance to the UK economy and exports. UKTI will have a total departmental budget of £133 million in 2015-16. This encompasses efficiency savings of around £12 million on UKTI’s 2014-15 resource budget.
• Maintaining in cash terms current levels of funding for the National Careers Service and Adult Community Learning.
• £20 million extra funding for the new Competition and Markets Authority (CMA) from 2015/16. The Government will be asking the CMA to deliver efficiency savings of 10% in 2015-16.
Two important initiatives that are worthy of describing are the on-going roll out of the Regional Growth Fund (RGF) and the emergence of Local Enterprise Partnerships (LEPs):
Regional Growth Fund
The RGF is a flexible and competitive £3.2 billion fund operating across England from 2011 to 2017.47 It supports projects and programmes that are using private sector investment to create economic growth and sustainable employment.
In its fourth round,48 102 companies and projects successfully applied for funding. They will share a £506 million pot of funding designed to attract significant private sector investment and create thousands of jobs across the country. This round will leverage £2.8 billion of additional private sector investment and create or safeguard 77,000 jobs. When added to the success of the first three rounds, this represents a total of £15 billion private sector investment.
Local Enterprise Partnerships
LEPs are to be given greater freedom and resources in a bid to stimulate local growth through the creation of a Growth Deal.49 This will form part of an individual LEP’s Strategic Economic Plan: essentially, a plan for local growth, “based on a strong rationale, value for money and partnerships for delivery”.
By March 2013, 39 LEPs had been created.50 To date, the Department for Communities and Local Government (DCLG) and the Department for Transport (DFT) have allocated £730 million
funding, specifically to support infrastructure projects that promote the delivery of jobs and housing. The 2012 Autumn Statement announced a new £474 million Local Infrastructure Fund and LEPs were invited to apply for £250,000 annually to draw up their strategic growth plans.51 Further, following recommendations in Lord Heseltine’s report on growth, a ‘single pot’ funding scheme is expected to be launched in 2015. The pot is intended to include employment and business support, skills, local infrastructure and housing.52
1.3 UK industry strengthsThis section highlights the UK Industrial strategy and sectors where the UK has proven strength and is demonstrating the capacity for growth and competitiveness. It ends with a brief review on low carbon. The much publicised eight great technologies are covered separately in the UK Engineering research and Innovation chapter (Section 3.6).
The Government can deploy a wide range of policy levers to drive national growth, including taxation, resource spending, procurement, regulation, skills development and innovation support. These policies work together to correct market failures by altering the risks, costs and rewards associated with particular forms of economic behaviour by firms and individuals. The drivers and barriers to growth are also likely to vary from one geographical area to another, meaning that Government intervention may need to be tailored to reflect particular features of the local market.53
The Government has publically shied away from picking ‘winners’. Nevertheless, its review of Industrial Strategy: UK Sector Analysis54 recognised that it does need to provide a sliding scale of support for sectors. Given the variations in market conditions by sector, and the need for Government to engage across the economy, it is clear that Government intervention should operate on a spectrum – from a more horizontal approach with certain sectors, to one where the Government is involved with the sector in shaping its development. This graduated approach is described in Figure 1.3.55
44 The Chancellor delivered his Spending Round 2013 statement to Parliament on 26 June 45 https://www.innovateuk.org/-/catapult-centres 46 See section 1.3.3 47 www.gov.uk/understanding-the-regional-growth-fund 48 https://www.gov.uk/government/news/multi-million-pound-fund-boosted-to-support-growing-businesses-across-england, 11 July 2013 49 https://www.gov.uk/government/publications/growth-deals-initial-guidance-for-local-enterprise-partnerships 50 Gov.uk, Supporting economic growth through local enterprise partnerships and enterprise zones: https://www.gov.uk/government/policies/supporting-economic-growth-through-local-enterprise-partnerships-and-enterprisezones/supportingpages/local-enterprise-partnerships 51 The Guardian, Local enterprise partnerships: a hopeful sign or a threat to local democracy? 11 December: http://www.guardian.co.uk/society/2012/dec/11/local-enterprise-partnerships-decentralise-funding 52 The Rt Hon the Lord Heseltine of Thenford CH, No stone unturned, October 2012: https://www.gov.uk/government/uploads/system/uploads/attachment_data/file/34648/12-1213-no-stone-unturned-in-pursuit-of-growth.pdf 53 Understanding local growth, BIS Economics Paper No 7, 2010 http://www.bis.gov.uk/assets/biscore/economics-and-statistics/docs/u/10-1226-understanding-local-growth 54 Industrial Strategy: UK Sector Analysis, BIS Economics Paper No. 18, September 2012 55 Ibid, p30

Part 1 – Engineering in Context Capacity for growth 1.0 8
Back to Contents
56 Industrial Strategy: UK Sector Analysis, BIS Economics Paper No. 18, September 2012, p10 57 Ibid, p11 58 https://www.gov.uk/government/speeches/industrial-strategy-cable-outlines-vision-for-future-of-british-industry 59 https://www.gov.uk/government/uploads/system/uploads/attachment_data/file/31584/2011budget_growth.pdf 60 http://webarchive.nationalarchives.gov.uk/+/http:/www.hm-treasury.gov.uk/d/growth_291110.pdf 61 https://www.gov.uk/government/publications/no-stone-unturned-in-pursuit-of-growth 62 https://www.gov.uk/government/organisations/department-for-business-innovation-skills/series/industrial-strategy-government-and-industry-in-partnership 63 https://www.gov.uk/government/publications/industrial-strategy-uk-sector-analysis 64 Industrial Strategy: government and industry in partnership, Driving success –a strategy for growth and sustainability in the UK, automotive sector, HM Government, July 2013 65 Global Auto Forecast, R.L. Polk & Co., January 2012 and The Challenges for the European Automotive Industry, R. L. Polk & Co., July 2012 66 Annual Business Survey, 2011, Office for National Statistics, June 2013 67 2012 Production Statistics, International Organization of Motor Vehicle Manufacturers (OICA), 2013 68 Motor Industry Facts 2013, Society of Motor Manufacturers and Traders, March 2013 69 Industrial Strategy: government and industry in partnership, Lifting Off – Implementing the Strategic Vision for UK Aerospace, HM Government, March 2013
1.3.1 The UK industrial strategy
Analysis by BIS shows that, like other countries, the UK’s economy is shifting markedly away from manufacturing and towards services: in particular, to knowledge intensive services such as finance, professional services and ICT.56
Rather than being due to contraction in manufacturing, BIS found that this shift has been driven by the rapid growth of service sectors. It can be attributed to several factors:57
• The rapid pace of globalisation and technological progress, particularly in manufacturing. An increase in low-wage competition and technological improvements have together led to continuing falls in global prices of manufactured goods relative to services, driving down their share of GDP.
• A growing global middle class, particularly in emerging economies. This has broadened the UK’s export market across services such as creative industries, professional business services and manufacturing.
• A steadily ageing population which is driving rising demand for health and social care. A third of UK health spending is on those aged over 65.
• Increased Government investment in the green agenda. This has fostered growth in the low carbon technologies, renewable energy and environmental goods and services, as well as investment in public services and construction.
In response to this, the Business Secretary, Vince Cable, set out the Government’s approach to industrial strategy58 in September 2012. The industrial strategy builds on the Government’s Plan for Growth59 and the Growth Review,60 which looked at how the Government is
addressing the barriers faced by industry. The importance of an industrial strategy was also highlighted in Lord Heseltine’s report on UK competitiveness, No stone unturned.61
The strategy, in essence, takes stock of which sectors could make the greatest contribution to future economic growth and employment in the UK and how growth may be best achieved. It is based on several key principles:
1. A focus on the long term to build sustainable growth – making enduring decisions, allowing sufficient time for policies to work, and creating long-lasting structures to support stable delivery.
2. A continuing commitment to open and competitive markets as a means to stimulate innovation and growth.
3. Identifying where the UK can have greatest success in capturing high value opportunities based on its key strengths and capabilities, and putting the weight of Government behind these areas to enhance them.
4. Building a collaborative but challenging strategic partnership with industry to ensure appropriate Government intervention which delivers the desired market outcomes.
The resultant outcomes fall into three groups: advanced manufacturing, enabling sectors and knowledge services. Under advanced manufacturing there is automotive manufacturing, aerospace, life sciences and agricultural technologies. The so-called ‘enabling sectors’ cover three energy sectors: offshore wind, civil nuclear plus oil and gas, and construction. In addition, there are three sectors grouped under knowledge services: international education, information economy, and professional and business services. Each sector has been selected on account of its future growth potential.
The Government’s industrial strategy publications62 and published analyses of industry sectors (outlining which factors are considered in choosing which industries to work with)63 can be accessed by following the links listed in the footnotes.
1.3.2 Strengths and opportunities
Automotive
Automotive is one of the UK’s leading export sectors by value, generating £30.7 billion revenue in 2012 and representing around 6.3% of all UK exports. Sales to the EU26 accounted for 46% of total automotive sector exports in 2012.64
The global auto industry is forecast to grow from 77.7 million cars, light trucks and commercial vehicles manufactured in 2012 to 96.3 million in 2016. In addition, there is a strengthening trend towards premium vehicles in line with middle class income growth in developing nations.65
The UK automotive industry accounts for 129,000 jobs in over 2,700 businesses: 5.2% of manufacturing employment and 7.3% of manufacturing output.66 In recent years, the industry has seen its fortunes transformed, and has now grown to become the fourth largest automotive producer in Europe, and 14th largest globally.67
Britain is the fourth largest vehicle producer in Europe, making 1.58 million vehicles in 2012. Every 20 seconds a car, van, bus or truck rolls off a UK production line. Over 80% of these are exported, to more than 100 countries.68 By 2040, almost none of Europe’s new cars will be powered solely by a traditional petrol or diesel engine.
Aerospace
UK aerospace has a 17% global market share, making it the number one aerospace industry in Europe and globally second only to the United States. The sector creates annual revenues of over £24 billion and exports circa 75% of what it produces, making a positive contribution to the UK’s trade balance. The sector supports more than 3,000 companies distributed across the UK, directly employing 100,000 people and supporting an additional 130,000 jobs indirectly.69
The UK aerospace industry is expected to grow at a rate of 6.8% over the next few years. This is driven by a global increase in air traffic, which is
Fig. 1.3: Graduated spectrum of Government sector support
Strategic partnershipSustained dialogueActionLight touch
Government sets the environment through horizontal policies (eg tax, IPR, skills)
Government takes action to respond to specific issues (eg tourism in 2012)
Strategic long termpartnership
Sustained dialogue and action eg sector councils,joint strategies

9 1.0 Capacity for growth Part 1 – Engineering in Context
Back to Contents
expected to be sustained at a rate of 4.7% per annum between now and 2030. This means a doubling in air traffic in the next 15 years.70
It is estimated that there will be global demand for 27,000 new passenger aircraft, worth around $3.7 trillion, by 2031. In addition, global demand for commercial helicopters is expected to be in excess of 40,000 and worth circa $165 billion by 2031.
Construction
Contributes £90 billion gross value added to the UK economy (nearly 7% of the total), comprises over 280,000 businesses and accounts for three million jobs.71 This is equivalent to about 10% of total UK employment.72
Construction contributes 8% to GDP and employs 2.47 million workers across its supply chain.73 This supply chain accounts for around £124 billion of intermediate consumption,74 almost all sourced within the UK. In other words, construction spend tends to stay within the UK supply chain.
The global construction market is forecast to grow by over 70% by 2025,75 concentrated primarily in emerging economies.76
Finally, we should note the commitment from the Chancellor in the June 2103 spending review77 to £50 billion capital investment in 2015, to include, “roads to railways, bridges to broadband and science to schools”.
Space Industry
The space industry’s economic contribution to the UK economy is impressive. Together, the 260 companies78 actively involved in the UK space industry recorded a total space-related turnover of £9.1 billion in 2010/11 (compared with £7.5 billion in 2008/09). This represents a real growth of 15.6% since 2008/09. The average annual growth rate over the last two years surveyed was 7.5%.79
The UK Space Agency is set to invest £1.2 billion in some of Europe’s biggest and most lucrative space projects. This will provide the UK with increased leadership in a rapidly-growing global sector and build on the British space industry’s £9.1 billion contribution to the economy.80
Employment in the space industry has grown rapidly since the previous survey, with an average annual growth rate of almost 15% between 2006/07 and 2008/09, reaching 24,900 in 2008/09. Survey responses indicate that the industry’s workforce is highly skilled, with over 70% of employees holding at least a first degree.81
Life sciences
The life science industry is truly a jewel in the crown of our economy. There are around 380 pharmaceutical companies based in the UK, employing nearly 70,000 people, with an annual turnover of £30bn. In addition, the medical technology and medical biotechnology sectors together employ over 96,000 people with a combined annual turnover of around £20bn.82
• Life sciences sectors remained resilient during the recession (eg pharmaceuticals export growth of 31% between 2008 and 2011).
• The pharmaceutical sector accounted for almost 39% of total manufacturing business research and development (R&D) spend in 2011, higher than any other manufacturing sector.
• Pharmaceutical R&D spend has shown robust growth, increasing by 70% between 2000 and 2011.
• The pharmaceuticals sector in particular makes an important contribution to the UK’s trade balance. Exports grew by 11% a year between 2000 and 2011.
Oil and gas
The UK oil and gas supply chain is well positioned across the value chain, with 1,100 companies achieving combined revenues of £27 billion in 2011.83 It meets almost one half of the UK’s total primary energy needs.84
Oil and gas provides a source of employment for over 400,000 people across the UK (45% in Scotland, and 55% in England, Wales and Northern Ireland).85
It is Britain’s largest industrial investor and is investing more than ever before (£11.5 billion in 2012 and a forecasted investment of £14 billion in 2013).86
This sector boosts the balance of payments by almost £50 billion a year by reducing oil and gas imports, and by exporting goods around the world.
Shale gas
Shale gas is already recognised as a major energy source in the US. In the UK, there has been a meteoric rise in interest in this controversial energy source.
The Institute of Directors (IoD) claims that shale gas production could satisfy one third of the UK’s annual gas demand at peak output by 2030 and could create 74,00 jobs.87 The business group said the industry, which involves the process of fracking, could also help to support manufacturers and reduce gas imports.
According to a report by PWC, shale oil production could boost the world economy by up to $2.7 trillion (£1.7 trillion) by 2035. The extra supply could reach up to 12% of global oil production, or 14 million barrels a day, and push global oil prices down by as much as 40%.88
Power
With an annual turnover of $50 billion, the UK’s power sector89 employs 230,000 people and has exports of more than $6 billion per year to over 100 countries.90 UK energy companies are forecast to generate revenues of $300 billion by 2030, employing one million workers.
By 2050, investment into six low carbon technologies that make up the renewable capabilities of the supply chain is expected to create 175,000 jobs and generate $40 billion a year. These are wind, marine, landfill gas and biomass, fuel cells, geothermal energy and hydroelectric power.
According to the Carbon Trust, the UK is forecast to capture just under a quarter of the global marine energy market by 2050, generating up to 68,000 jobs and $121 billion.
The UK’s solar power market is worth $1.6 billion a year and UK firms and universities number among the world’s leading centres of research into photovoltaics (PV).
By 2030, the global nuclear industry is forecast to increase its capacity by 10%, representing over $300 billion of investment over the next two decades.
70 Ibid, p9 71 ONS Annual Business Survey (ABS), 2011 provisional results. The ABS is preferred as it is the only source with sufficient detail to allow for the calculation of GVA for the wider construction sector, and for comparison of wider construction with other industries. It should be noted that the ONS National Accounts (2011) gives GVA for construction contracting alone as £90 billion because it makes adjustment for output unrecorded by the ABS; a figure for wider construction cannot be calculated from National Accounts, but it is likely to be higher 72 BIS analysis of Labour Force Survey micro-data, non-seasonally-adjusted for wider construction sector as above 73 Construction Skills Network, Blueprint for Construction 2013-2017 74 BIS analysis of ONS Labour Force Survey micro-data, January-March 2013 75 Industrial Strategy: government and industry in partnership, Construction 2025, HM Government, July 2013 76 Global Construction Perspectives and Oxford Economics (2013) Global Construction 2025. Construction output is estimated to grow from about $8.7 trillion in 2012 to $15 trillion in 2025. www.globalconstruction2025.com 77 The Chancellor delivered his Spending Round 2013 statement to Parliament on 26 June 78 Upstream (providers of space technology) and downstream (users of space technology) space sectors 79 UK Space Agency, Civil Space Strategy 2012-2016, July 2012 80 BIS press release: 21 November 2012, 16:00 81 The Size and Health of the UK Space Industry, A Report for the UK Space Agency, Executive Summary, November 2010 82 Industrial Strategy: government and industry in partnership, Strategy for UK Life Sciences One Year On, HM Government, December 2012 83 Ernst & Young Review of the UK oilfield Services Industry 2012 http://www.ey.com/Publication/vwLUAssets/Review_of_the_UK_oilfield_services_industry_2012/$FILE/EY_Review_of_the_UK_oilfield_services_industry_2012.pdf 84 Industrial Strategy: government and industry in partnership, UK Oil and Gas – Business and Government Action, HM Government, March 2013 85 Oil & Gas UK Economic Report 2012 http://www.oilandgasuk.co.uk/cmsfiles/modules/publications/pdfs/EC029.pdf 86 DECC, https://www.gov.uk/oil-and-gas-uk-field-data#ukcs-income-and-expenditure 87 http://www.telegraph.co.uk/finance/newsbysector/energy/10072029/Shale-gas-could-be-a-new-North-Sea-for-Britain.html 88 http://www.bbc.co.uk/news/business-21453393 89 UKTI identifies and describes in detail the power sector as: Renewables, Nuclear, Thermal, Transmission and distribution and Asset Management. 90 UK Power – Capabilities for a low carbon future, UK Trade and Investment, 2012

Part 1 – Engineering in Context Capacity for growth 1.0 10
Back to Contents
91 Industrial Strategy: government and industry in partnership, International Education: Global Growth and Prosperity, HM Government, July 2013, p6 92 Higher Education – Business and Community Interaction Survey 2011-12, May 2013, p1 93 https://www.gov.uk/government/uploads/system/uploads/attachment_data/file/249720/bis-13-1241-encouraging-a-british-invention-revolution-andrew-witty-review-R1.pdf 94 Jewels in the crown: The importance and characteristics of the UK’s world-class universities, The Russell Group, Russell Group Papers – Issue 4, 2012, p4 95 Constructing knowledge societies, World Bank, 2002 96 The PBS sector in the UK includes: legal activities, accounting, bookkeeping and auditing; activities of head offices and management consultancy; architectural and engineering activities and technical testing and analysis; scientific research and development; advertising and market research; other professional, scientific and technical activities; rental and leasing activities; office administrative, office support and other business support activities. 97 Industrial Strategy: government and industry in partnership, Growth is Our Business: A Strategy for Professional and Business Services, HM Government, July 2013 98 OECD Trade in Services data 99 ONS National Accounts data and BIS calculations 100 Ibid 101 ONS Pink Book 102 OECD Trade in Services data 103 Invest for Growth, EEF, March 2013, p4 104 Ibid, p3 105 The Route to Growth, Delivering a Stronger, Better Balanced Economy, The View From Industry, CBI, March 2013
Global investment in thermal power generating capacity between now and 2030 is expected to be around US$3 trillion.
Higher Education
The Department of Business, Innovation and Skills estimates that in 2011, education exports were worth £17.5 billion to the UK economy.91 Of this, universities contributed £3.4 billion through services to business, including commercialisation of new knowledge and delivery of professional training and consultancy. This is a 4% increase from 2010-11.
Particularly significant is the 11% increase in activity benefitting small and medium-sized enterprises. These gain a competitive advantage from their association with universities – for example through access to specialist knowledge (via consultancy) or facilities (such as rapid prototyping or computer-aided design).92
Engagement with large businesses increased by around 5% overall, including a notable rise (6%) in contract research income, from £343 million in 2010-11 to £365 million in 2011-12. This not only shows UK Higher Education Institutions responding to the needs of business at home, but investment from overseas seeking to take advantage of the UK’s world-class research.
Sir Andrew Witty’s Review of Universities and Growth93 endorsed the fact that universities have extraordinary potential to enhance economic growth. The report recommends that incentives should be strengthened to encourage maximum engagement in an enhanced Third Mission alongside Research and Education, and universities should make facilitating economic growth a core strategic goal. This is supported through the recommendation that the Government should establish a funding stream worth at least £1 billion over the life of the next Parliament available to Arrow Project consortium bids.
Finally, countries around the world are increasing their investments in Higher Education, and most are investing in a selective way and concentrating funding.94 This is in recognition of the benefits of a diverse Higher Education system, and the dangers in spreading funding too thinly across too many institutions. For many governments, the priority is to make sure that their top universities can compete at the cutting edge of intellectual and scientific development.95 Last year, China committed £7.2
billion of its education budget to achieving world-class status for just 100 of its 3,000+ universities. By 2017, more than £2 billion will have been invested in Germany’s Excellence Initiative, aiming to create 37 clusters of research excellence and nine excellent universities. Japan, South Korea, Taiwan, France and Canada are also investing selectively in leading institutions to attract academic talent, international students and research funding in order to boost their international competitiveness.
Professional and business services
We are among the world leaders in most of the highly skilled services which make up the professional and business services (PBS) sector.96,97 The UK is keenly competitive in world markets, with a share of exports to developed (OECD) economies of 12%, second only to the US.98
The PBS sector generates 11% of UK gross value added and provides nearly 12% of UK employment.99 It also contributes strongly to economic growth and productivity: despite the economic downturn, PBS has seen growth of nearly 4% a year in the last decade.100 Export performance is strong, totalling £47 billion in 2011101 and with a trade surplus of £19 billion (a third of the UK’s total services sector surplus).102
Manufacturing
During the last three decades, manufacturing has weathered four recessions, adapted to a more global operating environment and faced considerable pressure from emerging economies.103
There is now widespread agreement that a globally-competitive manufacturing sector is a critical component of a better balanced economy.104
Manufacturing contributes more than half of our exports. It has a 2.7 million-strong workforce, accounts for 72% of business R&D expenditure and was responsible for over £12 billion of new investment in 2011.105
Manufacturing productivity has increased 45% in a decade, contributing a third of the UK’s total productivity growth.
The share of manufacturing employees in highly skilled employment increased from 30% to 35% in a decade.
UK goods exports to China are up more than six-fold in a decade. Total exports to the BRICs are up 360%.
Mid-sized manufacturing firms
Within the manufacturing sector, mid-sized firms have started to receive significant attention. This is because the economic context for UK manufacturers is changing rapidly. Over

11 1.0 Capacity for growth Part 1 – Engineering in Context
Back to Contents
the coming decade, making products globally will become unattractive for many sectors, as new production technologies and rising costs and regulations fundamentally change the economics of production. This will mean more will be made at home and exporting will be replaced with owning or controlling factories in target markets abroad.
Mid-sized manufacturing firms have the right scale to take advantage of the changes, retaining the agility of smaller companies but large enough to invest in new production technologies. Indeed, these companies have managed to grow through the recession, adding employment while large companies have been shedding jobs, as well as not outsourcing at the same levels as larger firms.106
A report by the RSA showed that there are approximately 2,500 mid-sized manufacturing firms in the UK, with a turnover between £25 million and £500 million and with between 100 and 2,000 employees.107 The report states that due to their agility and their closeness to their customer base, mid-sized manufacturing firms will be key to future growth and rebalancing in UK manufacturing.
All of these attributes make mid-sized companies attractive to Government as a potential source of job stability and growth in regional economies.
Cities
The growing recognition and emergent Government support for our cities has to be captured as a key economic strength for the UK. The emergence and importance of global agglomerations was mentioned in section 1.1.1. This effect also plays a significant role within the UK through its cities and towns.
Business co-location – or what is often termed agglomeration effects – brings further advantages to cities. Typically, if businesses are located close together, there are potential sharing and matching advantages (eg saving on shared infrastructure costs, or finding appropriate customers, suppliers and employees). This facilitates knowledge exchange between businesses.
Overall, because urban environments offer agglomeration advantages, businesses in our towns and cities matter substantially to future economic prosperity.108
Recent policy changes have sought to do more to respond to cities’ individual needs: in particular, the Government’s City Deals initiative.109
Overall, cities account for 54% of the UK’s population. Four cities (London, Birmingham, Manchester and Glasgow) accounted for 23% of the UK’s total population. London alone accounted for 15% of the UK’s total population.110
London, Birmingham and Manchester – the UK’s largest cities – are home to almost 50% of the total number of businesses based in cities (553,900 out of 1,111,000) and 26% of all UK businesses.111 Other towns and cities are also growing in stature. Santander has developed a UK Town and City Index which shows Cambridge, Oxford, Edinburgh, Crawley and Worthing topping the ten cities and towns rankings.112
High technology industries
If you look at industries by their technological capability rather than by sector, some very interesting findings emerge. Eurostat showed that, despite the financial and economic crisis, production for EU-27 high technology industries rose by 26% between Q1 2005 and Q3 2012, whereas production for low technology industries fell by 6%.113
Indeed, high technology industries suffered less badly (falling by less than 10%) and recovered more quickly that low technology industries during the financial crisis. Production among Europe’s high technology industries in Q3 2012 was more than 21% higher than in 2005 and more than 12% higher than during the crisis. High technology industries are clearly a strategic opportunity for the UK.
1.3.3 Low carbon – revisited
“For the first time in human history, the concentration of climate-warming carbon dioxide in the atmosphere has passed the milestone level of 400 parts per million (ppm). The last time so much greenhouse gas was in the air was several million years ago, when the Arctic was ice-free, savannah spread across the Sahara desert and sea level was up to 40 metres higher than today.”114
Richard Rugg, MD, Carbon Trust Programmes, Carbon Trust
We last focused in detail on low carbon back in Engineering UK 2011,115 recognising that the current issues of low carbon / green technologies remain prominent within the climate change agenda. This ‘sector strength’ deserves a sub-section of its own to do it justice.
Through the Climate Change Act 2008, the UK has committed itself to a legally-binding target to reduce greenhouse gas emissions by 80% on 1990 levels by 2050.116 Most of these emissions are linked to energy from fossil fuels – the vast majority of our electricity, heat and transport.
Alongside this, the UK is a signatory of the European Union’s climate and energy package, which sets an ambition to reduce emissions and increase renewable deployment to 2020. Each member state has bespoke targets reflecting national circumstances. The UK’s target for renewable energy is 15%. A plan for accelerating deployment to 2020 is contained in the Renewables Roadmap, which identifies eight technologies117 considered most likely to help the UK achieve its 2020 obligations.
The UK has a solid stake in the global market118 with a market share of 3.7%, and has shown consistent growth since 2007/08. While the UK is the ninth-biggest manufacturing country in the world, it is the sixth-largest producer and provider of low carbon and environmental goods and services, behind only the US, China, India, Japan and Germany. UK output was £122.2 billion in 2010/11, providing employment for 940,000 people.119 Our trade is in surplus with exports of about £12 billion, exceeding imports of about £7 billion.120
The low carbon sector has showed its resilience. Research by the CBI, the Green Alliance and the UK Government has highlighted that it has been growing despite the recession (Figure 1.4)121 and that over a third of the UK’s economic growth in 2011/12 is likely to have come from green business.122
Globally, it is recognised that countries differ in their ability to prosper in a world moving to limit pollution. The Climate Institute/GE Low carbon Competitiveness Index123 indicates that the United Kingdom, France, Japan, China and South Korea are currently best positioned to prosper in the global low carbon economy.124
106 Making At Home, Owning Abroad – A Strategic Outlook for the UK’s Mid-Sized Manufacturers, Finbarr Livesey and Julian Thompson, April 2013, p8, www.thersa.org 107 Making At Home, Owning Abroad – A Strategic Outlook for the UK’s Mid-Sized Manufacturers, Finbarr Livesey and Julian Thompson, April 2013, p10, www.thersa.org 108 The Santander UK Town and City Index, January 2013 109 Cities Outlook 2013, Centre for Cities, January 2013, p7 110 Ibid, p39 111 The Santander UK Town and City Index, January 2013, p41 112 Ibid, p6 113 Eurostat, Statistics in focus — 1/2013, High-technology and medium-high technology industries main drivers of EU-27’s industrial growth 114 Richard Rugg, MD, Carbon Trust Programmes, Carbon Trust Monday 13 May 2013 115 Engineering UK 2011 The state of engineering, “Section 2- engineering in the low carbon economy, EngineeringUK”, December 2010, p21-30 116 Compared with 1990 levels. This is enshrined in the 2008 Climate Change Act 117 Onshore wind; offshore wind; marine energy; biomass electricity; biomass heat; ground source heat pumps; air source heat pumps; renewable transport 118 Tech for Growth, Delivering green growth through technology, EEF The manufacturers’ organisation, January 2013, p10 119 Low carbon environmental goods and services (LCEGS), BIS, http://www.bis.gov.uk/assets/BISCore/business-sectors/docs/l/12-p143-low-carbon-environmental-goods-and-services-2010-11.pdf 120 Low Carbon Goods and Services, Department for Business, Innovation and Skills, 2012. 121 Green Economy: a UK success story, Green Alliance, http://www.green-alliance.org.uk/uploadedFiles/Publications/reports/British_success_story_Issuu.pdf 122 The Colour of Growth, CBI, http://www.cbi.org.uk/media/1552876/energy_climatechangerpt_web.pdf 123 The Climate Institute/GE Low carbon Competitiveness Index measures the ability of G20 nations to provide prosperity for their citizens in a world that limits carbon emissions. The Index was first developed by Vivid Economics in 2008. It comprises analysis of 19 variables that have been shown to have a statistical relationship to a country’s carbon productivity, defined as the amount of carbon emissions produced by a given level of economic output. 124 Global Climate Leadership Review, The Climate Institute, 2013, p8

Part 1 – Engineering in Context Capacity for growth 1.0 12
Back to Contents
This bodes well, as the global low carbon market was worth more than £3.3 trillion in 2009/10125 and is projected to reach £4 trillion by 2015.126 The low carbon market in China alone is around £430 billion (13% of the market).127
There are many components under the banner of achieving a low carbon economy that contribute to helping the UK achieve both its agreed reduction in greenhouse gasses and increased contributions of renewable energy. The rest of this section itemises and describes the contribution of a few of the significant protagonists.
Nuclear
The Government’s Nuclear Industrial Strategy states that new nuclear power is essential to meeting the objective of delivering a secure, sustainable and low carbon energy future.128
Over the coming decades, the nuclear industry is set for a global expansion. Around £930 billion investment is planned globally to build new reactors129 and £250 billion is needed to decommission those that are coming off-line.130 Added to this is a significant potential market in extending the life of existing nuclear reactors and enhancing their efficiency.
Although UK firms have been involved in equipment supply and professional services to projects overseas, there has been no new civil
UK nuclear station built since the mid-1990s. In the UK, industry has set out plans to deliver around 16GW of new nuclear by 2030. This broadly translates into at least 12 new nuclear reactors.
In parallel, the UK’s strategy to clean up its existing nuclear facilities is being delivered by the Nuclear Decommissioning Authority (NDA)131 through the established decommissioning supply chain. This is an existing UK market worth around £3 billion a year. The skills, capabilities and capacity needed for this decommissioning work are significant in their own right.132
Gas
The Government expects that gas will continue to play a major role in our electricity mix over the coming decades, along with low carbon technologies, as the UK decarbonises its electricity system. There are several possible scenarios, depending on a range of factors such as fossil fuel prices, carbon prices, demand and the deployment rates and levels of low marginal cost, low carbon generation. Including capacity commissioned in 2012, they predict a need for investment in up to 26GW of new gas capacity by 2030.133
The gas generation strategy134 therefore sets out the important role that gas generation will play in any future generation mix, supporting a
reliable, secure, low carbon and affordable electricity system. The policies set out in the strategy aim to deliver an adequate level of overall generation capacity, which includes a significant role for gas (including with carbon capture and storage), to ensure security of supply and an affordable energy mix as we move in to a low carbon economy.
Wind power
The British Isles sit at Europe’s windy Atlantic fringe. As a result of its exposed location, the UK has the greatest potential for wind power of any European country, both onshore and offshore.135 This resource, when combined with the UK’s engineering heritage and the right market and policy framework, could be a source of significant economic opportunities for the UK.136 By 2020, the UK Government’s Renewable Energy Roadmap anticipates 18GW of offshore wind capacity will be added, supplying around 55TWh, from around 3,000 to 4,000 offshore turbines.137
Onshore wind is one of the most cost-effective of the low carbon technologies and, with continuing Government support, the average wind farm may produce power at costs that compete globally with fossil fuels as soon as 2016.138
Offshore wind is more expensive than onshore wind but the cost is expected to come down rapidly.139 It is capable of providing huge amounts of low carbon electricity for the UK – potentially 45% of the UK’s total electricity needs in 2030 – 140 and can make a major contribution to the 2020 renewables target. It could also generate significant benefits for the economy, contributing £3–10 billion annually between 2010 and 2050.141
Role of SMEs
“Small businesses… are the engine of the economy.”
David Cameron142
A report by the Carbon Trust highlights the pivotal role small and medium sized enterprises (SMEs)143 are playing in driving the UK’s low carbon economy. It also highlights the economic opportunities that exist both within the UK and in increasing the UK’s share of a global low carbon sector which is worth more than £3 trillion now and forecast to be worth £4 trillion by 2015.144
125 Low carbon environmental goods and services (LCEGS): Report for 2010/11, BIS, 2012 126 Tech for Growth, Delivering green growth through technology, EEF The manufacturers’ organisation, January 2013, p10 127 Country Attractiveness Indices (Cited in ECC Committee report: http://www.publications.parliament.uk/pa/cm201213/cmselect/cmenergy/529/529.pdf p15 128 Nuclear Industrial Strategy -The UK’s Nuclear Future, HMG, March 2013, p7 129 The World Nuclear Supply Chain: Outlook 2030, WNA, Sep 2012 130 A Review of the UK’s Nuclear R&D Capability, commissioned by the TSB, 2008 131 http://www.nda.gov.uk/ 132 Nuclear Industrial Strategy -The UK’s Nuclear Future, HMG, March 2013, p8 133 Gas Generation Strategy, DECC, December 2012, p14 134 Gas Generation Strategy, DECC, December 2012 135 Department for Energy and Climate Change [DECC] (2012a) UK Renewable Energy Roadmap. https://www.gov.uk/government/uploads/system/uploads/attachment_data/file/48128/2167-uk-renewable-energy-roadmap.pdf 136 Beyond The Bluster Why Wind Power is an Effective Technology, IPPR, August 2012 137 Offshore Wind Energy: A UK Success Story, UK Trade & Investment, April 2012, p4 138 Bloomberg New Energy Finance [BNEF] (2011) “Onshore wind to reach parity with fossil-fuel electricity by 2016”, press release, 10 November 2011 http://bnef.com/PressReleases/view/172 139 Department for Energy and Climate Change [DECC] (2012c) “Offshore wind industry to slash costs by over 30% in next seven years”, press release, 13 June 2012. 140 The Renewable Energy Review, Committee on Climate Change, 2011 141 Offshore wind green growth paper, Carbon Trust, 2011 142 Conservative Party Conference speech, October 2011 143 Low Carbon Entrepreneurs: The New Engines of Growth, Carbon Trust, May 2013, p7 144 The Move to a Green Economy: A Guide for small business, HM Government, http://uk.practicallaw.com/cs/Satellite?blobcol=urldata&blobheader=application%2Fpdf&blobkey=id&blobtable=MungoBlobs&blobwhere=1247310160575&ssbinary=true
Fig. 1.4: Indexed growth in green economy compared with overall economic growth
Source: Green Alliance, Green economy: a UK success story, p1
Projected growth
Indexed growth rate since the financial crisis
Indexed to 2007
Green economy turnover GDP
-10.0%
30.0%
10.0%
40.0%
20.0%
0.0%
2014
2008
2009
2010
2011
2012
2013

13 1.0 Capacity for growth Part 1 – Engineering in Context
Back to Contents
The report finds that SMEs represent 60% of all UK private sector jobs and that nine out of ten unemployed people who found work in the private sector since the economic downturn either started or joined an SME.145 Small businesses also account for 91.5% of the low carbon sector146 and are therefore critical to the present success and future potential of the low carbon economy.147
Green Investment Bank
In terms of helping to deliver green growth, the launch of The UK Green Investment Bank (GIB) is a welcome and innovative move. The first bank of its kind in the world, it has £3.8 billion of funding from the UK Government to invest in sustainable projects.148
There are five elements, or green purposes, that enshrine the way the bank sets its investment strategy and considers each investment. These are an investment’s ability to influence the following:
1. The reduction of greenhouse gas emissions
2. The advancement of efficiency in the use of natural resources
3. The protection or enhancement of the natural environment
4. The protection or enhancement of biodiversity
5. The promotion of environmental sustainability
State aid approval by the European Commission gives the UK GIB the remit to make investments on commercial terms across the following wide range of green economy sectors:
• Offshore wind
• Waste (treatment and recycling and energy from waste)
• Non-domestic energy efficiency
• Other sectors: – Biofuels for transport – Biomass power – Carbon capture and storage – Marine energy – Renewable heat
Whilst the low carbon glass appears to be half full, we should note the findings of the Committee on Climate Change (CCC) which has estimated that, despite reductions of around
20% in production emissions over the last 20 years, the UK’s carbon footprint has actually increased by more than 10%. According to its report, Reducing the UK’s carbon footprint and managing competitiveness risks,149 this is due to an increase in imports, as incomes have grown and manufacturing has shifted to other countries as part of the broader globalisation process.
1.4 Miscellaneous but noteworthyFinally, this section will examine three important but unrelated report findings.
1.4.1 UK universities engineering departments’ ability to double their capacity
In our 2103 report, we identified that the UK needs to roughly double its output of students with level 4+ qualifications to meet the future UK demand for engineers with level 4+ skills, and that this can be achieved via universities and colleges of Further Education. A clear question arising was: if the number of students applying for engineering at university did double, would universities actually have the capacity to recruit them? And if not, how long would it take for departments to build the capacity to be able to accommodate a doubling of numbers? To that end, the Engineering Professors’ Council carried out a poll among its members,150 asking the question:
Over what time period could you accommodate a doubling of your intake of undergraduate (and separately) postgraduate engineering students?
The majority of respondents said that increasing capacity to accommodate twice as many students would take three to five years.151 This significant time lag clearly needs to be factored into any policies and/or interventions aimed at significantly increasing the numbers of engineering undergraduates and postgraduates.
Specifically, 51% of those responding said that it would take three to five years to accommodate double the number of undergraduate students. Twenty-five per cent said it would take six to ten years, or even longer. For postgraduate
students, 34% said it would also take three to five years to accommodate twice as many, with a further 58% saying that they could do so immediately or within one to two years. There were no significant differences in the pattern of response by engineering discipline or university type.
1.4.2 Leadership and management
Research and innovation, advanced manufacturing processes, a highly skilled workforce and so on are not the only determinants or contributors to the UK economy. The quality of leadership and management is also a key factor. A paper developed by BIS’s Leadership and Management Network Group (LMNG), aimed at business intermediaries and representative bodies that offer business support and advice, puts forward the arguments for business investment in leadership and management skills. It bases its argument on evidence about current practice and the UK’s position relative to key competitor nations.152
The paper points out that a single point improvement in management practices (rated on a five-point scale) can be associated with the same increase in output as a 25% increase in the labour force or a 65% increase in invested capital.
This economic cost of poor leadership and management is also quantified by research from the Chartered Institute of Management (CMI),153 which shows that ineffective management is estimated to be costing UK businesses over £19 billion per year in lost working hours.
1.4.3 Food for thought
The Institution of Mechanical Engineers (IMechE), in its report Global Food Waste Not, Want Not154 came up with a significant but harrowing finding: with the global population estimated to reach 9.5 billion by 2075,155 mankind needs to ensure it has the food resources available to feed all these people. Today, we produce about four billion metric tonnes of food per annum.156 Yet due to poor practices in harvesting, storage and transportation, as well as market and consumer wastage, it is estimated that 30–50% (or 1.2–2 billion tonnes) of all food produced never reaches a human stomach.157,158
145 Supporting communities by supporting enterprises, Business in the Community, http://www.bitc.org.uk/programmes/responsible-business-week-2013/events/supporting-communities-supporting-enterprise-april 146 The Move to a Green Economy: A Guide for small business, HM Government, http://uk.practicallaw.com/cs/Satellite?blobcol=urldata&blobheader=application%2Fpdf&blobkey=id&blobtable=MungoBlobs&blobwhere=1247310160575&ssbinary=true 147 Low Carbon Entrepreneurs: The New Engines of Growth, Carbon Trust, May 2013, p8 148 http://www.greeninvestmentbank.com/ 149 http://www.theccc.org.uk/publication/carbon-footprint-and-competitiveness/ 150 This poll was conducted during the period 22-31 May, 2013. A total of 108 responses were received from amongst the membership of 78 UK institutions, all from unique IP addresses. 151 http://www.engineeringuk.com/_resources/documents/EPC-Engineering_UK_report_on_UK_HEI_engineering_student_capacity_June_2013.pdf 152 Leadership & Management In The UK – The Key To Sustainable Growth, A summary of the evidence for the value of investing in leadership and management development, BIS, July 2012, p5 153 This figure was calculated using average hours wasted a week (1.51) x 48 weeks worked in a year x median value of that time (£12.5) x number (21.32m) of fulltime employees in workforce = value of time wasted, annually, across the UK (£19,315,920,000) 154 Global Food Waste Not, Want Not, Institution of Mechanical Engineers, January 2013, p2 155 Population: One Planet, Too many People? Institution of Mechanical Engineers, London, 2010 156 Global food losses and food waste, Food and Agriculture Organization of the United Nations, Gustavsson et al, 2011 157 Ibid 158 Saving Water: From Field to Fork – Curbing Losses and Wastage in the Food Chain, J. Lundqvist, C. de Fraiture, D. Molden, SIWI Policy Brief, Stockholm International Water Institute, 2008

Back to Contents
159 The engineering footprint is defined in SIC 2007. For further details see Table 17.7 in the Annex (http://www.engineeringuk.com/_resources/documents/EngineeringUK_Report_2014_Annex.pdf) 160 Data was purchased from the ONS, using IDBR, based on the engineering footprint. 161 The IDBR collects data on VAT and/or PAYE registered businesses 162 The IDBR is the official Government statistics on the number of businesses
Part 1 – Engineering in Context Engineering in the UK 2.0 14
2.1 Number of engineering enterprises in the UKTable 2.0 shows that in March 2012 there were 565,320 engineering enterprises in the UK – a rise of 4.2% on the previous year. However, the impact of the recession can be seen by the fact that the number of enterprises in the UK is still 0.6% below the number in March 2009.
In 2012, the number of engineering enterprises in every region in England, Scotland and Wales grew on the previous year. In Northern Ireland, there was a decline of 1.1%. The four-year trend, however, is not as positive, with only London and Scotland showing growth, while the South East had no change. All other regions of England, Wales and Northern Ireland showed a decline in the number of enterprises.
The largest growth in the English regions last year was in London: at 10.1%, London showed double the growth of second-placed the North East (5.0%). Lowest growth (2.0%) was in the East Midlands. There was little variation between the other English regions, which all grew between 2.6% and 3.3%.
Of the devolved nations, Scotland grew by 6.4%, triple the rate of growth in Wales (2.1%).
Over four years, London grew by 6.7% and the South East showed no change. The largest decline was in the West Midlands, which fell by 4.7%, closely followed by the East Midlands (4.3%) and the North East (4.1%). Overall, the number of engineering enterprises in England declined by 0.8% over the four years.
Of the devolved nations, Scotland grew by 6.5%, while Wales declined by 3.9% and Northern Ireland by 7.3%.
Part 1 – Engineering in Context2.0 Engineering in the UK
We have illustrated the Government’s clear intent to rebalance the economy away from its pre-recession dependence on financial services and towards a knowledge-based, sustainable, technological economy that is biased towards the economically-productive STEM sectors – an intent that is now in full swing. This section, therefore, examines the size and contribution of the engineering sector, based on the engineering footprint159 160 as defined by EngineeringUK. The data used in this section comes from the Inter-Departmental Business Register (IDBR)161 162 and is split by home nations and English regions.

Back to Contents
163 Skills for self-employment, UKCES, August 2011, pi 164 10-49 employees 165 1-9 employees and turnover less than £2 million
The IDBR does not collect data on companies that are not VAT and/or PAYE registered. However, research by the UK Commission for Employment and Skills (UKCES)163 shows that 13% of the workforce is self-employed and that only one in five self-employed people have any employees. It is therefore possible that there are additional, very small, engineering enterprises that are not recorded in Table 2.0.
Looking at all enterprises in the UK (Table 2.1) shows there was growth of 3.3% in 2012, less than the growth achieved by engineering enterprises (4.2%). Over four years, there has been a marginal decline in the number of all enterprises (down 0.1%). By comparison, engineering enterprises declined by 0.6%.
The largest percentage growth in 2012 was in London – up 7.6%. The only area to show a decline in 2012 was Northern Ireland – down 0.7%. This pattern is similar to engineering enterprises.
Figures 2.0 and 2.1 shows the proportion of engineering enterprises in each nation and region by the number of employees. It highlights that most (97.9%) businesses are either small164 or micro.165 It also shows that Northern Ireland has the lowest proportion of enterprises with fewer than five employees (73.8%), while England has the highest (78.7%). However, there is limited variation in the proportion of companies with 250+ employees, with Northern Ireland having the least (0.3%) and Scotland the most (0.5%).
Looking specifically at the regions within England shows that London has the highest proportion of businesses with fewer than five employees (84.1%), followed by the South East (81.0%). The region with the lowest proportion of businesses with fewer than five employees was Yorkshire and the Humber (73.6%).
15 2.0 Engineering in the UK Part 1 – Engineering in Context
Table 2.0: Number of VAT and/or PAYE registered engineering enterprises (2009-2012) – UK
Source: ONS/IDBR
Home nation/English region 2009 2010 2011 2012 Change over
one yearChange over
four years
North East 15,545 15,010 14,545 15,275 5.0% -1.7%
North West 55,315 53,240 51,365 53,065 3.3% -4.1%
Yorkshire and The Humber
40,080 38,825 37,770 38,855 2.9% -3.1%
East Midlands 40,600 39,050 38,075 38,850 2.0% -4.3%
West Midlands 48,380 46,415 44,945 46,105 2.6% -4.7%
East 63,625 61,930 60,495 62,415 3.2% -1.9%
London 81,680 78,640 79,190 87,175 10.1% 6.7%
South East 98,005 95,500 94,535 98,020 3.7% 0.0%
South West 52,415 51,105 50,355 51,825 2.9% -1.1%
England 495,645 479,715 471,275 491,585 4.3% -0.8%
Wales 21,375 20,595 20,115 20,540 2.1% -3.9%
Scotland 36,125 35,920 36,180 38,490 6.4% 6.5%
Northern Ireland 15,860 15,290 14,870 14,705 -1.1% -7.3%
Total 569,005 551,520 542,440 565,320 4.2% -0.6%
Table 2.1: Number of VAT and/or PAYE registered enterprises (2009-2012) – UK
Source: ONS/IDBR
Home nation/English region 2009 2010 2011 2012 Change over
one yearChange over
four years
North East 57,425 55,865 54,770 56,420 3.0% -1.8%
North West 211,915 204,990 201,060 205,690 2.3% -2.9%
Yorkshire and The Humber
152,475 148,855 146,605 150,060 2.4% -1.6%
East Midlands 147,980 143,310 140,940 144,510 2.5% -2.3%
West Midlands 177,195 171,410 167,585 171,200 2.2% -3.4%
East 217,925 213,635 210,845 216,595 2.7% -0.6%
London 339,185 331,535 334,395 359,880 7.6% 6.1%
South East 337,380 330,375 328,015 337,810 3.0% 0.1%
South West 202,550 197,935 196,605 200,500 2.0% -1.0%
England 1,844,030 1,797,910 1,780,820 1,842,665 3.5% -0.1%
Wales 92,005 89,370 87,430 88,575 1.3% -3.7%
Scotland 145,745 144,565 144,650 150,455 4.0% 3.2%
Northern Ireland 70,620 68,525 67,960 67,490 -0.7% -4.4%
Total 2,152,400 2,100,370 2,080,860 2,149,185 3.3% -0.1%

Back to Contents
Part 1 – Engineering in Context Engineering in the UK 2.0 16
Fig. 2.0: Share of VAT and/or PAYE registered engineering enterprises by number of employees and by home nation (2012) – UK
Source: ONS/IDBR
0.0%
10.0
%
20.0
%
30.0
%
40.0
%
50.0
%
60.0
%
70.0
%
80.0
%
90.0
%
100.
0%
10-190-4 5-9 20-49 50-99 100-249 250+
78.4%
73.8%
77.6%
75.1%
78.7% 10.7% 5.4%
UK
Northern Ireland
Scotland
Wales
England
0.9%
13.2% 5.9%
0.4%
10.7% 5.8%
0.8%
0.5%
14.0% 6.4%
0.5%
0.3%
10.9% 5.5%
0.6%
0.4%
3.1%
1.1%
3.8%
1.3%
3.3%
1.4%
3.2%
1.3%
0.6%
0.4%
3.1%
1.1%
Fig. 2.1: Share of VAT and/or PAYE registered engineering enterprises by number of employees and by English region (2012) – UK
Source: ONS/IDBR
10-190-4 5-9 20-49 50-99 100-249
0.0%
10.0
%
20.0
%
30.0
%
40.0
%
50.0
%
60.0
%
70.0
%
80.0
%
90.0
%
100.
0%
250+
South West
South East
London
East
West Midlands
East Midlands
Yorkshire andThe Humber
North West
North East
0.5%
0.3%
0.9%
0.5%
0.4%
0.9%
0.4%
0.3%
0.7%
0.5%
0.3%
1.0%
0.7%
0.5%
1.4%
0.4%
1.4%
0.8%
0.5%
1.6%
0.8%
0.4%
1.3%
0.8%
0.6%
1.6%
0.9%
78.2%
81%
84.1%
79.7%
74.6%
74.7%
73.6%
76.3%
74.8% 12.1% 6.1%
11.5% 6.1%
12.8% 6.8%
12.4% 6.4%
12.5% 6.4%
10.3% 5.1%
8.1% 4.2%
9.8% 4.8% 2.6%
11.8% 5.5% 2.9%
2.2%
3.0%
4.0%
3.9%
3.9%
3.7%
4.0%

Back to Contents
Table 2.2 shows that out of the 565,320 engineering enterprises in the UK, 27.4% are in the construction sector and 27.2% are in information and communication. The number of engineering-related manufacturing companies is lower at a fifth (21.7%). There are very few companies in mining and quarrying (0.2%).
According to the Department of Business, Innovation and Skills (BIS),166 at the start of 2012 nearly a fifth (19.8%) of all UK private sector businesses were in the construction sector. A further 13.9% were in professional, scientific and technical activities.
2.2 Employment in engineering in the UKTable 2.3 shows that in March 2012, 5.4 million people worked in engineering enterprises,167 a marginal increase (0.8%) on March 2011. In the 2013 report,168 we showed that a fifth (20.1%) of people were working in engineering enterprises. Over the last year, this proportion has declined to 19.5%, indicating that employment growth for non-engineering enterprises has been faster than for engineering enterprises. Despite this slight decline, turnover rose by 3.5% in the last year (section 2.3).
Looking at employment data by geographical area for 2012 shows that the greatest engineering employment growth was in London (up 4.0%), followed by the North East (up 3.1%). However, four areas showed a decline in employment – although only one showed a decline in the number of engineering enterprises.
The four areas to record a decline in the workforce are:
• Northern Ireland – down 3.2%
• Wales – down 1.5%
• West Midlands – down 1.2%
• East – down 0.5%
Scotland was the only one of the devolved nations to show growth in employment, rising by 1.2%.
Looking at the four-year trend, the engineering workforce has declined by 7.9%, with every nation and region showing a decline in employment. The largest decline was Northern Ireland, down 20.9%. The region with the smallest decline in employees was the South West, down 2.4%.
17 2.0 Engineering in the UK Part 1 – Engineering in Context
Table 2.2: Number of engineering enterprises by selected industrial groups (2012) – UK
Source: ONS/IDBR
Home nation/English region Overall Manufacturing Mining and
quarrying ConstructionInformation
and communication
All other industrial
groups
North East 15,275 3,750 45 4,175 2,285 5,025
North West 53,065 13,465 70 14,065 10,960 14,510
Yorkshire and The Humber
38,855 11,140 90 11,540 6,920 9,165
East Midlands 38,850 11,230 75 11,605 7,030 8,905
West Midlands 46,105 13,725 55 12,245 9,360 10,715
East 62,415 13,150 80 19,305 16,125 13,755
London 87,175 11,180 120 16,370 43,820 15,685
South East 98,020 17,215 95 26,235 32,920 21,555
South West 51,825 11,260 105 16,170 12,320 11,970
England 491,585 106,115 735 131,710 141,740 111,285
Wales 20,540 5,055 60 7,005 3,290 5,130
Scotland 38,490 7,635 250 9,730 7,265 13,610
Northern Ireland 14,705 3,805 85 6,705 1,250 2,860
Total 565,320 122,610 1,130 155,150 153,545 132,885
Share of total UK engineering enterprises
21.7% 0.2% 27.4% 27.2% 23.5%
Table 2.3: Employment in VAT and/or PAYE registered engineering enterprises (2009-2012) – UK169
Source: ONS/IDBR
Home nation/English region 2009 2010 2011 2012 Change over
one yearChange over
four years
North East 189,000 175,000 159,000 164,000 3.1% -13.2%
North West 559,000 540,000 489,000 489,000 0.0% -12.5%
Yorkshire and The Humber
462,000 423,000 403,000 410,000 1.7% -11.3%
East Midlands 427,000 399,000 382,000 385,000 0.8% -9.8%
West Midlands 550,000 519,000 497,000 491,000 -1.2% -10.7%
East 657,000 633,000 607,000 604,000 -0.5% -8.1%
London 717,000 661,000 668,000 695,000 4.0% -3.1%
South East 1,018,000 1,000,000 961,000 969,000 0.8% -4.8%
South West 505,000 497,000 491,000 493,000 0.4% -2.4%
England 5,084,000 4,848,000 4,657,000 4,700,000 0.9% -7.6%
Wales 223,000 208,000 206,000 203,000 -1.5% -9.0%
Scotland 435,000 408,000 403,000 408,000 1.2% -6.2%
Northern Ireland 153,000 144,000 125,000 121,000 -3.2% -20.9%
UK 5,895,000 5,608,000 5,391,000 5,432,000 0.8% -7.9%
166 Business population estimates for the UK and Regions 2012, Statistical release, Department for Business, Innovation and Skills, 17 October 2012 167 The IDBR dataset is not the official source of statistics on employment and these figures are indicative. The Business Register Employment Survey is the official statistics on employment. Employment statistics have been rounded to the nearest thousand. 168 Engineering UK 2013 The state of engineering, EngineeringUK, December 2012, p21 169 Not all enterprises within an industrial sector are engineering enterprises. For further details on which enterprises are engineering enterprises please see Table 17.7 in the Annex (http://www.engineeringuk.com/_resources/documents/EngineeringUK_Report_2014_Annex.pdf)

Back to Contents
In Figure 2.0, we showed that engineering enterprises employing at least 250 people represent only 0.4% of all engineering enterprises. However, at a UK level, these enterprises represent more than two fifths (43.2%) of all employment within the engineering sector (Figure 2.2). The importance of large businesses is not consistent across the different home nations. Large employers employ 44.4% of the workforce in Scotland, followed by 43.8% in England. Large employers account for a third (37.3%) of all workers in Wales and around a quarter (27.6%) in Northern Ireland.
Conversely, Northern Ireland had the highest proportion of workers employed by engineering enterprises with fewer than ten employees (27.2%), compared with a UK average of 21.3%. The home nation with the lowest proportion of workers in companies with fewer than ten employees was Scotland, at 18.9%.
Examining the regions within England (Figure 2.3) shows that the North West has the lowest proportion of workers employed by businesses with at least 250 workers (33.6%), followed by the East Midlands (35.0%). By comparison, over half (51.7%) of workers in the South East and 47.2% of workers in the East are employed by businesses with at least 250 employees.
Figure 2.4 shows the proportion of people working in engineering enterprises by geographical area. Nearly a fifth (17.8%) of all of those working in engineering enterprises work in the South East, with the second largest concentration being in London (12.8%). The lowest proportion of workers is in Northern Ireland, which has just 2.2% of those working in engineering enterprises.
Fig. 2.4: Share of employment for VAT and/or PAYE registered enterprises by home nation and English region (2012) – UK
Source: ONS/IDBR
Part 1 – Engineering in Context Engineering in the UK 2.0 18
0.0%
10.0
%
20.0
%
30.0
%
40.0
%
50.0
%
60.0
%
70.0
%
80.0
%
90.0
%
100.
0%
10-190-4 5-9 20-49 50-99 100-249 250+
UK
Northern Ireland
Scotland
Wales
England
13.9%
16.4%
12.3%
14.0%
13.9% 7.3% 7.7% 9.9%
8.6% 8.1% 10.1%
6.6% 7.4% 9.6%
10.8% 10.4% 13.9%
7.4% 7.7% 10.0% 8.0% 9.9% 43.2%
10.3% 10.6% 27.6%
8.8% 10.9% 44.4%
9.0% 13.0% 37.3%
7.9% 9.6% 43.8%
Fig. 2.2: Share of employment in VAT and/or PAYE registered enterprises by enterprise size and home nation (2012) – UK
Source: ONS/IDBR
Fig. 2.3: Share of employment for VAT and/or PAYE registered enterprises by enterprise size and English region (2012) – UK
Source: ONS/IDBR
0.0%
10.0
%
20.0
%
30.0
%
40.0
%
50.0
%
60.0
%
70.0
%
80.0
%
90.0
%
100.
0%
0-4 20-49 250+5-9 50-9910-19 100-249
South West
South East
London
East
West Midlands
East Midlands
Yorkshire andThe Humber
North West
North East
14.5%
13.6%
16.1%
14.0%
12.4%
13.5%
12.6%
14.3%
12.2% 7.3% 7.7% 11.3% 10.4%
8.1% 8.9% 12.2% 10.0%
7.9% 8.8% 11.3% 10.1%
8.1% 8.7% 11.8% 9.6%
7.6% 8.1% 11.4% 8.8%
7.0% 7.1% 9.3%
6.6% 7.1% 8.5%
6.4% 6.6% 8.0%
8.0% 7.7% 9.1% 6.7% 8.2% 45.9%
6.3% 7.3% 51.7%
6.3% 8.4% 47.0%
7.2% 8.2% 47.2%
10.2% 41.5%
13.1% 35.0%
12.4% 37.0%
12.9% 33.6%
12.2% 38.8%
Yorkshire and The Humber 7.6%
North West 9.0%
North East 3.0%
Scotland 7.5%
Wales 3.7%
NorthernIreland 2.2%
East Midlands 7.1%
South West 9.1%South East
17.8%
East 11.1%
West Midlands 9.0%
London12.8%

Back to Contents
Table 2.2 shows the proportion of engineering enterprises in selected industrial groups. Overall, a fifth (21.7%) of all engineering enterprises were in the manufacturing sector. However, examining the proportion of employees in each industrial sector (Table 2.4) shows that nearly half (44.0%) of those working for engineering enterprises work for manufacturing companies – double the proportion of manufacturing enterprises. It is also worth noting that mining and quarrying enterprises represent 0.2% of all engineering enterprises but employ 1.0% of all those working for engineering enterprises.
Both construction and information and communication companies employ under a fifth (17.6% and 18.4% respectively) of all workers in engineering enterprises, but represent over a fifth of enterprises (27.4% and 27.2% respectively).
2.3 Turnover of engineering enterprises in the UKTable 2.5 shows the turnover of engineering enterprises rose by 3.5% to £1.1 trillion in the year ending March 2012.171 Engineering now accounts for 24.5% of the turnover of all enterprises in the UK, up from 23.9% in 2011.172
The March 2012 data shows that, of all geographical areas, only three showed a decline in turnover:
• The South East – down 2.8%
• Northern Ireland – down 0.8%
• The South West – down 0.7%
It should also be noted that the South East has the highest turnover of any of the regions in England or the devolved nations (£224 billion).
All the other geographical areas showed an increase in turnover, with the largest percentage increase being in Scotland (14.7%), followed by Yorkshire and the Humber (7.7%).
The four-year trend in turnover is also positive – up 2.2%. However, with a turnover of £1.10 trillion in 2012, it is still below its 2010 peak of £1.15 trillion. Over four years, Scotland had the highest turnover growth, up 20.2%. The second highest was London with 7.3%.
Seven areas showed a decline in the turnover of engineering enterprises over four years. The North East (down 27.4%) and West Midlands (down 12.1%) showed worryingly large declines.
19 2.0 Engineering in the UK Part 1 – Engineering in Context
Table 2.4: Employment in VAT and/or PAYE registered engineering enterprises by selected industrial groups (2009-2012) – UK170
Source: ONS/IDBR
Home nation/English region Overall Manufacturing Mining and
quarrying ConstructionInformation
and communication
All other industrial
groups
North East 164,000 86,923 2,501 31,441 11,963 31,029
North West 489,000 271,939 1,203 88,590 47,005 79,958
Yorkshire and The Humber
410,000 238,248 1,717 76,019 35,701 58,788
East Midlands 385,000 233,403 4,336 64,938 34,201 48,562
West Midlands 491,000 268,595 1,184 91,951 39,398 89,551
East 604,000 232,265 700 110,309 171,042 89,662
London 695,000 163,386 7,549 115,229 267,060 141,742
South East 969,000 360,150 3,741 157,103 262,515 185,948
South West 493,000 191,180 2,644 78,041 63,515 157,228
England 4,700,000 2,046,089 25,575 813,621 932,400 882,468
Wales 203,000 121,812 1,543 35,891 13,858 30,358
Scotland 408,000 161,082 28,303 74,003 39,597 104,711
Northern Ireland 121,000 61,311 1,073 33,378 11,520 13,715
UK 5,432,000 2,390,294 56,494 956,893 997,375 1,031,252
Share of total UK engineering enterprises turnover
44.0% 1.0% 17.6% 18.4% 19.0%
Table 2.5: Turnover (millions) in VAT and/or PAYE registered engineering enterprises (2009-2012) – UK
Source: ONS/IDBR
Home nation/English region
Turnover (millions)
2009
Turnover (millions)
2010
Turnover (millions)
2011
Turnover (millions)
2012
Change over one year
Change over four years
North East 38,171 35,807 27,065 27,694 2.3% -27.4%
North West 82,209 85,323 77,817 81,790 5.1% -0.5%
Yorkshire and The Humber
64,580 62,709 56,371 60,684 7.7% -6.0%
East Midlands 60,270 62,046 58,742 59,817 1.8% -0.8%
West Midlands 93,612 82,572 77,024 82,262 6.8% -12.1%
East 109,521 117,366 109,177 115,142 5.5% 5.1%
London 198,958 232,880 207,274 213,518 3.0% 7.3%
South East 211,568 237,578 230,367 223,813 -2.8% 5.8%
South West 65,936 69,162 67,289 66,811 -0.7% 1.3%
England 924,826 985,443 911,125 931,530 2.2% 0.7%
Wales 35,082 35,412 32,139 33,997 5.8% -3.1%
Scotland 94,329 107,388 98,805 113,339 14.7% 20.2%
Northern Ireland 19,357 19,377 18,082 17,939 -0.8% -7.3%
UK 1,073,594 1,147,619 1,060,151 1,096,806 3.5% 2.2%
170 Not all enterprises within an industrial sector are engineering enterprises. For further details on which enterprises are engineering enterprises please see Table 17.7 in the Annex (http://www.engineeringuk.com/_resources/documents/EngineeringUK_Report_2014_Annex.pdf) 171 The IDBR dataset is not the official source of statistics on turnover and these figures are indicative. The official statistics on turnover are the Annual Business Survey. 172 Engineering UK 2013 The state of engineering, EngineeringUK, December 2012, p23

Back to Contents
173 The retail sector has been defined as division 47 (Retail trade, except of motor vehicles and motorcycles) using the Standard Industrial Classification 2007. 174 Total turnover taken from the Annual Business Survey 175 Total employment – average during the year taken from the Annual Business Survey
Figure 2.5 shows the share of turnover of engineering enterprises by geographical location. A fifth (20.4%) of turnover is generated by engineering enterprises in the South East, closely followed by London (19.5%).
Northern Ireland generated only 1.6% of the turnover of all engineering enterprises, the lowest of all the regions. This was followed by the North East at 2.5%.
Scotland generated just over a tenth (10.3%) of total turnover from engineering enterprises – three times that of Wales (3.1%).
In terms of employment and turnover, it is interesting to compare the size of the engineering sector with the size of the retail sector.173 The turnover of the engineering sector is 3.2 times the turnover of the retail sector (£342 billion).174 In addition, employment in the engineering sector is 1.8 times higher than in retail (3.1million).175
Fig. 2.5: Share of turnover of VAT and/or PAYE registered engineering enterprises by home nation and English region (2012) – UK
Source: ONS/IDBR
In Table 2.2 we showed that a quarter (21.7%) of all engineering enterprises are manufacturing enterprises. Table 2.6 shows the turnover of engineering enterprises in different industrial groups. It shows that nearly half (45.3%) of all turnover comes from engineering enterprises in the manufacturing sector, demonstrating the importance of manufacturing to the engineering sector.
Table 2.2 also showed that only 0.2% of engineering enterprises are in mining and quarrying. However, they generate 6.2% of the turnover of all engineering enterprises.
Both construction (27.4%) and information and communication (27.2%) make up more than a quarter of engineering enterprises. However, they generate only 13.1% and 15.0% of turnover.
Part 1 – Engineering in Context Engineering in the UK 2.0 20
Yorkshire and The Humber5.5%
North West 7.5%
North East 2.5%
Scotland 10.3%
Wales 3.1%
NorthernIreland 1.6%
East Midlands 5.5%
South West 6.1%South East
20.4%
London19.5%
East 10.5% West
Midlands 7.5%
Table 2.6: Turnover (millions) in VAT and/or PAYE registered engineering enterprises by selected industrial groups (2009-2012) – UK
Source: ONS/IDBR
Home nation/English region
Overall (millions)
Manufacturing (millions)
Mining and quarrying (millions)
Construction (millions)
Information and communication
(millions)
All other industrial
groups (millions)
North East 27,694 17,187 598 3,794 924 5,191
North West 81,790 46,960 285 11,064 6,574 16,907
Yorkshire and The Humber
60,684 35,460 295 10,952 3,837 10,140
East Midlands 59,817 40,059 662 9,967 3,382 5,747
West Midlands 82,262 45,224 335 13,321 5,197 18,185
East 115,142 56,853 216 19,549 26,799 11,725
London 213,518 63,337 45,639 23,295 48,150 33,097
South East 223,813 88,100 2,927 25,476 56,684 50,627
South West 66,811 33,359 364 8,382 7,761 16,944
England 931,530 426,539 51,323 125,798 159,308 168,562
Wales 33,997 24,477 172 3,641 1,672 4,035
Scotland 113,339 37,091 16,907 9,173 2,850 47,319
Northern Ireland 17,939 8,834 141 4,718 1,142 3,104
UK 1,096,806 496,940 68,543 143,331 164,972 223,020
Share of total UK engineering enterprises turnover
45.3% 6.2% 13.1% 15.0% 20.3%

Back to Contents
21 3.0 UK engineering research and innovation Part 1 – Engineering in Context
Before delving deeper, we should state that the UK punches above its weight in research and innovation. Despite having only 1% of the world’s population, we produce:177
• 6.9% of the world’s research publications
• 10.9% of all citations
• 13.8% of the highest impact citations
• a UK research base that is second in the world for excellence and the most efficient in the G8
• a university system that is second in the world for university-business interactions
• Eighty-five Nobel prizes (so far)
• Four of the top 20 universities in the world, and 31 universities in the top 200178
3.1 Importance of research and innovationIf the growth in the number of articles published over the past three centuries is anything to go by (Table 3.0), then mankind’s propensity to persistently create new knowledge is comforting.179
Table 3.0: Number of academic articles published per year over the past three centuries
Source: Arif Jinha, Article 50 million: An estimate of the number of scholarly articles in existence
There is evidence that the importance of research and innovation is getting the recognition critical to its success. For instance, when science ministers from the G8 met for the first time in five years at a conference to discuss international issues requiring global cooperation,180 research-dependent global challenges were top of the agenda. These were, antibiotic resistance in medicine, and how governments can work together to develop new antibiotics and employ them more wisely.
It is reassuring that this intent is underpinned by funding: the European Commission has announced181 the final and biggest ever calls for proposals under its Seventh Framework Programme for Research (FP7). In total, €8.1 billion is available to support projects and ideas
Part 1 – Engineering in Context3.0 UK engineering research and innovation
“At this unique meeting we discussed how our nations could lead efforts to improve the transparency, coherence and coordination of the global scientific research enterprise in order to address global challenges and maximise the social and economic benefits of research.” 176
G8 Science Ministers Statement London UK, 2013
Year Academic articles published per year
1726 344
1750 699
1800 3,066
1850 13,439
1900 58,916
1950 258,284
2000 1,132,291
2009 1,477,383
176 https://www.gov.uk/government/uploads/system/uploads/attachment_data/file/206801/G8_Science_Meeting_Statement_12_June_2013.pdf 177 Data presented either by John Dodds, Director of Innovation, Department for Business, Innovation and Skills or Sir Alan Langlands, Chief Executive, HEFCE at: Science and Innovation 2013 – London, Nurturing Growth through Investment, 27 June 2013 178 Times Higher Education World University Rankings (2012-13), http://www.timeshighereducation.co.uk/world-university-rankings/2012-13/world-ranking 179 An avalanche is coming – High Education and the revolution ahead, IPPR, March 2013, p17 180 https://www.gov.uk/government/news/g8-science-ministers-meet-in-london 12 June 2013 181 http://ec.europa.eu/research/fp7/index_en.cfm?pg=press

Back to Contents
182 Abstracted from the Thematic priority factsheets, http://ec.europa.eu/research/fp7/index_en.cfm?pg=press 183 https://www.gov.uk/government/policies/investing-in-research-development-and-innovation 184 https://www.gov.uk/government/publications/government-innovation-and-research-strategy
Part 1 – Engineering in Context UK engineering research and innovation 3.0 22
that will boost Europe’s competitiveness and tackle issues such as improving human health, protecting the environment and finding new solutions to challenges arising, for example, from urbanisation and managing waste.
The 11 identified innovative EU thematic research priorities in this FP7 are summarised below:182
Antimicrobial resistance
• In the EU, more than 25,000 patients die each year from infections caused by drug-resistant bacteria. This translates into healthcare costs and productivity losses of €1.5 billion.
• Antibiotic-resistant germs are now found regularly in many hospitals in the EU, infecting some four million patients every year.
Bioresource efficiency
• Up to 15% of crude oil goes to the chemicals and materials industry and only 5% of chemical industry input is biological. Only an estimated 10% of the carbon in European waste streams is captured.
• An average 40% of bio-waste goes to landfills.
• A better use of biotechnological processes in industry and energy sector could reduce greenhouse gas emissions by up to 2.5 billion tonnes of CO2 per year.
Brain research
• One European out of two is likely to be affected by some brain disorder during his/her life.
• In 2010 alone, the cost of brain disorders in the EU and its associated countries was estimated by experts working in the field to be around €800 billion.
Energy
• Eighty per cent of the European energy system still relies on fossil fuels, and the sector produces 80% of all the Union’s greenhouse gas emissions.
• Every year, 2.5% of the Union’s GDP is spent on energy imports and this is likely to increase. This trend would lead to total dependence on oil and gas imports by 2050.
Marie Skłodowska-Curie actions
• Well-trained, dynamic and creative researchers are the key to top science and productive research based innovation.
• Forty per cent of the MCA budget is allocated to the training of early-stage researchers. Under FP7, by 2013, the programme expects to have supported 50,000 researchers and funded 10,000 PhDs.
Raw materials
• Raw materials are essential for the sound functioning of the EU’s economy and the competitiveness of European industry.
• Sectors such as the construction, chemicals, automotive, aerospace, machinery and equipment industry, which provide a total value added of €1,324 billion and employment for some 30 million people, all depend on access to raw materials.
European Research Council
• To date, the European Research Council (ERC) has supported over 2,500 projects with around €4.2 billion. It has thereby supported over 14,000 young PhD and post-doctoral researchers working in ERC teams.
Oceans of the future
• Seas and oceans provide the basis for large and essential economic sectors (shipping, coastal tourism, offshore oil and gas, fisheries, aquaculture, marine biotechnology, marine renewable energy…) but they are under considerable environmental pressure from human activities and climate change.
• The main maritime economic sectors account for nearly six million jobs in Europe.
Public sector
• Successful economic recovery, raising employment and ensuring the long-term sustainability of public finances require new approaches to public policy, the role of the state and the way public services are delivered.
Smart cities
• Seventy per cent of the EU population lives in urban areas, a proportion that is growing.
• Urban areas consume 70% of energy, and account for 75% of the EU’s greenhouse gas emissions. This share is projected to grow in the coming decades.
• Cities are therefore the places where most energy savings can be made, helping the EU achieve its 20% of primary energy saving target by 2020.
Water
• Water is essential for life but growing populations and climate change exacerbate problems related to pollution, over-
exploitation and depletion of resources, leading to degradation of water quality and aquatic ecosystems.
• Water is of high economic importance, with a market for products and services estimated to be as large as $1 trillion by 2020.
• The European water sector is an economic player of growing importance (1% of GDP) with an average growth rate of 5% and a turnover of about €80 billion a year.
3.2 UK Government interventionsTrying to capture the exact picture of Government investment in research, development and innovation is like trying to capture lightning – something just as powerful and elusive – in a bottle and then show it to the world.
However, BIS’s March 2013 policy statement183 does capture its intent. It states that: “The UK excels in research, development and innovation, and innovative companies are an important contributor to economic growth. We want to use our talent to make the UK the best place in the world to run an innovative business or service.”
In terms of actual actions, the BIS statement lists:
• Protecting the £4.6 billion annual funding for science and research programmes in cash terms during the spending review period.
• Trying to be smarter and more strategic in how we procure goods, works and services to encourage innovation.
• Helping researchers, developers, innovators and businesses bring together specific knowledge, skills, technical resources and financial capital.
• Getting business to work more closely with universities and research institutions to create more opportunities to commercialise their research.
• Making taxpayer-funded research accessible and free of charge to use.
• Helping England’s 26,000 most promising mid-sized businesses achieve growth – a 70% increase in turnover or employment – and funding business through the UK Innovation Fund.
All of the above elements build upon the published 2011 Innovation and research strategy for growth,184 which aimed to support business research and development in areas where the UK excels.

Back to Contents
23 3.0 UK engineering research and innovation Part 1 – Engineering in Context
What’s more, despite austerity measures, the Chancellor’s Spending Review 2015/16 announced:185
• that the science resource budget will be maintained in cash terms at £4.6 billion for 2015-16
• a long-term science capital budget – £1.1 billion a year from 2015-16
• £185 million extra for the Technology Strategy Board to support innovation
• using a Small Business Research Initiative (SBRI) approach to procurement to enable the public sector to engage with innovative companies
Two other substantive examples of Government intervention and intent are:
1. The June 2013186 roll out of the £300 million UK Research Partnership Investment Fund (UKRPIF).187 Combined with the levering of £855 million from business and charities, this makes a total investment of £1.156 billion.
The UKRPIF projects will focus on physical sciences, medical research, advanced materials, pharmaceutical manufacturing and advanced manufacturing. They will tackle global challenges like developing new treatments for cancer and ensuring advanced materials can cope under harsh conditions, including difficult-to-access oil and gas reservoirs.
2. The investment of £1.2 billion over three years through the Technology Strategy Board (TSB) to support business-led innovation.188 This shows that Government and other commentators have recognition that the so-called ‘valley of death’ is a real issue.
For those who may not be familiar with it, the valley of death is a concept describing how the progress of science from the laboratory bench to the point where it provides the basis of a commercially successful business or product can stall. The future success of the UK economy has been linked to the success of translating a world-class science base to generate new businesses with the consequent generation of UK jobs and wealth.189
Table 3.1 provides an abbreviated but informative picture of the net Government expenditure on science, engineering and technology (SET) by department over the past ten years.
Finally at the time of going to print we are pleased to be able to record the recent announcement of a £200 million fund from Government to be matched by universities aimed at boosting the UK’s national university infrastructure and to allow science and engineering departments to provide world-class facilities and teaching for students.
Table 3.1: Net cash Government expenditure on science, engineering and technology by departments (2002/03 – 2011/12) – UK
Notes: r revised Source: ONS Government R&D Survey
£ million
2002/03 2003/04 2004/05 2005/06 2006/07 2007/08 2008/09 2009/10 2010/11 2011/12
Research Councils Total 1,947 2,259 2,408 2,871 3,014 2,742 3,024 r3,196 3,238 3,286
Higher Education Funding Councils
Total 1,626 1,665 1,804 1,928 2,085 2,252 2,247 2,403 2,304 2,259
Civil departments Total 2,043 2,140 1,866 1,965 1,918 r2,262 r2,299 r2,598 2,431 2,389
Defence
MoD Development 2,218 2,153 1,937 1,921 1,492 1,505 1,406 r1,177 1,026 753
Research 516 524 639 598 632 635 584 r575 534 553
Total 2,734 2,677 2,576 2,519 2,124 2,139 1,991 r1,752 1,560 1,306
Indicative UK contribution to the EU R&D budget
440 390 325 365 374 374 r593 668 637 629
Grand total 8,791 9,130 8,980 9,649 9,515 r9,769 r10,153 r10,616 10,171 9,868
185 https://www.gov.uk/government/uploads/system/uploads/attachment_data/file/209036/spending-round-2013-complete.pdf 186 https://www.gov.uk/government/news/290-million-for-new-leading-edge-research-facilities 187 The UK RPIF was set up in 2012. Details of the UKRPIF are available on the HEFCE website. 188 https://www.gov.uk/government/news/bis-statement-on-the-science-and-technology-committee-report-bridging-the-valley-of-death-improving-the-commercialisation-of-research 189 http://www.publications.parliament.uk/pa/cm201213/cmselect/cmsctech/348/348.pdf

Back to Contents
190 R&D intensity = R&D expenditure as a percentage of GDP 191 http://ec.europa.eu/europe2020/pdf/themes/15_research__development.pdf 192 http://www.korea.net/Government/Briefing-Room/Presidential-Speeches/view?articleId=105853 193 http://www.nature.com/news/south-korea-s-president-elect-promises-science-boost-1.12114 194 http://www.china.org.cn/china/2013-01/20/content_27740488.htm 195 http://www.chinadaily.com.cn/bizchina/2013-03/02/content_16269593.htm 196 http://www.dal.ca/news/2012/08/17/chancellor-merkel-s-remarks.html 197 http://www.bmbf.de/en/96.php 198 http://www.brasil.gov.br/para/press/press-releases/march-2013/brazil-launches-r-32.9-billion-innovation-plan/br_model1?set_language=en 199 http://www.rdmag.com/articles/2012/12/bric-brazil 200 http://www.physicstoday.org/daily_edition/politics_and_policy/science_in_the_state_of_the_union_address 201 http://www.whitehouse.gov/sites/default/files/microsites/ostp/2014_R&Dbudget_Release.pdf 202 http://www.a-star.edu.sg/?TabId=828&articleType=ArticleView&articleId=1815 203 http://www.a-star.edu.sg/portals/0/media/otherpubs/step2015_1jun.pdf
3.3 The international contextOne way of comparing countries is to look at the extent of their research and innovation activities in terms of resources input and their R&D intensity.190 Figure 3.0 shows that the UK ranks only 13th within the EU member states and has not currently set a target for 2020. This is despite the Europe 2020 strategy setting a 3% objective for R&D intensity and that most Member States have already adopted their national R&D intensity target for 2020.
Furthermore, it is concerning to see that many of our non-EU competitor nations have also set ambitious targets: China is aiming for 2.5% of GDP by 2020, South Korea 5% by 2022, and Brazil 2.5% by 2022.191
The selected public statements below issued by Heads of State or Ministers of Science from some of our global competitors provide indisputable warnings:
South Korea
“At the very heart of a creative economy lie science, technology and the IT industry, areas that I have earmarked as key priorities. I will raise the quality of our science and technology to world-class levels.”
President Park, Republic of Korea, Presidential Inauguration Speech, February 2013192
President Park plans to increase the total expenditure on research and development to 5% of GDP by 2017, up from 4% in 2011. The Government’s investment in basic science will
rise from 35.2% of that total to 40% by 2017. She also aims to set up a new overarching ‘ministry of future innovative science’.193
China
“China’s innovation capability has been greatly boosted in the past five years, with scientific progress contributing 51.7% to the nation’s economic growth in 2011, compared with 48.8% in 2008.”
Wan Gang, Minister of Science and Technology194
China spent over ¥1 trillion (£106.3 billion) on research and development in 2012, representing 2% of the country’s GDP.195
Germany
“For Germany, as well as for Canada, ensuring growth and prosperity depends largely on the nature of our efforts and successes in science, research, and innovation.”
Chancellor Merkel, speech at Dalhousie University, August 2012196
The Federal Ministry of Education and Research’s 2013 budget has increased by 6.2% compared with last year – placing it at a total of €13.7 billion (£11.6 billion).197
Brazil
“With this plan (Inova Empresa Plan), Federal Government funding for technological innovation will reach an unprecedented level. We are taking a big step toward consolidating science, technology and innovation as a sustained pillar of the Brazilian economy.”
Marco Antonio Raupp – Minister of Science, Technology and Innovation at the launch of the Inova Empresa Plan, March 2013198
Brazil’s total R&D spending is expected to increase this year to $31.9 billion (£20.3 billion), an 8.1% increase over the $29.5 billion it spent in 2012.199
United States
“Now is the time to reach a level of research and development not seen since the height of the space race.”
President Barack Obama, 2013 State of the Union address200
The 2014 Science and Technology R&D Budget proposes $142.8 billion (£91 billion) for federal R&D, an increase of $1.9 billion or 1.3% over actual spend in 2012.201
Singapore
“Singapore’s journey in R&D is relatively young but one pursued with strong support and commitment from the Government and the research community.”
Mr Lim Chuan Poh, Chairman, Agency for Science, Technology and Research, May 2013202
The Singaporean Government plans to continue increasing investment through its Research, Innovation and Enterprise 2015 plan which allocates $16.1 billion (£8.2 billion) for 2011-15. This is an overall increase of 19% over the previous five-year period and a commitment of 1% of expected GDP to public sector research and innovation.203
Part 1 – Engineering in Context UK engineering research and innovation 3.0 24
Fig. 3.0: R&D intensities in 2011 and targets for 2020
Source: DG Research and Innovation – Economic Analysis Unit
1.0
2.0
4.0
Finl
and
Swed
en
Denm
ark
Ger
man
y
Aust
ria
Slov
enia
Esto
nia
Fran
ce
Neth
erla
nds
Uni
ted
King
dom
Belg
ium
Czec
h Re
publ
ic
Port
ugal
Spai
n
Hun
gary
Pola
nd
Mal
ta
Slov
akia
Bulg
aria
Cypr
usEU
Irel
and
Luxe
mbu
rg
Ital
y
Lith
uani
a
Croa
tia
Latv
ia
Gre
ece
Rom
ania
3.0
1.5
2.5
0
0.5
4.5
3.5
2011 performances National target for 2020

Back to Contents
25 3.0 UK engineering research and innovation Part 1 – Engineering in Context
Finally, the most recent International Comparative Performance of the UK Research Base report remains the 2011 report which was extensively referenced in EngineeringUK 2013.204 It is worth re-stating three key findings here:
In terms of value for money, the UK continues to punch well above its weight. When looking at the number of citations per billion dollars GDP205 and the number of citations per million dollars of Higher Education R&D (HERD),206 the UK is first in the world G8, emphasising our high productivity.
Looking more specifically at engineering, the UK is fourth in the world in engineering citations.207 With a 6.51% world share in 2010 (256,366 citations), it sits behind USA, China and Japan.
3.4 Research excellenceThe now defunct R&D Scoreboard analysed research and development (R&D) investment by the country’s top 1,000 research-active businesses, and investment in the UK by the top 1,000 global companies (Table 3.2).208 Since the Government is not going to reinstate the Scorecard, we have to look elsewhere for evidence of trends in R&D spend.
According to Booz and Company’s eighth annual study of the world’s 1,000 largest corporate R&D spenders209 Toyota has regained the number one spot among the top 20 spenders, reflecting the auto industry’s strong recovery. Of
the eight healthcare companies in the 2010 list, all but Novartis and Sanofi fell in the rankings.
It is noteworthy that the House of Commons Science and Technology Committee, whilst taking evidence for its ‘valley of death’ enquiry, saw fit to recommend that, “We consider that the R&D Scoreboard was a useful and widely respected source of information for technology businesses and we recommend that the Government should reinstate it.”210
Table 3.2: Top 20 R&D spend ranking (2010 and 2011)
Rank R&D Spending
2011 2010 Company 2011, $US billions
Change from 2010
As a % of sales Headquarters location Industry
1 6 Toyota $9.9 16.5% 4.2% Japan Auto
2 3 Novartis $9.6 5.5% 16.4% Europe Healthcare
3 1 Roche Holding $9.4 -2.1% 19.6% Europe Healthcare
4 2 Pfizer $9.1 -3.2% 13.5% North America Healthcare
5 4 Microsoft $9.0 3.4% 12.9% North America Software and internet
6 7 Samsung $9.0 13.9% 6.0% Asia Computing and electronics
7 5 Merck $8.5 -1.2% 17.6% North America Healthcare
8 11 Intel $8.4 27.3% 15.5% North America Computing and electronics
9 9 General Motors $8.1 15.7% 5.4% North America Auto
10 8 Nokia $7.8 0.0% 14.5% Europe Computing and electronics
11 14 Volkswagen $7.7 26.2% 3.5% Europe Auto
12 10 Johnson & Johnson $7.5 10.3% 11.6% North America Healthcare
13 16 Sanofi $6.7 15.5% 14.4% Europe Healthcare
14 12 Panasonic $6.6 6.5% 6.6% Japan Computing and electronics
15 17 Honda $6.6 15.8% 6.5% Japan Auto
16 13 GlaxoSmithKline $6.3 3.3% 14.3% Europe Healthcare
17 15 IBM $6.3 5.0% 5.9% North America Computing and electronics
18 19 Cisco Systems $5.8 9.4% 13.5% North America Computing and electronics
19 26 Daimler $5.8 26.1% 3.9% Europe Auto
20 18 AstraZeneca $5.5 3.8% 16.4% Europe Healthcare
204 EngineeringUK 2013 the state of engineering, December 2012, p29-31 205 EngineeringUK 2013 the state of engineering, December 2012,Figure 3.1 206 EngineeringUK 2013 the state of engineering, December 2012,Figure 3.2 207 EngineeringUK 2013 the state of engineering, December 2012,Figure 3.3 208 http://webarchive.nationalarchives.gov.uk/20101208170217/http:/www.innovation.gov.uk/rd_scoreboard/ 209 Making Ideas Work, The 2012 Global Innovation 1000 Study, Results Summary EXTERNAL.pptx, Booz and Company, 30 October 2012, slide 13 210 http://www.publications.parliament.uk/pa/cm201213/cmselect/cmsctech/348/348.pdf, p55 and paragraph 87

Back to Contents
211 Research Council and Funding Council Allocation Methods and the Pathways to Impact of UK Academics, The Centre For Business Research and The UK Innovation Research Centre, February 2013, p4 212 The REF survey of submission intentions was carried out in late 2012. All of the 162 HEIs that intend to participate in the REF completed the survey. 213 http://www.hefce.ac.uk/news/newsarchive/2013/name,76316,en.html 214 Higher Education in Science, Technology, Engineering and Mathematics (STEM) subjects, House of Lords, Select Committee on Science and Technology, 2nd Report of Session 2012–13, 24 July 2012, p225 215 Industrial Strategy: government and industry in partnership, International Education: Global Growth and Prosperity, HM Government, July 2013, p28 216 http://www.bbc.co.uk/news/education-21592765 217 Industrial Strategy: government and industry in partnership, International Education: Global Growth and Prosperity, HM Government, July 2013, p32
Part 1 – Engineering in Context UK engineering research and innovation 3.0 26
3.4.1 The UK dual funding structure for research
The UK has long been proud of its dual funding system. So it is interesting to note the key finding highlighted in Figure 3.1, taken from the Centre for Business Research and The UK innovation Research Centre’s statistical analysis of the anatomy of the dual funding system and its evolution since the 2001 Research Assessment Exercise (RAE).211
Figure 3.1 shows the breakdown of all sources of funds for research in UK universities by source of funding in 2002 and 2010. In 2002, the dual funding system provided 53% of the total sources of funds available. This total was little changed by 2010, when these combined sources accounted for 55%. The most significant increase was the share accruing from overseas funding, which rose from 9% in 2002 to 13% by 2010. Within the Funding Council element of the dual support system, the ‘other’ quality-related (QR) component grew from 3% in 2002 to 9% in 2010, while the mainstream QR share fell from 28% to 22%. The UK therefore has an overall funding system for research in which the combined elements of the dual system account for approximately half of the total funds available. This proportion has remained relatively stable over the period analysed in this report.
3.4.2 The Research Excellence Framework (REF)
The hiatus since the demise of the Research Assessment Exercise (RAE) in 2008 is finally coming to an end as its replacement, the Research Excellence Framework (REF), comes into force.
Figures collected by the Higher Education (HE) funding bodies show that UK HE institutions plan to submit the research of 54,269 academic staff for assessment in the REF.212 This is an increase of 3.6% over the 52,401 pieces of research submitted to the RAE in 2008.213 The deadline for institutions to make submissions to the REF is 29 November 2013. Results will be published in December 2014. The four UK HE funding bodies intend to use the assessment outcomes to inform the selective allocation of their research funding to Higher Education Institutions (HEIs), with effect from 2015/16.
As an aide memoire, the primary purpose of the REF is to produce assessment outcomes for each submission made by institutions. From 2015/15, the funding bodies will use this information to inform the selective allocation of their research funding to HEIs. The assessment will produce evidence of the benefits of public investment in research, while the outcomes will provide benchmarking information and establish reputational yardsticks.
3.5 ImmigrationThe immigration debate continues apace and the ramifications on either the UK’s R&D capacity or its economic prosperity are still not yet evident. The House of Lords Select Committee made its concerns clear when it said, “We are concerned that changes to the immigration rules may reduce the number of overseas students coming to study to the UK and, therefore, the income that HEIs derive from these students to support other activities. This may result in a general reduction of provision of STEM courses that rely on this income to make them viable.”214 This is an important point when you consider that the value to the UK of non-EU students studying at UK HEIs was £2.6 billion (section 11).
The Government is adamant that cutting net migration won’t make a difference to the number of overseas students215 and has refused to remove international students from its targets.216 Indeed, Government claims that the number of international overseas students at British universities and colleges could grow by 20% in five years. It estimates that about 90,000 more could arrive by 2018, with rising numbers expected to come from China, India, the Middle East and parts of South America.217
In contrast, the Institute for Public Policy Research (IPPR) has shown that the top ten
Fig. 3.1: The level and distribution of total university research income by funding source (2002/3 and 2010/11) – UK
Source: Author’s calculations based on HESA Financial Statistics
0
1,00
0,00
0
2,00
0,00
0
3,00
0,00
0
4,00
0,00
0
5,00
0,00
0
6,00
0,00
0
7.00
0,00
0
2002-03
in thousands (reference year: 2011)
2010-11
Research CouncilsMainstream QR Other QR Charities
Central Government Other sourcesIndustry Overseas

Back to Contents
27 3.0 UK engineering research and innovation Part 1 – Engineering in Context
countries, who are all in a broadly similar situation to the UK, measure student migration flows in very different ways.218 There is no single international standard, let alone requirement. Three of the countries – the US, Australia, and Canada – measure student flows in a way that does not contribute to permanent net migration figures, even though they show up in net migration statistics. These are the countries which are the UK’s most obvious competitors in the global market for international students.
In a separate report,219 the IPPR found that visa data for the year ending September 2012 showed a 26% decrease in the number of visas issued for study against the year ending September 2011 (down to 210,921 from 284,649).220 This is almost certainly a result of changes to the student immigration rules that came into force in April 2012 – representing, as it does, a substantial reversal of previous trends.221
Looking in more detail, the Institute found that the impact on Further Education colleges and English language schools was substantially more
negative than that on universities. Visa data showed a 1% increase for the university sector (UK-based HEIs) in the year to September 2012, and falls of 67%, 76% and 17% respectively for the Further Education sector and English language schools.
For information: UK international student recruitment is increasingly concentrated on a handful of countries and a handful of subject areas. In 2010/11 over half of all overseas research students came from China, Saudi Arabia, and the United States.222
3.5.1 Migration Advisory Committee (MAC) shortage list: approved engineering job titles
In context of the furore around overseas students, the department for Business, Innovation and Skills (BIS) has explicitly made the point to the Migration Advisory Committee (MAC) that a buoyant engineering and manufacturing sector is imperative to the UK’s success. In a supporting statement,223 BIS notes
that the UK is currently facing a significant demand for engineering skills and that, “it would benefit the economy to substantially increase the supply and quality of engineers entering the labour market, ensuring they have the right mix of skills as sought by employers.”
Interestingly, the MAC acknowledges that the on-going, increasing demand for specialist engineering skills continues to outstrip potential supply, at least in the short to medium term. However, the Committee also maintains that this is exacerbated by insufficient joined-up activity on the part of employers and relevant public bodies aimed at addressing the skills deficit. MAC goes on to stress that it expects to see more evidence at future reviews of efforts to minimise this long term shortage by BIS, the UK Commission for Employment and Skills, Sector Skills Councils and individual employers. Eventually, MAC believes, this would lessen the sector’s reliance on the shortage occupation list.
Following the review process, the engineering job titles remaining on the shortage list are listed in the box.224
Engineering job titles on the shortage list
Chemical and process engineering
Chemical engineer
Engineering in construction-related ground engineering
Geotechnical engineer; tunnelling engineer; engineering geologist; hydrogeologist; geophysicist; contaminated land specialist; geoenvironmental specialist; landfill engineer
Engineering in the energy sector
Job titles within the oil and gas industry
Geophysicist; geoscientist; geologist; geochemist; petroleum engineer; drilling engineer; completions engineer; fluids engineer; reservoir engineer; offshore and subsea engineer; control and instrument engineer; process safety engineer; wells engineer; all electrical engineers in the oil and gas industry; all chemical engineers
Job titles within the electricity transmission and distribution industry
Project manager; site manager; power systems engineer; control engineer and protection engineer; design engineer; planning/development engineer; quality, health, safety and environment (QHSE) engineer; project
engineer; proposals engineer; commissioning engineer; overhead lines worker (high voltage only)
Job titles within the nuclear industry
[The nuclear new build programme
We are aware that there has been a delay in commencing the new build programme, which suggests that the specialists jobs needed to carry out this important future work are not yet required. Therefore, the list does not include any of the job titles the nuclear industry has asked to be considered for its new build programme.]
The decommissioning and radioactive waste management areas of the civil nuclear industry
Managing director; programme director; site director; operations manager; technical services manager; technical services representative; decommission specialist manager; project/planning engineer; radiological protection advisor
The wider civil nuclear sector
Nuclear safety case engineer; mechanical design engineer (pressure vessels); piping design engineer; mechanical design engineer (stress); thermofluids/process engineer
Engineering in the mining sector
Senior mining engineer; senior resource geologist; staff geologist
Engineering in the aerospace industry
Licensed and military certifying engineer/inspection technician; chief of engineering; manufacturing engineer (process planning); manufacturing engineer (purchasing); advanced tooling and fixturing engineer; stress engineer; aerothermal engineer; electrical machine design engineer; power electronics engineer
Engineering in the railway industry
Signalling design manager; signalling design engineer; signalling principles designer; senior signalling design checker; signalling design checker; signalling systems engineer
Engineering in the automotive manufacturing and design industry
Product development engineer; product design engineer
Engineering in the electronics systems industry
Integrated circuit design engineer; integrated circuit test engineer; driver developer; embedded communications engineer; specialist electronics engineer
218 International Students and Net Migration In The UK, IPPR, April 2012 219 Migration Review 2012/2013, IPPR, December 2012 220 Home Office (2012) Immigration Statistics July – September 2012 http://www.homeoffice.gov.uk/publications/science-research-statistics/research-statistics/immigration-asylum-research/immigration-q3-2012/ 221 Student migration in the UK, S. Mulley and A. Sachrajda, IPPR, 2011 http://www.ippr.org/publication/55/1824/student-migration-in-the-uk 222 Postgraduate Education – An Independent Inquiry By The Higher Education Commission, Higher Education Commission, 2013, p38 223 Engineering occupations, Skilled Shortage sensible full review of the recommended shortage occupation lists for the UK and Scotland, a sunset clause and the creative occupations, Migration Advisory Committee, February 2013, p103 224 Abstracted from Chapter 6 Engineering occupations, Skilled Shortage sensible full review of the recommended shortage occupation lists for the UK and Scotland, a sunset clause and the creative occupations, Migration Advisory Committee, February 2013

Back to Contents
225 Eight Great Technologies, David Willetts, Policy Exchange, January 2013 226 https://www.gov.uk/government/news/600-million-investment-in-the-eight-great-technologies 227 Innovation and Survival of New Firms across British Regions, Economics Series Working Papers 416, Helmers and Rogers, University of Oxford, Department of Economics, 2008 228 The Value of Intellectual Property Rights to Firms, Economics Series Working Papers 319, Greenhalgh and Rogers, University of Oxford, 2007 229 Engineering UK 2012 The state of engineering, EngineeringUK, December 2012, p60 230 http://www.europarl.europa.eu/news/en/pressroom/content/20121210IPR04506/html/Parliament-approves-EU-unitary-patent-rules
3.6 Predicting the future“The world is full of people whose notion of a satisfactory future is, in fact, a return to the idealised past.”
Robertson Davies, A Voice from the Attic, 1960
David Willets, Minister for Universities and Science, in the Policy Exchange pamphlet entitled Eight Great Technologies stated that the UK is facing global challenges. “Our research is world class, but we need to be better at taking our great scientific research and applying it,” he said in the pamphlet that sets out eight great technologies that could help us achieve this aim.225 The accompanying box lists the technologies and provides a brief elaboration of each.
Subsequently, he set out in a speech at the Policy Exchange details of how the £600 million announced for science in the 2012 Autumn Statement226 would support delivery of these eight great technologies.
3.7 Intellectual property rights: a strategic national assetIn the Engineering UK Report 2013, we highlighted that Intellectual Property (IP) is a significant factor for growth for many companies and that innovative companies that use intellectual property rights are associated with significantly better chances of firm survival227 and company growth. This still remains the case.228
In the Engineering UK Report 2012, we also highlighted the economic importance of IP rights and, in particular, the comments of Baroness Wilcox. She stated in the Hargreaves report:229 “Intellectual property is a key UK export, and global trade in IP licences alone is worth more than £600 billion a year. UK businesses need to have confidence in the international IP framework so they are able to create and exploit value from their ideas.”
In this, the Engineering UK 2014 report, we are delighted to record that EU inventors will at last soon be able to get a unitary patent.230 After over 30 years of talks, a new regime will cut the cost of an EU patent by up to 80%, making it more competitive in relation to the US and Japan. There would also be a unified patent-court system. The move is due to be introduced in 2014. The new rules will say that applications and approvals need only to be made available in one of three languages: English, French or German.
Part 1 – Engineering in Context UK engineering research and innovation 3.0 28
Eight great technologies
1. The big data revolution and energy-efficient computing
The data deluge will transform scientific enquiry and many industries too. The UK can be in the vanguard of the big data revolution and energy-efficient computing.
2. Satellites and commercial applications of space
There is a surge in data coming from satellites that do not just transmit data but collect data by earth observation. We have opportunities to be a world leader in satellites and especially analysing the data from them.
3. Robotics and autonomous systems
There are particular challenges in collecting data from a range of sources in designing robots and other autonomous systems.
We can already see that this is a general purpose technology with applications ranging from assisted living for disabled people through to nuclear decommissioning.
4. Life sciences, genomics and synthetic biology
Modern genetics has emerged in parallel with the IT revolution and there is a direct link – genetic data comes in digital form. The future is the convergence of ‘dry’ IT and ‘wet’ biological sciences. One of the most ambitious examples of this is synthetic biology – engineering genes to heal us, feed us, and fuel us.
5. Regenerative medicine
This will open up new medical techniques for repairing and replacing damaged human tissue.
6. Agri-science
Although genetics is above all associated with human health, advances in agricultural technologies can put the UK at the forefront of the next green revolution.
7. Advanced materials and nano-technology
Just as we understand the genome of a biological organism, so we can think of the fundamental molecular identity of an inorganic material. Here too we can increasingly design new advanced materials from first principles. This will enable technological advances in sectors from aerospace to construction. Quantum photonics is an exciting area where advanced materials and digital IT converge.
8. Energy and its storage
One of the most important applications of advanced materials is in energy storage. This and other technologies will enable the UK to gain from the global transition to new energy sources.

Back to Contents
29 4.0 Population changes Part 1 – Engineering in Context
Part 1 – Engineering in Context4.0 Population changes
The National population projections for the UK are produced by the Office for National Statistics (ONS) in consultation with the statistical offices of the different home nations. ONS has published projected population statistics from 2010 to 2035, and for selected years beyond 2035. The projections are filtered by age or age group and are further broken down by gender.
The population of the UK was estimated to have grown by 419,000 people (0.7%) from 63.3 million in mid-2011 to 63.7 million in mid-2012.231 Based on the 2010 national population projects, the UK population is projected to increase to 73.2 million by mid-2035.232
The absolute increase in UK population was greater than that of any other European Union member state during the 12 months to June 2012.233 It has increased by about 4.6 million (7.8%) in the 11 years since 2001 and is projected to increase by 4.9 million over the next ten years, reaching 67.2 million by 2020.
In addition to growing, the population is ageing, with the median average age expected to rise to 39.9 years in 2020 and 42.2 years by 2035. There are an estimated 1.5 million people in the UK aged 85 and over. This number is projected to more than double, reaching 3.5 million by 2035.
Figure 4.0 looks at the proportion of 20- to 64-year-olds and over 65-year-olds as part of the total population between 2013 and 2035. The 20-64 cohort, which is considered to be the most economically active, will experience a gradual decline, whilst the proportion of those aged over 65 will increase. In 2013, the estimated proportion of 20- to 64-year-olds was 59.1%, declining to 57.1% by 2022 to 54.5% by
Fig. 4.0: The proportion of 20- to 64-year-olds and over 65-year-olds as part of the total population (2013-2035) – UK234
Source: ONS
0.0%
10.0%
20.0%
30.0%
40.0%
50.0%
60.0%
2014
2017
2021
2024
2027
2031
2035
2013
2015
2016
2018
2019
2020
2022
2023
2025
2026
2028
2029
2030
2032
2033
2034
20-64 year olds 65+ year olds
231 Annual Mid-year Population Estimates, 2011 and 2012, ONS, 2013 232 Based national population projections, principle projections and key variants, Office of National Statistics, 2010 233 Website accessed on 12 September 2013 (http://www.ons.gov.uk/ons/rel/pop-estimate/population-estimates-for-uk--england-and-wales--scotland-and-northern-ireland/mid-2011-and-mid-2012/index.html?format=print) 234 2010 base year

Back to Contents
235 2010 base year 236 2010 base year
Part 1 – Engineering in Context Population changes 4.0 30
2035. On the other hand, the number of over 65-year-olds is projected to increase from 17.5% in 2013 to 19.1% by 2022. By 2035, those aged over 65 will be almost a quarter (23.2%) of the UK population.
Figure 4.1 looks at the projected number of 0- to 29-year-olds between 2013 and 2035, broken down into 0- to 9, 10- to 19, and 20- to 29-year-olds. The number of 0- to 9-year-olds is expected to rise steadily in the first ten-year period, from 7,772,000 in 2013 to 8,356,000 by 2022. This increase puts pressure on Government to make sure there are enough primary and junior school places and teachers. Between 2022 and 2035, numbers in this cohort are expected to fall steadily to 8,008,000.
The number of young people aged 10-19 years is expected to see a decline until 2015, from 7,156,000 in 2013, down to 7,105,000. After 2015 it will increase rapidly, reaching 7,418,000 in 2020 and 8,454,000 by 2030 and finally declining slightly to 8,377,000 by 2035.
The projected number of young people aged 20 to 29 years is expected to increase from 8,941,000 to 8,989,000 by 2014, and then gradually decline to 8,235,000 by 2025. After that, a steep rise to 9,275,000 is expected by 2035.
Figure 4.2 looks at the projected number of 18-year-olds from 2013 to 2035: from 2013 to 2020, the numbers will decline annually from 754,100 to 688,700, an 8.7% decline, with the exception of a slight increase in 2015. As a result, there will be fewer young people completing education, going into Higher Education and, ultimately, joining the engineering workforce. However, from 2020 onwards, the number of 18-year-olds is expected to steadily increase, reaching 862,500 by 2035.
Fig. 4.1: Fig. 4.1: Projected 0- to 29-year-old population in thousands (2013-2035) – UK235
Source: ONS
8,000
7,500
7,000
8,500
9,000
9,500
0-9 10-19
2015
2018
2026
2030
2034
20-29
6,500
2013
2014
2016
2017
2019
2020
2021
2022
2023
2024
2025
2027
2028
2029
2031
2032
2033
2035
2015
2018
2026
2030
2034
750
700
650
850
900
2013
2014
2016
2017
2019
2020
2021
2022
2023
2024
2025
2027
2028
2029
2031
2032
2033
2035
800
Fig. 4.2: Projected 18-year-old population in thousands (2013-2035) – UK236
Source: ONS

Back to Contents
31 5.0 Understanding and influencing target audiences Part 1 – Engineering in Context
In section 15, we show that between 2010 and 2020 engineering companies will need to attract 1.86 million workers with engineering skills – equivalent to approximately a third of the 5.4 million people currently working in engineering enterprises.237 If the UK is to meet this substantial demand for workers, we need to ensure that potential current and future workers and their influencers see engineering and the engineering sector as a desirable area to work. Achieving this includes providing positive perceptions of science, technology, engineering and maths (STEM), influencing those who can influence future workers, providing valuable work experience and also demonstrating to potential workers that there is a positive career for people in engineering. However, to influence perceptions we also need to determine what those perceptions actually are and, over time, be able to monitor the effect of any interventions on them.
With regard to the general public, in 2013 almost two thirds (64%) of the general public could cite one engineering development of the last 50 years that has had the greatest impact on them. This was significantly up from 38% in 2010. When asked, 79% of parents of 7- to 14-year-old children said they would recommend a career in engineering to a family member.
It should come as no surprise that the vast amount of effort understanding and trying to positively affect perceptions towards STEM and engineering in particular is expended within schools. In particular, effort is needed at those year groups where there are key decision points ie Year 9 and GCSE choices. This chapter briefly outlines the progress that has been made over the past year in understanding, changing and monitoring changes in perceptions.
5.1 Aspiration and perceptionResearch has shown that aspiration is probably a reliable indicator of a young person’s future career.238 There is a large body of evidence to show that interest in science is formed by age 14. Students who had an expectation of science-related careers at that age were 3.4 times more likely to earn a physical science and engineering degree than students without this expectation.239
However, there is a concern that schools aren’t fully capitalising on student’s interests in science. Research commissioned by EngineeringUK240 shows that school provision for 7- to 11-year-olds may not be fully capitalising on student’s personal interest. In the research, 38% of student’s choose a STEM subject as their favourite. But this is only half the level of 7- to 11-year-olds who pursue science-related activities outside of school (76%).
5.1.1 Young people benefit from enriched STEM curriculum
We have previously reported on the Year 8 dip: where young people – particularly in Year 8 (ages 12/13) – exhibit a ‘dip’ in motivation, in particular towards science and maths. Academic research stretching back to 2004 has identified this dip.241 However, there is a growing body of evidence that challenges this view and indicates that the ‘dip’ now occurs amongst older students, 15– to 16-year-olds, and that there is an effective transition from primary school to secondary school with respect to science.
Some of the more recent research that questions the age at which students become disengaged with science and maths is highlighted below:
Part 1 – Engineering in Context5.0 Understanding and influencing target audiences
“Perception is reality.”
Lee Atwater
237 See section 2 for details on the number of workers currently employed in engineering companies 238 What shapes children’s science and career aspirations age 10-13?, King’s College London, 2013, p3 239 Ibid, p3 240 2013 Engineers and Engineering Brand Monitor, IFF Research, August 2013, p5 241 Wellcome Trust Monitor Report Wave 2: Tracking public views on science, research and science education, Wellcome Trust, May 2013, p117

Back to Contents
242 What shapes children’s science and career aspirations age 10-13?, King’s College London, 2013, p11 243 Wellcome Trust Monitor Report Wave 2: Tracking public views on science, research and science education, Wellcome Trust, May 2013, p117 244 Science education – have we overlooked what we are good at?, NFER, September 2013, p2 245 Wellcome Trust Monitor Report Wave 2: Tracking public views on science, research and science education, Wellcome Trust, May 2013, p114 246 2013 Engineers and Engineering Brand Monitor, IFF Research, August 2013, p4 247 Section 1.1.4 248 An investigation into why the UK has the lowest proportion of female engineers in the EU, EngineeringUK, April 2011, p3 249 2013 Engineers and Engineering Brand Monitor, IFF Research, August 2013, p7 250 Improving young people’s engagement with science, technology, engineering and mathematics (STEM), NFER, 2013, p3 251 Improving young people’s engagement with science, technology, engineering and mathematics (STEM), NFER, 2013, p2 252 Understanding Participation in Mathematics and Physics, Institute of Education, 2012, p20
Part 1 – Engineering in Context Understanding and influencing target audiences 5.0 32
• The ASPIRES project conducted by King’s College London in 2009 and 2011242 suggests that young people’s interest in school science lessons stays largely unchanged between Year 6 and Year 8.243 It also showed that over 70% of Year 6 and Year 8 students agree that they learn interesting things in science classes and that a majority of Year 6 and 8 students enjoy science lessons.
• Research by the National Foundation for Educational Research (NFER) identified that UK students are more likely than our international counterparts to aspire to a job involving science, but that the transition is often not made. The Foundation concluded that disengagement with science occurs after GCSEs and possibly during A levels.244
• The Wellcome Trust reports in its monitor that the majority (82%) of young people have a highly favourable view of their secondary school science lessons.245
• The 2013 Engineers and Engineering Brand Monitor appears to confirm the new supposition, showing that 52% of 11- to 14-year-olds said that a career in science was desirable, compared with 44% of 15- to 16-year-olds.
• EngineeringUK246 has also identified that students’ engagement in science activities outside school wanes with age, with 7- to 11-year-olds and 11- to 14-year-olds being significantly more likely to have participated in ‘any’ science related activities outside of school than those aged 15-16 (76% and 71% compared with 59%).
• Finally, in our own pre-event evaluation of young people registered to attend The Big Bang Fair 2013, 68.4% of 11- to 14-year-olds said that they found a career in science to be desirable compared with 56.3% of 15- to 16-year-olds.
However, as we stated at the outset, we need to dramatically increase the supply of young people studying the STEM subjects that are prerequisites for a career in engineering. Therefore, we still need to influence young people’s subject choice. This is best achieved by increasing young people’s enjoyment of STEM subjects and by having good teachers.247 In fact, enjoyment of a subject is as significant as attainment in terms of a pupil’s likelihood to pursue that subject further.248 This is brought into sharp focus when one considers the substantial proportion of young people with A*
in maths or physics (21% and 57% respectively) who choose not to progress to AS level (Table 1.1). We need to significantly improve the STEM subject conversion rate from GCSEs to AS and from AS to A level by providing better careers information, work experience, enrichment and enhancement activities and improving subject enjoyment.
Finally, it is worth considering a key recommendation from the Engineers and Engineering Brand Monitor survey. It concluded that, “increasing the number of extracurricular school science activities – starting at Key Stage 2 and sustaining this through to Key Stage 4 – would help to bridge the gap between personal interest and enjoyment at school…”249 This will only be achieved if the engineering community, third sector organisations and the Government work together to provide the appropriate stimulating extracurricular enrichment and enhancement activities required.
5.1.2 Positively influencing these perceptions
It is possible, through rationally constructed programmes, to positively influence student’s perceptions of STEM. NFER research has identified that a holistic approach, combining some or all of the elements listed in Figure 5.0, is at the heart of successful practice.250
NFER also looked at features of the activities and interventions in schools that were most successful at improving young people’s engagement in STEM. It found that the most beneficial activities:251
• engaged pupils at an early age and at key transition points
• focused teaching on practical activities, set in real life contexts and offering good quality enrichment and enhancement activities
• linked teaching to careers in STEM
• made clear links across and between the STEM subjects
• supported teachers
These research findings are supported by analysis from the Institute of Education (IOE) which shows that young people are more likely to continue with maths and/or physics after age 16 if they have:252
• extrinsic motivation linked to material gain
• advice and/or pressure to study physics
• an appreciation of the intrinsic value of maths and physics
• home support for achievement in maths and physics
• an emotional response to maths and physics lessons
• positive perceptions of maths/physics lessons
• maths and physics self-concept
• positive perceptions of maths/physics teachers
EngineeringUK’s own research found that it is possible to positively influence perceptions through rational, well-constructed programmes.
Fig. 5.0: Elements of a successful STEM engagement activity
Provide consistent, high quality professional development for teachers
Offer clubs, STEM days and enrichment activities
Use practical contexts for teaching and open-ended activities to foster creativity
Make links with real-life and cutting edge technology
Embed links between STEM subjects in the curriculum
Target transition points
Sustain two-way links with industry
Demonstrate the full range of STEM careers
Find role models who challenge stereotypes
STEMengagement
andachievement

Back to Contents
Our annual brand monitor survey253 found that 38% of 11- to 16-year-olds nationally said a career in engineering was desirable. However, when this question was asked of those at The Big Bang Fair,254 62% agreed, while 48% of those who took part in a Tomorrow’s Engineers255 activity agreed. Both these figures are well above the corresponding national figure.
The brand monitor survey256 also asks how much students know about what people working in engineering do. Overall, 16% of 11- to 16-year-olds said they had some knowledge. However, among 11- to 16-year-olds at The Big Bang Fair257 the comparable figure was 62%, and for Tomorrow’s Engineers participants258 it was 53%. Again, the programme responses were both above the corresponding national figure.
This finding is reinforced by qualitative research we did on the Tomorrow’s Engineering programme. It shows that students who took part in the activity gained an increased awareness of the different types of engineering and engineering careers, along with a broader understanding of the role of an engineer and the skills required to become an engineer.259
Indeed, our brand monitor research shows that perceptions of engineering careers have improved among 7- to 11-year-olds, 11- to 16-year-olds, 17- to 19-year-olds and adults over the last 12 months.260
Finally, we mentioned at the outset that influencing the influencers (parents / guardians and teachers) is also a key approach to influencing young people. It should therefore be noted that it is also possible to influence the perceptions of influencers. Research with teachers after The Big Bang Fair showed that four out of five (81%) teachers who collected STEM resources while at the fair intended to use them in their own teaching. In addition 38% of teachers said they intended to recreate ideas and experiments in the classroom.
5.1.3 Female aspiration and perception
In sections 7 and 8 we show that generally speaking female student’s A*-C attainment in STEM subjects is higher than male students. However, in sections 9, 10 and 11 we demonstrate that females are generally speaking under-represented in post-compulsory STEM courses – although biology is major the exception. It is therefore worth exploring female aspiration and perception further.
The Wellcome Trust highlighted that the male-dominated setting of science classrooms can put women off studying science.261 It also referenced research by the Institute of Physics which shows that gender stereotyping and a lack of female role models also play a role outside of the classroom.
EngineeringUK’s own research262 has highlighted that engineering suffers from being seen as a male career. Almost half (44%) of STEM educators interviewed in the research who said that engineering was an undesirable career for their students, cited it being seen as a career for men. Even three quarters of women who work as engineers believe engineering is regarded as a ‘male career’.263 In addition at the time of going to print, new research by EngineeringUK, shows
that one third (31%) of all adults interviewed said they would not advise a 14-year-old girl to consider a career in engineering because they were not interested in the industry.
However, the UK is not alone. The Organisation for Economic Co-operation and Development (OECD) identified that in no OECD country did the proportion of girls who wanted a career in computing or engineering exceed boys and that, on average, almost four times as many boys as girls wanted to be employed in these fields.264
5.2 Careers information, advice and guidanceIn section 5.1 showed that there is a lot to be positive about. However, we can’t rest on our laurels. If the education sector is going to inspire the next generation of engineers, then there is more work to do, particularly in relation to careers information, advice and guidance (CIAG). Indeed, we have conclusively shown in section 6.3.7 the vital difference that ‘good’ careers information, advice and guidance can make to young people.
In the box we provide an overview of CIAG provision in the different UK countries.
33 5.0 Understanding and influencing target audiences Part 1 – Engineering in Context
253 Engineers and Engineering Brand Monitor, IFF Research, August 2013, Data tables 254 The Big Bang Fair, FreshMinds Research, August 2013, Data tables 255 Tomorrows Engineers Quantitative Evaluation, Boxclever Consulting, September 2013, Data tables 256 Engineers and Engineering Brand Monitor, IFF Research, August 2013, Data tables 257 The Big Bang Fair, FreshMinds Research, August 2013, Data tables 258 Tomorrows Engineers Quantitative Evaluation, Boxclever Consulting, September 2013, Data tables 259 Qualitative evaluation of Tomorrow’s Engineers 2012/13, NFER, August 2013, p10 260 Engineers and Engineering Brand Monitor, IFF Research, August 2013 261 Wellcome Trust Monitor Report Wave 2: Tracking public views on science, research and science education, Wellcome Trust, May 2013, p115 262 2013 Engineers and Engineering Brand Monitor, IFF Research, August 2013, p5 263 Britain’s got talented female engineers – successful women in engineering: a careers research study, Atkins, 2013, p6 264 Education at a Glance 2012, OECD, September 2012, p75

Back to Contents
265 Statutory Guidance – The duty to secure independent and impartial careers guidance for young people in schools, Department for Education, March 2013, p4 266 Statutory Guidance – The duty to secure independent and impartial careers guidance for young people in schools, Department for Education, March 2013, p4 267 Using and Sharing Career Related Labour Market Information, UKCES, p11 268 Career Guidance in Colleges, Increasing National Careers Service co-location with colleges and the role of Colleges in providing a service to schools, Association of Colleges, October 2012, p7 269 Using and Sharing Career Related Labour Market Information, UKCES, p11 270 Using and Sharing Career Related Labour Market Information, UKCES, p12 271 Motivation and Barriers to Learning for Young People not in Education, Employment or Training, February 2013, Department for Business, Innovation and Skills, February 2013, p8-9 272 Engineering UK 2013 The state of engineering, EngineeringUK, December 2012, pXV 273 2013 Engineers and Engineering Brand Monitor, IFF Research, August 2013, p37 274 2013 Engineers and Engineering Brand Monitor, IFF Research, August 2013, p37 275 Motivation and Barriers to Learning for Young People not in Education, Employment or Training, Department for Business, Innovation and Skills, February 2013 276 Ibid, p27 277 Good Practice Evaluation of the Diversity in Apprenticeship Pilots, Becci Newton, Linda Miller, Joy Oakley and Ben Hicks (Institute for Employment Studies), 2012, p2 278 Science, Technology, Engineering and Maths (STEM) – Guidance for schools and colleges, Welsh Government, September 2012, p13 279 Wellcome Trust Monitor Report Wave 2: Tracking public views on science, research and science education, Wellcome Trust, May 2013, p124
BIS states that, “good quality and independent information advice and guidance is essential to help young people identify and access the education and training which is right for them”.271
In last year’s Engineering UK Report,272 we and the engineering community called for the provision of robust face-to-face CIAG and more support for teachers and careers advisors in giving STEM careers advice. The need for and importance of these two elements is strengthened by findings from our annual brand monitor survey, which showed that 11- to 14-year-olds said they were most likely to act on the advice of careers advisors (39% said they would).273 The research also shows that three fifths (57%) of STEM educators had been asked to provide careers advice in the last year, however, only 31% felt confident about providing careers advice about engineering.274
This key finding is strongly reinforced by several other pieces of research:
• BIS looked at the Motivation and Barriers to Learning for Young People not in Education, Employment or Training.275 One of its key findings was the essential role of good quality, independent information, advice and guidance in helping young people to identify and access appropriate education and training.276
• The Institute of Employment Studies277 identified in its evaluation of apprenticeship pilots that young women, parents and often teachers and advisors held outdated views on STEM occupations.
• The Welsh Government identified that career paths into engineering are poorly understood by learners.278
• The Wellcome Trust showed that over half (55%) of young people report that they know little or nothing about STEM careers and that half (49%) obtain careers information from teachers. However, only 18% feel that teachers are the most useful source of careers information, compared with 39% who say their family is.279
Part 1 – Engineering in Context Understanding and influencing target audiences 5.0 34
England
From September 2012, The Education Act of 2011 placed a statutory duty on schools to secure access to, “independent and impartial careers advice for their pupils in Years 9-11”.265 In September 2013, the Careers Guidance in Schools Regulations extended the age range to which the duty applies to include all registered pupils in Year 8, 12 and 13.266 With the dismantling of the Connexions service, the National Careers Service – formerly Next Steps (for adults) – has been tasked with providing an all-age service to include labour market intelligence. It currently offers a telephone and web-chat services.267
Career guidance policy in England is complicated by the fact that it is currently the responsibility of two Government departments: The Department for Education (DfE) is responsible for young people up to the age of 18 while the Department for Business, Innovation and Skills (BIS) is responsible for adults aged 19+ (and 18+ seeking work or in custody). This is further complicated by the fact that career guidance provision in Colleges is not funded directly by either department.268
Scotland
Scotland has an all-age careers service which has been operating for a number of years.269 In March 2011, a CIAG strategy was launched by the Scottish Government which aimed to help individuals develop career management skills and make informed choices. Since the development of this strategy, the Scottish Government has brought together a range of partner organisations to develop a labour market intelligence framework. This framework was published in March 2012.
Wales
Wales also has an all-age careers service which has been reviewed in the context of the Welsh Government’s Skills that Work for Wales strategy.270 Careers Wales is the body responsible for careers advice and is aiming to provide an integrated online, telephone and face-to-face service which is also able to provide labour market intelligence.
Northern Ireland
In Northern Ireland, careers guidance services are delivered by the Northern Ireland Careers Service and Educational Guidance Service for Adults.
The Careers Service provides an impartial, all-age careers information, advice and guidance service to help young people and adults make informed choices about their future career paths. Professionally-qualified careers advisers are based in Careers Resource Centres, Jobs and Benefits Offices and JobCentres throughout Northern Ireland.
The website, part of the Northern Ireland direct Government services website, can be found at www.nidirect.gov.uk/careers. The careers section is aimed at 14- to 19-year-olds, as well as adults. It includes pages on career planning, an A to Z of careers, preparation for employment, a parent zone and job opportunities.

Back to Contents
35 5.0 Understanding and influencing target audiences Part 1 – Engineering in Context
• The University of Warwick280 has shown that students don’t make links between the curriculum and future careers and that students don’t know that triple science is either desirable or essential for some STEM careers.
• Our own brand monitor research shows that while educators have considerable scope to influence young people about the perceptions of engineering, they are less likely to view engineering as a desirable career than adults in general.281
• 18% of all STEM teachers think that a career in engineering is undesirable for their students, rising to 23% for the 25- to 44-year-old STEM teacher group.
• Research from Ofsted shows that out of 60 schools it visited to explore CIAG provision, only 12 ensured that all students received sufficient information to consider all career possibilities.282
Finally, we mentioned previously in this section that schools in England now have a statutory duty to provide CIAG to young people. It is therefore disturbing to note that a recent research project by Pearson’s found that only 12% of educators said they knew a lot about their statutory duty.283
5.3 Bridging the transition from school to workHaving explored young people’s perceptions of STEM and careers advice, it is important to consider employers’ perceptions of young people and the education system. If we are to harness the potential of young people leaving the education system, we need to ensure the transition from the world of education to the world of work is smooth and that the ‘world of work’ messages are positive and properly targeted to different age groups. The current evidence suggests that it is anything but.
Research by Ofqual284 found that when recruiting a school leaver, nearly half (47%) of employers with fewer than 20 staff said general attitude to work/enthusiasm was a key factor (Figure 5.1). Personality fit was second, mentioned by two fifths (40%) of employers. Only a quarter (26%) mentioned technical/job-related skills.
While Figure 5.0 applies to businesses with fewer than 20 employees, businesses of all sizes have similar perceptions of school leavers. A report by the Chartered Institute of Personnel and Development (CIPD)285 highlighted the disturbing fact that only around 10% of all companies directly recruit 16- to 18-year-olds from school and less than a quarter of employers recruit anyone directly from education who is under the age of 24. Similarly, the Federation of Small Businesses (FSB)286 found that 81% of small businesses are not confident that students leaving school aged 16
have the right employability skills. The CIPD, in another report, highlighted that over half (59%) of employers felt that young people had unrealistic expectations about work.287 Finally Adecco, the recruitment company, has shown that half (53%) of employers feel that university graduates have unrealistic expectations of working life and a third (36%) think the education system is failing to meet the needs of employers.288 A clear communications gap exists between employers and young people which needs bridging if we are expecting smooth transitions from education into work.
Fig. 5.1: Top factors when recruiting a school leaver for employers with fewer than 20 staff (up to three choices could be made)
Source: Ofqual
0.0%
5.0%
10.0
%
15.0
%
20.0
%
25.0
%
30.0
%
35.0
%
40.0
%
45.0
%
50.0
%
10%
Acedemicqualifications/grades (all/appropriate/unspecified)
13%
12%
11%
10%
Appearance
Personalityfit/profiling
28%
23%
15%
14%
Literacy/numeracy
General attitudeto work/overallenthusiasm
Technical/job related skills
The candidate’sperformance atinterview
The candidate’spreviousexperience
To havecommon sense
GCSEqualifications
Communicationskills
47%
40%
280 Good Timing Implementing STEM careers strategy in secondary schools, Centre for Education and Industry, University of Warwick, the International Centre for Guidance Studies, University of Derby and Isinglass Consultancy Ltd, November 2011, p11 281 2013 Engineers and Engineering Brand Monitor, IFF Research, August 2013, p5 282 Going in the right direction?, Ofsted, September 2013, p4 283 A cloudy horizon: Careers Service in England, Pearson, September 2013, p27 284 Perceptions of A levels, GCSEs and other qualifications: Wave11. Employers and Higher Education Institutions, Ofqual, May 2013, p37 2013 Engineers and Engineering Brand Monitor, IFF Research, August 2013, p5 285 The Business Case for Employer Investment in Young People, CIPD, May 2012, p5 286 The apprenticeship journey, Federation of Small Businesses, November 2012 287 Learning to Work: survey report, CIPD, September 2012, p10 288 Unlocking Britain’s potential, Adecco, 2012, p10

Back to Contents
289 Learning to Work: survey report, CIPD, September 2012, p3 290 The apprenticeship journey, Federation of Small Businesses, November 2012 291 Wellcome Trust Monitor Report Wave 2: Tracking public views on science, research and science education, Wellcome Trust, May 2013, p7 292 The fit between graduate labour market supply and demand: 3rd year UK undergraduate degree final year students’ perceptions of the skills they have to offer and the skills employers seek, Warwick Institute for Employment Research and HESCU, September 2010, p14 293 Employer engagement in British secondary education: wage earning outcomes experienced by young adults, Education and Employers Taskforce, 25th February 2013, p1 294 Employer involvement in schools: a rapid review of UK and international evidence, NFER, 2012, p3 295 Quantitative evaluation of the Tomorrow’s Engineers programme 2012/13, Boxclever Consulting, September 2013 296 Nothing in Common: Career Aspirations of Young Britons Mapped Against projected Labour Demand (2010-2020), UKCES, March 2013, p8 297 An aspirational nation: creating a culture change in careers provision, National Careers Council, June 2013, p8 298 Nothing in Common: Career Aspirations of Young Britons Mapped Against projected Labour Demand (2010-2020), UKCES, March 2013, p5
Part 1 – Engineering in Context Understanding and influencing target audiences 5.0 36
Table 5.0: Industrial sector preferences of Year 7 pupils mapped against UK labour force by sector
Source: UKCES298
Industry Total number employed in that industry
% employed in that industry
% of Y7 choosing these careers (N=483)
Agriculture and fishing 250,943 0.9 0.21
Energy and water 171,718 0.6 0.21
Manufacturing 2,875,201 10.6 0
Construction 1,280,044 4.7 5.18
Distribution, hotels and restaurants
6,477,187 23.8 2.28
Transport and communications
1,580,448 5.8 6.42
Banking, finance and insurance
5,760,210 21.2 3.11
Public administration, education and health
7,329,546 27 36.23
Others 1,455,977 5.4 46.38
5.3.1 Experience of work
One proven way to bridge the transition from the world of education to the world of work is via work placements. This would also have the benefit of enabling businesses that currently do not recruit school leavers to ‘test the water’ and see if school leavers would be employable for their company. Research by CIPD289 found that three fifths (60%) of employers provide work experience, while the FSB highlights that among its members, 31% offer work experience to students in their local area. However, two thirds (67%) of members say they have never been approached by their local school or college.290
Similarly, only two thirds (61%) of young people surveyed by the Wellcome Trust291 said they had done work experience and, of these, only a quarter (28%) had done work experience in the STEM field. This means that 83% of young people haven’t experienced what a STEM career is like via work experience.
Work experience provides positive benefits. Research has shown that high-quality, relevant work experience has a positive impact on students’ employability.292 This finding is reinforced by more recent research which shows that, “those young adults earning a full-time annual salary who experienced four or more employer contacts whilst in education could expect to earn, on average in their early 20s, 18% or £3,600 more per year than their peers, qualified to similar levels, who undertook no activities during their schooling.”293 The importance of quality work experience cannot be more strongly emphasised.
Finally, a literature review by NFER294 has identified the ten key characteristics of successful employer engagement in schools, as:
• a clear vision of what all parties want to achieve
• good communication among partners
• partnership
• commitment, cooperation and leadership across all stakeholders
• time to build relationships and for professional development
• flexibility
• focus on curriculum
• well-structured programme design
• consideration of regional economic and development priorities
• early intervention
EngineeringUK believes both schools and employers should use these ten characteristics to build long-lasting school/employer links that benefit students and enable them to develop employability skills in relevant work areas.
Whilst not providing the same experience, STEM enrichment and enhancement events such as STEM fairs, STEM ambassador schemes and STEM activities in schools helps give children a greater understanding of what people working in STEM jobs do. For example, evaluation of the Tomorrow’s Engineers programme shows that 40% of secondary school students met a working engineer and two thirds (66%) said they learnt about the different jobs engineers do.295
5.4 Aspiration vs reality: labour market intelligenceAt the beginning of this chapter, we quoted that, “perception is reality”. Therefore, we shouldn’t be surprised that the UK Commission for Employment and Skills (UKCES) has demonstrated that young people’s career aspirations, “can be said to have nothing in common with the projected demand for labour in the UK between 2010 and 2020.”296 This is reinforced by research from the National Careers Council (NCC) who showed that, “young people’s aspirations are often misaligned with the opportunities presented by local labour markets”.297
Table 5.0 looks at the percentage of people employed in different industrial sectors and the percentage of Year 7 students who said they wanted to work in that area. It can be noted that just over a quarter (27%) of all jobs are in public administration, education and health but over a third (36.2%) of Year 7 students wanted to work in this area. Disturbingly, the analysis shows that nearly one in nine (10.6%) work in manufacturing, but no students wanted to work in this sector.
The STEM community in partnership with Government, business and the third sector clearly has more work to do.

Back to Contents
37 6.0 Mining the talent pool: capacity and equity Part 1 – Engineering in Context
The Work Foundation report International lessons: youth unemployment in the global context points out that the UK has a major youth unemployment problem. Almost a million young people in the UK are unemployed – and the size of this group was rising even during times of economic growth.300
However, it does go on to say that it doesn’t have to be this way. In many other developed nations, youth unemployment has remained low despite the global economic downturn. For example, youth unemployment in Germany has been
falling since the mid 2000s, while in the Netherlands and Switzerland the proportion of young people out of work remained low and stable throughout the economic crisis.
The report presents case studies of several EU countries, looking in detail at particular aspects of their youth labour markets. It reached the following findings:
• In Germany a strong dual apprenticeship system can facilitate transitions between school and work. This included looking at the importance of the dual education system in
supporting strong labour market outcomes for young people.301
• In Denmark, although unemployment rose rapidly over the recession, the level of long-term unemployment among young people is very low due to the role of active labour market policies (ALMP) in limiting of the number of young people who become long-term unemployed.302
• In the Netherlands, the labour market is characterised by very high employment rates for young people, the majority of whom are on non-standard employment contracts. The report looks at the role a flexible labour market can play in supporting youth employment.303
The Work Foundation does warn that, while the UK needs to be careful about directly importing policies from other countries, a number of international lessons can nevertheless be drawn about the best way to help young people make the transition from school to work:
• A strong dual apprenticeship system can facilitate transitions between school and work and can shelter young people from economic downturns.
• Intervening early with ALMP can reduce the duration of unemployment.
• The availability of part-time flexible employment opportunities supports high levels of youth employment.
The report goes on to suggest 11 potential policy responses.304 One certainly worthy of mention here is the recommendation to implement, “policy measures to maximise engagement of large corporates in the apprenticeship system to provide a guaranteed part-time job for six months305 for all unemployed young people, combined with intensive support from providers.” Wouldn’t that be a game changer? However, we should note the research by the National Foundation for
Part 1 – Engineering in Context6.0 Mining the talent pool: capacity and equity
“In difficult and challenging economic times, using the talents of the whole workforce is more important than ever. Considering the diversity of your workforce and fostering an inclusive working environment can bring business benefits and provide a market advantage in economically straightened times.”
Jo Swinson, Minister for Employment Relations and Consumer Affairs and Minister for Women and Equalities299
299 Occasional Paper No. 4, The Business Case for Equality and Diversity, A survey of the academic literature, Department of Business, innovation and Skills, January 2013 300 International Lessons: Youth unemployment in the global context, Lizzie Crowley, Katy Jones, Nye Cominetti and Jenny Gulliford, The Work Foundation, January 2013, p2 301 International Lessons: Youth unemployment in the global context, Lizzie Crowley, Katy Jones, Nye Cominetti and Jenny Gulliford, The Work Foundation, January 2013, chapter 4 302 Ibid, chapter 3 303 Ibid, chapter 4 304 International Lessons: Youth unemployment in the global context, Lizzie Crowley, Katy Jones, Nye Cominetti and Jenny Gulliford, The Work Foundation, January 2013, p4 305 Youth Unemployment: the crisis we cannot afford, ACEVO, 2012
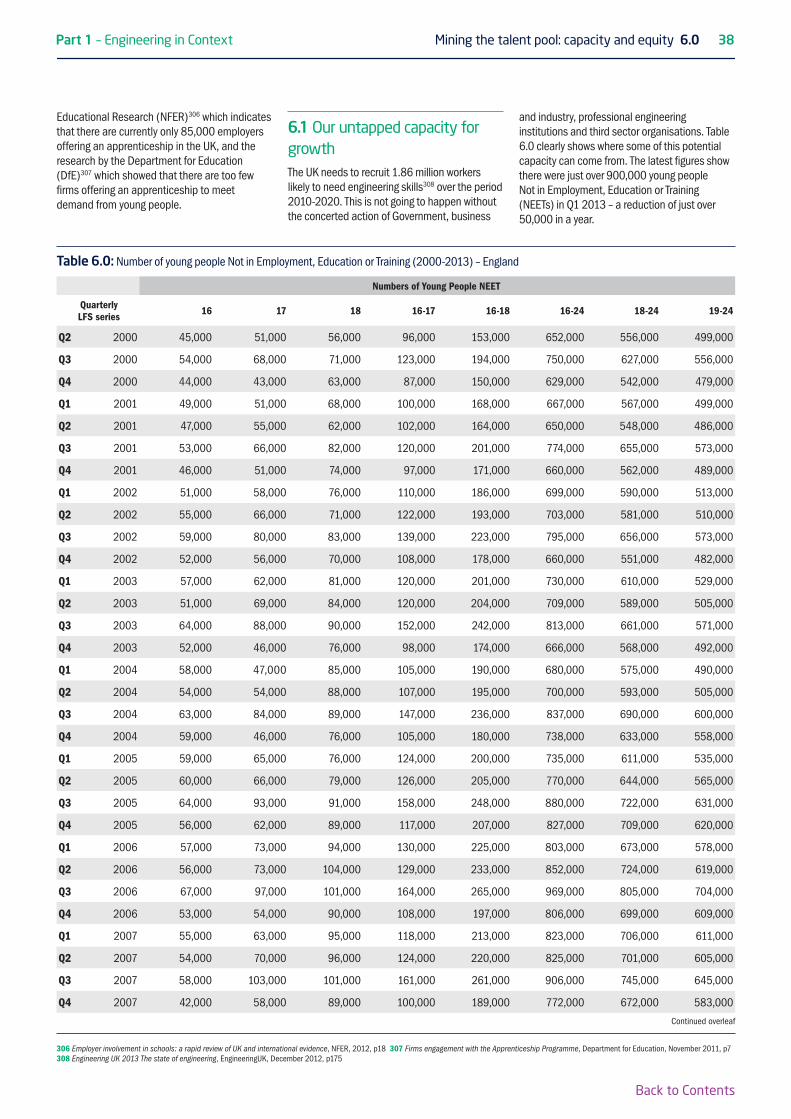
Back to Contents
Part 1 – Engineering in Context Mining the talent pool: capacity and equity 6.0 38
Educational Research (NFER)306 which indicates that there are currently only 85,000 employers offering an apprenticeship in the UK, and the research by the Department for Education (DfE)307 which showed that there are too few firms offering an apprenticeship to meet demand from young people.
6.1 Our untapped capacity for growthThe UK needs to recruit 1.86 million workers likely to need engineering skills308 over the period 2010-2020. This is not going to happen without the concerted action of Government, business
and industry, professional engineering institutions and third sector organisations. Table 6.0 clearly shows where some of this potential capacity can come from. The latest figures show there were just over 900,000 young people Not in Employment, Education or Training (NEETs) in Q1 2013 – a reduction of just over 50,000 in a year.
Numbers of Young People NEET
Quarterly LFS series 16 17 18 16-17 16-18 16-24 18-24 19-24
Q2 2000 45,000 51,000 56,000 96,000 153,000 652,000 556,000 499,000
Q3 2000 54,000 68,000 71,000 123,000 194,000 750,000 627,000 556,000
Q4 2000 44,000 43,000 63,000 87,000 150,000 629,000 542,000 479,000
Q1 2001 49,000 51,000 68,000 100,000 168,000 667,000 567,000 499,000
Q2 2001 47,000 55,000 62,000 102,000 164,000 650,000 548,000 486,000
Q3 2001 53,000 66,000 82,000 120,000 201,000 774,000 655,000 573,000
Q4 2001 46,000 51,000 74,000 97,000 171,000 660,000 562,000 489,000
Q1 2002 51,000 58,000 76,000 110,000 186,000 699,000 590,000 513,000
Q2 2002 55,000 66,000 71,000 122,000 193,000 703,000 581,000 510,000
Q3 2002 59,000 80,000 83,000 139,000 223,000 795,000 656,000 573,000
Q4 2002 52,000 56,000 70,000 108,000 178,000 660,000 551,000 482,000
Q1 2003 57,000 62,000 81,000 120,000 201,000 730,000 610,000 529,000
Q2 2003 51,000 69,000 84,000 120,000 204,000 709,000 589,000 505,000
Q3 2003 64,000 88,000 90,000 152,000 242,000 813,000 661,000 571,000
Q4 2003 52,000 46,000 76,000 98,000 174,000 666,000 568,000 492,000
Q1 2004 58,000 47,000 85,000 105,000 190,000 680,000 575,000 490,000
Q2 2004 54,000 54,000 88,000 107,000 195,000 700,000 593,000 505,000
Q3 2004 63,000 84,000 89,000 147,000 236,000 837,000 690,000 600,000
Q4 2004 59,000 46,000 76,000 105,000 180,000 738,000 633,000 558,000
Q1 2005 59,000 65,000 76,000 124,000 200,000 735,000 611,000 535,000
Q2 2005 60,000 66,000 79,000 126,000 205,000 770,000 644,000 565,000
Q3 2005 64,000 93,000 91,000 158,000 248,000 880,000 722,000 631,000
Q4 2005 56,000 62,000 89,000 117,000 207,000 827,000 709,000 620,000
Q1 2006 57,000 73,000 94,000 130,000 225,000 803,000 673,000 578,000
Q2 2006 56,000 73,000 104,000 129,000 233,000 852,000 724,000 619,000
Q3 2006 67,000 97,000 101,000 164,000 265,000 969,000 805,000 704,000
Q4 2006 53,000 54,000 90,000 108,000 197,000 806,000 699,000 609,000
Q1 2007 55,000 63,000 95,000 118,000 213,000 823,000 706,000 611,000
Q2 2007 54,000 70,000 96,000 124,000 220,000 825,000 701,000 605,000
Q3 2007 58,000 103,000 101,000 161,000 261,000 906,000 745,000 645,000
Q4 2007 42,000 58,000 89,000 100,000 189,000 772,000 672,000 583,000
Table 6.0: Number of young people Not in Employment, Education or Training (2000-2013) – England
306 Employer involvement in schools: a rapid review of UK and international evidence, NFER, 2012, p18 307 Firms engagement with the Apprenticeship Programme, Department for Education, November 2011, p7 308 Engineering UK 2013 The state of engineering, EngineeringUK, December 2012, p175
Continued overleaf

Back to Contents
39 6.0 Mining the talent pool: capacity and equity Part 1 – Engineering in Context
Table 6.0: Number of young people Not in Employment, Education or Training (2000-2013) – England – continued
Notes: 1) Age refers to academic age, which is the respondents’ age at the preceding 31 August. 2) All estimates are taken from the Labour Force Survey 3) All estimates refer to calendar quarters
Numbers of Young People NEET
Quarterly LFS series 16 17 18 16-17 16-18 16-24 18-24 19-24
Q1 2008 43,000 62,000 90,000 104,000 194,000 799,000 694,000 605,000
Q2 2008 46,000 66,000 98,000 112,000 210,000 839,000 727,000 629,000
Q3 2008 50,000 104,000 103,000 154,000 257,000 986,000 832,000 729,000
Q4 2008 41,000 55,000 107,000 95,000 202,000 850,000 755,000 648,000
Q1 2009 43,000 66,000 110,000 109,000 219,000 924,000 815,000 705,000
Q2 2009 53,000 76,000 108,000 129,000 237,000 950,000 821,000 713,000
Q3 2009 53,000 96,000 113,000 148,000 261,000 1,064,000 916,000 803,000
Q4 2009 28,000 49,000 98,000 77,000 175,000 888,000 810,000 713,000
Q1 2010 32,000 58,000 106,000 90,000 196,000 921,000 831,000 725,000
Q2 2010 32,000 67,000 100,000 99,000 199,000 868,000 769,000 669,000
Q3 2010 38,000 100,000 121,000 138,000 260,000 1,023,000 885,000 763,000
Q4 2010 27,000 41,000 90,000 68,000 158,000 934,000 866,000 776,000
Q1 2011 34,000 49,000 79,000 83,000 161,000 927,000 844,000 766,000
Q2 2011 42,000 56,000 92,000 98,000 190,000 991,000 893,000 801,000
Q3 2011 49,000 98,000 119,000 147,000 266,000 1,181,000 1,034,000 915,000
Q4 2011 31,000 50,000 93,000 81,000 174,000 969,000 887,000 794,000
Q1 2012 38,000 57,000 85,000 95,000 180,000 960,000 865,000 780,000
Q2 2012 36,000 59,000 100,000 95,000 195,000 986,000 891,000 791,000
Q3 2012 25,000 80,000 92,000 105,000 197,000 1,038,000 933,000 842,000
Q4 2012 21,000 32,000 93,000 53,000 146,000 890,000 837,000 744,000
Q1 2013 26,000 40,000 86,000 65,000 152,000 909,000 843,000 757,000

Back to Contents
Part 1 – Engineering in Context Mining the talent pool: capacity and equity 6.0 40
309 Global Employment Trends for Youth 2013, International Labour Organisation, January 2013 310 Ibid, p9 311 As shown in figure 1, the highest global youth unemployment rate occurred in 2002, which was the result of the relatively high youth unemployment rate in several regions at that time, including Latin America and the Caribbean, South East Asia and the Pacific and North Africa. 312 Underemployed workers are those people in employment who are willing to work more hours, either by working in an additional job, by working more hours in their current job, or by switching to a replacement job. They must also be available to start working longer hours within 2 weeks and their current weekly hours must be below 40 hours if they are between 16 and 18 and below 48 hours if they are over 18. 313 People in work wanting more hours increases by 1 million since 2008, ONS, 28 November 2012
Furthermore, as the International Labour Organisation (ILO) has clearly shown in its Global Employment Trends for Youth 2013 report,309 the UK is not alone in facing the youth unemployment dilemma. Since the unprecedented increase in youth unemployment between 2008 and 2009, the global youth unemployment rate has remained very high. From 2009 to 2011, the youth unemployment rate decreased from 12.7% to 12.3%. It increased again to 12.4% in 2012 and has continued to grow to 12.6% in 2013. Global youth unemployment is estimated to be 73.4 million in 2013, which is an increase of 3.5 million since 2007 and 0.8 million above the 2011 level (Figure 6.0).310,311
Finally, when it comes to untapped capacity, we would do well to remember that this also lies with the underemployed. The number of underemployed workers312 ie those who want to work more hours, has risen by an estimated one million (or 47.3%) since the start of the economic downturn in 2008 to stand at 3.05 million in 2012.313 This represented around one in ten of the 29.41 million people in work, giving an underemployment rate of 10.5%.
Fig. 6.0: Global youth unemployment and unemployment rate (1991-2013)
Note: p = projection. Source: ILO, Trends Economic Models, April 2013
58 60 64 66
Youth unemployment (millions)
Youth unemployment rate (%)
9.5
10.0
10.5
11.0
62 68 70 72 74 76 78 80
11.5
12.0
12.5
13.0
13.5
1991
1992
1993
1994
1995
1996
1997
1998
1999
2000
2001
2002
2003
2004
2005
2006
2007
2008
2009
2010
2011
2012p
2013p
70.111.7
65.410.9
67.411.4
66.511.4
67.711.7
68.511.9
68.812.0
70.012.3
71.212.4
72.612.7
73.812.8
75.813.0
75.912.8
76.812.8
77.812.8
74.912.3
69.911.5
70.411.7
75.612.7
74.012.5
72.612.3
72.912.4
73.412.6

Back to Contents
41 6.0 Mining the talent pool: capacity and equity Part 1 – Engineering in Context
6.2 What’s worth restating from the 2013 report?In studying educational provision and progression, Section 6 of the Engineering UK 2013 listed many factors that collectively hinder young people, creating a cohort of NEETS. These included social and financial factors, and factors relating to educational establishments and careers provision. The influence of these factors still remains true.314 Two more, however, are worth referencing again. These relate to the heterogeneous nature of NEETs.
One is the research that identified three ‘types’ of NEET young people within the heterogeneous overarching NEET umbrella:315
• ‘Open to learning’ NEETs – the largest sub-group (around 41% of the NEET group). These young people were the most likely to re-engage in education or training in the short term and generally had higher levels of attainment and better attitudes towards school than most other NEET young people.
• ‘Sustained’ NEETs – around 38% of the NEET group. These young people were characterised by their negative experience of school, higher levels of truancy and exclusion and lower academic attainment than other NEET young people, and the fact that they were most likely to remain NEET in the medium term.
• ‘Undecided’ NEETs – around 22% of the NEET group. These young people were similar in some respects (such as their attainment levels) to those who were ‘open to learning’, but they were dissatisfied with available opportunities and their ability to access what they wanted to do.
The second piece of research worth referencing again unpicked the surface number of 954,000 NEETs (taken from the Building Engagement, Building Futures report – December 2011)316 to show that:
• 150,000 are 16- to 17-year-olds who may need additional opportunities or support to re-engage in education or training.
• 523,000 are 18- to 24-year-olds who are unemployed, not in education, and looking for work. Of those, 249,000 have been unemployed for over six months and may need significant help to find work.
• 490,000 are 18- to 24-year-olds who are economically inactive. Of these, 371,000 are looking after family or home, or are sick or disabled. The remaining 119,000 are inactive for a wide range of other reasons.
314 Engineering UK 2013 The state of engineering, Engineering UK, December 2012, p40-48 315 Review of the curriculum and qualification needs of young people who are at risk of disengagement, Gill Bielby, Michelle Judkins, Lisa O’Donnell and Tami McCrone, (NFER Research Programme: From Education to Employment), NFER, August 2012, p6 316 Building Engagement, Building Futures: Our Strategy to Maximise the Participation of 16-24 Year Olds in Education, Training and Work, HM Government, December 2011, p4, Figure 1

Back to Contents
317 Widening Participation in Higher Education, August 2012 318 University Challenge :How Higher Education can Advance Social Mobility A progress report by the Independent Reviewer on Social Mobility and Child Poverty, October 2012, p29 319 The achievement gap in context, Jonathan Clifton and Will Cook, Excellence and Equity, Tackling educational disadvantage in England’s secondary schools, IPPR, June 2013, p21 320 Some critics have argued that the improved performance of FSM pupils is a result of grade inflation and the increased use of vocational ‘equivalent’ qualifications. However, the narrowing attainment gap can be seen even when ‘equivalent qualifications’ are stripped out of the analysis. This shows that the growth of vocational qualifications cannot explain more than a fraction of the reduction in educational inequality in recent years.
6.3 What’s new?Many new compelling research findings have emerged since the publication of the last report. The most noteworthy are described in the following sub-sections.
6.3.1 Free School Meals vs. non Free School Meals: progression to Higher Education
Table 6.1 shows that in 2005/6, an estimated 13% of maintained school pupils who received free school meals (FSM) at age 15 entered Higher Education by age 19. This rose steadily to an estimated 18% in 2009/10. The estimated progression rate for pupils not receiving free school meals has risen from 33% in 2007/08 to 36% in 2009/10. The estimated gap between FSM and non-FSM rates was 19 percentage points in 2005/06 and 2006/07 but has remained steady at 18 percentage points from 2007/08 to 2009/10.317
6.3.2 Free School Meals vs. Non Free School Meals: GCSE achievement gap
Increasing the pass rate for five GCSEs including English and maths for lower socio-economic groups has been cited as the most important factor when it comes to widening participation and ensuring fair access in Higher Education.318 So it is heartening to see that the Institute for Public Policy Research (IPPR) reporting319 that while both groups have improved their results in recent years, there has been a faster improvement among the FSM eligible group (Figure 6.1). There has therefore been a small narrowing of the class gap over the last decade.320
Part 1 – Engineering in Context Mining the talent pool: capacity and equity 6.0 42
Table 6.1: Estimated percentage of maintained school pupils on Free School Meals at age 15 who entered UK Higher Education Institutions and English Further Education Colleges by age 19 (2005/06-2009/10)
[1] FSM and Non-FSM refer to whether pupils were receiving Free School Meals or not.
[2] Gap is the difference between FSM and non-FSM expressed in percentage points. Percentage figures are rounded; gap figures are calculated from un-rounded data and therefore may not correspond to the gap between rounded percentages.
Estimated % who entered HE
FSM [1] Non-FSM [1] Gap (pp) [2] All
2005/06 13% 33% 19 30%
2006/07 14% 33% 19 31%
2007/08 15% 33% 18 31%
2008/09 17% 35% 18 33%
2009/10 18% 36% 18 34%
Fig. 6.1: Changes in the attainment gap at GCSE by Free School Meal eligibility (2003–2011) – England
Source: Department for Education
0.0
1.0
3.0
0.5
2.0
1.5
2.5
0 20 8010 4030 50 60 70
2007
2008
2009
2010
2011
2012
2006
2005
2004
2003
Eligible for Free School Meals Not eligible for Free School Meals Relative difference

Back to Contents
43 6.0 Mining the talent pool: capacity and equity Part 1 – Engineering in Context
6.3.3 Free School Meals: major ethnic groups’ GCSEs attainment
Since 2007, there have been big improvements in the performance of pupils from different ethnic backgrounds. At GCSE, all of the main ethnic groups have increased their levels of attainment, with Bangladeshi pupils making the greatest gains over time.321
In 2012, just over a third of pupils from low income backgrounds (36%) left school with five good GCSEs including English and maths, compared with over three-fifths of their better-off peers (63%). However, the performance of pupils from low income backgrounds varies greatly between different ethnic groups (Figure 6.2). Overall, white British pupils from disadvantaged backgrounds are consistently the lowest performing of all of the main ethnic groups and gaps in attainment to other groups have widened over time. Since 2007, the attainment of white British pupils eligible for free school meal has improved by only 13 percentage points compared with 22 percentage points for Bangladeshi pupils from low income backgrounds.322
6.3.4 High quality teaching is especially important for disadvantaged pupils
As previously stated, improving pass rates at GCSE is vital for widening participation in Higher Education. It is therefore important to recognise that the quality of teaching makes a crucial difference to pupils’ learning and achievement, particularly in disadvantaged schools.323,324 Ofsted’s Annual Report 2011/12 highlights in some detail the features of the most and least successful teaching seen during inspections. The characteristics of outstanding teaching include:
• excellent leadership of behaviour and attitudes to learning
• lessons that challenge pupils according to their needs and abilities
• frequent and purposeful opportunities to learn independently
• teachers’ excellent subject knowledge and use of questioning
• highly effective feedback to pupils
This relationship to high quality teaching is reinforced and quantified by the work of the Sutton Trust who showed that being taught over a two-year course by a high quality teacher adds
0.565 of a GCSE point per subject. The Trust also showed that, “over a school year, these pupils can gain 1.5 years’ worth of learning with very effective teachers, compared with 0.5 years with poorly performing teachers. In other words, for poor pupils the difference between a good teacher and a bad teacher is a whole year’s worth of learning.”325 This plainly emphasises that the effects of high quality teaching are especially significant for pupils from disadvantaged backgrounds.
6.3.5 Progression to Higher Education by type of school
The irreconcilable difference in progression to Higher Education is also evident between different types of schools.
The Widening Participation in Higher Education report by the Department for Business, Innovation and Skills (BIS) showed that an estimated 71% of those who studied A levels in state schools and colleges at age 17 in 2007/08 progressed to Higher Education by age 19 in 2009/10 (Table 6.2). For independent school and college pupils, the estimated progression rate was 87%. The gap between these progression rates has fluctuated between 13 and 16 percentage points from 2006/07 to 2009/10.
The estimated progression rate for state school and college pupils to the most selective Higher Education Institutions was 26% in 2009/10, the same as the previous year. The equivalent progression rate for independent school and college pupils was 65% in 2009/10, a rise of three percentage points since 2008/09.326
This disparity was separately endorsed by The Sutton Trust whose report, Degrees of success: university chances by individual school327 shows that independent school students were more than twice as likely as students in comprehensive schools or academies to be accepted into one of the 30 most highly selective universities: 48.2% of independent school students in England were accepted by these universities compared with 18% of students in non-selective state schools.
Fig. 6.2: Major ethnic groups: percentage of pupils eligible for Free School Meals attaining five GCSEs at grades A* to C including English and mathematics (2007–12) – UK
Figures for 2007 to 2011 are based on final data. 2012 figures are based on revised data. Based on students in state-funded schools (including academies and city technology colleges) at the end of Key Stage 4 in each academic year.
Source: Department for Education
20%
30%
60%
70%
10%
50%
80%
2007
2008
2009
2010
2011
2012
40%
White British
BangladeshiChinese Indian Black African
Black CaribbeanPakistani
60.7%
36.4%
41.9%
29.2%
29.5%
24.2%
17.4%
68.2%
58.6%
57.9%
48.4%
46.5%
40.2%
30.5%
321 Unseen children: access and achievement 20 years on Evidence report, Ofsted, June 2013, p26 322 Unseen children: access and achievement 20 years on Evidence report, Ofsted, June 2013, p29 323 Drivers and barriers to raising achievement: a focus on school and classroom level influences, Access and achievement in education review, Ofsted, 2013; www.ofsted.gov.uk/accessandachievement 324 Recruiting and retaining good quality teachers in disadvantaged schools: a review of the UK and international evidence, Access and achievement in education review, Ofsted, 2013; www.ofsted.gov.uk/accessandachievement 325 Improving the impact of teachers on pupil achievement in the UK – interim findings, The Sutton Trust, September 2011, http://www.suttontrust.com/public/documents/1teachers-impact-report-final.pdf 326 Widening Participation in Higher Education, Department for Business, Innovation and Skills, August 2012, p11 327 Degrees of success: university chances by individual school, The Sutton Trust, 2011, www.suttontrust.com/research/degree-of-success-university-chances-by-individual-school/

Back to Contents
328 Securing a Sustainable Future for Higher Education in England, Lord Browne, 2010 329 The Impact of University Degrees on the Lifecycle of Earnings: some further analysis, Department for Business, Innovation and Skills, August 2013, p6 330 The Impact of University Degrees on the Lifecycle of Earnings: some further analysis, Department for Business, Innovation and Skills, August 2013, p6 331 University Challenge :How Higher Education Can Advance Social Mobility A progress report by the Independent Reviewer on Social Mobility and Child Poverty, October 2012, p12 332 http://www.offa.org.uk/
Part 1 – Engineering in Context Mining the talent pool: capacity and equity 6.0 44
6.3.6 Widening access to Higher Education
Those who go to university in the UK derive great benefits in their lives. The Browne Review328 into the future of university funding found that graduates are more likely to be employed, more likely to enjoy higher wages and better job satisfaction, and more likely to find it easier to move from one job to the next. Higher education enables individuals from low-income backgrounds to enter higher status jobs and increase their earnings. Graduates also enjoy substantial health benefits – a reduced likelihood of smoking, and lower incidence of obesity and depression. They are less likely to be involved in crime, more likely to be engaged with their children’s education and more likely to be active in their communities. In short, graduates are wealthier, healthier and happier.
In terms of higher wages, the evidence is unequivocal: BIS has conducted research into lifetime earnings (net of tax and load repayments) of graduates, relative to those without a degree. It identified that on average the earnings premium is approximately £168,000 (28%) for men and approximately £252,000 (53%) for women.329 It also identified that those getting a first or upper second class degree got significantly larger returns than those with a lower degree class (circa £76,000 for men and £85,000 for women).330
This sub-section attempts to capture briefly the problem, the actions and the remaining challenges that we collectively still need to address within the widening access agenda in order to ensure a fair and equitable state of affairs.
The problem:
Universities have a broader economic and social role. They are the gatekeepers of opportunity and the main pathway into careers in the professions. As the British economy becomes ever more knowledge-based and professionalised, the role universities play will assume greater importance. Who gets into university, and how they get on once they have left, will have a critical role in determining whether Britain’s sluggish rates of social mobility can be improved. However, at present, the UK’s universities seem to be less open to people from lower and middle income groups in society than those in countries such as the US or Australia331 (Figure 6.3).
The actions:
The Government is addressing the widening access issue through the establishment of a new agency, OFFA (the Office For Fair Access), which is armed with significant funds.332
The key vehicles for change are access agreements which set out how a university or college intends to protect and promote fair access to Higher Education as a condition of charging higher fees. All publicly-funded universities and colleges charging higher undergraduate fees of more than £6,000 in 2012/13, were required to have an access agreement approved by OFFA.
Table 6.2: Estimated percentage of maintained school pupils aged 15, by Free School Meal status who entered HE by age 19 Academic UK Higher Education Institutions and English Further Education Colleges (2005/06-2009/10)
..= not available
[1] The most selective are defined as the top third of HEIs when ranked by mean UCAS tariff score from the top three A level grades of entrants.
Progression rate to all HE Progression rate to the most selective HE [1]
School/college type 2006/07 2007/08 2008/09 2009/10 2006/07 2007/08 2008/09 2009/10
Independent 85% 83% 82% 87% 63% 63% 62% 65%
Selective state .. .. 89% 89% .. .. 58% 60%
Other state .. .. 68% 69% .. .. 23% 22%
Total state 72% 68% 69% 71% 26% 25% 26% 26%
All 74% 68% 71% 72% 31% 29% 30% 30%
Independent/ state gap (pp)
13 16 13 16 37 38 37 39
Fig. 6.3: Higher education participation rates by social class
Source: J. Jerrim and A. Vignoles, University Access for Socio-economically Disadvantaged Children: A Comparison Across Anglophone Countries.
20.0
%
10.0
%
0.0%
40.0
%
70.0
%
50.0
%
30.0
%
60.0
%
Australia
US
England
Lower socio-economic status Middle socio-economic status Upper-socio economic status

Back to Contents
45 6.0 Mining the talent pool: capacity and equity Part 1 – Engineering in Context
In 2011/12, universities and colleges spent a total of £444.1 million (23.4% of their higher fee income) through their access agreements on measures to improve and sustain access to Higher Education for people from lower income and other under-represented groups (‘OFFA-countable’ expenditure),333 compared with £424.2 million (24.4% of their higher fee income) in 2010/11.334
The importance of outreach by universities has emerged as a key intervention. It is therefore important to note the continued efforts of universities and colleges to reach out to potential students in schools and communities where few currently progress to Higher Education. Spending on additional outreach activity monitored under access agreements is up by 26% from £45.7 million in 2012/11 to £57.6 million. Under the access agreements approved for the 2013/14 academic year, institutions will be spending £110 million on outreach.335
The significance of outreach was highlighted through the work of the Higher Education Funding council for England (HEFCE), OFFA and BIS who, among their eight conclusions reported in their National strategy for access and student success report,336 had two which are noteworthy and pertinent:
• Outreach is most effective when delivered as a progressive, sustained programme of activity and engagement over time.
• Outreach programmes need to be directed towards young people at different stages of their educational career and begin at primary level.
Widening access doesn’t and shouldn’t stop at first degree level, which is why the targeted investment for students from disadvantaged backgrounds is to be supported in postgraduate study, with up to £125 million of extra funding is welcomed.337
Still a long way to go
In 2013, applications in England from 18-year-olds from disadvantaged groups reached their highest recorded values. In 2004, demand from 18-year-olds in advantaged areas was 4.3 times greater than demand in disadvantaged areas – but this gap has now narrowed to 2.7 times more likely.338 Despite this improvement, we still have a long way to go.
This is evidenced by the work of the Social Mobility and Child Poverty Commission. The Commission welcomes the fact that the Higher Education (HE) sector is clearly taking social mobility issues seriously, but it finds that there is still much work to be done:339
• There has been much progress in widening participation: participation rates in the most disadvantaged geographical areas increased by 30% between 2004/05 and 2009/10.
However, those in the most advantaged areas are still three times as likely to participate in HE as those in the most disadvantaged areas.340
• There has been no improvement in participation by the least advantaged young people at the most selective universities since the mid-1990s. The most advantaged young people are still seven times more likely to attend the most selective universities than the most disadvantaged ones.341
• The odds of a child at a state secondary school who is eligible for free school meals in Year 11 being admitted to Oxbridge by the age of 19 is almost 2,000 to 1 against. By contrast, the odds of a privately-educated child being admitted to Oxbridge are 20 to 1.342
6.3.7 The importance of careers education and advice
The essential but often overlooked role of careers education and advice, particularly for young people still in education, is bought into sharp focus by findings from the Education and Employer Taskforce in its report, Nothing in Common. The Taskforce’s research showed that teenagers’ aspirations at 14, 16 and 18, when mapped against projected labour demand (2010-2020), have almost ‘nothing in common’ with the realities of the UK job market.343
This perennial lack of robust, useful careers education and advice has been independently reinforced by other key stakeholders:
The Work Foundation highlighted the problem in two reports. The first centred on the role of careers education and careers guidance344 and concluded that:
• school-to-work transitions are increasingly challenging for young people
• together, careers education and careers guidance can improve transitions
The Foundation’s second report345 addressed the youth employment challenge. It found that:
• Almost universally, young people identified receiving a lack of career guidance, either at school or since (for example through Connexions).346 In particular, young people said that the nature of advice was very focused on the next immediate step and much less on developing a career plan.
333 Access agreements cover students from lower income and other under-represented groups. Many universities and colleges also provide financial support for other students. OFFA only counts expenditure on outreach that is additional to what universities and colleges already invested before 2006, when access agreements were introduced. Universities and colleges also invest in other outreach activity that is not OFFA-countable. Therefore their total expenditure on outreach will be higher than the data reported here. 334 Access agreement and widening participation strategic assessment 2011-12 and National Scholarship Programme 2012-13 (in-year) monitoring outcomes, OFFA, HEFCE, June 2013 335 National strategy for access and student success: Interim report to the Department for Business, Innovation and Skills by HEFCE and the Office for Fair Access, OFFA, HEFCE, 18 January 2013, p3 336 Ibid 337 https://www.gov.uk/government/news/75-million-investment-in-removing-barriers-to-postgraduate-study, 2 July 2013 338 Demand for full-time undergraduate Higher Education (2013 cycle, March deadline), UCAS Analysis and Research, July 2013, p1 339 Higher Education: the Fair Access Challenge, Social Mobility and Child Poverty Commission, June 2013 340 Higher Education Funding Council for England, Trends in Young Participation in Higher Education, 2010 341 What More Can be Done to Widen Access to Highly Selective Universities – Annex C: Trends in Young Participation by Selectivity of Institution, Office for Fair Access, 2010 342 Trust Responding to the New Landscape for University Access, Independent Reviewer analysis using data from Sutton, 2010 and Schools, Pupils and their characteristics, Department for Education, 2010 343 Nothing in common: The career aspirations of young Britons mapped against projected labour market demand (2010-2020), Education and Employers Taskforce and UKCES, March 2013, http://www.educationandemployers.org/media/18037/nothing_in_common_final.pdf 344 Raising aspirations and smoothing transitions, The role of Careers Education and Careers Guidance in tackling youth unemployment, Brhmie Balaram and Lizzie Crowley, The Work Foundation, September 2012, p1 345 Short-term crisis – long-term problem? Addressing the youth employment challenge, Neil Lee, Paul Sissons, Brhmie Balaram, Katy Jones, and Nye Cominetti, The Work Foundation, June 2012 346 Ibid, p29

Back to Contents
347 Motivation and Barriers to Learning for Young People not in Education, Employment or Training, Department for Business, Innovation and Skills, February 2013 348 Ibid, p27 349 Educational Aspirations: How English schools can work with parents to keep them on track, Joseph Rowntree Foundation, 2013, http://www.jrf.org.uk/sites/files/jrf/england-education-aspirations-summary.pdf 350 Educational aspirations and attitudes over the business cycle, Institute for Social and Economic Research, November 2012 351 The report’s empirical analysis draws on data from the British Youth Panel component of the British Household Panel Survey. 352 Report summary, The most able students, Are they doing as well as they should in our non-selective secondary schools?, Ofsted, Main report published 13 June 2013, www.ofsted.gov.uk/resources/130118 353 The term ‘most prestigious’ is used to describe the Russell Group of 24 leading United Kingdom universities.
Part 1 – Engineering in Context Mining the talent pool: capacity and equity 6.0 46
The Government itself via the BIS looked at the Motivation and Barriers to Learning for Young People not in Education, Employment or Training,347 so that policies could be better targeted for this group within the funding available. Three findings from the summary report are worth citing:348
• Analysis has highlighted the essential role of good quality, independent information, advice and guidance in supporting young people to identify and access appropriate education and training.
• Practical challenges, such as securing appropriate childcare and supporting themselves financially while learning can prove to be a major barrier for some young people. Many young people are operating in tight financial circumstances and place great value on receiving financial support.
• Many young people who are NEET have had poor previous experiences of education. They will need to be convinced of the relevance and benefit of learning to their lives if they are to be encouraged to engage in learning in the future.
6.3.8 It’s not just a matter of ambition or attainment
A report by published by the Joseph Rowntree Foundation349 asserts that while schools and policy-makers in England put a lot of effort into ‘raising aspirations’ to increase achievement among disadvantaged pupils, the real challenge for disadvantaged young people is achieving their aspirations. The study found that disadvantaged pupils often have high aspirations. However, they may not know how to achieve them and may struggle to maintain them. Disadvantaged parents and their social networks can lack the experience and knowledge to help their children. Therefore, they need to be engaged to help them understand what their children’s aspirations involve and what will help them achieve their aspirations.
The Institute for Social and Economic Research350 reinforces the point that the policy debate in the UK has increasingly focused on young people’s educational aspirations, attitudes and expectations. This is because fostering positive aspirations towards learning, particularly among children in economically disadvantaged groups, will help address issues
related to poverty, wage and income inequality and intergenerational mobility.
However, through its analysis351 the Institute reveals that the positive impact of high unemployment on educational attitudes persists among children with highly educated parents and parents who themselves hold positive attitudes to education. But this is less apparent among children with poorly educated parents and parents with less positive views towards education. This suggests that negative economic shocks exacerbate differences in educational aspirations and motivations by socioeconomic status, and are therefore likely to have longer-lasting impacts on social inequality and immobility.
Finally, realising one’s potential is not just restricted to under-achieving young people. Ofsted has shown that just over a quarter of the pupils who achieved level 5 in English and mathematics at the end of Year 6 did not make the progress expected of them in their non-selective secondary schools. The Ofsted research352 found that:
• Almost two thirds (65%) of high-attaining pupils leaving primary school (securing level 5 in both English and mathematics) did not reach an A* or A grade in both these GCSE subjects in 2012 in non-selective secondary schools. This represented over 65,000 students.
• Just over a quarter (27%) of these previously high-attaining students attending non-selective secondary schools did not reach a B grade in both English and mathematics at GCSE in 2012. This represented just over 27,000 young people.
• Twenty percent of the 1,649 non-selective schools with sixth forms teaching A levels failed to produce a single student with an A level grade profile of at least two A grades and one B grade in at least two of the facilitating subjects required by many of the most prestigious universities.353
Ofsted mostly attributed this failure to:
• Leaders in our secondary schools who have not done enough to create a culture of scholastic excellence, where the highest achievement in academic work is recognised as vitally important.
• Transition arrangements from primary to secondary school not being effective enough to ensure that students maintain their academic momentum into Year 7.
• Teaching that is insufficiently focused on the most able at Key Stage 3.

Back to Contents
47 6.0 Mining the talent pool: capacity and equity Part 1 – Engineering in Context
6.3.9 Women
In this section on mining the talent pool, we have in the main concentrated on disadvantaged young people. Unfortunately, even in these enlightened times we still find ourselves having to explicitly highlight the under-utilised position of women. To this end, the Women’s Business Council (WBC)354 was set up in 2012 to advise Government on how women’s contribution to growth can be optimised.
At a basic level there is an economic argument to be made. The WBC report Maximising women’s contribution to future economic growth355 makes the point that while women need work, work also needs women. By equalising the labour force participation rates of men and women, the UK could further increase GDP per capita growth by 0.5 percentage points per year, with potential gains of 10% of GDP by 2030.356 The Council also states that there are over 2.4 million women who are not in work but want to work, and over 1.3 million women who want to increase the number of hours they work.357
The report also usefully highlights that girls tend to end up concentrated in sectors that offer narrower scope for reward, and are under-represented in areas of skills shortages and high potential such as science, technology, engineering and maths (STEM). We must also look at women’s involvement in entrepreneurship – a key driver of growth. Small and medium-sized enterprises (SMEs) are critical to employment and productivity, and women-led SMEs already add around £70 billion to the economy.358 However, only 19% of SMEs are majority-run by women and women are about half as likely as men to start a business.359
Two notable particulars cited by the Organisation for Economic Co-operation and Development (OECD) in its report into the extent to which the increase in women’s human capital, as measured by educational attainment, has contributed to economic growth in OECD countries over the past five decades, hammer home the point:
1. The potential effect of an increased female labour force on economic growth is dependent on the rate at which the male
and female labour forces converge. However, the total economy stands to gain an average of 12% across OECD countries by 2030 if complete convergence occurs in the next 20 years.360
2. The argument that the economic gains from educating girls are greater than those from educating boys is now widespread not just in developing, but also in more economically-advanced countries.361 The increase in female educational attainment can only add to the stock of better-qualified workers. It also generates externalities that ultimately promote economic growth.362
In terms of UK graduate earnings there is actually some unexpected but positive news. New data from BIS’s Impact of University Degrees on the Lifecycle of Earnings study363 shows that there are very substantial effects of a degree on the net present value of the lifecycle of incomes. Best estimates equate the likely impact on discounted lifecycle net earnings of having a degree over not having a degree to an average 28% for men (approximately £168k) but 53% for women (approximately £252k).364
Nevertheless, at the risk of repeating ourselves, there is still a long way to go. The Women in
Work Index recently ranked the UK 18 out of 27 OCED countries on five key indicators of women’s economic empowerment, including equality of earnings with men and the proportion of women in full-time employment.365
6.4 Government actionThe Government’s Youth Contract366 is a £1 billion programme designed to help young people enter employment. This three-year programme aims to provide nearly half a million new opportunities for 18- to 24-year-olds, including apprenticeships and work experience placements. The Youth Contract will also see increased support available through the Work Programme, Jobcentre Plus and sector-based work academies, alongside incentives for employers to recruit young people.367 The individual measures are:
• 160,000 wage incentives worth up to £2,275 for each 18- to 24-year-old and employer recruits
• 250,000 work experience placements
• 20,000 additional incentive payments to encourage employers to take on young (16- to 24-year-old) apprentices
354 http://womensbusinesscouncil.dcms.gov.uk/ 355 Maximising women’s contribution to future economic growth, Women’s Business Council, DCMS, June 2013 http://womensbusinesscouncil.dcms.gov.uk/ 356 Effects of Reducing Gender Gaps in Education and Labour Force Participation on Economic Growth in the OECD, OECD Social, Employment and Migration Working Papers No. 138, OECD, 2012 357 Labour Force Survey, Q4 2012 358 Diversity and SMEs, Enterprise Research Centre White Paper No. 3, Carter, Ram, Trehan & Jones, 2013 359 BIS Small Business Survey 2012, Department for Business Innovation and Skills, 2013, and Global Entrepreneurship Monitor: United Kingdom 2011 Monitoring Report, Levie & Hart, 2012 360 Effects of Reducing Gender Gaps in Education and Labour Force Participation on Economic Growth in the OECD, OECD Social, Employment and Migration Working Papers, No. 138, OECD, 2012, http://dx.doi.org/10.1787/5k8xb722w928-en 361 Why governments should invest more to educate girls, World Development, Vol.30(2), T.P. Schultz, 2002, p207-25 362 Effects of Reducing Gender Gaps in Education and Labour Force Participation on Economic Growth in the OECD, OECD Social, Employment and Migration Working Papers, No. 138, OECD, 2012, p9, http://dx.doi.org/10.1787/5k8xb722w928-en 363 The Impact of University Degrees on The Lifecycle of Earnings: Some Further Analysis, Department for Business, Innovation and Skills, August 2013, p6 364 These figures are simulations of lifecycles of earnings from a statistical model of gross earnings and are adjusted for tax and National Insurance liabilities, periods of non-participation, and for the effect of the loan scheme, and discounted at 3.5%. 365 Women in the Work Index, Price Waterhouse Cooper, March 2013, http://www.pwc.co.uk/the-economy/publications/women-in-work-index.jhtml 366 http://www.dwp.gov.uk/youth-contract/ 367 Short-term crisis – long-term problem? Addressing the youth employment challenge, Neil Lee, Paul Sissons, Brhmie Balaram, Katy Jones, and Nye Cominetti, The Work Foundation, June 2012

Back to Contents
Part 1 – Engineering in Context Mining the talent pool: capacity and equity 6.0 48
368 Youth Cohort Study and Longitudinal Study of Young People in England: The Activities and Experiences of 17 year olds: England 2008, Department for Children, Schools and Families 369 More information is available at www.education.gov.uk/rpa 370 Traineeships, Supporting young people to develop the skills for Apprenticeships and other sustained jobs, A discussion paper, Department for Education and Department for Business, Innovation and Skills, January 2013 371 http://www.education.gov.uk/childrenandyoungpeople/youngpeople/qandlearning/traineeships 372 Youth unemployment: the crisis we cannot afford, ACEVO, 2012 373 Short-term crisis – long-term problem? Addressing the youth employment challenge, Neil Lee, Paul Sissons, Brhmie Balaram, Katy Jones, and Nye Cominetti, The Work Foundation, June 2012, p3 374 NEETs Young people not in employment, education or training: Characteristics, costs and policy responses in Europe, European Foundation for the Improvement of Living and Working Conditions, October 2012 375 http://www.economist.com/news/leaders/21576663-number-young-people-out-work-globally-nearly-big-population-united
• £126 million set aside to specifically help 55,000 16- to 17-year-old NEETs into education, apprenticeships, or jobs with training
• Extra support from Jobcentre Plus in the form of weekly, rather than fortnightly, signing-on meetings, more time to talk to an adviser, and a National Careers Service interview
In addition to the Youth Contract actions, the introduction of traineeships by BIS is seen as a significant complementary intervention. Traineeships grew from the fact that young people who are NEET are a very diverse group and that in general they tend to be motivated primarily by work. Evidence shows that around a fifth of young people NEET at age 16-17 are aspiring to move into an apprenticeship and another two-fifths into other full-time employment.368 With the increasing age of compulsory participation in education or training rising to 17 in 2013 and to 18 in 2015,369 apprenticeships and part-time study alongside full-time employment will be key routes into full employment.370
Traineeships were introduced August 2013 for 16- to 24-year-olds and fit within broader study programmes for 16- to 19-year-olds.371 They will be the preferred route for young people who aspire to apprenticeships or other jobs and who need additional training to reach their goals.
6.5 Cost to the economyHigh levels of youth unemployment also have wider social and economic costs. The cost of youth unemployment over the next decade has been estimated at £28 billion.372 Yet, while we should be concerned about all those who are unemployed while young, many of these young people are only unemployed for a relatively short period. The most difficult challenge for policy is addressing the problem of long-term youth unemployment – the 264,000 young people in this country who have been out of work for 12 months or longer. The longer a young person is removed from employment, education, or training, the worse the long-term consequences for the individual and the economy. Many young people find themselves caught in a Catch 22 situation: they have no work experience, but need this experience to demonstrate to employers they have the skills required for the world of work.373
Collectively in Europe the economic cost is colossal. In 2011 alone, economic loss due to the disengagement of young people from the labour market was €153 billion.374 This is a conservative estimate and corresponds to 1.2% of European GDP. There is great variation between Member States, but some countries are paying an especially high price of 2% or more of their GDP: Bulgaria, Cyprus, Greece, Hungary, Ireland, Italy, Latvia and Poland.
And finally: the International Labour Organisation (ILO) reports375 that 75 million young people globally are looking for a job. The World Bank surveys suggest that 262 million young people in emerging markets are economically inactive. Depending on how you measure them, the number of young people without a job is nearly as large as the population of America (311 million).

49 7.0 GCSEs Part 2 – Engineering in Education and Training
Back to Contents
Part 2 – Engineering in Education and Training7.0 GCSEs

Part 2 – Engineering in Education and Training GCSEs 7.0 50
Back to Contents
376 Website accessed on 2 September 2013 http://www.education.gov.uk/schools/leadership/typesofschools/academies/primary/steps/b00204848/academy-funding 377 Website accessed on 2 September 2013 http://www.education.gov.uk/schools/leadership/typesofschools/academies/primary/steps/b00204848/academy-funding 378 Website accessed on 2 September 2013 http://www.education.gov.uk/researchandstatistics/statistics/keystatistics/a00214288/academies-and-free-schools 379 Website accessed on 3 September 2013 https://www.gov.uk/government/news/new-school-year-sees-number-of-free-schools-double 380 Website accessed on 2 September 2013 http://www.education.gov.uk/schools/leadership/typesofschools/technical/a00198954/utcs 381 Website accessed on 2 September 2013 http://www.edge.co.uk/news/2013/march/the-government-increases-number-of-utcs-to-45-by-approving-13-more 382 Website accessed on 2 September 2013 http://www.education.gov.uk/schools/leadership/typesofschools/technical/a0077819/about 383 Website accessed on 2 September 2013 http://www.education.gov.uk/schools/leadership/typesofschools/technical/a0077819/about 384 Unleashing greatness: Getting the best from an academised system, academies Commission, January 2013, p24 385 Managing the expansion of the academies programme, National Audit Office, 20 November 2012, p5 386 Website accessed on 2 September 2013 http://www.education.gov.uk/schools/leadership/typesofschools/academies/open/b00219097/academyfactsheets/academycurriculumfactsheet 387 Website accessed on 2 September 2013 https://www.education.gov.uk/schools/teachingandlearning/curriculum/nationalcurriculum2014 388 Website accessed on 2 September 2013 https://www.education.gov.uk/schools/teachingandlearning/curriculum/nationalcurriculum2014/nationalcurriculum 389 Pocket Watch – New implementation plans for A level and GCSE Introduction, Pearson, 9 September 2013, p1 390 Website accessed on 2 September 2013 http://wales.gov.uk/newsroom/educationandskills/2013/130129qualsreview/?lang=en 391 Engineering UK 2013 The state of engineering, EngineeringUK, December 2012, p50 392 Website accessed on 2 September 2013 http://www.education.gov.uk/schools/teachingandlearning/qualifications/englishbac/a0075980/ebac-contents-faqs 393 Website accessed on 12 September 2013 https://www.gov.uk/government/news/new-techbacc-will-give-vocational-education-the-high-status-it-deserves 394 Website accessed on 2 September 2013 http://www.education.gov.uk/vocabularies/educationtermsandtags/6877 395 Website accessed on 2 September 2013 http://www.bbc.co.uk/news/education-23925033 396 Level 2 and 3 Attainment by Young People in England Measured using Matched Administrative Data: Attainment by Age 19 in 2012, Department for Education, 27 March 2013, p2
As a result of reforms introduced by the coalition Government, the education sector has been undergoing a considerable change. The types of schools operating in the UK have changed significantly.
One of the major changes has been the expansion of the academies programme. Academy schools are funded directly by – and accountable to – the Department for Education (DfE).376 There are different types of academy: some sponsored by external organisations, some converted schools that operate autonomously, and others formed into chains of academy schools. Free Schools are academy schools that have been opened to meet parental demand, while University Technical Colleges (UTCs) and Studio Schools are also academy schools, but have been created to meet employer demand. As a result of all these changes the role of the Local Authority (LA) is reducing as the number of schools outside of LA control increases.
However, despite the rapid increase in academy schools, it should be noted that there are some aspects of education which do remain the responsibility of the LA (and responsibility has not transferred to the academy school). These include:377
• home to school transport
• education psychology, Special Educational Needs (SEN) statementing and assessment
• monitoring of SEN provision, parent partnerships, etc
• Individually-assigned SEN resources for pupils with rare conditions needing expensive tailored provision (this is usually a top-up to formula funding)
• provision of pupil referral units or education otherwise for a pupil who is no longer registered at an academy
The growth of academy schools has been very rapid. In March 2011 only 2.3% of all mainstream schools were academy or Free Schools, and hence outside LA control.378 By February 2013, this had increased to 13.3% with 2,055 schools that had converted to academy status and 618 that were sponsor-led. In September 2013, the were also 174 Free Schools open.379
Seventeen UTCs are currently open, of which fourteen have a specialism in engineering.380 A further 27 UTCs have been approved for opening, of which 21 have a specialism in engineering and related subjects. Once all these schools are fully operational they will be teaching 27,000 students.381
Studio Schools offer academic and vocational qualifications, but teach them in a practical and project-based way. Study is combined with work placements at local and national employers who are involved in the school.382 Currently there are 16 studio schools open and a further 26 have been approved for opening.383
The Government is now encouraging high-performing schools to become sponsors of other schools. There is also growth in the number of academy schools that are part of academy chains.384 Academy schools have greater freedoms. For example, they can set staff pay and conditions.385 And while they have to teach a broad and balanced curriculum, they don’t have to teach the national curriculum.386 For further details on the different types of schools please see the box.
On 7 February 2013, the Secretary of State for Education announced a public consultation on a draft new national curriculum to launch in 2014.387 The new National Curriculum will set
out only the essential knowledge that all children should acquire and, according to the Department, will give schools and teachers more freedom to decide how to teach this most effectively and design a wider school curriculum that best meets the needs of their pupils.388 Alongside this, the DfE is introducing new English (language and literature) and maths GCSEs in 2015.389 The Welsh Government has also conducted a review of GCSE qualifications and is introducing new qualifications from September 2015: two of these will cover numeracy and mathematical techniques.390
In the Engineering UK Report 2013391 we discussed in detail the English Baccalaureate (EBacc). One noteworthy change is that from 2014, computer science will be added to the list of separate science options (in addition to biology, chemistry and physics). Pupils who sit any three of the four separate sciences and get at least a C in two of them will have achieved the science element of the EBacc.392 Since then, and in response to industry concerns, the Government has announced the introduction of the Technical Baccalaureate (TechBacc).393 For further details on the TechBacc please see section 9.
From September 2013, students have had to stay in some form of education or training until the age of 17 and in September 2015 this will rise to 18.394 Alongside this, from September 2013 all students in England who fail to achieve a grade C or above in English and maths will have to continue studying the subjects until they either achieve a grade C or above or leave school.395 It is worth noting that in 2012 63.3% of 19-year-olds had a GCSE A*-C or equivalent in English or maths and 18.4% of those who failed to obtain a GCSE A*-C or equivalent in English and maths by age 16 had achieved it by age 19.396

51 7.0 GCSEs Part 2 – Engineering in Education and Training
Back to Contents
Academy
Academies are independent, state-funded schools, that receive their funding directly from central Government, rather than through a local authority.
They have more freedom than other state schools over their finances, curriculum, length of terms and school days and do not need to follow national pay and conditions for teachers.
Free school
Free schools are set up by groups of parents, teachers, charities, businesses, universities, trusts, religious or voluntary groups, but are funded directly by central Government.
They can be run by an ‘education provider’ – an organisation or company brought in by the group setting up the school – but these firms are not allowed to make a profit.
The schools are established as Academies, independent of local authorities and with increased control over their curriculum, teachers’ pay and conditions, and the length of school terms and days.
Grammar school
Grammar schools are state schools that select their pupils on the basis of academic ability. Pupils in their final year of primary school sit an exam known as the 11-plus which determines whether or not they get a place. There is no central 11-plus exam, with papers being set on a local basis.
They are funded in much the same way as other maintained schools. Central Government allocates funds, largely on a per pupil basis, to Local Authorities. A local funding formula then determines how much each school receives.
Maintained school
Maintained schools are funded by central Government via the Local Authority, and do not charge fees to students. The categories of maintained school are community, community special, foundation (including trust), foundation special (including trust), voluntary aided and voluntary controlled. There are also maintained nursery schools and pupil referral units.
Maintained faith school
A Maintained Faith school is a Foundation or Voluntary school with a religious character. It has a foundation which holds land on trust for the school – and which may have provided some or all of the land in the first place – and which appoints governors to the school. In many cases, the land is held on trust for the specific purposes of providing education in accordance with the tenets of a particular faith.
Decisions on the establishment of Maintained Faith schools are taken under local decision-making arrangements – either by the Local Authority or the Schools Adjudicator, following a statutory process. If proposals are approved to establish a Maintained Faith school, a further application will be needed to the Secretary of State to designate the school with a religious character.
Maintained Faith schools are like all other Maintained schools in a number of ways. They must:
• follow the National Curriculum
• participate in National Curriculum tests and assessments
• be inspected by Ofsted regularly
• follow the School Admissions Code
Trust school
Trust schools are state-funded Foundation schools that receive extra support (usually non-monetary) from a charitable trust made up of partners working together for the benefit of the school. Achieving trust status is one way in which maintained schools can formalise their relationship with their partners. Trust status can help schools ensure that their partners are committed to the success of the school for the long term, helping to shape its strategic vision and ethos.
Any Maintained school – primary, secondary or special schools (but not maintained nursery schools) can become a Trust school. Trust schools remain Local Authority-maintained.
Trust status will help schools to:
• raise standards through strengthening new and existing long-term partnerships between schools and external partners
• broaden opportunities and increase aspirations for pupils, support children’s all-round development, and tackle issues of deprivation and social exclusion
• strengthen overall leadership and governance
• give business foundations and other organisations the opportunity to be more involved in their local community
• engage with parents – schools will need to consult parents before entering a trust
• bring a renewed energy and enthusiasm to the way they work by learning from other schools and external partners
• create a distinctive, individual or shared ethos
University Technical Colleges (UTC)
The best-known model of Technical Academies, they specialise in subjects that need modern, technical, industry-standard equipment – such as engineering and construction – and teach these disciplines alongside business skills and the use of ICT. Each UTC is sponsored by a university and industry partner and responds to local skills needs. They provide young people with the knowledge and skills they need to progress at 19 into Higher or Further Education, an apprenticeship or employment.
Studio School
These are innovative new schools for 14- to 19-year-olds, delivering project-based, practical learning alongside mainstream academic study. Students will work with local employers and a personal coach, and follow a curriculum designed to give them the skills and qualifications they need in work or to continue in education.
Technical Academy
While there is no single definition or model for a Technical Academy, it is likely to be a new institution with no pre-existing school for secondary age pupils and to offer a curriculum combining academic with technical and/or vocational learning.

Part 2 – Engineering in Education and Training GCSEs 7.0 52
Back to Contents
397 TIMSS 2011: Mathematics and Science Achievement in England, NFER, Executive Summary 398 TIMSS 2011: Mathematics and Science Achievement in England, NFER, 2012, p6 399 TIMSS 2011: Mathematics and Science Achievement in England, NFER, 2012, p16 400 PIRLS 2011: Reading Achievement in England, NFER, 2012, Executive Summary 401 PIRLS 2011: Reading Achievement in England, NFER, 2012, p1 402 NFER PISA Overview, http://www.nfer.ac.uk/pisa/ 403 http://www.oecd.org/pisa/howtojoinpisa/
Schools in England take part in a number of renowned international comparison tests, these are:
• Programme for International Student Assessment (PISA)
• Progress in International Reading and Literacy Study (PIRLS)
• Trends in International Mathematics and Science Study (TIMSS)
Further information about these three international assessments and some limited key findings are provided in the box.
TIMSS 2011: Mathematics and science achievement in England
The Trends in International mathematics and Science Study (TIMSS) 2011 is the fifth in the Institute of Economic Affair’s (IEA’s) series of comparative international surveys of mathematics and science achievement. TIMSS has been administered on a four-yearly cycle since 1995. England has taken part in all cycles, allowing comparisons of mathematics and science achievement over time among its Year 5 and Year 9 pupils (9- to 10- and 13- to 14-year-olds respectively).397
Mathematics attainment: Year 9
The TIMSS 2011 score for Year 9 pupils in England was 507, not significantly different from the centre point of the international scale (500) and ranking tenth among participating nations.398
Science attainment: Year 9
The TIMSS 2011 score for Year 9 pupils in England was 533, above the centre point of the international scale (500) and ranking ninth among participating nations.399
PIRLS 2011: Reading achievement in England
The Progress in International Reading and Literacy Study (PIRLS) 2011 is the third in the IEA’s series of comparative international surveys of reading achievement of fourth grade (Year 5 in England) pupils. PIRLS is administered on a five-yearly cycle, so the 2011 survey updates the picture from 2006.
PIRLS is an important indication of the success of the Government in raising standards of reading. It provides comparisons with many other countries, in terms of the attainments of pupils and the strategies used to teach reading.400
England’s average scale score of 552 is above the scale centre point of 500. This is significantly higher than thirty-one countries, and significantly lower than just five countries.401
The Programme for International Student Assessment (PISA) in England
The Programme for International Student Assessment (PISA) is a survey of the educational achievement of 15-year-olds in maths, reading and science and was developed jointly by member countries of the OECD.402
The PISA survey has a three-year cycle, focusing in turn on maths, reading and science. The focus of PISA 2012 was on maths, with some questions assessing reading and science. Students in England also took part in a computer-based assessment of problem solving. Rankings from the 2012 are scheduled to be released in December 2013.403 The survey will inform education policy in the UK and other countries, and will be used to improve teaching and learning in maths, science and reading for students around the world.

53 7.0 GCSEs Part 2 – Engineering in Education and Training
Back to Contents
404 England Government national tables, January 2013 Table 2a https://www.gov.uk/government/publications/schools-pupils-and-their-characteristics-january-2013 405 State-funded primary and secondary schools 406 Welsh Government, School Census Results, January 2013, Table 1 http://wales.gov.uk/docs/statistics/2013/130711-school-census-results-2013-en.pdf 407 Maintained primary and secondary schools 408 Scottish Government Pupil Census December 2012, Table 1.1 http://www.scotland.gov.uk/Topics/Statistics/Browse/School-Education/dspupcensus/pupcensus2012 409 State-funded primary and secondary schools 410 The number of Independent schools is a reflection of the number of ‘member’ schools as registered by the Scottish Council of Independent schools http://www.scis.org.uk/ 411 Northern Ireland Department for Education, Schools and pupil summary data February 2013 412 Controlled and maintained primary and secondary schools 413 National Pupil Projections: Future Trends in Pupil Numbers, Department for Education, 21 March 2013, p3 414 Education and Training Statistics for the United Kingdom: 2012, Department for Education, 7 November 2012, p33 415 Must do better: Spending on schools, Reform, May 2013, p3 416 Must do better: Spending on schools, Reform, May 2013, p1 417 Evaluation of Pupil Premium, Department for Education, July 2013, p8 418 The Pupil Premium How schools are using the Pupil Premium funding to raise achievement for disadvantaged pupils, Ofsted, September 2012, p7 419 The Pupil Premium How schools are using the Pupil Premium funding to raise achievement for disadvantaged pupils, Ofsted, September 2012, p7 420 Review of efficiency in the schools system, Department for Education, June 2013, p3 421 Must do better: Spending on schools, Reform, May 2013, p1 422 Must do better: Spending on schools, Reform, May 2013, p1
7.1 Size of the school sectorTable 7.0 shows that there are 27,778 schools in the UK: 22,478 in England, 2,499 in Scotland, 1,807 in Wales and 994 in Northern Ireland. Of these, 4,158 are secondary schools, 21,054 are primary schools and 2,566 are independent schools.
The DfE reports that state-funded secondary school pupils numbers up to and including those aged 15 peaked in 2004.413 Since then, pupil numbers have been decreasing: between 2012 and 2015 numbers are projected to decline by a further 3%. However, by 2018 it is expected that pupil numbers will have rebounded back to their 2012 numbers. (See section 4, Population changes, for more details).
Figure 7.0 shows the fluctuating cohort size of 16-year-old GCSE students from 2003 to 2013. It shows that from a peak of nearly 800,000 in 2007, the cohort has declined to just over 700,000 in 2013.
7.2 Funding of the school sectorThe education sector in England represents a huge investment by central and local Government. In 2011/12, it is estimated that central and local Government spent £90.9 billion of which:414
• £5.2 billion was directly on under-fives
• £25.1 billion was on primary education
• £42.2 billion was on secondary education
• £11.4 billion was on tertiary education
• Some £58.0 billion was estimated as local authority expenditure and £32.9 billion as central Government expenditure
This expenditure represents 6.0% of GDP in 2011/12, down slightly on the percentage in 2011/11 (6.1%). Looking at it another way, 13% of Government expenditure is on education.415
According to policy Institute Reform,416 funding per pupil for primary and secondary schools in England increased by nearly 90% between 1999/2000 and 2009/10 in real terms. In 2009, spending on primary and secondary schools in the UK as a percentage of GDP was more than spending in 26 of the 32 OECD countries for which data is available.
The coalition Government has brought in a pupil premium to enable schools to support eligible students (those on free school meals or looked after continuously for more than six months) in a bid to close the attainment gap with those students who are not eligible.417 In 2012/13, the premium was £623 per eligible pupil and the eligibility criteria were widened to encompass around 27% of the student population. The cost of the programme in 2012/13 was £1.25 billion.418 A premium has also been introduced for students whose parents serve in the armed forces: in 2012/13 this was £250.419
Despite the current fiscal retrenchment, the schools budget in England remains protected in real terms until 2015/16.420 However, it should be noted that spending is no guarantee of quality. Research by Reform421 shows that there is no correlation between spending and outcomes in schools. On average, the same level of funding produces ‘inadequate’, ‘satisfactory’, ‘good’ and ‘outstanding’ teaching. This is reinforced by other research which shows that around one fifth of the variation observed in the PISA results can be explained by variations in spending, meaning that two countries with similar spending can have very different educational results.422
Table 7.0: Number of schools (2012 or 2013) – UK
School type England (2013) 404 405
Wales (2013) 406 407
Scotland (2012) 408 409 410
Northern Ireland (2012/13)411 412
All UK
Primary 16,784 1,374 2,064 832 21,054
Secondary 3,281 365 365 147 4,158
Independent 2,413 68 70 15 2,566
Total number of schools
22,478 1,807 2,499 994 27,778
Fig. 7.0: GCSE cohort size (2003-2013)
2006
2010
720
700
760
780
800
2003
2004
2005
2007
2008
2009
2011
2012
2013
740
Number of 16 year olds (in thousands)

Part 2 – Engineering in Education and Training GCSEs 7.0 54
Back to Contents
423 Pupils not claiming free school meals, Department for Education, November 2012, p3 424 Pupils not claiming free school meals, Department for Education, November 2012, p3 425 Pupils not claiming free meals, Department for Education, November 2012, p1 426 Quality Counts – What can analysis of the National Pupil Database tell us about educational outcomes?, Deloitte, November 2012, p28 427 Insights on educational disadvantage from Government Data, Association of School and College Leaders, December 2012, p12 428 The effects of the English Baccalaureate, Department for Education, September 2012, p16 429 Engineering UK 2013 The state of engineering, EngineeringUK, December 2012, p53 430 Engineering UK 2013 The state of engineering, EngineeringUK, December 2012, p127 431 Skills for the nation: engineering undergraduates in the UK, Royal Academy of Engineering, June 2013, p4
7.3 Free School MealsStudents are eligible to receive Free School Meals (FSM) if they or their parents are in receipt of any of the following benefits:423
• Income Support
• Income-based Job Seekers’ Allowance
• Income-related Employment and Support Allowance
• Support under Part VI of the Immigration and Asylum Act 1999
• the Guaranteed element of State Pension Credit
• Child Tax Credit, provided they are not also entitled to Working Tax Credit and have an annual gross income of no more than £16,190, as assessed by HMRC
To claim FSM, families have to register with the school or LA.424 Overall, 1.4 million children aged 4- to 15-year-olds are eligible for FSM (21% of 4- to 15-year-olds). However, only 1.2 million (18% of 4- to 15-year-olds) are in receipt. This means that nearly a seventh of disadvantaged children are not receiving free school meals.425
An independent analysis of the National Pupil Database by Deloitte426 found that FSM eligibility is an indicator of pupil performance at Key Stage 4 and that those eligible have less favourable educational outcomes. This is demonstrated by Figure 7.1, which shows that in every region of England there is an attainment gap between those eligible for FSM and those who are not eligible. It also shows that, in general terms, the performance gap gets wider as the percentage of students eligible for FSM decreases.
7.4 GCSE entrant numbersThe General Certificate of Secondary Education (GCSE) is the primary qualification taken by secondary school pupils aged 14-16 in England, Wales and Northern Ireland. It can also be taken with other awards, such as the National Vocational Qualification (NVQ) and BTec Firsts.
The number of entries for GCSE in the core subjects (English, mathematics and science, and Welsh in Wales) is determined by the statutory requirements of the National Curriculum in England, Northern Ireland and Wales. Most pupils studying these subjects will go on to take GCSEs in them.
Figure 7.2 (overleaf) shows the top ten GCSE subjects as a percentage of total entries for 2003 to 2013. As in 2012, mathematics had the largest number of entries at 760,170 – 14.0% of all GCSE entries. This was followed by English with 731,153 entries. Science has dropped from third place in 2012 to fourth place in 2013 with 451,433 entries. Although additional science was in fifth place, the number of entries was around two thirds (62.8%) of those for science (283,391). The other STEM subject to make the top ten was design and technology. However, this slipped from sixth place in 2012 to ninth in 2013 with 219,931 entries.
It is disappointing to see that none of the science subjects within triple science made it into the top ten subjects in 2013. It is possible that triple science subjects will break into the top ten in 2014, as 34% of Year 9 students chose triple science as their options in 2012.428
Last year’s report429 found that students who study double science at GCSE attain on average one grade lower at A level than those who studied GCSE triple science. Furthermore, those who study triple science are more likely to progress to A level science. According to DfE, those studying triple science are three times more likely to study A level physics than those studying core and additional science. Again in last year’s report430 we showed that studying maths and physics in combination was the primary route through into studying engineering at A level. This is reinforced by new research by the Royal Academy of Engineering (RAEng).431 This shows that only half (50%) of 16-year-olds in England pass both GCSE maths and at least two sciences, meaning that effectively half of 16-year-olds are disadvantaged if they wish to
Fig. 7.1: Percentage of students eligible for FSM and the attainment gap for 5+ A*-C grade GCSEs including English and maths (5EM) – England
Source: Association of School and College Leaders427
Yorkshire andthe Humber
East Midlands
South West
East of England
South East
West Midlands
North West
North East
London
0.0%
20.0
%
30.0
%
25.0
%
35.0
%
40.0
%
15.5
%
5.0%
10.0
%
Eligible for FSM Attainment gap at 5EM

55 7.0 GCSEs Part 2 – Engineering in Education and Training
Back to Contents
432 Good Timing Implementing STEM careers strategy in secondary schools, Centre for Education and Industry, University of Warwick, the International Centre for Guidance Studies, University of Derby and Isinglass Consultancy Ltd, November 2011, p11 433 GCSE results show a decline at the top grades and more students taking key subjects, JCQ, 22 August 2013, p1 434 Bespoke query to the Joint Council for Qualifications 435 Engineering UK 2013 The state of engineering, EngineeringUK, December 2012, p54 436 GCSE results show a decline at the top grades and more students taking key subjects, JCQ, 22 August 2013, p1 437 The most able students – Are they doing as well as they should in our non-selective secondary schools?, Ofsted, June 2013, p12
pursue engineering after the completion of their compulsory education.
There is an incorrect assumption that pupils make links between curriculum knowledge and their future careers. However, research by the University of Warwick432 found that students don’t make this link and need to know that, for some STEM careers, studying triple science is either desirable or essential. Links between the curriculum and future careers need to be made more explicit to students.
Table 7.1 show the number of GCSE full entries for different STEM courses for the last ten years. It shows a 4.2% increase in the number of entries in the last year. However, over ten years it has declined by 7.3% – perhaps not surprising considering the decline in the GCSE cohort shown in section 7.1.
Looking specifically at the ten-year trend it is encouraging to see that the three STEM subjects to have grown significantly faster than the others are the three subjects within triple science.
Biology has grown by 226.7%, chemistry by 224.2% and physics by 218.9%. The next largest increase over ten years is for statistics, which rose by 10.6%.
All three triple science subjects showed growth in the last year, with biology rising by 5.0%, chemistry by 4.4% and physics by 2.1%.
In addition to statistics growing by 10.6%, both mathematics and mathematics (additional) grew over ten years, rising by 2.5% and 8.5% respectively. Entry trends for the last year, however, paint a more complicated picture. Entries to mathematics (additional) grew by 1.2% while entries to statistics declined by 13.3%. Mathematics had an increase in entries of 12.5%. However, the Joint Council for Qualifications (JCQ) noted in its press release433 that the biggest increase in entries was for students aged 15 and that there were significant early and repeated entries for mathematics.
Over ten years, the number of students entered for ICT has fallen by a quarter (25.6%). However,
in the last year it grew by 38.1%, the second consecutive year of growth.
Design and technology entry numbers have declined by half (49.7%) over ten years and fell by another 8.6% in 2013.
Entrants to science fell by nearly a quarter (18.3%) to 451,433 in 2013. It should be noted that students studying core and additional science tend to take core science at age 15 and then additional science at age 16. As a result of this, 70% of entrants to core science were aged 15 or younger.434
Finally, engineering is a new GCSE in its third year, but entries grew by 36.1% in 2013 to reach 2,897.
In last year’s report435 we conclusively showed the early entry of students into STEM subjects was restricting the pool of students who would be able to progress through into AS level STEM subjects. This is because although early entry students were mainly high achievers, they performed statistically less well in their exams than those who did not enter their exams early. JCQ also makes this point in its press release, highlighting that the A*-C rate for 16-year-olds was 62.1% while for 15-year-olds it was 51.7% – 10.4 percentage points lower.436
These findings are reinforced by other analysis which shows that the progression from maths and physics GCSE level to AS level is primarily determined by the grade achieved at GCSE level, with 79% of those who get an A* progressing compared with just 1% of those who get a grade C (Table 7.2). Using the data presented by JCQ, it is possible to calculate that 22.4% of all mathematics entries are from those aged 15 and younger, ie early entries. Analysis by Ofsted437 found that 53% of pupils in non-selective schools who achieved a level 5 GCSE or above in both English and maths at the end of Year 6 in 2012 failed to attain an A* or A grade, while 22% failed to achieve a B grade. This is an area of deep concern for the STEM community, as early maths entry is restricting the pool of numerate high-achieving students who would otherwise be able to progress to AS level maths.
Fig. 7.2: Top ten GCSE subjects as a percentage of total entry (2003-2013) – all UK entrants
Source: Joint Council for Qualifications (JCQ)
6.0%
4.0%
10.0%
12.0%
8.0%
2.0%
0.0%
2013
2004
2005
2003
2006
2007
2008
2009
2010
2011
2012
14.0%
16.0%
Percentage of total entry
Additional science
Art and design subjects
EnglishMathematics
Design and technology
Science
Geography
Religious studies
History
English literature

Part 2 – Engineering in Education and Training GCSEs 7.0 56
Back to Contents
438 DfE research report RR195 Subject progression from GCSE to AS level and continuation to A level https://www.education.gov.uk/publications/eOrderingDownload/DFE-RR195.pdf Figures taken from Table B; note that these proportions are based on the number of entries (731,900 for mathematics for the 2007/08 cohort) rather than the number of students attempting (609,700). The former includes attempts by these pupils in previous years, but is relevant in assessing the progression of this cohort. 439 Ibid 440 Ibid, Table 1.1 – based on the progression of the 2007/08 cohort in the following two years 441 Ibid, Table 1.1 442 Ibid, Table 3.1 443 Ibid
Table 7.1: GCSE full STEM courses entries (2004-2013) – all UK candidates
Source: Joint Council for Qualifications (JCQ)
2004 2005 2006 2007 2008 2009 2010 2011 2012 2013 Change over one year
Change over 10 years
Science double award – halved to illustrate
527,017 494,450 479,789 478,028 8,433 - - - - - - -
Science double award
1,054,034 988,900 959,578 956,056 16,866 - - - - - - -
Science - - - 57,316 537,606 493,505 453,757 405,977 552,504 451,433 -18.3%
Additional science
- - - - 433,468 396,946 352,469 306,312 289,950 283,391 -2.3%
Mathematics 741,682 741,422 750,570 760,299 738,451 754,738 762,792 772,944 675,789 760,170 12.5% 2.5%
Design and technology
437,403 396,668 371,672 354,959 332,787 305,809 287,701 253,624 240,704 219,931 -8.6% -49.7%
Biology 53,389 56,522 60,082 63,208 85,521 100,905 129,464 147,904 166,168 174,428 5.0% 226.7%
Chemistry 51,225 53,428 56,764 59,219 76,656 92,246 121,988 141,724 159,126 166,091 4.4% 224.2%
ICT 98,833 103,400 109,601 99,656 85,599 73,519 61,022 47,128 53,197 73,487 38.1% -25.6%
Physics 50,404 52,568 56,035 58,391 75,383 91,179 120,455 140,183 157,377 160,735 2.1% 218.9%
Science single award
74,095 89,348 96,374 98,485
Statistics 39,666 51,432 68,331 82,682 86,224 77,744 69,456 53,400 50,620 43,870 -13.3% 10.6%
Mathematics (additional)
3,205 3,256 3,282 9,793 16,973 18,765 17,183 13,282 3,436 3,478 1.2% 8.5%
Engineering 1,850 2,128 2,897 36.1%
All subjects 5,875,373 5,736,505 5,752,152 5,827,319 5,669,077 5,469,260 5,374,490 5,151,970 5,225,288 5,445,324 4.2% -7.3%
Table 7.2: Progression from GCSE mathematics and physics to AS/A level mathematics and physics – 2012
Source: Department for Education and the National Pupil Database
A* A B C
Percentage of entries resulting in each GCSE mathematics grade (2007/08)438 5% 11% 17% 26%
Percentage of entries resulting in each GCSE physics grade (2007/08)439 23% 29% 26% 15%
Progression rate from GCSE to AS mathematics by mathematics grade440 79% 48% 15% 1%
Progression rate from GCSE to AS physics by physics grade441 43% 30% 21% 5%
Progression rate from GCSE to A level mathematics442 73% 34% 6% 0%
Progression rate from GCSE to A level physics443 38% 22% 8% 1%

57 7.0 GCSEs Part 2 – Engineering in Education and Training
Back to Contents
444 Grades A*-G are passes within GCSEs. However, we purposely only analyse the A*-C pass rate, as this is the range of grades frequently required for entry into AS level courses. 445 Website accessed on the 3 September 2013 (http://www.bbc.co.uk/news/education-23290889) 446 For further details on compulsory national curriculum subjects at Key Stage 4 please see https://www.gov.uk/national-curriculum/key-stage-3-4
Figure 7.3 shows the ten-year trend for the proportion of females in each subject within triple science. It shows that in each of the ten years, the proportion of females in each subject has been between 40.0% and 49.5%, and that the percentage of female students has increased over the ten-year period. It also shows that biology has consistently had a higher proportion of female students than chemistry or physics. Similarly, in each year physics has had a lower proportion of female students than either biology or chemistry.
7.5 A*-C444 achievement ratesThe ten-year trend in the proportion of students achieving an A*-C grade in different STEM subjects is shown in Figure 7.4. From 2004 to 2012, the subject with the lowest A*-C pass rate was maths. However, in 2013 this changed and science had the lowest A*-C pass rate. Table 7.1 demonstrates a decline of 18.3% in the numbers studying science and a smaller increase in the numbers studying triple science.
It is therefore possible that the profile of science students has changed from earlier years, and that higher-performing students have moved to triple science, causing the decline in the A*-C pass rate. Ofqual also warned schools of a decline in the pass rate for some science subjects as the exams were made tougher.445
In 2013, the A*-C pass rate for science was 53.1%, the lowest in the course’s seven-year history. It is also the second successive year of decline from its peak of 62.9% in 2011, to its lowest point in 2013.
Although maths no longer has the lowest A*-C pass rate for STEM subjects, this can’t be seen as a success. Overall, only just over half (57.6%) of maths entrants achieved an A*-C grade. This is below the average for all subjects, which is 68.1%. Maths is a compulsory subject446 and, as such, you would expect it to have a lower A*-C pass rate than optional subjects. However, a 10.5 percentage point gap versus all subjects is an area of concern.
Table 7.1 shows that over ten years the number of design and technology entrants has nearly halved (down 49.7%). Figure 7.4 shows that design and technology also had a below-average A*-C pass rate in 2013, at 61.8%. This is disappointing, as up until 2010 the pass rate was increasing, peaking at 63.5%. However, since then it has fallen for two years and only increased slightly for one (2012).
The other subject to show a below-average pass rate in 2013 was additional science, at 64.1%. This is the lowest pass rate since 2010, with the decline following four years of consistent growth.
The STEM subject with the highest pass rate was mathematics (additional). In 2013, 92.8% of entrants to this subject passed, the highest pass rate in the ten-year period. It was also the fourth year of consecutive growth from a low point of 69.0% in 2009.
Although statistics is an optional subject, its 2013 pass rate was far lower, at 77.4%, than the mathematics (additional) rate – also an optional subject. In fact, 2013 saw the lowest pass rate for this subject since 2008 (72.5%).
Fig. 7.3: Proportion of female entrants to separate science GCSEs (2004-2013) – all UK candidates
Source: Joint Council for Qualifications (JCQ)
10.0
%
5.0%
0.0%
20.0
%
30.0
%
60.0
%
25.0
%
40.0
%
15.0
%
35.0
%
50.0
%
55.0
%
45.0
%
2008
2009
2010
2011
2012
2013
2007
2006
2005
2004
47.9%47.0%
46.6%
49.5%48.8%48.6%
47.3%46.5%
46.0%
46.7%45.5%
44.8%
47.0%45.0%
44.0%
46.9%44.4%
43.1%
43.7%42.1%
41.1%
43.8%42.0%
40.7%
43.9%42.2%
41.1%
42.9%41.3%
40.0%
Biology Chemistry Physics

Part 2 – Engineering in Education and Training GCSEs 7.0 58
Back to Contents
447 GCSE results show a decline at the top grades and more students taking key subjects, JCQ, 22 August 2013, p1 448 GCSE results show a decline at the top grades and more students taking key subjects, JCQ, 22 August 2013, p1
The three subjects within triple science all showed a decline in the pass rate in 2013. This can partly be explained by the new exam specifications.447 However, JCQ reports that another factor was high-performing students switching to the International General Certificate of Education (IGCSE), as well as less able students moving from core and additional science to triple science, along with an increase in the number of 15-year-olds taking triple science.448
Physics had the highest pass rate in 2013 of the subjects within triple science, at 90.8%. In fact, since 2009 physics has consistently had the highest pass rate. However, the rate for 2013 is the lowest since 2007.
Chemistry had the second highest pass rate for triple science subjects, at 90.0%. However, this was only just above the 89.5% achieved in 2004 and is the lowest since 2006.
Biology had the lowest pass rate of the triple science subjects, at 89.8%. This is the lowest since 2007 and the second year of decline from the highpoint achieved in 2011.
Fig. 7.4: GCSE A*-C pass rates (2004-2013) – all UK candidates
Source: Joint Council for Qualifications (JCQ)
2013
2005
2006
2004
2007
2008
2009
2010
2011
2012
60.0%
50.0%
70.0%
80.0%
90.0%
100.0%
Biology
ICT
Physics
MathematicsDesign and technology
Science double award
Additional science
Chemistry
All subjects
StatisticsMathematics (additional)
Science

59 7.0 GCSEs Part 2 – Engineering in Education and Training
Back to Contents
449 The number of male and female students obtaining an A*-C grade has been calculated from the total number of entrants and the A*-C percentage pass rate
7.5.1 A*-C achievement rates by gender
Table 7.3 provides a breakdown of the A*-C pass rate by gender for 2013. It shows that for all the STEM subjects apart from maths, females have a higher pass rate than male students. This phenomenon can also be observed for all entrants.
Design and technology was the STEM subject with the lowest proportion of female entrants, at only two fifths (41.6%) of all entrants. However, with a pass rate of 72.2% compared with 54.4% for males, the number of students obtaining an A*-C grade is similar (69,820 compared with 66,125).
The subject with the lowest pass rate for males was science, where only half (50.1%) obtained an A*-C grade, compared with 56.0% of females. Science was only one of two STEM subjects where the number of females obtaining an A*-C surpassed males.
Another STEM subject to have more female students than male students obtaining an A*-C
grade was biology. Overall, 78,679 female students achieved this compared with 77,936 male students.
Additional science also had more female entrants (146,668) than male entrants (136,723). The female pass rate (67.3%) was higher than the male pass rate (60.8%), meaning that 98,708 females achieved the desired pass rate compared with 83,128 male students.
Overall, half (50.2%) of all entrants to maths, a compulsory subject, were female. However, maths was also the only STEM subject where the proportion of entrants obtaining an A*-C grade was higher for male students (58.0%) than it was for female students (57.3%).
The subject with the highest pass rate for female students was mathematics (additional), 94.1% compared with 91.5% for males. Both male and female entrant numbers, however, were below 2,000, making it the smallest of the STEM subjects.
Females represent 48.6% of all entrants to physics. With a pass rate of 91.1%, 71,199 females obtained an A*-C grade compared with 74,735 males.
The number of females obtaining an A*-C grade for chemistry (74,117) was very close to the number of male students (75,304). Although male and female students both had an above-average pass rate, females had a higher pass rate (91.5%) than males (88.5%).
Four fifths (80.0%) of female entrants to statistics obtained an A*-C grade, compared with three quarters (75.1%) of males. This higher pass rate means that although females represented 47.0% of all entrants, the number obtaining an A*-C grade (16,483) was similar to that of male students (17,473).
Two fifths (42.0%) of entrants to ICT were female. However, more females (76.3%) obtained the desired pass rate males (69.2%).
Table 7.3: Number of GCSE A*-C passes (2013) – all UK candidates449
Source: Joint Council for Qualifications (JCQ)
Male Students Female students All students
Total number of male
students
% A*-C for male students
Calculated number of male
students obtaining a grade A*-C
Total number
of female students
% A*-C for female
students
Calculated number
of female students
obtaining a grade A*-C
Percentage of all
entrants who are female
Total number
of all students
% A*-C for all
students
Calculated number of
all students obtaining a grade A*-C
Design and technology
128,345 54.4% 69,820 91,586 72.2% 66,125 41.6% 219,931 61.8% 135,917
ICT 42,593 69.2% 29,474 30,894 76.3% 23,572 42.0% 73,487 72.2% 53,058
Mathematics 378,414 58.0% 219,480 381,756 57.3% 218,746 50.2% 760,170 57.6% 437,858
Mathematics (additional)
1,831 91.5% 1,675 1,647 94.1% 1,550 47.4% 3,478 92.8% 3,228
Biology 88,063 88.5% 77,936 86,365 91.1% 78,679 49.5% 174,428 89.8% 156,636
Chemistry 85,089 88.5% 75,304 81,002 91.5% 74,117 48.8% 166,091 90.0% 149,482
Physics 82,580 90.5% 74,735 78,155 91.1% 71,199 48.6% 160,735 90.8% 145,947
Statistics 23,266 75.1% 17,473 20,604 80.0% 16,483 47.0% 43,870 77.4% 33,955
Science 225,222 50.1% 112,836 226,211 56.0% 126,678 50.1% 451,433 53.1% 239,711
Additional science
136,723 60.8% 83,128 146,668 67.3% 98,708 51.8% 283,391 64.1% 181,654
All subjects 2,662,285 63.7% 1,695,876 2,783,039 72.3% 2,012,137 51.1% 5,445,324 68.1% 3,708,266

Part 2 – Engineering in Education and Training GCSEs 7.0 60
Back to Contents
450 http://www.education.gov.uk/childrenandyoungpeople/youngpeople/qandlearning/a0074953/review-of-vocational-education-the-wolf-report 451 Engineering UK 2013 The state of engineering, EngineeringUK, December 2012, p58 452 An aspirational nation: creating a culture change in careers provision, National Careers Council, June 2013, p11 453 Vocational Education in English Schools – Protecting Options for pre-16 Pupils, IPPR, May 2013, P5 454 Vocational Education in English Schools – Protecting options for Pre-16 pupils, IPPR, p6 455 Quality Counts – What can analysis of the National Pupil Database tell us about educational outcomes? Deloitte, November 2012, p17 456 http://www.education.gov.uk/childrenandyoungpeople/youngpeople/qandlearning/a00202523/reform-of-14-to-16-performance-tables 457 http://media.education.gov.uk/assets/files/pdf/q/qualifications%20included%20in%20ks4%20performance%20tables%20in%202014.pdf 458 http://www.education.gov.uk/childrenandyoungpeople/youngpeople/qandlearning/otherqualifications/a00217137/14-16-performance-tables-2015 459 http://media.education.gov.uk/assets/files/pdf/q/2015%20ks4%20wolf%20list.pdf
Table 7.4 shows the proportion of pupils obtaining five or more A*-C grades at GCSE level in all subjects, and including English and maths, for all English regions. It shows that the South West had the lowest percentage of students obtaining at least five GCSEs overall, at 79.8%. However, when looking at the percentage obtaining at least five GCSEs including English and maths, Yorkshire and the Humber was lowest, with just over half (57.3%).
The North East had the highest proportion of students obtaining at least five GCSEs (88.0%), while London had the highest proportion of students obtaining at least five GCSEs including English and maths (62.3%).
Table 7.4: Students achieving five or more A*-C grades at GCSE level or equivalent in all subjects and subjects including English and maths (2011/12) – England
Source: Office of National Statistics
7.6 Year 11 diplomasThe coalition Government has stopped actively supporting the 14-19 Diplomas, following the decision to adopt the recommendations of the Wolf report.450 (Amongst other things, the report’s recommendations will ensure that at level 2 all approved vocational qualifications will only be equivalent to one GCSE.) Overall in 2010/11, there were 9,754 Year 11 learners on the diploma programme, 4,097 of whom were studying for engineering-related diplomas. This section briefly summarises the findings of last year’s Engineering UK report on the state of diplomas.451
7.7 Vocational qualificationsVocational education makes up a significant part of the 14-18 education landscape. The National Careers Council reported this year that a third (32%) of 14- to 18-year-olds were undertaking some form of vocational study452 – although it also highlighted that this was below the 50% average for the rest of the European Union. This is reinforced by analysis of DfE data by the Institute for Public Policy Research (IPPR) which shows that in 2011/12, there were over 400,000 level 2 BTec qualifications, nearly 300,000 level 2 OCR qualifications and 100,000 Vocationally Related Qualifications (VRQs). IPPR also reported that in aggregate there were between 630,000 and 800,000 14- to 16-year-olds taking vocational qualifications (Figure 7.5).453
Fig. 7.5: Vocational awards made by qualification and level of award at Key Stage 4 (2011/12)
Source: IPPR454
In January 2012, the DfE announced a reclassification of almost all GCSE equivalent qualifications at Key Stage 4 following the Wolf Review. As a result of these changes, the number of GCSE-equivalent courses was substantially reduced.455 The DfE provided details of what constitutes a Wolf-compliant qualification456 as well as a list of vocational qualifications that will count towards schools GCSE performance.457 The Department has also announced the details of Wolf-compliant vocational qualifications in 2015458 and listed those qualifications already approved.459
Following consultations, Edexcel have made aggregate data available to enable us to understand the importance of vocational qualifications at Key Stage 4 to the STEM supply line.
5+ A*-C grades
5+ A*-C grades
including English and
maths
North East 88.0% 58.5%
North West 84.2% 58.9%
Yorkshire and The Humber
84.1% 57.3%
East Midlands 82.7% 57.6%
West Midlands 85.5% 58.8%
East of England 80.6% 58.2%
London 84.1% 62.3%
South East 82.0% 60.2%
South West 79.8% 57.5%
BTEC
VROs
OCR
NVQ
200,
000
400,
000
300,
0000
100,
000
500,
000
Level 1 Level 2

61 7.0 GCSEs Part 2 – Engineering in Education and Training
Back to Contents
Table 7.5 shows the number of students studying for BTec STEM qualifications at level 2. It shows that overall there has been growth of 1,640.1% over nine years. Looking at all BTec subjects shows above-average growth for UK-domiciled students (1,657.9%), female students (1,943.5%) and those aged under 19 (1,878.2%) over nine years.
Looking specifically at the different STEM subjects shows that 143,107 students
completed other science subjects, 20,500 completed engineering, 44,564 completed ICT/computing and 14,130 completed construction qualifications in 2013.
For other science subjects, the number of completions has increased by 31,283.1% over nine years, and by 14.3% in the last year. Growth was highest amongst those aged under 19, at 41,084.1%.
Looking at engineering shows that numbers have increased by 674.2% over nine years and by over a quarter (29.2%) in 2012/13 alone. The nine-year trend shows that a growing number of females are completing engineering qualifications (+1,477.6%). There has been a decrease in UK-domiciled completions (-4.7%), but a substantial rise in international domiciled completions (+698.1%). Completers under the age of 19 have risen in number by 822.5%, compared with 151.3% for those aged 19-24 and 281.1% for those aged over 25.
Finally, it should be noted that international completions in engineering increased by 114.3% in 2012/13 alone.
Construction is a smaller sector than engineering, with 14,130 students in 2012/13. Over nine years, the subject has grown by 4,007.6%, with a rise of 5,454.9% among under 19s and 4,007.6% among over 25s, compared with 147.8% for those aged 19-24. In 2012/13, there were 469 female completers, a rise of 2,658.8% on 2004/05.
ICT/computing had 44,654 completions, a rise of 1,056.0% over nine years and an increase of 7.0% in the last year. Growth in completions from female students has been particularly strong over nine years (+2,241.2%). It should also be noted that UK-domiciled completions have increased by 1,095.9% over nine years, compared with a decrease of 9.4% amongst international-domiciled students.

Part 2 – Engineering in Education and Training GCSEs 7.0 62
Back to Contents
Table 7.5: Number of students completing selected BTec subjects at level 2, by gender and age (2004/05-2012/13) – all domiciles
Source: Edexcel
2004/05 2005/06 2006/07 2007/08 2008/09 2009/10 2010/11 2011/12 2012/13 Change over one year
Change over nine years
Other sciences
UK 456 1,077 4,038 17,601 34,383 68,314 105,468 125,183 143,081 14.3% 31277.4%
International 0 0 0 0 132 1 11 21 26 23.8%
Female 232 569 2,102 9,176 18,003 35,372 53,341 62,414 69,377 11.2% 29803.9%
Aged under 19 345 903 3,782 17,196 34,081 67,659 104,803 124,462 142,085 14.2% 41084.1%
Aged 19-24 95 140 207 297 314 411 441 482 629 30.5% 562.1%
Aged 25+ 13 30 42 97 113 215 209 238 360 51.3% 2669.2%
Total 456 1,077 4,038 17,601 34,515 68,315 105,479 125,204 143,107 14.3% 31283.1%
% non UK 0.4% 0.0% 0.0% 0.0% 0.0% 0.0%
% female 50.9% 52.8% 52.1% 52.1% 52.2% 51.8% 50.6% 49.8% 48.5% -2.6% -4.7%
Engineering
UK 2,488 3,575 4,802 6,652 8,686 9,987 11,735 15,566 19,857 27.6% 698.1%
International 160 713 376 381 181 214 102 300 643 114.3% 301.9%
Female 76 117 172 254 401 537 615 790 1,199 51.8% 1477.6%
Aged under 19 2,040 2,990 4,020 6,019 7,888 9,180 10,948 14,522 18,819 29.6% 822.5%
Aged 19-24 505 917 976 827 813 846 704 985 1,269 28.8% 151.3%
Aged 25+ 90 288 143 155 148 147 151 309 343 11.0% 281.1%
Total 2,648 4,288 5,178 7,033 8,867 10,201 11,837 15,866 20,500 29.2% 674.2%
% non UK 6.4% 19.9% 7.8% 5.7% 2.1% 2.1% 0.9% 1.9% 3.2% 68.4% -50.0%
% female 2.9% 2.7% 3.3% 3.6% 4.5% 5.3% 5.2% 5.0% 5.8% 16.0% 100.0%
ICT/Computing
UK 3,716 5,717 8,817 18,845 24,482 29,040 32,251 41,335 44,438 7.5% 1095.9%
International 139 260 164 237 222 121 12 319 126 -60.5% -9.4%
Female 702 1,143 1,986 6,184 8,310 10,021 11,248 15,363 16,439 7.0% 2241.7%
Aged under 19 3,153 4,936 7,536 17,329 22,716 26,946 30,084 39,395 42,355 7.5% 1243.3%
Aged 19-24 608 867 1,224 1,488 1,688 1,860 1,915 1,902 1,812 -4.7% 198.0%
Aged 25+ 81 159 200 237 268 314 229 312 347 11.2% 328.4%
Total 3,855 5,977 8,981 19,082 24,704 29,161 32,263 41,654 44,564 7.0% 1056.0%
% non UK 3.7% 4.5% 1.9% 1.3% 0.9% 0.4% 0.0% 0.8% 0.3% 166.7% -91.9%
% female 18.2% 19.1% 22.1% 32.4% 33.6% 34.4% 34.9% 36.9% 36.9% 0.0% 102.7%
Construction
UK 343 940 1,997 4,089 6,859 9,248 9,955 13,149 14,095 7.2% 4009.3%
International 1 58 62 92 13 35 25 30 35 16.7% 3400.0%
Female 17 32 59 152 254 319 358 409 469 14.7% 2658.8%
Aged under 19 246 880 1,908 4,037 6,707 9,067 9,695 12,513 13,665 9.2% 5454.9%
Aged 19-24 90 88 134 115 135 165 204 374 223 -40.4% 147.8%
Aged 25+ 7 13 17 21 23 43 76 275 228 -17.1% 3157.1%
Total 344 998 2,059 4,181 6,872 9,283 9,980 13,179 14,130 7.2% 4007.6%
% non UK 0.3% 6.2% 3.1% 2.2% 0.2% 0.4% 0.3% 0.2% 0.2% 0.0% -33.3%
% female 4.9% 3.2% 2.9% 3.6% 3.7% 3.4% 3.6% 3.1% 3.3% 6.5% 32.7%
All subjects (including STEM & non STEM)
UK 34,729 63,342 107,047 186,881 264,045 374,263 489,167 581,175 610,489 5.0% 1657.9%
International 439 1,167 830 1,060 848 826 534 1,578 1,467 -7.0% 234.2%
Female 14,078 26,765 47,903 87,420 124,038 178,582 235,135 278,419 287,678 3.3% 1943.5%
Aged under 19 29,938 54,525 96,005 175,192 250,175 358,296 473,033 564,261 592,247 5.0% 1878.2%
Aged 19-24 4,168 7,131 8,664 9,715 11,251 12,779 12,828 13,530 13,972 3.3% 235.2%
Aged 25+ 907 2,551 2,933 2,768 3,129 3,635 3,456 4,491 5,171 15.1% 470.1%
Total 35,168 64,509 107,877 187,941 264,893 375,089 489,701 582,753 611,956 5.0% 1640.1%
% non UK 1.3% 1.8% 0.8% 0.6% 0.3% 0.2% 0.1% 0.3% 0.2% -33.3% -84.6%
% female 40.0% 41.5% 44.4% 46.5% 46.8% 47.6% 48.0% 47.8% 47.0% -1.7% 17.5%

63 7.0 GCSEs Part 2 – Engineering in Education and Training
Back to Contents
7.8 Teacher workforceTable 7.6 shows that the total headcount of in-service teachers was 241,500. Of the different STEM subjects, maths had the largest number of teachers at 35,200. Of these, 30,600 taught at Key Stage 3, 27,900 taught at Key Stage 4 and just over a third (12,600) taught at Key Stage 5. However, as we show in Table 7.8, not all teachers teaching a subject have a post A level qualification in that subject.
The STEM subject with the second largest number of teachers is combined/general science, with 34,700, of whom 30,700 teach Key Stage 3 and 27,800 teach Key Stage 4.
Design and technology was the third largest subject with 14,800 teachers. Of these, 1,300 teach electronics/systems and control and 4,500 teach resistant materials.
Physics had 5,900 teachers, 1,200 of them teaching Key Stage 3, 3,000 Key Stage 4 and 4,300 Key Stage 5. This is a disturbing statistic when you consider that last year462 we reported a shortage of between 4,000 and 4,500 physics teachers in the UK.
It is also worth noting that 1,600 teachers are teaching engineering, mainly at Key Stage 4 (1,300) rather than Key Stage 3 (200) or Key Stage 5 (500).
Table 7.7 shows the proportion of teachers of STEM subjects who have a relevant post A level qualification in the subject they teach. It shows that teachers of combined/general science were the most likely to have a relevant post A level qualification (91.4%) and that four fifths (80.4%) had a degree or higher in a relevant qualification. By comparison, teachers of engineering had the lowest percentage of relevant post A level qualifications, at 19.0%. This means that four fifths (81.0%) of teachers of engineering don’t have a relevant post A level (level 3) qualification.
Just under three quarters (72.9%) of maths teachers have a relevant post A level qualification. However, less than half (45.4%) of teachers have a degree or higher qualification, while 7.1% have a BEd and 18.2% have a PGCE.
For physics, a third (33.7%) of teachers don’t have a relevant post A level qualification. Just over half (56.1%) of physics teachers have a degree or higher, while 6.3% have a PGCE and 3.0% have a BEd.
It is therefore pleasing to note the recent targeted recruitment drive through initial teacher training bursaries for mathematics teaching posts in the FE sector. The new bursary scheme, introduced from September, will pay graduates up to £20,000 to train and take up a maths teaching post463 within a Further Education College. At the same time, a maths conversion course has been developed to help existing teachers to retrain to teach this subject in a college. Similarly the DfE has announced £5,000 bursaries for maths and physics graduates who choose to enter teaching.464
More recently in an attempt to boost the numbers of specialist maths and physics teachers, the Government has lowered the level at which graduates can apply for bursaries so that graduates with a third-class degree will be offered bounties of £9,000 to train as teachers in key subjects, as recruitment shortfalls force the Government to lower its thresholds. Maths and physics graduates will qualify for a bursary to train as a teacher if they have a “relevant degree” of any classification, and a B or higher in the subject at A level.
Table 7.6: Head count of teachers and number of hours taught by subject and Key Stage to year groups 7-13 in all publicly funded secondary schools (November 2011) – England460
Source: Department for Education
Number of teachers (thousands):
Head count of in service
teachers (thousands)
Key Stage
3
Key Stage
4
Key Stage
5
Mathematics 35.2 30.6 27.9 12.6
Physics 5.9 1.2 3.0 4.3
Chemistry 6.9 1.2 3.3 5.4
Biology 8.5 1.4 3.7 6.9
Combined/General Science
34.7 30.7 27.8 2.7
Other Sciences 2.8 0.6 1.7 1.1
Design and technology 14.8 6.2 12.0 3.6
Of which:
Electronics / Systems and Control
1.3 0.6 0.9 0.3
Food Technology 5.3 2.4 4.0 0.8
Graphics 3.9 1.2 2.9 0.9
Resistant Materials 4.5 1.8 3.4 0.6
Textiles 3.3 1.1 2.4 1.2
Other/Combined Technology461
16.8 15.1 4.5 2.7
Engineering 1.6 0.2 1.3 0.5
ICT 18.6 15.8 12.5 5.6
Total headcount (STEM and non STEM subjects)
241.5 213.3 211.1 118.9
460 Teachers were counted once against each subject that they were teaching, regardless of the amount of time they spend teaching the subject. Teachers were counted under each key stage they were recorded as teaching to; a mathematics teacher who taught all years (7-13) would be included under Number of teachers of Key Stage 3, Key Stage 4 and Key Stage 5. 461 Includes construction and built environment 462 Engineering UK 2013 The state of engineering, EngineeringUK, December 2012, p75 463 https://www.gov.uk/government/publications/vocational-education-reform-matthew-hancock-writes-to-colleges-and-independent-training-providers 464 Website accessed on the 9 September 2013 (http://www.theguardian.com/education/2013/sep/05/maths-physics-graduates-teaching)

Part 2 – Engineering in Education and Training GCSEs 7.0 64
Back to Contents
465 Where a teacher has more than one post A level qualification in the same subject, the qualification level is determined by the highest level reading from left (Degree or higher) to right (Other Qualification). For example, teachers shown under PGCE have a PGCE but not a Degree. 466 Teachers are counted once against each subject which they are teaching. Head counts are used, so a teacher teaching French and German would be counted once in each 467 A full list of what was deemed as a ‘relevant’ qualification subject for each curriculum subject taught can be found in the SFR home page, November 2010 at http://www.education.gov.uk/rsgateway/DB/SFR/s000997/index.shtml 468 Data doesn’t come from a 100% census return and therefore is subject to a margin of error 469 Includes Certificate of Education, Non-UK Qualifications where the level was not provided and Other Qualification at National Qualifications Framework (NQF) level 4 or 5 and above eg diplomas or Higher Education and Further Education, foundation degrees, higher national diplomas and certificates of Higher Education 470 Teachers qualified in biology, chemistry, or physics are treated as qualified to teach both combined/general science and other science 471 Teachers qualified in each of the specialist design and technology subjects are treated as qualified to teach other/combined design and technology 472 Quality Counts – What can analysis of the National Pupil Database tell us about educational outcomes?, Deloitte, November 2012, p13 473 Review of efficiency in the schools system, Department for Education, June 2013, p3 474 Wellcome Trust Monitor Report Wave 2: Tracking public views on science, research and science education, Wellcome Trust, May 2013, p6
In section 1.1.4, we demonstrated the importance of teaching quality to the achievement of students. We showed that the most effective teachers are at least three times as effective as the least effective teachers. This is reinforced by research by Deloitte’s which shows that there is no correlation between levels of funding at Key stage 4 and pupil performance.472 Similarly, the DfE identified that teacher quality is the most important feature of successful education systems.473
In respect to young people progressing in STEM subjects, we consider that it is vitally important for teachers to inspire students. The Wellcome Trust474 has identified that the most commonly mentioned factor that encouraged, or discouraged, young people when learning science was the quality of the teacher. EngineeringUK believes that providing stimulating, high-impact STEM teaching is more difficult when the teacher lacks a relevant post A level qualification and ideally a teacher should have a relevant degree or higher level qualification.
Table 7.7: Highest post A level qualifications held by publicly funded secondary school teachers (head count) in the subjects they taught to year groups 7-13 (November 2011) – England465 466 467 468
Source: Department for Education
Highest level of qualification held in a relevant subject
Degree or higher
Bachelor of Education
Postgraduate Certificate of
Education
Other qualification469
Any relevant post A level
qualification
No relevant post A level
qualification
Head count of teachers
(thousands)
% % % % % %
Mathematics 45.4 7.1 18.2 2.2 72.9 27.1 35.2
Physics 56.1 3.0 6.3 0.8 66.3 33.7 5.9
Chemistry 65.8 2.4 6.2 0.6 75.0 25.0 6.9
Biology 76.0 3.8 5.7 0.8 86.3 13.7 8.5
Combined/general science470 80.4 4.8 4.9 1.3 91.4 8.6 34.7
Other sciences 77.7 3.5 4.4 1.4 87.0 13.0 2.8
Design and technology471 51.8 14.8 9.6 5.4 81.6 18.4 14.8
Electronics /systems and control
55.5 16.6 7.9 3.3 83.3 16.7 1.3
Food technology
42.5 16.3 9.6 8.0 76.4 23.6 5.3
Graphics 59.5 14.1 10.5 3.0 87.1 12.9 3.9
Resistant materials
56.6 16.4 10.0 4.5 87.5 12.5 4.5
Textiles 58.6 10.3 9.0 4.9 82.8 17.2 3.3
Other/combined technology 48.7 13.9 9.5 4.6 76.7 23.3 16.8
Engineering 16.4 0.9 0.8 1.0 19.0 81.0 1.6
ICT 26.4 2.0 8.9 0.6 37.9 62.1 18.6

65 7.0 GCSEs Part 2 – Engineering in Education and Training
Back to Contents
475 Engineering UK 2013 The state of engineering, EngineeringUK, December 2012, p64 476 http://www.sqa.org.uk/ 477 Engineering UK 2013 The state of engineering, EngineeringUK, December 2012, p64 478 Defined as neither gender is below 40.0%
7.9 Scottish StandardsIn August 2010, Scotland introduced the Curriculum for Excellence. The new curriculum aimed at 3- to 18-year-olds offers a broad general education up until S3 (13- to 14-year-olds), and a senior phase from S4-S6 (15- to 18-year-olds).475 Senior students are required to build a portfolio of academic qualifications alongside life skill programmes on health, well-being, physical activity and opportunities for personal achievement, service to others and practical experiences for the world of work. Science and engineering was introduced to develop the teaching of science within the Curriculum for Excellence, improve learners’ engagement with and achievement in science,
and also to develop public understanding and awareness of science. The Scottish Qualifications Authority (SQA) has responsibility for the development, assessment and certification of most qualifications in Scotland, excluding university degrees.476 Standard Grades or intermediates are taken by students aged 14-16 years in Scotland and broadly align with GCSEs. There are three, tiered levels (Foundation, General and Credit) at which Standard Grade examinations can be taken.477
7.9.1 Standard Grades
The number of pupils taking STEM courses at Standard Grade has declined by an average of 2.7% from 2012 to 2013, and 23.9% since
2005. However, the proportion of students taking STEM subjects as a proportion of all students studying Standard Grades has remained relatively consistent over nine years, being around a third in each year (Table 7.8). Over the nine-year period, science has seen the largest decline in student numbers (down 65.8%).
In 2013, mathematics, chemistry and biology were the STEM courses with the most equal gender balance.478 Physics and computing studies, however, had a much higher proportion of males (70.4% and 69.6% respectively). Biology had the highest proportion of female students, with 65.5% of all entrants being female (Table 7.9).
Table 7.8: Trends in entries for each STEM subject at Standard Grade (2005-2013) – Scotland
Source: SQA
2005 2006 2007 2008 2009 2010 2011 2012 2013 Change over one
year
Change over nine
years
Mathematics 53,842 53,782 53,979 50,982 46,782 43,990 42,651 40,879 38,684 -5.4% -28.2%
Biology 22,213 23,200 22,787 22,319 21,029 20,570 20,315 20,336 20,276 -0.3% -8.7%
Chemistry 20,876 20,688 20,078 19,773 19,475 18,906 19,020 18,747 18,785 0.2% -10.0%
Physics 16,917 17,064 15,940 15,299 14,780 14,571 14,442 14,227 14,178 -0.3% -16.2%
Science 6,206 5,741 4,205 3,525 2,961 2,607 2,369 2,086 2,125 1.9% -65.8%
Computing studies 17,237 16,508 16,040 15,383 13,586 12,390 11,659 11,126 10,454 -6.0% -39.4%
Total for all STEM entries 137,291 136,983 133,029 127,281 118,613 113,034 110,456 107,401 104,502 -2.7% -23.9%
All students 411,324 416,052 404,850 387,085 358,728 339,426 330,873 319,986 308,403 -3.6% -25.0%
Proportion of STEM entries 33.4% 32.9% 32.9% 32.9% 33.1% 33.3% 33.4% 33.6% 33.9% 1.0% 1.5%
Table 7.9: Proportion of Standard Grade entries by gender (2013) – Scotland
Source: SQA
Subject % of females % of males
Mathematics 49.5% 50.5%
Biology 65.5% 34.5%
Chemistry 50.2% 49.8%
Physics 29.6% 70.4%
Science 45.8% 54.2%
Computing studies 30.4% 69.6%
All students 49.4% 50.6%

Part 2 – Engineering in Education and Training GCSEs 7.0 66
Back to Contents
479 Engineering UK Report 2013 The state of engineering, EngineeringUK, December 2012, p127
7.9.2 Intermediate 1 and Intermediate 2
Overall, there was a decrease in entries at Intermediate 1 level, whilst Intermediate 2, total entries for National Courses, Higher and Advanced Higher levels all saw an increase in entrants (Table 7.10).
Entry volumes for Intermediate 1 increased by 89.9%, rising from 36,653 in 2005 to 69,618 in 2013, but were down 3.9% compared with
2012. Mathematics remained the most popular selected STEM subject at Intermediate level 1, with 11,721 entries in 2013.
At Intermediate 2, physics was the science subject with the largest increase in entrants, up by 11.5% since 2012, and an increase of 107% since 2005. Entry numbers to engineering craft skills has also increased since 2012 (up 22.5%) with an increase of 238.4% since 2005. Over the last year, entrants to mathematics (2.2%), biology (0.5%) and chemistry (1.0%) at Intermediate level 2 all increased slightly.
Two STEM subjects showed a decline at Intermediate over the eight-year period: Information systems entries fell by 51.4%, from 2,637 in 2005 to 1,281 in 2013; and technological studies entries fell by 19.2%, from 224 in 2005 to 181 in 2013.
In last year’s report,479 we discussed the study of maths and physics as a major pathway to engineering courses. The following case study shines a light on the issue of how we could encourage more students to study these key subjects.
Table 7.10: Trends in entries for each STEM subject at Intermediate 1 and 2 (2005-2013) – Scotland
Source: SQA
2005 2006 2007 2008 2009 2010 2011 2012 2013 Change over one
year
Change over nine
years
INTERMEDIATE 1
Mathematics 7,799 10,317 11,446 12,650 12,082 12,737 12,843 13,115 11,721 -10.6% 50.3%
Biology 3295 3,975 5,146 5,699 5,750 5,718 5,873 6,358 6,109 -3.9% 85.4%
Chemistry 1602 1,929 2,479 2,824 3,058 2,934 2,986 3,157 3,031 -4.0% 89.2%
Physics 1555 1,845 2,092 2,379 2,558 2,609 2,721 2,769 2,567 -7.3% 65.1%
Computing studies 1674 1,552 2,024 2,403 2,294 1,981 1,681 1,994 1,402 -29.7% -16.2%
Engineering craft skills 55 63 73 152 138 211 241 347 395 13.8% 618.2%
Engineering skills - - - 33 455 493 574 466 331 -29.0% 903.0%
Sub-total (all students at Intermediate 1)
36,653 45,174 53,840 60,267 65,735 69,510 72,174 72,427 69,618 -3.9% 89.9%
INTERMEDIATE 2
Mathematics 15,172 16,789 18,989 19,480 21,487 21,938 22,406 23,536 24,058 2.2% 58.6%
Biology 5,336 5,326 6,615 6,755 6,927 7,354 7,490 7,995 8,035 0.5% 50.6%
Chemistry 2,728 3,369 3,725 3,918 4,110 4,319 4,565 4,662 4,707 1.0% 72.5%
Physics 2,354 2,645 3,352 3,488 3,796 3,906 4,083 4,369 4,873 11.5% 107.0%
Computing 2,094 2,742 2,682 2,865 2,948 3,079 3,154 3,074 3,060 -0.5% 46.1%
Engineering craft skills 307 367 354 526 602 658 739 848 1,039 22.5% 238.4%
Information systems 2,637 2,263 1,993 1,846 1,765 1,547 1,366 1,184 1,281 8.2% -51.4%
Technological studies 224 197 207 155 213 173 131 174 181 4.0% -19.2%
Sub-total (all students at Intermediate 2)
87,100 94,686 107,340 113,388 122,463 130,497 134,516 140,046 144,368 3.1% 65.7%
All students (Intermediate 1&2)
123,753 139,860 161,180 173,655 188,198 200,007 206,690 212,473 213,986 0.7% 72.9%

67 7.0 GCSEs Part 2 – Engineering in Education and Training
Back to Contents
480 We have worked with a number of professional organisations so that the findings become embedded in practice. Please feel able to contact us at [email protected] or [email protected] 481 A full list of our publications is available at our project website www.ioe.ac.uk/UPMAP We are grateful to the Economic and Social Research Council for funding the study and to all the participating students, teachers and schools for participating in it. Other team members: Celia Hoyles, Bijan Riazi-Farzad, Melissa Rodd, Richard Sheldrake, Shirley Simon, Fani Stylianidou.
7.10 How can we get more students to study mathematics or physics?Authored by Professor Michael J. Reiss, Pro-Director, Research and Development and Professor of Science Education, Institute of Education, University of London, and Dr Tamjid Mujtaba, Research Officer at Learning for London@IOE Research Centre
Key findings480
Our study indicates that young people are more likely to continue with mathematics or physics once these subjects become optional (ie after the age of 16 in England) if four conditions are fulfilled:
• If they believe that they will benefit from studying the subject in terms of job satisfaction and/or material rewards, such as a bigger salary.
• If they demonstrate conceptual understanding in the subject, in other words ‘do well at it’ in more than a superficial way.
• If they have been well taught at school in the subject.
• If they have been encouraged to continue with these subjects by a key adult. This will usually be someone in their family or one of their teachers. If this person is a family member, they may not be good at mathematics or physics themselves, but they will be positive about the worth of studying these subjects.
From a policy point of view, given that governments have little control in the short term over how parents view subjects, two things are particularly important to encourage post-16 participation in mathematics or physics. Firstly, students need to develop deep conceptual understanding in these subjects and be clear as to the benefits of continuing to study them. Secondly, students need to have long-term relationships with excellent teachers: chopping and changing teachers is disruptive.
The nature of the research
Both in the UK and worldwide, there is still a shortage of studies in mathematics and science education that examine student engagement over time and research the reasons for the take up or non-take up of mathematics and science once these subjects become optional.
In the understanding participation rates in post-16 mathematics and physics (UPMAP) project481 we study these issues with particular reference to mathematics and physics. Our presumption is that, once students are no longer required to do certain subjects, participation depends at least in part on how students see themselves, the subjects and themselves in relation to the subjects. None of these is fixed. Each can shift as a result of experiences both inside and outside the classroom.
Research design and further findings
The UPMAP project has three strands. In Strand 1, a total of 23,000 students completed questionnaires in either Year 8 or 10
and 7,000 of these students also completed them two years later. The questionnaires explored things like performance, confidence and liking for mathematics and physics.
Factor analyses of these questionnaire returns indicated eight physics-specific constructs that correlate with intention to study physics post-16. In descending order of effect size these are:
• extrinsic material gain motivation
• advice-pressure to study physics
• intrinsic value of physics
• home support for achievement in physics
• emotional response to physics lessons
• perceptions of physics lessons
• physics self-concept
• perceptions of physics teachers
A further analysis using individual items from the survey rather than constructs (aggregates of items) supported the finding that extrinsic motivation in physics was the most important factor associated with intended participation. In addition, this item-level analysis indicated that within the advice-pressure to study physics construct, the encouragement individual students receive from their teachers is the key factor (amongst all items which explored students’ perceptions of teachers) in encouraging them to intend to continue with physics post-16. The findings from mathematics are similar.
Fig. 7.6: Factors that explain 15-year-old students' aspirations for post-16 physics.
0.2
1.6
1.0
0.0
1.2
0.6
0.8
0.4
1.4
Physics will help me in the job I want to do in the future
My teacher thinks that I should continue with physics beyondmy GCSEs (bottom quartile versus top quartile)
My teacher thinks that I should continue with physics beyondmy GCSEs (lower middle quartile versus top quartile)
I am good at physics
Gender (male)
I need help with physics
0.149
0.133
0.083
1.376
0.425
0.361
0.255
0.181
Physics is a useful subject
I enjoy my physics lessons
Effect size

Part 2 – Engineering in Education and Training GCSEs 7.0 68
Back to Contents
In Strand 2 we worked with 12 of our schools in more depth. Interviews were undertaken in each of these schools with six students when they were 15 years old, 16 years old and 17 years old. Interviews explored such issues as: student views of the role of parents and other significant adults, peers, teachers and out-of-school experiences on subject choice; student understandings of the nature of mathematics and physics; student views of their abilities in mathematics and physics.
The work we undertook in these schools showed the importance that good schools can make. The best schools were ones that were well managed, where the teachers felt positive about the difference they could make for their pupils and where pupils believed that their teachers were really interested in them as individuals and in their learning.
In Strand 3 we worked with 51 first year undergraduates under the age of 21 in four universities. Interviews explored the students’ experiences of, and feelings about, their education, their family and occasions on which they felt they had made a decision about their future. One of our key findings was that we discerned no evidence that ‘fun projects’, competitions or other innovations typically designed to increase maths or physics uptake had any effect on the desire to study either subject. It seems as though a lot of time and energy may be being wasted on such activities, often funded by well-meaning charities and companies. In the worst cases, it was clear that such activities had actively put students off studying physics or engineering.

Back to Contents
482 Website accessed on the 4 September 2013 http://ofqual.gov.uk/news/ofqual-announces-changes-to-a-levels/ 483 Level 3 Vocational Qualifications for 16 to 19 year olds, Department for Education, 2013, p5 484 Website accessed on the 4 September 2013 http://www.telegraph.co.uk/education/universityeducation/clearing/10245750/A-level-results-2013-Labours-540m-diploma-qualification-axed.html 485 Level 3 Vocational Qualifications for 16 to 19 year olds, Department for Education, 2013, p5 486 Level 3 Vocational Qualifications for 16 to 19 year olds, Department for Education, 2013, p5 487 Website accessed on the 5 September 2013 https://www.gov.uk/government/news/computer-science-to-be-included-in-the-ebacc
Looking into the future, the coalition Government has announced that the first of the new linear A levels are planned to be introduced for teaching in September 2015 and will be reported in performance tables from 2017.485 One consequence of this change will be that AS levels will become a standalone qualification and will no longer count towards A level results.486
8.1 AS level entrant numbersTable 8.0 shows the number of entrants to different STEM subjects over a ten-year period. Across all subjects there has been a 29.5% increase over ten years, although in 2013, entrant numbers declined by 0.4%.
In 2013, computing had the largest percentage increase in entrant numbers, rising by 15.1%. This is particularly impressive when you consider that the average for all subjects actually declined by 0.4%. However, looking at the ten-year trend is less positive: entrants have actually declined by a quarter (24.2%). It is possible that the coalition Government’s decision to recognise computing as a fourth science at GCSE487 has positively influenced students to choose this subject at AS level.
By comparison, ICT dropped by 8.1% in 2013 and by 31.8% over ten years. In 2004, there were 25,558 entrants to ICT. By 2013, this had declined to 17,421. ICT is being removed as a national curriculum subject at Key Stage 4 and this may have a negative impact on students choosing the subject at AS level.
The only other STEM subject to show a decline in entrant numbers over ten years was other science subjects, which fell by a quarter (26.7%) to reach 6,518. It also had a decline of 0.5% in 2013.
69 8.0 AS and A levels Part 2 – Engineering in Education and Training
Part 2 – Engineering in Education and Training8.0 AS and A levels
The post-compulsory education sector is also facing significant changes. Starting in September 2013, Ofqual introduced changes to the A level system so that students no longer sit exams in January.482 At the same time, Ofqual announced that universities would be more involved in the design of A level qualifications. In 2013, the Department for Education (DfE) announced that awarding organisations were reviewing the content of A level qualifications with the involvement of Higher Education (HE) Institutions.483 The coalition Government also announced the abolition of the advanced diploma, which was seen as being comparable to A levels.484

Back to Contents
488 Engineering UK 2013 The state of engineering, EngineeringUK, December 2012, p127
Further maths had the largest percentage increase over ten years, rising by 467.9%. It also increased by 7.9% in the last year. As a result, in 2013 there were 22,601 entrants to further maths, compared with 3,980 in 2004.
The second largest percentage increase over ten years was for maths, which increased by 142.8%, although the increase in 2013 was a more modest 1.5%. In 2013, it was the largest STEM subject, with 150,787 entrants. In fact, it has been the largest STEM subject in each year since 2007.
Entrants to physics have increased by 66.7% over ten years to reach 61,176. This is less than the number of entrants to maths in 2004
(62,098). We showed in Engineering UK 2013488 the importance of students studying both maths and physics. It is therefore worrying that the number of physics entrants is lower than the number of maths entrants ten years ago. In the last year, entrants to physics increased by 3.4%.
In 2004, biology was the largest STEM subject. However, with growth of 48.4% over ten years, it has declined to second place behind maths. In 2013, the 103,905 entrants were a 1.5% increase on the previous year.
Of the three separate sciences, chemistry has had the highest percentage increase over ten
years, rising by 77.8%. It also increased by 3.9% in 2013 to reach 85,631.
Finally, design and technology saw a decline of 2.1% in entrant numbers in 2013, falling to 25,124. However, over ten years, the picture is more positive with entrant numbers rising by 11.0%.
At AS level, four STEM subjects are in the top ten for percentage growth. Economics, which contains a large quantitative element, is third (Table 8.1). The top subject for growth was computing (15.1%), followed by mathematics (further) with 7.9% and chemistry on 3.9%. With growth of 3.4% physics was in sixth place.
Part 2 – Engineering in Education and Training AS and A levels 8.0 70
Table 8.0: GCE AS level STEM subject entrant volumes (2004-2013) – all UK candidates
Source: Joint Council for Qualifications (JCQ)
2004 2005 2006 2007 2008 2009 2010 2011 2012 2013 Change over one year
Change over 10 years
Biology 70,035 71,346 72,246 73,572 72,239 79,112 83,408 102,532 102,387 103,905 1.5% 48.4%
Chemistry 48,166 49,951 50,855 52,835 54,157 58,473 62,232 79,874 82,390 85,631 3.9% 77.8%
Computing 11,722 10,247 9,208 8,719 7,821 7,564 7,223 8,097 7,719 8,886 15.1% -24.2%
ICT 25,558 23,444 21,790 20,422 19,266 19,696 19,910 21,100 18,961 17,421 -8.1% -31.8%
Mathematics 62,098 68,178 70,805 77,387 84,613 103,312 112,847 141,392 148,550 150,787 1.5% 142.8%
Further mathematics 3,980 5,054 6,292 7,426 8,945 13,164 14,884 18,555 20,954 22,601 7.9% 467.9%
Physics 36,700 35,828 36,258 37,323 38,129 41,955 45,534 58,190 59,172 61,176 3.4% 66.7%
Other science subjects
8,892 9,053 9,801 9,343 9,529 6,947 6,873 7,064 6,550 6,518 -0.5% -26.7%
Design and technology/ technology subjects
22,629 23,736 23,099 22,702 22,953 25,120 25,201 28,674 25,661 25,124 -2.1% 11.0%
All subjects 1,039,379 1,079,566 1,086,634 1,114,424 1,128,150 1,177,349 1,197,490 1,411,919 1,350,345 1,345,509 -0.4% 29.5%
Table 8.1: Top ten AS level subjects as percentage increase in the number of entrants (2012-2013) – all UK candidates
Source: Joint Council for Qualifications (JCQ)
2012 2013 Change over one year
Computing 7,719 8,886 15.1%
Mathematics (further) 20,954 22,601 7.9%
Economics 38,386 40,311 5.0%
Chemistry 82,390 85,631 3.9%
Geography 45,923 47,586 3.6%
Physics 59,172 61,176 3.4%
Classical subjects 8,614 8,895 3.3%
Religious studies 33,654 34,679 3.1%
Spanish 11,781 12,136 3.0%
Other modern languages 9,591 9,857 2.8%

Back to Contents
489 Age in years at the start of the 2011/12 academic year 490 Covers local authority-funded schools; academies; free schools; city technology colleges; community and foundation special schools; hospital schools and FE sector colleges.
Table 8.2 shows a regional breakdown for A levels from 2011/12 for those students aged 16-18. It shows that for each STEM subject there are regional variations in entries. For biological sciences, the North West and East of England have the lowest percentage of entries (6.6%), compared with 7.6% in the West Midlands.
For chemistry, the South East and the East of England has the lowest percentage (4.7%), compared with 6.1% in London and the West Midlands.
In the South West, 4.1% of entries were for physics, compared with 3.2% in the North West.
In London, 11.7% of all entries were for mathematics, but in the North West it was only 8.2%.
The overall percentage of entries for further maths is just 1.3%. There is limited variation, with percentages ranging from 1.5% for the South East to 1.1% in the North West and West Midlands.
Just 1.8% of entries are for design and technology. In the East Midlands, there was a high of 2.3% compared with a low of 1.4% in the North West and London.
ICT also had a low proportion of all entries (1.2%), with the proportion ranging from 1.7% in the North West to 0.7% in the North East.
Entries to other science and computer studies are low as a percentage of all entries, never reaching above 0.7% and 0.6% respectively.
71 8.0 AS and A levels Part 2 – Engineering in Education and Training
Table 8.2: Entries by state-funded students aged 16-18 to GCE A level, as a percentage of all entries, by subject and region (2011/12) – England489 490
Source: Department for Education
North East North West
Yorkshire and the Humber
East Midlands
West Midlands
East Of England London South East South West Total for
England
Biological sciences 7.1% 6.6% 6.9% 7.4% 7.6% 6.6% 7.1% 6.7% 7.5% 7.0%
Chemistry 5.3% 5.7% 5.4% 5.5% 6.1% 4.7% 6.1% 4.7% 5.4% 5.4%
Physics 3.7% 3.2% 3.7% 3.8% 3.6% 3.7% 3.6% 3.9% 4.1% 3.7%
Other science 0.6% 0.6% 0.6% 0.6% 0.7% 0.6% 0.1% 0.7% 1.0% 0.6%
Mathematics 8.6% 8.2% 8.2% 9.6% 9.2% 8.8% 11.7% 9.9% 9.1% 9.4%
Further mathematics 1.2% 1.1% 1.2% 1.4% 1.1% 1.4% 1.4% 1.5% 1.4% 1.3%
Design and technology 1.8% 1.4% 2.2% 2.3% 1.6% 2.2% 1.4% 1.8% 2.0% 1.8%
Computer studies 0.6% 0.6% 0.3% 0.4% 0.5% 0.4% 0.4% 0.6% 0.5% 0.5%
ICT 0.7% 1.7% 0.7% 1.5% 1.3% 1.0% 1.5% 0.8% 0.8% 1.2%

Back to Contents
491 Grades A-E are passes at AS level. However, we purposely only analyse/group passes at grades A-C, as these are generally the grades required for entry into STEM honours degree courses.
8.2 AS level A-C491 achievement ratesFigure 8.1 shows that the overall A-C pass rate at AS level rose from 60.6% in 2012 to 60.8% in 2013, the highest it has been over the ten-year period. Only two STEM subjects were above this overall average in 2013: mathematics (further) and mathematics. Mathematics (further) had a pass rate of 82.3% in 2013. It has always had the highest pass rate over the ten-year period, never dropping below 79.9%. At 66.5% in 2013, mathematics also had an above-average pass rate. This was the highest pass rate for maths in the ten-year period.
At 59.9%, the chemistry pass rate was close to the overall average and ahead of other science subjects (58.6%), physics (58.5) and biology (56.4%).
Around half (51.3%) of design and technology entrants got an A-C grade in 2013. This was a decrease on the previous year and below the level in 2004 (52.8%).
Computing and ICT both had less than half their entrants achieving an A-C grade in each of the ten years. In 2013, ICT had a pass rate of 45.8%, which was higher than the 35.6% in 2004. Computing had a pass rate of 43.8%, which was the lowest of all the STEM subjects and was also below the 46.6% achieved in 2004.
Table 8.3 shows the number of male and female entrants to AS level STEM subjects as well as the numbers achieving an A-C grade. It shows that overall just over half (53.3%) of all entrants were female. However, females outnumbered males in just one individual subject – biology (57.3%) – and made up more than two fifths
of entrants in only two other STEM subjects – chemistry (48.3%) and design and technology (40.2%).
Females represented around a third of entrants to maths (39.5%), ICT (34.3%) and mathematics (further) (30.1%). Around a quarter of entrants to other science subjects (27.3%) and physics (23.4%) were female. Finally, less than one in ten (8.7%) of entrants to computing were female.
Looking at the A-C pass rate shows that overall, female entrants (63.8%) outperformed male entrants (57.4%). Female entrants also outperformed male entrants in each STEM subject – even computing, where they represented only 8.7% of all entrants.
Part 2 – Engineering in Education and Training AS and A levels 8.0 72
Fig. 8.1: GCE AS level STEM subject A-C achievement rates (2003-2012) – all UK candidates
Source: Joint Council for Qualifications (JCQ)
60%
50%
80%
90%
70%
40%
30%
2012
2005
2006
2004
2007
2008
2009
2010
2011
2012
Biology
ICT
Physics
MathematicsChemistry
Other science subjects
All subjects
Design and technology/technology subject
Computing
Further mathematics

Back to Contents
73 8.0 AS and A levels Part 2 – Engineering in Education and Training
The ten-year trend for the proportion of females in each STEM subject is show in Table 8.4. Over the period, the proportion of female entrants for all subjects fell, except design and technology, which increased from 39.0% in 2001 to 40.2% in 2013. As a result, it can be said that overall STEM subjects are becoming less gender
balanced, although biology (which has a majority of female entrants) and design and technology are becoming more gender balanced.
This represents a distinct risk to the STEM sector. In Table 8.3, we showed that females
outperformed males in every STEM subject and in Table 8.4 we show that overall females represent a declining proportion of entrants to STEM subjects.
Table 8.3: Number of GCE AS level A-C passes by gender (2013) – all UK candidates
Source: Joint Council for Qualifications (JCQ)
Male Students Female students All students
Total
number of male
students
% A-C for male students
Calculated number of male
students obtaining a
grade A-C
Total number
of female students
% A-C for female
students
Calculated number
of female students
obtaining a grade A-C
Percentage of all
entrants who are female
Total number of
students
% A-C for all
students
Calculated number of
all students obtaining a
grade A-C
Biology 44,384 53.4% 23,701 59,521 58.6% 34,879 57.3% 103,905 56.4% 58,602
Chemistry 44,311 59.2% 26,232 41,320 60.6% 25,040 48.3% 85,631 59.9% 51,293
Computing 8,114 43.6% 3,538 772 46.6% 360 8.7% 8,886 43.8% 3,892
ICT 11,454 41.9% 4,799 5,967 53.2% 3,174 34.3% 17,421 45.8% 7,979
Mathematics 91,209 65.7% 59,924 59,578 67.8% 40,394 39.5% 150,787 66.5% 100,273
Mathematics (further)
15,800 81.6% 12,893 6,801 84.1% 5,720 30.1% 22,601 82.3% 18,601
Physics 46,848 57.2% 26,797 14,328 62.8% 8,998 23.4% 61,176 58.5% 35,788
Other science subjects
4,741 58.2% 2,759 1,777 59.8% 1,063 27.3% 6,518 58.6% 3,820
Design and technology/ technology subjects
15,015 46.0% 6,907 10,109 59.3% 5,995 40.2% 25,124 51.3% 12,889
All subjects 628,685 57.4% 360,865 716,824 63.8% 457,334 53.3% 1,345,509 60.8% 818,069
Table 8.4: Percentage of female entrants to GCE AS level subjects (2004-2013) – all UK candidates
Source: Joint Council for Qualifications (JCQ)
2004 2005 2006 2007 2008 2009 2010 2011 2012 2013
Biology 59.7% 59.0% 58.8% 58.1% 57.2% 56.7% 56.1% 55.1% 56.3% 57.3%
Chemistry 50.2% 49.7% 49.5% 49.5% 49.0% 48.2% 47.9% 47.0% 47.9% 48.3%
Computing 12.5% 11.1% 11.3% 11.0% 11.1% 10.2% 9.5% 9.5% 8.2% 8.7%
ICT 37.0% 36.9% 37.3% 38.2% 37.6% 37.0% 36.9% 36.4% 35.8% 34.3%
Mathematics 39.8% 40.0% 41.0% 41.4% 41.7% 41.8% 41.0% 40.9% 40.3% 39.5%
Mathematics (further) 32.7% 33.6% 35.0% 33.8% 34.7% 35.3% 34.8% 32.8% 31.7% 30.1%
Physics 24.6% 24.6% 24.5% 24.7% 24.1% 23.6% 23.7% 23.3% 23.4% 23.4%
Other science subjects 31.3% 32.0% 32.5% 33.6% 34.8% 29.7% 29.3% 27.6% 27.3% 27.3%
Design and technology/technology subjects
39.0% 40.5% 41.5% 41.5% 41.4% 42.4% 42.1% 42.2% 40.7% 40.2%

Back to Contents
492 Post-16 Mathematics: A strategy for improving provision and participation, ACME, December 2012, p3 493 Fit for Purpose? The view of the Higher Education sector, teachers and employers on the suitability of A levels, Ipsos Mori Social Research Institute, April 2012, p4
Part 2 – Engineering in Education and Training AS and A levels 8.0 74
8.3 A level entrant numbersOver ten years, the number of entrants to all subjects has increased by 11.0%, although there was a decline of 1.3% in 2013 (Table 8.5). Compared to a one year decline of 1.3% for all subjects it is positive to note that six STEM subjects have shown growth in the number of entrants overall. This compares well to just two STEM subjects which have shown an above-average decline in the number of STEM entrants.
In 2013, maths was the largest STEM subject with 88,060 entrants. Over the course of ten years it has grown by 66.8%, while in the last year it grew by 2.7%. The STEM subject to show the largest percentage increase over ten years was mathematics (further). This grew by 141.6% overall – 4.5% in 2013 – to reach 13,821.
It is positive to see this growth in both the maths A level subjects, although further progress needs to be made. In 2012, the Advisory Committee on Mathematics Education
(ACME)492 identified that around 330,000 young people each year need some post-GCSE experience of maths. Additionally, Ipsos Mori493 found that A level maths students did not always study mechanics, which led to varying knowledge and gaps in the knowledge of first year engineering degree students.
Chemistry had the largest percentage one year increase in 2013, growing by 5.2%. However, its ten-year growth of 39.1% is modest compared with some other STEM subjects.
In 2013, other science subjects was the smallest STEM subject, with 3,477 entrants. Over ten years, entrant numbers have declined by a fifth (21.8%), although there was an increase of 3.0% in 2013.
Computing had the biggest decline in entrant numbers over ten years, falling by over half (55.7%) to 3,758. It also declined by 1.3% in 2013, which was the same as the average for all subjects.
Over ten years, ICT also showed a decline, falling by a third (35.3%). However, with 10,419 entrants in 2013, it is around three times the size of computing. It should be noted that ICT was one of only two STEM subjects to have a below-average decline in entrant numbers in 2013, falling by 6.0%.
Design and technology had the largest decline in entrant numbers in 2013, falling by 8.6% to 15,641. Over ten years, the decline was 9.4%. This means that most of the decline occurred in the last year.
In 2013, there were 35,569 entrants to physics: two thirds (67.4%) of the entrance numbers achieved by maths in 2004. Over ten years, entrant numbers have increased by a quarter (23.9%). They have also increased by 3.1% in the last year.
Finally, biology has grown by a fifth (22.3%) over ten years and by 1.4% in the last year. With 63,939 entrants in 2013, it is the second largest STEM subject, behind maths.
Table 8.5: GCE A level STEM subject entrant numbers (2004-2013) – all UK candidates
Source: Joint Council for Qualifications (JCQ)
2004 2005 2006 2007 2008 2009 2010 2011 2012 2013 Change over one year
Change over 10 years
Biology 52,264 53,968 54,890 54,563 56,010 55,485 57,854 62,041 63,074 63,939 1.4% 22.3%
Chemistry 37,254 38,851 40,064 40,285 41,680 42,491 44,051 48,082 49,234 51,818 5.2% 39.1%
Computing 8,488 7,242 6,233 5,610 5,068 4,710 4,065 4,002 3,809 3,758 -1.3% -55.7%
ICT 16,106 14,883 14,208 13,360 12,277 11,948 12,186 11,960 11,088 10,419 -6.0% -35.3%
Mathematics 52,788 52,897 55,982 60,093 65,593 72,475 77,001 82,995 85,714 88,060 2.7% 66.8%
Mathematics (further) 5,720 5,933 7,270 7,872 9,091 10,473 11,682 12,287 13,223 13,821 4.5% 141.6%
Physics 28,698 28,119 27,368 27,466 28,096 29,436 30,976 32,860 34,509 35,569 3.1% 23.9%
Other science subjects 4,444 4,414 4,209 4,544 4,555 4,496 3,361 3,277 3,375 3,477 3.0% -21.8%
Design and technology/ technology subjects
17,261 17,914 18,684 17,417 17,396 17,442 18,417 18,249 17,105 15,641 -8.6% -9.4%
All subjects 766,247 783,878 805,698 805,657 827,737 846,977 853,933 867,317 861,819 850,752 -1.3% 11.0%

Back to Contents
494 A new A* grade was introduced for A levels in 2010 495 Grades A*-E are passes at A level. However, we purposely only analyse/group passes at grades A*-C, as these are generally the grades required for entry into STEM honours degree courses. 496 Fit for Purpose? The view of the Higher Education sector, teachers and employers on the suitability of A levels, Ipsos Mori Social Research Institute, April 2012, p11
The top ten A level subjects, as a percentage increase, are shown in Table 8.6. It is positive to note that six of the ten subjects with the highest percentage growth are STEM subjects. Economics came top. Although this is not a STEM subject, it does still involve a lot of mathematics.
Chemistry had the second largest percentage increase, up 5.3% in a year to 51,818 entrants. Mathematics (further) has the third largest percentage increase, at 4.5%.
Physics had the fifth largest percentage increase, rising 3.1% to 35,569, closely followed by other sciences which rose by 3.0%. With 88,060 entrants, maths had a 2.7% increase, the seventh largest. Biology was ninth with a percentage increase of 1.4%.
Table 8.6: Top ten AS level subjects as percentage increase in the number of entrants (2012/2013) – all UK candidates
Source: Joint Council for Qualifications (JCQ)
8.4 A level A*494-C495 achievement ratesIn 2013, the A*-C pass rate was 77.2% – the highest recorded over the ten-year period, but only three STEM subjects had an above average pass rate (Table 8.7). Ipsos Mori’s research496 showed a perception from some respondents that some subjects, principally STEM subjects, are intrinsically harder than other subjects. They also identified that this finding was supported by the wider literature.
The STEM subject with the highest pass rate was mathematics (further), at 89.9%. This was the highest pass rate achieved in the last ten years. It is also worth noting that in each of the last ten years the pass rate for mathematics (further) has been at least ten percentage points higher than the pass rate for all subjects. The subject with the second highest pass rate in 2013 was maths, at 81.3%, although this was the second consecutive year that the pass rate has decreased.
The third subject to show an above-average pass rate in each of the last ten years was chemistry. At 79.5%, this was the highest achieved over the trend period.
Looking at the other science subjects shows that the pass rate for physics in 2013 – 73.9% – was very close to the figure for biology – 73.7%. Both of these science subjects have had a below-average pass rate in each of the last ten years.
Other science subjects had a pass rate of 76.3% in 2013, just below the average for all subjects. However, it has increased from 63.4% in 2004.
The pass rate for design and technology was 70.5% in 2013, the highest achieved over the ten-year period.
In each of the last ten years, either computing or ICT had the lowest percentage pass rate. In 2013, the pass rate for computing was 61.1%, while ICT had a pass rate of 65.1%.
75 8.0 AS and A levels Part 2 – Engineering in Education and Training
2012 2013Change
over one year
Economics 24,327 26,327 7.5%
Chemistry 49,234 51,818 5.3%
Mathematics (further)
13,223 13,821 4.5%
Spanish 7,351 7,651 4.1%
Physics 34,509 35,569 3.1%
Other sciences
3,375 3,477 3.0%
Mathematics 85,714 88,060 2.7%
Geography 32,005 32,872 2.7%
Biology 63,074 63,939 1.4%
Religious studies
23,042 23,354 1.4%

Back to Contents
Table 8.8 shows the number of male and female entrants to each STEM subject and also the number obtaining an A*-C grade. Overall, over half (54.2%) of all entrants were female. However, of the various STEM subjects, only biology had more than half female entrants (57.8%). For both chemistry (47.0%) and design and technology (42.3%), at least two fifths of
entrants were female, while over a third of entrants to ICT (37.7%) and maths (38.3%) were female.
Around a quarter of entrants to mathematics (further) (28.6%) and other science subjects (23.1%) were female, while a fifth (20.7%) of entrants to physics were female. Finally, only 6.5% of entrants to computing were female.
Overall, a higher proportion of female entrants (79.4%) achieved an A*-C than male students (74.5%). In addition, for all of the different STEM subjects female entrants were more likely to get an A*-C grade than male entrants. The widest variance was for ICT, with an 11.4 percentage point gap between female and male entrants.
Part 2 – Engineering in Education and Training AS and A levels 8.0 76
Table 8.7: Proportion achieving grade A*-C at GCE level (2003-2012) – all UK candidates
Source: Joint Council for Qualifications (JCQ)
2004 2005 2006 2007 2008 2009 2010 2011 2012 2013
Mathematics (further) 86.5% 86.6% 87.9% 88.5% 88.9% 88.9% 89.8% 89.5% 89.4% 89.9%
Mathematics 75.7% 77.9% 79.9% 80.7% 81.3% 81.8% 81.7% 81.8% 81.6% 81.3%
Chemistry 73.0% 73.1% 74.2% 75.2% 76.3% 76.2% 75.8% 78.2% 79.1% 79.5%
Physics 67.9% 68.1% 68.9% 70.2% 70.6% 70.8% 72.9% 73.5% 74.0% 73.9%
Biology 64.1% 65.0% 66.3% 67.7% 69.2% 70.2% 70.3% 73.3% 73.7% 73.7%
Design and technology/ technology subjects
63.5% 64.8% 67.6% 68.6% 68.6% 69.1% 69.6% 70.2% 69.9% 70.5%
Computing 55.6% 56.2% 57.8% 58.7% 59.0% 59.9% 61.3% 62.6% 60.8% 61.1%
ICT 49.4% 49.0% 50.6% 53.0% 55.8% 56.9% 60.2% 60.6% 62.8% 65.1%
Other science subjects 63.4% 63.0% 64.9% 67.4% 66.2% 69.0% 76.3% 75.2% 76.4% 76.3%
All subjects 69.0% 69.9% 71.3% 72.8% 73.9% 75.1% 75.4% 76.2% 76.6% 77.2%
Table 8.8: Number of GCE A level A*-C passes by gender (2013) – all UK candidates
Source: Joint Council for Qualifications (JCQ)
Male students Female students All students
Total number of male
students
% A*-C for male students
Calculated number of male
students obtaining a grade A*-C
Total number of
female students
% A*-C for female
students
Calculated number of
female students
obtaining a grade A*-C
Percentage of all
entrants who are female
Total number
of all students
% A*-C for male students
Calculated number of male
students obtaining a grade A*-C
Biology 26,988 71.0% 19,161 36,951 75.7% 27,972 57.8% 63,939 73.7% 47,123
Chemistry 26,988 78.4% 21,159 24,830 80.8% 20,063 47.9% 51,818 79.5% 41,195
Computing 3,513 60.8% 2,136 245 64.5% 158 6.5% 3,758 61.1% 2,296
ICT 6,492 60.8% 3,947 3,927 72.2% 2,835 37.7% 10,419 65.1% 6,783
Mathematics 53,435 80.7% 43,122 34,625 82.2% 28,462 39.3% 88,060 81.3% 71,593
Mathematics (further)
9,870 89.4% 8,824 3,951 91.1% 3,599 28.6% 13,821 89.9% 12,425
Physics 28,190 72.9% 20,551 7,379 77.8% 5,741 20.7% 35,569 73.9% 26,285
Other science subjects
2,674 75.4% 2,016 803 79.1% 635 23.1% 3,477 76.3% 2,653
Design and technology/ technology subjects
9,031 66.2% 5,979 6,610 76.4% 5,050 42.3% 15,641 70.5% 11,027
All subjects 389,550 74.5% 290,215 461,202 79.4% 366,194 54.2% 850,752 77.2% 656,781

Back to Contents
77 8.0 AS and A levels Part 2 – Engineering in Education and Training
Table 8.9 shows us the proportion of female entrants to different STEM subjects over a ten-year period. Out of the nine STEM subjects, five have seen a decline in the proportion of female entrants and four have seen an increase. The proportion of female entrant to all science subjects has declined over ten years, but maths and mathematics (further) have seen an increase.
The proportion of females in computing has decreased while the proportion doing ICT has increased. Finally, the proportion doing design and technology has also increased over ten years.
Table 8.9: Percentage of female entrants for STEM GCE A level courses (2004-2013) – all UK candidates
Source: Joint Council for Qualifications (JCQ)
2004 2005 2006 2007 2008 2009 2010 2011 2012 2013
Biology 60.3% 59.1% 58.8% 58.7% 58.1% 57.3% 56.4% 56.6% 56.5% 57.8%
Chemistry 50.8% 49.4% 49.1% 49.8% 48.7% 48.4% 47.8% 47.3% 47.2% 47.9%
Computing 12.2% 11.3% 9.7% 10.2% 9.5% 9.6% 8.9% 7.5% 7.8% 6.5%
ICT 34.9% 35.5% 36.3% 37.3% 38.0% 38.6% 38.1% 39.1% 38.6% 37.7%
Mathematics 38.7% 38.1% 39.1% 40.0% 39.4% 40.6% 40.6% 40.0% 40.0% 39.3%
Mathematics (further) 28.4% 28.6% 29.8% 29.4% 30.4% 31.3% 31.9% 31.2% 30.0% 28.6%
Physics 22.3% 22.0% 21.8% 22.2% 21.9% 22.2% 21.5% 20.8% 21.3% 20.7%
Other science subjects 27.5% 26.9% 27.1% 27.7% 27.0% 27.8% 21.5% 22.8% 22.6% 23.1%
Design and technology/ technology subjects
37.7% 39.1% 40.7% 41.9% 41.3% 41.5% 43.7% 42.2% 42.7% 42.3%
8.5 Vocational qualificationsIn section 7.7, we showed the importance of vocational qualifications at Key Stage 4. They are also important at Key Stage 5 as from here, young people can progress onto STEM carers or into HE. To give readers a flavour of the importance to the STEM sector of vocational qualifications at Key Stage 5, we have included data provided by Edexcel.
Table 8.10 shows the number of students completing a level 3 BTec qualification via Edexcel. It shows that in total there were 318,894 completions in 2012/13, an increase of 347.1% over nine years and a rise of nearly a quarter (23.4%) on the previous year.
Of the different STEM subjects, the largest is ICT/computing with 32,947 completers in 2012/13, an increase of 497.2% over nine years. In 2012/13, around a fifth (17.4%) of completers were female. Over the nine-year period, the number of female completers has increased by 443.3%. UK completers increased by 562.9% over nine years, compared with a decline of 68.3% for international completers. Those under the age of 19 increased by 855.7% over nine years, compared with 245.1% for those aged 19-24 and 105.55 for those aged 25+.
Engineering is the second largest STEM subject area with 19,131 completions in 2012/13. This was a rise of 92.1% over nine years and 29.2% on the previous year. Looking at both the nine-year and one-year trend shows that the number of women completing a qualification in engineering has increased faster than the average for all engineering students (129.8% and 32.9% respectively).
Growth in the number of engineering completions over nine years has come from two sources. International completions have risen by 94.0% compared with a decline of 16.3% for UK completions. Also, under 19s have increased by 314.1% compared with 45.0% among those aged 19-24. Those aged 25+ have actually declined by a quarter (24.6%) over the nine-year period.
Other sciences had 17,879 completions in 2012/13. This was an increase of 1,369.1% over nine years and a rise of 43.9% in the last year. There has been particularly strong growth amongst under 19s (up 4,858.3%) compared with those aged 19-24 (749.4%), while those aged 25+ have declined by 11.3%. In addition, UK-domiciled students increased by 1367.7%.
In 2012/13 construction had 3,915 completions. Over nine years, completions increased by 41.8%, with a 7.9% increase in the last year. Looking at completions by age shows that under 19s have increased by 165.5% over nine years, while 19-24s have increased by 11.8%. Those aged over 25 decreased by 17.6%. The proportion of women studying construction has hovered around one in ten for each of the last nine years.
Research by London Econometrics497 has shown that students who obtain a degree via A levels tend to follow a very linear route ie enrol for university straight after completing their A levels. However, those who obtain their degrees via a BTec route typically follow a non-linear route, ie they take a break in their education. BTecs therefore provide an important route through which potential engineers can obtain an engineering degree.
497 The outcomes associated with the BTEC route of degree level acquisition, London Econometrics, May 2013, piii

Back to Contents
Part 2 – Engineering in Education and Training AS and A levels 8.0 78
Table 8.10: Number of students completing selected BTec subjects at level 3 by gender and age (2004/05-2012/13) – all domiciles
Source: Edexcel
2004/05 2005/06 2006/07 2007/08 2008/09 2009/10 2010/11 2011/12 2012/13 Change over one year
Change over nine years
Biology
UK 109 89 131 145 291 731 760 499 613 22.8% 462.4%International 0 0 0 0 0 0 0 0 0 - -
Female 49 49 76 80 157 378 397 269 369 37.2% 653.1%Aged under 19 37 48 89 97 233 617 657 429 514 19.8% 1289.2%
Aged 19-24 62 32 34 43 54 109 99 70 97 38.6% 56.5%Aged 25+ 8 8 6 3 3 3 4 0 1 - -87.5%
Total 109 89 131 145 291 731 760 499 613 22.8% 462.4%% non UK 0.0% 0.0% 0.0% 0.0% 0.0% 0.0% 0.0% 0.0% 0.0% - -% female 45.0% 55.1% 58.0% 55.2% 54.0% 51.7% 52.2% 53.9% 60.2% 11.7% 33.8%
Chemistry
UK 17 13 23 27 82 82 68 53 56 5.7% 229.4%International 18 16 21 23 28 2 3 62 0 -100.0% -100.0%
Female 6 8 7 13 36 29 30 27 23 -14.8% 283.3%Aged under 19 5 2 3 10 47 51 56 33 37 12.1% 640.0%
Aged 19-24 15 8 18 18 33 20 10 20 18 -10.0% 20.0%Aged 25+ 10 17 21 20 26 10 2 52 1 -98.1% -90.0%
Total 35 29 44 50 110 84 71 115 56 -51.3% 60.0%% non UK 51.4% 55.2% 47.7% 46.0% 25.5% 2.4% 4.2% 53.9% 0.0% - -% female 17.1% 27.6% 15.9% 26.0% 32.7% 34.5% 42.3% 23.5% 41.1% 74.9% 140.4%
Physics
UK 0 3 2 18 32 28 31 16 21 31.3% -International 0 0 0 0 0 0 0 0 0 - -
Female 0 0 2 7 12 8 5 2 4 100.0% -Aged under 19 0 1 1 6 17 14 28 15 13 -13.3% -
Aged 19-24 0 2 1 12 11 13 3 1 8 700.0% -Aged 25+ 0 0 0 0 4 1 0 0 0 - -
Total 0 3 2 18 32 28 31 16 21 31.3% -% non UK - 0.0% 0.0% 0.0% 0.0% 0.0% 0.0% 0.0% 0.0% - -% female - 0.0% 100.0% 38.9% 37.5% 28.6% 16.1% 12.5% 19.0% 52.0% -
Other sciences
UK 1,217 1,820 2,275 2,750 3,706 5,573 8,796 12,419 17,862 43.8% 1367.7%International 0 0 6 22 22 11 10 9 17 88.9% -
Female 778 1,112 1,338 1,537 2,148 3,081 4,746 6,561 9,545 45.5% 1126.9%Aged under 19 259 520 810 1,080 1,741 3,101 5,413 8,619 12,842 49.0% 4858.3%
Aged 19-24 549 801 1,052 1,337 1,602 2,059 2,852 3,524 4,663 32.3% 749.4%Aged 25+ 355 444 370 309 328 358 462 240 315 31.3% -11.3%
Total 1,217 1,820 2,281 2,772 3,728 5,584 8,806 12,428 17,879 43.9% 1369.1%% non UK 0.0% 0.0% 0.3% 0.8% 0.6% 0.2% 0.1% 0.1% 0.1% 0.0% -% female 63.9% 61.1% 58.7% 55.4% 57.6% 55.2% 53.9% 52.8% 53.4% 1.1% -16.3%
Engineering
UK 9,647 9,734 10,036 10,936 11,874 13,335 12,660 14,044 18,716 33.3% 94.0%International 406 547 390 393 458 323 294 906 597 -34.1% 47.0%
Female 373 372 429 436 529 617 566 645 857 32.9% 129.8%Aged under 19 2,323 3,033 3,544 4,072 4,546 5,119 5,036 6,730 9,620 42.9% 314.1%
Aged 19-24 5,573 5,653 5,480 5,701 6,144 6,825 6,265 6,475 8,083 24.8% 45.0%Aged 25+ 1,742 1,349 1,152 1,255 1,368 1,436 1,352 1,405 1,313 -6.5% -24.6%
Total 10,053 10,281 10,426 11,329 12,332 13,658 12,954 14,950 19,313 29.2% 92.1%% non UK 4.0% 5.3% 3.7% 3.5% 3.7% 2.4% 2.3% 6.1% 3.1% -49.2% -22.5%% female 3.7% 3.6% 4.1% 3.8% 4.3% 4.5% 4.4% 4.3% 4.4% 2.3% 18.9%
ICT/Computing
UK 4,943 6,353 8,437 10,878 14,278 16,722 20,460 25,142 32,765 30.3% 562.9%International 574 641 499 371 429 289 199 884 182 -79.4% -68.3%
Female 1,053 1,058 1,369 1,666 2,310 2,649 3,591 4,789 5,721 19.5% 443.3%Aged under 19 2,346 3,353 4,329 5,566 7,449 8,991 11,895 16,290 22,421 37.6% 855.7%
Aged 19-24 2,858 3,392 4,284 5,327 6,846 7,537 8,199 8,929 9,863 10.5% 245.1%Aged 25+ 254 201 269 275 311 380 448 668 522 -21.9% 105.5%
Total 5,517 6,994 8,936 11,249 14,707 17,011 20,659 26,026 32,947 26.6% 497.2%% non UK 10.4% 9.2% 5.6% 3.3% 2.9% 1.7% 1.0% 3.4% 0.6% -82.4% -94.2%% female 19.1% 15.1% 15.3% 14.8% 15.7% 15.6% 17.4% 18.4% 17.4% -5.4% -8.9%
Construction
UK 2,704 3,324 3,666 4,406 4,085 3,983 3,160 3,579 3,854 7.7% 42.5%International 56 58 159 87 72 51 44 51 61 19.6% 8.9%
Female 262 353 429 484 473 378 293 297 327 10.1% 24.8%Aged under 19 682 1,024 1,194 1,558 1,687 1,707 1,415 1,640 1,811 10.4% 165.5%
Aged 19-24 1,309 1,498 1,681 1,955 1,697 1,571 1,223 1,392 1,464 5.2% 11.8%Aged 25+ 670 756 809 841 644 679 492 515 552 7.2% -17.6%
Total 2,760 3,382 3,825 4,493 4,157 4,034 3,204 3,630 3,915 7.9% 41.8%% non UK 2.0% 1.7% 4.2% 1.9% 1.7% 1.3% 1.4% 1.4% 1.6% 14.3% -20.0%% female 9.5% 10.4% 11.2% 10.8% 11.4% 9.4% 9.1% 8.2% 8.4% 2.4% -11.6%
All subjects (including STEM and non STEM)
UK 69,266 86,521 106,983 124,385 148,245 179,942 210,975 254,819 316,284 24.1% 356.6%International 2,061 2,144 1,959 2,051 2,064 1,629 1,782 3,693 2,610 -29.3% 26.6%
Female 30,722 38,754 48,471 55,951 67,107 81,135 95,908 117,451 144,301 22.9% 369.7%Aged under 19 32,487 44,718 56,771 68,420 86,481 106,818 131,067 169,520 219,585 29.5% 575.9%
Aged 19-24 31,493 36,904 45,042 50,892 56,648 67,167 73,986 80,562 90,280 12.1% 186.7%Aged 25+ 6,254 6,071 6,136 6,089 6,051 6,450 6,453 6,952 7,577 9.0% 21.2%
Total 71,327 88,665 108,942 126,436 150,309 181,571 212,757 258,512 318,894 23.4% 347.1%% non UK 2.9% 2.4% 1.8% 1.6% 1.4% 0.9% 0.8% 1.4% 0.8% -42.9% -72.4%% female 43.1% 43.7% 44.5% 44.3% 44.6% 44.7% 45.1% 45.4% 45.3% -0.2% 5.1%

Back to Contents
498 Scottish Qualifications Authority, National Qualifications, Quick Guide http://www.sqa.org.uk/files_ccc/nq_quick_guide.pdf
8.6 Scottish Highers and Advanced Highers
8.6.1 Scottish Highers
In Scotland, Highers are the equivalent qualifications to A levels. They are aimed particularly at students who have passed subjects at Standard Grade Credit level, or who have successfully completed a course at
Intermediate 2. Highers are set at Scottish Credit and Qualifications Framework (SCQF) level 6 and are roughly equivalent to NQF level 3.498 Since 2005 (Table 8.11), growth in entries to Scottish Highers has averaged 11.7%. Biology (11.4%), chemistry (6.3%) and mathematics (7.7%) entries have grown overall, whereas entries to information systems have declined by 50.5%, followed by computing (-13.8%), technology studies (-13.3%) and physics has declined by 1.8%.
Looking at the Scottish Highers entry data by gender (Table 8.12) shows chemistry as the subject with the most equal gender balance (49.6% males compared with 50.4% females), followed by mathematics (52.0% males and 48.0% females). Technology studies were 94.3% male, followed by computing (77.6%), physics (71.0%) and information systems (63.9%). Biology remained the only STEM subject with a dominant female presence, with two thirds (63.5%) female students.
79 8.0 AS and A levels Part 2 – Engineering in Education and Training
Table 8.11: Trends in entries for each STEM subject at National Higher and Advanced Higher (2005-2013) – Scotland
Source: SQA
Course Subject
2005 2006 2007 2008 2009 2010 2011 2012 2013 Change over one
year
Change over nine
years
HIGHER
Mathematics 19,181 18,623 18,792 19,636 19,638 20,657 20,550 20,564 20,663 0.5% 7.7%
Biology 8,943 9,044 9,169 9,132 9,107 9,308 9,767 9,548 9,964 4.4% 11.4%
Chemistry 9,411 9,168 9,490 9,505 9,582 10,179 10,288 10,361 10,001 -3.5% 6.3%
Physics 8,952 8,617 8,582 8,765 9,002 9,018 9,445 9,166 8,788 -4.1% -1.8%
Computing 4,628 4,356 4,180 4,256 4,307 4,356 4,124 4,025 3,990 -0.9% -13.8%
Information systems 2,469 1,904 1,656 1,484 1,413 1,433 1,407 1,208 1,223 1.2% -50.5%
Technological studies 848 771 771 758 621 728 683 690 735 6.5% -13.3%
Total STEM entries at Higher level
54,432 52,483 52,640 53,536 53,670 55,679 56,264 55,562 55,364 -0.4% 1.7%
Sub-total (all students at Higher)
164,142 159,140 161,081 162,576 167,792 175,614 178,838 181,568 183,314 1.0% 11.7%
ADVANCED HIGHER
Mathematics 2,318 2,598 2,484 2,752 3,027 2,936 3,098 3,239 3,314 2.3% 43.0%
Biology 1,693 1,886 1,929 1,955 2,095 2,177 2,288 2,417 2,470 2.2% 45.9%
Chemistry 1,792 2,016 2,039 2,143 2,183 2,226 2,472 2,496 2,656 6.4% 48.2%
Physics 1,426 1,437 1,380 1,403 1,550 1,736 1,757 1,917 1,929 0.6% 35.3%
Computing 499 450 349 366 411 414 461 460 435 -5.4% -12.8%
Total STEM entries at Advanced Higher level
7,728 8,387 8,181 8,619 9,266 9,489 10,076 10,529 10,804 2.6% 39.8%
Subtotal advanced (all students)
17,140 18,264 17,831 18,854 19,648 20,585 21,414 21,587 22,120 2.5% 29.1%

Back to Contents
499 http://www.iop.org/publications/iop/2012/page_55899.html
Table 8.12: Proportion of National Higher entries by gender (2013) – Scotland
Source: SQA
8.6.2 Advanced Highers
Advanced Highers are aimed at students who have passed Highers, and are usually taken in the sixth year of school or at college.
Over the nine-year period (Table 8.11), four of the five STEM subject areas have grown by more than 22.9% – the average across all entries: chemistry (32.5%), biology (31.5%), mathematics (30.1%) and physics (26.1%). Chemistry was the subject with the highest increase in entrants since 2012, growing by 6.0%. Computing is the smallest of the five STEM subjects and saw a decrease of 5.7% since 2011, and an overall decline of -14.7% since 2005.
Chemistry is the only subject area which is almost balanced in terms of gender (46.8% compared with 53.2%). Biology is favoured by females, who make up over two thirds of entrants (66.2%). Technological studies is the subject with the lowest proportion of women: they represent only 5.7% of all entrants. Information systems (36.1%), physics (29.0%) and computing (22.4%) also have a low proportion of female entrants (Table 8.13).
Table 8.13: Proportion of Advanced Higher entries by gender (2013) – Scotland
Source: SQA
The next section highlights the importance of physics to the engineering sector and the inherent challenges surrounding the teaching of this subject.
8.7 The next generationAuthored by Peter Main, Director Education and Science, Institute of Physics
Introduction
Recently, the Institute of Physics published a report499 showing the destinations of A level physics students. A striking feature of the data is that almost every student goes to university and the vast bulk of them to study STEM subjects (Figure 8.2). The most common destination for people taking A level physics is engineering, with about 40% of the cohort progressing to a university course in some type of engineering: more than 10% follow courses in mechanical engineering alone. These figures are skewed towards boys, with only around 25% of girls following an engineering pathway. Given that most physics graduates ultimately find jobs in the engineering sector, it is reasonable to add the physics numbers, which means that 50% of boys and 32% of girls progress from physics A level into engineering-related courses at university.
These data show the importance of physics as a gatekeeper subject for university STEM subjects and for engineering in particular. Around 85% of the physics A level cohort also takes mathematics, a figure that has increased markedly over the last few years. We can say with confidence, therefore, that school physics is at least as much concerned with engineering as it is with physics.
Part 2 – Engineering in Education and Training AS and A levels 8.0 80
Subject % of females % of males
Mathematics 48.0% 52.0%
Biology 63.5% 36.5%
Chemistry 50.4% 49.6%
Physics 29.0% 71.0%
Computing 22.4% 77.6%
Information systems
36.1% 63.9%
Technological studies
5.7% 94.3%
All students 55.6% 44.4%
Subject % of females % of males
Mathematics 37.8% 62.2%
Biology 66.2% 33.8%
Chemistry 46.8% 53.2%
Physics 21.8% 78.2%
Computing 14.3% 85.7%
All students 52.3% 47.7%

Back to Contents
500 http://www.buckingham.ac.uk/research/ceer/publications 501 http://www.iop.org/education/teach/itts/page_52632.html 502 http://www.stimulatingphysics.org/
81 8.0 AS and A levels Part 2 – Engineering in Education and Training
Teacher shortage
What are the barriers to increasing participation in physics? There are three related areas I want to mention: teachers, girls and practical work, all of which have been highlighted in one way or another in recent years. First the teachers: a few years ago, extrapolating from work carried out by Smithers and Robinson,500 the Institute estimated a staggering shortfall of between 4,000 and 4,500 specialist physics teachers out of a cohort of 10,000 – 11,000. We calculated that it would require 15 years of recruitment at 1,000 new teachers a year to redress the balance. At the time, the rate was 300-400 a year.
Happily, recruitment improved dramatically when, after prompting from the Institute and others, the Government set separate targets for physics, chemistry and biology teacher training. Two subsequent developments also helped: one, driven by the Institute, was the establishment of training courses in physics with mathematics. In its second year, physics with mathematics now supplies more than a third of all physics recruits. The other was the introduction of bursaries and the Government-funded IOP Teacher Training Scholarships,501 which were designed to attract more academically-able graduates. Not only did the scholarships boost the overall figures, the proportion of trainees with 1st class or 2(i) degrees rose by about 40%. In 2012, the number of trainee physicist teachers reached an all-time record level above 900.
Another aspect of the teacher shortage, is that, for the foreseeable future, much of the teaching of physics up to GCSE will be carried out by non-experts. More than ten years ago, the Institute realised this would be the case and developed resources to support these non-specialists and, in parallel, established a regional teacher network, covering the entire British Isles. Our thinking was the following: one of the strongest factors influencing progression in physics is the classroom experience. Given that the teaching will often be done by non-experts, the best approach is to improve their subject knowledge, pedagogy and confidence. More recently, this work has come together, thanks to Government funding for our Stimulating Physics Network (SPN).502 The main focus of this programme is to highlight schools where the progression from GCSE to A level physics could be improved, and then to work with their physics teams within the school, providing high-quality bespoke CPD.
The results to date have been excellent. Progression from the partner schools has moved from being below the national average to above it, even though they have higher ratios of pupils with free school meals. Further, the rate of increase is twice the national average, and even higher for girls (Figure 8.3). This last point is particularly satisfying, since the low proportion of girls taking A level physics, around 21%, has proved a stubborn block. More of that below. But another feature of the SPN work is that the partner schools have also shown an increase in take-up of triple science GCSE well above the national average. This welcome, but perhaps surprising result (we were, after all, only working on physics) is almost certainly due to the developing confidence of the non-specialist teachers who would otherwise have felt exposed offering physics GCSE.
Fig.8.2: Destinations of students with A level physics in 2011
Overall Males Females
Course destination
%Course destination
%Course destination
%
Physics 9.7Mechanical engineering
10.9 Mathematics 10.5
Mechanical engineering
9.1 Physics 10.3 Physics 7.5
Mathematics 9.0 Mathematics 8.5Preclinical medicine
5.7
Civil engineering
5.4Civil engineering
5.8 Chemistry 4.5
Electronic and electrical engineering
4.1Electronic and electrical engineering
4.8Civil engineering
3.8
Computer science
3.8Computer science
4.7Mechanical engineering
3.4
Chemistry 3.8Aerospace engineering
4.2
Combination of three sujects, or other general courses
3.3
Aerospace engineering
3.7 Chemistry 3.6 Architecture 3.3
Preclinical medicine
3.6General engineering
3.4Others in subjects allied to medicine
2.5
General engineering
3.1Preclinical medicine
3.0
Chemical, process and energy engineering
2.4

Back to Contents
503 see http://www.iop.org/publications/iop/archive/page_41614.html for a review 504 http://www.iop.org/publications/iop/2012/page_58292.html 505 http://www.score-education.org/media/11805/score%20resourcing%20secondary.pdf
Part 2 – Engineering in Education and Training AS and A levels 8.0 82
Girls in physics
The increase in the number of girls progressing to A level is no surprise, as it has been well known for some time503 that girls are more sensitive than boys to bad teaching. But the girls in physics issue is much deeper, as revealed in the work reported by the Institute in It’s Different for Girls in autumn 2012.504 Using the national pupil database, we were able to show the astonishing statistic that almost one half, 49%, of state-funded, coeducational schools sent no girls at all to do A level physics. Looking only at girls who progress to do A levels, a girl is four times more likely to take physics if she attends a single-sex, independent school than if she attends a state, mixed school (Figure 8.4).
These results have led to a qualitative shift in our thinking on this issue. Instead of the usual approach of trying to persuade girls into physics or engineering, as if it were somehow their fault that they did not want to do the subjects and that exposing them to a female physicist or engineer would change their mind, we now take it that their school environment is preventing many girls from benefiting from the opportunities that physics A level offers. Note, by the way, that there is no problem with academic achievement: generally girls outperform boys in physics as they do in most subjects. Our current work, therefore, is concerned with addressing two major barriers. The first is to overcome the reinforcement of gender stereotyping that is undoubtedly taking place in many secondary and, crucially, primary schools. The second is to build the confidence of the girls that they are more than capable of doing well in what they see as a very challenging subject.
Practical work
The third and final barrier to improving participation in physics is improperly resourced practical work, an area covered in a recent report by the SCORE partnership. This revealed, amongst other things, a huge variation in the resources allocated to practical work, the absence of basic equipment and a large fraction of the funding being diverted to photocopying. It is not a matter of inadequate Government funding in this case. It is the choice by school senior management on how to allocate resource. SCORE has also issued a set of benchmarks for
practical science in schools and colleges that will at least enable schools, and their inspectors, to measure the adequacy of provision.505
In summary, A level physics is a gateway subject for engineering just as it is for physics. Increasing numbers taking the subject requires expert teachers and a better gender balance. Recent research and interventions, notably the SPN, have shown that the problems are far from intractable but their solutions do require a clear focus on evidence-based activity.
Fig.8.3: Average increase in progression from GCSE to A level physics 2011-2012
Non-SPN
SPN 2010-12
15.05.00
10.0
20.0
7.19
Girls Boys All pupils
16.54
Fig.8.4: Percentages of girls and boys progressing to A level that took physics A level by school type
0.0%
5.0%
20.0
%
15.0
%
10.0
%
Girls Boys
Independentschools
Number of schools
Maintainedschools
Co-ed
Single sex
Co-ed
Single sex
423
257115
2605
218166
4.3%14.9%
1.8%10.0%
7.2% 19.1%
4.9% 18.7%

Back to Contents
506 Website accessed on 30 July 2013 (http://www.thedataservice.org.uk/Statistics/) 507 See section 9.6 for further details 508 The Qualifications and Credit Framework (QCF), Institute of Education, September 2009, p1 509 Supplementary Release to Statistical First Release: Ds/Sfr18 – Vocational Qualifications in the UK: 2011/12, Department for Education, 27 March 2013, p2
Figure 9.0 shows the changing number of achievements across the three main vocational qualifications that EngineeringUK monitors: National Vocational Qualifications (NVQs), Vocationally Related Qualifications (VRQs) and qualifications from within the Qualification and Credit Framework (QCFs). The chart shows that in 2006/07 there were only 900 achievements in QCFs. However, by 2011/12 this had risen to 5,283,400. Over the same period, the number of achievements in NVQs had declined from 630,400 to 128,800, while those achieving a VRQ declined from 2,246,600 to 575,800.
This dramatic change in numbers is due to the Government’s November 2008 announcement of plans to make all publically-funded vocational qualifications part of the QCF framework, following a two-year pilot.508 The QCF was a direct replacement for the NVQ and VRQ qualifications. In many instances, existing qualifications have had their terminology updated to meet QCF requirements but there has been little actual change to the content. This change in numbers has been recognised by the Department for Business, Innovation and Skills (BIS). BIS has directly attributed the decrease in N/SVQ qualifications to the replacement of NVQs with QCFs, leading some awarding organisations to stop offering NVQs.509
83 9.0 The Further Education sector Part 2 – Engineering in Education and Training
Part 2 – Engineering in Education and Training9.0 The Further Education sector
The Further Education (FE) sector is critical to meeting the education and skills needs of the UK. In 2011/12, the total number of learners achieving a vocational qualification in the UK was 8.7 million, an increase of 9.6% on the previous year.506 Significantly, 950,000 of these were achieved by 16- to 18-year-olds in STEM.507

Back to Contents
510 Website accessed on 7 August 2013 (http://www.bbc.co.uk/news/uk-scotland-23524047) 511 Website accessed on 12 September 2013 (http://www.bbc.co.uk/news/uk-scotland-scotland-politics-23871169) 512 Website accessed on 30 July 2013 (http://www.aoc.co.uk/en/about_colleges/index.cfm) 513 Engineering UK 2013 The state of engineering, EngineeringUK, December 2012, p66 514 Website accessed on 2 August 2013 http://thepearsonthinktank.com/2013/pocket-watch-autumn-leaves-little-time-for-colleges/ 515 Website accessed on 2 August 2013 http://thepearsonthinktank.com/2013/pocket-watch-autumn-leaves-little-time-for-colleges/ 516 Website accessed on 2 August 2013 http://www.education.gov.uk/childrenandyoungpeople/youngpeople/qandlearning/otherqualifications/a00222542/vocational-qualifications-16-19-year-olds 517 Website accessed on 2 August 2013 http://www.education.gov.uk/childrenandyoungpeople/youngpeople/qandlearning/otherqualifications/a00222542/vocational-qualifications-16-19-year-olds 518 Website accessed on 2 August 2013 http://www.education.gov.uk/childrenandyoungpeople/youngpeople/qandlearning/otherqualifications/a00222542/vocational-qualifications-16-19-year-olds 519 Website accessed on 2 August 2013 http://www.education.gov.uk/childrenandyoungpeople/youngpeople/qandlearning/otherqualifications/a00222542/vocational-qualifications-16-19-year-olds 520 Website accessed on 2 August 2013 http://www.education.gov.uk/childrenandyoungpeople/youngpeople/qandlearning/otherqualifications/a00222542/vocational-qualifications-16-19-year-olds 521 Website accessed on 2 August 2013 http://www.education.gov.uk/schools/teachingandlearning/qualifications/examsadmin/news/a00224333/techbacc
Table 9.0 shows that in April 2013 there were 402 colleges in the UK – five fewer than in 2012. This was predominately caused by the number of colleges in Scotland declining from 41 to 36, as a result of an on-going programme in Scotland to merge colleges into regional clusters.510 By the end of the year, this programme will reduce the number of colleges in Scotland to 21 (in 13 regions).511 Overall in England there are 341 colleges, of which 219 are General Further Education Colleges and 94 are Sixth Form Colleges. There are 19 colleges in Wales and six in Northern Ireland.
Table 9.0: Number of colleges by college type and home nation (2013) – UK
Source: Association of Colleges512
Like other parts of the education system in England, the FE sector is experiencing considerable change. As highlighted in the Engineering UK Report 2013,513 the school leaving age is rising to 17 in 2013 and 18 in 2015. What effect this will have on the number students progressing though to vocational education can’t yet be determined. However, last year 89.5% of 17-year-olds went into education or training.514 This means that around one in ten will be affected by this change and potentially more will be affected in 2015.
The Government is also introducing traineeships which will be explored in more detail in the apprenticeships chapter (Section 10). From last September, Colleges were able to enrol 14- to 16-year-olds, rather than just provide courses for them.515 Again, how this will affect the number of students progressing on to vocational education can’t yet be determined.
Current Government policy aims to raise the quality of vocational qualifications. Qualifications taught from September 2014 and reported in the 2016 performance tables will be categorised as either technical level or applied general qualifications, and only high-value vocational qualifications will be reported in school and college performance tables.516
A technical qualification will need the support of a professional body or at least five employers who represent the sector and its size must be at least that of an A level.517 Technical qualifications will be in areas that lead to recognised occupations in engineering, IT, accounting or hospitality.518
An applied general qualification will need the backing of at least three universities and must be at least the size of an AS level qualification.519 These qualifications will provide a broader area of study than technical qualifications.
The technical qualifications will also count towards the new Technical Baccalaureate (TechBacc).520 The three elements of the TechBacc are:
• a high-quality level 3 vocational qualification
• level 3 core maths qualification – including AS level maths
• an extended project to develop and test student skills in extended writing, communication, research, self-discipline and self-motivation521
Part 2 – Engineering in Education and Training The Further Education sector 9.0 84
Fig. 9.0: Vocational Qualification achievements in the UK by qualification type (2006/07-2011/12)
Source: The Data Service
0
2,00
0,00
0
6,00
0,00
0
4,00
0,00
0
1,00
0,00
0
3,00
0,00
0
5,00
0,00
0
2006/07
2007/08
2008/09
2009/10
2010/11
2011/12
Qualifications and CreditFramework Qualification
Vocational Related Qualification
National Vocational Qualification
630,400900
2,246,600
727,90033,700
2,461,400
922,900220,300
2,606,800
979,000777,000
2,607,500
587,8002,836,200
1,399,600
128,8005,283,400
575,800
Colleges in England 341
General Further Education Colleges 219
Sixth Form Colleges 94
Land-based Colleges 15
Art, design and performing Arts Colleges 3
Specialist designated Colleges 10
Colleges in Scotland 36
Colleges in Wales 19
Colleges in Northern Ireland 6
Colleges in the UK 402

Back to Contents
522 The challenges of Stem provision for Further Education colleges, 157 Group, October 2012, p9 523 OECD Review: Skills Beyond School Background Report for England – Briefing paper, UKCES, February 2013, p53 524 The challenges of Stem provision for Further Education colleges, 157 Group, October 2012, p9 525 Website accessed on the 2nd August 2013 (https://www.gov.uk/government/news/government-cuts-funding-to-low-value-qualifications) 526 No stone unturned in the pursuit of growth, The Rt Hon the Lord Heseltine of Thenford CH, October 2012 527 Skills Funding Statement 2012-2015, Skills Funding Agency, December 2012, p3 528 Engineering UK 2013 The state of engineering, EngineeringUK, December 2012, p79 529 The Net Present Value is defined as the present value of the benefits minus the present value of the costs associated with particular activity. 530 Level 3 apprenticeships receive 66% more funding in total than level 2 apprenticeships 531 A Disaggregated Analysis of the long run impact of Vocational Qualifications, Department for Business, Innovation and Skills, February 2013, p9 532 A Disaggregated Analysis of the long run impact of Vocational Qualifications, Department for Business, Innovation and Skills, February 2013, p8 533 The Impact of Further Education Learning, Department for Business, Innovation and Skills, January 2013, p10 534 Engineering UK 2013 The state of engineering, EngineeringUK, December 2012, p79
85 9.0 The Further Education sector Part 2 – Engineering in Education and Training
In addition to the changes in vocational qualifications, there are new funding arrangements for 2013/14 (Table 9.1). Depending on age, current learning level and whether someone is unemployed and on active benefits, courses can either be fully-funded, co-funded or dependent on the prospective student taking out a loan.
The Skills Funding Agency also recognises that teaching different types of courses for adults generates different levels of cost for colleges. Laboratory-based science programmes receive a 12% uplift from the basic level of funding for a classroom activity, and most construction, engineering and applied science programmes get uplifts of either 30% or 60%. The highest uplift, 92%, is for land-based programmes requiring field scale practical activities.522
However, the Education Funding Agency has announced a reduction in the number of funding bands for young people – from six bands to three – meaning that funding for young people will no longer match funding for adults. This could potentially impact on STEM subjects, which traditionally have enjoyed an uplift compared with the basic level of funding.524
In July,525 the Government announced that it was withdrawing public funding from 1,884 vocational courses. Most of these courses had fewer than 100 enrolled learners in the last two years.
Finally, in line with the Heseltine Review,526 Local Enterprise Partnerships (LEPs) are being given a strategic role over skills. Each LEP will develop a skills strategy for its area and the Government is expecting them to work closely with colleges and FE providers.527
9.1 Economic benefits of vocational educationThe Engineering UK Report 2013528 identified the Net Present Value529 of FE qualifications started in 2008/09 for those aged 19+ as £75 billion over the years in which the learners stay in the workforce (Table 9.2). The highest average Net Present Value was for a level 2 apprenticeship, at £112,000 per achievement, followed by a level 3 apprenticeship at £106,000.530 Provider-based level 3 NVQs had an average return of £87,000 compared with work-based level 3 NVQs at £72,000.
Analysis by BIS531 shows that the subjects appearing to deliver the strongest returns at level 3 are engineering and manufacturing technologies, and construction, planning and the built environment. Students completing a level 3 qualification gain a 8.3% increase in earnings in the first year, relative to those who don’t complete. By the fourth year this differential rises to 15%.
Interestingly, the same research project identified that those level 3 completers who did their training through the workplace route achieved, on average for all courses, an immediate and significant return of 7-8% when compared with non-completers. However, individuals who went through the classroom route took four years to achieve an earnings premium relative to non-completers.532
A third of men (35%) and over a quarter of women (29%) indicated that they got a better job after completing their learning and training,533 while 18% of men and 12% of women said they got a promotion. Completing learning and training also impacted on job satisfaction, with over half (58%) of men and women saying that having completed their course they were getting more satisfaction from their work.
Finally, in last year’s report534 we identified that colleges are significant economic assets for the UK, as well as improving the skills of the workforce. Colleges employ over a quarter of a million people (265,000), of whom 140,000 are teachers and lecturers. BIS has also estimated the value FE exports into technician and higher-level vocational skills at £1 billion a year.
Table 9.1: Funding entitlements (2013/14)
Source: UKCES523
Priority population groups and Government subsidy for learning
Learning level Individuals aged from 19-24 Individuals aged 24+
Individuals who are unemployed and on
active benefits
Basic skills Fully-funded Fully-funded Fully-funded
Level 2 (first) Fully-funded Co-funded Fully funded – targeted provision for learners
with skills barriers to employment aged 23 and under and/or training below level 3.
Loans for those aged 24+ on courses at level 3+
Level 2 (retraining) Co-funded Co-funded
Level 3 (first) Fully-funded Loans
Level 3 (retraining) Co-funded Loans
Level 4 (any) Co-funded Loans

Back to Contents
535 Figures for 2008/09 to 2010/11 are not directly comparable to earlier years as the introduction of demand led funding has changed how data is collected and how funded learners are defined. 536 Figures for 2011/12 onwards are not directly comparable to earlier years as a Single Individualised Learner Record (ILR) data collection system has been introduced. Small technical changes have been made in the way learners from more than one provision type are counted, leading to a removal of duplicate learners and a reduction in overall learner numbers of approximately 2%. 537 Caution should be exercised when looking at the percentage changes over time due to changes in how data has been collected
9.2 Participation in FE535 536 Table 9.3 shows the trend in overall participation in engineering-related Sector Subject Areas, science and mathematics, and all subjects. Although there have been some methodological changes over the years that mean it is not possible to directly compare different years, the table still shows an overall decline in participation over the seven years, with engineering and manufacturing technologies down 22.5% and information and communication technology down 64.0%. However, there has been a slight rise (5.0%) in construction, planning and the built environment. Overall participation in engineering-related Sector Subject areas
has decreased by half (50.0%) in seven years. This compares with a decline of a fifth (-20.8%) for all Sector Subject Areas over seven years.
Positively however, all three engineering-related Sector Subject Areas showed growth in the number of participants in 2011/12 that was higher than the growth for all subjects. Information and communication technology had the highest growth (21.4%), followed by engineering and manufacturing technologies (17.8%) and then construction, planning and the built environment (15.7%). This compares very favourably with growth of 12.8% for all subjects.
Looking at science and maths shows a marginal increase (0.2%) in 2011/12, with growth of 4.3% over the seven years.
Part 2 – Engineering in Education and Training The Further Education sector 9.0 86
Table 9.2: Net Present Value of the FE system for those aged 19+ (2008/09)
Source: BIS
Qualification aims (000s)
Participation funding (£m) Starts Achievements
Average NPV per
achievement (£000)
Total NPV (£bn)
Apprenticeships L2 179 76 56 112 6
Work-based NVQ L2 771 587 429 59 25
Provider-based NVQ L2 353 113 81 31 3
Apprenticeships L3 298 94 67 106 7
Work-based NVQ L3 298 197 131 72 9
Provider-based NVQ L3 283 68 47 87 4
Basic skills 557 651 476 27 13
Developmental learning 273 400 300 25 8
Total 3012 2,169 1,586 47 75
Table 9.3: Overall participation (aims) in FE, all levels, for STEM Sector Subject Areas and all subjects (2005/06-2011/12) – England
Source: The Data Service
2005/06 2006/07 2007/08 2008/09 2009/10 2010/11 2011/12 Change over one year537
Change over seven years
Engineering and manufacturing technologies
217,820 169,610 171,370 162,700 153,780 143,340 168,830 17.8% -22.5%
Construction, planning and the built environment
148,050 138,410 143,510 131,260 139,780 134,300 155,440 15.7% 5.0%
Information and communication technology
1,011,720 630,780 551,800 461,300 343,220 300,020 364,220 21.4% -64.0%
Sub-total all engineering-related Sector Subject Areas
1,377,590 938,800 866,680 755,260 636,780 577,660 688,490 19.2% -50.0%
Science and mathematics 309,220 303,410 303,180 306,660 324,280 321,900 322,590 0.2% 4.3%
All subjects 8,272,300 6,723,800 6,582,900 6,604,800 6,124,200 5,806,100 6,549,600 12.8% -20.8%
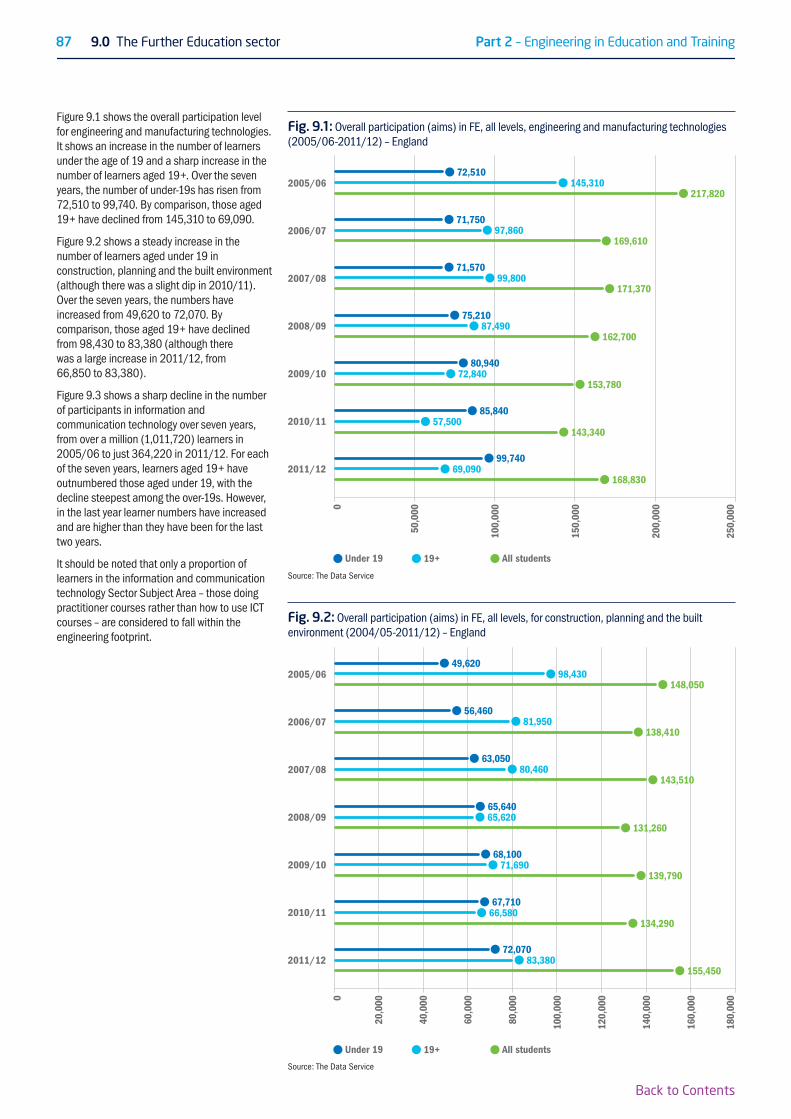
Back to Contents
87 9.0 The Further Education sector Part 2 – Engineering in Education and Training
Figure 9.1 shows the overall participation level for engineering and manufacturing technologies. It shows an increase in the number of learners under the age of 19 and a sharp increase in the number of learners aged 19+. Over the seven years, the number of under-19s has risen from 72,510 to 99,740. By comparison, those aged 19+ have declined from 145,310 to 69,090.
Figure 9.2 shows a steady increase in the number of learners aged under 19 in construction, planning and the built environment (although there was a slight dip in 2010/11). Over the seven years, the numbers have increased from 49,620 to 72,070. By comparison, those aged 19+ have declined from 98,430 to 83,380 (although there was a large increase in 2011/12, from 66,850 to 83,380).
Figure 9.3 shows a sharp decline in the number of participants in information and communication technology over seven years, from over a million (1,011,720) learners in 2005/06 to just 364,220 in 2011/12. For each of the seven years, learners aged 19+ have outnumbered those aged under 19, with the decline steepest among the over-19s. However, in the last year learner numbers have increased and are higher than they have been for the last two years.
It should be noted that only a proportion of learners in the information and communication technology Sector Subject Area – those doing practitioner courses rather than how to use ICT courses – are considered to fall within the engineering footprint.
Fig. 9.1: Overall participation (aims) in FE, all levels, engineering and manufacturing technologies (2005/06-2011/12) – England
Source: The Data Service
0
100,
000
250,
000
200,
000
50,0
00
150,
000
2006/07
2007/08
2008/09
2009/10
2010/11
2011/12
2005/06
19+ All studentsUnder 19
75,21087,490
162,700
80,94072,840
153,780
85,84057,500
143,340
99,74069,090
168,830
71,75097,860
169,610
71,57099,800
171,370
72,510145,310
217,820
Fig. 9.2: Overall participation (aims) in FE, all levels, for construction, planning and the built environment (2004/05-2011/12) – England
Source: The Data Service
0
40,0
00
180,
000
160,
000
140,
000
20,0
00
60,0
00
100,
000
80,0
00
120,
000
2006/07
2007/08
2008/09
2009/10
2010/11
2011/12
2005/06
19+ All studentsUnder 19
65,64065,620
131,260
68,10071,690
139,790
67,71066,580
134,290
72,07083,380
155,450
56,46081,950
138,410
63,05080,460
143,510
49,62098,430
148,050

Back to Contents
538 Supplementary Release to Statistical First Release: Ds/Sfr18 – Vocational Qualifications in the UK: 2011/12, Department for Education, 27 March 2013, p2 539 The Qualifications and Credit Framework (QCF), Institute of Education, September 2009, p1 540 Supplementary Release to Statistical First Release: Ds/Sfr18 – Vocational Qualifications in the UK: 2011/12, Department for Education, 27 March 2013, p2 541 Supplementary Release to Statistical First Release: Ds/Sfr18 – Vocational Qualifications in the UK: 2011/12, Department for Education, 27 March 2013, p1
Part 2 – Engineering in Education and Training The Further Education sector 9.0 88
9.3 National Vocational QualificationsN/SVQs were introduced in 1987 and recognise the level of skill and knowledge needed to demonstrate competency in the area of work related to the subject studied. Candidates must pass a performance-based assessment, usually in a work environment. It should be noted, however, that N/SVQs are not related to a specific course of study. N/SVQ level 3 qualifications also form a substantial element of
the Advanced/Modern Apprenticeship. Since their introduction and up to the end of September 2012, 10.3 million N/SVQs have been awarded.538
Table 9.4 shows the number of achievements in STEM NVQ Sector Subject Areas and the overall number of achievements. As previously mentioned in this section, the dramatic change in numbers studying NVQ qualifications is explained by the fact that in November 2008, after two years of piloting,539 the Government announced that all publically-funded vocational
qualifications would become part of the QCF framework. The QCF was a direct replacement for the NVQ and VRQ qualifications. In many instances, existing qualifications have had their terminology updated to meet QCF requirements but there has been little actual change to the content. BIS has attributed this change in numbers to the decrease in N/SVQ qualifications. This, in turn, can be directly attributed to the introduction of the QCF in place of NVQs and the consequential decision of some awarding organisations to no longer offer NVQs.540
Overall, the proportion of achievements over ten years has declined by two thirds (67.9%). The average decline for all engineering-related Sector Subject Areas was lower (down 49.7%). Engineering and manufacturing technologies (down 40.9%) and construction, planning and the built environment (down 58.8%) suffered below-average decline compared with information and communication technology, which suffered above-average decline (down 84.3%).
Over the ten years, the proportion of engineering-related NVQs hovered at between a quarter and a third, except in the final year when it increased to 41.9%.
In 2011/12 specifically, engineering and manufacturing technologies was the largest engineering-related Sector Subject Area, with 41,000 achievements. This was almost four times the size of construction, planning and the built environment (11,400). Information and communication technology only had 1,600 achievements.
There were very few achievements in science and mathematics. In 2004/05 and 2005/06, achievement numbers reached 400. But by 2010/11, this had declined to 100.
According to the Department for Education (DfE), 53% of all vocational qualifications in 2011/12 were achieved by learners aged 25 or over.541
Fig. 9.3: Overall participation (aims) in FE, all levels, information and communication technology (2005/06-2011/12) – England
Source: The Data Service
0
400,
000
1,20
0,00
0
800,
000
1,00
0,00
0
200,
000
600,
000
2006/07
2007/08
2008/09
2009/10
2010/11
2011/12
2005/06
19+ All studentsUnder 19
103,260358,040
461,300
98,370244,840
343,220
87,620212,400
300,020
85,500278,720
364,220
116,510514,280
630,780
109,330442,480
551,800
125,950885,760
1,011,720

Back to Contents
542 Numbers have been rounded to the nearest 100 543 Achievements between 1 October 2011 and 30 September 2012 544 Downing Street Press Release, 26 June 2013
89 9.0 The Further Education sector Part 2 – Engineering in Education and Training
The Government has announced that it aims to produce an additional 100,000 engineering technicians by 2018.544 Level 3+ qualifications are generally considered to be a requirement to become a technician. It is therefore concerning that Table 9.5 shows that of the three engineering-related Sector Subject Areas, only one – information and communications technology – has more than half its achievements at level 3+.
Of the 167,700 N/SVQ achievements, 51.9% were at level 3+. As previously reported, engineering and manufacturing technologies is the largest of the STEM subject areas, with 46,400 achievements. However, only 21,300 were at level 3+: less than half (45.9%) of all achievements. Of these, 300 were at levels 4 and 5. It is also worth noting that engineering and manufacturing technologies had 2,000 achievements at level 1.
Construction, planning and the built environment had the lowest proportion of level 3+ achievements (43.8%). However on a positive note, it had no achievements at level 1 and a total of 600 achievements at levels 4 and 5.
Information and communication technology had a total of 1,900 achievements, of which 1,100 were at level 3 – 57.9% of all achievements. It is also the only STEM Sector Subject Area to have an above-average number of level 3+ achievements.
The 100 achievements in science and mathematics were all at level 2.
Table 9.4: Achievements of NVQs by Sector Subject Area (2001/02-2011/12) – UK542 543
Source: The Data Service
2002/03 2003/04 2004/05 2005/06 2006/07 2007/08 2008/09 2009/10 2010/11 2011/12 Change over one year
Change over 10 years
Construction, planning and the built environment
27,700 48,500 52,800 55,400 74,000 99,100 116,500 93,300 40,300 11,400 -71.7% -58.8%
Engineering and manufacturing technologies
69,400 81,300 88,900 94,600 92,400 93,900 135,000 144,300 115,400 41,000 -64.5% -40.9%
Information and communication technology
10,200 9,200 8,500 12,600 16,600 27,200 35,300 35,400 10,500 1,600 -84.8% -84.3%
Sub-total all engineering related Sector Subject Areas
107,300 139,000 150,200 162,600 183,000 220,200 286,800 273,000 166,200 54,000 -67.5% -49.7%
All engineering-related Sector Subject Areas as a percentage of all NVQs
26.7% 29.6% 27.9% 27.2% 29.0% 30.3% 31.1% 27.9% 28.3% 41.9% 48.1% 59.9%
Science and mathematics
200 300 400 400 300 200 300 300 100 100 0.0% -50.0%
All NVQs 401,800 470,100 538,500 598,600 630,400 727,900 922,900 979,000 587,800 128,800 -78.1% -67.9%
Table 9.5: N/SVQ achievements by Sector Subject Area and level of award (2011/12) – UK
Source: The Data Service
Total achievements Level 1 Level 2 Level 3 Levels 4
and 5
Percentage of achievements
at level 3+
Construction, planning and the built environment
16,200 0 9,100 6,500 600 43.8%
Engineering and manufacturing technologies
46,400 2,000 23,100 21,000 300 45.9%
Information and communication technology
1,900 0 800 1,100 0 57.9%
Sub-total all engineering- related Sector Subject Areas
64,500 2,000 33,000 28,600 900 45.7%
Science and mathematics
100 0 100 0 0 0.0%
All NVQs 167,700 3,400 77,400 76,300 10,500 51.8%

Back to Contents
545 The VRQ achievements in this section relate to those submitted by the 37 awarding organisations and therefore are not complete UK estimates 546 Supplementary Release to Statistical First Release: Ds/Sfr18 – Vocational Qualifications in the UK: 2011/12, Department for Education, 27 March 2013, p3 547 Supplementary Release to Statistical First Release: Ds/Sfr18 – Vocational Qualifications in the UK: 2011/12, Department for Education, 27 March 2013, p3
Part 2 – Engineering in Education and Training The Further Education sector 9.0 90
Over two fifths (43.1%) of all NVQ achievements were awarded to female learners (Table 9.6). However, the average for all engineering-related Sector Subject Areas was only 4.8%. Nearly a third (31.6%) of achievements in information
and communication technology were awarded to female learners. This compares well to engineering and manufacturing technology (4.7%) and construction, planning and the built environment (1.9%).
9.4 Vocationally Related Qualifications545 VRQs, such as National Certificates and Diplomas, provide the knowledge and practical skills required for a job through a programme of structured learning. VRQs are usually assessed through assignments, projects and sometimes written tests. As well being a standalone qualification, VRQs are often, but not always, a component of apprenticeships. Since their introduction in 2001/02 there have been over 12 million VRQ achievements.546 As a direct result of the introduction of the QCF framework, there has been a reduction of six organisations awarding VRQs down to 37.547
Table 9.7 shows the proportion of achievements for STEM Sector Subject Areas and all VRQs by level. Whereas over half of all N/SVQ achievements were at level 3+, only 16.1% of VRQ achievements are at level 3. The figure for all engineering-related Sector Subject Areas is below this average at just 13.0%.
Of the various engineering-related Sector Subject Areas, information and communication technology is the largest with 308,000 achievements (52.8%) out of a total of 583,000 for all VRQs. Information and communication technology is skewed towards lower level qualifications, with 2,600 achievements at level 1 and 297,900 at level 2. Only 7,500 achievements are at level 3, which is 2.4% of all achievements. It is also interesting that there were only 1,900 N/SVQ achievements in 2011/12, compared with 308,000 VRQs.
By comparison, over half (52.8%) of achievements in engineering and manufacturing technologies were at level 3. Out of 64,600 achievements, 1,900 were at level 1, compared with 28,700 at level 2 and 34,100 at level 3.
Construction, planning and the built environment has the lowest number of achievements of the three engineering-related Sector Subject Areas at 28,500. However, it had the largest number of level 1 achievements (4,600). A further 13,600 achievements were at level 2 and 10,400 – over a third – were at level 3.
Table 9.6: N/SVQ achievements by Sector Subject Area and gender (2011/12) – UK
Source: The Data Service
Total achievements Male Female Percentage
female
Construction, planning and the built environment
16,200 16,000 300 1.9%
Engineering and manufacturing technologies
46,400 44,200 2,200 4.7%
Information and communication technology
1,900 1,300 600 31.6%
Sub-total all engineering-related Sector Subject Areas
64,500 61,500 3,100 4.8%
Science and mathematics 100 0 100 100.0%
All NVQs 167,700 95,500 72,200 43.1%

Back to Contents
548 Supplementary Release to Statistical First Release: Ds/Sfr18 – Vocational Qualifications in the UK: 2011/12, Department for Education, 27 March 2013, p4 549 Supplementary Release to Statistical First Release: Ds/Sfr18 – Vocational Qualifications in the UK: 2011/12, Department for Education, 27 March 2013, p4 550 Achievements between 1 October 2011 and 30 September 2012 551 Data is rounded to the nearest 100 552 The QCF achievements database is very good it is not yet comprehensive 553 Website accessed on the 5 August 2013 (http://ofqual.gov.uk/qualifications-and-assessments/qualification-frameworks/) 554 Supplementary Release to Statistical First Release: Ds/Sfr18 – Vocational Qualifications in the UK: 2011/12, Department for Education, 27 March 2013, p1
91 9.0 The Further Education sector Part 2 – Engineering in Education and Training
There were only 100 N/SVQ achievements in science and mathematics in 2011/12, compared with 33,100 VRQ achievements. None of these achievements were at level 1, but 33,000 (99.7%) were at level 2. Only 100 achievements were at level 3. Learners aged 25 and over achieved 12% of all VRQs awarded in 2011/12.548 Furthermore, two thirds (66%) of all VRQs were achieved in schools, a further 16% were achieved in FE/Tertiary Colleges and 8% were achieved with private training providers.549
Overall around two fifths (44.8%) of all VRQ achievements went to women (Table 9.8). Of the three engineering-related Sector Subject Areas only one, information and communication technology, was above this average (47.7%). However, by comparison only 3.9% of achievements in engineering and manufacturing technologies and 2.5% of achievements in construction, planning and the built environment were awarded to women.
Half (50.5%) of all achievements in science and mathematics were awarded to female learners.
9.5 Qualifications and Credit Framework552 As mentioned previously, Government education policy changes have led to a significant shift towards the uptake of qualifications from the QCF. There are three different types of QCF qualifications:
• Award – 1-12 credits
• Certificates – 13-36 credits
• Diploma – at least 37 credits
Each credit usually represents ten hours of learning. Qualifications are made up from a series of units that can have a variable number of credits. Units and qualifications are also awarded a level ranging from entry level to level 8. The title of a qualification denotes both its size and level.553
Table 9.9 shows the number of qualifications awarded in STEM and overall, by level. Overall, 4,135,400 qualifications were awarded – 18.1% at level 3+ (675,200 at level 3 and 74,000 at levels 4-8). According to DfE,554 1.7 million QCF achievements were Awards, 1.5 million were Certificates and almost a million were Diplomas.
Across the three engineering-related Sector Subject Areas, the proportion of qualifications at level 3+ is slightly below average at 17.9%.
The largest of the engineering-related Sector Subject Areas is information and communication technology, with 257,000 achievements in 2011/12. However, it had the lowest proportion of level 3+ achievements of all the engineering-related Sector Subject Areas at just 15.1%. Overall, 21,100 achievements were at entry level, compared with 38,300 at level 3 and 500 at levels 4-8.
Engineering and manufacturing technologies also had a below average proportion of achievements at level 3+ (16.4%). In 2011/12, entry level accounted for 5,300 of the total 206,900 achievements, with 35,400 at level 1. This is larger than the proportion at level 3+. Overall, there were 31,600 achievements at level 3 and 2,400 at levels 4-8.
Construction, planning and the built environment was the engineering related Sector Subject Area with the largest percentage of level 3+ achievements at nearly a quarter (23.0%). Despite this, it still had a higher proportion of achievements below level 2 than above levels 3. There were 2,900 achievements at entry level and 48,400 at level 1. This compares with 42,000 achievements at level 3 and 2,800 at levels 4-8.
Table 9.7: All VRQ achievements (as reported by participating awarding bodies) by Sector Subject Area and level (2011/12) – UK550 551
Source: The Data Service
Table 9.8: All VRQ achievements (as reported by participating awarding bodies) by Sector Subject Area and gender (2011/12) – UK
Source: The Data Service
Total
achievements Level 1 Level 2 Level 3Percentage of
VRQs level 3
Construction, planning and the built environment
28,500 4,600 13,600 10,400 36.5%
Engineering and manufacturing technologies
64,600 1,900 28,700 34,100 52.8%
Information and communication technology
308,000 2,600 297,900 7,500 2.4%
Sub-total all engineering-related Sector Subject Areas
401,100 9,100 340,200 52,000 13.0%
Science and mathematics 33,100 0 33,000 100 0.3%
All VRQs 583,800 22,900 466,900 94,000 16.1%
Total achievements Male Female Percentage
female
Construction, planning and the built environment
28,500 27,700 700 2.5%
Engineering and manufacturing technologies
64,600 62,100 2,500 3.9%
Information and communication technology
308,000 161,000 147,000 47.7%
Sub-total all engineering-related Sector Subject Areas
401,100 250,800 150,200 37.4%
Science and mathematics 33,100 16,400 16,700 50.5%
All VRQs 583,800 322,400 261,500 44.8%

Back to Contents
555 Data is rounded to the nearest 100
Part 2 – Engineering in Education and Training The Further Education sector 9.0 92
Of all the STEM Sector Subject Areas, science and mathematics had the lowest percentage of achievements at levels 3+. Only one in ten (10.2%) achievements were at level 3+. However, it did have a higher proportion of achievements above level 3 than below level 2. There were no entry level achievements in science and maths and 1,500 level 1 achievements. This compares with 13,000 at level 3 and 100 at levels 4-8.
Table 9.10 shows the profile of STEM Sector Subject Areas and all QCFs by gender. It shows that females accounted for just under half (47.2%) of all achievements. Only one STEM subject area had a higher proportion of female achievements: science and mathematics with 50.2%.
Looking at the three engineering-related Sector Subject Areas shows a much higher proportion of female achievements for information and communication technology (41.7%) than for construction, planning and the built environment (2.2%) or engineering and manufacturing technologies (9.3%). However, the proportion of engineering and manufacturing technology achievements by female students is double that of NVQs (4.7%) and VRQs (3.9%).
Section 9.6 provides detailed information on the importance of the FE sector to the STEM supply chain, while Section 9.7 covers the issues and challenges in teaching GCSE mathematics within the FE sector.
Table 9.9: All QCF achievements by Sector Subject Area and level of award (2011/12) – UK555
Source: The Data Service
Total achievements Entry level Level 1 Level 2 Level 3 Levels 4-8 Percentage of
QCFs level 3+
Construction, planning and the built environment
194,500 2,900 48,400 98,500 42,000 2,800 23.0%
Engineering and manufacturing technologies
206,900 5,300 35,400 132,200 31,600 2,400 16.4%
Information and communication technology
257,000 21,100 78,400 118,700 38,300 500 15.1%
Sub-total all engineering-related Sector Subject Areas
658,400 29,300 162,200 349,400 111,900 5,700 17.9%
Science and mathematics 128,600 0 1,500 114,000 13,000 100 10.2%
All VRQs 4,135,400 278,400 890,400 2,217,400 675,200 74,000 18.1%
Table 9.10: All QCF achievements by Sector Subject Area and gender (2011/12) – UK
Source: The Data Service
Total achievements Male Female Percentage
female
Construction, planning and the built environment
194,500 190,300 4,200 2.2%
Engineering and manufacturing technologies
206,900 187,600 19,300 9.3%
Information and communication technology
257,000 149,800 107,200 41.7%
Sub-total all engineering-related Sector Subject Areas
658,400 527,700 130,700 19.9%
Science and mathematics 128,600 64,000 64,600 50.2%
All QCFs 4,135,400 2,183,700 1,951,700 47.2%

Back to Contents
556 FE STEM Data Project Report, November 2012 www.thedataservice.org.uk/Statistics/fe_data_library/other_statistics_and_research/ 557 The OLAP data cube is an online analytical processing tool that enables you to analysis the data through a pivot table
93 9.0 The Further Education sector Part 2 – Engineering in Education and Training
9.6 STEM and young people aged 16-18Authored by Matthew Harrison, Director Education, Royal Academy of Engineering
Because of the raising of the participation age in England, pupils in English schools who started Year 11 in September 2013 are the first required to remain in education or training until their 18th birthday. With such a significant change occurring, now is a good time to consider where these young people will study and what they are likely to be studying.
The limited capacity of school sixth forms means that around two-thirds of 16- to 18-year-olds in England will get their post-16 education and training in the FE and skills system. Those young people make up a significant minority of the FE and skills system as a whole (currently only a quarter of all learners in the FE and skills sector in England are aged 16-18). But in many institutions, most notably Sixth Form Colleges but also general colleges of FE in areas of the country where there are no or few school sixth forms, young people will represent the majority of the student body.
Figure 9.5, taken from the Royal Academy of Engineering FE STEM Data Project report,556 shows that 59% of all STEM qualifications achieved by 16- to 18-year-olds in England in 2010/11 fell within the FE and skills sector. The significant contribution to the STEM pipeline made by the FE and skills sector in England is clear, explaining why the FE STEM Data Project has received so much attention since its inception in 2010.
The general process undertaken for the FE STEM Data project is:
1. To classify the 20,000 or so qualifications included in the Learning Aims Database as variously S, S-related, T, T-related, E, E-related, M, M-related, Numeracy and non-STEM. In addition, the Apprenticeship frameworks provided through the National Apprenticeship Service have also been classified.
2. To use the classifications above and the data from both the Individualised Learner Record and the Schools QSR datasets to produce a single Microsoft SSAS OLAP Data Cube557 that can be accessed using conventional spreadsheet software.
3. To analyse the Data Cube to produce charts and figures that exemplify the extent and nature of STEM provision in the FE and skills sector in England using data for 16- to 18-year-olds in schools for comparison as appropriate.
S, T, E and M qualifications are taken to be those that contain learning outcomes deeply rooted in science or mathematics, engineering and/or are of a ‘technical’ or ‘technology-application/use’ nature. They are deemed distinct from other qualifications because they can, for those who wish it, provide the required foundation for progression into further study or employment in a STEM-related field.
Qualifications are deemed to be S-, T-, E- or M-related when science, technology, engineering or mathematics features in many learning objectives, and/or the qualification provides a degree of learning that will aid progression in STEM. They are deemed to be outside of S, T, E or M if these subject areas do not feature in at least some learning objectives for all learners (not just those who take science-, technology-, engineering- or maths-related options within the qualification). By convention adopted by the FE STEM Data Project, qualifications allied to medicine (such as nursing) and qualifications allied to agriculture and animal keeping are deemed outside of STEM. Hybrid qualifications contain a mix of STEM learning objectives.
Mathematics has been further subdivided into mathematics and numeracy to distinguish the ‘life skills’ associated with numeracy qualifications from mathematics as a pure/applied discipline. There is a significant quantity of both mathematics and numeracy embedded in qualifications of all types and in a wide range of subjects. This is not accounted for in the analysis presented here.
Fig. 9.4: Proportions of funded STEM qualifications completed by 16- to 18-year-olds in England in 2010/11 (Total number of qualifications is 1,623,000)
Figures 9.5 and 9.6 show, by proportion, the STEM qualifications completed by 16- to 18-year-olds in both schools and the FE and skills sector in England in 2010/11. STEM accounted for a larger proportion of post-16 qualifications completed in schools (49%) than in the FE and skills sector (39%). But in terms of volume, more STEM qualifications were completed in the FE and skills sector (950,000) than in schools (670,000).
The principal differences in the composition of STEM in the two sectors are:
• Science and mathematics account for a larger proportion of the STEM qualifications completed in schools than in the FE and skills sector
• Engineering and numeracy accounts for a larger proportions of the STEM qualifications completed in the FE and skills sector than in schools
Fig. 9.5: Proportions of funded qualifications completed in schools (2010/11) – England (Total number qualifications is 1.37 million)
Schools 41.0%
FE and skills 59.0%
Technology 7.0%
Science 25.0%
Mathematics 11.0%
Hybrids 6.0%
Not STEM 51.0%
Engineering 0.0%
Numeracy 0.0%

Back to Contents
Fig. 9.6: Proportions of funded qualifications completed in the FE and Skills sector (2010/11) – England (Total number of qualifications is 3.07 million)
In addition, there are significant differences when it comes to levels of qualification. Figure 9.7 shows that post-16 STEM in schools in England is almost exclusively concerned with level 3 qualifications (A levels in mathematics, science, and design and technology in particular, with a wider range of level 3 qualification types in ICT, technology and computing).
Post-16 science in the FE and skills sector is also mostly concerned with A levels in science. However, Figure 9.8 shows that in other STEM disciplines there are more level 1 and 2 qualifications being completed than level 3 qualifications. This is partly a recognition of the fact that the FE and skills sector gives young people opportunities to re-sit science and mathematics GCSEs. But it also recognises the much wider role played by general colleges of Further Education when it comes to education and training: providing learners with a broader choice of both academic and vocational courses and subjects, many of which start with a level 1 or 2 qualification. However, it can also be said that in engineering and mathematics, more could be done to see a higher proportion of young people progressing quickly onto the level 3 qualifications that are known to have higher currency in the labour market.
Part 2 – Engineering in Education and Training The Further Education sector 9.0 94
Technology 8.0%
Science 7.0%
Mathematics 5.0%
Hybrids 2.0%
Not STEM 69.0%
Engineering 3.0%
Numeracy 6.0%
Fig. 9.7: Numbers of funded STEM qualifications completed by learners aged 16+ in schools (2010/11) – England
0
150,
000
250,
000
400,
000
200,
000
350,
000
50,0
00
300,
000
100,
000
Hybrids
Numeracy
Mathematics
Engineering
Technology
Science
Level 4+
Level 1
Mixed, unclassified
Level 2Entry level
Level 3

Back to Contents
558 Mathematics A level entrants numbers in 2012 were 85714 and in 2013 88060 an increase of 2346 or 2.7%. 559 Further mathematics entrants numbers in 2012 were 13223 and in 2013 1382 an increase of 598 or 4.5%. 560 Source: JCQ figures for all entries and ONS population estimates for those with academic age 17 in each year.
95 9.0 The Further Education sector Part 2 – Engineering in Education and Training
9.7 GCSE mathematics: the key to post-16 education reformAuthored by Barry Brooks, Strategic Adviser to the Tribal Board, Tribal PLC
Summer 2013 once again saw the percentage of young people entering A level mathematics and further mathematics examinations rise. The 3%558 increase in A level entries and the increase of 5%559 in further mathematics over the 2012 series is a clear signal that the Government’s investment in mathematics education is having a positive impact.
However, the key issue has to be the size of the cohort and the proportion of the post-16 population now studying mathematics at advanced level. Here too the story is an improving one: as Table 9.11 confirms, 12.4%560 of the cohort choose A level mathematics, up 0.6% on 2012. What we are now beginning to see is a trend among the most able where, after years in which an institution’s curriculum offer has too often been skewed to league tables rather than individual capability and future employment prospects, the numbers taking ‘hard’ subjects such as mathematics and physics have begun to increase. But in a world where mathematics capability is a key determinant of personal and professional success, is a participation rate of 12.4% of the annual post-16 cohort sufficient?
Fig. 9.8: Numbers of funded STEM qualifications completed by learners aged 16+ in FE and the skills sector (2010/11) – England
0
80,0
00
120,
000
180,
000
100,
000
160,
000
40,0
00
20,0
00
140,
000
60,0
00
Hybrids
Numeracy
Mathematics
Engineering
Technology
Science
Level 4+
Level 1
Mixed, unclassified
Level 2Entry level
Level 3

Back to Contents
561 Michael Gove, Secretary of State at the Department for Education, Foreword to the Wolf Report on Vocational Education 2011. 562 A Report on Vocational Education, Prof Alison Wolf, 2011 563 The GCSE mathematics achievements by nations were as follows: England 58.7%; Northern Ireland 63%; and Wales 52.8%. 564 Participation in GCE mathematics rose from 64,500 in 2009 to 78,000 in 2012 and in 2012 12,400 took Further mathematics GCE. 565 The Skills for Life Survey 2011 tested the basic English and mathematics skills of the population. 8.1 million did not have the mathematics skills expected of the average 11-year-old. 566 25th July 2013 extract from a letter from Matthew Hancock, Minister for Skills at the Department for Business, Innovation and Skills to providers in the learning and skills sector. 567 BIS Data Service, February 2013 568 The 41.3% of the 2011-12 Year 11 cohort without the required level of GCSE mathematics is equivalent to approximately 250 000 learners. 569 Whilst 2011-12 data were not available at the time of this report the AoC’s participation figures for 2010-11 in level 2 mathematics indicated 18,000 functional mathematics and 51,000 GCSE mathematics. 570 Ofqual press release 22nd August 2013
Part 2 – Engineering in Education and Training The Further Education sector 9.0 96
The Government’s answer is clearly, “No”. It has set about ensuring the talent pipeline of young people engaging in mathematics post-16 continues to develop, grow and is unhindered by a lack of opportunity to develop all levels of mathematical capability, irrespective of past performance or destination after Year 11.
“... the system actively discourages 16- to 19-year-olds from catching up with their English and maths so that each year 300,000 18-year-olds start adult life without the equivalent of a maths or English GCSE.” 561
Some two years after Professor Alison Wolf completed her Report on Vocational Education,562 its impact and influence has finally been felt across the learning and skills sector in England. September 2013 saw the introduction of a first tranche of changes and reforms across the whole of the post-16 sector designed to increase the employability of all young people as well as prepare them for further or higher levels of study. Central to these reforms was the increased role and status given to mathematics education. For the first time, everyone within the learning and skills sector is expected to study mathematics at a level that will increase their capability and confidence as well as their ability to apply this mathematical knowledge in contexts that are meaningful and valuable to them as citizens, as learners and as employees.
However, given that over 40% of young people consistently ‘graduate’ from compulsory schooling at the end of Year 11 without a GCSE grade A*-C, of greater concern must be the number of young people who do not seek to develop or improve their mathematics capability beyond the age of 16. In the UK in 2011/12, only 58.4% of young people secured a GCSE A*-C in mathematics at the end of Year 11.563 Only 20% continued to study any form of the subject beyond 16. In recent years, although Government initiatives have seen a considerable rise in participation at advanced level, this is still only around 13% of the age group.564 In 2011, the Government’s Skills for Life Survey showed that 24% of the post-16 and adult population (8.1 million people) lacked basic numeracy.565
It is against this background that the coalition Government has set out an ambitious programme designed to ensure that all of our young people have the opportunity to develop the mathematical skills that they need to make them employable and that employers, especially in the engineering sector, require of their employees.
Introduction
In the context of the learning and skills sector, the priority and profile now accorded to mathematics education is exactly where the STEM agenda in general, and engineering in particular, has always believed it should be. Further to recent policy announcements, three key questions were asked:
• What impact will these policies have on mathematics education pre-and post-16?
• How prepared will the learning and skills sector be to implement these policy ambitions?
• Will these policy ambitions result in measurable and meaningful outcomes where the next generation of young people entering the workforce possess the necessary mathematical capability, confidence, fluency and proficiency?
This brief review will attempt to address these questions and focus on the levels of mathematical attainment of those entering the learning and skills sector, the current state of the sector in terms of the teaching and learning of mathematics, and the plans and preparations that the sector has been putting in place to capitalise on the unprecedented priority being placed on mathematics.
Mathematics attainment at aged 16
“From September, students who fail to achieve a GCSE A*-C in either English or maths at age 16 will be expected to continue to study these subjects.”
Matthew Hancock, Minister for Skills at the Department for Business, Innovation and Skills566
The scale of the challenge facing the learning and skills sector can be readily demonstrated using the Government’s own data. In 2011/12, just over half (58.7%)567 of the 600,000 young people who left Year 11 had a GCSE Grade A*-C, while there were almost 1,067,000 young people under 19 in the FE sector studying for their first full level 2 programme. Whilst the Minister’s statement would only have applied to the 250,000 16-year-olds without a GCSE Grade A*-C,568 the 2011/12 data shows the potential for over 440,000 young people to be studying within the sector without the required level of GCSE mathematics. On the data available, there is a clear lack of participation in mathematics programmes or a lack of availability of experienced staff to deliver these level 2 programmes.569
These planned changes have added a degree of unforeseen turbulence to GCSE mathematics provision and performance pre-16 where, in an apparent attempt to address continued under-performance, schools entered more 15-year-olds than ever before. This resulted in a 49% increase in 15-year-old entrants over the 2012 series with over 23% of the 2013 entrants coming from this age group.
As Table 9.12 highlights, this had a negative impact on overall achievement rates, with a 10.4% gap between the performance of 15- and 16-year-olds in terms of A*-C. According to Ofqual,570 the increase in early entrants at 15 was almost totally responsible for the 0.8% drop in A*-C achievements in mathematics to 57.6%. The increase in 15-year-old entrants has made it difficult to directly compare the detail or the quality of maths performance of Year 11 leavers in 2013 with that of 2012, but the data does suggest a degree of stability, with 62.1% of 16-year-olds achieving A*-C in 2013 against 62% in 2012.
Table 9.11: A level mathematics entries (2001-2013)
Source: DfE Press Release, 15 August 2013
A level entries as a percentage of the cohort
2001 2010 2011 2012 2013Percentage
increase since 2001
Mathematics 10.1% 10.4% 11.6% 11.8% 12.4% 19.2%
Table 9.12: GCSE mathematics achievements by age, summer Series (2013)
Source: JCQ Data Release 22 August 2013
Grade A* and A in % Grade A*-C in %
GCSE mathematics Age 15 Age 16 Post 16 Age 15 Age 16 Post 16
2013 Series 10.6 17.0 4.5 51.7 62.1 41.1
2012 Series 12.0 17.7 4.5 52.0 62.0 43.1

Back to Contents
571 JCQ data shows that the overall performance for the GCSE Maths Summer Series was 57.7% but this includes the results of those aged 15 and those in the post-16 sector 572 Participation in education, training and employment by 16-18 year olds in England, DfE, 2013
97 9.0 The Further Education sector Part 2 – Engineering in Education and Training
What remains very clear from the 2013 Series data was that, despite the increased focus on post-16 mathematics, some 37.9%571 of Year 11 leavers still did not achieve A*-C grades and were, according to the policy directives, required to follow a level 2 mathematics programme when they entered education or training in autumn 2013.
The latest post-16 participation data572 shows that in recent years the number of young people staying on in some form of education and training has been reasonably stable. However, the proportion of 16- to 18-year-olds in full-time education fell from 68.6% in 2011 to 67.25% in 2012. The main reason for this change is fewer young people entering university at 18+. At aged 16, the overall proportion in education and work-based training in 2012 was 91%, with a small fall of 0.4%. The position at age 17 was more positive in 2012, with the overall proportion in education and work-based training at 85.2% – an increase of 0.9%. The education and training opportunities for young people are improving and are increasingly being designed to reflect their different needs and priorities. This diversity of opportunity has done much to motivate young people to seek and engage in meaningful education and training programmes, as is captured by Figure 9.9.
The other equally important reason for increased participation at age 16 is the current period of economic austerity. As Figure 9.10 confirms, with youth employment at its lowest level for nearly ten years, the paucity of opportunities in the employment market has inevitably contributed to driving participation up.
Teaching and learning in the learning and skills sector
The Further Education sector has always sought to ensure that all young people who enter education or training have the opportunity to address their under-achievement during their time within the compulsory sector. In respect of mathematics, this remedial work has tended to focus on using alternative qualifications to GCSE. These qualifications have included the Key Skills: Application of Number, Skills for Life, Adult Numeracy, and more recently the Functional Mathematics qualification. Table 9.13 provides an example of the number of young people in the learning and skills sector who have sought to address their mathematical deficiencies.
Fig. 9.9: Trends in participation in education and training at age 16 (end 1994 – end 2012) – England
Source: DfE, SFR 22/2013 Participation in Education, Training and Employment by 16- to 18-year-olds in England
End
1994
End
2007
20.0%
30.0%
70.0%
80.0%
End
2000
End
2002
End
2005
End
1997
End
2011
End
2010
40.0%
50.0%
60.0%
0.0%
10.0%
90.0%
100.0%
End
1995
End
1996
End
1998
End
1999
End
2001
End
2003
End
2004
End
2006
End
2008
End
2009
End
2012
Not in education or training All other education
Work based learning (less those in FT education)
Part time education (less those in WBL)
Full-time education
Fig. 9.10: Employment rate of young people Not in Education or Training by age (end 1994 – end 2012) – England
Source: DfE, SFR 22/2013 Participation in Education, Training and Employment by 16- to 18-year-olds in England
16 17 18
End
1994
End
2007
End
2000
End
2002
End
2005
End
1997
End
2011
End
2010
End
1995
End
1996
End
1998
End
1999
End
2001
End
2003
End
2004
End
2006
End
2008
End
2009
End
2012
20.0%
30.0%
70.0%
80.0%
40.0%
50.0%
60.0%
0.0%
10.0%

Back to Contents
573 Wolf Report on Vocational Education 2011. 574 Wolf Report, p15 575 NFER’s report for LSIS The FE Workforce 2012 576 Workforce Data for England, An analysis of the Staff Individualised Record data, Further Education College, 2011-2012 577 Mathematics and science teachers comprised 5.7% of the FE workforce and Foundation teachers 8.7%. 578 Many teachers of numeracy in the learning and skills sector do not possess a higher level mathematics qualification. 579 The 2012 data does not differentiate between and literacy and adult numeracy teaching.
Part 2 – Engineering in Education and Training The Further Education sector 9.0 98
In her Review of Vocational Education,573 Professor Alison Wolf was particularly critical of these adult numeracy qualifications as she believed – quite correctly – that they were not as challenging or rigorous as GCSEs.
However, the issue that Wolf failed to recognise and reflect in her report was that the majority of young people were placed on these alternative qualifications because they had entered the learning and skills sector with neither the ability nor the desire to reprise their negative Year 11 GCSE experiences. Indeed, Wolf recommended that under-19s who do not have these GCSE qualifications should be required as part of their Study Programme, “to pursue a course which either leads directly to these qualifications, or which provides significant progress towards future GCSE entry and success”.574
The Government accepted all the Wolf recommendations and decided to cease funding both the Key Skills and the Skills for Life qualifications from October 2012. This ensured that young people accessed only the compliant qualifications; the free-standing mathematics units, functional skills and GCSEs. Whilst this has been recognised by many as a positive development, it created a challenging scenario for providers in the Further Education sector, who faced a major shortage of experienced teachers capable of delivering GCSE
mathematics to this new cohort of learners. At the same time, they have lost access to those ‘stepping stone’ qualifications which had served as a useful bridge for young people seeking to rebuild confidence in their own mathematical capabilities and competence.
Teaching
The Government has recognised the immediate shortfall (starting in September 2013) of teachers capable of meeting this increased demand for mathematics programmes. For example, the DfE’s own early calculations showed the sector would require at least 530 new mathematics teachers to provide sufficient GCSE mathematics programmes for those young people who achieved a GCSE at grade D in the summer 2013 examination series and sought an early attempt to raise their GCSE grade.
To inform teaching workforce requirements, new research by the National Foundation for Educational Research (NFER)575 concluded that the sector did not have sufficient qualified staff to deliver GCSE mathematics for the likely cohort seeking entry in September 2013. It identified an urgent need for programmes of continuing professional development (CPD) and recruitment. As a result of this report, approaches were identified to address the
shortage of experienced and trained teachers of GCSE mathematics. These focused on three elements:
• converting appropriate sections of the existing learning and skills teaching workforce to be able to deliver GCSE and mathematics
• attracting new mathematics teachers to work in the FE sector
• providing opportunities for improved teaching of GCSE maths in the FE sector
There are many challenges in establishing the scale of what is required to build a mathematics teaching workforce. The first is to establish any baseline data on the current workforce involved in teaching mathematics. Currently, best estimates are that in 2011-12 SIR recorded576 which records 4,690 teachers of mathematics577 and science and 7,226 foundation teachers. However, this data is voluntary and has never been robust because the figures for mathematics have always included teachers of numeracy.578
The learning and skills workforce sector, unlike that of the schools workforce, is drawn from much more diverse backgrounds. Table 9.14 provides an overview of data from the 2012 Learning and Skills Improvement Service (LSIS) report. This drew on 2010/11 Staff Individualised Records for data on the FE teaching workforce, as well as surveys of Adult and Community Learning (ACL) and Work-based Learning (WBL) providers. What is clear is that the sector, as it stands, is totally inadequately prepared to provide the number of experienced mathematics teachers required to meet immediate needs as well as the likely demand in the coming years.
Table 9.13: Alternative mathematics qualifications
Source: BIS Statistical First Release, March 2012
Young people (under 18) FE and Apprenticeships 2011/12
Total learners Entry level Level 1 Level 2
Participation in adult numeracy programmes
275,800 78,000 127,500 78,700
Table 9.14: Mathematics teaching workforce
Source: LSIS Report on the FE Workforce 2012
2011 Learning and skills teaching workforce
Teaching workforce
Science/mathematics
workforce
Adult literacy/numeracy
workforce579
FE Colleges (FE) 110,332 6,446 722
Adult and Community Learning (ACL) 9,420 94 (approx) 1,224 (approx)
Work-based Learning (WBL) 3,530 35 (approx) 353 (approx)

Back to Contents
580 Workforce Data for England, An analysis of the Staff Individualised Record data, Further Education College, 2011-2012. 581 Wolf Review of Vocational Education, 2011, p32
99 9.0 The Further Education sector Part 2 – Engineering in Education and Training
Discussions are underway on introducing a ‘conversion course’ to retrain teachers with mathematics-related expertise and whose subjects are either not growing or are in decline. As Table 9.15 highlights, there is the possibility, with targeted investment and access to an appropriate programme of CPD, to ‘convert’ the professional skills of some and ‘enhance’ the skills of those who need a refresher course. The reduction of the ICT teaching workforce offers potential for converting or retraining the former and enhancing or up-skilling those within the Foundation sector.
Learning
There are very distinctive challenges facing those teaching GCSE mathematics in the learning and skills sector to over-16s compared with teaching students studying towards a GCSE at school. These challenges include:
• Motivating learners to retake GCSE after they have already failed to achieve an A*-C grade. Many simply do not want to re-sit the examination – especially if they have been told that they have passed with a grade D-G.
• Making the mathematics meaningful and relevant to young people’s lives. Many look to the learning and skills sector as a means of developing their vocational skills in preparation for work. To be meaningful and relevant the mathematics needs to be embedded in vocational programmes.
• Providing an appropriate and useful qualification that employers recognise. Many employers still suggest that young people with GCSE A*-C do not possess the mathematical skills they require of their employees.
• Developing, recruiting and re-training a teaching workforce that can engage, enthuse and motivate young people to study mathematics to the required level.
Practitioners in the learning and skills sector have expressed some concern about the change to GCSE as the mathematics qualification of choice, as there is no real tradition of embedding GCSE mathematics in vocational settings. It is clear that further work will be needed by practitioners within the learning and skills sector, in partnership with awarding organisations. They will need to find ways of developing an embedded approach and thereby securing engagement without unnecessarily distorting or diluting the demand, pitch or rigour of mathematical learning or the associated examinations.
On the horizon
The Government is committed to making mathematics (along with English language) a central pillar of its education policy. To this end, it has set out a further suite of reforms designed to ensure that the learning and skills sector will increase the quality, range and scope of its provision in the coming years. These future reforms will embed English and mathematics so much within the learning and skills curriculum that they will make a reality of Professor Lorna Unwin’s evidence to the Wolf Review where she is quoted as saying, “There is only one real level 2. Maths and English A*-C.” 581
Time will tell whether the increase in GCSE entrants at 15 years will continue to distort level 2 mathematics performance at age 16, whether the increase in young people entering apprenticeships rather than education will continue on its positive trajectory or whether the
Table 9.15: Potential mathematics teaching workforce
Source: Further Education College, Workforce Data, SIR, 2011-12
Further Education teaching workforce580
2007/8 2008/9 2009/10 2010/11 2011/12
Construction 4.9% 5.0% 5.3% 5.2% 5.6%
Engineering, technology and manufacturing
5.2% 5.5% 5.5% 5.6% 5.8%
Foundation 9.3% 9.0% 8.7% 8.4% 8.7%
Information and communication technology
5.5% 5.2% 5.1% 4.7% 4.5%
Science and mathematics 6.0% 5.9% 5.9% 6.0% 5.7%

Back to Contents
582 http://et-foundation.co.uk/ 583 Reform of vocational education, Department for Education, Letter from Mathew Hancock MP, Minister of Skills, July 2013 584 The Challenges of STEM provision for Further Education colleges, 157 Group, 2012 585 See Section 7 for more details on new types of schools, careers information advice and guidance and the English Baccalaureate 586 Reform of vocational education, Department for Education, Letter from Mathew Hancock MP, Minister of Skills, July 2013
Part 2 – Engineering in Education and Training The Further Education sector 9.0 100
latest policies will lead to a pool of more numerate young people entering Higher Education or the workforce. What is very clear though is that at long last there is recognition at the highest level that mathematics is not only the mother of the sciences. It is the cornerstone of our education system which, along with English language, determines who we are as citizens and employees and what, as a nation within the global economy, we aspire to be.
9.8 FE workforce The following information on labour market intelligence on the Further Education workforce in England is derived from the Staff Individualised Record (SIR), produced by LSIS. In August 2013, LSIS was taken over by the Education and Training Foundation (ETF),582 formally the FE guild. EFT has confirmed its commitment in the short term to maintaining the Excellence Gateway as currently structured. It will undertake a review of the sector’s needs in relation to resources and materials to inform its longer-term position.
9.8.1 Further Education teaching workforce
EngineeringUK understands and recognises that the Further Education sector, particularly with respect to the provision of STEM vocational skills, is a critical step in the transition from school to work or Higher Education. It provides young people with the vital STEM employability and literacy skills they are going to need to thrive in the current economic climate.
The FE sector is currently going through a period of significant change, with the raising of the participation age to 17 in this year and to 18 in 2015.583 This will undoubtedly give young people the opportunity to develop the skills they need for adult life, while helping the UK meet shortages in skilled workers. However, such policy changes will have a critical impact on the FE sector and its workforce, particularly in the form of larger group sizes, and greater demands on staff.
Other policy changes584
• The development of new types of institutions: academies and Free Schools, as well as university technical colleges and studio schools. These latter institutions will allow pupils to specialise in a vocational area, though not to undertake a curriculum narrowly focused on work skills.
• The transfer of responsibility for careers information and guidance to schools. This may result in a loss of impartial advice and the promotion of sixth-form study at the expense of other options.
• The promotion by the DfE of the English Baccalaureate (EBacc). This has led to a loss of participation in some vocational courses pre-16.585
Diversifying the workforce
In terms of workforce diversity, the UK FE system presents well against the rest of the economy. But it still has some way to go in terms of gender workforce representation in STEM. Around two thirds the FE workforce are female586 – LSIS data, for instance, shows that hairdressing and beauty therapy is taught by almost all female staff. However construction, and engineering, technology and manufacturing are predominantly taught by male staff. Therefore efforts to increase the uptake and retention of females teaching STEM subjects remains critical.
9.8.2 Further education staff
Table 9.16 illustrates the gender of staff working in Further Education Colleges in England. It shows that full-time teaching staff have an almost equal gender balance (52.1% male to 47.9% females). It also reveals that nearly two thirds (66.2%) of all part-time teaching staff are female, compared with a third (33.8%) male.
Table 9.16: Teaching staff and all Further Education staff by gender and by full-time or part-time (2011/12) – England
Source: LSIS
Teaching staff All staff
Male Female Male Female
Full time 52.1% 47.9% 47.5% 52.5%
Part time 33.8% 66.2% 28.8% 71.2%

Back to Contents
101 9.0 The Further Education sector Part 2 – Engineering in Education and Training
9.8.3 Subject areas taught
It is estimated that approximately 10-15% of Further Education college staff hold multiple contracts, which means a member of staff teaching an automotive course may also teach elements of mathematics and science instead of a mathematics or science lecturer. Therefore, the actual number of staff is approximately 85-90% of the total number of staff records.
Table 9.17 shows the number of teaching staff in the three engineering Sector Subject Areas for the last five years.
Overall, there continues to be a decline in the number of engineering FE teaching staff across all three subject areas, with information and
communication technology showing a steady decline since 2008/07 and engineering, manufacturing and technology and construction showing a decline since 2009/10.
Recent figures show that the proportion of staff teaching STEM subjects was declining from 2006/07 to 2010/11; however there was a slight increase in 2011/12.
The number of teaching staff had been falling both over six years and in the last year for all three engineering-related Sector Subject Areas. Over six years there has been a 26.8% decline for engineering and manufacturing technology; 16.4% decline for construction; and 43.8% for information and communication technology.
9.8.4 Gender in engineering Sector Subject Areas
Figure 9.11 shows the gender breakdown of FE teachers in the three engineering subject areas over a six-year period. Over the six years, information and communication technology is the only subject area that has managed to attract similar number of males and females (52.1% male: 47.9% female). In 2006/07, there were slightly more females (52.3%) than males, although this dropped to 47.9% in 2010/11 and remained consistent for 2011/12.
Construction, and engineering, manufacturing and technology have a strong bias towards male teachers, with over 90% being male in each of the six years.
Table 9.17: Sector Subject Areas taught by FE teaching staff (2006/07-2011/12) – England
Source: LSIS- Further Education College Workforce Data for England
Subject taught 2006/07 2007/08 2008/09 2009/10 2010/11 2011/12 Change over one year
Change over six years
Engineering, manufacturing and technologies
6,555 7,079 7,574 6,776 5,935 4,795 -19.2% -26.8%
Construction 5,549 6,710 6,903 6,444 5,542 4,638 -16.3% -16.4%
Information and communication technology
6,628 7,417 7,229 6,427 5,003 3,725 -25.5% -43.8%
Sub-total for all engineering-related Sector Subject Areas
18,732 21,206 21,706 19,647 16,480 13,158 -20.2% -29.8%
Engineering-related Sector Subject Areas as a percentage of all teaching staff
21.0% 15.6% 15.7% 16.0% 15.5% 15.9% 2.6% -24.3%
Total for all Sector Subject Areas
89,152 135,606 138,222 122,578 106,053 82,593 -22.1% -7.4%

Back to Contents
Part 2 – Engineering in Education and Training The Further Education sector 9.0 102
Fig. 9.11: Engineering subjects taught by FE teaching staff by gender (2006/07-2011/12) – England
Source: LSIS- Further Education College Workforce Data for England
0.0%
20.0
%
40.0
%
100.
0%
30.0
%
60.0
%
10.0
%
50.0
%
80.0
%
Engineering, manufacturing and technology
Construction Information and technology
70.0
%
90.0
%
2006/07
2007/08
2008/09
2009/10
2010/11
91.6%92.8%
52.1%
8.4%7.2%
47.9%
91.7%92.7%
49.1%
7.9%7.3%
50.9%
91.7%92.7%
49.1%
8.3%7.3%
50.9%
7.7%6.9%
51.4%
92.3%93.1%
48.6%
6.9%7.0%
52.3%
93.1%93.0%
47.7%
Female
Male
Female
Male
Female
Male
Female
Male
Female
Male
2011/12
92.1%92.8%
52.1%
7.9%7.2%
47.9%Fem
aleM
ale

Back to Contents
103 9.0 The Further Education sector Part 2 – Engineering in Education and Training
9.8.5 Salaries in engineering subject areasLSIS has identified that salary levels are very important when recruiting staff in vocational-related teaching jobs. Figure 9.12 looks at the salary levels for full-time staff in all Sector Subject Areas in 2011/12. The average pay for full-time teaching staff fell for teachers in all Sector Subject Areas in 2011/12. Out of the three engineering-related subject areas, teaching staff in information and communication
technology earn slightly above the average salary for all FE teachers (£29, 961 against an average £29,696). Teachers of engineering, manufacturing technology and construction earn slightly below the average for all FE teachers, with average salaries of £29,346 and £29,321 respectively. Although not an engineering subject area, it should be noted that those teaching science and mathematics have the second highest average salary at £31,998. With a difference of over £2,500, perhaps this is diverting potential engineering teachers away from teaching engineering.
Male teaching staff earned a slightly higher average salary than women (£29,910 against £29,458). Although male teaching staff continue to earn slighter higher average salaries, the salary for male teaching staff has declined slightly by 0.5%, whilst the salary for females increased slightly by 0.2%. Since 2007/08, the average pay for male teaching staff increased by 6.8% while, for female teaching staff, this increased by 8.1%.
Fig. 9.12: Average full-time teaching staff pay by subject taught (2011-12) – England
Source: LSIS- Further Education College Workforce Data for England
£5,0
00
£40,
000
£25,
000
£0
£30,
000
£15,
000
£20,
000
£10,
000
£35,
000
Engineering, technology and manufacturing
Information and communication technology
Hospitality, sports, leisure and travel
Health, social care and public services
Hairdressing beauty therapy
Foundation programmes
Land based provision
Retailing, customer service and transportation
£28,731
£25,999
£25,175
£30,946
£29,961
£29,634
£29,346
£29,321
£29,183
£29,983
£30,377
English, languages and communication
£31,969
£31,998
£32,551
Business administration, management and professional
Science and mathematics
HumanitiesAverage salary is £29,696
Visual and performing arts and media
Construction

Back to Contents
587 Engineering UK 2013 The state of engineering, EngineeringUK, December 2012, p88 588 Funding Rules 2012/13, Skills Funding Agency, April 2012, p27 589 Department for Business, Innovation and Skills press release, Department for Business, Innovation and Skills, 28th December 2012 590 Skills funding statement 2012-2015, Department for Business, Innovation and Skills and Skills Funding Agency, December 2012, p9 591 Employer involvement in schools: a rapid review of UK and international evidence, NFER, 2012, p18 592 Firms engagement with the Apprenticeship Programme, Department for Education, November 2011, p7 593 The apprenticeship journey, Federation of Small Businesses, November 2012, p4 594 Firms engagement with the Apprenticeship Programme, Department for Education, November 2011, p5 595 Firms engagement with the Apprenticeship Programme, Department for Education, November 2011, p43
Part 2 – Engineering in Education and Training Apprenticeships 10.0 104
Apprenticeships are a form of vocational training where learners work alongside experienced staff to gain job-specific skills and receive on- and off-the-job training. Learners gain skills necessary to succeed in their chosen career and earn money at the same time. Apprentices must spend a substantial period of time doing the job they are developing a competence in – usually 30 hours per week – in addition to learning time.588
An apprenticeship is not a qualification in itself but a framework that contains separately certified elements, which vary by level. There are three broad levels of apprenticeship:
• Intermediate level apprenticeships. Apprentices work towards work-based learning qualifications such as an NVQ level 2, functional skills and, in most cases, a relevant knowledge-based qualification such as a BTec. These provide the skills needed for their
chosen career and allow entry to an Advanced Apprenticeship.
• Advanced level apprenticeships. Advanced apprentices work towards work-based learning qualifications such as an NVQ level 3, functional skills and, in most cases, a relevant knowledge-based certificate such as a BTec. To start this programme, the applicant should ideally have five GCSEs (grade C or above) or have completed an apprenticeship.
• Higher Apprenticeships. Higher apprentices work towards work-based learning qualifications such as an NVQ level 4 and, in some cases, a knowledge-based qualification such as a foundation degree.
The Government589 has announced that it plans to introduce graduate and postgraduate apprenticeships in a number of subjects including:
• Law
• Accountancy
• Advanced engineering
It has also said that from 2013/14, level 5 and 6 vocational training will be solely channelled through the apprenticeship route to ensure training meets the needs of learners and employers.590
In his independent report on apprenticeships, Doug Richard called on the Government to improve the quality of apprenticeships and make them more focussed on the needs of employers. The review was warmly welcomed by Government who have responded through the launch of a 4-year implementation plan, designed to develop and test out a series of reforms to the apprenticeship system in England including: all apprenticeships to last a minimum of 12 months with 20% minimum off-the-job training, apprenticeships to be based on standards designed by employers and grading of pass, merit, distinction to be applied to the full standard.
Research by the National Foundation for Education Research (NFER)591 indicates that there are currently 85,000 employers offering an apprenticeship in the UK. However, research by the Department for Education (DfE)592 has shown that there are too few firms offering apprenticeships to meet demand from young people. Section 15 shows that there will be 691,000 job openings in engineering enterprises between 2010 and 2020 that are likely to require engineering skills at level 3. If we are to meet this demand, we will need to expand level 3 vocational education – which means addressing barriers that are stopping companies from offering apprenticeships.
A report by the Federation of Small Businesses (FSB)593 shows that only 9% of its members had taken on an apprentice in the last 12 months, and only 7% planned to so in the next 12 months. Interestingly, nearly half (47%) said an apprentice would never be suitable for their
Part 2 – Engineering in Education and Training10.0 Apprenticeships
Approximately two million workers are employed as technicians and skilled operatives in the UK.587 Apprenticeships are a critical and major route for training future generations of technicians.

Back to Contents
596 Website accessed on 6 August 2013 http://www.publications.parliament.uk/pa/cm201213/cmselect/cmbis/83/8302.htm 597 Website accessed on 7 August 2013 http://skillsfundingagency.bis.gov.uk/providers/programmes/nas/ 598 Website accessed on 7 August 2013 http://www.apprenticeships.org.uk/Partners/Policy/NationalMinimumWage.aspx 599 Website accessed on 7 August 2013 https://www.gov.uk/national-minimum-wage-rates 600 The Richards Review – Apprenticeships, Doug Richards, November 2012, p11 601 A Consultation on Funding Reform for Apprenticeships in England, Department for Education and Department for Business, Innovation and Skills, July 2013, p7 602 Productivity Matters: The Impact of Apprenticeships on the UK Economy, Centre for Economics and Business Research, March 2013, p11
105 10.0 Apprenticeships Part 2 – Engineering in Education and Training
business. In addition, research by the DfE594 has shown that although large firms are more likely to take on an apprentice, those operating on a national or international level are less likely to engage with the apprenticeship programme. It is also worth noting that the same research by the DfE595 identified that apprenticeship training complemented rather than replaced other forms of training.
In the last year, the Government spent £1.2 billion on the apprenticeship programme and in the same year saw 457,000 apprenticeship starts.596 The Government is at the same time trying to improve the quality of apprenticeships by specifying that apprenticeships for 16- to 18-year-olds must last at least 12 months and by reviewing the minimum duration for apprenticeships for those aged 19+.597
In addition to Government investment, it should also be noted that apprentices themselves invest in the system by receiving lower wages. The National Minimum Wage for apprentices is £2.65 per hour. This applies to apprentices aged 16-18 and also to those aged 19+ in the first year of an apprenticeship.598 This is substantially less than the minimum wage payable to those not on an apprenticeship, where 16- to 17-year-olds must be paid at least £3.72 and those aged 18-20 must be paid £5.03.599
Employers also contribute towards the cost of apprenticeships via the salaries they pay to apprentices (both for the hours they work and the hours they spend in on- and off-the-job training).
Table 10.0 shows the net training costs for apprenticeships at level 2 and/or 3 for a range of different sectors. It shows that in engineering the net cost for level 2 and 3 is £39,600, while for construction it is £26,000. This is much higher than the cost of apprenticeships in other sectors. Part of the reason why engineering and construction have much higher net training costs is because the duration of the apprenticeship is typically three to four years, whereas other sectors such as retailing and hospitality tend to deliver all their training within one year.
Table 10.1 shows that three of the evaluated sectors have a very quick payback period on an apprenticeship. These are transport (six months), business administration (nine months) and hospitality (ten months). Engineering had the second longest payback period, at three years and seven months, while construction had a much shorter payback period of two years and three months.
Employers tend to recoup their investment in apprenticeships by paying the apprentice a wage that is less than their marginal productivity. (As productivity rises, as a result of training, so do wages – but at a lower rate).
As the Richards Review highlighted,600 three parties contribute to the cost of apprenticeships. The Government (even if they don’t fund the apprenticeship they fund the accreditation process), the employer (through co-funding – which 11% of participating employers do – plus management, paying staff wages etc), and the apprentice (through the National Minimum Wage for apprentices).601 All three parties get a return on their ‘investment’.
Research by the Centre for Economics and Business Research (CEBR)602 estimates that an apprenticeship raises the productivity of the average completer in engineering and manufacturing by £414 per week, while for a completer in construction and planning, it is £401 per week. This compares very favourably to £83 per week for completers of retail apprenticeships and £268 for completers of apprenticeships in the business, administration and legal sector. In the same report, CEBR identified that forecast apprenticeship completions in England between 2012/13 and 2021/22 will contribute productivity gains of £3.4 billion in real terms, taking into account the cost of training the apprentices.
Table 10.0: Summary of employers net training costs
Source: Department for Business, Innovation and Skills
Apprenticeships
Level 2 Level 3 Level 2 and 3 combined
Engineering - - £39,600
Construction - - £26,000
Retailing £3,000 - -
Hospitality £5,050 - -
Transport and logistics £4,550 - -
Financial services £7,250 £11,400 -
Business administration £4,550 - -
Social care £3,800 - -
Table 10.1: Payback period by sector
Source: Department for Business, Innovation and Skills
Apprenticeship level Payback period
Engineering Level 3 3 years and 7 months
Construction Level 2 and 3 2 years and 3 months
Retailing Level 2 2 years and 3 months
Hospitality Level 2 10 months
Transport and logistics Level 2 6 months
Financial servicesLevel 3 2 years and 6 months
Level 2 3 years and 8 months
Business administration Level 2 9 months
Social care Level 2 3 years and 3 months

Back to Contents
603 Engineering UK 2013 The state of engineering, EngineeringUK, December 2012, p99 604 The Net Present Value is defined as the present value of the benefits minus the present value of the costs associated with particular activity. 605 Real Apprenticeships Creating a revolution in English skills, Boston Consulting Group and the Sutton Trust, October 2013 606 Engineering UK 2013 The state of engineering, EngineeringUK, December 2012, p99 607 Productivity Matters: The Impact of Apprenticeships on the UK Economy, Centre for Economics and Business Research, March 2013, p4-5 608 The economic value of apprenticeships, City & Guilds, 1 February 2012, p3 609 A Disaggregated Analysis of the long run impact of Vocational Qualifications, Department for Business, Innovation and Skills, February 2013, p9 610 Website accessed on 7 August 2013 (http://www.publications.parliament.uk/pa/cm201213/cmselect/cmbis/83/8310.htm#a40) 611 No Stone Unturned in pursuit of growth, The Rt Hon the Lord Heseltine of Thenford CH, October 2012, p169 612 Traineeships – Supporting young people to develop the skills for Apprenticeships and other sustained jobs, Department for Education and the Department for Business, Innovation and Skills, January 2013, p5 613 Traineeships – Supporting young people to develop the skills for apprenticeships and sustainable employment, Department for Education and Department for Business, Innovation and Skills, July 2013, p10 614 Traineeships – Supporting young people to develop the skills for Apprenticeships and other sustained jobs, Department for Education and the Department for Business, Innovation and Skills, January 2013, p10 615 Traineeships – Supporting young people to develop the skills for apprenticeships and sustainable employment, Department for Education and Department for Business, Innovation and Skills, July 2013, p5 616 Traineeships – Supporting young people to develop the skills for apprenticeships and sustainable employment, Department for Education and Department for Business, Innovation and Skills, July 2013, p15 617 Rigour and Responsiveness in Skills, Department for Education and the Department for Business, Innovation and Skills, April 2013, p24
Investing in apprenticeships offers a good rate of return for the taxpayer. In last year’s report,603 we showed that the Department for Business, Innovation and Skills (BIS) estimates the return on investment for apprenticeships to be around £24-35 per pound of funding. The National Audit Office, in its analysis, estimated the returns as slightly less: £21 per pound for advanced apprenticeships and £16 per pound for intermediate apprenticeships.
Another way of looking at the Government return on investment in apprenticeships is to look at the Net Present Value (NPV).604 The Government gets particularly high returns for level 3 qualifications. A level 3 NVQ typically has a return of £21,000 to £36,000. But for an Advanced Apprenticeship (also level 3), the return is £56,000 to £81,000. Further analysis by the Boston Consulting Group has shown that apprenticeships could potentially provide an even greater return for the taxpayer. They estimate that a move towards three year apprenticeships on a German scale could boost the UK economy by £8 billion and reduce public expenditure by £2.5 billion, after the initial cost of apprentice wage subsidies.605
In addition to productivity gains and returns for the Government, the apprentices all receive substantial returns. In last year’s report,606 we identified that employees also get a wage return from completing an apprenticeship. The lifetime benefits of getting an apprenticeship are between £48,000 and £74,000 for a Foundation Apprenticeship and between £77,000 and £117,000 for an Advanced Apprenticeship. BIS identified that earnings increased 24.1% in the first year after completing a Foundation Apprenticeship compared with those who didn’t complete the course. For an Advanced Apprenticeship, the earnings boost is slightly higher at 25.3%, with men getting a premium of 31.9% and women getting a premium of just 14.3%. The earnings premium for apprenticeship completers does deteriorate over time, but is still significant seven years after completion.
The CEBR report607 shows that, on average, apprentice completers earn a wage 10% higher than non-completers. In addition, City and Guilds608 identified that level 3 apprentices could expect an annual increase in earnings of £3,477 by 2020, compared with individuals who do no training and those who do other forms of vocational training, who could expect a wage
increase of £1,634. Additionally, achieving an apprenticeship generates other benefits, including high rates of employment, reduced welfare dependency and higher job satisfaction.
Research by DfE609 shows that level 3 apprenticeships in engineering and manufacturing technologies and construction, planning and the built environment offer apprentices the greatest returns. These apprenticeships offer an annual earnings premium of between 20% and 30% in the first six years after gaining the qualification.
Despite all the positive news on the value of apprenticeships, however, it should be noted that in the Business, Innovation and Skills Committee report on apprenticeships610 identified a lack of clarity on which sectors provided the best economic returns. This point was reinforced by the report by Lord Heseltine,611 which showed that the majority of growth in apprenticeships was in over-25 age group. The report does, however, make an important point: that the greatest economic impact will come from investment in younger people who are starting a new job as an apprentice.
One major change to the apprenticeship landscape is the introduction of traineeships for young people who aspire to an apprenticeship or other job but who need additional support in
reaching their goals.612 Traineeships will be part of the same family as apprenticeships.613 They are aimed at 16- to 24-year-olds, or 16- to 25-year-olds for those students with learning Difficulty Assessments that started in August 2013.614
It is expected that the duration of the work placements within a traineeship will be at least six weeks and no longer than five months.615 Everyone doing a traineeship will be required to study English and maths. (Those aged over 19 must study either a GCSE or an equivalent level 2 functional skills qualification unless they already have a GCSE A*-C.)616
The three key elements of a traineeship are as follows:617
• A focused period of work preparation training. This will centre on areas such as CV writing, interview preparation, job search, self-discipline and inter-personal skills.
• A substantial, high quality work placement to give the young person meaningful work experience, and a chance to develop workplace skills and prove themselves to an employer.
• English and maths for young people who have not achieved a GCSE grade C or equivalent (level 2).
Part 2 – Engineering in Education and Training Apprenticeships 10.0 106

Back to Contents
107 10.0 Apprenticeships Part 2 – Engineering in Education and Training
618 Traineeships – Supporting young people to develop the skills for apprenticeships and sustainable employment: Framework for Delivery, Department for Education and the Department for Business, Innovation and Skills, May 2013, p12 619 The Richards Review – Apprenticeships, Doug Richards, November 2012 620 A Consultation on Funding Reform for Apprenticeships in England, Department for Education and Department for Business, Innovation and Skills, July 2013, p5 621 Engineering UK 2013 The state of engineering, EngineeringUK, December 2012, p79 622 A Consultation on Funding Reform for Apprenticeships in England, Department for Education and Department for Business, Innovation and Skills, July 2013, p5 623 Progression of apprentices to Higher Education, Department of Business, Innovation and Skills, February 2013, p8 624 Progression of apprentices to Higher Education, Department of Business, Innovation and Skills, February 2013, p9 625 Progression of apprentices to Higher Education, Department of Business, Innovation and Skills, February 2013, p10 626 Engineering UK 2013 The state of engineering, EngineeringUK, December 2012, p90
The Government envisages that progression to apprenticeships will be one of the main outcomes of a traineeship, although progression will not be guaranteed.618 One of the key issues the traineeship is aiming to address is the fact that around a fifth of young people not in employment, education or training (NEET) at age 16-17 are aspiring to move into an apprenticeship and around two fifths want to move into full-time employment.
As a result of the Richards Review,619 the Government has opened a consultation on how to give employers control of apprenticeship funding. The consultation will look at the following options:620
• Direct payment model: Businesses register apprentices and report claims for Government funding through a new online system. Government funding is then paid directly into their bank account.
• PAYE payment model: Businesses register apprentices through a new online system. They then recover Government funding through their PAYE return.
• Provider payment model: Government funding continues to be paid to training providers, but they can only draw it down when they have received the employer’s financial contribution towards training.
All three of these models are designed to ensure employer co-investment in apprenticeships, a problem we identified in last year’s report.621 But they are also designed to give control of funding to employers, with payments made either to the employer (direct into their bank account or via the PAYE system) or directly to training providers.622
It is also interesting to look at progression from apprenticeships into Higher Education (HE). Research by BIS623 shows that 15.4% of those tracked from 2004/05 had progressed to HE within seven years. Of those who went into HE, 56% went to study in a college and 44% in a university. However, the research also shows that older apprentices are much less likely to progress to HE: the progression rate decreases as the proportion of apprenticeships awarded to over-25s increases.624 The research also showed that a majority of engineering apprentices progress onto a HNC/HND course.625
10.1 Top ten Apprenticeship Programme achievements by Sector FrameworkTable 10.2 looks at Sector Framework Codes, with each one representing a specific apprenticeship. One or more Sector Framework Codes then map to each Sector Subject Area. The table shows that overall 70.3% of all achievements occur in just ten Sector Framework Codes and that, out of the total of 168 Sector Framework Codes, 53 had fewer than five achievements in 2011/12.
Only one engineering Sector Framework Code, engineering (one of several Sector Framework Codes that map to the engineering and manufacturing technologies Sector Subject Area), makes it into the top ten, with 11,260 achievements in 2011/12. Of these achievements, almost half (50.2%) were at level 3+ and the rest (49.8%) were at level 2. Interestingly, engineering had a higher proportion of female achievements at level 2 (5.9%) than at level 3+ (2.8%).
The largest Sector Framework Code was customer service, with 31,370 achievements (12.1% of all achievements). Only a fifth (21.1%) were at level 3+.
The Sector Framework Code with the largest percentage of level 3+ achievements was children’s care learning and development (59.3%). This also had the highest percentage of female achievements (95.3%).
Overall, only a third (33.2%) of all Sector Framework Codes were at level 3+. This is concerning. In section 9, we highlighted how vital level 3+ vocational qualifications are for training the next generation of technicians. In the Engineering UK Report 2013,626 we showed that the proportion of apprenticeships at level 3+ in the UK is much lower than for some of our competitor countries, for example France, where 60% of apprentices are at level 3. It should also be noted that the UK has a lower proportion of apprentices per 1,000 than some of our major competitors.
Finally, it is worth noting that females account for just over half (52.9%) of all achievements, with this figure rising to 55.1% at level 3+.

Back to Contents
627 This table shows achievements for frameworks, some of which have been grouped after the introduction of SASE (Specification of Apprenticeship Standards for England) frameworks in 2010/11. 628 Figures are rounded to the nearest ten except for the Grand Totals which are rounded to the nearest hundred. 629 In this table full-year numbers are a count of the number of achievements at any point during the year. Learners achieving more than one apprenticeship will appear more than once. 630 Figures for 2011/12 onwards are not directly comparable to earlier years as a Single Individualised Learner Record (ILR) data collection system has been introduced. Small technical changes have been made in the way learners from more than one provision type are counted, leading to a removal of duplicate learners and a reduction in overall learner numbers of approximately 2%. 631 Figures are rounded to the nearest ten except for the Grand Totals which are rounded to the nearest hundred. 632 In this table full-year numbers are a count of the number of starts at any point during the year. Learners starting more than one Apprenticeship will appear more than once. 633 Sector Subject Areas are a classification of business areas as determined by the Qualification and Curriculum Authority (QCA).
10.2 Programme starts630 631 632
The Data Service publishes statistics on the number of apprenticeship Programme Starts within Sector Subject Areas.633 This provides key data on the number of people starting STEM apprenticeships generally and, more specifically, engineering-related apprenticeships.
Table 10.3 shows the number of Programme Starts for different STEM Sector Subject Areas, compared with the figures for all Sector Subject Areas. It shows that in 2011/12 there were 520,600 Programme Starts, a 13.9% increase from 457,200 the previous year. This increase is despite the change in methodology for counting Programme Starts which would have reduced overall learner numbers for 2011/12 by around 2%. Over ten years, the number of Programme
Starts has more than tripled, from 167,700 to 520,600 – a rise of 210.4%.
Looking at the different engineering-related Sector Subject Areas shows growth in just one – engineering and manufacturing technologies in 2011/12. The number of Programme Starts for this subject grew by 21.5% to 59,480. Uptake has also more than doubled over ten years, from a starting point of 26,220. It is worth noting that of the 102,000 Programme Starts in engineering-related Sector Subject Areas in 2011/12, over half (59,480) were in engineering and manufacturing technologies.
The second largest engineering-related Sector Subject Area is construction, planning and the built environment. In 2011/12, there were 24,000 Programme Starts, a decline from
28,090 the previous year. However, over ten years this subject area has growth by 19.0%.
The smallest of the three engineering-related Sector Subject Areas is information and communication technology, with 18,520 Programme Starts in 2011/12. Although there was a small decline in 2011/12 (down 5.1%), uptake has nearly quadrupled in size over ten years, increasing by 284.2%. Information and communication technology is the only engineering-related Sector Subject Area to have grown by more than the average for all Sector Subject Areas over ten years.
Finally, the number of Programme Starts for science and mathematics was below 50 for every year apart from 2011/12, when it increased to 370.
Table 10.2: Top ten Apprenticeship Programme achievements by Sector Framework Code, level and gender (2011/12) – England627 628 629
Source: The Data Service
Part 2 – Engineering in Education and Training Apprenticeships 10.0 108
Apprenticeship (level 2)Advanced Apprenticeship including Higher Apprenticeship (level 3+)
All apprenticeships
Male Female AllPercentage
femaleMale Female All
Percentage female
Male Female AllPercentage
female
Percentage of qualifications
at level 3+
Percentage of all
qualifications
Customer service
9,090 15,670 24,760 63.3% 2,080 4,530 6,610 68.5% 11,170 20,190 31,370 64.4% 21.1% 12.1%
Business administration
3,840 11,440 15,280 74.9% 1,560 6,990 8,550 81.8% 5,400 18,430 23,830 77.3% 35.9% 9.2%
Retail 6,720 12,750 19,470 65.5% 640 1,320 1,960 67.3% 7,360 14,060 21,420 65.6% 9.2% 8.3%
Health and social care
2,340 10,670 13,010 82.0% 1,330 6,860 8,190 83.8% 3,670 17,530 21,200 82.7% 38.6% 8.2%
Management 3,600 6,220 9,820 63.3% 2,950 4,950 7,900 62.7% 6,550 11,170 17,710 63.1% 44.6% 6.9%
Hospitality and catering
6,830 7,720 14,540 53.1% 1,470 1,690 3,160 53.5% 8,290 9,410 17,700 53.2% 17.9% 6.8%
Children's care learning and development
310 6,060 6,370 95.1% 420 8,860 9,280 95.5% 730 14,920 15,650 95.3% 59.3% 6.1%
Engineering 5,280 330 5,610 5.9% 5,490 160 5,650 2.8% 10,770 490 11,260 4.4% 50.2% 4.4%
Active leisure and learning
6,560 2,150 8,710 24.7% 1,660 860 2,520 34.1% 8,220 3,010 11,230 26.8% 22.4% 4.3%
Hairdressing 590 6,480 7,070 91.7% 230 3,020 3,250 92.9% 830 9,500 10,320 92.1% 31.5% 4.0%
All sector framework codes
83,000 89,400 172,400 51.9% 38,600 47,300 85,900 55.1% 121,600 136,800 258,400 52.9% 33.2% -

Back to Contents
634 – Indicates fewer than 5 starts
109 10.0 Apprenticeships Part 2 – Engineering in Education and Training
Table 10.4 shows the number of apprenticeship Programme Starts by level. Overall, Programme Starts have risen by 210.4%, with level 3+ Programme Starts rising faster than level 2 (288.2% rise compared to 175.8%) over ten years. However, looking at all engineering-related Sector Subject Areas shows that level 2 apprenticeship Programme Starts have risen faster than level 3+ (114.0% compared with 76.5%).
In engineering and manufacturing technologies, there has been a very rapid increase in level 2 apprenticeship Programme Starts over ten years
compared with level 3+ (212.0% to 36.9%). This trend continued in the last year, with level 2 starts increasing by 30.2% compared with 4.7% for levels 3+. The net effect is that while nearly half (48.9%) of all starts were at level 3+ in 2002/3, less than a third (29.7%) were by 2011/12.
Over ten years, there has been growth at both level 2 (5.8%) and level 3+ (47.1%) for construction, planning and the built environment. However, this growth is far lower than the average of all Sector Subject Areas (175.8%). In the last year, the number of starts
actually declined by a tenth (9.9%) for level 2 and by a fifth (20.8%) for levels 3+.
Of the three engineering-related Sector Subject Areas, only information and communication technology has shown above-average growth in level 3+ Programme Starts, rising by 493.4% over ten years. By comparison, level 2 starts have risen by 167.6%. Over the same period, the proportion of level 3+ starts has increased from a third (34.6%) in 2002/03 to over half (54.5%). It should be noted that in the last year there was a decline in both level 2 (2.4%) and level 3+ (8.5%) Programme Starts.
Looking specifically at those aged under 19 doing level 3 engineering-related apprenticeships, it can been seen that the number of programme starts has declined to 12.2% (16,280). This is steeper than the decline for all ages which was 6.4%.
Table 10.3: Apprenticeship Programme Starts by Sector Subject Area (2002/03-2011/12) – England
Source: The Data Service
2002/03 2003/04 2004/05 2005/06 2006/07 2007/08 2008/09 2009/10 2010/11 2011/12 Change over one year
Change over 10 years
Construction, planning and the built environment
20,160 26,680 25,450 21,670 27,520 27,830 29,220 25,210 28,090 24,000 -14.6% 19.0%
Engineering and manufacturing technologies
26,220 33,060 33,730 30,870 34,660 43,100 36,990 37,860 48,970 59,480 21.5% 126.8%
Information and communication technology
4,820 5,750 5,940 7,500 6,430 8,010 8,820 12,570 19,520 18,520 -5.1% 284.2%
Sub-total all engineering-related Sector Subject Areas
51,200 65,490 65,120 60,040 68,610 78,940 75,030 75,640 96,580 102,000 5.6% 99.2%
Science and mathematics
-634 - 40 - - - - - 10 370 3600.0% -
All Sector Subject Areas 167,700 193,600 189,000 175,000 184,400 224,800 239,900 279,700 457,200 520,600 13.9% 210.4%

Back to Contents
Part 2 – Engineering in Education and Training Apprenticeships 10.0 110
Table 10.4: Apprenticeship Programme Starts by Sector Subject Area and level (2002/03-2011/12) – England
Source: The Data Service
2002/03 2003/04 2004/05 2005/06 2006/07 2007/08 2008/09 2009/10 2010/11 2011/12 Change over one
year
Change over 10
years
Construction, planning and the built environment
Intermediate Apprenticeship
13,710 17,770 19,780 15,280 20,580 21,220 16,890 14,760 16,110 14,510 -9.9% 5.8%
Advanced Apprenticeship
6,450 8,910 5,670 6,390 6,940 6,610 12,330 10,450 11,980 9,490 -20.8% 47.1%
Higher Apprenticeship
0 0 0 0 - - - - - - - -
All apprenticeships 20,160 26,680 25,450 21,670 27,520 27,830 29,220 25,210 28,090 24,000 -14.6% 19.0%
Percentage level 3+
32.0% 33.4% 22.3% 29.5% 25.2% 23.8% 42.2% 41.5% 42.6% 39.5% -7.3% 23.4%
Engineering and manufacturing technologies
Intermediate Apprenticeship
13,400 17,000 16,830 17,170 17,570 22,360 22,210 22,620 32,120 41,810 30.2% 212.0%
Advanced Apprenticeship
12,820 16,060 16,900 13,700 17,060 20,750 14,770 15,180 16,770 17,550 4.7% 36.9%
Higher Apprenticeship
0 0 0 0 40 - 10 50 80 120 50.0% -
All apprenticeships 26,220 33,060 33,730 30,870 34,660 43,100 36,990 37,860 48,970 59,480 21.5% 126.8%
Percentage level 3+
48.9% 48.6% 50.1% 44.4% 49.3% 48.1% 40.0% 40.2% 34.4% 29.7% -13.7% -36.3%
Information and communication technology
Intermediate Apprenticeship
3,150 3,940 4,410 4,290 4,290 5,190 5,000 5,720 8,640 8,430 -2.4% 167.6%
Advanced Apprenticeship
1,670 1,810 1,530 3,210 2,120 2,770 3,770 6,710 10,830 9,910 -8.5% 493.4%
Higher Apprenticeship
0 0 0 0 20 50 60 140 60 190 216.7% -
All apprenticeships 4,820 5,750 5,940 7,500 6,430 8,010 8,820 12,570 19,520 18,520 -5.1% 284.2%
Percentage level 3+
34.6% 31.5% 25.8% 42.8% 33.3% 35.2% 43.4% 54.5% 55.8% 54.5% -2.3% 57.5%
Sub-total all engineering-related Sector Subject Areas
Intermediate Apprenticeship
30,260 38,710 41,020 36,740 42,440 48,770 44,100 43,100 56,870 64,750 13.9% 114.0%
Advanced Apprenticeship
20,940 26,780 24,100 23,300 26,120 30,130 30,870 32,340 39,580 36,950 -6.6% 76.5%
Higher Apprenticeship
0 0 0 0 60 50 70 190 140 310 121.4% -
All apprenticeships 51,200 65,490 65,120 60,040 68,610 78,940 75,030 75,640 96,580 102,000 5.6% 99.2%
Percentage level 3+
40.9% 40.9% 37.0% 38.8% 38.2% 38.2% 41.2% 43.0% 41.1% 36.5% -11.1% -10.8%
Science and mathematics
Intermediate Apprenticeship
- - 10 - - - - - - 90 - -
Advanced Apprenticeship
- - 30 - - - - - 10 280 2700.0% -
Higher Apprenticeship
0 0 0 0 - - - - - - - -
All apprenticeships - - 40 - - - - 10 370 3600.0% -
Percentage level 3+
0 0 75.0% 0 0 0 0 0 100.0% 75.7% - -
All Sector Subject Areas
Intermediate Apprenticeship
119,300 136,600 135,100 122,800 127,400 151,800 158,500 190,500 301,100 329,000 9.3% 175.8%
Advanced Apprenticeship
48,400 57,000 53,900 52,100 56,900 72,900 81,300 87,700 153,900 187,900 22.1% 288.2%
Higher Apprenticeship
0 0 0 0 100 100 200 1,500 2,200 3,700 68.2% -
All apprenticeships 167,700 193,600 189,000 175,000 184,400 224,800 239,900 279,700 457,200 520,600 13.9% 210.4%
Percentage level 3+
28.9% 29.4% 28.5% 29.8% 30.9% 32.5% 34.0% 31.9% 34.1% 36.8% 7.9% 27.3%

Back to Contents
635 Firms engagement with the Apprenticeship Programme, Department for Education, November 2011, p43 636 OECD Local Economic and Employment Development (LEED) Working Papers 2012/08, OECD, 2012, p5 637 Figures are based on postcode to geographic area assignments in the National Statistics Postcode Lookup. 638 Region is based upon the home postcode of the learner. Where the postcode is outside of England or unknown the learners are included in the all starts category but not included in any of the regions. 639 Volumes are rounded to the nearest ten except for all starts which are rounded to the nearest hundred.
111 10.0 Apprenticeships Part 2 – Engineering in Education and Training
Table 10.5 shows the number of Programme Starts by region for all engineering-related Sector Subject Areas and the overall figures for all Sector Subject Areas. It shows a degree of homogeneity in the proportion of engineering starts in each region. Approximately a fifth of all
programme starts in each region are for engineering related Sector Subject Areas. The South West has the highest proportion (22.3%) compared with the lowest, London at 16.0%.
However, research by the DfE635 shows that proportionately, apprenticeships are least likely
to be offered in London. This is due to the size of the youth population in the capital. The London Apprenticeship Campaign was launched in 2010 to counter this, and from 2009/10 to 2010/11, the number of apprentices doubled.636
Table 10.5 Apprenticeship Programme Starts by region and Sector Subject Area (2011/12) – England637 638 639
Source: The Data Service
Region Construction,
planning and the built environment
Engineering and manufacturing
technologies
Information and communication
technology
Sub-total all engineering-
related Sector Subject Areas
All engineering- related Sector Subject Areas
as a percentage of all
apprenticeships
Science and mathematics Total
North East 1,820 4,820 1,040 7,680 20.0% 50 38,340
North West 3,700 8,470 2,200 14,370 16.1% 80 89,310
Yorkshire and The Humber 2,880 7,160 2,950 12,990 20.2% 60 64,200
East Midlands 2,220 6,000 960 9,180 19.6% 10 46,790
West Midlands 2,520 8,450 2,150 13,120 21.7% 40 60,470
East of England 2,310 4,780 1,780 8,870 19.4% 40 45,820
London 1,880 3,750 1,920 7,550 16.0% 10 47,230
South East 3,320 8,460 2,630 14,410 21.6% 50 66,850
South West 2,980 6,710 2,780 12,470 22.3% 30 55,950
All starts 24,000 59,500 18,500 102,000 19.6% 400 520,600

Back to Contents
Part 2 – Engineering in Education and Training Apprenticeships 10.0 112
Figure 10.0 shows the number of Programme Starts in engineering and manufacturing technologies by age. It is quite easy to see from the chart the rise of apprenticeship starts amongst those aged over 25. In 2002/03, there were fewer than five Programme Starts in engineering and manufacturing technologies. By 2011/12, it had reached 21,380, with starts for the 25+ age groups outnumbering those for under-19s (20,730) and 19- to 24-year-olds (17,370).
The number of Programme Starts among under-19s was higher in 2011/12 than it was in 2002/03 (20,730 to 18,620). However, it is below its 2007/08 peak of 26,800. The number of Programme Starts among 19- to 24-year-olds was at its highest for ten years in 2011/12, at 17,370. This is a substantial rise from 7,600 in 2002/03.
Fig. 10.0: Apprenticeship Programme Starts in engineering and manufacturing technology by age (2002/03-2011/12) – England
Source: The Data Service
2005/06
2006/07
2007/08
2008/09
2009/10
2010/11
2011/12
2004/05
2003/04
2002/03
0
10,0
00
Under 19 25+19-24
5,00
0
20,0
00
25,0
00
30,0
00
15,0
00
20,77014,910
13,290
20,73017,370
21,380
19,74014,890
3,240
20,00013,160
26,80014,540
24,01010,620
21,9608,900
22,00011,060
25,0308,690
18,6207,600
10
<5
<5
40
10
1,770
3,830

Back to Contents
113 10.0 Apprenticeships Part 2 – Engineering in Education and Training
For construction, planning and the built environment, under-19s accounted for the largest number of Programme Starts in each year (Figure 10.1). Their numbers have fluctuated over the years, with fewer in 2011/12 than 2002/03 (13,740 from 16,220). By comparison, the number of 19- to 24-year-olds has increased over ten years, from 3,930 in 2002/03 to 8,010 in 2011/12. However, it is still below its 2010/11 peak of 9,290.
Fig. 10.1: Apprenticeship Programme Starts in construction, planning and the built environment by age (2002/03-2011/12) – England
Source: The Data Service
2005/06
2006/07
2007/08
2008/09
2009/10
2010/11
2011/12
2004/05
2003/04
2002/03
0
10,0
00
Under 19 25+19-24
5,00
0
20,0
00
25,0
00
15,0
0015,780
9,2903,010
13,7408,010
2,260
15,6608,200
1,350
18,3208,930
18,9308,270
19,2608,250
14,9706,690
19,9506,730
18,3307,120
16,2203,930
10
<5
<5
10
10
640
1,980

Back to Contents
Part 2 – Engineering in Education and Training Apprenticeships 10.0 114
We can see from Figure 10.2 that the number of Programme Starts for information and communication technology has increased over the ten-year period for all age ranges, although under-19s have been the largest age group each year. In 2002/03, there 3,170 under-19s starting an apprenticeship in information and communication technology. By 2011/12, this had increased to 7,930. However, this was below the peak of 9,850 in 2010/11.
Numbers of 19- to 24-year-olds have fluctuated over ten years. But since 2008/09, growth has been steady, and 2011/12 saw Programme Starts peak at 5,130 – the highest over the ten-year period. Over the ten years, there has been strong growth in the number of over-25s starting an apprenticeship in this field. Numbers have risen from ten in 2006/07 to 5,460 in 2011/12 – the highest to date.
Fig. 10.2: Apprenticeship Programme Starts in information and communication technology by age (2002/03-2011/12) – England
Source: The Data Service
2005/06
2006/07
2007/08
2008/09
2009/10
2010/11
2011/12
2004/05
2003/04
2002/03
0
4,00
0
Under 19 25+19-24
2,00
0
8,00
0
10,0
00
12,0
00
6,00
0
9,8504,490
5,180
7,9305,130
5,460
7,0003,910
1,660
4,6502,560
3,9502,860
3,6102,810
3,5803,860
3,6202,130
3,3102,620
3,1701,650
<5
<5
<5
10
60
1,200
1,610

Back to Contents
640 Figures for 2011/12 onwards are not directly comparable to earlier years as a Single Individualised Learner Record (ILR) data collection system has been introduced. Small technical changes have been made in the way learners from more than one provision type are counted, leading to a removal of duplicate learners and a reduction in overall learner numbers of approximately 2%. 641 Volumes are rounded to the nearest ten except for all Sector Subject Areas which is rounded to the nearest hundred. 642 – Indicates a base value of fewer than 5
115 10.0 Apprenticeships Part 2 – Engineering in Education and Training
10.3 Framework achievements640 641 642 Overall, according to Table 10.6, there were just over a quarter of a million (258,400) framework achievements in 2011/12. The change in methodology for counting framework achievements would have reduced overall learner numbers for 2011/12 by around 2%. Despite this, there has been considerable growth in the number of framework achievements over ten years, rising from 42,400 in 2002/03 to 258,400 in 2011/12. There was also strong growth in the last year, with numbers rising by 29.0%, even though the change in methodology reduced the count in 2011/12.
Together, the three engineering-related Sector Subject Areas have seen below-average growth, rising by 345.3% to reach 56,550 in 2011/12.
Engineering and manufacturing technologies had the lowest growth over ten years, rising by 274.8%. However, in 2011/12 it grew by 14.8%, which is above the average for all Sector Subject Areas (1.1%).
At 342.9%, growth in construction, planning and the built environment was just below average for the ten-year period. But in the last year, the number of framework achievements fell by 12.3%.
Information and communication technology was the only engineering-related Sector Subject Area to show above-average growth over ten years, rising 1,105.1% from 780 achievements in
2002/03 to 9,400 in 2011/12. However, there was a decline of 10.6% in the last year.
The number of Framework Achievements in science and mathematics failed to reach 50 in any of the ten years. It should also be noted that the number of starts (see Section 10.1) failed to reach 400 in any year. In Section 12, we show that the engineering sector recruits a lot of engineers who qualify with degrees in science and maths. Potentially, engineering companies could be competing with companies in the science and maths field, for engineering apprentices.
Along with apprenticeship achievements, professional registration is another form of recognition of professional competence. The box provides further details on registration in the engineering sector.
Table 10.6: Apprenticeship achievements by Sector Subject Area (2002/03-2011/12) – England
Source: The Data Service
2002/03 2003/04 2004/05 2005/06 2006/07 2007/08 2008/09 2009/10 2010/11 2011/12 Change over one year
Change over ten years
Construction, planning and the built environment
3,640 5,620 9,290 14,850 17,300 17,810 22,330 20,830 18,390 16,120 -12.3% 342.9%
Engineering and manufacturing technologies
8,280 8,340 12,010 18,210 21,470 20,770 22,890 26,090 27,040 31,030 14.8% 274.8%
Information and communication technology
780 2,470 2,920 4,270 4,880 5,550 5,670 7,770 10,510 9,400 -10.6% 1105.1%
Sub-total all engineering related Sector Subject Areas
12,700 16,430 24,220 37,330 43,650 44,130 50,890 54,690 55,940 56,550 1.1% 345.3%
Science and mathematics
- - 30 40 20 - - - - 10 - -
All Sector Subject Areas 42,400 49,300 67,200 98,700 111,800 112,600 143,400 171,500 200,300 258,400 29.0% 509.4%

Back to Contents
643 https://www.gov.uk/government/news/the-richard-review-of-apprenticeships 644 www.engc.org.uk/ukspec 645 http://www.ice.org.uk/Membership/Membership-grades-and-how-to-join/TMICE/Apprenticeships
Part 2 – Engineering in Education and Training Apprenticeships 10.0 116
Table 10.7 shows the number of apprenticeships achievements by level over a ten-year period. It shows that for all Sector Subject Areas, growth at level 2 has been 615.4% over ten years, compared with 360.3% for level 3+. As a result, the proportion of level 3+ apprenticeships has declined from 43.4% in 2002/03 to a third (33.2%) in 2011/12.
Looking at all engineering-related Sector Subject Areas shows that level 2 apprenticeship achievements have increased by more than average (745.8%), while level 3+ have increased by less than average (166.4%). In 2002/03, two thirds (69.2%) of all achievements were level 3+, but by 2011/12 this had declined to under half (41.5%).
Looking specifically at engineering and manufacturing technologies over ten years shows the proportion of level 3+ apprenticeships has halved from 72.9% in 2002/03 to 35.3% in 2011/12. However, due to the strong growth in overall apprenticeship numbers, the actual number of level 3+ apprentices has increased from 6,040 in 2002/03 to 10,960 in 2011/12.
Construction, planning and the built environment has also seen a large decline in the proportion of level 3+ apprenticeships, falling from 63.7% in 2002/03 to just under half (48.4%) in 2011/12. However again, the growth in overall apprenticeship achievements means that the actual number at level 3+ has risen from 2.320
to 7,800 in ten years. It should also be noted that construction, planning and the built environment had fewer than five higher level apprenticeships in each year since 2007/08.
Information and communication technology has shown a lot of fluctuations in the proportion of level 3+ achievements, falling to a low point of 25.4% in 2006/07 and reaching a high of 60.7% in 2010/11. In 2011/12, half (50.2%) of all achievements were at level 3+, which is similar to the 55.1% in 2002/03.
Apprenticeships: recognising professional competence
Thanks to the Richard Review,643 there is now enhanced interest in the outcome of apprenticeships, and apprenticeships being respected in industry standards. This interest is welcomed by the engineering profession, which has always supported and driven high-quality apprenticeship provision as a pathway to professional registration. Apprenticeships provide a work-based training programme for those who want to work in engineering and construction, and provide benefits to all stakeholders: apprentices who prefer a different approach to learning; employers who are keen to attract the right people; and the industry which needs to harness technical talent.
As apprenticeships of all levels across the engineering and construction sector grow
rapidly, the Government, apprentices and their employers are seeking assurance that these training pathways meet the standards set by the profession. The engineering profession already offers apprenticeship providers an opportunity to demonstrate this, by working with one or more Professional Engineering Institutions (PEIs) and gaining ‘approved for the purposes of registration’ status.
The established and respected UK Standard for Professional Engineering Competence (UK-SPEC)644 provides apprenticeship providers with a means to design programmes that provide the opportunity for those who complete their apprenticeship to become professionally registered technicians and engineers. Registered status through UK-SPEC provides a globally recognised measure of competence and demonstrates a commitment to continuing professional development. For
employers, a professionally-registered workforce demonstrates commitment to engineering competence on a global level, and the ability to develop and attract a high quality workforce, ultimately increasing their global competitiveness.
The Engineering Council and the PEIs, together with the National Apprenticeship Service, awarding organisations and other stakeholders, are exploring ways to ensure that all engineering apprenticeships align with UK-SPEC. This will enable the approval of more qualifications and apprenticeships leading to EngTech, ICTTech and IEng registration upon completion, whilst continuing to support and promote the value and benefit of professional registration of apprentices and technicians. One such example can be found in the Institution of Civil Engineers’ (ICE) Advanced Technician Apprenticeship645 case study.

Back to Contents
117 10.0 Apprenticeships Part 2 – Engineering in Education and Training
Table 10.7: Apprenticeship achievements by Sector Subject Area and level (2002/03-2011/12) – England
Source: The Data Service
2002/03 2003/04 2004/05 2005/06 2006/07 2007/08 2008/09 2009/10 2010/11 2011/12 Change over one
year
Change over 10
years
Construction, planning and the built environment
Intermediate Apprenticeship
1,320 2,750 5,920 9,910 12,560 12,580 13,680 11,340 9,110 8,320 -8.7% 530.3%
Advanced Apprenticeship
2,320 2,880 3,370 4,950 4,750 5,230 8,650 9,490 9,280 7,800 -15.9% 236.2%
Higher Apprenticeship
0 0 0 0 0 - - - - - - -
All apprenticeships 3,640 5,620 9,290 14,850 17,300 17,810 22,330 20,830 18,390 16,120 -12.3% 342.9%
Percentage level 3+
63.7% 51.2% 36.3% 33.3% 27.5% 29.4% 38.7% 45.6% 50.5% 48.4% -4.2% -24.0%
Engineering and manufacturing technologies
Intermediate Apprenticeship
2,240 3,350 5,710 9,120 10,620 10,290 13,840 15,290 15,830 20,070 26.8% 796.0%
Advanced Apprenticeship
6,040 4,990 6,290 9,100 10,860 10,470 9,040 10,780 11,200 10,940 -2.3% 81.1%
Higher Apprenticeship
0 0 0 0 0 - 10 20 - 20 - -
All apprenticeships 8,280 8,340 12,010 18,210 21,470 20,770 22,890 26,090 27,040 31,030 14.8% 274.8%
Percentage level 3+
72.9% 59.8% 52.4% 50.0% 50.6% 50.4% 39.5% 41.4% 41.4% 35.3% -14.7% -51.6%
Information and communication technology
Intermediate Apprenticeship
350 1,790 1,840 3,160 3,640 3,140 3,290 3,930 4,130 4,680 13.3% 1237.1%
Advanced Apprenticeship
430 690 1,080 1,110 1,240 2,410 2,380 3,830 6,320 4,680 -25.9% 988.4%
Higher Apprenticeship
0 0 0 0 0 - - 20 60 40 -33.3%
All apprenticeships 780 2,470 2,920 4,270 4,880 5,550 5,670 7,770 10,510 9,400 -10.6% 1105.1%
Percentage level 3+
55.1% 27.9% 37.0% 26.0% 25.4% 43.4% 42.0% 49.5% 60.7% 50.2% -17.2% -8.9%
Sub-total all engineering- related Sector Subject Areas
Intermediate Apprenticeship
3,910 7,890 13,470 22,190 26,820 26,010 30,810 30,560 29,070 33,070 13.8% 745.8%
Advanced Apprenticeship
8,790 8,560 10,740 15,160 16,850 18,110 20,070 24,100 26,800 23,420 -12.6% 166.4%
Higher Apprenticeship
0 0 0 0 0 0 10 40 60 60 0.0% -
All apprenticeships 12,700 16,430 24,220 37,330 43,650 44,130 50,890 54,690 55,940 56,550 1.1% 345.3%
Percentage level 3+
69.2% 52.1% 44.3% 40.6% 38.6% 41.0% 39.5% 44.1% 48.0% 41.5% -13.5% -40.0%
Science and mathematics
Intermediate Apprenticeship
- - 10 10 - - - - - - - -
Advanced Apprenticeship
- - 30 30 10 - - - - 10 - -
Higher Apprenticeship
0 0 0 0 0 - - - - - - -
All apprenticeships - - 30 40 20 - - - - 10 - -
Percentage level 3+
- - 100.0% 75.0% 50.0% - - - - 100.0% - -
All Sector Subject Areas
Intermediate Apprenticeship
24,100 32,600 48,400 70,300 78,400 76,300 98,100 111,900 131,700 172,400 30.9% 615.4%
Advanced Apprenticeship
18,400 16,700 18,900 28,400 33,400 36,200 45,200 59,400 67,500 84,700 25.5% 360.3%
Higher Apprenticeship
0 0 0 0 0 - - 200 1,000 1,200 20.0% -
All apprenticeships 42,400 49,300 67,200 98,700 111,800 112,600 143,400 171,500 200,300 258,400 29.0% 509.4%
Percentage level 3+
43.4% 33.9% 28.1% 28.8% 29.9% 32.1% 31.5% 34.8% 34.2% 33.2% -2.9% -23.5%

Back to Contents
646 Region is based upon the home postcode of the learner. Where the postcode is outside of England or unknown then they are included in all achievements but not in any of the regions 647 Figures are based on postcode to geographic area assignments in the National Statistics Postcode Lookup. 648 Volumes are rounded to the nearest ten except for all achievements which are rounded to the nearest hundred.
Part 2 – Engineering in Education and Training Apprenticeships 10.0 118
Table 10.8 shows the number of Framework Achievements for different engineering-related Sector Subject Areas by region. Compared with the breakdown of engineering-related starts by region (Table 10.5), there is more variation in the proportion of achievements. The region with the lowest proportion of achievements was London, with 15.3% of all apprenticeship starts
being in engineering-related Sector Subject Areas. These starts were fairly evenly spread between construction, planning and the built environment (1,010), information and communication technology (1,010) and engineering and manufacturing technologies (1,270).
The South West had the largest proportion of engineering-related apprenticeship achievements (24.8%). However, in the South West, there were far more achievements in engineering and manufacturing technologies (3,530), construction, planning and the built environment (2,260) and information and communication technologies (1,230).
Table 10.8: Apprenticeship Framework Achievements by region and Sector Subject Area (2011/12) – England646 647 648
Source: The Data Service
Region Construction,
planning and the built environment
Engineering and manufacturing
technologies
Information and communication
technology
Sub-total all engineering-
related Sector Subject Areas
All engineering- related Sector Subject Areas
as a percentage of all
apprenticeships
Science and mathematics Total
North East 1,400 2,280 520 4,200 21.2% - 19,840
North West 2,680 5,840 880 9,400 21.3% 10 44,210
Yorkshire and The Humber 2,000 4,390 1,430 7,820 24.0% - 32,580
East Midlands 1,540 3,320 480 5,340 22.6% - 23,680
West Midlands 1,400 3,510 1,430 6,340 21.3% - 29,800
East of England 1,500 2,160 1,080 4,740 21.5% - 22,070
London 1,010 1,270 1,010 3,290 15.3% - 21,480
South East 2,140 4,370 1,290 7,800 23.1% - 33,760
South West 2,260 3,530 1,230 7,020 24.8% - 28,260
All achievements 16,100 31,000 9,400 56,500 21.9% - 258,400

Back to Contents
649 Age is calculated based on age at start of the programme rather than based on 31 August.
119 10.0 Apprenticeships Part 2 – Engineering in Education and Training
Figure 10.3 shows the age of apprenticeship Framework Achievements in engineering and manufacturing technologies. It shows the dramatic rise in the number of Framework Achievements, from 20 in 2006/07 to 8,420 in 2011/12, for those aged 25 and over.
Looking at under 19s over ten years shows an increase from 5,880 in 2002/03 to 13,000 in 2011/12. However, there was some fluctuation – 2011/12 showed only 13,000 Framework Achievements, significantly below the highpoint of 15,100 in 2006/07.
The number of 19- to 24-year-old apprentices has grown steadily, from 2,400 in 2002/03 to 10,190 in 2010/11, although there was a decline to 9,610 in 2011/12.
Fig. 10.3: Apprenticeship Framework Achievements in engineering and manufacturing technology by age (2002/03-2011/12) – England649
Source: The Data Service
2005/06
2006/07
2007/08
2008/09
2009/10
2010/11
2011/12
2004/05
2003/04
2002/03
0
4,00
0
Under 19 25+19-24
6,00
0
8,00
0
2,00
0
12,0
00
14,0
00
16,0
00
10,0
0014,380
10,1902,470
13,0009,610
8,420
14,0909,830
2,170
12,6408,660
13,5307,140
15,100
6,360
12,6305,570
5,4102,930
8,2303,780
5,8802,400
<5
<5
<5
20
<5
100
1,590

Back to Contents
Part 2 – Engineering in Education and Training Apprenticeships 10.0 120
The distribution of Framework Achievements in construction, planning and the built environment by age is shown in Figure 10.4. In each year, under-19s accounted for the largest number of Framework Achievements. Between 2002/03 and 2008/09, there was steady growth in the number of achievements, rising from 2,670 to 14,700. However, since 2008/09 there has been a steady decline, falling to 9,050 in 2011/12.
Those aged 19-24 follow the same pattern as under-19s. From 970 achievements in 2002/03, there was steady growth to 7,180 in 2008/09. Since then, numbers have fallen each year to reach 5,550 in 2011/12.
The 25+ age group has again grown rapidly in this subject area, from ten in 2006/07 to 1,520 in 2011/12.
Fig. 10.4: Apprenticeship Framework Achievements in construction, planning and the built environment by age (2002/03-2011/12) – England
Source: The Data Service
2005/06
2006/07
2007/08
2008/09
2009/10
2010/11
2011/12
2004/05
2003/04
2002/03
0
4,00
0
Under 19 25+19-24
6,00
0
8,00
0
2,00
0
12,0
00
14,0
00
16,0
00
10,0
0011,000
6,3601,030
9,0505,550
1,520
13,2106,740
880
14,700
7,180
12,0805,670
11,9405,350
10,8603,990
4,1501,470
6,9202,370
2,670970
<5
<5
<5
10
<5
60
450

Back to Contents
121 10.0 Apprenticeships Part 2 – Engineering in Education and Training
Between 2002/03 and 2010/11, the number of Framework Achievements in information and communication technology grew very rapidly (Figure 10.5), from 470 to 6,700. However, in the last year numbers have fallen back to 4,290. Growth in the number of achievements for the 19- to 24-year-old age group has fluctuated although overall, numbers have increased over ten years, rising from 310 to 2,450 in 2011/12. However, this is below the peak of 2,610 in 2010/11.
Conversely, there has been a steady growth in the number of achievements for the over-25s since 2006/07, rising from 20 to 2,660. In 2011/12, the number of Framework Achievements for the 25+ age group overtook the 19-24s for the first time.
Fig. 10.5: Apprenticeship Framework Achievements in information and communication technology by age (2002/03-2011/12) – England
Source: The Data Service
2005/06
2006/07
2007/08
2008/09
2009/10
2010/11
2011/12
2004/05
2003/04
2002/03
0
5,00
0
1,50
0
3,00
0
2,50
0
4,00
0
500
Under 19 25+19-24
3,50
0
4,50
0
7,50
0
6,00
0
5,50
0
6,50
0
7,00
0
1,00
0
2,00
0
6,7002,610
1,200
4,2902,450
2,660
4,4702,200
1,110
3,5101,780
3,0302,230
2,8002,070
2,3601,890
1,730740
1,8601,060
470310
<5
<5
<5
20
30
280
380

Back to Contents
650 Figures for 2011/12 onwards are not directly comparable to earlier years as a Single Individualised Learner Record (ILR) data collection system has been introduced. Small technical changes have been made in the way learners from more than one provision type are counted, leading to a removal of duplicate learners and a reduction in overall learner numbers of approximately 2%. 651 Percentages are calculated based on pre-rounded data. 652 Apprenticeship success rates are based on the number of learners who meet all of the requirements of their apprenticeship framework, divided by the number of learners who have left training or successfully completed their training in the academic year. 653 Modern Apprenticeship Employer Survey 2012, Skills Development Scotland, March 2013, p12 654 Modern Apprenticeship Outcomes 2012, Skills Development Scotland, January 2013, p15
Part 2 – Engineering in Education and Training Apprenticeships 10.0 122
10.4 Success rates650 651 652
Figure 10.6 shows the apprenticeship success rates over eight years, for all Sector Subject Areas and the three engineering-related Sector Subject Areas. Across all Sector Subject areas, success rates have increased from just over a third (36.7%) in 2004/05 to 76.4% in 2010/11. Due to changes in data collection, the information for 2011/12 is not directly comparable to earlier years. However, it does show that the overall success rate has fallen back slightly to 73.8%.
For construction, planning and the built environment, percentage success rates increased year-on-year between 2004/5 and 2006/07 and were above the average for all Sector Subject Areas. From 2007/08 to 2010/11, success rates continued to increase. However, they were no longer above average for all Sector Subject Areas. In 2011/12, success rates declined slightly, again falling below the average for all Sector Subject Areas.
Engineering and manufacturing technologies enjoyed above-average success rates between 2004/05 and 2006/07, with percentages increasing year-on-year. The only decline was in 2007/08, when it fell below average. Since then, success rates have continued to grow each year, including 2011/12 when they reached 77.6%.
Information and communication technology has enjoyed above-average percentage pass rates in each of the eight years, with year-on-year increases from 47.7% in 2004/05 to 87.4% in 2010/11. However, there was a sharp decline to 78.0% in 2011/12.
10.5 Engineering apprenticeships in the devolved nationsIn Scotland, Modern Apprenticeships (MA) are a method of learning for the over-16s that combine paid employment and training to achieve industry qualifications at the level required for the job. Modern Apprenticeships can be delivered at one of a number of different levels.
A variety of agencies are involved in the design, development and delivery of MAs. Skills Development Scotland promotes and administers the public funding contribution for MAs on behalf of the Scottish Government. Each individual follows an MA Framework which is developed by the appropriate Sector Skills Council, in consultation with industry. Training providers, colleges and employers train and assess the competence of the apprentices.
Overall, nearly half (43.1%) of all MA starts were from females. But across engineering-related MAs, females only represent 8.4% of all starts (Table 10.9). Similarly, two fifths (39.5%) of all achievements are from females, but for engineering-related MAs it is only 6.7%. Overall, there were 7,668 engineering-related starts and 6,245 achievements.
Most engineering-related MAs have a low number of starts and/or achievements. However, the two largest MAs are construction (2,373 starts and 2,288 achievements) and engineering (1,210 starts and 1,032 achievements). Both of these MAs have a low proportion of female starts (1.3% and 2.6% respectively) and female achievements (1.2% and 2.4% respectively).
Excluding chemicals manufacturing and petroleum industries (which has a very low number of starts and achievements); only two MAs had at least 10% female starts. These were food manufacture (35.9%) and information and communication technologies professional (19.8%).
Research by Skills Development Scotland found that 88% of employers who are involved in the MA programme said they wanted to improve the proficiency of their staff. The same percentage said they wanted to ensure their staff can be trained in their way of doing things.653 Further research by Skills Development Scotland has shown that 92% of those who completed their MA were in employment six months after completing, while only 66% of non-completers were in work six months after leaving their MA.654
Fig. 10.6: Apprenticeship success rates by Sector Subject Area (2004/05-2011/12) – England
Source: The Data Service
10.0
%
40.0
%
60.0
%
100.
0%
50.0
%
80.0
%
20.0
%
70.0
%
90.0
%
30.0
%
All SectorSubject Areas
Information andcommunication technology
Engineering and manufacturing technologies
Construction, planning and the built environment
0.0%
2011/12
2008/092005/06
2010/11
2007/08
2009/10
2006/072004/05
36.7%
76.4%73.8%
73.8%
70.9%63.9%
59.0%48.6%
47.7%
87.4%82.6%
78%
80.4%71.3%
63.1%55.1%
43.3%
77.3%76.6%
77.6%
72.3%59.7%
63.3%49.2%
40.3%
72.2%70.4%
71.7%
70.3%67.7%
62.2%53.7%

Back to Contents
655 If an apprenticeship lasts longer than 12 months those starting an apprenticeship will not have had an opportunity to complete it
123 10.0 Apprenticeships Part 2 – Engineering in Education and Training
Table 10.9: Engineering-related Modern Apprenticeship starts and achievements by gender (2011/12) – Scotland
Source: Skills Development Scotland
Starts Achievements
Female Male Percentage female Female Male Percentage female
Automotive 10 840 1.2% 0 0655 -
Chemicals manufacturing and petroleum industries
1 1 50.0% 2 13 13.3%
Construction 31 2,342 1.3% 28 2,260 1.2%
Construction (civil engineering and specialist sector)
0 92 0.0% 0 0 -
Construction (technical operations)
7 218 3.1% 4 75 5.1%
Electrical installation 0 10 0.0% 0 0 -
Electricity industry 0 0 - 0 6 0.0%
Electrotechnical services 5 496 1.0% 11 701 1.5%
Engineering 31 1,179 2.6% 25 1,007 2.4%
Engineering construction 6 105 5.4% 6 59 9.2%
Extractive and mineral processing
2 75 2.6% 1 117 0.8%
Food manufacture 469 839 35.9% 291 473 38.1%
Furniture manufacture 0 0 - 1 14 6.7%
Gas industry 3 58 4.9% 0 72 0.0%
Glass industry operations 1 79 1.3% 0 23 0.0%
Information and communication technologies professional
68 276 19.8% 35 153 18.6%
Land-based engineering 0 52 0.0% 0 35 0.0%
Oil and gas extraction 5 110 4.3% 2 50 3.8%
Process manufacturing 0 12 0.0% 0 0 -
Rail transport engineering 0 0 - 0 8 0.0%
Vehicle body and paint operations
1 15 6.3% 2 99 2.0%
Vehicle fitting 0 0 - 0 1 0.0%
Vehicle maintenance and repair
5 161 3.0% 6 594 1.0%
Vehicle parts operations 0 25 0.0% 2 57 3.4%
Water industry 0 18 0.0% 0 12 0.0%
Wind turbine operations and maintenance
0 20 0.0% 0 0 -
Sub-total all engineering-related Modern Apprenticeships
645 7,023 8.4% 416 5,829 6.7%
All Modern Apprenticeships
11,381 15,048 43.1% 7,199 11,013 39.5%

Back to Contents
656 All whole numbers are rounded to the nearest 5
Part 2 – Engineering in Education and Training Apprenticeships 10.0 124
The Welsh Government published data on achievements in different Sector Subject Areas, for different apprenticeship levels (Table 10.10). It shows that the largest engineering-related Sector Subject Area is engineering and manufacturing technologies, with 1,685 achievements in 2011/12. Overall, the percentage achievement rate was 81%, with apprenticeships having a slightly higher achievements rate (84%) than Foundation Apprenticeships (79%). There was also a nearly even split between Foundation Apprenticeship Achievements (880) and Apprenticeship Achievements (805).
Construction, planning and the built environment had the lowest percentage achievements rate, at 61%. There was limited variation in the achievement rate between Foundation Apprenticeships (60%) and apprenticeships (63%). There were a larger number of achievements amongst Foundation Apprenticeships (655) than apprenticeships (480).
The smallest of the three engineering-related Sector Subject Areas is information and communication technology. Overall, there were 400 achievements with an average achievement rate of 81%. Nearly twice as many achievements were at foundation level (295) than apprenticeship level (110).
Table 10.10: Projected Apprenticeship Framework success rates by apprenticeship type and Sector Subject Area (2011/12) – Wales656
Source: Welsh Government
Foundation Apprenticeships Apprenticeships All apprenticeships
Number of leavers attaining
a full Framework
Percentage
Number of leavers attaining
a full Framework
Percentage
Number of leavers attaining
a full Framework
Percentage
Engineering and manufacturing technologies
880 79% 805 84% 1,685 81%
Construction, planning and the built environment
655 60% 480 63% 1,135 61%
Information and communication technology
295 81% 110 82% 400 81%
All Sector Subject Areas
6,775 77% 5,065 79% 11,840 78%

Back to Contents
657 Website accessed on 16 September 2013 (http://www.nidirect.gov.uk/index/information-and-services/education-and-learning/14-19/its-your-choice-options-after-16/apprenticeshipsni/apprentices.htm) 658 Website accessed on 16 September 2013 (http://www.nidirect.gov.uk/index/information-and-services/education-and-learning/14-19/its-your-choice-options-after-16/apprenticeshipsni/apprentices/apprenticeshipsni-qualifications-explained/apprenticeships-25-plus-frameowrks.htm) 659 Website accessed on 16 September 2013 (http://www.nidirect.gov.uk/apprenticeshipsni-explained) 660 Refers to the number of participants on the programme/provision at a particular point in time. Occupancy figures relate to those participants on provision on the last Friday of the quarter. 661 All apprenticeships are either level 2 or 3 662 Whole numbers have been rounded to the nearest 5, with 1 or 2 recorded as 0, percentages are calculated on the unrounded numbers
125 10.0 Apprenticeships Part 2 – Engineering in Education and Training
Apprenticeships Northern Ireland is a programme that offers training to those aged 16 and above at levels 2 and 3657 – although only certain apprenticeships are supported for those aged 25+.658 To undertake an apprenticeship, the candidate must be in, or about to start, work of at least 21 hours per week.659
Table 10.11 shows that out of a total of 10,070 apprentices, over a quarter (2,730) were in engineering-related frameworks, of whom nearly 95% (2,595 out of 2,730) are male. By comparison, out of 4,805 female apprentices, only 130 are studying for an engineering-related framework. Overall, 47.7% of all apprentices are female, but for engineering-related frameworks it drops to 5.0%.
The largest framework was engineering, with 425 participants. Of these, just 3.3% were female. The framework with the highest percentage of females was food manufacture at 44.1%, but this is from a small group of just 35 students.
Table 10.11: Apprenticeship occupancy660 levels (11 March 2013) – Northern Ireland661 662
Source: Department for Education and Learning Northern Ireland
Female Male Grand total
Percentage female
Engineering 15 410 425 3.3%
Electrotechnical services 0 375 380 0.5%
Engineering industry 10 360 370 2.7%
Vehicle maintenance and repair 5 315 320 1.6%
Construction crafts 0 235 235 0.4%
Motor vehicle industry 1 155 155 0.6%
Construction - 120 120 -
Food manufacture 45 65 110 40.0%
Food and drink manufacturing operations 10 90 105 10.7%
Mechanical engineering services (plumbing) 0 95 95 2.1%
IT services and development 25 35 55 42.1%
Electrical distribution and trans. engineering 0 45 50 4.1%
Food manufacture 15 20 35 44.1%
Mechanical engineering services (plumbing) - 35 35 -
Mechanical engineering services (HVACR) 0 25 25 -
Extractives and mineral processing 0 25 25 -
Printing industry - 25 25 -
Natural gas installation, maintenance and network operations
- 25 25 -
Light vehicle body and paint operations 0 20 20 -
Water utility operations 0 20 20 5.0%
Water utility operation - 20 20 -
Mechanical engineering services (HVACR) - 20 20 -
Information technology services and development 0 15 15 5.9%
Extractives and mineral processing - 10 10 -
Polymer processing and signmaking - 5 5 -
Land-based service engineering - 5 5 -
Land-based engineering - 5 5 -
Food and drink manufacturing 5 - 5 60.0%
Glass industry occupations - 5 5 -
Furniture production - 0 0 -
Electricity distribution - 0 0 -
Furniture production - 0 0 -
Telecommunications industry 0 - 0 100.0%
Engineering construction - 0 0 -
All engineering-related frameworks 130 2,595 2,730 5.0%
All frameworks 4,805 5,265 10,070 47.7%

Back to Contents
663 UKCES Working Futures 2010-2020 664 CBI/Pearson education and skills survey 2013, Changing the Pace 665 Engineering Technicians: The case for a change in culture and attitudes
Part 2 – Engineering in Education and Training Apprenticeships 10.0 126
10.6 The urgent need for more techniciansIt is estimated that by 2020 the UK will need approximately 450,000 more science, engineering and technology (SET) technicians.663 At the same time, existing shortages of science, technology, engineering and maths (STEM) qualified technicians have been identified by 29% of firms, who also expect the problem to become more acute.664 With shortages occurring in the very areas identified as crucial to the UK’s economic recovery, there is an urgent need to address the problem.
The Engineering Council says something must therefore be done to increase the number of registered technicians throughout the UK, whilst ensuring that appropriate levels of skills and quality are developed. The central challenge is that the value provided by technicians and technical careers is not sufficiently recognised and technician careers do not receive the credit they deserve. This lack of recognition must be addressed and transformational changes made to the process of developing technicians. This change needs to happen from school up, with employers placing value on occupationally-qualified professional technicians. Major changes are underway through the vocational development system and the Government is reshaping apprenticeships. Professional registration is central to the solution.
Professional registration through the Professional Engineering Institutions (PEIs) is supported by the Engineering and Science Councils and the Gatsby Charitable Foundation. A number of activities by various bodies are currently underway. These aim to promote professional registration as a means of improving the recognition and status of technicians and encouraging more people into technician careers. These activities are listed below:
The Technician Council
The Technician Council is a collaboration of employers, learning providers, professional and regulatory bodies and unions. Its core aim, through working together across the science, engineering and technology sector, is to improve the recognition of technicians by promoting the value of professional registration.
The TRaM project
The Engineering Council has completed phase 1 of its Technician Registration and Membership (TRaM) project, which has delivered a report on attitudes of employers and technicians towards registration, with recommendations as to future activities.665
Employers generally have a low awareness of the value of institution membership and registration. However, the report shows that those employers who actively support professional registration among their staff extol its virtues and recognise the clear benefits to their employees and their organisation. They cite the benefits of registration as:
• demonstrating a professionalised technician workforce
• acting as a stamp of quality and demonstrating a competent, qualified workforce, which helps justify prices and win bids and tenders
• creating a loyal, keen to learn, enthusiastic and motivated team
• driving recruitment and retention of high-calibre staff
• showing breadth of experience within technicians
• developing the right behaviours and attitudes, and creating an achievement-focused professional environment
• improving morale, raising self-esteem and building relationships between engineers and technicians
• providing third-party endorsement which demonstrates competence of employees when communicating with external organisations or the public
• encouraging staff to keep up to date and helping identify any gaps that need addressing
• helping ambitious employees towards IEng and CEng status by using EngTech registration as an interim step
One of the main reasons that individuals seek registration is because it is a professional recognition of their achievement. Existing engineering technicians (EngTechs) were asked for the main reasons for choosing to register, with results shown in Figure 10.7:

Back to Contents
127 10.0 Apprenticeships Part 2 – Engineering in Education and Training
The comprehensive set of recommendations generated through this project have the potential, if adopted and executed in a coordinated manner by the appropriate organisations, to progressively and significantly increase the number of registered EngTechs in the workforce. The Engineering Council is currently in talks with the PEIs to agree how these actions can be taken forward. If successful, the result could see the membership profiles of many PEIs being radically different to present profiles, with the number of registered technician members matching those for Incorporated and Chartered members.
Collaboration in promoting technician registration
The UK’s three largest PEIs have formed a partnership to significantly increase the EngTech population within their disciplines. The Institution of Civil Engineers (ICE), Institution of Mechanical Engineers (IMechE) and the Institution of Engineering and Technology (IET) will promote technician membership and professional registration to those entering the skills pipeline as well as those already employed. The key aims are to achieve 100,000 registered EngTechs by 2018, and to establish a valued membership product so that technician registration and membership becomes the norm for those entering the profession.
A number of other institutions are already in the process of developing activities to raise the profile of technicians.
Fig.10.7: Engineering technicians view of EngTech registration
Source: Engineering Council
10.0
%
40.0
%
60.0
%
100.
0%
50.0
%
80.0
%
20.0
%
70.0
%
90.0
%
30.0
%
I wanted to enhance my status within my company/industry
I wanted to be able to use the EngTech title
I wanted to improve my career prospects/employability
I wanted recognition of my skill and competence
I wanted to stay up to date with latest industry
I wanted to develop my learning and skill set
It was paid for by my employer
I was encouraged to by my employer
I wanted to be able to access additional resources
It was valued by my employer
It was an integral part of my apprenticeship/training
I wanted to develop a support network
I received a cash incentive to register
It’s just what everyone does/matter of course
I wanted to feel a sense of belonging
0.0%
5%
45%
87%
77%
69%
62%
38%
27%
23%
22%
15%
11%
11%
6%
6%

Back to Contents
666 Engineering UK 2013 The state of engineering, EngineeringUK, December 2012, p100 667 Website accessed on 12 July 2013 (http://www.bbc.co.uk/news/education-23261287) 668 Website accessed on 12 July 2013 (http://www.bbc.co.uk/news/education-23261287) 669 Only students domiciled in England or in EU countries outside the UK were eligible for these loans 670 Student Support for Higher Education in England, Academic Year 2012/13 (Provisional), Department for Business, Innovation and Skills, 29 November 2012, p3 671 Student Support for Higher Education in England, Academic Year 2012/13 (Provisional), Department for Business, Innovation and Skills, 29 November 2012, p3 672 Engineering UK 2013 The state of engineering, EngineeringUK, December 2012, p100
Part 2 – Engineering in Education and Training Higher Education 11.0 128
To support students in England faced with tuition fees, the UK Government made tuition fee loans of £2.8 billion in 2011/12, on behalf of 883,200 students.669 670
As well as taking out a loan for tuition fees, HE students were also able to take out a maintenance loan of £3,670 in 2011/12. Overall, £3.3 billion was distributed to students as maintenance loans.671 The loans will be repayable at the rate of 9% of earnings over £21,000. Full-time students start repaying their loans after graduation. Part-time students, however, will start repaying their loans while studying if they earn over £21,000.672
Scotland and Wales have different tuition fee systems to England. Table 11.0 shows their respective fee levels, depending on where the student is domiciled and where they were studying in 2012/13. The devolved Governments also have alternative ways of supporting students into Higher Education. These are detailed in Table 11.0.
Part 2 – Engineering in Education and Training11.0 Higher Education
The Higher Education (HE) sector is going through considerable change, particularly in England.666 In 2012/13, students entering English Higher Education Institutions (HEIs) were charged up to £9,000 per year in course fees. For 2014/15 entry, nearly three quarters of HEIs are planning to charge this maximum course fee for some or all of their courses,667 with the average course fee being around £8,650.668

Back to Contents
673 The funding environment for universities – an assessment, UniversitiesUK, May 2013, p8 674 Higher Education in England – Impact of the 2012 reforms, HEFCE, March 2013, p26 675 Engineering UK 2013 The state of engineering, EngineeringUK, December 2012, p100 676 According to HEFCE in 2011/12 a fifth of all A level applicants achieved an AAB grade 677 Engineering UK 2013 The state of engineering, EngineeringUK, December 2012, p100 678 Students outside the student number control in 2013-14, Department for Business, Innovation and Skills, November 2012, p1 679 Higher Education in England – Impact of the 2012 reforms, HEFCE, March 2013, p41 680 Student numbers for 2012-13, HEFCE, October 2011, p2 681 Higher Education in Science, Technology, Engineering and Mathematics (STEM) subjects, House Of Lords Select Committee on Science and Technology, July 2012, p37 682 Website accessed on 12 July 2013 http://www.bbc.co.uk/news/education-20464013 683 Website accessed on 17 September 2013 http://www.timeshighereducation.co.uk/news/liverpool-school-gets-hei-status/2006023.article 684 Website accessed on the 17 September 2014 http://www.bbc.co.uk/news/education-23605046 685 Press release, Department for Business, Innovation and Skills, 27 November 2012 686 Higher Education in England – Impact of the 2012 reforms, HEFCE, March 2013, p9 687 Higher Education in England – Impact of the 2012 reforms, HEFCE, March 2013, p4 688 Subject to regulated fees 689 Higher Education Funding for 2013/14, Department for Business, Innovation and Skills, 11 January 2013, p2
129 11.0 Higher Education Part 2 – Engineering in Education and Training
There is a concern that fear of debt can affect the choices made by students who are going to university. In particular, students from low income households are more likely to choose a university which allows them to live near home and to work during term time. Potentially, this could lead to them making compromises on which course is best for them or influence the amount of part-time work they take on, which could impact on their educational attainment.674 In the Engineering UK Report 2013675 we showed that students tend to underestimate the level of financial support they are eligible for and make key decisions based on very limited data.
The academic year 2012/13 saw the introduction in England of unrestricted recruitment of high achieving students (those achieving AAB or above at A level, or certain equivalent qualifications),676 with HE institutions competing to recruit these students.677 From 2013/14 onwards, this will be lowered to ABB grades.678 Unrestricted recruitment of ABB grade students will mean that around one third of student places will be contestable between institutions.
The Government also introduced 20,000 margin places in 2012/13. These were for institutions that combined good quality teaching with value for money. Of these 20,000 margin places, nearly half (9,643) were allocated to 35 HE institutions, while the remaining 10,357 places
were allocated to 155 Further Education (FE) Colleges. However, this policy initiative seems to have been less successful than planned: HE institutions have reporting that more than 4,000 of their margin places are unfilled, while for FE Colleges it is around 2,700.679 The likely reason for this under recruitment is institutions not being informed that they had been allocated margin places until after the January deadline for UCAS applications. In 2013/14, an additional 5,000 places are being allocated through the margin scheme.
The Government and the Higher Education Funding Council for England (HEFCE) have both recognised the potential impact of these fee arrangements on strategically important and vulnerable subjects (SIVS), of which engineering is one. HEFCE has therefore excluded numbers associated with SIVS from its calculation to create ‘margin’ places, on condition that the institutions at least maintain their entrant levels to SIVS courses.680 This is critical for the engineering sector. As the House of Lords Select Committee on Science and Technology681 stated: “It appears that the SIVS policy has been, at least partly, responsible for raising the numbers studying SIVS.”
In addition to introducing contestable and margin places, the Government has also introducing competition into the HE sector by changing the criterion for university status. In the
Engineering UK Report 2013, we examined the criterion for university status changing from 4,000 students to 1,000 students, of whom only 750 must be studying for a degree. The Government has also made it easier for new universities to open and given degree-awarding powers to some FE Colleges. As a result of these changes, 11 new Higher Education Institutions were announced: ten in November 2012682 and one in July 2013:683
• Arts University College at Bournemouth
• Bishop Grosseteste University College Lincoln
• Harper Adams University College
• Leeds Trinity University College
• Newman University College, Birmingham
• Norwich University College of the Arts
• Royal Agricultural College
• University College Birmingham
• University College Falmouth
• University College Plymouth St. Mark & St. John
• The Liverpool School of Tropical Medicine
In addition, BPP University College of Professional Studies has become BPP University, the UK’s second For Profit university.684
All of these changes represent the single biggest creation of universities since 1992.685
With such radical changes in the HE sector having taken place, it is important to consider the impact this has had on applications to HE. Analysis by HEFCE686 shows that the number of 18-year-olds applying for university has remained stable since 2010, even though the cohort has declined by 7-8%. But there is a significant gap in the number of applications between male and female students. Female students aged 18 are a third more likely to apply to HE than their male counterparts.687
Taking together the HEFCE recurrent grant for teaching and the estimated fee income from students,688 the resource for teaching could rise from some £8 billion in 2012/13 to almost £8.7 billion in 2013/14 and almost £9.1 billion in 2014/15.689 However, in these uncertain economic times, universities are also continuing to look to alternative sources of income.
Table 11.0: Fee arrangements across the UK (2012/13)
Source: Universities UK673
Students domiciled in England Wales Scotland Northern Ireland
EnglandVariable fee up to
£9,000Variable fee up to
£9,000Variable fee up to
£9,000Variable fee up to
£9,000
Wales
Variable fee up to £9,000(with fees
above £3,575 paid by the Welsh
Government)
Variable fee up to £9,000(with fees
above £3,575 paid by the Welsh
Government)
Variable fee up to £9,000(with fees
above £3,575 paid by the Welsh
Government)
Variable fee up to £9,000(with fees
above £3,575 paid by the Welsh
Government)
ScotlandVariable fee up to
£9,000Variable fee up to
£9,000No fees
Variable fee up to £9,000
Northern IrelandVariable fee up to
£9,000Variable fee up to
£9,000Variable fee up to
£9,000Variable fee up to
£3,465
EU
Fees as for English student
studying in England
Fees as for Welsh student
studying in Wales
Fees as for Scottish student
studying in Scotland
Fees as for Northern Irish
student studying in Northern Ireland

Back to Contents
690 International Students and Net Migration in the UK, IPPR, April 2012, p3 691 International Students and Net Migration in the UK, IPPR, April 2012, p3 692 Postgraduate Education – An Independent Inquiry By The Higher Education Commission, Higher Education Commission, p38 693 Parliamentary briefing – Budget 2013: what does it mean for universities?, UniversitiesUK, 21 March 2013, p3 694 Estimating the value of UK education exports, Department for Business, Innovation and Skills, June 2011, p9 695 Website accessed on 12 July 2013 https://www.gov.uk/government/news/new-team-to-help-uk-exploit-international-opportunities-in-education-exports 696 Website accessed on 30 July 2013 http://www.fenews.co.uk/fe-news/international-education-strategy-eyes-3bn-growth 697 Engineering UK 2013 The state of engineering, EngineeringUK, December 2012, p102 698 Final Report: Cost and benefit analysis project on immigration regulation, Higher Education Better Regulation Group, 11 July 2013, p3 699 Postgraduate education in England and Northern Ireland – Overview report 2013, HEFCE, July 2013, p47 700 Website accessed on 12 July 2013 http://www.bbc.co.uk/news/education-23261287 701 Higher Education in England – Impact of the 2012 reforms, HEFCE, March 2013, p11 702 Postgraduate education in England and Northern Ireland – Overview report 2013, HEFCE, July 2013, p4 703 Postgraduate education: better funding and better access. CentreForum, June 2013, p5 704 Website accessed on 29 July 2013 https://www.gov.uk/government/news/75-million-investment-in-removing-barriers-to-postgraduate-study
Part 2 – Engineering in Education and Training Higher Education 11.0 130
The OECD identified that almost 3.7 million tertiary students were enrolled for education in a country outside their home nation in 2009, which represents 6% growth on the previous year.690 The UK is the second largest provider of international education behind America,691 although the UK’s recruitment of international research students is becoming concentrated in a small number of countries, which carries risk if there is a shock in one of these key feeder countries.692
Universities UK has estimated that UK HE exports were worth £8 billion to the UK in 2009, and predicted that by 2025 this could more than double to £17 billion.693 Separately, the Department for Business, Innovation and Skills (BIS)estimated that total value of UK education exports in 2010 would be £14.7 billion,694 with the potential to reach £27 billion by 2025.695 The Government has also developed an International Education strategy designed to secure an addition £3 billion in education exports by 2020.696 Figure 11.0 shows that between 1994/95 and 2009/10, income from non-EU students has increased from £445 million to £2.6 billion.
However, as we showed in the Engineering UK Report 2013,697 changes to the UK visa system for students do raise concerns about the continued success of UK HE Institutions in recruiting international students. The Higher Education Better Regulation Group has also identified that in 2012/13 the cost to the HE sector of complying with Tier 4 visa regulations was around £67 million.698
Another potential revenue source for universities is postgraduate students. Research has shown that in 2011/12, fees for postgraduate-taught courses ranged from £2,970 to £33,100, with MBAs costing as much as £53,900. However, these very expensive courses are outliers. The median standard fee was £4,605 and 50% of institutions charged a fee between £3,500 and £4,500699 which is considerably less than the £8,650700 average fee for undergraduate students. Fees for postgraduate research courses seem to be based on the level set by Research Councils UK, which is around £3,800, despite the concern that these courses need to be subsidised from other sources of income.701
It is also worth noting that research by HEFCE702 has shown that most postgraduate-taught students have no financial backing and so have to finance the studies themselves or via loans.
Take-up rates for the Professional and Career Development Loan scheme, which the Government underwrites, has been very poor. Fewer than 3% of home students in starting a postgraduate course in 2010 secured one of these loans.703 To try and remove barriers to
postgraduate study, the Government has introduced a £125 million scheme to support students from disadvantaged backgrounds.704
“Massive open online courses” (MOOC) is a new trend in HE, which has the potential to disrupt
Fig. 11.0: HE income and student numbers (1994/95-2009/10) – all non-EU students
Source: Universities UK
0
100,
000
HEI income from fees Non-EU student numbers
£ million, cash termsAcademic years
Non-EU student numbers
0 500
1,00
0
1,50
0
£455m
£507m
£622m
£636m
£672m
£746m
£875m
£1,085m
£1,275m
£1,396m
£1,499m
£1,713m
£1,880m
£2,200m
£2,580m
50,0
00
150,
000
200,
000
250,
000
300,
000
2,00
0
2,50
0
3,00
0
1994/95
1995/96
1996/97
1997/98
1998/99
1999/00
2000/01
2001/02
2002/03
2003/04
2004/05
2005/06
2006/07
2007/08
2008/09
2009/10
£563m

Back to Contents
131 11.0 Higher Education Part 2 – Engineering in Education and Training
705 Massive Open Online Courses – Higher Education’s digital moment, UniversitiesUK, May 2013, p7 706 Massive Open Online Courses – Higher Education’s digital moment, UniversitiesUK, May 2013, p7 707 Massive Open Online Courses – Higher Education’s digital moment, UniversitiesUK, May 2013, p7 708 Massive Open Online Courses – Higher Education’s digital moment, UniversitiesUK, May 2013, p7 709 Website accessed on the 15 July 2013 http://www.bbc.co.uk/news/education-22368498 710 Website accessed on 18 September 2013 http://www.bbc.co.uk/news/business-24109190 711 Website accessed on 15 July 2013 http://www.bbc.co.uk/news/education-22368498 712 www.engc.org.uk/engineering-gateways
the traditional HE model. MOOCs have expanded rapidly since 2008. They use the low cost of online technology, peer-learning networks and a dispersed network of participants to deliver HE.705 In September 2011, three standard Engineering Everywhere courses showed the potential of MOOCs to deliver low-cost, high-volume courses via the internet.706 Each of these courses attracted over 100,000 students.707 To date, most MOOC courses have been adult learning short courses but the MOOC sector is evolving rapidly.708 Indeed, the University of Edinburgh has included elements from Coursera (an MOOC provider founded by Academics at Stanford University)709 into one of its courses, while FutureLearn will have 21 UK universities (plus Trinity College Dublin and Monash University) offering courses with other organisations such as the British Library providing materials for students.710 The potential for MOOCs to disrupt the current HE model can be seen from the fact that Coursera signed up more two million students in its first year alone.711
Finally, as the box highlights, the HE sector also caters for the up-skilling of the existing workforce, which in turn supports employee’s routes into professional recognition.
Engineering Gateways: a work-based learning route to professional registration
For engineers already in the workplace, the return to full-time Higher Education can often be too difficult. So over recent years, greater emphasis has been placed on work-based learning progression routes through Higher Education and ultimately, to professional registration.
It is not only individuals who seek work-based learning pathways: employers are increasingly seeking and investing in tailored solutions that meet business needs, and also demonstrate commitment to the professional development of their current and future staff, securing a talent pipeline for the future.
Engineering Gateways712 was developed to meet these needs. It is a flexible, work-based pathway to professional registration, aimed specifically at working engineers without the full exemplifying academic qualifications for professional registration.
The programme is delivered through a learning contract approach between the employer, employee, university and Professional Engineering Institution (PEI) and is often based on a piece of work specifically required by the employer. Successful completion leads to the award of an appropriate academic qualification (Masters or Bachelors degree) and demonstration of the required competencies for professional registration, as outlined in the UK Standard for Professional Engineering Competence (UK-SPEC). The candidate is thus eligible to apply for a Professional Review Interview for Incorporated Engineer or Chartered Engineer status with a participating PEI.
Employer benefits
• A flexible and cost-effective way of meeting company and employee aspirations, without losing engineers from the workplace.
• A structured learning programme tailored to the needs of the employer.
• Results in an increased number of in-company professionally qualified engineers.
• Relationship with a university or college and the potential for knowledge exchange.
• Well qualified professional engineers provide a significant commercial advantage. Increasingly, tendering or post-tender contract compliance, both in the UK and internationally, requires key members of the project team to be professionally qualified.
Employee benefits
• A workplace pathway to achieving academic qualifications, which lead to Incorporated or Chartered status.
• Learning and the development of professional competence are linked to workplace activities.
• ‘Learning whilst earning’ means no loss of income.
• Support and mentoring.
• Better promotion prospects.
• Increased job satisfaction.
The Engineering Gateways framework originally sought to increase the opportunities for integration of education and supervised training and development leading to professional registration. From an initial four universities and three PEIs in December 2006, the programme has grown to 12 universities and 18 PEIs, and over 135 learning contracts agreed to date for individuals working towards registration as Incorporated and Chartered Engineers.
An original aspiration of the programme to “offer an attractive progression route for those on Advanced Apprenticeships who need help progressing to professional registration” remains true. With heightened interest in apprenticeships, the Engineering Council is now seeking to develop the model to support the development and professional recognition of these learners for the benefit of their employers.

Back to Contents
713 This list excludes foreign HE institutions operating in the UK 714 There are also a significant number of Further Education Colleges at which HE students study 715 Institutions with ‘university’ title. Federal institutions such as the University of Wales and the University of London are counted as one University 716 The term Higher Education Institutions includes universities, university colleges, specialist HHigher Education Institutions and other Higher Education colleges 717 Engineering UK 2013 The state of engineering, EngineeringUK, December 2012, p102 718 Higher Education in England – Impact of the 2012 reforms, HEFCE, March 2013, p48 719 A real terms fall in income occurred as the percentage increase in funding, was below the level of inflation 720 University Challenge: How Higher Education Can Advance Social Mobility A progress report by the Independent Reviewer on Social Mobility and Child Poverty, Rt. Hon. Alan Milburn, October 2012, p23 721 Due to the changes in institutions with HE status the 2010/11 data is not 100% comparable to the 2011/12 data
11.1 HE sectorTable 11.1 provides an overview of the distribution of universities and HE institutions in the UK. As of August 2011, there were 115 universities and 165 HE institutions. Of these, 89 universities and 131 HE institutions are located in England. Scotland has the second largest number of institutions – 14 and 19 respectively – while Northern Ireland has the smallest number of institutions. However, as already mentioned, ten new unviersities were announced in November 2012 that are not in the table below.
Table 11.1: Overview of the HE sector (August 2011) – UK713 714
Source: Universities UK
In last year’s report,717 we showed the importance of HE in FE, with 38% of HE entrants going to colleges. Indeed, HE in FE is very important to the HE sector: in 2009/10 in England, 14,320 HE engineering students were studying in an FE college, in addition to the 9,280 level 3+ apprenticeship achievements in the three engineering-related frameworks. However, provision of HE in FE is very unevenly distributed, with 50-60 colleges out of a total 300 or so colleges accounting for half of all provision. FE colleges could therefore provide an important route into expanding engineering provision.
Table 11.2 provides a breakdown of funding and expenditure for publicly-funded HE institutions in 2010/11 and 2011/12. The table shows that in 2011/12 total income was £27.9 billion, an increase of £399 million on the previous year. As a percentage however, this was only a 1.4% increase, meaning that for the first time since 1994/95 the sector saw a real-terms fall in total income.718 719
Table 11.2 also shows that the importance of tuition fees and education contracts as a source of income has increased over the last year. In 2010/11, this represented 32.6% of all income. In 2011/12, this rose to 34.7%. Conversely, the importance of funding body grants as a source of income declined over the same time period. In 2010/11, funding body grants represented a third (32.2%) of income but a year later this had declined to 29.6%.
In 2011/12, other income represented 18.6% of income, which was similar to last year. Research grants and contracts were also broadly similar (16.2% in 2011/12 compared with 16.1% in 2010/11). Endowments and other investment income contribute the least income, generating only 1.0% in 2011/12.
It has been reported that of the 31 countries in the OECD, only six spend less than the UK on HE, as a percentage of their national wealth.720
Examination of the expenditure breakdown shows that over half (55.5%) of all expenditure is on staffing costs, although this percentage has decreased from 56.2% in the previous year. Other operating expenses account for the second-largest source of expenditure, representing over a third of the total expenditure in each year (36.7% in 2010/11 and 37.3% in 2011/12). The percentage of all expenditure represented by depreciation (5.8%) and interest and other finance costs (1.4%) has barely changed from 2010/11.
Part 2 – Engineering in Education and Training Higher Education 11.0 132
Universities715 Higher
Education Institutions716
England 89 131
Scotland 14 19
Wales 10 11
Northern Ireland 2 4
UK 115 165
Table 11.2: Total income and expenditure by source of income and category of expenditure (2009/10-2010/11) – UK721
Source: HESA finance table
Total in
thousand £ 2010/11
Percentage of 2010/11
total
Total in thousand £
2011/12
Percentage of 2011/12
total
One year change in
thousand £
One year percentage
change
Income
Funding body grants
8,865,958 32.2% 8,270,989 29.6% -594,969 -6.7%
Tuition fees and education contracts
8,979,964 32.6% 9,676,459 34.7% 696,495 7.8%
Research grants and contracts
4,435,783 16.1% 4,509,715 16.2% 73,932 1.7%
Other income 5,000,775 18.2% 5,180,126 18.6% 179,351 3.6%
Endowment and investment income
240,926 0.9% 285,027 1.0% 44,101 18.3%
Total income 27,523,406 27,922,316 398,910 1.4%
Expenditure
Staff costs 14,728,278 56.2% 14,808,923 55.5% 80,645 0.5%
Other operating expenses
9,626,469 36.7% 9,950,643 37.3% 324,174 3.4%
Depreciation 1,478,023 5.6% 1,543,750 5.8% 65,727 4.4%
Interest and other finance costs
372,657 1.4% 381,413 1.4% 8,756 2.3%
Total expenditure 26,205,427 26,684,729 479,302 1.8%

Back to Contents
722 Higher Education in England – Impact of the 2012 reforms, HEFCE, March 2013, p48 723 Adapting business models in a changing environment, UniversitiesUK, 9 July 2010, p4 724 The Economic Impacts of Scottish Universities, Scottish Enterprise, 2012, p3 725 The Economic Impacts of Scottish Universities, Scottish Enterprise, 2012, p3 726 University Challenge: How Higher Education Can Advance Social Mobility A progress report by the Independent Reviewer on Social Mobility and Child Poverty, Rt. Hon. Alan Milburn, October 2012, p15 727 Sir Andrew Witty’s Independent Review Of Universities And Growth, Department of Business, Innovation and Skills, July 2013 728 Higher Education in England – Impact of the 2012 reforms, HEFCE, March 2013, p8 729 Postgraduate Education – An Independent Inquiry by The Higher Education Commission, Higher Education Commission, p13 730 Higher Education in England – Impact of the 2012 reforms, HEFCE, March 2013, p3
Analysis by HEFCE shows that the sector is in reasonable financial health and that no institutions are likely to face insolvency in the short term. However, some institutions will face difficulties if they experience repeated falls in student recruitment.722
Investment in HE education provides a very good return. Research by Universities UK shows that the UK HE sector contributes £59 billion to the UK economy, more than double the investment made into it.723 In addition, for every 100 jobs within universities, a further 100 jobs are created outside of universities,724 and that for every £1 million of university ‘output’ a further £1.38 million is generated.725 HE also provides benefits to the UK in other ways. Analysis has identified that universities contribute £1.3 billion to the UK economy through improved outcomes in terms of health, politcal engagement and the building of trust.726 Through the Witty Review,727 the Government is trying to increase the impact universities have on their local economies.
11.2 Participation ratesIn 2011/12, the provisional Higher Education Initial Participation Rate (HEIPR) for English-domiciled first time students was 49.3% (Table 11.3). Looking at the actual number of students shows that the number rose from 325,000 in 2010/11 to 342,000 in 2011/12. This is probably a result of far fewer students deferring their entry to HE in the 2011 UCAS cycle728 so that they started their degree before the new fee regime came into effect.
Looking at male students shows that the participation rate has increased each year since 2006/07, rising from just over a third (37.8%) to nearly half (44.8%) in 2011/12. The female participation rate has also increased, but from a much higher base. In 2006/07, the participation rate ranged from just under half (47.9%) to over half (55.2%).
Full-time participation rates have increased each year from 2006/07. After only a marginal increase in 2010/11, the participation rate jumped three percentage points in 2011/12 to 43.3%.
Conversely, the part-time participation rate has declined from 6.6% in 2006/07 to 6.0% in 2011/12. There has been a decline each year apart from 2008/09, when the participation rate remained level with the previous year. Part-time students participating in an inquiry by The Higher Education Commission cited problems with finding a course they wanted to study on a flexible basis and timetabling as particular issues.729
With entrants to part-time undergraduate courses in England falling by 105,000 since 2010/11, part-time participation rates are an area for concern.730
The Scottish Funding Council also publishes HEIPR statistics for Scotland, although the age range for Scotland is 16-30 compared with 17-30 for England. Over six years, the HEIPR rate for Scotland has increased from 53.2% to 56.1%, although there was a decline in
2007/08 (Table 11.4). However, although the percentage participation rate increased in 2010/11 and 2011/12, there was a slight decline in the actual number of students entering HE.
The Male HEIPR rate for Scotland was 46.9% in 2006/07, rising to 49.8% in 2011/12. However, in each year the male participation rate was at least 10 percentage points behind the female rate which, over the same time period, has risen from 59.8% to 62.7%.
The full-time HEIPR rate in Scotland is nearly half (47.8%). There has been a steady rise in the HEIPR since 2007/08. By comparison, there has been much more fluctuation in the part-time HEIPR, although part-time participation has declined for each of the last three years. As a result, the part-time participation rate has fallen from 9.0% in 2006/07 to 8.3% in 2011/12.
133 11.0 Higher Education Part 2 – Engineering in Education and Training
Table 11.3: First time participation rates for 17- to 30-year-old students at UK Higher Education Institutions (2006/07-2011/12) – English domiciled
Source: Department for Business, Innovation and Skills
Academic year 2006/07 2007/08 2008/09 2009/10 2010/11 2011/12 (provisional)
HEIPR (male and female) %
42.5 43.7 45.7 46.3 46.4 49.3
Initial entrants (thousands)
284 294 312 322 325 342
HEIPR (male) % 37.8 38.9 40.7 41.5 41.9 44.8
Initial entrants (thousands)
127 132 141 146 149 158
HEIPR (female) % 47.9 48.9 50.6 51.9 52.6 55.2
Initial entrants (thousands)
157 162 171 176 176 184
HEIPR (full-time) %
35.9 37.4 39.3 40.1 40.3 43.3
Initial entrants (thousands)
239 251 268 279 281 299
HEIPR (part-time) %
6.6 6.3 6.3 6.2 6.1 6.0
Initial entrants (thousands)
45 43 44 43 44 43

Back to Contents
Figure 11.1 shows the HEIPR rate by gender for English- and Scottish-domiciled students for five years. In both countries, the female HEIPR rate is consistently higher than the comparable male rate, but the participation rate for male students in Scotland is only just behind that of female students in England.
Wales and Northern Ireland do not produce participation statistics in the same way as England and Scotland. It is therefore not possible to compare participation rates between these countries. The national participation rate for Welsh-domiciled students in 2006/07 was 3.7.731 732 The figure was higher for females, at 4.3, than it was for males, at 3.1. These figures have remained unchanged since 2004/05. The provisional 2009/10 Higher Education age participation index for Northern Ireland was 50.7%.733 This was a sizeable increase from 48.2% the previous year and more than double the 24.6% achieved in 1989/90.
Part 2 – Engineering in Education and Training Higher Education 11.0 134
Table 11.4: First time participation rates for 16- to 30-year-old students at UK Higher Education Institutions (2006/07-2011/12) – Scottish domiciled
Source: Scottish Funding Council
Academic year 2006/07 2007/08 2008/09 2009/10 2010/11 2011/12 (provisional)
HEIPR (all) % 53.2 52.0 54.2 55.6 55.6 56.1
Initial entrants (thousands)
34,880 34,173 36,085 37,379 37,274 37,155
HEIPR (male) % 46.9 44.7 47.6 49.3 49.8 49.8
Initial entrants (thousands)
15,775 15,059 16,214 16,958 17,075 16,831
HEIPR (female) % 59.8 59.7 61.2 62.2 61.6 62.7
Initial entrants (thousands)
19105 19113 19871 20421 20199 20324
HEIPR (full-time) %
44.2 43.5 44.7 46.7 47.0 47.8
Initial entrants (thousands)
29,067 28,522 29,715 31,310 31,383 31,482
HEIPR (part-time) %
9.0 8.6 9.5 9.0 8.6 8.3
Initial entrants (thousands)
5,813 5,651 6,370 6,069 5,891 5,673
Fig. 11.1: Higher Education participation rates by gender (2006/07-2010/11) – English and Scottish domiciled
Source: Scottish Funding Council
2006
/07
30.0%
70.0%
2007
/08
2008
/09
2009
/10
2010
/11
40.0%
50.0%
60.0%
HEIPR (male) %England
HEIPR (female) %England
HEIPR (male) %Scotland
HEIPR (female) %Scotland
731 Participation rates for Welsh students in Higher Education within the UK during 2006/07, HEFCW, June 2009 732 The Welsh participation data is based on a percentage of the whole population rather than a percentage of an age cohort. 733 Higher Education age participation index for Northern Ireland – 1989/90 to 2009/10, Department for Employment and Learning, June 2011

Back to Contents
Table 11.5 shows the postgraduate participation rate for English-domiciled 17- to 30-year-olds in the UK. It shows that in 2009/10, participation reached a high point of 9.7%. This has been followed by two years of decline and the participation rate is now 8.8% (although this is still above the 8.6% recorded in 2006/07). In 2011/12, the participation rate for males was 7.0% – below the 10.7% for women.
The full-time particpation rate has fluctuated over the period, but reached 6.4% in 2011/12, exceeding the 2006/07 rate of 5.8%. By comparison, the part-time participation rate has declined in the last two years and, at 2.4% in 2011/12, was below the rate recorded in 2006/07 (2.8%).
135 11.0 Higher Education Part 2 – Engineering in Education and Training
Table 11.5: Postgraduate participation rates for 17- to 30-year-old students at UK Higher Education Institutions (2006/07-2011/12) – English domiciled
Source: Department for Business, Innovation and Skills
Academic year 2006/07 2007/08 2008/09 2009/10 2010/11 2011/12 (provisional)
PGIPR (male and female) %
8.6 8.2 8.8 9.7 9.1 8.8
Initial entrants (thousands)
59 57 61 68 65 64
PGIPR (male) % 6.8 6.5 6.9 7.9 7.2 7.0
Initial entrants (thousands)
23 23 24 28 26 26
PGIPR (female) % 10.6 9.9 10.7 11.6 11.1 10.7
Initial entrants (thousands)
36 34 37 41 39 39
PGIPR (full-time) %
5.8 5.5 5.8 6.6 6.3 6.4
Initial entrants (thousands)
40 38 40 47 45 47
PGIPR (part-time) %
2.8 2.6 3.0 3.0 2.8 2.4
Initial entrants (thousands)
19 18 21 22 20 18

Back to Contents
734 UCAS applicants are those who apply to full-time, undergraduate Higher Education courses (first degrees, HNC/HNDs etc) offered by universities or colleges who are members of the UCAS scheme. Some applicants, predominantly international, apply directly without going through UCAS 735 Higher Education in England – Impact of the 2012 reforms, HEFCE, March 2013, p8 736 2013 cycle applicant figures – January deadline, UCAS, January 2013, p1 737 Higher Education in England – Impact of the 2012 reforms, HEFCE, March 2013, p9
11.3 Applicants and accepted applicants to STEM HE courses
11.3.1 Applicants to undergraduate STEM HE courses734
Table 11.6 shows the ten-year trend (2002/03-2011/12) for applicants to all subjects and also STEM subjects. The table shows that over this period, applicants to all subjects have risen by 37.2%, although there was a decline in the last year of 6.6%. Whilst we can state the size of the fall definitively, the reasons are less defined. It is likely that the introduction of higher tuition fees may have had a direct impact on applications. In 2011/12, the number of EU applicants and UK applicants fell by 12.4% and 7.6% respectively, while non-EU applicants rose by 6.8%.
As previously mentioned, much of this decline can be attributed to fewer students deferring their entry in the 2011 UCAS application cycle.735 The picture for 2012/13 is more positive: UCAS reported an increase in applicants of 3.5% by the January 2013 deadline, with UK applicant numbers up by 2.8%.736 It is also important to note that around one in ten full-time undergraduates apply directly to universities and colleges, and that around 40% of applicants to Further Education Colleges also apply directly, meaning that their applications are not captured in the UCAS statistics.737
The applicants data also shows that just over half (56.4%) of all applicants were female. This was a slight rise on the previous year (0.5%), but over ten years the proportion of female applicants has risen by 5.8%.
Looking at UK applicants, there was a decline in numbers for each STEM subject area in 2011/12. The STEM subject with the lowest one-year decline in UK applicant numbers was physical sciences (down 1.9%). Physical sciences also showed a one-year decline for applicants from the EU (down 4.5%). However, non-EU applications showed strong growth. These rose by 18.2%, meaning the overall decline was just 1.0%.
Applicant number for physical sciences have increased for all domicile areas over ten years. EU applications have risen the most (173.6%), followed by non-EU (119.4%) and UK-domiciled (42.3%).
Around a third (37.0%) of applicants to physical sciences in 2011/12 were female. This is a decrease of 1.6% on the previous year. Over ten years, the proportion of female applicants has decreased by 4.4%.
The subject area that showed the largest decline in UK applicant numbers in the last year was mathematical and computer sciences, which fell by 8.2%. It was also the only STEM subject area to show a decline over ten years for UK applicants (down 2.4%). Over ten years, applicants to mathematical and computer sciences has risen by a fifth (20.2%) and this has been driven by a 175.8% increase in EU applications. Over the same time period, non-EU applications fell by 13.6%.
The number of female applicants grew by 4.1% over ten years. However in 2011/12, the number of female applicants fell by 10.9%, following five years of continuous growth.
Biological sciences has the largest percentage of female applicants. Over ten years, consistently over half of applicants to this subject were female, ranging from 60.9% in 2002/03 to 56.7% in 2009/10 and 2010/11. In 2011/12, there was a slight shift, with the proportion of female applicants rising to 57.0%.
Over ten years, the number of applicants to biological sciences has increased by 34.8%, with growth occurring in all three domiciles. Growth was strongest among EU applicants (up 177.8%), followed by non-EU applicants (up 85.4%). The lowest percentage growth was for UK applicants, increasing by 27.9%. Within the last year, applicant numbers decreased by 4.5%, with UK numbers down by 5.7% and EU numbers down by 1.1%. By comparison, non-EU applicant numbers increased by 14.3%.
Applications to engineering have increased by 41.7% over ten years. However, they fell by 2.7% in the last year. This was driven by a decrease in UK applications (down 4.3%) and EU applications (down 14.0%). By comparison, non-EU applications rose by 7.1%.
Overall in 2011/12, females made up 13.0% of all applicants to engineering – a slight improvement on 2002/03, when the comparable figure was 11.2%.
Technology is the smallest of the STEM subject areas with just 1,891 applicants in 2011/12. This was a fifth (21.9%) down on 20110/11. However over ten years, applicant numbers have risen by 35.9%, with numbers of EU applicants rising by two thirds (69.5%) and UK applicants by a third (37.5%), compared with 8.8% for non-EU applicants.
Part 2 – Engineering in Education and Training Higher Education 11.0 136

Back to Contents
137 11.0 Higher Education Part 2 – Engineering in Education and Training
Table 11.6: Applicants to STEM HE courses by domicile (2002/03-2011/12)
2002/03 2003/04 2004/05 2005/06 2006/07 2007/08 2008/09 2009/10 2010/11 2011/12 Change over one
year
Change over 10
years
Biological sciences
UK 31,734 30,654 32,537 31,172 32,923 34,903 37,037 41,895 43,016 40,581 -5.7% 27.9%
EU 1,046 1,355 1,510 1,727 1,784 1,752 2,086 2,658 2,939 2,906 -1.1% 177.8%
Non-EU 1,362 1,492 1,567 1,383 1,421 1,454 1,682 1,920 2,210 2,525 14.3% 85.4%
Total 34,142 33,501 35,614 34,282 36,128 38,109 40,805 46,473 48,165 46,012 -4.5% 34.8%
All female applicants
20,789 20,425 21,339 20,484 21,663 22,615 23,803 26,343 27,291 26,220 -3.9% 26.1%
Percentage female applicants
60.9% 61.0% 59.9% 59.8% 60.0% 59.3% 58.3% 56.7% 56.7% 57.0% 0.5% -6.4%
% non UK 7.1% 8.5% 8.6% 9.1% 8.9% 8.4% 9.2% 9.9% 10.7% 11.8% 10.3% 66.2%
% non-EU 4.0% 4.5% 4.4% 4.0% 3.9% 3.8% 4.1% 4.1% 4.6% 5.5% 19.6% 37.5%
Physical sciences
UK 12,642 12,200 13,159 13,246 14,168 14,826 15,637 17,178 18,336 17,993 -1.9% 42.3%
EU 416 432 479 561 692 708 860 1,070 1,191 1,138 -4.5% 173.6%
Non-EU 608 649 746 692 707 880 961 1,113 1,145 1,334 16.5% 119.4%
Total 13,666 13,281 14,384 14,499 15,567 16,414 17,458 19,361 20,672 20,465 -1.0% 49.8%
All female applicants
5,284 5,091 5,602 5,657 6,068 6,519 6,886 7,515 7,773 7,579 -2.5% 43.4%
Percentage female applicants
38.7% 38.3% 38.9% 39.0% 39.0% 39.7% 39.4% 38.8% 37.6% 37.0% -1.6% -4.4%
% non UK 7.5% 8.1% 8.5% 8.6% 9.0% 9.7% 10.4% 11.3% 11.3% 12.1% 7.1% 61.3%
% non-EU 4.4% 4.9% 5.2% 4.8% 4.5% 5.4% 5.5% 5.7% 5.5% 6.5% 18.2% 47.7%
Mathematical and computer sciences
UK 26,473 22,107 21,929 21,086 20,967 22,373 24,988 27,274 28,152 25,843 -8.2% -2.4%
EU 752 996 1,093 1,143 1,441 1,444 1,674 1,982 2,448 2,074 -15.3% 175.8%
Non-EU 3,307 3,152 3,228 2,493 2,694 2,683 2,700 2,978 2,807 2,858 1.8% -13.6%
Total 30,532 26,255 26,250 24,722 25,102 26,500 29,362 32,234 33,407 30,775 -7.9% 0.8%
All female applicants
5,971 5,279 5,249 5,243 5,508 5,917 6,558 6,794 6,978 6,218 -10.9% 4.1%
Percentage female applicants
19.6% 20.1% 20.0% 21.2% 21.9% 22.3% 22.3% 21.1% 20.9% 20.2% -3.3% 3.1%
% non UK 13.3% 15.8% 16.5% 14.7% 16.5% 15.6% 14.9% 15.4% 15.7% 16.0% 1.9% 20.3%
% non-EU 10.8% 12.0% 12.3% 10.1% 10.7% 10.1% 9.2% 9.2% 8.4% 9.3% 10.7% 13.9%
Engineering
UK 14,737 14,619 14,913 13,856 14,679 16,313 18,910 20,464 21,206 20,300 -4.3% 37.7%
EU 1,457 1,853 1,918 2,084 2,406 2,302 2,749 2,976 3,086 2,653 -14.0% 82.1%
Non-EU 5,232 5,798 6,027 5,198 5,514 6,121 6,610 7,141 6,910 7,404 7.1% 41.5%
Total 21,426 22,270 22,858 21,138 22,599 24,736 28,269 30,581 31,202 30,357 -2.7% 41.7%
All female applicants
2,391 2,491 2,542 2,314 2,665 3,030 3,436 3,661 3,794 3,942 3.9% 64.9%
Percentage female applicants
11.2% 11.2% 11.1% 10.9% 11.8% 12.2% 12.2% 12.0% 12.2% 13.0% 6.6% 16.1%
% non UK 31.2% 34.4% 34.8% 34.4% 35.0% 34.1% 33.1% 33.1% 32.0% 33.1% 3.4% 6.1%
% non-EU 24.4% 26.0% 26.4% 24.6% 24.4% 24.7% 23.4% 23.4% 22.1% 24.4% 10.4% 0.0%
Technology
UK 1,114 1,193 1,219 1,362 1,571 1,731 2,006 2,092 2,062 1,532 -25.7% 37.5%
EU 95 93 83 96 108 132 140 164 162 161 -0.6% 69.5%
Non-EU 182 218 210 172 158 211 227 219 198 198 0.0% 8.8%
Total 1,391 1,504 1,512 1,630 1,837 2,074 2,373 2,475 2,422 1,891 -21.9% 35.9%
All female applicants
342 349 334 357 316 318 348 335 335 286 -14.6% -16.4%
Percentage female applicants
24.6% 23.2% 22.1% 21.9% 17.2% 15.3% 14.7% 13.5% 13.8% 15.1% 9.4% 38.6%
% non UK 19.9% 20.7% 19.4% 16.4% 14.5% 16.5% 15.5% 15.5% 14.9% 19.0% 27.5% -4.5%
% non-EU 13.1% 14.5% 13.9% 10.6% 8.6% 10.2% 9.6% 8.8% 8.2% 10.5% 28.0% -19.8%

Back to Contents
Part 2 – Engineering in Education and Training Higher Education 11.0 138
Table 11.6: Applicants to STEM HE courses by domicile (2002/03-2011/12) – continued
Source: UCAS
Figure 11.2 shows the number of applicants to STEM HE courses as a percentage of all applicants. The proportion of applicants for engineering and technology and physical sciences has stayed consistent over ten years. A consistent 6-7% of applicants chose biological sciences. The proportion of mathematics and computer science applicants has declined from 6.4% in 2002/03 to 4.7% in 2012/13. Technology had the lowest proportion of applicants, never rising above 0.4% in any of the ten years.
2002/03 2003/04 2004/05 2005/06 2006/07 2007/08 2008/09 2009/10 2010/11 2011/12 Change over one
year
Change over 10
years
All subject areas
UK 409,968 413,334 444,630 432,196 454,148 502,461 544,285 586,821 589,350 544,752 -7.6% 32.9%
EU 20,428 25,217 28,708 29,932 33,621 34,530 39,504 47,318 49,275 43,149 -12.4% 111.2%
Non-EU 46,071 47,477 48,817 44,176 46,726 51,698 56,071 63,212 61,536 65,736 6.8% 42.7%
Total 476,467 486,028 522,155 506,304 534,495 588,689 639,860 697,351 700,161 653,637 -6.6% 37.2%
All female applicants
254,092 262,236 283,491 277,183 293,591 328,811 355,103 390,444 393,096 368,569 -6.2% 45.1%
Percentage female applicants
53.3% 54.0% 54.3% 54.7% 54.9% 55.9% 55.5% 56.0% 56.1% 56.4% 0.5% 5.8%
% non UK 14.0% 15.0% 14.8% 14.6% 15.0% 14.6% 14.9% 15.8% 15.8% 16.7% 5.7% 19.3%
% non -EU 9.7% 9.8% 9.3% 8.7% 8.7% 8.8% 8.8% 9.1% 8.8% 10.1% 14.8% 4.1%
Fig. 11.2: Trends in applicants to STEM HE courses as a percentage of all applicants (2002/03-2011/12) – all domiciles
Source: UCAS
2002
/03
2006
/07
2.0%
1.0%
0.0%
5.0%
6.0%
2003
/04
2004
/05
2005
/06
2007
/08
2008
/09
2009
/10
2010
/11
2011
/12
3.0%
4.0%
8.0%
7.0%
Physical sciences Technology
EngineeringMathematical and computer sciences
Biological sciences

Back to Contents
738 Biology related includes botany, zoology, genetics, microbiology and molecular biology, biophysics and biochemistry 739 Applicants choosing other subjects, combinations or with no preferred subject line have been excluded from this figure 740 Close to gender parity is defined as neither gender is below 40% 741 Chemistry comprises chemistry and forensic and archaeology sciences 742 Physics comprises physics and astronomy 743 Geology comprises geology, science of aquatic and terrestrial environments and physical geographical sciences 744 Applicants choosing materials science, others in physical science, combinations within physical science and no preferred subject line have been excluded from this chart
11.3.2 Applicants to STEM by gender
Figure 11.3 shows the proportion of male and female applicants to different subjects within biological sciences. Just over half (57.0%) of applicants to biological sciences overall are female. Looking at the different subjects within biological sciences shows that biology and biology-related subjects are also close to the overall gender proportion. However, over three quarters (78.4%) of psychology applicants are female, while nearly three quarters (72.6%) of sports and exercise science applicants are male.
Figure 11.4 shows that overall a third (37.0%) of applicants to physical sciences are female. Physics has a fifth (20.3%) female applicants. Geology and chemistry are both close to gender parity,740 with female applicants representing 42.6% and 45.2% respectively.
139 11.0 Higher Education Part 2 – Engineering in Education and Training
Fig. 11.3: Applicant numbers in biological sciences by subject and gender (2010/11) – all domiciles738 739
Source: UCAS
0.0%
10.0
%
20.0
%
30.0
%
40.0
%
50.0
%
60.0
%
70.0
%
80.0
%
90.0
%
100.
0%
Biology related
All biologicalsciences
MaleFemale
Sports andexercise science
Biology
27.4%
54.9%
54.2%
57.0% 43.0%
Psychology 78.4% 21.6%
72.6%
45.1%
45.8%
Fig. 11.4: Applicant numbers in physical sciences by gender and subject type (2010/11) – all domiciles741 742 743 744
Source: UCAS
0.0%
10.0
%
20.0
%
30.0
%
40.0
%
50.0
%
60.0
%
70.0
%
80.0
%
90.0
%
100.
0%
All physicalsciences
MaleFemale
Physics
Geology
45.2%
20.3%
42.6%
37.0% 63.0%
Chemistry 54.8%
79.7%
57.4%

Back to Contents
745 Applicants with no preferred subject line have been excluded from this figure
Overall, only one in five (20.2%) applicants to mathematical and computer science subjects is female (Figure 11.5). The lowest number of female applicants is for computer science (12.9%). Mathematics is better represented but females still account for only a third (37.9%) of applicants.
Figure 11.6 shows the proportion of male and female applicants to engineering and technology. Of the different STEM subject areas examined, engineering and technology has the lowest proportion of female applicants (13.1%). Engineering has 13.0% female applicants and technology has 15.1%.
Part 2 – Engineering in Education and Training Higher Education 11.0 140
Fig. 11.5: Proportion of female applicants in mathematical and computer sciences subjects (2001/02-2010/11) – all domiciles745
Source: UCAS0.
0%
10.0
%
20.0
%
30.0
%
40.0
%
50.0
%
60.0
%
70.0
%
80.0
%
90.0
%
100.
0%
All mathematical &computer sciences
MaleFemale
Computer science
37.9%
12.9%
20.2% 79.8%
Mathematics 62.1%
87.1%
Fig. 11.6: Applicant numbers in engineering and technology by gender (2002/03-2011/12) – all domiciles
Source: UCAS
0.0%
10.0
%
20.0
%
30.0
%
40.0
%
50.0
%
60.0
%
70.0
%
80.0
%
90.0
%
100.
0%
All engineering and technology
MaleFemale
Technology
13.0%
15.1%
13.1% 86.9%
Engineering 87.0%
84.9%

Back to Contents
11.3.3 Applicants to engineering by sub-discipline
Tables 11.7 to 11.13 show the ten-year trends in the number of applicants for selected engineering sub-disciplines (general engineering, civil engineering, mechanical engineering, aerospace engineering, electronic and electrical engineering, production and manufacturing engineering and chemical, process and energy engineering).
The largest of the engineering sub-disciplines by number of applicants was mechanical engineering. In 2011/12, there were 9,513 applicants, an increase of 3.2% on the previous year. This growth occurred across all three domiciles, with non-EU applicant numbers rising 8.8%, EU numbers rising 4.6% and UK applicants rising by 1.4%. It is also noteworthy that in the last year the proportion of non-EU applicants rose from 19.9% to 21.0%. Finally, over the ten-year period the number of applicants nearly doubled (up 93.3%).
The only other selected sub-discipline to show an increase in applicant numbers in the last year was chemical, process and energy engineering. The number of applicants in 2011/12 was 2,851, an increase of 11.8% on the previous year. Over the ten-year period, the number of applicants tripled (up 207.2%). The strongest
growth over ten years has been amongst EU applicants, who have increased by 377.8%. UK applicant numbers have seen the second largest increase, tripling over ten years (up 204.3%), while applicants from outside the EU nearly tripled (up 196.4%). The number of female applicants has also nearly tripled over ten years, rising from 263 in 2002/03 to 761 in 2011/12. However, the proportion of female applicants has actually fallen by 5.7% over the same period.
The largest percentage decline in applicant numbers was for production and manufacturing engineering, which fell by a fifth (19.0%) in one year to 336 in 2011/12. However, the decline was not uniform by domicile. UK applicant numbers fell by 21.1%, compared with a 16.7% decline in non-EU applicant numbers and a 16.7% increase in EU applicants. Over the ten years, the number of applicants has fallen by two thirds (67.5%), with decline across all three domiciles: -69.0% for UK applicants, -65.7% for non-EU; and -27.6% for EU.
Civil engineering also had a double digit decline in applicant numbers in the last year, falling 13.6%. This decline was driven by a 40.8% decline in EU numbers and a 14.2% decline in UK numbers. By comparison, there was actually an 8.9% increase in applications from outside the EU. Over the ten-year period, the number of
applicants has increased by three quarters (75.3%) and the number of female applicants has doubled (100.7%), reaching 835 in 2011/12.
In 2011/12, females accounted for 18.6% of all applicants to general engineering, up from 15.1% the previous year. Female applicant numbers rose by a fifth (20.5%) in 2011/12, against an overall decline of 2.0%. Looking at applicant numbers in 2011/12 by domicile shows a decline in applicants from the EU (-12.2%) and the UK (-8.6%) but a rise in applicants from outside the EU (37.5%). Over ten years, overall applicant numbers have increased by three quarters (up 79.5%).
Over ten years, applications to aerospace engineering rose by 69.1%. However, over the last year numbers fell by 5.5%: down 7.0% from the UK, 4.7% from the EU but up very slightly (by 0.2%) from non-EU. Female applicant numbers also fell sharply in 2011/12, falling 15.2% to 324. As a result, the proportion of female applicants fell to 10.3% in that year.
In 2011/12, nearly a third (31.5%) of applicants to electronic and electrical engineering were from outside the EU, an increase from 29.7% the previous year. Although applicant numbers fell by 5.2% in 2011/12, non-EU applications rose by 0.5%. In comparison, applications from the UK fell by 7.9% and from the EU by 6.3%.
141 11.0 Higher Education Part 2 – Engineering in Education and Training
Table 11.7: Applicants to general engineering (2001/02-2010/11) – all domiciles
Source: UCAS
2002/03 2003/04 2004/05 2005/06 2006/07 2007/08 2008/09 2009/10 2010/11 2011/12 Change over one year
Change over 10 years
UK 755 754 853 855 824 1,070 1,299 1,470 1,381 1,262 -8.6% 67.2%
EU (excluding UK) 103 84 118 183 176 151 200 192 181 159 -12.2% 54.4%
Non-EU 146 147 185 229 215 246 283 355 277 381 37.5% 161.0%
Total non-UK 249 231 303 412 391 397 483 547 458 540 17.9% 116.9%
Female 141 141 164 172 168 208 273 276 278 335 20.5% 137.6%
Total 1,004 985 1,156 1,267 1,215 1,467 1,782 2,017 1,839 1,802 -2.0% 79.5%
Percentage of non-EU
14.5% 14.9% 16.0% 18.1% 17.7% 16.8% 15.9% 17.6% 15.1% 21.1% 39.7% 45.5%
Percentage of female applicants
14.0% 14.3% 14.2% 13.6% 13.8% 14.2% 15.3% 13.7% 15.1% 18.6% 23.2% 32.9%

Back to Contents
Part 2 – Engineering in Education and Training Higher Education 11.0 142
Table 11.8: Applicants to civil engineering (2002/03-2011/12) – all domiciles
Source: UCAS
2002/03 2003/04 2004/05 2005/06 2006/07 2007/08 2008/09 2009/10 2010/11 2011/12 Change over one year
Change over 10 years
UK 1,894 2,205 2,557 2,453 2,924 3,479 3,868 3,810 3,803 3,262 -14.2% 72.2%
EU (excluding UK) 378 607 626 698 831 879 960 939 880 521 -40.8% 37.8%
Non-EU 619 739 714 616 760 863 970 1,160 1,181 1,286 8.9% 107.8%
Total non-UK 997 1346 1340 1314 1591 1742 1930 2,099 2,061 1,807 -12.3% 81.2%
Female 416 488 561 514 627 838 865 923 907 835 -7.9% 100.7%
Total 2,891 3,551 3,897 3,767 4,515 5,221 5,798 5,909 5,864 5,069 -13.6% 75.3%
Percentage of non-EU
21.4% 20.8% 18.3% 16.4% 16.8% 16.5% 16.7% 19.6% 20.1% 25.4% 26.3% 18.7%
Percentage of female applicants
14.4% 13.7% 14.4% 13.6% 13.9% 16.1% 14.9% 15.6% 15.5% 16.5% 6.5% 14.6%
Table 11.9: Applicants to mechanical engineering (2002/03-2011/12) – all domiciles
Source: UCAS
2002/03 2003/04 2004/05 2005/06 2006/07 2007/08 2008/09 2009/10 2010/11 2011/12 Change over one year
Change over 10 years
UK 3,700 3,797 3,839 3,560 3,888 4,515 5,417 6,090 6,604 6,699 1.4% 81.1%
EU (excluding UK) 283 386 449 412 483 447 588 667 782 818 4.6% 189.0%
Non-EU 939 1,174 1,265 1,149 1,307 1,460 1,619 1,757 1,834 1,996 8.8% 112.6%
Total non-UK 1,222 1,560 1,714 1,561 1,790 1,907 2,207 2,424 2,616 2,814 7.6% 130.3%
Female 338 386 378 339 427 450 554 545 661 754 14.1% 123.1%
Total 4,922 5,357 5,553 5,121 5,678 6,422 7,624 8,514 9,220 9,513 3.2% 93.3%
Percentage of non-EU 19.1% 21.9% 22.8% 22.4% 23.0% 22.7% 21.2% 20.6% 19.9% 21.0% 5.5% 9.9%
Percentage of female applicants
6.9% 7.2% 6.8% 6.6% 7.5% 7.0% 7.3% 6.4% 7.2% 7.9% 9.7% 14.5%
Table 11.10: Applicants to aerospace engineering (2002/03-2011/12) – all domiciles
Source: UCAS
2002/03 2003/04 2004/05 2005/06 2006/07 2007/08 2008/09 2009/10 2010/11 2011/12 Change over one year
Change over 10 years
UK 1,459 1,628 1,673 1,647 1,714 1,760 2,101 2,399 2,454 2,281 -7.0% 56.3%
EU (excluding UK) 102 112 113 151 146 145 201 254 277 264 -4.7% 158.8%
Non-EU 306 379 472 447 465 493 609 710 612 613 0.2% 100.3%
Total non-UK 408 491 585 598 611 638 810 964 889 877 -1.3% 115.0%
Female 162 204 205 170 236 252 270 353 382 324 -15.2% 100.0%
Total 1,867 2,119 2,258 2,245 2,325 2,398 2,911 3,363 3,343 3,158 -5.5% 69.1%
Percentage of non-EU 16.4% 17.9% 20.9% 19.9% 20.0% 20.6% 20.9% 21.1% 18.3% 19.4% 6.0% 18.3%
Percentage of female applicants
8.7% 9.6% 9.1% 7.6% 10.2% 10.5% 9.3% 10.5% 11.4% 10.3% -9.6% 18.4%

Back to Contents
143 11.0 Higher Education Part 2 – Engineering in Education and Training
Table 11.11: Applicants to electronic and electrical engineering (2002/03-2011/12) – all domiciles
Source: UCAS
2002/03 2003/04 2004/05 2005/06 2006/07 2007/08 2008/09 2009/10 2010/11 2011/12 Change over one year
Change over 10 years
UK 3,729 3,146 2,934 2,462 2,381 2,504 2,766 2,937 3164 2,915 -7.9% -21.8%
EU (excluding UK) 367 376 335 336 397 339 399 442 494 463 -6.3% 26.2%
Non-EU 2,280 2,330 2,190 1,696 1,621 1,773 1,729 1,705 1543 1,551 0.5% -32.0%
Total non-UK 2647 2706 2525 2032 2018 2112 2128 2,147 2,037 2,014 -1.1% -23.9%
Female 670 630 527 424 425 422 498 491 484 502 3.7% -25.1%
Total 6,376 5,852 5,459 4,494 4,399 4,616 4,894 5,084 5201 4,929 -5.2% -22.7%
Percentage of non-EU 35.8% 39.8% 40.1% 37.7% 36.8% 38.4% 35.3% 33.4% 29.7% 31.5% 6.1% -12.0%
Percentage of female applicants
10.5% 10.8% 9.7% 9.4% 9.7% 9.1% 10.2% 9.7% 9.3% 10.2% 9.7% -2.9%
Table 11.12: Applicants to production and manufacturing engineering (2002/03-2011/12) – all domiciles
Source: UCAS
2002/03 2003/04 2004/05 2005/06 2006/07 2007/08 2008/09 2009/10 2010/11 2011/12 Change over one year
Change over 10 years
UK 904 801 721 467 424 376 369 401 355 280 -21.1% -69.0%
EU (excluding UK) 29 31 29 13 31 12 26 20 18 21 16.7% -27.6%
Non-EU 102 91 96 68 65 44 69 35 42 35 -16.7% -65.7%
Total non-UK 131 122 125 81 96 56 95 55 60 56 -6.7% -57.3%
Female 162 125 138 103 121 98 102 95 82 72 -12.2% -55.6%
Total 1,035 923 846 548 520 432 464 456 415 336 -19.0% -67.5%
Percentage of non-EU 9.9% 9.9% 11.3% 12.4% 12.5% 10.2% 14.9% 7.7% 10.1% 10.4% 3.0% 5.1%
Percentage of female applicants
15.7% 13.5% 16.3% 18.8% 23.3% 22.7% 22.0% 20.8% 19.8% 21.4% 8.1% 36.3%
Table 11.13: Applicants to chemical, process and energy engineering (2002/03-2011/12) – all domiciles
Source: UCAS
2002/03 2003/04 2004/05 2005/06 2006/07 2007/08 2008/09 2009/10 2010/11 2011/12 Change over one year
Change over 10 years
UK 559 561 683 713 877 1,042 1,240 1,302 1,499 1,701 13.5% 204.3%
EU (excluding UK) 31 48 51 62 84 91 105 128 148 148 0.0% 377.4%
Non-EU 338 420 494 493 553 681 786 855 902 1,002 11.1% 196.4%
Total non-UK 369 468 545 555 637 772 891 983 1,050 1,150 9.5% 211.7%
Female 263 267 323 335 388 475 569 618 673 761 13.1% 189.4%
Total 928 1,029 1,228 1,268 1,514 1,814 2,131 2,285 2,549 2,851 11.8% 207.2%
Percentage of non-EU 36.4% 40.8% 40.2% 38.9% 36.5% 37.5% 36.9% 37.4% 35.4% 35.1% -0.8% -3.6%
Percentage of female applicants
28.3% 25.9% 26.3% 26.4% 25.6% 26.2% 26.7% 27.0% 26.4% 26.7% 1.1% -5.7%

Back to Contents
Part 2 – Engineering in Education and Training Higher Education 11.0 144
11.3.4 Female applicants to selected engineering sub-disciplines
Figure 11.7 shows the ten-year trend for the percentage of female applicants to selected engineering sub-disciplines. It shows that chemical, process and energy engineering consistently had the highest proportion of female applicants: never falling below a quarter for the whole period. The only other selected sub-discipline to have over a fifth female applicants in 2011/12 was production and manufacturing engineering (21.4%). As previously mentioned, there was a strong
increase in the proportion of female applicants to general engineering – up to 18.6% in 2011/12.
Consistently, mechanical engineering has the lowest proportion of female applicants. Over ten years, there have never been more than one in ten women applying for this discipline. Although at 7.9%, 2011/12 saw the highest rates for ten years.
The proportion of female applicants to the other sub-disciplines in 2011/12 ranged from 10.2% to 16.5%.
Fig. 11.7: Percentage of female applicants by sub-discipline (2002/03-2011/12) – all domiciles
Source: UCAS
2002
/03
2006
/07
10.0%
5.0%
0.0%
25.0%
30.0%
2003
/04
2004
/05
2005
/06
2007
/08
2008
/09
2009
/10
2010
/11
2011
/12
15.0%
20.0%
General engineering Civil engineering Mechanical engineering
Aerospace engineering Electronic and electrical engineering
Production and manufacturing engineering
Chemical, process and energy engineering

Back to Contents
145 11.0 Higher Education Part 2 – Engineering in Education and Training
746 Engineering UK 2013 The state of engineering, EngineeringUK, December 2012, p115
11.3.5 Educational backgrounds of applicants to full-time undergraduate HE engineering courses
Figure 11.8 shows some interesting differences between the educational backgrounds of applicants to selected engineering sub-disciplines. Overall, 12.5% of all applicants came from a Further Education (FE) institution. Four engineering sub-disciplines recruited a higher than average proportion of applicants from FE: a fifth (21.3%) of applicants to electronic and electrical engineering, 16.4% of aerospace engineering applicants, 14.1% of civil engineering applicants, and 13.4% of mechanical engineering applicants. Conversely, only 6.7% of applicants to chemical, process and energy engineering were from the FE sector.
Sixth Form Colleges were the breeding ground for 12.0% of all applicants. Five engineering sub-disciplines had an above-average proportion of Sixth Form College applicants – four of which also had more than average numbers of applicants from the FE sector:
• Electronic and electrical engineering – 20.3%
• Aerospace engineering – 16.3%
• Civil engineering – 12.9%
• Mechanical engineering – 12.3%
The fifth sub-discipline to have an above-average number of Sixth Form College applicants was chemical, process and energy engineering (14.1%). Only production and manufacturing engineering (9.9%) and general engineering (9.2%) had a below-average proportion of applicants from the Sixth Form sector.
On average, only 5.3% of applicants came from independent schools. However, six of the seven selected engineering sub-disciplines bucked that trend, with an above-average independent schools contingent: production and manufacturing engineering (19.8%); general engineering (14.1%); chemical, process and energy engineering (12.5%); mechanical engineering (11.4%); civil engineering (8.3%); and aerospace engineering (6.3%). The only sub-discipline with a below-average proportion of independent school applicants was electronic and electrical engineering (4.6%).
We showed in last year’s report746 that 91% of post-18 school leavers from independent schools go to HE, so there is limited scope for encouraging further independent school leavers to progress to HE. But there is scope to persuade a higher proportion of them to choose to apply for engineering sub-disciplines.
Grammar schools show similar results to independent schools, with six out of seven
engineering sub-disciplines receiving a higher-than-average proportion of applicants from grammar schools. Overall, 3.1% of applicants came from a grammar school but 9.0% of chemical, process and energy engineering applicants did. Mechanical engineering (6.2%), civil engineering (5.9%), general engineering (5.8%), aerospace engineering (5.2%) and electronic and electrical engineering (3.5%) also had above-average numbers of grammar school applicants. However, only 2.0% of applicants to production and manufacturing engineering came from grammar schools.
Overall, nearly a fifth (18.1%) of all applicants to HE came from state schools (excluding grammar schools). All engineering sub-disciplines showed a higher-than-average proportion of applicants from state schools, as follows:
• Chemical process and energy engineering – 34.6%
• Production and manufacturing engineering – 34.7%
• Mechanical engineering – 30.1%
• Civil engineering – 29.9%
• Aerospace engineering – 28.3%
• General engineering – 22.9%
• Electronic and electrical engineering – 20.3%
Finally, it is interesting to see that 5.3% of applicants to HE came from Academy schools. Again, all the engineering sub-disciplines had an above-average number of Academy school applicants, with aerospace engineering (10.0%), chemical, process and energy engineering (9.4%), and production and manufacturing engineering (8.4%) having the largest proportion.

Back to Contents
11.3.6 Ethnicity of applicants
Figure 11.9 shows the percentage of applicants from different ethnic backgrounds for different subject areas. It shows that the subject area with the smallest proportion of white applicants in 2011/12 was medicine and dentistry (57.8%), followed by law (66.0%), business and administrative studies (67.5%), computer sciences (69.2%) and subjects allied to medicine (69.6%).
Medicine and dentistry had the highest proportion of Asian applicants (27.9%), while subjects allied to medicine (15.2%) and social studies (13.6%) had the highest proportion of black applicants.
For six subject areas, at least nine out of ten applicants were from a white background: veterinary science, agriculture and related (97.8%); non-European languages and related (96.9%); European languages, literature and related (96.4%); history and philosophical studies (93.6%); physical sciences (92.1%); and technologies (92.0%).
Part 2 – Engineering in Education and Training Higher Education 11.0 146
Fig. 11.8: Educational background of applicants to engineering undergraduate level full-time HE courses by selected sub-discipline (2011/12) – UK domiciled
Source: UCAS
0.0%
25.0
%
40.0
%
5.0%
50.0
%
Chemical, process and energy engineering
Production and manufacturing engineering
All applicantsto all subjects
Electronic and electrical engineering
Mechanical engineering
Aerospace engineering
Civil engineering
General engineering
15.0
%
20.0
%
10.0
%
30.0
%
45.0
%
35.0
%
Other/unknown State excluding grammar
Independent school
Academy
Sixth Form College Grammar schools
Further Education
9.2%14.1%
5.8%11.2%
30.6%6.2%
22.9%
12.9%8.3%
5.9%14.1%
21.4%7.5%
29.9%
12.3%11.4%
6.2%13.4%
17.7%8.9%
30.1%
16.3%6.3%
5.2%16.4%
17.6%10.0%
28.3%
9.9%19.8%
2.0%8.4%
16.8%8.4%
34.7%
14.1%12.5%
9.0%6.7%
13.7%9.4%
34.6%
12.0%5.3%
3.1%12.5%
43.6%5.3%
18.1%
13.7%4.6%
3.5%21.3%
31.2%5.4%
20.3%

Back to Contents
147 11.0 Higher Education Part 2 – Engineering in Education and Training
0.0%
10.0
%
20.0
%
30.0
%
40.0
%
50.0
%
60.0
%
70.0
%
80.0
%
90.0
%
100.
0%
White BlackAsian Mixed Other Unknown or prefer not to say
Creative arts and design
Education
Europeanlanguages,literature and relatedNon-Europeanlanguages and related
History andphilosophicalstudies
Linguistics,classics andrelated
Business and administrative studiesMass communications and documentation
Social studies
Law
Architecture, build and planning
Mathematical sciences
Technologies
Engineering
Veterinary science, agriculture and related
Physicalsciences
Subjects alliedto medicine
Biological sciences
Medicine anddentistry
96.4%
96.9%
93.6%
84.6% 7.7%
88.7% 5.1%
77.4% 7.0%
73.1% 13.6%
66.0% 10.4%
67.5% 6.9% 10.5%
8.5%
92.0% 3.7%
97.8%
0.1%0.2%
92.1% 4.7%
80.1%
73.8% 13.8% 9.6%
69.6% 11.1%
2.4%
84.1% 6.6% 4.9%
57.8% 27.9% 6.2%
15.2%
14.3%
7.9%
17.6%
10.8%
8.7%
17.8%
17.2%
3.7%
2.8%
1.4%
3.4%
0.5%0.6%0.9%
1.2%
69.2%
3.1%
3.4%
3.7%
3.0%
3.5%
3.5%
87.6% 3.8%3.7% 4.0%
86.4% 7.5% 3.3%
Computer sciences
0.4%
0.7%
0.2%0.4%2.6%1.0%2.1%
0.6%0.2%2.0%
0.1%0.6% 0.5% 2.4%
0.1%0.2%1.1%1.7%
0.8%0.3%2.2%2.3%
0.4%0.5%1.8%
1.9%0.3%2.4%
0.5%
1.8%0.3%2.7%
0.7%0.5%
1.6%0.5%
1.5%0.3%
0.5%0.1%
0.7%0.3%
1.6%0.5%2.6%
0.7%0.3%
3.9%
0.5%1.0% 1.6%
Fig. 11.9: Breakdown by ethnicity of applicants across HE subject areas (2011/12) – UK domiciled
Source: UCAS

Back to Contents
Part 2 – Engineering in Education and Training Higher Education 11.0 148
Table 11.14 shows the percentage of applicants to engineering by ethnicity over a ten-year period. It shows that prior to 2011/12, the proportion of white applicants was slowly declining. However, in the last year it has jumped from 70.9% to 73.8% – although this is still below the ten-year high of 76.9% in 2002/03.
The second largest ethnic group in 2011/12 was Asian, at 13.8%, followed by black (7.9%) and mixed race (2.4%).
Figures 11.10-11.12 show the number of UK applicants to engineering by ethnic group. The charts show a decline in applicants to engineering across all ethnic groups and both
genders in 2011/12. At an overall level, there have been particularly steep declines in the number of applicants coming from an Asian or black ethnic background. There has been a sharp decline in the number of female applicants from all ethnic groups. Male Asian and black applicants have also fallen in number.
Table 11.14: Percentage split of engineering applicants by ethnic group (2002/03-2011/12) – UK domiciled
Source: UCAS
2002/03 2003/04 2004/05 2005/06 2006/07 2007/08 2008/09 2009/10 2010/11 2011/12
Asian 10.3% 11.2% 10.7% 11.7% 12.0% 12.7% 12.9% 13.4% 14.2% 13.8%
Black 4.9% 5.6% 6.4% 7.1% 7.8% 7.8% 8.2% 8.3% 8.8% 7.9%
Mixed 2.0% 1.7% 2.5% 2.3% 2.8% 2.7% 3.0% 3.1% 3.2% 2.4%
Other 0.8% 1.1% 1.3% 1.5% 1.5% 1.3% 1.5% 1.5% 1.9% 1.9%
Unknown or prefer not to say
5.1% 4.9% 3.9% 1.6% 1.8% 1.7% 0.9% 1.1% 1.0% 0.3%
White 76.9% 75.6% 75.2% 75.8% 74.1% 73.8% 73.5% 72.6% 70.9% 73.8%
Fig. 11.10: Applicants to engineering by ethnic group (2002/03-2011/12) – UK domiciled
Source: UCAS
500
1,000
2,500
2,000
4,000
6,000
2,000
3,000
3,500
8,000
10,000
12,000
14,000
2002
/03
2003
/04
2004
/05
2005
/06
2006
/07
2007
/08
2008
/09
2009
/10
2010
/11
2011
/12
0
1,500
16,000
0
White (right axis)
BlackAsian Mixed Other Unknown or prefer not to say

Back to Contents
747 Higher Education in England – Impact of the 2012 reforms, HEFCE, March 2013, p4 748 Widening Participation in Higher Education, Department of Business, Innovation and Skills, August 2012, p4 749 Socio-economic gaps in HE participation: how have they changed over time?, Institute of Fiscal Studies, 2012, p1-2 750 University Challenge: How Higher Education Can Advance Social Mobility A progress report by the Independent Reviewer on Social Mobility and Child Poverty, Rt. Hon. Alan Milburn, October 2012, p21
149 11.0 Higher Education Part 2 – Engineering in Education and Training
11.3.7 Widening participation
If we are to achieve the target set out in last year’s Engineering UK Report of doubling the number of engineering graduates, then drawing more students into engineering from a diverse range of backgrounds becomes a key issue. Research shows that 18-year-olds from the most advantaged areas are three times more likely to apply to HE than those from the most disadvantaged areas. Among those institutions that require high grades, the ratio is typically six to nine times.747 Similarly, research by BIS into entry to HE by free school shows that in 2009/10 36% of those not in receipt of Free School Meals are estimated to enter HE, compared with 18% of those in receipt of Free School Meals (Table 11.15).
Table 11.15: Estimated percentage of maintained school pupils aged 15, by Free School Meal status who entered HE by age 19 Academic UK Higher Education Institutions and English Further Education Colleges (2005/06-2009/10)748
pp = percentage points
[1] FSM and Non-FSM refer to whether pupils were receiving Free School Meals or not.
[2] Gap is the difference between FSM and non-FSM expressed in percentage points. Percentage figures are rounded; gap figures are calculated from un-rounded data and therefore may not correspond to the gap between rounded percentages.
But there is evidence that this situation is improving. Research from the Institute of Fiscal Studies (IFS)749 shows that HE participation has been rising over time and increasing more rapidly among those from deprived backgrounds. The Rt. Hon Alan Milburn also identified that the likelihood of those from the lowest participation areas in the country (which tend to be the most disadvantaged communities) going to university increased by 50% between 1994/95 and 2009/10.750
Fig. 11.11: Female applicants to engineering by ethnic group (2002/03-2011/12) – UK domiciled
Source: UCAS
50
100
250
200
400
600
200
300
800
1,000
1,200
1,400
2002
/03
2003
/04
2004
/05
2005
/06
2006
/07
2007
/08
2008
/09
2009
/10
2010
/11
2011
/12
0
150
1,600
0
BlackAsian Mixed Other Unknown or prefer not to say
White (right axis)
Fig. 11.12: Male applicants to engineering by ethnic group (2002/03-2011/12) – UK domiciled
Source: UCAS
500
1,000
2,500
2,000
4,000
6,000
2,000
3,000
3,500
8,000
10,000
12,000
14,000
2002
/03
2003
/04
2004
/05
2005
/06
2006
/07
2007
/08
2008
/09
2009
/10
2010
/11
2011
/12
0
1,500
16,000
0
White (right axis)
BlackAsian Mixed Other Unknown or prefer not to say
FSM[1] Non- FSM[1]
Gap (pp)[2] All
2005/06 13% 33% 19 30%
2006/07 14% 33% 19 31%
2007/08 15% 33% 18 31%
2008/09 17% 35% 18 33%
2009/10 18% 36% 18 34%

Back to Contents
751 POLAR3 Young participation rates in Higher Education, HEFCE, October 2012, p18 752 Website accessed on 17 September 2013 http://www.offa.org.uk/press-releases/universities-get-smarter-in-their-approach-to-fair-access/ 753 Access All Areas? The Impact of Fees and Background on Student Demand for Postgraduate Higher Education in the UK, SERC, February 2013, p13 754 Higher Education in England – Impact of the 2012 reforms, HEFCE, March 2013, p3
Part 2 – Engineering in Education and Training Higher Education 11.0 150
The main measure of widening participation into HE is POLAR3. POLAR3 is based on the HE participation rates of people who were aged 18 between 2005 and 2009 and entered an HE course at age 18 or 19 between the academic years 2005/06 and 2010/11. The POLAR3 data is broken down into five quintiles. In quintile 1, fewer than one in five young people enter HE, compared with over half in quintile 5.
Table 11.16 shows the percentage of young people in each UK region in each of the quintile groups. In the North East, a third (34.9%) of young people live in an area which is quintile 1, compared with just 3.6% of young people living
in London. Conversely, a third (33.4%) of young people in London are living in quintile 5 areas, compared with one in nine young people (12.4%) in Yorkshire and the Humber.
Looking at the four nations of the UK shows that Scotland has the highest proportion of young people living in quintile 5 areas (29.1%), closely followed by Northern Ireland (27.3%). England (19.1%) and Wales (15.2%) have a much lower proportion of students in a quintile 5 area. Only one in nine young people (10.6%) in Scotland live in a quintile 1 area, compared with a quarter (25.4%) in Wales.
The Government recognises the importance of widening participation. Universities, in their agreements with the Office for Fair Access, have agreed to spend £707.5 million a year on access by 2016-17, broken down as follows:752
• £124.5 million on outreach, which is 12.6% more than under 2013/14 agreements
• £118.6 million on student success, which is 16.7% more than under 2013/14 agreements
• £464.5 million on financial support (eg bursaries, fee waivers and ‘in-kind’ support such as discounted accommodation), which is 1.1% more than under 2013/14 agreements
Finally, research into the social composition of postgraduate students shows that it broadly reflects the composition of undergraduate students. This suggests that postgraduate study doesn’t currently create additional barriers for those from poorer backgrounds.753 However, this situation will need to be monitored to see what effect the increase in tuition fees has on the social diversity of the postgraduate population – particularly since 2010/11 postgraduate entrant numbers have fallen by 27%.754
Table 11.16: Share of UK regions’ young population within each POLAR3 quintile751
Source: HEFCE
Quintile 1 Quintile 2 Quintile 3 Quintile 4 Quintile 5
North East 34.9% 22.8% 16.8% 12.4% 13.1%
North West 25.8% 21.2% 19.0% 17.4% 16.6%
Yorkshire and the Humber 29.6% 23.3% 19.0% 15.7% 12.4%
East Midlands 25.2% 21.8% 18.3% 18.4% 16.2%
West Midlands 21.6% 25.7% 22.0% 14.2% 16.4%
East of England 19.5% 22.9% 19.2% 21.8% 16.6%
London 3.6% 8.8% 28.0% 26.2% 33.4%
South East 17.2% 18.2% 17.3% 22.6% 24.7%
South West 22.9% 21.8% 21.4% 21.2% 12.7%
England 20.8% 20.1% 20.4% 19.5% 19.1%
Wales 25.4% 25.3% 16.8% 17.4% 15.2%
Scotland 10.6% 17.8% 19.5% 23.1% 29.1%
Northern Ireland 14.6% 13.9% 17.1% 27.1% 27.3%

Back to Contents
755 Higher Education in England – Impact of the 2012 reforms, HEFCE, March 2013, p4 756 The funding environment for universities – an assessment, UniversitiesUK, May 2013, p3
11.3.8 Accepted applicants to STEM degrees
Accepted applicant data is the closest indication that exists on the actual number of starts in a subject area. Table 11.17 shows the number of accepted applicants, broken down by domicile and gender, for STEM subjects and also all subjects over a ten-year period. In 2011/12, there was a 5.5% overall decline in the number of accepted applicants to all subject areas. This was driven by a 13.0% decline in EU accepted applicant numbers and a 5.5% decline in UK accepted applicant numbers, although non-EU accepted applicant numbers increased slightly by 0.6%.
Overall, females accounted for 55.2% of accepted applicants in 2011/12, an increase on the previous year and the joint highest proportion of female accepted applicants for ten years.
The largest STEM subject area was biological sciences, with 39,625 accepted applicants. This is a slight decline of 1.5% on the previous year, although the ten-year trend shows accepted applicant numbers have grown by a third (33.1%). In 2011/12, there was a decline in the number of UK (-1.8%) and EU (-5.2%) accepted applicants, but non-EU accepted applicants rose by 12.5%.
Biological sciences was the only STEM subject area with a majority of female accepted applicants. In 2011/12, females accounted for 58.3% of the intake, a figure unchanged from the previous year.
Physical sciences showed the lowest decline in the number of accepted applicants in 2011/12, down just 1.0%. There were around one in ten (10.6%) fewer accepted applicants from the EU in 2011/12 and a slight decrease (0.9%) in accepted applicants from the UK. But non-EU accepted applicants rose by 4.7%.
Over the ten-year period, accepted applicants to physical sciences have risen by a quarter (26.4%). Over the same period, the number of female accepted applicants only increased by a fifth (20.3%), meaning that the proportion of female applicants has decreased over the ten years.
Engineering is the third STEM subject area to show a below-average decline in the number of accepted applicants in 2011/12, falling by 2.8%. However, unlike biological sciences and physical sciences (the other two subject areas to show a below-average decline), the decline was across all three domiciles. The biggest fall was from the EU, with 10.7% fewer applicants accepted, compared with a 2.4% decline from outside the EU and a 2.0% decline from the UK. Over the ten-year period, engineering accepted applicants have increased by 16.4%, with the
EU (38.7%) and UK (18.6%) showing strong growth. This compares with a marginal increase of 1.1% from outside the EU.
EngineeringUK tracks two long-term indicators among accepted applicants to engineering. The first is the total number of accepted applicants to engineering for all domiciles. In 2011/12, this was 25,293. Secondly, EngineeringUK tracks the proportion of female UK domiciled accepted applicants, which this year was 12.0%.
Mathematical and computer sciences was one of two STEM subject areas to show an above-average decline in the number of accepted applicants in 2011/12, falling by 6.2%. It is also the only STEM subject area to show a decline in applicant numbers over ten years, falling 4.9%. Over these ten years, the number of accepted applicants from the EU has doubled (106.8%). However, everywhere else has seen a decline, with UK accepted applicants decreasing by 4.7% and non-EU accepted applicants decreasing by a third (33.1%). Over the ten-year period, the proportion of female accepted applicants has remained consistent, at around a fifth.
The smallest of the STEM subject areas is technology. In 2011/12, it had 2,345 accepted applicants – a decrease of 16.8% on the previous year. Accepted applicants from the UK fell by a fifth (19.5%), while non-EU accepted applicants fell by 4.5%. However, the number of accepted applicants from the EU rose by 12.4%. The proportion of female applicants to technology has declined over the ten-year period, from 33.0% in 2002/03 to 16.4% in 2011/12.
Examining the data in Tables 11.6 and 11.17 shows that overall engineering attracts 20.0% more applicants than it accepts. This ratio is lower than for all other subject areas, which together averaged 40.6% more applicants than acceptances. However, the STEM subjects with the lowest ratio of applicants to acceptances were physical sciences, and mathematical and computer sciences, where there were 12% more applicants than acceptances.
Overall, as shown by HEFCE,755 STEM subjects have generally fared better than arts, humanities and social science subjects. However, the numbers of mature full-time undergraduates accepted into HE fell for the second time in 2011/12.756 This is an issue that needs to be monitored in the future.
151 11.0 Higher Education Part 2 – Engineering in Education and Training

Back to Contents
Part 2 – Engineering in Education and Training Higher Education 11.0 152
Table 11.17: Number of accepted applicants to STEM degrees by subject area and domicile (2002/03-2011/12)
2002/03 2003/04 2004/05 2005/06 2006/07 2007/08 2008/09 2009/10 2010/11 2011/12 Change over one
year
Change over 10
years
Biological sciences
UK 27,945 27,735 30,662 29,051 30,976 33,189 34,316 35,781 36,978 36,305 -1.8% 29.9%
EU 835 1,101 1,182 1,294 1,366 1,372 1,594 1,736 1,902 1,804 -5.2% 116.0%
Non-EU 995 1,048 1,123 976 979 1,037 1,139 1,375 1,347 1,516 12.5% 52.4%
Total 29,775 29,884 32,967 31,321 33,321 35,598 37,049 38,892 40,227 39,625 -1.5% 33.1%
All female accepted applicants
18,315 18,386 19,925 18,968 20,147 21,221 21,780 22,424 23,446 23,089 -1.5% 26.1%
Percentage female accepted applicants
61.5% 61.5% 60.4% 60.6% 60.5% 59.6% 58.8% 57.7% 58.3% 58.3% 0.0% -5.2%
% non-UK 6.1% 7.2% 7.0% 7.2% 7.0% 6.8% 7.4% 8.0% 8.1% 8.4% 3.7% 37.7%
% non-EU 3.3% 3.5% 3.4% 3.1% 2.9% 2.9% 3.1% 3.5% 3.3% 3.8% 15.2% 15.2%
Physical sciences
UK 13,475 13,006 14,064 13,928 14,583 15,182 15,803 16,363 16,843 16,694 -0.9% 23.9%
EU 382 376 406 461 612 602 719 777 783 700 -10.6% 83.2%
Non-EU 596 571 604 623 615 739 806 901 838 877 4.7% 47.1%
Total 14,453 13,953 15,074 15,012 15,810 16,523 17,328 18,041 18,464 18,271 -1.0% 26.4%
All female accepted applicants
5,861 5,549 6,066 6,066 6,416 6,706 6,948 7,216 7,323 7,049 -3.7% 20.3%
Percentage female accepted applicants
40.6% 39.8% 40.2% 40.4% 40.6% 40.6% 40.1% 40.0% 39.7% 38.6% -2.8% -4.9%
% non-UK 6.8% 6.8% 6.7% 7.2% 7.8% 8.1% 8.8% 9.3% 8.8% 8.6% -2.3% 26.5%
% non-EU 4.1% 4.1% 4.0% 4.2% 3.9% 4.5% 4.7% 5.0% 4.5% 4.8% 6.7% 17.1%
Mathematical and computer sciences
UK 25,273 22,166 22,209 21,046 21,287 23,057 24,920 24,990 25,607 24,079 -6.0% -4.7%
EU 690 867 923 999 1,127 1,193 1,379 1,524 1,688 1,427 -15.5% 106.8%
Non-EU 2,908 2,538 2,492 2,119 2,208 2,222 2,239 2,434 1,970 1,945 -1.3% -33.1%
Total 28,871 25,571 25,624 24,164 24,622 26,472 28,538 28,948 29,265 27,451 -6.2% -4.9%
All female accepted applicants
5,909 5,372 5,432 5,266 5,459 5,959 6,369 6,390 6,517 5,820 -10.7% -1.5%
Percentage female accepted applicants
20.5% 21.0% 21.2% 21.8% 22.2% 22.5% 22.3% 22.1% 22.3% 21.2% -4.9% 3.4%
% non-UK 12.5% 13.3% 13.3% 12.9% 13.5% 12.9% 12.7% 13.7% 12.5% 12.3% -1.6% -1.6%
% non-EU 10.1% 9.9% 9.7% 8.8% 9.0% 8.4% 7.8% 8.4% 6.7% 7.1% 5.9% 29.7%
Engineering
UK 16,098 15,505 15,911 14,814 15,184 16,790 18,313 18,700 19,496 19,097 -2.0% 18.6%
EU 1,345 1,629 1,613 1,854 2,073 1,899 2,077 2,116 2,088 1,865 -10.7% 38.7%
Non-EU 4,282 4,828 4,535 4,318 4,657 4,830 5,062 5,254 4,438 4,331 -2.4% 1.1%
Total 21,725 21,962 22,059 20,986 21,914 23,519 25,452 26,070 26,022 25,293 -2.8% 16.4%
All female accepted applicants
2,591 2,681 2,608 2,479 2,739 2,968 3,135 3,258 3,249 3,384 4.2% 30.6%
Percentage female accepted applicants
11.9% 12.2% 11.8% 11.8% 12.5% 12.6% 12.3% 12.5% 12.5% 13.4% 7.2% 12.6%
% non-UK 25.9% 29.4% 27.9% 29.4% 30.7% 28.6% 28.0% 28.3% 25.1% 24.5% -2.4% -5.4%
% non-EU 19.7% 22.0% 20.6% 20.6% 21.3% 20.5% 19.9% 20.2% 17.1% 17.1% 0.0% -13.2%

Back to Contents
153 11.0 Higher Education Part 2 – Engineering in Education and Training
Table 11.17: Number of accepted applicants to STEM degrees by subject area and domicile (2002/03-2011/12) – continued
Source: UCAS
11.3.9 Accepted applicants by selected engineering sub-discipline
Tables 11.18-11.24 show the ten-year trend in the number of accepted applicants to selected engineering sub-disciplines by domicile and number of females.
Mechanical engineering was the largest sub-discipline, with 6,848 accepted applicants in 2011/12, an increase of 2.0% on the previous year. Growth was across all three domiciles, with non-EU rising the most (7.7%), compared with EU (6.1%) and the UK (0.6%). It is also pleasing to note that the number of female accepted applicants rose by 9.6% in the last year and has risen by 81.5% over ten years.
General engineering had the largest percentage growth in 2011/12, growing by 18.0%. It was the only subject area to have double digit growth from UK accepted applicants in 2011/12 (up 18.8%). Non-EU accepted applicants increased by nearly a quarter in the same period (up 22.5%). However, there was only marginal growth in numbers of accepted applicants from the EU (up 1.0%). In 2011/12, numbers of female accepted applicants increased by a third
(34.3%). Although this sub-discipline has grown by a quarter in ten years (up 25.6%), 18.0% of that growth was achieved in the last year, following two years of decline.
The third engineering sub-discipline to show growth in 2011/12 was chemical, process and energy engineering, which grew by 4.1%. Of all the sub-disciplines, chemical, process and energy engineering has shown the strongest growth over ten years, more than doubling (up by 119.5% to 2,221 accepted applicants). This has been driven by the UK (134.9% more accepted applicants) and the EU (136.4% more). By comparison, non-EU applicants rose by a more modest 80.1%. Over the ten-year period, growth in female accepted applicants has kept pace with growth across all accepted applicants (118.5% and 119.5% respectively).
The smallest engineering sub-discipline is production and manufacturing engineering, with 648 accepted applicants in 2011/12. This was a decrease of 10.7% on the previous year and of 55.6% over ten years. Over the trend period, non-EU accepted applicant numbers declined by 77.2% and UK accepted applicants numbers fell by 56.1%, but accepted applicants from the EU grew by 12.9%.
Civil engineering had the largest percentage decline in accepted applicants in 2011/12, falling by 12.8%. There was a decline in acceptances from all three domiciles. The largest drops in number were from the EU (down 31.5%) and the UK (down 12.8%). However, there was only a marginal decline of 0.9% from outside the EU.
Over ten years, there has been strong growth in accepted applications to civil engineering, with numbers rising by 52.2%. The largest growth came from the UK, with accepted applicants rising by over half (58.4%). This was followed by non-EU (up 49.0%) and EU applicants (up 17.4%). Interestingly, although all acceptances grew by 52.2% over ten years, female acceptances increased by 75.6%. In 2011/12, females made up 16.0% of the cohort compared with 13.9% in 2002/03.
In 2002/03, electronic and electrical engineering was the largest engineering sub-discipline. However, over ten years to 2011/12, the number of accepted applicants has declined by 31.6% to 4,645. There has been a fall in numbers of accepted applicants from outside the EU (down 41.6%) and the UK (down 30.7%), although EU accepted applicant numbers
2002/03 2003/04 2004/05 2005/06 2006/07 2007/08 2008/09 2009/10 2010/11 2011/12 Change over one
year
Change over 10
years
Technology
UK 1,950 2,098 2,117 2,246 2,468 2,592 2,746 2,762 2,460 1,981 -19.5% 1.6%
EU 106 98 103 120 134 147 161 165 137 154 12.4% 45.3%
Non-EU 255 303 246 297 312 229 270 317 220 210 -4.5% -17.6%
Total 2,311 2,499 2,466 2,663 2,914 2,968 3,177 3,244 2,817 2,345 -16.8% 1.5%
All female accepted applicants
763 792 746 669 786 638 698 592 517 384 -25.7% -49.7%
Percentage female accepted applicants
33.0% 31.7% 30.3% 25.1% 27.0% 21.5% 22.0% 18.2% 18.4% 16.4% -10.9% -50.3%
% non-UK 15.6% 16.0% 14.2% 15.7% 15.3% 12.7% 13.6% 14.9% 12.7% 15.5% 22.0% -0.6%
% non-EU 11.0% 12.1% 10.0% 11.2% 10.7% 7.7% 8.5% 9.8% 7.8% 9.0% 15.4% -18.2%
All subject areas
UK 333,942 334,295 360,244 345,564 364,544 405,024 425,063 424,634 431,235 407,391 -5.5% 22.0%
EU 12,572 15,452 17,247 18,280 20,661 21,363 23,807 25,607 26,701 23,233 -13.0% 84.8%
Non-EU 27,793 27,797 27,878 27,046 28,225 30,240 32,984 37,088 34,094 34,286 0.6% 23.4%
Total 374,307 377,544 405,369 390,890 413,430 456,627 481,854 487,329 492,030 464,910 -5.5% 24.2%
All female accepted applicants
198,198 201,887 216,972 210,334 223,745 251,932 263,669 267,244 270,154 256,623 -5.0% 29.5%
Percentage female accepted applicants
53.0% 53.5% 53.5% 53.8% 54.1% 55.2% 54.7% 54.8% 54.9% 55.2% 0.5% 4.2%
% non-UK 10.8% 11.5% 11.1% 11.6% 11.8% 11.3% 11.8% 12.9% 12.4% 12.4% 0.0% 14.8%
% non-EU 7.4% 7.4% 6.9% 6.9% 6.8% 6.6% 6.8% 7.6% 6.9% 7.4% 7.2% 0.0%

Back to Contents
Part 2 – Engineering in Education and Training Higher Education 11.0 154
actually grew by 9.6%. Over ten years, the proportion of female accepted applicants has also fallen, from 26.6% in 2002/03 to 22.8% in 2011/12.
Aerospace engineering accepted applicants have increased by 38.1% over ten years. On the
surface, there appears to have been very strong growth from the EU, up 141.7% over ten years. However, in 2011/12 EU candidates accounted for just 174 acceptances. Most of the accepted applicants to aerospace engineering came from the UK (1,916 out of a total of 2,394). Over the
ten-year period, female acceptances have grown at almost double the rate of all acceptances (73.0% compared with 38.1%). However, women still only represented one in nine acceptances (10.7%) in 2011/12.
Table 11.18: Accepted applicants onto first degrees in general engineering (2002/03-2011/12)
Source: UCAS
2002/03 2003/04 2004/05 2005/06 2006/07 2007/08 2008/09 2009/10 2010/11 2011/12 Change over one year
Change over 10 years
UK 2,156 2,118 2,347 2,236 2,364 2,597 2,755 2,664 2,305 2,738 18.8% 27.0%
EU (excluding UK) 130 170 189 251 275 211 232 218 198 200 1.0% 53.8%
Non-EU 404 443 465 442 443 445 388 355 360 441 22.5% 9.2%
Total non-UK 534 613 654 693 718 656 620 573 558 641 14.9% 20.0%
Female 362 402 406 365 398 441 427 451 426 572 34.3% 58.0%
Total 2,690 2,731 3,001 2,929 3,082 3,253 3,375 3,237 2,863 3,379 18.0% 25.6%
Percentage of non-EU 15.0% 16.2% 15.5% 15.1% 14.4% 13.7% 11.5% 10.8% 12.6% 13.1% 4.0% -12.7%
Percentage of female students
13.5% 14.7% 13.5% 12.5% 12.9% 13.6% 12.7% 14.2% 14.9% 16.9% 13.4% 25.2%
Table 11.19: Accepted applicants onto first degrees in civil engineering (2002/03-2011/12)
Source: UCAS
2002/03 2003/04 2004/05 2005/06 2006/07 2007/08 2008/09 2009/10 2010/11 2011/12 One year change
Change over 10 years
UK 1,963 2,335 2,563 2,563 2,790 3,281 3,398 3,428 3,564 3,109 -12.8% 58.4%
EU (excluding UK) 298 427 425 496 585 687 683 622 511 350 -31.5% 17.4%
Non-EU 518 629 567 505 571 607 641 892 779 772 -0.9% 49.0%
Total non-UK 816 1,056 992 1,001 1,156 1,294 1,324 1,514 1,290 1,122 -13.0% 37.5%
Female students 385 448 519 506 571 714 708 790 720 676 -6.1% 75.6%
Total 2,779 3,391 3,555 3,564 3,946 4,575 4,722 4,942 4,854 4,231 -12.8% 52.2%
Percentage of non-EU 18.6% 18.5% 15.9% 14.2% 14.5% 13.3% 13.6% 18.0% 16.0% 18.2% 13.8% -2.2%
Percentage of female students
13.9% 13.2% 14.6% 14.2% 14.5% 15.6% 15.0% 16.0% 14.8% 16.0% 8.1% 15.1%
Table 11.20: Accepted applicants onto first degrees in mechanical engineering (2002/03-2011/12)
Source: UCAS
2002/03 2003/04 2004/05 2005/06 2006/07 2007/08 2008/09 2009/10 2010/11 2011/12 Change over one year
Change over 10 years
UK 3,358 3,568 3,630 3,380 3,511 4,182 4,679 4,954 5,246 5,277 0.6% 57.1%
EU (excluding UK) 292 321 340 372 390 364 442 446 457 485 6.1% 66.1%
Non-EU 735 864 896 875 1,030 1,027 1,154 1,202 1,008 1,086 7.7% 47.8%
Total non-UK 1,027 1,185 1,236 1,247 1,420 1,391 1,596 1,648 1,465 1,571 7.2% 53.0%
Female students 303 336 323 293 372 383 465 463 502 550 9.6% 81.5%
Total 4,385 4,753 4,866 4,627 4,931 5,573 6,275 6,602 6,711 6,848 2.0% 56.2%
Percentage of non-EU 16.8% 18.2% 18.4% 18.9% 20.9% 18.4% 18.4% 18.2% 15.0% 15.9% 6.0% -5.4%
Percentage of female students
6.9% 7.1% 6.6% 6.3% 7.5% 6.9% 7.4% 7.0% 7.5% 8.0% 6.7% 15.9%

Back to Contents
155 11.0 Higher Education Part 2 – Engineering in Education and Training
Table 11.21: Accepted applicants onto first degrees in aerospace engineering (2002/03-2011/12)
Source: UCAS
2002/03 2003/04 2004/05 2005/06 2006/07 2007/08 2008/09 2009/10 2010/11 2011/12 Change over one year
Change over 10 years
UK 1,428 1,433 1,527 1,498 1,454 1,521 1,779 1,809 1,936 1,916 -1.0% 34.2%
EU (excluding UK) 72 87 80 120 111 95 140 161 173 174 0.6% 141.7%
Non-EU 233 256 302 303 308 330 427 465 424 304 -28.3% 30.5%
Total non-UK 305 343 382 423 419 425 567 626 597 478 -19.9% 56.7%
Female students 148 167 176 163 206 205 222 250 281 256 -8.9% 73.0%
Total 1,733 1,776 1,909 1,921 1,873 1,946 2,346 2,435 2,533 2,394 -5.5% 38.1%
Percentage of non-EU 13.6% 14.6% 15.8% 15.9% 16.4% 17.0% 18.2% 18.1% 16.7% 12.7% -24.0% -6.6%
Percentage of female students
8.5% 9.4% 9.2% 8.5% 11.0% 10.5% 9.5% 10.4% 11.1% 10.7% -3.6% 25.9%
Table 11.22: Accepted applicants onto first degrees in electronic and electrical engineering (2002/03-2011/12)
Source: UCAS
Table 11.23: Accepted applicants onto first degrees in production and manufacturing engineering (2002/03-2011/12)
Source: UCAS
2002/03 2003/04 2004/05 2005/06 2006/07 2007/08 2008/09 2009/10 2010/11 2011/12 Change over one year
Change over 10 years
UK 1,288 1,099 929 684 624 609 576 662 627 566 -9.7% -56.1%
EU (excluding UK) 48 44 37 36 49 44 41 26 58 54 -6.9% 12.5%
Non-EU 123 119 107 109 103 101 94 49 41 28 -31.7% -77.2%
Total non-UK 171 163 144 145 152 145 135 75 99 82 -17.2% -52.0%
Female students 249 211 203 167 189 175 144 155 154 148 -3.9% -40.6%
Total 1,459 1,262 1,073 829 776 754 711 737 726 648 -10.7% -55.6%
Percentage of non-EU 8.4% 9.4% 10.0% 13.1% 13.3% 13.4% 13.2% 6.6% 5.6% 4.3% -23.2% -48.8%
Percentage of female students
17.1% 16.7% 18.9% 20.1% 24.4% 23.2% 20.3% 21.0% 21.2% 22.8% 7.5% 33.3%
2002/03 2003/04 2004/05 2005/06 2006/07 2007/08 2008/09 2009/10 2010/11 2011/12 Change over one year
Change over 10 years
UK 4,638 3,782 3,624 3,066 2,932 2,946 3,282 3,256 3,579 3,212 -10.3% -30.7%
EU (excluding UK) 343 331 329 315 396 309 351 381 397 376 -5.3% 9.6%
Non-EU 1,809 2,004 1,647 1,514 1,570 1,555 1,472 1,504 1,098 1,057 -3.7% -41.6%
Total non-UK 2,152 2,335 1,976 1,829 1,966 1,864 1,823 1,885 1,495 1,433 -4.1% -33.4%
Female students 793 764 603 543 552 513 564 549 498 469 -5.8% -40.9%
Total 6,790 6,117 5,600 4,895 4,898 4,810 5,105 5,141 5,074 4,645 -8.5% -31.6%
Percentage of non-EU 26.6% 32.8% 29.4% 30.9% 32.1% 32.3% 28.8% 29.3% 21.6% 22.8% 5.6% -14.3%
Percentage of female students
11.7% 12.5% 10.8% 11.1% 11.3% 10.7% 11.0% 10.7% 9.8% 10.1% 3.1% -13.7%

Back to Contents
11.3.10 Gender of accepted applicants to selected engineering sub-disciplines
Over the ten-year period, chemical, process and energy engineering consistently had the highest proportion of female acceptances, always staying above a quarter (Figure 11.13). Production and manufacturing engineering started off with 17.1% female accepted applicants in 2002/03. By 2011/12, it had 22.8% female acceptances, but this was below its 2006/07 peak of 24.4%.
Mechanical engineering has consistently has fewer than one in ten female accepted candidates, although numbers did peak at 8.0% in 2011/12.
Electronic and electrical engineering is the only engineering sub-discipline to have a lower percentage of female acceptances in 2011/12 (10.1%) than it did in 2002/03 (11.7%).
Part 2 – Engineering in Education and Training Higher Education 11.0 156
Table 11.24: Accepted applicants onto first degrees in chemical, process and energy engineering (2002/03-2011/12)
Source: UCAS
2002/03 2003/04 2004/05 2005/06 2006/07 2007/08 2008/09 2009/10 2010/11 2011/12 Change over one year
Change over 10 years
UK 682 692 776 861 962 1,094 1,201 1,205 1,482 1,602 8.1% 134.9%
EU (excluding UK) 44 47 46 58 80 62 75 87 115 104 -9.6% 136.4%
Non-EU 286 366 391 394 423 496 552 554 537 515 -4.1% 80.1%
Total non-UK 330 413 437 452 503 558 627 641 652 619 -5.1% 87.6%
Female students 275 278 313 356 369 431 492 498 551 601 9.1% 118.5%
Total 1,012 1,105 1,213 1,313 1,465 1,652 1,828 1,846 2,134 2,221 4.1% 119.5%
Percentage of non-EU 28.3% 33.1% 32.2% 30.0% 28.9% 30.0% 30.2% 30.0% 25.2% 23.2% -7.9% -18.0%
Percentage of female students
27.2% 25.2% 25.8% 27.1% 25.2% 26.1% 26.9% 27.0% 25.8% 27.1% 5.0% -0.4%
Fig. 11.13: Percentage of female accepted applicants to degree courses by engineering discipline (2002/03-2011/12) – all domiciles
Source: UCAS
2002
/03
2006
/07
10.0%
5.0%
0.0%
25.0%
30.0%
2003
/04
2004
/05
2005
/06
2007
/08
2008
/09
2009
/10
2010
/11
2011
/12
15.0%
20.0%
General engineering Civil engineering Mechanical engineering
Aerospace engineering Electronic and electrical engineering
Production and manufacturing engineering
Chemical, process and energy engineering

Back to Contents
757 HESA cannot accept responsibility for any inferences or conclusions derived from the data by third parties. 758 Engineering UK 2013 The state of engineering, EngineeringUK, December 2012, p129 759 Other undergraduates have been excluded from this section 760 University Challenge: How Higher Education Can Advance Social Mobility A progress report by the Independent Reviewer on Social Mobility and Child Poverty, Rt. Hon. Alan Milburn, October 2012, p19 761 Expanding and improving Part-time Higher Education, Department for Business, Innovation and Skills, June 2012, p118 762 Expanding and improving Part-time Higher Education, Department for Business, Innovation and Skills, June 2012, p127 763 Expanding and improving Part-time Higher Education, Department for Business, Innovation and Skills, June 2012, p27
157 11.0 Higher Education Part 2 – Engineering in Education and Training
11.4 Engineering students
11.4.1 Qualifications of engineering students
The Higher Education Statistics Agency (HESA) provides data on the highest qualification status of first year full-time undergraduates (Table 11.25).757 This shows that 87.3% of students studying engineering entered with a level 3 qualification, which is very similar to the 87.4% recorded in last year’s report.758 The next highest category was other undergraduate qualifications, at 9.3%.
11.4.2 Number of engineering students759
Table 11.26 shows that overall there were nearly 2.5 million students (2,496,625) in UK HE in 2011/12. This is a remarkable increase in provision compared with just over 600,000 students at the start of the 1970s.760 In 2011/12, nearly a quarter (23.8%) of those 2.5 million students were studying for a STEM qualification. Male students were twice as likely as female students to be studying for a STEM qualification (34.3% compared with 15.7%), although female students (1,406,940) outnumbered their male counterparts (1,089,685). In fact, of the different STEM subjects, it is only for biological sciences where female students outnumber males.
In 2011/12, there were 60,935 undergraduate first degree students studying for a STEM degree part-time. Of these, 13,035 (21.4%) were studying engineering and technology. Research by BIS761 has shown that part-time students are more likely to be female, older and white. The research762 also identified that part-time students are more likely to be from low participation areas as defined by HEFCE.
Part-time students are now eligible for tuition fee loans. The Government stated in 2012/13 that the maximum fee for a part-time course should not exceed 75% of a full-time course fee. Therefore, it provides a maximum loan of £6,750 (75% of the maximum full-time loan).763 Part-time students are liable to repay their loan three years after starting their course if they are
earning over £21,000, which means many part-time students could start repaying their loans while still studying.
Overall, there are 162,015 students studying for a degree in engineering and technology. Of these, 136,525 are male and 25,490 are female. Most are studying at an undergraduate level, with 89,915 studying full-time and 13,035 studying part-time. At postgraduate level, full-time study is again prevalent, with 29,685 studying full-time compared with 12,300 part-time.
Table 11.25: First year undergraduate full-time first degree students by highest qualification on entry (2011/12) – UK domiciled
Source: HESA student record 2011/12
Postgraduate
(excluding PGCE)
PGCE First degree
Other undergraduate
qualification
Other qualification
Level 3 qualification
(including A levels and
Highers)
Qualifications at level 2
and below
No formal qualification Not known Total
Engineering and technology total
20 0 170 2,080 195 19,530 220 85 75 22,380
Percentage 0.1% 0.0% 0.8% 9.3% 0.9% 87.3% 1.0% 0.4% 0.3% 100.0%

Back to Contents
764 www.engc.org.uk/courses 765 www.engc.org.uk/accreditationinfo
Part 2 – Engineering in Education and Training Higher Education 11.0 158
Degree accreditation
Accreditation of degree programmes by recognised professional and statutory bodies is a mark of assurance that the programmes meet the standards set by a profession. In the UK, the Engineering Council sets and maintains standards for the engineering profession and sets the overall requirements for accreditation. The Engineering Council licenses professional engineering institutions to undertake the accreditation within these requirements – interpreting them as appropriate for their own sector of the profession – and maintains the registers of accredited or approved programmes. The licensed institutions use the accreditation process to assess whether specific educational programmes provide some or all of the underpinning knowledge, understanding and skills for eventual registration in a particular category.
Accreditation is an accepted and rigorous process that commands respect both in the UK and internationally. It helps students, their parents and advisers choose quality degree programmes. It also confers market advantage to graduates from accredited programmes, both when they are seeking employment and when they decide to seek professional registration. Some employers require graduation from an accredited programme as a minimum qualification.
Universities with accredited degree programmes (from foundation degree through to engineering doctorates) can promote this status through use of the Engineering Council Accredited Degree logo. All accredited courses are listed on the Engineering Council’s website.764
Increasingly, the advantages of professional accreditation are being recognised by individuals, universities and employers globally.765 The UK engineering profession participates in several major international accords, within and outside Europe, which establish the ‘tradeability’ of engineering and technology degrees. In each case, the system of accreditation applied in the UK is fundamental to the acceptance of UK degrees. With increasing globalisation, such accords and frameworks are assuming growing importance with employers as a means by which they can be confident in the skills and professionalism of the engineers involved. An accredited programme also has a market advantage for education providers wishing to attract international students to the UK.
11.4.3 Sandwich degrees
The number of students studying on sandwich degrees in 2011/12 is shown in Table 11.27. Overall, one in ten (9.6%) of all undergraduate first-degree students are studying on a sandwich degree. For all STEM subjects, the percentage is 13.6%. However, within STEM subjects there is a wide degree of variation, with two subject areas having an above-average proportion of students on sandwich courses and three having a below-average proportion.
Over a quarter (28.1%) of computer science students were studying on a sandwich course in 2011/12. Male students (28.3%) were slightly more likely than female students (27.0%) to be studying on a sandwich course.
Engineering and technology was the other subject area with an above-average number of students on a sandwich course (19.6%). However, in contrast to computer science, male engineering and technology students were much more likely than female students to be studying on a sandwich course (16.0% against 9.6%).
Biological sciences (6.9%) and mathematical sciences (9.2%) both had a below-average percentage of students on sandwich courses. For both of these subjects there was limited variation by gender. Physical sciences was the third STEM subject to have a below-average percentage of students on a sandwich degree, and female students were slightly more likely than male students (7.4%) to be taking a sandwich course (8.6% against 7.4%).
Table 11.26: Number of STEM students by study level, mode and percentage of all students (2011/12) – all domiciles
Source: HESA student record 2011/12
All HE students Postgraduate Undergraduate first degree
Full-time Part-time Full-time Part-time
Female Male Total Female Male Total Female Male Total Female Male Total Female Male Total
Biological sciences
123,030 76,245 199,275 13,785 7,600 21,385 7,900 3,680 11,580 78,505 53,055 131,560 16,595 6,855 23,450
Physical sciences
38,405 56,550 94,955 6,295 9,975 16,270 1,655 1,975 3,630 24,625 36,800 61,425 3,430 4,770 8,200
Mathematical sciences
16,930 26,235 43,165 1,620 2,985 4,605 410 910 1,320 11,700 17,225 28,925 2,250 3,810 6,060
Computer science
17,005 78,665 95,670 3,070 10,385 13,455 1,180 4,440 5,620 9,020 48,145 57,165 1,715 8,475 10,190
Engineering and technology
25,490 136,525 162,015 6,745 22,940 29,685 2,450 9,850 12,300 13,470 76,445 89,915 1,195 11,840 13,035
Total STEM 220,860 374,220 595,080 31,515 53,885 85,400 13,595 20,855 34,450 137,320 231,670 368,990 25,185 35,750 60,935
All subject areas
1,406,940 1,089,685 2,496,625 160,735 148,690 309,425 151,775 107,300 259,075 713,075 599,040 1,312,115 133,840 95,410 229,250
Percentage STEM
15.7% 34.3% 23.8% 19.6% 36.2% 27.6% 9.0% 19.4% 13.3% 19.3% 38.7% 28.1% 18.8% 37.5% 26.6%

Back to Contents
766 Engineering UK 2013 The state of engineering, EngineeringUK, December 2012, p129 767 Sandwich Courses in Higher Education – A report on current provision and analysis of barriers to increasing participation, Education for Engineering, July 2011, p2 768 Sandwich Courses in Higher Education – A report on current provision and analysis of barriers to increasing participation, Education for Engineering, July 2011, p12 769 Sandwich Courses in Higher Education – A report on current provision and analysis of barriers to increasing participation, Education for Engineering, July 2011, p3 770 Engineering UK 2013 The state of engineering, EngineeringUK, December 2012, p129 771 Following Up the Wilson Review of Business-University Collaboration, Department for Business, Innovation and Skills, June 2012, p14 772 Young students are those aged under 21, based on age being calculated on age on the 30 September of the academic year in which the student is recorded as commencing their studies 773 Computer science also has the lowest proportion of qualifiers achieving a first and upper second class degree, of all STEM subjects
159 11.0 Higher Education Part 2 – Engineering in Education and Training
In last year’s report,766 we showed that the proportion of engineering and technology students on sandwich degrees had declined from a third (33%) in 1994/95 and that provision was patchy, with a majority of students at some HE institutions studying on a sandwich course. The five most popular institutions for engineering sandwich courses are listed in Table 11.28. This shows that nearly two thousand (1,870) students are studying for an engineering sandwich degree at Loughborough University. In addition, just twenty HE institutions provide approximately 70% of all placements to business and industry.767
Table 11.28: Top five popular institutions for engineering sandwich courses 2008/09 – all domiciles768
Source: Education for Engineering
Education for Engineering769 identified a number of barriers to increased take up of sandwich courses by students:
• The need to complete application forms during the busy periods of the year
• Uncertainty in securing a placement
• Peer pressure to opt out of placements
• Finding a placement close to university or parents’ home
• A preference to concentrate on undergraduate studies
• A desire to finish studies early and start work
For institutions, the barriers to offering sandwich course are mainly related to the human resources required to develop and maintain relationships with new and existing businesses. Businesses perceived the costs and time required to offer work placements as the main barrier.
However this comes at a cost to the student. The CBI reports770 that employers want graduates to have work experience, which potentially means that graduate job prospects are being adversely affected. This assessment is reinforced by statistics produced from BIS, which show that 74.6% of engineering graduates who did a sandwich placement were in employment six months after graduation, compared with 67.8% of engineering graduates who did not do a sandwich placement.771
11.4.4 Non-continuation rates
HESA publish statistics on the non-continuation rates for young people772 on full-time first degrees. Figure 11.14 shows that overall the non-continuation rate for those entering HE in 2010/11 was 6.3%. Computer science had noticeably the worst non-continuation rate, at 11.2%,773 followed by combined subjects (8.9%) and engineering and technology (8.0%). If the engineering community wants to double the number of engineering graduates, then it needs to ascertain why the non-completion rate for engineering and technology is above average and identify ways to reduce this.
In contrast, it is worth noting that three STEM subjects have a below-average non-completion rate:
• Mathematical sciences – 4.3%
• Physical sciences – 4.9%
• Biological sciences – 6.5%
Table 11.27: Proportion of undergraduate first degree students who are on a sandwich course, by gender (2011/12) – all domiciles
Source: HESA student record 2011/12
Undergraduate first degree students Sandwich students Percentage sandwich students
Female Male Total Female Male Total Female Male Total
Biological sciences 78,505 53,055 131,560 5,390 3,720 9,110 6.9% 7.0% 6.9%
Physical sciences 24,625 36,800 61,425 2,115 2,720 4,835 8.6% 7.4% 7.9%
Mathematical sciences 11,700 17,225 28,925 1,085 1,575 2,660 9.3% 9.1% 9.2%
Computer science 9,020 48,145 57,165 2,435 13,635 16,070 27.0% 28.3% 28.1%
Engineering and technology 13,470 76,445 89,915 2,110 15,515 17,625 15.7% 20.3% 19.6%
Total STEM 137,320 231,670 368,990 13,135 37,165 50,300 9.6% 16.0% 13.6%
All subject areas 713,075 599,040 1,312,115 52,700 72,830 125,525 7.4% 12.2% 9.6%
Number of sandwich students
Loughborough University
1,870
Coventry University 1,025
The University of Northumbria at Newcastle
1,020
The University of Bath 905
The University of Surrey 785

Back to Contents
774 First degree qualifiers includes first degrees (including eligibility to register to practise with a health or social care or veterinary statutory regulatory body), first degrees with Qualified Teacher Status (QTS)/ registration with a General Teaching Council (GTC), enhanced first degrees, first degrees obtained concurrently with a diploma and intercalated first degrees. 775 University Challenge: How Higher Education Can Advance Social Mobility A progress report by the Independent Reviewer on Social Mobility and Child Poverty, Rt. Hon. Alan Milburn, October 2012, p19
Part 2 – Engineering in Education and Training Higher Education 11.0 160
11.5 Qualifications obtainedThis section looks at the number of students qualifying in different STEM degrees and thus able to enter the job market.
HESA collects data from all publically-funded universities on their HE students. This data is presented in Table 11.29, which shows the number of first degree qualifiers774 for different STEM subjects over ten years. Table 11.30 shows that the proportion of all qualifiers who qualify with a degree in STEM has been steadily declining, from 28.5% in 2003/04 to just under a quarter (24.9%) in 2011/12. The reason STEM subjects have been declining as a proportion of
all subjects can be explained by looking at the ten-year trends. Over ten-years, all qualifiers have increased by over a third (38.0%), but only biological sciences (51.4%) and mathematical sciences (46.0%) have increased by more than this average. Conversely, physical sciences has increased by a fifth (23.1%) and engineering and technology by a fifth (21.3%), while computer sciences has actually experienced a decline (down 16.5%).
Overall, there were 390,985 qualifiers in 2011/12. According to the Organisation for Economic Co-operation and Development (OECD), the UK is seventh in terms of the number of 25- to 34-year-olds who have a Higher Education degree.775
Biological sciences is the largest of the five STEM subjects, with 35,920 qualifiers in 2011/12 – up 6.3% on the previous year. On its own, biological sciences represents over a third of all STEM qualifiers in 2011/12 (35,920 out of 97,545). The proportion of all STEM qualifiers who qualify in biological sciences has increased over the ten year period, driven by the subject’s above average (51.4%) growth.
Engineering and technology is the second-largest STEM subject, with 23,595 qualifiers in 2011/12. However, growth for this subject is below-average, having increased by only 3.0% on the previous year and by 21.3% over ten years from 19,455 in 2002/03.
In 2003/04, computer science was the second-largest STEM subject area. However, its decline of 16.5% over ten years means that in 2011/12 it had fallen to fourth largest. Despite this overall decline, the number of qualifiers did increase by 5.0% in 2011/12.
Physical sciences was the third-largest STEM subject by number of qualifiers in 2011/12, overtaking computer sciences. But despite this increase in total numbers, it showed below-average growth over ten years (23.1% growth) and over the last year (4.2% growth).
Mathematical sciences was the smallest of the STEM subjects in 2011/12, with just 7,445 qualifiers. However, like biological sciences, it has had strong percentage growth over ten years, increasing from 5,100 in 2002/03. Growth has been particularly rapid since 2008/09 when it had 5,890 qualifiers.
It is important to note that a proportion of qualifiers in computer science, physical sciences and mathematical sciences go into engineering occupations within six months of graduating (Section 12.6). Between 61.3% and 65.7% of computer science graduates go into an engineering occupation, compared with 68.4% of engineering and technology graduates. In addition between 12.4% and 22.5% of physical science graduates and 10.2% and 15.9% of mathematical science graduates also go into an engineering occupation.
Fig. 11.14: Percentage of young entrants to full-time first degree courses in 2010/11 who are no longer in HE in 2011/12
Source: HESA non-continuation rates 2011/12
12.0
%
10.0
%
8.0%
6.0%
4.0%
2.0%
0.0%
5.6%
7.3%
7.5%
4.3%11.2%
8.0%
7.7%
5.6%
6.0%
8.9%
6.3%
4.0%
3.8%
7.4%
4.9%
1.8%
6.2%
6.5%
6.9%
Creative arts and design
Education
All subjects
Combined subjects
Historical and philosophical studies
Languages
Business and administrative studies
Mass communications and documentation
Social studies
Law
Architecture, building and planning
Mathematical sciences
Engineering and technology
Agriculture and related subjects
Physical sciences
Subjects allied to medicine
Biological sciences
Medicine, dentistry and veterinary science
Average for all subjects
Computer sciences

Back to Contents
161 11.0 Higher Education Part 2 – Engineering in Education and Training
Figure 11.15 shows the compound growth in the number of qualifiers in engineering and technology, all STEM and all subjects. It shows that all subjects have grown much faster than either all STEM or engineering and technology. It also shows that, for the last four years, the growth trajectory for all STEM, and engineering and technology, has been similar.
It is possible to examine first degree qualifiers by the classification of degree they were awarded. Table 11.30 shows that overall nearly two thirds (61.4%) of all qualifiers achieved either a first or upper second class degree. The average for all STEM was slightly above this, at 63.1%. Overall, four of the five subject areas had an above-average percentage of first and upper second class degrees. However, computer science had a below-average proportion of first and upper class degrees, at just 56.1%. This is disturbing when one considers that, of all subjects, computer science also has the highest non-continuation rates for young full-time first degree students.
Under two thirds (62.4%) of engineering and technology qualifiers achieve a first or upper second class degree. However, this is approximately four percentage points lower than the proportion of qualifiers getting a first or upper second class degree in physical sciences (66.7%) and mathematical sciences (66.5%). Around one in nine graduates in physical sciences and mathematical sciences go into an engineering career, so there are a lot of similarities between these two subjects and engineering and technology. It is therefore puzzling that there is such a large discrepancy in the percentage of qualifiers achieving a first or upper second class degree.
Overall, 6.8% of degrees are unclassified. For all STEM qualifiers, this falls to 3.8%. Three STEM subjects have between 2.1% and 2.6% unclassified degrees. By comparison, 5.7% of computer science degrees are unclassified, while 6.6% of engineering and technology degrees are. If the engineering community wants to improve the supply of graduates coming out of universities, then research needs to be done
into why such a high proportion of engineering and technology degrees are unclassified and what can be done to change this.
Table 11.29: Number of first degrees achieved in STEM (2002/03-2011/12) – all domiciles
Source: HESA qualifications table
2002/03 2003/04 2004/05 2005/06 2006/07 2007/08 2008/09 2009/10 2010/11 2011/12 Change over one year
Change over 10 years
Biological sciences 23,725 25,955 27,200 27,840 29,095 31,185 30,720 32,185 33,800 35,920 6.3% 51.4%
Physical sciences 12,480 11,995 12,530 12,900 12,480 13,015 13,510 13,795 14,745 15,360 4.2% 23.1%
Mathematical sciences 5,100 5,395 5,270 5,500 5,645 5,815 5,980 6,470 6,965 7,445 6.9% 46.0%
Computer science 18,240 20,205 20,095 18,840 16,445 14,915 14,035 14,255 14,505 15,225 5.0% -16.5%
Engineering and technology
19,455 19,780 19,575 19,765 19,900 20,420 20,805 21,955 22,905 23,595 3.0% 21.3%
Total STEM 79,000 83,330 84,670 84,845 83,565 85,350 85,050 88,660 92,920 97,545 5.0% 23.5%
All subjects 283,280 292,090 306,365 315,985 319,260 334,890 333,720 350,860 369,010 390,985 6.0% 38.0%
STEM proportion of all degrees
27.9% 28.5% 27.6% 26.9% 26.2% 25.5% 25.5% 25.3% 25.2% 24.9% -1.2% -10.8%
Fig. 11.15: Percentage growth in first degrees achieved (2002/03-2011/12) – all domiciles
Source: HESA qualifications table
All STEM subjects Engineering and technologyAll subjects
0.0%
20.0%
10.0%
30.0%
25.0%
15.0%
5.0%
35.0%
40.0%
2011
/12
2010
/11
2003
/04
2004
/05
2002
/03
2005
/06
2006
/07
2007
/08
2008
/09
2009
/10

Back to Contents
776 Domicile status does not denote nationality. Some international students will be UK domiciled and some UK national students may be non-UK domiciled.
Part 2 – Engineering in Education and Training Higher Education 11.0 162
11.5.1 Domicile status and gender of engineering qualifiers
Table 11.31 shows the domicile776 and gender of first degree qualifiers in engineering over a nine-year period. It shows that the number of first degree qualifiers in engineering has increased
by 17.5% to 20,855 over the trend period. Growth has mainly come from non-EU qualifiers, with numbers rising by nearly three quarters (71.3%) compared with 5.9% for the UK and 3.9% for the EU. It is pleasing to note that the proportion of female qualifiers over nine years has risen by a fifth (20.1%) – more than the overall increase.
In the last year specifically, the number of qualifiers grew by 4.4%. However, this growth wasn’t consistent across all domiciles. The UK grew the most, up 6.3% and outstripping the nine-year growth, while non-EU grew by 2.6%. Conversely, qualifiers from the EU declined by 3.6%.
Table 11.30: Classification of undergraduate first degrees by subject area (2011/12) – all domiciles
Source: HESA student record 2011/12
First Upper second
Lower second
Third/ Pass Unclassified
Total number of qualifiers
Percentage of degrees at
first or upper second
Percentage of degrees at first or
upper second (when
unclassified is excluded)
Percentage of degrees
unclassified
Biological sciences 5,505 17,565 10,090 1,985 775 35,920 64.2% 65.6% 2.2%
Physical sciences 3,395 6,855 3,895 895 320 15,360 66.7% 68.2% 2.1%
Mathematical sciences 2,360 2,590 1,710 590 195 7,445 66.5% 68.3% 2.6%
Computer science 3,195 5,350 4,185 1,625 875 15,225 56.1% 59.5% 5.7%
Engineering and technology 5,655 9,075 5,685 1,635 1,550 23,595 62.4% 66.8% 6.6%
Total STEM 20,110 41,435 25,565 6,730 3,715 97,545 63.1% 65.6% 3.8%
All subject areas 61,605 178,425 100,310 23,930 26,715 390,985 61.4% 65.9% 6.8%
Table 11.31: Number of first degrees achieved in engineering (2003/04-2011/12) – all domiciles
Source: HESA bespoke data request
2003/04 2004/05 2005/06 2006/07 2007/08 2008/09 2009/10 2010/11 2011/12 Change over one year
Change over nine years
UK 12,915 12,435 11,900 11,990 11,955 12,085 12,295 12,865 13,680 6.3% 5.9%
EU 1,655 1,575 1,625 1,690 1,745 1,715 1,860 1,780 1,720 -3.6% 3.9%
Non-EU 3,185 3,380 3,940 3,740 4,085 4,350 4,970 5,320 5,460 2.6% 71.3%
Total non-UK 4,840 4,960 5,565 5,430 5,830 6,065 6,835 7,105 7,175 1.0% 48.2%
All female students 2,435 2,260 2,430 2,280 2,372 2,405 2,650 2,710 2,925 7.9% 20.1%
Total 17,755 17,395 17,465 17,420 17,785 18,155 19,125 19,970 20,855 4.4% 17.5%
Percentage of non-EU 18.0% 19.4% 22.6% 21.5% 23.0% 24.0% 26.0% 26.6% 26.2% -1.5% 45.6%
Proportion of female students
13.7% 13.0% 13.9% 13.1% 13.3% 13.2% 13.9% 13.6% 14.0% 2.9% 2.2%
Percentage of non-EU (for all courses)
6.9% 7.3% 8.0% 8.2% 8.0% 8.5% 9.2% 10.2% 10.5% 2.9% 52.2%

Back to Contents
777 Postgraduate Education – An Independent Inquiry by The Higher Education Commission, Higher Education Commission, p12
163 11.0 Higher Education Part 2 – Engineering in Education and Training
Over nine years, the number of postgraduate qualifiers has doubled (99.6%) to reach 15,620 in 2011/12 (Table 11.32). As with first degree qualifiers, the greatest growth has come from outside of the EU, where numbers of qualifiers have risen by 174.1% over the period. By comparison, growth from students in the UK (46.4%) and EU (31.3%) has been more modest. Since 2005/06, at least half of all qualifiers have come from outside the EU, rising to 60.7% in 2011/12. This compares with an average for all courses of 40.8%.
In the last year, growth in the number of qualifiers was 2.2%, with EU qualifiers growing
6.1% and non-EU qualifiers by 3.7%. However, the number of UK-domiciled qualifiers fell by 3.3%.
The Higher Education Commission777 has identified that much of our postgraduate provision is unsustainable without international students, leaving our universities and postgraduate provision vulnerable to changes in demand for UK HE from international students.
In 2011/12, the number of students who gained their doctoral qualifications was 2,410 – an increase of 5.1% on the previous year (Table 11.33). Looking at entrants in 2011/12 by domicile shows that the strongest growth came
from outside the EU (7.6%), followed by UK-domiciled students (5.5%). Qualifiers from the EU, however, dropped by 4.4%.
Over nine years, the number of qualifiers has increased by a third (33.6%), with those outside the EU again showing the strongest growth (56.9%). Despite a fall in the number of qualifiers in 2011/12, over nine years qualifiers from the EU rose by more than average (up 35.5%). The UK had the lowest growth, increasing by just 9.6%.
The proportion of female qualifiers has risen from 19.3% in 2003/04 to 22.1% in 2011/12.
Table 11.32: Number of postgraduate degrees (excluding doctorates and PGCE) achieved in engineering (2003/04-2011/12) – all domiciles
Source: HESA bespoke data request
2003/04 2004/05 2005/06 2006/07 2007/08 2008/09 2009/10 2010/11 2011/12 Change over one year
Change over nine years
UK 2,665 2,960 2,860 2,760 2,815 2,925 3,170 4,030 3,900 -3.3% 46.4%
EU 1,700 1,735 1,665 1,755 1,550 1,420 1,670 2,105 2,235 6.1% 31.3%
Non-EU 3,460 4,565 5,175 5,025 5,640 5,690 7,560 9,145 9,485 3.7% 174.1%
Total non-UK 5,160 6,300 6,840 6,780 7,190 7,110 9,230 11,250 11,720 4.2% 127.0%
All female students 1,415 1,780 1,865 1,735 1,880 1,790 2,140 2,775 2,945 6.2% 108.5%
Total 7,825 9,260 9,700 9,540 10,005 10,035 12,400 15,285 15,620 2.2% 99.6%
Percentage of non-EU 44.2% 49.3% 53.4% 52.7% 56.4% 56.7% 60.9% 59.8% 60.7% 1.5% 37.3%
Percentage of female students
18.1% 19.2% 19.2% 18.2% 18.8% 17.8% 17.3% 18.2% 18.9% 4.4% 4.4%
Percentage of non-EU (for all courses)
28.8% 30.8% 31.8% 32.2% 34.7% 35.6% 38.1% 39.2% 40.8% 4.1% 41.7%
Table 11.33: Number of doctorates achieved in engineering (2003/04-2011/12) – all domiciles
Source: HESA bespoke data request
2003/04 2004/05 2005/06 2006/07 2007/08 2008/09 2009/10 2010/11 2011/12 Change over one year
Change over eight years
UK 780 750 760 850 690 780 810 810 855 5.5% 9.6%
EU 245 265 300 285 295 320 %350 345 330 -4.4% 35.5%
Non-EU 780 790 910 1,010 915 1,000 1,060 1,135 1,225 7.6% 56.9%
Total non-UK 1,025 1,060 1,210 1,295 1,210 1,320 1,410 1,485 1,555 4.8% 51.8%
All female students 350 320 385 425 350 430 430 465 530 14.5% 52.7%
Total 1,805 1,810 1,965 2,145 1,900 2,100 2,225 2,290 2,410 5.1% 33.6%
Percentage of non-EU 43.2% 43.8% 46.2% 47.2% 48.2% 47.6% 47.7% 49.6% 50.8% 2.4% 17.6%
Percentage of female students
19.3% 17.8% 19.6% 19.8% 18.5% 20.4% 19.4% 20.2% 22.1% 9.4% 13.9%
Percentage of non-EU (for all courses)
24.9% 25.8% 27.7% 28.0% 28.7% 29.5% 29.3% 30.7% 32.2% 4.9% 29.3%

Back to Contents
Part 2 – Engineering in Education and Training Higher Education 11.0 164
11.5.2 Degrees achieved in selected engineering sub-disciplines
Table 11.34 shows the number of UK-domiciled students achieving a first degree broken down by gender for selected engineering sub-disciplines. The largest of the selected sub-disciplines is mechanical engineering, with 3,435 qualifiers in 2011/12. Over nine years, the number of qualifiers has grown by 30.3%. However, growth in male qualifiers has been around three times that of female qualifiers (32.2% compared with 10.7%). In 2011/12, the number of qualifiers rose by 8.8%, with males increasing by 10.0% but females decreasing by 3.6%.
Civil engineering had the largest percentage growth over nine years. It grew by 89.6%, with strong growth in both the number of male (91.6%) and female (78.8%) qualifiers over the period. In 2011/12, there was an overall increase of 3.7%, however, female qualifiers (6.5%) had a larger percentage increase than male qualifiers (3.3%).
Only production and manufacturing engineering saw a declining number of qualifiers in 2011/12, down 4.2% to 640 graduates. Despite this, there is one positive piece of news: female qualifiers rose by 15.9% in 2011/12, compared with a decline of 7.6% for male qualifiers.
Over the nine-year trend, production and manufacturing engineering became the smallest of the selected engineering sub-disciplines. By 2010/11, the number of qualifiers had fallen by half (down 49.0%) – the largest percentage decline of all the sub-disciplines.
The only sub-discipline to have fewer than a thousand qualifiers in each of the nine years was chemical, process and energy engineering. However there has still been notable growth in this sub-discipline, with the number of qualifiers growing by two thirds (65.1%) to 890 over the
study period. The percentage of male qualifiers grew more strongly than that of female qualifiers (up 71.3% and 43.3% respectively). In fact, in the last year, the number of female qualifiers actually declined (down 4.4%), despite overall growth of 10.0%, while male qualifiers increased by 14.5%.
The number of qualifiers in aerospace engineering has fluctuated at around 1,000 per year. The high point was 2011/12, with 1,095 qualifiers, compared with a low point of 965 in 2007/08. Over the nine years, aerospace engineering has shown growth of 8.9%, but most of that is attributable to a 9.3% increase in 2011/12. Looking at the number of qualifiers by gender shows a strong bias towards males, with around 900 male qualifiers per year against 100 females.
In 2003/04, electronic and electrical engineering had the largest number of qualifiers of all the selected sub-disciplines. However over
nine years, this number has declined by 23.7% to 3,005. Despite this, it has remained the second-largest sub-discipline for the last four years, behind mechanical engineering. Over nine years, the decline in qualifiers has been similar between male students (down 23.8%) and female students (down 22.8%). However, 2011/12 saw an encouraging rise of 8.4% for both genders, with female qualifiers rising by 14.8% and males by 7.6%.
Over nine years, general engineering has declined by 12.0%, with female qualifiers falling more rapidly than male qualifiers (down 19.8% against 10.5%). In 2011/12, there was growth of 2.4% in the overall number of qualifiers. However, this was all driven by female students: female qualifiers rose by 19.0%, compared with a marginal decline of 0.1% for male students.

Back to Contents
165 11.0 Higher Education Part 2 – Engineering in Education and Training
778 Qualifiers of indeterminate gender are not included in this table 779 Website accessed on 29 July 2013 https://www.gov.uk/government/news/government-and-industry-team-up-to-fund-500-masters-degrees-in-aerospace-engineering
The number of postgraduate qualifiers has risen by 43.2% across all the selected engineering sub-disciplines over nine years, although there was a decline of 3.1% in the last year (Table 11.35).
At a postgraduate level, civil engineering had the largest number of qualifiers in 2011/12 with 1,310. Civil engineering postgraduate qualifiers have grown by 139.1% over nine years – predominantly among males (up 157.8%), although the number of females has also almost doubled (up 94.2%). However, the data for 2011/12 is less positive. There was a marginal decline in male qualifier numbers (down 0.5%), but a much larger decline among females (down 15.8%).
Aerospace engineering had the second-largest nine year increase in postgraduate qualifiers, with the numbers more than doubling (up 115.9%). In 2011/12, the number of qualifiers rose by 18.6%. However, the total number remains small at just 225. It is worth noting that
the Government, supported by industry, has introduced a £6 million bursary scheme to support 500 graduates and employees who wish to take a master’s degree in aerospace engineering.779 This will help the aerospace sector to develop the high skill levels it needs to compete internationally.
Chemical, process and energy engineering also showed strong growth in the number of postgraduate qualifiers over nine years, nearly doubling in number (96.1%). Over the nine years, most of the growth is attributable to male students rather than female students (up 136.7% against 16.4%). Chemical, process and energy engineering also grew strongly in 2011/12, rising by 11.9%.
In 2003/04, electronic and electrical engineering was the largest of the engineering sub-disciplines. However, a 26.3% decline over nine years (plus growth in other sub-disciplines) means that it is now the third largest sub-discipline. In the last year, the number of
qualifiers declined by 10.4% to 530 graduates. Male qualifiers declined by 13.2%, whereas female qualifiers rose by 12.1% to 75.
Production and manufacturing engineering was the only other engineering sub-discipline which showed a decline in the number of postgraduate qualifiers in the last year and over nine years (6.0% and 17.5% respectively).
Over nine years mechanical engineering has grown by 44.0% to reach 425. However, in the last year there was a decline of 9.6%, following a huge increase in numbers in 2010/11.
In 2011/12, there was a marginal decline (-0.3%) in the number of qualifiers to general engineering. This was caused by a 18.2% decline in female qualifiers. Male qualifiers actually rose by 3.6%. Over the nine years, numbers have risen by 47.8%, with female qualifiers rising slightly faster than male qualifiers (49.5% compared with 47.5%).
Table 11.34: Number of first degrees achieved in engineering subjects (2003/04-2011/12) – UK domiciled778
Source: HESA bespoke data request
2003/04 2004/05 2005/06 2006/07 2007/08 2008/09 2009/10 2010/11 2011/12 Change over one year
Change over nine years
General engineering
Female 285 225 260 245 230 205 200 190 230 19.0% -19.8%
Male 1,430 1,455 1,420 1,500 1,235 1,220 1,155 1,280 1,280 -0.1% -10.5%
Male and female 1,715 1,680 1,680 1,745 1,470 1,422 1,350 1,475 1,510 2.4% -12.0%
Civil engineering
Female 240 235 220 275 310 355 385 405 430 6.5% 78.8%
Male 1,310 1,500 1,380 1,620 1,920 2,160 2,255 2,430 2,510 3.3% 91.6%
Male and female 1,550 1,735 1,605 1,900 2,230 2,515 2,640 2,835 2,940 3.7% 89.6%
Mechanical engineering
Female 235 205 205 211 225 215 230 270 260 -3.6% 10.7%
Male 2,400 2,430 2,445 2,555 2,570 2,680 2,755 2,885 3,175 10.0% 32.2%
Male and female 2,640 2,635 2,650 2,765 2,800 2,895 2,980 3,155 3,435 8.8% 30.3%
Aerospace engineering
Female 109 93 105 105 90 105 100 105 100 -3.3% -6.9%
Male 905 945 925 895 875 940 900 895 990 10.8% 9.8%
Male and female 1,010 1,035 1,030 1,000 965 1,050 1,000 1,000 1,095 9.3% 8.0%
Electronic and electrical engineering
Female 431 360 310 282 315 255 275 290 335 14.8% -22.8%
Male 3,510 3,210 2,915 2,775 2,655 2,515 2,490 2,485 2,675 7.6% -23.8%
Male and female 3,940 3,565 3,222 3,060 2,980 2,770 2,765 2,775 3,005 8.4% -23.7%
Production and manufacturing engineering
Female 160 155 139 145 115 130 135 95 110 15.9% -30.9%
Male 1,090 955 870 730 690 620 600 570 525 -7.6% -51.7%
Male and female 1,250 1,105 1,010 875 805 755 735 665 640 -4.2% -49.0%
Chemical, process and energy engineering
Female 128 125 140 120 140 130 155 195 185 -4.4% 45.3%
Male 411 405 385 380 430 450 535 615 705 14.5% 71.3%
Male and female 539 535 522 500 570 580 690 810 890 10.0% 65.1%
Total of selected sub-disciplines
12,645 12,295 11,720 11,485 11,815 11,985 12,165 12,715 13,515 6.3% 6.9%

Back to Contents
780 * means the percentage has been removed due to small base size
Part 2 – Engineering in Education and Training Higher Education 11.0 166
Table 11.35: Number of postgraduate degrees (excluding doctorates and PGCE) achieved in engineering sub-disciplines (2003/04-2011/12) – UK domiciled
Source: HESA bespoke data request
2003/04 2004/05 2005/06 2006/07 2007/08 2008/09 2009/10 2010/11 2011/12 Change over one years
Change over nine years
General engineering
Female 60 110 110 85 80 85 100 110 90 -18.2% 49.5%
Male 360 625 610 535 500 465 490 515 535 3.6% 47.5%
Male and female 420 735 720 620 575 550 595 625 625 -0.3% 47.8%
Civil engineering
Female 160 160 140 195 205 230 260 370 310 -15.8% 94.2%
Male 390 390 412 470 545 665 740 1,005 1,000 -0.5% 157.8%
Male and female 550 550 555 670 750 895 1,000 1,375 1,310 -4.6% 139.1%
Mechanical engineering
Female 35 35 25 20 70 35 35 45 40 *780 *
Male 260 265 225 235 310 275 295 425 385 -9.4% 46.5%
Male and female 295 300 250 255 380 310 330 470 425 -9.6% 44.0%
Aerospace engineering
Female 20 20 20 20 10 15 20 25 20 * *
Male 80 105 115 90 115 130 120 165 205 24.5% 146.7%
Male and female 105 125 135 110 125 140 135 190 225 18.6% 115.9%
Electronic and electrical engineering
Female 130 150 105 100 80 75 50 65 75 12.1% -43.9%
Male 590 555 525 505 445 475 495 530 460 -13.2% -22.4%
Male and female 720 700 635 605 525 550 545 595 530 -10.4% -26.3%
Production and manufacturing engineering
Female 45 50 50 30 45 30 35 55 40 * *
Male 305 250 230 220 185 175 175 250 245 -1.9% -19.7%
Male and female 350 300 280 250 230 210 210 305 290 -6.0% -17.5%
Chemical, process and energy engineering
Female 60 60 60 40 30 50 50 60 70 8.0% 16.4%
Male 115 130 125 125 110 135 195 240 270 12.9% 136.7%
Male and female 170 190 185 160 140 185 245 300 335 11.9% 96.1%
Total of selected sub-disciplines
2,615 2,900 2,765 2,680 2,730 2,840 3,060 3,865 3,745 -3.1% 43.2%

Back to Contents
167 11.0 Higher Education Part 2 – Engineering in Education and Training
Table 11.36 shows the number of students qualifying with a doctorate in the selected engineering sub-disciplines. Overall, the number of qualifiers in 2011/12 for all the selected sub-disciplines rose by 5.4% and over nine years by 11.2%.
Due to the small number of qualifiers each year in the selected sub-disciplines, there is a lot of fluctuation in the percentages. However, it is positive to note that only one of the seven sub-disciplines analysed – civil engineering – has shown a decline over nine years, falling by 4.8%.
Table 11.36: Number of doctorates achieved in engineering sub-disciplines (2003/04-2011/12) – UK domiciled
Source: HESA bespoke data request
2003/04 2004/05 2005/06 2006/07 2007/08 2008/09 2009/10 2010/11 2011/12 Change over one year
Change over nine years
General engineering
Female 35 25 40 25 20 30 35 40 30 * *
Male 155 140 135 150 125 135 160 150 180 18.5% 14.4%
Male and female 190 170 175 175 145 165 190 190 210 11.0% 11.3%
Civil engineering
Female 20 25 25 30 30 30 25 30 30 * *
Male 75 70 75 70 65 50 60 65 55 -11.8% -22.0%
Male and female 95 95 105 105 90 80 85 95 90 -6.3% -4.8%
Mechanical engineering
Female 25 15 20 25 15 20 25 20 30 * *
Male 115 110 115 150 90 105 115 125 120 -3.2% 5.8%
Male and female 140 125 135 180 105 125 140 145 150 2.4% 7.3%
Aerospace engineering
Female 0 5 0 10 5 10 5 5 5 * *
Male 20 20 25 40 20 40 35 35 35 * *
Male and female 20 25 25 50 30 45 40 40 40 * *
Electronic and electrical engineering
Female 25 25 30 30 25 40 25 30 25 * *
Male 160 175 145 205 165 185 210 180 200 9.6% 23.9%
Male and female 190 200 175 235 190 230 235 210 225 5.2% 18.4%
Production and manufacturing engineering
Female 10 15 15 5 10 10 10 15 10 * *
Male 35 25 30 20 35 30 20 25 25 * *
Male and female 45 35 45 30 45 40 30 40 35 * *
Chemical, process and energy engineering
Female 30 20 25 20 30 20 25 30 35 * *
Male 60 60 65 55 60 75 60 55 70 20.2% 15.1%
Male and female 90 80 90 75 85 90 85 85 105 18.4% 15.7%
Total of selected sub-disciplines
765 730 745 845 690 780 810 805 850 5.4% 11.2%

Back to Contents
Part 2 – Engineering in Education and Training Higher Education 11.0 168
11.5.3 Ethnicity of engineering graduates
Table 11.37 shows the ethnicity of engineering first degree qualifiers. It shows that over the nine years there has been a marginal decrease in the number of white qualifiers. In the last year, the number of white qualifiers rose by 4.6%. However, as the overall number of qualifiers rose by 6.3%, this means that white graduates have declined to 74.3% of all qualifiers, their lowest percentage for nine years.
The highest percentage growth over nine years has been for graduates from a black or black British–African ethnic background. This group increased by 156.7% over the period and by 17.0% in the last year. Graduates from other Asian backgrounds nearly doubled (up 98.2%) over nine years and also showed strong growth in 2011/12 (up 19.9%).
Over nine years there was a 27.1% decline in the number of Chinese qualifiers. Chinese qualifiers also dropped by 9.9% in 2011/12.
Table 11.37: First degrees achieved in engineering by ethnic origin (2003/04-2011/12) – UK domiciled
Source: HESA bespoke data request
2003/04 2004/05 2005/06 2006/07 2007/08 2008/09 2009/10 2010/11 2011/12 Change over one year
Change over nine years
White 10,195 9,835 9,240 9,420 9,270 9,235 9,345 9,725 10,170 4.6% -0.3%
Black or black British–Caribbean
85 75 85 85 75 75 110 100 110 11.4% 34.6%
Black or black British–African
290 305 375 360 485 515 530 640 750 17.0% 156.7%
Other black background
50 25 40 35 25 20 45 35 40 18.5% -23.5%
Asian or Asian British–Indian
565 485 510 450 515 460 525 545 550 0.8% -3.3%
Asian or Asian British–Pakistani
265 265 270 240 265 300 290 310 340 9.1% 28.2%
Asian or Asian British–Bangladeshi
100 90 75 70 90 90 95 105 115 10.3% 17.6%
Chinese 275 240 215 250 230 260 220 225 200 -9.9% -27.1%
Other Asian background
190 190 230 215 235 285 285 315 375 19.9% 98.2%
Other (including mixed) ethnicity
285 280 295 360 365 450 440 475 600 26.8% 109.9%
Unknown 610 650 565 505 400 400 415 400 430 8.1% -29.4%
Percentage white 78.9% 79.1% 77.6% 78.6% 77.5% 76.4% 76.0% 75.6% 74.3% -1.7% -5.8%
Total 12,915 12,435 11,900 11,990 11,955 12,085 12,295 12,865 13,680 6.3% 5.9%

Back to Contents
169 11.0 Higher Education Part 2 – Engineering in Education and Training
The proportion of qualifiers from each ethnic group does vary by engineering sub-discipline (Table 11.38). Production and manufacturing engineering and general engineering have the greatest proportion of white qualifiers, at 82.1% and 81.4% respectively. However, three sub-disciplines only had around two thirds of their qualifiers from a white background:
• Chemical, process and energy engineering – 60.5%
• Aerospace engineering – 64.7%
• Electronic and electrical engineering – 69.1%
Overall, students from a black or black British–African background formed the second largest ethnic group. The three sub-disciplines with the
highest percentage of black or black British–African qualifiers were also the three sub-disciplines with the lowest percentage of white qualifiers. These were chemical, process and energy engineering, aerospace engineering and electronic and electrical engineering.
Asian or Asian British–Pakistani qualifiers represented 8.6% of all aerospace engineering qualifiers and 5.2% of qualifiers in chemical, process and energy engineering.
Table 11.39 shows the ethnic breakdown of qualifiers to different engineering sub-disciplines by gender. In Table 11.39, we established that around two thirds of qualifiers to electronic and electrical engineering and chemical, process and energy engineering were from a white ethnic
background. It is noticeable that for chemical, process and energy engineering, 62.7% of male qualifiers are white, compared with half (52.2%) of female qualifiers. Similarly, with electronic and electrical engineering, 70.2% of male qualifiers are white compared with 60.4% of female qualifiers.
The only engineering sub-discipline with a higher proportion of white female qualifiers to white male qualifiers is civil engineering (78.1% compared with 76.8%). For chemical, process and energy engineering, the proportion of female black or black British–African qualifiers is double that of males from the same ethnic group (19.9% compared with 9.1%).
Table 11.38: Percentage breakdown of first degrees achieved by ethnic origin in engineering subjects (2011/12) – UK domiciled
Source: HESA bespoke data request
White
Black or black
British–Caribbean
Black or black
British–African
Other black
background
Asian or Asian
British–Indian
Asian or Asian
British–Pakistani
Asian or Asian
British–Bangladeshi
ChineseOther Asian
background
Other (including
mixed) ethnicity
Unknown
General engineering
81.4% 0.6% 3.2% 0.0% 2.6% 1.4% 0.5% 1.1% 2.0% 3.6% 3.7%
Civil engineering
77.0% 0.5% 4.2% 0.3% 3.1% 2.6% 0.8% 1.3% 3.0% 4.4% 2.8%
Mechanical engineering
78.5% 0.6% 4.1% 0.1% 3.8% 1.9% 0.7% 1.4% 2.4% 4.1% 2.4%
Aerospace engineering
64.7% 0.6% 6.6% 0.5% 8.6% 2.5% 1.0% 2.2% 4.1% 6.0% 3.1%
Electronic and electrical engineering
69.1% 1.6% 8.0% 0.6% 4.0% 3.1% 1.2% 1.3% 2.7% 4.4% 3.9%
Production and manufacturing engineering
82.1% 0.8% 1.6% 0.2% 4.3% 1.6% 0.5% 1.8% 1.8% 3.2% 2.3%
Chemical, process and energy engineering
60.5% 0.6% 11.6% 0.4% 5.2% 4.6% 1.0% 2.7% 3.6% 5.4% 4.4%
Total engineering
74.3% 0.8% 5.5% 0.3% 4.0% 2.5% 0.9% 1.5% 2.7% 4.4% 3.1%

Back to Contents
Part 2 – Engineering in Education and Training Higher Education 11.0 170
At postgraduate level, at least a quarter of qualifiers for each engineering sub-discipline come from a non-white ethnic background (Table 11.40). For electronic and electrical engineering, fewer than half (45.2%) of the qualifiers were white, while chemical, process
and energy engineering (57.2%), production and manufacturing engineering (59.5%), mechanical engineering (61.4%) and aerospace engineering (62.2%) all had below two thirds of their qualifiers from a white ethnic background.
Four of the seven selected engineering sub-disciplines have at least one in ten postgraduate qualifiers from a black or black British–African ethnic background.
Table 11.39: Percentage breakdown by gender of first degrees achieved by ethnic origin in engineering subjects (2011/12) – UK domiciled
Source: HESA bespoke data request
White
Black or black
British–Caribbean
Black or black
British–African
Other black
background
Asian or Asian
British–Indian
Asian or Asian
British–Pakistani
Asian or Asian
British–Bangladeshi
ChineseOther Asian
background
Other (including
mixed)Unknown
General engineering
Female 78.8% 0.4% 3.9% 0.0% 3.7% 2.4% 0.0% 1.9% 4.0% 3.1% 1.6%
Male 81.8% 0.6% 3.1% 0.0% 2.3% 1.2% 0.6% 0.9% 1.6% 3.7% 4.0%
Civil engineeringFemale 78.1% 0.0% 4.0% 0.0% 2.6% 1.0% 0.5% 2.1% 4.2% 4.5% 3.1%
Male 76.8% 0.6% 4.2% 0.4% 3.2% 2.9% 0.9% 1.1% 2.8% 4.4% 2.7%
Mechanical engineering
Female 75.1% 0.8% 4.2% 0.0% 4.1% 3.1% 1.5% 1.8% 3.2% 4.5% 1.8%
Male 78.8% 0.6% 4.1% 0.1% 3.7% 1.8% 0.7% 1.4% 2.3% 4.1% 2.4%
Aerospace engineering
Female 61.5% 2.0% 7.9% 1.0% 6.9% 2.0% 1.0% 3.0% 4.9% 5.9% 4.0%
Male 65.0% 0.5% 6.5% 0.4% 8.8% 2.5% 1.0% 2.1% 4.0% 6.0% 3.1%
Electronic and electrical engineering
Female 60.4% 2.9% 5.7% 0.3% 6.3% 4.5% 3.0% 1.4% 5.0% 6.5% 4.1%
Male 70.2% 1.4% 8.3% 0.6% 3.7% 2.9% 1.0% 1.3% 2.5% 4.2% 3.9%
Production and manufacturing engineering
Female 79.2% 0.0% 2.2% 0.0% 4.3% 0.4% 0.9% 3.1% 3.6% 3.6% 2.7%
Male 82.7% 1.0% 1.4% 0.2% 4.2% 1.8% 0.4% 1.5% 1.4% 3.1% 2.2%
Chemical, process and energy engineering
Female 52.2% 1.1% 19.9% 0.5% 5.4% 3.0% 1.1% 4.3% 4.3% 3.8% 4.5%
Male 62.7% 0.4% 9.4% 0.4% 5.1% 5.1% 1.0% 2.2% 3.4% 5.8% 4.4%
Table 11.40: Percentage breakdown by ethnic origin of postgraduate degrees (excluding doctorates and PGCE) achieved in engineering subjects (2011/12) – UK domiciled
Source: HESA bespoke data request
White
Black or black
British–Caribbean
Black or black
British–African
Other black
background
Asian or Asian
British–Indian
Asian or Asian
British–Pakistani
Asian or Asian
British–Bangladeshi
ChineseOther Asian
background
Other (including
mixed)Unknown
General engineering 73.1% 0.3% 5.7% 0.3% 4.2% 1.6% 0.2% 1.4% 2.7% 3.0% 7.5%
Civil engineering 67.5% 0.5% 5.3% 0.3% 2.5% 1.0% 0.4% 1.6% 2.2% 5.0% 13.4%
Mechanical engineering
61.4% 0.7% 10.6% 0.0% 5.0% 2.2% 0.5% 2.3% 4.5% 3.8% 9.0%
Aerospace engineering
62.2% 0.9% 4.5% 0.0% 6.4% 4.0% 2.4% 1.3% 2.9% 3.1% 12.2%
Electronic and electrical engineering
45.2% 1.7% 10.4% 1.2% 5.5% 6.4% 1.0% 4.7% 6.7% 8.1% 9.0%
Production and manufacturing engineering
59.5% 0.6% 13.0% 1.0% 4.4% 3.1% 0.0% 2.8% 2.3% 8.0% 5.2%
Chemical, process and energy engineering
57.2% 0.9% 12.1% 0.3% 4.1% 5.5% 0.9% 1.8% 2.1% 9.3% 5.8%

Back to Contents
781 Section 10.4.1 has an analysis of apprenticeships by region, while section 15.2.1 shows demand for engineers in engineering enterprises, by region.
171 11.0 Higher Education Part 2 – Engineering in Education and Training
11.5.4 Geographical location of qualifiers781
Of the 13,680 engineering first degree graduates, 10,839 qualified at an English institution (Table 11.41). In fact, six English regions each had more than a thousand first degree qualifiers and one, London, had more qualifiers than each of the devolved nations.
Overall there were 1,980 in qualifiers in London. There were 545 qualifiers in electronic and electrical engineering, while both civil engineering and mechanical engineering had 430 qualifiers. By comparison, there were only 20 qualifiers in production and manufacturing engineering.
The West Midlands had the second largest number of qualifiers (1,435) of the English regions. Of these, 440 were in mechanical engineering and 370 in electronic and electrical engineering. In the West Midlands, aerospace engineering had the lowest number of qualifiers (55).
Overall, there were 1,425 qualifiers from institutions in the South East of England. Most of these were from just three sub-disciplines:
• Mechanical engineering – 355
• General engineering – 305
• Electronic and electrical engineering – 305
The fourth English region to have more than a thousand qualifiers (1,285) was Yorkshire and the Humber. It produced 305 qualifiers in civil engineering and 300 in mechanical engineering. Only 70 qualifiers from Yorkshire and the Humber were in production and manufacturing engineering.
The East Midlands also had over a thousand qualifiers (1,220). Of these, 325 were in mechanical engineering and 280 in civil engineering. It is also interesting to note that of the 640 graduates who qualified in production and manufacturing engineering, 135 were in the East Midlands. The East Midlands only produced 60 qualifiers in chemical, process and energy engineering.
The sixth and final English region to have more than a thousand qualifiers was the North West, with 1,155 qualifiers. Most qualifiers in the
North West studied just three engineering sub-disciplines: electronic and electrical engineering (285), mechanical engineering (275) and civil engineering (220). By comparison, three sub-disciplines – chemical, process and energy engineering (95), general engineering (85) and production and manufacturing engineering (60) – each had fewer than one hundred qualifiers.
The South West had just under a thousand qualifiers (975). Most of these were in mechanical (270) and civil engineering (245), compared with just 15 in production and manufacturing engineering.
In the North East, there were only 780 first degree engineering qualifiers in 2011/12. Of these, 290 were in electronic and electrical engineering. However, the North East had no first degree graduates in aerospace engineering and only 15 in production and manufacturing engineering.
The English region with the lowest number of first degree engineering graduates was East of England, with just 585. Nearly half (260) of these qualifiers were in general engineering, with a further 110 qualifiers in mechanical engineering. No other engineering sub-discipline had more than 100 qualifiers and production and manufacturing engineering had no qualifiers.
Looking at the devolved nations shows that Scotland produces the largest number of first degree qualifiers (1,755). Of these, 505 are in mechanical engineering and 430 in civil engineering. Statistics also show that 110 of the 640 production and manufacturing engineering graduates came from Scotland. The sub-discipline with the lowest number of qualifiers was aerospace engineering (75).
Wales had the second largest number of qualifiers from the devolved nations, with 720. However, Wales had fewer qualifiers than every English region except East of England. Of the 720 qualifiers, 225 were in civil engineering, 175 in mechanical engineering and 155 in electronic and electrical engineering. By comparison, Wales produced very few qualifiers in production and manufacturing engineering (15), general engineering (30) and chemical, process and energy engineering (35).
With only 365 first degree qualifiers, Northern Ireland was lowest of the devolved nations and English regions. Only one sub-discipline had more than 100 graduates – civil engineering, with 145.
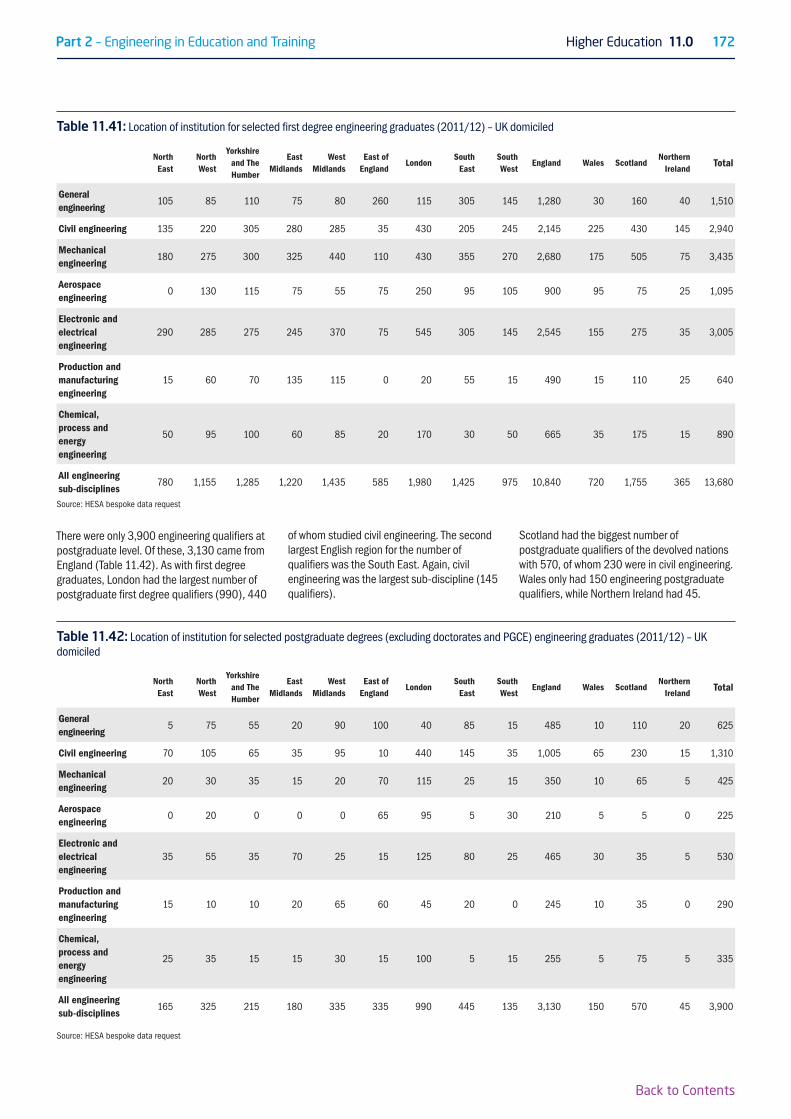
Back to Contents
Part 2 – Engineering in Education and Training Higher Education 11.0 172
There were only 3,900 engineering qualifiers at postgraduate level. Of these, 3,130 came from England (Table 11.42). As with first degree graduates, London had the largest number of postgraduate first degree qualifiers (990), 440
of whom studied civil engineering. The second largest English region for the number of qualifiers was the South East. Again, civil engineering was the largest sub-discipline (145 qualifiers).
Scotland had the biggest number of postgraduate qualifiers of the devolved nations with 570, of whom 230 were in civil engineering. Wales only had 150 engineering postgraduate qualifiers, while Northern Ireland had 45.
Table 11.41: Location of institution for selected first degree engineering graduates (2011/12) – UK domiciled
Source: HESA bespoke data request
North East
North West
Yorkshire and The Humber
East Midlands
West Midlands
East of England
LondonSouth
EastSouth West
England Wales ScotlandNorthern
IrelandTotal
General engineering
105 85 110 75 80 260 115 305 145 1,280 30 160 40 1,510
Civil engineering 135 220 305 280 285 35 430 205 245 2,145 225 430 145 2,940
Mechanical engineering
180 275 300 325 440 110 430 355 270 2,680 175 505 75 3,435
Aerospace engineering
0 130 115 75 55 75 250 95 105 900 95 75 25 1,095
Electronic and electrical engineering
290 285 275 245 370 75 545 305 145 2,545 155 275 35 3,005
Production and manufacturing engineering
15 60 70 135 115 0 20 55 15 490 15 110 25 640
Chemical, process and energy engineering
50 95 100 60 85 20 170 30 50 665 35 175 15 890
All engineering sub-disciplines
780 1,155 1,285 1,220 1,435 585 1,980 1,425 975 10,840 720 1,755 365 13,680
Table 11.42: Location of institution for selected postgraduate degrees (excluding doctorates and PGCE) engineering graduates (2011/12) – UK domiciled
Source: HESA bespoke data request
North East
North West
Yorkshire and The Humber
East Midlands
West Midlands
East of England
LondonSouth
EastSouth West
England Wales ScotlandNorthern
IrelandTotal
General engineering
5 75 55 20 90 100 40 85 15 485 10 110 20 625
Civil engineering 70 105 65 35 95 10 440 145 35 1,005 65 230 15 1,310
Mechanical engineering
20 30 35 15 20 70 115 25 15 350 10 65 5 425
Aerospace engineering
0 20 0 0 0 65 95 5 30 210 5 5 0 225
Electronic and electrical engineering
35 55 35 70 25 15 125 80 25 465 30 35 5 530
Production and manufacturing engineering
15 10 10 20 65 60 45 20 0 245 10 35 0 290
Chemical, process and energy engineering
25 35 15 15 30 15 100 5 15 255 5 75 5 335
All engineering sub-disciplines
165 325 215 180 335 335 990 445 135 3,130 150 570 45 3,900

Back to Contents
782 If studied full-time, an HNC takes one year to complete. 783 If studied full-time, an HND takes two years to complete.
173 11.0 Higher Education Part 2 – Engineering in Education and Training
11.6 Foundation degrees, BTec Higher National Certificates (HNCs) and Higher National Diplomas (HNDs)
11.6.1 Foundation degrees, BTec Higher National Certificates (HNCs) and Higher National Diplomas (HNDs) entrants
Foundation degrees are a degree level qualification equivalent to around two thirds of a full honours degree. Foundation degrees are designed in association with employers and they have a particular focus on a specific job or profession. They are intended to increase the professional and technical skills of current or potential staff, either within a profession or intending to go into that profession. A foundation degree can be studied either full-time or part-time.
HNCs782 and HNDs783 are highly flexible and can be studied part-time, full-time, as a sandwich course or through distance learning. They are assessed through projects and practical tasks rather than formal written exams and all involve work-related experience. They provide a recognised route to related degree courses; HNC/D holders may move on to the second or third year of a related degree course.
Changes to national qualifications frameworks (NQF) mean that HNC and HND qualifications are now at different levels within the NQF. An HNC is now a level 4 qualification and, as a result, HNCs started on or after 1 September 2010 are no longer exemplifying qualifications for Incorporated Engineer (IEng) registration. An HND qualification, however, is still a level 5 qualification and is still an exemplifying qualifications for IEng registration.
Table 11.43 shows the number of students entering foundation degrees, HNDs and HNCs by broad subject areas. It shows that overall there were 49,945 entrants to foundation degrees. Of these, a fifth (20.8%) were studying for a STEM
qualification and 7.4% (3,720) were studying for engineering and technology. Part-time entrants (9.5%) were slightly more likely than full-time entrants (6.2%) to be studying engineering and technology.
The number of students entering HNC (7,995) or HND (9,310) courses is much lower than the number entering foundation degrees (49,945). However, the proportion of entrants who are specifically studying a STEM subject or engineering and technology is much higher. Overall, nearly two thirds (60.9%) of students entering a HNC course start a STEM course and over half (57.5%) start an engineering and technology course. For HNDs, nearly half (44.7%) of entrants are doing a STEM course and nearly a third (30.8%) are studying engineering and technology. As a result, even though foundation degrees have significantly more entrants than HNCs and HNDs, 4,300 students entered an HNC engineering and technology course, compared with 3,720 entering a foundation degree in engineering and technology.
Table 11.43: Entrants to foundation degrees, BTec HNDs and HNCs by broad subject area of study (2011/12)
Source: HEFCE
Entrants to HNC programmes Entrants to HND programmes Entrants to foundation degree programmes
Subject area of study (broad) Full-time programmes
Part-time programmes
Total entrants
Full-time programmes
Part-time programmes
Total entrants
Full-time programmes
Part-time programmes
Total entrants
Clinical subjects 0 0 0 0 0 0 40 0 40
Agriculture and related subjects
10 45 55 170 15 180 2,090 480 2,570
Arts, humanities, social sciences and languages
655 2,415 3,070 4,030 930 4,960 22,590 14,350 36,940
Biological sciences 25 30 55 315 0 315 2,190 910 3,095
Physical sciences 0 80 80 50 10 60 375 285 660
Mathematical sciences 0 15 15 0 0 0 0 0 0
Computer sciences 150 275 425 830 100 925 2,160 730 2,890
Engineering and technology 430 3,870 4,300 1,135 1,730 2,865 1,955 1,765 3,720
All STEM subjects 610 4,265 4,870 2,325 1,840 4,165 6,680 3,685 10,365
Percentage of all subjects that are STEM subjects
48.0% 63.4% 60.9% 35.6% 66.1% 44.7% 21.3% 19.9% 20.8%
Percentage of all subjects that is engineering and technology
33.9% 57.5% 53.8% 17.4% 62.1% 30.8% 6.2% 9.5% 7.4%
Unknown and combined subjects
0 0 0 0 0 0 0 25 25
Total 1,270 6,725 7,995 6,525 2,785 9,310 31,400 18,545 49,945

Back to Contents
Part 2 – Engineering in Education and Training Higher Education 11.0 174
Over four years, the number of entrants to HNC courses declined by 8.2% (Table 11.44). This decline was not evenly spread between full-time and part-time students: part-time student numbers fell by 14.9%, while full-time numbers rose by 218.5%. However, full-time students represented only 430 of the 4,300 entrants in 2011/12.
HND engineering and technology entrant numbers rose 16.5% over four years, with particularly strong growth in 2011/12 (up 46.9%). In 2011/12, the number of part-time entrants increased by 133.8%, compared with a 6.2% decline for full-time students.
In 2011/12, there was a decline of 5.7% in the number of students entering a foundation degree in engineering and technology. However, the long term trend is positive, with entrant numbers growing by 3.8% over four years. Over this period, part-time entrants increased by 28.4%, against an 11.5% decline for full-time entrants.
Table 11.44: Entrants to engineering and technology foundation degrees, HNDs and HNCs (2008/09 – 2011/12)
Source: HEFCE
2008/09 2009/10 201011 2011/12Change
over one year
Change over four
years
Entrants to HNC programmes
Full-time programmes
135 195 530 430 -18.9% 218.5%
Part-time programmes
4,550 4,285 4,275 3,870 -9.5% -14.9%
Total entrants 4,685 4,485 4,810 4,300 -10.6% -8.2%
Entrants to HND programmes
Full-time programmes
1,515 1,665 1,210 1,135 -6.2% -25.1%
Part-time programmes
945 675 740 1,730 133.8% 83.1%
Total entrants 2,460 2,335 1,950 2,865 46.9% 16.5%
Entrants to foundation degree programmes
Full-time programmes
2,210 2,545 2,285 1,955 -14.4% -11.5%
Part-time programmes
1,375 1,295 1,665 1,765 6.0% 28.4%
Total entrants 3,585 3,840 3,945 3,720 -5.7% 3.8%

Back to Contents
784 Bespoke HESA data request.
175 11.0 Higher Education Part 2 – Engineering in Education and Training
Table 11.45 shows the proportion of female entrants to engineering and technology. Overall, it was only among full-time entrants to foundation degrees that the percentage of female entrants reached double figures
(15.3%). The next highest percentage of females was for part-time foundation degrees, at 7.9%. By comparison, only 2.3% of entrants to full-time HNC courses were female.
11.6.2 Foundation Degrees, BTec Higher National Certificates (HNCs) and Higher National Diplomas (HNDs) completions
Table 11.46 uses data provided by Edexcel on the number of BTec HNC and HND completions over nine years. It shows that overall in 2012/13 there were 27,980 completions, which was an increase of 1.3% on the previous year but down by 17.5% over the nine years. In 2004/05 13.7% of completions were from international students rising to 41.4% by 2012/13. In 2012/13 a third (33.6%) of completions were female students.
The largest of the STEM subject areas was engineering with 5,797 completions in 2012/13. However this was a decline of 8.9% on the previous year and a decline of 15.8% over the nine years. It can be seen that the percentage of completers who are female has increased over the nine years from 8.2% in 2004/05 to 11.4% in 2012/13.
ICT/computing was the second largest STEM subject with 3,477 completions. The number of completions in this subject declined slightly over one year (down 0.2%) but over nine years it is down by more than a third (38.0%). Since 2008/09 the majority of ICT/computing completers are international students. In 2012/13 two thirds (66.7%) of completers were international, this compares to a third (33.3%) in 2004/05.
In 2012/13 construction had 2,193 completions. This was a decline of a fifth (21.9%) on the previous year and a decline of a third (30.2%) over nine years. Construction has been declining ever since its highpoint of 3,616 in 2009/10. Of the 2,193 completions in 2012/13 1,184 came from students who were aged 25 or older.
According to the HESA student record there were also 1,460 students who completed a foundation degree in engineering in 2011/12.784
Table 11.45: Entrants to engineering and technology foundation degrees, HNDs and HNCs by gender (2011/12)
Source: HEFCE
Entrants to
full-time HNC programmes
Entrants to part-time HNC
programmes
Entrants to full-time HND programmes
Entrants to part-time HND
programmes
Entrants to full-time
foundation degree
programmes
Entrants to part-time
foundation degree
programmes
Female 10 210 55 85 300 140
Male 420 3,660 1,080 1,645 1,655 1,630
Percentage female
2.3% 5.4% 4.8% 4.9% 15.3% 7.9%
Total 430 3,870 1,135 1,730 1,955 1,765

Back to Contents
Part 2 – Engineering in Education and Training Higher Education 11.0 176
Table 11.46: Number of students completing selected STEM BTec HNC and HND subjects, by gender and age (2004/05-2012/13) – all domiciles
2004/05 2005/06 2006/07 2007/08 2008/09 2009/10 2010/11 2011/12 2012/13 Change over one year
Change over nine years
Biology
UK 192 152 119 79 84 49 78 71 112 57.7% -41.7%
International 0 0 0 0 0 0 0 105 40 -61.9% -
Female 90 88 68 40 29 32 52 101 87 -13.9% -3.3%
Aged under 19 0 0 0 1 0 0 0 1 0 - -
Aged 19-24 92 47 42 32 44 30 45 149 118 -20.8% 28.3%
Aged 25+ 40 22 46 25 20 15 27 20 29 45.0% -27.5%
Total 192 152 119 79 84 49 78 176 152 -13.6% -20.8%
% non-UK - - - - - - - 59.7% 26.3% -55.9% -
% female 46.9% 57.9% 57.1% 50.6% 34.5% 65.3% 66.7% 57.4% 57.2% -0.3% 22.0%
Chemistry
UK 71 127 53 53 56 41 79 67 47 -29.9% -33.8%
International 0 0 0 0 0 0 0 157 66 -58.0% -
Female 25 40 16 20 27 11 41 103 58 -43.7% 132.0%
Aged under 19 1 1 0 0 0 0 1 0 0 - -
Aged 19-24 41 36 24 22 25 26 40 158 90 -43.0% 119.5%
Aged 25+ 18 26 10 11 29 15 32 63 21 -66.7% 16.7%
Total 71 127 53 53 56 41 79 224 113 -49.6% 59.2%
% non-UK - - - - - - - 70.1% 58.4% -16.7% -
% female 35.2% 31.5% 30.2% 37.7% 48.2% 26.8% 51.9% 46.0% 51.3% 11.5% 45.7%
Other sciences
UK 666 478 298 401 476 477 301 139 15 -89.2% -97.7%
International 0 34 14 12 19 10 11 24 31 29.2% -
Female 117 92 74 44 40 26 35 45 26 -42.2% -77.8%
Aged under 19 1 2 1 1 1 0 2 0 0 - -
Aged 19-24 120 86 62 86 132 71 171 83 20 -75.9% -83.3%
Aged 25+ 451 365 212 295 345 402 127 70 22 -68.6% -95.1%
Total 666 512 312 413 495 487 312 163 46 -71.8% -93.1%
% non-UK - 6.6% 4.5% 2.9% 3.8% 2.1% 3.5% 14.7% 67.4% 358.5% -
% female 17.6% 18.0% 23.7% 10.7% 8.1% 5.3% 11.2% 27.6% 56.5% 104.7% 221.0%
Engineering
UK 5,650 4,827 3,642 3,658 3,660 3,599 4,266 4,210 3,798 -9.8% -32.8%
International 1,238 1,009 1,099 1,210 988 1,263 1,029 2,153 1,999 -7.2% 61.5%
Female 562 543 467 513 507 579 590 742 663 -10.6% 18.0%
Aged under 19 9 10 10 5 8 8 19 32 22 -31.3% 144.4%
Aged 19-24 3,054 2,412 2,221 2,384 2,631 3,028 3,078 3,889 3,572 -8.2% 17.0%
Aged 25+ 2,137 1,876 1,681 1,685 1,729 1,526 1,825 1,996 1,809 -9.4% -15.3%
Total 6,888 5,836 4,741 4,868 4,648 4,862 5,295 6,363 5,797 -8.9% -15.8%
% non-UK 18.0% 17.3% 23.2% 24.9% 21.3% 26.0% 19.4% 33.8% 34.5% 2.1% 91.7%
% female 8.2% 9.3% 9.9% 10.5% 10.9% 11.9% 11.1% 11.7% 11.4% -2.6% 39.0%

Back to Contents
177 11.0 Higher Education Part 2 – Engineering in Education and Training
Table 11.46: Number of students completing selected STEM BTec HNC and HND subjects, by gender and age (2004/05-2012/13) – all domiciles
Source: Edexcel
2004/05 2005/06 2006/07 2007/08 2008/09 2009/10 2010/11 2011/12 2012/13 Change over one year
Change over nine years
ICT/Computing
UK 3,736 2,352 1,740 1,499 1,218 1,096 1,224 1,135 1,157 1.9% -69.0%
International 1,869 1,972 2,394 1,413 1,733 1,271 1,427 2,349 2,320 -1.2% 24.1%
Female 1,310 1,060 1,023 905 964 565 583 823 756 -8.1% -42.3%
Aged under 19 18 18 31 14 13 19 19 23 38 65.2% 111.1%
Aged 19-24 2,100 1,953 1,764 1,457 1,570 1,506 1,826 2,314 2,386 3.1% 13.6%
Aged 25+ 1,963 1,440 1,449 976 1,095 663 634 901 802 -11.0% -59.1%
Total 5,605 4,324 4,134 2,912 2,951 2,367 2,651 3,484 3,477 -0.2% -38.0%
% non-UK 33.3% 45.6% 57.9% 48.5% 58.7% 53.7% 53.8% 67.4% 66.7% -1.4% 100.3%
% female 23.4% 24.5% 24.7% 31.1% 32.7% 23.9% 22.0% 23.6% 21.7% -8.1% -7.3%
Construction
UK 2,892 2,655 2,533 2,646 2,753 2,800 2,569 2,198 1,677 -23.7% -42.0%
International 252 205 479 444 391 816 712 610 516 -15.4% 104.8%
Female 347 390 438 481 468 604 430 364 225 -38.2% -35.2%
Aged under 19 2 3 4 1 3 2 3 1 3 200.0% 50.0%
Aged 19-24 1,017 969 1,064 1,095 1,387 1,608 1,505 1,268 855 -32.6% -15.9%
Aged 25+ 1,161 1,048 1,099 1,122 1,519 1,674 1,518 1,298 1,184 -8.8% 2.0%
Total 3,144 2,860 3,012 3,090 3,144 3,616 3,281 2,808 2,193 -21.9% -30.2%
% non-UK 8.0% 7.2% 15.9% 14.4% 12.4% 22.6% 21.7% 21.7% 23.5% 8.3% 193.8%
% female 11.0% 13.6% 14.5% 15.6% 14.9% 16.7% 13.1% 13.0% 10.3% -20.8% -6.4%
All subjects (including STEM and non-STEM)
UK 29,269 24,194 18,939 17,116 15,594 15,513 16,975 16,224 16,394 1.0% -44.0%
International 4,662 4,710 5,871 11,014 12,892 21,402 15,438 11,408 11,586 1.6% 148.5%
Female 12,250 10,807 8,893 12,402 12,475 17,278 13,331 9,340 9,411 0.8% -23.2%
Aged under 19 62 63 97 605 763 973 823 199 278 39.7% 348.4%
Aged 19-24 13,405 11,538 10,657 15,426 17,458 24,750 20,963 17,305 17,478 1.0% 30.4%
Aged 25+ 11,353 9,279 8,208 7,655 8,338 8,752 8,486 8,344 8,406 0.7% -26.0%
Total 33,931 28,904 24,810 28,130 28,486 36,915 32,413 27,632 27,980 1.3% -17.5%
% non-UK 13.7% 16.3% 23.7% 39.2% 45.3% 58.0% 47.6% 41.3% 41.4% 0.2% 202.2%
% female 36.1% 37.4% 35.8% 44.1% 43.8% 46.8% 41.1% 33.8% 33.6% -0.6% -6.9%

Back to Contents
785 Cost centre groups reflect both academic similarities and comparable resource requirements and are not the same as subject areas, used earlier in this chapter 786 The biological, mathematical and physical sciences cost centre includes biosciences, chemistry, physics, earth, marine and environmental sciences and mathematics 787 The engineering and technology cost centre includes general engineering, chemical engineering, mineral, metallurgy and materials engineering, civil engineering, electrical, electronic and computer engineering, mechanical, aero and production engineering, IT and systems sciences, computer software engineering. 788 Other comprises the following cost centres – academic services, central administration and services, staff and student facilities, premises plus residences and catering
Part 2 – Engineering in Education and Training Higher Education 11.0 178
11.7 Higher Education staffTable 11.47 shows that 117,845 full-time academic staff were working in the HE sector in 2011/12. Overall, two in five (39.0%) of all staff were female, with two cost centres785 having more than 50% female academic staff: education (53.3%) and medicine, dentistry and health (52.8%). All the other subject areas had a majority of male academic staff, with engineering and technology having the worst gender diversity – only 17.2% of academics working in engineering and technology were female. The cost centre with the second lowest percentage of female academics was architecture and planning with 28.3%.
Overall, there was 16,250 academic staff working in engineering and technology and 21,425 working in biological, mathematical and physical sciences.
Table 11.48 shows the nationality of all academic staff in each cost centre. Overall, a quarter (24.4%) of all academic staff are non-UK nationals and one in nine (11.0%) are non-EU nationals. Engineering and technology has the highest proportion of staff who are not UK nationals (33.8%) and are not EU nationals (19.3%). The cost centre with the second highest proportion of non-UK academic staff was biological, mathematical and physical sciences (32.3%).
Table 11.47: Full-time academic staff (excluding atypical) by cost centre group and gender (2011/12)
Source: HESA staff record 2011/12
Cost centre group Female Male TotalPercentage of staff who are female
Medicine, dentistry and health
16,700 14,945 31,645 52.8%
Agriculture, forestry and veterinary science
720 905 1,630 44.2%
Biological, mathematical and physical sciences786
6,085 15,340 21,425 28.4%
Engineering and technology787
2,800 13,450 16,250 17.2%
Architecture and planning 620 1,575 2,190 28.3%
Administrative, business and social studies
8,640 13,480 22,120 39.1%
Humanities and language based studies and archaeology
4,350 5,475 9,825 44.3%
Design, creative and performing arts
1,865 2,860 4,725 39.5%
Education 3,460 3,030 6,490 53.3%
Other788 660 880 1,550 42.6%
All staff 45,905 71,940 117,845 39.0%
Table 11.48: All academic staff by nationality and cost centre (2011/12)
Source: HESA staff record 2011/12
Medicine, dentistry and
health
Agriculture, forestry and
veterinary science
Biological, mathematical and physical
sciences
Engineering and
technology
Architecture and
planning
Administrative business
and social studies
Humanities and language
based studies and archaeology
Design, creative and
performing arts
Education Other Total
UK 35,045 1,605 17,680 13,610 2,870 24,435 11,235 11,290 11,635 2,290 131,695
EU (excluding the UK)
5,150 275 5,095 3,090 410 4,910 3,385 980 750 190 24,240
Non-EU 3,885 150 3,650 4,090 410 4,455 1,895 750 495 155 19,935
Unknown 895 25 665 420 155 1,125 410 1,240 460 115 5,515
All academic staff 44,975 2,050 27,085 21,215 3,845 34,925 16,930 14,260 13,340 2,755 181,385
Percentage non-UK 20.1% 20.7% 32.3% 33.8% 21.3% 26.8% 31.2% 12.1% 9.3% 12.5% 24.4%
Percentage non-EU 8.6% 7.3% 13.5% 19.3% 10.7% 12.8% 11.2% 5.3% 3.7% 5.6% 11.0%

Back to Contents
179 11.0 Higher Education Part 2 – Engineering in Education and Training
Figure 11.16 shows that around a third (34.4%) of academic staff had a salary of between £31,020 and £41,639 in 2011/12, and another third (33.1%) had a salary of between £41,639 and £55,908. Nearly a fifth (16.9%) earned more than £55,908. The statistics for engineering and technology are very close
to these averages. However, looking at salaries in excess of £55,908 shows that a quarter (27.6%) of those in the ‘other’ category earn this salary, compared with 8.3% of staff in education and 10.0% of staff in design, creative and performing arts.
Fig. 11.16 – Academic staff (excluding atypical) by cost centre group and salary range (2011/12)
Source: HESA staff record 2011/12
0.0%
10.0
%
20.0
%
30.0
%
40.0
%
50.0
%
60.0
%
70.0
%
80.0
%
90.0
%
100.
0%
Design, creative and performing arts
Education
All academic staff
Humanities and language based studies and archaeology
Administrative,business andsocial studies
Architecture and planning
Other
Engineeringand technology
Agriculture,forestry andveterinarysciences
Biological,mathematicaland physical sciences
Medicine,dentistry andhealth
41.7%
1.0%
3.3%
Contract salary < £17,329
Contract salary not applicable
Contract salary > £17,329 and < £23,121 Contract salary > £23,121 and < £31,020
Contract salary > £31,020 and < £41,639 Contract salary > £41,639 and < £55,908 Contract salary > £55,908
17.3%29.0%36.0%
10.0%33.8%
8.3%40.2%32.3%
9.1% 41.9%
11.3% 36.6%
33.0% 19.7%
14.9% 33.4% 36.1%
15.5% 37.6% 26.7%
15.0% 32.8%
33.7%
32.9%
34.5%
14.9%
18.1%
16.0%
11.4%
18.5%31.7%
15.2%
12.6%
16.5%
27.6%17.2%33.0%18.3%
16.9%33.1%34.4%13.7%
12.8%
0.8%
0.2%
1.7%
0.3%
2.9%
0.4%
2.9%
0.3%
1.6%
0.3%
1.4%
0.9%
1.5%
0.5%
1.6%
1.0%
1.6%
0.4%
0.5%
0.2%

Back to Contents
789 Postgraduate Education – An Independent Inquiry by The Higher Education Commission, Higher Education Commission, p12 790 Patterns and Trends in UK Higher Education, Universities UK, December 2012, p7 791 Patterns and Trends in UK Higher Education, Universities UK, December 2012, p7 792 Postgraduate Education – An Independent Inquiry By The Higher Education Commission, Higher Education Commission, p38 793 The funding environment for universities – an assessment, UniversitiesUK, May 2013, p50 794 The funding environment for universities – an assessment, UniversitiesUK, May 2013, p47 795 International students and net migration in the UK, IPPR, April 2012, p4 796 Transnational education refers to students who study for a qualification outside of the country of the awarding institution
Part 2 – Engineering in Education and Training Higher Education 11.0 180
11.8 International student perspectiveIn Section 11.0, we showed the financial importance of international students to the UK HE sector, while in Section 11.3.1 we showed the reliance of some – particularly postgraduate – engineering courses on international students.789 This section explores in more detail some of the issues surrounding international students.
Research shows significant growth in non-EU students coming to the UK to undertake taught postgraduate study, particularly in STEM subjects. Since 2002/03, the number of non-EU students studying engineering and technology and mathematical sciences has more than doubled (up 149% and 155% respectively).790
In 2010/11, the top five countries of origin for international students were:
• China (including special administrative regions)
• India
• Nigeria
• USA
• Pakistan791
The UK’s international student recruitment for research students is also becoming concentrated in a few subjects and countries. In 2010/11, over half of all international research students came from China, Saudi Arabia and the USA.792
Apart from the USA, the UK attracts more tertiary level international students than any other country.793 However, the UK’s market share in all international students has decreased slightly since 2000, as shown in Figure 11.17, with France, Canada, Japan, Spain and Italy all increasing their market shares. The UK needs to ensure it maintains its share of this valuable market. In 2010, there were 4.1 million international tertiary level students; by 2020, this figure is predicted to rise to seven million.
In 2012, Universities UK794 surveyed student recruitment agents in 107 countries and found that 64% rated the UK ‘very attractive’. However, this rating is lower than 2009’s, when 72% of
respondents gave the UK this rating. In terms of rating the country as ‘very attractive’ the UK is now tied in second place with Canada, which could potentially impact on future recruitment of international students.
11.8.1 Transnational education796
Along with students who come to the UK to study, it is important to recognise the transnational students, who study for a UK qualification outside of the UK. Table 11.49
shows the number of transnational students studying for UK qualifications, both within the EU and outside the EU. It shows that over half a million (556,055) students were studying for a UK qualification wholly overseas in 2011/12. A majority (410,615) of these students are studying for a first degree outside of the EU. In addition, more students were studying for a postgraduate qualification outside the EU (73,075) than were studying for any qualification within the EU (72,020).
Fig. 11.17: Market share in international education by country of destination795
Source: OECD 2011a. Data available at http://dx.doi.org/10.1787/888932464562
France
Canada
Japan
Spain
Italy
Switzerland
Germany
Australia
United Kingdom
United States
0.0%
15.0
%
20.0
%
5.0%
25.0
%
10.0
%
2000 2009
Table 11.49: Number of students studying wholly overseas for a UK qualification by region and study level (2011/12)
Source: HESA student record 2011/12
Within the European Union Outside the European Union
Total postgraduate
Total first degree
Further education All students Total
postgraduateTotal
first degreeFurther
education All students Total for EU and non-EU
Number of students 22,980 49,040 0 72,020 73,075 410,615 345 484,035 556,055

181 12.0 Graduate destinations Part 3 – Engineering in Employment
Back to Contents
Part 3 – Engineering in Employment12.0 Graduate destinations

Part 3 – Engineering in Employment Graduate destinations 12.0 182
Back to Contents
797 Post-doctoral and non-EU domiciled students are excluded from the DLHE. 798 London Metropolitan University, Liverpool Hope University and University College Birmingham are generally excluded from HESA statistics. The University of Buckingham, a private university was included. 799 Data collection is undertaken by individual HEIs using a questionnaire and procedure set by HESA, with the data collected returned to HESA for analysis. Returned DLHE data is linked to earlier student returns submitted by HEIs. 800 All whole numbers used in this section have had HESA data rounding policy applied. http://www.hesa.ac.uk/index.php/content/view/146/178/
Increasing the supply of Engineers is one of EngineeringUK’s two key objectives, therefore monitoring, analysing and understanding the destination pathways of engineering graduates is a critical facet of this report.
12.1 Destination of graduatesThe Higher Education Statistics Agency (HESA) Destination of Leavers from Higher Education survey (DLHE)797 798 is administered799 about six months after graduation. In 2011/12, 411,005800 UK and other EU domiciled qualifiers provided information about their destinations from a possible 567,390 within the eligible DLHE population. This gives a percentage with known destination of 72.4%.
Figure 12.0 shows the destination of all leavers and engineering and technology leavers. It shows that overall 55.1% of all graduates went into full-time employment and that amongst engineering and technology graduates 61.4% went into full-time employment. A further 6.8% of engineering and technology graduates also went into part-time work.
Looking at the proportion of students who combine work and study or who go into just further study the percentages are similar, with all differences being below 1%. However
engineering and technology graduates were slightly more likely to be unemployed (8.6%) than all graduates (7.1%).
“Everything that can be counted does not necessarily count; everything that counts cannot necessarily be counted.”
Albert Einstein
Fig. 12.0: Destinations of leavers of HE (all qualifications) in all subjects and engineering and technology (2011/12) – UK domiciled
Source: HESA/Destination of Leavers from Higher Education Institutions
Unemployed
0.0%
10.0
%
20.0
%
30.0
%
40.0
%
50.0
%
60.0
%
70.0
%
80.0
%
90.0
%
100.
0%
Work and further studyFull-time work Part-time work Full-time study
Part-time study Other
Engineering and technology
Total – all subject areas
61.4% 6.8% 6.5% 11.7% 8.6% 3.5%
1.4%
1.5%
55.1% 13.1% 7.4% 11.4% 7.1% 4.5%

183 12.0 Graduate destinations Part 3 – Engineering in Employment
Back to Contents
Figure 12.1 shows the destination of graduates in all subjects and engineering and technology, by gender. It shows that amongst male engineering and technology graduates 61.9% went into full-time employment and 6.6% went into part-time employment with a similar number, 6.5%, going into work and further study. For female engineering and technology graduates, although the overall number going into employment was similar to male graduates, the profile was different. Fewer females (58.8%) went into full-time employment while a higher
proportion (8.1%) went into part-time employment. The proportion going into work and further study was similar to male students.
Looking at graduates in all subjects shows that male students had a slightly higher full-time employment rate than female students (55.3% compared with 54.9%). By comparison, female graduates (14.7%) were much more likely to go into part-time employment than male graduates (10.9%). Female students were also more likely to combine further study with work (7.9%
compared with 6.6%). This is perhaps not surprising as when you consider that there are 5.2 million women in part-time employment in the UK, compared with 1.5 million men.801
Overall it is worth noting that female engineering and technology graduates were more likely to go into full-time employment (58.8%) than all male graduates (55.3%) or all female graduates (54.9%).
Fig. 12.1: Destinations of leavers of HE (all qualifications) in all subjects and engineering and technology, by gender (2011/12) – UK domiciled
Source: HESA/Destination of Leavers from Higher Education Institutions
801 Gender and skills in changing economy, UKCES, September 2011, pv
Unemployed
0.0%
10.0
%
20.0
%
30.0
%
40.0
%
50.0
%
60.0
%
70.0
%
80.0
%
90.0
%
100.
0%
Work and further studyFull-time work Part-time work Full-time study
Part-time study Other
Total – all subject areasfor males
Total – all subject areasfor females
55.3% 10.9% 6.6% 12.7% 8.9% 4.1%
1.5%
1.4%
54.9% 14.7% 7.9% 10.4% 5.8% 4.8%
Engineering and technologyfor males
Engineering and technologyfor females
61.9% 6.6% 6.5% 11.6% 8.7% 3.2%
1.4%
1.6%
58.8% 8.1% 6.3% 12.3% 7.9% 5.4%
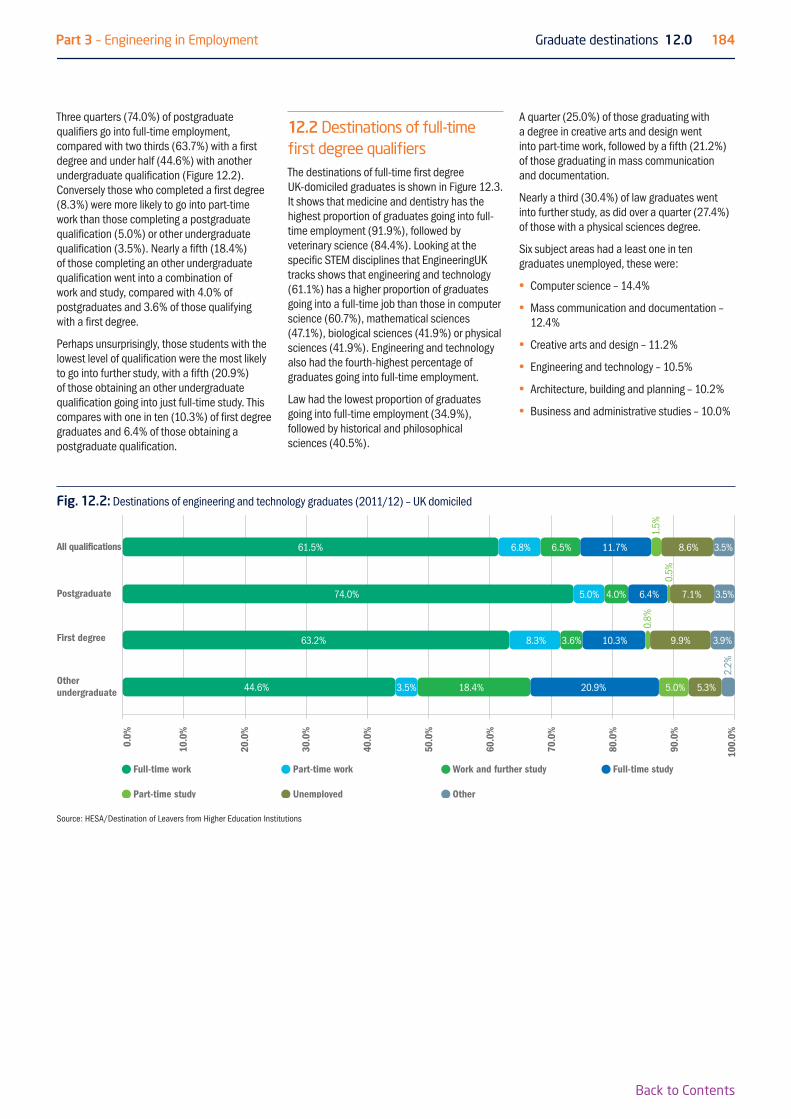
Part 3 – Engineering in Employment Graduate destinations 12.0 184
Back to Contents
Three quarters (74.0%) of postgraduate qualifiers go into full-time employment, compared with two thirds (63.7%) with a first degree and under half (44.6%) with another undergraduate qualification (Figure 12.2). Conversely those who completed a first degree (8.3%) were more likely to go into part-time work than those completing a postgraduate qualification (5.0%) or other undergraduate qualification (3.5%). Nearly a fifth (18.4%) of those completing an other undergraduate qualification went into a combination of work and study, compared with 4.0% of postgraduates and 3.6% of those qualifying with a first degree.
Perhaps unsurprisingly, those students with the lowest level of qualification were the most likely to go into further study, with a fifth (20.9%) of those obtaining an other undergraduate qualification going into just full-time study. This compares with one in ten (10.3%) of first degree graduates and 6.4% of those obtaining a postgraduate qualification.
12.2 Destinations of full-time first degree qualifiersThe destinations of full-time first degree UK-domiciled graduates is shown in Figure 12.3. It shows that medicine and dentistry has the highest proportion of graduates going into full-time employment (91.9%), followed by veterinary science (84.4%). Looking at the specific STEM disciplines that EngineeringUK tracks shows that engineering and technology (61.1%) has a higher proportion of graduates going into a full-time job than those in computer science (60.7%), mathematical sciences (47.1%), biological sciences (41.9%) or physical sciences (41.9%). Engineering and technology also had the fourth-highest percentage of graduates going into full-time employment.
Law had the lowest proportion of graduates going into full-time employment (34.9%), followed by historical and philosophical sciences (40.5%).
A quarter (25.0%) of those graduating with a degree in creative arts and design went into part-time work, followed by a fifth (21.2%) of those graduating in mass communication and documentation.
Nearly a third (30.4%) of law graduates went into further study, as did over a quarter (27.4%) of those with a physical sciences degree.
Six subject areas had a least one in ten graduates unemployed, these were:
• Computer science – 14.4%
• Mass communication and documentation – 12.4%
• Creative arts and design – 11.2%
• Engineering and technology – 10.5%
• Architecture, building and planning – 10.2%
• Business and administrative studies – 10.0%
Fig. 12.2: Destinations of engineering and technology graduates (2011/12) – UK domiciled
Source: HESA/Destination of Leavers from Higher Education Institutions
Unemployed
0.0%
10.0
%
20.0
%
30.0
%
40.0
%
50.0
%
60.0
%
70.0
%
80.0
%
90.0
%
100.
0%
Work and further studyFull-time work Part-time work Full-time study
Part-time study Other
First degree
Otherundergraduate
63.2% 8.3% 3.6% 10.3% 9.9% 3.9%
2.2%
0.8%
44.6% 3.5% 18.4% 20.9% 5.0% 5.3%
All qualifications
Postgraduate
61.5% 6.8% 6.5% 11.7% 8.6% 3.5%
0.5%
1.5%
74.0% 5.0% 4.0% 6.4% 7.1% 3.5%

185 12.0 Graduate destinations Part 3 – Engineering in Employment
Back to Contents
Fig. 12.3: Destinations of all full-time first degree graduates (2011/12) – UK domiciled
Source: HESA/Destination of Leavers from Higher Education Institutions
0.0%
10.0
%
20.0
%
30.0
%
40.0
%
50.0
%
60.0
%
70.0
%
80.0
%
90.0
%
100.
0%
UnemployedWork and further studyFull-time work Part-time work Further study Other
Creative arts and design
Education
Historical and philosophical studies
Languages
Business and administrative studies
Mass communications and documentation
Social studies
Law
Architecture, building and planning
Mathematical sciences
Engineering and technology
Veterinary science
Physicalsciences
Subjects alliedto medicine
Biological sciences
Medicine anddentistry
40.5% 14.4% 23.1%
47.2% 25.0% 7.6%
62.7% 14.7% 10.9%
53.2% 5.8%5.5%
44.5% 20.2%
60.4% 10.2% 8.4%
50.2% 14.7% 13.3%
34.9% 11.1% 30.4%
59.4% 6.4% 6.5%
14.4%
61.1% 8.9% 12.1%
84.8%
2.2% 2.2%
51.4% 16.5% 10.9%
41.9% 10.9% 27.4%
47.1% 7.9% 22.9%
67.3% 12.7% 7.8%
41.9% 17.9% 19.7%
91.9% 5.6%
4.1%
7.5%
4.9%
4.5%
8.2%
2.9%
3.3%
6.4%
6.6%
12.0%
12.6%
2.8%21.2%
7.4%
4.5%
0.2% 0.4%
8.0%
3.3% 6.5%
5.1%
8.9%
9.8%
9.1%
7.8%10.8%60.7%
10.5%
10.2%
9.5%
7.2%
10.0%
12.4%
6.5% 8.7%14.6%
9.1%
4.2% 11.2%
4.0%
48.9% 14.9% 7.3% 13.8% 8.0%
52.7% 14.6% 5.7% 13.7% 8.8%
Combinedsubjects
Agriculture and relatedsubjects
Total - allsubject areas
Computer science
0.4% 1.5%
1.0%
3.0%
3.3%
3.3%
5.0%
7.3%
5.5%
4.7%
4.1%
4.4%
5.7%
4.5%
5.0%
4.8%
5.5%
5.6%
4.9%
7.1%
4.6%

Part 3 – Engineering in Employment Graduate destinations 12.0 186
Back to Contents
802 Futuretrack Stage 4: transitions into employment, further study and other outcomes, HESCU and Warwick Institute for Employment Research, 7 November 2012, p95 803 By Standard Occupational Classification (SOC) code. For further details see Table 17.4 in the Annex http://www.engineeringuk.com/_resources/documents/EngineeringUK_Report_2014_Annex.pdf 804 For the 2011/12 dataset HESA has moved the occupation analysis to SOC (DLHE) 2010 which is not compatible with earlier years 805 It is possible that a proportion of people in non-STEM occupation will still be using their engineering skills eg someone working in sales could be a shop assistant or they could be selling engineering equipment. Equally as the HESA data is only presented in broad two- and three-digit categories it is possible some people classed as engineers are not actually working as engineers 806 Destination of Leavers from Higher Education Institutions, HESA, Data tables 807 Destination of Leavers from Higher Education Institutions, HESA, Data tables
In the Futuretrack research802 it was identified that there was a clear difference between STEM and non-STEM graduates in terms of why they accepted their current job. STEM graduates were more likely to make a positive career choice and say it was “exactly the type of job I want” while non-STEM graduates were more likely to say:
• “It’s better than being unemployed”
• “It suits me in the short term”
12.3 Occupation of engineering and technology graduatesThe DLHE data provided by HESA also provides a breakdown of type of occupation803 804 for qualifiers six months after graduation. Figure 12.4 shows that overall two thirds (68.4%) of engineering and technology graduates go into an engineering and technology occupation while 5.6% go into a science and maths occupation. However a quarter (26.0%) went into an occupation classed as non-STEM.805 The top two occupations engineering graduates undertake in non-STEM industries are sales (5.6%) and artistic, literary and media occupations (3.4%).
Fig. 12.4: Occupation of engineering and technology graduates who obtained first degrees (2011/12) – UK domiciled
Source: HESA/Destination of Leavers from Higher Education Institutions
When you examine the proportion of graduates going into an engineering and technology career by gender, it can be seen that over two thirds (70.5%) of males go into an engineering and technology career, compared with only 56.2% of females (Figure 12.5). By comparison, female graduates were more likely to go into science and maths careers (7.3% compared with 5.3%) and non-STEM careers (35.8% compared with 24.3%).
Figure 12.6 shows the destinations of postgraduate engineering and technology students. It shows that overall just under two thirds (63.1%) of postgraduate students go into an engineering and technology career. This is lower than the percentage of first degree students who go into an engineering career (Figure 12.4). However a fifth (19.3%) of postgraduates went into a science and maths career. The two main science and maths career choices that graduates make are natural and social science professionals, accounting for 7.9% of all engineering and technology postgraduates and business, research and administrative professionals, which accounts for 5.3% of all engineering and technology graduates.806
Overall 17.8% of all engineering postgraduates went into a non-STEM career.
Fig. 12.6: Occupation of engineering and technology graduates who obtained a postgraduate qualification (2011/12) – UK domiciled
Source: HESA/Destination of Leavers from Higher Education Institutions
By gender, two thirds (65.0%) of male postgraduates went into an engineering and technology occupation, compared with just over half (52.5%) of female graduates (Figure 12.7). A quarter (26.7%) of females went into a science and maths occupation, with 9.9% working as natural and social science professionals.807 By comparison only 17.6% of male postgraduates went into science and maths careers. Around a fifth of male (17.4%) and female (19.8%) postgraduates went into non-STEM occupations.
Scienceand mathsoccupations5.6%
Engineeringand technologyoccupations68.4%
Non-STEMoccupations26.0%
Fig. 12.5: Occupation of engineering and technology graduates who obtained first degrees, by gender (2011/12) – UK domiciled
Source: HESA/Destination of Leavers from Higher Education Institutions0.
0%
10.0
%
20.0
%
30.0
%
40.0
%
50.0
%
60.0
%
70.0
%
80.0
%
90.0
%
100.
0%
Male
Female
Non-STEM ocupationsEngineering and technology occupations
Science and maths occupations
70.5% 24.3%5.3%
56.2% 35.8%7.3%
Scienceand mathsoccupations19.3%
Engineeringand technologyoccupations63.1%
Non-STEMoccupations17.8%

187 12.0 Graduate destinations Part 3 – Engineering in Employment
Back to Contents
808 The methodology for DLHE changed in 2011/12 so while we have made comparisons with earlier years there will be an element of error 809 Standard Industrial Classification (SIC) codes. For further details see Table 17.8 in the Annex http://www.engineeringuk.com/_resources/documents/EngineeringUK_Report_2014_Annex.pdf
12.3.1 Occupations by selected engineering sub-disciplines
Figure 12.8 shows the proportion of graduates going into engineering and technology occupations by different engineering sub-disciplines. It shows that the engineering and technology sub-discipline that attracted the highest proportion of graduates was mechanical engineering (78.8%), closely followed by civil engineering (78.1%). Chemical, process and
energy engineering (73.7%), general engineering (72.1%), production and manufacturing engineering (72.2%) and aerospace engineering (71.9%) all have over two thirds of their graduates going into engineering and technology occupations. Electronic and electrical engineering has the lowest proportion of graduates going into an engineering occupation, at 65.0%.
12.4 Types of industry808 It is also possible to examine the destination of qualifiers by Standard Industrial Classification (SIC) codes.809 The SIC code denotes the primary occupation of the employer. However, it should be noted that the actual role of individuals within a company can be very different to the primary activity of the employer.
It should be noted that the modern engineering footprint (defined using Standard Industrial Classification codes) cuts across a number of industrial sectors. So in addition to the traditionally recognised areas such as construction, manufacturing, civil, mechanical and electrical engineering, the engineering footprint also encompasses engineering enterprises that appear in industrial sectors such as:
• supply of electricity and gas, steam and air conditioning
• information and communication
• water supply, sewerage, waste management and remediation activities
Figure 12.9 shows the five-year trend in the proportion of engineering and technology
Fig. 12.7: Occupation of engineering and technology graduates who obtained a postgraduate qualification, by gender (2010/11) – UK domiciled
Source: HESA/Destination of Leavers from Higher Education Institutions
0.0%
10.0
%
20.0
%
30.0
%
40.0
%
50.0
%
60.0
%
70.0
%
80.0
%
90.0
%
100.
0%
Male
Female
Non-STEM ocupationsEngineering and technology occupations
Science and maths occupations
65.0% 17.4%17.6%
52.5% 19.8%26.7%
Fig. 12.8: Qualifiers who obtained first degrees in engineering by sub-discipline, going into an engineering and technology occupation (2010/11) – UK domiciled
Source: HESA/Destination of Leavers from Higher Education Institutions
0.0%
90.0
%
60.0
%
70.0
%
50.0
%
80.0
%
20.0
%
30.0
%
10.0
%
40.0
%
Production and manufacturing engineering
General engineering
Aerospace engineering
Electronic and electrical engineering
Chemical, process and energy engineering
72.1%
78.1%
78.8%
71.9%
65.0%
72.2%
73.7%
Civil engineering
Mechanical engineering

Part 3 – Engineering in Employment Graduate destinations 12.0 188
Back to Contents
graduates who were employed by STEM and non-STEM companies. It shows that of those graduating in 2007/08, two thirds (67.0%) went to work for an employer in the engineering and technology field. This declined as the recession hit, to 61.4% in 2008/09. However, there has been a slow and steady recovery to reach 65.4% in 2010/11. There was then a leap in the proportion of graduates going to work for engineering and technology employers in 2011/12, reaching 67.5%, the highest figure over the five-year trend period.
By comparison, the number of graduates going to work for non-STEM based companies rises and falls in sequence with those going to work for engineering and technology companies. As the proportion of graduates going to work for engineering and technology employers rises, the proportion going to work for non-STEM based employers declines and vice versa. The proportion of graduates going to work for science and maths employers has consistently been around 2% in each year.
In each of the five years, around a third of engineering and technology first degree graduates went to work for companies whose primary activity was non-STEM.810 Looking at the HESA data for 2011/12 shows that the three most common non-STEM industries they went to work in were:
• Retail trade, except of motor vehicles and motorcycles – 730 graduates (8.0% of all engineering and technology graduates)
• Education – 295 graduates (3.2% of all engineering and technology graduates)
Figure 12.10 shows the destination of first degree engineering and technology graduates by gender for 2010/11 and 2011/12. It shows that over the two-year period, the proportion of male students going to work for an employer whose primary activity is engineering has increased slightly, from 68.3% to 69.1%. The proportion of female graduates who go to work for an employer whose primary activity is engineering has also increased, but much more significantly, rising from 50.0% in 20110/11 to 57.7% in 2011/12.
The proportion of graduates who go to work for employers whose primary activity is science and maths hovers around 2-3% for female students and 1-2% for male.
Fig. 12.9: Employer destinations for engineering and technology subject area leavers who obtained a first degree and entered employment by primary activity of employer (2007/08-2011/12) – UK domiciled
Source: HESA/Destination of Leavers from Higher Education Institutions
0.0%20
07/0
8
20.0%
30.0%
70.0%
80.0%
2008
/09
2009
/10
2010
/11
2011
/12
40.0%
50.0%
60.0%
Engineering and technology activity
Science andmaths activity
Non-STEM activity
10.0%
Fig. 12.10: Employer destinations for engineering and technology subject area leavers who obtained a first degree and entered employment by primary activity of employer and by gender (2010/11-2011/12) – UK domiciled
Source: HESA/Destination of Leavers from Higher Education Institutions
0.0%
10.0
%
20.0
%
30.0
%
40.0
%
50.0
%
60.0
%
70.0
%
80.0
%
90.0
%
100.
0%
Male 2010/11
Male 2011/12
Non-STEM activityEngineering and technology activity
Science and maths activity
68.3% 30.3%
69.1% 29.1%
2.5%
1.7%
1.3%
Female 2010/11
Female 2011/12
50.0% 47.5%
57.7% 40.0%
2.3%
810 Although the employer’s primary activity may be non-STEM a proportion of people working for that company may be using STEM skills in their occupation

189 12.0 Graduate destinations Part 3 – Engineering in Employment
Back to Contents
In 2007/08, 69.3% of postgraduate engineering and technology qualifiers went to work for an employer whose primary activity was engineering (Figure 12.11). As the recession took hold this percentage dropped, reaching a low point of 62.5% in 2009/10. There was a sharp rebound the following year, rising to 68.0% and further marginal growth in 2011/12 (68.4%).
As the number of postgraduates going to work for employers whose primary activity is engineering and technology has fallen, the proportion going to work for non-STEM employers has risen, and vice versa. The proportion of postgraduates who go to work for employers whose primary activity is science and maths has consistently hovered around 3-5% over the five-year period.
It can be seen from figure 12.12 that the proportion of male engineering and technology postgraduates who go to work for an employer whose primary activity is engineering and technology has barely changed between 2010/11 and 2011/12 (70.5% and 70.7% respectively). Although female postgraduates are much less likely to go and work for an engineering and technology company, there has been growth from 57.3% in 2010/11 to 58.4% in 2011/12.
Female postgraduates were much more likely to go and work for an employer whose primary activity is science and maths than male postgraduates. In 2010/11, 5.5% of females went to work in this area, rising to 6.9% in 2011/12. The comparable figures for male postgraduates are 2.5% and 3.4%.
Fig. 12.11: Employer destinations for engineering and technology subject area leavers who obtained a postgraduate degree and entered employment by primary activity of employer (2007/08-2011/12) – UK domiciled
Source: HESA/Destination of Leavers from Higher Education Institutions
0.0%20
07/0
8
20.0%
30.0%
70.0%
80.0%
2008
/09
2009
/10
2010
/11
2011
/12
40.0%
50.0%
60.0%
Engineering and technology activity
Science andmaths activity
Non-STEM activity
10.0%
Fig. 12.12: Employer destinations for engineering and technology subject area leavers who obtained a postgraduate degree and entered employment by primary activity of employer and by gender (2010/11-2011/12) – UK domiciled
Source: HESA/Destination of Leavers from Higher Education Institutions
0.0%
10.0
%
20.0
%
30.0
%
40.0
%
50.0
%
60.0
%
70.0
%
80.0
%
90.0
%
100.
0%
Male 2010/11
Male 2011/12
Non-STEM activityEngineering and technology activity
Science and maths activity
70.5% 27.0%
70.7% 26.0%
3.4%
2.5%
Female 2010/11
Female 2011/12
57.3% 37.3%5.5%
58.4% 34.7%6.9%

Part 3 – Engineering in Employment Graduate destinations 12.0 190
Back to Contents
12.4.1 Engineering and technology graduates going into finance
One common misconception is that a high percentage of engineering and technology graduates go to work for a company whose primary activity is financial and insurance services. Figure 12.13 shows that over five years only around 2-3% of engineering and technology graduates went to work for a financial and insurance services company, compared with
around 4-6% of all graduates. In addition, the percentage of engineering and technology graduates entering financial and insurance companies has risen and fallen roughly in line with the percentages for all graduates.
It should also be noted that the small percentage of engineering and technology graduates who do work for a financial and insurance services company, could still be working as an engineer: for example, they could be a software engineer.
12.5 Industry type by selected engineering sub-disciplinesFigure 12.14 looks at employer destinations for engineering and technology first degree graduates by selected sub-disciplines, and shows considerable variations.
Most first degree graduates in general engineering go into professional, scientific and technical activities (255), followed by manufacturing (235). None of the other top ten employer destinations recruited more than 55 general engineering graduates.
Of civil engineers, 715 went to work for an employer in the professional, scientific and technical activities field, with another 375 going to work for companies in construction. All the other employer sectors recruited fewer than 100 graduates. The highest of these (and the overall third choice for civil engineering graduates) was public administration and defence; compulsory social security, with 95.
Perhaps unsurprisingly the main employer sector for mechanical engineering graduates was manufacturing (830). In addition, 375 went to work for an employer in the professional; scientific and technical activities field, 175 went to work in wholesale and retail trade; repair of motor vehicles and motorcycles while 170 went to work for a company whose primary activity was mining and quarrying.
There was only one major employer sector for aerospace engineers, which was manufacturing (255). The second largest employer sector was professional; scientific and technical activities, which employed 65 graduates.
Three employer sectors recruited most of the electronic and electrical engineering graduates. These were manufacturing (330), professional, scientific and technical activities (240), and wholesale and retail trade; repair of motor vehicles and motorcycles (210). Seventy-five graduates went into education.
Manufacturing attracted 175 production and manufacturing engineering graduates. The second largest employer sector for production and manufacturing was wholesale and retail trade; repair of motor vehicles and motorcycles (60).
Nearly equal numbers of chemical, process and energy engineering graduates went to work for employers in the professional, scientific and technical activities sector (120) and the manufacturing sector (115), while 90 went into mining and quarrying.
Fig. 12.13: Engineering and technology subject area leavers who obtained first degree and went to work for an employer whose primary activity was financial and insurance services (2007/08-2011/12) – UK domiciled
Source: HESA/Destination of Leavers from Higher Education Institutions
0.0%
2007
/08
2.0%
3.0%
5.0%
6.0%
2008
/09
2009
/10
2010
/11
2011
/12
4.0%
Engineering and technology graduates All graduates
1.0%

191 12.0 Graduate destinations Part 3 – Engineering in Employment
Back to Contents
Fig. 12.14: Top ten employer destinations for engineering and technology graduates who obtained first degree qualifications, by SIC (2011/12) – UK domiciled
Source: HESA/Destination of Leavers from Higher Education Institutions
0
300
600
100
900
Chemical, process and energy engineering
Production and manufacturing engineering
Electronic and electrical engineering
Mechanical engineering
Aerospace engineering
Civil engineering
General engineering
200
400
700
800
500
Manufacturing
Wholesale and retail trade; repairof motor vehicles and motorcycles
Mining and quarrying
Professional, scientific and technical activities
Construction
Public administration and defence; compulsory social security
Education
Accommodation and food service activities
Transport and storage
Administrative andsupport serviceactivities
40
20
905
20105
115120
35
10
10551015
5
17550
60
15
4040
7075
5040
330240
210
50
25
20
25565
45
15
40170
604050
40
830375
175
35
37555
953040
60
65715
80
40
4535
5025
1020
235255
55
20
10
55

Part 3 – Engineering in Employment Graduate destinations 12.0 192
Back to Contents
811 This analysis has been conducted using the same occupational classification and engineering occupation used in Section 12.3 812 The HESA data is only provided at two- and three-digit level. Therefore, sub-categories of some occupations are classified as engineering using the two or three digit code. However at the four and five digit code level sub-categories of some occupations are classed as science and maths, or non-STEM related. We have therefore calculated the percentage of occupations that are definitely engineering and the percentage that are potentially engineering to arrive at the range of graduates going into engineering careers.813 It is possible that a proportion of people in non-STEM occupations will still be using their engineering skills eg someone working in sales could be a shop assistant or they could be selling engineering equipment.
12.6 Number of non-engineering and technology graduates going to work in engineering and technologyAs well as using the HESA data to look at the destination of first degree engineering and technology graduates, it is possible to explore the percentage of non-engineering and technology graduates who have gone into employment and are working in an engineering and technology occupation (Table 12.0).811 Three non-engineering and technology subject areas have been examined in detail: computer science, physical sciences and mathematical sciences. It shows that between 4,058 and 4,315 computer science graduates go into an engineering occupation. The comparable figure for physical science is 375-681, whereas for mathematical science it is 665-1,030. This means that in total, between 5,098 and 5,846 non-engineering graduates go into engineering occupations.
Table 12.1 shows the main engineering occupation destinations for computer science, mathematical science and physical science first degree graduates. Out of 4,315 computer science graduates who went into a potential engineering occupation, 3,110 became information technology and telecommunications professionals and 690 became information technology technicians. Information technology and telecommunications was also the main occupational destination for mathematical sciences graduates. Physical science graduates were spread across four main career categories:
• Science, engineering and production technicians – 400
• Information technology and telecommunications professionals – 220
• Engineering professionals – 185
• Public service and other associate professionals – 140
Table 12.0: Number of non-engineering and technology first degree graduates going into an engineering and technology occupation (2011/12) – UK domiciled812 813
Source: HESA/Destination of Leavers from Higher Education Institutions
Number of first degree graduates
Percentage potentially going
into an engineering and
technology occupation
Percentage definitely going
into engineering
Number of graduates going into engineering
careers
Computer science 6,565 65.7% 61.3% 4,058-4,315
Physical science 3,025 22.5% 12.4% 375-681
Mathematical science 6,490 15.9% 10.2% 665-1,030
Table 12.1: Main engineering occupation destinations for first degree non-engineering and technology graduates going into an engineering and technology occupation (2011/12) – UK domiciled
Source: HESA/Destination of Leavers from Higher Education Institutions
Occupation Computer science
Mathematical sciences
Physical sciences Total
Information technology and telecommunications professionals
3,110 260 220 3,590
Information technology technicians 690 35 60 785
Science, engineering and production technicians
45 20 400 465
Engineering professionals 90 30 185 305
Public services and other associate professionals
40 30 140 210
Functional managers and directors 65 25 25 115
Textiles, printing and other skilled trades
25 15 65 105
Managers and proprietors in other services
45 10 40 95
Skilled metal, electrical and electronic trades
50 5 25 80
Design occupations 70 0 5 75

193 12.0 Graduate destinations Part 3 – Engineering in Employment
Back to Contents
12.7 Destinations for foundation degrees, BTec Higher National Certificates (HNC) and Higher National Diplomas (HND)Table 12.2 shows the destination of foundation degree, HND and HNC graduates six months after graduation, over a three-year period. Each year, around a third of full-time foundation degree qualifiers go into employment (35%, 36% and 32% respectively). However, the percentage combining work and study has declined from a fifth (21%) in 2008/09 to 15% in 2010/11.
Of the three qualification types, foundation degrees had the largest number of full-time
engineering and technology qualifiers in each year. However, there has been a sharp decline in numbers in the last year, falling from 930 to 590.
A much higher proportion of those studying part-time went into employment after graduating. Each year, nearly half (47%, 49% and 48%) went into employment only, while over a third (38%, 38% and 42%) combined work and further study.
The pattern for HNDs is similar to that of foundation degrees. Again, examining full-time qualifiers shows that around a third (34%, 33% and 35% for each year) go into employment. The proportion of students combining work and study has also declined over the three-year period, from 19% in 2008/09 to 14% in 2010/11.
Just over half of all part-time qualifiers went into employment (60%, 57% and 56% for each year), while just under a third combined work and further study (28%, 30%, and 28%).
HNC programmes had the lowest number of full-time qualifiers: falling to 25 in 2010/11 from a three-year high of 80 in 2008/09. However, it has the largest number of part-time qualifiers – although numbers have fallen over the three years from 2,025 in 2008/09 to 1,535 in 2010/11.
Over half of part-time qualifiers went into employment (60%, 58% and 57% in each year), although this proportion has been slowly declining. Around a third combine work with further study (35%, 35% and 34%).
Table 12.2: Destination of engineering and technology qualifiers by foundation degrees, HNDs and HNCs and mode of study (2008/09-2010/11) – UK and EU domiciled814
Source: HEFCE
Foundation degrees HNDs HNCs
Mode of studyDestination six months after qualifying
2008/09 qualifiers
2009/10 qualifiers
2010/11 qualifiers
2008/09 qualifiers
2009/10 qualifiers
2010/11 qualifiers
2008/09 qualifiers
2009/10 qualifiers
2010/11 qualifiers
Full-time
Employment only 35% 36% 32% 34% 33% 35% 38% 51% 30%
Work and further study
21% 18% 15% 19% 18% 14% 33% 27% 39%
Further study only 38% 41% 46% 37% 41% 37% 18% 16% 17%
Assumed to be unemployed
5% 4% 5% 9% 7% 9% 1% 6% 9%
Not available for employment
1% 1% 1% 1% 1% 2% 2% 0% 4%
Other 1% 1% 1% 1% 0% 2% 7% 0% 0%
Subtotal: full-time 890 930 590 400 350 355 80 50 25
Part-time
Employment only 47% 49% 48% 60% 57% 56% 60% 58% 57%
Work and further study
38% 38% 42% 28% 30% 28% 35% 35% 34%
Further study only 12% 8% 6% 9% 11% 10% 3% 4% 6%
Assumed to be unemployed
2% 3% 2% 2% 2% 4% 2% 1% 2%
Not available for employment
1% 2% 0% 1% 1% 1% 0% 1% 1%
Other 1% 0% 1% 1% 0% 1% 0% 1% 0%
Subtotal: part-time 620 490 340 390 385 335 2,025 1,905 1,535
814 Data rounded to the nearest five

Back to Contents
815 The Impact of University Degrees on the Lifecycle of Earnings: some further analysis, Department for Business, Innovation and Skills, August 2013, p6 816 The Impact of University Degrees on the Lifecycle of Earnings: some further analysis, Department for Business, Innovation and Skills, August 2013, p6 817 The Impact of University Degrees on the Lifecycle of Earnings: some further analysis, Department for Business, Innovation and Skills, August 2013, p60 818 Education at a Glance 2012, OECD, September 2012, p13 819 Education at a Glance 2012, OECD, September 2012, p13 820 Education at a Glance 2012, OECD, September 2012, p13 821 Engineering UK 2013 The state of engineering, EngineeringUK, December 2012, p157
Part 3 – Engineering in Employment Graduate recruitment and salaries 13.0 194
13.1 The graduate premium in the labour marketThe Department for Business, Innovation and Skills (BIS) has conducted research lifetime earnings (net of tax and loan repayments) of graduates, relative to those without a degree. It found that the average earnings premium is approximately £168,000 (28%) for men and £252,000 (53%) for women.815 It also found that those getting a first or upper-second class degree got significantly larger returns than those with a lower degree class (circa £76,000 for men and £85,000 for women).816
The research also explored the impact of the expansion of graduate numbers in the 1990s on graduate/non graduate earning differentials. The research was unable to find any significant differences in the data for the cohorts before and after Higher Education (HE) expansion.817
Analysis by the Organisation for Economic Co-operation and Development (OECD) of OECD countries indicates that the earnings gap between those with and without HE qualifications grew wider during the global recession.818 In 2008, a man with higher education could expect to earn 58% more on average than a counterpart with no more than upper-secondary education, while a woman could expect to earn 54% more. By 2010, these pay differentials had increased to 67% for males and 59% for females.819 It is also worth noting that the proportion of adults who progress through HE increased from 22% in 2000 to 31% in 2010.820
As shown in last year’s report,821 the Office for National Statistic (ONS) published statistics on the median hourly wage for graduates aged 21-64 by their degree subject area (Figure 13.0). It shows that the highest paid graduates are those who studied medicine and dentistry (£21.29 per hour). Mathematical sciences, engineering, technology and architecture all came joint second, with a median salary of £18.92 per hour – 24.6% more than the median for all graduates, which is £15.18. This was followed by physical or environmental sciences on £17.74 (16.9% more).
Part 3 – Engineering in Employment13.0 Graduate recruitment and salaries
This chapter explores graduate recruitment and starting salaries. Before we start examining graduate starting salaries, however, we explore the earnings premium that you get from having a degree. With the recent dramatic increase in tuition fees, this is becoming a key aspect in the decision-making process for young people and their parents/guardians.

Back to Contents
822 Futuretrack Stage 4: transitions into employment, further study and other outcomes, HESCU and Warwick Institute for Employment Research, 7 November 2012, p79-80 823 The Impact of University Degrees on the Lifecycle of Earnings: some further analysis, Department for Business, Innovation and Skills, August 2013, p54 824 The Impact of University Degrees on the Lifecycle of Earnings: some further analysis, Department for Business, Innovation and Skills, August 2013, p6 825 Due to the low number of female engineering graduates it is not possible to provide an accurate estimate of their lifetime earning premium 826 The Postgraduate Premium: Revisiting Trends in Social Mobility and Educational Inequalities in Britain and America, The Sutton Trust, February 2013, p3 827 The Impact of University Degrees on the Lifecycle of Earnings: some further analysis, Department for Business, Innovation and Skills, August 2013, p5 828 Are Degrees Worth Higher Fees? Perceptions of the Financial Benefits of Entering Higher Education, SKOPE, June 2013, p3
In addition, Section 13.3 shows that within six months of graduating, graduates of medicine and dentistry have an average mean salary of £32,037, compared with £26,019 for engineering and technology graduates. The average graduate salary is £21,362.
These findings are supported by the Futuretrack research project, which shows that one of the key variables associated with earning a relatively high salary is the subject studied.822 Finally, research from BIS shows that males who graduated in engineering and technology had a lifetime’s earnings premium of around £210,000,823 compared with the average earnings premium for a male graduate of around £168,000.824 825
The earnings premium of a postgraduate qualification is higher than for an undergraduate qualification. It has been estimated that someone with a master’s degree can expect, on average, to earn £5,500 more a year than someone with a bachelor’s degree.826
Finally, as well as graduates getting a good return on their Higher Education, it should be noted that the Government also gets a good return. The social benefit of a degree is around £264,000 for men and £318,000 for women.827
Research by SKOPE828 indicates that the changes in tuition fees have had an impact on applicant behaviour for around a quarter (23%) of applicants. The most common change identified was students looking for a greater return on their investment, which included aiming for courses with a higher earnings potential.
195 13.0 Graduate recruitment and salaries Part 3 – Engineering in Employment
Fig. 13.0: Median hourly wage for all graduates (4 quarter average) by degree subject studied for those aged 21-64 (2001-2011) – UK
Source: Office for National Statistics
£0.0
0
£25.
00
£10.
00
£15.
00
£5.0
0
£20.
00
Social studies
Biological and agricultural sciences
Humanities
Arts
All graduates
Non-graduates
£16.33
£15.83
£14.85
£14.65
£14.63
£12.06
£15.18
£8.92
£17.74
£17.30
£16.95
£16.97
£18.92
£21.29
Law
Physical or environmental sciences
Business
Mathematical sciences, engineering, technology and architecture
Medicine and dentistry
Education
Librarianship and languages
Medical related subjects

Back to Contents
829 The AGR Graduate Recruitment Survey 2013 Summer Review, The Association of Graduate Recruiters, 2012, p8
13.2 Graduate vacanciesThe Association of Graduate Recruiters (AGR) conducts two annual surveys looking at recruitment trends in some of the UK’s largest graduate recruiters. In the more recent of these two surveys, the summer review, the AGR interviewed 209 AGR employers and estimated that they would offer a total of 18,913 graduate vacancies.829
Figure 13.1 shows the 14-year trend in the number of AGR graduate vacancies. It shows that following rises of 8.9% in 2010 and 1.7% in 2011, there was a decline of 8.2% in the number of vacancies in 2012. AGR members predict this decline to continue, albeit at a slower rate (3.9%) in 2013.
Table 13.0 shows the percentage change in the number of vacancies by sector. Consulting or
business services firms are predicted to have the largest percentage increase (36.3%). They are closely followed by energy, water or utility companies (30.8%). At the other end of the scale, vacancies in banking or financial services are predicted to fall by nearly half (45.1%). Engineering and industrial companies are predicting growth in vacancies of 10.1%.
Part 3 – Engineering in Employment Graduate recruitment and salaries 13.0 196
Fig. 13.1: Graduate vacancy changes at AGR employers (2000-2013)
Source: Association of Graduate Recruiters Summer Survey 2013
-15.
0%
20.0
%
0.0%
10.0
%
-10.
0%
15.0
%
5.0%
-5.0
%
2007
2006
2003
2002
2001
2000
12.7%
5.1%
5.1%
15.5%
-3.4%
-6.5%
14.6%
14.7%
1.7%
8.9%
-8.9%
-8.2%
-3.5%
2008
2011
2010
2012
2013 (predicted)
2009
2005
2004
0.6%
Table 13.0: Expected percentage changes in number of vacancies by sector (2011/12-2012/13)
Source: Association of Graduate Recruiters Summer Survey 2013
Consulting or business services firm 36.3%
Energy, water or utility company 30.8%
IT/telecommunications company 14.6%
Engineering or industrial company 10.1%
Retail 9.7%
Public sector 5.2%
Investment bank or fund managers No change
Law firm -5.4%
FMCG company -10.5%
Accountancy or professional services firm
-17.1%
Banking or financial services -45.1%

Back to Contents
830 Website access on 16 September 2013 http://www.ons.gov.uk/ons/publications/re-reference-tables.html?edition=tcm%3A77-280149
13.3 Graduate starting salariesThe AGR has also measured the predicted change in graduate median starting salaries over a 14-year period (Figure 13.2). From 2009 to 2011, there was no growth in graduate starting salaries, followed by growth of 4.0% in 2012. However, in 2013 starting salaries were once again at 0% growth.
Table 13.1 shows that there is a wide degree of variation in the predicted graduate starting salaries for various sectors. Investment bank or fund managers are predicted to have the highest starting salary, at £38,250, followed by law firms at £37,000. The lowest graduate starting salary is for those working in the public sector, at £22,500.
Graduates going to work for an engineering or industrial company receive an average starting salary of £25,000, while those working for
energy, water or utility companies get £25,500. IT/telecommunications companies pay a starting salary of £26,250.
By comparison, ONS calculates that the average median salary for all employees is £21,473, while the average mean salary is £26,664.830
AGR also provides an estimate of median graduate starting salaries by career area. It shows that in 2012/13, those going into investment banking were predicted to earn £38,250, followed by £37,000 for legal work.
Looking at the engineering-specific careers areas, manufacturing engineering was the highest paid, at £26,500. This was followed by electrical/electronic engineering, at £25,250. However, the two remaining engineering career areas were also the two lowest paid of all career areas. These were mechanical engineering (£25,000) and civil engineering (£24,500).
197 13.0 Graduate recruitment and salaries Part 3 – Engineering in Employment
Table 13.2: Median predicted graduate starting salary by career area (2012/13)
Source: Association of Graduate Recruiters Summer Survey 2013
Investment banking £38,250
Legal work £37,000
Actuarial work £28,250
Consulting £26,750
Manufacturing engineers £26,500
IT £27,000
Sales/customer management/business development
£26,500
Financial management £25,500
Logistics £26,500
Research and development £26,750
Science £26,250
Electrical/electronic engineering £25,250
Purchasing £25,500
Human resources £25,500
Accountancy £26,000
General management £25,000
Mechanical engineering £25,000
Marketing £26,250
Civil engineering £24,000
Retail management £26,000
Other £25,000
Fig. 13.2: Changes in median graduate starting salaries at AGR employers 2000-2012
Source: Association of Graduate Recruiters Summer Survey 2013
0.0%
8.0%
2.0%
6.0%
1.0%
7.0%
4.0%
5.0%
3.0%
2007
2006
2003
2002
2001
2000
2008
2010
2.6%
2.7%
5.7%
2.4%
2.0%
7.1%
3.4%
4.1%
1.8%
4.0%
2011
2012
2013 (predicted)
2009
2005
2004
0.0%
0.0%
0.0%
0.0%
Table 13.1: Median predicted graduate starting salary by sector (2012/13)
Source: Association of Graduate Recruiters Summer Survey 2013
2012/13 salary
Investment bank or fund managers £38,250
Law firm £37,000
Banking or financial services £29,750
Insurance company £28,500
FMCG company £27,000
IT/telecommunications company £26,250
Consulting or business services £26,000
Energy, water or utility company £25,500
Engineering or industrial company £25,000
Retail £25,000
Accountancy or professional services firm
£24,500
Transport or logistics company £24,000
Public sector £22,500
Other £23,000

Back to Contents
831 London Metropolitan University, Liverpool Hope University and University College Birmingham are generally excluded from HESA statistics 832 The salary is their actual salary six months after graduating which, for most, will be their starting salary. But it is acknowledged that some graduates will have received a pay rise during this six month period. 833 Mean starting salary is not as accurate as median starting salary as the mean can be distorted by a few particularly high or low salary figures. Caution should therefore be exercised when looking at this data 834 9,281 engineering and technology graduates provided salary details 835 Website access on the16 September 2013 http://www.ons.gov.uk/ons/publications/re-reference-tables.html?edition=tcm%3A77-280149 836 HESA DLHE data is provided in salary brackets: £0-£5, 000 then rising by £1,000 increments until £70,000 and then all salaries over £70,000. In order to calculate the mean average salary. The midpoint was used in each salary bracket. For salaries over £70,000 the salary midpoint used was £85,000. 837 The mean salary can be distorted by a few large salaries. 838 Not all graduates who completed the DLHE survey for 2010/11 provided salary information.
In its DLHE survey,831 HESA asks those graduates who are in employment what their salary is. Using this data, it is possible to calculate a mean average starting salary832 833 for graduates from different subject areas (Figure 13.3). The highest graduate starting salary is for those who graduated in medicine and dentistry (£32,037). The second highest graduate starting salary is for graduates of engineering and technology:834 at £26,019, it is a fifth (21.8%) more than the mean for all
graduates. At the other end of the scale, the lowest graduate starting salary was for students of creative arts and design, whose mean starting salary was £14,260, a third (33.2%) less than the mean.
Overall, the mean starting salary for all graduates was £21,362. Of the four STEM subjects other than engineering and technology, two had an above-average salary and two had a below-average salary. The two subject areas
with above-average salaries were mathematical sciences (£22,942) and computer sciences (£22,211). The two STEM subject areas with below-average salaries were physical sciences (£20,346) and biological sciences (£17,055).
As discussed previously, ONS calculates that the average median salary for all employees is £21,473, while the average mean salary is £26,664.835
Part 3 – Engineering in Employment Graduate recruitment and salaries 13.0 198
Fig. 13.3: Mean average starting salary for graduates by subject area (2011/12) – UK domiciled 836 837 838
Source: HESA/Destination of Leavers from Higher Education Institutions (bespoke request)
£35,
000
£30,
000
£25,
000
£20,
000
£15,
000
£10,
000
£5,0
00£0
Law
Historical and philosophical studies
Languages
Mass communications and documentation
Creative arts and design
Average for all graduates
£15,957
£14,260
£21,362
£22,001
£20,083
£17,717
£17,055
£17,053
£16,495
£20,346
£20,945
Physical sciences
Computer science
£22,126
£22,211
£22,375
Education
Architecture, building and planning
Mathematical sciences
Social studies
Biological sciences
Agriculture and related subjects
£22,986Subjects allied to medicine
Combined subjects
£22,942
Business and administrative studies
Veterinary science
Engineering and technology
Medicine and dentistry
Mean average starting salary £21,362
£24,753
£25,394
£26,019
£32,037

Back to Contents
839 The methodology for administering the DLHE survey changed in 2011/12 so while we have drawn comparisons with earlier years there will be an element of error
Table 13.3 shows the average starting salaries for graduates in different subject areas for 2010/11 and 2011/12. Overall, average graduate starting salaries declined by 4.1%. Every subject area except engineering and technology showed a decline in average starting salaries over the two years: engineering and technology had salary growth of 1.0%.
The two subject areas with the largest percentage decline in starting salaries were combined subjects (down 11.0%) and creative arts and design (down 10.2%).
The mean average salary for all engineering and technology graduates, irrespective of whether they go into an engineering job or not, was £26,019 (Table 13.4). Overall, male graduates had a slightly higher average starting salary of £26,367. By comparison, the average starting salary for female graduates was just £23,858 – or put another way, females on average earn 90.5% of the salary of male graduates.
Average starting salaries do vary quite widely by engineering sub-disciplines. Overall, the sub-discipline with the highest starting salary is general engineering (£30,648). The other sub-disciplines above the average for all engineering and technology graduates are:
• chemical, process and energy engineering – £28,492
• production and manufacturing engineering – £26,705
• mechanical engineering – £26,052
The engineering sub-discipline with the lowest average starting salary is electronic and electrical engineering (£24,341), closely followed by civil engineering (£24,392).
199 13.0 Graduate recruitment and salaries Part 3 – Engineering in Employment
Table 13.3: Average starting salaries by subject area (20110/11-2011/12) – UK domiciled839
Source: HESA/Destination of Leavers from Higher Education Institutions (bespoke request)
2010/11 2011/12 One-year change
Medicine and dentistry £32,546 £32,037 -1.6%
Engineering and technology £25,762 £26,019 1.0%
Veterinary science £25,630 £25,394 -0.9%
Business and administrative studies £25,458 £24,753 -2.8%
Subjects allied to medicine £23,238 £22,986 -1.1%
Mathematical sciences £23,142 £22,942 -0.9%
Architecture, building and planning £22,956 £22,375 -2.5%
Computer science £22,562 £22,211 -1.6%
Education £22,938 £22,126 -3.5%
Combined subjects £24,712 £22,001 -11.0%
Social studies £22,107 £20,945 -5.3%
Physical sciences £21,547 £20,346 -5.6%
Law £21,252 £20,083 -5.5%
Historical and philosophical studies £19,064 £17,717 -7.1%
Biological sciences £18,807 £17,055 -9.3%
Agriculture and related subjects £18,232 £17,053 -6.5%
Languages £18,077 £16,495 -8.8%
Mass communications and documentation £16,806 £15,957 -5.1%
Creative arts and design £15,884 £14,260 -10.2%
Average for all graduates £22,274 £21,362 -4.1%
Table 13.4: Mean average starting salary for graduates in engineering and technology, by selected sub-discipline and gender (2011/12) – UK domiciled
Source: HESA/Destination of Leavers from Higher Education Institutions (bespoke request)
All engineering students Male students Female
students
Female salary as a percentage
of male salary
General engineering £30,648 £31,220 £27,038 86.6%
Civil engineering £24,392 £24,323 £24,746 101.7%
Mechanical engineering £26,052 £26,000 £26,668 102.6%
Aerospace engineering £25,947 £26,162 £23,784 90.9%
Electronic and electrical engineering £24,341 £24,764 £20,186 81.5%
Production and manufacturing engineering
£26,705 £27,272 £23,332 85.6%
Chemical, process and energy engineering
£28,492 £28,658 £27,814 97.1%
Average for all engineering and technology graduates
£26,019 £26,367 £23,858 90.5%

Back to Contents
840 Destinations of leavers from Higher Education in Further Education colleges, HEFCE, January 2013, p15
Table 13.5 provides salary details for engineering and technology graduates who go to work for employers whose primary activity is engineering and employers whose primary activity is not engineering. It shows that when the primary activity of the employer is engineering, females earn on average 90.1% of the salary of their male peers (£25,488 compared with £28,283). But when the primary activity of the employer is not engineering, salaries for females are almost identical to salaries for males (£22,399 compared with £22,481).
Finally, it should be noted that there is a significant wage premium for engineering and technology graduates who go and work for an employer whose primary activity is engineering. Those working for an engineering employer on average earn £28,023, compared with £22,284 for those who go to work for a non-engineering employer.
Figure 13.4 shows the salary bands for all UK domiciled foundation degree qualifiers. Over 40% of those who gained their qualification in an FE college earned a salary of between £10,000 and £14,999 per annum in 2010/11, with only 5% earning between £25,000 and £29,999. In contrast, earnings for those who gained their qualification through an HE institution were similar – at 20-25% – for the £15,000-£19,999, £20,000-£24,999 and £25,000-£29,999 per annum wage brackets.
Part 3 – Engineering in Employment Graduate recruitment and salaries 13.0 200
Table 13.5: Mean starting salary for engineering and technology graduates, by primary activity of employer (2011/12) – UK domiciled
Source: HESA/Destination of Leavers from Higher Education Institutions (bespoke request)
All engineering and technology
graduates
Male engineering and
technology graduates
Female engineering
and technology graduates
Female salary as a
percentage of male salary
Engineering is the employers primary activity
£28,023 £28,283 £25,488 90.1%
Engineering is not the employers primary activity
£22,284 £22,481 £22,399 99.6%
Fig. 13.4: Salary of full-time foundation degree qualifiers in full-time paid UK employment, by institution type (2010/11) – UK domiciled
Source: HEFCE840
0.0%
10.0
%
35.0
%
50.0
%
25.0
%
40.0
%
5.0%
15.0
%
20.0
%
30.0
%
45.0
%
£25,000-£29,999
£20,000-£24,999
£10,000-£14,999
£0-£9,999
£15,000-£19,999
£40,000 and above
£35,000-£39,999
£30,000-£34,999
HEI FEC

Back to Contents
841 ASHE was developed to replace the New Earnings Survey (NES) in 2004 842 The mean salary can be distorted by a few very large or small salaries in each career
201 14.0 Earnings in STEM careers Part 3 – Engineering in Employment
This section presents mean842 UK salary figures for selected STEM professional careers and selected STEM technician/craft careers, broken down by gender, full-time and part-time.
14.1 Annual mean gross pay for selected STEM professionsFigure 14.0 shows that all STEM professions earn a higher mean salary than the average for all employees. The average salary for all employees is £26,664. By comparison, the lowest salary earned by a STEM profession is £26,874 for social and humanities scientists.
Production managers and directors in mining and energy had the highest mean salary, at £72,587. The second highest mean salary was £70,393 for information technology and telecommunications directors, followed by medical practitioners, at £69,741. There is then a substantial drop to £60,672 for actuaries, economists and statisticians, then another substantial drop to £51,352 for health services and public health managers and directors.
Looking specifically at mean salaries for engineering occupations shows that electrical engineers had the highest salary (£42,907) followed by mechanical engineers (£42,174) and electronics engineers (£40,704).
The lowest paid engineers were quality control and planning engineers on £34,269 per year.
Part 3 – Engineering in Employment14.0 Earnings in STEM careers841
The annual survey of hours and earnings (ASHE) provides information about the level, distribution and make-up of earnings paid to employees within industries, occupations and UK regions.

Back to Contents
Part 3 – Engineering in Employment Earnings in STEM careers 14.0 202
Fig. 14.0: Annual mean gross pay for selected STEM professions (2012) – UK
Source: ONS/ASHE 2012
£80,
000
£60,
000
£50,
000
£40,
000
£30,
000
£20,
000
£10,
000
£0
£70,
000
All employees £26,664
Conservation professionals £27,213
Social and humanities scientists £26,874
Chartered architectural technologists £27,597
Web design and development professionals £28,291
Opthalmic opticians £31,267
Environment professionals £32,277
£37,379Pharmacists
£37,009Production and process engineers
£36,263Natural and social science professionals n.e.c.
£35,659Business, research and administrative professionals n.e.c.
£34,269Quality control and planning engineers
£33,709Veterinarians
£36,921Managers and proprietors in other services n.e.c.
£36,642Chartered surveyors
£33,055Medical radiographers
Biologicals scientists and biochemists £38,370
Chartered and certified accountants £38,283
Chemical scientists £37,674
Electronics engineers £40,704
Information technology and telecommunications professionals £40,020
Design and development engineers £39,633
Civil engineers £39,236
Construction project managers and related professionals £38,961
Managers and directors in transport and distribution £38,746
Programmers and software development professionals £40,202
Engineering professionals £40,651
Mechanical engineers £42,174
Architects £42,563
Electrical engineers £42,907
IT business analysts, architects and systems designers £44,542
Quality assurance and regulatory professionals £44,339
Production managers and directors in construction £45,283
Waste disposal and environmental services managers £45,982
Dental practitioners £46,834
Research and developments managers £47,438
£72,587 Production managers and directors in mining and energy
£70,393Information technology and telecommunications directors
£51,352Health services and public health managers and directors
£51,215Production managers and directors in manufacturing
£49,366Physical scientists
£48,767IT project and programme managers
£69,741Medical practitioners
£60,672Actuaries, economists and statisticians
£48,271IT specialist managers
Average salary £26,664

Back to Contents
Table 14.0: Annual mean pay for selected full-time STEM professions by gender (2012) – UK
Source: ONS/ASHE 2012
14.1.1 Annual mean gross pay for selected full-time STEM professions by gender
Table 14.0 shows the mean salary for all full-time workers and for full-time male and female STEM professionals.843 Overall, female STEM professionals only earn three quarters (75.5%) of the salary of male STEM professionals. The only STEM professions where female earnings were close to male earnings844 were waste disposal and environmental service managers (100.7%), medical radiographers (99.0%) and conservation professionals (98.2%). The STEM profession with the lowest ratio of male to female salaries was dental practitioners, where females earn 58.7% of the salary of males.
Looking specifically at engineering shows that female quality control and planning engineers earn 97.2% of their male counterparts’ salaries. The only engineering occupation where female earnings were at least 90% of male earnings was electrical engineers (92.2%). The next highest was engineering professionals not elsewhere classified, where women on average earned 83.0% of the salary of men. The engineering occupation with the lowest female salary in relation to male salaries, was design and development engineers (79.8%).
203 14.0 Earnings in STEM careers Part 3 – Engineering in Employment
843 Only those STEM professions that have salary details for male and female STEM professionals are included in Tables 14.0 844 Close is defined as female earnings being at least 98.0% of male earnings
Description All full-time workers Male Female
Female salary as a percentage
of male salary
Waste disposal and environmental services managers
46,968 £46,909 £47,229 100.7%
Medical radiographers 37,223 £37,453 £37,083 99.0%
Conservation professionals 29,415 £29,530 £29,008 98.2%
Natural and social science professionals n.e.c. 37,969 £38,332 £37,313 97.3%
Quality control and planning engineers 35,155 £35,278 £34,305 97.2%
Production managers and directors in construction
46,846 £47,052 £44,054 93.6%
Environment professionals 32,781 £33,206 £30,989 93.3%
Ophthalmic opticians 36,753 £38,554 £35,881 93.1%
Managers and directors in transport and distribution
39,448 £39,760 £36,900 92.8%
Electrical engineers 43,080 £43,195 £39,837 92.2%
Programmers and software development professionals
40,890 £41,222 £37,490 90.9%
Web design and development professionals 30,194 £30,646 £27,744 90.5%
Information technology and telecommunications professionals n.e.c.
41,818 £42,302 £38,249 90.4%
Social and humanities scientists 27,531 £28,110 £25,206 89.7%
IT business analysts, architects and systems designers
45,453 £46,085 £41,263 89.5%
Business, research and administrative professionals n.e.c.
37,771 £39,744 £34,104 85.8%
IT specialist managers 49,014 £50,066 £42,676 85.2%
Research and development managers 50,232 £52,271 £44,517 85.2%
Biological scientists and biochemists 41,557 £44,441 £37,787 85.0%
Architects 39,163 £45,539 £38,213 83.9%
Engineering professionals n.e.c. 41,133 £41,913 £34,767 83.0%
IT project and programme managers 50,605 £53,582 £44,008 82.1%
Pharmacists 42,924 £48,060 £39,403 82.0%
Chartered and certified accountants 40,946 £44,288 £36,277 81.9%
Mechanical engineers 43,532 £44,323 £36,246 81.8%
Civil engineers 39,890 £40,473 £32,544 80.4%
Chartered surveyors 37,826 £38,542 £30,791 79.9%
Design and development engineers 40,665 £41,151 £32,836 79.8%
Managers and proprietors in other services n.e.c. 39,723 £42,851 £34,003 79.4%
Quality assurance and regulatory professionals 45,852 £49,165 £38,963 79.2%
Health services and public health managers and directors
53,190 £61,419 £47,861 77.9%
Production managers and directors in manufacturing
53,996 £56,115 £43,532 77.6%
Physical scientists 50,257 £52,571 £40,573 77.2%
Construction project managers and related professionals
39,586 £40,839 £29,664 72.6%
Medical practitioners 77,842 £86,075 £61,969 72.0%
Dental practitioners 67,521 £88,716 £52,087 58.7%
All employees 32,708 £36,156 £27,291 75.5%

Back to Contents
Part 3 – Engineering in Employment Earnings in STEM careers 14.0 204
14.1.2 Annual mean gross pay for selected part-time STEM professions by gender
Table 14.1 shows the mean salary for all part-time workers and for part-time male and female STEM professionals.845 For two STEM professions, women earn on average more than their male counterparts: design and development engineers females earn 124.4% of the salary of their male colleagues, while programmers and software development professionals females earn 112.5% of the salary of their male counterparts.
At the other end of the scale, females working as IT business analysts, architects and systems designers on average earn three quarters (75.4%) of the salary of their male counterparts.
14.2 Annual mean gross pay for selected STEM technician and craft careersFigure 14.1 shows the annual mean gross salary for selected STEM technician and craft careers.846 The highest average salary was £44,512, for financial and accounting technicians. Second-highest was pipe fitter – a substantial drop to £37,978. At the other end of the scale, industrial cleaning process occupations were lowest paid, averaging £16,254, which is just below weighers, graders and sorters (£16,476).
The highest paid engineering occupation was engineering technician at £32,647, followed by telecommunication engineers (£30,591).
Table 14.1: Annual mean pay for selected part-time STEM professions by gender (2012) – UK
Source: ONS/ASHE 2012
845 Only those STEM professions that have salary details for male and female STEM professionals are included in Tables 14.1 846 Only those STEM professions that have salary details for male and female STEM professionals are included in Tables 14.1
Description All part-time workers Male FemaleFemale salary
as a percentage of male salary
Design and development engineers 21,661 20,979 26,104 124.4%
Programmers and software development professionals 23,499 22,159 24,939 112.5%
Pharmacists 22,218 23,112 22,004 95.2%
Biological scientists and biochemists 20,557 21,859 20,257 92.7%
All employees 11,139 12,567 10,718 85.3%
Quality assurance and regulatory professionals 23,235 25,762 21,909 85.0%
Production managers and directors in manufacturing 19,253 21,059 16,210 77.0%
IT business analysts, architects and systems designers 25,233 28,867 21,772 75.4%

Back to Contents
205 14.0 Earnings in STEM careers Part 3 – Engineering in Employment
Fig. 14.1: Annual mean gross pay for selected STEM technician and craft careers (2012) – UK
Source: ONS/ASHE 2012
£50,
000
£30,
000
£25,
000
£20,
000
£15,
000
£10,
000
£5,0
00£0
£35,
000
£40,
000
£45,
000
£18,926£17,825
£16,476£16,254
£26,664
£22,537
£20,471
£20,324
£19,609£19,506£19,413
£20,924
£21,517
£22,827
£23,123
£22,260
£20,337
£19,776
£20,752
£21,180
£22,772
£22,988
£23,368
£23,936£23,852
£24,255£24,621£24,837£24,862
£26,695£26,478
£25,406£25,352£25,309£25,255
£25,968£25,523
£24,886
£27,386£27,265
£26,709
£29,104
£28,553£28,533£28,351£28,262
£27,743
£28,931£29,034
£29,194£29,255£29,285
£29,501£29,497
£29,530£29,734
£30,528£30,591
£44,512£37,978
£33,811£33,149£32,884£32,647
£36,328£34,908
£30,865
All employeesIndustrial cleaning process occupations
Weighers, graders and sortersFood, drink and tobacco process operatives
Elementary process plant occupations n.e.c.Moulders, core makers and die casters
Assemblers (electrical and electronic products)Tyre, exhaust and windscreen fitters
Glass and ceramics process operativesPaper and wood machine operatives
Printing machine assistantsPharmaceutical technicians
Textile process operativesElementary construction occupations
Laboratory techniciansPlastics process operatives
Metal working machine operativesHealth associate professionals n.e.c.
Pre-press techniciansTV, video and audio engineers
ElectroplatersSmiths and forge workers
Rubber process operativesVehicle body builders and repairers
Routine inspectors and testersEnergy plant operatives
Plant and machine operatives n.e.c.Sheet metal workers
Chemical and related process operativesVehicle paint technicians
Medical and dental techniciansProcess operatives n.e.c.
Vehicle technicians, mechanics and electriciansScience, engineering and production technicians n.e.c.
Metal making and treating process operativesPrinters
Quality assurance techniciansMetal machining setters and setter-operators
Tool makers, tool fitters and markers-outWelding trades
Architectural and town planning techniciansIT engineers
Plumbers and heating and ventilating engineersDraughtspersons
Product, clothing and related designersMetal working production and maintenance fitters
Precision instrument makers and repairersWater and sewerage plant operatives
IT user support techniciansIT operations technicians
Air-conditioning and refrigeration engineersAssemblers (vehicles and metal goods)
Boat and ship builders and repairersElectricians and electrical fitters
Electrical and electronic trades n.e.c.Planning, process and production technicians
Electrical and electronics techniciansTelecommunications engineers
Metal plate workers, and rivetersEngineering technicians
Coal mine operativesQuarry workers and related operatives
Aircraft maintenance and related tradesSkilled metal, electrical and electronic trades supervisors
Rail and rolling stock builders and repairersPipe fitters
Financial and accounting technicians
Average salary £26,664

Back to Contents
Part 3 – Engineering in Employment Earnings in STEM careers 14.0 206
14.2.1 Annual mean gross pay for selected full-time STEM technician and craft careers by gender
Table 14.2 shows that there are three full-time STEM technician and craft careers where females earn slightly more than males.847 Females working as water and sewerage plant operatives earn 105.6% of the salary of their male colleagues. Female plumbers and heating and ventilating engineers earn 4.8% more than their male counterparts, while female pre-press technicians earn 1.4% more than male ones.
For all other full-time STEM technician and craft careers, women earn less than men. Female sheet metal workers earn only 56.0% of the salary of their male colleagues and female energy plant operatives do only slightly better (57.0%). Overall, females earn three quarters (75.5%) of the salary of male STEM technicians.
Table 14.2: Annual mean pay for selected full-time STEM technician and craft careers by gender (2012) – UK
Source: ONS/ASHE 2012
Description All full-time workers Male Female
Female salary as a percentage
of male salary
Water and sewerage plant operatives 29,463 29,366 31,021 105.6%
Plumbers and heating and ventilating engineers 28,856 28,820 30,202 104.8%
Pre-press technicians 22,772 22,732 23,039 101.4%
Health associate professionals n.e.c. 28,988 29,552 28,860 97.7%
Architectural and town planning technicians 27,983 28,271 27,394 96.9%
Precision instrument makers and repairers 29,783 29,840 28,843 96.7%
Medical and dental technicians 28,788 29,735 27,661 93.0%
Draughtspersons 29,374 29,693 27,320 92.0%
Product, clothing and related designers 30,287 31,557 28,662 90.8%
Electrical and electronic trades n.e.c. 29,902 30,027 27,172 90.5%
Pharmaceutical technicians 23,811 25,687 23,200 90.3%
Quality assurance technicians 27,203 28,514 24,803 87.0%
Engineering technicians 33,268 33,784 28,683 84.9%
Electricians and electrical fitters 29,863 29,959 25,355 84.6%
Industrial cleaning process occupations 20,246 20,996 17,498 83.3%
IT user support technicians 30,443 31,939 26,518 83.0%
Paper and wood machine operatives 20,884 21,124 17,531 83.0%
IT operations technicians 30,894 32,595 27,050 83.0%
Food, drink and tobacco process operatives 19,133 20,141 16,599 82.4%
Elementary process plant occupations n.e.c. 19,878 20,506 16,590 80.9%
Metal working production and maintenance fitters
29,061 29,248 23,556 80.5%
Plastics process operatives 21,721 22,095 17,682 80.0%
Laboratory technicians 24,424 26,874 21,045 78.3%
Weighers, graders and sorters 18,906 20,214 15,550 76.9%
Science, engineering and production technicians n.e.c.
27,020 27,919 21,440 76.8%
Planning, process and production technicians 30,500 32,146 24,569 76.4%
Routine inspectors and testers 24,969 26,389 20,077 76.1%
Assemblers (electrical and electronic products) 20,352 22,115 16,598 75.1%
Elementary construction occupations 21,657 21,746 16,214 74.6%
Metal machining setters and setter-operators 27,326 27,558 20,216 73.4%
Textile process operatives 21,809 23,448 17,164 73.2%
Printing machine assistants 22,016 23,304 16,434 70.5%
Metal working machine operatives 23,093 23,898 16,030 67.1%
Plant and machine operatives n.e.c. 25,052 25,957 17,372 66.9%
Assemblers (vehicles and metal goods) 29,615 30,475 20,162 66.2%
Chemical and related process operatives 25,916 27,199 17,855 65.6%
Financial and accounting technicians 49,059 57,579 36,872 64.0%
Vehicle technicians, mechanics and electricians 25,835 25,889 16,374 63.2%
Process operatives n.e.c. 25,527 26,536 15,380 58.0%
Energy plant operatives 26,536 27,540 15,700 57.0%
Sheet metal workers 25,299 25,904 14,494 56.0%
All employees 32,708 36,156 27,291 75.5%
847 Only those STEM professions that have salary details for male and female STEM professionals are included in Tables 14.1

Back to Contents
848 Only those STEM professions that have salary details for male and female STEM professionals are included in Tables 14.1
14.2.2 Annual mean gross pay for selected part-time STEM technician and craft careers by gender
Table 14.3 shows the mean pay for selected part-time STEM technician and craft careers by gender.848 Females working as IT user support technicians and IT operations technicians both earn more than their male counterparts (125.9% and 120.6% of the male average salary, respectively). However overall, females earn only 85.3% of their male colleagues, with females working as plant and machine operatives not elsewhere classified earning just 42.9% of their male colleagues.
14.3 2013 Survey of professionally registered engineers and technicians
Salaries of professionally registered engineers and technicians
Table 14.4 shows the mean and median basic income for Chartered Engineers, Incorporated Engineers, Engineering Technicians and ICT Technicians from the 2013 Survey of Professionally Registered Engineers and Technicians. Also included in the table are comparisons of male and female salaries for those aged 21-34.
Direct comparisons with the 2010 Survey of Professionally Registered Engineers and Technicians shows that the mean and median salaries have increased for individuals in all sections of the register. (Please note that comparisons were not made for ICT Technicians as this register was newly established, so not surveyed in 2010).
Table 14.3: Annual mean pay for selected part-time STEM technician and craft careers by gender (2012) – UK
Source: ONS/ASHE 2012
207 14.0 Earnings in STEM careers Part 3 – Engineering in Employment
Description All part-time workers Male Female
Female salary as a percentage
of male salary
IT user support technicians 13,739 11,816 14,875 125.9%
IT operations technicians 13,792 12,160 14,665 120.6%
Medical and dental technicians 15,232 16,334 14,938 91.5%
Industrial cleaning process occupations 8,974 9,427 8,433 89.5%
Telecommunications engineers 17,328 18,760 15,347 81.8%
Metal machining setters and setter-operators 13,016 14,856 10,531 70.9%
Paper and wood machine operatives 12,603 14,479 9,256 63.9%
Metal working machine operatives 14,967 16,647 9,961 59.8%
Chemical and related process operatives 12,515 16,857 9,595 56.9%
Elementary process plant occupations n.e.c. 10,455 13,257 7,263 54.8%
Plant and machine operatives n.e.c. 20,132 24,193 10,368 42.9%
All employees 11,139 12,567 10,718 85.3%
Table 14.4: Mean and median basic income for Chartered Engineers, Incorporated Engineers, Engineering Technicians and ICT Technicians
Source: Engineering Council 2013 Survey of Professionally Registered Engineers and Technicians
Mean Median
Chartered Engineers £68,539 £60,000
Incorporated Engineers £51,227 £45,000
Engineering Technicians £52,349 £37,000
ICT Technicians £36,423 £35,500
Male Chartered Engineer aged 21-34 £49,681 £43,000
Female Chartered Engineer aged 21-34 £41,541 £38,653
Male Incorporated Engineer aged 21-34 £38,778 £36,000
Female Incorporated Engineer aged 21-34 £34,829 £33,850
Male Engineering Technician aged 21-34 £33,132 £30,600
Female Engineering Technician aged 21-34 £27,878 £26,000

Back to Contents
Figure 14.2 illustrates the median and mean basic income for Chartered Engineers, Incorporated Engineers, Engineering Technicians and ICT Technicians in 2010 and 2013. In 2013, the median basic annual income for Chartered Engineers had increased by 14% to £60,000, Incorporated Engineers’ income had increased by 9% to £45,000 and salaries for Engineering Technicians had risen by 5% to £37,000. For ICT Technicians, the median salary was £35,000 and the mean salary was £36,423.
Part 3 – Engineering in Employment Earnings in STEM careers 14.0 208
Fig. 14.2: Median and mean basic income for Chartered Engineers, Incorporated Engineers, Engineering Technicians and ICT Technicians (2010 and 2013)
Source: Engineering Council 2013 Survey of Professionally Registered Engineers and Technicians
£0
£40,
000
£30,
000
£60,
000
£80,
000
£50,
000
£10,
000
£70,
000
£20,
000
Median Mean
£45,941£53,471
£40,000£44,770
£55,000£64,828
£50,000£58,271
£35,000£36,423
£37,000£52,349
£45,000£51,227
£35,000£39,456
£60,000£68,539
£41,345£46,362
£52,609£62,386
Engineering Technicians 2010
Engineering Technicians 2013
ICT Technicians 2013
Male 2010
Male 2013
Female 2010
Female 2013
Incorporated Engineers 2013
Incorporated Engineers 2010
Chartered Engineers 2013
Chartered Engineers 2010

Back to Contents
Comparisons with the 2010 survey revealed that the median and mean overtime, bonus and commission payments decreased for Chartered Engineers, Incorporated Engineers and Engineering Technicians. Figure 14.3 compares median and mean bonuses in 2010 and 2013. Chartered Engineers have seen a 14% reduction in their median bonus to £6,000. The median bonus for Incorporated Engineers decreased by 20% to £4,000, and there was a 20% reduction to a £4,000 median bonus for Engineering Technicians. The 2013 survey showed that ICT Technicians received a median bonus of £5,000 and a mean bonus of £7,143.
The current rate of total annual earnings was calculated by combining the gross basic annual income from employment and all overtime, bonus and commission payments. Engineers and technicians in all three sections of registration saw an increase in their median annual earnings as shown in Figure 14.4. Combined income increased by 15% for Chartered Engineers, 5% for Incorporated Engineers and 8% for Engineering Technicians. Median annual earnings for ICT Technicians was £36,306 in the 2013 survey.
209 14.0 Earnings in STEM careers Part 3 – Engineering in Employment
Fig. 14.3: Median and mean overtime, bonus and commission payments for Chartered Engineers, Incorporated Engineers, Engineering Technicians and ICT Technicians (2010 and 2013)
Source: Engineering Council 2013 Survey of Professionally Registered Engineers and Technicians
£0
£8,0
00
£6,0
00
£12,
000
£14,
000
£10,
000
£2,0
00
£4,0
00Median Mean
Engineering Technicians 2010Engineering Technicians 2013
Engineering Technicians 2010Engineering Technicians 2013
ICT Technicians 2013
Incorporated Engineers 2013Incorporated Engineers 2010
Incorporated Engineers 2013Incorporated Engineers 2010
Chartered Engineers 2013Chartered Engineers 2010
Chartered Engineers 2013Chartered Engineers 2010
£5,000£7,143
£4,000
£8,695
£5,000
£8,188
£4,000
£8,728
£5,000
£10,427
£6,000
£12,461
£6,817
£13,063
Fig. 14.4: Median and mean total annual earnings for Chartered Engineers, Incorporated Engineers, Engineering Technicians and ICT Technicians (2010 and 2013)
Source: Engineering Council 2013 Survey of Professionally Registered Engineers and Technicians
£0
£40,
000
£30,
000
£60,
000
£80,
000
£50,
000
£10,
000
£70,
000
£20,
000
Median Mean
Engineering Technicians 2010Engineering Technicians 2013
Engineering Technicians 2010Engineering Technicians 2013
ICT Technicians 2013
Incorporated Engineers 2013Incorporated Engineers 2010
Incorporated Engineers 2013Incorporated Engineers 2010
Chartered Engineers 2013Chartered Engineers 2010
Chartered Engineers 2013Chartered Engineers 2010
£36,306£38,529
£40,000
£54,936
£37,000
£41,826
£45,500
£54,176
£43,300
£49,412
£63,000
£73,927
£55,000
£67,714
Back to Contents
The proportion of employers who pay the subscription for institution membership increased significantly. Table 14.5 shows the percentage of Chartered Engineers, Incorporated Engineers, Engineering Technicians and ICT Technicians who had their subscription paid for by their employer in 2010 and 2013.
In 2013, employers paid registration fees for 59% of Chartered Engineers, 54% of Incorporated Engineers, 46% of Engineering Technicians and 39% of ICT Technicians.
The willingness of employers to offer support for professional development continues to advance, with 76% of registrants receiving help. Table 14.6 shows how employers offer support for registrants’ professional development.
There has been a continuous significant increase in employers supporting registrants in all sections of registration.
14.4 Engineering vacancy and salary trends 2012/13Authored by Mark Tully, Managing Director, Roevin
Engineering vacancies
The last 12 months has seen numerous ups and downs within the engineering recruitment landscape.
Last summer, and the lead up to it, saw many UK recruitment markets, including engineering, buoyed by demand in relation to two major events: the London 2012 Olympics and the Queen’s Diamond Jubilee celebrations.
Following their conclusion, recruitment demand subsided in many sectors. However, demand in the engineering sector remained high right through until the end of November across both permanent and contract roles.
The engineering/manufacturing market has experienced steady growth since the start of 2013, with an overall 15% rise in demand for candidates so far.
Although all engineering sectors have fared well recruitment-wise over the past year, it is the automotive, aerospace, oil and gas, and nuclear sectors that have proved to be most successful. A recent increase in car production fuelled by global demand has seen demand for candidates with technical expertise increase. And the discovery of large shale gas deposits within the UK means there are various entities getting ready to both survey and extract this valuable resource.
Despite the continued economic fragility of both the UK and European economies, the UK employment market has been relatively strong. Compared with June 2012, the engineering/manufacturing market is exhibiting more than 40% higher demand for candidates. The increased spending on infrastructure projects announced in the 2013 budget is likely to further sustain this increased demand.
Part 3 – Engineering in Employment Earnings in STEM careers 14.0 210
Table 14.5: Percentage of Chartered Engineers, Incorporated Engineers, Engineering Technicians and ICT Technicians who had their institution membership paid for by their employer (2010 and 2013)
Source: Engineering Council 2013 Survey of Professionally Registered Engineers and Technicians
2010 % 2013 %
Chartered Engineers 61 68
Incorporated Engineers 51 57
Engineering Technicians 43 50
ICT Technicians - 29
Table 14.6: Ways in which employers offer support for professional development
Source: Engineering Council 2013 Survey of Professionally Registered Engineers and Technicians
% of registered engineers and technicians agreeing to the statement
On-the-job training 61
A good range of training courses at place of work 58
Financial support for external training 50
Opportunities to broaden experience at workplace 48

Back to Contents
Salary review
Weak pay growth has been a well-documented problem within the recruitment market during the last year. Public sector workers have often been working under a pay cap or freeze, while the private sector has rarely topped 2% pay growth.
Salary growth during the last 12 months was lower than during the previous 12 months. This trend can be seen in the Table 14.8, which shows monthly and yearly salary changes for particular engineering roles. Only two of the permanent role types managed to exceed 3% growth in advertised salaries over the year: CAD technicians and structural engineers. The contract market, as usual, was slightly more volatile but overall appears to have grown more, with building surveyors seeing the greatest growth in advertised salaries.
Popular vacancies
Highly skilled and qualified engineers continue to remain in high demand. As shown in Table 14.7, design, quality and project engineers are among the most sought-after candidates within both the permanent and contract markets.
211 14.0 Earnings in STEM careers Part 3 – Engineering in Employment
Fig. 14.5: Vacancies for permanent roles (rolling 12 months)
0
20,0
00
80,0
00
10,0
00
50,0
00
70,0
00
40,0
00
60,0
00
30,0
00
Jan 13
Dec 12
Sep 12
Aug 12
Jul 12
Jun 12
Feb 13
Apr 13
May 13
Jun 13
Mar 13
Nov 12
Oct 12
66,082
65,005
71,544
38,820
58,148
61,547
60,647
66,542
64,577
58,511
69,336
66,751
66,555
Fig. 14.6: Vacancies for contract roles (rolling 12 months)
0
4,00
0
20,0
00
2,00
0
10,0
00
16,0
00
8,00
0
14,0
00
18,0
00
12,0
00
6,00
0
16,185
14,973
17,420
10,212
13,357
16,438
16,514
16,484
16,420
13,056
17,377
17,103
16,281
Jan 13
Dec 12
Sep 12
Aug 12
Jul 12
Jun 12
Feb 13
Apr 13
May 13
Jun 13
Mar 13
Nov 12
Oct 12

Back to Contents
Table 14.8: Engineering pay (2012-2013)
Part 3 – Engineering in Employment Earnings in STEM careers 14.0 212
Table 14.7: Jobs in demand (2012-2013)
Jobs in demand (ranked by most in demand first)
Permanent Contract
Maintenance engineer Design engineer
Mechanical design engineer Project engineer
Quality engineer Engineer
Design engineer Electrical design engineer
Engineer Mechanical design engineer
Project engineer Quality engineer
Electrical engineer Welder
Electrical design engineer Mechanical fitter
Field service engineer Electrical engineer
Mechanical engineer Stress engineer
Manufacturing engineer Maintenance engineer
Electrical maintenance Commissioning engineer
Service engineer Manufacturing engineer
Quality manager Mechanical engineer
Senior engineer Process engineer
Process engineer Senior engineer
Cnc machinist Setting out engineer
Engineering manager Cnc miller
Senior design engineer Senior mechanical engineer
Production engineer Senior process engineer
Permanent Contract
Salary (average) % Monthly change
% Yearly change Daily rate (average) % Monthly
change% Yearly change
Job title (Jun-2013) (Jun-2012)(May-2013 –
Jun-2013)(Jun-2012 –
Jun-2013) (Jun-2013) (Jun-2012)(May-2013 –
Jun-2013)(Jun-2012 –
Jun-2013)
Aerospace quality engineer £33,500 N/A 4.50% N/A N/A
Architect £52,814 £60,004 31.10% -11.98% £323.71 £420.99 30.30% -23.11%
Automotive engineer £31,250 £32,297 13.60% -3.24% N/A
Building surveyor £31,824 £32,916 5.90% -3.32% £163.54 £126.42 9.40% 29.36%
Cad technician £25,926 £24,140 1.30% 7.40% £150.43 £130.11 -6.00% 15.62%
Chemical engineer £39,615 £40,954 17.80% -3.27% £221.88 N/A N/A N/A
Civil Engineer £30,480 £32,618 -4.40% -6.55% £234.66 £206.24 18.30% 13.78%
Electrical engineer £33,269 £32,640 1.60% 1.93% £226.93 £209.91 8.40% 8.11%
Facility manager £38,564 £37,658 1.50% 2.41% £133.84 £123.53 -1.10% 8.35%
Mechanical engineer £31,280 £30,601 -6.50% 2.22% £201.92 £237.46 1.90% -14.97%
Quantity surveyor £37,580 £37,923 0.40% -0.90% £215.37 £223.40 -1.20% -3.59%
Stress engineer aerospace £37,000 £43,579 1.70% 15.10% N/A
Structural engineer £34,181 £30,497 -5.50% 12.08% £297.17 £299.63 16.40% -0.82%
Town planner £28,357 £36,578 -10.00% -22.48% N/A

Back to Contents
849 The REC/KPMG Report on Jobs published by Markit Economics Ltd draws on original survey data provided by recruitment consultancies. 850 Recruitment Industry Trends Survey 2011/12 and REC Medium Term Forecast, REC Industry Research Unit, 2011 851 Data are represented in the form of diffusion indices whereby a reading of 50 indicates no change on the previous month. Readings above 50 signal stronger demand than a month ago 852 Recruitment 2022: The impact of Social Media and Technology on Future Recruitment, REC Industry Research Unit, 2012 853 Exploring the UK freelance workforce 2011, The Professional Contractors Group, 2012 854 Interim Management Association/Ipsos Mori survey Q2 2013
14.5 Emerging trends of the future workforceAuthored by Kim Regisford, Policy Advisor, Recruitment and Employment Confederation
In recent years, the labour market has evolved significantly, with structural and economic barriers leading firms to redefine models of talent management and talent acquisition to remain competitive. As the ‘race for talent’ strengthens and the uptake in flexible methods of working increases, employers must now introduce innovative and agile recruitment practices to sustain successful businesses.
Jobs market: current state of play
The UK jobs market has proved remarkably resilient over the last few years but more must be done to boost economic recovery.
Feedback from REC’s Report on Jobs849 and the Recruitment Industry Trends survey shows a steady increase in the use of temporary workers – this is linked directly with labour market performance and business culture. A flat line economy often means employers are reluctant to take the risks of employing permanent staff, resulting in a short-term approach to their resourcing models. In 2011/2012, the temporary market saw a 5.4% increase in placements when compared with the previous year. Total permanent placements were down by 8.9%.850 However, the engineering industry has bucked the trend. In the first and second quarters of 2013, the engineering sector recorded the strongest demand for permanent staff. This can be interpreted as a sign that confidence is returning to the jobs market, as businesses review the use of long-term resourcing strategies. But it also says something about persistent skills shortages across the sector.
According to the Report on Jobs index, the greatest demand for permanent staff since August 2010 has been in engineering. In June 2013, demand for engineering staff peaked at a rate faster than the overall UK trend – figures showed an index score of 69.4851 (Figure 14.7). The average demand across all sectors was recorded at 59.1.
General trends in working practices
‘Permanent flexibility’ has emerged as a new template for work and has taken many forms. The changing dynamics of the workforce have provided opportunities for workers to engage in methods of working that suit their lifestyles. REC’s Recruitment 2022 report852 provided an outline of changing work practices and predicted trends for the future fragmented workforce. These changes can be summarised as a growth in flexibility, increased self-employment, disappearance of the ‘job for life’ rhetoric, and an increased need for a work/life balance.
Independent Professionals (I-Pros), contractors, interims, and freelancers are increasingly used in many sectors, including engineering. As it stands, there is approximately the same number of self-employed freelancers in the UK as there are temporary workers (1.65 million). In Europe, there was an 82% rise in independent professionals between 2000 and 2011, with the UK accounting for 19% of the European total.
According to the Office for National Statistics (ONS) Labour Force Survey (February 2013), self-employment rose by 367,000 for the period 2008-2012. Additionally, the ONS Women in Business survey identified that, “in line with different occupations undertaken by the self-employed, the industries in which women work are very different from the most prevalent industries for men”. In 2007-2008, only 3% of self-employed men were working in architecture, engineering and consultancy. No such data was recorded for women in these specific industries.
Equally, the Professional Contractors Group (PCG) found in its 2012 report that more than six in ten freelancers were male and approximately 25% of engineering professionals were reported ‘as doing freelance work’.853 Although freelancing takes place in all twenty-one labour market sectors, the creative sector is reported to have the largest number using this work model.
Highly-skilled professionals often command between £500-800 per day854 for their services and are reported as constituting the largest percentage of the UK freelance workforce.
213 14.0 Earnings in STEM careers Part 3 – Engineering in Employment
Fig. 14.7: Demand for permanent staff by sector
Source: REC/KPMG Report on Jobs Index score
0.0
50.0
40.0
70.0
80.0
60.0
10.0
30.0
20.0
2013 2012
Nursing/medical/care
Construction
Accounting/financial
Executive/professional
IT and computing
Engineering

Back to Contents
855 Recruitment 2022: The impact of Social Media and Technology on Future Recruitment, REC Industry Research Unit, 2012 856 Engineering UK 2013 The state of engineering, EngineeringUK, 2013 857 Report on Jobs, Markit Economics Limited, June 2013 858 Engineering and Technical Services: REC Sector Profile, REC Industry, 2009
The use of crowdsourcing855 has also emerged as a fully-fledged business model. It is designed to distribute tasks to a large group of people, allowing businesses to source ‘collective intelligence, assess quality and process work in parallel’. In summary, the key trend is the development of a highly-skilled flexible workforce, able to provide fast and effective project-based support. Employer attitudes must shift to accommodate these changes.
Skills challenges – workforce planning
The lack of skills, and hence a shortage of good candidates, is one of the most persistent and challenging issues for employers and recruiters, as noted by the REC’s Recruitment Industry Trends survey 2011/12. A combination of demand alongside limited fluidity has caught agencies in a skills availability gap. Engineering companies are projected to have 2.74 million job openings from 2010 – 2020, 1.86 million of which will require engineering skills.856 Aerospace, automotive, oil and gas, power and rail were some of the key permanent skills reported as being in short supply.857
How do we make up the shortfall?
Making up the shortfall must be two tiered:
1. building a comprehensive and long term workforce strategy
2. developing the UK’s STEM capacity
These are dependent on the collaborative work of businesses, schools, employers and recruiters. It is imperative that the UK engineering industry leads the way in developing a strong talent pipeline. This will include working to improve education and workforce preparation. The REC’s sector profile working paper concluded that, “to meet both future cost pressures and realise opportunities, employers already recognise the need to attract and retain more highly skilled staff”.858
Workforce planning is crucial to any engineering company’s ability to remain competitive. Results from Manpower Group’s Talent Shortage Survey 2013 revealed the global challenge of filling engineering roles has led to employers adopting innovative measures. For example, over 23% of employers in the 24 EMEA (Europe, Middle East and Africa) countries are changing work models and 44% are modifying their people practices. This includes changing the mind-set of the industry in an effort to attract new talent and retain their existing workforce. Such methods of talent acquisition and retention consist of: implementing more flexible working arrangements, providing training and development opportunities, adopting new measures to enhance the talent pipeline in engineering and manufacturing such as wage incentives, and the ‘modification of work models’.
Thinking long term
With the fiscal pressures placed on the labour market, companies must be willing to invest in buoyant recruitment solutions to meet increased global challenges. Minimising the skills gap will also require businesses to support young people into the world of work, and marrying academia and enterprise will be key to supplying the future engineering and manufacturing workforce.
Part 3 – Engineering in Employment Earnings in STEM careers 14.0 214
Fig. 14.8: Gender profile of the freelance workforce (2008 and 2011) – UK
Source: ONS Quarterly Labour Force Survey, April – June 2011
Male Female
0.0
50.0
40.0
70.0
60.0
10.0
30.0
20.0
Freelancers 2008
Freelancers 2011
Employees 2011
Fig. 14.9: The freelance landscape – I choose to work on a temp/contact/interim basis
Source: REC Recruitment 2022 research paper 2012
0.0
90.0
60.0
70.0
50.0
80.0
20.0
30.0
10.0
40.0
PAYE: operational support
Day rate under £500 per day
Day rate over £500 per day
Average of all categories
PAYE: front line operations
Fig. 14.10: Freelance workforce, occupational structure (2011) – UK
Source ONS Quarterly Labour Force Survey, April – June 2011
Professional workers23.0%
Associateprofessionaland technicaloccupations37.0%Managerial
occupations40.0%

Back to Contents
859 Changing the Pace, CBI and Pearson, June 2013, p6 860 The relationship between graduates and economic growth across countries, Department for Business, Innovation and Skills, August 2013, p8 861 See sections 7-11 for further details 862 Local Enterprise Partnerships, House of Commons, Business, Innovation and Skills Committee, 23 April 2013, p5 863 See Section 1 for further details on the skills agenda 864 Changing the pace, CBI and Pearson, June 2013, p13 865 Assessing the economic benefits of education: reconciling microeconomic and macroeconomic approaches, Centre for Analysis of Youth Transitions, March 2013, p6
215 15.0 Skills Shortage Vacancies and employment projections Part 3 – Engineering in Employment
As Andreas Schleicher highlights in the quote above, workforce skills are critical to the future success of the UK economy. The same point is made in a different way by the Confederation of British Industry (CBI): its Change the Pace report identified that better education could add 1% to GDP each year, equivalent to £8 trillion over the lifetime of a child born today. 859 Meanwhile, the Department of Business, innovation and Skills (BIS) reports860 that a 1% increase in the share of the workforce with a university degree results in productivity increases over the long run of 0.2-0.5%.
The coalition Government has recognised the importance of the skills agenda and this has led to some of the education changes discussed in detail earlier in this report.861 The Government has also introduced Local Enterprise Partnerships (LEPs) – 39 in total, covering the whole of England862 – through which it is now channelling much of its skills agenda.863
15.1 Business investment in skills In addition to substantial Government investment, it should be recognised that businesses invest substantial amounts to support the education sector and deliver workforce skills. The UK Commission for Employment and Skills (UKCES) has identified that businesses in England spent £49 billion in 2011 on training their staff.864 Businesses invest in skills because they get a return on their investment. The Centre for Analysis of Youth Transitions has shown that businesses can expect a productivity increase that is double the salary increase resulting from the training.865
However as Figure 15.0 demonstrates, investment in training is not equal across all industries. Looking specifically at investment versus the number of people in the workforce shows that the education sector makes the largest investment (£2,650 per employee), followed by agriculture, forestry and fishing. Disappointingly, however, three of the four sectors with the lowest investment in training per head of workforce are sectors that employ a large percentage of engineers. Manufacturing was fourth from bottom, followed by mining and quarrying. Electricity, gas and water supply was bottom, investing just over £1,000 per worker in training.
Expenditure per trainee shows a very different picture. Agriculture, forestry and fishing, at £5,725 per employee, has the largest expenditure on training. Education and public administration were second and third with expenditure of just over £4,000. Construction was fourth, spending just under £4,000 on each trainee. Manufacturing and mining and quarrying both spend around £3,000 per trainee. However electricity, gas and water supply had the lowest investment per trainee at just over £2,000.
Part 3 – Engineering in Employment15.0 Skills Shortage Vacancies and employment projections
“Skills have become the global currency of the 21st century. Without proper investment in skills, people languish on the margins of society, technological progress does not translate into economic growth, and countries can no longer compete in an increasingly knowledge-based global society.”
Andreas Schleicher, OECD, 2012

Back to Contents
866 Measuring National Well-being – Education and skills, Office of National Statistics, 5 July 2012, p24 867 Training in Britain – First Findings from the Skills and Employment Survey 2012, Francis Green, Alan Felstead, Duncan Gallie, and Hande Inanc, p1 868 Training in Britain – First Findings from the Skills and Employment Survey 2012, Francis Green, Alan Felstead, Duncan Gallie, and Hande Inanc, p3 869 Training in Britain – First Findings from the Skills and Employment Survey 2012, Francis Green, Alan Felstead, Duncan Gallie, and Hande Inanc, p1 870 Unlocking Britain’s potential, Adecco, 2012, p10 871 2013 NIACE Adult participation in learning survey, NIACE, 2013, p1 872 Adult participation in learning survey – headline findings, NAICE, 2013, p1 873 Training in Britain: First Findings from the Skills and Employment Survey 2012, Francis Green, Alan Felstead, Duncan Gallie, and Hande Inanc, 2013, p1
Part 3 – Engineering in Employment Skills Shortage Vacancies and employment projections 15.0 216
Research by Green et al has shown that the proportion of workers engaging in at least ten hours of training per year has fallen from 38% in 2006 to 34% in 2013.867 They also highlight the fact that the decline in training has particularly affected women. In fact, the research concluded that the number of training days per worker year fell by around a third (32%) between 2006 and 2012.868 This is despite the same research identifying rising demand for work-placed training from workers, regardless of their level of education.869
Finally, some additional pertinent research which shows that over one-in-seven workers have never been given any training at work.870 Given the importance of increasing the skills of the UK workforce for our future economic wellbeing, this is a truly shocking statistics.
15.2 Who engages in further learning As well as Government and businesses investing in skills, the investment made by individuals needs to be recognised. Research by The National Institute of Adult Continuing Education (NIACE) found that just under a fifth (19%) of adults questioned were currently engaged in learning and nearly two fifths (38%) have engaged with some form of learning in the last three years.871 However, nearly two fifths (39%) have not engaged in any learning since leaving full-time education.
The research identified that participation in learning is determined by:872
• socio-economic class
• employment status
• age
• prior learning
This finding is reinforced by other research, which shows that quality and quantity of training is greater for those workers with more prior education, resulting in a magnification of inequalities in the workforce.873
Fig. 15.0: Training expenditure by sector (2011) – UK
Source: ONS866
Electricity, gas, water supply
Mining and quarrying
Manufacturing
£0
£1,0
00
£2,0
00
£3,0
00
£4,0
00
£5,0
00
£6,0
00
Wholesale and retail trade
Health and social work
Transport and communications
Financial services
Hotels and restaurants
Community, social andpersonal service activities
Construction
Public administration
Agriculture, forestry and fishing
Education
Real estate/businessactivities
Per trainee Whole workforce £s Per head

Back to Contents
874 No qualifications are classified as those below level 1 and so may include people with entry level qualifications 875 UK Skills levels and international competitiveness, UKCES, November 2012, p4-5 876 UK Skills levels and international competitiveness, UKCES, November 2012, pvii 877 Regional economic indicators, ONS March 2013, p31
15.3 Skill levels in the UK workforceTable 15.0 shows the changing composition of workforce skills between 2000 and 2010, and the projected change by 2020. The percentage of people with the highest level of skills (levels 7-8 – Masters/Doctorate level) doubled from 3.8% in 2000 to 8.0% in 2010 and is projected to increase to 12.6% of 16- to 64-year-olds by 2020.
Engineering has a particular focus and reliance on the number of workers with level 4+ skills (HNC/D, foundation degree, undergraduate, postgraduate and equivalent) and level 3 skills (technician level). The table shows that level 4+ skills rose from nearly a quarter (23.9%) in 2000 to a third (33.7%) in 2010. The projections are that it will reach 44.1% by 2020.
However, the proportion of the available workforce with level 3 skills is more complex.
From 2000 to 2010, it rose from 18.9% to 19.7%. But a decline to 17.2% is projected by 2020. This poses the question of how the engineering sector will recruit the level 3 technicians it will need in the future.
UKCES also reports876 that Scotland has the highest proportion of people with level 4+ skills (36.7%) and Northern Ireland the lowest (30.4%).
Table 15.1 shows the regional distribution of people with no qualifications aged 16-64 by the different nations of the UK and the English regions. In 2011, 11.0% of all 16- to 64-year-olds had no qualifications. However, there were strong regional variations. In Northern Ireland, over a fifth (21.7%) of 16- to 64-year-olds have no qualifications – this is nearly three times the level recorded in the South East (7.9%). The region with the second highest proportion of people with no qualification is the West Midlands (14.2%).
217 15.0 Skills Shortage Vacancies and employment projections Part 3 – Engineering in Employment
Table 15.0: Changing distribution of qualifications for those aged 19-64 (2000-2020) – UK
Source: UKCES875
2000 2010 2020 (projected)
% Numbers in thousands % Numbers in
thousands % Numbers in thousands
Level 7-8 3.8 1,359 8.0 3,035 12.6 4,969
Level 4-6 20.1 7,089 25.7 9,721 31.5 12,441
Level 4+ 23.9 8,449 33.7 12,756 44.1 17,410
Level 3 18.9 6,663 19.7 7,446 17.2 6,782
Level 2 20.2 7,129 19.7 7,437 18.6 7,347
Level <2 37.1 13,107 27.0 10,199 20.0 7,906
Level 1 19.3 6,805 16.4 6,187 14.3 5,649
No qualifications874 17.8 6,301 10.6 4,013 5.7 2,257
Table 15.1: Share of 16- to 64-year-olds with no qualifications (2011) – UK
Source: ONS877
No qualifications %
Wales 12.4
Scotland 11.7
Northern Ireland 21.7
North East 12.3
North West 12.1
Yorkshire and The Humber 12.0
East Midlands 11.6
West Midlands 14.2
East of England 9.7
London 9.3
South East 7.9
South West 8.1
UK average 11.0

Back to Contents
878 Skills Funding Statement 2012-2015, Skills Funding Agency, December 2012, p39 879 Education at a Glance 2012, OECD, September 2012, p118 880 Education at a Glance 2012, OECD, September 2012, p119 881 Future skills supply and demand in Europe – Forecast 2012, CEDEFOP, 2012, p17
15.4 Employment by skills levelFigure 15.1 clearly shows the relationship between the highest level of qualification and the proportion of people in employment. Looking at the pool of people in employment, two fifths (42%) are qualified to level 4+, while a fifth are qualified at level 3 (22%) and level 2 (20%). However, it should be noted that 16% of people in employment are qualified below level 2, or have no qualifications at all.
Looking at those unemployed, a third (34%) are qualified to below level 2 or have no qualifications. A quarter (24%) of the unemployed are qualified to level 4+, while a fifth are qualified at level 3 (20%) or level 2 (22%).
This is not a UK-specific phenomenon. As the OECD shows in its Education at a Glance report,879 individuals with at least upper secondary education are 18 percentage points more likely to be in employment than those without upper secondary education. Those with tertiary education are 28 percentage points more likely to be in employment that those without upper secondary education. OECD also concludes that, “education is generally good insurance against unemployment, even in difficult economic times”.880
This is reinforced by Figure 15.2 from the European Centre for the Development of Vocational Training (CEDEFOP), which shows unemployment rates by qualifications in the EU from 2000 to 2010 and then projected to 2020. Unemployment rates for those with high qualifications hover around 4-6% per year while, for those with low qualifications, unemployment is consistently in double figures, and is projected to reach 14% in 2020.
Part 3 – Engineering in Employment Skills Shortage Vacancies and employment projections 15.0 218
Fig. 15.1: Highest level of qualification held by adults of working age by economic activity (2011)
Source: Skills Funding Agency878
0.0%
15.0
%
25.0
%
45.0
%
20.0
%
35.0
%
5.0%
30.0
%
40.0
%
10.0
%
Economically inactive
ILO unemployed
Employed
Level 3 Proportion of populationLevel 4 and above
Level 2 Below level 2(including no qualifications)
17%
25%21%
36%
22%
24%20%
34%
20%
42%22%
16%
Fig. 15.2: Unemployment rate by qualification level (2000-2020) – EU27
Source: CEDEFOP881
6.0%
4.0%
10.0%
12.0%
8.0%
2.0%
0.0%
2000
2005
14.0%
16.0%20
10
2020
2015
Medium qualification High qualificationLow qualification All qualifications

Back to Contents
882 Skills at Work in Britain – First Findings from the Skills and Employment Survey 2012, Alan Felstead, Duncan Gallie, Francis Green and Hande Inanc, p1 883 The Supply and Demand for High-Level STEM Skills. UK Commission for Employment and Skills, 2013. 884 OECD Local Economic and Employment Development (LEED) Working Papers 2012/08, OECD, 2012, p11 885 UK Skills levels and international competitiveness, UKCES, November 2012, pvi 886 Talent 2020: Surveying the Talent Paradox from the Employee Perspective, Deloitte, September 2012, p1 887 Simply the Best? Highly-skilled migrants and the UK’s knowledge economy, The Work Foundation, June 2012, p25 888 An aspirational nation: creating a culture change in careers provision, National Careers Council, June 2013, p9 889 An aspirational nation: creating a culture change in careers provision, National Careers Council, June 2013, p9 890 Measuring National Well-being – Education and skills, Office of National Statistics, 5th July 2012, p21 891 Changing the pace, CBI and Pearson, June 2013, p6 892 Changing the pace, CBI and Pearson, June 2013, p20 893 Skills shortages in the STEM sector are discussed via two externally authored case studies in Section 16 by the CBI and EEF 894 Simply the Best? Highly-skilled migrants and the UK’s knowledge economy, The Work Foundation, June 2012, p27 895 For further details on migration occupations identified as having shortages please see Section 3.5.1
15.5 Changing qualification requirementsOver the last 25 years, the qualification requirements of jobs have risen. In 2012, the proportion of jobs requiring a degree hit an all-time high, while the proportion requiring no qualifications hit an all-time low.882 This state of affairs is highlighted by Figure 15.3. It shows that the proportion of jobs requiring a degree has been increasing steadily since 1986, while the proportion requiring no qualifications has been steadily decreasing. This means that in 2012, for the first time, the proportion of jobs requiring a degree overtook the proportion of jobs requiring no qualifications. This will help explain the different employment rates by skills level identified in Section 15.4.
The UK Government has identified that STEM skills are crucial to innovation and growth. These skills are found in numerous occupations across very diverse industries and are difficult to quantify. The latest UKCES report883 finds that, although there is currently no overall shortage of STEM skills in the workforce, certain sectors and regions suffer from skills “potholes” which hold back growth.
• Careers in science, technology, engineering and mathematics (STEM) are becoming increasingly difficult to move in and out of – the sector shows signs of impermeability.
• The report suggests that technology is accelerating so quickly that the skills of people working in the field swiftly atrophy if they change career or fail to find a relevant job soon after leaving education.
• There is still a major gender imbalance, particularly in engineering and IT – perception of careers in these industries are not matching the reality.
• Since the recession, 26% of core STEM vacancies have been hard for employers to fill, compared with 22% of vacancies overall.
• Vacancies more likely to be a problem in sectors where a high proportion of employment opportunities are STEM occupations.
• Unemployment – especially inactivity rates – of STEM degree holders is higher than in 2007 – this varies by subject area – eg it is higher in biological sciences and lower in engineering.
• Employers outside London find it hard to compete in graduate recruitment.
• Employers are concerned about recruitment difficulties as the economy picks up.
• Employers are very interested in increasing the use of apprenticeship schemes.
• Employers are responding to difficulties of recruiting by working existing employees harder.
Despite the skills shortages we will be discussing in the next section, the UK has actually been successful in reducing the proportion of workers who do not have an upper-secondary qualification. In 1997, two fifths (41%) of those aged 25-64 did not have an upper-secondary qualification. By 2010, this had declined to a quarter (25%) – below the OECD average of 26%.884 It should also be noted that in terms of gender, females are more likely to have a level 4+ qualification than males (34.8% compared with 32.5%).885
15.6 Skills shortagesDeloitte has identified what it calls “the talent paradox”. This is when there is high unemployment but employers still struggle to fill technical and skilled jobs.886 According to the Chartered Institute of Personnel and Development (CIPD) 2011 talent and resourcing survey,887 three quarters of UK companies experienced recruitment difficulties in the year to April 2011. These were primarily caused by a lack of technical or specialist skills in applicants. Separately, the National Careers Council reports888 that nearly half (46%) of Hard-to-Fill
Vacancies are the result of a low number of applicants with the right skills, and a further 13% are the result of applicants not having the right qualifications. Skills gaps have increased for mid-sized employers (25-199 staff) since 2009.889
As the Office for National Statistics (ONS) reports,890 almost 1.5 million employees (5% of all employees) are deemed to be “not fully proficient as they have a skills gap”. Among those deemed to have a skills gap are 101,000 people working in skilled trades occupations and 90,000 working in associate professional occupations.
Looking specifically at the STEM sector, the CBI reports that two fifths (39%) of companies that need employees with STEM skills have difficulties recruiting staff.891 It also reports that 29% of engineering companies are struggling to recruit technicians and 26% are struggling to recruit STEM graduates.892 893
Finally, it is worth considering the impact of migration. In 2008, 79,000 professionals and managers migrated to the UK. Of these, 13,000 were EU-born and 66,000 were non-EU born. At the same time, 39,000 UK-born professionals and managers migrated from the country, particularly to Australia.894 The coalition Government needs to ensure that in its immigration reforms, it still enables skilled workers who will enhance the UK economy to move to the UK.895
219 15.0 Skills Shortage Vacancies and employment projections Part 3 – Engineering in Employment
Fig. 15.3: Qualifications required (1986-2012)
Source: Skills at Work in Britain: First Findings from the Skills and Employment Survey 2012, Alan Felstead, Duncan Gallie, Francis Green and Hande Inanc, 2013, p3
5.0%
15.0%
10.0%
20.0%
30.0%
25.0%
40.0%
of jobs
35.0%
Degrees requiredNo qualifications required
0.0%
2012
1986
1992
1997
2001
2006

Back to Contents
896 Engineering UK 2013 The state of engineering, EngineeringUK, December 2012, p174 897 See Section 2 for more details on the current engineering workforce 898 This includes UK and international students graduating at foundation degree, HNC, HND, first degree, postgraduate and doctorate levels and completing a level 4+ apprenticeship. See tables 11.46, 11.43, 11.31, 11.32, 11.33, 12.0 and 10.7 and section 11.6.2 for further details. 898 In section 12 we showed that a proportion of graduates in computer science, mathematical sciences and physical sciences progress into engineering careers and so should be counted in the supply of potential future engineers 900 See table 10.7 for further details on the number of level 3 apprentices competing engineering-related apprenticeships 901 Occupation categories come from SOC2010
15.7 Workforce projections for engineering enterprises 2010-2020 In last year’s report,896 we showed that engineering companies are projected to see 2.74 million job openings across a diverse range of disciplines between 2010 and 2020. This represents 19.8% of all job openings across all industries by 2020 and is equivalent to 50% of the workforce897 who currently work in engineering enterprises (5.4 million). Of these 2.74 million jobs, 2.4 million will be to replace workers who are leaving the workforce, while the remaining 350,000 will be new jobs. Not everyone working in an engineering company is an engineer. Table 15.2 provides a breakdown of demand for labour across the major occupation groups identified in SOC2010, and by those selected sub-groups that we regard as the most likely to require engineering skills. This shows that by 2020 engineering companies will need to recruit 1.86 million workers who are likely to need engineering skills: pro rata, that’s 1.302 million over the next seven years (2013-2020).
Table 15.3 shows a simplified version of Table 15.2: major groups 1, 2 and 3 are grouped together (for those codes that are likely to require engineering skills) and the engineering-related codes in major group 5 are also grouped together. If we assume that the sub-groups that belong to major groups 1, 2 and 3 broadly relate to occupations that require a level 4+ qualification (HNC/D, foundation degree, undergraduate or postgraduate and equivalent), then it infers that there is a demand in engineering enterprises for 865,100 people with level 4+ qualifications over ten years. This gives an average demand of approximately 87,000 per year. It is heartening to see that this year’s supply of level 4+ graduates has risen substantially to 51,000 from 46,000 last year – this is mainly due to this year’s figures now containing the valid contribution, as identified by the HESA destinations data, from computer science, physical sciences and mathematical sciences graduates who enter engineering occupations.898 899
Similarly, if we assume that the sub-groups of major group 5 (skilled trades occupations) relate to those occupations that require at least a level 3 qualification, then we can expect demand for approximately 690,000 people qualified at level 3 over ten years. This gives an average demand of 69,000 people per year. In stark contrast to the positive growth in level 4+ graduates, the drop in the supply of level 3
apprentices to 23,500 from approximately 27,000 the previous year should set alarm bells ringing in the corridors of government and the Board rooms of Businesses.900
In Section 2, we showed that engineering enterprises in London had the highest level of employment of all the regions within England and the other home nations, followed by the
Part 3 – Engineering in Employment Skills Shortage Vacancies and employment projections 15.0 220
Table 15.2: Changing composition of employment, by occupation in the engineering sector (2010-2020) – UK901
Source: Working Futures 2010-2020
Major groupSelected sub-group (jobs likely to require engineering skills)
Net change by 2020 (in thousands)
Replacement demand
by 2020 (in thousands)
Total requirement by 2020 (in thousands)
1. Managers and senior officials 129.3 295.2 424.6
11 Corporate managers
and directors108.1 243.8 351.8
12 Other managers
and proprietors21.3 51.5 72.7
2. Professional occupations 166.9 424.0 590.9
21 Science, research, engineering and technology professionals
87.0 249.8 336.8
3. Associate professional and technical occupations
100.3 291.5 391.8
31 Science, engineering and
technology associate professionals
13.0 72.5 85.5
33 Protective service
occupations1.5 16.8 18.3
4. Administrative, clerical and secretarial occupations
-43.7 241.6 197.9
5. Skilled trades occupations 83.0 638.0 721.0
52 Skilled metal, electrical
and electronic trades-75.7 301.8 226.1
53 Skilled construction
and building trades194.7 262.5 457.2
54 Textiles, printing and
other skilled trades-43.5 52.0 8.5
6. Personal service occupations 12.4 22.7 35.1
7. Sales and customer service occupations
3.6 74.1 77.7
8. Transport and machine operatives
-111.0 278.9 167.9
81 Process, plant and
machine operatives-125.9 198.4 72.5
82 Transport and mobile
machine drivers and operatives
14.9 80.5 95.4
9. Elementary occupations 9.1 126.0 135.1
91 Elementary trades and
related occupations1 62 63
92 Elementary administration
and service occupations9 64 72
Total major group 350.0 2,391.9 2,742.0
Total selected sub-group 204.4 1,655.6 1,860.0

Back to Contents
221 15.0 Skills Shortage Vacancies and employment projections Part 3 – Engineering in Employment
902 The Business Case for Employer Investment in Young People, CIPD, May 2012, p5 903 Future skills supply and demand in Europe – Forecast 2012, CEDEFOP, 2012, p7
South East. Table 15.4 is structured to match the format of Section 2. It shows that although the South East was second in terms of employment in engineering enterprises, it was first in terms of the number of predicted job openings over the next ten years. In total, 13.6% of the 2010-2020 recruitment requirements are projected to be in engineering enterprises located in the South East. Engineering enterprises in London are set to have the second highest requirement, needing 344,800 new or replacement employees by 2020 (12.6% of the total).
Focusing on those occupations within engineering enterprises likely to require engineering skills, we can see that the highest demand will be in the South East, with 252,400 job openings – two thirds (67.7%) of the total requirement. This is followed by London with 206,100 job openings – only 59.8% of the total requirement. Overall, two thirds (67.8%) of all job openings in engineering companies are likely to require applicants to have engineering skills.
Projected demand for workers with engineering skills is strong in the other home nations. In Scotland, 66.6% of the total requirement is projected to come from jobs requiring engineering skills. Wales needs a higher proportion, at 73.3%, although the absolute number of workers required is lower. In Northern Ireland, 72.9% of total job openings are likely to require engineering skills.
Research by CIPD has shown that only a minority of companies (6%) anticipate their skills needs five years into the future.902 Given the large number of people with engineering skills who need to be recruited by engineering companies between 2010 and 2020, and the time required to train an engineer (including ensuring they study relevant courses at school to progress into engineering), this is a shortcoming that the engineering community needs to address.
15.7.1 Workforce projections in the EU 2010-2020
The European Union has conducted workforce projections for the EU from 2010-2020. It predicts that there will be 83 million job opportunities over this time period. Of these, 75 million jobs will be replacing workers who retire or leave the workforce. The remaining eight million jobs will be due to expansion.903 It predicts that most job openings will be in
services, with a significant number also in manufacturing. It also predicts that the trend towards more skill-intensive jobs will continue, with at least 80% of people requiring at least medium qualifications. Workforce expansion in the EU may inhibit the UK’s ability to recruit highly-skilled EU workers in the future, which again emphasises the importance of developing our own pipeline of talent sufficient to meet the demands of the engineering sector.
Table 15.3: Summary table – changing composition of employment, by occupation in the engineering sector (2010-2020) – UK
Source: Working Futures 2010-2020
Net change by 2020
(in thousands)
Replacement demand by 2020
(in thousands)
Replacement demand by 2020
(in thousands)
Selected jobs likely to require engineering skills
204.4 1,655.6 1,860.0
Jobs likely to require engineering qualifications at level 4+ (sub-codes: 11, 12, 21, 31, 32)
230.9 634.4 865.1
Jobs likely to require engineering qualifications at level 3 (sub codes: 52, 53, 54)
75.6 616.3 691.8
Table 15.4: Recruitment requirement, in engineering companies, by home nation and English region (2010-2020) – UK
Source: Working Futures 2010-2020
Home nation/English region
Total requirement in engineering
enterprises, 2010-2020
(in thousands)
Percentage of all requirement
Total requirement for jobs likely to require engineer
skills in engineering companies 2010-
2020 (in thousands)
Jobs likely to require engineer
skills as a percentage
of all jobs in the region
North East 107.2 3.9% 76.9 71.7%
North West 263.5 9.6% 187.1 71.0%
Yorkshire and The Humber 238.2 8.7% 152.3 63.9%
East Midlands 228.6 8.3% 158.4 69.3%
West Midlands 257.5 9.4% 179.0 69.5%
East 245.4 9.0% 172.0 70.1%
London 344.8 12.6% 206.1 59.8%
South East 372.8 13.6% 252.4 67.7%
South West 225.9 8.2% 156.6 69.3%
England 2,283.9 83.3% 1,540.8 67.5%
Wales 140.8 5.1% 103.2 73.3%
Scotland 240.7 8.8% 160.2 66.6%
Northern Ireland 76.5 2.8% 55.8 72.9%
Total 2,742.0 1,860.0 67.8%

Back to Contents
904 Changing the Pace: CBI/Pearson Education and Skills Survey 2013, CBI, June 2013 905 Jobs and growth: the importance of engineering skills to the UK economy, Final report, Royal academy of engineering, September 2012
Part 3 – Engineering in Employment Concerted employer action 16.0 222
Through externally-provided case studies and cameos, this section highlights the ways that employers and employer bodies are taking responsibility for delivering sustainable UK growth.
16.1 Meeting demand for STEM skillsAuthored by Grace Breen, Policy Advisor, CBI
Deploying science, technology, engineering and maths (STEM) skills effectively is vital to returning the UK economy to sustainable growth, and to improving its long-term performance. These skills underpin innovation and our ability to compete successfully in the high-value, high-growth sectors of the global economy.
The CBI/Pearson Education and Skills Survey 2013904 showed that demand for STEM skills at all levels remains high, and so does the number of employers who are facing difficulties in recruiting appropriately-skilled staff. While there are early indications that the proportion of businesses reporting problems in recruiting STEM-skilled employees may be falling, change is not happening fast enough. We need to raise the urgency of the debate in order to tackle STEM shortages.
Our survey gives clear messages and key priorities to employers around STEM skills:
• There is widespread demand for people with STEM skills.
• We need to raise the urgency of the debate to meet future demand.
• But it is not just an issue of under supply – businesses seek STEM candidates that are rounded, grounded and ready for work.
There is widespread demand for people with STEM skills. The CBI/Pearson Education and Skills Survey 2013 showed that demand for STEM skills at both graduate level and below remains high across the economy, but that demand continues to outstrip supply for individuals with these skills.905
Part 3 – Engineering in Employment16.0 Concerted employer action
“The time has come for concerted action to share the burden of adjustment and maximise the benefits that such action can produce.”
Josef Ackermann

Back to Contents
Almost two in five firms (39%) that require STEM-skilled employees report current difficulties in recruitment (Figure 16.0). Although the difficulty of recruiting is reducing gradually at all levels, improvement is not happening fast enough – despite STEM shortages being high on the agenda for both business and Government.
Employers also expect these difficulties to continue over the next three years (Figure 16.1). Two fifths (41%) of firms expect difficulties at some level over this time, with technicians and experienced STEM staff most commonly expected to be hard to recruit (20% and 17% respectively). These figures do show some improvement when compared with the expectations of employers in 2012. For example, the proportion of employers expecting difficulty in recruiting STEM-skilled graduates has fallen from 18% to 10%. But it is important to ensure that this trend continues.
The difficulties seen in recruiting STEM-skilled individuals vary by sector, and difficulties worryingly seem most intense in sectors that should be key drivers of the economic recovery (Table 16.0). In construction, only 8% of firms currently report difficulties in recruitment at technician level, but 35% of firms anticipate difficulties in the next three years as the sector begins sustained recovery.
Responses from firms in the engineering, high-tech/IT and science areas show the highest proportion of both current and future problems in recruiting STEM-skilled employees, with more than one in four reporting current challenges in recruiting technicians (29%) and STEM graduates (26%). These problems are expected to intensify in the coming three years (climbing to 39% for technicians and 32% for graduates). Difficulties are also expected in recruiting apprentices in the coming years as the economy strengthens, with nearly a third (30%) of firms in these sectors foreseeing problems.
223 16.0 Concerted employer action Part 3 – Engineering in Employment
Fig. 16.0: Current difficulties in recruiting individuals with STEM skills and knowledge
0.0%
10.0
%
35.0
%
50.0
%
25.0
%
40.0
%
5.0%
15.0
%
20.0
%
30.0
%
45.0
%
People to train asapprentices
Technician
Graduate
Post-graduate
Experienced
At somelevel
2012 2013
42%39%
23%22%
15%7%
17%12%
17%14%
13%12%
Fig. 16.1: Expected difficulties in next three years recruiting individuals with STEM skills and knowledge
0.0%
10.0
%
35.0
%
50.0
%
25.0
%
40.0
%
5.0%
15.0
%
20.0
%
30.0
%
45.0
%
People to train asapprentices
Technician
Graduate
Post-graduate
Experienced
At somelevel
2012 2013
45%41%
23%17%
14%12%
18%10%
19%20%
12%11%
Table 16.0: Difficulty recruiting individuals with STEM skills and knowledge by sector (%)
People to train as apprentices
Technician Graduate
Manufacturing – currently 17 24 17
– next three years 13 26 15
Construction – currently 19 8 12
– next three years 15 35 4
Engineering, hi-tech/IT & science – currently 15 29 26
– next three years 30 39 32

Back to Contents
906 School workforce in England: November 2012, Department for Education, April 2013 907 Initial teacher training census 2012, Teaching agency, 2012 908 Adult apprenticeships, National audit office, February 2012
We need to raise the urgency of the debate to meet future demand. Without sufficient levels of STEM-skilled individuals in the workforce, private sector growth in these key industries will falter, damaging the wider economic recovery. When asked to identify the most important areas for action to promote the study of STEM subjects (and so the supply of STEM-skilled employees for the future), respondents identified key roles for both businesses and the Government (Figure 16.2).
The highest priority is for businesses to engage more with schools to enthuse and inspire pupils about STEM study – a need cited by 55% of respondents. The ‘real world’ perspective that employers can bring to learning can help to open young peoples’ eyes to the practical value and creative scope of STEM subjects. And whilst some schemes do already exist, the level of business engagement in schools and colleges across the UK needs to increase.
In terms of priorities for Government, the employers we surveyed highlighted protected funding for STEM in Higher Education (52%), and recruiting and retaining more specialist teachers (50%). The problem of too few specialist STEM teachers in schools and colleges presents a large obstacle to tackling the STEM skills shortage: almost a quarter of those in secondary schools teaching maths (23%) and chemistry (24%), and a third
teaching physics (34%) have no qualification in the subject beyond A level.906 Success in promoting science and maths to young people, and encouraging continued STEM study, depends on high quality teaching delivered by subject specialists. While figures show that we are close to achieving targets for new specialist subject teachers, the challenge will be to maintain this in-flow in the years ahead.907
Also highlighted as a priority by 45% of employers is the need for more STEM apprenticeships, as apprenticeships in these sectors are an important means of addressing shortages of technicians. Engineering apprenticeships, however, accounted for only 2% of apprenticeship growth since 2006/07.908 Progress on this will rely partly on a renewed focus from the Government on high-quality, rigorous vocational education.
We know that students and their parents are starting to think about choices at 18 in a more career-focused way. In combination with business’ concerns about future talent pipelines, we’re seeing a strong driver for developing collaborative models of higher skills delivery with clear job outcomes including apprenticeships, sandwich and part-time courses. The CBI is publishing a report looking at this issue that will focus on how businesses and universities can work together to establish sustainable paths to higher skills for a larger number of people.
But it is not just an issue of undersupply – businesses seek STEM candidates that are rounded, grounded and ready for work. When asked about the barriers they face in filling jobs that require STEM-linked skills and qualifications, employers point to a range of concerns (Figure 16.3). The two biggest barriers faced by employers are weaknesses in attitudes and aptitudes to work (45%) and a lack of general workplace experience among applicants (39%). These findings highlight the wider need for all young people to develop awareness and understanding of the demands of the workplace in the sector in which they aim to work in the future, and to gain some relevant work experience to better prepare them for success.
There are also worries that the content of qualifications held by applicants to STEM roles are too often insufficiently relevant to genuine business needs. Nearly a third (30%) of those businesses facing STEM recruitment difficulties reported this as a concern, highlighting the need for employers and education and training providers to work together to ensure that programmes of study reflect workplace developments and technological advances in manufacturing and science-based industries.
Part 3 – Engineering in Employment Concerted employer action 16.0 224
Fig. 16.2: Priority action to promote STEM study
60.0
%
40.0
%
30.0
%
20.0
%
10.0
%
0.0%
50.0
%Government should recruit and retain more specialist teachers
More STEM apprenticeships
Businesses should provide more high-quality work placements
Employees should be encouraged to become STEM ambassadors
Businesses should provide financial incentives
Other
Closer working between businesses/universities to develop business-relevant STEM courses
Businesses should engage with schools to enthuse pupils about STEM study
Government should protect funding for STEM in higher education
55%
50%
45%
52%
50%
37%
27%
14%
6%

Back to Contents
909 Invest for Growth: Encouraging more globally focused companies to expand in the UK, EEF, the manufacturers’ organisation, 2012 910 Ibid 911 Skills for Growth: A more productive and flexible workforce, EEF, the manufacturers’ organisation, 2012
225 16.0 Concerted employer action Part 3 – Engineering in Employment
16.2 Manufacturers reap returns by investing in skillsAuthored by Tim Thomas, Head of Employment and Skills, EEF, the manufacturers’ organisation
Having the right people with the right skills is crucial to any successful business, and particularly to UK manufacturers who often compete in global markers on their ability to innovate and respond quickly to customer demand. EEF research909 has shown that manufacturers’ strategies are driven by the need to develop new markets, launch new products and services and introduce new processes – actions vital to competing successfully worldwide.
These strategies are driving manufacturers’ investment plans – with a core focus on skills. EEF’s Invest for Growth report revealed that 68% of companies made significant investments in
staff training and skills development in the past three years.910 This investment in skills tops investment in other areas such as product design and development, R&D and branding.
So investing in skills is crucial if manufacturers are to achieve their growth ambitions. But is there a simpler answer to why so many companies are investing in their workforces now? The answer is yes – to increase productivity and improve efficiency.
“Our apprentices are the guarantee for a successful future of our business. Since the introduction of our scheme, our productivity and therefore competitiveness has improved significantly.”
Ralph Saelzer, Managing Director, Liebherr Sunderland Works Ltd
Over a quarter of manufacturers explicitly told us that they offer training in order to increase productivity. It is unsurprising then that six in ten manufacturers expect their training budgets to
increase in the next two years, as the need to invest in their workforce heightens.911
Moreover, with a growing emphasis on research and development, more sophisticated products, and a relentless focus on improving processes, manufacturers recognise the need to bring high-level skills into their workforces – and need increased investment in order to do this. Acquisition of high-level skills is crucial if UK manufacturing is to compete internationally on cost, quality and productivity.
Our Skills for Growth report showed that seven in ten manufacturers surveyed bring new skills into their workforce via apprenticeships. Of those companies currently offering apprenticeships, two-thirds report increased productivity in the past two years following their completion. This demonstrates the positive impact major investment in apprenticeships has on a business.
Fig. 16.3: Barriers to recruiting STEM-skilled staff
50.0
%
35.0
%
20.0
%
15.0
%
10.0
%
5.0%
0.0%
25.0
%
30.0
%
45.0
%
40.0
%
Lack of appropriate attitude and aptitudes for working life
Shortage of STEM graduates
Content of qualification(s) not relevant to business needs
Lack of applications
Lack of practical experience/lab skills
Other
Quality of STEM graduates
45%
35%
30%
30%
28%
22%
4%

Back to Contents
Part 3 – Engineering in Employment Concerted employer action 16.0 226
Fig. 16.4: New strategies planned by manufacturers, % of companies reporting planned action in year ahead
Source: EEF/GfK NOP Investment Survey 2012
70.0
%
40.0
%
30.0
%
20.0
%
10.0
%
0.0%
60.0
%
50.0
%
Launching a new product in your current sector
Introducing new manufacturing processes
Entering a new export market
Developing new services
Starting to export products
Setting up manufacturing operations in a new market
Selling your services into new markets
Supplying a new customer in a new sector
Figure 16.5: Investment in skills is prioritised by manufacturers, % of companies making a significant investment in areas in past three years
Source: EEF/GfK NOP Investment Survey 2012
80.0
%
20.0
%
0.0%
40.0
%
60.0
%
Building relationships
Organisational change
Research and development
Branding
Buildings
Purchasing a trademark or patent
Marketing
Staff training and skills development
Product design and development
Figure 16.6: Manufacturers are offering training to increase productivity, % of companies saying reasons for offering training
Source: EEF Skills Survey 2012
60.0
%
30.0
%
20.0
%
10.0
%
0.0%
50.0
%
40.0
%
Address skills gaps
Increase productivity
Introduce new processes
Introduce technological developments
Introduce new products
Increase capacity
Employee engagement
Increase flexibility
Succession planning

Back to Contents
912 Apprentice Pay Survey, Department for Business, Innovation and Skills, 2011 913 Industry Strategic Business Plan January 2013
227 16.0 Concerted employer action Part 3 – Engineering in Employment
“Our apprentices are an invaluable asset to our company’s long term prosperity, ensuring both continuity and progression in the transfer of skill and knowledge.”
Craig Naylor, MD, NTR Limited
Furthermore, a report by the Centre for Economics and Business Research found that in 2012, gaining an apprenticeship raised an employee’s gross productivity by £214 per week on average. This increased significantly to £414 for apprenticeships in engineering and manufacturing. Some of the productivity gains are passed onto workers, in the form of higher wages. The average wage for an engineering apprentice is £6.23 – far higher than the minimum rate of £2.65 per hour.912 The remainder of this productivity then goes to employers as increased profits or is passed onto customers as lower prices or better products.
The business case for investing in skills in order to increase productivity and efficiency can then be told, in part, in numbers. But a more insightful view of how investing in skills can improve productivity comes straight from the companies investing in their workforces.
Manufacturers then need the right skills to succeed in a highly competitive global market place, where their competitors are increasingly up-skilling their own workforces, and may also have the benefit of lower production costs. Investment in skills is comparable and complementary to other forms of investment, and seen as vital if gains in competitiveness from capital investment are be realised. Productivity gains increasingly rest upon an agile workforce, where technicians and engineers are able – with a blend of qualifications and experience – to apply their skills to new, emerging and developing technologies, products and processes. This enables UK manufacturers to export, innovate and reinvest in the skills they will need tomorrow.
“We have recruited five apprentices within the last eighteen months, representing 17% of our total workforce of twenty-nine, and we see them as a core part of our company growth strategy.”
Andrew Esson, MD, Quick Hydraulics Ltd
16.3 Keeping the UK rail industry on trackAuthored by Elaine Clark, Head of Business Services, National Skills Academy for Railway Engineering
The challenge
The UK rail industry is currently benefitting from an ambitious programme of investment with exciting plans reaching well into the next decade. These include £11 billion of mainline network improvements,913 continued investment by Transport for London (TfL) in the London Underground, the completion of Crossrail, the start of HS2, and new rolling stock for the Intercity Express Programme (IEP) together with Thameslink and Crossrail. Anecdotal evidence suggested that in some disciplines there was likely to be a gap in the skills required to implement this investment. It was therefore vital that the industry gained an understanding of the volumes and types of skills required to deliver the planned investment safely and efficiently. Such an understanding was also important to ensure sustainability and, in an increasingly competitive global market, to ensure that organisations were able to capitalise on potential growth opportunities at home and abroad.
The challenge faced by the National Skills Academy for Railway Engineering (NSARE) was to develop a long-term skills forecasting model for the UK railway engineering sector that would enable us to predict the number of people and skills needed to meet the planned workload. This required engaging with employers to access existing workforce data – age demographics, skills disciplines, skills levels and geographical distribution – along with detailed information about future infrastructure projects, maintenance workloads and rolling stock procurement and refurbishment.
Case study: surgical innovations
Surgical Innovations specialises in the design and manufacturer of innovative devices for use in minimally-invasive (MIS) or keyhole surgery. The skills required by the company are extremely niche, so the business needs to ‘grow its own’ talent. Apprenticeships, lasting four years, play a major role in this.
The apprenticeships are structured so that apprentices spend their first year in college learning the core skills. As the apprentice progresses and the basic skills are acquired, the company then brings the training in-house. This is necessary because the business uses
specialist machines that are not available to train on at local colleges. By the third year, the apprentice becomes specialised and has a core function within the business. The apprentices play a key role in the organisation.
HR Manager Jennie Jones, said: “Nurturing young talent is a key priority for us and we run a proactive apprenticeship scheme across the organisation. Each year we will be increasing the number of apprentices we employ as we play our part in helping to combat the skills shortage throughout the manufacturing industry.”

Back to Contents
Part 3 – Engineering in Employment Concerted employer action 16.0 228
The approach
NSARE approached over 100 major employers in the railway engineering sector for information about their existing workforce. A standard template was provided for data returns. However, it was stressed to employers that if they could not provide all the information (eg gender, or geographical location) that had been asked for, then they should provide as much as possible. A dedicated resource was provided to work with employers to answer any questions, reassure them about confidentiality, clarify any data queries and in some cases work with them to extract the data from their systems. As a result of this support, NSARE was able to secure over 44,000 sets of ‘people data’. This sample provided its own challenges in terms of checking, filtering out non-engineering roles and attempting to ‘standardise’ the returns to ensure that a consistent approach to skill level assessment had been adopted. An employer workshop was held to assist with this process.
Alongside this data collection, further conversations were held with the railway infrastructure owners to understand current and future investment project plans. All known projects were aggregated into a single industry programme – the first time this had been attempted. This included numerous Network Rail and TfL programmes, several light rail/tram
extension projects, Crossrail and HS2. Estimates were also made of likely rolling stock orders and refurbishments. In total, more than 200 specific projects were identified with a combined value of around £25 billion planned railway engineering-related expenditure during the next regulatory investment cycle, known as Control Period 5. (As a regulated industry, the mainline railway operates within five-yearly investment cycles, with the planned work and funds to deliver this being agreed with the regulator. The next regulatory period, known as Control Period 5, will run from April 2014 to March 2019.)
Figure 16.7 breaks down expenditure based on the major activity areas within railway engineering: track, signalling/telecommunications (S&T), electrification/plant (E&P), and traction and rolling stock (T&RS).
Modelling the workforce
Based on the data received and from analysis of other existing databases, the current overall size and make-up of the workforce was extrapolated. This is shown in Table 16.1 and equates to some 100,000 individuals. The analysis indicates that only around 4.4% of the engineering workforce is female, meaning the industry is missing out on significant talent.
Table 16.1: Railway engineering workforce numbers
A skills forecasting model was developed capable of predicting retirements from the existing workforce, whilst allowing for natural attrition and changes in annual maintenance workloads. A key point that emerged from this was that the traction and rolling stock sector age profile was particularly high, with some 20% of the workforce over the age of 55. This can be seen in Figure 16.8. The model was further developed to analyse each future project by activity – eg track, S&T, E&P or T&RS – and calculate the numbers of people required to deliver these and their skill level. The model was then able to aggregate the overall need to predict the future workforce numbers and identify the ‘gaps’ and recruitment required.
Before officially publishing the results of the exercise, we made numerous presentations and held meetings with senior industry representatives to verify the assumptions in the model and ‘common-sense’ the outputs.
Figure 16.7: Future programme spend by client
Light Rail3%
TfL/Crossrail20%
NetworkRail77%
Light Rail7%
TfL/Crossrail39%
NetworkRail54%
LightRail6%
TfL/Crossrail15%
NetworkRail79%
Light Rail4%
TfL/Crossrail49%DfT/
RoSCOs45%
Network Rail2%
Track spend by client (CP5 only) £6.2bn S&T spend by client (CP5 only) £4.8bn
E&P spend by client (CP5 only) £4.3bn T&RS spend by client (CP5 only) £9.3bn
Type of activity Number of people %
Track 55,500
Signalling and Telecommunications
12,000
Electrification and Plant 3,500
Other Non-Specific 15,500
Total Infrastructure 86,500
Traction and Rolling Stock 13,500
Total 100,000
% Female 4.4%

Back to Contents
914 Rail Technical Strategy December 2012 available at http://www.futurerailway.org/RTS/Pages/Intro.aspx
Fig.16.9: Recruitment: numbers by discipline – Next 5 years
Outcome and next steps
The outputs from the modelling highlight the need for the industry to recruit around 10,000 new people over the next five years. Around 40% of these will replace people retiring. The remainder will be due to the increase in the absolute numbers of people needed in certain parts of the workforce to cope with growth arising from planned investment. As a result of the study, the industry now has a much better understanding of the scale of the challenge in different parts of the workforce. The greatest challenges are in E&P and T&RS, where the numbers shown in Figure 16.9 equate to roughly a third of the existing workforce.
The work has generated significant interest and discussion about what actions are needed – both at industry and company level – to address the potential gaps, and strategies are now being developed to address the issues. In some areas, the forecasting has led to further work to understand specific gaps in more detail – at job role or specific competence level. The intention is to refresh the forecasting model during the second half of 2013, as well as carry out further work to look at longer term skills needs – especially those associated with the introduction of new technology as part of delivering the Rail Technical Strategy.914 Work is already underway to look at the impact of the introduction of the European Rail Traffic Management System (ERTMS) – often referred to as in-cab signalling – since this will have implications for many jobs, from designers, installers and maintainers of equipment, to drivers, signallers and those building and maintaining trains.
229 16.0 Concerted employer action Part 3 – Engineering in Employment
Fig.16.8: Workforce age profile
10,0
00
9,50
0
9,00
0
1,00
0
500
2,00
0
1,50
0
3,50
0
3,00
0
2,50
0
4,50
0
4,00
0
5,50
0
5,00
0
6,50
0
6,00
0
7,50
0
7,00
0
8,50
0
8,00
00
Electrification and plant
Track
Signalling and telecommunicationsTraction and rolling stock
50-54
40-44
35-39
30-34
25-29
< 25
45-49
60+
55-59
1,00
0
500
2,00
0
1,50
0
3,50
0
3,00
0
2,50
0
4,50
0
4,00
0
5,00
00
Artisan (retirement age 65) 5,210
Artisan (retirement age 60) 6,820 Technician/engineer (retirement age 60) 3,100
Technician/engineer (retirement age 65) 2,400
Track
Signalling and telecommunications
Electrification and plant
Traction and rolling stock

Back to Contents
915 UK Standard for Professional Engineering Competence (UK-SPEC) www.engc.org.uk/ukspec 916 www.engc.org.uk/institutions 917 The equivalent academic standards in the Scottish Credit and Curriculum Framework are 11, 9 and 6 respectively. 918 www.engc.org.uk/icttech 919 Estimate based on LFS data
16.4 Recognising professional excellence in engineeringAuthored by Jon Prichard, CEO, Engineering Council
Regulation of the engineering profession
There are many forms of regulation within the UK, from statutory regulation that imposes legal restrictions and requirements, through to self-regulation based on voluntary codes and practices. Statutory regulation should only exist where there is a legitimate public interest and the UK generally prefers professions to be self-regulating. There is therefore no statutory requirement for engineers or technicians to be registered (although there are isolated areas of practice, including dams and reservoirs, aircraft maintenance and gas appliance installation and maintenance, where public registers are maintained).
The Government does, however, recognise the need for self-regulation and accordingly awards Royal Charters to professional bodies. This encourages the attainment of professional standards and the adoption of codes of conduct, which in turn provides a benefit to the public.
Professional registration
The Engineering Council is the chartered body that sets the collective standards915 for registration of competent engineers and engineering technicians on behalf of the professional engineering community. It maintains a register of all those who meet or exceed these standards and keeps the standards under review to ensure that they meet the needs of both business and society at large.
The process of assessment is undertaken by professional engineering institutions and societies licensed for that purpose by the Engineering Council. There are currently 36 of these.916 The Engineering Council regularly reviews these licences and also works within international protocols to ensure that registered engineers and technicians meet internationally-agreed standards for practice.
The categories of registration set out in UK-SPEC are:
• Engineering Technician (EngTech), which requires evidence of competence, including academic knowledge and understanding at or above level 3917
• Incorporated Engineer (IEng), which requires evidence of competence in practice including academic knowledge and understanding at or above level 6 of the National Qualifications Framework, or at Bachelors level
• Chartered Engineer (CEng), which requires evidence of competence, including academic knowledge and understanding at or above level 7 of the National Qualifications Framework, or at Masters level
In addition, the Engineering Council operates the register for those that meet the ICT Technician (ICTTech) standard,918 which is broadly equivalent to that of Engineering Technician.
Candidates for all four registers must, in addition to demonstrating their competence to practise in accordance with the relevant standard, also demonstrate that they are committed to maintaining their competence and to acting in a professional and socially-responsible manner.
The number of professionally-registered engineers
The number of professional engineers in the UK economy is estimated at up to 750,000.919 Approximately 180,000 are currently registered with the Engineering Council as Chartered Engineers and 33,500 as Incorporated Engineers. The overall number of registered Engineers continues to decline since its peak in the 1980s (Figure 16.10). This is not unexpected when we study the registrants’ age profile and make allowances for age of retirement (Figure 16.11). However, the rate of new registrations has steadily increased over the last few years (Figure 16.12), which is a positive sign. It indicates that more graduates are being retained within the profession and more are being encouraged to become professionally-registered.
The number of professionally-registered technicians (Figure 16.13) is significantly below the number of potential technicians to be found in the UK workplace. A major initiative from members of professional bodies and funded by the Gatsby Charitable Foundation is currently underway to address this. (See Section 10.6 for more information on registered Technicians.)
Part 3 – Engineering in Employment Concerted employer action 16.0 230
Fig.16.10: Total number of registered Incorporated Engineers and Chartered Engineers (1986-2012)
Source: Engineering Council Annual Registration Statistics 2012
100,000
50,000
150,000
200,000
CEng IEng
1991
1994
2002
2006
2010
0
1987
1988
1990
1992
1993
1995
1996
1997
1998
1999
2000
2001
2003
2004
2005
2007
2008
2009
2011
2012
1986
1989
250,000

Back to Contents
231 16.0 Concerted employer action Part 3 – Engineering in Employment
Fig.16.11: Age distribution of Engineering Technicians, Incorporated Engineers and Chartered Engineers
Source: Engineering Council Annual Registration Statistics 2012
1,500
1,000
2,500
3,000
2,000
500
IEng EngTechCEng
0
6525 3020 35 40 45 50 55 60
3,500
4,000
4,500
5,000
70 75 80 85 90 95 100
Fig.16.12: Newly registered Engineering Technicians, Incorporated Engineers and Chartered Engineers (2002-2012)
Source: Engineering Council Annual Registration Statistics 2012
IEng EngTechCEng
3,000
2,000
7,000
6,000
5,000
4,000
1,000
0
2011
2003
2004
2002
2005
2006
2007
2008
2009
2010
2012

Back to Contents
Professionally registered female engineers and technicians
Although females currently only represent 4.16% of those on the register, their total numbers continue to rise steadily (Figures 16.14 and 16.15).
Part 3 – Engineering in Employment Concerted employer action 16.0 232
Fig.16.14: Total number of female Chartered Engineer registrants (2002-2012)
Source: Engineering Council Annual Registration Statistics 2012
5,000
3,000
3,000
9,000
8,000
7,000
6,000
2,000
1,000
0
2011
2003
2004
2002
2005
2006
2007
2008
2009
2010
2012
Fig.16.13: Total number of Engineering Technicians (2002–2012)
Source: Engineering Council Annual Registration Statistics 2012
13,000
12,500
14,500
14,000
13,500
12,000
11,500
2011
2003
2004
2002
2005
2006
2007
2008
2009
2010
2012

Back to Contents
233 16.0 Concerted employer action Part 3 – Engineering in Employment
International comparison of professional engineer and technologist registration
Engineering is a highly mobile profession. So the Engineering Council works closely with similar organisations around the world to ensure that UK standards are globally recognised and to facilitate the international mobility of engineering professionals. Table 16.2 shows a comparison of professionally-registered engineers in some partner countries. It should be noted that Canada is the only country to have statutory regulation.
Fig.16.15: Total number of female Engineering Technicians and Incorporated Engineer registrants (2002-2012)
Source: Engineering Council Annual Registration Statistics 2012
IEng EngTech
500
400
300
200
100
0
2011
2003
2004
2002
2005
2006
2007
2008
2009
2010
2012
Table 16.2: International comparison of professional engineer and technologist registration
Source: Engineering Council August 2013 *data not available
Engineering Council
Engineers Ireland
Engineering Council South
Africa
Institution of Professional
Engineers New Zealand
Hong Kong Institution of
Engineers
Engineers Australia
Engineers Canada
Chinese Institute of Engineers
Taiwan
Total population (‘000s) 63,181 4,576 52,800 4,400 7,174 23,100 33,480 23,000
CEng/Professional Engineers (total in professional membership/registered)
176,479 6,934 15,826 6,000 14,157 58094 260,561 24,856
IEng/Technologists (total in professional membership/registered)
31,443 163 4,593 200 1,230 1,074 65,000 3,369,240
Technicians (total in professional membership/registered)
14,447 30 4,207 300 0 * * 0
CEng/Professional Engineers per 1000 population
2.79 1.51 3.33 1.36 1.97 2.51 7.78 1.08
Ratio
Engineer:Technologist
Engineer:Technician
Technologist:Technician
5.6:1
12.2:1
2.2:1
42.5:1
231:1
5.4:1
3.4:1
3.7:1
1.09:1
30:1
20:1
0.66:1
12:1
-
-
54:1
-
-
4:1
-
-
1:135
-
-

Back to Contents
920 “Employer engagement in British secondary education: wage earning outcomes experienced by young adults”, Anthony Mann and Christian Percy, Journal of Education and Work, 2013 921 Study on the impact of Non-Formal Education in youth organisations on young people’s employability, commissioned by the European Youth Forum, authored by Bath University/GHK Consulting, December 2012, p11 922 Scaling the youth employment challenge, UKCES, March 2013 923 “Employer Perspectives Survey 2012”, UKCES, http://www.ukces.org.uk/publications/er64-uk-employer-perspectives-survey-2012 data tables can be found here http://www.ukces.org.uk/ourwork/employer-surveys 924 Scaling the youth employment challenge, UKCES, March 2013, p19 925 http://www.engineeringuk.com/View/?con_id=258
Part 3 – Engineering in Employment Concerted employer action 16.0 234
16.5 The employer activistsSeveral previous editions of Engineering UK have stated that it will be the engineering employers themselves who will make the most significant, contribution to UK economic growth and indeed their own success. This observation remains true and deserves restating.
Evidence shows that employers who work directly with schools and colleges can make a demonstrable difference to young people.
For example, over the last decade, employer engagement has become commonplace in the educational experiences of British secondary school pupils. Since 2004, in each of the devolved education systems of England, Scotland and Wales, governments have legislated and devoted public funding to ensure that young people have access to a wide range of opportunities to interact with employers as part of their educational experience. Interactions have taken a range of forms, including short work experience placements (typically undertaken at age 15), workplace visits, careers advice, and business mentoring and enterprise education.
The relationship between the number of times 14- to 19-year-olds recalled having contact with employers during their education and their reported annual wage was analysed, with controls for gender, ethnicity, age at time of survey, location in the country, type of school attended and highest level of qualification achieved.920 The analysis found that the average correlation between each additional employer contact and earnings was between £500 and £1,300. With median earnings of £19,500, this reflects a typical 4.5% increase between each additional school-mediated employer contact.
However, comparing the US and UK studies showed that any link between school-mediated employer contact and eventual wages was likely to be driven by increased ‘social capital’ (better access to relevant, trustworthy information) and social network development than by the development of either technical or ‘employability’ skills.
The importance of increasing social capital has been reinforced by research commissioned by the European Youth Forum921 which states:
“Involvement with youth organisations helped a large proportion of our sample of young people to develop networks and connections (social capital) that can aid in obtaining information about employment opportunities as well as in securing employment.”
Despite this evidence, the messages still need to get through to many employers. A report922
undertaken by the UK Commission for Education and Skills (UKCES) investigated the extent to which UK employers were engaging in youth policy activities, including opening up recruitment practices and offering work experience or apprenticeships.
The report looked at some of the barriers to making these activities more widespread.923 It showed that, despite the fact that experience is overwhelmingly what employers value the most when recruiting young people, only a quarter of them actually offered young people the chance to gain work experience.
The main conclusions924 from this research that employers should note, were that:
• Employers in predominantly high skill occupations that are set to grow need to broaden their recruitment out to include more young people.
• Recruitment needs to be much more open and much less about ‘who you know’.
• Work experience needs to become much more widespread and be seen by employers as a key part of their recruitment strategies.
• Apprenticeships are a key part of the solution – there is significant potential demand among employers that the system needs to respond to maximise this potential.
Highlighting how proactive many enlightened employers have indeed been in determining their destinies, Figure 16.16 provides several brief cameos from companies who belong to our high-level Business and Industry Panel.925 They describe responses to the question, “Over the past two years, what steps has your company made in order to improve workforce skills and increase productivity?”

Back to Contents
235 16.0 Concerted employer action Part 3 – Engineering in Employment
Alstom is an international energy and rail engineering company, with over 6,500 employees in the UK and growing rapidly. Alstom builds the world’s fastest train and our technologies generate 50% of the UK’s electricity. This year, we are recruiting for 600 new engineers to deliver projects for customers including EDF, National Grid, London Underground and Crossrail in a range of diverse roles in power generation, electrical transmission and rail transportation. We work closely with colleges, universities and local communities to support the development of the UK’s next generation of engineers and have an active national recruitment programme at graduate and apprentice levels.
Atkins is one of the world’s leading design, engineering and project management consultancies. People are our greatest asset and in order for them to continue delivering brilliant things for clients it’s vital we invest in their skills. In a multidisciplinary business flexibility and mobility is important. Through the Atkins Training Academy we offer skills conversion programmes to allow engineers to retrain in different disciplines. To complement this we have a number of partnerships with universities offering specific MScs and post-graduate courses to boost their skills and our technical networks allow best practice to be shared and applied across all employees.
Employee-owned CH2M HILL is one of the world’s leading engineering and programme management companies serving Government, civil, industrial and energy clients. We employ 30,000 people across the world and over 3,300 people in the UK. In 2010, responding to the lack of structured alternatives to a traditional graduate career path in engineering, CH2M HILL established an engineering apprenticeship scheme in the UK and in 2012, we recruited 20 graduates and 10 apprentices. This year, as part of our £65 million investment in the UK, we will be creating 40 graduate level positions, as well as offering 30 apprenticeships and 30 paid internships.
Crossrail, Europe’s largest construction project, pro-actively ensures that it is able to meet its developing technical skills requirements. A prime example of this is the Tunnelling and Underground Construction Academy (TUCA) in Ilford, established specifically to improve skills within the tunnelling industry. Working in partnership with the National Construction College (NCC), an apprenticeship has been set up for skilled spray concrete operators. Using robotic simulators apprentices, and ultimately contractors, benefit from having highly skilled construction operatives. Additionally, TUCA also offers courses to improve contractor workforce skills and meet best health and safety practice for those working underground, constructing tunnels.
E.ON is one of the UK’s leading power and gas companies – generating electricity, retailing power and gas, developing renewable technologies and undertaking gas and oil exploration and production. We supply power and gas to around five million customers and employ around 12,000 people. The energy sector faces great challenges to ensure we have the engineering talent to support our drive to help mitigate the effects of climate change when we heat and light our homes. We believe collaboration is key and are actively working with the National Skills Academy for Power (NSAP) and EngineeringUK in order to address the UK’s industry-wide skills challenges.
Since 1946 Heathrow has been connecting people from around the globe, making us the world’s busiest international airport. In recent years, since 2003, £11bn has been invested in improving Heathrow. Over the past year Heathrow’s One Engineering Team has undertaken a major review of its workforce skills. A bespoke Competency and Training Analysis has been developed to assess the knowledge, skills and competence of all 500 technical staff which has enabled us to understand the high value skills that the workforce should retain and attain to deliver best value. We invest significantly in our engineering training and development and have an exceptional retention rate as a result with less than 2% turnover.
Jaguar Land Rover is the largest automotive business in the UK. To continue to meet the requirements of our global customers, we have invested significantly in innovative skills development programmes. Partnering with some of the leading Engineering Universities in the UK we have proactively pioneered Bachelors and Masters degree level modular programmes to up-skill experienced and early career engineers and technicians. We have introduced a six year Higher Apprenticeship programme broadening the talent within the business and championed the creation of a new UTC academy to nurture the diverse talent for the future.
Fig. 16.16: Over the past two years, what steps has your company made in order to improve workforce skills and increase productivity?

Back to Contents
Part 3 – Engineering in Employment Concerted employer action 16.0 236
National Grid is an international electricity and gas company and to maintain our prominence we seek to ensure a pipeline of new talent into our business through our ‘grow our own’ strategy. This starts with engagement with primary school pupils and goes through to our engineering Apprenticeships and Graduate programmes. Across this spectrum, we provide: careers information as well as scholarships and bursaries to organisations supporting engineering; work experience for secondary school children; events that provide insights to science and engineering and a number of sponsorships and activities that help people with their career choices and routes to employment.
Network rail runs, maintains and develops Britain’s national railway track, signalling, bridges, tunnels, level crossings, viaducts and 17 of the biggest stations. To help deliver 1.3 billion passenger journeys and move 100 million tonnes of freight every year, we have recruited around 400 apprentices and 100 graduates in engineering who receive first class training and development. We also support many more onto HNC, FD and BEng courses and have continuous professional development for all our people. We recognise that a highly skilled workforce will help us meet the huge challenges ahead of maintaining and building the railway of the future, one that balances the need for increased capacity with improved performance and safety.
Rolls-Royce is a global company, providing integrated power solutions for customers in civil and defence aerospace, marine and energy markets. “Trusted to Deliver Excellence,” we invest heavily in our people. Graduate and internship schemes are externally accredited and can be individually tailored resulting in high retention levels. We encourage women into engineering and see increased numbers on our schemes. Ofsted graded our Young, Advanced and Higher Apprentice programmes as “outstanding”. Our Apprentice Academy has supported a fivefold increase in apprentices for our supply chains and other local engineering companies. All Engineering employees are developed through a network of Skill Owners spanning our business keeping them at the leading edge of delivering excellence to customers.
Selex ES is an international leader in electronic and information technologies for defence systems, aerospace, data, infrastructures, land security and protection and sustainable ’smart’ solutions and understands the future of its high-tech business rests in the hands of the next generation of engineers. We recognise that our future and our ability to develop cutting-edge technology flows from the innovation and pioneering spirit of a highly competent workforce, this is why we invest heavily in education and continuously develop all our 4,700 employees in the UK.
Transport for London is London’s strategic transport authority and is responsible for 27 million journeys a day. To keep London moving we employ 27,000 people and support 59,000 jobs across the UK through our supply chain. Since 2010, alongside 200 graduate roles we have created over 3,500 apprenticeships both directly and through our supply chain utilising our award winning procurement approach. We are currently undertaking a multi-billion pound transport investment programme and are committed to the development of a highly skilled workforce, this includes being a sponsor for the new Royal Greenwich University Technical College thereby inspiring future employees in engineering.
United Utilities provides water and sewage services to around seven million people and 200,000 businesses in North West England. We’re dedicated to spending £3.5 billion to make our network more resilient to the effects of climate change, drought and improving drinking water quality. We’re a highly technical business committed to strengthening our capability and service quality through our engineering and technical graduate schemes and an apprentice programme. A review of our technical training, aimed at improving the skills of our field teams, led to the creation of a new technical training centre which will help us develop colleagues in the business and enable us to deliver bespoke and continually evolving quality training in a practical environment.

Back to Contents
237 Annex
The annex is a standalone, web-based document. By making the annex a standalone document, we are able to include more detailed information and will also be able to update it if required during the course of the year.
The annex can be accessed at: http://www.engineeringuk.com/_resources/documents/EngineeringUK_Report_2014_Annex.pdf
Annex

We gratefully acknowledge contributions and support from…
This Report is printed using an environmentally friendly ECF Paper stock, certified FSC, with a high content of recycled material and is chlorine and acid free.
EngineeringUK EngineeringUK is an independent organisation that promotes the vital contribution of engineers, engineering and technology in our society. EngineeringUK partners business and industry, Government and the wider science and engineering community: producing and sharing evidence on the state of engineering, inspiring young people to choose a career in engineering and matching employers’ demand for skills. EngineeringUK leads two programmes: The Big Bang and Tomorrow’s Engineers.
For more information about EngineeringUK please visit
www.EngineeringUK.com @_EngineeringUK

Engineering UK 2014 is produced with the support of the members and fellows of the following Professional Engineering Institutions: BCS The Chartered Institute for ITBritish Institute of Non-Destructive TestingChartered Institute of Plumbing & Heating EngineeringChartered Institution of Water & Environmental ManagementEnergy InstituteEngineering CouncilInstitute of AcousticsInstitute of Cast Metals EngineersInstitute of Highway EngineersInstitute of Marine Engineering, Science and TechnologyInstitute of Materials, Minerals & MiningInstitute of Measurement & ControlInstitute of PhysicsInstitute of Physics & Engineering In MedicineInstitute of WaterInstitution of Agricultural EngineersInstitution of Chemical EngineersInstitution of Civil EngineersInstitution of Diesel and Gas Turbine EngineersInstitution of Engineering DesignersInstitution of Fire EngineersInstitution of Gas Engineers & ManagersInstitution of Lighting ProfessionalsInstitution of Mechanical EngineersInstitution of Railway Signal EngineersInstitution of Royal EngineersNuclear InstituteRoyal Aeronautical SocietySociety of Environmental EngineersThe Chartered Institution of Building Services EngineersThe Chartered Institution of Highways & TransportationThe Institute of Healthcare Engineering and Estate ManagementThe Institution of Engineering and TechnologyThe Institution of Structural EngineersThe Royal Academy of EngineeringThe Royal Institution of Naval ArchitectsThe Society of Operations EngineersThe Welding Institute
Engineering UK
2014 The state of engineering
Engineering UK 2014The state of engineering