Performance of African catfish Clarias gariepinus larvae fed ...
Upload
independentCategory
view
0download
0
Ž .Aquaculture 194 2001 173–190www.elsevier.nlrlocateraqua-online
Reproductive performance in male European seaž /bass Dicentrarchus labrax, L. fed two
PUFA-enriched experimental diets: a comparisonwith males fed a wet diet
J.F. Asturiano a,1, L.A. Sorbera a, M. Carrillo a, S. Zanuy a,),J. Ramos a, J.C. Navarro a, N. Bromage b
a ( )Instituto de Acuicultura de Torre de la Sal CSIC , Ribera de Cabanes, 12595 Torre de la Sal,Castellon, Spain´
b Institute of Aquaculture, UniÕersity of Stirling, Stirling, FK9 4LA, UK
Received 18 November 1999; received in revised form 15 May 2000; accepted 19 July 2000
Abstract
Ž .Reproductive performance of male European sea bass Dicentrarchus labrax fed a wet dietŽ .WD was compared to that of fish fed two commercial pelleted diet enriched with polyunsatu-
Ž . Ž . Ž .rated fatty acids PUFAs by the use of Northern hemisphere fish oil ST or tuna orbital oil RO .Broodstock growth, spermiation duration, milt production, milt spermatozoa density, spermmotility, milt lipid composition, and fertilization rates were compared during the reproductiveseason.
RO and ST males exhibited longer spermiation periods producing statistically higher miltvolumes and milt spermatozoa densities as compared to WD; no differences in quality or motilityof sperm were observed between groups. Although the fertilization rates of RO, ST and WD milt
Ž .at 3 and 24 h after fertilization were similar 88–90% , significantly higher rates of embryonic andŽlarval survival were observed at 48 and 72 h after fertilization from eggs fertilized with ST 13.9%
. Ž . Ž .and 15.5% and RO milt 20.9% and 20.6% as compared to WD 1.0% and 1.2% . Analysis ofmilt PUFA profiles revealed several differences between groups. Although total PUFAs were
) Corresponding author. Tel.: q34-964-319500; fax: q34-964-319509.Ž . Ž .E-mail addresses: [email protected] J.F. Asturiano , [email protected] S. Zanuy .
1 Present address: Departamento de Produccion Animal y Ciencia de los Alimentos, Facultad de CienciasExperimentales y de la Salud, Universidad Cardenal Herrera CEU, Avda. Seminario srn. 46113 MoncadaŽ . Ž .Valencia , Spain. Tel.: q34-96-136-9000 ext. 1172 .
0044-8486r01r$ - see front matter q2001 Elsevier Science B.V. All rights reserved.Ž .PII: S0044-8486 00 00515-9

( )J.F. Asturiano et al.rAquaculture 194 2001 173–190174
increased in all groups as compared to diet PUFA composition, a greater increase was noted forST and RO. In January and March, fish fed the WD exhibited more weight gain and attainedsignificantly higher weights, respectively, than RO fish. Results showed that although fish fed theWD displayed increased weight gain, reproductive performance was enhanced in males fed thecommercially fabricated diets possibly reflecting benefits of PUFA-enrichment. q 2001 ElsevierScience B.V. All rights reserved.
Keywords: Diets; Spermiation; Reproduction; Reproductive performance; European sea bass
1. Introduction
Diets based on fresh fish products commonly used for most farmed marine brood-stocks have been implicated as a possible route for the accidental introduction of
Ž .pathogens such as nodavirus and viral haemorrhagic septicaemia VHS to the culturesystem. Commercial diets reduce this risk as a result of industrial processing. Moreover,commercial diets allow greater control over the biochemical composition. However,satisfying the dietary lipid requirements of marine broodstock using such diets has
Ž .proved difficult, particularly with respect to their highly unsaturated fatty acid HUFAcomposition.
Ž .Essential polyunsaturated fatty acids PUFA of the ny3 and ny6 series cannot besynthesized in vertebrates and must be provided by the diet for the maintenance of
Ž .cellular structure and function Weber, 1990; Sargent et al., 1995 . Hence, dietary intakestrongly influences the fatty acid composition in plasma and cell membranes. Fish cells
Žcontain high levels of ny3 series fatty acids such as eicosapentaenoic acid EPA;. Ž .20:5ny3 and docosahexaenoic acid DHA; 22:6ny3 in contrast to mammalian cells
Ž .which exhibit high levels of arachidonic acid AA, 20:4ny6 from the ny6 seriesŽ .Henderson and Tocher, 1987; Sargent et al., 1989 . Consequently, considerable atten-
Ž .tion has focused on the ny3 requirements of marine fish Sargent et al., 1989, 1995 .In attempts to increase reproductive performance in commercially important marine fish,studies have shown that ny3 series enriched diets have profound effects on femalereproduction, influencing patterns of gonadal development, plasma levels of lipids and
Žsex steroids, egg quality and lipid levels, fecundity, hatching and survival rates Cerda et´.al., 1994, 1995, 1997; Navas et al., 1997, 1998; Bruce et al., 1999 . However, only a
Ž .few studies Sorbera et al., 1998, 2000; Bruce et al., 1999 describe the influence ofŽ .series ny6 PUFAs i.e., AA on the reproduction of teleosts. Moreover, although
Žspermatozoa contain high levels of PUFA evident in the phospholipids Labbe et al.,´.1993; Tinoco, 1982 , very little information is available on the effects of dietary PUFAs
on male reproductive performance in the teleost.One of the main roles for PUFAs is that they are the metabolic precursors of
Ž .eicosanoids such as prostaglandins PGs , which are involved in steroidogenesis andŽoocyte maturation in vertebrates Stacey and Goetz, 1982; Murdoch et al., 1993; Sorbera
.et al., 1998 . Studies using freshwater fish have shown that AA, through conversion toŽ .PGs, stimulates testosterone production in goldfish Carassius auratus L. ovaries and
Žtestis Van Der Kraak and Chang, 1990; Wade and Van Der Kraak, 1993; Mercure and

( )J.F. Asturiano et al.rAquaculture 194 2001 173–190 175
.Van Der Kraak, 1996 while other PUFAs, including EPA and DHA, attenuategonadotropin-stimulated steroid production in both the goldfish testis and trout and
Ž .goldfish ovary Wade et al., 1994; Mercure and Van Der Kraak, 1995 .The aim of the present study was to compare the influence of two PUFA-enriched
Ž .diets on male European sea bass Dicentrarchus labrax broodstock reproductiveperformance in vivo to males fed a wet non-enriched diet.
2. Materials and methods
2.1. Animals and treatments
Three-year-old male European sea bass were maintained under natural photoperiodŽ .and temperature conditions ranging from 11.58C in January to 26.48C in August within
Žthe facilities of the Instituto de Acuicultura de Torre de la Sal east coast of Spain, 408N. Ž .and 08E . Fish were divided into three groups ns8 and placed in 500-l fiberglass
Ž .tanks supplied with aerated flow-through sea water 37.8‰ salinity renewed everyŽhour. The WD group was fed with a wet diet consisting of trash fish, bogue Boops
. Ž . Žboops L. and squid Loligo Õulgaris supplied in a 3:1 ratio during 3 years 6r94–. Ž .4r97 . The commercial PUFA-enriched diet groups RO and ST were fed with a
Žcommercial pelleted diet enriched with Northern hemisphere fish oil EWOS Technol-. Ž .ogy Centre, Livingston, UK; ST for 1 year 6r94–6r95 . This diet emulated the most
successful diet, from previous work, in terms of female reproductive performanceŽ . ŽBruce et al., 1999; Navas et al., 1997, 1998 . Later, during almost 2 years 6r95 until
.the end of the sampling period 4r97 , the ST group was maintained on this diet whilethe RO group received a similar diet with the lipid component replaced with tuna orbital
Ž .oil Ropufa 30, Roche Product, Heanor, UK , which is relatively low in EPA andcontains significantly more AA than standard fish oil. Fish were hand fed 4 days a week,
Ž .once a day at 1.1% ST and RO or 2.2% body weight in the case of WD to compensatefor the higher water content of the WD diet.
The three different diets had a similar energetic value as shown in Table 1. TheŽ .protein content was measured by a standard colorimetric method Lowry et al., 1951
Table 1Ž .Composition of experimental diets percentage of dry weight
Composition WD diet ST diet RO dieta bBogue Squid
Proteins 71 79 53 53Lipids 20 8 22 21Carbohydrates – 2 14 15Ash 9 8 10 10Fiber – – 1 1
Ž .Energetic value kcalrg 5.95 5.34 5.76 5.62
aB. boops.bL. Õulgaris.

( )J.F. Asturiano et al.rAquaculture 194 2001 173–190176
after digestion with NaOH. The ash content was estimated by calcination in an oven at6008C for 15 h. Fibre was determined gravimetrically prior to extraction in a Tecator1020 Hot Extractor. Carbohydrates was calculated by difference. The total lipids were
Ž . Ž .extracted with chloroform–methanol 2:1 vrv Folch et al., 1957 dried at 408C underŽ .nitrogen and determined colorimetrically Zollner and Kirsch, 1962 . Material for fatty
acid analysis of diets was stored in at least 10 volumes of chloroform–methanol 2:1Ž . Ž . Ž .vrv containing 0.01% wrv butylated hydroxytoluene BHT as an antioxidant.
Ž .Lipids were extracted using the method of Folch et al. 1957 . Fatty acid methyl estersŽ .were obtained by acid-catalyzed transmethylation Christie, 1982 and purified by thin
Ž .layer chromatography. Samples were analyzed following Bruce et al. 1999 . Fatty acidcompositions of all the diets are presented in Table 2.
For fertilization rate experiments, 15 malesrdiet were housed separately from theabove groups so milt could be freely obtained without altering evaluation of totalexpressible sperm. These males were maintained under the same conditions as theexperimental groups described above. Unless otherwise noted, all products used were
Ž .purchased from Sigma St. Louis, MO .
2.2. Collection of milt samples and analysis of milt fatty acid content
Fish were sampled at 7-day intervals from 9r96 to 4r97 and fish weight and lengthwere measured at each sampling. After cleaning the genital area with fresh water andthoroughly drying to avoid contamination of samples with feces, urine and sea water,
Ž . Ž .partial 9–12r96 or total 1–4r97 expressible milt was collected by applying gentleŽ .abdominal pressure to anesthetized males ethylenglycol–monophenylether; 1 mlrl .
Samples were maintained on ice and total expressible milt was noted in mlrkg.For analysis of milt fatty acid composition, milt was pooled from three fish per group
at the end of January. Aliquots of 4.5 ml were placed in glass tubes and lipids wereŽ .extracted using the method of Folch et al. 1957 and stored at y208C at a concentrationŽ . Ž .of 10 mgrml in chloroform–methanol 2:1 vrv containing 0.01% wrv BHT. Fatty
Ž .acid methyl esters were obtained by acid-catalyzed transmethylation Christie, 1982 andpurified by thin layer chromatography. Samples were analyzed in a Fisons 8000 serieshigh-resolution gas chromatograph using on-column injection in a 30 m=0.25 mm
Ž .DBwax capillary column J&W Scientific, Folson, CA .
2.3. EÕaluation of spermatozoa concentration and motility
Determination of spermatozoa concentration and assessment of motility were per-formed on all spermiating males immediately following the collection of milt withsamples kept on ice and by the same observer to avoid bias in assessment. To avoidsperm aggregation and achieve an appropriate concentration for counting, milt wasdiluted with a mixture of 100 mM NaCl, 13.4 mM KCl, 83.3 mM glycine, and 26.2 mM
Ž .NaHCO adjusted to pH 8.5 Sorbera et al., 1996 . Density of spermatozoa was3Ž .estimated after direct counting on a Thoma hemocytometer dilution 1r1500 or 1r3000
( )J.F. Asturiano et al.rAquaculture 194 2001 173–190 177
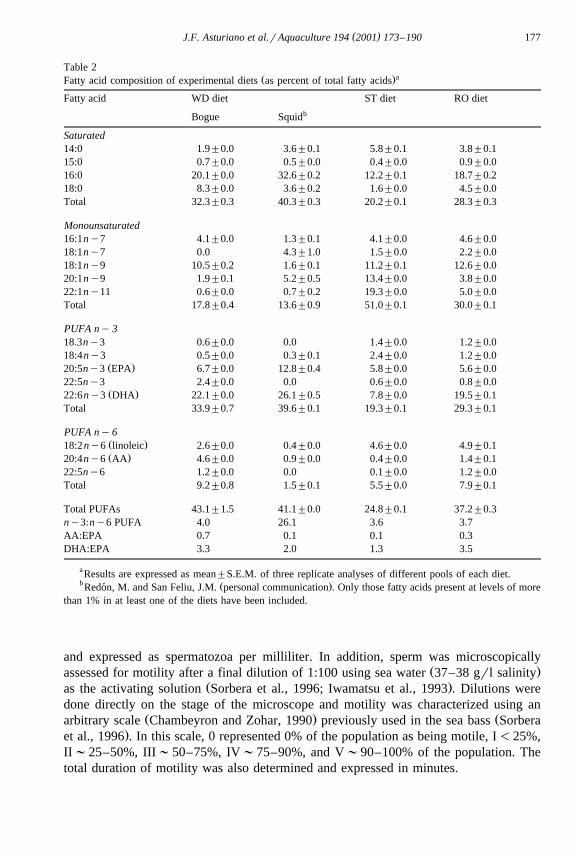
Table 2Ž .aFatty acid composition of experimental diets as percent of total fatty acids
Fatty acid WD diet ST diet RO dietbBogue Squid
Saturated14:0 1.9"0.0 3.6"0.1 5.8"0.1 3.8"0.115:0 0.7"0.0 0.5"0.0 0.4"0.0 0.9"0.016:0 20.1"0.0 32.6"0.2 12.2"0.1 18.7"0.218:0 8.3"0.0 3.6"0.2 1.6"0.0 4.5"0.0Total 32.3"0.3 40.3"0.3 20.2"0.1 28.3"0.3
Monounsaturated16:1ny7 4.1"0.0 1.3"0.1 4.1"0.0 4.6"0.018:1ny7 0.0 4.3"1.0 1.5"0.0 2.2"0.018:1ny9 10.5"0.2 1.6"0.1 11.2"0.1 12.6"0.020:1ny9 1.9"0.1 5.2"0.5 13.4"0.0 3.8"0.022:1ny11 0.6"0.0 0.7"0.2 19.3"0.0 5.0"0.0Total 17.8"0.4 13.6"0.9 51.0"0.1 30.0"0.1
PUFA ny 318.3ny3 0.6"0.0 0.0 1.4"0.0 1.2"0.018:4ny3 0.5"0.0 0.3"0.1 2.4"0.0 1.2"0.0
Ž .20:5ny3 EPA 6.7"0.0 12.8"0.4 5.8"0.0 5.6"0.022:5ny3 2.4"0.0 0.0 0.6"0.0 0.8"0.0
Ž .22:6ny3 DHA 22.1"0.0 26.1"0.5 7.8"0.0 19.5"0.1Total 33.9"0.7 39.6"0.1 19.3"0.1 29.3"0.1
PUFA ny6Ž .18:2ny6 linoleic 2.6"0.0 0.4"0.0 4.6"0.0 4.9"0.1Ž .20:4ny6 AA 4.6"0.0 0.9"0.0 0.4"0.0 1.4"0.1
22:5ny6 1.2"0.0 0.0 0.1"0.0 1.2"0.0Total 9.2"0.8 1.5"0.1 5.5"0.0 7.9"0.1
Total PUFAs 43.1"1.5 41.1"0.0 24.8"0.1 37.2"0.3ny3:ny6 PUFA 4.0 26.1 3.6 3.7AA:EPA 0.7 0.1 0.1 0.3DHA:EPA 3.3 2.0 1.3 3.5
aResults are expressed as mean"S.E.M. of three replicate analyses of different pools of each diet.b Ž .Redon, M. and San Feliu, J.M. personal communication . Only those fatty acids present at levels of more´
than 1% in at least one of the diets have been included.
and expressed as spermatozoa per milliliter. In addition, sperm was microscopicallyŽ .assessed for motility after a final dilution of 1:100 using sea water 37–38 grl salinity
Ž .as the activating solution Sorbera et al., 1996; Iwamatsu et al., 1993 . Dilutions weredone directly on the stage of the microscope and motility was characterized using an
Ž . Žarbitrary scale Chambeyron and Zohar, 1990 previously used in the sea bass Sorbera.et al., 1996 . In this scale, 0 represented 0% of the population as being motile, I-25%,
II;25–50%, III;50–75%, IV;75–90%, and V;90–100% of the population. Thetotal duration of motility was also determined and expressed in minutes.
( )J.F. Asturiano et al.rAquaculture 194 2001 173–190178
2.4. Examination of fertilization rates
Milt was obtained at the beginning of February as described above from threeŽ .randomly selected malesrdietrexperiment 3 mlrmale housed separately from the
main experimental groups. Pools of milt from each diet were maintained on ice,vortexed and the density, quality, and duration of motility of spermatozoa was deter-
Ž .mined for each. Ovulated eggs were obtained from females one female per experimentfed with a wet diet. Ovulation was stimulated by an i.p. injection of 5 mgrkg LHRH
Žanalog followed by a second 10 mgrkg injection 4 h later Alvarino et al., 1992;˜.Carrillo et al., 1995 . Mature eggs obtained via stripping 72 h after the second injection
were immediately placed in separate beakers to which the pooled milt from each dietŽ 9 .was added 0.4 ml miltr100 ml eggs or 1.93=10 spermatozoar100 ml eggs . Eggs
and milt were gently mixed for 1 min using a feather. Sea water was then added at twicethe volume of eggs and milt and mixed for an additional 30 s. Finally, eggs were washedwith sea water and placed in sterile sea water. After 15 min, approximately 200 buoyanteggs were removed to 30 ml beakers of sterile sea water and kept at 168C, underhumidity; with the sterile sea water being replaced every 24 h. At 3 and 24 h afterfertilization, the buoyant eggs were collected to determine the percentage of fertilizationand developing embryos, respectively. At 48 and 72 h after fertilization, all eggs andlarvae were collected to determine the percentage of embryo and larvae development,respectively. Determinations were made by observation through a dissecting microscope.Each sampling was performed in triplicate and the experiment was repeated five times atthe beginning of February coinciding with the maximum milt production period duringthe reproductive season.
2.5. Statistical analysis
Percentage data were subjected to arcsin transformation prior to statistical analysisŽ . Ž .Sokal and Rohlf, 1981 . One-way analysis of variance ANOVA was used to comparethe treatment groups. Post-ANOVA multiple comparison of means was carried out usinga Student–Newman–Keuls or a Tukey’s HSD test. When normality or equal variancefailed, one-way ANOVA on ranks was applied to data followed by a Dunn’s test.Frequency of milt quality classes was assessed using the x 2 test. Student’s t-test wasused to compare initial and final mean of weight and length in every experimentalgroup. Differences were considered significant at p-0.05. All values are expressed as
Ž .mean"standard error S.E.M. .
3. Results
3.1. Fish length and weight
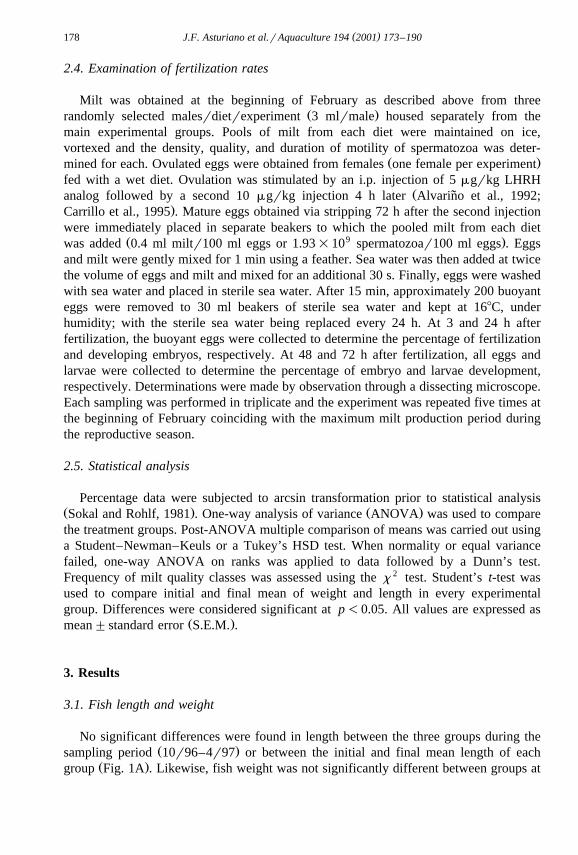
No significant differences were found in length between the three groups during theŽ .sampling period 10r96–4r97 or between the initial and final mean length of each
Ž .group Fig. 1A . Likewise, fish weight was not significantly different between groups at
( )J.F. Asturiano et al.rAquaculture 194 2001 173–190 179
Ž . Ž . Ž . Ž .Fig. 1. Growth of sea bass in length cm A and weight g B during the sampling period. Data representŽmean"S.E.M. of weekly samplings. Different lower case letters indicate statistical differences p-0.05;
.ANOVA, Student–Newman–Keuls test between groups at each sampling. Different upper case letters indicateŽ .statistical differences p-0.05; Student’s t-test only between the initial and final mean weight in every
group.
Ž .the beginning or at the end of the sampling period Fig. 1B . However, WD achieved aŽsignificantly greater weight in comparison with RO in January and March 1022.8"50.8
vs. 855.4"38.1 and 1000.7"51.7 vs. 831.6"44.3 for WD and RO in January and.March, respectively . Comparison of the initial and the final weight in each group,
revealed that WD was the only group that had a significant increment in weight duringthe sampling period.
3.2. Fatty acid composition of diets and collected milt
Table 2 indicates the percentages of fatty acids present in the experimental diets. TheWD diet consisted of two components: bogue and squid, with the total percentages ofsaturated, monounsaturated, and polyunsaturated fatty acids similar in both components.
( )J.F. Asturiano et al.rAquaculture 194 2001 173–190180
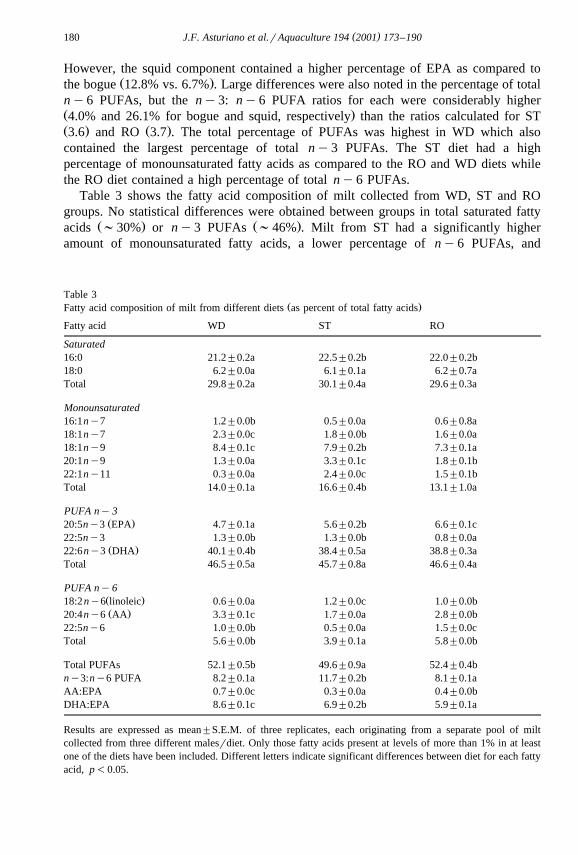
However, the squid component contained a higher percentage of EPA as compared toŽ .the bogue 12.8% vs. 6.7% . Large differences were also noted in the percentage of total
ny6 PUFAs, but the ny3: ny6 PUFA ratios for each were considerably higherŽ .4.0% and 26.1% for bogue and squid, respectively than the ratios calculated for STŽ . Ž .3.6 and RO 3.7 . The total percentage of PUFAs was highest in WD which alsocontained the largest percentage of total ny3 PUFAs. The ST diet had a highpercentage of monounsaturated fatty acids as compared to the RO and WD diets whilethe RO diet contained a high percentage of total ny6 PUFAs.
Table 3 shows the fatty acid composition of milt collected from WD, ST and ROgroups. No statistical differences were obtained between groups in total saturated fatty
Ž . Ž .acids ;30% or ny3 PUFAs ;46% . Milt from ST had a significantly higheramount of monounsaturated fatty acids, a lower percentage of ny6 PUFAs, and
Table 3Ž .Fatty acid composition of milt from different diets as percent of total fatty acids
Fatty acid WD ST RO
Saturated16:0 21.2"0.2a 22.5"0.2b 22.0"0.2b18:0 6.2"0.0a 6.1"0.1a 6.2"0.7aTotal 29.8"0.2a 30.1"0.4a 29.6"0.3a
Monounsaturated16:1ny7 1.2"0.0b 0.5"0.0a 0.6"0.8a18:1ny7 2.3"0.0c 1.8"0.0b 1.6"0.0a18:1ny9 8.4"0.1c 7.9"0.2b 7.3"0.1a20:1ny9 1.3"0.0a 3.3"0.1c 1.8"0.1b22:1ny11 0.3"0.0a 2.4"0.0c 1.5"0.1bTotal 14.0"0.1a 16.6"0.4b 13.1"1.0a
PUFA ny 3Ž .20:5ny3 EPA 4.7"0.1a 5.6"0.2b 6.6"0.1c
22:5ny3 1.3"0.0b 1.3"0.0b 0.8"0.0aŽ .22:6ny3 DHA 40.1"0.4b 38.4"0.5a 38.8"0.3a
Total 46.5"0.5a 45.7"0.8a 46.6"0.4a
PUFA ny6Ž .18:2ny6 linoleic 0.6"0.0a 1.2"0.0c 1.0"0.0bŽ .20:4ny6 AA 3.3"0.1c 1.7"0.0a 2.8"0.0b
22:5ny6 1.0"0.0b 0.5"0.0a 1.5"0.0cTotal 5.6"0.0b 3.9"0.1a 5.8"0.0b
Total PUFAs 52.1"0.5b 49.6"0.9a 52.4"0.4bny3:ny6 PUFA 8.2"0.1a 11.7"0.2b 8.1"0.1aAA:EPA 0.7"0.0c 0.3"0.0a 0.4"0.0bDHA:EPA 8.6"0.1c 6.9"0.2b 5.9"0.1a
Results are expressed as mean"S.E.M. of three replicates, each originating from a separate pool of miltcollected from three different malesrdiet. Only those fatty acids present at levels of more than 1% in at leastone of the diets have been included. Different letters indicate significant differences between diet for each fattyacid, p-0.05.

( )J.F. Asturiano et al.rAquaculture 194 2001 173–190 181
therefore, a higher ny3:ny6 ratio. The percentage of total PUFAs in milt wassignificantly lower for ST. However, these values from all groups were increased ascompared to percentages available in the diet; a greater increase was observed in miltfrom RO and ST. All the groups exhibited levels of DHA independent of the dietaryDHA concentrations with WD milt containing significantly higher levels than RO andST. Statistical differences were also detected in the EPA content of milt between groups,with RO exhibiting the highest concentrations followed by ST and WD. Thus, WD milt
Ž . Ž .had the statistically highest DHA:EPA ratio of 8.6 followed by ST 6.9 and RO 5.9 .Ž .The percentage of AA in milt increased fourfold from 0.4% to 1.7% and twofold
Ž .from 1.4% to 2.8% with respect to the diet composition in ST and RO, respectively. Inthe WD, the percentage of AA in milt was lower than the bogue composition. Thisresulted in an increased AA:EPA milt ratio for RO and ST. The AA:EPA ratio for WDmilt, although significantly higher than RO and ST, was similar to that provided by the
Ž .diet. The ny6 PUFA 22:4ny6 docosatetraenoic acid , although not detected in anyŽ .of the diets, was found in low percentages -1% in the milt of all groups.
3.3. Percentage of spermiating males and duration of milt release period
Table 4 shows the percentage of spermiating males observed during the spermiationperiod. RO and ST groups had a significantly higher percentage of spermiating males as
Table 4Ž . Ž . ŽPercentage of spermiating males % , total expressible milt mlrkg , spermatozoa concentration sper-
9. Ž .matozoarml=10 and sperm motility min of milt collected from sea bass fed WD, ST or RO diets duringthe period of December–March
October November December January February March April
Spermiating malesWD 0 16.5"7.1a 63.3"3.7a 69.8"83a 33.0"0.0a 2.8"2.8a 0ST 6.3"63 65.6"7.9b 87.5"0.0b 70.6"21.2a 96.5"3.5b 46.5"15.9b 0RO 16.5"16.5 73.8"3.6b 95.8"4.2b 100.0"0.0b 100.0"0.0b 46.5"10.5b 7.0"4.0
Total milt collectedWD nd nd nd 2.1"0.3a 2.5"0.7a 0a –ST nd nd nd 3.7"0.3ab 5.3"0.5b 3.2"0.4b –RO nd nd nd 4.4"0.4b 4.8"0.5b 2.2"0.3b 2.3"0.8
Milt concentrationWD – 2.1"0.4 3.5"0.4a 4.3"0.3a 4.3"0.4a 3.0"0.0 –ST nd 3.2"0.4 4.9"0.4b 7.3"0.3b 6.2"0.4b 4.7"0.4 –RO 3.2"0.3 3.4"0.3 5.6"0.4b 7.5"0.5b 7.1"0.5b 3.8"0.3 3.0"2.4
Sperm motilityWD – 1.8"0.3 1.9"0.2 2.5"0.2 1.4"0.3a – –ST 0.5"0.5 1.7"0.2 2.2"0.2 2.6"0.2 1.9"0.1b 1.5"0.1 –RO 1.6"0.4 1.7"0.1 2.1"0.1 2.4"0.2 1.9"0.1b 1.4"0.1 1.5"0.2
ŽData represent mean"S.E.M. of monthly samplings; different letters indicate statistical differences p-0.05;.ANOVA, Student–Newman–Keuls test between groups at each month. nd: Not determined.
( )J.F. Asturiano et al.rAquaculture 194 2001 173–190182
compared to WD during November, December, February and March . In January, onlyRO had a significantly higher percentage of spermiating males as compared to the othergroups.
The total milt release period varied for each group. RO displayed the longestspermiation period followed by ST and finally WD, which had the shortest period. Miltwas first detected in WD in the middle of November and spermiation ended at thebeginning of March. The milt release period for ST extended from the end of October tothe end of March while the period for RO began at the end of October and lasted untilthe middle of April.
3.4. Total milt Õolume collected
No positive correlations were detected between water temperature, fish weight, orŽ 3. Ž .condition factor weightrlength and milt volume collected data not shown . A
significant difference in the duration of peak milt volumes collected was noted betweengroups. For the WD group, maximum milt volume was collected at the beginning ofFebruary and had already decreased by the middle of the month. RO and ST groups, onthe other hand, produced peak milt volumes at the beginning of February that weremaintained until the end of February and the beginning of March, respectively.
Significantly different total milt volumes were collected for each month from eachŽ .treatment group Table 4 . During January, the largest total milt volume was obtained
from RO while WD exhibited the lowest volume; ST displayed an intermediate miltvolume value. ST and RO exhibited similar milt volumes during February and March,which were significantly higher than those of WD.
3.5. Milt spermatozoa concentration
Statistical differences in milt spermatozoa concentration were observed betweenŽ .groups during part of the reproductive period Table 4 . The concentration of spermato-
zoa in milt from RO and ST was significantly higher than WD milt in December,January and February. There were no significant differences between groups in miltspermatozoa concentration in March. Significant differences were observed betweengroups in the cumulative spermatozoa concentration achieved during the reproductiveseason with RO and ST producing significantly higher spermatozoa per milliliterŽ 9 9 .6.9"0.3=10 and 6.2"0.2=10 spermatozoarml, respectively as compared to
Ž 9 .WD 4.1"0.2=10 spermatozoarml .
3.6. Sperm quality and motility duration
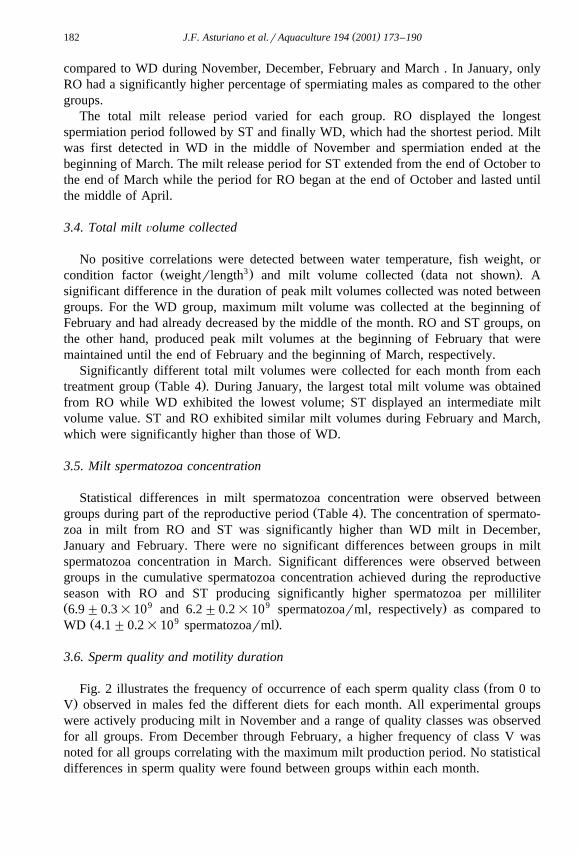
ŽFig. 2 illustrates the frequency of occurrence of each sperm quality class from 0 to.V observed in males fed the different diets for each month. All experimental groups
were actively producing milt in November and a range of quality classes was observedfor all groups. From December through February, a higher frequency of class V wasnoted for all groups correlating with the maximum milt production period. No statisticaldifferences in sperm quality were found between groups within each month.
( )J.F. Asturiano et al.rAquaculture 194 2001 173–190 183
Ž .Fig. 2. Frequency of sperm quality classes from 0 to V observed for each month from milt of sea bass fedWD, ST or RO diets.
ŽDuration of motility was similar for all groups during December and January Table.4 . In February, WD fish produced sperm with significantly shorter motility and milt
production in this group ended at the beginning of March.
3.7. Fertilization rates
At the beginning of February when fertilization experiments were performed, nostatistical differences in spermatozoa concentration or motility of milt pooled from thediet groups for fertilization experiments were found.
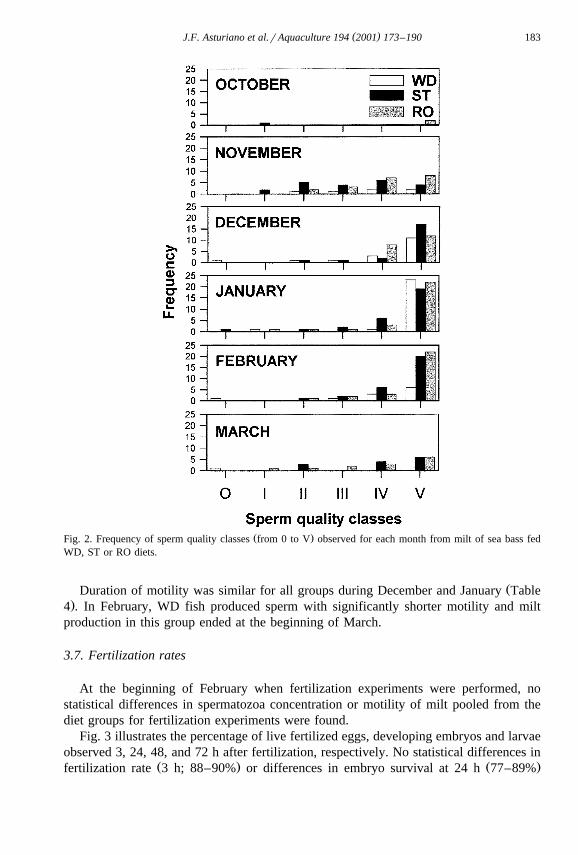
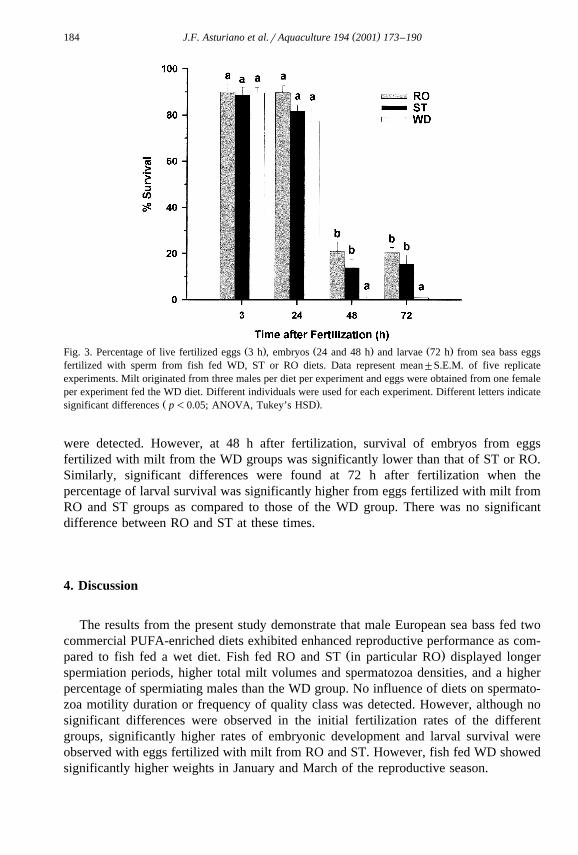
Fig. 3 illustrates the percentage of live fertilized eggs, developing embryos and larvaeobserved 3, 24, 48, and 72 h after fertilization, respectively. No statistical differences in
Ž . Ž .fertilization rate 3 h; 88–90% or differences in embryo survival at 24 h 77–89%
( )J.F. Asturiano et al.rAquaculture 194 2001 173–190184
Ž . Ž . Ž .Fig. 3. Percentage of live fertilized eggs 3 h , embryos 24 and 48 h and larvae 72 h from sea bass eggsfertilized with sperm from fish fed WD, ST or RO diets. Data represent mean"S.E.M. of five replicateexperiments. Milt originated from three males per diet per experiment and eggs were obtained from one femaleper experiment fed the WD diet. Different individuals were used for each experiment. Different letters indicate
Ž .significant differences p-0.05; ANOVA, Tukey’s HSD .
were detected. However, at 48 h after fertilization, survival of embryos from eggsfertilized with milt from the WD groups was significantly lower than that of ST or RO.Similarly, significant differences were found at 72 h after fertilization when thepercentage of larval survival was significantly higher from eggs fertilized with milt fromRO and ST groups as compared to those of the WD group. There was no significantdifference between RO and ST at these times.
4. Discussion
The results from the present study demonstrate that male European sea bass fed twocommercial PUFA-enriched diets exhibited enhanced reproductive performance as com-
Ž .pared to fish fed a wet diet. Fish fed RO and ST in particular RO displayed longerspermiation periods, higher total milt volumes and spermatozoa densities, and a higherpercentage of spermiating males than the WD group. No influence of diets on spermato-zoa motility duration or frequency of quality class was detected. However, although nosignificant differences were observed in the initial fertilization rates of the differentgroups, significantly higher rates of embryonic development and larval survival wereobserved with eggs fertilized with milt from RO and ST. However, fish fed WD showedsignificantly higher weights in January and March of the reproductive season.

( )J.F. Asturiano et al.rAquaculture 194 2001 173–190 185
Although males were maintained separate from females throughout the experiment,the length of the spermiation period observed for the experimental groups was notaffected. In fact, other males in the facility fed the same diets but housed with females
Ž .exhibited similar durations of spermiation data not shown . These results suggest thatthe major factors influencing spermiation in this species are environmental factors suchas photoperiod or water temperature. Moreover, these results corroborate previously
Ž .reported data Sorbera et al., 1996 showing that the frequency of stripping had nodeleterious effect on the length of the spermiation period in the European sea bass in
Žcontrast to studies reported by other authors Suquet et al., 1992, 1994; Zohar et al.,. Ž .1984 . After sampling three times during the reproductive season, Billard et al. 1977
reported a spermiation period for European sea bass from December until the end ofŽ .February. However, the results presented here from sampled fish Table 4 and
Ž .non-sampled fish data not shown show a spermiation period which extends from themiddle of November to the beginning of March for the WD, the end of October to theend of March for ST, and the end of October until the middle of April for the RO diet.
Ž .The energetic values for the three diets used were similar Table 1 . There weredifferences in the percentages of proteins between the commercial diets, RO and STŽ . Ž .53% for each , and the WD diet 71% and 79% . In fact, the improved growth of theWD fed fish could be related to the higher dietary protein level of their food, as theywould have eaten more total protein during the course of the experiment. However,previous studies have demonstrated that while protein deficiencies in the diet havedetrimental effects on European sea bass reproduction, crude protein levels provided at a
Žminimum of 40% or more do not influence reproductive performance Cerda et al.,´.1994, 1997; Navas et al., 1998 . Differences were also noted in carbohydrate content
although these differences appear in several previous studies and were not consideredŽinfluential on reproductive performance Bruce et al., 1999; Cerda et al., 1994, 1995,´
.1997; Navas et al., 1997, 1998 . The percentage of total lipids were similar in the ROŽ .and ST diets 21% and 22%, respectively as well as in the major part of the WD diet,
Ž . Ž .the fish B. boops component 20% . However, both components of the WD diet usedfor these studies had higher percentages of EPA and DHA and ny3:ny6 PUFA ratio,
Ž .while the RO and ST diets contained higher percentages of linoleic acid 18:2ny6 , theŽ .precursor to AA Table 2 . Although the commercial diets had lower percentages of total
PUFAs, male reproductive performance was enhanced as compared to fish fed the WDdiet. Since total lipid content was similar in the three diets, it is possible that the PUFAlipid composition may be influencing reproductive performance.
Dietary fatty acids have been shown to influence the fatty acid profiles of sperm inŽ . Ž .trout Labbe et al., 1993, 1995; Watanabe et al., 1984 , birds Blesbois et al., 1997 and´
Ž .in the European sea bass Bell et al., 1996 . The results from the present study suggestthat European sea bass can incorporate dietary PUFAs into milt since a similarity was
Ž .seen in the percentage of ny3 PUFAs EPA in particular in milt as compared to thepercentages available in the experimental diets. These results also support other studiescomparing wild and cultured European sea bass in which sea bass milt fatty acid
Ž .composition reflected dietary lipid intake Bell et al., 1996 .On the other hand, linoleic acid, the precursor of AA, was significantly lower in RO
and ST milt as compared to the percentages present in RO and ST diets. These results

( )J.F. Asturiano et al.rAquaculture 194 2001 173–190186
suggest the possibility of de novo synthesis of AA from its precursor. In contrast tofreshwater fish, it has been suggested that synthesis of long chain AA and docosate-traenoic acid PUFAs occurring through elongation and desaturation of the shorter
Žprecursor fatty acid linoleic acid is absent or minimal in marine fish Bruce et al., 1999;.Mourente and Tocher, 1994; Sargent et al., 1995 . However, results from this study
suggest that the increase of AA and docosatetraenoic acid in RO and ST milt may bedue to conversion of the available dietary linoleic acid thus reflected in the decreasedlevels of this precursor molecule in the milt from these groups. Similar results were alsoobserved in roosters where authors concluded that low levels of linoleic acid inspermatozoa and seminal plasma had been replaced by AA and docosatetraenoic acidŽ .Blesbois et al., 1997 . It must also be noted that the levels of docosatetraenoic acid
Ždetected in milt were low 0.3"0.1%, 0.1"0.0%, and 0.1"0.0% for WD, ST, and.RO, respectively and possibly this PUFA was also present in the diets in low amounts
that were not detected. More experiments are necessary to determine if in fact elongationand desaturation of linoleic acid is occurring in this species.
Interestingly, the percentage of DHA was increased in milt from all the groups ascompared to the levels available in the diets. Moreover, the percentage of AA in miltwas increased fourfold in ST and twofold in RO as compared to the percentage availablein the diets. Thus, sperm in which the percentage of AA was increased as compared to
Ž .dietary values RO and ST had significantly higher fertilization success rate. Theseresults may indicate that reproductive performance was in fact affected by the fatty acidcomposition of the sperm.
Significant differences were noted in total saturated and monounsaturated fatty acidsbetween diets. However, these differences did not correlate with reproductive perfor-mance. Comparison of fatty acid compositions of the milt from fish fed the differentdiets revealed no significant differences in total ny3 PUFAs. However, differenceswere noted in ny6 PUFAs with ST milt exhibiting the lowest total and thus, thehighest ny3:ny6 ratio. EPA was highest in RO milt and lowest in WD even thoughthe EPA content of WD diet was higher; the good performance displayed from the ROgroup suggest that incorporation of this PUFA is perhaps important to sperm function.ny3 PUFAs have been shown to be involved in the control of membrane permeabilityŽ .reviewed by March, 1992 . No correlation was found between total PUFAs in milt ascompared to reproductive performance. However, the highest levels of AA in milt
Ž .correlated with the lower overall reproductive performance WD , which seems to be incontrast to the fact that a significantly higher fertilization rate was observed in the sperm
Žin which the percentage of AA was increased as compared to dietary values RO and.ST . Factors other than AA could therefore be affecting the reproductive performance.Studies have shown that male European sea bass fed diets with varying levels of
ny3 and ny6 PUFAs exhibit depressed testicular steroidogenesis which may result inŽ .a delay in timing and extent of spermiation Cerda et al., 1997 . Moreover, if the in vitro´
Ž .studies Wade and Van Der Kraak, 1993; Wade et al., 1994 showing the regulatoryeffects of AA, EPA, and DHA on testicular function are taken into account, the resultsfrom this study demonstrating enhanced reproductive performance in fish fed commer-cial PUFA-enriched diets may reflect the fact that the state of the gonad may be furtherinfluenced by the dietary availability of essential PUFAs. In goldfish testis, in vitro

( )J.F. Asturiano et al.rAquaculture 194 2001 173–190 187
studies have shown that AA stimulates testosterone production, whereas ny3 PUFAs,Žparticularly EPA, may function as inhibitory regulators Wade and Van Der Kraak,
.1993; Wade et al., 1994 . Recent in vitro studies in European sea bass testis demon-strated that AA-stimulated PG series E production was enhanced in the presence of
Žgonadotropin, while EPA and DHA were ineffective Asturiano et al., 1997, 1999,.2000 . It has been proposed that the inhibitory actions of EPA and DHA may in part be
Ž .due to inhibition of PGE formation from AA Wade et al., 1994 . In addition, high2
cellular levels of EPA and DHA are known to displace AA and compete for cyclooxy-genase enzymes which convert these PUFAs to eicosanoids which are less effective than
Ž .PGE in reproductive events Murdoch et al., 1993; Weber, 1990 . In this regard, results2
from this study show that fish fed diets lower in EPA and DHA composition andny3:ny6 ratios had enhanced reproductive performance.
In previous studies involving examination of female reproductive performance, theŽWD proved to be the most beneficial Bruce et al., 1999; Cerda et al., 1994, 1995, 1997;´
.Navas et al., 1997, 1998 contrary to the results obtained in this study for males. TheWD used in this study consisted of two components: bogue and squid. The squid was
Žincluded with the intention of increasing the total EPA content of the diet 12.8% vs..6.7%, respectively since a higher percentage of EPA results in a higher ny3:ny6
Ž .ratio and better female reproductive performance Bruce et al., 1999; Cerda et al., 1995 .´From the results of this study, it appears that the dietary PUFA requirements for malereproductive success may be different. Males fed WD displayed higher weight gain inNovember and December and significantly greater weights in January and March ascompared to the other groups. However, since broodstock are not intended for sale, thisadvantage of the wet diet is secondary and the improved reproductive parametersobserved with RO and ST are more desirable. For female European sea bass, it has beenreported that lipid egg composition and the number of spawnings were improved with
Ž .ny3 PUFA-enriched diets Bruce et al., 1999; Cerda et al., 1995; Navas et al., 1998 .´Since steroidogenesis and eicosanoids are essential for testicular function, it is possiblethat contrary to what has been reported in females, a reduction in these ny3 dietaryPUFAs and an increase in AA resulting in an altered ny3:ny6 PUFA ratio mayimprove male European sea bass reproductive performance.
5. Conclusion
In summary, this study demonstrated that male European sea bass fed commercialPUFA-enriched diets exhibited enhanced reproductive performance as compared to fishfed a wet diet. However, fish fed the wet diet had a significantly greater weight gain inNovember and December and increased weight in January and March as compared tofish fed the other diets. Because broodstock are not intended for sale, this advantage ofthe wet diet is outweighed by the improved reproductive benefits in terms of spermiationduration, total milt production, milt spermatozoa density, and fertilization successdisplayed by fish fed the commercial diets. Further studies are necessary to determinethe exact nutritional factors involved and to clarify definitively the role of dietaryPUFAs in male sea bass reproductive function.

( )J.F. Asturiano et al.rAquaculture 194 2001 173–190188
Acknowledgements
Ž .These studies were supported by an E.C. grant AIR-CT93-1005 and a grant fromŽthe Spanish Interministerial Commission of Science and Technology CICYT; MAR96-
. Ž1859 to M.C. J.F.A. was supported by Generalitat Valenciana Regional Government of.Valencia, Spain .
References
Alvarino, J.M.R., Zanuy, S., Prat, F., Carrillo, M., Mananos, E., 1992. Stimulation of ovulation and steroid˜ ˜ ´Ž .secretion by LHRHa injection in the sea bass Dicentrarchus labrax : effect of time of day. Aquaculture
102, 177–186.Asturiano, J.F., Sorbera, L.A., Zanuy, S., Carrillo, M., 1997. Preliminary observations on the influence of
Žessential fatty acids and gonadotropin on prostaglandin series E production in sea bass Dicentrarchus.labrax primary testis culture. Abstracts Third International Symposium on Research for Aquaculture:
Ž . Ž .Fundamental and Applied Aspects ESCPB ; Barcelona, Spain. p. 33 Abstract P-013 .Asturiano, J.F., Sorbera, L.A., Zanuy, S., Carrillo, M., 1999. Evidence of the influence of polyunsaturated
Ž .fatty acids in vivo and in vitro in the reproduction of the European sea bass Dicentrarchus labrax .Abstracts 6th International Symposium on Reproductive Physiology of Fish; Bergen, Norway. p. 64Ž .Abstract PP-63 .
Asturiano, J.F., Sorbera, L.A., Zanuy, S., Carrillo, M., 2000. Effects of polyunsaturated fatty acids andgonadotropin on prostaglandin series E production in a primary testis cell culture system for the European
Ž .sea bass. J. Fish Biol. in press .Bell, M.V., Dick, J.R., Thrush, M., Navarro, J.C., 1996. Decreased 20:4ny6r20:5ny3 ratio in sperm from
cultured sea bass, Dicentrarchus labrax, broodstock compared to wild fish. Aquaculture 44, 189–199.Billard, R., Dupont, J., Barnabe, G., 1977. Diminution de la motilite et de la duree de conservation du sperme´ ´ ´
Ž .de Dicentrarchus labrax L. Poisson Teleosteen pendant la periode de spermiation. Aquaculture 11,´ ´ ´ ´363–367.
Blesbois, E., Lessire, M., Grasseau, I., Hallouis, J.M., Hermier, D., 1997. Effect of dietary fat on the fatty acidcomposition and fertilizing ability of fowl semen. Biol. Reprod. 56, 1216–1220.
Bruce, M., Oyen, F., Bell, G., Asturiano, J.F., Farndale, B., Ramos, J., Bromage, N., Carrillo, M., Zanuy, S.,Ž .1999. Development of broodstock diets for the European sea bass Dicentrarchus labrax with special
emphasis on the importance of ny3 and ny6 HUFA to reproductive performance. Aquaculture 177,85–97.
Carrillo, M., Zanuy, S., Prat, F., Cerda, J., Ramos, J., Mananos, E., Bromage, N., 1995. Sea bass´ ˜ ´Ž . Ž .Dicentrarchus labrax . In: Bromage, N., Roberts, R.J. Eds. , Broodstock Management and Egg andLarval Quality. Blackwell, Oxford, pp. 138–168.
Cerda, J., Carrillo, M., Zanuy, S., Ramos, J., de la Higuera, M., 1994. Influence of nutritional composition of´the diet on sea bass. Aquaculture 128, 345–361.
Cerda, J., Zanuy, S., Carrillo, M., Ramos, J., Serrano, R., 1995. Short- and long-term dietary effects on female´Ž .sea bass Dicentrarchus labrax : seasonal changes in plasma profiles of lipids and sex steroids in relation
to reproduction. Comp. Biochem. Physiol. 111C, 83–91.Cerda, J., Zanuy, S., Carrillo, M., 1997. Evidence for dietary effects on plasma levels of sexual steroids during´
spermatogenesis in the sea bass. Aquacult. Int. 5, 473–477.Chambeyron, F., Zohar, Y., 1990. A diluent for sperm cryopreservation of gilthead seabream, Sparus aurata.
Aquaculture 90, 345–352.Christie, W.W., 1982. Lipid Analyses. 2nd edn. Pergamon, Oxford, pp. 52–56.Folch, J., Lees, M., Sloane-Stanley, G.H., 1957. A simple method for the isolation and purification of total
lipids from animal tissues. J. Biol. Chem. 226, 497–509.Henderson, R.J., Tocher, D.R., 1987. The lipid-composition and biochemistry of freshwater fish. Prog. Lipid
Res. 26, 281–347.
( )J.F. Asturiano et al.rAquaculture 194 2001 173–190 189
Iwamatsu, T., Ishijima, S., Nakashima, S., 1993. Movement of spermatozoa and changes in micropyles duringfertilization in Medaka eggs. J. Exp. Zool. 266, 57–64.
Labbe, C., Loir, M., Kaushik, S., Maisse, G., 1993. The influence of both rearing temperature and dietary lipid´Ž .origin on fatty acid composition of spermatozoan polar lipids in rainbow trout Oncorhynchus mykiss .
Ž .Effect on sperm cryopreservation tolerance. Fish Nutrition in Practice INRA , Paris, France: LesColloques, vol. 61, pp. 49–59.
Labbe, C., Maisse, G., Muller, K., Zachowski, A., Kaushik, S., Loir, M., 1995. Thermal acclimation and´ ¨dietary lipids alter the composition, but not fluidity, of trout sperm plasma membranes. Lipids 30, 23–32.
Lowry, O.H., Riosebrouch, N.J., Far, A.L., Randall, R.J., 1951. Protein measurement with the Folin reagent. J.Biol. Chem. 193, 265–275.
March, B.E., 1992. Essential fatty acids in fish physiology. Can. J. Physiol. Pharmacol. 71, 684–689.Mercure, F., Van Der Kraak, G., 1995. Inhibition of gonadotropin-stimulated ovarian steroid production by
Ž .polyunsaturated fatty acids in teleost fish. Lipids 30 6 , 547–554.Mercure, F., Van Der Kraak, G., 1996. Mechanisms of action of free arachidonic acid on ovarian steroid
production in the goldfish. Gen. Comp. Endocrinol. 102, 130–140.w 14 x Ž Ž .. w 14 xMourente, G., Tocher, T.R., 1994. In vivo metabolism of 1- C linolenic acid 18:3 ny3 and 1- C eico-
Ž Ž ..pentaenoic acid 20:5 ny3 in a marine fish: time course of the desaturationrelongation pathway.Biochem. Biophys. Acta 1212, 109–118.
Murdoch, W.J., Hansen, T.R., McPherson, L.A., 1993. A review—role of eicosanoids in vertebrate ovulation.Prostaglandins 46, 85–115.
Navas, J.M., Bruce, M., Thrush, M., Farndale, B.N., Bromage, N., Zanuy, S., Carrillo, M., Bell, J., Ramos, J.,1997. The impact of seasonal alteration in the lipid composition of broodstock diets on egg quality in the
Ž .European of sea bass Dicentrarchus labrax . J. Fish Biol. 51, 760–773.Navas, J.M., Mananos, E., Thrush, M., Ramos, J., Zanuy, S., Carrillo, M., Zohar, Y., Bromage, N., 1998.˜ ´
Effect of dietary lipid composition on vitellogenin, 17b-estradiol and gonadotropin plasma levels andŽ .spawning performance in captive sea bass Dicentrarchus labrax L. . Aquaculture 165, 65–79.
Ž .Sargent, J.R., Henderson, R.J., Tocher, D.R., 1989. The lipids. In: Halver, J.E. Ed. , Fish Nutrition. 2nd edn.Academic Press, San Diego, CA, pp. 153–218.
Sargent, J.R., Bell, J.G., Bell, M.V., Henderson, R.J., Tocher, D.R., 1995. Requirement criteria for essentialfatty acids. J. Appl. Ichthyol. 11, 183–198.
Sokal, R.R., Rohlf, F.J., 1981. Biometry. 2nd edn. Freeman, New York, pp. 454–560.Sorbera, L.A., Mylonas, C.C., Zanuy, S., Carrillo, M., Zohar, Y., 1996. Sustained administration of GnRH
increases milt volume without altering sperm counts in the sea bass. J. Exp. Zool. 276, 361–368.Sorbera, L.A., Zanuy, S., Carrillo, M., 1998. A role for polyunsaturated fatty acids and prostaglandins in
Ž .oocyte maturation in the sea bass Dicentrarchus labrax . In: Vandry, H., Tonon, M-C., Roubos, E.W., deŽ .Loof, A. Eds. , Annals of the New York Academy of Sciences. Trends in Comparative Endocrinology and
Neurobiology: From Molecular to Integrative Biology, vol. 839, pp. 535–537.Sorbera, L.A., Asturiano, J.F., Zanuy, S., Carrillo, M., 2000. Mechanisms of action of polyunsaturated fatty
Žacids and prostaglandins on oocyte maturation in a marine teleost, the European sea bass Dicentrarchus. Ž .Labrax . Biol. Reprod. in press .
Stacey, N.E., Goetz, F.W., 1982. Role of prostaglandins in fish reproduction. Can. J. Fish. Aquat. Sci. 39,92–98.
Suquet, M., Omnes, M.H., Normant, Y., Fauvel, C., 1992. Influence of photoperiod, frequency of strippingŽ .and presence of females on sperm output in turbot Scopthalmus maximus . Aquacult. Fish. Manage. 23,
216–225.Suquet, M., Billard, J., Cosson, J., Dorange, G., Chauvaud, L., Mugnier, C., Fauvel, C., 1994. Sperm features
Ž .in turbot Scopthalmus maximus : a comparison with other freshwater and marine fish species. Aquat.Living Resour. 7, 283–294.
Tinoco, J., 1982. Dietary requirements and functions of a-linolenic acid in animals. Prog. Lipid Res. 21,1–45.
Van Der Kraak, G., Chang, J.P., 1990. Arachidonic acid stimulates steroidogenesis in goldfish preovulatoryovarian follicles. Gen. Comp. Endocrinol. 77, 221–228.
Wade, M., Van Der Kraak, G., 1993. Arachidonic acid and prostaglandin E2 stimulate testosterone productionby goldfish testis in vitro. Gen. Comp. Endocrinol. 90, 109–118.

( )J.F. Asturiano et al.rAquaculture 194 2001 173–190190
Wade, M.G., Van Der Kraak, G., Gerrits, M.F., Ballantyne, J.S., 1994. Release and steroidogenic actions ofpolyunsaturated fatty acids in the goldfish testis. Biol. Reprod. 51, 131–139.
Watanabe, T., Takeuchi, T., Saito, M., Nishimura, K., 1984. Effect of low protein-high calorie or essentialfatty acid deficiency diet on reproduction of rainbow trout. Bull. Jpn. Soc. Sci. Fish. 50, 1207–1215.
Weber, P.C., 1990. The modification of the arachidonic acid cascade by ny3 fatty acids. In: Samuelson, B.,Ž .Dahlen, S.E., Fritsch and, J., Hedqvist, P. Eds. , Advances in Prostaglandin, Thromboxane and Leukotriene
Research, vol. 20. Raven Press, New York, pp. 232–240.Ž . ŽZohar, Y., Billard, R., Weil, C., 1984. La reproduction de la daurade Sparus aurata et du bar Dicentrarchus
.labrax : connaissance du cycle sexuel et controle de la gamatogenese et de la ponte. In: Barnabe, G.,ˆ ´ ` ´Ž .Billard, R. Eds. , L’Aquaculture du Bar el des Sparides. INRA Publications, Paris, pp. 3–24.´
Ž .Zollner, N., Kirsch, A., 1962. Uber die quantitative bestimmung von lipoiden micrometode Mittels der vielenŽ .naturlichen lipoiden allen bekannte plasmolipoiden gemeinsamen sulphophosphovainillin reaktian. Z.¨
Gesamte. Exp. Med. Bd. 153S, 545–561.
Copyright © 2022 FDOKUMEN