Bulletin of the Treasury Department - FRASER - St. Louis Fed
Upload
khangminh22Category
view
0download
0
VOLUME 8 2 • NUMBER 1 0 • OCTOBER 1 9 9 6
FEDERAL RESERVE
BULLETIN
BOARD OF GOVERNORS OF THE FEDERAL RESERVE SYSTEM, WASHINGTON, D . C .
PUBLICATIONS COMMITTEE
Joseph R. Coyne, Chairman • S. David Frost • Griffith L. Garwood • Donald L. Kohn • J. Virgil Mattingly, Jr. • Michael J. Prell • Richard Spillenkothen • Edwin M. Truman
The Federal Reserve Bulletin is issued monthly under the direction of the staff publications committee. This committee is responsible for opinions expressed except in official statements and signed articles. It is assisted by the Economic Editing Section headed by S. Ellen Dykes, the Graphics Center under the direction of Peter G. Thomas, and Publications Services supervised by Linda C. Kyles.
Digitized for FRASER http://fraser.stlouisfed.org/ Federal Reserve Bank of St. Louis

Table of Contents
883 THE LOCATION OF U.S. CURRENCY: HOW MUCH is ABROAD?
Federal Reserve bank notes are widely used outside the United States. Knowledge of how much U.S. currency is abroad is important for a variety of reasons, but currency movements are notoriously difficult to measure, and estimates of the foreign component of currency stocks and flows have been subject to a great deal of specu-lation and uncertainty. This article brings to-gether several new methods and data sources to narrow the range of that uncertainty. The authors estimate that about $200 billion to $250 billion of U.S. currency was abroad at the end of 1995, or more than half the roughly $375 billion then in circulation outside of banks. Moreover, growth in foreign demand for U.S. currency— especially for hundred-dollar bills ($100s)—has been far stronger than growth in U.S. demand. On average over the 1990s, the currency stock abroad has been growing at about three times the rate of growth of the domestic stock.
904 INDUSTRIAL PRODUCTION AND CAPACITY UTILIZATION FOR AUGUST 1996
Industrial production increased 0.5 percent in August, to 126.9 percent of its 1987 average, after a gain of 0.1 percent in My. Industrial capacity utilization rose 0.2 percentage point, to 83.5 percent.
907 ANNOUNCEMENTS
Issuance of final agency guidelines on safety and soundness standards for asset quality and earnings.
Issuance of a final rule amending the risk-based capital standards to incorporate a measure of market risk.
Adoption of a final rule regarding investment adviser activities in Regulation Y.
Recission of a staff interpretive letter.
Amendment to regulations regarding loans in areas with special flood hazards.
Proposal to amend the risk-based capital guide-lines for banks and bank holding companies regarding the treatment of collateralized trans-actions; proposed amendments to Regulation Y.
Development of public service announcements on the sale of mutual funds at banks.
909 MINUTES OF THE FEDERAL OPEN MARKET COMMITTEE MEETING HELD ON JULY 2-3, 1996
At its meeting on July 2-3, 1996, the Commit-tee reaffirmed the ranges for 1996 growth of M2 and M3 of 1 to 5 percent and 2 to 6 percent respectively and the monitoring range for expansion of total domestic nonfinancial debt of 3 to 7 percent that it had established in January. The Committee provisionally set the same ranges for 1997.
For the intermeeting period ahead, the Com-mittee adopted a directive that called for maintaining the existing degree of pressure on reserve positions and that included a bias toward the possible firming of reserve condi-tions during the intermeeting period.
917 LEGAL DEVELOPMENTS
Various bank holding company, bank ser-vice corporation, and bank merger orders; and pending cases.
A1 FINANCIAL AND BUSINESS STATISTICS
These tables reflect data available as of August 28, 1996.
A3 GUIDE TO TABULAR PRESENTATION
A4 Domestic Financial Statistics A42 Domestic Nonfinancial Statistics A50 International Statistics
Digitized for FRASER http://fraser.stlouisfed.org/ Federal Reserve Bank of St. Louis

A63 GUIDE TO STATISTICAL RELEASES AND
SPECIAL TABLES
A66 INDEX TO STATISTICAL TABLES
A68 BOARD OF GOVERNORS AND STAFF
A70 FEDERAL OPEN MARKET COMMITTEE AND STAFF; ADVISORY COUNCILS
A72 FEDERAL RESERVE BOARD PUBLICATIONS
A74 M4.PS OF THE FEDERAL RESERVE SYSTEM
A76 FEDERAL RESERVE BANKS, BRANCHES, AND OFFICES
Digitized for FRASER http://fraser.stlouisfed.org/ Federal Reserve Bank of St. Louis

The Location of U.S. Currency: How Much Is Abroad?
Richard D. Porter and Ruth A. Judson, of the Divi-sion of Monetary Affairs, prepared this article. Lyle Kumasaka, Adam Reed, and James Walsh provided research assistance.
Federal Reserve bank notes are widely used outside the United States. Knowing how much U.S. currency is abroad is important for a variety of reasons, but currency movements are notoriously difficult to mea-sure, and estimates of the foreign component of cur-rency stocks and flows have been subject to a great deal of speculation and uncertainty. Here we bring together several new methods and data sources to narrow the range of that uncertainty. According to our estimates, about $200 billion to $250 billion of U.S. currency was abroad at the end of 1995, or more than half the roughly $375 billion then in circulation outside of banks. Moreover, that proportion has been rising. Our calculations indicate that growth in for-eign demand for U.S. currency—especially for hundred-dollar bills ($100s)—is far stronger than growth in U.S. demand. On average over the 1990s, the overseas stock has been growing at about three times the rate of growth of the domestic stock.
Today, foreigners hold U.S. currency for the same reasons that people once held gold coins: as a unit of account, a medium of exchange, and a store of value when the purchasing power of the domestic currency is uncertain or when other assets lack sufficient ano-nymity, portability, divisibility, liquidity, or security. A safe asset in an unpredictable world, dollars often flow into a country during periods of economic and political upheaval and sometimes remain there well after the crisis has subsided.
NOTE. We are grateful to Michael Bordo, David B. Humphrey, Russell Krueger, J.L. Laake, Robert M. Lucas, Jr., Howard Murad, Gerald Pollack, and our colleagues in the Federal Reserve for helpful assistance, comments, and discussions on various points. We thank FinCEN, the Financial Crimes Enforcement Network of the Depart-ment of the Treasury, for permission to use aggregate information derived from the U.S. Customs Service's Currency and Monetary Instrument Reports. Finally, we are grateful for the stimulating dia-logue we have had with Edgar L. Feige on all aspects of this study. Questions and comments can be e-mailed to the authors at [email protected] or [email protected].
Currency movements are difficult to measure for some of the same reasons that currency is popular: It can be easily concealed and readily carried across borders, even in large quantities (a briefcase can hold $1 million in $100s). The total amount of U.S. cur-rency in circulation is known; in principle, one could conduct a census to determine the domestic stock and assume that the rest of the currency is abroad. How-ever, such a census would be invasive, prohibitively costly, and unlikely to yield reliable results. Thus, the amount of currency held abroad can only be esti-mated, and then only from incomplete or indirect evidence about dollars flowing across U.S. borders.
Policymakers would find it useful to have a clear idea of how much U.S. currency is circulating outside the country. First, foreign demand for U.S. currency, if large and unrelated to domestic U.S. spending, will complicate the interpretation of movements in the amount of currency outstanding and in various other monetary aggregates.
Second, estimates of changes in foreign holdings of U.S. currency may also reduce the average size of the errors-and-omissions category in the U.S. interna-tional transaction accounts, which do not currently incorporate any estimates of changes in foreign hold-ings of currency.
Third, a significant foreign demand for U.S. cur-rency will have important effects on the amount of seigniorage that the United States can expect.1 All U.S. currency, including that held externally, can be thought of as a form of interest-free Treasury borrow-ing and therefore as a saving to the taxpayer. If the amount of currency abroad is around $200 billion, and the three-month Treasury bill rate is 5.2 percent (which it is as of this writing), the amount of seignior-age (and taxpayer saving) from externally circulating currency, calculated as the product of these two figures, would be more than $10 billion per year. Knowing more accurately the amount of seigniorage
1. Seigniorage is defined as the government's gain from converting valuable metal into more valuable coins. We use the term here in the looser sense that includes the central bank's income from issuing paper currency.
Digitized for FRASER http://fraser.stlouisfed.org/ Federal Reserve Bank of St. Louis
884 Federal Reserve Bulletin • October 1996
derived from externally circulating currency would assist policymakers in deciding how many resources to devote to protecting it by, for example, combating the counterfeiting of U.S. currency abroad or improv-ing the physical quality of externally circulating notes. Add to these reasons the fact that currency outstanding has surged over recent years, and a reli-able answer to the question of how much is abroad becomes a matter of considerable interest.
In all, we have examined ten methods for estimat-ing the amount of currency held abroad. We first outline the major sources of foreign demand for U.S. currency. We also review the available information, from statistical reports to institutional structure, none of which, alone, covers the full extent of currency stocks or flows but which nonetheless point to for-eign use as the major source of recent growth in US. currency. We then describe two of the ten methods we use to estimate the stock of currency abroad, the seasonal method and the biometric method, which provide convenient illustrations of the assumptions and empirical relationships required to estimate over-seas currency flows and stocks.
After briefly summarizing the remaining eight methods, we present a summary measure, the "median flow estimate," based on several methods for which we have sufficient time-series data. We show that although year-to-year changes in domestic holdings have been relatively stable, changes in total currency have grown and have become increasingly dominated by foreign movements. In light of the evidence, we examine and find unpersuasive several arguments supporting the claim that very little cur-rency is held outside the United States. Finally, when our estimate of U.S. currency held abroad is sub-tracted from the total outstanding, the amount of domestically circulating currency per U.S. resident that remains is considerably smaller than the corre-sponding measure for most other developed coun-tries, and we examine some of the economic forces underlying these cross-country differences.2
2. For earlier estimates of the foreign component of currency stocks and flows and related issues, see, for example,
Robert B. Avery, Gregory E. Elliehausen, Arthur B. Kennickell, and Paul A. Spindt, "Changes in the Use of Transaction Accounts and Cash from 1984 to 1986," Federal Reserve Bulletin, vol. 73 (March 1987), pp. 179-96.
Alan S. Blinder, "The Role of the Dollar as an International Currency," Eastern Economic Journal, vol. 22 (Spring 1996), pp. 127-36.
Edgar L. Feige, "Overseas Holdings of U.S. Currency and the Underground Economy," in Susan Pozo, ed., Exploring The Under-ground Economy: Studies of Illegal and Unreported Activity (Kalamazoo, Mich.: W.E. Upjohn Institute for Employment Research, 1996), pp. 5-62.
THE INTERNATIONAL MARKET FOR U.S. CURRENCY
Before the advent of paper currency, gold coin—in the form of Dutch guilders, Spanish pieces of eight, and other coins of the realm—circulated far outside the countries in which they were minted; similarly, bank notes (that is, notes issued by private commer-cial banks) in the United States and England in the 19th century circulated far beyond the market areas of those banks. U.S. currency today provides many of the monetary services that gold coins once did. As the leading international currency, Federal Reserve notes enter other national economies for reasons both public and private. Some countries, including Panama and Liberia, have elected at times to use the U.S. dollar as their currency. Other countries that issue currency maintain stable exchange rates between their own currency and the U.S. dollar; in the Carib-bean, for example, that stability allows tourists and residents to use both dollars and local currency with-out fear of a sudden change in exchange value. Work-ers employed outside their home countries are often paid in U.S. dollars, which make their way into local economies directly or via remittances: U.S. soldiers have been paid in dollars since World War II, and many expatriate workers in the oil-producing coun-tries of the Middle East are paid in dollars. The dollar is also the preferred currency for exchange: Travelers heading for points outside of Western Europe often economize on exchange costs by carrying dollars.
Jeffrey A. Frankel, "Still the Lingua Franca," Foreign Affairs, vol. 74 (July/August 1995), pp. 9-16.
Lawrence B. Lindsey, "America's Most Ignored Export," Durell Journal of Money and Banking, vol. 6 (Winter 1994-95), pp. 2-5.
John Mueller, "Most of Our Money Is Missing—Again," Durell Journal of Money and Banking, vol. 6 (Winter 1994-95), pp. 6-13.
Richard D. Porter, "Estimates of Foreign Holdings of U.S. Currency—An Approach Based on Relative Cross-Country Seasonal Variations," in Nominal Income Targeting with the Monetary Base as Instrument: An Evaluation ofMcCallums' Rule, Finance and Econom-ics Discussion Series Working Study 1 (Board of Governors of the Federal Reserve System, March 1993).
, "Foreign Holdings of U.S. Currency," International Economic Insights (November/December 1993), p. 5.
and Ruth A. Judson, "The Location of U.S. Currency: How Much Is Abroad?" (Board of Governors of the Federal Reserve System, April 15, 1996).
Franz Seitz, "The Circulation of Deutsche Mark Abroad," Discus-sion Paper 1/95, Economic Research Group of the Deutsche Bundesbank (May 1995).
Case M. Sprenkle, "The Case of the Missing Currency," Journal of Economic Perspectives, vol. 7 (Fall 1993), pp. 175-84.
Scott B. Summer, "The Case of the Missing Currency, Correspon-dence," Journal of Economic Perspectives, vol. 8 (Fall 1994), pp. 201-03.
, "The Transactions and Hoarding Demand for Cur-rency," Quarterly Review of Economics and Business, vol. 30 (Spring 1990), pp. 75-89.
Digitized for FRASER http://fraser.stlouisfed.org/ Federal Reserve Bank of St. Louis

The Location of U.S. Currency: How Much Is Abroad? 885
Episodes of economic and political turmoil have frequently been the catalyst for major influxes of dollars into a region. Recently, Argentina and the former Soviet Union received large inflows of dol-lars. In Argentina, which experienced chronic high inflation from the 1960s to the early 1990s and brief bouts of hyperinflation in the mid 1970s and late 1980s, U.S. currency is still used as the settlement medium for large-scale transactions such as those involving real estate and cars.3 Argentina has received as much as $40 billion in net shipments of U.S. currency, or well over $1,000 per capita.4 How-ever, a Federal Reserve and Treasury study of the use of U.S. currency in Argentina suggests that some currency that was initially shipped to Argentina could have subsequently moved to neighboring countries.5
In the countries of the former Soviet Union, past and current high inflation, confiscatory currency reforms, and the underdevelopment of the banking system encourage people to hold and use U.S. dollars for everything from retail purchases of imported con-sumer products to the settlement of debts between and within countries. Cumulative net shipments of U.S. dollars to this part of the world have likely surpassed those to Argentina, with some estimates as high as $60 billion. Moreover, evidence from Argentina and other countries indicates that long after crisis episodes have passed, many residents
3. Daniel Heymann and Axel Leijonhufvud discuss the forces affecting currency holdings in countries experiencing high inflation but not hyperinflation (High Inflation: The Arne Ryde Memorial Lectures, Clarendon Press, 1995). See also Carlos A. Vegh, "Stopping High Inflation," International Monetary Fund, Staff Papers, vol. 39 (September, 1992), pp. 626-95; and Miguel A. Savastano, "Dollariza-tion in Latin America: Recent Evidence and Some Policy Issues," in P.D. Mizen and E.J. Pentecost, eds., The Macroeconomics of Inter-national Currencies: Theory, Policy, and Evidence (Brookfleld, Vt.: Elgar, forthcoming).
For a perspective on this phenomenon and its relationship to sover-eignty, see Benjamin J. Cohen, "The Political Economy of Currency Regions," in Edward D. Mansfield and Helen V. Milner, eds., The Political Economy of Regionalism (Columbia University Press, forth-coming). For an international treatment of this issue, including a discussion of the implications for balance-of-payments statistics, see John Wilson, "Physical Currency Movements and Capital Flows," in Report on the Measurement of International Capital Flows: Part II—Background Papers (International Monetary Fund, 1992), pp. 91-97; and Russell Krueger and Jiming Ha, "Measurement of Co-Circulation of Currencies," Working Paper 95/34 (International Monetary Fund, 1995).
4. This figure extends through 1995 the cumulation of net currency shipments to Argentina calculated in Steven Kamin and Neil R. Ericsson, "Dollarization in Argentina," International Finance Discus-sion Papers 460 (Board of Governors of the Federal Reserve System, 1993). Kamin and Ericsson find their estimate of Argentine dollar holdings to be consistent with the reduction in domestic money demand attributable to high inflation.
5. Graciela Kaminsky, "Study by the U.S. Treasury Department and Federal Reserve System of the Use of U.S. Currency Outside the United States" (Board of Governors of the Federal Reserve System, 1994).
continue to hold dollars as an instantly liquid form of insurance against further political or economic upheaval. Finally, in a high-inflation economy, hold-ing dollars as currency and bearing the implicit interest cost can be more convenient than holding other available savings or transactions instruments, even if they earn interest.6
DATA SOURCES FOR ESTIMATES OF CURRENCY HELD ABROAD
We have two direct sources of information about currency flows abroad—the U.S. Customs Service and the Federal Reserve Bank of New York. How-ever, data from these sources are often inadequate for measuring the stock of currency abroad, in particular because they miss much of the cash that is hand-carried or remitted by mail by guest workers and travelers. Thus, to better estimate stocks, we also use sources of indirect information about currency flows. We first describe the major sources of direct and indirect data on currency flows in and out of the United States. We then present other institutional and general information on currency growth and eco-nomic activity that point to a large and increasing presence of U.S. currency outside the country.
The Currency and Monetary Instrument Reports
The most obvious direct source of information on currency flows across U.S. borders are the Currency and Monetary Instrument Reports (CMIRs) required by the U.S. Customs Service.7 In principle, these reports are a rich source of information because indi-viduals or firms making almost any shipment of more than $10,000 in cash across a U.S. border are required to file a CMIR (the reporting threshold was raised, from $5,000 to $10,000, in 1980). Although CMIR data on shipments by banks seem to agree with the banks' own reports to the Federal Reserve Bank of
6. In fact, some evidence indicates that the private holding of dollars in high-inflation regimes may possibly be more efficient than other arrangements: A recent study of the welfare cost of inflation presents evidence that the financial sectors in high-inflation countries are larger than they would be otherwise; but among such high-inflation economies, those that have been "dollarized" tend to have somewhat smaller financial sectors than the others. See William B. English, "Inflation and Financial Sector Size," Finance and Econom-ics Discussion Series 96-16 (Board of Governors of the Federal Reserve System, April 1996).
7. For more detail on these reports, see Feige, "Overseas Holdings of U.S. Currency."
Digitized for FRASER http://fraser.stlouisfed.org/ Federal Reserve Bank of St. Louis

886 Federal Reserve Bulletin • October 1996
New York, the CMIR data on nonbank shipments sum to improbably large net inflows.8 At least four factors indicate that CMIRs are neither accurate nor thorough measures of large cash shipments that take place outside the banking sector.
First, because arriving travelers must pass through Customs but departing travelers ordinarily do not, the CMIR data are biased toward measuring inflows of currency. Departing travelers are occasionally informed of the filing requirement or are targeted for enforcement purposes, but their responses are not adjusted statistically to account for the large propor-tion of outgoing travelers who should, but apparently do not, file CMIRs. For example, in 1994 the number of travelers entering the United States from anywhere in the world was about the same as the number of travelers leaving (about 45 million), but in that year, about 170,000 arriving travelers filed CMIRs, whereas only about 34.000 departing travelers did so.
Second, CMIRs do not capture shipments of $10,000 or less, activity that could cumulate to a significant total. In 1994, excluding travel to Mexico and Canada, 18.7 million U.S. residents left the United States, and 19.2 million visitors entered. If these travelers carried an average of $1,000 each, the unrecorded flows in each direction would be relatively large, around one-half of the measured $32.8 billion 1994 CMIR inflows and $39.1 billion outflows. For example, banking statistics seem to indicate that U.S. currency flows only back from the Caribbean to the United States; the currency going in the other direction, from the United States to the Caribbean, goes not through the international bank-ing system but via the pockets of American tourists and others, and most of it presumably goes unrecorded.
Third, many shipments greater than $10,000 are likely to be misreported or not reported at all. Although banks and other firms are accustomed to filing CMIRs and probably do so fairly diligently, individuals are potentially less aware of these reports, less willing to file them, or even eager to avoid them.
Fourth, the record-keeping system for CMIRs was designed with the purpose of identifying individual transactions, not of developing accurate aggregate statistics on currency flows. In sum, CMIRs are an important source of data, but they probably do not
8. In the CMIR system, double counting may exist for some transactions: for example, a bank and a commercial shipper may both report the same currency shipment. Further, not all cross-border consignments of cash require a CMIR. In particular, overland ship-ments of currency between banks and established customers do not need to be reported, nor do overland shipments between established offices of banks (31 C.F.R. 103.23, (3) and (9)).
provide accurate aggregate data because of a one-sided data collection process and the omission of some potentially large volumes of currency flows.
Foreign Currency Shipments by Banks
A second direct source of currency flow data is the information provided to the Federal Reserve Bank of New York by commercial bank-note brokers, pri-marily large commercial banks. Currently, we have monthly data on incoming and outgoing currency shipments by country for two intervals, the interwar period (for which the country data had been pub-lished annually) and the period beginning in 1988. We focus on the recent data.9
Overall, the shipments data indicate that well over $100 billion in U.S. currency on net has moved overseas since the late 1980s. From 1988 through 1991, the region receiving the bulk of currency ship-ments was Latin America, led by Argentina, which received a little more than one-third of total net shipments from the United States to the rest of the world in this period. Since then, Europe has become the dominant destination, reflecting the turbulence in the former Soviet Union. Net U.S. currency flows to Russia alone in both 1994 and 1995 have been at least $20 billion per year, or well more than half of total net foreign shipments of U.S. currency.
On the whole, from 1988 to 1995 about half of net U.S. currency shipments abroad have gone to Europe, with the bulk of those presumably going to Russia. About 30 percent has been evenly split between the Far East and the Middle East, with the remainder going to Latin America, particularly Argentina.
Disaggregated Sources: Surveys and Federal Reserve Cash Offices
Two of the most important sources of indirect infor-mation on currency flows are recent survey results
9. The details of the data from 1988 onward are confidential. For the interwar period, see for example, "Foreign Movements of United States Currency," Federal Reserve Bank of New York, Monthly Review of Credit and Business Conditions, October 1, 1926, p. 6; "Shipments of American Currency To and From Europe," Banking and Monetary Statistics: 1914-1941 (Board of Governors of the Federal Reserve System, 1943), pp. 405-07, and table 113, pp. 417-18; and "Shipments of American Currency To and From Europe," Federal Reserve Bulletin, vol. 18 (January 1932), pp. 7-9. Also, some annual data cover a brief period following World War II: See Balance of Payments Statistical Supplement to Survey of Current Business (Department of Commerce, 1958), pp. 178-79, note 3, international investment position table referencing U.S. currency abroad in 1946-56.
Digitized for FRASER http://fraser.stlouisfed.org/ Federal Reserve Bank of St. Louis

The Location of U.S. Currency: How Much Is Abroad? 887
and data from currency processing performed at the Federal Reserve System's Cash Offices. Twice in the mid-1980s and again in May 1995 the Federal Reserve engaged the Michigan Survey Research Center to poll at least 500 households regarding their use of currency and various transaction accounts (table l).10 In the latest survey, average cash holdings (line 1), the percentage of currency outstanding that is accounted for by holdings of adults (line 5), and the percentage of expenditures made with cash (line 10) all had dropped significantly from the levels of the mid-1980s. Furthermore, busi-nesses and children are not believed to hold signifi-cant amounts of currency. Hence, the declines recorded by the surveys over a period when real per capita currency was increasing sharply (see table 3) most likely point to growing demand outside the country.
The other type of indirect data, which we use in the biometric method (described below), comes from the
10. Results from the 1980s surveys are discussed in Avery and others, "Changes in the Use of Transaction Accounts"; and Robert B. Avery, Gregory E. Elliehausen, Arthur B. Kennickell, and Paul A. Spindt, "The Use of Cash and Transaction Accounts by American Families," Federal Reserve Bulletin, vol. 72 (February 1986), pp. 87-108.
1. Results of three household surveys on use of cash, 1984, 1986, and 1995
NOTE. Dollar values for 1984 and 1986 have been inflated by the chain-type price index for personal consumption expenditures to make them comparable to the nominal 1995 values. All statistics are sample means.
1. Estimated as cash on hand before the acquisition of cash (line 2) plus one-half of the cash acquired (line 3).
2. Based on 458 respondents. 3. Based on 453 respondents who held positive amounts of cash. Calculating
as in note 1 for the 453 respondents in lines 2 and 3 in May 1995, average cash balances were $27 + $ 1 4 9 / 2 = $101.50. The May 1995 entry in line 1 is $100 ($1.50 less) because it includes 5 additional individuals, who held no cash whatsoever. In both of the earlier surveys, all of the respondents reported that they held some cash.
n.a. Not available. SOURCE. Federal Reserve.
thirty-seven Federal Reserve Cash Offices. Each of the twelve Federal Reserve Banks has at least one main Cash Office and up to five Branch Cash Offices. The Cash Offices record—by denomination and, to a limited extent, by series—all currency received, pro-cessed, destroyed, and paid out or shipped to other Cash Offices. These data do not differentiate foreign and domestic flows, but by comparing Cash Office reports on shipments of $100s and $50s with informa-tion from the surveys, we can enhance our knowl-edge of stocks and flows abroad. The biometric method indicates that about two-thirds of $100s and nearly half of $50s are held abroad.
Institutional Knowledge: The New York Cash Office and $100 Notes
Hundred-dollar notes are the largest denomination now issued by the Federal Reserve. Although $20s are in more common use than $100s in the United States, $100s make up 60 percent of the dollar value of all U.S. currency outstanding. Two facts about the use of $100 notes suggest that the net new demand for them is coming primarily from abroad. First, the Federal Reserve Cash Office serving the New York City region is the primary supplier of currency to foreign users, especially of $100s, and second, its shipments of $ 100s are unusually large relative to the size of its District, as measured by several economic variables, including regional shares of vault cash, population, income, and deposits (table 2).11 This Cash Office, one of the two Cash Offices in the New York District (the other is in Buffalo), has accounted for 97 percent of the nationwide net issu-ance of $100s since 1988; for the twenty-two years of currency issuance reported in table 2, the New York City Cash Office accounted for nearly 83 percent of the net national issuance of $100s.
Given the survey data described above (table 1), the largest possible number of $100s per person in the United States is less than one-third of a single $100 bill, while for every U.S. resident about nine
11. The determination of a given District's share of nationwide currency holdings should depend on some combination of the vari-ables in the first five columns of table 2. Because the Federal Reserve System supplies currency on demand, we need consider only the demand for currency. That demand depends on national variables such as the price level and interest rates and on regional measures such as spending and population. If the use of cash in some Districts is more intensive than in others, that propensity would be visible in variables such as vault cash. Thus, it is fair to assume that a given District's share of currency is explained by some combination of spending (for which we substitute personal income), population, vault cash, or deposits in that District.
Item June 1984
June 1986
May 1995
1. Average cash holdings (dollars)1 148 153 1002
2. Cash on hand before acquisition of cash (dollars) 50 50 27
3. Cash acquired (dollars) 196 207 1493 4. Days between acquisitions of cash . . . . 12 16 12 5. Percentage of total currency and
coin outside of depository institutions and held by adults . . . 11 11 5
6. Percentage of cash acquired in $ 100s . n.a. n.a. 23 7. Annual turnover rate of cash g l j j / s
(cash spent divided by average I s j s cash balance) 50 49 36
8. Number of cash transactions per month n.a. n.a. 29
9. Monthly cash expenditures (dollars) . . 633 669 301 10. Percentage of total expenditures
34 made with cash 30 34 20
Digitized for FRASER http://fraser.stlouisfed.org/ Federal Reserve Bank of St. Louis

888 Federal Reserve Bulletin • October 1996
2. District shares of nationwide characteristics of economic size and total cash issuance Percent
Federal Reserve District Vault cash' Population 2 Personal income3
Transaction deposits1
Savings and transaction deposits1
$100s issued4 All
denominations issued4
Boston 5.0 5.0 6.1 4.4 4.6 4.4 10.7 New York 13.0 9.7 12.1 14.3 14.4 82.8 80.5 Philadelphia 3.6 4.6 5.1 3.3 3.6 3.0 - . 7 Cleveland 6.9 6.5 5.9 6.3 6.8 4.5 13.0 Richmond 9.7 9.4 9.3 8.8 9.5 6.7 9.4 Atlanta 12.7 12.8 11.2 11.1 12.0 - 1 5 . 9 -34 .8 Chicago 10.6 12.3 12.4 12.6 12.4 13.8 29.0 St. Louis 4.0 5.0 4.2 5.0 4.6 3.7 3.8 Minneapolis 1.9 3.0 2.6 3.2 2.9 1.7 1.9 Kansas City 4.6 5.4 5.0 5.9 5.3 3.0 4.3 Dallas 6.4 7.4 6.4 6.9 6.3 1.2 - 3 . 6 San Francisco 21.5 18.8 19.6 18.1 17.5 -9 .1 -13 .4
Total 100 100 100 100 100 100 100
NOTE. Because the distribution of these values changes extremely slowly, the variation in dates for which we have data introduces only a small discrepancy into the comparisons.
1. 1995:Q4.
2. 1990 census. 3. Per capita for 1989 multiplied by the 1990 population. 4. Value issued from 1974 to 1995 inclusive. SOURCE. Authors' calculations.
$100 notes circulate somewhere in the world.12 In sum, the basic information we have from surveys and the Federal Reserve Cash Offices about the circula-tion of $100 notes is consistent with relatively low dollar use domestically and high use abroad.
Aggregate Data on the Relative Growth of Currency and Related Economic Variables
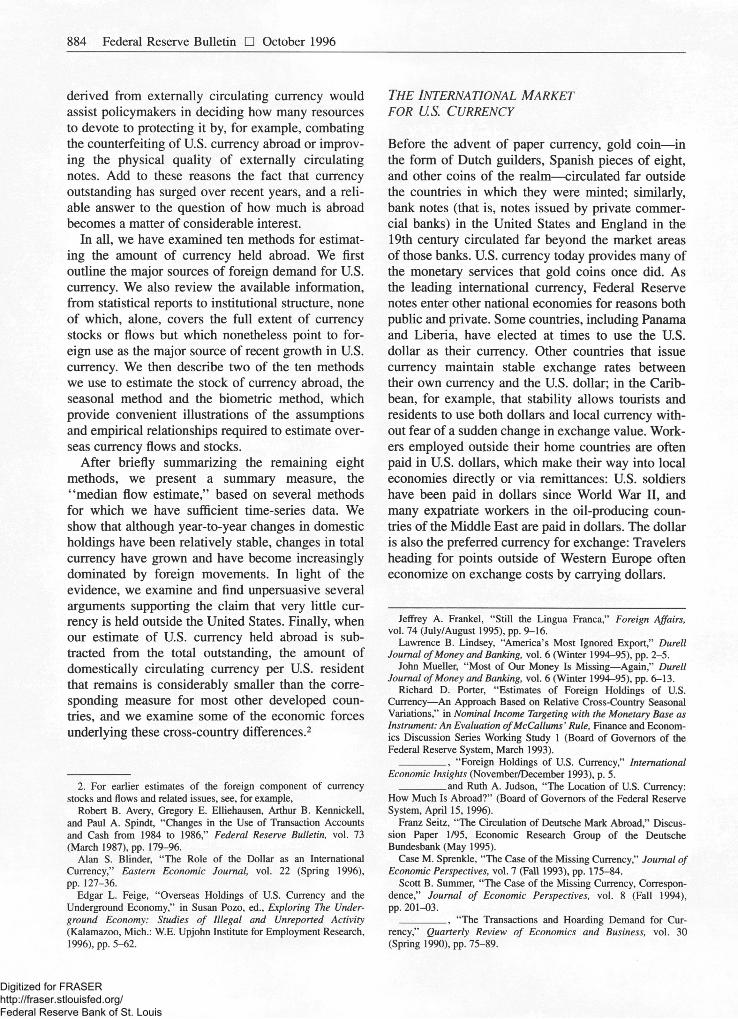
Finally, basic domestic macroeconomic data corrobo-rate our findings that recent currency growth is not driven by domestic factors. Empirically, the amount of currency outstanding typically grows in line with, or even a bit more slowly than, consumption in the United States. Indeed, this was the pattern until 1990. However, in the current decade, currency has grown about 3V6 percentage points more rapidly than con-sumption in nominal terms and in real per capita terms (table 3).13 Yet as the survey data show, the
12. We do not know the proportion of survey respondents who held $100s before their acquisition of cash, but we do know the maximum number of $100s they could have held from the individual data underlying table 1, line 2. Based on this maximum as well as on line 6 and the assumption that the average holding of this denomination is the initial amount plus one-half of the $100s acquired, the maximum amount of $100s held on average could not have been more than 30 percent of one note in the 1995 survey.
13. Currency in circulation is defined as currency, including coin, held outside of the Federal Reserve and the Treasury. The currency component of Ml is equal to currency in circulation less vault cash held at depository institutions. Definitive estimates on the amounts of currency that have been lost or destroyed are not available, but presumably the quantities are small (see Robert Laurent, "Currency in Circulation and the Real Value of Notes," Journal of Money, Credit, and Banking, vol. 16, May 1974, pp. 213-26). In this paper we use a variety of currency measures, the choice of which depends on the availability of the data needed for a given method; hence, our esti-mates of currency abroad do not always refer to exactly the same currency concept. The differences between the currency measures are
1990s have been a period of declining use of cash for consumption spending within the United States. In real per capita terms, the amount of notes outstand-ing, other than $100s, has not changed much since the late 1950s, so the increase is almost all attribut-able to $100s: the stock of $100s outstanding has risen about $700 in real terms, to nearly $850, since 1959.
Other data pointing to a dominant external demand for currency are the changes in total real per capita currency holdings and the ratio of currency to M2 since 1959, which are a puzzle if one ignores foreign currency demands (chart 1). In real terms, total per capita balances for all denominations plus coin increased relatively slowly from 1959 to 1979, then jumped sharply from the early 1980s to the end of 1995. In contrast, the direction of change in the ratio of currency to M2 was generally downward until the late 1980s, a trend that reflected in part the absence of interest paid on currency and the implicit or explicit interest paid on the rest of M2.14 Because most of M2 bears interest at the market rate and currency yields no interest, households have an incentive to econo-mize on currency in favor of other M2 assets, so the ratio should (other things equal) tend to decrease over time. Indeed, one might have expected this decline to have accelerated somewhat as more and more of M2 bore a market rate of interest, a process that began in 1978 and was completed for the explicit interest-
very small, however, relative to the magnitude of the uncertainty inherent in our estimates of overseas currency holdings. To reflect that uncertainty, we round all of the reported percentage estimates to the nearest percent.
14. A similar declining pattern for this or comparable ratios holds in most other developed countries.
Digitized for FRASER http://fraser.stlouisfed.org/ Federal Reserve Bank of St. Louis
The Location of U.S. Currency: How Much Is Abroad? 889
3. Spending and currency measures in the United States, 1959-95
Period
Mean year-end to year-end growth (percent) Level, end of period
Period Personal consumption expenditures
Currency component
of Ml $100s
Currency component
of M l $100s Other
denominations
1959 1960-69 1970-79 1980-89 1990-95
1959 1960-69 1970-79 1980-89 1990-95
Nominal Billions of dollars
1959 1960-69 1970-79 1980-89 1990-95
1959 1960-69 1970-79 1980-89 1990-95
28.8 5.9 24.4 6.5 4.6 6.2 45.7 11.0 36.9 9.9 8.3 13.4 104.8 42.0 72.0 7.9 7.5 10.4 222.6 118.7 123.6 5.1 8.6 11.8 372.2 241.5 159.9
1959 1960-69 1970-79 1980-89 1990-95
1959 1960-69 1970-79 1980-89 1990-95
Per capita, real terms Per capita dollars, real terms
1959 1960-69 1970-79 1980-89 1990-95
1959 1960-69 1970-79 1980-89 1990-95
701 144 594 3.0 1.1 2.7 779 188 630 2.3 .7 5.8 839 336 576 2.1 1.7 4.6 995 531 552 1.0 4.5 7.7 1,303 843 558
NOTE. Growth is at logarithmic rates. End-of-period values for the currency component of Ml are December averages; for denominations, December 31. Real terms calculated with the chain-type price index for personal consumption expenditures, 1992 base year.
. . . Not applicable. SOURCE. Federal Reserve, U.S. Department of the Treasury, and authors'
calculations.
bearing components of this aggregate in the mid-1980s. In any case, until the latter part of the 1980s, the downward trend in this currency ratio was inter-rupted only by business cycles. Thus, the large increase in the currency ratio starting at the end of the 1980s is a surprise, suggesting once more that explaining currency growth with domestic factors alone is problematic.15
estimates; thereafter, we summarize the other eight methods and present the median estimate.16 The sea-sonal and biometric approaches are indirect methods in that they do not directly use information about currency flows or currency abroad but infer them from other characteristics of currency.
The Seasonal Method
ESTIMATION METHODS
Because data on currency flows abroad are incom-plete, cumulating them does not provide a good esti-mate of the stock of currency held abroad. Thus, we combine the flow data with estimates from a variety of alternate methods. We have examined ten methods for estimating the share of currency abroad. We dis-cuss in detail two methods, one based on differences in the seasonal patterns of U.S. and Canadian cur-rency demand and one based on biometric population
In general, the seasonal method presupposes that U.S. currency held abroad behaves differently from U.S.
15. Part of the increase in the ratio reflects the shift of assets out of M2 into non-M2 instruments such as stock and bond funds in the first few years of the 1990s; see Athanasios Orphanides and Richard Porter, "P* Revisited: Money-Based Inflation Forecasts with a Chang-ing Equilibrium Velocity" (Board of Governors of the Federal Reserve System, 1996). But even after accounting for such shifts, the implied increase in the demand for currency from the low point of the ratio in the late 1980s would be quite large, on the order of $140 bil-lion to account for the increase in the ratio. We will show below that a shift of this magnitude is consistent with most of the estimates of net shipments of currency abroad during the period since 1988 (table 5).
We have not included interest rates in the discussion, even though they move in the right direction to explain some of the recent accelera-tion in currency growth (table 3). We do not find compelling evidence that the interest sensitivity of currency is large enough to explain this acceleration (see appendix A).
16. For details of these methods, see Porter and Judson, "The Location of U.S. Currency."
1. U.S. currency ratio and the total real stock of U.S. currency measured in dollars per U.S. resident
Chained (1992) dollars
NOTE. Currency ratio calculated with the currency component of Ml (see text note 13). Per capita holdings deflated by the chain-type price index for personal consumption expenditures, 1992 base year. Shading indicates periods of recession as defined by the National Bureau of Economic Research.
Digitized for FRASER http://fraser.stlouisfed.org/ Federal Reserve Bank of St. Louis

890 Federal Reserve Bulletin • October 1996
currency held at home in some measurable respect.17
The average measured characteristic of currency, say X, will be a weighted average of the characteristic for the domestically held currency, XD, and of that for the foreign-held currency, XI, as follows:
(1) X=(3Xrf + (l
where the weight P is the domestic share of total currency outstanding, and 1 — (3 is the foreign share. By observing the overall behavior of currency, we know X. We exploit various data to infer XD or XF, thus allowing an estimate of the shares of currency held at home and abroad (see box "The Seasonal Variation Technique").
The seasonal method uses relative seasonal varia-tions in the currency circulating in the United States and Canada to infer overseas holdings of dollars.18
Four assumptions underlie this method: (1) the sea-sonal pattern in domestic demand for U.S. dollars is similar to the seasonal pattern of demand within Canada for Canadian dollars, (2) foreign demand for U.S. dollars has no significant seasonal pattern, (3) the circulation of Canadian dollars outside of Canada is negligible, so that the demand for Cana-dian dollars can be attributed solely to domestic demand, and (4) U.S. currency is not used to a substantial degree inside Canada. Under these assumptions, the share of U.S. currency abroad can be deduced by comparing the seasonality of Cana-dian currency in circulation to the seasonality of all U.S. currency in circulation. If foreign holdings exhibit seasonality similar to that of domestic hold-ings, the estimate generally provides a lower bound on the share of currency held abroad.
Seasonality in Currency Holdings and in Banking Shipments
One factor undercutting any seasonality in foreign holdings is the unpredictable timing of foreign national crises, which tend to precipitate large dollar inflows to the affected nation. In addition, transaction costs may discourage foreign users from returning to the United States those dollars received in routine exchanges that may have a seasonal pattern. If for-eign currency holdings have relatively little seasonal-ity and have tended to increase relative to domestic
17. Two other indirect methods, the coin and demographic, also embody this assumption (Porter and Judson, "The Location of U.S. Currency").
18. Porter and Judson, "The Location of U.S. Currency."
holdings, then overall seasonal variations in U.S.cur-rency holdings should have diminished. Rough sup-port for such a hypothesis comes from a comparison of the 1959-63 seasonal variations in the currency component of Ml with the component's 1991-95 variations. The seasonal fluctuations for the last five-year period are much reduced from what they were in the early period (chart 2).19
Canada as the Benchmark for U.S. Domestic Behavior
Canada is a suitable benchmark for comparison for two basic reasons. First, Canadian currency is not used outside of Canada to any significant degree. Second, because the United States and Canada have a similar set of major holidays and school vacations and share many customs, the seasonal variations in retail sales and in consumption in the two countries are similar; hence the induced domestic demand for their respective currencies should also have about the
19. The degree of the decline may be overstated in the chart because of differing trends in the two periods. To investigate more precisely, we use a seasonal filter, STL, to extract the seasonal component of the series and focus on the seasonal amplitude, which is the difference between the maximum seasonal effect (reached in December) and the minimum (usually reached in the subsequent February). According to this measure, the amplitude of seasonal variation declines about one-half from 1960 to 1995. The STL method is set out in Robert B. Cleveland, William S. Cleveland, Jean E. McRae, and Irma Terpenning, "STL: A Seasonal-Trend Decomposi-tion Procedure Based on Loess," Statistics Sweden, Journal of Offi-cial Statistics, vol. 6, no. 1 (1990), pp. 3-73. More formally, statistical tests indicate that net foreign shipments of currency by banks do not have a significant seasonal pattern; see Porter and Judson, "The Location of U.S. Currency."
2. Stock of U.S. currency in two periods, 1959-63 and 1991-95
Ratio scale, billions of dollars Ratio scale, billions of dollars
34 — 360
32 — 1991-95, (right scale)
320
30 —
28 —
1959-63, (left scale)
280
1 Dec. Dec. Dec. Dec. Dec.
NOTE. Currency measured as currency component of M l .
Digitized for FRASER http://fraser.stlouisfed.org/ Federal Reserve Bank of St. Louis

The Location of U.S. Currency: How Much Is Abroad? 891
The Seasonal Variation Technique
Typically, the currency component of Ml is seasonally adjusted with a model in which the unadjusted series is viewed as a product of three terms: a trend-cycle term, a seasonal term, and an irregular, or noise, term. The seasonal term in the unadjusted series (the reciprocal of the seasonal factor) is around 1 in periods without a discernible seasonal influence; it registers its largest values above 1 in periods of significant seasonal increases of currency, which occur around Christmas and the summertime vacation period; and it is typically the furthest below 1 after such periods, when the seasonal term typically declines sharply.
Given the assumptions above, the model for the domestic and foreign holdings of currency can be written as follows. First, overall currency holdings can be modeled as the product of a trend-cycle (and irregular) component and a seasonal component in the respective (domestic and for-eign) locations. In symbols let S be the seasonal term and T be the trend term so that
(1.1) TtS, = T}Sd + 7?Sf
where the superscript d is associated with the multiplicative currency components held domestically, the superscript/is associated with those components held outside the country, and the subscript t denotes time.1 The left side of equation 1.1 represents the overall unadjusted currency series as the product of the trend-cycle and seasonal terms, while the right side displays a parallel decomposition for the domestic and foreign components. If we let (5, be the fraction of the overall trend held domestically, and 1 - (3, the fraction held abroad, then equation 1.1 can be rewritten as
(1.2) r , s , = P , r ( s ? + ( i - p , ) W
Cancelling Tt from both sides of equation 1.2,
(1.3) s , = p , s ? + a - P , ) #
Observe that equation 1.3 is an example of the main text's equation 1, with the seasonal term playing the role of the X variable in that definitional equation. Finally, assuming that the foreign seasonal component is always equal to 1 (that is,
foreign demand does not vary seasonally), we can simplify equation 1.3 slightly:
(1.4) S, = + (1 - P,)
Given values for the seasonal terms, equation 1.4 becomes a single equation in one unknown, (3,. We can solve for provided that the seasonal terms in equation 1.4 do not equal 1. In periods without a seasonal influence (which is when 5, = 1 and S,d =1), any value of P, is consistent with equation 1.4, so we cannot identify a unique value. Thus, the method generates sensible estimates at an annual fre-quency but not at all frequencies.
The best estimate of the model is obtained by measuring the seasonal variation around Christmas, specifically from the seasonal high that is reached in currency in December to the seasonal low in February. This period of the year is the one in which the seasonal in currency is best aligned with the seasonal in transactions (retail sales).
Formally, we take equation 1.4 and rewrite the time subscript t as m,y (where m refers to the mA month in the yA
year) and set (5, to (3. Then subtracting equation 1.4 for February from equation 1.4 for the preceding December and collecting terms in (3, we find that the share of currency held domestically is
°dec,y ^feb,y + 1
To calculate this equation with actual values, we assume, for the reasons given above, that Canadian data can be used to estimate what the relative seasonal variations in the United States would be without any foreign holdings of currency. Given a seasonal adjustment procedure, we can use the estimate of the overall seasonal component for the currency component of Ml in the United States to estimate the numerator in equation 1.5 and use the analogous term for Canada to estimate the denominator; with the value for p, the domestic share, the share held abroad is then calcu-lated as 1 - p.
1. The irregular term in the seasonal decomposition can be viewed as being confined within the trend term. Adding an explicit irregular term does not alter the results.
same seasonal pattern.20 This similarity implies that any difference between the seasonal variation in total
20. The notion that the seasonal term in retail sales induces the seasonal term in holdings of domestic currency is of long standing (see, for example, "Seasonal Variations in Money in Circulation," Federal Reserve Bulletin, vol. 18, December 1932, pp. 735^6) .
demand for U.S. currency and that for Canadian currency likely reflects foreign demand for U.S. cur-rency. In addition, Canada's set of denominations is similar to that in the United States, and the bilateral exchange rate is sufficiently close to 1 that pair-wise comparisons of individual denominations or combi-nations of denominations in the two currencies can be considered.
Digitized for FRASER http://fraser.stlouisfed.org/ Federal Reserve Bank of St. Louis

892 Federal Reserve Bulletin • October 1996
Estimates from the Seasonal Method
Applying the seasonal method produces an estimate of the share of currency held abroad that begins with about 40 percent in 1960 and then rises uniformly, reaching 70 percent by 1995 (chart 3, top panel).21
The estimated rise in the currency share abroad stems both from the drop in seasonal amplitude within the United States and from an increase in that for Canada. Toward the end of the period, the growth in the share of currency held abroad moderated, but the implied flows abroad picked up sharply (chart 3, bottom panel) because of the large increase in overall cur-rency holdings.
21. The seasonal adjustment method, applied to the logarithm of the series, is from Cleveland and others, "STL: A Seasonal-Trend Decomposition." On balance, the results using XI1 ARIMA or offi-cial (central bank) adjustment procedures are very similar to those shown here. We have chosen to report the STL results because they are the smoothest, but the basic results would be little changed if other estimates were substituted. Because the time-varying estimate is calcu-lated without averaging, it might seem surprising that the estimate shown in the top panel of chart 3 is so smooth. By construction the STL seasonal adjustment procedure guarantees that the monthly sea-sonal components are smooth through time, a property that evidently carries over in this application to the ratios.
3. U.S. currency abroad, estimated with seasonal method
Percent
Percentage held abroad
Billions of dollars
Net amount flowing^
1965 1970 1975 1980 1985 1990 1995
NOTE. Currency measured as currency component of Ml .
Biometric Estimates
Our use of the biometric method focuses on the supply of $100s. The share of the nationwide net issuance of $100s attributable to four Reserve Districts—New York, Atlanta, Dallas, and San Francisco—over the past twenty-two years is out of proportion to the Districts' shares of other national economic characteristics (table 2). The anomaly regarding these four Districts is consistent with our understanding that most foreign shipments of cur-rency go in and out of the New York District, with additional smaller net inflows through the Atlanta and Dallas Districts (from Latin America) and the San Francisco District (from the Far East).
To obtain a more precise understanding of such regional breakdowns, including the overall domestic-foreign split in currency holdings, the second estima-tion method we develop mimics a technique used by biologists to estimate the size of an animal population when they are able to capture only a sample of the population at any given time. The approach draws on studies by a Danish biologist, Carl Petersen, who worked more than 100 years ago. Petersen's work suggested that an animal population can be estimated by capturing a sample of animals, marking them, releasing them, and capturing another sample later.22
Assuming that the marks do not affect the animals' ability to survive (and thus their likelihood of being in the second sample), the share of marked animals in the (unknown) general population will be the same as the share of marked animals in the recaptured sample (see box "The Biometric Method").
We adapt Petersen's approach to obtain an estimate of how much U.S. currency is abroad by combining two sources of information. First, data from Federal Reserve Cash Offices on currency shipped to and from local banks allow us to obtain virtually continu-ous "samples" of currency. Second, although cur-rency is not literally marked, statistics for the pre-1990-series note are maintained separately from those for the 1990-series $100 note, which contains an embedded security thread.23 We can think of the 1990-series notes as marked animals: When a pre-
22. E.D. Le Cren, "A Note on the History of Mark-Recapture Population Estimates," The Journal of Animal Ecology, vol. 34 (June 1965), pp. 453-54, notes that Petersen did not use the method for counting but that others properly credit him with the method. See C.G. Joh. Petersen, "On the Biology of Our Fiat-Fishes and on the Decrease of Our Flat-Fish Fisheries," Report of the Danish Biological Station, vol. 4, 1893. See also G.A.F. Seber, The Estimation of Animal Abundance and Related Parameters, 2d ed. (Macmillan, 1982).
23. The 1990-series notes were introduced in August 1991, in $100s. The 1996-series $100 note was introduced in March 1966 (see box "The 1996-Series $100 Note").
Digitized for FRASER http://fraser.stlouisfed.org/ Federal Reserve Bank of St. Louis

The Location of U.S. Currency: How Much Is Abroad? 893
The Biometric Method
For any geographic area, the total population of notes to be estimated, N, can be expressed in relation to three known numbers: M, the total number of marked (1990-series) notes; n, the number of notes in a sample; and m, the number of marked (1990-series) notes in a sample. Assum-ing that the notes circulate freely and randomly, so that the sampled proportions of marked notes are representative of the notes circulating in the area chosen, Petersen's approach (see text note 22) tells us that the sample proportion of marked notes is equal to the proportion of marked notes in the whole population:
( i . D ^ N n
With the total number of notes in the population, N, in some geographic area (for example, a Federal Reserve Cash Office's area) as the only unknown in this relationship, we can solve for it as
(1.2) N =— M m
We have used the Petersen method to obtain estimates of Federal Reserve 1990-series $100 and $50 notes circulating in the United States and abroad ($50s with the embedded security thread were introduced in 1992). We know the total number of marked notes, M, from outflows of the 1990-series $100s and $50s from each of the Federal Reserve Cash Offices; and we know the ratio of total sampled notes to marked sampled notes, n/m, from notes that are received from circulation at each Cash Office.
Because almost all currency sent to and received from foreign countries goes through the New York City Cash Office, we provisionally assume that this office is the for-eign pool and the rest of the Offices together constitute the domestic pool. We estimate total notes in circulation throughout the United States excluding New York City, say Nmy, by applying equation 1.2 to the pool consisting of all the Offices outside New York City. Then, to obtain an estimate of total domestic currency circulation (that is, including New York City), Nd, we scale up to account for the population served by the New York City Cash Office:
Unlike the biologists, we do know N, apart from what has been lost or destroyed.1 Using N, the estimate for total notes, the number of notes held in foreign countries is Nf~ N - Nd, and the share of notes abroad is just Nf/N. This method has the advantage of using parallel estimates for domestic and foreign circulation. Using the actual N, the share of currency abroad is estimated as Nf/N, which has the advantage of using our knowledge of the total amount of currency in circulation for each of the denominations.
The range of estimates for each denomination (see table) can be considered outer bounds for the true figures because of the way they represent hoarded notes. The biometric method is able to estimate only the population of notes actively in circulation; the bank notes that are hoarded do not circulate and hence cannot be part of the estimates of n/m for any location. When the foreign share is estimated as the ratio of notes circulating in the foreign pool to all notes outstanding, the implicit assumption is that all uncounted notes are in the domestic pool, which is presum-ably not true; thus, the estimate is a lower bound of cur-rency held abroad. Similarly, estimating the foreign share as the number of notes in the foreign pool over total measured notes implicitly assumes that notes are hoarded in the same proportion that they circulate. In this case, if notes are hoarded disproportionately abroad, the estimate could be higher; however, the estimate for $100s is about 70 per-cent, and we find it unlikely that more than 70 percent of the hoarded notes in the world are hoarded abroad. Thus, we consider this estimate an upper bound.2
1. A difference between this problem and the biometricians' is that they capture and count marked species over discrete time intervals, whereas the Federal Reserve continuously processes currency. Thus, our computations should, in principle, use a lag of the quantity of new notes in circulation to account for the fact that notes released during the sample period are not actually part of the pool for the whole period. In practice, lags do not appear to matter. For estimates of notes that are lost and destroyed, see Laurent, "Currency in Circulation."
2. The estimates appear to be relatively robust to alternative assumptions about the location of the foreign pool. Little changes if, as part of the foreign pool, we include two other cities, Los Angeles and Miami, that are believed to have significant foreign currency activity. Generally, if we try to align the District biometric estimates with the relevant economic variables that influ-ence domestic currency location, we obtain estimates of domestic holdings that are similar to the aggregate biometric estimates.
P°Pny POPxn>
where popny is the population served by the New York City Office, and popxny is the population served by the rest of the Cash Offices combined.
We can estimate the foreign share of currency holdings in two different ways, depending on whether total notes are determined as the sum of the notes in all the Federal Reserve Districts, say N = Nny + Nmy (that is, an estimate) or are taken as the actual total of notes in circulation, say N.
Biometric estimates of currency held abroad Percent
Year
$50s $100s
Value used for total bank notes
Estimated Actual Estimated Actual
1991 n.a. n.a. 56 82 1992 29 62 47 75 1993 30 54 53 72 1994 34 48 60 71 1995 40 49 66 75
Digitized for FRASER http://fraser.stlouisfed.org/ Federal Reserve Bank of St. Louis

894 Federal Reserve Bulletin • October 1996
1990 note is "sampled," or returned to a Federal Reserve Cash Office, it is "marked" by being replaced with a 1990-series note. We know how many 1990-series notes have been issued by each Federal Reserve Cash Office, and we know how many return to the Cash Offices in later samples. Second, we make use of the institutional fact that the New York City Cash Office handles relatively few cash shipments to and from domestic banks and that most of the currency shipments it handles are to and from foreign banks. Thus, if we can estimate the "population" of dollars in the "pool" served by each Federal Reserve Cash Office, the currency abroad can be estimated as the population in the New York City Cash Office pool.
Using the biometric method, we find that the December 1995 estimate of the share of $100s held abroad is between 66 percent and 75 percent and the estimate for $50s (marked with a security thread in 1992) is between 40 percent and 49 percent.24
SUMMARY OF ALL ESTIMATION METHODS
In addition to the two methods described above, eight other techniques were developed to estimate the stock of U.S. currency held abroad. These are summarized in table 4.
The estimate of the foreign share of currency using indirect estimates of the type just described is just under 30 percent using the coin method and ranges from about 50 percent to 70 percent using the bio-metric, demographic, and seasonal methods (table 5).
Although flow-based methods (both direct and out-lier) do not yield straightforward estimates of the stock held abroad, such estimates can be derived because the flow data over the years can be consistent only with a relatively narrow range for the overseas stock. The estimates are obtainable from a trial-and-error procedure using various assumed values for the current proportion abroad.25
24. As an alternative, we have also estimated the model for each Cash Office and then aggregated the results. The estimate in the text should be preferred if there are significant movements of currency (leakages) across these domestic pools. In any event, this alternative estimate tends to be within a few percentage points of those shown in the text by the end of the sample period. Thus, it does not seem to matter very much whether we explicitly consider leakages of currency across the domestic pools.
25. To see the steps involved, consider what foreign holdings of currency would be consistent with some flow estimates. According to the shipments proxy, currency shipped abroad between 1977 and 1995 totaled $183.3 billion, on net, as shown in table 5, column 1. If no currency had been held overseas at the end of 1976, the total stock of foreign holdings at the end of 1995 would have been $183.3, or 49 percent of the total outstanding. At the other extreme, if all
The 1996-Series $100 Note
Domestic and foreign shipments of a newly designed U.S. $100 note began in March 1996. Aside from minor changes introduced in 1990, the 1996 note was the first redesign of U.S. currency since 1928. The goal of the change was to preserve as much of the traditional appear-ance of the note as possible while introducing new secu-rity features that would make the note more difficult to counterfeit. With the new design, which will be applied to smaller denominations over six- to twelve-month inter-vals, notes are the same size, use the same ink color and paper, and feature the same historical figures and monu-ments as before. However, the portrait has been enlarged and moved to the left to make room for a watermark that matches the portrait. Other security features include microprinting around the portrait and elsewhere, a thread woven into the note in a different position for each denomination, and, for the larger denominations, a spe-cial ink for the denomination number in the lower right front corner of the note that changes color when one changes the viewing angle of the note.
Taking the midpoint of this range of estimates gives us a way of assigning an end-of-year value for the share abroad for any method for which we have flow data; for example, we derive an extreme range of 49 percent to 71 percent for the shipments proxy (see note 25), the midpoint of which is 60 percent.26
Overall, the shares of currency held abroad at year-end 1995 as derived from the flow-based estimates range from the low of 17 percent for the CMIR statistics to a high of 60 percent using the shipments proxy.
We have also used the same trial-and-error method to get an estimate of currency held abroad averaging across all of the methods. We begin by taking the estimated flows abroad for each year of the period
currency outstanding at the end of 1976 had been held overseas ($80.1 billion, not seasonally adjusted), then the stock of foreign holdings would have been $263.4 billion, or 71 percent of the total.
26. Clearly, neither endpoint is likely to be correct, whereas a value near the middle is much more likely to be so. Thus, we will use the midpoint in what follows as a rough gauge of the percentage held abroad.
Digitized for FRASER http://fraser.stlouisfed.org/ Federal Reserve Bank of St. Louis

The Location of U.S. Currency: How Much Is Abroad? 895
the midpoint between the two extremes), we obtain a midpoint estimate of 55 percent as the proportion of total currency that was held abroad at the end of 1995.
As a check on this estimated percentage abroad, it is helpful to evaluate the largest denomination in active circulation, the hundred-dollar bill, which plays such a major role in the overseas currency market. The available estimates for $100s, shown in table 5, are consistent with 74 percent of this denomi-nation being held abroad. If only $100s were abroad, they alone could account for an overseas share for total currency of 44 percent. A reasonable assump-tion is that the smaller denominations could easily
4. Methods for estimating currency abroad
Method Description
Indirect (stock-based) Seasonal Described in text
Biometric Described in text
Coin As in the seasonal method, we use Canada's ratio of notes to coin to estimate the U.S. domestic ratio, assuming that U.S. coins are not typically used outside the country
Demographic Estimates of the ages of domestic and foreign notes were obtained from special samples of physical notes taken in March and October 1989. The overall age of notes in circulation is a weighted average of notes circulating abroad and domestically
Direct (flow-based) Customs reports Businesses and individuals moving more than $10,000 across U.S. borders must generally file
Currency and Monetary Instrument Reports (CMIRs) with U.S. Customs. Incoming travelers are informed of the filing requirement on their Customs Declaration. Departing travelers are occasionally informed of the filing requirement or are targeted for enforcement purposes
Foreign currency shipments Net foreign currency shipments are reported to Federal Reserve Cash Offices on an informal basis by the small number of commercial banks that are major international shippers of currency
Shipments proxy We assume that monthly net shipments of $100s from the New York City Cash Office are approximately equal to net shipments abroad of all currency. We exploit the institutional fact that foreign shipments are predominantly in $100 notes and that they most often originate at the Federal Reserve Bank of New York. We assume that the three sources of disparity between actual net flows and New York shipments (that is, the quantity of $100s used domestically within the area served by the N Y. Office, the quantity of lower-denomination notes this Office sends abroad, and foreign shipments by other Cash Offices) are all small
Cash Office flows We compare currency shipment data from each Federal Reserve Cash Office with other indicators of regional cash demand such as population and income. Cash Offices whose share of total shipments is much different from their population or income shares are assumed to be making or receiving foreign shipments. Statistical methods yield an estimate of the domestic cash demand component as indicated by local population and income
Outlier-based (flow-based) Money demand If currency holdings abroad increase sharply, then predictions of U.S. demand based on domestic
factors such as U.S. interest rates and transactions should produce a significant underestimate. This approach measures the net flows of currency abroad from prediction errors generated by the Federal Reserve Board staff's currency demand model
Signal extraction Like the money-demand method, this method is based on outliers from a prespecified relationship, in this case a time-series model
Summary measure of currency flows abroad Median flow estimate Computed as the median in each year of the estimates from seven of the above methods: seasonal,
coin, Customs reports, shipments proxy, Cash Office flows, money demand, and signal extraction. The remaining three methods do not have data for enough years to be included in this estimate
from 1977 to 1995 for each of the seven available methods.27 For each year of the period, we take the median value of the seven estimates, which are then summed across years to obtain the total median flow estimate for the entire period, shown in the first two columns of the bottom row of table 5. Taking the flows from the median flow estimate and using the same technique to estimate year-end shares that we used before for each of the direct methods (taking
27. For three of the methods (biometric, demographic, and foreign currency shipments), we do not have sufficient years of data to include them in the median calculation.
Digitized for FRASER http://fraser.stlouisfed.org/ Federal Reserve Bank of St. Louis

896 Federal Reserve Bulletin • October 1996
contribute 11 additional percentage points.28 Thus, the evidence for $100s appears consistent with an estimated minimum of around 55 percent of currency being held abroad.
PROPERTIES OF MEDIAN FLOW ESTIMATE OF OVERSEAS CURRENCY FLOWS
All our methods except the CMIR indicate that over-seas currency flows are large and growing. We focus on the median flow estimate because it does not depend very much on the results of any one method. The median flow calculations show that the overseas component of currency flows has been picking up, to more than 70 percent of total currency flows in the
28. Estimates from the biometric, seasonal, and demographic meth-ods for denominations less than $100 can easily account for the needed increment.
5. Net flows of U.S. currency to foreign locations and the percentage of U.S. currency abroad, by method of estimation
Method
Flow (billions
of dollars)1
Stock, December 1995 except as noted
(percent) Method
1977-95 1988-95 Overall $100s
Indirect (stock-based) methods Seasonal 223.6 132.5 70 74 Biometric n.a. n.a. n.a. 70' Coin 173.8 92.2 29 Demographic 4 9 2 51 3
Direct (flow-based) methods Customs reports 5.2 42.1 17* n.a. Net foreign currency shipments,
as compiled by N.Y. FR Cash Office n.a. 107.1 54 4
Shipments proxy 183.3 140.3 60 4
Estimates based on Cash Office flows 163.1 123.2 55 4 6 3 4
Outlier-based (flow-based) methods Money demand 119.6 104.6 43 4
Signal extraction 179.6 140.4 594 9 4 4
Median flow estimate3 163.8 123.1 55 4 7 4 6
NOTE. For detail on the results of the coin, shipments proxy, Cash Office, and outlier-based methods, see Porter and Judson, "The Location of U.S. Cur-rency." For detail on the demographic method, see Feige, "Overseas Hold-ings of U.S. Currency."
1. The average of the two estimates that bound the true value. 2. Surveys taken in the spring and fall of 1989. An updated estimate of the
currency held abroad based on this 1989 estimate and the median flow estimate (last row in table) yields a result of 59 percent at the end of 1995.
3. This value becomes 78 percent when updated by the increase in $100s since 1989 that is associated with the shipments proxy.
4. Midpoint of feasible range for proportion of currency held abroad; see text.
5. Computed by taking, for each year, the median of the seven methods that have data for 1977-95 and then taking the median of the resulting series.
6. Median of all methods yielding a value, with the demographic value updated as in note 3.
n.a. Not available. . . . Not applicable.
1990s (table 6). The domestic flows show no distinct trend, and most of the year-to-year changes in the currency component of Ml (including the pickup in the 1990s) are accounted for by variations in the foreign flows.29 (Appendix A is an economic and statistical analysis of these summary flows.)
Two notable multiyear spurts appear in the net amount of currency going abroad: in 1990 and the early part of 1991 and again in 1993 and 1994. The first surge is associated with an increase to Argentina and with a worldwide increase in the demand for dollar currency as a result of the Persian Gulf war; the second is part of the deteriorating situation in Russia and other parts of the former Soviet Union. Although overseas currency flows tended to drop back somewhat after these surges, the general upward path for foreign currency shipments is unmistakable.
Predicting the future course of shipments is even more problematic than estimating past flows. Some of the currency held abroad is used by travelers to areas outside of Western Europe, so that more such travel is likely to increases the foreign demand for currency. But the remaining, larger component is much more unpredictable and subject to massive and abrupt shifts because of wars or fundamental changes in economic and political regimes or to evolving fears about such developments.
29. Statistically, they have a simple correlation coefficient of 0.98 with annual data.
6. Increase in the currency component of Ml, by foreign or domestic destination Billions of dollars except as noted
Year Total increase1
Going to foreign economies
Going to domestic economy
Year Total increase1
Amount Percent Amount Percent
1977 7.9 1.6 20.2 6.3 79.8 1978 8.6 2.6 29.8 6.1 70.2 1979 8.8 2.4 27.2 6.4 72.8
1980 10.6 3.6 33.7 7.0 66.3 1981 7.2 2.3 32.0 4.9 68.0 1982 9.9 3.8 38.1 6.2 61.9 1983 13.7 5.3 38.7 8.4 61.3 1984 9.9 3.5 35.6 6.4 64.4
1985 11.8 5.0 42.5 6.8 57.5 1986 12.8 4.6 36.2 8.2 63.8 1987 16.1 6.0 37.3 10.1 62.7 1988 15.4 6.5 41.9 9.0 58.1 1989 10.4 5.7 54.5 4.7 45.5
1990 24.2 18.3 75.7 5.9 24.3 1991 20.6 15.1 73.1 5.5 26.9 1992 25.5 18.1 71.2 7.3 28.8 1993 29.5 22.3 75.6 7.2 24.4 1994 32.5 23.6 72.5 8.9 27.5
1995 18.3 13.6 74.5 4.7 25.5
1. December to December, seasonally adjusted. SOURCE. Federal Reserve and authors' calculations.
/ Digitized for FRASER http://fraser.stlouisfed.org/ Federal Reserve Bank of St. Louis

The Location of U.S. Currency: How Much Is Abroad? 897
Finally, the growth of total U.S. currency outstand-ing over the past fifteen years has clearly outpaced both the inflation rate and the growth of the U.S. population (that is, as shown in chart 4, total real U.S. currency outstanding per U.S. resident has risen sub-stantially since the early 1980s). But the level of real domestic balances has been nearly flat since the late 1980s (chart 4), a result, perhaps, of the increasing use of currency substitutes such as checks and credit cards (as found in the 1995 currency survey). By contrast, real foreign demand has been increasing sharply, resulting in a more stable appearance for the trend in total real currency per US. resident than for either of its components.30
The Contrarian View That Most U.S. Currency Is Held at Home
One of our basic findings is that most of the recent increase in the demand for currency has been from outside of the United States. The other possibility is that the increased demand has been domestic in ori-gin. But domestic sources for the recent surge in total cash holdings are difficult to identify. Most analysts do not ascribe very much currency holding to busi-nesses; the thinness of their likely holdings can be
30. The foreign component is the median flow estimate for 1977-95, here deflated by U.S. population because we are uncertain of the size of the foreign population that holds US. currency. The levels for the foreign component are based on the midpoint of the range for this series, estimated to be 55 percent at the end of 1995.
4. Median flow estimate of the foreign component of the total real stock of U.S. currency, measured in dollars per U.S. resident
Ratio scale, chained (1992) dollars
1980 1985 1990 1995
NOTE. Currency measured as currency component of Ml and deflated by the chain-type price index for personal consumption expenditures, 1992 base year.
1. The domestic component is defined here as total less foreign.
seen from simple back-of-envelope calculations.31
And we have already seen that surveys do not assign much cash to households, although respondents may understate the true amounts they hold.32
An unreported rise in the use of currency could reflect a rise in tax evasion or underground activity (such behavior is very unlikely to be picked up in a survey of currency usage). But the estimated size of the unrecorded economy does not seem sufficient to account for the observed increase in currency hold-ings. Suppose that 10 percent of U.S. gross domestic product were generated in the cash economy—a gen-erous assumption—and that all worldwide illegal drug transactions were exclusively done with U.S. currency (an assumption that double counts the illegal drug transactions included in the U.S. cash economy). We know from currency surveys that an average unit of currency turns over on the order of thirty-five to fifty times per year. Thus, the amount of currency required to support both the 10 percent of our $7 tril-lion GDP economy plus all drug trafficking (reported to be on the order of $300 billion) would be between about $20 billion and $30 billion, or only 5 percent to 8 percent of U.S. currency outstanding.33
Tax avoidance is the most likely other possibility that would account for the cash we attribute to for-eign holdings. Suppose that, to avoid taxation, indi-viduals and businesses manage to hide sizable
31. Most businesses need nothing more than seed cash to operate, and the total amount of such cash is not likely to be significant, as the following calculation shows. Almost 2.7 million retail establishments existed in 1992. Taking certain elements of cash use at supermarket chains as the standard for all retail establishments that year, assume that each establishment had ten cash registers (currently the median number for supermarket chains) and each register contained $200 of seed cash (the amount that at least one large supermarket chain uses for that purpose); then the total currency holdings by all retail estab-lishments would have been only $5.4 billion, or 1.8 percent of the total stock of currency at the end of 1992. If, in addition, one business days' worth of total consumption was always in transit to depository institutions, the total amount from both of these sources would have been only $22.3 billion, or only 7.7 percent of total currency holdings in that year.
32. Even taken at face value, CMIR statistics contradict claims that the foreign component is small. For example, the CMIR data imply that, taking the midpoint of the range of estimates, 17 percent of currency was held abroad at the end of 1995; but in that case, the implied amount overseas at the beginning of the sample (the end of 1976) would have been 67 percent. On the other hand, if little currency is held abroad currently, how would one account for the $53.2 billion in currency that was returned to the United States in 1995, according to CMIR statistics?
33. That is, with a turnover rate of fifty, ([0.1 x 7 x 1012] + [300 x 109]) / 50 = 20 x 109. The most recent cash survey, in 1995, found that the turnover rate of currency was about thirty-six times per year, down from a rate of fifty times per year in the mid-1980s (a decline from about seven days per turnover to ten). Such a decline might be expected in light of the generally lower level of interest rates prevail-ing more recently.
Digitized for FRASER http://fraser.stlouisfed.org/ Federal Reserve Bank of St. Louis
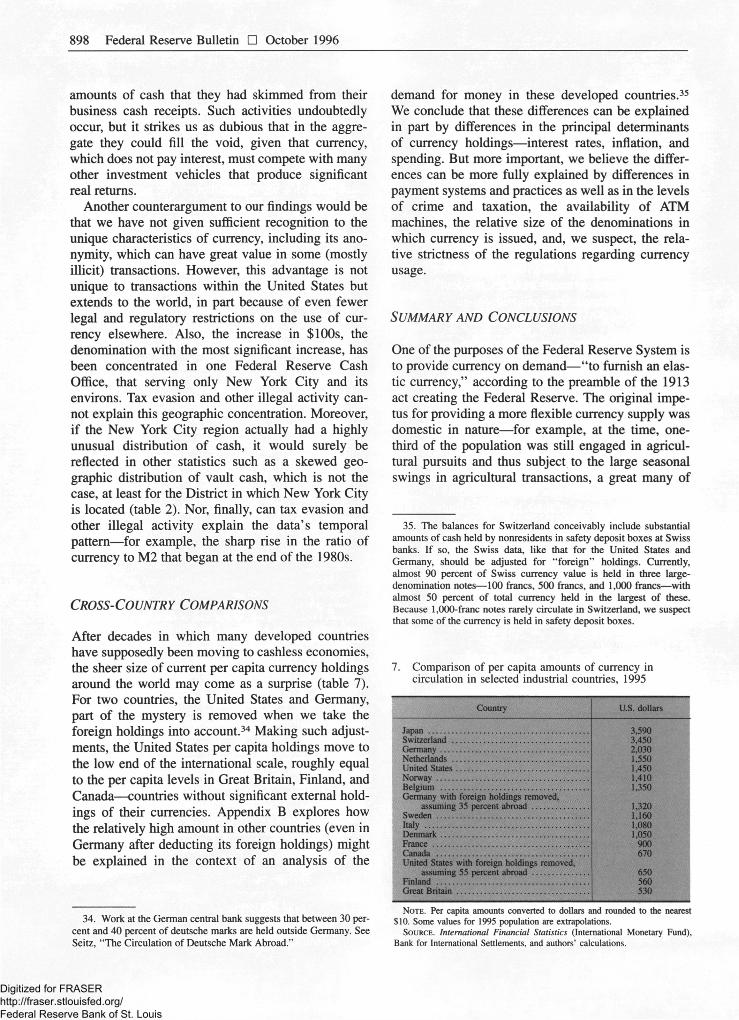
898 Federal Reserve Bulletin • October 1996
amounts of cash that they had skimmed from their business cash receipts. Such activities undoubtedly occur, but it strikes us as dubious that in the aggre-gate they could fill the void, given that currency, which does not pay interest, must compete with many other investment vehicles that produce significant real returns.
Another counterargument to our findings would be that we have not given sufficient recognition to the unique characteristics of currency, including its ano-nymity, which can have great value in some (mostly illicit) transactions. However, this advantage is not unique to transactions within the United States but extends to the world, in part because of even fewer legal and regulatory restrictions on the use of cur-rency elsewhere. Also, the increase in $100s, the denomination with the most significant increase, has been concentrated in one Federal Reserve Cash Office, that serving only New York City and its environs. Tax evasion and other illegal activity can-not explain this geographic concentration. Moreover, if the New York City region actually had a highly unusual distribution of cash, it would surely be reflected in other statistics such as a skewed geo-graphic distribution of vault cash, which is not the case, at least for the District in which New York City is located (table 2). Nor, finally, can tax evasion and other illegal activity explain the data's temporal pattern—for example, the sharp rise in the ratio of currency to M2 that began at the end of the 1980s.
CROSS-COUNTRY COMPARISONS
After decades in which many developed countries have supposedly been moving to cashless economies, the sheer size of current per capita currency holdings around the world may come as a surprise (table 7). For two countries, the United States and Germany, part of the mystery is removed when we take the foreign holdings into account.34 Making such adjust-ments, the United States per capita holdings move to the low end of the international scale, roughly equal to the per capita levels in Great Britain, Finland, and Canada—countries without significant external hold-ings of their currencies. Appendix B explores how the relatively high amount in other countries (even in Germany after deducting its foreign holdings) might be explained in the context of an analysis of the
demand for money in these developed countries.35
We conclude that these differences can be explained in part by differences in the principal determinants of currency holdings—interest rates, inflation, and spending. But more important, we believe the differ-ences can be more fully explained by differences in payment systems and practices as well as in the levels of crime and taxation, the availability of ATM machines, the relative size of the denominations in which currency is issued, and, we suspect, the rela-tive strictness of the regulations regarding currency usage.
SUMMARY AND CONCLUSIONS
One of the purposes of the Federal Reserve System is to provide currency on demand—"to furnish an elas-tic currency," according to the preamble of the 1913 act creating the Federal Reserve. The original impe-tus for providing a more flexible currency supply was domestic in nature—for example, at the time, one-third of the population was still engaged in agricul-tural pursuits and thus subject to the large seasonal swings in agricultural transactions, a great many of
35. The balances for Switzerland conceivably include substantial amounts of cash held by nonresidents in safety deposit boxes at Swiss banks. If so, the Swiss data, like that for the United States and Germany, should be adjusted for "foreign" holdings. Currently, almost 90 percent of Swiss currency value is held in three large-denomination notes—100 francs, 500 francs, and 1,000 francs—with almost 50 percent of total currency held in the largest of these. Because 1,000-franc notes rarely circulate in Switzerland, we suspect that some of the currency is held in safety deposit boxes.
7. Comparison of per capita amounts of currency in circulation in selected industrial countries, 1995
Country U.S. dollars
Japan Switzerland Germany Netherlands United States Norway Belgium Germany with foreign holdings removed,
assuming 35 percent abroad Sweden Italy Denmark France Canada United States with foreign holdings removed.
assuming 55 percent abroad Finland Great Britain
3,590 3,450 2,030 1,550 1,450 1,410 1,350
1,320 1,160 1,080 1,050
900 670
650 560 530
34. Work at the German central bank suggests that between 30 per-cent and 40 percent of deutsche marks are held outside Germany. See Seitz, "The Circulation of Deutsche Mark Abroad."
NOTE. Per capita amounts converted to dollars and rounded to the nearest $10. Some values for 1995 population are extrapolations.
SOURCE. International Financial Statistics (International Monetary Fund), Bank for International Settlements, and authors' calculations.
Digitized for FRASER http://fraser.stlouisfed.org/ Federal Reserve Bank of St. Louis

The Location of U.S. Currency: How Much Is Abroad? 899
which were undertaken with cash. But within a decade of the act's passage, the Federal Reserve began to collect data on overseas shipments of cur-rency by a number of large commercial banks in New York City, and over the subsequent seventy years, U.S. currency has become the world's leading cash medium. In addition to the dollar's virtues as cash (anonymity and compactness), dollars are held and used because of their liquidity and stability rela-tive to most of the world's currencies. While much of U.S. currency abroad is held in $100s, a significant amount also appears to be in smaller denominations.
Determining how much of U.S. currency has gone abroad or returned from abroad in any period is difficult. Identifying flows between the United States and any individual country is even more problematic. If the flows in both directions stay within the banking system, the banking data we have will often capture much of it. However, if the flows are extraordinarily large, as they appear to have been recently, the outlier methods—the money demand and signal extraction methods—may be able to pick up aggregate net out-flows as well.36
The difficulty is that not all currency moves across borders within the banking system. Thus, part of our motivation for developing the indirect methods, such as the seasonal and the biometric, was to capture flows that might not show up in the more direct measures. In fact, all of the methods except for that using the CMIR data from Customs suggest that a large amount of currency has gone abroad, and we are inclined to view those expansive estimates as being close to the truth. Does this mean that the methods are inherently good? Or is this just a coinci-dence? We think it safe to say that the movements abroad have been so large in the 1990s that any reasonable method would have a fair chance of pick-ing them up.
Our "median flow" estimates of the amount of currency held abroad and the size of recent overseas flows suggest that more than half of the nearly $300 billion increase in the currency component of Ml since 1976 has gone abroad to accommodate increased demands for Federal Reserve currency (table 6). Higher flows abroad would be registered if we used the shipments proxy (60 percent) and much lower flows would be estimated if we used the Cus-toms data on CMIRs (less than 2 percent). We have also estimated that between 55 percent and 70 per-
36. The same also applies to the Cash Office flows, which can be thought of as a crude form of money demand applied to the District or Branch level.
cent of the U.S. currency stock is currently held outside the country.
The large expansion of the stock of U.S. currency in the past decade—attributable, as we have seen, to foreign demand—has provided a significant rise in seigniorage to the U.S. Treasury and in the benefit that seigniorage provides to U.S. taxpayers. In the last several years, the Federal Reserve's holdings of U.S. securities (the bulk of the Federal Reserve's balance-sheet counterpart to the stock of U.S. currency outstanding) have yielded annual net earnings— seigniorage—of roughly $15 billion to $25 billion, which is turned over to the U.S. Treasury. Our esti-mate is that roughly one-half to two-thirds of the earnings is likely attributable to foreign holdings of U.S. currency.
In sum, we now have several methods of determin-ing the stocks and flows of dollars abroad. The esti-mates are far from identical, but they generally point in the same direction, toward large and increasing quantities of U.S. dollars abroad.
APPENDIX A: OTHER PROPERTIES OF THE MEDIAN FLOW ESTIMATE
Here are details on our investigation of the relation-ship of the changes in the overall demand for cur-rency and its domestic and foreign components and on considerations in determining a confidence inter-val for the median flow estimate.
The Median Flow Estimate and Domestic Demand
Recent changes in currency holdings seem to be dominated by the foreign component: While the for-eign component has been trending up, the domestic component has been rather flat at an average level of a little less than $7 billion (table 6). To see whether the domestic component responds to economic incen-tives, we regressed the change in the currency com-ponent of Ml on the median flow estimate as well as on variables possibly determining changes in the domestic demand for money.
If the coefficient on the median flow estimate is close to 1 (as it is in the regression reported in table A.l), then we can interpret the remaining coeffi-cients as a domestic money demand function for the annual change in domestic currency holdings. That is, with the full effect of the median flow esti-mate being captured by the change in the currency component of Ml, the result is essentially the same
Digitized for FRASER http://fraser.stlouisfed.org/ Federal Reserve Bank of St. Louis

900 Federal Reserve Bulletin • October 1996
as if we had subtracted the median flow estimate from the change in the currency component and then estimated a money demand function for domestic currency holdings. Of course, if the coefficient on the overseas flow is significantly different from 1, such an interpretation will not hold.
The domestic part of the specification explains the changes in domestic currency holdings by an inter-cept, the change in the nominal interest rate, and a consumption measure. The change in the nominal interest rate is measured (in the spirit suggested by Lawrence Ball) as the weighted average rate on a narrow alternative to holding currency, namely the components of M2 without any maturity: other checkable deposits, money market deposit accounts, savings accounts, and money market mutual fund accounts.37 The scale measure is the change in nomi-nal consumption expenditures (excluding those on automobiles, which are generally not bought with currency). The specification is in changes and not in levels because levels (together with lagged stocks to cover distributed lag effects) require accounting for the measurement error in the level of currency abroad.38
Each of the estimates has the correct sign, but most of the variance of the change in the currency compo-nent, at least at an annual frequency, apparently results from changes in foreign holdings and not domestic holdings. The framework of table A.l allows us to distinguish the relative contributions in an analysis of variance, and we find that almost 90 percent of the variance of currency changes results from changes in foreign currency holdings (row 2).
37. Lawrence Ball, "Velocity and the Return on Near Moneys," (Johns Hopkins University, June 1995).
38. If we drop any one of the methods from the median calculation, the resulting regression estimates are relatively similar to those shown in table A. 1.
1. Numbers in parentheses are t statistics. 2. Numbers in parentheses are the percentages of the variance of changes in
currency that are explained by each column or set of columns. . . . Not applicable.
Confidence Intervals for the Median Flow Estimate
An advantage of using the median flow estimate as the summary measure of currency flows abroad is that it readily permits statements of confidence inter-vals. From a statistical point of view, one may regard the seven estimates (one from each of our seven different methods) used in constructing the median flow estimate as a random sample from a continuous distribution of possible estimates; in that case, the sample median that we use is an estimate of the median of the population distribution.
In the example at hand, the median is the middle result obtained from the seven estimation methods and hence can be thought of as a result of discarding the three highest and three lowest estimates of net flows abroad; in that light, variations in confidence intervals for median flow estimates can be con-structed on the basis of variations in the number of extreme observations that are excluded from the calculation (chart A.l).39 For the widest confidence interval, none of the observations are excluded, so that the lower and upper confidence limits are formed by the lowest and highest of all seven observations; for the intermediate interval, the lowest and highest observations are excluded; and for the narrowest, the two lowest and two highest are discarded. These ranges may be useful if one wants to represent some
39. To obtain the widest interval, we drop none of the observations in constructing the range. In that case the probability that the range consisting of the smallest to largest flow would cover the true median in some period is about 0.98; alternatively, if one removed the top and bottom estimates from the set of seven, the resulting confidence interval for the median would be about 0.87; finally if one removed the top two and bottom two estimates, the probability that the result-ing interval would cover the true median would be about 0.55. See Robert V. Hogg and Allen T. Craig, Introduction to Mathematical Statistics, 5th ed. (Prentice Hall, 1995), pp. 497-98.
A.l. Results of regression of change in currency component of Ml on foreign demand and the determinants of domestic demand, and associated decomposition of variance
Item Foreign demand,
median flow estimate
Determinants of domestic demand
Residual standard error
Covariance term Ri Item
Foreign demand, median flow
estimate Intercept Change in
nominal interest rates
Change in consumption expenditures
Residual standard error
Covariance term Ri
Regression' .993 5.912 -1 .223 13.096 1.3 .9754 Regression' (15.1) (3.5) ( -2 .7) (.7)
Variance decomposition2 52.6 .9 1.7 3.1 Variance decomposition2
(90.3) 1 (1-5) (2.9) (5.3)
Digitized for FRASER http://fraser.stlouisfed.org/ Federal Reserve Bank of St. Louis

The Location of U.S. Currency: How Much Is Abroad? 901
of the uncertainty that exists about net flows of currency abroad.
For that purpose we are inclined to use either the intermediate or narrowest interval: The width of nei-ther interval shows any tendency to trend up over time; the widths are not constant but can get rela-tively narrow, as in 1990 or 1992, years for which the various methods are in broad agreement about net flows of currency abroad.
Another part of our reason for preferring the two narrowest ranges is that they exclude the smallest observation in each year and thus give less weight to
A. 1. Alternative confidence intervals for the median flow estimate
the CMIR data, which generally appear to underesti-mate net currency flows abroad and produce the smallest flow measure in nearly three-fourths of the periods. This result raises the question of how much the median flow estimate would rise if we excluded the CMIR statistics at the outset: In that case, the resulting summary measure matches the median flow estimate for much of the period and lies slightly above it otherwise; the average amount by which it exceeds the median flow estimate is only $0.5 billion per year.40
Alternatively, because the CMIR flows are most often at the bottom of the range of estimates, one could diminish their influence by constructing a con-fidence interval ranging from the next to the smallest flow to the largest flow in any period; such a range would cover the true median about 93 percent of the time. Further, as an indication of the level of uncer-tainty about net flows abroad, the implied standard error associated with such a range would currently lie between about %2Vi billion and $23/4 billion per year.
APPENDIX B: ESTIMATES OF CROSS-COUNTRY CURRENCY DEMAND
We investigated the degree to which the cross-country differences in per capita holdings of currency can be explained by various economic factors. We estimated currency demand equations for fourteen developed countries with data covering a seven-year period ending in 1993.41 The equations have the following specifications:
• The dependent variable, VELOCITY, which is the currency velocity of GNP, that is, the ratio of GNP to the estimated currency holdings that are inside the country but outside the banking system.
40. Taking the median of the six methods excluding the CMIR method would increase the midpoint estimate of the amount held abroad slightly, from 55 percent to 57 percent.
41. In our specification, all the variables are natural logs of the underlying series, and the variable names are written in small capital letters. We thank David B. Humphrey and his collaborators for mak-ing their cross-country currency data available to us (see David B. Humphrey, Lawrence B. Pulley, and Jukka M. Vesala, "Cash, Paper, and Electronic Payments," Journal of Money, Credit, and Banking, vol. 28, November 1996, part 2, in press). The only variable that we have added is RATIO OF REVENUE TO GDP from Robert Summers and Alan Heston, "The Penn World Table (Mark 5): An Expanded Set of International Comparisons, 1950-1988," The Quarterly Jour-nal of Economics, vol. 106 (May 1991), pp. 327-68. We used an updated version, Mark 5.5, available by anonymous ftp from ftp://nber.harvard.edu.
Digitized for FRASER http://fraser.stlouisfed.org/ Federal Reserve Bank of St. Louis

902 Federal Reserve Bulletin • October 1996
• Two opportunity cost terms, an interest rate (NOMINAL RATE) and the rate of inflation (INFLATION RATE). Higher opportunity costs tend to induce cur-rency holders to reduce their holdings, resulting in higher currency velocities.
• Two "scale" terms. The first, RATIO OF REVE-NUE TO GDP, accounts for the velocity effect of the underground economy: If government raises taxes, tax avoidance will rise, leading to more production in the off-the-books (cash) sector, which in turn increases the amount of currency per unit of output and thus works to lower velocity.
The second scale term is VIOLENT CRIME per 100,000 population. The effects of crime are ambigu-ous: On one hand, street crime is likely to reduce currency holdings (raise velocity) because of fear of being robbed; on the other hand, various forms of criminal activities involve the use of currency.
• The total estimated number of noncash pay-ments, NONCASH PAYMENTS, per capita. Presumably, other things equal, an economy with a higher level of noncash payments will have lower currency holdings and higher currency velocities.
• The number of automated teller machines, ATM, per capita. The effect of ATMs is ambiguous. On one hand, more ATMs reduce the cost of obtaining cur-rency and thus should lower currency obtained per transaction and overall currency holdings. On the other hand, lowering the cost of obtaining currency could also make it more convenient relative to other transaction media such as credit cards, thus increas-ing overall currency holdings and lowering velocity.
The last factor we consider accounts for the notable differences that exist among countries in the
purchasing power associated with the largest denomi-nation of domestic currency that is generally avail-able. For example, the largest denomination in active circulation in Japan (the ¥10,000 note), the-United Kingdom (the £50 note), and the United States (the $100 note) range in value in dollar terms from about $78 to $100 as of this writing; these values represent considerably less purchasing power than that of the largest denominations in Canada, Germany, the Netherlands, and Switzerland, all of which have 1,000-unit bank notes, which now range in value from about $600 to $830. Categorizing some coun-tries as "low-denomination" (those in which the largest denomination has relatively low purchasing power) and others as "high-denomination," we find that significant differences emerge between the two groups in the responsiveness of their currency demand functions. For example, for both groups, increases in the price level tend to redirect more transactions toward the largest denomination; but, for low-denomination countries, another effect of infla-tion may be more important: the substitution out of currency into other means of payment for large-value transactions that would otherwise require an inconve-nient amount of cash to execute.
The specification we estimate uses a pooled panel regression with different slopes for the low-denomination and high-denomination countries (table B.l). The opportunity-cost elasticities in the low-denomination countries are higher (in absolute value) than those in the high-denomination countries, perhaps because of the above-mentioned substitution effect in low-denomination countries as rising prices
B.2. Actual real per capita holdings of currency in selected industrial nations compared with holdings predicted by pooled panel-data regressions for velocity U.S. dollars
Country Actual Predicted
Low-denomination countries Denmark 714 839
407 610 784 650 943 1,028
2,247 2,033 1,132 924 1,108 840
United Kingdom 462 520 United States' 358 340
High-denomination countries 1,178 1,281
618 648 Germany2 906 1,067 Netherlands 1,309 1,057 Switzerland 2,732 2,566
NOTE. Holdings are averages for 1987-93. Dollar values deflated by the chain-type price index for personal consumption expenditures, 1992 base year.
1. After removal of foreign holdings, which were estimated using midpoint of overseas stock from the median flow estimate.
2. After removal of estimated foreign holdings (35 percent of total).
B.l. Pooled panel-data regressions for currency velocities
Variable Low-denomination countries
High-denomination countries
NOMINAL RATE 4.47 1.21 (3.0) (.4)
INFLATION RATE 7.52 5.05 (3.9) (1.4)
RATIO OF REVENUE TO GDP . . . - . 7 0 - .81 (-4-7) ( -5 .9)
VIOLENT CRIME - . 0 2 .29 ( - .3 ) (1.5)
NONCASH PAYMENTS .70 1.60 (7.2) (5.6)
ATM - . 15 - . 3 6 ( -1 .8 ) ( -3 .3 )
INTERCEPT 1.82 -3 .40 (4.3) ( -4 .1 )
R2 .78 .79 Number of observations 60 34
NOTE. Numbers in parentheses are t statistics.
Digitized for FRASER http://fraser.stlouisfed.org/ Federal Reserve Bank of St. Louis

The Location of U.S. Currency: How Much Is Abroad? 903
intensify the inconvenience of their low purchasing power currency.42 Except for the effect of crime, which is ambiguous, all of the variables appear to have the expected signs and are generally quite significant43
42. Using a Chow test, we solidly reject the hypothesis that the corresponding slope coefficients in the velocity specifications are equal in the high- and low-denomination countries; the test statistic equaled 5.50, which has a p value of 0.0001.
B o t h opportun i ty c o s t var iab les (NOMINAL RATE and INFLATION RATE) are measured as a gross return so that we treat them symmetri-cally and can take logs for the deflation of the price level that occurs in the sample. As a result, the coefficient of the elasticity of real money balances with respect to these opportunity costs measured as a net return (the more usual way of introducing such variables) will be x / (1 + x) times the gross elasticity, where x is a fraction; for example, a 5 percent rate would imply that the elasticity on the gross return should be reduced by 0.05 / 1.05 = 0.0471 to express it as an elasticity on a net return.
43. The crime variable has different signs in the two regressions and is insignificant in either case. The underground economy effects (RATIO OF REVENUE TO GDP) are s imi lar in m a g n i t u d e . W e b e l i e v e o n balance that crime should reduce currency holdings and thus increase velocity. We find such a result for the high-denomination countries, and it is marginally significant on a one-sided test of statistical significance.
The opportunity-cost elasticities in the high-denomination countries are not significant, perhaps because of the relatively low number of degrees of freedom.
The underground economy effects (RATIO OF REVE-NUE TO GDP), are similar in magnitude in both types of countries and appear to have powerful explanatory effects. The ATM results are especially significant in the high-denomination countries and indicate that the convenience effects dominate the transaction-cost effects. The difference between the intercepts in the two specifications implies that residents in the high-denomination countries hold on average about $185 more in currency than their counterparts in low-denomination countries. Excluding foreign holdings from the domestic currency stock of Germany and the United States yields values that on average tend to track the currency series in the various countries, with about 80 percent of the variation in velocity explained by the specification in both types of coun-tries (table B.2).
In sum, the cross-country differences in currency holdings appear to be somewhat explicable by the basic factors we have been considering, including the magnitude of the largest denomination in which cur-rency is issued. To be sure, consideration of such denomination effects, as well as of the NONCASH PAYMENTS variable, may also embody other aspects of the demand for currency, such as the regulatory environment in which bank notes are handled. •
Digitized for FRASER http://fraser.stlouisfed.org/ Federal Reserve Bank of St. Louis

904
Industrial Production and Capacity Utilization for August 1996
Released for publication September 17
Industrial production increased 0.5 percent in August after a gain of 0.1 percent in July. Some of the acceleration from July to August resulted from weather-related swings in utility output; manufactur-ing output increased 0.3 percent in both months. At 126.9 percent of its 1987 average, total industrial production in August was 3.4 percent higher than it
was in August 1995. Industrial capacity utilization rose 0.2 percentage point, to 83.5 percent.
When analyzed by market group, the data show that the output of consumer goods fell 0.6 percent, with the decline concentrated in durables; the produc-tion of nondurable consumer goods was unchanged. The drop in the output of durable consumer goods reflected decreases in the output both of automotive products and of other durable goods. Motor vehicle
Industrial production indexes Twelve-month percent change
Materials
Products
— Total industry Capacity
—
1 1 1 1
Production
I 1 1 1 1 1 1 1 1 1
Percent of capacity
Total industry Utilization -
1 1 1 1 1 1 1 1
10
1990 1991 1992 1993 1994 1995 1996
Capacity and industrial production Ratio scale, 1987 production = 100
90
80
70
1982 1984 1986 1988 1990 1992 1994 1996
Twelve-month percent change
Durable manufacturing
160 ~ Manufacturing Capacity _
—
140 - Capacity _ —~~ 120 ^
100 Production
-
80
1 1 1 1 1 1 1 1 1 1 I 1 1
Manufacturing Utilization
1 1 1 1 1 1 1 1 1 1 1 1 1 1
10
1990 1991 1992 1993 1994 1995 1996
Ratio scale, 1987 production = 1 0 0
Percent of capacity
160 140
120 100
80
9 0
80
7 0
1982 1984 1986 1988 1990 1992 1994 1996
All series are seasonally adjusted. Latest series, August. Capacity is an index of potential industrial production.
Digitized for FRASER http://fraser.stlouisfed.org/ Federal Reserve Bank of St. Louis

905
Industrial production and capacity utilization, August 1996
Category
Industrial production, index, 1987 = 100
Category 1996 Percentage change
Category 1996 19961 Aug. 1995
to Aug. 1996
Category
May' Juner Julyr Aug. p Mayr Juner Julyr Aug.p
Aug. 1995 to
Aug. 1996
Total
Previous estimate
Major market groups Products, total2
Consumer goods Business equipment Construction supplies
Materials
Major industry groups Manufacturing
Durable Nondurable
Mining Utilities
125.4
125.2
121.3 116.3 166.0 111.0 131.6
127.4 139.1 114.4 100.5 128.4
126.2
126.0
122.1 116.6 168.5 113.8 132.5
128.4 141.2 114.4 101.9 126.2
126.3
126.2
122.4 117.3 170.0 112.2 132.2
128.8 141.6 114.8 100.9 123.9
126.9
122.4 116.5 170.9 111.9 133.8
129.1 142.0 114.9 103.3 125.8
.7
.5
.5
.4 - . 2 1.7 1.0
.7
.6
.8
.1 1.6
.6
.6
.6
.3 1.5 2.5
.7
.8 1.5
.0 1.4
- 1 . 8
.1
.1
.2
.5
.8 - 1 . 4
- . 2
.3
.3
.3 - 1 . 0 - 1 . 8
.5
.0 - . 6
.6 - . 3 1.2
.3
.3
.2 2.4 1.5
3.4
2.7 .6
8.6 4.6 4.5
4.0 6.7
.6 3.3
- 2 . 4
Total
Previous estimate
Major market groups Products, total2
Consumer goods Business equipment Construction supplies
Materials
Major industry groups Manufacturing
Durable Nondurable
Mining Utilities
Capacity utilization, percent MEMO Capacity,
per-centage change,
Aug. 1995 to
Aug. 1996
Total
Previous estimate
Major market groups Products, total2
Consumer goods Business equipment Construction supplies
Materials
Major industry groups Manufacturing
Durable Nondurable
Mining Utilities
Average, 1967-95
Low, 1982
High, 1988-89
1995 1996
MEMO Capacity,
per-centage change,
Aug. 1995 to
Aug. 1996
Total
Previous estimate
Major market groups Products, total2
Consumer goods Business equipment Construction supplies
Materials
Major industry groups Manufacturing
Durable Nondurable
Mining Utilities
Average, 1967-95
Low, 1982
High, 1988-89
Aug. Mayr Juner Julyr Aug.?
MEMO Capacity,
per-centage change,
Aug. 1995 to
Aug. 1996
Total 82.1 71.8 84.9 83.9 83.3 83.5 83.3 83.5 3.9
Previous estimate 83.2 83.4 83.2
Manufacturing 81.4 70.0 85.2 82.7 82.1 82.5 82.4 82.3 4.4 Advanced processing 80.7 71.4 83.5 81.2 80.5 80.8 80.8 80.6 5.2 Primary processing 82.6 66.8 89.0 86.2 86.1 86.6 86.4 86.5 2.5
Mining 87.4 80.6 86.5 89.3 89.8 91.1 90.2 92.4 - . 1 Utilities 86.9 76.2 92.6 95.3 94.1 92.3 90.5 91.8 1.3
NOTE. Data seasonally adjusted or calculated from seasonally adjusted monthly data.
1. Change from preceding month.
assemblies fell 0.7 million units from their July level, to 12.6 million units (annual rate). The August rate was higher than in any month during the first half of the year. Decreases in the output of air conditioners, appliances, and television sets led the decline in other durables. Among consumer nondurables, increases in residential electricity usage and in the production of gasoline and heating oil were offset by decreases in the output of consumer chemical products and clothing.
The output of business equipment advanced 0.6 percent; the increase was concentrated at pro-ducers of information processing equipment. The out-put of industrial equipment, which had fallen for five consecutive months, barely edged up; because of the drop in motor vehicle assemblies, the production of transit equipment fell. However, the decrease in tran-sit equipment was muted somewhat by another month of increased activity at aircraft manufacturers. The output of defense and space equipment increased for a second month; production in this sector has risen since the end of last year, the first sustained increase since the 1980s. The production of construction sup-
2. Contains components in addition to those shown, r Revised, p Preliminary.
plies decreased 0.3 percent after a 1.4 percent drop in July. Despite these recent declines, the production index for this sector remains 4.6 percent above its year-earlier level.
The output of industrial materials rose 1.2 percent in August. Increases in electricity generation and in coal mining pushed the output of energy materials up 2.5 percent. The output of durable goods materials rose 1.1 percent, with gains in the output of parts destined for use in consumer goods or in business and defense equipment. The output of nondurable materi-als increased 0.4 percent for a second month; the production in this grouping has risen about 4]/i per-cent since its low point at the beginning of the year.
When analyzed by industry group, the data show that the 0.3 percent increase in factory output reflected gains both in durable goods and in nondura-ble goods. Among durables, large increases came in computer and office equipment, aerospace and miscellaneous transportation equipment, and instru-ments; all posted increases of more than 1 percent. Besides motor vehicles and parts, the production of lumber and of iron and steel fell significantly. Among
Digitized for FRASER http://fraser.stlouisfed.org/ Federal Reserve Bank of St. Louis

906 Federal Reserve Bulletin • October 1996
nondurables, the indexes for petroleum refining, rub-ber and plastics products, and tobacco showed gains of more than 1 percent. On the negative side, the output of textile mill products fell 1.1 percent, and the output indexes for both apparel and chemicals fell 0.5 percent. Apparel production is down nearly 6 per-cent from its year-earlier level.
The factory operating rate edged down 0.1 percent-age point, to 82.3 percent. The rate for advanced-processing industries decreased 0.2 percentage point, to 80.6 percent, and the rate for primary-processing industries edged up 0.1 percentage point, to 86.5 per-cent. Utilization for primary-processing industries remains about 4 percentage points above its 1967-95 average. Rates for primary metals, petroleum refin-ing, fabricated metals products, and rubber and plas-tics products are more than 5 percentage points above their long-run averages.
The operating rate for utilities increased 1.3 per-centage points in August but stayed below its level during the first half of the year; temperatures moved up from their low levels in July but remained below normal.
This release and the history for all series pub-lished here are available on the Internet at http://www.bog.frb.fed.us, the Board of Governors' World Wide Web site.
1996 REVISION ANNOUNCEMENT
During the fourth quarter, the Federal Reserve will publish revisions of its measures of industrial produc-tion (IP), capacity, capacity utilization, and industrial use of electric power; the current target month for the release is November. The revisions of IP, capacity, and capacity utilization will incorporate updated source data for recent years and will feature a change in the method of aggregating the indexes. From 1977 onward, the value-added proportions used to weight individual series will be updated annually rather than quinquennially. In addition, the IP indexes and the capacity measures will be rebased so that 1992 actual output equals 100. Capacity utilization, the ratio of IP to capacity, will be recomputed on the basis of revised IP and capacity measures.
The aggregate IP indexes will be constructed with a superlative index formula similar to that introduced by the Bureau of Economic Analysis as the featured measure of real output in its January 1996 compre-hensive revision of the National Income and Product Accounts. At present, the aggregate IP indexes are computed as linked Laspeyres indexes, with the weights updated every five years. Because of the rapid fall in the relative price of computers and
peripheral equipment, that periodic updating of weights is too infrequent to provide reliable estimates of current changes in output, capacity, and capacity utilization. With the publication of the revision, value-added proportions will be updated annually, and the new index number formula will be applied to all aggregates of IP, capacity, and gross value of product. For the most part, relative price movements among the 260 individual components of the IP index are likely to have little visible effect on total IP. However, the more frequent updating of the relative price of the output of the computer industry could lower overall IP growth in some years by as much as '/2 percentage point; in other years, the updating of weights will have virtually no effect. Because the new index number formula will slow capacity growth as well as IP growth, the effect of the reaggregation on overall capacity utilization should be small.
The regular updating of source data for IP will include the introduction of annual data from the 1994 Annual Survey of Manufactures and selected 1995 Current Industrial Reports of the Bureau of the Cen-sus. Available annual data on mining for 1994 and 1995 from the Department of the Interior will also be introduced. Revisions to the monthly indicators for each industry (physical product data, production-worker hours, or electric power usage) and revised seasonal factors will be incorporated back to 1992.
The statistics on the industrial use of electric power will be revised back to 1972. These revisions stem from three basic sources. First, the new figures incor-porate more complete reports received from utilities for the past few years. Second, an updated panel of reporters on cogeneration will be fully integrated into our survey of electric power use. Third, the levels of the monthly electric power series for manufacturing industries will be benchmarked to indexes derived from data published in the Census Bureau's annual surveys and censuses of manufactures. These indexes will also be revised so that 1992 electric power usage equals 100.
More detail on the plans for this revision is avail-able on the Internet at http://www.bog.frb.fed.us. Once the revision is published, the revised data will be available at that site and on diskettes from the Board of Governors of the Federal Reserve System, Publications Services, 202-452-3245. The revised data will also be available through the Economic Bulletin Board of the Department of Commerce, call 202-482-1986. In addition to the data currently pro-vided, the time series of implicit prices necessary for a user to aggregate IP and capacity under the new methodology will be provided by the Industrial Out-put Section, 202-452-3151. •
Digitized for FRASER http://fraser.stlouisfed.org/ Federal Reserve Bank of St. Louis

907
Announcements
ISSUANCE OF FINAL AGENCY GUIDELINES ON SAFETY AND SOUNDNESS STANDARDS FOR ASSET QUALITY AND EARNINGS
The Federal Reserve Board along with the Office of the Comptroller of the Currency, the Federal Deposit Insurance Corporation, and the Office of Thrift Supervision on August 27, 1996, issued final inter-agency guidelines prescribing safety and soundness standards for asset quality and earnings, thus com-pleting the requirements of section 132 of the Federal Deposit Insurance Corporation Improvement Act of 1991. The guidelines were effective October 1, 1996.
The guidelines prescribe that insured depository institutions establish and maintain systems that are commensurate with the institution's size and the nature and scope of its operations to accomplish the following:
• Identify problem assets and prevent deterioration in those assets
• Evaluate and monitor earnings and ensure that earnings are sufficient to maintain adequate capital and reserves.
The guidelines are general in nature and focus on what proper management should achieve, while leav-ing the methods for achieving those objectives to each institution. Because the guidelines are consistent with existing sound practices at banks, the Board believes that well-managed banks will not need to alter their operations to comply with the guidelines.
The final guidelines are substantially the same as those proposed in 1995.
ISSUANCE OF FINAL RULE AMENDING THE RISK-BASED CAPITAL STANDARDS TO INCORPORATE A MEASURE OF MARKET RISK
The Federal Reserve Board along with the Office of the Comptroller of the Currency (OCC) and the Federal Deposit Insurance Corporation (FDIC) on August 29, 1996, issued a final rule amending risk-based capital standards to incorporate a measure for market risk. The final rule is effective January 1,
1997, and compliance is mandatory as of January 1, 1998.
The final rule implements an amendment to the Basle Capital Accord that sets forth a supervisory framework for measuring market risk to cover debt and equity positions located in an institution's trading account and foreign exchange and commodity posi-tions wherever located.
The effect of the final rule is that any bank or bank holding company (institution) that is regulated by the Board, the OCC, or the FDIC and has significant exposure to market risk must measure that risk using its own internal value-at-risk model, subject to the parameters contained in the final rule, and hold a commensurate amount of capital.
ADOPTION OF A FINAL RULE REGARDING INVESTMENT ADVISER ACTIVITIES IN REGULATION Y
The Federal Reserve Board on August 26, 1996, announced adoption of a final amendment to the Board's interpretive rule regarding invest-ment adviser activities contained in Regulation Y (12 C.F.R. 225.125). The final rule was effective September 30, 1996.
The amendment permits a bank holding company (and its bank and nonbank subsidiaries) to purchase, in a fiduciary capacity, securities of an investment company advised by the bank holding company if the purchase is specifically authorized by the terms of the instrument creating the fiduciary relationship, by court order, or by the law of the jurisdiction under which the trust is administered.
RESCISSION OF A STAFF INTERPRETIVE LETTER
The Federal Reserve Board on August 26, 1996, determined to rescind a June 27, 1986, staff interpre-tive letter setting forth restrictions that a bank holding company must abide by in selling mutual fund and unit investment trust shares through a nonbanking subsidiary engaged in securities brokerage. In light of regulatory changes that have occurred since the issu-
Digitized for FRASER http://fraser.stlouisfed.org/ Federal Reserve Bank of St. Louis

908 Federal Reserve Bulletin • October 1996
ance of the so-called Sovran Letter, the Board deter-mined that the restrictions contained in the letter either have been effectively superseded or are no longer necessary.
AMENDMENT TO REGULATIONS REGARDING LOANS IN AREAS WITH SPECIAL FLOOD HAZARDS
The Federal Reserve Board is amending regulations regarding loans in areas having special flood hazards. The Board's action was effective October 1, 1996. This action implements the provisions of the National Flood Insurance Reform Act of 1994.
As required by statute, the final rules establish new escrow requirements for flood insurance premiums, add reference to the statutory authority and the re-quirement for lenders and servicers to "force place" flood insurance under certain circumstances, enhance flood hazard notice requirements, set forth new authority for lenders to charge fees for determining whether a property is located in a special flood hazard area, and contain various other provisions necessary to implement the National Flood Insurance Reform Act of 1994.
Similar action is being taken by the Office of the Comptroller of the Currency, the Federal Deposit Insurance Deposit Corporation, the Office of Thrift Supervision, the National Credit Union Administra-tion, and the Farm Credit Administration.
PROPOSED ACTIONS
The Federal Reserve Board along with the Office of the Comptroller of the Currency, the Federal Deposit Insurance Corporation, and the Office of Thrift Supervision (Agencies) on August 8, 1996, requested comments on a proposal to amend the risk-based capital guidelines for banks and bank holding com-
panies (banking organizations) regarding the treat-ment of collateralized transactions. Comments are requested by October 15, 1996.
The Federal Reserve Board on August 28, 1996, requested comment on proposed revisions to Regula-tion Y that are intended to improve the competi-tiveness of bank holding companies by eliminating unnecessary regulatory burden and operating restric-tions and by streamlining the application and notice process. Comments are requested by October 31, 1996.
PUBLIC SERVICE ANNOUNCEMENTS ON THE SALE OF MUTUAL FUNDS
The Federal Reserve announced on August 15, 1996, that it is providing public service announcements to 145 television stations across the United States as part of its continuing nationwide education program entitled "Mutual Funds: Understand the Risks."
The public service announcements, in 15- and 30-second versions, deal with the sale of mutual funds and annuities at banks. The announcements highlight that these investment products, even when purchased through banks, are not insured by the Federal Deposit Insurance Corporation and are subject to market risks, including loss of principal.
As part of the education campaign, the Federal Reserve System has been offering seminars on this topic for consumer and banker groups. Additional information may be obtained from the regional Fed-eral Reserve Banks. Following is a list of contact numbers:
Boston (617) 973-3647
N e w York (212) 720-6136
Philadelphia (215) 574-6439
Cleveland (216) 579-2891
Richmond (804) 697-8135
Atlanta (404) 521-8934
Chicago
St. Louis
Minneapolis
Kansas City
Dallas
(312) 322-5110
(314 )444 -8688
(612) 340-2373
(816)881-2681
(214) 922-5255
San Francisco (415) 974-2489
Digitized for FRASER http://fraser.stlouisfed.org/ Federal Reserve Bank of St. Louis

909
Minutes of the Federal Open Market Committee Meeting Held on July 2-3, 1996
A meeting of the Federal Open Market Committee was held in the offices of the Board of Governors of the Federal Reserve System in Washington, D.C., on Tuesday, July 2, 1996, at 1:00 p.m. and continued on Wednesday, July 3, 1996, at 9:00 a.m.
Present: Mr. Greenspan, Chairman Mr. McDonough, Vice Chairman Mr. Boehne Mr. Jordan Mr. Kelley Mr. Lindsey Mr. McTeer Mr. Meyer Ms. Phillips Ms. Rivlin Mr. Stern Ms. Yellen
Messrs. Broaddus, Guynn, Moskow, and Parry, Alternate Members of the Federal Open Market Committee
Messrs. Hoenig and Melzer, and Ms. Minehan, Presidents of the Federal Reserve Banks of Kansas City, St. Louis, and Boston respectively
Mr. Kohn, Secretary and Economist Mr. Bernard, Deputy Secretary Mr. Coyne, Assistant Secretary Mr. Gillum, Assistant Secretary Mr. Mattingly, General Counsel Mr. Baxter, Deputy General Counsel Mr. Prell, Economist Mr. Truman, Economist
Messrs. D. Lindsey, Mishkin, Promisel, Rolnick, Rosenblum, Siegman, Simpson, Sniderman, and Stockton, Associate Economists
Mr. Fisher, Manager, System Open Market Account
Mr. Winn,1 Assistant to the Board, Office of Board Members, Board of Governors
Mr. Ettin, Deputy Director, Division of Research and Statistics, Board of Governors
1. Attended portion of meeting concerning issues relating to the long-run price objective for monetary policy.
Messrs. Madigan and Slifman, Associate Directors, Divisions of Monetary Affairs and Research and Statistics respectively, Board of Governors
Mr. Bray ton,2 Ms. Johnson,2 Messrs. Reinhart and Smith,3 Assistant Directors, Divisions of Research and Statistics, International Finance, Monetary Affairs, and International Finance respectively, Board of Governors
Ms. Kusko2 and Mr. Wilcox,2 Senior Economists, Divisions of Research and Statistics and Monetary Affairs respectively, Board of Governors
Ms. Garrett, Economist, Division of Monetary Affairs, Board of Governors
Ms. Low, Open Market Secretariat Assistant, Division of Monetary Affairs, Board of Governors
Ms. Holcomb, First Vice President, Federal Reserve Bank of Dallas
Mr. Beebe, Ms. Browne, Messrs. Davis, Dewald, Eisenbeis, Goodfriend, and Hunter, Senior Vice Presidents, Federal Reserve Banks of San Francisco, Boston, Kansas City, St. Louis, Atlanta, Richmond, and Chicago respectively
Messrs. Kos and Meyer, Vice Presidents, Federal Reserve Banks of New York and Philadelphia respectively
By unanimous vote, the minutes of the meeting of the Federal Open Market Committee held on May 21, 1996, were approved.
The Manager of the System Open Market Account reported on recent developments in foreign exchange markets. There were no open market transactions in foreign currencies for System account during the period since the meeting on May 21, 1996, and thus no vote was required of the Committee.
The Manager also reported on recent developments in domestic financial markets and on System open market transactions in U.S. government securities and federal agency obligations during the period May 21,
2. Attended portion of the meeting relating to the Committee's discussion of the economic outlook and its longer-run growth ranges for the monetary and debt aggregates.
3. Attended portion of the meeting relating to the Committee's review of its swap line agreements.
Digitized for FRASER http://fraser.stlouisfed.org/ Federal Reserve Bank of St. Louis

910 Federal Reserve Bulletin • October 1996
1996, through July 2, 1996. By unanimous vote, the Committee ratified these transactions.
The Committee then turned to a discussion of the economic and financial outlook, the ranges for the growth of money and debt in 1996 and 1997, and the implementation of monetary policy over the inter-meeting period ahead. A summary of the economic and financial information available at the time of the meeting and of the Committee's discussion is pro-vided below, followed by the domestic policy direc-tive that was approved by the Committee and issued to the Federal Reserve Bank of New York.
The information reviewed at this meeting sug-gested that economic activity advanced considerably further in the second quarter, although growth in aggregate final demand showed some signs of slow-ing. Consumer spending continued to post sizable gains, but business investment in equipment and structures apparently was rising less vigorously, and higher mortgage rates evidently were starting to exert some restraint on housing construction activity. Busi-ness inventories had been brought into better balance with sales, and production and employment had risen appreciably. Upward pressures on food and energy prices had led to somewhat larger increases in the consumer price index over recent months.
Nonfarm payroll employment continued to expand briskly over April and May. Job gains were concen-trated in the service-producing and construction industries, while employment in manufacturing was stable on balance over the April-May period after having declined somewhat in 1995 and the first quar-ter of 1996. The civilian unemployment rate rose in May to 5.6 percent, which was the average rate for the year to date.
Industrial production increased appreciably further in May. In contrast to April's advance, much of which had resulted from the resumption of operations at a major motor vehicle manufacturer after the settle-ment of a strike, the May rise largely reflected gains in a wide range of non-auto-related manufacturing industries as well as a weather-related jump in elec-tricity generation. The surge in overall output lifted total utilization of industrial capacity somewhat above the average rate recorded during the previous two quarters.
Total nominal retail sales surged in May after having changed little in April; the increase in sales, coupled with available information on prices, sug-gested that real consumer spending on goods had risen substantially on balance since the first quarter. Recent data (available through April) indicated that spending on services had increased moderately on balance in recent months. Single-family housing
starts fell considerably in May from the relatively high April level. The decline suggested that the rise in mortgage rates in recent months had begun to damp construction activity, but indicators of housing demand, such as sales of new and existing homes, remained relatively robust.
Growth in business expenditures on durable equip-ment and nonresidential structures appeared to be slowing following a surge in outlays in the first quarter. In May, shipments of nondefense capital goods rebounded from the substantial decline in April; however, excluding movements in the volatile aircraft category, shipments were down on balance over the two months. Among the major components, shipments of both computing and communications equipment fell sharply in April and retraced only part of that decline in May. Recent data on new orders pointed to more modest increases in spending on business equipment over the months ahead. Nonresi-dential building activity increased considerably fur-ther in April (latest data available), but incoming information on contracts suggested that growth in nonresidential construction would weaken somewhat in coming months.
Businesses had made considerable progress in recent months in bringing their inventories into better alignment with sales. In manufacturing, stocks rose moderately in April after a decline in March. The stock-to-shipments ratio dropped further in April and was at a low level. At the wholesale trade level, inventory accumulation was appreciable in April after several months of modest growth. The inventory-to-sales ratio for this sector edged up in April but remained well below the elevated levels of last fall. Retail inventories increased slightly in April after a large decline in March associated with a substantial liquidation of motor vehicle stocks. The aggregate ratio of inventories to sales for retail estab-lishments was around the lower end of its range in recent years.
The nominal deficit on U.S. trade in goods and services widened in April from its rate in the first quarter, reflecting a slightly larger increase in the value of imports than in that of exports. The expan-sion in imports was concentrated in oil as U.S. refin-ers sought to meet growing domestic demand and rebuild their inventories. The rise in exports was broadly based, although exports of computers, semi-conductors, and automotive products edged off. Economic activity in the major foreign industrial countries appeared to have expanded moderately on balance since the beginning of the year. In the first quarter, economic performance ranged from unex-pectedly robust in Japan to further weakness in
Digitized for FRASER http://fraser.stlouisfed.org/ Federal Reserve Bank of St. Louis

Minutes of the Federal Open Market Committee 911
Germany; the limited data available for the second quarter suggested a slowdown in Japan, a bounce-back in Germany, and moderate growth in other major trading partners.
Although upward pressures on energy prices con-tinued to boost overall consumer prices in April and May, price increases for nonfood, non-energy items remained small. Over the twelve months ended in May, the increase in core consumer prices was appre-ciably smaller than in the previous twelve-month period; much of the deceleration reflected swings in automobile finance charges. At the producer level, higher prices for finished energy goods over April and May were partially offset by slightly lower prices for finished foods; prices for nonfood, non-energy finished goods were little changed over the two-month period and rose less over the twelve months ended in May than in the comparable year-earlier period. Data on average hourly earnings of produc-tion and nonsupervisory workers indicated that this measure of labor costs had increased by a somewhat larger amount in the year ended in May than in the comparable year-earlier period.
At its meeting on May 21, 1996, the Committee adopted a directive that called for maintaining the existing degree of pressure on reserve positions and that did not include a presumption about the likely direction of any adjustments to policy during the intermeeting period. The directive stated that in the context of the Committee's long-run objectives for price stability and sustainable economic growth, and giving careful consideration to economic, financial, and monetary developments, slightly greater reserve restraint or slightly lesser reserve restraint would be acceptable during the intermeeting period. The reserve conditions associated with this directive were expected to be consistent with moderate growth in M2 and M3 over coming months.
Open market operations were directed toward maintaining the existing degree of pressure on reserve positions throughout the intermeeting period. The federal funds rate averaged near 5lA percent, the level expected to be associated with the unchanged policy stance. Because the Committee's decision had been largely anticipated in financial markets, other market interest rates also were little changed during the early part of the period. However, market rates increased appreciably following the release of a strong employ-ment report in early June, though most of that rise was later retraced as expectations of near-term tight-ening of monetary policy diminished. On balance, most market rates were up a little over the intermeet-ing period. Major indexes of stock prices were down on balance over the period.
In foreign exchange markets, the trade-weighted value of the dollar in terms of the other G-10 curren-cies depreciated slightly over the intermeeting period. The dollar declined against the German mark and other European currencies as growing indications of a recent pickup in economic activity in Germany damped market expectations of any further easing of monetary policy by the Bundesbank. By contrast, the dollar rose against the yen in apparent response to a series of statements by Japanese officials suggesting that there would be no near-term firming of Japanese monetary policy.
The broad monetary aggregates were weak in May: M2 declined, and M3 expanded relatively sluggishly. The weakness in M2 and M3 was associated in part with the adverse effects of the earlier rise in market interest rates on the opportunity costs of holding deposits. Deposit balances also may have been drawn down to meet unusually large individual tax liabili-ties on the April 15 tax date. Partial data for June pointed to a rebound in both aggregates. For the year through June, these aggregates were estimated to have grown at rates around the upper bounds of their respective annual ranges. Expansion of total domestic nonfinancial debt had slowed somewhat in recent months, but the debt aggregate had remained in the middle portion of its annual range.
The staff forecast prepared for this meeting sug-gested that, after a sizable advance in economic activ-ity in the second quarter, growth would moderate and the economy would expand around or perhaps a little above its estimated potential. Consumer spending was projected to expand at a more moderate pace, in line with disposable income; the favorable effect of higher equity prices on household wealth and the still-ample availability of credit were expected to balance persisting consumer concerns about job and retirement security and the restraining effect of high household debt burdens. Homebuilding was forecast to slow somewhat in response to the back-up in residential mortgage rates but was expected to remain at a relatively high level in the context of sustained income growth and the still-favorable cash flow affordability of home ownership. Business spending on equipment and structures was projected to grow less rapidly in light of the anticipated moderate growth of sales and profits and the reduced rate of utilization of production capacity now prevailing. The external sector was expected to exert a small restraining influence on economic activity over the projection period, even though an anticipated firming of economic activity abroad would bolster demand for U.S. exports. Little further fiscal contraction was forecast over the projection period. Inflation recently
Digitized for FRASER http://fraser.stlouisfed.org/ Federal Reserve Bank of St. Louis

912 Federal Reserve Bulletin • October 1996
had been lifted by adverse developments in energy markets and was projected to remain above the levels of recent years, given the still-high level of resource utilization and the effects of tight grain supplies on food prices.
In the Committee's discussion of current and prospective economic developments, members com-mented on the stronger-than-expected expansion in overall economic activity in recent months, but for a variety of reasons they anticipated that growth would slow appreciably over the second half of the year to a pace more in line with the growth in the economy's potential. Key factors bearing on this outlook included the prospective effects of the rise in interest rates and the dollar that had occurred since earlier in the year and the waning influence of transitory fac-tors that had stimulated economic activity in the second quarter. The members generally agreed, how-ever, that, apart from evidence of some moderation in the growth of business investment expenditures from a very rapid pace, there were few hard indications of a slowing in the expansion and the risks were clearly to the upside of their current forecasts. Against that background, they were concerned that inflation could begin to rise. Cost and price pressures had been surprisingly well contained at high levels of resource utilization, but this unusually favorable performance might not be sustained, and in any event even greater resource utilization, as would occur if growth did not moderate appreciably, carried substantial inflation risk. There were some scattered indications in statisti-cal and anecdotal reports that tended to suggest that wage inflation might be trending higher, although key measures of price inflation, excluding their food and energy components, continued to display a flat or even a declining trend.
In keeping with the practice at meetings when the Committee sets its long-run ranges for the money and debt aggregates, the members of the Committee and the Federal Reserve Bank presidents not currently serving as members provided individual projections of the growth in real and nominal GDP, the rate of unemployment, and the rate of inflation for the years 1996 and 1997. (The ranges in this paragraph take into account minor revisions made by a few members subsequent to the meeting.) The forecasts of the rate of expansion in real GDP for 1996 as a whole had a central tendency of 2Vi to 23A percent, reflecting expectations of considerable moderation in the rate of economic growth over the second half of the year; for 1997, the projections centered on continued moderate growth of GDP in a range of l3A to 2'A percent. With regard to the expansion of nominal GDP, the fore-casts were concentrated in growth ranges of 5 to
5Y2 percent for 1996 and 4]A to 5 percent for 1997. The civilian rate of unemployment associated with these forecasts was expected by most members to remain around 5V2 percent this year and to be in a range of 5XA to 53A percent in 1997. This level of resource utilization was expected to be associated with a slightly higher rate of inflation in 1996, as measured by the consumer price index, than that recorded in 1995 owing to developments in the food and energy sectors, but a decline was anticipated in 1997. Specifically, the projections converged on rates of 3 to 3lA percent in 1996 and 23A to 3 percent in 1997. The projections for both 1996 and 1997 were based on individual views concerning what would be an appropriate monetary policy over the projection horizon.
In their assessment of factors bearing on the out-look for final demand, members commented that growth in consumer spending was likely to moderate in coming quarters from its pace thus far this year. This moderation would reflect the projected slowing in income growth. While overall employment condi-tions, the buildup of household net worth, and access to financing would bolster consumer expenditures, members also cited a number of limiting factors. The latter included the increase in consumer indebted-ness, satisfaction of earlier pent-up demand for con-sumer durable goods, and continuing concern about job security. Higher interest rates also were expected to exert an inhibiting effect on purchases of consumer durables, including those related to housing. Some members observed that while slower growth in con-sumer spending was the most probable forecast, they saw an upside risk from the wealth effects of the large rise that had occurred in the value of stock market holdings.
Business expenditures for plant and equipment were expected to grow at a slower though still appre-ciable pace. Indeed, such spending already appeared to be moderating. Contract data suggested that non-residential construction activity was on a slowing growth trajectory and expansion of outlays for pro-ducers' durable equipment also appeared to have softened. Given the outlook for slower growth in final demand, many businesses would not have to add significantly to capacity. However, spending for com-puting equipment, while perhaps moderating from the exceptional pace of recent quarters, was thought likely to remain buoyant as continuing innovations and declining prices stimulated further solid gains in this segment of business spending.
Housing was seen as another important sector of the economy that was likely to exert a retarding effect on the expansion as the rise that had occurred in
Digitized for FRASER http://fraser.stlouisfed.org/ Federal Reserve Bank of St. Louis

Minutes of the Federal Open Market Committee 913
mortgage interest rates was felt increasingly in hous-ing markets. The anecdotal information from around the nation and the available statistics suggested, how-ever, that those markets generally had remained surprisingly ebullient thus far, and there were only limited indications of some softening in home con-struction activity.
Business inventory investment was viewed as a key upside risk in the economic outlook for coming quarters. An inventory overhang at the end of last year had been corrected in the first quarter, and inventory investment was indicated to have turned positive again in the second quarter. However, cur-rent inventory-to-sales ratios appeared to be rela-tively lean, and final sales that exceeded current expectations might well induce a sharp upward adjustment in inventory accumulation, especially if lead times were to lengthen and producers perceived shortfalls in their safety stocks.
Members viewed the outlook for inflation as a source of substantial uncertainty in their forecasts, though many saw reasonable prospects that a rate of economic expansion in line with their forecasts and associated levels of capacity utilization would prove to be consistent with little change in the core rate of inflation. Some important measures of price inflation, after adjustment to exclude their volatile food and energy components, had shown a flat or even a declining trend in recent quarters. The outlook for overall price increases would remain contingent in part on food and energy price developments, but more importantly on underlying cost pressures in the economy.
Several members commented that the levels of utilization of capital and labor resources that had prevailed over the past couple of years would have been expected, on the basis of historical patterns, to foster rising cost pressures and greater inflation. However, labor compensation gains had been sub-dued in relation to earlier cyclical experience, likely as a consequence of increased worker concerns about job security and job opportunities. Despite the con-tinued low rate of unemployment and widespread anecdotal reports of tight labor markets across the country, there were only limited indications in national data that wage inflation might be increasing. Whether greater labor cost pressures would emerge in the context of the members' consensus forecast for economic activity was a critical issue in the outlook for prices, though it was noted that at least some of the rising costs were likely to be absorbed in shrink-ing profit margins. Even if greater price inflation were averted under that scenario, the members saw a substantial risk that if economic growth did not slow
in line with their current forecasts, the resulting added pressures on resources would at some point translate into higher price inflation. Accordingly, the factors bearing on the outlook for resource use and inflation needed to be monitored with special care in this period.
With regard to inflation over the long run, the members agreed that it was essential for the Commit-tee to continue to focus on reducing inflation over time because the achievement of an even less infla-tionary economic environment would foster a more productive economy and maximum sustainable eco-nomic expansion. The members acknowledged that as inflation diminished to very low levels, questions about the measurement of the overall price level presented difficult problems for assessing progress toward price stability. Some also observed that the precise level of average price inflation that might be compatible with the optimal functioning of the econ-omy was an unsettled issue owing, for example, to potential rigidities in labor markets. Thus far, such rigidities had not impeded the economy from func-tioning at a very high level as inflation came down, and continued adaptation to even lower inflation rates was very likely. However, the Committee would need to pay careful attention to these potential problems as inflation fell further. For now, the members agreed that some additional progress in reducing inflation was very likely to improve the ultimate performance of the economy, and that it was particularly important at this juncture to resist firmly any tendency for inflation to worsen.
In keeping with the requirements of the Full Employment and Balanced Growth Act of 1978 (the Humphrey-Hawkins Act), the Committee at this meeting reviewed the ranges for growth of the mone-tary and debt aggregates that it had established in January for 1996, and it decided on tentative ranges for those aggregates for 1997. The current ranges set in January for the period from the fourth quarter of 1995 to the fourth quarter of 1996 were unchanged from the ranges for 1995 and included expansion of 1 to 5 percent for M2 and 2 to 6 percent for M3. An unchanged monitoring range of 3 to 7 percent was set in January for growth of total domestic nonfinancial debt in 1996.
A majority of the members favored retaining the current ranges for this year and extending them on a provisional basis to 1997. They anticipated that growth of M2 and M3 probably would continue at rates close to the upper limit of their respective ranges in both years, given the Committee's expecta-tions for the performance of the economy and prices. However, despite a degree of concern about setting
Digitized for FRASER http://fraser.stlouisfed.org/ Federal Reserve Bank of St. Louis

914 Federal Reserve Bulletin • October 1996
ranges that did not more comfortably encompass expected growth, these members preferred not to change the ranges for a variety of reasons. The cur-rent ranges for the broad monetary aggregates could be viewed as anchors or benchmarks for money growth that would be associated with approximate price stability and sustained economic growth, assuming behavior of velocity in line with historical experience. Accordingly, a reaffirmation of those ranges would underscore the Committee's commit-ment to a policy of achieving price stability over time; and in the view of some members, higher ranges could raise questions in this regard. Moreover, a change in the ranges might be misinterpreted as a signal of greater reliance on the broad monetary aggregates in the formulation and conduct of mone-tary policy. In this connection, the members noted that the behavior of M2 in relation to nominal GDP and interest rates had displayed a pattern over the past two years or so that was in line with historical norms before the 1990s. However, in light of difficul-ties in the early 1990s and changes in financial mar-kets, the prospective growth of M2 and its velocity remained subject to considerable uncertainty and the members felt that it would be premature for the Committee to place increased reliance on M2 at this point.
A few members preferred somewhat higher growth ranges for M2 and M3 because such ranges would more comfortably surround the Committee's expecta-tions for monetary growth. The higher ranges would be more informative for the Congress and the public as to the money growth likely to be associated with the Committee's expected economic outcomes for the period covered by the ranges. They believed that the reasons for establishing the higher ranges could readily be explained and understood as appropriate technical adjustments that did not imply any lessened commitment to the Committee's price stability goal. For example, such an explanation appeared to have been accepted with little or no comment by the public when the range for M3 was increased in July 1995.
The Committee members were unanimously in favor of retaining the current monitoring range of 3 to 7 percent for growth of total domestic nonfinancial debt in 1996 and extending that range on a provi-sional basis to 1997. They took account of a staff projection indicating that growth of the debt aggre-gate was likely to slow somewhat from its pace earlier this year in line with some moderation in the expansion of nominal income. According to the staff projection, growth in the debt measure would be near the midpoint of the existing range over the period through 1997.
At the conclusion of this discussion, the Commit-tee voted to reaffirm the ranges for growth of M2 and M3 and the monitoring range for expansion of total domestic nonfinancial debt that it had established in January for 1996. For the year 1997, the Committee approved provisional ranges for M2 and M3 and a provisional monitoring range for total domestic non-financial debt that were unchanged from the 1996 ranges. In keeping with its usual procedure under the Humphrey-Hawkins Act, the Committee would review its preliminary ranges for 1997 early next year, or sooner if interim conditions warranted, in light of their growth and velocity behavior and ongoing economic and financial developments. Accordingly, the Committee voted to incorporate the following statement regarding the 1996 and 1997 ranges in its domestic policy directive:
The Federal Open Market Committee seeks monetary and financial conditions that will foster price stability and promote sustainable growth in output. In furtherance of these objectives, the Committee reaffirmed at this meeting the ranges it had established in January for growth of M2 and M3 of 1 to 5 percent and 2 to 6 percent respectively, measured from the fourth quarter of 1995 to the fourth quarter of 1996. The monitoring range for growth of total domestic nonfinancial debt was maintained at 3 to 7 per-cent for the year. For 1997 the Committee agreed on tentative ranges for monetary growth, measured from the fourth quarter of 1996 to the fourth quarter of 1997, of 1 to 5 percent for M2 and 2 to 6 percent for M3. The Commit-tee provisionally set the associated monitoring range for growth of total domestic nonfinancial debt at 3 to 7 percent for 1997. The behavior of the monetary aggregates will continue to be evaluated in the light of progress toward price level stability, movements in their velocities, and developments in the economy and financial markets.
Votes for this action: Messrs. Greenspan, McDonough, Boehne, Jordan, Kelley, McTeer, Meyer, Mses. Phillips and Rivlin, and Mr. Stern. Votes against this action: Mr. Lindsey and Ms. Yellen.
Mr. Lindsey and Ms. Yellen dissented because they preferred somewhat higher ranges for M2 and M3 growth in 1996 and 1997. The central tendencies of the members' forecasts of nominal GDP for the two years were likely to be associated with growth of the broad monetary aggregates at rates around the top of the current ranges. Somewhat higher ranges would more comfortably encompass the anticipated growth of the monetary aggregates and in their view would conform more closely with the provisions and intent of the Federal Reserve Act that require the System to communicate its objectives and plans for monetary growth to the Congress. They believed the reasons for raising the ranges could easily be explained and understood as a technical adjustment that did not represent a reduced commitment to the goal of price
Digitized for FRASER http://fraser.stlouisfed.org/ Federal Reserve Bank of St. Louis

Minutes of the Federal Open Market Committee 915
stability or an increased emphasis on the monetary aggregates in policy formulation.
In the Committee's discussion of policy for the intermeeting period ahead, all but one of the mem-bers supported a proposal to maintain an unchanged policy stance. These members also indicated that they preferred or could accept an asymmetric direc-tive that was biased toward restraint. In their view, the most likely outcome was a slowing of the expan-sion to a more sustainable pace and a continuation of subdued inflation. Nevertheless, they were concerned that the risks to that outcome were tilted toward higher inflation. While a strong economy generally was a welcome development, at current levels of resource use a continuation of rapid growth was not likely to be sustainable because it would have the potential for adding significantly to inflation pres-sures. However, inflation had remained relatively damped thus far, and the rise in interest rates among other factors was expected to curb demand. More-over, any tendency for price pressures to mount was likely to emerge only gradually and be reversible through a relatively limited policy adjustment. The current stance of monetary policy could not be de-scribed in this view as clearly accommodative. While the federal funds rate had been reduced appreciably in nominal terms over the past year, its current level on an inflation-adjusted basis seemed to be only marginally below its peak prior to mid-1995. In the circumstances, the Committee could afford to wait for more evidence to see whether additional inflation pressures were likely to develop. A number of key economic data would become available over the next several weeks that would provide a much better basis for assessing the economy's momentum over the second half of the year and the outlook for inflation.
A differing view gave more emphasis to prospects for rising inflation and the need for immediate action to forestall a buildup of cost and price pressures before they undermined the expansion. There was little firm evidence that economic growth was slow-ing and reports of appreciable wage pressures were increasing. Inflation expectations persisted in finan-cial markets, and probably in product and labor mar-kets as well; if they were allowed to worsen, the Committee's long-run goal of price stability would become much more difficult to achieve. Delaying action risked the need for a greater adjustment in policy at a later date with possible disruption to the economy.
Members observed that an asymmetric directive would represent a shift from the symmetric directives that had been adopted over the past year but would be in keeping with their assessments of the risks of
higher inflation. Several commented that an asym-metric directive did not imply a commitment to tighten monetary policy at some point, whether dur-ing the intermeeting period or at a future meeting, but it did imply the need for special vigilance. Some noted that a policy tightening action could tend to have a more pronounced effect than usual because it would indicate a shift in the direction of policy and might generate expectations of further tightening. Under the circumstances, the Committee would con-sult in some way before any policy tightening was undertaken.
At the conclusion of the Committee's discussion, all but one member indicated that they supported a directive that called for maintaining the existing degree of pressure on reserve positions and that included a bias toward the possible firming of reserve conditions during the intermeeting period. Accord-ingly, in the context of the Committee's long-run objectives for price stability and sustainable eco-nomic growth, and giving careful consideration to economic, financial, and monetary developments, the Committee decided that somewhat greater reserve restraint would be acceptable and slightly lesser reserve restraint might be acceptable during the inter-meeting period. The reserve conditions contemplated at this meeting were expected to be consistent with moderate growth of M2 and M3 over coming months.
At the conclusion of the meeting, the Federal Reserve Bank of New York was authorized and directed, until instructed otherwise by the Commit-tee, to execute transactions in the System Account in accordance with the following domestic policy directive:
The information reviewed at this meeting suggests that economic activity advanced considerably further in the second quarter, but increases in final demand showed some signs of moderation. Nonfarm payroll employment was up substantially in April and May; the civilian unemployment rate rose to 5.6 percent in May. Industrial production increased appreciably further in May, reflecting gains across a wide range of industries. Real consumer spending rose substantially on balance over April and May. Single-family housing starts fell considerably in May from a relatively high level in April. Orders and contracts point to some deceleration in spending on business equipment and nonresidential structures after a very rapid expansion ear-lier in the year. The nominal deficit on U.S. trade in goods and services widened in April from its rate in the first quarter. Upward pressures on food and energy prices have led to somewhat larger increases in the consumer price index over recent months.
Most market interest rates have edged higher since the Committee meeting on May 21. In foreign exchange mar-kets, the trade-weighted value of the dollar in terms of the other G-10 currencies has depreciated slightly over the intermeeting period.
Digitized for FRASER http://fraser.stlouisfed.org/ Federal Reserve Bank of St. Louis

916 Federal Reserve Bulletin • October 1996
M2 declined in May, though partial data for June pointed to a rebound. Growth of M3 was relatively sluggish in May but also appears to have turned up in June. For the year through June, both aggregates are estimated to have grown at rates around the upper bounds of their respective ranges for the year. Expansion in total domestic nonfinancial debt has been moderate on balance over recent months and has remained in the middle portion of its range.
The Federal Open Market Committee seeks monetary and financial conditions that will foster price stability and promote sustainable growth in output. In furtherance of these objectives, the Committee reaffirmed at this meeting the ranges it had established in January for growth of M2 and M3 of 1 to 5 percent and 2 to 6 percent respectively, measured from the fourth quarter of 1995 to the fourth quarter of 1996. The monitoring range for growth of total domestic nonfinancial debt was maintained at 3 to 7 per-cent for the year. For 1997 the Committee agreed on tentative ranges for monetary growth, measured from the fourth quarter of 1996 to the fourth quarter of 1997, of 1 to 5 percent for M2 and 2 to 6 percent for M3. The Commit-tee provisionally set the associated monitoring range for growth of total domestic nonfinancial debt at 3 to 7 percent for 1997. The behavior of the monetary aggregates will continue to be evaluated in the light of progress toward price level stability, movements in their velocities, and developments in the economy and financial markets.
In the implementation of policy for the immediate future, the Committee seeks to maintain the existing degree of pressure on reserve positions. In the context of the Com-mittee's long-run objectives for price stability and sustain-able economic growth, and giving careful consideration to economic, financial, and monetary developments, some-what greater reserve restraint would or slightly lesser reserve restraint might be acceptable in the intermeeting period. The contemplated reserve conditions are expected to be consistent with moderate growth in M2 and M3 over coming months.
Votes for short-run policy: Messrs. Greenspan, McDonough, Boehne, Jordan, Kelley, Lindsey, McTeer, Meyer, Mses. Phillips, Rivlin, and Yellen. Vote against this action: Mr. Stern.
Mr. Stern dissented because he was convinced that a modestly more restrictive policy was warranted. In his view, the momentum of the economy and strains on capacity in labor and some other markets raised the possibility of an acceleration of inflation that would jeopardize the economic expansion. This con-cern aside, Mr. Stern also believed that current cir-cumstances were favorable for policy action to reduce inflation further and thereby help to sustain the ongo-ing improvement in the economy.
As a prelude to its formal review later in the year, the Committee at this meeting considered its existing network of swap arrangements with a number of foreign central banks and the Bank for International Settlements. From time to time in recent years the Committee had discussed a variety of issues relating to its foreign exchange activities and its financial arrangements with other central banks. In this dis-cission, the Committee considered in particular whether the swap arrangements, all of which had been put in place in the 1960s, remained an appro-priate approach to international financial cooperation among central banks in light of the evolution of the international financial system in recent decades, and whether other approaches should be considered. The Committee made no decisions relating to these mat-ters, though it was understood that these issues would be explored further.
It was agreed that the next meeting of the Commit-tee would be held on Tuesday, August 20, 1996.
The meeting adjourned at 12:50 p.m.
Donald L. Kohn Secretary
Digitized for FRASER http://fraser.stlouisfed.org/ Federal Reserve Bank of St. Louis
917
Legal Developments
JOINT FINAL RULE—AMENDMENTS TO REGULA-TIONS H AND Y
The Office of the Comptroller of the Currency (OCC), the Board of Governors of the Federal Reserve System (Board), and the Federal Deposit Insurance Corporation (FDIC) (collectively, the Agencies) are amending their respective risk-based capital standards to incorporate a measure for market risk to cover all positions located in an institution's trading account and foreign exchange and commodity positions wherever located. The final rule im-plements an amendment to the Basle Capital Accord that sets forth a supervisory framework for measuring market risk. The effect of the final rule is that any bank or bank holding company (institution) regulated by the OCC, the Board, or the FDIC, with significant exposure to market risk must measure that risk using its own internal value-at-risk model, subject to the parameters contained in this final rule, and must hold a commensurate amount of capital.
Effective January 1, 1997, 12C.F.R. Parts 3, 208, 225, and 325 are amended as follows:
Part 3—Minimum Capital Ratios; Issuance of Directives
1. The authority citation for Part 3 continues to read as follows:
Authority. 12U.S.C. 93a, 161, 1818, 1828(n), 1828 note, 183In note, 1835, 3907, and 3909.
2. Section 3.6 is amended by revising paragraph (a) to read as follows:
Section 3.6—Minimum capital ratios.
(a) Risk-based capital ratio. All national banks must have and maintain the minimum risk-based capital ratio as set forth in Appendix A (and, for certain banks, in Appen-dix B).
3. A new Appendix B is added to Part 3 to read as follows:
Appendix B to Part 3—Risk-Based Capital Guidelines; Market Risk Adjustment
Section 1—Purpose, Applicability, Scope, and Effective Date.
(a) Purpose. The purpose of this Appendix is to ensure that banks with significant exposure to market risk maintain adequate capital to support that exposure.1 This Appendix supplements and adjusts the risk-based capital ratio calcu-lations under Appendix A of this part with respect to those banks. (b) Applicability. (1) This Appendix applies to any national
bank whose trading activity2 (on a worldwide consoli-dated basis) equals:
(i) 10 percent or more of total assets;3 or (ii) $1 billion or more.
(2) The OCC may apply this Appendix to any national bank if the OCC deems it necessary or appropriate for safe and sound banking practices. (3) The OCC may exclude a national bank otherwise meeting the criteria of paragraph (b)(1) of this section from coverage under this Appendix if it determines the bank meets such criteria as a consequence of accounting, operational, or similar considerations, and the OCC deems it consistent with safe and sound banking prac-tices.
(c) Scope. The capital requirements of this Appendix sup-port market risk associated with a bank's covered posi-tions. (d) Effective date. This Appendix is effective as of Janu-ary 1, 1997. Compliance is not mandatory until January 1, 1998. Subject to supervisory approval, a bank may opt to comply with this Appendix as early as January 1, 1997.4
Section 2—Definitions.
For purposes of this Appendix, the following definitions apply:
(a) Covered positions means all positions in a bank's trading account, and all foreign exchange5 and commodity
1. This Appendix is based on a framework developed jointly by supervisory authorities from the countries represented on the Basle Committee on Banking Supervision and endorsed by the Group of Ten Central Bank Governors. The framework is described in a Basle Committee paper entitled "Amendment to the Capital Accord to Incorporate Market Risk," January 1996.
2. Trading activity means the gross sum of trading assets and liabilities as reported in the bank's most recent quarterly Consolidated Report of Condition and Income (Call Report).
3. Total assets means quarter-end total assets as reported in the bank's most recent Call Report.
4. A bank that voluntarily complies with the final rule prior to January 1, 1998, must comply with all of its provisions.
5. Subject to supervisory review, a bank may exclude structural positions in foreign currencies from its covered positions.
Digitized for FRASER http://fraser.stlouisfed.org/ Federal Reserve Bank of St. Louis

918 Federal Reserve Bulletin • October 1996
positions, whether or not in the trading account.6 Positions include on-balance-sheet assets and liabilities and off-balance-sheet items. Securities subject to repurchase and lending agreements are included as if they are still owned by the lender. (b) Market risk means the risk of loss resulting from movements in market prices. Market risk consists of gen-eral market risk and specific risk components.
(1) General market risk means changes in the market value of covered positions resulting from broad market movements, such as changes in the general level of interest rates, equity prices, foreign exchange rates, or commodity prices. (2) Specific risk means changes in the market value of specific positions due to factors other than broad market movements and includes such risk as the credit risk of an instrument's issuer.
(c) Tier 1 and Tier 2 capital are the same as defined in Appendix A of this part. (d) Tier 3 capital is subordinated debt that is unsecured; is fully paid up; has an original maturity of at least two years; is not redeemable before maturity without prior approval by the OCC; includes a lock-in clause precluding payment of either interest or principal (even at maturity) if the payment would cause the issuing bank's risk-based capital ratio to fall or remain below the minimum required under Appendix A of this part; and does not contain and is not covered by any covenants, terms, or restrictions that are inconsistent with safe and sound banking practices. (e) Value-at-risk (VAR) means the estimate of the maxi-mum amount that the value of covered positions could decline during a fixed holding period within a stated confi-dence level, measured in accordance with section 4 of this Appendix.
Section 3—Adjustments to the Risk-Based Capital Ratio Calculations.
(a) Risk-based capital ratio denominator. A bank subject to this Appendix shall calculate its risk-based capital ratio denominator as follows:
(1) Adjusted risk-weighted assets. Calculate adjusted risk-weighted assets, which equals risk-weighted assets (as determined in accordance with Appendix A of this part), excluding the risk-weighted amounts of all cov-ered positions (except foreign exchange positions out-side the trading account and over-the-counter derivative positions).7
(2) Measure for market risk. Calculate the measure for market risk, which equals the sum of the VAR-based capital charge, the specific risk add-on (if any), and the capital charge for de minimis exposure (if any).
6. The term trading account is defined in the instructions to the Call Report.
7. Foreign exchange positions outside the trading account and all over-the-counter derivative positions, whether or not in the trading account, must be included in adjusted risk-weighted assets as deter-mined in Appendix A of this part.
(i) VAR-based capital charge. The VAR-based capital charge equals the higher of:
(A) The previous day's VAR measure; or (B) The average of the daily VAR measures for each of the preceding 60 business days multiplied by three, except as provided in section 4(e) of this Appendix;
(ii) Specific risk add-on. The specific risk add-on is calculated in accordance with section 5 of this Appen-dix; and (iii) Capital charge for de minimis exposure. The capital charge for de minimis exposure is calculated in accordance with section 4(a) of this Appendix.
(3) Market risk equivalent assets. Calculate market risk equivalent assets by multiplying the measure for market risk (as calculated in paragraph (a)(2) of this section) by 12.5. (4) Denominator calculation. Add market risk equiva-lent assets (as calculated in paragraph (a)(3) of this section) to adjusted risk-weighted assets (as calculated in paragraph (a)(1) of this section). The resulting sum is the bank's risk-based capital ratio denominator.
(b) Risk-based capital ratio numerator. A bank subject to this Appendix shall calculate its risk-based capital ratio numerator by allocating capital as follows:
(1) Credit risk allocation. Allocate Tier 1 and Tier 2 capital equal to 8.0 percent of adjusted risk-weighted assets (as calculated in paragraph (a)(1) of this section).8
(2) Market risk allocation. Allocate Tier 1, Tier 2, and Tier 3 capital equal to the measure for market risk as calculated in paragraph (a)(2) of this section. The sum of Tier 2 and Tier 3 capital allocated for market risk must not exceed 250 percent of Tier 1 capital allocated for market risk. (This requirement means that Tier 1 capital allocated in this paragraph (b)(2) must equal at least 28.6 percent of the measure for market risk.) (3) Restrictions, (i) The sum of Tier 2 capital (both allocated and excess) and Tier 3 capital (allocated in paragraph (b)(2) of this section) may not exceed 100 percent of Tier 1 capital (both allocated and ex-cess).9
(ii) Term subordinated debt (and intermediate-term preferred stock and related surplus) included in Tier 2 capital (both allocated and excess) may not exceed 50 percent of Tier 1 capital (both allocated and excess).
(4) Numerator calculation. Add Tier 1 capital (both allocated and excess), Tier 2 capital (both allocated and excess), and Tier 3 capital (allocated under paragraph (b)(2) of this section). The resulting sum is the bank's risk-based capital ratio numerator.
8. A bank may not allocate Tier 3 capital to support credit risk (as calculated under Appendix A).
9. Excess Tier 1 capital means Tier 1 capital that has not been allocated in paragraphs (b)(1) and (b)(2) of this section. Excess Tier 2 capital means Tier 2 capital that has not been allocated in paragraph (b)( 1) and (b)(2) of this section, subject to the restrictions in paragraph (b)(3) of this section.
Digitized for FRASER http://fraser.stlouisfed.org/ Federal Reserve Bank of St. Louis

Legal Developments 919
Section 4—Internal Models.
(a) General. For risk-based capital purposes, a bank sub-ject to this Appendix must use its internal model to mea-sure its daily VAR, in accordance with the requirements of this section.10 The OCC may permit a bank to use alterna-tive techniques to measure the market risk of de minimis exposures so long as the techniques adequately measure associated market risk. (b) Qualitative requirements. A bank subject to this Appen-dix must have a risk management system that meets the following minimum qualitative requirements:
(1) The bank must have a risk control unit that reports directly to senior management and is independent from business trading units. (2) The bank's internal risk measurement model must be integrated into the daily management process. (3) The bank's policies and procedures must identify, and the bank must conduct, appropriate stress tests and backtests.11 The bank's policies and procedures must identify the procedures to follow in response to the results of such tests. (4) The bank must conduct independent reviews of its risk measurement and risk management systems at least annually.
(c) Market risk factors. The bank's internal model must use risk factors sufficient to measure the market risk inher-ent in all covered positions. The risk factors must address interest rate risk,12 equity price risk, foreign exchange rate risk, and commodity price risk. (d) Quantitative requirements. For regulatory capital pur-poses, VAR measures must meet the following quantitative requirements:
(1) The VAR measures must be calculated on a daily basis using a 99 percent, one-tailed confidence level with a price shock equivalent to a ten-business day movement in rates and prices. In order to calculate VAR measures based on a ten-day price shock, the bank may either calculate ten-day figures directly or convert VAR figures based on holding periods other than ten days to the equivalent of a ten-day holding period (for instance,
10. A bank's internal model may use any generally accepted mea-surement techniques, such as variance-covariance models, historical simulations, or Monte Carlo simulations. However, the level of sophis-tication and accuracy of a bank's internal model must be commensu-rate with the nature and size of its covered positions. A bank that modifies its existing modeling procedures to comply with the require-ments of this Appendix for risk-based capital purposes should, none-theless, continue to use the internal model it considers most appropri-ate in evaluating risks for other purposes.
11. Stress tests provide information about the impact of adverse market events on a bank's covered positions. Backtests provide infor-mation about the accuracy of an internal model by comparing a bank's daily VAR measures to its corresponding daily trading profits and losses.
12. For material exposures in the major currencies and markets, modeling techniques must capture spread risk and must incorporate enough segments of the yield curve—at least six—to capture differ-ences in volatility and less than perfect correlation of rates along the yield curve.
by multiplying a one-day VAR measure by the square root of ten). (2) The VAR measures must be based on an historical observation period (or effective observation period for a bank using a weighting scheme or other similar method) of at least one year. The bank must update data sets at least once every three months or more frequently as market conditions warrant. (3) The VAR measures must include the risks arising from the non-linear price characteristics of options posi-tions and the sensitivity of the market value of the positions to changes in the volatility of the underlying rates or prices. A bank with a large or complex options portfolio must measure the volatility of options positions by different maturities. (4) The VAR measures may incorporate empirical corre-lations within and across risk categories, provided that the bank's process for measuring correlations is sound. In the event that the VAR measures do not incorporate empirical correlations across risk categories, then the bank must add the separate VAR measures for the four major risk categories to determine its aggregate VAR measure.
(e) Backtesting. (1) Beginning one year after a bank starts to comply with this Appendix, a bank must conduct backtesting by comparing each of its most recent 250 business days' actual net trading profit or loss13 with the corresponding daily VAR measures generated for inter-nal risk measurement purposes and calibrated to a one-day holding period and a 99 percent, one-tailed confi-dence level. (2) Once each quarter, the bank must identify the num-ber of exceptions, that is, the number of business days for which the magnitude of the actual daily net trading loss, if any, exceeds the corresponding daily VAR mea-sure. (3) A bank must use the multiplication factor indicated in Table 1 of this Appendix in determining its capital charge for market risk under section 3(a)(2)(i)(B) of this Appendix until it obtains the next quarter's backtesting results, unless the OCC determines that a different ad-justment or other action is appropriate.
1. Multiplication Factor Based on Results of Backtesting Number of exceptions Multiplication factor
4 or fewer 3.00 5 3.40 6 3.50 7 3.65 8 3.75 9 3.85
10 or more 4.00
13. Actual net trading profits and losses typically include such things as realized and unrealized gains and losses on portfolio posi-tions as well as fee income and commissions associated with trading activities.
Digitized for FRASER http://fraser.stlouisfed.org/ Federal Reserve Bank of St. Louis
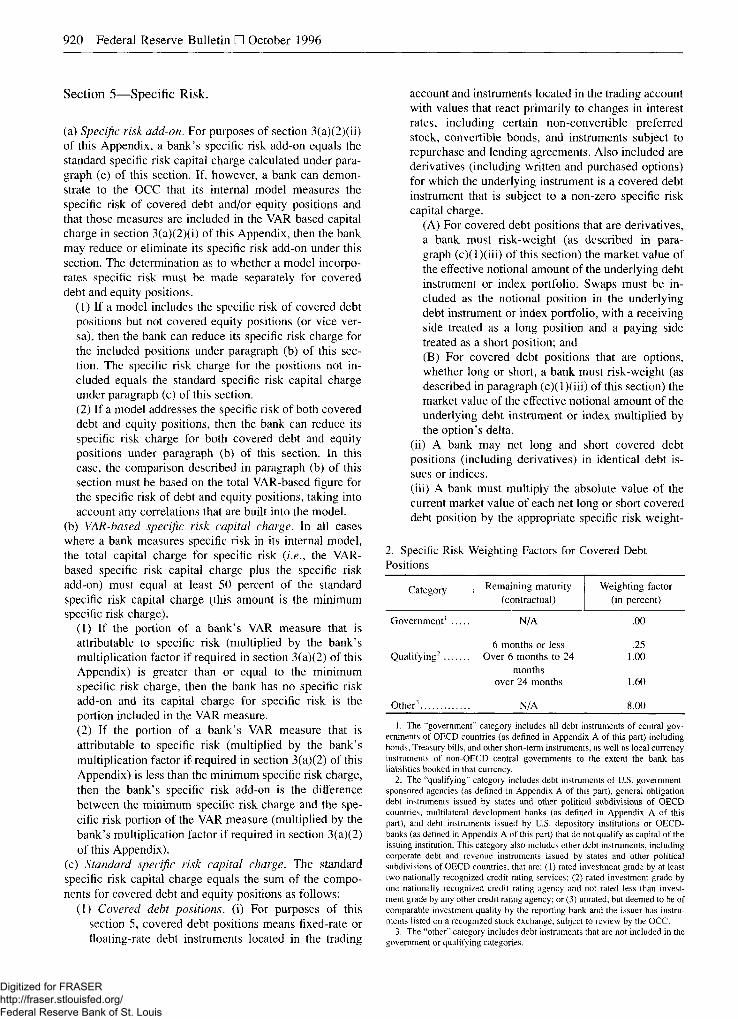
920 Federal Reserve Bulletin • October 1996
Section 5—Specific Risk.
(a) Specific risk add-on. For purposes of section 3(a)(2)(ii) of this Appendix, a bank's specific risk add-on equals the standard specific risk capital charge calculated under para-graph (c) of this section. If, however, a bank can demon-strate to the OCC that its internal model measures the specific risk of covered debt and/or equity positions and that those measures are included in the VAR-based capital charge in section 3(a)(2)(i) of this Appendix, then the bank may reduce or eliminate its specific risk add-on under this section. The determination as to whether a model incorpo-rates specific risk must be made separately for covered debt and equity positions.
(1) If a model includes the specific risk of covered debt positions but not covered equity positions (or vice ver-sa), then the bank can reduce its specific risk charge for the included positions under paragraph (b) of this sec-tion. The specific risk charge for the positions not in-cluded equals the standard specific risk capital charge under paragraph (c) of this section. (2) If a model addresses the specific risk of both covered debt and equity positions, then the bank can reduce its specific risk charge for both covered debt and equity positions under paragraph (b) of this section. In this case, the comparison described in paragraph (b) of this section must be based on the total VAR-based figure for the specific risk of debt and equity positions, taking into account any correlations that are built into the model.
(b) VAR-based specific risk capital charge. In all cases where a bank measures specific risk in its internal model, the total capital charge for specific risk (i.e., the VAR-based specific risk capital charge plus the specific risk add-on) must equal at least 50 percent of the standard specific risk capital charge (this amount is the minimum specific risk charge).
(1) If the portion of a bank's VAR measure that is attributable to specific risk (multiplied by the bank's multiplication factor if required in section 3(a)(2) of this Appendix) is greater than or equal to the minimum specific risk charge, then the bank has no specific risk add-on and its capital charge for specific risk is the portion included in the VAR measure. (2) If the portion of a bank's VAR measure that is attributable to specific risk (multiplied by the bank's multiplication factor if required in section 3(a)(2) of this Appendix) is less than the minimum specific risk charge, then the bank's specific risk add-on is the difference between the minimum specific risk charge and the spe-cific risk portion of the VAR measure (multiplied by the bank's multiplication factor if required in section 3(a)(2) of this Appendix).
(c) Standard specific risk capital charge. The standard specific risk capital charge equals the sum of the compo-nents for covered debt and equity positions as follows:
(1) Covered debt positions, (i) For purposes of this section 5, covered debt positions means fixed-rate or floating-rate debt instruments located in the trading
account and instruments located in the trading account with values that react primarily to changes in interest rates, including certain non-convertible preferred stock, convertible bonds, and instruments subject to repurchase and lending agreements. Also included are derivatives (including written and purchased options) for which the underlying instrument is a covered debt instrument that is subject to a non-zero specific risk capital charge.
(A) For covered debt positions that are derivatives, a bank must risk-weight (as described in para-graph (c)(l)(iii) of this section) the market value of the effective notional amount of the underlying debt instrument or index portfolio. Swaps must be in-cluded as the notional position in the underlying debt instrument or index portfolio, with a receiving side treated as a long position and a paying side treated as a short position; and (B) For covered debt positions that are options, whether long or short, a bank must risk-weight (as described in paragraph (c)(l)(iii) of this section) the market value of the effective notional amount of the underlying debt instrument or index multiplied by the option's delta.
(ii) A bank may net long and short covered debt positions (including derivatives) in identical debt is-sues or indices. (iii) A bank must multiply the absolute value of the current market value of each net long or short covered debt position by the appropriate specific risk weight-
2. Specific Risk Weighting Factors for Covered Debt Positions
Category Remaining maturity Weighting factor Category (contractual) (in percent)
Government1 N/A .00
6 months or less .25 Qualifying2 Over 6 months to 24 1.00
months over 24 months 1.60
Other3 N/A 8.00
1. The "government" category includes all debt instruments of central gov-ernments of OECD countries (as defined in Appendix A of this part) including bonds, Treasury bills, and other short-term instruments, as well as local currency instruments of non-OECD central governments to the extent the bank has liabilities booked in that currency.
2. The "qualifying" category includes debt instruments of U.S. government-sponsored agencies (as defined in Appendix A of this part), general obligation debt instruments issued by states and other political subdivisions of OECD countries, multilateral development banks (as defined in Appendix A of this part), and debt instruments issued by U.S. depository institutions or OECD-banks (as defined in Appendix A of this part) that do not qualify as capital of the issuing institution. This category also includes other debt instruments, including corporate debt and revenue instruments issued by states and other political subdivisions of OECD countries, that are: (1) rated investment grade by at least two nationally recognized credit rating services; (2) rated investment grade by one nationally recognized credit rating agency and not rated less than invest-ment grade by any other credit rating agency; or (3) unrated, but deemed to be of comparable investment quality by the reporting bank and the issuer has instru-ments listed on a recognized stock exchange, subject to review by the OCC.
3. The "other" category includes debt instruments that are not included in the government or qualifying categories.
Digitized for FRASER http://fraser.stlouisfed.org/ Federal Reserve Bank of St. Louis

Legal Developments 921
ing factor indicated in Table 2 of this Appendix. The specific risk capital charge component for covered debt positions is the sum of the weighted values.
(2) Covered equity positions, (i) For purposes of this section 5, covered equity positions means equity in-struments located in the trading account and instru-ments located in the trading account with values that react primarily to changes in equity prices, including voting or non-voting common stock, certain convert-ible bonds, and commitments to buy or sell equity instruments. Also included are derivatives (including written and purchased options) for which the underly-ing is a covered equity position.
(A) For covered equity positions that are deriva-tives, a bank must risk weight (as described in paragraph (c)(2)(iii) of this section) the market value of the effective notional amount of the under-lying equity instrument or equity portfolio. Swaps must be included as the notional position in the underlying equity instrument or index portfolio, with a receiving side treated as a long position and a paying side treated as a short position; and (B) For covered equity positions that are options, whether long or short, a bank must risk weight (as described in paragraph (c)(2)(iii) of this section) the market value of the effective notional amount of the underlying equity instrument or index multiplied by the option's delta.
(ii) A bank may net long and short covered equity positions (including derivatives) in identical equity issues or equity indices in the same market.14
(iii) (A) A bank must multiply the absolute value of the current market value of each net long or short covered equity position by a risk weighting factor of 8.0 percent, or by 4.0 percent if the equity is held in a portfolio that is both liquid and well-diversified. For covered equity positions that are index contracts com-prising a well-diversified portfolio of equity instru-ments, the net long or short position is multiplied by a risk weighting factor of 2.0 percent.
(B) For covered equity positions from the following futures-related arbitrage strategies, a bank may ap-ply a 2.0 percent risk weighting factor to one side (long or short) of each position with the opposite side exempt from charge:
(1) Long and short positions in exactly the same index at different dates or in different market centers; or (2) Long and short positions in index contracts at the same date in different but similar indices.
(C) For futures contracts on broadly-based indices that are matched by offsetting positions in a basket
14. A bank may also net positions in depository receipts against an opposite position in the underlying equity or identical equity in different markets, provided that the bank includes the costs of conver-sion.
of stocks comprising the index, a bank may apply a 2.0 percent risk weighting factor to the futures and stock basket positions (long and short), provided that such trades are deliberately entered into and separately controlled, and that the basket of stocks comprises at least 90 percent of the capitalization of the index.
(iv) The specific risk capital charge component for covered equity positions is the sum of the weighted values.
Section 6—Reservation of Authority.
The OCC reserves the authority to modify the application of any of the provisions in this Appendix to any bank, upon reasonable justification.
Part 208—Membership of State Banking Institutions in the Federal Reserve System (Regulation H)
1. The authority citation for Part 208 is revised to read as follows:
Authority. 12 U.S.C. 36, 248(a), 248(c), 321-338a, 371d, 461, 481-486, 601, 611, 1814, 1823(j), 1828(o), 1831o, 183lp-1, 3105, 3310, 3331-3351, and 3906-3909; 15 U.S.C. 78b, 781(b), 781(g), 781(i), 78o-4(c)(5), 78q, 78q-l, and 78w; 31 U.S.C. 5318; 42 U.S.C. 4012a, 4104a, 4104b, 4106, and 4128.
2. In Part 208, section 208.13 is revised to read as follows:
Section 208.13—Capital Adequacy.
The standards and guidelines by which the capital ade-quacy of state member banks will be evaluated by the Board are set forth in Appendix A and Appendix E for risk-based capital purposes, and, with respect to the ratios relating capital to total assets, in Appendix B to Part 208 and in Appendix B to the Board's Regulation Y, 12 C.F.R. Part 225.
3. In Part 208, Appendix A is amended in the introductory text, by adding a new paragraph after the second undesig-nated paragraph to read as follows:
Appendix A to Part 208—Capital Adequacy Guidelines for State Member Banks; Risk-Based Measure
In addition, when certain banks that engage in trading activities calculate their risk-based capital ratio under this Appendix A, they must also refer to Appendix E of this part, which incorporates capital charges for certain market risks into the risk-based capital ratio. When calculating
Digitized for FRASER http://fraser.stlouisfed.org/ Federal Reserve Bank of St. Louis

922 Federal Reserve Bulletin • October 1996
their risk-based capital ratio under this Appendix A, such banks are required to refer to Appendix E of this part for supplemental rules to determine qualifying and excess capital, calculate risk-weighted assets, calculate market risk equivalent assets, and calculate risk-based capital ra-tios adjusted for market risk.
4. In Part 208, a new Appendix E is added to read as follows:
Appendix E to Part 208 —Capital Adequacy Guidelines for State Member Banks; Market Risk Measure
Section 1—Purpose, Applicability, Scope, and Elfective Date.
(a) Purpose. The purpose of this Appendix is to ensure that banks with significant exposure to market risk maintain adequate capital to support that exposure.1 This Appendix supplements and adjusts the risk-based capital ratio calcu-lations under Appendix A of this part with respect to those banks. (b) Applicability. (1) This Appendix applies to any insured
state member bank whose trading activity2 (on a world-wide consolidated basis) equals:
(i) 10 percent or more of total assets;3 or (ii) $1 billion or more.
(2) The Federal Reserve may additionally apply this Appendix to any insured state member bank if the Fed-eral Reserve deems it necessary or appropriate for safe and sound banking practices. (3) The Federal Reserve may exclude an insured state member bank otherwise meeting the criteria of para-graph (b)(1) of this section from coverage under this Appendix if it determines the bank meets such criteria as a consequence of accounting, operational, or similar considerations, and the Federal Reserve deems it consis-tent with safe and sound banking practices.
(c) Scope. The capital requirements of this Appendix sup-port market risk associated with a bank's covered posi-tions.
1. A portfolio is liquid and well-diversified if: (1) It is characterized by a limited sensitivity to price changes of any single equity issue or closely related group of equity issues held in the portfolio; (2) The volatility of the portfolio's value is not dominated by the volatility of any individual equity issue or by equity issues from any single industry or economic sector; (3) It contains a large number of individual equity positions, with no single position representing a substantial portion of the portfo-lio's total market value; and (4) It consists mainly of issues traded on organized exchanges or in well-established over-the-counter markets.
2. Trading activity means the gross sum of trading assets and liabilities as reported in the bank's most recent quarterly Consolidated Report of Condition and Income (Call Report).
3. Total assets means quarter-end total assets as reported in the bank's most recent Call Report.
(d) Effective date. This Appendix is elfective as of Janu-ary 1, 1997. Compliance is not mandatory until January 1, 1998. Subject to supervisory approval, a bank may opt to comply with this appendix as early as January 1, 1997.4
Section 2—Definitions.
For purposes of this Appendix, the following definitions apply:
(a) Covered positions means all positions in a bank's trading account, and all foreign exchange5 and commodity positions, whether or not in the trading account.6 Positions include on-balance-sheet assets and liabilities and off-balance-sheet items. Securities subject to repurchase and lending agreements are included as if they are still owned by the lender. (b) Market risk means the risk of loss resulting from movements in market prices. Market risk consists of gen-eral market risk and specific risk components.
(1) General market risk means changes in the market value of covered positions resulting from broad market movements, such as changes in the general level of interest rates, equity prices, foreign exchange rates, or commodity prices. (2) Specific risk means changes in the market value of specific positions due to factors other than broad market movements and includes such risk as the credit risk of an instrument's issuer.
(c) Tier I and Tier 2 capital are defined in Appendix A of this part. (d) Tier 3 capital is subordinated debt that is unsecured; is fully paid up; has an original maturity of at least two years; is not redeemable before maturity without prior approval by the Federal Reserve; includes a lock-in clause preclud-ing payment of either interest or principal (even at matu-rity) if the payment would cause the issuing bank's risk-based capital ratio to fall or remain below the minimum required under Appendix A of this part; and does not contain and is not covered by any covenants, terms, or restrictions that are inconsistent with safe and sound bank-ing practices. (e) Value-at-risk (VAR) means the estimate of the maxi-mum amount that the value of covered positions could decline during a fixed holding period within a stated confi-dence level, measured in accordance with section 4 of this Appendix.
4. A bank that voluntarily complies with the final rule prior to January 1, 1998, must comply with all of its provisions.
5. Subject to supervisory review, a bank may exclude structural positions in foreign currencies from its covered positions.
6. The term trading account is defined in the instructions to the Call Report.
Digitized for FRASER http://fraser.stlouisfed.org/ Federal Reserve Bank of St. Louis

Legal Developments 923
Section 3—Adjustments to the Risk-Based Capital Ratio Calculations.
(a) Risk-based capital ratio denominator. A bank subject to this Appendix shall calculate its risk-based capital ratio denominator as follows:
(1) Adjusted risk-weighted assets. Calculate adjusted risk-weighted assets, which equals risk-weighted assets (as determined in accordance with Appendix A of this part), excluding the risk-weigh ted amounts of all cov-ered positions (except foreign exchange positions out-side the trading account and over-the-counter derivative positions).7
(2) Measure for market risk. Calculate the measure for market risk, which equals the sum of the VAR-based capital charge, the specific risk add-on (if any), and the capital charge for de minimis exposures (if any).
(i) VAR-based capital charge. The VAR-based capital charge equals the higher of:
(A) The previous day's VAR measure; or (B) The average of the daily VAR measures for each of the preceding 60 business days multiplied by three, except as provided in section 4(e) of this Appendix;
(ii) Specific risk add-on. The specific risk add-on is calculated in accordance with section 5 of this Appen-dix; and (iii) Capital charge for de minimis exposure. The capital charge for de minimis exposure is calculated in accordance with section 4(a) of this Appendix.
(3) Market risk equivalent assets. Calculate market risk equivalent assets by multiplying the measure for market risk (as calculated in paragraph (a)(2) of this section) by 12.5. (4) Denominator calculation. Add market risk equiva-lent assets (as calculated in paragraph (a)(3) of this section) to adjusted risk-weighted assets (as calculated in paragraph (a)(1) of this section). The resulting sum is the bank's risk-based capital ratio denominator.
(b) Risk-based capital ratio numerator. A bank subject to this Appendix shall calculate its risk-based capital ratio numerator by allocating capital as follows:
(1) Credit risk allocation. Allocate Tier 1 and Tier 2 capital equal to 8.0 percent of adjusted risk-weighted assets (as calculated in paragraph (a)(1) of this section).8
(2) Market risk allocation. Allocate Tier 1, Tier 2, and Tier 3 capital equal to the measure for market risk as calculated in paragraph (a)(2) of this section. The sum of Tier 2 and Tier 3 capital allocated for market risk must not exceed 250 percent of Tier 1 capital allocated for market risk. (This requirement means that Tier 1 capital
7. Foreign exchange positions outside the trading account and all over-the-counter derivative positions, whether or not in the trading account, must be included in adjusted risk weighted assets as deter-mined in Appendix A of this part.
8. A bank may not allocate Tier 3 capital to support credit risk (as calculated under Appendix A of this part).
allocated in this paragraph (b)(2) must equal at least 28.6 percent of the measure for market risk.) (3) Restrictions, (i) The sum of Tier 2 capital (both
allocated and excess) and Tier 3 capital (allocated in paragraph (b)(2) of this section) may not exceed 100 percent of Tier 1 capital (both allocated and excess).9
(ii) Term subordinated debt (and intermediate-term preferred stock and related surplus) included in Tier 2 capital (both allocated and excess) may not exceed 50 percent of Tier 1 capital (both allocated and ex-cess).
(4) Numerator calculation. Add Tier 1 capital (both allocated and excess), Tier 2 capital (both allocated and excess), and Tier 3 capital (allocated under para-graph (b)(2) of this section). The resulting sum is the bank's risk-based capital ratio numerator.
Section A—Internal Models.
(a) General. For risk-based capital purposes, a bank sub-ject to this Appendix must use its internal model to mea-sure its daily VAR, in accordance with the requirements of this section.10 The Federal Reserve may permit a bank to use alternative techniques to measure the market risk of de minimis exposures so long as the techniques adequately measure associated market risk. (b) Qualitative requirements. A bank subject to this Appen-dix must have a risk management system that meets the following minimum qualitative requirements:
(1) The bank must have a risk control unit that reports directly to senior management and is independent from business trading units. (2) The bank's internal risk measurement model must be integrated into the daily management process. (3) The bank's policies and procedures must identify, and the bank must conduct, appropriate stress tests and backtests.11 The bank's policies and procedures must identify the procedures to follow in response to the results of such tests.
9. Excess Tier 1 capital means Tier 1 capital that has not been allocated in paragraphs (b)(1) and (b)(2) of this section. Excess Tier 2 capital means Tier 2 capital that has not been allocated in para-graph (b)(1) and (b)(2) of this section, subject to the restrictions in paragraph (b)(3) of this section.
10. A bank's internal model may use any generally accepted mea-surement techniques, such as variance-covariance models, historical simulations, or Monte Carlo simulations. However, the level of sophis-tication and accuracy of a bank's internal model must be commensu-rate with the nature and size of its covered positions. A bank that modifies its existing modeling procedures to comply with the require-ments of this Appendix for risk-based capital purposes should, none-theless, continue to use the internal model it considers most appropri-ate in evaluating risks for other purposes.
11. Stress tests provide information about the impact of adverse market events on a bank's covered positions. Backtests provide infor-mation about the accuracy of an internal model by comparing a bank's daily VAR measures to its corresponding daily trading profits and losses.
Digitized for FRASER http://fraser.stlouisfed.org/ Federal Reserve Bank of St. Louis

924 Federal Reserve Bulletin • October 1996
(4) The bank must conduct independent reviews of its risk measurement and risk management systems at least annually.
(c) Market risk factors. The bank's internal model must use risk factors sufficient to measure the market risk inher-ent in all covered positions. The risk factors must address interest rate risk,12 equity price risk, foreign exchange rate risk, and commodity price risk. (d) Quantitative requirements. For regulatory capital pur-poses, VAR measures must meet the following quantitative requirements:
(1) The VAR measures must be calculated on a daily basis using a 99 percent, one-tailed confidence level with a price shock equivalent to a ten-business day movement in rates and prices. In order to calculate VAR measures based on a ten-day price shock, the bank may either calculate ten-day figures directly or convert VAR figures based on holding periods other than ten days to the equivalent of a ten-day holding period (for instance, by multiplying a one-day VAR measure by the square root of ten). (2) The VAR measures must be based on an historical observation period (or effective observation period for a bank using a weighting scheme or other similar method) of at least one year. The bank must update data sets at least once every three months or more frequently as market conditions warrant. (3) The VAR measures must include the risks arising from the non-linear price characteristics of options posi-tions and the sensitivity of the market value of the positions to changes in the volatility of the underlying rates or prices. A bank with a large or complex options portfolio must measure the volatility of options positions by different maturities. (4) The VAR measures may incorporate empirical corre-lations within and across risk categories, provided that the bank's process for measuring correlations is sound. In the event that the VAR measures do not incorporate empirical correlations across risk categories, then the bank must add the separate VAR measures for the four major risk categories to determine its aggregate VAR measure.
(e) Backtesting. (1) Beginning one year after a bank starts to comply with this Appendix, a bank must conduct backtesting by comparing each of its most recent 250 business days' actual net trading profit or loss13 with the corresponding daily VAR measures generated for inter-nal risk measurement purposes and calibrated to a one-
12. For material exposures in the major currencies and markets, modeling techniques must capture spread risk and must incorporate enough segments of the yield curve—at least six—to capture differ-ences in volatility and less than perfect correlation of rates along the yield curve.
13. Actual net trading profits and losses typically include such things as realized and unrealized gains and losses on portfolio posi-tions as well as fee income and commissions associated with trading activities.
day holding period and a 99 percent, one-tailed confi-dence level. (2) Once each quarter, the bank must identify the num-ber of exceptions, that is, the number of business days for which the magnitude of the actual daily net trading loss, if any, exceeds the corresponding daily VAR mea-sure. (3) A bank must use the multiplication factor indicated in Table 1 of this Appendix in determining its capital charge for market risk under section 3(a)(2)(i)(B) of this Appendix until it obtains the next quarter's backtesting results, unless the Federal Reserve determines that a different adjustment or other action is appropriate.
1. Multiplication Factor Based on Results of Backtesting Number of exceptions Multiplication factor
4 or fewer 3.00 5 3.40 6 3.50 7 3.65 8 3.75 9 3.85
10 or more 4.00
Section 5—Specific Risk.
(a) Specific risk add-on. For purposes of section 3(a)(2)(ii) of this Appendix, a bank's specific risk add-on equals the standard specific risk capital charge calculated under para-graph (c) of this section. If, however, a bank can demon-strate to the Federal Reserve that its internal model mea-sures the specific risk of covered debt and/or equity positions and that those measures are included in the VAR-based capital charge in section 3(a)(2)(i) of this Ap-pendix, then the bank may reduce or eliminate its specific risk add-on under this section. The determination as to whether a model incorporates specific risk must be made separately for covered debt and equity positions.
(1) If a model includes the specific risk of covered debt positions but not covered equity positions (or vice ver-sa), then the bank can reduce its specific risk charge for the included positions under paragraph (b) of this sec-tion. The specific risk charge for the positions not in-cluded equals the standard specific risk capital charge under paragraph (c) of this section. (2) If a model addresses the specific risk of both covered debt and equity positions, then the bank can reduce its specific risk charge for both covered debt and equity positions under paragraph (b) of this section. In this case, the comparison described in paragraph (b) of this section must be based on the total VAR-based figure for the specific risk of debt and equity positions, taking into account any correlations that are built into the model.
(b) VAR-based specific risk capital charge. In all cases where a bank measures specific risk in its internal model, the total capital charge for specific risk (i.e., the VAR-based specific risk capital charge plus the specific risk
Digitized for FRASER http://fraser.stlouisfed.org/ Federal Reserve Bank of St. Louis

Legal Developments 925
add-on) must equal at least 50 percent of the standard specific risk capital charge (this amount is the minimum specific risk charge).
(1) If the portion of a bank's VAR measure that is attributable to specific risk (multiplied by the bank's multiplication factor if required in section 3(a)(2) of this Appendix) is greater than or equal to the minimum specific risk charge, then the bank has no specific risk add-on and its capital charge for specific risk is the portion included in the VAR measure. (2) If the portion of a bank's VAR measure that is attributable to specific risk (multiplied by the bank's multiplication factor if required in section 3(a)(2) of this Appendix) is less than the minimum specific risk charge, then the bank's specific risk add-on is the difference between the minimum specific risk charge and the spe-cific risk portion of the VAR measure (multiplied by the bank's multiplication factor if required in section 3(a)(2) of this Appendix).
(c) Standard specific risk capital charge. The standard specific risk capital charge equals the sum of the compo-nents for covered debt and equity positions as follows:
(1) Covered debt positions, (i) For purposes of this section 5, covered debt positions means fixed-rate or floating-rate debt instruments located in the trading account and instruments located in the trading account with values that react primarily to changes in interest rates, including certain non-convertible preferred stock, convertible bonds, and instruments subject to repurchase and lending agreements. Also included are derivatives (including written and purchased options) for which the underlying instrument is a covered debt instrument that is subject to a non-zero specific risk capital charge.
(A) For covered debt positions that are derivatives, a bank must risk-weight (as described in para-graph (c)(l)(iii) of this section) the market value of the effective notional amount of the underlying debt instrument or index portfolio. Swaps must be in-cluded as the notional position in the underlying debt instrument or index portfolio, with a receiving side treated as a long position and a paying side treated as a short position; and (B) For covered debt positions that are options, whether long or short, a bank must risk-weight (as described in paragraph (c)(l)(iii) of this section) the market value of the effective notional amount of the underlying debt instrument or index multiplied by the option's delta,
(ii) A bank may net long and short covered debt positions (including derivatives) in identical debt is-sues or indices. (iii) A bank must multiply the absolute value of the current market value of each net long or short covered debt position by the appropriate specific risk weight-ing factor indicated in Table 2 of this Appendix. The specific risk capital charge component for covered debt positions is the sum of the weighted values.
2. Specific Risk Weighting Factors for Covered Debt Positions
Category Remaining Maturity Weighting Factor Category (contractual) (in percent)
Government N/A .00
6 months or less .25 Qualifying over 6 months to 24 1.00
months over 24 months 1.60
Other N/A 8.00
(A) The government category includes all debt in-struments of central governments of OECD-based countries14 including bonds, Treasury bills, and other short-term instruments, as well as local cur-rency instruments of non-OECD central govern-ments to the extent the bank has liabilities booked in that currency. (B) The qualifying category includes debt instru-ments of U.S. government-sponsored agencies, gen-eral obligation debt instruments issued by states and other political subdivisions of OECD-based countries, multilateral development banks, and debt instruments issued by U.S. depository institutions or OECD-banks that do not qualify as capital of the issuing institution.15 This category also includes other debt instruments, including corporate debt and revenue instruments issued by states and other political subdivisions of OECD countries, that are:
(1) Rated investment-grade by at least two na-tionally recognized credit rating services; (2) Rated investment-grade by one nationally recognized credit rating agency and not rated less than investment-grade by any other credit rating agency; or (3) Unrated, but deemed to be of comparable investment quality by the reporting bank and the issuer has instruments listed on a recognized stock exchange, subject to review by the Federal Reserve.
(C) The other category includes debt instruments that are not included in the government or qualify-ing categories.
(2) Covered equity positions, (i) For purposes of this section 5, covered equity positions means equity in-struments located in the trading account and instru-ments located in the trading account with values that react primarily to changes in equity prices, including voting or non-voting common stock, certain convert-ible bonds, and commitments to buy or sell equity instruments. Also included are derivatives (including
14. Organization for Economic Cooperation and Development (OECD)-based countries is defined in Appendix A of this part.
15. U.S. government-sponsored agencies, multilateral development banks, and OECD banks are defined in Appendix A of this part.
Digitized for FRASER http://fraser.stlouisfed.org/ Federal Reserve Bank of St. Louis
926 Federal Reserve Bulletin • October 1996
written and purchased options) for which the underly-ing is a covered equity position.
(A) For covered equity positions that are deriva-tives, a bank must risk weight (as described in paragraph (c)(2)(iii) of this section) the market value of the effective notional amount of the under-lying equity instrument or equity portfolio. Swaps must be included as the notional position in the underlying equity instrument or index portfolio, with a receiving side treated as a long position and a paying side treated as a short position; and (B) For covered equity positions that are options, whether long or short, a bank must risk weight (as described in paragraph (c)(2)(iii) of this section) the market value of the effective notional amount of the underlying equity instrument or index multiplied by the option's delta.
(ii) A bank may net long and short covered equity positions (including derivatives) in identical equity issues or equity indices in the same market.16
(iii) (A) A bank must multiply the absolute value of the current market value of each net long or short covered equity position by a risk weighting factor of 8.0 percent, or by 4.0 percent if the equity is held in a portfolio that is both liquid and well-diversified.17 For covered equity positions that are index contracts comprising a well-diversified port-folio of equity instruments, the net long or short position is multiplied by a risk weighting factor of 2.0 percent. (B) For covered equity positions from the following futures-related arbitrage strategies, a bank may ap-ply a 2.0 percent risk weighting factor to one side (long or short) of each position with the opposite side exempt from charge, subject to review by the Federal Reserve:
(7) Long and short positions in exactly the same index at different dates or in different market centers; or (2) Long and short positions in index contracts at the same date in different but similar indices.
(C) For futures contracts on broadly-based indices that are matched by offsetting positions in a basket
16. A bank may also net positions in depository receipts against an opposite position in the underlying equity or identical equity in different markets, provided that the bank includes the costs of conver-sion.
17. A portfolio is liquid and well-diversified if: (1) It is characterized by a limited sensitivity to price changes of any single equity issue or closely related group of equity issues held in the portfolio; (2) The volatility of the portfolio's value is not dominated by the volatility of any individual equity issue or by equity issues from any single industry or economic sector; (3) It contains a large number of individual equity positions, with no single position representing a substantial portion of the portfo-lio's total market value; and (4) It consists mainly of issues traded on organized exchanges or in well-established over-the-counter markets.
of stocks comprising the index, a bank may apply a 2.0 percent risk weighting factor to the futures and stock basket positions (long and short), provided that such trades are deliberately entered into and separately controlled, and that the basket of stocks comprises at least 90 percent of the capitalization of the index.
(iv) The specific risk capital charge component for covered equity positions is the sum of the weighted values.
Part 225—Bank Holding Companies and Change in Bank Control (Regulation Y)
1. The authority citation for Part 225 continues to read as follows:
Authority. 12U.S.C. 1817(j)(13), 1818, 1831i, 1831p-l, 1843(c)(8), 1844(b), 1972(1), 3106, 3108, 3310, 3331-3351,3907, and 3909.
2. In Part 225, Appendix A is amended in the introductory text, by adding a new paragraph after the second undesig-nated paragraph to read as follows:
Appendix A to Part 225—Capital Adequacy Guidelines for Bank Holding Companies: Risk-Based Measure
In addition, when certain organizations that engage in trading activities calculate their risk-based capital ratio under this Appendix A, they must also refer to Appendix E of this part, which incorporates capital charges for certain market risks into the risk-based capital ratio. When calcu-lating their risk-based capital ratio under this Appendix A, such organizations are required to refer to Appendix E of this part for supplemental rules to determine qualifying and excess capital, calculate risk-weighted assets, calculate market risk equivalent assets, and calculate risk-based cap-ital ratios adjusted for market risk.
3. In Part 225, a new Appendix E is added to read as follows:
Appendix E to Part 225—Capital Adequacy Guidelines for Bank Holding Companies: Market Risk Measure
Section 1—Purpose, Applicability, Scope, and Effective Date.
(a) Purpose. The purpose of this Appendix is to ensure that bank holding companies (organizations) with significant exposure to market risk maintain adequate capital to sup-
Digitized for FRASER http://fraser.stlouisfed.org/ Federal Reserve Bank of St. Louis

Legal Developments 927
port that exposure.1 This Appendix supplements and ad-justs the risk-based capital ratio calculations under Appen-dix A of this part with respect to those organizations. (b) Applicability. (1) This Appendix applies to any bank
holding company whose trading activity2 (on a world-wide consolidated basis) equals:
(i) 10 percent or more of total assets;3 or (ii) $1 billion or more.
(2) The Federal Reserve may additionally apply this Appendix to any bank holding company if the Federal Reserve deems it necessary or appropriate for safe and sound banking practices. (3) The Federal Reserve may exclude a bank holding company otherwise meeting the criteria of para-graph (b)(1) of this section from coverage under this Appendix if it determines the organization meets such criteria as a consequence of accounting, operational, or similar considerations, and the Federal Reserve deems it consistent with safe and sound banking practices.
(c) Scope. The capital requirements of this Appendix sup-port market risk associated with an organization's covered positions. (d) Effective date. This Appendix is effective as of Jan-uary 1, 1997. Compliance is not mandatory until January 1, 1998. Subject to supervisory approval, a bank holding company may opt to comply with this Appendix as early as January 1, 1997.4
Section 2—Definitions.
For purposes of this Appendix, the following definitions apply:
(a) Covered positions means all positions in an organiza-tion's trading account, and all foreign exchange5 and com-modity positions, whether or not in the trading account.6
Positions include on-balance-sheet assets and liabilities and off-balance-sheet items. Securities subject to repur-chase and lending agreements are included as if still owned by the lender. (b) Market risk means the risk of loss resulting from movements in market prices. Market risk consists of gen-eral market risk and specific risk components.
1. This Appendix is based on a framework developed jointly by supervisory authorities from the countries represented on the Basle Committee on Banking Supervision and endorsed by the Group of Ten Central Bank Governors. The framework is described in a Basle Committee paper entitled "Amendment to the Capital Accord to Incorporate Market Risk," January 1996.
2. Trading activity means the gross sum of trading assets and liabilities as reported in the bank holding company's most recent quarterly Y-9C Report.
3. Total assets means quarter-end total assets as reported in the bank holding company's most recent Y-9C Report.
4. A bank holding company that voluntarily complies with the final rule prior to January 1, 1998, must comply with all of its provisions.
5. Subject to supervisory review, a bank may exclude structural positions in foreign currencies from its covered positions.
6. The term trading account is defined in the instructions to the Call Report.
(1) General market risk means changes in the market value of covered positions resulting from broad market movements, such as changes in the general level of interest rates, equity prices, foreign exchange rates, or commodity prices. (2) Specific risk means changes in the market value of specific positions due to factors other than broad market movements and includes such risk as the credit risk of an instrument's issuer.
(c) Tier 1 and Tier 2 capital are defined in Appendix A of this part. (d) Tier 3 capital is subordinated debt that is unsecured; is fully paid up; has an original maturity of at least two years; is not redeemable before maturity without prior approval by the Federal Reserve; includes a lock-in clause preclud-ing payment of either interest or principal (even at matu-rity) if the payment would cause the issuing organization's risk-based capital ratio to fall or remain below the mini-mum required under Appendix A of this part; and does not contain and is not covered by any covenants, terms, or restrictions that are inconsistent with safe and sound bank-ing practices. (e) Value-at-risk (VAR) means the estimate of the maxi-mum amount that the value of covered positions could decline due to market price or rate movements during a fixed holding period within a stated confidence level, mea-sured in accordance with section 4 of this Appendix.
Section 3—Adjustments to the Risk-Based Capital Ratio Calculations.
(a) Risk-based capital ratio denominator. An organization subject to this Appendix shall calculate its risk-based capi-tal ratio denominator as follows:
(1) Adjusted risk-weighted assets. Calculate adjusted risk-weighted assets, which equals risk-weighted assets (as determined in accordance with Appendix A of this part) excluding the risk-weighted amounts of all covered positions (except foreign exchange positions outside the trading account and over-the-counter derivative posi-tions).7
(2) Measure for market risk. Calculate the measure for market risk, which equals the sum of the VAR-based capital charge, the specific risk add-on (if any), and the capital charge for de minimis exposures (if any).
(i) VAR-based capital charge. The VAR-based capital charge equals the higher of:
(A) The previous day's VAR measure; or (B) The average of the daily VAR measures for each of the preceding 60 business days multiplied by three, except as provided in section 4(e) of this Appendix;
7. Foreign exchange positions outside the trading account and all over-the-counter derivative positions, whether or not in the trading account, must be included in adjusted risk weighted assets as deter-mined in Appendix A of this part.
Digitized for FRASER http://fraser.stlouisfed.org/ Federal Reserve Bank of St. Louis

928 Federal Reserve Bulletin • October 1996
(ii) Specific risk add-on. The specific risk add-on is calculated in accordance with section 5 of this Appen-dix; and (iii) Capital charge for de minimis exposure. The capital charge for de minimis exposure is calculated in accordance with section 4(a) of this Appendix.
(3) Market risk equivalent assets. Calculate market risk equivalent assets by multiplying the measure for market risk (as calculated in paragraph (a)(2) of this section) by 12.5. (4) Denominator calculation. Add market risk equiva-lent assets (as calculated in paragraph (a)(3) of this section) to adjusted risk-weighted assets (as calculated in paragraph (a)(1) of this section). The resulting sum is the organization's risk-based capital ratio denominator.
(b) Risk-based capital ratio numerator. An organization subject to this Appendix shall calculate its risk-based capi-tal ratio numerator by allocating capital as follows:
(1) Credit risk allocation. Allocate Tier 1 and Tier 2 capital equal to 8.0 percent of adjusted risk-weighted assets (as calculated in paragraph (a)(1) of this section).8
(2) Market risk allocation. Allocate Tier 1, Tier 2, and Tier 3 capital equal to the measure for market risk as calculated in paragraph (a)(2) of this section. The sum of Tier 2 and Tier 3 capital allocated for market risk must not exceed 250 percent of Tier 1 capital allocated for market risk. (This requirement means that Tier 1 capital allocated in this paragraph (b)(2) must equal at least 28.6 percent of the measure for market risk.) (3) Restrictions, (i) The sum of Tier 2 capital (both
allocated and excess) and Tier 3 capital (allocated in paragraph (b)(2) of this section) may not exceed 100 percent of Tier 1 capital (both allocated and excess).9
(ii) Term subordinated debt (and intermediate-term preferred stock and related surplus) included in Tier 2 capital (both allocated and excess) may not exceed 50 percent of Tier 1 capital (both allocated and ex-cess).
(4) Numerator calculation. Add Tier 1 capital (both allocated and excess), Tier 2 capital (both allocated and excess), and Tier 3 capital (allocated under para-graph (b)(2) of this section). The resulting sum is the organization's risk-based capital ratio numerator.
Section A—Internal Models.
(a) General. For risk-based capital purposes, a bank hold-ing company subject to this Appendix must use its internal model to measure its daily VAR, in accordance with the
8. An institution may not allocate Tier 3 capital to support credit risk (as calculated under Appendix A of this part).
9. Excess Tier 1 capital means Tier 1 capital that has not been allocated in paragraphs (b)(1) and (b)(2) of this section. Excess Tier 2 capital means Tier 2 capital that has not been allocated in para-graph (b)(1) and (b)(2) of this section, subject to the restrictions in paragraph (b)(3) of this section.
requirements of this section.10 The Federal Reserve may permit an organization to use alternative techniques to measure the market risk of de minimis exposures so long as the techniques adequately measure associated market risk. (b) Qualitative requirements. A bank holding company subject to this Appendix must have a risk management system that meets the following minimum qualitative re-quirements:
(1) The organization must have a risk control unit that reports directly to senior management and is indepen-dent from business trading units. (2) The organization's internal risk measurement model must be integrated into the daily management process. (3) The organization's policies and procedures must identify, and the organization must conduct, appropriate stress tests and backtests.11 The organization's policies and procedures must identify the procedures to follow in response to the results of such tests. (4) The organization must conduct independent reviews of its risk measurement and risk management systems at least annually.
(c) Market risk factors. The organization's internal model must use risk factors sufficient to measure the market risk inherent in all covered positions. The risk factors must address interest rate risk,12 equity price risk, foreign ex-change rate risk, and commodity price risk. (d) Quantitative requirements. For regulatory capital pur-poses, VAR measures must meet the following quantitative requirements:
(1) The VAR measures must be calculated on a daily basis using a 99 percent, one-tailed confidence level with a price shock equivalent to a ten-business day movement in rates and prices. In order to calculate VAR measures based on a ten-day price shock, the organiza-tion may either calculate ten-day figures directly or convert VAR figures based on holding periods other than ten days to the equivalent of a ten-day holding period (for instance, by multiplying a one-day VAR measure by the square root of ten).
10. An organization's internal model may use any generally ac-cepted measurement techniques, such as variance-covariance models, historical simulations, or Monte Carlo simulations. However, the level of sophistication and accuracy of an organization's internal model must be commensurate with the nature and size of its covered posi-tions. An organization that modifies its existing modeling procedures to comply with the requirements of this Appendix for risk-based capital purposes should, nonetheless, continue to use the internal model it considers most appropriate in evaluating risks for other purposes.
11. Stress tests provide information about the impact of adverse market events on a bank's covered positions. Backtests provide infor-mation about the accuracy of an internal model by comparing an organization's daily VAR measures to its corresponding daily trading profits and losses.
12. For material exposures in the major currencies and markets, modeling techniques must capture spread risk and must incorporate enough segments of the yield curve—at least six—to capture differ-ences in volatility and less than perfect correlation of rates along the yield curve.
Digitized for FRASER http://fraser.stlouisfed.org/ Federal Reserve Bank of St. Louis

Legal Developments 929
(2) The VAR measures must be based on an historical observation period (or effective observation period for an organization using a weighting scheme or other simi-lar method) of at least one year. The organization must update data sets at least once every three months or more frequently as market conditions warrant. (3) The VAR measures must include the risks arising from the non-linear price characteristics of options posi-tions and the sensitivity of the market value of the positions to changes in the volatility of the underlying rates or prices. An organization with a large or complex options portfolio must measure the volatility of options positions by different maturities. (4) The VAR measures may incorporate empirical corre-lations within and across risk categories, provided that the organization's process for measuring correlations is sound. In the event that the VAR measures do not incorporate empirical correlations across risk categories, then the organization must add the separate VAR mea-sures for the four major risk categories to determine its aggregate VAR measure.
(e) Backtesting. (1) Beginning one year after a bank hold-ing company starts to comply with this Appendix, it must conduct backtesting by comparing each of its most recent 250 business days' actual net trading profit or loss13 with the corresponding daily VAR measures gen-erated for internal risk measurement purposes and cali-brated to a one-day holding period and a 99th percentile, one-tailed confidence level. (2) Once each quarter, the organization must identify the number of exceptions, that is, the number of business days for which the magnitude of the actual daily net trading loss, if any, exceeds the corresponding daily VAR measure. (3) A bank holding company must use the multiplication factor indicated in Table 1 of this Appendix in determin-ing its capital charge for market risk under section
1. Multiplication Factor Based on Results of Backtesting Number of exceptions Multiplication factor
4 or fewer 3.00 5 3.40 6 3.50 7 3.65 8 3.75 9 3.85
10 or more 4.00
3(a)(2)(i)(B) of this Appendix until it obtains the next quarter's backtesting results, unless the Federal Reserve determines that a different adjustment or other action is appropriate.
13. Actual net trading profits and losses typically include such things as realized and unrealized gains and losses on portfolio posi-tions as well as fee income and commissions associated with trading activities.
Section 5—Specific Risk.
(a) Specific risk add-on. For purposes of section 3(a)(2)(h) of this Appendix, a bank holding company's specific risk add-on equals the standard specific risk capital charge calculated under paragraph (c) of this section. If, however, an organization can demonstrate to the Federal Reserve that its internal model measures the specific risk of covered debt and/or equity positions and that those measures are included in the VAR-based capital charge in section 3(a)(2)(i) of this Appendix, then it may reduce or eliminate its specific risk add-on under this section. The determina-tion as to whether a model incorporates specific risk must be made separately for covered debt and equity positions.
(1) If a model includes the specific risk of covered debt positions but not covered equity positions (or vice ver-sa), then the organization can reduce its specific risk charge for the included positions under paragraph (b) of this section. The specific risk charge for the positions not included equals the standard specific risk capital charge under paragraph (c) of this section. (2) If a model addresses the specific risk of both covered debt and equity positions, then the organization can reduce its specific risk charge for both covered debt and equity positions under paragraph (b) of this section. In this case, the comparison described in paragraph (b) of this section must be based on the total VAR-based figure for the specific risk of debt and equity positions, taking account of any correlations that are built into the model.
(b) VAR-based specific risk capital charge. In all cases where a bank holding company measures specific risk in its internal model, the total capital charge for specific risk {i.e., the VAR-based specific risk capital charge plus the specific risk add-on) must equal at least 50 percent of the standard specific risk capital charge (this amount is the minimum specific risk charge).
(1) If the portion of an organization's VAR measure that is attributable to specific risk (multiplied by the organi-zation's multiplication factor if required in sec-tion 3(a)(2) of this Appendix) is greater than or equal to the minimum specific risk charge, then the organization has no specific risk add-on and its capital charge for specific risk is the portion included in the VAR measure. (2) If the portion of an organization's VAR measure that is attributable to specific risk (multiplied by the organi-zation's multiplication factor if required in sec-tion 3(a)(2) of this Appendix) is less than the minimum specific risk charge, then the organization's specific risk add-on is the difference between the minimum specific risk charge and the specific risk portion of the VAR measure (multiplied by the multiplication factor if re-quired in section 3(a)(2) of this Appendix).
(c) Standard specific risk capital charge. The standard specific risk capital charge equals the sum of the compo-nents for covered debt and equity positions as follows:
(1) Covered debt positions, (i) For purposes of this section 5, covered debt positions means fixed-rate or floating-rate debt instruments located in the trading
Digitized for FRASER http://fraser.stlouisfed.org/ Federal Reserve Bank of St. Louis

930 Federal Reserve Bulletin • October 1996
account or instruments located in the trading account with values that react primarily to changes in interest rates, including certain non-convertible preferred stock, convertible bonds, and instruments subject to repurchase and lending agreements. Also included are derivatives (including written and purchased options) for which the underlying instrument is a covered debt instrument that is subject to a non-zero specific risk capital charge.
(A) For covered debt positions that are derivatives, an organization must risk-weight (as described in paragraph (c)(l)(iii) of this section) the market value of the effective notional amount of the under-lying debt instrument or index portfolio. Swaps must be included as the notional position in the underlying debt instrument or index portfolio, with a receiving side treated as a long position and a paying side treated as a short position; and (B) For covered debt positions that are options, whether long or short, an organization must risk-weight (as described in paragraph (c)(l)(iii) of this section) the market value of the effective notional amount of the underlying debt instrument or index multiplied by the option's delta.
(ii) An organization may net long and short covered debt positions (including derivatives) in identical debt issues or indices. (iii) An organization must multiply the absolute value
2. Specific Risk Weighting Factors for Covered Debt Positions
Category Remaining Maturity Weighting Factor Category (contractual) (in percent)
Government N/A .00
6 months or less .25 Qualifying over 6 months to 24 1.00
months over 24 months 1.60
Other N/A 8.00
of the current market value of each net long or short covered debt position by the appropriate specific risk weighting factor indicated in Table 2 of this Appen-dix. The specific risk capital charge component for covered debt positions is the sum of the weighted values.
(A) The government category includes all debt in-struments of central governments of OECD-based countries14 including bonds, Treasury bills, and other short-term instruments, as well as local cur-rency instruments of non-OECD central govern-
ments to the extent the organization has liabilities booked in that currency. (B) The qualifying category includes debt instru-ments of U.S. government-sponsored agencies, gen-eral obligation debt instruments issued by states and other political subdivisions of OECD-based countries, multilateral development banks, and debt instruments issued by U.S. depository institutions or OECD banks that do not qualify as capital of the issuing institution.15 This category also includes other debt instruments, including corporate debt and revenue instruments issued by states and other political subdivisions of OECD countries, that are:
(7) Rated investment-grade by at least two na-tionally recognized credit rating services; (2) Rated investment-grade by one nationally recognized credit rating agency and not rated less than investment grade by any other credit rating agency; or (3) Unrated, but deemed to be of comparable investment quality by the reporting organization and the issuer has instruments listed on a recog-nized stock exchange, subject to review by the Federal Reserve.
(C) The other category includes debt instruments that are not included in the government or qualify-ing categories.
(2) Covered equity positions, (i) For purposes of this section 5, covered equity positions means equity in-struments located in the trading account and instru-ments located in the trading account with values that react primarily to changes in equity prices, including voting or non-voting common stock, certain convert-ible bonds, and commitments to buy or sell equity instruments. Also included are derivatives (including written or purchased options) for which the underling is a covered equity position.
(A) For covered equity positions that are deriva-tives, an organization must risk weight (as de-scribed in paragraph (c)(2)(iii) of this section) the market value of the effective notional amount of the underlying equity instrument or equity portfolio. Swaps must be included as the notional position in the underlying equity instrument or index portfolio, with a receiving side treated as a long position and a paying side treated as a short position; and (B) For covered equity positions that are options, whether long or short, an organization must risk weight (as described in paragraph (c)(2)(iii) of this section) the market value of the effective notional amount of the underlying equity instrument or in-dex multiplied by the option's delta.
14. Organization for Economic Cooperation and Development 15. U.S. government-sponsored agencies, multilateral development (OECD)-based countries is defined in Appendix A of this part. banks, and OECD banks are defined in Appendix A of this part.
Digitized for FRASER http://fraser.stlouisfed.org/ Federal Reserve Bank of St. Louis

Legal Developments 931
(ii) An organization may net long and short covered equity positions (including derivatives) in identical equity issues or equity indices in the same market.16
(iii) (A) An organization must multiply the absolute value of the current market value of each net long or short covered equity position by a risk weighting factor of 8.0 percent, or by 4.0 percent if the equity is held in a portfolio that is both liquid and well-diversified.17 For covered equity positions that are index contracts comprising a well-diversified port-folio of equity instruments, the net long or short position is to be multiplied by a risk weighting factor of 2.0 percent. (B) For covered equity positions from the following futures-related arbitrage strategies, an organization may apply a 2.0 percent risk weighting factor to one side (long or short) of each equity position with the opposite side exempt from charge, subject to review by the Federal Reserve:
(7) Long and short positions in exactly the same index at different dates or in different market centers; or (2) Long and short positions in index contracts at the same date in different but similar indices.
(C) For futures contracts on broadly-based indices that are matched by offsetting positions in a basket of stocks comprising the index, an organization may apply a 2.0 percent risk weighting factor to the futures and stock basket positions (long and short), provided that such trades are deliberately entered into and separately controlled, and that the basket of stocks comprises at least 90 percent of the capi-talization of the index.
(iv) The specific risk capital charge component for covered equity positions is the sum of the weighted values.
Part 325—Capital Maintenance
1. The authority citation for Part 325 continues to read as follows:
16. An organization may also net positions in depository receipts against an opposite position in the underlying equity or identical equity in different markets, provided that the organization includes the costs of conversion.
17. A portfolio is liquid and well-diversified if: (1) It is characterized by a limited sensitivity to price changes of any single equity issue or closely related group of equity issues held in the portfolio; (2) The volatility of the portfolio's value is not dominated by the volatility of any individual equity issue or by equity issues from any single industry or economic sector; (3) It contains a large number of individual equity positions, with no single position representing a substantial portion of the portfo-lio's total market value; and (4) It consists mainly of issues traded on organized exchanges or in well-established over-the-counter markets.
Authority: 12U.S.C. 1815(a), 1815(b), 1816, 1818(a), 1818(b), 1818(c), 1818(t), 1819(Tenth), 1828(c), 1828(d), 1828(i), 1828(n), 1828(o), 1831o, 3907, 3909, 4808; Pub. L. 102-233, 105 Stat. 1761, 1789, 1790 (12U.S.C. 1831n note); Pub. L. 102-242, 105 Stat. 2236, 2355, 2386 (12 U.S.C. 1828 note).
2. Appendix A to Part 325 is amended in the introductory text, by adding a new paragraph after the third undesig-nated paragraph to read as follows:
Appendix A to Part 325—Statement of Policy on Risk-Based Capital
In addition, when certain banks that engage in trading activities calculate their risk-based capital ratio under this Appendix A, they must also refer to Appendix C of this part, which incorporates capital charges for certain market risks into the risk-based capital ratio. When calculating their risk-based capital ratio under this Appendix A, such banks are required to refer to Appendix C of this part for supplemental rules to determine qualifying and excess capital, calculate risk-weighted assets, calculate market risk equivalent assets and add them to risk-weighted assets, and calculate risk-based capital ratios as adjusted for mar-ket risk.
3. A new Appendix C is added to Part 325 to read as follows:
Appendix C to Part 325—Risk-Based Capital for State Non-Member Banks; Market Risk
Section 1—Purpose, Applicability, Scope, and Effective Date.
(a) Purpose. The purpose of this Appendix is to ensure that banks with significant exposure to market risk maintain adequate capital to support that exposure.1 This Appendix supplements and adjusts the risk-based capital ratio calcu-lations under Appendix A of this part with respect to those banks. (b) Applicability. (1) This Appendix applies to any insured
state nonmember bank whose trading activity2 (on a worldwide consolidated basis) equals:
(i) 10 percent or more of total assets;3 or
1. This Appendix is based on a framework developed jointly by supervisory authorities from the countries represented on the Basle Committee on Banking Supervision and endorsed by the Group of Ten Central Bank Governors. The framework is described in a Basle Committee paper entitled "Amendment to the Capital Accord to Incorporate Market Risk," January 1996.
2. Trading activity means the gross sum of trading assets and liabilities as reported in the bank's most recent quarterly Consolidated Report of Condition and Income (Call Report).
3. Total assets means quarter-end total assets as reported in the bank's most recent Call Report.
Digitized for FRASER http://fraser.stlouisfed.org/ Federal Reserve Bank of St. Louis

932 Federal Reserve Bulletin • October 1996
(ii) $1 billion or more. (2) The FDIC may additionally apply this Appendix to any insured state nonmember bank if the FDIC deems it necessary or appropriate for safe and sound banking practices. (3) The FDIC may exclude an insured state nonmember bank otherwise meeting the criteria of paragraph (b)(1) of this section from coverage under this Appendix if it determines the bank meets such criteria as a conse-quence of accounting, operational, or similar consider-ations, and the FDIC deems it consistent with safe and sound banking practices.
(c) Scope. The capital requirements of this Appendix sup-port market risk associated with a bank's covered posi-tions. (d) Effective date. This Appendix is effective as of Janu-ary 1, 1997. Compliance is not mandatory until January 1, 1998. Subject to supervisory approval, a bank may opt to comply with this Appendix as early as January 1, 1997.4
Section 2—Definitions.
For purposes of this Appendix, the following definitions apply:
(a) Covered positions means all positions in a bank's trading account, and all foreign exchange5 and commodity positions, whether or not in the trading account.6 Positions include on-balance-sheet assets and liabilities and off-balance-sheet items. Securities subject to repurchase and lending agreements are included as if they are still owned by the lender. (b) Market risk means the risk of loss resulting from movements in market prices. Market risk consists of gen-eral market risk and specific risk components.
(1) General market risk means changes in the market value of covered positions resulting from broad market movements, such as changes in the general level of interest rates, equity prices, foreign exchange rates, or commodity prices. (2) Specific risk means changes in the market value of specific positions due to factors other than broad market movements and includes such risk as the credit risk of an instrument's issuer.
(c) Tier 1 and Tier 2 capital are defined in Appendix A of this part. (d) Tier 3 capital is subordinated debt that is unsecured; is fully paid up; has an original maturity of at least two years; is not redeemable before maturity without prior approval by the FDIC; includes a lock-in clause precluding payment of either interest or principal (even at maturity) if the payment would cause the issuing bank's risk-based capital
4. A bank that voluntarily complies with the final rule prior to January 1, 1998, must comply with all of its provisions.
5. Subject to FDIC review, a bank may exclude structural positions in foreign currencies from its covered positions.
6. The term trading account is defined in the instructions to the Call Report.
ratio to fall or remain below the minimum required under Appendix A of this part; and does not contain and is not covered by any covenants, terms, or restrictions that are inconsistent with safe and sound banking practices, (e) Value-at-risk (VAR) means the estimate of the maxi-mum amount that the value of covered positions could decline during a fixed holding period within a stated confi-dence level, measured in accordance with section 4 of this Appendix.
Section 3—Adjustments to the Risk-Based Capital Ratio Calculations.
(a) Risk-based capital ratio denominator. A bank subject to this Appendix shall calculate its risk-based capital ratio denominator as follows:
(1) Adjusted risk-weighted assets. Calculate adjusted risk-weighted assets, which equals risk-weighted assets (as determined in accordance with Appendix A of this part), excluding the risk-weighted amounts of all cov-ered positions (except foreign exchange positions out-side the trading account and over-the-counter derivative positions).7
(2) Measure for market risk. Calculate the measure for market risk, which equals the sum of the VAR-based capital charge, the specific risk add-on (if any), and the capital charge for de minimis exposures (if any).
(i) VAR-based capital charge. The VAR-based capital charge equals the higher of:
(A) The previous day's VAR measure; or (B) The average of the daily VAR measures for each of the preceding 60 business days multiplied by three, except as provided in section 4(e) of this Appendix;
(ii) Specific risk add-on. The specific risk add-on is calculated in accordance with section 5 of this Appen-dix; and (iii) Capital charge for de minimis exposure. The capital charge for de minimis exposure is calculated in accordance with section 4(a) of this Appendix.
(3) Market risk equivalent assets. Calculate market risk equivalent assets by multiplying the measure for market risk (as calculated in paragraph (a)(2) of this section) by 12.5. (4) Denominator calculation. Add market risk equiva-lent assets (as calculated in paragraph (a)(3) of this section) to adjusted risk-weighted assets (as calculated in paragraph (a)(1) of this section). The resulting sum is the bank's risk-based capital ratio denominator.
(b) Risk-based capital ratio numerator. A bank subject to this Appendix shall calculate its risk-based capital ratio numerator by allocating capital as follows:
7. Foreign exchange positions outside the trading account and all over-the-counter derivative positions, whether or not in the trading account, must be included in adjusted risk weighted assets as deter-mined in Appendix A of this part.
Digitized for FRASER http://fraser.stlouisfed.org/ Federal Reserve Bank of St. Louis

Legal Developments 933
(1) Credit risk allocation. Allocate Tier 1 and Tier 2 capital equal to 8.0 percent of adjusted risk-weighted assets (as calculated in paragraph (a)(1) of this section).8
(2) Market risk allocation. Allocate Tier 1, Tier 2, and Tier 3 capital equal to the measure for market risk as calculated in paragraph (a)(2) of this section. The sum of Tier 2 and Tier 3 capital allocated for market risk must not exceed 250 percent of Tier 1 capital allocated for market risk. (This requirement means that Tier 1 capital allocated in this paragraph (b)(2) must equal at least 28.6 percent of the measure for market risk.) (3) Restrictions, (i) The sum of Tier 2 capital (both
allocated and excess) and Tier 3 capital (allocated in paragraph (b)(2) of this section) may not exceed 100 percent of Tier 1 capital (both allocated and excess).9
(ii) Term subordinated debt (and intermediate-term preferred stock and related surplus) included in Tier 2 capital (both allocated and excess) may not exceed 50 percent of Tier 1 capital (both allocated and ex-cess).
(4) Numerator calculation. Add Tier 1 capital (both allocated and excess), Tier 2 capital (both allocated and excess), and Tier 3 capital (allocated under paragraph (b)(2) of this section). The resulting sum is the bank's risk-based capital ratio numerator.
Section A—Internal Models.
(a) General. For risk-based capital purposes, a bank sub-ject to this Appendix must use its internal model to mea-sure its daily VAR, in accordance with the requirements of this section.10 The FDIC may permit a bank to use alterna-tive techniques to measure the market risk of de minimis exposures so long as the techniques adequately measure associated market risk. (b) Qualitative requirements. A bank subject to this Appen-dix must have a risk management system that meets the following minimum qualitative requirements:
(1) The bank must have a risk control unit that reports directly to senior management and is independent from business trading units.
8. A bank may not allocate Tier 3 capital to support credit risk (as calculated under Appendix A of this part).
9. Excess Tier 1 capital means Tier 1 capital that has not been allocated in paragraphs (b)(1) and (b)(2) of this section. Excess Tier 2 capital means Tier 2 capital that has not been allocated in paragraph (b)(1) and (b)(2) of this section, subject to the restrictions in paragraph (b)(3) of this section.
10. A bank's internal model may use any generally accepted mea-surement techniques, such as variance-covariance models, historical simulations, or Monte Carlo simulations. However, the level of sophis-tication and accuracy of a bank's internal model must be commensu-rate with the nature and size of its covered positions. A bank that modifies its existing modeling procedures to comply with the require-ments of this Appendix for risk-based capital purposes should, none-theless, continue to use the internal model it considers most appropri-ate in evaluating risks for other purposes.
(2) The bank's internal risk measurement model must be integrated into the daily management process. (3) The bank's policies and procedures must identify, and the bank must conduct, appropriate stress tests and backtests.11 The bank's policies and procedures must identify the procedures to follow in response to the results of such tests. (4) The bank must conduct independent reviews of its risk measurement and risk management systems at least annually.
(c) Market risk factors. The bank's internal model must use risk factors sufficient to measure the market risk inher-ent in all covered positions. The risk factors must address interest rate risk,12 equity price risk, foreign exchange rate risk, and commodity price risk. (d) Quantitative requirements. For regulatory capital pur-poses, VAR measures must meet the following quantitative requirements:
(1) The VAR measures must be calculated on a daily basis using a 99 percent, one-tailed confidence level with a price shock equivalent to a ten-business day movement in rates and prices. In order to calculate VAR measures based on a ten-day price shock, the bank may either calculate ten-day figures directly or convert VAR figures based on holding periods other than ten days to the equivalent of a ten-day holding period (for instance, by multiplying a one-day VAR measure by the square root of ten). (2) The VAR measures must be based on an historical observation period (or effective observation period for a bank using a weighting scheme or other similar method) of at least one year. The bank must update data sets at least once every three months or more frequently as market conditions warrant. (3) The VAR measures must include the risks arising from the non-linear price characteristics of options posi-tions and the sensitivity of the market value of the positions to changes in the volatility of the underlying rates or prices. A bank with a large or complex options portfolio must measure the volatility of options positions by different maturities. (4) The VAR measures may incorporate empirical corre-lations within and across risk categories, provided that the bank's process for measuring correlations is sound. In the event that the VAR measures do not incorporate empirical correlations across risk categories, then the bank must add the separate VAR measures for the four
11. Stress tests provide information about the impact of adverse market events on a bank's covered positions. Backtests provide infor-mation about the accuracy of an internal model by comparing a bank's daily VAR measures to its corresponding daily trading profits and losses.
12. For material exposures in the major currencies and markets, modeling techniques must capture spread risk and must incorporate enough segments of the yield curve—at least six—to capture differ-ences in volatility and less than perfect correlation of rates along the yield curve.
Digitized for FRASER http://fraser.stlouisfed.org/ Federal Reserve Bank of St. Louis

934 Federal Reserve Bulletin • October 1996
major risk categories to determine its aggregate VAR measure.
(e) Backtesting. (1) Beginning one year after a bank starts to comply with this Appendix, a bank must conduct backtesting by comparing each of its most recent 250 business days' actual net trading profit or loss13 with the corresponding daily VAR measures generated for inter-nal risk measurement purposes and calibrated to a one-day holding period and a 99 percent, one- tailed confi-dence level. (2) Once each quarter, the bank must identify the num-ber of exceptions, that is, the number of business days for which the magnitude of the actual daily net trading loss, if any, exceeds the corresponding daily VAR mea-sure. (3) A bank must use the multiplication factor indicated in Table 1 of this Appendix in determining its capital charge for market risk under section 3(a)(2)(i)(B) of this Appendix until it obtains the next quarter's backtesting results, unless the FDIC determines that a different ad-justment or other action is appropriate.
1. Multiplication Factor Based on Results of Backtesting Number of exceptions Multiplication factor
4 or fewer 3.00 5 3.40 6 3.50 7 3.65 8 3.75 9 3.85
10 or more 4.00
Section 5—Specific Risk.
(a) Specific risk add-on. For purposes of section 3(a)(2)(ii) of this Appendix, a bank's specific risk add-on equals the standard specific risk capital charge calculated under para-graph (c) of this section. If, however, a bank can demon-strate to the FDIC that its internal model measures the specific risk of covered debt and/or equity positions and that those measures are included in the VAR-based capital charge in section 3(a)(2)(i) of this Appendix, then the bank may reduce or eliminate its specific risk add-on under this section. The determination as to whether a model incorpo-rates specific risk must be made separately for covered debt and equity positions.
(1) If a model includes the specific risk of covered debt positions but not covered equity positions (or vice ver-sa), then the bank can reduce its specific risk charge for the included positions under paragraph (b) of this sec-tion. The specific risk charge for the positions not in-
13. Actual net trading profits and losses typically include such things as realized and unrealized gains and losses on portfolio posi-tions as well as fee income and commissions associated with trading activities.
eluded equals the standard specific risk capital charge under paragraph (c) of this section. (2) If a model addresses the specific risk of both covered debt and equity positions, then the bank can reduce its specific risk charge for both covered debt and equity positions under paragraph (b) of this section. In this case, the comparison described in paragraph (b) of this section must be based on the total VAR-based figure for the specific risk of debt and equity positions, taking into account any correlations that are built into the model.
(b) VAR-based specific risk capital charge. In all cases where a bank measures specific risk in its internal model, the total capital charge for specific risk (i.e., the VAR-based specific risk capital charge plus the specific risk add-on) must equal at least 50 percent of the standard specific risk capital charge (this amount is the minimum specific risk charge).
(1) If the portion of a bank's VAR measure that is attributable to specific risk (multiplied by the bank's multiplication factor if required in section 3(a)(2) of this Appendix) is greater than or equal to the minimum specific risk charge, then the bank has no specific risk add-on and its capital charge for specific risk is the portion included in the VAR measure. (2) If the portion of a bank's VAR measure that is attributable to specific risk (multiplied by the bank's multiplication factor if required in section 3(a)(2) of this Appendix) is less than the minimum specific risk charge, then the bank's specific risk add-on is the difference between the minimum specific risk charge and the spe-cific risk portion of the VAR measure (multiplied by the bank's multiplication factor if required in section 3(a)(2) of this Appendix).
(c) Standard specific risk capital charge. The standard specific risk capital charge equals the sum of the compo-nents for covered debt and equity positions as follows:
(1) Covered debt positions, (i) For purposes of this section 5, covered debt positions means fixed-rate or floating-rate debt instruments located in the trading account and instruments located in the trading account with values that react primarily to changes in interest rates, including certain non-convertible preferred stock, convertible bonds, and instruments subject to repurchase and lending agreements. Also included are derivatives (including written and purchased options) for which the underlying instrument is a covered debt instrument that is subject to a non-zero specific risk capital charge.
(A) For covered debt positions that are derivatives, a bank must risk-weight (as described in para-graph (c)(l)(iii) of this section) the market value of the effective notional amount of the underlying debt instrument or index portfolio. Swaps must be in-cluded as the notional position in the underlying debt instrument or index portfolio, with a receiving side treated as a long position and a paying side treated as a short position; and (B) For covered debt positions that are options,
Digitized for FRASER http://fraser.stlouisfed.org/ Federal Reserve Bank of St. Louis

Legal Developments 935
whether long or short, a bank must risk-weight (as described in paragraph (c)(l)(iii) of this section) the market value of the effective notional amount of the underlying debt instrument or index multiplied by the option's delta.
(ii) A bank may net long and short covered debt positions (including derivatives) in identical debt is-sues or indices. (iii) A bank must multiply the absolute value of the current market value of each net long or short covered debt position by the appropriate specific risk weight-ing factor indicated in Table 2 of this Appendix. The specific risk capital charge component for covered debt positions is the sum of the weighted values.
2. Specific Risk Weighting Factors for Covered Debt Positions
Category Remaining Maturity Weighting Factor Category (contractual) (in percent)
Government N/A 0.00
6 months or less 0.25 Qualifying over 6 months to 24 1.00
months over 24 months 1.60
Other N/A 8.00
(A) The government category includes all debt in-struments of central governments of OECD-based countries14 including bonds, Treasury bills, and other short-term instruments, as well as local cur-rency instruments of non-OECD central govern-ments to the extent the bank has liabilities booked in that currency. (B) The qualifying category includes debt instru-ments of U.S. government-sponsored agencies, gen-eral obligation debt instruments issued by states and other political subdivisions of OECD-based countries, multilateral development banks, and debt instruments issued by U.S. depository institutions or OECD-banks that do not qualify as capital of the issuing institution.15 This category also includes other debt instruments, including corporate debt and revenue instruments issued by states and other political subdivisions of OECD countries, that are:
(7) Rated investment-grade by at least two na-tionally recognized credit rating services; (2) Rated investment-grade by one nationally recognized credit rating agency and not rated less than investment-grade by any other credit rating agency; or (3) Unrated, but deemed to be of comparable investment quality by the reporting bank and the
14. Organization for Economic Cooperation and Development (OECD)-based countries is defined in Appendix A of this part.
15. U.S. government-sponsored agencies, multilateral development banks, and OECD banks are defined in Appendix A of this part.
issuer has instruments listed on a recognized stock exchange, subject to review by the FDIC.
(C) The other category includes debt instruments that are not included in the government or qualify-ing categories.
(2) Covered equity positions, (i) For purposes of this section 5, covered equity positions means equity in-struments located in the trading account and instru-ments located in the trading account with values that react primarily to changes in equity prices, including voting or non-voting common stock, certain convert-ible bonds, and commitments to buy or sell equity instruments. Also included are derivatives (including written and purchased options) for which the underly-ing is a covered equity position.
(A) For covered equity positions that are deriva-tives, a bank must risk weight (as described in paragraph (c)(2)(iii) of this section) the market value of the effective notional amount of the under-lying equity instrument or equity portfolio. Swaps must be included as the notional position in the underlying equity instrument or index portfolio, with a receiving side treated as a long position and a paying side treated as a short position; and (B) For covered equity positions that are options, whether long or short, a bank must risk weight (as described in paragraph (c)(2)(iii) of this section) the market value of the effective notional amount of the underlying equity instrument or index multiplied by the option's delta.
(ii) A bank may net long and short covered equity positions (including derivatives) in identical equity issues or equity indices in the same market.16
(iii) (A) A bank must multiply the absolute value of the current market value of each net long or short covered equity position by a risk weighting factor of 8.0 percent, or by 4.0 percent if the equity is held in a portfolio that is both liquid and well-diversified.17 For covered equity positions that are index contracts comprising a well-diversified port-folio of equity instruments, the net long or short position is multiplied by a risk weighting factor of 2.0 percent.
16. A bank may also net positions in depository receipts against an opposite position in the underlying equity or identical equity in different markets, provided that the bank includes the costs of conver-sion.
17. A portfolio is liquid and well-diversified if: (1) It is characterized by a limited sensitivity to price changes of any single equity issue or closely related group of equity issues held in the portfolio; (2) The volatility of the portfolio's value is not dominated by the volatility of any individual equity issue or by equity issues from any single industry or economic sector; (3) It contains a large number of individual equity positions, with no single position representing a substantial portion of the portfo-lio's total market value; and (4) It consists mainly of issues traded on organized exchanges or in well-established over-the-counter markets.
Digitized for FRASER http://fraser.stlouisfed.org/ Federal Reserve Bank of St. Louis

936 Federal Reserve Bulletin • October 1996
(B) For covered equity positions from the following futures-related arbitrage strategies, a bank may ap-ply a 2.0 percent risk weighting factor to one side (long or short) of each position with the opposite side exempt from charge, subject to review by the FDIC:
(/) Long and short positions in exactly the same index at different dates or in different market centers; or (2) Long and short positions in index contracts at the same date in different but similar indices.
(C) For futures contracts on broadly-based indices that are matched by offsetting positions in a basket of stocks comprising the index, a bank may apply a 2.0 percent risk weighting factor to the futures and stock basket positions (long and short), provided that such trades are deliberately entered into and separately controlled, and that the basket of stocks comprises at least 90 percent of the capitalization of the index.
(iv) The specific risk capital charge component for covered equity positions is the sum of the weighted values.
JOINT FINAL RULE—AMENDMENT TO REGULATION H
The Comptroller of the Currency (OCC), Board of Gover-nors of the Federal Reserve System (Board), Federal De-posit Insurance Corporation (FDIC), Office of Thrift Super-vision (OTS). and National Credit Union Administration (NCUA) are amending their regulations, and the Farm Credit Administration (FCA) is issuing new regulations, regarding loans in areas having special flood hazards. This action is required by statute to implement the provisions of the National Flood Insurance Reform Act of 1994. The joint final rules establish new escrow requirements for flood insurance premiums, add references to the statutory authority and the requirement for lenders and servicers to ''force place" flood insurance under certain circumstances, enhance flood hazard notice requirements, set forth new authority for lenders to charge fees for determining whether a property is located in a special flood hazard area, and contain various other provisions necessary to implement the National Flood Insurance Reform Act of 1994.
Effective October 1, 1996; except for Part 614, which will be effective October 3, 1996, and Part 760, which will be effective November 1, 1996, 12C.F.R. Parts 22, 208, 339, 563, 572, 614, and 760 are amended as follows:
Part 22—Loans in Areas Having Special Flood Hazards
Section
22.1—Authority, purpose, and scope. 22.2—Definitions.
22.3—Requirement to purchase flood insurance where available.
22.4—Exemptions. 22.5—Escrow requirement. 22.6—Required use of standard flood hazard determination
form. 22.7—Forced placement of flood insurance. 22.8—Determination fees. 22.9—Notice of special flood hazards and availability of
Federal disaster relief assistance. 22.10—Notice of servicer's identity.
Appendix A to Part 22—Sample Form of Notice of Special Flood Hazards and Availability of Federal Disaster Relief Assistance
Authority. 12U.S.C. 93a; 42 U.S.C. 4012a, 4104a, 4104b, 4106, and 4128.
Section 22.1—Authority, purpose, and scope.
(a) Authority. This part is issued pursuant to 12 U.S.C. 93a and 42 U.S.C. 4012a, 4104a, 4104b, 4106, and 4128. (b) Purpose. The purpose of this part is to implement the requirements of the National Flood Insurance Act of 1968 and the Flood Disaster Protection Act of 1973, as amended (42 U.S.C. 4001-4129). (c) Scope. This part, except for sections 22.6 and 22.8, applies to loans secured by buildings or mobile homes located or to be located in areas determined by the Director of the Federal Emergency Management Agency to have special flood hazards. Sections 22.6 and 22.8 apply to loans secured by buildings or mobile homes, regardless of loca-tion.
Section 22.2—Definitions.
(a) Act means the National Flood Insurance Act of 1968, as amended (42 U.S.C. 4001-4129). (b) Bank means a national bank or a bank located in the District of Columbia and subject to the supervision of the Comptroller of the Currency. (c) Building means a walled and roofed structure, other than a gas or liquid storage tank, that is principally above ground and affixed to a permanent site, and a walled and roofed structure while in the course of construction, alter-ation, or repair. (d) Community means a State or a political subdivision of a State that has zoning and building code jurisdiction over a particular area having special flood hazards. (e) Designated loan means a loan secured by a building or mobile home that is located or to be located in a special flood hazard area in which flood insurance is available under the Act. (f) Director of FEM A means the Director of the Federal Emergency Management Agency. (g) Mobile home means a structure, transportable in one or more sections, that is built on a permanent chassis and
Digitized for FRASER http://fraser.stlouisfed.org/ Federal Reserve Bank of St. Louis

Legal Developments 937
designed for use with or without a permanent foundation when attached to the required utilities. The term mobile home does not include a recreational vehicle. For purposes of this part, the term mobile home means a mobile home on a permanent foundation. The term mobile home includes a manufactured home as that term is used in the NFIP. (h) NFIP means the National Flood Insurance Program authorized under the Act. (i) Residential improved real estate means real estate upon which a home or other residential building is located or to be located. (j) Servicer means the person responsible for:
(1) Receiving any scheduled, periodic payments from a borrower under the terms of a loan, including amounts for taxes, insurance premiums, and other charges with respect to the property securing the loan; and (2) Making payments of principal and interest and any other payments from the amounts received from the borrower as may be required under the terms of the loan.
(k) Special flood hazard area means the land in the flood plain within a community having at least a one percent chance of flooding in any given year, as designated by the Director of FEMA. (1) Table funding means a settlement at which a loan is funded by a contemporaneous advance of loan funds and an assignment of the loan to the person advancing the funds.
Section 22.3—Requirement to purchase flood insurance where available.
(a) In general. A bank shall not make, increase, extend, or renew any designated loan unless the building or mobile home and any personal property securing the loan is cov-ered by flood insurance for the term of the loan. The amount of insurance must be at least equal to the lesser of the outstanding principal balance of the designated loan or the maximum limit of coverage available for the particular type of property under the Act. Flood insurance coverage under the Act is limited to the overall value of the property securing the designated loan minus the value of the land on which the property is located. (b) Table funded loans. A bank that acquires a loan from a mortgage broker or other entity through table funding shall be considered to be making a loan for the purposes of this part.
Section 22.4—Exemptions.
The flood insurance requirement prescribed by section 22.3 does not apply with respect to: (a) Any State-owned property covered under a policy of self-insurance satisfactory to the Director of FEMA, who publishes and periodically revises the list of States falling within this exemption; or (b) Property securing any loan with an original principal balance of $5,000 or less and a repayment term of one year or less.
Section 22.5—Escrow requirement.
If a bank requires the escrow of taxes, insurance premiums, fees, or any other charges for a loan secured by residential improved real estate or a mobile home that is made, increased, extended, or renewed after October 1, 1996, the bank shall also require the escrow of all premiums and fees for any flood insurance required under section 22.3. The bank, or a servicer acting on behalf of the bank, shall deposit the flood insurance premiums on behalf of the borrower in an escrow account. This escrow account will be subject to escrow requirements adopted pursuant to section 10 of the Real Estate Settlement Procedures Act of 1974 (12 U.S.C. 2609) (RESPA), which generally limits the amount that may be maintained in escrow accounts for certain types of loans and requires escrow account state-ments for those accounts, only if the loan is otherwise subject to RESPA. Following receipt of a notice from the Director of FEMA or other provider of flood insurance that premiums are due, the bank, or a servicer acting on behalf of the bank, shall pay the amount owed to the insurance provider from the escrow account by the date when such premiums are due.
Section 22.6—Required use of standard flood hazard determination form.
(a) Use of form. A bank shall use the standard flood hazard determination form developed by the Director of FEMA (as set forth in Appendix A of 44 C.F.R. Part 65) when determining whether the building or mobile home offered as collateral security for a loan is or will be located in a special flood hazard area in which flood insurance is avail-able under the Act. The standard flood hazard determina-tion form may be used in a printed, computerized, or electronic manner. (b) Retention of form. A bank shall retain a copy of the completed standard flood hazard determination form, in either hard copy or electronic form, for the period of time the bank owns the loan.
Section 22.7—Forced placement of flood insurance.
If a bank, or a servicer acting on behalf of the bank, determines at any time during the term of a designated loan that the building or mobile home and any personal property securing the designated loan is not covered by flood insur-ance or is covered by flood insurance in an amount less than the amount required under section 22.3, then the bank or its servicer shall notify the borrower that the borrower should obtain flood insurance, at the borrower's expense, in an amount at least equal to the amount required under section 22.3, for the remaining term of the loan. If the borrower fails to obtain flood insurance within 45 days after notification, then the bank or its servicer shall pur-chase insurance on the borrower's behalf. The bank or its servicer may charge the borrower for the cost of premiums and fees incurred in purchasing the insurance.
Digitized for FRASER http://fraser.stlouisfed.org/ Federal Reserve Bank of St. Louis
938 Federal Reserve Bulletin • October 1996
Section 22.8—Determination fees.
(a) General. Notwithstanding any Federal or State law other than the Flood Disaster Protection Act of 1973 as amended (42 U.S.C. 4001-4129), any bank, or a servicer acting on behalf of the bank, may charge a reasonable fee for determining whether the building or mobile home se-curing the loan is located or will be located in a special flood hazard area. A determination fee may also include, but is not limited to, a fee for life-of-loan monitoring. (b) Borrower fee. The determination fee authorized by paragraph (a) of this section may be charged to the bor-rower if the determination:
(1) Is made in connection with a making, increasing, extending, or renewing of the loan that is initiated by the borrower; (2) Reflects the Director of FEMA's revision or updating of floodplain areas or flood-risk zones; (3) Reflects the Director of FEMA's publication of a notice or compendium that:
(i) Affects the area in which the building or mobile home securing the loan is located; or (ii) By determination of the Director of FEMA, may reasonably require a determination whether the build-ing or mobile home securing the loan is located in a special flood hazard area; or
(4) Results in the purchase of flood insurance coverage by the bank or its servicer on behalf of the borrower under section 22.7.
(c) Purchaser or transferee fee. The determination fee authorized by paragraph (a) of this section may be charged to the purchaser or transferee of a loan in the case of the sale or transfer of the loan.
(4) A statement whether Federal disaster relief assis-tance may be available in the event of damage to the building or mobile home caused by flooding in a Feder-ally declared disaster.
(c) Timing of notice. The bank shall provide the notice required by paragraph (a) of this section to the borrower within a reasonable time before the completion of the transaction, and to the servicer as promptly as practicable after the bank provides notice to the borrower and in any event no later than the time the bank provides other similar notices to the servicer concerning hazard insurance and taxes. Notice to the servicer may be made electronically or may take the form of a copy of the notice to the borrower. (d) Record of receipt. The bank shall retain a record of the receipt of the notices by the borrower and the servicer for the period of time the bank owns the loan. (e) Alternate method of notice. Instead of providing the notice to the borrower required by paragraph (a) of this section, a bank may obtain satisfactory written assurance from a seller or lessor that, within a reasonable time before the completion of the sale or lease transaction, the seller or lessor has provided such notice to the purchaser or lessee. The bank shall retain a record of the written assurance from the seller or lessor for the period of time the bank owns the loan. (f) Use of prescribed form of notice. A bank will be considered to be in compliance with the requirement for notice to the borrower of this section by providing written notice to the borrower containing the language presented in Appendix A to this part within a reasonable time before the completion of the transaction. The notice presented in Appendix A to this part satisfies the borrower notice re-quirements of the Act.
Section 22.9—Notice of special flood hazards and availability of Federal disaster relief assistance.
(a) Notice requirement. When a bank makes, increases, extends, or renews a loan secured by a building or a mobile home located or to be located in a special flood hazard area, the bank shall mail or deliver a written notice to the borrower and to the servicer in all cases whether or not flood insurance is available under the Act for the collateral securing the loan. (b) Contents of notice. The written notice must include the following information:
(1) A warning, in a form approved by the Director of FEMA, that the building or the mobile home is or will be located in a special flood hazard area; (2) A description of the flood insurance purchase re-quirements set forth in section 102(b) of the Flood Disaster Protection Act of 1973, as amended (42 U.S.C. 4012a(b)); (3) A statement, where applicable, that flood insurance coverage is available under the NFIP and may also be available from private insurers; and
Section 22.10—Notice of servicer's identity.
(a) Notice requirement. When a bank makes, increases, extends, renews, sells, or transfers a loan secured by a building or mobile home located or to be located in a special flood hazard area, the bank shall notify the Director of FEMA (or the Director's designee) in writing of the identity of the servicer of the loan. The Director of FEMA has designated the insurance provider to receive the bank's notice of the servicer's identity. This notice may be pro-vided electronically if electronic transmission is satisfac-tory to the Director of FEMA's designee. (b) Transfer of servicing rights. The bank shall notify the Director of FEMA (or the Director's designee) of any change in the servicer of a loan described in paragraph (a) of this section within 60 days after the effective date of the change. This notice may be provided electronically if elec-tronic transmission is satisfactory to the Director of FEMA's designee. Upon any change in the servicing of a loan described in paragraph (a) of this section, the duty to provide notice under this paragraph (b) shall transfer to the transferee servicer.
Digitized for FRASER http://fraser.stlouisfed.org/ Federal Reserve Bank of St. Louis

Legal Developments 939
Appendix A to Part 22—Sample Form of Notice of Special Flood Hazards and Availability of Federal Disaster Relief Assistance
We are giving you this notice to inform you that: The building or mobile home securing the loan for which you have applied is or will be located in an area with special flood hazards. The area has been identified by the Director of the Federal Emergency Management Agency (FEMA) as a special flood hazard area using FEMA's Flood Insur-ance Rate Map or the Flood Hazard Boundary Map for the following community: . This area has a one percent (1%) chance of a flood equal to or exceeding the base flood elevation (a 100-year flood) in any given year. During the life of a 30-year mortgage loan, the risk of a 100-year flood in a special flood hazard area is 26 percent (26%). Federal law allows a lender and bor-rower jointly to request the Director of FEMA to review the determination of whether the property securing the loan is located in a special flood hazard area. If you would like to make such a request, please contact us for further information.
The community in which the property securing the loan is located participates in the National Flood Insurance Program (NFIP). Federal law will not allow us to make you the loan that you have applied for if you do not purchase flood insurance. The flood insurance must be maintained for the life of the loan. If you fail to purchase or renew flood insurance on the property, Federal law authorizes and requires us to purchase the flood insurance for you at your expense.
• Flood insurance coverage under the NFIP may be purchased through an insurance agent who will obtain the policy either directly through the NFIP or through an insurance company that participates in the NFIP. Flood insurance also may be available from private insurers that do not participate in the NFIP.
• At a minimum, flood insurance purchased must cover the lesser of.
(1) The outstanding principal balance of the loan; or (2) The maximum amount of coverage allowed for the type of property under the NFIP. Flood insurance coverage under the NFIP is limited to
the overall value of the property securing the loan minus the value of the land on which the property is located.
• Federal disaster relief assistance (usually in the form of a low-interest loan) may be available for damages incurred in excess of your flood insurance if your commu-nity's participation in the NFIP is in accordance with NFIP requirements.
Flood insurance coverage under the NFIP is not available for the property securing the loan because the community in which the property is located does not participate in the NFIP. In addition, if the non-participating community has been identified for at least one year as containing a special flood hazard area, properties located in the community will not be eligible for Federal disaster
relief assistance in the event of a Federally declared flood disaster.
PART 208—MEMBERSHIP OF STATE BANKING INSTITUTIONS IN THE FEDERAL RESERVE SYSTEM (REGULATION H)
1. The authority citation for Part 208 is revised to read as follows:
Authority. 12 U.S.C. 36, 248(a), 248(c), 321-338a, 37Id, 461, 481-486, 601, 611, 1814, 1823(j), 1828(o), 1831o, 183lp-1, 3105, 3310, 3331-3351 and 3906-3909; 15 U.S.C. 78b, 781(b), 781(g), 781(i), 78o-4(c)(5), 78q, 78q-l, and 78w; 31 U.S.C. 5318; 42 U.S.C. 4012a, 4104a, 4104b, 4106, and 4128.
Section 208.8(e) [Removed and Reserved]
2. In section 208.8, paragraph (e) is removed and reserved, and APPENDIX A— SAMPLE NOTICES is removed.
3. A new section 208.23 and its Appendix A are added at the end of subpart A to read as follows:
Section 208.23—Loans in areas having special flood hazards.
(a) Purpose and scope—(1) Purpose. The purpose of this section is to implement the requirements of the National Flood Insurance Act of 1968 and the Flood Disaster Protection Act of 1973, as amended (42 U.S.C. 4001-4129). (2) Scope. This section, except for paragraphs (f) and (h) of this section, applies to loans secured by buildings or mobile homes located or to be located in areas deter-mined by the Director of the Federal Emergency Man-agement Agency to have special flood hazards. Para-graphs (f) and (h) of this section apply to loans secured by buildings or mobile homes, regardless of location.
(b) Definitions. (1) Act means the National Flood Insur-ance Act of 1968, as amended (42 U.S.C. 4001-4129). (2) Building means a walled and roofed structure, other than a gas or liquid storage tank, that is principally above ground and affixed to a permanent site, and a walled and roofed structure while in the course of con-struction, alteration, or repair. (3) Community means a State or a political subdivision of a State that has zoning and building code jurisdiction over a particular area having special flood hazards. (4) Designated loan means a loan secured by a building or mobile home that is located or to be located in a special flood hazard area in which flood insurance is available under the Act. (5) Director of FEMA means the Director of the Federal Emergency Management Agency. (6) Mobile home means a structure, transportable in one or more sections, that is built on a permanent chassis and
Digitized for FRASER http://fraser.stlouisfed.org/ Federal Reserve Bank of St. Louis

940 Federal Reserve Bulletin • October 1996
designed for use with or without a permanent foundation when attached to the required utilities. The term mobile home does not include a recreational vehicle. For pur-poses of this section, the term mobile home means a mobile home on a permanent foundation. The term mobile home includes a manufactured home as that term is used in the NFIR (7) NFIP means the National Flood Insurance Program authorized under the Act. (8) Residential improved real estate means real estate upon which a home or other residential building is located or to be located. (9) Servicer means the person responsible for:
(i) Receiving any scheduled, periodic payments from a borrower under the terms of a loan, including amounts for taxes, insurance premiums, and other charges with respect to the property securing the loan; and (ii) Making payments of principal and interest and any other payments from the amounts received from the borrower as may be required under the terms of the loan.
(10) Special flood hazard area means the land in the flood plain within a community having at least a one percent chance of flooding in any given year, as desig-nated by the Director of FEMA. (11) Table funding means a settlement at which a loan is funded by a contemporaneous advance of loan funds and an assignment of the loan to the person advancing the funds.
(c) Requirement to purchase flood insurance where available—
(1) In general. A state member bank shall not make, increase, extend, or renew any designated loan unless the building or mobile home and any personal property securing the loan is covered by flood insurance for the term of the loan. The amount of insurance must be at least equal to the lesser of the outstanding principal balance of the designated loan or the maximum limit of coverage available for the particular type of property under the Act. Flood insurance coverage under the Act is limited to the overall value of the property securing the designated loan minus the value of the land on which the property is located. (2) Table funded loans. A state member bank that ac-quires a loan from a mortgage broker or other entity through table funding shall be considered to be making a loan for the purposes of this section.
(d) Exemptions. The flood insurance requirement pre-scribed by paragraph (c) of this section does not apply with respect to:
(1) Any State-owned property covered under a policy of self-insurance satisfactory to the Director of FEMA, who publishes and periodically revises the list of States falling within this exemption; or (2) Property securing any loan with an original principal balance of $5,000 or less and a repayment term of one year or less.
(e) Escrow requirement. If a state member bank requires the escrow of taxes, insurance premiums, fees, or any other charges for a loan secured by residential improved real estate or a mobile home that is made, increased, extended, or renewed after October 1, 1996, the state member bank shall also require the escrow of all premiums and fees for any flood insurance required under paragraph (c) of this section. The state member bank, or a servicer acting on its behalf, shall deposit the flood insurance premiums on behalf of the borrower in an escrow account. This escrow account will be subject to escrow requirements adopted pursuant to section 10 of the Real Estate Settlement Proce-dures Act of 1974 (12 U.S.C. 2609) (RESPA), which gener-ally limits the amount that may be maintained in escrow accounts for certain types of loans and requires escrow account statements for those accounts, only if the loan is otherwise subject to RESPA. Following receipt of a notice from the Director of FEMA or other provider of flood insurance that premiums are due, the state member bank, or a servicer acting on its behalf, shall pay the amount owed to the insurance provider from the escrow account by the date when such premiums are due. (f) Required use of standard flood hazard determination form—
(1) Use of form. A state member bank shall use the standard flood hazard determination form developed by the Director of FEMA (as set forth in Appendix A of 44 C.F.R. Part 65) when determining whether the build-ing or mobile home offered as collateral security for a loan is or will be located in a special flood hazard area in which flood insurance is available under the Act. The standard flood hazard determination form may be used in a printed, computerized, or electronic manner. (2) Retention of form. A state member bank shall retain a copy of the completed standard flood hazard determina-tion form, in either hard copy or electronic form, for the period of time the bank owns the loan.
(g) Forced placement of flood insurance. If a state member bank, or a servicer acting on behalf of the bank, determines at any time during the term of a designated loan that the building or mobile home and any personal property secur-ing the designated loan is not covered by flood insurance or is covered by flood insurance in an amount less than the amount required under paragraph (c) of this section, then the bank or its servicer shall notify the borrower that the borrower should obtain flood insurance, at the borrower's expense, in an amount at least equal to the amount required under paragraph (c) of this section, for the remaining term of the loan. If the borrower fails to obtain flood insurance within 45 days after notification, then the state member bank or its servicer shall purchase insurance on the borrow-er's behalf. The state member bank or its servicer may charge the borrower for the cost of premiums and fees incurred in purchasing the insurance. (h) Determination fees—(1) General. Notwithstanding any
Federal or State law other than the Flood Disaster Pro-tection Act of 1973, as amended (42 U.S.C. 4001-4129), any state member bank, or a servicer acting on behalf of
Digitized for FRASER http://fraser.stlouisfed.org/ Federal Reserve Bank of St. Louis

Legal Developments 941
the bank, may charge a reasonable fee for determining whether the building or mobile home securing the loan is located or will be located in a special flood hazard area. A determination fee may also include, but is not limited to, a fee for life-of-loan monitoring. (2) Borrower fee. The determination fee authorized by paragraph (h)(1) of this section may be charged to the borrower if the determination:
(i) Is made in connection with a making, increasing, extending, or renewing of the loan that is initiated by the borrower; (ii) Reflects the Director of FEMA's revision or updat-ing of floodplain areas or flood-risk zones; (iii) Reflects the Director of FEMA's publication of a notice or compendium that:
(A) Affects the area in which the building or mobile home securing the loan is located; or (B) By determination of the Director of FEMA, may reasonably require a determination whether the building or mobile home securing the loan is located in a special flood hazard area; or
(iv) Results in the purchase of flood insurance cover-age by the lender or its servicer on behalf of the borrower under paragraph (g) of this section.
(3) Purchaser or transferee fee. The determination fee authorized by paragraph (h)(1) of this section may be charged to the purchaser or transferee of a loan in the case of the sale or transfer of the loan. (i) Notice of special flood hazards and availability of Federal disaster relief assistance— (1) Notice requirement. When a state member bank makes, increases, extends, or renews a loan secured by a building or a mobile home located or to be located in a special flood hazard area, the bank shall mail or deliver a written notice to the borrower and to the servicer in all cases whether or not flood insurance is available under the Act for the collateral securing the loan. (2) Contents of notice. The written notice must include the following information:
(i) A warning, in a form approved by the Director of FEMA, that the building or the mobile home is or will be located in a special flood hazard area; (ii) A description of the flood insurance purchase requirements set forth in section 102(b) of the Flood Disaster Protection Act of 1973, as amended (42 U.S.C. 4012a(b)); (iii) A statement, where applicable, that flood insur-ance coverage is available under the NFIP and may also be available from private insurers; and (iv) A statement whether Federal disaster relief assis-tance may be available in the event of damage to the building or mobile home caused by flooding in a Federally declared disaster.
(3) Timing of notice. The state member bank shall pro-vide the notice required by paragraph (i)(l) of this section to the borrower within a reasonable time before the completion of the transaction, and to the servicer as promptly as practicable after the bank provides notice to
the borrower and in any event no later than the time the bank provides other similar notices to the servicer con-cerning hazard insurance and taxes. Notice to the ser-vicer may be made electronically or may take the form of a copy of the notice to the borrower. (4) Record of receipt. The state member bank shall retain a record of the receipt of the notices by the borrower and the servicer for the period of time the bank owns the loan. (5) Alternate method of notice. Instead of providing the notice to the borrower required by paragraph (i)(l) of this section, a state member bank may obtain satisfac-tory written assurance from a seller or lessor that, within a reasonable time before the completion of the sale or lease transaction, the seller or lessor has provided such notice to the purchaser or lessee. The state member bank shall retain a record of the written assurance from the seller or lessor for the period of time the bank owns the loan. (6) Use of prescribed form of notice. A state member bank will be considered to be in compliance with the requirement for notice to the borrower of this para-graph (i) by providing written notice to the borrower containing the language presented in Appendix A to this section within a reasonable time before the completion of the transaction. The notice presented in Appendix A to this section satisfies the borrower notice requirements of the Act.
(j) Notice of servicer's identity—(1) Notice requirement. When a state member bank makes, increases, extends, renews, sells, or transfers a loan secured by a building or mobile home located or to be located in a special flood hazard area, the bank shall notify the Director of FEMA (or the Director's designee) in writing of the identity of the servicer of the loan. The Director of FEMA has designated the insurance provider to receive the state member bank's notice of the servicer's identity. This notice may be provided electronically if electronic trans-mission is satisfactory to the Director of FEMA's desig-nee. (2) Transfer of servicing rights. The state member bank shall notify the Director of FEMA (or the Director's designee) of any change in the servicer of a loan de-scribed in paragraph (j)(l) of this section within 60 days after the effective date of the change. This notice may be provided electronically if electronic transmission is satis-factory to the Director of FEMA's designee. Upon any change in the servicing of a loan described in para-graph (j)(l) of this section, the duty to provide notice under this paragraph (j)(2) shall transfer to the transferee servicer.
Appendix A to Section 208.23—Sample Form of Notice Notice of Special Flood Hazards and Availability of Federal Disaster Relief Assistance
We are giving you this notice to inform you that: The building or mobile home securing the loan for which
Digitized for FRASER http://fraser.stlouisfed.org/ Federal Reserve Bank of St. Louis

942 Federal Reserve Bulletin • October 1996
you have applied is or will be located in an area with special flood hazards. The area has been identified by the Director of the Federal Emergency Management Agency (FEMA) as a special flood hazard area using FEMA's Flood Insurance Rate Map or the Flood Hazard Boundary Map for the following community: . This area has a one percent (1%) chance of a flood equal to or exceeding the base flood elevation (a 100-year flood) in any given year. During the life of a 30-year mortgage loan, the risk of a 100-year flood in a special flood hazard area is 26 percent (26%). Federal law allows a lender and bor-rower jointly to request the Director of FEMA to review the determination of whether the property securing the loan is located in a special flood hazard area. If you would like to make such a request, please contact us for further information.
The community in which the property securing the loan is located participates in the National Flood Insurance Program (NFIP). Federal law will not allow us to make you the loan that you have applied for if you do not purchase flood insurance. The flood insurance must be maintained for the life of the loan. If you fail to purchase or renew flood insurance on the property, Federal law authorizes and requires us to purchase the flood insurance for you at your expense.
• Flood insurance coverage under the NFIP may be purchased through an insurance agent who will obtain the policy either directly through the NFIP or through an insurance company that participates in the NFIP. Flood insurance also may be available from private insurers that do not participate in the NFIP.
• At a minimum, flood insurance purchased must cover the lesser of:
(1) the outstanding principal balance of the loan; or (2) the maximum amount of coverage allowed for the type of property under the NFIP. Flood insurance coverage under the NFIP is limited to
the overall value of the property securing the loan minus the value of the land on which the property is located.
• Federal disaster relief assistance (usually in the form of a low-interest loan) may be available for damages incurred in excess of your flood insurance if your commu-nity's participation in the NFIP is in accordance with NFIP requirements.
Flood insurance coverage under the NFIP is not available for the property securing the loan because the community in which the property is located does not participate in the NFIP. In addition, if the non-participating community has been identified for at least one year as containing a special flood hazard area, properties located in the community will not be eligible for Federal disaster relief assistance in the event of a Federally declared flood disaster.
FINAL RULE—AMENDMENT TO REGULATION Y
The Board of Governors is adopting a final rule amending its interpretive rule regarding investment adviser activities
of bank holding companies to allow a bank holding com-pany (and its bank and nonbank subsidiaries) to purchase, in a fiduciary capacity, securities of an investment com-pany advised by the bank holding company if the purchase is specifically authorized by the terms of the instrument creating the fiduciary relationship, by court order, or by the law of the jurisdiction under which the trust is adminis-tered. This amendment would reflect changes that have occurred since the rule was adopted; and would conform the Board's interpretive rule to rules applied to banks by the Federal Deposit Insurance Corporation and the Office of the Comptroller of the Currency, and the standard in section 23B of the Federal Reserve Act for this type of activity.
Effective September 30, 1996, 12 C.F.R. Part 225 is amended as follows:
Part 225—Bank Holding Companies and Change in Bank Control (Regulation Y)
1. The authority citation for 12 C.F.R. Part 225 continues to read as follows:
Authority: 12 U.S.C. 1817(j)(13), 1818, 1831i, 1831p-l, 1843(c)(8), 1844(b), 1972(1), 3106, 3108, 3310, 3331-3351,3907, and 3909.
2. Section 225.125 is amended by revising paragraph (g) to read as follows:
Section 225.125—Investment adviser activities.
(g) In view of the potential conflicts of interests that may exist, a bank holding company and its bank and nonbank subsidiaries should not:
(1) Purchase for their own account securities of any investment company for which the bank holding com-pany acts as investment adviser; (2) Purchase in their sole discretion, any such securities in a fiduciary capacity (including as managing agent) unless the purchase is specifically authorized by the terms of the instrument creating the fiduciary relation-ship, by court order, or by the law of the jurisdiction under which the trust is administered; (3) Extend credit to any such investment company; or (4) Accept the securities of any such investment com-pany as collateral for a loan which is for the purpose of purchasing securities of the investment company.
ORDERS ISSUED UNDER BANK HOLDING COMPANY ACT
Orders Issued Under Section 3 of the Bank Holding Company Act
First Merchants Corporation Muncie, Indiana
Digitized for FRASER http://fraser.stlouisfed.org/ Federal Reserve Bank of St. Louis

Legal Developments 943
Order Approving the Acquisition of a Bank Holding Company
First Merchants Corporation, Muncie, Indiana ("First Mer-chants"), a bank holding company within the meaning of the Bank Holding Company Act ("BHC Act"), has re-quested the Board's approval under section 3 of the BHC Act (12 U.S.C. § 1842) to merge with Randolph County Bancorp ("Randolph"), and thereby acquire its wholly owned subsidiary bank, Randolph County Bank ("Ran-dolph Bank"), both in Winchester, Indiana.
Notice of the proposal, affording interested persons an opportunity to submit comments, has been published (61 Federal Register 31,941 (1996)). The time for filing comments has expired, and the Board has considered the proposal and all comments received in light of the factors set forth in section 3(c) of the BHC Act.
First Merchants is the 14th largest commercial banking organization in Indiana, controlling deposits of approxi-mately $596 million, representing approximately 1.1 per-cent of total deposits in commercial banking organizations in Indiana.1 Randolph is the 88th largest commercial bank-ing organization in Indiana, controlling approximately $63.4 million in deposits, representing less than 1 percent of total deposits in commercial banking organizations in the state. On consummation of the proposal, First Mer-chants would become the 13th largest commercial banking organization in Indiana and control approximately $659.4 million in deposits, representing approximately 1.2 percent of total deposits in commercial banking organiza-tions in the state.
Competitive Considerations
First Merchants's subsidiary bank, First Merchants Bank, National Association, Muncie ("Merchants Bank"), and Randolph Bank compete directly in the Muncie banking market ("Muncie banking market").2 Merchants Bank is the largest depository institution in the Muncie banking market, controlling deposits of approximately $446.9 mil-lion, representing approximately 31.6 percent of total de-posits in depository institutions in the market ("market deposits").3 Randolph Bank is the eighth largest deposi-
1. State deposit data are as of December 31, 1995, and market share data are as of June 30, 1995.
2. The Muncie banking market is approximated by Delaware and Randolph Counties in Indiana, excluding Washington and Greensfork townships; Licking and Jackson townships in Blackford County, Indi-ana; and Jackson township in Darke County, Ohio.
3. In this context, depository institutions include commercial banks, savings banks, and savings associations. Market share data are based on a calculation in which the deposits of thrift institutions are included at 50 percent. The Board previously has indicated that thrift institu-tions have become, or have the potential to become, significant competitors of commercial banks. See WM Bancorp, 76 Federal Reserve Bulletin 788 (1990); National City Corporation, 70 Federal Reserve Bulletin 743 (1984). Thus, the Board has regularly included thrift deposits in the calculation of market share on a 50-percent weighted basis. See, e.g., First Hawaiian Inc., 11 Federal Reserve Bulletin 52 (1991).
tory institution in the Muncie banking market, controlling deposits of $62.8 million, representing approximately 4.4 percent of market deposits. After consummation of the proposal, First Merchants would control deposits of ap-proximately $509.7 million, representing approximately 36 percent of market deposits. The Herfindahl-Hirschman Index ("HHI") for the Muncie banking market would increase by 281 points to 2184. Consummation of the proposal, therefore, would exceed the threshold levels of market concentration as measured by the HHI under the Department of Justice Merger Guidelines.4
The Board believes that several factors in the Muncie banking market mitigate the potential anticompetitive ef-fects of the proposal. For example, eight other competitors would remain in the market, including three relatively large out-of-state banking organizations, each with total deposits of more than $2 billion. In addition, three of the eight other competitors, including one of the large out-of-state banking organizations, would each control at least 9 percent of total deposits in depository institutions in the market.
The Muncie banking market also has several characteris-tics that make it attractive for entry. Deposit growth in the Muncie Metropolitan Statistical Area ("MSA") has sub-stantially exceeded the average deposit growth in Indiana's other MSAs during recent years, and recent job growth in the market has been substantial.5 The Muncie MSA also has recently experienced both de novo entry and entry by acquisition,6 and a large interstate banking organization has announced its intention to enter the Muncie banking market. Indiana's interstate and branch banking laws, moreover, permit both statewide branching and interstate banking, and, therefore, present low legal barriers to entry into the Muncie banking market for in-state and out-of-state banking organizations.7 The Department of Justice has reviewed the proposal and advised the Board that consummation of the proposal would not likely have any significantly adverse competitive effects in this or any relevant banking market.8
4. Under the revised Department of Justice Merger Guidelines, 49 Federal Register 26823 (June 29, 1984), a market in which the post-merger HHI is above 1800 is considered to be highly concen-trated. The Department of Justice has informed the Board that a bank merger or acquisition generally will not be challenged (in the absence of other factors indicating anticompetitive effects) unless the post-merger HHI is at least 1800 and the merger increases the HHI by more than 200 points. The Department of Justice has stated that the higher than normal HHI thresholds for screening bank mergers for anticom-petitive effects implicitly recognize the competitive effect of limited-purpose lenders and other nondepository financial entities.
5. One recent study ranked the Muncie metropolitan area first among 50 similarly sized metropolitan areas in terms of job creation in the United States.
6. Michigan's third largest bank entered the market de novo in 1995, and entry by acquisition occurred in 1994 and 1995.
7. Indiana Code Annotated §§ 28-2-13-19 and 28-2-16-15 (Burns 1996).
8. The Office of the Comptroller of the Currency and the Federal Deposit Insurance Corporation have not objected to the proposal.
Digitized for FRASER http://fraser.stlouisfed.org/ Federal Reserve Bank of St. Louis

944 Federal Reserve Bulletin • October 1996
Based on these and all the facts of record, the Board concludes that consummation of the proposal is not likely to have a significantly adverse effect on competition or on the concentration of banking services in the Muncie bank-ing market or any other relevant market. In light of all the facts of record, the Board also concludes that the financial and managerial resources and future prospects of First Merchants and Randolph and their respective subsidiaries are consistent with approval, as are considerations relating to the convenience and needs of the community to be served and other supervisory factors the Board must con-sider under the BHC Act.
For these reasons, and in light of all the other facts of record, the Board has determined that the application should be, and hereby is, approved. The Board's approval is expressly conditioned on First Merchants' compliance with all the commitments made in connection with the application. The commitments relied on by the Board in reaching this decision shall be deemed to be conditions imposed in writing by the Board in connection with its findings and decision, and, as such, may be enforced in proceedings under applicable law.
The merger with Randolph shall not be consummated before the fifteenth calendar day following the effective date of this order or later than three months after the effective date of this order, unless such period is extended for good cause by the Board or by the Federal Reserve Bank of Chicago, acting pursuant to delegated authority.
By order of the Board of Governors, effective August 28, 1996.
Voting for this action: Chairman Greenspan, and Governors Lind-sey, Phillips, Yellen, and Meyer. Absent and not voting: Vice Chair Rivlin and Governor Kelley.
WILLIAM W. WILES Secretary of the Board
InterWest Bancorp, Inc. Oak Harbor, Washington
Order Approving the Acquisition of a Bank Holding Company
InterWest Bancorp, Inc., Oak Harbor ("InterWest"), a bank holding company within the meaning of the Bank Holding Company Act ("BHC Act"), has requested the Board's approval under section 3 of the BHC Act (12 U.S.C. § 1842) to merge with Central Bancorporation, Wenatchee ("Central"), and thereby indirectly acquire its wholly owned subsidiary banks, Central Washington Bank, Wenatchee, and North Central Washington Bank, Omak, all in Washington.
Notice of the proposal, affording interested persons an opportunity to submit comments, has been published (61 Federal Register 21,183 (1996)). The time for filing comments has expired, and the Board has considered the proposal and all comments received in light of the factors set forth in section 3(c) of the BHC Act.
InterWest is the ninth largest depository institution in Washington, controlling deposits of approximately $833 million, representing approximately 1.6 percent of total deposits in depository institutions in Washington.1
Central is the 3 2d largest depository institution in Washing-ton, controlling approximately $178 million in deposits, representing less than 1 percent of total deposits in deposi-tory institutions in the state. On consummation of the proposal, InterWest would become the seventh largest commercial banking organization in Washington, and con-trol approximately $1 billion in deposits, representing ap-proximately 2 percent of total deposits in depository insti-tutions in the state.
Competitive Considerations
InterWest's subsidiary savings bank, Interwest Savings Bank, Oak Harbor, Washington ("Savings Bank"), and Central's commercial bank subsidiaries, Central Washing-ton Bank, Wenatchee, Washington ("Central Washing-ton"), and North Central Washington Bank, Omak, Wash-ington ("North Central"), compete directly in the Washington banking markets of Wenatchee ("Wenatchee banking market"), Omak-Okanogan ("Omak-Okanogan banking market"), and Chelan ("Chelan banking mar-ket").2 Consummation of the proposal would not exceed the threshold levels of market concentration3 as measured by the Herfindahl-Hirschman Index ("HHI") under the Department of Justice Merger Guidelines in the Wenatchee banking market.4
1. Deposit and market share data are as of June 30, 1995, adjusted for mergers and acquisitions that were consummated as of April 30, 1996. In this context, depository institutions include commercial banks, savings banks, and savings associations.
2. The Wenatchee banking market is approximated by the towns of Wenatchee, East Wenatchee, Leavenworth, Cashmere, and Waterville, Washington. The Omak-Okanogan banking market is approximated by the towns of Omak, Okanogan, Oroville, Tonasket, Twisp, and Winthrop, Washington. The Chelan banking market is approximated by the towns of Manson and Chelan, Washington.
3. Market share data are based on a calculation in which the deposits of thrift institutions are included at 50 percent. The Board previously has indicated that thrift institutions have become, or have the potential to become, significant competitors of commercial banks. See WM Bancorp, 76 Federal Reserve Bulletin 788 (1990); National City Corporation, 70 Federal Reserve Bulletin 743 (1984). Thus, the Board has regularly included thrift deposits in the calculation of market share on a 50-percent weighted basis. See, e.g., First Hawaiian Inc., 77 Federal Reserve Bulletin 52 (1991).
4. The HHI for the Wenatchee banking market would increase by 145 points to 1987. Under the revised Department of Justice Merger Guidelines, 49 Federal Register 26,823 (June 29, 1984), a market in which the post-merger HHI is above 1800 is considered to be highly concentrated. The Department of Justice has informed the Board that a bank merger or acquisition generally will not be challenged (in the absence of other factors indicating anticompetitive eifects) unless the post-merger HHI is at least 1800 and the merger increases the HHI by more than 200 points. The Department of Justice has stated that the higher than normal HHI thresholds for screening bank mergers for anticompetitive eifects implicitly recognize the competitive effect of limited-purpose lenders and other nondepository financial entities.
Digitized for FRASER http://fraser.stlouisfed.org/ Federal Reserve Bank of St. Louis

Legal Developments 945
These thresholds, however, would be exceeded in the Omak-Okanogan and Chelan banking markets.5 The Board notes that HHI levels are only guidelines that are used by the Board, the Department of Justice, and the other bank-ing agencies to help identify cases in which a more detailed competitive analysis is appropriate to assure that the pro-posal would not have a significantly adverse effect on competition in any relevant market. A proposal that fails to pass the HHI market screen may nonetheless be approved because other information may indicate that the proposal would not have a significantly adverse effect on competi-tion. The Department of Justice has reviewed the proposal and advised the Board that consummation of the proposal would not likely have any significantly adverse competi-tive effects in these or any relevant Washington banking market.6
The Board also believes that several factors in the Omak-Okanogan and Chelan markets mitigate the potential anti-competitive effects of the proposal. The Board believes that a calculation of the HHI based on total market deposits does not accurately reflect the competitive effects of this proposal in these markets. In addition, numerous competi-tors would remain in both banking markets after consum-mation of the proposal. In the Omak-Okanogan banking market, seven depository institutions would remain, includ-ing three large regional commercial banking organizations each with more than 10 percent of market deposits. In the Chelan banking market, four depository institution compet-itors would remain, including two large bank holding com-panies that would control more than 34 percent and 24 percent of market deposits, respectively.
The record indicates that governmental deposits of local political subdivisions represent a majority of the deposits held by Interwest in the Omak-Okanogan banking market. These types of deposits may be volatile because they generally are short-term, subject to competitive bidding, and usually can be used to fund only short-term loans. The Board previously has determined that individual, partner-ship, and corporation ("IPC") deposits may be the proper focus for the competitive analysis of markets in which government deposits constitute a relatively large share of total market deposits.7 In the Omak-Okanogan banking market, 62.6 percent of InterWest's deposits are non-IPC deposits, compared with market-wide non-IPC deposits of approximately 9.4 percent.8 In light of these and all the facts of record, the Board concludes that the competitive
effects of the proposal should be considered on the basis of IPC deposits. When analyzed on the basis of IPC deposits, the HHI for deposits in the Omak-Okanogan banking mar-ket would increase 172 points to 1757, and Interwest would control 24.3 percent of IPC deposits after consum-mation of the proposal.
Barriers to entry into these markets are relatively low because Washington law permits banks to branch statewide without restriction. The Chelan banking market, in particu-lar, has characteristics that make it attractive for entry by an out-of-market firm. The population of the Chelan bank-ing market increased by 15.9 percent from 1990 to 1994, while the population for the entire state increased by 9.8 percent.
Based on these and all the facts of record, the Board concludes that consummation of the proposal is not likely to have a significantly adverse effect on competition or on the concentration of banking services in the Omak-Okanogan or Chelan banking markets or any other relevant market. The Board also concludes in light of all the facts of record that the financial and managerial resources and future prospects of InterWest and Central and their respec-tive subsidiaries are consistent with approval, as are con-siderations relating to the convenience and needs of the community to be served and other supervisory factors the Board must consider under the BHC Act.9
For these reasons, and in light of all the other facts of record, the Board has determined that the application should be, and hereby is, approved. The Board's approval is expressly conditioned on InterWest's compliance with all the commitments made in connection with the applica-tion. The commitments relied on by the Board in reaching this decision shall be deemed to be conditions imposed in writing by the Board in connection with its findings and decision, and, as such, may be enforced in proceedings under applicable law.
The transactions shall not be consummated before the fifteenth calendar day following the effective date of this order, or later than three months after the effective date of this order, unless such period is extended for good cause by the Board or by the Federal Reserve Bank of San Fran-cisco, acting pursuant to delegated authority.
By order of the Board of Governors, effective August 12, 1996.
5. The HHI would increase for the Omak-Okanogan banking market by 397 points to 1875, and for the Chelan banking market by 211 points to 2981.
6. The Office of the Comptroller of the Currency and the Federal Deposit Insurance Corporation ("FDIC") have not objected to the proposal.
7. See Banco Popular de Puerto Rico, 79 Federal Reserve Bulletin 979 (1993); CNB Bancshares, Inc., 80 Federal Reserve Bulletin 538 (1994).
8. On average, non-IPC deposits account for approximately 6.4 percent of total deposits in banks in the United States. These data are as of June 30, 1995.
9. Interwest proposes to operate Savings Bank's branches, which are insured by the Savings Association Insurance Fund, in tandem with the branches of Central's subsidiary banks, which are insured by the Bank Insurance Fund. The FDIC has determined generally that tandem operations of the type proposed are consistent with restrictions on a "conversion transaction" under the Federal Deposit Insurance Act (12 U.S.C. § 1815), see FDIC Press Release 47-96 (July 1, 1996). InterWest has proposed steps to ensure that deposit transfers by customers are voluntary and to inform customers that the depository subsidiaries of InterWest and Central are separate.
Digitized for FRASER http://fraser.stlouisfed.org/ Federal Reserve Bank of St. Louis

946 Federal Reserve Bulletin • October 1996
Voting for this action: Chairman Greenspan, Vice Chair Rivlin, and Governors Kelley, Phillips, and Meyer. Absent and not voting: Gover-nors Lindsey and Yellen.
JENNIFER J. JOHNSON Deputy Secretary of the Board
KeyCorp Cleveland, Ohio
Order Approving the Acquisition of a Bank
KeyCorp, Cleveland, Ohio ("KeyCorp"), a bank holding company within the meaning of the Bank Holding Com-pany Act ("BHC Act"), and its wholly owned subsidiary, Key Bancorp of New Hampshire, Inc., Bedford, New Hampshire, have requested the Board's approval under section 3 of the BHC Act (12 U.S.C. § 1842) to acquire Key Bank, Bedford, New Hampshire ("Key Bank"), a de novo state-chartered bank.
Notice of the proposal, affording interested persons an opportunity to submit comments, has been published (61 Federal Register 26,181 (1996)).1 The time for filing comments has expired, and the Board has considered the proposal and all comments received in light of the factors set forth in section 3 of the BHC Act.
KeyCorp, with total consolidated assets of $66.3 billion, operates subsidiary banks in 13 states. KeyCorp is the tenth largest commercial banking organization in the United States, controlling 1.7 percent of total United States bank-ing assets, and is the third largest commercial banking organization in Ohio, controlling approximately $13.2 bil-lion in deposits, representing 13.4 percent of all deposits in commercial banking organizations in the state.2 KeyCorp also engages in a number of permissible nonbanking activ-ities throughout the United States.
Interstate Analysis
Section 3(d) of the BHC Act, as amended by section 101 of the Riegle-Neal Interstate Banking and Branching Effi-ciency Act of 1994, allows the Board to approve an appli-
1. Inner City Press/Community on the Move ("Protestant") con-tends that notice of the proposal was required under the Board's Rules of Procedure to be published in Albany, New York. The Board's Rules of Procedure provide for newspaper publication in the "community or communities in which the head offices of the largest subsidiary bank, if any, or an applicant and of each bank, shares of which are to be directly or indirectly acquired, are located in the case of applications under section 3 of the Bank Holding Company Act." 12 C.F.R. 262.3(b)(l)(ii)(E). The record indicates that Key Bancorp of New Hampshire, Inc., a New Hampshire corporation, initially was char-tered as a non-operating company located in Albany, New York, but subsequently moved its headquarters to New Hampshire. Accordingly, KeyCorp's publication of notice of the proposal in newspapers of general circulation on April 26, 1996, in appropriate areas in Ohio and New Hampshire complied with the Board's Rules of Procedure.
2. U.S. banking asset data are as of March 31, 1996. State deposit data are as of June 30, 1995.
cation by a bank holding company to acquire control of a bank located in a state other than the home state of such bank holding company, if certain conditions are met. For purposes of the BHC Act, the home state of KeyCorp is Ohio.3 As noted above, KeyCorp would establish a de novo bank in New Hampshire. The conditions for an interstate acquisition under section 3(d) are met in this case.4 In view of all the facts of record, the Board is permitted to approve the proposal under section 3(d) of the BHC Act.
Competitive Considerations
Section 3 of the BHC Act prohibits the Board from approv-ing an application if the proposal would result in a monop-oly, or would substantially lessen competition in any rele-vant market unless such anticompetitive effects are clearly outweighed in the public interest by the probable effects of the transaction in meeting the convenience and needs of the community to be served. KeyCorp currently does not operate an insured depository institution in New Hamp-shire. Based on all the facts of record, the Board concludes that consummation of the proposal would not have any significantly adverse effects on competition or the concen-tration of banking resources in any relevant banking mar-ket. Accordingly, the Board concludes that competitive considerations are consistent with approval.
Other Factors under the BHC Act
The BHC Act also requires the Board to consider the financial and managerial resources and future prospects of the companies and banks involved, the convenience and needs of the community to be served, and certain other supervisory factors.
A. Supervisory Factors
The Board has carefully considered the financial and man-agerial resources and future prospects of KeyCorp and its subsidiaries, as well as other supervisory factors in light of all the facts of record. These facts include supervisory
3. Pub. L. No. 103-328, 108 Stat. 2338 (1994). A bank holding company's home state is the state in which the operations of the bank holding company's banking subsidiaries were principally conducted on July 1, 1966, or the date on which the company became a bank holding company, whichever is later.
4. See 12 U.S.C. § § 1842(d)(1)(A) and (B) and 1842(d)(2)(A) and (B). KeyCorp is adequately capitalized and adequately managed. The New Hampshire Banking Department has determined that Key Bank is not subject to the minimum charter age requirements under current New Hampshire law because the transaction was authorized and approved before New Hampshire law was amended to impose a minimum age requirement. In addition, on consummation of the proposal, KeyCorp and its affiliates would control less than 10 percent of the total amount of deposits of insured depository institutions in the United States, and less than 20 percent of the total amount of deposits of insured depository institutions in New Hampshire, as required by state law. The New Hampshire Banking Department approved Key-Corp 's petition to organize a de novo bank, and has issued a Certifi-cate to Affiliate to KeyCorp.
Digitized for FRASER http://fraser.stlouisfed.org/ Federal Reserve Bank of St. Louis

Legal Developments 947
reports of examination assessing the financial and manage-rial resources of the organizations and confidential finan-cial information provided by KeyCorp. Based on these and all other facts of record, the Board concludes that all the supervisory factors under the BHC Act, including financial and managerial considerations, weigh in favor of approv-ing the proposal.5
B. Convenience and Needs Factor
The Board has long held that consideration of the conve-nience and needs factor includes a review of the records of the relevant depository institutions under the Community Reinvestment Act (12 U.S.C. § 2901 et seq.) ("CRA"). As provided in the CRA, the Board has evaluated this factor in light of examinations by the primary federal supervisors of the CRA performance records of the relevant institutions.
The Board also has carefully considered comments from Protestant contending that branch closings by KeyCorp's subsidiary banks have adversely affected access to credit and banking services in low-to-moderate income ("LMI") communities located in several states.6 Protestant also ar-gues that KeyCorp's reported plan to close up to 40 percent of its traditional brick and mortar branches over the next four to five years would disproportionately disadvantage LMI areas. In addition, Protestant criticizes the record of lending of several of KeyCorp's subsidiary banks in LMI areas and areas with predominantly African-American pop-ulations7 by citing housing-related loan data filed under the Home Mortgage Disclosure Act (12 U.S.C. § 2801 et seq.) ("HMDA") for a number of metropolitan areas.8
An institution's most recent CRA performance evalua-tion is a particularly important consideration in the applica-tions process because it represents a detailed on-site evalu-ation of the institution's overall record of performance under the CRA by its primary federal supervisor.9 In addi-
5. Protestant alleges that KeyCorp management improperly paid for a flight for the New York State Tax Commissioner from Cleveland to Albany in May, 1996. KeyCorp states that it has billed the Commis-sioner's office for the cost of passage on the flight which had been scheduled to transport KeyCorp employees from Cleveland to Albany.
6. In particular, Protestant alleges that specific branch closings and consolidations in Indiana and Ohio in 1995 and 1996 eliminated convenient banking alternatives in a number of communities. Protes-tant believes that the criteria that these banks have used to determine whether a branch should be closed have a disparate impact on LMI areas and communities with predominantly minority populations.
7. These banks include Key Bank of New York, Albany, New York ("Key Bank-NY"), Key Bank of Washington, Tacoma, Washington ("Key Bank-WA"), Key Bank of Oregon, Portland, Oregon ("Key Bank-OR"), Society National Bank, Cleveland, Ohio ("Society-OH"), Society National Bank, South Bend, Indiana ("Society-IN"), and Society Bank, Ann Arbor, Michigan ("Society-MI").
8. Data for KeyCorp's subsidiary banks cited by Protestant include data from the following metropolitan areas: Albany, Buffalo, Roches-ter, Syracuse, Binghamton, and New York City, all in New York; Seattle and Tacoma, both in Washington; Portland and Salem, both in Oregon; Detroit, Michigan; Bloomington, Indianapolis and Elkhart-Goshen, all in Indiana; and Cincinnati, Ohio.
9. The Board notes that the Statement of the Federal Financial Supervisory Agencies Regarding the Community Reinvestment Act
tion, the Board considers an institution's policies and prac-tices for compliance with applicable fair lending laws. The Board also takes into account information on an institu-tion's lending activities that assist in meeting the credit needs of low- and moderate-income neighborhoods, in-cluding programs and activities initiated since its most recent CRA performance examination.10
Performance Examinations. All of KeyCorp's subsid-iary banks, including the banks conducting the banking activities in the areas discussed in Protestant's comments, received a CRA performance rating of "satisfactory" or "outstanding" in their most recent evaluations for CRA performance by their primary federal supervisors (collec-tively, "CRA Examinations").11 In particular, Key Bank-NY, Key Bank-OR, Society-OH, Society-IN, and Society-MI received "outstanding" ratings from their pri-mary federal supervisors.12 Key Bank-WA was rated "sat-isfactory" by the Federal Deposit Insurance Corporation ("FDIC") at its most recent CRA performance evaluation.
The examinations of the particular KeyCorp subsidiary banks that were the primary focus of Protestant's com-ments generally found that the community delineations for the banks were reasonable and did not exclude any LMI neighborhoods.13 In general, examiners also concluded that the geographic distribution of credit demonstrated reason-able penetration of all segments of each bank's communi-ties, including LMI neighborhoods. None of the banks was found to have engaged in illegal credit practices or prac-
provides that a CRA examination is an important and often controlling factor in the consideration of an institution's CRA record and that reports of these examinations will be given great weight in the applications process. 54 Federal Register 13,742, 13,745 (1989).
10. Protestant argues that KeyCorp's examinations should be ac-corded little weight because they are outdated. As noted, the Board has considered all the information of record since the performance examinations of KeyCorp's subsidiary banks, including information provided by Protestant and KeyCorp. The Board has also considered supervisory information from the primary federal supervisors of the subsidiary banks, particularly when the most recent examination of a KeyCorp subsidiary bank indicated areas to be addressed to improve its performance.
11. The CRA ratings for all of KeyCorp's subsidiary banks are set forth in Appendix A. KeyCorp also owns Key Bank USA, N.A., Cleveland, Ohio ("Key Bank USA"), which was chartered in Septem-ber 1995 and has not been examined for CRA performance. Protestant maintains that the bank's recent designation as a limited purpose bank under the new CRA regulations was in error. See 60 Federal Register 22,156 (1995). This designation was made by the Office of the Comptroller of the Currency ("OCC"), the primary federal supervisor of Key Bank USA, under 12 C.F.R. 25.25(b) and is not reviewable by the Board.
12. Key Bank-NY also received an "outstanding" rating for CRA performance from the New York State Banking Department ("NYSBD") as of December 31, 1995. Protestant contends that this examination should be given little weight because it was conducted off-site. The Board has considered information provided by the NYSBD examination, which assesses the bank's compliance under section 28-b of the New York Banking Law, as well as information provided by the FDIC's on-site examination.
13. FDIC examiners concluded that Key Bank-WA had inconsis-tently applied the bank's methodology for delineating its service community. The Board has considered the bank's new delineated community in light of supervisory information provided by the FDIC.
Digitized for FRASER http://fraser.stlouisfed.org/ Federal Reserve Bank of St. Louis

948 Federal Reserve Bulletin • October 1996
tices that discourage applications for credit.14 Examiners also determined that the banks' ascertainment efforts were effective, and marketing activities sufficiently informed all residents of banks' delineated community of its available banking products and services. Examiners indicated that all the banks offered some programs to support affordable housing and small business lending in their communities and that all the banks participated to some extent in federal and local government-sponsored loan programs. These ex-aminations, moreover, found that many of the banks were actively involved in community development lending pro-grams with local nonprofit organizations or community development corporations.
KeyCorp has developed several products on the corpo-rate level to help meet the credit and banking service needs of LMI customers. KeyCorp's Home Assist program offers mortgages with a lower downpayment and the ability to finance closing costs. Under this program, an approved applicant is eligible to receive a contribution from the bank of up to 2 percent of the purchase price of a home, up to a maximum of $1,000. A related corporate product called LoanAssist helps customers establish or improve credit histories.
KeyCorp's subsidiary banks also locally develop and participate in special lending programs that reflect the unique credit needs of particular communities. Each sub-sidiary bank has several specialized programs designed to improve its lending to LMI and minority communities. For example, Key Bank-NY has committed permanent mort-gage financing for Affordable Housing Projects in several cities in New York and has developed the Key Affordable Mortgage Program in conjunction with the New York State Commissioner of Housing to provide homeownership op-portunities for LMI individuals. In April 1994, Key Bank-NY introduced the Key to the City program that required only a $500 down payment for the purchase of a one-to-four family residential dwelling located in an LMI census tract. Through May 1995, Key Bank-NY originated approximately $50 million in mortgages under the Key to the City product. In addition, in January 1994, Key Bank-NY committed $20 million to the Key to Ownership program offered with New York state's Home Ownership Development Program and the State of New York Mort-gage Agency's Mortgage Insurance Fund. The Key to Ownership program has a $5,000 minimum loan amount, terms up to 30 years, flexible underwriting standards, and reduced downpayment and closing costs.
14. The KeyCorp-WA examination noted weaknesses in the bank's procedures for fair lending law compliance, including reviews of all denied applications, and in the bank's ability to retrieve denied loan files. The examiners found that there was no indication of prohibited discriminatory or other illegal credit practices, but noted that record-keeping deficiencies prevented the completion of their assessment. KeyCorp-WA has initiated steps to improve its fair lending law compliance, including a second review process for initially denied housing-related loan applications, and other steps to address examin-ers' comments. The Board has reviewed these steps in light of supervisory information from the FDIC.
KeyBank National Association ("KeyBank, N.A."), par-ticipates in special lending programs in Ohio, Michigan, and Indiana involving loan pools, entrepreneurial groups, housing partnerships and other local, state, and federal programs.15 In Ohio, KeyBank, N.A., provides financing for the Microloan Initiative Fund for women-owned busi-nesses, participates in programs with the Coalition for Community Reinvestment Group, and offers its Business-Assist Program, which assists in paying the Small Business Administration guarantee fee. In Indiana, KeyBank, N.A., participates in projects with Habitat for Humanity, Elkhart Housing Partnership, Noblesville Housing Association, and Corporation for Entrepreneurial Development.
Key Bank-WA and Key Bank-OR also participate in programs offered with community reinvestment associa-tions, small business associations, and affordable housing organizations. For example, examiners noted that Key Bank-WA, is a founding member of the Washington Com-munity Reinvestment Association, a nonprofit mortgage banking consortium that assists in providing affordable housing to LMI individuals throughout the state. Key Bank-OR offers the Federal Home Administration ("FHA") Title I Home Improvement program and the bank's own Basic Home Repair Loan Program.16
HMDA Data. The Board has carefully reviewed HMDA data cited by Protestant to support its contention that certain of KeyCorp's subsidiary banks have inadequate and discriminatory lending records. These data show that in some respects, such as in the percentage of applications received from and loans made to African-American appli-cants, KeyCorp's performance is comparable to or exceeds the performance of lenders in the aggregate in a significant number of the metropolitan areas analyzed by Protestant. In other respects, however, the data show disparities in application and denial rates to African-American loan ap-plicants as compared to white applicants in certain mar-kets.17
The Board is concerned when the record of an institution indicates such disparities in lending, and believes that all
15. In the first half of 1996, Society-OH, Society-IN, and Society-MI merged to form KeyBank, N.A.
16. The Basic Home Repair Loan Program supplements the FHA program and focuses on low-income individuals who have little or no equity in their homes but need to improve basic functions, such as electrical wiring and plumbing.
17. Protestant claims that KeyCorp's mortgage lending has declined and, consequently, that KeyCorp is no longer committed to serving the mortgage credit needs of its communities. The Board notes that KeyCorp's subsidiary banks continue to provide housing-related loans, including loans to LMI neighborhoods. The Board has re-viewed KeyCorp's HMDA data for 1994 and 1995 for areas in which KeyCorp's mortgage lending has declined. In New York, for example, the Board notes that mortgage lending by all HMDA-reporting lenders in Key Bank-NY's delineated community also declined during this period. In addition, the Board notes that the CRA does not require banks to provide any specific type of loan product, participate in any specific type of loan program, or allocate any particular level of resources to any such product or program. As discussed, KeyCorp's subsidiary banks provide a variety of products and programs to meet the housing-related credit needs of LMI communities.
Digitized for FRASER http://fraser.stlouisfed.org/ Federal Reserve Bank of St. Louis

Legal Developments 949
banks are obligated to ensure that their lending practices are based on criteria that assure not only safe and sound lending, but also assure equal access to credit by creditwor-thy applicants regardless of race. The Board recognizes, however, that HMDA data alone provide an incomplete measure of an institution's lending in its community be-cause these data cover only a few categories of housing-related lending and provide limited information about the covered loans.18 HMDA data, therefore, have limitations that make the data an inadequate basis, absent other infor-mation, for concluding that an institution has engaged in illegal discrimination in lending.
Because of the limitations of HMDA data, the Board has carefully reviewed other information such as the examina-tions reports of the banks' primary supervisors. As noted, the CRA examinations found none of the KeyCorp's sub-sidiary banks engaged in practices that would discourage individuals from applying for credit. In addition, KeyCorp has initiated a number of steps to ensure compliance with fair lending laws. For example, Key Corp has implemented a second review of denied loan applications in many of its banks to ensure that consistent loan decisions are made. The second review generally is conducted before a final decision when denial of a mortgage application is recom-mended. In addition, examiners noted in the CRA Exami-nations that management of all of KeyCorp's subsidiary banks had implemented training and compliance programs to support fair and equal treatment of loan applicants.19
18. For example, these data do not provide a basis for an indepen-dent assessment of whether an applicant who was denied credit was in fact creditworthy. Thus, credit history problems and excessive debt levels relative to income—reasons most frequently cited for a credit denial—are not available from the HMDA data.
19. Protestant alleges that 1994 HMDA data reported by Key Bank-NY, Key Bank-WA, and Key Bank-OR reflect illegal pre-screening because of the extremely high approval rates for home purchase loans to minorities in certain MSAs. KeyCorp denies that it has engaged in illegal pre-screening and believes that the data issues raised by Protestant result from the operations of its former mortgage subsidiary, KeyCorp Mortgage Inc. ("KMI"), which was sold in 1995. Data reported by Key Bank-NY reflect coding errors for loans made under one special loan program by KMI in 1994. In essence, incorrect computer coding of these items caused applications under this program that were denied, withdrawn, closed for incompleteness, or approved but not accepted to be deleted from the relevant HMDA Loan Application Register ("LAR"). Key Bank-NY also inadver-tently reported loans under this special program as originations in-stead of purchases in its HMDA LAR. KeyCorp has and undertaken steps to improve the accuracy of its HMDA data reporting. For example, in 1995, KeyCorp implemented significant enhancements to its programming systems and centralized all HMDA data processing at the parent holding company. KeyCorp also states that the three banks cited by Protestant may have had high approval rates because many loans and applications resulted from an accommodation loan program with KMI. Under this program, if a loan application did not meet secondary market guidelines, KMI, as an accommodation for its affiliate banks, would offer the banks the opportunity to originate the loan. This practice ended with the sale of KMI and KeyCorp's subsidiary banks now originate their loans directly. The Board also has provided Protestant's comments and KeyCorp's responses regard-ing HMDA data reporting to the banks' primary federal supervisor, the FDIC, to consider in conducting its scheduled on-site examina-tions of the banks in October 1996.
Branch Closings. Protestant maintains that KeyCorp's branch closings have adversely affected access to credit and banking services, particularly in Indiana and Ohio.20
KeyCorp indicates that Society-IN has not closed or con-solidated any branches in LM1 neighborhoods since its 1995 examination. Examiners concluded that the eight branches closed during the two years preceding the 1995 examination had not adversely affected overall access to the bank's loan products.21 Society-IN's branch closing policy required management to consider the impact of a proposed closure or reduction in services on the commu-nity, customers, and employees. Before a final decision on closure was made, the proposal was reviewed by the bank's local Advisory Board and the Community Investment Committee.
Society-OH has closed or consolidated 31 branches with five branches located in LMI neighborhoods during the period January 1, 1994, to May 31, 1996. Examiners reviewed the bank's closure of 12 branches and automated teller machines ("ATMs") for the two-year period preced-ing the examination, and the proposed closure of 14 branches and one ATM at the time of the examination, and concluded that these closures had not and would not adversely impact LMI areas. Examiners also considered Society-OH's record of opening and closing branches within its communities to be very strong and noted that its Community Development Department was involved in the beginning if a proposed branch closing affected an LMI area.22
The Board also has considered Protestant's comments regarding KeyCorp's reported plan—independent of the proposed transaction under review in this case—to close branches over a four to five year period. This case involves the establishment by KeyCorp of a new bank in New Hampshire. KeyCorp currently does not operate any banks or branches in New Hampshire, and KeyCorp proposes to open seven new branches to serve communities in New Hampshire.23 The Board notes, moreover, that any pro-
20. Protestant disputes KeyCorp's determination that certain cessa-tions of branch operations were branch consolidations, which do not require advanced notice, instead of branch closings, which do require advanced notice. Protestant also disputes KeyCorp's interpretation of the Joint Policy Statement on Branch Closings (58 Federal Register 49,083 (1993)), with respect to the distinction between consolidations and closings set forth in the statement. The OCC is conducting an on-site CRA examination of KeyBank, N.A.. which serves Ohio and Indiana. The Board has considered Protestant's comments in light of information provided by the OCC. and information made public by KeyCorp in connection with the proposal that indicates that advance notice was provided regardless of whether the cessation in branch operations was categorized as a consolidation or a closing.
21. Examiners also noted that Society-IN initiated discussions with some city officials and community leaders on potential new inner-city branch sites in LMI areas and alternative delivery systems.
22. Branch closings by other KeyCorp banks discussed in Protes-tant's comments are reviewed in Appendix B.
23. Protestant criticizes KeyCorp's plan to open seven supermarket branches by noting that no supermarket is located in an LMI commu-nity and by arguing that such smaller automated facilities dispropor-tionately exclude LMI communities and businesses. KeyCorp states that three of Key Bank's proposed supermarket branches are located
Digitized for FRASER http://fraser.stlouisfed.org/ Federal Reserve Bank of St. Louis
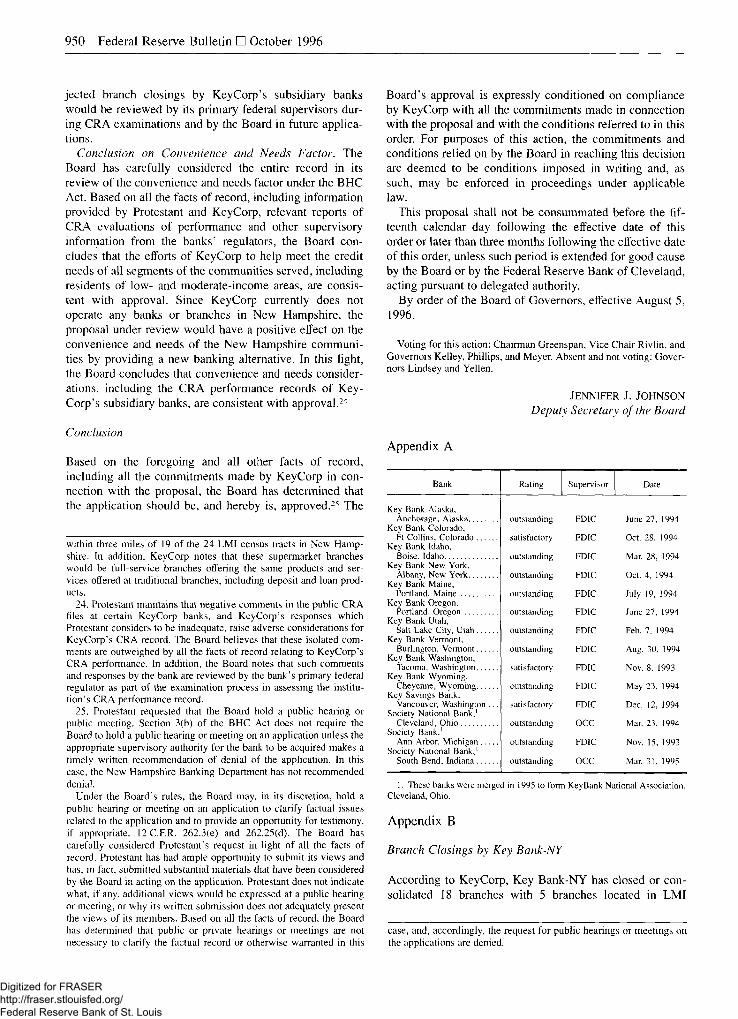
950 Federal Reserve Bulletin • October 1996
jected branch closings by KeyCorp's subsidiary banks would be reviewed by its primary federal supervisors dur-ing CRA examinations and by the Board in future applica-tions.
Conclusion on Convenience and Needs Factor. The Board has carefully considered the entire record in its review of the convenience and needs factor under the BHC Act. Based on all the facts of record, including information provided by Protestant and KeyCorp, relevant reports of CRA evaluations of performance and other supervisory information from the banks' regulators, the Board con-cludes that the efforts of KeyCorp to help meet the credit needs of all segments of the communities served, including residents of low- and moderate-income areas, are consis-tent with approval. Since KeyCorp currently does not operate any banks or branches in New Hampshire, the proposal under review would have a positive effect on the convenience and needs of the New Hampshire communi-ties by providing a new banking alternative. In this light, the Board concludes that convenience and needs consider-ations, including the CRA performance records of Key-Corp's subsidiary banks, are consistent with approval.24
Conclusion
Based on the foregoing and all other facts of record, including all the commitments made by KeyCorp in con-nection with the proposal, the Board has determined that the application should be, and hereby is, approved.25 The
within three miles of 19 of the 24 LMI census tracts in New Hamp-shire. In addition, KeyCorp notes that these supermarket branches would be full-service branches offering the same products and ser-vices offered at traditional branches, including deposit and loan prod-ucts.
24. Protestant maintains that negative comments in the public CRA files at certain KeyCorp banks, and KeyCorp's responses which Protestant considers to be inadequate, raise adverse considerations for KeyCorp's CRA record. The Board believes that these isolated com-ments are outweighed by all the facts of record relating to KeyCorp's CRA performance. In addition, the Board notes that such comments and responses by the bank are reviewed by the bank's primary federal regulator as part of the examination process in assessing the institu-tion's CRA performance record.
25. Protestant requested that the Board hold a public hearing or public meeting. Section 3(b) of the BHC Act does not require the Board to hold a public hearing or meeting on an application unless the appropriate supervisory authority for the bank to be acquired makes a timely written recommendation of denial of the application. In this case, the New Hampshire Banking Department has not recommended denial.
Under the Board's rules, the Board may, in its discretion, hold a public hearing or meeting on an application to clarify factual issues related to the application and to provide an opportunity for testimony, if appropriate. 12 C.F.R. 262.3(e) and 262.25(d). The Board has carefully considered Protestant's request in light of all the facts of record. Protestant has had ample opportunity to submit its views and has, in fact, submitted substantial materials that have been considered by the Board in acting on the application. Protestant does not indicate what, if any, additional views would be expressed at a public hearing or meeting, or why its written submission does not adequately present the views of its members. Based on all the facts of record, the Board has determined that public or private hearings or meetings are not necessary to clarify the factual record or otherwise warranted in this
Board's approval is expressly conditioned on compliance by KeyCorp with all the commitments made in connection with the proposal and with the conditions referred to in this order. For purposes of this action, the commitments and conditions relied on by the Board in reaching this decision are deemed to be conditions imposed in writing and, as such, may be enforced in proceedings under applicable law.
This proposal shall not be consummated before the fif-teenth calendar day following the effective date of this order or later than three months following the effective date of this order, unless such period is extended for good cause by the Board or by the Federal Reserve Bank of Cleveland, acting pursuant to delegated authority.
By order of the Board of Governors, effective August 5, 1996.
Voting for this action: Chairman Greenspan, Vice Chair Rivlin, and Governors Kelley, Phillips, and Meyer. Absent and not voting: Gover-nors Lindsey and Yellen.
JENNIFER J. JOHNSON Deputy Secretary of the Board
Appendix A
Bank Rating Supervisor Date
Key Bank Alaska, Anchorage, Alaska outstanding FDIC June 27, 1994
Key Bank Colorado, Ft Collins, Colorado satisfactory FDIC Oct. 28, 1994
Key Bank Idaho, satisfactory
Boise, Idaho outstanding FDIC Mar. 28, 1994 Key Bank New York,
outstanding
Albany, New York outstanding FDIC Oct. 4, 1994 Key Bank Maine,
Portland, Maine outstanding FDIC July 19, 1994 Key Bank Oregon,
Portland, Oregon outstanding FDIC June 27, 1994 Key Bank Utah,
Salt Lake City, Utah outstanding FDIC Feb. 7, 1994 Key Bank Vermont,
Burlington, Vermont outstanding FDIC Aug. 30, 1994 Key Bank Washington,
Aug. 30, 1994
Tacoma, Washington satisfactory FDIC Nov. 8, 1993 Key Bank Wyoming,
Cheyenne, Wyoming outstanding FDIC May 23, 1994 Key Savings Bank,
Vancouver, Washington . . . satisfactory FDIC Dec. 12, 1994 Society National Bank,1
Cleveland, Ohio outstanding occ Mar. 23, 1994 Society Bank,1
outstanding
Ann Arbor, Michigan outstanding FDIC Nov. 15, 1993 Society National Bank,1
South Bend, Indiana outstanding occ Mar. 31, 1995
1. These banks were merged in 1995 to form KeyBank National Association, Cleveland, Ohio.
Appendix B
Branch Closings by Key Bank-NY
According to KeyCorp, Key Bank-NY has closed or con-solidated 18 branches with 5 branches located in LMI
case, and, accordingly, the request for public hearings or meetings on the applications are denied.
Digitized for FRASER http://fraser.stlouisfed.org/ Federal Reserve Bank of St. Louis

Legal Developments 951
neighborhoods from January 1, 1994, to May 31, 1996. Examiners reviewed the bank's closure of 20 branches in the 18 months preceding the 1994 examination, and noted that the bank had opened and closed numerous offices as a result of the acquisition of two institutions in 1993. Exam-iners found that Key Bank-NY had established written policies and procedures covering branch openings and closings, which include the requirements of federal law and specify individual responsibilities for all personnel involved in branch closings.
Branch Closings by Key Bank-ME
KeyCorp indicates that Key Bank-ME has closed or con-solidated 16 branches with 5 branches located in LMI neighborhoods from January 1, 1994, to May 31, 1996.1
KeyCorp also indicates that many of these closures and consolidations were in connection with Key Bank-ME's merger with Casco Northern Bank. Examiners reviewed the bank's closure of 5 branches in the two years preceding the 1994 examination, and noted that in all cases it appears that the bank reviewed all possible options prior to actually closing the branches and complied with federal regula-tions. Examiners found that Key Bank-ME decided against closing one branch office as a result of receiving strong support from the community to keep the branch open. In addition, examiners noted that the bank's branch closing policy meet the requirements of federal law.
Branch closings by Key Bank-WA
KeyCorp indicates that Key Bank-WA has closed or con-solidated 21 branches with 8 branches located in LMI neighborhoods from January 1, 1994, to May 31, 1996. Examiners reviewed the bank's closure of 16 branches in the three years preceding the 1993 examination, and noted that all branches closed involved a facility which was within one half mile of another full service Key Bank-WA branch. Examiners also noted that the bank appeared to consider the possible elfects of any reduction in banking services prior to closing branches and that the bank adopted a branch closing policy in conformance with federal law.
Shinhan Bank Seoul, Korea
Order Approving the Formation of a Bank Holding Company
Shinhan Bank, Seoul, Korea ("Shinhan"), has requested the Board's approval under section 3 of the Bank Holding Company Act (12 U.S.C. § 1842(a)) ("BHC Act") to
1. Key Bank-ME has applied to the FDIC to establish and relocate branches in Maine. Protestant has objected to these applications and maintains that these actions do not constitute relocations. Protestant's comments are under consideration by the FDIC.
become a bank holding company by acquiring Marine National Bank, Irvine, California ("Marine").
Notice of the proposal, affording interested persons an opportunity to submit comments, has been published (60 Federal Register 67,137 (1995)). The time for filing comments has expired, and the Board has considered the application and all comments received in light of the factors set forth in section 3 of the BHC Act.
Shinhan, with total assets equivalent to approximately $22.7 billion, is the 11th largest banking organization in Korea.1 Shinhan also operates a branch in New York, New York. Marine controls $94.3 million in deposits, represent-ing less than 1 percent of total deposits in banks and thrifts in California.2 Shinhan and Marine do not compete in any relevant banking market. Accordingly, the Board con-cludes that consummation of this proposal would not have a significantly adverse effect on competition or the concen-tration of banking resources in any relevant banking mar-ket.
Under section 3 of the BHC Act, as amended by the Foreign Bank Supervision Enhancement Act of 1991,3 the Board may not approve an application involving a foreign bank unless the bank is "subject to comprehensive supervi-sion or regulation on a consolidated basis by the appropri-ate authorities in the bank's home country."4 The Board has previously determined, in applications under the Inter-national Banking Act (12 U.S.C. § 3101 et seq.) (the "IBA"), that certain Korean commercial banks were sub-ject to comprehensive consolidated supervision by their home country authorities.5 In this case, the Board has determined that Shinhan is supervised on substantially the same terms and conditions as the other Korean commercial banks. Based on all the facts of record, the Board has concluded that Shinhan is subject to comprehensive super-vision and regulation on a consolidated basis by its home country supervisors.
The BHC Act also requires the Board to determine that the foreign bank has provided adequate assurances that it will make available to the Board such information on its operations and activities and those of its affiliates that the Board deems appropriate to determine and enforce compli-ance with the BHC Act. The Board has reviewed the
1. Asset and ranking data are as of December 31, 1995, and employ the exchange rate then in effect.
2. Deposit data are as of December 31, 1995. 3. Pub. L. No. 102-242, § 201 et seq., 105 Stat. 2286 (1991). 4. 12 U.S.C. § 1842(c)(3)(B). As provided in Regulation Y, the
Board determines whether a foreign bank is subject to consolidated home country supervision under the standards set forth in Regula-tion K (International Banking Operations). 12C.F.R. 225.13(b)(5). Regulation K provides that a foreign bank may be considered subject to consolidated supervision if the Board determines that the bank is supervised or regulated in such a manner that its home country supervisor receives sufficient information on the worldwide operations of the foreign bank, including the relationship of the bank to its affiliates, to assess the foreign bank's overall financial condition and compliance with law and regulation. 12 C.F.R. 211.24(c)(l)(ii).
5. See Donghwa Bank, 81 Federal Reserve Bulletin 744 (1995), Cho Hung Bank, 81 Federal Reserve Bulletin 475 (1995), KorAm Bank, 80 Federal Reserve Bulletin 184 (1994) ("KorAm").
Digitized for FRASER http://fraser.stlouisfed.org/ Federal Reserve Bank of St. Louis

952 Federal Reserve Bulletin • October 1996
restrictions on disclosure in jurisdictions where Shinhan has material operations and has communicated with the relevant government authorities concerning access to infor-mation. Shinhan has committed that, to the extent not prohibited by applicable law, it will make available to the Board such information on the operations of Shinhan and any of its affiliates that the Board deems necessary to determine and enforce compliance with the BHC Act, the IBA, and other applicable federal law. Shinhan also has committed to cooperate with the Board to obtain any waivers or exemptions that may be necessary in order to enable Shinhan to make any such information available to the Board. In light of these commitments and other facts of record,6 the Board has concluded that Shinhan has pro-vided adequate assurances of access to any appropriate information the Board may request. For these reasons, and based on all the facts of record, the Board has concluded that the supervisory factors the Board is required to con-sider under section 3 of the BHC Act are consistent with approval.
The Board also has concluded that considerations relat-ing to the financial and managerial resources7 and future prospects of Shinhan and its subsidiaries and Bank and the convenience and needs of the community to be served are consistent with approval of this proposal, as are other supervisory factors.
Based on the foregoing and all the other facts of record, the Board has determined that this application should be, and hereby is, approved. The Board's approval of this proposal is expressly conditioned on Shinhan's compliance with all the commitments made in connection with this application, and with the conditions in this order. For purposes of this action, these commitments and conditions are deemed to be conditions imposed in writing by the Board in connection with its findings and decision and, as such, may be enforced in proceedings under applicable law.
This transaction shall not be consummated before the fifteenth calendar day following the effective date of this order or later than three months after the effective date of this order, unless such period is extended for good cause by the Board or by the Federal Reserve Bank of San Fran-cisco, acting pursuant to delegated authority.
By order of the Board of Governors, effective August 19, 1996.
Voting for this action: Chairman Greenspan, Vice Chair Rivlin, and Governors Kelley, Lindsey, Phillips, Yellen, and Meyer.
JENNIFER J. JOHNSON Deputy Secretary of the Board
6. The Board previously has reviewed relevant provisions of confi-dentiality, secrecy, and other laws in jurisdictions in which Shinhan has material operations. See KorAm; Bank of Tokyo, 81 Federal Reserve Bulletin 279 (1995).
7. Shinhan's capital exceeds the minimum levels that would be required under the Basle Capital Accord, and is considered equivalent to the capital that would be required of a U.S. banking organization.
Orders Issued Under Section 4 of the Bank Holding Company Act
CNB Financial Corp. Canajoharie, New York
Order Approving a Notice to Engage in Certain Investment Advisory Activities
CNB Financial Corp., Canajoharie, New York ("CNB"), a bank holding company within the meaning of the Bank Holding Company Act ("BHC Act"), has applied for the Board's approval under section 4(c)(8) of the BHC Act (12 U.S.C. § 1843(c)(8)) and section 225.23 of Regula-tion Y (12 C.F.R. 225.23) to establish and retain all the voting shares of Central Asset Management, Inc., also of Canajoharie, New York ("Company"), and thereby engage de novo in providing portfolio investment advisory ser-vices, including discretionary investment management ser-vices to institutional customers, and general economic ad-vice pursuant to sections 225.25(b)(4)(iii) and (iv) of Regulation Y. CNB also proposes to provide discretionary investment management services to customers who do not qualify as institutional customers under Regulation Y.1
Notice of the proposal, affording interested persons an opportunity to submit comments, has been published (61 Federal Register 31,942 (1996)). The time for filing comments has expired, and the Board has considered the notice and all comments received in light of the factors set forth in section 4(c)(8) of the BHC Act.
CNB, with total consolidated assets of $583.4 million, controls one commercial bank in New York.2 CNB has committed to the Board that Company would be registered as an investment adviser under the Investment Advisers Act of 1940 (15 U.S.C. § 80b-1 et seq.) ("Investment Advisers Act") before engaging in any investment advi-sory activities.
Section 4(c)(8) of the BHC Act provides that a bank holding company may engage, with Board approval, in any activity that the Board determines to be "so closely related to banking or managing or controlling banks as to be a proper incident thereto." The Board previously has deter-mined that all of the proposed investment advisory activi-ties are closely related to banking.3
In order to approve this notice, the Board also must find that the performance of the proposed activities by CNB "can reasonably be expected to produce benefits to the public . . . that outweigh possible adverse effects, such as undue concentration of resources, decreased or unfair com-petition, conflicts of interests, or unsound banking prac-tices."4 As part of its evaluation of these factors, the Board considers the financial and managerial resources of the
1. 12 C.F.R. 225.2(g). 2. Asset data are as of March 31, 1996. 3. See 12 C.F.R. 225.25(b)(4)(iii) and (iv); and CoreStates Financial
Corp., 80 Federal Reserve Bulletin 644 (1994) ("CoreStates"). 4. 12 U.S.C. § 1843(c)(8).
Digitized for FRASER http://fraser.stlouisfed.org/ Federal Reserve Bank of St. Louis

Legal Developments 953
notificant and its subsidiaries and the effect the transaction would have on such resources.5 Based on all the facts of record, the Board concludes that financial and managerial considerations are consistent with approval.
The Board expects that consummation of this proposal to engage de novo in these activities would result in greater competition in the market for these services. In addition, consummation of the proposal can reasonably be expected to provide added convenience and services to CNB's cus-tomers. CNB has stated that Company would be able to make investment advisory services more accessible to cus-tomers in the central New York region. Consummation of this proposal is unlikely to result in significantly adverse effects, such as undue concentration of resources, de-creased or unfair competition, conflicts of interests, or unsound banking practices.6 Based on all the facts of record, the Board finds that the public benefits of CNB's proposed activities outweigh any adverse effects, and, therefore, that the activities are a proper incident to bank-ing for purposes of section 4(c)(8) of the BHC Act.
Based on the foregoing and all the facts of record, including the commitments discussed in this order and all other commitments and representations made by CNB in connection with this notice, and subject to the terms and
5. See 12 C.F.R. 225.24. 6. CNB has committed that, with two exceptions, Company will
conduct these activities pursuant to the conditions and limitations specified in the Board's regulations and in CoreStates. In CoreStates, the Board, in approving the provision of discretionary investment management services to non-institutional customers, relied on certain commitments intended to mitigate any potential for abuse, conflicts of interest, or customer confusion. In this regard, CNB has committed that no investment transactions will be executed by Company on behalf of non-institutional customers through Company, CNB, or any affiliate of CNB; Company will not purchase, for discretionary invest-ment advisory accounts, any securities for which CNB acts as under-writer, dealer, distributor, or placement agent, other than obligations of the United States, unless directed to do so in writing by the customer prior to each such transaction and after disclosure of any such affili-ated relationships involved in the particular transaction; fees charged by Company to its non-institutional customers for its discretionary investment advisory services will not be based on the number of account transactions executed; the services of Company will not be advertised, promoted, or otherwise marketed through branches of CNB's depository institution subsidiaries; Company's affiliation with CNB will not be advertised or promoted, unless and to the extent required by law; Company, CNB, and affiliates of CNB will not share confidential information regarding their respective customers without the customer's consent; and Company's offices will not be located in, located in the same building as, or geographically proximate to any branches of CNB's depository institution subsidiaries. CNB has re-quested relief, however, from two other restrictions. In particular, CNB has proposed that its depository institution subsidiaries be per-mitted to refer non-institutional customers to Company, and that Company be permitted to have a name that is similar to the name of the existing depository institution subsidiary of CNB. To mitigate the potential for customer confusion, CNB has committed that its deposi-tory institution subsidiaries will provide customers with oral and written disclosures before making any referral to Company to enforce the understanding that Company and CNB's depository institution subsidiaries are separate and that products provided by Company are uninsured. These disclosures are similar to those required in the Interagency Statement on the Retail Sale of Nondeposit Investment Products. I FRRS ^ 3-1579.51 and 3-1579.52.
conditions set forth in this order, the Board has determined that the notice should be, and hereby is, approved. The Board's determination is subject to all the conditions set forth in Regulation Y, including those in sections 225.7 and 225.23(b)(3) and (b)(7) of Regulation Y (12 C.F.R. 225.7 and 225.25(b)(3) and (b)(7)), and to the Board's authority to require modification or termination of the activities of a bank holding company or any of its subsidiaries as the Board finds necessary to assure compliance with, and to prevent evasion of, the provisions of the BHC Act and the Board's regulations and orders issued thereunder. The Board's decision is specifically conditioned on CNB's compliance with the commitments and representations made in connection with this notice, including the commit-ments and conditions discussed in this order. The commit-ments, representations, and conditions relied on in reaching this decision shall be deemed to be conditions imposed in writing by the Board in connection with its findings and decision and may be enforced in proceedings under appli-cable law.
This transaction shall not be consummated later than three months after the effective date of this order, unless such period is extended for good cause by the Board or the Federal Reserve Bank of New York, acting pursuant to delegated authority.
By order of the Board of Governors, effective August 12, 1996.
Voting for this action: Chairman Greenspan, Vice Chair Rivlin, and Governors Kelley, Phillips, and Meyer. Absent and not voting: Gover-nors Lindsey and Yellen.
JENNIFER J. JOHNSON Deputy Secretary of the Board
First State Bancshares of Blakely, Inc. Blakely, Georgia
Order Denying Acquisition of a Thrift Holding Company
First State Bancshares of Blakely, Inc., Blakely, Georgia ("First State"), a bank holding company within the mean-ing of the Bank Holding Company Act ("BHC Act"), has requested the Board's approval under section 4(c)(8) of the BHC Act (12 U.S.C. § 1843(c)(8)) and section 225.23 of the Board's Regulation Y (12 C.F.R. 225.23) to acquire First Southwest Bancorp, Inc. ("Southwest"), and South-west's wholly owned thrift subsidiary, First Federal Sav-ings Bank of Southwest Georgia ("FFSB"), both of Donal-sonville, Georgia, and thereby to engage in operating a savings association.
Notice of the proposal, affording interested persons an opportunity to submit comments, has been published (61 Federal Register 33,920 (1996)). The time for filing comments has expired, and the Board has considered the application and all comments received in light of the factors set forth in section 4(c)(8) of the BHC Act.
First State is the 138th largest depository institution in Georgia, controlling deposits of $69.8 million, represent-
Digitized for FRASER http://fraser.stlouisfed.org/ Federal Reserve Bank of St. Louis

954 Federal Reserve Bulletin • October 1996
ing less than 1 percent of total deposits in depository institutions in the state.' Southwest, with deposits of $69.6 million, is the 140th largest depository institution in the state. On consummation of the proposal, First State would be the 62d largest depository institution in Georgia, controlling total deposits of $139.4 million, representing less than 1 percent of the total deposits in depository institutions in the state.
The Board previously has determined by regulation that the operation of a savings association by a bank holding company is closely related to banking within the meaning of section 4(c)(8) of the BHC Act. 12 C.F.R. 225.25(b)(9). The Board requires savings associations acquired by bank holding companies to conform their direct and indirect activities to those permissible for bank holding companies under section 4 of the BHC Act and Regulation Y.2
Competitive Considerations
Under section 4(c)(8) of the BHC Act, the Board is re-quired to consider whether a proposal is likely to result in any significant adverse effects, such as undue concentration of resources, decreased or unfair competition, conflicts of interests, or unsound banking practices.3 The Board has carefully considered First State's contentions that consum-mation of this proposal would not result in significantly adverse competitive effects because First State and FFSB do not provide the same types of banking products and services in Early County, Georgia ("Early County"), a rural county in southwest Georgia near the Alabama and Florida state lines. In addition, First State maintains that the relevant geographic banking market for analyzing the competitive effects of this proposal extends beyond Early County and includes the City of Dothan, which is the county seat of Houston County, Alabama ("Dothan").
In evaluating the competitive effects of a proposed trans-action, the Board must determine the appropriate product market and geographic market. Using the cluster of bank-ing products and services approximated by market depos-its, which is the traditional method for analyzing the com-petitive effects of an acquisition of a depository institution,4
the Board concludes that consummation of this proposal would result in significantly adverse effects on competition in the Early County banking market for the reasons dis-cussed below.
The Board also concludes that the relevant banking market does not include Dothan. The Board and the courts have found that the relevant geographic banking market for
1. Deposit data are as of December 31, 1995. In this context, depository institutions include commercial banks, savings banks, and savings associations.
2. Southwest and FFSB currently do not engage in any activities that are not permissible for bank holding companies under the BHC Act.
3. 12 U.S.C. § 1843(c)(8). 4. First Hawaiian, Inc., 79 Federal Reserve Bulletin 966, 966-68
(1993); SouthTrust Corporation, 78 Federal Reserve Bulletin 710 (1992); see also United States v. Philadelphia Nat'I Bank, 374 U.S. 321, 357 (1963).
analyzing the competitive effects of a proposal must reflect commercial and banking realities and should consist of the local area where the depository institutions involved offer their services and where local consumers can practicably turn for alternatives.5 In making a determination on the geographic market in this case, the Board has considered worker commuting patterns (as indicated by census data), shopping patterns, and other indicia of economic integra-tion and the transmission of competitive forces among depository institutions.6 In addition, the Board has re-viewed information from an on-site investigation of the area conducted by Board staff and the Federal Reserve Bank of Atlanta in connection with the proposal ("Federal Reserve Survey").
First State Bank is headquartered and FFSB's branch is located in Blakely, which is approximately 32 miles north-east of Dothan and connected to Dothan by a two-lane state highway. Blakely and Dothan are separated by the Chatta-hoochee River, and there is little commercial development between the two towns. Traffic count data do not indicate a significant amount of daily travel from Blakely to Dothan.7
In addition, commuting data from the 1990 US. Census indicate that only approximately 4 percent of the resident work force in Early County commutes to the Dothan Metropolitan Statistical Area ("MSA").8 Moreover, the Dothan Ranally Metro Area ("RMA") does not include
5. See St. Joseph Valley Bank, 68 Federal Reserve Bulletin 673 (1982). The key question to be considered in making this selection "is not where the parties to the merger do business or even where they compete, but where, within the area of competitive overlap, the effect of the merger on competition will be direct and immediate." United States v. Philadelphia Nat'I Bank, 374 U.S. at 357; United States v. Phillipsburg Nat'I Bank, 399 U.S. 350 (1969).
6. First State discounts the value of commuting data for Early County and contends that data showing where Early County residents regularly travel to obtain goods and services is more useful in defining the relevant banking market. First State conducted an informal survey of FFSB customers, which found that 44 percent of the 128 FFSB customers questioned believe Blakely, the county seat of Early County, is the most important town for their shopping and financial needs, but that 30 percent selected Dothan. First State reports that 46 percent of the FFSB customers surveyed had banking relationships with one of the other financial institutions in Blakely, and 9 percent had banking relationships with institutions in Dothan. First State also contends that Early County's small population and declining eco-nomic base require its residents to travel regularly to Dothan to obtain goods, services, and entertainment. To support this view. First State notes that Blakely does not have a major shopping center, sit-down restaurant, or movie theater and that all these facilities are available in Dothan. Dothan also has three college-level institutions, all of which waive out-of-state tuition for residents of Early County.
7. The population of Early County is approximately 11,800 resi-dents. Data from the Georgia Department of Transportation for 1995 indicate that approximately 2300 cars travel daily on state highway 62 from Blakely to Dothan. Assuming that not more than 50 percent of the cars (1150) that drive through Blakely to get to Dothan are from counties surrounding Early County, approximately 10 percent of the residents (assuming one passenger per car) travel daily to Dothan.
8. MSAs are designated by the Office of Management and Budget and reflect some degree of economic integration. No part of Early County is included within the Dothan MSA.
Digitized for FRASER http://fraser.stlouisfed.org/ Federal Reserve Bank of St. Louis

Legal Developments 955
any portion of Early County or extend to the Alabama-Georgia line.9
Basic shopping and medical facilities are available to residents within Early County. For example, a grocery store, small retail operations, farm supply and hardware stores, car dealerships and 17 fast-food restaurants are located in Blakely. Medical services are provided by a small hospital, six physicians, two dentists, and several pharmacies that are located in the county. In addition, Early County residents have a number of entertainment facilities, including video rental stores, several private clubs, a swimming pool, and a ball park. Approximately 68 percent of the participants in a telephone survey conducted as part of the Federal Reserve Survey indicated that their regular shopping was done in the Early County area, pri-marily Blakely, and only 28.3 percent of the participants regularly shopped in Dothan.10
The Federal Reserve Survey also indicates that Early County residents rely on financial institutions located in the county for banking services. A survey of Early County residents showed that 91 percent of Early County house-holds with depository institution accounts had their transac-tion accounts with in-market institutions. In addition, 84 percent of savings accounts and 78 percent of certifi-cates of deposit ("CDs") held by Early County residents are with the local banks and thrift. The Federal Reserve Survey found that, by contrast, residents of Early County do not use Dothan's financial institutions." Georgia state law also limits a Georgia bank's ability to compete with other depository institutions located outside a particular county. In fact, until this year, Georgia banks were prohib-ited from branching de novo in counties other than the county where the main office of the bank was located.12
Observations of bank practices and discussions with senior management of depository institutions in Early County and Dothan confirm that competition between Early County
and Dothan banking organizations is limited. Deposit rates paid by the banks in Early County appear to be alfected primarily by rates offered by other institutions in the Early County banking market, and not by institutions in Dothan. In addition, Dothan-based institutions do not report ac-tively seeking customers in Early County. Overall, Dothan is regarded as too distant to be considered a convenient or cost-effective alternative source of banking services for most of Early County's residents and small business.13
Based on all the facts of record, and for the reasons discussed above, the Board concludes that the Early County banking market, an area that includes all of Early County except the town of Arlington, is the appropriate geographic market for analyzing the competitive effects of the proposal, and that Dothan should not be included in the relevant banking market.
Competitive Effects in the Early County Banking Market
First State Bank is the largest of three depository institu-tions in the Early County banking market, controlling $53.3 million of deposits, representing nearly 54 percent of the total deposits in the market ("market deposits").14
FFSB is the smallest of the three depository institutions in the market, controlling deposits of $18.6 million, which represents 9.4 percent of market deposits based on weight-ing thrift deposits at 50 percent. On consummation, First State would control total deposits of $71.9 million, repre-senting more than 66 percent of market deposits. Only one depository institution would compete with First State in the market.13 The market, as measured by the Herfindahl-Hirschman Index ("HHI"), would be highly concentrated. The HHI would increase by 1208 points to 5549, an increase in concentration that would significantly exceed
9. RMA is a privately defined geographic locality that is demo-graphically and economically integrated. The Board previously has found RMA definitions to be useful guidelines in defining relevant geographic markets. See, e.g., SouthTrust Corporation, 78 Federal Reserve Bulletin 711 (1992).
10. The Federal Reserve Survey also showed little evidence of economic integration between the town of Arlington and Early County. Arlington straddles the county line between Early and Cal-houn Counties and most of its residents live and work in Calhoun County. Arlington also is served by a different local telephone com-pany from the one that serves Early County, and Arlington residents are not listed in the Early County telephone directory. Accordingly, in light of all the facts of record, the Board concludes that Arlington should be excluded from the definition of the Early County banking market.
11. Of the 81 households surveyed that reported having checking accounts, only one maintained an account with an institution in Dothan; of the 82 savings and time deposit accounts maintained by the survey respondents, only one was held at an institution in Dothan. In addition, none of the respondents who reported obtaining a loan in the last five years received their loan from a Dothan-based institution.
12. Effective July 1, 1996, Georgia law was amended to permit de novo branching into three non-contiguous counties. Statewide branching is authorized after July 1, 1998. See Ga. Code Ann. § 7-1-601.
13. The ability of residents to bank locally is important in view of the county's large proportion of low-income families, who are un-likely to travel considerable distances for goods and services. Two-thirds of Early County households have annual incomes of less than $25,000, and 27 percent of families have annual incomes below the poverty level.
14. Market data are as of June 30, 1996. Market share data are based on calculations that include the deposits of the thrift institution at 50 percent. The Board previously has indicated that thrift institutions have become, or have the potential to become, significant competitors of commercial banks. See WM Bancorp, 76 Federal Reserve Bulletin 743 (1984). Because the deposits of FFSB would be controlled by a commercial banking organization after consummation of the proposal, those deposits are included at 100 percent in the calculation of First State's pro forma market share. See Norwest Corporation, 78 Federal Reserve Bulletin 452 (1992); First Banks, Inc., 76 Federal Reserve Bulletin 669 (1990).
15. First State contends that the remaining competitor, Bank of Early, Blakely, Georgia, has an established record of aggressively competing with First State across several major product lines. As a result of this proposal, however, First State Bank would control twice the percentage of market deposits controlled by Bank of Early (66 percent of market deposits compared to 33 percent) and have three branches or offices in the Early County banking market as compared to Bank of Early's single office in the market.
Digitized for FRASER http://fraser.stlouisfed.org/ Federal Reserve Bank of St. Louis

956 Federal Reserve Bulletin • October 1996
the threshold levels in the Department of Justice merger guidelines.16
The Board notes that HHI thresholds are only guidelines that are used by the Board, the Department of Justice, and other banking agencies to help identify cases in which a more detailed competitive analysis is appropriate to ensure that the proposal would not have a significantly adverse effect on competition in any relevant market. A proposal that fails to pass the HHI market screen nevertheless may be approved because other information may indicate that the proposal would not have a significantly adverse effect on competition.
First State contends that First State Bank and FFSB do not provide the same types of banking products and ser-vices in the Early County area.17 First State also argues that a number of factors mitigate the potential anticompetitive effects of the proposal, including competition offered by nonbank competitors in Early County and the inability of the declining Early County economy to support three de-pository institutions.
Although First State Bank and FFSB do not focus on the same products, they do compete directly, in particular across four individual loan product lines that are important to Early County residents: commercial and industrial ("C&I") loans, agricultural loans, l-to-4 family mortgage loans, and consumer loans. First State Bank and FFSB both offer C&I loans.18 Following consummation of this pro-posal, concentration in the market for C&I loans, as mea-sured by the HHI, would increase 1082 points to 5779.19
Both institutions also offer agricultural loans to Early County residents and, although FFSB does less agricultural lending than First State Bank, there is evidence that the thrift plays an important role in the provision of agricul-tural credit. FFSB is one of a small number of financial institutions in southwest Georgia that offers guaranteed and/or subsidized loans through the Rural Economic and Community Development Service and the Farm Services
16. Under the revised Department of Justice Merger Guidelines, 49 Federal Register 26,823 (1984), a market in which the post-merger HHI is above 1800 is considered highly concentrated. The Department of Justice has informed the Board that a bank merger or acquisition generally will not be challenged (in the absence of other factors indicating anticompetitive effects) unless the post-merger HHI is at least 1800 and the merger increases the HHI by more than 200 points. The Justice Department has stated that the higher than normal HHI thresholds for screening bank mergers for anticompetitive effects implicitly recognize the competitive effect of limited-purpose lenders and other non-depository institutions.
17. FFSB, a thrift institution, engages primarily in residential mort-gage and real estate lending and provides few unsecured commercial loans and agricultural loans in the market. First State Bank, on the other hand, engages in limited residential mortgage lending and has focused its activities on commercial and agricultural lending.
18. FFSB offers only secured C&I loans, whereas First State Bank makes both secured and unsecured loans. Each C&I loan made in the market was for less than $1 million. Data submitted by First State indicate that the average size of its secured C&I loans is $24,000; the average size of such loans made by FFSB is $20,000.
19. Interviews conducted as part of the Federal Reserve Study indicate that FFSB would welcome the opportunity to do more com-mercial and industrial lending.
Administration. These loans provide Early County farmers with operating funds necessary to plant and harvest crops, and they provide guaranteed lines of credit to farmers for operating expenses.
FFSB and First State Bank also are important competi-tors in the provision of consumer loans, and approval of this proposal would result in the elimination of one impor-tant source for this type of credit.20 Following consumma-tion of this proposal, the market concentration for these loans, as measured by the HHI, would increase by 2010 points to 5581.21 Both FFSB and First State Bank also engage in l-to-4 family mortgage lending. More than 70 percent of FFSB's loans consist of home mortgages, and 16 percent of First State Bank's loans are such mort-gages. Accordingly, both institutions have the expertise and familiarity with Early County real estate to make mortgage loans in this market.22
First State and FFSB also compete directly with respect to deposit accounts. Both institutions concentrate on pro-viding small retail deposit accounts (accounts with average balances of less than $10,000), and both institutions have a significant number of these accounts.23 First State main-tains that FFSB is an ineffective competitor for small accounts because it offers interest rates lower than its two commercial bank competitors in the market. The Board notes, however, that FFSB has offered competitive rates on certain products in the past and currently offers the highest rate in the market for small passbook savings accounts, a particularly important product in a county in which 42 percent of the population has an annual income of less than $15,000 a year.
Nonbank organizations are not significant competitors for the depository institutions in the Early County banking market. The largest nonbank competitor, Five Star Federal Credit Union, Cedar Springs, Georgia ("Five Star"), has membership requirements that would disqualify approxi-mately 50 percent of Early County residents and offers
20. As of May 9, 1996, First State Bank made 44.4 percent of the total amount of these loans in the market ("market share") and, as of March 31, 1996, FFSB had a 22.6 percent market share. Following consummation of this proposal, First State would control 67.1 percent of the market for this type of credit.
21. The Board recognizes that there are other lenders that provide consumer credit to Early County residents. These nonbanking firms are not significant competitors of the three depository institutions. Nonetheless, if the total volume of consumer loans made by an in-market credit union and several area finance companies were considered in calculating the competitive effects of the proposal, the HHI would increase by 268 points to 4029.
22. First State Bank generally limits the maturity of its mortgages to 15 years, while FFSB offers a broader array of products with maturi-ties extending to 30 years. Each institution has the capacity to offer various types of mortgages should demand for a particular type of mortgage increase.
23. More than 76 percent of FFSB's accounts and almost 81 percent of First State Bank's accounts are small retail deposit accounts. As of June 30, 1996, small retail deposit accounts in the Blakely office of FFSB included 780 savings accounts, 439 CDs, and 737 checking and NOW accounts. These accounts at First State Bank's Blakely office included 1,747 savings accounts, 1,365 CDs, and 3,131 transaction accounts.
Digitized for FRASER http://fraser.stlouisfed.org/ Federal Reserve Bank of St. Louis

Legal Developments 957
limited products and services.24 In addition, the mitigating effect of competition provided by Five Star would be minimal even if it were considered to be an equal competi-tor of the depository institutions.25 Moreover, the Federal Reserve Survey indicates that the overwhelming majority of Early County residents obtain their deposit and credit products from the three depository institutions in the mar-ket.26 Small businesses as well rely on in-market deposi-tory institutions.27
Data indicate that Early County is recovering from the economic decline that First State cites as a factor support-ing its contention that three depository institutions cannot operate profitability in the market. From 1990 to 1995, the population in Early County increased by 2.9 percent and, from 1991 to 1994 (the latest available data), per capita income increased at a rate equal to the rate of increase for the state as a whole and the rate of increase for the state's non-metropolitan areas. From 1993 to 1994, per capita income growth in Early County was double the state aver-age and nearly three times the national average.28 The Federal Reserve Survey, which included discussions with Early County officials and businessmen, indicates that the current rate of growth is anticipated to continue in part because of the planned expansion of highway connections between Early County and other parts of the region.
A review of profitability data also indicates that the three depository institutions have generally performed well. Bank performance ratios for Early County, although below average, are comparable to those in other rural Georgia counties.29 The banking market's growth rate for deposits and population also slightly exceeds the state and rural Georgia county averages.
First State contends that FFSB's Blakely branch is not performing well to support its view that Early County is a declining market. The Board notes that, although First State claims that FFSB's Blakely office was unprofitable in the last two years, FFSB's Blakely office earned a profit in
24. Other nonbank firms in the market provide negligible deposit services and offer a narrow range of loan products.
25. If Five Star's deposits were given 100 percent weight, the HHI would increase 1205 points to 4182 as a result of the proposal.
26. For example, evidence suggests that the finance companies that operate in the Early County banking market do not compete with the depository institutions. Interviews conducted as part of the Federal Reserve Survey suggested that the customer base of the finance companies differs substantially from the customer base of the deposi-tory institutions.
27. According to Federal Reserve Survey, nearly 85 percent of the 177 small business reporting had relationships with Early County depository institutions. Large regional bank holding companies had almost no accounts.
28. During this time period, per capita income grew in Early County by 11.5 percent, while the growth rate was 5.0 percent in Georgia and 4.2 percent in the United States. In 1994, Early County was ranked 107th of 159 Georgia counties in terms of population, but ranked 88th in terms of per capita income.
29. First State consistently earned 1 percent or more on assets in the 1990s. Bank of Early earned more than 1 percent on assets in each of the last four years.
1993.30 The data thus do not establish any long-term down-ward trend. Moreover, FFSB's Blakely office has experi-enced a steady growth in deposits since it was established 20 years ago, including a significant deposit growth in the past several years. For example, deposits in the branch have grown from $13.2 million in 1990 to $19.2 million in 1995, a 45 percent increase.
Public Benefits
The Board also has considered whether the potential bene-fits to the public, such as greater convenience, increased competition, or gains in efficiency outweigh possible ad-verse effects. First State contends that cost savings realized as a result of this proposal would permit the combined institutions to provide more products and services to its customers, increased community development activities, and affordable banking products for low- and moderate-income residents in Early County. First State believes that it can expand FFSB's programs to benefit the existing customers of both institutions.
The requirement under section 4 of the BHC Act that the Board must determine that public benefits from a proposal can reasonably be expected to outweigh potential adverse effects necessarily involves a balancing process that takes into account the extent of the potential for adverse effects. For the reasons discussed in this order, the effects on competition in the Early County banking market are sub-stantially adverse.
The Board also notes that Southwest and FFSB are well-managed organizations in satisfactory financial condi-tion. FFSB has an "outstanding" rating from its primary federal supervisor in its most recent evaluation for perfor-mance under the Community Reinvestment Act. In light of these and all the facts of record, the Board does not believe that the public benefits derived from costs savings and gains in efficiency in the proposal are sufficient, on bal-ance, to outweigh the significantly adverse effects on com-petition in the Early County banking market.
For these reasons, and based on all of the facts of record, the Board concludes that the proposed transaction would have significantly adverse effects of the Early County banking market. The Board also concludes that consider-ations relating to public benefits, including financial and managerial resources of the institutions involved, do not lend sufficient weight to outweigh these adverse competi-tive effects. Accordingly, the Board hereby denies First State's notice under section 4(c)(8) of the BHC Act.
By order of the Board of Governors, effective August 26, 1996.
30. The record suggests that the Blakely branch may have been unprofitable in part because deposits gathered at the branch have been invested in the federal funds market rather than in higher yielding loans. Also, income earned from FFSB's investments are allocated to the FFSB home office, while the corresponding expenses are divided equally between the home office and the branches. Such internal accounting procedures may understate the profits earned at the Blakely office.
Digitized for FRASER http://fraser.stlouisfed.org/ Federal Reserve Bank of St. Louis

958 Federal Reserve Bulletin • October 1996
Voting for this action: Chairman Greenspan, Vice Chair Rivlin, and Governors Kelley, Lindsey, Yellen, and Meyer. Voting against this action: Governor Phillips.
WILLIAM W. WILES Secretary of the Board
KeyCorp Cleveland, Ohio
Order Approving a Notice to Engage in Certain Nonbanking Activities
KeyCorp, Cleveland, Ohio, a bank holding company within the meaning of the Bank Holding Company Act ("BHC Act"), has requested the Board's approval under section 4(c)(8) of the BHC Act (12 U.S.C. § 1843(c)(8)) and section 225.23 of the Board's Regulation Y (12 C.F.R. 225.23) to acquire all the voting shares of Carleton, Mc-Creary, Holmes & Co. ("CMHC"), Cleveland, Ohio. Un-der this proposal, KeyCorp would merge CMHC with and into Key Capital Markets, Inc., Cleveland, Ohio ("Key Capital"), a wholly owned subsidiary of KeyCorp autho-rized to engage in certain nonbanking activities, including underwriting and dealing in, to a limited extent, securities that a state member bank may not underwrite or deal in ("bank-ineligible securities").1 KeyCorp would thereby engage in the following nonbanking activities throughout the United States: (1) Providing corporate financial advisory services pursu-ant to 12 C.F.R. 225.25(b)(4), and (2) acting as agent in the private placement of all types of debt and equity securities as permitted by Board order.2
Notice of the proposal, affording interested persons an opportunity to submit comments, has been published (61 Federal Register 33,118 (1996)). The time for filing comments has expired, and the Board has considered the notice and all comments received in light of the factors set forth in section 4(c)(8) of the BHC Act.
KeyCorp, with total consolidated assets of approxi-mately $65 billion, is the 13th largest banking organization in the United States.3 KeyCorp operates banking subsidiar-ies in several states and engages through other subsidiaries in various permissible nonbanking activities. Key Capital is registered as a broker-dealer with the Securities and Exchange Commission ("SEC") under the Securities Ex-change Act of 1934 ("1934 Act") (15 U.S.C. § 78a et seq.), and is a member of the National Association of Securities Dealers, Inc. ("NASD"). Accordingly, Key Capital is sub-ject to the record keeping and reporting obligations, fidu-
1. See KeyCorp, 82 Federal Resen'e Bulletin 359 (1996) ("Key-Corp Order"). The transaction would involve two steps. KeyCorp would acquire 100 percent of the voting shares of CMHC through its wholly owned subsidiary, KeySub, Inc., Cleveland, Ohio. Shortly thereafter, KeyCorp would merge the corporation surviving the acqui-sition ("NewCo") with and into Key Capital.
2. See J.P. Morgan & Company Incorporated, 76 Federal Reserve Bulletin 26 (1990).
3. Assets and ranking are as of March 31, 1996.
ciary standards, and other requirements of the 1934 Act, the SEC, and the NASD.
Activities Approved by Order
The Board previously determined that it was permissible under section 4(c)(8) of the BHC Act and section 20 of the Glass-Steagall Act for KeyCorp to conduct the proposed activities through Key Capital.4 KeyCorp has committed to engage in these activities in accordance with the conditions and limitations relied on by the Board in the KeyCorp Order, with one exception.5
Director Interlocks
KeyCorp has requested that the Board permit three (of seven) directors of Key Capital also to serve as directors of Key Capital's bank or thrift affiliates ("affiliated banks").6
KeyCorp has committed that the three interlocking direc-tors would not be officers of Key Capital or the affiliated banks, or have the authority to conduct the daily business or handle individual transactions of Key Capital or its affiliated banks. In addition, KeyCorp has committed that, at a meeting of the board of directors of Key Capital or the affiliated banks, a quorum will not be deemed to exist unless the interlocking directors are less than a majority of the directors present.
The Board previously has permitted limited interlocks between a banking organization and an affiliated subsidiary engaged in bank-ineligible securities activities ("section 20 subsidiary").7 The addition of the interlocks proposed by KeyCorp would not, in view of the commitments pro-vided by KeyCorp, appear to give the affiliated banks managerial control over Key Capital or otherwise raise any conflicts of interest. Accordingly, the Board finds these limited interlocks should be permitted, since it appears that Key Capital would be operationally distinct from its affili-ated banks. The Board expects that KeyCorp will ensure that the framework established in the KeyCorp Order will be maintained in all other respects.
4. See KeyCorp Order. 5. KeyCorp anticipates that there may be a brief period (ranging
from one or two days to a few weeks) between the acquisition of the voting shares of CMHC through KeySub and the merger of the assets of CMHC into Key Capital. During the period between the acquisition and the merger, KeyCorp will conduct the proposed activities through NewCo. KeyCorp has committed that, during this time, it will treat NewCo as if it were Key Capital for the purposes of the commitments and limitations of the KeyCorp Order.
6. KeyCorp previously received the Board's approval to have two director interlocks and one officer interlock between Key Capital and its affiliated banks. The interlocking officer provides only legal coun-sel and corporate record keeping services to Key Capital and does not serve as a management official of, have sales or policy making responsibilities for, or have contact with customers of Key Capital. See KeyCorp Order.
1. See KeyCorp Order, National City Corporation, 80 Federal Reserve Bulletin 346 (1994); Synovus Financial Corp., 11 Federal Reserve Bulletin 954 (1991); Banc One Corporation, 76 Federal Resen'e Bulletin 756 (1990).
Digitized for FRASER http://fraser.stlouisfed.org/ Federal Reserve Bank of St. Louis

Legal Developments 959
Financial Factors, Managerial Resources and Other Considerations
In order to approve this notice, the Board must consider whether the proposed activities "can reasonably be ex-pected to produce benefits to the public, such as greater convenience, increased competition, or gains in efficiency, that outweigh possible adverse effects, such as undue con-centration of resources, decreased or unfair competition, conflicts of interests, or unsound banking practices."8 As part of its evaluation of these factors, the Board considers the financial condition and managerial resources of the notificant and its subsidiaries and the effect of the proposed transaction on these resources.9 Based on all the facts of record, including relevant reports of examination, the Board has concluded that financial and managerial consid-erations are consistent with approval of the proposal.
The Board expects that the proposed transaction would result in public benefits by permitting CMHC and its customers to draw upon the greater resources of and broader range of products offered by Key Capital and its affiliates. The Board also expects that the transaction would produce efficiencies and economies of scale for KeyCorp and thereby would permit KeyCorp to provide better in-vestment banking services to its customers. In sum, the proposal should yield greater convenience for KeyCorp's and CMHC's customers and may be expected to foster improved methods of meeting customer needs. There is no evidence in the record to indicate that the proposed transac-tion would result in any undue concentration of resources or decreased or unfair competition, conflicts of interests, unsound banking practices, or other adverse effects. In addition, to address any potential adverse impact from its performance of the proposed activities, KeyCorp has com-mitted to conduct the activities pursuant to conditions the Board previously has found satisfactory to mitigate poten-tial adverse effects. Accordingly, the Board has concluded that the performance of the proposed activities by KeyCorp can reasonably be expected to produce public benefits that outweigh possible adverse effects under the proper incident to banking standard of section 4(c)(8) of the BHC Act.
Based on the foregoing and all the facts of record, the Board has determined that the notice should be, and hereby is, approved. Approval of this notice is specifically condi-tioned on compliance by KeyCorp with the commitments made in connection with this notice. The Board's determi-nation also is subject to all the terms and conditions set forth in Regulation Y, including those in sections 225.7 and 225.23(b) (12 C.F.R. 225.27 and 225.23(b)), and to the Board's authority to require such modification or termina-tion of the activities of a bank holding company or any of its subsidiaries as the Board finds necessary to ensure compliance with, and to prevent evasion of, the provisions of the BHC Act and the Board's regulations and orders thereunder. For purposes of this transaction, the commit-
8. 12 U.S.C. § 1843(c)(8). 9. See 12 C.F.R. 225.24.
ments and conditions agreed to by KeyCorp shall be deemed to be conditions imposed in writing by the Board in connection with its findings and decision, and as such may be enforced in proceedings under applicable law.
These activities shall not be commenced later than three months after the effective date of this order, unless such period is extended for good cause by the Board or, pursuant to delegated authority, by the Federal Reserve Bank of Cleveland.
By order of the Board of Governors, effective August 14, 1996.
Voting for this action: Chairman Greenspan, Vice Chair Rivlin, and Governors Kelley, Phillips, and Meyer. Absent and not voting: Gover-nors Lindsey and Yellen.
JENNIFER J. JOHNSON Deputy Secretary of the Board
Union Planters Corporation Memphis, Tennessee
Order Approving Notice to Acquire a Savings Association and Engage in Certain Nonbanking Activities
Union Planters Corporation ("Applicant"), a bank holding company within the meaning of the Bank Holding Com-pany ("BHC") Act, has requested the Board's approval under section 4(c)(8) of the BHC Act (12 U.S.C. § 1843(c)(8)) and section 225.23 of the Board's Regula-tion Y (12 C.F.R. 225.23) to acquire all the voting shares of Leader Financial Corporation ("Leader Financial") and its wholly owned subsidiary, Leader Federal Bank for Savings ("Savings Bank"), a federal savings bank, all in Memphis, Tennessee. Applicant also has requested the Board's ap-proval under section 4(c)(8) of the BHC Act to acquire the other direct and indirect nonbanking subsidiaries of Leader Financial listed in the Appendix and thereby engage nation-wide in permissible nonbanking activities.1
Notice of the proposal, affording interested persons an opportunity to submit comments, has been published (61 Federal Register 30,240 (1996)). The time for filing comments has expired, and the Board has considered the notice and all comments received in light of the factors set forth in section 4(c)(8) of the BHC Act.
Applicant, with total consolidated assets of $11.4 billion, operates subsidiary banks in Alabama, Arkansas, Ken-
1. The proposal is the first step in a series of transactions to merge Savings Bank with and into Applicant's wholly owned subsidiary bank, Union Planters National Bank, Memphis, Tennessee ("UPNB"). Immediately after the merger, UPNB would sell Savings Bank's Nashville branches to Union Planters Bank-Middle Tennessee, Nash-ville, Tennessee ("UPB-Middle Tennessee"). These transactions (the "Bank Mergers") are subject to the approval of the Office of the Comptroller of the Currency ("OCC") under section 18(c) of the Federal Deposit Insurance Act (12 U.S.C. § 1828(c)).
Digitized for FRASER http://fraser.stlouisfed.org/ Federal Reserve Bank of St. Louis

960 Federal Reserve Bulletin • October 1996
tucky, Louisiana, Mississippi, Missouri, and Tennessee.2
Applicant is the third largest depository organization in Tennessee, controlling $4.9 billion in deposits, represent-ing approximately 8.9 percent of total deposits in deposi-tory institutions in the state.3 Leader Financial, with total consolidated assets of $3.2 billion, is the 8th largest depos-itory organization in Tennessee, controlling $1.5 billion in deposits, representing 2.8 percent of total deposits in de-pository institutions in the state. On consummation of the proposal, Applicant would remain the third largest deposi-tory organization in Tennessee, controlling deposits of $6.4 billion, representing approximately 11.7 percent of total deposits in depository institutions in the state.
The Board has determined that the operation of a savings association by a bank holding company is closely related to banking for purposes of section 4(c)(8) of the BHC Act.4
Applicant has committed to conform all activities of Sav-ings Bank to those permissible for bank holding companies under section 4(c)(8) of the BHC Act and Regulation Y.5
The Board also has determined by regulation that the proposed lending, leasing, community development, credit-related insurance, and full-service securities brokerage ac-tivities are closely related to banking within the meaning of section 4(c)(8) of the BHC Act.6 Applicant has committed to conduct these activities subject to the limitations set forth in Regulation Y.
Competitive Considerations
Under section 4(c)(8) of the BHC Act, the Board is re-quired to consider whether a proposal is likely to result in any significantly adverse effects, such as undue concentra-tion of resources, decreased or unfair competition, conflicts of interests, or unsound banking practices.7 In evaluating the competitive eifects of a proposed transaction, the Board must determine the appropriate product market and geo-graphic market.8 Using the cluster of banking products and
2. Consolidated asset data are as of March 31, 1996. All other data are as of June 30, 1995, and are adjusted to reflect acquisitions of Applicant consummated through March 15, 1996.
3. In this context, depository institutions include commercial banks, savings banks, and savings associations.
4. See 12 C.F.R. 225.25(b)(9). Applicant's proposed acquisition of Leader Financial also is subject to the approval of the Office of Thrift Supervision ("OTS") pursuant to the Home Owners Loan Act (12 U.S.C. § 1467a(e)).
5. Applicant has committed that all impermissible real estate activi-ties will be divested or terminated within two years of consummation of the proposal, that no new impermissible projects or investments will be undertaken during this period, and that capital adequacy guidelines will be met excluding impermissible real estate invest-ments. Applicant also has committed that any impermissible securities or insurance activities conducted by Savings Bank will cease on or before consummation of the proposal. Savings Bank may continue to service any impermissible insurance policies for two years after consummation of the proposal, but may not renew any policies during this two-year period.
6. See 12 C.F.R. 225.25(b)(1), (5), (6), (8)(i), and (15)(ii). 7. 12 U.S.C. § 1843(c)(8). 8. See First Hawaiian, Inc., 79 Federal Reserve Bulletin 966,
966-68 (1993); SouthTrust Corporation, 78 Federal Reserve Bulletin
services, which is the traditional method for analyzing the competitive effects of an acquisition of a depository institu-tion, the Board finds that consummation of the proposal would not have a significantly adverse effect on competi-tion in any relevant banking market.9
Applicant and Savings Bank compete directly in the Memphis and Nashville, Tennessee, banking markets.10
Consummation of the proposal would not cause the levels of concentration as measured by the Herfindahl-Hirschman Index ("HHI") to exceed the Department of Justice merger guidelines in either of these banking markets,11 and a large number of depository institutions would continue to oper-
710 (1992); see also United States v. Philadelphia National Bank, 374 U.S. 321, 357 (1963). Mid-South Peace and Justice Center, Mem-phis, Tennessee ("Mid-South"), maintains that the Board should analyze the competitive eifects of the proposal on specific loan prod-ucts and banking services, including loans secured by used automo-biles. Mid-South provides no evidence to support the conclusion that individual products and services should be considered separately. Available data indicate that consummation of the proposal is not likely to increase appreciably the level of concentration in consumer lending or commercial lending, including small business lending. Moreover, numerous competitors, including a number of nonbank lenders that provide consumer loans, would remain after consummation of the proposal, and the relevant markets are attractive for entry by other competitors.
9. Mid-South and Inner City Press/Community on the Move, Bronx, New York ("ICP"), contend that the Board should separately consider the competitive effects of the proposal in several downtown and low-to moderate-income areas of Memphis, Tennessee. In determining the relevant geographic markets, the Board has considered the location of the depository institutions, worker commuting patterns (as indicated by census data), and other indicia of economic integration and the transmission of competitive forces among depository institutions. Commuting data from the 1990 Census show significant levels of commuting into Shelby County, Tennessee, which includes Memphis, from the five surrounding counties. In addition, Memphis is the largest city in the six-county area and is the primary location for shopping, services and entertainment for residents in the area. Other relevant indicators, moreover, including the Memphis Metropolitan Statistical Area ("MSA") and Memphis Ranally Metropolitan Area, reflect a substantial degree of economic integration between Shelby County and its surrounding counties. Based on all the facts of record, the Board concludes that the appropriate geographic market for analyzing the combination of Applicant and Leader Financial in this area is the Memphis, Tennessee banking market, which is approximated by Shelby, Tipton and Fayette Counties in Tennessee; Crittendon County, Arkansas; and De Soto and Tate Counties in Mississippi.
10. The Nashville, Tennessee, banking market is approximated by Cheatham, Davidson, Robertson, Rutherford, Sumner, Williamson, and Wilson Counties, and the town of Spring Hill in Maury County, all in Tennessee.
11. On consummation of the proposal, the HHIs would increase 261 points to 1671 in the Memphis banking market, and 1 point to 1467 in the Nashville banking market. Under the revised Department of Jus-tice Merger Guidelines, 49 Federal Register 26,823 (June 29, 1984), a market in which the post-merger HHI is between 1000 and 1800 is considered moderately concentrated. The Justice Department has in-formed the Board that a bank merger or acquisition will not be challenged (in the absence of other factors indicating anti-competitive effects) unless the post-merger HHI is at least 1800 and the merger increases the HHI by more than 200 points. The Justice Department has stated that the higher than normal HHI thresholds for screening bank mergers for anticompetitive effects implicitly recognize the competitive effect of limited purpose lenders and other non-depository financial entities.
Digitized for FRASER http://fraser.stlouisfed.org/ Federal Reserve Bank of St. Louis

Legal Developments 961
ate in these markets.12 Based on these and all other facts of record, the Board concludes that consummation of the proposal would not result in any significantly adverse eifects on competition or on the concentration of banking resources in the Memphis or Nashville banking markets or any other relevant banking market.
Applicant also operates subsidiaries that engage in mort-gage lending, leasing, credit-related insurance, and securi-ties brokerage activities in competition with Leader Finan-cial subsidiaries. The record indicates that there are numerous providers of these services and that the markets for these services are unconcentrated. Based on all the facts of record, the Board concludes that consummation of the proposal would not have any significantly adverse eifects on competition in the markets for these nonbanking ser-vices.
Record of Performance Under the Community Reinvestment Act
In acting on a proposal to acquire a savings association under section 4(c)(8) of the BHC Act, the Board reviews the records of the relevant depository institutions under the Community Reinvestment Act (12 U.S.C. § 2901 et seq.) ("CRA").13 As provided in the CRA, the Board has evalu-ated the record of performance of Applicant's depository institutions and Savings Bank in light of the CRA perfor-mance examinations of these organizations by their pri-mary federal supervisors.
12. After consummation of the proposal, Applicant would remain the second largest depository institution in the Memphis banking market and the fourth largest depository institution in the Nashville banking market. Applicant would control approximately 25.5 percent of total deposits in depository institutions in the Memphis banking market ("market deposits") and 8.6 percent of market deposits in the Nashville banking market after consummation of the proposal. In addition, 37 depository institutions would remain in the Memphis banking market and 32 depository institutions would remain in the Nashville banking market after consummation of the proposal.
Market share data are based on calculations in which the deposits of thrift institutions are included at 50 percent. The Board previously has indicated that thrift institutions have become, or have the potential to become, significant competitors of commercial banks. See WM Ban-corp, 76 Federal Reserve Bulletin 743 (1984). Because the deposits of Savings Bank would be controlled by a commercial banking organiza-tion after consummation of the proposal, those deposits are included at 100 percent in the calculation of Applicant's pro forma market share. See Norwest Corporation, 78 Federal Reserve Bulletin 452 (1992); First Banks, Inc., 76 Federal Reserve Bulletin 669 (1990).
13. The Board previously has determined that the CRA by its terms generally does not apply to applications by bank holding companies to acquire nonbanking companies under section 4(c)(8) of the BHC Act. See The Mitsui Bank, Ltd., 76 Federal Reserve Bulletin 381 (1990). The Board also has stated that, unlike other companies that may be acquired by bank holding companies under section 4(c)(8) of the BHC Act, savings associations are depository institutions, as that term is defined in the CRA, and thus acquisitions of savings associations are subject to review under the express terms of the CRA. See Norwest Corporation, 76 Federal Reserve Bulletin 873 (1990).
The Board also has carefully considered comments from several organizations and an individual ("Protestants")14
that criticize the record of Applicant and Savings Bank in meeting the credit needs of minority individuals and low-to moderate-income communities in Memphis, Tennessee. In addition, some Protestants contend that UPNB and Savings Bank have an insufficient number of branches in downtown and low- to moderate-income areas of Mem-phis, and that Applicant's proposed branch closings in Memphis after consummation of this transaction would adversely affect the local communities. Several Protestants also contend that data filed under the Home Mortgage Disclosure Act ("HMDA") (12 U.S.C. § 2801 et seq.) indicate that UPNB and Savings Bank have refused or failed to assist in meeting the housing-related credit needs of African Americans, low- to moderate-income neighbor-hoods, and areas with predominantly minority populations ("minority communities") in Memphis.
An institution's most recent CRA performance evalua-tion is a particularly important consideration in the applica-tions process because it represents a detailed on-site evalu-ation of an institution's overall record of performance under the CRA by its primary federal supervisor.15 In addition, the Board considers an institution's policies and practices for compliance with applicable fair lending laws. The Board also takes into account information on an insti-tution's lending activities that assist in meeting the credit needs of low- to moderate-income neighborhoods.
Performance Examinations. All of Applicant's subsid-iary banks and savings associations that have been exam-ined for CRA performance received "outstanding" or "sat-isfactory" ratings from their primary federal supervisors in their most recent examinations. In particular, UPNB re-ceived a "satisfactory" CRA performance rating from the OCC, its primary federal supervisor, at its most recent examination as of October 1994 ("UPNB Examination").16
Furthermore, Savings Bank received a "satisfactory" CRA performance rating from the OTS at its most recent exami-nation as of April 1995 ("Savings Bank Examination").
Performance Records of Applicant and Savings Bank. As noted above, Applicant proposes to merge Savings Bank with and into UPNB, after which the operations of Savings Bank would become subject to the CRA policies, procedures, and programs of UPNB. The Board has care-
14. In addition to Mid-South and ICP, Protestants include Memphis Area Community Reinvestment Organization ("MACRO"); VECA Community Development Corporation; Students, Mothers, and Con-cerned Citizens, Inc.; and Douglass, Bungalow & Crump Neighbor-hood Association's Coalition Alliance ("DBC Neighborhood Alli-ance"), all of Memphis, Tennessee.
15. The Board notes that the Statement of the Federal Financial Supervisory Agencies Regarding the Community Reinvestment Act provides that a CRA examination is an important and often controlling factor in consideration of an institution's CRA record and that reports of these examinations will be given great weight in the applications process. See 54 Federal Register 13,742, 13,745 (1989).
16. UPB-Middle Tennessee also received a "satisfactory" CRA performance rating from the OCC at its most recent examination as of January 1996.
Digitized for FRASER http://fraser.stlouisfed.org/ Federal Reserve Bank of St. Louis

962 Federal Reserve Bulletin • October 1996
fully reviewed Applicant's CRA performance record in light of substantially similar comments submitted in con-nection with a number of recent applications filed by Applicant.17 In the Union Planters Orders, the Board care-fully reviewed UPNB's CRA performance record, includ-ing its lending, marketing, and outreach activities, the services provided through its branches, its branch closing policies, and the actions that the bank had taken to strengthen its lending in low- to moderate-income areas. The Board also considered Applicant's HMDA data for 1990 to 1994, and preliminary 1995 HMDA data. For the reasons discussed in detail in the Union Planters Orders, which are hereby incorporated by reference, the Board concluded that the CRA performance record of Applicant was consistent with approval of the applications under the BHC Act.
The Union Planters Orders noted that the UPNB Exam-ination found that the bank's community delineation was reasonable and did not exclude any low- to moderate-income neighborhoods. The examination also found that UPNB had a satisfactory record of ascertaining community credit needs and that the bank's marketing program effec-tively informed all segments of its delineated community of the bank's credit products and services. In addition, examiners concluded that the bank's distribution of loans, applications, and denials was reasonable. The Union Plant-ers Orders also reviewed UPNB's special lending pro-grams to assist in meeting the credit needs of low- to moderate-income borrowers, including participation in a number of government-sponsored programs through the Federal Housing Administration ("FHA"), Veterans Ad-ministration ("VA"), Tennessee Housing Development Au-thority, and Small Business Administration.18
The Savings Bank Examination found that the institu-tion's delineated community was reasonable and did not unreasonably exclude any low- to moderate-income neigh-borhoods. Examiners found that Savings Bank's branches that accepted mortgage loan applications were easily acces-sible to members of the local communities. Examiners also found that Savings Bank had a strong record of ascertain-
17. See Union Planters Corporation, 82 Federal Reserve Bulletin 756 (1996); Union Planters Corporation, 82 Federal Reserve Bulletin 745 (1996); Union Planters Corporation, 82 Federal Reserve Bulletin 78 (1996); and Union Planters Corporation, 81 Federal Reserve Bulletin 800 (1995) (collectively, "Union Planters Orders"). These matters have included UPNB's sensitivity to the credit needs of African Americans, its history of providing loans and other banking services to low- to moderate-income neighborhoods and minority residents of Memphis, and its branch locations in downtown and low-to moderate-income areas of Memphis.
18. One Protestant expresses concern that consummation of the proposal would reduce the level of funding available for community development activities in Memphis. The UPNB Examination noted that UPNB was a charter member of the Memphis Multi-Bank Com-munity Development Corporation, and had formed an association with the City of Memphis and community groups to develop housing for low- to moderate-income persons. Applicant, moreover, has requested approval to continue Leader Financial's participation in two commu-nity development housing projects that will be rented primarily to low- to moderate-income persons.
ing the credit needs of, and marketing its credit products to, residents of Memphis.19 The Savings Bank Examination concluded that Savings Bank had performed reasonably well in attracting loan applications from individuals in low- to moderate-income census tracts in the Memphis MSA, and that the association's credit extensions, credit applications and credit denials were adequately distributed throughout its delineated community. In addition, examin-ers noted that Savings Bank was an active participant in the market for FHA and VA loans and participated in a variety of community development projects in Memphis.20
Branch Locations and Closings. The UPNB Examina-tion concluded that the bank's branch and automated teller machine ("ATM") networks were reasonably accessible to all segments of the bank's community, including low- to moderate-income neighborhoods. UPNB operates 35 full-service branches and 37 stand-alone ATMs in Shelby County.21 Five of UPNB's branches in Memphis are lo-cated in low- to moderate-income census tracts. The bank recently applied for the OCC's approval to establish an additional 55 stand-alone ATMs in convenience stores located throughout Shelby County, and 26 of these ATMs would be located in low- to moderate-income census tracts.22 Savings Bank operates 15 branches in Shelby County, including two branches that are located in low- to moderate-income census tracts.
19. Examiners noted that Savings Bank initiated a marketing plan in the Memphis area that placed special emphasis on attracting credit applications from individuals in low- to moderate-income census tracts. Examiners also found that the association marketed its credit products through local newspapers and radio programs with predomi-nately minority audiences and through advertisements in low- to moderate-income and minority communities.
20. Savings Bank purchased and originated 6,245 FHA and VA loans in 1993 and 1994, totalling more than $419 million. In connec-tion with its operations, Savings Bank purchases and services pools of delinquent FHA and VA loans. Certain Protestants contend, without providing any substantiation, that Savings Bank may use improper collection techniques to service these delinquent loans, and question whether UPNB's proposed acquisition of this line of business is consistent with the convenience and needs of the community. The Board has carefully considered Protestants comments in light of confidential reports of examination assessing Savings Bank's FHA/VA loan purchase and servicing program. The Board also notes that OTS examiners favorably noted Savings Bank's purchase of FHA and VA loans at the Savings Bank Examination.
21. Fifteen of UPNB's branches are designated "Home Buyer Centers" and are staffed by employees with particular knowledge of the bank's mortgage products, including its special housing-related lending programs.
22. Two Protestants submitted proposals requesting that Applicant agree to establish a bank branch in specific neighborhoods in Mem-phis. UPNB is conducting an internal analysis to determine whether UPNB should construct a branch at the locations identified by Protes-tants. Although communications by depository institutions with com-munity groups provide a valuable method of assessing and determin-ing how an institution may best address the credit needs of the community, the Board believes that the CRA does not require that a depository institution enter into an agreement with any organization. Accordingly, in reviewing the proposal, the Board has focused on the programs and policies that Applicant and Savings Bank have in place to serve the credit needs of their entire communities. See Fifth Third Bancorp, 80 Federal Reserve Bulletin 838 (1994).
Digitized for FRASER http://fraser.stlouisfed.org/ Federal Reserve Bank of St. Louis

Legal Developments 963
UPNB has publicly stated that it plans to close or consol-idate 14 branches of UPNB and Savings Bank in the Memphis banking market after consummation of the pro-posal and the related Bank Mergers. The operations of the 14 branches would be transferred to other branches of the combined entity.23 More than 70 percent of the branches to be closed or consolidated in the Memphis area are located within one-half mile of another UPNB branch, and all of the branches are located within one mile of another UPNB branch.24 Two of the branches to be closed or consolidated are located in low- to moderate-income areas. After the proposed branch actions, UPNB would continue to operate five branches in low- to moderate-income census tracts.25
Applicant has stated that the proposed branch closings and consolidations in Memphis would be conducted in accordance with UPNB's branch closing policy. The UPNB Examination concluded that the bank's branch closing/service reduction policy seeks to minimize the impact of any reduction in services and that UPNB had an acceptable record of opening and closing branch offices. The Board notes that UPNB's branch closing policy re-quires the bank to notify community groups and leaders prior to closing any branch, and that UPNB has sent notification of the proposed closings and consolidations to a variety of community groups in the Memphis area.26 In addition, UPNB's proposed branch closings will be subject to the Joint Agency Policy Statement on Branch Closings ("Joint Policy Statement").27 The Board also notes that the impact of UPNB's proposed branch closings and consoli-
23. Some Protestants contend that the closure of specific branches would negatively affect the local communities. Applicant has stated that it would continue to serve all communities currently served by the branches slated for closure or consolidation. Applicant also has noted that UPNB intends to establish a telephone banking center capable of opening accounts and accepting loan applications from customers located throughout the Memphis area.
24. Applicant also has stated that it intends to close or consolidate an additional four branches of Savings Bank and UPB-Middle Tennes-see in the Nashville banking market after consummation of the pro-posal. Three of the four branches to be closed or consolidated in the Nashville area are located within one-half mile of another UPB-Middle Tennessee branch, and none of the four branches is located in a low- to moderate-income census tract.
25. None of the branches to be closed or consolidated in connection with the proposal are located in a census tract that has a minority population of 80 percent or more.
26. These groups include the National Association for the Advance-ment of Colored People, the Memphis Urban League, the Memphis Area Neighborhood Development Community Organization, and the DBC Neighborhood Alliance.
27. See 58 Federal Register 49,083 (1993) (interpreting section 42 of the Federal Deposit Insurance Act (12 U.S.C. § 1831r-l)). Under these provisions, all insured depository institutions are required to submit a notice of any proposed branch closing to the appropriate federal banking agency no later than 90 days before the date of closure that contains:
(1) The identity of the branch to be closed and the proposed closing date; (2) A detailed statement of the reasons for the decision to close the branch; and (3) Statistical or other information supporting the reasons for clo-sure, consistent with the institution's written policy for branch closings.
dations will be assessed by examiners as part of the bank's next CRA performance examination and will be reviewed by the Board in future applications to acquire a depository facility.
HMDA Data. In the Union Planters Orders, the Board noted that 1990-1994 HMDA data for Applicant and UPNB generally reflect reasonable efforts by UPNB to assist in meeting the credit needs of communities with low-to moderate-income and minority residents.28 In connec-tion with the proposal, the Board has carefully reviewed the 1995 HMDA data for Applicant and the 1993, 1994, and 1995 HMDA data for Savings Bank.29 These data for UPNB indicate that UPNB continues to assist in meeting the needs of minorities and low- to moderate-income com-munities.30
HMDA data for Applicant and Savings Bank, however, also generally indicate some disparities in the rate of loan originations, denials, and applications by racial group and income level. The Board is concerned when an institution's record indicates disparities in lending to minority appli-cants and believes that all banks are obligated to ensure that their lending practices are based on criteria that assure not only safe and sound banking, but also equal access to credit by creditworthy applicants regardless of race. The Board recognizes, however, that HMDA data alone provide an incomplete measure of an institution's lending in its community because these data cover only a few categories of housing-related lending and provide limited information about the covered applications and loans.31 HMDA data, therefore, have limitations that make the data an inade-quate basis, absent other information, for concluding that an institution has engaged in illegal discrimination in mak-ing lending decisions.
Movement of branches within the same immediate neighborhood that do not substantially affect the nature of the business or the customers served are considered consolidations or relocations under the Joint Policy Statement and, as such, do not require prior notice.
28. The Board noted, for example, that the percentage of the total number of applications received by UPNB from African Americans had increased every year from 1992 to 1994. In addition, the Board noted that UPNB had received a greater percentage of loan applica-tions from, and originated a greater percentage of loans to, African Americans than the aggregate average of banking institutions in the Memphis MSA from 1992 to 1994.
29. MACRO submitted a survey of 1993 and 1994 HMDA data for Applicant and Leader Financial in the Memphis MSA. Based on this survey, MACRO concluded that Applicant had an "above average" record of housing-related lending in the Memphis MSA and in the center city area of Memphis, and that Leader Financial had a "below average" record of housing-related lending in these areas.
30. For example, the 1995 data indicate that UPNB continued to receive a higher percentage of its total loan applications in Shelby County from, and continued to originate a higher percentage of its total loans to, African Americans than lenders in the aggregate. These data also indicate that UPNB originated a higher percentage of the loan applications that it received from low- to moderate-income census tracts in 1995 than in 1994.
31. For example, HMDA data do not provide a basis for an independent assessment of whether an applicant who was denied credit was in fact creditworthy. Thus, credit history problems and excessive debt levels relative to income—reasons most frequently cited for a credit denial—are not available from the HMDA data.
Digitized for FRASER http://fraser.stlouisfed.org/ Federal Reserve Bank of St. Louis

964 Federal Reserve Bulletin • October 1996
Because of the limitations of HMDA data, the Board has carefully reviewed other information, particularly examina-tion reports that provide an on-site evaluation of compli-ance by UPNB and Savings Bank with the fair lending laws. The UPNB Examination and Savings Bank Examina-tion found no evidence of prohibited discrimination or other illegal credit practices at the institutions.32 Examiners at both institutions also found no evidence of any practices intended to discourage applications for the types of credit listed in the bank's CRA statement.
In addition, UPNB and Savings Bank have initiated several measures to assure compliance with the fair lend-ing laws. For example, UPNB has instituted a "second look" program for its retail and mortgage loan divisions and provides sensitivity and diversity training to bank personnel.33 In May 1996, UPNB also hired a private consulting firm to conduct a comprehensive fair lending review of its residential mortgage activities. The Savings Bank Examination noted that management routinely moni-tored the association's underwriting policies and proce-dures to assure that loan applicants are not discriminated against on a prohibited basis.34
Conclusion Regarding Record of Performance Under CRA. The Board has carefully reviewed all the facts of record in considering the CRA performance record of Applicant and Savings Bank, including information pro-vided by Protestants, Applicant's responses, and the results of the performance examinations of Applicant's bank sub-sidiaries and Savings Bank. Based on this review, and for the reasons discussed in this order and the Union Planters Orders, the Board concludes that considerations relating to the CRA are consistent with approval.35
32. Examiners at the UPNB Examination reviewed all first mort-gage and home improvement loan applications received by UPNB during the first six months of 1994, and compared the loan files of white applicants whose loans were approved with the files of African-American applicants whose loans were denied. This review revealed no instances, practices, or policies indicating that customers were treated in an illegal manner. Examiners at the Savings Bank Examina-tion also conducted a comparative review of loan files for white applicants who received loans and minority applicants who were denied loans. Examiners found no patterns of discriminatory treatment and concluded that minority and non-minority applicants were given similar levels of assistance during the underwriting process.
33. UPNB also takes a "second look" at loan applications received through the bank's automated loan machines.
34. Examiners also noted that Savings Bank's board of directors had instructed management to reemphasize to all employees the institu-tion's commitment to nondiscriminatory lending.
35. One Protestant contends, without providing supporting facts, that banking organizations in the Memphis area, including Applicant and Leader Financial, charge an excessive fee for returned checks and that banking organizations have colluded to establish a uniformly high fee for this service. The record indicates that UPNB has an established record of providing a full range of banking and lending services in its delineated communities, including substantial lending services, and offers access to a full range of retail banking services, including a checking account with no monthly fee for senior citizens and other low-cost checking account products. While the Board has recognized that banks help serve the banking needs of their communities by making available basic banking services at a nominal or no charge, the CRA does not require that banks limit the fees charged for services.
Other Considerations
In order to approve the proposal, the Board also must determine that the proposed activities are a proper incident to banking, that is, that the proposal "can reasonably be expected to produce benefits to the public, such as greater convenience, increased competition, or gains in efficiency, that outweigh possible adverse eifects, such as undue con-centration of resources, decreased or unfair competition, conflicts of interests, or unsound banking practices."36 As part of the Board's evaluation of these factors, the Board has carefully reviewed the financial and managerial re-sources of Applicant, Leader Financial, and their respec-tive subsidiaries, and the effect the transaction would have on such resources in light of all the facts of record.37 These facts of record include confidential reports of examination and other supervisory information received from the pri-mary federal supervisors of the organizations assessing their financial and managerial resources and compliance with consumer-related laws.38 Based on all the facts of record, the Board concludes that the financial and manage-rial resources of the organizations involved in this proposal are consistent with approval.39
The record does not support the conclusion that the fees charged by Applicant or Leader Financial for checking accounts or other banking services are based in any way on a factor prohibited by law.
The Board also has noted that the limited jurisdiction granted to the Board under the BHC Act does not authorize the Board to adjudicate unsubstantiated allegations that arise under a statute administered and enforced by another agency. See Norwest Corporation, 82 Federal Reserve Bulletin 580 (1996). The Department of Justice ("DOJ") has express statutory authority to investigate and prosecute the type of collusive practices alleged by Protestant, and the Board has provided Protestant's comments to the DOJ for its consideration.
36. 12 U.S.C. § 1843(c)(8). One Protestant notes that Leader Finan-cial is a defendant in lawsuits concerning the forced placement of collateral insurance. The "forced placement" of insurance occurs when a creditor obtains, at the borrower's expense, insurance to protect collateral after other coverage for the collateral has lapsed. Leader Financial has denied any wrongdoing and the courts have not reached any final judgment in these lawsuits. The Board retains adequate supervisory authority to take action, if appropriate, should the allegations of improper actions be substantiated. Protestant also reiterates comments that the Board previously reviewed in the Union Planters Orders, including comments relating to pending lawsuits against Applicant involving the forced placement of collateral insur-ance, a past lawsuit against Applicant involving the sale of securitized automobile receivables by Applicant's three nonbank subsidiaries, and allegations of management misconduct at a Mississippi state bank acquired by Applicant in 1994.
37. See 12 C.F.R. 225.24; see also The Fuji Bank, Limited, 75 Federal Reserve Bulletin 94 (1989); Bayerische Vereinsbank AG, 73 Federal Reserve Bulletin 155 (1987).
38. In conducting this review, the Board has carefully considered comments from certain Protestants alleging misconduct and violations of banking laws by the management of Leader Financial, and viola-tions of the Real Estate Settlement Procedures Act (12 U.S.C. § 2601 et seq.) by UPNB and Leader Financial. Based on all the facts of record, including supervisory information provided by the primary federal supervisor of UPNB and Leader Financial, the Board does not believe that the record supports these allegations.
39. One Protestant has questioned whether the proposal would be eligible for "pooling-of-interests" accounting treatment and why Ap-plicant's pro forma financial statements do not reflect the "goodwill"
Digitized for FRASER http://fraser.stlouisfed.org/ Federal Reserve Bank of St. Louis

Legal Developments 965
In reviewing the public interest factors in this case, the Board also has carefully considered the contentions of certain Protestants that Applicant has not sufficiently dem-onstrated the public benefits of the proposal.40 The record indicates that consummation of the proposal and the Bank Mergers would provide customers of the combined institu-tions with access to a broader array of banking products and services than currently is offered by each of the institu-tions individually.41 In addition, the proposed merger of Savings Bank and UPNB would provide the customers of Savings Bank with access to Applicant's larger network of branches and ATMs.42 Applicant also has stated that it intends to invest approximately $2.5 million to upgrade the branches of Savings Bank acquired by UPNB and UPB-Middle Tennessee.43 Applicant states, moreover, that the combination of Savings Bank and UPNB would permit UPNB to achieve greater economies of scale and efficien-cies in its mortgage operations.
The requirement under section 4 of the BHC Act that the Board must determine that public benefits from a proposal can reasonably be expected to outweigh potential adverse effects necessarily involves a balancing process that takes
currently maintained by Leader Financial. The Board has reviewed these comments in light of relevant accounting principles and all the facts of record, including a preliminary opinion of Applicant's inde-pendent public accountant stating that the proposal would qualify for pooling-of-interests accounting treatment. In addition, Applicant has stated that it will not consummate the proposal unless it qualifies for pooling-of-interests accounting treatment. The Board also notes that Leader Financial has no "goodwill" on its financial statements.
40. One Protestant also contends, without providing any supporting factual evidence, that prior acquisitions by Applicant have benefited only stockholders of the institutions and resulted in adverse effects such as increased fees to consumers and fewer banking services and facilities for low- to moderate-income customers. The facts of record in this application, and the facts of record considered in the Union Planters Orders, do not support these contentions.
41. For example, UPNB operates ten automated loan machines and offers retail trust services and telephone bill payment services to its customers. Comparable products or services currently are not offered by Savings Bank. In addition, Applicant has stated that consummation of the proposal would permit Applicant to offer to its expanded customer base certain mortgage and loan products that have been developed by Savings Bank, including a variety of adjustable-rate mortgage programs and a temporary construction loan that converts to a permanent loan upon completion of the project.
42. After the Bank Mergers and the proposed branch consolidations, current customers of Savings Bank would have access to 36 full-ser-vice UPNB branches in the Memphis banking market and 24 full-ser-vice UPB-Tennessee branches in the Nashville banking market. This represents a substantial increase over the 15 branches that Savings Bank currently operates in the Memphis banking market, and the four branches operated by Savings Bank in the Nashville banking market. Applicant also operates 37 stand-alone ATMs in the Memphis banking market and 11 stand-alone ATMs in the Nashville banking market. In comparison, Savings Bank operates four stand-alone ATMs in the Memphis banking market and no stand-alone ATMs in the Nashville banking market. As noted above, UPNB also has requested the ap-proval of the OCC to establish 55 more stand-alone ATMs throughout Shelby County.
43. Applicant states that these improvements may include expand-ing the branches to accommodate increased staff, providing drive-through teller or ATM access, or adding safe deposit boxes or night depositories.
into account the extent of the potential for adverse effects. For the reasons discussed in this order and the Union Planters Orders, the potential for adverse effects, if any, resulting from the transaction is negligible. The Board also concludes that, based on the considerations discussed above, including the expanded products and services for customers, the proposal can reasonably be expected to produce notable public benefits. Accordingly, based on all the facts of record, the Board has determined that consum-mation of the proposal can reasonably be expected to produce public benefits that would outweigh any likely adverse effects under the proper incident to banking stan-dard of section 4(c)(8) of the BHC Act.44
Conclusion
Based on the foregoing and all the facts of record, includ-ing the commitments discussed in this order and all other commitments and representations made by Applicant in connection with the notice, and subject to the terms and conditions set forth in this order, the Board has determined that the notice should be, and hereby is, approved.43 The Board's determination is subject to all the conditions set forth in Regulation Y, including those in sections 225.7 and 225.23(g) of Regulation Y (12 C.F.R. 225.7 and
44. Some Protestants contend that the Board should delay consider-ation of the proposal and request additional information from Appli-cant on the competitive impact of the proposal, proposed branch closures, the public benefits anticipated from consummation of the proposal, and the management of Savings Bank's FHA/VA loan program. Protestants have not provided any facts to demonstrate that a delay is warranted. The Board is required by the BHC Act and the Board's rules to act on applications submitted under section 4 of the BHC Act within specified time periods. Based on all the facts of record, the Board concludes that the record on this notice is sufficient to act on the notice at this time and that delay or denial of the proposal on the grounds of informational insufficiency is not warranted.
45. Some of the Protestants have requested that the Board hold a public hearing or meeting to receive public testimony on this pro-posal, including testimony relating to Applicant's proposed branch closures, the effect of the proposal on banking competition and the level of lending in Memphis, and the CRA record of performance of Applicant and Leader Financial. Under the Board's rules, a hearing is required under section 4 of the BHC Act only if there are disputed issues of material fact that cannot be resolved in some other manner. 12 C.F.R. 225.23(f). Protestants do not identify disputed issues of fact that are material to the Board's decision. In addition, interested parties have had an ample opportunity to present their views, and Protestants have submitted substantial written comments that have been consid-ered by the Board. Protestants' requests fail to demonstrate why a written presentation would not suffice and to summarize the evidence that would be presented at a hearing or meeting. See 12 C.F.R. 262.3(e). The Board has carefully considered the proposal in light of all the facts of record, including Protestants' comments on the issues discussed above, and, for the reasons discussed in this order and the Union Planters Orders, has concluded that the factors that the Board must consider under section 4 of the BHC Act are consistent with approval. Protestants' requests dispute the weight that should be accorded to, and the conclusions that the Board should draw from, the existing facts of record. For these reasons, and based on all the facts of record, the Board has determined that a public hearing or meeting is not required or necessary to clarify the factual record in the notice, or otherwise warranted in this case. Accordingly, the requests for a public hearing or meeting on the notice are hereby denied.
Digitized for FRASER http://fraser.stlouisfed.org/ Federal Reserve Bank of St. Louis

966 Federal Reserve Bulletin • October 1996
225.25(g)), and to the Board's authority to require modifi-cation or termination of the activities of a bank holding company or any of its subsidiaries as the Board finds necessary to assure compliance with, and to prevent eva-sion of, the provisions of the BHC Act and the Board's regulations and orders issued thereunder. The Board's deci-sion is specifically conditioned on Applicant's compliance with the commitments made in connection with the notice, including the commitments and conditions discussed in this order. The commitments and conditions relied on in reaching this decision shall be deemed to be conditions imposed in writing by the Board in connection with its findings and decision and may be enforced in proceedings under applicable law.
This transaction shall not be consummated later than three months after the effective date of this order, unless such period is extended for good cause by the Board or the Federal Reserve Bank of St. Louis, acting pursuant to delegated authority.
By order of the Board of Governors, effective August 5, 1996.
Voting for this action: Chairman Greenspan, Vice Chair Rivlin, and Governors Kelley, Phillips, and Meyer. Absent and not voting: Gover-nors Lindsey and Yellen.
JENNIFER J. JOHNSON Deputy Secretary of the Board
Appendix
Other Nonbanking Subsidiaries of Leader Financial to be Acquired by Applicant
(1) Leader Services, Inc., Memphis, Tennessee, and thereby engage in acting as principal, agent or broker in the sale of certain insurance (including home mortgage re-demption insurance) that is directly related to an extension of credit by the bank holding company or its subsidiaries pursuant to section 225.25(b)(8)(i) of the Board's Regula-tion Y; and in full-service brokerage activities pursuant to section 225.25(b)(15)(ii) of the Board's Regulation Y; (2) Leader Federal Mortgage, Inc. ("Leader Mortgage"), Leader Funding Corporation I, and Leader Funding Corpo-ration III, all in Memphis, Tennessee, and thereby engage in making, acquiring and servicing loans or other exten-sions of credit pursuant to section 225.25(b)(1) of the Board's Regulation Y; and (3) Leader Leasing, Inc., Memphis, Tennessee, and thereby engage in leasing real and personal property, including certain higher-residual-value leasing, pursuant to section 225.25(b)(5) of the Board's Regulation Y and making, acquiring, or servicing commercial loans pursuant to sec-tion 225.25(b)(1) of the Board's Regulation Y.
Applicant also has applied to retain Leader Financial's direct and indirect ownership interest in the following joint ventures:
(1) Millcreek Development Partnership, L.P. and Hoover Road, L.P., both in Memphis, Tennessee, and thereby en-gage in community development activities pursuant to section 225.25(b)(6) of the Board's Regulation Y; and (2) Southeastern Mortgage of Alabama, L.L.C., Birming-ham, Alabama, and ASMI, LLC, Indianapolis, Indiana, and thereby engage in making, acquiring, or servicing loans or other extensions of credit pursuant to section 225.25(b)(1) of the Board's Regulation Y.
ORDERS ISSUED UNDER FEDERAL RESERVE ACT
Community Bank of Nevada Las Vegas, Nevada
Order Approving Establishment of a Branch
Community Bank of Nevada, Las Vegas, Nevada ("Bank"), a state member bank, has requested the Board's approval under section 9 of the Federal Reserve Act (12 U.S.C. § 321 et seq.) to establish a branch at 2887 South Maryland Parkway, Las Vegas, Nevada.
Notice of the proposal, affording interested persons an opportunity to submit comments, has been published in accordance with the Board's Rules of Procedure. The time for filing comments has expired, and the Board has consid-ered the application and all comments received in light of the factors specified in the Federal Reserve Act.
Bank, with total deposits of approximately $34.9 mil-lion, is the 18th largest commercial banking organization in Nevada, controlling less than 1 percent of the total deposits in commercial banking organizations in the state.1
Bank has been in operation since July 1995, and, under this proposal, would establish its first permanent branch.
Considerations Related to the Community Reinvestment Act
In reviewing an application to establish a branch, the Board is required to take into account the institution's record under the Community Reinvestment Act (12 U.S.C. § 2901 et seq.) ("CRA").2 The Board has received comments from the Culinary Workers Union, Local 226, and a number of individuals ("Protestants") criticizing Bank's record of performance under the CRA.3 In particular, Protestants maintain that Bank: .
(1) Has a declining loan-to-deposit ratio;
1. Deposit and state ranking data are as of March 31, 1996. 2. See 12 U.S.C. §§ 2902(3)(C), 2903(2). 3. The Board has also considered comments supporting Protestants'
contentions from the Association of Community Organizations for Reform Now, the National Community Reinvestment Coalition, and the National Low Income Housing Coalition.
Digitized for FRASER http://fraser.stlouisfed.org/ Federal Reserve Bank of St. Louis

Legal Developments 967
(2) Originates a small percentage of real estate loans within its assessment area; (3) Lends primarily to borrowers in high-income census tracts and to large residential developments and commer-cial projects; and (4) Does not sufficiently provide residential lending in census tracts with substantial minority populations.
Protestants also contend that the significant amount of lending to Bank's directors and shareholders impairs its ability to assist in meeting the credit needs of its communi-ties.4 The Board has carefully reviewed those comments in light of all the facts of record.
An institution's most recent CRA performance evalua-tion is a particularly important consideration in the applica-tions process because it represents a detailed on-site evalu-ation of the institution's overall record of performance under the CRA by its primary federal supervisor.5 In con-nection with this application, the Federal Reserve Bank of San Francisco ("Reserve Bank") conducted a full-scope, on-site examination of Bank's CRA record of performance (the "July 1996 Examination") and has preliminarily rated Bank's performance as "satisfactory."
Bank qualifies as a small bank for purposes of the new regulations jointly promulgated by the federal financial supervisory agencies to implement the CRA.6 Bank was evaluated under the small bank performance standards, which consider:
(1) The bank's loan-to-deposit ratio, adjusted for sea-sonal variation and, as appropriate, other lending-related activities; (2) The percentage of loans and, as appropriate, other lending-related activities located in the bank's assess-ment area; (3) The bank's record of lending to and, as appropriate, engaging in other lending-related activities for borrow-ers of different income levels and businesses and farms of different sizes; (4) The geographic distribution of the bank's loans; and (5) The bank's record of taking actions, if warranted, in response to written complaints about its performance in helping to meet credit needs in its assessment area(s).7
Examiners also consider any evidence of discriminatory or other illegal credit practices.8
4. In addition, Protestants believe that Bank should provide Spanish language brochures and other materials.
5. The Board notes that the Statement of the Federal Financial Supervisory Agencies Regarding the Community Reinvestment Act provides that a CRA examination is an important and often controlling factor in the consideration of an institution's CRA record and that reports of these examinations will be given great weight in the applications process. See 54 Federal Register 13,742, 13,745 (1989).
6. See 60 Federal Register 22,156 (May 4, 1995). See also 12 C.F.R. 228.12(t) which defines a "small bank" with no parent holding company as a bank that had less than $250 million in assets as of December 31 of either of the prior two years. Bank's assets totalled approximately $37 million as of December 31, 1995.
7. See 12 C.F.R. 228.26. 8. 12 C.F.R. 228.28(c).
Bank's loan-to-deposit ratio averaged approximately 70 percent over the four quarters from September 30, 1995, to June 30, 1996. The July 1996 Examination found that this ratio exceeded the standards for satisfactory perfor-mance in light of peer averages for commercial banks within Bank's assessment area and nationally. Although Bank's loan-to-deposit ratio declined to 58 percent as of June 30, 1996, examiners concluded that the decline re-sulted from the greater than expected success of Bank's certificate of deposit program and not from a diminution in lending.9
As noted, Bank is a small institution and is primarily engaged in business-purpose lending, especially small busi-ness loans.10 Bank's outstanding loans consist of approxi-mately 66 percent for business-related purposes, totaling $16.5 million, and approximately 23 percent for financing real estate construction and development, totaling $5.7 million. The July 1996 Examination found that all of Bank's business-related loans were small business loans, and that approximately 74 percent by count and 72 percent by dollar amount of those loans were made in its assess-ment area.11 Approximately 49 percent of Bank's construc-tion and development loans by count and 56 percent by dollar amount of commitment were also made in its assess-ment area. Overall, approximately 67 percent by count of Bank's business-related and construction and development loans and 62 percent by dollar amount were conducted within its assessment area.
Of Bank's small business loans, 24 percent by count and 35 percent by dollar amount were made in moderate-income census tracts.12 Bank also is qualified to make government-sponsored loans through the Small Business Administration ("SBA"), specifically the SBA's 504 and
9. If Bank's loans to directors were excluded from consideration in calculating the ratio, as suggested by Protestants, examiners still considered Bank's loan-to-deposit ratio to be reasonable as compared to the ratio for its national peers. Examiners also reviewed the level of aggregate loans to Bank's directors and their related interests. They concluded that the level was not unusual for a de novo bank that had been in operation for a short period of time, because such institutions often rely on established relationships to generate business.
10. For purposes of the new CRA regulation, a small business loan is a commercial and industrial loan with an original amount of $1 million or less, or a loan secured by nonfarm nonresidential property with an original amount of $1 million or less. See 12 C.F.R. 228.12(u). Bank also participated as a mortgage broker in 67 home mortgages, totaling approximately $12.6 million, as of the July 1996 Examination.
11. As determined by the examiners, Bank's assessment area en-compasses 52 census tracts in Clark County, Nevada, which includes the City of Las Vegas. This area, which is located in the western part of the city and includes only whole geographies (i.e, in this case, census tracts), was considered by examiners to be reasonable and not to reflect any illegal discrimination or to exclude arbitrarily any low-and moderate-income areas. Bank's assessment area is comprised of the following numbers of census tracts by income: low income—4, moderate income—10, middle income—21, and high income—17. Bank intends to expand its assessment area after opening the proposed branch.
12. The largest dollar amount of loans extended by Bank was in moderate-income census tracts (as opposed to middle- or upper-income census tracts).
Digitized for FRASER http://fraser.stlouisfed.org/ Federal Reserve Bank of St. Louis

968 Federal Reserve Bulletin • October 1996
7A programs. Examiners also found that residential real estate development within Bank's assessment area was focused primarily in middle- and high-income census tracts, consistent with construction and development lend-ing by Bank and by other institutions. Nevertheless, Bank financed the development of 16 condominiums to provide affordable housing to low- and moderate-income individu-als, with purchase prices ranging from $68,000 to $70,000.13
Examiners considered Bank to be generally responsive to written complaints about its efforts to assist in meeting the credit needs of its community. The July 1996 Examina-tion noted a number of complaints in Bank's public com-ment file from members of the Culinary Workers Union. Bank invited all complainants who provided return ad-dresses to discuss their concerns, but no complainant has responded. The July 1996 Examination also found no evidence of illegal discrimination and considered Bank's compliance with fair lending laws and regulations satisfac-tory.14
The Board has carefully reviewed all the facts of record in considering the CRA performance record of Bank, in-cluding information provided by Protestants, Bank's re-sponses, and the results of the July 1996 Examination. Based on this review, the Board concludes that consider-ations relating to the CRA are consistent with approval.15
Other Considerations
The Board also carefully reviewed the factors required to be considered in proposals to establish a branch, including the financial condition of Bank,16 the general character of
13. Bank also financed the development of 23 single family homes with purchase prices ranging from $89,950 to $112,945. Examiners noted, based on information from the Housing Authority of the City of Las Vegas and the Nevada Fair Housing Center, that housing with a purchase price of less than $90,000 is considered affordable for low-to moderate-income individuals.
14. The compliance examination included a sampling of approved and denied loan applications, a review of Bank's loan policies and lending criteria, and interviews with Bank personnel. Examiners also noted that Bank financed a real estate development project in one census tract and made 13 percent of its small business loans in another census tract within Bank's assessment area that have substantial minority populations.
15. Protestants question whether Bank has provided sufficient infor-mation to demonstrate a benefit to the community from this proposal. In reviewing an application to establish a branch, the Board is re-quired to consider the specific factors set forth in the Federal Reserve Act and the bank's record of performance under the CRA. As dis-cussed in this order, the Board has carefully reviewed the proposal in light of these considerations. Neither of these Acts, however, requires a separate finding that benefits to the community would result from the establishment of a branch. Protestants also maintain that Bank has not complied with all aspects of its internal CRA policy, including documentation of its outreach efforts. The new CRA regulations, as a general matter, focus on an institution's actual performance and not the documentation of its lending efforts.
16. Protestants contend that a substantial portion of Bank's deposits is from large depositors in amounts of $100,000 or more.
Approximately 60 percent of Bank's large deposits are held by Bank's primary shareholders, and two of these depositors are Bank
its management, and the proposed exercise of corporate powers. Protestants argue that an administrative action by the National Labor Relations Board ("NLRB") against a casino owned by one of Bank's outside directors, past business proposals between Bank and its officers and direc-tors, and current loans extended to Bank insiders raise adverse managerial considerations and conflicts of interests concerns. Protestants also allege that Bank has made loans to single borrowers and their related interests that exceed 25 percent of its unimpaired capital in violation of Nevada state law.17
The Board does not believe that the conduct at issue in the NLRB proceeding warrants a denial of the proposal.18
In addition, the Board notes that issues raised by Bank's proposed business dealings with its officers and directors were resolved in the context of Bank's application for membership in the Federal Reserve System two years ago. Reserve Bank and state examiners also recently conducted a joint safety and soundness examination of Bank. Examin-ers reviewed all of Bank's loans to insiders and concluded that they complied with Regulation 0 ( 1 2 C.F.R. Part 215), the regulation applicable to loans to insiders of state mem-ber banks, including the requirement that an insider abstain from voting on his or her own loan application. Bank also has sold to institutions unaffiliated with Bank or Bank's directors participations in loans to single borrowers, in order to comply with Nevada limitations on loans to single borrowers; and state examiners did not find any violations of applicable state law lending limits. The Board also notes that Bank has a compliance officer and written procedures to ensure compliance with all applicable regulations. In light of these and all the facts of record, the Board con-cludes that other factors required to be considered under section 9 of the Federal Reserve Act are consistent with approval.19
directors. In this light, examiners in a recent safety and soundness examination did not consider the volatility of these deposits to ad-versely affect the financial condition of Bank and noted that Bank management monitors large depositor relationships closely.
17. See Nevada Revised Stat. §§ 662.145 and 662.155 (1992); Nevada Administrative Code § 662.002 et seq.
18. The NLRB proceeding is part of a long-standing dispute be-tween the casino and the unions representing beverage dispensers and hotel and restaurant employees. The NLRB found that the casino had engaged in unfair labor practices that:
(1) Interfered with, restrained, or coerced employees in the exercise of their rights under the National Labor Relations Act ("NLRA"), and (2) Refused to bargain collectively with the representatives of employees. See §§ 8(a)(1) and (a)(5) of the NLRA (29 U.S.C. §§ 158(a)(1) and
(a)(5)). The conduct at issue included surveillance on and ejection of union representatives, unilaterally imposing new rules on employee conduct and unilaterally ceasing to pay pension fund contributions. The casino was ordered to cease and desist from these activities, and the NLRB's finding was upheld by a federal circuit court of appeals.
19. Protestants argue that the record of this proposal is information-ally incomplete because Bank has failed to respond to their requests for information, including information regarding its CRA-related ac-tivities. In light of all the facts of record, and for the reasons discussed above, the Board concludes that the record of the proposal is sufficient
Digitized for FRASER http://fraser.stlouisfed.org/ Federal Reserve Bank of St. Louis

Legal Developments 969
Based on the foregoing, the Board has determined that the application should be, and hereby is, approved.20 The Board's approval is specifically conditioned on compliance by Bank with all the commitments made in connection with the application. For purposes of this action, these commitments and conditions are conditions imposed in writing by the Board in connection with its findings and decisions and, as such, may be enforced in proceedings under applicable law.
Approval of the establishment of the branch is subject to the completion of the facility within one year after the effective date of this order, unless such period is extended for good cause by the Board or the Reserve Bank, acting pursuant to delegated authority.
By order of the Board of Governors, effective August 28, 1996.
Voting for this action: Chairman Greenspan and Governors Lind-sey, Meyer, Phillips, and Yellen. Absent and not voting: Vice Chair Rivlin and Governor Kelley.
WILLIAM W. WILES Secretary of the Board
ORDERS ISSUED UNDER INTERNATIONAL BANKING ACT
Korea Development Bank Seoul, Korea
Order Approving Establishment of a Branch
Korea Development Bank, Seoul, Korea ("Bank"), a for-eign bank within the meaning of the International Banking Act ("IBA"), has applied under section 7(d) of the IBA (12 U.S.C. § 3105(d)) to establish a state-licensed branch in New York, New York. The Foreign Bank Supervision Enhancement Act of 1991 ("FBSEA"), which amended
to act on the application at this time and that delay or denial of the proposal on the grounds of informational insufficiency is not war-ranted.
20. Protestants have requested that the Board hold a public hearing or meeting on this proposal to allow Protestants to question Bank on its submissions, to obtain additional information from Bank, and to present information on the proposal. The Federal Reserve Act does not require the Board to hold a public hearing on applications to establish branches. Generally, under its Rules of Procedure, the Board may, in its discretion, hold a public hearing or meeting on an applica-tion to clarify factual issues related to the application and to provide an opportunity for testimony, if appropriate. 12 C.F.R. 262.3(e) and 262.25(d). Protestants in this case have had ample opportunity to submit their views, and have, in fact, submitted substantial written comments that have been carefully considered in connection with the Board's decision. Protestants' requests fail to demonstrate why writ-ten comments are inadequate in this case to present their views or resolve the issues raised by their comments as required by the Board's rules. 12 C.F.R. 262.3(e). For these reasons, and based on all the facts of record, the Board has determined that a public hearing or meeting is not necessary to clarify the factual record in this application, or otherwise warranted in this case. Accordingly, Protestants' requests for a public hearing or meeting on the proposal are denied.
the IBA, provides that a foreign bank must obtain the approval of the Board to establish a branch in the United States.
Notice of the application, affording interested persons an opportunity to submit comments, has been published in a newspaper of general circulation in New York (The New York Times, April 26, 1996). The time for filing comments has expired, and the Board has considered the application and all comments received.
Bank has total consolidated assets of approximately $62 billion, and is wholly owned by the Government of the Republic of Korea.1 Bank, which originally was chartered as a development bank focused on executing the govern-ment's economic development plans after the Korean War, now engages in a wide range of commercial banking activities in the domestic and international markets.2 In addition to its network of domestic branches, Bank also operates 13 domestic subsidiaries engaged in leasing, ven-ture capital finance, investment advisory and securities services, merchant and investment banking and manufac-turing activities. International operations include branches, representative offices, and banking and financial subsidiar-ies located in Europe, Asia, and North America. In the United States, Bank operates a representative office and a broker-dealer subsidiary, Korea Associated Securities, Inc. ("KASI"),3 in New York, New York, and several nonbank subsidiaries and affiliates.4 Bank would be a qualifying banking organization within the meaning of Regulation K after establishment of the proposed branch. 12 C.F.R. 211.23(b).
Bank would upgrade its existing representative office in New York, New York, to a state-licensed branch that would engage in wholesale banking activities including the provision of long-term facility loans to Korean manufactur-ing companies operating in the United States, loan syndica-tions for project and lease finance, and trade financing for export and import transactions between Korea and the United States.
The Ministry of Finance and Economy of the Republic of Korea (the "Ministry") has no objection to the establish-ment of the proposed branch. The State of New York Banking Department has approved the application of Bank to establish the proposed branch.
1. All data are as of December 31, 1995. 2. The Government of Korea does not direct Bank's lending activi-
ties or impose legal restrictions, goals, quotas or directives on Bank as to particular types of commercial transactions or particular borrowers. A relatively small percentage of Bank's lending is to government-owned companies.
3. Bank would apply under section 4(c)(8) of the Bank Holding Company Act for the approval of the Board to retain its ownership interest in KASI following establishment of the proposed branch.
4. KDB has indirect investments in the following non-bank entities in the U.S.: Pohang Steel America, a wholly owned subsidiary of Pohang Iron & Steel Co. of Korea, Daewoo Equipment Corporation and Daewoo Machinery Corporation, subsidiaries of Daewoo Indus-tries of Korea, Hanjung America Corporation, a wholly owned subsid-iary of Korea Heavy Industries & Construction Co., Ltd., and a direct investment in Asiana Airlines, a Korean commercial air carrier with ticketing offices in the United States.
Digitized for FRASER http://fraser.stlouisfed.org/ Federal Reserve Bank of St. Louis

970 Federal Reserve Bulletin • October 1996
In order to approve an application by a foreign bank to establish a branch in the United States, the IBA and Regu-lation K require the Board to determine that the foreign bank applicant engages directly in the business of banking outside of the United States, and has furnished to the Board the information it needs to adequately assess the applica-tion. The Board also must determine that the foreign bank is subject to comprehensive supervision or regulation on a consolidated basis by its home country supervisor (12 U.S.C. § 3105(d)(2)). The Board may also take into account additional standards as set forth in the IBA (12 U.S.C. § 3105(d)(3)-(4)) and Regulation K (12 C.F.R. 211.24(c)).
Bank engages directly in the business of banking outside of the United States through its commercial banking opera-tions in Korea. Bank also has provided the Board with the information necessary to assess the application through submissions that address the relevant issues.
Regulation K provides that a foreign bank will be con-sidered to be subject to comprehensive supervision or regulation on a consolidated basis if the Board determines that the bank is supervised and regulated in such a manner that its home country supervisor receives sufficient infor-mation on the foreign bank's worldwide operations, includ-ing the relationship of the foreign bank to any affiliate, to assess the overall financial condition of the foreign bank and its compliance with law and regulation (12 C.F.R. 211.24(c)(1)).5 In making its determination under this stan-dard, the Board has considered the following information.
Bank's primary supervisor is the Ministry. Additionally, Bank is subject to supervision by the Office of Bank Supervision and Examination (the "OBSE") of the Bank of Korea.6 As a government-owned institution, Bank also is subject to audit and inspection by the Board of Audit and
5. In assessing this standard, the Board considers, among other factors, the extent to which the home country supervisors:
(i) Ensure that the bank has adequate procedures for monitoring and controlling its activities worldwide; (ii) Obtain information on the condition of the bank and its subsidiaries and offices through regular examination reports, audit reports, or otherwise; (iii) Obtain information on the dealings with and relationship between the bank and its affiliates, both foreign and domestic; (iv) Receive from the bank financial reports that are consolidated on a worldwide basis, or comparable information that permits analysis of the bank's financial condition on a worldwide consol-idated basis; (v) Evaluate prudential standards, such as capital adequacy and risk asset exposure, on a worldwide basis.
These are indicia of comprehensive, consolidated supervision. No single factor is essential and other elements may inform the Board's determination.
6. The Board previously has determined that several other Korean banks are subject to comprehensive supervision on a consolidated basis in connection with their applications filed under the FBSEA. These banks, however, are chartered as commercial banks and are subject to primary supervision by the OBSE. In addition, the Board recently determined that Long Term Credit Bank of Korea, a private development bank under the primary supervision of the Ministry, is also subject to comprehensive supervision on a consolidated basis. 82 Federal Reserve Bulletin 767 (1996).
Inspection (the "BAI"), an independent government agency that reports directly to the President of Korea.7
The Ministry's supervisory authority extends to estab-lishment or change of location of Bank's subsidiaries and offices, amendments to the by-laws, approval of an annual operational program and annual budget, changes in the amount of capital, nomination of the governor of Bank and the appointment of the auditor of Bank, and determination of any permissible incidental activities of Bank.
The BAI is authorized to audit the books and records of all government-owned institutions, including Bank and its subsidiaries. The results of the BAI's annual on-site exam-inations of Bank are reviewed by the Ministry in its role as the principal supervisor of Bank. BAI inspectors have broad authority to request any documents necessary to conduct their examination and their inspection authority extends to all domestic and foreign offices and subsidiaries of Bank.
On-site examinations of Bank's head office occur once a year. These examinations include a review of asset quality, capital adequacy, accounting procedures, compliance with laws and regulations, adequacy of internal compliance and controls, proper procurement of goods and services, appro-priateness of expenditures, adequacy of foreign operations, including an evaluation of management effectiveness over those operations, and accuracy of reports submitted by foreign offices.
The BAI has authority to audit all domestic and foreign offices and subsidiaries of Bank. On-site examinations of foreign offices occur generally every three years. The schedule, however, is adjusted as necessary to address changes in risk profiles or other specific issues. Off-site examinations are conducted annually in conjunction with the head office examination, and are similar in scope to on-site examinations.
Bank is required to submit periodic reports to the Minis-try and the OBSE. The Ministry requires the submission of reports from Bank on all aspects of Bank's banking opera-tions including management, financial performance, and foreign exchange activity. Certain financial statements, in-cluding the balance sheet and income statement, and the report on capital adequacy are prepared on a consolidated basis. Reports submitted monthly to either the OBSE or the Ministry include a balance sheet, deposit and reserve re-quirement information, credit exposures exceeding 15 per-cent of equity, aggregate large exposure concentrations, and loans outstanding to the 30 largest Korean business conglomerates. Additionally, Bank is required to provide the OBSE with semiannual operational reports of its for-eign branches and subsidiaries. These reports include fi-
7. Certain domestic nonbanking subsidiaries of Bank are subject to supervision and audit by other regulatory authorities in addition to the BAI, the Ministry and the Bank of Korea. KDB Securities Co., Ltd. and Korea Development Investment Management Co., Ltd. are sub-ject to supervision by the Securities Supervisory Board (the "SSB"), a Ministry-subordinated entity that supervises and regulates securities firms. The SSB examines these entities on an as-needed basis and reports the result of the examinations to the Ministry upon request.
Digitized for FRASER http://fraser.stlouisfed.org/ Federal Reserve Bank of St. Louis

Legal Developments 971
nancial statements and analyses of past due loans and other exposures. Bank also provides the OBSE with annual financial reports. The OBSE has the authority to require any relevant statistical data or information.
In addition to the audits performed by the BAI, all of Bank's foreign subsidiaries are audited by external audi-tors at least annually. The external auditors review, among other things, asset quality and internal controls. Internal control weaknesses are reported to senior management and the board of directors. Although there is no formal and direct communication channel between the external audi-tors and the Ministry and Bank of Korea, audited financial statements are provided to the Ministry and Bank of Korea upon request.
Bank provides the Ministry with operational information on a consolidated basis which includes materials concern-ing the business activities of Bank and its domestic and foreign subsidiaries. Although there are no express legal or regulatory restrictions imposed on transactions between Bank and its affiliates, Bank represents that it observes restrictions fundamentally similar to those imposed on commercial banks. In this regard, Bank applies limits on loans to its officers and employees as well as officers or employees of its affiliated companies. Additionally, certain restrictions on equity investments apply to Bank.
Bank's internal audit function is responsible for annual on-site audits of the head office and branches and bi-annual audits of foreign offices. In accordance with standards set by the Ministry, the audit group conducts general, specific, and routine (daily) audits.8 The scope of the general audit is broad, covering financial performance as well as compli-ance with Korean banking law and regulations. Head office audits include a review of asset quality, internal controls, accounting policies and procedures, operational policies and controls, budgeting and expenditure controls. The an-nual internal audit report is submitted to the Ministry and includes the examination scope, correction orders, and recommendations. The audit group is also responsible for ensuring that the foreign offices are complying with Bank's internal policies and procedures and all applicable banking laws and regulations of the host countries. The branch also would be audited by the BAI.
Under the KDB Act, the Ministry has the power to dismiss the senior officers, executive directors, and auditor of KDB, and may request the dismissal of the governor. The BAI may request the Ministry to take disciplinary action against any officer or employee of KDB who has committed any unlawful act, refused inspection, or caused any delay in the presentation of documents requested by the BAI.
Based on all the facts of record, including the informa-tion described above, the Board concludes that Bank is
8. A general audit encompasses an annual review of all operating departments. Special audits may be conducted at the request of the Ministry, the board of directors, or the governor in response to specific issues or concerns which may arise. Routine or daily audits relate specifically to the loan approval process.
subject to comprehensive supervision on a consolidated basis by its home country supervisor.
The Board has also taken into account the additional standards set forth in section 7 of the IB A (see 12 U.S.C. § 3105(d)(3)-(4); 12 C.F.R. 211.24(c)(2)). Bank has pro-vided the Board with the information necessary to assess the application through submissions that address the rele-vant issues. As noted above, Bank has received the consent of the Ministry to establish the proposed state-licensed branch. In addition, the Ministry may share information on Bank's operations with other supervisors, including the Board.
Korea is a signatory to the Basle risk-based capital standards, and Korean risk-based capital standards meet those established by the Basle Capital Accord. Bank's capital is in excess of the minimum levels that would be required by the Basle Capital Accord and is considered equivalent to capital that would be required of a U.S. banking organization. Managerial and other financial re-sources of Bank also are considered consistent with ap-proval, and Bank appears to have the experience and capacity to support the proposed branch. Bank has estab-lished controls and procedures for the proposed branch in order to ensure compliance with U.S. law, as well as controls and procedures for its worldwide operations in general.
Finally, the Board has reviewed the restrictions on dis-closure in relevant jurisdictions in which Bank operates and has communicated with relevant government authori-ties about access to information. Bank has committed that it will make available to the Board such information on the operations of Bank and any affiliate of Bank that the Board deems necessary to determine and enforce compliance with the IBA, the Bank Holding Company Act of 1956, as amended, and other applicable federal law. To the extent that the provision of such information is prohibited or impeded by law, Bank has committed to cooperate with the Board to obtain any necessary consents or waivers that might be required from third parties in connection with disclosure of certain information. In addition, subject to certain conditions, the Ministry may share information on Bank's operations with other supervisors, including the Board. In light of these commitments and other facts of record, and subject to the condition described below, the Board concludes that Bank has provided adequate assur-ances of access to any necessary information the Board may request.
On the basis of all the facts of record, and subject to the commitments made by Bank, as well as the terms and conditions set forth in this order, the Board has determined that Bank's application to establish a state-licensed branch should be, and hereby is, approved. Should any restrictions on access to information on the operations or activities of Bank and its affiliates subsequently interfere with the Board's ability to obtain information to determine and enforce compliance by Bank or its affiliates with applicable federal statutes, the Board may require termination of any of Bank's direct or indirect activities in the United States.
Digitized for FRASER http://fraser.stlouisfed.org/ Federal Reserve Bank of St. Louis

972 Federal Reserve Bulletin • October 1996
Approval of this application is also specifically conditioned on Bank's compliance with the commitments made in connection with this application and with the conditions in this order.9 The commitments and conditions referred to above are conditions imposed in writing by the Board in connection with its decision, and may be enforced in
9. The Board's authority to approve establishment of the proposed branch office parallels the continuing authority of the State of New York to license offices of a foreign bank. The Board's approval of this application does not supplant the authority of the State of New York and its agent, the New York State Banking Department, to license the
proceedings under 12 U.S.C. § 1818 or 12 U.S.C. § 1847 against Bank, its offices, and its affiliates.
By order of the Board of Governors, elfective August 23, 1996.
Voting for this action: Chairman Greenspan, Vice Chair Rivlin, and Governors Kelley, Lindsey, Phillips, and Meyer. Absent and not voting: Governor Yellen.
JENNIFER J. JOHNSON Deputy Secretary of the Board
proposed branch office of Bank in accordance with any terms or conditions that the New York State Banking Department may impose.
INDEX OF ORDERS ISSUED OR ACTIONS TAKEN BY THE BOARD OF GOVERNORS OF THE FEDERAL RESERVE SYSTEM (APRIL I, 1996-JUNE 30,1996)
,. Merged or Acquired Bank Date of Bulletin Applicant * • • * Volume or Activity Approval , _ and Page
Aspen Bancshares, Inc., Aspen, Colorado
Bank of Boston Corporation, Boston, Massachusetts
The Bank of New York Company, Inc., New York, New York
The Bessemer Group, Incorporated, Woodbridge, New Jersey
BNCCORP, Inc., Bismarck, North Dakota
Butte Bank Shares, Inc., Butte, Montana
Caisse Nationale de Credit Agricole, S.A., Paris, France
Capital One Financial Corporation, Falls Church, Virginia
Cardinal Bancshares, Inc., Lexington, Kentucky
Cedel Bank, S.A., Luxembourg
Commercial Bank "Ion Tiriac", S.A., Bucharest, Romania
Val Cor Bancorporation, Inc., Cortez, Colorado
Valley National Bank of Cortez, Cortez, Colorado
The Boston Bancorp, Boston, Massachusetts
South Boston Savings Bank, Boston, Massachusetts
BNY Capital Markets, Inc., New York, New York
Bessemer Asset Management, Inc., New York, New York
Cambridge Bank Professionals, LLC, St. Cloud, Minnesota
BNC Financial Corporation, St. Cloud, Minnesota
First Citizens Bank of Butte, Butte, Montana
CALFP (US), Inc., New York, New York
Order approving an exemption from the anti-tying provisions
Security First Network Bank, Pineville, Kentucky
Five Paces Software, Inc., Atlanta, Georgia
To establish a representative office in New York, New York
To establish a representative office in New York, New York
May 31, 1996 82, 665
June 3, 1996 82, 733
June 10, 1996 82, 748
April 24, 1996 82, 569
May 1, 1996 82, 673
April 1, 1996 82, 554
June 10, 1996 82, 754
April 11, 1996 82,584
May 21, 1996 82, 674
April 24, 1996 82, 591
April 22, 1996 82, 592
Digitized for FRASER http://fraser.stlouisfed.org/ Federal Reserve Bank of St. Louis

Legal Developments 973
Bulletin Applicant Merged or Acquired Bank
or Activity Date of Approval Volume
and Page
Community Bancshares of Community State Bank, June 17, 1996 82, 735 Marysville, Inc., Hanover, Kansas Marysville, Kansas
Creditanstalt-Bankverein, To relocate its existing federally April 22, 1996 82, 594 Vienna, Austria licensed uninsured branch from
New York, New York, to Greenwich, Connecticut
Croghan Bancshares, Inc., Union Bancshares Corp., June 10, 1996 82, 737 Fremont, Ohio Bellevue, Ohio
Union Bank and Savings Company, Bellevue, Ohio
The Croghan Colonia Bank, Union Bank and Savings Company, June 10, 1996 82, 737 Fremont, Ohio Bellevue, Ohio
Dresdner Bank AG, RCM Capital Management, California May 30, 1996 82, 676 Frankfurt, Germany Limited Partnership,
San Francisco, California RCM Capital Trust Company,
San Francisco, California Emigrant Bancorp, Inc., Queens County Bancorp, Inc., April 1, 1996 82, 555
New York, New York Flushing, New York Farmers State Corporation, First Security Bank-Madison, April 8, 1996 82, 557
Mountain Lake, Minnesota Madison, Minnesota Bank Southwest Corporation,
Worthington, Minnesota Firstar Corporation, Jacob Schmidt Company, June 24, 1996 82, 762
Milwaukee, Wisconsin St. Paul, Minnesota Firstar Corporation of Minnesota, American Bancorporation, Inc.,
Bloomington, Minnesota St. Paul, Minnesota First Commerce Banks of Florida, Prime Bank of Central Florida, June 5, 1996 82, 738
Inc., Titusville, Florida Winter Haven, Florida
First Commerce Corporation, 150 Baronne Street Limited Partnership, May 29, 1996 82, 679 New Orleans, Louisiana New Orleans, Louisiana
First Hawaiian, Inc., Pacific One Bank, April 8, 1996 82, 575 Honolulu, Hawaii Portland, Oregon
Pioneer Federal Savings Bank, Honolulu, Hawaii
Flathead Holding Company of Bank West, N.A., June 24, 1996 82, 741 Bigfork, Kalispell, Montana Bigfork, Montana
Fleet Financial Group, Inc., NatWest Bank National Association, April 15, 1996 82, 558 Boston, Massachusetts Jersey City, New Jersey
Huntington Bancshares, Order approving an exemption from the May 23, 1996 82, 688 Incorporated, anti-tying provisions Columbus, Ohio
National City Corporation, Cleveland, Ohio
Digitized for FRASER http://fraser.stlouisfed.org/ Federal Reserve Bank of St. Louis

974 Federal Reserve Bulletin • October 1996
Date of Approval
Bulletin Applicant Merged or Acquired Bank
or Activity Date of Approval Volume
and Page
Huntington Bancshares Five Paces Software, Inc., May 21, 1996 82, 680 Incorporated, Atlanta, Georgia Columbus, Ohio
Wachovia Corporation, Winston-Salem, North Carolina
Area Bancshares Corporation, Owensboro, Kentucky
Iowa State Bank, To establish a branch at June 24, 1996 82, 767 Hull, Iowa 1101 Main Street,
Hull, Iowa Komercni Banka, a.s., To establish a representative office in April 22, 1996 82, 597
Prague, Czech Republic New York, New York Korea Long Term Credit Bank, To establish a state-licensed branch in June 24, 1996 82, 767
Seoul, Korea New York, New York Morgan Guaranty Trust Company of J.P. Morgan Delaware, April 29, 1996 82, 585
New York, Wilmington, Delaware New York, New York
National Bancshares Corporation of Corpus Christi Bancshares, Inc., April 29, 1996 82, 565 Texas, Corpus Christi, Texas Laredo, Texas
National Bank of Canada, To establish representative offices in June 10, 1996 82, 769 Montreal, Cananda Denver, Colorado; Boca Raton,
Florida; Baltimore, Maryland; Boston, Massachusetts; Southfield, Michigan; Charlotte, North Carolina; Cincinnati, Ohio; Cleveland, Ohio; Pittsburgh, Pennsylvania; Memphis, Tennessee; and Richmond, Virginia
Norwest Corporation, AmeriGroup, Incorporated, April 29, 1996 82, 580 Minneapolis, Minnesota Minnetonka, Minnesota
AmeriBank, Bloomington, Minnesota
Norwest Corporation, The Prudential Home Mortgage May 6, 1996 82, 683 Minneapolis, Minnesota Company, Inc.,
Clayton, Missouri Norwest Corporation, Union Texas Bancorporation, Inc., May 29, 1996 82, 667
Minneapolis, Minnesota Laredo, Texas Union National Bank of Texas,
Laredo, Texas Promstroybank of Russia, To establish a representative office in April 8, 1996 82, 599
Moscow, Russian Federation New York, New York R&G Financial Corporation, R-G Premier Bank of Puerto Rico, June 17, 1996 82, 745
Hato Rey, Puerto Rico Hato Rey, Puerto Rico R&G Mortgage Corporation,
Hato Rey, Puerto Rico Signet Bank, Signet Bank N.A., April 29, 1996 82, 590
Richmond, Virginia Falls Church, Virginia Swiss Bank Corporation, S.G. Warburg Overseas Ltd., May 13, 1996 82, 685
Basle, Switzerland London, England S.G. Warburg Forex Ltd.,
London, England (branch located in New York, New York)
Digitized for FRASER http://fraser.stlouisfed.org/ Federal Reserve Bank of St. Louis

Legal Developments 975
Applicant Merged or Acquired Bank or Activity
Date of Approval
Bulletin Volume and Page
Swiss Bank Corporation, Basle, Switzerland
Union Planters Corporation, Memphis, Tennessee
Union Planters Corporation, Memphis, Tennessee
West One Bank, Idaho, Boise, Idaho
Wilson Bank Holding Company, Lebanon, Tennessee
Woodforest Bancshares, Inc., Houston, Texas
To establish a representative office in Houston, Texas
Eastern National Bank, Miami, Florida
Franklin Financial Group, Inc., Morristown, Tennessee
Franklin Federal Savings Bank, Morristown, Tennessee
U.S. Bank of Idaho, National Association, Coeur D'Alene, Idaho
DeKalb Community Bank, Smithville, Tennessee
Mutual Money Investments, Inc., Houston, Texas
May 13, 1996
June 5, 1996
June 10, 1996
June 17, 1996
April 1, 1996
April 8, 1996
82, 690
82, 745
82, 756
82, 765
82, 568
82, 573
APPLICATIONS APPROVED UNDER BANK HOLDING COMPANY ACT By the Secretary of the Board
Recent applications have been approved by the Secretary of the Board as listed below. Copies are available upon request to the Freedom of Information Office, Office of the Secretary, Board of Governors of the Federal Reserve System, Washington, D.C. 20551.
Section 4
Applicant(s) Bank(s) Effective Date
Wachovia Corporation, Winston-Salem, North Carolina
Wachovia Capital Markets, Inc., Atlanta, Georgia
August 26, 1996
By Federal Reserve Banks
Recent applications have been approved by the Federal Reserve Banks as listed below. Copies are available upon request to the Reserve Banks.
Section 3
Applicant(s) Bank(s) Reserve Bank Effective Date
Alabama National Bancorporation, Birmingham, Alabama
BancFirst Corporation, Inc., Oklahoma City, Oklahoma
The Belknap Partnership, L.P., Poplar Bluff, Missouri
FIRSTBANC Holding Company, Inc., Robertsdale, Alabama
First Bank of Baldwin County, Robertsdale, Alabama
Commerce Bancorporation, Inc., McLoud, Oklahoma
Bootheel Bancorp, Inc., Maiden, Missouri
First Community Bank, Bernie, Missouri
Atlanta
Kansas City
St. Louis
August 21, 1996
July 26, 1996
August 19, 1996
Digitized for FRASER http://fraser.stlouisfed.org/ Federal Reserve Bank of St. Louis

976 Federal Reserve Bulletin • October 1996
Section 3—Continued
Applicant(s) Bank(s) Reserve Bank Effective Date
Big Bend Bancshares Corporation, Presidio, Texas
Rio Bancshares Corporation, Wilmington, Delaware
Bullsboro Bancshares, Inc., Newnan, Georgia
Community Holdings Corporation, Palos Hills, Illinois
DFC Acquisition Corporation Two, Kansas City, Missouri
East Texas Bancorp, Inc., Longview, Texas
East Texas Delaware Financial Corporation, Dover, Delaware
FirstBank Holding Company of Colorado Employee Stock Ownership Plan, Lakewood, Colorado
FirstBank Holding Company of Colorado, Lakewood, Colorado
First Commercial Corporation, Little Rock, Arkansas
First Interstate BancSystem of Montana, Inc., Billings, Montana
First National Bancorp, Inc., St. Mary's, West Virginia
F & M National Corporation, Winchester, Virginia
FNB Bancshares, Inc., Gaffney, South Carolina
Freeman Bancstock Investments, Dallas, Texas
Inwood Bancshares, Inc., Dallas, Texas
Independent Bancshares, Inc., Clarkfield, Minnesota
Investors Bancorp, MHC, Millburn, New Jersey
Investors Bancorp, Inc., Millburn, New Jersey
JS Investments, Limited Partnership, Billings, Montana
Nbar5, Limited Partnership, Ranchester, Wyoming
Marfa National Bank, Marfa, Texas
The Bank of Newnan, Newnan, Georgia
First State Bank and Trust Company of Palos Hills, Palos Hills, Illinois
Air Academy National Bancorp, United States Air Force Academy, Colorado
East Texas Delaware Financial Corporation, Dover, Delaware
Community Bank, Longview, Texas
Community Bank, Longview, Texas
FirstBank of Greeley, Greeley, Colorado
Dallas
Atlanta
Chicago
Kansas City
Dallas
Dallas
Kansas City
City National Bank, Whitehouse, Texas
First Interstate Bank of Montana, N.A., Kalispell, Montana
First Interstate Bank of Wyoming, N.A. Casper, Wyoming
The First National Bank of St. Mary's, St. Mary's, West Virginia
Allegiance Banc Corporation, Bethesda, Maryland
Richmond
UB&T Financial Corporation, Dallas, Texas
Granite Holding Corporation, Granite Falls, Minnesota
Investors Savings Bank, Millburn, New Jersey
First Interstate Bank of Montana, N.A., Kalispell, Montana
First Interstate Bank of Wyoming, N.A., Casper, Wyoming
St. Louis
Richmond
Dallas
Minneapolis
New York
Minneapolis
July 30, 1996
August 14, 1996
August 19, 1996
August 21, 1996
July 30, 1996
July 30, 1996
August 20, 1996
July 29, 1996
August 14, 1996
August 14, 1996
August 15, 1996
August 16, 1996
August 2, 1996
July 30, 1996
August 16, 1996
August 14, 1996
Digitized for FRASER http://fraser.stlouisfed.org/ Federal Reserve Bank of St. Louis

Legal Developments 977
Section 3—Continued
Applicant(s) Bank(s) Reserve Bank Effective Date
Kingsbury BDC Financial Services, Bank of Dixon County, Kansas City July 30, 1996 Inc., Ponca, Nebraska Ponca, Nebraska American State Bank,
Newcastle, Nebraska Lawton Partners Holding Company, First United, Inc., St. Louis August 21, 1996
Central City, Kentucky Central City, Kentucky Mark Twain Bancshares, Inc., Northland Bancshares, Inc., St. Louis August 15, 1996
St. Louis, Missouri Kansas City, Missouri Mark Twain Acquisition Corp. II, First National Bank of Platte County,
St. Louis, Missouri Kansas City, Missouri Mercantile Bancorporation Inc., Peoples State Bank, St. Louis August 5, 1996
St. Louis, Missouri Topeka, Kansas Ameribanc, Inc.,
St. Louis, Missouri Mesaba Bancshares, Inc., River Bancorp, Inc., Minneapolis July 31, 1996
Biwabik, Minnesota Ramsey, Minnesota Mid State Banks, Inc., The First State Bank of Ocilla, Atlanta August 8, 1996
Cordele, Georgia Ocilla, Georgia National City Bancshares, Inc., First National Bank of Wayne City, St. Louis August 2, 1996
Evansville, Indiana Wayne City, Illinois Norwest Corporation, Texas Bancorporation, Inc., Minneapolis August 20, 1996
Minneapolis, Minnesota Odessa, Texas ONB Financial Services, Inc., Ocala National Bank, Atlanta August 22, 1996
Ocala, Florida Ocala, Florida Ouachita Bancshares Corp., Ouachita Independent Bank, Dallas August 2, 1996
West Monroe, Louisiana Monroe, Louisiana Premier Bancorp, Inc., Premier Bank, Kansas City August 20, 1996
Denver, Colorado Lenexa, Kansas R. Banking Limited Partnership, Commerce Bancorporation, Inc., Kansas City July 26, 1996
Oklahoma City, Oklahoma McLoud, Oklahoma The Ringsmuth Family Limited Wakefield Bancorporation, Inc., Minneapolis August 7, 1996
Partnership, Wakefield, Michigan Wakefield, Michigan
River Bancorp, Inc., Northland Security Bank, Minneapolis July 31, 1996 Ramsey, Minnesota Ramsey, Minnesota
SSB Holdings, Inc., Second Bancshares, Inc., Kansas City July 31, 1996 Miami, Oklahoma Miami, Oklahoma
S.Y. Bancorp, Inc., The Austin State Bank, St. Louis August 12, 1996 Louisville, Kentucky Austin, Indiana
WKS, Inc., Sierra Thrift, San Francisco August 8, 1996 Fresno, California Fresno, California
Section 4
Applicant(s) Nonbanking Activity/Company Reserve Bank Effective Date
Arrow Financial Corporation, Glens Falls, New York
Arrow Vermont Corporation, Rutland, Vermont
Centura Banks, Inc., Rocky Mount, North Carolina
VNB Trust Company, Rutland, Vermont
First Greensboro Home Equity, Inc. Greensboro, North Carolina
New York July 31, 1996
Richmond August 12, 1996
Digitized for FRASER http://fraser.stlouisfed.org/ Federal Reserve Bank of St. Louis

978 Federal Reserve Bulletin • October 1996
Section 4—Continued
Applicant(s) Nonbanking Activity/Company Reserve Bank Elfective Date
Century Bancshares, Inc., To engage de novo in discount St. Louis July 30, 1996 Gainesville, Missouri brokerage securities activities
Commerzbank Aktiengesellschaft, Commerz Futures Corporation, New York August 12, 1996 Frankfurt am Main, Germany Chicago, Illinois
Deutsche Bank AG, Deutsche Financial Capital Limited New York August 16, 1996 Frankfurt (Main), Federal Liability Company, Republic of Germany, Greensboro, North Carolina
Oakwood Homes Corporation, Greensboro, North Carolina
Greater Community Bancorp, Greater Community Financial, L.L.C., New York August 2, 1996 Totowa, New Jersey Totowa, New Jersey
NBN Corp., Smoky Mountain Financial Services, Atlanta July 31, 1996 Newport, Tennessee Inc.,
Jefferson City, Tennessee NEB Corporation, To engage in making and servicing Chicago August 8, 1996
Fond du Lac, Wisconsin loans NBN Corp., Smoky Mountain Financial Services, Atlanta August 16, 1996
Newport, Tennessee Inc., Jefferson City, Tennessee
Norwest Corporation, Central Computers, Inc., Minneapolis July 26, 1996 Minneapolis, Minnesota Victoria, Texas
Norwest Corporation, Norwest Technical Services, Inc., Minneapolis August 22, 1996 Minneapolis, Minnesota Minneapolis, Minnesota
Norwest Financial, Inc., To engage de novo in the issuance Des Moines, Iowa and sale at retail of money orders
Norwest Financial Services, Inc., Sunburst Financial Services, Inc., Minneapolis July 26, 1996 Des Moines, Iowa Jackson, Mississippi, dba Rapid
Norwest Corporation, Finance, Inc., Minneapolis, Minnesota Jackson, Mississippi
Norwest Financial Services, Inc., Des Moines, Iowa
Norwest Financial, Inc., Des Moines, Iowa
Security Banc Corporation, Third Financial Corporation, Cleveland August 2, 1996 Springfield, Ohio Piqua, Ohio
Sharon Bancshares, Inc., To engage de novo in full-service St. Louis July 26, 1996 Sharon, Tennessee brokerage activities
The Tokai Bank, Limited, Tokai Financial Services, Inc., San Francisco August 14, 1996 Nagoya, Japan Berwyn, Pennsylvania
Wells Fargo & Company, To engage de novo on a nationwide San Francisco August 6, 1996 San Francisco, California basis, through all of its subsidiary
banks, in the issuance and sale of money instruments as follows: (1) domestic money orders up to a maximum face value of $10,000; (2) international money orders in denominations not to exceed $10,000; and (3) official checks with no maximum limitation on the face amount, but subject to certain limitations
Digitized for FRASER http://fraser.stlouisfed.org/ Federal Reserve Bank of St. Louis

Legal Developments 979
Section 4—Continued
Applicant(s) Nonbanking Activity/Company Reserve Bank Effective Date
Wells Fargo & Company, To expand to nationwide, the San Francisco August 5, 1996 San Francisco, California geographic scope of the previously
approved activity of installing, owning, operating, and maintaining automatic teller machines
Zions Bancorporation, To engage de novo in the activity of San Francisco August 9, 1996 Salt Lake City, Utah installing, owning, and operating
automatic teller machines
Sections 3 and 4
Applicant(s) Nonbanking Activity/Company Reserve Bank Effective Date
North Shore Community Bancorp, Inc., Wilmette, Illinois
Roosevelt Financial Group, Inc., Chesterfield, Missouri
Lake Forest Bancorp, Inc., Lake Forest, Illinois
Hinsdale Bancorp, Inc., Hinsdale, Illinois
Libertyville, Bancorp, Inc., Lake Forest, Illinois
Crabtree Capital Corporation, Schaumburg, Illinois
Community Charter Corporation, St. Louis, Missouri
Missouri State Bank and Trust Company, St. Louis, Missouri
Roosevelt Bank, Chesterfield, Missouri
Roosevelt Mortgage Company, Chesterfield, Missouri
Chicago August 14, 1996
St. Louis August 19, 1996
APPLICATIONS APPROVED UNDER BANK MERGER ACT By Federal Reserve Banks
Recent applications have been approved by the Federal Reserve Banks as listed below. Copies are available upon request to the Reserve Banks.
Applicant(s) Bank(s) Reserve Bank Effective Date
BancFirst, Oklahoma City, Oklahoma
Boulder Valley Bank & Trust, Boulder, Colorado
Triangle Bank, Raleigh, North Carolina
The Bank of Commerce, McLoud, Oklahoma
Mountain Parks Bank-East, Evergreen, Colorado
Mountain Parks Bank-West, Breckenridge, Colorado
The Bank of Louisville, Louisville, Colorado
Granville United Bank, Oxford, North Carolina
Kansas City
Kansas City
Richmond
July 26, 1996
July 26, 1996
August 2, 1996
Digitized for FRASER http://fraser.stlouisfed.org/ Federal Reserve Bank of St. Louis

980 Federal Reserve Bulletin • October 1996
Bank Merger Act—Continued
Applicant(s) Bank(s) Reserve Bank Effective Date
Yellowstone Bank, Yellowstone Bank, Minneapolis August 20, 1996 Laurel, Montana Absarokee, Montana
Yellowstone Bank, Billings, Montana
Yellowstone Bank, Columbus, Montana
PENDING CASES INVOLVING THE BOARD OF GOVERNORS
This list of pending cases does not include suits against the Federal Reserve Banks in which the Board of Governors is not named a party.
Long v. Board of Governors, No. 96-9526 (10th Cir., filed July 31, 1996). Petition for review of Board order dated July 2, 1996, assessing a civil money penalty and cease and desist order for violations of the Bank Holding Company Act.
Esformes v. Board of Governors, No. 96-1916 (S.D. Fla., filed July 12, 1996). Complaint challenging Board denial of administrative request for confidential supervisory informa-tion. On July 12, 1996, plaintiffs moved for an expedited hearing on the complaint. The motion was denied on Au-gust 1, 1996.
Board of Governors v. Interamericas Investments, Ltd., No. 96-7108 (D.C. Cir., filed June 14, 1996). Appeal of district court ruling granting, in part, the Board's applica-tion to enforce an adminstrative investigatory subpoena for documents and testimony. Appellants filed a motion for a stay of the district court ruling on July 17, 1996; the Board's opposition was filed on July 23, 1996.
Interamericas Investments, Ltd. v. Board of Governors, No. 96-60326 (5th Cir., filed May 8, 1996). Petition for review of order imposing civil money penalties and cease and desist order in enforcement case. Petitioners' brief was filed on July 26, 1996. On August 20, petitioners' motion for a stay of the Board's orders pending judicial review was denied by the Court of Appeals.
Kuntz v. Board of Governors, No. 96-1137 (D.C. Cir., filed April 25, 1996). Petition for review of a Board order dated March 25, 1996, approving an application by CoreStates Financial Corp., Philadelphia, Pennsylvania to acquire Me-ridian Bancorp, Inc., Reading, Pennsylvania. The Board's motion to dismiss was filed on June 3, 1996.
Kuntz v. Board of Governors, No. 96-1079 (D.C. Cir., filed March 7, 1996). Petition for review of a Board order dated February 7, 1996, approving applications by The Fifth Third Bank, Cincinnati, Ohio, and The Firth Third Bank of Columbus, Columbus, Ohio, to acquire certain assets and assume certain liabilities of 25 branches of NBD Bank, Columbus, Ohio. Petitioner has moved to consolidate the
case with Kuntz v. Board of Governors, No. 95-1495. On April 8, 1996, the Board filed a motion to dismiss the action.
Henderson v. Board of Governors, No. 96-1054 (D.C. Cir., filed February 16, 1996). Petition for review of a Board order dated January 17, 1996, approving the merger of First Citizens BancShares, Inc., Raleigh, North Carolina, with Allied Bank Capital, Inc., Sanford, North Carolina. Petition-ers' motion for a stay was denied on March 7, 1996.
Research Triangle Institute v. Board of Governors, No. 1:96CV00102 (M.D.N.C., filed February 12, 1996). Contract dispute. On May 3, 1996, the Board filed a motion to dismiss the action.
Inner City Press/Community on the Move v. Board of Gover-nors, No. 96-4008 (2nd Cir., filed January 19, 1996). Peti-tion for review of a Board order dated January 5, 1996, approving the applications and notices by Chemical Bank-ing Corporation to merge with The Chase Manhattan Cor-poration, both of New York, New York, and by Chemical Bank to merge with The Chase Manhattan Bank, N.A., both of New York, New York. Petitioners' motion for an emer-gency stay of the transaction was denied following oral argument on March 26, 1996. The Board's brief on the merits was filed July 8, 1996. The case has been consoli-dated for oral argument and decision with Lee v. Board of Governors, No. 95^1134 (2d Cir.).
Menick v. Greenspan, No. 95-CV-01916 (D. D.C., filed Octo-ber 10, 1995). Complaint alleging sex, age, and handicap discrimination in employment.
Kuntz v. Board of Governors, No. 95-1495 (D.C. Cir., filed September 21, 1995). Petition for review of Board order dated August 23, 1995, approving the applications of The Fifth Third Bank, Cincinnati, Ohio, to acquire certain assets and assume certain liabilities of 12 branches of PNC Bank, Ohio, N.A., Cincinnati, Ohio, and to establish certain branches. The Board's motion to dismiss was filed on October 26, 1995.
Lee v. Board of Governors, No. 95-4134 (2nd Cir., filed August 22, 1995). Petition for review of Board orders dated July 24, 1995, approving certain steps of a corporate reorga-nization of U.S. Trust Corporation, New York, New York, and the acquisition of U.S. Trust by Chase Manhattan
Digitized for FRASER http://fraser.stlouisfed.org/ Federal Reserve Bank of St. Louis

Legal Developments 981
Corporation, New York, New York. On September 12, 1995, the court denied petitioners' motion for an emergency stay of the Board's orders. The Board's brief was filed on April 16, 1996.
Beckman v. Greenspan, No. 95-35473 (9th Cir., filed May 4, 1995). Appeal of dismissal of action against Board and others seeking damages for alleged violations of constitu-tional and common law rights. The appellants' brief was filed on June 23, 1995; the Board's brief was filed on July 12, 1995.
Money Station, Inc. v. Board of Governors, No. 95-1182 (D.C. Cir., filed March 30, 1995). Petition for review of a Board order dated March 1, 1995, approving notices by Bank One Corporation, Columbus, Ohio; CoreStates Finan-cial Corp., Philadelphia, Pennsylvania; PNC Bank Corp., Pittsburgh, Pennsylvania; and KeyCorp, Cleveland, Ohio, to acquire certain data processing assets of National City Corporation, Cleveland, Ohio, through a joint venture sub-sidiary. On April 23, 1996, the court vacated the Board's order. On July 31, 1996, the full court granted the Board's suggestion for rehearing en banc, and vacated the April 23 panel decision.
In re Subpoena Duces Tecum, Misc. No. 95-06 (D.D.C., filed January 6, 1995). Action to enforce subpoena seeking pre-decisional supervisory documents sought in connection with an action by Bank of New England Corporation's trustee in bankruptcy against the Federal Deposit Insurance Corpora-tion. The Board filed its opposition on January 20, 1995. Oral argument on the motion was held July 14, 1995.
Board of Governors v. Pharaon, No. 91-CIV-6250 (S.D. New York, filed September 17, 1991). Action to freeze assets of individual pending administrative adjudication of civil money penalty assessment by the Board. On September 17, 1991, the court issued an order temporarily restraining the transfer or disposition of the individual's assets.
FINAL ENFORCEMENT ORDERS ISSUED BY THE BOARD OF GOVERNORS
Joseph G. Donner, Jr. Lenexa, Kansas
The Federal Reserve Board announced on August 14, 1996, the issuance of an Order of Prohibition against Joseph G. Donner, Jr., an appraiser for the Premier Bank, Lenexa, Kansas, a state member bank, and other banks.
Albert L. Margolin Lenexa, Kansas
The Federal Reserve Board announced on August 14, 1996, the issuance of an Order of Prohibition against Albert L. Margolin, an appraiser for the Premier Bank, Lenexa, Kansas, a state member bank, and other banks.
WRITTEN AGREEMENTS APPROVED BY FEDERAL RESERVE BANKS
The Bank of Corning Company Corning, Ohio
The Federal Reserve Board announced on August 13, 1996, the execution of a Written Agreement by and among The Bank of Corning Company, Corning, Ohio, the Fed-eral Reserve Bank of Cleveland, and the Superintendent of Financial Institutions of the State of Ohio.
Digitized for FRASER http://fraser.stlouisfed.org/ Federal Reserve Bank of St. Louis

A1
Financial and Business Statistics
A3 GUIDE TO TABULAR PRESENTATION
DOMESTIC FINANCIAL STATISTICS
Money Stock and Bank Credit A4 Reserves, money stock, liquid assets, and debt
measures A5 Reserves of depository institutions, Reserve Bank
credit A6 Reserves and borrowings—Depository
institutions A6 Selected borrowings in immediately available
funds—Large member banks
Policy Instruments A7 Federal Reserve Bank interest rates A8 Reserve requirements of depository institutions A9 Federal Reserve open market transactions
Federal Reserve Banks A10 Condition and Federal Reserve note statements A l l Maturity distribution of loan and security
holdings
Monetary and Credit Aggregates A12 Aggregate reserves of depository institutions
and monetary base A13 Money stock, liquid assets, and debt measures A15 Deposit interest rates and amounts outstanding—
commercial and BIF-insured banks A16 Bank debits and deposit turnover
Commercial Banking Institutions A17 Assets and liabilities, Wednesday figures
Weekly Reporting Commercial Banks— Assets and liabilities
A19 Large reporting banks A21 Branches and agencies of foreign banks
Financial Markets A22 Commercial paper and bankers dollar
acceptances outstanding A22 Prime rate charged by banks on short-term
business loans A23 Interest rates—money and capital markets A24 Stock market—Selected statistics
Federal Finance A25 Federal fiscal and financing operations A26 U.S. budget receipts and outlays A27 Federal debt subject to statutory limitation A27 Gross public debt of U.S. Treasury—
Types and ownership A28 U.S. government securities
dealers—Transactions A29 U.S. government securities dealers—
Positions and financing A30 Federal and federally sponsored credit
agencies—Debt outstanding
Securities Markets and Corporate Finance A31 New security issues—Tax-exempt state and local
governments and corporations A32 Open-end investment companies—Net sales
and assets A32 Corporate profits and their distribution A3 3 Domestic finance companies—Assets and
liabilities, and consumer, real estate, and business credit
Real Estate A34 Mortgage markets A35 Mortgage debt outstanding
Consumer Installment Credit A3 6 Total outstanding A36 Terms
Flow of Funds A37 Funds raised in U.S. credit markets A39 Summary of financial transactions A40 Summary of credit market debt outstanding A41 Summary of financial assets and liabilities
DOMESTIC NONFINANCIAL STATISTICS
Selected Measures A42 Nonfinancial business activity—
Selected measures A42 Labor force, employment, and unemployment A43 Output, capacity, and capacity utilization A44 Industrial production—Indexes and gross value A46 Housing and construction A47 Consumer and producer prices
Digitized for FRASER http://fraser.stlouisfed.org/ Federal Reserve Bank of St. Louis

2 Federal Reserve Bulletin • October 1996
DOMESTIC NONFINANCIAL STATISTICS-CONTINUED
Selected Measures—Continued A48 Gross domestic product and income A49 Personal income and saving
INTERNATIONAL STATISTICS
Summary Statistics A50 U.S. international transactions—Summary A51 U.S. foreign trade A51 U.S. reserve assets A51 Foreign official assets held at Federal Reserve
Banks A52 Selected U.S. liabilities to foreign official
institutions
Reported by Banks in the United States A52 Liabilities to and claims on foreigners A53 Liabilities to foreigners A55 Banks' own claims on foreigners A56 Banks' own and domestic customers' claims on
foreigners A56 Banks' own claims on unaffiliated foreigners A57 Claims on foreign countries—
Combined domestic offices and foreign branches
Reported by Nonbanking Business Enterprises in the United States
A58 Liabilities to unaffiliated foreigners A59 Claims on unaffiliated foreigners
Securities Holdings and Transactions A60 Foreign transactions in securities A61 Marketable U.S. Treasury bonds and
notes—Foreign transactions
Interest and Exchange Rates A61 Discount rates of foreign central banks A61 Foreign short-term interest rates A62 Foreign exchange rates
A63 GUIDE TO STATISTICAL RELEASES AND SPECIAL TABLES
SPECIAL TABLE
A64 Pro forma balance sheets and income statements for priced service operations, June 30, 1996
A66 INDEX TO STATISTICAL TABLES
Digitized for FRASER http://fraser.stlouisfed.org/ Federal Reserve Bank of St. Louis

A3
Guide to Tabular Presentation
SYMBOLS AND ABBREVIATIONS
c Corrected G-10 Group of Ten e Estimated GNMA Government National Mortgage Association n.a. Not available GDP Gross domestic product n.e.c. Not elsewhere classified HUD Department of Housing and Urban P Preliminary Development r Revised (Notation appears on column heading IMF International Monetary Fund
when about half of the figures in that column IO Interest only are changed.) IPCs Individuals, partnerships, and corporations
* Amounts insignificant in terms of the last decimal IRA Individual retirement account place shown in the table (for example, less than MMDA Money market deposit account 500,000 when the smallest unit given is millions) MSA Metropolitan statistical area
0 Calculated to be zero NOW Negotiable order of withdrawal Cell not applicable OCD Other checkable deposit
ATS Automatic transfer service OPEC Organization of Petroleum Exporting Countries BIF Bank insurance fund OTS Office of Thrift Supervision CD Certificate of deposit PO Principal only CMO Collateralized mortgage obligation REIT Real estate investment trust FFB Federal Financing Bank REMIC Real estate mortgage investment conduit FHA Federal Housing Administration RP Repurchase agreement FHLBB Federal Home Loan Bank Board RTC Resolution Trust Corporation FHLMC Federal Home Loan Mortgage Corporation SAIF Savings Association Insurance Fund FmHA Farmers Home Administration SCO Securitized credit obligation FNMA Federal National Mortgage Association SDR Special drawing right FSLIC Federal Savings and Loan Insurance Corporation SIC Standard Industrial Classification G-7 Group of Seven VA Department of Veterans Affairs
GENERAL INFORMATION
In many of the tables, components do not sum to totals because of rounding.
Minus signs are used to indicate (1) a decrease, (2) a negative figure, or (3) an outflow.
"U.S. government securities" may include guaranteed issues of U.S. government agencies (the flow of funds figures also
include not fully guaranteed issues) as well as direct obliga-tions of the Treasury. "State and local government" also in-cludes municipalities, special districts, and other political subdivisions.
Digitized for FRASER http://fraser.stlouisfed.org/ Federal Reserve Bank of St. Louis

A4 Domestic Nonfinancial Statistics • October 1996
1.10 RESERVES, MONEY STOCK, LIQUID ASSETS, AND DEBT MEASURES
Percent annual rate of change, seasonally adjusted'
Monetary or credit aggregate 1995 1996 1996
Monetary or credit aggregate Q3 Q4 Ql Q2 Mar. Apr. May June July
Reserves of depository institutions2
1 Total - 1 . 5 - 6 . 9 - 7 . 9 - 6 . 4 19.2 -11.7 -20 .8 -2 .5 -20 .2 2 Required - 2 . 5 -7 .7 -8 .5 - 5 . 7 13.2 -11 .6 -15 .4 - 9 . 1 ' -18 .8 3 Nonborrowed - 2 . 4 - 6 . 4 -6 .5 - 7 . 6 19.6 -13 .2 -21 .6 -8 .3 ' - 20 .0 4 Monetary base3 1.7 2.7 1.5 2.1 8.9 - . 6 1.0 5.7 7.6
Concepts of money, liquid assets, and debt4
5 Ml -1 .5 - 5 . 1 -2 .7 - , 7 r 10.0 -3 .2 r -6 .8 r - . 5 ' - 8 . 8 6 M2 6.9 4.1 5.9 4.1 11.7 1.9r - 1.7r 5.5' 2.3 7 M3 8.0 4.5 7.2 5.4r 11.1 1.8r 3.0r 4.7 3.8 8 L 9.1 5.9 5.1 5.9 12.6 5.7r - . r 6.5 n.a. 9 Debt 4.9 4.7 4.7 4.8 6.1r 4.5r 3.7 3.8 n.a.
Nontransaction components 10 In M25 10.9 8.3 9.7 6.r 12.4 4.1r .6 8.1' 7.0 11 In M3 only6 12.1 6.3 12.6 10.6 9.0 1.5 21.2r 1.5' 9.5
Time and savings deposits Commercial banks
12 Savings, including MMDAs 9.0 13.1 22.6 12.7 25.2 8.6r 4.1r 12.3 10.9 13 Small time7 11.0 4.8 2.5 —2.6r - 4 . 5 - 3 . 5 -2 .1 ' 1.3' 5.6 14 Large time8,9 13.0 19.4 8.9 17.8r 27.4 8.1r 20.2' 18.5' 25.1
Thrift institutions 15 Savings, including MMDAs - 7 . 3 - 2 . 8 - . 3 8.1 5.7 13.91 5.2' 2.9 .0 16 Small time7 4.1 5.0 -2 .5 - 3 . 4 - 8 . 4 - 1 . 7 -2 .7 -3 .4 ' - 3 . 1 17 Large time8 13.7 8.0 6.2 - 2 . 8 - 9 . 5 1.6 - 9 . 5 6.4 12.7
Money market mutual funds 18 Retail 36.9 16.5 14.7 11.5 32.6 2.7 - 3 . 2 21.2 14.0 19 Institution-only 27.6 10.3 27.9 8.7 21.6 -13 .0 -10 .3 29.1 16.8
Repurchase agreements and Eurodollars 20 Repurchase agreements10 - 5 . 0 -14.6 1.3 5.0r -13 .5 - 7 . 8 80.0 -70 .7 ' -18 .3 21 Eurodollars10 9.4 —6.6r 16.9r 10.8r -29 .8 33.1' 17.4' 11.0 -19 .4
Debt components4
22 Federal 4.6 2.3 2.7 5.2 11.2 3.6 1.8 2.5 n.a. 23 Nonfederal 5.0 5.5 5.4 4.7 4.3r 4.8r 4.4 4.3 n.a.
1. Unless otherwise noted, rates of change are calculated from average amounts outstand-ing during preceding month or quarter.
2. Figures incorporate adjustments for discontinuities, or "breaks," associated with regulatory changes in reserve requirements. (See also table 1.20.)
3. The seasonally adjusted, break-adjusted monetary base consists of (1) seasonally adjusted, break-adjusted total reserves (line 1), plus (2) the seasonally adjusted currency component of the money stock, plus (3) (for all quarterly reporters on the "Report of Transaction Accounts, Other Deposits and Vault Cash" and for all weekly reporters whose vault cash exceeds their required reserves) the seasonally adjusted, break-adjusted difference between current vault cash and the amount applied to satisfy current reserve requirements.
4. Composition of the money stock measures and debt is as follows: Ml: (1) currency outside the U.S. Treasury, Federal Reserve Banks, and the vaults of
depository institutions, (2) travelers checks of nonbank issuers, (3) demand deposits at all commercial banks other than those owed to depository institutions, the U.S. government, and foreign banks and official institutions, less cash items in the process of collection and Federal Reserve float, and (4) other checkable deposits (OCDs), consisting of negotiable order of withdrawal (NOW) and automatic transfer service (ATS) accounts at depository institutions, credit union share draft accounts, and demand deposits at thrift institutions. Seasonally adjusted Ml is computed by summing currency, travelers checks, demand deposits, and OCDs, each seasonally adjusted separately.
M2: Ml plus (1) savings (including MMDAs), (2) small-denomination time deposits (time deposits—including retail RPs—in amounts of less than $100,000), and (3) balances in retail money market mutual funds (money funds with minimum initial investments of less than $50,000). Excludes individual retirement accounts (IRAs) and Keogh balances at depository institutions and money market funds. Seasonally adjusted M2 is calculated by summing savings deposits, small-denomination time deposits, and retail money fund balances, each seasonally adjusted separately, and adding this result to seasonally adjusted M1.
M3: M2 plus (1) large-denomination time deposits (in amounts of $100,000 or more), (2) balances in institutional money funds (money funds with minimum initial investments of $50,000 or more), (3) RP liabilities (overnight and term) issued by all depository institutions, and (4) Eurodollars (overnight and term) held by U.S. residents at foreign branches of U.S. banks worldwide and at all banking offices in the United Kingdom and Canada. Excludes
amounts held by depository institutions, the U.S. government, money market funds, and foreign banks and official institutions. Seasonally adjusted M3 is calculated by summing large time deposits, institutional money fund balances, RP liabilities, and Eurodollars, each seasonally adjusted separately, and adding this result to seasonally adjusted M2.
L: M3 plus the nonbank public holdings of U.S. savings bonds, short-term Treasury securities, commercial paper, and bankers acceptances, net of money market fund holdings of these assets. Seasonally adjusted L is computed by summing U.S. savings bonds, short-term Treasury securities, commercial paper, and bankers acceptances, each seasonally adjusted separately, and then adding this result to M3.
Debt: The debt aggregate is the outstanding credit market debt of the domestic nonfinancial sectors—the federal sector (U.S. government, not including government-sponsored enter-prises or federally related mortgage pools) and the nonfederal sectors (state and local governments, households and nonprofit organizations, nonfinancial corporate and nonfarm noncorporate businesses, and farms). Nonfederal debt consists of mortgages, tax-exempt and corporate bonds, consumer credit, bank loans, commercial paper, and other loans. The data, which are derived from the Federal Reserve Board's flow of funds accounts, are break-adjusted (that is, discontinuities in the data have been smoothed into the series) and month-averaged (that is, the data have been derived by averaging adjacent month-end levels).
5. Sum of (1) savings deposits (including MMDAs), (2) small time deposits, and (3) retail money fund balances, each seasonally adjusted separately.
6. Sum of (1) large time deposits, (2) institutional money fund balances, (3) RP liabilities (overnight and term) issued by depository institutions, and (4) Eurodollars (overnight and term) of U.S. addressees, each seasonally adjusted separately.
7. Small time deposits—including retail RPs—are those issued in amounts of less than $100,000. All IRA and Keogh account balances at commercial banks and thrift institutions are subtracted from small time deposits.
8. Large time deposits are those issued in amounts of $100,000 or more, excluding those booked at international banking facilities.
9. Large time deposits at commercial banks less those held by money market funds, depository institutions, the U.S. government, and foreign banks and official institutions.
10. Includes both overnight and term.
Digitized for FRASER http://fraser.stlouisfed.org/ Federal Reserve Bank of St. Louis

Money Stock and Bank Credit A5
1.11 RESERVES OF DEPOSITORY INSTITUTIONS AND RESERVE BANK CREDIT1
Millions of dollars
Average of daily figures
Factor 1 9 9 6 1996
May June July June 19 June 26 July 3 July 10 July 17 July 24 July 31
SUPPLYING RESERVE FUNDS
1 Reserve Bank credit outstanding 4 1 6 , 8 0 7 420 ,911 R 4 2 3 , 8 1 0 4 2 2 , 8 6 9 4 2 0 , 6 3 8 R 4 2 5 , 0 3 7 4 2 5 , 4 4 8 4 2 5 , 1 9 8 4 1 9 , 2 7 4 4 2 4 , 5 6 1 U.S. government securities2
2 Bought outright—System account 3 8 0 , 1 7 8 3 8 2 , 0 0 0 3 8 3 , 1 6 6 3 8 2 , 8 5 7 3 8 2 , 4 9 5 3 8 3 , 3 6 2 3 8 3 , 4 3 7 3 8 3 , 3 9 3 3 8 2 , 7 6 3 3 8 3 , 0 4 9 3 Held under repurchase agreements 1 , 9 8 3 4 , 4 5 6 5 , 6 7 7 5 , 4 1 8 3 , 0 8 6 7 , 2 8 2 7 , 6 1 1 6 , 4 2 2 1 , 7 9 4 6 , 0 7 8
Federal agency obligations 4 Bought outright 2 , 4 4 2 2 , 4 0 1 2 , 3 5 9 2 , 3 8 8 2 , 3 8 8 2 , 3 8 8 2 , 3 8 3 2 ,351 2 , 3 5 1 2 , 3 3 6 5 Held under repurchase agreements 5 0 3 5 2 4 4 4 9 2 5 6 7 4 7 6 2 9 6 1 ,010 4 1 4 4 0 7 6 Acceptances 0 0 0 0 0 0 0 0 0 0
Loans to depository institutions 7 Adjustment credit 2 4 185 9 2 5 8 6 2 2 2 6 9 3 0 5 16 261 8 Seasonal credit 106 1 9 0 2 8 5 193 2 2 7 2 5 4 2 6 3 2 8 3 2 9 9 3 0 8 9 Extended credit 0 0 0 0 0 0 0 0 0 0
10 Float 5 1 7 380R 4 6 8 3 1 2 718R 127 6 7 0 3 8 5 4 5 0 2 6 6 11 Other Federal Reserve assets 3 1 , 0 5 4 30 ,775 R 3 1 , 3 1 4 3 0 , 8 6 1 30 ,956 R 3 1 , 2 9 3 3 0 , 9 5 8 3 1 , 3 4 9 3 1 , 1 8 8 3 1 , 8 5 6
12 Gold stock 11 ,051 11 ,051 1 1 , 0 5 0 11 ,051 1 1 , 0 5 0 1 1 , 0 5 0 1 1 , 0 5 0 1 1 , 0 5 0 1 1 , 0 5 0 1 1 , 0 5 0 13 Special drawing rights certificate account 1 0 , 1 6 8 10 ,168 1 0 , 1 6 8 1 0 , 1 6 8 1 0 , 1 6 8 1 0 , 1 6 8 1 0 , 1 6 8 1 0 , 1 6 8 1 0 , 1 6 8 1 0 , 1 6 8 14 Treasury currency outstanding 24,415 R 24,482 R 2 4 , 5 4 3 24 ,483 R 24 ,497 R 2 4 , 5 1 1 2 4 , 5 2 5 2 4 , 5 3 9 2 4 , 5 5 3 2 4 , 5 6 7
ABSORBING RESERVE FUNDS
15 Currency in circulation 420 ,050 R 423 ,445 R 4 2 8 , 3 8 1 4 2 3 , 2 1 7 R 4 2 3 , 3 0 3 R 4 2 6 , 1 8 3 4 3 0 , 1 0 9 4 2 8 , 9 5 8 4 2 7 , 4 2 2 4 2 7 , 1 6 4 16 Treasury cash holdings 2 7 6 2 8 1 2 6 9 2 8 5 2 7 9 2 8 0 2 7 8 2 6 8 2 6 7 2 5 8
Deposits, other than reserve balances, with Federal Reserve Banks
17 Treasury 5 , 7 1 4 6 , 1 6 2 5 , 3 0 4 6 , 0 2 2 7 , 1 8 4 6 , 4 1 7 5 , 2 7 7 5 , 4 6 4 5 , 2 6 0 5 , 3 8 4 18 Foreign 196 177 1 8 0 173 171 188 2 0 7 176 173 164 19 Service-related balances and adjustments 6 , 1 8 8 6 , 1 6 1 6 , 2 2 8 6 , 1 1 7 6 , 1 8 4 6 , 1 7 2 6 , 2 7 0 6 , 0 0 2 6 , 3 8 0 6 , 2 8 1 2 0 Other 3 6 2 3 3 0 3 1 8 3 3 6 3 3 2 3 3 3 3 1 4 3 4 2 3 1 3 2 9 5 21 Other Federal Reserve liabilities and capital 12 ,885 1 3 , 2 2 4 13 ,391 1 3 , 3 0 4 1 3 , 2 5 2 13 ,351 1 3 , 2 2 8 1 3 , 2 5 2 1 3 , 2 4 2 1 3 , 8 8 5 2 2 Reserve balances with Federal Reserve Banks3 . . . 16 ,771 16,832R 15 ,501 19 , 117 15,649R 1 7 , 8 4 2 1 5 , 5 0 7 1 6 , 4 9 4 1 1 , 9 8 8 1 6 , 9 1 4
End-of-month figures Wednesday figures
May June July June 19 June 26 July 3 July 10 July 17 July 24 July 31
SUPPLYING RESERVE FUNDS
1 Reserve Bank credit outstanding 4 2 0 , 9 5 9 4 2 5 , 2 9 2 R 4 3 6 , 3 2 6 4 3 3 , 3 3 3 4 2 1 , 3 9 2 R 4 2 6 , 6 2 7 4 2 6 , 0 6 6 4 3 2 , 2 7 5 4 1 9 , 9 4 6 4 3 6 , 3 2 6 U.S. government securities2
2 Bought outright—System account 3 8 1 , 3 4 6 3 8 3 , 9 1 4 3 8 2 , 3 7 8 3 8 2 , 7 6 1 3 8 2 , 5 2 2 3 8 2 , 7 0 2 3 8 3 , 7 8 5 3 8 3 , 3 6 4 3 8 2 , 9 6 7 3 8 2 , 3 7 8 3 Held under repurchase agreements 5 , 7 0 4 7 , 0 8 6 1 5 , 4 5 8 12 ,711 4 , 2 2 6 9 , 0 1 2 8 , 7 9 8 1 2 , 7 0 0 2 , 0 8 0 1 5 , 4 5 8
Federal agency obligations 4 Bought outright 2 , 4 2 8 2 , 3 8 8 2 , 3 3 6 2 , 3 8 8 2 , 3 8 8 2 , 3 8 8 2 , 3 5 1 2 , 3 5 1 2 , 3 5 1 2 , 3 3 6 5 Held under repurchase agreements 1 , 3 5 0 0 2 8 2 195 0 4 3 3 4 0 1 , 6 9 0 7 0 0 2 8 2 6 Acceptances 0 0 0 0 0 0 0 0 0 0
Loans to depository institutions 7 Adjustment credit 8 3 8 8 1 ,423 3 , 6 4 4 17 10 4 9 17 1 ,423 8 Seasonal credit 148 2 4 8 2 9 5 2 0 7 2 4 1 2 5 5 2 7 2 2 9 5 3 1 0 2 9 5 9 Extended credit 0 0 0 0 0 0 0 0 0 0
10 Float - 3 4 2 - 1 9 0 R 5 0 4 9 2 907R 6 6 4 - 4 5 0 18 197 5 0 4 11 Other Federal Reserve assets 3 0 , 3 1 8 31 ,458 R 3 3 , 6 4 9 3 1 , 3 3 4 31 ,091 R 3 1 , 1 6 2 3 1 , 2 6 5 3 1 , 8 4 8 3 1 , 3 2 4 3 3 , 6 4 9
12 Gold stock 11 ,051 1 1 , 0 5 0 1 1 , 0 5 0 11 ,051 1 1 , 0 5 0 1 1 , 0 5 0 1 1 , 0 5 0 1 1 , 0 5 0 1 1 , 0 5 0 1 1 , 0 5 0 13 Special drawing rights certificate account 1 0 , 1 6 8 10 ,168 1 0 , 1 6 8 10 ,168 1 0 , 1 6 8 1 0 , 1 6 8 1 0 , 1 6 8 1 0 , 1 6 8 1 0 , 1 6 8 1 0 , 1 6 8 14 Treasury currency outstanding 24,455 R 2 4 , 5 l l r 2 4 , 5 6 7 24 ,483 R 24 ,497 R 2 4 , 5 1 1 2 4 , 5 2 5 2 4 , 5 3 9 2 4 , 5 5 3 2 4 , 5 6 7
ABSORBING RESERVE FUNDS
15 Currency in circulation 4 2 2 , 4 1 l r 4 2 4 , 7 8 0 R 4 2 8 , 7 1 5 4 2 3 , 8 3 0 R 4 2 4 , 8 3 0 R 4 2 9 , 5 3 7 4 3 0 , 7 0 1 4 2 8 , 9 3 5 4 2 7 , 6 9 3 4 2 8 , 7 1 5 16 Treasury cash holdings 2 6 5 2 8 0 2 6 1 2 7 9 2 8 0 2 8 2 2 6 8 2 6 9 2 5 7 2 6 1
Deposits, other than reserve balances, with Federal Reserve Banks
17 Treasury 3 , 7 5 7 7 , 7 0 1 6 , 8 3 6 6 , 1 4 2 7 , 2 9 0 3 , 7 0 3 5 , 6 6 8 5 , 3 2 3 5 , 2 1 1 6 , 8 3 6 18 Foreign 1 6 0 183 166 167 163 171 190 167 167 166 19 Service-related balances and adjustments 6 , 2 3 7 6 , 1 7 2 6 , 2 8 1 6 , 1 1 7 6 , 1 8 4 6 , 1 7 2 6 , 2 7 0 6 , 0 0 2 6 , 3 8 0 6 , 2 8 1 2 0 Other 3 0 0 3 2 6 2 7 8 3 2 6 3 2 6 3 1 5 3 4 7 3 6 3 2 9 1 2 7 8 21 Other Federal Reserve liabilities and capital 1 3 , 1 4 8 1 3 , 3 7 4 1 4 , 8 1 7 13,141 1 3 , 0 2 4 1 3 , 0 4 9 1 3 , 0 9 4 1 3 , 0 6 7 1 3 , 1 9 4 14 , 817 2 2 Reserve balances with Federal Reserve Banks3 2 0 , 3 5 7 18,205R 2 4 , 7 5 6 2 9 , 0 3 3 15,012R 19 , 127 15 ,271 2 3 , 9 0 7 1 2 , 5 2 4 2 4 , 7 5 6
Average of daily figures for week ending on date indicated
1. Amounts of cash held as reserves are shown in table 1.12, line 2. 2. Includes securities loaned—fully guaranteed by U.S. government securities pledged
with Federal Reserve Banks—and excludes securities sold and scheduled to be bought back under matched sale-purchase transactions.
3. Excludes required clearing balances and adjustments to compensate for float.
Digitized for FRASER http://fraser.stlouisfed.org/ Federal Reserve Bank of St. Louis

A6 Domestic Nonfinancial Statistics • October 1996
1.12 RESERVES AND BORROWINGS Depository Institutions1
Millions of dollars
Prorated monthly averages of biweekly averages
Reserve classification 1993 1994 1995 1996 Reserve classification
Dec. Dec. Dec. Jan. Feb. Mar. Apr. May June July
1 Reserve balances with Reserve Banks2 29,374 24,658 20,440 17,763 16,792 18,426 19,181 16,753 16,590r 15,395 2 Total vault cash3 36,818 40,378 42,088 44,676 42,115 40,892 40,889 41,146 41,979 42,773 3 Applied vault cash4 33,484 36,682 37,460 39,170 36,957 36,458 36,688 36,382 37,095 37,451 4 Surplus vault cash5 3,334 3,696 4,628 5,506 5,158 4,435 4,201 4,764 4,883 5,322 5 Total reserves6 62,858 61,340 57,900 56,934 53,749 54,884 55,869 53,135 53,685r 52,846 6 Required reserves 61,795 60,172 56,622 55,449 52,898 53,747 54,750 52,275 52,535r 51,778 7 Excess reserve balances at Reserve Banks7 1,063 1,168 1,278 1,485 851 1,137 1,120 860 1,150r 1,068 8 Total borrowings at Reserve Banks8 82 209 257 38 35 21 91 127 386 368 9 Seasonal borrowings 31 100 40 7 7 10 34 105 192 284
10 Extended credit9 0 0 0 0 0 0 0 0 0 0
Biweekly averages of daily figures for two week periods ending on dates indicated
1996
Mar. 27 Apr. 10 Apr. 24 May 8 May 22 June 5 June 19 July 3 July 17 July 31
1 Reserve balances with Reserve Banks2 18,492 18,954 20,331 16,876 16,946 16,341 16,565 16,735r 16,049 14,453 2 Total vault cash3 40,362 40,903 40,398 42,013 40,823 40,879 42,824 41,403 42,347 43,492 3 Applied vault cash4 36,011 36,767 36,417 37,190 36,091 36,117 37,747 36,712 37,320 37,741 4 Surplus vault cash5 4,352 4,136 3,981 4,823 4,732 4,762 5,078 4,692 5,027 5,751 5 Total reserves6 54,502 55,721 56,748 54,065 53,037 52,458 54,311 53,447r 53,369 52,194 6 Required reserves 53,346 54,567 55,629 53,002 52,201 51,743 53,234 52,007r 52,543 50,965 7 Excess reserve balances at Reserve Banks7 1,156 1,154 1,119 1,063 836 715 1,078 l,439r 826 1,229 8 Total borrowings at Reserve Banks8 20 47 122 92 129 156 469 386 290 442 9 Seasonal borrowings 12 16 30 71 103 138 173 241 273 304
10 Extended credit9 0 0 0 0 0 0 0 0 0 0
1. Data in this table also appear in the Board's H.3 (502) weekly statistical release. For ordering address, see inside front cover. Data are not break-adjusted or seasonally adjusted.
2. Excludes required clearing balances and adjustments to compensate for float and includes other off-balance-sheet "as-of' adjustments.
3. Total "lagged" vault cash held by depository institutions subject to reserve requirements. Dates refer to the maintenance periods during which the vault cash may be used to satisfy reserve requirements. The maintenance period for weekly reporters ends sixteen days after the lagged computation period during which the vault cash is held. Before Nov. 25, 1992, the maintenance period ended thirty days after the lagged computation period.
4. All vault cash held during the lagged computation period by "bound" institutions (that is, those whose required reserves exceed their vault cash) plus the amount of vault cash applied during the maintenance period by "nonbound" institutions (that is, those whose vault cash exceeds their required reserves) to satisfy current reserve requirements.
5. Total vault cash (line 2) less applied vault cash (line 3). 6. Reserve balances with Federal Reserve Banks (line 1) plus applied vault cash
(line 3). 7. Total reserves (line 5) less required reserves (line 6). 8. Also includes adjustment credit. 9. Consists of borrowing at the discount window under the terms and conditions estab-
lished for the extended credit program to help depository institutions deal with sustained liquidity pressures. Because there is not the same need to repay such borrowing promptly as with traditional short-term adjustment credit, the money market effect of extended credit is similar to that of nonborrowed reserves.
1.13 SELECTED BORROWINGS IN IMMEDIATELY AVAILABLE FUNDS Large Banks1
Millions of dollars, averages of daily figures
Source and maturity 1996, week ending Monday
Source and maturity June 3 June 10 June 17 June 24 July 1 July 8 July 15 July 22 July 29
Federal funds purchased, repurchase agreements, and other selected borrowings
From commercial banks in the United States 1 For one day or under continuing contract 85,577 82,179 80,092 73,504r 77,701 81,116 75,971 75,271 72,877 2 For all other maturities 18,749r 17,752' 18,129r 18,182r 17,457 16,080 16,780 15,435 14,984
From other depository institutions, foreign banks and official institutions, and U.S. government agencies
3 For one day or under continuing contract 21,158 19,602 17,394 24,776 18,186 22,846 22,183 22,679 18,460 4 For all other maturities 22,330r 21,178r 21,307r 22,056r 21,159 20,122 21,500 20,195 20,210
Repurchase agreements on U.S. government and federal agency securities
Brokers and nonbank dealers in securities 5 For one day or under continuing contract 21,158r 18,891r 17,804r 17,786r 15,609 17,296 14,058 11,804 12,467 6 For all other maturities 41,306r 41,082r 40,444r 39,570r 37,087 38,104 39,958 39,674 41,571
All other customers 7 For one day or under continuing contract 39,439 38,153 37,560 35,588 34,254 36,086 37,174 37,226 37,015 8 For all other maturities 13,652 13,611 14,195 14,362 13,905 13,089 12,734 13,145 13,065
MEMO Federal funds loans and resale agreements in immediately
available funds in maturities of one day or under continuing contract
9 To commercial banks in the United States 68,874 68,559 70,490 66,112 72,735 70,774 64,529 64,835 66,286 10 To all other specified customers2 21,sir 25,847 27,762 24,775 22,878 25,514 25,023 22,049 21,470
1. Banks with assets of $4 billion or more as of Dec. 31, 1988. 2. Brokers and nonbank dealers in securities, other depository institutions, foreign banks Data in this table also appear in the Board's H.5 (507) weekly statistical release. For and official institutions, and U.S. government agencies,
ordering address, see inside front cover.
Digitized for FRASER http://fraser.stlouisfed.org/ Federal Reserve Bank of St. Louis

Policy Instruments A7
1.14 FEDERAL RESERVE BANK INTEREST RATES
Percent per year
Current and previous levels
Federal Reserve Bank
Adjustment credit1 Seasonal credit2 Extended credit3
Federal Reserve Bank On
8/30/96 Effective date Previous rate On 8/30/96 Effective date Previous rate On
8/30/96 Effective date Previous rate
Boston New York Philadelphia Cleveland Richmond Atlanta
Chicago St. Louis Minneapolis Kansas City Dallas San Francisco
5.00
5.00
2/1/96 1/31/96 1/31/96 1/31/96 2/1/96 1/31/96
2/1/96 2/5/96 1/31/96 2/1/96 1/31/96 1/31/96
5.25
5.25
5.30
5.30
8/29/96
8/29/96
5.35
5.35
5.80
5.80
8/29/96
8/29/96
5.85
5.85
Range of rates for adjustment credit in recent years4
Range (or F.R. Bank Effective date level)—All of Effectiv
F.R. Banks N.Y.
In effect Dec. 31, 1977 6 6 1981—Nov. 2
1978—Jan. 9 6-6.5 6.5 Dec. 4 20 6.5 6.5
May 11 6.5-7 7 1982—July 20 12 7 7 23
July 3 7-7.25 7.25 Aug. 2 10 7.25 7.25 3
Aug. 21 7.75 7.75 16 Sept. 22 8 8 27 Oct. 16 8-8.5 8.5 30
20 8.5 8.5 Oct. 12 Nov. 1 8.5-9.5 9.5 13
3 9.5 9.5 Nov. 22 26
1979—July 20 10 10 Dec. 14 Aug. 17 10-10.5 10.5 15
20 10.5 10.5 17 Sept. 19 10.5-11 11
21 11 11 1984—Apr. 9 Oct. 8 11-12 12 13
10 12 12 Nov. 21 26
1980—Feb. 15 12-13 13 Dec. 24 19 13 13
May 29 12-13 13 1985—May 20 30 12 12 24
June 13 11-12 11 16 11 11 1986—Mar. 7
July 28 10-11 10 10 29 10 10 Apr. 21
Sept 26 11 11 23. 11 11 Nov. 17 12 12 July 11 Dec. 5 12-13 13 Aug. 21
8 13 13 22 1981—May 5
8 13-14 14 1981—May 5
8 14 14 1987—Sept. 4 11
Range (or level)—All F.R. Banks
F.R. Bank of
N.Y.
Range (or level)—All F.R. Banks
13-14 13 12
11.5-12 11.5
11-11.5 11
10.5 10-10.5
10 9.5-10
9.5 9-9.5
9 8.5-9 8.5-9
8.5
8.5-9 9
8.5-9 8.5
7.5-8 7.5
7-7.5 7
6.5-7 6.5 6
5.5-6 5.5
5 . 5 - 6 6
13 13 12
11.5 11.5 11 11 10.5 10 10 9.5 9.5 9 9 9 8.5 8.5
9 9 8.5 8.5
7.5 7.5
7 7 6.5 6.5 6 5.5 5.5
6 6
1988—Aug. 9 11
1989—Feb. 24
27
1990—Dec. 19
1991—Feb. 1 4
Apr. 30 May 2 Sept. 13
1 7 Nov. 6
7 Dec. 20
24 1992—July 2
7
1994—May 17 1 8
Aug. 16 18
Nov. 15 17
1995—Feb. 1 9
1996—Jan. 31 Feb. 5
In effect Aug. 30, 1996
6-6.5 6.5 6.5 6.5
6.5-7 7 7 7
6.5 6.5
6-6.5 6 6 6
5.5-6 5.5 5.5 5.5
5-5.5 5 5 5
4.5-5 4.5 4.5 4.5
3.5^1.5 3.5 3.5 3.5
3-3.5 3 3 3
3-3.5 3.5 3.5 3.5
3.5-4 4 4 4
4-4.75 4.75 4.75 4.75
4.75-5.25 5.25 5.25 5.25
5.00-5.25 5.00 5.00 5.00
5.00 5.00
1. Available on a short-term basis to help depository institutions meet temporary needs for funds that cannot be met through reasonable alternative sources. The highest rate established for loans to depository institutions may be charged on adjustment credit loans of unusual size that result from a major operating problem at the borrower's facility.
2. Available to help relatively small depository institutions meet regular seasonal needs for funds that arise from a clear pattern of intrayearly movements in their deposits and loans and that cannot be met through special industry lenders. The discount rate on seasonal credit takes into account rates charged by market sources of funds and ordinarily is reestablished on the first business day of each two-week reserve maintenance period; however, it is never less than the discount rate applicable to adjustment credit.
3. May be made available to depository institutions when similar assistance is not reasonably available from other sources, including special industry lenders. Such credit may be provided when exceptional circumstances (including sustained deposit drains, impaired access to money market funds, or sudden deterioration in loan repayment performance) or practices involve only a particular institution, or to meet the needs of institutions experiencing difficulties adjusting to changing market conditions over a longer period (particularly at times of deposit disintermediation). The discount rate applicable to adjustment credit ordinarily is charged on extended-credit loans outstanding less than thirty days; however, at the discretion
of the Federal Reserve Bank, this time period may be shortened. Beyond this initial period, a flexible rate somewhat above rates charged on market sources of funds is charged. The rate ordinarily is reestablished on the first business day of each two-week reserve maintenance period, but it is never less than the discount rate applicable to adjustment credit plus 50 basis points.
4. For earlier data, see the following publications of the Board of Governors: Banking and Monetary Statistics, 1914-1941, and 1941-1970; and the Annual Statistical Digest, 1970-1979.
In 1980 and 1981, the Federal Reserve applied a surcharge to short-term adjustment-credit borrowings by institutions with deposits of $500 million or more that had borrowed in successive weeks or in more than four weeks in a calendar quarter. A 3 percent surcharge was in effect from Mar. 17, 1980, through May 7, 1980. A surcharge of 2 percent was reimposed on Nov. 17, 1980; the surcharge was subsequently raised to 3 percent on Dec. 5, 1980, and to 4 percent on May 5, 1981. The surcharge was reduced to 3 percent effective Sept. 22, 1981, and to 2 percent effective Oct. 12, 1981. As of Oct. 1, 1981, the formula for applying the surcharge was changed from a calendar quarter to a moving thirteen-week period. The surcharge was eliminated on Nov. 17, 1981.
Digitized for FRASER http://fraser.stlouisfed.org/ Federal Reserve Bank of St. Louis

A8 Domestic Nonfinancial Statistics • October 1996
1.15 RESERVE REQUIREMENTS OF DEPOSITORY INSTITUTIONS1
Type of deposit
Net transaction accounts 1 $0 million—$52.0 million3 . 2 More than $52.0 million4 .
3 Nonpersonal time deposits'
4 Eurocurrency liabilities6. . .
12/19/95 12/19/95
12/27/90
12/27/90
1. Required reserves must be held in the form of deposits with Federal Reserve Banks or vault cash. Nonmember institutions may maintain reserve balances with a Federal Reserve Bank indirectly, on a pass-through basis, with certain approved institutions. For previous reserve requirements, see earlier editions of the Annual Report or the Federal Reserve Bulletin. Under the Monetary Control Act of 1980, depository institutions include commercial banks, mutual savings banks, savings and loan associations, credit unions, agencies and branches of foreign banks, and Edge Act corporations.
2. Transaction accounts include all deposits against which the account holder is permitted to make withdrawals by negotiable or transferable instruments, payment orders of with-drawal, or telephone or preauthorized transfers for the purpose of making payments to third persons or others. However, accounts subject to the rules that permit no more than six preauthorized, automatic, or other transfers per month (of which no more than three may be by check, draft, debit card, or similar order payable directly to third parties) are savings deposits, not transaction accounts.
3. The Monetary Control Act of 1980 requires that the amount of transaction accounts against which the 3 percent reserve requirement applies be modified annually by 80 percent of the percentage change in transaction accounts held by all depository institutions, determined as of June 30 of each year. Effective Dec. 19, 1995, the amount was decreased from $54.0 million to $52.0 million.
Under the Garn-St Germain Depository Institutions Act of 1982, the Board adjusts the amount of reservable liabilities subject to a zero percent reserve requirement each year for the
succeeding calendar year by 80 percent of the percentage increase in the total reservable liabilities of all depository institutions, measured on an annual basis as of June 30. No corresponding adjustment is made in the event of a decrease. The exemption applies only to accounts that would be subject to a 3 percent reserve requirement. Effective Dec. 19, 1995, the exemption was raised from $4.2 million to $4.3 million.
4. The reserve requirement was reduced from 12 percent to 10 percent on Apr. 2, 1992, for institutions that report weekly, and on Apr. 16, 1992, for institutions that report quarterly.
5. For institutions that report weekly, the reserve requirement on nonpersonal time deposits with an original maturity of less than 1 '/> years was reduced from 3 percent to 1 [/i percent for the maintenance period that began Dec. 13, 1990, and to zero for the maintenance period that began Dec. 27, 1990. For institutions that report quarterly, the reserve requirement on nonpersonal time deposits with an original maturity of less than 11/2 years was reduced from 3 percent to zero on Jan. 17, 1991.
The reserve requirement on nonpersonal time deposits with an original maturity of 1 xfi years or more has been zero since Oct. 6, 1983.
6. The reserve requirement on Eurocurrency liabilities was reduced from 3 percent to zero in the same manner and on the same dates as the reserve requirement on nonpersonal time deposits with an original maturity of less than 1 !/> years (see note 5).
Digitized for FRASER http://fraser.stlouisfed.org/ Federal Reserve Bank of St. Louis

Policy Instruments A9
1.17 FEDERAL RESERVE OPEN MARKET TRANSACTIONS1
Millions of dollars
Type of transaction and maturity 1993 1994 1995
1995 1996 Type of transaction
and maturity 1993 1994 1995 Dec. Jan. Feb. Mar. Apr. May June
U .S . TREASURY SECURITIES
Outright transactions (excluding matched transactions)
Treasury bills 0 3,311 1 Gross purchases 17,717 17,484 10,932 0 0 0 0 88 0 3,311
2 Gross sales 0 0 0 0 0 0 0 0 0 0 3 Exchanges 332,229 376,277 398,487 31,535 31,476 39,332 30,556 32,218 40,467 31,726 4 Redemptions 0 0 900 0 0 0 0 0 0 0
Others within one year 0 5 Gross purchases 1,223 1,238 390 390 0 0 0 35 0 0
6 Gross sales 0 0 0 0 0 0 0 0 0 0 7 Maturity shifts 31,368 0 0 0 2,048 2,746 0 3,511 5,107 0 8 Exchanges -36,582 -21,444 0 0 -3,287 -7,575 0 -4,824 -5,448 0 9 Redemptions 0 0 0 0 1,228 0 0 787 0 0
One to five years 0 0 10 Gross purchases 10,350 9,168 4,966 2,317 0 0 0 1,899 0 0
11 Gross sales 0 0 0 0 0 0 0 0 0 0 12 Maturity shifts -27,140 -6,004 0 0 -2,048 -1,908 0 -3,511 -4,049 0 13 Exchanges 0 17,801 0 0 3,287 5,175 0 4,824 3,748 0
Five to ten years 479 0 0 14 Gross purchases 4,168 3,818 1,239 0 0 0 0 479 0 0
15 Gross sales 0 0 0 0 0 0 0 0 0 0 16 Maturity shifts 0 -3,145 0 0 0 - 8 1 8 0 0 -1,058 0 17 Exchanges 0 2,903 0 0 0 1,500 0 0 1,700 0
More than ten years 0 18 Gross purchases 3,457 3,606 3,122 1,884 0 0 0 1,065 0 0
19 Gross sales 0 0 0 0 0 0 0 0 0 0 20 Maturity shifts 0 - 9 1 8 0 0 0 - 2 0 0 0 0 0 21 Exchanges 0 775 0 0 0 900 0 0 0 0
All maturities 22 Gross purchases 36,915 35,314 20,649 4,591 0 0 0 3,566 0 3,311 23 Gross sales 0 0 0 0 0 0 0 0 0 0 24 Redemptions 767 2,337 2,376 0 1,228 0 0 787 0 0
Matched transactions 25 Gross purchases 1,475,941 1,700,836 2,197,736 227,858 260,425 274,290 251,623 253,482 259,135 248,534 26 Gross sales 1,475,085 1,701,309 2,202,030 228,071 259,186 275,979 251,086 251,510 259,595 249,277
Repurchase agreements 30,688 43,048 27 Gross purchases 475,447 309,276 331,694 34,325 16,040 6,230 31,602 48,869 30,688 43,048
28 Gross sales 470,723 311,898 328,497 28,546 28,802 6,230 27,706 50,345 27,404r 41,666
29 Net change in U.S. Treasury securities 41,729 29,882 17,175 10,157 -12,751 -1,689 4,433 3,274 2,824r 3,950
FEDERAL AGENCY OBLIGATIONS
Outright transactions 0 0 0 30 Gross purchases 0 0 0 0 0 0 0 0 0 0
31 Gross sales 0 0 0 0 0 0 0 0 0 0 32 Redemptions 774 1,002 1,303 58 0 0 108 82 16 40
Repurchase agreements 2,372 5,122' 5,138 33 Gross purchases 35,063 52,696 36,851 2.888 9,793 765 5,640 2,372 5,122' 5,138
34 Gross sales 34,669 52,696 36,776 1,788 10,893 765 4,640 3,372 4,372r 6,488
35 Net change in federal agency obligations - 3 8 0 -1,002 -1 ,228 1,042 -1,100 0 892 -1,082 l,334r -1,390
36 Total net change in System Open Market Account.. . 41,348 28,880 15,948 11,199 -13,851 -1,689 5,325 2,192 4,158r 2,560
1. Sales, redemptions, and negative figures reduce holdings of the System Open Market Account; all other figures increase such holdings.
Digitized for FRASER http://fraser.stlouisfed.org/ Federal Reserve Bank of St. Louis

A10 Domestic Nonfinancial Statistics • October 1996
1.18 FEDERAL RESERVE BANKS Condition and Federal Reserve Note Statements'
Millions of dollars
Wednesday End of month
Account 1 9 9 6 1 9 9 6
July 3 July 10 July 17 July 24 July 31 May 31 June 30 July 31
Consolidated condition statement
ASSETS
1 Gold certificate account 1 1 , 0 5 0 11 ,050 1 1 , 0 5 0 1 1 , 0 5 0 1 1 , 0 5 0 11 ,051 1 1 , 0 5 0 1 1 , 0 5 0 2 Special drawing rights certificate account 1 0 , 1 6 8 10 ,168 10 ,168 1 0 , 1 6 8 1 0 , 1 6 8 1 0 , 1 6 8 1 0 , 1 6 8 1 0 , 1 6 8 3 Coin 5 2 3 4 9 5 4 9 4 5 0 8 521 552 552 521
Loans 4 To depository institutions 265 276 3 0 4 3 2 7 1 ,718 155 6 3 6 1,718 5 Other 0 0 0 0 0 0 0 0 6 Acceptances held under repurchase agreements 0 0 0 0 0 0 0 0
Federal agency obligations 2 , 3 8 8 2 , 3 3 6 7 Bought outright 2 , 3 8 8 2 ,351 2 , 3 5 1 2 , 3 5 1 2 , 3 3 6 2 , 4 2 8 2 , 3 8 8 2 , 3 3 6
8 Held under repurchase agreements 433 40 1,690 700 282 1,350 0 282
9 Total U.S. Treasury securities 3 9 1 , 7 1 4 3 9 2 , 5 8 3 3 9 6 , 0 6 4 3 8 5 , 0 4 7 3 9 7 , 8 3 6 3 8 7 , 0 5 0 3 9 1 , 0 0 0 3 9 7 , 8 3 6
10 Bought outright2 382,702 383,785 383,364 382,967 382,378 381,346 383,914 382,378 11 Bills 186,158 187,241 186,819 186,422 185,833 184,801 187,370 185,833 12 Notes 150,102 150,102 150,102 150,102 150,102 150,102 150,102 150,102 13 Bonds 46,443 46,443 46,443 46,443 46,443 46,443 46,443 46,443 14 Held under repurchase agreements 9,012 8,798 12,700 2,080 15,458 5,704 7,086 15,458
15 Total loans and securities 3 9 4 , 8 0 1 3 9 5 , 2 5 1 4 0 0 , 4 1 0 3 8 8 , 4 2 5 4 0 2 , 1 7 3 3 9 0 , 9 8 3 3 9 4 , 0 2 5 4 0 2 , 1 7 3
16 Items in process of collection 7,106 5,938 6,567 5,830 6,143 4,007 4,152 6,143 17 Bank premises 1,182 1,184 1,190 1,191 1,190 1,171 1,182 1,190
Other assets 18 Denominated in foreign currencies3 19,556 19,564 19,573 19,581 20,183 19,561 19,554 20,183 19 All other4 10,436 10,682 11,203 10,598 12,349 9,538 10,726 12,349
20 Total assets 4 5 4 , 8 2 2 4 5 4 , 3 3 3 4 6 0 , 6 5 4 4 4 7 , 3 5 1 4 6 3 , 7 7 7 4 4 7 , 0 3 2 4 5 1 , 4 0 9 4 6 3 , 7 7 7
LIABILITIES
21 Federal Reserve notes 405,830 406,938 405,159 403,905 404,930 398,773 401,101 404,930
22 Total deposits 2 9 , 4 4 2 2 8 , 8 5 5 3 6 , 5 0 1 2 4 , 8 8 6 3 8 , 3 3 2 3 0 , 9 0 1 3 2 , 8 0 4 3 8 , 3 3 2
23 Depository institutions 25,253 22,649 30,649 19,217 31,052 26,685 24,594 31,052 24 U.S. Treasury—General account 3,703 5,668 5,323 5,211 6,836 3,757 7,701 6,836 25 Foreign—Official accounts 171 190 167 167 166 160 183 166 26 Other 315 347 363 291 278 300 326 278
27 Deferred credit items 6,501 5,446 5,927 5,366 5,697 4,210 4,130 5,697 28 Other liabilities and accrued dividends5 4,416 4,364 4,323 4,182 5,156 4,542 4,464 5,156
29 Total liabilities 4 4 6 , 1 8 9 4 4 5 , 6 0 3 4 5 1 , 9 1 1 4 3 8 , 3 3 9 4 5 4 , 1 1 6 4 3 8 , 4 2 6 4 4 2 , 4 9 9 4 5 4 , 1 1 6
CAPITAL ACCOUNTS
30 Capital paid in 4,139 4,139 4,159 4,421 4,437 4,154 4,138 4,437 31 Surplus 3,966 3,966 3,966 3,966 3,966 3,960 3,966 3,966 32 Other capital accounts 528 624 618 625 1,257 492 806 1,257
33 Total liabilities and capital accounts 4 5 4 , 8 2 2 4 5 4 , 3 3 3 4 6 0 , 6 5 4 4 4 7 , 3 5 1 4 6 3 , 7 7 7 4 4 7 , 0 3 2 4 5 1 , 4 0 9 4 6 3 , 7 7 7
MEMO 34 Marketable U.S. Treasury securities held in custody for
559,611 foreign and international accounts 547,336 550,556 549,228 553,814 559,611 556,832 551,797 559,611
Federal Reserve note statement
35 Federal Reserve notes outstanding (issued to Banks) 518,722 518,712 519,731 520,444 521,387 514,098 519,234 521,387 36 LESS: Held by Federal Reserve Banks 112,892 111,773 114,573 116,539 116,457 115,325 118,133 116,457 37 Federal Reserve notes, net 405,830 406,938 405,159 403,905 404,930 398,773 401,101 404,930
Collateral held against notes, net 38 Gold certificate account 11,050 11,050 11,050 11,050 11,050 11,051 11,050 11,050 39 Special drawing rights certificate account 10,168 10,168 10,168 10,168 10,168 10,168 10,168 10,168 40 Other eligible assets 0 0 0 0 0 0 0 0 41 U.S. Treasury and agency securities 384,611 385,720 383,941 382,687 383,713 377,554 379,883 383,713
42 Total collateral 4 0 5 , 8 3 0 4 0 6 , 9 3 8 4 0 5 , 1 5 9 4 0 3 , 9 0 5 4 0 4 , 9 3 0 3 9 8 , 7 7 3 4 0 1 , 1 0 1 4 0 4 , 9 3 0
1. Some of the data in this table also appear in the Board's H.4.1 (503) weekly statistical release. For ordering address, see inside front cover.
2. Includes securities loaned—fully guaranteed by U.S. Treasury securities pledged with Federal Reserve Banks—and excludes securities sold and scheduled to be bought back under matched sale-purchase transactions.
3. Valued monthly at market exchange rates. 4. Includes special investment account at the Federal Reserve Bank of Chicago in Treasury
bills maturing within ninety days. 5. Includes exchange-translation account reflecting the monthly revaluation at market
exchange rates of foreign exchange commitments.
Digitized for FRASER http://fraser.stlouisfed.org/ Federal Reserve Bank of St. Louis

Federal Reserve Banks A l l
1.19 FEDERAL RESERVE BANKS Millions of dollars
Maturity Distribution of Loan and Security Holding
Type of holding and maturity
Wednesday
July 3 July 10 July 17 July 24 July 31 May 31
1 Total loans
2 Within fifteen days1
3 Sixteen days to ninety days
4 Total U.S. Treasury securities...
5 Within fifteen days' 6 Sixteen days to ninety days 7 Ninety-one days to one year 8 One year to five years 9 Five years to ten years
10 More than ten years 11 Total federal agency obligations
12 Within fifteen days' 13 Sixteen days to ninety days 14 Ninety-one days to one year 15 One year to five years 16 Five years to ten years 17 More than ten years
61 204
3 9 1 , 7 1 4
17,925 93,246
116,132 92,749 32,941 38,721
2,821
470 730 645 485 467
25
52 224
3 9 2 , 5 8 3
23,270 88,725
116,177 92,749 32,941 38,721
2 , 3 9 1
55 715 655 475 467
25
282 23
3 9 6 , 0 6 4
27,773 87,508
116,650 91,751 33,662 38,721
4 , 0 4 1
659 555 475 467
25
301 26
3 8 5 , 0 4 7
17,531 91,086
112,295 91,751 33,662 38,721
3 , 0 5 1
871 709 505 475 467
25
1 , 7 1 8
1,555 1,163
3 9 7 , 8 3 6
28,057 86,783
118,032 92,581 33,662 38,721
2,618
438 722 492 475 467
25
75 80
3 8 1 , 3 4 6
2,926 98,950
116,114 91,694 32,941 38,721
2 , 4 2 8
372 473 575 512 472
25
231 18
3 8 3 , 9 1 4
4,410 99,558
116,591 91,694 32,941 38,721
2 , 3 8 8
307 495 610 485 467
25
1. Holdings under repurchase agreements are classified as maturing within fifteen days in NOTE. Total acceptances data have been deleted from this table because data are no longer accordance with maximum maturity of the agreements. available.
Digitized for FRASER http://fraser.stlouisfed.org/ Federal Reserve Bank of St. Louis

A12 Domestic Nonfinancial Statistics • October 1996
1.20 AGGREGATE RESERVES OF DEPOSITORY INSTITUTIONS AND MONETARY BASE1
Billions of dollars, averages of daily figures
1995 1996 Item 1992 1993 1994 1995 Item Dec. Dec. Dec. Dec.
Dec. Jan. Feb. Mar. Apr. May June July
ADJUSTED FOR Seasonally adjusted
CHANGES IN RESERVE REQUIREMENTS2
1 Total reserves3 54.37 60.52 59.36 56.36 56.36 55.61 54.85 55.73 55.18 54.23 54.1 l r 53.20 2 Nonborrowed reserves4 54.24 60.44 59.16 56.11 56.11 55.57 54.81 55.71 55.09 54.10 53.73 52.83 3 Nonborrowed reserves plus extended credit5 54.24 60.44 59.16 56.11 56.11 55.57 54.81 55.71 55.09 54.10 53.73 52.83 4 Required reserves 53.21 59.46 58.20 55.09 55.09 54.12 54.00 54.59 54.06 53.37 52.96 52.13 5 Monetary base6 351.24 386.88 418.72 435.01 435.01 435.18 433.67 436.87 436.64 437.01r 439.08r 441.85
Not seasonally adjusted
6 Total reserves7 56.06 62.37 61.13 58.02 58.02 56.95 53.80 54.97 56.00 53.29 53.87 53.06 7 Nonborrowed reserves 55.93 62.29 60.92 57.76 57.76 56.91 53.77 54.95 55.90 53.16 53.48r 52.69 8 Nonborrowed reserves plus extended credit5 55.93 62.29 60.92 57.76 57.76 56.91 53.77 54.95 55.90 53.16 53.48r 52.69 9 Required reserves8 54.90 61.31 59.96 56.74 56.74 55.47 52.95 53.84 54.88 52.43 52.72 51.99
10 Monetary base9 354.55 390.59 422.51 439.03 439.03 436.01 430.29 434.86 437.12 436.13 439.88r 443.19
NOT ADJUSTED FOR CHANGES IN RESERVE REQUIREMENTS10
11 Total reserves" 56.54 62.86 61.34 57.90 57.90 56.93 53.75 54.88 55.87 53.14 53.69 52.85 12 Nonborrowed reserves 56.42 62.78 61.13 57.64 57.64 56.90 53.72 54.86 55.78 53.01 53.30 52.48 13 Nonborrowed reserves plus extended credit5 56.42 62.78 61.13 57.64 57.64 56.90 53.72 54.86 55.78 53.01 53.30 52.48 14 Required reserves 55.39 61.80 60.17 56.62 56.62 55.45 52.90 53.75 54.75 52.28 52.54r 51.78 15 Monetary base12 360.90 397.62 427.25 444.45 444.45 441.96 436.26 440.77 442.96 442.17r 445.94r 449.26 16 Excess reserves13 1.16 1.06 1.17 1.28 1.28 1.49 .85 1.14 1.12 .86 1.15r 1.07 17 Borrowings from the Federal Reserve .12 .08 .21 .26 .26 .04 .04 .02 .09 .13 .39 .37
1. Latest monthly and biweekly figures are available from the Board's H.3 (502) weekly statistical release. Historical data starting in 1959 and estimates of the effect on required reserves of changes in reserve requirements are available from the Money and Reserves Projections Section, Division of Monetary Affairs, Board of Governors of the Federal Reserve System, Washington, DC 20551.
2. Figures reflect adjustments for discontinuities, or "breaks," associated with regulatory changes in reserve requirements. (See also table 1.10.)
3. Seasonally adjusted, break-adjusted total reserves equal seasonally adjusted, break-adjusted required reserves (line 4) plus excess reserves (line 16).
4. Seasonally adjusted, break-adjusted nonborrowed reserves equal seasonally adjusted, break-adjusted total reserves (line 1) less total borrowings of depository institutions from the Federal Reserve (line 17).
5. Extended credit consists of borrowing at the discount window under the terms and conditions established for the extended credit program to help depository institutions deal with sustained liquidity pressures. Because there is not the same need to repay such borrowing promptly as with traditional short-term adjustment credit, the money market effect of extended credit is similar to that of nonborrowed reserves.
6. The seasonally adjusted, break-adjusted monetary base consists of (1) seasonally adjusted, break-adjusted total reserves (line 1), plus (2) the seasonally adjusted currency component of the money stock, plus (3) (for all quarterly reporters on the "Report of Transaction Accounts, Other Deposits and Vault Cash" and for all those weekly reporters whose vault cash exceeds their required reserves) the seasonally adjusted, break-adjusted difference between current vault cash and the amount applied to satisfy current reserve requirements.
7. Break-adjusted total reserves equal break-adjusted required reserves (line 9) plus excess reserves (line 16).
8. To adjust required reserves for discontinuities that are due to regulatory changes in reserve requirements, a multiplicative procedure is used to estimate what required reserves would have been in past periods had current reserve requirements been in effect. Break-adjusted required reserves include required reserves against transactions deposits and nonper-sonal time and savings deposits (but not reservable nondeposit liabilities).
9. The break-adjusted monetary base equals (1) break-adjusted total reserves (line 6), plus (2) the (unadjusted) currency component of the money stock, plus (3) (for all quarterly reporters on the "Report of Transaction Accounts, Other Deposits and Vault Cash" and for all those weekly reporters whose vault cash exceeds their required reserves) the break-adjusted difference between current vault cash and the amount applied to satisfy current reserve requirements.
10. Reflects actual reserve requirements, including those on nondeposit liabilities, with no adjustments to eliminate the effects of discontinuities associated with regulatory changes in reserve requirements.
11. Reserve balances with Federal Reserve Banks plus vault cash used to satisfy reserve requirements.
12. The monetary base, not break-adjusted and not seasonally adjusted, consists of (1) total reserves (line 11), plus (2) required clearing balances and adjustments to compensate for float at Federal Reserve Banks, plus (3) the currency component of the money stock, plus (4) (for all quarterly reporters on the "Report of Transaction Accounts, Other Deposits and Vault Cash" and for all those weekly reporters whose vault cash exceeds their required reserves) the difference between current vault cash and the amount applied to satisfy current reserve requirements. Since the introduction of contemporaneous reserve requirements in February 1984, currency and vault cash figures have been measured over the computation periods ending on Mondays.
13. Unadjusted total reserves (line 11) less unadjusted required reserves (line 14).
Digitized for FRASER http://fraser.stlouisfed.org/ Federal Reserve Bank of St. Louis

Monetary and Credit Aggregates A13
1.21 MONEY STOCK, LIQUID ASSETS, AND DEBT MEASURES1
Billions of dollars, averages of daily figures
1996r
Item 1992 1993 1994 1995 Item Dec. Dec. Dec. Dec. Apr. May June July
Seasonally adjusted
Measures2
1 Ml 1,024.4 1,128.6 1,148.7 1,124.9 1,123.6 1,117.2 1,116.7 1,108.5 2 M2 3,438.7 3,494.1 3,509.4 3,662.6 3,735.9 3,730.7 3,747.8 3,755.0 3 M3 4,187.3 4,249.6 4,319.7 4,576.0 4,693.4 4,705.1 4,723.5 4,738.3 4 L 5,075.8 5,164.5 5,303.7 5,685.5 5,813.0 5,812.7 5,844.2 n.a. 5 Debt 11,880.5 12,517.4 13,159.3 13,894.8 14,132.9 14,177.0 14,222.4 n.a.
Ml components 6 Currency3 292.9 322.4 . 354.9 373.2 376.0 377.1 379.4 382.6 7 Travelers checks4 8.1 7.9 8.5 8.9 8.9 8.7 8.6 8.5 8 Demand deposits5 339.1 384.3 382.4 389.8 406.3 409.6 413.6 410.5 9 Other checkable deposits6 384.2 414.0 402.9 353.0 332.4 321.8 315.0 306.9
Nontransaction components 10 In M27 2,414.3 2,365.4 2,360.7 2,537.7 2,612.3 2,613.5 2,631.2 2,646.5 11 In M3 only8 748.6 755.6 810.3 913.4 957.5 974.4 975.6 983.3
Commercial banks 12 Savings deposits, including MMDAs 754.1 785.0 751.9 775.0 826.9 829.7 838.2 845.8 13 Small time deposits9 509.3 470.4 505.4 578.5 576.4 575.4 576.0 578.7 14 Large time deposits10' " 286.6 272.3 298.7 342.4 356.6 362.6 368.2 375.9
Thrift institutions 15 Savings deposits, including MMDAs 433.0 433.8 397.0 359.5 366.3 367.9 368.8 368.8 16 Small time deposits9 361.9 317.6 318.2 359.6 354.0 353.2 352.2 351.3 17 Large time deposits10 67.1 61.5 64.8 75.0 75.6 75.0 75.4 76.2
Money market mutual funds 18 Retail 356.0 358.7 388.1 465.1 488.7 487.4 496.0 501.8 19 Institution-only 199.8 197.9 183.7 227.2 245.6 243.5 249.4 252.9
Repurchase agreements and Eurodollars 20 Repurchase agreements12 128.1 157.5 180.8 177.6 182.9 195.1 183.6 180.8 21 Eurodollars12 66.9 66.3 82.3 91.2 96.8 98.2 99.1 97.5
Debt components 22 Federal debt 3,068.6 3,328.3 3,497.6 3,644.6 3,707.0 3,712.6 3,720.2 n.a. 23 Nonfederal debt 8,812.0 9,189.1 9,661.7 10,250.2 10,425.9 10,464.4 10,502.1 n.a.
Not seasonally adjusted
Measures2
24 Ml 1,046.0 1,153.7 1,174.2 1,150.7 1,129.9 1,104.0 1,112.8 1,108.5 25 M2 3,455.1 3,514.1 3,529.8 3,682.3 3,748.8 3,716.1 3,746.2 3,761.9 26 M3 4,205.3 4,271.3 4,341.5 4,597.1 4,698.2 4,690.0 4,720.7 4,740.4 27 L 5,103.1 5,194.2 5,333.2 5,715.0 5,818.6 5,793.5 5,835.3 n.a. 28 Debt 11,881.5 12,509.6 13,150.2 13,878.0 14,060.2 14,070.7 14,138.7 n.a.
Ml components 29 Currency3 295.0 324.8 357.5 376.1 375.8 377.5 380.5 383.8 30 Travelers checks4 7.8 7.6 8.1 8.5 8.6 8.6 8.9 9.1 31 Demand deposits5 354.4 401.8 400.1 407.9 406.0 399.5 409.8 411.1 32 Other checkable deposits6 388.9 419.4 408.4 358.1 339.4 318.3 313.6 304.5
Nontransaction components 33 In M27 2,409.1 2,360.4 2,355.6 2,531.5 2,618.9 2,612.1 2,633.4 2,653.4 34 In M3 only8 750.2 757.1 811.7 914.8 949.4 973.8 974.5 978.5
Commercial banks 35 Savings deposits, including MMDAs 752.9 784.3 751.6 775.0 825.9 827.7 839.9 848.3 36 Small time deposits9 507.8 468.2 502.5 574.5 578.4 577.5 578.1 581.2 37 Large time deposits10, 11 286.2 272.1 298.5 342.3 353.8 364.9 369.0 374.2
Thrift institutions 38 Savings deposits, including MMDAs 432.4 433.4 396.9 359.5 365.9 367.0 369.5 369.9 39 Small time deposits9 360.9 316.1 316.4 357.1 355.2 354.4 353.4 352.7 40 Large time deposits10 67.0 61.5 64.8 75.0 75.0 75.5 75.5 75.8
Money market mutual funds 41 Retail 355.1 358.3 388.2 465.4 493.5 485.5 492.5 501.4 42 Institution-only 201.1 199.4 185.5 229.4 242.8 241.1 244.5 250.2
Repurchase agreements and Eurodollars 43 Repurchase agreements'2 127.2 156.6 179.6 176.1 182.3 195.4 187.2 181.4 44 Eurodollars12 68.7 67.6 83.4 92.0r 95.5 96.9 98.3 96.9
Debt components 45 Federal debt 3,069.8 3,329.5 3,499.0 3,645.9 3,699.5 3,692.0 3,698.0 n.a. 46 Nonfederal debt 8,811.7 9,180.1 9,651.2 10,232.1 10,360.7 10,378.7 10,440.6 n.a.
Footnotes appear on following page.
Digitized for FRASER http://fraser.stlouisfed.org/ Federal Reserve Bank of St. Louis

A14 Domestic Nonfinancial Statistics • October 1996
NOTES TO TABLE 1.21 1. Latest monthly and weekly figures are available from the Board's H.6 (508) weekly
statistical release. Historical data starting in 1959 are available from the Money and Reserves Projections Section, Division of Monetary Atfairs, Board of Governors of the Federal Reserve System, Washington, DC 20551.
2. Composition of the money stock measures and debt is as follows: Ml: (1) currency outside the U.S. Treasury, Federal Reserve Banks, and the vaults of
depository institutions, (2) travelers checks of nonbank issuers, (3) demand deposits at all commercial banks other than those owed to depository institutions, the U.S. government, and foreign banks and official institutions, less cash items in the process of collection and Federal Reserve float, and (4) other checkable deposits (OCDs), consisting of negotiable order of withdrawal (NOW) and automatic transfer service (ATS) accounts at depository institutions, credit union share draft accounts, and demand deposits at thrift institutions. Seasonally adjusted Ml is computed by summing currency, travelers checks, demand deposits, and OCDs, each seasonally adjusted separately.
M2: Ml plus (1) savings deposits (including MMDAs), (2) small-denomination time deposits (time deposits—including retail RPs—in amounts of less than $100,000), and (3) balances in retail money market mutual funds (money funds with minimum initial invest-ments of less than $50,000). Excludes individual retirement accounts (IRAs) and Keogh balances at depository institutions and money market funds. Seasonally adjusted M2 is calculated by summing savings deposits, small-denomination time deposits, and retail money fund balances, each seasonally adjusted separately, and adding this result to seasonally adjusted Ml.
M3: M2 plus (1) large-denomination time deposits (in amounts of $100,000 or more) issued by all depository institutions, (2) balances in institutional money funds (money funds with minimum initial investments of $50,000 or more), (3) RP liabilities (overnight and term) issued by all depository institutions, and (4) Eurodollars (overnight and term) held by U.S. residents at foreign branches of U.S. banks worldwide and at all banking offices in the United Kingdom and Canada. Excludes amounts held by depository institutions, the U.S. govern-ment, money market funds, and foreign banks and official institutions. Seasonally adjusted M3 is calculated by summing large time deposits, institutional money fund balances, RP liabilities, and Eurodollars, each seasonally adjusted separately, and adding this result to seasonally adjusted M2.
L: M3 plus the nonbank public holdings of U.S. savings bonds, short-term Treasury securities, commercial paper, and bankers acceptances, net of money market fund holdings of
these assets. Seasonally adjusted L is computed by summing U.S. savings bonds, short-term Treasury securities, commercial paper, and bankers acceptances, each seasonally adjusted separately, and then adding this result to M3.
Debt: The debt aggregate is the outstanding credit market debt of the domestic nonfinancial sectors—the federal sector (U.S. government, not including government-sponsored enter-prises or federally related mortgage pools) and the nonfederal sectors (state and local governments, households and nonprofit organizations, nonfinancial corporate and nonfarm noncorporate businesses, and farms). Nonfederal debt consists of mortgages, tax-exempt and corporate bonds, consumer credit, bank loans, commercial paper, and other loans. The data, which are derived from the Federal Reserve Board's flow of funds accounts, are break-adjusted (that is, discontinuities in the data have been smoothed into the series) and month-averaged (that is, the data have been derived by averaging adjacent month-end levels).
3. Currency outside the U.S. Treasury, Federal Reserve Banks, and vaults of depository institutions.
4. Outstanding amount of U.S. dollar-denominated travelers checks of nonbank issuers. Travelers checks issued by depository institutions are included in demand deposits.
5. Demand deposits at commercial banks and foreign-related institutions other than those owed to depository institutions, the U.S. government, and foreign banks and official institu-tions, less cash items in the process of collection and Federal Reserve float.
6. Consists of NOW and ATS account balances at all depository institutions, credit union share draft account balances, and demand deposits at thrift institutions.
7. Sum of (1) savings deposits (including MMDAs), (2) small time deposits, and (3) retail money fund balances.
8. Sum of (1) large time deposits, (2) institutional money fund balances, (3) RP liabilities (overnight and term) issued by depository institutions, and (4) Eurodollars (overnight and term) of U.S. addressees.
9. Small time deposits—including retail RPs—are those issued in amounts of less than $100,000. All IRAs and Keogh accounts at commercial banks and thrift institutions are subtracted from small time deposits.
10. Large time deposits are those issued in amounts of $100,000 or more, excluding those booked at international banking facilities.
11. Large time deposits at commercial banks less those held by money market funds,, depository institutions, the U.S. government, and foreign banks and official institutions.
12. Includes both overnight and term.
Digitized for FRASER http://fraser.stlouisfed.org/ Federal Reserve Bank of St. Louis

Monetary and Credit Aggregates A15
1.22 DEPOSIT INTEREST RATES AND AMOUNTS OUTSTANDING Commercial and BIF-insured saving banks1
1995 1 9 9 6
Item 1993 1 9 9 4 Item Dec. Dec. Nov. Dec. Jan. Feb. Mar. Apr. May June July
Interest rates (annual effective yields)2
INSURED COMMERCIAL BANKS
1 Negotiable order of withdrawal accounts 1.86 1 .96 1 .93 1.91 1 .90 1.91 1.85 1 .89 1.88 1 .90 1 .94 2 Savings deposits3
2 . 4 6 2 . 9 2 3 . 1 3 3 . 1 0 3 .01 2 . 9 8 2 . 9 1 2 . 9 1 2 . 8 9 2.86R 2 . 8 7
Interest-bearing time deposits with balances of less than $100,000, by maturity
3 7 to 91 days 2 .65 3 . 7 9 4 . 1 3 4 . 1 0 4 . 0 2 3 . 9 9 4 . 0 2 4 . 0 1 4 .03R 4.08R 4 . 1 3 4 92 to 182 days 2.91 4 . 4 4 4 . 7 4 4 . 6 8 4 . 5 7 4 . 4 5 4 . 4 9 4 . 5 1 4 . 5 1 4 . 5 5 4 . 5 9 5 183 days to 1 year 3 .13 5 . 1 2 5 . 1 1 5 . 0 2 4 . 9 1 4 . 7 9 4 . 8 3 4 . 8 6 4 .88R 4.95R 5 . 0 0 6 More than 1 year to 2'/> years 3 .55 5 . 7 4 5 . 2 7 5 . 1 7 5 . 0 3 4 . 8 9 4 . 9 4 5 . 0 3 5.10R 5 . 1 8 5 . 2 5 7 More than 2 vl years 4 .28 6 . 3 0 5 . 4 9 5 . 4 0 5 . 2 6 5 . 1 0 5 . 1 9 5 . 2 8 5 . 3 6 5 . 4 6 5 .51
BIF-INSURED SAVINGS BANKS 4
8 Negotiable order of withdrawal accounts 1.87 1 .94 1 .94 1.91 1.85 1 .84 1.83 1 .84 1 .82 1 .80 1.81 9 Savings deposits3 2 . 6 3 2 . 8 7 2 . 9 9 2 . 9 8 2 . 9 5 2 . 9 2 2 . 8 6 2 .85 2 . 8 4 2 . 8 5 2 . 8 8
Interest-bearing time deposits with balances of less than $100,000, by maturity
10 7 to 91 days 2 .81 3 . 8 0 4 . 4 3 4 . 4 3 4 . 3 8 4 . 2 6 4 . 3 7 4 . 4 2 4 . 4 9 4 . 5 4 4 . 6 4 11 92 to 182 days 3 . 0 2 4 . 8 9 5 . 0 2 4 . 9 5 4 . 8 6 4 . 7 7 4 . 7 6 4 . 7 7 4 . 8 3 4 .91 5 .01 12 183 days to 1 year 3.31 5 . 5 2 5 . 2 8 5 . 1 8 5 . 0 6 4 . 9 1 4 . 8 9 4 . 9 1 4 . 9 6 5 . 0 2 5 . 0 9 13 More than 1 year to 2 x/i years 3 .67 6 . 0 9 5 . 4 7 5 . 3 3 5 . 2 2 5 . 1 0 5 . 1 5 5 . 2 3 5 . 2 5 5 .35 5 .41 14 More than 2yi years 4 . 6 2 6 . 4 3 5 . 6 4 5 . 4 6 5 . 3 4 5 . 2 4 5 . 2 4 5 . 3 2 5 . 3 8 5 .51 5 . 6 0
Amounts outstanding (millions of dollars)
INSURED COMMERCIAL BANKS
15 Negotiable order of withdrawal accounts 305,237 304,896 257,098 248,417 245,749 242,930 218,604 228,637r 208,890r 203,034r 207,043 16 Savings deposits3 767,035 737,068 753,139 776,466 768,071 784,035 827,666 805,317r 839,482r 844,348r 841,265 17 Personal 598,276 580,438 588,995 615,113 612,321 623,110 661,919 639,92 l r 669,107r 672,737r 667,595 18 Nonpersonal 168,759 156,630 164,144 161,353 155,750 160,925 165,748 165,396r 170,375r 171,61 l r 173,670
Interest-bearing time deposits with balances of less than $100,000, by maturity
19 7 to 91 days 29,362 32,265 31,093 32,170 33,783 35,719 35,377 34,07 r 30,356r 31,345r 31,691 20 92 to 182 days 109,050 96,650 95,513 93,941 95,350 97,219 97,141 96,052r 95,896r 95,100r 94,659 21 183 days to 1 year 145,386 163,062 184,704 183,834 184,046 184,095 186,158 190,018r 193,722r 195,450r 197,958 22 More than 1 year to 2 V5 years 139,781 164,395 208,315 208,601 212,394 210,493 208,915 208,252r 208,767r 209,587r 209,067 23 More than 2 Yl years 180,461 192,712 199,389 199,002 199,254 198,922 198,980 197,783r 198,332r 198,856r 197,733
24 IRA and Keogh plan deposits 144,011 144,155 149,647 150,546 150,366 149,965 150,496 150,580r 150,889r 151,349r 151,273
BIF-INSURED SAVINGS BANKS 4
25 Negotiable order of withdrawal accounts 11,191 11,175 11,088 11,918 11,139 11,597 11,703 11,492 11,744 11,234 10,921 26 Savings deposits3 80,376 70,082 68,345 68,643 66,702 67,614 67,276 66,808 67,715 66,886 66,956 27 Personal 77,263 67,159 64,932 65,366 63,377 64,524 64,208 63,559 64,199 63,594r 63,651 28 Nonpersonal 3,113 2,923 3,413 3,277 3,325 3,090 3,068 3,249 3,516 3,292r 3,305
Interest-bearing time deposits with balances of less than $100,000, by maturity
29 7 to 91 days 2,746 2,144 1,819 2,001 2,009 2,131 2,140 2,179 2,345 2,226 2,372 30 92 to 182 days 12,974 11,361 11,394 12,140 12,334 13,247 13,477 13,911 13,934 13,702 13,613 31 183 days to 1 year 17,469 18,391 24,833 25,686 26,304 26,863 26,534 27,265 28,079 27,907 28,556 32 More than 1 year to 2'/i years 16,589 17,787 27,149 27,482 26,582 26,945 25,934 25,684 25,422 25,492 26,186 33 More than 2 Vl years 20,501 21,293 22,552 22,866 22,449 21,819 22,646 22,526 22,638 22,569r 22,556
34 IRA and Keogh plan accounts 19,791 19,013 21,231 21,321 20,827 20,845 20,615 20,553 20,543 20,709 20,647
1. BIF, Bank Insurance Fund. Data in this table also appear in the Board's H.6 (508) Special Supplementary Table monthly statistical release. For ordering address, see inside front cover. Estimates are based on data collected by the Federal Reserve System from a stratified random sample of about 425 commercial banks and 75 savings banks on the last day of each month. Data are not seasonally adjusted and include IRA and Keogh deposits and foreign currency-denominated deposits. Data exclude retail repurchase agreements and depos-its held in U.S. branches and agencies of foreign banks.
2. As of October 31, 1994, interest rate data for NOW accounts and savings deposits reflect a series break caused by a change in the survey used to collect these data.
3. Includes personal and nonpersonal money market deposits. 4. Includes both mutual and federal savings banks.
Digitized for FRASER http://fraser.stlouisfed.org/ Federal Reserve Bank of St. Louis

A16 Domestic Financial Statistics • October 1996
1.23 BANK DEBITS AND DEPOSIT TURNOVER1
Debits are in billions of dollars; turnover is ratio of debits to deposits; monthly data are at annual rates
1995 1 9 9 6
Dec. Jan. Feb. Mar. Apr.' May
DEBITS Seasonally adjusted
Demand deposits3
1 All insured banks 3 3 4 , 7 8 4 . 1 3 6 9 , 0 2 9 . 1 3 9 7 , 6 4 9 . 3 3 9 7 , 5 3 8 . 3 4 3 0 , 4 2 1 . 2 4 4 7 , 8 6 9 . 0 4 2 2 , 6 9 6 . 7 4 6 3 , 2 4 6 . 0 4 7 0 , 7 4 3 . 6 2 Major New York City banks 1 7 1 , 2 2 4 . 3 1 9 1 , 1 6 8 . 8 2 0 1 , 1 6 1 . 4 2 0 3 , 9 7 7 . 5 2 2 9 , 3 7 9 . 2 2 3 8 , 5 3 8 . 4 2 2 4 , 0 6 6 . 5 2 4 5 , 4 4 0 . 5 2 5 2 , 3 8 8 . 3 3 Other banks 1 6 3 , 5 5 9 . 7 1 7 7 , 8 6 0 . 3 1 9 6 , 4 8 7 . 9 1 9 3 , 5 6 0 . 8 2 0 1 , 0 4 2 . 0 2 0 9 , 3 3 0 . 6 1 9 8 , 6 3 0 . 2 2 1 7 , 8 0 5 . 5 2 1 8 , 3 5 5 . 3
4 Other checkable deposits4 3 , 4 8 1 . 5 3 , 7 9 8 . 6 4 , 2 0 7 . 4 4 , 5 9 5 . 5 4 ,967 .8 R 5 ,024 .4 R 4 ,942 .7 R 5 , 2 8 1 . 1 5 , 7 0 3 . 5
5 Savings deposits (including MMDAs)5 3 , 4 9 7 . 4 3 , 7 6 6 . 3 4 , 5 0 7 . 8 5 , 7 0 3 . 6 6 ,035 .9 R 6 ,406 .6 R 6 , 2 8 3 . F 7 , 3 5 7 . 0 7 , 1 3 2 . 9
DEPOSIT TURNOVER
Demand deposits3
6 All insured banks 7 8 5 . 9 8 1 7 . 4 8 7 4 . 1 8 5 2 . 7 9 1 6 . 8 9 5 0 . 6 8 8 1 . 0 9 7 0 . 0 9 8 7 . 3 7 Major New York City banks 4 , 1 9 8 . 1 4 , 4 8 1 . 5 4 . 8 6 7 . 3 5 , 0 6 9 . 7 5 , 3 6 8 . 0 5 , 8 5 2 . 3 5 , 6 0 8 . 2 5 , 8 8 4 . 3 6 , 0 3 2 . 3 8 Other banks 4 2 4 . 6 4 3 5 . 1 4 7 5 . 2 4 5 4 . 4 4 7 1 . 1 4 8 6 . 4 4 5 1 . 6 4 9 9 . 7 5 0 2 . 0
9 Other checkable deposits4 11 .9 12.6 15 .4 18 .6 2 0 . 8 2 1 . 6 21.7R 2 3 . 3 2 6 . 4
10 Savings deposits (including MMDAs)5 4 . 6 4 . 9 6.1 7 . 4 7 .7 8.1 7 .8 9 . 0 8 .7
DEBITS Not seasonally adjusted
Demand deposits3
11 All insured banks 3 3 4 , 8 9 9 . 2 3 6 9 , 1 2 1 . 8 3 9 7 , 6 5 7 . 8 4 1 1 , 8 0 2 . 7 4 2 9 , 2 1 3 . 3 4 1 4 , 8 1 9 . 1 4 4 2 , 9 7 7 . 6 4 5 6 , 9 0 0 . 3 4 5 9 , 0 6 3 . 0 12 Major New York City banks 1 7 1 , 2 8 3 . 5 1 9 1 , 2 2 6 . 0 2 0 1 , 1 8 2 . 6 2 1 0 , 7 8 0 . 0 2 2 7 , 2 9 3 . 7 2 2 2 , 0 0 7 . 5 2 3 6 , 9 5 4 . 2 2 3 8 , 3 3 5 . 3 2 4 0 , 8 9 3 . 0 13 Other banks 1 6 3 , 6 1 5 . 7 1 7 7 , 8 9 5 . 7 1 9 6 , 4 7 5 . 3 2 0 1 , 0 2 2 . 7 2 0 1 , 9 1 9 . 6 1 9 2 , 8 1 1 . 6 2 0 6 , 0 2 3 . 4 2 1 8 , 5 6 5 . 0 2 1 8 , 1 7 0 . 0
14 Other checkable deposits4 3 , 4 8 1 . 7 3 , 7 9 5 . 6 4 , 2 0 2 . 6 4 , 7 8 4 . 8 5 ,393 .9 R 4 , 6 2 9 . l r 4 ,990 .4 R 5 , 5 8 0 . 8 5 , 4 7 9 . 6
15 Savings deposits (including MMDAs)5 3 . 4 9 8 . 3 3 , 7 6 4 . 4 4 , 5 0 0 . 8 6 , 0 1 3 . 9 6 ,309 .7 R 5 ,798 .9 R 6 ,444 .7 R 7 , 6 9 0 . 1 7 , 0 6 1 . 8
DEPOSIT TURNOVER
Demand deposits3
16 All insured banks 7 8 6 . 1 8 1 8 . 2 8 7 4 . 6 8 4 7 . 5 8 9 5 . 4 9 0 0 . 9 9 4 7 . 0 9 5 6 . 6 9 8 0 . 1 17 Major New York City banks 4 , 1 9 7 . 9 4 , 4 9 0 . 3 4 , 8 7 3 . 1 4 , 9 0 0 . 9 5 , 1 0 9 . 7 5 , 4 2 7 . 5 6 , 0 6 0 . 5 5 , 7 7 4 . 9 5 , 9 6 3 . 5 18 Other banks 4 2 4 . 8 4 3 5 . 3 4 7 5 . 4 4 5 3 . 9 4 6 4 . 3 4 5 9 . 6 4 8 0 . 6 5 0 0 . 9 5 0 9 . 8
19 Other checkable deposits4 11 .9 12 .6 15 .3 19 .0 22.0R 19.9 21.8R 24 .1 2 5 . 6
2 0 Savings deposits (including MMDAs)5 4 . 6 4 . 9 6 .1 7 .8 8.1 7 . 3 1.9' 9 . 4 8 . 6
1. Historical tables containing revised data for earlier periods can be obtained from the Publications Section, Division of Support Services, Board of Governors of the Federal Reserve System, Washington, DC 20551.
Data in this table also appear in the Board's G.6 (406) monthly statistical release. For ordering address, see inside front cover.
2. Annual averages of monthly figures. 3. Represents accounts of individuals, partnerships, and corporations and of states and
political subdivisions.
4. As of January 1994, other checkable deposits (OCDs), previously defined as automatic transfer to demand deposits (ATSs) and negotiable order of withdrawal (NOW) accounts, were expanded to include telephone and preauthorized transfer accounts. This change redefined OCDs for debits data to be consistent with OCDs for deposits data.
5. Money market deposit accounts.
Digitized for FRASER http://fraser.stlouisfed.org/ Federal Reserve Bank of St. Louis

Commercial Banking Institutions A17
1.26 ASSETS AND LIABILITIES OF COMMERCIAL BANKS1
Billions of dollars
Monthly averages Wednesday figures
Account 1995 1996r 1996
July Jan. Feb. Mar. Apr. May June July July 10 July 17 July 24 July 31
ALL COMMERCIAL Seasonally adjusted BANKING INSTITUTIONS
Assets 3,664.7 1 Bank credit 3,533.2r 3,633.6 3,647.3 3,641.1 3,659.4 3,663.2 3,668.4 3,671.9 3,670.0 3,678.3 3,676.2 3,664.7
7 Securities in bank credit 982.8r 991.2 998.2 983.0 982.0 988.2 980.3 975.0 978.0 979.6 975.4 967.1 U.S. government securities 703.9 702.4 715.3 704.7 704.8 713.2 706.6 706.2 706.9 705.2 707.3 705.2
4 Other securities 278.8r 288.8 282.9 278.3 277.3 275.0 273.7 268.8 271.0 274.4 268.2 261.9 Loans and leases in bank credit2 . . . 2,550.4 2,642.3 2,649.1 2,658.1 2,677.4 2,675.0 2,688.1 2,696.9 2,692.1 2,698.7 2,700.8 2,697.6
6 Commercial and industrial 697.7 723.6 728.0 726.9 732.8 735.1 738.1 741.9 738.8 743.2 743.4 743.0 7 Real estate l,062.2r 1,086.4 1,090.0 1,095.4 1,097.3 1,099.0 1,102.3 1,103.5 1,101.7 1,103.5 1,104.3 1,105.7 8 Revolving home equity 78.0 79.7 80.0 80.0 80.2 79.8 79.4 79.8 79.6 79.9 79.8 80.0 9 Other 984.2r 1,006.7 1,010.0 1,015.4 1,017.1 1,019.2 1,022.9 1,023.7 1,022.0 1,023.6 1,024.5 1,025.8
in Consumer 481.0 500.2 500.3 503.8 507.4 504.9 510.0 511.9 511.5 511.9 512.8 511.7 ii Security3 87.1 85.0 85.7 84.9 85.9 82.6 82.1 80.3 82.7 80.5 80.4 76.8 l? Other 222.4 247.1 245.1 247.1 254.0 253.5 255.7 259.1 257.4 259.7 259.8 260.3 13 Interbank loans4 192.8 203.2 192.3 202.6 208.9 208.7 207.0 199.6 196.2 198.3 198.8 203.1 14 Cash assets5 213.8 233.3 219.6 216.4 222.5 219.4 216.7 216.9 209.8 219.7 214.6 227.0 15 Other assets6 225.4r 237.9 243.0 242.0 243.6 242.8 253.3 264.8 265.4 264.3 265.3 267.0
16 Total assets7 4,108.2r 4,251.1 4,245.5 4,245.2 4211.2 4,277.1 4,288.1 4,2953 4,283.6 4302.7 4,297.0 4303.7
Liabilities 17 Deposits 2,609.0 2,687.5 2,681.7 2,702.6 2,718.7 2,717.7 2,721.5 2,728.4 2,722.2 2,726.4 2,732.3 2,736.8 18 Transaction 792.0 782.9 765.5 766.7 770.1 756.4 749.8 742.6 737.1 739.9 748.8 752.7 IP Nontransaction 1,817.0 1,904.7 1,916.2 1,935.9 1,948.7 1,961.3 1,971.7 1,985.9 1,985.1 1,986.5 1,983.4 1,984.1 ?0 Large time 402.0 422.0 426.4 429.1 433.3 440.0 445.4 448.0 448.8 448.7 447.4 445.8 71 Other 1,415.0 1,482.7 1,489.8 1,506.8 1,515.3 1,521.3 1,526.3 1,537.9 1,536.2 1,537.8 1,536.1 1,538.3 77 Borrowings 685.8 705.1 691.8 688.8 710.5 710.4 702.2 692.5 683.9 694.6 695.9 697.5 ?3 From banks in the U.S 195.5r 206.6 192.6 204.0 207.6 207.4 203.6 200.2 197.6 203.4 197.4 201.4 ?4 From nonbanks in the U.S 490.3r 498.5 499.2 484.8 502.9 503.0 498.6 492.3 486.3 491.2 498.4 496.1 ?5 Net due to related foreign offices 235.5r 270.2 276.6 261.6 254.6 256.1 255.1 248.1 247.8 251.5 240.9 248.1 26 Other liabilities8 213.7r 231.6 233.8 224.1 231.7 219.9 226.9 225.3 226.6 227.8 225.6 221.9
27 Total liabilities 3,744.0r 3394.4 3,883.9 3,877.0 3,915.5 3,904.0 3,905.6 3,894.4 3380.4 3,900.4 3,894.7 3,9043
28 Residual (assets less liabilities)9 364.2r 356.7 361.5 368.2 361.6 373.1 382.5 400.9 403.2 402.4 402.3 399.4
Not seasonally adjusted
Assets 79 Bank credit 3,526.ff 3,624.4 3,638.9 3,635.4 3,660.4 3,660.1 3,665.3 3,664.7 3,662.4 3,670.3 3,661.6 3,661.7
Securities in bank credit 979.6r 978.9 993.2 987.4 987.2 992.7 981.5 971.7 973.5 973.7 972.0 967.0 31 U.S. government securities 701.9 697.1 710.6 709.1 710.8 714.0 706.8 704.0 703.9 702.3 705.1 704.7 3? Other securities 277.7r 281.8 282.6 278.4 276.4 278.7 274.7 267.7 269.6 271.4 266.9 262.3 33 Loans and leases in bank credit2 . . . 2,546.4 2,645.5 2,645.7 2,648.0 2,673.2 2,667.4 2,683.8 2,693.0 2,688.9 2,696.6 2,689.6 2,694.7 34 Commercial and industrial 698.5 720.6 726.1 730.9 738.7 740.5 741.1 743.0 740.9 744.7 742.5 742.5 35 Real estate 1,062.1 1,086.2 1,086.9 1,089.8 1,093.4 1,095.9 1,100.9 1,103.3 1,102.4 1,103.7 1,103.3 1,104.8 36 Revolving home equity 78.1 79.5 79.5 79.2 79.6 79.7 79.3 79.9 79.7 80.0 79.9 80.2 37 Other 984.0 1,006.6 1,007.4 1,010.6 1,013.8 1,016.3 1,021.6 1,023.4 1,022.7 1,023.7 1,023.4 1,024.6 38 Consumer 478.5 504.8 500.8 499.5 504.7 503.2 506.3 509.2 507.6 509.0 510.5 510.5 39 Security3 84.3 86.9 88.7 84.8 86.7 78.4 80.0 77.8 79.3 78.4 76.4 76.2 40 Other 223.0 247.0 243.2 243.0 249.7 249.5 255.6 259.6 258.7 260.8 256.8 260.7 41 Interbank loans4 189.6 212.2 194.2 200.5 205.9 202.3 203.3 196.8 195.0 193.5 188.9 203.3 47 Cash assets5 211.7 240.8 220.4 209.2 217.0 216.7 214.6 214.6 208.8 215.7 200.0 228.6 43 Other assets6 225,6r 238.6 242.3 240.5 241.0 243.8 252.8 265.5 265.7 263.3 262.4 270.8
44 Total assets7 4,0%.2r 4,2593 4,239.1 4,228.5 4,267.5 4,265.9 4,278.8 4,284.0 4,274.6 4,285.2 4,2553 4306.6
Liabilities 45 Deposits 2,601.6 2,694.3 2,672.7 2,688.9 2,715.6 2,707.4 2,718.3 2,721.6 2,724.0 2,715.7 2,693.8 2,737.1 46 Transaction 784.2 794.6 758.3 751.9 769.0 744.0 743.3 735.4 736.1 729.0 712.1 752.3 47 Nontransaction 1,817.4 1,899.7 1,914.4 1,937.0 1,946.6 1,963.4 1,974.9 1,986.2 1,987.9 1,986.7 1,981.7 1,984.7 48 Large time 400.1 419.0 426.9 430.6 433.2 445.4 445.2 445.9 445.6 446.6 446.8 445.2 49 Other 1,417.3 1,480.7 1,487.4 1,506.4 1,513.4 1,517.9 1,529.7 1,540.2 1,542.2 1,540.0 1,534.8 1,539.5 50 Borrowings 695.4 692.2 686.2 680.7 696.6 707.7 711.9 704.7 698.1 709.9 701.8 708.9 51 From banks in the U.S 193.7r 213.6 194.3 199.2 206.4 204.6 205.3 198.5 197.3 200.0 190.3 200.8 5? From nonbanks in the U.S 501.7r 478.6 491.9 481.5 490.2 503.1 506.6 506.2 500.7 509.9 511.5 508.1 53 Net due to related foreign offices 233.8r 277.3 278.2 262.2 254.8 258.4 247.6 246.7 243.8 245.5 248.9 247.5 54 Other liabilities8 212.9r 233.3 234.3 225.5 228.0 222.5 227.7 224.8 224.4 226.7 224.4 223.9
55 Total liabilities 3,743.7r 3^97.1 3,871.4 3,8573 3,895.0 3,896.0 3,905.4 3,897.7 3,890.2 3,897.9 3,868.9 3,917.4
56 Residual (assets less liabilities)9 352.5r 362.2 367.7 371.2 372.5 369.9 373.3 386.3 384.4 387.3 386.4 389.2
Footnotes appear on following page.
Digitized for FRASER http://fraser.stlouisfed.org/ Federal Reserve Bank of St. Louis

A18 Domestic Nonfinancial Statistics • October 1996
1.26 ASSETS AND LIABILITIES OF COMMERCIAL BANKS'—Continued Billions of dollars
Monthly averages Wednesday figures
Account 1995 1996' 1996
July Jan. Feb. Mar. Apr. May June July July 10 July 17 July 24 July 31
DOMESTICALLY CHARTERED COMMERCIAL BANKS
Seasonally adjusted
Assets 57 Bank credit 3,110.0 3,197.3 3,196.0 3,197.9 3,211.6 3,213.4 3,210.9 3,212.2 3,211.5 3,217.8 3,215.9 3,204.2 58 Securities in bank credit 849.4r 854.2 852.6 843.0 841.8 845.2 835.9 833.2 835.9 837.0 834.7 825.0 59 U.S. government securities 639.9 639.2 641.8 633.5 633.2 635.3 627.2 625.5 625.5 624.8 627.2 623.8 60 Other securities 209.5 215.1 210.8 209.4 208.6 209.9 208.6 207.8 210.4 212.1 207.5 201.2 61 Loans and leases in bank credit2 2,260.6 2,343.0 2,343.4 2,354.9 2,369.8 2,368.2 2,375.0 2,379.0 2,375.6 2,380.8 2,381.2 2,379.2 62 Commercial and industrial 522.9 540.3 541.0 541.4 545.8 548.0 548.1 549.4 547.8 550.0 549.9 549.9 63 Real estate 1,024.3 1,051.1 1,055.7 1,062.1 1,064.1 1,065.9 1,069.4 1,070.2 1,068.4 1,070.2 1,071.2 1,072.1 64 Revolving home equity 78.0 79.7 79.9 80.0 80.1 79.7 79.3 79.8 79.6 79.9 79.8 80.0 65 Other 946.3r 971.5 975.8 982.2 983.9 986.2 990.1 990.4 988.8 990.4 991.4 992.2 66 Consumer 481.0 500.2 500.3 503.8 507.4 504.9 510.0 511.9 511.5 511.9 512.8 511.7 67 Security3 51.9 55.5 52.2 51.2 52.9 50.7 46.8 46.1 48.2 46.7 45.6 43.3 68 Other 180.5 195.8 194.2 196.5 199.6 198.8 200.7 201.3 199.7 202.0 201.7 202.1 69 Interbank loans4 171.4 181.4 171.6 181.8 187.8 187.4 184.6 180.4 176.9 177.9 179.8 184.9 70 Cash assets5 187.0 202.2 190.3 189.1 196.3 193.2 191.5 191.6 184.3 194.3 189.3 201.8 71 Other assets6 171.6 182.7 186.4 187.0 188.7 187.4 201.1 215.1 215.3 214.6 215.6 217.7
72 Total assets7 3,582.9 3,706.7 3,687.6 3,698.9 3,7273 3,7245 3,730.8 3,741.5 3,730.2 3,746.8 3,742.7 3,750.6
Liabilities 73 Deposits 2,445.1 2,523.6 2,516.9 2,534.6 2,549.2 2,545.1 2,549.3 2,553.9 2,545.8 2,551.9 2,558.9 2,563.0 74 Transaction 782.5 772.1 754.8 756.8 759.5 745.4 739.0 731.9 726.3 729.4 738.1 742.0 75 Nontransaction 1,662.5 1,751.5 1,762.1 1,777.8 1,789.7 1,799.7 1,810.4 1,822.0 1,819.5 1,822.5 1,820.8 1,821.0 76 Large time 248.3 272.3 274.4 273.3 275.6 279.4 283.1 285.5 285.2 286.3 285.8 283.8 77 Other 1,414.3 1,479.2 1,487.7 1,504.5 1,514.0 1,520.3 1,527.3 1,536.6 1,534.3 1,536.3 1,535.0 1,537.2 78 Borrowings 567.2 590.8 574.1 577.0 591.1 585.4 582.1 576.1 568.6 579.8 576.3 580.3 79 From banks in the U.S 176.4r 185.2 173.1 183.5 184.4 183.9 183.3 180.6 178.9 183.8 175.7 181.9 80 From nonbanks in the U.S 390.71" 405.7 401.0 393.5 406.7 401.5 398.8 395.5 389.7 396.1 400.6 398.5 81 Net due to related foreign offices . . . . 82.9 93.0 90.5 81.3 84.6 88.2 79.7 76.1 76.0 76.4 74.8 74.4 82 Other liabilities8 137.2 152.7 153.9 147.1 154.8 146.4 155.9 155.8 156.5 158.1 155.9 153.5
83 Total liabilities 3,2323r 3,360.2 3335.4 3,340.0 3379.7 3365.1 3367.0 3361.9 3346.8 33663 3365.9 3371.2
84 Residual (assets less liabilities)9 350.6 346.5 352.2 358.9 347.6 359.4 363.8 379.6 383.4 380.5 376.8 379.4
Not seasonally adjusted
Assets 85 Bank credit 3,102.4 3,185.6 3,187.8 3,190.7 3,214.3 3,213.8 3,211.3 3,204.4 3,204.5 3,208.5 3,200.3 3,200.1 86 Securities in bank credit 845.4 843.2 848.6 846.2 846.9 848.5 839.3 829.3 832.1 831.0 829.3 823.3 87 U.S. government securities 638.0 632.0 637.7 636.6 638.9 637.0 628.6 623.5 624.2 622.2 624.0 622.8 88 Other securities 207.4 211.2 210.9 209.6 208.0 211.5 210.7 205.9 208.0 208.8 205.3 200.5 89 Loans and leases in bank credit2 2,257.0 2,342.4 2,339.3 2,344.5 2,367.4 2,365.3 2,372.0 2,375.0 2,372.3 2,377.5 2,371.1 2,376.7 90 Commercial and industrial 522.9 537.2 540.2 544.5 551.7 553.5 550.6 549.4 548.7 550.1 548.0 549.2 91 Real estate l,024.2r 1,051.0 1,052.4 1,056.4 1,060.6 1,063.0 1,068.1 1,070.1 1,069.3 1,070.4 1,070.1 1,071.4 92 Revolving home equity 78.1 79.5 79.5 79.2 79.5 79.6 79.3 79.9 79.7 79.9 79.9 80.1 93 Other 946.1r 971.5 973.0 977.2 981.0 983.4 988.8 990.2 989.6 990.5 990.2 991.3 94 Consumer 478.5 504.8 500.8 499.5 504.7 503.2 506.3 509.2 507.6 509.0 510.5 510.5 95 Security3 50.5 53.9 53.2 51.3 53.9 49.5 47.0 44.8 46.3 45-5 43.4 43.1 96 Other 180.9 195.5 192.6 192.9 196.6 196.2 200.0 201.5 200.5 202.5 199.0 202.5 97 Interbank loans4 168.2 189.1 175.3 180.5 185.7 180.8 182.6 177.6 175.9 174.3 169.8 184.2 98 Cash assets5 184.4 210.0 192.2 182.2 191.4 191.0 188.6 188.9 183.1 190.0 174.3 202.9 99 Other assets6 172.5 183.7 185.2 186.3 187.9 187.7 200.9 216.5 216.8 214.2 213.3 221.7
100 Total assets7 3,570.9 3,711.9 3,683.9 3,682.7 3,722.4 3,7163 3,726.1 3,729.8 3,722.8 3,729.5 3,700.2 3,751.1
Liabilities 101 Deposits 2,439.4 2,529.4 2,508.2 2,520.6 2,548.4 2,533.3 2,544.0 2,549.3 2,551.8 2,543.4 2,521.4 2,564.6 102 Transaction 774.8 783.8 747.7 742.2 759.0 733.7 732.7 724.7 725.5 718.4 701.5 741.7 103 Nontransaction 1,664.7 1,745.7 1,760.5 1,778.3 1,789.4 1,799.6 1,811.2 1,824.5 1,826.4 1,825.1 1,820.0 1,823.0 104 Large time 248.3 269.6 275.8 273.8 277.0 282.7 282.9 285.6 285.3 286.3 286.5 284.8 105 Other 1,416.3 1,476.0 1,484.7 1,504.6 1,512.4 1,517.0 1,528.3 1,538.9 1,541.1 1,538.8
588.1 1,533.5 1,538.1
106 Borrowings 571.6 581.7 573.2 569.5 576.3 584.5 587.6 582.8 576.3 1,538.8
588.1 579.9 586.9 107 From banks in the U.S 173.5r 192.1 175.6 178.5 184.1 182.8 183.4 177.8 176.7 179.3 169.6 180.1 108 From nonbanks in the U.S 398. r 389.6 397.6 390.9 392.1 401.7 404.2 405.0 399.6 408.7 410.3 406.8 109 Net due to related foreign offices . . . . 81.8 92.9 92.3 84.5 85.0 93.2 78.5 75.1 72.2 73.9 77.1 75.7 110 Other liabilities8 137.0 153.4 152.3 148.8 152.8 147.9 156.2 155.8 155.5 157.8 155.4 154.8
111 Total liabilities 3,229.9 3357.4 3326.0 3323.4 3362.4 3358.9 33663 3362.9 3355.8 3363.2 3333.9 3382.1
112 Residual (assets less liabilities)9 341.0 354.4 357.9 359.3 360.0 357.4 359.8 366.9 367.0 366.3 366.3 369.0
1. Covers the following types of institutions in the fifty states and the District of Columbia: domestically chartered commercial banks that submit a weekly report of condition (large domestic); other domestically chartered commercial banks (small domestic); branches and agencies of foreign banks; New York State investment companies, and Edge Act and agreement corporations (foreign-related institutions). Excludes international banking facili-ties. Data are Wednesday values, or pro rata averages of Wednesday values. Large domestic banks constitute a universe; data for small domestic banks and foreign-related institutions are estimates based on weekly samples and on quarter-end condition reports. Data are adjusted for breaks caused by reclassifications of assets and liabilities.
2. Excludes federal funds sold to, reverse repurchase agreements with, and loans to commercial banks in the United States.
3. Consists of reserve repurchase agreements with broker-dealers and loans to purchase and carry securities.
4. Consists of federal funds sold to, reverse repurchase agreements with, and loans to commercial banks in the United States.
5. Includes vault cash, cash items in process of collection, demand balances due from depository institutions in the United States, balances due from Federal Reserve Banks, and other cash assets.
6. Excludes the due-from position with related foreign offices, which is included in lines 25, 53, 81, and 109.
7. Excludes unearned income, reserves for losses on loans and leases, and reserves for transfer risk. Loans are reported gross of these items.
8. Excludes the due-to position with related foreign offices, which is included in lines 25, 53, 81, and 109.
9. This balancing item is not intended as a measure of equity capital for use in capital adequacy analysis.
Digitized for FRASER http://fraser.stlouisfed.org/ Federal Reserve Bank of St. Louis
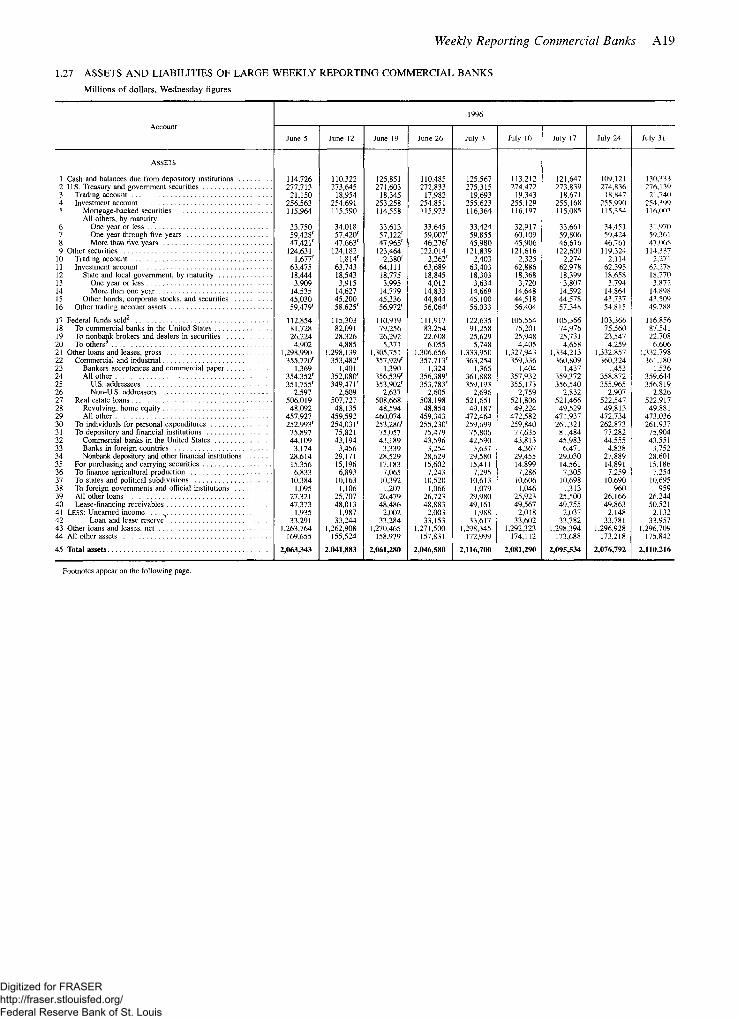
Weekly Reporting Commercial Banks A19
1.27 ASSETS AND LIABILITIES OF LARGE WEEKLY REPORTING COMMERCIAL BANKS Millions of dollars, Wednesday figures
Account 1996
Account June 5 June 12 June 19 June 26 July 3 July 10 July 17 July 24 July 31
ASSETS
1 Cash and balances due from depository institutions 114,726 110,322 125,851 110,485 125,567 113,212 121,647 109,121 130,333 2 U.S. Treasury and government securities 277,713 273,645 271,603 272,833 275,315 274,472 273,839 274,836 276,139 3 Trading account 21,150 18,954 18,345 17,982 19,693 19,343 18,671 18,847 21,740 4 Investment account 256,563 254,691 253,258 254,851 255,623 255,129 255,168 255,990 254,399 5 Mortgage-backed securities' 115,964 115,590 114,558 115,923 116,364 116,197 115,085 115,354 116,003
All others, by maturity 6 One year or less 33,750 34,018 33,613 33,645 33,424 32,917 33,661 34,451 31,970 7 One year through five years 59,428r 57,420r 57,122' 59,007' 59,855 60,109 59,806 59,424 59,361 8 More than five years 47,421r 47,663r 47,965r 46,276' 45,980 45,906 46,616 46,761 47,065 9 Other securities 124,631 124,182 123,464 122,014 121,839 121,616 122,600 119,324 114,337
10 Trading account l,677r l,814r 2,380r 2,262' 2,403 2,325 2,274 2,114 2,271 11 Investment account 63,475 63,743 64,111 63,689 63,403 62,886 62,978 62,395 62,278 12 State and local government, by maturity 18,444 18,543 18,775 18,845 18,303 18,368 18,399 18,658 18.770 13 One year or less 3,909 3,915 3,995 4,012 3,634 3,720 3,807 3,794 3,872 14 More than one year 14,535 14,627 14,779 14,833 14,669 14,648 14,592 14,864 14,898 15 Other bonds, corporate stocks, and securities 45,030 45,200 45,336 44,844 45,100 44,518 44,578 43,737 43,509 16 Other trading account assets 59,479r 58,625r 56,972r 56,064' 56,033 56,404 57,348 54,815 49,788
17 Federal funds sold2 112,854 115,303 110,919 111,917 122,635 105,554 105,366 103,366 116,856 18 To commercial banks in the United States 81,728 82,091 79,256 83,254 91,258 75,201 74,976 75,560 87,541 19 To nonbank brokers and dealers in securities 26,224 28,326 26,292 22,608 25,629 25,948 25,731 23,547 22,708 20 To others3 4,902 4,885 5,371 6,055 5,748 4,405 4,658 4,259 6,606 21 Other loans and leases, gross 1,298,990 1,298,139 1,305,751 1,306,656 1,333,950 1,327,943 1,334,213 1,332,857 1,332,798 22 Commercial and industrial 355,720r 353,482r 357,929r 357,713' 363,254 359,336 360,809 360,324 361,180 23 Bankers acceptances and commercial paper 1,369 1,401 1,390 1,324 1,365 1,404 1,437 1,453 1,536 24 All other 354,352r 352,080r 356,539r 356,389' 361,888 357,932 359,372 358,872 359,644 25 U.S. addressees 351,755' 3 4 9 , 4 7 LR 353,902' 353,783' 359,193 355,173 356,540 355,965 356,819 26 Non-U.S. addressees 2,597 2,609 2,637 2,605 2,696 2,759 2,832 2,907 2,826 27 Real estate loans 506,019 507,727 508,668 508,198 521,651 521,806 521,466 522,547 522,917 28 Revolving, home equity 48,092 48,135 48,594 48,854 49,187 49,224 49,529 49,813 49,881 29 All other 457,927 459,592 460,074 459,343 472,464 472,582 471,937 472,734 473,036 30 To individuals for personal expenditures 252,993r 254,03 l r 253,286' 255,230' 259,699 259,840 261,321 262,873 261,937 31 To depository and financial institutions 75,897 75,821 75,057 75,479 75,806 77,635 81,484 77,282 75,904 32 Commercial banks in the United States 44,109 43,194 43,189 43,596 42,590 43,813 45,983 44,555 43,551 33 Banks in foreign countries 3,174 3,456 3,339 3,254 3,637 4,367 6,471 4,838 3,752 34 Nonbank depository and other financial institutions 28,614 29,171 28,529 28,629 29,580 29,455 29,030 27,889 28,601 35 For purchasing and carrying securities 15,356 15,196 17,183 15,602 15,411 14,899 14,561 14,891 15,186 36 To finance agricultural production 6,833 6,893 7,065 7,243 7,295 7,286 7,305 7,259 7,254 37 To states and political subdivisions 10,384 10,163 10,392 10,520 10,613 10,606 10,698 10,690 10,695 38 To foreign governments and official institutions 1,095 1,106 1,207 1,066 1,079 1,046 1,313 960 959 39 All other loans 27,321 25,707 26,479 26,723 29,980 25,923 25,500 26,166 26,244 40 Lease-financing receivables 47,373 48,013 48,486 48,883 49,161 49,567 49,755 49,863 50,521 41 LESS: Unearned income 1,935 1,987 2,002 2,003 1,988 2,018 2,037 2,148 2,132 42 Loan and lease reserve3 33,291 33,244 33,284 33,153 33,617 33,602 33,782 33,781 33,957 43 Other loans and leases, net 1,263,764 1,262,908 1,270,465 1,271,500 1,298,345 1,292,323 1,298,394 1,296,928 1,296,709 44 All other assets 169,655 155,524 158,979 157,831 172,999 174,112 173,688 173,218 175,842
45 Total assets 2,063,343 2,041,883 2,061,280 2,046,580 2,116,700 2,081,290 2,095,534 2,076,792 2,110,216
Footnotes appear on the following page.
Digitized for FRASER http://fraser.stlouisfed.org/ Federal Reserve Bank of St. Louis

A20 Domestic Nonfinancial Statistics • October 1996
1.27 ASSETS AND LIABILITIES OF LARGE WEEKLY REPORTING COMMERCIAL BANKS—Continued Millions of dollars, Wednesday figures
Account
1996
Account June 5 June 12 June 19 June 26 July 3 July 10 July 17 July 24 July 31
LIABILITIES
46 Deposits 1,238,748 1,230,539 1,230,209 1,221,262 1,289,538 1,264,586 1,263,211 1,253,938 1,283,224 47 Demand deposits 317,013 311,611 311,034 305,247 334,354 314,641 313,598 304,755 331,139 48 Individuals, partnerships, and corporations 271,951 267,381 262,712 260,886 286,262 272,047 269,945 262,340 284,903 49 Other holders 45,061 44,230 48,323 44,361 48,091 42,594 43,653 42,415 46,237 50 States and political subdivisions 8,238 7,790 9,318 9,059 8,647 7,715 7,816 7,938 9,328 51 U.S. government 2,147 2,432 4,319 2,095 2,466 1,681 1,619 1,765 2,321 52 Depository institutions in the United States 22,222 20,565 21,596 19,480 22,769 20,002 19,370 19,596 21,449 53 Banks in foreign countries 5,172 5,933 5,464 5,892 5,861 5,439 6,871 5,168 4,566 54 Foreign governments and official institutions 564 588 569 555 761 539 802 523 807 55 Certified and officers' checks 6,718 6,922 7,057 7,279 7,587 7,218 7,175 7,424 7,766 56 Transaction balances other than demand deposits4 73,194 72,100 73,684 72,220 70,019 70,413 70,631 69,991 70,901 57 Nontransaction balances 848,541 846,828 845,491 843,795 885,166 879,532 878,983 879,192 881,184 58 Individuals, partnerships, and corporations 818,924 817,297 816,880 815,778 857,087 851,281 850,729 850,882 852,651 59 Other holders 29,618 29,531 28,611 28,017 28,079 28,251 28,254 28,310 28,533 60 States and political subdivisions 23,619 23,587 22,663 21,938 22,007 22,179 22,059 22,131 22,489 61 U.S. government 4,030 4,014 4,009 4,050 4,242 4,004 4,010 4,005 4,026 62 Depository institutions in the United States 1,669 1,631 1,633 1,724 1,424 1,531 1,675 1,663 1,582 63 Foreign governments, official institutions, and banks . . 300 299 305 306 406 536 509 510 436
64 Liabilities for borrowed money5 408,777 400,126 419,678 413,207 406,560 400,223 412,173 400,513 407,117 65 Borrowings from Federal Reserve Banks 0 0 3,522 0 0 0 0 0 1,381 66 Treasury tax and loan notes 580 2,710 24,581 22,963 6,143 2,692 12,316 18,540 22,640 67 Other liabilities for borrowed money6 408.197 397,416 391,575 390,244 400,416 397,531 399,857 381,973 383,096 68 Other liabilities (including subordinated notes and debentures) . . . 218,946 213,405 213,780 214,996 214,170 209,098 212,799 213,759 211,755
69 Total liabilities 1,866,471 1,844,069 1,863,667 1,849,464 1,910,268 1,873,906 1,888,184 1,868,209 1,902,096
70 Residual (total assets less total liabilities)7 196,872 197,814 197,613 197,115 206,432 207,383 207,351 208,583 208,120
MEMO 71 Total loans and leases, gross, adjusted, plus securities8 1,688,351 1,685,983 1,689,292 1,686,570 1,719,892 1,710,572 1,715,058 1,710,268 1,709,038 72 Time deposits in amounts of $100,000 or more 126,160 126,540 126,910 126,032 130,282 130,983 131,296 132,154 130,448 73 Loans sold outright to affiliates9 1,020 1,014 1,000 989 980 974 967 958 951 74 Commercial and industrial 264 264 264 263 263 263 263 263 263 75 Other 755 750 736 725 717 711 704 695 689 76 Foreign branch credit extended to U.S. residents10 28,415 28,332 29,051 28.633 28,993 28,681 28,623 28,729 28,859 77 Net owed to related institutions abroad 68,820 74,965 72,643 78,224 73,058 67,112 68,578 72,397 71,078
1. Includes certificates of participation, issued or guaranteed by agencies of the U.S. government, in pools of residential mortgages.
2. Includes securities purchased under agreements to resell. 3. Includes allocated transfer risk reserve. 4. Includes negotiable order of withdrawal (NOWs) and automatic transfer service (ATS)
accounts, and telephone and preauthorized transfers of savings deposits. 5. Includes borrowings only from other than directly related institutions. 6. Includes federal funds purchased and securities sold under agreements to repurchase. 7. This balancing item is not intended as a measure of equity capital for use in capital-
adequacy analysis.
8. Excludes loans to and federal funds transactions with commercial banks in the United States.
9. Affiliates include a bank's own foreign branches, nonconsolidated nonbank affiliates of the bank, the bank's holding company (if not a bank), and nonconsolidated nonbank subsidiaries of the holding company.
10. Credit extended by foreign branches of domestically chartered weekly reporting banks to nonbank U.S. residents. Consists mainly of commercial and industrial loans, but includes an unknown amount of credit extended to other than nonfinancial businesses.
Digitized for FRASER http://fraser.stlouisfed.org/ Federal Reserve Bank of St. Louis

Weekly Reporting Commercial Banks A21
1.28 LARGE WEEKLY REPORTING U.S. BRANCHES AND AGENCIES OF FOREIGN BANKS Assets and Liabilities
Millions of dollars, Wednesday figures
Account 1 9 9 6
Account June 5 June 12 June 19 June 26 July 3 July 10 July 17 July 24 July 31
ASSETS
1 Cash and balances due from depository institutions 1 5 , 9 4 3 15 ,613 1 5 , 9 9 4 15 ,533 15 ,588 1 5 , 0 6 9 1 5 , 4 8 6 15 ,065 1 5 , 5 0 8
2 U.S. Treasury and government agency securities 4 9 , 8 9 9 5 0 , 4 1 3 5 0 , 0 1 8 4 9 , 9 6 2 5 0 , 3 0 1 5 0 , 9 2 7 5 1 , 1 0 5 5 1 , 7 8 0 5 2 , 2 4 7
3 Other securities 4 4 , 0 2 6 ' 4 3 , 2 9 4 ' 4 0 , 3 4 7 4 0 , 2 7 8 3 9 , 8 1 9 4 0 , 2 0 6 4 0 , 8 3 8 4 0 , 1 0 1 4 0 , 2 5 2 4 Federal funds sold1 2 6 , 2 6 7 3 0 , 2 1 5 2 9 , 3 9 9 2 7 , 3 8 9 2 8 , 1 2 2 2 8 , 7 7 9 2 8 , 4 0 6 2 6 , 4 8 0 2 6 , 7 1 0 5 To commercial banks in the United States 7 , 3 2 0 6 , 0 7 8 7 , 7 8 7 6 , 2 8 5 6 , 0 7 2 6 , 6 6 7 6 , 5 3 1 4 , 8 3 1 5 , 6 7 4 6 To others2 1 8 ,9 4 7 2 4 , 1 3 8 2 1 , 6 1 2 2 1 , 1 0 4 2 2 , 0 5 0 2 2 , 1 1 2 2 1 , 8 7 5 2 1 , 6 5 0 2 1 , 0 3 6 7 Other loans and leases, gross 186,699R 1 8 8 , 3 9 7 ' 1 9 0 , 5 8 1 ' 1 9 0 , 6 3 0 ' 1 9 3 , 6 5 2 1 9 2 , 4 3 5 1 9 4 , 7 5 0 1 9 4 , 5 3 6 1 9 4 , 7 3 1 8 Commercial and industrial 1 2 0 , 2 6 0 1 2 0 , 5 3 9 1 2 1 , 1 0 0 1 2 1 , 9 5 8 1 2 2 , 7 7 3 1 2 1 , 8 6 8 1 2 3 , 2 9 2 1 2 3 , 2 9 4 1 2 2 , 4 0 1 9 Bankers acceptances and commercial paper . 4 , 9 4 2 5 , 0 6 6 4 , 8 8 7 4 , 9 6 9 5 , 0 9 6 4 , 9 7 9 4 , 9 5 3 4 , 9 5 1 4 , 7 1 8
10 All other 1 1 5 , 3 1 8 1 1 5 , 4 7 3 1 1 6 , 2 1 4 1 1 6 , 9 8 9 1 1 7 , 6 7 8 1 1 6 , 8 8 9 1 1 8 , 3 3 9 1 1 8 , 3 4 4 1 1 7 , 6 8 4 11 U.S. addressees 1 0 9 , 0 8 0 1 0 9 , 2 3 3 1 0 9 , 9 3 5 1 0 9 , 9 2 7 1 1 0 , 8 5 0 1 0 9 , 9 7 0 1 1 1 , 3 6 0 1 1 1 , 3 8 8 1 1 0 , 7 4 7 12 Non-U.S. addressees 6 , 2 3 9 6 , 2 4 1 6 , 2 7 9 7 , 0 6 1 6 , 8 2 7 6 , 9 1 9 6 , 9 7 9 6 , 9 5 6 6 , 9 3 6 13 Loans secured by real estate 20 ,048 R 2 0 , 0 5 4 ' 2 0 , 1 4 7 ' 2 0 , 2 9 1 ' 1 9 , 9 7 9 2 0 , 1 0 5 1 9 , 8 4 8 1 9 , 8 3 7 1 9 , 8 9 0 14 Loans to depository and financial
2 0 , 0 5 4 '
institutions 3 3 , 6 7 6 3 5 , 3 0 6 3 5 , 9 7 8 3 6 , 0 4 4 3 7 , 3 5 2 3 7 , 5 2 9 3 8 , 7 7 3 3 8 , 3 9 7 3 9 , 3 4 0 15 Commercial banks in the United States 3 , 1 0 0 3 , 2 5 3 3 , 0 0 7 2 , 7 3 5 2 , 7 1 5 2 , 7 0 4 2 , 7 0 9 2 , 5 8 6 2 , 5 8 4 16 Banks in foreign countries 3 , 0 6 2 3 , 0 7 5 3 , 0 7 5 3 , 1 2 9 3 , 3 3 4 3 , 2 4 4 3 , 5 1 8 3 , 3 5 1 3 , 3 7 0 17 Nonbank financial institutions 2 7 , 5 1 4 2 8 , 9 7 8 2 9 , 8 9 6 3 0 , 1 8 1 3 1 , 3 0 2 3 1 , 5 8 1 3 2 , 5 4 6 3 2 , 4 6 0 3 3 , 3 8 5 18 For purchasing and carrying securities 5 , 3 8 7 5 , 1 4 3 5 , 7 4 2 4 , 9 9 4 5 , 9 2 0 5 , 3 0 0 5 , 4 4 4 5 , 4 9 0 5 , 4 7 2 19 To foreign governments and official
institutions 5 8 7 5 9 9 7 9 1 7 8 3 7 7 3 7 7 8 7 7 5 7 8 7 9 3 3 2 0 All other 6,740 R 6 , 7 5 5 ' 6 , 8 2 2 ' 6 , 5 6 0 ' 6 , 8 5 5 6 , 8 5 5 6 , 6 1 9 6 , 7 3 1 6 , 6 9 6 21 Other assets (claims on nonrelated parties) 39,783 R 3 8 , 8 9 7 ' 3 4 , 6 4 3 ' 3 3 , 6 3 6 ' 3 2 , 9 4 4 3 3 , 6 3 4 3 4 , 0 4 9 3 4 , 4 9 0 3 5 , 7 4 0
2 2 Total assets3 3 9 7 , 6 2 5 R 3 9 9 , 3 0 6 R 3 9 1 , 7 4 5 R 3 8 8 , 6 4 9 R 3 8 7 , 0 9 9 3 8 7 , 1 0 9 3 8 8 , 8 8 3 3 8 8 , 0 7 1 3 9 3 , 0 3 3
LIABILITIES
2 3 Deposits or credit balances owed to other than directly related institutions 1 1 1 , 0 8 8 1 1 0 , 5 9 5 1 0 8 , 6 0 8 1 0 8 , 3 1 1 1 0 4 , 0 2 0 1 0 6 , 5 8 2 1 0 9 , 7 8 7 1 0 9 , 3 0 4 1 0 9 , 1 9 0
2 4 Demand deposits4 4 , 3 2 5 4 , 1 4 5 4 , 4 6 2 4 , 3 8 0 4 , 2 0 3 4 , 0 9 5 4 , 6 6 4 3 , 8 3 9 4 , 1 9 2
25 Individuals, partnerships, and corporations . . . . 3 , 6 1 7 3 , 4 8 7 3 , 5 6 3 3 , 6 8 4 3 , 5 0 3 3 , 4 1 3 4 , 0 1 5 3 , 2 2 3 3 , 4 1 6 2 6 Other 7 0 8 6 5 8 8 9 9 6 9 6 7 0 0 6 8 3 6 4 8 6 1 6 7 7 6 2 7 Nontransaction accounts 1 0 6 , 7 6 3 1 0 6 , 4 5 0 1 0 4 , 1 4 6 1 0 3 , 9 3 1 9 9 , 8 1 8 1 0 2 , 4 8 6 1 0 5 , 1 2 3 1 0 5 , 4 6 5 1 0 4 , 9 9 7 28 Individuals, partnerships, and corporations . . . . 7 8 , 1 4 7 7 7 , 7 8 7 7 5 , 8 7 0 7 6 , 0 0 5 7 3 , 7 8 4 7 4 , 8 6 7 7 6 , 4 8 0 7 6 , 3 2 9 7 5 , 5 4 8 2 9 Other 2 8 , 6 1 6 2 8 , 6 6 3 2 8 , 2 7 6 2 7 , 9 2 7 2 6 , 0 3 4 2 7 , 6 1 9 2 8 , 6 4 3 2 9 , 1 3 6 2 9 , 4 4 9 3 0 Borrowings from other than directly
related institutions 8 1 , 7 2 9 8 6 , 1 7 7 8 4 , 7 1 4 8 1 , 6 1 0 8 3 , 9 8 2 8 1 , 8 0 3 7 8 , 5 9 5 8 0 , 9 0 0 8 6 , 0 6 8 31 Federal funds purchased5 4 9 , 3 3 0 5 2 , 3 5 0 5 0 , 5 0 9 4 9 , 9 8 7 5 3 , 6 5 2 5 2 , 0 9 1 4 8 , 0 8 3 4 8 , 6 4 9 5 3 , 6 7 3 3 2 From commercial banks in the United States . . 11 ,993 1 1 , 2 3 4 1 1 , 0 0 2 1 0 , 2 0 2 11 ,635 1 0 , 0 8 9 7 , 8 9 7 9 , 0 4 2 1 3 , 6 8 8 33 From others 3 7 , 3 3 7 4 1 , 1 1 6 3 9 , 5 0 7 3 9 , 7 8 6 4 2 , 0 1 8 4 2 , 0 0 1 4 0 , 1 8 6 3 9 , 6 0 7 3 9 , 9 8 5 3 4 Other liabilities for borrowed money 3 2 , 3 9 9 3 3 , 8 2 7 3 4 , 2 0 6 3 1 , 6 2 3 3 0 , 3 2 9 2 9 , 7 1 2 3 0 , 5 1 2 3 2 , 2 5 1 3 2 , 3 9 5 3 5 To commercial banks in the United States 3 , 8 1 2 3 , 9 7 0 4 , 0 2 4 4 , 2 4 1 3 , 9 5 3 4 , 1 2 9 3 , 7 1 2 3 , 6 1 2 3 , 6 4 1 3 6 To others 2 8 , 5 8 7 2 9 , 8 5 6 3 0 , 1 8 1 2 7 , 3 8 2 2 6 , 3 7 7 2 5 , 5 8 3 2 6 , 8 0 0 2 8 , 6 3 9 2 8 , 7 5 4 3 7 Other liabilities to nonrelated parties 62 ,494 R 6 2 , 3 9 0 ' 5 5 , 3 1 3 ' 5 6 , 2 9 0 ' 5 5 , 7 3 1 5 6 , 0 5 1 5 5 , 7 0 8 5 5 , 5 6 3 5 7 , 3 5 3
3 8 Total liabilities6 397 ,62S R 3 9 9 , 3 0 6 R 391 ,745 R 3 8 8 , 6 4 9 R 3 8 7 , 0 9 9 3 8 7 , 1 0 9 3 8 8 , 8 8 3 3 8 8 , 0 7 1 3 9 3 , 0 3 3
MEMO 3 9 Total loans (gross) and securities, adjusted7 2 9 6 , 4 7 1 ' 3 0 2 , 9 8 8 ' 2 9 9 , 5 4 9 ' 2 9 9 , 2 3 9 ' 3 0 3 , 1 0 6 3 0 2 , 9 7 6 3 0 5 , 8 5 9 3 0 5 , 4 8 1 3 0 5 , 6 8 2 4 0 Net owed to related institutions abroad 1 0 7 , 3 0 6 ' 1 0 7 , 6 6 7 ' 1 1 2 , 3 4 5 ' 1 1 1 , 2 1 6 ' 1 1 6 , 6 9 2 1 1 6 , 6 1 5 1 2 0 , 5 4 4 1 1 6 , 6 8 6 1 1 2 , 5 7 7
1. Includes securities purchased under agreements to resell. 2. Includes transactions with nonbank brokers and dealers in securities. 3. For U.S. branches and agencies of foreign banks having a net "due from" position,
includes net due from related institutions abroad. 4. Includes other transaction deposits.
5. Includes securities sold under agreements to repurchase. 6. For U.S. branches and agencies of foreign banks having a net "due to" position,
includes net owed to related institutions abroad. 7. Excludes loans to and federal funds transactions with commercial banks in the United
States.
Digitized for FRASER http://fraser.stlouisfed.org/ Federal Reserve Bank of St. Louis

A22 Domestic Nonfinancial Statistics • October 1996
1.32 COMMERCIAL PAPER AND BANKERS DOLLAR ACCEPTANCES OUTSTANDING
Millions of dollars, end of period
Year ending December 1996 Item Item
1991 1992 1993 1994 1995 Jan. Feb. Mar. Apr. May June
Commercial paper (seasonally adjusted unless noted otherwise)
1 All issuers 528,832 545,619 555,075 595,382 674,904 685,791 687,669 695,230r 710,690r 719,069r 731,027
Financial companies' 2 Dealer-placed paper2, total 212,999 226,456 218,947 223,038 275,815 288,368 293,313 291,600' 302,504' 301,670' 310,524 3 Directly placed paper3, total 182,463 171,605 180,389 207,701 210,829 208,159 208,046 208,880 211,833 221,463 223,236
4 Nonfinancial companies4 133,370 147,558 155,739 164,643 188,260 189,264 186,310 194,750' 196,352' 195,936' 197,267
5 Total
By holder 6 Accepting banks 7 Own bills 8 Bills bought from other banks
Federal Reserve Banks6
9 Foreign correspondents 10 Others
By basis 11 Imports into United States 12 Exports from United States 13 All other
Bankers dollar acceptances (not seasonally adjusted)
43,770 38,194 32,348 29,835
11,017 10,555 12,421 11,783 9,347 9,097 10,707 10,462 1,670 1,458 1,714 1,321
1,739 1,276 725 410 31,014 26,364 19,202 17,642
12,843 12,209 10,217 10,062 10,351 8,096 7,293 6,355 20,577 17,890 14,838 13,417
29,242
1. Institutions engaged primarily in commercial, savings, and mortgage banking; sales, personal, and mortgage financing; factoring, finance leasing, and other business lending; insurance underwriting; and other investment activities.
2. Includes all financial-company paper sold by dealers in the open market. 3. As reported by financial companies that place their paper directly with investors. 4. Includes public utilities and firms engaged primarily in such activities as communica-
tions, construction, manufacturing, mining, wholesale and retail trade, transportation, and services.
5. Data on bankers dollar acceptances are gathered from approximately 100 institutions. The reporting group is revised every January. Beginning January 1995, data for Bankers dollar acceptances will be reported annually in September.
6. In 1977 the Federal Reserve discontinued operations in bankers dollar acceptances for its own account.
1.33 PRIME RATE CHARGED BY BANKS Short-Term Business Loans1
Percent per year
Date of change Rate Period Average rate Period Average
rate Period Average rate
1993—Jan. 1 6.00 1993 6.00 1994—Jan 6.00 1995—Jan 8.50 1994 7.15 Feb 6.00 Feb 9.00
1994—Mar. 24 6.25 1995 8.83 Mar 6.06 Mar. 9.00 Apr. 19 6.75 Apr. 6.45 Apr. 9.00 May 17 7.25 1993- -Jan 6.00 May 6.99 May 9.00 Aug. 16 7.75 Feb 6.00 June 7.25 June 9.00 Nov. 15 8.50 Mar 6.00 July 7.25 July 8.80
Apr. 6.00 Aug 7.51 Aug 8.75 1995—Feb. 1 9.00 May 6.00 Sept 7.75 Sept 8.75
July 7 8.75 June 6.00 Oct 7.75 Oct 8.75 Dec. 20 8.50 July 6.00 Nov 8.15 Nov 8.75
Aug 6.00 Dec 8.50 Dec 8.65 1996—Feb. 1 8.25 Sept 6.00
Oct 6.00 1996—Jan 8.50 Nov 6.00 Feb 8.25 Dec 6.00 Mar 8.25
Apr 8.25 May 8.25 June 8.25 July 8.25 Aug 8.25
1. The prime rate is one of several base rates that banks use to price short-term business loans. The table shows the date on which a new rate came to be the predominant one quoted by a majority of the twenty-five largest banks by asset size, based on the most recent Call
Report. Data in this table also appear in the Board's H.15 (519) weekly and G.13 (415) monthly statistical releases. For ordering address, see inside front cover.
Digitized for FRASER http://fraser.stlouisfed.org/ Federal Reserve Bank of St. Louis

Financial Markets A23
1.35 INTEREST RATES Money and Capital Markets
Percent per year; figures are averages of business day data unless otherwise noted
Item 1993 1994 1995 1996 1996, week ending
Item 1993 1994 1995 Apr. May June July June 28 July 5 July 12 July 19 July 26
MONEY MARKET INSTRUMENTS
1 Federal funds1'2,3 3.02 4.21 5.83 5.22 5.24 5.27 5.40 5.21 5.53 5.26 5.23 5.25 2 Discount window borrowing2'4 3.00 3.60 5.21 5.00 5.00 5.00 5.00 5.00 5.00 5.00 5.00 5.00
Commercial paper3-5,6
3 1-month 3.17 4.43 5.93 5.40 5.38 5.45 5.44 5.50 5.49 5.45 5.44 5.40 4 3-month 3.22 4.66 5.93 5.39 5.39 5.49 5.53 5.51 5.52 5.56 5.54 5.51 5 6-month 3.30 4.93 5.93 5.38 5.42 5.57 5.67 5.61 5.63 5.70 5.69 5.65
Finance paper, directly placed*'5'1
6 1-month 3.12 4.33 5.81 5.31 5.29 5.35 5.33 5.38 5.35 5.36 5.31 5.29 7 3-month 3.16 4.53 5.78 5.28 5.29 5.37 5.43 5.40 5.39 5.45 5.44 5.42 8 6-month 3.15 4.56 5.68 5.20 5.23 5.35 5.44 5.38 5.36 5.48 5.45 5.43
Bankers acceptances3,5,8
9 3-month 3.13 4.56 5.81 5.28 5.29 5.38 5.45 5.40 5.43 5.47 5.45 5.44 10 6-month 3.21 4.83 5.80 5.28 5.31 5.47 5.57 5.49 5.52 5.59 5.58 5.55
Certificates of deposit, secondary market3,9
11 1-month 3.11 4.38 5.87 5.34 5.32 5.37 5.37 5.39 5.39 5.40 5.36 5.33 12 3-month 3.17 4.63 5.92 5.36 5.36 5.46 5.53 5.49 5.49 5.57 5.54 5.51 13 6-month 3.28 4.96 5.98 5.42 5.47 5.64 5.75 5.66 5.69 5.80 5.75 5.73
14 Eurodollar deposits, 3-month3,10 3.18 4.63 5.93 5.36 5.36 5.46 5.49 5.48 5.45 5.54 5.48 5.47
U.S. Treasury bills Secondary market3,5
15 3-month 3.00 4.25 5.49 4.95 5.02 5.09 5.15 5.09 5.13 5.15 5.13 5.16 16 6-month 3.12 4.64 5.56 5.06 5.12 5.25 5.30 5.22 5.26 5.34 5.28 5.30 17 1-year 3.29 5.02 5.60 5.23 5.33 5.48 5.52 5.47 5.49 5.57 5.47 5.53
Auction average3'5'" 18 3-month 3.02 4.29 5.51 4.99 5.02 5.11 5.17 5.10 5.12 5.21 5.19 5.14 19 6-month 3.14 4.66 5.59 5.08 5.12 5.26 5.32 5.23 5.22 5.41 5.36 5.30 20 1-year 3.33 5.02 5.69 5.17 5.31 5.56 5.49 5.56 n.a. n.a. n.a. 5.49
U.S. TREASURY NOTES AND BONDS
Constant maturities12
21 1-year 3.43 5.32 5.94 5.54 5.64 5.81 5.85 5.79 5.82 5.90 5.80 5.85 22 2-year 4.05 5.94 6.15 5.96 6.10 6.30 6.27 6.25 6.25 6.34 6.22 6.25 23 3-year 4.44 6.27 6.25 6.11 6.27 6.49 6.45 6.44 6.43 6.53 6.40 6.44 24 5-year 5.14 6.69 6.38 6.30 6.48 6.69 6.64 6.63 6.60 6.72 6.59 6.62 25 7-year 5.54 6.91 6.50 6.48 6.66 6.83 6.76 6.76 6.73 6.86 6.71 6.73 26 10-year 5.87 7.09 6.57 6.51 6.74 6.91 6.87 6.86 6.85 6.95 6.81 6.85 27 20-year 6.29 7.49 6.95 6.98 7.11 7.22 7.14 7.16 7.12 7.23 7.11 7.12 28 30-year 6.59 7.37 6.88 6.79 6.93 7.06 7.03 7.02 7.00 7.11 7.00 7.02
Composite 29 More than 10 years (long-term) 6.45 7.41 6.93 6.94 7.08 7.20 7.13 7.14 7.10 7.21 7.09 7.10
STATE AND LOCAL NOTES AND BONDS
Moody's series13
30 5.38 5.77 5.80 5.62 5.75 5.67 5.83 5.90 5.90 5.80 5.86 5.76 31 Baa 5.83 6.17 6.10 5.94 5.97 5.98 5.96 5.96 5.96 5.92 6.01 5.94 32 Bond Buyer series14 5.60 6.18 5.95 5.94 5.98 6.02 5.92 5.97 5.94 6.00 5.88 5.86
CORPORATE BONDS
33 Seasoned issues, all industries15 7.54 8.26 7.83 7.80 7.91 8.00 7.95 7.96 7.92 8.02 7.92 7.93
Rating group 34 Aaa 7.22 7.97 7.59 7.50 7.62 7.71 7.65 7.66 7.62 7.73 7.61 7.62 35 Aa 7.40 8.15 7.72 7.68 7.77 7.87 7.82 7.83 7.79 7.89 7.79 7.81 36 A 7.58 8.28 7.83 7.83 7.94 8.02 7.97 7.97 7.94 8.05 7.94 7.95 37 Baa 7.93 8.63 8.20 8.19 8.30 8.40 8.35 8.36 8.32 8.42 8.32 8.34 38 A-rated, recently offered utility bonds16 7.46 8.29 7.86 7.90 8.02 8.13 8.07 7.97 8.23 8.09 8.01 8.06
MEMO Dividend-price raticP
39 Common stocks 2.78 2.82 2.56 2.24 2.21 2.21 2.28 2.22 2.19 2.25 2.32 2.35
1. The daily effective federal funds rate is a weighted average of rates on trades through New York brokers.
2. Weekly figures are averages of seven calendar days ending on Wednesday of the current week; monthly figures include each calendar day in the month.
3. Annualized using a 360-day year for bank interest. 4. Rate for the Federal Reserve Bank of New York. 5. Quoted on a discount basis. 6. An average of offering rates on commercial paper placed by several leading dealers for
firms whose bond rating is AA or the equivalent. 7. An average of offering rates on paper directly placed by finance companies. 8. Representative closing yields for acceptances of the highest-rated money center banks. 9. An average of dealer offering rates on nationally traded certificates of deposit.
10. Bid rates for Eurodollar deposits at approximately 11:00 a.m. London time. Data are for indication purposes only.
11. Auction date for daily data; weekly and monthly averages computed on an issue-date basis.
12. Yields on actively traded issues adjusted to constant maturities. Source: U.S. Depart-ment of the Treasury.
13. General obligation bonds based on Thursday figures; Moody's Investors Service. 14. State and local government general obligation bonds maturing in twenty years are used
in compiling this index. The twenty-bond index has a rating roughly equivalent to Moodys' A1 rating. Based on Thursday figures.
15. Daily figures from Moody's Investors Service. Based on yields to maturity on selected long-term bonds.
16. Compilation of the Federal Reserve. This series is an estimate of the yield on recently offered, A-rated utility bonds with a thirty-year maturity and five years of call protection. Weekly data are based on Friday quotations.
17. Standard & Poor's corporate series. Common stock ratio is based on the 500 stocks in the price index.
NOTE. Some of the data in this table also appear in the Board's H.15 (519) weekly and G.13 (415) monthly statistical releases. For ordering address, see inside front cover.
Digitized for FRASER http://fraser.stlouisfed.org/ Federal Reserve Bank of St. Louis

A24 Domestic Nonfinancial Statistics • October 1996
1.36 STOCK MARKET Selected Statistics
1995 1996 Indicator 1993 Indicator 1993
Nov. Dec. Jan. Feb. Mar. Apr. May June July
Prices and trading volume (averages of daily figures)1
Common stock prices (indexes) 1 New York Stock Exchange
(Dec. 31, 1965 = 50) 249.71 254.16 291.18 317.58 327.90 329.22 346.46 346.73 347.50 354.84 358.32 345.06 2 Industrial 300.10 315.32 367.40 398.66 412.11 413.05 435.92 439.55 441.99 452.63 458.30 438.58 3 Transportation 242.68 247.17 270.14 300.06 303.53 300.43 315.29 324.77 326.42 334.66 331.57 316.57 4 Utility 114.55 104.96 110.64r 119.49 123.95r 127.09 135.51 122.83 122.44 124.86 123.60 122.66 5 Finance 216.55 209.75 238.48 266.12 273.36 274.96 290.97 290.44 287.92 290.43 294.42 287.89
6 Standard & Poor's Corporation (1941-43 = 10)2 451.63 460.42 541.72 595.53 614.57 614.42 649.54 647.07 647.17 661.23 668.50 644.06
7 American Stock Exchange (Aug. 31, 1973 = 50)3 438.77 449.49 498.13 529.93 538.01 540.48 562.34 565.69 580.60 600.93 591.99 550.16
Volume of trading (thousands of shares) 8 New York Stock Exchange 263,374 290,652 345,729 360,199 384,310 416,048 434,607 426,198 419,941 404,184 392,413 398,245 9 American Stock Exchange 18,188 17,951 20,387 16,724 21,085 21,069 27,107 22,988 24,886 28,127 23,903 21,281
Customer financing (millions of dollars, end-of-period balances)
10 Margin credit at broker-dealers4 60,310 61,160 76,680 77,875 76,680 73,530 77,090 78,308 81,170 86,100 87,160 79,860
Free credit balances at brokers5
11 Margin accounts6 12,360 14,095 16,250 15,590 16,250 14,950 15,840 15,770 15,780 16,890 16,800r 17,700 12 Cash accounts 27,715 28,870 34,340 30,340 34,340 32,465 34,700 33,113 33,100 33,760 33,775r 32,935
Margin requirements (percent of market value and eifective date)7
Mar. 11, 1968 June 8, 1968 May 6, 1970 Dec. 6, 1971 Nov. 24, 1972 Jan. 3, 1974
13 Margin stocks 70 80 65 55 65 50 14 Convertible bonds 50 60 50 50 50 50 15 Short sales 70 80 65 55 65 50
1. Daily data on prices are available upon request to the Board of Governors. For ordering address, see inside front cover.
2. In July 1976 a financial group, composed of banks and insurance companies, was added to the group of stocks on which the index is based. The index is now based on 400 industrial stocks (formerly 425), 20 transportation (formerly 15 rail), 40 public utility (formerly 60), and 40 financial.
3. On July 5, 1983, the American Stock Exchange rebased its index, effectively cutting previous readings in half.
4. Since July 1983, under the revised Regulation T, margin credit at broker-dealers has included credit extended against stocks, convertible bonds, stocks acquired through the exercise of subscription rights, corporate bonds, and government securities. Separate report-ing of data for margin stocks, convertible bonds, and subscription issues was discontinued in April 1984.
5. Free credit balances are amounts in accounts with no unfulfilled commitments to brokers and are subject to withdrawal by customers on demand.
6. Series initiated in June 1984. 7. Margin requirements, stated in regulations adopted by the Board of Governors pursuant
to the Securities Exchange Act of 1934, limit the amount of credit that can be used to
purchase and carry "margin securities" (as defined in the regulations) when such credit is collateralized by securities. Margin requirements on securities other than options are the difference between the market value (100 percent) and the maximum loan value of collateral as prescribed by the Board. Regulation T was adopted effective Oct. 15, 1934; Regulation U, effective May 1, 1936; Regulation G, effective Mar. 11, 1968; and Regulation X, effective Nov. 1, 1971.
On Jan. 1, 1977, the Board of Governors for the first time established in Regulation T the initial margin required for writing options on securities, setting it at 30 percent of the current market value of the stock underlying the option. On Sept. 30, 1985, the Board changed the required initial margin, allowing it to be the same as the option maintenance margin required by the appropriate exchange or self-regulatory organization; such maintenance margin rules must be approved by the Securities and Exchange Commission. Effective Jan. 31, 1986, the SEC approved new maintenance margin rules, permitting margins to be the price of the option plus 15 percent of the market value of the stock underlying the option.
Eifective June 8, 1988, margins were set to be the price of the option plus 20 percent of the market value of the stock underlying the option (or 15 percent in the case of stock-index options).
Digitized for FRASER http://fraser.stlouisfed.org/ Federal Reserve Bank of St. Louis

Federal Finance A25
1.38 FEDERAL FISCAL AND FINANCING OPERATIONS
Millions of dollars
Type of account or operation
Fiscal year Calendar year
Type of account or operation
1993 1994 1995 1996 Type of account or operation
1993 1994 1995 Feb. Mar. Apr. May June July
U.S. budget1
1 Receipts, total 1.153,535 1,257,737 1,355,213 89,349 89,011 203,386 90,044 151,919 103,813 2 On-budget 841,601 922,711 1,004,134 60,912 56,677 160,774 60,106 116,718 75,202 3 Off-budget 311,934 335,026 351,079 28,437 32,334 42,612 29,938 35,201 28,611 4 Outlays, total 1,408,675 1,460,841 1,519,133 133,644 136,286 130,993 143,342 117,818 130,909 5 On-budget 1.142,088 1,181,469 1,230,469 105,711 108,365 105,131 114,486 104,161 104,454 6 Off-budget 266,587 279,372 288,664 27,933 27,921 25,862 28,856 13,657 26,455 7 Surplus or deficit ( - ) , total -255,140 -203,104 -163,920 -44,295 -47,275 72,393 -53,298 34,101 -27,096 8 On-budget -300,487 -258,758 -226,335 -44,799 -51,688 55,643 -54,380 12,557 -29,252 9 Off-budget 45,347 55,654 62,415 504 4,413 16,750 1,082 21,544 2,156
Source of financing (total) 10 Borrowing from the public 248,619 185,344 171,288 47,022 39,189 -35,466 20,633 -8,619 29,098 11 Operating cash (decrease, or increase (—)) 6,283 16,564 -2,007 6,297 9,283 -26,449 43,809 -33,519 1,262 12 Other 2 238 1,196 -5,361 -9,024 - 1 9 7 -10,478 -11,144 8,037 -3,264
MEMO 13 Treasury operating balance (level, end of
period) 52,506 35,942 37,949 31,157 21,874 48,323 4,514 38,033 36,771 14 Federal Reserve Banks 17,289 6,848 8,620 5,632 7,021 11,042 3,757 7,701 6,836 15 Tax and loan accounts 35,217 29,094 29,329 25,525 14,853 37,281 757 30,332 29,936
1. Since 1990, off-budget items have been the social security trust funds (federal old-age survivors insurance and federal disability insurance) and the U.S. Postal Service.
2. Includes special drawing rights (SDRs); reserve position on the U.S. quota in the International Monetary Fund (IMF); loans to the IMF; other cash and monetary assets; accrued interest payable to the public; allocations of SDRs; deposit funds; miscellaneous liability (including checks outstanding) and asset accounts; seigniorage; increment on gold;
net gain or loss for U.S. currency valuation adjustment; net gain or loss for IMF loan-valuation adjustment; and profit on sale of gold.
SOURCE. Monthly totals: U.S. Department of the Treasury, Monthly Treasury Statement of Receipts and Outlays of the U.S. Government; fiscal year totals: U.S. Office of Management and Budget, Budget of the U.S. Government.
Digitized for FRASER http://fraser.stlouisfed.org/ Federal Reserve Bank of St. Louis

A26 Domestic Nonfinancial Statistics • October 1996
1 .39 U.S . B U D G E T R E C E I P T S A N D O U T L A Y S 1
Millions of dollars
Calendar year
May July
Source or type
Fiscal year
RECEIPTS
1 All sources
2 Individual income taxes, net 3 Withheld 4 Nonwithheld 5 Refunds
Corporation income taxes 6 Gross receipts 7 Refunds 8 Social insurance taxes and contributions, net 9 Employment taxes and contributions2
10 Unemployment insurance 11 Other net receipts3
12 Excise taxes 13 Customs deposits 14 Estate and gift taxes 15 Miscellaneous receipts4
OUTLAYS
16 All types
17 National defense 18 International affairs 19 General science, space, and technology 20 Energy 21 Natural resources and environment 22 Agriculture
23 Commerce and housing credit 24 Transportation 25 Community and regional development 26 Education, training, employment, and
social services
27 Health 28 Social security and Medicare 29 Income security
30 Veterans benefits and services 31 Administration of justice 32 General government 33 Net interest5
34 Undistributed offsetting receipts6
1 , 2 5 7 , 7 3 7
543,055 459,699 160,433 77,077
154,205 13,820
461,475 428,810
28,004 4,661
55,225 20,099 15,225 22,274
1 , 4 6 0 , 8 4 1
281,642 17,083 16,227 5,219
21,064 15,046
-5,118 38,066 10,454
46,307
107,122 464,312 214,031
37,642 15,256 11,303
202,957 -37,772
1 , 3 5 5 , 2 1 3
590,244 499,927 175,855 85,538
174,422 17,418
484,473 451,045
28,878 4,550
57,484 19,301 14,763 31,944
1 , 5 1 9 , 1 3 3
272,066 16,434 16,724 4,936
22,105 9,773
-14,441 39,350 10,641
115,418 495,701 220,449
37,938 16,223 13,835
232,173 -44,455
6 2 5 , 5 5 6
273,315 240,063 42,029
8,787
78,393 7,747
220,140 206,615
11.177 2,349
30.178 11,041 7,067
13,169
7 5 2 , 1 5 0
141,885 11,889 7,604 2,923
11,911 7,623
-4,270 21,835
6,283
27,450
54,147 236,817 101,806
19,761 7,753 7,355
109,434 -20,066
7 1 0 , 5 4 2
307,498 251,398 132,001 75,959
92,132 10,399
261,837 241,557
18,001 2,279
27,452 8,848 7,425
15,750
7 6 0 , 8 2 4
135,648 4,797 8 , 6 1 1 2,358
10,273 4,039
-13,937 18,193 5,073
25,893
59,057 251,975 117,190
19,269 8,051 5,796
116,169 -17,631
6 5 6 , 4 0 2
292,393 256,916 43,100 10,058
88,302 7,518
224,269 211,323
10,702 2,247
30,014 9,849 7,718
11,374
7 5 2 , 5 1 1
132,870r
6,994 8 , 8 1 0 2,203
12,633 3,062
-4,412 19,931 6,169r
57,098r
251,387 104,041r
18,684 8,116 r
7,621 119,351r
— 26,994
7 6 6 , 6 3 1
347,285 264,177 162,782 79,735
96,480 9,704
277,767 257,446
18 ,068 2,254
25,682 8,731 8,775
11,620
7 8 5 , 7 3 0
133,439r
8,074 8,897 1,355
10,238 71
-7,334 18,291 5,237r
26,137
59,957 264,649 121,032
18,164 9,021 4,641
120,579 -16,716
9 0 , 0 4 4
29,914 45,399
6,352 21,850
3,647 1,077
48,676 38,104 10,155
417
4,113 1,427 1,415 1,929
1 4 3 , 3 4 2
26,609 1,165 1,584
216 1,757 -175
256 3,324
826
3,961
11 ,201 46,727 21,407
5,254 1,683 180
20,359 -2,991
1 5 1 , 9 1 9
6 0 , 8 1 6 35,941 26,926
2 , 0 6 1
37,950 992
45,583 44,888
400 295
4,310 1,450 1,141 1,663
1 1 7 , 8 1 8
19,769 837
1,536 822
1,543 - 1 2 4
-1,368 3,185
9,762 44,731 11,332
1,570 1,327 1,755
18,977 -2,636
1 0 3 , 8 1 3
49,814 48,072
3,631 1,893
5,656 681 39,258 36,946
1,939 372
4,508 1,712 1,259 2,287
1 3 0 , 9 0 9
22,541 497
1,660 187
2,062 843
- 3 0 4 3,648
959
10,077 45,376 18,189
3,255 1,989
53 20,311 -3,543
1. Functional details do not sum to total outlays for calendar year data because revisions to monthly totals have not been distributed among functions. Fiscal year total for receipts and outlays do not correspond to calendar year data because revisions from the Budget have not been fully distributed across months.
2. Old-age, disability, and hospital insurance, and railroad retirement accounts. 3. Federal employee retirement contributions and civil service retirement and
disability fund.
4. Deposits of earnings by Federal Reserve Banks and other miscellaneous receipts. 5. Includes interest received by trust funds. 6. Rents and royalties for the outer continental shelf, U.S. government contributions for
employee retirement, and certain asset sales. SOURCE. Fiscal year totals: U.S. Office of Management and Budget, Budget of the U.S.
Government, Fiscal Year 1997; monthly and half-year totals: U.S. Department of the Trea-sury, Monthly Treasury Statement of Receipts and Outlays of the U.S. Government.
Digitized for FRASER http://fraser.stlouisfed.org/ Federal Reserve Bank of St. Louis

Federal Finance A25
1.40 FEDERAL DEBT SUBJECT TO STATUTORY LIMITATION
Billions of dollars, end of month
Item 1994 1995 1996
Item June 30 Sept. 30 Dec. 31 Mar. 31 June 30 Sept. 30 Dec. 31 Mar. 31 June 30
1 Federal debt outstanding 4,673 4,721 4,827 4,891 4,978 5,001 5,017 5,153 5,197
2 Public debt securities 4,646 4,693 4,800 4,864 4,951 4,974 4,989 5,118 5,161 3 Held by public 3,443 3,480 3,543 3,610 3,635 3,653 3,684 3,764 n.a. 4 Held by agencies 1,203 1,213 1,257 1,255 1,317 1,321 1,305 1,354 n.a.
5 Agency securities 28 29 27 27 27 27 28 36 36 6 Held by public 27 29 27 26 27 27 28 28 n.a. / Held by agencies 0 0 0 0 0 0 0 8 n.a.
8 Debt subject to statutory limit 4,559 4,605 4,711 4,775 4,861 4,885 4,900 5,030 5,073
9 Public debt securities 4,559 4,605 4,711 4,774 4,861 4,885 4,900 5,030 5,073 10 Other debt1 0 0 0 0 0 0 0 0 0
MEMO 11 Statutory debt limit 4,900 4,900 4,900 4,900 4,900 4,900 4,900 5,500 5,500
1. Consists of guaranteed debt of U.S. Treasury and other federal agencies, specified SOURCE. U.S. Department of the Treasury, Monthly Statement of the Public Debt of the participation certificates, notes to international lending organizations, and District of Colum- United States and Treasury Bulletin. bia stadium bonds.
1.41 GROSS PUBLIC DEBT OF U.S. TREASURY Types and Ownership
Billions of dollars, end of period
Type and holder 1992 1993 1994 1995 1995 1996
Type and holder 1992 1993 1994 1995 Q3 Q4 Q1 Q2
1 Total gross public debt 4,177.0 4,535.7 4,800.2 4,988.7 4,974.0 4,988.7 5,117.8 5,161.1
By type 2 Interest-bearing 4,173.9 4,532.3 4,769.2 4,964.4 4,950.6 4,964.4 5,083.0 5,126.8 3 Marketable 2,754.1 2,989.5 3,126.0 3,307.2 3,260.5 3,307.2 3,375.1 3,348.4 4 Bills 657.7 714.6 733.8 760.7 742.5 760.7 811.9 773.6 5 Notes 1,608.9 1,764.0 1,867.0 2,010.3 1,980.3 2,010.3 2,014.1 2,025.8 6 Bonds 472.5 495.9 510.3 521.2 522.6 521.2 534.1 534.1 7 Nonmarketable1 1,419.8 1,542.9 1,643.1 1,657.2 1,690.2 1,657.2 1,707.9 1,778.3 8 State and local government series 153.5 149.5 132.6 104.5 113.4 104.5 96.5 97.8 9 Foreign issues2 37.4 43.5 42.5 40.8 41.0 40.8 40.4 37.8
10 Government 37.4 43.5 42.5 40.8 41.0 40.8 40.4 37.8 11 Public .0 .0 .0 .0 .0 .0 .0 .0 12 Savings bonds and notes 155.0 169.4 177.8 181.9 181.2 181.9 183.0 183.8 13 Government account series' 1,043.5 1,150.0 1,259.8 1,299.6 1,324.3 1,299.6 1,357.7 1,428.5 14 Non-interest-bearing 3.1 3.4 31.0 24.3 23.3 24.3 34.8 34.3
By holder 4
15 U.S. Treasury and other federal agencies and trust funds 1,047.8 1,153.5 1,257.1 1,304.5 1,320.8 1,304.5 1,353.8 16 Federal Reserve Banks 302.5 334.2 374.1 391.0 374.1 391.0 381.0 17 Private investors 2,839.9 3,047.4 3,168.0 3,294.9 3,279.5 3,294.9 3,382.8 18 Commercial banks 294.4 322.2 290.1 280.1 289.0 280.1 281.0 19 Money market funds 79.7 80.8 67.6 71.3 64.2 71.3 87.3 20 Insurance companies 197.5 234.5 240.1 252.6 249.8 252.6 254.5 21 Other companies 192.5 213.0 226.5 228.8 224.1 228.8 229.0 n a. 22 State and local treasuries5'6 563.3 605.9 483.4 343.8 384.9 343.8 343.0
Individuals 23 Savings bonds 157.3 171.9 180.5 185.0 183.5 185.0 185.8 24 Other securities 131.9 137.9 150.7 162.7 162.4 162.7 161.4 25 Foreign and international7
549.7 623.0 688.6 861.8 848.1 861.8 930.1 26 Other miscellaneous investors6'8 673.5 658.3 840.5 908.8 873.5 908.8 910.7
1. Includes (not shown separately) securities issued to the Rural Electrification Administra-tion, depository bonds, retirement plan bonds, and individual retirement bonds.
2. Nonmarketable series denominated in dollars, and series denominated in foreign cur-rency held by foreigners.
3. Held almost entirely by U.S. Treasury and other federal agencies and trust funds. 4. Data for Federal Reserve Banks and U.S. government agencies and trust funds are actual
holdings; data for other groups are Treasury estimates. 5. Includes state and local pension funds. 6. In March 1996, in a redefinition of series, fully defeased debt backed by nonmarketable
federal securities was removed from "Other miscellaneous investors" and added to "State and local treasuries." The data shown here have been revised accordingly.
7. Consists of investments of foreign balances and international accounts in the United States.
8. Includes savings and loan associations, nonprofit institutions, credit unions, mutual savings banks, corporate pension trust funds, dealers and brokers, certain U.S. Treasury deposit accounts, and federally sponsored agencies.
SOURCE. U.S. Treasury Department, data by type of security, Monthly Statement of the Public Debt of the United States; data by holder, Treasury Bulletin.
Digitized for FRASER http://fraser.stlouisfed.org/ Federal Reserve Bank of St. Louis

A28 Domestic Nonfinancial Statistics • October 1996
1.42 U.S. GOVERNMENT SECURITIES DEALERS Transactions1
Millions of dollars, daily averages
1996 1996, week ending
Item Item Apr. May June June 5 June 12 June 19 June 26 July 3 July 10 July 17 July 24 July 31
OUTRIGHT TRANSACTIONS2
By type of security 1 U.S. Treasury bills 55,901 47,278 52,915 57,129 53,849 55,294 47,770 51,172 45,975 46,759 44,730 45,143
Coupon securities, by maturity 2 Five years or less 97,216 94,636 99,169 98,440 108,694 96,599 92,456 99,661 89,231 102,734 101,135 76,322 3 More than five years 41,971 49,383 43,649 44,864 48,800 42,796 36,010 50,178 53,013 48,832 40,111 37,812 4 Federal agency 28,936 29,131 33,225 29,123 30,317 35,178 35,464 36,166 35,736 34,710 35,317 34,819 5 Mortgage-backed 34,788 35,929 35,542 35,943 56,857 31,260 21,376 27,774 52,724 41,762 27,177 24,319
By type of counterparty With interdealer broker
6 U.S. Treasury 112,758 111,032 113,378 111,907 126,241 113,458 101,372 113,246 106,315 115,888 108,081 91,951 7 Federal agency 795 661 704 496 752 828 707 575 629 748 662 665 8 Mortgage-backed 11,979 13,422 13,267 15,522 19,210 11,399 8,498 11,624 18,216 15,669 10,056 7,890
With other 9 U.S. Treasury 82,330 80,265 82,355 88,526 85,103 81,230 74,864 87,765 81,904 82,436 77,896 67,327
10 Federal agency 28,141 28,470 32,521 28,626 29,565 34,350 34,757 35,591 35,108 33,962 34,654 34,154 11 Mortgage-backed 22,808 22,507 22,275 20,421 37,647 19,861 12,878 16,150 34,509 26,093 17,121 16,429
FUTURES TRANSACTIONS3
By type of deliverable security 12 U.S. Treasury bills 369 410 539 481 779 866 121 250 265 316 n.a. 100
Coupon securities, by maturity 13 Five years or less 1,203 1,550 l,761r 2,158 2,064 1,946 1.026 1,781 1,494 1,945 1,774 1,086 14 More than five years 11,717 12,854 12,742 14,370 15,346 13,997 8.484 11,299 11,484 11,291 11,071 9,513 15 Federal agency 0 0 0 0 0 0 0 0 0 0 0 0 16 Mortgage-backed 0 0 0 0 0 0 0 0 0 0 0 0
OPTIONS TRANSACTIONS4
By type of underlying security 17 U.S. Treasury bills 0 0 0 0 0 0 0 0 0 0 0 0
Coupon securities, by maturity 18 Five years or less 1,582 2,294 2,937 2,255 4,289 2,502 2,329 3,186 1,417 2,187 1,978 1,588 19 More than five years 3,773 4,057 4,494 4,562 5,585 4,753 3,252 4,119 4,806 4,064 3,654 3,644 20 Federal agency 0 0 0 0 0 0 0 0 0 0 0 0 21 Mortgage-backed 1,110 1,046 786 971 1,288 467 510 740 1,089 590 633 489
1. Transactions are market purchases and sales of securities as reported to the Federal Reserve Bank of New York by the U.S. government securities dealers on its published list of primary dealers. Monthly averages are based on the number of trading days in the month. Transactions are assumed evenly distributed among the trading days of the report week. Immediate, forward, and futures transactions are reported at principal value, which does not include accrued interest; options transactions are reported at the face value of the underlying securities.
Dealers report cumulative transactions for each week ending Wednesday. 2. Outright transactions include immediate and forward transactions. Immediate delivery
refers to purchases or sales of securities (other than mortgage-backed federal agency securi-ties) for which delivery is scheduled in five business days or less and "when-issued" securities that settle on the issue date of offering. Transactions for immediate delivery of mortgage-backed agency securities include purchases and sales for which delivery is scheduled in thirty business days or less. Stripped securities are reported at market value by maturity of coupon or corpus.
Forward transactions are agreements made in the over-the-counter market that specify delayed delivery. Forward contracts for U.S. Treasury securities and federal agency debt securities are included when the time to delivery is more than five business days. Forward contracts for mortgage-backed agency securities are included when the time to delivery is more than thirty business days.
3. Futures transactions are standardized agreements arranged on an exchange. All futures transactions are included regardless of time to delivery.
4. Options transactions are purchases or sales of put and call options, whether arranged on an organized exchange or in the over-the-counter market, and include options on futures contracts on U.S. Treasury and federal agency securities.
NOTE, "n.a." indicates that data are not published because of insufficient activity. Major changes in the report form filed by primary dealers induced a break in the dealer data
series as of the week ending July 6, 1994.
Digitized for FRASER http://fraser.stlouisfed.org/ Federal Reserve Bank of St. Louis

Federal Finance A25
1.43 U.S. GOVERNMENT SECURITIES DEALERS Positions and Financing1
Millions of dollars
Item 1996 1996, week ending
Item Apr. May June June 5 June 12 June 19 June 26 July 3 July 10 July 17 July 24
Positions"
NET OUTRIGHT POSITIONS3
By type of security 1 U.S. Treasury bills 17,119 15,447 13,791 28,159 22,380 8,845 4,991 4,854 10,113 12,921 23,286
Coupon securities, by maturity 2 Five years or less 7,771 2,210 -4,136 -961 -3,042 -10,342 -1 ,686 -3,448 -14,023 -10,059 -8,166 3 More than five years -27,702 -23,291 -20,940 -22,315 -21,501 -21,006 -20,230 -19,366 -17,599 -19,276 -20,244 4 Federal agency 26,566 23,921 22,350 22,655 24,935 22,365 22,229 17,632 18,296 22,818 24,189 5 Mortgage-backed 32,583 34,206 35,764 36,270 35,104 35,001 35,372 38,307 37,003 39,147 40,305
NET FUTURES POSITIONS4
By type of deliverable security 6 U.S. Treasury bills -3,560 -4,625 -2,006 —3,484 -2,941 -1,157 -1,049 -1,681 -1,571 -2,778 -3,226
Coupon securities, by maturity 7 Five years or less 1,073 632 254 7 466 1,617 260 -2,202 -1,978 -2,079 -1,015 8 More than five years -4,285 -3,598 -7,798 -4,910 -5,945 -5,821 -10,124 -14,039 -11,211 -12,557 -15,194 9 Federal agency 0 0 0 0 0 0 0 0 0 0 0
10 Mortgage-backed 0 0 0 0 0 0 0 0 0 0 0
NET OPTIONS POSITIONS
By type of deliverable security 11 U.S. Treasury bills 0 0 0 0 0 0 0 0 0 0 0
Coupon securities, by maturity 12 Five years or less 1,542 - 1 3 9 -2,515 -1 ,868 -2,276 -3,099 -2,796 -2,225 - 7 3 2 - 9 0 8 -1,058 13 More than five years 1,081 - 7 0 3 670 - 7 3 5 235 70 1,308 3,123 1,884 1,162 3,229 14 Federal agency 0 0 0 0 0 0 0 n.a. n.a. n.a. 0 15 Mortgage-backed 4,435 3,902 3,075 3,465 3,479 2,941 2,896 2,425 2,886 2,548 2,604
Financing5
Reverse repurchase agreements 16 Overnight and continuing 256,694 251,988 243,475 235,548 238,277 248,074 242,786 255.640 267,488 263,405 250,706 17 Term 467,590 453,182 463,139 428,448 470,543 471,190 479,431 450,945 475,371 488,031 507,791
Securities borrowed 18 Overnight and continuing 166,490 173,105 179,427 182,616 181,178 182,894 173,201 177,206 182,305 185,499 182,017 19 Term 67,330 63,987 60,592 58,906 61,003 60,316 61,212 61,379 59,185 58,974 64,132
Securities received as pledge 20 Overnight and continuing 3,275 2,488 5,063 4,501 4,446 5,423 5,411 5,605 5,503 4,516 4,060 21 Term 53 52 82 47 91 112 86 51 56 56 49
Repurchase agreements 22 Overnight and continuing 577,949 559,390 540,745 556,952 561,144 545,801 508,525 532,327 563,727 568,361 560,993 23 Term 399,259 392,946 409,135 362,346 403,262 415,376 444,087 405,814 412,138 424,209 449,452
Securities loaned 24 Overnight and continuing 4,728 4,804 5,341 5,577 5,711 5,890 4,636 4,670 4,697 4,915 4,384 25 Term 2,611 3,094 3,160 0 0 0 0 3,160 3,133 3,159 3,524
Securities pledged 26 Overnight and continuing 37,160 41,591 46,541 45,317 45,388 47,466 51,352 40,053 39,833 40,852 37,337 27 Term 8,518 6,797 6,584 6,016 6,063 6,060 7,419 7,664 7,595 6,566 6,668
Collateralized loans 28 Overnight and continuing 12,819 10,687 10,828 11,827 12,080 10,911 6,955 14,023 15,662 15,662 14,260 29 Term 1,328 1,411 1,327 1,270 1,470 1,289 1 ,284 1 ,289 1 ,794 1 ,189 1,289 30 Total 14,045 12,091 12,155 13,097 13,550 12,200 8,239 15,312 17,456 16,791 15,549
MEMO: Matched book6
Securities in 31 Overnight and continuing 244,480 244,668 243,847 236,593 236,204 250,199 244,804 253,497 270,866 271,578 265,571 32 Term 464,018 441,772 448,381 413,953 459,074 453,905 461,803 439,546 460,576 475,035 497,723
Securities out 33 Overnight and continuing 362,930r 349,379r 344,632 337,593 356,820 350,654 330,951 345,504 374,155 369,901 369,738 34 Term 349,263 337,119 353,804 309,423 345,288 360,676 385,233 357,154 361,575 379,096 397,826
1. Data for positions and financing are obtained from reports submitted to the Federal Reserve Bank of New York by the U.S. government securities dealers on its published list of primary dealers. Weekly figures are close-of-business Wednesday data. Positions for calendar days of the report week are assumed to be constant. Monthly averages are based on the number of calendar days in the month.
2. Securities positions are reported at market value. 3. Net outright positions include immediate and forward positions. Net immediate posi-
tions include securities purchased or sold (other than mortgage-backed agency securities) that have been delivered or are scheduled to be delivered in five business days or less and "when-issued" securities that settle on the issue date of offering. Net immediate positions for mortgage-backed agency securities include securities purchased or sold that have been delivered or are scheduled to be delivered in thirty business days or less.
Forward positions reflect agreements made in the over-the-counter market that specify delayed delivery. Forward contracts for U.S. Treasury securities and federal agency debt securities are included when the time to delivery is more than five business days. Forward contracts for mortgage-backed agency securities are included when the time to delivery is more than thirty business days.
4. Futures positions reflect standardized agreements arranged on an exchange. All futures positions are included regardless of time to delivery.
5. Overnight financing refers to agreements made on one business day that mature on the next business day; continuing contracts are agreements that remain in effect for more than one business day but have no specific maturity and can be terminated without advance notice by either party; term agreements have a fixed maturity of more than one business day. Financing data are reported in terms of actual funds paid or received, including accrued interest.
6. Matched-book data reflect financial intermediation activity in which the borrowing and lending transactions are matched. Matched-book data are included in the financing break-downs given above. The reverse repurchase and repurchase numbers are not always equal because of the "matching" of securities of different values or different types of collateraliza-tion.
NOTE, "n.a." indicates that data are not published because of insufficient activity. Major changes in the report form filed by primary dealers induced a break in the dealer data
series as of the week ending July 6, 1994.
Digitized for FRASER http://fraser.stlouisfed.org/ Federal Reserve Bank of St. Louis

A30 Domestic Nonfinancial Statistics • October 1996
1.44 FEDERAL AND FEDERALLY SPONSORED CREDIT AGENCIES Debt Outstanding
Millions of dollars, end of period
Agency 1992 1993 1994 1995 1996
Agency 1992 1993 1994 1995 Jan. Feb. Mar. Apr. May
1 Federal and federally sponsored agencies 483,970 570,711 738,928 844,611 836,820 840,384 846,807
2 Federal agencies 41,829 45,193 39,186 37,347 37,273 31,986 31,284 3 Defense Department' 7 6 6 6 6 6 6 4 Export-Import Bank2'3 7,208 5,315 3,455 2,050 2,050 2,050 2,015 5 Federal Housing Administration4 374 255 116 97 31 35 52 n a. n a. 6 Government National Mortgage Association certificates of
participation5 n.a. n.a. n.a. n.a. n.a. n.a. n.a. 7 Postal Service6 10,660 9,732 8,073 5,765 5,765 300 300 8 Tennessee Valley Authority 23,580 29,885 27,536 29,429 29,421 29,595 28,911 9 United States Railway Association6 n.a. n.a. n.a. n.a. n.a. n.a. n.a.
10 Federally sponsored agencies7 442,141 523,452 699,742 807,264 799,547 808,398 815,523 837,570 11 Federal Home Loan Banks 114,733 139,512 205,817 243,194 234,664 233,404 239,253 242,437 243,389 12 Federal Home Loan Mortgage Corporation 29,631 49,993 93,279 119,961 120,868 123,777 124,278 136,185 141,248 13 Federal National Mortgage Association 166,300 201,112 257,230 299,174 297,657 304,159 306,815 306,361 305,050 14 Farm Credit Banks8 51,910 53,123 53,175 57,379 58,659 57,536 59,428 60,815 61,197 15 Student Loan Marketing Association9 39,650 39,784 50,335 47,529 47,673 49,495 45,723 47,052 46,735 16 Financing Corporation10 8,170 8,170 8,170 8,170 8,170 8,170 8,170 8 170 8,170 17 Farm Credit Financial Assistance Corporation" 1,261 1,261 1,261 1,261 1,261 1,261 1,261 1,261 1,261 18 Resolution Funding Corporation12 29,996 29,996 29,996 29,996 29,996 29,996 29,996 29,996 29,996
MEMO 19 Federal Financing Bank debt13 154,994 128,187 103,817 78,681 78,512 68,037 66,725
Lending to federal and federally sponsored agencies 20 Export-Import Bank3 7,202 5,309 3,449 2,044 2,044 2,044 2,009 21 Postal Service6 10,440 9,732 8,073 5,765 5,765 300 300 22 Student Loan Marketing Association 4,790 4,760 n.a. n.a. n.a. n.a. n.a. 23 Tennessee Valley Authority 6,975 6,325 3,200 3,200 3,200 n.a. n.a. n.a. n a. 24 United States Railway Association6 n.a. n.a. n.a. n.a. n.a. n.a. n.a.
Other lending14
25 Farmers Home Administration 42,979 38,619 33,719 21,015 21,015 21,015 21,015 26 Rural Electrification Administration 18,172 17,578 17,392 17,144 17,026 17,040 17,049 27 Other 64,436 45,864 37,984 29,513 29,462 27,638 26,352
1. Consists of mortgages assumed by the Defense Department between 1957 and 1963 under family housing and homeowners assistance programs.
2. Includes participation certificates reclassified as debt beginning Oct. 1, 1976. 3. On-budget since Sept. 30, 1976. 4. Consists of debentures issued in payment of Federal Housing Administration insurance
claims. Once issued, these securities may be sold privately on the securities market. 5. Certificates of participation issued before fiscal year 1969 by the Government National
Mortgage Association acting as trustee for the Farmers Home Administration, the Department of Health, Education, and Welfare, the Department of Housing and Urban Development, the Small Business Administration, and the Veterans Administration.
6. Off-budget. 7. Includes outstanding noncontingent liabilities: notes, bonds, and debentures. Includes
Federal Agricultural Mortgage Corporation; therefore details do not sum to total. Some data are estimated.
8. Excludes borrowing by the Farm Credit Financial Assistance Corporation, which is shown on line 17.
9. Before late 1982, the association obtained financing through the Federal Financing Bank (FFB). Borrowing excludes that obtained from the FFB, which is shown on line 22.
10. The Financing Corporation, established in August 1987 to recapitalize the Federal Savings and Loan Insurance Corporation, undertook its first borrowing in October 1987.
11. The Farm Credit Financial Assistance Corporation, established in January 1988 to provide assistance to the Farm Credit System, undertook its first borrowing in July 1988.
12. The Resolution Funding Corporation, established by the Financial Institutions Reform, Recovery, and Enforcement Act of 1989, undertook its first borrowing in October 1989.
13. The FFB, which began operations in 1974, is authorized to purchase or sell obligations issued, sold, or guaranteed by other federal agencies. Because FFB incurs debt solely for the purpose of lending to other agencies, its debt is not included in the main portion of the table to avoid double counting.
14. Includes FFB purchases of agency assets and guaranteed loans; the latter are loans guaranteed by numerous agencies, with the amounts guaranteed by any one agency generally being small. The Farmers Home Administration entry consists exclusively of agency assets, whereas the Rural Electrification Administration entry consists of both agency assets and guaranteed loans.
Digitized for FRASER http://fraser.stlouisfed.org/ Federal Reserve Bank of St. Louis

Securities Market and Corporate Finance A31
1.45 NEW SECURITY ISSUES Tax-Exempt State and Local Governments
Millions of dollars
Type of issue or issuer, or use 1993 1994 1995
1995 1996 Type of issue or issuer,
or use 1993 1994 1995 Dec. Jan. Feb. Mar. Apr. May June July
1 All issues, new and refunding1 279,945 153,950 143,101 16,978 11,545 11,598 15,244 13,199 14,991 16,533 11,162
By type of issue 2 General obligation 90,599 54,404 55,737 5,489 6,074 2,063 4,846 5,083 5,476 6,493 4,078 3 Revenue 189,346 99,546 86,555 11,489 5,471 9,535 10,398 8,116 9,515 10,040 7,084
By type of issuer 4 State 27,999 19,186 14,215 951 1,630 695 904 926 2,807 1,047 680 5 Special district or statutory authority2 178,714 95,896 91,419 11,678 7,052 7,820 10,141 9,571 9,824 9,899 6,923 6 Municipality, county, or township 73,232 38,868 36,658 4,349 2,863 3,083 4,199 2,702 2,360 5,587 3,559
7 Issues for new capital 91,434 105,972 94,412 11,070 6,517 6,383 10,621 9,487 9,594 13,864 9,364
By use of proceeds 8 Education 16,831 21,267 24,926 2,968 2,065 2,226 1,847 2,142 2,442 3,453 1,859 9 Transportation 9,167 10,836 11,887 1,178 573 359 1,417 682 778 1,390 547
10 Utilities and conservation 12,014 10,192 9,618 1,664 439 582 892 592 1,368 974 984 11 Social welfare 13,837 20,289 18,612 1,614 935 904 2,715 1,669 1,764 3,152 2,074 12 Industrial aid 6,862 8,161 6,566 1,325 322 110 785 751 302 414 326 13 Other purposes 32,723 35,227 26,518 2,321 2,183 2,202 2,965 3,651 2,940 4,481 3,574
1. Par amounts of long-term issues based on date of sale. SOURCE. Securities Data Company beginning January 1993; Investment 2. Includes school districts. Dealer's Digest before then.
1.46 NEW SECURITY ISSUES U.S. Corporations
Millions of dollars
Type of issue, offering, or issuer 1993 1994 1995
1995 1996 Type of issue, offering,
or issuer 1993 1994 1995 Nov. Dec. Jan. Feb. Mar. Apr. May June
1 All issues' 769,088 583,240 n a. 55,349 40,149 49,520r 62,115r 55,666r 48,844r 69,176 66,233
2 Bonds2 646,634 498,039 n a. 47,568 34,619 44,764r 52,955r 48,256r 36,344r 55,894 53,492
By type of offering 3 Public, domestic 487,029 365,222 408,806 43,336 32,219 35,443r 45,972r 41,419r 30,585r 46,825 45,446 4 Private placement, domestic3 121,226 76,065 n a. n.a. n.a. n.a. n.a. n.a. n.a. n.a. n.a. 5 Sold abroad 38,379 56,755 76,910 4,232 2,399 9,321r 6,984r 6,837r 5,759r 9,069 8,046
By industry group 6 Manufacturing 88,160 43,423 42,950 4,017 3,205 3,952r 2,522r 3,335 2,503r 5,937 5,339 7 Commercial and miscellaneous 58,559 40,735 37,139 4,178 3,099 2,277r 2,840r 3,803r 2,663r 4,933 4,272 8 Transportation 10,816 6,867 5,727 225 1,240 664 584 137 120 819 850 9 Public utility 56,330 13,322 11,974 485 685 l,906r 965r 788r 444r 691 1,144
10 Communication 31,950 13,340 18,158 3,333 648 748 2,691 2,253r 724r 1,187 2,231 11 Real estate and financial 400,820 380,352 369,769 35,330 25,742 35,217r 43,354r 37,94 l r 29,890r 42,326 39,658
12 Stocks2 122,454 85,155 n.a. 7,781 5,530 4,756 9,160 7,410r 12,500 13,282 12,741
By type of offering 13 Public preferred 18,897 12,570 10,964 2,210 890 2,167 3,258 967 2,000 1,660 3,195 14 Common 82,657 47,828 57,809 5,571 4,640 2,589 5,902 6,443 10,500 11,622 9,546 15 Private placement3 20,900 24,800 n.a. n.a. n.a. n.a. n.a. n.a. n.a. n.a.
By industry group 16 Manufacturing 22,271 17,798 2,209 681 295 1,543 2,036 3,968 2,777 2,688 17 Commercial and miscellaneous 25,761 15,713 n.a. 3,274 2,632 2,521 2,659 3,577 4,122 5,041 6,444 18 Transportation 2,237 2,203 97 156 38 141 232 37 322 189 19 Public utility 7,050 2,214 36 322 115 809 319 149 147 569 20 Communication 3,439 494 0 0 200 122 100 144 1,205 837 21 Real estate and financial 61,004 46,733 2,166 1,739 1,588 3,719 1,130 4,079 3,789 2,015
1. Figures represent gross proceeds of issues maturing in more than one year; they are the principal amount or number of units calculated by multiplying by the offering price. Figures exclude secondary offerings, employee stock plans, investment companies other than closed-end, intracorporate transactions, equities sold abroad, and Yankee bonds. Stock data include ownership securities issued by limited partnerships.
2. Monthly data cover only public offerings. 3. Monthly data are not available. SOURCE. Beginning July 1993, Securities Data Company and the Board of Governors of
the Federal Reserve System.
Digitized for FRASER http://fraser.stlouisfed.org/ Federal Reserve Bank of St. Louis

A32 Domestic Nonfinancial Statistics • October 1996
1.47 OPEN-END INVESTMENT COMPANIES Net Sales and Assets1
Millions of dollars
Item 1994 1995 1995 1996
Item 1994 1995 Nov. Dec. Jan. Feb. Mar. Apr. May June
1 Sales of own shares2 841,286 871,415 70,499 94,719 112,332 90,370 93,856 101,310 96,501 88,115
2 Redemptions of own shares 699,823 699,497 52,727 67,945 75,354 60,398 65,748 81,005 69,419 69,072 3 Net sales3 141,463 171,918 17,772 26,774 36,978 29,972 28,108 20,305 27,082 19,044
4 Assets4 1,550,490 2,067,337 2,032,958 2,067,337 2,143,185 2,181,711 2,212,517 2,293,491 2,356,307 2,363,024
5 Cash5 121,296 142,572 141,489 142,572 150,772 144,520 142,697 148,777 145,554 144,275 6 Other 1,429,195 1,924,765 1,891,470 1,924,765 1,992,414 2,037,191 2,069,820 2,144,713 2,201,752 2,218,749
1. Data on sales and redemptions exclude money market mutual funds but include limited-maturity municipal bond funds. Data on asset positions exclude both money market mutual funds and limited-maturity municipal bond funds.
2. Includes reinvestment of net income dividends. Excludes reinvestment of capital gains distributions and share issue of conversions from one fund to another in the same group.
3. Excludes sales and redemptions resulting from transfers of shares into or out of money market mutual funds within the same fund family.
4. Market value at end of period, less current liabilities. 5. Includes all U.S. Treasury securities and other short-term debt securities. SOURCE. Investment Company Institute. Data based on reports of membership, which
comprises substantially all open-end investment companies registered with the Securities and Exchange Commission. Data reflect underwritings of newly formed companies after their initial offering of securities.
1.48 CORPORATE PROFITS AND THEIR DISTRIBUTION
Billions of dollars; quarterly data at seasonally adjusted annual rates
Account 1993 1994r 1995r
1994' 1995r 1996
Account 1993 1994r 1995r
Q3 Q4 Ql Q2 Q3 Q4 Ql r Q2
1 Profits with inventory valuation and capital consumption adjustment 464.4r 529.5 586.6 553.1 570.9 560.0 562.3 612.5 611.8 645.1 653.8
2 Profits before taxes 464.3 531.2 598.9 550.8 572.4 594.5 589.6 607.2 604.2 642.2 644.0 3 Profits-tax liability 163.8 195.3 218.7 203.4 213.5 217.3 214.2 224.5 218.7 233.4 236.7 4 Profits after taxes 300.5 335.9 380.2 347.4 358.8 377.2 375.3 382.8 385.5 408.8 407.4 5 Dividends 197.3 211.0 227.4 212.5 218.5 221.7 224.6 228.5 234.7 239.9 243.1 6 Undistributed profits 103.2r 124.8 152.8 134.9 140.3 155.5 150.8 154.3 150.8 168.9 164.3
7 Inventory valuation - 6 . 6 -13 .3 -28 .1 -16 .5 -22 .8 -51 .9 -42 .3 - 9 . 3 - 8 . 8 -17 .4 -13 .0 8 Capital consumption adjustment 6.7 11.6 15.9 18.8 21.3 17.4 15.0 14.6 16.5 20.4 22.7
SOURCE. U.S. Department of Commerce, Survey of Current Business.
Digitized for FRASER http://fraser.stlouisfed.org/ Federal Reserve Bank of St. Louis

Securities Markets and Corporate Finance A3 3
1.51 DOMESTIC FINANCE COMPANIES Assets and Liabilities1
Billions of dollars, end of period; not seasonally adjusted
Account 1993 1994 1995
1994 1995 1996
Account 1993 1994 1995 Q3 Q4 Ql Q2 Q 3 Q4 Ql
ASSETS
1 Accounts receivable, gross2 482.8 551.0 614.6 524.1 551.0 568.5 586.9 594.7 614.6 621.8r
2 Consumer 116.5 134.8 152.0 130.3 134.8 135.8 141.7 146.2 152.0 151.9r
3 Business 294.6 337.6 375.9 317.2 337.6 351.9 361.8 362.4 375.9 380.9r
4 Real estate 71.7 78.5 86.6 76.6 78.5 80.8 83.4 86.1 86.6 89.1
5 LESS: Reserves for unearned income 50.7 55.0 63.2 51.1 55.0 58.9 62.1 61.2 63.2 61.5r
6 Reserves for losses 11.2 12.4 14.1 12.1 12.4 12.9 13.7 13.8 14.1 14.2
7 Accounts receivable, net 420.9 483.5 537.3 460.9 483.5 496.7 511.1 519.7 537.3 546. r 8 All other 170.9 183.4 210.7 177.2 183.4 194.6 198.1 198.1 210.7 212.8r
9 Total assets 591.8 666.9 748.0 638.1 666.9 691.4 709.2 717.8 748.0 758.9
LIABILITIES AND CAPITAL
10 Bank loans 25.3 21.2 23.1 21.6 21.2 21.0 21.5 21.8 23.1 23.5 11 Commercial paper 159.2 184.6 184.5 171.0 184.6 181.3 181.3 178.0 184.5 184.8
Debt 12 Owed to parent 42.7 51.0 62.3 50.0 51.0 52.5 57.5 59.0 62.3 62.3 13 Not elsewhere classified 206.0 235.0 284.7 228.2 235.0 254.4 264.4 272.1 284.7 291.4 14 All other liabilities 87.1 99.5 106.2 95.0 99.5 102.5 102.1 102.4 106.2 105.7 15 Capital, surplus, and undivided profits 71.4 75.7 87.2 72.3 75.7 79.7 82.5 84.4 87.2 91.1
16 Total liabilities and capital 591.8 666.9 748.0 638.1 666.9 691.4 709.2 717.8 748.0 758.9
1. Includes finance company subsidiaries of bank holding companies but not of retailers 2. Before deduction for unearned income and losses, and banks. Data are amounts carried on the balance sheets of finance companies; securitized pools are not shown, as they are not on the books.
1.52 DOMESTIC FINANCE COMPANIES Consumer, Real Estate, and Business Credit1
Millions of dollars, amounts outstanding, end of period
Type of credit 1993 1994 1995
1996
Type of credit 1993 1994 1995 Jan. Feb. Mar. Apr. May June
Seasonally adjusted
1 Total 546,103 615,618 691,616 696,099 700,977 703,398 708,343 710,367 719,536
2 Consumer 160,227 176,085 198,861 200,162 202,548 203,280 205,184 207,027 210,341 3 Real estate2 72,043 78,910 87,077 88,084 88,188 89,502 89,943 90,180 93,917 4 Business 313,833 360,624 405,678 407,853 410,241 410,616 413,216 413,160 415,278
Not seasonally adjusted
5 550,751 620,975 697,340 697,312 701,576 705,650 710,762 712,429 722,597
6 162,770 178,999 202,101 201,774 202,108 202,337 203,532 205,678 209,851 7 Motor vehicles 56,057 61,609 70,061 71,420 73,312 72,129 73,810 74,327 74,286 8 Other consumer3 60,396 73,221 81,988 81,186 81,214 79,779 79,489 80,435 80,344 9 Securitized motor vehicles 36,024 31,897 33,633 32,128 30,364 31,093 30,476 31,435 34,826
10 Securitized other consumer 10,293 12,272 16,419 17,040 17,218 19,336 19,757 19,481 20,395 11 Real estate2 71,727 78,479 86,606 88,495 88,520 89,056 89,975 90,182 93,100 12 Business 316,254 363,497 408,633 407,043 410,948 414,257 417,255 416,569 419,646 13 Motor vehicles 95,173 118,197 133,277 132,062 132,153 134,098 134,500 134,196 137.477 14 Retail loans5 18,091 21,514 25,304 25,906 26,591 27,140 27,954 27,151 29,032 15 Wholesale loans6 31,148 35,037 36,427 34,198 33,386 33,910 32,155 31,360 32,095 16 Leases 45,934 61,646 71,546 71,958 72,176 73,048 74,391 75,685 76,350 17 Equipment 145,452 157,953 177,297 175,984 176,461 177,285 178,507 178,151 178,983 18 Loans7 43,514 49,358 59,109 57,997 57,574 57,909 57,576 57,327 58,788 19 Leases 101,938 108,595 118,188 117,987 118,887 119,376 120,931 120,824 120,195 20 Other business8 53,997 61,495 65,363 66,643 68,070 69,497 69,193 68,112 67,210 21 Securitized business assets 21,632 25,852 32,696 32,354 34,264 33,377 35,055 36,110 35,976 22 Retail loans 2,869 4,494 4,723 4,467 4,252 4,067 4,367 4,790 4,688 23 Wholesale loans 10,584 14,826 21,327 21,130 23,460 22,622 24,327 25,028 24,950 24 Leases 8,179 6,532 6,646 6,757 6,552 6,688 6,361 6,292 6,338
1. Includes finance company subsidiaries of bank holding companies but not of retailers and banks. Data are before deductions for unearned income and losses. Data in this table also appear in the Board's G.20 (422) monthly statistical release. For ordering address, see inside front cover.
2. Includes all loans secured by liens on any type of real estate, for example, first and junior mortgages and home equity loans.
3. Includes personal cash loans, mobile home loans, and loans to purchase other types of consumer goods such as appliances, apparel, general merchandise, and recreation vehicles.
4. Outstanding balances of pools upon which securities have been issued; these balances are no longer carried on the balance sheets of the loan originator.
5. Passenger car fleets and commercial land vehicles for which licenses are required. 6. Credit arising from transactions between manufacturers and dealers, that is, floor plan
financing. 7. Beginning with the June 1996 data, retail and wholesale business equipment loans have
been combined and are no longer separately available. 8. Includes loans on commercial accounts receivable, factored commercial accounts, and
receivable dealer capital; small loans used primarily for business or farm purposes; and wholesale and lease paper for mobile homes, campers, and travel trailers.
Digitized for FRASER http://fraser.stlouisfed.org/ Federal Reserve Bank of St. Louis

A34 Domestic Nonfinancial Statistics • October 1996
1.53 MORTGAGE MARKETS Mortgages on New Homes
Millions of dollars except as noted
Item 1993 1994 1995 1996
Item 1993 1994 1995 Jan. Feb. Mar. Apr. May June July
Terms and yields in primary and secondary markets
PRIMARY MARKETS
Terms[
1 Purchase price (thousands of dollars) 163.1 170.4 175.8 179.2 181.7 184.5 175.2 179.5 180.1 194.0 2 Amount of loan (thousands of dollars) 123.0 130.8 134.5 135.8 143.2 141.5 133.2 137.6 139.4 144.2 3 Loan-to-price ratio (percent) 78.0 78.8 78.6 77.3 80.3 77.8 78.4 79.3 78.7 76.2 4 Maturity (years) 26.1 27.5 27.7 27.7 27.8 26.4 27.1 27.2 25.8 26.7 5 Fees and charges (percent of loan amount)2 1.30 1.29 1.21 1.07 1.24 1.30 1.17 1.16 1.31 1.25
Yield (percent per year) 6 Contract rate1 7.03 7.26 7.65 7.15 7.00 7.25 7.57 7.61 7.75 7.80 7 Effective rate1,3 7.24 7.47 7.85 7.32 7.20 7.49 7.76 7.80 8.05 8.01 8 Contract rate (HUD series)4 7.37 8.58 8.05 7.23 7.56 7.97 8.22 8.34 8.37 8.28
SECONDARY MARKETS
Yield (percent per year) 9 FHA mortgages (Section 203)5 7.46 8.68 8.18 7.11 7.57 8.09 8.52 8.57 8.55 8.56
10 GNMA securities6 6.65 7.96 7.57 6.71 6.85 7.40 7.63 7.81 7.91 7.84
Activity in secondary markets
FEDERAL NATIONAL MORTGAGE ASSOCIATION
Mortgage holdings (end of period) 11 Total 190,861 222,057 253,511 255,619 257,970 262,014 263,809 267,330 270,042 272,458 12 FHA/VA insured 23,857 27,558 28,762 28,622 28,502 28,744 29,132 30,442 30,936 30,830 13 Conventional 167,004 194,499 224,749 226,997 229,468 233,270 234,677 236,888 239,106 241,628
14 Mortgage transactions purchased (during period) 92,037 62,389 56,598 4,810 5,371 7,681 5,339 6,720 5,421 5,345
Mortgage commitments (during period) 15 Issued7 92,537 54,038 56,092 5,750 7,013 6,293 5,599 5,228 5,280 5,036 16 To sell8 5,097 1,820 360 3 0 29 0 13 0 0
FEDERAL HOME LOAN MORTGAGE CORPORATION
Mortgage holdings (end of period)8
17 Total 55,012 72,693 107,424 111,143 114,793 117,420 119,520 121,058 123,806 125,574 18 FHA/VA insured 321 276 267 226 223 220 216 212 209r 205 19 Conventional 54,691 72,416 107,157 110,917 114,570 117,200 119,304 120,846 123,597r 125,369
Mortgage transactions (during period) 20 Purchases 229,242 124,697 98,470 13,357 10,891 11,984 12,740 12,385 10,266 9,934 21 Sales 208,723 117,110 85,877 11,624 9,733 11,384 11,958 11,904 9,969 9,496
22 Mortgage commitments contracted (during period)' 274,599 136,067 118,659 12,765 10,378 14,520 13,009 11,075 11,164 10,626
1. Weighted averages based on sample surveys of mortgages originated by major institu-tional lender groups for purchase of newly built homes; compiled by the Federal Housing Finance Board in cooperation with the Federal Deposit Insurance Corporation.
2. Includes all fees, commissions, discounts, and "points" paid (by the borrower or the seller) to obtain a loan.
3. Average effective interest rate on loans closed for purchase of newly built homes, assuming prepayment at the end of ten years.
4. Average contract rate on new commitments for conventional first mortgages; from U.S. Department of Housing and Urban Development (HUD). Based on transactions on the first day of the subsequent month.
5. Average gross yield on thirty-year, minimum-downpayment first mortgages insured by the Federal Housing Administration (FHA) for immediate delivery in the private secondary market. Based on transactions on first day of subsequent month.
6. Average net yields to investors on fully modified pass-through securities backed by mortgages and guaranteed by the Government National Mortgage Association (GNMA), assuming prepayment in twelve years on pools of thirty-year mortgages insured by the Federal Housing Administration or guaranteed by the Department of Veterans Affairs.
7. Does not include standby commitments issued, but includes standby commitments converted.
8. Includes participation loans as well as whole loans. 9. Includes conventional and government-underwritten loans. The Federal Home Loan
Mortgage Corporation's mortgage commitments and mortgage transactions include activity under mortgage securities swap programs, whereas the corresponding data for FNMA exclude swap activity.
Digitized for FRASER http://fraser.stlouisfed.org/ Federal Reserve Bank of St. Louis

Real Estate A3 5
1.54 MORTGAGE DEBT OUTSTANDING1
Millions of dollars, end of period
Type of holder and property 1992 1993 1994 1995 1996
Type of holder and property 1992 1993 1994
Ql Q2 Q3 Q4 Ql p
1 All holders 4,092,984 4,268,420 4,473,100 4,515,854 4,584,566 4,663,864 4,715,884 4,773,998
By type of property 2 One- to four-family residences 3,037,408 3,227,134 3,430,023 3,465,065 3,524,378 3,593,966 3,634,698 3,682,610 3 Multifamily residences 274,234 270,796 275,303 276,398 280,390 284,238 288,090 292,448 4 Nonfarm, nonresidential 700,604 689,296 684,803 690,988 695,947 701,241 708,467 713,751 5 80,738 81,194 82,971 83,403 83,850 84,420 84,629 85,189
By type of holder 6 Major financial institutions 1,769,187 1,767,835 1,815,810 1,841,815 1,868,175 1,895,285 1,890,539 1,895,878 7 Commercial banks2 894,513 940,444 1,004,280 1,024,854 1,053,048 1,072,780 1,080,373 1,087,174 8 One- to four-family 507,780 556,538 611,697 625,378 648,705 662,126 663,588 666,306 9 Multifamily 38,024 38,635 38,916 39,746 40,593 43,003 43,846 45,201
10 Nonfarm, nonresidential 328,826 324,409 331,100 336,795 340,176 343,826 349,109 351,736 11 Farm 19,882 20,862 22,567 22,936 23,575 23,824 23,829 23,931 12 Savings institutions3 627,972 598,330 596,199 601,777 599,745 604,614 596,789 595,903 13 One- to four-family 489,622 469,959 477,499 483,625 482,005 489,150 482,765 484,020 14 Multifamily 69,791 67,362 64,400 63,778 64,404 63,569 61,926 60,494 15 Nonfarm, nonresidential 68,235 60,704 54,011 54,085 53,054 51,604 51,809 51,089 16 Farm 324 305 289 288 282 291 288 299 17 Life insurance companies 246,702 229,061 215,332 215,184 215,382 217,892 213,377 212,801 18 One- to four-family 11,441 9,458 7,910 7,892 7,911 8,006 7,833 7,815 19 Multifamily 27,770 25,814 24,306 24,250 24,310 24,601 24,070 24,013 20 Nonfarm, nonresidential 198,269 184,305 173,539 173,142 173,565 175,643 171,855 171,445 21 Farm 9,222 9,484 9,577 9,900 9,596 9,643 9,619 9,528
22 Federal and related agencies 286,263 327,014 319,401 317,753 315,722 319,923 320,828 322,131 23 Government National Mortgage Association 30 22 6 15 7 2 2 2 24 One- to four-family 30 15 6 15 7 2 2 2 25 Multifamily 0 7 0 0 0 0 0 0 26 Farmers Home Administration4 41,695 41,386 41,781 41,857 41,917 41,858 41,791 41,594 27 One- to four-family 16,912 15,303 13,826 13,507 13,217 12,914 12,643 12,327 28 Multifamily 10,575 10,940 11,319 11,418 11,512 11,557 11,617 11,636 29 Nonfarm, nonresidential 5,158 5,406 5,670 5,807 5,949 6,096 6,248 6,365 30 Farm 9,050 9,739 10,966 11,124 11,239 11,291 11,282 11,266 31 Federal Housing and Veterans' Administrations 12,581 12,215 10,964 10,890 10,098 9,535 9,809 8,439 32 One- to four-family 5,153 5,364 4,753 4,715 4,838 4,918 5,180 4,228 33 Multifamily 7,428 6,851 6,211 6,175 5,260 4,617 4,629 4,211 34 Resolution Trust Corporation 32,045 17,284 10,428 9,342 6,456 4,889 1,864 0 35 One- to four-family 12,960 7,203 5,200 4,755 2,870 2,299 691 0 36 Multifamily 9,621 5,327 2,859 2,494 1,940 1,420 647 0 37 Nonfarm, nonresidential 9,464 4,754 2,369 2,092 1,645 1,170 525 0 38 Farm 0 0 0 0 0 0 0 0 39 Federal Deposit Insurance Corporation 0 14,112 7,821 6,730 6,039 5,015 4,303 5,553 40 One- to four-family 0 2,367 1,049 840 731 618 492 1,848 41 Multifamily 0 1,426 1,595 1,310 1,135 722 428 560 42 Nonfarm, nonresidential 0 10,319 5,177 4,580 4,173 3,674 3,383 3,145 43 Farm 0 0 0 0 0 0 0 0 44 Federal National Mortgage Association 137,584 166,642 178,059 177,615 178,462 182,229 183,782 183,531 45 One- to four-family 124,016 151,310 162,160 161,780 162,674 166,393 168,122 167,895 46 Multifamily 13,568 15,332 15,899 15,835 15,788 15,836 15,660 15,636 47 Federal Land Banks 28,664 28,460 28,555 28,065 28,005 28,151 28,428 28,891 48 One- to four-family 1,687 1,675 1,671 1,651 1,648 1,656 1,673 1,700 49 Farm 26,977 26,785 26,885 26,414 26,357 26,495 26,755 27,191 50 Federal Home Loan Mortgage Corporation 33,665 46,892 41,786 43,239 44,738 48,243 50,849 54,120 51 One- to four-family 31,032 44,345 38,956 40,105 41,477 44,809 46,997 50,058 52 Multifamily 2,633 2,547 2,830 3,134 3,261 3,434 3,852 4,062
53 Mortgage pools or trusts5 1,434,264 1,564,571 1,718,297 1,731,468 1,759,091 1,795,041 1,853,613 1,895,309 54 Government National Mortgage Association 419,516 414,066 450,934 454,401 457,101 463,654 472,298 475,823 55 One- to four-family 410,675 404,864 441,198 444,632 446,855 453,114 461,453 464,644 56 Multifamily 8,841 9,202 9,736 9,769 10,246 10,540 10,845 11,179 57 Federal Home Loan Mortgage Corporation 407,514 447,147 490,851 492,194 498,216 503,370 515,051 524,326 58 One- to four-family 401,525 442,612 487,725 489,114 495,182 500,417 512,238 521,721 59 Multifamily 5,989 4,535 3,126 3,080 3,034 2,953 2,813 2,605 60 Federal National Mortgage Association 444,979 495,525 530,343 533,262 543,669 559,585 582,959 599,546 61 One- to four-family 435,979 486,804 520,763 523,903 533,091 548,400 569,724 585,527 62 Multifamily 9,000 8,721 9,580 9,359 10,578 11,185 13,235 14,019 63 Farmers Home Administration4 38 28 19 14 13 12 11 10 64 One- to four-family 8 5 3 2 2 2 2 1 65 Multifamily 0 0 0 0 0 0 0 0 66 Nonfarm, nonresidential 17 13 9 7 6 5 5 5 67 Farm 13 10 7 5 5 5 4 4 68 Private mortgage conduits 162,217 207,806 246,150 251,597 260,093 268,420 283,294 295,604 69 One- to four-family6 140,718 173,635 194,451 198,040 202,718 207,679 214,635 220,022 70 Multifamily 6,305 8,701 14,925 15,743 17,281 18,903 21,279 24,477 71 Nonfarm, nonresidential 15,194 25,469 36,774 37,814 40,094 41,838 47,380 51,104 72 Farm 0 0 0 0 0 0 0 0
73 Individuals and others7 603,270 609,000 619,592 624,819 641,578 653,615 650,904 660,680 74 One- to four-family 447,871 455,676 461,157 465,111 480,447 491,463 486,660 494,495 75 Multifamily 64,688 65,397 69,601 70,305 71,050 71,897 73,243 74,354 76 Nonfarm, nonresidential 75,441 73,917 76,153 76,667 77,284 77,384 78,152 78,861 77 Farm 15,270 14,009 12,681 12,736 12,796 12,872 12,850 12,970
1. Multifamily debt refers to loans on structures of five or more units. 2. Includes loans held by nondeposit trust companies but not loans held by bank trust
departments. 3. Includes savings banks and savings and loan associations. 4. FmHA-guaranteed securities sold to the Federal Financing Bank were reallocated from
FmHA mortgage pools to FmHA mortgage holdings in 1986:Q4 because of accounting changes by the Farmers Home Administration.
5. Outstanding principal balances of mortgage-backed securities insured or guaranteed by the agency indicated.
6. Includes securitized home equity loans. 7. Other holders include mortgage companies, real estate investment trusts, state and local
credit agencies, state and local retirement funds, noninsured pension funds, credit unions, and finance companies.
SOURCE. Based on data from various institutional and government sources. Separation of nonfarm mortgage debt by type of property, if not reported directly, and interpolations and extrapolations, when required for some quarters, are estimated in part by the Federal Reserve. Line 69 from Inside Mortgage Securities and other sources.
Digitized for FRASER http://fraser.stlouisfed.org/ Federal Reserve Bank of St. Louis

A36 Domestic Nonfinancial Statistics • October 1996
1.55 CONSUMER INSTALLMENT CREDIT1
Millions of dollars, amounts outstanding, end of period
Holder and type of credit 1993 1994 1995 1996r
Holder and type of credit 1993 1994 1995
Jan. Feb. Mar. Apr. May June
1 Total
2 Automobile 3 Revolving 4 Other2
Seasonally adjusted
1 Total
2 Automobile 3 Revolving 4 Other2
844,118
279,786 287,011 277,321
966,457
317,182 339,337 309,939
1,103,164
351,052 413,894 338,218
1,112,235
352,520 418,971 340,745
1,123,182
355,136 425,658 342.388
1,132,882
357,752 431,035 344,095
1,139,830
360,460 438,222 341,148
1,145,428
361,627 443,909 339,892
1,153,703
366,936 446,707 340,060
5 Total
By major holder 6 Commercial banks 7 Finance companies 8 Credit unions 9 Savings institutions
10 Nonfinancial business3
11 Pools of securitized assets4..
By major type of credit5
12 Automobile 13 Commercial banks 14 Finance companies 15 Pools of securitized assets4
16 Revolving 17 Commercial banks 18 Nonfinancial business3 . . . 19 Pools of securitized assets4
20 Other 21 Commercial banks 22 Finance companies 23 Nonfinancial business3 . . . 24 Pools of securitized assets4
Not seasonally adjusted
863,924 990,247 1,131,747 1,122,524 1,120,273 1,122,549 1,129,073 1,135,676 1,146,536
399,683 116,453 101,634 37,855 77,229
131,070
462,923 134,830 119,594 38,468 86,621
147,811
507,414 152,624 131,939 40,106 85,061
214,603
501,083 152,606 131,257 40,224 80,733
216,621
498,804 154,365 130,839 40,448 78,138
217,679
498,302 151,749 130,837 40,762 76,681
224,218
503,371 153,299 131,844 41,000 73,765
225,794
502,173 155,893 133,367 41,000 74,680
228,563
504,866 154,630 134,710 40,323 72,521
239,486
281,538 122,000 56,057 39,561
319,715 141,895 61,609 36,376
354,260 149,094 70,626 44,616
352,028 148,186 71,420 42,373
352,907 147,703 73,312 41,568
354,061 148,455 72.129 42,800
356,014 150,434 73,810 40,545
358,948 151,271 74,327 41,021
365,449 153,814 74,286 44,828
302,201 149.920 50,125 80,242
357,307 182,021 56,790 96,130
435,674 210,298
53,525 147,934
425,964 200,080
50,520 151,640
424,537 198,886 48,613
153,390
425,664 196,836 47,416
157,690
431,499 201,903 44,526
161,185
438,033 205,011
45,182 163,774
441,814 204,658
43,097 169,865
280,185 127,763 60,396 27,104 11,267
313,225 139,007 73,221 29,831 15,305
341,813 148,022 81,998 31,536 22,053
344,532 152,817 81,186 30,213 22,608
342,829 152,215 81,053 29,525 22,721
342,824 153,011 79,620 29,265 23,728
341,560 151,034 79,489 29,239 24,064
338,695 145,891 81,566 29,498 23,768
339,273 146,394 80,344 29,424 24,793
1. The Board's series on amounts of credit covers most short- and intermediate-term credit extended to individuals that is scheduled to be repaid (or has the option of repayment) in two or more installments. Data in this table also appear in the Board's G.19 (421) monthly statistical release. For ordering address, see inside front cover.
2. Comprises mobile home loans and all other installment loans that are not included in automobile or revolving credit, such as loans for education, boats, trailers, or vacations. These loans may be secured or unsecured.
3. Includes retailers and gasoline companies. 4. Outstanding balances of pools upon which securities have been issued; these balances
are no longer carried on the balance sheets of the loan originator. 5. Totals include estimates for certain holders for which only consumer credit totals are
available.
1.56 TERMS OF CONSUMER INSTALLMENT CREDIT1
Percent per year except as noted
Item 1993 1994 1995 1995 1996
Item 1993 1994 1995 Dec. Jan. Feb. Mar. Apr. May June
INTEREST RATES
Commercial banks~ 1 48-month new car 8.09 8.12 9.57 n.a. n.a. 9.12 n.a. 8.93 2 24-month personal 13.47 13.19 13.94 n.a. n.a. 13.63 n.a. n.a. 13.52 n.a.
Credit card plan 3 All accounts n.a. 15.69 16.02 n.a. n.a. 15.82 n.a. n.a. 15.44 4 Accounts assessed interest n.a. 15.77 15.79 n.a. n.a. 15.41 n.a. n.a. 15.41 n.a.
Auto finance companies 5 New car 9.48 9.79 11.19 10.52 9.74 9.86 9.77 9.64 9.37 9.53 6 Used car 12.79 13.49 14.48 13.83 13.27 13.28 13.19 13.26 13.49 13.62
OTHER TERMS3
Maturity (months) 7 New car 54.5 54.0 54.1 53.6 51.8 52.3 51.8 51.5 50.8 50.4 8 Used car 48.8 50.2 52.2 51.8 52.2 52.1 52.0 51.8 51.7 51.6
Loan-to-value ratio 9 New car 91 92 92 92 92 91 91 91 91 91
10 Used car 98 99 99 99 99 98 98 99 99 100
Amount financed (dollars) 11 New car 14,332 15,375 16,210 17,034 16,698 16,627 16,520 16,605 16,686 16,854 12 Used car 9,875 10,709 11,590 12,152 12,059 11,990 11,934 12,024 12,233 12,249
1. The Board's series on amounts of credit covers most short- and intermediate-term credit 2. Data are available for only the second month of each quarter, extended to individuals that is scheduled to be repaid (or has the option of repayment) in two 3. At auto finance companies, or more installments. Data in this table also appear in the Board's G.19 (421) monthly statistical release. For ordering address, see inside front cover.
Digitized for FRASER http://fraser.stlouisfed.org/ Federal Reserve Bank of St. Louis

Flow of Funds A37
1.57 FUNDS RAISED IN U.S. CREDIT MARKETS1
Billions of dollars; quarterly data at seasonally adjusted annual rates
Transaction category or sector 1991 1992 1993 1994 1995 1994 1995 1996
Transaction category or sector 1991 1992 1993 1994 1995 Q3 Q4 QL Q2 Q3 Q4 QL
Nonfinancial sectors
1 Total net borrowing by domestic nonfinancial sectors. . . . 481.7 543.0 628.5 618.9 732.9 587.6 634.8 880.4 888.3 584.8 578.2 863.5
By sector and instrument 2 U.S. government 278.2 304.0 256.1 155.9 144.4 135.6 150.1 266.8 202.8 65.8 42.4 288.7 3 Treasury securities 292.0 303.8 248.3 155.7 142.9 132.8 155.7 268.0 201.2 65.4 37.2 291.0 4 Budget agency issues and mortgages -13 .8 .2 7.8 .2 1.5 2.9 -5 .7 -1 .2 1.6 .4 5.1 -2 .3
5 Private 203.5 239.0 372.3 463.1 588.5 452.0 484.7 613.6 685.6 519.1 535.9 574.8
By instrument 6 Municipal securities 87.8 30.5 74.8 -29 .3 -41 .3 -58 .4 -53 .8 -45.8 - 4 . 3 -107.4 - 7 . 6 - 6 . 4 7 Corporate bonds 78.8 67.6 75.2 23.3 73.3 15.4 6.2 53.0 98.4 59.8 82.0 58.9 8 Mortgages 158.4 130.9 157.2 194.3 237.5 205.5 210.6 222.5 239.6 290.5 197.4 285.4 9 Home mortgages 173.6 187.6 187.9 202.4 204.7 210.3 216.8 196.8 207.2 256.8 157.8 250.1
10 Multifamily residential -5 .5 -10.4 - 6 . 0 1.3 11.0 5.6 - 4 . 2 2.7 14.2 13.7 13.6 15.6 11 Commercial -10 .0 -47.8 -25 .0 -11.1 20.1 -12.7 - 3 . 4 21.2 16.3 17.7 25.2 17.4 12 Farm .4 1.4 .5 1.8 1.7 2.2 1.4 1.7 1.8 2.3 .8 2.2 13 Consumer credit -13 .7 5.0 61.5 124.9 142.9 133.8 141.8 138.3 156.9 158.5 118.2 121.7 14 Bank loans n.e.c -40.9 -13.7 3.8 73.1 103.0 92.1 76.7 152.5 96.8 76.8 86.0 52.8 15 Commercial paper -18.4 8.6 10.0 21.4 18.1 28.5 30.7 12.3 39.1 13.9 7.2 37.9 16 Other loans and advances -48.5 10.1 -10 .2 55.4 54.9 35.1 72.4 80.8 59.1 27.1 52.7 24.5
By borrowing sector 17 Household 183.8 198.4 249.1 362.2 383.5 385.3 392.4 358.6 393.0 448.1 334.5 387.7 18 Nonfinancial business -61.9 19.5 61.0 144.3 250.6 132.1 160.8 300.1 303.6 181.5 217.4 190.7 19 Farm 2.1 1.3 2.0 2.8 2.0 2.4 - 2 . 0 .9 3.6 4.3 - . 8 .9 20 Nonfarm noncorporate -11.0 -16.0 7.0 12.1 35.9 8.8 16.5 51.3 34.4 29.8 28.2 29.3 21 Corporate -53 .0 34.1 52.0 129.3 212.7 120.9 146.3 247.9 265.6 147.4 190.0 160.5 22 State and local government 81.6 21.1 62.3 -43.4 -45.7 -65 .4 -68 .5 -45.1 -11.1 -110.6 -16 .0 -3 .7
23 Foreign net borrowing in United States 14.8 22.6 68.8 -20 .3 67.7 19.6 33.5 61.4 40.4 94.1 75.1 36.9 24 Bonds 15.0 15.7 81.3 7.1 46.5 20.8 27.7 13.5 49.9 52.1 70.6 45.4 25 Bank loans n.e.c 3.1 2.3 .7 1.4 8.5 4.7 - . 5 8.1 5.6 8.2 11.9 8.7 26 Commercial paper 6.4 5.2 - 9 . 0 -27 .3 13.6 -8 .1 5.9 37.9 -11 .1 30.9 - 3 . 4 -13 .8 27 Other loans and advances - 9 . 8 - . 6 - 4 . 2 - 1 . 6 - . 8 2.2 .4 1.9 - 4 . 0 2.9 - 4 . 1 -3 .3
28 Total domestic plus foreign 496.5 565.6 697.3 598.6 800.7 607.2 668.3 941.8 928.8 678.9 653.3 900.4
Financial sectors
29 Total net borrowing by financial sectors 155.6 240.0 291.1 467.9 444.9 428.7 536.8 273.1 436.1 490.0 580.4 313.6
By instrument 30 U.S. government-related 145.7 155.8 164.2 288.6 205.1 250.3 321.2 89.4 192.1 221.4 317.5 147.2 31 Government-sponsored enterprise securities 9.2 40.3 80.6 176.9 106.9 152.1 249.0 62.9 127.2 101.5 136.1 37.4 32 Mortgage pool securities 136.6 115.6 83.6 116.5 98.2 98.3 72.2 26.4 64.9 119.9 181.4 109.8 33 Loans from U.S. government .0 .0 .0 - 4 . 8 .0 .0 .0 .0 .0 .0 .0 .0
34 Private 9.8 84.2 126.9 179.2 239.8 178.3 215.6 183.7 244.0 268.6 262.9 166.4 35 Corporate bonds 69.9 82.7 120.1 117.5 185.5 103.9 84.9 167.5 182.3 208.1 184.0 136.2 36 Mortgages .5 .6 3.6 9.8 5.3 12.0 4.9 5.2 5.2 5.2 5.6 5.5 37 Bank loans n.e.c 8.8 2.2 -13 .0 -12.3 3.0 -11.7 1.9 - 3 . 0 21.2 7.1 -13 .4 7.6 38 Open market paper -32 .0 - . 7 - 6 . 2 41.6 42.6 41.3 85.9 38.5 34.0 43.3 54.7 22.6 39 Other loans and advances -37 .3 - . 6 22.4 22.6 3.4 32.8 38.1 -24.5 1.3 4.9 32.0 - 5 . 5
By borrowing sector 40 Government-sponsored enterprises 9.1 40.2 80.6 172.1 106.9 152.1 249.0 62.9 127.2 101.5 136.1 37.4 41 Federally related mortgage pools 136.6 115.6 83.6 116.5 98.2 98.3 72.2 26.4 64.9 119.9 181.4 109.8 42 Private financial sectors 9.8 84.2 126.9 179.2 239.8 178.3 215.6 183.7 244.0 268.6 262.9 166.4 43 Commercial banks -10.7 7.7 4.6 9.9 8.1 23.9 4.1 6.3 18.2 8.8 - . 9 -4 .8 44 Bank holding companies - 2 . 5 2.3 8.8 10.3 14.4 11.5 16.0 16.3 20.8 28.2 - 7 . 8 -25.8 45 Funding corporations - 6 . 5 13.2 2.9 24.2 32.0 47.3 11.1 61.5 21.7 52.1 - 7 . 3 26.6 46 Savings institutions -44.7 - 7 . 0 11.3 12.8 2.6 14.8 36.1 -18.9 - 7 . 2 5.1 31.5 10.9 47 Credit unions .0 .0 .2 .2 - . 1 .5 .2 - . 3 - . 1 .1 .0 - . 1 48 Life insurance companies * .0 .0 .2 .3 - . 1 .0 1.3 .0 .1 - . 1 - . 4 2.5 49 Finance companies 17.7 - 1 . 6 .2 50.2 51.6 16.3 57.3 83.1 57.2 6.5 59.6 50.0 50 Mortgage companies - 2 . 4 8.0 .0 -11.5 -2 .1 - 7 . 0 1.1 - 7 . 4 14.8 4.0 -20 .0 .7 51 Real estate investment trusts (REITs) 1.2 .3 3.4 13.7 5.4 18.8 6.3 5.2 5.2 5.2 6.0 5.9 52 Brokers and dealers 3.7 2.7 12.0 .5 - 5 . 0 - 7 . 6 19.3 -29 .5 - . 1 2.1 7.7 -31 .8 53 Issuers of asset-backed securities (ABSs) 54.0 58.5 83.3 68.5 133.0 59.8 62.8 67.6 113.2 156.5 194.5 132.2
Digitized for FRASER http://fraser.stlouisfed.org/ Federal Reserve Bank of St. Louis

A38 Domestic Nonfinancial Statistics • October 1996
1.57 FUNDS RAISED IN U.S. CREDIT MARKETS'—Continued
1994 1995 1996 Transaction category or sector Transaction category or sector
Q3 Q4 QI Q2 Q3 Q4 QL
All sectors
54 Total net borrowing, all sectors 652.1 805.6 988.4 1,066.5 1,245.6 1,035.9 1,205.2 1,214.8 1,364.9 1,169.0 1,233.7 1,214.0
55 U.S. government securities 424.0 459.8 420.3 449.3 349.5 386.0 471.3 356.2 394.9 287.2 359.9 435.9 56 Municipal securities 87.8 30.5 74.8 -29 .3 -41 .3 -58 .4 -53 .8 -45 .8 - 4 . 3 -107.4 - 7 . 6 - 6 . 4 57 Corporate and foreign bonds 163.6 166.0 276.6 147.9 305.3 140.1 118.8 234.0 330.6 320.0 336.7 240.5 58 Mortgages 158.9 131.5 160.8 204.1 242.8 217.5 215.5 227.7 244.8 295.7 202.9 290.9 59 Consumer credit -13 .7 5.0 61.5 124.9 142.9 133.8 141.8 138.3 156.9 158.5 118.2 121.7 60 Bank loans n.e.c -29.1 - 9 . 3 -8 .5 62.2 114.5 85.1 78.1 157.6 123.7 92.1 84.5 69.0 61 Open market paper -44 .0 13.1 -5 .1 35.7 74.3 61.7 122.5 88.8 61.9 88.1 58.5 46.6 62 Other loans and advances -95 .6 8.9 8.0 71.7 57.5 70.2 111.0 58.1 56.5 34.9 80.6 15.7
Funds raised through mutual funds and corporate equities
63 Total net share issues 209.4 294.9 442.1 150.8 159.3 113.2 -81 .1 40.0 156.7 196.1 244.3 273.4
64 Mutual funds 147.2 209.1 323.7 128.9 173.9 129.7 -12 .6 78.5 173.3 195.3 248.6 290.9 65 Corporate equities 62.2 85.8 118.4 21.9 -14.7 -16 .4 -68 .5 -38.5 -16.6 .7 - 4 . 3 -17 .6 66 Nonfinancial corporations 18.3 27.0 21.3 -44 .9 -74 .2 -50 .0 -118.0 -60 .0 -71 .3 -92 .8 -72 .8 -118.0 67 Financial corporations 13.3 28.1 36.6 24.1 12.3 10.5 16.3 8.7 17.7 9.7 13.3 11.5 68 Foreign shares purchased by U.S. residents 30.7 30.7 60.5 42.7 47.2 23.1 33.2 12.8 37.0 83.9 55.3 89.0
1. Data in this table also appear in the Board's Z.l (780) quarterly statistical release, tables F.2 through F.5. For ordering address, see inside front cover.
Digitized for FRASER http://fraser.stlouisfed.org/ Federal Reserve Bank of St. Louis

Flow of Funds A39
1.58 SUMMARY OF FINANCIAL TRANSACTIONS1
Billions of dollars except as noted; quarterly data at seasonally adjusted annual rates
Transaction category or sector 1991 1 9 9 2 1993 1994 1995
1 9 9 4 1995 1996
Transaction category or sector 1991 1 9 9 2 1993 1994 1995
Q3 Q 4 Ql Q2 Q3 Q4 Ql
NET LENDING IN CREDIT MARKETS2
1 Total net lending in credit markets 6 5 2 . 1 8 0 5 . 6 9 8 8 . 4 1 , 0 6 6 . 5 1 , 2 4 5 . 6 1 , 0 3 5 . 9 1 , 2 0 5 . 2 1 , 2 1 4 . 8 1 , 3 6 4 . 9 1 , 1 6 9 . 0 1 , 2 3 3 . 7 1 , 2 1 4 . 0
2 Private domestic nonfinancial sectors 105 .2 8 7 . 9 6 5 . 6 2 5 8 . 9 - 8 4 . 8 2 1 3 . 4 2 2 7 . 8 3 5 . 3 - 1 4 2 . 3 - 5 4 . 9 - 1 7 7 . 3 - 1 3 3 . 6 3 Households 2 9 . 0 8 1 . 7 5 2 . 2 3 0 4 . 7 5 1 . 5 2 9 2 . 3 3 4 3 . 4 170 .8 - 7 7 . 2 2 0 3 . 2 - 9 0 . 7 - 1 0 3 . 6 4 Nonfarm noncorporate business - 5 . 3 - . 1 .6 .7 1.0 .7 .9 .5 1.1 1.1 1.2 1.2 5 Nonfinancial corporate business 30 .7 2 7 . 8 9.1 48 .1 - 3 . 5 3 7 . 3 5 3 . 2 -41 .1 39 .5 - 5 0 . 2 3 7 . 6 5 2 . 7 6 State and local governments 5 0 . 8 - 2 1 . 5 3 .7 - 9 4 . 6 - 1 3 3 . 7 - 1 1 7 . 0 - 1 6 9 . 7 - 9 4 . 9 - 1 0 5 . 7 - 2 0 9 . 0 - 1 2 5 . 3 - 8 3 . 9 7 U.S. government 10.5 - 1 1 . 9 - 1 8 . 4 -24.2 - 2 1 . 3 - 1 1 . 3 -24 .4 - 1 3 . 2 -24 .3 - 2 3 . 9 - 2 3 . 9 - 2 4 . 6 8 Rest of the world 13.3 9 8 . 2 128 .3 134 .4 2 7 1 . 7 137 .5 2 1 0 . 9 2 4 1 . 2 326.1 3 5 8 . 0 161 .7 3 2 7 . 6 9 Financial sectors 5 2 3 . 1 6 3 1 . 5 8 1 2 . 8 6 9 7 . 4 1 , 0 8 0 . 0 6 9 6 . 3 7 9 0 . 8 9 5 1 . 6 1 ,205 .3 8 8 9 . 8 1 ,273.1 1 ,044 .5
10 Government sponsored enterprises 15.1 6 8 . 8 9 0 . 2 119.1 9 4 . 7 1 2 1 . 9 171 .4 2 8 . 2 9 7 . 5 61.5 191.7 42.3 11 Federally related mortgage pools 136.6 115.6 83.6 116.5 98.2 98.3 72.2 26.4 64.9 119.9 181.4 109.8 12 Monetary authority 31.1 27.9 36.2 31.5 12.7 29.7 30.0 16.3 20.8 -11.1 24.7 14.3 13 Commercial banking 80.8 95.3 142.2 163.4 266.3 183.4 174.5 343.1 315.6 248.9 157.7 130.7 14 U.S. chartered banks 35.7 69.5 149.6 148.1 186.6 155.6 174.2 183.4 222.4 227.5 112.9 85.9 15 Foreign banking offices in United States 48.5 16.5 - 9 . 8 11.2 75.4 22.9 - 5 . 6 158.8 83.9 24.1 35.0 51.1 16 Bank holding companies - 1 . 5 5.6 .0 .9 - . 3 2.7 - 2 . 4 -1 .5 5.3 - 9 . 6 4.6 - 5 . 3 17 Banks in U.S. affiliated areas -1 .9 3.7 2.4 3.3 4.7 2.2 8.3 2.4 4.0 7.0 5.2 - . 9 18 Funding corporations 8.2 17.7 -19 .4 -27.4 6.2 -43 .4 -4 .2 39.8 - 3 . 5 5.5 -17 .0 154.9 19 Thrift institutions -146.1 -61 .3 -1 .7 34.9 8.7 53.8 32.4 28.2 9.7 43.6 -46 .8 - 2 . 1 20 Life insurance companies 86.5 78.5 100.9 66.3 98.7 89.5 79.4 132.4 131.2 77.0 54.3 122.1 21 Other insurance companies 30.0 6.7 27.7 24.9 21.4 25.3 30.4 19.2 21.7 21.8 22.8 22.2 22 Private pension funds 35.4 41.1 45.9 47.0 61.3 42.5 74.7 58.9 57.2 50.5 78.5 77.8 23 State and local government retirement funds 41.1 23.0 19.8 29.0 21.4 -11.1 36.6 62.4 3.2 6.8 13.2 87.3 24 Finance companies - 9 . 2 7.5 - 9 . 0 68.2 63.6 63.8 81.7 92.5 65.7 43.7 52.7 56.7 25 Mortgage companies 11.2 .1 .0 -22.9 - 3 . 4 -14 .0 2.1 -14.4 29.9 7.3 -36 .4 1.7 26 Mutual funds 80.1 126.2 159.5 -7 .1 52.5 -29 .3 -70 .4 -15.1 21.5 52.0 151.5 62.9 27 Closed-end funds 12.8 18.2 11 .0 -5 .5 5.8 -13 .6 -10 .0 3.5 6.4 8.4 5.0 -1 .2 28 Money market mutual funds 32.7 4.7 20.4 30.0 86.5 57.7 53.9 53.1 135.2 33.2 124.6 170.1 29 Real estate investment trusts (REITs) - . 7 1.1 .6 4.7 1.8 5.5 .2 1.8 1.8 1.8 1.9 1.9 30 Brokers and dealers 17.5 -1 .3 14.8 -44.2 90.1 -21 .9 - 8 . 0 30.5 146.2 - 1 . 8 185.6 -101.1 31 Asset-backed securities issuers (ABSs) 50.0 53.7 80.8 61.9 112.3 50.6 42.6 55.5 100.9 144.6 148.0 112.2 32 Bank personal trusts 10.0 8.0 9.5 7.1 -18.8 7.7 1.4 -10 .8 -20 .6 -23.7 -20 .2 -18.1
RELATION OF LIABILITIES TO FINANCIAL ASSETS
33 Net flows through credit markets 6 5 2 . 1 8 0 5 . 6 9 8 8 . 4 1 , 0 6 6 . 5 1 , 2 4 5 . 6 1 , 0 3 5 . 9 1 , 2 0 5 . 2 1 , 2 1 4 . 8 1 , 3 6 4 . 9 1 , 1 6 9 . 0 1 , 2 3 3 . 7 1 , 2 1 4 . 0
Other financial sources 34 Official foreign exchange - 5 . 9 - 1 . 6 .8 -5 .8 8.8 .2 - 8 . 6 17.8 10.3 9.0 - 1 . 9 - 2 . 1 35 Special drawing rights certificates .0 - 2 . 0 .0 .0 2.2 .0 .0 .0 .0 8.6 .0 .0 36 Treasury currency .0 .2 .4 .7 .6 .8 .7 .7 .7 .8 .0 .0 3 / Life insurance reserves 25.7 27.3 35.2 34.0 49.9 67.7 21.6 54.0 49.9 29.9 66.0 56.0 38 Pension fund reserves 198.2 238.6 247.3 248.0 258.5 238.0 293.4 302.5 3 1 0 . 7 223.0 197.7 301.5 39 Interbank claims - 3 . 4 49.4 50.5 89.7 10.1 4.1 99.9 -13.6 25.2 -43 .2 71.8 -80 .9 40 Checkable deposits and currency 86.3 113.5 117.3 -9 .7 -12.5 -66 .0 -40 .5 42.8 133.5 -151.5 -75 .0 51.7 41 Small time and savings deposits 1.5 -57.2 -70 .3 -40.0 96.5 -51 .8 -46 .9 18.1 112.0 142.2 113.6 174.7 42 Large time deposits -58 .5 -73 .2 -23.5 19.6 65.6 84.0 36.5 116.8 69.2 76.3 .3 52.0 43 Money market fund shares 41.6 4.5 20.2 43.3 142.3 56.4 86.5 59.9 233.5 121.2 154.8 225.6 44 Security repurchase agreements -16.5 43.1 71.2 78.3 110.7 86.0 51.9 161.8 130.7 85.1 65.2 -31 .6 45 Foreign deposits -26.5 -3 .5 -18.5 45.8 5.8 28.1 97.9 39.2 90.6 -63 .8 -42 .8 -32 .0 46 Mutual fund shares 147.2 209.1 323.7 128.9 173.9 129.7 -12 .6 78.5 173.3 195.3 248.6 290.9 47 Corporate equities 62.2 85.8 118.4 21.9 -14.7 -16 .4 -68 .5 -38.5 -16 .6 .7 - 4 . 3 -17 .6 48 Security credit 51.4 4.6 61.4 - . 1 26.7 -59 .3 37.1 -10.7 30.8 35.4 51.3 80.3 49 Trade payables 31.0 46.6 54.4 111 .0 106.0 97.2 149.4 113.6 30.5 183.2 96.8 129.7 50 Taxes payable - 7 . 4 9.7 5.2 3.2 1.3 10.2 4.2 15.3 - 4 . 3 4.0 - 9 . 8 9.5 51 Noncorporate proprietors' equity .5 16.7 3.4 22.6 38.7 46.0 23.1 26.9 33.5 48.6 45.7 53.1 52 Investment in bank personal trusts 16.1 -7 .1 1.6 18.8 -47.7 23.6 11.9 -44 .3 -45 .6 -63 .9 -37.1 -47 .3 53 Miscellaneous 278.2 280.5 364.6 236.8 461.9 264.8 303.4 327.2 505.1 347.6 667.6 466.0
54 Total financial sources 1 , 4 7 3 . 9 1 , 7 9 0 . 4 2 , 3 5 1 . 7 2 , 1 1 3 . 5 2 , 7 3 0 . 1 1 , 9 7 9 . 2 2 , 2 4 5 . 7 2 , 4 8 2 . 9 3 , 2 3 7 . 8 2 , 3 5 7 . 5 2 , 8 4 2 . 3 2 , 8 9 3 . 5
Floats not included in assets ( —) 55 U.S. government checkable deposits -13 .1 .7 - 1 . 5 -4 .8 - 6 . 0 7.4 -24 .4 13.2 -16 .3 3.5 -24 .3 17.8 56 Other checkable deposits 4.5 1.6 - 1 . 3 -2 .8 -3 .8 - 3 . 3 - 2 . 3 -3 .7 - 3 . 9 -3 .5 - 4 . 2 - 3 . 9 57 Trade credit 36.1 11.3 - 6 . 6 -7 .8 -14.8 12.6 -44 .0 79.5 12.7 -44.1 -107.3 -71 .6
Liabilities not identified as assets (—) 58 Treasury currency - . 6 - . 2 - . 2 - . 2 - . 5 - . 2 - . 2 - . 2 - . 4 - . 3 - 1 . 0 - . 9 5 9 Interbank claims 26.2 - 4 . 9 4.2 -2 .7 - 3 . 1 10.1 - 1 . 7 .8 8.2 7.6 -29.1 12.4 60 Security repurchase agreements - 9 . 5 3.6 34.3 31.5 11.0 -53.5 86.7 64.4 -47 .3 39.6 -12.7 -76.7 61 Foreign deposits -24 .0 - 2 . 8 - 7 . 0 36.9 -1 .5 39.5 55.7 45.6 81.6 -93 .6 -39.5 -41.5 62 Taxes payable - 2 . 2 11.9 11.1 8.6 8.7 10.8 - . 9 - 8 . 9 31.6 10.8 1.4 -24 .0 63 Miscellaneous 9.7 - . 1 -126.1 -138.7 -29 .8 -44 .3 -107.3 -230.6 -36 .9 - 4 . 8 153.1 123.3
64 Total identified to sectors as assets 1 , 4 4 6 . 8 1 , 7 6 9 . 3 2 , 4 4 4 . 9 2 , 1 9 3 . 7 2 , 7 6 9 . 8 2 , 0 0 0 . 1 2 , 2 8 4 . 2 2 , 5 2 2 . 7 3 , 2 0 8 . 3 2 , 4 4 2 . 4 2 , 9 0 5 . 9 2 , 9 5 8 . 8
1. Data in this table also appear in the Board's Z.l (780) quarterly statistical release, tables 2. Excludes corporate equities and mutual fund shares. F.6 and F.7. For ordering address, see inside front cover.
Digitized for FRASER http://fraser.stlouisfed.org/ Federal Reserve Bank of St. Louis

A40 Domestic Nonfinancial Statistics • October 1996
1.59 SUMMARY OF CREDIT MARKET DEBT OUTSTANDING1
Billions of dollars, end of period
1994 1995 1996 Transaction category or sector Transaction category or sector
Q3 Q4 Ql Q2 Q3 Q4 Ql
Nonfinancial sectors
1 Total credit market debt owed by domestic nonfinancial sectors 11,894.5 12,537.8 13,163.0 13,895.9 12,965.8 13,163.0 13,339.3 13,548.4 13,707.8 13,895.9 14,072.1
By sector and instrument 2 U.S. government 3,080.3 3,336.5 3,492.3 3,636.7 3,432.3 3,492.3 3,557.9 3,583.5 3,603.4 3,636.7 3,717.2
Treasury securities 3,061.6 3,309.9 3,465.6 3,608.5 3,404.1 3,465.6 3,531.5 3,556.7 3,576.5 3,608.5 3,689.6 4 Budget agency issues and mortgages 18.8 26.6 26.7 28.2 28.2 26.7 26.4 26.8 26.9 28.2 27.6
5 Private 8,814.2 9,201.3 9,670.7 10,259.2 9,533.6 9,670.7 9,781.4 9,964.9 10,104.4 10,259.2 10,354.9
By instrument 6 Municipal securities 1,302.8 1,377.5 1,348.2 1,307.0 1,362.6 1,348.2 1,335.4 1,331.7 1,309.9 1,307.0 1,304.1 / Corporate bonds 1,154.5 1,229.7 1,253.0 1,326.3 1,251.5 1,253.0 1,266.3 1,290.9 1,305.8 1,326.3 1,341.0 8 Mortgages 4,088.7 4,260.0 4,454.4 4,691.8 4,400.5 4,454.4 4,495.8 4,563.2 4,641.2 4,691.8 4,748.6 9 Home mortgages 3,037.4 3,227.6 3,430.0 3,634.7 3,374.6 3,430.0 3,465.1 3,524.4 3,594.0 3,634.7 3,682.6
10 Multifamily residential 272.5 267.8 269.1 280.2 270.2 269.1 269.8 273.3 276.8 280.2 284.1 11 Commercial 698.1 683.4 672.3 692.4 673.1 672.3 677.6 681.6 686.1 692.4 696.7 12 Farm 80.7 81.2 83.0 84.6 82.6 83.0 83.4 83.9 84.4 84.6 85.2 13 Consumer credit 802.4 863.9 988.8 1,131.7 933.9 988.8 989.3 1,029.7 1,077.5 1,131.7 1,123.3 14 Bank loans n.e.c 672.2 676.0 749.0 852.0 724.9 749.0 782.8 810.6 825.6 852.0 861.9 15 Commercial paper 107.1 117.8 139.2 157.4 138.7 139.2 149.8 162.9 163.3 157.4 173.2 16 Other loans and advances 686.5 676.3 738.0 792.9 721.6 738.0 762.0 775.8 781.2 792.9 802.7
By borrowing sector 1/ Household 4,021.4 4,272.9 4,634.7 5,018.3 4,515.1 4,634.7 4,676.5 4,784.1 4,908.0 5,018.3 5,063.2 18 Nonfinancial business 3,696.8 3,770.3 3,921.1 4,171.8 3,885.6 3,921.1 4,002.7 4,084.0 4,122.3 4,171.8 4,224.8 19 Farm 136.3 138.3 141.2 143.2 143.1 141.2 138.9 142.8 144.9 143.2 140.9 20 Nonfarm noncorporate 1,122.9 1,129.9 1,142.0 1,178.0 1,137.4 1,142.0 1,154.5 1,163.3 1,170.4 1,178.0 1,185.0 21 Corporate 2,437.6 2,502.0 2,638.0 2,850.7 2,605.0 2,638.0 2,709.2 2,777.8 2,807.0 2,850.7 2,898.9 22 State and local government 1,095.9 1,158.2 1,114.8 1,069.1 1,132.8 1,114.8 1,102.2 1,096.8 1,074.1 1,069.1 1,066.9
23 Foreign credit market debt held in United States 313.1 381.9 361.6 429.4 352.4 361.6 376.8 387.6 409.9 429.4 438.5
24 Bonds 146.2 227.4 234.6 281.1 227.6 234.6 237.9 250.4 263.4 281.1 292.4 25 Bank loans n.e.c 23.9 24.6 26.1 34.6 26.3 26.1 28.2 29.6 31.6 34.6 36.8 26 Commercial paper 77.7 68.7 41.4 55.0 39.9 41.4 50.9 48.1 55.8 55.0 51.5 27 Other loans and advances 65.3 61.1 59.6 58.7 58.6 59.6 59.8 59.5 59.0 58.7 57.8
28 Total credit market debt owed by nonfinancial sectors, domestic and foreign 12,207.6 12,919.7 13,524.6 14,325.3 13,318.3 13,524.6 13,716.1 13,935.9 14,117.7 14,325.3 14,510.7
Financial sectors
29 Total credit market debt owed by financial sectors 3,025.0 3,321.5 3,794.6 4,242.1 3,656.2 3,794.6 3,861.4 3,971.8 4,093.9 4,242.1 4,317.1
By instrument 30 U.S. government-related 1,720.0 1,884.1 2,172.7 2,377.8 2,093.3 2,172.7 2,196.2 2,247.1 2,300.1 2,377.8 2,416.6 31 Government-sponsored enteipnses securities 443.1 523.7 700.6 807.5 638.3 700.6 716.3 748.1 773.5 807.5 816.9 32 Mortgage pool securities 1,272.0 1,355.6 1,472.1 1,570.3 1,454.9 1,472.1 1,479.9 1,499.0 1,526.6 1,570.3 1,599.7 33 Loans from U.S. government 4.8 4.8 .0 .0 .0 .0 .0 .0 .0 .0 .0 34 Private 1,305.1 1,437.4 1,621.9 1,864.3 1,563.0 1,621.9 1,665.2 1,724.7 1,793.8 1,864.3 1,900.6 35 Corporate bonds 738.4 858.5 973.5 1,158.9 949.5 973.5 1,012.3 1,056.4 1,110.2 1,158.9 1,189.6 36 Mortgages 5.4 8.9 18.7 24.0 17.5 18.7 20.0 21.3 22.6 24.0 25.4 3/ Bank loans n.e.c 80.5 67.6 55.3 58.3 53.4 55.3 53.4 58.4 60.3 58.3 59.1 38 Open market paper 394.3 393.5 442.8 488.1 420.5 442.8 454.1 462.8 473.6 488.1 492.8 39 Other loans and advances 86.6 108.9 131.6 135.0 122.0 131.6 125.4 125.7 127.0 135.0 133.6
By borrowing sector 40 Government-sponsored enterprises 447.9 528.5 700.6 807.5 638.3 700.6 716.3 748.1 773.5 807.5 816.9 41 Federally related mortgage pools 1,272.0 1,355.6 1,472.1 1,570.3 1,454.9 1,472.1 1,479.9 1,499.0 1,526.6 1,570.3 1,599.7 42 Private financial sectors 1,305.1 1,437.4 1,621.9 1,864.3 1,563.0 1,621.9 1,665.2 1,724.7 1,793.8 1,864.3 1,900.6 43 Commercial banks 80.0 84.6 94.5 102.6 92.6 94.5 95.0 99.9 102.0 102.6 100.5 44 Bank holding companies 114.6 123.4 133.6 148.0 129.6 133.6 137.7 142.9 150.0 148.0 141.6 45 Funding corporations 161.6 169.9 199.3 233.9 200.6 199.3 221.0 229.9 240.0 233.9 244.6 46 Savings institutions 88.4 99.6 112.4 115.0 103.4 112.4 107.7 105.9 107.2 115.0 117.8 47 Credit unions .0 .2 .5 .4 .4 .5 .4 .3 .4 .4 .4 48 Life insurance companies .0 .2 .6 .5 .3 .6 .6 .6 .6 .5 1.1 49 Finance companies 390.4 390.5 440.7 492.3 420.9 440.7 456.7 467.2 471.9 492.3 499.8 50 Mortgage companies 30.2 30.2 18.7 16.6 18.5 18.7 16.9 20.6 21.6 16.6 16.8 51 Real estate investment trusts (REITs) 13.9 17.4 31.1 36.5 29.5 31.1 32.4 33.7 35.0 36.5 38.0 52 Brokers and dealers 21.7 33.7 34.3 29.3 29.4 34.3 26.9 26.8 27.4 29.3 21.4 53 Issuers of asset-backed securities (ABSs) 404.3 487.6 556.1 689.1 537.7 556.1 570.0 596.8 637.8 689.1 718.8
All sectors
54 Total credit market debt, domestic and foreign.... 15,232.6 16,241.2 17,319.2 18,567.4 16,974.5 17,319.2 17,577.5 17,907.8 18,211.5 18,567.4 18,827.8
55 U.S. government securities 4,795.5 5,215.8 5,665.0 6,014.6 5,525.6 5,665.0 5,754.1 5,830.6 5,903.5 6,014.6 6,133.8 56 Municipal securities 1,302.8 1,377.5 1,348.2 1,307.0 1,362.6 1,348.2 1,335.4 1,331.7 1,309.9 1,307.0 1,304.1 57 Corporate and foreign bonds 2,039.0 2,315.6 2,461.0 2,766.3 2,428.6 2,461.0 2,516.5 2,597.7 2,679.5 2,766.3 2,823.1 58 Mortgages 4,094.1 4,269.0 4,473.1 4,715.9 4,418.0 4,473.1 4,515.9 4,584.6 4,663.9 4,715.9 4,774.0 59 Consumer credit 802.4 863.9 988.8 1,131.7 933.9 988.8 989.3 1,02.9.7 1,077.5 1,131.7 1,123.3 60 Bank loans n.e.c 776.6 768.2 830.4 944.9 804.5 830.4 864.4 898.6 917.4 944.9 957.8 61 Open market paper 579.0 580.0 623.5 700.4 599.2 623.5 654.7 673.8 692.7 700.4 717.6 62 Other loans and advances 843.1 851.1 929.1 986.6 902.2 929.1 947.2 961.0 967.1 986.6 994.2
1. Data in this table also appear in the Board's Z.l (780) quarterly statistical release, tables L.2 through L.4. For ordering address, see inside front cover.
Digitized for FRASER http://fraser.stlouisfed.org/ Federal Reserve Bank of St. Louis

Flow of Funds A41
1.60 SUMMARY OF FINANCIAL ASSETS AND LIABILITIES1
Billions of dollars except as noted, end of period
Transaction category or sector 1992 1993 1994 1995
1994 1995 1996
Transaction category or sector 1992 1993 1994 1995
Q 3 Q 4 Qi Q 2 Q 3 Q 4 Ql
CREDIT MARKET DEBT OUTSTANDING2
1 Total credit market assets 15 ,232 .6 16 ,241 .2 17 ,319 .2 18 ,567 .4 16 ,974 .5 17 ,319 .2 17 ,577 .5 17 ,907 .8 18 ,211 .5 18 ,567 .4 18 ,827 .8
2 Private domestic nonfinancial sectors 2 ,671 .6 2 ,730 .1 3 ,019 .3 2 ,930 .4 2 ,900 .6 3 ,019 .3 2 ,984 .8 2 ,935.1 2 ,942 .2 2 , 9 3 0 . 4 2 ,858 .6 3 Households 1,618.5 1 ,658.9 1 ,993.9 2 ,041 .3 1,857.7 1 ,993.9 2 ,013 .6 1,974.3 2 ,048 .3 2 ,041 .3 2 ,001 .8 4 Nonfarm noncorporate business 38.1 38 .8 39 .5 4 0 . 4 39.3 39 .5 39 .6 39 .9 4 0 . 2 4 0 . 4 4 0 . 7 5 Nonfinancial corporate business 257 .8 271 .5 319 .7 316.1 295 .3 319 .7 2 9 1 . 0 302 .8 2 9 0 . 4 316.1 306 .6 6 State and local governments 7 5 7 . 2 760 .8 666 .3 532 .5 708 .3 666 . 3 6 4 0 . 6 618.1 5 6 3 . 4 532 .5 5 0 9 . 4 7 U.S. government 2 3 5 . 0 230 .7 206 .5 185.2 212 .6 206 .5 203 .2 197.1 191.2 185.2 179.0 8 Rest of the world 1,022.8 1 ,146.6 1,255.7 1,527.5 1,240.7 1,255.7 1 ,324.4 1 ,402.6 1,493.1 1 ,527.5 1,617.8 9 Financial sectors 11,303.2 12,133.8 12,837.7 13,924.3 12 ,620.6 12,837.7 13 ,065 .2 13 ,372 .9 13,585.1 13 ,924.3 14,172.5
10 Government-sponsored enterprises 457 .8 5 4 8 . 0 667.1 761 .8 624 .3 667 .1 673 .5 6 9 8 . 6 7 1 4 . 0 761 .8 771 .7 11 Federally related mortgage pools 1,272.0 1 ,355.6 1,472.1 1,570.3 1,454.9 1,472.1 1 ,479.9 1 ,499.0 1 ,526.6 1,570.3 1,599.7 12 Monetary authority 300 .4 336 .7 368 .2 380 .8 356 .8 368 .2 367.1 375 .7 3 7 0 . 6 380 .8 379 .6 13 Commercial banking 2 ,948 .6 3 ,090 .8 3 ,254 .3 3 ,520 .6 3 ,203 .9 3 ,254 .3 3 ,327 .8 3 ,409 .8 3 , 4 7 4 . 2 3 ,520 .6 3 ,541 .4 14 U.S. chartered banks 2 ,571 .9 2 ,721 .5 2 ,869 .6 3 ,056.1 2 ,822 .3 2 ,869 .6 2 ,906 .5 2 ,963 .7 3 ,023 .7 3 ,056.1 3 ,068 .8 15 Foreign banking offices in United States 335 .8 3 2 6 . 0 337.1 4 1 2 . 6 335 .5 337.1 373 .6 3 9 6 . 0 401 .1 4 1 2 . 6 422 . 3 16 Bank holding companies 17.5 17.5 18.4 18.0 19.0 18.4 18.0 19.3 16.9 18.0 16.7 17 Banks in U.S. affiliated areas 23 .4 25 .8 29 .2 33.8 27.1 29 .2 29 .8 30.8 32.5 33.8 33 .6 18 Funding corporations 162.5 149.2 129.5 138.3 130.2 129.5 140.8 137.4 143.1 138.3 174.9 19 Thrift institutions 1,134.5 1,132.7 1 ,167.6 1,176.3 1 ,160.4 1 ,167.6 1 ,173.4 1 ,177.4 1 ,188.9 1,176.3 1 ,174.6 20 Life insurance companies 1,309.1 1 ,420.6 1 ,487.0 1,585.7 1,470.7 1 ,487.0 1,523.1 1,557.1 1,575.5 1,585.7 1,619.2 21 Other insurance companies 3 8 9 . 4 422 .7 4 4 6 . 4 471 .9 439.1 4 4 6 . 4 451 .8 458 .5 4 6 4 . 4 4 7 1 . 9 478 .1 2 2 Private pension funds 5 7 1 . 7 6 1 7 . 6 6 6 4 . 6 725 .9 6 4 5 . 9 6 6 4 . 6 679 . 3 6 9 3 . 6 706 .2 725 .9 745 .3 23 State and local government retirement funds 417 .5 4 3 7 .3 466 . 3 4 8 7 . 7 4 5 4 . 3 4 6 6 . 3 480 .7 482.1 481 .8 4 8 7 . 7 508 .2 24 Finance companies 4 9 6 . 4 482 .8 5 5 1 . 0 614 .6 524.1 5 5 1 . 0 568 .5 5 8 6 . 9 5 9 4 . 7 6 1 4 . 6 623 .3 25 Mortgage companies 60.5 60 .4 37 .5 34.1 37 .0 37.5 33 .9 4 1 . 4 4 3 . 2 34.1 34.5 26 Mutual funds 5 6 6 . 4 7 2 5 . 9 718 .8 771 .3 741 .8 718 .8 719 .3 724 .8 739 .2 771 . 3 791 .7 27 Closed-end funds 67 .7 78 .6 73.1 78 .9 75 .6 73.1 7 4 . 0 7 5 . 6 77 .7 78 .9 78 .6 28 Money market mutual funds 4 0 8 . 6 4 2 9 . 0 4 5 9 . 0 545 .5 4 3 7 . 9 4 5 9 . 0 4 8 0 . 6 5 0 8 . 0 505 .7 545 .5 595 .6 29 Real estate investment trusts (REITs) 8.1 8 .6 13.3 15.1 13.3 13.3 13.8 14.2 14.7 15.1 15.6 30 Brokers and dealers 122.7 137.5 93 .3 183.4 95.3 93 .3 101.0 137.5 137.0 183.4 158.2 31 Asset-backed securities issuers (ABSs) 378 .0 458 .8 5 2 0 . 7 632 .9 507 .3 520 .7 531 .5 555 .2 5 9 3 . 2 6 3 2 . 9 6 5 7 . 6 32 Bank personal trusts 231 .5 240 .9 2 4 8 . 0 229 .2 247 .7 2 4 8 . 0 245 .3 240 .2 2 3 4 . 2 229 .2 224 .7
RELATION OF LIABILITIES TO FINANCIAL ASSETS
33 Total credit market debt 15 ,232 .6 16 ,241 .2 17 ,319 .2 18 ,567 .4 16 ,974 .5 17 ,319 .2 17 ,577 .5 17 ,907 .8 18 ,211 .5 1 8 , 5 6 7 . 4 18 ,827 .8
Other liabilities 34 Official foreign exchange 51.8 53 .4 53 .2 63.7 55 .5 53 .2 64.1 67.1 65.1 63 .7 62.1 35 Special drawing rights certificates 8.0 8 .0 8 .0 10.2 8 .0 8 .0 8 .0 8 .0 10.2 10.2 10.2 36 Treasury currency 16.5 17.0 17.6 18.2 17.5 17.6 17.8 18.0 18.2 18.2 18.2 37 Life insurance reserves 4 3 3 . 0 4 6 8 . 2 5 0 2 . 2 552.1 4 9 6 . 8 5 0 2 . 2 515 .7 528 .1 535 .6 552 .1 566.1 38 Pension fund reserves 4 .055 .1 4 ,471 .6 4 , 6 9 3 . 9 5 ,499 .6 4 , 6 7 7 . 0 4 , 6 9 3 . 9 4 ,895 .7 5 , 0 9 5 . 4 5 ,318 .1 5 ,499 .6 5 ,745 .6 39 Interbank claims 138.5 189.3 2 8 0 . 0 290 .7 250.1 2 8 0 . 0 2 7 3 . 0 2 6 5 . 9 2 6 7 . 4 290 .7 266 .2 4 0 Deposits at financial institutions 5 ,050 .2 5 ,154 .9 5 ,296 .0 5 ,704 .4 5 ,212 .4 5 ,296 .0 5 ,389 .5 5 ,572 .4 5 ,615 .3 5 , 7 0 4 . 4 5 ,799.1 41 Checkable deposits and currency 1,134.4 1,251.7 1 ,242.0 1,229.5 1 ,205.0 1 ,242.0 1 ,193.9 1,246.3 1 ,200.4 1 ,229.5 1 ,183.8 4 2 Small time and savings deposits 2 ,293 .5 2 ,223 .2 2 ,183 .3 2 ,279 .7 2 ,199.1 2 ,183 .3 2 ,200 . 1 2 ,222 .4 2 ,255 .6 2 ,279 .7 2 , 3 3 6 . 4 4 3 Large time deposits 4 1 5 . 2 391 .7 4 1 1 . 2 4 7 6 . 9 4 0 2 . 6 4 1 1 . 2 441 .1 4 5 6 . 2 4 7 7 . 4 4 7 6 . 9 4 9 0 . 6 4 4 Money market fund shares 539 .5 5 5 9 . 6 6 0 2 . 9 745 .3 578 .7 6 0 2 . 9 6 3 4 . 0 678 .5 702 .7 745 . 3 816 .9 4 5 Security repurchase agreements 399 .9 471 .1 5 4 9 . 4 660 .1 548 .1 5 4 9 . 4 6 0 3 . 4 629 .3 6 5 5 . 6 660 . 1 666 .5 4 6 Foreign deposits 267 .7 2 5 7 . 6 307.1 312 .9 278 .9 307.1 316 .9 3 3 9 . 6 3 2 3 . 6 312 .9 304 .9 47 Mutual fund shares 992 .5 1,375.4 1,477.3 1,852.8 1,515.8 1,477.3 1,553.3 1 ,661.0 1 ,782.0 1 ,852.8 2 ,004 .8 48 Security credit 217.7 2 7 9 . 0 2 7 9 . 0 305 .6 263 .9 2 7 9 . 0 269 .5 277 .9 286 .2 3 0 5 . 6 318 . 3 4 9 Trade payables 995 .1 1,049.4 1,160.5 1,266.5 1,099.8 1 ,160.5 1,159.8 1,174.2 1,217.3 1,266.5 1,269.7 50 Taxes payable 79.7 84 .9 88 .0 89.3 87.1 88 .0 94 .3 89 .2 91 .9 89.3 94 .2 51 Investment in bank personal trusts 6 6 0 . 6 6 9 1 .3 6 9 9 . 4 7 6 7 . 4 701.1 6 9 9 . 4 719 .7 739 .7 7 5 8 . 6 7 6 7 . 4 7 8 1 . 6 52 Miscellaneous 4 , 7 8 5 . 2 5 ,165 .2 5 ,397 .3 5 ,769 .9 5 ,373 .0 5 ,397 .3 5 ,459 .7 5 ,537 .2 5 ,626 .9 5 ,769 .9 5 , 8 3 6 . 4
53 Total liabilities 3 2 , 7 1 6 . 4 35 ,248 .7 3 7 , 2 7 1 . 6 40 ,757 .9 3 6 , 7 3 2 . 4 3 7 , 2 7 1 . 6 3 7 , 9 9 7 . 6 38 ,941 .9 3 9 , 8 0 4 . 3 4 0 , 7 5 7 . 9 4 1 , 6 0 0 . 4
Financial assets not included in liabilities (+) 5 4 Gold and special drawing rights 19.6 20.1 21.1 22.1 21.0 21.1 22.7 22 .9 22.1 22.1 22.1 55 Corporate equities 5 ,462 .9 6 ,278 .5 6 , 2 9 3 . 4 8 ,345 .4 6 ,228 .7 6 , 2 9 3 . 4 6 ,835 .8 7 ,393 .0 8 ,013 .8 8 ,345 .4 8 ,820 .5 56 Household equity in noncorporate business 2 ,458 .3 2 ,476 .3 2 ,564 .6 2 ,657 .7 2 ,550 .9 2 ,564 .6 2 ,576 .7 2 ,607 .0 2 ,619 .3 2 ,657 .7 2 ,669 .9
Floats not included in assets (—) 57 U.S. government checkable deposits 6.8 5 .6 3 .4 3.1 1.2 3 .4 4 .2 2 .0 .6 3.1 .0 58 Other checkable deposits 4 2 . 0 40 .7 38 .0 34 .2 30 .6 38 .0 33.3 35.7 27 .3 34 .2 29 .6 59 Trade credit - 2 5 1 . 1 - 2 5 1 . 4 - 2 6 0 . 1 - 2 7 4 . 9 - 3 2 3 . 2 - 2 6 0 . 1 - 2 9 7 . 1 - 3 1 5 . 8 - 3 3 1 . 3 - 2 7 4 . 9 - 3 5 6 . 1
Liabilities not identified as assets ( - ) 60 Treasury currency - 4 . 9 - 5 . 1 - 5 . 4 - 5 . 8 - 5 . 3 - 5 . 4 - 5 . 4 - 5 . 5 - 5 . 6 - 5 . 8 - 6 . 0 61 Interbank claims - 9 . 3 - 4 . 7 - 6 . 5 - 9 . 0 - 3 . 4 - 6 . 5 - 2 . 7 - 2 . 9 .1 - 9 . 0 - 2 . 5 62 Security repurchase agreements 4 3 . 0 77 .3 108.8 119.8 100.7 108.8 132.9 114.5 136.4 119.8 108.7 63 Foreign deposits 2 1 7 . 6 218 .4 258 .7 257 .2 241 .3 258 .7 270.1 290 .5 267.1 257 .2 246 .8 6 4 Taxes payable 25 .2 26 .8 25 .0 33.7 22 .8 25 .0 10.0 25 .6 28.7 33.7 13.5 65 Miscellaneous - 5 1 4 . 5 - 6 6 7 . 2 - 8 3 0 . 5 - 8 5 9 . 2 - 6 8 8 . 2 - 8 3 0 . 5 - 8 9 2 . 2 - 8 7 8 . 5 - 8 8 4 . 9 - 8 5 9 . 2 - 8 9 6 . 0
66 Total identified to sectors as assets 4 1 , 1 0 2 . 3 4 4 , 5 8 3 . 2 4 6 , 8 1 9 . 3 52 ,483 .9 46 ,156 .5 4 6 , 8 1 9 . 3 48 ,179 .7 4 9 , 6 9 9 . 2 51 ,221 .1 5 2 , 4 8 3 . 9 5 3 , 9 7 5 . 0
1. Data in this table also appear in the Board's Z.l (780) quarterly statistical release, tables 2. Excludes corporate equities and mutual fund L.6 and L.7. For ordering address, see inside front cover.
Digitized for FRASER http://fraser.stlouisfed.org/ Federal Reserve Bank of St. Louis

A42 Domestic Nonfinancial Statistics • October 1996
2.10 NONFINANCIAL BUSINESS ACTIVITY Selected Measures
Monthly data seasonally adjusted, and indexes 1987=100 , except as noted
Apr. May' Juner
1 Industrial production
Market groupings 2 Products, total 3 Final, total 4 Consumer goods 5 Equipment 6 Intermediate 7 Materials
Industry groupings
8 Manufacturing
9 Capacity utilization, manufacturing (percent)'
10 Construction contracts3
11 Nonagricultural employment, total4
12 Goods-producing, total 13 Manufacturing, total 14 Manufacturing, production workers 15 Service-producing 16 Personal income, total 17 Wages and salary disbursements 18 Manufacturing 19 Disposable personal income5
20 Retail sales5
Prices6
21 Consumer (1982-84=100) 22 Producer finished goods (1982=100)
110.0 112.7 109.5 117.5 101.8 113.8
105.1
108.6 94.6 95.1 95.3
113.1 141.3 136.0 119.3 142.4 134.7
144.5 124.7
115.6 118.3 113.7 125.3 107.3 122.0
114.2
112.0 96.9 96.4 97.5
116.8 148.4r
142.6 124.9r
149.3r
144.8
148.2 125.5
118.3 121.4 115.1 131.4 109.0 127.4
118.3
115.0 98.1 97.2 98.7
120.3 157.7r
150.9r
130.4r
158.2r
152.2
152.4 127.9
118.8 121.9 115.9 131.4 109.3 128.4
122.0
115.6 97.8 96.6 98.0
121.3 160.7r
153.8r
131.6r
161.3r
154.3
153.6 128.7
119.2 122.1 115.7 132.3 110.1 128.4
117.0
115.9 97.9 96.7 98.1
1 2 1 . 6 161,6r
154.6r
132.0r
162.3r
155.3
153.5 129.1
118.6 121.9 114.6 133.7 108.5 128.5
120.0r
115.8 97.7 96.4 97.7
121.6 161.7r
154.4r
130.8r
162.2r
155.3
154.4 129.4
120.7 124.5 116.6 137.3 109.3 129.4
113.0
116.3 98.3 96.5 97.8
122.1 162.9r
156.0r
132.5r
163.2r
158.6
154.9 129.4
120.0 123.4 115.3 136.5 109.6 129.1
126.0r
116.5 98.1 96.2 97.4
122.3 163.5r
156.7r
131.8r
163.7r
159.3
155.7 130.1'
120.8r
124.8 115.9r
139.2 108.6 130.3r
127.0'
116.7 98.1 96.2 97.5
122.6 164.3r
157.5r
134.4r
162.9r
159.1
156.3 130.8
121.2 125.0 116.1 139.4 109.7 131.4
125.0
117.0 98.3 96.3 97.5
123.0 165.1 158.2 135.1 165.1 160.4
156.6 131.0
121.8 125.5 116.1 140.8 110.5 132.5
120.0
117.3 98.4 96.3 97.5
123.3 166.6 160.3 135.7 166.5 159.5
156.7 131.6
1. Data in this table also appear in the Board's G.17 (419) monthly statistical release. For the ordering address, see the inside front cover. The latest historical revision of the industrial production index and the capacity utilization rates was released in November 1995. See "A Revision to Industrial Production and Capacity Utilization, 1991-95," Federal Reserve Bulletin, vol. 82 (January 1996), pp. 16—25. For a detailed description of the industrial production index, see "Industrial Production: 1989 Developments and Historical Revision," Federal Reserve Bulletin, vol. 76 (April 1990), pp. 187-204.
2. Ratio of index of production to index of capacity. Based on data from the Federal Reserve, DRI McGraw-Hill, U.S. Department of Commerce, and other sources.
3. Index of dollar value of total construction contracts, including residential, nonresiden-tial, and heavy engineering, from McGraw-Hill Information Systems Company, F.W. Dodge Division.
4. Based on data from U.S. Department of Labor, Employment and Earnings. Series covers employees only, excluding personnel in the armed forces.
5. Based on data from U.S. Department of Commerce, Survey of Current Business. 6. Based on data not seasonally adjusted. Seasonally adjusted data for changes in the price
indexes can be obtained from the U.S. Department of Labor, Bureau of Labor Statistics, Monthly Labor Review.
NOTE. Basic data (not indexes) for series mentioned in notes 4 and 5, and indexes for series mentioned in notes 3 and 6, can also be found in the Survey of Current Business.
Figures for industrial production for the latest month are preliminary, and many figures for the three months preceding the latest month have been revised. See "Recent Developments in Industrial Capacity and Utilization," Federal Reserve Bulletin, vol. 76 (June 1990), pp. 411-35. See also "Industrial Production Capacity and Capacity Utilization since 1987," Federal Reserve Bulletin, vol. 79 (June 1993), pp. 590-605.
2.11 LABOR FORCE, EMPLOYMENT, AND UNEMPLOYMENT
Thousands of persons; monthly data seasonally adjusted
Category 1993 1994 1995 1995 1996
Category 1993 1994 1995 Dec. Jan. Feb. Mar. Apr. May' June' July
HOUSEHOLD SURVEY DATA1
1 Civilian labor force2 129,200 131.056 132,304 132,352 132,903 133,018 133,655 133,361 133,910 133,669 134,181 Employment
2 Nonagricultural industries3 117,144 119,651 121,460 121,656 121,698 122,143 122,664 122,726 122,971 123,228 123,382 3 Agriculture 3,115 3,409 3,440 3,325 3,529 3,519 3,487 3,368 3,491 3,382 3,502
Unemployment 4 Number 8,940 7,996 7,404 7,371 7,677 7,355 7,504 7,266 7,448 7,060 7,297 5 Rate (percent of civilian labor force) 6.9 6.1 5.6 5.6 5.8 5.5 5.6 5.4 5.6 5.3 5.4
ESTABLISHMENT SURVEY DATA
6 Nonagricultural payroll employment4 110,730 114,172 117,203 118,136 118,070 118,579 118,737 118,928 119,335 119,555 119,748
7 Manufacturing 18,075 18,321 18,468 18,367 18,309 18,332 18,282 18,283 18,302 18,298 18,278 8 Mining 610 601 580 570 569 573 574 573 576 574 570 9 Contract construction 4,668 4,986 5,158 5,223 5,234 5,349 5,340 5,353 5,384 5,406 5,431
10 Transportation and public utilities 5,829 5,993 6,165 6,249 6,254 6,270 6,289 6,294 6,311 6,329 6,336 11 Trade 25,755 26,670 27,585 27,832 27,780 27,869 27,891 27,972 28,066 28,162 28,263 12 Finance 6,757 6,896 6,830 6,887 6,894 6,919 6,932 6,942 6,964 6,968 6,987 13 Service 30,197 31,579 33,107 33,661 33,694 33,902 34,035 34,114 34,274 34,364 34,392 14 Government 18,841 19,128 19,310 19,347 19,336 19,365 19,394 19,397 19,458 19,454 19,491
1. Beginning January 1994, reflects redesign of current population survey and population controls from the 1990 census.
2. Persons sixteen years of age and older, including Resident Armed Forces. Monthly figures are based on sample data collected during the calendar week that contains the twelfth day; annual data are averages of monthly figures. By definition, seasonality does not exist in population figures.
3. Includes self-employed, unpaid family, and domestic service workers.
4. Includes all full- and part-time employees who worked during, or received pay for, the pay period that includes the twelfth day of the month; excludes proprietors, self-employed persons, household and unpaid family workers, and members of the armed forces. Data are adjusted to the March 1992 benchmark, and only seasonally adjusted data are available at this time.
SOURCE. Based on data from U.S. Department of Labor, Employment and Earnings.
Digitized for FRASER http://fraser.stlouisfed.org/ Federal Reserve Bank of St. Louis

Selected Measures A43
2.12 OUTPUT, CAPACITY, AND CAPACITY UTILIZATION1
Seasonally adjusted
Series 1995 1996 1995 1996 1995 1996
Series Q3 Q4 Ql Q2r Q3 Q4 Ql Q2 Q3 Q4 Ql Q2r
Output (1987=100) Capacity (percent of 1987 output) Capacity utilization rate (percent)2
1 Total industry 122.3 122.5 123.4 125.2 146.3 147.7 149.1 150.6 83.6 82.9 82.8 83.2
2 Manufacturing 124.1 124.6 125.3 127.3 150.2 151.9 153.5 155.1 82.6 82.0 81.6 82.1
3 Primary processing3 117.1 117.1 116.7 118.5 135.2 136.1 136.9 137.8 86.6 86.1 85.2 86.0 4 Advanced processing4 127.5 128.1 129.4 131.5 157.5 159.5 161.5 163.5 80.9 80.3 80.1 80.4
5 Durable goods 133.0 134.2 136.0 139.5 161.7 164.2 166.7 169.4 82.3 81.7 81.6 82.4 6 Lumber and products 104.6 105.8 104.6 108.3 119.8 120.9 121.7 122.4 87.3 87.5 85.9 88.4 7 Primary metals 118.2 118.8 118.9 119.8 128.8 129.5 130.3 131.4 91.8 91.8 91.2 91.2 8 Iron and steel 121.3 121.3 122.6 123.3 132.9 133.5 134.4 135.7 91.3 90.9 91.2 90.9 9 Nonferrous 113.9 115.3 113.8 114.9 123.3 124.0 124.8 125.5 92.4 93.0 91.2 91.5
10 Industrial machinery and equipment 178.9 186.8 195.3 201.4 206.1 212.0 218.1 224.5 86.8 88.1 89.5 89.7 11 Electrical machinery 178.4 182.9 186.3 189.4 206.3 213.9 221.8 229.9 86.5 85.5 84.0 82.4 12 Motor vehicles and parts 140.7 140.5 132.6 145.9 176.8 179.2 181.3 182.9 79.6 78.4 73.2 79.8 13 Aerospace and miscellaneous
transportation equipment 86.9 79.0 84.0 86.3 130.1 129.3 128.6 128.1 66.8 61.1 65.3 67.4
14 Nondurable goods 114.3 113.9 113.5 113.8 137.7 138.4 139.0 139.6 83.0 82.3 81.7 81.5 15 Textile mill products 110.9 109.4 106.4 109.3 131.6 132.8 133.7 134.2 84.3 82.4 79.6 81.5 16 Paper and products 119.5 118.1 114.6 119.2 132.8 133.9 134.9 135.8 90.0 88.2 85.0 87.8 17 Chemicals and products 124.6 126.4 126.9 126.3 155.6 156.5 157.5 158.5 80.1 80.7 80.6 79.7 18 Plastics materials 118.3 123.1 126.9 135.4 137.1 138.6 87.3 89.7 91.6 19 Petroleum products 109.2 107.7 109.7 109.7 116.4 116.6 116.8 117.1 93.8 92.4 93.9 93.7
20 Mining 100.2 98.2 98.7 100.8 111.9 111.9 111.9 111.8 89.5 87.8 88.2 90.1 21 Utilities 124.7 124.1 126.7 126.7 135.2 135.6 136.0 136.5 92.3 91.5 93.2 92.8 22 Electric 125.0 123.7 126.4 127.2 132.5 133.0 133.4 133.9 94.3 93.1 94.8 94.9
1973 1975 Previous cycle5 Latest cycle6 1995 1996
High Low High Low High Low July Feb. Mar. Apr/ Mayr June Julyp
Capacity utilization rate (percent)2
1 Total industry 89.2 72.6 87.3 71.8 84.9 78.0 83.3 83.3 82.6 83.0 83.2 83.4 83.2
2 Manufacturing 88.9 70.8 87.3 70.0 85.2 76.6 82.4 82.3 81.3 81.9 82.0 82.3 82.3
3 Primary processing3 92.2 68.9 89.7 66.8 89.0 77.9 86.7 84.9 85.3 85.5 86.0 86.5 86.2 4 Advanced processing4 87.5 72.0 86.3 71.4 83.5 76.1 80.6 81.1 79.6 80.4 80.3 80.6 80.7
5 Durable goods 88.8 68.5 86.9 65.0 84.0 73.7 81.7 82.5 80.9 82.1 82.2 82.9 83.0 6 Lumber and products 90.1 62.2 87.6 60.9 93.3 76.1 86.9 84.8 88.2 88.7 87.6 89.0 87.7 7 Primary metals 100.6 66.2 102.4 46.8 92.8 74.2 92.0 89.8 90.3 91.0 90.6 92.0 90.8 8 Iron and steel 105.8 66.6 110.4 38.3 95.7 72.0 89.8 88.9 89.1 90.8 89.7 92.1 90.9 9 Nonferrous 92.9 61.3 90.5 62.2 88.7 75.2 94.8 91.0 91.8 91.1 91.6 91.8 90.8
10 Industrial machinery and equipment 96.4 74.5 92.1 64.9 84.0 71.8 86.2 89.9 89.9 89.5 89.5 90.1 89.9
11 Electrical machinery 87.8 63.8 89.4 71.1 84.9 77.0 86.2 85.1 83.7 82.5 82.1 82.5 82.5 12 Motor vehicles and parts 93.4 51.1 93.0 44.5 85.1 56.6 77.7 77.9 66.7 79.1 79.1 81.0 84.2 13 Aerospace and miscellaneous
transportation equipment 77.0 66.6 81.1 66.9 88.4 78.8 67.2 65.5 66.7 67.0 67.3 67.8 67.8
14 Nondurable goods 87.9 71.8 87.0 76.9 86.7 80.3 83.1 81.9 81.6 81.5 81.7 81.5 81.3 15 Textile mill products 92.0 60.4 91.7 73.8 92.1 78.8 83.7 79.4 81.4 80.7 81.0 82.6 82.4 16 Paper and products 96.9 69.0 94.2 82.0 94.8 86.7 91.6 84.1 85.4 87.7 87.9 87.7 89.0 17 Chemicals and products 87.9 69.9 85.1 70.1 85.9 79.0 79.9 80.7 80.1 79.7 79.7 79.6 79.5 18 Plastics materials 102.0 50.6 90.9 63.4 97.0 74.8 87.9 91.3 92.6 93.4 94.5 19 Petroleum products 96.7 81.1 89.5 68.2 88.5 84.6 93.7 94.3 94.0 93.8 93.8 93.6 92.9
20 Mining 94.4 88.4 96.6 80.6 86.5 86.1 90.0 87.6 90.3 89.7 89.6 91.1 90.9 71 Utilities 95.6 82.5 88.3 76.2 92.6 83.1 90.8 93.1 94.0 92.7 93.7 92.2 90.3 22 Electric 99.0 82.7 88.3 78.7 94.8 86.7 92.3 94.9 95.2 94.0 96.1 94.8 92.6
1. Data in this table also appear in the Board's G.17 (419) monthly statistical release. For the ordering address, see the inside front cover. The latest historical revision of the industrial production index and the capacity utilization rates was released in November 1995. See "A Revision to Industrial Production and Capacity Utilization, 1991-95," Federal Reserve Bulletin, vol. 82 (January 1996), pp. 16—25. For a detailed description of the industrial production index, see "Industrial Production: 1989 Developments and Historical Revision," Federal Reserve Bulletin, vol. 76 (April 1990), pp. 187-204.
2. Capacity utilization is calculated as the ratio of the Federal Reserve's seasonally adjusted index of industrial production to the corresponding index of capacity.
3. Primary processing includes textiles; lumber; paper; industrial chemicals; synthetic materials; fertilizer materials; petroleum products; rubber and plastics; stone, clay, and glass; primary metals; and fabricated metals.
4. Advanced processing includes foods; tobacco; apparel; furniture and fixtures; printing and publishing; chemical products such as drugs and toiletries; agricultural chemicals; leather and products; machinery; transportation equipment; instruments; and miscellaneous manufac-tures.
5. Monthly highs, 1978-80; monthly lows, 1982. 6. Monthly highs, 1988-89; monthly lows, 1990-91.
Digitized for FRASER http://fraser.stlouisfed.org/ Federal Reserve Bank of St. Louis

A44 Domestic Nonfinancial Statistics • October 1996
2.13 INDUSTRIAL PRODUCTION Indexes and Gross Value1
Monthly data seasonally adjusted
1992 1995 1996 pro- 1995 Group por- avg. tion July Aug. Sept. Oct. Nov. Dec. Jan. Feb. Mar. Apr.r May' June Julyp
Index (1987 = 100)
MAJOR MARKETS
1 Total index 100.0 121.9 121.5 122.7 122.8 122.2 122.6 122.8 122.5 124.2 123.6 124.5 125.2 126.0 126.2
2 Products 60,6 118.3 118.0 119.2 119.4 118.3 118.8 119.2 118.6 120.7 120.0 120.8 121.2 121.8 122.0 J Final products 46.3 121.4 121.2 122.4 122.6 121.3 121.9 122.1 121.9 124.5 123.4 124.8 125.0 125.5 125.9 4 Consumer goods, total 28.6 115.1 114.6 115.9 116.0 114.9 115.9 115.7 114.6 116.6 115.3 115.9 116.1 116.1 116.5
Durable consumer goods 5.6 124.2 121.4 124.0 125.8 123.4 124.9 126.3 120.3 125.1 119.3 125.5 126.1 130.1 133.5 6 Automotive products 2.5 130.7 125.3 130.7 132.9 128.5 130.5 132.8 125.9 133.1 120.3 133.5 134.1 137.5 145.0 / Autos and trucks 1.6 131.4 123.9 132.0 133.1 128.6 129.8 132.1 124.1 133.5 111.1 135.9 135.4 138.9 149.8 8 Autos, consumer .9 103.1 101.0 100.6 102.6 100.2 100.2 99.5 92.8 99.7 77.0 104.1 106.2 110.4 116.5 9 Trucks, consumer .7 181.7 163.9 188.2 187.7 179.1 182.8 190.6 180.4 194.4 173.1 192.7 187.3 189.2 209.3
10 Auto parts and allied goods .9 127.8 126.6 126.6 130.8 126.7 130.2 132.7 128.1 130.7 137.2 127.2 129.9 133.1 133.5 11 Other 3.0 118.6 118.1 118.1 119.6 118.9 119.9 120.5 115.5 118.1 118.5 118.5 119.2 123.6 123.5 12 Appliances, televisions, and air
conditioners .7 135.5 132.2 135.8 139.4 140.1 145.3 141.9 132.2 137.5 138.3 139.7 138.9 151.6 153.3 13 Carpeting and furniture .8 105.8 107.9 104.4 106.9 105.6 104.1 107.4 101.1 103.4 105.7 104.4 105.5 110.0 109.5 14 Miscellaneous home goods 1.5 118.2 117.4 118.0 117.8 116.9 117.6 118.3 116.2 117.7 116.9 117.1 118.2 118.6 117.9 15 Nondurable consumer goods 23.0 112.9 113.0 113.9 113.7 112.9 113.8 113.2 113.3 114.5 114.4 113.6 113.7 112.7 112.3 16 Foods and tobacco 10.3 111.3 112.8 111.8 111.6 111.1 110.9 110.6 110.6 112.0 112.3 112.2 111.8 111.4 110.6 1/ Clothing 2.4 94.8 93.6 93.9 93.4 92.9 91.5 89.7 88.2 90.3 88.9 88.8 89.2 88.2 88.1 18 Chemical products 4.5 131.3 128.6 132.6 134.0 135.7 135.0 136.5 138.1 138.1 136.7 133.8 134.0 132.3 133.1 19 Paper products 2.9 106.6 107.6 106.7 107.3 106.6 108.4 106.3 104.9 106.0 105.8 106.1 107.2 106.6 108.0 20 Energy 2.9 116.5 116.1 122.3 119.0 113.1 121.1 119.5 121.0 122.6 123.9 121.8 122.0 119.6 117.0 21 Fuels .9 108.8 108.2 108.4 111.4 107.3 108.2 108.6 108.6 111.8 112.2 111.5 111.7 110.7 110.0 22 Residential utilities 2.1 119.6 119.4 128.2 122.2 115.4 126.6 124.1 126.1 127.2 128.8 126.2 126.3 123.3 119.9
23 Equipment 17.7 131.4 131.6 132.9 133.1 131.5 131.4 132.3 133.7 137.3 136.5 139.2 139.4 140.8 141.2 24 Business equipment 13.7 155.7 155.7 157.5 158.2 156.5 156.9 158.4 160.5 164.8 162.7 166.3 166.2 168.5 169.3 25 Information processing and related 5.7 198.1 197.2 201.0 203.0 206.5 208.1 209.4 213.3 220.5 221.6 224.9 225.9 229.9 230.3 26 Computer and office equipment 1.4 373.5 371.7 379.6 390.0 402.9 417.8 431.7 442.9 463.3 476.0 491.1 503.3 513.1 521.8 21 Industrial 4.0 127.5 127.1 129.1 128.7 128.6 129.1 129.5 129.6 131.3 130.3 129.9 129.4 128.7 128.4 28 Transit 2.6 136.3 139.8 138.0 137.9 122.3 119.6 124.5 128.1 133.2 121.2 136.1 135.1 138.9 144.5 29 Autos and trucks 1.2 140.1 139.9 141.3 143.3 135.7 134.2 135.3 129.1 136.0 113.6 140.0 138.2 141.9 152.0 30 Other 1.4 123.2 122.6 122.2 123.3 120.9 121.4 121.7 122.1 123.5 122.5 122.1 121.2 124.0 123.2 31 Defense and space equipment 3.3 65.9 66.5 66.1 65.2 64.4 62.9 62.0 61.6 63.1 64.2 64.0 64.4 63.8 63.6 32 Oil and gas well drilling .6 87.1 88.4 89.5 88.3 83.5 83.1 83.8 85.1 89.7 96.3 100.6 104.3 102.3 99.1 33 Manufactured homes .2 152.7 148.6 155.9 158.0 158.9 161.8 164.4 158.1 157.8 168.2 170.7 170.4 172.4
34 Intermediate products, total 14.3 109.0 108.5 109.4 109.5 109.2 109.3 110.1 108.5 109.3 109.6 108.6 109.7 110.5 110.2 35 Construction supplies 5.3 108.2 107.3 107.0 108.4 108.3 108.7 110.5 107.2 109.3 111.5 109.2 110.4 112.8 112.8 36 Business supplies 9.0 109.6 109.5 111.0 110.3 109.9 109.9 110.0 109.6 109.5 108.6 108.4 109.4 109.2 108.7
37 Materials 39.4 127.4 126.8 128.1 128.1 128.1 128.4 128.4 128.5 129.4 129.1 130.3 131.4 132.5 132.6 38 Durable goods materials 20.8 141.5 140.2 142.3 144.1 143.9 145.3 144.8 145.8 147.3 145.5 147.3 148.8 150.5 151.1 39 Durable consumer parts 4.0 138.5 133.9 138.4 139.8 138.6 140.1 139.3 140.6 141.1 132.5 142.1 143.4 148.0 148.7 40 Equipment parts 7.5 163.0 164.4 167.1 169.1 169.4 171.0 170.8 171.7 176.3 176.8 177.2 178.8 181.3 183.1 41 Other 9.2 126.2 124.4 124.9 126.8 126.5 127.9 127.2 128.2 127.8 127.4 126.8 128.1 128.1 127.6 42 Basic metal materials 3.1 125.7 124.9 123.1 127.0 124.3 128.1 126.6 125.7 123.7 124.4 123.7 124.3 125.4 124.3 43 Nondurable goods materials 8.9 119.8 118.9 118.8 117.8 118.7 116.6 117.4 115.7 116.1 116.3 118.8 119.8 120.3 120.5 44 Textile materials 1.1 109.2 102.6 109.2 106.2 107.3 104.8 103.3 100.3 101.8 103.0 104.9 106.1 106.8 107.0 45 Paper materials 1.8 120.5 123.9 120.4 117.0 121.4 114.3 115.2 113.4 113.4 113.7 118.9 118.6 115.2 118.2 46 Chemical materials 3.9 124.4 124.4 123.1 123.3 122.9 122.7 121.9 121.8 121.3 121.6 123.6 125.3 127.0 126.5 47 Other 2.1 116.5 113.8 114.6 115.1 114.6 114.1 118.9 115.2 117.1 116.4 117.8 118.3 120.0 119.0 48 Energy materials 9.7 106.6 107.5 108.5 105.8 105.5 105.7 106.0 105.9 106.1 108.2 107.0 107.5 107.8 106.9 49 Primary energy 6.3 101.9 102.3 101.4 101.2 101.7 100.8 101.0 100.6 101.3 103.9 103.1 102.4 103.3 102.7 50 Converted fuel materials 3.3 116.0 118.1 122.8 115.0 113.1 115.4 116.2 116.6 115.5 116.7 114.9 117.8 116.9 115.4
SPECIAL AGGREGATES
51 Total excluding autos and trucks 97.2 121.5 121.2 122.3 122.4 121.9 122.3 122.5 122.4 123.8 123.9 124.1 124.8 125.5 125.4 52 Total excluding motor vehicles and parts 95.2 120.9 120.7 121.7 121.8 121.3 121.7 121.9 121.9 123.3 123.7 123.5 124.2 124.8 124.7 53 Total excluding computer and office
equipment 98.2 118.2 117.8 118.9 118.9 118.1 118.4 118.5 118.0 119.5 118.7 119.5 120.1 120.7 120.8 54 Consumer goods excluding autos and trucks . 27.0 114.0 114.0 114.8 114.9 114.0 115.0 114.7 114.0 115.5 115.6 114.6 114.8 114.6 114.3 55 Consumer goods excluding energy 25.7 114.9 114.5 115.1 115.7 115.1 115.3 115.3 113.9 115.9 114.3 115.2 115.4 115.7 116.4 56 Business equipment excluding autos and
trucks 12.5 157.0 157.2 158.9 159.5 158.4 159.0 160.5 163.5 167.5 167.5 168.7 168.8 170.9 170.9 57 Business equipment excluding computer and
office equipment 12.2 133.0 133.2 134.4 134.3 131.6 130.8 131.3 132.6 135.5 132.3 134.8 133.8 135.4 135.6 58 Materials excluding energy 29.7 134.9 133.7 135.1 136.1 136.2 136.6 136.4 136.6 137.8 136.6 138.6 139.9 141.3 141.7
Digitized for FRASER http://fraser.stlouisfed.org/ Federal Reserve Bank of St. Louis

Selected Measures A45
2.13 INDUSTRIAL PRODUCTION Indexes and Gross Value1—Continued
1992 1995 1996 Group S I C pro- 1995 Group code por- avg.
tion July Aug. Sept. Oct. Nov. Dec. Jan. Feb. Mar. Apr/ Mayr June Julyp
Index (1987 = 100)
MAJOR INDUSTRIES
59 Total index 100.0 121.9 121.5 122.7 122.8 122.2 122.6 122.8 122.5 124.2 123.6 124.5 125.2 126.0 126.2
60 Manufacturing 85.4 123.9 123.3 124.2 124.9 124.4 124.5 124.8 124.5 126.2 125.2 126.5 127.2 128.1 128.6 61 Primary processing 26.6 117.6 116.9 116.6 117.8 117.0 117.1 117.3 116.7 116.3 117.1 117.5 118.5 119.4 119.2 62 Advanced processing 58.9 126.8 126.3 127.8 128.2 127.9 128.0 128.4 128.2 131.0 129.0 130.8 131.3 132.3 133.0
63 Durable goods 45.0 132.5 131.5 133.2 134.4 133.5 134.3 134.8 134.9 137.5 135.6 138.3 139.2 141.2 142.0 (A Lumber and products " ' 2 4 2.0 104.5 103.7 103.7 106.2 105.7 104.8 106.9 103.1 103.3 107.5 108.4 107.3 109.1 107.8 65 Furniture and fixtures 25 1.4 111.6 111.1 110.9 112.0 110.9 109.8 109.3 109.3 110.5 107.7 108.9 111.9 113.0 112.5 66 Stone, clay, and glass
products 32 2.1 104.1 103.2 103.0 103.8 104.5 104.9 104.3 105.5 104.1 102.9 103.6 104.9 105.9 104.4 67 Primary metals 33 3.1 119.2 118.3 115.4 121.0 115.7 120.8 120.0 121.5 117.1 118.0 119.2 119.0 121.1 120.0 68 Iron and steel 331,2 1.7 122.4 119.3 117.7 127.0 115.1 126.1 122.7 128.1 119.5 120.2 122.9 121.8 125.4 124.1 69 Raw steel 331PT .1 114.7 111.5 114.2 118.6 111.3 116.4 118.0 113.9 112.5 114.9 112.9 113.2 115.7 70 Nonfeirous 333-6,9 1.4 114.8 116.5 111.9 113.2 115.8 113.8 116.2 113.0 113.6 114.8 114.2 115.1 115.5 114.4 71 Fabricated metal products. . . 34 5.0 113.9 112.4 114.3 115.1 114.0 114.5 115.0 115.6 117.0 116.1 115.5 116.7 117.4 117.5 72 Industrial machinery and
equipment 35 8.0 177.8 176.0 179.5 181.3 183.8 186.5 190.1 191.9 196.1 197.8 199.0 201.0 204.2 205.7 73 Computer and office
equipment 357 1.8 373.5 371.7 379.6 390.0 402.9 417.8 431.7 442.9 463.3 476.0 491.1 503.3 513.1 521.8 74 Electrical machinery 36 7.2 174.9 175.7 178.7 180.8 182.4 183.6 182.8 182.4 188.7 187.9 187.3 188.8 192.0 194.2 75 Transportation equipment. . . 37 9.5 113.3 111.6 114.1 114.1 109.3 108.6 109.7 108.3 112.1 103.1 114.6 114.9 117.1 120.1 76 Motor vehicles and parts . 371 4.8 141.9 136.7 142.1 143.3 139.7 140.7 141.2 135.5 141.1 121.3 144.3 144.7 148.7 155.0 77 Autos and light trucks . 371PT 2.5 131.3 124.3 131.6 132.8 128.4 129.6 131.5 123.5 132.8 109.9 135.5 135.3 138.9 149.6 78 Aerospace and
miscellaneous transportation equipment 372-6,9 4.7 85.8 87.6 87.2 85.9 80.0 77.7 79.4 82.2 84.2 85.7 86.0 86.3 86.8 86.6
79 Instruments 38 5.4 110.7 110.2 111.4 111.3 111.4 111.5 109.7 111.0 113.4 112.9 112.8 112.4 113.3 112.6 80 Miscellaneous 39 1.3 122.7 121.4 122.4 122.9 122.2 123.3 123.5 122.1 124.0 124.0 122.6 123.0 124.4 123.1
81 Nondurable goods 40.5 114.3 114.3 114.3 114.4 114.3 113.7 113.8 113.1 113.8 113.6 113.5 114.0 113.8 113.8 82 Foods " ' 2 0 9.4 115.3 115.3 115.5 115.5 115.4 114.8 114.8 114.8 116.0 115.6 115.4 115.4 114.6 114.1 83 Tobacco products 21 1.6 90.2 99.1 91.3 90.2 88.2 88.9 88.4 87.1 90.9 92.6 94.6 91.9 93.0 90.8 84 Textile mill products 22 1.8 112.6 109.9 112.4 110.5 111.1 108.9 108.3 104.1 106.2 109.0 108.2 108.8 111.1 111.0 85 Apparel products 23 2.2 95.7 94.8 94.5 94.5 93.3 92.4 91.5 89.2 90.9 89.7 90.4 90.8 90.9 90.5 86 Paper and products 26 3.6 119.8 121.3 118.6 118.5 119.7 116.2 118.2 114.9 113.5 115.5 118.9 119.5 119.4 121.4 87 Printing and publishing 27 6.8 99.4 99.0 100.5 99.8 98.9 99.3 98.8 97.9 98.7 96.7 96.3 97.5 96.6 96.7 88 Chemicals and products . . . . 28 9.9 125.0 124.0 124.4 125.3 126.7 126.0 126.5 127.1 127.1 126.5 126.0 126.4 126.5 126.6 89 Petroleum products 29 1.4 108.3 109.0 108.5 110.0 106.9 107.4 108.9 108.9 110.2 109.9 109.7 109.8 109.7 108.9 90 Rubber and plastic products . 30 3.5 139.4 137.7 138.7 139.8 139.7 140.3 139.3 139.0 139.7 140.5 137.6 140.7 140.5 140.5 91 Leather and products 31 .3 81.3 78.7 80.8 80.5 79.7 78.2 76.8 75.6 77.1 76.7 76.2 75.9 75.7 73.9
92 Mining 6.9 99.9 100.7 100.0 100.0 98.2 98.3 98.1 97.1 98.0 101.1 100.4 100.2 101.9 101.6 93 Metal " lO .5 169.3 172.2 172.1 170.8 178.3 175.9 172.8 159.5 157.1 166.1 158.3 161.3 164.4 164.0 94 Coal 12 1.0 112.9 117.0 109.7 116.2 112.3 109.5 108.5 103.3 108.0 114.8 109.5 111.9 113.2 108.5 95 Oil and gas extraction 13 4.8 91.9 91.9 92.4 91.2 89.2 90.1 90.1 90.8 90.2 92.6 93.3 92.8 94.1 94.5 96 Stone and earth minerals 14 .6 112.3 113.5 111.6 113.1 112.4 110.9 112.4 108.9 117.2 117.4 115.6 112.7 117.9 118.7
97 Utilities 7.7 122.0 122.7 128.8 122.7 121.6 125.4 125.1 125.6 126.6 128.0 126.4 127.9 125.9 123.6 98 Electric 491,493PT 6.1 122.1 122.2 130.0 122.7 123.7 123.6 123.9 125.5 126.6 127.1 125.7 128.7 127.1 124.4 99 Gas 492,493PT 1.6 121.7 124.5 124.3 122.4 113.6 132.5 129.9 125.6 126.3 131.5 128.9 124.8 121.4 120.5
SPECIAL AGGREGATES
100 Manufacturing excluding motor vehicles and parts 80.6 122.8 122.5 123.1 123.8 123.4 123.6 123.9 123.9 125.4 125.4 125.5 126.1 126.9 127.0
101 Manufacturing excluding office and computing machines . . . 83.7 119.5 118.9 119.8 120.3 119.6 119.6 119.7 119.3 120.7 119.5 120.7 121.2 122.0 122.3
Gross value (billions of 1992 dollars, annual rates)
MAJOR MARKETS
102 Products, total 2,002.9 2,245.6 2,238.8 2,257.8 2,268.1 2,240.3 2,255.8 2,265.7 2,248.9 2,293.1 2,269.5 2,300.3 2,304.8 2,316.9 2,326.4
103 Final 1,552.2 1,748.7 1,743.2 1,760.5 1,768.2 1,741.9 1,756.8 1,761.9 1,753.0 1,794.2 1,766.8 1,801.5 1,803.5 1,810.7 1,821.9 104 Consumer goods 1,033.4 1.130.5 1,124.0 1,135.7 1,141.1 1,125.1 1,139.3 1,139.0 1,124.7 1,148.4 1,129.5 1,144.9 1,145.6 1,145.6 1,151.2 105 Equipment 518.8 618.3 619.2 624.8 627.1 616.7 617.5 622.9 628.4 645.8 637.3 656.6 657.9 665.0 670.8 106 Intermediate 450.7 496.9 495.6 497.3 499.9 498.4 499.0 503.8 495.9 498.8 502.7 498.8 501.3 506.2 504.5
1. Data in this table also appear in the Board's G. 17 (419) monthly statistical release. For the ordering address, see the inside front cover. The latest historical revision of the industrial production index and the capacity utilization rates was released in November 1995. See "A Revision to Industrial Production and Capacity Utilization, 1991-95," Federal Reserve
Bulletin, vol. 82 (January 1996), pp. 16-25. For a detailed description of the industrial production index, see "Industrial Production: 1989 Developments and Historical Revision," Federal Reserve Bulletin, vol. 76, (April 1990), pp. 187-204.
2. Standard industrial classification.
Digitized for FRASER http://fraser.stlouisfed.org/ Federal Reserve Bank of St. Louis

A46 Domestic Nonfinancial Statistics • October 1996
2.14 HOUSING AND CONSTRUCTION
Monthly figures at seasonally adjusted annual rates except as noted
1995 1996
Sept. Oct. Nov. Dec. Jan. Feb. Mar. Apr/ May June
Private residential real estate activity (thousands of units except as noted)
NEW UNITS
1 Permits authorized 1,199 1,372 1,332 1,427 1,393 1,450 1,487 1,378 1,417 1,423 1,459 1,452 1,415 2 One-family 987 1,068 997 1,079 1,050 1,073 1,123 1,056 1,087 1,097 1,115 1,098 1,085 3 Two-family or more 213 303 335 348 343 377 364 322 330 326 344 354 330 4 Started 1,288 1,457 1,354 1,401 1,351 1,458 1,425 1,453 1,514 1,439 1,511 1,478 1,474 5 One-family 1,126 1,198 1,076 1,130 1,109 1,129 1,150 1,146 1,183 1,163 1,209 1,144 1,201 6 Two-family or more 162 259 278 271 242 329 275 307 331 276 302 334 273 7 Under construction at end of period1 680 762 776 783 781 790 800 803 800 816 826 833 842 8 One-family 543 558 547 555 560 562 569 569 565 581 591 594 604 9 Two-family or more 137 204 229 228 221 228 231 234 235 235 235 239 238
10 Completed 1,193 1,347 1,313 1,267 1,320 1,360 1,225 1,403 1,328 1,391 1,350 1,392 1,398 11 One-family 1,040 1,160 1,066 1,009 1,039 1,081 1,003 1,113 1,052 1,112 1,073 1,108 1,100 12 Two-family or more 153 187 247 258 281 279 222 290 276 279 277 284 298 13 Mobile homes shipped 254 304 340 352 354 355 352 352 341 364 378 369 372
Merchant builder activity in one-family units
14 Number sold 666 670 665 684 673 679 683 743 784 713r 740 739 726 15 Number for sale at end of period1 293 337 372 350 360 368 372 370 355 368r 369 365 363
Price of units sold (thousands of dollars)2
16 Median 126.1 130.4 133.4 130.0 135.2 137.0 138.6 131.9 139.4 137.0r 140.0 136.0 140.0 17 Average 147.6 153.7 157.6 155.6 156.2 160.7 165.6 155.3 163.7 162.lr 170.0 162.1 165.3
EXISTING UNITS ( o n e - f a m i l y )
18 Number sold 3,800 3,946 3,801 4,090 4,070 4,000 3,870 3,720 3,940 4,200 4,200 4,280 4,160
Price of units sold (thousands of dollars)2
19 Median 106.5 109.6 112.2 114.8 113.2 114.3 113.9 114.8 114.0 115.7 116.5 117.6 122.9 20 Average 133.1 136.4 138.4 140.2 138.7 139.5 138.7 141.2 138.7 140.1 141.9 144.4 150.2
Value of new construction (millions of dollars)3
CONSTRUCTION
21 Total put in place 482,737 527,063 547,079 550,467 549,952 549,745 555,701 558,952 544,577 556,983 564,985 559,198 565,891
22 Private 362,587 400,007 410,197 411,326 410,550 411,015 417,191 418,896 411,248 419,726 423,568 417,414 424,749 23 Residential 210,455 238,873 236,598 237,663 237,952 239,938 243,104 242,474 238,558 245,881 247,469 246,744 246,076 24 Nonresidential 152,132 161,134 173,599 173,663 172,598 171,077 174,087 176,422 172,690 173,845 176,099 170,670 178,673 25 Industrial buildings 26,482 28,947 32,301 32,427 31,422 32,032 31,996 32,495 30,792 30,593 30,316 27,363 29,360 26 Commercial buildings 53,375 59,728 67,528 67,660 67,259 65,555 66,447 66,475 66,461 65,503 67,485 65,748 69,043 27 Other buildings 26,219 26,961 26,923 27,340 27,899 27,418 28,197 28,103 27,470 27,884 27,426 27,755 29,837 28 Public utilities and other 46,056 45,498 46,847 46,236 46,018 46,072 47,447 49,349 47,967 49,865 50,872 49,804 50,433
29 Public 120,151 127,056 136,884 139,140 139,402 138,729 138,510 140,056 133,329 137,257 141,417 141,784 141,142 30 Military 2,454 2,319 3,005 3,218 2,295 3,217 3,211 3,554 3,982 3,126 3,192 3,015 3,307 31 Highway 34,342 37,673 38,161 38,209 40,125 38,344 40,402 39,444 40,956 39,527 39,763 38,071 38,517 32 Conservation and development 5,908 6,370 6,389 6,212 5,222 5,888 6,014 5,352 5,455 5,811 5,884 5,689 5,920 33 Other 77,447 80,694 89,329 91,501 91,760 91,280 88,883 91,706 82,936 88,793 92,578 95,009 93,398
1. Not at annual rates. 2. Not seasonally adjusted. 3. Recent data on value of new construction may not be strictly comparable with data for
previous periods because of changes by the Bureau of the Census in its estimating techniques. For a description of these changes, see Construction Reports (C—30-76-5), issued by the Census Bureau in July 1976.
SOURCE. Bureau of the Census estimates for all series except (1) mobile homes, which are private, domestic shipments as reported by the Manufactured Housing Institute and season-ally adjusted by the Census Bureau, and (2) sales and prices of existing units, which are published by the National Association of Realtors. All back and current figures are available from the originating agency. Permit authorizations are those reported to the Census Bureau from 19,000 jurisdictions beginning in 1994.
Digitized for FRASER http://fraser.stlouisfed.org/ Federal Reserve Bank of St. Louis

Selected Measures A47
2.15 CONSUMER AND PRODUCER PRICES
Percentage changes based on seasonally adjusted data except as noted
Item
Change from 12 months earlier
Change from 3 months earlier (annual rate) Change from 1 month earlier
Index level, July
1996 1 Item
1995 July
1996 July
1995 1996 1996
Index level, July
1996 1 Item
1995 July
1996 July
Sept. Dec. Mar. June Mar. Apr. May June July
Index level, July
1996 1
CONSUMER PRICES2
(1982-84=100)
1 All items 2 . 8 3 . 0 1 . 6 2 . 4 4 . 0 3 . 1 .4 .4 . 3 .1 . 3 1 5 7 . 0
2 2.7 3.4 2.7 1.9 3.2 4.6 .6 .3 .1 .7 .5 153.2 3 Energy items 1.2 4.1 -10 .5 1.9 15.8 8.4 1.4 3.2 1.1 - 2 . 2 - . 4 112.5 4 All items less food and energy 3.0 2.7 2.8 2.2 3.5 2.2 .3 .1 .2 .2 .3 165.5
Commodities 1.1 1.4 2.0 1.7 2.6 - . 3 .4 - . 1 .0 .0 .0 140.3 6 Services 3.8 3.3 3.0 2.5 3.4 3.9 .2 .3 .3 .3 .3 179.9
PRODUCER PRICES (1982=100)
7 Finished goods 1.7 2.6 1.6 4.4 2.5 1.9 .5 .4 - . 1 .2 .0 131.5 8 Consumer foods 1.8 4.0 8.8 4.4 ,6r 4.9r ,8r - , 4 r .0 1.6 .2 133.6 9 Consumer energy .4 5.3 -10.2 10.8 17.8 .0 2.6 2.8 - . 6 - 2 . 1 - . 9 84.1
10 Other consumer goods 2.2 1.7 2.3 3.4 - , 3 r 2.5r - . R . R .1 .3 - . 1 144.4 11 Capital equipment 1.8 1.2 1.8 2.9 ,0r - . 3 ' .l1 .R - . 1 - . 1 .3 138.2
Intermediate materials 12 Excluding foods and feeds 6.4 - . 9 - . 6 - . 6 - 1 . 0 .0 .2 .3 .2 - . 6 - . 4 125.5 13 Excluding energy 7.4 - 1 . 8 1.5 - 2 . 9 -3 .5 r .0' -.2' - . r .2 - . 1 - . 3 133.6
Crude materials 14 Foods 1.0 24.7 34.8 20.8 - 4 . r 58.1r . f 4.0 6.3 1.4 2.7 130.4 15 Energy - 9 . 4 15.1 -21 .0 33.9 52.8r —15.0r —2.5r 8.2r - 3 . 8 - 7 . 7 1.4 78.5 16 Other 13.8 -13 .5 -17.6 -18 .4 - 10.6r -1.9' -2 .3 r - . 4 r - . 3 - 1 . 4 - 1 . 6 153.1
1. Not seasonally adjusted. SOURCE. U.S. Department of Labor, Bureau of Labor Statistics. 2. Figures for consumer prices are for all urban consumers and reflect a rental-equivalence
measure of homeownership.
Digitized for FRASER http://fraser.stlouisfed.org/ Federal Reserve Bank of St. Louis

A48 Domestic Nonfinancial Statistics • October 1996
2.16 GROSS DOMESTIC PRODUCT AND INCOME
Billions of current dollars except as noted; quarterly data at seasonally adjusted annual rates
Account 1993 1994 1995
1995 1 9 9 6
Account 1993 1994 1995
Q 2 Q 3 Q 4 QL Q 2
GROSS DOMESTIC PRODUCT
1 Total 6,553.0r 6,935.7r 7,253.8r 7,204.9r 7,309.8r 7,350.6r 7,426.8r 7,538.1
By source 2 Personal consumption expenditures 4 , 4 5 4 . 1 4 , 7 0 0 . 9 ' 4 , 9 2 4 . 9 ' 4 , 9 1 0 . 5 ' 4 , 9 5 7 . 9 ' 4 , 9 9 0 . 5 ' 5 , 0 6 0 . 5 ' 5 , 1 4 3 . 9 3 Durable goods 5 3 0 . 7 5 8 0 . 9 6 0 6 . 4 6 0 4 . 0 6 1 5 . 8 6 1 2 . 8 6 2 5 . 2 6 4 1 . 6 4 Nondurable goods 1 , 3 6 8 . 9 1 ,429 .7 1 , 4 8 5 . 9 ' 1 , 486 .7 ' 1 , 4 9 1 . 2 ' 1 , 494 .2 ' 1 , 522 .1 ' 1 ,549 .3 5 Services 2 , 5 5 4 . 6 2 , 6 9 0 . 3 ' 2 , 8 3 2 . 6 ' 2 , 8 1 9 . 8 ' 2 , 8 5 0 . 9 ' 2 , 8 8 3 . 5 ' 2 , 9 1 3 . 2 ' 2 , 9 5 3 . 1
6 Gross private domestic investment 8 7 1 . 1 1 ,014 .4 1 ,065 .3 1 ,050 .3 1 , 0 7 4 . 8 1 , 0 6 4 . 0 1 , 0 6 8 . 9 1 , 0 9 3 . 0 7 Fixed investment 8 5 0 . 5 9 5 4 . 9 1 , 0 2 8 . 2 1 ,016 .3 1 ,036 .6 1 , 0 4 6 . 2 1 ,070 .7 1 , 0 8 1 . 6 8 Nonresidential 5 9 8 . 8 6 6 7 . 2 7 3 8 . 5 7 3 4 . 4 7 4 6 . 3 7 4 9 . 7 7 6 9 . 0 7 6 8 . 0 9 Structures 171 .8 180 .2 199 .7 197 .6 2 0 2 . 5 2 0 4 . 0 2 0 8 . 4 2 0 5 . 9
10 Producers' durable equipment 4 2 7 . 0 4 8 7 . 0 5 3 8 . 8 5 3 6 . 8 5 4 3 . 8 5 4 5 . 7 5 6 0 . 6 5 6 2 . 1 11 Residential structures 2 5 1 . 7 2 8 7 . 7 2 8 9 . 8 2 8 1 . 9 2 9 0 . 3 2 9 6 . 5 3 0 1 . 7 3 1 3 . 6
12 Change in business inventories 2 0 . 6 59 .5 3 7 . 0 3 4 . 0 3 8 . 2 17.8 - 1 . 7 11 .4 13 Nonfarm 2 6 . 8 4 8 . 0 3 9 . 6 36 .1 4 1 . 5 19 .9 2 .7 15.1
14 Net exports of goods and services - 6 2 . 7 R - 9 4 . 4 R - 9 4 . 7 ' - 1 1 5 . 3 ' - 8 7 . 6 ' - 6 7 . 2 ' - 8 6 . 3 ' - 1 0 5 . 0 15 Exports 657.8 R 7 1 9 . 1 ' 8 0 7 . 4 ' 7 9 7 . 3 ' 8 1 9 . 0 ' 8 3 7 . 0 ' 8 3 9 . 5 ' 8 5 0 . 9 16 Imports 7 2 0 . 5 ' 8 1 3 . 5 ' 9 0 2 . 0 ' 9 1 2 . 6 ' 9 0 6 . 6 ' 9 0 4 . 2 ' 9 2 5 . 8 ' 9 5 5 . 9
17 Government consumption expenditures and gross investment 1 ,290 .4 ' 1 ,314 .7 1 , 3 5 8 . 3 ' 1 , 359 .4 ' 1 , 3 6 4 . 6 ' 1 , 363 .4 ' 1 ,383 .7 1 , 4 0 6 . 2 18 Federal 5 2 2 . 6 ' 5 1 6 . 4 ' 5 1 6 . 6 ' 5 2 2 . 0 ' 5 1 6 . 8 ' 5 0 7 . 7 ' 5 1 8 . 6 5 2 7 . 7 19 State and local 7 6 7 . 8 7 9 8 . 4 8 4 1 . 7 8 3 7 . 3 8 4 7 . 7 8 5 5 . 7 865 .1 8 7 8 . 5
By major type of product 2 0 Final sales, total 6 , 5 3 2 . 4 ' 6 , 8 7 6 . 2 ' 7 , 2 1 6 . 7 ' 7 , 1 7 0 . 9 ' 7 , 2 7 1 . 5 ' 7 , 3 3 2 . 8 ' 7 , 4 2 8 . 6 ' 7 , 5 2 6 . 8 21 Goods 2 , 4 0 1 . 4 ' 2 , 5 3 4 . 4 ' 2 , 6 6 2 . 2 ' 2 , 6 4 6 . 2 ' 2 , 6 8 8 . 8 ' 2 , 6 9 8 . 0 ' 2 , 7 4 9 . 3 ' 2 , 7 8 2 . 7 2 2 Durable 1 ,014 .3 ' 1 , 0 8 6 . 2 ' 1 , 1 4 7 . 3 ' 1 , 138 .6 ' 1 , 167 .2 ' 1 , 1 6 6 . 4 ' 1 , 192 .1 ' 1 ,215 .1 2 3 Nondurable 1 , 3 8 7 . 2 1 ,448 .3 1 ,515 .0 ' 1 , 5 0 7 . 7 ' 1 , 5 2 1 . 6 ' 1 , 531 .7 ' 1 , 557 .1 ' 1 , 5 6 7 . 5 2 4 Services 3 , 5 8 4 . 0 ' 3 , 7 4 6 . 5 ' 3 , 9 2 6 . 9 ' 3 , 9 0 8 . 9 ' 3 , 9 5 0 . 2 ' 3 , 9 9 2 . 4 ' 4 , 0 2 7 . 9 ' 4 , 0 7 9 . 6 2 5 Structures 5 4 7 . 0 5 9 5 . 3 6 2 7 . 6 6 1 5 . 7 6 3 2 . 6 6 4 2 . 3 6 5 1 . 4 6 6 4 . 5
2 6 Change in business inventories 2 0 . 6 59 .5 3 7 . 0 3 4 . 0 3 8 . 2 17.8 - 1 . 7 11 .4 2 7 Durable goods 15.7 3 1 . 9 3 4 . 9 28 .5 2 9 . 2 2 7 . 3 12.3 12.6 2 8 Nondurable goods 4 . 9 2 7 . 7 2 . 2 5 . 4 9 .1 - 9 . 4 - 1 4 . 0 - 1 . 2
MEMO 2 9 Total GDP in chained 1992 dollars 6,386.4' 6,608.7r 6,742.9r 6,713.5r 6,776.4r 6,780.7r 6,814.3r 6,885.1
NATIONAL INCOME
3 0 Total 5,195.3r 5,501.6r 5,813.5r 5,755.4r 5,861.4r 5,927.4r 6,015.3r n.a.
31 Compensation of employees 3 , 8 0 9 . 5 ' 4 , 0 0 9 . 8 ' 4 , 2 2 2 . 7 ' 4 , 1 9 1 . 6 ' 4 , 2 4 7 . 7 ' 4 , 3 0 1 . 1 ' 4 , 3 4 4 . 3 ' 4 , 4 2 0 . 8 3 2 Wages and salaries 3 , 0 9 5 . 3 ' 3 , 2 5 7 . 3 ' 3 , 4 3 3 . 2 ' 3 , 4 0 6 . 0 ' 3 , 4 5 4 . 0 ' 3 , 5 0 1 . 1 ' 3 , 5 4 0 . 2 ' 3 , 6 0 6 . 3 33 Government and government enterprises 5 8 4 . 2 6 0 2 . 5 6 2 1 . 7 6 1 9 . 6 6 2 4 . 1 6 2 6 . 9 6 3 4 . 0 6 3 9 . 0 3 4 Other 2 , 5 1 1 . 1 ' 2 , 6 5 4 . 8 ' 2 , 8 1 1 . 5 ' 2 , 7 8 6 . 4 ' 2 , 8 2 9 . 9 ' 2 , 8 7 4 . 2 ' 2 , 9 0 6 . 1 ' 2 , 9 6 7 . 3 35 Supplement to wages and salaries 7 1 4 . 2 7 5 2 . 4 7 8 9 . 5 7 8 5 . 6 7 9 3 . 7 8 0 0 . 1 8 0 4 . 1 8 1 4 . 5 3 6 Employer contributions for social insurance 3 3 3 . 3 3 5 0 . 2 3 6 5 . 5 3 6 3 . 6 3 6 7 . 8 3 6 9 . 8 3 7 5 . 0 3 8 0 . 5 37 Other labor income 3 8 0 . 9 4 0 2 . 2 4 2 4 . 0 4 2 2 . 0 4 2 5 . 9 4 3 0 . 2 4 2 9 . 1 4 3 4 . 0
3 8 Proprietors' income' 4 2 0 . 0 4 5 0 . 9 4 7 8 . 3 4 7 4 . 7 4 7 9 . 6 4 8 6 . 7 4 9 9 . 5 5 1 5 . 8 3 9 Business and professional' 388 .1 4 1 5 . 9 4 4 9 . 3 4 4 7 . 1 4 5 1 . 5 4 5 4 . 9 4 6 1 . 1 4 7 0 . 1 4 0 Farm' 3 2 . 0 3 5 . 0 2 9 . 0 2 7 . 6 ' 28 .1 31 .8 3 8 . 4 4 5 . 7
4 1 Rental income of persons2 102.5 116 .6 122 .2 121 .6 120 .9 125 .8 126 .9 1 2 2 . 6
4 2 Corporate profits' 4 6 4 . 4 ' 5 2 9 . 5 ' 5 8 6 . 6 ' 5 6 2 . 3 ' 6 1 2 . 5 ' 6 1 1 . 8 ' 6 4 5 . 1 ' n.a. 4 3 Profits before tax3
4 6 4 . 3 5 3 1 . 2 ' 5 9 8 . 9 ' 5 8 9 . 6 ' 6 0 7 . 2 ' 6 0 4 . 2 ' 6 4 2 . 2 ' n.a. 4 4 Inventory valuation adjustment - 6 . 6 - 1 3 . 3 - 2 8 . 1 - 4 2 . 3 - 9 . 3 - 8 . 8 - 1 7 . 4 - 1 5 . 8 4 5 Capital consumption adjustment 6 . 7 11.6 15.9 15.0 14.6 16.5 2 0 . 4 2 2 . 7
4 6 Net interest 3 9 8 . 9 ' 3 9 4 . 9 ' 4 0 3 . 6 ' 4 0 5 . 2 ' 4 0 0 . 7 ' 4 0 1 . 9 ' 3 9 9 . 5 ' n.a.
1. With inventory valuation and capital consumption adjustments. 2. With capital consumption adjustment.
3. For after-tax profits, dividends, and the like, see table 1.48. SOURCE. U.S. Department of Commerce, Survey of Current Business.
Digitized for FRASER http://fraser.stlouisfed.org/ Federal Reserve Bank of St. Louis

Selected Measures A49
2.17 PERSONAL INCOME AND SAVING
Billions of current dollars except as noted; quarterly data at seasonally adjusted annual rates
Account 1993 1994' 1995r
1995r 1996
Account 1993 1994' 1995r
Q2 Q3 Q4 Ql r Q2
PERSONAL INCOME AND SAVING
1 Total personal income 5,480.1r 5,753.1 6,115.1 6,074.4 6,146.9 6,234.5 6,308.5 6,411.3
2 Wage and salary disbursements 3,090.7r 3,241.8 3,430.6 3,403.1 3,451.2 3,500.2 3,538.2 3,606.3 3 Commodity-producing industries 781.3 824.9 863.5 858.7 866.7 873.9 878.7 900.2 4 Manufacturing 593.1 621.1 648.4 645.3 650.1 654.7 654.8 671.6
Distributive industries 698.4 739.2 783.7 777.3 789.3 800.7 810.5 822.1 6 Service industries l,026.7r 1,075.2 1,161.6 1,147.5 1,171.1 1,198.6 1,215.1 1,245.0 7 Government and government enterprises 584.2 602.5 621.7 619.6 624.1 626.9 634.0 639.0
8 Other labor income 380.9 402.2 424.0 422.0 425.9 430.2 429.1 434.0 9 Proprietors' income' 420.0 450.9 478.3 474.7 479.6 486.7 499.5 515.8
10 Business and professional' 388.1 415.9 449.3 447.1 451.5 454.9 461.1 470.1 11 Farm' 32.0 35.0 29.0 27.6 28.1 31.8 38.4 45.7 12 Rental income of persons 102.5 116.6 122.2 121.6 120.9 125.8 126.9 122.6 13 Dividends 186.8 199.6 214.8 212.2 215.8 221.7 226.6 229.3 14 Personal interest income 648. l r 663.7 717.1 716.6 719.9 727.2 726.1 733.1 15 Transfer payments 910.7 956.3 1,022.6 1,016.8 1,029.9 1,041.4 1.063.0 1,076.0 16 Old-age survivors, disability, and health insurance benefits 444.4 472.9 507.4 505.1 510.7 516.1 529.9 536.4
17 LESS: Personal contributions for social insurance 259.6 278.1 294.5 292.7 296.2 298.8 301.0 305.8
18 EQUALS: Personal income 5,480. r 5,753.1 6,115.1 6,074.4 6,146.9 6,234.5 6,308.5 6,411.3
19 LESS: Personal tax and nontax payments 689.9 731.4 794.3 801.5 798.4 807.2 824.9 867.4
20 EQUALS: Disposable personal income 4,790.2r 5,021.7 5,320.8 5,272.9 5,348.5 5,427.3 5,483.5 5,544.0
21 LESS: Personal outlays 4,575.8r 4,832.3 5,071.5 5,054.4 5,106.6 5,144.7 5,218.1 5,304.4
22 EQUALS: Personal saving 2I4.4r 189.4 249.3 218.5 241.9 282.6 265.4 239.6
MEMO Per capita (chained 1992 dollars)
23 Gross domestic product 24,734.3r 25,349.8 25,628.7 25,555.9 25,726.7 25,684.5 25,753.3 25,962.0 24 Personal consumption expenditures 16,806.7r 17,158.4 17,399.5 17,395.8 17,453.8 17,459.9 17,570.2 17,692.4 25 Disposable personal income 18,078.0r 18,330.0 18,799.0 18,676.0 18,829.0 18,986.0 19,041.0 19,071.0
26 Saving rate (percent) 4.5 3.8 4.7 4.1 4.5 5.2 4.8 4.3
GROSS SAVING
27 Gross saving 935.5r 1,056.3 1,151.8 1,102.9 1,168.6 1,220.6 1,217.9 n.a.
28 Gross private saving 962.4r 1,006.7 1,071.8 1,018.5 1,085.9 1,138.9 1,133.8 n.a.
29 Personal saving 214.4r 189.4 249.3 218.5 241.9 282.6 265.4 239.6 30 Undistributed corporate profits' 103.3r 123.2 140.6 123.5 159.6 158.4 171.8 n.a. 31 Corporate inventory valuation adjustment - 6 . 6 -13.3 -28.1 -42 .3 - 9 . 3 - 8 . 8 -17 .4 -15 .8
Capital consumption allowances 470.6 32 Corporate 417.0 441.0 454.0 451.3 456.9 463.6 465.6 470.6
33 Noncorporate 223.1 237.7 225.2 222.4 224.7 233.4 229.1 232.4
34 Gross government saving -26.9 r 49.6 80.0 84.4 82.7 81.7 84.1 n.a. 35 Federal -187.4 r -119.6 -87.9 -86 .9 -84 .6 -80.7 -82 .0 n.a. 36 Consumption of fixed capital 68.2 70.6 73.8 74.2 73.8 73.8 73.2 72.5 37 Current surplus or deficit ( - ) , national accounts -255.6 r -190.2 -161.7 -161.1 -158.5 -154.5 -155.2 n.a. 38 State and local 160.5 169.2 167.9 171.3 167.3 162.4 166.1 n.a. 39 Consumption of fixed capital 65.6 69.4 72.9 72.3 73.4 74.3 75.1 76.0 40 Current surplus or deficit ( —), national accounts 94.9 99.7 95.0 99.0 93.9 88.1 91.0 n.a.
41 Gross investment 993.S 1,090.4 1,150.9 1,123.2 1,161.5 1,173.9 1,167.9 n.a.
42 Gross private domestic investment 871.1 1,014.4 1,065.3 1,050.3 1,074.8 1,064.0 1,068.9 1,093.0 43 Gross government investment 210.6 212.3 221.9 223.7 224.7 220.1 228.8 233.6 44 Net foreign investment -88.2 -136.4 -136.3 -150.8 -138.1 -110.2 -129.9 n.a.
45 Statistical discrepancy 58.0r 34.1 - . 9 20.3 - 7 . 1 -46 .7 -50 .0 n.a.
1. With inventory valuation and capital consumption adjustments. SOURCE. U.S. Department of Commerce, Survey of Current Business. 2. With capital consumption adjustment.
Digitized for FRASER http://fraser.stlouisfed.org/ Federal Reserve Bank of St. Louis
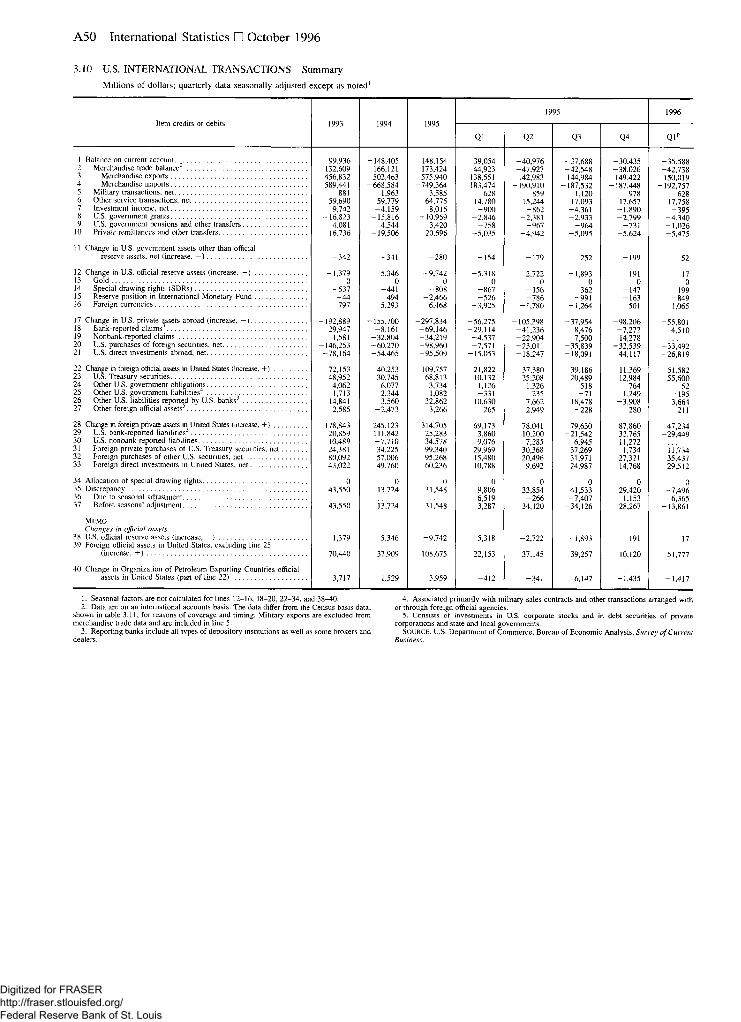
A50 International Statistics • October 1996
3.10 U.S. INTERNATIONAL TRANSACTIONS Summary
Millions of dollars; quarterly data seasonally adjusted except as noted1
Item credits or debits 1993 1994 1995 1995 1996
Item credits or debits 1993 1994 1995
Q1 Q2 Q3 Q4 Ql p
1 Balance on current account -99,936 -148,405 -148,154 -39,054 -40,976 -37,688 -30,435 -35,588 2 Merchandise trade balance2 -132,609 -166,121 -173,424 -44,923 -47,927 -42,548 -38,026 -42,738 3 Merchandise exports 456,832 502,463 575,940 138,551 142,983 144,984 149,422 150,019 4 Merchandise imports -589,441 -668,584 -749,364 -183,474 -190,910 -187,532 -187,448 -192,757 5 Military transactions, net 881 1,963 3,585 628 859 1,120 978 628 6 Other service transactions, net 59,690 59,779 64,775 14,780 15,244 17,093 17,657 17,758 / Investment income, net 9,742 -4,159 -8,016 - 9 0 0 - 8 6 2 -4,361 -1,890 - 3 9 5 8 U.S. government grants -16,823 -15,816 -10,959 -2,846 -2,381 -2,933 -2,799 -4 ,340 y U.S. government pensions and other transfers -4,081 -4,544 -3,420 - 7 5 8 - 9 6 7 - 9 6 4 - 7 3 1 -1 ,026
10 Private remittances and other transfers -16,736 -19,506 -20,696 -5,035 -4,942 -5,095 -5,624 -5,475
i i Change in U.S. government assets other than official reserve assets, net (increase, - ) - 3 4 2 - 3 4 1 - 2 8 0 - 1 5 4 - 1 7 9 252 - 1 9 9 52
12 Change in U.S. official reserve assets (increase, —) -1,379 5,346 -9,742 -5,318 -2,722 -1,893 191 17 13 Gold 0 0 0 0 0 0 0 0 14 Special drawing rights (SDRs) - 5 3 7 -441 - 8 0 8 -867 - 1 5 6 362 - 1 4 7 - 1 9 9 13 Reserve position in International Monetary Fund - 4 4 494 -2,466 - 5 2 6 - 7 8 6 - 9 9 1 - 1 6 3 - 8 4 9 16 Foreign currencies - 7 9 7 5,293 -6,468 -3,925 -1,780 -1,264 501 1,065
17 Change in U.S. private assets abroad (increase, —) -192,889 -155,700 -297,834 -56,275 -105,398 -37,954 -98,206 -55,801 18 Bank-reported claims3 29,947 -8,161 -69,146 -29,114 -41,236 8,476 -7,272 4,510 19 Nonbank-reported claims 1,581 -32,804 -34,219 -4,537 -22,904 7,500 -14,278
4,510
20 U.S. purchases of foreign securities, net -146,253 -60,270 -98,960 -7,571 -23,011 -35,839 -32,539 -33,492 21 U.S. direct investments abroad, net -78,164 -54,465 -95,509 -15,053 -18,247 -18,091 -44,117 -26,819
22 Change in foreign official assets in United States (increase, +) 72,153 40,253 109,757 21,822 37,380 39,186 11,369 51,582 23 U.S. Treasury securities 48,952 30,745 68,813 10,132 25,208 20,489 12,984 55,600 24 Other U.S. government obligations 4,062 6,077 3,734 1,126 1,326 518 764 52 25 Other U.S. government liabilities4 1,713 2,344 1,082 - 3 3 1 235 - 7 1 1,249 - 1 9 5 26 Other U.S. liabilities reported by U.S. banks3 14,841 3,560 32,862 10,630 7,662 18,478 -3,908 -3 ,664 21 Other foreign official assets5 2,585 -2,473 3,266 265 2,949 - 2 2 8 280 - 2 1 1
28 Change in foreign private assets in United States (increase, +) 178,843 245,123 314,705 69,173 78,041 79,630 87,860 47,234 29 U.S. bank-reported liabilities3 20,859 111,842 25,283 3,860 10,200 -21,542 32,765 -29,449 30 US. nonbank-reported liabilities 10,489 -7,710 34,578 9,076 7,285 6,945 11,272
-29,449
31 Foreign private purchases of U.S. Treasury securities, net 24,381 34,225 99,340 29,969 30,368 37,269 1,734 11,734 32 Foreign purchases of other U.S. securities, net 80,092 57,006 95,268 15,480 20,496 31,971 27,321 35,437 33 Foreign direct investments in United States, net 43,022 49,760 60,236 10,788 9,692 24,987 14,768 29,512
34 Allocation of special drawing rights 0 0 0 0 0 0 0 0 35 Discrepancy 43,550 13,724 31,548 9,806 33,854 -41,533 29,420 -7,496 36 Due to seasonal adjustment 6,519 - 2 6 6 -7,407 1,153 6,365 3 / Before seasonal adjustment 43,550 13,724 31,548 3,287 34,120 -34,126 28,267 -13,861
MEMO Changes in official assets
38 U.S. official reserve assets (increase, - ) -1,379 5,346 -9,742 -5,318 -2,722 -1,893 191 17 39 Foreign official assets in United States, excluding line 25
-1,379 5,346 -9,742 -5,318 -1,893 17
(increase, +) 70,440 37,909 108,675 22,153 37,145 39,257 10,120 51,777
40 Change in Organization of Petroleum Exporting Countries official assets in United States (part of line 22) -3,717 -1,529 3,959 -412 -341 6,147 -1,435 -1,417
1. Seasonal factors are not calculated for lines 12-16, 18-20, 22-34, and 38^10. 2. Data are on an international accounts basis. The data differ from the Census basis data,
shown in table 3.11, for reasons of coverage and timing. Military exports are excluded from merchandise trade data and are included in line 5.
3. Reporting banks include all types of depository institutions as well as some brokers and dealers.
4. Associated primarily with military sales contracts and other transactions arranged with or through foreign official agencies.
5. Consists of investments in U.S. corporate stocks and in debt securities of private corporations and state and local governments.
SOURCE. U.S. Department of Commerce, Bureau of Economic Analysis, Survey of Current Business.
Digitized for FRASER http://fraser.stlouisfed.org/ Federal Reserve Bank of St. Louis

Summary Statistics A51
3.11 U.S. FOREIGN TRADE1
Millions of dollars; monthly data seasonally adjusted
Item 1993 1994 1995 1995 1996
Item 1993 1994 1995 Dec. Jan. Feb. Mar. Apr. May Junep
1 Goods and services, balance -72,037 -104,381 -105,064 -6,399 -9,686 -6,654 -8,012 -9,606 -10,546 -8,111 2 Merchandise -132,607 -166,123 -173,424 -12,601 -15,505 -12,784 -14,450 -15,585 -16,791 -14,454 3 Services 60,570 61,742 68,360 6,202 5,819 6,130 6,438 5,979 6,245 6,343
4 Goods and services, exports 642,953 698,301 786,529 68,088 66,493 69,163 69,277 68,990 69,893 69,706 5 Merchandise 456,834 502,462 575,939 50,120 48,645 50,883 50,490 50,740 51,384 51,192 6 Services 186,119 195,839 210,590 17,968 17,848 18,280 18,787 18,250 18,509 18,514
7 Goods and services, imports -714,990 -802,682 -891,593 -74,487 -76,179 -75,817 -77,289 -78,596 -80,439 -77,817 8 Merchandise -589,441 -668,585 -749,363 -62,721 -64,150 -63,667 -64,940 -66,325 -68,175 -65,646 9 Services -125,549 -134,097 -142,230 -11,766 -12,029 -12,150 -12,349 -12,271 -12,264 -12,171
1. Data show monthly values consistent with quarterly figures in the U.S. balance of SOURCE. FT900, U.S. Department of Commerce, Bureau of the Census and Bureau of payments accounts. Economic Analysis.
3.12 U.S. RESERVE ASSETS
Millions of dollars, end of period
Asset 1992 1993 1994 1995 1996
Asset 1992 1993 1994 Dec. Jan. Feb. Mar. Apr. May June Julyp
1 Total 71,323 73,442 74,335 85,832 82,717 84,270 84,212 83,710 83,468 83,455 85,099
2 Gold stock, including Exchange Stabilization Fund' 11,056 11,053 11,051 11,050 11,052 11,053 11,053 11,052 11,051 11,050 11,050
3 Special drawing rights2,3 8,503 9,039 10,039 11,037 10,778 11,106 11,049 10,963 11,037 11,046 11,216 4 Reserve position in International Monetary
Fund2 11,759 11,818 12,030 14,649 14,312 14,813 15,249 15,117 15,227 15,282 15,665 5 Foreign currencies4 40,005 41,532 41,215 49,096 46,575 47,298 46,861 46,578 46,153 46,077 47,168
1. Gold held "under earmark" at Federal Reserve Banks for foreign and international accounts is not included in the gold stock of the United States; see table 3.13, line 3. Gold stock is valued at $42.22 per fine troy ounce.
2. Special drawing rights (SDRs) are valued according to a technique adopted by the International Monetary Fund (IMF) in July 1974. Values are based on a weighted average of exchange rates for the currencies of member countries. From July 1974 through December 1980, sixteen currencies were used; since January 1981, five currencies have been used. U.S.
SDR holdings and reserve positions in the IMF also have been valued on this basis since July 1974.
3. Includes allocations of SDRs by the International Monetary Fund on Jan. 1 of the year indicated, as follows: 1970—$867 million; 1971—$717 million; 1972—$710 million; 1979— $1,139 million; 1980—$1,152 million; 1981—$1,093 million; plus net transactions in SDRs.
4. Valued at current market exchange rates.
3.13 FOREIGN OFFICIAL ASSETS HELD AT FEDERAL RESERVE BANKS1
Millions of dollars, end of period
Asset 1992 1993 1994 1995 1996
Asset 1992 1993 1994 Dec. Jan. Feb. Mar. Apr. May June July"
1 Deposits 205 386 250 386 165 209 191 166 160 182 166
Held in custody 2 U.S. Treasury securities2 314,481 379,394 441,866 522,170 532,776 559,741 573,435 573,924 578,608 572,839 580,277 3 Earmarked gold3 13,118 12,327 12,033 11,702 11,702 11,689 11,590 11,445 11,339 11,296 11,273
1. Excludes deposits and U.S. Treasury securities held for international and regional 3. Held in foreign and international accounts and valued at $42.22 per fine troy ounce; not organizations. included in the gold stock of the United States.
2. Marketable U.S. Treasury bills, notes, and bonds and nonmarketable U.S. Treasury securities, in each case measured at face (not market) value.
Digitized for FRASER http://fraser.stlouisfed.org/ Federal Reserve Bank of St. Louis

A52 International Statistics • October 1996
3.15 SELECTED U.S. LIABILITIES TO FOREIGN OFFICIAL INSTITUTIONS
Millions of dollars, end of period
Item 1993 1994 1995 1996
Item 1993 1994
Dec. Jan. Feb. Mar. Apr. May Junep
1 Total1 482,915 520,934 630,775 644,570 670,229 682,952 687,217r 689,711 695,954
By type 2 Liabilities reported by banks in the United States 69,721 73,386 107,258 103,919 103,242 103,994 111,017' 104,926 117,835 3 U.S. Treasury bills and certificates3 151,100 139,571 168,534 173,949 191,188 198,382 186,638 188,321 187,171
U.S. Treasury bonds and notes 4 Marketable 212,237 254,059 293,684 306,299 314,980 319,728 327,981 334,463 327,815 5 Nonmarketable4 5,652 6,109 6,491 6,120 6,159 6,199 6,238r 5,903 5,941 6 U.S. securities other than U.S. Treasury securities5 44,205 47,809 54,808 54,283 54,660 54,649 55,343 56,098 57,192
By area 7 Europe1 207,034 215,374 222,314 223,569 231,389 242,589 241,161 244.294 245,385 8 Canada 15,285 17,235 19,473 19,078 18,850 20,846 20,878 21.670 21,250 9 Latin America and Caribbean 55,898 41,492 66,720 70,281 70,497 73,039 71,287r 67.949 69,739
10 Asia 197,702 236,824 310,966 320,512 338,999 335,006 341,148' 343,206 346,071 11 Africa 4,052 4,180 6,296 6,924 6,574 6,584 7,388 7.173 6,996 12 Other countries 2,942 5,827 5,004 4,204 3,918 4,886 5,353 5,417 6,511
1. Includes the Bank for International Settlements. 2. Principally demand deposits, time deposits, bankers acceptances, commercial paper,
negotiable time certificates of deposit, and borrowings under repurchase agreements. 3. Includes nonmarketable certificates of indebtedness and Treasury bills issued to official
institutions of foreign countries. 4. Excludes notes issued to foreign official nonreserve agencies. Includes current value of
zero-coupon Treasury bond issues to foreign governments as follows: Mexico, beginning March 1988, 20-year maturity issue and beginning March 1990, 30-year maturity issue;
Venezuela, beginning December 1990, 30-year maturity issue; Argentina, beginning April 1993, 30-year maturity issue.
5. Debt securities of U.S. government corporations and federally sponsored agencies, and U.S. corporate stocks and bonds.
SOURCE. Based on U.S. Department of the Treasury data and on data reported to the department by banks (including Federal Reserve Banks) and securities dealers in the United States, and on the 1989 benchmark survey of foreign portfolio investment in the United States.
3.16 LIABILITIES TO, AND CLAIMS ON, FOREIGNERS Reported by Banks in the United States1
Payable in Foreign Currencies
Millions of dollars, end of period
Item 1992 1993 1994 1995 1996
Item 1992 1993 1994
June Sept. Dec. Mar.
1 Banks'liabilities 2 Banks' claims 3 Deposits 4 Other claims 5 Claims of banks' domestic customers2
72,796 62,799 24,240 38,559 4,432
78,259 62,017 20,993 41,024 12,854
89,284 60,689 19,661 41,028 10,878
106,621 77,042 28,909 48,133 10,244
102,147 69,481 25,712 43,769
6,624
112,556 74,830 22,688 52,142
6,145
109,635' 69,522 22,220 47,302
6,064
1. Data on claims exclude foreign currencies held by U.S. monetary authorities. 2. Assets owned by customers of the reporting bank located in the United States that represent claims on foreigners held by reporting banks for the accounts of the domestic customers.
Digitized for FRASER http://fraser.stlouisfed.org/ Federal Reserve Bank of St. Louis

Nonbank-Reported Data A53
3.17 LIABILITIES TO FOREIGNERS Reported by Banks in the United States1
Payable in U.S. dollars
Millions of dollars, end of period
Item 1993 1994 1995 1995 1996
Item 1993 1994 1995 Dec. Jan. Feb. Mar. Apr. May Junep
B Y HOLDER AND TYPE OF LIABILITY
1 Total, all foreigners 926,672 1,014,808 l,099,665r l,099,665r l,098,640r l,101,912r l,100,426r l,100,602r 1,096,063 1,097,972
2 Banks' own liabilities 626,919 718,440 753,545r 753,545r 747,46 l r 732,922' 729,805r 735,762' 723,566 731,351 3 Demand deposits 21,569 23,386 24,460 24,460 22,182 23,507 23,371 23,958 23,337 27,486 4 Time deposits2 175,106 186,512 192,700 192,700 198,434' 192,116r 193,549' 192,011' 181,031 189,671 5 Other3 111,971 112,984 139,780 139,780 141,963 149,009 138,311 146,589' 144,051 149,290 6 Own foreign offices4 318,273 395,558 396,605r 396,605r 384,882 368,290 374,574 373,204 375,147 364,904
7 Banks' custodial liabilities5 299,753 296,368 346,120 346,120 351,179 368,990 370,621 364,840 372,497 366,621 8 U.S. Treasury bills and certificates6 176,739 162,908 197,341 197,341 203,478 223,395 228,705 217,106 220,823 218,604 9 Other negotiable and readily transferable
162,908 197,341 223,395 228,705 217,106 218,604
instruments7 36,289 42,532 52,246 52,246 46,973 43,404 40,483 44,823 49,655 51,465 10 Other 86,725 90,928 96,533 96,533 100,728 102,191 101,433 102,911 102,019 96,552
11 Nonmonetary international and regional organizations8... 10,936 8,606 11,039 11,039 10,622 11,109 9,476 11,266' 11,954 12,093 12 Banks' own liabilities 5,639 8,176 10,347 10,347 9,628 10,314 8,558 10,440' 11,167 10,849 13 Demand deposits 15 29 21 21 30 43 16 28 34 123 14 Time deposits2 2,780 3,298 4,656 4,656 4,385 3,479 3,527 3,979 3,402 3,987 15 Other3 2,844 4,849 5,670 5,670 5,213 6,792 5,015 6,433' 7,731 6,739
16 Banks' custodial liabilities5 5,297 430 692 692 994 795 918 826 787 1,244 17 U.S. Treasury bills and certificates6 4,275 281 350 350 764 555 564 426 376 874 18 Other negotiable and readily transferable
4,275
instruments7 1,022 149 341 341 230 230 298 400 390 370 19 Other 0 0 1 1 0 10 56 0 21 0
20 Official institutions9 220,821 212,957 275,792 275,792 277,868 294,430 302,376 297,655' 293,247 305,006 21 Banks' own liabilities 64,144 59,935 83,311 83,311 85,040 84,077 88,537 91,602' 81,894 91,502 22 Demand deposits 1,600 1,564 2,098 2,098 1,522 1,655 1,423 1,679 1,504 2,216 23 Time deposits2 21,653 23,511 30,716 30,716 28,069 29,904 32,404 36,637' 32,656 38,567 24 Other3 40,891 34,860 50,497 50,497 55,449 52,518 54,710 53,286' 47,734 50,719
25 Banks' custodial liabilities5 156,677 153,022 192,481 192,481 192,828 210,353 213,839 206,053 211,353 213,504 26 U.S. Treasury bills and certificates6 151,100 139,571 168,534 168,534 173,949 191,188 198,382 186,638 188,321 187,171 27 Other negotiable and readily transferable
198,382 186,638
instruments7 5,482 13,245 23,603 23,603 18,532 18,138 14,970 19,065 22,661 25,835 28 Other 95 206 344 344 347 1,027 487 350 371 498
29 Banks10 592,171 678,367 691,555r 691,555r 687,180r 670,727r 666,739' 665,4901 662,333 654,502 30 Banks' own liabilities 478,755 563,466 567,980r 567,980r 558,951r 541,421r 539,657' 537,427' 533,016 530,708 31 Unaffiliated foreign banks 160,482 167,908 171,375 171,375 174,069r 173,13 lr 165,083' 164,223' 157,869 165,804 32 Demand deposits 9,718 10,633 11,756 11,756 10,247 10,948 10,971 11,453 10,660 12,389 33 Time deposits2 105,262 111,171 103,554 103,554 110,436r 104,230r 101,013' 96,222' 89,075 90,901 34 Other3 45,502 46,104 56,065 56,065 53,386 57,953 53,099 56,548' 58,134 62,514 35 Own foreign offices4 318,273 395,558 396,605r 396,605r 384,882 368,290 374,574 373,204 375,147 364,904
36 Banks' custodial liabilities5 113,416 114,901 123,575 123,575 128,229 129,306 127,082 128,063 129,317 123,794 37 U.S. Treasury bills and certificates6 10,712 11,251 15,869 15,869 15,992 17,947 15,967 16,801 17,584 18,241 38 Other negotiable and readily transferable
15,869 15,869 17,947 15,967 16,801 17,584
instruments7 17,020 14,505 13,035 13,035 13,590 12,094 11,864 10,814 11,775 11,021 39 Other 85,684 89,145 94,671 94,671 98,647 99,265 99,251 100,448 99,958 94,532
40 Other foreigners 102,744 114,878 121,279 121,279 122,970 125,646 121,835 126,191 128,529 126,371 41 Banks' own liabilities 78,381 86,863 91,907 91,907 93,842 97,110 93,053 96,293 97,489 98,292 42 Demand deposits 10,236 11,160 10,585 10,585 10,383 10,861 10,961 10,798 11,139 12,758 43 Time deposits2 45,411 48,532 53,774 53,774 55,544 54,503 56,605 55,173 55,898 56,216 44 Other3 22,734 27,171 27,548 27,548 27,915 31,746 25,487 30,322 30,452 29,318
45 Banks' custodial liabilities5 24,363 28,015 29,372 29,372 29,128 28,536 28,782 29,898 31,040 28,079 46 U.S. Treasury bills and certificates6 10,652 11,805 12,588 12,588 12,773 13,705 13,792 13,241 14,542 12,318 47 Other negotiable and readily transferable
13,241 14,542 12,318
instruments7 12,765 14,633 15,267 15,267 14,621 12,942 13,351 14,544 14,829 14,239 48 Other 946 1,577 1,517 1,517 1,734 1,889 1,639 2,113 1,669 1,522
MEMO 49 Negotiable time certificates of deposit in custody for
foreigners 17,567 17,895 9,099 9,099 10,479 10,544 10,005 8,306 9,284 9,580
1. Reporting banks include all types of depository institutions as well as some brokers and dealers. Excludes bonds and notes of maturities longer than one year.
2. Excludes negotiable time certificates of deposit, which are included in "Other negotia-ble and readily transferable instruments."
3. Includes borrowing under repurchase agreements. 4. For U.S. banks, includes amounts owed to own foreign branches and foreign subsidiar-
ies consolidated in quarterly Consolidated Reports of Condition filed with bank regulatory agencies. For agencies, branches, and majority-owned subsidiaries of foreign banks, consists principally of amounts owed to the head office or parent foreign bank, and to foreign branches, agencies, or wholly owned subsidiaries of the head office or parent foreign bank.
5. Financial claims on residents of the United States, other than long-term securities, held by or through reporting banks for foreign customers.
6. Includes nonmarketable certificates of indebtedness and Treasury bills issued to official institutions of foreign countries.
7. Principally bankers acceptances, commercial paper, and negotiable time certificates of deposit.
8. Principally the International Bank for Reconstruction and Development, the Inter-American Development Bank, and the Asian Development Bank. Excludes "holdings of dollars" of the International Monetary Fund.
9. Foreign central banks, foreign central governments, and the Bank for International Settlements.
10. Excludes central banks, which are included in "Official institutions."
Digitized for FRASER http://fraser.stlouisfed.org/ Federal Reserve Bank of St. Louis

A54 International Statistics • October 1996
3.17 LIABILITIES TO FOREIGNERS Reported by Banks in the United States'—Continued
Item 1993 1994 1995
1995 1996
Item 1993 1994 1995
Dec. Jan. Feb. Mar. Apr. May Junep
AREA
5 0 Total, all foreigners 926,672 1,014,808 l,099,665r l,099,665r l,098,640r l,101,912r l,100,426r l,100,602r l,096,063r 1,097,972
51 Foreign countries 915,736 1,006,202 l,088,626r l,088,626r l,088,018r l,090,803r l,090,950r l,089,336r l,084,109r 1,085,879
5 2 377 ,911 3 9 0 , 7 1 0 3 6 2 , 7 8 6 3 6 2 , 7 8 6 368 ,325 3 7 4 , 0 4 8 370 ,581 375,5 25R 367,761R 3 6 3 , 7 9 0 53 Austria 1,917 3 ,588 3 ,537 3 ,537 3 , 4 3 7 2 , 9 9 6 2 ,848 3 ,477 3 ,624 3 ,234 5 4 Belgium and Luxembourg 2 8 , 6 7 0 21 ,877 24 ,842 24 ,842 24 ,881 2 7 , 1 8 2 2 5 , 5 8 4 2 7 , 5 7 2 25 ,955 20 ,831 55 Denmark 4 ,517 2 ,884 2,921 2,921 2 ,979 3 ,861 2 , 8 7 6 2 ,787 2 ,645 2 , 7 9 6 56 Finland 1,872 1,436 2,831 2 ,831 2 ,421 2 , 4 0 9 1,768 2 ,203 2 ,188 1,745 57 France 4 0 , 3 1 6 44,361 3 9 , 2 0 4 3 9 , 2 0 4 3 9 , 6 9 7 4 1 , 0 9 9 4 1 , 3 3 2 41,304R 39,640R 4 0 , 4 4 4 58 Germany 26 ,685 2 7 , 1 0 9 24 ,035 24 ,035 25 ,988 24 ,695 2 5 , 2 2 9 2 4 , 8 5 4 2 3 , 9 5 0 2 5 , 8 6 3 59 Greece 1,519 1,393 2,011 2 ,011 1,998 2 ,063 1 ,966 1,714 1,665 1 ,690 6 0 Italy 11,759 10,885 10,875 10.875 9 , 6 1 6 12,468 11,475 10,178 11,045 12,109 61 Netherlands 16,096 16,033 13 ,724 13,724 11,350 12,173 12,839 12,397 12,578 12,161 62 Norway 2,966 2,338 1,394 1,394 1,067 1,246 1,034 915 828 1,388 63 Portugal 3,366 2,846 2,761 2 ,761 3,055 2,931 2,843 2,529 1,858 1,401 64 Russia 2,511 2,726 7,950 7,950 7,858 9,180 9 ,321 8,798 7,260 6,925 65 Spain 20,496 14,675 10,012 10,012 11,838 11,589 18,976 19,548 19,010 20,312 66 Sweden 2,738 3,094 3,245 3,245 2,555 2,813 2,2 56 3,943 2,410 2,693 67 Switzerland 41,560 40,515 43,627 43,627 40,806 42,010 39,083 36,805 37,099 39,008 68 Turkey 3,227 3,341 4,124 4,124 4,350 4,559 4,103 4,453 4,669 4,926 69 United Kingdom 133,993 163,795 139,127 139,127 152,654 146,985 144,136 146,612 146,335r 143,770 70 Yugoslavia11 372 2 4 5 177 177 163 163 143 145 146 217 11 Other Europe and other former U.S.S.R.12 33,331 27,769 26,389 26,389 21,612 23,626 22,769 25,291 24,856r 22,277
72 20,235 24,768 30,470r 30,470r 33,012 32,031 31,500 31,285 33,178 33,389
73 Latin America and Caribbean 362,238 423,830 440,216 440,216 435,624r 421,950r 433,599r 430,933r 433,075' 432,566 14 Argentina 14,477 17,203 12,236 12,236 13,524 11,764 11,985 14,117 11,650 13,580 75 Bahamas 73,820 104,002 94,991 94,991 96,77 l r 91,124r 87,987r 85,769r 86,303r 85,257 /6 Bermuda 8,117 8,424 4,897 4,897 4,633 4,702 5,035 4,262 4,998 4,172 7/ Brazil 5,301 9,145 23,797 23,797 22,715 21,761 21,483r 20,222 20,105 28,130 78 British West Indies 193,699 229,599 239,083 239,083 233,383 227,438 240,61 r 239,129 243,145r 231,948 79 Chile 3,183 3.127 2,825 2,825 2,978 2,772 2,815 2,882 2,867 2,937 80 Colombia 3,171 4,615 3,666 3,666 3,505 3,682 3,637 3,790 3,430
8 3,680
81 Cuba 33 13 8 8 7 7 7 13 3,430
8 10 82 Ecuador 880 875 1,315 1,315 1,236 1,201 1,274 1,265 1,284 1,302 83 Guatemala 1,207 1,121 1,275 1,275 1,058 1,075 1,060 1,085 1.073 1,073 84 Jamaica 410 529 481 481 500 495 503 516 550 534 85 Mexico 28,019 12,227 24,555 24,555 23,643 23,899 24,577 23,330 23.214 24,777 86 Netherlands Antilles 4,686 5,217 4,672 4,672 4,448 4,461 4,402 5,272 4.722 5,162 8/ Panama 3,582 4,551 4,265 4,265 4,030 4,166 4,026 3,887 3.846 3,878 88 Peru 929 900 974 974 1,025 1,092 962 1,081 1,064 1,011 89 Uruguay 1,611 1,597 1,835 1,835 1,799 1,726 1,908 1,748 1.757 1,769 9 0 Venezuela 12,786 13,985 11,810 11,810 12,662 12,611 13,255 14,244 14.672 14,925 91 Other 6,327 6,700 7,531 7,531 7,707 7,974 8,072 8,321 8,387r 8,421
92 Asia 144,527 154,334 240,740 240,740 238,175 249,447 241,958 237,705 235,906 239,232 China
238,175 249,447 241,958 237,705 239,232
93 People's Republic of China 4,011 10,066 33,750 33,750 35,733 32,200 24,430 25,861 24,857 25,485 94 Republic of China (Taiwan) 10,627 9,844 11,714 11,714 12,311 12,955 15,513 14,953 14,598 16,637 95 Hong Kong 17,132 17,104 20,303 20,303 20,307 22,286 20,187 18,379 18,605 18,257 9 6 1,114 2,338 3,373 3,373 3,263 3,527 3,990 3,752 3,938 4,012 97 Indonesia 1,986 1,587 2,708 2,708 2,011 2,349 2,169 2,627 2,374 2,317 98 Israel 4,435 5,157 4,073 4,073 4,348 5,780 5,344 5,450 5,123 5,199 99 Japan 61,466 62,981 109,193 109,193 106,728 113,361 117,325 111,635 111,498 113,802
100 Korea (South) 4,913 5,124 5,749 5,749 5,092 5,607 5,875 5,860 5,664 6,569 101 Philippines 2,035 2,714 3,089 3,089 2,394 2,366 2,336 2,467 2,897 2,970 102 Thailand 6,137 6,466 12,279 12,279 13,121 13,389 12,158 12,905 13,387 12,262 103 Middle Eastern oil-exporting countries13 15,822 15,482 15,582 15,582 14,417 13,491 13,741 14,895 14,234 13,379 104 Other 14,849 15,471 18,927 18,927 18,450 22,136 18,890 18,921 18,731 18,343
105 6,633 6,524 7,641 7,641 7,679 7,818 7,089 7,832 7,404 7,507 106 Egypt 2,208 1,879 2,136 2,136 1,848 2,375 2,057 2,002 1,873 1,831 107 Morocco 99 97 104 104 99 52 65 114 113 115 108 South Africa 451 433 739 739 1,217 665 413 1,001 745 666 109 Zaire 12 9 10 10 11 8 9 8 16 6 110 Oil-exporting countries14 1,303 1,343 1,797 1,797 1,774 1,968 1,706 1,904 1,887 2,013 111 Other 2,560 2,763 2,855 2,855 2,730 2,750 2,839 2,803 2,770 2,876
112 Other 4,192 6,036 6,773 6,773 5,203 5,509 6,223 6,056 6,785r 9,395 113 Australia 3,308 5,142 5,644 5,644 4,326 4,503 5,239 4,896 5,757 7,981 114 Other 884 894 1,129 1,129 877 1,006 984 1,160 l,028r 1,414
115 Nonmonetary international and regional organizations.. . 10,936 8,606 11,039 11,039 10,622 11,109 9,476 11,266r 1 l,954r 12,093 116 International'5 6,851 7,537 9,300 9,300 9,639 10,075 7,938 9,982r 10,587r 10,835 117 Latin American regional16 3,218 613 893 893 349 292 758 422 594 451 118 Other regional17 867 456 846 846 634 742 780 862 773 807
11. Since December 1992, has excluded Bosnia, Croatia, and Slovenia. 12. Includes the Bank for International Settlements. Since December 1992, has
included all parts of the former U.S.S.R. (except Russia), and Bosnia, Croatia, and Slovenia. 13. Comprises Bahrain, Iran, Iraq, Kuwait, Oman, Qatar, Saudi Arabia, and United Arab
Emirates (Trucial States). 14. Comprises Algeria, Gabon, Libya, and Nigeria.
15. Principally the International Bank for Reconstruction and Development. Excludes "holdings of dollars" of the International Monetary Fund.
16. Principally the Inter-American Development Bank. 17. Asian, African, Middle Eastern, and European regional organizations, except the Bank
for International Settlements, which is included in "Other Europe."
Digitized for FRASER http://fraser.stlouisfed.org/ Federal Reserve Bank of St. Louis

Nonbank-Reported Data A55
3.18 BANKS' OWN CLAIMS ON FOREIGNERS Reported by Banks in the United States1
Payable in U.S. Dollars
Millions of dollars, end of period
Area or country 1993 1994 1995 1995 1996
Area or country 1993 1994 1995 Dec. Jan. Feb. Mar. Apr/ May Junep
1 Total, all foreigners 488,497 483,242 529,948r 529,948r 527,317 520,790 531,340r 527,363 518,375 536,311
2 Foreign countries 486,092 478,651 528,017r 528,017r 525,015 518,011 527,526r 524,647 514,881 533,289
3 Europe 123,741 123,380 130,315 130,315 133,923 138,574 138,820' 135,605 134,471 146,204 4 Austria 412 692 565 565 683 773 892r 1,213 1,212 1,088 5 Belgium and Luxembourg 6,532 6,738 7,599 7,599 8,365 8,519 6,003r 8,688 8,711 6,921 6 Denmark 382 1,129 403 403 541 599 698r 543 482 432 7 Finland 594 512 1,055 1,055 1,397 1,313 1,782 1,305 1,282 1,013 8 France 11,822 12,146 14,798 14,798 12,253 13,161 13,740 11,604 11,954 11,767 9 Germany 7,724 7,608 8,864 8,864 8,072 8,774 9,260 8,647 8,099 11,831
10 Greece 691 604 449 449 555 603 507 622 554 563 11 Italy 8,834 6,043 5,364 5,364 5,010 4,838 5,865r 5,696 6,166 5,721 12 Netherlands 3,063 2,959 5,051 5,051 4,305 4,722 5,585r 6,346 5,618 6,546 13 Norway 396 504 665 665 1,098 1,408 1,016 793 933 1,243 14 Portugal 834 938 888 888 853 743 773 889 813 704 15 Russia 2,310 973 660 660 678 775 868 741 482 472 16 Spain 3,717 3,530 2,166 2,166 3,811 4,041 5,420 5,092 3,158 2,519 17 Sweden 4,254 4,098 2,060 2,060 2,315 2,151 2,206r 3,534 2,526 2,799 18 Switzerland 6,605 5,746 7,074 7,074 4,613 4,016 4,841 6,370 8,713 12,144 19 Turkey 1,301 878 785 785 732 707 810 973 867 930 20 United Kingdom 62,013 66,846 67,388 67,388 75,147 78,040 73,741r 69,117 69,581 75,810 21 Yugoslavia- 473 265 147 147 481 118 120 208 204 164 22 Other Europe and other former U.S.S.R.3 1,784 1,171 4,334 4,334 3,014 3,273 4,693 3,224 3,116 3,537
23 Canada 18,617 18,490 20,192r 20,192r 20,068 18,421 18,040r 22,061 20,885 22,241
24 Latin America and Caribbean 225,238 223,523 256,955r 256,955r 257,146 248,483 252,727 245,845 237,369 239,237 25 Argentina 4,474 5,844 6,439 6,439 6,185 6,057 6,216 6,187 6,037 6,437 26 Bahamas 63,353 66,410 58,815r 58,815r 60,284 63,240 65,628 54,911 55,476 60,592 27 Bermuda 8,901 8,481 5,717 5,717 5,011 4,742 4,829 5,031 2,993 3,113 28 Brazil 11,848 9,583 13,297 13,297 13,252 13,915 13,813 14,175 14,189 15,076 29 British West Indies 99,319 95,741 123,914 123,914 122,759 108,833 113,239 118,599 110,770 101,589 30 Chile 3,643 3,820 5,024 5,024 4,996 4,593 4,559 4,605 4,363 5,062 31 Colombia 3,181 4,004 4,550 4,550 4,622 4,492 4,547 4,517 4,523 4,540 32 Cuba 0 0 0 0 0 0 0 0 0 0 33 Ecuador 681 682 825 825 841 842 977 959 944 957 34 Guatemala 288 366 457 457 439 461 465 473 461 456 35 Jamaica 195 258 323 323 299 362 332 335 345 368 36 Mexico 15,879 17,749 18,028 18,028 17,114 17,167 16,953 17,071 16,857 16,811 37 Netherlands Antilles 2,683 1,396 9,229 9,229 11,043 12,973 10,902 8,728 8,674 12,888 38 Panama 2,894 2,198 3,018 3,018 2,845 2,820 2,612 2,503 2,397 2,567 39 Peru 657 997 1,829 1,829 1,762 1,928 1,936 2,042 2,350 2,395 40 Uruguay 969 503 466 466 422 463 623 578 602 623 41 Venezuela 2,910 1,831 1,661 1,661 1,575 1,572 1,559 1,377 1,279 1,392 42 Other 3,363 3,660 3,363 3,363 3,697 4,023 3,537 3,754 5,109 4,371
43 111,775 107,079 115,361r 115,361r 108,989 107,056 111,390 115,030 115,954 118,381 China
44 People's Republic of China 2,271 836 1,023 1,023 1,014 1,351 2,439 3,405 2,857 2,141 45 Republic of China (Taiwan) 2,625 1,448 1,713 1,713 1,407 1,404 1,729 1,626 1,514 1,490 46 Hong Kong 10,828 9,161 12,895 12,895 13,254 13,867 15,545 15,329 14,738 16,016 47 India 589 994 1,846 1,846 1,864 1,859 1,869 1,787 1,786 1,794 48 Indonesia 1,527 1,470 1,678 1,678 1,458 1,478 1,604 1,526 1,539 1,537 49 Israel 826 688 739 739 668 683 665 642 615 615 50 Japan 60,032 59,151 61,308 61,308 55,897 55,077 52,776 54,657 54,685 54,260 51 Korea (South) 7,539 10,286 14,089r 14,089r 14,501 15,523 17,362 17,250 17,854 19,256 52 Philippines 1,410 662 1,350 1,350 814 779 1,202 779 836 1,298 53 Thailand 2,170 2,902 2,599 2,599 2,397 3,256 3,060 2,970 3,015 3,194 54 Middle Eastern oil-exporting countries4 15,115 13,748 9,639 9,639 8,053 6,410 7,145 7,252 8,976 8,354 55 Other 6,843 5,733 6,482 6,482 7,662 5,369 5,994 7,807 7,539 8,426
56 Africa 3,861 3,050 2,727 2,727 2,798 2,879 2,884 2,743 2,691 2,768 57 Egypt 196 225 210 210 208 237 247 225 217 198 58 Morocco 481 429 514 514 514 561 585 594 628 639 59 South Africa 633 671 465 465 483 520 567 493 468 515 60 Zaire 4 2 1 1 1 1 1 1 1 1 61 Oil-exporting countries5 1,129 856 552 552 589 526 516 501 478 474 62 Other 1,418 867 985 985 1,003 1,034 968 929 899 941
63 Other 2,860 3,129 2,467 2,467 2,091 2,598 3,665 3,363 3,511 4,458 64 Australia 2,037 2,186 1,622 1,622 1,822 2,243 2,645 2,620 2,333 2,513 65 Other 823 943 845 845 269 355 1,020 743 1,178 1,945
66 Nonmonetary international and regional organizations6 . . . 2,405 4,591 1,931 1,931 2,302 2,779 3,814 2,716 3,494 3,022
1. Reporting banks include all types of depository institutions as well as some brokers and dealers.
2. Since December 1992, has excluded Bosnia, Croatia, and Slovenia. 3. Includes the Bank for International Settlements. Since December 1992, has included all
parts of the former U.S.S.R. (except Russia), and Bosnia, Croatia, and Slovenia.
4. Comprises Bahrain, Iran, Iraq, Kuwait, Oman, Qatar, Saudi Arabia, and United Arab Emirates (Trucial States).
5. Comprises Algeria, Gabon, Libya, and Nigeria. 6. Excludes the Bank for International Settlements, which is included in "Other Europe."
Digitized for FRASER http://fraser.stlouisfed.org/ Federal Reserve Bank of St. Louis

A56 International Statistics • October 1996
3.19 BANKS' OWN AND DOMESTIC CUSTOMERS' CLAIMS ON FOREIGNERS Reported by Banks in the United States1
Payable in U.S. Dollars
Millions of dollars, end of period
1995 1996
Type of claim 1993 1994 1995 Type of claim 1993 1994 1995 Dec. Jan. Feb. Mar.' Apr.' May Junep
1 Total 575,818 599,521 652,715r 652,715r 657,231
2 Banks' claims 488,497 483,242 529,948r 529,948' 527,317 520,790 531,340 527,363 518,375 536,311 3 Foreign public borrowers 29,228 23,416 22,522 22,522 23,148 24,383 27,759 26,263 22,217 22,697 4 Own foreign offices2 285,510 283,183 307,509' 307,509' 305,118 295,217 297,601 298,972 300,425 307,516 5 Unaffiliated foreign banks 100,865 109,228 98,702 98,702 97,240 98,139 103,509 101,182 98,174 105,549 6 Deposits 49,892 59,250 37,343 37,343 35,520 37,565 41,914 37,393 35,413 33,866 7 Other 50,973 49,978 61,359 61,359 61,720 60,574 61,595 63,789 62,761 71,683 8 All other foreigners 72,894 67,415 101,215 101,215 101,811 103,051 102,471 100,946 97,559 100,549
9 Claims of banks' domestic customers3 87,321 116,279 122,767 122,767 125,891 10 Deposits 41,734 64,829 58,519 58,519 68,800 11 Negotiable and readily transferable
instruments4 31,186 36,008 44,161 44,161 39,274 12 Outstanding collections and other
31,186 36,008
claims 14,401 15,442 20,087 20,087 17,817
MEMO 13 Customer liability on acceptances 7,920 8,427 8,410 8,410 9,026
14 Dollar deposits in banks abroad, reported by nonbanking business enterprises in the United States5 29,150 32,796 30,717 30,717 27,830 32,777 33,113 32,384 34,258 30,598
1. For banks' claims, data are monthly; for claims of banks' domestic customers, data are for quarter ending with month indicated.
Reporting banks include all types of depository institution as well as some brokers and dealers.
2. For U.S. banks, includes amounts due from own foreign branches and foreign subsidiar-ies consolidated in quarterly Consolidated Reports of Condition filed with bank regulatory agencies. For agencies, branches, and majority-owned subsidiaries of foreign banks, consists
principally of amounts due from the head office or parent foreign bank, and from foreign branches, agencies, or wholly owned subsidiaries of the head office or parent foreign bank.
3. Assets held by reporting banks in the accounts of their domestic customers. 4. Principally negotiable time certificates of deposit, bankers acceptances, and commercial
paper. 5. Includes demand and time deposits and negotiable and nonnegotiable certificates of
deposit denominated in U.S. dollars issued by banks abroad.
3.20 BANKS' OWN CLAIMS ON UNAFFILIATED FOREIGNERS Reported by Banks in the United States1
Payable in U.S. Dollars
Millions of dollars, end of period
Maturity, by borrower and area" 1992 1993 1994 1995 1996
Maturity, by borrower and area" 1992 1993 1994 June Sept. Dec. Mar.
1 Total 195,119 202,566 200,042 220,360r 216,986r 222,338 233,591
By borrower 2 Maturity of one year or less 163,325 172,662 168,331 186,383' 178,686' 176,172 193,803 3 Foreign public borrowers 17,813 17,828 15,435 15,822 14,192 15,015 19,569 4 All other foreigners 145,512 154,834 152,896 170,561' 164,494' 161,157 174,234 5 Maturity of more than one year 31,794 29,904 31,711 33,977 38,300 46,166 39,788 6 Foreign public borrowers 13,266 10,874 7,838 7,892 8,220 7,506 8,110 7 All other foreigners 18,528 19,030 23,873 26,085 30,080 38,660 31,678
By area Maturity of one year or less
8 Europe 53,300 57,413 55,742 60,323 52,045 53,897 58,001 9 Canada 6,091 7,727 6,690 7,838 7,135 6,089 5,473
10 Latin America and Caribbean 50,376 60,490 58,877 68,681' 71,319 72,393 84,297 11 Asia 45,709 41,418 39,851 43,965' 42,556' 40,133 40,332 12 Africa 1,784 1,820 1,376 1,447 1,261 1,271 1,302 13 All other3 6,065 3,794 5,795 4,129 4,370 2,389 4,398
Maturity of more than one year 14 Europe 5,367 5,310 4,203 4,240 4,594 4,885 6,827 15 Canada 3.287 2,581 3,505 3,685 3,571 2,731 2,563 16 Latin America and Caribbean 15,312 14,025 15,717 17,557 20,224 27,811 19,532 17 Asia 5,038 5,606 5,318 6,058 7,373 8,023 8.461 18 Africa 2,380 1,935 1,583 1,389 1,389 1,430 1,474 19 All other3 410 447 1,385 1,048 1,149 1,286 931
1. Reporting banks include all types of depository institutions as well as some brokers and dealers.
2. Maturity is time remaining until maturity. 3. Includes nonmonetary international and regional organizations.
Digitized for FRASER http://fraser.stlouisfed.org/ Federal Reserve Bank of St. Louis

Nonbank-Reported Data A57
3.21 CLAIMS ON FOREIGN COUNTRIES
Billions of dollars, end of period
Held by U.S. and Foreign Offices of U.S. Banks'
Area or country 1994 1995 1996
1992 1993 1992 1993 June Sept. Dec. Mar. June Sept. Dec. Mar. Junep
344.7 407.7 486. l r 486.4r 496.6r 541.8r 526.3r 527.0r 549.0r 571.6 605.0
131.3 161.8 173.3r 182.6' 190.6' 210.6' 202.6' 196.8' 203.4' 202.3 222.0 .0 7.4 8.6 9.6 7.0 10.2 9.4 10.7 13.5 10.7 8.0
15.3 12.0 18.6 20.7 19.1 19.8 19.3 17.5' 19.2 17.9 17.7 9.1 12.6 24.7 24.0 24.7 31.2 29.9' 27.2 26.9' 31.5 31.4 6.5 7.7 14.0 11.6 11.8 10.6 10.7 12.6 11.5 13.2 14.9
.0 4.7 3.4 3.4 3.6 3.5 4.3 4.1 3.4 3.0 4.7 2.3 2.7 3.0 2.6 2.7 3.1 3.0 2.7 2.7 3.3 2.7 4.8 5.9 5.4 5.5 5.1 5.7 6.2 6.3 6.3 5.2 6.3
59.7 84.3 64.9r 78.4r 85.7' 89.9' 86.7' 80.0' 82.0' 84.8 101.4 6.3 6.9 9.9 10.2 10.0 10.5 11.1 11.9 9.4 9.7 11.1
18.8 17.6 20.7 16.5 20.7 25.9 22.1 24.0 28.5 22.9 23.9
24.0 25.6 42.6r 42.6r 45.2' 44.1' 43.3' 50.1' 50.2' 61.3 55.5 1.2 .4 1.0 1.0 1.1 .9 .7 1.2 .9 1.3 1.2 .9 1.0 1.1 1.0r 1.3 1.7 1.1 1.8 2.6 3.4 3.3 .7 .4 .8 .8 .9 1.1 .5 .7 .8 .7 .6
3.0 3.2 4.6 4.3r 4.5' 4.9' 5.0' 5.1' 5.7' 5.6 5.6 1.2 1.7 1.6 1.6 2.0 2.4 1.8 2.3 3.2 2.1 2.3 .4 .8 1.1 1.0 1.2 1.0 1.2 1.9 1.3 1.6 1.6
8.9 9.9 12.6 14.0 13.6 14.1 13.3 13.3 11.6 17.5 13.6 1.3 2.1 2.1 1.8 1.6 1.4 1.4 2.0' 1.9' 2.0 2.2 1.7 2.6 2.8 1.0 2.7 2.5 2.6 3.0 4.7 3.8 3.4 1.7 1.1 1.2 1.2 1.0 1.5 1.4 1.3 1.2 1.7 2.0 2.9 2.3 13.7 15.0 15.4 12.6 14.3 17.4 16.4 21.7 19.7
15.8 17.4 21.6 21.7' 23.9' 19.5 20.3' 22.4 22.1 21.2 20.1 .6 .5 .5 .4 .5 .5 .7 .7 .7 .8 .9
5.2 5.1 4.4 3.9 3.7 3.5 3.5 3.0 2.7 2.9 2.3 2.7 3.3 3.2 3.3 3.8 4.0 4.1 4.4 4.8 4.7 4.9 6.2 7.4 12.4 13.0 15.0 10.7 11.4 13.6 13.3 12.3 11.5 1.1 1.2 1.1 1.1 .9' .7 .6' .6 .6 .6 .5
72.6 83.1 94.8r 93.2' 96.0' 98.5' 103.6 104.0 112.6' 116.8 125.9
6.6 7.7 9.8 10.5 11.2 11.4 12.3 10.9 12.9 12.7 14.1 10.8 12.0 12.0 9.3 8.4 9.2 10.0' 13.6 13.7 17.8 22.2 4.4 4.7 5.1 5.5 6.1 6.4 7.1 6.4 6.8 6.4 6.7 1.8 2.1 2.4 2.4 2.6 2.6 2.6 2.9 2.9 2.9 2.8
16.0 17.8 18.6 19.8 18.4 17.8 17.6 16.3 17.3 16.1 15.3 .5 .4 .6 .6 .5 .6 .8 .7 .8 .9 1.2
2.6 3.1 2.7 2.8 2.7 2.4 2.6 2.6 2.8 3.1 3.1
.7 2.0 .8 1.0 1.1 1.1 1.4 1.7 1.8 3.3 2.9 5.2 7.3 7.1 6.9 9.2 8.5 9.0 9.0 9.4 9.7 9.8 3.2 3.2 3.7 3.9 4.2 3.8 4.0 4.4 4.4 4.7 4.2
.4 .5 .4 .4 .4 .6 .7 .5 .5 .5 .5 6.6 6.7 14.3 14.4 16.2 16.9 18.7 18.0 19.1 19.4 21.8 3.1 4.4 5.2 3.9 3.1 3.9 4.1 4.3 4.4 4.7 5.0 3.6 3.1 3.2 2.9 3.3 3.0 3.6 3.3 4.1 3.9 4.7 2.2 3.1 3.3 3.5 2.1 3.3 3.8 3.9 4.9 5.2 5.4 3.1 3.1 3.2 3.4 4.7 4.9 3.5 3.7 4.5 4.3 4.7
.2 .4 ,5r .3 .3 .4 .4 .4 .4 .2 .2
.6 .7 .7 .7 .6 .6 .9 .9' .7 .7 .8
.0 .0 .0 .0 .0 .0 .0 .0 .0 .0 .0 1.0 .8 1.0 .9 .8 .7 .6 .7 .9 .7 .8
3.1 3.2 3.2 3.0 2.7 2.3 1.8 3.4 4.2 6.2 5.0 1.9 1.6 1.3 1.1 .8 .7 .4 .6 1.0 1.4 1.0 .6 .6 .5 .5 .5 .4 .3 .4 .3 .3 .3 .6 .9 1.4 1.5 1.4 1.2 1.0 2.3 2.8 4.5 3.7
58.1 73.0 80.61 77.2' 71.4' 84.4' 82.1 86.0' 99.0 100.7 103.2 6.9 10.9 13.3 13.8 10.3 12.5 8.4 12.6 11.0 13.4 17.3 6.2 8.9 6.5 6.0 8.4 8.6 8.3 6.1 6.3 5.3 3.6
21.5 18.0 23.8 21.5 19.9 19.4 23.7 23.4 32.1 28.5 23.6 1.1 2.6 2.5 1.7 1.3 .9 2.4 5.5 9.9 10.7 13.0 1.9 2.4 2.0 1.9' 1.3 1.1 1.3 1.3' 1.4 1.6 1.7
13.9 18.7 21.8 203 19.9 22.5' 23! 1 23.7 25.1 25.7 27^8 6.5 11.2 10.6 11.8 10.1 19.2' 14.8 13.3 13.1 15.4 15.9
.0 .1 .0 .0 .1 .0 .0 .1 .1 .1 .1
39.7 43.4 69.1' 65.8' 66.7' 82.2 72.3 64.0' 57.3' 62.5 72.8
1 Total
2 G-10 countries and Switzerland 3 Belgium and Luxembourg 4 France 5 Germany 6 Italy 7 Netherlands 8 Sweden 9 Switzerland
10 United Kingdom 11 Canada 12 Japan
13 Other industrialized countries 14 Austria 15 Denmark 16 Finland 17 Greece 18 Norway 19 Portugal 20 Spain 21 Turkey 22 Other Western Europe 23 South Africa 24 Australia
25 OPEC2
26 Ecuador 27 Venezuela 28 Indonesia 29 Middle East countries 30 African countries
31 Non-OPEC developing countries
Latin America 32 Argentina 33 Brazil 34 Chile 35 Colombia 36 Mexico 37 Peru 38 Other
Asia China
39 People's Republic of China 40 Republic of China (Taiwan) 41 India 42 Israel 43 Korea (South) 44 Malaysia 45 Philippines 46 Thailand 47 Other Asia
Africa 48 Egypt 49 Morocco 50 Zaire 51 Other Africa3
52 Eastern Europe 53 Russia4
54 Yugoslavia5
55 Other
56 Offshore banking centers 57 Bahamas 58 Bermuda 59 Cayman Islands and other British West Indies 60 Netherlands Antilles 61 Panama6
62 Lebanon 63 Hong Kong 64 Singapore 65 Other'
66 Miscellaneous and unallocated8
1. The banking offices covered by these data include US. offices and foreign branches of U.S. banks, including U.S. banks that are subsidiaries of foreign banks. Offices not covered include U.S. agencies and branches of foreign banks. Beginning March 1994, the data include large foreign subsidiaries of U.S. banks. The data also include other types of U.S. depository institutions as well as some types of brokers and dealers. To eliminate duplication, the data are adjusted to exclude the claims on foreign branches held by a U.S. office or another foreign branch of the same banking institution.
These data are on a gross claims basis and do not necessarily reflect the ultimate country risk or exposure of U.S. banks. More complete data on the country risk exposure of U.S. banks are available in the quarterly Country Exposure Lending Survey published by the Federal Financial Institutions Examination Council.
2. Organization of Petroleum Exporting Countries, shown individually; other members of OPEC (Algeria, Gabon, Iran, Iraq, Kuwait, Libya, Nigeria, Qatar, Saudi Arabia, and United Arab Emirates); and Bahrain and Oman (not formally members of OPEC).
3. Excludes Liberia. Beginning March 1994 includes Namibia. 4. As of December 1992, excludes other republics of the former Soviet Union. 5. As of December 1992, excludes Croatia, Bosnia and Hercegovinia, and Slovenia. 6. Includes Canal Zone. 7. Foreign branch claims only. 8. Includes New Zealand, Liberia, and international and regional organizations.
Digitized for FRASER http://fraser.stlouisfed.org/ Federal Reserve Bank of St. Louis

A58 International Statistics • October 1996
3.22 LIABILITIES TO UNAFFILIATED FOREIGNERS Reported by Nonbanking Business Enterprises in the United States
Millions of dollars, end of period
Type of liability, and area or country 1992 1993 1994 1994 1995 1996
Type of liability, and area or country 1992 1993 1994
Dec. Mar. June Sept. Dec. Mar.p
1 Total 45,511 50,597 54,309 54,309 50,187 49,973 47,673 46,448 49,608
2 Payable in dollars 37,456 38,728 38,298 38,298 35,903 34,281 33,908 33,903 36,314 3 Payable in foreign currencies 8,055 11,869 16,011 16,011 14,284 15,692 13,765 12,545 13,294
By type 4 Financial liabilities 23,841 29,226 32,954 32,954 29,775 29,282 26,237 24,241 26,225
Payable in dollars 16,960 18,545 18,818 18,818 16,704 15,028 13,872 12,903 13,826 6 Payable in foreign currencies 6,881 10,681 14,136 14,136 13,071 14,254 12,365 11,338 12,399
7 Commercial liabilities 21,670 21,371 21,355 21,355 20,412 20,691 21,436 22,207 23,383 8 Trade payables 9,566 8,802 10,005 10,005 9,844 10,527 10,061 11,013 10,815 y Advance receipts and other liabilities 12,104 12,569 11,350 11,350 10,568 10,164 11,375 11,194 12,568
10 Payable in dollars 20,496 20,183 19,480 19,480 19,199 19,253 20,036 21,000 22,488 i i Payable in foreign currencies 1,174 1,188 1,875 1,875 1,213 1,438 1,400 1,207 895
By area or country Financial liabilities
12 Europe 13,387 18,810 21,703 21,703 17,541 18,223 16,401 15,622 16,605 13 Belgium and Luxembourg 414 175 495 495 612 778 347 369 483 14 France 1,623 2,539 1,727 1,727 2,046 1,101 1,365 999 1,679 lb Germany 889 975 1,961 1,961 1,755 1,589 1,670 1,974 2,161 16 Netherlands 606 534 552 552 633 530 474 466 479 17 Switzerland 569 634 688 688 883 1,056 948 895 957 18 United Kingdom 8,610 13,332 15,543 15,543 10,764 12,138 10,518 10,138 10,241
19 Canada 544 859 629 629 1,817 893 797 632 1,166
20 Latin America and Caribbean 4,053 3,359 2,034 2,034 2,065 1,950 1,904 1,783 1,876 21 Bahamas 379 1,148 101 101 135 81 79 59 78 22 Bermuda 114 0 80 80 149 138 144 147 126 23 Brazil 19 18 207 207 58 58 111 57 57 24 British West Indies 2,850 1,533 998 998 1,068 1,030 930 866 946 25 Mexico 12 17 0 0 10 3 3 12 16 26 Venezuela 6 5 5 5 5 4 3 2 2
27 5,818 5,956 8,403 8,403 8,156 8,023 6,947 5,988 6,390 28 Japan 4,750 4,887 7,314 7,314 7,182 7,141 6,308 5,436 5,980 29 Middle Eastern oil-exporting countries' 19 23 35 35 27 25 25 27 26
30 Africa 6 133 135 135 156 151 149 150 131 31 Oil-exporting countries2 0 123 123 123 122 122 122 122 122
32 All other3 33 109 50 50 40 42 39 66 57
Commercial liabilities 33 Europe 7,398 6,827 6,773 6,773 6,642 6,776 7,263 7,700 8,444 34 Belgium and Luxembourg 298 239 241 241 271 311 349 331 370 35 France 700 655 728 728 642 504 528 481 648 36 Germany 729 684 604 604 482 556 660 767 870 37 Netherlands 535 688 722 722 536 448 566 500 659 38 Switzerland 350 375 327 327 327 432 255 413 432 39 United Kingdom 2,505 2,039 2,444 2,444 2,848 2,902 3,351 3,568 3,525
40 Canada 1,002 879 1,037 1,037 1,235 1,146 1,219 1,040 960
41 Latin America and Caribbean 1,533 1,658 1,857 1,857 1,368 8
1,836 1,607 1
1,740 1
2,114 42 Bahamas 3 21 19 19
1,368 8 3
1,607 1
1,740 1 28
43 Bermuda 307 350 345 345 260 397 219 205 570 44 Brazil 209 214 161 161 96 107 143 98 129 45 British West Indies 33 27 23 23 29 12 5 56 10 46 Mexico 457 481 574 574 356 420 357 416 470 47 Venezuela 142 123 276 276 273 204 175 221 243
48 Asia 10,594 10,980 10,741 10,741 10,151 9,978 10,275 10,421 10,496 49 Japan 3,612 4,314 4,555 4,555 4,110 3,531 3,475 3,315 3,726 50 Middle Eastern oil-exporting countries' 1,889 1,534 1,576 1,576 1,787 1,790 1,647 1,912 1,747
51 Africa 568 453 428 428 463 481 589 619 708 52 Oil-exporting countries2 309 167 256 256 248 252 241 254 254
53 Other3 575 574 519 519 553 474 483 687 661
1. Comprises Bahrain, Iran, Iraq, Kuwait, Oman, Qatar, Saudi Arabia, and United Arab 2. Comprises Algeria, Gabon, Libya, and Nigeria. Emirates (Trucial States). 3. Includes nonmonetary international and regional organizations.
Digitized for FRASER http://fraser.stlouisfed.org/ Federal Reserve Bank of St. Louis

Nonbank-Reported Data A59
3.23 CLAIMS ON UNAFFILIATED FOREIGNERS Reported by Nonbanking Business Enterprises in the United States
Millions of dollars, end of period
Type of claim, and area or country 1992 1993 1994 1994 1995 1996
Type of claim, and area or country 1992 1993 1994 Dec. Mar. June Sept. Dec. Mar.p
1 Total 45,073 49,159 57,888 57,888 52,218 58,051 53,424 52,509 55,398
2 Payable in dollars 42,281 45,161 53,805 53,805 48,425 54,138 49,696 48,711 50,999 3 Payable in foreign currencies 2,792 3,998 4,083 4,083 3,793 3,913 3,728 3,798 4,399
By type 4 Financial claims 26,509 27,771 33,897 33,897 29,606 34,574 29,891 27,398 30,810 5 Deposits 17,695 15,717 18,507 18,507 17,115 22,046 17,974 15,133 17,595 6 Payable in dollars 16,872 15,182 18.026 18.026 16,458 21,351 17,393 14,654 17,044 7 Payable in foreign currencies 823 535 481 481 657 695 581 479 551 8 Other financial claims 8,814 12,054 15,390 15,390 12,491 12,528 11,917 12,265 13,215 9 Payable in dollars 7,890 10,862 14,306 14,306 11,275 11,370 10,689 10,976 11,328
10 Payable in foreign currencies 924 1,192 1,084 1,084 1,216 1,158 1,228 1,289 1,887
11 Commercial claims 18,564 21,388 23,991 23,991 22,612 23,477 23,533 25,111 24,588 12 Trade receivables 16,007 18,425 21,158 21,158 20,415 21,326 21,409 22,998 22,077 13 Advance payments and other claims 2,557 2,963 2,833 2,833 2,197 2,151 2,124 2,113 2,511
14 Payable in dollars 17,519 19,117 21,473 21,473 20,692 21,417 21,614 23,081 22,627 15 Payable in foreign currencies 1,045 2,271 2,518 2,518 1,920 2,060 1,919 2,030 1,961
By area or country Financial claims
16 Europe 9,331 7,299 7,936 7,936 7,630 7,927 7,840 7,609 8,929 17 Belgium and Luxembourg 8 134 86 86 146 155 160 193 159 18 France 764 826 800 800 808 730 753 803 1,015 19 Germany 326 526 540 540 527 356 301 436 320 20 Netherlands 515 502 429 429 606 601 522 517 486 21 Switzerland 490 530 523 523 490 514 530 498 470 22 United Kingdom 6,252 3,585 4,649 4,649 4,040 4,790 4,924 4,303 5,568
23 Canada 1,833 2,032 3,581 3,581 3,848 3,705 3,526 2,851 5,269
24 Latin America and Caribbean 13,893 16,224 19,536 19,536 16,109 21,159 15,345 14,500 13,865 25 Bahamas 778 1,336 2,424 2,424 940 2,355 1,552 1,965 1,588 26 Bermuda 40 125 27 27 37 85 35 81 77 27 Brazil 686 654 520 520 528 502 851 830 1,943 28 British West Indies 11,747 12,699 15,228 15,228 13,531 17,013 11,816 10,393 9,164 29 Mexico 445 872 723 723 583 635 487 554 461 30 Venezuela 29 161 35 35 27 27 50 32 40
31 Asia 864 1,657 1,871 1,871 1,504 1,235 2,160 1,579 1,890 32 Japan 668 892 953 953 621 471 1,404 871 1,171 33 Middle Eastern oil-exporting countries' 3 3 141 141 4 3 4 3 13
34 Africa 83 99 373 373 141 138 188 276 277 35 Oil-exporting countries' 9 1 0 0 9 9 6 5 5
36 All other3 505 460 600 600 374 410 832 583 580
Commercial claims 37 Europe 8,451 9,105 9,540 9,540 8,947 9,200 8,862 9,824 9,757 38 Belgium and Luxembourg 189 184 213 213 199 218 224 231 247 39 France 1,537 1,947 1,881 1,881 1,790 1,669 1,706 1,830 1,803 40 Germany 933 1,018 1,027 1,027 977 1,023 997 1,070 1,407 41 Netherlands 552 423 311 311 324 341 338 452 442 42 Switzerland 362 432 557 557 556 612 438 520 575 43 United Kingdom 2,094 2,377 2,556 2,556 2,388 2,469 2,479 2,656 2,607
44 Canada 1,286 1,781 1,988 1,988 2,010 2,003 1,971 1,951 2,044
45 Latin America and Caribbean 3,043 3,274 4,117 4,117 4,140 4,370 4,359 4,364 4,147 46 Bahamas 28 11 9 9 17 21 26 30 30 47 Bermuda 255 182 234 234 208 210 245 272 273 48 Brazil 357 460 612 612 695 777 745 898 808 49 British West Indies 40 71 83 83 55 83 66 79 106 50 Mexico 924 990 1,243 1,243 1,106 1,109 1,026 993 868 51 Venezuela 345 293 348 348 295 319 325 285 308
52 Asia 4,866 6,014 6,982 6,982 6,200 6,516 6,826 7,312 7,078 53 Japan 1,903 2,275 2,655 2,655 1,911 2,011 1,998 1,870 2,009 54 Middle Eastern oil-exporting countries' 693 704 708 708 689 707 775 974 1,024
55 Africa 554 493 454 454 468 478 544 654 667 56 Oil-exporting countries2 78 72 67 67 71 60 74 87 107
57 Other3 364 721 910 910 847 910 971 1,006 895
1. Comprises Bahrain, Iran, Iraq, Kuwait, Oman, Qatar, Saudi Arabia, and United Arab 2. Comprises Algeria, Gabon, Libya, and Nigeria. Emirates (Trucial States). 3. Includes nonmonetary international and regional organizations.
Digitized for FRASER http://fraser.stlouisfed.org/ Federal Reserve Bank of St. Louis

A60 International Statistics • October 1996
3.24 FOREIGN TRANSACTIONS IN SECURITIES
Millions of dollars
1996 1995 1996
Transaction, and area or country 1994 1995 Jan.— June Dec. Jan. Feb. Mar. Apr. May Junep
U.S. corporate securities
STOCKS
1 Foreign purchases 350,593 462,950 305,207 46,479 43,574 52,260 55,281 53,047 57,671 43,374 2 Foreign sales 348,716 451,710 294,700 44,372 41,948 51,083 54,450 48,774 56,084 42,361
3 Net purchases, or sales ( - ) 1,877 11,240 10,507 2,107 1,626 1,177 831 4,273 1,587 1,013
4 Foreign countries 1,867 11,445 10,530 2,109 1,623 1,306 877 4,129 1,582 1,013
5 Europe 6,714 4,912 3,121 1,028 1,954 -1,072 1,377 1,429 - 2 5 9 - 3 0 8 b France - 2 0 1 -1,099 - 3 1 7 -382 164 - 1 6 1 661 - 3 3 6 - 3 0 6 - 3 3 9 1 Germany 2,110 -1,837 650 - 1 1 239 - 3 7 86 174 - 3 0 218 8 Netherlands 2,251 3,507 1,187 373 660 20 208 237 - 6 7 129 9 Switzerland - 3 0 -2,283 1,320 191 639 - 4 4 1 566 618 - 1 4 0 78
10 United Kingdom 840 8,066 - 2 8 3 1,277 - 1 6 5 - 2 2 3 - 2 4 1 345 417 - 4 1 6 11 Canada -1,160 -1,517 781 - 1 7 5 645 518 - 9 0 52 - 4 2 5 81 12 Latin America and Caribbean -2,111 5,814 3,984 219 - 4 8 7 2,694 - 3 1 8 808 1,245 42 13 Middle East1 -1,142 -337 -1,206 148 - 5 0 7 - 2 8 5 - 3 3 - 6 - 2 6 1 - 1 1 4 14 Other Asia -1,234 2,503 3,924 883 - 4 0 - 3 3 6 - 2 9 1 1,852 1,380 1,359 15 Japan 1,162 -2,725 1,535 1,231 94 - 1 3 1 - 7 4 9 1,446 73 802 16 Africa 29 2 - 6 7 - 1 6 - 6 2 - 4 4 31 6 - 4 17 Other countries 771 68 - 7 7 52 - 1 5 1 276 - 3 7 - 1 0 4 - 4 3
18 Nonmonetary international and regional organizations 10 - 2 0 5 - 2 3 - 2 3 - 1 2 9 - 4 6 144 5 0
BONDS 2
19 Foreign purchases 289,586 293,533 192,385 22,020 26,598 32,759 39,808 24,116r 34,753 34,351 20 Foreign sales 229,665 206,951 134,909 21,117 17,726 23,608 25,113 18,693 24,026 25,743
21 Net purchases, or sales ( - ) 59,921 86,582 57,476 903 8,872 9,151 14,695 5,423r 10,727 8,608
22 Foreign countries 59,036 87,036 57,374 875 8,830 9,230 14,607 5,392r 10,722 8,593
23 Europe 37,065 70,318 36,238 1,631 5,631 8,968 6,476 3,947 7,144 4,072 24 France 242 1,143 3,047 137 839 314 670 785 113 326 25 Germany 657 5,938 3,913 236 - 2 6 1,859 467 721 891 1 26 Netherlands 3,322 1,463 834 101 163 365 - 6 6 - 5 2 371 53 21 Switzerland 1,055 494 199 -381 56 - 8 6 - 3 8 - 1 4 4 178 233 28 United Kingdom 31,642 57,591 24,292 1,247 3,854 6,280 4,745 2,264 4,247 2,902 29 Canada 2,958 2,569 2,113 181 104 235 149 359 952 314
862 30 Latin America and Caribbean 5,442 6,141 10,671 - 8 4 8 2,096 - 7 1 3 7,140 33 1,253 314 862
31 Middle East1 771 1,869 - 5 5 187 - 1 9 4 - 3 3 4 13 122 120 218 32 Other Asia 12,153 5,659 8,777 - 2 9 3 1,272 1,161 831 l,094r 1,279 3,140 33 Japan 5,486 2,250 3,503 - 9 0 4 338 336 245 135' 537 1,912 34 Africa - 7 234 187 86 - 1 6 - 4 0 37 49 107 50 35 Other countries 654 246 -557 - 6 9 - 6 3 - 4 7 - 3 9 - 2 1 2 - 1 3 3 - 6 3
36 Nonmonetary international and regional organizations 885 - 4 5 4 102 28 42 - 7 9 88 31 5 15
Foreign securities
37 Stocks, net purchases, or sales ( —) -48,071 -50,291 -39,720 -6,602 -6,434 -5,704 -10,345 -6,706 -3,055 -7,476 38 Foreign purchases 386,106 345,540 224,817 32,369 33,481 37,464 36,115 37,764 43,515 36,478 39 Foreign sales 434,177 395,831 264,537 38,971 39,915 43,168 46,460 44,470 46,570 43,954 40 Bonds, net purchases, or sales (—) -9,224 -48,545 -14,648 -4,050 -4,584 -1,404 -6,038 - 1 5 3 - 5 2 7 -1,942 41 Foreign purchases 848,368 889,471 519,705 80,328 84,638 95,201 93,345 81,256 82,414 82,851 42 Foreign sales 857,592 938,016 534,353 84,378 89,222 96,605 99,383 81,409 82,941 84,793
43 Net purchases, or sales (—), of stocks and bonds . . . . -57,295 -98,836 -54,368 -10,652 -11,018 -7,108 -16,383 -6,859 -3,582 -9,418
44 Foreign countries -57,815 -98,031 -54,059 -10,711 -11,049 -6 ,983 -16,387 -6,802 -3,473 -9,365
45 Europe -3,516 -48,125 -19,947 -5,926 -4,068 -2,552 -4,508 -1,949 1,475 -8,345 46 Canada -7,475 -7,952 -4,680 - 1 4 -2,668 - 5 8 -1,865 614 - 2 3 1 - 4 7 2 47 Latin America and Caribbean -18,334 -7,634 -5,962 - 8 0 2 - 3 -1,031 -2,582 -1,190 -2,136 980 48 -24,275 -34,056 -20,767 -4,391 -4,685 -2,557 -5,756 -4,094 -2,260 -1,415 49 Japan -17,427 -25,072 -11,416 -3,687 -3,427 -1,592 -3,224 - 9 5 0 - 9 2 1 -1,302 50 Africa - 4 6 7 - 3 2 7 - 8 6 1 - 4 4 - 9 6 - 1 6 1 - 4 3 6 - 1 4 - 3 2 - 1 2 2 51 Other countries -3,748 63 -1,842 466 471 - 6 2 4 -1,240 - 1 6 9 - 2 8 9 9
52 Nonmonetary international and regional organizations 520 - 8 0 5 - 3 0 9 59 31 - 1 2 5 4 - 5 7 - 1 0 9 - 5 3
1. Comprises oil-exporting countries as follows: Bahrain, Iran, Iraq, Kuwait, Oman, Qatar, 2. Includes state and local government securities and securities of U.S. government Saudi Arabia, and United Arab Emirates (Trucial States). agencies and corporations. Also includes issues of new debt securities sold abroad by U.S.
corporations organized to finance direct investments abroad.
Digitized for FRASER http://fraser.stlouisfed.org/ Federal Reserve Bank of St. Louis

Securities Holdings and Transactions!Interest and Exchange Rates A61
3.25 MARKETABLE U.S. TREASURY BONDS AND NOTES Foreign Transactions1
Millions of dollars; net purchases, or sales (—) during period
Area or country 1994 1995
1996 1995 1996
Area or country 1994 1995 Jan. -June Dec. Jan. Feb. Mar. Apr. May Junep
1 Total estimated 78,801 133,991 75,261 -9,454 14,018 15,451 7,025 15,751r 14,368 8,648
2 Foreign countries 78,637 133,552 77,034 -9,016 13,713 16,192 6,414 17,126' 14,130 9,459
3 Europe 38,542 50,000 42,058 -1,120 7,291 8,462 4,083 8,712 7,776 5,734 4 Belgium and Luxembourg 1,098 591 579 171 149 - 1 2 0 81 399 - 1 5 1 221 5 Germany 5,709 6,136 8,875 452 1,385 1,829 958 1,833 1,674 1,196 6 Netherlands 1,254 1,891 -2,263 381 807 354 -1,597 -2,137 - 7 5 7 1,067 7 Sweden 794 358 1,729 - 2 8 5 - 4 5 803 372 286 342 - 2 9 8 Switzerland 481 - 4 7 2 1,395 - 6 6 4 76 84 65 1,329 683 - 8 4 2 9 United Kingdom 23,365 34,778 19,715 -4,377 1,177 1,644 2,270 6,070 3,364 5,190
10 Other Europe and former U.S.S.R 5,841 6,718 12,028 3,202 3,742 3,868 1,934 932 2,621 -1,069 11 Canada 3,491 252 4,723 208 1,867 1,863 35 1,766 - 6 6 9 - 1 3 9
1? Latin America and Caribbean -10,383 48,609 -8,214 3,762 -2,648 -2,931 -4,985 l,993r -1,167 1,524 13 Venezuela - 3 1 9 - 2 -301 61 - 1 4 2 - 9 3 - 4 4 4 - 3 9 13 14 Other Latin America and Caribbean -20,493 25,152 1,566 4,710 8,922 -1,896 -2,696 3,865r -2,195 -4,434 15 Netherlands Antilles 10,429 23,459 -9,479 -1,009 -11,428 - 9 4 2 -2,245 -1,876 1,067 5,945 16 47,317 32,319 38,076 -11,843 6,920 8,616 6,941 4,478 8,202 2,919 17 Japan 29,793 16,863 15,957 -5,695 2,619 3,069 2,443 2,382 4,565 879 18 Africa 240 1,464 950 252 515 - 1 0 0 311 250 - 4 8 22 19 Other - 5 7 0 908 - 5 5 9 - 2 7 5 - 2 3 2 282 29 - 7 3 36 -601
20 Nonmonetary international and regional organizations 164 439 -1,773 - 4 3 8 305 - 7 4 1 611 -1,375 238 - 8 1 1 21 International 526 9 - 6 2 1 -347 210 - 3 0 8 647 - 4 1 4 - 9 - 7 4 7 22 Latin American regional - 1 5 4 261 -1,279 -115 - 4 5 - 2 5 4 12 -1,008 9 7
MEMO 2 3 Foreign countries 78,637 133,552 77,034 -9,016 13,713 16,192 6,414 17,126r 14,130 9,459 ?4 Official institutions 41,822 39,625 34,131 2,651 12,615 8,681 4,748 8,253 6,482 -6,648 25 Other foreign 36,815 93,927 42,903 -11,667 1,098 7,511 1,666 8,873r 7,648 16,107
Oil-exporting countries 793 7.6 Middle East2 - 3 8 3,075 4,409 -1,085 - 6 5 8 122 1,127 863 2,162 793
27 0 2 1 0 0 1 0 0 1 - 1
1. Official and private transactions in marketable U.S. Treasury securities having an original maturity of more than one year. Data are based on monthly transactions reports. Excludes nonmarketable U.S. Treasury bonds and notes held by official institutions of foreign countries.
3.26 DISCOUNT RATES OF FOREIGN CENTRAL BANKS1
Percent per year, averages of daily figures
2. Comprises Bahrain, Iran, Iraq, Kuwait, Oman, Qatar, Saudi Arabia, and United Arab Emirates (Trucial States).
3. Comprises Algeria, Gabon, Libya, and Nigeria.
Country
Rate on Aug. 31, 1996
Month effective
Country
Rate on Aug. 31, 1996
Austria. ., Belgium. . Canada. . Denmark France2 .
2.5 2.5 4.25 3.25 3.55
Apr. 1996 Apr. 1995 Aug. 1996 Apr. 1996 July 1996
Germany . . . Italy Japan Netherlands . Switzerland .
2.5 8.25
.5 2.5 1.5
1. Rates shown are mainly those at which the central bank either discounts or makes 2. Since February 1981, the rate has been that at which the Bank of France discounts advances against eligible commercial paper or government securities for commercial banks or Treasury bills for seven to ten days, brokers. For countries with more than one rate applicable to such discounts or advances, the rate shown is the one at which it is understood that the central bank transacts the largest proportion of its credit operations.
3.27 FOREIGN SHORT-TERM INTEREST RATES1
Percent per year, averages of daily figures
Type or country 1993 1994 1995
1996
Type or country 1993 1994 1995 Feb. Mar. Apr. May June July Aug.
1 Eurodollars 3.18 4.63 5.93 5.14 5.28 5.36 5.36 5.46 5.49 5.41 2 United Kingdom 5.88 5.45 6.63 6.13 6.02 5.97 6.03 5.80 5.69 5.72 3 Canada 5.14 5.57 7.14 5.22 5.23 5.03 4.82 4.87 4.76 4.30 4 Germany 7.17 5.25 4.43 3.26 3.25 3.22 3.19 3.29 3.29 3.20 5 Switzerland 4.79 4.03 2.94 1.61 1.68 1.68 1.99 2.53 2.52 2.21 6 Netherlands 6.73 5.09 4.30 3.00 3.09 2.83 2.61 2.81 2.99 3.05 7 France 8.30 5.72 6.43 4.29 4.14 3.87 3.78 3.85 3.73 3.84 8 Italy 10.09 8.45 10.43 9.90 9.82 9.60 8.88 8.73 8.72 8.77 9 Belgium 8.10 5.65 4.73 3.23 3.25 3.23 3.19 3.23 3.29 3.21
10 Japan 2.96 2.24 1.20 .61 .60 .61 .62 .57 .67 .62
1. Rates are for three-month interbank loans, with the following exceptions: Canada, finance company paper; Belgium, three-month Treasury bills; and Japan, CD rate.
Digitized for FRASER http://fraser.stlouisfed.org/ Federal Reserve Bank of St. Louis

A62 International Statistics • October 1996
3.28 FOREIGN EXCHANGE RATES1
Currency units per dollar except as noted
Country/currency unit 1993 1 9 9 4 1995
1 9 9 6
Country/currency unit 1993 1 9 9 4 1995
Mar. Apr. May June July Aug.
1 Australia/dollar2 6 7 . 9 9 3 7 3 . 1 6 1 7 4 . 0 7 3 7 7 . 1 3 6 7 8 . 5 6 6 7 9 . 7 0 0 7 9 . 1 2 2 7 8 . 9 7 4 7 8 . 3 0 5 2 Austria/schilling 11 .639 1 1 . 4 0 9 1 0 . 0 7 6 10 .391 1 0 . 5 8 0 1 0 . 7 8 2 10 .755 1 0 . 5 7 6 1 0 . 4 3 5 3 Belgium/franc 3 4 . 5 8 1 3 3 . 4 2 6 2 9 . 4 7 2 3 0 . 3 7 1 3 0 . 9 0 2 3 1 . 5 0 2 3 1 . 4 3 3 3 0 . 9 4 7 3 0 . 5 5 3 4 Canada/dollar 1 .2902 1 . 3 6 6 4 1 .3725 1 . 3 6 5 6 1 . 3 5 9 2 1 . 3 6 9 3 1 . 3 6 5 8 1 . 3697 1 . 3 7 2 2 5 China, P.R./yuan 5 . 7 7 9 5 8 . 6 4 0 4 8 . 3 7 0 0 8 . 3 4 9 5 8 . 3 5 8 3 8 . 3 4 7 9 8 . 3 4 2 4 8 . 3 4 0 9 8 . 3 3 7 9 6 Denmark/krone 6 . 4 8 6 3 6 . 3 5 6 1 5 . 5 9 9 9 5 . 7 0 7 4 5 . 8 0 5 0 5 . 9 1 6 0 5 . 8 9 4 1 5 . 8 0 1 4 5 . 7 3 2 7 7 Finland/markka 5 . 7 2 5 1 5 . 2 3 4 0 4 . 3 7 6 3 4 . 6 0 6 6 4 . 7 2 8 8 4 . 7 5 4 1 4 . 6 7 1 0 4 . 5 8 1 2 4 . 4 7 9 3 8 France/franc 5 . 6 6 6 9 5 . 5 4 5 9 4 . 9 8 6 4 5 . 0 5 8 3 5 . 1 0 4 9 5 . 1 8 5 5 5 . 1 7 8 7 5 . 0 8 8 1 5 . 0 6 3 6 9 Germany/deutsche mark 1 .6545 1 . 6 2 1 6 1 .4321 1 . 4 7 7 6 1 . 5 0 4 8 1 . 5 3 2 4 1 . 5 2 8 2 1 .5025 1 . 4 8 2 6
10 Greece/drachma 2 2 9 . 6 4 2 4 2 . 5 0 2 3 1 . 6 8 2 4 1 . 5 4 2 4 2 . 0 0 2 4 3 . 2 7 2 4 1 . 7 5 2 3 7 . 6 5 2 3 7 . 0 0
11 Hong Kong/dollar 7 . 7 3 5 7 7 . 7 2 9 0 7 . 7 3 5 7 7 . 7 3 2 5 7 . 7 3 4 5 7 . 7 3 6 3 7 . 7 4 0 4 7 . 7 3 7 9 7 . 7 3 4 5 12 India/rupee 31 .291 3 1 . 3 9 4 3 2 . 4 1 8 3 4 . 4 8 5 3 4 . 3 2 0 3 5 . 0 2 5 3 5 . 1 0 0 3 5 . 6 6 7 3 5 . 8 0 0 13 Ireland/pound2 146 .47 1 4 9 . 6 9 160 .35 157 .21 156 .51 1 5 6 . 2 9 158 .31 160 .31 161 .08 14 Italy/lira 1,573.41 1 , 6 1 1 . 4 9 1 ,629 .45 1 , 5 6 2 . 4 3 1 , 5 6 5 . 6 0 1 ,556 .71 1 , 5 4 2 . 3 0 1 , 5 2 6 . 8 2 1 , 5 1 6 . 6 2 15 Japan/yen 111 .08 1 0 2 . 1 8 9 3 . 9 6 1 0 5 . 9 4 1 0 7 . 2 0 1 0 6 . 3 4 1 0 8 . 9 6 1 0 9 . 1 9 1 0 7 . 8 7 16 Malaysia/ringgit 2 . 5 7 3 8 2 . 6 2 3 7 2 . 5 0 7 3 2 . 5 4 1 7 2 . 5 1 1 3 2 . 4 9 3 6 2 . 4 9 6 7 2 . 4 9 1 5 2 . 4 9 3 3 17 Netherlands/guilder 1 .8585 1 . 8 1 9 0 1 . 6 0 4 4 1 . 6 5 4 0 1 .6805 1 . 7 1 3 5 1 . 7 1 2 0 1 . 6 8 6 2 1 . 6 6 3 3 18 New Zealand/dollar2 5 4 . 1 2 7 5 9 . 3 5 8 6 5 . 6 2 5 6 8 . 0 7 9 6 8 . 2 4 2 6 8 . 5 7 1 6 7 . 6 5 0 6 9 . 0 0 1 6 8 . 8 6 0 19 Norway/krone 7 . 1 0 0 9 7 . 0 5 5 3 6 . 3 3 5 5 6 . 4 2 7 7 6 . 4 9 0 1 6 . 5 7 4 8 6 . 5 3 7 6 6 . 4 4 6 5 6 . 4 1 5 3 20 Portugal/escudo 161 .08 165 .93 149 .88 152 .93 154 .51 1 5 7 . 5 4 1 5 7 . 4 0 1 5 4 . 5 6 152 .27
21 Singapore/dollar 1 .6158 1 . 5 2 7 5 1 .4171 1 .4095 1 . 4 0 8 2 1 . 4 0 7 4 1 . 4 0 9 0 1 . 4 1 6 0 1 . 4 1 2 4 22 South Africa/rand 3 . 2 7 2 9 3 . 5 5 2 6 3 . 6 2 8 4 3 . 9 2 9 3 4 . 2 1 3 0 4 . 3 6 7 9 4 . 3 5 1 9 4 . 3 9 6 3 4 . 5 2 8 9 23 South Korea/won 8 0 5 . 7 5 8 0 6 . 9 3 7 7 2 . 6 9 7 8 1 . 3 1 7 8 0 . 4 2 7 8 0 . 8 6 7 9 8 . 4 5 8 1 3 . 0 3 8 1 7 . 5 2 24 Spain/peseta 127 .48 1 3 3 . 8 8 1 2 4 . 6 4 1 2 4 . 3 9 1 2 5 . 4 9 1 2 7 . 9 7 128 .87 1 2 6 . 9 6 1 2 5 . 7 2 25 Sri Lanka/rupee 4 8 . 2 1 1 4 9 . 1 7 0 5 1 . 0 4 7 5 3 . 7 4 8 5 4 . 1 6 3 5 4 . 8 6 8 5 5 . 5 2 9 5 5 . 2 9 3 5 5 . 6 0 3 26 Sweden/krona 7 . 7 9 5 6 7 . 7 1 6 1 7 . 1 4 0 6 6 . 7 3 1 8 6 . 7 1 4 1 6 . 7 9 8 4 6 . 6 8 0 7 6 . 6 3 9 4 6 . 6 2 1 1 27 Switzerland/franc 1.4781 1 .3 6 6 7 1 . 1 8 1 2 1 . 1 9 5 9 1 . 2 1 8 0 1 . 2 5 3 9 1 .2579 1 . 2 3 2 0 1 . 2 0 2 9 28 Taiwan/dollar 2 6 . 4 1 6 2 6 . 4 6 5 2 6 . 4 9 5 2 7 . 4 0 0 2 7 . 1 8 8 2 7 . 3 5 2 2 7 . 6 7 4 2 7 . 5 7 3 2 7 . 4 9 6 29 Thailand/baht 2 5 . 3 3 3 2 5 . 1 6 1 2 4 . 9 2 1 2 5 . 2 5 1 2 5 . 2 9 0 2 5 . 2 8 9 2 5 . 3 5 4 2 5 . 3 5 5 2 5 . 2 8 9 30 United Kingdom/pound2 150 .16 1 5 3 . 1 9 157 .85 152 .71 1 5 1 . 6 0 1 5 1 . 5 2 1 5 4 . 1 6 1 5 5 . 3 0 1 5 4 . 9 9
MEMO 31 United States/dollar3 9 3 . 1 8 9 1 . 3 2 8 4 . 2 5 8 6 . 5 7 8 7 . 4 6 8 8 . 2 8 8 8 . 1 6 8 7 . 2 5 8 6 . 5 4
1. Averages of certified noon buying rates in New York for cable transfers. Data in this 3. Index of weighted-average exchange value of U.S. dollar against the currencies of ten table also appear in the Board's G.5 (405) monthly statistical release. For ordering address, industrial countries. The weight for each of the ten countries is the 1972-76 average world see inside front cover. trade of that country divided by the average world trade of all ten countries combined. Series
2. Value in U.S. cents. revised as of August 1978 (see Federal Reserve Bulletin, vol. 64 (August 1978), p. 700).
Digitized for FRASER http://fraser.stlouisfed.org/ Federal Reserve Bank of St. Louis
A63
Guide to Statistical Releases and Special Tables
STATISTICAL RELEASES—List Published Semiannually, with Latest Bulletin Reference Issue Page
Anticipated schedule of release dates for periodic releases June 1996 All
SPECIAL TABLES—Data Published Irregularly, with Latest Bulletin Reference
Title and Date Issue Page
Assets and liabilities of commercial banks March 31, 1993 August 1993 A70 June 30, 1993 November 1993 A70 September 30, 1993 February 1994 A70 December 31, 1993 May 1994 A68
Terms of lending at commercial banks August 1995 November 1995 A68 November 1995 February 1996 A68 February 1996 May 1996 A68 May 1996 August 1996 A64
Assets and liabilities of U.S. branches and agencies of foreign banks June 30, 1995 November 1995 All September 30, 1995 February 1996 All December 31, 1995 May 1996 All March 31, 1996 September 1996 A64
Pro forma balance sheet and income statements for priced service operations June 30, 1995 October 1995 All September 30, 1995 January 1996 A68 March 31, 1996 July 1996 A64 June 30, 1996 October 1996 A64
Assets and liabilities of life insurance companies June 30, 1991 December 1991 A79 September 30, 1991 May 1992 A81 December 31, 1991 August 1992 A83 September 30, 1992 March 1993 A71
Residential lending reported under the Home Mortgage Disclosure Act 1994 September 1995 A68 1995 September 1996 A68
Digitized for FRASER http://fraser.stlouisfed.org/ Federal Reserve Bank of St. Louis

A64 Special Tables • October 1996
4.31 PRO FORMA FINANCIAL STATEMENTS FOR FEDERAL RESERVE PRICED SERVICES
A. Pro forma balance sheet Millions of dollars
Item June 30, 1996 June 30, 1995
Short-term assets (Note 1) Imputed reserve requirement on clearing balances Investment in marketable securities Receivables Materials and supplies Prepaid expenses Items in process of collection
603.0 5,427.0
61.9 11.0 24.6
2,154.8
404.3 3,638.7
63.0 8.1
25.5 2,125.1
Total short-term assets 8,282.2 6,264.7
Long-term assets (Note 2)
Furniture and equipment Leases and leasehold improvements Prepaid pension costs
377.1 149.5 21.2
266.3
349.0 162.8 23.0
221.3
Total long-term assets 814.0 756.2
Total assets 9,096.3 7,020.9
Short-term liabilities Clearing balances and balances arising from early credit
of uncollected items Deferred-availability items Short-term debt
6,093.5 2,091.2
97.5
4,096.2 2,071.8
96.7
Total short-term liabilities 8,282.2 6,264.7
Long-term liabilities Obligations under capital leases Long-term debt Postretirement/postemployment benefits obligation
2.3 181.0 183.7
3.8 159.5 170.8
Total long-term liabilities 367.0 334.1
Total liabilities 8,649.2 6,598.8
Equity 447.1 422.1
Total liabilities and equity (Note 3) 9,096.3 7,020.9
NOTE. Components may not sum to totals because of rounding. The priced services financial statements consist of these tables and the accompanying notes.
(1 ) SHORT-TERM ASSETS
The imputed reserve requirement on clearing balances held at Reserve Banks by depository institutions reflects a treatment comparable to that of compensating balances held at corre-spondent banks by respondent institutions. The reserve requirement imposed on respondent balances must be held as vault cash or as nonearning balances maintained at a Reserve Bank; thus, a portion of priced services clearing balances held with the Federal Reserve is shown as required reserves on the asset side of the balance sheet. The remainder of clearing balances is assumed to be invested in three-month Treasury bills, shown as investment in marketable securities.
Receivables are (1) amounts due the Reserve Banks for priced services and (2) the share of suspense-account and difference-account balances related to priced services.
Materials and supplies are the inventory value of short-term assets. Prepaid expenses include salary advances and travel advances for priced-service personnel. Items in process of collection is gross Federal Reserve cash items in process of collection
(CIPC) stated on a basis comparable to that of a commercial bank. It reflects adjustments for intra-System items that would otherwise be double-counted on a consolidated Federal Reserve balance sheet; adjustments for items associated with non-priced items, such as those collected for government agencies; and adjustments for items associated with providing fixed availability or credit before items are received and processed. Among the costs to be recovered under the Monetary Control Act is the cost of float, or net CIPC during the period (the difference between gross CIPC and deferred-availability items which is the portion of gross CIPC that involves a financing cost), valued at the federal funds rate.
(2) LONG-TERM ASSETS
Consists of long-term assets used solely in priced services, the priced-services portion of long-term assets shared with nonpriced services, and an estimate of the assets of the Board of Governors used in the development of priced services. Elfective Jan. 1, 1987, the Reserve Banks implemented the Financial Accounting Standards Board's Statement of Financial Accounting Standards No. 87, Employers' Accounting for Pensions (SFAS 87). Accordingly, the Federal Reserve Banks recognized credits to expenses of $12.0 million in the second quarter of 1996, S12.2 million in the first quarter of 1996, S8.7 million in the second quarter of 1995 and $7.2 million in the first quarter of 1995, and corresponding increases in this asset account.
(3) LIABILITIES AND EQUITY
Under the matched-book capital structure for assets that are not "self-financing," short-term assets are financed with short-term debt. Long-term assets are financed with long-term debt and equity in a proportion equal to the ratio of long-term debt to equity for the fifty largest bank holding companies, which are used in the model for the private-sector adjustment factor (PSAF). The PSAF consists of the taxes that would have been paid and the return on capital that would have been provided had priced services been furnished by a private-sector firm. Other short-term liabilities include clearing balances maintained at Reserve Banks and deposit balances arising from float. Other long-term liabilities consist of obligations on capital leases.
Digitized for FRASER http://fraser.stlouisfed.org/ Federal Reserve Bank of St. Louis

Nonbank-Reported Data A65
4.31 PRO FORMA FINANCIAL STATEMENTS FOR FEDERAL RESERVE PRICED SERVICES
B. Pro forma income statement Millions of dollars
Item Quarter ending June 30, 1996 Quarter ending June 30, 1995
Revenue from services provided to depository institutions (Note 4) 196.0 183.1 Operating expenses (Note 5) 162.3 161.8
Income from operations 33.7 21.3 Imputed costs (Note 6)
Interest on float Interest on debt Sales taxes FDIC insurance
1.1 4.3 2.6 0.0 8.0
3.1 4.1 2.9 1.8 11.9
Income from operations after imputed costs 25.7 9.4 Other income and expenses (Note 7)
Investment income on clearing balances Earnings credits
75.7 68.6 7.1
61.6 55.8 5.8
Income before income taxes 32.8 15.1 Imputed income taxes (Note 8) 9.8 4.7
Income before cumulative effect of a change in accounting principle 23.0 10.4 Cumulative effect on previous years from retroactive application of accrual
method of accounting for postemployment benefits (net of $6.5 million tax) (Note 9)
Net income 23.0 10.4 MEMO Targeted return on equity (Note 10) 10.7 9.6
Six months ending June 30, 1996 Six months ending June 30, 1995
Revenue from services provided to depository institutions (Note 4) 390.1 365.1 Operating expenses (Note 5) 323.4 330.7
Income from operations 66.7 34.3 Imputed costs (Note 6)
Interest on float Interest on debt Sales taxes FDIC insurance
11.8 8.6 5.4 0.0 25.8
8.8 8.1 5.1 5.4 27.4
Income from operations after imputed costs 40.9 6.9 Other income and expenses (Note 7)
Investment income on clearing balances Earnings credits
147.2 134.0 13.2
125.5 110.1 15.3
Income before income taxes 54.1 22.3 Imputed income taxes (Note 8) 16.2 6.9
Income before cumulative effect of a change in accounting principle 37.9 15.4 Cumulative effect on previous years from retroactive application of accrual
method of accounting for postemployment benefits (net of $6.5 million tax) (Note 9) -14 .6
Net income 37.9 .8 MEMO Targeted return on equity (Note 10) 21.0 17.7
NOTE. Components may not sum to totals because of rounding. The priced services financial statements consist of these tables and the accompanying notes.
(4) REVENUE
Revenue represents charges to depository institutions for priced services and is realized from each institution through one of two methods: direct charges to an institution's account or charges against its accumulated earnings credits.
(5) OPERATING EXPENSES
Operating expenses consist of the direct, indirect, and other general administrative expenses of the Reserve Banks for priced services plus the expenses for staif members of the Board of Governors working directly on the development of priced services. The expenses for Board staff members were $.7 million in the first and second quarters of 1996 and 1995. The credit to expenses under SFAS 87 (see note 2) is reflected in operating expenses.
(6) IMPUTED COSTS
Imputed costs consist of interest on float, interest on debt, sales taxes, and the FDIC assessment. Interest on float is derived from the value of float to be recovered, either explicitly or through per-item fees, during the period. Float costs include costs for checks, book-entry securities, noncash collection, ACH, and funds transfers.
Interest is imputed on the debt assumed necessary to finance priced-service assets. The sales taxes and FDIC assessment that the Federal Reserve would have paid had it been a private-sector firm are among the components of the PSAF (see note 3).
The following list shows the daily average recovery of float by the Reserve Banks for the second quarter of 1996 and 1995 in millions of dollars:
1996 1995
Total float 413.4 457.6 Unrecovered float 15.4 41.2 Float subject to recovery 398.0 416.4 Sources of float recovery
Income on clearing balances 40.3 42.2 As-of adjustments 318.4 210.5 Direct charges 107.7 77.9 Per-item fees (68.5) 85.8
Unrecovered float includes float generated by services to government agencies and by other central bank services. Float recovered through income on clearing balances is the result of the increase in investable clearing balances; the increase is produced by a deduction for float for cash items in process of collection, which reduces imputed reserve requirements. The income on clearing balances reduces the float to be recovered through other means. As-of adjustments and direct charges are mid-week closing float and interterritory check float, which may be recovered from depositing institutions through adjustments to the institution's reserve or clearing balance or by valuing the float at the federal funds rate and billing the institution directly. Float recovered through per-item fees is valued at the federal funds rate and has been added to the cost base subject to recovery in the second quarters of 1996 and 1995.
(7) OTHER INCOME AND EXPENSES
Consists of investment income on clearing balances and the cost of earnings credits. Investment income on clearing balances represents the average coupon-equivalent yield on three-month Treasury bills applied to the total clearing balance maintained, adjusted for the effect of reserve requirements on clearing balances. Expenses for earnings credits granted to depository institutions on their clearing balances are derived by applying the average federal funds rate to the required portion of the clearing balances, adjusted for the net effect of reserve requirements on clearing balances.
(8) INCOME TAXES
Imputed income taxes are calculated at the effective tax rate derived from the PSAF model (see note 3).
(9) POSTEMPLOYMENT BENEFITS
Effective Jan. 1, 1995, the Reserve Banks implemented SFAS 112, Employers' Accounting for Postemployment Benefits. Accordingly in the first quarter of 1995 the Reserve Banks recognized a one-time cumulative charge of $21.1 million to reflect the retroactive application of this change in accounting principle.
(10) RETURN ON EQUITY
Represents the after-tax rate of return on equity that the Federal Reserve would have earned had it been a private business firm, as derived from the PSAF model (see note 3). This amount is adjusted to reflect the recovery of automation consolidation costs of $1.6 million for the second quarter of 1996, $1.2 million for the first quarter of 1996, $1.7 million for the second quarter of 1995, and $.3 million for the first quarter of 1995. The Reserve Banks plan to recover these amounts, along with a finance charge, by the end of the year 2001.
Digitized for FRASER http://fraser.stlouisfed.org/ Federal Reserve Bank of St. Louis

A66
Index to Statistical Tables
References are to pages A3-A65 although the prefix "A" is omitted in this index ACCEPTANCES, bankers (See Bankers acceptances) Agricultural loans, commercial banks, 19, 20 Assets and liabilities (See also Foreigners)
Banks, by classes, 17-21 Domestic finance companies, 33 Federal Reserve Banks, 10 Financial institutions, 25 Foreign banks, U.S. branches and agencies, 21
Automobiles Consumer installment credit, 36 Production, 44, 45
BANKERS acceptances, 10, 11, 19-22, 23 Bankers balances, 17-21. (See also Foreigners) Bonds (See also U.S. government securities)
New issues, 31 Rates, 23
Branch banks, 21 Business activity, nonfinancial, 42 Business loans (See Commercial and industrial
loans)
CAPACITY utilization, 43 Capital accounts
Banks, by classes, 17 Federal Reserve Banks, 10
Central banks, discount rates, 61 Certificates of deposit, 23 Commercial and industrial loans
Commercial banks, 19, 20 Weekly reporting banks, 19-21
Commercial banks Assets and liabilities, 17-21 Commercial and industrial loans, 17-21 Consumer loans held, by type and terms, 36 Deposit interest rates of insured, 15 Loans sold outright, 20 Real estate mortgages held, by holder and
property, 35 Time and savings deposits, 4
Commercial paper, 22, 23, 33 Condition statements (See Assets and liabilities) Construction, 42, 46 Consumer installment credit, 36 Consumer prices, 42 Consumption expenditures, 49, 50 Corporations
Profits and their distribution, 32 Security issues, 31, 61
Cost of living (See Consumer prices) Credit unions, 36 Currency in circulation, 5, 13 Customer credit, stock market, 24
DEBITS to deposit accounts, 16 Debt (See specific types of debt or securities) Demand deposits
Banks, by classes, 17-21 Ownership by individuals, partnerships, and
corporations, 20, 21 Turnover, 16
Depository institutions Reserve requirements, 8 Reserves and related items, 4, 5, 6, 12
Deposits (See also specific types) Banks, by classes, 4, 17-21 Federal Reserve Banks, 5, 10 Interest rates, 15 Turnover, 16
Discount rates at Reserve Banks and at foreign central banks and foreign countries (See Interest rates)
Discounts and advances by Reserve Banks (See Loans) Dividends, corporate, 32
EMPLOYMENT, 42 Eurodollars, 23
FARM mortgage loans, 35 Federal agency obligations, 5, 9, 10, 11, 28, 29 Federal credit agencies, 30 Federal finance
Debt subject to statutory limitation, and types and ownership of gross debt, 27
Receipts and outlays, 25, 26 Treasury financing of surplus, or deficit, 25 Treasury operating balance, 25
Federal Financing Bank, 30 Federal funds, 6, 19, 20, 21, 23, 25 Federal Home Loan Banks, 30 Federal Home Loan Mortgage Corporation, 30, 34, 35 Federal Housing Administration, 30, 34, 35 Federal Land Banks, 35 Federal National Mortgage Association, 30, 34, 35 Federal Reserve Banks
Condition statement, 10 Discount rates (See Interest rates) U.S. government securities held, 5, 10, 11, 27
Federal Reserve credit, 5, 6, 10, 11 Federal Reserve notes, 10 Federal Reserve System
Balance sheet for priced services, 64, 65 Condition statement for priced services, 64, 65
Federally sponsored credit agencies, 30 Finance companies
Assets and liabilities, 33 Business credit, 33 Loans, 36 Paper, 22, 23
Financial institutions, loans to, 19, 20, 21 Float, 5 Flow of funds, 37-41 Foreign banks, assets and liabilities of U.S. branches and agencies,
20,21 Foreign currency operations, 10 Foreign deposits in U.S. banks, 5, 20 Foreign exchange rates, 62 Foreign trade, 51 Foreigners
Claims on, 52, 55, 56, 57, 59 Liabilities to, 20, 51, 52, 53, 58, 60, 61
GOLD Certificate account, 10 Stock, 5 ,51
Government National Mortgage Association, 30, 34, 35 Gross domestic product, 48
HOUSING, new and existing units, 46
Digitized for FRASER http://fraser.stlouisfed.org/ Federal Reserve Bank of St. Louis

A67
INCOME and expenses, Federal Reserve System, 64, 65 Income, personal and national, 42, 48, 49 Industrial production, 42, 44 Installment loans, 36 Insurance companies, 27, 35 Interest rates
Bonds, 23 Consumer installment credit, 36 Deposits, 15 Federal Reserve Banks, 7 Foreign central banks and foreign countries, 61 Money and capital markets, 23 Mortgages, 34 Prime rate, 22
International capital transactions of United States, 50-61 International organizations, 52, 53, 55, 58, 59 Inventories, 48 Investment companies, issues and assets, 32 Investments (See also specific types)
Banks, by classes, 17-21 Commercial banks, 4, 17-21 Federal Reserve Banks, 10, 11 Financial institutions, 35
LABOR force, 42 Life insurance companies (See Insurance companies) Loans (See also specific types)
Banks, by classes, 17—21 Commercial banks, 17-21 Federal Reserve Banks, 5, 6, 7, 10, 11 Federal Reserve System, 64, 65 Financial institutions, 35 Insured or guaranteed by United States, 34, 35
MANUFACTURING Capacity utilization, 43 Production, 43, 45
Margin requirements, 24 Member banks (See also Depository institutions)
Federal funds and repurchase agreements, 6 Reserve requirements, 8
Mining production, 45 Mobile homes shipped, 46 Monetary and credit aggregates, 4, 12 Money and capital market rates, 23 Money stock measures and components, 4, 13 Mortgages (See Real estate loans) Mutual funds, 32 Mutual savings banks (See Thrift institutions)
NATIONAL defense outlays, 26 National income, 48
OPEN market transactions, 9
PERSONAL income, 49 Prices
Consumer and producer, 42, 47 Stock market, 24
Prime rate, 22 Producer prices, 42, 47 Production, 42, 44 Profits, corporate, 32
REAL estate loans Banks, by classes, 19, 20, 35
Real estate loans—Continued Terms, yields, and activity, 34 Type of holder and property mortgaged, 35
Repurchase agreements, 6 Reserve requirements, 8 Reserves
Commercial banks, 17 Depository institutions, 4, 5, 6, 12 Federal Reserve Banks, 10 U.S. reserve assets, 51
Residential mortgage loans, 34 Retail credit and retail sales, 36, 42
SAVING Flow of funds, 37-41 National income accounts, 48
Savings institutions, 35, 36, 37 Savings deposits (See Time and savings deposits) Securities (See also specific types)
Federal and federally sponsored credit agencies, 30 Foreign transactions, 60 New issues, 31 Prices, 24
Special drawing rights, 5, 10, 50, 51 State and local governments
Deposits, 19, 20 Holdings of U.S. government securities, 27 New security issues, 31 Ownership of securities issued by, 19, 21 Rates on securities, 23
Stock market, selected statistics, 24 Stocks (See also Securities)
New issues, 31 Prices, 24
Student Loan Marketing Association, 30
TAX receipts, federal, 26 Thrift institutions, 4. (See also Credit unions and Savings institutions)
Time and savings deposits, 4, 13, 15, 17-21 Trade, foreign, 51 Treasury cash, Treasury currency, 5 Treasury deposits, 5, 10, 25 Treasury operating balance, 25
UNEMPLOYMENT, 42 U.S. government balances
Commercial bank holdings, 17-21 Treasury deposits at Reserve Banks, 5, 10, 25
U.S. government securities Bank holdings, 17-21, 27 Dealer transactions, positions, and financing, 29 Federal Reserve Bank holdings, 5, 10, 11, 27 Foreign and international holdings and
transactions, 10, 27, 61 Open market transactions, 9 Outstanding, by type and holder, 27, 28 Rates, 23
U.S. international transactions, 50-62 Utilities, production, 45
VETERANS Administration, 34, 35
WEEKLY reporting banks, 17-21 Wholesale (producer) prices, 42, 47
YIELDS (See Interest rates)
Digitized for FRASER http://fraser.stlouisfed.org/ Federal Reserve Bank of St. Louis

A68
Federal Reserve Board of Governors and Official Staff
ALAN GREENSPAN, Chairman ALICE M. RIVLIN, Vice Chair
EDWARD W . KELLEY, JR. LAWRENCE B . LINDSEY
OFFICE OF BOARD MEMBERS
JOSEPH R. COYNE, Assistant to the Board DONALD J. WINN, Assistant to the Board THEODORE E. ALLISON, Assistant to the Board for Federal
Reserve System Affairs LYNN S. FOX, Deputy Congressional Liaison WINTHROP P. HAMBLEY, Special Assistant to the Board BOB STAHLY MOORE, Special Assistant to the Board DIANE E. WERNEKE, Special Assistant to the Board PORTIA W. THOMPSON, Equal Employment Opportunity
Programs Adviser
LEGAL DIVISION
J. VIRGIL MATTINGLY, JR., General Counsel SCOTT G. ALVAREZ, Associate General Counsel RICHARD M. ASHTON, Associate General Counsel OLIVER IRELAND, Associate General Counsel KATHLEEN M. O'DAY, Associate General Counsel ROBERT DEV. FRIERSON, Assistant General Counsel KATHERINE H. WHEATLEY, Assistant General Counsel
OFFICE OF THE SECRETARY
WILLIAM W . WILES, Secretary JENNIFER J. JOHNSON, Deputy Secretary BARBARA R. LOWREY, Associate Secretary and Ombudsman
DIVISION OF BANKING SUPERVISION AND REGULATION RICHARD SPILLENKOTHEN, Director
STEPHEN C. SCHEMERING, Deputy Director WILLIAM A. RYBACK, Associate Director HERBERT A. BIERN, Deputy Associate Director ROGER T. COLE, Deputy Associate Director JAMES I. GARNER, Deputy Associate Director HOWARD A. AMER, Assistant Director GERALD A. EDWARDS, JR., Assistant Director STEPHEN M. HOFFMAN, JR., Assistant Director JAMES V. HOUPT, Assistant Director JACK P. JENNINGS, Assistant Director MICHAEL G. MARTINSON, Assistant Director RHOGER H PUGH, Assistant Director SIDNEY M. SUSSAN, Assistant Director MOLLY S. WASSOM, Assistant Director WILLIAM SCHNEIDER, Project Director,
National Information Center
DIVISION OF INTERNATIONAL FINANCE EDWIN M. TRUMAN, Staff Director LARRY J. PROMISEL, Senior Associate Director CHARLES J. SIEGMAN, Senior Associate Director DALE W. HENDERSON, Associate Director DAVID H. HOWARD, Senior Adviser DONALD B. ADAMS, Assistant Director THOMAS A. CONNORS, Assistant Director PETER HOOPER III, Assistant Director KAREN H. JOHNSON, Assistant Director CATHERINE L. MANN, Assistant Director RALPH W. SMITH, JR., Assistant Director
DIVISION OF RESEARCH AND STATISTICS MICHAEL J. PRELL, Director
EDWARD C. ETTIN, Deputy Director DAVID J. STOCKTON, Deputy Director MARTHA BETHEA, Associate Director WILLIAM R. JONES, Associate Director MYRON L. KWAST, Associate Director PATRICK M. PARKINSON, Associate Director THOMAS D. SIMPSON, Associate Director LAWRENCE SLIFMAN, Associate Director MARTHA S. SCANLON, Deputy Associate Director PETER A. TINSLEY, Deputy Associate Director DAVID S. JONES, Assistant Director STEPHEN A. RHOADES, Assistant Director CHARLES S. STRUCKMEYER, Assistant Director ALICE PATRICIA W H I T E , Assistant Director
JOYCE K. ZICKLER, Assistant Director JOHN J. MINGO, Senior Adviser G L E N N B . C A N N E R , Adviser
DIVISION OF MONETARY AFFAIRS
D O N A L D L . K O H N , Director
DAVID E. LINDSEY, Deputy Director BRIAN F. MADIGAN, Associate Director RICHARD D. PORTER, Deputy Associate Director VINCENT R. REINHART, Assistant Director NORMAND R.V. BERNARD, Special Assistant to the Board
DIVISION OF CONSUMER AND COMMUNITY AFFAIRS GRIFFITH L . GARWOOD, Director
GLENN E. LONEY, Associate Director DOLORES S. SMITH, Associate Director MAUREEN P. ENGLISH, Assistant Director IRENE S H A W N M C N U L T Y , Assistant Director
Digitized for FRASER http://fraser.stlouisfed.org/ Federal Reserve Bank of St. Louis

A69
S U S A N M . PHILLIPS LAURENCE H . MEYER JANET L . YELLEN
OFFICE OF STAFF DIRECTOR FOR MANAGEMENT S. DAVID FROST, Staff Director SHEILA CLARK, EEO Programs Director
DIVISION OF HUMAN RESOURCES MANAGEMENT DAVID L . S H A N N O N , Director
JOHN R. WEIS, Associate Director JOSEPH H. HAYES, JR., Assistant Director FRED HOROWITZ, Assistant Director
OFFICE OF THE CONTROLLER GEORGE E . LIVINGSTON, Controller STEPHEN J. CLARK, Assistant Controller (Programs and Budgets) DARRELL R. PAULEY, Assistant Controller (Finance)
DIVISION OF SUPPORT SERVICES
DIVISION OF RESERVE BANK OPERATIONS AND PAYMENT SYSTEMS CLYDE H . FARNSWORTH, JR., Director DAVID L. ROBINSON, Deputy Director (Finance and Control) LOUISE L. ROSEMAN, Associate Director CHARLES W. BENNETT, Assistant Director JACK DENNIS, JR., Assistant Director EARL G. HAMILTON, Assistant Director JEFFREY C. MARQUARDT, Assistant Director JOHN H. PARRISH, Assistant Director FLORENCE M. YOUNG, Assistant Director
OFFICE OF THE INSPECTOR GENERAL BRENT L. BOWEN, Inspector General DONALD L. ROBINSON, Assistant Inspector General BARRY R. SNYDER, Assistant Inspector General
ROBERT E . FRAZIER, Director GEORGE M. LOPEZ, Assistant Director DAVID L. WILLIAMS, Assistant Director
DIVISION OF INFORMATION RESOURCES MANAGEMENT S T E P H E N R . M A L P H R U S , Director MARIANNE M. EMERSON, Assistant Director P o KYUNG KIM, Assistant Director RAYMOND H. MASSEY, Assistant Director EDWARD T. MULRENIN, Assistant Director DAY W. RADABAUGH, JR., Assistant Director ELIZABETH B. RIGGS, Assistant Director RICHARD C. STEVENS, Assistant Director
Digitized for FRASER http://fraser.stlouisfed.org/ Federal Reserve Bank of St. Louis

70 Federal Reserve Bulletin • October 1996
Federal Open Market Committee and Advisory Councils
FEDERAL OPEN MARKET COMMITTEE
MEMBERS
A L A N GREENSPAN, Chairman WILLIAM J. M C D O N O U G H , Vice Chairman
EDWARD G . BOEHNE JERRY L. JORDAN EDWARD W . KELLEY, JR.
LAWRENCE B . LINDSEY ROBERT D . MCTEER, JR. LAURENCE H . MEYER SUSAN M . PHILLIPS
ALICE M . RIVLIN GARY H . STERN JANET L . YELLEN
ALTERNATE MEMBERS
J. ALFRED BROADDUS, JR. MICHAEL H . MOSKOW ERNEST T. PATRIKIS JACK G U Y N N ROBERT T. PARRY
D O N A L D L. KOHN, Secretary and Economist NORMAND R . V . BERNARD, Deputy Secretary JOSEPH R . COYNE, Assistant Secretary GARY P. GILLUM, Assistant Secretary J. VIRGIL MATTINGLY, JR., General Counsel THOMAS C. BAXTER, JR., Deputy General Counsel MICHAEL J. PRELL, Economist EDWIN M . TRUMAN, Economist RICHARD W . LANG, Associate Economist
STAFF DAVID E . LINDSEY, Associate Economist FREDERIC S . MISHKIN, Associate Economist LARRY J. PROMISEL, Associate Economist ARTHUR J. ROLNICK, Associate Economist HARVEY ROSENBLUM, Associate Economist CHARLES J. SIEGMAN, Associate Economist THOMAS D . SIMPSON, Associate Economist MARK S . SNIDERMAN, Associate Economist DAVID J. STOCKTON, Associate Economist
PETER R. FISHER, Manager, System Open Market Account
FEDERAL ADVISORY COUNCIL
RICHARD G . TILGHMAN, President FRANK V. CAHOUET, Vice President
WILLIAM M . CROZIER, JR., First District WALTER V. SHIPLEY, Second District WALTER E. DALLER, JR., Third District FRANK V. CAHOUET , Fourth District RICHARD G. TILGHMAN , Fifth District CHARLES E. RICE, Sixth District
ROGER L. FITZSIMONDS, Seventh District THOMAS H . JACOBSEN, Eighth District RICHARD M . KOVACEVICH, Ninth District CHARLES E. NELSON , Tenth District CHARLES T. DOYLE , Eleventh District WILLIAM F. ZUENDT , Twelfth District
HERBERT V. PROCHNOW, Secretary Emeritus
JAMES ANNABLE, Co-Secretary
WILLIAM J. KORSVIK, Co-Secretary
Digitized for FRASER http://fraser.stlouisfed.org/ Federal Reserve Bank of St. Louis

A71
CONSUMER ADVISORY COUNCIL
KATHARINE W. MCKEE, Durham, North Carolina, Chairman JULIA M. SEWARD, Richmond, Virginia, Vice Chairman
RICHARD S . AMADOR, LOS A n g e l e s , C a l i f o r n i a THOMAS R . BUTLER, R i v e r w o o d s , I l l i n o i s ROBERT A . COOK, B a l t i m o r e , M a r y l a n d ALVIN J. COWANS, O r l a n d o , F l o r i d a ELIZABETH G . FLORES, L a r e d o , T e x a s HERIBERTO FLORES, S p r i n g f i e l d , M a s s a c h u s e t t s E M A N U E L FREEMAN, P h i l a d e l p h i a , P e n n s y l v a n i a DAVID C . F Y N N , C l e v e l a n d , O h i o ROBERT G . GREER, H o u s t o n , T e x a s KENNETH R. HARNEY, Chevy Chase, Maryland GAIL K . HILLEBRAND, S a n F r a n c i s c o , C a l i f o r n i a TERRY JoRDE,'Cando, North Dakota FRANCINE JUSTA, N e w Y o r k , N e w Y o r k E U G E N E I. LEHRMANN, M a d i s o n , W i s c o n s i n
ERROL T. LOUIS, B r o o k l y n , N e w Y o r k WILLIAM N . L U N D , F a l m o u t h , M a i n e R O N A L D A . PRILL, M i n n e a p o l i s , M i n n e s o t a LISA RICE-COLEMAN, T o l e d o , O h i o JOHN R . RINES, D e t r o i t , M i c h i g a n MARGOT SAUNDERS, W a s h i n g t o n , D . C . A N N E B . SHLAY, P h i l a d e l p h i a , P e n n s y l v a n i a REGINALD J. SMITH, Kansas City, Missouri GEORGE P. SURGEON, A r k a d e l p h i a , A r k a n s a s GREGORY D . SQUIRES, M i l w a u k e e , W i s c o n s i n JOHN E . TAYLOR, W a s h i n g t o n , D . C . LORRAINE V A N E T T E N , T r o y , M i c h i g a n THEODORE J. WYSOCKI, JR., C h i c a g o , I l l i n o i s LILY K. YAO, Honolulu, Hawaii
THRIFT INSTITUTIONS ADVISORY COUNCIL
E. LEE BEARD, Hazleton, Pennsylvania, President DAVID F. HOLLAND, Burlington, Massachusetts, Vice President
BARRY C . BURKHOLDER, H o u s t o n , T e x a s MICHAEL T. CROWLEY, JR., M i l w a u k e e , W i s c o n s i n GEORGE L . ENGELKE, JR., L a k e S u c c e s s , N e w Y o r k DOUGLAS A . FERRARO, E n g l e w o o d , C o l o r a d o BEVERLY D . HARRIS, L i v i n g s t o n , M o n t a n a
CHARLES R . RINEHART, I r w i n d a l e , C a l i f o r n i a JOSEPH C . SCULLY, C h i c a g o , I l l i n o i s R O N A L D W . STIMPSON, M e m p h i s , T e n n e s s e e LARRY T. WILSON, Raleigh, North Carolina WILLIAM W . ZUPPE, S p o k a n e , W a s h i n g t o n
Digitized for FRASER http://fraser.stlouisfed.org/ Federal Reserve Bank of St. Louis

A72
Federal Reserve Board Publications
For ordering assistance, write PUBLICATIONS SERVICES, MS-127, Board of Governors of the Federal Reserve System, Washington, DC 20551 or telephone (202) 452-3244 or FAX (202) 728-5886. You may also use the publications order form available on the Board's World Wide Web site (http://www.bog.frb.fed.us). When a charge is indicated, payment should accompany request and be made payable to the Board of Governors of the Federal Reserve System or may be ordered via Mastercard or Visa. Payment from foreign residents should be drawn on a U.S. bank.
BOOKS AND MISCELLANEOUS PUBLICATIONS T H E FEDERAL RESERVE SYSTEM—PURPOSES AND FUNCTIONS.
1994. 157 pp. A N N U A L REPORT. A N N U A L REPORT: BUDGET REVIEW, 1 9 9 5 - 9 6 . FEDERAL RESERVE BULLETIN. Monthly. $25.00 per year or $2.50
each in the United States, its possessions, Canada, and Mexico. Elsewhere, $35.00 per year or $3.00 each.
ANNUAL STATISTICAL DIGEST: period covered, release date, num-ber of pages, and price.
1981 October 1982 239 pp. $ 6.50 1982 December 1983 266 pp. $ 7.50 1983 October 1984 264 pp. $11.50 1984 October 1985 254 pp. $12.50 1985 October 1986 231 pp. $15.00 1986 November 1987 288 pp. $15.00 1987 October 1988 272 pp. $15.00 1988 November 1989 256 pp. $25.00 1980-89 March 1991 712 pp. $25.00 1990 November 1991 185 pp. $25.00 1991 November 1992 215 pp. $25.00 1992 December 1993 215 pp. $25.00 1993 December 1994 281 pp. $25.00 1994 December 1995 190 pp. $25.00
SELECTED INTEREST AND EXCHANGE RATES—WEEKLY SERIES OF CHARTS. Weekly. $30.00 per year or $.70 each in the United States, its possessions, Canada, and Mexico. Elsewhere, $35.00 per year or $.80 each.
THE FEDERAL RESERVE ACT and other statutory provisions affect-ing the Federal Reserve System, as amended through August 1990. 646 pp. $10.00.
REGULATIONS OF THE BOARD OF GOVERNORS OF THE FEDERAL RESERVE SYSTEM.
A N N U A L PERCENTAGE RATE TABLES ( T r u t h i n L e n d i n g — Regulation Z) Vol. I (Regular Transactions). 1969. 100 pp. Vol. II (Irregular Transactions). 1969. 116 pp. Each volume $2.25.
G U I D E TO THE FLOW OF F U N D S ACCOUNTS. 6 7 2 p p . $ 8 . 5 0 e a c h . FEDERAL RESERVE REGULATORY SERVICE. L o o s e - l e a f ; u p d a t e d
monthly. (Requests must be prepaid.) Consumer and Community Affairs Handbook. $75.00 per year.
Monetary Policy and Reserve Requirements Handbook. $75.00 per year.
Securities Credit Transactions Handbook. $75.00 per year. The Payment System Handbook. $75.00 per year. Federal Reserve Regulatory Service. Four vols. (Contains all
four Handbooks plus substantial additional material.) $200.00 per year.
Rates for subscribers outside the United States are as follows and include additional air mail costs:
Federal Reserve Regulatory Service, $250.00 per year. Each Handbook, $90.00 per year.
FEDERAL RESERVE REGULATORY SERVICE FOR PERSONAL COMPUTERS. Diskettes; updated monthly.
Standalone PC. $300 per year. Network, maximum 1 concurrent user. $300 per year. Network, maximum 10 concurrent users. $750 per year. Network, maximum 50 concurrent users. $2,000 per year. Network, maximum 100 concurrent users. $3,000 per year. Subscribers outside the United States should add $50 to cover
additional airmail costs. T H E U . S . ECONOMY IN AN INTERDEPENDENT WORLD: A MULTI-
COUNTRY MODEL, May 1984. 590 pp. $14.50 each. INDUSTRIAL PRODUCTION — 1 9 8 6 EDITION. D e c e m b e r 1 9 8 6 .
440 pp. $9.00 each. FINANCIAL FUTURES A N D OPTIONS IN THE U . S . ECONOMY.
December 1986. 264 pp. $10.00 each. FINANCIAL SECTORS IN O P E N ECONOMIES: EMPIRICAL ANALY-
SIS AND POLICY ISSUES. August 1990. 608 pp. $25.00 each.
EDUCATION PAMPHLETS Short pamphlets suitable for classroom use. Multiple copies are available without charge.
Consumer Handbook on Adjustable Rate Mortgages Consumer Handbook to Credit Protection Laws A Guide to Business Credit for Women, Minorities, and Small
Businesses Series on the Structure of the Federal Reserve System
The Board of Governors of the Federal Reserve System The Federal Open Market Committee Federal Reserve Bank Board of Directors Federal Reserve Banks Organization and Advisory Committees
A Consumer's Guide to Mortgage Lock-Ins A Consumer's Guide to Mortgage Settlement Costs A Consumer's Guide to Mortgage Refinancings Home Mortgages: Understanding the Process and Your Right
to Fair Lending How to File a Consumer Complaint Making Deposits: When Will Your Money Be Available? Making Sense of Savings SHOP: The Card You Pick Can Save You Money Welcome to the Federal Reserve When Your Home is on the Line: What You Should Know
About Home Equity Lines of Credit
Digitized for FRASER http://fraser.stlouisfed.org/ Federal Reserve Bank of St. Louis

A73
STAFF STUDIES: Only Summaries Printed in the BULLETIN
Studies and papers on economic and financial subjects that are of general interest. Requests to obtain single copies of the full text or to be added to the mailing list for the series may be sent to Publications Services.
Staff Studies 1-157 are out of print.
1 5 8 . T H E ADEQUACY AND CONSISTENCY OF MARGIN REQUIRE-MENTS IN THE MARKETS FOR STOCKS AND DERIVATIVE PRODUCTS, by Mark J. Warshawsky with the assistance of Dietrich Earnhart. September 1989. 23 pp.
1 5 9 . N E W DATA ON THE PERFORMANCE OF N O N B A N K SUBSIDI-ARIES OF B A N K HOLDING COMPANIES, b y N e l l i e L i a n g a n d Donald Savage. February 1990. 12 pp.
1 6 0 . BANKING MARKETS A N D THE U S E OF FINANCIAL SER-VICES BY SMALL AND M E D I U M - S I Z E D BUSINESSES, b y Gregory E. Elliehausen and John D. Wolken. September 1990. 35 pp.
1 6 1 . A REVIEW OF CORPORATE RESTRUCTURING ACTIVITY, 1980-90, by Margaret Hastings Pickering. May 1991. 21 pp.
1 6 2 . EVIDENCE ON THE SIZE OF BANKING MARKETS FROM MORT-GAGE L O A N RATES IN T W E N T Y CITIES, b y S t e p h e n A . Rhoades. February 1992. 11 pp.
1 6 3 . CLEARANCE AND SETTLEMENT IN U . S . SECURITIES M A R -KETS, by Patrick Parkinson, Adam Gilbert, Emily Gollob, Lauren Hargraves, Richard Mead, Jeff Stehm, and Mary Ann Taylor. March 1992. 37 pp.
1 6 4 . T H E 1 9 8 9 - 9 2 CREDIT C R U N C H FOR R E A L ESTATE, b y James T. Fergus and John L. Goodman, Jr. July 1993. 20 pp.
1 6 5 . T H E D E M A N D FOR TRADE CREDIT: A N INVESTIGATION OF MOTIVES FOR TRADE CREDIT U S E BY SMALL BUSINESSES, b y Gregory E. Elliehausen and John D. Wolken. September 1 9 9 3 . 18 pp.
1 6 6 . T H E ECONOMICS OF THE PRIVATE PLACEMENT MARKET, b y Mark Carey, Stephen Prowse, John Rea, and Gregory Udell. January 1994. I l l pp.
1 6 7 . A SUMMARY OF MERGER PERFORMANCE STUDIES IN B A N K -ING, 1 9 8 0 - 9 3 , AND AN ASSESSMENT OF THE "OPERATING PERFORMANCE" AND " E V E N T S T U D Y " METHODOLOGIES, by Stephen A. Rhoades. July 1994. 37 pp.
1 6 8 . T H E ECONOMICS OF THE PRIVATE EQUITY MARKET, b y George W. Fenn, Nellie Liang, and Stephen Prowse. Novem-ber 1 9 9 5 . 6 9 pp.
1 6 9 . B A N K MERGERS AND INDUSTRYWIDE STRUCTURE, 1 9 8 0 - 9 4 , by Stephen A. Rhoades. February 1996. 32 pp.
Digitized for FRASER http://fraser.stlouisfed.org/ Federal Reserve Bank of St. Louis

A74
Maps of the Federal Reserve System
ALASKA
9 1
10 4 M KANSAS C I T Y B . ^ •
MINNEAPOLIS • 2 ° N
• N E W YORK 1 2 C B I C A O D M • 3 U
CLEVELAND PHILADELPHIA
^ RICHMOND ST. LOUIS 5
^ DALLAS
6 i ATLANTA
HAWAII
LEGEND
Both pages
• Federal Reserve Bank city
• Board of Governors of the Federal Reserve System, Washington, D.C.
NOTE
The Federal Reserve officially identifies Districts by number and Reserve Bank city (shown on both pages) and by letter (shown on the facing page).
In the 12th District, the Seattle Branch serves Alaska, and the San Francisco Bank serves Hawaii.
The System serves commonwealths and territories as follows: the New York Bank serves the Commonwealth
Facing page
• Federal Reserve Branch city
— Branch boundary
of Puerto Rico and the U.S. Virgin Islands; the San Francisco Bank serves American Samoa, Guam, and the Commonwealth of the Northern Mariana Islands. The Board of Governors revised the branch boundaries of the System most recently in December 1991.
Digitized for FRASER http://fraser.stlouisfed.org/ Federal Reserve Bank of St. Louis

A75
1-A
V T
NH
M A I
c r
BOSTON
2 - B
K CT
• I / \ Buffalo
/ NY
NEW YORK
3 - C
PHILADELPHIA
4 - D
•Cincinnati
CLEVELAND
5 - E
wv
Baltimore MD vt IJ NC
•Charlotte
sc
RICHMOND
6 - F
Birmingham
•Nashville
• New Orleans
Jacksonville Ft J
ATLANTA
Miami
7 - G
Detroit •
CHICAGO
8 - H
KY
JL ; J N ^ Louisville
^ d •Memphis Little/ Roek ( MS
ST. LOUIS
9 - 1
• Helena
MINNEAPOLIS
10-J WY
1 NTI
CO Omaha*
Beaver S 3
NM 1
Oklahoim City OK
KANSAS CITY
11-K T X
FL _ L A • EL Paso EL Paso
RA—H " X Houston • V* San Antonio
DALLAS
1 2 - L
H i Seattle
Salt Lake City
•Los Angeles
SAN FRANCISCO
Digitized for FRASER http://fraser.stlouisfed.org/ Federal Reserve Bank of St. Louis

A76
Federal Reserve Banks, Branches, and Offices FEDERAL RESERVE BANK Chairman President Vice President branch, or facility Zip Deputy Chairman First Vice President in charge of branch
BOSTON* 02106 Jerome H. Grossman Cathy E. Minehan William C. Brainard Paul M. Connolly
NEW YORK* 10045 John C. Whitehead William J. McDonough Thomas W. Jones Ernest T. Patrikis
Buffalo 14240 Joseph J. Castiglia Carl W. Turnipseed1
PHILADELPHIA 19105 Donald J. Kennedy Edward G. Boehne Joan Carter William H. Stone, Jr.
CLEVELAND* 44101 A. William Reynolds Jerry L. Jordan G. Watts Humphrey, Jr. Sandra Pianalto
Cincinnati 45201 John N. Taylor, Jr. Charles A. Cerino1
Pittsburgh 15230 John T. Ryan III Harold J. Swart'
RICHMOND* 23219 Claudine B. Malone J. Alfred Broaddus, Jr. Robert L. Strickland Walter A. Varvel
Baltimore 21203 Michael R. Watson William J. Tignanelli1
Charlotte 28230 James O. Roberson Dan M. Bechter1
Culpeper 22701 Julius Malinowski, Jr.2
ATLANTA 30303 Hugh M. Brown Jack Guynn Daniel E. Sweat, Jr. Patrick K. Barron James M. Mckee1
Birmingham 35283 Donald E. Boomershine Fred R. Herr1
Jacksonville 32231 Joan D. Ruffier James D. Hawkins1
Miami 33152 R. Kirk Landon James T. Curry III Nashville 37203 Paula Lovell Melvyn K. Purcell New Orleans 70161 Lucimarian Roberts Robert J. Musso
CHICAGO* 60690 Robert M. Healey Michael H. Moskow Lester H. McKeever, Jr. William C. Conrad
Detroit 48231 Florine Mark David R. Allardice1
ST. LOUIS 63166 John F. McDonnell Thomas C. Melzer Susan S. Elliott W. LeGrande Rives
Little Rock 72203 Janet M. Jones Robert A. Hopkins Louisville 40232 John A. Williams Thomas A. Boone Memphis 38101 John V. Myers John P. Baumgartner
MINNEAPOLIS 55480 Jean D. Kinsey Gary H. Stern David A. Koch Colleen K. Strand
Helena 59601 Lane W. Basso John D. Johnson
KANSAS CITY 64198 Herman Cain Thomas M. Hoenig A. Drue Jennings Richard K. Rasdall
Denver 80217 Peter I. Wold Carl M. Gambs1
Oklahoma City 73125 Barry L. Eller Kelly J. Dubbert Omaha 68102 LeRoy W. Thom Harold L. Shewmaker
DALLAS 75201 Cece Smith Robert D. McTeer, Jr. Roger R. Hemminghaus Helen E. Holcomb
El Paso 79999 Patricia Z. Holland-Branch Sammie C. Clay Houston 77252 Issac H Kempner III Robert Smith, III1
San Antonio 78295 Carol L. Thompson James L. Stull1
SAN FRANCISCO . . . . 94120 Judith M. Runstad Robert T. Parry James A. Vohs John F. Moore
Los Angeles 90051 Anita E. Landecker Mark L. Mullinix1
Portland 97208 Ross R. Runkel Raymond H. Laurence1
Salt Lake City 84125 Gerald R. Sherratt Andrea P. Wolcott Seattle 98124 George F. Russell, Jr. Gordon R. G. Werkema3
•Additional offices of these Banks are located at Lewiston, Maine 04240; Windsor Locks, Connecticut 06096; East Rutherford, New Jersey 07016; Jericho, New York 11753; Utica at Oriskany, New York 13424; Columbus, Ohio 43216; Columbia, South Carolina 29210; Charleston, West Virginia 25311; Des Moines, Iowa 50306; Indianapolis, Indiana 46204; Milwaukee, Wisconsin 53202; and Peoria, Illinois 61607.
1. Senior Vice President. 2. Assistant Vice President. 3. Executive Vice President
Digitized for FRASER http://fraser.stlouisfed.org/ Federal Reserve Bank of St. Louis

Federal Reserve Statistical Releases Available on the Commerce Department's Economic Bulletin Board
The Board of Governors of the Federal Reserve Sys-tem makes some of its statistical releases available to the public through the U.S. Department of Com-merce's economic bulletin board. Computer access to the releases can be obtained by subscription.
For further information regarding a subscription to the economic bulletin board, please call (202) 482-1986. The releases transmitted to the economic bulle-tin board, on a regular basis, are the following:
Reference Number Statistical release Frequency of release
H.3 Aggregate Reserves Weekly/Thursday
H.4.1 Factors Affecting Reserve Balances Weekly /Thursday
H.6 Money Stock Weekly/Thursday
H.8 Assets and Liabilities of Insured Domestically Chartered Weekly/Monday and Foreign Related Banking Institutions
H.10 Foreign Exchange Rates Weekly/Monday
H.15 Selected Interest Rates Weekly/Monday
G.5 Foreign Exchange Rates Monthly/end of month
G.17 Industrial Production and Capacity Utilization Monthly/midmonth
G.19 Consumer Installment Credit Monthly/fifth business day
Z. 1 Flow of Funds Quarterly
Digitized for FRASER http://fraser.stlouisfed.org/ Federal Reserve Bank of St. Louis

Publications of Interest
FEDERAL RESERVE CONSUMER CREDIT PUBLICATIONS
The Federal Reserve Board publishes a series of pam-phlets covering individual credit laws and topics, as pictured below.
Three booklets on the mortgage process are available: A Consumer's Guide to Mortgage Lock-Ins, A Consum-er's Guide to Mortgage Refinancings, and A Consumer's Guide to Mortgage Settlement Costs. These booklets were prepared in conjunction with the Federal Home Loan Bank Board and in consultation with other federal agencies and trade and consumer groups. The Board also publishes the Consumer Handbook to Credit Pro-tection Laws, a complete guide to consumer credit pro-tections. This forty-four-page booklet explains how to shop and obtain credit, how to maintain a good credit rating, and how to dispute unfair credit transactions.
Shop . . . The Card You Pick Can Save You Money is designed to help consumers comparison shop when looking for a credit card. It contains the results of the Federal Reserve Board's survey of the terms of credit card plans offered by credit card issuers throughout the United States. Because the terms can affect the amount an individual pays for using a credit card, the booklet lists the annual percentage rate (APR), annual fee, grace period, type of pricing (fixed or variable rate), and a telephone number for each card issuer surveyed.
Copies of consumer publications are available free of charge from Publications Services, Mail Stop 127, Board of Governors of the Federal Reserve System, Washington, DC 20551. Multiple copies for classroom use are also available free of charge.
A Guide to
B u s i n e s s C r e d i t
for Women, Minorities, and Small Businesses
A Consumer's Quid* to
Mortgage Settlement
Costs
SHOP
The Card You Pick Can Save You Money
Digitized for FRASER http://fraser.stlouisfed.org/ Federal Reserve Bank of St. Louis
Copyright © 2022 FDOKUMEN