Economic Report of the President ... - FRASER - St. Louis Fed
368
Digitized for FRASER http://fraser.stlouisfed.org/ Federal Reserve Bank of St. Louis
-
Upload
khangminh22 -
Category
Documents
-
view
1 -
download
0
Transcript of Economic Report of the President ... - FRASER - St. Louis Fed

Digitized for FRASER http://fraser.stlouisfed.org/ Federal Reserve Bank of St. Louis

Digitized for FRASER http://fraser.stlouisfed.org/ Federal Reserve Bank of St. Louis
Economic Report
of the President
Transmitted to the CongressFebruary 1982
TOGETHER WITH
THE ANNUAL REPORTOF THE
COUNCIL OF ECONOMIC ADVISERS
UNITED STATES GOVERNMENT PRINTING OFFICE
WASHINGTON : 1982
For sale by the Superintendent of Documents, U.S. Government Printing OfficeWashington, D.C 20402
Digitized for FRASER http://fraser.stlouisfed.org/ Federal Reserve Bank of St. Louis

Digitized for FRASER http://fraser.stlouisfed.org/ Federal Reserve Bank of St. Louis
CONTENTS
Page
ECONOMIC REPORT OF THE PRESIDENT 1
ANNUAL REPORT OF THE COUNCIL OF ECONOMIC AD-VISERS* 11
CHAPTER 1. ECONOMIC POLICY FOR THE 1980s 21
CHAPTER 2. GOVERNMENT AND THE ECONOMY 27
CHAPTER 3. MONETARY POLICY, INFLATION, AND EMPLOYMENT 47
CHAPTER 4. FEDERAL BUDGET ISSUES 78
CHAPTER 5. TAX POLICY AND ECONOMIC GROWTH 109
CHAPTER 6. REFORMING GOVERNMENT REGULATION OF ECONOM-IC ACTIVITY 134
CHAPTER 7. THE UNITED STATES IN THE INTERNATIONAL ECO-NOMIC SYSTEM 167
CHAPTER 8. REVIEW AND OUTLOOK 192
APPENDIX A. REPORT TO THE PRESIDENT ON THE ACTIVITIES OFTHE COUNCIL OF ECONOMIC ADVISERS DURING 1981 217
APPENDIX B. STATISTICAL TABLES RELATING TO INCOME, EM-PLOYMENT, AND PRODUCTION 227
*For a detailed table of contents of the Council's Report, see page 15.
(Ill)
Digitized for FRASER http://fraser.stlouisfed.org/ Federal Reserve Bank of St. Louis

Digitized for FRASER http://fraser.stlouisfed.org/ Federal Reserve Bank of St. Louis

ECONOMIC REPORT
OF THE PRESIDENT
Digitized for FRASER http://fraser.stlouisfed.org/ Federal Reserve Bank of St. Louis

Digitized for FRASER http://fraser.stlouisfed.org/ Federal Reserve Bank of St. Louis

ECONOMIC REPORT OF THE PRESIDENT
To the Congress of the United States:
In the year just ended, the first decisive steps were taken toward afundamental reorientation of the role of the Federal Government inour economy—a reorientation that will mean more jobs, more oppor-tunity, and more freedom for all Americans. This long overdue redi-rection is designed to foster the energy, creativity, and ambition ofthe American people so that they can create better lives for them-selves, their families, and the communities in which they live. Equallyimportant, this redirection puts the economy on the path of less in-flationary but more rapid economic growth.
My economic program is based on the fundamental precept thatgovernment must respect, protect, and enhance the freedom and in-tegrity of the individual. Economic policy must seek to create a cli-mate that encourages the development of private institutions condu-cive to individual responsibility and initiative. People should be en-couraged to go about their daily lives with the right and the responsi-bility for determining their own activities, status, and achievements.
This Report reviews the condition of the American economy as itwas inherited by this Administration. It describes the policies whichhave been adopted to reverse the debilitating trends of the past, andwhich will lead to recovery in 1982 and sustained, noninflationarygrowth in the years to follow. And, finally, this Report explains theimpact these policies will have on the economic well-being of allAmericans in the years to come.
The Legacy of the Past
For several decades, an ever-larger role for the Federal Govern-ment and, more recently, inflation have sapped the economic vitalityof the Nation.
In the 1960s Federal spending averaged 19.5 percent of the Na-tion's output. In the 1970s it rose to 20.9 percent, and in 1980 itreached 22.5 percent. The burden of tax revenues showed a similarpattern, with increasingly high tax rates stifling individual initiativeand distorting the flow of saving and investment.
The substantially expanded role of the Federal Government hasbeen far deeper and broader than even the growing burden ofspending, and taxing would suggest. Over the past decade the gov-ernment has spun a vast web of regulations that intrude into almost
Digitized for FRASER http://fraser.stlouisfed.org/ Federal Reserve Bank of St. Louis

every aspect of every American's working day. This regulatory webadversely affects the productivity of our Nation's businesses, farms,educational institutions, State and local governments, and the oper-ations of the Federal Government itself. That lessened productivitygrowth, in turn, increases the costs of the goods and services we buyfrom each other. And those regulations raise the cost of governmentat all levels and the taxes we pay to support it.
Consider also the tragic record of inflation—that unlegislated taxon everyone's income—which causes high interest rates and discour-ages saving and investment. During the 1960s, the average yearly in-crease in the consumer price index was 2.3 percent. In the 1970s therate more than doubled to 7.1 percent; and in the first year of the1980s it soared to 13.5 percent. We simply cannot blame crop fail-ures and oil price increases for our basic inflation problem. The con-tinuous, underlying cause was poor government policy.
The combination of these two factors—ever higher rates of infla-tion and ever greater intrusion by the Federal Government into theNation's economic life—have played a major part in a fundamentaldeterioration in the performance of our economy. In the 1960s pro-ductivity in the American economy grew at an annual rate of 2.9 per-cent; in the 1970s productivity growth slowed by nearly one-half, to1.5 percent. Real gross national product per capita grew at an annualrate of 2.8 percent in the 1960s compared to 2.1 percent in the1970s. This deterioration in our economic performance has beenaccompanied by inadequate growth in employment opportunities forour Nation's growing work force.
Reversing the trends of the past is not an easy task. I neverthought or stated it would be. The damage that has been inflicted onour economy was done by imprudent and inappropriate policies overa period of many years; we cannot realistically expect to undo it all ina few short months. But during the past year we have made a sub-stantial beginning.
Policies for the 1980s
Upon coming into office, my Administration set out to design andcarry out a long-run economic program that would decisively reversethe trends of the past, and make growth and prosperity the norm,rather than the exception for the American economy. To that end,my first and foremost objective has been to improve the performanceof the economy by reducing the role of the Federal Government inall its many dimensions. This involves a commitment to reduce Fed-eral spending and taxing as a share of gross national product. Itmeans a commitment to reduce progressively the size of the Federaldeficit. It involves a substantial reform of Federal regulation,
Digitized for FRASER http://fraser.stlouisfed.org/ Federal Reserve Bank of St. Louis

eliminating it where possible and simplifying it where appropriate. Itmeans eschewing the stop-and-go economic policies of the pastwhich, with their short-term focus, only added to our long-run eco-nomic ills.
A reduced role for the Federal Government means an enhancedrole for State and local governments. A wide range of Federal activi-ties can be more appropriately and efficiently carried out by theStates. I am proposing in my Budget Message a major shift in this di-rection. This shift will eliminate the "freight charge" imposed by theFederal Government on the taxpayers' money when it is sent toWashington and then doled out again. It will permit a substantial re-duction in Federal employment involved in administering these pro-grams. Transfers of programs will permit public sector activities tobe more closely tailored to the needs and desires of the electorate,bringing taxing and spending decisions closer to the people. Further-more, as a result of last year's Economic Recovery Tax Act, Federaltaxation as a share of national income will be substantially reduced,providing States and localities with an expanded tax base so that theycan finance those transferred programs they wish to continue. Thattax base will be further increased later in this decade, as Federalexcise taxes are phased out.
These initiatives follow some common sense approaches to makinggovernment more efficient and responsive:
• We should leave to private initiative all the functions that individ-uals can perform privately.
• We should use the level of government closest to the communityinvolved for all the public functions it can handle. This principleincludes encouraging intergovernmental arrangements amongthe State and local communities.
• Federal Government action should be reserved for those neededfunctions that only the national government can undertake.
The accompanying report from my Council of Economic Advisersdevelops the basis for these guidelines more fully.
To carry out these policies for the 1980s, my Administration hasput into place a series of fundamental and far-reaching changes inFederal Government spending, taxing, and regulatory policy, and wehave made clear our support for a monetary policy that will steadilybring down inflation.
Slowing the Growth of Government Spending
Last February I promised to bring a halt to the rapid growth ofFederal spending. To that end, I made budget control the cuttingedge of my program for economic recovery. Thanks to the coopera-tion of the Congress and the American people, we have taken a
Digitized for FRASER http://fraser.stlouisfed.org/ Federal Reserve Bank of St. Louis

major step forward in accomplishing this objective, although muchmore remains to be done.
The Congress approved rescissions in the fiscal 1981 budget of$12.1 billion, by far the largest amount ever cut from the budgetthrough this procedure. Spending for fiscal 1982 was subsequentlyreduced . by another $35 billion. The Omnibus Budget Recon-ciliation Act of 1981 also cut $95 billion from the next 2 fiscalyears, measured against previous spending trends. Many of these cutsin so-called "uncontrollable" programs were carried out by substan-tive changes in authorizing legislation, demonstrating that we canbring government spending under control—if only we have the will.These spending cuts have been made without damaging the pro-grams that many of our truly needy Americans depend upon. Indeed,my program will continue to increase the funds, before and after al-lowing for inflation, that such programs receive in the future.
In this undertaking to bring spending under control, I have made aconscious effort to ensure that the Federal Government fully dis-charges its duty to provide all Americans with the needed servicesand protections that only a national government can provide. Chiefamong these is a strong national defense, a vital function which hadbeen allowed to deteriorate dangerously in previous years.
As a result of my program, Federal Government spending growthhas been cut drastically—from nearly 14 percent annually in the 3fiscal years ending last September to an estimated 7 percent over thenext 3 years—at the same time that we are rebuilding our nationaldefense capabilities.
We must redouble our efforts to control the growth in spending.We face high, continuing, and troublesome deficits. Although thesedeficits are undesirably high, they will not jeopardize the economicrecovery. We must understand the reasons behind the deficits nowfacing us: recession, lower inflation, and higher interest rates thananticipated. Although my original timetable for a balanced budget isno longer achievable, the factors which have postponed it do notmean we are abandoning the goal of living within our means. Theappropriate ways to reducing the deficit will be working inour favor in 1982 and beyond: economic growth, lower interest rates,and spending control.
Reducing Tax Burdens
We often hear it said that we work the first few months of the yearfor the government and then we start to work for ourselves. But thatis backwards. In fact, the first part of the year we work for ourselves.We begin working for the government only when our income reachestaxable levels. After that, the more we earn, the more we work for
Digitized for FRASER http://fraser.stlouisfed.org/ Federal Reserve Bank of St. Louis

the government, until rising tax rates on each dollar of extra incomediscourage many people from further work effort or from furthersaving and investment.
As a result of passage of the historic Economic Recovery Tax Actof 1981, we have set in place a fundamental reorientation of our taxlaws. Rather than using the tax system to redistribute existingincome, we have significantly restructured it to encourage people towork, save, and invest more. Across-the-board cuts in individualincome tax rates phased-in over 3 years and the indexing of taxbrackets in subsequent years will help put an end to making inflationprofitable for the Federal Government. The reduction in marginalrates for all taxpayers, making Individual Retirement Accounts availa-ble to all workers, cutting the top tax bracket from 70 percent to 50percent, and reduction of the "marriage penalty" will have a power-ful impact on the incentives for all Americans to work, save, andinvest.
These changes are moving us away from a tax system which hasencouraged individuals to borrow and spend to one in which savingand investment will be more fully rewarded.
To spur further business investment and productivity growth, thenew tax law provides faster write-offs for capital investment and a re-structured investment tax credit. Research and development expendi-tures are encouraged with a new tax credit. Small business tax rateshave been reduced.
Regulatory Reform
My commitment to regulatory reform was made clear in one of myvery first acts in office, when I accelerated the decontrol of crude oilprices and eliminated the cumbersome crude oil entitlements system.Only skeptics of the free market system are surprised by the results.For the first time in 10 years, crude oil production in the continentalUnited States has begun to rise. Prices and availability are now deter-mined by the forces of the market, not dictated by Washington. And,helped by world supply and demand developments, oil and gasolineprices have been falling, rather than rising.
I have established, by Executive order, a process whereby all ex-ecutive agency regulatory activity is subject to close and sensitivemonitoring by the Executive Office of the President. During the firstyear of my Administration, 2,893 regulations have been subjected toExecutive Office review. The number of pages in the Federal Register,the daily publication that contains a record of the Federal Govern-ment's official regulatory actions, has fallen by over one-quarter afterincreasing steadily for a decade.
Digitized for FRASER http://fraser.stlouisfed.org/ Federal Reserve Bank of St. Louis

But the full impact of this program cannot be found in easy-to-measure actions by the Federal Government. It is taking place out-side of Washington, in large and small businesses, in State and localgovernments, and in our schools and hospitals where the full benefitsof regulatory reform are being felt. The redirection of work andeffort away from trying to cope with or anticipate Federal regulationtoward more productive pursuits is how regulatory reform will makeits greatest impact in raising productivity and reducing costs.
Controlling Money Growth
Monetary policy is carried out by the independent Federal ReserveSystem. I have made clear my support for a policy of gradual and lessvolatile reduction in the growth of the money supply. Such a policywill ensure that inflationary pressures will continue to decline withoutimpairing the operation of our financial markets as they mobilize sav-ings and direct them to their most productive uses. It will also ensurethat high interest rates, with their large inflation premiums, will nolonger pose a threat to the well-being of our housing and motor ve-hicle industries, to small business and farmers, and to all who relyupon the use of credit in their daily activities. In addition, reducedmonetary volatility will strengthen confidence in monetary policy andhelp lower interest rates.
The International Aspects of the Program
The poor performance of the American economy over the pastdecade and more has had its impact on our position in the worldeconomy. Concern about the dollar was evidenced by a prolongedperiod of decline in its value on foreign exchange markets. A declinein our competitiveness in many world markets reflected, in part,problems of productivity at home.
A strengthened domestic economy will mean a faster growingmarket for our trading partners and greater competitiveness forAmerican exports abroad. At the same time it will mean that thedollar should increase in its attractiveness as the primary internation-al trading currency, and thus provide more stability to world tradeand finance.
I see an expansion of the international trading system as the chiefinstrument for economic growth in many of the less developedcountries as well as an important factor in our own future and that ofthe world's other major industrial nations. To this end, I reaffirm myAdministration's commitment to free trade. International cooperationis particularly vital, however, in confronting the challenge of in-creased protectionism both at home and abroad. My Administration
Digitized for FRASER http://fraser.stlouisfed.org/ Federal Reserve Bank of St. Louis

will work closely with other nations toward reducing trade barrierson an even-handed basis.
I am sensitive to the fact that American domestic economic policiescan have significant impacts on our trading partners and on theentire system of world trade and finance. But it is important for allconcerned that the United States pursue economic policies that focuson our long-run problems, and lead to sustained and vigorousgrowth at home. In this way the United States will continue to be aconstructive force in the world economy.
1981: Building for the Future
In 1981 not only were the far-reaching policies needed for the re-mainder of the 1980s developed and put into place, their first posi-tive results also began to be felt.
The most significant result was the contribution these policiesmade to a substantial reduction in inflation, bringing badly neededrelief from inflationary pressures to every American. For example, in1980 the consumer price index rose 13.5 percent for the year as awhole; in 1981 that rate of increase was reduced substantially, to 10.4percent. This moderation in the rate of price increases meant that in-flation, "the cruelest tax/' was taking less away from individual sav-ings and taking less out of every working American's paycheck.
There are other, more indirect but equally important benefits thatflow from a reduction in inflation. The historically high level of inter-est rates of recent years was a direct reflection of high rates of actualand expected inflation. As the events of this past year suggested, onlya reduction in inflationary pressures will lead to substantial, lastingreductions in interest rates.
In the 6 months preceding this Administration's taking office, in-terest rates had risen rapidly, reflecting excessively fast monetarygrowth. Since late last summer, however, short- and long-term inter-est rates have, on average, moved down somewhat in response toanti-inflationary economic policies.
Unfortunately, the high and volatile money growth of the past, andthe high inflation and high interest rates which accompanied it, wereinstrumental in bringing about the poor and highly uneven economicperformance of 1980 and 1981, culminating in a sharp fall in outputand a rise in unemployment in the latter months of 1981.
This Administration views the current recession with concern. I amconvinced that our policies, now that they are in place, are the appro-priate response to our current difficulties and will provide the basisfor a vigorous economic recovery this year. It is of the greatest im-portance that we avoid a return to the stop-and-go policies of thepast. The private sector works best when the Federal Government
9
Digitized for FRASER http://fraser.stlouisfed.org/ Federal Reserve Bank of St. Louis
intervenes least. The Federal Government's task is to construct asound, stable, long-term framework in which the private sector is thekey engine to growth, employment, and rising living standards.
The policies of the past have failed. They failed because they didnot provide the environment in which American energy, entrepre-neurship, and talent can best be put to work. Instead of being a suc-cessful promoter of economic growth and individual freedom, gov-ernment became the enemy of growth and an intruder on individualinitiative and freedom. My program—a careful combination of reduc-ing incentive-stifling taxes, slowing the growth of Federal spendingand regulations, and a gradually slowing expansion of the moneysupply—seeks to create a new environment in which the strengths ofAmerica can be put to work for the benefit of us all. That environ-ment will be an America in which honest work is no longer discour-aged by ever-rising prices and tax rates, a country that looks forwardto the future not with uncertainty but with the confidence that in-fused our forefathers.
(\ x &^*&d^ \ CJL^KJXK^
February 10, 1982
10Digitized for FRASER http://fraser.stlouisfed.org/ Federal Reserve Bank of St. Louis
THE ANNUAL REPORT
OF THECOUNCIL OF ECONOMIC ADVISERS
Digitized for FRASER http://fraser.stlouisfed.org/ Federal Reserve Bank of St. Louis

Digitized for FRASER http://fraser.stlouisfed.org/ Federal Reserve Bank of St. Louis

LETTER OF TRANSMITTAL
COUNCIL OF ECONOMIC ADVISERS,Washington, D.C., February 6, 1982.
MR. PRESIDENT:The Council of Economic Advisers herewith submits its 1982
Annual Report in accordance with the provisions of the EmploymentAct of 1946 as amended by the Full Employment and BalancedGrowth Act of 1978.
Sincerely,
Murray L. WeidenbaumCHAIRMAN
William A. Niskanen
13
358-691 0 - 82 - 2 : QL3Digitized for FRASER http://fraser.stlouisfed.org/ Federal Reserve Bank of St. Louis

Digitized for FRASER http://fraser.stlouisfed.org/ Federal Reserve Bank of St. Louis
CONTENTS
Page
CHAPTER 1. ECONOMIC POLICY FOR THE 1980s 21The Legacy of "Stagflation" 21The President's Program for Economic Recovery 23A Summary of Economic Conditions 23Prospects for Recovery 25Organization of this Report 26
CHAPTER 2, GOVERNMENT AND THE ECONOMY 27The LimitecJ Case for Government Intervention 29
Externalities 30Monopoly 31Public Goods 33Income Redistribution ,.'. 33Macroeconomic Stability 35
The Division of Roles in a Federal System 36Limits on the Exercise of the Federal Role 37
The Political Process 37Supply by Government Agencies 39Diversity of Conditions and Preferences 40Limits on Information 41Time Horizon 41
Principles Guiding the President's Economic Program 42Emphasis on Personal Responsibility 42Reform of Regulation 43Federalism 44Long-Run Focus 44Increased Reliance on the Market 44Emphasis on the General Welfare 45
CHAPTER 3. MONETARY POLICY, INFLATION, AND EMPLOYMENT 47The Legacies , 48
The Legacy of Economic Stabilization Policy 48The Legacy of "Stagflation" 50The Business Cycle and Rising Inflation Legacy 52
The Nature of the Inflation Process 54The Costs of Inflation 56
The Costs of Reducing Inflation 58Money and Monetary Policy 61
15Digitized for FRASER http://fraser.stlouisfed.org/ Federal Reserve Bank of St. Louis

Page
Money Creation and Federal Finance 61Money Versus Credit 62Monetary Policy Objectives and Strategy 63
Institutionalization of a Noninflationary Monetary Policy.... 68Gold Standard 69A Monetary Rule 74
The Future Challenge 75CHAPTER 4. FEDERAL BUDGET ISSUES 78
The Overall Level of Federal Spending 80Reallocation of Budget Priorities 83
Defense 85Social Security 88
Strengthening the Federal System 90Federal Credit Activity 92
Federal Deficits in Perspective 95Why Deficits Matter 95Measuring the Deficit 96An Analysis of Deficits and Debt Financing 97The Deficit and Politics of the Budget 101
Appendix to Chapter 4: A Broader Perspective on theFederal Debt 102
CHAPTER 5. TAX POLICY AND ECONOMIC GROWTH 109Economic Growth; Past Performance and Future Potential. I l l
Measuring Growth I l lEconomic Growth—The Historical Record 112Explaining the Productivity Slowdown 114Prospects for Growth in the 1980s 115Increasing Factor Supply 115
The Economic Effects of Tax Policy 117The Structure of the Tax System 118The Personal Income Tax 119Taxation of Income from Business Investment 122Tax Treatment of Depreciable Property 122Leasing Provisions 125Effects of Tax Act on Housing and Consumer Dura-
bles 126Implicit Taxation of Labor Supply by the Social Secu-
rity and Welfare Systems 127Monetary Policy as a Fiscal Instrument 129
Structural Tax Policy and Economic Growth 182CHAFFER 6. REFORMING GOVERNMENT REGULATION OF ECONOM-
IC ACTIVITY 134The Growth of Federal Regulation 134
Reasons for Regulation 135An Overview of Regulation 137
16
Digitized for FRASER http://fraser.stlouisfed.org/ Federal Reserve Bank of St. Louis
Page
Benefit-Cost Analysis of Government Regulation 137Quantification 139
The Evolution of Regulatory Review 140The Clean Air Act and Economic Analysis 143
Long-Range Transport 143Ambient Air Standards 144Technology-Based Stationary Source Standards 144Mobile Source Standards 145Hazardous Emissions Standards 146
The Control of Health Care Costs: A Contrast of Ap-proaches 147
The Industry v 147Proposals for Reform 150
Regulatory Reform in the Agencies 150Financial Institutions 150Agriculture 153Energy 156Transportation 161Telecommunications 163
Antitrust 164Guidelines for Regulatory Reform 165
CHAPTER 7. THE UNITED STATES IN THE INTERNATIONAL ECO-NOMIC SYSTEM 167
International Financial Markets 168The Dollar in the International Setting 168Exchange-Rate Movements 169Official Intervention in the Exchange Markets 172Implications for U.S. Monetary Policy 173
Trade Issues and Policies 174Trade in the U.S. Economy 174The Stance of U.S. Trade Policy 176Changing Attitudes Toward International Trade 177The Significance of External Imbalances 179
Development, Adjustment, and International Institutions... 181The Heritage and the Challenges 181Meeting the Challenges 183Evolving Role of International Institutions 184
Appendix to Chapter 7: U.S. Policies on Exchange-RateIntervention Since 1973.... 189
CHAPTER 8. REVIEW AND OUTLOOK 192Overview of 1981 192Major Sectors of Aggregate Demand 196
Personal Consumption Expenditures 197Residential Investment 198
17Digitized for FRASER http://fraser.stlouisfed.org/ Federal Reserve Bank of St. Louis

PageBusiness Fixed Investment 198Inventory Accumulation 199Net Export 199
The Farm Economy 199Labor Market Developments 201Wages, Prices, and Productivity 203Credit Markets.... 205
Interest Rates and Monetary Developments 206International Capital Flows 208Thrift Institutions 1 209
Prospects for 1982 and 1983 209Prospects Beyond 1983 213
APPENDIXESA. Report to the President on the Activities of the Council
of Economic Advisers During 1981 217B. Statistical Tables Relating to Income, Employment and
Production 227
List of Tables and ChartsTables1-1, Major Economic Conditions and the Federal Role, 1960-
80 223-1. Wholesale Price Indexes, 1814-1913 713-2. Comparison of the Behavior of Price Level, Real Output,
and Money Growth in the United Kingdom and theUnited States, Selected Periods, 1821-1979 71
3-3. Changes in Gold Output and the Price Level, 1800-1980. 724-1. Structure of Federal Government Expenditures, NIPA,
Calendar Years, 1951-83 824-2. Composition of Federal Unified Budget Outlays, Selected
Fiscal Years, 1960-87 834-3. Federal and Federally Assisted Credit Programs, Fiscal
Years 1970-81 944-4. Total Federal Budget and Off-Budget Surplus or Deficit
and Gross National Product, Fiscal Years 1958-87 984-5. Illustrative Measures of Federal Government's Net Liabil-
ities, 1950-80 1044-6. Comparisons of Total Measured Federal Government's
Indebtedness, Unfunded Social Security Retirement Li-abilities, and Household Wealth, 1950-77 107
5-1. Average Annual Growth Rates of Real GNP, Total FactorProductivity, and Factor Inputs, 1959-79 113
5-2. Average Annual Consumption and Saving Rates, 1951-80 116
18Digitized for FRASER http://fraser.stlouisfed.org/ Federal Reserve Bank of St. Louis

List of Tables and Charts—ContinuedTables Page
5-3. Comparison of Marginal Personal Income Tax Rates byReal Income Level Under the Economic Recovery TaxAct of 1981 and Old Law, 1979-86 119
5-4. Marginal Personal Income Tax Rates for Four-PersonFamilies, Selected Years, 1965-84 120
5-5. Real Before-Tax Rate of Return Required to Provide a 4Percent Real After-Tax Return, 1955-86 123
5-6. Real Before-Tax Rate of Return Required to Provide a 4Percent After-Tax Return in 1986 at Selected Rates ofInflation 124
5-7. Effective Tax Rates on New Depreciable Assets, SelectedIndustries, 1982 l 124
5-8. Sources of Changes in Federal Government's Real NetFinancial Liabilities, 1966-80 131
6-1. Regulatory Outlays of Federal Agencies, Fiscal Years1974-81 136
6-2. Domestic Crude Oil Production and Drilling Activity,1973-81 157
6-3. Domestic Crude Oil Production, 1980-81 1576-4. Imports of Crude Oil and Refined Products, 1980-81 1587-1. U.S. Merchandise Exports, Imports, and Balance, 1977-
81 1757-2. U.S. International Transactions, 1977-81 1807-3. Real GNP Growth Rates, 1950 to 1980 1828-1. Performance in 1981 Compared to January 15 Projec-
tions 1958-2. Growth in Major Components of Real Gross National
Product, 1977-81 1968-3. Labor Market Developments, 1977-81 2018-4. Measures of Compensation, 1978-81 2038-5. Changes in Productivity and Unit Labor Costs, 1977-81 .. 2048-6. Measures of Price Change, 1977-81 2048-7. Alternative Measures of Changes in Real Earnings Per
Hour, 1979-81 2058-8. Economic Outlook for 1982 2108-9. Economic Projections, 1982-87 214Charts
3-1. Inflation and Unemployment Rate 513-2. The Inflation Ratchet (CPI) 543-3. Money and GNP Growth 643-4. Jevons-Sauerbeck Index of Wholesale Commodity Prices . 704-1. Defense Outlays as Percent of GNP 856-1. Growth of Federal Regulatory Agencies 135
19Digitized for FRASER http://fraser.stlouisfed.org/ Federal Reserve Bank of St. Louis

List of Tables and Charts—ContinuedCharts Page
7-1. Nominal and Real Effective Foreign Exchange Value ofthe Dollar 170
7-2. U.S. External Terms of Trade 1718-1. Growth Rates of Money Stock, Real GNP, and GNP De-
flator 1938-2. Employment Ratio and Unemployment Rate 2038-3. Interest Rates in 1981 207
20Digitized for FRASER http://fraser.stlouisfed.org/ Federal Reserve Bank of St. Louis

CHAPTER 1
Economic Policy for the 1980s
THE YEAR JUST ENDED was an especially significant one for theeconomy and for economic policymaking. When future Reports arewritten, we hope that 1981 will be described as the watershed year inwhich the more than decade-old rising trend of inflation was finallyarrested. This development should contribute to more rapidly risingstandards of living, more productive patterns of investment andsaving, and a strengthened U.S. position in the world economy.
At the same time that inflation was moderating, a far-reaching setof economic policies was being developed to provide a framework forgrowth and stability in the years ahead, reversing more than a decadeof declining productivity growth and wide swings in economic activi-ty-
The speed with which the economy adjusts to the Administration'spolicies will be largely determined by the extent to which individuals,at home and at work, believe the Administration will maintain, un-changed, its basic approach to personal and business taxation, Feder-al spending and regulation, and monetary policy. When public expec-tations fully adjust to this commitment, a necessary condition forboth reduced inflation and higher growth will be fully established. Inshort, as this Report attempts to demonstrate, what some people havereferred to as "monetarism" and "supply-side economics" should beseen as two sides of the same coin—compatible and necessary meas-ures to both reduce inflation and increase economic growth.
THE LEGACY OF "STAGFLATION"
Over the last 15 years the U.S. economy has experienced progres-;sively higher rates of inflation and unemployment, a combination ofconditions commonly called "stagflation." This development was as-sociated with a substantial increase in the Federal Government's rolein the economy. Federal spending and tax revenues absorbed an in-creasing share of national output, Federal regulations were extendedto a much broader scope of economic activity, and the rate of moneygrowth increased substantially. Table 1-1 contrasts economic condi-tions during the 1960-65 period (the last business cycle prior to the
21
Digitized for FRASER http://fraser.stlouisfed.org/ Federal Reserve Bank of St. Louis

Vietnam war), the 1974-79 period (the most recent extended busi-ness cycle), and 1980.
TABLE 1-1.—Major economic conditions and the Federal role, 1960-80
[Percent; annual average, except as noted]
Item
Economic conditions:
Productivity increase
Unemployment rate
Inflation
Interest rate
The Federal role:
Spending shar^ of GNP
Revenue share of GNP
Regulation increase
Money supply increase
1960-1965
26
5.5
1.6
44
18.8
18.6
76
3.0
1974-1979
07
68
7 5
87
217
197
139
6.6
1980
-02
7.1
90
119
22.9
206
123
7.3
Note. For this table, the following are used:Productivity—Output per hour, private nonfarm business, all employees.Unemployment rate—unemployment as percent of civilian labor force, persons 16 years of age and over.Inflation—Change in implicit price deflator for gross national product (GNP).Interest rate—Corporate Aaa bond yield.Spending share—Federal expenditures, national income and product accounts (NiPA), as percent of GNP.Tax share—Federal receipts (NIPA) as percent of GNP. 'Regulation—Number of pages in the Federal Register.Money supply—Ml (fourth quarter to fourth quarter).
Sources: Department of Commerce (Bureau of Economic Analysis), Department of Labor (Bureau of Labor Statistics), Board of Governors ofthe Federal Reserve System, Office of the Federal Register, and Moody's Investors Service.
As this table illustrates, economic conditions worsened between theearly 1960s and the late 1970s, and deteriorated sharply during therecession year 1980, Part of the decline in U.S, economic perform-ance was clearly attributable to developments not affected by Federaleconomic policy, such as the oil price increases of the 1970s. Suchdevelopments, however, explain only a small part of the decline inoverall U.S. economic performance.
A full explanation of stagflation in the United States and othercountries has yet to be developed. An important lesson of thisperiod, however, is that there is no long-term tradeoff between un-employment and inflation. The increasing role of the Federal Gov-ernment in the economy—whether that role was to aid the poor andaged, to protect consumers and the environment, or to stabilize theeconomy—contributed to our declining economic performance. Mostof the increase in Federal spending over the past 15 years has beenin the form of transfer payments, which tend to reduce employmentof the poor and of older workers. A combination of increases insome tax rates and inflation raised marginal tax rates on real wagesand capital income. The rapid growth in regulatory activity—howevermeasured—has significantly increased production costs. The FederalGovernment bears the most direct responsibility for the increases in
22
Digitized for FRASER http://fraser.stlouisfed.org/ Federal Reserve Bank of St. Louis
inflation and interest rates, which were due to excessive expansion ofthe money supply. In short, Federal economic policies bear the majorresponsibility for the legacy of stagflation.
THE PRESIDENT'S PROGRAM FOR ECONOMIC RECOVERY
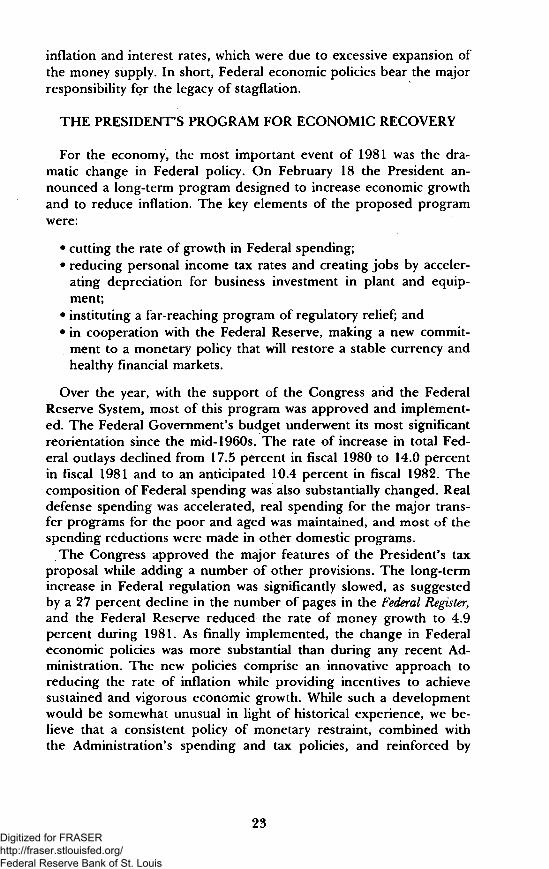
For the economy, the most important event of 1981 was the dra-matic change in Federal policy. On February 18 the President an-nounced a long-term program designed to increase economic growthand to reduce inflation. The key elements of the proposed programwere:
• cutting the rate of growth in Federal spending;• reducing personal income tax rates and creating jobs by acceler-
ating depreciation for business investment in plant and equip-ment;
• instituting a far-reaching program of regulatory relief; and• in cooperation with the Federal Reserve, making a new commit-
ment to a monetary policy that will restore a stable currency andhealthy financial markets.
Over the year, with the support of the Congress and the FederalReserve System, most of this program was approved and implement-ed. The Federal Government's budget underwent its most significantreorientation since the mid-1960s. The rate of increase in total Fed-eral outlays declined from 17.5 percent in fiscal 1980 to 14.0 percentin fiscal 1981 and to an anticipated 10.4 percent in fiscal 1982. Thecomposition of Federal spending was also substantially changed. Realdefense spending was accelerated, real spending for the major trans-fer programs for the poor and aged was maintained, and most of thespending reductions were made in other domestic programs.
The Congress approved the major features of the President's taxproposal while adding a number of other provisions. The long-termincrease in Federal regulation was significantly slowed, as suggestedby a 27 percent decline in the number of pages in the Federal Register,and the Federal Reserve reduced the rate of money growth to 4.9percent during 1981. As finally implemented, the change in Federaleconomic policies was more substantial than during any recent Ad-ministration. The new policies comprise an innovative approach toreducing the rate of inflation while providing incentives to achievesustained and vigorous economic growth. While such a developmentwould be somewhat unusual in light of historical experience, we be-lieve that a consistent policy of monetary restraint, combined withthe Administration's spending and tax policies, and reinforced by
23Digitized for FRASER http://fraser.stlouisfed.org/ Federal Reserve Bank of St. Louis
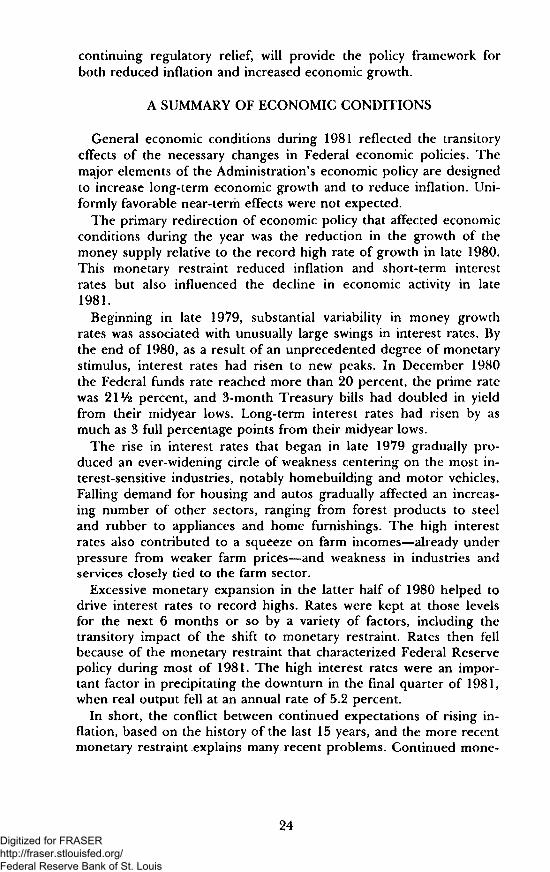
continuing regulatory relief, will provide the policy framework forboth reduced inflation and increased economic growth,
A SUMMARY OF ECONOMIC CONDITIONS
General economic conditions during 1981 reflected the transitoryeffects of the necessary changes in Federal economic policies. Themajor elements of the Administration's economic policy are designedto increase long-term economic growth and to reduce inflation. Uni-formly favorable near-term effects were not expected.
The primary redirection of economic policy that affected economicconditions during the year was the reduction in the growth of themoney supply relative to the record high rate of growth in late 1980.This monetary restraint reduced inflation and short-term interestrates but also influenced the decline in economic activity in late1981.
Beginning in late 1979, substantial variability in money growthrates was associated with unusually large swings in interest rates. Bythe end of 1980, as a result of an unprecedented degree of monetarystimulus, interest rates had risen to new peaks. In December 1980the Federal funds rate reached more than 20 percent, the prime ratewas 21V2 percent, and 3-month Treasury bills had doubled in yieldfrom their midyear lows. Long-term interest rates had risen by asmuch as 3 full percentage points from their midyear lows.
The rise in interest rates that began in late 1979 gradually pro-duced an ever-widening circle of weakness centering on the most in-terest-sensitive industries, notably homebuilding and motor vehicles.Falling demand for housing and autos gradually affected an increas-ing number of other sectors, ranging from forest products to steeland rubber to appliances and home furnishings. The high interestrates also contributed to a squeeze on farm incomes—already underpressure from weaker farm prices—and weakness in industries andservices closely tied to the farm sector.
Excessive monetary expansion in the latter half of 1980 helped todrive interest rates to record highs. Rates were kept at those levelsfor the next 6 months or so by a variety of factors, including thetransitory impact of the shift to monetary restraint. Rates then fellbecause of the monetary restraint that characterized Federal Reservepolicy during most of 1981. The high interest rates were an impor-tant factor in precipitating the downturn in the final quarter of 1981,when real output fell at an annual rate of 5.2 percent.
In short, the conflict between continued expectations of rising in-flation, based on the history of the last 15 years, and the more recentmonetary restraint explains many recent problems. Continued mone-
24Digitized for FRASER http://fraser.stlouisfed.org/ Federal Reserve Bank of St. Louis
tary restraint and a reduction of the within-year variability of moneygrowth, however, are necessary both to reduce inflation and providethe basis for sustained economic growth.
PROSPECTS FOR RECOVERY
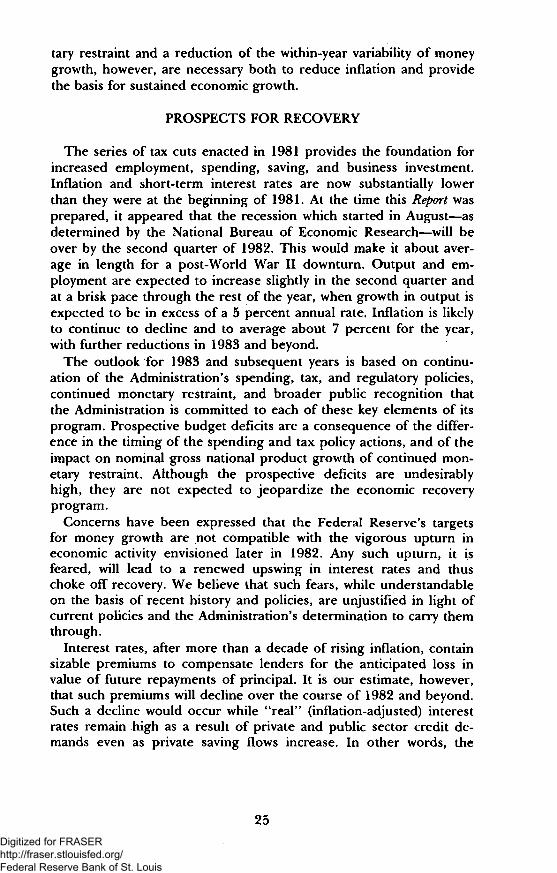
The series of tax cuts enacted in 1981 provides the foundation forincreased employment, spending, saving, and business investment.Inflation and short-term interest rates are now substantially lowerthan they were at the beginning of 1981. At the time this Report wasprepared, it appeared that the recession which started in August—asdetermined by the National Bureau of Economic Research—will beover by the second quarter of 1982. This would make it about aver-age in length for a post-World War II downturn. Output and em-ployment are expected to increase slightly in the second quarter andat a brisk pace through the rest of the year, when growth in output isexpected to be in excess of a 5 percent annual rate. Inflation is likelyto continue to decline and to average about 7 percent for the year,with further reductions in 1983 and beyond.
The outlook for 1983 and subsequent years is based on continu-ation of the Administration's spending, tax, and regulatory policies,continued monetary restraint, and broader public recognition thatthe Administration is committed to each of these key elements of itsprogram. Prospective budget deficits are a consequence of the differ-ence in the timing of the spending and tax policy actions, and of theimpact on nominal gross national product growth of continued mon-etary restraint. Although the prospective deficits are undesirablyhigh, they are not expected to jeopardize the economic recoveryprogram.
Concerns have been expressed that the Federal Reserve's targetsfor money growth are not compatible with the vigorous upturn ineconomic activity envisioned later in 1982. Any such upturn, it isfeared, will lead to a renewed upswing in interest rates and thuschoke off recovery. We believe that such fears, while understandableon the basis of recent history and policies, are unjustified in light ofcurrent policies and the Administration's determination to carry themthrough.
Interest rates, after more than a decade of rising inflation, containsizable premiums to compensate lenders for the anticipated loss invalue of future repayments of principal. It is our estimate, however,that such premiums will decline over the course of 1982 and beyond.Such a decline would occur while "real" (inflation-adjusted) interestrates remain high as a result of private and public sector credit de-mands even as private saving flows increase. In other words, the
25
Digitized for FRASER http://fraser.stlouisfed.org/ Federal Reserve Bank of St. Louis
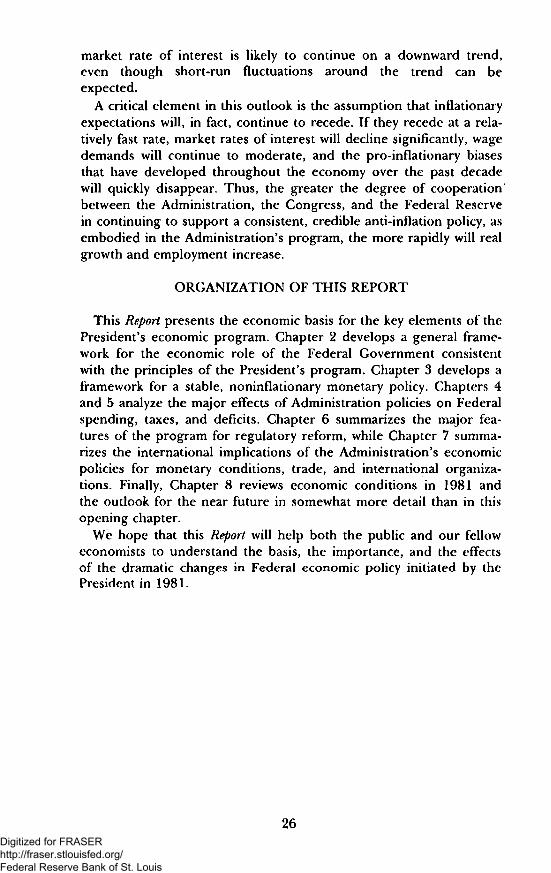
market rate of interest is likely to continue on a downward trend,even though short-run fluctuations around the trend can beexpected.
A critical element in this outlook is the assumption that inflationaryexpectations will, in fact, continue to recede. If they recede at a rela-tively fast rate, market rates of interest will decline significantly, wagedemands will continue to moderate, and the pro-inflationary biasesthat have developed throughout the economy over the past decadewill quickly disappear. Thus, the greater the degree of cooperationbetween the Administration, the Congress, and the Federal Reservein continuing to support a consistent, credible anti-inflation policy, asembodied in the Administration's program, the more rapidly will realgrowth and employment increase.
ORGANIZATION OF THIS REPORT
This Report presents the economic basis for the key elements of thePresident's economic program. Chapter 2 develops a general frame-work for the economic role of the Federal Government consistentwith the principles of the President's program. Chapter 3 develops aframework for a stable, noninflationary monetary policy. Chapters 4and 5 analyze the major effects of Administration policies on Federalspending, taxes, and deficits. Chapter 6 summarizes the major fea-tures of the program for regulatory reform, while Chapter 7 summa-rizes the international implications of the Administration's economicpolicies for monetary conditions, trade, and international organiza-tions. Finally, Chapter 8 reviews economic conditions in 1981 andthe outlook for the near future in somewhat more detail than in thisopening chapter.
We hope that this Report will help both the public and our felloweconomists to understand the basis, the importance, and the effectsof the dramatic changes in Federal economic policy initiated by thePresident in 1981.
26Digitized for FRASER http://fraser.stlouisfed.org/ Federal Reserve Bank of St. Louis

CHAPTER 2
Government and the EconomyPOLITICAL FREEDOM AND ECONOMIC FREEDOM are closely
related. Any comparison among contemporary nations or examina-tion of the historical record demonstrates two important relation-ships between the nature of the political system and the nature of theeconomic system:
• All nations which have broad-based representative governmentand civil liberties have most of their economic activity organizedby the market.
• Economic conditions in market economies are generally superiorto those in nations (with a comparable culture and a comparableresource base) in which the government has the dominant eco-nomic role.
The evidence is striking. No nation in which the government hasthe dominant economic role (as measured by the proportion of grossnational product originating in the government sector) has main-tained broad political freedom; economic conditions in such coun-tries are generally inferior to those in comparable nations with apredominantly market economy. Voluntary migration, sometimes at highpersonal cost, is uniformly to nations with both more political free-dom and more economic freedom.
The reasons for these two relationships between political and eco-nomic systems are simple but not widely understood. Everyonewould prefer higher prices for goods sold and lower prices for goodsbought. Since the farmer's wheat is the consumer's bread, however,both parties cannot achieve all they want. The most fundamental dif-ference among economic systems is how these conflicting preferencesare resolved.
A market system resolves these conflicts by allowing the seller toget the highest price at which others will buy and the buyer to getthe lowest price at which others will sell, by consensual exchangesthat are expected to benefit both parties. Any attempt by one partyto improve his outcome relative to the market outcome requires acoercive activity at the expense of some other party. The politiciza-
27
Digitized for FRASER http://fraser.stlouisfed.org/ Federal Reserve Bank of St. Louis

tion of price decisions—whether of wages, commodities, or interestrates—tends to reduce both the breadth of popular support forthe government and the efficiency of the economy. A rich nation cantolerate a good bit of such mischief, but not an unlimited amount.One should not be surprised that all nations in which the govern-ment has dominant control of the economy are run by a narrow oli-garchy and in most economic conditions are relatively poor. In theabsence of limits on the economic role of government, the erosion ofeconomic freedom destroys both political freedom and economicperformance.
Only a few dozen nations now guarantee their citizens both politi-cal and economic freedom. The economic role of government inthese nations differs widely, without serious jeopardy to political free-dom. Within the range of experience of the United States and theother free nations, the relation between the political system and thegovernment's economic role is more subtle. Expansion of the eco-nomic role of the government tends to reduce both the level ofagreement on government policies and the inclination to engage inpolitical dissent. The link between political and economic freedom isimportant. Increasing economic freedom will also provide greater as-surance of our political freedom.
A major objective of this Administration's economic program is toreduce the Federal Government's role in economic decisionmakingwhile strengthening the economic role of individuals, private organi-zations, and State and local governments. This shift will entail sub-stantial reductions in the size and number of Federal spending pro-grams, significant reductions in both personal and business Federaltax rates, major reforms of Federal regulatory activities, and a re-duced rate of money growth. While an important element in this re-definition of the Federal Government's economic role is a politicaljudgment about the appropriate relationship among individuals, theStates, and the Federal Government, this redefinition also is sup-ported by an extensive body of economic analysis.
This chapter discusses the extent to which government interven-tion in economic matters is appropriate, why concern over "toomuch government" appears to have emerged so strongly in recentdecades, and why the Administration's program is an appropriateresponse.
In probing the role of government in the economy, economistsusually start by analyzing the effects of a competitive economy oneconomic efficiency. In a rough sense, economic efficiency refers tothe ability of an economy to satisfy each person as much as possible,consistent with the preferences of others. For such a competitiveeconomy to be completely efficient, however, certain assumptions
28Digitized for FRASER http://fraser.stlouisfed.org/ Federal Reserve Bank of St. Louis

would have to be satisfied that are never fully satisfied in the realworld. Therefore, it is often argued that government intervention isjustified in order to correct the inefficiencies which occur when thedesired conditions are not achieved.
However, failure to satisfy certain assumptions is not sufficient tojustify government intervention. To show that a perfectly functioninggovernment can correct some problem in a free economy is notenough, for government itself does not function perfectly. Moreover,many current interventions cannot be explained easily by argumentsbased on the alleged failure of the operation of free markets. Manycurrent interventions, in other words, cannot be justified by any effi-ciency criterion.
The following section of this chapter discusses situations in whichsome types of government intervention in the economy may be justi-fied, The section on The Division of Roles in a Federal System dis-cusses the considerations involved in determining the appropriatelevel of government at which such intervention should take place.The section on Limits on the Exercise of the Federal Role discussesthe political process and argues that government intervention willnot always be consistent with the principles developed in the priorsections; that is, this section focuses on the possibility of "govern-ment failure" in intervening in the economy. The last section, Princi-ples Guiding the President's Economic Program, discusses the Ad-ministration's economic program in light of the preceding analysis.
THE LIMITED CASE FOR GOVERNMENT INTERVENTION
Under certain assumptions discussed below, a competitive econo-my can be shown to lead to general economic efficiency. In standardeconomics, an economy is said to be "efficient" if it is impossible tomake anyone better off without making someone else worse off. Thatis, there is no possible rearrangement of resources, in either produc-tion or consumption, which could improve anyone's position withoutsimultaneously harming some other person. If there is a possibility ofsuch a rearrangement occurring, then this means that, someone couldbe made better off without harming anyone else. If such a possibilitydoes exist, then the economy is not efficient.
Each person in such an economy is considered to be concernedprimarily with his or her own welfare. Since there is no central au-thority directing the course of this economy, whatever results occurare the unintended consequences of millions of individual actions.Nonetheless, the outcome of this undirected but self-interested be-havior is efficient in the sense mentioned above. Despite the absenceof any central direction, it can be shown that an economic order is
29Digitized for FRASER http://fraser.stlouisfed.org/ Federal Reserve Bank of St. Louis
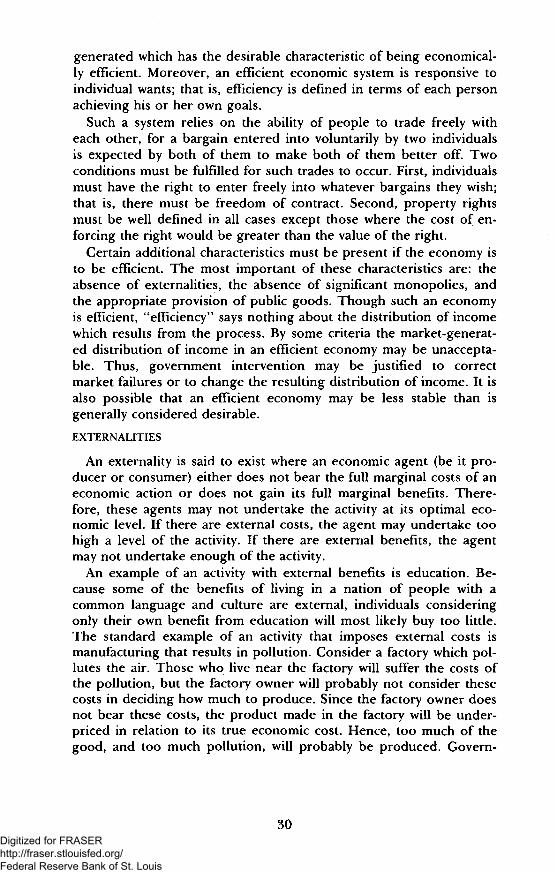
generated which has the desirable characteristic of being economical-ly efficient. Moreover, an efficient economic system is responsive toindividual wants; that is, efficiency is defined in terms of each personachieving his or her own goals.
Such a system relies on the ability of people to trade freely witheach other, for a bargain entered into voluntarily by two individualsis expected by both of them to make both of them better off. Twoconditions must be fulfilled for such trades to occur. First, individualsmust have the right to enter freely into whatever bargains they wish;that is, there must be freedom of contract. Second, property rightsmust be well defined in all cases except those where the cost of en-forcing the right would be greater than the value of the right.
Certain additional characteristics must be present if the economy isto be efficient. The most important of these characteristics are: theabsence of externalities, the absence of significant monopolies, andthe appropriate provision of public goods. Though such an economyis efficient, "efficiency" says nothing about the distribution of incomewhich results from the process. By some criteria the market-generat-ed distribution of income in an efficient economy may be unaccepta-ble. Thus, government intervention may be justified to correctmarket failures or to change the resulting distribution of income. It isalso possible that an efficient economy may be less stable than isgenerally considered desirable.
EXTERNALITIES
An externality is said to exist where an economic agent (be it pro-ducer or consumer) either does not bear the full marginal costs of aneconomic action or does not gain its full marginal benefits. There-fore, these agents may not undertake the activity at its optimal eco-nomic level. If there are external costs, the agent may undertake toohigh a level of the activity. If there are external benefits, the agentmay not undertake enough of the activity.
An example of an activity with external benefits is education. Be-cause some of the benefits of living in a nation of people with acommon language and culture are external, individuals consideringonly their own benefit from education will most likely buy too little.The standard example of an activity that imposes external costs ismanufacturing that results in pollution. Consider a factory which pol-lutes the air. Those who live near the factory will suffer the costs ofthe pollution, but the factory owner will probably not consider thesecosts in deciding how much to produce. Since the factory owner doesnot bear these costs, the product made in the factory will be under-priced in relation to its true economic cost. Hence, too much of thegood, and too much pollution, will probably be produced. Govern-
30Digitized for FRASER http://fraser.stlouisfed.org/ Federal Reserve Bank of St. Louis

ment intervention may therefore be justified where either marginalcosts or benefits are external.
Private transactions between parties may sometimes be adequate tosolve externality problems, but this requires that transaction costs below. This requirement will not in general be satisfied when many par-ties are involved.
Since externality problems occur because decisionmakers either donot pay all the costs of their actions or do not reap all of the benefits,the most efficient way to correct the problem is to change the mar-ginal costs and benefits. With respect to education the conventionalsolution has been to establish systems of public education paid for bytaxes and offered below cost to students. This solution itself createsproblems, since the creation of a tax-subsidized producer of educa-tion may lead to the producer having a monopoly over education.But monopoly is inefficient, whether it is public or private. An alter-native would be to grant a "voucher," with the amount of this vouch-er equal to the difference between private benefit (the benefit to thestudent) and total benefit (the benefit which accrues to other mem-bers of society as well as to the student). This would avoid the prob-lem of monopoly and might generate pressures for more efficientschools.
To deal with the external costs of pollution, the conventional solu-tion has been regulation of pollution control technology by govern-ment agencies. Since this form of regulation often does not take ac-count of differences in abatement costs for different polluters, it isoften inefficient in that the public pays more than is necessary for agiven amount of pollution reduction (or a smaller reduction in pollu-tion is achieved for a given expenditure than would be possible with amore efficient scheme).
Two ways of reducing pollution more efficiently have been identi-fied. One is to charge those who pollute a fee based on the cost im-posed on others by the pollution. This method has been used inWest German waterways and has been quite effective. Another alter-native is for the government to create property rights in air or water.These rights would then be purchased by those who valued themmost—that is, by those who would pay the highest cost to reducetheir pollution. These two methods, if implemented correctly, wouldprobably lead to the same outcome.
MONOPOLY
One of the conditions of market efficiency is that there must beenough buyers and sellers of a good so that each of them has littleinfluence on its price. This condition is not always satisfied, however.Sometimes technical and cost conditions in an industry are such that
31
Digitized for FRASER http://fraser.stlouisfed.org/ Federal Reserve Bank of St. Louis
there will be room for only one or a few firms. Two approaches havebeen taken in the United States to this problem. In cases of naturalmonopoly, direct government regulation or ownership is common. Inindustries where only a few firms exist, the antitrust laws are morecommonly used to avoid the costs of monopoly.
Most of the natural monopolies arise from the need to providepublic utility services, such as electricity and water. Regulation ofmost of these natural monopolies occurs primarily at the State andlocal level and is not covered in this Report, but there are some mo-nopolies regulated at the Federal level. In some cases of natural mo-nopoly, however, newer technology may so change technical and costconsiderations that additional firms would enter the market if permit-ted to do so by regulatory authorities.
In an industry with few firms it may be possible for the firms to actin collusion and thus behave as a monopoly. When this occurs, theprofits of the firms are increased, but efficiency losses are imposedon the economy. Even though such collusions are unstable, losses ofefficiency occur during their existence. The antitrust laws make suchbehavior illegal.
The effects of mergers on economic efficiency are more difficult todiscern than the effects of illegal monopoly. Two firms in the sameindustry may merge for any of at least three reasons. First, a mergermay be an attempt to obtain monopoly power. When this occurs themerger will be inefficient and should be stopped. But, firms may alsodecide to merge to take advantage of economies of scale or becauseone is better managed and can therefore increase efficiency in re-source use. In these latter two cases a merger is likely to improve ef-ficiency and should be allowed. The difficulty, of course, is that it isnot always obvious whether monopoly or an increase in efficiency willbe the dominant effect of any given merger.
Though there are difficult cases, this Administration has alreadymade some changes in policy in the administration of Federal arid-trust laws, changes based on economic analysis. First, a merger be-tween two firms which have a relatively small share of the marketshould be allowed, for there is little danger of monopoly. Second, nosignificant economic problems are likely to arise from a merger offirms in unrelated industries (a conglomerate merger); such a mergerwill not create any significant monopoly power. Third, there is littledanger of monopoly and therefore no reason for Federal interven-tion when a firm merges with another firm that is a customer or asupplier of the first (a vertical merger). Finally, a firm that obtains alarge share of a market by being a more efficient competitor is actingin a desirable fashion and should not be punished by antitrust actionon the part of the Federal Government. In recent years, those in
32Digitized for FRASER http://fraser.stlouisfed.org/ Federal Reserve Bank of St. Louis
charge of administering Federal antitrust laws sometimes have be-haved as if they viewed their function as protecting existing firmsfrom competition. From an economic viewpoint the purpose of theantitrust laws is to maintain competition, even if competition leads tothe decline of firms which are less efficient.
PUBLIC GOODS
A public good has two distinctive characteristics. The first is thatconsumption of the good by one party does not reduce consumptionof the good by others, and the second is that there is no effectiveway to restrict the benefits of such goods to those who directly payfor them. The standard example of a public good is national defense.If national defense deters a foreign aggressor, everyone in the coun-try benefits. This means that no individual will have sufficient incen-tive to spend his own resources on national defense, since he willbenefit from his neighbor's spending. Hence, such public goods asnational defense are usually provided by some action of the nationalgovernment. Government action is usually necessary for the optimalprovision of many public goods, and this point does not arouse con-troversy among economists. Sometimes there are debates, however,about whether a particular good is sufficiently public in nature to jus-tify its being provided by the government.
Another public good is information. If one person learns some val-uable fact and tells someone else, the use of the information by onedoes not reduce the use of the same information by the other. If aconsumer organization spends resources to find out which productsare best and sells a publication that provides this information to sub-scribers, these subscribers may then pass the information on toothers who did not pay for it. This can be shown as a market failure,in the sense that the private market did not generate enough infor-mation; if the organization could capture all of the returns, it wouldprovide additional information. Patents and copyrights are designedto reduce this problem by giving inventors and writers propertyrights in their product, thus providing incentives for production, butthere are still cases where the private market does not generate suffi-cient information. This provides the rationale for government financ-ing of certain kinds of research.
INCOME REDISTRIBUTION
In a market economy, individual income depends upon what onehas to sell and on the amount which others are willing to pay for it.What most people sell on the market is their labor. About 75 percentof national income is in the form of wages and salaries and otherforms of labor remuneration. Others have capital or land to rent, and
33Digitized for FRASER http://fraser.stlouisfed.org/ Federal Reserve Bank of St. Louis

their return is interest and dividends, or rent income. Most peopleearn income from both capital and labor over their lifetimes. Butsome persons may have few or no valuable things to sell, and thesepersons will have low incomes. A decision may then be made totransfer income to such people directly through government. Twojustifications can be presented for such transfers of income, onebased on the social value of providing certain forms of income insur-ance, the other based on benevolence. We consider each.
Anyone may lose his ability to earn income. A worker may becomephysically disabled or find that technological progress has made hisor her skills obsolete. Or an investor may find that changing marketconditions have eroded the return on capital. Since individuals gen-erally do not like the risk of losing their ability to earn income, theyoften seek to insure themselves against such a possibility.
But there are difficulties in providing insurance against falling in-comes by way of private-market mechanisms. A major difficulty iswhat is called "adverse selection/* Assume that some insurance com-pany offered actuarily fair insurance against this risk and charged allpersons the same premium. (That is, the amount of the premiumequals the expected cost of having a low income.) Since most personsare averse to risk, they might buy this insurance even though the pre-mium would be somewhat greater than the expected cost because ofthe expense of writing the insurance. Some persons would be betterrisks than average, and new insurance companies would competewith the first company for these better risks. This would leave theoriginal company insuring only the bad risks, which the companywould then find financially intolerable. Ultimately, one class of per-sons would be unable to obtain any insurance.
This would be an example of market failure and an argument forgovernment provision of insurance, since the government can forceeveryone to join the same insurance pool. The appropriate form ofinsurance to those who experience a temporary loss of income is acash grant. Welfare payments and unemployment compensation maybe viewed as just this sort of insurance.
The second argument for government transfers to the poor is anargument based on benevolence. Many people prefer not to live in asociety where there is poverty and thus have an incentive to transfersome of their resources to the poor voluntarily. When one individualperforms such a transfer, all individuals who dislike poverty benefit.Thus, most people will have an incentive to reduce their contribu-tions to the poor and rely on the contributions of others. In all likeli-hood, such voluntary transfers would be too low to keep people outof poverty; it may become necessary for the government to do it.
34Digitized for FRASER http://fraser.stlouisfed.org/ Federal Reserve Bank of St. Louis

In cases where transfers of income are desirable, economic theorycan indicate the most efficient form of transfer. One goal should beto minimize interference in private markets. Price controls on gaso-line and laws decreeing minimum wages, for example, are consideredby many economists to be inefficient ways of helping the poor.
The way in which resources should be transferred to the poor de-pends on the goal of the donors. If the goal is simply to improve thewelfare of the poor, the most efficient solution probably would be asystem of cash transfers, since it can be assumed that recipients arebest able to determine the pattern of spending that maximizes theirwelfare. But if the donor is more concerned with the specific goodswhich the recipient consumes, a direct transfer of goods may be pref-erable. In this case the argument can be made for using some formof voucher. A voucher is essentially a coupon usable only for the pur-chase of a specific type of good. Food stamps are one example. Useof vouchers instead of a direct transfer of goods allows recipients todetermine their own consumption but restricts the type of goodswhich the recipient may purchase.
Regardless of the form of transfer, there is still an efficiency cost.Transfers reduce the incentive of recipients to work, and the taxesimposed on the rest of society to finance these transfers also causelosses in efficiency. There are also costs of administering the pro-gram. Economists are able to give advice on ways of transferringincome which may serve to minimize these effects, but the decisionas to the amount of the transfers is a political decision, not an eco-nomic one.
MACROECONOMIC STABILITY
A market system may sometimes be subject to unacceptably largefluctuations in income. When this occurs, it has implications for thegeneral welfare. First, average income levels may be smaller withfluctuations than if the level of activity is more stable. Second, even ifthe average level of incomes is unaffected by such fluctuations,people are generally risk-averse. That is, most people prefer a steadystream of income to a fluctuating stream, even if their total income isthe same over a period of time. For these reasons, government mayhave a role in helping to provide stability.
An alternative view is that a market economy is inherently quitestable. According to this view, government actions are the primarydestabilizing factors in the economy. That is, many fluctuations inincome which seem to be caused by private sector actions are actuallycaused by attempts to outguess the government. (This issue is dis-cussed in more detail in Chapter 3.)
35Digitized for FRASER http://fraser.stlouisfed.org/ Federal Reserve Bank of St. Louis

Macroeconomic stability also involves the question of what to doabout money. Money performs several functions in an economy. Itsuse economizes on transaction costs and on information costs, sinceall persons accept the same money and are aware of its value. How-ever, the government must be careful in its money creating functionnot to exacerbate cyclical fluctuations. Excess creation of moneyleads to inflation, which reduces money's value.
Although the Federal Government is the appropriate agent for sta-bilizing the economy, the limits of such action must be understood.This Administration believes that "fine tuning" of the economy—at-tempting to offset every fluctuation—is not possible. The informationneeded to do so is often simply not available, and when it becomesavailable it is quite likely that underlying conditions will already havechanged. As a result, a policy of fine tuning the economy is aslikely to be counterproductive as it is to be helpful. Though it is nec-essary for the government to have macroeconomic policies, includingboth monetary and fiscal policies designed to achieve some desiredgrowth of income, such policies are not suitable for correcting smallfluctuations in economic activity.
THE DIVISION OF ROLES IN A FEDERAL SYSTEM
The preceding sections have discussed situations where govern-ment intervention in private economic activities may be appropriate.An equally important concern is determining the level of governmentat which intervention, when desirable, should take place.
Our system of government is a Federal system, one in which cer-tain powers have been granted to the Federal Government whileother powers have been granted to the States. In recent decades,however, there has been a substantial centralization of power at thenational level.
One constraint on the power of any government to impose costson its citizens is the ability of those citizens to move elsewhere. Thus,one argument for reliance on State government is essentially the ar-gument that it restricts the power of government, since any Statewhich passed laws which were sufficiently inefficient would probablyfind itself losing residents. The long-term increase in the power ofthe Federal Government at the expense of the State governments hasprobably weakened this constraint on governmental power.
Another argument for federalism is that State and local govern-ments are more likely to choose the amount and quality of govern-mental services preferred by their voters, whose preferences and re-sources vary greatly. This argument has important implications forboth the types of services that should be provided at the different
36Digitized for FRASER http://fraser.stlouisfed.org/ Federal Reserve Bank of St. Louis
levels of government and the structure of the tax system. Decisionson government services that benefit people throughout the Nation,such as national defense and the protection of basic constitutionalrights, are appropriately made by the Federal Government, and suchservices should be financed by Federal taxes. But, government serv-ices that provide benefits only or predominantly to residents of aspecific region, such as urban transit and sewer systems, can prob-ably be provided more efficiently by State or local governments andfinanced by State and local taxes or user charges on those personsdirectly benefited.
In this view, Federal grants-in-aid to State and local governmentsshould be restricted to services provided by these governments thathave significant benefits for residents in other regions of the country.Over the last several decades, however, Federal grants-in-aid havenot been directed at assisting such services. Instead, these grantshave in many cases reduced the State or local "tax price" of a widerange of other services and therefore have increased their utilizationbeyond that which most local residents would prefer. Consequently,the relative growth of Federal financing of State and local serviceshas probably increased the total size of government in the UnitedStates while reducing its efficiency and responsiveness. The case fora return to a more balanced federalism is a case for both efficiency inthe provision of public services and for greater individual freedomand choice in the Federal system.
LIMITS ON THE EXERCISE OF THE FEDERAL ROLE
So far, this chapter has summarized the theoretical reasons for alimited role of the Federal Government in the economy. Even whenthe government justifiably undertakes certain activities, however,there are reasons for believing that it is unlikely to do a perfect job.Just as there sometimes are reasons for expecting "market failure,"sometimes there also are reasons for expecting "government failure."In this section we discuss some of these reasons.
THE POLITICAL PROCESS
For several reasons the political process is overly responsive tospecial interest groups. One cause of this is the high cost of informa-tion. Consider, for example, an import quota program that will giverather large benefits to firms and workers in the industry to be pro-tected by the quota. Although such a program will impose only smallcosts on everyone else in the economy, it will be inefficient becausethe sum of the losses will be greater than the sum of the gains.However, each of the losers will lose so little that it will often not
37
Digitized for FRASER http://fraser.stlouisfed.org/ Federal Reserve Bank of St. Louis

pay to spend the resources necessary to learn about the losses.The average voter would have to make a detailed study of law andeconomics, for example, to determine how much government-in-duced cartelization of the trucking industry costs him. It is quiterational for the average voter not to bother to learn about this cost,for the resources spent in doing so would probably be greater thanthe per capita cost of the government activity that led to carteliza-tion. (Economists refer to this as "rational ignorance/') On the otherhand, the beneficiaries of government policies gain substantialamounts, and it pays for them to spend resources in learning aboutgovernment activities. Thus, trade associations hire lobbyists whosejob includes informing members of an industry about political deci-sions which may affect their operations.
Moreover, even if the average voter had the information requiredto make a rational decision on how to vote in the next election, it isnot clear what effect this would have. Assume that a citizen knowsthat his or her legislative representative voted for an import quotathat will cost the voter $50 but also voted for some other bill whichwill benefit the voter's own special interest group and give him orher a benefit worth $500. The rational behavior of the voter willtherefore be to vote for the reelection of the representative. That is,there are good reasons for expecting the political process to be re-sponsive to special interests. It is possible for a representative to beelected by favoring a set of special interest policies, each of which ap-peals only to a minority of the electorate. Moreover, achieving a vic-tory with such a "coalition of minorities" would be possible even ifall the voters had all the information they needed to make a reasonedchoice. That is because the gains from such special interest policieswill be concentrated among the majority, while the costs will beborne by members of both the majority and the minority. Therefore,it is possible for a majority coalition made up of several special inter-est groups to gain benefits for themselves, even if the sum of thecosts to all affected parties is greater than the sum of the benefits.
The same arguments also apply to other political activities. It willpay for concentrated special interests (including both business andunions) to make campaign contributions to those who vote for bene-fits for people in the industry, but it will not, in general, pay for citi-zens to make contributions to representatives who vote against suchbills. This is because the losses suffered by each voter are small andbecause overturning inefficient legislation is a public good. It doesnot generally pay to contribute voluntarily to the provision of apublic good that affects a large number of people.
38
Digitized for FRASER http://fraser.stlouisfed.org/ Federal Reserve Bank of St. Louis

The fact that the political process is likely to be overly responsiveto interest groups constitutes an argument for limiting the power ofgovernment to intervene in the economy. Each citizen would like touse government to transfer resources to himself but is often skepticalor hostile when the government transfers resources to others. More-over, the net result of all such transfers is an efficiency loss. One ofthe ways by which particular special interest programs can be con-strained is to limit the power of government to provide any such pro-grams.
For a long period the Federal Government behaved as if con-straints on such legislation were binding. More recently, its power tointervene in many areas has been greatly expanded, and the amountof transfers, and of resources spent on obtaining transfers, has in-creased to a marked degree.
The essence of the problem is that each individual has an incentiveto take actions which, considered in their entirety, have a net nega-tive impact on society, even though they are generally rationalized asbeing in the public interest. Intervention begets intervention. Onlyby changing the general principles which encourage intervention inmany areas can we resist the multiple appeals for special interest lawswhich, taken as a whole, reduce the general welfare.
SUPPLY BY GOVERNMENT AGENCIES
When government directly provides some service, the service is or-dinarily performed by government employees. Government employ-ees are sometimes criticized for being inefficient and sometimespraised, for being dedicated to the public interest. Most theories ofbureaucratic behavior make neither of these assumptions. Rather, itis assumed that government employees behave like everyone else andare concerned primarily with promoting their own interests. Thus, tostudy the effects of government provision of goods and services, it isimportant to study the incentives that motivate government employ-ees.
There are several incentives for government managers to increasethe size and power of their agency. First, the salary and promotionprospects of a manager depend in good measure on the size and in-fluence of the agency, as does the manager's power. Second, evenwhen government employees are motivated by their perceptions ofthe public interest, this often leads to the same desire to enlargetheir agency's size and influence. Once a person goes to work foran agency which fulfills his vision of the public interest, hewill then be likely to want to expand the power of the agency, inde-pendent of his own self-interest, because he believes such expan-
39
Digitized for FRASER http://fraser.stlouisfed.org/ Federal Reserve Bank of St. Louis
sion will benefit the public. This is a partial explanation of the rela-tively long life of agencies and the difficulty in terminating them—those who work for the agency become a special interest group. It isalso a partial explanation for overspending by government.
It can be argued that the risk structure arising from governmentregulation also creates perverse incentives for agency managers. Twoerrors can occur, for example, when a government official mustdecide whether to approve a new drug. If the official approves a drugwhich is unsafe, some persons who use it will suffer harmful side ef-fects. Alternatively, the official may fail to approve some safe drug, inwhich case some persons will suffer needlessly from a disease.
These types of errors will always be possible, no matter what deci-sionmaking process is used. Nonetheless, the official faces an asym-metric situation. If the drug is approved and someone dies fromhaving used it, the official will be blamed for approving an unsafedrug. Conversely, if the drug is not approved, those who wouldbenefit from using it are not likely to know that the drug has beendisapproved. Thus, in circumstances like these, agency managers canbe expected to be overly risk-averse—not because of the nature ofthe manager but because of the incentive structure in which the offi-cial must operate.
Since these types of responses by agency managers are predictable,they must be considered in designing programs. We must begin withthe realization that government will not function perfectly and thenattempt to determine if a predictably imperfect government programwill achieve better results than those of an unregulated market.
DIVERSITY OF CONDITIONS AND PREFERENCES
One advantage of a market economy, mentioned earlier, is thatsuch an economy is responsive to varying consumer demands. Indi-viduals have different preferences and desire different goods andservices. Tastes differ. If these desires are matched by a willingnessto pay for them, then firms will find satisfying them worthwhile. Themarket will produce diverse products in response to diverse de-mands.
If a good is a public good, however, this diversity will probably notbe found. We are all provided the same amount of national defense,whether we are pacifists or hawks. That is the nature of public goods,and for true public goods there is no alternative. However, govern-ment sometimes treats goods which could be private as if they werepublic goods only. Thus, students from families that are not willingto pay the full cost of private school tuition have no choice but toattend the same public school system. Voucher plans are attempts to
40
Digitized for FRASER http://fraser.stlouisfed.org/ Federal Reserve Bank of St. Louis
get around this problem, as are proposals for refundable tuition taxcredits.
Detailed government regulation of technology also works to reducethe responsiveness of the economy to changed conditions. Such reg-ulation, by not allowing entrepreneurs to take advantage of new tech-nologies, retards economic progress.
LIMITS ON INFORMATION
If government policies are to achieve their goals, they must bebased on correct information, a condition which is not always satis-fied. Examples of problems in obtaining the information needed toformulate and implement macroeconomic policy were discussedabove.
Sometimes the problem is that policymakers cannot predict theextent to which individuals will respond to changes in policy. The im-position of credit controls in 1980 had surprisingly rapid and per-verse effects on the economy. Policymakers also underestimated theextent to which the cost of medical care would rise as a result of themedicare and medicaid programs. As a result, there were substantialunanticipated budgetary consequences.
In general, it can be predicted that people will respond to newrules or regulations by trying to minimize the adverse impact of suchregulations on themselves. However, it is generally difficult or impos-sible to predict the exact nature of this response, since there may bemillions of individuals affected by a given regulation and some ofthem will think of alternatives which did not occur to the policy-makers. The myriad of ways in which individuals subvert price con-trols is illustrative. One solution is to attempt to devise policieswhich make use of incentives. Too often, regulation takes the form ofspecific rules which ignore the possibility of unexpected responses.
One critical advantage of a market economy is that it is "informa-tionally efficient." That is, a market will function well even if eachindividual knows only his own preferences and opportunities. Whengovernment controls an activity, on the other hand, much more in-formation must be collected. This is an expensive process, and some-times the necessary information is simply not available. This placesanother restriction on the ability of the government to achieve itsgoals.
TIME HORIZON
Elected officials are generally interested in reelection. Thus, it isoften argued that a program which imposes costs today in return forfuture benefits will be overly discounted by elected representatives,even if the program has a positive net present value. ("Net present
41Digitized for FRASER http://fraser.stlouisfed.org/ Federal Reserve Bank of St. Louis

value" refers to the sum of benefits less costs, adjusted for the timevalue of money.) Conversely, elected officials are likely to prefer pro-grams with near-term benefits and deferred costs. In such cases,costs may not be appropriately discounted and net benefits may beoverstated. In the private market, on the other hand, projects with apositive value over an extended time period are more likely to be un-dertaken because the benefits of such projects can be capitalized andthe property rights sold. Although government does undertake somesuch projects, it is more often preoccupied with short-term effects.
Recently, for example, some analysts have detected a "politicalbusiness cycle" in which government spending projects or programsinitiated just before an election lead to higher taxes or inflationwhich do not occur until after the election. This is a predictableresult of the political process. Wage and price controls, which pro-duce short-run moderation in the rate of inflation, lead to longerterm losses because they reduce the responsiveness and flexibility ofthe economy. Since some of these ill effects occur long after controlsare imposed, there sometimes are incentives to impose such controlsjust before an election. The short time horizon inherent in a politicalprocess with nontransferable property rights is another obstacle tothe development of truly effective programs.
PRINCIPLES GUIDING THE PRESIDENT'S ECONOMICPROGRAM
The problems discussed in this chapter have prompted the neweconomic policies of the Administration. In this section the Adminis-tration's Program for Economic Recovery is related to general princi-ples concerning the proper role of government in the economy andto the necessary constaints on government action discussed above.
EMPHASIS ON PERSONAL RESPONSIBILITY
Many government programs, such as detailed safety regulations orthe provision of specific goods (rather than money) to the poor, arebest described as paternalistic. Paternalism occurs when the govern-ment is reluctant to let individuals make decisions for themselves andseeks to protect them from the possible bad effects of their own deci-sions by outlawing certain actions. Paternalism has the effect of disal-lowing certain preferences or actions. This Administration rejects pa-ternalism as a basis for policy. There is no reason to think that com-mands from government can do a better job of increasing an individ-ual's economic welfare than the individual can by making choiceshimself. Moreover, the long-term cost of paternalism may be to de-stroy an individual's ability to make decisions for himself.
42Digitized for FRASER http://fraser.stlouisfed.org/ Federal Reserve Bank of St. Louis

As discussed above, there are economic arguments for transferringresources to the poor. However, if the primary concern is the welfareof the poor, the most efficient form of transfer is probably cashrather than benefits in kind. (Examples of benefits in kind are publichousing, food stamps, and medical care.) Poor people given moneycan best determine for themselves what goods to buy. If they aregiven goods or services instead, their ability to learn to make theirown choices is limited.
REFORM OF REGULATION
As discussed above, many current regulations cannot be based onallegations of market failure, and many regulations which do havesuch justification are administered inefficiently. Efforts are beingmade by the Administration to cut back the scope of the first kind ofregulation and to improve the workings of the second. One areawhere there has been a major effort at reducing the scale of govern-ment intervention is energy, which is discussed in Chapter 6.
The Administration is also involved in a careful review of Federalenforcement of the antitrust laws. The purpose of these laws is tomaximize consumer satisfaction by reducing monopoly power. In thepast, however, the laws often have served both to protect smallerbusinesses and to penalize larger ones, even when greater size wasdue to increased efficiency. Efforts are being made at both the Feder-al Trade Commission and the Department of Justice to reform theenforcement of the antitrust laws to make them more consistent withthe promotion of economic efficiency.
Because property rights in air and water have not been sufficientlyextensive there are .grounds for government intervention to alleviatepollution. However, the form of much prior intervention was ineffi-cient. Most of this regulation has been carried out by specifying theallowable pollution control technology rather than by defining prop-erty rights or by charging fees for polluting.
This Administration is also making a major effort to emphasize theuse of benefit-cost analysis in regulation. Regulation which imposesmore costs than benefits is inefficient. For example, regulations thatlimit entry to a potentially competitive industry, such as interstatetrucking, generate high transportation costs which are ultimatelyborne by consumers. The most elementary benefit-cost analysiswould demonstrate the inefficiency of such regulation.
Even if used as well as possible, however, benefit-cost analysis isonly the second best solution. The best solution is to respect thejudgment of the private market whenever k is available. Jn manyareas of safety regulation, for example, the best solution would prob-ably be to rely on market judgments about the value of safety. Where
43
Digitized for FRASER http://fraser.stlouisfed.org/ Federal Reserve Bank of St. Louis
this may not be possible, benefit-cost analysis can improve the infor-mation on which regulation is based.
In areas such as environmental regulation, where the market willnot work unaided, benefit-cost analysis may be necessary to identifythe optimal degree and form of pollution control. Even if a system ofeffluent charges were used, for example, an analysis of costs andbenefits would be necessary to determine the optimal charge. If asystem of pollution rights were used, the amount of rights to be cre-ated would have to be determined in some similar way.
FEDERALISM
One important principle of this Administration is an increased reli-ance on State and local governments to carry out necessary govern-mental activities. The replacement of many categorical grant pro-grams by large block grants is one example of this policy change. Alonger term policy of the Administration is to shift a substantialnumber of programs—and a portion of the Federal tax base—to theStates.
As indicated earlier, there are economic reasons for this increasedreliance on State governments. States are generally more responsiveto voters in their jurisdiction than is the Federal Government and canmake better judgments about local conditions,
LONG-RUN FOCUS
As discussed above, the political process has placed its major em-phasis on the achievement of short-term goals. This Administrationintends to place emphasis on long-run policies. For example, theEconomic Recovery Tax Act of 1981 cuts tax rates over a 3-yearperiod, after which the personal income tax structure will be indexedso that inflation will not increase marginal tax rates on real income.The Administration is also seeking a long-term solution to the finan-cial problems facing the social security system.
However, there is a more fundamental sense in which emphasis isbeing placed on long-term goals. Many of the Administration's poli-cies have reduced government expenditures for various groups orprovided less of an increase in such outlays than has been expected.The fundamental premise behind these reductions is that they ulti-mately will lead to substantial and sustainable economic growth. Thishas particular relevance for the poor, most of whom probably havehistorically benefited more from sustained economic growth thanfrom government transfer programs.
INCREASED RELIANCE ON THE MARKET
Another principle mentioned several times in this chapter is anincreased reliance on market-like devices when appropriate gov-
44
Digitized for FRASER http://fraser.stlouisfed.org/ Federal Reserve Bank of St. Louis

ernment interventions are undertaken. Since this is an importantprinciple, an indication of how such a principle will be translated intoaction will demonstrate some relationships between seemingly dispa-rate changes in the forms of intervention.
First, consider the reason for reliance on devices which simulatemarket operations where intervention is the desired policy. The onlyalternative is direct regulation, which puts the government in an ad-versarial position to the party being regulated. Such adversary rela-tionships create ill will between the government and business orother regulated parties. Ill will is also created when, for example,government employees monitor and control the spending of welfarerecipients. Besides creating ill will, monitoring of behavior is expen-sive. Yet monitoring allows regulators to achieve their goals only im-perfectly, since there are millions of regulated individuals, business-es, and other private institutions, and regulators will be able to moni-tor only a small fraction of these agents.
The advantage of market-like devices is that they can create incen-tives to behave in the desired way. That is, if we can simulate an ef-fective market, we can rely on self-interest to achieve the desiredgoals. This will reduce the cost of achieving the regulatory goal andalso increase the extent to which the goal will be achieved.
A good example is provided by comparing government safety reg-ulation of firms with private market insurance against risks. In thecase of government regulations, violators are punished, commonlywith a fine, which may create incentives for the regulated firms toconceal possible violations and to avoid cooperation with safety in-spectors. If, on the other hand, a firm which is insured can make itsoperations safer, it will usually benefit by having its insurance premi-um reduced. Thus, such firms have an incentive to cooperate with in-surance company inspectors and adopt any recommendations whichare made. This is but one example of how a market device, by elicit-ing cooperation, is more efficient in achieving desired goals than isregulation, which elicits conflict.
EMPHASIS ON THE GENERAL WELFARE
As stressed throughout this chapter, many current programs pro-vide benefits to special interest groups. These programs are ineffi-cient in that the gains to the beneficiaries are generally less than thecost to the public as a whole. Nonetheless, the political process, ifunconstrained, would continue to establish such programs. In recentyears effective constraints have been reduced. But if these special in-terest programs could be eliminated, almost everyone would benefitbecause of the losses in economic efficiency caused by these pro-grams. However, it is extremely difficult politically to reduce such
45Digitized for FRASER http://fraser.stlouisfed.org/ Federal Reserve Bank of St. Louis
programs one at a time, since the beneficiaries would then perceivetheir losses clearly and seek to regain them.
The alternative, which this Administration adopted in both itsspending and tax cuts, is to reduce a large number of programs si-multaneously. If enough cuts in both spending and tax rates can bemade simultaneously, most individuals may recognize that, while theymay lose from cuts in a specific program, they gain enough from cutsin other programs and in lower taxes to compensate for their losses.Thus, the principles of optimal government intervention explain whythe Administration insisted on very broad cuts in spending. Congres-sional approval of much of this plan indicates that this strategy wasappropriate. A general reduction in special interest programs is anecessary step to meet the constitutional charge to "promote thegeneral Welfare. . . ."
46Digitized for FRASER http://fraser.stlouisfed.org/ Federal Reserve Bank of St. Louis

CHAPTER 3
Monetary Policy, Inflation, andEmployment
THE ECONOMIC STORY of the late 1960s and the 1970s was astory of rising inflation, slackening growth, and rising unemployment.The challenge of the 1980s is to eliminate inflation, restore growth,and reduce unemployment. Despite differences over the precise com-bination of policies that will do the job, there is widespread agree-ment that inflation can and must be reduced if the economy is to op-erate successfully. The obstacles to successful implementation of ananti-inflation policy have been largely political, although public un-derstanding of this has been complicated by the economic conse-quences of the oil price shocks of 1974-75 and 1979-80. The properpolicy would be one based on a careful weighing of the long-termbenefits of ending inflation against the costs which are essentially shortrun. It is the nature of the political process, however, to focus primarilyon the short-run costs of dealing with inflation, as these appear to bemore easily quantifiable, and to ignore the more distant but equallyimportant benefits of price stability.
As the acute costs of rising inflation have become more widely rec-ognized, the public has demanded action. That has made possible theimplementation of the current set of fiscal and monetary policiesaimed at reducing inflation. The decision to end inflation over aperiod of several years will be sustained by this Administration, eventhough short-run costs will be suffered before long-term benefitsbegin to accrue. A broad public understanding of the nature of theimmediate but transitory costs and the longer run benefits of reduc-ing inflation can contribute to the overall success of the current poli-cies. On the other hand, any perception that the policies may soonbe reversed would cause transitional costs to rise, since upward ad-justments in inflation expectations—and, subsequently, prices andwages—would then be realized. In short, any lack of credibility wouldgreatly extend the period of adjustment, thereby increasing the sizeand duration of short-term costs.
Chapters 1 and 2 reviewed the economic policies and problems in-herited by this Administration and the challenges that its economicrecovery program poses. This chapter focuses first on the legacies re-
47
Digitized for FRASER http://fraser.stlouisfed.org/ Federal Reserve Bank of St. Louis

suiting from macroeconomic policymaking over the past two decadesbefore turning to a discussion of monetary policy issues whose suc-cessful resolution is central to the Administration's economic recov-ery program. The concluding section of the chapter outlines the chal-lenge to policymakers to improve upon the past.
THE LEGACIES
THE LEGACY OF ECONOMIC STABILIZATION POLICY
To policymakers in the early 1960s, the main solutions to futureeconomic problems seemed to be in hand. The Eederal Governmentwas thought to have all of the tools needed for economic stabiliza-tion, along with the skills to use them. Recessions might still occurbecause investment shifted erratically or because the response togovernment action was variable, but it was believed that a discretion-ary stablization policy could successfully limit the frequency and mag-nitude of recessions. Inflation might result from decisions to reduceunemployment and increase output beyond the point consistent withprice stability, but for the most part inflation seemed manageable.Essentially, it was thought that the economy could be kept on asteadily rising trend by "fine tuning" government actions.
Three key elements characterized policy prescriptions. Greater usewas made of models and forecasts of short-term economic activity,prices, and interest rates. Policy decisions were based on a perceivedshort-run tradeoff between inflation and unemployment, and therewas some belief that a long-run tradeoff between inflation and unem-ployment could also be exploited. Greater emphasis was given toplanned changes in budget deficits or surpluses as a means of achiev-ing annual (and sometimes quarterly) targeted rates of inflation andunemployment.
To avoid a potentially painful reliance on fiscal and monetary disci-pline, budget policy was supplemented by other programs. One ap-proach, the creation of guideposts, was designed to influencechanges in individual prices and wages. The belief was that guide-posts announced by the government could improve the tradeoff be-tween inflation and unemployment. Proponents of guideposts regard-ed them as efficient devices for slowing inflation during periods ofrising employment and expanding output, and controlling, in the lan-guage of the time, "cost-push" inflation. Another program, aimed atreducing the U.S. balance of payments deficit and sustaining an inter-national monetary system based on fixed-exchange rates, involvedlevying taxes on interest payments from foreign sources to Americansand restricting the amount of U.S. Government and private spendingabroad.
48Digitized for FRASER http://fraser.stlouisfed.org/ Federal Reserve Bank of St. Louis
Both policy and theory have undergone substantial change sincethen. A major reason for the change is that additional research re-vealed the errors and limitations of earlier policy recommendations.Although there was some research that supported the activist policiesimplemented in the past two decades, many subsequent studies havecast doubt on those findings.
The major failure of the late 1960s and 1970s was to give insuffi-cient weight to the long-term effects of economic policies. For exam-ple, the so-called Phillips curve—the observed inverse relationshipbetween wage inflation and unemployment—and its implication thata tradeoff is possible was one of the key notions relied on by eco-nomic advisers. But nothing in Phillips' work or in subsequent stud-ies showed that higher inflation was associated with sustainable lowerunemployment, and nothing in economic theory gave reason to be-lieve that the relationship uncovered by Phillips was a dependablebasis for policies designed to accept more inflation or less unemploy-ment. Nevertheless, Phillips curves jumped quickly from scholarlyjournals to the policy arena. The speed with which the case made forthis tradeoff was accepted as a cornerstone of economic policy con-trasts with the slow acceptance of both neoclassical economic theoryand the substantial body of evidence which suggests that there is nolasting tradeoff between inflation and unemployment. The economicpolicies which are now being implemented by the Administration aregrounded in this tradition.
Another example of policy failure was the imposition of direct con-trols on prices, which were defended on grounds that they wouldbring about lower unemployment in an economy subject to "cost-push" inflation without imposing uneven burdens on the various sec-tors of the economy. The decision to impose these controls wasbased on the presumably favorable effects they would have on theexpectations of consumers, unions, and businessmen.
Neither guideposts nor price controls, however, have succeeded instopping inflation. The failures of these approaches have not beenfailures of economic theory. Instead, they have shown that politicalexpediency or guesses about expectations of inflation are a less reli-able guide to successful policy than sound economic analysis.
While economic analysis provides a framework for policy recom-mendations designed to reduce inflation, increase efficiency, andexpand long-run growth of output and employment, policy recom-mendations based on the notion that it is possible to "fine tune" theeconomy from quarter to quarter or year to year promise more thaneconomics can deliver. The events of the past 15 years are a goodillustration of the dangers of pursuing economic policies based onshort-run analysis and focused on immediate problems. Sound policy
49Digitized for FRASER http://fraser.stlouisfed.org/ Federal Reserve Bank of St. Louis
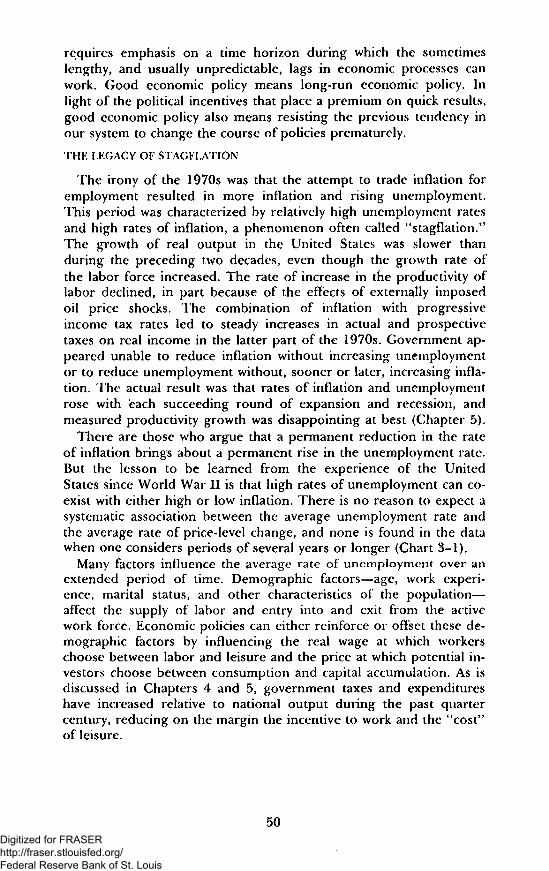
requires emphasis on a time horizon during which the sometimeslengthy, and usually unpredictable, lags in economic processes canwork. Good economic policy means long-run economic policy, Inlight of the political incentives that place a premium on quick results,good economic policy also means resisting the previous tendency inour system to change the course of policies prematurely.
THE LEGACY OF STAGFLATION
The irony of the 1970s was that the attempt to trade inflation foremployment resulted in more inflation and rising unemployment.This period was characterized by relatively high unemployment ratesand high rates of inflation, a phenomenon often called "stagflation/'The growth of real output in the United States was slower thanduring the preceding two decades, even though the growth rate ofthe labor force increased. The rate of increase in the productivity oflabor declined, in part because of the effects of externally imposedoil price shocks. The combination of inflation with progressiveincome tax rates led to steady increases in actual and prospectivetaxes on real income in the latter part of the 1970s. Government ap-peared unable to reduce inflation without increasing unemploymentor to reduce unemployment without, sooner or later, increasing infla-tion. The actual result was that rates of inflation and unemploymentrose with each succeeding round of expansion and recession, andmeasured productivity growth was disappointing at best (Chapter 5).
There are those who argue that a permanent reduction in the rateof inflation brings about a permanent rise in the unemployment rate.But the lesson to be learned from the experience of the UnitedStates since World War II is that high rates of unemployment can co-exist with either high or low inflation. There is no reason to expect asystematic association between the average unemployment rate andthe average rate of price-level change, and none is found in the datawhen one considers periods of several years or longer (Chart 3-1).
Many factors influence the average rate of unemployment over anextended period of time. Demographic factors—age, work experi-ence, marital status, and other characteristics of the population—affect the supply of labor and entry into and exit from the activework force. Economic policies can either reinforce or offset these de-mographic factors by influencing the real wage at which workerschoose between labor and leisure and the price at which potential in-vestors choose between consumption and capital accumulation. As isdiscussed in Chapters 4 and 5, government taxes and expenditureshave increased relative to national output during the past quartercentury, reducing on the margin the incentive to work and the "cost"of leisure.
50Digitized for FRASER http://fraser.stlouisfed.org/ Federal Reserve Bank of St. Louis

Chart 3-1
Inflation and Unemployment Rate
INFLATION (PERCENT)1
10174
J I
3 4 5 6 7 8 9
UNEMPLOYMENT RATE (PERCENT)
1 PERCENT CHANGE IN GNP IMPLICIT PRICE DEFLATOR.
SOURCES: DEPARTMENT OF COMMERCE AND DEPARTMENT OF LABOR.
During 1977 and 1978 there was emphasis on idle resources andan output gap that was to be closed by expansive economic poli-cies. The belief was that stimulative policies would be less inflation-ary as long as excess capacity existed. The amount of idle capacitywas probably overestimated for a variety of reasons—errors in assess-ing the effects of the 1974 oil price shock, failure to account for theeffects of regulation, and the effects of tax and income transfer poli-cies on unemployment and potential output. The presumed gap,however, was not a reliable buffer that would permit additionaloutput without provoking an increase in the rate of inflation. Theeffort to reduce the unemployment rate by stimulating aggregatedemand led to a much higher inflation rate, higher interest rates, anda sharp depreciation of the dollar, but it had no lasting effect on theunemployment rate.
The primary reason for the increase in the underlying rate of infla-tion in 1979-81 was the excessive fiscal and monetary expansion of1977-78. Moderate policies probably would have left us with an aver-age rate of unemployment no higher, and possibly lower, coupled
51
Digitized for FRASER http://fraser.stlouisfed.org/ Federal Reserve Bank of St. Louis
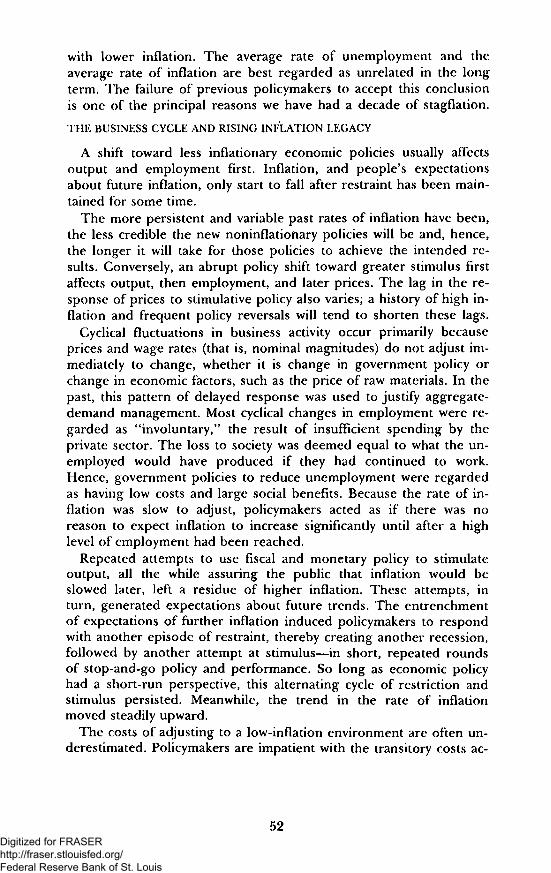
with lower inflation. The average rate of unemployment and theaverage rate of inflation are best regarded as unrelated in the long-term. The failure of previous policymakers to accept this conclusionis one of the principal reasons we have had a decade of stagflation.
THE BUSINESS CYCLE AND RISING INFLATION LEGACY
A shift toward less inflationary economic policies usually affectsoutput and employment first. Inflation, and people's expectationsabout future inflation, only start to fall after restraint has been main-tained for some time.
The more persistent and variable past rates of inflation have been,the less credible the new noninflationary policies will be and, hence,the longer it will take for those policies to achieve the intended re-sults. Conversely, an abrupt policy shift toward greater stimulus firstaffects output, then employment, and later prices. The lag in the re-sponse of prices to stimulative policy also varies; a history of high in-flation and frequent policy reversals will tend to shorten these lags.
Cyclical fluctuations in business activity occur primarily becauseprices and wage rates (that is, nominal magnitudes) do not adjust im-mediately to change, whether it is change in government policy orchange in economic factors, such as the price of raw materials. In thepast, this pattern of delayed response was used to justify aggregate-demand management. Most cyclical changes in employment were re-garded as "involuntary," the result of insufficient spending by theprivate sector. The loss to society was deemed equal to what the un-employed would have produced if they had continued to work.Hence, government policies to reduce unemployment were regardedas having low costs and large social benefits. Because the rate of in-flation was slow to adjust, policymakers acted as if there was noreason to expect inflation to increase significantly until after a highlevel of employment had been reached.
Repeated attempts to use fiscal and monetary policy to stimulateoutput, all the while assuring the public that inflation would beslowed later, left a residue of higher inflation. These attempts, inturn, generated expectations about future trends. The entrenchmentof expectations of further inflation induced policymakers to respondwith another episode of restraint, thereby creating another recession,followed by another attempt at stimulus—in short, repeated roundsof stop-and-go policy and performance. So long as economic policyhad a short-run perspective, this alternating cycle of restriction andstimulus persisted. Meanwhile, the trend in the rate of inflationmoved steadily upward.
The costs of adjusting to a low-inflation environment are often un-derestimated. Policymakers are impatient with the transitory costs ac-
52Digitized for FRASER http://fraser.stlouisfed.org/ Federal Reserve Bank of St. Louis

companying such a change. Even when policymakers fully intend tomake a permanent change, workers are unable to distinguish immedi-ately between permanent and transitory changes in market conditionsaffecting their industry. They do not know whether a layoff is tempo-rary or permanent, or whether the real wages prevailing in their in-dustry will be sustainable in the future. Immediate reductions inwages are therefore resisted, and workers are often willing to experi-ence a period of unemployment while waiting to be called back towork in the same industry and at the same wages, rather than changeoccupation or relocate.
Although changes in labor market conditions do occur, it is notalways obvious to those affected whether the changes are permanent.Workers and employers must decide on a course of action while la-boring under a high degree of uncertainty. Accepting a lower realwage will entail a reduction in lifetime income if the reduction indemand is temporary. But failing to cut real wages when the reduc-tion in demand proves to be permanent also will mean a reduction inlifetime income as a consequence of lost jobs. The proper choice isusually not obvious at the time. This is a major reason why businessesand workers are slow to adjust prices and wages.
For at least two decades the government has responded to reces-sions by pushing up Federal spending and monetary growth to stimu-late the economy. Each time this has been done, output has recov-ered and employment has risen. Meanwhile, however, the rate of in-flation has been higher in each trough than in the previous trough,and higher at each peak than at the previous peak (Chart 3-2).
The public has apparently drawn two lessons from this experience.First, people have come to expect on average that the rate of priceand wage change will rise from cycle to cycle. As a result, resistanceto price and wage reduction relative to the increase in the generalprice level has increased through successive recessions. As antici-pated inflation increased, the pressure for higher wages intensified.Second, all recessions are expected to be offset by stimulative gov-ernment policies, and the costs of unemployment are expected to bereduced by unemployment compensation and related benefits. Thus,there are fewer incentives to look for employment at lower realwages and more reasons to wait for stimulative policies to restoreemployment in the old jobs at the same real wages.
Discretionary monetary and fiscal policies have added an additionalelement of uncertainty to economic life. People who want to knowwhether tax rates will rise or fall must guess whether the bulge ingovernment spending during a recession is a portent of permanentlyhigher spending and tax rates or simply an indication of temporarilyhigher spending. Past experience gives imperfect guidance. Yet dif-
53Digitized for FRASER http://fraser.stlouisfed.org/ Federal Reserve Bank of St. Louis
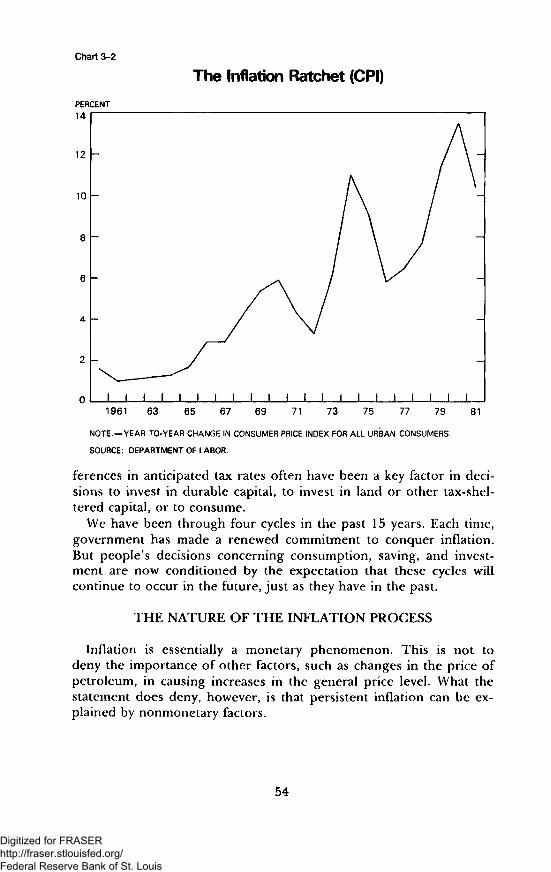
Chart 3-2
The Inflation Ratchet (CPI)
i t i i i i t i i i i t i i i i1961 63 65 67 69 71 73 75 77 79 81
NOTE. — YEAR-TO-YEAR CHANGE IN CONSUMER PRICE INDEX FOR ALL URBAN CONSUMERS,
SOURCE: DEPARTMENT OF LABOR.
ferences in anticipated tax rates often have been a key factor in deci-sions to invest in durable capital, to invest in land or other tax-shel-tered capital, or to consume.
We have been through four cycles in the past 15 years. Each time,government has made a renewed commitment to conquer inflation.But people's decisions concerning consumption, saving, and invest-ment are now conditioned by the expectation that these cycles willcontinue to occur in the future, just as they have in the past.
THE NATURE OF THE INFLATION PROCESS
Inflation is essentially a monetary phenomenon. This is not todeny the importance of other factors, such as changes in the price ofpetroleum, in causing increases in the general price level. What thestatement does deny, however, is that persistent inflation can be ex-plained by nonmonetary factors.
54
Digitized for FRASER http://fraser.stlouisfed.org/ Federal Reserve Bank of St. Louis

Monetary policy actions affect primarily nominal quantities—ex-change rates, the price level, national income, and the quantity ofmoney—as well as the rate of change in nominal quantities. But cen-tral bank actions do not have significant long-run effects in achievingspecific values of real magnitudes—the real rate of interest, the rate ofunemployment, the level of real national income, the real quantity ofmoney—or rates of growth of real magnitudes.
Economists recognized long ago that output and employment maybe no higher when prices are high than when they are low. A mainpoint of Adam Smith's Wealth of Nations is that a country's wealth andincome depend on the country's real resources and the way in whichproduction is organized, and not on the level of prices. It was real-ized that changes in the price level had some short-term effects onoutput, but these effects were recognized as the result of transitorychanges in demand.
The classical gold-standard mechanism embodied these principles.Unanticipated increases in the flow of gold from abroad stimulateddomestic production but gradually raised domestic prices relative toforeign prices. The rise in domestic prices then reduced exports andraised imports, thereby lowering domestic production and employ-ment and eventually lowering prices. The continuous ebb and flow ofgold was expected, but the timing of the movements could not bepredicted accurately. Inability to predict the movements was recog-nized as a cause of changes in prices and output.
Once people anticipate that prices will rise, they seek higher wagesfor their labor and higher prices for their products. The increase inemployment produced by stimulative policies vanishes, but the infla-tion remains. Attempts to reduce unemployment by increasing infla-tion will work only if people are fooled by the changes in policy.Once people learn to expect inflation, the short-run gains in employ-ment disappear.
It is often stated that inflation is an intractable problem, caused byforces beyond our control. But the monetary nature of inflation sug-gests that this is not so. More importantly, it suggests that a decrease inmoney growth is the necessary strategy to end inflation. Frequent useof monetary policy to reduce unemployment at certain times andinflation at others would raise the prospect of generating the same kindof cyclical behavior in economic activity that we have experienced inthe past and analyzed in the previous section.
Stop-and-go policies cause uncertainty, hamper the ability of mon-etary authorities to achieve noninflationary conditions, and ultimately
55
Digitized for FRASER http://fraser.stlouisfed.org/ Federal Reserve Bank of St. Louis

raise the transitional costs of eliminating inflation. The next sectiondiscusses in detail the nature of these costs.
THE COSTS OF INFLATION
Over the last decade, as inflation worsened, the attention of thegeneral public: focused on the detrimental effects that rapidly risingprices have on economic performance. These effects were felt inmany ways, but the mechanisms by which inflation generated themwere not well understood.
The effects of inflation fall into two general categories: (1) thosethat occur because no one is able to predict the precise rate of infla-tion; and (2) those that occur even when the rate of inflation is fullyanticipated.
The concept of a "fully anticipated inflation" implies a rate of in-flation that people can predict and hence take action to minimize itseffects. But it is doubtful that a high rate of inflation that was alsopredictable could ever exist because the same lack of monetary disci-pline which leads to unacceptably high inflation is also likely to leadto more variable inflation. Indeed, periods of high inflation ratesgenerally have been associated with periods of higher variability ofinflation rates. It would take at least as much monetary discipline tomaintain a constant high inflation rate as it takes to maintain price-level stability. Once a positive rate of inflation is accepted it becomesdifficult to argue against a slightly higher rate.
One of the most important costs of unanticipated inflation is its ar-bitrary redistribution of wealth and income. Economic transactionsare often formalized in contracts that require one party to pay a fixeddollar amount to the other party at some point in the future. Whenboth parties anticipate inflation during the life of the contract, thesefuture dollar payments will be adjusted upward to compensate fortheir expected lower real value. This upward adjustment is the so-called inflation premium. If, however, the actual rate of inflationturns out to be different from the anticipated rate, the real terms ofthe contract will have been altered arbitrarily. If the actual rate ishigher than anticipated, the fixed payments in dollars will have alower than expected real value, and the debtor will gain at the ex-pense of the creditor. The same kind of arbitrary transfer occurswhen workers and firms agree to wage contracts that implicitly or ex-plicitly assume rates of inflation which later turn out to be incorrect.
In a market economy, changes in the price of one good relative toanother signal changes in demand and supply conditions among var-ious markets. An uncertain rate of inflation obscures these signalsand thereby reduces economic efficiency. Since prices are rising more
56Digitized for FRASER http://fraser.stlouisfed.org/ Federal Reserve Bank of St. Louis

or less together during a general inflationary period, the fact that aprice has risen is no guarantee that it has risen relative to otherprices. The difficulty of distinguishing between relative and absoluteprice changes increases as inflation and its variability increase. Thisleads people to use more time and resources to attempt to decipherrelative price changes, as opposed to engaging in more productiveactivities. Differently stated, inflation tends to make the economic in-formation that people accumulate through experience more rapidlyobsolescent than when prices are stable.
Perhaps more importantly, inability to correctly anticipate inflationcreates confusion about relative prices over time and compounds theproblem of efficient resource allocation. Economic decisionmaking,especially in the private sector, is inherently forward-looking. Deci-sions made today determine tomorrow's levels of capital stock, pro-duction, and consumption. Decisions based on correct anticipation offuture relative prices lead to a more efficient allocation of resourcesover time. High and variable inflation, on the other hand, leads todivergent inflation expectations, and therefore to a larger proportionof incorrect decisions.
Because inability to anticipate the rate of inflation correctly in-creases the uncertainty associated with economic decisions, especiallythose that involve fixed-dollar commitments far into the future, itleads to a shortening of the time horizon over which such commit-ments are made. In the financial markets, uncertainty about inflationcauses a relative decline in the volume of long-term bond financing.Neither borrowers nor lenders are willing to compensate the otheradequately for the risk. Consequently, the sales volume of fixed-ratelong-term debt instruments shrinks and the volume of real invest-ment normally financed in this way decreases. More generally, pro-ductive activities yield a relatively lower real return than activitiesaimed at "beating" inflation. Hence, as more and more resources aredevoted to coping with the uncertainty that accompanies inflation,fewer resources are available for real productive activities.
Two costs of anticipated inflation have been widely recognized. Inthe economics literature they have been dubbed "menu" and "shoeleather" costs. Because inflation requires frequent changes in pub-lished (that is, "menu") prices, these changes absorb resources thatcould be used in other activities. "Shoe leather" costs are those in-curred by people attempting to minimize their money holdings bymore frequent trips to the bank. Since a great deal of money is heldas a noninterest-bearing asset, its real value declines with inflation.People therefore make more strenuous efforts to realize the highestreturn on their assets and hence they economize on noninterest-bear-ing balances.
57Digitized for FRASER http://fraser.stlouisfed.org/ Federal Reserve Bank of St. Louis

The interaction of a nonindexed tax system with inflation wouldimpose costs even if the rate of inflation were correctly anticipated.Imperfect adjustment for inflation in the taxation of both currentlabor income and income from capital causes changes in inflation toaffect real after-tax levels of income. These, in turn, alter the leveland composition of these activities relative to each other and relativeto activities on which the return is not distorted. One analyst has esti-mated the unavoidable costs from this cause alone to be 0,7 percentof gross national product (GNP), and perhaps as high as 2 to 3 per-cent of GNP. The indexation of tax brackets beginning in 1985, aslegislated by the Economic Recovery Tax Act of 1981, will substan-tially reduce this problem.
The interaction between the tax system and inflation also affectscapital formation because of the way in which depreciationallowances are treated. Depreciation allowances for capital assets arebased on historical cost rather than current replacement cost. Duringperiods of high inflation the difference between historical cost andreplacement cost widens rapidly, leading to allowances smaller thanwould be considered justifiable. Since deductions for depreciationare determined on the basis of the actual purchase price, smaller realdeductions mean higher capital costs. This, in turn, reduces the paceof investment and hence of economic growth. (See Chapter 5 for anextended discussion of these issues.)
THE COSTS OF REDUCING INFLATION
There is, as noted above, a short-lived tradeoff between unemploy-ment and the rate of inflation. This means that policies designed toreduce inflation significantly will temporarily increase unemploymentand reduce output growth. The temporary decline in output growthinduced by anti-inflation policies forms a rough benchmark againstwhich the subsequent benefits of reduced inflation can be compared.The extent of these costs of reducing inflation depends on four fac-tors: (1). the institutional process of setting wages and prices; (2) therole of expectations in this process; (3) the policy instruments em-ployed to reduce inflation; and (4) the initial rate of inflation.
Flexibility in wages and prices reduces the transitional costs ofending inflation. A policy-induced decline in the growth rate of mon-etary aggregates will be associated with a decline in the growth ofreal output, but the more rapidly this decline in output is followed bya moderating of inflation, the more rapidly will output growth returnto a rising trend. One important factor affecting the flexibility ofwages and prices is the institutional environment in which they aredetermined. The costs of continuously negotiating and resettingprices and wages, for example, has given rise to the common practice
58Digitized for FRASER http://fraser.stlouisfed.org/ Federal Reserve Bank of St. Louis
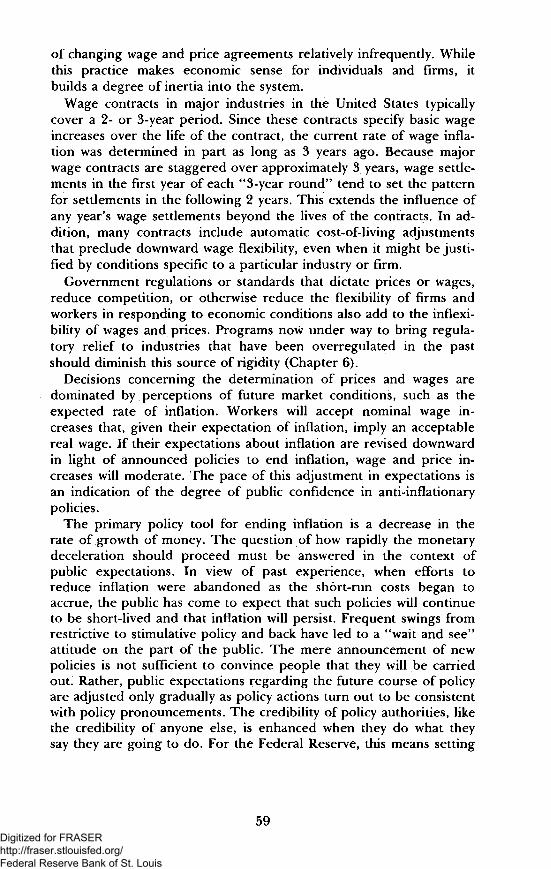
of changing wage and price agreements relatively infrequently. Whilethis practice makes economic sense for individuals and firms, itbuilds a degree of inertia into the system.
Wage contracts in major industries in the United States typicallycover a 2- or 3-year period. Since these contracts specify basic wageincreases over the life of the contract, the current rate of wage infla-tion was determined in part as long as 3 years ago. Because majorwage contracts are staggered over approximately 3 years, wage settle-ments in the first year of each "3-year round" tend to set the patternfor settlements in the following 2 years. This extends the influence ofany year's wage settlements beyond the lives of the contracts. In ad-dition, many contracts include automatic cost-of-living adjustmentsthat preclude downward wage flexibility, even when it might be justi-fied by conditions specific to a particular industry or firm.
Government regulations or standards that dictate prices or wages,reduce competition, or otherwise reduce the flexibility of firms andworkers in responding to economic conditions also add to the inflexi-bility of wages and prices. Programs now under way to bring regula-tory relief to industries that have been overregulated in the pastshould diminish this source of rigidity (Chapter 6).
Decisions concerning the determination of prices and wages aredominated by perceptions of future market conditions, such as theexpected rate of inflation. Workers will accept nominal wage in-creases that, given their expectation of inflation, imply an acceptablereal wage. If their expectations about inflation are revised downwardin light of announced policies to end inflation, wage and price in-creases will moderate. The pace of this adjustment in expectations isan indication of the degree of public confidence in anti-inflationarypolicies.
The primary policy tool for ending inflation is a decrease in therate of growth of money. The question of how rapidly the monetarydeceleration should proceed must be answered in the context ofpublic expectations. In view of past experience, when efforts toreduce inflation were abandoned as the short-run costs began toaccrue, the public has come to expect that such policies will continueto be short-lived and that inflation will persist. Frequent swings fromrestrictive to stimulative policy and back have led to a "wait and see"attitude on the part of the public. The mere announcement of newpolicies is not sufficient to convince people that they will be carriedout. Rather, public expectations regarding the future course of policyare adjusted only gradually as policy actions turn out to be consistentwith policy pronouncements. The credibility of policy authorities, likethe credibility of anyone else, is enhanced when they do what theysay they are going to do. For the Federal Reserve, this means setting
59Digitized for FRASER http://fraser.stlouisfed.org/ Federal Reserve Bank of St. Louis
money growth targets consistent with a sustained decrease in the rateof inflation and then adhering to those targets. The more success theFederal Reserve has in meeting those targets, the less time it will takebefore the public is convinced of the policy's credibility.
In the current environment, even if a successful effort is made toreduce money growth, past experience with high and variable infla-tion will affect the speed at which financial markets reflect progresstoward a long-run noninflationary policy. Having repeatedly sufferedsizable capital losses on their holdings of long-term bonds, investorswill be unwilling to commit new funds to these markets unless theyare compensated for the risk that the current commitment to over-come inflation might be abandoned. Without adequate compensationfor this risk, individuals will continue to prefer to invest in short-livedrather than long-lived financial assets. While this preference may pre-vent investors from maximizing the expected return on their assets, itallows them to minimize the adverse effects of future increases in in-flation and interest rates.
Present concern about future monetary growth, inflation, and in-terest rates is related to the knowledge that the Federal budget willcontinue to show large deficits for the next several years. Financialinvestors fear that these deficits will cause either a sharp increase ininterest rates—which would slow the recovery from recession—or anincrease in monetary growth if the Federal Reserve attempts to holdinterest rates down by adding reserves to the banking system throughopen market purchases of government securities.
Interest rates that are considerably higher than the current rate ofinflation can have an adverse effect on investment and real economicgrowth. The level of long-term interest rates at the end of 1981 didnot reflect investor willingness to believe that inflation will declineover the next several years. The presumably large but unmeasurablepremiums being demanded by investors constitute a major obstacleto achieving rising output and employment with falling inflation.
Expectations about future rates of money growth, like expectationsof future inflation, are likely to be more divergent the greater thevariability of past money growth. These expectations should con-verge more rapidly as the Federal Reserve improves its ability to con-trol money growth. More precise control of money growth aroundthe target path will reduce the difficulty of inferring from actualgrowth rates whether or not the announced targets are, in fact, a reli-able indicator of future money growth. In such an environment, vari-ations in money growth will reflect only random and short-lived devi-ations, which would have little effect on either short- or long-run ex-pectations about monetary policy. But failure to achieve more precisemonetary control, by impeding a rapid adjustment of expectations,
60Digitized for FRASER http://fraser.stlouisfed.org/ Federal Reserve Bank of St. Louis

would significantly raise the costs of reducing inflation. Thus, thepayoffs of greater precision could be quite large.
In summary, high and varying inflation imposes costs on society byreducing future standards of living. These costs, though presumed tobe large and pervasive, are not easily calculated. There is a tempo-rary output loss in the initial stage of a transition to price stability.Such loss, however, must be weighed against the future increases inoutput that would be achieved by ending inflation. The policies ofthe Administration are based on the view that the cost of continuingto endure the high rates of inflation of the 1970s would be greaterthan the costs of implementing a successful noninflationary policy.
MONEY AND MONETARY POLICY
MONEY CREATION AND FEDERAL FINANCE
The deficit of the Federal Government is financed by the issuing ofinterest-bearing liabilities, such as Treasury bills and long-termbonds, and noninterest-bearing liabilities, which include currency andbank reserves held as deposits with the Federal Reserve System. Thenoninterest-bearing liabilities constitute the monetary base. Whenthere is unanticipated inflation, holders of the interest-bearing liabil-ities are implicitly taxed because the nominal interest rates on theirholdings no longer fully compensate for inflation. Holders of curren-cy and reserves, however, bear an implicit tax even when inflation isanticipated. Banks usually seek to shift some of the implicit tax ontheir reserves to depositors. The portion of the tax ultimately ab-sorbed by depositors depends on the administrative limits on interestpaid on these deposits, and on the degree of competitiveness in thebanking industry.
The purchasing power of the dollar declines over time when thegrowth of the money stock exceeds the growth of demand for realmoney balances. As a result, holders of money incur a loss that is re-lated to the rate of inflation. As discussed more fully in Chapter 5,the Federal Government benefits from anticipated inflation becausethe real value of its noninterest-bearing liabilities falls. It also bene-fits from unanticipated inflation because the nominal interest on itsinterest-bearing debt does not fully compensate for the decline in thepurchasing power of money. The revenues obtained in this fashionby the Federal Government serve as a substitute for other, moredirect taxes. This "inflation tax" may be more or less efficient thanother taxes in financing government expenditures, but while all othertaxes are legislated by the Congress (or State and local govern-ments), the inflation tax is not.
61Digitized for FRASER http://fraser.stlouisfed.org/ Federal Reserve Bank of St. Louis
One troublesome aspect of the inflation tax is not so much its ex-istence as uncertainty about its amount. Historically, high averagerates of inflation have been associated with high volatility—that is,large swings in inflation rates from year to year. Financial marketsreadily incorporate expected rates of inflation into interest rates, butthey are unable to price that portion of the inflation rate that is un-anticipated.
MONEY VERSUS CREDIT
Discussions of monetary policy frequently fail to take account ofthe difference between money and credit. Money is an asset thatpeople generally accept as payment for goods and services. It con-sists of coins, currency, and checkable deposits. Credit, in contrast, isone party's claim against another party, which is to be settled by afuture payment of money. Confusion about the difference betweenmoney and credit arises because people can increase their spendingeither by reducing their money balances or by obtaining credit.
The market for money is distinct from the market for credit. Thesupply of and demand for credit influence primarily the interest rate,which is the price of credit. The supply of and demand for money,on the other hand, determine the purchasing power of money. Addi-tional confusion about the difference between money and creditarises because the monetary authorities create money primarily bypurchasing credit market instruments. These actions tend to increasethe supply of available bank credit and consequently tend to lowerinterest rates, at least initially. Over a longer period of time, howev-er, the creation of money has important effects on economic activitythat tend to raise interest rates. Monetary expansion leads to an ex-pansion in nominal income and economic activity, which in turn gen-erates an increased demand for credit, thus reversing the initial de-cline in interest rates. In addition, a sustained higher rate of mone-tary growth will soon produce higher nominal interest rates to com-pensate lenders for the expected decline in the real value of theirwealth.
When interest rates are high, credit is often said to be "tight,"meaning that it is expensive. This does not necessarily mean thatmoney is tight in the sense that its quantity is restricted. Indeed,quite the opposite is likely to be the case. "Easy" money, in the senseof rapid growth in the stock of money, may very well be the underly-ing reason for a tight credit market. Conversely, tight money in thesense of slow growth in the stock of money is likely to lead eventuallyto a fall in nominal interest rates as inflation expectations subside.But it is credit, not money, that is easy. Over the long run, the effectof the growth of money on the real volume of credit is essentially
62
Digitized for FRASER http://fraser.stlouisfed.org/ Federal Reserve Bank of St. Louis
neutral. Monetary expansion can succeed in driving up the nominalsupply of credit as well as other nominal magnitudes. But it cannotsignificantly alter the real supply of credit or the real interest rate(the nominal rate adjusted for inflation), except indirectly throughthe uncertainty associated with inflation and because of the effects ofan unindexed tax system. Monetary expansion can permanentlyreduce the purchasing power of money, but not the real price ofcredit.
It is often stated that such financial innovations as money-marketfunds undermine the conduct of monetary policy. Statistical supportfor this assertion is dubious. What would have to be demonstrated isthat financial innovation—which is to a large extent the result ofpolicy-imposed constraints on the financial system in an inflationaryenvironment—has made it more difficult to achieve a given monetarytarget, and that the link between changes in nominal GNP andchanges in the monetary aggregates—that is, changes in velocity—hasbecome less predictable. The evidence does not seem to supporteither proposition. A study recently published by the Federal Reservesuggests that the monetary authorities have the ability to control themeasure of transactions balances known as Ml with a reasonabledegree of precision. Furthermore, changes in velocity do not appearto be any more volatile than they have in the past. Indeed, changesin the trend of the growth rate of nominal GNP over the period 1960to 1981 are almost entirely attributable to changes in the trend of thegrowth rate of the money stock, (Ml), as opposed to changes in thetrend of the growth rate of velocity (Chart 3-3).
It is inflation and a highly regulated financial system that havespurred financial innovation. Inflation, and consequent higher inter-est rates, have also raised the real cost of reserve requirements forfinancial institutions. At the same time, the public has tended toeconomize on noninterest-bearing money balances. Thus, incentiveswere created for the public to demand, and for financial institutionsto supply, substitutes for existing transactions accounts that are sub-ject neither to reserve requirements nor interest rate restrictions. Butinnovations which are attractive only because they provide a meansof avoiding existing regulations waste resources. The inefficiencieswhich such innovations are designed to circumvent could have beenminimized by payment of interest on required reserves and on trans-actions balances. These inefficiencies will be greatly reduced whenprice level stability is restored.
MONETARY POLICY OBJECTIVES AND STRATEGY
A slow and steady rate of money growth is one of the four basicelements of the Administration's economic recovery program. Whilethe formulation and implementation of monetary policy is the re-
63
Digitized for FRASER http://fraser.stlouisfed.org/ Federal Reserve Bank of St. Louis

Chart 3-3
Money and GNP Growth
PERCENT CHANGE (ANNUAL RATE)1
16
14
12
10
8
6
4
2
0
AVERAGE ANNUAL PERCENT CHANGE
19591019701970la 19811959 to 1981
Velocity
2,86.75.2
MONEY GROWTHPLUS AVERAGE
VELOCITY GROWTH2
1961 63 65 67 69 71 73 75 77 79 81
1 PERCENT CHANGE IN 4-QUARTER MOVING AVERAGES OF SEASONALLY ADJUSTED MONEYSTOCK (M1) AND GNP.2 AVERAGE VELOCITY GROWTH IS AVERAGE ANNUAL PERCENT CHANGE OVER THE PERIOD1959 TO 1981.
NOTE.—SHADED AREAS INDICATE RECESSIONS AS DEFINED BY THE NATIONAL BUREAU OFECONOMIC RESEARCH.
SOURCES: DEPARTMENT OF COMMERCE AND BOARD OF GOVERNORS OF THE FEDERALRESERVE SYSTEM.
sponsibility of the Federal Reserve, the Administration believes theannounced policy of the Federal Reserve is consistent with the eco-nomic recovery program. Thus, the Administration expects that theFederal Reserve will achieve an orderly reduction in the trend ofmoney growth to a noninflationary rate, (See .Chapter 8 for a discus-sion of recent monetary developments.)
We have discussed in the previous section how large risk premi-ums—the inflationary psychology—impose costs on the economy andconstitute a major obstacle to achieving a high rate of saving and in-vestment and rapidly rising standards of living. Announced changesin policy cannot lower these risk premiums in the short run. Credibil-ity must be earned by performance. The longer the heritage of infla-tion, the longer it will take to demonstrate the credibility of currentpolicy.
Controlling Monetary Aggregates
Some basic principles can be used to evaluate monetary policy ac-tions. First, the monetary aggregate that is selected for policy pur-poses should be chosen with two factors in mind. One is that growth
64
Digitized for FRASER http://fraser.stlouisfed.org/ Federal Reserve Bank of St. Louis

of the aggregate should be closely related to a primary objective ofpolicy, which is to reduce inflation. This means that the aggregatemust be closely related to national income in current prices. Thesecond factor is that the Federal Reserve should be able to controlthe aggregate. Although a broader monetary aggregate may bear acloser relationship to nominal income than a narrower one, it is notappropriate for the Federal Reserve to emphasize the broader aggre-gate if it cannot be controlled as closely. Such a broader aggregate,however, may be a useful indicator of the effects of policy if timelydata are available. As has already been discussed, the Federal Re-serve has the ability to control the Ml aggregate with a reasonabledegree of precision.
Success in controlling monetary aggregates is in part dependent onprevailing exchange-rate policy. A policy designed to maintain agiven value of the dollar on foreign exchanges is inconsistent in thelong run with a policy of achieving given monetary targets. As will bediscussed in detail in Chapter 7, the policy of the Administration is topermit exchange rates to be determined by market forces. Such aposture relaxes an important constraint on the ability of the mone-tary authorities to set and achieve monetary targets.
Financial innovations in recent years have complicated the evalua-tion of the inflationary potential of monetary growth. The develop-ment of new financial instruments necessitated a recent redefinitionof the monetary aggregates used by the Federal Reserve. The newmeasure of transactions balances (Ml), in addition to including thepublic's holdings of currency and demand deposits at commercialbanks, also includes the new types of checkable deposits offered byfinancial institutions, such as negotiable order of withdrawal (NOW)accounts. These interest-bearing checkable deposits are clearly usedfor transaction purposes and thus properly belong in Ml.
Under the operating procedures of the Federal Reserve, accuracyin controlling a particular monetary aggregate depends upon the re-serve requirement structure. In principle, reserve requirementsshould be applied uniformly to all deposits included in the monetaryaggregate that the Federal Reserve is most committed to controllingand held at zero on deposits the Federal Reserve is less interested incontrolling. Since the existing structure of reserve requirements wasoriginally specified for other reasons, such as bank safety and alloca-tion of credit, it does not meet this principle. As a result, the FederalReserve must continuously monitor and compensate for the shiftingrelationships between the various monetary aggregates and totalbank reserves.
This problem, which has been severe in the past, will be reducedgreatly over the next few years. A restructuring of reserve require-
65
Digitized for FRASER http://fraser.stlouisfed.org/ Federal Reserve Bank of St. Louis
ments that will allow closer control of Ml is currently being carriedout under provisions of the Depository Institutions Deregulation andMonetary Control Act of 1980. After complete implementation ofthese provisions is achieved by 1988, reserve requirements on trans-action accounts will be nearly uniform, and those on most other ac-counts could be eliminated.
Interest Rates Versus Money Stock Targets
Prior to the 1970s the Federal Reserve (like most central banks)judged the appropriateness of monetary policy primarily by lookingat credit conditions and interest rates—specifically, by watchingshort-term interest rates as an indicator of money-market conditions.However, the problem raised by this procedure was the difficulty inknowing exactly how much to vary interest rates in order to stabilizethe economy. In times when credit demand was strong, too small anincrease in interest rates generated spending in excess of the econo-my's capacity to produce, thereby fueling inflation. Similarly, interestrates might be allowed to decline by too little at times of weak creditdemand, contributing to a recession.
In practice, monetary policymakers tended to be cautious in at-tempting to change interest rates, with the result generally being toomuch expansion of money when credit demand was strong and toolittle expansion when credit demand was weak. This procyclicalmoney growth has tended to exacerbate, rather than dampen, busi-ness cycle fluctuations (Chart 3-3).
The procyclical growth in money was accompanied by a seculargrowth in money and increases in inflation. As the rate of inflationsoared in the 1970s, market interest rates became an even less reli-able guide to monetary policy. Market interest rates tend to be highwhen the inflation rate is high and low when inflation is low, givenprivate and public borrowing demand. Consumption and investmentdecisions are based on real (inflation-adjusted) interest rates, notnominal interest rates. High nominal interest rates do not necessarilymean that *'money is tight." High interest rates, in fact, may gohand-in-hand with "easy money." Since it is difficult to measure in-flation expectations, it is difficult to know how much of an adjust-ment to make in nominal interest rates to determine the real interestrate. For these reasons, monetary policy is more appropriately basedon changes in the growth of money than on changes in market inter-est rates.
When the Federal Reserve first adopted monetary targets in theearly 1970s, it attempted to alter interest rates to achieve a desiredrate of monetary growth. The growth of money was controlledthrough the marginal cost to banks of acquiring additional reserves,as indicated by the Federal funds rate, rather than through direct
66
Digitized for FRASER http://fraser.stlouisfed.org/ Federal Reserve Bank of St. Louis
control of the quantity of reserves. (The Federal funds rate is therate at which banks borrow excess reserves from each other.) In1975, however, the Congress urged the Federal Reserve to adoptannual targets for monetary growth. With passage of the Full Em-ployment and Balanced Growth Act of 1978 (the Humphrey-HawkinsAct), the requirement for money growth targeting became more spe-cific. Since then, monetary authorities have been modifying their pro-cedures in order to achieve their monetary targets.
On October 6, 1979, the Federal Reserve adopted a new approachwhich put much less emphasis on fluctuations in short-term interestrates. Instead, the new procedure placed primary emphasis on theamount of bank reserves as an operating target and allowed interestrates to be determined more freely by the market. What the FederalReserve decided to do at that point was to control the quantity of re-serves, rather than their price. Under the old procedures the averageFederal funds rate typically did not vary by much more than one-halfof a percentage point between monthly meetings of the FederalOpen Market Committee. But after October 1979 the allowablerange of the Federal funds rate was increased.
Enhancing Monetary Control
Stable monetary growth will serve to stabilize prices, act as anautomatic stabilizer against temporary output fluctuations, and helpto make public expectations about inflation consistent with the un-derlying rate of monetary growth. Achievement of stable monetarygrowth will require adequate control over total bank reserves. Twotypes of reserves are available. Nonborrowed reserves are owned out-right by banks and are supplied by the Federal Reserve through openmarket operations. Borrowed reserves are supplied through tempo-rary loans from the discount window of the Federal Reserve. Themonetary authorities can directly control the amount of nonborrowedreserves, but they have only indirect control over the small but po-tentially volatile amount of reserves which bank borrow at the dis-count window.
Although borrowed reserves constitute, on average, only 2 to 3percent of total reserves, fluctuations in borrowing can contributesignificantly to short-run changes in total reserves. Reform of the dis-count window has therefore been proposed to make borrowed re-serves more controllable and thus more predictable. Under theseconditions, the Federal Reserve would be able to meet its targets fortotal banks reserves and the monetary base more accurately.
The volatility in borrowed reserves could be reduced by tying thediscount rate to market rates so as to reduce variability in the incen-tive to borrow. To keep such variability to an absolute minimum, theFederal Reserve would also have to set its discount rate somewhat
67
Digitized for FRASER http://fraser.stlouisfed.org/ Federal Reserve Bank of St. Louis

above market interest rates—that is, to act as a penalty. A penaltydiscount rate would be especially effective when the Depository Insti-tutions Deregulation and Monetary Control Act of 1980, whichmakes reserve requirements significantly more uniform, is fully im-plemented.
An even more successful operation of a penalty rate would requirea switch from the Federal Reserve's lagged reserve-requirement ruleto a system of contemporaneous reserve requirements. The currentrule, which became effective in 1968, states that in any given weekinstitutions must hold reserves (as deposits at a Federal ReserveBank or vault cash) in prescribed percentages of their various typesof deposits 2 weeks earlier. The earlier system of contemporaneousreserve accounting required banks to hold reserves based on the cur-rent week's deposits.
Under lagged reserve accounting, the amount of borrowed re-serves fluctuates considerably over the short run. During any 2-weekperiod the total reserve requirement is predetermined by deposits 2weeks earlier. This means that reserves must be supplied within theperiod, either borrowed or nonborrowed. Under current operatingprocedures, the Federal Reserve controls the growth of total reservesin future periods by varying the mix between borrowed and nonbor-rowed reserves. If a penalty discount rate tied to market interest rateswere introduced, borrowed reserves would probably shrink to a smalland relatively constant amount.
The Federal Reserve Board has requested public comment on itsproposal to return to a system of contemporaneous reserve account-ing. An important reason for going back to contemporaneous ac-counting would be to permit greater flexibility in the discount rate, ata penalty level or otherwise, which in turn would provide more pre-cise short-run control over total reserves by reducing the volatility ofborrowings. Even in the absence of a penalty discount rate, however,contemporaneous reserve accounting would allow open market oper-ations to have a more immediate effect on total bank reserves.
INSTITUTIONALIZATION OF A NONINFLATIONARYMONETARY POLICY
The existence of high and varying rates of inflation, high and vary-ing rates of interest, and volatile exchange rates for more than adecade clearly suggests that monetary management can be improvedin the future. The Administration has supported and will continue tosupport the pursuit of a noninflationary monetary policy. The issuediscussed in this section is: Once inflation has been eliminated, howcan price-level stability be maintained?
68
Digitized for FRASER http://fraser.stlouisfed.org/ Federal Reserve Bank of St. Louis
Price stability is an objective that is arrived at through the politicalprocess, but it often conflicts with other political and economic ob-jectives in the short run. It has therefore been difficult to establishinstitutional arrangements that will ensure price-level stability. Thetraditional argument for an independent monetary authority is thatinsulation from politics enables the central bank to resist pressuresfor inflating, even when the government would find an inflationarypolicy politically appealing.
Existing institutional arrangements have not ensured price stability.In the past 17 years, gold reserve clauses related to demand depositsat commercial banks, and then to currency held by the public, havebeen terminated. The Bretton Woods fixed exchange-rate systembegan to break down in the late 1960s, and the last link between theU.S. dollar and gold was formally severed in 1971. Since then, themonetary authorities have had considerable discretion in determiningthe rate at which new money is created.
As a result of the rising and volatile inflation of the past, econo-mists have been evaluating alternative approaches to achieving andmaintaining a noninflationary monetary policy. The congressionalmandate to create a Gold Commission is symptomatic of a desire tofind institutional arrangements that will ensure price-level stability.The remainder of this section discusses two approaches to the prob-lem. One would involve some linkage of our monetary system to theofficial U.S. gold stock. The other would involve statutory or consti-tutional rules limiting monetary growth or requiring a stable pricelevel.
It is important to keep in mind that alternatives to the present ar-rangement should be evaluated in terms of the answers they provideto these two questions: Is the rule or norm perceived to be credibleby the public? Will departures from the stated norm impel policy-making institutions to correct them? If the answer to either questionis "no," institutional change would not have served its purpose.
GOLD STANDARD
Some economists and elected officials have recently been advocat-ing a return to a gold standard as a lasting way to restore confidencein the U.S. monetary system. The basic idea is that excessive moneycreation could be prevented by anchoring money to a scarce re-source. In addition, it is argued that the establishment of a goldstandard would induce savers to accept lower nominal rates of returnon their assets. This would occur because fiat money would be con-vertible into gold at a fixed price, and thus an effective constraintwould be placed on growth of the money stock and the rate of infla-tion. Lower rates of interest, in turn, would result in a rapid resump-
69Digitized for FRASER http://fraser.stlouisfed.org/ Federal Reserve Bank of St. Louis

tion of economic growth. So, in essence, the contention is that resto-ration of a gold standard would not only stabilize prices but alsoraise and stabilize output growth.
It is useful to review at this point how gold standards actually per-formed in the past. The evidence does not suggest that it achievedgreater stability in price levels or growth. Much of the claimed price-level stability achieved under previous gold standards is based onGustav Cassers observation that "the general level of prices in 1910was practically the same as in 1850." l Professor Phinney of Harvardwas one of the first to point out that "unfortunately, when Casselcame to choose base years, he completely forgot the distinction be-tween the secular and the cyclical to which he had called attention/*2
Chart 3-4
Jevons-Sauerbeck Indexof Wholesale Commodity Prices
1830_~ 100.
120
100
80
I I I I I I I\>C/ I I601820 1830 1840 1850 1860 1870 1880 1890 1900 1910
NOTE,—INDEX OF PRICES IN BRITISH POUNDS OF A SELECTED GROUP OF INTERNATIONALLYTRADED COMMODITIES.
SOURCE: REPRODUCED FROM J. T. PHINNEY, "GOLD PRODUCTION AND THE PRICE LEVEL: THECASSEL THREE PERCENT ESTIMATE," QUARTERLY JOURNAL OF ECONOMICS, VOL. 47,1932-33, pp. 647-679.
Chart 3-4 reproduces the Jevons-Sauerbeck index which appeared inthe Phinney article. The index shows large and extremely longswings in prices lasting up to 30 years. Increases and decreases wereon the order of 30 to 50 percent. The chart reveals very little evi-dence of long-run price-level stability. More information can begleaned by considering the wholesale price indexes of four countriesfor the period 1814-1913 (Table 3-1). Perusal of the table leads to twoconclusions. First, the gold-standard period was very deflationary on
1 "The Supply of Gold," in Interim Report of the Gold Delegation of the Financial Committee,Geneva, 1930, p. 72. See also his Theory of Social Economy, p. 441.
2J. T. Phinney, "Gold Production and the Price Level: The Cassel Three Percent Estimate,"Quarterly Journal of Economics, Vol. 47, 1932-33, p. 650.
70Digitized for FRASER http://fraser.stlouisfed.org/ Federal Reserve Bank of St. Louis

the whole, with the price levels in the United States and the UnitedKingdom dropping by 44 percent. Second, price-level cycles weredeep and protracted.
TABLE $-\.—Wholesale price indexes, 1814-1913
Item
Indexes (1913=100):
18141849 .187218961913
Percent change:
1814 to 1849 ..1849 to 18721872 to 18961896 to 1913
1814 to 1913
UnitedStates
17880
13367
100
-5566
-5049
-44
UnitedKingdom
17890
12576
100
-4939
-3932
-44
Germany
12971
11171
100
4556
-3641
-22
France
U3296
12471
100
2 -2729
-4341
-24
Italy
74100
35
' Data are for 1820.2 Change from 1820.Source: Robert Triffin, "The Evolution of the International Monetary System: Historical Reappraisal and Future Perspective,"
Princeton Studies in International Finance No. 12,1964, p. 13.
Table 3-2 compares the sample mean and coefficient of variation[standard deviation divided by sample mean] of the rate of change ofthe wholesale price level for the United States and the United King-dom for three different periods.
TABLE 3-2.—Comparison of the behavior of price level, real output, and money growth in the UnitedKingdom and the United States, selected periods, 1821-1979
Item
(1) Average annual percent change in the pricelevel
(2) Coefficient of variation of annual percentchanges in the price level (ratio)
(3) Coefficient of variation of annual percentchanges in real per capita income (ratio)
(4) Average level of the unemployment rate(percent)
(5) Average annual percent change in themoney supply
(6) Coefficient of variation of annual percentchanges in the money supply (ratio)
The Gold Standard »
UnitedKingdom
1870-1913(1821-1913)
-0.7(-.4)
-14.9(-16.3)
2.5
2 4.3
1.5
1.6
United States
1879-1913(1834-1913)
0.1(-.1)
17.0(6.5)
3.5
36.8
6.1
.8
The Interwar Period
UnitedKingdom
1919-38
-4.6
-3.8
4.9
13.3
.9
3.6
UnitedStates
1919-40
-2.5
-5.2
5.5
11.3
1.5
2.4
Post- World War II
UnitedKingdom
1946-79
5.6
1.2
1.4
2.5
5.9
1.0
UnitedStates
1946-79
2.8
1.3
1.6
5.0
5.7
.5
'Data for the longer periods (in parentheses) were available only for the price level. Years 1838-43 and 1861-78 wereexcluded for the United States.
21888-1913.31890-1913.
• Note.—Lines 1 and 5 calculated as the time coefficient from a regression of the logarithm of the variable on a time trend.Lines 2, 3, and 6 calculated as the ratio of the standard deviation of annual percent changes to their mean.
Source: Michael David Bordo "The Classical Gold Standard: Some Lessons for Today", Federal Reserve Bank of St. LouisReview, May. 1981, Vol. 63, No. 5,
71Digitized for FRASER http://fraser.stlouisfed.org/ Federal Reserve Bank of St. Louis
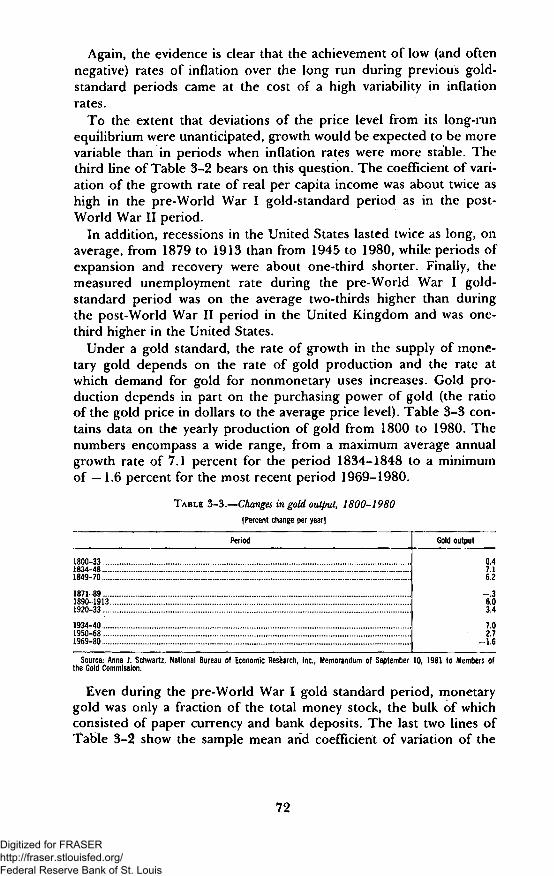
Again, the evidence is clear that the achievement of low (and oftennegative) rates of inflation over the long run during previous gold-standard periods came at the cost of a high variability in inflationrates.
To the extent that deviations of the price level from its long-runequilibrium were unanticipated, growth would be expected to be morevariable than in periods when inflation rates were more stable. Thethird line of Table 3-2 bears on this question. The coefficient of vari-ation of the growth rate of real per capita income was about twice ashigh in the pre-World War I gold-standard period as in the post-World War II period.
In addition, recessions in the United States lasted twice as long, onaverage, from 1879 to 1913 than from 1945 to 1980, while periods ofexpansion and recovery were about one-third shorter. Finally, themeasured unemployment rate during the pre-World War I gold-standard period was on the average two-thirds higher than duringthe post-World War II period in the United Kingdom and was one-third higher in the United States.
Under a gold standard, the rate of growth in the supply of mone-tary gold depends on the rate of gold production and the rate atwhich demand for gold for nonmonetary uses increases. Gold pro-duction depends in part on the purchasing power of gold (the ratioof the gold price in dollars to the average price level). Table 3-3 con-tains data on the yearly production of gold from 1800 to 1980. Thenumbers encompass a wide range, from a maximum average annualgrowth rate of 7,1 percent for the period 1834-1848 to a minimumof —1.6 percent for the most recent period 1969-1980.
TABLE 3-3.—Changes in gold output, 1800-1980
[Percent change per year]
Period
1800-331834-481849-70
1871-89 .. . .. ... .1890=19131920-33 . . . ... ,
1934=401950-681969-80
Gold output
0,47.16.2
— > 36.03.4
7.02.7
-1.6
Source: Anna J. Schwartz, National Bureau of Economic Research, Inc., Memorandum of September 10, 1981 to Members ofthe Gold Commission.
Even during the pre-World War I gold standard period, monetarygold was only a fraction of the total money stock, the bulk of whichconsisted of paper currency and bank deposits. The last two lines ofTable 3-2 show the sample mean and coefficient of variation of the
72
Digitized for FRASER http://fraser.stlouisfed.org/ Federal Reserve Bank of St. Louis

annual growth rate of ML The average growth rate of Ml for theUnited Kingdom during the pre-World War I gold standard periodwas one-fourth of the average during the post-World War II period.For the United States the two sample means are approximately thesame. However, the variability of Ml growth was over 50 percenthigher in the gold-standard period than in the post-war period.
In sum, the evidence presented indicates that previous gold-stand-ard periods were characterized by: (1) lower average inflation andmoney supply growth; (2) greater fluctuations in inflation, money supplygrowth, and output growth; and (3) higher unemployment rates thanin the period 1946 to 1979. Although comparisons across time peri-ods are difficult to make because of the difficulty of controlling fordifferences, including the effects of wars, droughts, and other shocksto the economy, it is far from clear that gold standards producedbetter overall results than those produced during the post-WorldWar II period.
Could the United States forge a better gold standard now? Thereare two options: restore some form of gold cover requirement with-out convertibility or restore a gold cover requirement with convert-ibility; either with partial or full gold backing. The first option pre-vailed from 1934 until 1968, a period during which Federal ReserveBanks were required to keep a minimum of legal value gold certifi-cates (valued at $35 an ounce) behind each $1 of their note liabil-ities. A more structured variant would be to restrain money creationby linking the central bank's ability to create liabilities to a legislatedschedule of changes in the official price of gold and changes in theamount of gold reserves required for each dollar of central bank li-abilities. Central to such a proposal would be a requirement that theactual gold stock remain fixed in size and that changes in its valueoccur only through variations in the official or bookkeeping price ofgold. Not only would there be no requirement to buy and sell gold atthe official price, the Treasury would be prohibited from doing so. Inother words, there would be a gold reserve requirement for themoney supply, but no convertibility regardless of whether the officialprice of gold was below, at, or above the market price. In sum, thisoption would essentially constrain the annual growth of the monetarybase.
Under the second option the United States would fix permanentlythe dollar price of gold—that is, make the dollar convertible intogold—without concern for whether or not other countries wouldfollow our example. The difference between a partial and a full back-ing would be that, whereas full backing would establish a one-to-onelink between the gold stock and the money stock, partial backingwould not. But in both cases, random shocks in the gold markets
73Digitized for FRASER http://fraser.stlouisfed.org/ Federal Reserve Bank of St. Louis
would create serious problems in controlling monetary aggregatesand hence the general price level,
A MONETARY RULE
Enactment of a statute or constitutional amendment requiring themonetary authorities to abide by a rule regarding monetary growthor inflation is another method that has been suggested for dealingwith the problem of maintaining long-run price stability. Such a rulewould free the Federal Reserve from having to interpret either the"social welfare function'* of the country or, more practically, the ob-jectives of current elected officials. The rule could be stated either interms of an ultimate objective for inflation, as it is in some industrialcountries, or in terms of a monetary growth target that would beconsistent with the maintenance of price-level stability.
A rule fixing a final outcome for inflation would oblige the mone-tary authorities to maintain monetary conditions consistent with thestability of a broad index of commodity and service prices (for exam-ple, the consumer price index). One might argue that the Humphrey-Hawkins Act implicitly incorporates such a rule. This legislation hasas goals the reduction of "the rate of inflation to no more than 3 percentum" in the interim and ultimately to zero. The act, however,does not make the Federal Reserve responsible for the achievementof price-level stability. Furthermore, it mandates that "policies andprograms for reducing the rate of inflation shall be designed so asnot to impede achievement of goals and timetables" for reducing un-employment. In sum, there is no recognition in the act of a divisionof responsibilities that would include assigning responsibility forprice-level stability exclusively to the Federal Reserve.
The advantage of formulating a rule on the final outcome for infla-tion is that the monetary authorities would be free to devise the bestmonetary strategy to achieve the mandated outcome. The disadvan-tage would be the rule's potential inflexibility. Temporary changes inthe price level can be caused by a variety of shocks for which themonetary authorities cannot be held accountable. One approachwould be to state the final outcome in terms of the average rate ofgrowth of the consumer price index or nominal GNP over a periodof several years.
The alternative of a target rule for monetary growth would have tobe specified in such a way as to be consistent with price-level stabil-ity, again, over a period of several years. The rule could be revisedfrom time to time in light of any changes in the relation of moneygrowth to inflation. Such calibration would be the job of the centralbank. Of course, the mere enactment of a rule would not ensure itssuccessful implementation. Suitable institutional constraints would
74
Digitized for FRASER http://fraser.stlouisfed.org/ Federal Reserve Bank of St. Louis
have to be present to correct for possible deviations from desiredoutcomes.
At this time it is not clear which rule, if any, would be optimal andlikely to prove preferable over a long period. Hence, the Federal Re-serve's current policy of gradually reducing the target growth rate ofmoney over several years is providing a transition to a less inflation-ary environment.
One of the Administration's long-run objectives is the eliminationof inflation. The implementation of a monetary policy that is consist-ent with this objective can be viewed in the following way. Each year,the monetary authorities would announce the rate of growth of themoney supply that is consistent with achieving their medium-termobjectives for nominal income and inflation. Over the longer run therate of growth of the money supply mustv be consistent with theachievement of the rate of nominal income implied by the inflationobjective. To implement this procedure, the Federal Reserve woulddetermine the rate of growth of total bank reserves that was consist-ent with the targeted growth of the deposit component of Ml. Openmarket operations by the Federal Reserve would expand the mone-tary base by a sufficient amount to provide total bank reserves andthe currency component of targeted Ml growth.
Ultimately, the Federal Reserve would set a reserve growth pathconsistent with the desired price level performance on the basis ofestimates of several parameters. These would include the trend pathof real output, the trend of Ml velocity, and the trend of the ratio ofMl to the monetary base. As these changed, the targets for nominalincome, Ml growth, and growth of the monetary base would be al-tered to maintain a stable price level. Unexpected changes in any ofthese parameters could be offset to maintain long-run price stability,
THE FUTURE CHALLENGE
A few basic propositions about inflation can summarize the role ofmonetary policy in the future. First, there is more agreement nowthan there was a decade ago that inflation is essentially a monetaryphenomenon. In addition, events that occurred during the 1970sshowed the importance of distinguishing between a transitory changein the rate of inflation occasioned by a "real shock" and the underly-ing rate of inflation. Second, an assumption of a positive but predict-able rate of inflation is not very realistic. For the past 20 years theUnited States has experienced several cycles around a rising trend ofinflation. We are now experiencing a cyclical decline in inflation. Amajor objective of the Administration's economic recovery programis to achieve the elimination of inflation in the long run. The ulti-
75Digitized for FRASER http://fraser.stlouisfed.org/ Federal Reserve Bank of St. Louis

mate costs of adjusting to a significantly less inflationary environmentwill be influenced by how rapidly expectations about future inflationare revised downward.
Finally, in a world where the U.S. dollar is the dominant interna-tional currency, many other countries* policy options are influencedby the success of U.S. anti-inflation policies. Most other countriesfind it difficult to maintain an inflation rate that is significantly belowthat of the United States, although Germany, Japan, and Switzerlandhave done so in recent years. Realization of that fact has increasedthe sense of urgency felt in the United States about achieving andmaintaining a low rate of inflation.
The appropriate policy for reducing the inflation rate is a decreasein the rate of money growth. Unfortunately, a slowing of moneygrowth in the past has tended to reduce output and employmentwithin roughly two quarters, while as many as eight quarters typicallyhave had to pass before monetary restraint produced a significant re-duction in the inflation rate. However, the whole process of renewedeconomic growth without inflation can be speeded up if the policy ofmonetary restraint is believed by the public, since it is an unanticipat-ed decrease in the rate of money growth that significantly affectsoutput and employment in the short run.
If the decrease is generally anticipated, wages and prices will beginto rise more slowly and the adverse short-run effects on output andemployment will be minimized. That is why it is so important for thepublic to be convinced that an anti-inflationary monetary policy hasfinally been adopted. The Federal Reserve can maximize the credibil-ity of its monetary policy, and hence reduce the transition costs ofeliminating inflation, by announcing a specific target for the rate ofmoney growth and by minimizing short-run deviations from thattarget.
Theoretically, restrictive monetary policy could achieve price-levelstability regardless of fiscal policy. As a practical matter, however, re-ducing the growth of government spending and reducing deficits inthe Federal budget will help to strengthen the belief that anti-infla-tionary policies will be maintained. That, in turn, will help lower thecosts of adjusting to lower rates of inflation. In short, the credibilityof monetary policy is influenced by the fiscal policy that accompaniesit.
The monetary system is evolving toward one in which the FederalReserve will have very close control over Ml, suitably redefined fromtime to time, through control of reserves. With uniform reserve re-quirements on transaction accounts, there will be relatively little vari-ability in the ratio of Ml to the monetary base. Longer term move-ments in this ratio can be offset by open market operations. Mone-
76Digitized for FRASER http://fraser.stlouisfed.org/ Federal Reserve Bank of St. Louis

tary aggregates other than Ml may serve as useful indicators of theeffects of policy actions, but they will not be directly controllable bythe Federal Reserve and therefore will not be useful as short-run tar-gets.
A policy of providing slow and steady growth of money will notpermit the central bank to attempt to offset the effects of transitoryshocks to aggregate demand or productivity. In other words, short-run fluctuations in inflation and output growth will occur: economicexpansion and contraction induced by changes in productivity orprice shocks cannot be completely avoided. What can be avoided arethe procyclical changes in the growth of the money supply that haveoccurred in the past.
77Digitized for FRASER http://fraser.stlouisfed.org/ Federal Reserve Bank of St. Louis
CHAPTER 4
Federal Budget IssuesTHE FEDERAL BUDGET presents economic policymakers with
three fundamental questions. First, how much should the FederalGovernment spend? Second, how should that spending be allocated?Third, how should the spending be financed—by current taxes only,by borrowing to cover a deficit in tax revenues, or by adding to themonetary base. Without spending there would be no need to imposetaxes or to borrow to cover deficits. The composition of a given levelof spending has implications for how it should be financed. And thechoice of the level of spending is influenced by the recognition thatgovernment spending cannot indefinitely grow faster than the econo-my and that the financing mechanisms available to the governmentimpose costs on the economy.
This chapter examines issues related to the size and allocation ofthe Federal budget and explores the implications for the economy offinancing a part of Federal spending through budgetary deficits. Fi-nancing Federal spending through various forms of taxation, togeth-er with related issues, are the subject of Chapter 5.
The Administration's spending policies rest on both philosophicalbeliefs and economic judgments. As discussed in Chapter 2, the viewthat the size and scope of the Federal Government are too large re-flects the belief that most individuals know best what they want andhow best to attain it. In the aggregate their actions will generallyresult in the most appropriate distribution of our economic re-sources. This belief is accompanied by the judgment that resourcesleft in the private sector generally are more effective in generatinggrowth and productive employment than resources moved to thepublic sector.
Because of these philosophical beliefs and economic judgments,the Administration has initiated a major transformation of the role ofthe Federal Government in the U.S. economy. The Administration'seconomic recovery program will change both the size and the natureof government involvement, reversing the trend of recent decadeswhen the Federal budget usually grew faster than the rest of theeconomy as the Federal Government took upon itself responsibilities
78Digitized for FRASER http://fraser.stlouisfed.org/ Federal Reserve Bank of St. Louis
that had previously been left to the private sector or to State andlocal governments.
Federal spending is a highly visible form of government involve-ment in the economy, and the Administration's economic programcalls for a slowdown in the growth of Federal spending. Federalspending rose from 20.2 percent of the gross national product (GNP)in 1970 to 23.0 percent in 198L By fiscal 1987, Federal spending isprojected to fall to 19.7 percent of GNP. Federal tax rates on individ-uals and businesses will also fall, as will the share of gross nationalproduct used to pay Federal taxes. By 1987, Federal tax revenues willrepresent 2.3 percentage points less of the gross national productthan they did in 1981. At the same time the Federal budget deficitalso will shrink relative to the size of the economy, dropping from2.0 percent of GNP in 1981 and 3.2 percent in 1982 to 1.1 percentby 1987,
In 1981 the Congress and the Administration took important stepstoward achieving this shift in emphasis from the public to the privatesector. The enactment of the Economic Recovery Tax Act of 1981will reduce income tax rates over the next few years, and the Omni-bus Budget Reconciliation Act of 1981 will restrain the growth ofmany open-ended entitlement programs. This shift will be incom-plete, however, without further Federal spending restraint in theyears ahead.
The shift in the role of the Federal Government is more than a re-duction in size. It also encompasses a restructuring of priorities atthe Federal level and a reallocation of responsibilities and resourcesbetween the Federal and the State and local levels of government.Within the Federal budget, spending will shift toward those activitiesthat, in this Administration's view, reflect truly national needs, suchas strengthening the Nation's defenses and maintaining the integrityof the social insurance programs.
Economic criteria will be applied to various spending programs tohelp ensure that the resulting benefits offset the costs to the taxpay-ers who ultimately must bear them. These criteria should apply notonly to direct Federal spending, but also to on- and off-budget creditactivities. Such Federal credit programs reallocate national resourcesby financing activities that might not be attractive to investors in theprivate market.
The first step in the realignment of responsibilities among Federal,State, and local jurisdictions was the consolidation of a number ofcategorical grant programs into block grants in fiscal 1982. Thesecond step, proposed in the budget for fiscal 1983, is to shift re-sponsibility for some programs now jointly operated by the Statesand the Federal Government either to the States or to the national
79Digitized for FRASER http://fraser.stlouisfed.org/ Federal Reserve Bank of St. Louis
government, and to turn some other programs that are now whollyfederally funded back to the States. The proposed restructuring offunctions would be accompanied by a phased withdrawal of the Fed-eral Government from the excise tax base. These proposals are in-tended to strengthen the Federal system by improving the operationof government at all levels, making it more responsive to the people.
THE OVERALL LEVEL OF FEDERAL SPENDING
The benefits of many types of Federal spending are easily seen.Parks are built, research is conducted, and the sick and the elderlyare supported with Federal dollars. Yet Federal spending in the ag-gregate also imposes many costs on the economy. First, costs arisethrough the mechanisms used to pay for what the governmentspends. The government can raise taxes now or in the future toobtain the funds it needs, or it can obtain those funds indirectlythrough monetary expansion. As discussed in Chapter 5, taxes tendto reduce growth in the private sector by transferring productive re-sources from private to public hands, using tax methods that general-ly distort the decisions of households and firms to supply labor andcapital to the economy. Deficits also impose real costs on the econo-my (as explored later in this chapter), whether financed by lowerfuture spending, higher future taxes, or by expanding the moneysupply. For government spending to be economically justified, there-fore, the benefits resulting from that spending—whether in terms ofmore economic growth or the enhanced well-being of the society—must exceed the costs.
Discretionary changes in the level of government spending made inthe attempt to offset cyclical fluctuations in the economy can imposeadditional costs. Such changes, which increase the uncertainty facedby households and firms in making their economic decisions, can dis-courage the supply of productive factors to the economy. Further-more, attempts to implement discretionary countercyclical policy canin fact prove to be procyclical.
A third way in which Federal spending can impose costs on theeconomy is by altering the allocation of resources, both currently andover time. For a given level of spending and method of financing, theallocation of federal resources between current consumption and in-vestment can affect economic growth.
Government spending can be divided into four categories: con-sumption, transfers, investment (both defense and nondefense invest-ment), and other (which mainly includes interest payments andgrants to State and local governments). Government spending mayabsorb private sector resources for use by the public sector or reallo-
80Digitized for FRASER http://fraser.stlouisfed.org/ Federal Reserve Bank of St. Louis

cate resources within the private sector, or both; the predominant ef-fects differ by category.
Transfer payments do not absorb resources aside from administra-tive costs, but they may have strong allocative effects within the econ-omy. Transfer payments may lead recipients to change their work orsaving behavior, and they may change the composition of thedemand for goods and services. (Examples of the factor supply re-sponse are discussed in Chapter 5.) Federal grants to State and localgovernments affect the use of resources in the economy throughtheir effect on the behavior of those jurisdictions. State and localgovernments may respond to the Federal grants by changing thelevel of spending and taxing, as well as the composition of the out-lays.
The direct effect of government purchases of goods and servicesfor either consumption or investment is to absorb resources from theprivate sector. To the extent that such spending substitutes for pri-vate purchases public sector purchases may also redirect the use ofresources within the private sector. For example, public provision ofeducation or police services reduces the private demand for such ac-tivities. The dominant effect that government purchases have on theeconomy, however, is likely to be through absorption rather thanreallocation of private sector resources. Since a dollar of governmentconsumption spending is unlikely to substitute fully for a dollar ofprivate consumption, an increase in government consumption spend-ing would tend to increase the share of total consumption in GNP(apart from any effects of the financing arrangements). Similarly,government investment tends to increase the share of total invest-ment in the economy. Furthermore, government consumption andinvestment spending is likely to alter the composition of both con-sumption and investment in the economy from what would have pre-vailed if the resources had stayed in private hands.
In practice, the distinction between government consumption andinvestment is difficult to make. The government consumption figuresshown in Table 4-1 include various expenditures to promote educa-tion, training, and research and development. Like physical capital,these activities contribute to economic growth. Published measures ofgovernment investment expenditures encounter similar problems.For example, current Federal investment expenditures mainly com-prise purchases of military hardware and structures, whose acquisi-tion will provide future benefits in terms of stronger national securitythat cannot be captured in GNP. Although services of governmentcapital are not counted in GNP, the future services resulting from theconstruction of airports, highways, and other civilian investment out-lays are reflected in part in the recorded output of private sector
81
Digitized for FRASER http://fraser.stlouisfed.org/ Federal Reserve Bank of St. Louis
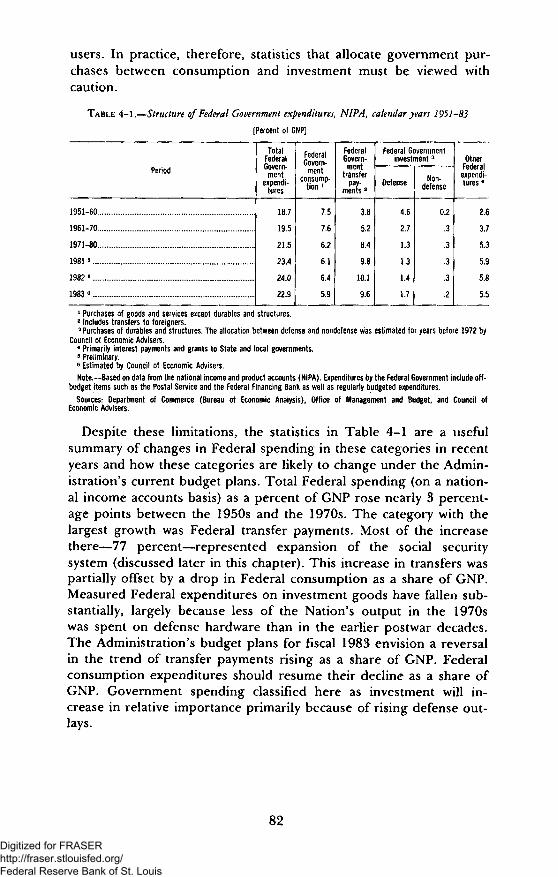
users. In practice, therefore, statistics that allocate government pur-chases between consumption and investment must be viewed withcaution.
TABLE 4-1.—Structure of Federal Government expenditures, NIPA, calendar yean 1951-83
[Percent of GNP]
Period
1951-60
1961-70
1971-80
1981 5
1982 6
1983°
TotalFederalGovern-
mentexpendi-
tures
18.7
19.5
21.5
23.4
24.0
22.9
FederalGovern-
mentconsump-
tion1
7.5
7.6
6.2
6.1
6.4
5.9
FederalGovern-
menttransfer
pay-ments 2
3.8
5.2
8.4
9.8
10.1
9.6
Federal Governmentinvestment 3
Defense
4.6
2.7
1.3
1.3
1.4
1.7
Non-defense
0.2
.3
.3
.3
.3
.2
OtherFederal
expendi-tures 4
2.6
3.7
5.3
5.9
5.8
5.5
1 Purchases of goods and services except durables and structures.2 Includes transfers to foreigners."Purchases of durables and structures. The allocation between defense and nondefense was estimated for years before 1972 by
Council of Economic Advisers.4 Primarily interest payments and grants to State and local governments,5 Preliminary.6 Estimated by Council of Economic Advisers.
Note.—Based on data from the national income and product accounts (NIPA). Expenditures by the Federal Government include off-budget items such as the Postal Service and the Federal Financing Bank as well as regularly budgeted expenditures.
Sources: Department of Commerce {Bureau of Economic Analysis), Office of Management and Budget, and Council ofEconomic Advisers.
Despite these limitations, the statistics in Table 4-1 are a usefulsummary of changes in Federal spending in these categories in recentyears and how these categories are likely to change under the Admin-istration's current budget plans. Total Federal spending (on a nation-al income accounts basis) as a percent of GNP rose nearly 3 percent-age points between the 1950s and the 1970s. The category with thelargest growth was Federal transfer payments. Most of the increasethere—77 percent—represented expansion of the social securitysystem (discussed later in this chapter). This increase in transfers waspartially offset by a drop in Federal consumption as a share of GNP.Measured Federal expenditures on investment goods have fallen sub-stantially, largely because less of the Nation's output in the 1970swas spent on defense hardware than in the earlier postwar decades.The Administration's budget plans for fiscal 1983 envision a reversalin the trend of transfer payments rising as a share of GNP. Federalconsumption expenditures should resume their decline as a share ofGNP, Government spending classified here as investment will in-crease in relative importance primarily because of rising defense out-lays.
82
Digitized for FRASER http://fraser.stlouisfed.org/ Federal Reserve Bank of St. Louis

REALLOCATION OF BUDGET PRIORITIES
A substantial shift in the composition of the budget has accompa-nied the expansion of the Federal role in the economy since 1960.Table 4-2 shows how the priorities of the Federal Government haveevolved over the last 20 years and how this Administration intends torestructure them.
TABLE 4-2.—Composition of Federal unified budget outlays, selected fiscal years-, 1960-87
[Percent]
Item
Defense3
Payments for individuals4
Retirement4
UnemploymentMedical careFood, nutrition, and public assistanceOther . . . .
Interest
Other3
international, justice, general government.Energy, natural resources, environment.AgricultureCommerce and community development,. . .TransportationEducation and trainingGeneral fiscal assistanceOther, net of offsetting receipts
Addendum:
Grants to State and local governments.- Total
Not for individuals
Fiscal years
1960
48.2
26.4
17.03.01.23.91.5
9.0
16.2
4.72.22.82.04.41.0.2
-1.1
7.6
4.9
1965
38.9
28.4
19.62.41.54.2.8
8.7
23.9
6.02.73.31.94.91.8
3.1
9.2
5.9
1970
38.7
33.7
20.41.76.33.81.5
9.4
19.9
3.62.12.62.33.64.2
.31.2
12.3
7.7
1975
24.5
48.3
26,74.28.35.93.2
9.5
17.7
4.02.9
.52.93.24.42.2
-2.4
15.4
10.1
1980
21.5
49.1
27.13.1
10.15.92.8
11.2
18.2
3.43.5
.83.13.64.51.5
-2.2
15.9
10.0
1981 l
22.2
50.2
28.13.3
10.55.43.0
12,6
15.0
3.13,6
.82.73.53.81.0
-3.7
14.4
8.3
1982 2
23.8
50.5
28.44.0
10.74.92.5
13.7
12.0
2.92.61.22.22.93.0
.9-3.6
12.6
6.8
1983 2
27.0
50.5
29.23.7
11.04.12.5
14.9
7.6
2.91.9.6
1.52.51.81.0
-4.6
10.7
5.8
19872
35.4
49.0
29.72.0
12.03.41.9
11.9
3.7
2.21.1.3.9
2.01.4.8
-4.8
8.9
4.1
1 Preliminary.2 Estimated by Council of Economic Advisers.3 Excludes military retirement.4 Includes military retirement.s Includes grants to State and local governments other than payments for individuals.
Note.—Detail may not add to 100 percent due to rounding.
Sources: Office of Management and Budget and Council of Economic Advisers.
The most notable change over this period was the substantial re-duction in the share of the budget going to national defense, fromnearly one-half to less than one-quarter. While the defense share wasfalling, transfer payments to individuals were growing. In 1960 trans-fer payments absorbed about one-quarter of the budget, whereas by1981 they accounted for one-half. Most of this growth came in twotypes of programs: (1) retirement programs, principally social secu-rity, but also outlays for military and civil service pensions, and (2)the medical assistance programs of medicare for the elderly and med-icaid for the poor. (A section of Chapter 6 examines factors contrib-uting to medical cost increases.) The third notable shift in the com-position of the budget was the greater fraction of Federal revenuestransferred to State and local governments through such programs as
83Digitized for FRASER http://fraser.stlouisfed.org/ Federal Reserve Bank of St. Louis

general revenue sharing. (In Table 4-2, grants to State and local gov-ernments are included with direct Federal spending in each of thefunctional categories.)
This Administration has a different set of spending priorities thanthose reflected in the budgets of the recent past. This difference isexpressed in the following guidelines used in developing the Admin-istration's plans for restraining the growth of Federal spending:
• Strengthen the national defense.• Maintain the integrity of social insurance programs while reform-
ing entitlement programs to ensure that they serve those ingreatest need.
• Reduce subsidies to middle- and upper-income groups,• Apply sound economic criteria to programs where subsidies are
justified.• Recover costs that can clearly be allocated to users of services
provided by Federal programs.• Strengthen the Federal structure of government.• Reduce the Federal role in allocating credit by restraining on-
and off-budget credit activities.
The Administration's estimate of 1987 budget outlays reflectsthese guidelines, which are consistent with the role for the FederalGovernment described in Chapter 2. Despite the substantial changesaccomplished in the budget for fiscal 1982, reforming the budgetcannot be achieved in a year or two. The difference in priorities canbest be seen by comparing the Administration's projections for fiscal1987 with the budget that ended September 30, 1981.
As Table 4-2 indicates, the Administration intends to raise signifi-cantly the share of the budget spent on defense, from 22.2 percent oftotal outlays in 1981 to 35.4 percent in 1987. Funding for retirementprograms will increase as a share of the budget while other payments toindividuals are being reduced. An example of a program in this lattercategory is trade adjustment assistance, which has provided more gen-erous unemployment benefits to workers who may have been displacedby foreign competition than to other unemployed workers. Increasesin the share of the budget going to retirement programs and decreasesin the share of other transfer programs will mean that total paymentsfor individuals will account for approximately the same fraction ofFederal spending in 1987 as in 1981.
The reordering of Federal priorities raises a number of issues thatwarrant special attention. First, what will be the economic effects ofthe large increase in defense spending? Second, what caused the sub-stantial expansion in retirement programs, and what issues should beaddressed for the future? Third, what advantages can be expected
84Digitized for FRASER http://fraser.stlouisfed.org/ Federal Reserve Bank of St. Louis

from reallocating responsibilities between the Federal Governmentand the State and local governments? Finally, how will changes inFederal credit activity affect the economy?
DEFENSE
Real military spending is expected to grow 9 percent annually be-tween 1981 and 1987. Over that period, military spending (includingmilitary retirement) will rise from 5.6 percent to 7.8 percent of GNP,and from 25 percent to 37 percent of total Federal spending. As isclear from Chart 4-1, such an increase would not even restore defensespending to its pre-Vietnam share of GNP. Although the military'sshares of national output and Federal spending will not be as high asin the early 1960s, the buildup will be a sharp reversal of the trendof the last decade. As a result, some concern has been expressedabout whether this increase could adversely affect the economy. Anyeconomic effects, however, must be assessed in the context of theoverriding need for maintaining the level of defense spending neces-sary for national security.
Chart 4-1
Defense Outlays as Percent of GNP
r/i M I I I 1 I I I I I I I I I 1 I I I I I I I I I I I I I I I ( I I I 1 I r1950 1955 1960 1965 1970 1975 1980 1985
FISCAL YEARS
SOURCES: DEPARTMENT OF COMMERCE, OFFICE OF MANAGEMENT AND BUDGET,AND COUNCIL OF ECONOMIC ADVISERS
85
Digitized for FRASER http://fraser.stlouisfed.org/ Federal Reserve Bank of St. Louis

The concern over the economic impact of defense spending hasprobably been overstated. The U.S. economy as a whole should beable to accommodate the projected expansion in defense spendingwithout experiencing an increase in the general inflation rate. Mone-tary and budget policies can offset the impact of a large increase ingovernment spending for national security, although unusual growthin any spending category, military or civilian, makes the goal of over-all restraint that much more difficult to achieve. Moreover, the econ-omy currently has ample slack to accommodate the beginning of amajor expansion in defense work.
As the economy emerges from the current recession, however,growth in the defense program will compete with expanding de-mands in the private sector. As the Administration's economic recov-ery program begins to take full effect, private demand for producerdurables should rise significantly. Expenditures for defense also will beconcentrated in the durables sector. Real purchases of defense dura-bles (research and development and procurement of major weaponsystems) will grow at an estimated rate of 16 percent annually between1981 and 1987. This exceeds the 14 percent annual rate of increasethat occurred during the 3 peak years of the Vietnam buildup. Thecurrent defense buildup thus will add to pressures on the durablemanufacturing sector in these years.
Although it is difficult to predict which industrial markets will beespecially affected, three results of the defense buildup can be antici-pated. First, the substantial transfer of resources in the durablessector to defense production may increase relative prices in at leastsome of the affected industries. Both the Department of Defense(DOD) and private purchasers may have to pay more for goods fromthese industries. Second, increased demand may produce delays inthe delivery of military goods. Delivery timetables that seem realistictoday may in some cases become obsolete as producers try to accom-modate the defense buildup and vigorous expansion in civilian in-vestment at the same time. A third effect may be some temporarycrowding out of private investment. Defense procurement and associ-ated production equipment use many of the same physical resourcesneeded for private investment in civilian producer durables. Someprivate firms may turn to foreign sources for materials while othersmay cancel or postpone plans for expansion.
The Department of Defense is attempting to minimize the poten-tially adverse economic effects of the defense buildup through long-term planning, better management of defense contracts, and the de-velopment of more comprehensive cost estimates. This long-termplanning will help defense industries increase their capacity in antici-pation of new orders. The department's plans to place greater reli-
86Digitized for FRASER http://fraser.stlouisfed.org/ Federal Reserve Bank of St. Louis

ance on multiyear contracts will also help defense contractors oper-ate more efficiently, especially by providing incentives to increase ca-pacity and to plan optimal production rates.
In the private sector, competition tends to prevent inefficient pro-ducers from passing their higher costs on to consumers. In the de-fense sector the function of encouraging efficiency is largely per-formed by DOD analysts of contract negotiations and administration.Their jobs are always difficult because of unanticipated problems indeveloping high technology equipment, lack of competition amongsuppliers, and a history of erratic fluctuations in defense procure-ment levels. The defense buildup will therefore increase the chal-lenge to DOD administrators. Careful planning, tight management,and accurate cost estimates can reduce the adverse consequences ofthe buildup, but some problems may arise.
Economic Impact of Increased Military Manpower
Over the next 5 years the armed services plan to increase theiractive duty forces by 9 to 10 percent. Quality standards for recruitsare also scheduled to rise. Declining unemployment rates and a re-duction in the available manpower pool because of the decline in therecruiting-age population will make these goals difficult to achieveand will increase pressure to shift the costs of achieving them fromtaxpayers onto the young—that is, by reinstituting the draft.
As the Administration's economic recovery program begins to takeeffect, increases in the number of civilian jobs will make it harder forthe military to attract personnel. The problem of attracting first-timerecruits is likely to be especially serious. Between 1980 and the endof the decade the number of 18-year-old males will fall by 19 per-cent, from 2.1 million to 1.7 million, with the bulk of that decline oc-curring before 1985. Thus, the armed services will need to attract aconsiderably higher percentage of high school graduates than it doestoday. Although a considerably smaller U.S. population supported asomewhat larger military throughout the 1950s, the United Stateshad a draft in those years.
Just as the potential supply of recruits will be diminishing, thedemand—especially for high-quality recruits—will be rising. Withoutthe right combination of incentives, the costs of military compensa-tion may rise sharply while a shortage of recruits may create pres-sures for a return to a peacetime draft. To prevent such problems,bonuses for recruits in certain areas and for experienced military per-sonnel with special skills may have to be raised.
Resumption of the draft would bring about an increase in forcelevels at substantially lower budget outlays. However, the real coststo the economy would not disappear; they would simply be movedout of DOD's budget and onto the draftees, and the costs would
87Digitized for FRASER http://fraser.stlouisfed.org/ Federal Reserve Bank of St. Louis

probably rise in the process. The output that the draftees would haveproduced as members of the civilian work force would be lost in anycase.
SOCIAL SECURITY
Over the past 20 years, 29 percent of the growth in Federal spend-ing has been due to increases in retirement programs, with most ofthe growth occurring in the social security program. Over the next 5years the retirement portion of social security will rise nearly 50 per-cent faster than the total Federal budget. Because of the large frac-tion of Federal resources devoted to the social security program, itsrapid growth, and the program's importance to so many Americans,it is useful to understand the causes of its growth and the problemsthat may occur in the future.
Three major factors apart from inflation have contributed to thegrowth in social security retirement expenditures over the past twodecades, First, there are 9 million more people 65 or over today thanthere were 20 years ago, an increase of 54 percent. Second, socialsecurity eligibility has been broadened steadily since the systembegan in the 1930s. In 1960, 66 percent of the elderly received socialsecurity benefits, compared to 93 percent in 1980. Furthermore, thenumber of people between 62 and 65 who received retirement bene-fits more than tripled between 1960 and 1980.
Third, the level of social security benefits, after adjusting for infla-tion, has also risen substantially. The average real benefit paid to aretired worker was $191 a month in 1960 (in 1980 dollars) and $341in 1980. In part, this increase reflects growth in the real wages thatthe average worker earns over a lifetime and therefore in 4:he retire-ment benefit for which the worker is eligible. The growth in eligibil-ity for survivor and dependent benefits, and their levels, has alsobeen substantial. Much of this liberalization in benefits came in thelate 1960s and early 1970s when the Congress, faced with projectedand growing surpluses in the social security trust funds, chose toraise benefits. In 1972 the Congress sought to index benefits toinflation, in part to discourage discretionary increases that had beenraising benefits faster than inflation. However, the Congress effectively"double-indexed" them through a technical flaw in the indexingprocedure. As a result, nominal social security benefits continued torise faster than consumer prices. Congressional action in 1977 correct-ed the technical problem but did not return real individual benefits totheir 1972 level.
Expansion of the social security system has substantially improvedthe lot of the elderly poor. The system has been a major factor inreducing both the percentage and the absolute number among the
88
Digitized for FRASER http://fraser.stlouisfed.org/ Federal Reserve Bank of St. Louis
elderly with incomes below the official poverty line. In 1959, 35.2percent of individuals age 65 and over were classified as poor, com-pared to 22.4 percent of the total population. There was a substantialdecline in poverty during the 1960s, so that by 1970, 24.5 percent ofthe elderly and 12.6 percent of the rest of the population had meas-ured incomes below the poverty line. During the 1970s the percent-age of those classified as poor among the general population stoppeddeclining but continued to decline for the elderly. Thus, by 1980only 15.7 percent of those 65 and over were formally considered tobe living in poverty, compared to 13.0 percent of the rest of the pop-ulation. In addition to reducing poverty among the elderly, the in-dexing of social security benefits in 1972 assured them that inflationwould not erode at least that part of their incomes.
The social security system now faces serious problems, however,both in the short run and in the long run. The short-run problem isthat the Old-Age and Survivors Insurance Trust Fund is in danger ofrunning out of money. Because of high unemployment and slowgrowth in earnings, relative to the consumer price index by whichbenefits are automatically adjusted, trust fund receipts have not keptpace with the rise in outlays required by indexing. In 1981 the Con-gress authorized borrowing among the Old-Age Survivors Insurance,Disability Insurance and Hospital Insurance Trust Funds. This actionwill ease the short-run problem, which is expected to disappear as eco-nomic growth resumes and inflation subsides.
The long-term problem in the social security system arises fromthe fact that the baby-boom generation will begin to reach retirementage around the year 2010. The ratio of the working-age population(20 to 64) to the elderly (65 and over) will fall from 5.1 today to 4.7in 2005, and to 3.0 in 2030. After the turn of the century, contribu-tors will not be able to support beneficiaries at today's retirementage, replacement rates, and payroll tax rates. Because of this shift inage distribution, today's young workers are unlikely to receive thesame rate of return on their contributions to social security that theirparents received. Thus, some combination of an increase in the re-tirement age, a decrease in benefits relative to prior earnings, and anincrease in contribution rates will almost certainly be necessary in thelong run. The President has established a National Commission onSocial Security Reform to examine the problems and propose solu-tions to both the short-run and long-run problems by January 1983.
Indexing in General
The practice of adjusting benefits automatically for inflation raisesa set of issues that applies to all indexed Federal programs. Current-ly, 30 percent of Federal outlays rise automatically with inflation. In-dexing benefit payments to inflation has been intended to preserve
89Digitized for FRASER http://fraser.stlouisfed.org/ Federal Reserve Bank of St. Louis
the real purchasing power of benefits—to serve as a kind of insur-ance against inflation. Experience with indexing has revealed prob-lems, however.
One problem is the accuracy of the consumer price index (CPI) asa measure of inflation. In recent years at least, the method of com-puting the CPI has caused it to overstate increases in the cost ofliving. In October 1981 the Bureau of Labor Statistics announced itsintention to correct these technical deficiencies. The correction willfirst affect Federal outlays in fiscal 1985. The cumulative effect ofmismeasurement may have increased the real level of benefits paid byas much as $10 billion in 1981 alone. These same measurementproblems should have the opposite effect over the next few years,however, as interest rates come down.
There are more fundamental problems with indexing. Since a con-tinuous inflation is caused by excessive money growth, all incomestend to rise proportionally, so that increases in other incomes tend tokeep pace with indexed benefits. However, when supply shocks, suchas the Organization of Petroleum Exporting Countries (OPEC) oilprice increases of the 1970s, cause changes in the price level, wageincomes typically do not keep pace with inflation. In such circum-stances, recipients of indexed benefits have an advantage, since mosttaxpayers who pay for the benefits have no such protection for theirincomes. Several proposals have suggested that, when real wages fall,it would be more equitable to adjust benefit payments only by theamount of increases in wages. Automatic increases in benefit pay-ments also give recipients an advantage in times of budget stringen-cy, when the real levels of other programs are being reduced.
STRENGTHENING THE FEDERAL SYSTEM
A central feature of the Administration's budget policies is a com-mitment to strengthening the concept and the practical application offederalism. The goal is a system that includes an effective centralgovernment interacting with effective and responsive State govern-ments. As the Federal Government has extended its involvement inthe economy in recent years, it has tended to reduce the autonomy ofState governments and to centralize the responsibility for a numberof social, economic, and regulatory programs. In the Administration'sview, the result has made the entire public sector less effective andless efficient.
There are four major reasons for seeking to create a stronger andmore balanced Federal system. First, such a system would encouragediversity among State and local governments. The diversity thatexists among communities and regions requires a structure of gov-ernment that recognizes the differences in circumstances, prefer-
90Digitized for FRASER http://fraser.stlouisfed.org/ Federal Reserve Bank of St. Louis
ences, and demands for public services. Many services that are appro-priately provided by the public sector generate benefits sufficientlylimited geographically that they are properly the responsibility ofState or local governments. This permits the individuals who willbenefit from and pay for a given service to decide whether it shouldbe provided and if so, in what quantity.
That diversity also permits a "portfolio" approach to solving prob-lems that are common to many communities, in that a single ap-proach—the Federal Government's approach—is not the onlymethod that can be tried. As different jurisdictions choose differentstrategies for handling similar problems, the chances of finding supe-rior solutions increases. This portfolio approach means that somemethods will fail, possibly more severely than the single method thatthe national government would have chosen. But each jurisdictioncan learn from the experience of others, and the portfolio approachshould help the public sector function more effectively.
A second reason for strengthening the Federal system is to makethe public sector more accountable for its actions. Accountabilitycomes from matching the responsibility for providing services withthe resources for financing them. It can be argued that voters can seemore clearly at the State and local levels of government the connec-tion between their tax bills and the use to which government fundsare put. Greater accountability would make for a more informed bal-ancing of the costs and benefits of public spending and, again, amore efficient allocation of resources.
The current array of Federal programs reflects some desire forboth greater accountability and diversity. Revenue sharing is an ex-ample of a Federal attempt to promote diversity with Federal tax dol-lars by distributing Federal funds to local governments (and formerlyto State governments too) to use essentially as they wish. Althoughsuch a strategy may achieve substantial diversity, it lacks accountabil-ity. Local officials who run revenue sharing programs do not have toanswer at the next election to the taxpayers who pay for the pro-grams. Block grants suffer from some of the same failings.
The usual Federal solution to accountability has been through reg-ulation that by its nature effectively limits diversity. Even where sev-eral levels of government are involved in operating a program—suchas medicaid—diversity is often hindered by the need for accountabil-ity. This need has been used to justify the imposition of many com-plex and burdensome regulations, and thereby administrative costs,on lower levels of government. Thus a third reason for the Adminis-tration's commitment to federalism is to reduce some of the adminis-trative burdens that Washington now places on State and local gov-ernments participating in Federal programs.
91Digitized for FRASER http://fraser.stlouisfed.org/ Federal Reserve Bank of St. Louis

Finally, a heightened role for State and local governments is con-sistent with the Administration's shift in Federal budget prioritiestoward clearly national needs, such as defense. In a time of budgetrestraint at the Federal level, State and local government may wellwant to assume responsibility for some of the activities that can nolonger be financed by the Federal budget.
The consolidation of a number of categorical grant programs intoblock grant programs in the fiscal 1982 budget was the first in aseries of steps toward revising the role of the central government inthe Federal system. The Administration is proposing further consoli-dations of categorical programs in the 1983 budget. A more historicstep toward strengthening the Federal system is the Administration'sproposal to turn back the excise tax base to the States and to pro-duce a clearer division of labor between the States and Washington.Beginning in 1984, for example, the States would become responsi-ble for the major income-based transfer programs for able-bodiedresidents, while the Federal Government would assume full responsi-bility for medicaid, the major program of medical assistance to thepoor.
One reason for this revised division of labor is a basic tenet ofthe Administration that income redistribution is not a compelling jus-tification in the 1980s for Federal taxing and spending programs. Itis the Administration's view that the Federal Government can domore to provide lasting assistance to the disadvantaged by assuringstrong and less inflationary economic growth than through incometransfer programs.
FEDERAL CREDIT ACTIVITY
Although Federal credit programs, unlike direct Federal purchasesof goods and services, do not take resources out of the private sectorof the economy, they do redirect the allocation of resources withinthe private sector. In some instances this redirection can improve theefficiency of the economy if the private market fails to realize the fullrange of benefits that would result from extending particular types ofcredit. Otherwise, however, Federal credit programs provide fundsfor projects that bring a lower rate of return than if those funds hadbeen lent by the private sector, thereby reducing the overall efficien-cy of the economy. In addition, many Federal credit activities add tothe Treasury's borrowing requirements.
Three types of Federal and federally assisted loan programs haveproliferated in recent years. First, there are direct loans by both on-budget and off-budget agencies, which amounted to an estimated$26.1 billion in net lending in 1981. Direct lending activity includescredit extensions by such agencies as the Export-Import Bank and
92Digitized for FRASER http://fraser.stlouisfed.org/ Federal Reserve Bank of St. Louis
the Small Business Administration. These loans must be financed byTreasury borrowing from the public if tax receipts are not sufficientto cover them. At one time the unified budget deficit reflected the out-lays of most of these direct Federal lending programs, but in recent yearsborrowing to supply the loan programs of off-budget Federal entitieshas increased dramatically. Most of this borrowing has been under-taken through the Federal Financing Bank which in turn receives itsfunds from Treasury borrowing. The Farmers Home Administrationand the Rural Electrification Administration originate the bulk of theoff-budget direct loans.
The effects of direct Federal loan programs on the national alloca-tion of credit depend upon the degree of subsidy involved. When aloan is subsidized, it is equivalent to providing the loan at market ratesand giving borrowers a cash grant equal to the present value of thesubsidy. The Office of Management and Budget estimates a $14.5billion present value of subsidy on $57.2 billion in new obligations fordirect Federal loans in 1981.
The second major type of federally related lending activity consists ofloans for which the Federal Government (wholly or partly) guaran-tees or insures the payment of loan principal or interest. The interestrate on guaranteed loans is below market rates because Federal par-ticipation removes any default risk and because the government prom-ises to pay a share of the interest in some cases. The oldest and bestknown examples are FHA-insured and VA-guaranteed mortgages.However, in recent years Federal guarantees and insurance have in-creasingly been used outside the housing sector. Net guaranteed andinsured loans amounted to $28.0 billion in 1981. The Office ofManagement and Budget has estimated a $4.3 billion present value ofsubsidy on $7.8 billion of the most heavily subsidized new guaranteedand insured loan obligations.
The third major type of loan activity is the lending generated bygovernment-sponsored but privately owned enterprises, including thefarm credit system, the Federal Home Loan Bank system, the Feder-al National Mortgage Association, and the Federal Home Loan Mort-gage Corporation. Like federally owned corporations, these spon-sored enterprises channel credit to certain sectors of the economy,primarily through purchases of loans in the private sector. In 1981,borrowing by federally sponsored agencies amounted to $34.8 billion.
Loans by government-sponsored institutions typically provide asmaller subsidy to borrowers than either direct Federal loans or guar-anteed loans. The subsidy in the former type of loan is created bythe ability to sell the obligations of sponsored agencies at interestrates only slightly above the rates on comparable U.S. Treasuryissues. In the area of housing it has been estimated that for every $1
93Digitized for FRASER http://fraser.stlouisfed.org/ Federal Reserve Bank of St. Louis

billion infusion of mortgage credit by sponsored agencies, the stockof home mortgages has increased* by only $150 million, indicating arelatively smaller subsidy. The addition to the stock of home mort-gages is much smaller than the amount of debt issued by the sponsoredagencies largely because their debt issues draw funds away from thriftinstitutions.
As shown in Table 4-3, the importance of Federal credit programshas greatly increased in recent years. Government redirection of partof the Nation's credit resources has added to the financing costs borneby private borrowers who do not receive Federal credit assistance.
TABLE. 4.3—Federal and federally assisted credit program, fiscal years 1970-81[Billions of dollars, except as noted]
Item
Total funds raised in U.S. credit ma
Total Federal credit activity
Direct loansGuaranteed loansGovernment-sponsored loans....
Total Federal credit activity as percc
rkets
nt of total funds raised (percent)
Fiscal years
1970=74 1
156.9
22,0
2.614.45.0
14.0
1975-79 l
309.4
42.6
14.914.812.9
13.8
1980
344.7
79.9
24.231.624.1
23.2
1981
361.0
86.5
26.128.032.4
24.0
Sources: Board of Governors of the Federal Reserve System and Office of Management and Budget (OMB).
This, in turn, leads to reduced demand for credit by unassisted bor-rowers. Increasingly, therefore, political judgments, rather than mar-ketplace judgments, have been responsible for allocating the supply ofcredit. As the discipline of the marketplace is replaced by the politicalprocess, less efficient economic activities are financed, and productivityin the economy declines.
The Administration is committed to reducing Federal credit pro-grams. A plan for reducing new Federal loan guarantee commit-
94Digitized for FRASER http://fraser.stlouisfed.org/ Federal Reserve Bank of St. Louis
ments by $20.3 billion for the 1982 fiscal year is already in place.Further actions are being proposed to reduce Federal and federallyassisted credit commitments in fiscal 1983 and 1984. In addition, theAdministration strongly supports efforts to formalize a Federal creditbudget and to incorporate it into the budget process.
FEDERAL DEFICITS IN PERSPECTIVE
The President and the Congress together determine the annuallevel of government spending and tax rates. These decisions, whencarried out in the context of prevailing economic conditions, deter-mine the size of the Federal budget deficit. The deficit cannot beknown in advance; it can only be projected using assumptions aboutthe future course of the economy. During the last year, better-than-expected progress on inflation has reduced taxable income, slowingthe growth of revenues below earlier projections. The recession hastemporarily slowed the growth of the tax base while increasing out-lays for employment-related programs. In addition, the projected de-cline in inflation increases the projected deficit because the associat-ed reduction in revenue growth precedes the later reduction inspending growth, largely as a result of the indexing of governmentprograms.
All these factors together have contributed to projected deficits.Thus, the fiscal 1983 Budget projects the unified Federal deficit at$98.6 billion in fiscal 1982, $91.5 billion in 1983, and $82.9 billionin 1984.
WHY DEFICITS MATTER
The Administration is strongly committed to reducing the projecteddeficits in the years ahead. A variety of economic reasons, as well asconsiderations of practical policymaking, make deficits a cause forcontinuing concern. In particular, the magnitude of the projecteddeficits demands attention to their current and prospective economicimpacts.
Financing a budget deficit may draw on private saving and foreigncapital inflows that otherwise would be available to the private sector.The Federal Government's demand for funds is insensitive tochanges in interest rates—that is, the Treasury will raise the fundsthat it requires regardless of interest rates. Weak and marginal bor-rowers may be "rationed" out of the market by higher interest ratesunless saving flows are adequate.
The impact of a specific deficit will vary, however, depending onthe conditions that lead to it. For example, during a recession—asnow exists—the borrowing requirements of business and consumerstend to be relatively small. At such a time a given deficit can be fi-
95Digitized for FRASER http://fraser.stlouisfed.org/ Federal Reserve Bank of St. Louis

nanced with less pressure on interest rates than during a period ofgrowth, when business and consumer demands for credit are increas-ing. This is why it is important for the government to reduce thebudget deficit in fiscal 1983 and beyond, a period of anticipatedrapid economic growth when private investment demands are expect-ed to rise substantially.
The impact of a deficit of a given size will also depend on theextent of private saving in the economy. An economy with a highersaving rate can absorb the demands of public sector borrowing moreeasily than one with lower saving and still accommodate the needs ofprivate borrowers. Much of the Administration's tax program is de-signed to increase the private saving of the Nation. As a conse-quence, both public and private borrowing will be accommodatedmore easily.
A higher volume of Federal borrowing to finance deficits makesthe task of the Federal Reserve System more difficult when it is fol-lowing a policy of monetary restraint. However, maintenance of mon-etary restraint is a key part of the Administration's program andhence the potentially inflationary effects of monetizing the Federaldeficit will not be realized.
Continued budget deficits may generate uncertainty about the abil-ity of government to control spending. Any increases in interest rateswhich reflect this uncertainty, in turn, will tend to increase furtherthe size of the deficit. In contrast, the maintenance of a long-termpolicy to reduce the size of budget deficits—the policy of the Admin-istration—will tend to counterbalance the pressures for further in-creases in government spending.
MEASURING THE DEFICIT
It is important to recognize that there are several measures of thedeficit. The unified deficit, the figure generally cited as "the deficit,"includes only the deficit arising from on-budget expenditures. Butthe Federal Government borrows to finance off-budget activities aswell. Including off-budget activities, the Federal deficit for fiscal 1985is projected to be $107 billion.
Of course, the Federal Government constitutes only one part ofthe public sector; State and local budgets affect the economy in afashion similar to the Federal budget. Given the large transfers offederally raised funds to State and local budgets, Federal, State, andlocal deficits should be considered jointly. Because the other levels ofgovernment have been accumulating funds to meet employee pen-sion obligations, their budgets tend to be in current surplus (al-though some States and localities are generating unfunded liabilitiesfor future retirement payments). In calendar year 1981, when theFederal Government reported a total deficit of $62 billion (on the
96
Digitized for FRASER http://fraser.stlouisfed.org/ Federal Reserve Bank of St. Louis

national income and product accounts basis), the State and local sectorshowed a surplus of $37 billion. A broader perspective on the Federaldebt is contained in the appendix to this chapter.
Regardless of how inclusive the definition of the deficit, it is notonly the annual deficit that affects the economy but also the trend indeficits over the business cycle and beyond. Because of the structureof certain spending and tax programs, deficits tend to vary inverselywith the economy. To some extent, deficits that are generated whenthe economy is weak can be made up when the economy is strong. Itis the trend of deficits that serves as an indicator of fiscal discipline.
The relative size of the deficit is far more important than the dollarmagnitude. To the extent that deficits affect the economy, the effectsof a given deficit will be relatively small in a large economy and largein a small economy. From an historical perspective, the projectedbudget deficits for fiscal years 1982-1984 are clearly substantial,yet they are not unprecedented when measured against the size ofthe economy. In recent years only the fiscal 1976 deficit was larger,as a share of GNP, than the projected deficit for fiscal 1982, as Table4-4 indicates. However, the ratio is projected to decline fairly rapidlyso that by 1985 the deficit, relative to GNP, will be below the averagefor the decade of the 1970s.
In view of concern over the current projections of a large deficitduring economic recovery in 1982, it is worth noting that the 1976deficit also occurred during a period of economic recovery. In thefour quarters ending in June 1976, nominal GNP rose 12 percent,real output gained 6 percent, and interest rates were essentially un-changed.
AN ANALYSIS OF DEFICITS AND DEBT FINANCING
A given deficit is consistent with different levels of spending andtaxes. Even if economic conditions do not change, a deficit may in-crease because spending is increased and tax rates are not increasedto yield the necessary added revenues, or because spending is un-changed but tax rates are reduced, or because spending is reducedbut lower tax rates reduce revenues by a greater amount.
These three circumstances may yield the same deficit but havequite different effects. The effects will depend on the timing, level,and composition of government spending as well as the means usedto pay for that spending. The spending imposes a cost on the econo-my by taking resources away from private use. As discussed earlier,government spending may augment or it may substitute for privatespending. It will therefore alter decisions about private spending.Each of the methods of financing spending imposes costs in additionto the simple transfer of resources from the private sector to the
97
Digitized for FRASER http://fraser.stlouisfed.org/ Federal Reserve Bank of St. Louis
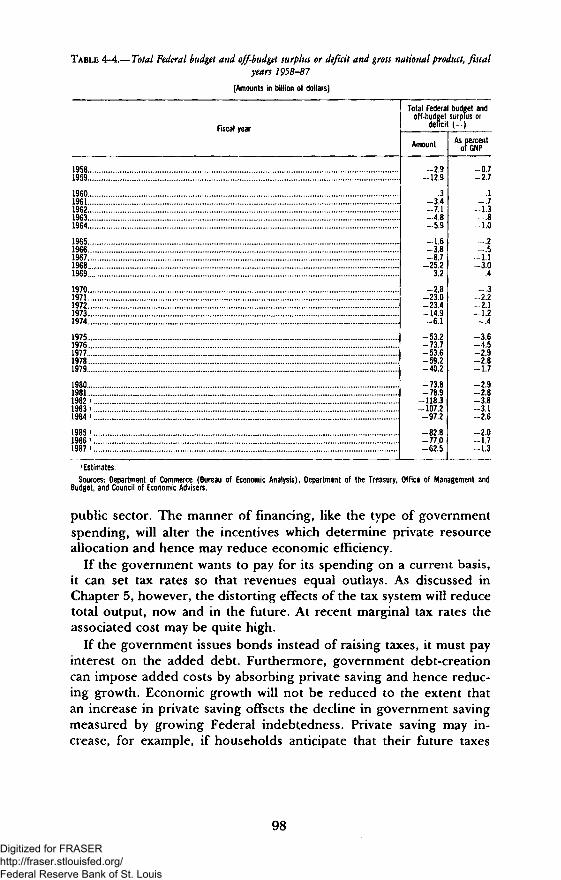
TABLE 4-4.—-Total Federal budget and off-budget surplus or deficit and gross national product, fiscalyears 1958-87
[Amounts in billion of dollars]
Fiscal year
19581959
I960 . ...1961196219631964. .
19651966196719681969 ...
1970 .. . . . .19711972. ...19731974
19751976 ..197719781979
19801981198219831984
198519861987
Total Federal budget andoff-budget surplus or
deftcit (-)
Amount
-2.9-=12.9
.3-3.4-7.1-4.8-5.9
-1.6= 3.8=8,7
-25.23.2
=2.8-23.0-23.4-14.9-6.1
-^53.2-73.7-53.6-59.2-40.2
= 73.8= 78.9
= 118.3-107.2-97.2
=82.8-77.0-62.5
As percentof GNP
-0.7-2.7
.1= .7
-1.3
-7.0
= .2
— 11-s!o
.4
= .3-2.2-2.1-1.2-.4
-3.6-4,5-2.9-2,8-1.7
-2.9-2.8-3.8-3.1-2.6
-2.0-1.7-1.3
1 Estimates.Sources: Department of Commerce (Bureau of Economic Analysis), Department of the Treasury, Office of Management and
Budget, and Council of Economic Advisers,
public sector. The manner of financing, like the type of governmentspending, will alter the incentives which determine private resourceallocation and hence may reduce economic efficiency.
If the government wants to pay for its spending on a current basis,it can set tax rates so that revenues equal outlays. As discussed inChapter 5, however, the distorting effects of the tax system will reducetotal output, now and in the future. At recent marginal tax rates theassociated cost may be quite high.
If the government issues bonds instead of raising taxes, it must payinterest on the added debt. Furthermore, government debt-creationcan impose added costs by absorbing private saving and hence reduc-ing growth. Economic growth will not be reduced to the extent thatan increase in private saving offsets the decline in government savingmeasured by growing Federal indebtedness. Private saving may in-crease, for example, if households anticipate that their future taxes
98
Digitized for FRASER http://fraser.stlouisfed.org/ Federal Reserve Bank of St. Louis
will increase and they respond by setting aside additional saving topay for the expected increase in tax liabilities. Since individuals*saving also tends to be affected by what services they perceive they aregetting from the government, the composition of government spend-ing associated with the deficit will play a key role in determining theresponse of saving.
Distortions may also occur in the allocation of resources if the gov-ernment chooses to finance deficits by adding excessively to themonetary base. This burdens the economy with inflation in ways dis-cussed in Chapter 3.
Whichever approach, or combination of approaches, the govern-ment chooses to pay for its spending, it cannot avoid the reality thatgovernment spending, while it may confer benefits on the economy,also imposes costs. The choice among financing mechanisms de-pends on which is the least-cost approach, or on which approach im-poses the most appropriate patterns of costs on the economy overtime.
Evaluating these costs is not a simple matter. Since deficits affectexpectations about the future course of economic policies, only partof the effect of a deficit is an immediate consequence of what the in-creases in debt do to markets. Deficits also work indirectly throughthe changes they produce in individual expectations and the resultantchanges in their behavior. Neither the direct effect nor the effect onexpectations is readily observable. In addition, analysts differ in theirviews about the relative effects of different conditions on inflation,investment, and economic growth. Unless these differences in opinionare recognized, debates that ostensibly focus on the deficit often maskbroader, underlying debates on how the economy works.
Deficits and Inflation
As discussed in Chapter 3, it is now generally agreed that contin-ued excessive growth in the money supply will cause sustained infla-tion. Thus, deficits financed by money creation will have persistentinflationary consequences.
Additional government debt might also raise the price levelthrough its impact on desired money balances. If the increasedsupply of government bonds raises interest rates, households andfirms will respond by reducing their money balances and increasingtotal nominal spending. This implies an increase in velocity. Unless themonetary authorities offset the higher velocity by reducing the mone-tary base, both the price level and output will rise in the short run,although the mix of increases in the price level and in output isindeterminate. To the extent workers and firms believe that
Digitized for FRASER http://fraser.stlouisfed.org/ Federal Reserve Bank of St. Louis
deficits are inflationary, however, and bargain accordingly, the rela-tive effects on the price level will be correspondingly larger.
The magnitude of the increase in aggregate demand that resultsfrom added government debt will depend both on the responsivenessof money demand to interest rates and on the size of the increase ininterest rates. For the former, empirical studies consistently show thedemand for money to be only weakly responsive to interest rates, sothat any given increase in interest rates will result in a relatively smallincrease in nominal spending.
As to the size of the increase in interest rates resulting fromthe added debt, the evidence is less clear cut. There are two forcesmoderating any increase. First, market interest rates equate thedemand for financial assets with their supply. In anygiven year, added debt represents only a small increment to the totalstock of government debt, and is also small by comparison with themarket value of other assets in the economy. Second, a higher inter-est rate today means that saving is more attractive and current con-sumption relatively less attractive. Thus, the effect of additional gov-ernment debt on interest rates will tend to be moderated by an in-crease in the flow of private saving attracted by the higher rates.
On the other hand, two factors may add to the increase in interestrates. If participants in financial markets believe that deficits areinflationary, long-term bond rates may include an additional inflationpremium in response to larger deficits. The incremental uncertaintycaused by deficits may also increase real interest rates. This results inlarge measure from the past history of discretionary, countercyclicalpolicies. The prospect of large deficits contributed to uncertainty inthe financial markets in 1981 and may have raised market interest ratesto a higher level than they otherwise would have been.
If added debt does raise the price level through its effect on de-sired money balances, this is not equivalent to continued inflation.For the price level to increase in a sustained fashion, the annual in-crements to government debt would have to grow continually at arate faster than the growth of the economy. Thus, deficits will be in-flationary only if the monetary authorities monetize the debt or if theadded debt continually grows as a share of GNP. This is preciselywhy the Administration is determined to reduce the budget deficit infiscal 1983 and beyond. The maintenance of monetary restraint willensure that deficits will not be monetized and that the potentially in-flationary effects that might otherwise result from government bor-rowing will not be realized.
Debt Financing, Crowding Out, and Growth
It has been argued that net government borrowing may preemptcredit that otherwise would have been used to finance private invest-ment. Unless the supply of private saving expands to provide com-
100
Digitized for FRASER http://fraser.stlouisfed.org/ Federal Reserve Bank of St. Louis

pletely for the increased government borrowing, thereby preventinga rise in real interest rates, the additional government debt will tendto deter some private investment. Some saving could also come fromabroad. If international credit flows respond sufficiently to onlyslightly higher interest rates, significant crowding out of U.S. privateinvestment may be prevented.
When private saving rates are relatively high (perhaps because of atax system that fosters saving rather than consumption), a larger defi-cit can be accommodated more easily than if saving rates are low. Inrecent years, for example, Japan and a number of Western Europeannations have experienced larger budget deficits (measured as a per-cent of their Gross Domestic Product) than has the United States. Asa result of higher rates of saving, however, their ratios of private in-vestment to GNP have also been higher. As discussed in Chapter 5, adominant thrust of the Economic Recovery Tax Act of 1981 is toprovide increased incentives to household and business saving.
Any current increase in government debt leaves future generationsfacing either a higher tax bill or lower government services, or acombination of the two, than would otherwise have prevailed. Thisreduces their economic well-being in two ways. First, if current gen-erations do not provide their successors with the resources to pay forthe accumulated debt, current deficits make future generations worseoff. But even if later generations inherit the additional resources tomeet the tax bill, the tax revenues are likely to be collected in waysthat distort their economic choices and impair the efficient operationof their economy. There is, then a tradeoff between these later dis-tortions and the distortions from taxing now. Again, a choice of theless costly alternative must be made. In the case of governmentspending in war time, for example, it has long been recognized thatthe cost of taxing all at once may be significantly larger than the costof issuing debt and paying the debt with taxes spread over manyyears.
THE DEFICIT AND POLITICS OF THE BUDGET
Perhaps the most damaging effects of deficits are not directly eco-nomic but result from the political process. There are many advo-cates for government spending because the beneficiaries of spendinghave an interest in promoting it. At the same time, those who pay foradditional government spending through taxes have an interest inholding taxes down. But the interests of future taxpayers are not wellrepresented in our political process. Deficit spending allows govern-ment to be financed in a way that is almost invisible to the taxpayer,and the pull and tug of the political process may result in more gov-ernment spending than is generally desired. To counteract this tend-
101Digitized for FRASER http://fraser.stlouisfed.org/ Federal Reserve Bank of St. Louis

ency, many have argued that policymakers ought to follow a rule—such as balancing the budget each year (that is, financing it onlythrough taxes) or limiting Federal revenues to a fixed percent ofGNP—to restrain the tendency toward excessive government spending.
Perhaps the most useful and practical of these rules is the simplestrule: balance the budget. Even this needs to be seen as a long-runrule, however, since the business cycle does cause variations that aredifficult to calculate and offset. Furthermore, a strategy of reducingtaxes in advance of spending cuts implies that it will take some timeto achieve the desired level of deficits. Enforcing a trend toward abalanced budget would impose the fiscal discipline necessary to re-strain the growth of government and send a message of governmen-tal restraint to private individuals who can incorporate this essentialinformation into their planning.
In sum, government spending can never be costless. Although thegovernment can use direct taxes, debt finance, or money creation topay its bills, each imposes costs on the economy. The goal of fiscalpolicy is to achieve the mix of financing that minimizes these costs.Given the high cost of further direct taxes on capital and laborincome, and the high costs imposed on society by excessive expansionof the monetary base, the Administration has chosen what it views atthis time as the least costly means of financing government spending.But its current actions are an essential part of a long-term strategy ofreducing the scope of the Federal Government. To achieve this end,the Administration will continue to enforce a trend toward a bal-anced budget.
APPENDIX TO CHAPTER 4
A BROADER PERSPECTIVE ON THE FEDERAL DEBT
The Federal debt is the sum of past budget deficits—the cumula-tive excess of past spending over past tax receipts. As discussed inChapter 4, increases in government debt can alter the Nation's rateof capital formation as well as real interest rates. Deficits can also in-fluence the distribution across generations of the burden of payingfor government spending.
This appendix discusses different measures of the Federal Govern-ment's debt. The broadest measure first subtracts the government'sassets from its liabilities to determine the government's net liabilities.It uses market prices rather than book values of those assets andtakes account of the erosion of the real value of the debt through in-flation by measuring net liabilities in constant dollars rather than cur-rent dollars. This measure of government debt also includes most ofthe implicit liabilities of the social security system. Table 4-5 pre-
102Digitized for FRASER http://fraser.stlouisfed.org/ Federal Reserve Bank of St. Louis

sents estimates of these measures over time in constant (1980) dol-lars.
In 1980 the book value of the financial liabilities of the U.S. Gov-ernment and its' credit agencies equaled $1.046 trillion, of which ap-proximately two-thirds was privately held. Because the book valuedoes not change as interest rates fluctuate, the market value is abetter measure of the claim on tax resources that would be needed topay off the outstanding debt. The market value in 1980 was $981 bil-lion, $65 billion less than the gross book liability.
Although government debt increases when spending exceeds taxrevenues, some of that spending purchases assets that should be con-sidered as well, To the extent that the government has marketableassets—financial assets in particular, such as gold, U.S. Governmentsecurities, and mortgages—these assets could be sold to finance itsexpenditures and thus obviate (at least for a while) the need fortaxes. In 1980 the market value of the government's financial liabil-ities less the market value of its financial assets equaled $450 billion.
Valuing tangible assets is particularly difficult. The conventionalapproach is to value government buildings, highways, dams, etc., ona depreciated cost basis, although this value may differ substantiallyfrom the asset's value to the economy. Although certain tangibleassets may not be marketable, they provide a stream of services thatwould otherwise have to be purchased through additional taxes. Oneprivate estimate, presented in Table 4-5, values the government'stangible assets—reproducible capital plus land—at $727 billion. Thisestimate does not include the value of mineral resources on Federalproperty. Mineral wealth is especially difficult to estimate since it canchange both with fluctuations in the prices of minerals and with newinformation on the size of the mineral reserves. In light of these prob-lems, estimates of the replacement cost of the government's net tangi-ble assets should be viewed with caution.
Government debt issued by the Treasury means delaying taxationto pay for government expenditures. The purchasers of official gov-ernment debt are not adversely affected by these transactions, butfuture generations may be if they have to reduce government servicesor pay higher taxes to meet interest payments on the accumulateddebt. If crowding out also occurs future generations will have asmaller capital stock with which to produce goods and services.
A similar delay in taxation occurs in the case of implicit debt asso-ciated with the social security system and the civil service and militaryretirement programs. The social security system is financed on a"pay as you go" basis; the program collects money from youngerpeople to pay retirement and other benefits to older people and
103
Digitized for FRASER http://fraser.stlouisfed.org/ Federal Reserve Bank of St. Louis

other beneficiaries. Unlike other taxes, which reduce lifetime income,some economists view social security "tax" contributions as pur-chases of implicit government pledges of similar benefits in thefuture. The contributions do not cover both current outlays and theexpected future benefits. In this manner the levying of taxes to coverthese future benefits is delayed. Hence, succeeding generations mayend up paying for these implicit shortfalls by receiving a lower rate
TABLE 4-5.—Illustrative measures of Federal Government's net liabilities, 1950-80
[Billions of 1980 dollars]
YearBook value
of grossfinancial
liabilities'
Marketvalue of
grossfinancial
liabilities2
Marketvalue of net
financialliabilities3
Replace-ment valueof tangible
assets4
Value ofunfunded
socialsecurity
retirementliabilities3
Total netliabilitiesincluding
socialsecurity
retirementliabilities ®
1950 7921951 7501952 .. 7581953 7691954 767
1955 7521956 7181957 6931958 7101959 720
1960 7101961 7281962 7391963 7441964 752
1965 7511966 7541967 7681968 7761969 751
1970 7601971 7761972 7851973 .. . 7921974 782
1975 8511976 9211977 9611978 1,0041979 1,011
1980 1,046
797743753769769
742696689688686
704715733731740
730738740744702
746773773771763
842933949963962
981
650582590605616
581542535540525
536539546535537
520516521512464
491514506465416
511581587552456
450
372370414474523
549565550549536
535537546558567
571570579583592
584578580600621
613622647676706
727
240358611702829
1,0541,0291,0551,2381,298
1,3101,2401,2881,3261,322
1,4211,4921,3561,6731,576
2,0122,3662,5043,0863,405
3,6293,7494,018
PI
564618840889983
1,1501,0691,1001,2881,340
1,3631,2921,3341,3491,339
1,4141,4851,3521,6581,510
1,9822,3642,4933,0133,258
3,5803,7574,000
HI0)
1 The sum of total liabilities of the U.S. Government and federally sponsored credit agencies as reported In the flow of fundsaccounts of the Federal Reserve.2 Estimates of the market, value of liabilities of the U.S. Government and credit agencies prepared by Eisner and Pieper.3 Estimates by Eisner and Pieper of market value of financial liabilities less market value of financial assets held by the U.S.Government and credit agencies.4 Estimates of the replacement value of tangible assets owned by the government prepared by Eisner and Pieper. Totalincludes land as well as depreciable assets.s Estimate of unfunded social security retirement liabilities by Leimer and Lesnoy. This series assumes social security benefitskept pace with income growth and uses the legislated social security taxes of the period. Social security unfunded retirementliabilities equals the estimated present value of future retirement benefits less future taxes for the adult population less thevalue of the OASI trust fund.11 Total net liabilities equals the market value of net financial liabilities plus the Leimer and Lesnoy estimated unfunded socialsecurity liabilities less U.S. Government tangible assets plus the OASI trust fund.7 Not available.
Note.—Data converted to 1980 dollars using GNP implicit price deflator.
Sources: Department of Commerce (Bureau of Economic Analysis); Board of Governors of the Federal Reserve System; RobertEisner and Paul Pieper, "Government Net Worth: Assets, Liabilities and Revaluations" (1982); and Dean Leimer and Selig Lesnoy,"Social Security and Private Saving: A Reexamination of the Time Series Evidence Using Alternative Social Security WealthVariables" (1980).
104
Digitized for FRASER http://fraser.stlouisfed.org/ Federal Reserve Bank of St. Louis

of return on their contributions to social security than they would, onaverage, have received on money invested elsewhere.
There are important differences, however, between implicit and ex-plicit debt. These implicit promises to pay social security benefits arenot legal commitments; as a consequence, they have a different legalstanding from explicit forms of government debt. Social securitybenefits can be, and have been, changed. Although the social securitysystem has become an enduring feature of U.S. society, and sizablesocial security benefits will be paid to current generations when theyretire, the amount of those benefits cannot be predicted with certain-ty. In addition, most individuals do not know precisely the retirementbenefits to which they would be entitled-under existing law. A givenamount of implicit liabilities is, therefore, likely to reducesaving by a smaller amount than would the same amount of explicitdebt.
Social security and Federal employee retirement programs are notthe only implicit future liabilities that the Federal Government isfirmly committed to pay. The Department of the Treasury lists threecategories of financial commitments that are not fixed, legally bind-ing liabilities: undelivered orders, long-term contracts, and contin-gencies. These vary in the likelihood that they will become legal obli-gations and in the time when they are apt to mature into liabilities.The implicit -pension liabilities are by far the largest component inany of these categories. Although there is no single correct way tomeasure total implicit and explicit government liabilities, one reason-able approach would be to separate other nonbinding commitmentsfrom the unfunded social security and other pension liabilities be-cause of their size and their possible effects on household saving.
The data presented in Table 4-5 are rough but reasonable illustra-tions that are useful in examining trends and making general com-parisons. Tangible assets are valued at replacement cost, sincemarket values are not available; the replacement costs of the govern-ment's tangible assets, however, can vary substantially from their po-tential market value, which is ultimately the measure of interest interms of the broader concept of debt described here. Estimates ofthe unfunded implicit retirement liabilities are extremely sensitive toassumptions concerning real interest rates, future birth, death, andimmigration rates, labor force participation rates, and benefit toearnings ratios. The unofficial figures reported in Table 4-5 as esti-mates of social security's unfunded retirement liabilities includetypes of benefits that represent about two-thirds of total social securityunfunded liabilities.
While actuaries of the social security, civil service, and military re-tirement systems have made recent estimates of their unfunded liabil-ities that range from $3.5 to $6.5 trillion, depending on the interest rate
105Digitized for FRASER http://fraser.stlouisfed.org/ Federal Reserve Bank of St. Louis

assumed in the calculations, they have no historical data that couldbe included in this table. The estimates in the table refer to unfund-ed social security retirement liabilities associated with workers andretirees currently in the social security system. These figures do notinclude either expected future benefit payments to or future tax re-ceipts from generations not yet in the system. Hence, these estimatesreflect a snapshot of the system at one point in time in order toevaluate the current net claims against it, that is, the current trustfund that would be necessary to fully fund the system.
The first two columns of Table 4-5 compare the government'sgross financial liabilities in 1980 dollars, measured at book andmarket values, for the years 1950 through 1980. While the columnsare generally quite similar in many years, the difference in thesevalues has been growing recently.
Column 3 presents the market value, in constant 1980 dollars, ofthe Federal Government's net financial liabilities. The government'sreal financial debt in 1980 equaled $450 billion, having fallen fairlysteadily from $650 billion in 1950.
Simultaneous with this decline in real net financial debt has beenan increase in the value of the government's tangible assets, meas-ured at replacement cost, from $372 billion in 1950 to $727 billionin 1980.
While these components of the broader concept of governmentdebt suggest an improving fiscal position, the sixth column of Table4-5 suggests that Federal debt, broadly defined, has increased enor-mously over the past three decades. While the constant dollar marketvalue of financial liabilities only rose from $797 billion in 1950 to$949 billion in 1977, unfunded social security retirement debt, ac-cording to this estimate, rose from $240 billion in 1950 to over $4trillion by 1977. In 1981, actuaries of the social security system offi-cially estimated the system's total unfunded liabilities to be $5.9 tril-lion.
Broadly defined, government debt is large relative to total house-hold net worth, even when household net worth is also broadly de-fined to include expected claims to future retirement benefits net offuture contributions to these retirement systems for individuals cur-rently in social security. Table 4-6 presents the ratio of Federal Gov-ernment total net liabilities to this broad measure of householdwealth. The ratio equaled 0.17 in 1950 and rose to 0.35 by 1977.The table also presents the ratio of unfunded social security retire-ment liabilities to the estimate of total Federal net liabilities. In 1950,this ratio was less than one-half; by 1977 the unfunded social securityretirement liabilities represented almost all of total Federal Govern-ment net liabilities.
106
Digitized for FRASER http://fraser.stlouisfed.org/ Federal Reserve Bank of St. Louis

TABLE 4-6.—Comparisons of total measured Federal Government's indebtedness, unfunded socialsecurity retirement liabilities, and household wealth, 1950-77
[Ratio]
Year
1950. .1951195219531954
19551956195719581959
19601961196219631964
19651966. .196719681969
19701971 . . . .1972 .19731974
1975. ...19761977
Ratio of FederalGovernment's total net
liabilities (includingsocial security
retirement liabilities) tohousehold wealth
0.166.172212
.217218
231.210.219.230231
.234
.211220
.212
.202
.201
.210
.183
.203193
.241
.267
.265
.304
.326
.344342350
Ratio of unfunded socialsecurity retirement
liabilities to total netliabilities
0.426.579.727.790.843
.917
.962
.959
.961
.969
.961
.959
.965
.983
.988
1.0051.0051.0021.0091.044
1.0151.0011.0051.0241.045
1.014.998
1005
Note.—Federal Government's total net liabilities equals the market value of net financial liabilities plus estimated unfundedsocial security retirement liabilities less U.S. Government tangible assets plus the OASI trust fund. Tangible assets are valued atreplacement cost. Net financial liabilities are valued at market prices. These estimates include liabilities of the U.S. Treasuryheld by the OASI.
Unfunded social security retirement liabilities equals the present value of projected retirement benefits less the present valueof projected tax contributions to social security less the value of the OASI trust fund. Retirement benefits and tax contributionsare projected for the adult population separately for each year from 1950 through 1977.
Household net worth as estimated by the Board of Governors of the Federal Reserve System plus unofficial estimates of socialsecurity retirement wealth prepared by Leimer and Lesnoy.
Sources.- Department of Commerce (Bureau of Economic Analysis); Board of Governors of the Federal Reserve System; RobertEisner and Paul Pieper, "Government Net Worth; Assets, Liabilities and Revaluations" (1982); and Dean Leimer and Selig Lesnoy,"Social Security and Private Saving: A Reexamination of the Time Series Evidence Using Alternative Social Security WealthVariables" (1980).
Conclusion
These adjustments to the traditional book value measure of gov-ernment liabilities put projected official government deficits in someperspective. When government's explicit debt is adjusted to take ac-count of inflation and assets, its real net liabilities show a declineover the last twenty years. Official deficits that merely offset the de-valuation of the debt due to inflation or that finance the purchase ofassets do not increase the government's claim on private resources.
Since 1960, however, implicit liabilities have grown considerably sothat by some estimates they greatly overshadow the explicit liabilities.Under the broader measure that includes implicit debt, total Federaldebt tripled between 1967 and 1977. Compared to historical in-
107
Digitized for FRASER http://fraser.stlouisfed.org/ Federal Reserve Bank of St. Louis
creases in the broad measure of government debt, the unified deficitsprojected for the 1980s are small. If the effect of implicit liabilitieson economic behavior is similar to the effect of explicit liabilities, theeffects of the official projected deficits on national investment andreal interest rates would be small relative to the impact of the accu-mulation of total explicit and implicit debt over the last 20 years.Thus, when inflation, government holdings of assets, and implicitdebt are taken into account in measuring Federal debt, governmentdeficits in the range of those projected for the 1980s will add onlymarginally to the burden of the debt.
108
Digitized for FRASER http://fraser.stlouisfed.org/ Federal Reserve Bank of St. Louis
CHAPTER 5
Tax Policy and Economic Growth
THE ADMINISTRATION, in cooperation with the Congress,brought about a fundamental change in Federal tax policy in 1981.The new policy involves far more than simply reducing tax burdens.The Economic Recovery Tax Act of 1981 has changed the basic char-acter of the tax system by shifting the burden of taxation away fromcapital income, thereby providing substantially greater incentives forcapital investments and personal saving.
This tax policy is a sharp break from the policies of the recentpast. It reflects a different understanding of the way tax policy affectsthe U.S. economy. This chapter provides a framework for analyzingthe effects of the Administration's tax policy on the economy. TheAdministration's fiscal policy has two key characteristics. First, theAdministration views the principal fiscal policy instruments—spend-ing, taxing, and deficit—chiefly in terms of their impact on the indi-vidual decisions of households and businesses, since it is these deci-sions that ultimately generate employment and growth.
The second key element that distinguishes current policies fromthose of the past is that they are fundamentally long term in nature.Economic growth is a long-run process that is determined by techno-logical change and the supply and allocation of such productive fac-tors as raw materials, labor, and capital. Households and businesseslook to the future in making current economic decisions. The gov-ernment has some direct influence on factor inputs, but its main in-fluence is through the indirect and long-term incentives it providesto work and save.
The fact that households and businesses make long-term as well asday-to-day decisions underscores the importance of consistency ingovernment policy. Frequent changes in policy generate uncertaintyabout the probable duration of current policies and jeopardize thechances that any particular policy will succeed. Since the long run issimply a sequence of short runs, short-run policies that deviate fromlong-run goals ultimately mean abandoning long-run goals. The cur-rent economic policies, more than those of any recent Administra-tion, are policies for the long term.
109Digitized for FRASER http://fraser.stlouisfed.org/ Federal Reserve Bank of St. Louis

Fiscal policy involves three interrelated choices. One is choosing anexpenditure policy—how much to spend, and what kind of expendi-tures to make. The second is taxation—how much to collect, andwhich tax instruments to use, including implicit taxation through thecreation of money, to raise revenues. The third, deficit policy, in-volves deciding on the size and distribution of the deficit over time;that is, the difference in the time pattern of receipts and expendi-tures.
The governments long-term budget constraint provides a frame-work for considering the coordination of fiscal and monetary policy,for understanding the impact of deficits on economic growth, and fordiscussing the allocation across generations of the burden of tax-ation. The American people must eventually pay for what the govern-ment spends. While the government can borrow from the privatesector to delay payment for its spending on consumption and trans-fer payments, such borrowing is subject to a limit. Eventually thegovernment must either reduce spending or raise tax revenues to paythe interest payments on past accumulations of debt. When the gov-ernment borrows, and thereby delays levying taxes to pay for its cur-rent spending, it shifts the burden of paying for its current spendingto future generations.
The government uses explicit taxation, such as personal and cor-porate income taxes, to raise revenue. As will be shown in this chap-ter, it also raises revenue with implicit taxes. By increasing the supplyof money, for example, the Federal Government, in effect, createssome of the dollars needed to pay for current expenditures. But ex-cessive expansion of the money supply results in a rise in prices thatreduces the real value of the existing stock of money held by the pri-vate sector. This is one way in which the money creation processtransfers real resources from the private to the public sector. Asecond way is that the inflation produced by excessive monetary ex-pansion reduces the real value of the nominal government debt heldby the private sector. By creating inflation the government can payoff its obligations in cheaper dollars. The purchasers of governmentbonds require higher interest rates to compensate for the expectedinflation. Consequently, the government collects real resources fromdevaluing the stock of nominal bonds only when the actual inflationrate exceeds the expected inflation rate. The reduction in the realvalue of outstanding debt that results from inflation means that thegovernment requires less revenue from explicit taxes. The Adminis-tration's program is based on a commitment to reducing both explic-it and implicit taxation.
The fact that explicit taxation and money creation are alternativeways to finance government expenditures means that conventional
110Digitized for FRASER http://fraser.stlouisfed.org/ Federal Reserve Bank of St. Louis

fiscal and monetary policy must be coordinated. If the governmentdoes not pay for its expenditures with explicit taxes, now or in thefuture, it will eventually be forced to resort to the printing press,Hence, the ultimate path to lower explicit and implicit taxation is areduction in the growth of government spending.
The Administration^ with the support of the Congress, has signifi-cantly changed national macroeconomic policy. However, the ulti-mate success of the Administration's policy will depend on thedegree to which it is credible in the eyes of the public. Householdswill increase their long-term saving and labor supply in response tolower taxes on capital and labor income if they believe those taxeswill remain low. Workers and employers will agree to moderatenominal wage increases only to the extent that they believe inflationwill moderate. Businesses will raise prices at slower rates only if theyknow that other prices—primarily those of their competitors—arealso increasing at slower rates. In short, the problem of coordinatingthe private sector's response to government policy is a problem ofconvincing the public that the Federal Government will be steadfastin maintaining its new economic course.
ECONOMIC GROWTH: PAST PERFORMANCE AND FUTUREPOTENTIAL
Economic growth in the United States has been unusually lowsince 1973. Annual growth in real disposable per capita income be-tween 1973 and 1979 slowed to 1.6 percent from an average rate of3.0 percent in the period 1959 to 1973. The country is now experi-encing its third recession since 1973.
Our recent economic performance has been unsatisfactory not onlyin comparison with our own postwar experience but also in compari-son with the economic performance of our principle trading partners.In the 1970s, annual rates of increase in real per capita incomeamong the other developed countries exceeded U.S. rates by nearlyone-fourth. Other indications of economic malaise were declines inthe measured growth rates of total output, capital input, and totalfactor productivity. While the period from 1959 to 1973 witnessedaverage annual growth rates in real gross national product (GNP) of4.0 percent, the rate from 1973 to 1979 was only 2.8 percent.
MEASURING GROWTH
Economic growth reflects increases in factor inputs and total factorproductivity. Each of these concepts, as well as output itself, is diffi-cult to quantify. The growth of productivity is not directly observ-able. Rather, it is a measure of the real economic growth that is not
111Digitized for FRASER http://fraser.stlouisfed.org/ Federal Reserve Bank of St. Louis
accounted for by growth of the labor force or growth in the capitalstock. Several problems in defining both output and input musttherefore be addressed in any attempt to measure economic growthand productivity growth.
The measure of output—real GNP—primarily reflects the valueplaced on goods and services traded in the marketplace. While pollu-tion control devices and similar capital goods designed to improvethe quality of life are counted in the input figures, the output figuresexclude such items as cleaner air and water. In addition, there areproblems in measuring the true quantities and qualities of somegoods and services. One problem, for example, is determining thevalue of government output. Government services are measured interms of their labor costs, which may differ substantially from theirmarginal value; other government outputs, such as the value of theservices from tangible assets, are not counted in GNP at all.
Quality changes in tangible commodities also present difficultproblems in measuring productivity growth. Today's color televisionset technologically surpasses the 1960 model, and 1981 computersdiffer greatly from their 1970 predecessors. These changes in qualityare not adequately reflected in government reports of GNP growth.The procedures followed for some products ignore quality changes,in effect, counting a computer as a computer regardless of its year ofmanufacture.
There are also difficulties in quantifying inputs. Private capital istypically measured as the sum of accumulated investment expendi-tures, with allowances for depreciation rather than as the amount ofcapital actually in productive use. In addition, the amount of capitalavailable for use is miscounted when changes in the longevity of in-vestments are not recognized and depreciation allowances are not ad-justed accordingly. The statistics on labor input also fail to capturemany changes in the quality and quantity of labor services. There is,for example, little available data indicating the intensity with whichworkers actually work within any given period of time.
ECONOMIC GROWTH—THE HISTORICAL RECORD
Table 5-1 shows the historic growth rates in real gross nationalproduct, capital input, labor input, and total factor productivity. Be-cause of the problems of aggregating private and public outputs andinputs, the table also shows growth in the private economy, exclud-ing the farm and housing sectors. These data, based on estimatesprepared by the Council of Economic Advisers, are presented forfour periods. Each of these periods encompasses a full economiccycle.
112Digitized for FRASER http://fraser.stlouisfed.org/ Federal Reserve Bank of St. Louis

TABLE 5-1.—Average annual growth rates of real GNP, total factor productivity, and factorinputs, 1959-79
[Percent]
Period
1959 to 1965....1965 to 19691969 to 19731973 to 1979
1959 to 1965 . . . . .1965 to 19691969 to 1973 .1973 to 1979
Real GNP Total factorproductivity Capital Labor
Total GNP
4.34.03.62.8
2.51.92.31.2
3.84.13.52.5
0.91.2.4
1.6
Private nonfarm nonhousing GNP
4.44.04.12.8
2.51.32.4
.6
4.15.84.23.2
1.01.3.7
1.8
Sources: Department of Commerce (Bureau of Economic Analysis); Gollop, Frank and Jorgenson, Dale, "U.S. ProductivityGrowth By Industry 1947-1973"; and Council of Economic Advisers.
Labor input is measured as total annual hours worked, adjusted byage and sex. In accounting for total GNP growth, labor input in-cludes agricultural workers, government and civilian workers, andmilitary personnel. Capital input includes government capital plusprivate residential, nonresidential, and agricultural capital. For pri-vate GNP, factor inputs are taken to be only those specific to thissegment of the economy. The growth rate of total factor productivityis computed for both total GNP and private GNP assuming a simpleproduction relationship between output and the supplies of capitaland labor.
Some of the poorer growth performance in recent years reflects aslowdown in capital formation. The Nation's total net capital stock,including both private and government capital, but excluding con-sumer durables, grew at an average annual rate of 3.8 percent duringthe period 1965 to 1973, but at only 2.5 percent per year between1973 and 1979. The slowdown in capital formation was equally pro-nounced in the private nonfarm nonhousing sector; the 1973 to 1979growth rate was less than two-thirds of the growth rate from 1965 to1973. This reduction in the rate of capital formation coincided with adecline of nearly one-fourth in the Nation's saving rate. The Na-tion's saving rate is defined here as the share of net national prod-uct not consumed by either the government or household sectors.Household consumption includes purchases of consumer durables.
Since 1973 the growth of labor input has greatly exceeded that ex-perienced in the previous 25 years. Adjusted for age and sex, laborinput grew at only 0.7 percent per year between 1950 and 1973, lessthan half the rate of growth between 1973 and 1979. The primarycauses of the acceleration of labor input are the rapid rise in femaleemployment rates, particularly for women aged 25 to 44, a rise in the
113Digitized for FRASER http://fraser.stlouisfed.org/ Federal Reserve Bank of St. Louis

population aged 18 to 35, and a leveling off of employment rates formales aged 65 and over.
Table 5-1 indicates a sizable reduction in productivity growth ratesduring the middle and late 1970s in comparison with prior years.This reduction reflected a combination of a lower growth rate forother, nonmeasured inputs and a less efficient allocation of re-sources. Measured productivity growth of total GNP declined by 48percent between these periods; the decline for the private nonfarmnonhousing sector was 73 percent. By itself, the slower productivitygrowth from 1973 to 1979 can account for a 1.1 percentage point de-cline in GNP growth from that experienced in the previous 14 years.This method of growth accounting attributes a 1.8 percentage pointdecline in the growth of private nonfarm nonhousing output to theproductivity slowdown between these periods.
EXPLAINING THE PRODUCTIVITY SLOWDOWN
There have been concerted efforts to explain the measured slow-down. These efforts have met with only limited success. While thereare a number of possible explanatory variables, available studies sug-gest that none separately nor in combination is capable of explainingmore than half of the decline. Capital expenditures for pollutionabatement equipment (which provides no measurable output) appearresponsible for a small fraction of <he slowdown. Another explana-tion is the growth of productive factors other than capital and laborthat are typically not included as inputs in growth accounting. As aresult, changes in the availability or use of such inputs as energy orimproved land are measured as a change in productivity. The reduc-tions in the use of energy following the 1974 and 1979 oil priceshocks also explain some fraction of the measured productivity slow-down.
Other possible, but less well-documented, explanations include adecline in economic efficiency associated with higher levels of distort-ing taxes and increased levels of government regulation. Regulationof energy in the 1970s was a prime example of the way in which gov-ernment intervention in the private economy reduced economic effi-ciency.
Productive efficiency can also be reduced by tax policies that dis-tort the allocation of inputs. Federal subsidies to particular industriespermit them to gain more access to productive inputs than is eco-nomically efficient, and differential tax treatment of productive inputscan also result in economic inefficiency. For example, if the return oncapital expenditures of a particular type, such as spending for equip-ment, is taxed at a lower rate than the return on other-capital ex-penditures, such as those for plant, business investment will shift
114Digitized for FRASER http://fraser.stlouisfed.org/ Federal Reserve Bank of St. Louis

toward the favorably treated input. Hence, the composition of thecapital stock will be altered, and national output would be producedless efficiently from what would occur with neutral tax treatment.
One-time changes in regulation or the tax structure that impair theefficient operation of the economy are more likely to produce a one-time decline in output than permanently alter the growth rate.During the period in which output drops, however, measured pro-ductivity growth will be smaller. Hence, the drop in measured pro-ductivity shown in Table 5-1 may reflect, in part, the progressive in-crease in regulation and effective marginal tax rates through the1970s.
PROSPECTS FOR GROWTH IN THE 1980s
The Administration projects a 3.2 percent annual rate of growth inreal GNP over the period 1979 through 1987. While higher than therate from 1974 to 1979, this rate is one-fifth lower than the rate ex-perienced from 1959 to 1973. An increase in the rate of capital for-mation from the 1973-79 rate of 2.5 percent per year to the 1969-73rate of 3.5 percent per year would, by itself, raise output growth to3.1 percent, even if productivity and labor growth rates remainedconstant. Given the incentives for capital formation provided by theEconomic Recovery Tax Act of 1981, a 3.5 percent growth in capitalover this period seems attainable. Growth in output will also be stim-ulated by demographic changes. Between 1979 and the mid-1980s alarge segment of the baby-boom generation will become fully inte-grated into the U.S. labor market. The associated changes in the age andsex composition of the labor force should, by themselves, account fora 0.3 percent annual rate of growth in output between 1979 and 1986.Growth in labor input is expected to exceed this, however, as the Ad-ministration's new incentives for additional labor supply lead to long-term increases in employment rates and hours worked.
A growth in total factor productivity greater than the 1.2 percentexperienced from 1973 to 1979 is not essential to meet the Adminis-tration's 1987 GNP projection, but it is likely to occur as a result ofthe reduction in the general level of distorting taxation and the newregulatory environment.
INCREASING FACTOR SUPPLY
Current and future supplies of labor and capital to the economyprimarily reflect the long-term supply and demand decisions ofhouseholds and firms. At any point in time the aggregate supplies oflabor and capital depend not only on the number and types of work-ers and the amount of plant and equipment available, but also on therate of utilization of these productive factors. People can work and
115Digitized for FRASER http://fraser.stlouisfed.org/ Federal Reserve Bank of St. Louis

machines can be worked more or less within any period of time. Inthe very short run, changes in the supplies of factor services involvechanges in factor utilization rates. In the longer run, the number andquality of workers, and the quantity and quality of structures andequipment, are variable.
Near-term increases in the stock of physical capital require produc-ing or importing more capital goods in the current period. But pro-ducing more capital goods means producing fewer goods for con-sumption. Hence, one way to expand the stock of physical capital isfor the household and government sectors to reduce their combineddemands for current consumption. Another way to expand capitalformation is simply to expand current output faster than current con-sumption. A third way is to import capital.
The Administration seeks to increase capital formation by bothraising the level of output and reducing the fraction of output con-sumed. A reduction in the Federal Government's own rate of con-sumption is an important element in this equation, but creating anenvironment where households choose to save a larger share of theirincome is of paramount importance. The figures in Table 5-2 illus-trate this point.
Table 5»2 presents historical data on household and governmentconsumption rates and the rate of total net national saving. Theseconsumption and saving rates are useful for portraying aggregatesaving behavior. The household consumption rate is defined ashousehold (private sector) consumption divided by the difference be-tween net national product and total government consumption. Na-tional output less government consumption provides a measure ofthe private sector's effective disposable income, because the privatesector must pay for the government's current consumption, eithernow or in the future.
TABLE 5-2.—Average annual consumption and saving rates, 1951-80
[Percent of net national product (NNP)]
Period
1951=60
1961-70
1971-80
TotalGovernmentconsump-tion as
percent ofNNP
141
167
18.9
FederalGovernmentconsump-
tion aspercent of
NNP
82
83
70
Householdconsump-tion as
percent ofnongovern-mental NNP
810
81 7
855
Net nationalsaving aspercent of
NNP
164
152
117
Sources: Department of Commerce (Bureau of Economic Analysis) and Council of Economic Advisers.
Government consumption is defined here as government expendi-tures on goods and services immediately consumed. Governmentpurchases of capital goods are not included. The table also indicates
116Digitized for FRASER http://fraser.stlouisfed.org/ Federal Reserve Bank of St. Louis
average rates by decade of net national saving, defined as net na-tional product less household and government consumption, dividedby net national product.
From the 1960s to the 1970s the Nation's total net saving rate fellfrom 15.2 percent to 11.7 percent. Changes in both government andhousehold consumption rates played a role in reducing the savingrate, but the changes in the household consumption rate were farmore important. If the rate of household consumption out of totaldisposable income—output less government consumption—had notchanged over this period, the Nation's saving rate would have fallenby only 0.4 percentage point rather than by 3.5 percentage points,despite an increase in government consumption as a share of net na-tional product from 16.7 to 18.9 percent. Thus, to achieve higher na-tional saving rates it is important to lower the household consump-tion rate.
There are two ways in which the household consumption rate canbe reduced and the national saving rate increased. One way is forhouseholds to increase total output by supplying more labor withoutat the same time increasing current consumption proportionately.The other is for households to maintain their current supply of labor(and therefore output) but reduce their levels of consumption. Ineither case the household consumption rate falls, and the economysaves more.
THE ECONOMIC EFFECTS OF TAX POLICY
In making the decisions that determine national output and capitalformation households consider their options. Each household makesdecisions on consumption, saving, and work based on the house-hold's current and future resources. These include the household'snet worth (the current market value of all financial and real assetsminus liabilities), the household's expected inheritances, the house-hold's expected receipt of government transfer payments, and thehousehold's human capital endowment. The endowment of humancapital is the present value of after-tax income the household wouldearn if it was solely interested in maximizing its labor earnings.
Household choices between consumption and saving and betweenwork and leisure are influenced by after-tax wage rates and after-taxrates of return on capital. When the government changes either thelevel or the structure of taxes, it ultimately alters household decisionsabout consumption, saving, and work effort. All aspects of the taxsystem, including both personal and business taxes, influence thesedecisions. For example, higher after-tax returns on capital incomemake present consumption more expensive than future consumption;
117Digitized for FRASER http://fraser.stlouisfed.org/ Federal Reserve Bank of St. Louis

forgoing a dollar of consumption today and investing that dollar pro-vides more than a dollar of consumption tomorrow, with the addi-tional amount determined by the after-tax return on the investment.
It is customary to associate taxes on wage income with changes inincentives to work and to associate taxes on capital income withchanges in incentives to consume or to save. Wage taxes also influ-ence consumption and saving decisions, however, and taxes on capi-tal income influence labor and leisure decisions. Lowering taxes oncapital income raises the after-tax return on that income. The largerafter-tax return effectively lowers the cost of enjoying leisure as wellas consuming in the future relative to the present. Hence, a reduc-tion in taxes on capital income increases the incentive to work nowand can thus stimulate the supply of labor.
U.S. households and businesses face, at best, a highly uncertaineconomic environment resulting from continuing changes in prefer-ences, prices, and productivity. Uncertainty with respect to govern-ment fiscal and monetary policy increases the uncertainty underwhich households make current and future consumption and laborsupply decisions. In such an environment, households may choose topostpone supplying labor and businesses may decide to postponenew investment until the economic environment is more settled.
The Administration and the Congress have greatly reduced uncer-tainty with respect to the tax policy. The Economic Recovery Tax Act of1981 clearly spells out the major features of the U.S. tax system for thenext several years; the indexation of the Federal income tax slated tobegin in 1985 will reduce the uncertainty associated with inflationpushing households into higher marginal tax brackets.
THE STRUCTURE OF THE TAX SYSTEM
The United States has a complex tax system that influences thechoices households make between current and future consumptionand current and future work effort. The tax system also influencesthe types of investments businesses undertake and the set of com-modities households choose to purchase. The Federal personal andcorporate income taxes, the social security program, the welfaresystem, and the money creation process all affect the economic be-havior of firms and households. This section describes the changesintroduced by the Economic Recovery Tax Act of 1981 to the per-sonal and corporate income tax systems, and discusses the likely ef-fects of these changes on labor supply and saving rates. Tax aspectsof the social security system, the welfare system, and monetary policyare also addressed.
118Digitized for FRASER http://fraser.stlouisfed.org/ Federal Reserve Bank of St. Louis
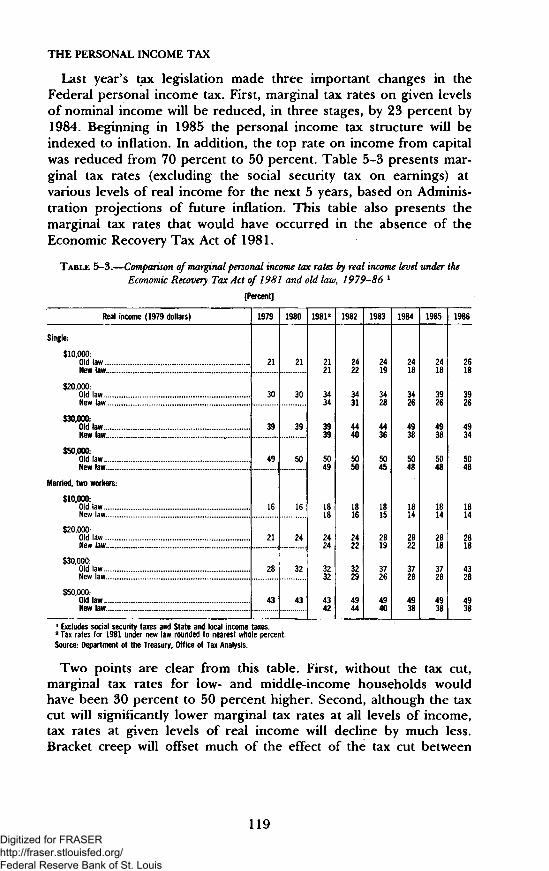
THE PERSONAL INCOME TAX
Last year's tax legislation made three important changes in theFederal personal income tax. First, marginal tax rates on given levelsof nominal income will be reduced, in three stages, by 23 percent by1984. Beginning in 1985 the personal income tax structure will beindexed to inflation. In addition, the top rate on income from capitalwas reduced from 70 percent to 50 percent. Table 5-3 presents mar-ginal tax rates (excluding the social security tax on earnings) atvarious levels of real income for the next 5 years, based on Adminis-tration projections of future inflation. This table also presents themarginal tax rates that would have occurred in the absence of theEconomic Recovery Tax Act of 1981.
TABLE 5-3.—Comparison of marginal personal income tax rates by real income level under the
Economic Recovery Tax Act of 1981 and old law, 1979-86 1
[Percent]
Real income (1979 dollars)
Single:
$10,000:Old lawNew law
$20,000:Old lawNew law ..
$30,000:Old lawNew law
$50,000:Old lawNew law .
Married, two workers:
$10,000:Old lawNew law
$20,000:Old lawNew law
$30,000:Old lawNew law
$50,000:Old lawNew law.,
1979
21
30
39
49
16
21
28
43
1980
21
30
39
50
16
24
32
43
19812
2121
3434
3939
5049
1818
2424
3232
4342
1982
2422
3431
4440
5050
1816
2422
3229
4944
1983
2419
3428
4436
5045
1815
2819
3726
4940
1984
2418
3426
4938
5048
1814
2822
3728
4938
1985
2418
3926
4938
5048
1814
2818
3728
4938
1986
2618
3926
4934
5048
1814
2818
4328
4938
1 Excludes social security taxes and State and local income taxes.2 Tax rates for 1981 under new law rounded to nearest whole percent.Source: Department of the Treasury, Office of Tax Analysis.
Two points are clear from this table. First, without the tax cut,marginal tax rates for low- and middle-income households wouldhave been 30 percent to 50 percent higher. Second, although the taxcut will significantly lower marginal tax rates at all levels of income,tax rates at given levels of real income will decline by much less.Bracket creep will offset much of the effect of the tax cut between
119Digitized for FRASER http://fraser.stlouisfed.org/ Federal Reserve Bank of St. Louis

1981 and 1985. Under the Administration's inflation projections,most households will still face marginal tax rates that are high by his-torical standards. Table 5-4 presents past and projected marginal taxrates for households at 3 points in the income distribution from 1965to 1984. For the projected inflation path, marginal tax rates formedian income households in 1984 will decline to roughly their1977-80 levels, but will remain considerably above earlier rates.Thus, despite the substantial reductions introduced by the 1981 taxcut, most rates in 1984 will remain near the historical high rates onreal income.
TABLE 5-4.—Marginal personal income tax rates for four-person families, selected years, 1965-84 1
[Percent]
Year
1965
1970
1975
1980
1981198219831984
1981198219831984
Family income
One-halfmedian income
14
15
17
18
Median income
17
20
22
24
Twice medianincome
22
26
32
43
Under Economic Recovery Tax Act of 1981
17.8161516
18181821
27.7252325
Under old law
28282832
42.5394038
43434949
1 Excludes social security taxes and State and local income taxes.
Source: Department of the Treasury, Office of Tax Analysis.
To discuss the effects of the tax cuts on labor supply and savingdecisions, it is necessary to understand the various incentives onhousehold behavior created by reductions in marginal tax rates. Cut-ting tax rates increases an individual's after-tax wage rate. With theFederal Government taking a smaller share of the last dollar of earn-ings, the return to an individual from an extra hour of work or amore demanding job will increase, strengthening the incentive towork more hours, or accept a more demanding job.
Similarly, cutting tax rates increases after-tax interest rates. Thehigher the after-tax interest rate, the higher the level of future con-sumption possible for a given reduction of current consumption. Theincrease in after-tax interest rates resulting from the tax cuts will thustend to decrease present consumption, including consumption of lei-sure as well as goods. In other words, households will tend both towork more and to save more.
120Digitized for FRASER http://fraser.stlouisfed.org/ Federal Reserve Bank of St. Louis

Operating in the other direction is the effect of the tax cut onhousehold income. As marginal tax rates fall, the total tax bill paidby a household will fall and its after-tax income will rise. As dispos-able incomes rise, both in the present and in the future, consumptionof both goods and leisure will rise. Thus the effect of increasedincome will tend to decrease saving and decrease work effort. Thenet effect of the tax cut on saving and labor supply will vary accord-ing to household circumstances. The preponderance of empiricalstudies suggests that the labor supply effects of a tax cut are smallfor married men, somewhat larger for unmarried people, and sub-stantial for married women. The most important effect of thesechanges in personal marginal income tax rates may thus be to in-crease labor force participation rates and hours of work by marriedwomen.
The second important change in the personal income tax intro-duced by last year's tax legislation was the extension of the opportu-nity to use Individual Retirement Accounts (IRAs) to all workinghouseholds. Under the new law, each worker may contribute up to$2,000 to these accounts regardless of whether the worker is alreadycovered under an employer-sponsored pension plan. One-earnercouples can contribute up to $2,250. IRAs provide two tax advan-tages to contributors. First, contributions are deductible from taxableincome. Second, returns on IRA investments accumulate tax-free aslong as the funds are not withdrawn from the account. Given the siz-able tax savings available from IRAs, the total amount of money in-vested in them can be expected to rise sharply. Some of this moneywill simply be transferred from other types of savings, includingstocks, bonds, and savings accounts. However, for many householdswithout sufficient liquid assets to transfer to IRAs, the last dollarcontributed to an IRA will correspond to their marginal saving. Thatis, the last dollar of current consumption forgone will correspond tothe last dollar invested in an IRA. Since the marginal tax rate on cap-ital income obtained from these accounts is quite low, this provisionis expected to increase the national saving rate as well as contributeto an increase in the labor supply.
The prospect of moving into higher marginal income tax bracketsbiases households away from activities that would generate higherfuture incomes. Hence, income tax progressivity encourages currentconsumption and leisure and discourages saving for the future. Inthe presence of inflation and an unindexed tax system, "bracketcreep" strengthens this disincentive for generating future income. In-dexation of the tax system in 1985 will, therefore, provide furtherstimulus for saving and economic growth.
121Digitized for FRASER http://fraser.stlouisfed.org/ Federal Reserve Bank of St. Louis
Other changes in the tax code will also provide taxpayers withgreater incentives to join the work force. The new law provides mar-ried couples filing a joint 1982 return with a 5 percent deduction in1982 and a 10 percent deduction starting in 1983 on the earnings upto $30,000 of the lower earning spouse. If the couple's marginal taxrate would otherwise be 30 percent, the 10 percent deduction after1982 will reduce the marginal tax rate on earnings of the secondspouse to 27 percent. The spousal deduction will also place certainhouseholds in lower marginal tax brackets, thus further loweringmarginal tax rates. This change should help sustain the growth offemale labor force participation.
TAXATION OF INCOME FROM BUSINESS INVESTMENT
The Economic Recovery Tax Act of 1981 also made major changesin the taxation of business income. The most important change is themore generous treatment of the way in which capital can be depreci-ated for tax purposes, known as the accelerated cost recovery system(ACRS). A second change was the introduction of leasing rules thatprovide businesses with temporarily low taxable income the same in-vestment incentives as other businesses. A third provision of the actis an increase in the investment tax credit for some types of equip-ment. Finally, a fourth provision allows small businesses to expenseup to $5,000 of new investment in 1982 and 1983. The $5,000 limitwill rise to $7,500 in 1984 and 1985, and $10,000 thereafter. Thesechanges should substantially increase business investment by increas-ing the after-tax return available on new business projects.
TAX TREATMENT OF DEPRECIABLE PROPERTY
The ACRS will encourage business investment by shortening theperiod over which assets can be fully depreciated and by allowingfirms to claim more of the depreciation early in the tax life of theasset. Before the adoption of ACRS, businesses were permitted towrite off industrial equipment over an average period of 8.6 years.The ACRS asset life for this equipment is 5 years. For industrialplant, asset lives have been reduced by 37 percent, from an averageof 23.8 years to 15 years. The ACRS depreciation schedules repre-sent a combination of the declining balance and straightline methodof depreciation through 1984. For 1985 and beyond, declining bal-ance switching to sum of years digits is used. The depreciationschedules for the years after 1984 provide increasingly more accel-eration'of depreciation. The combined result of the ACRS and theinvestment tax credit will be a decline in effective tax rates on newinvestment over the period 1982 to 1987.
122Digitized for FRASER http://fraser.stlouisfed.org/ Federal Reserve Bank of St. Louis

Table 5-5 shows historic and projected before-tax real rates ofreturn in new capital investment required to provide a 4 percentafter-tax real return. This real return is a commonly used analyticalassumption. These numbers reflect the combined effect of the depre-ciation provisions and the investment tax credit. Historical numbersare based on historical rates of inflation.. Rates of return in futureyears are based on the Administration's inflation projections. Abefore tax rate of return of 8 percent, for example, implies an effec-tive tax rate of 50 percent on new investments. The calculationsassume the new investment is equity financed. Hence, the tax advan-tages from the deduction of interest expense associated with debt fi-nancing are not included.
TABLE 5-5.—Real before-tax rate of return required to provide a 4 percent real after-tax return,1955-86
[Percent]
Period
1955-59
1960-64
1965-69
1970-74
1975-79
1981 . ..
1982
1983
1984
1985 ..
1986
Construc-tion
machinery
8.9
7.4
65
6.6
6.1
34
31
2.9
2.9
23
22
Generalindustrialequipment
9.5
7.8
6.9
6.7
6.4
35
33
3.2
3.1
27
26
Trucks,buses, and
trailers
108
8.7
75
76
76
35
31
3.0
2.9
26
25
Industrialbuildings
80
79
76
86
90
66
64
6.4
6.4
63
63
Commer-cial
buildings
80
79
76
8.4
87
62
61
6.0
60
60
60
Note.—Data for 1955-79 are based on Auerbach and Jorgenson calculations of expected inflation in each year. Data for1981-86 are based on the Administration's projections of inflation (year-over-year percent change in the GNP implicit pricedeflator): 1982, 7,9; 1983, 6.0; 1984, 5.0; 1985, 4.7; 1986, 4.6; and 1987 and beyond, 4.5.
Sources: Auerbach, Alan and Jorgenson, Dale, "Inflation Proof Depreciation of Assets," Harvard Business Review, Sept -Oct1980 (1955-79), and Council of Economic Advisers (1981-86, based on Economic Recovery Tax Act of 1981).
Under the assumptions made here, in comparison with the years1975 to 1979, the 1982 real before-tax rate of return required to jus-tify a new investment in general industrial equipment has been re-duced from 6.4 to 3.3 percent. For investment in plant the requiredrate of return estimated here declines from 9.0 to 6.4 percent. Theeffective tax rates associated with these numbers decline between 1982and 1986. This reflects both the more favorable depreciation schedulesafter 1984 and projections of continued declines in inflation.
Since depreciation allowances are not indexed, higher rates of in-flation will raise effective tax rates. Table 5-6 presents the before-taxrates of return required in 1986 to provide a 4 percent after-tax
123Digitized for FRASER http://fraser.stlouisfed.org/ Federal Reserve Bank of St. Louis

return under different assumptions about the rate of inflation prevail-ing in 1986 and beyond. The table shows that a reduction in inflationfrom 8 percent to 5 percent will lower the required before-tax rate ofreturn from 3.2 percent to 2.7 percent in general industrial equip-ment and from 6.9 percent to 6.4 percent on plant. Conversely, a1986 level of inflation of 12 percent would raise required before-taxrates of return to 3.7 percent for equipment and 7.4 percent for plant.
TABLE 5-6.—Real before-tax rate of return required to provide a 4 percent after-tax return in 1986 atselected rates of inflation
[Percent]
Type of capital
Construction machinery
General industrial equipment
Trucks, buses and trailers
Industrial buildings
Commercial buildings
Inflation rate (percent)
5
2.3
2.7
2.5
6.4
6.1
8
2.9
3.2
3.1
6.9
6.5
12
3.7
3.7
3.7
7.4
6.9
Source: Council of Economic Advisers.
Tables 5-5 and 5-6 also indicate that the ACRS does not treat alltypes of business investment equally. Although favorable to all newinvestment, ACRS is relatively more favorable to investment inequipment. As a consequence, industries for which short-lived equip-ment represents a large fraction of their total capital will face lowereffective tax rates than industries with a low equipment-intensive cap-ital structure. Table 5-7 presents calculations of industry specific taxrates on new investment for 1982. There are two sets of numbers;the first indicates the tax rates that would have prevailed under theold law, while the second column indicates tax rates in 1982 underthe Accelerated Cost Recovery System.TABLE 5-7.—Effective tax rates on new depreciable assets, selected industries, 1982J
Industry
AgricultureMiningPrimary metals .Machinery and instruments.Motor vehicles .FoodPulp and paper.Chemicals.Petroleum refining.Transportation services.UtilitiesCommunications .Services and trade
Old Law
32.728.434.038.225.844.128.528.835.031.043.239.8532
New law
16.6-3.4
7.518.6
-11.320.8
.98.61.1
-2.930.614.1371
1 Industries chosen had at least $5 billion in new investment in 1981.
Note.—Assumes a 4 percent real after-tax rate of return and 8 percent inflation.Source: Department of the Treasury, Office of Tax Analysis.
124Digitized for FRASER http://fraser.stlouisfed.org/ Federal Reserve Bank of St. Louis

The table shows substantial reductions in tax rates for all indus-tries, but differences among industries in the rate of tax reduction.The effect on each industry is different because each industry uses adifferent mix of capital. Tax rates vary across industries, from a highof 37 percent in the services and trade sector to a low of -11 per-cent in the motor vehicle industry. Effective tax rates on new invest-ment are negative for some industries. The result will be lower totalcorporate tax liabilities rather than direct payments by the Treasury.These differential rates of taxation at the industry level will probablylead to relatively more investment in industries with lower tax rates.
LEASING PROVISIONS
The ACRS provides the same investment incentives to firms withtaxable income and those with nontaxable income. The leasing provi-sion of the Economic Recovery Tax Act of 1981 should enhance effi-cient allocation of capital across industries and across firms withinthe same industry. The fundamental principle underlying the leasingprovisions is that investment incentives should be equal for all busi-nesses in a given industry and across industries; that is, investmentincentives should not favor investment in one firm over another.Prior to the establishment of these leasing provisions, firms with tem-porary tax losses (a condition especially characteristic of new enter-prises) were often unable to take advantage of investment tax incen-tives. The reason was that temporarily unprofitable companies hadno taxable income against which to apply the investment tax deduc-tions. As a result, these companies were placed at a relative disadvan-tage, although the new investment undertaken by these companieswas potentially as profitable as investment undertaken by firms withtemporarily positive profits.
The leasing provisions will permit companies with no current tax-able income to take advantage of investment incentives by transfer-ring their tax credits and additional deductions associated with in-vestment to firms with taxable income. For example, American auto-mobile manufacturers who are currently reporting losses will now beable to take the same advantage of the incentives as more profitablefirms. In the absence of the leasing provisions, investment wouldprobably be too low in the automobile industry relative to the mostproductive mix of investment.
The leasing provisions will also have the advantage of reducing in-centives for mergers. Under the old law, companies with positive tax-able income had an incentive to merge with companies with taxlosses because these tax losses could be used to offset the parent
125
358-691 0 - 82 - 9 : QL3Digitized for FRASER http://fraser.stlouisfed.org/ Federal Reserve Bank of St. Louis

company's taxable income. The leasing provisions, by permittingcompanies with positive taxable income to effectively purchase thenegative taxable income of other companies, will eliminate this moti-vation for mergers.
EFFECTS OF TAX ACT ON HOUSING AND CONSUMER DURABLES
The 1981 act will alter the allocation of existing capital and laboramong industries. It will also affect the allocation of new business in-vestment, the fraction of investment allocated to business as opposedto residential investment, and the division of consumption betweendurable commodities—such as residential real estate, automobiles,and furniture—and nondurable commodities.
The Tax Act improves the attractiveness of business investmentrelative to other forms of investment. As relative returns rise forbusiness investment, financial institutions will tend to increase theirbusiness lending and decrease their consumer and mortgage lending.Households themselves will tend to lower their investments in thesegoods in order to put more of their savings directly into businesscapital by purchasing corporate stocks and bonds, or indirectly byplacing their savings with financial institutions who will make theseinvestments for them. In either case, more money will be channeledto business investment and less to housing and consumer durablesthan would have occurred without the ACRS.
To understand the effects of the new depreciation system on theconsumption of durables versus nondurables, one must first realizethat the implicit price of consuming durable goods is the after-taxreturn the owners of these durables would otherwise receive if theysold these assets and invested the proceeds.
The sizable reductions in tax rates on capital income mean thatreal after-tax returns on household saving will be substantially higherthan they have been in the recent past. As a result, the implicit priceof consumer durables has risen, and a long-run shift in demand awayfrom housing, automobiles, and other consumer durables may result.While housing and durables provide important service flows, the taxtreatment of service flows from durables may have led to overinvest-ment in them in the 1970s. Much of the spectacular rise in housingprices during the last decade was associated with the increasinglypro-durables bias imbedded in a very inflation-senstive system of cap-ital income taxation. As inflation rose, so did effective taxes on capi-tal income. This rise lowered the relative price of consuming dura-bles because it lowered the opportunity costs of holding these dura-bles. As a result, the demand for consumer durables in general, andhousing in particular, was greatly stimulated. In the short run, hous-ing prices were bid up dramatically, reflecting the tax-induced in-
126Digitized for FRASER http://fraser.stlouisfed.org/ Federal Reserve Bank of St. Louis
creased demand for housing services. The higher housing prices, inturn, stimulated construction of new housing, since it increased theprice at which newly constructed houses could be sold.
An offsetting consideration with respect to the durables industriesis the relatively more favorable treatment of the motor vehicle indus-try under the 1981 Tax Act (Table 5-7). The effective tax rate on thereturn to new investment in the motor vehicle industry has been cutfrom 26 to — 11 percent.
Another pertinent point is that the tax structure is simply one ofnumerous determinants of the demand for different commodities.The surge in new family formation resulting from the baby-boom ofthe 1950s will lead to a strong demand for housing that could wellswamp the effects of the tax change on residential investment. Thesame is likely to be true of other durables that are in relatively great-er demand by young families setting up a household.
IMPLICIT TAXATION OF LABOR SUPPLY BY THE SOCIAL SECURITY AND
WELFARE SYSTEMS
It is ironic that the social security and welfare programs may,themselves, contribute to the relatively low income levels of the el-derly and the poor. Social security and welfare recipients may wellface the highest marginal tax rates of any members of our society.These systems provide very small incentives to work. Not surprising-ly, therefore, relatively few beneficiaries of these two programs work,especially at full-time jobs.
There is mounting evidence that the social security earnings testhas contributed significantly to the dramatic increase in early retire-ment. In 1950 the labor force participation rate of males 65 and overwas 46 percent; today it is only 20 percent. Not only are there fewerolder men working on any given day during the year, but there arefewer older men who work at any time during the year. The fractionof men 65 to 69 who are completely retired has risen from 40 per-cent to 60 percent since 1960. For males 60 to 64 the retirement rateis now 30 percent, double the 1960 figure of 15 percent. Those oldermales who do choose to work are working fewer hours. Since 1967the fraction of working males 65 and over who work part-time hasincreased from one-third to almost one-half. This reduction in workhas occurred despite a substantial increase in the general health ofpeople in this age group.
The social security earnings test currently reduces benefits by 50cents for every dollar of earnings above $6,000 and represents a 50percent implicit tax for workers aged 65 to 72. In combination withthe Federal and State income taxes and the social security payrolltax, this 50 percent tax on earnings penalizes the work effort of the
127
Digitized for FRASER http://fraser.stlouisfed.org/ Federal Reserve Bank of St. Louis

elderly at rates that can easily exceed 80 percent. These exceedinglylarge tax rates extend over a wide range of the typical older worker'spotential supply of labor hours.
Eliminating the earnings test, as has been proposed by the Admin-istration, would unquestionably increase the incomes of older work-ers as well as generate tax revenues that would offset a portion of thecosts of doing so. Because of impending changes in the demographicstructure of the population, it is important to reverse the trendtoward early retirement. By the year 2025 the proportion of the pop-ulation age 62 and over will rise to 24.5 percent, compared to 13.6percent in 1981. The ratio of workers paying social security taxes toretired beneficiaries will fall from a current level of 3.7 to 2.4. If thework disincentives for older citizens were reduced, U.S. per capitaincome would rise more rapidly and social security's long-run finan-cial position would be improved.
Current provisions of the social security system also generate workdisincentives for a significant fraction of married women. While mar-ried women are joining the labor force in increasing numbers, thetypical wife's earnings are still one-third to one-half that of husbands.Hence, the marginal tax contributions to social security of manywives will yield them no marginal social security benefits becausethey will collect benefits based on their husband's earnings record.(This applies only to retirement and medicare benefits. A wife whobecomes disabled cannot currently Collect disability benefits based onher husband's account.) The combined employer-employee retire-ment and medicare tax rates total 11.75 percent and represent a puremarginal tax on the work effort of married women. The response tofemales to the level of net compensation is estimated to be quitehigh. Hence, the bias in the current structure regarding dependentand survivor benefits may represent a significant disincentive to theparticipation of married females in the labor force.
Similar work disincentives potentially reduce the labor supply ofwelfare recipients. Welfare recipients do not face a single and easilyunderstood tax schedule relating their gross earnings to their net dis-posable income. Instead, they are confronted with eight different andhighly complicated implicit and explicit tax schedules. These includethe work and income tests of Aid to Families with Dependent Chil-dren (AFDC), food stamps, housing assistance, social security insur-ance and medicaid, the earned income tax credit, the Federal incometax, and State income taxes. Each of the welfare programs has itsown eligibility requirements, its own definition of income, its own setof deductions and exclusions, and its own tax rates. These explicitand implicit tax systems differ across States as well. Even within aState, implicit tax schedules vary, depending on both the charac-
128Digitized for FRASER http://fraser.stlouisfed.org/ Federal Reserve Bank of St. Louis
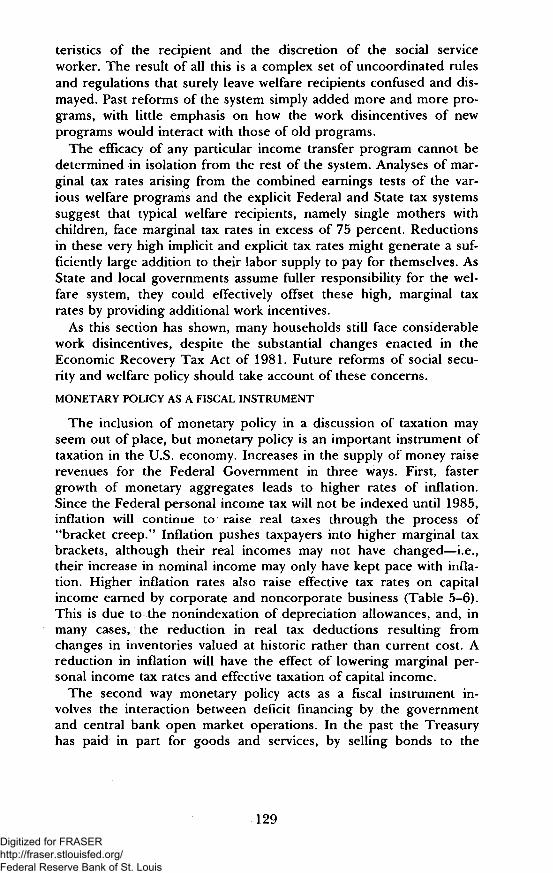
teristics of the recipient and the discretion of the social serviceworker. The result of all this is a complex set of uncoordinated rulesand regulations that surely leave welfare recipients confused and dis-mayed. Past reforms of the system simply added more and more pro-grams, with little emphasis on how the work disincentives of newprograms would interact with those of old programs.
The efficacy of any particular income transfer program cannot bedetermined in isolation from the rest of the system. Analyses of mar-ginal tax rates arising from the combined earnings tests of the var-ious welfare programs and the explicit Federal and State tax systemssuggest that typical welfare recipients, namely single mothers withchildren, face marginal tax rates in excess of 75 percent. Reductionsin these very high implicit and explicit tax rates might generate a suf-ficiently large addition to their labor supply to pay for themselves. AsState and local governments assume fuller responsibility for the wel-fare system, they could effectively offset these high, marginal taxrates by providing additional work incentives.
As this section has shown, many households still face considerablework disincentives, despite the substantial changes enacted in theEconomic Recovery Tax Act of 1981. Future reforms of social secu-rity and welfare policy should take account of these concerns.
MONETARY POLICY AS A FISCAL INSTRUMENT
The inclusion of monetary policy in a discussion of taxation mayseem out of place, but monetary policy is an important instrument oftaxation in the U.S. economy. Increases in the supply of money raiserevenues for the Federal Government in three ways. First, fastergrowth of monetary aggregates leads to higher rates of inflation.Since the Federal personal income tax will not be indexed until 1985,inflation will continue to raise real taxes through the process of"bracket creep." Inflation pushes taxpayers into higher marginal taxbrackets, although their real incomes may not have changed—i.e.,their increase in nominal income may only have kept pace with infla-tion. Higher inflation rates also raise effective tax rates on capitalincome earned by corporate and noncorporate business (Table 5-6).This is due to the nonindexation of depreciation allowances, and, inmany cases, the reduction in real tax deductions resulting fromchanges in inventories valued at historic rather than current cost. Areduction in inflation will have the effect of lowering marginal per-sonal income tax rates and effective taxation of capital income.
The second way monetary policy acts as a fiscal instrument in-volves the interaction between deficit financing by the governmentand central bank open market operations. In the past the Treasuryhas paid in part for goods and services, by selling bonds to the
129
Digitized for FRASER http://fraser.stlouisfed.org/ Federal Reserve Bank of St. Louis

public. When the Federal Reserve purchases Treasury bonds, it in-creases the monetary base. The net effect of these'transactions is thatthe government acquires goods and services while the private sectoris left holding a larger stock of money. The larger stock of money forthe same amount of goods and services in the economy translatesinto a higher price level. The increase in prices then lowers the realpurchasing power of the money held by the private sector, and thetransfer of resources from the private sector to the government iscomplete.
A third way in which the government "taxes" the private sectorthrough expansion of the monetary base is that the ensuing higherprices devalue nominal outstanding debt. The real capital losses ex-perienced by the private sector on their holdings of outstanding gov-ernment liabilities correspond to the real capital gains accruing to thegovernment. Private investors are not, however, so foolish as to pur-chase government bonds in an inflationary environment without re-quiring higher interest payments to offset expected real capital losseson the nominal value of these bonds. Given this fact, the governmentcollects real revenues from "watering down*' the value of nominaldebt only if the actual inflation rate exceeds the rate expected by theprivate sector. Actual rates of inflation in excess of expected ratesappear to have been the case for much of the 1970s.
Standard government accounting procedures fail to record eitherthe increase in base money or the real capital gains on outstandingnominal government debt as sources of financing government ex-penditures. Even when actual inflation equals expected inflation, analternative method of bookkeeping would suggest entering the gov-ernment's real capital gain as revenue, since the higher nominal in-terest payments required because of expected inflation are enteredon the government's books as current real expenditures. The failure touse accounting procedures that recognize the impact of inflation dis-guises the government's actual method of financing its expenditures.
There are a variety of possible ways of analyzing changes in thegovernment's net liabilities. Table 5-8 presents estimates of changesin the real market value of outstanding Federal net financial liabilitiesfrom 1966 to 1980. The table relates changes in the Federal Govern-ment's real net financial debt (valued at market prices) in 1980 dol-lars to the differences between its real expenditures and its realtaxes, including taxation associated with money creation.
130Digitized for FRASER http://fraser.stlouisfed.org/ Federal Reserve Bank of St. Louis
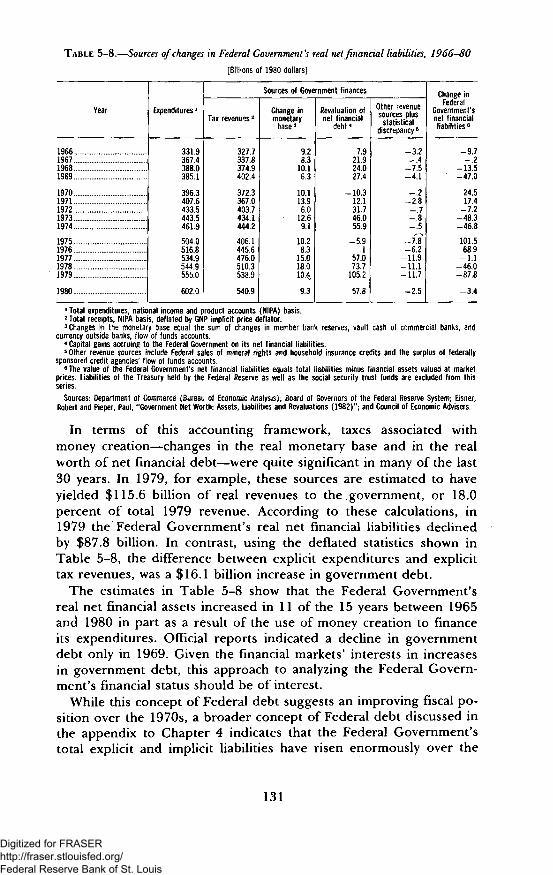
TABLE 5-8.—Sources of changes in Federal Government's real net financial liabilities, 1966-80
[Billions of 1980 dollars]
Year
1966196719681969
19701971197219731974
19751976197719781979
1980
Expenditures '
331.9367.4388.0385.1
396.3407.6433.5443.5461.9
504.0516.8534.9544.9555.0
602.0
Sources of Government finances
Tax revenues2
327.7337.8374.9402.4
372.3367.0403.7434.1444.2
406.1445.6476.0510.3538.9
540.9
Change inmonetary
base3
9.28.3
10.16.3
10.113.96.0
12.69.1
10.28.3
15.018.010.49.3
Revaluation ofnet financial
debt4
7.921.924.027.4
-10.312.131.746.055.9
-5.9.1
57.073.7
105.2
57.8
Other revenuesources plus
statisticaldiscrepancy5
-3.2-.4
-7.5-4.1
-.2=-2.8-.7-.8-.5
-7.V-6.2
-11.9-11.1-11.7
-2.5
Change inFederal
Government'snet financialliabilities 6
-9.7-.2
-13.5-47.0
24.517.4
= 7.2-48.3-46.8
101.568.9
-1.1-46.0-87.8
-3.4
1 Total expenditures, national income and product accounts (NIPA) basis.2 Total receipts, NIPA basis, deflated by GNP implicit price deflator.3 Changes in the monetary base equal the sum of changes in member bank reserves, vault cash of commercial banks, and
currency outside banks, flow of funds accounts.4 Capital gains accruing to the Federal Government on its net financial liabilities,5 Other revenue sources include Federal sales of mineral rights and household insurance credits and the surplus of federally
sponsored credit agencies' flow of funds accounts.6 The value of the Federal Government's net financial liabilities equals total liabilities minus financial assets valued at market
prices. Liabilities of the Treasury held by the Federal Reserve as well as the social security trust funds are excluded from thisseries.
Sources: Department of Commerce (Bureau of Economic Analysis); Board of Governors of the Federal Reserve System; Eisner,Robert and Pieper, Paul, "Government Net Worth: Assets, Liabilities and Revaluations (1982)"; and Council of Economic Advisers.
In terms of this accounting framework, taxes associated withmoney creation—changes in the real monetary base and in the realworth of net financial debt—were quite significant in many of the last30 years. In 1979, for example, these sources are estimated to haveyielded $115.6 billion of real revenues to the government, or 18.0percent of total 1979 revenue. According to these calculations, in1979 the Federal Government's real net financial liabilities declinedby $87.8 billion. In contrast, using the deflated statistics shown inTable 5-8, the difference between explicit expenditures and explicittax revenues, was a $16.1 billion increase in government debt.
The estimates in Table 5-8 show that the Federal Government'sreal net financial assets increased in 11 of the 15 years between 1965and 1980 in part as a result of the use of money creation to financeits expenditures. Official reports indicated a decline in governmentdebt only in 1969. Given the financial markets' interests in increasesin government debt, this approach to analyzing the Federal Govern-ment's financial status should be of interest.
While this concept of Federal debt suggests an improving fiscal po-sition over the 1970s, a broader concept of Federal debt discussed inthe appendix to Chapter 4 indicates that the Federal Government'stotal explicit and implicit liabilities have risen enormously over the
131
Digitized for FRASER http://fraser.stlouisfed.org/ Federal Reserve Bank of St. Louis

last 20 years. The narrower focus of this section and objective ofTable 5-7 is to point out that monetary growth raises sizable realtaxes for the Federal Government. Monetary growth is a form of tax-ation. It is an insidious form of taxation. It is taxation that is not leg-islated by the Congress, it is taxation that is hard to understand, andit is taxation that inhibits economic growth by raising effective mar-ginal tax rates on wages and on saving.
STRUCTURAL TAX POLICY AND ECONOMIC GROWTH
Structural tax policy probably constitutes the Federal Govern-ment's most powerful tool for influencing economic growth. Ifhouseholds anticipate their own and their descendants' future tax li-abilities, changes in the tax structure generating the same revenuehave only "substitution" effects on their decisions; "income" effectsare zero or negligible. If households consider only their own futuretax liabilities and not those of their descendants, income effects doarise for different age groups, but they are largely offsetting. Suchchanges in the tax structure do not change household budgets, in theaggregate, but they do change household incentives to work andsave. The rate of savings and capital formation can be increased sig-nificantly by switching away from taxes on capital income to someother tax base, such as wages or consumption. As described earlier,reductions in the tax rates on capital income reduce the relative costof future consumption and leisure and encourage the substitution offuture consumption and leisure for current consumption and leisure.Such substitution leads to increases in the current supplies of bothcapital and labor.
The 1981 Tax Act's reduction in marginal tax rates on capitalincome under both personal and corporate income taxes, the provi-sion for substantial increases in Individual Retirement Accounts andKeogh accounts, and the recent expansion of pension fund savingsall constitute major reductions in taxation of capital income. Thesehistoric changes in the structure of taxation, assuming they are main-tained for the indefinite future, are expected to lead to a significantlong-term rise in the private business capital stock and increases inlabor supply over what would otherwise be the case.
While capital formation and economic growth are predicted to beenhanced, it should be emphasized that the choice of a tax baseshould be determined on grounds of economic welfare and efficien-cy, rather than simply the effect of structural tax change on factorsupplies. Economic research suggests that rather sizable efficiencyand welfare gains are available from switching from the taxation ofwage and capital income to the taxation of consumption. In contrast,
132Digitized for FRASER http://fraser.stlouisfed.org/ Federal Reserve Bank of St. Louis
there is evidence that switching from wage and capital income tax-ation to wage taxation alone can reduce economic welfare and effi-ciency, even though this structural tax change would lead to morecapital formation. In recent years, Federal tax policy has increasinglymoved away from marginal taxation of capital income toward an al-ternative structure that can best be described as a hybrid mixture ofwage and consumption taxation.
The change in the structure of taxation will increase labor supplyand capital formation over time, provided there is no significant dete-rioration in the government's real net debt position. While the moveaway from marginal capital income taxation is necessary to stimulatesaving, the Nation still retains a tax system that is overly complex,that is still sensitive to inflation (especially with respect to effectivebusiness taxation), that is administratively expensive, and that ab-sorbs too much talent in the fundamentally nonproductive endeavorof what is gently termed "tax planning." In short, there is a need forfurther simplification and rationalization of the U.S. tax code.
133Digitized for FRASER http://fraser.stlouisfed.org/ Federal Reserve Bank of St. Louis

CHAPTER 6
Reforming Government Regulation ofEconomic Activity
GOVERNMENT REGULATION OF ECONOMIC ACTIVITY ex-panded rapidly during the 1970s. Although regulation can serveuseful purposes, changes in the world and national economies havearoused increasing concern that regulation is imposing excessive bur-dens on individuals and businesses. This chapter focuses on the Ad-ministration's efforts to reform the regulatory process. The presentscope of Federal regulation is reviewed, and a framework is present-ed for judging the desirability of specific regulations. This frameworkis then used in reviewing the status of regulation in a number of im-portant industries and sectors of the economy. The chapter con-cludes with a set of guidelines for regulatory reform.
THE GROWTH OF FEDERAL REGULATION
The number and size of the agencies devoted to carrying out Fed-eral regulation have expanded rapidly during the past 15 years. Sincethe mid-1960s we have seen the formation of the Consumer ProductSafety Commission, the Environmental Protection Agency, the De-partment of Energy, and the Occupational Safety and Health Admin-istration, to cite just the better known ones. The recent growth in thenumber and size of regulatory agencies has been greater than thatwhich took place during the New Deal period (Chart 6-1).
The direct costs of Federal regulatory activities to the taxpayersare large. As shown in Table 6-1, the regulatory expenses of Federalagencies were $2.8 billion in fiscal 1974 and increased to $5.5 billionin fiscal 1979. A further increase to $7.1 billion was budgeted for1981van amount 50 percent higher in constant dollars than the 1974total.
It is apparent that the biggest budgets are not those for the inde-pendent regulatory commissions, such as the Interstate CommerceCommission or the Federal Communications Commission. The larg-est proportion of funds in recent years has been devoted to broaderregulatory activities, such as those conducted by the EnvironmentalProtection Agency, and the Department of Agriculture (mainly foodinspection).
134
Digitized for FRASER http://fraser.stlouisfed.org/ Federal Reserve Bank of St. Louis
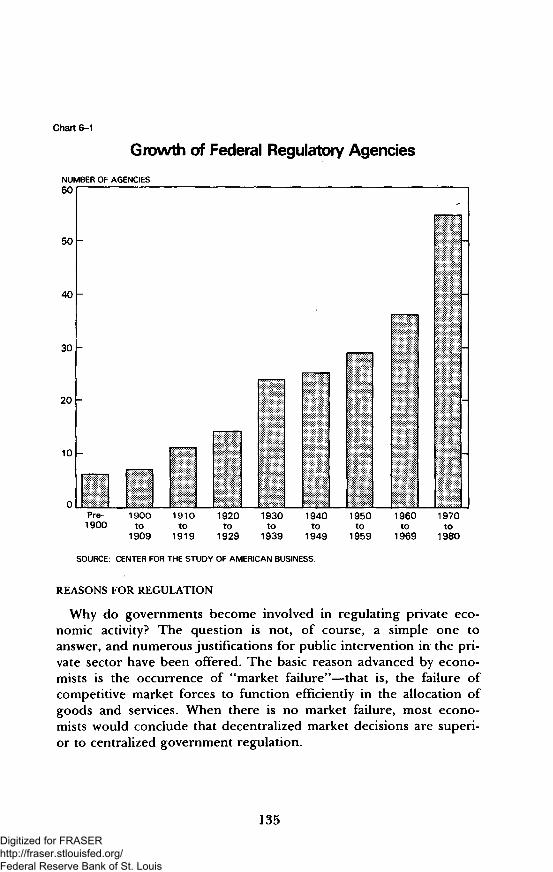
Chart 6-1
Growth of Federal Regulatory Agencies
NUMBER OF AGENCIES60 I
50
40
30
20
10
Pre-1900
1900to
1909
1910to
1919
1920to
1929
1930to
1939
1940to
1949
1950to
1959
1960to
1969
1970to
1980
SOURCE: CENTER FOR THE STUDY OF AMERICAN BUSINESS,
REASONS FOR REGULATION
Why do governments become involved in regulating private eco-nomic activity? The question is not, of course, a simple one toanswer, and numerous justifications for public intervention in the pri-vate sector have been offered. The basic reason advanced by econo-mists is the occurrence of "market failure"—that is, the failure ofcompetitive market forces to function efficiently in the allocation ofgoods and services. When there is no market failure, most econo-mists would conclude that decentralized market decisions are superi-or to centralized government regulation.
135Digitized for FRASER http://fraser.stlouisfed.org/ Federal Reserve Bank of St. Louis

Although regulation is often used by the government as a means ofcorrecting market failure, regulatory action is not necessarily the onlymeans available. For instance, consumers can be provided with infor-mation about goods or services offered for sale. Special taxes can belevied on polluters, or property rights could be extended to includethe resources subject to pollution as discussed in Chapter 2.
TABLE 6-1.—Regulatory outlays of Federal agencies, fiscal years 1974-81
[Fiscal years; millions of dollars]
Agency
TOTAL
Agriculture
Commerce
Defense
Energy
Health and Human Services
Interior
Justice
Labor
Transportation
Treasury
Civil Aeronautics Board
Commodity Futures Trading Commission
Comptroller of the Currency
Consumer Product Safety Commission
Environmental Protection Agency
EQual Employment Opportunity Commission
Federal Communications Commission
Federal Deposit Insurance Corporation
Federa! Energy Regulatory Commission
Federal Maritime Commission ..
Federal Trade Commission
International Trade Commission
Interstate Commerce Commission
National Labor Relations Board
National Transportation Safety Board
Nuclear Regulatory Commission ...
Securities and Exchange Commission
All other
1974
2,834
410
76
10
33
165
5
22
208
466
161
89
50
19
629
42
38
58
27
6
32
7
38
55
8
80
35
65
1975
3,268
447
75
16
6
201
6
30
257
460
166
81
1
65
34
850
56
48
66
34
7
39
8
44
61
9
86
44
71
1976
3,598
475
86
22
40
218
9
31
314
506
185
91
11
77
38
772
59
52
74
36
8
44
10
47
68
11
180
51
83
1977
4,062
590
94
32
49
245
13
35
332
603
246
103
13
83
40
718
72
56
88
41
8
52
n59
81
13
231
54
100
1978
4,916
921
99
38
79
276
22
45
373
679
267
101
14
91
40
885
74
64
105
38
9
59
12
65
90
16
271
61
122
1979
5,518
979
115
43
82
300
55
66
446
767
288
99
15
97
39
1,024
92
70
115
50
10
63
12
67
97
15
309
66
137
1980
6,526
1,258
129
41
132
326
105
62
486
865
317
117
16
113
44
1,259
131
76
116
67
11
68
14
77
109
18
378
74
117
1981 *
7,088
1,213
147
45
144
347
184
60
539
971
335
147
19
127
42
1,321
140
80
130
79
12
69
18
77
119
18
435
78
192
1 Data for 1981 are estimated using the budget revisions made in March 1981.
Source: "Directory of Federal Regulatory Agencies," Center for the Study of American Business, 3rd Edition, 1981.
Outside the realm of market failure, it is often claimed that "dis-tributive justice," a concern about political or social equity, is areason for governmental intervention. In other words, the govern-
136
Digitized for FRASER http://fraser.stlouisfed.org/ Federal Reserve Bank of St. Louis
merit's involvement is seen primarily as a way of bringing about atransfer of wealth to a worthy segment of society. But in practice asmall group (that is, a "special interest'*) usually benefits at the ex-pense of the mass of consumers. This type of regulation is differentfrom that designed to correct market failure, although the statedrationale may be similar. Although economics cannot provide suffi-cient guidance to resolve equity issues, it can assist by identifying thecosts and benefits of alternative policies addressed to these issues.
AN OVERVIEW OF REGULATION
Many Federal rules have yielded benefits to the public. The auto-mobile emission standards, for example, have substantially reducedemissions from this source.
Regulations, however, can also impose substantial costs on society.Regulations themselves can create problems which call for additionalregulations. Furthermore, the resources used to comply with regula-tions are diverted from other activities, with a resultant loss in pro-ductivity and economic growth. Restrictions on the development ofnuclear energy, for example, have resulted in expanding coal mining,which increases the probability that coal miners will be injured. Noris it likely that the costs and benefits of regulations will be evenlyshared. One group in society may receive the bulk of the benefitsfrom a Federal regulation, while the costs are borne primarily bysome other group. For example, regulations making it uneconomicalto use low sulfur (low-polluting) coal have been supported by peoplein areas producing high sulfur coal. To the extent that these regula-tions have been successful in making low sulfur coal uneconomical,the producers in the low sulfur coal areas and consumers generallyare losers as a result.
BENEFIT-COST ANALYSIS OF GOVERNMENT REGULATION
Interest has risen in efforts to determine more precisely the bene-fits and the costs of regulation. The motive for incorporating benefit-cost analysis into the regulatory decisionmaking process is to achievea more efficient allocation of government resources by subjecting thepublic sector to the same type of efficiency tests used in the privatesector. In making an investment decision, for example, business ex-ecutives compare the costs to be incurred with the expected rev-enues. The investment is likely to be pursued only if the expectedcosts are less than the expected revenues.
The government agency decisionmaker does not face the samearray of economic incentives and constraints. If the costs of anagency action exceed the benefits, the result may not have an imme-
137
Digitized for FRASER http://fraser.stlouisfed.org/ Federal Reserve Bank of St. Louis

diate adverse impact on the agency. Analytical information on eco-nomic costs has in the past rarely existed in the public sector, so that,more often than not, the governmental decisionmaker has not beenaware of approving a regulation that is economically inefficient. Theaim of requiring agencies to perform benefit-cost analysis is to makethe regulatory process more efficient and to eliminate regulatory ac-tions that, on balance, generate more costs than benefits. This resultis not assured by benefit-cost analysis, since political and other im-portant considerations may dominate the decisionmaking. Even inthose cases, however, benefit-cost analysis may provide valuableguidance.
The review of a proposed Federal regulatory activity should in-volve analysis of three types of questions. The first is whether someform of market failure has occurred that warrants the imposition ofregulation. The second is whether Federal regulation, in contrast toState and local regulation, is appropriate. The last question, assum-ing the response to the first two is positive, is whether a specific reg-ulation will increase net benefits to society. Traditionally, much ofthe responsibility for answering the first two questions has fallen onthe Congress, while the last question has been addressed by the reg-ulatory agencies.
Careful analysis of the first two questions, unfortunately, has oftenbeen neglected. Such analysis should address itself to whether thereis any significant market imperfection in the absence of regulation.Observed differences in safety conditions among workplaces, for ex-ample, are not sufficient evidence of a market imperfection, becauseemployer and employee knowledge of these conditions may lead tocompensating differences in wages and employment conditions. Ob-served differences in economic outcomes among demographicgroups are not sufficient evidence of discrimination because thesedifferences may be the result of nondiscriminatory processes. Morecareful analysis of these types of issues is necessary to determine theexistence and nature of any market imperfection.
For Federal regulations, in addition, it is important to determinewhether the nature of the imperfection is such that Federal regula-tion, rather than State or local regulation, is appropriate. Federalregulation is most likely to be appropriate where the externalities ofan activity in one State have substantial effects in other States orcountries, the activity affects basic constitutional rights, or interstatecommerce would be significantly disrupted by varying local regula-tions. In the absence of these conditions, State and local regulation islikely to be more efficient by more accurately reflecting local prefer-ences and conditions.
138Digitized for FRASER http://fraser.stlouisfed.org/ Federal Reserve Bank of St. Louis
When some Federal regulation is clearly appropriate, an analysis ofits benefits and costs can provide valuable information to help selectthe form and extent of the regulation. In practice, a benefit-cost anal-ysis will not always be a sufficient basis for resolving all controversyabout the regulation. Given the increasing concern about the efficien-cy of Federal regulations, however, a more general use of benefit-cost analysis can contribute to a broader consensus on appropriatechanges in the nature and degree of Federal regulations.
QUANTIFICATION
The benefits and costs attributable to regulation are the differencebetween the benefits and costs that would occur because of regula-tion and those that would prevail in its absence. Although this ideamay seem straightforward, its application can be complex. Determin-ing what would occur in the absence of regulation may involve a con-siderable amount of judgment.
Sometimes the indirect effects of regulation may be as important asthe direct ones. Consider, for example, the question of tighter stand-ards on emissions from new automobiles. Higher new car prices, at-tributable in part to these tighter standards, have reduced the rate atwhich older cars with higher emissions are being scrapped. A recentstudy indicates that the tighter emission standards implemented inthe 1981 model year may increase total emissions for several years asa result of this process.
Even when it is not possible to put a dollar sign on benefits, acost-effectiveness analysis still can be helpful by ranking the relativeeconomic efficiency of alternatives. By using this method, originallydeveloped for military programs, estimates can be made of the costsof different ways to accomplish an objective. Cost-effectiveness analy-ses permit policymakers to identify least-cost solutions. In this morelimited approach, the analyst begins with the assumption that theregulatory objective is worth achieving. This approach may be par-ticularly useful in dealing with programs to reduce personal hazards.Instead of dealing with such a difficult conceptual question as theeconomic value of human life, the emphasis shifts to identifying regu-latory approaches that would maximize the number of lives saved fora given amount of resources.
Reliable measures of costs and benefits are not easily achieved oralways possible. Should the loss of a forest, for example, be meas-ured only by the value of the timber cut? What of the beauty de-stroyed? What of the area's value as a wildlife habitat? Such unquan-tifiable questions usually arise in the course of making a decisionabout any Federal regulation.
139Digitized for FRASER http://fraser.stlouisfed.org/ Federal Reserve Bank of St. Louis

However, the difficulties involved in estimating benefits or costsneed not serve as a deterrent to analysis. Merely identifying impor-tant but often overlooked impacts may be useful to the decisionmak-ing process. An example on the cost side is the beneficial drugs thatare not available because of regulatory obstacles. An example on thebenefit side is the more productive work force that results from alower rate of accidents on the job.
THE EVOLUTION OF REGULATORY REVIEW
The last decade has been marked by a shift in emphasis from in-dustry-specific regulations to rules affecting specific aspects of theoperation of virtually all industries, such as occupational safety andenvironmental protection.
The recent expansion of Federal regulatory activity has occurreddespite the fact that the Federal Government has no explicit powerto regulate intrastate economic activity. The 10th amendment, whichreserves to the States and the people all powers not delegated to theUnited States, confirms the States' powers to enact laws to protectpublic health, safety, morals, and general welfare. The Federal Gov-ernment was not given comparable power, except as such activity af-fects interstate commerce.
The recent growth of Federal regulation of economic activities hasbeen based largely on broadened judicial interpretation of the scopeof the "commerce clause," which gives the Congress the power "toregulate Commerce with foreign Nations, and among the severalStates, and with the Indian Tribes." Until the Great Depression, Fed-eral regulation of the economy was small in comparison to controlexercised by the States. Since that time, however, Federal regulationhas expanded and numerous Federal regulatory agencies have beencreated and given broad discretion by the Congress to regulate theeconomic activity of private institutions. But the Congress and theexecutive branch have been limited in their ability to control the spe-cific decisions of regulatory agencies, although both can exert somecontrol through the appointments process, the budget, and changesin enabling statutes.
Concern has grown that many of the decisions of regulatory agen-cies are economically inefficient. Explicit guidance to an agency toweigh the costs and benefits of its decisions has been Federal lawsince it was included in the Rivers and Harbors Act of 1902. Thebenefit-cost procedure was explicitly required for the first time underthe Flood Control Act of 1936. Until the 1970s, however, the benefit-cost technique was used with regularity only in reviewing expenditureprograms.
140Digitized for FRASER http://fraser.stlouisfed.org/ Federal Reserve Bank of St. Louis

In 1975 a major expansion in the use of benefit-cost analysisoccurred when the President directed regulatory agencies to prepare"inflation impact statements" to accompany proposed rules. Under thenext Administration this approach was modified to require "regulatoryanalyses,'* However, it was stressed that its requirements for regulatoryanalysis should not be interpreted as subjecting proposed rules to abenefit-cost test.
Regulatory relief is a key element of the President's economic re-covery plan, along with expenditure restraint, tax cuts, and monetarystability. Executive Order 12291, issued on February 17, 1981, di-rects agencies, to the extent permitted by law, to use benefit-costanalysis when promulgating new regulations, reviewing existing regu-lations, or developing legislative proposals concerning regulation.Administrative decisions on regulations are to be based on adequateinformation concerning the need for the regulations and their eco-nomic consequences. Not only must the benefits from the regulationexceed the costs, but the Executive order requires that the approachselected (where alternative approaches exist) should be chosen tomaximize net benefits.
In the case of major rules, agencies must publish preliminary andfinal regulatory impact analyses (RIAs) that set forth conclusions re-garding the benefit-cost balance and feasible alternatives. Major rulesconsist of those that will have any of the following three effects: (1)an annual effect of $100 million or more; (2) a major increase incosts or prices; or (3) a significant adverse effect on a specific indus-try or on the economy in general. Regulatory impact analyses are toinclude: (1) a description of the potential costs and benefits of theproposed rule; (2) a determination of its potential net benefits; and(3) a description of feasible cheaper alternatives with an explanationof the legal reasons why such alternatives, if proposed, could not beadopted. The analyses and rules must be submitted to the Office ofManagement and Budget before publication in the Federal Register.
In addition, regulatory agencies must review rules currently ineffect and prepare regulatory impact analyses for those which areclassified as major. The Executive order also requires agencies topublish semiannual calendars of proposed regulations and currentregulations that are under review.
To spearhead the Administration's regulatory relief efforts, thePresident created the Task Force on Regulatory Relief, which ischaired by the Vice President. The task force reviews proposed regu-lations, using the guidelines established by Executive Order 12291,and is assessing existing regulations with an eye toward their revi-sion. During 1981 the task force earmarked 100 existing rules andpaperwork requirements for review, and more than a third of those
141Digitized for FRASER http://fraser.stlouisfed.org/ Federal Reserve Bank of St. Louis
reviews have already resulted in formal proposals or final action toeliminate or revise the rules and programs involved. The task forcewill designate other existing programs for review, and it will continueto press for formal action to implement the conclusions of thereviews.
Through December 31, 1981, the Office of Management andBudget (OMB) had reviewed 2,715 proposed regulations and had ap-proved 2,546 as being consistent with the Executive order. Thesenumbers do not reflect the number of regulations that were evaluat-ed within the agencies and found to be inconsistent with the Execu-tive order and therefore not submitted to OMB. Agencies haveissued 40 major regulations. Nineteen were supported by regulatoryimpact analyses, while analyses of the 21 others were waived for suchreasons as emergency conditions.
Although the Executive order is an important procedural reform,some important regulatory areas are still immune from OMB review.These are areas under the regulatory authority of independent agen-cies, such as the Federal Trade Commission, and programs under theauthority of executive branch agencies which are guided by otherstandards based on their enabling legislation. In these areas it willtake legislative changes to open up regulatory activities to OMBreview.
Recent court decisions have demonstrated the importance of in-cluding specific economic efficiency criteria in the enabling legisla-tion of agencies. In its June 1981 decision on standards establishedfor acceptable levels of cotton dust in textile plants, the SupremeCourt held that an agency must meet the standard of "feasibility" ifthat is the standard established by its enabling legislation, whether ornot the regulation is reasonable on the basis of other criteria, such aseconomic efficiency.
Just as a standard of feasibility can cause agencies to make ineffi-cient regulatory decisions, so can a standard of reasonableness. Forexample, the Fifth Circuit Court held that Interstate Commerce Com-mission (ICC) guidelines that allowed motor carriers to seek the re-moval of restrictions on which commodities they might carry, butonly by choosing to carry commodities in one of three categories, ex-ceeded ICC's authority under the Motor Carrier Act of 1980 to "rea-sonably broaden" existing carrier certificates. Although the guide-lines could be supported on economic grounds as increasing compe-tition, they were rejected by the court because they failed to meet thelegal definition of "reasonable." Although the agency can still exer-cise some discretion in broadening categories, substantial further de-regulation of the for-hire trucking industry may be dependent on a
142Digitized for FRASER http://fraser.stlouisfed.org/ Federal Reserve Bank of St. Louis
change in the law that would eliminate limitations on the commod-ities that a certificated carrier can transport.
The Administration has also been working with the Congress onlegislation that would require economic analysis of proposed regula-tions. The Congress has held extensive hearings on several bills thatwould require all Federal regulatory agencies to analyze the costs andbenefits of their major regulations. The Administration is supportingS. 1080, which would codify the requirements of Executive Order12291 so that it would apply to all agencies. In addition, the billwould require that each major rule be reviewed every 10 years.
THE CLEAN AIR ACT AND ECONOMIC ANALYSIS
The most important regulatory enabling legislation now being re-viewed by the Congress is the Clean Air Act. Many of the questionsthat permeate social regulation arise in the case of this landmark law.The Council of Economic Advisers has developed three general prin-ciples which illustrate the role of economic analysis in designing aregulatory program such as the Clean Air Act.
First, Federal regulation should focus on situations where there is a clear na-tional problem. An example of this approach would be strengtheningFederal responsibility for dealing with air pollution transportedacross State and national boundaries while leaving air pollution prob-lems that are local in nature to State or local governments wheneverpractical.
Second, the benefits and costs of regulation should be considered in designinga new regulatory program. For example, various emission standardscould be set at levels at which the incremental benefits are equal tothe incremental costs, and benefits and costs could be consideredwhen determining State implementation strategies.
Third, consumers, businesses, and State and local governments should begranted flexibility in the way they meet Federal standards. Thus, those sub-ject to regulation would be encouraged to use the lowest cost meansfor achieving standards.
The following discussion shows how these three principles relateto several important provisions of the Clean Air Act.
LONG-RANGE TRANSPORT
The pollution control programs established under the currentClean Air Act focus on improving ground-level air quality relativelynear the sources of pollution. Although the act contains provisionsfor States to notify the Environmental Protection Agency (EPA) if aneighboring State is "exporting" its pollution, EPA's authority toorder remedies is limited. Moreover, the States typically have been
143Digitized for FRASER http://fraser.stlouisfed.org/ Federal Reserve Bank of St. Louis

unable to arrive independently at appropriate and inexpensive solu-tions to such problems through negotiation or litigation. Therefore,a case can be made for strengthening Federal involvement in air pol-lution problems which transcend State or national boundaries.
AMBIENT AIR STANDARDS
The Clean Air Act requires EPA to set uniform primary and sec-ondary National Ambient Air Quality Standards (NAAQS) for severalpollutants that are considered to endanger public health and welfare.The primary NAAQS are to be set at levels adequate to "protect thepublic health," with an "adequate margin of safety** to account forscientific uncertainties. However, a Federal court has ruled that theconsideration of costs in setting the primary standards is prohibited.
The secondary standards are to be set at levels that protect thepublic welfare, which covers such things as property damage. Theconsideraton of costs is also constrained in setting secondary stand-ards.
If the Federal Government were given effective authority to regu-late pollution that crosses State and national boundaries, then theStates could play a major role in establishing the primary air qualitystandards and an exclusive role in establishing secondary standards.The Federal Government could set a presumptive primary ambientair standard, but the States would be free to modify the national pri-mary standard applicable to them in light of local conditions. Thesetting of secondary standards could be left entirely to the States.The desirability of such changes, of course, depends on a variety offactors in addition to economic impact.
TECHNOLOGY-BASED STATIONARY SOURCE STANDARDS
The Clean Air Act requires EPA and the States to establish emis-sions standards for stationary sources. EPA must set new source per-formance standards primarily on the basis of the cost and availabilityof control technologies and the financial strength of the individualindustries.
The current system of technology-based emissions standards, how-ever, creates numerous difficulties. EPA does not consider benefitswhen setting stationary source standards. The standards are setprimarily on the basis of the feasibility of the control technology,subject to an industry's ability to pay for the controls. The benefitsand costs of air pollution control are, therefore, only considered indi-rectly.
Second, under these standards the marginal cost of emission con-trols may vary widely among different sources within a given region,thereby unnecessarily increasing the total costs of abatement. For ex-
144Digitized for FRASER http://fraser.stlouisfed.org/ Federal Reserve Bank of St. Louis

ample, more stringent controls on new sources than on existingsources often lead to a much higher marginal cost per ton of pollut-ant removed in new plants than in old, even though a ton of pollut-ant causes comparable health damage, regardless of its source. Therequirement for more stringent standards on new sources may inhibitplant modernization and, by delaying the replacement of olderplants, may even increase near-term pollution.
Many students of the subject have urged that the current system bechanged to a system in which marketable permits would be used asthe principal means of achieving control over stationary source emis-sions. Under a marketable permit system, the State or local pollutioncontrol authority would issue a number of emissions permits consist-ent with ambient air quality goals. In areas currently within thestandards but experiencing economic growth, the operators of exist-ing sources of pollution would have an incentive to sell their permitsto new polluters when the market value of the permits exceeded thecosts of controlling existing sources of pollution. This would ensurethat ambient standards were achieved at lowest total cost. In areasnot yet meeting the standard, some of the emissions permits wouldexpire on a predetermined schedule to bring the area into compli-ance. In this view, the trading of permits among sources would helpto assure that the standard was reached using the most efficient con-trols.
EPA has been moving toward a transferable permit system with its"bubble," "emission banking/' and "offset" policies. However, EPA'sefforts are seriously constrained by statutory directives that requirethe establishment of various technology-based standards for differenttypes of sources of air pollution.
In addition, the 1977 amendments to the act require new sourceperformance standards for fossil-fuel-fired stationary sources to beset in terms of a percentage reduction from uncontrolled emissionsrates rather than as a maximum allowable emissions rate. Hence, thepercentage reduction in emissions must be the same for both lowand high sulfur coal. Since low sulfur coal is generally more expen-sive than high sulfur coal and the legislation requires that the per-centage reduction in emission rates be the same for sources usingeither type of coal, the legislation creates an incentive to burn highsulfur coal even though low sulfur coal might be the most cost-effec-tive method of meeting the goals of the legislation.
MOBILE SOURCE STANDARDS
The Clean Air Act directs EPA to enforce uniform national stand-ards for motor vehicle emissions. California has been allowed tomaintain a more stringent set of standards for vehicles sold in that
145Digitized for FRASER http://fraser.stlouisfed.org/ Federal Reserve Bank of St. Louis
State. In the view of some analysts, the uniform Federal standardsresult in overcontrolling motor vehicle emissions in some relativelyclean areas and perhaps undercontrolling emissions in some relative-ly polluted areas.
An alternative approach would be to allow EPA to issue two sets ofstandards: a stringent set for autos registered in areas with severe airpollution problems, and a less stringent set for autos registered inrelatively clean areas. Each State would decide which of the two setsof standards its cars would be required to meet, which would dependon the State's ambient air standards.
According to its proponents, such a strategy would not cause sig-nificant environmental or health damage, since ttye less stringentlycontrolled vehicles would be registered in areas where additionalautomotive emissions would not violate the standards. Moreover,studies show that such a strategy might substantially reduce the na-tional costs of controlling automotive emissions.
The Clean Air Act has been interpreted to mean that every auto-mobile line must meet applicable national emissions standards. Thisprevents EPA from allowing the manufacturers to meet the standardsby averaging the results of different model lines. An alternative ap-proach, allowing EPA to use an averaging procedure in determiningcompliance, might save consumers millions of dollars. Such a changewould not increase overall emissions and thus presumably wouldleave average public health conditions unaffected.
The Clean Air Act requires that, smarting in the 1984 model year,all cars and light trucks must meet the act's high altitude standards,regardless of the area in which the vehicles are sold. This require-ment will have the effect of significantly increasing the amount ofemissions control required of all cars. Since only 3.5 percent of thecountry's cars are sold at the specified high altitudes (principally inand around Denver), this uniform national requirement may requirea large amount of unnecessary expenditures.
HAZARDOUS EMISSIONS STANDARDS
The Clean Air Act instructs EPA to prepare a list of air pollutantsthat may cause serious damage to human health and to set emissions(but not ambient) standards for them. The emissions standards are tobe set at levels which provide "an ample margin of safety to protectthe public health."
Consideration of benefits and costs is not prohibited in listing thepollutants or setting emissions standards, but it is not requiredeither. In its rulemakings to date and in its proposed "Airborne Car-cinogens Policy," EPA has not always balanced the benefits of airpollution control against its costs.
146Digitized for FRASER http://fraser.stlouisfed.org/ Federal Reserve Bank of St. Louis
THE CONTROL OF HEALTH CARE COSTS: A CONTRAST OFAPPROACHES
The policies of this Administration toward the health care industryoffer an interesting contrast to the policies of earlier Administrations.Few analysts doubt that there are serious economic problems in thisindustry. The previous Administration attempted to solve these prob-lems by proposing a Hospital Cost Containment Act, but the Con-gress did not pass the proposed bill, which would have imposed adetailed regulatory scheme on hospital managements. This Adminis-tration has examined the basic causes of inefficiencies in medical careand is attempting to change the factors which lead to them. Theseinefficiencies are due to inappropriate tax policy and to inadequateincentives for both consumers of medical services and providers ofhealth care to reduce costs. In this section the structure of the industrywill be examined to show the nature of the problems, and the changesproposed by the Administration to resolve these problems arediscussed.
THE INDUSTRY
The health care industry is large, and it is growing rapidly. In 1980the Nation spent nearly $250 billion on health, representing 9.4 per-cent of the total gross national product (GNP), substantially morethan the $42 billion and 6.0 percent of GNP in 1965. Prices forhealth care have risen more rapidly than prices as a whole through-out the postwar period. From 1975 to 1980 prices in the healthsector rose at an annual rate of 9.1 percent, compared to a rise of 7.4percent for all personal consumption.
Rising expenditures resulted in a larger quantity and a higher qual-ity of health care, as well as better access for the poor and elderly tomedical services. But because of the structure of the health care in-dustry, this expansion caused a substantial amount of waste. Werethe rising expenditures simply due to changing consumer prefer-ences, rising incomes, or improved technology, there would be nopolicy problem. The manner in which people choose to make unsub-sidized purchases is generally not a policy matter. Much of the in-crease, however, has been due to perverse incentives that are builtinto the medical system. A set of arrangements for buying and sellinghealth services has developed which insulates the participants fromthe economic consequences of their actions and raises serious ques-tions about the effectiveness of these increased expenditures inbuying more "health." The major problems are the prevalence ofthird-party payments and the exclusion of employer contributions forhealth insurance from the taxable income of employees.
147Digitized for FRASER http://fraser.stlouisfed.org/ Federal Reserve Bank of St. Louis

A major defect of the system is a lack of competitive forces amongthose who supply health care. Providers of care who are paid accord-ing to the costs they incur—cost-based reimbursement—have little in-centive to provide care in a cost-effective manner. Retrospective pay-ments, where payments are based on expenses previously incurred, re-quire large administrative bureaucracies in the private as well as.thepublic sectors, and provide little reward for attempts to improveefficiency.
Health maintenance organizations (HMOs), which provide virtuallycomplete coverage for a flat premium, have introduced an element ofcompetition into the supply side of the industry. The incentives forefficient use of health resources rest with the HMOs, not the pa-tients, and health maintenance organizations appear to have succeed-ed in reducing hospitalization use among their members.
Third-Party PaymentsMeanwhile, third-party payments by private insurance companies
or through government programs lower the prices of medical serv-ices to people covered by the programs, thus increasing the quantityof medical services which they seek and bidding up total medicalcosts. The larger the fraction of costs borne by third parties, thelarger the effect of third-party payments on the price and quantity ofservices consumed.
Two-thirds of the personal health care expenditures of $218 billionin 1980 were paid by third parties. One hundred and seventy millionpeople have private insurance for hospital care, 18 million of thenonelderly poor are covered under medicaid, and 24 million elderlyreceive medical care under the medicare program. (There is someoverlap among people in these categories, particularly private plansand medicare.) About 23 million people in the country do not havepublic or private insurance coverage.
The particular provisions of insurance plans determine the pricesthat individual patients face and the effect of third-party payments ondemand. For example, a system of deductibles and copaymentsmakes the individual share in the costs. It leads to a more efficientuse of resources than a plan that covers all medical expenses, begin-ning with the first dollar of expense. With "first-dollar'* coverage, theindividual has no financial incentive not to seek treatment if it hasany chance of being beneficial, regardless of its cost. First-dollar cov-erage is necessarily more "shallow" than cost-sharing plans with thesame premium and provides less insurance against unexpected seri-ous illnesses.
The extent of first-dollar coverage and its costs to the individualvary greatly, but it is prevalent in the private sector. In the publicsector one finds medicare, which, like first-dollar coverage, is not de-
148
Digitized for FRASER http://fraser.stlouisfed.org/ Federal Reserve Bank of St. Louis

signed to encourage efficient use of health care resources. The medi-care program only imposes cost sharing late in the hospital stay,when the patient can least afford it and when it is least likely to influ-ence doctor or patient behavior, and it puts no limit on the out-of-pocket costs people can incur. States are required to provide basicservices to medicaid recipients but are unable to require even mini-mal copayments. Instead, nonmarket mechanisms, such as regulationand rationing of services, are used to restrain utilization and costs.
Since most people are risk-averse they seek to avoid large and un-certain costs, such as those which may be imposed by a serious ill-ness. This is why individuals buy insurance, even though the cost ofinsurance is greater than the expected value of the benefits. Expenseswhich are relatively small and predictable, on the other hand, aregenerally not covered by insurance. It is not rational for medical in-surance to provide first-dollar coverage, since much of this insurancewould be for predictable routine expenses. Rational medical insur-ance would contain coverage against catastrophic occurrences wheremedical expenses might bankrupt an individual. The reality is quitedifferent from the logical arrangement just outlined. Some privateplans provide first-dollar coverage but no catastrophic coverage. Thisis also true of medicare.
The inefficient use of resources that results from third-party pay-ments leads to higher insurance premiums, even though the insuranceis sold in the private market, where competitive forces presumablywould lead to a lower premium. One reason why this does nothappen is that employer contributions for health insurance premiumsare not subject to payroll or income taxes.
Tax Exclusion
This tax exclusion lowers the price of health insurance to employ-ers and employees, thereby leading to greater spending on insurancethan if employer contributions for health care were included in tax-able income or if individuals bought insurance with their own money.For the employee in the 30 percent income tax bracket paying socialsecurity tax of 6.65 percent, a $100 contribution by the employer tohealth insurance costs the worker in effect only $63.35 compared toreceiving the $100 as taxable income and buying the insurance di-rectly. Even though the worker may not want to spend another $100of his own money on health insurance, if he values the additional in-surance at more than $63.35, he will prefer that his employer put the$100 into health insurance rather than into his taxable earnings. Forworkers in higher tax brackets the amount of inefficiency is evengreater. Employers also prefer to put the $100 into insurance premi-ums rather than into wages, since they do not pay social security andunemployment insurance taxes on the premiums.
149Digitized for FRASER http://fraser.stlouisfed.org/ Federal Reserve Bank of St. Louis

The dilution of competition in the health care industry and the re-sultant inefficiencies have frequently led consumers to purchase morehealth care than they would have purchased if compelled to pay truecosts. The lack of competition means that people receive less"health" for their expenditures, and by spending so much on healththey have less to spend on other goods and services. It is difficult toquantify this loss in efficiency, but recent estimates place it in therange of $25 billion a year.
PROPOSALS FOR REFORM
Policymakers have recognized these inefficiencies and have at-tempted to devise solutions, but the standard solution chosen hasbeen detailed regulation of the behavior of participants in the system.The alternative to that kind of regulation, as discussed in Chapter 2,is to give participants in the medical care system more incentive touse resources efficiently. This Administration is adopting this ap-proach.
A proposal is under consideration which would require medicarebeneficiaries to pay a part of the costs for each day they are in thehospital. In addition, a catastrophic health insurance plan whichwould guarantee that annual costs to the patient would not exceed acertain amount is also being considered. These proposals wouldreduce many inefficiencies in the system. Other proposals aimed atincreasing competition in the medical care system are currentlyunder development.
Some analysts have suggested replacing medicare with a voucherscheme. Recipients would be given a voucher nearly equal to the cur-rent cost of medicare and would be able to use this voucher to buywhatever form of medical insurance they desired, subject to certainconstraints. This would give beneficiaries an incentive to purchasemore efficient forms of medical insurance, since they would reap thesavings.
REGULATORY REFORM IN THE AGENCIES
The current status of Federal regulation can be illustrated by areview of the situations in five key areas: financial institutions, agri-culture, energy, transportation, and telecommunications.
FINANCIAL INSTITUTIONS
Federal regulation of financial institutions was initially designed toassure that savings channeled into investments were protected andthat investors had enough information to make rational decisions oninvestments. The early regulatory statutes, however, reflected an am-
150Digitized for FRASER http://fraser.stlouisfed.org/ Federal Reserve Bank of St. Louis

bivalent attitude toward competition in the financial industry. Restric-tions on bank mergers and interstate branch banking were imposedto prevent banking monopoly, but at the same time restrictions ontypes of assets, entry, and rates of interest paid to depositors wereimposed to limit competition and dissuade managers from risky ven-tures. A legal separation of depository institutions and securitiesfirms was written into law in response to concern about conflicts ofinterest.
Over the last decade, however, technological innovation, high infla-tion, and the slowness of some regulatory bodies to adjust their regu-lations to conditions in the financial markets have made traditionaldepository institutions less attractive to depositors. They have foundit more advantageous to shift their funds among institutions or, inmany cases, to move them outside the banking system itself.
Thrift Institutions
The principal cause of the thrift industry's current problems is theimbalance between increasingly rate-sensitive liabilities and long-termfixed-rate assets. Time and savings deposits, the major sources offunds for thrift institutions, have traditionally been subject to Federalinterest rate ceilings. These funds enabled the thrifts to make long-term loans, for such things as residential mortgages, at fixed rates ofinterest during times of steady and low interest rates. As interestrates began to rise in the 1970s, however, regulation prevented thethrift institutions from increasing the interest they paid on depositsto compete with other institutions, which had begun to offer a higherreturn on alternative instruments. Some regulatory changes thenwere made to allow thrifts to pay market rates of interest on certaintypes of deposits as well. These changes, however, did not eliminatethe long-term problem faced by many thrifts. The need to financelarge numbers of fixed-rate long-term loans at low interest rates withdeposits on which they paid higher interest rates severely strainedmany thrift institutions.
The removal of two restrictions provided some relief for thrifts. In1979 they were given limited authority to make loans at variable ratesof interest, and in 1981 most restrictions on variable-rate loans werelifted. Meanwhile, they have also obtained permission to invest in thefutures markets as a way of hedging their risks.
The Administration supports proposed legislation that would givethrift institutions greater flexibility in carrying out their operations.Various proposals would give thrift institutions many of the samepowers to vary their assets and liabilities that commercial banks nowhave. Thrift institutions would be permitted to make additional short-term consumer and commercial loans in addition to residential mort-gage loans, and alternative mortgage instruments would be estab-
151Digitized for FRASER http://fraser.stlouisfed.org/ Federal Reserve Bank of St. Louis
lished to make real estate lending more attractive. Other provisionsof proposed legislation would clarify the authority to utilize interstateand interindustry mergers to rescue troubled thrifts and commercialbanks, thereby leading to stronger financial institutions.
Commercial Banks
Under the Glass-Steagall Act of 1933, depository institutions andsecurities firms became legally separate entities offering quite differ-ent types of services. In recent years, however, high interest rateshave led securities firms to offer investors the opportunity to investin money-market mutual funds, a change that has, in effect, circum-vented the 1933 act. The funds invested in money-market funds,unlike those deposited in commercial bank and thrift institution sav-ings accounts, are not subject to interest rate ceilings, and investorsare generally allowed limited checkwriting privileges. As a result, de-positors over the last several years have withdrawn substantialamounts of funds from low interest accounts at banks and thrifts toplace their money in high yielding money-market instruments, includ-ing money-market funds and government securities.
Within the bounds of their statutory constraints, banks have beentrying to meet this new form of competition. They have, for example,been offering their customers access to market-level rates of interestthrough repurchase agreements against their portfolios of govern-ment securities. In many respects, however, the regulations thatapply to banks remain more restrictive than those that apply to secu-rities firms.
The Administration has proposed that commercial banks be per-mitted to engage in some activities previously reserved for securitiesfirms through the establishment of bank holding company subsidiar-ies. Commercial banks would be authorized to set up these subsidiar-ies to underwrite and deal in municipal revenue bonds and to spon-sor and underwrite shares in mutual funds. Such a change wouldhelp to equalize competition for funds between commercial banksand securities firms. The use of the holding company subsidiarywould help separate the riskier securities activities of a bank from itsfederally insured depository activities.
Regulatory Relief
Thrift institutions, commercial banks, and securities firms shouldbe allowed to compete on an equal basis, without the restrictions thatprevent them from offering similar services and paying competitiverates. The Congress has recently passed laws that should go furthertoward achieving a competitive environment, and the regulatoryagencies themselves have taken decisions to bring about more com-petition.
152Digitized for FRASER http://fraser.stlouisfed.org/ Federal Reserve Bank of St. Louis
Under the Depository Institutions Deregulation and MonetaryControl Act of 1980, interest rate ceilings on time and savings depos-its are to be raised over a period of 6 years, after which the ceilingswill be abolished. The same law permitted depository institutions tooffer negotiable order of withdrawal (NOW) accounts, and certainState usury ceilings were preempted. Uniform reserve requirementson transactions liabilities at all depository institutions are beingphased in, and the Federal Reserve System has begun charging banksfor certain services previously provided without charge.
The Depository Institutions Deregulation Committee, createdunder authority of the 1980 act, adopted two significant deregulatoryactions in 1981. It removed the ceiling on interest rates paid on 2J/2to 4-year small saver certificates, resulting in a 50 percent increase inpurchases of such certificates between August and the end of 1981,and it authorized a 1 %-year account that would not be subject to in-terest rate ceilings for Individual Retirement Accounts (IRAs) andKeogh deposits.
During the last decade, the financial regulatory system has notadapted quickly to a changing economic environment. To ensure thefuture adaptability of financial institutions to evolving technology andcompetitive forces, regulation of the financial industry needs to bereviewed and reformed.
AGRICULTURE
Three important regulatory programs relating to agriculture pre-sent important issues: food safety, Federal marketing orders, andmeat inspection.
Food Safety
Certain food safety laws and regulations are outdated and fail toshow adequate recognition of the fact that there is a degree of riskinherent in providing an economical and sufficient food supply.These points can be illustrated by a discussion of the problems thathave arisen in connection with the Delaney anticancer clauses of the1958 Food Additives amendment to the Federal Food, Drug, andCosmetic Act. The Delaney clauses prohibit the use of any chemicalsubstance in any amount as a food additive if the substance has beenfound, by appropriate tests, to induce cancer in people or laboratoryanimals.
Scientific progress since the Delaney clauses were enacted in 1958has brought about a quantum improvement in the ability of scientiststo measure chemical substances. It is now possible to detect parts pertrillion of a chemical substance in food. This is significant, since un-certainty exists regarding the degree of risk to human beings fromexposure to extremely low levels of carcinogens, and strict enforce-
153Digitized for FRASER http://fraser.stlouisfed.org/ Federal Reserve Bank of St. Louis
ment can result in ignoring severe impacts on food availability andpreservation.
It seems clear that the zero-risk approach embodied in the Delaneyclauses has become untenable. Policymakers and scientists need toestablish procedures for defining levels of food contaminants thatrepresent acceptable levels of risk for consumers, develop ways tohelp consumers protect themselves against significant risks whensuch risks are found to exist for particular foods, and give firms in-centives to develop safe food additives and to reduce contaminants.
Marketing Orders
Legislative authority for Federal marketing orders is contained inthe Agricultural Marketing Agreement Act of 1937. The orders origi-nally were designed partly to reflate farm prices and thus increasefarmer income during the 1930s. Federal marketing orders for fruits,vegetables, and specialty crops establish restrictions on the qualityand quantity of products that can be marketed. Those restrictionsvary, but they may include minimum grade and size requirements,limits on product shipments during all or part of the marketingseason, limits on quantities entering the fresh market, restrictions ontotal marketings (in a few cases), and rules on packaging standards.During 1980 commodities marketed under the orders had a farmvalue of $5.2 billion.
As a part of the Department of Agriculture's regulatory reformeffort, a team comprised of Department of Agriculture and universityeconomists was appointed during 1981 to examine the economic ef-fects of marketing orders for fruits, vegetables, and specialty crops.The study revealed that Federal orders for hops, spearmint oil, Cali-fornia-Arizona navel oranges, Valencia oranges, and lemons (and per-haps those for walnuts and filberts) had been used in ways that re-sulted in significant resource misallocation. Marketing allotments,market allocation provisions, and season-long prorates were the pro-visions identified as having the greatest capacity for causing misallo-cation. It was also reported that marketing orders can increase eco-nomic efficiency by stabilizing returns to growers, providing qualityassurance for buyers, and facilitating research and container stand-ardization.
Early in 1982, Department of Agriculture officials issued policyguidelines on marketing orders calling for changing the proceduresto curb the supply restrictions resulting from the use of producer al-lotments, to lessen restrictions on handler shipments caused by pro-rate provisions, to reduce supply restrictions caused by stockpiling ofreserves, and to limit the incentives for chronic overproduction. Ifcarried out, these changes will produce substantial efficiencies.
154
Digitized for FRASER http://fraser.stlouisfed.org/ Federal Reserve Bank of St. Louis

Federal milk orders establish the minimum prices that milk proces-sors pay farmers for Grade A milk. Basically, these orders are pricediscrimination (classified pricing) devices. Approximately two-thirdsof the milk marketed in the United States (valued at $12.2 billion atthe plant level) was priced under Federal milk orders in 1981.
Without this kind of regulation, some milk processors would havean incentive to purchase concentrated milk products (e.g., unsaltedbutter and nonfat dry milk) from lower cost sources and add waterto produce a reconstituted fluid milk product. Little reconstitutedmilk is now sold in the United States, partly because Federal milkorder regulations strongly encourage processors to buy fresh milk.
During 1979 the Department of Agriculture was asked to hold ahearing on the question of whether to make reconstituted milk lessexpensive for use by processors. This also would have reduced retailmilk prices, since market forces would tend to force processors topass along a portion of their savings to consumers. After extensivestudy, the Department denied the request for a hearing in April1981, chiefly because the proposal would have undermined the clas-sified pricing system, caused losses to dairy farmers that would haveexceeded the gains to consumers and the Federal Government, andignored the fact that consumers presently have a lower cost alterna-tive to fresh milk priced under the orders—that is, to buy dry milkand add the water themselves. These are important considerations.However, if new technologies for handling concentrated milk prod-ucts are to be accommodated under the Federal orders, this issue willdeserve reexamination in the future.
Meat Inspection
The Department of Agriculture has developed draft legislation toincrease the flexibility and reduce the costs of its meat and poultryinspection programs. Present meat and poultry inspection laws—some of which date back to the early 1900s—emphasize continuous,on-site inspection of slaughtering and processing plants. The pro-posed change would permit periodic inspection—for example, once aweek or once a month—of meat and poultry processing plants whichhave good quality control systems, while retaining continuous inspec-tion of slaughtering plants. The proposed change would reduce theDepartment of Agriculture's costs as well as those of plants with ef-fective quality control systems.
While this proposed legislation would produce savings in the Fed-eral meat inspection program, where costs now run to $300 million ayear, other methods might permit still larger savings and produceother efficiencies. Such alternative programs would include user feesto cover certain meat and poultry inspection costs, licensed andbonded private inspectors rather than government inspectors, inspec-
155Digitized for FRASER http://fraser.stlouisfed.org/ Federal Reserve Bank of St. Louis

tion and insurance arrangements that would give meat processors in-centives to maintain effective quality control systems to qualify forlow-cost product liability insurance, and periodic rather than continu-ous inspection of poultry slaughtering plants.
ENERGY
Many of the past energy policies of the government have not beenconsistent with the general principles presented in Chapter 2 for gov-ernment intervention. The actual effects of such policies have beenhighly adverse to the interests of the Nation. The policy of this Ad-ministration is to remove the inconsistency, inefficiencies, and uncer-tainty caused by inherited policy, and thereafter to facilitate the oper-ation of market forces as the guiding and disciplining constraintsshaping investment, production, and consumption decisions in theenergy sector.
Decontrol of the Petroleum Markets
Beginning with the Economic Stabilization Program of 1971, thepetroleum sector has been subject to continuous price and allocationcontrols. Because price controls increase quantities demanded andreduce quantities supplied, they must be accompanied by nonpricerationing mechanisms. The complex system of controls included enti-tlements regulations, the "buy-sell" program, and other rules servingthat purpose. These made the task of efficiently allocating availablesupplies of crude oil and refined products much more difficult. Otherrules gave special consideration to small refiners and other interests,thus introducing additional distortions into the system. In particular,the rules provided strong disincentives to prepare for possible futuresupply interruptions.
As the inefficiencies and other adverse effects of the controlsbecame increasingly manifest, the Congress enacted a law to phaseout all petroleum controls by September 30, 1981. Using the legaldiscretion available to him, the President moved the date of full de-control forward by about 8 months. It is instructive to review thedata on some of the more salient effects of full decontrol.
The steady decline in domestic production (excluding oil fromPrudhoe Bay) during the price control period has been reversed(Tables 6-2 and 6-3). November 1981 marked the fourth consecutivemonth of production increases over year-earlier levels, a feat not ob-served in the United States for 10 years. Furthermore, oil-drilling ac-tivity in 1981 was almost 40 percent greater than in 1980 (Table 6-2). There has also been a reduction in petroleum imports, part ofwhich is probably due to other factors (Table 6-4). The entitlementsregulations provided artificial incentives to import crude oil and re-sidual fuel oil; the abolition of the regulatory framework has removed
156Digitized for FRASER http://fraser.stlouisfed.org/ Federal Reserve Bank of St. Louis
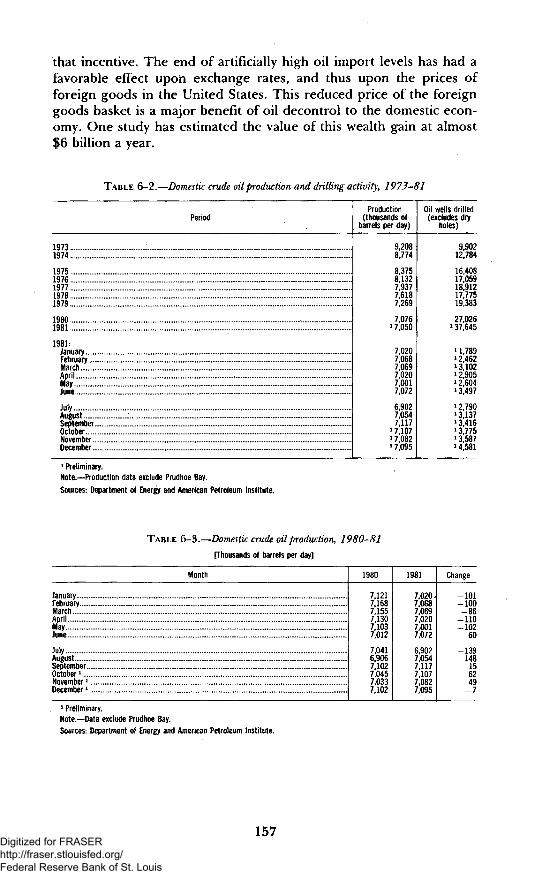
that incentive. The end of artificially high oil import levels has had afavorable effect upon exchange rates, and thus upon the prices offoreign goods in the United States. This reduced price of the foreigngoods basket is a major benefit of oil decontrol to the domestic econ-omy. One study has estimated the value of this wealth gain at almost$6 billion a year.
TABLE 6-2.—Domestic crude oil production and drilling activity, 1973-81
Period
19731974
197519761977 . ., ...1978 . . . . .1979 . ,
1980 .1981
1981:JanuaryFebruary . . ..March... ... ... ...AprilMayJune
JulyAugust ... .SeptemberOctober ., \NovemberDecember
Production(thousands of
barrels per day)
9,2088,774
8,3758,1327,9377,6187,269
7,0761 7,050
7,0207,0687,0697,0207,0017,072
6,9027,0547,117
1 7,1071 7,0821 7,095
Oil wells drilled(excludes dry
holes)
990212,784
16,40817,05918,91217,77519,383
27,0261 37,645
1 1,7891 2,4621 3,1021 2,9051 2,604'3497
'27901 3,137134161 3,7751 3,587* 4,581
1 Preliminary.Note.—Production data exclude Prudhoe Bay.
Sources: Department of Energy and American Petroleum Institute.
TABLE 6-3.—Domestic crude oil production, 1980-81
[Thousands of barrels per day]
Month
JanuaryFebruaryMarchAprilMayJune ,
July . . . . . .AugustSeptemberOctober * . .. .November *December 1
1980
71217 1687 155713071037,012
704169067,102704570337 102
1981
7020.70687069702070017,072
690270547ill77 10770827095
Change
10110086
11010260
139148
1562497
1 Preliminary.
Note.—Data exclude Prudhoe Bay.
Sources.- Department of Energy and American Petroleum Institute.
157Digitized for FRASER http://fraser.stlouisfed.org/ Federal Reserve Bank of St. Louis
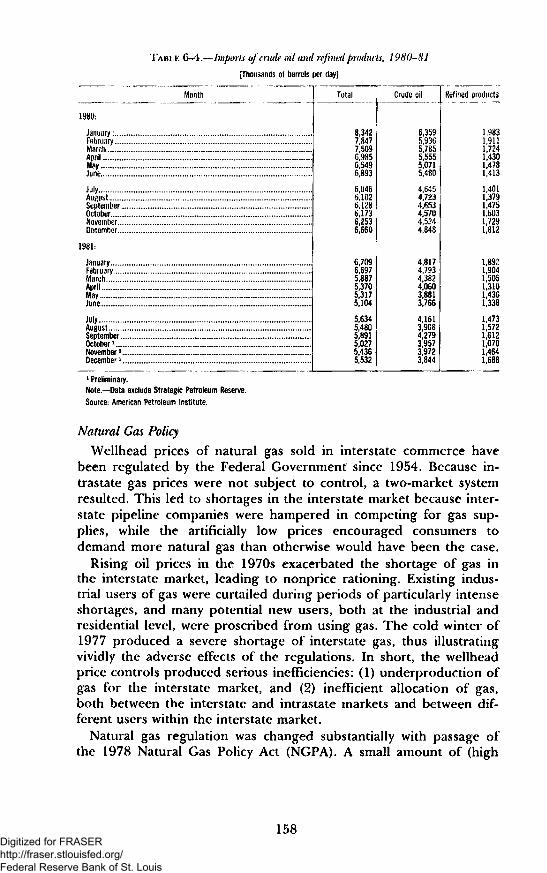
TABLE 6=4.—/w/w>r/.y of crude oil and refined products, 1980-81
[Thousands of barrels per day]
Month
1980:
JanuaryFebruary . . .March .AprilMayJune ... . . . . .
JulyAugustSeptemberOctoberNovemberDecember
1981:
JanuaryFebruaryMarchApril .... ... .. .MayJune., „
July.AugustSeptemberOctober 'November »December *
Total
83427,8477,5096,9856,5496,893
6,0466,1026,1286,1736,2536,660
6,7096,6975,8875,3705,3175,104
5,6345,4805,8915,0275,4365,532
Crude oil
63595,9365,7855,5555,0715,480
4,6454,7234,6534,5704,524 I4,848
4,8174,7934,3824,0603,8813,766
4,1613,9084,2793,9573,9723,844
Refined products
1,9831,9111,7241,4301,4781,413
1,4011,3791,4751,6031,7291,812
1,8921,9041,5051,3101,4361,338
1,4731,57216121,0701,4641,688
1 Preliminary.Note.—Data exclude Strategic Petroleum Reserve.Source: American Petroleum Institute.
Natural Gas Policy
Wellhead prices of natural gas sold in interstate commerce havebeen regulated by the Federal Government since 1954. Because in-trastate gas prices were not subject to control, a two-market systemresulted. This led to shortages in the interstate market because inter-state pipeline companies were hampered in competing for gas sup-plies, while the artificially low prices encouraged consumers todemand more natural gas than otherwise would have been the case.
Rising oil prices in the 1970s exacerbated the shortage of gas inthe interstate market, leading to nonprice rationing. Existing indus-trial users of gas were curtailed during periods of particularly intenseshortages, and many potential new users, both at the industrial andresidential level, were proscribed from using gas. The cold winter of1977 produced a severe shortage of interstate gas, thus illustratingvividly the adverse effects of the regulations. In short, the wellheadprice controls produced serious inefficiencies: (1) underproduction ofgas for the interstate market, and (2) inefficient allocation of gas,both between the interstate and intrastate markets and between dif-ferent users within the interstate market.
Natural gas regulation was changed substantially with passage ofthe 1978 Natural Gas Policy Act (NGPA). A small amount of (high
158Digitized for FRASER http://fraser.stlouisfed.org/ Federal Reserve Bank of St. Louis
cost) new gas was deregulated under the NGPA almost immediately,and the price of between 40 and 60 percent of all gas is scheduled tobe deregulated on January 1, 1985. The price of a smaller volume ofgas will be deregulated on July 1, 1987. Under the NGPA, price con-trols were extended to gas sold in intrastate markets. About 20 cate-gories of gas were created, each with its own ceiling price and infla-tion adjustment or other escalation factor.
Because of the various price categories of gas under the NGPA,producers receive distorted signals and incentives affecting develop-ment and production decisions. Instead of producing the lowest costgas first and moving successively to higher cost sources, producershave been induced by the different price categories to produce high-cost sources first in many cases, and otherwise to shift their produc-tion efforts away from those most efficient. This means that total gasproduction will consume more resources than necessary. The currentboom in drilling for high-cost (deep) gas is illustrative of this proc-ess.
Another problem is likely to arise because the prices for new gasthat are scheduled to be decontrolled in 1985 and 1987 are tied untilthen by the NGPA to 1978 oil prices. Since oil prices have roughlydoubled since then, and are not likely to fall substantially, partial de-control will generate a sharp increase in delivered gas prices, as con-sumers bid up gas prices to levels equivalent to those of close substi-tutes, such as oil. The Department of Energy estimates that averagedomestic wellhead prices in 1980 dollars per thousand cubic feet willrise under the NGPA from $2.27 in 1982 to $4.45 in 1985. Becausethe prices of decontrolled gas can be averaged (rolled in) with thoseof controlled gas, and because consumer demands are determined insubstantial part by the prices of substitute fuels, average 1985 pricesunder the NGPA are not likely to differ greatly from those that wouldevolve under full decontrol. This implies that the prices of decon-trolled gas will be bid up well above the levels that would be ob-served in a fully decontrolled market. Indeed, decontrolled high-costgas is now being sold at the wellhead for over $9, while the Depart-ment of Energy estimates that the average 1985 price under full de-control would be $4.65.
The high prices that will be paid for decontrolled gas in 1985 andthereafter imply that gas consumers in general will not be thebeneficiaries of the remaining controls. Instead, the beneficiaries willbe the producers of decontrolled gas. However, under the NGPA dif-ferent groups of consumers will fare differently. Pipeline companieswith access to substantial quantities of price-controlled gas will beable to bid deregulated gas away from other pipelines because thehigher prices on decontrolled gas can be averaged with the lower
159Digitized for FRASER http://fraser.stlouisfed.org/ Federal Reserve Bank of St. Louis

prices paid for gas still subject to controls. This means that differentconsumers may well pay substantially different average prices, andthat large quantities of gas will be reallocated artificially because ofdifferential access to controlled gas. In particular, the intrastate pipe-lines will have relatively little access to controlled gas, and so a verysubstantial amount of gas will shift out of the intrastate market intothe interstate market. Interstate pipelines also will vary in their abilityto bid for decontrolled gas. In short, in addition to the resourcewaste involved in gas production under the NGPA, both controlledand decontrolled gas will be allocated inefficiently. The Departmentof Energy estimates that the efficiency gain to the economy from fullgas decontrol in 1982 would be about $10 billion.
The prospect of a sharp price increase in 1985, along with theother problems inherent in the NGPA, may provide an impetustoward extension of price controls on all gas beyond 1985. Thiswould resurrect all of the additional consumption and production in-efficiencies experienced before passage of the NGPA. If price con-trols were extended, gas production would be reduced and oil con-sumption and imports would be stimulated. Furthermore, the totalnet decrease in proved domestic gas reserves from 1971 through1979 was almost 96 trillion cubic feet. Extension of controls there-fore would have very serious effects upon future domestic gas re-serves.
Some observers have argued that decontrol would make producersbetter off at the expense of consumers, and that decontrol wouldhurt the poor. Both of these assertions are subject to serious ques-tion. Compared to conditions under the NGPA, decontrol wouldmake some producers and consumers better off and some worse off.The averaging of controlled and uncontrolled prices under theNGPA results in high prices for some producers and lower ones forothers. Decontrol would move all prices toward the common market-clearing level. Similarly, the NGPA forces some consumers implicitlyto subsidize others, so that consumers as a group would be no betteroff under the NGPA than under full decontrol. Moreover, decontrolwould benefit a wide class of individuals and groups, including thepoor, by improving the productive efficiency of the economy as awhole. Hence, decontrol would make some poor individuals worseoff, but others better off. Price controls are a costly and inefficientmethod of avoiding the adverse effects of rising fuel prices.
Some commentators have argued that gas decontrol ought to beaccompanied by a "windfall profits" tax, perhaps patterned after thecrude oil "windfall profits" tax. It should be noted that the latter taxis not based on profits, windfall or otherwise. It is actually an excisetax on domestic crude oil production. A "windfall profits" tax on gas
160Digitized for FRASER http://fraser.stlouisfed.org/ Federal Reserve Bank of St. Louis

would be likely to generate the same sort of inefficiencies: reduceddomestic production, increased imports, and consumption of moreresources in domestic production than otherwise would be the case.Other taxes, such as severance taxes on old gas, may be less harmfulif they generate only small distortions in incremental production in-centives.
TRANSPORTATION
The reduction in Federal economic regulation of the transporta-tion industry is promoting a more efficient transportation system.The airline, motor carrier, railroad, and intercity bus industries arenot now characterized by any of the market failures discussed inChapter 2. There are many competitors in each industry. Transporta-tion is not a public good, since individuals pay for each trip or ship-ment. There are no external costs or benefits that would warrant theregulation of prices or the number of competitors.
Since 1978 the Congress has passed three major pieces of legisla-tion to reduce the regulation of these industries. A phased deregula-tion of the airlines is now being carried out and will be completedwith the elimination of the Civil Aeronautics Board (CAB) on January1, 1985. The Motor Carrier Act of 1980 and the Staggers Rail Act of1980 provide the authority to eliminate significant portions of theeconomic regulation of trucks and railroads, but they do not pre-scribe an end to regulation. Both require definite action by the Inter-state Commerce Commission to eliminate as much regulation as thelaw permits. A bill to reform regulation of the intercity bus industrypassed the House of Representatives in November 1981.
Airlines
Deregulation of domestic airlines continued in 1981 according tothe schedule of the Airline Deregulation Act of 1978. On December31, 1981, the Civil Aeronautics Board lost the power to determinethe routes of individual airlines. Earlier in the year CAB approved aproposal to allow the airlines to file only maximum fares. In the pastthey have been required to include in their tariff filings every pricethat they offered to the public.
A pending prohibition on U.S. airline participation in the Interna-tional Air Transport Association conference, which determines airfares between the United States and Europe, became a bargainingpoint in multilateral meetings with European governments. A tenta-tive interim agreement was reached in December 1981. If implement-ed, greater price flexibility could allow airlines to offer new discountfares for flights to and from Europe. In exchange, U.S. airlines willbe able to participate in the conferences to set prices.
161Digitized for FRASER http://fraser.stlouisfed.org/ Federal Reserve Bank of St. Louis
Intercity Trucking
The regulatory framework for the motor carrier industry waschanged by the Motor Carrier Act of 1980. The act's provisions wererapidly implemented initially by ICC. A large number of applicationsfor authority to provide service were granted, the geographic andcommodity authority in new certificates was broadened, and price re-ductions occurred in both the truckload and less-than-truckload sec-tors. The industry, although not fully deregulated, appears to bemuch more competitive than in the past.
More recently, however, the pace of regulatory reform has slowed.Restrictions on the scope of new certificates have increased, andsome applications for rate reductions have been rejected by the ICC.Discounts offered to shippers have been called "blatantly illegal/'
Railroads
The deregulatory provisions of the Staggers Rail Act of 1980 havehelped to increase the efficiency of the railroads and to improve theirperformance. A new standard of revenue adequacy, based on the cur-rent cost of capital, gives greater rate flexibility to railroads with in-adequate revenues. Despite an improved financial position during thelast year, almost all railroads are currently considered as having inad-equate revenues.
Significant changes in ICC regulation of the rail industry have beenimplemented as a result of the Staggers Rail Act of 1980. Contractsbetween railroads and individual shippers are now legal and are vir-tually free of any ICC regulation. Approximately 550 such contractswere filed at the ICC during the first year of the new law. Rates thatare less than 165 percent of variable cost are not regulated. Ratesand practices for shipping trailers or containers on flatcars are nowexempt from regulation. Rates and practices for shipping fresh fruitsand vegetables have been exempt since 1979. In addition, four rail-road mergers have been submitted and two have received ICC ap-proval without the attachment of the traditional restrictive conditionsto protect affected railroads.
Intercity Buses
Federal regulation of the intercity bus industry began almost acci-dently in 1935, when motor carriers of passengers (buses) were in-cluded under ICC regulation of intercity trucks. In November 1981the House of Representatives passed a bill that would provide forsome regulatory reform of the bus industry. The bill would eliminateone of the many criteria that the ICC uses to determine whether abus company can begin new service. It would also allow more priceflexibility by establishing a zone in which the ICC cannot reject farechanges, but the rate bureau, which sets collective rates for the in-
162Digitized for FRASER http://fraser.stlouisfed.org/ Federal Reserve Bank of St. Louis

dustry, would continue. The Administration will work with the Senateduring 1982 to strengthen the deregulatory initiatives in the House-passed legislation.
TELECOMMUNICATIONS
Government regulation of telecommunications affects both broad-casters, including owners of cable television systems, and commoncarriers.
Broadcasting
The Federal Communications Commission (FCC) exercises controlover broadcasting through the issuance of radio and television broad-casting licenses. There were 4,575 commercial AM, 3,272 commercialFM, and 751 commercial TV stations (518 VHF and 233 UHF) onthe air on November 30, 1980. Because no party can own more than7 AM, 7 FM, and 7 TV licenses, ownership is fairly unconcentrated.Cable television (CATV) had approximately 17 million subscribers in1980, with the five largest firms having about 30 percent of the sub-scribers.
The economic justification for government regulation of this indus-try has been based on perceived rather than actual conditions. Theusual justification has been scarcity of available broadcasting frequen-cies. Closer examination, however, reveals that the scarcity was aproduct of government action as much as it was a product of naturalcauses. This was apparent in the manner in which the FCC allocatedchannels for TV stations in 1952 to protect existing VHF licensees.Whatever the justification for regulation in the past, the growth ofCATV, pay TV, and the possibility of direct satellite transmissionsare reducing the importance of the frequency spectrum.
The FCC has made several moves toward deregulation. In Febru-ary 1981 the Commission deregulated most commercial radio broad-casting, while in May it introduced a simplified renewal applicationwhich has only five questions. On the other hand, the FCC withdrewits proposal to allow AM radio stations to broadcast at intervals of 9kilohertz rather than the present 10 kilohertz. This change wouldhave increased the number of AM stations, although at some cost toexisting AM stations. The standard in most of the world has become9 kilohertz.
The Congress also contributed to the deregulation of broadcastingby including some important provisions in the Omnibus Budget Rec-onciliation Act of 1981. This act extended the length of TV licensesfrom 3 to 5 years and radio licenses from 3 to 7 years, while estab-lishing a lottery to determine who will get new licenses.
In September 1981 the Commission transmitted legislative propos-als to the Congress designed to streamline FCC operations and allow
163Digitized for FRASER http://fraser.stlouisfed.org/ Federal Reserve Bank of St. Louis
it to rely on market forces as the primary factor in telecommunica-tions policymaking. These proposals would be an important step for-ward in the deregulation of broadcasting.
Common CarrierAt the present time there is no competition in the provision of
local telephone service. Such service is provided on a franchised mo-nopoly basis by American Telephone and Telegraph (AT&T) (80percent) and independent telephone companies (20 percent). AT&Thandles 95 percent of long-distance telephone calls, but it now facescompetition in this area from other suppliers, such as MCI andSouthern Pacific.
The growth of effective competitors for AT&T, especially in cus-tomer equipment and long-distance service, has eroded some ofAT&T's ability to cross-subsidize from high-profit to low-profit activi-ties. Since regulation has been based on the assumption that thecross-subsidy would be maintained, the market's new conditions havemade the existing regulatory framework inappropriate.
A restructuring of the industry has come from three directions. In1980 the FCC permitted AT&T to start selling customer equipmentand enhanced services through a fully separate subsidiary to be es-tablished by March 1, 1982. That date has been shifted to January 1,1983, Meanwhile, the Congress has been considering legislation thatwould alter the structure of AT&T by separating it into regulatedand unregulated components under the same corporate framework.More recently, the Justice Department's antitrust suit against AT&T,which had sought full divestiture of the company's potentially mo-nopolistic services, was resolved by a tentative agreement that AT&Twould divest itself of all of its local operating companies in exchangefor an end to the court suit. Since the local operating companies areregulated monopolies, their divestiture is an essential developmentfor the remainder of AT&T to be a truly competitive force.
ANTITRUST
There has been a dramatic shift in antitrust policy under this Ad-ministration. Enforcement will focus on the critical areas implied bythe analysis in Chapter 2: horizontal mergers among dominant firmsin an industry, and price-fixing agreements among competing firms.
Meanwhile, antitrust enforcement actions whose benefits are ques-tionable are under continuous review. The Robinson-Patman Act, whichprohibits price discrimination, can restrict the ability of wholesaleproducers to give quantity discounts to retail sellers. Because sellersfind it hard to erect long-term barriers to competition from othersellers, it is illogical for them to try to carry on the predatory prac-
164Digitized for FRASER http://fraser.stlouisfed.org/ Federal Reserve Bank of St. Louis

tices which the law seeks to prohibit. Vertical mergers and agree-ments, which can be illegal under the Clayton Act, generally are mo-tivated more by a desire for greater economic efficiency than a wishto eliminate competition. For example, it is a common practice for adealer to sell the product of one firm after obtaining the contractualprotection of having an exclusive right to make sales in a given terri-tory. Without territorial protection, a dealer would have only a limit-ed incentive to advertise the qualities of the product, since much ofthe benefit of advertising would be captured by competitors. Sinceadvertising is an important source of information for buyers, territo-rial restrictions can promote its dissemination.
Enforcement of the antitrust laws has now taken a clearly economicorientation in both the Antitrust Division of the Department of Jus-tice and the Federal Trade Commission. In the Antitrust Division,decisions on which companies to investigate and what cases topursue are carefully scrutinized to determine whether the cases areeconomically sound. The department has also been developing a newset of merger guidelines that would follow broader economic criteriathan the present set, which focuses almost exclusively on concentra-tion ratios and market shares within an industry.
In addition to the tentative agreement in the AT&T case men-tioned above, the Department of Justice settled its longstanding caseagainst International Business Machines (IBM) in early 1982. TheIBM case was dismissed because the Department of Justice decidedthat the government's case was without merit. The restructuredAT&T will be an important new competitive element in the marketsthat have been served by IBM.
GUIDELINES FOR REGULATORY REFORM
During its first year in office the Administration has attempted toestablish a new regulatory environment. The Administration's goal isto eliminate wasteful or outdated regulation and to make necessaryregulation more efficient and more flexible. This effort includesthree tasks: (1) review of the basic statutes authorizing regulation; (2)review of existing regulations; and (3) review of proposed regula-tions. The Administration's program has not yet focused on the firstof these tasks (except for the Clean Water Act construction grantsprogram and the Clean Air Act), but it will do so next year after ithas completed its review of the major existing regulatory programs.
In pursuit of the goal of better Federal regulation, several guidelinesmay be useful.
1. Individuals should have maximum opportunity for personal choice. Regu-lation is not a substitute for efficient markets but an alternative to
165Digitized for FRASER http://fraser.stlouisfed.org/ Federal Reserve Bank of St. Louis

unregulated markets which have failed to allocate resources efficient-ly. Therefore, regulation should be limited to cases where marketfailure has-been demonstrated and the cost of government interven-tion is less than the benefits of improved resource allocation. Eventhough there is a need for government regulation of some markets,the means used should maintain consumer sovereignty to the maxi-mum extent possible.
2. Regulation should take place at the appropriate level of government Theprimary economic reason for most regulation is the existence of ex-ternal effects. The costs or tolerance of these external effects mayvary among locations. Economic efficiency, therefore, calls for thedegree and type of regulation to vary also. National standards tendto be too severe in some regions, while being too lax in others. Fed-eral regulation should be limited to situations where the actions inone State have substantial external effects in other States, constitu-tional rights are involved, or interstate commerce would be signifi-cantly disrupted by differences in local regulations,
3. Wherever possible, the government should provide incentives rather thandirectives. Regulation occurs within a dynamic environment. Thelowest cost technology for pollution abatement at the present time,for example, will certainly be obsolete at some time in the future.Directives do not create incentives for commercial firms to search forlower cost technologies, unlike such approaches as the establishmentof marketable rights in pollution emissions, which would create acontinuing incentive for firms to search for methods to achieve lowerlevels of pollution. Benefit-cost analysis can be a valuable tool inevaluating alternative regulatory schemes.
166Digitized for FRASER http://fraser.stlouisfed.org/ Federal Reserve Bank of St. Louis

CHAPTER 7
The United States in the InternationalEconomic System
THE SUCCESSFUL IMPLEMENTATION OF POLICIES to con-trol inflation and restore vigorous real growth in the United Stateswill have a profound and favorable impact on the rest of the world.As the President told delegates at the 1981 Annual Meetings of theWorld Bank and International Monetary Fund, ". . . the most impor-tant contribution any country can make to world development is topursue sound economic policies at home." More generally, the Ad-ministration's approach to international economic issues is based onthe same principles which underlie its domestic programs: a belief inthe superiority of market solutions to economic problems and an em-phasis on private economic activity as the engine of noninflationarygrowth.
This chapter reviews three areas important to U.S. internationaleconomic policy: the role of the dollar in the international monetarysystem, the increased importance of international trade and financefor the U.S. economy, and the evolving role of international institu-tions in promoting a more open international economic environment.
During much of the postwar period, under what was known as theBretton Woods system, most governments held their exchange ratesfixed against the dollar by intervening in the exchange markets when-ever supply of and demand for their currencies were not in balanceat the prevailing exchange rate. The U.S. Government usually didnot intervene in the exchange markets, but stood ready to buy andsell gold against dollars at a fixed price with foreign official agencies.In 1973 the Bretton Woods system of fixed but periodically adjust-able exchange rates collapsed. An increasingly expansionary U.S.monetary policy and a decline in U.S. economic performance acceler-ated that collapse, but the end of the fixed-rate system probablywould have occurred in any case.
Although the role of the dollar in international markets has de-clined somewhat over the past three decades, it remains the centralcurrency of the international monetary system. Consequently, boththe United States and the rest of the world benefit from having astrong and stable dollar, that is, one with stable purchasing power.
167Digitized for FRASER http://fraser.stlouisfed.org/ Federal Reserve Bank of St. Louis
This cannot be met through government intervention in exchangemarkets. Rather, it requires that the United States pursue noninfla-tionary economic policies designed to strengthen its economic per-formance.
A strong economy requires the maintenance of open markets bothat home and abroad. Open trade based on mutually agreed uponrules is consistent with, indeed integral to, the Administration's com-mitment to strenthening the domestic economy. The maintenance ofopen markets has become increasingly important in recent years asthe shares of foreign trade and investment have grown relative to thesize of the U.S. economy.
International institutions have contributed greatly to the economicprosperity the world has enjoyed since World War II by helping topromote increased international trade and investment and tostrengthen individual economies. In his World Bank-InternationalMonetary Fund speech President Reagan also remarked that, "TheBretton Woods institutions and the General Agreement on Tradeand Tariffs (GATT) established generalized rules and procedures tofacilitate individual enterprise and an open international trading andfinancial system. They recognized that economic incentives and in-creased commercial opportunities would be essential to economicrecovery and growth." As the economic environment in which theseinstitutions operate continues to change, we must assure that theseinstitutions continue to evolve in a manner suitable to maintainingand strengthening the open international economic system fromwhich we all benefit.
INTERNATIONAL FINANCIAL MARKETS
THE DOLLAR IN THE INTERNATIONAL SETTING
The availability of a stable and convertible dollar for use as a storeof value and a medium of international exchange contributed signifi-cantly to the sustained world economic recovery following WorldWar II. The U.S. dollar still holds a major position in world financialmarkets. However, this position was weakened by high and varyinginflation in the United States relative to that abroad during the1970s. Poor U.S. economic performance and stronger records insuch countries as Japan and West Germany led to a depreciation ofthe dollar in foreign exchange markets and to the diversification ofprivate and official asset holdings in international financial marketsinto other currencies. When the purchasing power of the dollarbecame less stable than the purchasing power of other major curren-cies, foreigners did not want to continue to hold as large a share of
168Digitized for FRASER http://fraser.stlouisfed.org/ Federal Reserve Bank of St. Louis

their wealth in dollar-denominated assets or rely as much on thedollar as the standard currency in international transactions.
The dollar remains the principal currency for international com-mercial and financial transactions. Because of this, both the UnitedStates and the rest of the world would benefit from a stronger andmore stable U.S. dollar. The strength and stability of the dollardepend directly on the ability of the United States to pursue nonin-flationary economic policies. In the late 1960s and the 1970s theUnited States failed to meet this objective. A continuing high andvarying rate of inflation led to a sharp decline in the dollar's foreignexchange value during the late 1970s and to the dollar crisis of 1978,which threatened the stability of international financial markets.
It would be desirable to lessen the differences in economic policiesand performance at home and abroad which have caused much of theexchange-rate volatility in the recent past. Formal arrangements whichpeg exchange rates, however, cannot guarantee lasting coordination,as was demonstrated by the history of the Bretton Woods system. Asa general proposition, one way to achieve compatibility of policies isfor countries voluntarily to adopt the monetary rule of a large countrywhose avowed goal is to stabilize prices. Such a commitment be-comes a de facto affiliation which will last as long as that larger coun-try performs its task reliably and the smaller countries determine thearrangements to be beneficial. The larger country must be aware thata systematic oversupply of its money will erode confidence and hencereduce the foreign exchange value of its currency. In internationalmarkets, where there is competition among monies, high confidencemonies eventually replace low confidence monies.
EXCHANGE-RATE MOVEMENTS
Changes in exchange rates, like changes in stock market prices, arelargely unpredictable in the short run. New infomation continuouslyleads exchange-market participants to revise their forecasts of thestate of the economy and the stance of economic policies. Exchangerates can exhibit large short-run fluctuations in response to suchchanges in economic outlook.
Over a longer period, exchange-rate changes reflect differences ininflation rates between countries; that is, purchasing power parityshould hold in the long run. In Chart 7-1, measures of the nominaland the real effective exchange rates are shown for the United Statesfrom 1973 to 1981. The real effective exchange rate is here definedas the nominal effective foreign exchange value of the dollar (a trade-weighted exchange rate) multiplied by the ratio of the U.S. consumerprice index (CPI) to the foreign consumer price index (March1973=100). Purchasing power parity holds when the real effective
169Digitized for FRASER http://fraser.stlouisfed.org/ Federal Reserve Bank of St. Louis

exchange rate is 100; below 100 the dollar depreciates in real terms;above 100 the dollar appreciates in real terms. Two observationsabout the graph are in order. First, there were substantial andpersistent deviations from purchasing power parity but a tendencyfor the real effective exchange rate to gravitate around the 100 line.Second, nominal and real effective exchange rates generally moved inthe same direction.
Chart 7-1
Nominal and Real EffectiveForeign Exchange Value of the Dollar
MARCH 1973-100
120
115
110
105
100
95
90
85
80
75 iimlmiiliiMiliimliiiiiliiiiiliimliiiiilimihiiiih1973 1974 1975 1976 1977 1978 1979 1980 1981
NOTE.—THE EFFECTIVE EXCHANGE RATE IS COMPUTED USING MULTILATERAL TRADESHARES OF THE G-10 COUNTRIES PLUS SWITZERLAND. THE REAL EXCHANGE RATEIS CALCULATED BY ADJUSTING THE NOMINAL INDEX FOR RELATIVE MOVEMENTS INCONSUMER PRICES (THIS IS ONE AMONG VARIOUS WAYS TO MEASURE REAL EXCHANGERATES).
SOURCES: DEPARTMENT OF LABOR AND BOARD OF GOVERNORS OF THE FEDERAL RESERVESYSTEM.
The substantial movement in this measure of real exchange rates,however, does not invalidate the long-term purchasing power parityrelationship. There are three main reasons why short-run deviationsfrom long-run purchasing power parity occur. First, changes in thegeneral price level, accompanied by changes in the ratio of traded tonontraded commodities prices (the internal terms of trade), affectreal exchange rates. This is so because the net export surplus (defi-cit) of the country experiencing an improvement in the relative priceof traded goods rises (falls). For a given price level, the exchangerate must adjust to restore long-run equilibrium in the current account.
170Digitized for FRASER http://fraser.stlouisfed.org/ Federal Reserve Bank of St. Louis

Movements in real exchange rates also can take place because the"terms of finance" change. That is, there may be shifts in the curren-cy preferences and risks faced by participants in international finan-cial markets which in turn affect expected yields on assets denominatedin various currencies.
Finally, real exchange rates tend to move in the same direction asnominal exchange rates because prices change more slowly thannominal exchange rates. As a consequence, changes in monetarypolicy quickly affect nominal interest rates in financial markets,and more gradually, the price level. Thus, changes in monetarygrowth affect both real and nominal exchange rates in the short run.Over the longer term, however, monetary growth does not influencereal exchange rates.
All of these forces have been present during the last decade. Overthis period the U.S. economy has been subjected to significantchanges in the prices of internationally traded goods, especially oil.For instance, the external terms of trade, measured by the ratio ofthe price deflator for exports of goods and services to the price de-flator for imports of goods and services, fell sharply in 1973 and in1979 as the two oil price shocks of the 1970s left their marks on theU.S. economy (Chart 7-2). In addition, the U.S. economy became
Chart 7-2
U.S. External Terms of Trade
1973 1974 1975 1976 1977 1978 1979 1980 1981
NOTE.—DATA ARE RATIO OF IMPLICIT PRICE DEFLATOR FOR EXPORTS OF GOODS AND SERVICESTO IMPLICIT PRICE DEFLATOR FOR IMPORTS OF GOODS AND SERVICES.
SOURCE: DEPARTMENT OF COMMERCE.
171Digitized for FRASER http://fraser.stlouisfed.org/ Federal Reserve Bank of St. Louis

much more open in the 1970s than it used to be. As an example, ex-ports as a proportion of gross national product (GNP) nearly dou-bled during the 1970s.
Historically, real exchange rates generally have moved in the direc-tion of restoring long-term equilibrium in external accounts. In the1977-78 period the United States had a cumulative current accountdeficit of $28.2 billion. The United States and foreign central banksthen intervened massively in an effort to contain the depreciation ofthe dollar. Foreign net purchases of dollars were more than doublethe amount of the cumulative current account deficit. Yet the dollarcontinued to depreciate, both in nominal and real terms. Market par-ticipants judged the intervention to be ineffective and viewed the de-terioration in the U.S. current account as an accurate reflection ofunderlying U.S. economic policies and performance. The depreci-ation was pronounced and persistent, but achieved the expectedresult of redressing the current account imbalance during 1979 and1980.
In 1981 the dollar appreciated sharply, both in nominal and realterms. The nominal appreciation of the dollar on a trade-weightedbasis relative to other major currencies was 15.6 percent. This move-ment is explained only in part by the current account surplus of theUnited States relative to that of its trading partners. Another factorwas a shift toward dollar-denominated assets, which may have been aconsequence of the President's economic recovery program. Largesales of dollar assets by foreign central banks and an increase in for-eign interest rates relative to U.S. interest rates did little to preventthe dollar from rising. The growing preference for dollar-denomi-nated assets relative to other assets reflected a positive response to un-derlying economic policies of the Administration.
OFFICIAL INTERVENTION IN THE EXCHANGE MARKETS
There is a long tradition among monetary authorities of interven-ing in the foreign exchange markets to prevent what is known asovershooting, undershooting, or, more generally, disorderly marketconditions. But there is no conclusive evidence that official interven-tion in the past has achieved its purpose. The large purchases ofdollar-denominated assets by foreign central banks in 1977-78 didnot prevent the dollar from depreciating, and their large sales ofdollar assets in 1980-81 did not prevent the dollar from appreciat-
172
Digitized for FRASER http://fraser.stlouisfed.org/ Federal Reserve Bank of St. Louis

ing. Moreover, intervention may have been counterproductive.Market participants did not know whether it signaled a change inmonetary policy, thereby leading to increased uncertainty on theirpart.
When the previous Administration left office, intervention by theUnited States was being conducted at a relatively high volume, virtu-ally on a day-to-day basis, with the objective of using the periods ofdollar strength first to cover outstanding foreign currency liabilitiesand later to build foreign currency reserves. This was the first time,at least in recent history, that the United States had embarked on adeliberate policy of acquiring substantial foreign currency reserves.(For a brief history of U.S. Government intervention in the exchangemarkets, see the appendix to this chapter.)
Early in 1981 the new Administration scaled back U.S. interventionin foreign exchange markets. In conjunction with a strong emphasison economic fundamentals, this Administration has returned to thepolicy of intervening only when necessary to counter conditions ofsevere disorder in the market.
As in the past, no attempt has been made to define disorderlymarket conditions in advance. When making a decision on whetherexchange-market conditions justify intervention, the U.S. Govern-ment will consult closely with the governments of other major indus-trial countries. Also as in the past, the Department of the Treasuryand the Federal Reserve will keep the public informed regarding U.S.exchange-market intervention policy. Although the Administrationdoes not expect intervention in the exchange markets to occur on aregular basis, it will continue to monitor closely developments inthose markets.
With the President's economic program firmly in place, and withthe Federal Reserve following a policy of gradually reducing the rateof monetary growth to a noninflationary level, the occurrence of dis-orderly conditions is likely to be significantly less in the future thanin the past. But unforeseen circumstances at home or abroad couldcause disorderly conditions, and intervention may at times be neces-sary.
IMPLICATIONS FOR U.S. MONETARY POLICY
In Chapter 3 it was argued that monetary authorities have the abili-ty to achieve given values and growth rates of nominal magnitudes
173
Digitized for FRASER http://fraser.stlouisfed.org/ Federal Reserve Bank of St. Louis
and that price stability is the principal objective of monetary policy.Under such a policy, interest rates cannot be fixed. But market inter-est rates and exchange rates are related by what is known as interestrate parity: the premium in the forward exchange markets approxi-mates the difference between comparable domestic and foreign inter-est rates, It follows that as interest rates change over time, nominalexchange rates will vary as well. A stable price level, therefore, maynot necessarily imply constant nominal interest rates or constant ex-change rates.
Price stability in the United States might lessen considerably thedispersion of inflation rates now prevailing in the world, but cannoteliminate them altogether. Economic policies and performance willcontinue to differ from country to country. Hence, exchange rateswill adjust to reflect such differences. But even if differences in infla-tion were to disappear, exchange rates would have to accommodatechanges in relative prices. Real exchange rates cannot be held con-stant in dynamic economies. The greatest contribution that U.S. pricestability will make to the exchange market is that it will act to reduceexchange rate volatility.
Current U.S. monetary and intervention policies are not expres-sions of "benign neglect/' That notion was based on the premisethat the foreign trade sector of the United States was so small rela-tive to the rest of the economy that it could be ignored. By contrast,the Administration stresses the pivotal role of the United States inthe world.
TRADE ISSUES AND POLICIES
TRADE IN THE U.S. ECONOMY
Foreign trade has become a vital factor in U.S. business activityand employment. In 1980 exports and imports of goods and serviceseach represented over 12 percent of the gross national product.Twenty years ago exports were less than 6 percent of GNP; imports,less than 5 percent. Much of this shift has occurred in the lastdecade, during which exports and imports as shares of GNP haveabout doubled. In real terms, however, the rate of growth in U.S. im-ports of goods and services was stronger in the 1960s than in 1970s,while U.S. export growth was stronger in the 1970s than in the1960s. The improved export performance reflects two key factorsapart from the evolving ramifications of the trade liberalization of thepostwar period and the real depreciation of the dollar in the 1970s:our increased trade with developing countries, whose real .GNPgrowth slowed less in the 1970s than that of the developed countries,
174Digitized for FRASER http://fraser.stlouisfed.org/ Federal Reserve Bank of St. Louis
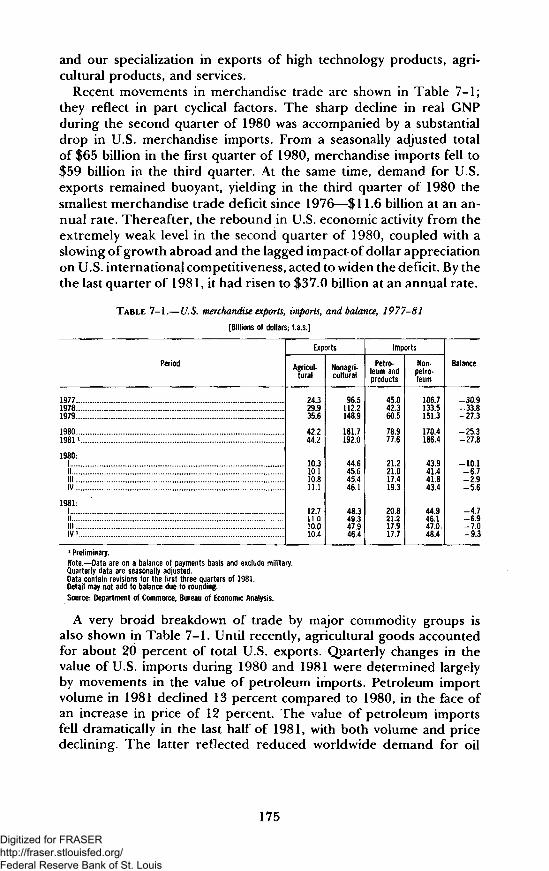
and our specialization in exports of high technology products, agri-cultural products, and services.
Recent movements in merchandise trade are shown in Table 7-1;they reflect in part cyclical factors. The sharp decline in real GNPduring the second quarter of 1980 was accompanied by a substantialdrop in U.S. merchandise imports. From a seasonally adjusted totalof $65 billion in the first quarter of 1980, merchandise imports fell to$59 billion in the third quarter. At the same time, demand for U.S.exports remained buoyant, yielding in the third quarter of 1980 thesmallest merchandise trade deficit since 1976—$11.6 billion at an an-nual rate. Thereafter, the rebound in U.S. economic activity from theextremely weak level in the second quarter of 1980, coupled with aslowing of growth abroad and the lagged impact of dollar appreciationon U.S. international competitiveness, acted to widen the deficit. By thethe last quarter of 1981, it had risen to $37.0 billion at an annual rate.
TABLE 7-1.—U.S. merchandise exports, imports, and balance, 1977-81
[Billions of dollars; f.a.s.J
Period
197719781979
19801981 1
1980:1IIIl lIV
1981:|IIII! . .I V 1
Exp
Agricul-tural
24.329935.6
422442
10310.110.811 1
12.711.0100104
>rts
Nonagri-culturai
96.51122148.9
1817192.0
44645.6454461
48349.3479464
Imp
Petro-leum andproducts
45.042.360.5
78.977.6
21.221.017.4193
20.821.217.9177
orts
Non-petro-leum
106.7133.5151.3
170.4186.4
43.941.441.8434
44.946.1470.484
Balance
-30.9-33.8-27.3
-25327.8
-10.1-6.7-2.9-56
-4.7-6.9-7.0-9.3
1 Preliminary.Note.—Data are on a balance of payments basis and exclude military.Quarterly data are seasonally adjusted.Data contain revisions for the first three quarters of 1981.Detail may not add to balance due to rounding.
Source: Department of Commerce, Bureau of Economic Analysis.
A very broad breakdown of trade by major commodity groups isalso shown in Table 7-1. Until recently, agricultural goods accountedfor about 20 percent of total U.S. exports. Quarterly changes in thevalue of U.S. imports during 1980 and 1981 were determined largelyby movements in the value of petroleum imports. Petroleum importvolume in 1981 declined 13 percent compared to 1980, in the face ofan increase in price of 12 percent. The value of petroleum importsfell dramatically in the last half of 1981, with both volume and pricedeclining. The latter reflected reduced worldwide demand for oil
175
Digitized for FRASER http://fraser.stlouisfed.org/ Federal Reserve Bank of St. Louis

due to the continued appreciation of the U.S. dollar and the down-turns in economic activity in the United States and Europe, all intandem with adjustments to oil inventories.
While the dollar price of oil has fallen, the appreciation of thedollar has caused the price of oil in European and Japanese curren-cies to rise. For Europe and Japan, therefore, oil import values rosemore rapidly than in the United States during 1981 and a parallel in-crease in their concern with their own trade balances has added toprotectionist pressures in some of those countries.
Although cyclical factors have played and will continue to play animportant role in movements of the trade account, the strong appre-ciation of the dollar through much of 1981 has already begun to bereflected in trade flows. While changes in economic activity arequickly translated into movements of exports and imports, changes inrelative prices generally take more time to alter trade flows. Hence,trade flows in early 1982 will continue to be influenced by the earliersharp real appreciation of the dollar.
In some instances the impact of exchange-rate changes in 1981 wasstronger than cyclical effects. U.S. imports of nonpetroleum productsgrew steadily throughout 1981, despite the weakening of U.S. eco-nomic activity. The volume of nonpetroleum imports grew verystrongly, while their price fell during the year, both reflecting the ap-preciation of the dollar.
THE STANCE OF U.S. TRADE POLICY
The Administration spelled out in its July 1981 "Statement on U.S.Trade Policy" its commitment to pursue, at home and abroad, poli-cies aimed at achieving open trade and reducing trade distortions.There are five central components to that policy.
• Restoring strong noninflationary growth at home. Fundamental to anyeffective trade policy is carrying out domestic programs that in-crease the incentives to invest, to raise productivity, and toreduce costs, thus helping to lower inflationary pressures. Thesepolicies will strengthen the ability of American firms to respondto changes in domestic and international markets.
• Reducing self-imposed trade disincentives. Confusing and needlesslycomplex laws and regulations that inhibit exports and importswill be reformed.
• Effective and strict enforcement of U. S. trade laws and international agree-ments. Our policy toward other nations' barriers to trade and toinvestment or export subsidies is one of strong opposition. Ourtrading partners must recognize that it is in their own interest, aswell as ours, to assure that international trade and investmentremain a two-way street.
176Digitized for FRASER http://fraser.stlouisfed.org/ Federal Reserve Bank of St. Louis

• A more effective approach to industrial adjustment problems. In a healthyeconomy some industries and regions will grow more rapidlythan others, and some sectors will experience more difficulty. Ifunhindered, the market will signal these changes and provide in-centives for adjustments. Market forces, rather than governmentbail-outs, will be relied upon to make appropriate adjustments.
• Reducing government barriers to the flow of trade and investment amongnations. To this end it is necessary to continue efforts to improveand expand existing international trade rules, particularly intothe areas of services and investment.
At home, as well as in other nations, public policy discussionsabout international trade often lead to disagreement. The directbeneficiaries of import relief or export subsidy are usually few innumber, but each has a large individual stake in the outcome. Thus,their incentive for vigorous political activity is strong.
But the costs of such policies may far exceed the benefits. It maycost the public $40,000-$50,000 a year to protect a domestic job thatmight otherwise pay an employee only half that amount in wages andbenefits. Furthermore, the costs of protection are widely diffused—inthe United States, among 50 States and some 230 million citizens.Since the cost borne by any one citizen is likely to be quite small, andmay even go unnoticed, resistance at the grass-roots level to protec-tionist measures often is considerably less than pressures for theiradoption.
The decisions taken in trade cases inevitably reflect political andsocial forces as well as basic economic considerations. The record ofdecisions, not surprisingly, continues to be mixed. For example, theextension of the Multifiber Arrangement, agreed upon in December1981, is more restrictive than open-trade advocates might have pre-ferred, but the principle of openness was adhered to closely in thedecision concerning the nonrubber footwear industry. A similar con-trast can be found in the automobile and industrial fastener cases.
CHANGING ATTITUDES TOWARD INTERNATIONAL TRADE
The gradual opening of the world economy to trade in the postwarperiod has brought major benefits both to the United States and toour trading partners. Long experience has shown that the benefits oftrade tend to be mutual. Competition, whether domestic or interna-tional, fosters the allocation of resources to relatively more produc-tive activities. Better products, at lower prices, appear in the market-place. Consumer choice is expanded. Technologies are more readilydiffused. Inflationary pressures are reduced. With time, productivity,and hence income, rise.
177Digitized for FRASER http://fraser.stlouisfed.org/ Federal Reserve Bank of St. Louis

The benefits from open trade are derived as much from reductionsin barriers to imports as from expansion of exports. American ex-porters seek foreign buyers who have access to the U.S. dollars nec-essary to buy U.S. goods and services. While the U.S. dollar is a con-vertible currency that, is widely used in a variety of internationaltransactions, significant amounts of dollars are made available whenAmericans import foreign goods and services, paying in U.S. dollars.Put simply, our imports put U.S. dollars into the hands of foreignerswho then use those dollars—be it to buy U.S. goods, services, orassets, or to exchange currencies with others who want dollars. In theshort run, we can, and in many cases do, lend foreigners the dollarsto finance their purchases of our exports. When such loans are madeat market rates of interest, trade is advanced. But when government-subsidized credit is provided, instead, such funds are denied to other,more productive uses.
Restricting U.S. imports would reduce the amount of dollars availa-ble to those in other countries who would buy our wheat, aircraft,chemicals, or machinery unless we made up the difference by loansto foreigners. In some cases, the connection between imports and ex-ports is even more direct. Import restraints can reduce employmentand profits in our more productive export industries. The nonrubberfootwear industry offers one such example. U.S. exporters of hides toforeign shoe producers suffered as a result of our restraints onimports of foreign shoes. More generally, import restriction by onecountry may invite others to retaliate.
Pressures for retaliation, which tend to strengthen when, as now,output growth rates are declining and unemployment is rising, areone of a number of forces threatening to stem the growth of worldtrade. In the last year or so, the U.S. automobile, footwear, steel, andtextile industries have been among those actively seeking relief fromimport competition. There are similarly strong pressures for govern-ment subsidy of export expansion—for example, in agriculture and inhigh technology industries.
Such pressures for further government intervention reflect a po-tentially troublesome "neomercantilist" view which stresses exportexpansion to the near exclusion of all other factors in a healthy inter-national trading climate. If the U.S. Government, the reasoning runs,were to take steps to favor sectors with export potential, the do-mestic economy would benefit. In this view, a large surplus in themerchandise trade account is deemed an unmitigated "good/* a defi-cit "bad."
There is a fundamental inconsistency between such neomercantil-ism and the overall economic philosophy of the Administration,which is committed to the goal of less, not more, government inter-
178Digitized for FRASER http://fraser.stlouisfed.org/ Federal Reserve Bank of St. Louis

ference in the marketplace. It is just as easy to waste taxpayer dollarsand scarce economic resources on subsidizing exports as it is towaste them on better-known examples of Federal profligacy. What isdesirable, indeed necessary, is that, consistent with the Administra-tion's "Statement on U.S. Trade Policy/' the U.S. Government assurethe proper enforcement of trade laws, remove any unnecessary do-mestic impediments to trade, and likewise seek elimination of foreigntrade barriers which effectively limit our exports.
Competitiveness that is impaired by market forces should not berestored by raising tariffs or subsidizing export industries. Such ac-tions simply protect the trade-dependent industries, inviting them topostpone the steps necessary to meet world competition while raisingcosts to consumers and reducing the choices available in the market-place. Policymakers can design and implement policies that invite im-provements in investment, productivity, and employment, but the de-cision on whether to make such improvements is best left to the pri-vate sector.
THE SIGNIFICANCE OF EXTERNAL IMBALANCES
In most circumstances a trade deficit by itself should not causeconcern. A trade deficit is a narrow concept. Goods are only partof what the world trades; another major part of trade is composed ofservices. Hence, the current account, which includes both, better in-dicates the country's international payments position. But the currentaccount balance is not a complete measure of international competi-tiveness either. What also matters is how current account deficits arefinanced.
Table 7-2 sets out the major components of the current account ofthe U.S. balance of payments: exports and imports (from Table 7-1),services, and unilateral transfers. The growing importance of trade inservices is evident. The major contributor, by far, to the surplus onservices is investment income. Net investment income rose from lessthan $18 billion in 1977 to almost $33 billion in 1980. As has been thecase in the recent past, large surpluses in the services account offsetlarge deficits in the merchandise account, yielding a small surplus inthe current account for the first three quarters of 1981.
Concern with the country's international payments position is ap-propriate when the basis of that concern is that the country is simul-taneously experiencing a sustained deficit in its current account and apersistent depreciation of its currency in the exchange markets. Thejoint occurrence of these two events should alert economic policy-makers to the possibility that the country may be losing competitive-ness.
179Digitized for FRASER http://fraser.stlouisfed.org/ Federal Reserve Bank of St. Louis

TABLE 7-2.—I'.S. international transactions, 1977-81
[Billions of dollars]
Period
197719781979
19801981 y
1980;
Itt i lIV
1981:
II ".'. . ' " ' ' . " . ! .' '.Ill 2|V a
Merchandise *
Exports
120.8142.1184.5
224.0236.1
55.055.756.357.1
61.060.457.956.8
Imports
151.7175.8211.8
249.3264.0
65.062.459.262.7
65.767.365.066.1
Balance
-30.9-33.8-27.3
-25.3-27.8
-10.1^6.7=2.9-5.6
=4.7= 6.9= 7.0-9.3
Services
Exports
63.579.0
104,5
120.7
30.928.030.431.5
33.334.636.2
Imports
42.154.270.1
84.6
21.020.421.022.2
23.925.025.2
Balance
21.424.834.4
36.1
9.97.59.49.3
9.59.6
11.0
Uni-lateraltrans-
fers, net
-4.6-5.1-5.6
-7.1
-1.9-1.3-1.5=2.3
-1.5-1.5-1.9
Currentaccountbalance
- 14,1-14.1
1.4
3.7
-=2.10.55.01.4
3.31.12.1
1 Excludes military.2 Preliminary,Note.—Data are on a balance of payments basis.Quarterly data are seasonally adjusted.Merchandise trade data contain revisions for the first three quarters of 1981.Detail may not add to balances due to rounding.Source: Department of Commerce, Bureau of Economic Analysis.
It is particularly important not to become unduly preoccupied withthe trade or current account balances with a single foreign country.Any policy to reduce a bilateral imbalance by restricting imports is like-ly to reduce the absolute volume of trade, and in consequence, the levelof economic well-being of both countries, and could have wider reper-cussions. A far more constructive approach would be for the nationswith restrictive trade practices and institutional barriers to imports toreduce systematically those obstacles to the freer flow of trade and in-vestment. Actions like those recently taken by Japan, for example,should prove far more beneficial than measures by the United States torestrict imports.
More broadly, and setting aside the sometimes significant statisticaldiscrepancies, global current account imbalances must add up tozero. All countries cannot possibly run surpluses simultaneously. Ifeach nation tried to achieve such a goal, strong deflationary forceswould be set in motion. Today, for example, the Organization of Pe-troleum Exporting Countries (OPEC) continues to report large cur-rent account surpluses; these have to be matched by current accountdeficits in other countries. Given the important role of the UnitedStates in world financial markets, one need not be concerned if theU.S. current account moves into deficit as domestic economic policiesbegin to revitalize the economy. With strong domestic performance,U.S. import demand will also strengthen; the effects of this revitaliza-tion on U,S. exports will take more time. Thus, a deficit on currentaccount will simply reflect the adjustment process at work.
180
Digitized for FRASER http://fraser.stlouisfed.org/ Federal Reserve Bank of St. Louis
Nor should a current account deficit that is comfortably financedby net inflows of capital evoke concern. The relationship is straight-forward: goods and services comprise one aspect of internationalcommerce, financial and real assets another. If foreigners purchasemore U.S. real and financial assets in the United States—land, build-ings, equities, and bonds—then the United States can afford toimport more goods and services from abroad. To look at one aspectwithout considering the others is misleading.
In sum, the macroeconomic significance of a current account defi-cit depends on what gave rise to it and how it is financed. It is initself neither good nor bad. Nor should exchange-rate changesrequired by long-term current account considerations be viewed as,in themselves, good or bad; the costs to society of suppressingexchange-rate movements must be compared to the costs of allowingthose movements. It is for these reasons that interference withmarket mechanisms—whether in markets for goods or markets forforeign exchange—is not part of the Administration's policy.
DEVELOPMENT, ADJUSTMENT, AND INTERNATIONALINSTITUTIONS
THE HERITAGE AND THE CHALLENGES
In his speech to the World Affairs Council of Philadelphia on Oc-tober 15, 1981, President Reagan said:
"The postwar international economic system was created on thebelief that the key to national development and human progress isindividual freedom—both political and economic. This system pro-vided only generalized rules in order to maintain maximum flexibilityand opportunity for individual enterprise and an open internationaltrading and financial system."
The record of this economic system is a record of more achieve-ments than failures. As Table 7-3 shows, the industrialized world hasnot been the only beneficiary of an open international trading andfinancial system. A number of developing countries have done welltoo. The real per capita GNP of 60 middle-income countries roseabout as fast as that of the industrial countries over the period 1950to 1980, while GNP in those middle-income countries grew over 30percent faster than in the industrial countries. On the other hand,there are many low-income countries whose economic progress hasbeen disappointing.
As a result of faster economic growth abroad than in the UnitedStates, the U.S. share of world output declined substantially over thesame period. Immediately after World War II this share was estimat-ed to be approximately 40 percent. By 1950, with Europe and Japan
181Digitized for FRASER http://fraser.stlouisfed.org/ Federal Reserve Bank of St. Louis

back on their feet, it had declined to one-third. It dropped to 25 per-cent by 1970 and further declined to 23 percent by 1980.
TABLE 7-3.—Real GNPgrowth rates, 1950 to 1980
[Average annual percent change]
Country grouping
Industrial countries
MarketNo n market
Developing countries
Middle-income countries ..Low-income countries
Capital-surplus oil exporters
GNP
4.2
4.245
5.5
5.65,1
11.2
GNP percapita
3.2
3.134
3.2
3.12.9
7.9
Note,—Country groupings are classified according to World Development Report, 1981, World Bank.Source: National Foreign Assessment Center.
Despite this favorable record for much of the rest of the world andthe United States, the open international system today faces threemajor challenges. The first challenge arises from the conflict betweeneach country's short-term internal domestic objectives and mutuallonger term external interests. In the past, leadership in meetingsuch a challenge was provided by large countries. The United King-dom fulfilled this role for much of the 19th century up to World WarI, while the United States played a larger role after World War II.Under U.S. leadership the Western alliance developed a nuclear"umbrella,** achieved massive reductions of tariffs and other impedi-ments thus giving major impetus to world trade, and created an in-ternational monetary system which provided rules of conduct for ad-justing balance of payments imbalances. In today's environment, ad-dressing issues such as defense and the evolution of internationaleconomic arrangements are part of this challenge. The nature andmutual importance of these issues implies that solutions to theseproblems must be arrived at through consultation.
The second challenge is to maintain an open international eco-nomic system. A new wave of protectionism has taken the form ofquotas, subsidies, international cartels, administrative delays, andburdensome enforcement of product standards. Imposition of suchmeasures has increased dramatically since the international negotia-tions in the Kennedy Round (completed in 1967) sharply reducedboth tariffs and the scope for their future use. The gains made inopening markets for international trade, investment, and finance arenow threatened.
The third challenge is to respond to the aspirations of the develop-ing countries for greater growth and development. Work under therubric of the New International Economic Order, as well as the
182Digitized for FRASER http://fraser.stlouisfed.org/ Federal Reserve Bank of St. Louis

Brandt Commission report and the Tinbergen report, have focusedglobal attention on important development and resource issuesbefore the world community. While these reports make an effectivecase for aid to the least developed countries, they in general placetoo much emphasis on resource transfer and not enough emphasison resource development through private market mechanisms.Indeed, these reports tend to downplay the role of the private sectorin the development process and instead rely on governments and in-ternational organizations as the best vehicles to promote develop-ment.
As already noted, a sizable number of developing countries havedone well in the post-World War II era. On the other hand, develop-ing countries continue to be justified in claiming that the world trad-ing system discriminates against them. Some industrial countrieshave restricted trade in sensitive sectors of particular export interestto developing countries, such as textiles.
MEETING THE CHALLENGES
The U.S. response to these challenges is based on an explicit shifttoward market-oriented solutions to economic problems. Solutions tocommon problems in the world economy should be found throughcontinued efforts at cooperation and consultation among nations.These efforts should aim at a renewed resolve to fight inflation andsecure higher investment with sustainable growth. At the OttawaSummit in July 1981 the President, along with other Western lead-ers, reaffirmed "our common objectives and our recognition of theneed to take into account the effects on others of policies we pursue.We are confident in our joint determination and ability to tackle ourproblems in a spirit of shared responsibility . . ."
International cooperation is particularly vital in stemming the drivefor greater protectionism both at home and abroad. The response ofmany countries during the recent period of sluggish worldwidegrowth has been to call for or impose new barriers to investment andtrade flows. The United States will continue to resist these tactics andwork for reductions in trade barriers through the General Agreementon Tariffs and Trade (GATT) and through bilateral relationships.
In approaching the challenge to contribute to the needs of the de-veloping world, the Administration seeks to emphasize the importantand historically dominant roles of trade and investment in economicdevelopment. Although economic assistance on concessionary termscontinues to be a vital part of U.S. policy, establishment of a vibrantprivate sector through trade and investment offers the best hope forsustained noninflationary growth. The program for action that the
183Digitized for FRASER http://fraser.stlouisfed.org/ Federal Reserve Bank of St. Louis

President put forth at the Cancun Summit in October 1981 containsfive guiding principles for development policy:
• stimulating international trade by opening up markets;• tailoring particular development strategies to specific needs and
regions;• guiding assistance toward the development of self-sustaining pro-
ductive capacities;• improving the climate in many developing countries for private
investment and technology transfer; and• creating a political climate in which practical solutions can move
forward rather than founder on the reef of government policiesthat interfere unnecessarily with the marketplace.
In line with these principles, the major goal of concessional foreignaid programs should be to help those poorer countries which, forreasons beyond their control, have not been able to improve theirstandards of living. The rationale for aid to countries whose low eco-nomic performance results more from inappropriate domestic poli-cies than from external factors needs to be reexamined.
EVOLVING ROLE OF INTERNATIONAL INSTITUTIONS
The United States recognizes the important roles and specializedfunctions of the international financial institutions and believes theseinstitutions must continue to evolve. It is important to review theroles of these institutions to ensure that they remain effective in theyears ahead. Most importantly, these institutions should be directed to-ward promoting market-oriented rather than government-adminis-tered solutions to international and domestic economic problems.
General Agreement on Tariffs and Trade
The General Agreement on Tariffs and Trade has served the worldwell in promoting and monitoring progress toward a liberalized trad-ing system. Originally written in the immediate post-World War IIera with a small number of Western industrial countries as Contract-ing Parties, the GATT system has had to adapt to the changing worldeconomy. During the 1960s a Part V was added to the GeneralAgreement to take into account the special problems of developingcountries and to allow many of them to be brought within the GAITsystem. Special Protocols of Accession were drafted to bring EasternEuropean nonmarket economies under the GATT umbrella as well.
Over the years, the emphasis of GATT has been altered to copewith the ingenuity of governments and interest groups in devisingnew forms of economic protectionism. The first several rounds of ne-
184Digitized for FRASER http://fraser.stlouisfed.org/ Federal Reserve Bank of St. Louis

gotiations under GATT were concerned mainly with reducing hightariff levels. The Kennedy Round, in addition to achieving sizabletariff reductions, made a modest attempt to negotiate other commit-ments—including one on antidumping—while the principal focus ofthe Tokyo Round (completed in 1979) was on extending GATT dis-cipline to areas other than tariffs. These agreements proved decisive-ly that the GATT system is flexible and can be improved over time.
However, GATT now faces a challenge because of increasing pro-tectionist pressures worldwide and because the effectiveness ofGATT rules, which formally include all goods, has tended in practiceto be limited to trade in manufactures. GATT must now addressareas of international commerce where existing norms are inad-equate, such as agriculture, and must define its role in establishingnorms in areas which traditionally have not been dealt with in GATT,such as trade in services. Another area where distortions exist andwhere greater international efforts are needed is in international in-vestment. Finally, steps to integrate developing countries more com-pletely into the GATT framework should be made, along with effortsto encourage nonmembers to join agreements under GATT.
A new political impetus among developed and developing coun-tries is required to revitalize GATT. The GATT Ministerial meetingset for November 1982 will offer the international community an op-portunity to maintain momentum toward a more open tradingsystem.
The World Bank
The International Bank for Reconstruction and Development(IBRD) was created to lend funds for reconstruction of the war-rav-aged economies and for economic development. Having accomplishedthe first task admirably, it has, over the last quarter century, come tofocus heavily on the second. With the creation in 1956 of the Interna-tional Finance Corporation—mandated to promote private sector en-terprise in developing countries—and in 1960 by the establishment ofthe International Development Association (IDA) to lend on highlyconcessional terms to the poorest countries, the World Bank group wasformed.
During the 1970s these three institutions underwent rapid growthand innovation, some of which has been controversial. PresidentReagan indicated at the 1981 World Bank-International MonetaryFund Annual Meetings that because the United States strongly sup-ports the World Bank, the Administration also feels "a special re-sponsibility to provide constructive suggestions to make it more ef-fective." A major U.S. policy reassessment of the World Bank andthe regional development banks was thus carried out during 1981and the final report was recently released.
185Digitized for FRASER http://fraser.stlouisfed.org/ Federal Reserve Bank of St. Louis

That study strongly endorses the overall performance of the multi-lateral development banks, but also identifies key aspects which re-quire improvement. Loan quality, not quantity, should have highestpriority. In addition, renewed attention should be focused on the cri-teria under which countries "mature" from soft loan window to hardloan window, and "graduate" to unsubsidized participation in inter-national capital markets. The study recommends that the UnitedStates should begin to reduce its contributions to the soft loan facili-ties, noting that such reductions would not adversely affect users ofthese facilities as long as strengthened "maturation" and "gradua-tion" policies are followed,
In further assessing how the World Bank can be most effective, itis useful to distinguish between its soft loan window (IDA) and itshard loan window (IBRD), since these give it the capacity to tailor itsfinancing to a broad range of developing countries. There is no dis-pute that a good many countries need development assistance. Butviews do vary on how best to give assistance—that is, through loansor grants—and whether assistance should be on a multilateral or bi-lateral basis. A multilateral approach to official aid has the presumedadvantages of being cost-effective (that is, greater volumes of re-sources can be obtained for a given budget dollar), of allowing poli-tics to be bypassed to some extent, and of facilitating policy reformby conditioning loans and grants on certain changes. An arguabledisadvantage is that taxpayers in donor countries lose some controlboth over where aid goes (since decisions are made collectively) andhow it is used. Verification of the effectiveness of aid is an issuewhich was emphasized at times during the 1970s when the Bank itselfwas among the chief spokesmen for larger aid programs. In light ofthese considerations, the Council takes the view that official aidwould be more effective on a bilateral basis, and the Administrationhas repeatedly stressed its intention to pursue a larger bilateral aidprogram.
In any case, soft loan resources disbursed by the World Bankshould be directed to countries which are making serious attempts todevelop their economies on a rational basis but have inadequatedebt-servicing capacity and hence have little or no access to creditmarkets. Part of the inability of some countries to achieve greater de-velopment can be traced to their domestic policies, and aid fromboth the soft and hard loan windows should be more explicitly condi-tioned on improvements in those policies. In practice, there has beenresistance in some recipient countries to adopting policies whichreduce government intervention and allow a fuller play of marketforces. The chances that more efficient development will take place
186Digitized for FRASER http://fraser.stlouisfed.org/ Federal Reserve Bank of St. Louis

are improved to the extent that the lending activities of the Bank aredesigned so as to generate an increase in privately produced output.
Finally, there remain unresolved questions about the future sizeand emphasis of World Bank activities. The success of the Bankshould not be measured by its ability to obtain funds from donorcountries, but rather by its performance in fostering economicgrowth in developing countries.
The International Monetary Fund
The International Monetary Fund (IMF) currently provides aframework in which governments can consult and cooperate in deter-mining the structure and functioning of the international monetarysystem. In particular, the Fund extends technical assistance and tem-porary balance of payments financing to members, in part condition-ed on the implementation of economic policy measures designed tocorrect the factors underlying their balance of payments imbalances.In addition, it serves as a means for monitoring the exchange rate ar-rangements and policies of member governments. Finally, the IMF isalso charged with reviewing the adequacy of international liquidityand with supplementing reserves, when necessary, through the allo-cation of Special Drawing Rights.
The Administration's approach to the IMF reflects a basic view ofthe world economy which focuses on economic fundamentals, sup-port for timely adjustment, and recognition of the pervasiveness andbenefits of market forces. The IMF Articles of Agreement recognizethat exchange-rate stability requires stability in the underlying eco-nomic and financial determinants of exchange rates.
Although nations may differ on the appropriate degree of ex-change-market intervention, there is consensus that exchange-ratedevelopments are influenced fundamentally by domestic economicconditions within member countries. The Administration stronglysupports further development under the IMF surveillance proceduresof what has become known as the Article IV consultation process.
Under the second amendment to the Articles of Agreement, theFund set forth a set of principles to govern developments and policyactions that are consistent with an open international economicsystem. In cases where the Fund believes that these principles maynot have been honored, it may send a staff mission to a member'scapital to discuss the member's economic policies with governmentofficials.
IMF Article IV consultations contribute to international stability ina number of ways. First, such consultations provide information tomember governments regarding the national economic policies of
187Digitized for FRASER http://fraser.stlouisfed.org/ Federal Reserve Bank of St. Louis

other member governments. Such information may be helpful inshaping each member's domestic policies as well as useful in avoidingconflicts because of misundertandings. Second, Article IV consulta-tions provide a valuable base of information for Fund staff assess-ments of global economic and exchange-rate developments which inturn provide useful information for national economic authorities.Third, Article IV consultations provide a framework for frank cri-tiques among the representatives of member governments. Fourth,Article IV consultations provide a base from which all nations can de-velop a better understanding of the economic linkages among na-tions. And finally, these consultations can help a country to identifyand address emerging payments problems at an early stage.
The Administration, however, has encouraged the Fund to give re-newed attention to the kinds of financial programs that it supports inmember countries. The U.S. Government has stressed the impor-tance of effective IMF conditionality in promoting balance of pay-ments adjustments. The justification for IMF financing is to encour-age appropriate payments adjustment.
With the emergence of very large imbalances in world paymentssince 1974, a major effort was made to expand access to IMF re-sources and to enhance the Fund's ability to support its members*adjustment efforts. The access of individual countries to IMF financ-ing has been increased significantly. In addition, IMF resources havebeen expanded through the implementation of a 50 percent quota in-crease at the end of 1980 and through the establishment of IMF bor-rowing arrangements with Saudi Arabia and a few other countries.The duration of IMF adjustment programs has been lengthened inmany cases because of the structural nature and depth of countries'adjustment problems. Also, greater emphasis is being placed onstructural change—the reduction of economic distortions and disin-centives, and enhancement of factors that will lead to greater saving,innovation, investment, and growth.
The IMF must ensure that its increased resources are used in amanner that is consistent with its Articles of Agreement. Traditional-ly, this has meant that access to IMF resources is available on a tem-porary basis to countries confronted with an external imbalance andwilling to undertake economic policy adjustments to eliminate theseimbalances and repay the Fund. Effective balance of payments adjust-ment frequently requires wider acceptance of market-oriented solu-tions. Import and export restrictions, price controls, rigid exchangerates, and excessive government regulation often prevent a countryfrom achieving a sustainable balance of payments over time as well ashigher domestic growth rates.
188Digitized for FRASER http://fraser.stlouisfed.org/ Federal Reserve Bank of St. Louis

Finally, the Administration has looked closely at the justificationsfor a new proposed allocation of Special Drawing Rights. This issueis controversial, given some countries1 financing problems and differ-ences of opinion about the meaning and role of international liquid-ity. Although many countries have advocated an increase in holdingsof this international reserve asset, the United States has opposedsuch an allocation at this time, given world inflation and the currentlevel of world liquidity. Even a modest new allocation of SpecialDrawing Rights in present circumstances would appear to conflictwith the policies of monetary restraint being pursued in many coun-tries.
Most international institutions were created after World War II,each with clear objectives to satisfy. Over the last three and a halfdecades the economic environment has changed dramatically, andthe member governments of these institutions have had to reachagreement on how to reorganize the priorities and functions of theinstitutions. These institutions continue to play vital roles in theworld economy. But to guarantee their ongoing viability, membergovernments must continue to review the approaches and goals ofthese institutions in light of the changing economic environment.
APPENDIX TO CHAPTER 7
U.S. POLICIES ON EXCHANGE-RATE INTERVENTIONSINCE 1973
The current era of floating exchange rates formally began in March1973, when most major industrial countries abandoned their effortsto maintain fixed-exchange rates against the dollar. Although rateswere no longer held fixed, many governments outside the UnitedStates continued to intervene in exchange markets from time to time toinfluence their exchange rates. Initially the United States adopted apolicy of nonintervention, but substantial changes in dollar exchangerates led the United States to intervene during the summer of 1973 andfrom late 1974 to early 1975.
In July 1973 the U.S. Government adopted a policy of active inter-vention at whatever times and in whatever amounts were appropriatefor maintaining orderly market conditions. In November 1975, aspart of the "Declaration of Rambouillet" following an economic sum-mit meeting, the heads of the industrial countries announced that theyhad agreed to act to counter disorderly market conditions or erraticfluctuations in exchange rates. Although the difference between thestatements may appear to be only one of nuance, the latter statementmore accurately reflected what in effect was a limited interventionpolicy on the part of the United States.
189
Digitized for FRASER http://fraser.stlouisfed.org/ Federal Reserve Bank of St. Louis
The previous Administration also began its term of office support-ing limited intervention in exchange markets. Official U.S. statements,however, were interpreted as favoring a decline in the dollar to reducethe U.S. current account deficit (that is, "benign neglect*' of the dollar).Using Federal Reserve swap arrangements, the United States inter-vened in support of the dollar, beginning in September 1977.* In total,the United States sold (net) $2.6 billion in foreign currencies in supportof the dollar between September 1977 and March 1978, financed byFederal Reserve and Department of the Treasury drawings underswap agreements. When the dollar recovered in the second and thirdquarters of 1978, the United States was able to acquire $2.1 billion inforeign currencies, permitting repayment of a substantial portion ofthe earlier swap drawings.
In April 1978, pursuant to the notification provisions of theamended IMF Articles of Agreement, the United States notified theIMF that, ". . . exchange rates are determined on the basis ofdemand and supply conditions in the exchange markets. However,the [U.S.] authorities will intervene when necessary to counter disor-derly conditions in the exchange markets."
The definition of disorderly markets was left open and of neces-sity subject to interpretation by officials. Although at times interven-tion was heavy, it is fair to characterize U.S. policy until late 1978 asone in which intervention was the exception, and not the rule.
In late 1978, however, the character of U.S. intervention changed.In August 1978 pressure on the dollar renewed amid spreading rec-ognition of serious U.S. economic problems—including inflation andinadequate energy adjustments—and growing skepticism over the ef-fectiveness of the previous Administration's plans to deal with them.President Carter announced a dollar support package on November1, 1978. A major element of this program was a commitment to amore active intervention policy, to be funded by mobilizing large for-eign currency resources, including the issuance of foreign currencysecurities (which became known as "Carter bonds"). From November1, 1978, until shortly after the Administration took office in January1981, U.S. intervention in exchange markets often reached mas-sive proportions by historical U.S. standards (although not by themore activist standards of many foreign governments). As of March1981, the U.S. Government had acquired $11.9 billion worth of for-eign currencies. Since the values of these currencies dropped dra-
*Under a swap agreement, the Federal Reserve and Department of the Treasury borrow foreigncurrencies from foreign central banks and then use the currencies to intervene in foreign exchangemarkets. The United States has used swap agreements with Belgium, France, Germany, Japan, theNetherlands, and Switzerland since July 1973, all but Belgium and the Netherlands since November
190
Digitized for FRASER http://fraser.stlouisfed.org/ Federal Reserve Bank of St. Louis
matically relative to the U.S. dollar in 1981, as of October 31, 1981,the government (Federal Reserve System plus Treasury) sustained abookkeeping loss on these holdings of $661 million. This loss wouldhave been realized had the United States sold these currency hold-ings and repaid its liabilities.
191Digitized for FRASER http://fraser.stlouisfed.org/ Federal Reserve Bank of St. Louis
CHAPTER 8
Review and OutlookECONOMIC DEVELOPMENTS IN 1981 reflected the inflationary
economic policies of more than a decade and the transitory effects ofreversing those policies. Past policies alternated periodically betweenshort-run efforts to reduce unemployment and short-lived attemptsto fight inflation. Economic forecasting, however, was not sufficientlyaccurate to produce finely tuned countercyclical policies that madeproper allowance for the lag between policy actions and their effects.Stimulative policies had relatively immediate effects on employment,followed by delayed effects in the form of higher inflation. Restrictivepolicies for fighting the inflation were not seen by the public as partof a credible long-term commitment and therefore were not expectedto be sustained. Consequently, they tended to have a more severeimpact on output and employment than on inflation. The result hasbeen a ratcheting-up in the trend rate of inflation from one cycle tothe next.
This legacy of stop-and-go policies prevented a direct move tolower inflation and higher real growth in 1981. During the first halfof 1980, restrictive policies—in the form of credit controls and asharp reduction in monetary growth—had produced a brief, sharp re-cession. The subsequent removal of these controls and a postwarrecord high rate of monetary growth then led to an unsustainablerate of economic expansion through early 1981.
OVERVIEW OF 1981
The historical patterns of monetary growth, inflation, and realoutput are shown in Chart 8-1. The average growth of money over5-year periods (solid line) has trended upward since the 1960s; this isreflected in the rising rate of inflation. The two-quarter growth rateof money (dashed line) has fluctuated sharply, compared to the un-derlying growth trend, and has contributed to rapid expansions andcontractions of real economic growth, after a one- or two-quarter lag.Variations in money growth result in changes in spending and nomi-nal income growth. During short periods, such changes show up aschanges in real income growth since inflation responds to moneygrowth only after a considerable lag.
192
Digitized for FRASER http://fraser.stlouisfed.org/ Federal Reserve Bank of St. Louis

Chart 8-1
Growth Rates of Money Stock, Real GNP,and GNP Deflator
PERCENT CHANGE (ANNUAL RATE)
1965 66
PERCENT CHANGE (ANNUAL RATE)
81
GNP IMPLICITPRICE DEFLATOR
.' ' 20-QUARTER GROW
/VREAL GNP
2-QUARTERGROWTH
-101965 66 67 68 69 70 71 72 73 74 75 76 77 78 79 80 81
NOTE.—BASED ON SEASONALLY ADJUSTED DATA. SHADED AREAS INDICATE RECESSIONSAS DEFINED BY THE NATIONAL BUREAU OF ECONOMIC RESEARCH.
SOURCES: DEPARTMENT OF COMMERCE AND BOARD OF GOVERNORS OF THE FEDERALRESERVE SYSTEM.
193Digitized for FRASER http://fraser.stlouisfed.org/ Federal Reserve Bank of St. Louis
This pattern held true in 1981 as well. In the last half of 1980 themoney stock, as measured by Ml, rose at a 12.9 percent annual rate,a postwar record. Then, in the first quarter of 1981, the rate ofgrowth in nominal gross national product (GNP) leaped by 19.2 per-cent, with growth in real output rising 8.6 percent. Money growth inthe first two quarters of 1981 receded to a 6.9 percent rate, followedby a further reduction to 3 percent in the final two quarters. Thesedecelerations in monetary growth led to a sharp decline in realoutput in the final quarter of the year.
Continued business investment demand and high inflation in early1981 sustained a rise in short-term interest rates, which peakedduring the spring. Long-term interest rates peaked in early fall.These increases had their most adverse effects on the most credit-sensitive industries—housing, consumer durables, and, to a lesserextent, business investment. The sharp reduction in money growth inthe summer and fall led to a sharp decline in total output and inter-est rates. By December 1981, short-term interest rates were about 5to 6 percentage points lower than in December 1980, while long-term interest rates were about one point higher.
The average level of real GNP in 1981 was 1.9 percent higher thanin 1980, but this increase for the year as a whole masked a pattern ofdeclining output for two of the final three quarters. After growing atan unsustainable rate in the first quarter, the economy remained on aplateau for a time: a modest annual rate of decline of 1.6 percent inthe second quarter and an increase of 1.4 percent in the third. In thefinal quarter the economy dropped sharply, with real GNP decliningat an annual rate of 5.2 percent.
The unemployment rate at the close of 1980 had been 7.3 percent,and it averaged around 7.4 percent through the first 9 months of1981. But the weakening of the economy in the last quarter broughtwith it a rapid increase in the unemployment rate to 8.8 percent inDecember. Civilian employment grew slowly, from 99.6 million atyear-end 1980 to over 101 million by May 1981, before dipping to99.6 million at year-end 1981.
Meanwhile, however, the deceleration in monetary growth began toproduce declining inflation in 1981. The growth of Ml slowed to 4.9percent during 1981, compared to an average growth rate of 7.8 per-cent over the previous 4 years. The GNP deflator advanced 8.6 per-cent through 1981, down from 9.8 percent during the four quartersof 1980, while the consumer and producer price indexes slowed moresharply. The producer price index for finished goods, which had risen12.4 percent during 1980, rose at a 10.1 percent annual rate in the firsttwo quarters of 1981 and at only a 4.4 percent rate in the last twoquarters.
194Digitized for FRASER http://fraser.stlouisfed.org/ Federal Reserve Bank of St. Louis

TABLE 8-1.—Performance in 1981 compared to January 15 projections
Item
Percent change:
Real GNPConsumer price index l
Level:
Unemployment rate (percent)
Projected Actual
Year to year
0.912,5
1.910.2
Year
7.8 7.6
Projected Actual
Fourth quarter tofourth quarter
1.712.6
0.79.4
Fourth quarter
7.7 8.3
1 Consumer price index for urban wage earners and clerical workers.Sources: Actual data: Department of Commerce (Bureau of Economic Analysis) and Department of Labor (Bureau of Labor
Statistics); projected data.- Office of Management and Budget (January 15, 1981).
As shown in Table 8-1, the average performance of the economyin 1981 was better than had been predicted by the prior Administra-tion. Actual real GNP in 1981 was 1.9 percent higher than in 1980,compared with a 0.9 percent growth rate forecast by the prior Ad-ministration. Consumer prices in 1981 exceeded their 1980 level by10,2 percent, but this was significantly less than the 12.5 percent rateof inflation that had been forecast. In addition, the average rate ofunemployment for 1981 turned out to be 0.2 percentage point lessthan had been forecast. However, real growth from the fourth quar-ter of 1980 to the fourth quarter of 1981 was lower than forecast,and unemployment in the fourth quarter of 1981 was greater thanforecast as a result of the decline in output and employment late inthe year.
Although the Administration was able to effect some reductions inthe growth of Federal spending in fiscal 1981, such spending as ashare of GNP continued to rise. In nominal terms, Federal spendinggrowth (including off-budget outlays) in 1981 slowed to 14.8 percent,from 17.4 percent in fiscal 1980, one of the largest peacetime in-creases in history.
The real Federal tax burden was increased by the scheduled pay-roll tax increase on January 1, 1981, and the tax burden driftedupward during most of the year as inflation contributed to highernominal incomes and rising marginal tax rates. The Economic Recov-ery Tax Act of 1981, however, provided an initial 5 percent cut inmarginal tax rates for individuals, effective October 1. This had theeffect of reducing marginal tax rates by only 1*/4 percent over the full1981 tax year, not large enough to prevent a substantial increase inthe total tax burden. For business, however, many of the changes inthe tax code were retroactive to the beginning of the year.
Since tax revenues as a share of GNP will decline by about 2 per-centage points over the next few years and budget outlays will notyet have been reduced as much, large Federal budget deficits can beexpected unless the growth of Federal spending is reined in even
195
Digitized for FRASER http://fraser.stlouisfed.org/ Federal Reserve Bank of St. Louis

more. The possibility of large deficits received much attention in thefinancial markets during 1981. The concern was that these deficitsmight engender an acceleration of inflation and higher interest rates.Fear of inflation kept long-term interest rates at high levels, althoughsome decline did occur in the final months of the year.
In the climate of high interest rates, investments in money-marketfunds provided savers with some of the highest yields in history.Many thrift institutions were not able to compete successfully for de-posits, and the resulting outflow of funds contributed to a reductionin the availability of mortgages and construction financing. Mortgagerates on new homes remained above 15 percent throughout 1981. Inconsequence, home sales and housing starts were among theirpostwar lows. The motor vehicle industry also suffered from the highcost of credit.
MAJOR SECTORS OF AGGREGATE DEMAND
Mirroring the small expansion in real output during 1981 was theslow expansion in the real growth of consumer expenditures (1.2percent), business fixed investment (1.4 percent), and total govern-ment purchases (1.2 percent). Purchases of consumer durablesdeclined 4.4 percent, partially offsetting modest gains in purchases ofother consumer items. As shown in Table 8-2, residential constructiondecreased by a dramatic 21.9 percent. Net exports also declined lastyear, as real exports declined 1.0 percent while imports increased 9.5percent.
TABLE 8-2.—Growth in major components of real gross national product, 1977-81
[Change, fourth quarter to fourth quarter]
Component
Percent change:
Real gross national product .... . .
Personal consumption expendituresBusiness fixed investmentResidential fixed investmentGovernment purchases of goods and services
FederalState and local
Real domestic final sales 2
Change in billions of dollars:
Inventory investment . . .Net exports of goods and services . .
1977
58
501351253.6
5.02.7
59
5.9-55
1978
5.3
4890- 01.6
-1.33.3
44
2.312.6
1979
1.7
2029
-611.9
2.11.7
1.7
-11.311.7
1980
=0.3
.6=-43
-1291.6
4.1.1
-.3
=6.56.3
198 11
0,7
1214
2191.2
6.6-2.0
4
15.7-118
1 Preliminary.2 GNP excluding change in business inventories and net exports of goods and services.
Source: Department of Commerce, Bureau of Economic Analysis.
196
Digitized for FRASER http://fraser.stlouisfed.org/ Federal Reserve Bank of St. Louis
PERSONAL CONSUMPTION EXPENDITURES
Although the rising costs of borrowing discouraged purchases ofconsumer durables, growth in personal income was sufficient to sus-tain purchases of nondurables and services. The latter categoriesmanaged to show a modest increase for the year. But durables pur-chases (approximately 20 percent of which are expenditures on newautos) exhibited sharp swings from quarter to quarter, with thefourth quarter level 4.4 percent below the same quarter in 1980. Theslow pace of durables purchases ensured a modest improvement inthe consumer debt burden, as the ratio of consumer installmentcredit to personal income declined from its recent peak in May 1979of 14.9 percent to 13.2 percent in November. The personal saving rate,after dropping one-half of a percentage point to 4.6 percent in the firstquarter, recovered somewhat in the next two quarters and rose sharplyto 6 percent in the final quarter of the year.
Real expenditures on consumer durables declined for the thirdconsecutive year. The pace of durables purchases had been stalled bythe imposition of credit controls in the first half of 1980, but re-bounded sharply in the last two quarters of 1980 and the first quarterof 1981. Then came the termination of rebates on auto sales and rap-idly rising interest rates, resulting in a sharp 23.3 percent reductionin durables purchases at an annual rate in the second quarter. Amoderation in interest rates in the third quarter, in conjunction withfactory subsidized financing and further rebates, then helped to stim-ulate auto sales, allowing outlays for consumer durables to rise mod-erately. Although the fourth quarter saw a significant drop in interestrates, it was not enough to boost total durables purchases. The resultwas another steep decline in such purchases, this time at a 19.2 per-cent annual rate.
At the beginning of 1981 new cars were being sold at an annualrate of about 10 million units, some of this relatively high volumebeing attributable to manufacturers' rebates. In the second quartersales dropped to an annual rate of 7.8 million units; they then rose to9.1 million units in the third quarter, before falling to 7.4 millionunits in the final quarter. Sales of American cars accounted for about73 percent of all U.S. car sales for the year. In order to defuse pro-tectionist pressures in the United States, the Japanese government in-stituted an export restraint program, which limited Japanese car ex-ports to the United States to 1.68 million units during its first year.Because of the weak U.S. market, however, the limit probably has notbeen binding.
197
Digitized for FRASER http://fraser.stlouisfed.org/ Federal Reserve Bank of St. Louis
RESIDENTIAL INVESTMENT
Investment in residential structures during 1981 continued a de-cline that started in 1979. The decline was evident in the construc-tion of both single-family homes and multiple units. By the fourthquarter of 1981, starts of new single-unit structures had declined44.8 percent below their year-earlier level, and multiple-unit con-struction declined 34.5 percent. In the last quarter of 1981 the inven-tory of new private homes waiting to be sold was about eight timesthe monthly sales pace. During the latter half of the 1970s the inven-tory-sales ratio typically was less than that, approximately six timessales.
The continued slow pace of residential construction was primarilydue to tightness in the financial markets in which the housing indus-try competes for funds. Mortgage rates on new homes rose to over18 percent in October, up from 15 percent at the beginning of theyear. By year-end, however, the rate had fallen to 17 percent.
Home purchase prices were essentially unchanged during 1981.Thus, there was a significant decrease in the real price of housing—that is, housing prices in relation to the general price level. In con-trast the rapid increase in house prices from 1977 to 1980 had re-flected rising expectations about inflation and a growing tendency toview real estate as a good hedge against inflation.
BUSINESS FIXED INVESTMENT
Real business fixed investment finished the year above the previousyear's fourth quarter level. This fact, however, masks the underlyingvariations that occurred during the year. Business investment variedfrom quarter to quarter in the same direction as real GNP, but thepercentage deviations were much larger. Real business investmentrose at a 13.3 percent annual rate in the first quarter of 1981, re-mained relatively flat in the second and third quarters, and then fell10.9 percent in the fourth quarter.
Producers' durable equipment was responsible for most of the vari-ation in business fixed investment, with fleet sales of cars and trucksaccounting for a large part of this instability. The structures compo-nent of investment maintained a steady increase that began in thefourth quarter of 1980. Though investment in structures is less thanhalf as large as investment in producer's durable equipment, its in-crease of 7.5 percent from the fourth quarter of 1980 to the fourthquarter of 1981 more than offset the decline in the latter, allowing amodest increase in total real business investment.
198
Digitized for FRASER http://fraser.stlouisfed.org/ Federal Reserve Bank of St. Louis
INVENTORY ACCUMULATION
Inventory levels at the start of 1981 were lean. Real business in-ventory levels in the fourth quarter of 1980, after declining for fourof the five previous quarters, were equivalent to 2.7 months ofoutput. In the first quarter of 1981, real output rose to nearly matchfinal sales so that the real level of inventories declined only $1.4billion at an annual rate. In the second quarter inventory accumula-tion was led by a rise in new car inventories, and there was also somebuildup in other stocks in the third quarter. The speed with whichoutput declined in the fourth quarter prevented an excessive accumu-lation of stocks at year-end.
NET EXPORTS
Economic growth abroad was subdued during 1981, contributingto a small decline in real exports from the United States. In contrastto 1980, the volume of non-oil imports grew briskly during the yeardue in part to the steady appreciation of the dollar from the latterpart of 1980 through August 1981. For the year as a whole, net ex-ports (measured in 1972 dollars) slipped $7.7 billion below the levelof 1980.
Measured in current dollars, the merchandise trade deficit (NIPAbasis) increased $4.2 billion from the $27.7 billion registered for1980. Merchandise exports increased moderately in the first quarterand then declined to post a small gain for the year, while merchan-dise imports rose during most of the year. Growth in the value ofagricultural exports was weak, as a strong U.S. dollar and better har-vests abroad dampened foreign demand. The strong growth in thevalue of imports of nonpetroleum products was only partly offset bya drop in imports of petroleum and related products. Average net oilimports in the first three quarters of 1981 fell to their lowest levelsince 1972, partly as a result of reduced domestic consumption.That, in turn, was due primarily to higher oil prices.
Net service inflows for 1981 increased $4.8 billion over 1980 to$55.8 billion. Almost all of this increase was due to a rise in net re-ceipts of factor income. This continued strong performance on theservice account produced an overall net export surplus for 1981 of$23.8 billion in current dollars.
THE FARM ECONOMY
Record large crops, sluggish demand for farm products, high inter-est rates, and a nearly constant tonnage of agricultural exports limit-ed the recovery of farm incomes and created cash flow problems forsome farmers during 1981. In nominal terms, farm exports totaled a
199
Digitized for FRASER http://fraser.stlouisfed.org/ Federal Reserve Bank of St. Louis

record $43 billion in 1981; however, the tonnage of farm exports forthe year was about the same as in 1980.
According to Department of Agriculture forecasts, net farm incomefor 1981 in current dollars will be approximately $23 billion. Thisfigure is about $3 billion higher than the comparable income figurefor 1980, but approximately $10 billion lower than the total for 1979,which was a prosperous year for U.S. farmers. For 1981, real netfarm income is forecast to exceed the 1980 total by about 4 percent.The value of large crop inventories, which is reflected in the 1981income figures, accounts for part of the increase.
Large grain stocks and weakness in the demand for certain live-stock and crop products are expected to exert downward pressure onfarm prices and net farm incomes during much of the first half of1982, but the expected recovery of the economy should expand thedemand for farm products during the final two quarters of 1982.Also, farm price support payments provided under the Agricultureand Food Act of 1981 will supplement the incomes of farmers during1982.
The statistics on aggregate farm income mask how different groupsof farmers fared during 1981. Farmers carrying small amounts ofdebt experienced a less severe cash flow squeeze than highly lever-aged operators. Many in the latter group had cash flow problems be-cause of high interest rates and lower commodity prices. However,some farmers who experienced cash flow problems used equity accu-mulated from rapid appreciation of their farmland to refinance theiroperations. As usual, income earned by farmers from off-farmsources, which recently has comprised over 60 percent of the averagefarmer's income and a substantially larger share of the income ofsmall farmers, supplemented farm incomes.
Food prices generally exerted a moderating influence on the con-sumer price index during 1981, although two minor supply shocksproduced temporary increases in food prices. The first was a mid-January freeze in Florida, which pushed up prices for citrus productsand tomatoes last winter and spring. The second was a reduction inmeat supplies during the summer. Food prices for the fourth quarterof 1981 were 5.0 percent higher than in the fourth quarter of 1980.This increase was 5.2 percentage points less than the comparableyear earlier figure.
The moderate increases in food prices largely reflected supply phe-nomena. Supplies of many raw food products, including poultry,dairy products, sugar, and grain were abundant during 1981, as werebeef supplies during the first half of the year. Data available so farsuggest that marketing costs, which account for about two-thirds of
200
Digitized for FRASER http://fraser.stlouisfed.org/ Federal Reserve Bank of St. Louis
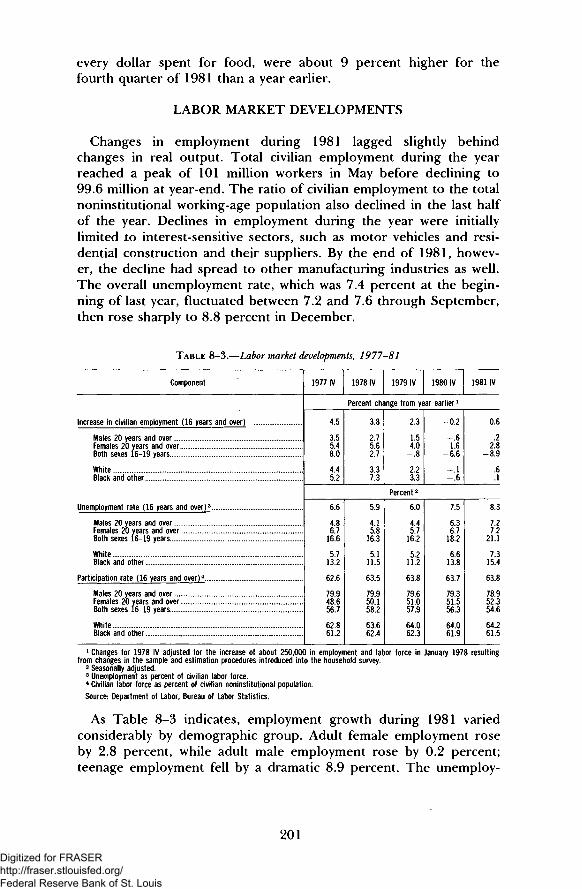
every dollar spent for food, were about 9 percent higher for thefourth quarter of 1981 than a year earlier.
LABOR MARKET DEVELOPMENTS
Changes in employment during 1981 lagged slightly behindchanges in real output. Total civilian employment during the yearreached a peak of 101 million workers in May before declining to99.6 million at year-end. The ratio of civilian employment to the totalnoninstitutional working-age population also declined in the last halfof the year. Declines in employment during the year were initiallylimited to interest-sensitive sectors, such as motor vehicles and resi-dential construction and their suppliers. By the end of 1981, howev-er, the decline had spread to other manufacturing industries as well.The overall unemployment rate, which was 7.4 percent at the begin-ning of last year, fluctuated between 7.2 and 7.6 through September,then rose sharply to 8.8 percent in December.
TABLE 8-3.—Labor market developments, 1977-81
Component
Increase in civilian employment (16 years and over)
Males 20 years and over .Females 20 years and over .Both sexes 16-19 years..
WhiteBlack and other .
Unemployment rate (16 years and over)3
Males 20 years and overFemales 20 years and overBoth sexes 16-19 years
WhiteBlack and other
Participation rate (16 years and over)4
Males 20 years and overFemales 20 years and overBoth sexes 16-19 years
WhiteBlack and other f
1977 IV 1978 IV 1979 IV 1980 IV 1981 IV
Percent change from year earlier 1
4.5
3.55.48.0
4.45.2
3.8
2.75.62.7
3.37.3
2.3
1.54.0-.8
2.23.3
-0.2
-.61.6
-6.6
-.1-.6
0.6
.22.8
-8.9
.6
.1
Percent 2
6.6
4.86.7
16.6
5.713.2
62.6
79.948.656.7
62.861.2
5.9
4.15.8
16.3
5.111.5
63.5
79.950.158.2
63.662.4
6.0
4.45.7
16.2
5.211.2
63.8
79.651.057.9
64.062.3
7.5
6.36.7
18.2
6.613.8
63.7
79.351.556.3
64.061.9
8.3
7.27.2
21.1
7.315.4
63.8
78.952.354.6
64.261.5
1 Changes for 1978 IV adjusted for the increase of about 250,000 in employment and labor force in January 1978 resultingfrom changes in the sample and estimation procedures introduced into the household survey.
2 Seasonally adjusted.3 Unemployment as percent of civilian labor force.4 Civilian labor force as percent of civilian noninstitutional population.
Source: Department of Labor, Bureau of Labor Statistics.
As Table 8-3 indicates, employment growth during 1981 variedconsiderably by demographic group. Adult female employment roseby 2.8 percent, while adult male employment rose by 0.2 percent;teenage employment fell by a dramatic 8.9 percent. The unemploy-
201
Digitized for FRASER http://fraser.stlouisfed.org/ Federal Reserve Bank of St. Louis
ment rate for adult men, who tend to work in disproportionate num-bers in cyclically sensitive industries, rose from 6.1 percent in De-cember 1980 to 7.9 percent in December 1981. The unemploymentrate for adult women, who work in industries that exhibit more cycli-cal stability, rose 0.7 of a point, from 6.7 percent to 7.4 percent,during the same period. The teenage unemployment rate increased,from 17.8 percent to 21.5 percent, over the year.
The age-sex composition of the unemployed depends on the un-employment rates of different demographic groups and on theirshare of the total labor force. Teenagers, for instance, have relativelyhigh unemployment rates, but in December 1981 they comprisedonly 7.9 percent of the labor force. Adult men have relatively low un-employment rates, but in 1981 they constituted 52.8 percent of thelabor force. Thus, 19.4 percent of the unemployed in December1981 were teenagers, 47.5 percent were adult men, and 33.2 percentwere adult women.
The unemployment insurance system is designed to moderate thefinancial burden placed on experienced workers who lose their jobsby providing income until they can find employment. However, thesystem does not cover recent entrants to the labor market or workerswho quit their jobs voluntarily. In December 1981 the number of in-dividuals receiving unemployment compensation was 41 percent ofthe total unemployed. This was partly because 44.2 percent of theunemployed had left their jobs voluntarily or had no recent work ex-perience. Over two-thirds of the people who had lost their jobs invol-untarily were receiving unemployment benefits.
The percentage of take-home pay replaced by unemploymentbenefits varies widely according to an individual's weekly earnings,marginal tax rate, and State of residence. Replacement rates are gen-erally higher for lower paid workers than for higher paid workers.However, several studies suggest that the average replacement rate isabout one-half of take-home pay.
A combination of cyclical and secular trends produced disparatechanges in labor force participation rates during 1981. Labor forceparticipation rates continued to increase for adult women, and by thefourth quarter 52.3 percent of all women 20 or older were in the ci-vilian labor market, an increase of 0.8 of a percentage point over 1980.Meanwhile, the labor force participation rates of adult men continuedtheir long-term downward trend.
The ratio of civilian employment to the total working-age popula-tion varied inversely with the unemployment rate. The number ofemployed rose from 58.3 percent of the noninstitutional populationin December 1980 to 58.8 percent in May 1981, but fell to 57.5 per-cent in December. Although this percentage was less than the lastpeak of 59.3 percent, reached in the fourth quarter of 1979, it ex-ceeded the previous 1973 peak (Chart 8-2).
202
Digitized for FRASER http://fraser.stlouisfed.org/ Federal Reserve Bank of St. Louis

Chart 8-2
Employment Ratio and Unemployment Rate
PERCENT PERCENT
1961
1 EMPLOYMENT AS PERCENT OF NONINSTITUTIONAL POPULATION.2 UNEMPLOYMENT AS PERCENT OF CIVILIAN LABOR FORCE.
NOTE. —DATA RELATE TO PERSONS 16 YEARS OF AGE AND OVER; SEASONALLY ADJUSTEDQUARTERLY AVERAGES.
SOURCE: DEPARTMENT OF LABOR.
WAGES, PRICES, AND PRODUCTIVITY
Wage increases showed moderation in 1981. As indicated in Table8-4, the average hourly earnings index, compensation per hour, andwages set in larger collective bargains slowed significantly, while theemployment cost index increased at about the same rate as in 1980.
TABLE 8-4.—Measures of compensation, 1978-81
[Percent change, fourth quarter to fourth quarter, except as noted]
Measure
Employment cost index2
UnionNonunion
Average hourly earnings index4
Compensation per hour5
Wage changes in large collective bargaining agreements (total effective adjustment)
1 Preliminary.2 Data are for wages and salaries of all private nonfarm workers.
1978
7 7
8076
84
90
8.2
1979
87
9085
80
99
9.1
1980
90
10980
96
102
9.9
1981 *
39 1
3 9 938 8
83
93
9.1
3Changes are from third quarter to third quarter.4 Data are not seasonally adjusted.5 Data are for private business sector, all employees.
Source: Department of Commerce (Bureau of Economic Analysis), Department of Labor (Bureau of Labor Statistics), andCouncil of Economic Advisers.
203
Digitized for FRASER http://fraser.stlouisfed.org/ Federal Reserve Bank of St. Louis

Labor productivity declined by 0.5 percent during 1981 (Table 8-5). This was the fourth successive year of little change in productiv-ity. Chapter 5 has discussed various reasons for the disappointingtrends in productivity over the last decade. In addition, during thelast 3 years, total output growth has been low, which has also tended todepress productivity performance. The near-zero productivity resultmeant that unit labor costs, the largest single cost in production, hadto increase roughly one-for-one with total compensation last year.
TABLE 8-5.—Changes in productivity and unit labor costs, 1977-81
[Percent change, fourth quarter to fourth quarter]
Item
Output per hour
Unit labor costs
1977
21
5.2
1978
-05
9.5
1979
-06
10.5
1980
02
9.9
1981 1
-05
9.8
1 Preliminary.
Note.—Data relate to private business sector, all employees.
Sources: Department of Labor (Bureau of Labor Statistics) and Council of Economic Advisers.
During a year in which unit labor costs rose by 9.8 percent, pricescould not rise at a substantially lower rate without sharply squeezingprofits. The GNP deflator rose by 8.6 percent during 1981, some-what lower than the 9.8 percent increase experienced during 1980(Table 8-6).
TABLE 8-6.—Measures of price change, 1977-81
[Percent change, fourth quarter to fourth quarter]
Item
Implicit price deflators.-2
Gross national productPersonal consumption expenditures-Private nonfarm business output
Consumer prices:
CPI-U, X-l
CPI-U
Farm value of foodEnergy3
Home purchase and finance4
All other
Producer prices of finished goods ..
FoodEnergyAll other
1977
6.1595.7
6.2
6.6
6482896.1
71
7.711064
1978
8.5788.3
7.8
9.0
17575
1347.5
88
11.17480
1979
8.1958.3
106
12.7
7336519880
128
7656994
1980
9.8101100
108
126
13518917898
124
8329211 1
1981 »
867893
88
96
5212611992
72
1815276
1 Preliminary.2 Seasonally adjusted data.3 Includes only prices for direct consumer purchases of energy for the home and for motor vehicles.4 Consists of home purchase and financing, taxes, and insurance on owner-occupied homes.
Sources: Department of Agriculture, Department of Commerce (Bureau of Economic Analysis), and Department of Labor(Bureau of Labor Statistics).
204
Digitized for FRASER http://fraser.stlouisfed.org/ Federal Reserve Bank of St. Louis

The deflator for personal consumption expenditures rose only 7.8percent last year, down significantly from the year before. Inflation,as measured by the consumer price index for urban workers (CPI-U),declined even more, from 12.6 percent during 1980 to 9.6 percentduring 1981. The CPI-U is widely recognized as having an upwardbias in a period of rising mortgage interest rates, due to its treatmentof owner-occupied housing. Some of the components that are usedto measure the cost of homeownership—finance, insurance, andtaxes—jumped quite sharply during much of 1981. An alternativemeasure of consumer prices known as "CPI-U, X-l" more appropri-ately measures the consumer cost of owner-occupied homes. It ad-vanced only 8.8 percent. In late 1981 the Bureau of Labor Statisticsannounced plans to incorporate this alternative method of measuringthe rise or fall in homeowner costs into the index. As shown in Table8-7, real compensation per hour, computed on the basis of either thedeflator for personal consumption expenditures or the alternative CPImeasure, rose in 1981 after declining for 2 straight years.
TABLE 8-7.—Alternative measures of changes in real earnings per hour, 1979-81
[Percent change, fourth quarter to fourth quarter]
Item
Average hourly earnings index:
Deflated by:CPI-U..CPI-U, X-lFixed-weight price index for personal consumption expenditures (PCE).
Compensation per hour: 2
Deflated by:CPI-UCPI-U, X-lFixed-weight price index for PCE
1979
-4.2-2.4-2.1
-25-.7_ 4
1980
-2.6-1.1-.9
-21-.6_ 4
1981 1
-1.1-.5
.2
_ 2.4
1 1
1 Preliminary.2 Data are for the private nonfarm business sector, all employees.
Sources: Department of Commerce (Bureau of Economic Analysis) and Department of Labor (Bureau of Labor Statistics).
CREDIT MARKETS
During the first three quarters of 1981, total funds raised in U.S.credit markets rebounded from the depressed levels of a year earlier,when credit controls and the recession restrained borrowing. Never-theless, borrowing by all private domestic nonfinancial sectors re-mained well below the pace reached in 1979. High interest rates dis-couraged borrowing for purchases of consumer durables and housingand resulted in a rate of household debt accumulation, although upfrom 1980, only about three quarters of that experienced in 1979.Borrowing by the nonfinancial business sector grew only modestly
205358-691 0 - 8 2 - 1 4 QL3
Digitized for FRASER http://fraser.stlouisfed.org/ Federal Reserve Bank of St. Louis

during the first three quarters of 1981. This sector relied heavily onshort-term financing, as extremely high and rising long-term bondrates restrained net bond issues to only half the total of the previousyear. As a result, bank loans to businesses and the volume of out-standing commercial paper surged.
Borrowing by State and local governments declined modestly in1981, as growth of expenditures slowed relative to tax receipts. How-ever, Federal Government borrowing was up from 1980, and at morethan double the rate of 1979. Federal borrowing totaled $79.3 bil-lion, of which approximately $55.6 billion was used to finance ex-penditures on goods and services or transfer payments, while the restwas used for relending. Federally guaranteed loans declined in 1981,but borrowing by federally sponsored enterprises grew by almosttwo-thirds. Overall Federal participation in the credit markets rose toapproximately the level of the previous peak in 1976.
INTEREST RATES AND MONETARY DEVELOPMENTS
One of the four key elements of the Administration's program issupport for a policy of continued gradual reductions in the rate ofmonetary growth to bring down inflation. This restraint was moreimportant to the 1981 economy than other features of the Adminis-tration's program, which are aimed at encouraging long-term growth.From the fourth quarter of 1979 to the fourth quarter of 1980, Ml(currency plus checkable deposits) grew at a 7.3 percent annual rate.The Administration assumes a gradual but steady reduction in thegrowth of money to one-half that rate by 1986. After a period of ad-justment, sustained declines in inflation and nominal interest ratesare expected.
Federal Reserve policy in 1981 did produce a substantial reductionin monetary growth (as measured by Ml) on a fourth-quarter tofourth-quarter basis—from 7.3 percent during 1980 to 4.9 percent in1981. Nonetheless, interest rates remained high on average. Theyield on 3-month Treasury bills, which had averaged 15.5 percent inDecember 1980, fell in early 1981, then rose again and peaked at16.3 percent in May 1981. The prime rate charged by commercialbanks declined from a peak of 21.5 percent in January 1981 to 17percent in April 1981 before rising again to 20.5 percent by the end ofMay. By year-end, the prime rate had declined to 15.75 percent.Given that prices were advancing at somewhat less than double-digitrates, real short-term interest rates (that is, adjusted for inflation)were unusually high during most of 1981 (Chart 8-3).
206Digitized for FRASER http://fraser.stlouisfed.org/ Federal Reserve Bank of St. Louis

Chart 8-3
Interest Rates in 1981PERCENT PER ANNUM
22
20
18
16
14
12
10 _
I I I I I I I I I I I I I I I I I I I I I I I I I I I I I I I II I I I I I I I I I I I I I I I I I I >JAN FEB MAR APR MAY JUN JUL AUG SEP OCT NOV DEC
1981
SOURCES: DEPARTMENT OF THE TREASURY AND BOARD OF GOVERNORS OF THE FEDERALRESERVE SYSTEM.
When allowance is made for the effects of taxes on interest rates,the high average level of short-term rates becomes more understan-dable. In an environment of high expected inflation, interest ratestend to rise sufficiently to compensate lenders for the anticipated lossin purchasing power of their money. Under the U.S. tax system, in-terest payments are deductible, and interest receipts are taxed as or-dinary income. We would expect market interest rates to exceed agiven real after-tax interest rate by .more than the expected inflation.For example, if the real after-tax interest rate is 3 percent and theapplicable income tax rate is 30 percent, an expected inflation rate of10 percent would tend to produce a nominal interest rate of 19 per-cent—not very different from the peaks in short-term rates actuallyexperienced in 1981. Viewed in this light, the question is not whyshort-term interest rates were so high in 1981, but why they were solow in the 1970s.
At least a partial answer to this question is that in the 1970s lowState usury and Regulation Q, ceilings prevented the effects of ex-pected inflation from being fully reflected in interest rates, while theinflation that actually occurred was probably more than had been an-ticipated. Also, the oil price shocks of the 1970s, coupled with in-
30-YEAR GOVERNMENTBONDS
(CONSTANT MATURITIES)
207
Digitized for FRASER http://fraser.stlouisfed.org/ Federal Reserve Bank of St. Louis

creasing regulatory and tax burdens, may have reduced the expectedreal return on capital. With the change in the investment outlookbrought about by the Administration's program, this negative influ-ence on real interest rates began to disappear. However, as the Fed-eral Reserve's program of bringing down the rate of monetarygrowth succeeds in reducing current and expected rates of inflation,nominal interest rates will fall somewhat more than the expected rateof inflation, even as real after-tax interest rates rise somewhat.
INTERNATIONAL CAPITAL FLOWS
High real returns on U.S. securities helped to attract foreign in-vestment to the United States during 1981. The dollar's foreign ex-change value rose 23 percent on a trade-weighted average basis fromJanuary through August before falling back slightly through December.Net foreign private purchases of U.S. securities during the first threequarters of 1981 totaled $8.3 billion, an increase of 68 percent overthe same period a year earlier. A large part of this increase was inpurchases of U.S. stocks, possibly suggesting confidence abroad inthe medium-term potential of U.S. industry and the Administration'sprogram.
Direct U.S. investment abroad in the first three quarters of 1981slowed somewhat from its 1980 rate, making 1981 the second year ofdecline. The drop was due in part to sluggish foreign economic activ-ity. In contrast, foreign direct investment in the United States re-mained strong during 1981 and may have approached the record levelsof 1979.
Monetary flows associated with official transactions between theUnited States and other industrialized countries swung from a mod-erate net inflow in late 1980 to a substantial net outflow in the firstthree quarters of 1981. These net outflows primarily reflected salesof dollar-denominated assets by foreign central banks (mainly U.S.Treasury securities) related to intervention in foreign exchange mar-kets. Changes in official U.S. reserve assets moved from net acquisi-tions of foreign currencies in late 1980 and the first quarter of 1981to negligible acquisitions from the second quarter on. This reflectedthe decision by this Administration to adopt a policy of noninterven-tion in foreign exchange markets, except in conditions of severe dis-order. (The issues involved in this policy are discussed in Chapter 7.)
Net capital flows between the United States and the Organizationof Petroleum Exporting Countries (OPEC) recently have beenquite stable relative to flows between the United States and theindustrialized countries. The capital movements between the OPECcountries and the United States have been net inflows since early1979 and generally have taken the form of investments in U.S. Treas-
208
Digitized for FRASER http://fraser.stlouisfed.org/ Federal Reserve Bank of St. Louis

ury securities, although investments in real estate and energy-relatedindustries have risen during the past year.
THRIFT INSTITUTIONS
High interest rates and regulatory restrictions had an adverse effecton thrift institutions in 1981. From November 1980 to November1981, the net worth of thrifts dropped over $5.7 billion, or approxi-mately 13 percent. Net new deposits also declined.
In response to the plight of the thrift institutions, the Congress in-cluded in the Economic Recovery Tax Act a provision authorizingthose institutions, as well as commercial banks, to issue All-SaversCertificates. The certificates were given tax-exempt status so as toprovide thrifts and banks with a lower cost of funds. From Octoberto December, the first 3 months of issuance, thrift institutions issuedapproximately $24 billion in certificates. Their impact on the net de-posit inflows of the thrifts is in some doubt, however, since the avail-ability of the certificates caused some savers to transfer funds fromother thrift accounts, such as passbook savings, 6-month money-market certificates, and small savers' certificates.
Meanwhile, delinquent loans rose and liquidity ratios for insuredsavings and loans deteriorated. The delinquent loan ratio—the dollaramount of mortgage loans and contracts delinquent 60 days or moreas a percentage of total mortgages and contracts held at the end ofeach month—increased steadily last year. The ratio rose from justover 1 percent in late 1980 to almost P/2 percent in late 1981. Theliquidity ratio—cash and other liquid assets as a percent of savingsdeposits plus loans payable in a year or less—declined from almost 9percent to about 8.5 percent in late 1981. The deterioration of theseratios was not surprising in light of historically high inflation and in-terest rates and the weakness of the economy in the past couple ofyears. The financial condition of thrift institutions can be expected toimprove substantially, however, as inflation expectations and interestrates fall and financial asset prices rise.
PROSPECTS FOR 1982 AND 1983
The current recession is expected to end early in 1982, followedby a resumption of growth by mid-year. The moderating pattern ofprice increases which began last year should become more general-ized and significant this year. With money growth expected to bemoderate, the extent of the deceleration of inflation will become thecritical factor in sustaining economic recovery beyond 1982. Apartfrom the very high rate of expected inflation reflected in current in-
209
Digitized for FRASER http://fraser.stlouisfed.org/ Federal Reserve Bank of St. Louis
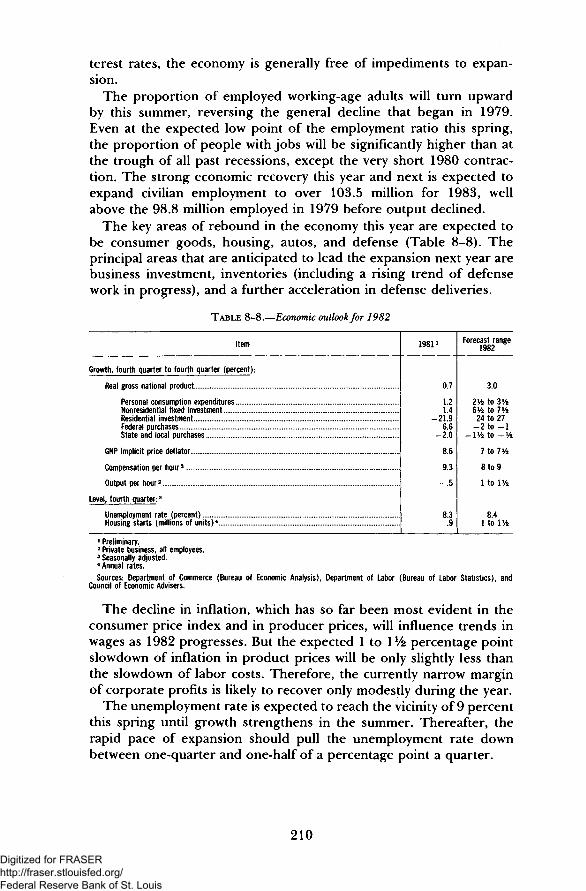
terest rates, the economy is generally free of impediments to expan-sion.
The proportion of employed working-age adults will turn upwardby this summer, reversing the general decline that began in 1979.Even at the expected low point of the employment ratio this spring,the proportion of people with jobs will be significantly higher than atthe trough of all past recessions, except the very short 1980 contrac-tion. The strong economic recovery this year and next is expected toexpand civilian employment to over 103.5 million for 1983, wellabove the 98.8 million employed in 1979 before output declined.
The key areas of rebound in the economy this year are expected tobe consumer goods, housing, autos, and defense (Table 8-8). Theprincipal areas that are anticipated to lead the expansion next year arebusiness investment, inventories (including a rising trend of defensework in progress), and a further acceleration in defense deliveries.
TABLE 8-8.—Economic outlook for 1982
Item
Growth, fourth quarter to fourth quarter (percent):
Real gross national product . . . . . . . . . . . . . .
Personal consumption expendituresNonresidential fixed investmentResidential investmentFederal purchasesState and local purchases . .
GNP implicit price deflator
Compensation per hour2
Output per hour2
Level, fourth quarter: 3
Unemployment rate (percent)Housing starts (millions of units)4
1981 »
0.7
1214
-21966
-20
86
9.3
_ 5
83.9
Forecast range1982
3.0
2Vfe to 31/2BVz to 7V224 to 27-2 to -1
— IVfe to —¥2
7 to 7V2
8 to 9
1 tO 1V2
841 to 1V2
1 Preliminary.2 Private business, all employees.3 Seasonally adjusted.4 Annual rates.
Sources: Department of Commerce (Bureau of Economic Analysis), Department of Labor (Bureau of Labor Statistics), andCouncil of Economic Advisers.
The decline in inflation, which has so far been most evident in theconsumer price index and in producer prices, will influence trends inwages as 1982 progresses. But the expected 1 to l*/2 percentage pointslowdown of inflation in product prices will be only slightly less thanthe slowdown of labor costs. Therefore, the currently narrow marginof corporate profits is likely to recover only modestly during the year.
The unemployment rate is expected to reach the vicinity of 9 percentthis spring until growth strengthens in the summer. Thereafter, therapid pace of expansion should pull the unemployment rate downbetween one-quarter and one-half of a percentage point a quarter.
210
Digitized for FRASER http://fraser.stlouisfed.org/ Federal Reserve Bank of St. Louis
The growth in household consumption was restrained last year byhigh interest rates as well as by modest income growth. By the lastquarter of 1981, consumption was approximately 1 percent higher inreal terms than a year earlier, and new auto sales had fallen to anannual rate of 7.4 million. The decline in interest rates that beganlast fall, and improvements in household financial positions due tothe reduced consumer debt burden and the first step of the personaltax cut, should lead to increased consumption early this year. Thesecond step of the tax cut and the scheduled step-up in social secu-rity benefits will raise household disposable income roughly 2 per-cent this summer. It is difficult to predict how much of this increasewill be allocated to saving or consumption. If between one-quarterand one-half of it is saved and the remainder is spent, the addition tothe growth rate of consumption in the second half of this year wouldbe about 3 percent at an annual rate. A large share of this would beexpected to be used for the purchase of durables, whose annualgrowth rate in the second half is projected to approach 10 percent.
The recent improvement in early indicators of housing activitypresages a rapid recovery that should be apparent by spring andproceed through the year. In 1980 the decline in housing early in theyear was quickly reversed, and the ensuing recovery was quite rapid.Though the second reversal in the housing industry in as many yearshas forced some builders out of business, a rapid expansion this yearis still possible. The necessary capital equipment remains, and addi-tions to the stock of construction equipment and tools can be maderapidly. Though the supply of unsold homes relative to monthly salesis large, the absolute number of available new homes is not. Hence,rising sales will quickly generate faster building activity. While hous-ing starts for 1982 as a whole may only exceed last year's by 10 per-cent, the increase during the year could exceed 50 percent. Thiswould raise the pace of new housing starts from about 900,000 at anannual rate for the last quarter of 1981 to the vicinity of 1.5 millionby the end of this year.
Business fixed investment has been maintained at a reasonablyhigh level during the past year. The stimulus of the Accelerated CostRecovery System depreciation package should make itself felt whenrecovery begins. Since businesses have not allowed inventories tobuild by large amounts, stepped-up sales this spring and summer willtranslate quite directly into rising output.
The Administration's program of strengthening U.S. defense capa-bilities will continue to be reflected in the overall economy as 1982progresses. Deliveries of defense goods and services in real terms will
211
Digitized for FRASER http://fraser.stlouisfed.org/ Federal Reserve Bank of St. Louis
rise about 8l/2 percent during this fiscal year, about twice the increasein 1981. The rise in procurement of military hardware will be steeper.It will also generate stepped-up economic activity prior to deliveries.Defense industries are beginning to build up inventories of work inprogress as components and materials move through the stages offabrication toward delivery to the Department of Defense. Though thisstep-up has not yet become particularly evident in statistics of work inprogress, this type of inventory accumulation will be strengthened incoming quarters.
Nondefense Federal purchases increased 10.7 percent in real termsduring 1981 but may shrink as much as 9 percent during 1982 as theAdministration's fiscal 1982 budget cuts take effect. The much largervolume of purchases by State and local governments is also expectedto decline slightly in real terms. Taken in aggregate, the budgets ofState and local units of government have shown small operating sur-pluses in the past 2 years. Increased revenue from economic growthis expected to more than offset declines in Federal grants, permittinga modest increase in nominal spending by State and local units.
Earlier parts of this Report have emphasized the relative size of theprospective Federal deficits in comparison to GNP. While it is helpfulto standardize deficits against the size of the economy, this relationgives little feel for the distribution through the economy of the flowof government securities. These are purchased by banking, other cor-porate, household, and foreign savers, who are also filling their port-folios with privately issued notes for everything from consumer loansto mortgages to loans for business capital projects.
It is anticipated that each of these groups will not be called uponto raise their holdings of U.S. Government securities disproportion-ately. Thus, household purchases of U.S. securities should be aboutone-quarter of the volume of personal saving, which is near historicrates, and domestic financial institution purchases should be near1.5 percent of GNP, also close to historic experience. While foreigninvestors also can be expected to take some of the securities issued,these two domestic sectors likely will account for most U.S. securitypurchases.
The net export balance of the United States is expected to beboosted by rising exports of goods and services as the economic re-covery abroad strengthens but depressed by a large expansion of im-ports as growth picks up here later this year. Continued market ad-justments to last year's appreciation of the dollar may also depressnet exports. Depending on the timing of these effects, net exports ofthe United States may decline from a surplus of $23.8 billion lastyear to an approximate balance this year. Because the United Statesearns much more abroad through the export of services than it
212
Digitized for FRASER http://fraser.stlouisfed.org/ Federal Reserve Bank of St. Louis

spends on services imports, our net export position is stronger thanthe frequently cited trade balance on merchandise alone would sug-gest. That balance will move to a sizable negative position by year-end.
With a continuation of monetary restraint and further significantdownward adjustments in inflationary expectations, 1982 and 1983should become the first of several years of prosperous growth anddeclining inflation occurring simultaneously. While business invest-ment and defense will continue to expand more rapidly than othersectors, the total growth in the economy should be sufficient to ac-commodate further sizable increases in the output of consumer dura-bles, motor vehicles, and housing.
PROSPECTS BEYOND 1983
Continuing deceleration in money growth, fairly rapid adaptation ofexpectations to lower inflation, and growth aided by tax policies that areweighted toward investment are expected to be characteristic of the mid-1980s. The combination of growth-oriented fiscal policy and anti-inflationary monetary policy should mean substantial progress towardthe economic goals embodied in the Full Employment and BalancedGrowth Act of 1978.
The general objectives of this act—and those of the Administra-tion—are to achieve full employment, growth in productivity, pricestability, and a reduced share of governmental spending in theNation's output. The act states clearly that ultimate price stabilitymeans eliminating inflation altogether. Although it does not define fullemployment as any specific unemployment rate, the act establishes as anational goal "the fulfillment of the right to full opportunities foruseful paid employment at fair rates of compensation of all individualsable, willing, and seeking to work." It places emphasis on encouragingcapital formation and relying on the private sector to meet the act'sobjectives of full employment, growth in productivity, and price stabil-ity. It requires an annual Investment Policy Report, which is providedin Chapters 4 and 5 of this volume. In addition, the act responds to thewidespread desire for reduced governmental intervention by callingfor steady reductions in the share of the Nation's output accounted forby governmental spending, and for the ultimate reduction of Federaloutlays to 20 percent of GNP.
To provide a focus for the government in its effort to achieve thesegeneral objectives, the Full Employment and Balanced Growth Actrequires that the Administration set annual numerical goals for keyindicators over a 5-year horizon leading toward a group of interimgoals set forth by the Congress. Table 8-9 responds to this require-
213
Digitized for FRASER http://fraser.stlouisfed.org/ Federal Reserve Bank of St. Louis
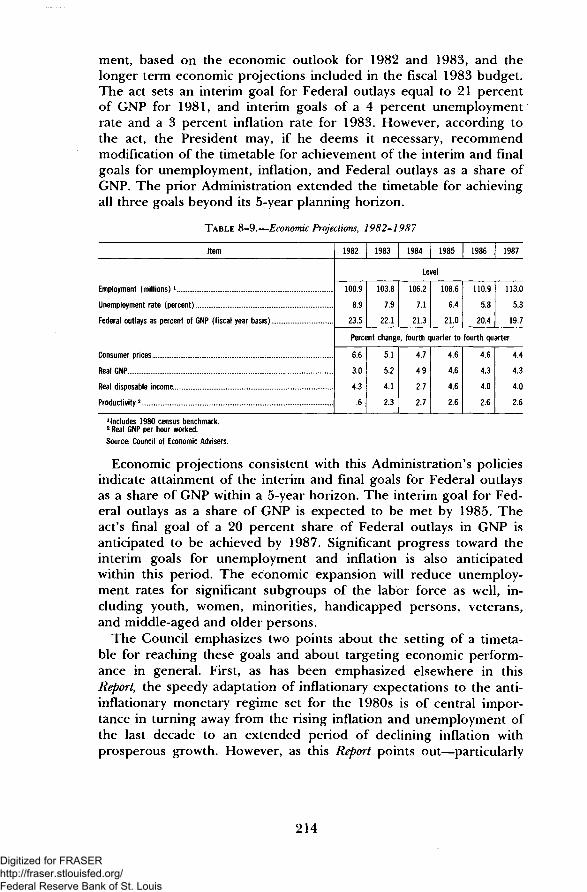
ment, based on the economic outlook for 1982 and 1983, and thelonger term economic projections included in the fiscal 1983 budget.The act sets an interim goal for Federal outlays equal to 21 percentof GNP for 1981, and interim goals of a 4 percent unemploymentrate and a 3 percent inflation rate for 1983. However, according tothe act, the President may, if he deems it necessary, recommendmodification of the timetable for achievement of the interim and finalgoals for unemployment, inflation, and Federal outlays as a share ofGNP. The prior Administration extended the timetable for achievingall three goals beyond its 5-year planning horizon.
TABLE 8-9.— Economic Projections, 1982-1987
Item
Employment (millions) *
Unemployment rate (percent)
Federal outlays as percent of GNP (fiscal year basis)
Consumer prices
Real GNP
Real disposable income
Productivity 2
1982 1983 | 1984 1985 1986 | 1987
Level
100.9
8.9
23.5
103.8
7.9
22.1
106.2
7.1
21.3
108.6
6.4
21.0
110.9
5.8
20.4
113.0
5.3
19.7
Percent change, fourth quarter to fourth quarter
6.6
3.0
4.3
.6
5.1
5.2
4.1
2.3
4.7
4.9
2.7
2.7
4.6
4.6
4.6
2.6
4.6
4.3
4.0
2.6
4.4
4.3
4.0
2.6
1 Includes 1980 census benchmark.2 Real GNP per hour worked.
Source: Council of Economic Advisers.
Economic projections consistent with this Administration's policiesindicate attainment of the interim and final goals for Federal outlaysas a share of GNP within a 5-year horizon. The interim goal for Fed-eral outlays as a share of GNP is expected to be met by 1985. Theact's final goal of a 20 percent share of Federal outlays in GNP isanticipated to be achieved by 1987. Significant progress toward theinterim goals for unemployment and inflation is also anticipatedwithin this period. The economic expansion will reduce unemploy-ment rates for significant subgroups of the labor force as well, in-cluding youth, women, minorities, handicapped persons, veterans,and middle-aged and older persons.
The Council emphasizes two points about the setting of a timeta-ble for reaching these goals and about targeting economic perform-ance in general. First, as has been emphasized elsewhere in thisReport, the speedy adaptation of inflationary expectations to the anti-inflationary monetary regime set for the 1980s is of central impor-tance in turning away from the rising inflation and unemployment ofthe last decade to an extended period of declining inflation withprosperous growth. However, as this Report points out—particularly
214
Digitized for FRASER http://fraser.stlouisfed.org/ Federal Reserve Bank of St. Louis
in Chapter 3—government efforts to intervene directly in wage andprice setting in the private sector are essentially destabilizing and donot alter the longer term path of the economy. Second, the FederalGovernment cannot fully anticipate the course of the economy; neithercan it direct economic outcomes precisely. In view of these limits,the annual goals should best be viewed as benchmarks of economicprogress.
215
Digitized for FRASER http://fraser.stlouisfed.org/ Federal Reserve Bank of St. Louis

Digitized for FRASER http://fraser.stlouisfed.org/ Federal Reserve Bank of St. Louis
Appendix A
REPORT TO THE PRESIDENT ON THE ACTIVITIES
OF THE
COUNCIL OF ECONOMIC ADVISERS DURING 1981
Digitized for FRASER http://fraser.stlouisfed.org/ Federal Reserve Bank of St. Louis

Digitized for FRASER http://fraser.stlouisfed.org/ Federal Reserve Bank of St. Louis
LETTER OF TRANSMITTAL
COUNCIL OF ECONOMIC ADVISERS,Washington, D.C., December 31, 1981.
MR. PRESIDENT:The Council of Economic Advisers submits this report on its activi-
ties during the calendar year 1981 in accordance with the require-ments of the Congress, as set forth in section 10(d) of the Employ-ment Act of 1946 as amended by the Full Employment and BalancedGrowth Act of 1978.
Sincerely,
MURRAY L. WEIDENBAUM, Chairman
JERRY L. JORDAN
WILLIAM A. NISKANEN
219
Digitized for FRASER http://fraser.stlouisfed.org/ Federal Reserve Bank of St. Louis

Digitized for FRASER http://fraser.stlouisfed.org/ Federal Reserve Bank of St. Louis

Report to the President on the Activities of theCouncil of Economic Advisers during 1981
The Employment Act of 1946 (P.L. 304-79th Congress), as amend-ed, provides the statutory base for the activities of the Council ofEconomic Advisers. The Council, through the Chairman, providesadvice to the President on a wide range of domestic and internationaleconomic policy issues, assists in the preparation of the President'sEconomic Report to the Congress, and conducts analyses and studieson a wide range of economic issues in support of its primary mission.
The membership of the Council of Economic Advisers changedearly in 1981, following the inauguration of President Reagan.Murray L. Weidenbaum was designated Chairman of the Council onJanuary 23, and was formally sworn in on February 27, 1981, replac-ing Charles L. Schultze, who returned to the Brookings Institution.The Chairman is on leave of absence from Washington University(St. Louis), where he holds the Mallinckrodt Distinguished UniversityProfessorship.
William A. Niskanen and Jerry L. Jordan became Members on June12, 1981, and July 14, 1981, respectively. They succeeded George C.Eads, who returned to the Rand Corporation, and Stephen G. Gold-feld, who returned to Princeton University. Mr. Niskanen is on leaveof absence from a position as a professor at the University of Califor-nia, Los Angeles. Mr. Jordan is on leave of absence from the Univer-sity of New Mexico, where he was the Dean of the Anderson Schoolsof Management.
221358-691 0 - 8 2 - 1 5 : QL3Digitized for FRASER
http://fraser.stlouisfed.org/ Federal Reserve Bank of St. Louis
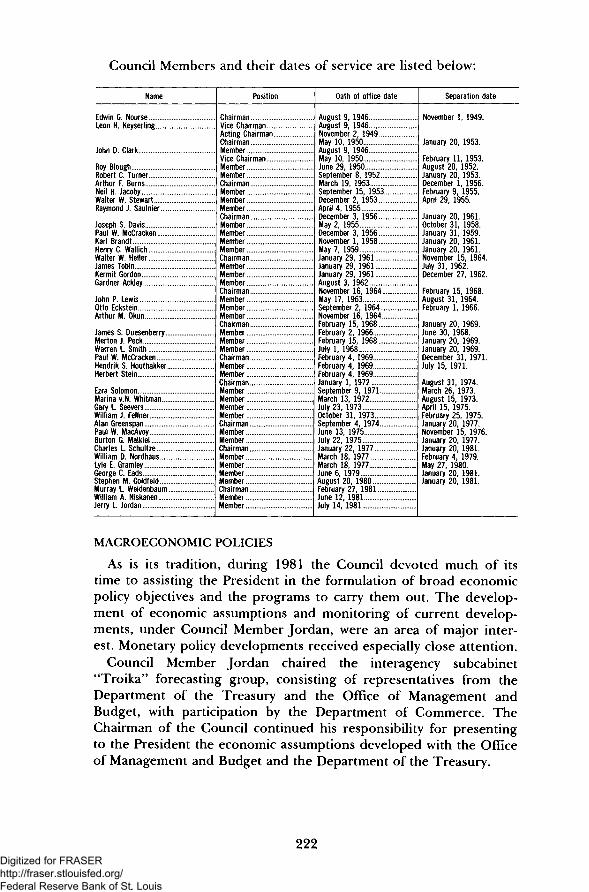
Council Members and their dates of service are listed below:
Name
Edwin G. NourseLeon H. Keyserling
John D. Clark
Roy BloughRobert C TurnerArthur F BurnsNeil H JacobyWalter W StewartRaymond J Saulnier
Joseph S DavisPaul W McCrackenKarl BrandtHenry C WallichWalter W HellerJames Tobin. . . .Kermit Gordon.. . . . . . .Gardner Ackley . . .
John P. LewisOtto Eckstein . . . .Arthur M. Okun
James S. DuesenberryMerton J. PeckWarren L Smith . . .Paul W. McCrackenHendrik S. HouthakkerHerbert Stein
Ezra SolomonMarina v N. WhitmanGary L SeeversWilliam J. FellnerAlan GreenspanPaul W. MacAvoyBurton G. MalkielCharles L SchultzeWilliam D NordhausLyle E. GramleyGeorge C EadsStephen M. GoldfeldMurray L. WeidenbaumWilliam A. NiskanenJerry L. Jordan
Position
ChairmanVice ChairmanActing ChairmanChairmanMemberVice ChairmanMemberMemberChairmanMemberMemberMemberChairmanMemberMemberMemberMemberChairmanMemberMemberMemberChairmanMemberMemberMemberChairmanMemberMemberMemberChairmanMemberMemberChairmanMemberMemberMemberMemberChairman
MemberChairmanMemberMemberMemberMemberChairmanMemberMember
Oath of office date
August 9, 1946August 9, 1946..November 2 1949May 10, 1950.August 9, 1946.May 10, 1950June 29 1950September 8 1952March 19 1953September 15 1953December 2, 1953April 4 1955December 3, 1956May 2, 1955December 3, 1956 .November 1, 1958.May 7, 1959.January 29, 1961 ,January 29, 1961January 29, 1961August 3, 1962..November 16, 1964.May 17, 1963.September 2, 1964.November 16, 1964.February 15, 1968.February 2, 1966.February 15, 1968July 1, 1968February 4, 1969.February 4, 1969..February 4 1969January 1, 1972September 9, 1971.March 13, 1972.July 23, 1973.October 31, 1973.September 4, 1974.June 13, 1975.July 22, 1975.January 22 1977March 18 1977March 18, 1977..June 6, 1979August 20, 1980.February 27, 1981June 12 1981July 14, 1981
Separation date
November 1, 1949.
January 20, 1953.
February 11, 1953.August 20 1952January 20 1953December 1 1956February 9 1955April 29, 1955.
January 20, 1961October 31, 1958January 31, 1959January 20, 1961.January 20, 1961.November 15, 1964.July 31, 1962.December 27, 1962.
February 15, 1968.August 31, 1964.February 1, 1966.
January 20, 1969.June 30, 1968.January 20, 1969.January 20, 1969.December 31, 1971.July 15, 1971.
August 31 1974March 26, 1973August 15, 1973April 15, 1975.February 25, 1975.January 20, 1977.November 15, 1976.January 20, 1977.January 20 1981February 4 1979May 27, 1980.January 20 1981January 20, 1981.
MACROECONOMIC POLICIES
As is its tradition, during 1981 the Council devoted much of itstime to assisting the President in the formulation of broad economicpolicy objectives and the programs to carry them out. The develop-ment of economic assumptions and monitoring of current develop-ments, under Council Member Jordan, were an area of major inter-est. Monetary policy developments received especially close attention.
Council Member Jordan chaired the interagency subcabinet"Troika" forecasting group, consisting of representatives from theDepartment of the Treasury and the Office of Management andBudget, with participation by the Department of Commerce. TheChairman of the Council continued his responsibility for presentingto the President the economic assumptions developed with the Officeof Management and Budget and the Department of the Treasury.
222Digitized for FRASER http://fraser.stlouisfed.org/ Federal Reserve Bank of St. Louis

Council Members chaired or participated in numerous CabinetCouncil working groups dealing with such issues as economic statis-tics, financial industry deregulation, conditions in the thrift industry,and the balance of payments.
The Chairman actively participated during the early months of theAdministration, and then during the late fall budget cycle, in Cabinetlevel reviews of agency budget requests and appeals.
MICROECONOMIC POLICIES
A wide variety of microeconomic issues received Council attentionduring the year. Council Member Niskanen chaired Cabinet Councilworking groups dealing with the Alaska National Gas Pipeline andemployee pension legislation. Trade issues were an area of continu-ing attention. Early in the year the Council studied in depth theimpact of automobile import quotas on the economy.
The Council assisted in the preparation of agency guidelines forimplementing Executive Order 12291 dealing with Executive Officereview of agency regulatory proposals, and worked closely with theOffice of Management and Budget on selected regulatory issues.
INTERNATIONAL ECONOMIC POLICIES
The President's economic recovery program evoked considerableinterest on the part of U.S. friends and allies, and the Council devot-ed considerable effort to explaining the program to interested partiesin the United States and abroad. Council Members and staff assistedin the preparations for the Ottawa Economic Summit in June. Mem-bers and staff also participated in the various working parties of theOrganization for Economic Cooperation and Development (OECD)dealing with economic and financial issues. The Chairman served asChairman of OECD's Economic Policy Committee.
PUBLIC INFORMATION
The Council's Annual Report is the principal medium through whichthe Council informs the public of its work and its views. It is also animportant vehicle for presenting and explaining the Administration'sdomestic and international economic policies. Distribution of theReport in recent years has averaged about 50,000 copies. The Councilalso assumes primary responsibility for the monthly Economic Indica-tors, a publication prepared by the Council's Statistical Office underthe supervision of Catherine H. Furlong. The Joint Economic Com-mittee issues the Indicators, which has a distribution of approximately10,000 copies. Information is also provided to members of the publicthrough speeches and other public appearances by the Chairman,Members, and staff economists of the Council. In 1981 the Chairman
223
Digitized for FRASER http://fraser.stlouisfed.org/ Federal Reserve Bank of St. Louis

and Members made 25 appearances before Committees of the Con-gress to testify on Administration economic policies.
ORGANIZATION AND STAFF OF THE COUNCIL
OFFICE OF THE CHAIRMAN
The Chairman is responsible for communicating the Council'sviews to the President. This function is carried out through directconsultation with the President, and through written memoranda andreports on economic developments and on particular programs andproposals. The Chairman exercises ultimate responsibility for direct-ing the work of the professional staff. He represents the Council atmeetings of the full Cabinet and the various Cabinet Councils, and theTrade Policy Committee. Chairman Weidenbaum also served as amember of the President's Task Force on Regulatory Relief, the con-gressionally established Gold Commission, and the President's TaskForce on Military Manpower.
COUNCIL MEMBERS
The two Council Members are responsible for all subject mattercovered by the Council, including direct supervision of the work ofthe professional staff. Members represent the Council at a wide vari-ety of interagency and international meetings and assume major re-sponsibility for selecting issues for Council attention.
In practice, the small size of the Council permits the Chairman andCouncil Members to work as a team in most circumstances. There was,however, an informal division of subject matter among them in 1981.Mr. Jordan assumed primary responsibility for domestic and interna-tional macroeconomic analysis, economic projections, and monetaryand financial issues. He also served, with the Chairman, on the GoldCommission. Mr. Niskanen is primarily responsible for microeconomicand sectoral analysis, international trade questions, and regulatoryissues.
PROFESSIONAL STAFF
At the end of 1981 the professional staff consisted of the SpecialAssistant to the Chairman, who also acts as staff director, the SeniorStatistician, 13 senior staff economists, and 5 junior staff economists.
The professional staff and their special fields at the end of 1981were:
James B. Burnham Special Assistant to the Chairman
Senior Staff Economists
Geoffrey O. Carliner Labor and PensionsWilliam D. Dobson Agriculture and Food Policy
224
Digitized for FRASER http://fraser.stlouisfed.org/ Federal Reserve Bank of St. Louis
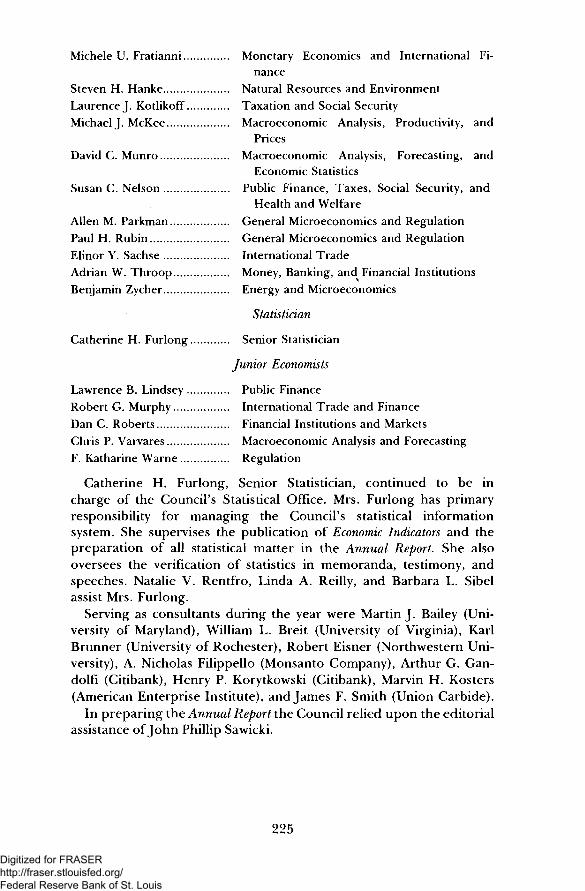
Michele U. Fratianni Monetary Economics and International Fi-nance
Steven H. Hanke Natural Resources and EnvironmentLaurence J. Kotlikoff Taxation and Social SecurityMichael J. McKee Macroeconomic Analysis, Productivity, and
PricesDavid C. Munro Macroeconomic Analysis, Forecasting, and
Economic StatisticsSusan C. Nelson Public Finance, Taxes, Social Security, and
Health and WelfareAllen M. Parkman General Microeconomics and RegulationPaul H. Rubin General Microeconomics and RegulationElinor Y. Sachse International TradeAdrian W. Throop Money, Banking, and Financial InstitutionsBenjamin Zycher Energy and Microeconomics
Statistician
Catherine H. Furlong Senior Statistician
Junior Economists
Lawrence B. Lindsey Public FinanceRobert G. Murphy International Trade and FinanceDan C. Roberts Financial Institutions and MarketsChris P. Varvares Macroeconomic Analysis and ForecastingF. Katharine Warne Regulation
Catherine H. Furlong, Senior Statistician, continued to be incharge of the Council's Statistical Office. Mrs. Furlong has primaryresponsibility for managing the Council's statistical informationsystem. She supervises the publication of Economic Indicators and thepreparation of all statistical matter in the Annual Report. She alsooversees the verification of statistics in memoranda, testimony, andspeeches. Natalie V. Rentfro, Linda A. Reilly, and Barbara L. Sibelassist Mrs. Furlong.
Serving as consultants during the year were Martin J. Bailey (Uni-versity of Maryland), William L. Breit (University of Virginia), KarlBrunner (University of Rochester), Robert Eisner (Northwestern Uni-versity), A. Nicholas Filippello (Monsanto Company), Arthur G. Gan-dolfi (Citibank), Henry P. Korytkowski (Citibank), Marvin H. Kosters(American Enterprise Institute), and James F. Smith (Union Carbide).
In preparing the Annual Report the Council relied upon the editorialassistance of John Phillip Sawicki.
225
Digitized for FRASER http://fraser.stlouisfed.org/ Federal Reserve Bank of St. Louis

SUPPORTING STAFF
The Administrative Office of the Council of Economic Advisersprovides general support for the Council's activities. Serving in theAdministrative Office were Elizabeth A. Kaminski, Staff Assistant tothe Council, and Catherine Fibich.
Members of the secretarial staff for the Chairman and CouncilMembers during 1981 were Carolyn L. Bazarnick, Patricia A. Lee,Georgia A. O'Connor, and Alice H. Williams. Secretaries for the pro-fessional staff were Catherine Fibich, Bessie M. Lafakis, Rosemary M.Rogers, Margaret L. Snyder, and Lillie M. Sturniolo. Elizabeth A.Cralle, Secretary, and Joseph Henley, Clerk, provided assistanceduring the summer months.
DEPARTURES
The Council's professional staff members are in most cases onleave from universities, other government agencies, or research insti-tutions. Their tenure with the Council is usually limited to 1 or 2years. Senior staff economists who resigned during the year and theirsubsequent affiliations were William T. Boehm (the Kroger Compa-ny), Marshall L. Casse (Department of State), Stephen H. Brooks(Consultant), Jose A. Gomez-Ibanez (Harvard University), Val L.Koromzay (Organization for Economic Cooperation and Develop-ment), Robert A. Leone (Harvard University), Perry D. Quick (staff ofSenator Gary Hart), and Andrew J. Strenio (Federal Trade Commis-sion). Susan J. Irving, Special Assistant to the Chairman, joined theInternational Monetary Fund.
Junior Economists who resigned in 1981 were Martin A. Asher(Joel Popkin and Associates), Elizabeth J. Jensen (Massachusetts Insti-tute of Technology), Stephen A. O'Connell (Massachusetts Instituteof Technology), David H. Romer (Massachusetts Institute of Tech-nology), and Robert W. Turner (Massachusetts Institute of Technol-ogy)-
Retired during the year were Nancy F. Skidmore, AdministrativeOfficer, Joyce A. Pilkerton, Secretary, and Earnestine Reid, StatisticalAssistant. Pauline H. Thompson, secretary, resigned from the Coun-cil staff.
226
Digitized for FRASER http://fraser.stlouisfed.org/ Federal Reserve Bank of St. Louis
Appendix B
STATISTICAL TABLES RELATING TO INCOME,
EMPLOYMENT, AND PRODUCTION
Digitized for FRASER http://fraser.stlouisfed.org/ Federal Reserve Bank of St. Louis

Digitized for FRASER http://fraser.stlouisfed.org/ Federal Reserve Bank of St. Louis

CONTENTS
NATIONAL INCOME OR EXPENDITURE: PageB-l. Gross national product, 1929-81 233B-2. Gross national product in 1972 dollars, 1929-81 234B-3. Implicit price deflators for gross national product, 1929-81 236B-4. Fixed-weighted price indexes for gross national product, 1972
weights, 1959-81 238B-5. Changes in gross national product and GNP price measures, 1929-
81 239B-6. Gross national product by major type of product, 1929-81 240B-7. Gross national product by major type of product in 1972 dollars,
1929-81 241B-8. Gross national product by sector, 1929-81 242B-9. Gross national product by sector in 1972 dollars, 1929-81 243B-10. Gross national product by industry, 1947-80 244B-ll. Gross national product by industry in 1972 dollars, 1947-80 245B-12. Gross domestic product of nonfinancial corporate business, 1929-
81 246B-l3. Output, costs, and profits of nonfinancial corporate business,
1948-81 247B-14. Personal consumption expenditures, 1929-81 248B-15. Gross private domestic investment, 1929-81 250B-16. Gross and net private domestic investment, 1929-81 251B-17. Inventories and final sales of business, 1946-81 252B-18. Inventories and final sales of business in 1972 dollars, 1947-81 253B-l9. Relation of gross national product, net national product, and na-
tional income, 1929-81 254B-20. Relation of national income and personal income, 1929-81 255B-21. National income by type of income, 1929-81 256B-22. Sources of personal income, 1929-81 258B-23. Disposition of personal income, 1929-81 260B-24. Total and per capita disposable personal income and personal con-
sumption expenditures in current and 1972 dollars, 1929-81 261B-25. Gross saving and investment, 1929-81 262B-26. Saving by individuals, 1946-81 263B-27. Money income (in 1980 dollars) and poverty status of families and
unrelated individuals by race of householder, 1952-80 264
POPULATION, EMPLOYMENT, WAGES, AND PRODUCTIVITY:B-28. Population by age groups, 1929-80 265B-29. Noninstitutional population and the labor force, 1929-81 266B-30. Civilian employment and unemployment by sex and age, 1947-81 .. 268B-31. Selected employment and unemployment data, 1948-81 269B-32. Civilian labor force participation rate by demographic characteris-
tic, 1954-81 270B-33. Unemployment rate by demographic characteristic, 1948-81 271
229
Digitized for FRASER http://fraser.stlouisfed.org/ Federal Reserve Bank of St. Louis

Page
B-34. Unemployment by duration, 1947-81 272B-35. Unemployment by reason, 1967-81 273B-36. Unemployment insurance programs, selected data, 1946-81 274B-37. Wage and salary workers in nonagricultural establishments, 1929-
81 275B-38. Average weekly hours and hourly earnings in selected private non-
agricultural industries, 1947-81 276B-39. Average weekly earnings in selected private nonagricultural indus-
tries, 1947-81 277B-40. Productivity and related data, private business sector, 1947-81 278B-41. Changes in productivity and related data, private business sector,
1948-81 279
PRODUCTION AND BUSINESS ACTIVITY:B-42. Industrial production indexes, major industry divisions, 1929-81 .... 280B-43. Industrial production indexes, market groupings, 1947-81 281B-44. Industrial production indexes, selected manufactures, 1947-81 282B-45. Capacity utilization rate in manufacturing, 1948-81 283B-46. New construction activity, 1929-81 284B-47. New housing units started and authorized, 1959-81 286B-48. Nonfarm business expenditures for new plant and equipment,
1947-82 287B-49. Sales and inventories in manufacturing and trade, 1947-81 288B-50. Manufacturers' shipments and inventories, 1947-81 289B-51. Manufacturers' new and unfilled orders, 1947-81 290
PRICES:B-52. Consumer price indexes, major expenditure classes, 1929-81 291B-53. Consumer price indexes, selected expenditure classes, 1939-81 292B-54. Consumer price indexes, commodities, services, and special
groups, 1939-81 293B-55. Changes in consumer price indexes, commodities and services,
1948-81 295B-56. Changes in special consumer price indexes, 1958-81 296B-57. Producer price indexes by stage of processing, 1947-81 297B-58. Producer price indexes by stage of processing, special groups,
1974-81 299B-59. Producer price indexes by major commodity groups, 1940-81 300B-60. Changes in producer price indexes for finished goods, 1948-81 302
MONEY STOCK, CREDIT, AND FINANCE:B-61. Money stock measures and liquid assets, 1959-81 303B-62. Components of money stock measures and liquid assets, 1959-81... 304B-63. Commercial bank loans and investments, 1939-81 305B-64. Total funds raised in credit markets by nonfinancial sectors, 1973-
81 306B-65. Federal Reserve Bank credit and member bank reserves, 1929-81.... 308B-66. Aggregate reserves and monetary base, 1959-81 309B-67. Bond yields and interest rates, 1929-81 310B-68. Consumer credit outstanding and net change, 1950-81 312B-69. Consumer installment credit extended and liquidated, 1950-81 313B-70. Mortgage debt outstanding by type of property and of financing,
1939-81 314B-71. Mortgage debt outstanding by holder, 1939-81 315
230Digitized for FRASER http://fraser.stlouisfed.org/ Federal Reserve Bank of St. Louis

GOVERNMENT FINANCE: PageB-72. Federal budget receipts, outlays, and debt, fiscal years 1971-83 316B-73. Federal budget receipts and outlays, fiscal years 1929-83 317B-74. Relation of Federal Government receipts and expenditures in the
national income and product accounts to the unified budget,1980-83 319
B-75. Government receipts and expenditures, national income and prod-uct accounts, 1929-81 320
B-76. Federal Government receipts and expenditures, national incomeand product accounts, 1958-83 321
B-77. State and local government receipts and expenditures, nationalincome and product accounts, 1946-81 322
B-78. State and local government revenues and expenditures, selectedfiscal years, 1927-79 323
B-79. Interest-bearing public debt securities by kind of obligation, 1967-81 324
B-80. Estimated ownership of public debt securities, 1967-81 325B-81. Maturity distribution average length and of marketable interest-
bearing public debt securities held by private investors, 1967-81. 326
CORPORATE PROFITS AND FINANCE:B-82. Corporate profits with inventory valuation and capital consumption
adjustments, 1929-81 327B-83. Corporate profits by industry, 1929-81 328B-84. Corporate profits of manufacturing industries, 1929-81 329B-85. Sales, profits, and stockholders' equity, all manufacturing corpora-
tions, 1950-81 330B-86. Relation of profits after taxes to stockholders' equity and to sales,
all manufacturing corporations, 1947-81 331B-87. Relation of profits after taxes to stockholders' equity and to sales,
all manufacturing corporations, by industry group, 1979-81 332B-88. Determinants of business fixed investment, 1955-81 333B-89. Sources and uses of funds, nonfarm nonfinancial corporate busi-
ness, 1946-81 334B-90. Current assets and liabilities of U.S. corporations, 1939-81 335B-91. State and municipal and corporate securities offered, 1934-81 336B-92. Common stock prices and yields, 1949-81 337B-93. Business formation and business failures, 1929-81 338
AGRICULTURE:B-94. Farm income, 1929-81 339B-95. Farm output and productivity indexes, 1929-81 340B-96. Farm input use, selected inputs, 1929-81 341B-97. Indexes of prices received and prices paid by farmers, 1940-81 342B-98. U.S. exports and imports of agricultural commodities, 1940-81 343B-99. Balance sheet of the farming sector, 1929-82 344
INTERNATIONAL STATISTICS:B-100. Exchange rates, 1967-81 345B-101. U.S. international transactions, 1946-81 346B-102. U.S. merchandise exports and imports by principal end-use catego-
ry, 1965-81 348B-103. U.S. merchandise exports and imports by area, 1973-81 349
231
Digitized for FRASER http://fraser.stlouisfed.org/ Federal Reserve Bank of St. Louis

PageB-104. U.S. merchandise exports and imports by commodity groups,
1958-81 350B-105. International investment position of the United States at year-end,
selected years, 1970-80 351B-106. World trade: Exports and imports, 1965, 1970, 1975, and 1978-
81 352B-107. World trade balance and current account balances, 1965, 1970,
1975, and 1978-81 353B-108. International reserves, selected years, 1952-81 354B-109. Growth rates in real gross national product, 1960-81 355B-110. Industrial production and consumer prices, major industrial coun-
tries, 1960-81 356B-lll. Unemployment rate and hourly compensation, major industrial
countries, 1960-81 357
General Notes
Detail in these tables may not add to totals because of rounding.Unless otherwise noted, all dollar figures are in current dollars.Symbols used:
p Preliminary.—Not available (also, not applicable).
232Digitized for FRASER http://fraser.stlouisfed.org/ Federal Reserve Bank of St. Louis
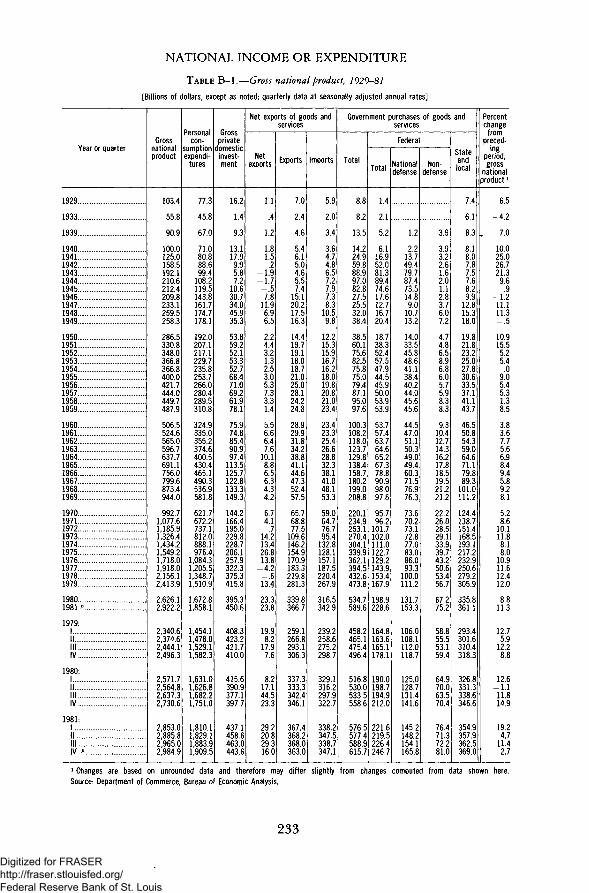
NATIONAL INCOME OR EXPENDITURE
TABLE B-l.—Gross national product, 1929-81
[Billions of dollars, except as noted; quarterly data at seasonally adjusted annual rates]
Year or quarter
1929
1933
1939
1940..1941.19421943194419451946194719481949
1950195119521953195419551956195719581959
1960196119621963196419651966196719681969
1970197119721973197419751976197719781979
19801981 P..
19791I II I II V .
1980:1III l lIV
1981:1I II I IIV P
Grossnationalproduct
103.4
55.8
90.9
100.0125.0158.5192.1210.6212.4209.8233.1259.5258.3
286.5330.8348.0366.8366.8400.0421.7444.0449.7487.9
506.5524.6565.0596.7637.7691.1756.0799.6873.4944.0
992.71,077.61,185.91,326.41,434.21,549.21,718.01,918.02,156.12,413.9
2,626.12,922.2
2,340.62,374.62,444.12,496.3
2,571.72,564.8263732,730.6
2,853.0288582,965.02,984.9
Personalcon-
sumptionexpendi-
tures
77.3
45.8
67.0
71.080.888.699.4
108.2119.5143.8161.7174.7178.1
192.0207.1217.1229.7235.8253.7266.0280.4289.5310.8
324.9335.0355.2374.6400.5430.4465.1490.3536.9581.8
621.7672.2737.1812.0888.1976.4
1,084.31,205.51,348.71,510.9
1,672.81,858.1
1,454.11,478.01,529.11,582.3
1,631.01,626.8168221,751.0
1,810.1182911,883.91,909.5
Grossprivate
jomesticinvest-ment
16.2
1.4
9.3
13.117.99.95.87.2
10.630.734.045.935.3
53.859.252.153.352.768.471.069.261.978.1
75.974.885.490.997.4
113.5125.7122.8133.3149.3
144.2166.4195.0229.8228.7206.1257.9322.3375.3415.8
395.3450.6
408.3423.2421.7410.0
415.6390.9377 1397.7
437.14586463.0443.6
Net exports of goods andservices
Netexports
1.1
.4
1.2
1.81.5.2
-1.9-1.7-.57.8
11.96.96.5
2.24.43.21.32.53.05.37.33.31.4
5.56.66.47.6
10.18.86.56.34.34.2
6.74.1
.714.213.426.813.8
-4.2-.613.4
23.323.8
19.98.2
17.97.6
8.217.144523.3
29.220829.316.0
Exports
7.0
2.4
4.6
5.46.15.04.65.57.4
15.120.217.516.3
14.419.719.118.018.721.025.028.124.224.8
28.929.931.834.238.841.144.647.352.457.5
65.768.877.5
109.6146.2154.9170.9183.3219.8281.3
339.8366.7
259.1266.8293.1306.3
337.3333.33424346.1
367.43682368.0363.0
Imports
5.9
2.0
3.4
3.64.74.86.57.27.97.38.3
10.59.8
12.215.315.916.716.218.019.820.821.023.4
23.423.325.426.628.832.338.141.048.153.3
59.064.776.795.4
132.8128.1157.1187.5220.4267.9
316.5342.9
239.2258.6275.2298.7
329.1316.22979322.7
338.23475338.7347.1
Government purchases of goods andservices
Total
8.8
8.2
13.5
14.224.959.888.997.082.827.525.532.038.4
38.560.175.682.575.875.079.487.195.097.6
100.3108.2118.0123.7129.8138.4158.7180.2199.0208.8
220.1234.9253.1270.4304.1339.9362.1394.5432.6473.8
534.7589.6
458.2465.1475.4496.4
516.8530.05335558.6
576.55774588.9615.7
Federal
Tntalloiai
14
2.1
5.2
6.116.952.081.389.474.617.612.716.720.4
18.738.352.457.547.944.545.950.053.953.9
53.757.463.764.665.267.378.890.998.097.6
95.796.2
101.7102.0111.0122.7129.2143.9153.4167.9
198.9228.6
164.8163.6165.1178.1
190.0198.71949212.0
221.62195226.4246.7
Nationaldefense
1.2
2.213.749.479.787.473.514.89.0
10.713.2
14.033.545.848.641.138.440.244.045.645.6
44.547.051.150.349.049.460.371.576.976.3
73.670.273.172.877.083.086.093.3
100.0111.2
131.7153.3
106.0108.1112.0118.7
125.0128.71314141.6
145.21482154.1165.8
Non-defense
3.9
3.93.22.61.62.01.12.83.76.07.2
4.74.86.58.96.86.05.75.98.38.3
9.310.412.714.316.217.818.519.521.221.2
22.226.028.529.133.939.743.250.653.456.7
67.275.2
58.855.553.159.4
64.970.063570.4
76.471372.281.0
StateandInrallOCdl
7.4
6.1
8.3
8.18.07.87.57.68.29.9
12.815.318.0
19.821.823.225.027.830.633.537.141.143.7
46.550.854.359.064.671.179.889.3
101.0111.2
124.4138.7151.4168.5193.1217.2232.9250.6279.2305.9
335.8361.1
293.4301.6310.4318.3
326.8331.33386346.6
354.93579362.5369.0
Percentchange
frompreced-
ingperiod,gross
nationalproduct 1
6.5
-4.2
7.0
10.025.026.721.39.6
.9-1.211.111.3-.5
10.915.55.25.4
.09.05.45.31.38.5
3.83.67.75.66.98.49.45.89.28.1
5.28.6
10.1. 11.8
8.18.0
10.911.612.412.0
8.811.3
12.75.9
12.28.8
12.6-1.111814.9
19.24 7
11.42.7
1 Changes are based on unrounded data and therefore may differ slightly from changes computed from data shown here.Source: Department of Commerce, Bureau of Economic Analysis.
233
Digitized for FRASER http://fraser.stlouisfed.org/ Federal Reserve Bank of St. Louis

TABLE B-2.—Gross national product in 1972 dollars, 1929-81
[Billions of 1972 dollars, except as noted; quarterly data at seasonally adjusted annual rates]
Year or quarter
1929
1933
1939
1940.194119421943194419451946194719481949
1950195119521953195419551956195719581959
1960196119621963196419651966196719681969
197019711972.1973197419751976197719781979
19801981"
1979:1II ....I l lIV
1980:I..IIIllIV
1981:1III I IIV p
Grossnationalproduct
315.7
222.1
319.8
344.1400.4461.7531.6569.1560.4478.3470.3489.8492.2
534.8579.4600.8623.6616.1657.5671.6683.8680.9721.7
737.2756.6800.3832.5876.4929.3984.8
1,011.41,058.11,087.6
1,085.61,122.41,185.91,255.01,248.01,233.91,300.41,371.71,436.91,483.0
1,480.71,509.6
147991,473 41,488 21,490.6
1,501 91,463 3147191,485.6
1,516.4151041,515.81,495.6
Personal consumption expenditures
Total
215.1
170.5
219.8
229.9243.6241.1248.2255.2270.9301.0305.8312.2319.3
337.3341.6350.1363.4370.0394.1405.4413.8418.0440.4
452.0461.4482.0500.5528.0557.5585.7602.7634.4657.9
672.1696.8737.1768.5763.6780.2823.7863.9904.8930.9
935.1959.1
92559228933.4941.6
943491939308946.8
960.29551962.8958.3
Durablegoods
20.9
10.7
18.6
21.224.215.714.013.014.425.430.132.535.5
42.639.138.042.142.551.148.848.645.350.7
51.449.354.759.764.872.678.479.588.391.8
89.198.2
111.1121.3112.3112.7126.6138.4146.3146.6
135.8139.4
149614421467146.0
1454126.21326139.1
146.81374140.3133.0
Non-Hurohloouraoiegoods
98.1
82.9
115.1
119.9127.6129.9134.0139.4150.3158.9154.8155.0157.4
161.8165.3171.2175.7177.0185.4191.6194.9196.8205.0
208.2211.9218.5223.0233.3244.0255.5259.5270.5277.3
283.7288.7300.6308.0303.3308.2322.5334.0345.7354.6
358.4367.4
351 1350'63554361.3
361535663549360.4
364.53670368.8369.2
Services
96.1
76.9
86.1
88.891.895.5
100.2102.8106.3116.7120.9124.7126.5
132.9137.2140.9145.6150.5157.6165.0170.3175.9184.8
192.4200.2208.8217.8229.8240.9251.8263.7275.6288.8
299.3309.9325.3339.2348.0359.3374.7391.5412.8429.6
440.9452.4
42484280431.3434.3
4365436.54433447'.3
44894507453.7456.1
Gross private domestic investment
TntallOTdl
55.8
8.4
33.6
44.555.829.518.119.727.770.970.082.165.4
93.593.983.085.383.1
103.8102.697.087.5
108.0
104.7103.9117.6125.1133.0151.9163.0154.9161.6171.4
158.5173.9195.0217.5195.5154.8184.5213.5229.7232.6
203.6215.0
237J2387232.6221.5
2183200'.51953200'.5
211.62197221.5207.1
Fixed investment
Total
51.2
13.2
32.0
38.343.824.318.022.031.458.770.276.669.8
83.080.278.783.885.396.196.895.589.3
100.9
101.2100.9109.7117.5125.9140.1146.2142.7152.6160.4
154.8165.8184.8200.4183.9161.5176.7201.2215.8222.5
206.6206.8
222.32204225.'0222.2
2192199^2200.2207^6
213.12089206^5198.7
Nonresidential
Total
37.5
10.4
20.9
25.830.417.614.018.727.642.148.951.146.0
50.052.952.156.355.461.365.466.259.363.6
66.966.772.075.182.797.4
108.0105.6109.5116.8
113.8112.2121.0138.1135.7119.3125.6140.6153.4163.3
158.4161.6
161.41613166.4164.1
16501561155.5157^0
1620161 1163!9159.2
Qtrnroiruc-tures
21.1
5.0
8.7
10.012.06.84.25.58.3
18.917.418.417.9
19.220.720.622.623.625.428.328.426.827.4
29.530.231.631.934.440.643.442.042.845.0
43.942.844.147.443.638.339.540.544.648.5
48.450.7
45.848^049450.7
50548'746.847^8
4965045L551.4
Producers'durable
equipment
16.4
5.5
12.1
15.818.510.99.8
13.219.223.231.532.628.1
30.832.231.533.731.835.937.037.832.536.2
37.436.540.443.148.356.864.563.666.871.8
69.969.376.990.792.181.186.1
100.0108.8114.8
110.0110.8
115.6113^21170113^5
114.51074108 8109*3
112.4110 71124107.8
See next page for continuation of table.
234
Digitized for FRASER http://fraser.stlouisfed.org/ Federal Reserve Bank of St. Louis
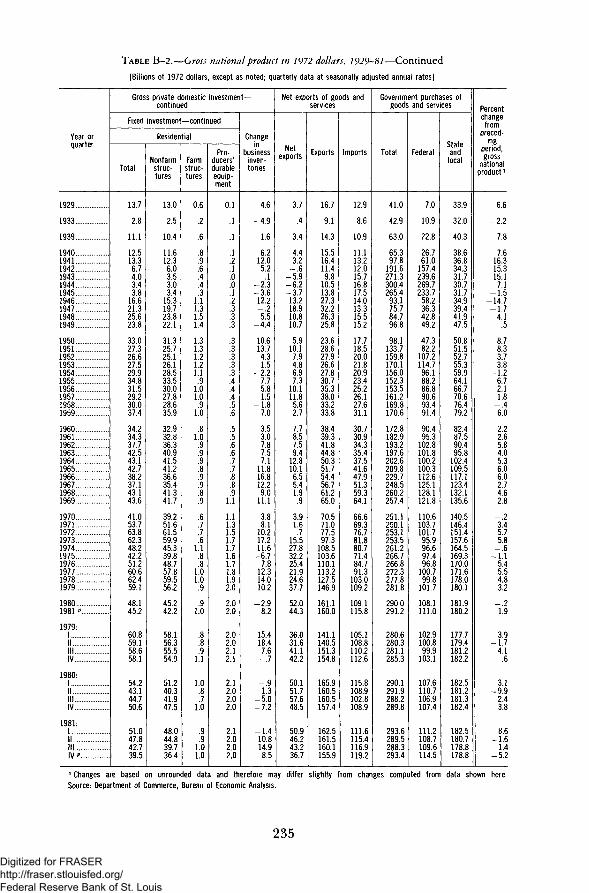
TABLE B-2.—Gross national product in 1972 dollars, 1929-81—Continued
[Billions of 1972 dollars, except as noted; quarterly data at seasonally adjusted annual rates]
Year orquarter
1929
1933
1939
1940194119421943194419451946194719481949
1950195119521953195419551956195719581959 ....
1960196119621963196419651966196719681969
1970197119721973197419751976197719781979
19801981 P
1979:1||I I IIV
1980:II II l lIV
1981:1III l lIV p
Gross private domestic investment-continued
Fixed investment— continued
Residential
Total
13.7
2.8
11.1
12.513.36.74.03.43.8
16.621.325.623.8
33.027.326.627.529.934.831.529.230.037.4
34.234.337.742.543.142.738.237.143.143.6
41.053.763.862.348.242.251.260.662.459.1
48.145.2
60.859.158.658.1
54.243.144.750.6
51.047.842.739.5
Nonfarmstruc-tures
13.0
2.5
10.4
11.612.36.03.53.03.4
15.319.723.822.1
31.325.725.126.128.533.530.027.828.635.9
32.932.836.340.941.541.236.635.441.341.7
39.251.661.559.945.339.848.757.859.556.2
45.242.2
58.156.355.554.9
51.240.341.947.5
48.044.839.736.4
Farmstruc-tures
0.6
.2
.6
.8
.9
.6
.4
.4
.31.11.31.51.4
1.31.31.21.21.1.9
1.01.0.9
1.0
.81.0
.9
.9
.9
.8
.9
.9
.8
.9
.6
.7
.7
.61.1.8.8
1.01.0.9
.91.0
.8
.8
.91.1
1.0.8.7
1.0
.9
.91.01.0
Pro-ducers'durableequip-ment
0.1
.1
.1
.1
.2
.1
.0
.0
.1
.2
.3
.3
.3
.3
.3
.3
.3
.3
.4
.4
.4
.5
.6
.5
.5
.6
.6
.7
.7
.8
.8
.91.1
1.11.31.51.71.71.61.71.81.92.0
2.02.0
2.02.02.12.1
2.12.02.02.0
2.12.02.02.0
Changein
businessinven-tories
4.6
-4.9
1.6
6.212.05.2.1
-2.3-3.612.2-.25.5
-4.4
10.613.74.31.5
-2.27.75.81.5
-1.87.0
3.53.07.87.57.1
11.816.812.29.0
11.1
3.88.1
10.217.211.6
-6.77.8
12.314.010.2
-2.98.2
15.418.47.6
-.7
-.91.3
-5.0-7.2
-1.410.814.98.5
Net exports of goods andservices
Netexports
3.7
.4
3.4
4.43.2
-.6-5.9-6.2-3.713.218.910.810.7
5.910.17.94.86.97.3
10.111.85.62.7
7.78.57.59.4
12.810.16.55.41.9.9
3.91.6
.715.527.832.225.421.924.637.7
52.044.3
36.031.641.142.2
50.151.757.648.5
50.946.243.236.7
Exports
16.7
9.1
14.3
15.516.411.49.8
10.513.827.332.226.325.8
23.628.627.926.627.830.735.338.033.233.8
38.439.341.844.850.351.754.456.761.265.0
70.571.077.597.3
108.5103.6110.1113.2127.5146.9
161.1160.0
141.1140.5151.3154.8
165.9160.5160.5157.4
162.5161.5160.1155.9
Imports
12.9
8.6
10.9
11.113.212.015.716.817.514.013.315.515.2
17.718.520.021.820.923.425.226.127.631.1
30.730.934.335.437.541.647.951.359.364.1
66.669.376.781.880.771.484.791.3
103.0109.2
109.1115.8
105.1108.8110.2112.6
115.8108.9102.8108.9
111.6115.4116.9119.2
Government purchases ofgoods and services
Total
41.0
42.9
63.0
65.397.8
191.6271.3300.4265.4
93.175.784.796.8
98.1133.7159.8170.1156.0152.3153.5161.2169.8170.6
172.8182.9193.2197.6202.6209.8229.7248.5260.2257.4
251.1250.1253.1253.5261.2266.7266.8272.3277.8281.8
290.0291.2
280.6280.3281.1285.3
290.1291.9288.2289.8
293.6289.5288.3293.4
Federal
7.0
10.9
22.8
26.761.0
157.4239.6269.7233.7
58.236.342.849.2
47.382.2
107.2114.7
96.188.286.890.693.491.4
90.495.3
102.8101.8100.2100.3112.6125.1128.1121.8
110.6103.7101.7
95.996.697.496.8
100.799.8
101.7
108.1111.0
102.9100.8
99.9103.1
107.6110.7106.9107.4
111.2108.7109.6114.5
Stateandlocal
33.9
32.0
40.3
38.636.834.331.730.731.734.939.441.947.5
50.851.552.755.359.964.166.770.676.479.2
82.487.590.495.8
102.4109.5117.1123.4132.1135.6
140.5146.4151.4157.6164.5169.3170.0171.6178.0180.1
181.9180.2
177.7179.4181.2182.2
182.5181.2181.3182.4
182.5180.7178.8178.8
Percentchange
frompreced-
ingperiod,gross
nationalproduct 1
6.6
-2.2
7.8
7.616.315.315.17.1
-1.5-14.7-1.7
4.1.5
8.78.33.73.8
-1.26.72.11.8
-.46.0
2.22.65.84.05.36.06.02.74.62.8
-.23.45.75.8
-.6-1.1
5.45.54.83.2
-.21.9
3.9-1.7
4.1.6
3.1-9.9
2.43.8
8.6-1.6
1.4-5.2
1 Changes are based on unrounded data and therefore may differ slightly from changes computed from data shown here.Source: Department of Commerce, Bureau of Economic Analysis.
235
Digitized for FRASER http://fraser.stlouisfed.org/ Federal Reserve Bank of St. Louis

TABLE B-3.—Implicit price deflators for gross national product, 1929-81
[Index numbers, 1972=100, except as noted; quarterly data seasonally adjusted]
Year or quarter
1929
1933
1939
1940.1941.1942.1943.1944.1945.1946.1947.1948.1949.
1950.19511952.1953.1954.1955.1956.1957.1958.1959.
1960.19611962.1963.1964.1965.1966.1967.1968.1969.
1970.1971.1972 .1973.1974.1975.1976.1977.1978.1979.
1980.1981 *..
1979:1I I .I l lI V .
1980:1I I .IllI V .
1981:1I I .I I I .IV.
Grossnationalproduct *
32.76
25.13
28.43
29.0631.2334.3236.1437.0137.9143.8849.5552.9852.49
53.5657.0957.9258.8259.5560.8462.7964.9366.0467.60
68.7069.3370.6171.6772.7774.3676.7679.0682.5486.79
91.4596.01
100.00105.69114.92125.56132.11139.83150.05162.77
177.36193.58
158.16161.17164.23167.47
171.23175.28179.18183.81
188.14191.06195.61199.58
Personal consumption expenditures
Total
35.9
26.9
30.5
30.933.236.740.142.444.147.852.956.055.8
56.960.662.063.263.764.465.667.869.270.6
71.972.673.774.875.977.279.481.484.688.4
92.596.5
100.0105.7116.3125.2131.6139.5149.1162.3
178.9193.7
157.1160.2163.8168.0
172.9177.0180.7184.9
188.5191.5195.7199.3
Durablegoods
44.2
32.5
35.9
36.740.043.746.751.355.562.167.870.370.5
72.276.376.777.275.075.677.780.981.383.8
83.884.385.486.287.186.886.788.291.193.3
95.799.0
100.0101.7108.2117.3123.9129.2136.2144.8
156.0166.5
142.0143.9145.4148.0
151.9154.1157.5160.5
162.3165.4168.3170.2
Nondurablegoods
38.4
26.8
30.5
30.933.639.143.746.247.852.158.762.360.3
60.765.866.566.366.666.367.369.471.071.4
72.673.373.974.975.877.380.181.985.389.4
93.696.6
100.0108.3123.1132.1137.0143.4153.2169.8
188.6202.4
162.9167.3172.1176.9
182.9186.2190.0195.2
199.2200.4203.7206.1
Services
31.6
26.1
29.2
29.530.832.434.236.137.338.841.744.446.0
47.449.952.655.457.258.460.162.264.166.0
67.969.070.471.772.774.276.478.781.986.0
90.595.6
100.0104.7113.0121.6129.6139.91501162.1
178.1195.1
157.7159.9163.3167.4
171.6176.0180.3184.3
188.4192.2197.6202.2
Gross private domestic investment 1
Fixed investment
Total
28.3
22.4
27.7
28.530.733.535.737.037.241.349.053.754.9
56.760.962.363.163.665.068.571.171.071.8
72.171.872.272.372.974.076.378.882.287.0
91.195.7
100.0105.5116.7131.9139.2149.7163.7179.1
194.2209.1
172.8177.0181.5184.9
188.5192.5196.4199.9
203.1208.4210.9214.4
Nonresidential
Total
28.3
22.9
28.2
29.131.033.935.936.836.740.046.951.553.0
54.559.160.161.261.762.967.371.070.972.2
72.572.072.573.173.874.776.979.582.886.7
91.396.2
100.0103.8115.4132.2138.6146.2157.7171.3
186.8202.5
165.5169.2173.4176.8
180.5185.7189.1192.4
195.0201.4204.5208.9
Structures
24.3
19.2
23.0
23.424.928.432.433.833.936.644.048.848.4
49.355.156.357.456.557.662.464.963.964.2
63.763.363.664.164.966.469.272.275.881.5
88.294.5
100.0107.7128.2144.8149.0159.4176.4198.6
224.7246.4
190.6194.0201.4207.4
214.3222.4229.5233.3
236.2244.1249.2255.6
Producers'durable
equipment
33.4
26.2
32.0
32.834.937.337.338.037.942.848.653.056.0
57.861.762.663.865.566.671.175.576.678.3
79.479.379.479.780.180.682.184.387.289.9
93.297.2
100.0101.8109.3126.2133.9140.9150.1159.7
170.2182.3
155.6158.7161.5163.2
165.6169.0171.7174.5
176.8182.0184.0186.6
See next page for continuation of table.
236
Digitized for FRASER http://fraser.stlouisfed.org/ Federal Reserve Bank of St. Louis
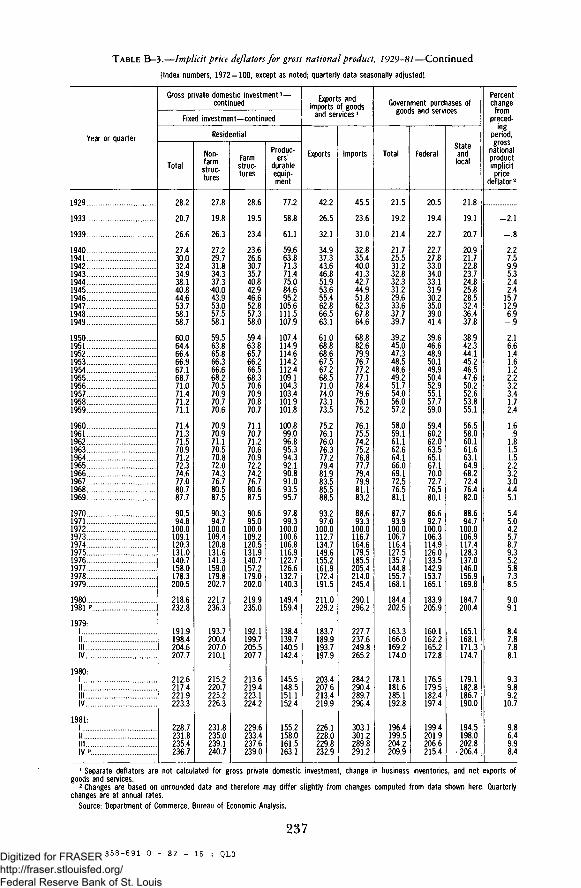
TABLE B-3.—Implicit price deflators for gross national product, 1929-81—Continued
[Index numbers, 1972 = 100, except as noted; quarterly data seasonally adjusted]
Year or quarter
1929
1933
1939. .
1940.1941.1942.1943.1944.1945.1946.1947.1948.1949.
1950.1951.1952.1953. .1954.1955.1956.1957.1958.1959.
1960.1961.1962.1963.1964.1965.19661967.19681969.
1970.1971.19721973.1974.19751976.1977.19781979.
19801981 "..
19791I I .I I I .IV
1980:1I I .I l lIV
19811I II I IIV
Gross private domestic investment l—continued
Fixed investment— continued
Residential
Total
28.2
20.7
26.6
27.430.032.434.938.140.844.653.758.158.7
60.064.466.466.967.168.771.071.471.271.1
71.471.371.570.971.272.374.677.080.787.7
90.594.8
100.0109.1120.3131.0140.7158.0178.3200.5
218.6232.8
191.9198.4204.6207.7
212.6217.4221.9223.3
228.7231.8235.4236.7
Non-farmstruc-tures
27.8
19.8
26.3
27.229.731.834.337.340.043.953.057.558.1
59.563.865.866.366.668.270.570.970.770.6
70.970.971.170.570.872.074.376.780.587.5
90.394.7
100.0109.4120.8131.6141.3159.0179.8202.7
221.7236.3
193.7200.4207.0210.1
215.2220.7225.2226.3
231.8235.0239.1240.7
Farmstruc-tures
28.6
19.5
23.4
23.626.630.735.740.842.946.652.857.358.0
59.463.865.766.266.568.370.670.970.870.7
71.170.771.270.670.972.274.276.780.687.5
90.695.0
100.0109.2120.5131.9140.7157.2179.0202.0
219.9235.0
192.1199.7205.5207.7
213.6219.4223.1224.2
229.6233.4237.6239.0
Produc-ers'
durableequip-ment
77.2
58.8
61.1
59.663.871.371.475.084.695.2
105.6111.5107.9
107.4114.9114.6114.2112.4109.1104.3103.4101.9101.8
100.899.096.895.394.392.190.891.093.595.7
97.899.3
100.0100.6106.8116.9122.7126.6132.7140.3
149.4159.4
138.4139.7140.5142.4
145.5148.5151.1152.4
155.2158.0161.5163.1
Exports andimports of goods
and services 1
Exports
42.2
26.5
32.1
34.937.343.646.851.953.655.462.866.563.1
61.068.868.667.567.268.571.074.073.173.5
75.276.176.076.377.279.481.983.585.588.5
93.297.0
100.0112.7134.7149.6155.2161.9172.4191.5
211.0229.2
183.7189.9193.7197.9
203.4207.6213.4219.9
226.1228.0229.8232.9
Imports
45.5
23.6
31.0
32.835.440.041.342.744.951.862.367.864.6
68.882.679.976.777.277.178.479.676.175.2
76.175.574.275.276.877.779.479.981.183.2
88.693.3
100.0116.7164.6179.5185.5205.4214.0245.4
290.1296.2
227.7237.6249.8265.2
284.2290.4289.7296.4
303.1301.2289.8291.2
Government purchases ofgoods and services
Total
21.5
19.2
21.4
21.725.531.232.832.331.229.633.637.739.7
39.245.047.348.548.649.251.754.056.057.2
58.059.161.162.664.166.069.172.576.581.1
87.793.9
100.0106.7116.4127.5135.7144.8155.7168.1
184.4202.5
163.3166.0169.2174.0
178.1181.6185.1192.8
196.4199.5204.2209.9
Federal
20.5
19.4
22.7
22.727.833.034.033.131.930.235.039.041.4
39.646.648.950.149.950.452.955.157.759.0
59.460.262.063.565.167.170.072.776.580.1
86.692.7
100.0106.3114.9126.0133.5142.9153.7165.1
183.9205.9
160.1162.2165.2172.8
176.5179.5182.4197.4
199.4201.9206.6215.4
Stateandlocal
21.8
19.1
20.7
20.921.722.823.724.825.828.532.436.437.8
38.942.344.145.246.547.650.252.653.855.1
56.558.060.161.663.164.968.272.476.482.0
88.694.7
100.0106.9117.4128.3137.0146.0156.9169.8
184.7200.4
165.1168.1171.3174.7
179.1182.8186.7190.0
194.5198.0202.8206.4
Percentchange
frompreced-
ingperiod,gross
nationalproductimplicit
pricedeflator2
-2.1
-.8
2.27.59.95.32.42.4
15.712.96.9-.9
2.16.61.41.61.22.23.23.41.72.4
1.6.9
1.81.51.52.23.23.04.45.1
5.45.04.25.78.79.35.25.87.38.5
9.09.1
8.47.87.88.1
9.39.89.2
10.7
9.86.49.98.4
1 Separate deflators are not calculated for gross private domestic investment, change in business inventories, and net exports ofgoods and services.
2 Changes are based on unrounded data and therefore may differ slightly from changes computed from data shown here. Quarterlychanges are at annual rates.
Source: Department of Commerce, Bureau of Economic Analysis.
237
358-691 0 - 8 2 - 1 6 : QL3Digitized for FRASER http://fraser.stlouisfed.org/ Federal Reserve Bank of St. Louis
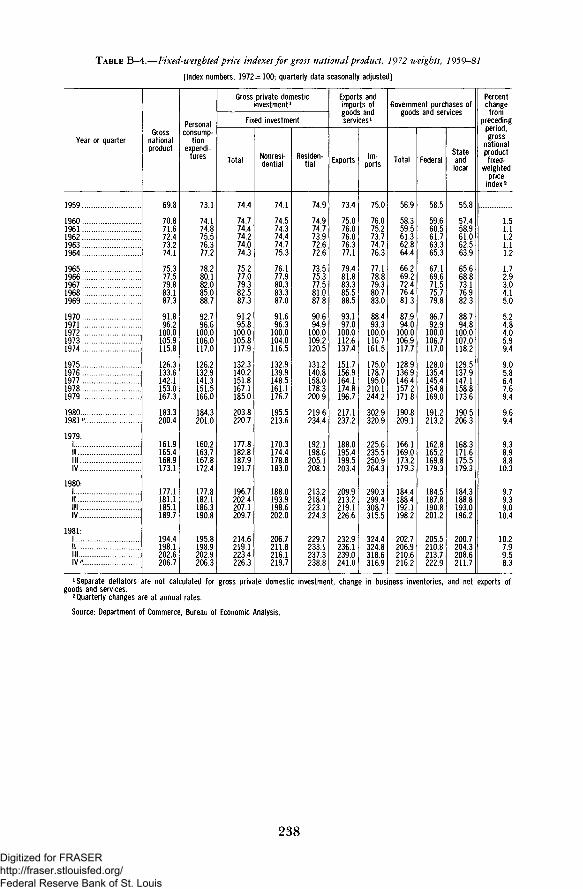
TABLE B-4.—Fixed-weighted price indexes for gross national product, 1972 weights, 1959-81
[Index numbers, 1972 = 100; quarterly data seasonally adjusted]
Year or quarter
1959
19601961196219631964
1965
196719681969
19701971197219731974
19751976197719781979
19801981 p
1979:iI II l lIV
1980:II IIll .IV
1981:1I II l lIV.
Grossnationalproduct
69.8
70.871.672.473.274.1
75.377.579.883.187.3
91.896.2
100.0105.9115.8
126.3133.6142.1153.0167.3
183.3200.4
161.9165.4168.9173.1
177.1181.1185.1189.7
194.4198.1202.6206.7
Personalconsump-
tionexpendi-
tures
73.1
74.174.875.576.377.2
78.280.182.085.088.7
92.796.6
100.0106.0117.0
126.2132.9141.3151.5166.0
184.3201.0
160.2163.7167.8172.4
177.8182.1186.3190.8
195.8198.9202.9206.3
Gross private domesticinvestment1
Fixed investment
Total
74.4
74.774.474.274.074.3
75.277.079.382.587.3
91.295.8
100.0105.8117.9
132.3140.2151.8167.1185.0
203.8220.7
177.8182.8187.9191.7
196.7202.4207.1209.7
214.6219.1223.4226.3
Nonresi-dential
74.1
74.574.374.474.775.3
76.177.980.383.387.0
91.696.3
100.0104.0116.5
132.9139.9148.5161.1176.7
195.5213.6
170.3174.4178.8183.0
188.0193.9198.6202.0
206.7211.8216.1219.7
Residen-tial
74.9
74.974.773.972.672.6
73.575.377.581.087.8
90.694.9
100.0109.2120.5
131.2140.8158.0178.3200.9
219.6234.4
192.1198.6205.1208.1
213.2218.4223.1224.3
229.7233.1237.3238.8
Exports andimports ofgoods andservices1
Exports
73.4
75.076.076.076.377.1
79.481.883.385.588.5
93.197.0
100.0112.6137.4
151.7156.9164.1174.8196.7
217.1237.2
188.0195.4199.5203.4
209.9213.2219.1226.6
232.9236.1239.0241.0
Im-ports
75.0
76.075.273.774.776.3
77.178.879.380.783.0
88.493.3
100.0116.7161.5
175.0178.7195.0210.1244.2
302.9320.9
225.6235.5250.9264.3
290.3299.4308.7315.5
324.4324.8318.6316.9
Government purchases ofgoods and services
Total
56.9
58.359.561.362.864.4
66.269.272.476.481.3
87.994.0
100.0106.9117.7
128.9136.9146.4157.2171.8
190.8209.1
166.1169.0173.2179.3
184.4188.4192.1198.2
202.7206.9210.6216.2
Federal
58.5
59.660.561.763.365.3
67.169.671.575.779.8
86.792.9
100.0106.7117.0
128.0135.4145.4154.8169.0
191.2213.2
162.8165.2169.8179.3
184.5187.8190.8201.2
205.5210.8213.7222.9
Stateandlocal
55.8
57.458.961.062.563.9
65.668.873.176.982.3
88.794.8
100.0107.0118.2
129.5137.9147.1158.8173.6
190.5206.3
168.3171.6175.5179.3
184.3188.8193.0196.2
200.7204.3208.6211.7
Percentchange
frompreceding
period,gross
nationalproduct
fixed-weighted
priceindex2
1.51.11.21.11.2
1.72.93.04.15.0
5.24.84.05.99.4
9.05.86.47.69.4
9.69.4
9.38.98.8
10.3
9.79.39.0
10.4
10.27.99.58.3
Separate deflators are not calculated for gross private domestic investment, change in business inventories, and net exports ofgoods and services.
2 Quarterly changes are at annual rates.
Source: Department of Commerce, Bureau of Economic Analysis.
238
Digitized for FRASER http://fraser.stlouisfed.org/ Federal Reserve Bank of St. Louis
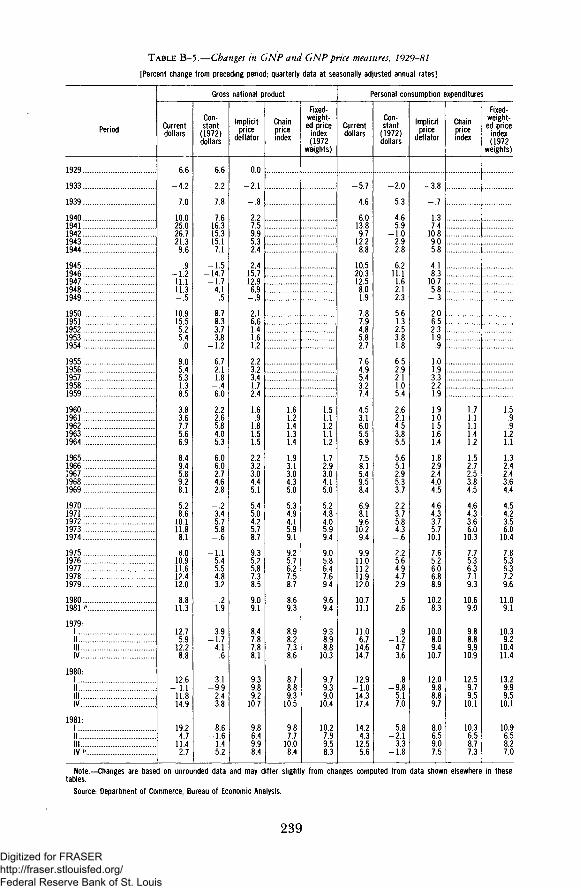
TABLE B-5.—Changes in GNP and GNPprice measures, 1929-81
[Percent change from preceding period; quarterly data at seasonally adjusted annual rates]
Period
1929
1933
1939.
1940.1941.1942.1943.1944.
1945.1946.1947.1948.1949.
1950.1951.1952.1953.1954.
1955.1956.1957.19581959.
1960.1961.1962.1963.1964.
1965.1966.1967.1968.1969.
1970.1971.1972.1973.1974.
1975.1976.1977.1978.1979.
1980.1981 P..
1979:1 .I I .I I I .IV.
1980:1III I IIV
1981:1 .t lI I I .IV P
Gross national product
Currentdollars
6.6
-4.2
7.0
10.025.026.721.39.6
.9-1.211.111.3-.5
10.915.55.25.4
.0
9.05.45.3138.5
3.83.67.75.66.9
8.49.45.89.28.1
5.28.6
10.111.88.1
8.010.911.612.412.0
8.811.3
12.75.9
12.28.8
12.6-1.1
11.814.9
19.24.7
11.42.7
Con-stant
(1972)dollars
6.6
-2.2
7.8
7.616.315.315.17.1
-1.5-14.7-1.7
4.1.5
8.78.33.73.8
-1.2
6.72.11.8
_ 46.0
2.22.65.84.05.3
6.06.02.74.62.8
-.23.45.75.8-.6
-1.15.45.54.83.2
-.21.9
3.9-1.7
4.1.6
3.1-9.9
2.43.8
8.6-1.6
1.4-5.2
Implicitprice
deflator
0.0
-2.1
-.8
2.27.59.95.32.4
2.415.712.96.9
— .9
2.16.61.41.61.2
2.23.23.4172.4
1.6.9
1.81.51.5
2.23.23.04.45.1
5.45.04.25.78.7
9.35.25.87.38.5
9.09.1
8.47.87.88.1
9.39.89.2
10.7
9.86.49.98.4
Chainpriceindex
1.61.21.41.31.4
1.93.13.04.35.0
5.34.94.15.99.1
9.25.76.27.58.7
8.69.3
8.98.27.38.6
8.78.89.3
10.5
9.87.7
10.08.4
Fixed-weight-ed price
index(1972
weights)
1.51.11.21.11.2
1.72.93.04.15.0
5.24.84.05.99.4
9.05.86.47.69.4
9.69.4
9.38.98.8
10.3
9.79.39.0
10.4
10.27.99.58.3
Personal consumption expenditures
Currentdollars
-5.7
4.6
6.013.89.7
12.28.8
10.520.312.58.01.9
7.87.94.85.82.7
7.64.95.4327.4
4.53.16.05.56.9
7.58.15.49.58.4
6.98.19.6
10.29.4
9.911.011.211.912.0
10.711.1
11.06.7
14.614.7
12.9-1.0
14.317.4
14.24.3
12.55.6
Con-stant
(1972)dollars
-2.0
5.3
4.65.9
-1.02.92.8
6.211.11.62.12.3
5.61.32.53.81.8
6.52.92.1105.4
2.62.14.53.85.5
5.65.12.95.33.7
2.23.75.84.3-.6
2.25.64.94.72.9
.52.6
.9-1.2
4.73.6
.8-9.8
5.17.0
5.8-2.1
3.3-1.8
Implicitprice
deflator
-3.8
-.7
1.37.4
10.89.05.8
4.18.3
10.75.8-.3
2.06.52.31.9.9
1.01.93.32 21.9
1.91.01.51.61.4
1.82.92.44.04.5
4.64.33.75.7
10.1
7.65.26.06.88.9
10.28.3
10.08.09.4
10.7
12.09.88.89.7
8.06.59.07.5
Chainpriceindex
1.71.11.11.41.2
1.52.72.53.84.5
4.64.33.66.0
10.3
7.75.36.37.19.3
10.69.0
9.88.89.9
10.9
12.59.79.5
10.1
10.36.58.77.3
Fixed-weight-ed price
index(1972
weights)
1.5.9.9
1.21.1
1.32.42.43.64.4
4.54.23.56.0
10.4
7.85.36.37.29.6
11.09.1
10.39.2
10.411.4
13.29.99.5
10.1
10.96.58.27.0
Note.—Changes are based on unrounded data and may differ slightly from changes computed from data shown elsewhere in thesetables.
Source: Department of Commerce, Bureau of Economic Analysis.
239
Digitized for FRASER http://fraser.stlouisfed.org/ Federal Reserve Bank of St. Louis

TABLE B-6.—Gross national product by major type of product, 1929-81
[Billions of dollars; quarterly data at seasonally adjusted annual rates]
Year orquarter
1929
1933
1939
1940194119421943194419451946194719481949
1950195119521953195419551956195719581959
1960196119621963196419651966196719681969
1970197119721973197419751976197719781979
19801981 P
1979:1III l lIV
1980:1IIIllIV
1981:1III l lIV P.
Grossnationalproduct
103.4
55.8
90.9
100.0125.0158.5192.1210.6212.4209.8233.1259.5258.3
286.5330.8348.0366.8366.8400.0421.7444.0449.7487.9
506.5524.6565.0596.7637.7691.1756.0799.6873.4944.0
992.71,077.61,185.91,326.41,434.21,549.21,718.01,918.02,156.12,413.9
2,626.12,922.2
2,340.62,374.62,444.12,496.3
2,571.72,564.82,637.32,730.6
2,853.02,885.82,965.02,984.9
Finalsales
101.7
57.4
90.5
97.8120.6156.7192.8211.6213.5203.5233.5254.8261.4
279.7320.5344.8366.3368.4394.1417.0442.6451.2482.2
503.6522.2558.8590.7632.1681.2741.9789.3865.5934.2
989.51,070.01,175.71,307.91,420.11,556.11,706.21,897.02,133.92,396.4
2,632.02,904.0
2,316.22,341.52,430.82,497.1
2,569.12,557.42,653.42,748.0
2,848.52,862.52,937.62,967.3
Inven-tory
change
1.7
-1.6
.4
2.24.51.8-.6-1.0-1.06.4-.54.7
-3.1
6.810.33.1.4
-1.56.04.71.3
-1.55.7
3.02.36.36.05.69.914.110.37.99.8
3.27.710.218.514.1-6.911.821.022.217.5
-5.918.2
24.333.113.3-.8
2.57.4
-16.0-17.4
4.523.327.517.6
Goods
Total
Total
56.1
27.0
49.0
56.072.593.7120.4132.3128.9125.3139.8154.4147.7
162.4189.5194.6203.1196.1214.5223.3232.3228.2248.5
254.2257.4278.5290.3309.8338.4375.0389.4421.3450.2
459.9485.3529.6604.1646.7694.0771.1852.6946.6
1,055.9
1,130.41,271.2
1,038.61,041.91,064.91,078.3
1,116.91,106.41,129.41,169.0
1,247.51,257.01,298.31,282.0
Finalsales
54.4
28.6
48.6
53.868.091.9121.0133.3129.9118.9140.3149.7150.8
155.6179.2191.5202.7197.6208.5218.6231.0229.7242.9
251.3255.0272.2284.3304.2328.5360.9379.1413.4440.4
456.6477.7519.4585.6632.5700.9759.3831.6924.4
1,038.5
1,136.31,253.0
1,014.31,008.81,051.61,079.1
1,114.41,099.01,145.41,186.3
1,243.11,233.71,270.81,264.4
Inven-tory
change
1.7
-1.6
.4
2.24.51.8-.6-1.0-1.06.4-.54.7
-3.1
6.810.33.1.4
-1.56.04.71.3
-1.55.7
3.02.36.36.05.69.914.110.37.99.8
3.27.710.218.514.1-6.911.821.022.217.5
-5.918.2
24.333.113.3-.8
2.57.4
-16.0-17.4
4.523.327.517.6
Durable goods
Finalsales
16.1
5.4
12.4
15.423.834.554.258.550.131.844.448.050.0
56.266.472.577.873.981.485.991.384.490.8
93.392.7102.9109.4118.9131.6147.0153.5167.9178.5
179.2187.1207.4237.6250.7279.4312.5353.9392.0439.7
462.6498.0
434.7426.4449.2448.4
468.2441.3464.9476.0
505.5498.3506.6481.6
Inven-tory
change
1.4
-.5
.3
1.23.11.0.0
-.6-1.35.31.41.0
-1.8
3.66.11.21.5
-2.53.42.1.5
-2.83.1
1.6-.13.42.74.06.710.25.54.76.4_ }2'.87.2
13.112.0-8.47.78.817.811.5
-4.09.0
18.920.96.7-.4
-11.83.3
-8.4.7
-4.218.518.63.1
Nondurable goods
Finalsales
38.3
23.2
36.2
38.444.257.466.874.879.887.195.9101.7100.9
99.4112.8119.0124.9123.7127.1132.7139.6145.3152.1
158.0162.4169.3174.9185.3196.9213.9225.6245.5261.9
277.5290.6312.0348.0381.8421.5446.7477.7532.5598.8
673.7754.9
579.5582.4602.4630.7
646.2657.7680.5710.3
737.5735.3764.2782.8
Inven-tory
change
0.3
-1.1
.1
1.01.4.7
-.6-.3
.21.1
-1.93.7
-1.3
3.24.22.0
-1.11.02.62.6.81.32.5
1.32.42.83.31.63.23.94.93.13.4
3.34.83.05.32.21.54.212.24.46.0
-1.89.2
5.512.26.6-.5
14.34.1
-7.7-18.1
8.64.88.914.6
Services
35.9
25.9
34.4
35.740.850.863.072.377.068.871.677.282.2
88.5103.5113.9121.6126.2136.1146.2158.7167.7179.8
193.8207.0222.0237.1255.0273.3299.0326.5358.2391.9
429.9472.0519.0571.5636.1705.2779.3869.0976.2
1,097.2
1,229.61,370.3
1,055.51,078.51,112.01,142.8
1,178.61,205.61,249.01,285.3
1,317.11,344.71,390.51,429.0
Struc-tures
11.4
2.9
7.5
8.311.814.08.76.16.515.721.728.028.4
35.637.839.442.044.549.552.253.053.859.5
58.560.264.569.372.979.382.083.694.0101.8
102.9120.3137.3150.8151.4150.0167.6196.4233.2260.8
266.0280.7
246.5254.2267.3275.1
276.2252.8258.9276.4
288.4284.1276.3273.9
Autooutput
7.28.8
11.9
15.413.312.016.114.721.216.919.414.419.4
21.317.822.525.225.931.230.428.035.134.9
28.739.141.646.239.240.755.965.369.668.0
60.270.2
76.069.564.961.8
64.453.654.368.8
68.173.676.862.3
Source.- Department of Commerce, Bureau of Economic Analysis.
240
Digitized for FRASER http://fraser.stlouisfed.org/ Federal Reserve Bank of St. Louis

TABLE B-7.—Gross national product by major type of product in 1972 dollars, 1929-81
[Billions of 1972 dollars; quarterly data at seasonally adjusted annual rates]
Year or quarter
1929
1933
1939.
1940194119421943194419451946194719481949
1950195119521953195419551956195719581959
1960196119621963196419651966196719681969
1970197119721973197419751976197719781979
19801981 "
1979:II IIl lIV
1980:1III I IIV
1981:1III l lIV *
Grossnationalproduct
315.7
222.1
319.8
344.1400.4461.7531.6569.1560.4478.3470.3489.8492.2
534.8579.4600.8623.6616.1657.5671.6683.8680.9721.7
737.2756.6800.3832.5876.4929.3984.8
1,011.41,058.11,087.6
1,085.61,122.41,185.91,255.01,248.01,233.91,300.41,371.71,436.91,483.0
14807l!509'.6
147991,4734148821,490.6
1,501.9146331,471.91,485.6
151641,510.41,515.81,495.6
Finalsales
311.0
227.0
318.2
337.9388.4456.5531.5571.4564.0466.1470.6484.3496.6
524.2565.6596.5622.1618.2649.8665.8682.2682.7714.7
733.7753.7792.4825.0869.3917.5968.0999.2
1,049.11,076.6
1,081.81,114.31,175.71,237.81,236.41,240.61,292.71,359.31,422.91,472.9
14836l!5014
146441,455'.0148061,491.3
1,502 8146201,476.91,492.7
151781,499.61,500.91,487.1
Inven-tory
change
4.6
-4.9
1.6
6.212.05.2.1
-2.3-3.6
12.2-.25.5
-4.4
10.613.74.31.5
-2.27.75.81.5
-1.87.0
3.53.07.87.57.1
11.816.812.29.0
11.1
3.88.1
10.217.211.6
-6.77.8
12.314.010.2
— 2 98'.2
15418476
-.7
_ 913
-5.0-7.2
-1410.814.98.5
Goods
Total
Total
144.3
97.5
154.3
171.7198.6221.4263.3287.3278.5238.3237.7244.8240.3
261.5283.7292.1306.8292.7316.7320.9321.7311.6332.5
335.8338.0361.3372.2393.8422.6456.4463.4483.1496.0
486.9497.2529.6573.0564.0549.2588.9628.8655.9674.5
665 2685ll
6818669'.!67366713
68216581657.5662.9
6889686.36919673.1
Finalsales
139.7
102.3
152.7
165.5186.6216.2263.3289.6282.2226.2237.9239.4244.7
250.9270.0287.8305.3294.9309.0315.1320.2313.4325.5
332.3335.0353.5364.7386.7410.8439.6451.2474.1484.9
483.2489.1519.4555.8552.4555.9581.1616.5641.9664.3
668 167619
6664650i86660674'.0
68306568662.4670.1
6903675.56770664.7
Inven-tory
change
4.6
-4.9
1.6
6.212.05.2.1
-2.3-3.6
12.2-.25.5
-4.4
10.613.74.31.5
-2.27.75.81.5
-1.87.0
3.53.07.87.57.1
11.816.812.29.0
11.1
3.88.1
10.217.211.6
-6.77.8
12.314.010.2
— 2 98^2
15418'.47.6_'l
_ 913
-5.0-7.2
-1410.91498.5
Durable goods
Finalsales
40.4
17.5
35.5
43.157.875.7
118.8135.9121.260.375.577.378.3
86.198.2
107.9116.2109.0117.2117.8119.4109.2113.6
115.6114.7125.7132.5143.0157.2174.0178.3187.4193.0
187.5188.7207.4236.1234.1230.3242.8264.2278.6290.2981 32783
2950283^8292 1289'.9
295.227012784281.5
2925279J2792261.8
Inven-tory
change
3.5
-2.1
.7
3.48.23.5
.7-1.8-3.710.81.41.6
-2.9
5.59.01.72.3
-3.74.52.9
.9-3.4
3.9
2.0-.14.23.45.18.2
12.36.65.47.2
.03.07.2
12.79.4
-6.45.45.8
10.96.7
— 193^8
1141L938-!3
-4.67
-3.8.3
-3 18.9781.5
Nondurable goods
Finalsales
99.3
84.9
117.2
122.4128.7140.5144.4153.7161.0165.8162.4162.1166.4
164.8171.8179.9189.1185.9191.9197.2200.8204.3211.9
216.6220.3227.8232.2243.7253.6265.6272.9286.7291.9
295.7300.4312.0319.7318.3325.7338.3352.3363.3374.1
386 8398i6
3713367^03738384J
387.73867384iO388.6
3979395.83978402.8
Inven-tory
change
1.1
-2.8
.9
2.83.81.7
-.6-.5
.11.3
-1.63.8
-1.5
5.14.72.6-.81.53.22.9
.61.63.1
1.63.03.74.21.93.64.55.63.63.9
3.75.13.04.52.2-.32.46.53.03.5
1 14.4
406438
-'.4
3.76
-U—7.5
171.9717.0
Services
127.4
110.7
135.2
139.9158.5193.9242.0263.7263.0200.8188.1192.5198.3
207.4231.3243.2247.5249.1260.1270.2282.4287.6299.4
312.5326.9341.5356.2374.0390.7412.6434.1453.0469.2
482.4497.8519.0542.9563.0576.4595.6618.2649.0678.0
695 77074
669 1674!86830684^9
69076906699i9701.7
703670477099711.2
Struc-tures
43.9
14.0
30.3
32.543.346.326.218.118.839.144.652.453.6
65.964.365.569.374.380.780.579.781.789.8
89.091.797.4
104.1108.6116.0115.9113.9122.0122.5
116.3127.3137.3139.1121.0108.3116.0124.6132.1130.6
1198117'.1
129 0129i513161324
129.11146114.'5121.0
123911941140111.2
Autooutput
12.313.918.0
23.019.317.122.621.629.823.024.518.623.2
25.321.226.028.729.435.734.831.838.537.4
29.838.941.646.437.135.745.350.750.246.8
3864L9
532484440414
42.534634.642.8
42844^344835.8
Source: Department of Commerce, Bureau of Economic Analysis.
241
Digitized for FRASER http://fraser.stlouisfed.org/ Federal Reserve Bank of St. Louis
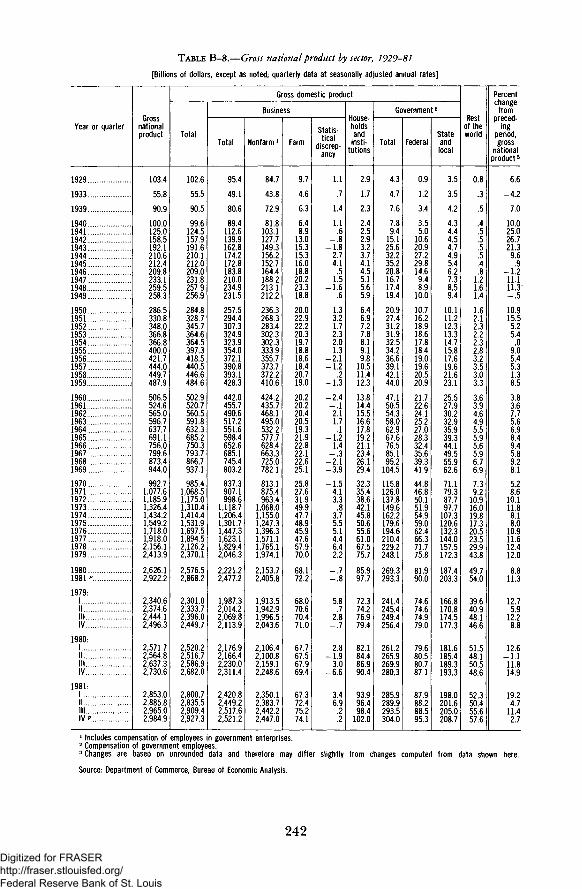
TABLE B-8.—Gross national product by sector, 1929-81
[Billions of dollars, except as noted; quarterly data at seasonally adjusted annual rates]
Year or quarter
1929.
1933.
1939.
1940.,1941.1942.1943.1944.1945.1946.1947.1948.1949.
1950.1951.1952.1953.1954.1955.1956.1957.1958.1959.
1960.1961.1962.19631964.19651966.19671968.1969.
1970.1971.1972.1973.1974.1975.1976..1977.1978.1979.
1980.1981 "..
19791I I .I l lIV
1980:1I I .I l lIV
19811I II I IIV..
Grossnationalproduct
103.4
55.8
90.9
100.0125.0158.5192.1210.6212.4209.8233.1259.5258.3
286.5330.8348.0366.8366.8400.0421.7444.0449.7487.9
506.5524.6565.0596.7637.7691.1756.0799.6873.4944.0
992.71,077.61,185.91,326.41,434.21,549.21,718.01,918.02,156.12,413.9
2,626.12,922.2
2,340.62,374.62,444.12,496.3
2,571.72,564.82,637.32,730.6
2,853.02,885.82,965.02,984.9
Gross domestic product
Total
102.6
55.5
90.5
99.6124.5157.9191.6210.1212.0209.0231.8257.9256.9
284.8328.7345.7364.6364.5397.3418.5440.5446.6484.6
502.9520.7560.5591.8632.3685.2750.3793.7866.7937.1
985.41,068.51,175.01,310.41,414.41,531.91,697.51,894.52,126.22,370.1
2,576.52,868.2
2,301.02,333.72,396.02,449.7
2,520.22,516.72,586.92,682.0
2,800.72,835.52,909.42,927.3
Business
Total
95.4
49.1
80.6
89.4112.6139.9162.8174.2172.8183.8210.0234.9231.5
257.5294.4307.3324.9323.9354.0372.1390.8393.1428.3
442.0455.7490.6517.2551.6598.4652.6685.1745.4803.2
837.3907.1998.6
1,118.71,206.41,301.71,447.31,623.11,829.42,046.3
2,221.22,477.2
1,987.32,014.22,069.82,113.9
2,176.92,166.42,230.02,311.4
2,420.82,449.22,517.62,521.2
Nonfarm 1
84.7
43.8
72.9
81.8103.1127.7149.3156.2152.7164.4188.2213.1212.2
236.3268.3283.4302.3302.3333.9355.7373.7372.2410.6
424.2435.7468.1495.0532.2577.7628.4663.3725.0782.1
813.1875.4963.4
1,068.01,155.01,247.31,396.31,571.11,765.11,974.1
2,153.72,405.8
1,913.51,942.91,996.52,043.6
2,106.42,100.82,159.12,248.6
2,350.12,383.72,442.22,447.0
Farm
9.7
4.6
6.3
6.48.9
13.015.315.316.018.820.223.318.8
20.022.922.220.319.718.818.618.420.719.0
20.220.220.420.519.321.922.822.122.625.1
25.827.631.949.947.748.945.947.657.970.0
68.172.2
68.070.670.471.0
67.767.567.969.4
67.372.475.274.1
CfatkOldllo-tiralllCdl
discrep-ancy
1.1
.7
1.4
1.1.6
-.8-1.8
2.74.1
.51.5
-1.6.6
1.33.21.72.32.01.3
-2.1-1.2
.2-1.3
-2.4-.12.11.7.1
-1.21.4
-.3-2.1-3.9
-1.54.13.3
.83.75.55.14.46.42.2
-.7-.8
5.8.7
2.8-.7
2.8-1.9
3.0-6.6
3.4-6.9
.2
.2
House-holdsand
insti-tutions
2.9
1.7
2.3
2.42.52.93.23.74.14.55.15.65.9
6.46.97.27.88.19.19.8
10.511.412.3
13.814.415.516.617.819.221.123.426.129.4
32.335.438.642.145.850.655.661.067.575.7
85.997.7
72.374.276.979.4
82.184.486.990.4
93.996.498.4
102.0
Government2
Total
4.3
4.7
7.6
7.89.4
15.125.632.235.220.816.717.419.4
20.927.431.231.932.534.236.639.142.144.0
47.150.554.358.062.967.676.585.195.2
104.5
115.8126.0137.8149.6162.2179.6194.6210.4229.2248.1
269.3293.3
241.4245.4249.4256.4
261.2265.9269.9280.3
285.9289.9293.5304.0
Federal
0.9
1.2
3.4
3.55.0
10.620.927.229.814.69.48.9
10.0
10.716.218.918.617.818.419.019.620.520.9
21.722.624.125.227.028.332.435.639.341.9
44.846.850.151.954.959.062.466.371.775.8
81.990.0
74.674.674.979.0
79.680.580.787.1
87.988.288.595.3
Stateandlocal
3.5
3.5
4.2
4.34.44.54.74.95.46.27.38.59.4
10.111.212.313.314.715.817.619.621.623.1
25.527.930.232.935.939.344.149.555.962.6
71.179.387.797.7
107.3120.6132.3144.0157.5172.3
187.4203.3
166.8170.8174.5177.3
181.6185.4189.3193.3
198.0201.6205.0208.7
PoetK6SIof theworld
0.8
.3
.5
.4
.5
.5
.5
.5
.4
.81.21.61.4
1.62.12.32.22.32.83.23.53.03.3
3.63.94.64.95.55.95.65.96.76.9
7.39.2
10.916.019.817.320.523.529.943.8
49.754.0
39.640.948.146.6
51.548.150.548.6
52.350.455.657.6
Percentchange
frompreced-
ingperiod,gross
nationalproduct 3
6.6
-4.2
7.0
10.025.026.721.39.6
.9-1.211.111.3-.5
10.915.55.25.4
.09.05.45.31.38.5
3.83.67.75.66.98.49.45.89.28.1
5.28.6
10.111.88.18.0
10.911.612.412.0
8.811.3
12.75.9
12.28.8
12.6-1.111.814.9
19.24.7
11.42.7
1 Includes compensation of employees in government enterprises.2 Compensation of government employees.3 Changes are based on unrounded data and therefore may differ slightly from changes computed from data shown here.
Source: Department of Commerce, Bureau of Economic Analysis.
242
Digitized for FRASER http://fraser.stlouisfed.org/ Federal Reserve Bank of St. Louis

TABLE B-9.—Gross national product by sector in 1972 dollars, 1929-81
[Billions of 1972 dollars, except as noted; quarterly data at seasonally adjusted annual rates]
Year or quarter
1929
1933
1939
1940..194119421943194419451946194719481949
1950195119521953195419551956195719581959
1960196119621963196419651966196719681969
1970197119721973197419751976197719781979
19801981 "
1979:1I IIll ,IV
1980:1I IIllIV
1981:1I II l lIV *
Grossnationalproduct
315.7
222.1
319.8
344.1400.4461.7531.6569.1560.4478.3470.3489.8492.2
534.8579.4600.8623.6616.1657.5671.6683.8680.9721.7
737.2756.6800.3832.5876.4929.3984.8
1,011.41,058.11,087.6
1,085.61,122.41,185.91,255.01,248.01,233.91,300.41,371.71,436.91,483.0
1,480.71,509.6
1,479.91,473.41,488.21,490.6
1,501.91,463.31,471.91,485.6
1,516.41,51041,515.81,495.6
Gross domestic product
Total
313.2
220.9
318.2
342.8398.7460.1530.3567.7559.3476.4467.8486.8489.4
531.8575.6596.9619.8612.1653.0666.5678.3676.2716.8
732.0751.0793.8825.6868.9921.4977.5
1,003.91,050.01,079.7
1,077.61,112.81,175.01,239.91,230.71,220.01,284.81,354.71,416.81,455.9
1,452.41,481.4
1,454.61,447.81,458.61,462.4
1,471.51,435.51,443.41,458.9
1,488.41,483 81,487.11,466.4
Business
Total
271.5
180.0
261.0
282.7327.6361.8385.6403.6397.9385.5393.8412.0409.8
448.7478.0492.8515.6508.5547.0557.4566.1561.7600.0
610.1625.1663.2691.6730.3777.7824.0842.0882.1907.1
904.8938.6998.6
1,061.41,049.11,034.71,097.61,165.11,222.61,258.3
1,251.81,279.6
1,258.81,250.81,260.01,263.6
1,271.91,235.21,242.31,257.5
1,286.4128181,285.71,264.4
Nonfarm l
244.7
152.5
231.3
254.6299.8335.3362.1370.1362.8358.6367.0389.0383.4
419.4447.2463.7484.3477.0516.0531.5539.5532.0574.0
584.2596.3631.5659.7701.3749.6794.1812.8855.6881.9
875.4901.7963.4
1,029.11,014.1
996.71,061.61,128.91,185.51,222.1
1,216.81,242.2
1,221.81,215.01,223.21,228.2
1,233.31,198.51,207.61,227.9
1,250.91,248 91,246.21,222.7
Farm
23.6
24.9
25.2
24.526.228.627.727.125.625.824.025.825.6
27.025.826.427.728.429.328.928.229.327.8
29.228.928.829.628.829.828.229.529.029.5
31.132.631.931.631.833.632.133.032.934.9
35.337.8
33.335.335.135.8
37.037.833.133.2
33.636539.441.6
Statisti-ralCdl
discrep-ancy
3.1
2.6
4.6
3.61.6
-2.1-4.2
6.49.41.12.9
-2.8.8
2.45.02.63.63.11.8
-3.0-1.7
.3-1.9
-3.3-.22.92.3
.2-1.6
1.7-.3
-2.5-4.4
-1.74.23.3
.73.24.43.93.24.21.4
-.4-.4
37.5
1.7_.4
1.6-1.1
1.7-3.6
1.8-36
.1
.1
House-holdsand
insti-tutions
15.6
12.2
15.1
16.115.916.415.215.115.015.116.016.717.3
18.318.718.619.319.421.422.523.124.224.7
26.627.028.128.929.830.932.634.335.437.0
36.737.638.639.439.340.540.941.342.343.7
45.447.0
42943.344.244.4
44.844.945.646.1
46.746946.847.5
Government2
Total
26.2
28.8
42.1
44.055.281.9
129.4149.1146.475.958.058.162.3
64.779.085.585.084.184.686.789.190.392.2
95.398.9
102.5105.2108.8112.7120.8127.7132.4135.7
136.1136.7137.8139.1142.3144.9146.3148.4151.9153.9
155.2154.9
1529153.7154.4154.5
154.8155.4155.5155.3
155.31552154.6154.5
Federal
5.2
6.6
16.9
18.629.656.7
105.0125.2121.849.729.829.231.3
32.746.251.649.647.245.945.645.844.544.5
45.246.248.348.248.548.753.057.258.058.2
55.252.550.148.248.548.448.548.649.349.0
49.249.0
49149.049.048.9
49.049.449.448.9
49.049049.049.1
Stateandlocal
21.0
22.1
25.2
25.425.625.224.523.924.626.228.229.031.0
32.032.833.935.436.938.641.043.345.847.7
50.152.754.357.060.464.067.970.574.477.4
80.984.287.790.893.896.597.899.7
102.6104.9
106.0105.9
1038104.7105.3105.6
105.8105.9106.1106.3
106.41062105.6105.4
Restof theworld
2.4
1.3
1.6
1.41.71.51.31.41.11.82.53.02.7
3.03.73.93.74.04.55.15.54.64.9
5.25.76.56.97.57.97.47.58.27.9
8.09.5
10.915.117.313.915.616.920.127.2
28.328.1
25325.629.628.1
30.427.828.526.7
28.026628.729.2
Percentchange
frompreced-
ingperiod,gross
nationalproduct 3
6.6
-2.2
7.8
7.616.315.315.17.1
-1.5-14.7-1.7
4.1.5
8.78.33.73.8
-1.26.72.11.8
4e'.o2.22.65.84.05.36.06.02.74.62.8
-.23.45.75.8
-.6-1.1
5.45.54.83.2
-.21.9
39-1.7
4.1.6
3.1-9.9
2.43.8
8.6-16
1.4-5.2
1 Includes compensation of employees in government enterprises.2 Compensation of government employees.3 Changes are based on unrounded data and therefore may differ slightly from changes computed from data shown here.Source: Department of Commerce, Bureau of Economic Analysis.
243
Digitized for FRASER http://fraser.stlouisfed.org/ Federal Reserve Bank of St. Louis
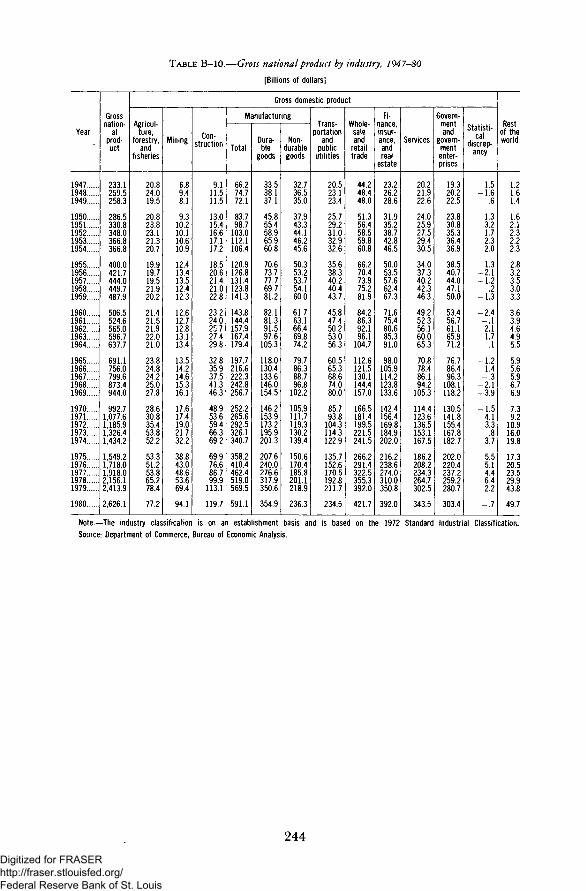
TABLE B-10.—Gross national product by industry, 1947-80
[Billions of dollars]
Year
194719481949
19501951195219531954
19551956195719581959
19601961196219631964
19651966196719681969
19701971197219731974
19751976197719781979
1980
Grossnation-
alprod-uct
233.1259.5258.3
286.5330.8348.0366.8366.8
400.0421.7444.0449.7487.9
506.5524.6565.0596.7637.7
691.1756.0799.6873.4944.0
992.71,077.61,185.91,326.41,434.2
1,549.21,718.01,918.02,156.12,413.9
2,626.1
Gross domestic product
Agricul-ture,
forestry,and
fisheries
20.824.019.5
20.823.823.121.320.7
19.919.719.521.920.2
21.421.521.922.021.0
23.824.824.225.027.8
28.630.835.453.852.2
53.351.253.865.278.4
77.2
Mining
6.89.48.1
9.310.210.110.610.9
12.413.413.512.412.3
12.612.712.813.113.4
13.514.214.615.316.1
17.617.419.021.732.2
38.843.048.653.669.4
94.1
Con-struction
9.111.511.5
13.015.416.617.117.2
18.520.621.421.022.8
23.224.025.727.429.8
32.835.937.541.346.3
48.953.659.466.369.2
69.976.686.799.9
113.1
119.7
Manufacturing
Total
66.274.772.1
83.798.7
103.0112.1106.4
120.9126.8131.4123.8141.3
143.8144.4157.9167.4179.4
197.7216.6222.3242.8256.7
252.2265.6292.5326.1340.7
358.2410.4462.4519.0569.5
591.1
Dura-ble
goods
33.538.137.1
45.855.458.965.960.8
70.673.777.769.781.2
82.181.391.597.6
105.3
118.0130.4133.6146.0154.5
146.2153.9173.2195.9201.3
207.6240.0276.6317.9350.6
354.9
Non-durablegoods
32.736.535.0
37.943.344.146.245.6
50.353.253.754.160.0
61.763.166.469.874.2
79.786.388.796.8
102.2
105.9111.7119.3130.2139.4
150.6170.4185.8201.1218.9
236.3
Trans-portation
andpublic
utilities
20.523.123.4
25.729.231.032.932.6
35.638.340.240.443.7
45.847.450.253.056.3
60.565.368.674.080.0
85.793.8
104.3114.3122.9
135.7152.6170.5192.8211.7
234.5
UUhrtlownoie-saleand
retailtrade
44.248.448.0
51.356.458.559.860.8
66.270.473.975.281.9
84.286.392.196.1
104.7
112.6121.5130.1144.4157.0
166.5181.4199.5221.5241.5
266.2291.4322.5355.3392.0
421.7
Fi-nance,insur-ance,andreal
estate
23.226.228.6
31.935.238.742.846.5
50.053.557.662.467.3
71.675.480.685.391.0
98.0105.9114.2123.8133.6
142.4156.4169.8184.9202.0
216.2238.6274.0310.0350.8
392.0
Services
20.221.922.6
24.025.927.529.430.5
34.037.340.242.346.3
49.252.356.160.065.3
70.878.486.194.2
105.3
114.4123.6136.5153.1167.5
186.2208.2234.3264.7302.5
343.5
Govern-mentand
govern-mententer-prises
19.320.222.5
23.830.835.336.436.9
38.540.744.047.150.0
53.456.761.165.971.2
76.786.496.3
108.1118.2
130.5141.8155.4167.8182.7
202.0220.4237.2259.2280.7
303.4
Statist!-palcai
discrep-ancy
1.5-1.6
.6
1.33.21.72.32.0
1.3-2.1-1.2
.2-1.3
-2.4-.12.11.7.1
-1.21.4
-.3-2.1-3.9
-1.54.13.3.8
3.7
5.55.14.46.42.2
-.7
Restof theworld
1.21.61.4
1.62.12.32.22.3
2.83.23.53.03.3
3.63.94.64.95.5
5.95.65.96.76.9
7.39.2
10.916.019.8
17.320.523.529.943.8
49.7
Note.—The industry classification is on an establishment basis and is based on the 1972 Standard Industrial Classification.
Source: Department of Commerce, Bureau of Economic Analysis.
244
Digitized for FRASER http://fraser.stlouisfed.org/ Federal Reserve Bank of St. Louis

TABLE B-ll.—Gross national product by industry in 1972 dollars, 1947-80
[Billions of 1972 dollars]
Year
194719481949.
19501951195219531954
19551956195719581959
19601961196219631964
19651966196719681969
19701971197219731974
1975.1976197719781979
1980
Grossnationalproduct
470.3489.8492.2
534.8579.4600.8623.6616.1
657.5671.6683.8680.9721.7
737.2756.6800.3832.5876.4
929.3984.8
1,011.41,058.11,087.6
1,085.61,122.41,185.91,255.01,248.0
1,233.91,300.41,371.71,436.91,483.0
1,480.7
Gross domestic product
Agri-culture,forest-ry, andfisher-
ies
26.328.228.0
29.328.429.230.531.3
32.131.731.132.230.6
32.131.831.732.531.8
32.831.332.632.132.7
34.435.935.435.335.8
37.135.836.837.239.6
40.2
Min-ing
10.811.39.9
11.112.111.912.211.8
13.213.913.812.713.3
13.513.613.914.515.1
15.716.517.017.618.2
18.918.419.019.219.2
18.919.119.820.521.0
22.1
Con-struc-tion
22.926.526.5
29.332.533.834.836.0
38.240.940.942.145.5
46.146.748.449.952.2
54.454.653.456.955.8
53.457.959.460.153.3
48.352.855.358.858.3
54.4
Manufacturing
Total
114.9121.4115.1
131.1146.0150.8161.1149.6
165.7166.9167.7153.3171.2
171.8172.0186.7202.2216.7
236.7254.9254.3268.2277.2
261.2266.8292.5325.3311.7
289.6317.4338.7356.9368.0
351.0
Dura-ble
goods
68.572.066.3
78.189.994.3
102.691.7
103.4102.5102.988.8
100.9
101.099.5
110.0119.5129.8
144.6157.3157.4165.5170.3
155.2156.4173.2194.2186.3
168.8187.2202.9217.4223.5
208.7
Non-durablegoods
46.449.448.8
53.056.156.558.557.9
62.364.464.864.570.3
70.872.576.782.886.8
92.097.696.9
102.7106.8
106.0110.4119.3131.1125.3
120.8130.1135.8139.5144.5
142.3
Trans-por-
tationand
publicutil-ities
42.342.139.2
41.245.545.546.645.8
49.752.153.251.955.4
57.558.661.565.068.1
73.479.481.688.292.6
94.997.9
104.3110.6111.9
113.5118.6125.2134.3141.1
144.0
lA/hnlownoie-saleand
retailtrade
75.978.079.8
87.588.391.093.994.5
103.1106.2107.9107.8115.4
117.5118.7126.3131.1139.1
148.2156.3160.1169.9173.6
176.4185.5199.5211.1207.0
209.7220.2230.8242.1248.1
243.0
Fi-nance,insur-ance,andreal
estate
54.756.659.8
63.966.770.973.977.3
81.885.889.893.498.5
102.7107.3113.3116.8122.1
128.5133.9139.4145.7152.9
155.8162.6169.8177.2184.5
187.9194.8208.9218.9227.5
236.4
Serv-ices
55.957.557.6
59.760.861.662.762.9
67.670.974.176.280.8
83.586.690.394.098.8
103.1109.0115.0118.8124.0
126.7128.4136.5144.8147.9
148.5154.7162.4171.2178.6
183.5
Govern-mentand
govern-mententer-prises
68.769.273.3
75.690.096.996.395.2
95.797.8
100.4101.7104.0
107.7111.6115.5118.7123.1
127.8136.9144.1148.9152.5
152.9153.9155.4157.2161.2
164.3165.7168.1172.3174.9
176.3
Sta-tis-
ticaldis-
crep-ancy
2.9-2.8
.8
2.45.02.63.63.1
1.8-3.0-1.7
.3-1.9
-3.3-.22.92.3
.2
-1.61.7
-.3-2.5-4.4
-1.74.23.3
.73.2
4.43.93.24.21.4
-.4
Resid-ual !
-7.4-1.2-.6
.8
.22.64.14.6
4.23.4
.94.54.0
3.14.43.2
-1.51.7
2.33.06.76.24.6
4.71.2.0
-1.8-4.8
-2.02.05.4
.3-2.4
1.9
PoetKesiof theworld
2.53.02.7
3.03.73.93.74.0
4.55.15.54.64.9
5.25.76.56.97.5
7.97.47.58.27.9
8.09.5
10.915.117.3
13.915.616.920.127.2
28.3
1 Equals GNP in constant dollars measured as the sum of incomes less GNP in constant dollars measured as the sum of grossproduct by industry.
Note.—The industry classification is on an establishment basis and is based on the 1972 Standard Industrial Classification.
Source: Department of Commerce, Bureau of Economic Analysis.
245
Digitized for FRASER http://fraser.stlouisfed.org/ Federal Reserve Bank of St. Louis
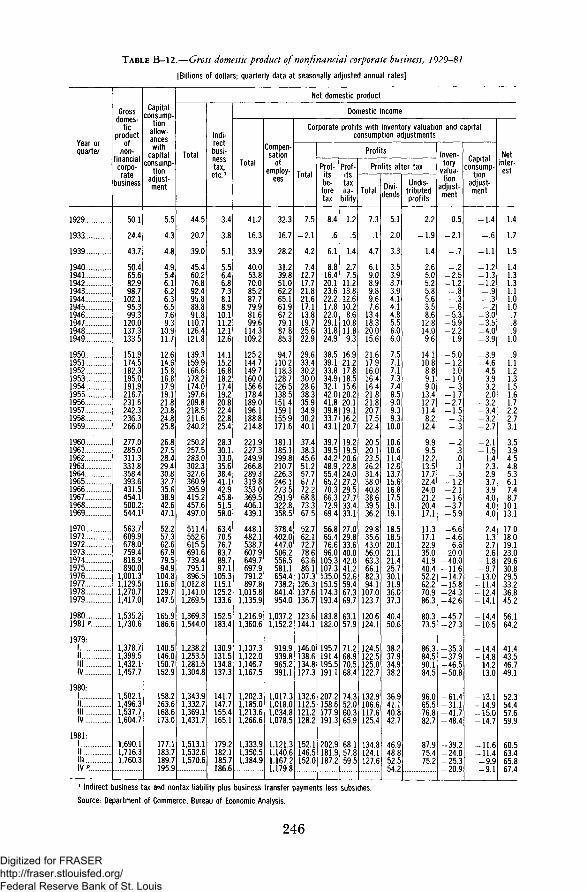
TABLE B-12.—Gross domestic product of nonfinancial corporate business, 1929-81
[Billions of dollars; quarterly data at seasonally adjusted annual rates]
Year orquarter
1929
1933
1939
1940194119421943194419451946194719481949
1950195119521953195419551956195719581959
I960.....196119621963196419651966196719681969
1970197119721973197419751976197719781979
19801981 ".
1979:1I II l lIV
1980:1IIIl lIV
1981:1I II l lIV ".
Grossdomes-
ticproduct
ofnon-
f inancialcorpo-rate
business
50.1
24.4
43.7
50.465.682.998.7
102.195.399.3
120.0137.3133.5
151.9174.5182.3195.0191.9216.7231.6242.3236.3266.0
277.0285.0311.3331.8358.4393.6431.5454.1500.2544.1
563.7609.9678.0759.4818.9890.0
1,001.31,129.51,270.71,417.0
1,535.21,730.6
1,378.71,399.51,432.11,457.7
1,502.11,496.31,537.71,604.7
1,690.11,716.31,760.3
Capitalconsump-
tionallow-anceswith
capitalconsump-
tionadjust-ment
5.5
4.3
4.8
4.95.46.16.26.36.57.69.3
10.911.7
12.614.615.816.817.919.121.823.824.825.8
26.827.528.429.430.832.735.638.942.647.1
52.257.362.667.979.594.9
104.8116.6129.7147.5
165.9186.6
140.5146.0150.7152.9
158.2163.6168.6173.0
177.1183.7189.7195.9
Net domestic product
Total
44.5
20.2
39.0
45.460.276.892.495.888.891.8
110.7126.4121.8
139.3159.9166.6178.2174.0197.6209.8218.5211.6240.2
250.2257.5283.0302.3327.6360.9395.9415.2457.6497.0
511.4552.6615.5691.6739.4795.1896.5
1,012.81,141.01,269.5
1,369.31,544.0
1,238.21,253.51,281.51,304.8
1,343.91,332.71,369.11,431.7
1,513.11,532.61,570.6
Indi-rect
busi-nesstax,etc.1
3.4
3.8
5.1
5.56.46.87.38.18.9
10.111.212.112.6
14.115.216.818.217.419.220.822.422.825.4
28.330.133.035.638.441.142.945.851.558.0
63.470.576.783.789.797.1
105.3115.1125.2133.6
152.5183.4
130.9131.5134.8137.3
141.7147.7155.4165.1
179.2182.1185.7186.6
Domestic income
Total
41.2
16.3
33.9
40.053.870.085.287.779.981.699.6
114.3109.2
125.2144.7149.7160.0156.6178.4189.0196.1188.8214.8
221.9227.3249.9266.8289.3319.8353.0369.5406.1439.1
448.1482.1538.7607.9649.7697.9791.2897.8
1,015.81,135.9
1,216.91,360.6
1,107.31,122.01,146.71,167.5
1,202.31,185.01,213.61,266.6
1,333.91,350.51,384.9
Compen-sation
ofemploy-
ees
32.3
16.7
28.2
31.239.851.062.265.161.967.279.187.885.3
94.7110.2118.3128.7126.5138.5151.4159.1155.9171.6
181.1185.1199.8210.7226.3246.1273.5291.9322.8358.5
378.4402.0447.0506.2556.5581.1654.4738.2841.4954.0
1,037.21,152.2
919.9939.8965.2991.1
1,017.31,018.01,034.81,078.5
1,121.31,140.61,167.21,1798
Corporate profits with inventory valuation and capitalconsumption adjustments
Total
7.5
-2.1
4.2
7.412.717.721.821.617.113.819.725.622.9
29.633.430.230.028.638.335.934.930.240.1
37.438.345.651.257.767.772.268.873.367.5
52.762.172.778.663.686.1
107.3126.3137.6136.7
123.6144.1
146.0138.6134.8127.3
132.6112.5121.2128.2
152.1146.5152.0
Profits
Prof-itsbe-
foretax
8.4
.6
6.1
8.816.420.123.622.217.822.029.131.824.9
38.539.133.834.932.142.041.839.833.743.1
39.739.544.248.955.465.270.366.372.969.4
56.865.476.696.0
105.3107.3135.0153.5174.3193.4
183.8182.0
195.7191.4195.5191.1
207.2158.6177.9191.3
202.9181.9187.2
Prof-itstaxlia-
bil i ty
1.2
.5
1.4
2.77.5
11.213.812.610.28.6
10.811.89.3
16.921.217.818.515.620.220.119.116.220.7
19.219.520.622.824.027.229.527.733.433.1
27.029.833.640.042.041.252.659.467.369.7
63.157.9
71.268.970.568.4
74.352.060.365.9
68.157.859.5
Profits after tax
Total
7.3
.1
4.7
6.19.08.99.89.67.6
13.418.320.015.6
21.617.916.016.416.421.821.820.717.522.4
20.520.123.526.231.438.040.838.639.536.2
29.835.643.056.063.366.182.394.1
107.0123.7
120.6124.1
124.5122.5125.0122.7
132.9106.6117.6125.4
134.8124.1127.6
Divi-dends
5.1
2.0
3.3
3.53.93.73.94.14.14.85.56.06.0
7.57.17.17.37.48.59.09.39.3
10.0
10.610.611.412.613.715.616.817.519.119.1
18.518.520.121.121.425.730.131.936.037.3
40.450.6
38.237.934.938.2
36.941.140.842.7
46.948.852.554.2
Undis-tributedprofits
2.2
-1.9
1.4
2.65.05.25.85.63.58.6
12.814.09.6
14.110.88.89.19.0
13.412.711.48.2
12.4
9.99.5
12.213.517.722.424.021.220.417.1
11.317.122.935.041.940.452.262.270.986.3
80.373.5
86.384.590.184.5
96.065.576.882.7
87.975.475.2
Inven-tory
valua-tion
adjust-ment
0.5
-2.1
-.7
-.2-2.5-1.2-.8-.3-.6
-5.3-5.9-2.2
1.9
-5.0-1.2
1.0-1.0-.3
-1.7-2.7-1.5-.3-.3
-.2.3.0.1
-.5-1.2-2.1-1.6-3.7-5.9
-6.6-4.6-6.6
-20.0-40.0-11.6-14.7-15.8-24.3-42.6
-45.7-27.3
-35.3-37.9-46.5-50.8
-61.4-31.1-41.7-48.4
-39.2-24.0-25.3-20.9
Capitalconsump-
tionadjust-ment
-1.4
-.6
-1.1
-1.2-1.3-1.2-.9-.3-.2
-3.0-3.5-4.0-3.9
-3.9-4.6-4.5-3.9-3.2-2.0-3.2-3.4-3.2-2.7
-2.1-1.5
1.42.32.93.73.94.04.04.0
2.41.32.72.6
-1.8-9.7
-13.0-11.4-12.4-14.1
-14.4-10.5
-14.4-14.8-14.2-13.0
-13.1-14.9-15.0-14.7
-11.6-11.4-9.9-9.1
Netinter-est
1.4
1.7
1.5
1.41.31.31.11.01.0
.7
.8
.91.0
.91.11.21.31.51.61.72.22.73.1
3.53.94.54.85.36.17.48.7
10.113.1
17.018.019.123.029.630.829.533.236.845.2
56.164.2
41.443.546.749.1
52.354.457.659.9
60.563.465.867.4
1 Indirect business tax and nontax liability plus business transfer payments less subsidies.
Source: Department of Commerce, Bureau of Economic Analysis.
246
Digitized for FRASER http://fraser.stlouisfed.org/ Federal Reserve Bank of St. Louis
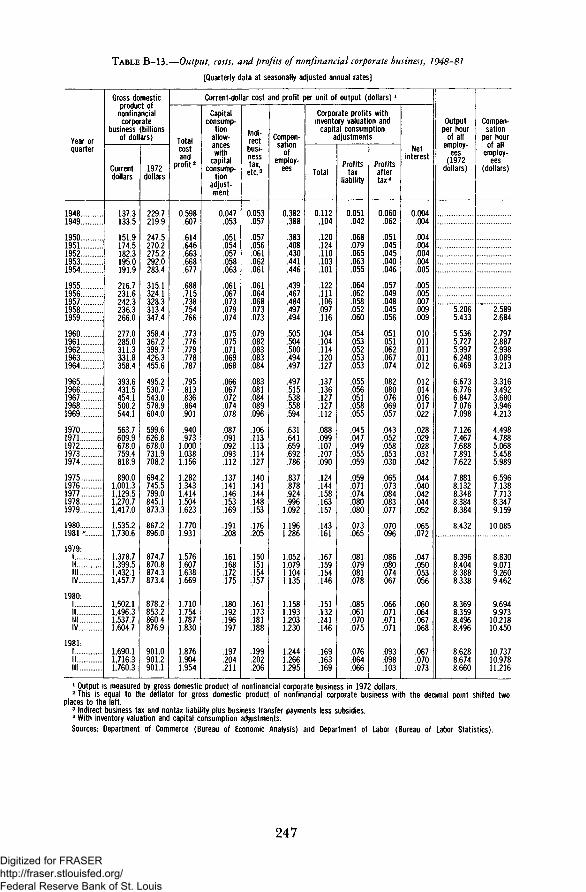
TABLE B-13.—Output, costs, and profits of nonfinancial corporate business, 1948-81
[Quarterly data at seasonally adjusted annual rates]
Year orquarter
19481949
19501951195219531954
19551956195719581959
19601961196219631964
19651966196719681969
19701971197219731974
19751976197719781979
19801981 P.
1979:II II l lIV
1980:1IIIllIV
1981:1I IIl l
Gross domesticproduct of
nonfinancialcorporate
business (billionsof dollars)
Currentdollars
137.3133.5
151.9174.5182.3195.0191.9
216.7231.6242.3236.3266.0
277.0285.0311.3331.8358.4
393.6431.5454.1500.2544.1
563.7609.9678.0759.4818.9
890.01,001.31,129.51,270.71,417.0
1,535.21,730.6
1,378.71,399.51,432.11,457.7
1,502.11,496.31,537.71,604.7
1,690.11,716.31,760.3
1972dollars
229.7219.9
247.5270.2275.2292.0283.4
315.1324.1328.3313.4347.4
358.4367.2399.7426.3455.6
495.2530.7543.0578.9604.0
599.6626.8678.0731.9708.2
694.2745.5799.0845.1873.3
867.2896.0
874.7870.8874.3873.4
878.2853.2860.4876.9
901.0901.2901.1
Current-dollar cost and profit per unit of output (dollars) '
Totalcostand
profit2
0.598.607
.614
.646
.663
.668
.677
.688
.715
.738
.754
.766
.773
.776
.779
.778
.787
.795
.813
.836
.864
.901
.940
.9731.0001.0381.156
1.2821.3431.4141.5041.623
1.7701.931
1.5761.6071.6381.669
1.7101.7541.7871.830
1.8761.9041.954
Capitalconsump-
tionallow-anceswith
capitalconsump-
tionadjust-ment
0.047.053
.051
.054
.057
.058
.063
.061
.067
.073
.079
.074
.075
.075
.071
.069
.068
.066
.067
.072
.074
.078
.087
.091
.092
.093
.112
.137
.141
.146
.153
.169
.191
.208
.161
.168
.172
.175
.180
.192
.196
.197
.197
.204
.211
Indi-rectbusi-nesstax,etc.3
0.053.057
.057
.056
.061
.062
.061
.061
.064
.068
.073
.073
.079
.082
.083
.083
.084
.083
.081
.084
.089
.096
.106
.113
.113
.114
.127
.140
.141
.144
.148
.153
.176
.205
.150
.151
.154
.157
.161
.173
.181
.188
.199.202.206
Compen-sation
ofemploy-
ees
0.382.388
.383
.408
.430
.441
.446
.439
.467
.484
.497
.494
.505
.504
.500
.494
.497
.497
.515
.538
.558
.594
.631
.641
.659
.692
.786
.837
.878
.924
.9961.092
1.1961.286
1.0521.0791.1041.135
1.1581.1931.2031.230
1.2441.2661.295
Corporate profits withinventory valuation and
capital consumptionadjustments
Total
0.112.104
.120
.124
.110
.103
.101
.122
.111
.106
.097
.116
.104
.104
.114
.120
.127
.137
.136
.127
.127
.112
.088
.099
.107
.107
.090
.124
.144
.158
.163
.157
.143
.161
.167
.159
.154
.146
.151
.132
.141
.146
.169
.163
.169
Profitstax
liability
0.051.042
.068
.079
.065
.063
.055
.064
.062
.058
.052
.060
.054
.053
.052
.053
.053
.055
.056
.051
.058
.055
.045
.047
.049
.055
.059
.059
.071
.074
.080
.080
.073
.065
.081
.079
.081
.078
.085
.061
.070
.075
.076
.064
.066
Profitsaftertax4
0.060.062
.051
.045
.045
.040
.046
.057
.049
.048
.045
.056
.051
.051
.062
.067
.074
.082
.080
.076
.069
.057
.043
.052
.058
.053
.030
.065
.073
.084
.083
.077
.070
.096
.086
.080
.074
.067
.066
.071
.071
.071
.093
.098
.103
Netinterest
0.004.004
.004
.004
.004
.004
.005
.005
.005
.007
.009
.009
.010
.011
.011
.011
.012
.012
.014
.016
.017
.022
.028
.029
.028
.031
.042
.044
.040
.042
.044
.052
.065
.072
.047
.050
.053
.056
.060
.064
.067
.068
.067
.070
.073
Outputper hour
of allemploy-
ees(1972
dollars)
5.206"5.433
5.5365.7275.9976.2486.469
6.6736.7766.8477.0767.098
7.1267.4677.6887.8917.622
7.8818.1328.3488.3848.384
8.432
8.3968.4048.3888.338
8.3698.3598.4968.496
8.6288.6748.660
Compen-sation
per hourof all
employ-ees
(dollars)
2.5892.684
2.7972.8872.9983.0893.213
3.3163.4923.6803.9464.213
4.4984.7885.0685.4585.989
6.5967.1387.7138.3479.159
10.085
8.8309.0719.2609.462
9.6949.973
10.21810.450
10.73710.97811.216
1 Output is measured by gross domestic product of nonfinancial corporate business in 1972 dollars.2 This is equal to the deflator for gross domestic product of nonfinancial corporate business with the decimal point shifted two
places to the left.3 Indirect business tax and nontax liability plus business transfer payments less subsidies.4 With inventory valuation and capital consumption adjustments.Sources: Department of Commerce (Bureau of Economic Analysis) and Department of Labor (Bureau of Labor Statistics).
247
Digitized for FRASER http://fraser.stlouisfed.org/ Federal Reserve Bank of St. Louis

TABLE B-14.—Personal consumption expenditures, 1929-81
[Billions of dollars; quarterly data at seasonally adjusted annua l rates]
Year or quarter
1929
1933
1939
1940194119421943194419451946194719481949
1950195119521953195419551956195719581959
1960196119621963196419651966196719681969
1970197119721973197419751976197719781979
19801981"
1979:1.I II I I .IV.
1980:1I II l lIV
1981:1I II l lIV P
Personalconsump-
tionexpendi-
tures
77.3
45.8
67.0
71.080.888.699.4
108.2119.5143.8161.7174.7178.1
192.0207.1217.1229.7235.8253.7266.0280.4289.5310.8
324.9335.0355.2374.6400.5430.4465.1490.3536.9581.8
621.7672.2737.1812.0888.1976.4
1,084.31,205.51,348.71,510.9
1,672.81,858.1
1,454.11,478.01,529.11,582.3
1,631.01,626.81,682.21,751.0
1,810.11,829.11,883.91,909.5
Durablegoods
9.2
3.5
6.7
7.89.76.96.56.78.0
15.820.422.925.0
30.829.829.132.531.838.637.939.336.842.4
43.141.646.751.456.463.068.070.180.585.7
85.297.2
111.1123.3121.5132.2156.8178.8199.3212.3
211.9232.0
212.5207.4213.3216.1
220.9194.4208.8223.3
238.3227.3236.2226.4
Nondura-ble goods
37.7
22.3
35.1
37.042.950.858.664.371.982.790.996.694.9
98.2108.8113.9116.5118.0122.9128.9135.2139.8146.4
151.1155.3161.6167.1176.9188.6204.7212.6230.6247.8
265.7278.8300.6333.4373.4407.3441.7479.0529.8602.2
675.7743.4
571.8586.4611.5639.2
661.16640674.2703.5
7260735.3751.3760.9
Services
30.3
20.1
25.2
26.228.231.034.337.139.645.350.455.358.2
63.068.574.080.686.192.199.2
105.9112.8121.9
130.7138.1147.0156.1167.1178.7192.4207.6225.8248.2
270.8296.2325.3355.2393.2437.0485.7547.7619.6696.3
785.2882.7
669.9684.2704.3727.0
749.07684799.2824.2
8458866.5896.4922.2
Durable goods
Motorvehicles
and parts
3.3
1.1
2.3
2.83.5
.7
.8
.81.04.16.68.0
10.6
13.712.211.313.913.017.815.817.214.818.9
19.717.821.524.426.130.030.430.136.338.7
36.245.452.457.150.455.872.685.094.395.5
89.998.2
100.191.794.795.4
100.677587.094.6
105493.4
101.692.3
Furnitureand
house-holdnoiu
equip-ment
4.7
1.9
3.4
3.84.84.63.93.84.58.4
10.611.511.3
13.714.014.014.614.616.217.116.916.617.8
17.717.918.920.322.824.727.729.532.334.1
35.237.241.747.150.653.559.165.872.981.1
84.692.7
78.080.182.483.8
83.681384.688.9
92392.493.293.0
Other
1.2
.5
1.0
1.11.31.61.92.12.53.23.33.43.2
3.33.63.94.14.24.65.05.25.45.8
5.85.86.36.77.68.39.9
10.511.813.0
13.914.616.919.220.522.925.228.032.135.8
37.341.2
34.435.636.237.0
36.835637.239.8
40641.641.441.1
Nondurable goods
Food
19.5
11.5
19.1
20.223.428.433.236.740.647.452.354.252.5
53.960.463.464.465.467.269.973.676.479.1
81.183.285.587.892.798.9
106.6109.6118.7127.5
138.9144.2154.9172.1193.7213.6230.6250.3276.4312.1
345.7382.1
299.1306.0314.3329.0
336.23384347.7360.4
3725377.8386.5391.6
Clothingand
shoes
9.4
4.6
7.1
7.58.8
11.013.414.616.518.218.820.119.3
19.621.221.922.122.123.124.124.324.726.1
26.727.428.729.531.933.536.638.242.145.5
46.850.655.461.464.869.675.382.191.998.9
104.8115.9
95.897.0
100.3102.5
102.21023105.3109.4
1134115.8117.5116.8
See next page for continuation of table.
248
Digitized for FRASER http://fraser.stlouisfed.org/ Federal Reserve Bank of St. Louis

TABLE B-14.—Personal consumption expenditures, 1929-81—Continued
[Billions of dollars; quarterly data at seasonally adjusted annual rates]
Year orquarter
1929..
1933..
1939..
1940..1941..19421943..19441945..1946194719481949
195019511952195319541955..1956195719581959
1960196119621963..19641965..1966196719681969..
1970..197119721973197419751976197719781979
19801981 "...
19791III I I .I V .
19801III I II V .
19811III I I .IV P
Nondurable goods— cont'd
Gasolineand oil
1.8
1.5
2.2
2.32.62.11.31.41.83.44.04.85.3
5.56.16.87.47.88.69.4
10.210.611.3
12.012.012.612.913.514.716.017.018.620.7
22.423.925.428.636.640.444.048.252.768.4
89.094.5
60.663.272.177.6
89.490.985.390.5
93.592.495.197.1
Fuel oiland coal
1.6
1.2
1.4
1.51.71.92.02.02.22.53.03.43.1
3.43.53.43.43.53.83.94.14.24.0
3.83.73.74.04.14.44.74.84.74.5
4.44.55.06.27.78.29.8
10.611.716.0
19.821.0
13.114.917.918.1
18.819.220.720.5
20.521.021.321.0
Other
5.4
3.5
5.3
5.66.47.58.79.6
10.813.815.817.517.7
19.221.121.822.722.624.125.527.128.229.9
31.332.734.836.838.741.645.647.851.154.1
57.660.164.971.278.283.791.998.4
108.8122.9
136.2150.9
116.3120.3124.9130.0
133.3132.4136.0143.3
146.6149.4152.1155.5
Services
Housing '
11.7
8.1
9.4
9.710.411.211.812.312.814.216.017.919.6
21.724.327.029.832.234.336.739.342.045.0
48.151.254.758.061.465.569.574.179.887.0
93.9102.7112.5123.8137.4149.8166.5186.8213.1241.9
272.0306.7
231.4238.1244.9253.0
259.8267.3275.7285.3
293.6302.1310.9320.3
Household operation
Total
4.0
2.8
3.8
4.04.34.85.25.96.46.87.58.18.5
9.510.411.112.012.614.015.216.217.318.5
20.121.022.223.424.826.328.030.032.235.0
37.741.045.249.655.263.371.680.889.598.7
111.6126.3
96.196.499.5
102.7
104.2109.3116.1116.9
118.1123.4130.5133.1
Electricityand gas
1.2
1.1
1.4
1.51.51.61.71.81.92.12.32.62.9
3.33.74.14.55.05.56.16.57.17.6
8.38.89.49.9
10.410.911.512.213.114.2
15.417.018.820.524.029.232.938.242.447.3
55.762.8
46.445.947.349.8
50.054.559.358.8
58.461.565.565.8
Other
2.9
1.7
2.4
2.62.73.23.54.14.54.75.15.45.6
6.26.77.07.57.68.59.29.7
10.210.9
11.812.212.813.614.415.416.517.819.220.8
22.224.026.429.131.234.138.742.647.151.3
56.063.5
49.750.652.252.9
54.254.856.858.2
59.761.965.067.3
Transpor-tation
2.6
1.5
2.0
2.12.42.73.43.74.05.05.35.85.9
6.26.77.17.87.98.28.69.09.3
10.1
10.711.211.712.212.813.715.016.217.619.5
22.025.127.528.830.933.238.645.351.057.2
64.168.8
54.456.558.259.9
61.461.665.867.5
67.667.969.670.1
Other
Total
12.0
7.7
10.0
10.311.212.213.915.216.419.421.723.624.1
25.627.028.831.033.335.638.741.444.348.3
51.754.858.362.568.173.379.987.296.2
106.8
117.2127.4140.1153.0169.8190.7209.0234.8266.0298.5
337.5380.9
288.0293.2301.7311.4
323.7330.2341.5354.5
366.5373.0385.4398.8
Medicalcare
2.2
1.5
2.1
2.22.42.62.93.33.64.55.56.36.4
6.97.38.08.99.7
10.311.012.013.114.3
15.416.418.019.522.323.926.028.431.436.5
41.045.951.457.464.573.783.397.8
109.4124.3
143.6169.5
120.4122.2125.0129.8
135.3141.2145.0152.8
159.9165.6172.9179.5
1 Includes imputed rental value of owner-occupied housing.Source: Department of Commerce, Bureau of Economic Analysis.
249
Digitized for FRASER http://fraser.stlouisfed.org/ Federal Reserve Bank of St. Louis
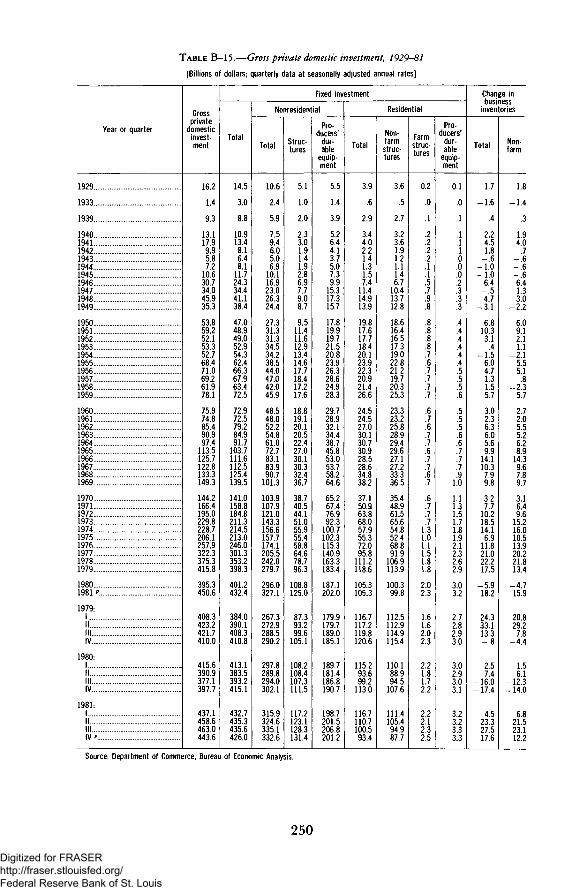
TABLE B-15.—Gross private domestic investment, 1929-81
[Billions of dollars; quarterly data at seasonally adjusted annual rates]
Year or quarter
1929
1933
1939
1940..194119421943194419451946194719481949
1950195119521953195419551956195719581959
19601961.19621963196419651966196719681969
1970197119721973197419751976197719781979
19801981 P
1979:1I II I IIV
1980:1I II l lIV
1981:1I Iiv p
Grossprivate
domesticinvest-ment
16.2
1.4
9.3
13.117.99.95.87.2
10.630.734.045.935.3
53.859.252.153.352.768.471.069.261.978.1
75974.885.490.997.4
113.5125.7122.8133.3149.3
144.2166.4195.0229.8228.7206.1257.9322.3375.3415.8
395.3450.6
408.34232421.7410.0
4156390.93771397.7
437.14586463.0443.6
Fixed investment
Total
14.5
3.0
8.8
10.913.48.16.48.1
11.724.334.441.138.4
47.048.949.052.954.362.466.367.963.472.5
72.972.579.284.991.7
103.7111.6112.5125.4139.5
141.0158.8184.8211.3214.5213.0246.0301.3353.2398.3
401.2432.4
384.03901408.3410.8
4131383.53932415.1
432.74353435.6426.0
Nonresidential
Total
10.6
2.4
5.9
7.59.46.05.06.9
10.116.923.026.324.4
27.331.331.334.534.238.544.047.042.045.9
48548.052.254.861.072.783.183.990.7
101.3
103.9107.9121.0143.3156.6157.7174.1205.5242.0279.7
296.0327.1
26732729288.5290.2
2978289.82940302.1
315.93246335.1332.6
Struc-tures
5.1
1.0
2.0
2.33.01.91.41.92.86.97.79.08.7
9.511.411.612.913.414.617.718.417.217.6
18819.120.120.522.427.030.130.332.436.7
38.740.544.151.055.955.458.864.678.796.3
108.8125.0
87393299.6
105.1
1082108^41073111.5
117.2123 1128.3131.4
Pro-ducers'
dur-able
equip-ment
5.5
1.4
3.9
5.26.44.13.75.07.39.9
15.317.315.7
17.819.919.721.520.823.926.328.624.928.3
29728.932.134.438.745.853.053.758.264.6
65.267.476.992.3
100.7102.3115.3140.9163.3183.4
187.1202.0
17991797189.0185.1
1897181.41868190.7
198.7201 5206.8201.2
Residential
Total
3.9
.6
2.9
3.44.02.21.41.31.57.4
11.414.913.9
19.817.617.718.420.123.922.320.921.426.6
24524.527.030.130.730.928.528.634.838.2
37.150.963.868.057.955.372.095.8
111.2118.6
105.3105.3
116.71172119.8120.6
115293.6992
113.0
116.71107100.593.4
Non-farmstruc-tures
3.6
.5
2.7
3.23.61.91.21.11.46.7
10.413.712.8
18.616.416.517.319.022.821.219.720.325.3
23.323.225.828.929.429.627.127.233.336.5
35.448.961.565.654.852.468.891.9
106.9113.9
100.399.8
112.51129114.9115.4
110 188.9945
107'.6
111.4105494.987.7
Farmstruc-tures
0.2
.0
.1
.2
.2
.2
.2
.1
.1
.5
.7
.9
.8
.8
.8
.8
.8
.7
.6
.7
.7
.7
.7
.6
.7
.6
.7
.7
.6
.7
.7
.6
.7
.6
.7
.7
.71.31.01.11.51.81.8
2.02.3
1.6162.Q2.3
2 21.81 72'.2
2.22 12.32.5
Pro-ducers'
dur-able
equip-ment
0.1
.0
.1
.1
.1
.1
.0
.0
.0
.2
.3
.3
.3
.4
.4
.4
.4
.4
.4
.5
.5
.5
.6
5.5.5.6.6.7.7.7.9
1.0
1.11.31.51.71.81.92.12.32.62.9
3.03.2
2.7282^93.0
302^9303'.1
3.2323'.33.3
Change inbusiness
inventories
Total
1.7
-1.6
.4
2.24.51.8
-.6-1.0-1.0
6.4-.54.7
-3.1
6.810.33.1
.4-1.5
6.04.71.3
-1.55.7
302.36.36.05.69.9
14.110.37.99.8
3.27.7
10.218.514.1
-6.911.821.022.217.5
-5.918.2
24.333 113^3-.8
251A
— 160-17'.4
4.523327'.517.6
Non-farm
1.8
-1.4
.3
1.94.0
.7-.6-.6-.66.41.33.0
-2.2
6.09.12.11.1
-2.15.55.1.8
-2.35.7
272.05.55.26.28.9
14.39.67.89.7
3.16.49.6
15.216.0
-10.513.920.221.813.4
-4.715.9
20.8292
7.'8-4.4
1 5e!i
-123-RO
6.821523^112.2
Source: Department of Commerce, Bureau of Economic Analysis.
250
Digitized for FRASER http://fraser.stlouisfed.org/ Federal Reserve Bank of St. Louis

TABLE B-16.—Gross and net private domestic investment, 1929-81
[Billions of dollars]
Year
1929
1933
1939
1940194119421943194419451946194719481949
1950195119521953195419551956195719581959
1960196119621963196419651966196719681969
1970197119721973197419751976197719781979
19801981 "..
Grossprivatedomes-
ticinvest-ment
16.2
1.4
9.3
13.117.99.95.87.2
10.630.734.045.935.3
53.859.252.153.352.768.471.069.261.978.1
75.974.885.490.997.4
113.5125.7122.8133.3149.3
144.2166.4195.0229.8228.7206.1257.9322.3375.3415.8
395.3450.6
Less:Capital
consump-tion
allowanceswith
capitalconsump-
tionadjust-ment
9.7
7.4
8.7
9.110.011.211.511.712.214.017.320.221.8
23.527.229.331.032.734.838.741.743.544.9
46.347.549.050.652.956.060.765.972.180.0
88.196.5
106.4116.5136.0159.3175.0196.0221.2253.6
287.3321.5
Equals: Net private domestic investment
Total
6.5
-6.0
.6
4.17.9
-1.3-5.7-4.6-1.616.616.625.613.5
30.332.022.822.420.033.632.327.518.433.2
29.627.336.540.344.557.565.057.061.269.3
56.269.988.6
113.392.746.882.8
126.3154.2162.2
108.1129.1
Net fixed investment
Total
4.8
-4.5
.1
1.93.4
-3.0-5.0-3.6-.610.317.120.916.6
23.521.719.721.921.627.627.626.119.927.5
26.724.930.234.438.947.650.946.653.359.5
52.962.378.494.878.553.771.0
105.3132.0144.7
114.0110.9
Nonresidential
Total
3.1
-3.5
-.6
.72.0'
-2.5-3.5-1.7
1.36.6
10.211.38.1
9.610.79.1
10.89.1
11.913.914.38.1
10.6
12.310.914.015.319.728.935.431.933.638.1
33.931.137.051.949.230.334.350.168.080.9
69.471.6
Struc-tures
1.7
-1.6
-1.0
_ 7-'.3
-1.7-2.6-2.0-1.2
2.42.12.72.3
2.93.93.84.85.15.97.97.96.46.4
7.37.37.97.89.1
12.914.813.814.516.6
16.315.616.620.718.913.114.116.223.232.1
35.242.7
Pro-ducers'durableequip-ment
1.4
-1.8
.3
1.42.2
-.7-.9
.32.44.28.28.65.8
6.76.75.36.04.06.06.06.41.84.2
5.03.66.17.5
10.616.020.618.219.121.5
17.615.520.431.230.317.320.234.044.848.9
34.228.9
Residential
Total
1.7
-1.0
.8
1.21.5
-.6-1.6-1.9-1.8
3.76.89.78.5
13.911.010.611.112.515.713.711.811.816.9
14.414.016.219.019.118.715.514.719.821.3
19.031.241.342.929.323.436.855.164.063.8
44.539.3
Non-farmstruc-tures
1.7
-.9
.8
1.11.4
-.5-1.4-1.7-1.6
3.46.49.17.9
13.410.610.310.812.215.613.411.711.616.7
14.313.916.118.818.918.615.314.519.621.0
18.930.940.942.528.423.136.554.563.363.1
44.138.7
Farmstruc-tures
-0.1
-.1
-.0
.0
.0-.1-.1-.1-.2
.2
.3
.4
.4
.3
.3
.3
.3
.2
.0
.1
.1
.1
.1
-.0.1.0.0.0
-.0.0.0
-.1-.0
-.2_ 2-.2-A
.2-.2-.2
.1
.1-.0
-.2.1
Pro-ducers'durableequip-ment
0.0
-.0
.0
.0
.0-.0-.1-.1-.1
.1
.2
.2
.1
.2
.1
.1
.1
.1
.1
.1
.1
.1
.2
.1
.1
.1
.1
.2
.2
.2
.2
.3
.4
.4
.5
.6
.7
.7
.5
.5
.6
.6
.7
.6
.6
Changein
busi-ness
inven-tories
1.7
-1.6
.4
2.24.51.8
-.6-1.0-1.0
6.4-.54.7
-3.1
6.810.33.1
.4-1.5
6.04.71.3
-1.55.7
3.02.36.36.05.69.9
14.110.37.99.8
3.27.7
10.218.514.1
-6.911.821.022.217.5
-5.918.2
Source: Department of Commerce, Bureau of Economic Analysis.
251
Digitized for FRASER http://fraser.stlouisfed.org/ Federal Reserve Bank of St. Louis

TABLE B-17.—Inventories and final sales of business, 1946-81
[Billions of dollars, except as noted; seasonally adjusted]
Year and quarter
Fourth quarter:19461947.19481949
19501951195219531954
19551956195719581959
19601961196219631964
19651966.1967.1968.1969.
1970.1971.1972.1973.1974.
1975.1976.1977.1978.1979.
1980..1981 '..
1979:1.III I I .IV .
1980:1.III I IIV
1981:1I I .I I I .IV "..
Inventories *
Total
72.082.687.278.7
98.0110.5109.2110.1107.6
114.8124.0127.6127.3132.0
136.0137.9144.6150.4156.2
170.5187.4199.4213.5234.6
244.0260.8288.7357.7434.4
439.4473.6520.9600.5710.1
785.4834.9
626.2654.5681.9710.1
724.5740.4765.8785.4
796.9811.3825.6834.9
Farm
22.725.122.919.8
26.128.326.024.623.8
22.522.924.325.624.4
25.625.927.327.626.5
29.929.629.530.633.3
32.336.745.666.662.4
64.560.661.476.084.3
92.684.0
79.480.583.484.3
77.881.892.692.6
86.986.785.184.0
Nonfarm
Total
49.357.564.359.0
71.982.2
83.1985.583.9
92.2101.0103.3101.7107.6
110.4112.1117.3122.7129.7
140.6157.8169.9182.9201.3
211.6224.1243.1291.2372.0
374.9413.0459.5524.5625.9
692.8750.9
546.7574.0598.5625.9
646.6658.5673.2692.8
710.0724.6740.5750.9
Manu-facturing
26.729.332.528.9
35.243.444.446.444.3
48.854.554.853.255.7
56.657.760.962.966.4
71.581.788.795.2
104.8
108.4109.9116.8141.1189.6
189.8207.5225.6254.7311.2
344.2373.7
267.6281.9295.0311.2
325.0331.2335.3344.2
355.2363.2369.7373.7
Whole-sale
trade
10.110.511.711.8
13.814.614.815.015.3
16.617.918.218.320.0
20.420.921.523.124.4
26.329.932.434.337.7
41.744.949.460.276.9
77.386.998.5
114.2134.6
151.7164.2
118.8123.9129.4134.6
138.5142.0146.3151.7
155.7158.8160.6164.2
Retailtrade
11.413.115.114.0
17.518.017.718.318.5
20.921.722.922.923.9
25.324.926.327.629.0
31.934.635.339.042.8
44.350.555.764.874.1
74.682.993.7
108.4122.6
130.3141.0
111.3116.3119.7122.6
122.8124.0127.3130.3
129.8132.6139.2141.0
Other
3.54.65.04.3
5.46.16.25.85.9
6.06.97.37.38.0
8.18.78.69.29.9
10.911.613.514.416.0
17.318.821.225.031.3
33.335.741.647.257.5
66.571.9
49.051.954.557.5
60.361.364.366.5
69.470.071.071.9
Finalsales2
16.018.319.619.5
21.724.626.127.227.5
29.731.432.733.735.6
36.938.841.143.746.2
51.054.157.663.367.4
70.877.285.894.5
102.0
113.6124.1139.2159.3176.2
194.1208.6
163.6165.1171.4176.2
181.2179.9187.2194.1
201.4202.2207.5208.6
Inventory— fina lsales ratio
Total
4.504.514.444.03
4.534.494.184.053.91
3.863.953.903.773.71
3.693.553.523.443.38
3.343.463.463.373.48
3.453.383.373.794.26
3.873.823.743.774.03
4.054.00
3.833.963.984.03
4.004.124.094.05
3.964.013.984.00
Non-f a r m 3
3.083.143.273.02
3.323.343.183.153.05
3.103.223.163.013.02
2.992.892.852.812.81
2.762.922.952.892.99
2.992.902.833.083.65
3.303.333.303.293.55
3.573.60
3.343.483.493.55
3.573.663.603.57
3.533.583.573.60
1 End of quarter.2 Quarterly totals at monthly rates. Business final sales equals final sales less gross product of households and institutions,
government, and rest of the world, and includes a small amount of final sales by farms.3 Ratio based on total business final sales, which includes a small amount of final sales by farms.
Note.—The industry classification of inventories is on an establishment basis and is based on the 1972 Standard IndustrialClassification (SIC) beginning 1948 and on the 1942 SIC prior to 1948.
Source: Department of Commerce, Bureau of Economic Analysis.
252Digitized for FRASER http://fraser.stlouisfed.org/ Federal Reserve Bank of St. Louis

TABLE B-18.—Inventories and final sales of business in 1972 dollars, 1947-81
[Billions of 1972 dollars, except as noted; seasonally adjusted]
Year and quarter
Fourth quarter:194719481949.
1950.1951.1952,1953,1954,
1955,1956..1957.1958..1959..
I960..1961,1962,1963.1964,
1965,1966,1967,1968.1969
1970. .1971.197219731974
19751976197719781979
19801981 P
1979:LIII I IIV
1980:Iif".I l lIV
1981:1.I I .I l lI V " .
Inventories J
Total
1161121.6117.2
127.7141.4145.7147.2145.0
152.8158.6160.1158.3165.3
168.8171.8179.7187.2194.3
206.1222.9235.1244.1255.1
258.9267.0277.2294.4306.0
299.2307.0319.3333.3343.5
340.6348.7
337.2341 7343.7343.5
343.33436342.3340.6
340.2342.9346.6348.7
Farm
25726.726.2
27.529.130.430.231.1
31.530.731.432.432.4
32.833.234.535.735.1
36.236.036.837.037.3
37.739.239.842.141.8
43.041.141.141.143.5
43.044.2
41.642243.043.5
43.643843.443.0
42.742.943.544.2
Nonfarm
Total
90594.891.0
100.2112.3115.4117.1114.0
121.2127.8128.7125.9132.9
136.1138.6145.2151.5159.Z
169.9186.8198.3207.0217.8
2212227.8237.4252.3264.2
256.3265.9278.3292.2300.0
297.6304.6
295.52995300.7300.0
299.62998299.0297.6
297.5300.0303.2304.6
Manu-facturing
47.448.846.2
49.360.062.764.560.9
64.369.168.766.169.1
69.971.775.678.282.0
87.097.2
104.1108.4112.8
112.9111.8114.4121.8130.9
127.1130.9133.9139.1145.9
145.0147.8
141.81439145.0145.9
147.31472145.9145.0
146.1146.3147.7147.8
Whole-sale
trade
16017.217.2
19.219.720.120.320.6
22.122.822.522.524.6
25.125.726.628.429.9
31.635.337.838.941.2
44045.947.950.454.1
52.255.559.563.264.2
64.766.9
63.964 164.564.2
64.164564.764.7
64.465.265.866.9
Retailtrade
18.320.319.8
23.023.023.023.623.7
26.526.827.827.528.7
30.329.831.633.034.5
37.440.040.043.045.9
46151.254.658.858.3
55.858.863.066.866.8
64.666.5
66.868468.' 166.8
64.964765164.6
63.565.266.466.5
Other
8.78.67.8
8.79.59.68.78.8
8.49.29.89.8
10.5
10.711.411.412.012.8
13.814.316.316.817.9
18.219.020.521.420.9
21.120.821.923.023.1
23.423.3
23.023223.123.1
23.423423.423.4
23.423.223.323.3
Finalsales2
33.234.434.6
36.939.841.643.043.1
45.646.547.148.149.7
50.753.155.358.360.9
66.167.570.173.874.7.
75278.984.787.385.1
88.392.497.9
103.1105.4
105.4104.7
103.61027104.4105.4
106.110281039105.4
107.3105.9105.9104.7
Inventory— finalsales ratio
Total
3.503.533.38
3.463.553.513.423.36
3.353.413.403.293.33
3.333.243.253.213.19
3.123.303.363.313.41
3443.383.273.373.59
3.393.323.263.233.26
3.233.33
3.253333.293.26
3.243343293.23
3.173.243.273.33
Non-fa rm 3
2.732.762.63
2.722.822.782.722.64
2.662.752.732.622.68
2.682.612.622.602.61
2.572.772.832.812.92
2.942.892.802.893.10
2.902.882.842.832.85
2.822.91
2.852922.882.85
2.822922.882.82
2.772.832.862.91
1 End of quarter.2 Quarterly totals at monthly rates. Business final sales equals final sales less gross product of households and institutions,
government, and rest of world, and includes a small amount of final sales by farms.3 Ratio based on total business final sales, which includes a small amount of final sales by farms.
Note.—The industry classification of inventories is on an establishment basis and is based on the 1972 Standard IndustrialClassification (SIC) beginning 1948 and on the 1942 SIC prior to 1948.
Source: Department of Commerce, Bureau of Economic Analysis.
358-691 0 - 82 - 17 : QL3253
Digitized for FRASER http://fraser.stlouisfed.org/ Federal Reserve Bank of St. Louis

TABLE B-19.—Relation of gross national product, net national product, and national income, 1929-81
[Billions of dollars; quarterly data at seasonally adjusted annual rates]
Year or quarter
1929
1933
1939
1940.19411942.1943194419451946.194719481949
1950195119521953195419551956195719581959
1960196119621963196419651966196719681969
1970197119721973197419751976197719781979
19801981 p
1979:1||IIIIV
1980:1IIIll . .IV
1981:1IIIl lIV P
Grossnationalproduct
1034
558
909
100.0125.0158.5192.1210.6212.4209.8233.1259.5258.3
286.5330.8348.0366.8366.8400.0421.7444.0449.7487.9
506.5524.6565.0596.7637.7691.1756.0799.6873.4944.0
992.71,077.61,185.91,326.41,434.21,549.21,718.01,918.02,156.12,413.9
2,626.129222
2340623746244412,496.3
257172,564.8263732,730.6
28530288582965029849
Less-.
consump-tion
allowanceswith
capitalconsump-
tionadjustment
9.7
74
87
9.110.011.211.511.712.214.017.320.221.8
23.527.229.331.032.734.838.741.743.544.9
46.347.549.050.652.956.060.765.972.180.0
88.196.5
106.4116.5136.0159.3175.0196.0221.2253.6
287.33215
240124982596265.1
2746283.729182989
3065316732653361
Equals:Net
nationalproduct
93.7
48.4
82.2
91.0115.0147.3180.7198.9200.2195.8215.7239.3236.5
263.0303.6318.7335.8334.1365.3383.0402.3406.2443.0
460.2477.0516.1546.1584.8635.0695.3733.7801.3864.0
904.7981.1
1,079.51,209.91,298.21,389.91,543.01,722.01,934.92,160.3
2,338 926007
210052 12482'l84 62 231.2
229712281 12345524317
25464256912638526488
Indirectbusinesstax andnontaxliability
7.1
7.1
9.4
10.111.311.812.814.215.517.118.420.121.3
23.425.327.729.729.632.235.137.538.741.8
45.448.051.654.658.862.665.370.278.986.6
94.3103.7111.5120.9129.1140.1151.7166.0178.1188.4
21232512
1845185819001935
1989206321582280
2455249425402558
Less:
Busi-ness
transferpay-
ments
0.6
.7
.5
.4
.5
'.5.5.5.5.6.7.8
.8
.91.01.21.11.21.41.51.61.8
2.02.02.12.42.72.83.03.13.43.9
4.14.44.95.55.87.47.98.28.79.4
105116
9 1939698
10 1103106109
11 211511812 1
Statis-tical
discrep-ancy
1 1
.7
1.4
1.1.6
-.8-1.8
2.74.1
L5-1.6
.6
1.3.3.21.72.32.01.3
-2.1-1.2
.2-1.3
-2.4-.12.11.7
-1.21.4
-.3-2.1-3.9
-1.54.13.3.8
3.75.55.14.46.42.2
78
587
28_ 7
28193066
3469
2
PIUS:CnhciHioc
lesscurrentsurplus
ofgovern-
mententer-prises
-02
-0
.4
.4
.1
.1
.1
.6
.7
.9
~'.l
.1-.1
-.5
-'.Q.7.7
1.1.1
.41.71.81.11.71.62.51.61.41.9
2.92.63.83.41.12.41.03.13.63.1
465 1
2430402 7
3 1376354
4 7575 148
Equals:Nationalincome
84.8
39.9
71.4
79.7102.7135.9169.3182.1180.7178.6194.9219.9213.6
237.6274.1287.9302.1301.1330.5349.4365.2366.9400.8
415.7428.8462.0488.5524.9572.4628.1662.2722.5779.3
810.7871.5963.6
1,086.21,160.71,239.41,379.21,546.51,745.41,963.3
2121423437
190361932019862203l'3
20885207002 122422048
2 291 1232092 377 6
Source: Department of Commerce, Bureau of Economic Analysis.
254
Digitized for FRASER http://fraser.stlouisfed.org/ Federal Reserve Bank of St. Louis
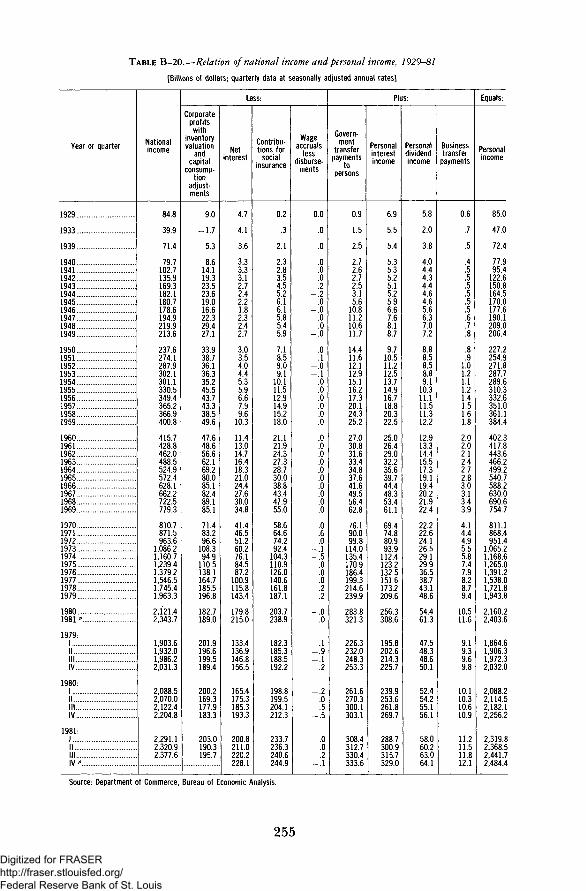
TABLE B-20.—Relation of national income and personal income, 1929-81
[Billions of dollars; quarterly data at seasonally adjusted annual rates]
Year or quarter
1929.
1933.
1939.
1940.1941.1942.1943.1944..1945.1946.19471948.1949.
1950.1951.1952. .1953.1954.1955.1956.1957.1958.1959.
19601961.1962.1963.1964.1965.1966.1967.1968.1969.
1970.1971.1972.1973.1974.1975.1976.1977.1978.1979.
19801981"
1979:1I II l lIV
1980:1I II l lIV
1981:1I II l lIV
Nationalincome
84.8
39.9
71.4
79.7102.7135.9169.3182.1180.7178.6194.9219.9213.6
237.6274.1287.9302.1301.1330.5349.4365.2366.9400.8
415.7428.8462.0488.5524.9572.4628.1662.2722.5779.3
810.7871.5963.6
1,086.21,160.71,239.41,379.21,546.51,745.41,963.3
2 12142,343.7
1,903.61,932.01,986.22,031.3
2,088.52,070.02,122.42,204.8
2,291 12,320.923776
Corporateprofits
withinventoryvaluation
andcapital
consump-tion
adjust-ments
9.0
-1.7
5.3
8.614.119.323.523.619.016.622.329.427.1
33.938.736.136.335.245.543.743.338.549.6
47.648.656.662.169.280.085.182.489.185.1
71.483.296.6
108.394.9
110.5138.1164.7185.5196.8
1827189.0
201.9196.6199.5189.4
200.2169.3177.9183.3
2030190.31957
Le
Netinterest
4.7
4.1
3.6
3.33.33.12.72.42.21.82.32.42.7
3.03.54.04.45.35.96.67.99.6
10.3
11.413.014.716.418.321.024.427.630.034.8
41.446.551.260.276.184.587.2
100.9115.8143.4
1798215.0
133.4136.9146.8156.5
165.4175.3185.3193.3
2008211.02202228.1
SS:
Contribu-tions for
socialinsurance
0.2
.3
2.1
2.32.83.54.55.26.16.15.85.45.9
7.18.59.09.1
10.111.512.914.915.218.0
21.121.924.327.328.730.038.843.447.955.0
58.664.674.292.4
104.3110.9126.0140.6161.8187.1
2037238.9
182.3185.3188.5192.2
198.8199.5204.1212.3
233.7236.32406244.9
Wageaccruals
lessdisburse-
ments
0.0
.0
.0
.0
.0
.0
.2-.2
.0-.0
.0
.0-.0
.0
.1-.0-.1
.0
.0
.0
.0
.0
.0
.0
.0
.0
.0
.0
.0
.0
.0
.0
.0
.0
.6
.0_ i-.5
.0
.0
.0
.2-.2
- 0.0
.1-.9-.1
.2
— .2'.Q.5
_.5
00
.2— 1
Govern-ment
transferpayments
topersons
0.9
1.5
2.5
2.72.62.72.53.15.6
10.811.210.611.7
14.411.612.112.915.116.217.320.124.325.2
27.030.831.633.434.837.641.649.556.462.8
76.190.099.8
114.0135.4170.9186.4199.3214.6239.9
2838321.3
226.3232.0248.3253.3
261.6270.3300.1303.1
3084312.73304333.6
Plu
Personalinterestincome
6.9
5.5
5.4
5.35.35.25.15.25.96.67.68.18.7
9.710.511.212.513.714.916.718.820.322.5
25.026.429.032.235.639.744.448.353.461.1
69.474.880.993.9
112.4123.2132.5151.6173.2209.6
2563308.6
195.8202.6214.3225.7
239.9253.6261.8269.7
288730093157329.0
S:
Personaldividendincome
5.8
2.0
3.8
4.04.44.34.44.64.65.66.37.07.2
8.88.58.58.89.1
10.311.111.511.312.2
12.913.314.415.517.319.119.420.221.922.4
22.222.624.126.529.129.936.538.743.148.6
54461.3
47.548.348.650.1
52.454.255.156.1
58060.263064.1
Businesstransfer
payments
0.6
.7
.5
.4
.5
.5
.5
.5
.5
.5
.6
.7
.8
.8
.91.01.21.11.21.41.51.61.8
2.02.02.12.42.72.83.03.13.43.9
4.14.44.95.55.87.47.98.28.79.4
10511.6
9.19.39.69.8
10.110.310.610.9
11211.511812.1
Equals:
Personalincome
85.0
47.0
72.4
77.995.4
122.6150.8164.5170.0177.6190.1209.0206.4
227.2254.9271.8287.7289.6310.3332.6351.0361.1384.4
402.3417.8443.6466.2499.2540.7588.2630.0690.6754.7
811.1868.4951.4
1,065.21,168.61,265.01,391.21,538.01,721.81,943.8
216022,403.6
1,864.61,906.31,972.32,032.0
2,088.22,114.52,182.12,256.2
231982,368.5244172,484.4
Source: Department of Commerce, Bureau of Economic Analysis.
255
Digitized for FRASER http://fraser.stlouisfed.org/ Federal Reserve Bank of St. Louis

TABLE B-21.—National income by type of income, 1929-81
[Billions of dollars; quarterly data at seasonally adjusted annual rates]
Year orquarter
1929
1933
1939
1940194119421943194419451946194719481949
1950195119521953195419551956195719581959
19601961196219631964 ..1965196619671968 .1969
1970197119721973197419751976197719781979
19801981 ».
1979:|II. .I l lIV
1980:1III I IIV
1981:1||I I IIV "
Nationalincome l
84.8
39.9
71.4
79.7102.7135.9169.3182.1180.7178.6194.9219.9213.6
237.6274.1287.9302.1301.1330.5349.4365.2366.9400.8
415.7428.8462.0488.5524.9572.4628.1662.2722.5779.3
810.7871.5963.6
1,086.21,160.71,239.41,379.21,546.51,745.41,963.3
2,121.42,343.7
1,903.61,932.01,986.22,031.3
2,088.52,070.02,122.42,204.8
2,291.12,320.92,377.6
Compensationof employees
Total
51.1
29.5
48.1
52.164.885.3
109.5121.2123.1118.1129.2141.4141.3
154.8181.0195.7209.6208.4224.9243.5256.5258.2279.6
294.9303.6325.1342.9368.0396.5439.3471.4519.9572.9
612.0652.2718.0801.3877.5931.4
1,036.31,152.31,299.71,460.9
1,596.51,771.7
1,409.91,439.01,476.71,518.1
1,558.01,569.01,597.41,661.8
1,722.41,752.01,790.71,821.7
Wagesand
salaries
50.5
29.0
46.0
49.962.182.1
105.8116.7117.5112.0123.1135.5134.7
147.0171.3185.3198.5196.8211.7228.3239.3240.5258.9
271.9279.5298.0313.4336.1362.0398.4427.0469.6515.7
548.7581.5635.2702.6765.2806.4889.9983.8
1,105.41,235.9
1,343.61,482.9
1,194.91,217.81,248.51,282.4
1,314.51,320.41,342.31,397.3
1,442.91,467.01,498.71,522.9
Supple-ments
towages
andsal-
aries2
0.6
.5
2.1
2.32.73.23.84.55.66.06.15.96.6
7.89.7
10.411.011.613.215.217.217.720.6
23.024.127.129.531.834.540.944.450.357.2
63.270.782.898.7
112.3125.0146.4168.5194.3225.0
252.9288.8
215.0221.2228.2235.7
243.5248.6255.0264.5
279.5285.1292.0298.9
Proprietors' income with inventory valuation and capital consumptionadjustments
Total
15.0
5.9
11.8
13.017.524.229.130.431.836.735.940.936.4
38.743.243.441.841.242.943.945.347.747.6
47.248.649.950.552.556.960.561.264.067.0
66.269.476.993.888.790.094.1
103.5117.1131.6
130.6134.4
127.8129.4132.9136.3
133.7124.9129.7134.0
132.1134.1137.1134.1
Farm
Total
6.1
2.5
4.4
4.46.4
10.112.012.012.414.915.117.612.8
13.716.115.113.112.511.511.211.113.210.9
11.712.112.312.010.813.114.112.612.714.6
14.315.018.732.826.524.619.118.426.130.8
23.422.0
30.932.630.229.5
25.723.322.122.5
18.921.724.722.7
Propri-etors'
in-come3
6.3
2.6
4.5
4.56.5
10.312.212.212.715.215.718.213.5
14.416.916.013.913.312.212.112.114.111.9
12.612.913.012.811.513.814.913.513.715.7
15.616.420.434.629.028.022.822.631.036.6
30.329.7
36.338.336.235.7
32.330.229.029.6
26.129.332.630.9
Capitalconsump-
tionadjust-ment
-0.2
-.0
-.1
-.1— 2-.2-.2-.3-.3
-^5-.6-.7
-.7-.8-.8-.8-.8-.8-.9-.9-.9
-1.0
-.9-.8-.8-.7-.7-.7-.8-.9
-1.0-1.2
-1.3-1.4-1.6-1.8-2.5-3.4-3.7-4.3-4.9-5.8
-6.9-7.7
-5.4-5.7-5.9-6.2
-6.5-6.9-6.9-7.2
-7.2-7.6-7.9-8.2
Nonfarm
Total
8.9
3.3
7.4
8.611.114.117.118.419.421.820.823.323.6
25.027.228.228.628.731.432.734.234.536.7
35.536.537.638.541.743.846.448.651.352.5
51.954.458.161.062.265.475.085.191.0
100.7
107.2112.4
96.896.8
102.7106.8
107.9101.6107.6111.6
113.2112.5112.4111.5
Propri-etors'
in-come4
8.8
3.9
7.6
8.611.714.417.118.319.323.321.823.122.2
25.126.426.927.627.630.531.833.133.235.3
34.235.336.437.240.242.745.347.550.651.9
51.754.558.162.365.867.477.187.193.8
105.2
112.7116.0
100.5100.6107.3112.2
114.8105.5113.1117.5
117.4115.7115.9115.2
Inven-tory
valua-tion
adjust-ment
0.1
-.5
-.2
-.0-.6-.4-.2-.1-.1
-1.7-1.5-.4
.5
-1.1-.3
.2-.2-.0-.2-.5
-il-.0
.0
.0-.0-.0-.1-.2-.2-.2-.4-.5
-.5^.6-.7
-2.0-3.7-1.2-1.2-1.3-2.2-3.4
-3.7-1.6
3 0-3.1-3.5-4.0
-5.3-2.0-3.5-4.0
-2.5-1.2-1.4-1.3
Capitalconsump-
tionadjust-ment
-0.1
.0
-.0
.0
.0
.1
.2
.2
'.2.5.6.9
1.01.01.11.21.21.21.41.41.41.4
1.31.21.21.41.51.31.31.31.11.1
.8
.4
.8
.6
.1-.8-.9
7-.6
-1.0
-1.9-2.1
-.7-.8
-1.2-1.5
-1.6-1.9-2.0-2.0
-1.7-2.0
2 2-2.4
See next page for continuation of table.
256
Digitized for FRASER http://fraser.stlouisfed.org/ Federal Reserve Bank of St. Louis

TABLE B-21.—National income by type of income, 1929-81—Continued
[Billions of dollars; quarterly data at seasonally adjusted annual rates]
Year or quarter
1929.
1933.
1939.
19401941.194219431944194519461947.1948.1949.
1950.1951.1952.1953.1954.1955. .19561957.19581959.
1960.1961.1962.1963.1964.196519661967.19681969.
19701971.1972.19731974.197519761977.19781979 -
19801981 * .. .
19791I I .I l lIV
19801I II I IIV
19811I I .I l lIV P.
Rental income of personswith capital consumption
adjustment
Total
4.9
2.2
2.6
2.73.14.04.44.54.65.55.35.76.1
7.17.78.8
10.011.011.311.612.212.913.6
14.515.015.816.517.118.018.719.719.519.6
19.720.221.022.623.523.023.525.127.430.5
31.833.6
30.730.130.331.0
31.231.532.032.4
32.733.333934.5
Rentalincome
ofpersons
5.7
2.3
3.1
3.33.95.05.65.96.27.37.78.58.9
10.011.012.213.414.414.815.215.916.717.4
18.018.419.119.720.221.222.323.624.025.2
25.827.129.032.135.336.839.244.250.858.9
64.969.8
56.757.659-.761.4
62.964.565.966.4
68.269.370571.2
Capitalcon-
sumptionadjust:
ment
-0.8
-.1
-.6
-.6-.8
-1.0-1.2-1.4-1.6-1.8-2.5-2.8-2.8
-2.9-3.3-3.4-3.4-3.3-3.5-3.6-3.6-3.8-3.8
-3.5-3.4-3.4-3.2-3.2-3.3-3.6-3.9-4.5-5.6
-6.1-6.9-8.0-9.5
-11.8-13.8-15.6-19.1-23.4-28.3
-33.1-36.2
-26.0-27.5-29.4-30.4
-31.6-33.0-33.9-33.9
-35.5-35.9-366-36.7
Corporate profits with inventory valuation and capital consumption adjustments
Total
9.0
-1.7
5.3
8.614.119.323.523.619.016.622.329.427.1
33.938.736.136.335.245.543.743.338.549.6
47.648.656.662.169.280.085.182.489.185.1
71.483.296.6
108.394.9
110.5138.1164.7185.5196.8
182.7189.0
201.9196.6199.5189.4
200.2169.3177.9183.3
203.0190.31957
Profits with inventory valuation adjustment and withoutcapital consumption adjustment
Total
10.5
-1.2
6.5
9.815.420.524.524.019.319.625.933.431.1
37.943.340.640.238.447.546.946.641.652.3
49.750.055.159.766.076.080.978.184.980.8
68.982.094.0
105.696.7
120.6151.6176.7199.0212.7
199.8202.9
217.8213.0215.6204.5
215.6186.9195.9201.0
217.7205.12091
PrnfitcrTOlllS
Profitsbeforetaxes
10.0
1.0
7.2
10.017.921.725.324.219.824.831.835.629.2
42.944.539.641.238.749.249.648.141.952.6
49.849.755.059.666.577.283.079.788.586.7
75.486.6
100.6125.6136.7132.1166.3192.6223.3255.4
245.5230.2
253.1250.9262.0255.4
277.1217.9237.6249.5
257.0229.02344
Profitstax
liability
1.4
.5
1.4
2.87.6
11.414.112.910.79.1
11.312.41€.2
17.922.619.420.317.622.022.021.419.023.6
22.722.824.026.228.030.933.732.539.239.5
34.237.541.649.051.650.663.872.683.087.6
82.376.4
88.586.488.487.2
94.271.578.585.2
87.776.4781
Profits after tax
Total
8.6
.4
5.7
7.210.310.311.211.39.1
15.720.523.219.0
25.021.920.220.921.127.227.626.722.928.9
27.126.931.133.438.546.349.447.249.447.2
41.349.058.976.685.181.5
102.5120.0140.3167.8
163.2153.9
164.6164.6173.6168.2
182.9146,5159.1164.3
169.2152.71563
Divi-dends
5.8
2.0
3.8
4.04.44.34.44.64.65.66.37.07.2
8.88.58.58.89.1
10.311.111.511.312.2
12.913.314.415.517.319.119.420.222.022.5
22.522.924.427.029.930.837.439.944.650.2
56.063.1
49.049.850.251.6
53.955.756.757.7
59.662.064866.0
Undis-tributedprofits
2.8
-1.6
2.0
3.25.86.06.76.74.5
10.214.216.211.8
16.213.411.812.111.916.916.615.211.616.7
14.313.616.617.921.227.229.927.027.324.7
18.826.134.549.655.250.765.180.195.7
117.6
107.290.7
115.5114.8123.5116.6
128.990.7
102.4106.6
109.690.6915
Inven-tory
valua-tion
adjust-ment
0.5
-2.1
-.7
-.2-2.5-1.2-.8-.3-.6
-5.3-5.9-2.2
1.9
-5.0-1.2
1.0-1.0-.3
-1.7-2.7-1.5-.3-.3
-.2.3.0.1
-.5-1.2-2.1-1.6-3.7-5.9
-6.6-4.6-6.6
-20.0-40.0-11.6-14.7-15.8-24.3-42.6
-45.7-27.3
-35.3-37.9-46.5-50.8
-61.4-31.1-41.7-48.4
-39.2-24.0-253-20.9
Capitalcon-
sumptionadjust-ment
-1.4
-.6
-1.1
-1.2-1.3-1.2-1.0-.3-.2
-3.0-3.6-4.0-3.9
-4.0-4.6-4.5-3.9-3.2-2.0-3.2-3.4-3.2-2.7
-2.0-1.4
1.52.53.14.04.24.34.34.3
2.51.32.72.7
-1.8-10.1-13.5-12.0-13.5-15.9
-17.2-13.9
-15.9-16.4-16.1-15.1
-15.4-17.6-17.9-17.8
-14.7-14.7-134-12.8
Notroeiinterest
4.7
4.1
3.6
3.33.33.12.72.42.21.82.32.42.7
3.03.54.04.45.35.96.67.99.6
10.3
11.413.014.716.418.321.024.427.630.034.8
41.446.551.260.276.184.587.2
100.9115.8143.4
179.8215.0
133.4136.9146.8156.5
165.4175.3185.3193.3
200.8211.02202228.1
1 National income is the total net income earned in production. It differs from gross national product mainly in that it excludesdepreciation charges and other allowances for business and institutional consumption of durable capital goods and indirect businesstaxes. See Table B-19.
2 Employer contributions for social insurance and to private pension, health, and welfare funds; workmen's compensation; directors'fees; and a few other minor items.
3 With inventory valuation adjustment and without capital consumption adjustment.4 Without inventory valuation and capital consumption adjustments.Source: Department of Commerce, Bureau of Economic Analysis.
257
Digitized for FRASER http://fraser.stlouisfed.org/ Federal Reserve Bank of St. Louis

TABLE B-22.—Sources of personal income, 1929-81
[Billions of dollars; quarterly data at seasonally adjusted annual rates]
Year or quarter
1929
1933
1939..
1940194119421943194419451946194719481949
1950195119521953195419551956195719581959
1960196119621963196419651966196719681969
19701971.19721973197419751976197719781979
19801981 »..
1979:1.III I IIV
1980:1,III I IIV
1981:1III l lIV
Personalincome
85.0
47.0
72.4
77.995.4
122.6150.8164.5170.0177.6190.1209.0206.4
227.2254.9271.8287.7289.6310.3332.6351.0361.1384.4
402.3417.8443.6466.2499.2540.7588.2630.0690.6754.7
811.1868.4951.4
1,065.21,168.61,265.01,391.21,538.01,721.81,943.8
2,160.22,403.6
1,864.61,906.31,972.32,032.0
2,088.22,114.52,182.12,256.2
2,319.82,368.52441.72,484.4
Wage and salary disbursements 1
Total
50.5
29.0
46.0
49.962.182.1
105.6116.9117.5112.0123.1135.5134.8
147.0171.3185.4198.6196.8211.7228.3239.3240.5258.9
271.9279.5298.0313.4336.1362.0398.4427.0469.6515.7
5487580.9635.2702.7765.7806.4889.9983.8
1,105.21,236.1
1,343.71,482.8
1,194.81,218.61,248.61,282.2
1,314.71,320.41,341.81,397.8
144291,467.0149851,522.9
Commodity-producingindustries
Total
21.5
9.8
17.4
19.727.539.149.050.445.946.054.261.157.8
64.876.382.089.685.793.1
100.6104.2100.0109.6
113.1113.7121.8126.9135.4146.0161.0168.3183.4199.6
2030208.3227.3254.3274.7275.0307.3343.5389.1437.9
465.4512.7
425.1434.3441.6450.4
461.7456.0460.1484.0
5013508.15202521.2
Manu-facturing
16.1
7.8
13.6
15.621.730.940.942.938.236.542.547.144.6
50.359.364.171.267.573.879.482.478.686.8
89.789.896.7
100.6107.1115.5128.0134.1145.8157.5
1582160.3175.4196.2211.4211.0237.4266.0299.2333.4
350.7387.4
326.1331.7335.5340.4
347.9343.2346.7364.9
377438673939391.4
Distrib-utive
indus-tries
15.6
8.8
13.3
14.216.318.020.122.724.831.035.237.537.7
39.844.346.949.750.153.457.760.560.864.8
68.269.372.876.381.487.294.4
100.9110.0120.8
1303139.4152.1168.3184.6195.6216.6239.4270.5303.0
328.9361.1
292.8297.5306.5315.0
322.6323.2329.2340.6
3519357'83653369.5
Serviceindus-tries
8.4
5.2
7.1
7.58.19.09.9
10.911.914.316.117.918.5
19.821.523.124.926.128.631.333.635.638.5
41.444.147.250.254.458.964.771.379.689.7
983106.7118.2131.3145.6159.7177.4198.6226.1259.2
295.7335.1
247.0252.6263.4273.7
283.6290.8298.7310.0
3225330'.53385348^8
G vernmentand
govern-mententer-prises
5.0
5.2
8.2
8.510.216.026.633.034.920.717.519.020.8
22.629.233.334.434.936.638.841.044.146.0
49.252.456.360.064.969.978.386.496.6
105.5
117 1126.5137.5148.7160.9176.1188.7202.3219.4236.1
253.6273.9
229.8234.2237.1243.1
246.8250.5253.9263.3
267 1270!52745283'.4
Otherlabor
income l
0.5
.4
.6
.6
.7
.91.11.51.82.02.42.72.9
3.74.65.25.96.17.08.09.09.4
10.6
11.211.813.014.015.717.819.921.725.228.5
32536.743.048.855.864.575.989.0
102.2118.6
137.1154.2
111.6115.9120.9126.0
130.9135.1139.1143.5
148.015181563160^5
Proprietors' incomewith inventoryvaluation and
capitalconsumptionadjustments
Farm
6.1
2.5
4.4
4.46.4
10.112.012.012.414.915.117.612.8
13.716.115.113.112.511.511.211.113.210.9
11.712.112.312.010.813.114.112.612.714.6
14315.018.732.826.524.619.118.426.130.8
23.422.0
30.932.630.229.5
25.723.322.122.5
18.921724722J
Nonfarm
8.9
3.3
7.4
8.611.114.117.118.419.421.820.823.323.6
25.027.228.228.628.731.432.734.234.536.7
35.536.537.638.541.743.846.448.651.352.5
51954.458.161.062.265.475.085.191.0
100.7
107.2112.4
96.896.8
102.7106.8
107.9101.6107.6111.6
113 2112*5112 4lll'.S
See next page for continuation of table.
258
Digitized for FRASER http://fraser.stlouisfed.org/ Federal Reserve Bank of St. Louis

TABLE B-22.—Sources of personal income, 1929-81—Continued
[Billions of dollars; quarterly data at seasonally adjusted annual rates]
Year or quarter
1929
1933
1939
1940194119421943194419451946194719481949
1950195119521953195419551956195719581959
1960196119621963196419651966196719681969
1970197119721973197419751976197719781979
19801981 *
1979:1III l lIV
1980:1 .III I IIV
1981:1III I I .IV "
Rentalincome
ofpersons
withcapital
con-sumption
adjust-ment
4.9
2.2
2.6
2.73.14.04.44.54.65.55.35.76.1
7.17.78.8
10.011.011.311.612.212.913.6
14.515.015.816.517.118.018.719.719.519.6
19.720.221.022.623.523.023.525.127.430.5
31.833.6
30.730.130.331.0
31.231.532.032.4
32.733.333.934.5
Personaldividendincome
5.8
2.0
3.8
4.04.44.34.44.64.65.66.37.07.2
8.88.58.58.89.1
10.311.111.511.312.2
12.913.314.415.517.319.119.420.221.922.4
22.222.624.126.529.129.936.538.743.148.6
54.461.3
47.548.348.650.1
52.454.255.156.1
58.060.263.064.1
Personalinterestincome
6.9
5.5
5.4
5.35.35.25.15.25.96.67.68.18.7
9.710.511.212.513.714.916.718.820.322.5
25.026.429.032.235.639.744.448.353.461.1
69.474.880.993.9
112.4123.2132.5151.6173.2209.6
256.3308.6
195.8202.6214.3225.7
239.9253.6261.8269.7
288.7300.9315.7329.0
Transfer payments
Total
1.5
2.1
3.0
3.13.13.13.03.66.2
11.311.711.312.5
15.212.613.114.116.217.518.721.625.927.0
28.932.833.835.837.440.444.752.659.866.7
80.194.4
104.7119.5141.2178.3194.3207.5223.3249.4
294.2332.9
235.4241.3257.8263.1
271.7280.7310.7313.9
319.6324.2342.2345.7
Old-age,survivors,
disabil-ity, andhealthinsur-ance
benefits
0.0
.0
.1
.1
.2
.2
.3
.4
.5
.6
.7
1.01.92.23.03.64.95.77.38.5
10.2
11.112.614.315.216.018.120.825.530.232.9
38.544.549.660.470.181.492.9
104.9116.2131.8
153.8180.3
123.6126.5137.8139.3
142.0144.7163.2165.3
169.8172.0188.5191.1
Govern-ment
unem-ployment
insur-ance
benefits
0.4
.5
.4
.4
.1
.1
.41.1.8.9
1.9
1.5.9
1.11.02.21.51.51.94.12.8
3.04.33.13.02.72.31.92.22.12.2
4.05.85.74.46.8
17.615.812.79.79.8
16.015.4
9.29.49.8
10.6
11.416.019.017.5
15.615.614.815.7
Veteransbenefits
0.6
.6
.5
.5
.5
.5
.51.03.07.07.05.95.3
7.74.64.34.14.24.44.44.54.74.6
4.65.04.74.84.74.94.95.65.96.7
7.78.89.7
10.411.814.514.413.813.914.4
15.016.0
14.414.214.414.6
14.814.614.915.5
15.915.915.916.4
Govern-ment
employ-ee
retire-ment
benefits
0.1
.2
.3
.3
.3
.3
.4
.4
.5
.7
.7
.7
.9
1.01.11.21.41.51.71.92.22.52.8
3.13.43.74.24.75.26.16.97.68.7
10.211.813.816.019.022.726.129.032.737.0
42.848.6
35.036.437.339.2
40.242.343.145.7
46.748.548.950.1
Aid tofamilies
withdepend-
entchildren(AFDC)
0.
1.
1.
1.1.1.1.2.2.2
.3
.4
.5
.6
.6
.5
!e.6.6.7.8.9
1.01.11.31.41.51.71.92.32.83.5
4.86.26.97.27.99.2
10.110.610.711.0
12.413.2
10.710.811.111.5
11.712.012.813.1
13.313.613.412.4
Other
8
4
7
7888001
2.52.93.3
3.53.63.84.14.14.34.54.95.35.8
6.26.46.77.37.88.39.2
10.211.112.5
15.017.419.021.125.632.835.136.540.145.4
54.359.4
42.544.147.347.8
51.651.057.756.8
58.358.760.560.1
Less:Personalcontribu-tions for
socialinsurance
0.1
.2
.6
.7
.81.21.82.22.32.02.12.22.2
2.93.43.84.04.65.25.86.76.97.9
9.39.7
10.311.812.613.317.820.622.926.2
27.930.734.542.647.950.455.561.169.680.6
87.9104.2
79.080.081.282.4
86.285.988.191.2
102.3103.1105.0106.5
Nonfarmpersonalincome2
159.9171.9188.2190.4
210.2235.4253.1271.3273.9295.5318.0336.6344.4369.8
386.7401.6427.1449.7483.7522.6568.9611.9672.1733.9
790.0846.5925.3
1,023.71,131.81,229.11,359.31,505.01,679.21,892.9
2,112.62,353.3
1,814.81,853.91,921.51,981.2
2,039.62,067.32,135.32,208.3
2,274.52,319.22,388.22,431.4
1 The total of wage and salary disbursements and other labor income differs from compensation of employees in Table B-21 in thatit excludes employer contributions for social insurance and the excess of wage accruals over wage disbursements.
2 Personal income exclusive of farm proprietors' income, farm wages, farm other labor income, and agricultural net interest.Note.—The industry classification of wage and salary disbursements and proprietors' income is on an establishment basis and is
based on the 1972 Standard Industrial Classification (SIC) beginning 1948 and on the 1942 SIC prior to 1948.Source: Department of Commerce, Bureau of Economic Analysis.
259
Digitized for FRASER http://fraser.stlouisfed.org/ Federal Reserve Bank of St. Louis
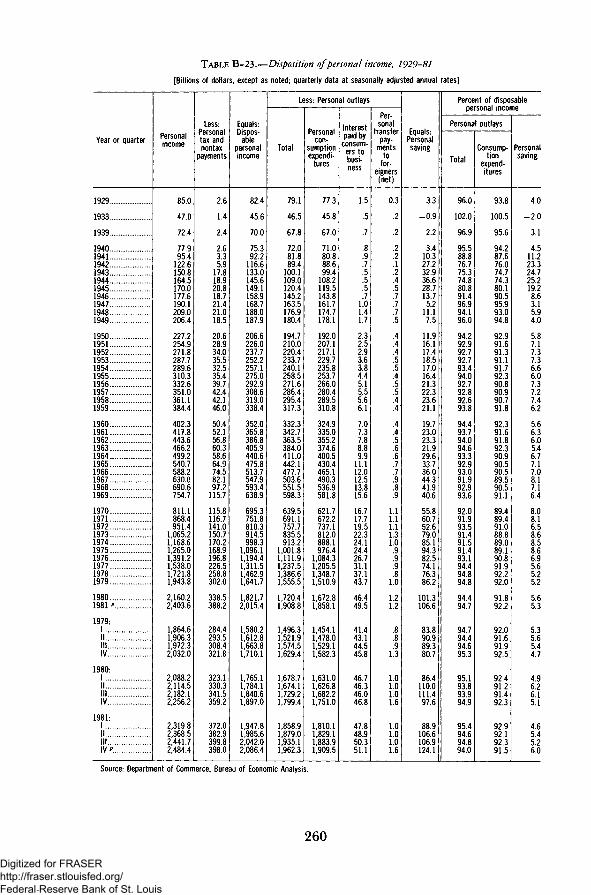
TABLE B-23.—Disposition of personal income, 1929-81
[Billions of dollars, except as noted; quarterly data at seasonally adjusted annual rates]
Year or quarter
1929
1933
1939
1940194119421943194419451946194719481949
1950195119521953195419551956195719581959
196019611962196319641965196619671968. .1969
1970.197119721973197419751976197719781979
19801981 "
1979:1||I I IIV
1980:1I II l lIV
1981:1I II l lIV *
Personalincome
85.0
47.0
72.4
77.995.4
122.6150.8164.5170.0177.6190.1209.0206.4
227.2254.9271.8287.7289.6310.3332.6351.0361.1384.4
402.3417.8443.6466.2499.2540.7588.2630.0690.6754.7
811.1868.4951.4
1,065.21,168.61,265.01,391.21,538.01,721.81,943.8
2,160.22,403.6
1,864.61,906.31,972.32,032.0
2,088.22,114.52,182.12,256.2
2,319.82,368.52,441.72,484.4
Less:Personaltax andnontax
payments
2.6
1.4
2.4
2.63.35.9
17.818.920.818.721.421.018.5
20.628.934.035.532.535.439.742.442.146.0
50.452.156.860.358.664.974.582.197.2
115.7
115.8116.7141.0150.7170.2168.9196.8226.5258.8302.0
338.5388.2
284.4293.5308.4321.8
323.1330.3341.5359.2
372.0382.9399.8398.0
Equals:Dispos-
ablepersonalincome
82.4
45.6
70.0
75.392.2
116.6133.0145.6149.1158.9168.7188.0187.9
206.6226.0237.7252.2257.1275.0292.9308.6319.0338.4
352.0365.8386.8405.9440.6475.8513.7547.9593.4638.9
695.3751.8810.3914.5998.3
1,096.11,194.41,311.51,462.91,641.7
1,821.72,015.4
1,580.21,612.81,663.81,710.1
1,765.11,784.11,840.61,897.0
1,947.81,985.62,042.02,086.4
Less: Personal outlays
Total
79.1
46.5
67.8
72.081.889.4
100.1109.0120.4145.2163.5176.9180.4
194.7210.0220.4233.7240.1258.5271.6286.4295.4317.3
332.3342.7363.5384.0411.0442.1477.7503.6551.5598.3
639.5691.1757.7835.5913.2
1,001.81,111.91,237.51,386.61,555.5
1,720.41,908.8
1,496.31,521.91,574.51,629.4
1,678.71,674.11,729.21,799.4
1,858.91,879.01,935.11,962.3
Personalcon-
sumptionexpendi-
tures
77.3
45.8
67.0
71.080.888.699.4
108.2119.5143.8161.7174.7178.1
192.0207.1217.1229.7235.8253.7266.0280.4289.5310.8
324.9335.0355.2374.6400.5430.4465.1490.3536.9581.8
621.7672.2737.1812.0888.1976.4
1,084.31,205.51,348.71,510.9
1,672.81,858.1
1,454.11,478.01,529.11,582.3
1,631.01,626.81,682.21,751.0
1,810.11,829.11,883.91,909.5
Interestpaid by
consum-ers tobusi-ness
1.5
.5
.7
.8
.9
.7
.5
.5
.5
.71.01.41.7
2.32.52.93.63.84.45.15.55.66.1
7.07.37.88.89.9
11.112.012.513.815.6
16.717.719.522.324.124.426.731.137.143.7
46.449.5
41.443.144.545.8
46.746.346.046.8
47.848.950.351.1
Per-sonal
transferpay-
mentsto
for-eigners
(net)
0.3
.2
.2
.2
.2
.1
.2
.4
.5
.7
.7
.7
.5
.4
.4
.4
.5
.5
.4
.5
.5
.4
.4
.4
.4
.5
.6
.6
.7
.7
.9
.8
.9
1.11.11.11.31.0.9.9.9.8
1.0
1.21.2
.8
.8
.91.3
1.01.01.01.6
1.01.01.01.6
Equals:Personalsaving
3.3
-0.9
2.2
3.410.327.232.936.628.713.75.2
11.17.5
11.916.117.418.517.016.421.322.323.621.1
19.723.023.321.929.633.736.044.341.940.6
55.860.752.679.085.194.382.574.176.386.2
101.3106.6
83.890.989.380.7
86.4110.0111.497.6
88.9106.6106.9124.1
Percent of disposablepersonal income
Personal outlays
Total
96.0
102.0
96.9
95.588.876.775.374.880.891.496.994.196.0
94.292.992.792.793.494.092.792.892.693.8
94.493.794.094.693.392.993.091.992.993.6
92.091.993.591.491.591.493.194.494.894.8
94.494.7
94.794.494.695.3
95.193.893.994.9
95.494.694.894.0
Consump-tion
expend-itures
93.8
100.5
95.6
94.287.676.074.774.380.190.595.993.094.8
92.991.691.391.191.792.390.890.990.791.8
92.391.691.892.390.990.590.589.590.591.1
89.489.491.088.889.089.190.891.992.292.0
91.892.2
92.091.691.992.5
92.491.291.492.3
92.992.192.391.5
Personalsaving
4.0
-2.0
3.1
4.511.223.324.725.219.28.63.15.94.0
5.87.17.37.36.66.07.37.27.46.2
5.66.36.05.46.77.17.08.17.16.4
8.08.16.58.68.58.66.95.65.25.2
5.65.3
5.35.65.44.7
4.96.26.15.1
4.65.45.26.0
Source: Department of Commerce, Bureau of Economic Analysis.
260
Digitized for FRASER http://fraser.stlouisfed.org/ Federal Reserve Bank of St. Louis
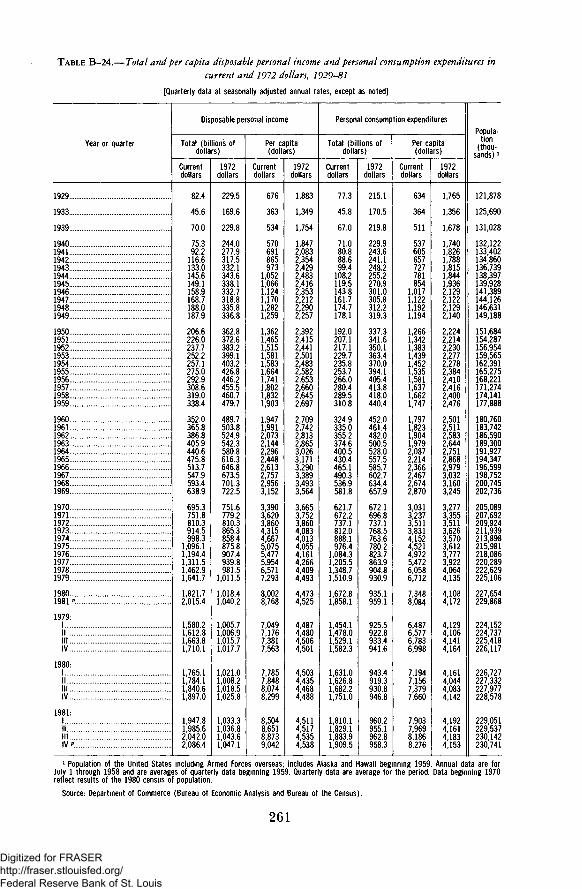
TABLE B-24.—Total and per capita disposable personal income and personal consumption expenditures in
current and 1972 dollars, 1929-81
[Quarterly data at seasonally adjusted annual rates, except as noted]
Year or quarter
1929
1933
1939
1940194119421943194419451946194719481949
1950195119521953195419551956195719581959
1960196119621963196419651966196719681969
1970197119721973197419751976197719781979
19801981 p
1979:I||IIIIV
1980:1IIIllIV
1981:1IIIllIV.
Disposable personal income
Total (billions ofdollars)
Currentdollars
82.4
45.6
70.0
75.392.2116.6133.0145.6149.1158.9168.7188.0187.9
206.6226.0237.7252.2257.1275.0292.9308.6319.0338.4
352.0365.8386.8405.9440.6475.8513.7547.9593.4638.9
695.3751.8810.3914.5998.3
1,096.11,194.41,311.51,462.91,641.7
1,821.72,015.4
1,580.2161281,663.81,710.1
1,765.11,784.11,840 61,897.0
1,947.81,985.62,042 02,086.4
1972dollars
229.5
169.6
229.8
244.0277.9317.5332.1343.6338.1332.7318.8335.8336.8
362.8372.6383.2399.1403.2426.8446.2455.5460.7479.7
489.7503.8524.9542.3580.8616.3646.8673.5701.3722.5
751.6779.2810.3865.3858.4875.8907.4939.8981.5
1,011.5
1,01841,040.2
1,005 7100691,015.71,017.7
1,021.01,008.21,01851,025.8
1,033 31,036.8104361,047,1
Per capita(dollars)
Currentdollars
676
363
534
570691865973
1,0521,0661,1241,1701,2821,259
1,3621,4651,5151,5811,5831,6641,7411,8021,8321,903
1,9471,9912,0732,1442,2962,4482,6132,7572,9563,152
3,3903,6203,8604,3154,6675,0755,4775,9546,5717,293
8,0028,768
7,0497 1767i3817,563
7,7857,84880748,299
8,5048,65188739,042
1972dollars
1,883
1,349
1,754
1,8472,0832,3542,4292,4832,4162,3532,2122,2902,257
2,3922,4152,4412,5012,4832,5822,6532,6602,6452,697
2,7092,7422,8132,8653,0263,1713,2903,3893,4933,564
3,6653,7523,8604,0834,0134,0554,1614,2664,4094,493
4,4734,525
4,48744804,5064,501
4,5034,43544684,488
4,5114,5174,5354,538
Personal consumption expenditures
Total (billions ofdollars)
Currentdollars
77.3
45.8
67.0
71.080.888.699.4
108.2119.5143.8161.7174.7178.1
192.0207.1217.1229.7235.8253.7266.0280.4289.5310.8
324.9335.0355.2374.6400.5430.4465.1490.3536.9581.8
621.7672.2737.1812.0888.1976.4
1,084.31,205.51,348.71,510.9
1 672.81,858.1
1,454.1147801,529.11,582.3
1,631.01,626.81,682.21,751.0
1,810.11,829.1188391,909.5
1972dollars
215.1
170.5
219.8
229.9243.6241.1248.2255.2270.9301.0305.8312.2319.3
337.3341.6350.1363.4370.0394.1405.4413.8418.0440.4
452.0461.4482.0500.5528.0557.5585.7602.7634.4657.9
672.1696.8737.1768.5763.6780.2823.7863.9904.8930.9
9351959.1
92559228933.4941.6
943.4919.39308946.8
9602955.19628958.3
Per capita(dollars)
Currentdollars
634
364
511
537605657727781854
1,0171,1221,1921,194
1,2661,3421,3831,4391,4521,5351,5811,6371,6621,747
1,7971,8231,9041,9792,0872,2142,3662,4672,6742,870
3,0313,2373,5113,8314,1524,5214,9725,4726,0586,712
7,3488,084
648765776,7836,998
7,1947,1567,3797,660
7,9037,9698,1868,276
1972dollars
1,765
1,356
1,678
1,7401,8261,7881,8151,8441,9362,1292,1222,1292,140
2,2242,2142,2302,2772,2782,3842,4102,4162,4002,476
2,5012,5112,5832,6442,7512,8682,9793,0323,1603,245
3,2773,3553,5113,6263,5703,6123,7773,9224,0644,135
41084,172
412941064,1414,164
4,1614,0444,0834,142
4,1924,16141834,153
Popula-tion(thou-sands) 1
121,878
125,690
131,028
132,122133,402134,860136,739138,397139,928141,389144,126146,631149,188
151,684154,287156,954159,565162,391165,275168,221171,274174,141177,888
180,760183,742186,590189,300191,927194,347196,599198,752200,745202,736
205,089207,692209,924211,939213,898215,981218,086220,289222,629225,106
227,654229,868
224,152224 737225,418226,117
226,727227,332227 977228,578
229,051229,537230 142230,741
1 Population of the United States including Armed Forces overseas; includes Alaska and Hawaii beginning 1959. Annual data are forJuly 1 through 1958 and are averages of quarterly data beginning 1959. Quarterly data are average for the period. Data beginning 1970reflect results of the 1980 census of population.
Source: Department of Commerce (Bureau of Economic Analysis and Bureau of the Census).
261
Digitized for FRASER http://fraser.stlouisfed.org/ Federal Reserve Bank of St. Louis
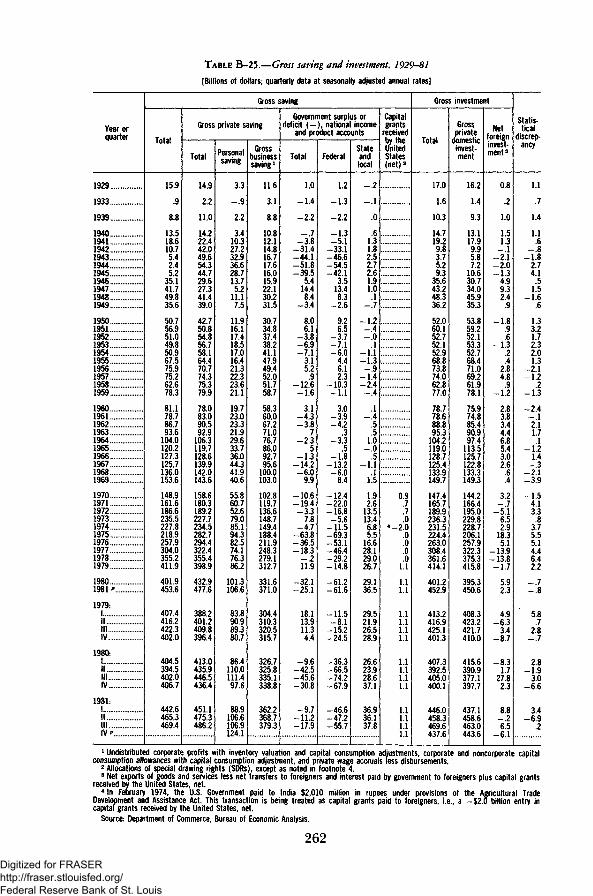
TABLE B-25.—Gross saving and investment, 1929-81
[Billions of dollars; quarterly data at seasonally adjusted annual rates]
Year orquarter
1929
1933
1939
1940194119421943194419451946194719481949
19501951195219531954..!!19551956195719581959
1960196119621963196419651966196719681969
1970.. .197119721973197419751976197719781979
19801981 *
1979:
IIIIIIV
1980:
I I .IllIV
1981:1IIIIIIV '
Gross saving
Total
15.9
.9
8.8
13.518.610.75.42.45.2
35.141.749.835.6
50.756.951.049.850.967.575.975.262.678.3
81.178.786.793.6
104.0120.2127.3125.7136.0153.6
148.9161.6186.6235.5227.8218.9257.9304.0355.2411.9
401.9453.6
407.4416.2422.3402.0
404.5394.5402.0406.7
442.6465.3469.4
Gross private saving
Total
14.9
2.2
11.0
14.222.442.049.654.344.729.627.341.439.0
42.750.854.856.758.164.470.774.375.379.9
78.083.090.592.9
106.3119.7128.6139.9142.0143.6
158.6180.3189.2227.7234.5282.7294.4322.4355.4398.9
432.9477.6
388.2401.2409.8396.4
413.0435.9446.5436.4
451.1475.3486.2
Personalsaving
3.3
-.9
2.2
3.410.327.232.936.628.713.75.2
11.17.5
11.916.117.418.517.016.421.322.323.621.1
19.723.023.321.929.633.736.044.341.940.6
55.860.752.679.085.194.382.574.176.386.2
101.3106.6
83.890.989.380.7
86.4110.0111.497.6
88.9106.6106.9124.1
Grossbusinesssaving l
11.6
3.1
8.8
10.812.114.816.717.616.015.922.130.231.5
30.734.837.438.241.147.949.452.051.758.7
58.360.067.271.076.786.092.795.6
100.0103.0
102.8119.7136.6148.7149.4188.4211.9248.3279.1312.7
331.6371.0
304.4310.3320.5315.7
326.7325.8335.1338.8
362.2368.7379.3
Government surplus ordeficit ( - , national income
and product accounts
Total
1.0
-1.4
-2.27
-3.8-31.4-44.1-51.8-39.5
5.414.48.4
-3.4
8.06.1
-3.8-6.9-7.1
3.15.2
.9-12.6-1.6
3.1-4.3-3.8
-2.3
-L3-14.2-6.0
9.9
106-19.4-3.3
7.8-4.7
-63.8-36.5-18.3
-.211.9
32 1-25.1
18.113.911.34.4
-9.6-42.5-45.6-30.8
-9.7112
-17.9
Federal
1.2
-1.3
-2.2
-1.3-5.1331
-46.6-54.5-42.1
3.513.48.3
-2.6
9.26.5
-3.7-7.1-6.0
4.46.12.3
-10.3-1.1
3.0-3.9-4.2
-3^3
-L8-13.2-6.0
8.4
-12.4-22.0
168-5.6
-11.5-69.3-53.1-46.4-29.2
148
-61.2-61.6
-11.5-8.1
-15.2-24.5
-36.3665
-74.2679
-46.6-47.2-55.7
Stateandlocal
-.2_ 1
.0
.61.31.82.52.72.61.91.0.1
-1.2-.4-.0
.1-1.1-1.3-.9
-1.4-2.4-.4
.1— 4
'.5
LO-.0
.5-1.1
L5
1.92.6
13.513.46.85.5
16.628.129.026.7
29.136.5
29.521.926.528.9
26.623.928.637.1
36.936.137.8
Capitalgrants
receivedby theUnitedStates(net)2
0.9.7.7.04-2.0.0.0.0.0
1.1
1.11.1
1.11.11.11.1
1.11.11.11.1
1.11.11.11.1
Gross investment
Total
17.0
1.6
10.3
14.719.29.83.75.29.3
35.643.248.336.2
52.060.152.752.152.968.873.874.062.877.0
78.778.688.895.3
104.2119.0128.7125.4133.9149.7
147.4165.7189.9236.3231.5224.4263.0308.4361.6414.1
401.2452.9
413.2416.9425.1401.3
407.3392.5405.0400.1
446.0458.3469.6437.6
Grossprivate
domesticinvest-ment
16.2
1.4
9.3
13.117.99.95.87.2
10.630.734.045.935.3
53.859.252.153.352.768.471.069.261.978.1
75.974.885.490.997.4
113.5125.7122.8133.3149.3
144.2166.4195.0229.8228.7206.1257.9322.3375.3415.8
395.3450.6
408.3423.2421.7410.0
415.6390.9377.1397.7
437.1458.6463.0443.6
Netforeigninvest-ment3
0.8
.2
1.0
1.51.3-.1
-2.1-2.0-1.3
4.99.32.4
.9
-1.8.9.6
-1.3.2.4
2.84.8
.9-1.2
2.83.83.44.46.85.43.02.6.6.4
3.2-.75 16.52.9
18.35.1
-13.9-13.8-1.7
5.92.3
4.9-6.3
3.4-8.7
831.7
27.82.3
8.82
6.5-6.1
Statis-tical
discrep-ancy
1.1
.7
1.4
1.1.6
-.8-1.8
2.74.1.5
1.5-1.6
.6
1.33.21.72.32.01.3
-2.1-1.2
-L3
24-.12.11.7.1
-1.21.4
-.3-2.1-3.9
-1.54.13.3.8
3.75.55.14.46.42.2
— 7-'.8
5.8.7
2.8-.7
2.8-1.9
3.0-6.6
3.4-6.9
.2
1 Undistributed corporate profits with inventory valuation and capital consumption adjustments, corporate and noncorporate capitalconsumption allowances with capital consumption adjustment, and private wage accruals less disbursements.2 Allocations of special drawing rights (SDRs), except as noted in footnote 4.
3 Net exports of goods and services less net transfers to foreigners and interest paid by government to foreigners plus capital grantsreceivedbytheUnitedStates.net.
4 In February 1974, the U.S. Government paid to India $2,010 million in rupees under provisions of the Agricultural TradeDevelopment and Assistance Act. This transaction is being treated as capital grants paid to foreigners, i.e., a -$2.0 billion entry incapital grants received by the United States, net.
Source-. Department of Commerce, Bureau of Economic Analysis.
262
Digitized for FRASER http://fraser.stlouisfed.org/ Federal Reserve Bank of St. Louis

TABLE B-26.—Saving by individuals, 1946-81l
[Billions of dollars; quarterly data at seasonally adjusted annual rates]
Year orquarter
1946194719481949
195019511952 ..19531954
19551956195719581959
19601961196219631964
19651966196719681969
19701971197219731974
19751976197719781979
1980
1979:II II l lIV
1980:1I II l lIV
1981:1I II l l
Total
24.620.124.320.9
30.634.731.332528.2
34.137.236.534.138.0
36.735942.046757.8
66.774.479.484477.7
92.2104.0123.5147.9140.8
164.0175.5182.1204.2213.9
251.2
196.8229.3215.9213.9
248.8247.9255.4253.0
232.0222.0249.3
Increase in financial assets
Total
18.813.29.199
13.719.123.222822.2
28.030.228.631.637.4
32.135440.146655.7
58.857.969.875665.2
81.5102.1131.5148.9144.5
171.7211.2234.3270.5286.0
303.8
265.7317.5289.8271.2
315.1248.8321.8329.8
292.1305.1315.1
Check-able
depos-its
andcur-
rency
5.6.1
-2.9-2.0
2.64.61.6102.2
1.21.8
-.43.81.0
1.09-1.2
425.3
7.62.49.9
11 1-2.5
8.912.213.914.17.4
6.915.721.322.323.4
11.0
15.437.228.012.9
4.6-3.846.4
-3.2
58.16.3
-22.1
Timeandsav-ingsde-
posits
6.33.42.226
2.44.778819.1
8.69.4
11.913.911.0
12.018326.126226.1
27.819.035.331 19.1
43.667.774.463.655.7
83.4107.5107.5100.179.2
131.2
74.467.2
107.268.0
85.5100.8114.7224.0
2.893.247.7
Moneymar-ket
fundshares
III
III
2.4
1.3-.0
.26.9
34.4
29.2
28.831.633.144.1
61.362.55.1
-11.9
148.459.9
137.3
Securities
Govern-ment
securi-ties2
-1.51.61.31.8
-.1-.62.52.51.0
5.83.92.3
-2.510.1
2.21.41.3
.64.8
3.711.3
-1.25.2
25.9
-5.4-12.2
2.723.828.1
24.912.315.432.554.2
23.5
58.988.122.147.9
55.0-14.5
29.823.7
-2.166.699.7
Corpo-rateequi-ties3
1.11.11.0
.7
.71.81.61.0.8
1.02.01.51.5.5
-.6.3
-2.1-2.6-.2
-2.1-.7
-4.7-7.5-2.8
-1.7-5.5-5.1-5.8-.6
-3.8-4.6-4.3-5.8
-16.8
-1.9
-11.0-18.6-19.4-18.1
_ 72!e
-4.1-5.3
-9.5-41.2-46.0
Othersecuri-ties4
-0.9-.8
.0-.4
-.7.3.0.3
-.9
.81.21.01.1
-.3
2.4.1.1
1.4.4
1.32.45.27.9
10.0
6.96.54.9
11.16.8
4.48.65.9
13.417.8
-4.0
18.712.125.814.6
1.1-14.3
.1-3.1
-8.5-9.2
-28.4
Insur-anceand
pensionre-
serves 5
5.35.45.35.6
6.96.37.77.97.8
8.59.59.5
10.411.9
11.512.112.713.916.1
16.919.218.619.821.5
23.927.429.433.036.2
43.552.466.173.866.9
89.0
58.270.765.573.2
83.693.0
101.578.1
79.1104.9100.2
Miscel-laneous
financialassets 6
2.82.42.21.6
1.91.92.02.12.1
2.12.52.83.53.3
3.64.33.22.93.2
3.74.46.78.14.0
5.45.8
11.49.18.5
11.119.322.027.326.9
25.7
22.329.427.628.5
24.722.428.427.5
24.024.626.5
Net investment 7
Owner-occu-pied
homes
3.66.79.18.4
11.811.711.312.312.7
16.715.613.212.316.3
14.812.713.514.315.0
14.513.511.715.716.3
13.620.728.031.025.2
23.536.152.163.667.5
48.2
68.168.867.066.1
59.950.439.543.2
49.050.443.6
Con-sumerdura-bles
6.19.09.8
10.6
14.811.38.6
10.17.1
12.28.57.73.67.3
7.04.38.5
11.815.0
20.223.121.127.026.3
20.026.634.640.428.4
26.540.050.256.352.4
33.8
58.949.951.449.5
49.819.028.537.7
48.232.037.8
Non-cor-
poratebusi-nessas-
sets8
2.31.86.91.8
6.84.52.31.01.9
2.911.22.72.65.0
3.64.77.59.89.2
13.310.810.210.012.7
11.517.520.626.610.6
5.83.3
14.717.118.8
7.5
19.120.320.015.7
13.12.13.6
11.0
12.810.210.1
Less: Net increase indebt
Mort-gagedebton
non-farm
homes
3.64.74.64.4
6.76.66.27.68.7
12.21.28.99.5
12.8
11.712.214.116.217.5
17.013.812.516.918.6
14.126.241.447.335.4
38.061.593.0
107.6114.6
83.4
113.2124.5115.9104.9
104.264.780.983.8
77.576.867.4
Con-sumercredit
3.13.73.23.2
4.81.65.34.21.5
7.23.92.9
.58.0
4.42.56.38.99.8
10.66.55.7
11.510.8
5.414.719.824.39.9
9.625.440.247.646.3
2.3
57.844.140.043.2
23.2-33.4
8.311.1
27.530.937.3
Otherdebt89
-0.42.22.82.2
5.03.72.71.95.5
6.43.23.86.07.2
4.96.57.2
10.79.8
12.610.615,115.413.3
14.921.930.027.622.6
15.828.236.048.049.8
56.4
44.058.656.340.4
61.741.148.873.8
65.268.052.7
1 Saving by households, personal trust funds, nonprofit institutions, farms, and other noncorporate business.2 Consists of U.S. savings bonds, other U.S. Treasury securities, U.S. Government agency securities and sponsored agency securities,
mortgage pool securities, and State and local obligations.3 Includes mutual fund shares.4 Corporate and foreign bonds and open market paper.5 Private life insurance reserves, private insured and noninsured pension reserves, and government insurance and pension reserves.6 Other assets consists of security credit, mortgages, accident and health insurance reserves, and nonlife insurance claims for
households and consumer credit, equity in sponsored agencies, and nonlife insurance claims for noncorporate business.7 Purchases of physical assets less depreciation.8 Includes data for corporate farms.9 Other debt consists of security credit, policy loans, and noncorporate business debt.
Source: Board of Governors of the Federal Reserve System.
263
Digitized for FRASER http://fraser.stlouisfed.org/ Federal Reserve Bank of St. Louis

TABLE B-27.—Money income (in 1980 dollars) and poverty status of families and unrelated individuals byrace of householder, 1952-80
Year
FAMILIES1
19521953195419551956195719581959196019611962196319641965196619671968196919701971197219731974 4.19751976197719781979s.1980«.
UNRELATEDINDIVIDUALS6
1952 . . . .19531954195519561957195819591960196119621963196419651966196719681969197019711972197319744
197519761977197819791980
Total
Totalnumber
(mil-lions)
40841242042.943543.744245.1
345.53 46.4M7.13 47.53 48.03 48.53 49.23 50.13 50.83 51.63 52.2
53.354.455.155.756.256.757.257.858.460.3
9.79.59.79.99.8
10.410.910.9
311.13 11.23 11.03 11.23 12.13 12.23 12.53 13.23 13.93 14.63 15.5
16.316.818.318.920.221.523.124.625.627.1
Medianincome
$12,07613,0701277513,5961449314,5391449715,31415,63715,79716,22516,81817,45118,16919,12419,57920,44521,20320,93920,92621,89522,34621,55921,00421,65221,76922,28022,32021,023
4,3744,3013,7464,0534,3244,3714,2354,4024,7864,8314,7754,8445,2685,6235,8155,8716,5996,5886,6576,7476,9357,6657,6917,4747,7808,0328,4698,5858,296
Percent withincomes—
Belowpoverty
level
18.518.118.117.215.915.013.911.811.410.097
10.110.09.38.88.89.79.49.39.19.1
10.3
Belowpoverty
level
46.145.245.945.444.242.739.838.338.134.034.032.931.629.025.624.125.124.922.622.121.822.9
$25,000andover
8410.510.611.914.313.514317.218.920.221.623.726.127.731.433.035.637.937.537.440.741.940.738.740.441.643.142.639.3
$15,000and
over
565.75.96.47.59.09.59.8
10.812.313.414.215.416.616.417.820.220.321.120.822.023.622.621.923.024.025.324.824.5
White
Totalnumber
(mil-lions)
38239.039.539.740240.941.141.942.442.743.143.544.144.845.446.046.547.648.548.949.449.950.150.550.951.452.7
8.38.58.58.99.29.39.69.69.59.7
10.410.510.711.312.012.513.414.214.515.816.317.518.619.921.322.123.4
Medianincome
$12,77213,55113,30014,19615,16615,13015,10415,95316,23516,47416,99017,62318,21918,93719,86820,32221,16722,01421,72221,71422,74823,35422,40421,84522,49022,76323,20023,27521,904
4,7164,5394,0324,3084,4394,6784,5374,7045,1755,1925,1105,0795,5475,8636,1146,0966,9926,9186,9677,0507,2427,9187,9697,8078,1158,3378,8798,8958,763
Percent withincomes—
Belowpoverty
level
"".'"!!!!"!!15.2'14.914.813.912.812.211.19.39.08.07.78.07.97.16.66.87.77.17.06.96.88.0
Belowpoverty
level
44.143.043.242.742.040.738.136.136.532.232.130.829.627.123.721.822.722.720.419.819.620.4
$25,000andover
9.211.311.413.015.414.615.418.720.321.723.425.627.829.733.434.937.540.139.639.542.944.442.840.742.744.045.445.041.6
$15,000and
over
606.87.0738.3
10.310510.811.713.514.815.516.417.817.819.221.621.722.522.223.024.423.722.824.025.126.525.625.8
Black
Totalnumber
(mil-lions)
2 3.82 3.92 4.02 4.02402 4.22 4.324.52 4.62 4.82 4.82 4.82 5.0
4.64.64.84.95.25.35.45.55.65.85.85.96.06.3
i'Df2142 1.32 1.52162 1.62 1.52 1.62 1.521.52 1.62 1.72 1.6
1.61.71.81.71.92.02.22.42.42.62.92.93.13.2
Medianincome
2 $7,2582 7, 5982 7,4072 7,8292 7,9802 8,0892 7,7372 8,2412 8,9872 8,7892 9,0662 9,326
2 10,1962 10,428211,911
12,03212,69513,48413,32513,10313,52013,47913,37813,44113,37813,00413,74113,21912,674
2 3 2632 3,5682 2,6762 2 8772 3,2962 2,9722 3 0782 3,0392 2,97223,18723,4112 3,4852 3,8022 4,2752 3,844
4,3444,6524,7344,4924,5785,0605,8505,3755,0325,4566,0325,5716,1885,394
Percent withincomes—
Belowpoverty
level
248.12 49.02 49.02 48.02 43.72 40.02 39.7
35.533.929.427.929.528.829.028.126.927.127.928.227.527.628.9
Belowpoverty
level
2 57.02 59.32 62.72 62.12 58.32 55.02 50.7
54.449.346.346.748.346.042.937.939.342.139.837.038.636.941.0
$25,000andover
2 1.52 2.422.12 1.82 2.62 2.82 3.72 4.22 6.727.22 6.52 6.82 9.9
2 10.32 12.9
13.616.416.918.517.920.719.719.819.420.620.922.622.119.8
$15,000and
over2312 0.52 0.52132 2.721.52 2 523.524.52 5.52 5.22 5.12 8.22 8.62 6.9
8.711.010.911.011.014.418.015.014.215.616.316.517.514.2
1 The term "family" refers to a group of two or more persons related by blood, marriage, or adoption and residing together; all suchpersons are considered members of the same family.
2 Data for "black" include "other" races.3 Revised using population controls based on the 1970 census. Such controls are not available by race.4 Based on revised methodology; comparable with succeeding years.5 Based on householder concept. Restricted to primary families.6The term "unrelated individuals" refers to persons 15 years old and over as of March 1980 and 1981 and 14 years old and over for
previous years (other than inmates of institutions) who are not living with any relatives.Note.—The poverty level is based on the poverty index adopted by a Federal interagency committee in 1969. That index reflects
different consumption requirements for families based on size and composition, sex and age of family householder, and farm-nonfarmresidence. The poverty thresholds are updated every year to reflect changes in the consumer price index. For further details see"Current Population Reports," Series P-60, Nos. 127, 129, and 130.
Source: Department of Commerce, Bureau of the Census.
264
Digitized for FRASER http://fraser.stlouisfed.org/ Federal Reserve Bank of St. Louis

POPULATION, EMPLOYMENT, WAGES, AND PRODUCTIVITY
TABLE B-28.—Population by age groups, 1929-80
[Thousands of persons]
July 1
1929
1933
1939
19401941194219431944
19451946194719481949
19501951195219531954
19551956195719581959
19601961196219631964
19651966196719681969
19701971197219731974
19751976197719781979
198019802
Total
121,767
125,579
130,880
132,122133,402134,860136,739138,397
139,928141,389144,126146,631149,188
152,271154,878157,553160,184163,026
165,931168,903171,984174,882177,830
180,671183,691186,538189,242191,889
194,303196,560198,712200,706202,677
204,878207,053208,846210,410211,901
213,559215,152216,880218,717220,584
222,807227,020
Under 5
11,734
10,612
10,418
10,57910,85011,30112,01612,524
12,97913,24414,40614,91915,607
16,41017,33317,31217,63818,057
18,56619,00319,49419,88720,175
20,34120,52220,46920,34220,165
19,82419,20818,56317,91317,376
17,14817,17716,99016,69416,288
15,87915,34515,24815,37815,649
16,344
5-15
26,800
26,897
25,179
24,81124,51624,23124,09323,949
23,90724,10324,46825,20925,852
26,72127,27928,89430,22731,480
32,68233,99435,27236,44537,368
38,49439,76541,20541,62642,297
42,93843,70244,24444,62244,840
44,77444,44143,94843,22742,538
41,95641,45940,57539,62338,643
(>)38,997
16-19
9,127
9,302
9,822
9,8959,8409,7309,6079,561
9,3619,1199,0978,9528,788
8,5428,4468,4148,4608,637
8,7448,9169,1959,54310,215
10,68311,02511,18012,00712,736
13,51614,31114,20014,45214,800
15,27515,63515,94616,31016,590
16,79316,92816,96616,93516,838
17.U
Age (years)
20-24
10,694
11,152
11,519
11,69011,80711,95512,06412,062
12,03612,00411,81411,79411,700
11,68011,55211,35011,06210,832
10,71410,61610,60310,75610,969
11,13411,48311,95912,71413,263
13,74614,05015,24815,78616,480
17,18418,08918,03218,34518,741
19,22919,63020,07720,46120,726
0)21,523
25-44
35,862
37,319
39,354
39,86840,38340,86141,42042,016
42,52143,02743,65744,28844,916
45,67246,10346,49546,78647,001
47,19447,37947,44047,33747,192
47,14047,08447,01346,99446,958
46,91247,00147,19447,72148,064
48,43548,81150,25451,41152,593
53,73555,12956,70658,38060,161
«£}
45-64
21,076
22,933
25,823
26,24926,71827,19627,67128,138
28,63029,06429,49829,93130,405
30,84931,36231,88432,39432,942
33,50634,05734,59135,10935,663
36,20336,72237,25537,78238,338
38,91639,53440,19340,84641,437
41,97542,41342,78543,07743,319
43,54643,70743,79543,87643,910
«£i
65 andover
6,474
7,363
8,764
9,0319,2889,5849,86710,147
10,49410,82811,18511,53811,921
12,39712,80313,20313,61714,076
14,52514,93815,38815,80616,248
16,67517,08917,45717,77818,127
18,45118,75519,07119,36519,680
20,08720,48820,89221,34621,833
22,42022,95423,51324,06424,658
(')25,544
1 Not available.2 As of April 1; based on 1980 census.Note.—includes Armed Forces overseas beginning 1940. Includes Alaska and Hawaii beginning 1950. Data for 1970-79 have not yet
been revised to be consistent with the results of the 1980 census.
Source: Department of Commerce, Bureau of the Census.
265
Digitized for FRASER http://fraser.stlouisfed.org/ Federal Reserve Bank of St. Louis
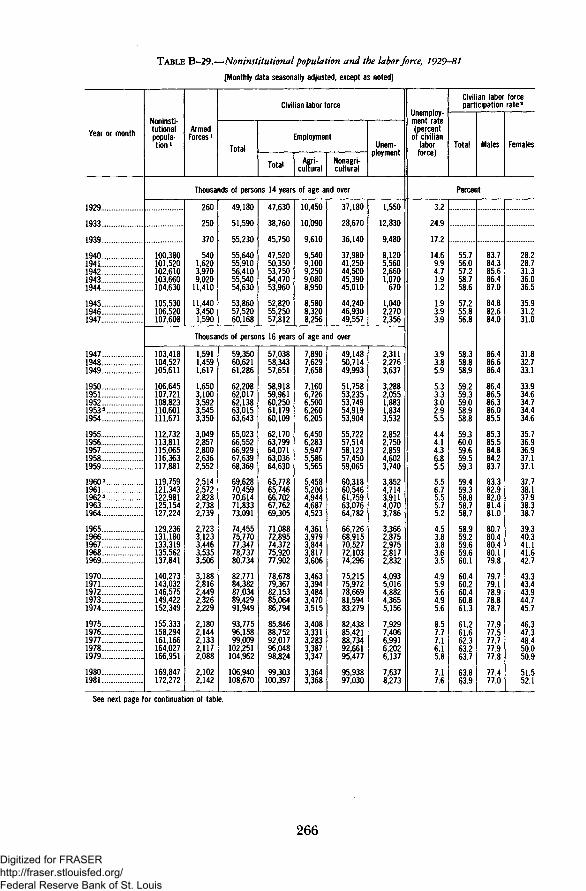
TABLE B-29.—Noninstitutional population and the labor force, 1929-81
[Monthly data seasonally adjusted, except as noted]
Year or month
1929
1933
1939
19401941194219431944
194519461947
1947 . ...19481949
1950195119521953 3
1954
19551956195719581959
I9603
19611962 3
19631964
196519661967 ..19681969
19701971197219731974
19751976197719781979
19801981
Noninsti-tutionalpopula-tion1
ArmedForces *
Civilian labor force
TotalEmployment
Total Agri-cultural
Nonagri-cultural
Unem-ployment
Thousands of persons 14 years of age and over
100,380101,520102,610103,660104,630
105,530106,520107r608
260
250
370
5401,6203,9709,020
11,410
11,4403,4501,590
49,180
51,590
55,230
55,64055,91056,41055,54054,630
53,86057,52060,168
47,630
38,760
45,750
47,52050,35053,75054,47053,960
52,82055,25057,812
10,450
10,090
9,610
9,5409,1009,2509,0808,950
8,5808,3208,256
37,180
28,670
36,140
37,98041,25044,50045,39045,010
44,24046,93049,557
1,550
12,830
9,480
8,1205,5602,6601,070
670
1,0402,2702,356
Thousands of persons 16 years of age and over
103,418104,527105,611
106,645107,721108,823110,601111,671
112,732113,811115,065116,363117,881
119,759121,343122,981125,154127,224
129,236131,180133,319135,562137,841
140,273143,032146,575149,422152,349
155.333158,294161,166164,027166,951
169,847172,272
1,5911,4591,617
1,6503,1003,5923,5453,350
3,0492,8572,8002,6362,552
2,5142,5722,8282,7382,739
2,7233,1233,4463,5353,506
3,1882,8162,4492,3262,229
2,1802,1442,1332,1172,088
2,1022,142
59,35060,62161,286
62,20862,01762,13863,01563,643
65,02366,55266,92967,63968,369
69,62870,45970,61471,83373,091
74,45575,77077,34778,73780,734
82,77184,38287,03489,42991,949
93,77596,15899,009
102,251104,962
106,940108,670
57,03858,34357,651
58,91859,96160,25061,17960,109
62,17063,79964,07163,03664,630
65,77865,74666,70267,76269,305
71,08872,89574,37275,92077,902
78,67879,36782,15385,06486,794
85,84688,75292,01796,04898,824
99,303100,397
7,8907,6297,658
7,1606,7266,5006,2606,205
6,4506,2835,9475,5865,565
5,4585,2004,9444,6874,523
4,3613,9793,8443,8173,606
3,4633,3943,4843,4703,515
3,4083,3313,2833,3873,347
3,3643,368
49,14850,71449,993
51,75853,23553,74954,91953,904
55,72257,51458,12357,45059,065
60,31860,54661,75963,07664,782
66,72668,91570,52772,10374,296
75,21575,97278,66981,59483,279
82,43885,42188,73492,66195,477
95,93897,030
2,3112,2763,637
3,2882,0551,8831,8343,532
2,8522,7502,8594,6023,740
3,8524,7143,9114,0703,786
3,3662,8752,9752,8172,832
4,0935,0164,8824,3655,156
7,9297,4066,9916,2026,137
7,6378,273
Unemploy-ment rate(percent
of civilianlabor
force)
Civilian labor forceparticipation rate2
Total Males Females
Percent
3.2
24.9
17.2
14.69.94.71.91.2
1.93.93.9
3.93.85.9
5.33.33.02.95.5
4.44.14.36.85.5
5.56.75.55.75.2
4.53.83.83.63.5
4.95.95.64.95.6
8.57.77.16.15.8
7.17.6
55.756.057.258.758.6
57.255.856.8
58.358.858.9
59.259.359.058.958.8
59.360.059.659.559.3
59.459.358.858.758.7
58.959.259.659.660.1
60.460.260.460.861.3
61.261.662.363.263.7
63.863.9
83.784.385.686.487.0
84.882.684.0
86.486.686.4
86.486.586.386.085.5
85.385.584.884.283.7
83.382.982.081.481.0
80.780.480.480.179.8
79.779.178.978.878.7
77.977.577.777.977.8
77.477.0
28.228.731.336.036.5
35.931.231.0
31.832.733.1
33.934.634.734.434.6
35.736.936.937.137.1
37.738.137.938.338.7
39.340.341.141.642.7
43.343.443.944.745.7
46.347.348.450.050.9
51.552.1
See next page for continuation of table.
266
Digitized for FRASER http://fraser.stlouisfed.org/ Federal Reserve Bank of St. Louis

TABLE B-29.—Noninstitutional population and the labor force, 1929-81—Continued
[Monthly data seasonally adjusted, except as noted]
Year or month
1979:JanFebMar
&::::::=June
JulyAugSeptOctNovDec
1980:JanFebMar
June
JulyAugSeptOctNovDec
1981:JanFebMar
MayJune
JulyAug
OctNovDec
Noninsti-tutionalpopula-tion1
ArmedForces l
Civilian labor force
Total
Employment
Total Agri-cultural
Nonagri-cultural
Unem-ployment
Thousands of persons 16 years of age and over
165,610165,820166,117166,244166,537166,797
167,052167,288167,523167,906168,143168,389
168,625168,845169,074169,289169,495169,735
170,031170,217170,418170,624170,814171,007
171,229171,400171,581171,770171,956172,172
172,385172,559172,758172,966173,155173,330
2,0942,0942,0902,0822,0782,076
2,0822,0902,0922,0932,0922,089
2,0812,0862,0902,0922,0882,092
2,0992,1142,1212,1212,1192,124
2,1252,1212,1282,1292,1272,131
2,1392,1602,1652,1582,1582,164
104,036104,421104,524104,114104,237104.597
105,039105,151105,601105,724105,825106,366
106,493106,548106,321106,482107,022106,809
107,221107,159107,232107,437107,600107,531
107,923108,034108,364108,777109,293108,434
108,688108,818108,494109,012109,272109,184
97,93098,27398,41698,03898,32498,684
99,05498,85399,42899,43199,57099,957
99,83399,91399,60799,11298,96398,785
98,89198,92099,20899,32899,53499,632
99,901100,069100,406100,878101,045100,430
100,864100,840100,258100,343100,17299,613
3,3133,3673,3593,2613,2863,334
3,3483,3853,3793,3263,4103,396
3,3273,3923,4023,2803,4113,302
3,3453,2533,4493,3633,3703,486
3,4453,3463,3433,4703,4053,348
3,3423,4043,3583,3783,3723,209
94,61794,90695,05794,77795,03895,350
95,70695,46896,04996,10596,16096,561
96,50696,52196,20595,83295,55295,483
95,54695,66795,75995,96596,16496,146
96,45696,72397,06397,40897,64097,082
97,52297,43696,90096,96596,80096,404
6,1066,1486,1086,0765,9135.913
5,9856,2986,1736,2936,2556,409
6,6606,6356,7147,3708,0598,024
8,3308,2398,0248,1098,0667,899
8,0227,9657,9587,8998,2488,004
7,8247,9788,2368,6699,1009,571
Unemploy-ment rate(percent
of civilianlabor
force)
Civilian labor forceparticipation rate2
Total Males Females
Percent
5.95.95.85.85.75.7
5.76.05.86.05.96.0
6.36.26.36.97.57.5
7.87.77.57.57.57.3
7.47.47.37.37.57.4
7.27.37.68.08.38.8
63.663.863.763.463.463.5
63.763.763.863.863.764.0
63.963.963.763.763.963.7
63.863.763.763.863.863.7
63.863.863.964.164.463.8
63.863.963.663.863.963.8
78.278.378.077.877.677.8
77.977.778.077.777.677.7
77.777.877.577.477.877.4
77.577.377.377.477.377.2
77.277.177.277.377.676.7
76.776.876.876.876.876.9
50.550.850.950.550.650.7
50.951.151.151.351.351.6
51.651.451.351.451.551.4
51.651.651.551.551.651.6
51.851.952.052.252.552.2
52.352.251.852.252.352.0
1 Not seasonally adjusted.2 Civilian labor force as percent of civilian noninstitutional population.3 Not strictly comparable with earlier data due to population adjustments as follows: Beginning 1953, introduction of 1950 census
data added about 600,000 to population and about 350,000 to labor force, total employment, and agricultural employment. Beginning1960, inclusion of Alaska and Hawaii added about 500,000 to population, about 300,000 to labor force, and about 240,000 to, , , , ,nonagricultural employment. Beginning 1962, introduction of 1960 census data reduced population by about 50,000 and labor force andemployment by about 200,000. Beginning 1972, introduction of 1970 census data added about 800,000 to civilian noninstitutionalpopulation and about 333,000 to labor force and employment. A subsequent adjustment based on 1970 census in March 1973 added60,000 to labor force and to employment. Beginning 1978, changes in sampling and estimation procedures introduced into thehousehold survey added about 250,000 to labor force and to employment. Unemployment levels and rates were not significantlyaffected.
Note.—Data for 1970-81 revised based on 1980 census of population.Labor force data in Tables B-29 through B-35 are based on household interviews and relate to the calendar week including the 12th
of the month. For definitions of terms, area samples used, historic comparability of the data, comparability with other series, etc., see"Employment and Earnings."
Source: Department of Labor, Bureau of Labor Statistics.
267
Digitized for FRASER http://fraser.stlouisfed.org/ Federal Reserve Bank of St. Louis
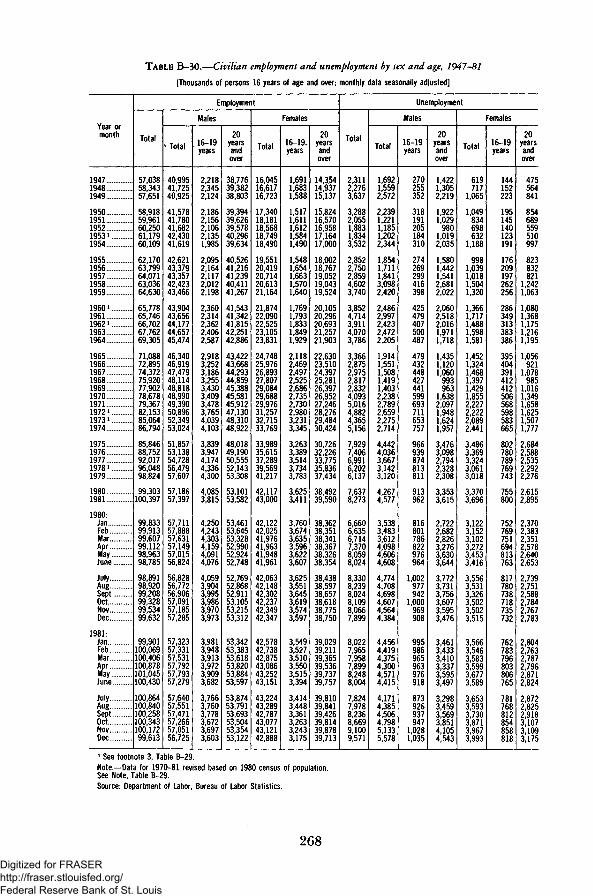
TABLE B-30.—Civilian employment and unemployment by sex and age, 1947-81
[Thousands of persons 16 years of age and over; monthly data seasonally adjusted]
Year ormonth
194719481949
1950195119521953 »1954
19551956195719581959
I9601 . .19611962 »19631964
19651966196719681969197019711972 l
1973 »1974
1975 . . .197619771978 »1979
19801981
1980:JanFebMar
%June
JulyAugSeptOctNovDec
1981:JanFebMarAprMayJune
JulyAugSeptOctNovDec
Employment
Total
57,03858,34357,651
58,91859,96160,25061,17960,109
62,17063,79964,07163,03664,630
65,77865,74666,70267,76269,305
71,08872,89574,37275,92077,90278,67879,36782,15385,06486,794
85,84688,75292,01796,04898,824
99,303100,397
99,83399,91399,60799,11298,96398,785
98,89198,92099,20899,32899,53499,632
99,901100,069100,406100,878101,045100,430
100,864100,840100,258100,343100,17299,613
Males
' Total
40,99541,72540,925
41,57841,78041,68242,43041,619
42,62143,37943,35742,42343,466
43,90443,65644,17744,65745,474
46,34046,91947,47948,11448,81848,99049,39050,89652,34953,024
51,85753,13854,72856,47957,607
57,18657,397
57,71157,88857,63157,14957,01556,824
56,82856,77256,90657,09157,18557,285
57,32357,33157,53157,79257,79357,279
57,64057,55157,47157,26657,05156,725
16-19years
2,2182,3452,124
2,1862,1562,1062,1351,985
2,0952,1642,1172,0122,198
2,3602,3142,3622,4062,587
2,9183,2523,1863,2553,4303,4093,4783,7654,0394,103
3,8393,9474,1744,3364,300
4,0853,815
4,2504,2434,3034,1594,0914,076
4,0593,9043,9953,9863,9703,973
3,9813,9483,9133,9723,9093,682
3,7663,7603,7783,6723,6973,603
20yearsandover
38,77639,38238,803
39,39439,62639,57840,29639,634
40,52641,21641,23940,41141,267
41,54341,34241,81542,25142,886
43,42243,66844,29344,85945,38845,58145,91247,13048,31048,922
48,01849,19050,55552,14353,308
53,10153,582
53,46153,64553,32852,99052,92452,748
52,76952,86852,91153,10553,21553,312
53,34253,38353,61853,82053,88453,597
53,87453,79153,69353,50453,35453,122
Females
Total
16,04516,61716,723
17,34018,18118,56818,74918,490
19,55120,41920,71420,61321,164
21,87422,09022,52523,10523,831
24,74825,97626,89327,80729,08429,68829,97631,25732,71533,769
33,98935,61537,28939,56941,217
42,11743,000
42,12242,02541,97641,96341,94841,961
42,06342,14842,30242,23742,34942,347
42,57842,73842,87543,08643,25243,151
43,22443,28942,78743,07743,12142,888
16-19,years
1,6911,6831,588
1,5171,6111,6121,5841,490
1,5481,6541,6631,5701,640
1,7691,7931,8331,8491,929
2,1182,4692,4972,5252,6862,7352,7302,9803,2313,345
3,2633,3893,5143,7343,783
3,6253,411
3,7603,6743,6353,5963,6223,607
3,6253,5513,6453,6193,5743,597
3,5493,5273,5103,5503,5153,394
3,4143,4483,3613,2633,2433,175
20yearsandover
14,3.5414,93715,137
15,82416,57016,95817,16417,000
18,00218,76719,05219,04319,524
20,10520,29620,69321,25721,903
22,63023,51024,39725,28126,39726,95227,24628,27629,48430,424
30,72632,22633,77535,83637,434
38,49239,590
38,36238,35138,34138,36738,32638,354
38,43838,59738,65738,61838,77538,750
39,02939,21139,36539,53639,73739,757
39,81039,84139,42639,81439,87839,713
Unemployment
Total
2,3112,2763,637
3,2882,0551,8831,8343,532
2,8522,7502,8594,6023,740
3,8524,7143,9114,0703,786
3,3662,8752,9752,8172,8324,0935,0164,8824,3655,156
7,9297,4066,9916,2026,137
7,6378,273
6,6606,6356,7147,3708,0598,024
8,3308,2398,0248,1098,0667,899
8,0227,9657,9587,8998,2488,004
7,8247,9788,2368,6699,1009,571
Males
Total
1,6921,5592,572
2,2391,2211,1851,2022,344
1,8541,7111,8413,0982,420
2,4862,9972,4232,4722,205
1,9141,5511,5081,4191,4032,2382,7892,6592,2752,714
4,4424,0363,6673,1423,120
4,2674,577
3,5383,4833,6124,0984,6064,608
4,7744,7084,6984,6074,5644,384
4,4564,4194,3754,3004,5714,415
4,1714,3854,5064,7985,1335,578
16-19years
270255352
318191205184310
274269299416398
425479407500487
479432448427441599693711653757
966939874813811
913962
816801786822976964
1,002977942
1,000969908
995986965963976918
873926937947
1,0281,035
20yearsandover
1,4221,3052,219
1,9221,029980
1,0192,035
1,5801,4421,5412,6812,022
2,0602,5182,0161,9711,718
1,4351,1201,060993963
1,6382,0971,9481,6241,957
3,4763,0982,7942,3282,308
3,3533,615
2,7222,6822,8263,2763,6303,644
3,7723,7313,7563,6073,5953,476
3,4613,4333,4103,3373,5953,497
3,2983,4593,5693,8514,1054,543
Females
Total
619717
1,065
1,049834698632
1,188
9981,0391,0181,5041,320
1,3661,7171,4881,5981,581
1,4521,3241,4681,3971,4291,8552,2272,2222,0892,441
3,4863,3693,3243,0613,018
3,3703,696
3,1223,1523,1023,2723,4533,416
3,5563,5313,3263,5023,5023,515
3,5663,5463,5833,5993,6773,589
3,6533,5933,7303,8713,9673,993
16-19years
144152223
195145140123191
176209197262256
286349313383386
395404391412412506568598583665
802780789769743
755800
752769751694813763
817780738718735732
762783796803806765
781768812854858818
20yearsandover
475564841
854689559510997
823832821
1,2421,063
1,0801,3681,1751,2161,195
1,056921
1,078985
1,0161,3491,6581,6251,5071,777
2,6842,5882,5352,2922,276
2,6152,895
2,3702,3832,3512,5782,6402,653
2,7392,7512,5882,7842,7672,783
2,8042,7632,7872,7962,8712,824
2,8722,8252,9183,1073,1093,175
1 See footnote 3, Table B-29.Note.—Data for 1970-81 revised based on 1980 census of population.See Note, Table B-29.Source: Department of Labor, Bureau of Labor Statistics.
268
Digitized for FRASER http://fraser.stlouisfed.org/ Federal Reserve Bank of St. Louis

TABLE B-31.—Selected employment and unemployment data, 1948-81
[Percent; monthly data seasonally adjusted]
Year or month
19481949
19501951 .19521953195419551956195719581959
1960196119621963196419651966196719681969
1970197119721973197419751976197719781979
19801981
1980-JanFebMarAprMayJune
JulyAugSeptOctNovDec
1981:JanFebMarAprMayJune
JulyAugSeptOctNovDec
Employment as percent of population 1
Total
558546
55?55755.455.353.855.156.155.754.254.8
54.954.254.254.154.555.055.655.856.056.5
56.155.556.056.957.055.356.157.158.659.2
58.558.3
59.259.258.958.558.458.2
58.258.158.258.258.358.3
58.358.458.558.758.858.3
58.558.458.058.057.957.5
Bothsexes16-19
years
45543.0
43.844944.143.940.141.342.741.137.638.1
39.037.537.635.835.837.740.740.440.642.1
41.240.442.644.845.042.343.245.147.447.7
45.843.7
47.346.846.945.945.745.5
45.644.345.545.345.045.3
45.044.844.645.344.842.8
43.543.843.542.942.441.6
Males20
yearsandover
83981 6
81 981680.880.678.880.080.880.278.079.0
78.777.677.477.377.777.977.677.477.176.9
76.175.375.876.375.772.973.273.774.574.7
72.972.3
74.174.273.773.172.972.5
72.472.472.472.572.672.6
72.672.572.772.972.972.4
72.672.472.271.871.571.1
Fe-males
20years
and over
30730.6
31.632.633.032.932.333.834.935.034.635.1
35.735.535.836.236.937.638.639.340.041.1
41.240.841.342.242.742.343.544.746.547.6
48.048.5
48.248.248.148.047.947.9
47.948.048.047.948.047.9
48.248.348.548.648.848.7
48.748.748.148.548.548.3
White
:::::::
54.054.354.855.455.755.956.5
56.255.756.457.357.555.956.857.959.360.0
59.459.3
60.160.159.859.559.359.1
59.058.959.159.159.259.2
59.359.459.559.759.859.4
59.659.659.159.158.958.5
Blackand
other
55.256.156.857.256.956.656.7
55.553.853.254.053.350.451.051.553.754.0
52.451.4
53.253.152.652.252.252.1
52.452.552.352.352.352.0
52.151.751.952.352.051.2
51.351.151.151.051.050.7
Unemployment rate 2
Allwork-
ers
3.85.9
5.33.33.0295.54.4414.36.85.5
5.56.75.55.75.24.53.83.83.63.5
4.95.95.64.95.68.57.77.16.15.8
7.17.6
6.36.26.36.97.57.5
7.87.77.57.57.57.3
7.47.47.37.37.57.4
7.27.37.68.08.38.8
By sex and age
Bothsexes16-19
years
9.213.4
12.28.28.576
12.611 011 111.615.914.6
14.716.814.717.216.214.812.812.912.712.2
15.316.916.214.516.019.919.017.816.416.1
17.819.6
16.416.516.216.418.818.4
19.119.118.018.418.417.8
18.919.119.219.019.419.2
18.719.019.720.421.421.5
Males20
yearsandover
3.25.4
4.72.52.4254.93.8343.66.24.7
4.75.74.64.53.93.22.52.32.22.1
3.54.44.03.33.86.85.95.24.34.2
5.96.3
4.84.85.05.86.46.5
6.76.66.66.46.36.1
6.16.06.05.86.36.1
5.86.06.26.77.17.9
Fe-males
20yearsandover
3.65.3
5.14.03.2295.54.44 24.16.15.2
5.16.35.45.45.24.53.84.23.83.7
4.85.75.44.95.58.07.47.06.05.7
6.46.8
5.85.95.86.36.46.5
6.76.76.36.76.76.7
6.76.66.66.66.76.6
6.76.66.97.07.27.4
By selected groups
Experi-encedwageand
salarywork-ers
4.36.8
6.03.73.3326.24.8444.67.25.7
5.76.85.65.55.04.33.53.63.43.3
4.85.75.34.55.38.27.36.65.65.5
6.97.3
5.95.96.16.77.37.3
7.47.47.37.37.27.1
7.17.17.06.97.27.0
6.86.97.37.68.08.5
Mar-ried
men,spousepres-ent3
3.5
4.61.51.4174.02.8262.85.13.6
3.74.63.63.42.82.41.91.81.61.5
2.63.22.82.32.75.14.23.62.82.8
4.24.3
3.53.23.54.14.54.6
4.94.94.74.64.44.3
4.24.15.13.84.04.2
3.94.04.44.85.25.7
Wom-en
whomain-tain
fami-lies
4.9"4.44.4
5.47.37.27.17.0
10.010.19.48.58.3
9.210.4
8.98.68.89.18.48.6
8.89.39.1
10.29.8
10.2
10.39.89.69.9
10.410.7
11.210.110.710.610.810.5
Full-time
work-ers4
5.4
5.02.62.5
5.23.83.74.07.2
67"
5.5"4.94.23.53.43.13.1
4.55.55.14.45.18.17.36.65.65.3
6.97.3
5.85.86.06.67.27.3
7.67.57.37.37.37.2
7.27.17.16.97.17.1
6.86.97.37.78.18.7
Blue-collarwork-ers5
4.28.0
7.23.93.63.47.25.85.16.2
10.27.6
7.89.27.47.36.35.34.24.44.13.9
6.27.46.55.46.7
11.79.48.16.97.0
10.010.3
8.28.08.39.7
10.811.0
11.411.210.810.810.610.4
10.210.210.09.79.99.8
9.59.5
10.210.911.812.7
1 Civilian employment as percent of total noninstitutional population.2 Unemployment as percent of civilian labor force in group specified.3 Data for 1949 and 1951-54 are for April; 1950, for March.4 Data for 1949-61 are for May.5 Includes craft and kindred workers, operatives, and nonfarm laborers. Data for 1948-57 are based on data for January, April, July,
and October.
Note.—Data revised for 1970-81 based on 1980 census of population. See footnote 3 and Note, Table B-29.
Source: Department of Labor, Bureau of Labor Statistics.
358-691 0 - 82 - 18 : QL3 269Digitized for FRASER http://fraser.stlouisfed.org/ Federal Reserve Bank of St. Louis
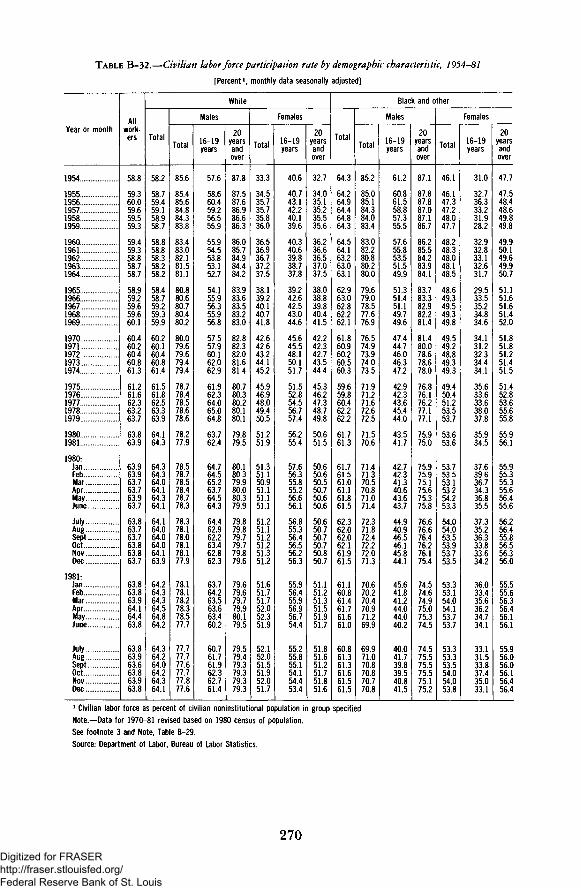
TABLE B-32.—Civilian labor force participation rate by demographic characteristic, 1954-81
[Percent1, monthly data seasonally adjusted]
Year or month
1954
19551956195719581959
196019611962 . .19631964 .. .
1965196619671968 .1969
19701971197219731974
19751976197719781979
19801981
1980:JanFebMar
MayJune
JulyAuL:::::::Sept....OctNovDec.
1981:JanFebMar
MayJune
JulyAugSeptOctNovDec
Allwork-ers
58.8
59.360.059.659.559.3
59.459.358.858.758.7
58.959.259.659.660.1
60.460.260.460.861.3
61.261.662.363.263.7
63.863.9
63.963.963.763.763.963.7
63.863763.763.863.863.7
63.863.863.964.164.463.8
63.863.963.663.863.963.8
White
Total
58.2
58.759.459.158.958.7
58.858.858.358.258.2
58.458.759.259.359.9
60.260.160.460.861.4
61.561.862.563.363.9
64.164.3
64.364.364.064.164.364.1
64.164.064.064.064.163.9
64.264.364.364.564.864.2
64.364.264.064.264.364.1
Males
Total
85.6
85.485.684.884.383.8
83.483.082.181.581.1
80.880.680.780.480.2
80.079.679.679.479.4
78.778.478.578.678.6
78.277.9
78.578.778.578.478.778.3
78.378.178.078.178.177.9
78.178.178.278.378.577.7
77.777.777.677.777.877.6
16-19years
57.6
58.660.459.256.555.9
55.954.553.853.152.7
54.155.956.355.956.8
57.557.960.162.062.9
61.962.364.065.064.8
63.762.4
64.764.565.263.764.564.3
64.462.962.263.462.862.3
63.764.263.563.663.460.2
60.761.761.962.362.761.4
20yearsandover
87.8
87.587.686.986.686.3
86.085.784.984.484.2
83.983.683.583.283.0
82.882.382.081.681.4
80.780.380.280.180.1
79.879.5
80.180.379.980.080.379.9
79.879.879.779.779.879.6
79.679.679.779.980.179.5
79.579.479.379.379.379.3
Females
Total
33.3
34.535.735.735.836.0
36.536.936.737.237.5
38.139.240.140.741.8
42.642.643.244.145.2
45.946.948.049.450.5
51.251.9
51.351.150.951.151.151.1
51.251.151.251.251.351.2
51.651.751.752.052.351.9
52.152.051.551.952.051.7
16-19years
40.6
40.743.142.240.139.6
40.340.639.838.737.8
39.242.642.543.044.6
45.645.548.150.151.7
51.552.854.556.757.4
56.255.4
57.656.355.855.256.656.1
56.855.356.456.556.256.3
55.956.455.956.956.754.4
55.255.855.154.154.453.4
20yearsandover
32.7
34.035.135.235.535.6
36.236.636.537.037.5
38.038.839.840.441.5
42.242.342.743.544.4
45.346.247.348.749.8
50.651.5
50.650.650.550.750.650.6
50.650.750.750.750.850.7
51.151.251.351.551.951.7
51.851.651.251.751.851.6
Black and other
Total
64.3
64.264.964.464.864.3
64.564.163.263.063.1
62.963.062.862.262.1
61.860.960.260.560.3
59.659.860.462.262.2
61.761.3
61.761.561.061.161.861.5
62.362.062.062.161.961.5
61.160.861.461.761.661.0
60.861.361.361.661.561.5
Males
Total
85.2
85.085.184.384.083.4
83.082.280.880.280.0
79.679.078.577.676.9
76.574.973.974.073.5
71.971.271.672.672.5
71.570.6
71.471.370.570.871.071.4
72.371.872.472.272.071.3
70.670.270.470.971.269.9
69.971.070.870.870.770.8
16-19years
61.2
60.861.558.857.355.5
57.655.853.551.549.9
51.351.451.149.749.6
47.444.746.046.347.2
42.942.343.645.444.0
43.541.7
42.742.341.340.643.643.7
44.940.946.546.145.844.1
45.641.841.244.044.040.2
40.041.739.839.540.841.5
20yearsandover
87.1
87.887.887.087.186.7
86.285.584.283.984.1
83.783.382.982.281.4
81.480.078.678.678.0
76.876.176.277.177.1
75.975.0
75.975.975.175.675.375.8
76.676.676.476.276.175.4
74.574.674.975.075.374.5
74.575.575.575.575.175.2
Females
Total
46.1
46.147.347.248.047.7
48.248.348.048.148.5
48.649.349.549.349.8
49.549.248.849.349.3
49.450.451.253.553.7
53.653.6
53.753.553.153.254.253.3
54.054.053.553.953.753.5
53.353.154.054.153.753.7
53.353.353.554.054.053.8
16-19years
31.0
32.736.333.231.928.2
32.932.833.132.631.7
29.533.535.234.834.6
34.131.232.334.434.1
35.633.633.638.037.8
35.934.5
37.639.636.734.336.835.5
37.335.236.333.833.634.2
36.033.435.636.234.734.1
33.131.533.837.435.033.1
20yearsandover
47.7
47.548.448.649.849.8
49950.149.649.950.7
51.151.651.651.452.0
51.851.851.251.451.5
51.452.853.655.655.8
55.956.1
55.955.355.355.656.455.6
56.256.455.856.556.356.0
55.555.656.356.456.156.1
55.956.056.056.156.456.4
1 Civilian labor force as percent of civilian noninstitutional population in group specified.Note.—Data for 1970-81 revised based on 1980 census of population.See footnote 3 and Note, Table B-29.Source: Department of Labor, Bureau of Labor Statistics.
270Digitized for FRASER http://fraser.stlouisfed.org/ Federal Reserve Bank of St. Louis
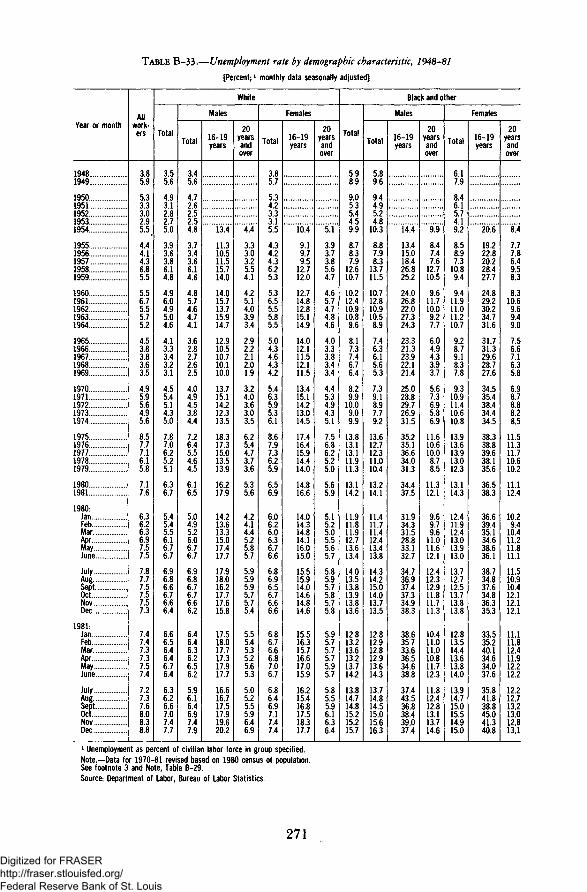
TABLE B-33.—Unemployment rate by demographic characteristic, 1948-81
[Percent;1 monthly data seasonally adjusted]
Year or month
19481949
1950.1951195219531954 . . .
19551956195719581959
19601961196219631964
19651966196719681969
19701971197219731974
19751976197719781979
19801981
1980:JanFebMarAprMayJune
JulyAugSept. ..OctNovDec
1981:JanFebMar
J&I~Z"June
JulyAugSeptOct. .NovDec . .
Allwork-ers
3.85.9
5.33.33.02.95-5,4.44.14.36.85.5
5.56.75.55.75.2
4.53.83.83.63.5
4.95.95.64.95.6
8.57.77.16.15.8
7.17.6
6.36.26.36.97.57.5
7.87.77.57.57.57.3
7.47.47.37.37.57.4
7.27.37.68.08.38.8
White
Total
3.55.6
4.93.12.82.75.0
3.93.63.86.14.8
4.96.04.95.04.6
4.13.33.43.23.1
4.55.45.14.35.0
7.87.06.25.25.1
6.36.7
5.45.45.56.16.76.7
6.96.86.66.76.66.4
6.66.56.46.46.76.4
6.36.26.67.07.47.7
Males
Total
3.45.6
4.72.62.52.54.8
3.73.43.66.14.6
4.85.74.64.74.1
3.62.82.72.62.5
4.04.94.53.84.4
7.26.45.54.64.5
6.16.5
5.04.95.26.06.76.7
6.96.86.76.76.66.2
6.46.46.36.26.56.2
5.96.16.46.97.47.9
16-19years
13.4
11.310.511.515.714.0
14.015.713.715.914.7
12.910.510.710.110.0
13.715.114.212.313.5
18.317.315.013.513.9
16.217.9
14.213.613.315.017.417.7
17.918.016.217.717.615.8
17.518.011117.317.917.7
16.616.717.517.919.620.2
20yearsandover
4.4
3.33.03.25.54.1
4.25.14.03.93.4
2.92.22.12.01.9
3.24.03.63.03.5
6.25.44.73.73.6
5.35.6
4.24.14.45.25.85.7
5.95.95.95.75.75.4
5.55.45.35.25.65.3
5.05.25.55.96.46.9
Females
Total
3.85.7
5.34.23.33.15.5
4.34.24.36.25.3
5.36.55.55.85.5
5.04.34.64.34.2
5.46.35.95.36.1
8.67.97.36.25.9
6.56.9
6.06.26.06.36.76.6
6.86.96.56.76.66.6
6.86.76.66.87.06.7
6.86.46.97.17.47.4
16-19years
10.4
9.19.79.5
12.712.0
12.714.812.815.114.9
14.012.111.512.111.5
13.415.114.213.014.5
17.416.415.914.414.0
14.816.6
14.014.314.814.116.015.0
15.515.914.014.614.814.6
15.516.315.716.617.015.9
16.215.416.817.518.317.7
20yearsandover
5.1
3.93.73.85.64.7
4.65.74.74.84.6
4.03.33.83.43.4
4.45.34.94.35.1
7.56.86.25.25.0
5.65.9
5.15.25.05.55.65.7
5.85.95.75.85.75.8
5.95.75.75.75.95.7
5.85.55.96.16.36.4
Black and other
Total
5.98.9
9.05.35.44.59.9
8.78.37.9
12.610.7
10.212.410.910.89.6
8.17.37.46.76.4
8.29.9
10.09.09.9
13.813.113.111.911.3
13.114.2
11.911.811.912.713.613.4
14.013.513.813.913.813.6
12.813.213.613.213.714.2
13.814.714.815.215.215.7
Males
Total
5.89.6
9.44.95.24.8
10.3
8.87.98.3
13.711.5
10.712.810.910.58.9
7.46.36.15.65.3
7.39.18.97.79.2
13.612.712.311.010.4
13.214.1
11.411.711.412.413.413.8
14.314.215.014.013.713.5
12.812.912.812.913.614.3
13.714.814.515.015.616.3
16-19years
14.4
13.415.018.426.825.2
24.026.822.027.324.3
23.321.323.922.121.4
25.028.829.726.931.5
35.235.136.634.031.3
34.437.5
31.934.331.528.833.132.7
34.736.937.437.334.938.3
38.635.733.636.534.638.8
37.443.536.838.439.037.4
20yearsandover
99
8.47.47.6
12.710.5
9.611.710.09.27.7
6.04.94.33.93.7
5.67.36.95.86.9
11.610.610.08.78.5
11.312.1
9.69.79.6
11.011.612.1
12.412.312.911.811.711.3
10.411.011.010.811.712.3
11.812.412.813.113.714.6
Females
Total
6.17.9
8.46.15.74.19.2
8.58.97.3
10.89.4
9.411.911.011.210.7
9.28.79.18.37.8
9.310.911.410.610.8
13.913.613.913.012.3
13.114.3
12.411.912.413.013.913.0
13.712.712.513.713.813.8
12.813.514.413.613.814.0
13.914.715.015.514.915.0
16-19years
20.6
19.222.820.228.427.7
24.829.230.234.731.6
31.731.329.628.727.6
34.535.438.434.434.5
38.338.839.638.135.6
36.538.3
36.639.435.134.638.636.1
38.734.837.634.836.335.3
33.535.240.134.634.037.6
35.841.838.845.041.340.8
20yearsandover
8.4
7.77.86.49.58.3
8.310.69.69.49.0
7.56.67.16.35.8
6.98.78.88.28.5
11.511.311.710.610.2
11.112.4
10.29.4
10.411.211.811.1
11.510.910.412.112.112.1
11.111.812.411.912.212.2
12.212.713.213.012.813.1
1 Unemployment as percent of civilian labor force in group specified.Note.—Data for 1970-81 revised based on 1980 census of population.See footnote 3 and Note, Table B-29.Source: Department of Labor, Bureau of Labor Statistics.
271
Digitized for FRASER http://fraser.stlouisfed.org/ Federal Reserve Bank of St. Louis

TABLE B-34.—Unemployment by duration, 1947-81
[Monthly data seasonally adjusted1]
Year or month
194719481949
19501951195219531954
19551956195719581959
I9601961196219631964
19651966196719681969
19701971197219731974
19751976197719781979
19801981
1980Jan.FebMar.
MayJune.
JulyAugSeptOctNovDec
1981-Jan.FebMar.
tJune
JulyAugSept .oct : :: i..::.::::.:":::".NovDec
Totalunem-ploy-ment
Duration of unemployment
Less than5 weeks
5-14weeks
15-26weeks
27 weeksand over
Thousands of persons 16 years of age and over
2,3112,2763,637
3,2882,0551,8831,8343,532
2,8522,7502,8594,6023,740
3,8524,7143,9114,0703,786
3,3662,8752,9752,8172,832
4,0935,0164,8824,3655,156
7,9297,4066,9916,2026,137
7,6378,273
6,6606,6356,7147,3708,0598,024
8,3308,2398,0248,1098,0667,899
8,0227,9657,9587,8998,2488,004
7,8247,9788,2368,6699,1009,571
1,2101,3001,756
1,4501,1771,1351,1421,605
1,3351,4121,4081,7531,585
1,7191,8061,6631,7511,697
1,6281,5731,6341,5941,629
2,1392,2452,2422,2242,604
2,9402,8442,9192,8652,950
3,2953,449
3,2063,1213,0693,3733,7323,388
3,4573,4223,1753,2653,1763,148
3,2903,2673,2773,1893,3783,303
3,3233,3263,5293,7073,8524,037
704669
1,194
1,055574516482
1,116
815805891
1,3961,114
1,1761,3761,1341,2311,117
983779893810827
1,2901,5851,4721,3141,597
2,4842,1962,1321,9231,946
2,4702,539
2,0532,1812,2552,3992,6202,888
2,7482,6542,6542,5622,5552,247
2,3242,3792,4082,4722,6062,423
2,3122,4692,5852,6862,8823,016
234193428
425166148132495
366301321785469
503728534535491
404287271256242
428668601483574
1,3031,018913766706
1,0521,122
803841832972
1,0171,048
1,1181,2321,3381,2441,2111,249
1,1231,0721,0571,0481,0611,227
1,0961,0781,1461,1661,2291,189
164116256
3571378478317
336232239667571
454804585553482
351239177156133
235519566343381
1,2031,3481,028648535
8201,162
549511620695726778
876917958
1,0561,1301,152
1,2681,2501,2121,1391,1701,136
1,0741,1391,1021,1261,1351,183
Average(mean)durationin weeks
8.610.0
12.19.78.48.011.8
13.011.310.513.914.4
12.815.614.714.013.3
11.810.48.88.57.9
8.611.312.010.09.8
14.215.814.311.910.8
11.913.7
10.510.611.011.310.711.7
11.912.413.013.213.513.6
14.414.113.913.713.314.3
14.114.313.713.613.112.8
1 Because of independent seasonal adjustment of the various series, detail will not add to totals.Note.—Data for 1970-81 revised based on 1980 census of population.See footnote 3 and Note, Table B-29.Source: Department of Labor, Bureau of Labor Statistics.
272
Digitized for FRASER http://fraser.stlouisfed.org/ Federal Reserve Bank of St. Louis

TABLE B-35.—Unemployment by reason, 1967-81
[Monthly data seasonally adjusted1]
Year or month
196719681969
19701971197219731974
1975197619771978 .1979
1980 ...1981
1981:Jan . . . .Feb..Mar.
MayJune.
JulyAug.SeptOctNovDec
19671968 ....1969.
19701971197219731974
19751976197719781979
19801981
1981JanFebMar.
£June,
JulyAugSeptOctNovDec
Totalunem-ploy-ment
Job losers Job leavers Reentrants Newentrants
Thousands of persons 16 years of age and over
2,9752,8172,832
4,0935,0164,8824,3655,156
7,9297,4066,9916,2026,137
7,6378,273
8,0227,9657,9587,8998,2488,004
7,8247,9788,2368,6699,1009,571
1,2291,0701,017
1,8112,3232,1081,6942,242
4,3863,6793,1662,5852,635
3,9474,267
3,9824,0503,9893,9584,0324,173
3,8674,1064,4264,5734,9055,343
438431436
550590641683768
827903909874880
891923
923911901903
1,004896
926879921976916923
945909965
1,2281,4721,4561,3401,463
1,8921,9281,9631,8571,806
1,9272,102
2,0512,0202,0692,0442,1062,039
2,0782,0342,0582,1782,3392,244
396407413
504630677649681
823895953885817
872981
1,015943988988956973
940971977
1,002996
1,021
Percent of civilian labor force
3.83.63.5
4.95.95.64.95.6
8.57.77.16.15.8
7.17.6
7.47.47.37.37.57.4
7.27.37.68.08.38.8
1.61.31.2
2.22.82.41.92.4
4.73.83.22.52.5
3.73.9
3.73.73.73.63.73.8
3.63.84.14.24.54.9
0.6.5.5
.7
.7
'.S.8
.9
.9
.9
.9
.8
.8
.8
.9
.8
.8
.8
.9
.8
.9
.8
.8
.9
.8
.8
1.21.21.2
1.51.71.71.51.6
2.02.02.01.81.7
1.81.9
1.91.91.91.91.91.9
1.91.91.92.02.12.1
0.5.5.5
.6
.7
.8
.7
.7
.9
.91.0.9.8
.8
.9
.9
.9
.9
.9
.9
.9
.9
.9
.9
.9
.9
.9
1 Because of independent seasonal adjustment of the various series, detail will not add to totals.Note.—Data for 1970-81 revised based on 1980 census of population.See footnote 3 and Note, Table B-29.Source: Department of Labor, Bureau of Labor Statistics.
273
Digitized for FRASER http://fraser.stlouisfed.org/ Federal Reserve Bank of St. Louis

TABLE B-36.—Unemployment insurance programs, selected data, 1946-81
Year or month
19461947194819491950195119521953195419551956195719581959196019611962196319641965196619671968196919701971197219731974197519761977197819791980 8.1980:
JanFeb.Mar
MayJune.JulyAugSeptOctNovDec
1981:JanFebMar
£June.JulyAug.SeptOctNovDec
All programs
Coveredemploy-ment1
Insuredunemploy-ment
(weeklyaver-
age) « »
Thousands
31,85633,87634,64633,09834,30836,33437,00638,07236,62240,01842,75143,43644,41145,72846,33446,26647,77648,43449,63751,58054,73956,34257,97759,99959,52659,37566,45869,89772,45171,03773,45976,41988,80492,06292,659
2,8041,7931,4462,4741,6051,0001,0691,0672,0511,3991,3231,5712,7731,8602,0712,9941,9467 1,9731,7531,4501,1291,2701,1871,1772,0702,6082,1921,7932,5584,9373,8463,3082,6452,5923,837
3,7403,7303,6523,6293,6803,7904,1403,9113,9613,6613,7264,085
4,6214,2643,9483,4533,1112,9493,0122,8742,6802,7533,220
Totalbenefits
paid(millions
ofdollars) 2 4
2,878.51,785.51,328.72,269.81,467.6
862.91,043.51,050.62,291.61,560.21,540.61,913.04,290.62,854.33,022.84,358.13,145.13,025.92,749.22,360.41,890.92,221.52,191.02,298.64,209.36,154.05,491.14,517.36,933.9
16,802.412,344.810,998.99,006.99,401.3
17,252.5
1,368.21,307.01,323.81,378.31,338.31,592.61,579.51,441.81,503.01,432.01,516.61,618.1
1,762.91,565.91,662.61,420.71,192.81,191.31,190.71,081.01,088.21,063.91,130.5
State programs
Insuredunem-
ploymentInitialclaims
Exhaus-tions5
Weekly average; thousands
1,295997980
1,9731,513
9691,044
9901,8701,2651,2151,4462,5101,6841,9082,2901,7837 1,8061,6051,3281,0611,2051,1111,1011,8052,1501,8481,6322,2623,9862,9912,6552,3592,4343,350
**2,8012,7932,9283,2393,6233,8813,7373,6483,6753,5403,3513,167
3,0532,9202,9542,9492,9042,8972,7672,8442,9613,1593,4283,583
1891872003402362082152183042262272703692773313503027 298268232203226201200296295261247363478386375346388489
**419401466539624579511504488452430423
424415435405408407397435482522541567
3824203736161815342520235033314632302621151716162539352937816355393959
474852595759656258666570
7069666657565451474648
Insuredunemploy-ment aspercent
ofcoveredemploy-
ment
4.33.13.06.24.62.82.92.85.23.53.23.66.44.44.85.64.44.33.83.02.32.52.22.13.44.13.52.73.56.04.63.93.32.93.9**
3.33.33.43.84.24.54.34.24.34.13.93.6
3.53.43.43.43.33.33.23.33.43.63.941
Benefits paid
Total(millions
ofdollars)4
1,094.9775.1789.9
1,736.01,373.1
840.4998.2962.2
2,026.91,350.31,380.71,733.93,512.72,279.02,726.73,422.72,675.42,774.72,522.12,166.01,771.32,092.32,031.62,127.93,848.54,957.04,471.04,007.65,974.9
11,754.78,974.58,357.27,717.28,612.9
14,590.3
1,283.91,229.91,218.21,232.21,196.81,213.61,397.51,244.41,144.91,125.6
934.41,244.0
1,416.51,313.51,393.61,226.81,006.31,009.81,061.91,004.91,001.2
997.2
Averageweeklycheck
(dollars) «
18.5017.8319.0320.4820.7621.0922.7923.5824.9325.0427.C228.1730.5830.4132.8733.8034.5635.2735.9237.1939.7541.2543.4346.1750.3454.0256.7659.0064.2570.2375.1678.7983,6789.6798.92
96.4198.3999.1999.5299.5599.8898.7599.6899.8692.32
101.96101.43
102.34101.89105.63105.98105.49101.69103.47105.94107.39108.87110.44
"Monthly data are seasonally adjusted.1 Includes persons under the State, UCFE (Federal employee, effective January 1955), and RRB (Railroad Retirement Board)
programs. Beginning October 1958, also includes the UCX program (unemployment compensation for ex-servicemen).2 Includes State, UCFE, RR, UCX, UCV (unemployment compensation for veterans, October 1952-January 1960), and SRA(Servicemen's Readjustment Act, September 1944-September 1951) programs. Also includes Federal and State extended benefitprograms. Does not include FSB (Federal supplemental benefits) and SUA (special unemployment assistance) programs.3 Covered workers who have completed at least 1 week of unemployment.4 Annual data are net amounts and monthly data are gross amounts.5 Individuals receiving final payments in benefit year.6 For total unemployment only.
7 Programs include Puerto Rican sugarcane workers for initial claims and insured unemployment beginning July 1963.8 Latest data available for all programs combined. Workers covered by State programs account for about 97 percent of wage andsalary earners.
Source: Department of Labor, Employment and Training Administration.
274Digitized for FRASER http://fraser.stlouisfed.org/ Federal Reserve Bank of St. Louis
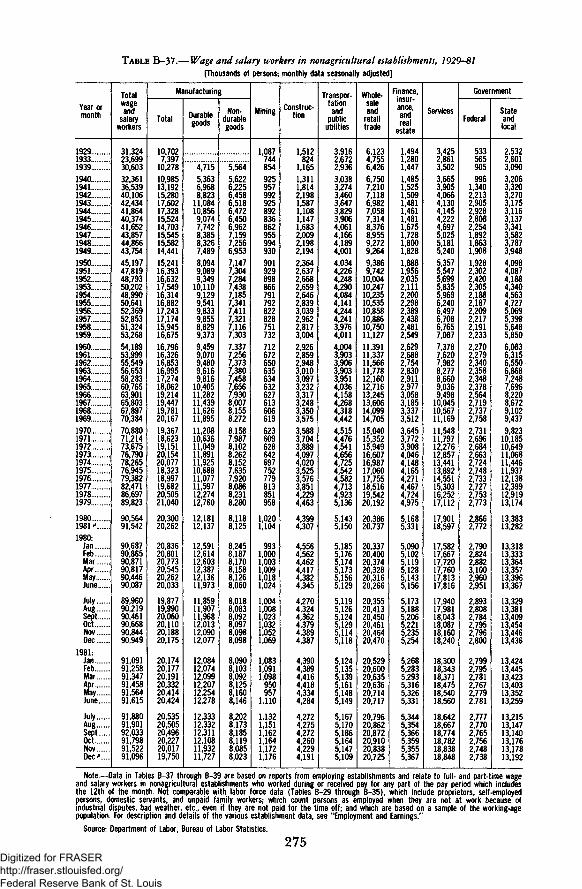
TABLE B-37.— Wage and salary workers in nonagricultural establishments, 1929-81[Thousands of persons; monthly data seasonally adjusted]
Year ormonth
1929193319391940194119421943194419451946194719481949195019511952195319541955195619571958195919601961196219631964196519661967196819691970197119721973197419751976197719781979
19801981 *1980:JanFebMarAprMayJune
JulyAug
11'.::::NovDec
1981:JanFebMarAprMayJune
JulyAugSeptOctNovDecp
Totalwageand
salaryworkers
31,3242369930,60332,36136,53940,10642,43441,86440,37441,65243,85744,86643,75445,19747,81948,79350,20248,99050,64152,36952,85351,32453,26854,18953,99955,54956,65358,28360,76563,90165,80367,89770,38470,88071,21473,67576,79078,26576,94579,38282,47186,69789,823
90,56491,542
90,68790,86590,87190,81790,44690,087
89,96090,21990,46190,66890,84490,949
91,09191,25891,34791,45891,56491,615
91,88091,90192,03391,79891,52291,096
Manufacturing
Total
10,7027,39710,27810,98513,19215,28017,60217,32815,52414,70315,54515,58214,44115,24116,39316,63217,54916,31416,88217,24317,17415,94516,67516,79616,32616,85316,99517,27418,06219,21419,44719,78120,16719,36718,62319,15120,15420,07718,32318,99719,68220,50521,040
20,30020,262
20,83620,80120,77320,54520,26220,033
19,87719,99020,06020,11020,18820,175
20,17420,17720,19120,33220,41420,424
20,53520,50520,49620,22720,01719,750
Durablegoods
4,7155,3636,9688,82311,08410,8569,0747,7428,3858,3267,4898,0949,0899,34910,1109,1299,5419,8339,8558,8299,3739,4599,0709,4809,6169,81610,40511,28211,43911,62611,89511,20810,63611,04911,89111,92510,68811,07711,59712,27412,760
12,18112,137
12,59112,61412,60312,38712,13611,973
11,85911,90711,96812,01312,09012,077
12,08412,07412,09912,20712,25412,278
12,33312,33212,31112,10811,93211,727
Non-durablegoods
5,5645,6226,2256,4586,5186,4726,4506,9627,1597,2566,9537,1477,3047,2847,4387,1857,3417,4117,3217,1167,3037,3377,2567,3737,3807,4587,6567,9308,0078,1558,2728,1587,9878,1028,2628,1527,6357,9208,0868,2318,280
8,1188,125
8,2458,1878,1708,1588,1268,060
8,0188,0838,0928,0978,0988,098
8,0908,1038,0928,1258,1608,146
8,2028,1738,1858,1198,0858,023
Mining
1,087744854925957992925892836862955994930901929898866791792822828751732712672650635634632627613606619623609628642697752779813851958
1,0201,104
9931,0001,0031,0091,0181,024
1,0041,0081,0231,0321,0521,069
1,0831,0911,098950957
1,110
1,1321,1511,1621,1641,1721,176
Construc-tion
1512824
1,1651,3111,8142,1981,5871,1081,1471,6832,0092,1982,1942,3642,6372,6682,6592,6462,8393,0392,9622,8173,0042,9262,8592,9483,0103,0973,2323,3173,2483,3503,5753,5883,7043,8894,0974,0203,5253,5763,8514,2294,463
4,3994,307
4,5564,5624,4624,4174,3824,345
4,2704,3244,3624,3794,3894,387
4,3904,3894,4164,4184,3344,284
4,2724,2754,2724,2604,2294,191
Transpor-tationand
publicutilities
391626722,9363,0383,2743,4603,6473,8293,9064,0614,1664,1894,0014,0344,2264,2484,2904,0844,1414,2444,2413,9764,0114,0043,9033,9063,9033,9514,0364,1584,2684,3184,4424,5154,4764,5414,6564,7254,5424,5824,7134,9235,136
5,1435,150
5,1855,1765,1745,1735,1565,129
5,1195,1265,1245,1295,1145,118
5,1245,1355,1395,1615,1485,149
5,1675,1705,1865,1645,1475,109
Whole-saleandretailtrade
6,1234,7556,4266,7507,2107,1186,9827,0587,3148,3768,9559,2729,2649,3869,74210,00410,24710,23510,53510,85810,88610,75011,12711,39111,33711,56611,77812,16012,71613,24513,60614,09914,70515,04015,35215,94916,60716,98717,06017,75518,51619,54220,192
20,38620,737
20,33720,40020,37420,32820,31620,266
20,35520,41320,45020,46120,46420,470
20,52920,60020,63520,63620,71420,717
20,79620,86220,87220,91020,83820,725
Finance,insur-ance,andreal
estate
149412801,4471,4851,5251,5091,4811,4611,4811,6751,7281,8001,8281,8881,9562,0352,1112,2002,2982,3892,4382,4812,5492,6292,6882,7542,8302,9112,9773,0583,1853,3373,5123,6453,7723,9084,0464,1484,1654,2714,4674,7244,975
5,1685,331
5,0905,1025,1195,1285,1435,156
5,1735,1885,2065,2215,2355,254
5,2685,2835,2935,3165,3265,331
5,3445,3545,3665,3595,3555,367
Services
3,42528613,5023,6653,9054,0664,1304,1454,2224,6975,0255,1815,2405,3575,5475,6995,8355,9696,2406,4976,7086,7657,0877,3787,6207,9828,2778,6609,0369,49810,04510,56711,16911,54811,79712,27612,85713,44113,89214,55115,30316,25217,112
17,90118,597
17,58217,66717,72017,76017,81317,816
17,94017,98118,04318,08718,16018,240
18,30018,34318,37118,47518,54018,560
18,64218,66718,77418,78218,83818,848
Government
Federal
533565905996
1,3402,2132,9052,9282,8082,2541,8921,8631,9081,9282,3022,4202,3052,1882,1872,2092,2172,1912,2332,2702,2792,3402,3582,3482,3782,5642,7192,7372,7582,7312,6962,6842,6632,7242,7482,7332,7272,7532,773
2,8662,772
2,7902,8242,8823,1002,9602,951
2,8932,8082,7842,7952,7962,800
2,7992,7952,7812,7672,7792,781
2,7772,7702,7652,7562,7482,738
Stateandlocal
2,5322,6013,0903,2063,3203,2703,1753,1163,1373,3413,5823,7873,9484,0984,0874,1884,3404,5634,7275,0695,3995,6485,8506,0836,3156,5506,8687,2487,6968,2208,6729,1029,4379,82310,18510,64911,06811,44611,93712,13812,39912,91913,174
13,38313,282
13,31813,33313,36413,35713,39613,367
13,32913,38113,40913,45413,44613,436
13,42413,44513,42313,40313,35213,259
13,21513,14713,14013,17613,17813,192
Note.—Data in Tables B-37 through B-39 are based on reports from employing establishments and relate to full- and part-time wageand salary workers in nonagricultural establishments who worked during or received pay for any part of the pay period which includesthe 12th of the month. Not comparable with labor force data (Tables B-29 through B-35), which include proprietors, self-employedpersons, domestic servants, and unpaid family workers; which count persons as employed when they are not at work because ofindustrial disputes, bad weather, etc., even if they are not paid for the time off; and which are based on a sample of the working-agepopulation. For description and details of the various establishment data, see "Employment and Earnings."
Source: Department of Labor, Bureau of Labor Statistics.
275Digitized for FRASER http://fraser.stlouisfed.org/ Federal Reserve Bank of St. Louis

TABLE B-38.—Average weekly hours and hourly earnings in selected private nonagricultural industries,
1947-81
[For production or nonsupervisory workers; monthly data seasonally adjusted]
Year ormonth
194719481949
19501951195219531954
19551956195719581959
19601961196219631964
19651966196719681969
19701971197219731974
19751976197719781979.
19801981p ...
1980:JanFebMarAprMayJune
JulyAugSeptOctNovDec
1981:JanFebMar
fc=June
JulyAugSeptOctNov :.Dec"
Average weekly hours
Totalprivate
non-agricul-tura l*
40.340.039.4
39.839.939.939.639.1
39.639.338.838.539.0
38.638.638.738.838.7
38.838.638.037.837.7
37.136.937.036.936.5
36.136.136.035.835.7
35.335.2
35.435.435.335.335.235.2
35.135.235.335.335.335.3
35.335.235.335.435.335.2
35.335.234.935.035.034.9
Manufac-turing
40.440.039.1
40.540.640.740.539.6
40.740.439.839.240.3
39.739.840.440.540.7
41.241.440.640.740.6
39.839.940.540.740.0
39.540.140.340.440.2
39.739.8
40.140.039.739.839.539.3
39.239.539.639.739.839.9
40.139.839.940.240.340.1
40.040.039.339.539.339.0
Con-struction
38.238.137.7
37.438.138.937.937.2
37.137.537.036.837.0
36.736.937.037.337.2
37.437.637.737.337.9
37.337.236.536.836.6
36.436.836.536.837.0
37.036.8
37.237.136.436.936.837.0
36.836.637.337.137.237.1
38.336.437.437.136.836.3
36.936.635.036.537.437.0
Whole-saleand
retailtrade
40.540.440.5
40.540.540.039.539.5
39.439.138.738.638.8
38.638.338.238.137.9
37.737.136.636.135.7
35.335.134.934.634.2
33.933.733.332.932.6
32.232.1
32.532.432.332.132.132.0
32.032.132.132.132.232.1
32.232.232.232.332.132.1
32.232.132.131.932.031.9
Average gross hourly earnings,current dollars
Totalprivate
non-agricul-tural »
$1.1311.2251.275
1.3351.451.521.611.65
1.711.801.891.952.02
2.092.142.222.282.36
2.462.562.682.853.04
3.233.453.703.944.24
4.534.865.255.696.16
6.667.25
6.396.446.516.546.576.64
6.666.726.766.836.906.94
6.997.047.097.147.187.23
7.267.347.377.397.457.44
Manufac-turing
$1.2161.3271.376
1.4391.561.641.741.78
1.851.952.042.102.19
2.262.322.392.452.53
2.612.712.823.013.19
3.353.573.824.094.42
4.835.225.686.176.70
7.277.98
6.946.997.077.117.167.22
7.297.367.417.497.597.63
7.697.747.807.907.957.99
8.028.088.148.148.188.18
Con-struction
$1.5401.7121.792
1.8632.022.132.282.38
2.452.572.712.822.93
3.073.203.313.413.55
3.703.894.114.414.79
5.245.696.066.416.81
7.317.718.108.669.27
9.9210.75
9.449.639.719.769.809.87
9.9310.0210.0510.1510.2110.30
10.3910.4410.4910.5210.5710.69
10.7710.8510.8810.9911.0911.16
Whole-saleand
retailtrade
$0.9401.0101.060
1.1001.181.231.301.35
1.401.471.541.601.66
1.711.761.831.891.97
2.042.142.252.412.56
2.722.883.053.233.48
3.733.974.284.675.06
5.485.92
5.285.305.375.395.425.46
5.505.545.575.615.665.69
5.725.785.815.845.895.91
5.935.996.056.026.056.07
Adjusted hourly earnings, totalprivate nonagricultural2
Index,1977 = 100
Currentdollars
21.623.424.5
25.427.328.730.331.3
32.434.035.737.238.5
39.841.042.443.644.8
46.448.450.853.957.5
61.365.769.874.180.0
86.792.9
100.0108.1116.8
127.3
121.7122.8124.1124.7125.8127.0
127.6128.7129.4130.6132.1132.6
133.8135.0135.8136.7137.7138.4
139.0140.7141.5141.9143.2143.3
1977dollars3
58.558.962.3
64.063.665.568.770.5
73.375.976.978.080.0
81.483.085.086.387.5
89.090.392.294.095.0
95.798.3
101.2101.1
98.3
97.699.0
100.0100.5
97.4
93.5
94.393.993.793.393.493.4
93.893.993.393.293.392.7
92.892.792.893.093.192.9
92.292.792.192.092.492.1
Percent changefrom a year
earlier4
Currentdollars
8.34.7
3.77.55.15.63.3
3.54.95.04.23.5
3.43.03.42.82.8
3.64.35.06.16.7
6.67.26.26.28.0
8.47.27.68.18.0
9.0
7.98.28.88.59.09.4
9.29.38.99.79.99.3
10.09.99.59.69.59.0
8.99.39.38.68.48.1
1977dollars
0.75.8
2.7-.63.04.92.6
4.03.51.31.42.6
1.82.02.41.51.4
1.71.52.12.01.1
.72.73.0-.1
-2.8
-.71.41.0.5
-3.1
-4.0
-5.3-5.3-5.1-5.3-4.6-4.3
-3.4-3.0-3.2-2.6-2.5-2.8
-1.6-1.3-.9
-'.5
-1.7-1.3-1.3-1.3-.8-.6
1 Also includes other private industry groups shown in Table B-37.2 Adjusted for overtime (in manufacturing only) and for interindustry employment shifts.3 Current-dollar earnings index divided by the consumer price index for urban wage earners and clerical workers on a 1977=base.
4 Monthly data are computed from indexes to two decimal places and are based on data not seasonally adjusted.Note.—See Note, Table B-37.Source: Department of Labor, Bureau of Labor Statistics.
276
100
Digitized for FRASER http://fraser.stlouisfed.org/ Federal Reserve Bank of St. Louis

TABLE B-39.—Average weekly earnings in selected private nonagricultural industries, 1947-81
[For production or nonsupervisory workers; monthly data seasonally adjusted]
Year or month
1947.,19481949
19501951195219531954
19551956195719581959
19601961196219631964
19651966196719681969
19701971197219731974
19751976197719781979
19801981"
1980Jan.Feb.Mar.Apr.MayJune.
July.Aug.SeptOctNovDec
1981:JanFeb.MarAprMayJune.
JulyAugSeptOctNovDecp
Average gross weekly earnings
Total privatenonagricultural 1
Currentdollars
$45.5849.0050.24
53.1357.8660.6563.7664.52
67.7270.7473.3375.0878.78
80.6782.6085.9188.4691.33
95.4598.82101.84107.73114.61
119.83127.31136.90145.39154.76
163.53175.45189.00203.70219.91
235.10255.20
226.21227.98229.80230.86231.26233.73
233.77236.54238.63241.10243.57244.98
246.75247.81250.28252.76253.45254.50
256.28258.37257.21258.65260.75259.66
1977dollars2
123.52123.43127.84
133.83134.87138.47144.58145.32
153.21157.90158.04157.40163.78
164.97167.21172.16175.17178.38
183.21184.37184.83187.68189.44
186.94190.58198.41198.35190.12
184.16186.85189.00189.31183.41
172.74170.13
175.36174.43173.56172.80171.69171.99
171.89172.53172.05172.09171.89171.19
171.12170.20170.96172.06171.37170.92
170.06170.20167.45167.74168.23166.98
Manufac-turing(currentdollars)
$49.1353.0853.80
58.2863.3466.7570.4770.49
75.3078.7881.1982.3288.26
89.7292.3496.5699.23102.97
107.53112.19114.49122.51129.51
133.33142.44154.71166.46176.80
190.79209.32228.90249.27269.34
288.62317.60
278.29279.60280.68282.98282.82283.75
285.77290.72293.44297.35302.08304.44
308.37308.05311.22317.58320.39320.40
320.80323.20319.90321.53321.47319.02
Construc-tion
(currentdollars)
$58.8365.2367.56
69.6876.9682.8686.4188.54
90.9096.38100.27103.78108.41
112.67118.08122.47127.19132.06
138.38146.26154.95164.49181.54
195.45211.67221.19235.89249.25
266.08283.73295.65318.69342.99
367.04395.60
351.17357.27353.44360.14360.64365.19
365.42366.73374.87376.57379.81382.13
397.94380.02392.33390.29388.98388.05
397.41397.11380.80401.14414.77412.92
Wholesaleand retailtrade
(currentdollars)
$38.0740.8042.93
44.5547.7949.2051.3553.33
55.1657.4859.6061.7664.41
66.0167.4169.9172.0174.66
76.9179.3982.3587.0091.39
96.02101.09106.45111.76119.02
126.45133.79142.52153.64164.96
176.46190.03
171.60171.72173.45173.02173.98174.72
176.00177.83178.80180.08182.25182.65
184.18186.12187.08188.63189.07189.71
190.95192.28194.21192.04193.60193.63
Percent change froma year earlier, total
privatenonagricultural 3
Currentdollars
7.52.5
5.88.94.85.11.2
5.04.53.72.44.9
2.42.44.03.03.2
4.53.53.15.86.4
4.66.27.56.26.4
5.77.37.77.88.0
6.98.6
6.96.66.58.36.46.4
5.76.46.37.38.27.9
9.59.19.29.59.99.2
10.09.88.17.76.76.0
1977dollars
-0.13.6
4.7.82.74.4.5
5.43.1.1
-.44.1
.71.43.01.71.8
2.7.6.21.5.9
-1.31.94.1-.0-4.1
-3.11.51.2.2
-3.1
-5.8-1.5
-6.1-6.7-7.1-5.5-6.9-6.9
-6.4-5.6-5.6-4.7-3.9-4.1
-2.0-2.1-1.2-.4
.1-.3
-.7-.9-2.5-2.1-2.0-2.5
1 Also includes other private industry groups shown in Table B-37.2 Earnings in current dollars divided by the consumer price index for urban wage earners and clerical workers on a 1977=100 base.3 Based on unadjusted data.Note.—See Note, Table B-37.Source: Department of Labor, Bureau of Labor Statistics.
277Digitized for FRASER http://fraser.stlouisfed.org/ Federal Reserve Bank of St. Louis

TABLE B-40.—Productivity and related data, private business sector, 1947-81
[1977=100]
Year
1947.1948.1949
1950.1951.19521953.1954.
1955,1956,19571958,1959
1960,1961.1962.1963.1964,
1965,1966,1967.1968.1969,
1970.1971.1972.1973.1974.
1975.1976.1977.1978.1979. .
1980.198F..
1979:1.I I .I I I .IV,
1980:1I I .I l lIV
1981:1.III I IIV
Output 1
Privatebusinesssector
35.137.236.5
39.942.243.645.444.6
48.249.449.949.152.7
53.654.557.560.063.6
67.971.673.276.979.2
78.580.986.292.090.2
88.594.1
100.0104.7107.7
106.8108.9
107.7107.1107.7108.2
108.7105.4105.7107.5
109.5109.5109.4107.3
Nonfarmbusinesssector
34.036.135.4
38.741.242.644.443.5
47.148.449.048.051.9
52.653.656.759.262.9
67.371.372.876.778.9
78.180.485.991.990.1
88.194.0
100.0104.9107.7
106.8108.7
107.9107.1107.8108.2
108.5105.1105.8107.7
109.7109.4109.0106.7
Hours of allpersons 2
Privatebusiness
sector
80.480.978.3
79.281.581.682.479.7
82.784.082.779.082.1
82.381.082.382.884.2
86.888.988.890.392.7
91.290.793.497.097.4
93.496.1
100.0104.9108.2
107.5108.5
108.1107.4108.4109.1
109.2106.4106.3108.4
109.2108.2108.4108.4
Nonfarmbusinesssector
68.369.466.8
68.872.072.874.672.1
75.177.076.673.476.6
77.176.378.078.980.7
83.786.586.788.591.3
90.089.792.596.496.8
92.795.9
100.0105.1108.7
108.1109.1
108.4108.0109.0109.4
109.7107.0106.9108.8
109.7109.0109.1108.8
Output per hourof all persons
Privatebusiness
sector
43.646.046.7
50.351.753.455.156.0
58.258.860.362.264.2
65.167.269.872.475.5
78.280.682.485.285.4
86.189.292.494.892.7
94.897.9
100.099.899.5
99.3100.4
99.799.799.499.1
99.599.199.499.1
100.3101.2100.999.0
Nonfarmbusinesssector
49.851.953.0
56.257.258.559.560.3
62.762.863.965.567.6
68.270.272.775.078.0
80.482.483.986.786.4
86.789.693.095.393.1
95.098.1
100.099.899.1
98.899.7
99.599.198.998.8
98.998.299.099.0
100.0100.499.998.0
Compensation perhour3
Privatebusinesssector
17.018.418.7
20.022.023.424.925.7
26.328.129.931.232.5
33.935.236.838.140.1
41.744.647.050.654.2
58.262.066.071.378.0
85.592.9
100.0108.4119.3
131.5144.6
115.0118.1120.7123.2
126.4130.1133.1135.9
139.8143.3146.5148.5
Nonfarmbusinesssector
18.520.020.6
21.823.725.026.427.3
28.329.931.732.934.2
35.636.838.339.641.4
42.845.447.851.454.8
58.662.566.671.778.4
86.093.0
100.0108.5119.0
130.8143.9
114.9117.7120.2123.0
126.0129.4132.3135.4
139.2142.4145.7148.0
Unit labor cost
Privatebusinesssector
38.940.040.1
39.842.543.845.245.9
45.247.749.650.250.7
52.152.352.752.753.1
53.355.357.059.563.5
67.669.571.575.284.2
90.294.8
100.0108.6119.9
132.4144.1
115.4118.5121.4124.3
127.0131.3133.9137.1
139.4141.6145.2150.0
Nonfarmbusinesssector
37.138.638.9
38.841.542.844.545.2
45.147.749.550.250.5
52.352.452.652.853.1
53.255.157.059.363.4
67.669.771.775.284.3
90.594.8
100.0108.7120.0
132.4144.4
115.4118.7121.5124.4
127.4131.8133.6136.8
139.1141.9145.8151.0
Implicit pricedeflator4
Privatebusinesssector
38.240.840.4
41.044.144.645.045.4
46.147.649.349.950.9
51.751.952.753.353.8
54.856.558.060.363.3
66.269.171.575.382.4
90.494.7
100.0107.4116.9
127.6139.3
113.4115.8118.1120.2
123.0126.1129.1132.2
135.4137.5140.9143.5
Nonfarmbusinesssector
36.639.139.5
40.242.843.644.445.0
46.047.649.349.850.9
51.752.052.753.454.0
54.956.458.260.563.4
66.469.471.474.181.6
89.994.5
100.0107.0116.2
127.4139.6
112.6115.1117.4119.7
122.9126.3128.8131.9
135.3137.5141.2144.3
1 Output refers to gross domestic product originating in the sector in 1972 dollars.2 Hours of all persons engaged in the sector, including hours of proprietors and unpaid family workers. Estimates based primarily on
establishment data.3 Wages and salaries of employees plus employers' contributions for social insurance and private benefit plans. Also includes an
estimate of wages, salaries, and supplemental payments for the self-employed.4 Current dollar gross domestic product divided by constant dollar gross domestic product.Source: Department of Labor, Bureau of Labor Statistics.
278Digitized for FRASER http://fraser.stlouisfed.org/ Federal Reserve Bank of St. Louis

TABLE B-41.—Changes in productivity and related data, private business sector, 1948-81
[Percent change from preceding period]
Year
1948.1949
19501951.1952.1953.1954.
19551956.1957.1958.1959.
19601961.19621963.1964.
1965.19661967.1968.1969.
1970.1971.19721973.1974.
1975.19761977.19781979.
1980.1981'..
19791III I IIV
19801III I IIV
1981:1.I II I IIV
Output1
Privatebusinesssector
6.1-1.9
9.15.83.34.3
-1.8
7.92.61.0
-1.67.3
1.61.75.54.36.0
6.85.52.25.12.9
-.83.06.66.6
-1.9
-1.96.36.34.72.8
-.81.9
4.0-2.2
2.41.7
1.8-11.5
1 16.9
7.9-.1-.3
-7.5
Nonfarmbusinesssector
6.0-1.9
9.46.53.44.2
-2.0
8.22.81.2
-1.97.9
1.51.85.84.46.4
6.95.92.15.32.9
-1.02.96.96.9
-1.9
-2.26.76.44.92.7
gL8
4.1-3.0
2.61.5
1.4-12.1
297.1
7.9-1.1-1.4-8.4
Hours of allpersons 2
Privatebusinesssector
0.7-3.3
1.12.9
.11.0
-3.3
3.81.5
-1.5-4.5
3.9
.2-1.5
1.6.6
1.6
3.22.3.0
1.72.6
-1.7— 53!o3.9
.4
-4.12.94.04.93.1
-.6.9
4.8-2.3
3.62.8
.2-9.9_ 28.1
3.0-3.6
.8-.2
Nonfarmbusinesssector
1.6-3.8
3.14.61.02.5
-3.4
4.12.5-.5
-4.24.4
.6-1.1
2.21.12.4
3.73.4.3
2.03.2
-1.4-.43.14.2
.4
-4.23.44.35.13.4
-.6.9
5.0-1.5
3.71.8
1.1-9.5_ 77.3
3.4-2.5
.4-.9
Output per hourof all persons
Privatebusinesssector
5.31.5
7.92.83.23.21.6
4.01.02.53.13.2
1.53.33.83.74.3
3.53.12.23.3
.2
.93.63.52.7
-2.3
2.33.32.1-.2-.3
-.21.0
-.8.1
-1.2-1.0
1.6-1.8
13-1.1
4.73.5
-1.1-7.2
Nonfarmbusinesssector
4.32.0
6.01.72.31.71.4
3.9.3
1.72.43.4
.82.93.63.23.9
3.12.51.93.3-.3
.33.33.72.5
-2.4
2.13.22.0
2-7
-.3.9
-.9-1.6-1.1-.2
.3-2.9
36-.2
4.41.4
-1.8-7.6
Compensation perhour3
Privatebusinesssector
8.51.6
7.19.86.46.43.2
2.56.56.54.44.3
4.23.84.63.75.2
3.97.05.37.87.0
7.46.66.58.09.4
9.68.67.78.4
10.1
10.210.0
11.611.38.98.6
10.812.3958.6
11.910.49.35.7
Nonfarmbusinesssector
8.62.9
5.88.85.55.63.2
3.66.05.73.84.0
4.33.24.03.54.5
3.46.05.57.56.5
7.06.66.77.69.4
9.68.17.68.59.7
9.910.1
10.910.48.69.7
10.311.3909.S
11.79.69.56.5
Unit labor cost
Privatebusinesssector
3.0.1
-.86.93.03.11.6
-1.45.53.91.31.0
2.7.5.7.0.8
.33.83.04.46.7
6.42.92.95.2
11.9
7.25.15.58.6
10.4
10.48.9
12.411.210.29.8
9.014.48 19.8
6.96.6
10.614.0
Nonfarmbusinesssector
4.1.9
-.26.93.13.91.7
-.35.73.91.4.6
3.5.3.4.2.6
.33.53.54.16.8
6.63.12.84.9
12.1
7.44.75.58.7
10.4
10.39.1
11.912.19.79.9
9.914.653
10.1
7.08.1
11.515.2
Implicit pricedeflator*
Privatebusinesssector
7.0-1.0
1.67.41.1.9
1.0
1.63.33.51.32.0
1.4.6
1.51.11.0
1.93.02.74.04.9
4.54.43.45.49.4
9.74.75.67.48.8
9.29.2
8.88.48.27.4
9.710.5989.9
10.06.2
10.47.5
Nonfarmbusinesssector
6.8.9
1.76.61.82.01.4
2.23.53.6.9
2.3
1.5.6
1.51.21.2
1.62.83.24.04.7
4.84.53.03.7
10.1
10.35.15.87.08.6
9.79.5
8.18.98.57.8
11.311.382
10.0
11.06.5
11.48.9
1 Output refers to gross domestic product originatini2 Hours of all persons engaged in the sector, includ
establishment data.3 Wages and salaries of employees plus employers' contributions for social insurance and private benefit plans. Also includes an
Iin the sector in 1972 dollars,g hours of proprietors and unpaid family workers. Estimates based primarily on
estimate of wages, salaries, and supplemental payments for the self-employed.4 Current dollar gross domestic product divided by constant dollar gross donby constant dollar gross domestic product.Note.—Percent changes are based on original data and therefore may differ slightly from percent changes based on indexes in Table
B-40.Source: Department of Labor, Bureau of Labor Statistics.
279
Digitized for FRASER http://fraser.stlouisfed.org/ Federal Reserve Bank of St. Louis

PRODUCTION AND BUSINESS ACTIVITY
TABLE B-42.—Industrial production indexes, major industry divisions, 1929-81
[1967=100; monthly data seasonally adjusted]
Year or month
1967 proportion
19291933.1939.
1940.1941.1942.1943.1944.1945.1946.1947.1948. .1949.
1950.1951.1952.1953.1954.1955.1956.1957.1958.1959.
1960.1961.1962.1963.1964.1965.1966.1967.1968.1969.
1970. .1971,1972.1973.1974.1975.1976.1977.1978.1979.1980.1981 1
1980:Jan.Feb..Mar.AprMay..June.July.Aug.SeptOctNov.Dec.
1981Jan.Feb.,Mar.
MayJune.
July.Aug.SeptOctNov "..Dec "..
Totalindustrialproduction
100.00
21613.721.7
25.031.636.344.047.440.735.039.441.138.8
44.948.750.654.851.958.561.161.957.964.8
66.266.772.276.581.789.897.8100.0106.3111.1
107.8109.6119.7129.8129.3117.8130.5138.2146.1152.5
147.0151.0
153.0152.8152.1148.2143.8141.4
140.3142.2144.4146.6149.2150.4
151.4151.8152.1151.9152.7152.9
153.9153.6151.6149.2146.4143.3
Total
87.95
22.814.021.525.432.437.847.050.942.635.339.440.938.7
45.048.650.655.251.558.260.561.257.064.2
65.465.671.575.881.089.797.9100.0106.4111.0
106.4108.2118.9129.8129.4116.3130.3138.4146.8153.6146.7150.4
153.5153.1152.0148.0143.5140.2
139.3141.2143.9146.5148.9150.4
151.1151.2151.6152.0152.8152.4
153.2153.2151.1148.2145.1141.7
Manufacturing
Dura-ble
51.98
22.59.117.7
23.531.439.954.259.945.231.637.739.335.7
43.548.951.958.751.859.261.161.653.961.9
62.961.868.673.178.389.098.9100.0106.5110.6
102.3102.4113.7127.1125.7109.3122.3130.0139.7146.4136.7140.5
144.8144.4143.5138.5133.3129.9
128.7129.9132.1135.7139.2140.3
141.0140.8142.1142.5143.5143.2
143.6143.4140.9137.9134.4131.0
Non-durable
35.97
23.219.926.1
27.533.334.637.138.638.539.741.342.742.0
46.748.349.251.251.657.260.161.161.667.7
69.371.575.880.085.290.996.7100.0106.2111.5
112.3116.6126.5133.8134.6126.4141.8150.5156.9164.0161.2164.8
166.0165.8164.3161.6158.1155.1
154.6157.6161.0162.1163.0165.0
165.6166.2165.3165.9166.4165.8
167.1167.3165.9163.2160.5157.2
Minmin-ing
6.36
43.130.642.1
46.849.751.352.556.255.154.261.364.457.1
63.870.069.471.269.977.982.082.175.378.7
80.380.883.186.489.993.298.2100.0104.2108.3
112.2109.8113.1114.7115.3112.8114.2118.2124.0125.5132.7142.4
133.2132.9133.1132.7132.7132.6
130.6129.6130.7132.1135.1138.6
140.4143.1143.2135.2135.4141.7
146.5146.0145.0145.7144.0143.8
lltrliUllll-
ties
5.69
7.46.710.7
11.813.314.916.517.517.818.620.122.423.9
27.231.033.736.539.343.948.251.553.959.3
63.467.072.077.083.688.795.5100.0108.4117.3
124.5130.5139.4145.4143.7146.0151.7156.5161.4166.0168.3169.0
163.4166.3171.1167.2165.2167.1
169.6172.6170.6167.7169.9167.9
167.6166.4167.8167.6170.7172.7
173.1171.9167.8168.4167.9167.0
1 Preliminary estimates by Council of Economic Advisers.Source: Board of Governors of the Federal Reserve System.
280
Digitized for FRASER http://fraser.stlouisfed.org/ Federal Reserve Bank of St. Louis

TABLE B-43.—Industrial production indexes, market groupings, 1947-81
[1967=100; monthly data seasonally adjusted]
Year or month
1967 proportion
1947.19481949
19501951195219531954
19551956195719581959
19601961196219631964
19651966196719681969
19701971197219731974
19751976197719781979
19801981 4 .
1980JanFebMar.AprMayJune.July .Aug.SeptOctNov.Dec.
1981JanFebMar.AprMayJune.
July.Aug.Sept.OctNov..Dec "..
Totalindustrial
production
100.00
39.441.138.8
44.948.750.654.851.9
58.561.161.957.964.8
66.266.772.276581.7
89.897.8
100.0106.3111.1
107.8109.6119.7129.8129.3
117.8130.5138.2146.1152.5
147.0151.0
153.0152.8152.1148.2143.8141.4
140.3142.2144.4146.6149.2150.4
151.4151.8152.1151.9152.7152.9
153.9153.6151.6149.2146.4143.3
Final products
Total
47.82
38.640.038.8
43.747.250.754.151.3
55.458.660.357.663.2
65.365.871.475.579.7
87.695.9
100.0106.2109.6
105.3106.3115.7124.4125.1
118.2127.6135.9142.2147.2
145.3149.5
147.2147.7147.5145.4142.9142.2142.4143.3144.1145.7147.4147.8
147.8148.2149.0149.9151.3151.4
152.1151.5150.0149.1147.5145.5
Consumer goods '
Total
27.68
42.443.743.4
49.649.150.253.252.9
59.061.262.662.168.1
70.772.277.181.385.9
92.697.3
100.0105.9109.8
109.0114.7124.4131.5128.9
124.0137.1145.3149.1150.8
145.4148.0
147.9148.2148.0145.2142.1141.8
142.1142.9144.5146.3148.1147.1
146.9147.8148.3148.9150.7150.3
150.7149.6147.8146.9145.0142.3
Auto-motive
products
2.83
45.347.447.0
59.152.347.159.555.4
73.660.663.550.563.3
72.566.180.187.791.9
113.3112.8100.0119.4118.1
98.8124.4141.4153.0132.8
125.8155.7175.6179.9167.7
132.8138.1
132.6143.2140.9126.9118.6121.3
127.5120.7131.2140.9146.1139.0
130.4133.9139.2142.9151.8153.1
147.6137.6139.1132.8122.4120.4
Homegoods
5.06
37.539.136.2
49.943.043.048.644.9
53.055.754.551.459.0
59.461.366.571.878.4
88.997.9
100.0106.4113.2
110.2115.6129.5142.5136.8
118.8134.1141.9147.7149.2
138.9142.0
148.8146.2146.2141.8134.5131.8
128.3132.6134.7137.8141.8142.6
145.6145.2146.1145.0144.8145.0
145.8145.3141.1138.2133.9126.7
Equipment2
Total
20.14
30.632.228.7
31.143.351.956.349.3
50.455.357.551.556.5
58.157.363.767.571.4
80.794.0
100.0106.5109.3
100.194.7
103.8114.5120.0
110.2114.6123.0132.8142.2
145.2151.6
146.1147.1146.8145.8144.0142.8
142.8143.7143.6144.8146.5148.8
149.1148.7150.0151.4152.1153.0
154.1154.0152.9152.2151.0149.9
Busi-ness
12.63
38.039.534.5
37.045.251.253.346.8
50.858.861.151.557.9
59.457.762.765.873.7
84.497.7
100.0105.5112.5
107.0104.1118.0134.2142.4
128.2135.4147.8160.3171.3
173.2180.8
175.2176.5176.2174.5171.8169.7
169.5171.1170.7171.9173.9177.1
177.7177.5179.3181.0182.0183.6
184.8184.4182.7180.5178.4176.3
Inter-mediateproducts
12.89
41.944.342.0
48.851.350.954.554.3
61.764.464.463.069.5
70.071.475.779.985.2
90.696.2
100.0106.3112.9
112.9116.7126.5137.2135.3
123.1137.2145.1154.1160.5
151.9154.6
160.9159.2158.5150.3145.5143.7
144.6148.9151.2152.4153.4155.4
157.5157.7157.1156.3156.1154.9
156.2156.8154.6151.4149.2147.0
Materials3
Total
39.29
39.541.237.6
45.049.850.556.151.8
61.362.862.856.565.2
66.166.272.176.782.9
92.4100.7100.0106.5112.5
109.2111.3122.3133.9132.4
115.5131.7138.6148.3156.4
147.6151.5
157.6156.9155.7150.9144.2139.8136.4138.8142.5145.9150.1152.2
153.8154.3154.4152.9153.4154.0
155.3155.2152.5148.5144.1139.5
Dura-ble
goods
20.35
38.339.435.3
44.450.551.660.352.0
63.763.963.853.764.0
64.863.370.475.181.9
93.8103.3100.0106.2112.1
103.8104.9117.7134.6132.7
109.1128.0136.1149.0157.8
143.0149.2
156.3155.2154.6147.9140.0134.2
129.0131.3133.9139.5146.1147.4
150.0150.6152.2151.8152.8152.4
153.6154.3150.4145.6140.4134.9
Non-durablegoods
10.47
45.9
52.554.954.754.462.1
63.265.871.375.682.2
90.397.5
100.0108.8115.7
115.4120.2132.9142.2142.6
126.6147.8155.6165.6175.9
171.5174.6
182.2180.8177.7173.3165.4159.5
157.1161.3171.3174.3175.1179.6
180.2179.9177.5179.3179.0176.9
176.5175.4175.5170.6164.4158.5
1 Also includes clothing and consumer staples, not shown separately.2 Also includes defense and space equipment, not shown separately.3 Also includes energy materials, not shown separately.4 Preliminary estimates by Council of Economic Advisers.
Source: Board of Governors of the Federal Reserve System.
281Digitized for FRASER http://fraser.stlouisfed.org/ Federal Reserve Bank of St. Louis

TABLE B-44.—Industrial production indexes, selected manufactures, 1947-81
[1967 = 100; monthly data seasonally adjusted]
Year or month
1967 proportion
194719481949
19501951195219531954
19551956195719581959
19601961196219631964
19651966196719681969
19701971197219731974
19751976197719781979
19801981 *.
1980Jan .FebMar .AprMayJune.
July .AugSeptOctNov.Dec
1981-Jan.FebMarAprMayJune.
Ju ly .AugSeptOctNov "..Dec "..
Durable manufactures
Primarymetals
Total
6.57
63.365855.4
69.775869.278.563.5
82.582.078.562.372.7
72.471.176.382.392.8
102.1108.4100.0104.3113.8
106.6100.2112.1126.7123.1
96.4109.7111.1119.9121.3
102.3107.9
117.7113.6115.2107.096.891.3
83.386.990.699.6
113.2111.5
114.1114.5114.9110.6111.9107.4
109.4113.1108.6102.096.389.9
Ironand
steel
4.21
70.1
93.291.588.266.576.5
77.774.277.384.395.9
105.2108.4100.0103.2112.6
104.796.1
107.1122.3119.8
95.8104.8103.8113.21132
92.4
108.9105.6108.197.885.176.4
68.776.080.492.0
107.6103.0
108.7108.4108.0103.4105.698.5
99.7105.199.291.886.8
Fabri-catedmetalprod-ucts
5.93
49.950845.8
56.159958.566.059.4
67.868.870.663.371.0
71.169.475.477.882.6
90.897.2
100.0105.6107.9
102.4103.5112.1124.7124.2
109.9123.9131.0141.6148.5
134.1136.2
144.8145.3144.8140.6132.2125.0
122.6124.8128.8131.7132.3135.7
135.8137.6139.2139.5138.4139.3
140.1140.0136.8133.7129.0125.1
Non-elec-trical
machin-ery
9.15
39.039233.4
37.547751.954.046.1
50.658.057.948.656.7
56.955.462.166.375.6
85.098.8
100.0101.8109.3
104.4100.2116.0133.7140.1
125.1134.5143.6153.6163.7
162.8171.0
167.1167.0166.5163.2162.1158.3
159.1159.6159.5160.9162.9166.9
167.3168.3169.2169.7172.1174.1
176.7176.4173.9170.2168.1164.3
Electri-ralCdl
machin-ery
8.05
22.223021.6
29.629834.039.034.7
39.943.142.839.247.6
51.654.862.964.768.4
81.797.9
100.0105.5111.9
108.1107.7122.2143.1143.8
116.5134.8145.4159.4175.0
172.8178.3
181.3179.5179.9177.4171.1166.2
165.8166.8167.4169.8173.0175.1
177.6174.9177.4178.8179.9180.1
180.9182.6180.0179.6175.7170.2
Transportationequipment
Total
9.27
31.834834.9
41.846654.268.059.2
68.066.070.755.863.2
65.461.571.178.080.0
95.1102.0100.0111.1108.4
89.597.9
108.2118.3108.7
97.4111.1122.2132.5135.4
116.9116.0
122.0126.0123.9116.0110.0110.0
110.3108.5113.3118.3121.8120.4
117.4116.1119.5121.3123.7123.4
119.8115.4114.2110.6105.4103.9
Motorvehicles
andparts
4.50
60.5
81.265.869.051.066.2
74.765.579.888.390.7
115.9113.9100.0120.3116.5
92.3118.6135.8148.8128.2
111.1142.0161.1169.9159.9
119.0122.2
127.0134.6130.1116.2106.7106.8
107.0104.1113.7123.2129.2125.7
120.0119.9127.1130.7136.4137.5
130.5123.1120.4113.8104.3100.9
LumberanddilU
prod-ucts
1.64
58.961354.1
65.765564.768.468.0
75.975.068.869.979.3
74.778.282.586.392.7
96.3100.0100.0105.5107.9
105.6113.8120.8126.0116.2
107.6123.2131.2136.3136.9
119.3
131.7130.9126.6104.4104.9110.2
113.8120.2121.6121.4123.7123.6
127.4126.2125.6126.3126.2122.5
122.9119.1113.2109.61062
Nondurable manufactures
Apparelprod-ucts
3.31
57.860359.7
64.363166.367.266.4
73.375.074.972.880.1
81.782.285.589.192.2
97.499.9
100.0102.9106.7
101.4104.7109.4117.3114.3
107.6125.7134.2134.2134.4
127.0
131.7130.7133.5130.0128.7126.1
123.6125.5123.5121.7125.7122.7
123.8121.6120.2121.6122.6121.1
122.6122.6122.5118.4
Printingand
publish-ing
4.72
43.345446.6
48.949749.752.054.1
59.563.265.463.968.2
71.071.373.977.882.6
87.994.6
100.0103.2107.4
107.0107.1112.7118.2118.2
113.3122.5127.6131.5136.9
139.61441
138.5139.9139.1136.7135.6135.3
139.2141.7140.9142.5142.1143.0
143.9144.8142.7141.6141.3143.1
144.4146.1145.9145.91435144.0
Chem-icalsand
prod-ucts
7.74
19.721321.0
26.229731.133.634.1
39.842.745.246.654.3
56.459.265.771.878.8
87.895.7
100.0109.5118.4
120.4125.9143.6154.5159.4
147.2170.9185.7197.4211.8
207.1
218.2217.3212.9208.7198.9191.5
190.8198.2208.2209.4211.7220.5
218.9219.8218.5219.8220.6218.4
221.5219.2216.3209.72037
Foods
8.75
55.855255.9
57.959060.261.462.7
66.370.171.172.976.5
78.680.983.486.490.4
92.496.0
100.0102.6106.1
108.9112.8116.8120.9124.0
123.4133.0138.8142.7147.5
149.6
149.9149.4148.6148.1148.6149.3
149.1148.7149.9151.1151.6151.0
151.9152.5152.4151.9152.2151.3
151.6151.9150.7151.61524
1 Preliminary estimates by Council of Economic Advisers.Source: Board of Governors of the Federal Reserve System.
282Digitized for FRASER http://fraser.stlouisfed.org/ Federal Reserve Bank of St. Louis
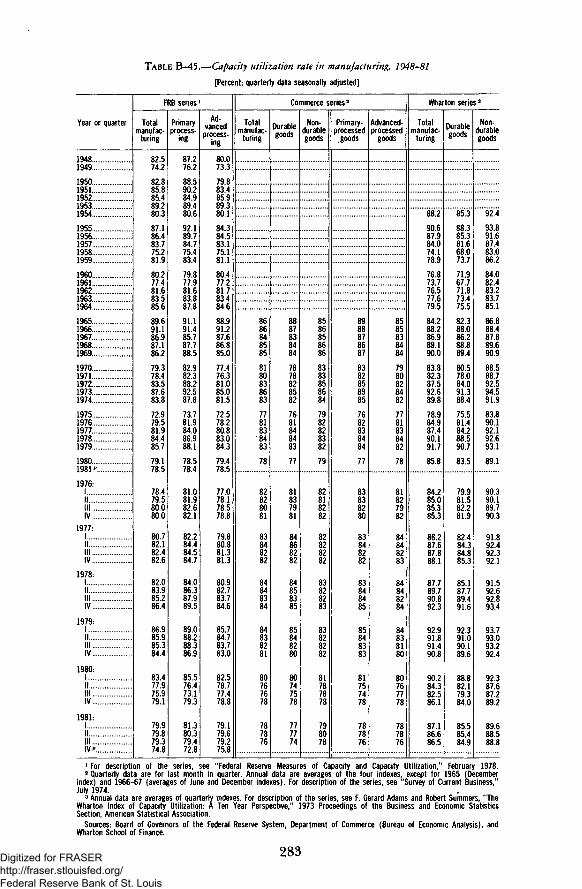
TABLE B-45.—Capacity utilization rate in manufacturing, 1948-81
[Percent; quarterly data seasonally adjusted]
Year or quarter
19481949..
19501951195219531954
19551956195719581959
19601961196219631964
19651966196719681969
19701971197219731974
19751976197719781979
19801981",
19761III I II V .
19771III I I .I V .
19781III I I .I V .
1979:1III I IIV.
19801ItI I I .IV.
19811III I IIV"
FRB series '
Totalmanufac-
turing
82.574.2
82.885.885.489.280.3
87.186.483.775.281.9
80.277.481.683.585.6
89.691.186.987.186.2
79.378.483.587.683.8
72.979.581.984.485.7
79.178.5
78.479.580.080.0
80.782.182.482.6
82.083.985.286.4
86.985.985.384.4
83.477.975.979.1
79.979.879.374.8
Primaryprocess-
ing
87.276.2
88.590.284.989.480.6
92.189.784.775.483.4
79.877.981.683.887.8
91.191.485.787.788.5
82.982.388.292.587.8
73.781.984.086.988.1
78.578.4
81.081.982.682.1
82.284.484.584.7
84.086.387.989.5
89.088.288.386.9
85.576.473.179.3
81.380.379.472.8
Ad-vanced
process-ing
80.073.3
79.883.485.989.380.1
84.384.583.175.181.1
80.477.281.783.484.6
88.991.287.686.885.0
77.476.381.085.081.5
72.578.280.883.084.3
79.478.5
77.078.178.578.8
79.880.881.381.3
80.982.783.784.6
85.784.783.783.0
82.578.777.478.8
79.179.679.275.8
Commerce series2
Totalmanufac-
turing
8686848585
8180838683
7781838483
78
82828081
83848282
84848384
84838281
80767678
787876
Durablegoods
8887838484
7878828582
7681848483
77
81837981
84868282
84858385
85848280
80747578
777774
Non-durablegoods
8586858686
8383858684
7982828382
79
82818282
82828282
83828283
83828282
81787878
798078
Primary-processed
.goods
8988878687
8382858985
7682838484
77
83838280
83848282
83848485
85848383
81757478
787876
Advanced-processed
goods
8585838484
7980828482
7781838482
78
81827982
84848283
84848284
84838180
80767778
787876
Wharton series 3
Totalmanufac-
turing
88.2
90.687.984.074.178.9
76.873.776.577.679.5
84.288.286.989.190.0
83.882.387.592.689.8
78.984.987.490.191.7
85.8
84.285.085.385.3
86.287.687.888.1
87.789.790.892.3
92.991.891.490.8
90.284.382.586.1
87.186.686.5
Durablegoods
85.3
88.385.381.668.073.7
71.967.771.873.475.5
82.388.086.288.889.4
80.578.084.091.388.4
75.581.484.288.590.7
83.5
79.981.582.281.9
82.484.384.885.3
85.187.789.491.6
92.391.090.189.6
88.882.179.384.0
85.585.484.9
Non-durablegoods
92.4
93.891.687.483.086.2
84.082.483.283.785.1
86.888.487.889.690.9
88.588.792.594.591.9
83.890.192.192.693.1
89.1
90.390.189.790.3
91.892.492.392.1
91.592.692.893.4
93.793.093.292.4
92.387.687.289.2
89.688.588.8
1 For description of the series, see "Federal Reserve Measures of Capacity and Capacity Utilization," February 1978.2 Quarterly data are for last month in quarter. Annual data are averages of the four indexes, except for 1965 (Decemberindex) and 1966-67 (averages of June and December indexes). For description of the series, see "Survey of Current Business,"July 1974.3 Annual data are averages of quarterly indexes. For description of the series, see F. Gerard Adams and Robert Summers, "TheWharton Index of Capacity Utilization: A Ten Year Perspective," 1973 Proceedings of the Business and Economic StatisticsSection, American Statistical Association.
Sources: Board of Governors of the Federal Reserve System, Department of Commerce (Bureau of Economic Analysis), andWharton School of Finance.
283Digitized for FRASER http://fraser.stlouisfed.org/ Federal Reserve Bank of St. Louis

TABLE B-46.—New construction activity, 1929-81
[Value put in place, billions of dollars; monthly data at seasonally adjusted annual rates]
Year or month
1929
1933
1939
19401941194219431944
19451946
New series
194719481949
19501951195219531954
19551956195719581959
19601961196219631964
19651966196719681969
19701971197219731974
19751976197719781979
19801981"
Totalnew
construc-tion
10.8
2.9
8.2
8.712.014.18.35.3
5.814.3
20.026.126.7
33.635.436.839.141.4
46.547.649.150.055.4
54.756.460.264.868.0
74.176.878.587.594.3
95.2110.3124.4138.4139.2
135.9151.1173.8205.6230.8
230.3236.3
Private construction
Total
8.3
1.2
4.4
5.16.23.42.02.2
3.412.1
16.721.420.5
26.726.226.027.929.7
34.834.935.134.639.3
38.939.342.345.547.7
52.052.852.959.966.3
67.180.494.2
105.9100.9
95.1112.0135.7159.7181.7
174.9182.8
Residentialbuildings '
Total2
3.6
.5
2.7
3.03.51.7.9.8
1.36.2
9.913.112.4
18.115.915.816.618.2
21.920.219.019.824.3
23.023.125.227.928.0
27.925.725.630.633.2
31.943.354.359.750.4
46.560.581.093.499.0
87.385.7
Newhousing
units
3.0
.3
2.3
2.63.01.4.7.6
.74.8
7.810.510.0
15.613.212.913.414.9
18.216.114.715.419.2
17.317.119.421.721.8
21719.419.024.025.9
24.335.144.950.140.6
34.447.365.775.878.6
63.161.9
Nonresidential buildings and otherconstruction 1
Total
4.7
.8
1.7
2.12.71.71.11.4
2.15.8
6.98.28.0
8.610.310.211.311.5
12.914.716.114.815.1
15.916.217.217.619.7
24.127.127.329.333.1
35.337.240.046.250.5
48.651.454.766.282.7
87.697.1
Commer-cial3
1.1
.1
.3
.3
.4
.2
.0
.1
.21.2
1.01.41.2
1.41.51.11.82.2
3.23.63.63.63.9
4.24.75.15.05.4
7.89.4
9.811.613.515.515.9
12.812.814.818.624.9
29.933.3
Indus-trial
0.9
.2
.3
.4
.8
.3
.2
.2
.61.7
1.71.41.0
1.12.12.32.22.0
2.43.13.62.42.1
2.92.82.82.93.6
6.06.8
6.55.44.76.27.9
8.07.27.7
11.015.0
13.816.8
Other4
2.6
.5
1.2
1.31.51.2.9
1.1
1.33.0
4.25.55.9
6.16.76.87.37.2
7.38.09.08.89.0
8.98.79.29.7
10.7
15.516.9
19.020.121.824.526.7
27.831.532.236.742.8
43.946.9
Public construction
Total
2.5
1.6
3.8
3.65.8
10.76.33.1
2.42.2
3.34.76.3
6.99.3
10.811.211.7
11.712.714.115.516.1
15.917.117.919.420.4
22 124.025527.628.0
28.129.930.232.538.3
40.939.138.245.949.1
55.453.5
Federal
0.2
.5
.8
1.23.89.35.62.5
1.7.9
.81.21.5
1.63.04.24.13.4
2.82.73.03.43.7
3.63.93.94.03.9
404.0353.43.3
3.34.04.44.95.3
6.37.07.38.48.9
10.010.7
State andlocal5
2.3
1.1
3.1
2.42.01.3.7.6
.71.4
2.53.54.8
5.26.36.67.18.3
8.910.011.112.112.3
12.213.314.015.416.5
18020022124.224.6
24.825.925.827.633.0
34.632.130.937.540.2
45.442.8
See next page for continuation of table.
284
Digitized for FRASER http://fraser.stlouisfed.org/ Federal Reserve Bank of St. Louis

TABLE B-46.—New construction activity, 1929-81—Continued
[Value put in place, billions of dollars; monthly data at seasonally adjusted annual rates]
Year or month
1980:JanFebMarAprMayJune
JulyAugSeptOctNovDec
1981:JanFeb.MarAprMay.June
JulyAug.Sept.OctNovDec "
Totalnew
construc-tion
257.5248.3240.8228.6221.6218.5
216.4217.9224.6228.9234.3245.4
259.0254.5250.3246.5235.9234.0
233.9229.8230.9229.9231.6229.3
Private construction
Total
196.9191.4183.0173.5167.0163.1
161.5163.5169.1174.9180.9187.9
193.9193.2189.6189.9184.1181.8
182.3180.6178.6178.2179.2177.3
Residentialbuildings1
Total2
103.599.293.985.378.875.0
75.679.384.589.895.698.9
100.799.796.395.289.786.0
82.980.578.578.278.178.9
Newhousing
units
79.073.768.762.356.853.3
53.156.360.764.268.170.4
74.275.173.072.967.764.3
60.558.155.952.851.050.4
Nonresidential buildings and otherconstruction l
Total
93.492.289.188.288.288.1
85.984.284.785.185.389.0
93.293.593.494.794.495.8
99.4100.0100.1100.0101.198.4
Commer-cial3
32.031.230.830.330.529.4
29.129.028.729.129.630.8
33.033.433.333.432.432.4
34.033.733.433.034.533.8
Indus-trial
15.615.713.914.014.214.8
13.312.812.912.412.914.3
15.315.115.415.515.516.2
17.218.318.318.618.417.2
Other4
45.945.344.443.843.643.9
43.642.343.143.642.843.9
44.945.044.745.846.547.2
48.248.048.448.448.247.4
Public construction
Total
60.657.057.855.154.655.4
54.954.455.554.053.457.6
65.261.360.656.651.852.2
51.649.352.251.652.452.0
Federal
9.99.5
10.610.09.99.7
10.99.7
10.29.59.7
10.6
11.411.410.310.910.510.7
10.89.5
10.711.210.410.8
State andlocal5
50.747.447.245.144.745.7
44.044.745.244.543.747.0
53.849.950.445.741.341.5
40.839.841.640.442.041.2
1 Beginning 1960, farm residential buildings included in residential buildings; prior to 1960, included in nonresidentialbuildings and other construction.
2 Total includes additions and alterations and nonhousekeeping units, not shown separately.3 Office buildings, warehouses, stores, restaurants, garages, etc.4 Religious, educational, hospital and institutional, miscellaneous nonresidential, farm (see also footnote 1), public utilities,
and all other private.5 Includes Federal grants-in-aid for State and local projects.Source: Department of Commerce, Bureau of the Census.
285358-691 0 - 82 - 19 : QL3Digitized for FRASER
http://fraser.stlouisfed.org/ Federal Reserve Bank of St. Louis
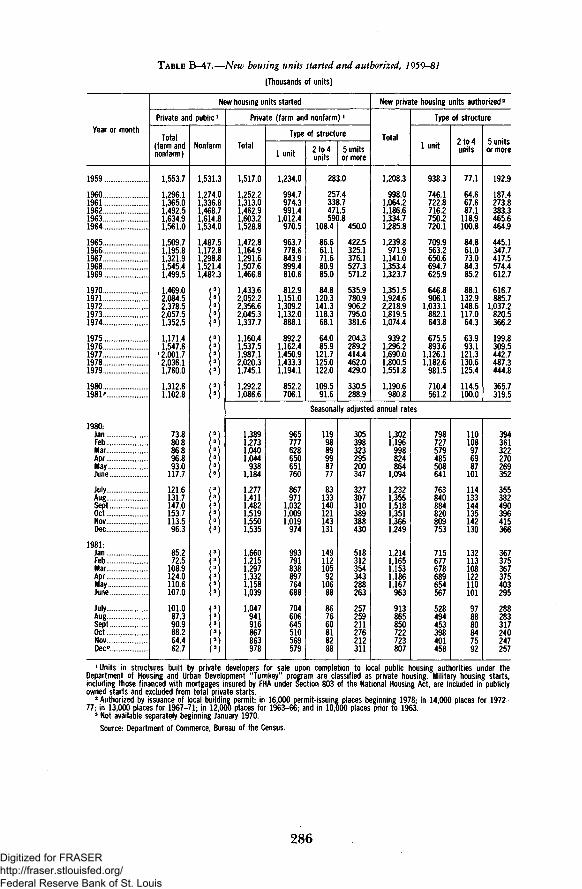
TABLE B-47.—New housing units started and authorized, 7959-87
[Thousands of units]
Year or month
1959 .
19601961196219631964
19651966196719681969 . .
19701971197219731974
19751976197719781979
19801981"
1980:JanFebMarAprMayJune
JulyAugSeptOctNovDec
1981:JanFebMarAprMayJune
JulyAugSeptOctNovDec"
New housing units started
Private and public1
Total(farm andnonfarm)
1,553.7
1,296.11,365.01,492.51,634.91,561.0
1,509.71,195.81,321.91,545.41,499.5
1,469.02,084.52,378.52,057.51,352.5
1,171.41,547.6
1 2,001.72,036.11,760.0
1,312.61,102.8
73.880.886.896.893.0
117.7
121.6131.7147.0153.7113.596.3
85.272.5
108.9124.0110.6107.0
101.087.390.988.264.462.7
Nonfarm
1,53
1,271,321,461,611,52
1,48Ul1,2S1,521,48
1.3
4.06.88.74.84.0
7.52.88.81.42.33
3
3
3
3
:*3
3
3
3
3
3
3
3
3
3
3
3
3
3
3
3
3
3)
3}
Private (farm and nonfarm) l
Total
1,517.0
1,252.21,313.01,462.91,603.21,528.8
1,472.81,164.91,291.61,507.61,466.8
1,433.62,052.22,356.62,045.31,337.7
1,160.41,537.51,987.12,020.31,745.1
1,292.21,086.6
Type of structure
1 unit
1,234.0
994.7974.3991.4
1,012.4970.5
963.7778.6843.9899.4810.6
812.91,151.01,309.21,132.0
888.1
892.21,162.41,450.91,433.31,194.1
852.2706.1
2to4units
28:
25-33!47]59(
108.4
86.661.171.680.985.0
84.8120.3141.3118.368.1
64.085.9
121.7125.0122.0
109.591.6
5 unitsor more
J.O
r.4*.7.5
).8450.0
422.5325.1376.1527.3571.2
535.9780.9906.2795.0381.6
204.3289.2414.4462.0429.0
330.5288.9
New private housing units authorized2
Total
1,208.3
998.01,064.21,186.61,334.71,285.8
1,239.8971.9
1,141.01,353.41,323.7
1,351.51,924.62,218.91,819.51,074.4
939.21,296.21,690.01,800.51,551.8
1,190.6980.8
Type of structure
1 unit
938.3
746.1722.8716.2750.2720.1
709.9563.2650.6694.7625.9
646.8906.1
1,033.1882.1643.8
675.5893.6
1,126.11,182.6
981.5
710.4561.2
2 to 4units
77.1
64.667.687.1
118.9100.8
84.861.073.084.385.2
88.1132.9148.6117.064.3
63.993.1
121.3130.6125.4
114.5100.0
5 unitsor more
192.9
187.4273.8383.3465.6464.9
445.1347.7417.5574.4612.7
616.7885.7
1,037.2820.5366.2
199.8309.5442.7487.3444.8
365.7319.5
Seasonally adjusted annual rates
1,3891,2731,0401,044
9381,184
1,2771,4111,4821,5191,5501,535
1,6601,2151,2971,3321,1581,039
1,047941916867863978
965111628650651760
867971
1,0321,0091,019
974
993791838897764688
704606645510569579
1199889998777
83133140121143131
14911210592
10688
867660818288
305398323295200347
327307310389388430
518312354343288263
257259211276212311
1,3021,196
998824864
1,094
1,2321,3551,5181,3511,3661,249
1,2141,1651,1531,1861,167
963
913865850722723807
798727579485508641
763840884820809753
715677678689654567
528494453398401458
110108976987
101
114133144135142130
132113108122110101
978880847592
394361322270269352
355382490396415366
367375367375403295
288283317240247257
1 Units in structures built by private developers for sale upon completion to local public housing authorities under theDepartment of Housing and Urban Development "Turnkey" program are classified as private housing. Military housing starts,including those financed with mortgages insured by FHA under Section 803 of the National Housing Act, are included in publiclyowned starts and excluded from total private starts.2 Authorized by issuance of local building permit: in 16,000 permit-issuing places beginning 1978; in 14,000 places for 1972-77; in 13,000 places for 1967-71; in 12,000 places for 1963-66; and in 10,000 places prior to 1963.3 Not available separately beginning January 1970.
Source: Department of Commerce, Bureau of the Census.
286Digitized for FRASER http://fraser.stlouisfed.org/ Federal Reserve Bank of St. Louis

TABLE B-48.—Nonfarm business expenditures for new plant and equipment, 1947-82
[Billions of dollars; quarterly data at seasonally adjusted annual rates]
Year orquarter
194719481949
19501951195219531954
19551956195719581959
19601961196219631964
19651966196719681969
19701971197219731974
19751976197719781979
19801981 3
1982 3
1980:1tlI I IIV
1981:1III l lIV3 ... .
1982:I3
II3
Total
21.8025.4623.54
25.3230.8331.5933.5833.13
36.5844.7648.1242.1744.78
48.6347.8251.2853.2561.66
70.4382.2283.4288.4599.52
105.61108.53120.25137.70156.98
157.71171.45198.08231.24270.46
295.63322.61346.42
291.89294.36296.23299.58
312.24316.73328.25332.06
345.4635483
Plant
8.4510.3510.20
10.9413.0813.1413.8214.09
15.9719.3420.9419.4119.89
20.9421.1222.1222.2324.96
27.2432.2132.2235.5140.54
44.2446.6049.3556.6664.29
65.2171.2080.3192.70
105.73
117.55
115.96116.50117.59120.27
128.57131.05136.40
Equip-ment
13.3515.1113.34
14.3717.7418.4519.7619.03
20.6025.4227.1922.7624.89
27.7026.7029.1631.0336.70
43.1950.0151.2052.9458.99
61.3661.9370.8981.0492.69
92.50100.25117.77138.54164.73
178.08
175.93177.86178.64179.32
183.67185.68191.85
Plant and equipment
Manufacturing
Total
8.739.257.32
7.7311.0712.1212.4312.00
12.5016.3317.5012.9813.76
16.3615.5316.0317.2721.23
25.4131.3732.2532.3436.27
36.9933.6035.4242.3753.21
54.9259.9569.2279.7298.68
115.81128.26139.34
111.77115.69116.40118.63
124.50125.49130.11132.22
136.47140.58
Dura-ble
goods
3.393.542.67
3.225.125.755.715.49
5.878.198.596.216.72
8.287.437.818.64
10.98
13.4917.2317.8317.9319.97
19.8016.7818.2222.7527.44
26.3328.4734.0440.4351.07
58.9162.9467.81
58.2859.3858.1959.77
61.2463.1062.5864.73
66.2668.34
Non-durablegoods
5.345.714.64
4.515.956.376.726.51
6.628.158.916.777.04
8.088.108.228.63
10.25
11.9214.1514.4214.4016.31
17.1916.8217.2019.6225.76
28.5931.4735.1839.2947.61
56.9065.3271.53
53.4956.3258.2158.86
63.2762.4067.5367.50
70.2172.24
Nonmanufacturing
Total
13.0716.2116.22
17.5919.7619.4721.1621.13
24.0828.4330.6229.1931.02
32.2832.2935.2535.9940.43
45.0250.8451.1856.1163.25
68.6274.9384.8295.33
103.78
102.79111.50128.87151.52171.77
179.81194.35207.08
180.13178.66179.83180.95
187.74191.24198.13199.84
208.98214.25
Min-ing
0.69.93.88
.841.111.211.251.29
1.311.641.691.431.35
1.291.261.411.261.33
1.361.421.381.441.77
2.022.672.883.314.62
6.107.449.24
10.2111.38
13.5116.8018.79
11.8912.8113.8615.28
16.2016.8017.5516.59
17.2317.81
Transpor-tation
2.212.662.30
2.383.052.992.972.42
2.603.073.352.343.17
3.192.823.263.364.46
5.466.436.346.797.04
6.955.936.727.418.23
8.688.899.40
10.6812.35
12.0912.0713.39
12.4712.0912.2311.70
11.7411.7011.6113.20
11.7913.89
Publicutili-ties
1.642.673.28
3.423.753.964.614.23
4.264.785.955.745.46
5.405.205.125.335.80
6.497.829.33
10.5211.70
13.0314.7016.2617.9719.83
19.9822.3726.7929.9533.96
35.4437.9439.86
36.2635.0335.5834.96
36.0537.8439.5538.09
40.1440.29
Tradeand
serv-ices1
6.136.927.13
8.378.838.058.949.59
11.4913.6413.6814.1115.40
16.1516.5318.2718.5720.38
22.1324.6923.0225.3128.31
29.7734.2040.0045.5347.79
46.2349.3056.5468.6679.26
81.7986.2791.16
82.1781.0781.1982.91
83.4385.8887.5588.27
95.1296.29
Com-munication
andother2
2.403.042.63
2.583.033.253.383.60
4.425.305.965.585.63
6.256.487.197.478.46
9.5810.4911.1112.0614.43
16.8517.4318.9621.1223.30
21.8023.5126.9032.0234.83
36.9941.2743.88
37.3437.6636.9736.11
40.3239.0241.8943.69
44.7145.97
'Wholesale and retail trade; finance, insurance, and real estate; and personal, business, and professional services.2 "Other" consists of construction; social services and membership organizations; and forestry, fisheries, and agriculturalservices.
3 Planned capital expenditures reported by business in late October-December 1981, corrected for biases.Source.- Department of Commerce, Bureau of Economic Analysis.
287
Digitized for FRASER http://fraser.stlouisfed.org/ Federal Reserve Bank of St. Louis

TABLE B-49.—Sales and inventories in manufacturing and trade 1947-81
[Amounts in millions of dollars-, monthly data seasonally adjusted]
Year or month
19471948..1949
19501951195219531954
19551956195719581959
19601961196219631964
196519661967 v19681969
19701971197219731974
19751976197719781979
19801981"
1980:Jan.FebMar.AprMayJune.
July.Aug.SeptOctNovDec
1981Jan.Feb.Mar.
MayJune
JulyAugSeptOctNovDec"
Total manufacturing andtrade
Sales '
35,26033,788
38,59643,35644,84047,98746,443
51,69454,06355,87954,20159,729
60,82761,15965,66268,99573,682
80,28387,18790,34898,104105,003
107,448116,017130,030153,412177,625
182,230204,277229,623258,724294,733
320,540
318,101317,901312,469305,440302,071305,326
315,633317,906327,758335,873339,049343,752
349,018350,334349,898350,923349,245354,442
354,759352 783353,717345,287344,683
Inven-tories2
52,50749,497
59,82270,24272,37776,12273,175
79,51687,30489,05287,09392,129
94,71395,594101,063105,480111,503
120,907136,790145,340156,167169,833
178,321188,544203,103233,237285,807
288,375318,544350,678395,252444,224
475,202
448,535452,803455,920461,445462,979464,187
466,828468,943471,500473,617474,884475,202
478,451484,069485,467487,060490,254494,226
498,098502 458508,132511,682515,138
Ratio3
1.421.53
1.361.551.581.581.60
1.471.551.591.601.50
1.561.541.501.491.47
1.451.471.561.541.55
1.621.581.501.411.45
1.571.481.461.441.43
1.45
1.411.421.461.511.531.52
1.481.481.441.411.401.38
1.371.381.391.391.401.39
1.401421441.481.49
Manufacturing
Sales'
1551317,31616,126
18,63421,71422,52924,84323,355
26,48027,74028,73627,24730,286
30,87930,92333,35735,05837,331
40,99544,87046,48750,22853,501
52,80555,90663,02372,93784,794
86,59598,802113,201126,953143,941
153,828166,515
154,409155,396152,250147,791145,625145,768
150,332151,188156,915161,038162,384163,719
164,588165,508165,804167,491167,527171,494
170,324169 518168 581164,085161,979161,629
Inven-tories2
25,89728,54326,321
31,07839,30641,13643,94841,612
45,06950,64251,87150,24152,945
53,78054,88558,18660,04663,409
68,18577,95284,66490,61898,202
101,651102,658108,238124,628157,792
159,934175,193189,157210,079241,572
257,979277,172
245,669248,198251,485255,047256,129256,421
257,207256,740256,837256,218257,042257,979
261,752264,496266,524267,506269,260269,709
271,872273 361276*616278,440279,544277,172
Ratio3
1581.571.75
1.481.661.781.761.81
1.621.731.801.841.70
1.751.741.701.691.64
1.601.621.761.741.77
1.901.831.671.581.65
1.841.691.611.571.57
1.651.62
1.591.601.651.731.761.76
1.711.701.641.591.581.58
1.591.601.611.601.611.57
1.60161l'641.701.731.71
Merchant wholesalers
Sales'
6,8086,514
7,6958,5978,7829,0528,993
9,89310,51310,47510,25711,491
11,65611,98812,67413,38214,529
15,61116,98719,44820,84622,609
23,94326,25729,58438,01447,748
46,62350,69455,98764,71576,264
86,991
84,13183,60682,61681,24580,47181,714
85,81086,88990,22393,28293,90196,591
98,96798,01696,48697,57796,21795,564
97,085946749643794,54295,471
Inven-tories2
7,9577,706
9,2849,88610,21010,68610,637
11,67813,26012,73012,73913,879
14,12014,48814,93616,04817,000
18,31720,76525,37726,60429,114
32,80335,82339,78645,37256,948
56,69764,07872,31183,49293,817
105,529
94,71995,81395,59496,65497,35198,328
99,618101,920102,953104,293105,203105,529
104,909106,066105,539105,591105,568107,210
106,402107,820109297109,757111,697
Ratio3
1.131.19
1.071.161.121.171.18
1.131.191.231.241.15
1.221.201.161.151.14
1.151.151.251.251.23
1.291.301.271.111.07
1.211.191.211.211.17
1.14
1.131.151.161.191.211.20
1.161.171.141.121.121.09
1.061.081.091.081.101.12
1.101.141 13U61.17
Retail trade
Sales'
10,20011,13511,149
12,26813,04613,52914,09114,095
15,32115,81116,66716,69617,951
18,29418,24919,63020,55621,823
23,67725,33024,41327,03028,893
30,70033,85337,42242,46245,082
49,01254,78160,43567,05774,529
79,72187,126
79,56178,89977,60376,40475,97577,843
79,49179,82980,62081,55282,76483,443
85,46386,81087,60885,85585,50187,385
87,35688,59388'69986*66087,23387541
Inven-tories 2
1424116,00715,470
19,46021,05021,03121,48820,926
22,76923,40224,45124,11325,305
26,81326,22127,94129,38631,094
34,40538,07335,29938,94542,517
43,86750,06355,07963,23771,067
71,74479,27389,210101,681108,835
111,694
108,147108,792108,841109,744109,499109,438
110,003110,283111,710113,106112,639111,694
111,790113,507113,404113,963115,426117,307
119,824121,277122*219123*485123,897
Ratio3
1261.391.41
1.381.641.521.531.51
1.431.471.441.431.40
1.451.431.381.391.40
1.391.441.431.381.41
1.411.411.401.401.48
1.441.381.391.421.43
1.38
1.361.381.401.441.441.41
1.381.381.391.391.361.34
1.311.311.291.331.351.34
1.371.37138l'.421.42
1 Monthly average for year and t9tal for month.2 Seasonally adjusted, end of period.3 Inventory/sales ratio. For annual periods, ratio of weighted average inventories to average monthly sales; for monthly data, ratio of
inventories at end of month to sales for month.Note.—Earlier data are not strictly comparable with data beginning 1958 for manufacturing and beginning 1967 for wholesale and
retail trade.The inventory figures in this table do not agree with the estimates of change in business inventories included in the gross national
product since these figures cover only manufacturing and trade rather than all business, and show inventories in terms of current bookvalue without adjustment for revaluation.
Source: Department of Commerce (Bureau of Economic Analysts and Bureau of the Census).
288Digitized for FRASER http://fraser.stlouisfed.org/ Federal Reserve Bank of St. Louis
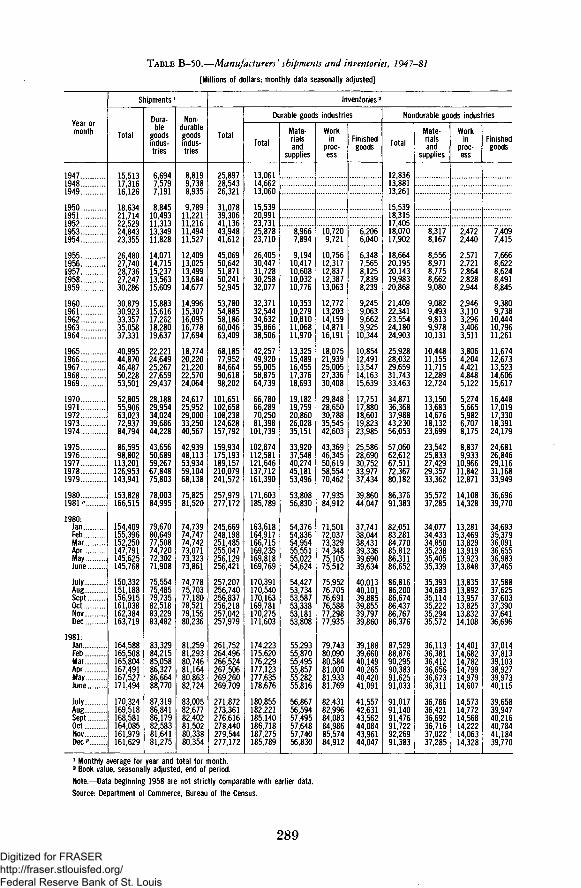
TABLE B-50.—Manufacturers' shipments and inventories, 1947-81
[Millions of dollars; monthly data seasonally adjusted]
Year ormonth
194719481949
19501951195219531954
19551956195719581959
19601961196219631964
19651966196719681969
19701971197219731974..
1975197619771978.1979
19801981 "
1980:JanFebMarAprMayJune
JulyAugSeptOctNovDec
1981:JanFebMarAprMayJune
JulyAugSeptOctNovDec*
Shipments 1
Total
15,51317,31616,126
18,63421,71422,52924,84323,355
26,48027,74028,73627,24730,286
30,87930,92333,35735,05837,331
40,99544,87046,48750,22853,501
52,80555,90663,02372,93784,794
86,59598,802113,201126,953143,941
153,828166,515
154,409155,396152,250147,791145,625145,768
150,332151,188156,915161,038162,384163,719
164,588165,508165,804167,491167,527171,494
170,324169,518168,581164,085161,979161,629
Dura-ble
goodsindus-tries
6,6947,5797,191
8,84510,49311,31313,34911,828
14,07114,71515,23713,56315,609
15,88315,61617,26218,28019,637
22,22124,64925,26727,65929,437
28,18829,95434,02439,68644,228
43,65650,68959,26767,84875,803
78,00384,995
79,67080,64977,50874,72072,30271,908
75,55475,48579,73582,51883,22983,482
83,32984,21585,05886,32786,66488,770
87,31986,84186,17982,58381,64181,275
Non-durablegoodsindus-tries
8,8199,7388,935
9,78911,22111,21611,49411,527
12,40913,02513,49913,68414,677
14,99615,30716,09516,77817,694
18,77420,22021,22022,57024,064
24,61725,95229,00033,25040,567
42,93948,11353,93459,10468,138
75,82581,520
74,73974,74774,74273,07173,32373,861
74,77875,70377,18078,52179,15580,236
81,25981,29380,74681,16480,86382,724
83,00582,67782,40281,50280,33880,354
Inventories 2
Total
25,89728,54326,321
31,07839,30641,13643,94841,612
45,06950,64251,87150,24152,945
53,78054,88558,18660,04663,409
68,18577,95284,66490,61898,202
101,651102,658108,238124,628157,792
159,934175,193189,157210,079241,572
257,979277,172
245,669248,198251,485255,047256,129256,421
257,207256,740256,837256,218257,042257,979
261,752264,496266,524267,506269,260269,709
271,872273,361276,616278,440279,544277,172
Durable goods industries
Total
13,06114,66213,060
15,53920,99123,73125,87823,710
26,40530,44731,72830,25832,077
32,37132,54434,63235,86638,506
42,25749,92055,00558,87564,739
66,78066,28970,25081,398101,739
102,874112,581121,646137,712161,390
171,603185,789
163,618164,917166,715169,235169,818169,769
170,391170,540170,163169,781170,275171,603
174,223175,620176,229177,123177,635178,676
180,855182,221185,140186,718187,275185,789
Mate-rialsand
supplies
8,9667,894
9,19410,41710,60810,03210,776
10,35310,27910,81011,06811,970
13,32515,48916,45517,37618,693
19,18219,75920,86026,02835,151
33,92037,54840,27445,18153,496
53,80856,830
54,37654,83654,95455,55155,02254,624
54,42753,73453,58753,33853,18153,808
55,29355,87055,49555,85755,28255,816
56,86756,59457,49557,64857,74056,830
Workin
proc-ess
10,7209,721
10,75612,31712,83712,38713,063
12,77213,20314,15914,87116,191
18,07521,93925,00527,33630,408
29,84828,65030,78835,54542,603
43,36946,34550,61958,55470,462
77,93584,912
71,50172,03773,32974,34875,10575,512
75,95276,70576,69176,58877,29877,935
79,74380,09080,58481,00081,93381,769
82,43182,99684,08384,98685,57484,912
Finishedgoods
6,2066,040
6,3487,5658,1257,8398,239
9,2459,0639,6629,92510,344
10,85412,49113,54714,16315,639
17,75117,88018,60119,82323,985
25,58628,69030,75233,97737,434
39,86044,047
37,74138,04438,43139,33639,69039,634
40,01340,10139,88539,85539,79739,860
39,18839,66040,14940,26540,42041,091
41,55742,63143,56244,08443,96144,047
Nondurable goods industries
Total
12,83613,88113,261
15,53918,31517,40518,07017,902
18,66420,19520,14319,98320,868
21,40922,34123,55424,18024,903
25,92828,03229,65931,74333,463
34,87136,36837,98843,23056,053
57,06062,61267,51172,36780,182
86,37691,383
82,05183,28184,77085,81286,31186,652
86,81686,20086,67486,43786,76786,376
87,52988,87690,29590,38391,62591,033
91,01791,14091,47691,72292,26991,383
Mate-rialsand
supplies
8,3178,167
8,5568,9718,7758,6629,080
9,0829,4939,8139,97810,131
10,44811,15511,71512,28912,724
13,15013,68314,67618,13223,699
23,54225,83327,42929,35733,362
35,57237,285
34,07734,43334,85035,23835,40535,339
35,39334,68335,11435,22235,29435,572
36,11336,38136,41236,65636,67336,311
36,78636,42136,69236,71637,02237,285
Workin
proc-ess
2,4722,440
2,5712,7212,8642,8282,944
2,9463,1103,2963,4063,511
3,8064,2044,4214,8485,122
5,2745,6655,9826,7078,175
8,8379,93310,96611,84212,871
14,10814,328
13,28113,46913,82913,91913,92313,848
13,83513,89213,95713,82513,83214,108
14,40114,68214,78214,79914,97914,607
14,57314,77214,56814,22214,06314,328
Finishedgoods
7,4097,415
7,6668,6228,6248,4918,845
9,3809,73810,44410,79611,261
11,67412,67313,52314,60615,617
16,44817,01917,33018,39124,179
24,68126,84629,11631,16833,949
36,69639,770
34,69335,37936,09136,65536,98337,465
37,58837,62537,60337,39037,64136,696
37,01437,81339,10338,92739,97340,115
39,65839,94740,21640,78441,18439,770
1 Monthly average for year and total for month.2 Book value, seasonally adjusted, end of period.Note.—Data beginning 1958 are not strictly comparable with earlier data.Source: Department of Commerce, Bureau of the Census.
289Digitized for FRASER http://fraser.stlouisfed.org/ Federal Reserve Bank of St. Louis
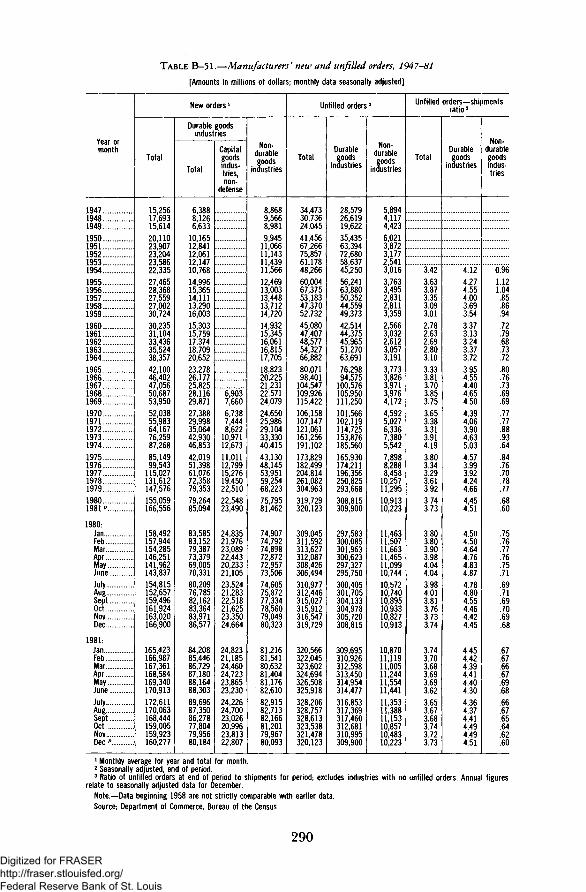
TABLE B-51.—Manufacturers' new and unfilled orders, 1947-81
[Amounts in millions of dollars; monthly data seasonally adjusted]
Year ormonth
19471948194919501951195219531954195519561957195819591960196119621963196419651966... .196719681969197019711972197319741975197619771978197919801981"
1980:JanFebMarAprMayJuneJulyAugSeptOctNovDec
1981:JanFebMarAprMayJuneJulyAugSeptOctNovDec "
New orders 1
Total
15,25617,69315,61420,11023,90723,20423,58622,33527,46528,36827,55927,00230,72430,23531,10433,43635,52438,35742,10046,40247,05650,68753,95052,03855,98364,16776,25987,26885,14999,543115,027131,612147,576155,059166,556
158,492157,944154,285146,251141,962143,837154,815152,657159,496161,924163,020166,900
165,423166,987167,361168,584169,340170,913172,611170,063168,444159,005159,923160,277
Durable goodsindustries
Total
6,3888,1266,63310,16512,84112,06112,14710,76814,99615,36514,11113,29016,00315,30315,75917,37418,70920,65223,27826,17725,82528,11629,87127,38829,99835,06442,93046,85342,01951,39861,07672,35879,35379,26485,094
83,58583,15279,38773,37969,00570,33180,20976,78582,16283,36483,97186,577
84,20885,44686,72987,18088,16488,30389,69687,35086,27877,80479,95680,184
Capitalgoodsindus-tries,non-
defense
6,9037,6606,7387,4448,62210,97112,67311,01112,79915,27619,45022,51022,54823,490
24,83521,97623,08922,44320,23321,10523,52421,28322,51821,62523,35024,664
24,82321,18524,46024,72323,86523,23024,22624,70023,02620,99623,81322,807
Non-durablegoods
industries
8,8689,5668,9819,94511,06611,14311,43911,56612,46913,00313,44813,71214,72014,93215,34516,06116,81517,70518,82320,22521,23122,57124,07924,65025,98629,10433,33040,41543,13048,14553,95159,25468,22375,79581,462
74,90774,79274,89872,87272,95773,50674,60575,87277,33478,56079,04980,323
81,21681,54180,63281,40481,17682,61082,91582,71382,16681,20179,96780,093
Unfilled orders2
Total
34,47330,73624,04541,45667,26675,85761,17848,26660,00467,37553,18347,37052,73245,08047,40748,57754,32766,88280,07198,401104,547109,926115,422106,158107,147121,061161,256191,102173,829182,499204,814261,082304,963319,729320,123
309,045311,592313,627312,087308,426306,494310,977312,446315,027315,912316,547319,729
320,566322,045323,602324,694326,508325,918328,206328,757328,613323,538321,478320,123
Durablegoods
industries
28,57926,61919,62235,43563,39472,68058,63745,25056,24163,88050,35244,55949,37342,51444,37545,96551,27063,69176,29894,575100,576105,950111,250101,566102,119114,725153,876185,560165,930174,211196,356250,825293,668308,815309,900
297,583300,085301,963300,623297,327295,750300,405301,705304,133304,978305,720308,815
309,695310,926312,598313,450314,954314,477316,853317,369317,460312,681310,995309,900
Non-durablegoods
industries
5,8944,1174,4236,0213,8723,1772,5413,0163,7633,4952,8312,8113,3592,5663,0322,6123,0573,1913,7733,8263,9713,9764,1724,5925,0276,3367,3805,5427,8988,2888,45810,25711,29510,91310,223
11,46311,50711,66311,46511,09910,74410,57210,74010,89510,93310,82710,913
10,87011,11911,00511,24411,55411,44111,35311,38811,15310,85710,48310,223
Unfilled orders— shipmentsratio3
Total
3.423.633.873.353.093.012.782.632.692.803.103.333.813.703.853.753.653.383.313.914.193.803.343.293.613.923.743.73
3.803.803.903.984.044.043.984.013.813.763.733.74
3.743.703.683.693.693.623.653.673.683.743.723.73
Durablegoods
industries
4.124.274.554.003.693.543.373.133.243.373.723.954.554.404.654.504.394.063.904.635.034.573.993.924.244.664,454.51
4.504.504.644.764.834.874.784.804.554.464.424.45
4.454.424.394.414.404.304.364.374.414.494.494.51
Non-durablegoodsindus-tries
0.961.121.04.85.86.94.72.79.68.73.72.80.76.73.69.69.77.77.88.93.64.84.76.70.78.77.68.60
.75
.76
.77
.76
.75
.71
.69
.71
.69
.70
.69
.68
.67
.67
.66
.67
.69
.68
.66
.67
.65
.64
.62
.60
1 Monthly average for year and total for month.2 Seasonally adjusted, end of period.3 Ratio of unfilled orders at end of period to shipments for period; excludes industries with no unfilled orders. Annual figuresrelate to seasonally adjusted data for December.
Note.—Data beginning 1958 are not strictly comparable with earlier data.Source: Department of Commerce, Bureau of the Census.
290
Digitized for FRASER http://fraser.stlouisfed.org/ Federal Reserve Bank of St. Louis

TABLE B-52.—Consumer price indexes, major expenditure classes, 1929-81
[1967=100]
Year or month
192919331939
1940194119421943194419451946194719481949
1950195119521953195419551956195719581959
19601961196219631964 .. .1965196619671968 .1969
1970197119721973197419751976197719781979
19801981
1980:JanFebMarAprilMayJune
JulyAugSeptOctNovDec
1981:JanFebMarAprMayJune
JulyAugSeptOctNovDec
Allitems
51.338.841.6
42.044.148.851.852.753.958.566.972.171.4
72.177.879.580.180.580.281.484.386.687.3
88.789.690.691.792.994597.2
100.0104.2109.8
116.3121.3125.3133.1147.7161.2170.5181.5195.4217.4
246.8272.4
233.2236.4239.8242.5244.9247.6
247.8249.4251.7253.9256.2258.4
260.5263.2265.1266.8269.0271.3
274.4276.5279.3279.9280.7281.5
Food andbeverages
Total »
zzz
ioo.o"103.6108.8
114.7118.3123.2139.5158.7172.1177.4188.0206.3228.5
248.0267.3
237.5238.6241.0242.8244.1245.7
248.3252.0254.2255.5257.4259.3
261.4263.7265.0265.7265.4266.5
268.9270.1270.7270.3269.9270.5
Food
48330.634.6
35.238.445.150.349.650.758.170.676.673.5
74.582.884.383.082.881.682.284.988.587.1
88.089.189.991.292.494.499.1
100.0103.6108.9
114.9118.4123.5141.4161.7175.4180.8192.2211.4234.5
254.6274.6
243.8244.9247.3249.1250.4252.0
254.8258.7261.1262.4264.5266.4
268.6270.8272.2272.9272.5273.6
276.2277.4278.0277.6277.1277.8
Housing
Total2
52.2"
52.453.756.256.858.159.160.665.269.870.9
72.877.278.780.881.782.383.686.287.788.6
90.290.991.792.793.894.997.2
100.0104.0110.4
118.2123.4128.1133.7148.8164.5174.6186.5202.8227.6
263.3293.5
247.3250.5254.5257.9261.7266.7
265.1265.8267.7271.1273.8276.9
279.1280.9282.6284.8288.5292.2
297.0299.7303.7303.5304.2305.2
Rent,resi-
dential
76.054.156.0
56.257.258.558.558.658.859.261.165.168.0
70.473.276.280.383.284.385.987.589.190.4
91.792.994.095.095.996.998.2
100.0102.4105.7
110.1115.2119.2124.3130.6137.3144.7153.5164.0176.0
191.6208.2
184.1185.6186.6187.0188.9191.1
192.1193.2195.1197.1198.3199.6
200.9201.9203.0204.2205.9206.8
207.8210.3211.9213.6215.0216.5
Homeowner-
ship
75.076.377.078.381.783.584.4
86.386.987.989.090.892.796.3
100.0105.7116.0
128.5133.7140.1146.7163.2181.7191.7204.9227.2262.4
314.0352.7
292.5296.3302.0307.7312.9320.4
315.4315.4317.6323.8329.4334.2
335.8335.8336.8339.3345.0350.4
358.0361.8367.8366.7367.2367.8
Fuel andother
utilities3
83.083.585.187.389.991.793.8
95.997.197.398.298.498.398.8
100.0101.3103.6
107.6115.0120.1126.9150.2167.8182.7202.2216.0239.3
278.6319.2
258.6263.8268.0270.5275.9282.2
285.5286.8288.2287.6285.7289.9
296.7304.5308.4310.5314.9320.2
325.1327.8331.1330.1329.8331.8
Appareland
upkeep
48.536.942.4
42.844.852.354.658.561.567.578.283.380.1
79.086.185.384.684.584.185.887.387.588.2
89.690.490.991.992.793.796.1
100.0105.4111.5
116.1119.8122.3126.8136.2142.3147.6154.2159.6166.6
178.4186.9
171.0171.9176.0177.3177.5177.2
176.2178.6182.2183.9184.8183.9
181.1182.0185.1186.4186.4185.8
184.7187.4190.7191.5191.3190.5
Trans-portation
43.0
42.744.248.147.947.947.850.355.561.866.4
68.272.577.379.578.377.478.883.386.089.6
89.690.692.593.094.395.997.2
100.0103.2107.2
112.7118.6119.9123.8137.7150.6165.5177.2185.5212.0
249.7280.0
233.5239.6243.7246.8249.0249.7
251.0252.7254.7256.1259.0261.1
264.7270.9273.5275.3277.8279.9
282.6283.7285.2287.2289.1289.8
Medicalcare
36.7
36.837.038.039.941.142.144.448.151.152.7
53.756.359.361.463.464.867.269.973.276.4
79.181.483.585.687.389.593.4
100.0106.1113.4
120.6128.4132.5137.7150.5168.6184.7202.4219.4239.7
265.9294.5
253.9257.9260.2262.0263.4264.7
266.6268.4270.6272.8274.5275.8
279.5282.6284.7287.0289.0291.5
295.6299.3301.7304.8308.2310.2
Enter-tainment
100.0105.7111.0
116.7122.9126.5130.0139.8152.2159.8167.7176.6188.5
205.3221.4
195.3197.8200.6202.5204.0205.3
206.6208.0209.8210.9211.2212.0
214.4216.7218.2219.2220.3220.8
221.1222.3224.0225.5226.8227.3
Othergoods
andservices
100.0105.2110.4
116.8122.4127.5132.5142.0153.9162.7172.2183.3196.7
214.5235.7
206.3208.1208.9209.8211.2212.5
213.5214.5220.6221.5222.8224.6
226.2227.4228.7229.9232.2233.4
234.4235.6243.0245.2245.9246.7
Ener-gy4
90.190.391.8
94.294.494.795.094.696.397.8
100.0101.5104.2
107.0111.2114.3123.5159.7176.6189.3207.3220.4275.9
361.1410.0
327.9344.6355.0358.8363.2367.8
370.4370.7370.1368.0366.1370.4
381.7401.1409.3409.8411.3414.0
415.7416.1417.1414.9414.1414.6
1 Includes alcoholic beverages, not shown separately.2 Includes other items not shown separately. Series beginning 1967 not comparable with series for earlier years.3 Fuel oil, coal, and bottled gas; gas (piped) and electricity; and other utilities and public services.4 Fuel oil, coal, and bottled gas; gas (piped) and electricity; and motor fuel, motor oil, coolant, etc.Note.—Data beginning 1978 are for all urban consumers; earlier data are for urban wage earners and clerical workers.Source: Department of Labor, Bureau of Labor Statistics.
291Digitized for FRASER http://fraser.stlouisfed.org/ Federal Reserve Bank of St. Louis
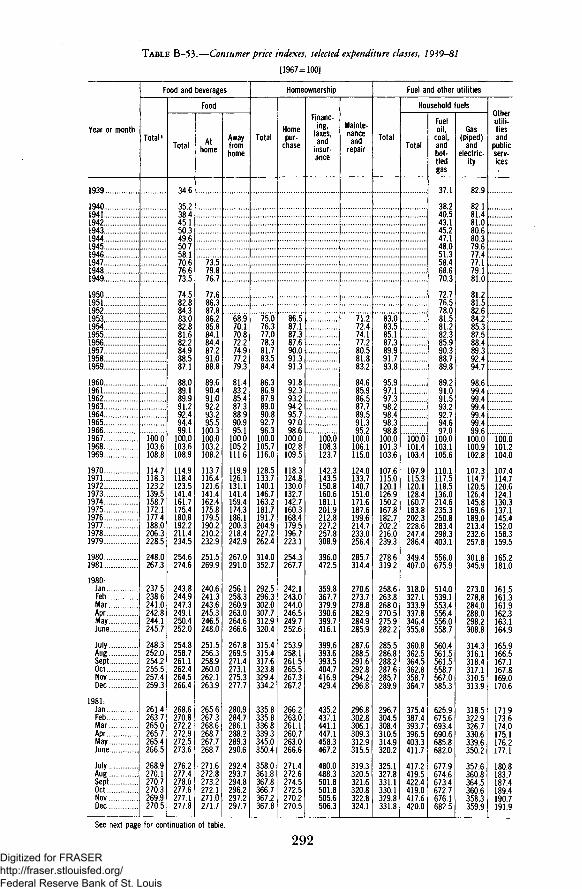
TABLE B-53.—Consumer price indexes, selected expenditure classes, 1939-81
[1967=100]
Year or month
1939..
1940194119421943194419451946194719481949
1950195119521953,195419551956195719581959
1960196119621963196419651966196719681969
1970197119721973197419751976197719781979
19801981
1980:JanFebMarAprMayJune
JulyAugSeptOctNovDec
1981:JanFebMarAprMayJune
JulyAugSeptOctNovDec
Food and beverages
Total1
100.0103.6108.8
114.7118.3123.2139.5158.7172.1177.4188.0206.3228.5
248.0267.3
237.5238.6241.0242.8244.1245.7
248.3252.0254.2255.5257.4259.3
261.4263.7265.0265.7265.4266.5
268.9270.1270.7270.3269.9270.5
Food
Total
34.6
35.238.445.150.349.650.758.170.676.673.5
74.582.884.383.082.881.682.284.988.587.1
88.089.189.991.292.494.499.1
100.0103.6108.9
114.9118.4123.5141.4161.7175.4180.8192.2211.4234.5
254.6274.6
243.8244.9247.3249.1250.4252.0
254.8258.7261.1262.4264.5266.4
268.6270.8272.2272.9272.5273.6
276.2277.4278.0277.6277.1277.8
Athome
73.579.876.7
77.686.387.886.285.884.184.487.291.088.8
89.690.491.092.293.295.5
100.3100.0103.2108.2
113.7116.4121.6141.4162.4175.8179.5190.2210.2232.9
251.5269.9
240.6241.3243.6245.3246.5248.0
251.5256.3258.9260.0262.1263.9
265.6267.3268.6268.7267.7268.7
271.6272.8273.2272.1271.0271.7
Awayfromhome
68.970.170.872.274.977.279.3
81.483.285.487.388.990.995.1
100.0105.2111.6
119.9126.1131.1141.4159.4174.3186.1200.3218.4242.9
267.0291.0
256.1258.3260.9263.0264.6266.6
267.8269.5271.4273.1275.3277.7
280.9284.7286.1288.2289.3290.6
292.4293.7294.8296.2297.2297.7
Homeownership
Total
75076.377.078.381.783.584.4
86.386.987.989.090.892.796.3
100.0105.7116.0
128.5133.7140.1146.7163.2181.7191.7204.9227.2262.4
314.0352.7
292.5296.3302.0307.7312.9320.4
315.4315.4317.6323.8329.4334.2
335.8335.8336.8339.3345.0350.4
358.0361.8367.8366.7367.2367.8
Homepur-
chase
86587.187.387.690.091.391.3
91.892.393.294.295.797,098.6
100.0102.8109.5
118.3124.8130.0132.7142.7160.3168.4179.5196.7223.1
254.3267.7
242.1243.0244.0246.5249.7252.6
253.9258.1261.5265.5267.3267.2
266.2263.0261.1260.7263.0266.6
271.4272.6274.5272.5270.2270.5
Financ-ing,
taxes,and
insur-ance
l6o.o"108.3123.7
142.3143.5150.8160.6181.1201.9212.8227.2257.8308.9
396.0472.5
359.8367.7379.9390.6399.7416.1
399.6393.6393.5404.7416.9429.4
435.2437.1441.1447.1458.3467.2
480.0488.3501.8501.8505.6506.3
Mainte-nance
andrepair
71.272.474.177.280.581.883.2
84.685.986.587.789.591.395.2
100.0106.1115.0
124.0133.7140.7151.0171.6187.6199.6214.7233.0256.4
285.7314.4
270.6273.7278.8282.9284.9285.9
287.6288.5291.6292.8294.2296.8
296.8302.8306.1309.3312.9315.5
319.3320.5321.6320.8322.8324.1
Fuel and other utilities
Total
83.083.585.187.389.991.793.8
95.997.197.398.298.498.398.8
100.0101.3103.6
107.6115.0120.1126.9150.2167.8182.7202.2216.0239.3
278.6319.2
258.6263.8268.0270.5275.9282.2
285.5286.8288.2287.6285.7289.9
296.7304.5308.4310.5314.9320.2
325.1327.8331.1330.1329.8331.8
Household fuels
Total
...............
101.4103.4
107.9115.3120.1128.4160.7183.8202.3228.6247.4286.4
349.4407.0
318.0327.1333.9337.8346.4355.8
360.8362.5364.5362.8358.7364.7
375.4387.4393.7396.5403.3411.7
417.2419.5422.4419.0417.6420.0
Fueloil,
coal,andbot-tledgas
37.1
38.240.543.145.247.148.051.358.468.670.3
72.776.578.081.581.282.385.990388.789.8
89.291.091.593.292.794.697.0
100.0103.1105.6
110.1117.5118.5136.0214.6235.3250.8283.4298.3403.1
556.0675.9
514.0539.1553.4556.4556.0558.7
560.4561.5561.5558.7567.0585.3
625.9675.6693.4690.6685.8682.0
677.9674.6673.4672.7676.1682.5
Gas(piped)
andelectric-
ity
82.9
82.181.481.080.680.379.677.477.179.181.0
81.281.582.684.285.387.588.489392.494.7
98.699.499.499.499.499.499.6
100.0100.9102.8
107.3114.7120.5126.4145.8169.6189.0213.4232.6257.8
301.8345.9
273.0278.8284.0288.0298.2308.8
314.3316.1318.4317.1310.5313.9
318.5322.9326.7330.6339.6350.2
357.6360.8364.5360.6358.3359.9
Otherutili-tiesand
publicserv-ices
iiz
...._101.2104.0
107.4114.7120.6124.1130.3137.1145.4152.0158.3159.5
165.2181.0
161.5161.3161.9162.3163.1164.9
165.9166.5167.1167.8169.0170.6
171.9173.6174.0175.1176.2177.1
180.8183.7187.4189.4190.7191.9
See next page for continuation of table.
292Digitized for FRASER http://fraser.stlouisfed.org/ Federal Reserve Bank of St. Louis

TABLE B-53.—Consumer price indexes, selected expenditure classes, 1939-81—Continued
[1967=100]
Year or month
19391940..194119421943194419451946194719481949195019511952195319541955195619571958195919601961196219631964196519661967196819691970197119721973197419751976197719781979198019811980
Jan.FebMar.AprMayJune.Ju lyAug.SeptOctNovDec.
1981-Jan .FebMar .Apr.MayJune.J u l y .Aug.Sept.Oct.NovDec
Transportation
Total
43.042.744.248.147.947.947.850.355.561.866.468.272.577.379.578.377.478.883.386.089.689.690.692.593.094.395.997.2
100.0103.2107.2112.7118.6119.9123.8137.7150.6165.5177.2185.5212.0249.7280.0
233.5239.6243.7246.8249.0249.7251.0252.7254.7256.1259.0261.1
264.7270.9273.5275.3277.8279.9282.6283.7285.2287.2289.1289.8
Private transportation
Total
44.243.645.952.351.451.451.354.361.568.272.372.575.880.882.480.378.980.184.787.491.190.691.393.093.494.796.397.5
100.0103.0106.5111.1116.6117.5121.5136.6149.8164.6176.6185.0212.3249.2277.5
233.5239.8244.0247.0249.2249.7250.5251.6253.2254.5257.4259.4
262.9269.4271.7273.4276.0277.9279.6280.5281.9283.9285.8286.5
Newcars
43.243.346.6
69.2"75.682.883.487.494.995.894.390.993.598.4
101.5105.9104.5104.5104.1103.5103.2100.999.1
100.0102.8104.4107.6112.0111.0111.1117.5127.6135.7142.9153.8166.0179.3190.2
173.9175.3175.0177.0178.9178.5179.2181.1181.7181.9184.3184.5
185.3184.8182.9186.1190.9192.2192.5191.9191.3192.5195.3197.0
Usedcars
89.2"75.971.869.177.480.289.583.686.994.896.0
100.199.497.0
100.0(3)
103.1104.3110.2110.5117.6122.6146.4167.9182.8186.5201.0208.1256.9
197.2195.3195.2196.7199.3200.7203.4206.4214.6222.7230.8234.4
234.0234.3235.4239.1245.2252.9260.3266.9272.8278.2281.4281.9
Motorf u e l 2
49.048.150.553454.054.253.854.962.270.472.371.873.975.880.382.583.686.590.088.889.992.591.491.991.891.494.997.0
100.0101.4104.7105.6106.3107.6118.1159.9170.8177.9188.2196.3265.6369.1410.9
334.6357.6370.9374.7375.4376.2376.7375.9373.0370.5370.5373.3
385.2410.8420.7419.3416.5414.4412.9411.7
Mll.l409.9409.5408.4
Auto-mobilemainte-nance
andrepair
43.143.044.948849.450.050.452.056.459.661.162.367.068.672.374.876.579.582.483.785.587.289.390.491.692.894.596.2
100.0105.5112.2120.6129.2135.1142.2156.8176.6189.7203.7220.6242.6268.3293.6
255.1258.2260.9264.1266.1267.3269.0271.1273.8276.0278.4280.1
282.7285.4287.7289.0290.8291.9293.5295.5298.7301.3302.8304.1
Other
100.0103.4109.7119.2128.4129.1127.8132.4141.2163.1177.3184.6198.6222.6241.3
209.8212.6216.5221.3224.5225.0224.5224.7226.0226.5228.8231.0
232.4234.2234.7236.3238.9241.0242.9243.0244.2247.5249.5250.6
Publictranspor-
tation
33.133.133.133.333.433.533.534.436.040.745.248.954.057.561.365.567.470.072.776.178.381.084.687.488.590.191.995.2
100.0104.6112.7128.5137.7143.4144.8148.0158.6174.2182.4187.8200.3251.6312.0
226.8229.5232.1235.9239.5242.2250.5261.5271.0273.6277.0280.1
286.4288.1293.9297.2297.7303.9323.1326.5329.1330.8333.2333.8
Medical care
Total
36.736.837.038.039.941.142.144.448.151.152.753.756.359.361.463.464.867.269.973.276.479.181.483.585.687.389.593.4
100.0106.1113.4120.6128.4132.5137.7150.5168.6184.7202.4219.4239.7265.9294.5
253.9257.9260.2262.0263.4264.7266.6268.4270.6272.8274.5275.8
279.5282.6284.7287.0289.0291.5295.6299.3301.7304.8308.2310.2
Medicalcarecom-
modities
71.170.871.473.073.574.374.876.281.886.187.488.591.091.892.693.794.796.799.3
102.8104.4104.5103.3101.7100.8100.5100.2100.5100.0100.2101.3103.6105.4105.6105.9109.6118.8126.0134.1143.5153.8168.1186.5
160.5162.1163.5164.9166.4167.9169.1170.2171.3172.5173.8175.1
176.7179.2180.7182.4184.7186.3187.7189.4190.8192.1193.1194.9
Medi-cal
careserv-ices
32.532.532.733.735.436.937.940.143.546.448.149.251.755.057.058.760.462.865.568.772.074.977.780.282.684.687.392.0
100.0107.3116.0124.2133.3138.2144.3159.1179.1197.1216.7235.4258.3287.4318.2
274.4279.0281.5283.4284.7285.9288.0289.8292.3294.8296.6297.9
302.1305.2307.5309.8311.7314.4319.2323.4326.1329.7333.7335.7
1 Includes alcoholic beverages, not shown separately.2 Includes direct pricing of diesel and gasohol beginning September 1981.3 Not available.
Note.—Data beginning 1978 are for all urban consumers; earlier data are for urban wage earners and clerical workers.Source: Department of Labor, Bureau of Labor Statistics.
293Digitized for FRASER http://fraser.stlouisfed.org/ Federal Reserve Bank of St. Louis

TABLE B-54.—Consumer price indexes, commodities, services, and special groups, 1939-81
[1967=100]
Year ormonth
1939
1940194119421943194419451946194719481949
1950195119521953 ... .19541955 .1956195719581959
19601961196219631964 .19651966 ...19671968 ....1969
197019711972197319741975 ...197619771978 .1979
19801981
1980:JanFeb ....MarAprMayJune
JulyAugSeptOctNovDec
1981:JanFebMarAprMayJune
JulyAugSeptOctNovDec
Commodities
Allitems
41.6
42.044.148.851.852.753.958.566.972.171.4
72.177.879.580.180.580.281.484.386.687.3
88.789.690.691.792.994.597.2
100.0104.2109.8
116.3121.3125.3133.1147.7161.2170.5181.5195.4217.4
246.8272.4
233.2236.4239.8242.5244.9247.6
247.8249.4251.7253.9256.2258.4
260.5263.2265.1266.8269.0271.3
274.4276.5279.3279.9280.7281.5
Allcom-
modities
40.2
40.643.349.654.054.756.362.475.080.478.3
78.885.987.086.785.985.185.988.690.690.7
91.592.092.893.694.695.798.2
100.0103.7108.4
113.5117.4120.9129.9145.5158.4165.2174.7187.1208.4
233.9253.6
222.4225.2228.0229.9231.4232.8
234.1236.7239.0240.7242.5243.8
245.4248.3249.8250.8251.9253.2
255.0256.2257.7257.9258.0258.4
Food
34.6
35.238.445.150.349.650.758.170.676.673.5
74.582.884.383.082.881.682.284.988.587.1
88.089.189.991.292.494.499.1
100.0103.6108.9
114.9118.4123.5141.4161.7175.4180.8192.2211.4234.5
254.6274.6
243.8244.9247.3249.1250.4252.0
254.8258.7261.1262.4264.5266.4
268.6270.8272.2272.9272.5273.6
276.2277.4278.0277.6277.1277.8
Commodities less food
All
47.7
48.050.456.058.461.664.168.176.882.781.5
81.487.588.388.587.586.987.890.591.592.7
93.193.494.194.895.696.297.5
100.0103.7108.1
112.5116.8119.4123.5136.6149.1156.6165.1174.7195.1
222.0241.2
210.4213.8216.7218.6220.2221.4
222.2224.2226.6228.3230.0231.0
232.4235.4237.0238.0239.6241.1
242.6243.8245.5245.9246.2246.5
Durable
48.5
48.151.458.460.365.970.974.180.386.287.4
88.495.196.495.793.391.591.594.495.997.3
96.796.697.697.998.898.498.5
100.0103.1107.0
111.8116.5118.9121.9130.6145.5154.3163.2173.9191.1
210.4227.1
201.3202.1203.0204.9207.1208.6
209.8212.4215.3218.1220.6221.1
221.0220.3219.8221.1223.9226.6
229.6230.9232.6232.9233.2233.7
Non-durable
44.3
44.746.751.653.856.658.662.972.277.876.3
76.282.082.483.183.583.585.387.688.289.3
90.791.291.892.793.594.897.0
100.0104.1108.8
113.1117.0119.8124.8140.9151.7158.3166.5174.3198.7
235.2257.5
220.5227.3232.6234.6235.5236.3
236.6237.8239.3239.6240.5242.0
245.3253.2257.5258.1258.2258.0
257.5258.4260.3260.7261.1261.1
Services
Allservices
43.5
43.644.245.646.447.548.249.151.154.356.9
58.761.864.567.369.570.972.775.678.580.8
83.585.286.888.590.292.295.8
100.0105.2112.5
121.6128.4133.3139.1152.1166.6180.4194.3210.9234.2
270.3305.7
253.1256.8261.3265.3269.2274.2
272.4272.5274.8277.9280.9284.7
287.7290.1292.5295.4299.6303.5
308.8312.2317.3318.6320.6321.8
Rent
56.0
56.257.258.558.558.658.859.261.165.168.0
70.473.276.280.383.284.385.987.589.190.4
91.792.994.095.095.996.998.2
100.0102.4105.7
110.1115.2119.2124.3130.6137.3144.7153.5164.0176.0
191.6208.2
184.1185.6186.6187.0188.9191.1
192.1193.2195.1197.1198.3199.6
200.9201.9203.0204.2205.9206.8
207.8210.3211.9213.6215.0216.5
Serv-iceslessrent
38.1
38.138.640.342.144.245.146.749.051.954.5
56.059.362.264.866.768.270.173.376.479.0
81.983.985.587.389.291.595.3
100.0105.7113.8
123.7130.8135.9141.8156.0171.9186.8201.6219.4244.9
285.1324.3
266.1270.2275.4280.0284.4290.0
287.6287.4289.8293.2296.4300.7
304.2306.9309.5312.8317.4321.9
328.1331.7337.5338.7340.8342.0
Special indexes
Allitemslessfood
47.2
47.348.752.153.655.756.959.464.969.670.3
71.175.777.579.079.579.781.183.885.787.3
88.889.790.892.093.294.596.7
100.0104.4110.1
116.7122.1125.8130.7143.7157.1167.5178.4191.2213.0
244.0270.6
229.9233.5237.1239.9242.6245.5
245.1246.3248.6250.9253.2255.5
257.6260.4262.3264.2267.0269.5
272.7274.9278.2279.0280.1280.8
Allitemsless
energy
83.986.387.0
88.389.390.491.692.994.397.3
100.0104.4110.3
117.0122.0126.1133.8146.9160.2169.2179.8193.8213.1
238.0261.7
225.9228.0230.8233.4235.7238.3
238.3240.0242.5245.1247.7249.7
251.2252.5253.8255.6257.9260.2
263.5265.6268.6269.4270.4271.1
Allitemslessfoodand
ener-gy
83.385.287.0
88.389.390.591.693.094.396.6
100.0104.6110.7
117.6123.1126.9131.3142.2155.3165.5175.8188.7207.0
232.8257.1
220.6222.8225.7228.5231.0233.7
233.1234.3236.9239.7242.4244.5
245.7246.8248.1250.1253.0255.6
259.0261.3264.8265.9267.2267.9
Ener-gy1
90.190.391.8
94.294.494.795.094.696.397.8
100.0101.5104.2
107.0111.2114.3123.5159.7176.6189.3207.3220.4275.9
361.1410.0
327.9344.6355.0358.8363.2367.8
370.4370.7370.1368.0366.1370.4
381.7401.1409.3409.8411.3414.0
415.7416.1417.1414.9414.1414.6
1 Fuel oil, coal, and bottled gas; gas (piped) and electricity; and motor fuel, motor oil, coolant, etc.Note.—Data beginning 1978 are for all urban consumers; earlier data are for urban wage earners and clerical workers.Source: Department of Labor, Bureau of Labor Statistics.
294Digitized for FRASER http://fraser.stlouisfed.org/ Federal Reserve Bank of St. Louis
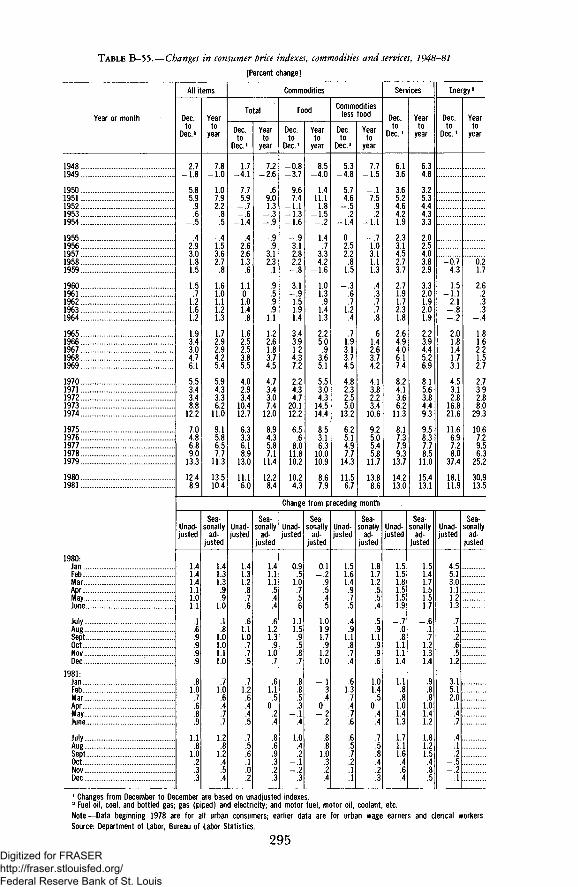
TABLE B-55.—Changes in consumer brice indexes, commodities and services, 1948-81
[Percent change]
Year or month
19481949
19501951195219531954
19551956195719581959
196019611962 .19631964
19651966196719681969
19701971197219731974
19751976197719781979
19801981
1980:JanFeb..Mar.AprMayJune.
July.Aug.Sept.OctNov.Dec
1981:JanFebMarAprMayJune.
JulyAugSeptOctNovDec
All items
Dec.to
Dec.1
2.7-1.8
5.85.9
.9
.6-.5
.42.93.01.81.5
1.5.7
1.21.61.2
1.93.43.04.76.1
5.53.43.48.8
12.2
7.04.86.89.0
13.3
12.48.9
Yearto
year
7.8-1.0
1.07.92.2
.8
.5_ 4L53.62.7
.8
1.61.01.11.21.3
1.72.92.94.25.4
5.94.33.36.2
11.0
9.15.86.57.7
11.3
13.510.4
Commodities
Total
Dec.to
Dec.1
1.7-4.1
7.75.9-.7-.6
-1.4
-.42.62.61.3.6
1.101.01.4.8
1.62.52.53.85.5
4.02.93.4
10.412.7
6.33.36.18.9
13.0
11.16.0
Yearto
year
7.2-2.6
.69.01.3
-.3-.9
— 9!9
3.12.3
.1
.9
.5
.9
.91.1
1.22.61.83.74.5
4.73.43.07.4
12.0
8.94.35.87.1
11.4
12.28.4
Food
Dec.to
Dec.1
-0.8-3.7
9.67.4
-1.1-1.3-1.6
-.93.12.82.2-.8
3.1-.91.51.91.4
3.43.91.24.37.2
2.24.34.7
20.112.2
6.5.6
8.011.810.2
10.24.3
Yearto
year
8.5-4.0
1.411.11.8
-1.5-.2
-1.4.7
3.34.2
-1.6
1.01.3.9
1.41.3
2.25.0
.93.65.1
5.53.04.3
14.514.4
8.53.16.3
10.010.9
8.67.9
Commoditiesless food
Dec.to
Dec.1
5.3-4.8
5.74.6-.5
.2-1.4
02.52.2.8
1.5
— 3!e.7
1.2.4
.71.93.13.74.5
4.82.32.55.0
13.2
6.25.14.97.7
14.3
11.56.7
Yearto
year
7.7-1.5
-.17.5
.9
.2-1.1
-.71.03.11.11.3
.4
.3
.7
.7
.8
.61.42.63.74.2
4.13.82.23.4
10.6
9.25.05.45.8
11.7
13.88.6
Services
Dec.to
Dec.1
6.13.6
3.65.24.64.21.9
2.33.14.52.73.7
2.71.91.72.31.8
2.64.94.06.17.4
8.24.13.66.2
11.3
8.17.37.99.3
13.7
14.213.0
Yearto
year
6.34.8
3.25.34.44.33.3
2.02.54.03.82.9
3.32.01.92.01.9
2.23.94.45.26.9
8.15.63.84.49.3
9.58.37.78.5
11.0
15.413.1
Energy2
Dec.to
Dec.1
..............
4.3
1.5-1.1
2.1-.8-.2
2.01.81.41.73.1
4.53.12.8
16.821.6
11.66.97.28.0
37.4
18.111.9
Yearto
year
0.21.7
2.6.2
'.3-A
1.81.62.21.52.7
2.73.92.88.0
29.3
10.67.29.56.3
25.2
30.913.5
Change from preceding month
Unad-justed
1.41.41.41.11.01.1
.1
.6
.9
.9
.9
.9
.81.0.7.6.8.9
1.1.8
1.0.2.3.3
Sea-sonally
ad-justed
1.41.31.3.9.9
1.0
.1
.81.01.01.11.0
.71.0.6.4.7.7
1.2.8
1.2.4.5.4
Unad-justed
1.41.31.2.8.7.6
.61.11.0
.7
.7
.5
.71.2.6.4.4.5
.7
.5
.6
.1
.0
.2
Sea-sonally
ad-justed
1.41.11.1.5.4.4
.61.21.3.9
1.0.7
.61.1.5
0.2.4
.8
.6
.9
.3
.2
Unad-justed
0.9
i!o.7.5.6
1.11.5.9.5.8.7
.8
.8
.5
.3-.1
.4
1.0.4.2
-.1_ 2
Sea-sonally
ad-justed
0.1-.2
.9
.5
.4
.5
1.01.91.7.9
1.21.0
-.1.3.4
0-.2
.2
.8
.81.0.3.2.4
Unad-justed
1.51.61.4.9.7.5
.4
.91.1.8.7.4
.61.3
.7
.4
.7
.6
.6
.5
.7
.2
.1
.1
Sea-sonally
ad-justed
1.81.71.2.5.5.4
.5
.91.1.9.9.6
1.01.4.5
0.4.4
.7
.5
.8
.4
.2
Unad-justed
1.51.51.81.51.51.9
-.7.0.8
1.11.11.4
1.1.8.8
1.01.41.3
1.71.11.6
.4
.6
.4
Sea-sonally
ad-justed
1.51.41.71.51.51.7
-.6.1.7
1.21.31.4
.9
.8
.81.01.41.2
1.81.21.5
.4
.8
.5
Unad-justed
4.55.13.01.11.21.3
.7
.1-.2-.6-.51.2
3.15.12.0
.1
.4
.7
.4
.1
.2-.5-.2
.1
Sea-sonally
ad-justed
1 Changes from December to December are based on unadjusted indexes.2 Fuel oil, coal, and bottled gas; gas (piped) and electricity; and motor fuel, motor oil, coolant, etc.
Note.—Data beginning 1978 are for all urban consumers; earlier data are for urban wage earners and clerical workers.Source: Department of Labor, Bureau of Labor Statistics.
295Digitized for FRASER http://fraser.stlouisfed.org/ Federal Reserve Bank of St. Louis

TABLE B-56.—Changes in special consumer price indexes, 1958-81
[Percent change]
Year or month
19581959
19601961196219631964
19651966196719681969
19701971197219731974
19751976197719781979
19801981
1980:JanFebMarAprMayJune
JulyAugSeptOctNovDec
1981:JanFeb.Mar .
fcJune.
Ju ly .AugSeptOctNovDec
All items
Dec.to
Dec.1
181.5
1.5.7
1.21.61.2
1.93.43.04.76.1
5.53.43.48.8
12.2
7.04.86.89.0
13.3
12.48.9
Yearto
Year
27.8
1.61.01.11.21.3
1.72.92.94.25.4
5.94.33.36.2
11.0
9.15.86.57.7
11.3
13.510.4
All items lessfood
Dec.to
Dec.1
162.3
1.01.11.21.61.0
1.63.33.54.95.7
6.53.13.05.6
12.2
7.16.26.38.5
14.0
12.99.9
Yearto
Year
231.9
1.71.01.21.31.3
1.42.33.44.45.5
6.04.63.03.99.9
9.36.66.57.2
11.4
14.610.9
All items lessenergy
Dec.to
Dec.1
191.4
1.4.8
1.21.81.3
1.93.53.14.96.4
5.63.33.58.3
11.5
6.74.66.89.2
11.1
11.78.6
Yearto
Year
2.9.8
1.51.11.21.31.4
1.53.22.84.45.7
6.14.33.46.19.8
9.15.66.37.8
10.0
11.710.0
All itemsless food
and energy
Dec.to
Dec.1
1.82.2
.81.51.11.81.2
1.53.33.95.16.1
6.63.13.04.7
11.3
6.76.16.48.5
11.3
12.19.6
Yearto
Year
232.1
1.51.11.31.21.5
1.42.43.54.65.8
6.24.73.13.58.3
9.26.66.27.39.7
12.510.4
All items lessfood, energy,
and homepurchase and
finance2
Dec.to
Dec.1
4.65.2
5.73.42.94.0
11.1
6.36.85.56.97.5
9.99.4
Yearto
Year
4.54.9
5.25.02.73.37.8
8.76.86.16.07.3
9.09.5
All itemsX-l3
Dec.to
Dec.1
3.95.2
4.53.53.38.5
11.1
6.65.16.37.9
10.8
10.88.5
Yearto
Year
3.74.4
4.94.33.16.2
10.1
8.35.76.46.89.6
11.29.5
Change from preceding month
Unad-justed
1.41.41.41.11.01.1
.1
.6
.9
.99.9
.81.0
.7
.6
.8
.9
1.1.8
1.0.2.3.3
Sea-sonal-ly ad-justed
1.41.31.3.9.9
1.0
.1
.81.01.01 11.0
.71.0.6.4.7.7
1.2.8
1.2.4.5.4
Unad-justed
1.51.61.51.21.11.2
-.2.5.9.99.9
.81.1.7.7
1.1.9
1.2.8
1.2.3.4.2
Sea-sonal-ly ad-justed
1.71.51.51.01.01.0
-.1.5.9
1.01 11.0
1.01.1.7.5.9.8
1.3.8
1.2.4.5.4
Unad-justed
1.0.9
1.21.11.01.1
.0
.71.01.11 1.8
.6
.5
.5
.7
.9
.9
1.3.8
1.1.3.4.3
Sea-sonal-ly ad-justed
1.0.8
1.11.0.9
1.1
.1
.81.21.1121.0
.6
.3
.4
.5
.8
.9
1.4.9
1.2.4.4.5
Unad-justed
1.11.01.31.21.11.2
-.3.5
1.11.211.9
.5
.4
.5
.81.21.0
1.3.9
1.3.4.5.3
Sea-sonal-ly ad-justed
1.31.01.21.11.11.2
1!e
1.01.11 11.1
.6
.4
.4
.61.11.0
1.4.9
1.2.4.5.5
Unad-justed
0.7.9
1.1.9.7.5
.5
.81.3.78.5
.5
.8
.7
.9
.8
.7
.9
.81.1.7.7.4
Sea-sonal-ly ad-justed
0.8.9
1.0.7.6.6
.7
.71.2.88.8
.5
.8
.6
.8
.6
.7
1.2.7
1.0.7.5.7
Unad-justed
1.21.31.2.7.9.7
.6
.81.0.66.6
.91.3.8.6.6.6
.8
.7
.8
.4
.4
.4
Sea-sonal-ly ad-justed
1.21.01.2.5.7.7
.61.01.0.7.8.8
.81.0.8.4.4.6
.8
.9
.8
.7
.5
.5
1 Changes from December to December are based on unadjusted indexes.2 All items less food, energy, and home purchase and financing, taxes, and insurance; estimated series.3 An experimental measure using a rental equivalence approach for homeownership costs. Effective with data for January
1983, the consumer price index for all urban consumers will incorporate a rental equivalence measure.
Note.—Data beginning 1978 are for all urban consumers; earlier data are for urban wage earners and clerical workers.
Source: Department of Labor, Bureau of Labor Statistics.
296Digitized for FRASER http://fraser.stlouisfed.org/ Federal Reserve Bank of St. Louis

TABLE B-57.—Producer price indexes by stage of processing, 1947-81
[1967=100]
Year or month
19471948194919501951195219531954195519561957195819591960196119621963196419651966196719681969197019711972197319741975197619771978197919801981 *
1980:JanFebMarAprMayJune
JulyAugSeptOctNovDec
1981:iJanFebMarAprMayJune
JulyAugSeptOctNovDec
Finished goods
Totalfinishedgoods
74.079.977.679.086.586.085.185.385.587.991.193.293.093.793.794.093.794.195.798.8
100.0102.8106.6110.3113.7117.2127.9147.5163.4170.6181.7195.9217.7247.0269.8
234.4237.7240.0242.1243.4244.9
249.3251.4251.4255.4256.2257.2
260.9263.3266.0268.5269.6270.5
271.8271.5271.1274.0274.5275.3
Consumer foods
Total
82.890.483.184.795.294.389.488.786.586.389.394.590.192.191.792.591.491.995.4
101.6100.0103.6110.0113.5115.3121.7146.4166.9181.0180.4189.9207.2226.2239.5253.5
231.8232.1233.6230.1231.9233.0
241.6246.5247.4248.0248.9249.3
251.0251.3252.6251.9252.8253.8
257.6256.3255.5253.7252.7253.0
Crude
99.4107.1101.392.2
105.9112.8105.294.798.898.797.4
103.594.3
100.696.197.095.598.298.6
104.8100.0107.5116.0116.3115.8121.2160.7180.8181.2193.9201.0216.8233.1237.2263.6
225.9 .221.2230.6224.1229.1224.5
240.9247.0259.8237.8250.5254.8
257.9265.6279.7279.3263.1258.9
262.7256.9253.0253.3259.5273.4
Proc-essed
80.287.680.183.493.291.386.787.684.484.387.993.189.590.790.991.790.790.894.9
101.0100.0103.0108.9113.1115.1121.7143.9164.6181.3177.8187.3204.6223.8237.8250.6
230.4231.2232.0228.8230.3231.8
239.7244.4244.3246.9246.7246.7
248.4247.9248.1247.4249.8251.3
255.0254.2253.7251.7250.0249.1
Finished goods excluding consumer foods
Total
100.0102.6105.4109.1113.1115.4120.1139.3156.2166.1177.7190.7213.3247.8273.2
233.7238.0240.6244.5245.6247.3
250.2251.4251.1256.2257.0258.2
262.4265.5268.7272.1273.3274.1
274.7274.6274.4278.7279.7280.6
Consumer goods
Total
79.084.082.283.589.588.389.189.490.192.394.694.795.996.396.296.096.095.996.698.1
100.0102.1104.6107.7111.4113.5118.6138.6153.1162.6174.3186.7211.5250.8276.3
235.2240.8243.8247.7249.0250.9
253.9255.0254.6258.7259.5260.9
265.1268.5272.5276.1277.0277.7
277.9277.7277.4281.3282.0282.8
Durable
74.679.781.882.788.288.989.690.391.294.397.198.499.699.298.898.397.898.297.998.5
100.0102.2104.0106.9110.8113.3115.4125.9138.2144.5152.8166.9183.2206.2218.5
200.1202.6200.8202.3201.9204.1
207.5208.1206.2214.0213.1213.5
214.9215.1214.0216.6218.1218.2
218.1218.3215.6224.3224.3225.0
Non-durable
80.785.882.383.690.087.888.688.9
91."f93.292.694.094.794.794.895.194.895.997.8
100.0102.2105.0108.3111.7113.6120.5146.8163.0174.8189.3200.0231.3283.9319.4
260.4268.6275.6281.5284.2285.9
288.4290.0290.9291.7293.9296.2
302.7308.4316.0320.4321.0322.0
322.5322.1323.5323.8325.0325.9
Capitalequipment
55.460.463.464.971.272.473.674.576.782.487.589.891.591.791.892.292.493.394.496.8
100.0103.5106.9112.0116.6119.5123.5141.0162.5173.4184.6199.2216.5239.8264.3
229.1230.5232.2236.2236.7237.8
240.6241.9241.8249.2250.2250.9
254.6256.7258.1260.8262.5263.8
265.4265.8265.6271.4272.9274.1
Totalfinished
consumergoods
80.586.582.583.991.890.789.289.188.589.892.494.493.694.594.394.694.194.396.199.4
100.0102.7106.6109.9112.9116.6129.2149.3163.6169.7180.7194.9217.9248.9271.2
235.8239.7242.2243.7245.2246.8
251.7254.1254.1257.0257.9258.9
262.5265.0268.2270.6271.5272.3
273.5273.0272.6274.7274.9275.6
See next page for continuation of table.
297Digitized for FRASER http://fraser.stlouisfed.org/ Federal Reserve Bank of St. Louis

TABLE B-57.—Producer price indexes by stage of processing, 1947-81—Continued
[1967=100]
Year or month
1947.19481949
19501951195219531954
19551956195719581959
19601961196219631964
19651966196719681969
1970197119721973....1974
19751976 .197719781979
19801981 - 1 . . . .
1980:JanFebMarAprMay.June
JulyAugSeptOct .NovDec
1981: 1
JanFebMarAprMayJune
JulyAugSeptOct.NovDec.
Intermediate materials, supplies, and components
Total
72.478.375.2
78.688.185.586.086.5
88.192.094.194.395.6
95.695.094.995.295.5
96.899.2
100.0102.3105.8
109.9114.1118.7131.6162.9
180.0189.1201.5215.6243.2
280.3306.0
266.2271.9274.3275.7277.0278.8
281.6284.3285.3287.7289.1291.9
296.1298.3302.0305.8306.7307.2
308.5310.1309.6309.3309.0309.6
Foodsand
feeds «
100.099.4
102.7
109.1111.7118.5168.4200.2
195.3185.3190.5203.1226.1
252.6250.7
228.3239.3235.3229.5239.7242.0
251.4263.7265.9280.3285.7270.0
270.9261.3255.6254.9253.1253.2
251.1250.2243.7240.6236.9236.4
Other
70.076.174.2
77.787.084.385.385.7
88.392.695.094.896.4
96.895.595.395.095.6
96.998.9
100.0102.5106.1
109.9114.3118.9128.1159.5
178.6189.4202.3216.5244.4
282.3310.1
268.9274.2277.1279.1279.6281.5
283.8285.8286.6288.2289.3293.5
298.0301.0305.4309.5310.7311.2
312.7314.5314.5314.5314.3315.1
Materials andcomponents
Formanufac-
turing
72.177.874.5
78.188.584.886.286.3
88.492.694.895.296.5
96.595.394.794.995.9
97.499.3
100.0102.2105.8
110.0112.8117.0127.7162.2
178.7185.4195.4208.7234.4
265.7286.2
255.3259.6259.6260.6262.5264.3
265.6268.9269.5273.3273.9275.7
279.6280.3281.6284.1285.1285.8
287.9289.8290.2290.3289.6289.7
Forcon-
struction
66.073.173.2
77.084.383.785.185.5
88.993.594.094.096.6
95.994.694.294.595.4
96.298.8
100.0105.0110.8
112.6119.7126.2136.7161.6
176.4188.4203.4224.7247.4
268.3287.5
258.0262.5265.9265.5265.2266.9
269.6271.4271.7272.4274.0276.6
279.2280.3282.7288.0288.5289.6
290.4290.7289.9289.8289.9290.8
Proc-essedfuelsand
lubri-cants
85.596.988.2
89.993.992.893.493.3
93.396.2
101.996.095.6
98.299.499.098.196.0
97.499.2
100.097.698.5
105.0115.2118.9131.5199.1
233.0250.1282.5295.3364.8
503.0595.0
450.0471.1489.8496.6498.2502.0
514.2517.4519.5516.2521.3539.4
551.9569.8598.3608.5608.7605.7
602.0607.8600.1595.1594.2597.7
Con-tainers
66.869.870.1
72.084.579.980.081.5
82.688.692.594.794.2
95.594.795.994.794.0
95.898.4
100.0102.4106.3
111.4116.6121.9129.2152.2
171.4180.2188.3202.8226.8
254.5276.2
244.8245.7247.4253.2254.4256.2
257.0257.4257.9260.1259.5260.6
264.6268.2270.9274.3276.4277.2
278.8280.3280.8281.1280.7280.6
Supplies
77.581.076.3
78.988.888.884.386.3
84.887.188.090.091.2
90.791.893.895.294.3
95.299.4
100.0101.0102.8
108.0111.0115.6140.6154.5
168.1179.0188.7198.5218.2
244.5263.9
230.9237.3239.4239.7240.0241.2
245.3247.7250.3252.3255.2255.0
257.8257.8258.9262.4264.0264.6
266.0266.1266.1267.1267.4268.7
Crude materials for further processing
Total
101.2110.996.0
104.6120.1110.3101.9101.0
97.197.699.8
102.099.4
97.096.597.595.494.5
99.3105.7100.0101.6108.4
112.3115.1127.6174.0196.1
196.9202.7209.2234.4274.3
304.6329.1
287.8298.5293.6286.2289.3288.4
304.3317.0319.3322.8324.6323.5
328.0336.5334.2336.3334.4335.4
337.3333.0327.7320.3314.1311.6
Food-stuffsand
feed-stuffs
111.7120.8100.3
107.6124.5117.2104.9104.9
95.193.197.2
103.096.2
95.193.895.792.990.8
97.1105.9100.0101.3109.3
112.0114.2127.5180.0189.4
191.8190.2192.1216.2247.9
259.2257.4
243.6253.1246.5235.8243.0243.0
263.4276.8276.6279.1277.3271.6
270.7267.1262.1263.5260.6264.3
267.2261.8253.4245.6238.3233.7
Other
Total
..............
102.2106.8
112.7117.0128.0162.5208.9
206.9228.5245.0272.3330.0
401.0482.6
381.6394.7393.8393.4387.5384.6
390.8401.9409.8415.4424.9433.8
450.1484.9488.4492.1492.4487.4
487.2485.3486.8480.5476.9479.1
Fuel
66.678.778.3
77.979.479.982.779.0
78.884.489.290.391.9
92.892.692.193.292.8
93.596.3
100.0102.3106.6
122.6139.0148.7164.5219.4
271.5305.3372.1426.8507.6
615.0751.5
559.0579.8579.8591.4600.0604.0
615.1626.3639.1650.9664.9670.2
677.4697.7703.6716.6738.4759.2
781.2766.7790.6779.7792.6814.7
Other
90.6100.791.6
104.7120.7104.6100.198.2
103.8107.6106.2102.2105.8
101.4102.5102.0100.7102.4
104.5106.7100.0102.1106.9
109.8110.7121.9161.5205.4
188.3206.7212.2233.1284.5
346.1413.9
334.9346.0344.9342.0333.3328.9
333.9344.8351.4355.6363.9373.3
391.0427.9430.9432.5428.3418.1
413.1413.9410.7405.5398.5396.4
1 Data have been revised through August 19131 to reflect the availability of late reports and corrections by respondents. Alldata are subject to revision 4 months after original publication.2 Intermediate materials for food manufacturing and feeds.
Source: Department of Labor, Bureau of Labor Statistics.
298Digitized for FRASER http://fraser.stlouisfed.org/ Federal Reserve Bank of St. Louis

TABLE B-58.—Producer price indexes by stage of processing, special groups, 1974-81
[1967=100]
Year or month
1974
1975 .1976 , ...197719781979
198019812
1980:JanFebMar.. ..AprMayJune
JulyA u g . . .Sept . . . .OctNov. ..Dec
1981: 2
JanFeb ..Mar ..Apr.. . .May .J u n e ,
July .AugSeptOct. .Nov.Dec . . . .
Finished goods
Total
147.5
163.4170.6181.71959217.7
247.0269.8
234.4237.7240.0242.1243.4244.9
249,3251.4251.4255.4256.2257.2
260.9263.3266.0268.5269.6270.5
271.8271.5271.1274.0274.5275.3
Food
166.9
181.0180.4189.92072226.2
239.5253.5
231.8232.1233.6230.1231.9233.0
241.6246.5247.4248.0248.9249.3
251.0251.3252.6251.9252.8253.8
257.6256.3255.5253.7252.7253.0
Energy
215.2
252.4282.3326.7347.7469.9
701.3835.5
601.0640.9676.8701.3712.4714.3
720.1724.3726.1724.9731.4741.8
758.1790.2838.7853.9854.2857.3
852.4842.0848.0841.5842.0847.9
Excluding food andenergy
Total
133.3
148.5156.8166.3178.7194.7
216.4235.0
207.9209.9210.4213.0213.4215.1
217.8218.8218.3223.7224.2224.8
228.2229.5230.2232.8234.0234.7
235.5236.1235.5240.4241.3241.9
Capi-tal
equip-ment
141.0
162.5173.4184.61992216.5
239.8264.3
229.1230.5232.2236.2236.7237.8
240.6241.9241.8249.2250.2250.9
254.6256.7258.1260.8262.5263.8
265.4265.8265.6271.4272.9274.1
Con-sumergoods
exclud-ing
foodand
energy
129.1
141.0148.1156.61680183.3
204.2220.0
196.6199.0198.9200.8201.2203.1
205.7206.6206.0210.4210.7211.2
214.4215.4215.8218.3219.3219.7
220.3220.9220.1224.6225.3225.7
Intermediate materials,supplies, and components
Total
162.9
180.0189.1201.52156243.2
280.3306.0
266.2'271.9274.3275.7277.0278.8
281.6284.3285.3287.7289.1291.9
296.1298.3302.0305.8306.7307.2
308.5310.1309.6309.3309.0309.6
Foodsand
feeds1
200.2
195.3185.3190.5203.1226.1
252.6250.7
228.3239.3235.3229.5239.7242.0
251.4263.7265.9280.3285.7270.0
270.9261.3255.6254.9253.1253.2
251.1250.2243.7240.6236.9236.4
Energy
188.7
220.8236.8267.3280.3348.6
484.9573.3
432.1453.3471.2478.9481.0485.6
496.6499.6501.2498.1502,7519,0
532.0548.8575.4585.3586.0583.4
580.6585.9578.6574.0573.2576.4
Other
156.7
174.7185.0196.12104234.2
261.8283.4
252.5256.2257.5258.8259.3260.8
262.2264.2264.9266.9267.6270.6
274.3275.9277.8281.3282.6283.4
285.5287.0287.7288.2288.1288.6
Crude materials for furtherprocessing
Total
196.1
196.9202.7209.22344274.3
304.6329.1
287.8298.5293.6286.2289.3288.4
304.3317.0319.3322.8324.6323.5
328.0336.5334.2336.3334.4335.4
337.3333.0327.7320.3314.1311.6
Food-stuffsand
feed-stuffs
189.4
191.8190.2192.1216.2247.9
259.2257.4
243.6253.1246.5235.8243.0243.0
263.4276.8276.6279.1277.3271.6
270.7267.1262.1263.5260.6264.3
267.2261.8253.4245.6238.3233.7
Energy
223.0
266.9283.1323.53625439.9
586.1783.5
538.3547.9552.3563.4570.6577.2
583.3596.6604.6614.2632.0652.2
696.0782.6785.1790.5798.2793.5
793.6786.4796.6787.2791.3801.4
Other
198.3
165.0191.0190.12092253.0
269.4266.3
270.7286.6281.7272.7257.2247.1
253.5263.1271.0273.8277.2277.9
274.1271.1275.5277.9272.7267.5
267.0269.0264.0259.9250.3246.5
1 Intermediate materials for food manufacturing and feeds. :2 Data have been revised through August 1981 to reflect the availability of late reports and corrections by respondents. All
data are subject to revision 4 months after original publication.Source: Department of Labor, Bureau of Labor Statistics.
299Digitized for FRASER http://fraser.stlouisfed.org/ Federal Reserve Bank of St. Louis

TABLE B-59.—Producer price indexes for major commodity groups, 1940-81
[1967-100]
Year or month
1940194119421943194419451946... . . . .1947. . .19481949. . . .1950. .1951 .. .1952.. .. . .1953 . .195419551956 . . .1957 .1958195919601961 .1962 . .. ..1963... .196419651966196719681969197019711972197319741975197619771978197919801981s
1980:JanFebM a r .AprMay... .,June
JulyJugSeptOctNovDec
1981: 2
JanFebMarAprMayJune
JulyAug.SeptOct.:::::::::::;::::::::::::::::.NovDec
Farm products and processedfoods and feeds
Total
94.3 '101.589.693.9
106.9102.796.095.791.290.693.798.193.593.793.794.793.893.297.1
103.5100.0102.4108.0111.7113.9122.4159.1177.4184.2183.1188.8206.6229.8244.7251.5
231.9237.0234.9229.3233.8234.3246.6255.1256.5259.4260.5257.0
257.9255.1253.5253.8252.9254.3
256.8254.2250.0246.1242.7241.2
Farmproducts
41450.364.875.075.578.590.9
109.4117.5101.6106.7124.2117.2106.2104.798.296.999.5
. 103.997.597.296.398.096.094.698.7
105.9100.0102.5109.1111.0112.9125.0176.3187.7186.7191.0192.5212.5241.4249.4254.9
236.4242.3239.3228.9233.5233,4254.3263.8267.0263.6264.9265.3
264,5262.4260.7263.3259.6260,7
263.3257.9251.0243.3237.4234.5
Processedfoods and
feeds
82.988.780.683.492.791.687.488.985.084.987.491.889.489.591.091.992.592.395.5
101.2100.0102.2107.3112.1114.5120.8148.1170.9182.6178.0186.1202.6222.5241.2248.7
228.5233.1231.6228.6233.1233.9241.5249.4249.8256.1257.2251.5
253.3250.2248.5247.6248.2249.9
252.2251.2248.4246.6244.7244.0
Industrial commodities
Total
44.047.350.751.552353.058.070.876.975.378.086.184.184.885.086.990.893.393.695.395.394.894.894.795.296.498.5
100.0102.5106.0110.0114.1117.9125.9153.8171.5182.4195.1209.4236.5274.8304.1-
260.6265.9268.6271.3271.9273.5276.2278.2278.8282.0283.4286.6
291.5295.7299.6303.5304.7305.1
306.2307.2307.2308.8309.1310.1
Textileproducts
andapparel
1036108.1
• 98.9102.7114.6103.4100.898.698.798.798.897.098.499.597.798,698.599.299.8
100.1100.0103.7106.0107.1109.0113.6123;8139.1137.9148,2154.0159.8168.7183.5199.6
175.2176.5179.3181.2182.0183.0184.7185.6186.6188.1189.6190.4
193.1193.9195.2197.6199.2200.1
201.3202.4202.5203.0203.2203.1
Hides,skins,
leather,and
relatedproducts
45.248.452.852.752,252.961.183.384.279.986.399.180.181,377.677.381.982.082.994.290.891.792.790.090.394.3
103.4100.0103.2108.9110.3114.1131.3143.1145.1148.5167.8179.3200.0252.4248.9261.5
255.7250.9246.8243.5240.7240.9245.1251,3247.8251.2255.4256.9
258.2257.7261.2263.5263.7261.6
261.1261.3263.0262.7261.7262.7
Fuels andrelated
products,and
power *
51.454.656.257.859.560.164.476.990.586.287.190.390.192.691.391.294.099.195.395.396.197.296.796.393.795.597.8
100.098.9
100.9106.2115.2118.6134.3208.3245.1265.6302.2322.5408.1574.0694.4
508.0532.7553.5566.6572.1576.5585.5590.6593.5592.9600.2615.7
634.6667.5696.5707.2709.0707.6
704.9704.3703.2697.2697.5702.7
Chemicalsand alliedproducts »
52.457.063.364.164,865.270.593.795.987.688.9
101.796.597.798.998.599.1
101.2102.0101.6101.8100.799.197.998.399.099.4
100.099.899.9
102.2104.1104.2110.0146.8181.3187.2192.8198.8222.3260.3287.8
246.0248.7252.8259.8262.5262.8263.3264.4263.4264,8266.7268.1
274.3277.6280.4286.0288.6290.5
291.3293.3293.3292.8292.5292.7
1 Prices for some items in this grouping are lagged and refer to 1 month earlier than the index month.2 Data have been revised through August 1981 to reflect the availability of late reports and corrections by respondents All
data are subject to revision 4 months after original publication.
300Digitized for FRASER http://fraser.stlouisfed.org/ Federal Reserve Bank of St. Louis
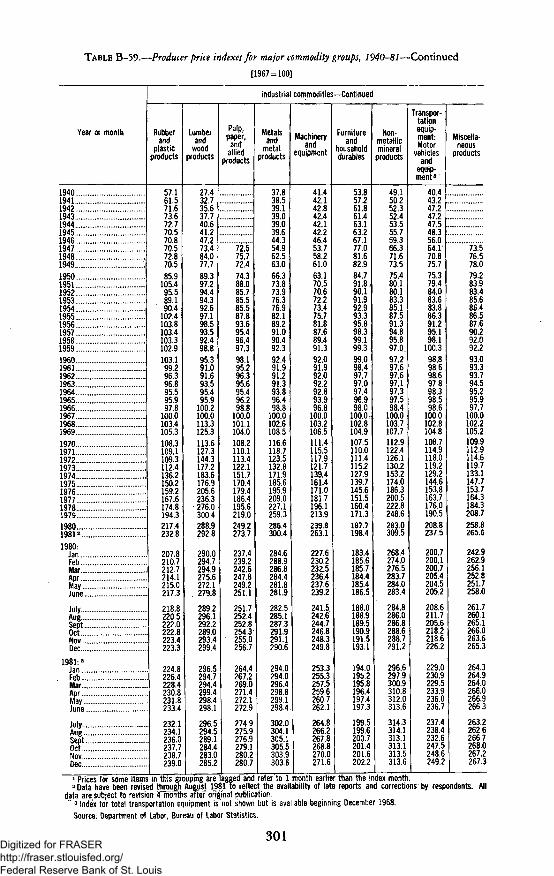
TABLE B-59.—Producer price indexes for major commodity groups, 1940-81—-Continued
[1967=100]
Year or month
1940194119421943194419451946194719481949195019511952195319541955195619571958 . . .19591960196119621963196419651966196719681969197019711972197319741975 . . . . ,197619771978197919801981 2
1980:JanFebMarAprMayJune. .
JulyAugSeptOct .NovDec
1981: 2
Jan. Feb....
MarAprMay. ..June
July .AugSeptOct. . .Nov. ..Dec.. ..
Industrial commodities— Continued
Rubberand
plasticproducts
57.161.571.673.672.770.570.870.572.870.585.9
105.495.589.190.4
102.4103.8103.4103.3102.9103.1
99.296.396.895.595.997.8
100.0103.4105.3108.3109.1109.3112.4136.2150.2159.2167.6174.8194.3217.4232.8
207.8210.7212.7214.1215.0217.3
218.8220.5222.0222.8223.4223.3
224.8226.4228.4230.8231.8233.4
232.1234.1236.0237.7238.7239.0
Lumberand
woodproducts
27.432.735.637.740.641.247.273.484.077.789.397.294.494.392.697.198.593.592.498.895.391.091.693,595.495.9
100.2100.0113.3125.3113.6127.3144.3177.2183.6176.9205.6236.3276.0300,4288.9292.8
290.0294.7294.9275.6272.1279.8
289.2296.1292.2289.0293.4299.4
296.5294.7294,4299.4298.4298.1
296.5294,5289,1284.4283.0285.2
Pulp,paper,
andallied
products
'•"••"-'"""•
72.5"75.772.474.388.085.785.585.587.893.695.496.497.398.195.296.395.695.496.298.8
100.0101.1104.0108.2110.1113.4122.1151.7170.4179.4186.4195.6219.0249.2273.7
237.4239.2242.6247.8249.2251.1
251.7252.4252.8254.3*255.0256.7
264.4267.2269.0271.4272.1272.9
274.9275.9276.9279.1280.2280.7
Metalsand
metalproducts
37.838.539.139.039.039.644.354.962.563.066.373.873.976.376.982.189.291.090.492.392.491.991.291.393.896.498.8
100.0102.6108.5116.6118.7123.5132.8171.9185.6195.9209.0227.1259.3286.4300.4
284.6288.9286.8284.4281,8281.9
282.5285.1287.3291.9291.1290.6
294.0294.0296.4298.8299.1298.4
302.0304.1305.1305.5303.9303.6
Machineryand
equipment
41.442.142.842.442.142.246.453.758.261.063.170.570.672.273.475.781.887.689.491.392.091.992.092.292.893.996.8
100.0103.2106.5111.4115.5117.9121.7139.4161.4171.0181.7196.1213.9239.8263.1
227.6230.2232.5236.4237.6239.2
241.5242.6244.7246.8248.3249.8
253.3255.3257.5259.6260.7262.1
264.8266.2267.8268.8270.0271.6
Furnitureand
householddurables
53.857.261.861.463.163,267,177.081.682.984.791.8;90.191.992.993.395.898.399.199.399,098.497.797.097.496.998,0
100,0..102.8104.9107.5110.0111.4115.2127.9139.7145.6151.5160.4171,3187.7198.4
183.4185,6185.7184.4185.4186.5
188.0188.9189.5190.9191.5193.1
194.0195.2195.8196.4197.4197.3
199.5199.6200.7201.4201.6202.2
Non-metallicmineral
products
49.150.252.352.453.555.759.366.371.673.575.480.180.183.385.187.591.394.895.897.0.97.297.697.697.197.397.598.4
100.0103.7107.7112.9122.4126.1130.2153.2174.0186.3200.5222.8248.6283.0309.5
268.4274.0276.5283.7284.0283.4
284.8286.0286.8288.6288.7291.2
296.6297.9300.9310.8312.0313.6
314.3314.1313.1313.1313.5313.6
Transpor-tationequip-ment:Motor
vehiclesand
equip-ment 3
40.443247.247247.548.356.064.170.875.775.379.484.083.683.886.391.295.198.1
100.398.898.698.697.898.398.598.6
100.0102.8104,8108,7114.9118.0119.2129.2144.6153.8163.7176.0190.5208.8237.5
200.7200.1200.7205.4204.5205.2
208.6211.7205.6218.2218.6226.2
229.0230.9229.5233.9236.0236.7
237.4238.4232.6247.5248.6249.2
Miscella-neous
products
73.576.578.079.283.983.485.686.486.587.690.292.092.293.093.393.794.595.295.997.7
100.0102,2105.2109.9112.9114.6119.7133.1147.7153.7164.3184.3208.7258.8265.6
242.9262.9256.1252.8251.7258.0
261.7260.1265.1266.0263.6265.3
264.3264.9264.0266.0266.9266.3
263.2262.6266.7268.0267,2267.3
2 Data have been revised through August 1981 to reflect the availability of late reports and corrections by respondents. Alldata are subject to revision 4 months after original publication.'"3 Index for total transportation equipment is'not shown but is available beginning December 1968.
Source: Department of labor, Bureau of Labor Statistics.
301Digitized for FRASER http://fraser.stlouisfed.org/ Federal Reserve Bank of St. Louis

TABLE B-60.—Changes in producer &rice indexes for finished goods, 1950-81[Percent change]
Year or month
195019511952195319541955195619571958195919601961196219631964196519661967196819691970197119721973... .197419751976. ..19771978 ... .197919801981 2
Totalfinishedgoods
Dec.to
Dec.'
10.42.9
-2.2.51
1.24.23.2
.5-.41.8
-.5.1
— 2!s
3.32.21.63.14.82.23.23.8
11.818.36.63.76.99.2
12.811.87.0
Yearto
year
1.89.5
~l!o2
.22.83.62.3
— 28
0
— 3!4
1.73.21.22.83.73.53.13.19.1
15.310.84.46.57.8
11.113.59.2
Finishedconsumer
foods
Dec.to
Dec.1
13.35.3
-5,9= 2.2
19-2.9
3.65.3
-3.75.2
-1.8
-n.4
9.11.4
-.44.88.2
-2.55.98.0
22.513.05.5
= 2.56.9,
11.77.47,51.5
Yearto
year
1.912.4— 9
-5^2g
-2.5-=,23.55.8
-4.72.2-.4
.9-1.2
.53.86.5
-1.63.66.23.21.65.6
20.314.08.4
"£39.19.25,95.8
Finished goods excluding consumer foods
Total
Dec.to
Dec.1
' "2.43.44.32.12.16.6
21.27.26.26,98.3
14.813.38.7
Yearto
year
:::::
....
' 262.73.53.72.04.1
16.012.16.37.07.3
11.916.210.3
Consumergoods
Dec.to
Dec.1
8.2.9
-1.11.6
1.72.51.7.2.84
— 3'l,1.1.9
1.72.12.02.93.92.02.07.4
20.56.76.06.78.5
17.514.28.4
Yearto
year
1.67.2
-1.3.9.3.8
2.42.5
1.34
-.12
0-.1
.71.61.92.12.43.03.41.94.5
16.910.56.27.27.1
13.318.610.2
Capitalequipment
Dec.to
Dec.1
10.33.4
.82.31.15.68.34.31.31.0
1
3
!91.53.93.13.04.64.92.42.05.3
22.68.26.47.37,98.8
11.49.2
Yearto
year
2.49.71.71.71.23.07.46.22.61.9
2.14.2
1.01.22.53.33.53.34.84.12.53.3
14.215.26.76.57.98.7
10.810.2
Finishedenergygoods
Dec.to
Dec.1
.:"":.
16,411.512.18.5
58.027.814.3
Yearto
year
17.311.815.76.4
35.149.219.1
Finished goodsexcluding food
and energy
Dec.to
Dec.1
'...'..".'
6.15.66.38.39.4
10.77.6
Yearto
year
."."..:.:
'...'.".".
11.45.66.17.59.0
11.18.6
Percent change from preceding month
1980:JanFeb. .MarAprMay. .June.July... .Aug.Sept . .Oct.. .NovDec. ...
1981: aJanFeb..Mar. . . ,
[Jay" !.JuneJulyAugSeptOctNovDec
Unad-justed
1.91.410.9.5.6
1.88
01.6.3.4
1.4.9
1.0.9.4.3.5^-1
1.1.2,3
Sea-son-
Sjusted
1.61.3l.i.8.5.8
1.71.2.3.9.7.4
1.2.8
1.2.8.4.5.4.2.1.6.5.3
Unad-justed
-0.0'.6
-1.5.8
3.72.0
.4
.2
.4
.2
.7
.1
-!3.4.4
1.5
~'.3-.7-.4
.1
Sea-son-
»justed
=0.6=.61.0
-1.3.4.6
3.72.7
.5
.7
.3
.0
.1-.61.0
=.1.1.5
1,4.3
-.3-.2-.5
.1
Unad-justed
2.61.8l.i1.6.4.7
1.2.5
-.12.0.3.5
1.61.21.21.3
.4
.3
.2-.0-.11.6.4.3
Sea-son-
3justed
2.51.91.21.5.5.9
1.1.7.2
1.1.8.4
1.51.21.31.1.4.5.1.2.2.8.8.3
Unad-justed
2.92.41,21.6.5.8
1.2.4
= .21.6.3.5
1.61.31.51.3.3,3.1
-.1= .11.4
.2
.3
Sea-son-
Sjusted
2.92.41.31.4.5
1.01.0.6.2.8.9.4
1.61.31.51.1
'.4-.1
.0
.2
.7
.8
.2
Unad-justed
1.7.6.7
1.7.2.5
1.2.5
-.03.1
.4
.3
1.5.8.5
1.0.7.5.6.2
-.12.2.6.4
Sea-son-
111'justed
1.5.8,9
1,6.3.7
1.21.0.1
1.7.6.4
1.2,9.7.9.7,7.7.6.1.9.8.6
Unad-justed
3.56.65.63.61.6.3.8,6.2
— 2'.9
1.4
2.24.26.11.8.0.4
-.6-1.2
.7-.8
.1
.7
Sea-son-allyad-
justed
4.06.85.63.31.0.1.3.3.2,2
1.81.5
2.64.36.11.4
= !2-1.0-1.5
.7, ,4
'.9.7
Unad-justed
2,41.0
1.2.2.8
1.3.5
-.22.5
.2
.3
1.5.6.3
1.1
!3.3.3
-=.32.1
.4
.2
Senson-allyad-
justed
2.21.1.3
1.1.3
1.11.3.8.2
1.2.6.3
1.2.6.3
1.0.6.6.3.5.1
1.0.8.2
1 Changes from December to December are based on unadjusted indexes.a Data have been revised through August 1981 to reflect the availability of late reports and corrections by respondents. Alldata are subject to revision 4 months after original publication.
Source: Department of Labor, Bureau of Labor Statistics.
302Digitized for FRASER http://fraser.stlouisfed.org/ Federal Reserve Bank of St. Louis

MONEY STOCK, CREDIT, AND FINANCE
TABLE B-<$1.—Money stock measures and liquid assets, 1959—81
[Averages of daily figures; billions of dollars, seasonally adjusted]
Year and month
December:195919601961 .. . .196219631964196519661967196819691970 ..197119721973197419751976 . .19771978197919801981".
1980:J a n . . . .FebMarAprMayJuneJulyAugSeptOct "NovDec
1981:JanFebMarApr.A,..: ..:...:.: - . . . - . . . "T :.:.../JuneJulyAugSeptOctNov . .Dec*
Ml
Sum ofcurrency,demanddeposits,travelers'
checks, andother
checkabledeposits 1
(OCD)
141.2142.2146.7149.4154.9162.0169.6173.8185.2199.5205.9216.8231.0252.4266.4278.0291.8311.1336.4364.2390.5415.6441.9
392.7396.9396.7391.0391.3394.9399.3406.9411.8416.3419.1415.6
419.2421.2425.7433.3431.3428.8430.1432.8431.8433.0437.9441.9
M2
Ml-B plusovernightRPs and
Eurodollars,MWMF
shares, andsavings andsmall timedeposits 2
297.1311.7334.4361.7392.0423.4457.9479.2524.4567.1588.6626.4711.1803.2859,8908.0
1,024.41,169.41,296.41,404.21,525.21,669.41,841.2
1,538.71,553.41,559.61,553.61,568.21,589.31,614.01,633.41,644.91,654.01,668.51,669.4
1,680.81,695.71,718.41,737.71,743.21,749.31,760.11,777.21,786.81,798.91,824.71,841.2
. M3
M2 pluslarge timedepositsand term
RPs
298.3313.7338.3368.7402.9438.7479.1502.9556.5606.2611.4672.9771.1879.5977.9
1,060.41,163.01,302.31,462.51,625.91,775.61,965.12,187.2
1,792.01,811.51,819.11,817.51,833.51,852.61,873.61,897.41,912.81,928.31,951.01,965.1
1,989.32,009.12,027.02,045.72,060.72,079.02,094.02,117.52,133.72,144.22,168.92,187.2
L
M3 plusother liquid. assets
388.0402.9429.5465.0502.4538.9583.0614.6668.0731.7762.6814.2900.7
1,020.31,140.31,246.01,373.51,528.91,722.71,936.82,151.72,378.4
2,175.32,199.52,210.92,218.82,232.12,246.62,264.42,291.32,309.02,326.02,355.62,378.4
2,408.72,433.62,445.12,457.42,479.92,502.82,519.42,550.82,574.4
Percent change fromyear or 6 months
earlier 3
Ml
0.73.21.83.74.64.72.56.67.73.25.36.59.35.54.45.06.68.18.37.26.46.3
5.66.65.42.01.32.33.45.17.8
13.414.710.8
10.27.26.98.35.96.55.35,62.9-.13.16.2
M2
4.97.38.28.48.08.14.79.48.13.86.4
13.513.07.05.6
12.814.210.98.38.69.5
10.3
7.77.97.15.76.88.6
10.010.611.213.313.210.3
8.47.89.1
10.49.29.89.79.88.17.29.6
10.8
M3
5.27.89.09.38.99.25.0
10.78.9.9
10.114.614.111.28,49.7
12.012.311,29.2
10.711.3
9.29.47.96.67.88.99.39.7
10.612.613.212.5
12.712.112.312.511.611.910.811.110.89.9
10.810.7
1 Net of demand deposits due to foreign commercial banks and official institutions. Ml differs from the sum of componentspresented in Table B-62 by the amount of demand deposits held by thrift institutions at commercial banks that are estimated to beused in servicing thrift OCD liabilities.2 M2 differs From the sum of components presented in Table B-62 by the amount of demand deposits held by thrift institutions atcommercial banks.
3 Monthly percent changes are from 6 months earlier at a compound annual rate.Note.—See Table B-62 for components.Source: Board of Governors of the Federal Reserve System.
303Digitized for FRASER http://fraser.stlouisfed.org/ Federal Reserve Bank of St. Louis

TABLE B-62.—- Components of money stock measures and Iiqt4id assets, 1959-81
[Averages of daily figures; billions of dollars, seasonally adjusted, except as noted]
Period
Decem-ber:1959....
I960..,.1961....1962.,..1963....1964,..
19651966196719681969
19701971197219731974
19751976197719781979
19801981"...
1980:JanFebMarAprMayJune
JulyAugSeptOctNovDec
1981:JanFebMarAprMayJune
JulyAugSeptOctNovDec"
Currency
28.9
29.029.630.632.534.2
36.338.340.443.546.1
49.052.656.961.667.8
73.880.688.697.4
106.1
116.1123.1
107.3108,1108.9109.1110.4111.1
112.1113.4113.8114.9115.7116.1
116.6117.2117.9118.9119.8119.9
120.8121.2121.1121.4122.1123.1
Demanddepos-its1
111.8
112.7116.6118,2121.7127.0
132.4134.5143.7154.9158.6
166.4176.8193.6202.5207.4
214.1224.4239.7253.9262.8
267.4236.8
263.3265.2263.8257.1256.1258.7
260.7265.4268.6271.2271.6267.4
254.4245.8243.5243.1240.7237.9
236.4236.7234.4234.7235.9236.8
Travel-ers'
checks
0.4
.4
.4
.4(j
Ij
.6
.6
.7
.8
.8
1.01.11.31.51.8
2.32.83.13.53.8
4.24.5
3.83.83.83.83.83.8
3.83.94.04.04.14.2
4.24.24.24.34.34.2
4.14.44.54,54.64.5
Otherchecka-
bledepos-
its
0.1
.2
.2
.2
.3
.3
.3
.3
.3
.4
.4
.4
.5
.6
.8
.9
1.63.45.09.4
17.8
28.177.9
18.419.920.321.121.021.4
22.824.225.526.327.928.1
44.354.360.267.366.967.1
69.070.872.272.875.677.9
Over-nightrepur-chaseagree-ments(RPs)(net)
0.0
.0
.0
.0
.0
.0
.0
.51.11.62.5
1.42.53.16.87.2
7.513.617.621.921.8
27.927.5
23.124.322.919.520.622.3
26.027.929.328,328.127.9
27.527.028.729.331.833.3
32.332.429.826.927.127.5
Over-nightEuro-
dollarsNSA
0.0
.0
.0
.0
.0•0.
.0
.0
.0
.0
.0
.0
.0
.0
.0
.0
.0
.01.02.03.6
4.56.7
4.43.53.42.52.83.0
3.63.83.74.44J4.5
5.24.94.65.06.56.4
6.97.86.95.96.56.7
Moneymarketmutual
fund(MMMF)shares
NSA
0.0
.0
.0
.0
.0
.0
.0
.0
.0
.0
.0
.0
.0
.0
.12.3
3.63.43.8
10.343.6
75.8184.5
49.156.760.960.466.874.2
80.680.778.277.477.075.8
80.792.4
105.6117.1118.1122.8
134.3145.4157.0166.4176.6184.5
Savingsdeposits
145.2
157.8173.9193.1212.6233.3
255.0251.1261.4266.3261.0
256.7287.5317.2322.4333.9
383,9447.8486.5475.5416.5
393.0335.6
412,6406.4396.0381.9377.7384.6
395.9404.6407.9407.8406.1393.0
376.9370.8368.3367.0361.1354.0
349.1340.7334.5329.6331.5335.6
Smalldenom-inationtimeHo(HJ-
pQSitS 2
11.5
12.614.820.225.729.3
34.555.178.1
101.1120.7
153.0191.8232.6266.4288.9
340.1396.2453.8533.3652.7
756.8848.6
660.4669.2683.5702.2712.9714.1
712.6713.6718.1724.0738.0756.8
775.7783.3789.4790.0798.4807.7
811.3821.9830.7841.1849.0848.6
Largedenom-ination
timeHP.irc-
nnclte 2posus *
1.2
2.04.07.1
10.915.3
21.323.231.137.620.4
45.157.673.1
111.0144.0
129.6117.9145.1194.0219.7
256.8298.4
222.8227.5230.2234.4235.9233.3
228.2229.6233.4237.7245,4256.8
268.0273.9271.0269.5277.2287.3
290.3296.6299.9298.9296.5298.4
Termrepur-chaseagree-ments(RPs)NSA
0.0
.0
.0
.0
.0
.0
.0
.51.01.52.4
1.42.53.37.18.4
9.015.021.027.730.7
38.947.6
30.530.629.229.529.430.0
31.434.534.536.537.138.9
40.439.537.638.540.242.4
43.543.747.146.447.847.6
TermEuro-
dollars(net)NSA
0.7
.81.41.61,92.4
1.72.12.12.92.7
2.22.73.65.48.0
9.713.118.729.942.9
48.4
45.649.449.150.150.248.9
48.348.345.145.246.348.4
50.252.252.252.657.057.9
58.761.061.2
Sav-ings
bonds
46.1
45.746.546.948.149.0
49.750.251.251.851.7
52.054.357.560.463.2
67.271.876.480.379.6
72.3
79.278.277.075.474.273.7
73.573.273.072.872.672.3
71.971.170.770.469.969.7
69.368.868.4
Short-term
Treasurysecuri-
ties
38.7
36.837.139.940.738.5
40.743.238.746.159.5
49.336.341.150.053.6
77.181.190.199.6
129.3
159.9
132.4134.2138.3146.3148.6145.1
143.5146.7149.9150.2154.6159.9
165.1169.9164.6157.6157.5160.3
160.7161.8167.8
Bankersaccept-ances
0.5
.81.01.01.11.2
1.51.61.72.23.2
3.33.53.34.7
10.6
8.48.8
11.921.727.0
32.5
27.627.128.128.929.229.6
29.328.829.730.631.332.5
33.032.033.034.635.736.5
37.236.937.0
Commer-cial
paper
3.6
5.15.26.87.79.1
10.214.417.822.534.0
34.532.735.241.950.1
48.151.863.179.497.3
100.2
98.699.099.3
100.696.596,7
96.296.898.598.999.8
100.2
99.299.497.696.599.199.3
99.6104.8106.2
1 Demand deposits at all commercial banks other than those due to domestic banks, the U.S. Government, and foreign banks andofficial institutions less cash items in the process of collection and Federal Reserve float.
2 Small denomination and large denomination deposits are those issued in amounts of less than $100,000 and more than $100,000,respectively.
Note.—NSA indicates data are not seasonally adjusted.See also Table B-61.Source: Board of Governors of the Federal Reserve System.
304Digitized for FRASER http://fraser.stlouisfed.org/ Federal Reserve Bank of St. Louis

TABLE B-63.—Commercial bank loans and investments, 1939-81[Billions of dollars]
Year and month
End of month >
1939- Dec
1940- Dec1941: Dec. . .1942: Dec1943: Dec .1944: Dec
1945: Dec1946- Dec1947: Dec1948: Dec
1948: Dec1949: Dec
1950: Dec1951: Dec1952- Dec1953: Dec . .1954: Dec
1955- Dec1956: Dec1957: Dec1958: Dec .1959: Dec
1960: Dec1961- Dec . ..1962: Dec1963: Dec1964: Dec
1965: Dec1966- Dec1967: Dec1968- Dec1969: Dec
1970; Dec1971- Dec1972: D e c . . . . ...
Average for month 2
1972: Dec1973: Dec1974: Dec
1975: Dec1976: Dec1977: Dec1978: Dec1979: Dec
1980: Dec1981- Dec 3
1981:J a n . . . .FebMarApr -flfay.June
JulyAugSeptOctNovDec.3
Totalloansand
invest-ments
40.7
43.950.767.485.1
105.5
124.0114.0116.3114.3
Loans
Total
17.2
18.821.719.219.121.6
26.131.138.142.5
Com-mercial
andindus-trial
Investments
U.S.Treas-
urysecu-rities
16.3
17.821.841.459.877.6
90.674.869.262.6
Othersecuri-
ties
7.1
7.47.26.86.16.3
7.38.19,09.2
Seasonally adjusted
113,0118.7
124.7130.2139.1143.1153.1
157.6161.6166.4181.2188.7
197.4212,8231.2250.2272.4
300.1316.1352.0390.2401.7
435.5485.7558.0
572.6647.8713.6
745.2804.6891.5
1,013.51,135.9
1,239.61,317.7
1,251.41,255.71,261.01,267.91,285.11,295.4
1,302.81,312.21,317.51,323.81,327.51,317.7
41.542.0
51.156.562.866.269.1
80.688.191.595.6
110.5
116.7123.6137.3153.7172.9
198.2213.9231.3258.2279.4
292.0320.9378.9
390.5460.5520.1
517.4555.0632.5747.0849.9
915.1974.9
921.6924.4928.8934.5948.5957.1
964.0972.8978.8982.6986.0974.9
39.4
42.143.947.652.158.4
69.578.686.295.9
105.7
110.0116.2130.4
137.5165.4196.9
189.6190.9210.9245.9291.2
326.8357.9.
330.0330.0331.4332.8339.4345.1
350.9356.7360.5363.6363.5357.9
62.366.4
61.160.462.262.267.6
60.357.256.965.157.7
59.965.364.761.560.8
57.153.559.460.751.2
57.860.662.6
65.858.553.6
82.2100.899.893.894.5
110.0110.9
113.2113.4112.9113.9116.0116.7
116.4115.6113.2112.5110.3110.9
9.210.3
12.413.414.214.716.4
16.816.317.920.520.5
20.823.929.235.038.7
44.848.761.371.371.1
85.7104.2116.5
116.3128.8139.9
145.6148.8159.3172.8191.5
214.4231.8
216.6217.9219.4219.5220.6221.6
222.3223.8225.6228.7231.2231.8
Loansplus
loanssold to
bankaff i l i -ates
283.3
' 294.7323.7381.5
393.1464.8524.8
521.8558.7637.1750.7852.9
917.8977.7
924.3927.2931.5937.2951.3960.0
966.7975.4981.5985.3988.8977.7
1 Data are for December 31 call dates.3 Data are prorated averages of Wednesday figures for domestically chartered banks and averages of current and previous month-enddata for foreign-related institutions. Lease financing receivables are included in total loans and investments and in total loans.3 Shifts of foreign loans and securities from U.S. banking offices to international banking facilities reduced the December levels forseveral items as follows: total loans and investments, $23.4 billion; total loans, $23.1 billion; commercial and industrial loans, $11.0billion; and other securities, $0.3 billion.
Source.- Board of Governors of the Federal Reserve System.
305Digitized for FRASER http://fraser.stlouisfed.org/ Federal Reserve Bank of St. Louis
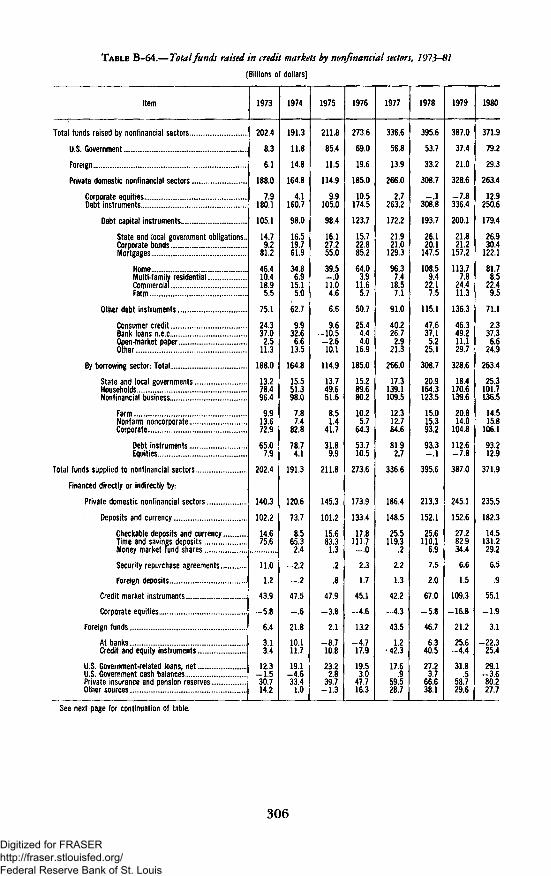
TABLE B-64.—Total funds raised in credit markets by nonfinancial sectors, 1973-81
[Billions of dollars]
Item
Total funds raised by nonfinancial sectors
U S Government
Foreign
Private domestic nonfinanclal sectors
Corporate equitiesDebt instruments
Debt capital instruments
State and local government obligations..Corporate bondsMortgages
HomeMulti-family residentialCommercialFarm
Other debt instruments . . . . .
Consumer creditBank loans n.e.c. .Open-market paperOther. ...
By borrowing sector: Total.
State and local governmentsHouseholds . . .Nonfinancial business
Farm .Nonfarm noncorporateCorporate,.
Debt instrumentsEquities
Total funds supplied to nonfinancial sectors
Financed directly or indirectly by:
Private domestic nonfinancial sectors
Deposits and currency
Checkable deposits and currencyTime and savings deposits .Money market fund shares
Security repurchase agreements
Foreign deposits
Credit market instruments
Corporate equities .
Foreign funds
At banksCredit and equity instruments
U.S. Government-related loans, netU.S. Government cash balancesPrivate insurance and pension reservesOther sources
1973
2024
83
61
188.0
79180.1
1051
14.79.2
81.2
46.410.418.95.5
75.1
24.337.02.5
11.3
188.0
13.278.496.4
9.913672.9
65.07.9
202.4
140.3
1022
14.675.6
11.0
1.2
43.9
-58
64
313.4
123-1530714.2
1974
191.3
11.8
14.8
164.8
4.1160.7
98.0
16.519.761.9
34.86.9
15.15.0
62.7
9.932.66.6
13.5
164.8
15.551.398.0
7.874
82.8
78.74.1
191.3
1206
737
8.565.324
-2.2
-.2
47.5
- 6
218
10111.7
191-463341.0
1975
211.8
85.4
11.5
114.9
9.9105.0
98.4
16.127.255.0
39.5-.011.04.6
6.6
9.6-10.5
-2.610.1
114.9
13749.651.6
8.514
41.7
31.89.9
211.8
145.3
101.2
15.683.313
.2
.8
47.9
-38
2 1
-8.710.8
23.228
397-1.3
1976
2736
690
19.6
185.0
10.5174.5
123.7
15.722.885.2
64.03.9
11.65.7
50.7
25.44.44.0
16.9
185,0
15.289.680.2
10.257
64.3
53.710.5
273.6
173.9
1334
17.8111.7-0
2.3
1.7
45.1
-4.6
132
-4.717.9
19.530
47716.3
1977
336,6
56.8
13.9
266.0
27263.2
172.2
21.921.0
129.3
96.37.4
18.57.1
91.0
40.226.72.9
21.3
266.0
17.3139.1109.5
12.312784.6
81.92.7
336.6
1864
1485
25.5119.3
2
2.2
1.3
42.2
-43
435
12•42.3
17.69
59528.7
1978
395.6
53.7
33.2
308.7
-.1308.8
193.7
26.120.1
147.5
108.59.4
22.17.5
115.1
47.637.1
5,225.1
308.7
20.9164.3123.5
15.015393.2
93.3
395.6
213.3
152.1
25.6110.1
6.9
7.5
2.0
67.0
-5.8
467
6.340.5
27.23.7
66638.1
1979
387.0
37.4
21.0
328.6
-7.8336.4
200.1
21.821.2
157.2
113.77.8
24.411.3
136.3
46.349.211.129.7
328.6
18.4170.6139.6
20.8140
104.8
112.6-7.8
387.0
245.1
152.6
27.282.934.4
6.6
1,5
109.3
-16.8
212
25.6-4.4
31.85
58729.6
1980
371.9
79.2
29.3
263.4
12.9250.6
179.4
26.930.4
122.1
81.78.5
22.49.5
71.1
2.337.36.6
24.9
263.4
25.3101.7136.5
14.5158
106.1
93.212.9
371.9
235.5
182.3
14.5131.229.2
6.5
.9
55.1
-1.9
31
-22.325.4
29.1-3680227.7
See next page for continuation of table.
306
Digitized for FRASER http://fraser.stlouisfed.org/ Federal Reserve Bank of St. Louis

TABLE B-64.—Total funds raised in credit markets by nonfinancial sectors, 1973-81—Continued
[Billions of dollars]
Item
Total funds raised by nonfinancial sectors
U.S. Government
Foreign
Private domestic nonfinancial sectors
Corporate equitiesDebt instruments
Debt capital instruments.
State and local government obligationsCorporate bondsMortgages
Home mortgagesMulti-family residentialCommercial ... . . .Farm.
Other debt instruments
Consumer creditBank loans n e eOpen-market paper
By borrowing sector: Total
State and local governmentsHouseholdsNonfinancial business
FarmNonfarm noncorporateCorporate
Debt instruments ..Equities
Total funds supplied to nonfirtancial sectors
Financed directly or indirectly by:
Private domestic nonfinancial sectors
Deposits and currency
Checkable deposits and currency-Time and savings depositsMoney market fund shares
Security repurchase agreements .
Foreign deposits
Credit market instruments
Corporate equities
Foreign funds
At banksCredit and equity instruments
U.S. Government-related loans netU S Government cash balancesPrivate insurance and pension reservesOther sources
1981 unadjusted quarterlyflows
1
89.9
35.8
5.6
48.4
3.045.5
33.0
4.56.3
22.2
13.91,34.32.7
12.5
-2.51.65.48.0
48.4
4.018.326.1
5.23.0
17.9
15.03.0
89.9
57.6
45.1
-8.09.2
37.1
4.2
2.6
13.1
-.6
6.4
-4.811.2
3.317
18.45.9
II
91.3
-2.6
8.6
85.3
-2.587.8
41.5
7.34.9
29.3
18.81.36.03.2
46.3
9.318.45.8
12.9
85.3
6.530.947.9
8.65.0
34.3
36.8-2.5
91.3
39.8
31.8
4.814.515.0
-.4
-2.0
19.2
-11.2
8.0
5.03.0
11.16.7
23.52.2
III
105.3
18.5
10.7
76.1
-6.282.3
36.3
6.91.8
27.6
18.71,44.72.8
46.0
12.020.08.15.9
76.1
6.335.634.2
6.12.3
25.8
32.0-6.2
105.3
59.5
45.6
-3.716.434.3
-1.0
-.4
25.4
-11.6
9.1
10.8-1.8
11.82.8
20.71.6
1981 seasonally adjustedannual rates
1
433.5
127.0
32.3
274.2
11.9262.3
174.9
31.028.5
115.3
79.95.1
20.79.7
87.5
27.512.519.428.2
274.2
29.4123.6121.3
23.819.478.1
66.211.9
433.5
290.0
263.1
74.912.6
148.4
16.9
10.2
36.4
-9.5
17.7
-43.060.6
25.124.175.21.3
II
400.2
50.9
38.2
311.0
-10.0321.1
149.6
24.612.6
112.4
72.45.7
24.69.7
171.5
30.980.214.446.0
311.0
21.2130.0159.8
22.214.2
123.5
133.5-10.0
400.2
205.3
142.1
5797.759.9
16
-8.1
104.4
-41.2
70.6
32.737.9
21.9-9.795.516.6
III
377.4
59,7
34.7
282.9
-24.8307.7
117.4
15.45.3
96.8
61.45.6
17.612.3
190.3
37.378.334.640.2
282.9
12.7124.3146.0
24.19.8
112.0
136.8-24.8
377.4
253.7
183.6
-9.561.5
137.3
-4.1
-1.6
116.0
-46.0
7.0
36.3-29.3
49.1-16.8
81.03.4
Source.- Board of Governors of the Federal Reserve System.
307
Digitized for FRASER http://fraser.stlouisfed.org/ Federal Reserve Bank of St. Louis
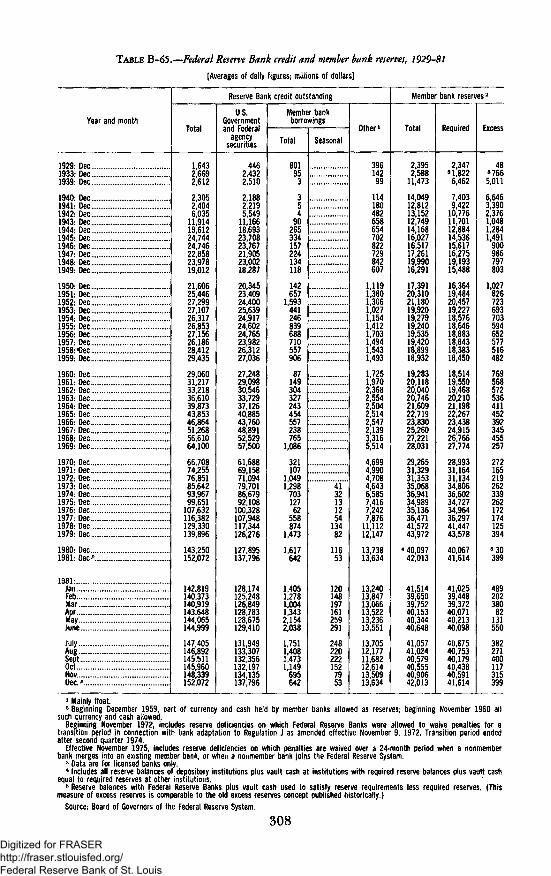
TABLE B-65.—-Federal Reserve Bank credit and member bank reserves, 1929-81
[Averages of daily figures; millions of dollars]
Year and month
1929: Dec,1933: Dec1939: Dec .
1940: Dec1941: Dec1942: Dec1943: Dec1944: Dec1945: Dec1946: Dec1947: Dec1948: Dec1949; Dec
1950- Dec1951: Dec1952- Dec1953; Dec1954- Dec1955- Dec1956- Dec1957: Dec1958: «0ec1959: Dec
I960- Dec.1961: Dec1962: Dec1963; Dec1964- Dec1965: Dec1966: Dec1967: Dec1968- Dec1969: Dec
1970: Dec1971- Dec1972: Dec1973- Dec1974: Dec...1975: Dec1976: Dec1977- Dec1978: Dec1979- Dec
1980: Dec1981: Dec"
1381:JanFebMarAprMayJune
JulyAugSeptOctNovDec."
Reserve Bank credit outstanding
Total
1,6432,6692,612
2,3052,4046,03511,91419,61224,74424,74622,85823,97819,012
21,60625,44627,29927,10726,31726,85327,15626,18628,41229,435
29,06031,21733,21836,61039,87343,85346,86451,26856,61064,100
66,70874,25576,85185,64293,96799,651107,632116,382129,330139,896
143,250152,072
142,819140,373140,919143,648144,065144,999
147,405146,892145,511145,960148,339152,072
U.S.Governmentand Federal
agencysecurities
4462,4322,510
2,1882,2195,54911,16618,69323,70823,76721,90523,00218,287
20,34523,40924,40025,63924,91724,60224,76523,98226,31227,036
27,24829,09830,54633,72937,12640,88543,76048,89152,52957,500
61,68869,15871,09479,70186,67992,108100,328107,948117,344126,276
127,895137,796
128,174125,248126,849128,783128,675129,410
131,949133,307132,356132,197134,135137,796
Member bankborrowings
Total
801953
35490265334157224134118
142657
1,593441246839688710557906
87149304327243454557238765
1,086
321107
1,0491,29870312762558874
1,473
1,617642
1,4051,2781,0041,3432,1542,038
1,7511,4081,4731,149695642
Seasonal
413213125413482
11653
120148197161259291
2482202221527953
Other1
39614299
114180482658654702822729842607
1,1191,3801,3061,0271,1541,4121,7031,4941,5431,493
1,7251,9702,3682,5542,5042,5142,5472,1393,3165,514
4,6994,9904,7084,6436,5857,4167,2427,87611,11212,147
13,73813,634
13,24013,84713,06613,52213,23613,551
13,70512,17711,68212,61413,50913,634
Member bank reserves 2
Total
2,3952,58811,473
14,04912,81213,15212,74914,16816,02716,51717,26119,99016,291
17,39120,31021,18019,92019,27919,24019,53519,4201B.89918,932
19,28320,11820,04020,74621,60922,71923,83025,26027,22128,031
29,26531,32931,35335,06836,94134,98935,13636,47141,57243,972
« 40,09742,013
41,51439,65039,75240,15340,34440,648
41,05741,02440,57940,55540,90642,013
Required
2,3473 1,8226,462
7,4039,42210,77611,70112,88414,53615,61716,27519,19315,488
16,36419,48420,45719,22718,57618,64618,88318,84318,38318,450
18,51419,55019,46820,21021,19822,26723,43824,91526,76627,774
28,99331,16431,13434,80636,60234,72734,96436,29741,44743,578
40,06741,614
41,02539,44839,37240,07140,21340,098
40,67540,75340,17940,43840,59141,614
Excess
4837665,011
6,6463,3902,3761,0481,2841,491900986797803
1,027826723693703594652577516482
769568572536411452392345455257
2721652192623392621721741253945 30399
48920238082131550
382271400117315399
1 Mainly float.2 Beginning December 1959, part of currency and cash held by member banks allowed as reserves; beginning November 1960 all
such currency and cash allowed.Beginning November 1972, includes reserve deficiencies on which Federal Reserve Banks were allowed to waive penalties for a
transition period in connection with bank adaptation to Regulation J as amended effective November 9, 1972. Transition period endedafter second quarter 1974.
Effective November 1975, includes reserve deficiencies on which penalties are waived over a 24-month period when a nonmemberbank merges into an existing member bank, or when a nonmember bank joins the Federal Reserve System.3 Data are for licensed banks only.4 Includes all reserve balances of depository institutions plus vault cash at institutions with required reserve balances plus vault cashequal to required reserves at other institutions.
•' Reserve balances with Federal Reserve Banks plus vault cash used to satisfy reserve requirements less required reserves. (Thismeasure of excess reserves is comparable to the old excess reserves concept published historically.)
Source: Board of Governors of the Federal Reserve System.
308
Digitized for FRASER http://fraser.stlouisfed.org/ Federal Reserve Bank of St. Louis
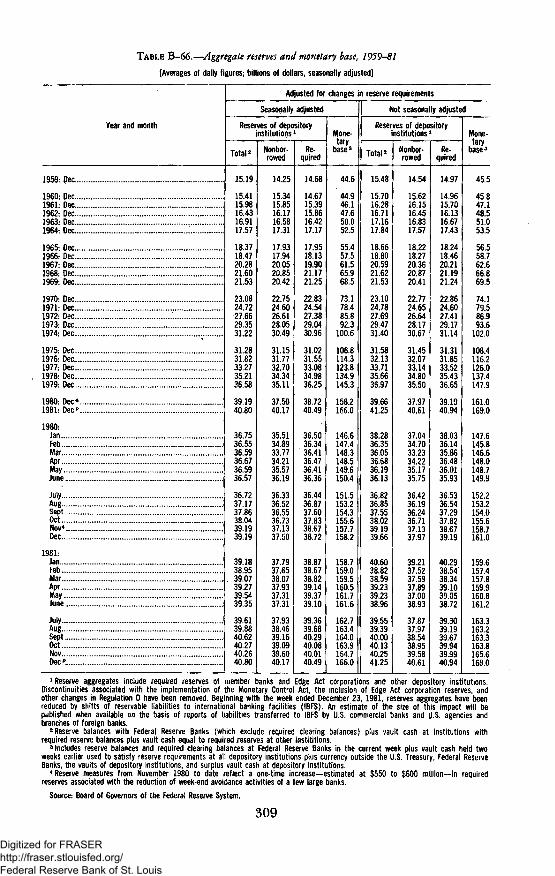
TABLE B-66.—Aggregate reserves and monetary base, 1959-81
[Averages of daily figures; billions of dollars, seasonally adjusted]
Year and month
1959- Dec
I960- Dec1961- Dec1962- Dec1963- Dec1964: Dec
1965: Dec1966- Dec1967: Dec1968- Dec1969: Dec
1970- Dec1971: Dec1972- Dec1973: Dec1974: Dec
1975: Dec1976- Dec1977- Dec1978: Dec1979: Dec
1980: Dec*1981: Dec"
1980:JanFebMarAprMayJune
JulyAugSept . . . . . . . .OctNov*Dec
1981.JanFebMarAprMayJune
JulyAug .SeptOctNovDec"
Adjusted for changes in reserve requirements
Seasonally adjusted
. Reserves of depositoryinstitutions 1
Total 2
15.19
15.4115.9816.4316.9117.57
18.3718.4720.2821.6021.53
23.0824.7227.6629.3531.22
31.2831.8233.2735.2136.58
39.1940.80
36.7536.5536.5936.6736.5936.57
36.7237.1737.8638.0439.1939.19
39.1838.9539.0739.2739.5439.35
39.6139.8840.6240.2740.2640.80
Nonbor-rowed
14.25
15.3415.8516.1716.5817.31
17.9317.9420.0520.8520.42
22.7524.6026.6128.0530.49
31.1531.7732.7034.3435.11
37.5040.17
35.5134.8933.7734.2135.5736.19
36.3336.5236.5536.7337.1337.50
37.7937.6538.0737.9337.3137.31
37.9338.4639.1639.0939.6040.17
Re-quired
14.68
14.6715.3915.8616.4217.17
17.9518.1319.9021.1721.25
22.8324.5427.3829.0430.96
31.0231.5533.0834.9836.25
38.7240.49
36.5036.3436.4136.4736.4136.36
36.4436.8737.6037.8338.6738.72
38.8738.6738.8239.1439.3739.10
39.3639.6840.2940.0840.0140.49
Mone-tary
base^
44.6
44.946.147.650.052.5
55.457.561.565.968.5
73.178.485.892.3
100.6
106.8114.3123.8134.9145.3
158.2166.0
146.6147.4148.3148.5149.6150.4
151.5153.2154.3155.6157.7158.2
158.7159.0159.5160.5161.7161.6
162.7163.4164.0163.9164.7166.0
Not seasonally adjusted
Reserves of depositoryinstitutions 1
Total2
15.48
15.7016.2816.7117.1617.84
18.6618.8020.5921.6221.53
23.1024.7827.6929.4731.40
31.5832.1333.7135.6636.97
39.6641.25
38.2836.3536.0536.6836.1936.13
36.8236.8537.5538.0239.1939.66
40.6038.8238.5939.2339.2338.96
39.5539.3940.0040.1340.2541.25
Nonbor-rowed
14.54
15.6216.1516.4516.8317.57
18.2218.2720.3620.8720.41
22.7724.6526.6428.1730.67
31.4532.0733.1434.8035.50
37.9740.61
37.0434.7033.2334.2235.1735.75
36.4236.1936.2436.7137.1337.97
39.2137.5237.5937.8937.0036.93
37.8737.9738.5438.9539.5840.61
Re-quired
14.97
14.9615.7016.1316.6717.43
18.2418.4620.2121.1921.24
22.8624.6027.4129.1731.14
31.3131.8533.5235.4336.65
39.1940.94
38.0336.1435.8636.4836.0135.93
36.5336.5437.2937.8238.6739.19
40.2938.5438.3439.1039.0538.72
39.3039.1939.6739.9439.9940.94
Mone-tary
base3
45.5
45.847.148.551.053.5
56.558.762.666.869.5
74.179.586.993.6
102.0
108.4116.2126.0137.4147.9
161.0169.0
147.6145.8146.6148.0148.7149.9
152.2153.2154.0155.6158.7161.0
159.6157.4157.8159.9160.8161.2
163.3163.2163.3163.8165.6169.0
'Reserve aggregates include required reserves of member banks and Edge Act corporations and other depository institutions.Discontinuities associated with the implementation of the Monetary Control Act, the inclusion of Edge Act corporation reserves, andother changes in Regulation D have been removed. Beginning with the week ended December 23, 1981, reserves aggregates have beenreduced by shifts of reservable liabilities to international banking facilities (IBFS). An estimate of the size of this impact will bepublished when available on the basis of reports of liabilities transferred to IBFS by U.S. commercial banks and U.S. agencies andbranches of foreign banks.
2 Reserve balances with Federal Reserve Banks (which exclude required clearing balances) plus vault cash at institutions withrequired reserve balances plus vault cash equal to required reserves at other instititions.3 Includes reserve balances and required clearing balances at Federal Reserve Banks in the current week plus vault cash held twoweeks earlier used to satisfy reserve requirements at all depository institutions plus currency outside the U.S. Treasury, Federal ReserveBanks, the vaults of depository institutions, and surplus vault cash at depository institutions.
4 Reserve measures from November 1980 to date reflect a one-time increase—estimated at $550 to $600 million—in requiredreserves associated with the reduction of week-end avoidance activities of a few large banks.
Source: Board of Governors of the Federal Reserve System.
309
Digitized for FRASER http://fraser.stlouisfed.org/ Federal Reserve Bank of St. Louis
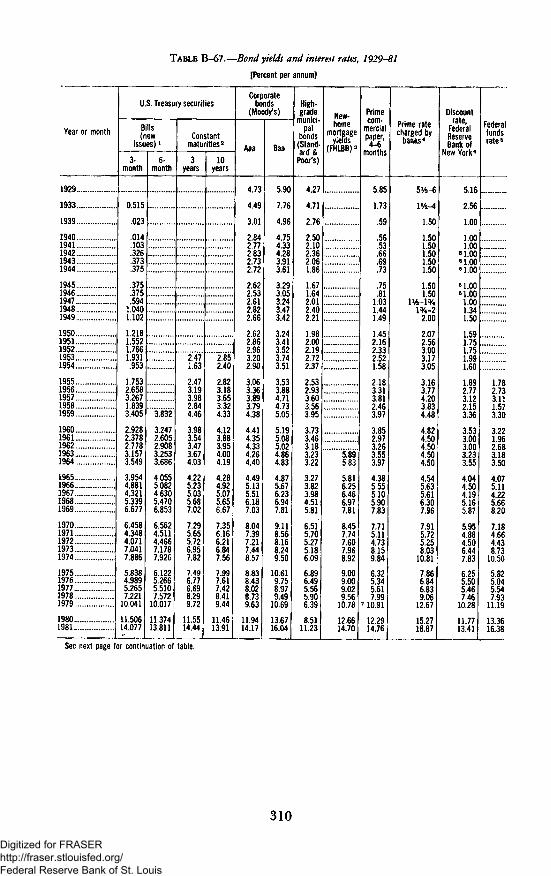
TABLE B-67 .—Bond yields and interest rates, 1929-82
[Percent per annum]
Year or month
1929
1933
1939
19401941 ..194219431944
19451946 ..194719481949
1950195119521953 "."". .1954
19551956195719581959
19601961196219631964
19651966196719681969
197019711972 ,19731974
19751976197719781979
19801981
U.S. Treasury securities
Bills(new
issues) 1
3-month
0.515
.023
.014103
.326
.373
.375
375375.594
1.0401.102
1.2181.5521.7661.931.953
1.7532.6583.2671.8393.405
2.9282.3782.7783.1573.549
3.9544.8814.3215.3396.677
6.4584.3484.0717.0417.886
5.8384.9895.2657.221
10.041
11.50614.077
6-month
I.:.".'.'.
""1832"
3.2472.6052.9083.2533.686
4.0555.0824.6305.4706.853
6.5624.5114.4667.1787.926
6.1225.2665.5107.572
10.017
11.37413.811
Constantmaturities2
3years
" •
2.47'1.63
2.473.193.982.844.46
3.983.543.473.674.03
4.225.235.035.687.02
7.295.655.726.957.82
7.496.776.698.299.72
11.5514.44
10years
2.852.40
2.823.183.653.324.33
4.123.883.954.004.19
4.284.925.075.656.67
7.356.166.216.847.56
7.997.617.428.419.44
11.4613.91
Corporatebonds
(Moody's)
Aaa
4.73
4.49
3.01
2.842.772.832.732.72
2.622.532.612.822.66
2.622.862.963.202.90
3.063.363.893.794.38
4.414.354.334.264.40
4.495.135.516.187.03
8.047.397.217.448.57
8.838.438.028.739.63
11.9414.17
Baa
5.90
7.76
4.96
4.754.334.283.913.61
3.293.053.243.473.42
3.243.413.523.743.51
3.533.884.714.735.05
5.195.085.024.864.83
4.875.676.236.947.81
9.118.568,168.249.50
10.619.758.979.49
10.69
13.6716.04
High-grade
munici-pal
bonds(Stand-ard &
Poor's)
4.27
4.71
2.76
2.502.102.362.061.86
1.671.642.012.402.21
1.982.002.192.722.37
2.532.933.603.563.95
3.733.463.183.233.22
3.273.823.984.515.81
6.515.705.275.186.09
6.896.495.565.906.39
8.5111.23
New-hntnp
mortgageviews
(FHLBB)a
5.89'5.83
5.816.256.466.977,81
8.457.747.607.968.92
9.009.009.029.56
10.78
12.6614.70
Primecom-
mercialpaper,4-6
months
5.85
1.73
.59
.56
.53
.66
.69
.73
.75
.811.031.441.49
1.452.162.332.521.58
2.183.313.812.463.97
3.852.973.263.553.97
4.385.555.105.907.83
7.715.114.738.159.84
6.325.345.617.997 10.91
12.2914.76
Prime ratecharged by
banks*
5Vfe-6
lVa-4
1.50
1.501.501.501.501.50
1.501.50
1V6-IV4l%-2
2.00
2.072.563.003.173.05
3.163.774.203.834.48
4.824.504.504.504.50
4.545.635.616.307.96
7.915.725.258.03
10.81
7.866.846.839.06
12.67
15.2718.87
Discountrate,
FederalReserveBank of
New York4
5.16
2.56
1.00
1.001.00
•1.00•1.00•1.00
•1.00•1.00
1.001.341.50
1.591,751.751.991.60
1.892.773.122.153.36
3.533.003.003.233.55
4.044.504.195.165.87
5,954,884,506.447.83
6.255.505.467.46
10.28
11.7713.41
Federalfundsrate6
Ill
1.782.733.111.573.30
3.221.962.683.183.50
4.075.114.225.668.20
7.184.664,438.73
10.50
5,825.045.547.93
11.19
13.3616.38
See next page for continuation of table.
310
Digitized for FRASER http://fraser.stlouisfed.org/ Federal Reserve Bank of St. Louis
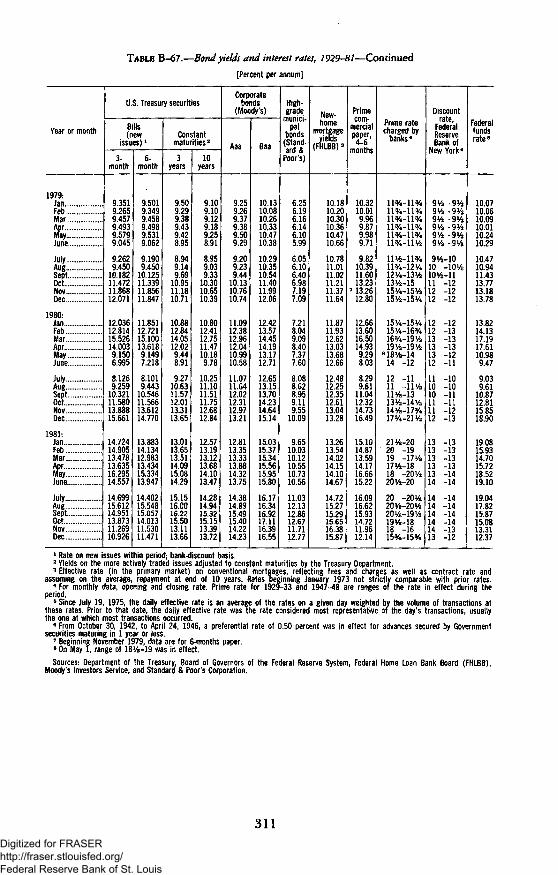
TABLE B-67.—Bond yields and interest rates, 1929-81—Continued
[Percent per annum]
Year or month
1979:JanFebMarAprMayJune
JulyAugSeptOctNovDec
1980:JanFeb . . .Mar.. .AprM a y . . . .June . . .
JulyAugSept . .. .Oct . . . .Nov ... .Dec
1981:JanFebMarAprMayJune
JulyAugSeptOctNovDec
U.S. Treasury securities
Bills(new
issues) l
3-month
9.3519.2659.4579.4939.5799.045
9.2629.450
10.18211.47211.86812.071
12.03612.81415.52614.0039.1506.995
8.1269.259
10.32111.58013.88815.661
14.72414.90513.47813.63516.29514.557
14.69915.61214.95113.87311.26910.926
6-month
9.5019.3499.4589.4989.5319.062
9.1909.450
10.12511.33911.85611.847
11.85112.72115.10013.6189.1497.218
8.1019.443
10.54611.56613.61214.770
13.88314.13412.98313.43415.33413.947
14.40215.54815.05714.01311.53011.471
Constantmaturities 2
3years
9.509.299.389.439.428.95
8.949.149.69
10.9511.1810.71
10.8812.8414.0512.029.448.91
9.2710.6311.5712.0113.3113.65
13.0113.6513.5114.0915.0814.29
15.1516.0016,2215.5013.1113.66
10years
9.109.109.129.189.258.91
8.959.039.33
10.3010.6510.39
10.8012.4112.7511.4710.189.78
10.2511.1011.5111.7512.6812.84
12.5713.1913.1213.6814.1013.47
14.2814.9415.3215.1513.3913.72
Corporatebonds
(Moody's)
Aaa
9.259.269.379.389.509.29
9.209.239.44
10.1310.7610.74
11.0912.3812.9612.0410.9910.58
11.0711.6412.0212.3112.9713.21
12.8113.3513.3313.8814.3213.75
14.3814.8915.4915.4014.2214.23
Baa
10.1310.0810.2610.3310.4710.38
10.2910.3510.5411.4011.9912.06
12.4213.5714.4514.1913.1712.71
12.6513.1513.7014.2314.6415.14
15.0315.3715.3415.5615.9515.80
16.1716.3416.9217.1116.3916.55
High-grade
munici-pal
bonds(Stand-_ rj parc &Poor's)
6.256.196.166.146.105.99
6.056.106.406.987.197.09
7.218.049.098.407.377.60
8.088.628.959.119.55
10.09
9.6510.0310.1210.5510.7310.56
11.0312.1312.8612.6711.7112.77
Mew-home
mortgageyields
(FHLBB) 3
10.1810.2010.3010.3610.4710.66
10.7811.0111.0211.2111.3711.64
11.8711.9312.6213.0313.6812.66
12.4812.2512.3512.6113.0413.28
13.2613.5414.0214.1514.1014.67
14.7215.2715.2915.6516.3815.87
Primecom-
mercial"&•
rrmnthomonins
10.3210.019.969.879.989.71
9.8210.3911.6013.23
7 13.2612.80
12.6613.6016.5014.939.298.03
8.299.61
11.0412.3214.7316.49
15.1014.8713.5914.1716.6615.22
16.0916.6215.9314.7211.9612.14
Prime ratecharged by
banks4
11%-11%11%-11%H3/4-ll3/4
11 ¥4-11%11%-11%im-imllV2-ll3/4
n%-i2y412V4-13V213y2-1515V4-15V215V2-15V4
15V4-15V415V4-16%
16%-19Vii19V2-19V2
8 18V2-1414 -12
12 -1111 -11 Vz11V2-1313V2-14V214y2-173A173/4-21V2
21V2-2020 -1919 -17 V217V2-1818 -20y220V2-20
20 -20y220V2-20V220*2-19^19V2-1818 -1615%-15%
Discountrate,
FederalReserveBank of
New York4
9 ¥2 -9V29V2 -9V29V2 -9V29Va -9y29V3 -9V69y2 -9y2
9*2-1010 -lOVs10V2-1111 -1212 -1212 -12
12 -1212 -1313 -1313 -1313 -1212 -11
11 -1010 -1010 -1111 -1111 -1212 -13
13 -1313 -1313 -1313 -1313 -1414 -14
14 =1414 =1414 =1414 -1414 -1313 -12
Federalfundsrate6
10.0710.0610.0910.0110.2410.29
10.4710.9411.4313.7713.1813.78
13.8214.1317.1917.6110.989.47
9.039.61
10.8712.8115.8518.90
19.0815.9314.7015.7218.5219.10
19.0417.8215.8715.0813.3112.37
1 Rate on new issues within period; bank-discount basis.z Yields on the more actively traded issues adjusted to constant maturities by the Treasury Department.3 Effective rate (in the primary market) on conventional mortgages, reflecting fees and charges as well as contract rate and
assuming on the average, repayment at end of 10 years. Rates beginning January 1973 not strictly comparable with prior rates.4 For monthly data, opening and closing rate. Prime rate for 1929-33 and 1947-48 are ranges of the rate in effect during theperiod.
* Since July 19, 1975, the daily effective rate is an average of the rates on a given day weighted by the volume of transactions atthese rates. Prior to that date, the daily effective rate was the rate considered most representative of the day's transactions, usuallythe one at which most transactions occurred.
6 From October 30, 1942, to April 24, 1946, a preferential rate of 0.50 percent was in effect for advances secured by Governmentsecurities maturing in 1 year or less.7 Beginning November 1979, data are for 6-months paper.
8 On May 1, range of 18V2-19 was in effect.Sources: Department of the Treasury, Board of Governors of the Federal Reserve System, Federal Home Loan Bank Board (FHLBB),
Moody's Investors Service, and Standard & Poor's Corporation.
311Digitized for FRASER http://fraser.stlouisfed.org/ Federal Reserve Bank of St. Louis

TABLE B-68.—Consumer credit outstanding and net change, 1950-81
[Millions of dollars]
Year and month
1950: Dec ..1951: Dec1952: Dec1953: Dec1954: Dec1955: Dec1956: Dec1957: Dec1958: Dec1959: Dec
I960: Dec ..1961: Dec1962: Dec1963: Dec1964: Dec1965: Dec1966: Dec . . . .1967: Dec1968: Dec1969: Dec
1970: Dec1971: Dec1972: Dec1973: Dec1974: Dec1975: Dec1976: Dec1977: Dec1978: Dec1979: Dec
1980: Dec
1980:JanFebMar
ft-:.-June
JulyAugSeptOctNovDec
1981:JanFebMar
May,. ,'.. "June
JulyAugSept. .. ,OctNov..
Amount outstanding (end of month)
Total
25,58327,19232,45336,60838,03845,15949,03551,90452,39860,391
64,70767,20573,44282,28792,031102,551108,945114,491125,830136,444
141,463157,795177,639203,077213,427223,140248,916289,133337,905383,359
385,659
381,227380,115379,522377,797375,157373,562
373,585376,256378,038378,840380,071385,659
382,124380,674383,175386,557388,968392,457
395,312399,584403,772404,514405,806
Installment credit >
Total
15,50316,22020,47024,25424,89130,26933,17135,44335,33941,123
45,05146,02750,99457,82965,57273,88179,33983,14891,681101,161
105,528118,255133,173155,108164,594171,996193,525230,564273,645312,024
313,435
311,012310,149309,127307,831305,788304,399
303,853305,763306,926307,222308,051313,435
310,554309,188310,766313,419315,465318,459
320,886324,653328,296328,826328,944
Auto-mobile
6,0155,9587,6359,6859,74713,47114,48415,47214,25816,632
18,08317,59919,92422,84225,81729,35530,99231,13134,34836,946
36,32540,51947,86253,77254,26657,24267,70782,911101,647116,362
116,327
116,719117,202117,642117,502117,058116,456
116,125116,868116,781116,657116,517116,327
115,262115,677117,517118,479118,932119,685
121,002123,219125,646126,235125,929
Revolv-ing2
•I:'.':.
24053,720
5,1288,5289,70011,709
. 13,68115,01917,18939,27448,30956,937
59,862
56,25655,26954,26953,69053,22553,042
53,03653,77154,40654,59855,30459,862
58,98557,56656,83157,32257,52458,470
58,97659,74560,41560,65161,166
Mobilehome3
2,4617,2269,52613,58014,64214,43414,57314,94515,23516,838
17,327
16,83216,87516,94416,97416,91216,988
17,00417,06817,11317,27617,29317,327
17,24417,18917,27317,42217,62617,724
17,78417,98818,15718,32918,385
Other
9,48810,26212,83514,56915,14416,79818,68719,97121,08124,491
26,96828,42831,07034,98739,75544,52648,34752,01755,22860,495
61,61461,98266,08576,04782,00585,30194,05693,434108,454121,887
119,919
121,205120,803120,272119,665118,593117,913
117,688118,056118,626118,691118,937119,919
119,063118,756119,145120,196121,383122,580
123,124123,701124,078123,611123,464
Nonin-stallmentcredit*
10,08010,97211,98312,35413,14714,89015,86416,46117,05919,268
19,65621,17822,44824,45826,45928,67029,60631,34334,14935,283
35,93539,54044,46647,96948,83351,14455,39158,56964,26071,335
72,224
70,21569,96670,39569,96669,36969,163
69,73270,49371,11271,61872,02072,224
71,57071,48672,40973,13873,50373,998
74,42674,93175,47675,68876,862
Net change from preceding period
Total
4,7761,6095,2614,1551,4307,1213,8762,869494
7,993
4,3162,4986,2378,8459,74410,5206,3945,54611,33910,614
5,01916,33219,84425,43810,3509,71325,77640,21748,77245,454
2,300
Installmentcredit »
Total
3,271717
4,2503,784637
5,3782,9022,272-1045,784
3,928976
4,9676,8357,7438,3095,4583,8098,5339,480
4,36712,72714,91821,9359,4867,40221,52937,03943,08138,379
1,411
Auto-mobile
1,537=-571,6772,050
623,7241,013988
-1,2142,374
1,451=4842,3252,9182,9753,5381,637139
3,2172,598
=6214,1947,3435,910494
2,97610,46515,20418,73614,715
=35
Nonin*stallmentcredit 4
1,505892
1,011371793
1,743974§97598
2,209
3881,5221,2702,0102,0012,211936
1,7372,8061,134
6523,6054,9263,503864
2,3114,2473,1785,6917,075
889
Seasonally adjusted *
2,8781,6851,532
-2,109-3,296-2,200
-1541,0481,524685
1,048985
1,2072,2933,3643,3111,7932,616
2,9683,0743,290683
1,397
2,7272,403654
-1,671-2,677-2,045
-1,199489
1,055702839
1,619
8691,9963,1082,3311,3461,930
1,9542,8592,8191,014342
1,538982513
=-643= 1,041-1,026
= 71735584201245302
=63979
1,682428
= 19557
1,2082,1152,282962274
151= 718878
= 438= 619.455
1,045559469= 17209
= 634
338297256980447686
1,014215471
= 3311,055
1 Installment credit covers most short- and intermediate-term credit extended to individuals through regular business channels,usually to finance the purchase of consumer goods and services or to refinance debts incurred for such purposes, and scheduled to berepaid (or with the option of repayment) in two or more Installments.
2 Consists of credit cards at retailers, gasoline companies, and commercial banks, and check credit at commercial banks. Prior to1968, included in "other," except gasoline companies, included in noninstallment credit prior to 1971. Beginning 1977, includes open-end credit at retailers, previously included in "other. Also beginning 1977, some retail credit was reclassified from commercial intoconsumer credit. Credit secured by real estate is generally excluded.3 Not reported separately prior to July 1970.
4 Because of inconsistencies in the data and infrequent benchmarking, series on noninstallment credit is no longer published by theFederal Reserve Board on a regular basis. Data are shown here as a general indication of trends.
s For installment credit, computed as the difference between extensions and liquidations (both seasonally adjusted); see also TableB-69. For noninstallment credit, computed as the change from one month to another in the seasonally adjusted amount outstanding.
Source: Board of Governors of the Federal Reserve System.
312Digitized for FRASER http://fraser.stlouisfed.org/ Federal Reserve Bank of St. Louis
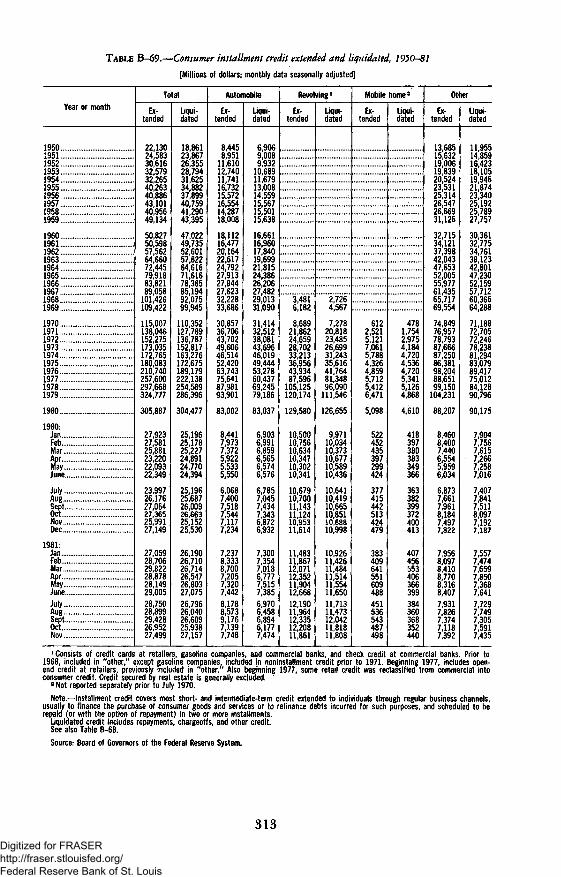
TABLE B-69.—Consumer installment credit extended and liquidated, 7950-87
[Millions of dollars; monthly data seasonally adjusted]
Year or month
1950195119521953195419551956195719581959
1960196119621963196419651966196719681969
1970197119721973197419751976197719781979
1980 . ..
1980:JanFebMarAprMayJune
JulyAUBsof... .••...::..:NovDec
1981-JanFebMarAprfayJuneJulyAugSeptOctNov
Total
Ex-tended
22,13024,58330,61632,57932,26540,26340,88643,10140,95649,134
50,82750,59857,56264,66072,44579,91883,82189,058101,426109,422
115,007138,046152,275173,035172,765180,083210,740257,600297,668324,777
305,887
27,92327,58125,88123,22022,09322,349
23,99726,17627,06427,36525,99127,149
27,05928,70629,82228,87828,14929,00528,75028,39929,42826,95227,499
Liqui-dated
18,86123,86726,35528,79431,62534,88237,89940,75941,29043,395
47,02249,73552,60157,82264,61671,61678,36585,19492,07599,945
110,352127,789136,787152,817163,276172,675189,179222,138254,589286,396
304,477
25,19625,17825,22724,89124,77024,394
25,19625,68726,00926,6632545225,530
26,19026,71026,71426,54726,80327,07526,79626,04026,60925,93827,157
Automobile
Ex-tended
8,4458,95111,61012,74011,74116,73215,57216,55414,28718,008
18,11216,47720,16422,61724,79227,91327,84427,62332,22833,686
30,85736,70643,70249,60646,51452,42063,74375,64187,98193,901
83,002
8,4417,9737,3725,9225,5335,550
6,0687,4007,5187,5447,1177,234
7,2378,3338,7007,2057,3207,4428,1788,5739,1767,1397,748
Liqui-dated
6,9069,0089,93210,68911,67913,00814,55915,56715,50115,638
16,66116,96017,84019,69921,81524,38626,20627,48229,01331,090
31,41432,51238,08143,69646,01949,44453,27860,43769,24579,186
83,037
6,9036,9916,8596,5656,5746,576
6,7857,0457,4347,3436,8726,932
7,3007,3547,0186,7777,5157,3856,9706,4586,8946,1777,474
Revolving »
Ex-tended
3,4816,182
8,68921,86224,65928,70233,21336,95643,93487,596105,125120,174
129,580
10,50010,75610,63410,34710,30210,341
10,67910,70011,14311,12410,95311,614
11,48311,86712,07112,35211,90412,66812,19011,96412,33512,20811,861
Liqui-dated
2,7264,567
7,27820,81823,48526,69931,24335,61641,76481,34896,090111,546
126,655
9,97110,03410,37310,67710,58910,436
10,64110,41910,66510,85110,68810,998
10,92611,42611,48411,51411,55411,65011,71311,47312,04211,81811,808
Mobile home2
Ex-tended
6122,5215,1217,0615,7884,3264,8595,7125,4126,471
5,098
522452435397299424
377415442513424479
383409641551609488451536543487498
Liqui-dated
... .
4781,7542,9754,1844,7204,5364,7205,3415,1264,868
4,610
418397380383349366
363382399372400413
407456553406366399384360368352440
Other
Ex-tended
13,68515,63219,00619,83920,52423,53125,31426,54726,66931,126
32,71534,12137,39842,04347,65352,00555,97761,43565,71769,554
74,84976,95778,79387,66687,25086,38198,20488,65199,150104,231
88,207
8,4608,4007,4406,5545,9596,034
6,8737,6617,9618,1847,4977,822
7,9568,0978,4108,7708,3168,4077,9317,8267,3747,1187,392
Liqui-dated
11,95514,85916,42318,10519,94621,87423,34025,19225,78927,757
30,36132,77534,76138,12342,80147,23052,15957,71260,36664,288
71,18872,70572,24678,23881,29483,07989,41775,01284,12890,796
90,175
7,9047,7567,6157,2667,2587,016
7,4077,8417,5118,0977,1927,187
7,5577,4747,6597,8507,3687,6417,7297,7497,3057,5917,435
'Consists of credit cards at retailers, gasoline companies, and commercial banks, and check credit at commercial banks. Prior to1968, included in "other," except gasoline companies, included in noninstallment credit prior to 1971. Beginning 1977, includes open-end credit at retailers, previously included in ''other." Also beginning 1977, some retail credit was reclassified from commercial intoconsumer credit. Credit secured by real estate is generally excluded.2 Not reported separately prior to July 1970.
Note.—Installment credit covers most short- and intermediate-term credit extended to individuals through regular business channels,usually to finance the purchase of consumer goods and services or to refinance debts incurred for such purposes, and scheduled to berepaid (or with the option of repayment) in two or more installments.
Liquidated credit includes repayments, chargeoffs, and other credit.See also Table 8-68.Source: Board of Governors of the Federal Reserve System.
313Digitized for FRASER http://fraser.stlouisfed.org/ Federal Reserve Bank of St. Louis

TABLE B-70.—Mortgage debt outstanding by type of property and of financing, J 959-81
[Billions of dollars]
End of yearor quarter
1939
19401941..19421943. .1944
1945. .1946 .194719481949.
19501951 . . . .1952.19531954
19551956195719581959
19601961. ..196219631964
196519661967. .1968 . .. .1969
1970197119721973. . .1974 . . . .
1975 . .19761977 . .19781979
1980, ..
19791IIlitIV
1980:1 ..||I I IIV
1981:1I Im
Allproper-
ties
35.5
36.537.636.735.334.7
35.541.848.956.262.7
72.882.391.4
101.3113.7
129.9144.5156.5171.8190.8
207.5228.0251.4278.5305.9
333.3356.5381.2410.9441.4
474.2526.5603.4682.3742.5
801.5888.7
1,021.11,169.01,326.9
1,445.7
1,201.51,246.01,289.51,326,9
1,356.41,378.61,411.41,445.7
1,467.01,496.41,523,6
Farmproper-
ties
6.6
6.56.46.05.44.9
4.84.95.1
W
6.16.77.27.78.2
9.09.8
10.411.112.1
12.813.915.216.818.9
21.223.125.127.429.2
30.332.235.841.346.3
50.956.663.670.882.7
91.9
74.277.980.882.7
85.888.890.291.9
94.497.3
100.0
Nonfarm properties
Total
28.9
30.031.230.829.929.7
30.836.943.950.957.1
66.775.684.293.6
105.4
120.9134.6146.1160.7178.7
194.7214.1236.2261.7287.0
312.1333.4356.1383.5412.2
443.8494.3567.7641.1696.2
750.7832.2957.4
1,098.21,244.2
1,353.8
1,127.41,168.11,208.71,244.2
1,270.61,289.81,321.21,353.8
1,372.61,399.11,423.6
1- to 4-familyhouses
16.3
17.418.418.217.817.9
18.623.028.233.337.6
45.251.758.566.175.7
88.299.0
107.6117.7130.9
141.9154.7169.3186.4203.4
220.5232.9247.3264.8282.8
298.1328.3372,2416.2449.4
490.8556.5655.9765.2878.9
960.1
787.9820.4852.3878.9
898.0910.4935.7960.1
972.2990.4
1,008.3
Multi-familyproper-
ties
5.6
5.7555^85.85.6
5.76.16.67.58.6
10.111.512.312.913.5
14.314,915.316.818.7
20.323.025.829.033.6
37.240.343.947.352.3
60.170.182.893.1
100.0
100.6104.5111.8121.1128.9
137.2
122.9125.0126.8128.9
130.3132.7134.8137.2
138.6140.1141.7
Com-mercialproper-ties1
7.0
6.97.06.76.36.2
6.47.79.1
10.210.8
11.512.513.414.516,3
18.320.723.226.129.2
32.436.441.146.250.0
54.560.164.871.477.1
85.695.9
112.7131.7146.9
159.3171.2189.7211.9236.5
256.5
216.5222.7229.6236.5
242.4246.7250.7256.5
261.8268.6273.6
Nonfarm properties by type of mortgage
Government underwritten
Total2
1.8
2.33.03.74.14.2
4 2.6.19.8
13.617.1
22.126.629.332.136.2
42.947.851.655.159.3
62.365.669.473.477.2
81.284.188.293.4
100.2
109.2120.7131.1135.0140.2
147.0154.1161.7176.4199.0
225.1
183.0187.1194.3199.0
207.5211.6218.9225.1
229.1233.6237.0
1- to 4-f3mily houses
Total
1.8
2.33.03.74.14.2
4.36.19 ^
12.515.0
18.922.925.428.132.1
38.943.947.250.153.8
56.459.162.265.969.2
73.176.179.984.490.2
97.3105.2113.0116.2121.3
127.7133.5141.6153.4172.9
195.2
158.4162.2168.2172.9
180.8184.1190.0195.2
198.8202.7205.9
FHAinsured
1.8
3iC3.74.14.2
4.13.73.8
&9
8.69.7
10.812.012.8
14.315.516.519.723.8
26.729.532.335.038.3
42.044.847.450.654.5
59.965.768.266.265.1
66.166.568.071.481.0
93.6
73.976.479.181.0
86.087.490.693.6
95.798.1
100.0
VAguar-
anteed
0.22.4557.28.1
10.313.214.616.119.3
24.628.430.730.430.0
29.729.629.930.930.9
31.131.332.533.835.7
37.339.544.750.056.2
61.667.073.682.092.0
101.6
84.585.889.292.0
94.896.799.4
101.6
103.1104.6105.9
Conventional ;)
Total
27.1
27.728.227.125.825.5
26.530.634.137.340.0
44.649.054.961.569.2
78.086.894.6
105.5119.4
132.3148.5166.9188.2209.8
231.0249.3267.9290.1312.0
334.6373.5436.5506.0556.0
603.7678.0795.7921.8
1,045.2
1,128.7
944.4981.0
1,014.41,045.2
1,063.11,078.21,102.31,128.7
1,143.51,165.51,186.7
l- to4-familyhouses
14.5
15.115.414.513.713.7
14.316.918.920.822.6
26.328.833.138.043.6
49.355.160.467.677.0
85.595.6
107.1120.5134.1
147.4156.9167.4180.4192.7
200.8223.1259.2300.0328.1
363.0422.9514.3611.8706.0
764.9
629.5658.2684.1706.0
717.1726.2745.7764.9
773.4787.7802.4
1 Includes negligible amount of farm loans held by savings and loan associations.2 Includes FHA insured multifamily properties, not shown separately.3 Derived figures. Total includes multifamily and commercial properties, not shown separately.Source: Board of Governors of the Federal Reserve System, based on data from various Government and private organizations.
314Digitized for FRASER http://fraser.stlouisfed.org/ Federal Reserve Bank of St. Louis

TABLE B-71.—Mortgage debt outstanding by holder, 1939-81
[Billions of dollars]
End of yearor quarter
1939
19401941194219431944
19451946194719481949
19501951195219531954.'
19551956195719581959,.
19601961 'I. ""'..'.196219631964
19651966196719681969
19701971197219731974
19751976197719781979
1980
1979:)II "IllIV
1980:tIIIll(V
1981:1III l l
Total
35.5
36.537.636.735.334.7
35.541.848.956.262.7
72.882.391.4
101.3113.7
129.9144.5156.5171.8190.8
207.5228.0251.4278.5305.9
333.3356.5381.2410.9441.4
474.2526.5603.4682.3742.5
801.5888.7
1,021.11,169.01,326.9
1,445.7
1,201.51,246.01,289.51,326.9
1,356.41,378.61,411.41,445.7
1,467.01,496.41,523.6.
Major financial institutions
Total
18.6
19.520.720.720.220.2
21.026.031.837.842.9
51.759.566.975.185.7
99.3111.2119.7131.5145.5
157.6172.6192.5217.1241.0
264.6280.8298.8319.9339.1
355.9394.2450.0505.4542.6
581.2647.5745.0848.2938.6
996.8
865.6893.6919.3938.6
951.2958.7977.3996.8
1,006.81,023.31,036.4
Savingsand loanassocia-
tions
3.8
4.14.64.64.64.8
5.47.18.9
10.311.6
13.715.618.422.026.1
31.435.740.045.653.1
60.168.878.890.9
101.3
110.3114.4121.8130.8140.2
150.3174.3206.2231.7249.3
278.6323.0381.2432.8475.7
502.8
441.4456.5468.2475.7
479.0481.0491.9502.8
507.2514.8518.4
Mutualsavingsbanks
4.8
4.94.84.64.44.3
4.24.44.95.86.7
8.39.9
11.412.915.0
17.519.721.223.325.0
26.929.132.336.240.6
44.647.350.553.556.1
57.962.067.673.274.9
77.281.688.195.298.9
99.9
96.197.297.998.9
99.299.299,399.9
99.7100.099.0
Commer-cial
banks <
4.3
4.64.94.74.54.4
4.87.29.4
10.911.6
13.714.715.916.918.6
21.022.723.325.528.1
28.830.434.539.444.0
49.754.459.065.770.7
73.382.599.3
119.1132.1
136.2151.3179.0214.0245.2
263.0
219.7228.8238.8245.2
250.7253.0258.0263.0
266.7273.2281.1
Lifeinsur-ancecom-
panies
5.7
6.06.46.76.76.7
6.67.28.7
10.812.9
16.119.321.323.326,0
29.433.035.237.139.2
41.844.246.950.555.2
60.064.667.570.072.0
74.475.576.981.486.2
89.291.696.8
106,2118.8
131.1
108.4111.1114.4118.8
122.4125.6128.1131.1
133.2135.3137.0
Other holders
Federaland
relatedagen-cies2
5.0
4.94.74.33.63.0
2.42.01.81.82.3
2.83.54.14.64.8
5.36.27.78.0
10.2
11.512.212.611.812.2
13.517.520.925.131.1
38.346.454.664.882.1
101.0116.6140.3170.4216.4
256.6
181.1192.2203,6216.4
228.6238.2247.1256.6
263.5271.4279.9
Individ-uals andothers
11.9
12.012.211.711.511.5
12.113.815.316.617.5
18.419.320.421.723.2
25.327.129.132.335.1
38.443.146.349.552.7
55.258.261.465.971.2
79.985.998.9
112.2117.8
119.3124.7135.7150.5172.0
192.3
154.8160.3166.6172.0
176.7181.7187.0192.3
196.7201.6206.8
1 Includes loans held by nondeposit trust companies, but not by bank trust departments.2 Includes former Federal National Mortgage Association (FNMA) and new Government National Mortgage Association (QNMA),
as well as Federal Housing Administration, Veterans Administration, Public Housing Administration, Farmers Home Administration,and in earlier years Reconstruction Finance Corporation, Homeowners Loan Corporation, and Federal Farm Mortgage Corporation.Also includes GNMA Pools and U.S.-sponsored agencies such as new FNMA, Federal Land Banks, and Federal Home LoanMortgage Corporation. Other U.S. agencies (amounts small or current separate data not readily available) included with"individuals and others."
Source: Board of Governors of the Federal Reserve System, based on data from various Government and private organizations.
315Digitized for FRASER http://fraser.stlouisfed.org/ Federal Reserve Bank of St. Louis

GOVERNMENT FINANCE
TABLE 3-72.—Federal budget receipts, outlays, and debt, fiscal years 1972-83
[Millions of dollars; fiscal years]
Description
BUDGET RECEIPTS AND OUTLAYS:
Total receipts
Federal fundsTrust fundsInterfund transactions
Total outlays
Federal fundsTrust fundsInterf und transactions
Total surplus or deficit ( — }
Federal fundsTrust funds
OUTSTANDING DEBT, END OF PERIOD:
Gross Federal1 debt
Held by Government agenciesHeld by the public
Federal Reserve SystemOther .
BUDGET RECEIPTS
Individual income taxesCorporation income taxesSocial insurance taxes and contribu-
tionsExcise taxes .Estate and gift taxesCustoms duiiesMiscellaneous receipts:
Deposits of earnings by FederalReserve System
All other
BUDGET OUTLAYS
National defenseInternational affairs .. ... .General science, space, and technol-
ogyEnergyNatural resources and environmentAgriculture ,Commerce and housing creditTransportationCommunity and regional development...Education, training, employment and
social servicesHealthIncome securityVeterans benefits and servicesAdministration of justiceGeneral governmentGeneral purpose fiscal assistanceInterestAllowancesUndistributed offsetting receipts
Composition of undistributed offset-ting receipts:
Employer share, employee retire-ment
Interest received by trust funds....Rents and royalties on the Outer
Continental Shelf
1972
207,309
148,84671,619
-13156
230,681
17811065J27
-13,156
-23,373
-29 2645,892
437,329
113,559323,770
71,426252,344
207,309
94,73732,166
52,57415,47754363,287
3,252380
230 681
76,5504,693
41731*2704,2355,2802,21683883^422
125191612763,9131073016502415
67320,563
-8,137
-2,768-5,089
-279
1973
230,799
161,35790,766
=21 325
245 647
186 95180,021
-21,325
= 14,849
-25 59410,745
468,426
125,381343 045
75,181267,863
230,779
103,24636,153
63,1151626049173,188
3495425
245 647
74,5414066
40301,1794,7634852
92490654',595
127351740572,96512013213125687,351
22782
-12,318
-2927-5,436
-3,956
1974
263,224
181,219103,138
= 21,133
267,912
199,91889,126
-=21,133
-4,688
- 18,69914,011
486,247
140,194346,053
80,648265,405
263,224
118,95238,620
75,07116,84450353,334
4,845523
267 912
77,7815,681
3,977837
5,6702,2273,92591724,134
1234420'36484,43713,386246232436,890
28,032
-16,651
= 3319= 6!583
-6,748
Actual
1975
279,090
187,505116,683
-=-25,098
324,245
240,081109,261
= 25,098
-45,154
-52,5767,422
544,131
147,225396,906
84,993311,913
279,090
122,38640,621
84,53416,55146113,676
5777935
324 245
85,5526922
39892,1697,3361,6595,607
103883,738
1587025742
108,57616597294231337,187
30,911
-14,075
-3980-7,667
-2,428
1976
298,060
201,099131,75034,789
364,473
269,921129,341- 34,789
-=66,413
-68,8222,409
631,866
151,566480,300
94,714385,586
298,060
131,60341,409
90,76916,9635,2164,074
5,4512,576
364 473
89,4305,554
4,3703,1278,1242,5023,792
13,4354,767
18,73731,503
127,39018,4323,32029487|235
34,511
-14,704
-4,242-7,800
-2,662
Transitionquarter
81,232
54,08531,530
-4,383
94,188
65,08833,482
-4,383
-12,956
= 11,004-1,952
646,379
148,052498,327
96,702401,625
81,232
38,8018,460
25,2194,4731,4551,212
1,500111
94188
22,3072,191
1,161794
2,532584
1,39233041,340
5,1628181
32,7973,962
859883
2,0927,216
-2,567
=985-270
-1,311
1977
355,559
241,312150,560
-36,313
400,506
295,756141,063
-36,313
=44,948
= 54,4449,496
709,138
157,295551,843
105,004446,839
355,559
157,62654,892
106,48517,5487,3275,150
5,908623
400,506
97,5014,819
4,6774,172
10,0005,526
9814,6366,348
20,98536,582
137,90018,0383,6003,1699,499
38,009
15,053
-4,548-8,131
-2,374
See next page for continuation of table.
316Digitized for FRASER http://fraser.stlouisfed.org/ Federal Reserve Bank of St. Louis
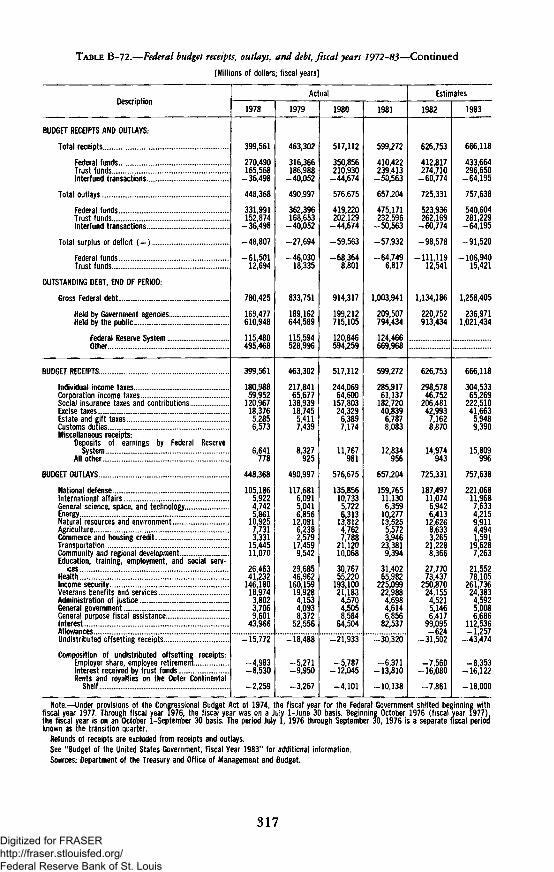
TABLE B-72.—Federal budget receipts, outlays, and debt, fiscal years 1972-83^Continued[Millions of dollars; fiscal years}
Description
BUDGET RECEIPTS AND OUTLAYS:
Total receipts
Federal fundsTrust fundsInterfund transactions
Total outlays
Federal funds ,Trust funds ..Interfund transactions
Total surplus or deficit { )
federal fundsTrust funds
OUTSTANDING DEBT, END OF PERIOD:
Gross Federal debt
Held by Government agenciesHeld by the public
Federal Reserve SystemOther
BUDGET RECEIPTS
Individual income taxes, . .Corporation income taxesSocial insurance taxes and contributions.Excise taxesEstate and gift taxesCustoms duties.. . . . . . .Miscellaneous receipts:
Deposits of earnings by Federal ReserveSystem
All other
BUDGET OUTLAYS
National defenseInternational affairsGeneral science, space, and technologyEnergy.Natural resources and environmentAgriculture. .Commerce and housing creditTransportationCommunity and regional development.Education, training, employment, and social serv-
ices. . .HealthIncome securityVeterans benefits and services.Administration of justice . .General governmentGeneral purpose fiscal assistanceInterestAllowances. . ,Undistributed offsetting receipts. . . . . .
Composition of undistributed offsetting receipts;Employer share, employee retirementInterest received by trust fundsRents and royalties on the Outer Continental
Shelf
Actual
1978
399,561
270,490165,568
-36,498
448,368
331,991152,874
-36,498
-48,807
-61,50112,694
780,425
169,477610,948
115,480495,468
399,561
180,98859,952
120,96718,3765,2856,573
6,641778
448,368
105,1865,9224,7425,861
10,9257,7313,331
15,44511,070
26,46341,232
146,18018,9743,8023,7069,601
43,966
-15,772
-4,983-8,530
-2,259
1979
463,302
316,366186,988
-40,052
490,997
362,396168,653
-40,052
-27,694
-46,03018,335
833,751
189,162644,589
115,594528,996
463,302
217,84165,677
138,93918,7455,4117,439
8,327925
490,997
117,6816,0915,0416,856
12,0916,2382,579
17,4599,542
29,68546,962
160,15919,9284,1534,0938,372
52,556
-18,488
-5,271-9,950
-3,267
1980
517,112
350,856210,930
-44,674
576,675
419,220202,129
-44,674
-59,563
-68,3648,801
914,317
199,212715,105
120,846594,259
517,112
244,06964,600
157,80324,3296,3897,174
11,767981
576,675
135,85610,7335,7226,313
13,8124,7627,788
21,12010,068
30,76755,220
193,10021,1834,5704,5058,584
64,504
-21,933
-5,787-12,045
-4,101
1981
599,272
410,422239,413
-50,563
657,204
475,171232,596
-50,563
-57,932
-64,7496,817
1,003,941
209,507794,434
124,466669,968
599,272
285,91761,137
182,72040,839
6,7878,083
12,834956
657,204
159,76511,1306,359
10,27713,5255,5723,946
23,3819,394
31,40265,982
225,09922,988
4,6984,6146,856
82,537
-30,320
= 6,371-13,810
-10,138
Estimates
1982
626,753
412,817274,710
-60,774
725,331
523,936262,169
-60,774
-98,578
-111,11912,541
1,134,186
220,752913,434
626,753
298,57846,752
206,48142,993
7,1628,870
14,974943
725,331
187,49711,0746,9426,413
12,6268,6333,265
21,2288,366
27,77073,437
250,87024,1554,5215,1466,417
99,095-624
-31,502
-7,560-16,080
=7,861
1983
666,118
433,664296,650
-64,195
757,638
540,604281,229
-64,195
-91,520
-106,94015,421
1,258,405
236,9711,021,434
666,118
304r53365,269
222,51041,663
5,9489,390
15,809996
757,638
221,06811,9687,6334,2159,9114,4941,591
19,6287,263
21,55278,105
261,73624,383
4,5925,0086,686
112,536-1,257
-43,474
-8,353-16,122
-18,000
Note.—Under provisions of the Congressional Budget Act of 1974, the fiscal year for the Federal Government shifted beginning withfiscal year 1977. Through fiscal year 1976, the fiscal year was on a July 1-June 30 basis. Beginning October 1976 {fiscal vear 1977).the fiscal year is on an October 1-September 30 basis. The period July 1, 1976 through September 30, 1976 is a separate fiscal periodknown as the transition quarter.
Refunds of receipts are excluded from receipts and outlays.See "Budget of the United States Government, Fiscal Year 1983" for additional information.Sources: Department of the Treasury and Office of Management and Budget.
317Digitized for FRASER http://fraser.stlouisfed.org/ Federal Reserve Bank of St. Louis

TABLE B-73-—Federal budget receipts and outlays, fiscal years 1929-83
[Millions of dollars]
Fiscal year
1929... .
1933
1939
1940... .1941 . .1942....19431944
1945 . . . .1946..,1947 . . .. . .19481949...
195019511952...19531954.., . .
19551956 ... ....1957 .
19601961196219631964 . ...
19651966196719681969
1970 .1971197219731974....
19751976Transition quarter , ,197719781979....
1980 .. ...1981 .1982 >19831
Receipts
3,862
1,997
4,979
6,3618,62114,35023,64944,276
45,21639,32738,39441,77439,437
394855164666,20469,57469,719
65,46974,54779,99079,63679,249
92,4929438999,676106,560112,662
116,833130,856148,906152,973186,882
192,807187,139207,309230,799263 224
279,090298,06081232355!559399 561463)302
517 112599 272626,753666,118
Outlays
3,127
4,598
8,841
9,45613,63435,11478,53391,280
92,69055,18334,53229,77338,834
42,59745,54667,72176,10770,890
68,50970,46076,74182,57592,104
92,22397795106,813111,311118,584
118,430134,652157,608178,134183,645
195,652210,172230,681245,647267 912
324,245364,47394 188400,506448,368490,997
576 675657*204725,331757,638
Surplus ordeficit (-)
734
- 2,602
-3,862
=3,095-5,013=20,764=54,884=47,004
=47,474= 15,856
3,86212,001603
-3 1126,100
-1,517~=6,533-1,170
-3,04140873,249
-2,939- 12,855
269-3406-7',137-4,751=5,922
-1596-3,796-8,702-25,161
3,236
-2,845= 23,033-23,373-14,849
4688
=45,154-66,41312956
-44̂ 948=48,807-27,694
-5956357932
=98,578-91,520
1 Estimates.Note.—Under provisions of the Congressional Budget Act of 1974, the fiscal year for the Federal Government shifted beginning with
fiscal year 1977. Through fiscal year 1976, the fiscal year was on a July 1-June 30 basis; beginning October 1976 (fiscal year 1977),the fiscal year is on an October 1-September 30 basis. The 3-month period from July 1, 1976 through September 30, 1976 Is aseparate fiscal period known as the transition quarter.
Data for 1929-39 are according to the administrative budget and those beginning 1940 according to the unified budget.Refunds of receipts are excluded from receipts and outlays.See "Budget of the United States Government, Fiscal Year 1983" for additional information.Sources: Department of the Treasury and Office of Management and Budget.
318Digitized for FRASER http://fraser.stlouisfed.org/ Federal Reserve Bank of St. Louis
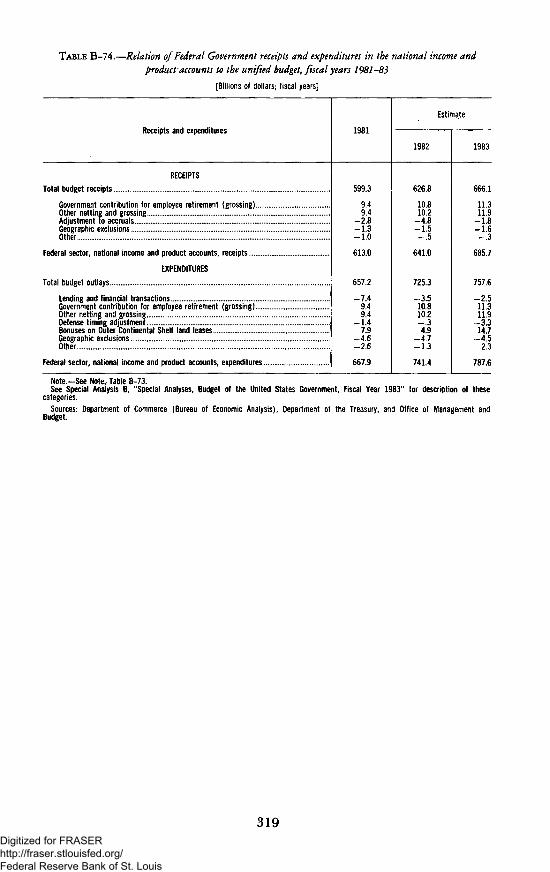
TABLE B-74.—Relation of Federal Government receipts and expenditures in the national income andproduct accounts to the unified budget, fiscal years 1981-83
[Billions of dollars; fiscal years]
Receipts and expenditures
RECEIPTS
Total budget receipts . ,.
Government contribution for employee retirement (grossing) .Other netting and grossingAdjustment to accrualsGeographic exclusionsOther
Federal sector, national income and product accounts, receipts
EXPENDITURES
Total budget outlays
Lending and financial transactionsGovernment contribution for employee retirement (grossing)Other netting and grossingDefense timing adjustmentBonuses on Outer Continental Shelf land leasesGeographic exclusionsOther
Federal sector, national income and product accounts, expenditures .,
1981
599.3
9.49.4
-2.8-1.3-1.0
613.0
657.2
-7.49.49.4
-1.47.9
-4.6-2.6
667.9
Estimate
1982
626.8
10.810.2
-4.8-1.5-.5
641.0
725.3
-3.510.810.2-.34.9
-4.7-1.3
741.4
1983
666.1
11.311.9
-1.8-1.6-.3
685.7
757.6
-2.511.311.9
-3.314.7
-4.52.3
787.6
Note.—See Note, Table 8-73.See Special Analysis B, "Special Analyses, Budget of the United States Government, Fiscal Year 1983" for description of these
categories.
Sources: Department of Commerce (Bureau of Economic Analysis), Department of the Treasury, and Office of Management andBudget.
319Digitized for FRASER http://fraser.stlouisfed.org/ Federal Reserve Bank of St. Louis

TABLE B-75.—Government receipts and expenditures, national income and product accounts, 1929-BJ
[Billions of dollars; quarterly data at seasonally adjusted annual rates]
Calendar year or quarter
1929
1933
1939
1940194119421943194419451946 . . .1947 . ...19481949
19501951 '.19521953195419551956195719581959
1960196119621963196419651966196719681969
1970197119721973197419751976197719781979..
19801981"
19791ItI l lI V . .
1980:1II .IllI V . . .
1981:
I I . ' ' . . ' .IllI V "
Total government
Receipts
11.3
9.3
15.4,
17.725.032.649.251.253.251.056.958.955.9
69.085.290.194.689.9
101.1109.7116.2115.0129.4
139.5144.8156.7168.5174.0188.3212.3228.2263.1296.7
302.8322,6368.3413.1455.2470.5538.4605.7681.6765.2
836.8954.6
739.7750.9775.3794.7
815.0807.6839.9884.7
938.9945,0972.5
Expendi-tures
10.3
10.7
17.6
18.428.864.093.3
103.092.745.642.550.559.3
61.079,293.9
101.697.098.0
104.5115.2127.6131.0
136.4149.1160.5167.8176.3187.8213.6242.4269.1286.8
313.4342.0371.6405.3460.0534.3574.9624.0681.3753.2
869.0979.7
721.7737.0764.0790.3
824.6850.2885.5915.5
948.6956.2990.4
1,023.6
Surplus ordeficit
nationalincome
andproduct
accounts
1.0
= 1.4
=2,2
— 7-3^8
= 31.4=44.1=51.8= 39.5
5.414.48.4
=3.4
8.06.1
= 3.8= 6.9= 7.1
3.15.2.9
= 12.6-1.6
3.1=4.3= 3.8
.7=2.3
-n-14.2= 6.0
9.9
= 10.6= 19.4-3.3
7.8=4.7
=63.8= 36.5= 18.3
1L9
=32.1=25.1
18.113.911.34.4
-9,6=42.5-45.6=30.8
=9.7-11.2= 17.9
Federal Government
Receipts
3.8
2.7
6.7
8.615.422.939.341.042.539.143.243.238.7
50.064.367.370.063.772.678.081.978.789.8
96.198.1
106.2114.4114.9124.3141.8150.5174.4196.9
191.9198.6227.5258.6287.8287.3331.8375.1431.5494.4
540.8624.8
477.0485.9500.6514.0
528.4520.9540.8573.2
617.4621.0638.3
Expendi-tures
2.6
4.0
8.9
10.020.556.185.895.584.635.629.834.941.3
40.857.871.177.169.868.171.979.688.991.0
93.1101.9110.4114.2118.2123.8143.6163.7180.5188.4
204.3220.6244.3264.2299.3356.6384.8421.5460.7509.2
602.0686.4
488.4494.0515.8538.6
564.7587.3615.0641.1
664.0668.2694.0719.4
Surplus ordeficit
nationalincome
andproduct
accounts
1.2
-1.3
-2.2
-1.3= 5.1
=33.1=46.6-54.5-42.1
3.513.48.3
-2.6
9.26,5
=3.7=7.1-6.0
4.46.12.3
= 10.3= 1.1
3.0=3.9=4.2
= 13
-L8= 13.2-.6.0
8.4
= 12.4= 22.0= 16.8^5.6
= 11.5=69.3-53.1=46.4-29.2=14.8
=61.2=61.6
= 11.5=8.1
-15.2= 24.5
= 36.3=66.5= 74.2= 67.9
=46.6=47,2-55.7
State and localgovernment
Receipts
7.6
7.2
9.6
10.010.410.610.911.111,613.015.417.719.5
21.323.425.427.429.031.735.038.542.046.4
49.954.058.563.269.575.184.893.6
107.3120.2
135.4153.0178.3195.0211.4,237.7267.8298.0327.4351.2
384.0416.8
340.9342.7355.4365.6
372.1373.9386.8403.4
411.7413.6419.6
Expend^lures
7.8
7.2
9.6
9.39.18.88.48.59.0
11.114.417.620.2
22.523.925.527.330.232.935.939.844.346.9
49.854.458.062.868.575.184.394.7
107.2118.7
133.5150.4164.8181.6204.6232.2251.2270.0298.4324.4
355.0380.3
311.4320.8328.9336.7
345.4350.0358.2366.3
374.8377.5381.8387.1
Surplus ordeficit(-),national
incomeand
productaccounts
=0.2
~.l
.0
.61.31.82.52.72.61.91.0.1
= .7
-1.2= .4= .0
.1= 1.1= 1.3-.9
= 1.4=2.4
— 4
.1«-.4
.5
l!fl--.0
-I'.l
L5
1.92.6
13.513.46.85.5
16.628.129.026.7
29.136.5
29.521.926.528.9
26.623.928.637.1
36.936.137.8
Note.—Federal grants-in-aid to State and local governments are reflected in Federal expenditures and State and local receipts. Totalgovernment receipts and expenditures have been adjusted to eliminate this duplication.
Source: Department of Commerce, Bureau of Economic Analysis,
320Digitized for FRASER http://fraser.stlouisfed.org/ Federal Reserve Bank of St. Louis

TABLE B-76.—Federal Government receipts and expenditures, national income and product accounts,
1958-83
[Billions of dollars; quarterly data at seasonally adjusted annual rates]
Year or qu.arter
Fiscal year: 219581959196019611962196319641965196619671968196919701971197219731974 . .19751976197719781979198019811982 3
1983 3
Calendar year:195819591960196119621963196419651966196719681969197019711972197319741975197619771978197919801981 p .
1980:IItI I IIV
1981:1I II l lIV '
Receipts
Total
78.185.494.895.0
104.0110.0115.6120.0132.7146.0159.9189.8194.8192.4213.4240.7271.6283.4314.9365.9414.2480.7527.3613.0641.0685.7
78.789.896.198.1
106.2114.4114.9124.3141.8150.5174.4196.9191.9198.6227.5258.6287.8287.3331.8375.1431.5494.4
540.8624.8
528.4520.9540.8573.2
617.4621.0638.3
Personaltax andnontaxreceipts
36.338.242.543.647.349.650.751.457.564.471.490.294.087.9
100.5107.4122.7127.5137.2166.4186.4223.1249.7290.7303.5307.7
36.839.943.644.748.651548.653.961.767.579.795.192.690.3
108.2114.7131.3125.8147.3170.1194.9231.4257.8296.2
246.9252.0259.4272.9
283.3293.2306.43019
Corpo-rate
profitstax
accruals
17.921.422.320.022.723.325.727.130.830.333.136.832.931.934.241.243.441.852.558.867.275.870.669.658.778.1
18.022.521.421.522.524.626.128.931.430.036.136.130.633.536.643.345.143.654.661.671.274.670.264.9
80.560.966.772.6
74.664.866.4
Indirectbusinesstax andnontax
accruals
11.612.013.213.314.215.015.616.915.515.817.118.619.220.019.920.721.422.224.324.527.229.135.756.657.457.5
11.512.513.413.614.615316.216.515.616.318.019.019.320.420.021.221.723.923.425.028.129.440.661.3
31.938.742.949.1
60.662.661.860.2
Contri-butions
forsocialinsur-ance
12.313.916.718.119.922.123.624.528.935.538.344.248.852.658.971.584.291.9
101.0116.2133.4152.7171.3196.1221.4242.4
12.414.917.618.320.523124.025.033.136.740.746.749.354.462.779.589.894.1
106.5118.5137.2159.0172.2202.5
169.2169.3171.8178.6
198.9200.4
. 203.7206.9
Expenditures
Total '
82.891.291.398.1
106.2111,7117.2118.5132.7154.9172.2184.6195.5212.9232.7255.7278.2328.8370.7411.7450.5494.7578.2667.9741.4787.6
88.991.093.1
101.9110.41142118.2123.8143.6163.7180.5188.4204.3220.6244.3264.2299.3356.6384.8421.5460.7509.2602.0686.4
564.7587.3615.0641,1
664.0668,2694.0719.4
Pur-chases
of goodsand
services
51.154.852.955.861.063.765.964.672.486.095.098.097.194.9
100.6101.1104.5117.9125.1140.3150.7163.4190.2218.3249.0272.9
53.953.953.757.463.764665.267.378.890.998.097.695.796.2
101.7102.0111.0122.7129.2143.9153.4167.9198.9228.6
190.0198.7194.9212.0
221.6219.5226.4246.7
Transferpayments
Topersons
17.819.920.623.625.126.527.428.431.837.242.748.755.067.776.187.2
101.8131.4153.8166.6178.7197.8234.7273.9306.0324.6
19.620.121.625.025.627027.930.333.540.146.050.661.372.780.593.3
114.5146.3158.8169.6181.8204.9244.9279.3
224.4232.2260.4262.6
267.3270.7287.8291.4
Toforeign-
ers
1.71.81.82.12.12.12.22.22.32.22.12.22.02.32.82.73.03.13.03.23.54.04.65.86.16.2
1.81.81.92.12.22 22.22.22.32.22.12.12.22.62.72.63.23.13.23.23.84.24.95.1
4.53.84.96.4
4.74.15.85.7
Grants-irt-aid to
Stateand
localgovern-ments
4.76.26.96.97.68.39.8
10.912.714.817.819.222.626.832.640.441.648.457.568.374.779.186.790.186.376.8
5.66.86.57.28.091
10.411.114.415.918.620.324.429.037.540.643.954.661.167.577.380.488.087.0
85.587.287.791.8
90.289.685.482.9
Netinter*est
paid
5.45.66.86.46.47.17.78.28.79.6
10.411.913.514.014.015.719.621.725.228.433.540.651.266.981.495.9
5.26.26.86.26.8738.08.49.29,8
11,312,714,113.814.418.020.723.126.829.135.242.353.373.3
50.354.453.555.2
67.770.475.679,4
Subsi-diesless
currentsurplus
ofgovern-
mententer-prises
2.42.52.43.34.14.04.14.34.85.24.14.75.57.06.59.27.66.06.27.09.69.8
10.813.012.511.2
2.82.12.64.04.2394.54.65.54.74.55.26.56.37.97.85.56.95.88.29.39.4
12.013.2
10.111.013.713.1
12.613.913.313.1
Surplusor
deficit<-),
nationalincome
andproduct
accounts
-4.7-5.8
3.4-3.1-2.2-1.7-1.5
1.4.0
-8.9-12.3
5.2-.1
-20.5-19.2-14.9-6.6
-45.4-55.8-45.8-36.3-14.0-50.9-54.9
-100.4-101.9
-10.3= 1.1
3.0=3.9=4.2
3-3.3
.5-1.8
-13.2-6.0
8.4-12.4-22.0-16.8= 5.6
-11.5-69.3-53.1-46.4-29.2-14.8=61.2-61.6
=36.3-66.5= 74.2-67.9
^46.6-47.2-55.7
1 Includes an item for the difference between wage accruals and disbursements, not shown separately.2 Under provisions of the Congressional Budget Act of 1974, the fiscal year for the Federal Government shifted beginning with fiscalyear 1977. Through fiscal year 1976, the fiscal year was on a July 1-June 30 basis; beginning October 1976 (fiscal year 1977), thefiscal year is on an October 1-September 30 basis. The 3-month period from July 1, 1976 through September 30, 1976 is a separatefiscal period known as the transition quarter.3 Estimates.
Sources: Department of Commerce (Bureau of Economic Analysis) and Office of Management and Budget.
321Digitized for FRASER http://fraser.stlouisfed.org/ Federal Reserve Bank of St. Louis

TABLE B-77.—State and local government receipts and expenditures, national income and product accounts,
1946-81
[Billions of dollars; quarterly data at seasonally adjusted annual rates]
Calendar yearor quarter
1946..1947.1948..1949
19501951195219531954
195519561957 . .19581959
1960, . .1961196219631964
19651966, . . ....196719681969
197019711972.. .19731974
19751976..1977.. .19781979
19801981 » .
1979:1III I I . .IV...
1980:1II '. * "IIIIV
1981:|||IIIIV
Receipts
Total
13.015.417.719.5
21.323.425.427.429.0
31.735.038542.046.4
49.954.058.563.269.5
75.184.893.6
107.3120.2
135.4153.0178.31950211.4
237.7267.8298.0327.4351.2
384.0416.8
340.9342.7355.4365.6
372.1373.9386.8403.4
411 7413.6419.6
Personaltax andnontax
receipts
1.51.72.12.4
2.52.83.03.23.5
3.94.5505.46.1
6.77.48.28.8
10.0
10.912.814.617.520.6
23.226.432.836039.0
43.149.656.463.970.6
80.791.9
67.767.872.374.7
76.278.382.186.3
88689.793.396.1
Corpo-rate
profitstax
accruals
0.5.6.7.6
.8
.9
.8
.8
.8
1.01.0101.01.2
1.21.31.51.71.8
2.02.22.53.13.4
3.54.15.0586.5
7.19.3
11.011.713.0
12.211.5
13.212.913.112.9
13.710.611.712.6
13 1ire11.7
Indirectbusinesstax andnontax
accruals
9.310.712.213.3
14.615.917.418.819.9
21.623.825727.229.3
32.034.437.039.442.6
46.149.754.060.967.6
75.083.391.5997
107.4
116.2128.3141.0149,9159.0
171.6189.9
155.1156.4160.6163.9
167.0167.7173.0179.0
184918&9192.3195.6
Contribu-tions for
socialinsurance
0.6.7.8.9
1.11,41.61.72.0
2.12,3262,83.1
3.43.73.94.24.7
5.05.76.77.28.3
9.210.211.5130R6
16.819.522.124.628.1
31.536.4
26.827.928.629,2
29.630.232.333.7
34835l936.938.0
Federalgrants-m-
aid
1.11.72.02.2
2.32.52.62.82.9
3.13.34 25.66.8
6.57.28.09.1
10.4
1U14.415.918.620.3
24.429.037.540643.9
54.661.167.577.380,4
88.087.0
78.277.880.884.9
85.587.287.791.8
90 289^685.482.9
Expenditures
Total »
11.114.417.620,2
22.523,925.527.330.2
32.935.939844.346.9
49.854.458.062.868.5
75.184.394.7
107.2118.7
133.5150.4164.81816204^6
232.2251.2270.0298.4324.4
355.0380.3
311.4320.8328.9336.7
345.4350.0358.2366,3
374 837L5381.8387.1
Pur-chases
ofgoods
andservices
9.912.815.318.0
19,821.823.225.027.8
30.633.537141.143.7
46.550.854.359.064.6
71.179.889.3
101.0111.2
124.4138.7151.41685193!l
217.2232.9250.6279.2305.9
335.8361.1
293.4301.6310.4318.3
326.8331.3338,6346.6
3549357!9362.5369.0
Trans-fer
pay-ments
toper-sons
1.72.33.03.0
3.63.13.33.53.6
3.83.9434.85.1
5.45.86.06.46.9
7.38.19.4
10.512.2
14.717.319.320720^9
24.627.629.732.835.0
38.942.0
33.834.535.436.4
37.238.139.740.5
41 242ll42.642.2
Netinterest
paidlessdivi-
dendsreceived
0.2.1.1.1
.1
.0
.0
.0
.1
.1
.1
.1
.1
.1
.1
.1
.1
.1«.l
-.3= .7-.9
-1.1-1.4
= 2.0-1.7-1.9= 33-si)-5.1-4.5-5,2=-7.7
-10.3
-12.4-14.6
-9.4-9.9
-10.6-11.2
-11.8-12.2-12.7=-13.0
— 13 4-K2-15.1= 15.8
Subsi-diesless
currentsurplus
ofgovern-
mententer-prises
=0.7~,8-.8-.9
-.9-1.0-1.1= 1.2-1.3
-1.5= 1.6= 1 7-17^2.0
=2.2=2.3=2.5= 2.8=2.8
= 3.0=3.0=3.1-3.2= 3.3
= 3.6=3.7=4.2=43= 4>
-4.5-4.8= 5.1-5.7= 6.3
-7,4= 8.2
=6.0-6.2-6.5=6.7
-7.0-7.2-7.5-7.7
—7 9-87= 8.2-8.3
Surplusor
deficit(»),
nationalincome
andproduct
accounts
1.91.0.1
-7
-1.2= .4-,0
.1-1.1
-1.3-.9
— 1 4-24
.1--.4
.5
.51.0
= .0
=n.1
1.5
1.92.6
13.51346i8
5.516.628.129.0267
Z9.136.5
29.521.926.528.9
26.623.928.637.1
36936! 137.8
1 Includes an item for the difference between wage accruals and disbursements, not shown separately.Source: Department of Commerce, Bureau of Economic Analysis.
322Digitized for FRASER http://fraser.stlouisfed.org/ Federal Reserve Bank of St. Louis

TABLE B-78.—State and local government revenues and expenditures, selected fiscal years, 1927-80
[Millions of dollars]
Fiscal year 1
1927
1932193419361938
19401942194419461948
1950195219531954
19551956195719581959
19601961 .19621963.
1962-63 8
1963-64 6
1964-65 5
1965-66 5
1966-67 5
1967-68 5
1968-69*1969-70«
1970-71 «1971-72*1972-73 s
1973-74 5
1974-75 6
1975-76 5
1976-77 «1977-78 5
1978-79 5
1979-80 5
General revenues by source2
Total
7,271
7,2677,6788,3959,228
9,6091041810,90812,35617,250
20,91125,18127,30729,012
31,07334,66738,16441,21945,306
50,50554,03758,25262,890
62,26968,44374,000
83,03691,197
101,264114,550130,756
144,927166,352190,214207,670228,171
256,176285,796315,960343,278382,322
Propertytaxes
4,730
4,4874,0764,0934,440
4,43045374,6044,9866,126
7,3498,6529,3759,967
10,73511,74912,86414,04714,983
16,40518,00219,05420,089
19,83321,24122,583
24,67026,04727,74730,67334,054
37,85242,13345,28347,70551,491
57,00162,53566,42264,94468,499
Salesand
grossre-
ceiptstaxes
470
7521,0081,4841,794
1,9822,3512,2892,9864,442
5,1546,3576,9277,276
7,6438,6919,4679,829
10,437
11,84912,46313,49414,456
14,44615,76217,118
19,08520,53022,91126,51930,322
33,23337,48842.04746,09849,815
54,54760,59567,59674,24779,927
Individu-al
incometaxes
70
7480
153218
224276342422543
788998
1,0651,127
1,2371,5381,7541,7591,994
2,4632,6133,0373,269
3,2673,7914,090
4,7605,8267,3088,908
10,812
11,90015,23717,99419,49121,454
24,57529,24533,17636,93242,080
Corpo-ration
netincometaxes
92
7949
113165
156272451447592
593846817778
744890984
1,0181,001
1,1801,2661,3081,505
1,5051,6951,929
2,0382,2272,5183,1803,738
3,4244,4165,4256,0156,642
7,2739,174
10,73812,12813,321
Revenuefrom
FederalGovern-
ment
116
2321,016
948800
945858954855
1,861
2,4862,5662,8702,966
3,1313,3353,8434,8656,377
6,9747,1317,8718,722
8,66310,00211,029
13,21415,37017,18119,15321,857
26,14631,25339,25641,82047,034
55,58962,57569,59275,16483,029
Allother3
1,793
1,6431,4491,6041,811
1,87221232,2692,6613,685
4,5415,7636,2526,897
7,5848,4659,2509,699
10,516
11,63412,56313,48914,850
14,55615,95117,250
19,26921,19723,59826,11829,971
32,37435,82640,21046,54151,735
57,19161,67368,43679,86495,466
General expenditures by function 2
Total
7,210
7,7657,1817,6448,757
9,2299,1908,863
11,02817,684
22,78726,09827,91030,701
33,72436,71140,37544,85148,887
51,87656,20160,20664,816
63,97769,30274,546
82,84393,350
102,411116,728131,332
150,674166,873181,227198,959230,721
256,731274,388296,983327,517369,086
Education
2,235
2,3111,8312,1772,491
2,63825862,7933,3565,379
7,1778,3189,390
10,557
11,90713,22014,13415,91917,283
18,71920,57422,21623,776
23,72926,28628,563
33,28737,91941,15847,23852,718
59,41364,88669,71475,83387,858
97,216102,805110,758119,448133,211
High-ways
1,809
1,7411,5091,4251,650
1,57314901,2001,6723,036
3,8034,6504,9875,527
6,4526,9537,8168,5679,592
9,4289,844
10,35711,136
11,15011,66412,221
12,77013,93214,48115,41716,427
18,09519,01018,61519,94622,528
23,90723,10524,60928,44033,311
Publicwelfare
151
444889827
1,069
1,1561,2251,1331,4092,099
2,9402,7882,9143,060
3,1683,1393,4853,8184,136
4,4044,7205,0845,481
5,4205,7666,315
6,7578,2189,857
12,11014,679
18,22621,07023,58225.08528^55
32,60435,94139,14041,89847,288
Allother4
3,015
3,2692,95232153,547
3,86238893,7374,5917,170
8,86710,3421061911,557
12,19713,39914,94016,54717,876
19,32521,06322,54924,423
23,67825,58627,447
30,02933,28136,91541,96347,508
54,94061,90769,31678,09692,180
103,004112,537122,476137,731155,277
1 Fiscal years not the same for all governments. See footnote 5.2 Excludes revenues or expenditures of publicly owned uttfities and liquor stores, and of insurance-trust activities. Intergovernmentalreceipts and payments between State and local governments are also excluded.3 Includes licenses and other taxes and charges and miscellaneous revenues.4 Includes expenditures for health, hospitals, police, local fire protection, natural resources, sanitation, housing and urban renewal,local parks and recreation, general control, financial administration, interest on general debt, and unallocable expenditures.5 Data for fiscal year ending in the 12-month period through June 30. Data for 1963 and earlier years include local governmentamounts grouped in terms of fiscal years ended during the particular calendar year.
Note.—Data are not available for intervening years.Source.- Department of Commerce, Bureau of the Census.
323Digitized for FRASER http://fraser.stlouisfed.org/ Federal Reserve Bank of St. Louis

TABLE B-79.—Interest-bearing public debt securities by kind of obligation, 1967-8 J
[Millions of dollars]
End of yearor month
Fiscal year:1967 , .1968.. . .1969
19701971197219731974
19751976197719781979
19801981
1980:JanFebMarAprMayJune
July ..' *Aug,Sept. .OctNovDec
1981:JanFebMar .. .
MayJune.
July., . .AugSept ... .Oct.Nov.Dec
Totalinterest-bearingpublicdebt
securities
322,286344,401351,729
369,026396,289425,360456,353473,238
532,122619,254697,629766,971819,007
906,402996,495
846,517853,366862,211868,866873,529876,275
880,395888,733906,402906,948909,371928,912
929,825946,455963,207962,779964,792969,921
972,053978,920996,495999,451
1,011,9361,027,300
Marketable
Total
4 210,672226,592226,107
232,599245,473257,202262,971266,575
315,606392,581443,508485,155506,693
594,506683,209
535,658540,636557,493564,869567,560566,735
576,145583,419594,506599,406605,381623,186
628,482642,905661,142657,906656,185660,769
666,405673,765683,209689,578704,819720,293
Treasurybills
58,53564,44068,356
7615486',67794,648100,061105,019
128,569161,198156,091160,936161,378
199,832223,388
175,522177,422190,780195,296195,387184,684
191,491199,306199,832202,309208,721216,104
220,423228,972235,315225,849224,514218,786
217,532219,854223,388229,061233,905245,015
Treasurynotes
49,10871,07378,946
93489104,807113,419117,840128,419
150,257191,758241,692267,865274,242
310,903363,643
283,990286,814290,390291,831291,532301,455
302 626300,251310,903311,927311,119321,634
321,176324,540336,505341,052338,419348,788
354,005357,603363,643362,649370,794375,332
Treasurybonds >
97,41891,07978,805
6295653,98949,13545,07133,137
36,77939,62645,72456,35571,073
83,77296,178
76,14776,40076,32377,74180,64180,596
82,02783,86183,77285,17085,54185,449
86,88389,39389,32391,00693,25293,196
94,86896,30896,17897,867100,11999,946
Nonmarketabte
Total
111,614117,808125,623
136,426150,816168,158193,382206,663
216,516226,673254,121281,816312,314
311,896313,286
310,859312,730304,718303,997305,968309,539
304,250305,314311,896307,542303,989305,726
301,343303,550302,065304,873308,608309,152
305,647305,155313,286309,874307,117307,007
u ssavingsbonds
51,21351,71251,711
51,28153,00355,92159,41861,921
65,48269,73375,41179,79880,440
72,72768,017
78,24777,33875,64373,88973,24773,072
72,96872,85372,72772,66972,52472,217
71,05770,44370,05769,51869,22968,934
68,71968,35568,01767,71867,73967,837
Foreigngovernmentand
publicseries 2
1,5143,7414,070
4,7559,27018,98528,52425,011
23,21621,50021,79921,68028,115
25,15820,499
30,04529,64326,90126,25025,92525,460
25,77925,84525,15824,80524,50124,034
23,80423,98624,16224,41124,78923,514
21,94321,43120,49920,47120,30919,025
Govern-ment
accountseries
56,15559,52666,790
76,32382,78489,598101,738115,442
124,173130,557140,113153,271176,360
189,848201,052
174,904178,415175,451179,652182,642186,842
181,479182,447189,848185,665182,447185,092
182,197185,020183,833186,979190,839192,962
191,647192,060201,052198,053195,541196,665
Other ̂
2,7312,8283,051
4,0685,7593,6543,7014,289
3,6444,88316,79727,06727,400
24,16423,718
27,66427,33626,72224,20724,15624,165
24,02224,17024,16424,40424,51824,385
24,28724,10224,01523,96523,75023,741
23,33923,31023,71823,63223,52923,480
1 Includes Treasury bonds and minor amounts of Panama Canal and postal savings bonds.8 Nonmarketable certificates of indebtedness, notes, bonds, and bills in the Treasury foreign series of dollar-denominated and foreign-
currency denominated issues.3 Includes depository bonds, retirement plan bonds, Rural Electrification Administration bonds, State and local bonds, and special
issues held only by U.S. Government agencies and trust funds and the Federal home loan banks.4 Includes $5,610 million in certificates not shown separately.
Note.—Through fiscal year 1976, the fiscal year was on a July 1-June 30 basis; beginning October 1976 (fiscal year 1977) the fiscalyear is on an October 1-September 30 basis.
Source: Department of the Treasury.
324Digitized for FRASER http://fraser.stlouisfed.org/ Federal Reserve Bank of St. Louis

TABLE B-80.—Estimated ownership of public debt, securities, 1967-81
[Par values;1 billions of dollars]
End of year or month
Fiscal year:196719681969
197019711972. .19731974
197519761977. . . . . . .19781979
19801981
1980:JanFebMarApr ..MayJune
JulyAugSeptOctNovDec
1981-Jan .FebMarAprMay ..June
JulyAugSept... .OctNovDec.
Public debt securities
Total2
322.9345.4352.9
370.1397.3426.4457.3474.2
533.2620.4698.8771.5826.5
907.7997.9
847.7854.6863.5870.0877.9877.6
881.7893.4907.7908.2913.8930.2
934.1950.5964.5964.0968.5971.2
973.3980.2997.9
1,005.01,013.31,028.7
Held byGovern-
mentaccounts
71.876.184.8
95.2102.9111.5123.4138.2
145.3149.6155.5167.9187.7
197.7208.1
184.5187.8186.3188.2190.7194.9
189.2189.8197.7193.4189.8192.5
189.5192.0190.9193.9197.8199.9
198.6199.0208.1204.9202.1203.3
HetdbyFederalReserveBanks
46.752.254.1
57.765.571.475.080.5
84.794.4
104.7115.3115.5
120.7124.3
116.3115.2116.7118.8124.3124.5
119.6119.8120.7121.5120.8121.3
117.2118.9119.0119.7118.3120.0
123.4124.5124.3123.0126.5129.9
Held by private investors
Total ^
204.4217.0214.0
217.2228.9243.6258.9255.6
303.2376.4438.6488.3523.4
589.2665.4
546.9551.6560.5563.0562.9558.2
573.0583.8589.2593.3603.2616.4
627.4639.6654.6650.4652.3651.2
651.3656.7665.4677.2684.6695.5
Com-mercialbanks4
55.559.755.3
52.661.060.958.853.2
69.092.599.894.492.5
109.7112.2
97.098.298.196.397.7
100.3
101.4106.1109.7113.2111.4116.0
117.2116.4117.5113.5113.2113.3
114.2115.0112.2111.3110.0
Mutualsavingsbanks
andinsur-ancecom-
panies
13.212.511.6
10.410.310.29.68.5
10.616.020.521.221.5
24.326.2
21.121.522.622.622.622.3
23.223.424.324.725.425.5
25.525.323.723.725.324.0
25.426.126.224.724.5
Corpora-tions6
11.012.011.1
8.57.49.39.8
10.8
13.824.721.218.122.1
25.937.8
23.023.123.223.022.822.6
23.724.325.925.925.825.7
30.435.240.040.438.838.7
37.838.037.838.638.3
State andlocal
govern-ments6
23.625.126.4
29.025.926.928.828.3
31.739.348.263.866.5
77.086.2
70.375.570.770.770.771.1
72.974.777.076.878.378.8
77.380.482.383.685.183.0
86.086.286.288.387.5
Indi-viduals 7
70.474.277.3
81.875.473.275.980.7
86.896.2
106.5113.9115.5
123.0140.3
117.0113.8124.8125.3124.3120.2
121.2124.1123.0122.9125,3129.2
134.2136.2138.6138.2139.9139.6
139.5140.2140.3141.0141.6
Miscel-laneousinves-
tors3 8
30.733.432.3
35.049.163.276.074.2
91.3107.7142.4176.9205.3
229.3262.7
218.5219.5221.1225.1224.8221.7
230.6231.2229.3229.8237.0241.2
242.8246.1252.5251.0250.0252.6
248.4251.2262.7273.3282.6
1 U.S. savings bonds, series A-F and J, and U.S. savings notes are included at current redemption value.2 As of July 31, 1974, public debt outstanding has been adjusted to exclude the notes of the International Monetary Fund to conformwith the Budget presentation. This adjustment applies to the 1967-81 data in this table.3 For comparability with 1975-81 published data, published data for 1967-74 have been adjusted to exclude notes of theInternational Monetary Fund. These adjustments amounted to $3.3 billion in 1967, $2.2 billion in 1968, and $0.8 billion in each year1969 through 1974. These adjustments were necessary in order to add to the total public debt figures as published by the Departmentof the Treasury.4 Includes commercial banks, trust companies, and stock savings banks in the United States and Territories and island possessions,-figures exclude securities held in trust departments.6 Exclusive of banks and insurance companies.6 Includes trust, sinking, and investment funds of State and local governments and their agencies, and of Territories andpossessions.7 Includes partnerships and personal trust accounts.8 Includes savings and loan associations, nonprofit institutions, corporate pension trust funds, dealers and brokers, certaingovernment deposit accounts and government-sponsored agencies, and investments of foreign balances and international accounts inthe United States.
Note.—Through fiscal year 1976, the fiscal year was on a July 1—June 30 basis; beginning October 1976 (fiscal year 1977), thefiscal year is on an October 1—September 30 basis.
Source: Department of the Treasury.
325Digitized for FRASER http://fraser.stlouisfed.org/ Federal Reserve Bank of St. Louis
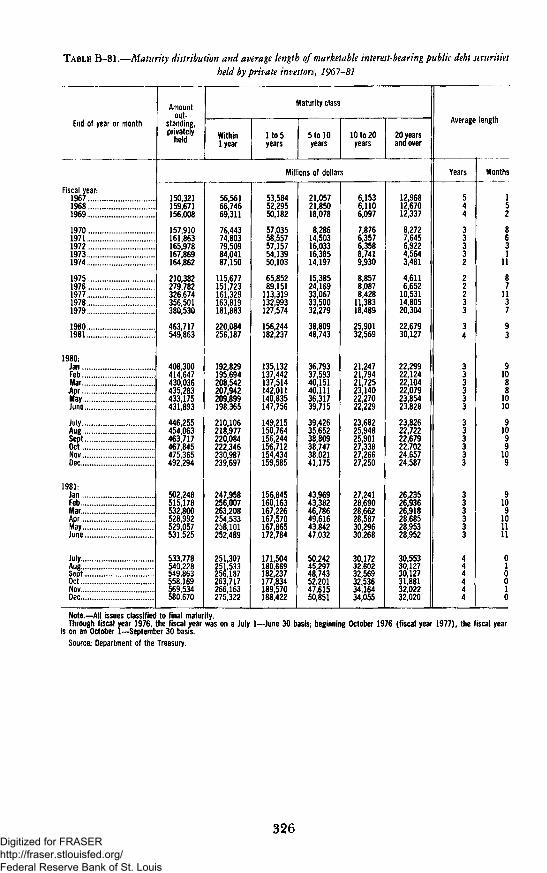
TABLE B-81.—Maturity distribution and average length of marketable interest-bearing public debt securitiesheld by private investors, 1967-81
End of year or month
Fiscal year:196719681969
19701971197219731974 ...
19751976197719781979
19801981
1980:JanFeb.MarAprMayJune. .
JulyAugSeptGetNovDec
1981JanFebMarApr . . . .MayJune
JulyAugSept..Oct..NovDec
Amountout-
standing,privately
heldnelQ
Maturity class
Withinlyear
Ito5years
5 to 10years
10 to 20years
20 yearsana over
Millions of dollars
150,321159,671156,008
157,910161,863165,978167,869164,862
210,382279,782326,674356,501380,530
463,717549,863
408 300414,647430,036435,283433,175431,893
446,255454,063463,717467,845475,365492,294
502,248515,178532,800528,992529,057531,525
533,778540,228549,863558,169569,534580,670
56,56166,74669,311
76,44374,80379,50984,04187,150
115,677151,723161,329163,819181,883
220,084256,187
192 829195,694208,542207,942209,899198,365
210,106218,977220,084222,346230,987239,697
247,958256,007263,208254,533258,101252,489
251,307251.533256,187263,717266 163275,322
53,58452,29550,182
57,03558,55757,15754,13950,103
65,85289,151113,319132,993127,574
156,244182,237
135,132137,442137,514142,011140,835147,756
149,215150,764156,244156,712154,434159,585
156,845160,163167,226167,570167,865172,784
171,504180,669182,237177,834189,570188,422
21,05721,85018,078
8,28614,50316,03316,38514,197
15,38524,16933,06733,50032,279
38,80948,743
36,79337,59340,15140,11136,31739,715
39,42635,65238,80938,74738,02141,175
43,96943,38246,78649,61643,84247,032
50,24245,29748,74352,20147,61550,851
6,1536,1106,097
7,8766,3576,3588,7419,930
8,8578,0878,42811,38318,489
25,90132,569
21,24721,79421,72523,14022,27022,229
23,68225,94825,90127,33827,26627,250
27,24128,69028,66228,58730,29630,268
30,17232,60232,56932,53634,16434,055
12,96812,67012,337
8,2727,6456,9224,5643,481
4,6116,65210,53114,80520,304
22,67930,127
22,29922,12422,10422,07923,85423,828
23,82622,72222,67922,70224,65724,587
26,23526,93626,91828,68528,95328,952
30,55330,12730,12731,88132,02232,020
Average length
Years
544
33332
22233
34
333333
333333
333333
444444
Months
152
8631
11
87113
93
910881010
91099109
9109101111
010010
Note.—All issues classified to final maturity.Through fiscal year 1976, the fiscal year was on a July 1- June 30 basis; beginning October 1976 (fiscal year 1977), the fiscal year
is on an October 1—September 30 basis.Source: Department of the Treasury.
326Digitized for FRASER http://fraser.stlouisfed.org/ Federal Reserve Bank of St. Louis
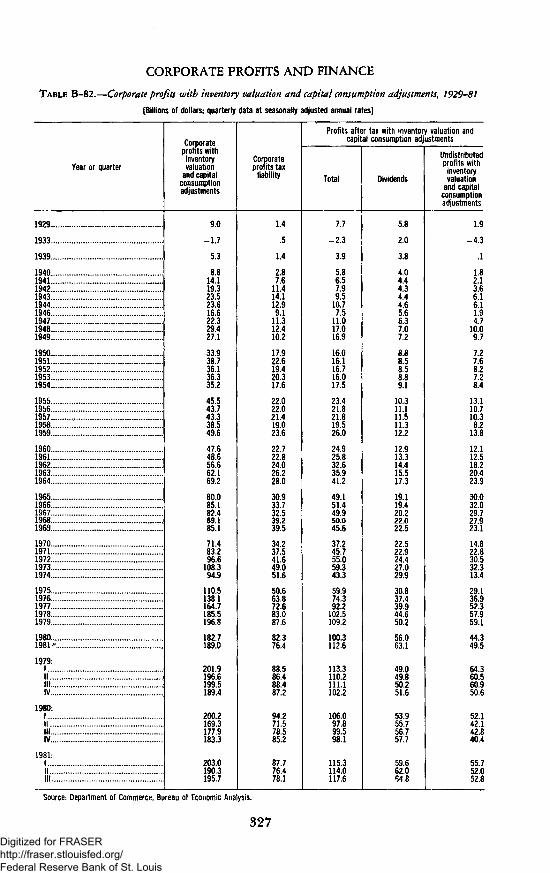
CORPORATE PROFITS AND FINANCE
TABLE B-82.—Corporate profits with inventory valuation and capital consumption adjustments, 1929-81
[Billions of dollars; quarterly data at seasonally adjusted annual rates]
Year or quarter
1929
1933
1939
194019411942194319441946194719481949
19501951 .... .. . .19521953 . .1954
195519561957 '19581959
19601961196219631964
19651966196719681969
19701971197219731974
197519761977 . . .19781979
19801981"
1979:IIIIIIIV . v
1980:\||IllIV
1981:1IIHI
Corporateprofits with
inventoryvaluation
and capitalconsumptionadjustments
9.0
-1.7
5.3
8.614.119.323.523.616.622.329.427.1
33.938.736.136.335.2
45.543.743.338.549.6
47.648.656.662.169.2
80.085.182.489.185.1
71.483.296.6
108.394.9
110.5138.1164.7185.5196.8
182.7189.0
201.9196.6199.5189.4
200.2169.3177.9183.3
203.0190.3195.7
Corporateprofits tax
liability
1.4
.5
1.4
2.87.6
11.414.112.99.1
11.312.410.2
17.922.619.420.317.6
22.022.021.419.023.6
22.722.824.026.228.0
30.933.732.539.239.5
34.237.541.649.051.6
50.663.872.683.087.6
82.376.4
88.586.488.487.2
94.271.578.585.2
87.776.478.1
Profits after tax with inventory valuation andcapital consumption adjustments
Total
7.7
-2.3
3.9
5.86.57.99.5
10.77.5
11.017.016.9
16.016.116.716.017.5
23.421.821.819.526.0
24.925.832.635.941.2
49.151.449.950.045.6
37.245.755.059.343.3
59.974.392.2
102.5109.2
100.3112.6
113.3110.2111.1102.2
106.097.899.598.1
115.3114.0117.6
Dividends
5.8
2.0
3.8
4.04.44.34.44.65.66.37.07.2
8.88.58.58.89.1
10.311.111.511.312.2
12.913.314.415,517.3
19.119.420.222.022.5
22.522.924.427.029.9
30.837.439.944.650.2
56.063.1
49.049.850.251.6
53.955.756.757.7
59,662.084.8
Undistributedprofits with
inventoryvaluation
and capitalconsumptionadjustments
1.9
-4.3
.1
1.82.13.66.16.11.94.7
10.09.7
7.27.68.27.28.4
13.110.710.38.2
13.8
12.112.518.220.423.9
30.032.029.727.923.1
14.822.830.532.313.4
29.136.952.357.959.1
44.349.5
64.360.560.950.6
52.142.142.840.4
55.752.052.8
Source: Department of Commerce, Bureau of Economic Analysis.
327Digitized for FRASER http://fraser.stlouisfed.org/ Federal Reserve Bank of St. Louis
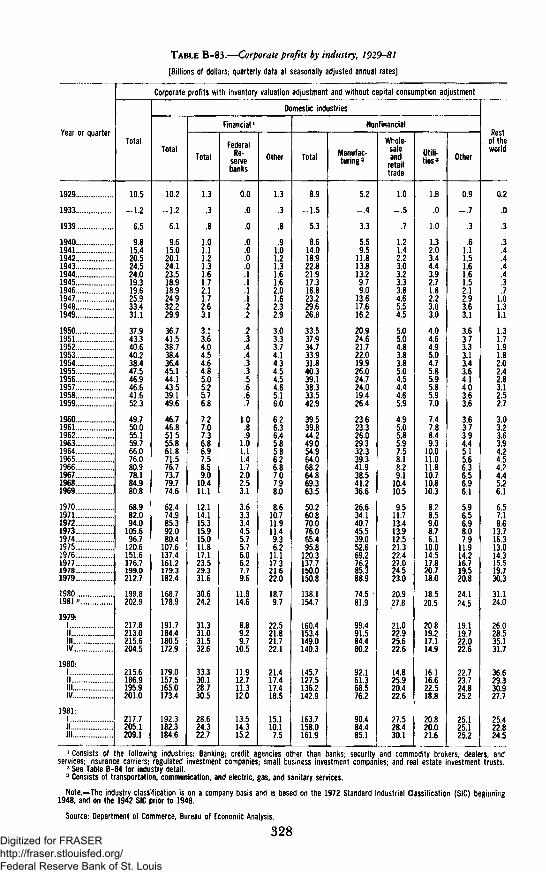
TABLE B-83.—Corporate profits by industry, 1929-81
[Billions of dollars; quarterly data at seasonally adjusted annual rates]
Year or quarter
1929 ..
1933
1939 . .
1940. .1941...1942194319441945 .1946 . . .1947.,.1948 .1949
19501951 , , . .19521953, ...195419551956195719581959
196019611962 .1963.. .19641965 ..196619671968 .1969
1970 . ..1971 . .1972 .1973.. .1974 . . .197519761977 . , ,19781979 . ...
19801981 »
1979:I||Il lIV
1980:1III l lIV
1981:IIIIll
Corporate profits with inventory valuation adjustment and without capital consumption adjustment
Total
10.5
-1.2
6.5
9.815.420.524.524.019.319.625.933.431.1
37.943.340.640.238.447.546.946.641.652.3
49.750.055.159.766.076.080.978.184.980.8
68.982.094.0
105.696.7
120.6151.6176.7199.0212.7
199.8202.9
217.8213.0215.6204.5
215.6186.9195.9201.0
217.7205.1209.1
Domestic industries
Total
10.2
-1.2
6.1
9.615.020.124.123.518.918.924.932.229.9
36.741.538.738.436.445.144.143.539.149.6
46.746.851.555.861.871.576.773.779.774.6
62.474.985.392.080.4
107.6137.4161.2179.3182.4
168.7178.9
191.7184.4180.5172.9
179.0157.5165.0173.4
192.3182.3184.6
Financial l
Total
1.3
,3
.8
1.01.11.21.31.61.72.11.72.63.1
3.13.64.04.54.64.85.05.25.76.8
7.27.07.36.86.97.58.59.0
10.411.1
12.114.115.315.915.011.817.123.529.331.6
30.624.2
31.331.031.532.6
33.330.128.730.5
28.624.322.7
FederalRe-
servebanks
0.0
.0
.0
.0
.0
.0
.0
!l.1
.2
.2
.3
.4
.4
.3
!6.6
1.0.8.9
1.01.11.41.72.02.53.1
3.63.33.44.55.75.76.06.27.79.6
11.914.6
8.89.29.7
10.5
11.912.711.312.0
13.514.315.2
Other
1.3
.3
.8
.91.01.21.31.61.62.01.62.32.9
3.03.33.74.14.34.54.54.65.16.0
6.26.36.45.85.86.26.87.07.98.0
8.610.711.911.49.36.2
11.117.321.622.0
18.79.7
22.521.821.722.1
21.417.417.418.5
15.110.17.5
Nonfinancial
Total
8.9
-1.5
5.3
8.614.018.922.821.917.316.823.229,626,8
33.537.934.733.931.840.339.138.333.542.9
39.539.844.249.054.964.068.264.869.363.5
50.260.870.076.065.495.8
120.3137.7150.0150.8
138.1154.7
160.4153.4149.0140.3
145.7127.5136.2142.9
163.7158.0161.9
Manufac-tu r ing '
5.2
= .4
3.3
5.59.5
11.813.813.29.79.0
13.617.616.2
20.924.621.722.019.926.024.724.019.426.4
23.623.326.029.332.339.341.938.541.236.6
26.634.140.745.539.052,669.276.285.388.9
74,5 •81.9
99.491.584.480.2
92.161.368.576.2
90.484.485.1
Whole-saleand
retailtrade
1.0
-.5
.7
1.21.42.23,03.23.33.84.65.54.5
5.05.04.83.83.85.04.54.44.65,9
4.95.05.85.97.58.18.29.1
10.410.5
9.511.713.413.912.521.322.427.024.523.0
20.927.8
21.022.925.622.6
14.825.920.422.6
27.528.430.1
Utili-ties3
1.8
.0
1.0
1.32.03.44.43.92.71.82.23.03.0
4.04.64.95.04.75.65.95.85.97.0
7.47.88.49.3
10.011.011.810.710.810.3
8.28.59.08.76.1
10.014.517.820.718.0
18,520.5
20.819.217.114.9
16.116.622.518.8
20.820.021.6
Other
0.9
-.7
.3
.61.11.51.61.61.52.12.93.63.1
3.63.73.33.13.43.64.14.03.63.6
3.63.73.94.45.15.66.36.56.96.1
5.96.56,98.07.9
11.914.216.719.520.8
24.124.5
19.119.722.022.6
22.723.724.825.2
25.125.125.2
Rest, of the
world
0,2
.0
.3
.3
.4
.4
.4
.4
.3
.71.01.31.1
1.31.71.91.82.02.42.83.12.52.7
3.03.23.63.94,24.54.24.45.26.1
6.57.18.6
13.716.313.014.315.519.730.3
31.124.0
26.028.535.131.7
36.629.330.927.7
25.422.824.5
1 Consists of the following industries: Banking; credit agencies other than banks; security and commodity brokers, dealers, andservices; insurance carriers; regulated investment companies; small business investment companies; and real estate investment trusts.2 See Table B-84 for industry detail.3 Consists of transportation, communication, and electric, gas, and sanitary services.
Note.=The industry classification is on a company basis and is based on the 1972 Standard Industrial Classification (SIC) beginning1948, and on the 1942 SIC prior to 1948.
Source: Department of Commerce, Bureau of Economic Analysis.
328Digitized for FRASER http://fraser.stlouisfed.org/ Federal Reserve Bank of St. Louis

TABLE B-84.—Corporate profits of manufacturing industries, 1929-81
[Billions of dollars; quarterly data at seasonally adjusted annual rates]
Year or quarter
1929
1933
1939
1940194119421943194419451946194719481949
195019511952195319541955 ... .1956195719581959
1960196119621963196419651966196719681969
1970197119721973197419751976197719781979
19801981".
1979:IIIIllIV
1980:IIII l lIV . .
1981:1III l l
Corporate profits with inventory valuation adjustment and without capital consumption adjustment
Totalmanufac-
turing
5.2
-4
3.3
5.59.5
11.813.813.29.79.0
13.617.616.2
20.924.621.722.019.926.024.724.019.426.4
23.623.326.029.332.339.341.938.541.236.6
26.634.140.745.539.052.669.276.285.388.9
74.581.9
99.491.584.480.2
92,161.368.576.2
90.484.485.1
Durable goods
Total
2.6
_ 4
1.7
3.16.47.28.1744.52.45.87.58.1
12.013.211.711.910.514.312.813.39.3
13.7
11.611.414.016.317.923.023.820.922.218.9
10.216.322.424.313.218.930.436.043.039.5
20.926.4
50.943.034.829.3
28.110.119.425.8
31.531.926.0
Pri-marymetalindus-tries
. .,
"i.61.5
2.33.11.92.51.72.93.03.01.92.3
2.01.61.62.02.53.13.62.71.91.4
.8
.71.62.25.42.92.11.33.24.2
3.13.9
4.84.74.52.8
5.92.0
.73.8
5.13.83.7
Fabri-catedmetalprod-ucts
.8
.7
1.11.31.01.0.9
1.01.11.1.9
1.1
.81.01.11.31.42.02.42.42.32.0
1.11.52.12.51.63.03.84.54.85.0
3.94.2
5.55.34.64.8
5.21.73.94.8
4.14.64.7
Machin-ery,
exceptelectri-
cal
'"l.2~1.3
1.62,32.31.91.71.72.12.01.42.1
1.81.92.32.53.33.94.54.14.13.7
2.92.94.34.62.94.76.37.68.98.8
6.37.9
9.38.89.28.0
7.35.76.26.1
8.78.28.6
Electricandelec-
tronicequip-ment
'.B
1.21.31.51.41.21.11.21.51.31.7
1.31.31.51.61.72.73.02.92.82.3
1.21.92.83.0
.42.13.45.46.36.3
5.36.5
7.16.45.85.7
6.63.85.55.3
8.46.26.6
Motorvehicles
andequip-ment
.. .. ...̂
2.1
3.12.42.42.62.14.12.22.6.9
3.0
3.02.54.04.94.76.25.13.95.54.7
1.25.05.95.7
l!97.29.28.94.3
-4.3-1.1
11.86.6
-.8
-2.9-8.8-4.8-.8
-1.62.72 2
Other
1.81.7
2.62.82.62.62.93.53.23.12.93.5
2.73.13.54.04.45.15.24.95.74.9
2.94.35.76.22.94.37.68.0
11.010.8
6.55.0
12.411.111.18.8
6.05.68.06.6
6.86.34.7
Nondurable goods
Total
2.6
.0
17
2.4314.65.7595.2667.8
10.08.1
8.911.49.9
10.19.4
11.811.910.710.012.7
12.011.912.013.114.416.318.117.619.117.7
16.517.818.321.225.833.638.840.242.349.4
53.755.4
48.548.549.650.9
64.051.249.150.4
58.952.559.0
Foodand
kindredprod-ucts
' "1.91,6
1.61.41.71,81.62.21.81.82.12.4
2.22.32.32.72.72.83.23.23.23.0
3.23.52.92.42.88.66.96.75.96.9
7.39.2
6.67.56.76.7
8.26.75.78.6
10.49.58.9
Chemi-calsand
alliedprod-ucts
1.71.8
2.32.82.32.22.23.02.82.82.53.5
3.13.23.23.64.04.64.94.35.24.5
3.94.45.26.05.66.58.38.08.3
. 8-2
7.58.5
9.48.87.86.6
8.86.07.08.1
10.18.38.5
Petro-leumandcoatprod-ucts
2.81.9
2.32.72.32.82.73.03.32.62.12.5
2.52.22.22.12.42.93.23.93.73.2
3.53.53.05.0
10.59.6
12.611.812.618.3
24.623.2
15.016.917.723.7
31.025.322.219.9
21.619.626.4
Other
3.72.8
2.74.43.63.32.93.64.13.63.34.3
4.24.14.34.65.36.06.86.37.06.9
5.96.47.27.86.88.9
11.013.715.416.0
14.314.6
17.415.417.413.8
16.013.214.213.8
16.815.115.2
Note.—The industry classification is on a company basis and is based on the 1972 Standard Industrial Classification (SIC) beginning1948, and on the 1942 SIC prior to 1948.
Source: Department of Commerce, Bureau of Economic Analysis.
329
Digitized for FRASER http://fraser.stlouisfed.org/ Federal Reserve Bank of St. Louis
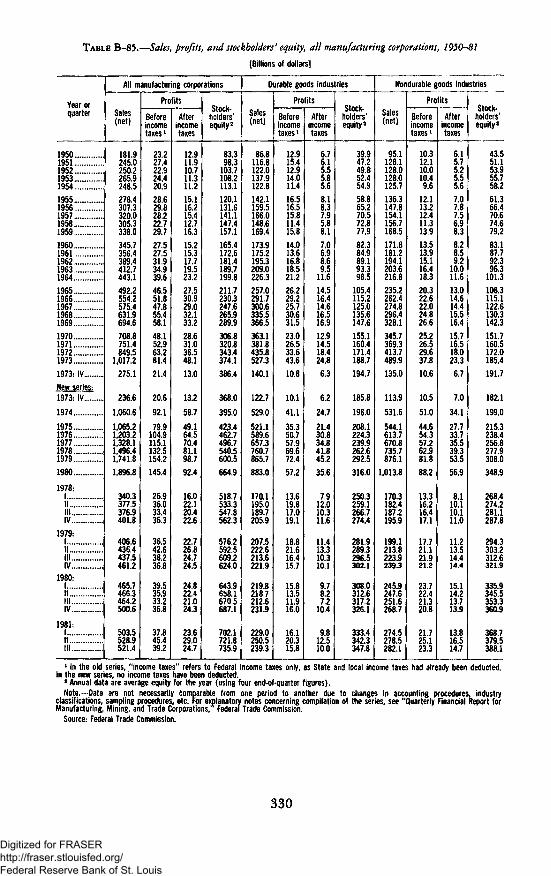
TABLE B-85.—Sales, profits, and stockholders' eqtrity, all manufacturing corporations, 1950-81
[Billions of dollars]
Year orquarter
19501951....19521953.....1954....
19551956....19571958.,,1959I960....1961 ....1962,..,1963..,.1964....
196519661967.,.1968196919701971197219731973: IV.... .
TgTsTIvT.1974....
197519761977.,..197819791980
1978:|tiinIV
1979:|li'ZIIIIV
1980:I.IIIllIV
1981;tIIIll
All manufacturing corporations
Sales(net)
181.9245.0250.2265.9248.5278.4307.3320.0305.3338.0
345.7356,4389.44127443.1492.2554.2575.4631.9694.6
708.8751.4849.5
1,017.2275.1
236.6
1,060.6
1,065.21,203.21,328.11,496.41,741.8
1,896.8
340.33775376.9401.8
406.6436.4437.5461.2
4657466.3464.2500.6
503.5528.9521.4
Profits
Beforeincometaxes1
23.227.422.924.420.928.629.828.222.729.727.527.531.934.939.646.551.847.855.458.148.152.963.281.421.4
20.6
92.1
79.9104.9115.1132.5154.2145.4
26.936033.436.3
36.542.638.236.8
39.535.933.236.8
37.845.439.2
Afterincometaxes
12.911.910711.311.215.116.215.412716.315.215.317719.523.227.530.929.032.133.228.631.036.548.113.0
13.2
58.7
49.164.570.481.198.792.4
16.022120.422.6
22.726.824724.5
24.822.421.024.3
23.629.024.7
Stock-holders'equity2
83.398.3
103.7108.2113.1120.1131.6141.1147.4157.1165.4172.6181.41897199.8211.7230.3247.6265.9289.9
306.8320.8343.4374.1386.4
368.0
395.0
423.44627496.7540.5600.5664.9
518.75333547'.8562.3
576.2592.5609.2624.0
643.9658.1670.5687.1
702.1721.8735.9
Durable goods industries
Sales(net)
86.8116.8122.0137.9122.8142.1159.5166.0148.6169.4173.9175.2195.3209.0226.3
257.0291.7300.6335.5366.5363.1381.8435.8527.3140.1
1227
529.0
521.1589.6657.37607865.7883.0
170.119501897205.9
207.5222.6213.6221.9
219.82187212.6231.9
229.0250.5239.3
Profits
Beforeincometaxes l
12.915.412.914.011.416.516.515,811.415.814,013.616.818.521.226.229.225.730.631,523.026.533.643.610.8
10.1
41.1
35.350757,969.672.457.2
13.619817J)19.1
18.821.616.4157
15.813.511.916.0
16.120.315.8
Afterincometaxes
6.76.15.55.85.68.18.37.95.88.17.06.98.69.5
11.614.516.414.616.516.912.914.518.424.86.3
6.2
24.7
21.430.834.841.845.235.6
7.912010^311.6
11.413.310.310.1
978.27.2
10.4
9.812.510.0
Stock-holders'equity2
39.947.249.852.454.958.865.270.572.877.982.384.989.193.398.5
105.4115.2125.0135.6147.6155.1160.4171.418871947
185.8
196.0
208.1224,3239.9262.6292.5
316.0
250.325912667274.4
281.9289.3296.5302.1
308.0312.6317.2326.1
333.4342.3347.8
Nondurable goods industries
Sales(net)
95.1128.1128.0128.01257136.3147.8154.1156.7168.5171.8181.2194.1203.6216.8235.2262.4274.8296.4328.1345.7369.34137489.9135.0
113.9
531.6
544.16137670.87357876.1
1,013.8
170.31824187.2195.9
199,1213.8223,9239.3
245.9247.6251.62687
274,5278.5282.1
Profits
Beforeincometaxes1
10.312.110.010.49.6
12.113.212.411.313.913.513.915.116.418.320.322.622.024.826.625.226.529.637,810.6
10.5
51.0
44.654.357.262.981.888.2
13.316216*.417.1
17.721.121.921.2
23.722.421.320.8
21725.123.3
Afterincometaxes
6.15.75.25.55.67.07.87.56.98.38.28.59.2
10.011.613.014.614.415.516.415716.518.023.367
7.0
34.1
27733.735.539.353.556.9
8.1101lO'.l11.0
11.213.514.414.4
15.114.213.713.9
13.816.5147
Stock-holders'equity *
43.551.153.955.758.261.366.470.674.679.283.187.792.396.3
101.3106.3115.1122.6130.3142.31517160.5172.0185.41917
182.1
199,0
215.3238.4256.8277.9308.0
348.9
268.4274228U287.8
294.3303.2312.63Z1.9
335.9345.5353.3360.9
3687379.5388.1
1 In the old series, "income taxes" refers to Federal income taxes only, as State and local income taxes had already been deducted.In the new series, no income taxes have been deducted.8 Annual data are average equity for the year (using four end-of-quarter figures).
Note,—Data are not necessarily comparable from one period to another due to changes In accounting procedures, industryclassifications, sampling procedures, etc. For explanatory notes concerning compilation of the series, see "Quarterly Financial Report forManufacturing, Mining, and Trade Corporations, Federal Trade Commission.
Source: Federal Trade Commission.
330
Digitized for FRASER http://fraser.stlouisfed.org/ Federal Reserve Bank of St. Louis
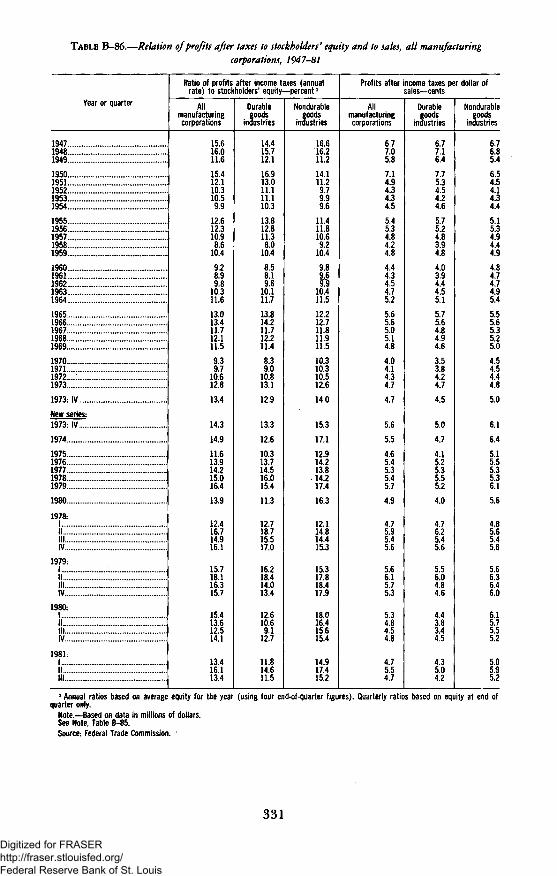
TABLE B-86.—Relation of profits after taxes to stockholders' equity and to sales, all manufacturing
corporations, 1947-81
Year or quarter
194719481949
19501951195219531954
19551956 . ...195719581959
1960196119621963 .. ..1964
19651966196719681969
19701971. .1972 . . . . . . .1973
1973: IV
New series:1973: IV
1974
19751976197719781979
1980 . . .
1978:1IIIII.,IV
1979:|||IIIIV
1980:III . . . .IllIV
1981:
IIIll
Ratio of profits after income taxes (annualrate) to stockholders' equity— percent '
Allmanufacturingcorporations
15.616.011.6
15.412.110.310.59.9
12.612.310.98.6
10.4
9.28.99.8
10.311.6
13.013.411.712.111.5
9.39.7
10.612.8
13.4
14.3
14.9
11.613.914.215.016.4
13.9
12.416.714.916.1
15.718.116.315.7
15.413,612.514.1
13.416.113.4
Durablegoods
industries
14.415.712.1
16.913.011.111.110.3
13.812.811.38.0
10.4
8.58.19.6
10.111.7
13.814.211.712.211.4
8.39.0
10.813.1
12.9
13.3
12.6
10.313.714.516.015.4
11.3
12.718.715.517.0
16.218.414.013.4
12.610.69.1
12.7
11.814.611.5
Nondurablegoods
industries
16.616.211.2
14.111.29.79.99.6
11.411.810.69.2
10.4
9.8
U10.411.5
12.212.711.811.911.5
10.310.310.512.6
14.0
15.3
17.1
12.914.213.8
-14.217.4
16.3
12.114.814.415.3
15.317.818.417.9
18.016.415.615.4
14.917.415.2
Profits after income taxes per dollar ofsales— cents
Allmanufacturingcorporations
6.77.05.8
7.14.94.34.34.5
5.45.34.84.24.8
4.44.34.54.75.2
5.65.65.05.14.8
4.04.14.34.7
4.7
5.6
5.5
4.65.45.35.45.7
4.9
4.75.95.45.6
5.66.15.75.3
5.34.84.54.8
4.75.54.7
Durablegoods
industries
6.77.16.4
7.75.34.54.24.6
5.75.24.83.94.8
4.03.94.44.55.1
5,75.64.84.94.6
3.53.84.24.7
4.5
5.0
4.7
4.15.25.35.55.2
4.0
4.76.25.45.6
5.56.04.84.6
4.43.83.44.5
4.35.04.2
Nondurablegoods
industries
6.76.85.4
6.54.54.14.34.4
5.15.34.94.44.9
4.84.74.74.95.4
5.55,65.35.25.0
4.54.54.44.8
5.0
6.1
6.4
5.15.55.35.36.1
5.6
4.85.65.45.6
5.66.36.46.0
6.15.75.55.2
5.05.95.2
1 Annual ratios based on average equity for the year (using four end-of-quarter figures). Quarterly ratios based on equity at end ofquarter only.
Note.—Based on data in millions of dollars.See Note, Table B-85.Source: Federal Trade Commission. •
331
Digitized for FRASER http://fraser.stlouisfed.org/ Federal Reserve Bank of St. Louis
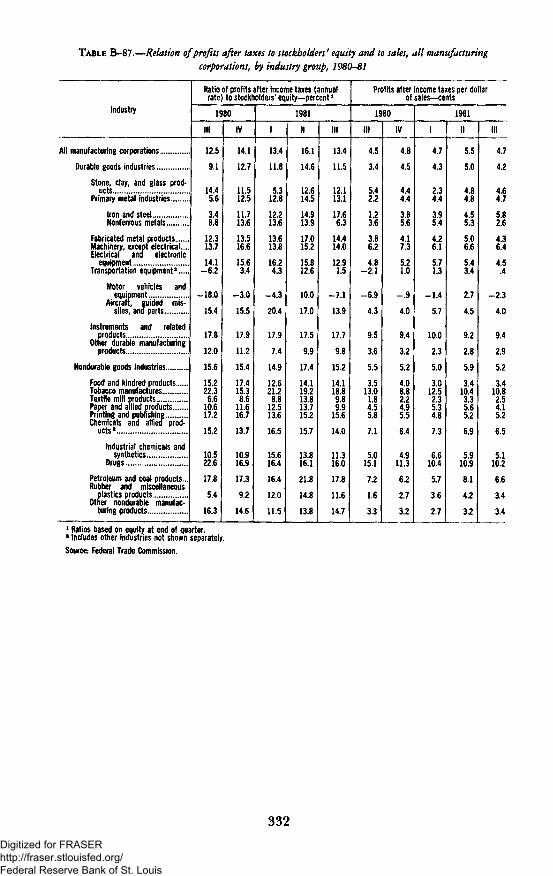
TABLE B-87.—Relation of pro/its after taxes to stockholders' equity and to sales, all manufacturing
corporations, by industry group, 1980-81
Industry
All manufacturing corporations
Durable goods industries
Stone, clay, and glass prod-ucts
Primary metal industries
Iron and steelNonferrous metals
Fabricated metal productsMachinery, except electricalElectrical and electronic
equipmentTransportation equipment2
Motor vehicles andequipment
Aircraft, guided mis-siles, and parts
Instruments and relatedproducts
Other durable manufacturingproducts , ,.,
Nondurable goods industries
Food and kindred productsTobacco manufacturesTextile mill productsPaper and allied productsPrinting and publishingChemicals and allied prod-
ucts2
Industrial chemicals andsynthetics
Drugs
Petroleum and coal products...Rubber and miscellaneous
plastics products ,Other nondurable manufac-
turing products
Ratio of profits after income taxes (annualrate) to stockholders' equity— percent *
1980
III
12.5
9.1
14.45.6
3.48.8
12.313.7
14.1-6.2
-18.0
15.4
17,8
12.0
15.6
15.222.36.6
10.617.2
15.2
10.522.6
17.8
5.4
16.3
IV
14.1
12.7
11.512.5
11.713.6
13.516.6
15.63.4
-3.0
15.5
17.9
11.2
15.4
17.415.38.6
11.616.7
13.7
10.916.9
17.3
9.2
14.6
1981
1
13.4
1L8
5.312.8
12.213.6
13.613.8
16.24.3
-4.3
20.4
17,9
7.4
14.9
12.621.28.8
12.513.6
16.5
15.616.4
16.4
12.0
11.5
II
16.1
14.6
12.614.5
14.913.9
17.015.2
15.812.6
10.0
17.0
17.5
9.9
17.4
14.119.213.813.715.2
15.7
13.816.1
21.8
14.8
13.8
III
13.4
11.5
12.113.1
17.66.3
14.414,0
12.91.5
-7.1
13.9
17.7
9.8
15.2
14.118.89.89.9
15.6
14.0
11.316.0
17.8
11.6
14.7
Profits after income taxes per dollarof sales— cents
1980
III
4.5
3.4
5.42.2
1.23.6
3.86.2
4.8-2.1
-6.9
4.3
9.5
3.6
5.5
3.513.01.84.55.8
7.1
5.015.1
7.2
1.6
3.3
IV
4.8
4.5
4.44.4
3.85.6
4.17.3
5.21.0
= .9
4.0
9.4
3.2
5.2
4,08.82.24.95.5
6.4
4.911.3
6.2
2.7
3.2
1981
1
4.7
4.3
2.34,4
3.95.4
4.26.1
5.71.3
-1.4
5.7
10.0
2.3
5.0
3.012.52.35.34.8
7.3
6.610.4
5.7
3.6
2.7
II
5.5
5.0
4.84.8
4.55.3
5.06.6
5.43.4
2.7
4.5
9.2
2.8
5.9
3.410.43.35.65.2
6.9
5.910.9
8.1
4,2
3.2
III
4,7
4.2
4.64.7
5.82.6
4.36.4
4.5.4
-2.3
4.0
9.4
2.9
5.2
3.410.82,54.15.2
6.5
5.110.2
6.6
3.4
3.4
1 Ratios based on equity at end of quarter.* Includes other industries not shown separately.Source; Federal Trade Commission.
332
Digitized for FRASER http://fraser.stlouisfed.org/ Federal Reserve Bank of St. Louis
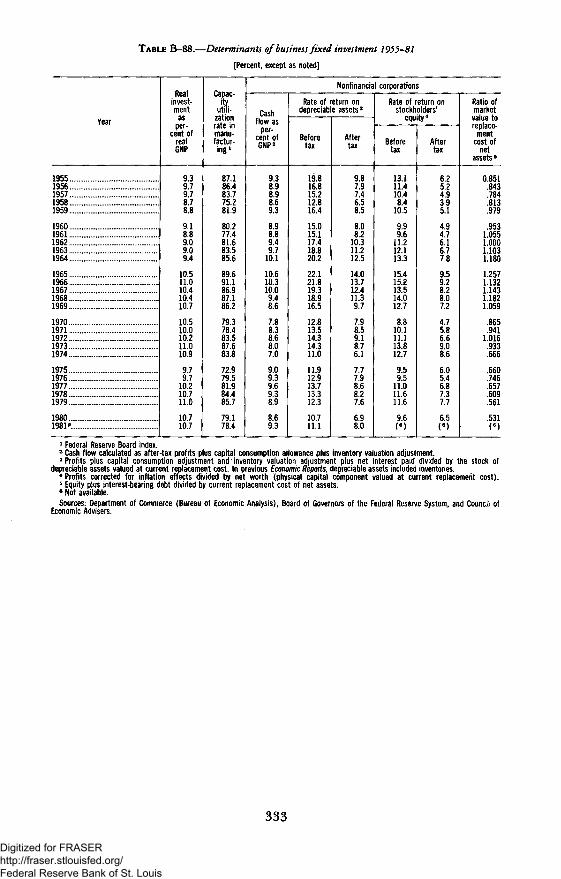
TABLE B-88.—Determinants of business fixed investment 1955-81
[Percent, except as noted]
Year
195519561957. . . . . .19581959
196019611962. . . . . . .1963 . . . .1964
19651966196719681969
19701971197219731974
19751976197719781979
19801981*.
Realinvest-ment
asper-
cent ofrealGNP
9.39.79.78.78.8
9.18.89.09.09.4
10.511.010.410.410.7
10.510.010.211.010.9
9.79.7
10.210.711.0
10.710.7
Capac-
utifi-zationrate inmanu-factur-
ing '
87.186.483.775.281.9
80.277.481.683.585.6
89.691.186.987.186.2
79.378.483.587.683.8
72.979.581.984.485.7
79.178.4
Nonfinancia! corporations
Cashflow as
per-cent ofGNP2
9.38.98.98.69.3
8.98.89.49.7
10.1
10.610.310.09.48.6
7.88.38.68.07.0
9.09.39.69.38.9
8.69.3
Rate of return ondepreciable assets3
Beforetax
19.816.815.212.816.4
15.015.117.418.820.2
22.121.819.318.916.5
12.813.514.314.311.0
11.912.913,713.312.3
10.711.1
Aftertax
9.87.97.46.58.5
8.08.2
10.311.212.5
14.013.712.411.39.7
7.98.59.18.76.1
7.77.98.68.27.6
6.98.0
Rate of return onstockholders'
equity4
Beforetax
13.111.410.48.4
10.5
9.99.6
11.212.113.3
15.415.513.514.012.7
8.810.111.113.812.7
9.59.5
11.011.611.6
9.6( 6 )
Aftertax
6.25.24.93.95.1
4.94.76.16.77.8
9.59.28.28.07.2
4.75.86.69.08.6
6.05.46.87.37.7
6.5(6)
Ratio ofmarketvalue toreplace-
mentcost of
netassets5
0.851.843.784.813.979
.9531.0551.0001.1031.180
1.2571.1321.1431.1821.059
.865
.9411.016
.933
.666
.660
.746
.657
.609
.561
.531(6)
1 Federal Reserve Board index.2 Cash flow calculated as after-tax profits plus capital consumption allowance plus inventory valuation adjustment.3 Profits plus capital consumption adjustment and inventory valuation adjustment plus net interest paid divided by the stock ofdepreciable assets valued at current replacement cost. In previous Economic Reports, depreciable assets included inventories.4 Profits corrected for inflation effects divided by net worth (physical capital component valued at current replacement cost).5 Equity plus interest-bearing debt divided by current replacement cost of net assets.
• Not available.Sources: Department of Commerce (Bureau of Economic Analysis), Board of Governors of the Federal Reserve System, and Council of
Economic Advisers.
333
Digitized for FRASER http://fraser.stlouisfed.org/ Federal Reserve Bank of St. Louis

TABLE B-89.—Sources and uses of funds, nonfarm nonfmancial corporate business, 1946-81
[Billions of dollars; quarterly data at seasonally adjusted annual rates]
Year orquarter
1946194719481949
19501951195219531954
19551956195719581959
19601961196219631964
19651966196719681969
19701971197219731974
19751976197719781979
1980.... ..
1979:|III I I . . . .IV
1980:1III I I . .IV
1981:
ill . " .Ill P.
Sources
Total
18.727.028.919.9
42.136.429.927.829.6
52.744.943.441.956.3
48.656.360.168.474.9
93.599.297.2
117.4121.6
108.1133.7165.8208.7202.9
167.9223.4264.2320.4366.7
336.2
369.1362.6403.2332.0
359.6265.4325.4394.3
340.7396.6393.1
Internal '
8.112.919.119.5
18,020.221.921.723.9
29.529.531.530.336.0
35.436.542.846.551.8
58.562.663.665.064.4
61.873.585.091.785.6
119.7134.2156.1171.9190.6
196,8
188.8190.7195.6187.3
194.9192.9199.2200.3
222.0228.2233.0
External
Total
10.614.19.7
.4
24.016.28.06.15.7
23.215.411.911.720.2
13.219.817.322.023.1
35.036.633.652.457.2
46.360.280.8
117.0117.3
48.389.2
108.1148.5176.1
139.3
180.3171.9207.6144.8
164.772.5
126.3194.0
118.8168.4160.1
Credit market funds
Total
6.98.46.53.1
8.110.59.55.76.5
10.212.812.310.512.3
12.112.912.812.515.1
20.225.330.331.538.4
41.145.657.672.982.8
41.764.384.693.2
104.8
106.1
105.4113.2112.987.6
126.770.193.3
134.3
78.1123.5112.0
Securi-ties and
mort-gages
3.65.46.74.9
4.26.48.06.06.7
6.47.5
10.410.58.1
7.510.79.48.48.8
9.315.921.618.920.7
32.141.240.736.939.1
49.748.048.145.839.5
66.5
38.835.341.142.5
65.962.363.574.1
62.129.0
-4.1
Loansand
short-termpaper
3.33.0-.2
-1.8
3.94.11.4
= .4-.2
3.75.31.9
-.04.2
4.62.23.44.06.2
11.09.58.7
12.617.7
9.04.4
16.936.043.6
-8.016.336.547.465.3
39.7
66.677.971.845.0
60.87.8
29.860.2
16.094.5
116.1
Other2
3.75.83.3
-2.7
15.95.7
-1.5
~'.B
13.12.5
-.41.27.9
1.26.94.69.58.0
14.811.23.3
20.918.8
5.314.623.244.034.5
6.524.923.555.371.4
33.2
74.958.794.757.2
37.92.4
33.059.6
40.744.948.1
Uses
Total
16.825.625.318.3
40.437.629.228.027.8
49.140.839.138.551.2
41.451,055.560.464.9
82.791.388.5
106.0115.3
98.7122.7149.1191.9190.1
150.9201.4228.5290.9340.6
291.7
343.1337.1374.8307.4
310.6224.8289,1342.4
319.4356.3362.9
Capitalexpendi-tures 3
18.117.320.314.8
24.030.224.625,722.9
32.636.834.927.737.0
37.536.743.244.750.1
61.074,772.275.483.7
80.086.099.0
121.5137.9
109.7148.3174.1199.2220.9
216.9
219.6224.6223.6215.9
224.1212.0207.1224.3
231.6265.4276.1
Increasein
financialassets
«1.48.45.03.5
16.47.44.62.34.9
16.54.04.2
10.814.2
3,914.212.315.714.8
21.816.616.330.631.6
18.736.750.170.552.2
41,253.054.491.7
119.7
74.9
123.5112.5151.291.5
86.512.882.0
118.2
87.890.986.8
Discrep-ancy
(sourcesless uses)
1.91.43.61.6
1.7^1.2
.6= .11.8
3.54.14.33.45.0
7.25.34.68.0
10.0
10.87.98.7
11.46.3
9.411.016.716.712.9
17.022.035.729.526.2
44.5
26.025.628.424.7
49.040.736.351.9
21.440.330.1
1 Undistributed profits (after inventory valuation and capital consumption adjustments), capital consumption allowances, and foreignbranch profits, dividends, and subsidiaries' earnings retained abroad.2 Consists of tax liabilities, trade debt, and direct foreign investment in the United States.3 Plant arid equipment, residential structures, inventory investment, and mineral rights from U.S. Government.
Source: Board of Governors of the Federal Reserve System.
334
Digitized for FRASER http://fraser.stlouisfed.org/ Federal Reserve Bank of St. Louis
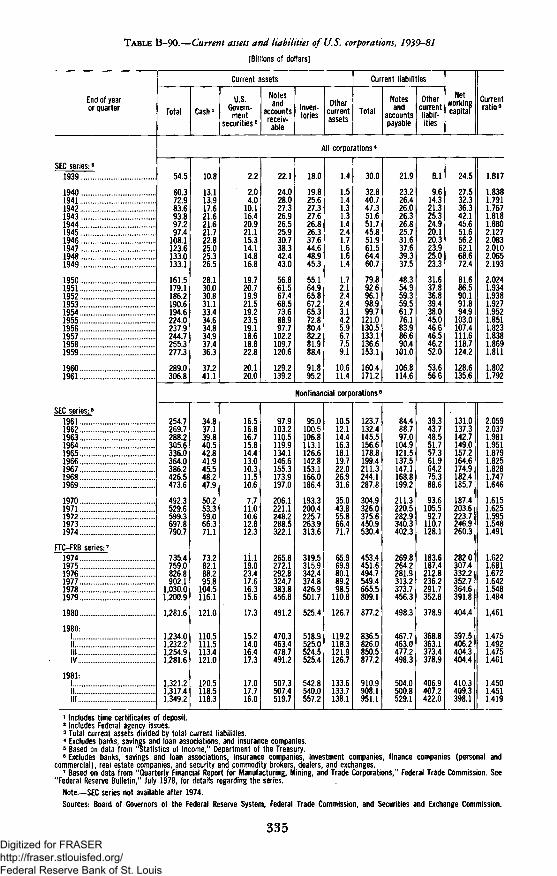
TABLE B-90.—Current assets and liabilities of U.S. corporations, 1939-81
[Billions of dollars]
End of yearor quarter
SEC series: 5
1939
1940194119421943194419451946194719481949
19501951 ..19521953195419551956195719581959
19601961
SEC series:5
196119621963196419651966196719681969 .
19701971197219731974
FTC-FRB series: 7
197419751976197719781979
1980
1980:1(1Il lI V . . . .
1981:1III l l
Current assets
Total Cash1U.S.
Govern-ment
securities 2
Notesand
accountsreceiv-
able
Inven-tories
Othercurrentassets
Current liabilities
TotalNotesand
accountspayable
Othercurrentliabil-ities
Networkingcapital
Currentratio3
All corporations4
54.5
60,372.983.693.897.297.4
108.1123.6133.0133.1
161.5179.1186.2190.6194.6224.0237.9244.7255.3277.3
289.0306.8
10,8
13.113.917.621.621.621.722.825.025.326.5
28.130.030.831.133.434.634.834.937.436.3
37.241.1
2.2
2.04.0
10.116.420.921.115.314.114.816.8
19.720.719.921.519.223.519.118.618.822.8
20.120.0
22.1
24.028.027.326.926.525.930.738.342.443.0
56.861.567.468.573.688.997.7
102.2109.7120.6
129.2139.2
18.0
19.825.627.327.626.826.337.644.648.945.3
55.164.965.867.265.372.880.482.281.988.4
91.895.2
1.4
1.51.41.31.31.42.41.71.61.61.4
1.72.12.42.43.14.25.96.77.59.1
10.611.4
30.0
32.840.747.351.651.745.851.961.564.460.7
79.892.696.198.999.7
121.0130.5133.1136.6153.1
160.4171.2
21.9
23.226.426.026.326.825.731.637.639.337.5
48.354.959.359.561.776.183.986.690.4
101.0
106.8114.6
8.1
9.614.321.325.324.920.120.323.925.023.3
31.637.836.839.438.0
'45.046.646.546.252.0
53.656.6
24.5
27.532.336.342.145.651.656.262.168.672.4
81.686.590.191.894.9
103.0107.4111.6118.7124.2
128.6135.6
1.817
1.8381.7911.7671.8181.8802.1272.0832.0102.0652.193
2.0241.9341.9381.9271.9521.8511.8231.8381.8691.811
1.8021.792
Nonfinancial corporations6
254.7269.7288.2305.6336.0364.0386.2426.5473.6
492.3529.6599.3697.8790.7
735.4759.0826.8902.1
1,030.01,200.9
1,281.6
1,234.01,232.21,254.91,281.6
1,321.21,317.41,349.2
34.837.139.840.542.841.945.548.247.9
50.253.359.066.371.1
73.282.188.295.8
104.5116.1
121.0
110.5111.5113.4121.0
120.5118.5118.3
16.516.816.715.814.413.010.311.510.6
7.711.010.612.812.3
11.119.023.417.616.315.6
17.3
15.214.016.417.3
17.017.716.0
97.9103.2110.5119.9134.1146.6155.3173.9197.0
206.1221.1248.2288.5322.1
265.8272.1292.8324.7383.8456.8
491.2
470.3463.4478.7491.2
507.3507.4519.7
95.0100.5106.8113.1126.6142,8153.1166.0186.4
193.3200.4225.7263.9313.6
319.5315.9342.4374.8426.9501.7
525.4
518.9525.0524.5525.4
542.8540.0557.2
10.512.114.416.318.119.722.026.931.6
35.043.855.866.471.7
65.969.980.189.298.5
110.8
126.7
119.2118.3121.9126.7
133.6133.7138.1
123.7132.4145.5156.6178.8199.4211.3244.1287.8
304.9326.0375.6450.9530.4
453.4451.6494.7549.4665.5809.1
877.2
836.5826.0850.5877.2
910.9908.1951.1
84.488.797.0
104.9121.5137.5147.1168.8199.2
211.3220.5282.9340.3402.3
269.8264.2281.9313.2373.7456.3
498.3
467.7463.0477.2498.3
504.0500.8529.1
39.343.748.551.757.361.964.275.388.6
93.6105.592.7
110.7128.1
183.6187.4212.8236.2291.7352.8
378.9
368.8363.1373.4378.9
406.9407.2422.0
131.0137.3142.7149.0157.2164.6174.9182.4185.7
187.4203.6223.7246.9260.3
282.0307.4332.2352.7364.6391.8
404.4
397.5406.2404.3404.4
410.3409.3398.1
2.0592.0371.9811.9511.8791.8251.8281.7471.646
1.6151.6251.5951.5481.491
1.6221.6811.6721.6421.5481.484
1,461
1.4751.4921.4751.461
1.4501.4511.419
1 Includes time certificates of deposit.2 Includes Federal agency issues.3 Total current assets divided by total current liabilities.4 Excludes banks, savings and loan associations, and insurance companies.5 Based on data from "Statistics of Income," Department of the Treasury.6 Excludes banks, savings and loan associations, insurance companies, investment companies, finance companies (personal and
commercial), real estate companies, and security and commodity brokers, dealers, and exchanges.1 Based on data from "Quarterly Financial Report for Manufacturing, Mining, and Trade Corporations," Federal Trade Commission. See
"Federal Reserve Bulletin," July 1978, for details regarding the series.
Note.—SEC series not available after 1974.
Sources-. Board of Governors of the Federal Reserve System, Federal Trade Commission, and Securities and Exchange Commission.
335Digitized for FRASER http://fraser.stlouisfed.org/ Federal Reserve Bank of St. Louis
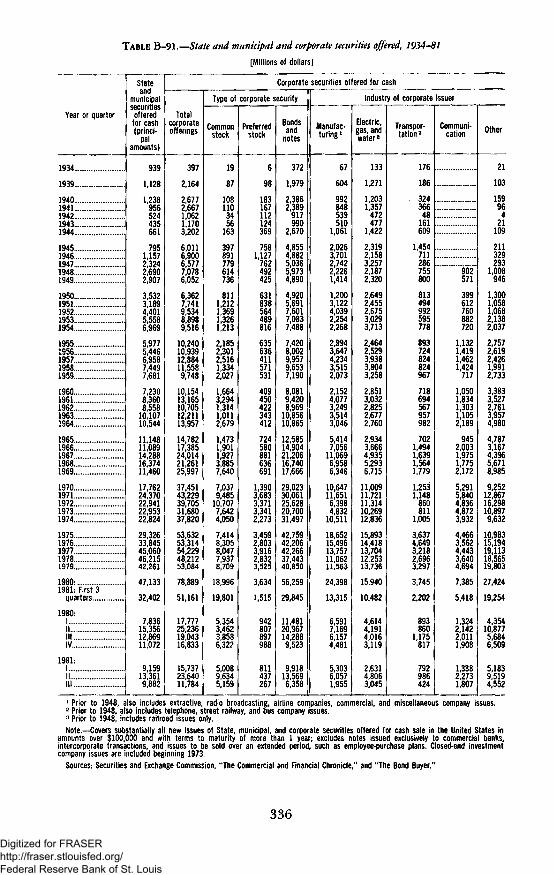
TABLE B-91.—State and municipal and corporate securities offered, 1934-81
[Millions of dollars]
Year or quarter
1934.
1939.
19401941 . ..1942 .194319441 ' '. . '..
1945.1946194?' ., ". . ! .19481949 . . .
1950..1951,19521953., .1954 .
1955195619571958. . .1959
1960 ..19611962. ...1963 . .1964 . .
19651966 . . .19671968 .. .1969
1970 ..1971,197219731974
1975.,1976197719781979
1980 .1981: First 3
quarters
1980:1II111 .IV .
1981:1 . . . .III I I
Stateand
municipalsecurities
offeredfor cash{princi-
palamounts)
939
1,128
1,238956524435661
7951 1572|3242,6902,907
3,5323,1894,4015,5586,969
5,9775,4466,9587,4497,681
7,2308,3608,558
10,10710,544
1114811,08914,28816,37411,460
17,76224,37022,94122,95322,824
29,32633,84545,06046,21542,261
47,133
32,402
7,83615,35612,86911,072
9,15913,3619,882
Corporate securities offered for cash
Totalcorporateofferings
397
2,164
2,6772,6671,0621 1703^202
60116*9006!5777,0786,052
6,3627,7419,5348,8989,516
10,24010,93912,88411,5589,748
10,15413,16510,70512,21113,957
14,78217,38524,01421,26125,997
37,45143,22939,70531,68037,820
53,63253,31454,22948,21253,084
78,889
51,161
17,77725,23619,04316,833
15,73723,64011,784
Type of corporate security
Commonstock
19
87
108no3456
163397891779614736
8111,2121,3691,3261,213
2,1852,3012,5161,3342,027
1,6643,2941,3141,0112,679
14731,9011,9273,8857,640
7,0379,485
10,7077,6424,050
7,4148,3058,0477,9378,709
18,996
19,801
5,3543,4623,8586,322
5,0089,6345,159
Preferredstock
6
98
183167112124369
7581 127'762492425
631838564489816
635636411571531
409450422343412
724580881636691
1,3903,6833,3713,3412,273
3,4592,8033,9162,8323,525
3,634
1,515
942807897988
811437267
Bondsand
notes
372
1,979
2,3862,389
917990
2,670
48554*8825,0365,9734,890
4,9205,6917,6017,0837,488
7,4208,0029,9579,6537,190
8,0819,4208,969
10,85610,865
12,58514,90421,20616,74017,666
29,02330,06125,62820,70031,497
42,75942,20642,26637,44340,850
56,259
29,845
11,48120,96714,2889,523
9,91813,5696,358
Industry of corporate issuer
Manufac-turing l
67
604
992848539510
1,061
202637012,7422,2261,414
1,2003,1224,0392,2542,268
2,9943,6474,2343,5152,073
2,1524,0773,2493,5143,046
5,4147,056
11,0696,9586,346
10,64711,6516,3984,832
10,511
18,65215,49613,75711,06211,563
24,398
13,315
6,5917,1696,1574,481
5,3036,0571,955
Electric,gas, andwater2
133
1,271
1,2031,357
472477
1,422
231921583,2572,1872,320
2,6492,4552,6753,0293,713
2,4642,5293,9383,8043,258
2,8513,0322,8252,6772,760
2,9343,6664,9355,2936,715
11,00911,72111,31410,26912,836
15,89314,41813,70412,25313,736
15,940
10,482
4,6144,1914,0163,119
2,6314,8063,045
Transpor-tation3
176
186
32436648
161609
1454711286755800
813494992595778
893724824824967
718694567957982
7021,4941,6391,5641,779
1,2531,148
860811
1,005
3,6374,6493,2182,6963,297
3,745
2,202
893860
1,175817
792986424
Communi-cation
"902"571
399612760882720
1,1321,4191,4621,424
717
1,0501,8341,3031,1052,189
9452,0031,9751,7752,172
5,2915,8404,8364,8723,932
4,4663,5624,4433,6404,694
7,385
5,418
1,3242,1422,0111,908
1,3382,2731,807
Other
21
103
15996
421
109
211329293
1,008946
1,3001,0581,0682,1382,037
2,7572,6192,4261,9912,733
3,3833,5272,7613,9574,980
4,7873,1674,3965,6718,985
9,25212,86716,29810,8979,632
10,98315,19419,11318,56519,803
27,424
19,254
4,35410,8775,6846,509
5,1839,5194,552
1 Prior to 1948, also includes extractive, radio broadcasting, airline companies, commercial, and miscellaneous company issues.2 Prior to 1948, also includes telephone, street railway, and bus company issues.3 Prior to 1948, includes railroad issues only.Note.—Covers substantially alt new issues of State, municipal, and corporate securities offered for cash sale in the United States in
amounts over $100,000 and with terms to maturity of more than 1 year; excludes notes issued exclusively to commercial banks,intercorporate transactions, and issues to be sold over an extended period, such as employee-purchase plans. Closed-end investmentcompany issues are included beginning 1973.
Sources: Securities and Exchange Commission, "The Commercial and Financial Chronicle," and "The Bond Buyer."
336
Digitized for FRASER http://fraser.stlouisfed.org/ Federal Reserve Bank of St. Louis

TABLE B-92.—Common stock prices and yields, 1949-81
Year or month
1949
1950195119521953195419551956195719581959
1960196119621963196419651966196719681969
1970197119721973197419751976197719781979
19801981
1980:JanFebMarAprway ::. ;...~'."June
Jufy. .AugSeptOct.NovDec
1981:JanFebMar
t :•:::.•: ......June
JulyAugSept „OctNovDec
Common stock prices 1
New York Stock Exchange indexes (Dec. 31, 1965=50) 2
Composite
9.02
10.8713.0813.8113.6716.1921.5424.4023.6724.5630.73
30.0135.3733.49375143.7647.3946.1550.7755.3754.67
45.7254.2260.2957.4243.8445.7354.4653.6953.7058.32
68.1074.02
63.7466.0659.5258.4761.3865.43
68.5670.8773.1275.1778.1576.69
76.2473.5276.4677.6076.2876.80
74.9875.2468.3769.4071.4971.81
Industrial
.'."....'."...
46.1851.9758.0057.44
48.0357.9265.7363.0848.0850.5260.4457.8658.2364.76
78.7085.44
72.6776.4268.7166.3169.3974.47
78.6782.1584.9288.0092.3290.37
89.2385.7489.3990.5788.7888.63
86.6486.7278.0778.9380.8681.70
Transpor-tation
50.26"53.5150.5846.96
32.1444.3550.1737.7431.8931.1039.5741.0943.5047.34
60.6172.61
52.6157.9251.7748.6251.0754.04
59.1462.4865.8970.7677.2375.74
74.4372.7677.0980.6376.7876.71
74.4273.2763.6765.6567.6868.27
Utility '
45.4145.4344.1942.80
37.2439.5338.4837.6929.7931.5036.9740.9239.2238.20
37.3538.91
37.0836.2233.3835.2937.3138.53
38.7738.1838.7738.4438.3537.84
38.5337.5937.8238.3438,2739.23
38.9040.2238.1738.8740.7340.22
Finance
.1. '.'
44.4549.8265.8570.49
60.0070.3878.3570.1249.6747.1452.9455.2556.6561.42
64.2573.52
64.2261.8454.7157.3261.4765.16
66.7667.2269.3368.2967.2167.46
70.0468.4872.8274.5974.6579.79
74.9773.7669.3872.5676.4774.74
Dow-Jones
industrialaverage3
179.48
216.31257.64270.76275.97333.94442.72493.01475.71491.66632.12
618.04691.55639.76714.81834.05910.88873.60879.12906.00876.72
753.19884.76950.71923.88759.37802.49974.92894.63820.23844.40
891.41932.92
860.74878.22803.56786.33828.19869.86
909.79947.33946.67949.17971.08945.96
962.13945.50987.18
1,004.86979.52996.27
947.94926.25853.38853.25860.44878.28
Standard& Poor's
compositeindex
(1941-43=10)*
15.23
18.4022.3424.5024.7329.6940.4946.6244.3846.2457.38
55.8566.2762.3869.8781.3788.1785.2691.9398.7097.84
83.2298.29
109.20107.4382.8586.16
102.0198.2096.02
103.01
118.78128.05
110.87115.34104.69102.97107.69114.55
119.83123.50126.51130.22135.65133.48
132.97128.40133.19134.43131.73132.28
129.13129.63118.27119.80122.92123.79
Common stock yields(percent) 5
Dividend-priceratio8
6.59
6.576.135.805.804.954.084.094.353.973.23
3.472.983.373.173.013.003.403.203.073.24
3.833.142.843.064.474.313.774.625.285.47
5.265.20
5.415.245.876.055.775.39
5.205.064.904.804.634.74
4.805.004.884.864.985.03
5.185.165.695.655.545.57
Earnings-priceratio'
15.48
13.9911.829.47
10.268.577.957.557.896.235.78
5.904.625.825.505.325.596.635.735.676.08
6.455.415.507.12
11.599.158.90
10.7912.0313.46
12.66
i'4.98
13.08
ii'.67
10.92
10.72
11.48
1 Averages of daily closing prices, except New York Stock Exchange data through May 1964 are averages of weekly closing prices.2 Includes all the stocks (more than 1,500) listed on the New York Stock Exchange.3 Includes 30 stocks.4 Includes 500 stocks.5 Standard & Poor's series, based on 500 stocks in the composite index.6 Aggregate cash dividends (based on latest known annual rate) divided by aggregate market value based on Wednesday closing
prices. Monthly data are averages of weekly figures; annul data are averages of monthly figures.7 Quarterly data are ratio of earnings (after taxes) for 4 quarters ending with particular quarter to price index for last day of that
quarter. Annual ratios are averages of quarterly ratios.Note.—All data relate to stocks listed on the New York Stock Exchange.Sources: New York Stock Exchange, Dow-Jones & Co., Inc., and Standard & Poor's Corporation.
337
Digitized for FRASER http://fraser.stlouisfed.org/ Federal Reserve Bank of St. Louis
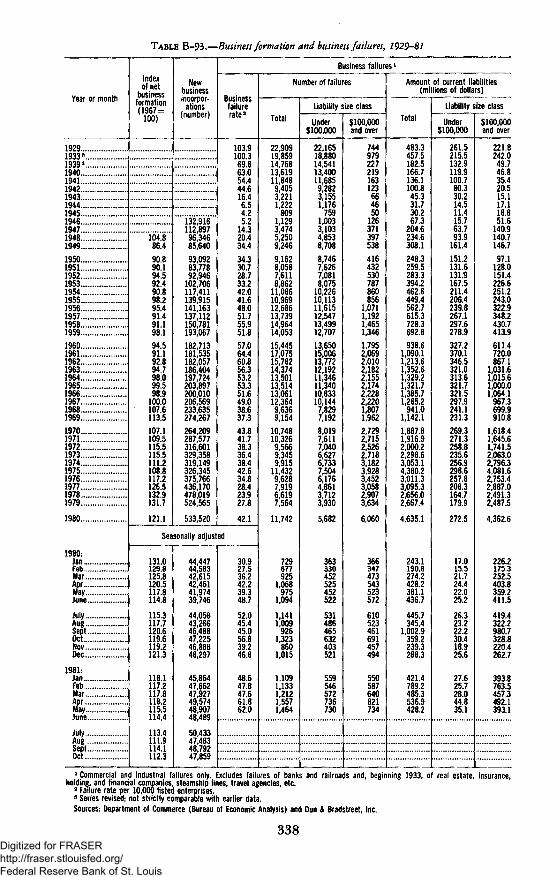
TABLE B-93.—Business formation and business failures, 1929-81
Year or month
19291933"1939 s1940194119421943194419451946194719481949195019511952...19531954... .19551956 . . . .195719581959196019611962196319641965 ,196619671968 . .19691970 .. .19711972 .1973 ..19741975 . .1976197719781979
1980
1980:JanFebMar
f c - • . . : : • :JuneJulyAugSeptOctNovDec
1981:JanFebMarMay ' ' '. '..June
JulyAug . .SeptOdt
Indexof net
businessformation(1967^
100)
' 104.8"86.490.890.194.592.490.898.295,491.491.198,194.591.192.894.798.099.598.9
100,0107.6113.5107.1109.5115.5115.5111.2108.8117.2126.5132,9131.7
121.1
Newbusinessincorpor-
ations(number)
132,916112,89796,34685,640
93,09283,77892,946
102,706117,411139,915141,163137,112150,781193,067
182,713181,535182,057186,404197,724203,897200,010206,569233,635274,267
264,209287,577316,601329,358319,149326,345375,766436,170478,019524,565
533,520
Business failures l
Businessfailurerate2
103.9100.369.663.054.444.616.46.54.25.2
14.320.434.434.330.728.733.242.041.648.051.755.951.857.064.460.856.353.253.351.649.038.637.343.841.738.336.438.442.634.828.423.927.8
42.1
Seasonally adjusted
131.0129.8125.8120.5117.8114.8
115.3117,7120.6119.6119.2121.3
118.1117.2117.8118.2115.5114.4
113.4111.9114.1112.3
44,44744,58342,61542,46141,97439,746
44,05843,26646,48847,22546,88848,297
45,86447,66247,92749,57448,90748,489
50,43347,48348,79247,859
30.927.536.242.239.348.7
52.045.445.056.839.246.8
48.647.847.661.862.0
Number of failures
Total
22,90919,85914,76813,61911,8489,4053,2211,222
8091,1293,4745,2509,246
9,1628,0587,6118,862
11,08610,96912,68613,73914,96414,053
15,44517,07515,78214,37413,50113,51413,06112,3649,6369,154
10,74810,3269,5669,3459,915
11,4329,6287,9196,6197,564
11,742
729677925
1,068975
1,094
1,1411,009
9261,323
8601,015
1,1091,1331,2121,5571,464
Liability size class
Under$100,000
22,16518,88014,54113,40011,6859,2823,1551,176
7591,0033,1034,8538,708
8,7467,6267,0818,075
10,22610,11311,61512,54713,49912,707
13,65015,00613,77212,19211,34611,34010,83310,1447,8297,1928,0197,6117,0406,6276,7337,5046,1764,8613,7123,930
5,682
363330452525452522
531486465632403521
559546572736730
$100,000and over
744979227219163123664650
126371397538416432530787860856
1,0711,1921,4651,3461,7952,0692,0102,1822,1552,1742,2282,2201,8071,9622,7292,7152,5262,7183,1823,9283,4523,0582,9073,634
6,060
366347473543523572
610523461691457494
550587640821734
Amount of current liabilities(millions of dollars)
Total
483.3457.5182.5166.7136.1100.845.331.730.267.3
204.6234.6308.1248.3259.5283.3394.2462.6449.4562.7615.3728.3692.8
938.61,090.11,213,61,352.61,329,21,321.71,385.71,265.2
941.01,142.11,887.81,916.92,000.22,298.63,053.14,380.23,011.33,095.32,656.02,667.4
4,635.1
243.1190.8274.2428.2381.1436.7
445.7345.4
1,002.9359.2239.3288.3
421.4789.2485.3536.9428.2
Liability size class
Under$100,000
261.5215.5132.9119.9100.780.330.214.511.415.763.793.9
161.4151.2131.61313167.5211.4206.4239.8267.1297.6278.9
327.2370,1346.5321.0313.6321.7321.5297.9241.1231.3269.3271.3258.8235.6256.9298.6257.8208.3164.7179.9
272.5
17.015.521.724.422.025.2
26.323.222.230.418.925.6
27.625.728.044.835.1
$100,000and over
221.8242.0
49.746.835.420.515.117.118.851.6
140.9140.7146.797,1
128.0151.4226.6251.2243.0322.9348.2430.7413.9611.4720.0867.1
1,031.61,015.61,000.01,064.1
967,3699.9910.8
1,618.41,645.61,741.52,063.02,796.34,081.62,753.42,887.02,491.32,487.5
4,362.6
226.2175.3252.5403.8359.2411.5
419.4322.2980.7328.8220.4262,7
393.8763.5457.3492.1393.1
1 Commercial and industrial failures only. Excludes failures of banks and railroads and, beginning 1933, of real estate, insurance,holding, and financial companies, steamship lines, travel agencies, etc.2 Failure rate per 10,000 listed enterprises.3 Series revised; not strictly comparable with earlier data.
Sources: Department of Commerce (Bureau of Economic Analysis) and Dun & Bradstreet, Inc.
338Digitized for FRASER http://fraser.stlouisfed.org/ Federal Reserve Bank of St. Louis

AGRICULTURE
TABLE B-94.—Farm income 1929-81
[Billions of dollars; quarterly data at seasonally adjusted annual rates]
Year or quarter
192919331939
1940194119421943194419451946194719481949
195019511952 . . . .1953195419551956195719581959
19601961196219631964.19651966196719681969
1970.197119721973197419751976197719781979
198019814
1979:I||IllIV
1980:II II l lIV
1981:1||IllIV*
Income of farm operators from farming
Gross farm income
Total '
13.86.9
10.7
11.314.319.923.324.025.429.632.436.530.8
33.138.337.834.434.233.534.034.839.037.9
38.940.542.343.442.346.550.550.551.856.4
58.662.071.098.998.3
100.3101.8108.7127.5151.9
150.5164.4
148.2152.8152.5154.1
149.3145.8151.9155.1
159.2163.9167.6166.8
Cash marketing receipts
Total
11.35.37.9
8.411.115.619.620.521.724.829.630.227.8
28.532.932.531.029.829.530.429.733.533.6
34.235.236.537.537.339.443.442.844.248.2
50.552.961.287.192.488.294.896.3
112.9131.9
136.4142.5
129.8132.8131.4133.6
133.0131.9139.2141.5
142.5143.1143.8140.5
Livestockand
products
6.22.84.5
4.96.59.0
11.511.412.013.816.517.115.4
16.119.618.216.916.316.016.417.419.218.9
19.019.520.220.019.921.925.024.425.528.6
29.630.635.745.941.443.046.147.659.268.5
67.468.8
70.069.567.167.5
66.364.068.970.4
69.868.969.467.0
Crops
5.12.53.3
3.54.66.58.19.29.7
11.013.113.112.4
12.413.214.314.113.613.514.012.314.214:7
15.315.716.317.417.217.518.418.418.719.6
21.022.325.541.151.145.148.748.753.763.4
69.073.7
59.863.364.366.1
66.767.970.371.1
72.774.274.473.5
Value ofinventorychanges2
-0.1-.2
.1
.3
.41.1-.1-.4-.4
.0-1.8
1.7-.9
.81.2
.9-.6
'.2-.5
.6
.8
.0
.4
.3
.6
.6-.81.0-.1
.7
.1
.1
.01.4.9
3.4-1.6
3.4-2.4
1.0.6
5.3
-2.04.0
4.45.16.65.1
.9-1.9-3.7-3.3
-.53.46.07.1
Produc-tion
expenses
7.74.46.3
6.97.8
10.011.612.313.114.517.018.818.0
19.522.322.821.521.822.222.723.725.827.2
27.428.630.331.631.833.736.538.239.542.1
44.447.452.365.672.275.9
. 83.190.3
101.1119.2
130.7141.5
114.8116.9120.2124.9
125.9128.9132.2135.6
139.3141.0142.9142.8
Net farm income
Currentdollars
6.22.64.4
4.56.59.9
11.711.712.315.115.417.712.8
13.615.915.013.012.411.311.311.113.210.7
11.512.012.111.810.512.914.012.312.314.3
14.214.618.733.326.124.518.718.426.532.7
19.922.9
33.435.932.329.2
23.416.919.719.5
19.922.924.724.0
1967dollars3
12.06.6
10.6
10.714.720.222.722.222.825.823.024.517.9
18.920.518.816.215.414.113.813.115.212.3
13.013.313.312.811.313.714.412.311.813.0
12.212.114.925.117.715.211.010.113.515.0
8.08.4
16.116.814.612.8
9.96.97.97.6
7.58.58.98.5
'Cash marketing receipts and inventory changes plus Government payments, other farm cash income, and nonmoney incomefurnished by farms.2 Physical changes in end-qf-period inventory of crop and livestock commodities valued at average prices during the period.3 Income in current dollars divided by the consumer price index (Department of Labor).4 Forecast.
Source: Department of Agriculture, except as noted.
339
Digitized for FRASER http://fraser.stlouisfed.org/ Federal Reserve Bank of St. Louis

TABLE B-95-—Farm output and productivity indexes, 1929-81
[1967-100]
Year
1929
1933
1939
19401941194219431944.. .
1945194619471948..1949
19501951 ,195219531954
19551956..195719581959
19601961....196219631964.. . ..
1965.. . . .1966.. . .196719681969
19701971197219731974
197519761977.. .. .1978.. .1979
19801981"
Farm output
Total1
53
51
58
6062706971
7071697674
7476797980
8282818788
9191929695
9895100102102
101110110112106
114117119122129
122134
Crops2
Total »
62
55
64
6768767175
7377738379
7678818179
8282808989
9391929694
9995100103104
100112113119110
121121129131144
131152
Feedgrains
48
44
51
5256645962
6065507263
6459636164
6868748084
8778798675
88891009599
8911611211593
114120126135148
123154
Foodgrains
52
36
48
5260635467
7072858170
6564837667
6366629173
8780747786
888810010698
91107102114120
142' 141132125144
157188
Oilcrops
11
8
25
2929404136
3634394745
4647464749
5360586964
6877788181
9597100114116
117121131155127
153132175182219
171199
Live-stockandprod-ucts2
53
57
59
6064717773
7371706872
7578787982
8484838488
8791929597
9597100100101
105106107105106
101105106106109
113115
Productivity indicators
Farmoutputper
unit oftotalinput
52
53
59
6062686667
6871687471
7171747576
7880808787
9091929695
10097100102103
102110110111105
115115114116119
115126
Croppro-
ductionperacre*
56
50
60
6263706468
6771667569
6870727271
7476768685
8991959795
10097100105106
102112115116104
112111116121129
116132
Farm output per hour offarm work
Total
16
16
19
2021242424
2627283132
3435383942
4447515759
6567717781
8992100106110
115128136140136
152162170182198
194209
Crops
16
15
20
2123252425
2729293333
3635394042
4548536161
6668727779
9094100106108
111126135138128
142146157166182
165192
Live-stockandprod-ucts
26
25
27
2728303130
3132333435
3739404143
4648505458
6266717782
8693100105112
121128137144156
160178189204222
240244
1 Farm output measures the annual volume of net farm production available for eventual human use through sales from farms orconsumption in farm households.a Gross production.
3 Includes items not included in groups shown.4 Computed from variable weights for individual crops produced each year.Source: Department of Agriculture.
340
Digitized for FRASER http://fraser.stlouisfed.org/ Federal Reserve Bank of St. Louis

TABLE B-96.—Farm input use, selected inputs, 1929-81
Year
1929
1933
1939
19401941 . . .194219431944
1945 -1946194719481949
195019511952 . ,19531954
19551956195719581959
19601961196219631964
19651966196719681969
19701971197219731974 . .
197519761977. . . .19781979
19801981 P.
farm populationApril1
Num-ber
(thou-sands)
30,580
32,393
30,840
30,54730,11828,91426,18624,815
24,42025,40325,82924,38324,194
23,04821,89021,74819,87419,019
19,07818,71217,65617,12816,592
15,63514,80314,31313,36712,954
12,36311,59510,87510,45410,307
9,7129,4259,6109,4729,264
8,8648,253
7 6,1947 6,5017 6,241
6,0515,800
Asper-centof
totalpopu-lation2
25.1
25.8
23.5
23.122.621.419.217.9
17.518.017.916.616.2
15.214.213.912.511.7
11.511.110.39.89.3
8.68.17.77.16.7
6.45.95.55.25.1
4.74.54.64.54.3
4.13.8
7 2.87 2.97 2.87 2.77 2.5
Farm employment(thousands 3
Total
12,763
12,739
11,338
10,97910,66910,50410,44610,219
10,00010,29510,38210,3639,964
9,9269,5469,149
. 8,8648,651
8,3817,8527,6007,5037,342
7,0576,9196,7006,5186,110
5,6105,2144,9034,7494,596
4,5234,4364,3734,3374,389
4,3424,3744,1703,9573,774
3,705' (8)
Fam-
\work-ers
9,360
9,874
8,611
8,3008,0177,9498,0107,988
7,8818,1068,1158,0267,712
7,5977,3107,0056,7756,570
6,3455,9005,6605,5215,390
5,1725,0294,8734,7384,506
4,1283,8543,6503,5353,419
3,3483,2753,2283,1693,075
3,0262,9972,8632,6892,501
2,402<8)
Hiredwork-ers
3,403
2,865
2,727
2,6792,6522,5552,4362,231
2,1192,1892,2672,3372,252
2,3292,2362,1442,0892,081
2,0361,9521,9401,9821,952
1,8851,8901,8271,7801,604
1,4821,3601,2531,2131,176
1,1751,1611,1461,1681,314
1,3171,3771,3071,2681,273
1,303(•)
Cropshar-
vested(mil-
lions ofacres) *
365
340
331
341344348357362
354352355356360
345344349348346
340324324324324
324302295298298
298294306300290
293305294321328
336337344337349
352367
Selected indexes of input use (1967=100)
Total
102
96
98
100100103104105
103101101103105
104107107106105
105103101100102
101100100100100
989810010099
100100100101100
100103105105108
106106
Farmlabor
329
321
294
293288296292289
271260246240231
217218208200192
185174162156151
145139133
-129122
1101031009793
8986828078
7673716766
6564
Farmreal
estate
103
97
102
1031021009898
98102103103104
105105105105105
105102102100101
100100100100100
99991009998
10199989795
9697999796
9697
Me-chanicalpowerand
machin-ery
38
32
40
4244515557
5857647280
8490949696
9798979798
9794949393
9496100101101
100102101105109
113116120126130
128127
Agri-culturalchemi-cals8
10
6
11
1314151720
2021232527
2932353637
3941414349
4953586571
7585100105111
115124131136140
127145154161184
174175
Feed,seed,andlive-stockpur-
chases8
31
28
41
4245485252
5453555661
6367696971
7275747984
8488909092
939710097101
104111113116107
101110112115120
119120
^arm population as defined by Department of Agriculture and Department of Commerce, i.e., civilian population living on farms,regardless of occupation. See also footnote 7.2 Total population of United States, including Armed Forces overseas. Data revised to incorporate results of the 1980 census.3 Includes persons doing farmwork on all farms. These data, published by the Department of Agriculture, differ from those onagricultural employment by the Department of Labor (see Table B-29) because of differences in the method of approach, in conceptsof employment, and in time of month for which the data are collected.4Acreage harvested plus acreages in fruits, tree nuts, and farm gardens.6 Fertilizer, lime, and pesticides.6 Nonfarm constant dollar value of feed, seed, and livestock purchases.7 Based on new definition of a farm. Under old definition of a farm, farm population (in thousands and as percent of totalpopulation) for 19/7, 1978, and 1979 is 7,806 and 3.5; 8,005 and 3.6; and 7,553 and 3.4, respectively.6 Report discontinued.
Sources: Department of Agriculture and Department of Commerce (Bureau of the Census).
341
Digitized for FRASER http://fraser.stlouisfed.org/ Federal Reserve Bank of St. Louis

TABLE B-97.—Indexes of prices received and prices paid by farmers, 1940-81
[1977 = 100]
Year or month
19401941. ' . .',' .1942.1943.19441945.1946. ..19471948.19491950.. .1951.. . ..195219531954,19551956195719581959..19601961 .,19621963..1964., . .1965.. .19661967.. . .1968..1969.. .
1970...19711972.. . ,1973..19741975 ....197619771978197919801981
1980:Jan. .FebMarApr.. .May. .June
JulyAueSeptOct.NovDec
1981:Jan ....Feb ...Mar. . . "". ".'.'.AprMayJuneJulyAugSeptOct....NovDec ,
Prices received by farmers
Allfarmprod-ucts
222735424345526063555666635654515051555352535353525458555659
60626998105101102100115132134138
130131128123125127135140141142145145
144144143143142142142137133130130128
Crops
212534434647536159525461625556535452525151525455555355525250
52566091117105102100105116125134
115115115113117118125130132133141143
144144145143142138138129120119121122
Live-stockandprod-ucts
232936414144506065565870645652494751575353525351495460576067
6767771049498101100124147144142
144146141133133136144150150150149148
145144141143141146146145146140138133
Prices paid by farmers
Allcomrnod-
ities,services,interest,taxes,andwagerates *
181922252628303538363741424040404042434344444545454749495153
55586271818995100108123138150
132134136135135137138139141142143143
147148149150150150150151151150150150
Production items
Total2
212226283030333943414247474444434344464646464747474850505052
54576173839197100108125138148
132134135135135136137140141142144144
146146147149149150148148148147147145
Tractorsandself-pro-pelledmachin-
ery
"39"40424447
49515458688291100109122136152
127127133133133137137137142142142142
142142146146146155155155159159159159
Fertil-izer
373741444445455055565457595959585758585757585857575756555248
4850525692120102100100108134144
123123135135137137137137137136136136
136136145145147147147147147144144143
Fuelsand
energy
.."'.:.'.'/. '
49*49505051
52535457798893100105137188213
171181187190191192192190191190191193
201212216217216215214214214214214214
Wagerates3
7810141719202223222225262727272829303233333435363841444853
57596369798593100107117127136
126126126126126126128128128128128128
140140140135135135135135135135135135
Adden-dum:Aver-agefarmreal
estatevalueperacre4
7778910It131414
1416181818191921222324252627293133353840
42434753667586100109125145158
145
158
' Includes items used for family living, not shown separately.2 Includes other items not shown separately.3 Seasonally adjusted; annual data are averages of seasonally adjusted data.4 Average for 48 States. Annual data are for March 1 of each year through 1975 and for February 1 beginning 1976. Monthly data
are for first of month.Source: Department of Agriculture,
342Digitized for FRASER http://fraser.stlouisfed.org/ Federal Reserve Bank of St. Louis

TABLE B-98.—U.S. exports and imports of agricultural commodities, 1940-81
[Billions of dollars]
Year
1940 . .1941194219431944 ,
1945194619471948 . .. .1949
1950195119521953 .. . .1954
1955195619571958 . . .1959
I96019611962 , . .1963. .1964. . .
19651966196719681969 . .
19701971. , .19721973 . . ..1974
1975 . .. .1976 .19771978 , . . .1979
19801981
Total »
0.5
122.12.1
2.33.1403.53.6
2.94.03.42.83.1
3.24.24.53.94.0
4.85.05.05.66.3
6.26.96.46.36.0
7.37.794
17.722.0
21.923.023.629.434.7
41.243.3
Feedgrains
44444
<o'{.1
.2
'.3
.2
.3
.4
.3
'.6
.5
.5
.8
.8
.9
1.11.31.1.9.9
1.11.0153.546
5.26.04.9597.7
9.894
Foodgrains 2
ft(4)!i.4.7
141.51.1
.61.11.1
,7.5
.61.01.0.8.9
1.21.41.31.51.7
1.41.81.51.41.2
1.41.3184.754
6.24.73.6556.3
7.996
Exports
Oil-seedsand
prod-ucts
<4)ti0.1.1
PI2.3
.2
'.22.3
.45
.5
.4
.6
.6
.6
.7
.81.0
121.21.31.31.3
1.92.22 44.357
4.55.16.6828.9
9.496
Cot-ton
0.2.11
.2
.1
.3
4
.9
1.01.1
.9
.8
.5
1.0.7.4
1.0.9
.6
.5
.4
.5
.5
.4
.6
.913
1.01.01.5172.2
2.923
To-bacco
S3.2.1
.2
.43.2.3
.3
.3
.2
.3
.3
.4
.3
.4
.4
.3
.4
.4
.4
.4
.4
.4
.5
'.5.6
.5
.57.79
.9
.91.1141.2
1.315
Ani-malsand
prod-ucts
0.1.3.8
1.21.3
.9
.9
.7
.5
.4
.3
.5
,4
.6
.7
.5
.6
.6
.6
.6
.7
.8
.8
.7
.7
.7
.8
.91.01 11.618
1.72.42.73.03.8
3.84.2
Total1
1.31.7131.51.8
1.72.3283.12.9
4.05.24.54.24.0
4.04.04.03.94.1
3.83.73.94.04.1
4.14.54.55.05.0
5.85.8658.4
102
9.311.013.414816.7
17.4168
Crops,fruits,
andvege-
tables 3
(o'l(4)
!i.1"i.2
.2
'.2
.2
.2
.2
'.2
.22
.3
.3
.3
.4
.4
.5
.5
.6
.88
.8
.91.2152.1
2.126
mports
Ani-malsand
prod-ucts
0.2
'5.4.3
.4
.44.6.4
.71.1.7.6.5
.5
.4
.5
.7
.8
.6
.7
.9
.9
.8
.91.21.11.31.4
1.61.5182.62 2
1.82.32.3313.9
3.835
Cof-fee
0.1
'.2
!3
.3
'6
.8
1.11.41.41.51.5
1.41.41.41.21.1
1.01.01.01.01.2
1.11.11.01.2.9
1,21.2131.716
1.72.94.24.04.2
4.22.9
Cocoabeans
andprod-ucts
44444
<o*2
,2.1
.2
.2
.2
.2
.3
.2
.2
.2
.2
.2
.2
.2
.2
.2
.2
.1
.1
.2
.2
.2
.3
.22
'5
.5
.61.01.41.2
.9
.9
Agri-cultural
tradebalance
-0.8-1.0=.1
.6
.3
.81.2.3.7
-1.1-1.1-1.1-1.3-.9
=.8.2.6
l'{1.01.31.21.62.3
2.12.41.91.31.1
1.51.9299.3
118
12.612.010.214.618.0
23.8265
1 Total includes items not shown separately.2 Rice, wheat, and wheat flour.3 includes nuts, fruits, and vegetable preparations.4 Less than $50 million.Note.—Data derived from official estimates released by the Bureau of the Census, Department of Commerce. Agricultural
commodities are defined as (1) nonrnarine food products and (2) other products of agriculture which have not passed through complexprocesses of manufacture. Export value, at U.S. port of exportation, is based on the selling price and includes inland freight,insurance, and other charges to the port. Import value, defined generally as the market value in the foreign country, excludes importduties, ocean freight, and marine insurance.
Source.- Department of Agriculture.
343
Digitized for FRASER http://fraser.stlouisfed.org/ Federal Reserve Bank of St. Louis

TABLE B-99.—Balance sheet of the farming sector, 1929-82
[Billions of dollars]
Beginning ofyear
19291933
1939
1940.. . .1941 . . ..194219431944
19451946. .. .194719481949
1950. . . .1951195219531954 ,.
1955.19561957. . . .1958 . . ..1959.
1960196119621963 .1964
19651966 .. . .1967 . .1968.1969 . .
1970.197119721973 . . . .1974
197519761977 3
19781979.
19801981 . .1982 «
Assets
Total
53.054.862.9736844
93.8102,9115.9127.4134.6
134.5154.3170.1167.6164.6
168.8173.6182.8191.3208.4
210.2210.8219.3227.7235.8
243.8260.8274.2288.0302.8
314.9326.0351.8394.8478.5
503.8576.3664.0737.1872.9
1,004.41,090.31,176.5
Realestate
^ .48.0
30.8
34.1
33.634.437.541648.2
53.961.068.573.776.6
77.689.598.4
100.198.7
102.2107.5115.7121.8131.1
137.21385144.5150.2158.6
167.5179.2189.1199.7209.2
215.8223.2239.6267.3327.7
359.8418.2496.4554.6655.1
756.2828.7894.5
Live-stock1
6.6
3.0
5.1
5.15.37.1969.7
9.09.7
11.913.214.4
12.917.119.514.811.8
11.210.611.013.917.7
15.315.616.417.315.9
14.517.619.018.920.2
23.523.727.334.142.4
24.529.429.031.951.3
61.460.963.0
Other physical assets
Machin-ery andmotor
vehicles
3.2
2.5
3.2
3.13.34.04.95.4
6.55.45.37.4
10.1
12.214.116.717.418.4
18.619.320.220.121.8
22.722.222.523.523.9
24.826.027.429.831.3
32.334.436.639.344.2
54.764.071.076.985.1
96.7102.3109.5
Crops2
2.73.03.95.16.1
6.76.37.19.08.5
7.67.98.89.09.2
9.68.38.37.69.3
7.78.08.89.39.8
9.29.7
10.09.6
10.6
10.910.711.814.522.1
23.321.322.124.828.0
33.536.442.8
House-hold
equip-mentand
furnish-ings
4.24.14.84.84.7
5.25.57.28.18.9
8.49.6
10.19.69.5
9.710.09.69.69.4
9.28.78.98.88.8
8.48.48.38.89.4
9.610.010.811.912.3
12.612.813.715.518.0
19.422.023.7
Financial assets
Depos-its
andcur-
rency
3.23.54.25.56.6
7.99.4
10.29.99.6
9.19.19.49.49.4
9.49.59.49.5
10.0
9.2878.89.29.2
9.610.010.310.911.5
11.912.413.214.014.9
14.014.514.815.215.5
15.916.216.6
U.S.savingsbonds
0.3.3.5
1.12.2
3.44.24.24.44.6
4.74.74,74.64.7
5.05.25.15.15.2
4.74.64.54.44.2
4.24.03.93.83.8
3.73.63.74.04.1
3.83.93.93.94.2
4.03.83.9
Invest-ments incooper-atives
0.8.9.9
1.01.1
1.21.41.51.71.9
2.02.32.52.72.9
3.13.23.53.73.9
4.24.54.95,05,4
5.65.96.26,56.8
7.28.08.89,7
10.8
11.012.213.114.315.7
17.320.022.0
Claims
Total
53.054.862.973.684.0
93.8102.9115.9127.4134.6
134.5154.3170.1167.6164.6
168.8173.6182.8191.3208,4
210.2210.8219.3227.7235.8
243.8260.8274.2288.0302.8
314.9326.0351.8394.8478.5
503.8576.3664.0737.1872.9
1,004.41,090.31,176.5
Realestatedebt
9.8
8.5
6.8
6.66.56.46.05.4
4.94.74.95.15.3
5.66.16.77.27.7
8,29,09.8
10.411.1
12.012.813.915.216.8
18.921.223,125.127.4
29.230.332.235.841.3
46.351.156.563.770.8
82.792.0
103.4
Otherdebt
3.43.94.13.93.5
3.43.23.54.16.1
6.86.98.08.99.2
9.59.89.5
10.012.6
12.813.414.616.217.6
17.919.520.922.323.1
23.824.226.929.532.8
35.539.846.155.665.3
75.282.691.1
Propri-etors'
equities
43.044.452.463.775.1
85.595.0
107.4118.1123.2
122.1141.3155.4151.5147.7
151.2154.8163.5170.9184.8
185.4184.6190.8196.3201.4
207.0220.1230.1240.6252.3
261.9271.5292.7329.5404.4
421.9485.5561,4617.8736.8
846.5915.7982.1
..j with 1961, horses and mules are excluded.Includes all crops held on farms and crops held off farms by farmers as security for Commodity Credit Corporation loans.3 Beginning 1977, data are for farms included in the new farm definition, that is, places with sales of $1,000 or more annually.4 Forecast.Note, Beginning 1960, data include Alaska and Hawaii.Source: Department of Agriculture.
344
Digitized for FRASER http://fraser.stlouisfed.org/ Federal Reserve Bank of St. Louis

INTERNATIONAL STATISTICS
TABLE B-100.—Exchange rates, 1967-81
[Cents per unit of foreign currency, except as noted]
Year and month
March 1973,,
196719681969
19701971197219731974
19751976197719781979
1980 .1981
1980:1f|ill ....IV
1981:1I II NIV
March 1973
196719681969
1970.19711972 „ .19731974
19751976197719781979
19801981
1980:II III!., .IV
1981:1 . .||I I IIV
Belgian franc
2.5378
2.01252.00261.9942
2.01392.05982.27162.57612.5713
2.72532.59212.79113.18093.4098
3.42472.7007
3.47683.44173.51643.2625
2.96332.68992.51572.6465
Netherlandsguilder
34.834
27.75927.62627.592
27.65128.65031.15335.97737.267
39.63237.84640.75246.28449.843
50.36940.191
51.22850.27451.68048.295
43.86439.56737.05740.500
Canadiandollar
100.333
92.68992.80192.855
95.80299.021
100.93799.977
102.257
98.297101.41094.11287.72985.386
85.53083.408
85.90485.44286.30284.461
83.78483.42782.54783.918
Swedish krona
22.582
19.37319.34919.342
19.28219.59221.02222.97022.563
24.14122.95722.38322.13923.323
23.64719.860
23.69823.53324.08823.269
21.97620.52018.86618.096
French franc
22.191
20.32320.19119.302
18.08718.14819.82522.53620.805
23.35420.94220.34422.21823.504
23.69418.489
24.11723.73824.27322.643
20.60918.48417.24717.682
Swiss franc
31.084
23.10423.16923.186
23.19924.32526.19331.70033.688
38.74340.01341.71456.28360.121
59.69751.025
60.12359.39861.24758.050
52.81749.09747.75654.726
German mark
35.548
25.08425.04825.491
27.42428.76831.36437.75838.723
40.72939.73743.07949.86754.561
55.08944.362
56.40955.24156.33252.387
48.00943.95841.17044.508
United Kingdompound
247.24
275.04239.35239.01
239.59244.42250.08245.10234.03
222.16180.48174.49191.84212.24
232.58202.43
225.26228.24238.16238.55
230.96207.92183.62188.22
Italian lira
0.17604
.16022
.16042
.15940
.15945
.16174
.17132
.17192
.15372
.15338
.12044
.11328
.11782
.12035
.11694
.08842
.12136
.11750
.11856
.11048
.09995
.08827
.08232
.08352
Japanese yen
0.38190
.27613
.27735
.27903
.27921
.28779
.32995
.36915
.34302
.33705
.33741
.37342
.47981
.45834
.44311
.45432
.41074
.43213
.45514
.47484
.48644
.45491
.43173
.44572
Multilateral trade-weighted value ofthe U.S. dollar (March 1973 = 100)
Nominal
100.0
120.0122.1122.4
121.1117.8109.1
99.1101.4
98.5105.6103.392.488.1
87.4102.9
87.487.885.489.0
94.5103.1110.1105.3
Real1
100.0
98.899.2
93.997.393.184.283.2
84.8100.7
84.285.382.986.8
92.3100.3108.1102.2
1 Adjusted by the consumer price index for all urban consumers.Source: Board of Governors of the Federal Reserve System.
345
Digitized for FRASER http://fraser.stlouisfed.org/ Federal Reserve Bank of St. Louis

TABLE B-101.—U.S. international transactions, 1946-81
[Millions of dollars; quarterly data seasonally adjusted, except as noted]
Year orquarter
1946194719481949
19501951195219531954
19551956"195719581959.,.
19601961196219631964
19651966196719681969.
1970...19711972, .1973,1974...
1975.1976197719781979
1980
1979:Ij|I I IIV
1980:1IIillIV
1981:1I IIII".
Merchandise » 2
Exports
11,76416,09713,26512,213
10,20314,24313,44912,41212,929
14,42417,55619,56216,41416,458
19,65020,10820,78122,27225,501
26,46129,31030,66633,62636,414
42,46943,31949,38171,41098,306
107,088114,745120,816142,054184,473
223,966
42,0364383447J23651,367
54,89855,66756,25257,149
61,09860,47758,037
Imports
-5,067-5,973-7,557-6,874
-9,081-11,176-10,838-10,975-10,353
-11,527-12,803"13,291-12,952-15,310
= 14,758-14,537-16,260-17,048-18,700
=21,510-25,493-26,866-32,991-35,807
-39,866-45,579-55,797-70,499
= 103,649
-98,041= 124,051= 151,689= 175,813= 211,819
-249,308
-46,76651 117
-54,210- 59,726
-65,024-62,411-59,154-62,719
-65,775-67,387- 65,079
Net
6,69710,1245,7085,339
1,1223,0672,6111,4372,576
2,8974,7536,2713,4621,148
4,8925,5714,5215,2246,801
4,9513,8173,800
635607
2,603= 2,260= 6,416
911-5,343
9,047-9,306
= 30,873=33,759-27,346
-25,342
=4,730=7283-6|974-=8,359
-10,126=6,744-2,902-5,570
=4,677-6,910=7,042
Investment income3
Receipts
7721,1021,9211,831
2,0682,6332,7512,7362,929
3,4063,8374,1803,7904,132
4,6164,9995,6186,1576,824
7,4377,5288,0209,368
10,912
11,74712,70714,76421,80827,587
25,35129,28632,17943,26566,699
75,936
14,1111558218',05518,952
20,46516,86018,85019,764
21,56622,39923,610
Payments
-212-245-437--476
-559-583-555-624-582
-676-735-796-825
-1,061
-1,237-1,245-1,324-1,561-1,784
-2,088-2,481-2,747-3,378-4,869
-5,516- 5,436-6,572-9,655
-12,084
= 12,564= 13,311= 14,217=21,865=33,236
=43,174
-7,351—7948-8>34-9,203
-10,629= 10,342-10,697-11,507
-12,513-13,666-14,120
Net
560857
1,4841,355
1,5092,0502,1962,1122,347
2,7303,1023,3842,9653,071
3,3793,7544,2944,5965,040
5,3495,0475,2735,9906,043
6,2317,2718,192
12,15315,503
12,78715,97517,96221,40033,463
32,762
6,7607 6349!3219,749
9,8366,5188,1538,257
9,0538,7339,490
Netmilitarytransac-
tions
=493-455-799-621
-576-1,270-2,054-2,423-2,460
-2,701-2,788-2,841-3,135-2,805
-2,752=2,596= 2,449-2,304-2,133
-2,122-2,935-3,226-3,143-3,328
= 3,354= 2,893=3,420= 2,070-1,653
-746559
1,528738
-1,947
-2,515
-134—324= 565-923
-918-427-455-715
~568-698= 72
Net (rave!and
transpor-tation
receipts
733946374230
= 12029883
=238= 269
= 297= 361-189-633-821
=964-978
-1,152-1,309-1,146
= 1,280= 1,3314,750
-1,548-1,763
-2,038-2,345-3,063-3,158= 3,184
-2,792-2,558-3,293-3,178-2,622
-798
-678— 677=722-545
-532-152-38-76
-668=245-66
Otherservices,
net»
310145175208
242254309307305
299447482486573
579594809960
1,041
1,3871,3651,6121,6301,833
2,1802,4952,7663,1843,986
4,5984,7115,1825,7925,460
6,674
1,3221353l',3931,390
1,5231,5921,7191,838
1,6501,7801,684
Balanceon goods
andservices 1 4
7,80711,6176,9426,511
2,1774,3993,1451,1952,499
2,9285,1537,1073,1451,166
5,1326,3466,0257,1679,604
8,2855,9635,7083,5633,393
5,6252,269
-1,94111,0219,309
22,8939,382
-9,493-9,008
7,008
10,779
2,539702
2,4531,312
-217787
6,4783,734
4,7902,6603,994
Remittances,pensionsand otherunilateral
transfers '
-2,922-2,625-4,525-5,638
-4,017=3,515=2,531= 2,481-2,280
-2,498= 2,423=2,345= 2,361-2,448
=2,308= 2,524-2,638-2,754^2,781
=2,854= 2,932--3,125•=2,952-2,994
=3,294=3,701-3,854= 3,8815 = 7,186
^4,613- 4,998-4,617-5,067-5,593
-.7,056
-1,311= 1381-l',401-1,501
-1,878-1,332-1,503-2,344
-1,527-1,518-1,894
Balance oncurrent
account ' 4
4,8858,9922,417
873
-1,840884614
-1,286219
4302,7304,762
784-1,282
2,8243,8223,3874,4146,823
5,4323,0312,583
611399
2,331-1,433=5,795
7,1402,124
18,2804,384
-14,11044,075
1,414
3,723
1,228679
1,052-189
= 2,095-5454,9751,390
3,2631,1422,100
1 Excludes military.2 Adjusted from Census data for differences in valuation, coverage, and timing.a Fees and royalties from U.S. direct investments abroad or from foreign direct investments in the United States are excluded frominvestment income and included in other services, net.4 In concept, balance on goods and services is equal to net exports and imports in the national income and product accounts (andthe sum of balance on current account and allocations of special drawing rights is equal to net foreign investment in the accounts),although the series differ because of different handling of certain items {gold, extraordinary military shipments, etc,), revisions, etc.
(See next page for continuation of table,)
346
Digitized for FRASER http://fraser.stlouisfed.org/ Federal Reserve Bank of St. Louis

TABLE B-101.—U.S. international transactions, 1946-81— Continued
[Millions of dollars; quarterly data seasonally adjusted, except as noted]
Year or quarter
19461947.. .19481949... .
19501951195219531954
19551956195719581959.. . .
19601961,. ...196219631964
1965196619671968 . . ..1969
1970197119721973.. .1974
19751976 ..1977.19781979
1980....
1979:
II .."IllIV. ..
1980
i f *IllIV
1981if.....
lllp.. . .
U.S. assets abroad, net[increase/capital outf low (-)]
Total
Z'". .. .!
-4,099-5,538-4,174-7,270-9,560
-5,716-7,321-9,757
-10,977-11,585
-9,337-12,475
14497-22,874-34,745
-39,703-51,269-34,785-61,070-62,639
-84,776
-8,057-15,639-24,942-14,003
-12,63924837
-19,302-27,995
-22,397-21,971-18,004
U.S. officialreserveassets8
623-3,315-1,736
-266
1,758-33
-4151,256
480
182-869
-1,1652,2921,035
2,145607
1,535378171
1,22557053
-870-1,179
2,4812,349-4158
-1,467
-849-2,558
-375732
-1,133
-8,155
-3,585322
2,779-649
-3,268502
-1,109-4,279
-4,529-905
-4
Other U.S,Government
assets
••
-1,100-910
-1,085-1,662-1,680
-1,605-1,543-2,423-2,274-2,200
-1,589-1,884-1,568-2,6445 366
-3,474-4,214-3,693-4,644-3,767
-5,165
-1,093-971-778-925
-1,456-1,187-1,427-1,094
-1,395-1,485-1,242
U.S.privateassets
-5,144-5,235-4,623-5,986-8,050
-5,336-6,347-7,386-7,833-8,206
-10,229=-12,940-12,925-20,388-33,643
-35,380-44,498-30,717-57,159-57,739
-71,456
-3,379-14,990
2694312*429
-7,91524152
-16,766-22,622
-16,473-19,581-16,758
Foreign assets in the U.S., net[increase/capital inflow { + )]
Total
2,2942,7051,9113,2173,643
7423,6617,3799,928
12,702
6,35922,97021,46118,38834,241
15,67036,51851,21863,74838,946
50,261
2,2597,007
24,3455,335
7,5097,232
11,65123,870
7,14012,88815,056
Foreignofficialassets
1,473765
1,2701,9861,660
134-6723,451-774
-1,301
6,90826,87910,4756,026
10,546
7,02717,69336,81633,561
-13,757
15,492
= 8,688=9,785
6,011-1,295
-7,4627,5577,6867,711
5,503-2,779-5,847
Otherforeignassets
8211,939
6411,2311,983
6074,3333,928
10,70314,002
-550-3,90910,98612,36223,696
8,64318,82614,40330,18752,703
34,769
10,94816,79218,3346,630
14,971-3263,965
16,158
1,63715,66720,903
Allocationsof specialdrawingrights
(SDRs)
867717710
7,139"
1,152
1,139
1,152
1,093
Statistical discrepancy
Total (sumof the
items withsign
reversed)
-1,019989
-1,124-360-907
-458629
-205438
-1,516
-219-9,779-1,879-2,654-1,620
5,75310,367
-2,32311,39821,140
29,640
3,4309,309=4558,857
6,07318,1512,6762,736
10,9017,941
848
Of which:Seasonal
adjustmentdiscrepancy
... .
ZZZZ
zzzz
=421,165
-3,1222,000
-2061,355
-3,2912,139
-3401,222
=2,592
6 Includes extraordinary U.S. Government transactions with India.9 Consists of gold, special drawing rights, convertible currencies, and the U.S. reserve position in the International Monetary Fund(IMF).
Note.—Quarterly data for U.S. official reserve assets and foreign assets in the United States are not seasonally adjusted.Source: Department of Commerce, Bureau of Economic Analysis.
347Digitized for FRASER http://fraser.stlouisfed.org/ Federal Reserve Bank of St. Louis
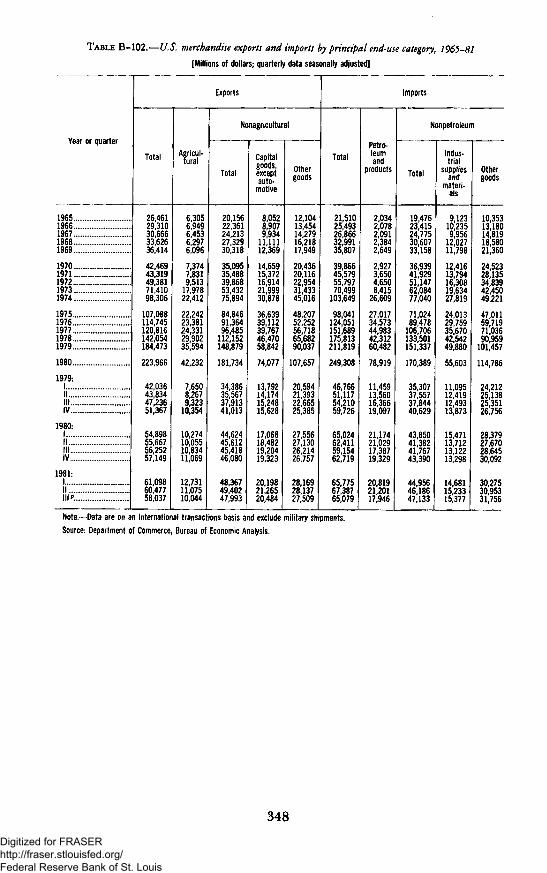
TABLE B-102.—U,S. merchandise exports and imports by principal end-use category, 1965-81[Millions of dollars; quarterly data seasonally adjusted]
Year or quarter
19651966196719681969
19701971197219731 "™. .".1974
19751976197719781979
1980
1979;1I I . . . .litIV
1980:1I I . . .IllIV
1981:|IIIl l"
Exports
Total
26,46129,31030,6663362636,414
42,46943,31949,38171,41098,306
107,088114,745120,816142,054184,473
223,966
42,03643,83447,23651,367
54,89855,66756,25257,149
61,09860,47758,037
Agricul-tural
6,3056,949645362976,096
7,3747,8319,513
17,97822,412
22,24223,38124,33129,90235,594
42,232
76508,2679,323
10,354
10,27410,05510,83411,069
12,73111,07510,044
Nonagricuitural
Total
20,15622,36124,2132732930,318
35,09535,48839,86853,43275,894
84,84691,36496,485
112,152148,879
181,734
3438635,56737,91341,013
44,62445,61245,41846,080
48,36749,40247,993
Capitalgoods,exceptauto-
motive
8,0528,9079,934
11 11112,369
14,65915,37216,91421,99930,878
36,63939,11239,76746,47058,842
74,077
1379214,17415,24815,628
17,06818,48219,20419,323
20,19821,26520,484
Othergoods
12,10413,45414,2791621817,949
20,43620,11622,95431,43345,016
48,20752,25256,71865,68290,037
107,657
2059421,39322,66525,385
27,55627,13026,21426,757
28,16928,13727,509
Imports
Total
21,51025,4932686632*99135,807
39,86645,57955,79770,499
103,649
98,041124,051151,689175,813211,819
249,308
4676651,11754,21059,726
65,02462,41159,15462,719
65,77567,38765,079
Petro-leumand
products
2,0342,0782,09123842,649
2,9273,6504,6508,415
26,609
27,01734,57344,98342,31260,482
78,919
1145913,56016,36619,097
21,17421,02917,38719,329
20,81921,20117,946
Nonpetroleum
Total
19,47623,41524,7753060733458
36,93941,92951,14762,08477,040
71,02489,478
106,706133,501151,337
170,389
3530737i55737,84440,629
43,85041,38241,76743,390
44,95646,18647,133
Indus-trial
suppliesand
materi-als
9,12310,2359956
12,02711 798
12,41613,79416,30819,63427,819
24,01329,75935,67042,54249,880
55,603
1109512,41912,49313,873
15,47113,71213,12213,298
14,68115,23315,377
Othergoods
10,35313,18014,819185802l'360
24,52328,13534,83942,45049,221
47,01159,71971,03690,959
101,457
114,786
2421225113825,35126,756
28,37927,67028,64530,092
30,27530,95331,756
Note.—Data are on an international transactions basis and exclude military shipments.Source: Department of Commerce, Bureau of Economic Analysis.
348
Digitized for FRASER http://fraser.stlouisfed.org/ Federal Reserve Bank of St. Louis
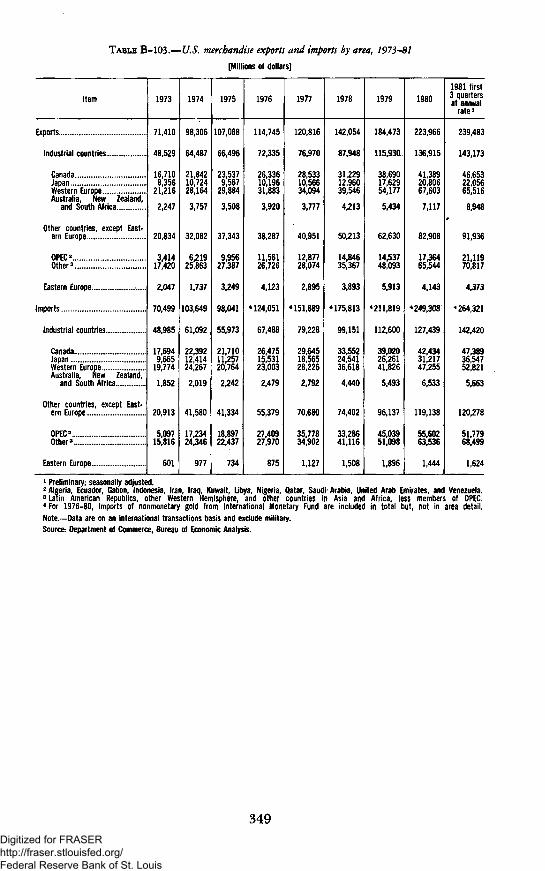
TABLE B-103.—U.S. merchandise exports and imports by area, 1973-81
[Millions of dollars]
Item
Exports
Industrial countries
CanadaJapanWestern EuropeAustralia, New Zealand,
and South Africa
Other countries, except East-ern Europe
OPEC 2
Other3
Eastern Europe
Imports
Industrial countries
CanadaJapanWestern EuropeAustralia, New Zealand,
and South Africa
Other countries, except East-ern Europe
OPEC2....Other3
Eastern Europe
1973
71,410
48,529
16,7108,356
21216
2,247
20,834
341417,420
2047
70,499
48,985
17,6949665
19,774
1,852
20,913
5,09715,816
601
1974
98,306
64,487
2184210,72428 164
3,757
32,082
621925,863
1737
103 649
61,092
223921241424267
2,019
41,580
17,23424,346
977
1975
107,088
66,496
23,5379,567
29,884
3,508
37,343
9,95627,387
3249
98,041
55,973
21,7101125720[764
2,242
41,334
18,89722,437
734
1976
114,745
72,335
26,33610,19631,883
3,920
38,287
11,56126,726
4,123
4 124,051
67,488
26,47515,53123,003
2,479
55,379
27,40927,970
875
1977
120,816
76,970
28,53310,56634094
3,777
40,951
12,87728,074
2,895
4 151,689
79,228
29,64518,56528,226
2,792
70,680
35,77834,902
1127
1978
142,054
87,948
31,22912,96039 546
4,213
50,213
14,84635,367
3,893
4 175,813
99,151
33,55224 54136,618
4,440
74,402
33,28641,116
1508
1979
184,473
115,930i
38,69017,62954177
5,434
62,630
14,53748,093
5913
4211,819
112,600
39,0202626141,826
5,493
96,137
45,03951,098
1896
1980
223,966
136,915
4138920,80667603
7,117
82,908
17 36465,544
4143
4 249,308
127,439
42,4343121747,255
6,533
119,138
55,60263,536
1444
1981 first3 quartersat annual
rate1
239,483
143,173
4665322,05665516
8,948
91,936
2111970,817
4373
4 264 321
142,420
473893654752,821
5,663
120,278
51,77968,499
1624
1 Preliminary; seasonally adjusted.2 Algeria, Ecuador, Gabon, Indonesia, Iran, Iraq, Kuwait, Libya, Nigeria, Qatar, Saudi-Arabia, United Arab Emirates, and Venezuela.3 Latin American Republics, other Western Hemisphere, and other countries in Asia and Africa, less members of OPEC.4 For 1976-80, imports of nonmonetary gold from International Monetary Fund are included in total but, not in area detail.Note.—Data are on an international transactions basis and exclude military.Source: Department of Commerce, Bureau of Economic Analysis.
349Digitized for FRASER http://fraser.stlouisfed.org/ Federal Reserve Bank of St. Louis

TABLE B-104.—U.S. merchandise exports and imports by commodity groups, 1958-81
[Millions of dollars; monthly data seasonally adjusted]
Year ormonth
19581959196019611962196319641965196619671968196919701971197219731974
1974*1975*1976*1977*1978*1979*
1980*1981*
1980:JanFebMarAprMayJune
JulyAugSeptOctNovDec
1981:JanFebMarAprMayJune
JulyAugSeptOctNovDec
Merchandise exports1
Totaldomes-tic andforeign
exports2
Domestic exports
Total2 a
Food,bever-ages,and
tobacco
Crudemateri-als andfuels4
Manu-facturedgoods5
Merchandise imports
General imports8
Total3
Food,bever-ages,and
tobacco
Crudemateri-als andfuels4
Manu-facturedgoods8
F.a.s. value8 Customs value
16,37516,42619,65920,22620,986
» 22,46725,83226,74229,49031,03034,06337,33242,65943,54949,19970,82397,998
98,181107,652115,223121,232143,681181,860
220,630233,677
17,41916,98418,26518,56717,64718,440
18,26719,08718,82819,21418,71519,251
18,82519,76421,43419,81818,86919,870
19,26419,05019,65519,04419,11818,821
16,21116,24319,45919,98220,71722,18225,47926,39929,05430,64633,62636,78842,02542,91148,39969,73096,634
96,634106,100113,476118,944141,040178,426
216,436228,899
17,07916,69517,88718,22817,27018,059
17,95318,77118,52118,77018,34418,918
18,45919,44121,00019,40818,49919,461
18,89418,74019,21218,61418,71618,312
2,6882,8523,1673,4663,7434,1884,6374,5195,1864,7104,5924,4465,0585,0766,569
12,93815,233
15,23316,79317,23415,96320,60424,587
30,40733,206
2,2082,1762,53523752,1532,365
2,4452,5342,7242,8862,9093,099
2,9262,9383,3342,8792,6802,582
2,5342,4552,7832,9082,6842,518
3,0522,9963,9423,8643,3563,7754,3374,2734,4044,726
• 4,8655,0066,6926,4417,091
10,73515,802
15,80215,19716,09518,57920,95728,222
33,71933,022
2,8472,8112,9612,8772,8912,867
2,8253,1492,7522,5542,4472,746
2,8962,9363,2452,4582,5412,328
2,4342,6372,8052,8772,8382,940
11,54711,17912,58312,78413,66814.29716,52917,43319,21820,84423,81826,78529,34430,44333,74044,73163,523
63,52370,95177,24180,15194,473
116,587
143,891154,283
11,36411,25311,55711,86011,54112,124
12,22712,44812,48312,47312,24112,368
11,91312,81613,65813,39212,56213,581
13,04613,05113,03012,33812,58012,245
13,39215,69015,07314,76116,46417,20718,74921,42725,61826,88933,22636,04339,95145,56355,58369,476
101,394
3,5503,5803,3923,4553,6743,8634,0224,0134,5904,7015,3655,3086,2306,4047,3799,235
10,701
4,1644,6154,4184,3344,6914,7555,0295,4405,7185,3676,0316,3916,5427,2688,838
13,44631,842
5,3117,1176,8636,5377,6498,0709,106
11,24414,44615,75620,62423,01125,90730,41437,76745,00156,202
F.a.s. value8
102,55998,503
123,477150,390174,757209,458
244,871261,305
21,14221,77920,94719,76620,58720,353
19,13919,71319,94120,34719,86021,436
23,19421,92220,94922,28921,31021,975
19,80723,52821,22923,23422,52219,516
10,7099,923
11,89114,22715,74317,735
18,55118,376
1,6631,4121,5581,4981,5361,592
1,5941,4671,3911,5831,6801,583
1,7481,5881,6091,4771,6761,467
1,3851,5001,3961,6021,4251,515
32,06432,59641,47453,55451,90171,390
93,97393,090
8,1459,1738,5777,7448,0348,174
6,8537,2927,1127,5067,0598,331
9,0419,1417,4788,9477,2068,270
6,5987,7687,4007,6467,4716,155
55,22351,08064,77576,554
100,317112,226
125,122142,544
10,81510,57610,3459,971
10,42110,063
10,13810,39010,52410,52010,57210,897
11,77710,71411,29411,29111,82211,597
11,29613,63611,93213,26112,82311,229
Total,c.i.f.
value7
I...".' ..
28,74535,32038,24142,42948,34258,86273,573
108,392
110,468105,880132,498160,411186,045222,228
256,984273,352
22,29922,94722,04820,81221,68321,403
20,07420,66520,83721,24420,75122,364
24,26522,91021,88623,28322,31422,993
20,72824,66522,23124,31223,53020,412
Merchandise trade balance
Exportsless
imports,customs
value
2,983736
4,5865,4654,5225,2607,0835,31538724,141
8371,2892,708
-2,014- 6,384
1,348=3,396
z~:
Exportsless
imports,f.a.s.
--4.3789,149
-8,254-29,158-31,076-27,599
-24,24127,628
-3,723-4,794-2,682-1,198-2,941= 1,912
-872-6261,112
-1,134-1,145=2,185
4,370-2,158
485-2,471^2,441-2,105
-542-4,478-1,574=4,191-3,404
= 695
Exportsless
imports,ci.f.
2,283-1,257
-909230
=4,793-9,663
2,752-10,395
12,2871,772
-17,274-=39,179-42,364-40,368
-36,354=39,675
-=4,880-5,963
•3,783-2,245-4,036=2,963
= 1,808= 1,578- 2,008-2.031=2,036= 3,113
-5,440^3,146
=451-3,4654,445
-3,123
-1,463-5,614- 2,576-5,268
4,412-1,591
1 Beginning 1960, data have been adjusted for comparability with the revised commodity classifications effective in 1965.2 Department of Defense shipments of grant-aid military supplies and equipment under the Military Assistance Program are excludedfrom total exports.
3 Total includes commodities and transactions not classified according to kind.4 Includes fats and oils.6 Includes machinery, transportation equipment, chemicals, metals, and other manufactures. Export data for these items include
military grant-aid shipments through 1977 and exclude them thereafter.s TotaT arrivals of imported goods other than intransU shipments.7 C.i.f. (costs, insurance, and freight) import value at first port of entry into United States. Data for 1967=73 are estimates.8 F.a.s. (free alongside ship) value basis at U.S. port of exportation for exports and at foreign port of exportation for imports.Note.—Data are as reported by the Bureau of the Census adjusted to include silver ore and bullion reported separately prior to 1969.
Trade in gold is included beginning 1974. Export statistics cover all merchandise shipped from the U.S. customs area, except suppliesfor the U.S. Armed Forces. Exports include shipments under Agency for International Development and Food for Peace programs as wellas other private relief shipments.
Data for 1980 and 1981 include trade of the U.S. Virgin Islands, except that for 1980 Virgin Islands exports are reflected only in thefigures for total domestic and foreign exports and trade balance.
*Data for 1974-79 for total domestic and foreign exports, total general imports, imports of fuels, and trade balance include trade ofthe Virgin Islands.
Source: Department of Commerce (Bureau of the Census and International Trade Administration).
350Digitized for FRASER http://fraser.stlouisfed.org/ Federal Reserve Bank of St. Louis

TABLE B-105.—International investment position of the United States at year-end, selected years, 1970-80
[Billions of dollars]
Type of investment
Net international investment position of the United States...U S assets abroad
U S official reserve assetsGoldSpecial drawing rights (SDRs)Reserve position in the International Monetary
Fund (IMF)Foreign currency reserves
Other U S Government assetsU.S. loans and other long-term assetsU S short-term assets other than reserves
U.S. private assetsDirect investments abroad (book value)Foreign securitiesClaims on foreigners reported by U.S. banks, not
included elsewhereClaims on unaffiliated foreigners reported by
U.S. nonbanksForeign assets in the United States
Foreign official assetsU S Government securities *Other U S Government liabilitiesLiabilities reported by U.S. banks, not included
elsewhereOther official assets
Other foreign assetsDirect investments in the United States (book
value)Liabilities reported by U.S. banks, not included
elsewhereU.S. Treasury securities.. . .Other U.S. securities2. . .Liabilities to unaffiliated foreigners reported by
U S nonbanks
1970
58.6
165.5
145
11.1.9
1.9.6
321
29.72.5
118.8
75.5210
138
8.5
1068
26.1
1771.7
6.7o80.7
13.3
22.71.2
34.7
88
1972
37.1
199.013210.52.0
.5
36134.12.0
149.789.927.6
207
11.4
1618
63.2
5291.6
8.52
98.7
14.9
21.21.2
50.7
107
1974
58.8
255.715911.72.4
1.9.0
384
36.32.1
201.5110.1282
462
17.0
1969
79.8
5812.6
18.46
1171
25.1
41.81.7
34.9
136
1976
83.8
347.218711.62.4
4.4.3
46044.11.9
282.4136.8
44.2
81.1
20.3
2634104.27268.8
17.256
159.1
30.8
53.57.0
54.9
130
1977
71.3
379.119311.72.6
4.9.0
49647.8
1.8
310.2146.0494
926
22.3
3078140.8105410.2
18.072
1670
34.6
60.27.6
51.2
134
1978
77.5
447.918711.71.6
1.04.4
54.2
52.31.9
375.0162.7534
1308
28.1
3704172.91285
12.5
23.385
197.5
42.5
77.78.9
53.6
149
1979
95.0
508.919011.22.7
1.33.8
58456.51.9
431.5186.8566
1570
31.1
4139
159.51066
12.4
30.599
2544
54.5
110.314.158.6
169
1980
122.7603.626811.22.6
2.910.1
63561.91.7
513.3213.5621
2040
33.7
4809175.71182
13.0
30.4141
3052
65.5
121.116.074.0
286
1 Includes Treasury and agency issues of securities.2 Corporate and other bonds and corporate stocks.Note.—Gold is valued at SDR35 per ounce, throughout. The SDR value is converted to dollars at $1/SOR before December 1971, at
$1.08571/SDR from December 1971 through January 1973, at $1.20635/SDR from February 1973 through June 1974, and as measuredby the basket valuation of the SDR beginning July 1974.
Source: Department of Commerce, Bureau of Economic Analysis.
351
Digitized for FRASER http://fraser.stlouisfed.org/ Federal Reserve Bank of St. Louis
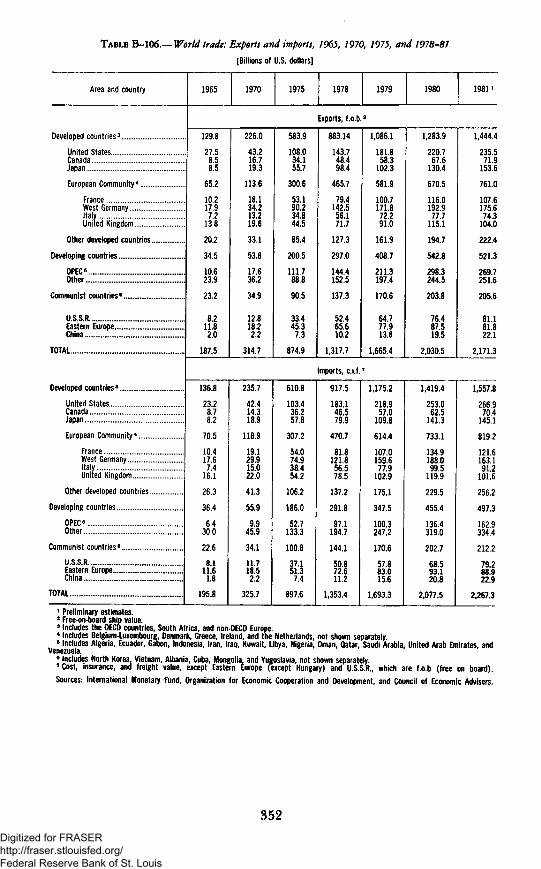
TABLE B-IQ6.—World trade: Exports and imports, 1965, 1970, 1975, and 1978-81
[Billions of U.S. dollars]
Area and country
Developed countries3
United StatesCanada,Japan
European Community4
France.West GermanyItaly. . .United Kingdom
Other developed countries
Developing countries
OPEC8
Other
Communist countries8
U.S.S.REastern EuropeChina
TOTAL
Developed countries3
United StatesCanadaJapan
European Community4
FranceWest GermanyItaly .United Kingdom
Other developed countries
Developing countries
OPEC6
Other
Communist countries*
U.S.S.REastern EuropeChina 11IZ
TOTAL
1965
129.8
27.58.58.5
65.2
10.217.97.2
13.8
20.2
34.5
10.623.9
23.2
8211.820
187.5
136.8
23.28782
70.5
10417.674
161
263
364
64300
226
8 111.61.8
195 8
1970
226.0
43,216.719.3
113.6
18.134.213.219.6
33.1
53.8
17.636.2
34.9
12.818.22.2
314.7
235.7
42.4143189
118.9
19129.9150220
413
559
99459
341
11 718.52.2
325 7
1975
583.9
108.034.155.7
300.6
53.190.234.844.5
85.4
200.5
111.788.8
90.5
33.445.373
874.9
610.8
103.4362578
307.2
54074.9384542
1062
1860
5271333
1008
37 1sii7.4
897 6
1978
Exports, f.o.b
883.14
143.748.498.4
465.7
79.4142.5
56.171.7
127.3
297.0
144.4152.5
137.3
52.465.6102
1,317.7
Imports, c.i.f.
917.5
183.1465799
470.7
81812L8565785
1372
2918
9711947
144 1
50872.611.2
1 353 4
1979
2
1,086.1
181.858.3
102.3
581.9
100.7171.8
72.291.0
161.9
408.7
211.3197.4
170.6
64777.9138
1,665.4
7
1,175.2
218.9570
1098
614,4
1070159.6779
1029
175 1
3475
1003247 2
170 6
57 883.015.6
I CQ-3 0
1980
1,283.9
220.767.6
130.4
670.5
116.0192.9
77.7115.1
194.7
5428
2983244.5
203.8
76487.5195
2,030.5
1,419.4
253.0625
141 3
733.1
1349188.099 5
1199
2295
4554
1364319 0
202 7
68 593.120.8
2 077 5
1981 »
1,444.4
235.571.9
153.6
761.0
107.6175.6
74.3104.0
2224
5213
2697251,6
205.6
81181.822 1
2,171.3
1,557,8
266.9704
145 1
819.2
121 6163.191 2
1016
2562
4973
16293344
212 270 i)88.922.9
9 9fi7 ̂
1 Preliminary estimates.2 Free-on-board ship value.3 Includes the OECD countries, South Africa, and non-OECD Europe.4 Includes Belgium-Luxembourg, Denmark, Greece, Ireland, and the Netherlands, not shown separately.5 Includes Algeria, Ecuador, Gabon, Indonesia, Iran, Iraq, Kuwait, Libya, Nigeria, Oman, Qatar, Saudi Arabia, United Arab Emirates, and
Venezuela.8 Includes North Korea. Vietnam, Albania, Cuba, Mongolia, and Yugoslavia, not shown separately.7 Cost, insurance, and freight value, except Eastern Europe (except Hungary) and U.S.S.R,, which are f.o.b (free on board).Sources: International Monetary-fund, Organization for Economic Cooperation and Development, and Council of Economic Advisers.
352Digitized for FRASER http://fraser.stlouisfed.org/ Federal Reserve Bank of St. Louis
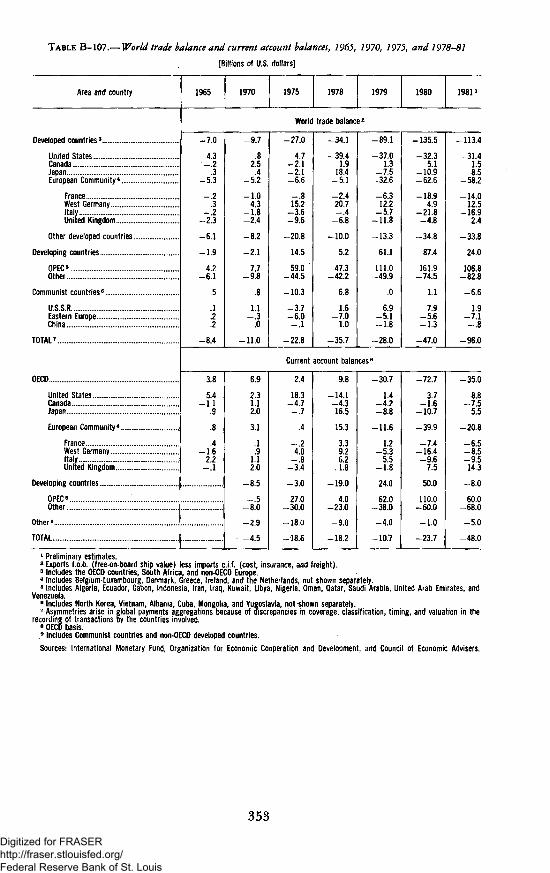
TABLE B-107.— World trade balance and current account balances, 1965, 1970, 1975, and 1978-81
[Billions of U.S. dollars]
Area and country
Developed countries3
United States...CanadaJapan . . . .European Community4
FranceWest GermanyItalyUnited Kingdom. . .
Other developed countries
Developing countries
OPEC5
Other
Communist countries6
U.S.S.REastern EuropeChina
TOTAL7 .. ..
OECD
United StatesCanadaJapan..
European Community4
FranceWest GermanyItalyUnited Kingdom
Developing countries
OPEC5 ..Other
Other9
TOTAL
1965 1970 1975 1978 1979 1980 1981 >
World trade balance2
-7.0
4.3'-.2
-5i3
-.2.3
-.2-2.3
-6.1
-1.9
4.2-6.1
.5
.1
.2
.2
-8.4
3.8
5.4-1.1
.9
.8
.4-1.6
2.2-.1
97
.82.5.4
-5.2
-1.04.3
-1.8-2.4
-8.2
-2.1
7.7-9.8
.8
1.1
.0
-11.0
-27.0
4.7-2.1-2.1-6.6
-.815.2
-3.6-9.6
-20.8
14.5
59,0 *-44.5
-10.3
-3.7-6,0-.1
-22.8
Current
6.9
2.31.12.0
3.1
.1
.91.12.0
-8.5
-.580
29
-4.5
2.4
18.3-4.7-.7
.4
-.24.0-.8
-3.4
-3.0
27.0-30.0
= 18.0
-18.6
341
-39.41.9
18.4— 5.1
-2.420.7-.4
-6.8
-10.0
5.2
47.3-42.2
68
1.6701.0
35.7
-89.1
-37.01.3
-7.5-32.6
-6.312.2
-5.7-11.8
-13.3
61.1
111.0-49.9
.0
6.9-5.1-1.8
-28.0
-135.5
-32.35.1
-10.9-62.6
-18.94.9
-21.8-4.8
-34.8
87.4
161.9-74.5
1.1
7.9-5.6-1.3
-47.0
-113.4
-31.41.58.5
-58.2
-14.012.5
-16.92.4
338
24.0
106.8-82.8
-6.6
1.9-7.1-.8
-96.0
account balances8
9.8
-14.1-4.316.5
15.3
3.39.26.2
,1.8
190
4.0-23.0
-9.0
-18,2
-30.7
1.4-4.2-8.8
-11.6
1.2-5.3
5.5-1.8
24.0
62.0-38.0
-4.0
-10.7
-72.7
3.7-1.6
-10.7
-39.9
-7.4-16.4-9.6
7.5
50.0
110.0-60.0
10
-23.7
350
8.8-7.5
5.5
208
-6.5-8.5-9.514.3
-8.0
60.0680
-5.0
-48.0
1 Preliminary estimates.2 Exports f.o.b. (free-on-board ship value) less imports c.i.f. (cost, insurance, and freight).3 Includes the OECD countries, South Africa, and non-OECD Europe.4 Includes Belgium-Luxembourg, Denmark, Greece, ireland, and the Netherlands, not shown separately.5 Includes Algeria, Ecuador, Gabon, Indonesia, Iran, Iraq, Kuwait, Libya, Nigeria, Oman, Qatar, Saudi Arabia, United Arab Emirates, and
Venezuela.6 Includes North Korea, Vietnam, Albania, Cuba, Mongolia, and Yugoslavia, not-shown separately.7 Asymmetries arise in global payments aggregations because of discrepancies in coverage, classification, timing, and valuation in the
recording of transactions By the countries involved.• OECD basis..9 Includes Communist countries and non-OECD developed countries.
Sources: International Monetary Fund, Organization for Economic Cooperation and Development, and Council of Economic Advisers.
353
Digitized for FRASER http://fraser.stlouisfed.org/ Federal Reserve Bank of St. Louis
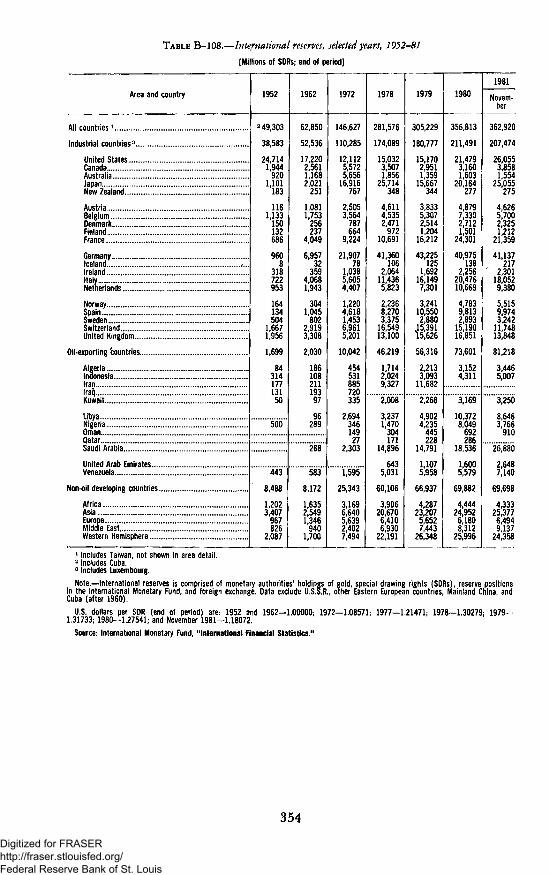
TABLE B-108.—International reserves, selected years, 1952-81
[Millions of SDRs; end of period]
Area and country
All countries *
Industrial countries3
United StatesCanada . ..Australia.. . . .Japan.. . . . _ .New Zealand.
Austria. .Belgium,Denmark..Finland .France
GermanyIceland &IrelandItalyNetherlands .
NorwaySpainSwedenSwitzerlandUnited Kingdom
Oil-exporting countries
AlgeriaIndonesia.IranIraqKuwait . . . .
Libya . . . .NigeriaOmanQatarSaudi Arabia
United Arab EmiratesVenezuela
Non-oil developing countries
Africa. ..AsiaEuropeMiddle EastWestern Hemisphere . . .
1952
2 49 303
38,583
24,7141,944
9201,101
183
1161,133
150132686
9608
318722953
164134504
1,6671,956
1,699
8431417713150
500
443
8,488
1,2023407
967826
2,087
1962
62850
52,536
17,2202,5611,1682,021
251
1,0811,753
256237
4,049
6,95732
3594,0681,943
3041,045
8022,9193,308
2030
18610821119397
96289
268
583
8172
1,6352549U46
9401,700
1972
146,627
110,285
12,1125,5725,656
16,916767
2,5053,564
787664
9,224
21,90778
1,0385,6054,407
1,2204,6181,4536,9615,201
10,042
454531885720335
2,69434614927
2,303
1,595
25,343
3,16966405,6392,4027,494
1978
281 576
174,089
15,0323,5071,856
25,714348
4,6114,5352,471
97210,691
41,360106
2,06411,4365,823
2,2368,2703!375
16,54913,100
46,219
1,7142,0249327
2,008
3,2371,470
304171
14,896
6435,031
60,106
3,906206706,4106,930
22,191
1979
305 229
180,777
15,1702,9511,359
15,667344
3,8335,3072,5141,204
16,212
43,225125
1,69216,1497,301
3,24110,5502,880
15,39115,626
56,316
2,2133,093
11682
2,268
4,9024,235
445228
14,791
11075,958
66,937
4,287232075,6527,443
26,348
1980
356,813
211,491
21,4793,1601,603
20,164277
4,8797,3302,7121,501
24,301
40,975138
2,25620,47610,669
4,7839,8132,893
15,19016,851
73,601
3,1524,311
3,169
10,3728,049
692286
18,536
16005,579
69882
4,444249526,1808,312
25,996
1981
Novem-ber
362,920
207,474
26,0553,8581,554
25,055275
4,6265,7002,3251,212
21,359
41,137217
2,30118,0529,380
5,5159,9743,242
11,74813,848
81218
3,4465,007
3,250
8,6463,766
910
26,880
26487,140
69698
4,333253776,4949,137
24,358
1 Includes Taiwan, not shown In area detail.2 Includes Cuba.3 Includes Luxembourg.
Note.- International reserves is comprised of monetary authorities' holdings of gold, special drawing rights (SDRs), reserve positionsin the International Monetary Fund, and foreign exchange. Data exclude U.S.S.R., other Eastern European countries, Mainland China, andCuba (after I960).
U.S. dollars per SDR (end of period) are: 1952 and 1962-1.00000; 1972-1.08571; 1977-1.21471; 1978-1.30279; 1979^1.31733; 1980—1.27541; and November 1981—1.18072.
Source: International Monetary Fund, "International Financial Statistics."
354
Digitized for FRASER http://fraser.stlouisfed.org/ Federal Reserve Bank of St. Louis

TABLE B-109.—Growth rates in real gross national product, 1960-81
[Percent change]
Area and country
OECD countries
United StatesCanadaJapan
European Community3
FranceWest GermanyItalyUnited Kingdom
Other OECD4
Communist countries 5
U S S REastern EuropeChina
Developing countries6
Oil exporting7....,other!: ::.TOTAL
1960-73annualaverage
4.8
4.254
10.5
4.7
57485.232
5.4
4.9
4.94.164
8908 5.8
1974
0.9
_.636_ 3
1.6
3.25
4.110
3.5
4.0
3.94.737
8.05.6
1975
-0.4
-1.1121.4
-1.2
2-18-3.6-6
.2
3.3
1.74.177
-.34.0
1976
4.9
5.45.56.5
5.0
5.2525.936
3.7
3.7
4.83.4
6
12.35.4
1977
3.7
5.52.15.3
2.4
3.1281.913
2.0
4.0
3.22.886
5.94.8
1978
3.8
4.83.75.1
3.3
3.7362.733
2.4
4.8
3.43.0
116
1.95.5
1979.
3.4
3.2355.6
3.4
3.5454.914
2.8
2.4
.81.385
2.34.9
1980
1.2
-.2.0
4.2
1.1
1.2184.0
-18
2.0
2.1
1.3.4
62
-3.04.4
1981 l
1.3
1.9303.8
-.8
.510.0
20
.8
1.2
2.0-2.2
30
U.S. dollarvalue in
1980(billions) ^
7,553
2,626246
1,098
2,740
660826376509
843
2,755
1,420613569
1907
5401,367
12215
Preliminary estimates.2 Estimates based on conversion at average rates of exchange for 1980, except for those of the Communist countries, which were
converted at U.S. purchasing power equivalents.3 Includes Belgium-Luxembourg, Denmark, Greece, Ireland, and the Netherlands, not shown separately."Growth rates are for OECD countries other than the Big Seven (United States, Canada, Japan, France, West Germany, Italy, and the
United Kingdom).5 Includes North Korea, Vietnam, Albania, Cuba, Mongolia, and Yugoslavia, not shown separately.6 Growth rates are for country groupings used in International Financial Statistics, International Monetary Fund.7 Includes Algeria, Indonesia, Iran, Iraq, Kuwait, Libya, Nigeria, Oman, Qatar, Saudi Arabia, United Arab Emirates, and Venezuela.81967-72 annual average.Note.—for France, Italy, the United Kingdom, the developing countries, and industrial country groupings, data relate to real gross
domestic product.Sources: Department of Commerce, International Monetary Fund, Organization for Economic Cooperation and Development (OECD),
and Council of Economic Advisers.
355Digitized for FRASER http://fraser.stlouisfed.org/ Federal Reserve Bank of St. Louis

TABLE B-110.—Industrial production and consumer prices, major industrial countries, 1960-81[1967-100]
Year or quarter
I960196119621963..1964
196519661967 "."" .'..'.'.. .19681969 ....
1970.1971197219731974
19751976197719781979
19801981
1980:IIII I IIV
1981:I||HIIV
I9601961196219631964
19651966 .19671968. .1969 !
1970 .1971197219731974
19751976197719781979
19801981
1980:III . .I l lIV . „
1981:|IIIll(V . . . .
UnitedStates Canada Japan
EuropeanCommun-
ity'France West
Germany Italy
Industrial production 2
66,266.772.276.581.7
89.897.8
100.0106,3111.1
107.8109.6119.7129.8129.3
117.8130.5138.2146.1152.5
147.0151.0
152.6144.5142.3148.7
151.8152.5153.0146.3
63.165.671.275.782.6
89.796.2
100.0106.4113.7
115.3121.5130.7144.6149.2
140,3148.5152.2157.7166.0
162.7
165.0160.9160.8164.4
166.1170.4165.4
43.051.255.461.771.4
74.283.8
100,0115.2133.4
151.8155.7167.0190.5183.1
163.9182.0189.7201.1217.7
232.5
233.6234.1229.2233.0
236.7236.0238.5
74.778.181.384.891.0
94.798.4
100.0107.4117.6
123.3126.1131.7141.4142.3
132.8142.6145.9149.4156.6
155,1
159.4157.6153.1151.4
150.9150.9
7073788690
9398
100104114
120128135145148
139149152155163
160
166162162158
152151155
78.482.886.188.996.6
102.1103.0100.0109.2123.2
131.1133.6138.7147.7145.1
137.1149.1152.0154.1161.8
162.3
167163161159
162160161
59.265.571.978.479.2
82.893.3
100.0106.4110.5
117.6117.5122.7134,6140.6
127.6143.5145.1147.9157.6
166.5
174.2169.6156.8165.0
166.1161.8154.7
Consumer prices
88.789.690.691.792.9
94.597.2
100.0104.2109.8
116.3121.3125.3133.1147.7
161.2170.5181.5195.4217.4
246.8272.4
236.5245.0249.6256.2
262.9269.0276.7280,7
85.986.787.789.290.9
93.196.5
100.0104.0108.8
112.4115.6121.2130.3144.5
160.1172.1185.9202.5221.0
243.5273.9
233.5240.0246.8253.8
262.0270.2278.2285.0
68.371.876.782.585.8
91.696.3
100.0105.3110.9
119.3126.5132.3147.9184.0
205.8224.9243.0252.3261.3
282,3
273.2282.2285.2288.8
291.4296.3296.9
77.081.184.587.690.8
94.297.5
100.0103.7108.0
113.3120.3127.6138.3156.4
176.7195.2214.7229.9250.7
281.8
270.1279.0285.2292.0
300.7310.2317.8
a78.0^ 80.6
85.489.592.5
94.897.4
100.0104.5111.3
117.1123.5131.1140.7160.0
178.9196.1214.5233.9259.1
294.2
280.3289.0298.3306.6
315.7326.1338.9
82.984.887.489.992.0
95.098.4
100.0101.6103.5
107.1112.7119.0127.2136.1
144.2150.4155.9160.2166.8
175.9186.4
172.5175.7176.9174.8
182.2185.5187.8190.0
74.175.779.285.190.1
94.296.4
100.0101.4104.1
109.2114.4121.0134.0159.7
186.8218.1255.2286.2328.5
398.0
373.5388.1404.6426.1
448.4468.0482.1
UnitedKingdom
84.484.385.188.495.0
97.799.2
100.0106.7110.3
110.9110.6113.2123.0120.0
114.3117.4122.9126.9131.7
122.9
128.0124.2120.6118.2
117,2117.5118.5
79.081.685.186.889,6
93.997.6
100.0104.8110.3
117.4128.5137.7150.2174.3
216.5252.4292.4316.6359.0
423.6473.9
399.6422,9431.9439.9
450.4472.3480.5492.3
1 Consists of Belgium-Luxembourg, Denmark, France, Greece, Ireland, Italy, Netherlands, United Kingdom, and West jGermany.Industrial production excludes data for Greece, which joined the EC in 1981.2 All data exclude construction. Quarterly data are seasonally adjusted.3 Data for 1960 and 1961 are for Paris only.
Sources: Department of Commerce {International Trade Administration) and Department of Labor (Bureau of Labor Statistics).
356Digitized for FRASER http://fraser.stlouisfed.org/ Federal Reserve Bank of St. Louis
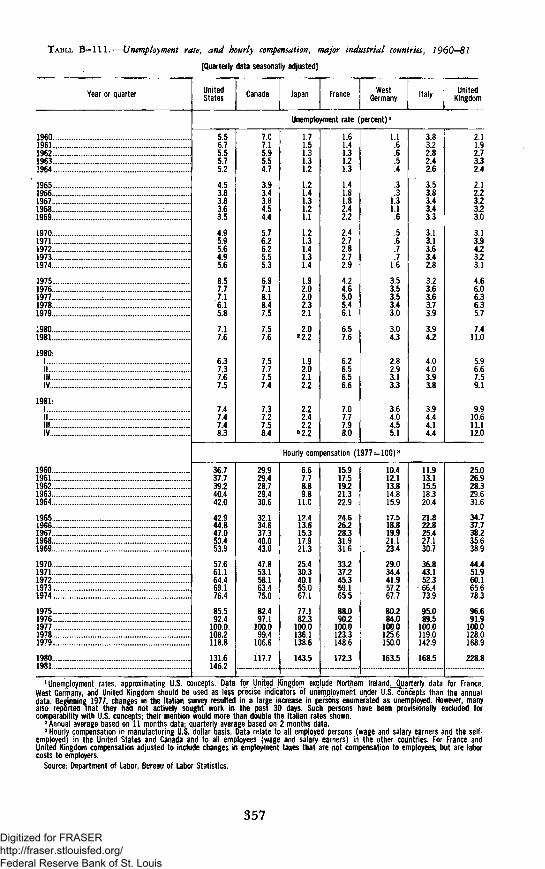
TABLE B—111.—Unemployment rate, and hourly compensation, major industrial countries, 1960—81
[Quarterly data seasonally adjusted]
Year or quarter
I96019611962.,' . . ! ! ..19631964 ....
196519661967.19681969 .
1970.1971197219731974
19751976197719781979
19801981
1980:1.ItIIIIV
1981:1III I IIV .. . ..
I960..1961196219631964.
19651966196719681969.
19701971. „ .197219731974
19751976197719781979..
19801981 . . .
UnitedStates Canada Japan France West
Germany Italy UnitedKingdom
Unemployment rate (percent) l
5.56.75.55.7 .5.2
4.53.83.83.63.5
4.95.95.64.95.6
8.57.77.16.15.8
7.17.6
6.37.37.67.5
7.47.47.48.3
7.07.15.95.54.7
3.93.43.84.54.4
5.76.26.25.55.3
6.97.18.18.47.5
7.57.6
7.57.77.57.4
7.37.27.58.4
1.71.51.31.31.2
1.21.41.31.21.1
1.21.31.41.31.4
1.92.02.02.32.1
2.022.2
1.92.02.12.2
2.22.42.22 2.2
1.61.41.31.21.3
1.41.81.82.42.2
2.42.72.82.72.9
4.24.65.05.46.1
6.57.6
6.26.56.56.6
7.07.77.98.0
1.1.6.6.5.4
.3
.31.31.1.6
.5
.6
.7
.71.6
3.53.53.53.43.0
3.04.3
2.82.93.13.3
3.64.04.55.1
3.83.22.82.42.6
3.53.83.43.43.3
3.13.13.63.42.8
3.23.63.63.73.9
3.94.2
4.04.03.93.8
3.94.44.14.4
2.11.92.73.32.4
2.12.23.23.23.0
3.13.94.23.23.1
4.66.06.36.35.7
7.411.0
5.96.67.59.1
9.910.611.112.0
Hourly compensation (1977= 100) 3
36.737.739.240.442.0
42.944.847.050.453.9
57.661.164.469.176.4
85.592.4
100.0.108.2118.8
131.6146.2
29.929.428.729.430.6
32.134.637.340.043.0
47.853.158.163.475.0
82.497.1
100.099.4
106.6
117.7
6.67.78.89.8
11.0
12.413.615.317.921.3
25.430.340.155.067.1
77.182.3
100.0136.1138.6
143.5
15.917.519.221.322.9
24.626.228.331.931.6
33.237.245.359.165.5
88.090.2
100.0123.3148.6
172.3
10.412.113.814.815.9
17.518.819.921.123.4
29.034.441,957.267.7
80.284.0
100.0125.6150.0
163.5
11.913.115.518.320.4
21.822.825.427.130.7
36.843.152.3
- 66.473.9
95.089.5
100.0119.0142.9
168.5
25.026.928.329.631.6
34.737.738.235.638.9
44.451.960.165.678.3
96.691.9
100.0128.0168.9
228.8
'Unemployment rates, approximating U.S. concepts. Data for United Kingdom exclude Northern lreland^_Quarterly data for France,West Germany, and United Kingdom should be used as less precise indicators of unemployment under IfS. concepts than the annualdata. Beginning 1977t changes in the Italian survey resulted in a large increase in persons enumerated as unemployed. However, manyalso reported that they had not actively sought work in the pasi 30 days. Such persons have been provisionally excluded forcomparability with U.S. concepts; their mention would more than double the Italian rates shown.2 Annual average based on 11 months data; quarterly average based on 2 months data.3 Hourly compensation in manufacturing U.S. dollar basis. Data relate to all employed persons (wage and salary earners and the self-employed) in the United States and Canada and to all employees (wage and salary earners) in the other countries. For France andUnited Kingdom compensation adjusted to include changes in employment taxes that are not compensation to employees, but are laborcosts to employers.
Source: Department of Labor, Bureau of Labor Statistics.
357Digitized for FRASER http://fraser.stlouisfed.org/ Federal Reserve Bank of St. Louis

Digitized for FRASER http://fraser.stlouisfed.org/ Federal Reserve Bank of St. Louis

Digitized for FRASER http://fraser.stlouisfed.org/ Federal Reserve Bank of St. Louis

Digitized for FRASER http://fraser.stlouisfed.org/ Federal Reserve Bank of St. Louis

Digitized for FRASER http://fraser.stlouisfed.org/ Federal Reserve Bank of St. Louis

Digitized for FRASER http://fraser.stlouisfed.org/ Federal Reserve Bank of St. Louis
![[Volume 23], July - December 1925 - FRASER - St. Louis Fed](https://static.fdokumen.com/doc/165x107/63389ed1283e1abca203decf/volume-23-july-december-1925-fraser-st-louis-fed.jpg)