A Dynamic Model for Estimating the Interaction of ROS–PUFA ...
20
Citation: Mattioli, S.; Dimauro, C.; Cesarani, A.; Dal Bosco, A.; Bartolini, D.; Galli, F.; Migni, A.; Sebastiani, B.; Signorini, C.; Oger, C.; et al. A Dynamic Model for Estimating the Interaction of ROS–PUFA– Antioxidants in Rabbit. Antioxidants 2022, 11, 531. https://doi.org/ 10.3390/antiox11030531 Academic Editors: Alica Pizent and Eva Tvrdá Received: 1 February 2022 Accepted: 9 March 2022 Published: 10 March 2022 Publisher’s Note: MDPI stays neutral with regard to jurisdictional claims in published maps and institutional affil- iations. Copyright: © 2022 by the authors. Licensee MDPI, Basel, Switzerland. This article is an open access article distributed under the terms and conditions of the Creative Commons Attribution (CC BY) license (https:// creativecommons.org/licenses/by/ 4.0/). antioxidants Article A Dynamic Model for Estimating the Interaction of ROS–PUFA–Antioxidants in Rabbit Simona Mattioli 1, * , Corrado Dimauro 2 , Alberto Cesarani 2 , Alessandro Dal Bosco 1 , Desiree Bartolini 3 , Francesco Galli 3 , Anna Migni 4 , Bartolomeo Sebastiani 5 , Cinzia Signorini 6 , Camille Oger 7 , Giulia Collodel 6 and Cesare Castellini 1 1 Department of Agricultural, Environmental and Food Science, University of Perugia, Borgo 20 Giugno, 74, 06123 Perugia, Italy; [email protected] (A.D.B.); [email protected] (C.C.) 2 Department of Agricultural Sciences, University of Sassari, Sassari, Viale Italia, 39, 07100 Sassari, Italy; [email protected] (C.D.); [email protected] (A.C.) 3 Department of Pharmaceutical Sciences, University of Perugia, Via Enrico Dal Pozzo, 06126 Perugia, Italy; [email protected] (D.B.); [email protected] (F.G.) 4 Department of Life Science and System Biology, Università di Torino, Via Accademia Albertina, 13, 10123 Torino, Italy; [email protected] 5 Department of Chemistry, Biology and Biotechnology, Via del Giochetto, University of Perugia, 06126 Perugia, Italy; [email protected] 6 Department of Molecular and Developmental Medicine, University of Siena, Policlinico Santa Maria alle Scotte, Viale Bracci 16, 53100 Siena, Italy; [email protected] (C.S.); [email protected] (G.C.) 7 Institut des Biomolécules Max Mousseron (IBMM), Pôle Chimie Balard Recherche, 1919 route de Mende, CEDEX 05, 34293 Montpellier, France; [email protected] * Correspondence: [email protected]; Tel.: +39-075-585-7123 Abstract: Defining optimal nutrition in animals and humans remains a main scientific challenge. The objective of the work was to develop a dynamic model of reactive oxygen species (ROS)– polyunsaturated fatty acid (PUFA)–antioxidant homeostasis using the rabbit as a model. The problem entity was to evaluate the main metabolites generated from interactions between traits included in the conceptual model and identified by three main sub–models: (i) ROS generation, (ii) PUFA oxidation and (iii) antioxidant defence. A mathematical model (VENSIM software) that consisted of molecular stocks (INPUTs, OUTPUTs), exchange flows (intermediate OUTPUTs) and process rates was developed. The calibration was performed by using standard experimental data (Experiment 1), whereas the validation was carried out in Experiments 2 and 3 by using supra–nutritional dietary inputs (VIT E+ and PUFA+). The accuracy of the models was measured using 95% confidence intervals. Analytical OUTPUTs (ROS, PUFA, Vit E, Ascorbic acid, Iso–/NeuroProstanes, Aldehydes) were well described by the standard model. There was also good accuracy for the VIT E+ scenario, whereas some compensatory rates (Kc1–Kc4) were added to assess body compensation when high levels of dietary PUFA were administered (Experiment 3). In conclusion, the model can be very useful for predicting the effects of dietary treatments on the redox homeostasis of rabbits. Keywords: metabolism; dynamic model; oxidation; antioxidants; polyunsaturated fatty acids 1. Introduction Reactive oxygen species (ROS) such as peroxides, the superoxide anion, the hy- droxyl radical and singlet oxygen have complex interactions with the different classes of biomolecules and physiological processes of living organisms [1], thus playing funda- mental roles in health and disease [2]. In isolated mitochondria, it is estimated that 0.1–2% of oxygen consumed produces ROS [3]. Depending on their relative concentrations and site of production, these molecular species can damage different cellular targets, including proteins [4], nucleic acids [5] Antioxidants 2022, 11, 531. https://doi.org/10.3390/antiox11030531 https://www.mdpi.com/journal/antioxidants
-
Upload
khangminh22 -
Category
Documents
-
view
3 -
download
0
Transcript of A Dynamic Model for Estimating the Interaction of ROS–PUFA ...
�����������������
Citation: Mattioli, S.; Dimauro, C.;
Cesarani, A.; Dal Bosco, A.; Bartolini,
D.; Galli, F.; Migni, A.; Sebastiani, B.;
Signorini, C.; Oger, C.; et al. A
Dynamic Model for Estimating the
Interaction of ROS–PUFA–
Antioxidants in Rabbit. Antioxidants
2022, 11, 531. https://doi.org/
10.3390/antiox11030531
Academic Editors: Alica Pizent
and Eva Tvrdá
Received: 1 February 2022
Accepted: 9 March 2022
Published: 10 March 2022
Publisher’s Note: MDPI stays neutral
with regard to jurisdictional claims in
published maps and institutional affil-
iations.
Copyright: © 2022 by the authors.
Licensee MDPI, Basel, Switzerland.
This article is an open access article
distributed under the terms and
conditions of the Creative Commons
Attribution (CC BY) license (https://
creativecommons.org/licenses/by/
4.0/).
antioxidants
Article
A Dynamic Model for Estimating the Interaction ofROS–PUFA–Antioxidants in RabbitSimona Mattioli 1,* , Corrado Dimauro 2, Alberto Cesarani 2 , Alessandro Dal Bosco 1, Desiree Bartolini 3 ,Francesco Galli 3 , Anna Migni 4, Bartolomeo Sebastiani 5, Cinzia Signorini 6, Camille Oger 7 ,Giulia Collodel 6 and Cesare Castellini 1
1 Department of Agricultural, Environmental and Food Science, University of Perugia,Borgo 20 Giugno, 74, 06123 Perugia, Italy; [email protected] (A.D.B.);[email protected] (C.C.)
2 Department of Agricultural Sciences, University of Sassari, Sassari, Viale Italia, 39, 07100 Sassari, Italy;[email protected] (C.D.); [email protected] (A.C.)
3 Department of Pharmaceutical Sciences, University of Perugia, Via Enrico Dal Pozzo, 06126 Perugia, Italy;[email protected] (D.B.); [email protected] (F.G.)
4 Department of Life Science and System Biology, Università di Torino, Via Accademia Albertina,13, 10123 Torino, Italy; [email protected]
5 Department of Chemistry, Biology and Biotechnology, Via del Giochetto, University of Perugia,06126 Perugia, Italy; [email protected]
6 Department of Molecular and Developmental Medicine, University of Siena, Policlinico Santa Maria alleScotte, Viale Bracci 16, 53100 Siena, Italy; [email protected] (C.S.); [email protected] (G.C.)
7 Institut des Biomolécules Max Mousseron (IBMM), Pôle Chimie Balard Recherche,1919 route de Mende, CEDEX 05, 34293 Montpellier, France; [email protected]
* Correspondence: [email protected]; Tel.: +39-075-585-7123
Abstract: Defining optimal nutrition in animals and humans remains a main scientific challenge.The objective of the work was to develop a dynamic model of reactive oxygen species (ROS)–polyunsaturated fatty acid (PUFA)–antioxidant homeostasis using the rabbit as a model. The problementity was to evaluate the main metabolites generated from interactions between traits includedin the conceptual model and identified by three main sub–models: (i) ROS generation, (ii) PUFAoxidation and (iii) antioxidant defence. A mathematical model (VENSIM software) that consisted ofmolecular stocks (INPUTs, OUTPUTs), exchange flows (intermediate OUTPUTs) and process rateswas developed. The calibration was performed by using standard experimental data (Experiment 1),whereas the validation was carried out in Experiments 2 and 3 by using supra–nutritional dietaryinputs (VIT E+ and PUFA+). The accuracy of the models was measured using 95% confidenceintervals. Analytical OUTPUTs (ROS, PUFA, Vit E, Ascorbic acid, Iso–/NeuroProstanes, Aldehydes)were well described by the standard model. There was also good accuracy for the VIT E+ scenario,whereas some compensatory rates (Kc1–Kc4) were added to assess body compensation when highlevels of dietary PUFA were administered (Experiment 3). In conclusion, the model can be veryuseful for predicting the effects of dietary treatments on the redox homeostasis of rabbits.
Keywords: metabolism; dynamic model; oxidation; antioxidants; polyunsaturated fatty acids
1. Introduction
Reactive oxygen species (ROS) such as peroxides, the superoxide anion, the hy-droxyl radical and singlet oxygen have complex interactions with the different classesof biomolecules and physiological processes of living organisms [1], thus playing funda-mental roles in health and disease [2].
In isolated mitochondria, it is estimated that 0.1–2% of oxygen consumed producesROS [3]. Depending on their relative concentrations and site of production, these molecularspecies can damage different cellular targets, including proteins [4], nucleic acids [5]
Antioxidants 2022, 11, 531. https://doi.org/10.3390/antiox11030531 https://www.mdpi.com/journal/antioxidants

Antioxidants 2022, 11, 531 2 of 20
and lipids [6]. As a consequence, these reactive species are reported to contribute toageing processes [7] and age–related diseases (such as neurodegeneration, cancer andcardiovascular disease) [8]. ROS are also a crucial factor in male infertility because theycould lead to sperm dysfunction [9].
Organisms have evolved molecular systems, including enzymes (metalloproteins suchas superoxide dismutase and catalase [10], as well as thiol–based redox couples) [11] andnon–enzymatic substances (i.e., glutathione, tocols, ascorbic acid (AA) and carotenoids) [12],to scavenge ROS or to react with them in order to maintain their physiological effects [8].In fact, controlled generation of ROS, particularly hydrogen peroxide (H2O2), modulatesvirtually all cellular processes and is essential for living systems. A prime example isthe presence of ROS in human/animal sperm, which activates spermatozoa capacitationto trigger egg fertilisation [13,14]. Again, H2O2 and other ROS play essential functionsin biological signalling pathways spanning growth [15], cell differentiation [16] and mi-gration [17] and immune system function [18]. However, if ROS production exceeds thephysiological needs and the detoxification capacity, a cascade of negative responses andinflammation mechanisms can develop [19] and compensatory mechanisms occur at thetranscriptional level to repair ROS–induced damage [20].
Lipid oxidation (peroxidation) is a major occurrence in both the toxic and physio-logical functions of cellular ROS. Increased lipid peroxidation may modify the structureand function of several classes of lipids, especially polyunsaturated fatty acids (PUFAs),including those esterified to triacylglycerols or membrane phospholipids of tissues, andfree fatty acids (FFAs) [21]. Double bonds in the carbon chain of PUFAs are a main tar-get of the electrophilic properties of ROS. Modifications mainly occur in n–6 and n–3long–chain PUFAs (LC–PUFAs), such as alpha–linolenic acid (ALA: 18:3 n–3), arachidonicacid (ARA: 20:4 n–6), eicosapentaenoic acid (EPA: 20:5 n–3) and docosahexaenoic acid(DHA: 22:6 n–3) [22,23]. This uncontrolled oxidation of membrane PUFAs may have manymetabolic and cellular effects, such as structural and functional modifications of the lipidbilayer and the production of metabolites such as malondialdehyde (MDA), alkenals andisoprostanoids, which can also be biomarkers of oxidative stability and lipid mediators.
Such oxidative susceptibility holds great importance in the reproductive system,because LC–PUFAs, mainly docosapentaenoic acid (DPA) and DHA, constitute > 60% ofthe sperm membrane [24]. Furthermore, in male rabbits fed a diet rich in PUFAs, thereare increased LC–PUFA concentrations in the sperm and testes, which positively affectssperm kinetics [14]. However, these positive effects are only found when the animals havea concomitant increase in antioxidant intake (vitamin E, vitamin C and/or Selenium) tocounteract MDA generation [12,24,25].
MDA is an aldehyde that originates from the fragmentation of oxidised lipids. Con-versely, isoprostanoids, which are mainly prostaglandin (PG)–like substances, are producedby free radical–induced autoxidation of PUFAs [6,26] and represent a very specific andsensitive index of lipid peroxidation. Isoprostanoids are derived from fatty acids (FAs)esterified from membrane phospholipids and are released in free form in biological fluids.The main isoprostanoids are F2–isoprostanes (F2–IsoPs), F3–IsoPs and F4–neuroprostanes(F4–NeuroPs), which originate from AA, EPA and DHA, respectively [27]. Dietary levels ofn–3 PUFA that are too high can increase F4–NeuroPs and negatively affect the oxidativestatus of rabbit sperm [14]. However, at certain levels, F4–NeuroPs (7 ng/mL) can also havepositive effects on human reproduction, increasing the number of sperm able to fertiliseeggs [28].
Vitamin E (tocotrienols and tocopherols) is one of the most important fat–solubledietary antioxidants, with alpha–tocopherol as the most active and abundant form foundin animal tissues (as reviewed recently [29,30]). Vitamin E plays a main role in PUFAprotection; it works synergistically with other co–antioxidants to scavenge the lipoper-oxyl radicals (LOO•) produced in the lipid peroxidation chain reaction. In a sequentialprocess, two molecules of LOO• generate a tocopheroxyl radical intermediate and thena relatively stable oxidation metabolite, namely tocopherylquinone (TQ) [20,31]. When

Antioxidants 2022, 11, 531 3 of 20
the primary defences are not sufficient, other mechanisms, such as transcription of genesand transduction of essential proteins, interfere with the oxidative response (i.e., the cy-tochrome P450 [CYP450] family [32]). Furthermore, the tocopheroxyl radical can be reducedback to tocopherol by the activity of a redox antioxidant system that includes AA andthiol–dependent enzymes (e.g., glutathione reductase) as the main players [12], and thescavenging function of vitamin E (Vit E) cooperates with that of the membrane peroxidase,especially phospholipid hydroperoxide 4 (GPx4) [33].
Quantifying ROS, and, in general, the oxidation products of lipids and other biomolecules,remain very challenging. Current analytical tools provide different opportunities, but most ofthese exhibit a lack of specificity and sensitivity. Most common measurements are based onoxidation biomarkers, including aldehydes and isoprostanoids [34–36]. However, using thesebiomarkers without evaluating the molecules involved in the oxidative processes of tissuesprovides little information. Moreover, they do not represent the entire metabolic system, butonly a portion of the mechanism.
The objective of this work was to build a model to simulate redox homeostasis of therabbit in which the dynamic interactions of blood plasma indicators of ROS productionand variations in PUFA and antioxidant levels (i.e., Vit E and AA) are considered duringthe response to metabolic and environmental stimuli (such as dietary intake of Vit E andPUFAs).
2. Materials and Methods2.1. Cognitive Map Used for Definition, Calibration and Validation of the Model
The method reported by Sargent [37] was applied to build the model. Accordingly,we defined the Problem Entity, as well as the Conceptual and the Structural (i.e., comput-erised) models (Sections 2.1.1–2.1.3), integrating it with the states of Trucano et al. [38] andDimokas et al. [39] to define the verification and validation procedures (Section 2.2).
Once we verified that the Structural model represents the Conceptual Description,we calibrated the model (showing the degree to which the model accurately fit the in vivovalues (experiment 1, see Section 2.3) and successively validated it with another set of data(experiments 2 and 3, see Section 2.3).
2.1.1. Problem Entity
As introduced earlier, evaluation of single products generated during the redox home-ostasis of a system (i.e., aldehydes, isoprostanoids and antioxidants) from the interaction ofmultiple factors (ROS–PUFA–antioxidants) cannot describe the complexity and dynamicinteractions of internal and external factors.
2.1.2. Conceptual Model
Figure 1 shows the map of the conceptual model used in this study. We consideredthree main sub–models for simulations and validation of the main biological interactions inthe redox–homeostasis system of the rabbit plasma: (i) ROS generation, (ii) PUFA oxidationand (iii) antioxidant defences. The rate of every reaction depends on the metabolic balanceof the model (see Section 2.1.3).
2.1.3. Structural Model
Inflows and outflows represent ‘gaining’ and ‘losing’ molecules, respectively. The‘dynamic’ flow of substrates and products of a reaction, including transient intermedi-ates (i.e., hydroperoxides, peroxides, Vit E oxidation, etc.) is represented by the reactionrates as reported in the following sections. The time considered is 1 h (3600 s), whichrepresents about one fifth of the time for standard feed digestion in the rabbit (4–6 h) [36].To build the operation map in VENSIM software [40], different traits were analyticallydetermined (Section 2.5) and classified as INPUTs and OUTPUTs (Figure 2). The modelalso calculates intermediate OUTPUTs resulting from the interaction of several components.The symbols A1–A9 represent the metabolic pathways that generate intermediate outcomes

Antioxidants 2022, 11, 531 4 of 20
described in detail in Section 2.1.3. Kc1–4 and Kc1.1–4.1 represent compensatory ratesintroduced in the system after model validation (Figure 3; see Section 2.2).
Figure 1. Conceptual model of the redox homeostasis system. Three sub–models are considered:the blue block includes ROS and enzyme antioxidants (SOD and CAT); the orange block includesPUFA and oxidised lipid forms (aldehydes [MDA and 4HNE] and isoprostanoids [F2–IsoPs, F3–IsoPsand F4–NeuroPs]); and the yellow block includes antioxidant defence (Vit E, AA and enzyme pat-terns, both in oxidised [red] and reduced [blue] forms). Abbreviations: MDA, malondialdehyde;4HNE, 4–hydroxynonenal; GSH, glutathione; GPX, glutathione peroxidase; GR, glutathione reduc-tase; F2–3–IsoPs, F2–3–isoprostanes; F4–NeuroPs, F4–Neuroprostanes; SOD, superoxide dismutase;CAT, catalase; ROS, reactive oxygen species. Modified from Mattioli et al. [12].
Figure 2. The structure of the dynamic model built with the VENSIM software. The model is split intothree main sub–models: ROS generation (blue), PUFA oxidation (orange) and antioxidant defence(yellow) (as detailed in Figure 1). The variables inside the angle brackets (<>) are reported as ashadow of the stock variables. Abbreviations: AA, ascorbic acid; AA ox, oxidised ascorbic acid;PUFA, polyunsaturated fatty acids; ROS, reactive oxygen species; Vit E, vitamin E; Vit E ox, oxidisedvitamin E.
Antioxidants 2022, 11, 531 5 of 20
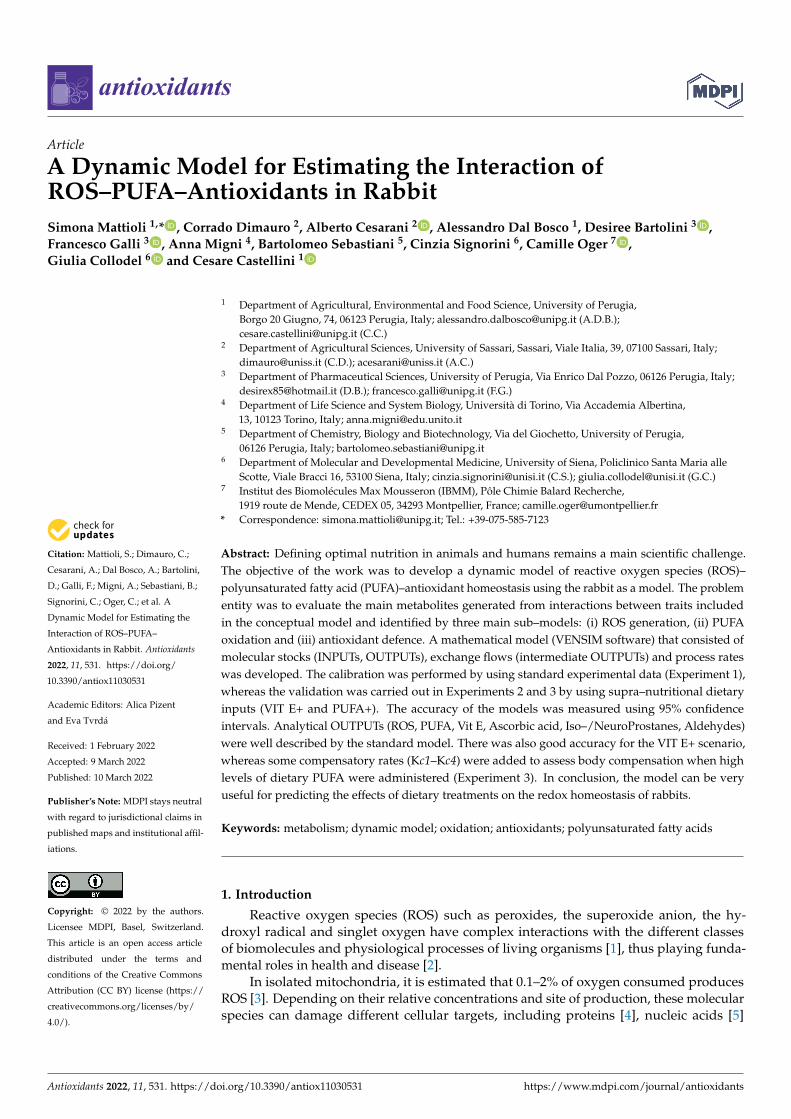
Figure 3. Schematic representation of the model, with INPUTs and OUTPUTs in white and blackboxes, respectively. Intermediate OUPUTs are shown in grey boxes and result from molecularcomponents (substrates and products) and sub–model interactions. The symbols A1–A9 represent themetabolic pathways generating intermediate outcomes (see Section 2.1.3), and Kc1–4 and Kc1.1–4.1 arecompensatory rates introduced after model verification by in vivo experimental data (see Section 2.2).Abbreviations: AA, ascorbic acid; AA ox, oxidised ascorbic acid; PUFA, polyunsaturated fatty acids;ROS, reactive oxygen species; Vit E, vitamin E; Vit E ox, oxidised vitamin E.
Sub–Model 1: ROS Production
For ROS, the physiological concentrations and basal rate of generation are describedin the model system as ROS input and kROS, respectively. These variables are assumedto represent both the standard metabolism of a living system (i.e., the respiratory process,movement and cell metabolism [16]) and the compensatory response to external stimuli(Kc4 and Kc4.1; e.g., hyperventilation, nutrition, stress, environmental perturbation, etc.),which can increase and even exceed the antioxidant capacity of the system and leadto oxidative stress [41]. ROS output (Equation (1)) is the sum of ROS input and ROSgenerated through the neutralisation of Aldehydes (A6; Equation (11)). Furthermore, anumeric value (i.e., 400) has been added to convert the units of the considered variables tomoles. A1 (Equation (2)) represents the reactive molecules originated by the reaction stepsof Vit E.
ROS = ((inputROS + A5 × 400) × kROS) × Kc4 (1)
A1 = kHydroperoxide × Hydroperoxide (2)
Sub–Model 2: Oxidative Thrust
In the model, PUFA represents the main substrate of oxidation. PUFA can be intro-duced with the diet (input PUFA) to follow different metabolic routes associated withspecific metabolic pathways (A1–A6; Equations (3)–(12)).
The first pathway (A2; Equation (3)) represents PUFA storage in tissues, regulated bya continuous rate (ckstorage) mainly dependent on PUFA intake:
A2 = inputPUFA × 1/cksorage (3)
The second pathway encompasses different routes involved in eicosanoid generation.Eicosanoids can form through different pathways by the activity of a series of oxidoreduc-

Antioxidants 2022, 11, 531 6 of 20
tases, including cyclooxygenases (COX), lipoxygenases (LOX) and CYP450 isoenzymes(EnzymeOx; Equation (4)). COX produce prostaglandins (PGs) and thromboxanes (TXs);LOX form leukotrienes (LTs) and lipoxins (LXs); and CYP450s form various epoxy, hy-droxy and dihydroxy derivatives. All these pathways influence the flux of eicosanoidmolecules (kEnzymeOx) and PUFAs (kUNS).
EnzymeOx = kEnzymeOx × kUNS (4)
The third pathway is β–oxidation (βOxidation; Equation (5)) [42] that, independently ofROS activity, promotes LC–PUFA catabolism (reported in the system as kUNS) to produceenergy in the mitochondria with a rate (kβOx) affected by the energy balance of the differenttissues, negatively correlating with storage of PUFA in cells [43].
βOxidation = PUFA × kβOx × kUNS × 1/ckstorage (5)
The fourth route is autoxidation of PUFA to produce isoprostanoids (IsoNeuroPs). These aregenerated from LC–PUFA in cell membranes. After oxidation, they are cleaved by phospholi-pase and released in the interstitial fluids. Consequently, IsoNeuroPs are found in the plasma andcan be eliminated through phospholipase A2 [44] with urine (IsoNeuro excretion; Equation (6))at a specific excretion rate (kIsoNeuro excretion). Their concentrations and autoxidation (AutoOx;Equation (7)) are assumed to depend on PUFA precursors and/or ROS (kIsoNeuroPs). Com-pensations introduced for this pathway are Kc1 and Kc1.1 (see Section 2.2).
IsoNeuroPs excretion = IF(Kc1 = 0)THEN(kIsoNeuroPs excretion× IsoNeuroPs)ELSE(kIsoNeuroPs excretion × IsoNeuroPs × Kc1)
(6)
AutoOx = IF(ROS > 0)THEN(PUFA × IsoNeuroPs)ELSE(0) (7)
The fifth pathway is PUFA oxidation that correlates with the unsaturation level (kUNS)of FA, ROS and antioxidant activity [45]. PUFA oxidation produces Peroxides (initialisationstep, A3; Equation (8)), a phenomenon that can be prevented, at least in part, by the H atom–donating activity of Vit E. This is also expected to influence Hydroperoxide levels, dependingon the downstream activity of membrane peroxidases (primary metabolites resulting fromtermination activity, A4; Equation (9)). If not properly scavenged, lipoperoxyl radicalsand lipoperoxides undergo extensive fragmentation to form meta–stable–molecules, suchas Aldehydes (secondary metabolites, A6; Equation (11)). In particular, one molecule ofhydroperoxide is broken down into two molecules of aldehydes (final Aldehydes) [46]. TheAldehyde generation depends on antioxidants (reported as kAldehydes), and on molecules’susceptibility to oxidation (kPerox, A5; Equation (10)). Finally, aldehydes can be excreted byurine (Aldehyde excretion), assuming that the rate of excretion is related to their concentra-tions (kAldehyde excretion; Equation (12)). This rate can change in relation to the activationof compensatory activities aimed at reducing the damage to lipids and proteins (Kc2 andKc2.1; as reported in the following scenarios Section 2.3). It should be underlined that theconcentrations of these latter molecules could be affected by mechanisms of re–absorption,transport and/or excretion that are difficult to estimate with our experimental plan.
A3 = IF(ROS > 0)THEN((PUFA × kUNS × kPerox) + A5)ELSE(0) (8)
A4 = IF(vit E > 0)THEN(vit E × 1000)ELSE(0) (9)
Note that 1000 is the scale factor to compare Vit E to peroxides.
A5 = IF((Peroxide-A4) > 0)THEN(Peroxide)ELSE(0) (10)
A6 = Hydroperoxide × kAldehyde (11)
Aldehyde excretion = IF(Kc2 = 0)THEN(Aldehyde× kAldehyde excretion)ELSE(Aldehyde × kAldehyde excretion × Kc2)
(12)

Antioxidants 2022, 11, 531 7 of 20
Sub–Model 3: Antioxidant Defence
Antioxidants are substances that delay or prevent the oxidation of other molecules. Inour model, Vit E is the main fat–soluble antioxidant capable of preventing PUFA peroxida-tion. It works both as a scavenger of peroxyl radicals and an inhibitor of oxidoreductasesinvolved in the enzymatic oxidation of PUFA. The antioxidant activity of Vit E results inthe formation of α–TQ (Vit Eox and Vit Eox remained or Vit Eox transit, A7; Equations (13)and (14), respectively) with a molar rate of 1/2 with respect to peroxyl radicals scavengedduring the H atom transfer process. Vit E in the model changes according to differentmetabolic pathways (A7–A9) and together with AA is regulated by Equations (13)–(20).
Vit Eox transit = IF(Vit E > Peroxide)THEN((Vit E/2) × kVit E+ Vit E remained/2)ELSE(Vit Eox remained/2)
(13)
A7 = Vit E recycled + input Vit E (14)
The availability of Vit E is modulated by a series of exogenous and endogenous fac-tors [47]. Under physiological conditions, the main exogenous factor is dietary intake(Vit E input) [12]. Furthermore, Vit E (A8; Equation (15)) stored in the cells or other depots(cell storage) and recovered by recycling tocopheryl radicals formed during lipoperoxyl radicalscavenging (Vit E recycling; Equation (16)) is the endogenous counterpart acting on the innerpool of the vitamin. Indeed, Vit E is regenerated by the intervention of AA, which acts as asecondary antioxidant (A9; Equation (17)), with a specific rate indicated as kVit E_AA.
Vit E not recycled after oxidation or in excess is assumed to be excreted in theurine or bile (Vit Eox excretion) with a concentration–dependent rate (kVit Eox excretion;Equation (18)). Compensatory mechanisms considered in this respect are indicated as Kc3and Kc3.1, which include CYP450 detoxification and other excretion processes [48]).
A8 = Vit E × kCell storage (15)
Vit E recycle = IF(AA > 0)AND(Vit Eox > 0)THEN(AA × kE_AA)ELSE(0) (16)
A9 = AA recycle + input AA (17)
Vit Eox excretion = IF(Kc3 = 0)THEN(kVit Eox excretion× Vit Eox)ELSE(kVit Eox excretion × Vit Eox × Kc3)
(18)
The same recycling process is considered in the case of AA that is oxidised (AAox)according to AAox transit. Thus, it is restored back to the reduced form (AA recycling;Equation (19)) by trans–hydrogenases modulated by glutathione reductase (GR) [49] andspecific ascorbate reductases [50], with a rate identified in the model as kAA enzyme. Simi-larly to Vit E, AA is modulated by dietary intake (AA input), AAox excretion (Equation (20)),the rate of excretion (kAAox excretion) and AA recycle.
AA recycle = IF(AAox > 0)THEN(kAA enzyme × AAox)ELSE(0) (19)
AAox excretion = kAAox excretion × AAox (20)
2.2. Verification and Validation of the Model
We calibrated the model by using the data from Experiment 1 (standard model) toevaluate its accuracy. We validated the model by using data from Experiments 2 and 3,where the main INPUTs were changed (VIT E+ and PUFA+ scenarios; Figure 4); the fitnessof the results was assessed.
We confirmed the model if the model outcomes of Experiments 2 and 3 were within the95% CI (e.g., VIT E+). Otherwise, starting from the examination of final and intermediateOUTPUTs, we introduced compensation (Kc1–kc4 and Kc1.1–Kc4.1.; Equations (21)–(24);Section 3.2) to re–stabilise equilibrium and fitness and then generated new estimates andvalidated the model again (Figure 4).

Antioxidants 2022, 11, 531 8 of 20
Figure 4. Cognitive map for calibration and validation of the model. The first step was to construct themodel calibrated with analytical data (mean and 95% confidence interval [CI]) of Experiment 1 (exp 1).We considered the model to be accurate when the outcomes were included in the 95% CI. Thesecond step was verification of this model by using data from Experiment 2 (exp 2, VIT E+) andExperiment 3 (exp 3, PUFA+). The VIT E+ scenario resulted in good accuracy (green box); thus, itdid not require further adjustment. However, some OUTPUTs of the PUFA+ scenario were out of the95% CI (red–coloured box) and showed unstable results. Hence, the model was improved throughthe introduction of compensatory values (Kc) obtained from intermediate OUTPUTs (Vit E/Vit Eoxratio). After compensation, the system was validated again (boxes surrounded by red dashed linesindicate > CI, whereas boxes surrounded by green dashed lines indicate < CI).
Kc1 = IF(input_PUFA < 55.5)THEN(0)ELSE(Kc1.1) (21)
Kc2 = IF(input_PUFA < 55.5)AND(Vit E/Vit Eox < 3.45)THEN(0)ELSE (Kc2.1) (22)
Kc3 = IF(input_PUFA < 55.5)AND(Vit E/Vit Eox < 3.45)THEN(0)ELSE(Kc3.1) (23)
Kc4 = IF(input_PUFA < 55.5)AND(Vit E/Vit Eox < 3.45)THEN(1)ELSE(Kc4.1) (24)
We set the values (in moles) of PUFA <55.5 and the ratio Vit E/Vit Eox <3.45 based onthe results obtained during validation of the model (Section 3.1). We subsequently usedand compared data from animal experiments (Section 2.3).
2.3. Experimental Plan: Animals and Dietary Treatments
Thirty blood samples were used to test and validate the model in two experimentalsessions. Experiment 1 tested and verified the standard model (n = 10 samples), whereasvalidation was performed by using the same number of samples in Experiments 2 and 3(n = 10 samples for each experiment) and diets with supra–nutritional levels of Vit E andPUFA [51].
Experiment 1.Samples were collected from 10 New Zealand White male rabbits, 140 days old, reared
at an experimental facility of Siena University and fed ad libitum a standard diet (Table A1 ofAppendix A) containing 50 mg/kg alpha–tocopheryl acetate (vitamin–mineral premix) [52].
Experiments 2 and 3.We verified the model by using data from two distinct dietary interventions with high
dosages of Vit E and PUFA:

Antioxidants 2022, 11, 531 9 of 20
# High VITAMIN E (VIT E+): 10 rabbits of the same age and breed mentioned abovewere fed ad libitum the standard diet (50 mg/kg alpha–tocopheryl acetate by vitamin–mineral premix), including 200 mg/kg alpha–tocopheryl acetate.
# High PUFA (PUFA+): 10 rabbits of the same age and breed mentioned above were fedad libitum a standard diet supplemented with 10% extruded flaxseed and 200 mg/kgalpha–tocopheryl acetate, following the rabbit requirements for a flaxseed enricheddiet [53]. This diet had a 1.34–fold higher concentration of ALA than the standard diet.
The dietary protocols involved 50 days of adaptation during which the rabbits wereonly monitored and a subsequent 60 days during which blood samples were collectedevery 2 weeks.
2.4. Samples Collection
About 2 mL of blood was taken from the auricular marginal vein, after the local ap-plication of an anaesthetic cream (EMLA®), using a 2.5 mL syringe fitted with a butterflyneedle. Serum was obtained from blood samples coagulated at room temperature for 2 h,whereas plasma was obtained from blood samples collected in tubes containing Na2–EDTA(ethylenediaminetetraacetic acid) and centrifuged immediately at 2500× g for 15 min at 4 ◦C.
For the plasma F2–IsoP, F3–IsoP and F4–NeuroP determinations, butylhydroxyt-oluene (BHT) was added (90 µM, final concentration).
The experimental trial was conducted in accordance with the Guiding Principles inthe Use of Animals and approved by the Animal Ethics Committee of the Siena University(CEL AOUS; authorisation n◦ 265/2018–PR, ISOPRO 7DF19.23).
2.5. Analytical Determinations2.5.1. Determination of the Fatty Acids
Lipids were extracted from the serum and feed according to the method of Folch et al. [54],and the esterification was carried out following the procedure of Christie [55].
The FA profile was determined by using a Varian gas chromatograph (CP–3800)equipped with a flame ionisation detector (FID) and a capillary column 100 m in length ×0.25 mm × 0.2 µm film (Supelco, Bellefonte, PA, USA). Helium was used as the carrier gas(0.6 mL/min). The split ratio was 1:20 for serum and 1:50 for feed. The oven temperaturewas programmed as reported by Mattioli et al. [56]. Individual fatty acid methyl esters(FAME) were identified by comparing the relative retention times of peaks in the samplewith those of a standard mixture (FAME Mix Supelco; 4:0 to 24:0) plus cis–9, cis–12 C18:2;cis–9 cis–12 cis–15 C18:3; cis–9 cis–12 cis–15 C18:3 (all from Sigma–Aldrich, Steinheimam Albuch, Germany). The main PUFAs of both n–6 and n–3 series were quantified byusing heneicosanoic acid methyl esters (Sigma Chemical Co., Schnelldorf, Germany) asan internal standard and are expressed in mg/mL of blood. Subsequently, each FA wasconverted to moles based on its specific molecular weight.
2.5.2. Determination of Vit E and AA
Vit E, in both the reduced form (α–tocopherol [α–TOH]) and oxidised form (α–tocopherylquinone [α–TQ]), was quantified in plasma. Before lipid extraction, the sampleswere thawed at room temperature and homogenised by gentle pipetting.
α–TQ and α–TOH were quantified as described by Torquato et al. [20], with minormodifications. Briefly, 70 µL of plasma was spiked with α–TOH–d6 as an internal standardand mixed with 0.2 mL of sodium acetate buffer (pH 5) for the incubation (30 min at37 ◦C) with 700 units of β–glucuronidase from Helix pomatia (Sigma–Aldrich, Steinheimam Albuch, Germany, G7017, Type HP–2). One hundred microlitres of glacial acetic acidand 1 mL of ethanol were added and, after mixing, the samples were incubated for 30 minat −20 ◦C and centrifugated at 3500 rpm for 5 min. Then, the ethanol was removed undera gentle stream of nitrogen and 2 mL of Milli–Q water was added to the sample. The lipidfraction was extracted twice by liquid/liquid partition with 3 mL of n–hexane/n–tert methyltertiary–butyl ether (MTBE) mixture (2:1; v/v). After centrifugation at 3500 rpm for 5 min at

Antioxidants 2022, 11, 531 10 of 20
10 ◦C, the extracts were collected and dried under a stream of nitrogen. Then, the residueswere resuspended with 80 µL of MOX reagent (Sigma Aldrich, TS–45950) and incubatedat 70 ◦C for 2 h. The samples were further dried under nitrogen and then the analyteswere derivatised with 50 µL of N–methyl–N–(trimethylsilyl)–trifluoroacetamide (Sigma–Aldrich, Steinheim am Albuch, Germany, 69479–5ML) in 50 µL of pyridine. Followingincubation at 70 ◦C for 1 h, the samples were dried under a gentle stream of nitrogen andre–suspended in 125 µL of toluene for gas chromatography–mass spectrometry (GC–MS).Specifically, α–TOH and α–TQ were qualitatively and quantitatively assessed by using amass spectrometer (Agilent Technologies, Milan, Italy; MSD 5975C, VLD with Triple AxisDetector) coupled to a gas chromatograph (GC 7890A) equipped with an Agilent VF–5ms capillary column (15 m × 0.15 mm internal diameter [i.d.], 0.15 µm film thickness).The constant flow of the helium carrier gas was 1.0 mL/min and the injector operatedin pulsed splitless mode (pressure 50 psi) at 300 ◦C. The oven temperature ramp for α–TOH and α–TQ was: from 120 ◦C (held for 1.5 min) to 240 ◦C at 113 ◦C/min, then to270 ◦C at 8.5 ◦C/min (held for 1.5 min), to 350 ◦C at 28.3 ◦C/min, and finally the systemwas maintained under isothermal conditions for 5 min. The transfer line, ion source andquadrupole temperatures were set at 300, 230 and 150 ◦C, respectively. For each analyteand related recovery internal standard, the mass spectrometer operated in selected ionmonitoring mode (EI+ SIM) at 70 eV: 508, 243 m/z for α–TOH–d6; 502, 237 and 430, 293 m/z,for α–TOH and α–TQ, respectively. We ensured high quality assurance and quality controlof the performed methods by evaluating the testing linearity, detection limit, quantificationlimit, reproducibility and percentage of recovery values. The data are expressed as numberof moles.
AA was measured in plasma by using a high–performance liquid chromatogra-phy system (HPLC) as described by Ross [57] with minor modifications as reported byMattioli et al. [12]. AA was quantified by ultraviolet (UV) reverse–phase HPLC usinga Waters 600 E System Controller HPLC equipped with a Waters Dual k 2487 detector(Milford, MA, USA) set at 262 nm. A 5 µm Ultrasphere ODS column (Beckman, San Ra-mon, CA, USA) was used with acetonitrile:water (49:51, v/v) as the mobile phase at a flowrate of 0.8 mL/min. AA concentrations were calculated by peak areas determined usingan Agilent 3395 integrator (Agilent Technologies, Santa Clara, CA, USA); the results areexpressed in moles.
2.5.3. Determination of ROS, Malondialdehyde, F2–Isoprostane, F3–Isoprostane,and F4–Neuroprostane
ROS levels in plasma were evaluated by using a commercial kit (Diacron, Grosseto,Italy) and are expressed as moles of H2O2.
Lipid peroxidation in plasma was assessed by the MDA level using malondialdehydetetrabutylammonium as a standard (Sigma–Aldrich, Steinheim am Albuch, Germany) andindicated in the model as Aldehydes. Rabbit plasma samples were mixed in a 0.04 MK+–phosphate buffer (pH 7.4) containing 0.01% BHT (1:5 w/v, 0 ◦C) to prevent artificialoxidation of free PUFA during the assay. The supernatants resulting from deproteinisationwith acetonitrile (1:1) were used for aldehyde analysis after pre–column derivatisation with2,4–dinitrophenylhydrazine [58]. The samples were stirred immediately, extracted with5 mL of pentane and dried under a nitrogen flow. The aldehyde hydrazone was quantifiedby isocratic HPLC using a Waters 600 E system controller HPLC instrument equipped witha Waters Dual λ 2487 UV detector set at 307 nm. A 5 µm Ultrasphere ODS C18 column wasused with a mobile phase composed of acetonitrile (45%) and 0.01 N HCl (55%) at a flowrate of 0.8 mL/min. The aldehyde concentration was calculated based on the peak areasusing an Agilent 3395 integrator. The results are expressed as moles of Aldehyde.
Levels of isoprostanoids (free form plus esterified)—F2–IsoPs, F3–IsoPs andF4–NeuroPs—were determined by GC/negative–ion chemical ionisation tandem massspectrometry (GC/NICI–MS/MS, Thermo Finnigan Instrument, Midland, Canada) as de-tailed by Mattioli et al. [12]. Prostaglandin F2α (PGF2α–d4; 500 pg) was used as an internal

Antioxidants 2022, 11, 531 11 of 20
standard. Solid phase extraction procedures were carried out according to a previouspublication [59]. All final eluates were derivatised to convert the carboxylic group ofisoprostanoids or PGF2α–d4 into pentafluorobenzyl ester and the hydroxyl group intotrimethylsilyl ethers, as reported previously [26]. Derivatised isoprostanoids were detectedand quantified by GC/NICI–MS/MS. The mass ions determined were the product ionsat m/z 299 (F2–IsoPs), m/z 297 (F3–IsoPs) and m/z 323 (F4–NeuroPs). For the internalstandard (PGF2α–d4), the mass ions determined were the product ions at m/z 303. Allthe product ions were derived from the [M–181]− precursor ions. Reference molecules forF2–IsoPs, F3–IsoPs, and PGF2α–d4 were purchased (Cayman Chemical, Ann Arbor, MI,USA). 4(RS)–F4t–NeuroP, 10®−10–F4t–NeuroP and 10(S)−10–F4t–NeuroP were synthesisedby C.O. and used as reference molecules for F4–NeuroP determination. The results areexpressed in moles.
The concentration of all the blood traits was divided by 1016 to make the data easierto read.
2.6. Statistical Evaluation
A linear model (SAS, [60]) was used to evaluate the fixed effect of diet (Standard, VIT E+,PUFA+) on blood traits resulting from chemical evaluation. We used multiple comparisons(Bonferrini’s test) to establish the significance of differences between dietary treatments(p < 0.05). We calculated the mean, standard error and 95% CI of the analytical data.
VENISM software (release 9.1.0; Ventana Systems, UK Ltd., Wiltshire, UK) createdseveral non–linear equations for estimating the outcomes at different lag–times based onthe relationship between variables, which were imposed by the developer. We evaluatedthe accuracy of the models by comparing the 95% CI of the analytical data with the relativeoutputs estimated for calibration and then for the validation procedure.
As exemplified in the cognitive map (Figure 4), for Experiment 3 when the outcomeswere far from the CI (e.g., PUFA+; Table 1), the model became unstable and needed compen-sation. We calculated this compensation from the effect of PUFA increase on the Vit E/Vit Eoxratio by fitting a polynomial regression curve. We used a first derivative equal to 0 to calculatethe flex points (average, minimum and maximum) and we used the relative y value to assessthe compensation rates (Kc1–Kc4 and Kc1.1–Kc4.1) (Equations (21)–(24)). We re–evaluatedthe accuracy of the resulting model by using the above–mentioned procedure.
Table 1. Analytic (mean ± SE and lower/upper confidence intervals) and VENSIM resultedvalues (moles) of OUTPUTs used for calibration and validation of models (standard, VIT E+ and PUFA+).
VENSIMINPUT 1 OUTPUT 2 Mean ± SE (Analytic
Determination)
Confidence Interval (95%) VENSIMValuesLower Limit Upper Limit
standard model7000 ROS 5704.29 ± 101.53 a 5474.59 5933.99 5600.005.10 PUFA 5.27 ± 0.08 a 5.01 5.54 5.48
0.0024 Vit E 422.00 ± 6.95 × 10⁻⁵ a 400.61 × 10⁻⁵ 435.60 × 10⁻⁵ 401.00 × 10⁻⁵
0.0026 AA 929.74 ± 34.66 × 10⁻⁵ 851.80 × 10⁻⁵ 1008.67 × 10−5 920.00 × 10⁻⁵
– IsoNeuroPs 0.1494 ± 0.026 a 0.1434 0.1554 0.1400– Aldehydes 10.10 ± 0.16 a 9.72 10.48 9.00– Vit Eox 5.99 ± 0.69 × 10⁻⁵ a 4.63 × 10⁻⁵ 7.33 × 10⁻⁵ 4.98 × 10⁻⁵
VIT E +7000 ROS 6690.82 ± 164.04 b 6319.71 7061.93 6720.005.10 PUFA 6.62 ± 0.50 a 5.49 7.75 5.50
0.0030 Vit E 458.41 ± 22.2 × 10⁻⁵ a 408.82 × 10⁻⁵ 501.00 × 10⁻⁵ 457.00 × 10⁻⁵
0.0026 AA 937.48 ± 47.60 × 10⁻⁵ 829.93 × 10⁻⁵ 1045.73 × 10−5 928.00 × 10⁻⁵
– IsoNeuroPs 0.1412 ± 0.00329 a 0.1338 0.1487 0.140– Aldehydes 7.45 ± 0.27 b 6.84 8.07 7.02– Vit Eox 16.42 ± 1.44 × 10⁻⁵ b 11.71 × 10⁻⁵ 20.50 × 10⁻⁵ 12.60 × 10⁻⁵
Antioxidants 2022, 11, 531 12 of 20
Table 1. Cont.
VENSIMINPUT 1 OUTPUT 2 Mean ± SE (Analytic
Determination)
Confidence Interval (95%) VENSIMValuesLower Limit Upper Limit
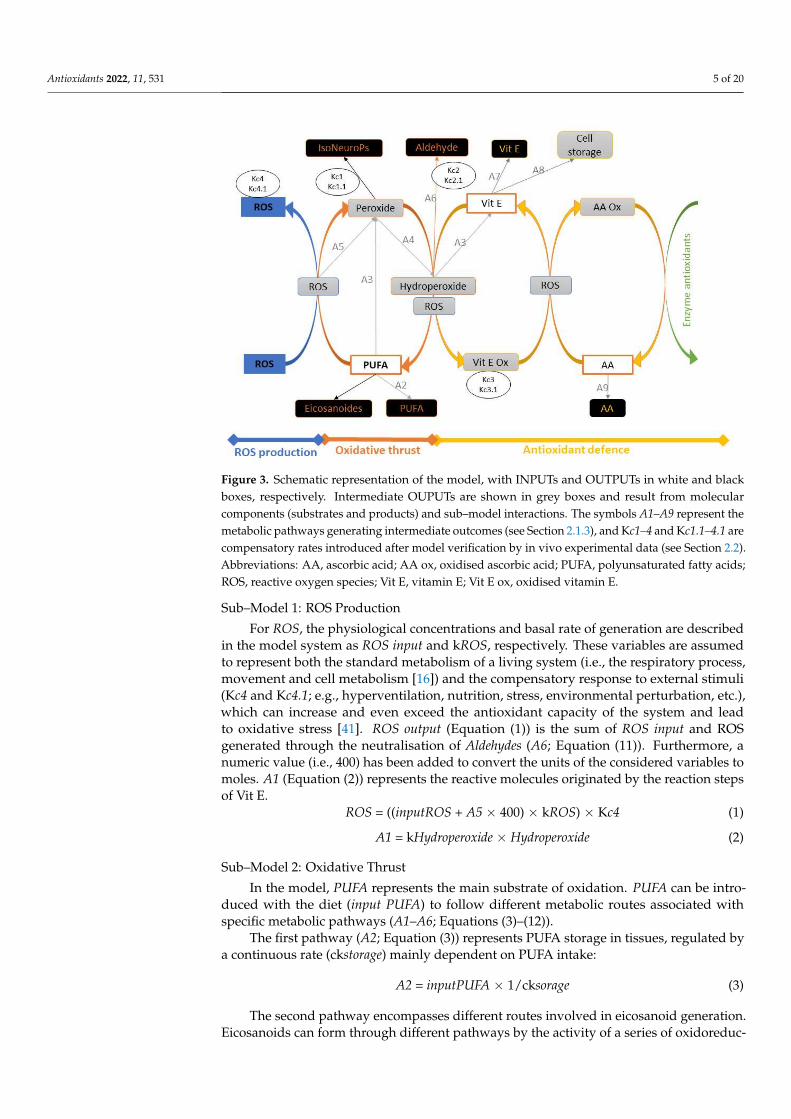
PUFA +7000 ROS 7871.43 ± 227.15 b 7357.57 8385.30 7416.00600 PUFA 82.15 ± 3.58 b 74.17 90.12 76.99
0.0030 Vit E 260.22 ± 8.75 × 10⁻⁵ b 243.06 × 10⁻⁵ 277.38 × 10⁻⁵ 298.00 × 10⁻⁵
0.0026 AA 976.78 ± 31.99 × 10⁻⁵ 904.46 × 10⁻⁵ 1049.50 × 10−5 953.30 × 10⁻⁵
– IsoNeuroPs 0.2566 ± 0.0608 b 0.2412 0.2720 0.3000– Aldehydes 14.05 ± 0.40 c 13.13 14.97 14.81– Vit Eox 4.67 ± 0.77 × 10⁻⁵ a 2.92 × 10⁻⁵ 6.19 × 10⁻⁵ 4.69 × 10⁻⁵
Different letters (a–c) for the same traits in different scenarios mean p < 0.05. 1 INPUT represents the starting valuesintroduced in the VENSIM model (moles), in order to calculate the OUTPUTs. 2 ROS, reactive oxygen species;PUFA, polyunsaturated fatty acids; vit E, vitamin E; AA, ascorbic acid; IsoNeuroPs, iso– and neuro–prostanes;Vit Eox, oxidized vitamin E.
3. Results3.1. Calibration of the Standard Model
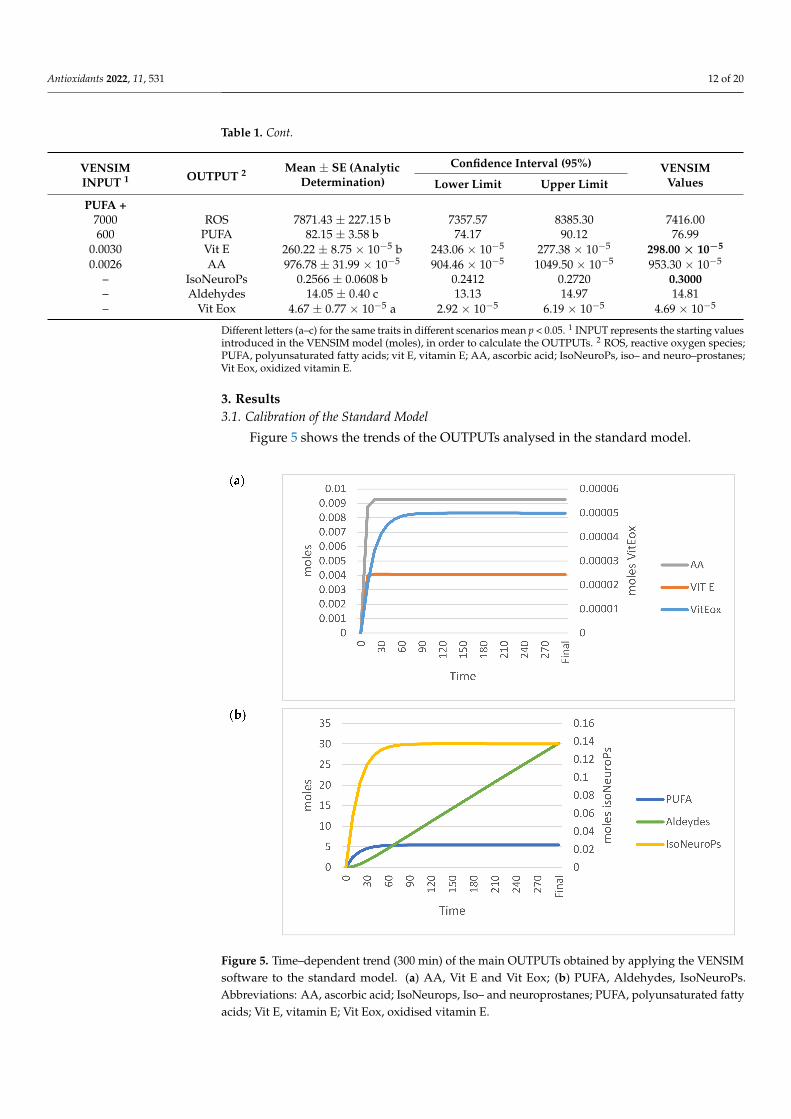
Figure 5 shows the trends of the OUTPUTs analysed in the standard model.
Figure 5. Time–dependent trend (300 min) of the main OUTPUTs obtained by applying the VENSIMsoftware to the standard model. (a) AA, Vit E and Vit Eox; (b) PUFA, Aldehydes, IsoNeuroPs.Abbreviations: AA, ascorbic acid; IsoNeurops, Iso– and neuroprostanes; PUFA, polyunsaturated fattyacids; Vit E, vitamin E; Vit Eox, oxidised vitamin E.

Antioxidants 2022, 11, 531 13 of 20
Table 1 (standard model section) shows the analytical values and those estimatedby the standard model (OUTPUTs). All estimated values for ROS, PUFA, Vit E, AA,IsoNeuroPs, Aldehydes and Vit Eox were within the 95% CI.
3.2. Model Validation in the VIT E+ and PUFA+ Scenarios
We compared the analytical and model outcomes for the VIT E+ and PUFA+ scenarios.As shown in the cognitive map (Figure 4), the VIT E+ scenario was estimated accuratelywith the standard model, whereas the PUFA+ scenario results were far from the 95% CI.
The VIT E+ scenario resulted in similar amounts of IsoNeuroPs and AA and lowerAldehydes than the standard one. The Vit E concentration resulting from addition tothe diets was similar to what was recorded in the standard scenario (458.41 × 10⁻⁵ vs.422.00 × 10−5 moles, respectively), but its oxidised form (Vit Eox) was 3–fold higher.
On the contrary, when PUFA INPUTs increased, the model outcomes becameunstable (Figure 6) and far from the 95% CI (data not shown; IsoNeuroPs = 0.34 moles,Aldehydes = 16 moles, Vit Eox = 32.2 × 10⁻⁵ moles). In this situation, one of the mostrelevant disturbing factors was the Vit E/Vit Eox ratio, which decreased as PUFA increased.The flex points of this polynomial relationship correspond to about 55.5 moles PUFA anda Vit E/Vit Eox ratio of 3.45 (Figure 7). As mentioned previously, we applied some com-pensatory rates (for Kc1.1–Kc1.4, 12.50, 0.10, 37.4 and 0.50, respectively) in this scenarioto render the molecular flows more physiological and the results more accurate. Aftercompensation, we re–validated the system (Table 1), and almost all the estimated values(except for IsoNeuroPs and Vit E) were within the 95% CI. This scenario showed about13–fold more PUFA than the others, and it also showed higher ROS, whereas Vit E was quitesimilar. Supra–nutritional PUFA resulted in an almost 3–fold higher level of IsoNeuroPsand Aldehydes compared with the standard model.
Figure 6. Time–dependent trends (300 min) of the main OUTPUTs obtained by applying the VENSIMsoftware to the standard model when input PUFA increased (>55.5 moles). (a) AA, Vit E and VitEox; (b) PUFA, Aldehydes and IsoNeuroPs. Abbreviations: AA, ascorbic acid; IsoNeurops, Iso– andneuroprostanes; PUFA, polyunsaturated fatty acids; Vit E, vitamin E; Vit Eox, oxidised vitamin E.

Antioxidants 2022, 11, 531 14 of 20
Figure 7. Polynomial regression curve of the Vit E/Vit Eox ratio and PUFA (R2 = 95%) data re-sulting from analytical determinations. The first derivative calculation produced the followingflex points: xaverage = 51.95, x1 = 48.41 (minimum), x2 = 55.48 (maximum). Abbreviations: PUFA,polyunsaturated fatty acids; Vit E, vitamin E; Vit Eox, oxidised vitamin E.
4. Discussion
Organisms exhibit a myriad of homeostatic mechanisms based on internal and exter-nal interactions, which modulate biological responses at different scales and dynamicalrates [61]. Building a mathematical model can be an effective way to describe and un-derstand some aspects of such variability. The best outcome of such models is to predictthe behaviour of these complex systems, returning values close to the measured one. Therationale of modelling is based on the simplification of the system by assuming someapproximations and uncertainty. Moreover, to better adhere to in vivo values, the modelshould approximate the complexity and the number of variables of the biological systemas much as possible. According to such methodological needs, in the present study weproposed a modelling strategy for a living system, using as a case study the metabolism offat–soluble nutrients in the rabbit. Within this framework, the dynamic model outlinedsome crucial aspects in the balance of the ROS–PUFA–antioxidant system.
In this model system, we evaluated some common OUTPUTs that approximate theoxidative status of the investigated organism, although the quantification of some of them(i.e., ROS, aldehydes, isoprostanoids) is not fully representative of oxidative stress andrequires mentioning their specific chemical entities [62]. Starting from a standard con-dition (standard diet), we introduced dietary changes in the model system (VIT E+ andPUFA+ scenarios) and predicted the relative OUTPUTs (ROS, PUFA, Vit E, AA, IsoNeu-roPs, Aldehydes and Vit Eox). We estimated the accuracy of the prediction by compar-ing analytical data obtained in the corresponding experimental models of nutritionalintervention (Figure 4, Table 1). The accuracy of the model was high and the OUTPUTvariables were well described by the simulation in both the standard and VIT E+ scenarios,but not in the PUFA+ scenario.
VIT E+ resulted in IsoNeuroP and AA levels similar to the standard model; on thecontrary, the Aldehyde levels were reduced. Vit E levels were increased slightly, but itsoxidised form (Vit Eox) was 3–fold higher in this comparison. As expected, the addition of200 mg/kg ofα–tocopheryl acetate (VIT E+) reduced the global oxidation index (Aldehydes)of the standard model without affecting specific oxidation markers (IsoNeuroPs). Althoughexcess Vit E may lead to undesirable effects, such as accumulation of this vitamin in fatdepots [20] and its increased exposure to autoxidation processes [24,29], based on theformation of α–TQ, the system can utilise a certain amount of the administered Vit E to

Antioxidants 2022, 11, 531 15 of 20
donate H atoms to other substrates. This finding confirms its redox interaction with theother lipids of the system. In fact, the Vit E levels remained in the physiological range [24]in VIT E+ conditions, that is, similar to the levels observed in animals fed a standard diet(458.41 × 10⁻⁵ vs. 422.00 × 10⁻⁵ moles, respectively).
The PUFA+ scenario presented a marked increase in blood PUFA (about 13 timeshigher than the other scenarios). This elevation apparently destabilised the main re-lationship between key molecules involved in detoxification of PUFA–derived oxida-tive products (i.e., Vit E and its oxidised form). Accordingly, when PUFA INPUT was>55.5 moles (e.g., 80 moles), the model became unstable (Figure 6) and the outcomes lackedaccuracy. Hence, we introduced compensatory rates in the model. This type of correction isnot a mathematical artifact due to fitting analytical and estimated values, but rather a wayto keep considering metabolic changes that occur in a system that becomes unstable.
It is widely known that high dietary levels of PUFA increase the risk of autoxidationand could impair the antioxidant defence of the organism [12,63]. Moreover, deficientantioxidant defence in a tissue could result in higher risk of chronic inflammation anddevelopment of degenerative diseases [64]. Obviously, increased PUFA intake was welltolerated in the healthy rabbits utilised as the experimental model in this study. Thiselevated intake stimulated compensatory responses relevant to the redox homeostasis of theanimal. Considering these facts, we introduced different compensatory rates (Kc1–Kc4 inthe PUFA+ scenario. These compensatory rates represent critical checkpoints of the system;when self–adjustments are required (e.g., change of flow or genetic reprogramming),this indicates unbalanced homeostasis and the need for appropriate corrections to beintroduced in the system (i.e., changes in Vit E/PUFA intake or the reduced glutathione[GSH]/oxidised glutathione [GSSG] ratio, etc.). The reasons for each compensatory factormanually introduced in the system are as follows:
Kc1 aims to counteract isoprostanoid accumulation that is activated when PUFAsconcentrations exceed physiological levels. Indeed, in healthy conditions, isoprostanoidscirculate in the plasma and are excreted in the urine [27]. However, when these metabolitesreach certain levels, they undergo rearrangement, dehydration or conjugation with glu-curonide in the liver to yield a variety of secondary metabolites, thus leading to a reductionin their concentrations and the risk of adverse effects [6].
Kc2 compensates for the accumulation of aldehydes in the system. This increases theconversion of 4–hydroxynonenal (4HNE) to less reactive chemical species [20] throughthree main catabolic reactions: (1) the formation of adducts with GSH, which occursspontaneously or catalysed by glutathione–S–transferases (GSTs); (2) its reduction to 1,4–dihydroxy–2–nonene (DHN) by aldo–keto reductases (AKRs) or alcohol dehydrogenases(ADH); and 3) its oxidation to 4–hydroxy–2–nonenoic acid (HNA) by aldehyde dehydroge-nase (ALDH) [65].
Kc3 intervenes when the levels of the free radical–derived metabolites of Vit E, α–TQor the same Vit E, are too high (Figure 6), implying increased expression of detoxifyinggenes encoding CYP450s involved in the metabolism of this vitamin and other antioxidants,as well as of xenobiotics, electrophiles, heavy metals, etc. [66].
Finally, Kc4 compensates for external perturbation variables (i.e., diet), eventuallyinterfering with antioxidant capacity and with oxidative processes.
Independently of these compensations, the PUFA+ scenario showed more PUFA andROS, whereas Vit E was quite similar to the other models (p < 0.05). However, IsoNeu-roPs, Aldehydes and Vit E ox were almost 2–3–fold higher compared with the standardmodel (Table 1). Although the introduction of these compensatory rates improved theaccuracy of the PUFA+ scenario, some traits (Vit E, IsoNeuroPs) remained slightly outsidethe 95% CI. The differences observed could be ascribed to different factors: on the one hand,the sensitivity of analytical methods, including systematic errors of the measurements, arenot considered in the model; on the other hand, the model has limits because it forcefullymisses or miscalculates some molecular interactions and their outcomes. Furthermore, theaccuracy of the model should improve when the number of samples increases.
Antioxidants 2022, 11, 531 16 of 20
In this view, comparison of in vivo data with what is estimated by the model highlightssome advantages and disadvantages of the modelling strategy. Regarding advantages, themodel provides an integrated tool to assess the time–course of a complex set of variablesrepresenting a comprehensive and dynamic picture of the system. This information cannotbe obtained from punctual analyses and techniques that describe the system only withstatic snapshots. Regarding disadvantages, the model is naturally based on limitationsand assumptions dealing with the complexity of the aspects considered in the study.Furthermore, some of them are still unknown or undetermined.
There are only a few examples in the literature of similar procedures for modellingbiological processes. Musesti et al. [67] and Giantesio et al. [68] created a mathematicalmodel of muscle tissue modification to study cell ageing in sarcopenia, using physio-logical parameters (i.e., muscle mass, electrical impedance) and variations in externalfactors (e.g., diet, physical activity, pharmacological treatments, environmental pollutionexposure, etc.). They applied the model to analyse two typical symptoms of sarcopenia [68]:loss of mass and loss of force, finding non–linear functions that described these alterationsof muscle physiology. These authors also applied a compensatory strategy. Specifically,they developed these functions by defining some constants (identified in their studies as d)representing the constant damage associated with the different symptoms of sarcopenia.This approach demonstrated the relevance of modulating these constants in the simulationto depict different scenarios of the biological system.
Although our approach may have biological and mathematical limits, it is apparentthat it could be very useful when applied to determine single or combined effects ofdietary interventions on the redox homeostasis of the rabbit. In particular, the scientificand technical literature has shown that rabbit bucks and/or does require high levels ofPUFA and Vit E for suitable reproductive performance [53,69]. Indeed, germ cells have aparticularly high level of LC–PUFA in their membranes. Thus, to ensure good fertility, it isnecessary to include certain amounts of PUFA (i.e., LA, ALA, EPA, DPA, and DHA) andantioxidants (i.e., Vit E and AA) in their diets [14]. However, the levels of these compoundsshould be regulated objectively and carefully; otherwise, they could miss or even hinderthe expected improvements. For these reasons, the development of modelling tools holdsgreat potential for precision nutrition studies using animal models and humans.
5. Conclusions
We developed a mathematical model based on computer software that mimics thecomplex interactions of the ROS–PUFA–antioxidant system in rabbit, namely the VENSIMmodel. This can be used to estimate a priori the effect of dietary treatments (i.e., antioxidants,PUFAs) on the redox homeostasis of the rabbit, and in turn on the animal’s health.
In this view, the model can assist in assessing the effect of oxidative challenges anddietary interventions with bioactive lipids such as Vit E and PUFA on the reproductiveefficiency of animals/humans, which is a physiological function very sensitive to redoximbalance and oxidative stress. This model system can be implemented and easily beinstructed to simulate a wide panel of processes and to assess several phenotypic traits.
In particular, self–learning processes able to identify potential health risks linked toimbalances of the system can be developed. Further improvements of the model wouldpermit studying other systems (i.e., male/female reproduction, key organs, etc.) and theresponse to exogenous factors different from diets, such as environmental, pathologicaland pharmacological perturbations.
Author Contributions: Conceptualization, S.M. and C.C.; data curation, S.M., C.D. and C.C.; formalanalysis, S.M., D.B., A.M., C.S., C.O. and G.C.; investigation, S.M., A.D.B., F.G., B.S., G.C. and C.C.;methodology, S.M., C.D. and C.C.; project administration, G.C. and C.C.; resources, S.M., A.C. andC.C.; software, S.M. and A.C.; validation, C.C.; writing—original draft, S.M., C.D., A.D.B. and C.C.;writing—review & editing, D.B., F.G., C.S. and G.C. All authors have read and agreed to the publishedversion of the manuscript.

Antioxidants 2022, 11, 531 17 of 20
Funding: This research was funded by the Department of Molecular and Developmental Medicine,University of Siena, PSR 2020.
Institutional Review Board Statement: The study was conducted according to the Guiding Prin-ciples in the Use of Animals and approved by the Animal Ethics Monitoring Committee of theUniversity of Siena (CEL AOUS; authorisation n◦ 265/2018–PR, ISOPRO 7DF19.23).
Informed Consent Statement: Not applicable.
Data Availability Statement: Data is contained within the article.
Acknowledgments: The authors would like to thank Francesco Matteucci (veterinarian) and thetechnicians of the experimental units for their technical skills in managing and training of rabbit bucks.
Conflicts of Interest: The authors declare no conflict of interest.
Appendix A
Table A1. Formulation, proximate analysis and fatty acid profile of the control (Standard) andpolyunsaturated + (PUFA+) and vitamin E + diet (Vit E+).
Units Standard VIT E+ PUFA +
IngredientsDehydrated alfalfa meal g/kg 300 300 380Soybean meal 44% g/kg 150 150 100Barley meal g/kg 410 410 310Wheat bran g/kg 52 52 52Soybean oil g/kg 30 30 –Extruded flaxseed g/kg – – 100Beet molasses g/kg 20 20 10Calcium carbonate g/kg 7 7 7Calcium diphosphate g/kg 13.5 13.5 13.5Salt g/kg 7 7 7DL–methionine g/kg 0.5 0.5 0.5Vitamin–mineral premix 1 g/kg 10 10 10α–tocopheryl acetate mg/kg – 200 200
Proximate compositionCrude protein g/kg 174 174 174Ether extract g/kg 47.7 47.7 47.2Crude fibre g/kg 122 122 137Ash g/kg 89 89 84
Fatty acids provided by flaxseedC18:3 ALA g/kg 9.23 9.05 12.08
1 Per kg diet: vitamin A, 11,000 IU; vitamin D3, 2000 IU; vitamin B1, 2.5 mg; vitamin B2, 4 mg; vitamin B6, 1.25 mg;vitamin B12, 0.01 mg; alpha–tocopheryl acetate, 5 mg; biotin, 0.06 mg; vitamin K, 2.5 mg; niacin, 15 mg; folic acid,0.30 mg; D–pantothenic acid, 10 mg; choline, 600 mg; Mn, 60 mg; Fe, 50 mg; Zn, 15 mg; I, 0.5 mg; Co, 0.5 mg.– indicates that the specific ingredient was not included in the diet [52].
References1. Murphy, M.P.; Holmgren, A.; Larsson, N.G.; Halliwell, B.; Chang, C.J.; Kalyanaraman, B.; Rhee, S.G.; Thornalley, P.J.; Partridge, L.;
Gems, D.; et al. Unraveling the biological roles of reactive oxygen species. Cell Metab. 2011, 13, 361–366. [CrossRef] [PubMed]2. Lauridsen, C. From oxidative stress to inflammation: Redox balance and immune system. Poult. Sci. 2019, 98, 4240–4246.
[CrossRef] [PubMed]3. Chance, B.; Sies, H.; Boveris, A. Hydroperoxide metabolism in mammalian organs. Physiol. Rev. 1979, 59, 527–605. [CrossRef]4. Reeg, S.; Grune, T. Protein Oxidation in Aging: Does It Play a Role in Aging Progression? Antioxid. Redox Signal. 2015, 23, 239–255.
[CrossRef] [PubMed]5. Kanvah, S.; Joseph, J.; Schuster, G.B.; Barnett, R.N.; Cleveland, C.L.; Landman, U.Z.I. Oxidation of DNA: Damage to nucleobases.
Acc. Chem. Res. 2010, 43, 280–287. [CrossRef] [PubMed]6. Milne, G.L.; Dai, Q.; Roberts, L.J. The isoprostanes-25 years later. Biochim. Biophys. Acta-Mol. Cell Biol. Lipids 2015, 1851, 433–445.
[CrossRef] [PubMed]
Antioxidants 2022, 11, 531 18 of 20
7. Ali, S.S.; Ahsan, H.; Zia, M.K.; Siddiqui, T.; Khan, F.H. Understanding oxidants and antioxidants: Classical team with new players.J. Food Biochem. 2020, 44, e13145. [CrossRef]
8. Finkel, T.; Holbrook, N.J. Oxidants, oxidative stress and the biology of ageing. Nature 2000, 408, 239–247. [CrossRef]9. Agarwal, A.; Virk, G.; Ong, C.; du Plessis, S.S. Effect of Oxidative Stress on Male Reproduction. World J. Mens. Health 2014, 32, 1.
[CrossRef]10. Halliwell, B. Antioxidant defence mechanisms: From the beginning to the end (of the beginning). Free Radic. Res. 1999, 31,
261–272. [CrossRef]11. Sies, H. Glutathione and its role in cellular functions. Free Radic. Biol. Med. 1999, 27, 916–921. [CrossRef]12. Mattioli, S.; Collodel, G.; Signorini, C.; Cotozzolo, E.; Noto, D.; Cerretani, D.; Micheli, L.; Fiaschi, A.I.; Brecchia, G.; Menchetti, L.;
et al. Tissue antioxidant status and lipid peroxidation are related to dietary intake of n-3 polyunsaturated acids: A rabbit model.Antioxidants 2021, 10, 681. [CrossRef] [PubMed]
13. Griveau, J.F.; Le Lannou, D. Reactive oxygen species and human spermatozoa: Physiology and pathology. Int. J. Androl. 1997, 20,61–69. [CrossRef] [PubMed]
14. Castellini, C.; Mattioli, S.; Signorini, C.; Cotozzolo, E.; Noto, D.; Moretti, E.; Brecchia, G.; Dal Bosco, A.; Belmonte, G.; Durand, T.;et al. Effect of Dietary n-3 Source on Rabbit Male Reproduction. Oxid. Med. Cell. Longev. 2019, 2019, 3279670. [CrossRef]
15. Foreman, J.; Demidchik, V.; Bothwell, J.H.F.; Mylona, P.; Miedema, H.; Angel Torres, M.; Linstead, P.; Costa, S.; Brownlee, C.;Jones, J.D.G.; et al. Reactive oxygen species produced by NADPH oxidase regulate plant cell growth. Nature 2003, 422, 442–446.[CrossRef]
16. Sauer, H.; Rahimi, G.; Hescheler, J.; Wartenberg, M. Role of reactive oxygen species and phosphatidylinositol 3-kinase incardiomyocyte differentiation of embryonic stem cells. FEBS Lett. 2000, 476, 218–223. [CrossRef]
17. Niethammer, P.; Grabher, C.; Look, A.T.; Mitchison, T.J. A tissue-scale gradient of hydrogen peroxide mediates rapid wounddetection in zebrafish. Nature 2009, 459, 996–999. [CrossRef]
18. Chakrabarti, S.; Visweswariah, S.S. Intramacrophage ROS Primes the Innate Immune System via JAK/STAT and Toll Activation.Cell Rep. 2020, 33, 108368. [CrossRef]
19. Foyer, C.H.; Noctor, G. Redox homeostasis and antioxidant signaling: A metabolic interface between stress perception andphysiological responses. Plant Cell 2005, 17, 1866–1875. [CrossRef]
20. Torquato, P.; Bartolini, D.; Giusepponi, D.; Piroddi, M.; Sebastiani, B.; Saluti, G.; Galarini, R.; Galli, F. Increased plasma levels ofthe lipoperoxyl radical-derived vitamin E metabolite α-tocopheryl quinone are an early indicator of lipotoxicity in fatty liversubjects. Free Radic. Biol. Med. 2019, 131, 115–125. [CrossRef]
21. Suburu, J.; Gu, Z.; Chen, H.; Chen, W.; Zhang, H.; Chen, Y.Q. Fatty acid metabolism: Implications for diet, genetic variation, anddisease. Food Biosci. 2013, 4, 1–12. [CrossRef] [PubMed]
22. Simopoulos, A.P. Human requirement for N-3 polyunsaturated fatty acids. Poult. Sci. 2000, 79, 961–970. [CrossRef] [PubMed]23. Simopoulos, A.P. Genetic variation and dietary response: Nutrigenetics/nutrigenomics. Asia Pac. J. Clin. Nutr. 2002, 11, S117–S128.
[CrossRef]24. Castellini, C.; Mourvaki, E.; Dal Bosco, A.; Galli, F. Vitamin E biochemistry and function: A case study in male rabbit. Reprod.
Domest. Anim. 2007, 42, 248–256. [CrossRef]25. Mattioli, S.; Dal Bosco, A.; Duarte, J.M.M.; D’Amato, R.; Castellini, C.; Beone, G.M.; Fontanella, M.C.; Beghelli, D.; Regni, L.;
Businelli, D.; et al. Use of Selenium-enriched olive leaves in the feed of growing rabbits: Effect on oxidative status, mineral profileand Selenium speciation of Longissimus dorsi meat. J. Trace Elem. Med. Biol. 2019. [CrossRef]
26. Signorini, C.; Cardile, V.; Pannuzzo, G.; Graziano, A.C.E.; Durand, T.; Galano, J.M.; Oger, C.; Leoncini, S.; Cortelazzo, A.;Lee, J.C.Y.; et al. Increased isoprostanoid levels in brain from murine model of Krabbe disease–Relevance of isoprostanes,dihomo-isoprostanes and neuroprostanes to disease severity. Free Radic. Biol. Med. 2019, 139, 46–54. [CrossRef]
27. Ahmed, O.; Galano, J.-M.; Pavlickova, T.; Revol-Cavalier, J.; Vigor, C.; Lee, J.-Y.; Oger, C.; Durand, T. Moving forward withisoprostanes, neuroprostanes and phytoprostanes: Where are we now? Essays Biochem. 2020, 64, 463–484. [CrossRef]
28. Signorini, C.; Moretti, E.; Noto, D.; Mattioli, S.; Castellini, C.; Pascarelli, N.A.; Durand, T.; Oger, C.; Galano, J.M.; De Felice, C.;et al. F4-neuroprostanes: A role in sperm capacitation. Life 2021, 11, 655. [CrossRef]
29. Galli, F.; Azzi, A.; Birringer, M.; Cook-Mills, J.M.; Eggersdorfer, M.; Frank, J.; Cruciani, G.; Lorkowski, S.; Özer, N.K. Vitamin E:Emerging aspects and new directions. Free Radic. Biol. Med. 2017, 102, 16–36. [CrossRef]
30. Traber, M.G.; Atkinson, J. Vitamin E, antioxidant and nothing more. Free Radic. Biol. Med. 2007, 43, 4–15. [CrossRef]31. Torquato, P.; Giusepponi, D.; Galarini, R.; Bartolini, D.; Piroddi, M.; Galli, F. Analysis of vitamin E metabolites. In Vitamin E:
Chemistry and Nutritional Benefits; Royal Society of Chemistry: London, UK, 2019; pp. 208–227.32. Meunier, B.; de Visser, S.P.; Shaik, S. Mechanism of oxidation reactions catalyzed by cytochrome P450 enzymes. Chem. Rev. 2004,
104, 3947–3980. [CrossRef] [PubMed]33. Sies, H.; Ursini, F. Homeostatic control of redox status and health. IUBMB Life 2022, 74, 24–28. [CrossRef] [PubMed]34. Xiong, Y.L. Protein Oxidation and Implications for Muscle Food Quality. In Antioxidants in Muscle Foods: Nutritional Strategies to
Improve Quality; John Wiley & Sons: New York, NY, USA, 2000; ISBN 0-471-31454-4.35. Xiong, J. Fatty Acid Oxidation in Cell Fate Determination. Trends Biochem. Sci. 2018, 43, 854–857. [CrossRef] [PubMed]36. Suckow, M.A.; Stevens, K.A.; Wilson, R.P. (Eds.) The Laboratory Rabbit, Guinea Pig, Hamster, and Other Rodents; Academic Press:
Cambridge, MA, USA, 2012.
Antioxidants 2022, 11, 531 19 of 20
37. Sargent, R.G. Verification and validation of simulation models. Proc.-Winter Simul. Conf. 2010, 166–183. [CrossRef]38. Trucano, T.G.; Swiler, L.P.; Igusa, T.; Oberkampf, W.L.; Pilch, M. Calibration, validation, and sensitivity analysis: What’s what.
Reliab. Eng. Syst. Saf. 2006, 91, 1331–1357. [CrossRef]39. Dimokas, G.; Tchamitchian, M.; Kittas, C. Calibration and validation of a biological model to simulate the development and
production of tomatoes in Mediterranean greenhouses during winter period. Biosyst. Eng. 2009, 103, 217–227. [CrossRef]40. VENSIM, Vensim(R) PLE, Version 9.0.1, Ventana Systems, Inc. Available online: https://vensim.com/vensim-personal-learning-
edition (accessed on 30 November 2021).41. Brieger, K.; Schiavone, S.; Miller, F.J.; Krause, K.H. Reactive oxygen species: From health to disease. Swiss Med. Wkly. 2012, 142,
w13659. [CrossRef]42. Turchini, G.M.; Francis, D.S.; De Silva, S.S. A whole body, in vivo, fatty acid balance method to quantify PUFA metabolism
(desaturation, elongation and beta-oxidation). Lipids 2007, 42, 1065–1071. [CrossRef]43. Bargut, T.C.L.; Frantz, E.D.C.; Mandarim-De-Lacerda, C.A.; Aguila, M.B. Effects of a diet rich in n-3 polyunsaturated fatty acids
on hepatic lipogenesis and beta-oxidation in mice. Lipids 2014, 49, 431–444. [CrossRef]44. Mouchlis, V.D.; Hayashi, D.; Vasquez, A.M.; Cao, J.; McCammon, J.A.; Dennis, E.A. Lipoprotein-associated phospholipase A2: A
paradigm for allosteric regulation by membranes. Proc. Natl. Acad. Sci. USA 2022, 119, 1–8. [CrossRef]45. Min, B.; Ahn, D.U. Mechanism of lipid peroxidation in meat and meat products-A review. Food Sci. Biotechnol. 2005, 14, 152–163.46. Fereidoon, S.; Ying, Z. Lipid oxidation and improving the oxidative stability. Chem. Soc. Rev. 2010, 39, 4067–4079. [CrossRef]47. Galli, F.; Polidori, M.C.; Stahl, W.; Mecocci, P.; Kelly, F.J. Vitamin E biotransformation in humans. Vitam. Horm. 2007, 76, 263–280.
[PubMed]48. Torquato, P.; Giusepponi, D.; Bartolini, D.; Barola, C.; Marinelli, R.; Sebastiani, B.; Galarini, R.; Galli, F. Pre-analytical monitoring
and protection of oxidizable lipids in human plasma (vitamin E andω−3 andω−6 fatty acids): An update for redox-lipidomicsmethods. Free Radic. Biol. Med. 2021, 176, 142–148. [CrossRef]
49. Meister, A. Glutathione-ascorbic acid antioxidant system in animals. J. Biol. Chem. 1994, 269, 9397–9400. [CrossRef]50. Combs, G.F. Biomarkers of selenium status. Nutrients 2015, 7, 2209–2236. [CrossRef]51. De Blas, C.; Wisewan, J. Nutrition of the Rabbit; Cabi: Wallingford, UK, 2020.52. Castellini, C.; Lattaioli, P.; Dal Bosco, A.; Beghelli, D. Effect of supranutritional level of dietary α-tocopheryl acetate and selenium
on rabbit semen. Theriogenology 2002, 58, 1723–1732. [CrossRef]53. Rodríguez, M.; Rebollar, P.G.; Mattioli, S.; Castellini, C. n-3 PUFA sources (precursor/products): A review of current knowledge
on rabbit. Animals 2019, 9, 806. [CrossRef]54. Folch, J.; Lees, M.; Sloane Stanley, G.H. A simple method for the isolation and purification of total lipides from animal tissues. J.
Biol. Chem. 1957, 226, 497–509. [CrossRef]55. Christie, W.W. A simple procedure for rapid transmethylation of glycerolipids and cholesteryl esters. J. Lipid Res. 1982, 23,
1072–1075. [CrossRef]56. Mattioli, S.; Machado Duarte, J.M.; Castellini, C.; D’Amato, R.; Regni, L.; Proietti, P.; Businelli, D.; Cotozzolo, E.; Rodrigues, M.;
Dal Bosco, A. Use of olive leaves (whether or not fortified with sodium selenate) in rabbit feeding: Effect on performance, carcassand meat characteristics, and estimated indexes of fatty acid metabolism. Meat Sci. 2018, 143, 230–236. [CrossRef] [PubMed]
57. Ross, M.A. Determination of ascorbic acid and uric acid in plasma by high-performance liquid chromatography. J. Chromatogr. BBiomed. Sci. Appl. 1994, 657, 197–200. [CrossRef]
58. Shara, M.A.; Dickson, P.H.; Bagchi, D.; Stohs, S.J. Excretion of formaldehyde, malondialdehyde, acetaldehyde and acetone inthe urine of rats in response to 2,3,7,8-tetrachlorodibenzo-p-dioxin, paraquat, endrin and carbon tetrachloride. J. Chromatogr. BBiomed. Sci. Appl. 1992, 576, 221–233. [CrossRef]
59. Longini, M.; Moretti, E.; Signorini, C.; Noto, D.; Iacoponi, F.; Collodel, G. Relevance of seminal F2-dihomo-IsoPs, F2-IsoPs andF4-NeuroPs in idiopathic infertility and varicocele. Prostaglandins Other Lipid Mediat. 2020, 149, 106448. [CrossRef]
60. SAS. Proc GLM in SAS, Release 9.4; SAS Institute Inc.: Cary, NC, USA, 2015.61. Feature, T. A Living System By Monya Baker. Nature 2011, 471, 661–665.62. Sies, H. Oxidative stress: A concept in redox biology and medicine. Redox Biol. 2015, 4, 180–183. [CrossRef]63. Bartolini, D.; Torquato, P.; Barola, C.; Russo, A.; Rychlicki, C.; Giusepponi, D.; Bellezza, G.; Sidoni, A.; Galarini, R.; Svegliati-Baroni,
G.; et al. Nonalcoholic fatty liver disease impairs the cytochrome P-450-dependent metabolism of α-tocopherol (vitamin E). J.Nutr. Biochem. 2017, 47, 120–131. [CrossRef]
64. Chakraborty, P.; Dugmonits, K.N.; Végh, A.G.; Hollandi, R.; Horváth, P.; Maléth, J.; Hegyi, P.; Németh, G.; Hermesz, E. Failurein the compensatory mechanism in red blood cells due to sustained smoking during pregnancy. Chem. Biol. Interact. 2019, 313,108821. [CrossRef]
65. Zhong, H.; Yin, H. Role of lipid peroxidation derived 4-hydroxynonenal (4-HNE) in cancer: Focusing on mitochondria. RedoxBiol. 2015, 4, 193–199. [CrossRef]
66. Bartolini, D.; Marinelli, R.; Giusepponi, D.; Galarini, R.; Barola, C.; Stabile, A.M.; Sebastiani, B.; Paoletti, F.; Betti, M.; Rende, M.;et al. Alpha-tocopherol metabolites (the vitamin E metabolome) and their interindividual variability during supplementation.Antioxidants 2021, 10, 173. [CrossRef]
67. Musesti, A.; Giusteri, G.G.; Marzocchi, A. Predicting ageing: On the mathematical modelization of ageing muscle tissue. In 821Active Ageing and Healthy Living; IOS Press: Amsterdam, The Netherlands, 2014; pp. 185–192.

Antioxidants 2022, 11, 531 20 of 20
68. Giantesio, G.; Marzocchi, A.; Musesti, A. Loss of mass and performance in skeletal muscle tissue: A continuum model. Commun.Appl. Ind. Math. 2018, 9, 1–19. [CrossRef]
69. Mattioli, S.; Dal Bosco, A.; Maranesi, M.; Petrucci, L.; Rebollar, P.G.; Castellini, C. Dietary fish oil and flaxseed for rabbit does: Fattyacids distribution and ∆6-desaturase enzyme expression of different tissues. Animal 2019, 13, 1934–1942. [CrossRef] [PubMed]