
Estimating network proximity and latency
11
• • • • • • • • • • • • • • • • • • • • • • • • • • • • • • • • • • • • • • • • • • • • • • • • • • • • • • • • • • • • • • • • • • • • • • Public Review for Estimating Network Proximity and Latency Puneet Sharma, Zhichen Xu, Sujata Banerjee and Sung-Ju Lee Given all the previous work, is there space for improvement in this problem? This paper shows that this is actually the case. First, Sharma et al. focus on a different version of the problem: what if a client wants to find out the nearest server that offers a certain service without knowing the actual IP addresses of the can- didate servers? Second, even though their scheme, called Netvigator, requires some landmarks, they find a practical way to increase the set of nodes that are used as landmarks based on latency responses from the routers along the path to each landmark (the responses can be collected with a tool such as traceroute). This simple idea can have a major impact on accuracy, without requiring additional installed infrastructure in the form of more landmarks. The paper also presents interesting measurement results from two actual deploy- ments, one over Planetlab and another over a large corporate intranet. The reviewers were mostly positive about the paper and they liked the approach of using traceroute and router responses for expanding the latency information provided to the clustering algorithms. They also expressed some concerns, however, that the reader should be aware of. First, the comparison of Netvigator with GNP and Vivaldi may be unfair, to a certain degree, for the reason that Netvigator uses a larger num- ber of effective landmarks (when we consider the router-milestones as landmarks). Similarly, the overhead comparisons are also not obvious, given that Nevigator introduces an indirect overhead due to router ICMP responses. Finally, the reviewers also pointed out that a comparison with Meridian would be more appro- priate, as both Netvigator and Meridian take the approach of avoiding coordinate systems in order to find the closest server to a given node. As it usually happens with problems that have already seen several possible solutions, a quantitative com- parison with previous work is important, but also quite difficult. It is possible, in my opinion, that the solu- tions that eventually prevail in the field are not always the most accurate or elegant but those that satisfy the needs of actual applications in a practical way. Public review written by Constantine Dovrolis Georgia Institute of Technology a c m s i g c o m m ACM SIGCOMM Computer Communication Review 39 Volume 36, Number 3, July 2006
-
Upload
independent -
Category
Documents
-
view
1 -
download
0
Transcript of Estimating network proximity and latency

••••••••••••••••••••••••••••••••••••••••••••••••••••••••••••••••••••••
Public Review forEstimating Network Proximity and Latency
Puneet Sharma, Zhichen Xu, Sujata Banerjee and Sung-Ju Lee
Given all the previous work, is there space for improvement in this problem? This paper shows that this isactually the case. First, Sharma et al. focus on a different version of the problem: what if a client wants tofind out the nearest server that offers a certain service without knowing the actual IP addresses of the can-didate servers? Second, even though their scheme, called Netvigator, requires some landmarks, they finda practical way to increase the set of nodes that are used as landmarks based on latency responses from therouters along the path to each landmark (the responses can be collected with a tool such as traceroute). Thissimple idea can have a major impact on accuracy, without requiring additional installed infrastructure in theform of more landmarks. The paper also presents interesting measurement results from two actual deploy-ments, one over Planetlab and another over a large corporate intranet.
The reviewers were mostly positive about the paper and they liked the approach of using traceroute androuter responses for expanding the latency information provided to the clustering algorithms. They alsoexpressed some concerns, however, that the reader should be aware of. First, the comparison of Netvigatorwith GNP and Vivaldi may be unfair, to a certain degree, for the reason that Netvigator uses a larger num-ber of effective landmarks (when we consider the router-milestones as landmarks). Similarly, the overheadcomparisons are also not obvious, given that Nevigator introduces an indirect overhead due to router ICMPresponses. Finally, the reviewers also pointed out that a comparison with Meridian would be more appro-priate, as both Netvigator and Meridian take the approach of avoiding coordinate systems in order to findthe closest server to a given node.
As it usually happens with problems that have already seen several possible solutions, a quantitative com-parison with previous work is important, but also quite difficult. It is possible, in my opinion, that the solu-tions that eventually prevail in the field are not always the most accurate or elegant but those that satisfythe needs of actual applications in a practical way.
Public review written by
Constantine DovrolisGeorgia Institute of Technology
a c m s i g c o m m
ACM SIGCOMM Computer Communication Review 39 Volume 36, Number 3, July 2006

Estimating Network Proximity and Latency∗
Puneet Sharma∗, Zhichen Xu†, Sujata Banerjee∗, and Sung-Ju Lee∗∗Hewlett-Packard Labs, Palo Alto, CA †Yahoo! Inc., Sunnyvale, CA
puneet,sujata,[email protected], [email protected]
ABSTRACTNetwork proximity and latency estimation is an important compo-nent in discovering and locating services and applications. With thegrowing number of services and service providers in the large-scaleInternet, accurately estimating network proximity/latency with min-imal probing overhead becomes essential for scalable deployment.Although there exist a number of network distance estimation schemes,they either rely on extensive infrastructure support, require the IPaddress of the potential targets, falsely cluster distant nodes, or per-form poorly with even few measurement errors. We propose Netvi-gator, a scalable network proximity and latency estimation tool thatuses information obtained from probing a small number of land-mark nodes and intermediate routers (termed milestones) that arediscovered en route to the landmarks, to identify the closest nodes.With very little additional probing overhead, Netvigator uses dis-tance information to the milestones to accurately locate the closestnodes. We developed a Netvigator prototype and report our per-formance evaluation on PlanetLab and in the intranet of a largeenterprise. Netvigator is a running service on PlanetLab as a partof HP Labs’ S3 (Scalable Sensing Service).
Categories and Subject DescriptorsC.2.1 [Network Architecture and Design]: Distributed networks;C.2.3 [Network Operations]: Network monitoring; C.2.5 [Localand Wide-Area Networks]: Internet
General TermsMeasurement, Management, Algorithms
KeywordsNetwork measurement, Network distance estimation
1. INTRODUCTIONProliferation of Internet access has not only whetted consumers’
appetite for context-sensitive personalized delivery of services, buthas also put the tools for service creation in their own hands. Webelieve that the distinction between service consumer and providerwill blur further. Our vision differs from current hosting of servicesby large providers because we believe there will be a vast numberof small providers in the new Internet economy. Such an environ-ment will cause tremendous growth in service composition and dis-tribution on the Internet. Building a scalable and adaptive Internetservice infrastructure is a key enabler for our vision. An impor-tant challenge facing future network infrastructure is to balance thetradeoffs between providing individualized service to each client
∗This work was supported in part by DARPA Contract N66001-05-9-8904.
and making efficient use of the networked resources. Efficient re-source utilization enables the same infrastructure to accommodatemore services and clients and respond better to flash crowds.
A key issue in effectively utilizing network resources and ser-vices is efficiently and quickly locating the desired resources orservices in specific network locations. These kinds of location ser-vices allow a service provider to construct efficient service over-lay networks, which for example could be used to distribute richmedia content, enable a client to identify the closest cache/proxythat has the desired data or service, enable a client to quickly lo-cate a well provisioned nearby server for participating in a mas-sive multiple-user online game, or to quickly construct a proximity-aware peer-to-peer (P2P) overlay for applications such as contentsharing. Hence, techniques that accurately and efficiently estimatelocality of resources/services and compute network distances havebecome important.
Currently proximity estimation is based on pairwise distance es-timate between any two given nodes. Such schemes find the nodeclosest to a client from a given set of potential targets by estimat-ing the distance to each candidate and picking the minimum. Thisprocess requires a priori knowledge about the set of all the can-didates. Furthermore in some systems, such as P2P systems, theset of service providing nodes changes dynamically, necessitatingfast recomputation of proximity. In practice, when finding a ser-vice/resource, knowledge about the distance to the complete set ofpotential servers is usually not of interest, and ideally, the proxim-ity estimation tool should be able to answer client queries such as“Which is the closest node that can provide a media transcodingservice?” without requiring information about all potential nodes.Most of the distance estimation techniques build a globally con-sistent network model designed to optimize the estimation erroraveraged globally. For proximity estimation it is more importantto lower the distance estimation error between closeby nodes. Theglobal optimization schemes perform poorly for proximity estima-tion. Their proximity accuracy can be greatly improved by relaxingthe global consistency requirement.
Landmark clustering [11, 15] is a popular scheme used for net-work distance estimation that uses a node’s distances to a set oflandmark nodes to estimate the node position in a Cartesian space.However, current landmark clustering techniques are prone to falseclustering where distant nodes are positioned near each other. Fur-ther, the estimation quality of current landmark clustering schemesdepends on the quality of measurement data and can be signifi-cantly inferior to the optimal when there is bad measurement data.
In this paper, we describe Netvigator (Network Navigator), anew network proximity and latency estimation tool that is moreefficient and accurate than the existing schemes.1 Netvigator pri-
1In this paper we use the terms latency and distance interchangeably.
ACM SIGCOMM Computer Communication Review 41 Volume 36, Number 3, July 2006
5 2
1
3
6
4
landmarks milestones
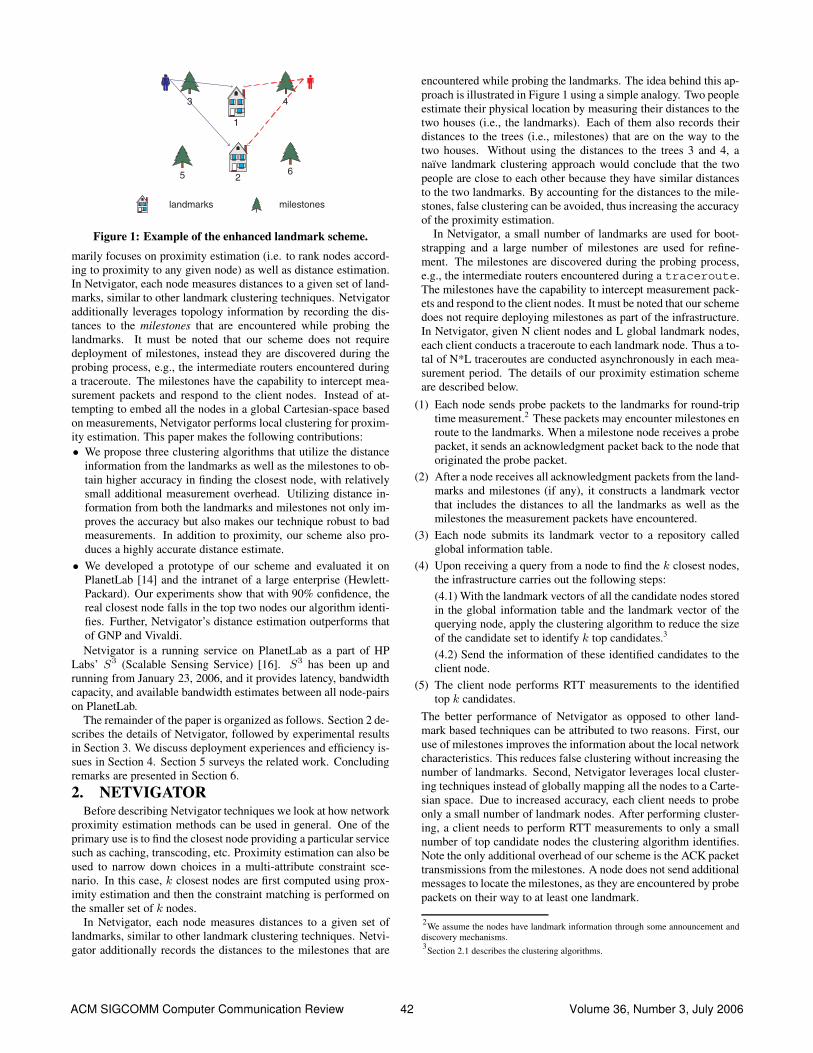
Figure 1: Example of the enhanced landmark scheme.
marily focuses on proximity estimation (i.e. to rank nodes accord-ing to proximity to any given node) as well as distance estimation.In Netvigator, each node measures distances to a given set of land-marks, similar to other landmark clustering techniques. Netvigatoradditionally leverages topology information by recording the dis-tances to the milestones that are encountered while probing thelandmarks. It must be noted that our scheme does not requiredeployment of milestones, instead they are discovered during theprobing process, e.g., the intermediate routers encountered duringa traceroute. The milestones have the capability to intercept mea-surement packets and respond to the client nodes. Instead of at-tempting to embed all the nodes in a global Cartesian-space basedon measurements, Netvigator performs local clustering for proxim-ity estimation. This paper makes the following contributions:• We propose three clustering algorithms that utilize the distance
information from the landmarks as well as the milestones to ob-tain higher accuracy in finding the closest node, with relativelysmall additional measurement overhead. Utilizing distance in-formation from both the landmarks and milestones not only im-proves the accuracy but also makes our technique robust to badmeasurements. In addition to proximity, our scheme also pro-duces a highly accurate distance estimate.
• We developed a prototype of our scheme and evaluated it onPlanetLab [14] and the intranet of a large enterprise (Hewlett-Packard). Our experiments show that with 90% confidence, thereal closest node falls in the top two nodes our algorithm identi-fies. Further, Netvigator’s distance estimation outperforms thatof GNP and Vivaldi.Netvigator is a running service on PlanetLab as a part of HP
Labs’ S3 (Scalable Sensing Service) [16]. S3 has been up andrunning from January 23, 2006, and it provides latency, bandwidthcapacity, and available bandwidth estimates between all node-pairson PlanetLab.
The remainder of the paper is organized as follows. Section 2 de-scribes the details of Netvigator, followed by experimental resultsin Section 3. We discuss deployment experiences and efficiency is-sues in Section 4. Section 5 surveys the related work. Concludingremarks are presented in Section 6.
2. NETVIGATORBefore describing Netvigator techniques we look at how network
proximity estimation methods can be used in general. One of theprimary use is to find the closest node providing a particular servicesuch as caching, transcoding, etc. Proximity estimation can also beused to narrow down choices in a multi-attribute constraint sce-nario. In this case, k closest nodes are first computed using prox-imity estimation and then the constraint matching is performed onthe smaller set of k nodes.
In Netvigator, each node measures distances to a given set oflandmarks, similar to other landmark clustering techniques. Netvi-gator additionally records the distances to the milestones that are
encountered while probing the landmarks. The idea behind this ap-proach is illustrated in Figure 1 using a simple analogy. Two peopleestimate their physical location by measuring their distances to thetwo houses (i.e., the landmarks). Each of them also records theirdistances to the trees (i.e., milestones) that are on the way to thetwo houses. Without using the distances to the trees 3 and 4, anaı̈ve landmark clustering approach would conclude that the twopeople are close to each other because they have similar distancesto the two landmarks. By accounting for the distances to the mile-stones, false clustering can be avoided, thus increasing the accuracyof the proximity estimation.
In Netvigator, a small number of landmarks are used for boot-strapping and a large number of milestones are used for refine-ment. The milestones are discovered during the probing process,e.g., the intermediate routers encountered during a traceroute.The milestones have the capability to intercept measurement pack-ets and respond to the client nodes. It must be noted that our schemedoes not require deploying milestones as part of the infrastructure.In Netvigator, given N client nodes and L global landmark nodes,each client conducts a traceroute to each landmark node. Thus a to-tal of N*L traceroutes are conducted asynchronously in each mea-surement period. The details of our proximity estimation schemeare described below.
(1) Each node sends probe packets to the landmarks for round-triptime measurement.2 These packets may encounter milestones enroute to the landmarks. When a milestone node receives a probepacket, it sends an acknowledgment packet back to the node thatoriginated the probe packet.
(2) After a node receives all acknowledgment packets from the land-marks and milestones (if any), it constructs a landmark vectorthat includes the distances to all the landmarks as well as themilestones the measurement packets have encountered.
(3) Each node submits its landmark vector to a repository calledglobal information table.
(4) Upon receiving a query from a node to find the k closest nodes,the infrastructure carries out the following steps:(4.1) With the landmark vectors of all the candidate nodes storedin the global information table and the landmark vector of thequerying node, apply the clustering algorithm to reduce the sizeof the candidate set to identify k top candidates.3
(4.2) Send the information of these identified candidates to theclient node.
(5) The client node performs RTT measurements to the identifiedtop k candidates.
The better performance of Netvigator as opposed to other land-mark based techniques can be attributed to two reasons. First, ouruse of milestones improves the information about the local networkcharacteristics. This reduces false clustering without increasing thenumber of landmarks. Second, Netvigator leverages local cluster-ing techniques instead of globally mapping all the nodes to a Carte-sian space. Due to increased accuracy, each client needs to probeonly a small number of landmark nodes. After performing cluster-ing, a client needs to perform RTT measurements to only a smallnumber of top candidate nodes the clustering algorithm identifies.Note the only additional overhead of our scheme is the ACK packettransmissions from the milestones. A node does not send additionalmessages to locate the milestones, as they are encountered by probepackets on their way to at least one landmark.
2We assume the nodes have landmark information through some announcement anddiscovery mechanisms.3Section 2.1 describes the clustering algorithms.
ACM SIGCOMM Computer Communication Review 42 Volume 36, Number 3, July 2006

Table 1: Notations.Notation Description
n a node that wants to find the nearest servicenode.
Cthe set of candidate nodes the global infor-mation table identifies by examining onlythe distances to the landmarks.
L(n, c) and c ∈ C the common set of nodes (landmark andmilestone) that c and n have measured to.
dist(a, b) the distance(latency) between nodes a andb.
2.1 Clustering AlgorithmsBefore we describe the clustering algorithms, we first define no-
tations in Table 1. The three clustering algorithms we present are:min sum , max diff , and inner product . The clustering algo-rithms min sum and max diff are based on the triangle inequal-ity, while inner product is motivated by information retrieval lit-erature.4 For each node, the k candidates having the smallest clus-tering metric values are picked as the k closest candidates. Whileall three clustering algorithms have been designed with the goal ofproviding proximity information, the min sum clustering metriccan also be used for distance estimation.
2.1.1 min sum
The intuition behind min sum is that if there are sufficient num-ber of landmark nodes that two nodes n and c measure against, itis very likely one of the landmark nodes is located on the shortestpath between the two nodes. Suppose this landmark node is l. Thesum of dist(n, l) and dist(c, l) should be minimal if the triangleinequality holds. For a given node n and its candidate node set C,nodes are ranked in the increasing order of the min sum clusteringmetric as follows. For each node c ∈ C,
min sum(n, c) = min∀l∈L(n,c){dist(n, l) + dist(c, l)}.Note from the above definition, min sum(n, c) is the short-
est distance among all overlay paths between nodes n and c con-structed using each milestone/landmark common to nodes n and c.Thus min sum(n, c) provides an upper bound on latency betweennodes n and c and can be used as an estimate of the latency be-tween them. In other words, �dist(n, c) = min sum(n, c), wherethe estimate of dist(n, c) is denoted by �dist(n, c).
For a given node n, when all nodes c ∈ C have been rankedusing the above metric, the k closest nodes to node n are identifiedas the first k nodes in this ranked list, i.e., the k nodes that have thesmallest values of the min sum metric. Thus the closest node (saynode x) to node n is the one that satisfies the following:
min sum(n, x) = min∀c∈C :l∈L(n,c)(dist(n, l) + dist(c, l)).
2.1.2 max diff
Similar to min sum , the idea behind max diff is that if thereare sufficient number of landmark nodes that both n and c measureagainst, then there is a large likelihood that there exists a landmarknode l such that c is on the shortest path from n to l, or n is on theshortest path between c and l. In that case, ABS(dist(n, l) − dist(c, l))is the maximum when the triangle inequality holds.5 The formulamax diff (n,C ) is defined as
max∀c∈C :l∈L(n,c)ABS(dist(n, l) − dist(c, l)).
4Violation of triangular inequality in the Internet has been reported in [1, 28]. How-ever, such violations are less likely in this context as they do not include the interme-diate routers as points of the triangle.5The function ABS(x) returns the absolute value of x.
2.1.3 inner product
The algorithm inner product is motivated by document rankingalgorithm used in information retrieval [21]. The semantic infor-mation of a document is represented as a term vector. The weightof each term is set to be proportional to the frequency of the termin the document and inversely proportional to the total number ofdocuments that contain this term in the entire corpus. The intuitionis that the more frequent a term in a document, the more likely theterm uniquely identifies the document. However, if the term alsoappears in a lot of other documents, the importance of the termshould be diminished. The similarity between a document and aquery is determined using the inner product of the vector represen-tation of the two. Applying this concept, inner product expectsthat if a landmark node is close to node n, then it can give a betterindication of the physical network position of n. inner product(n, C )is defined as
max∀c∈CΣl∈L(n,c)((1 .0/(dist(n, l)2)) × (1 .0/(dist(c, l)2 ))).
Our experimental results in the following section will show thatthe algorithms min sum and max diff perform better than theinner product algorithm. In addition, only min sum provides areasonable distance estimate between any two nodes and thus holdsthe most promise for deployment. For inner product , the choiceof square in 1 .0/dist(n, l) is somewhat arbitrary with a goal tofavor a close landmark node than a far away one. In the future, wewill explore possible improvements to inner product .
2.2 Prototype ImplementationNetvigator comprises the following three modules:
• Path Probing Module: The path probing module resides onall participating nodes. It sends probes towards the landmarksto collect the path information. Our system uses the traceroutetool. Each client periodically collects the path information andsends landmark vectors to the information data module.
• Information Data Module: The information data module col-lects the path information from the participating nodes. The datais filtered to remove any specious information. If available, italso consults a router-alias database to further enhance the data.The router-alias database contains a list of interface IP addressesassigned to the same physical router. This enables the identifica-tion of multiple interface IP addresses to a single router, ratherthan identifying each interface IP address as a separate router.
• Clustering Module: From the partial topology information, theclustering module performs the proximity computation for dif-ferent nodes.In the current Netvigator implementation, the information data
module and the clustering module are centralized and reside on asingle node.
3. PERFORMANCE EVALUATIONWe experimented with Netvigator prototype on two different real
networks: a geographically distributed HP enterprise network anda set of PlanetLab nodes connected via open Internet [14]. To givethe readers a flavor of how our tool performs before diving into adetailed evaluation, Figure 2 visualizes the partial topology infor-mation our tool collects and uses to derive the results. Netviga-tor computes the k closest nodes for each participating node. Wealso compute the latency estimate for all client node pairs and eval-uate its accuracy. We compare our results with two distance estima-tion techniques - GNP [11] and Vivaldi [5]. While Meridian [26]computes node proximity leveraging an overlay network, it is basedon direct measurements rather than estimation, which is our focus.
ACM SIGCOMM Computer Communication Review 43 Volume 36, Number 3, July 2006
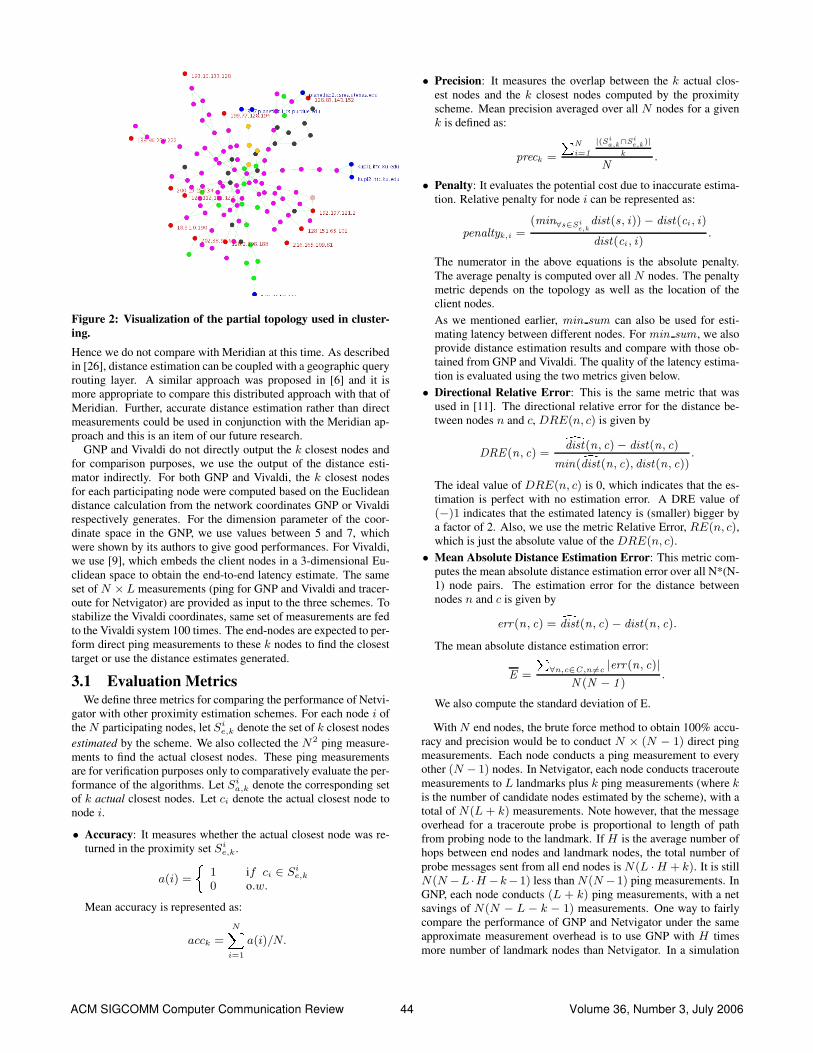
Figure 2: Visualization of the partial topology used in cluster-ing.
Hence we do not compare with Meridian at this time. As describedin [26], distance estimation can be coupled with a geographic queryrouting layer. A similar approach was proposed in [6] and it ismore appropriate to compare this distributed approach with that ofMeridian. Further, accurate distance estimation rather than directmeasurements could be used in conjunction with the Meridian ap-proach and this is an item of our future research.
GNP and Vivaldi do not directly output the k closest nodes andfor comparison purposes, we use the output of the distance esti-mator indirectly. For both GNP and Vivaldi, the k closest nodesfor each participating node were computed based on the Euclideandistance calculation from the network coordinates GNP or Vivaldirespectively generates. For the dimension parameter of the coor-dinate space in the GNP, we use values between 5 and 7, whichwere shown by its authors to give good performances. For Vivaldi,we use [9], which embeds the client nodes in a 3-dimensional Eu-clidean space to obtain the end-to-end latency estimate. The sameset of N × L measurements (ping for GNP and Vivaldi and tracer-oute for Netvigator) are provided as input to the three schemes. Tostabilize the Vivaldi coordinates, same set of measurements are fedto the Vivaldi system 100 times. The end-nodes are expected to per-form direct ping measurements to these k nodes to find the closesttarget or use the distance estimates generated.
3.1 Evaluation MetricsWe define three metrics for comparing the performance of Netvi-
gator with other proximity estimation schemes. For each node i ofthe N participating nodes, let Si
e,k denote the set of k closest nodesestimated by the scheme. We also collected the N2 ping measure-ments to find the actual closest nodes. These ping measurementsare for verification purposes only to comparatively evaluate the per-formance of the algorithms. Let Si
a,k denote the corresponding setof k actual closest nodes. Let ci denote the actual closest node tonode i.
• Accuracy: It measures whether the actual closest node was re-turned in the proximity set Si
e,k.
a(i) =
�1 if ci ∈ Si
e,k
0 o.w.
Mean accuracy is represented as:
acck =N�
i=1
a(i)/N.
• Precision: It measures the overlap between the k actual clos-est nodes and the k closest nodes computed by the proximityscheme. Mean precision averaged over all N nodes for a givenk is defined as:
preck =
�Ni=1
|(Sia,k∩Si
e,k )|k
N.
• Penalty: It evaluates the potential cost due to inaccurate estima-tion. Relative penalty for node i can be represented as:
penaltyk,i =(min∀s∈Si
e,kdist(s, i)) − dist(ci , i)
dist(ci , i).
The numerator in the above equations is the absolute penalty.The average penalty is computed over all N nodes. The penaltymetric depends on the topology as well as the location of theclient nodes.As we mentioned earlier, min sum can also be used for esti-mating latency between different nodes. For min sum , we alsoprovide distance estimation results and compare with those ob-tained from GNP and Vivaldi. The quality of the latency estima-tion is evaluated using the two metrics given below.
• Directional Relative Error: This is the same metric that wasused in [11]. The directional relative error for the distance be-tween nodes n and c, DRE(n, c) is given by
DRE (n, c) =�dist(n, c) − dist(n, c)
min(�dist(n, c), dist(n, c)).
The ideal value of DRE(n, c) is 0, which indicates that the es-timation is perfect with no estimation error. A DRE value of(−)1 indicates that the estimated latency is (smaller) bigger bya factor of 2. Also, we use the metric Relative Error, RE(n, c),which is just the absolute value of the DRE(n, c).
• Mean Absolute Distance Estimation Error: This metric com-putes the mean absolute distance estimation error over all N*(N-1) node pairs. The estimation error for the distance betweennodes n and c is given by
err(n, c) = �dist(n, c) − dist(n, c).
The mean absolute distance estimation error:
E =
�∀n,c∈C ,n �=c |err(n, c)|
N (N − 1 ).
We also compute the standard deviation of E.
With N end nodes, the brute force method to obtain 100% accu-racy and precision would be to conduct N × (N − 1) direct pingmeasurements. Each node conducts a ping measurement to everyother (N − 1) nodes. In Netvigator, each node conducts traceroutemeasurements to L landmarks plus k ping measurements (where kis the number of candidate nodes estimated by the scheme), with atotal of N(L + k) measurements. Note however, that the messageoverhead for a traceroute probe is proportional to length of pathfrom probing node to the landmark. If H is the average number ofhops between end nodes and landmark nodes, the total number ofprobe messages sent from all end nodes is N(L · H + k). It is stillN(N −L ·H −k−1) less than N(N −1) ping measurements. InGNP, each node conducts (L + k) ping measurements, with a netsavings of N(N − L − k − 1) measurements. One way to fairlycompare the performance of GNP and Netvigator under the sameapproximate measurement overhead is to use GNP with H timesmore number of landmark nodes than Netvigator. In a simulation
ACM SIGCOMM Computer Communication Review 44 Volume 36, Number 3, July 2006

0
0.25
0.5
0.75
1
0 5 10 15
Acc
urac
y
Number of Returned Top Candidates (k)
min_summax_diff
inner_product
Figure 3: Accuracy of Netvigator algorithms in HP intranet.
0
0.25
0.5
0.75
1
0 5 10 15
Acc
urac
y
Number of Returned Top Candidates (k)
NV,L=7NV,L=3NV,L=2
GNP,L=7GNP,L=3GNP,L=2
Figure 4: Accuracy of Netvigator and GNP in HP intranet.
study in [27], we found that Netvigator with five landmark nodessignificantly outperformed GNP with 40 landmark nodes. Due tospace limitations, we omit the simulation results here.
In the next two sections, we present our proximity estimationresults on an enterprise network and PlanetLab respectively. For thesake of brevity, the results of our distance estimation are condensedand presented in Section 3.4.
3.2 Enterprise NetworkWe ran our experiments on a well managed and provisioned en-
terprise intranet at Hewlett-Packard. We selected 43 globally dis-tributed end-hosts for the experiments. NetIQTM Chariot [2] per-formance endpoints were installed on these hosts running Linuxor Microsoft windows operating systems. The traceroute capabil-ity of the endpoint was used to collect path information when re-motely triggered via the Chariot console. Complete router-aliasinginformation about the enterprise network was available from themanagement servers. The endpoints were also used for conducting432(=1849) ping measurements required for algorithm verification.
We assigned up to 7 landmark nodes among 43 end hosts in thisset of experiments. The landmark nodes were selected manuallywith some coarse geographical input.6 We varied the number oflandmark nodes (1, 2, 3, and 7 nodes) and computed the metricsfor the 43 end nodes as a function of k, the number of top closestcandidates returned by the proximity estimation algorithm.
We use our three clustering algorithms— min sum , max diff
6They are located in Palo Alto, CA, Roseville, CA, Corvallis, OR, Fort Collins, CO,Boise, ID, Atlanta, GA, and Bristol, England.
0
0.25
0.5
0.75
1
0 5 10 15
Pre
cisi
on
Number of Returned Top Candidates (k)
NVGNP
Figure 5: Precision of Netvigator and GNP in HP intranet.
0.01
0.1
1
10
0 5 10 15
Pen
alty
Number of Returned Top Candidates
GNP (absolute)NV (absolute)GNP (relative)
NV (relative)
Figure 6: Penalty of Netvigator and GNP in HP intranet.
and inner product for Netvigator. We denote these as m0, m1,and m2 in the plots. The router aliasing information greatly im-proves the performance and hence we show results with those in-formation incorporated.
In Figure 3, we compare the three different clustering algorithmsfor the Netvigator, with 7 landmarks and the value of k varied. Wefind that the inner product algorithm performs the worst, whilethe performance of min sum and max diff are similar. Althoughthe accuracy of max diff is the highest when k is large, min sumhas the advantage of providing a higher accuracy at low values ofk (which reduces the total overhead). Thus in the remainder of thepaper, we only show the results for the min sum algorithm forNetvigator.
Figure 4 plots the mean accuracy for the Netvigator and GNP asL and k are varied. A key observation from the result is that forGNP, having more landmark nodes shows clear advantage and theaccuracy is very poor when k is small. These results indicate thatfor GNP to have the same accuracy as Netvigator, the overhead hasto be significantly higher than Netvigator. When k = 5, Netvi-gator has an accuracy of 90.7% (L=7) and 86.05% (L=2,3), whileGNP has an accuracy of only 72.09% (L=7).
In Figures 5 and 6, the mean precision and mean penalty incurredfor Netvigator and GNP (with dimension 5) are compared for the 7landmarks case. The absolute penalty numbers are in milliseconds.As expected, the precision values increase with k, while the penaltynumbers decrease with k. We find that Netvigator outperformsGNP in both metrics.
In summary, although the accuracy and precision of Netviga-tor are not 100%, with L=7, it incurs a significantly less measure-
ACM SIGCOMM Computer Communication Review 45 Volume 36, Number 3, July 2006
0
0.25
0.5
0.75
1
0 25 50 75
Acc
urac
y
Number of Returned Top Candidates (k)
NV, L=15NV, L=12
GNP, L=15GNP, L=12
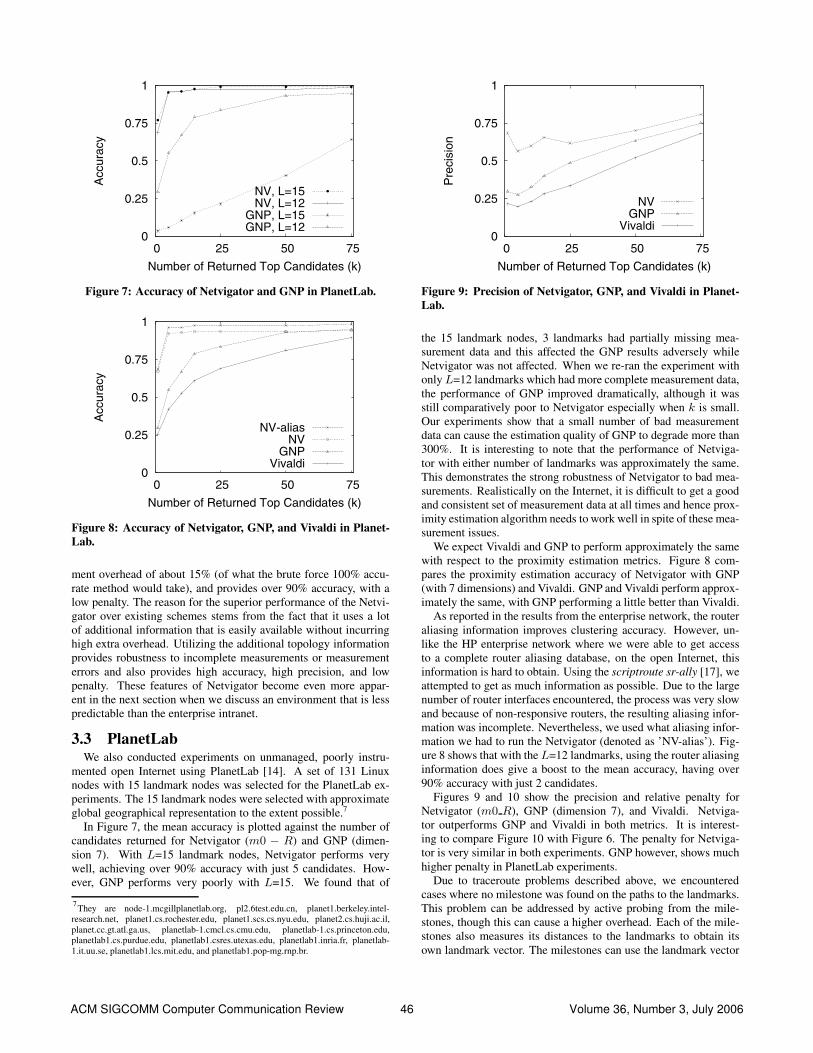
Figure 7: Accuracy of Netvigator and GNP in PlanetLab.
0
0.25
0.5
0.75
1
0 25 50 75
Acc
urac
y
Number of Returned Top Candidates (k)
NV-aliasNV
GNPVivaldi
Figure 8: Accuracy of Netvigator, GNP, and Vivaldi in Planet-Lab.
ment overhead of about 15% (of what the brute force 100% accu-rate method would take), and provides over 90% accuracy, with alow penalty. The reason for the superior performance of the Netvi-gator over existing schemes stems from the fact that it uses a lotof additional information that is easily available without incurringhigh extra overhead. Utilizing the additional topology informationprovides robustness to incomplete measurements or measurementerrors and also provides high accuracy, high precision, and lowpenalty. These features of Netvigator become even more appar-ent in the next section when we discuss an environment that is lesspredictable than the enterprise intranet.
3.3 PlanetLabWe also conducted experiments on unmanaged, poorly instru-
mented open Internet using PlanetLab [14]. A set of 131 Linuxnodes with 15 landmark nodes was selected for the PlanetLab ex-periments. The 15 landmark nodes were selected with approximateglobal geographical representation to the extent possible.7
In Figure 7, the mean accuracy is plotted against the number ofcandidates returned for Netvigator (m0 − R) and GNP (dimen-sion 7). With L=15 landmark nodes, Netvigator performs verywell, achieving over 90% accuracy with just 5 candidates. How-ever, GNP performs very poorly with L=15. We found that of
7They are node-1.mcgillplanetlab.org, pl2.6test.edu.cn, planet1.berkeley.intel-research.net, planet1.cs.rochester.edu, planet1.scs.cs.nyu.edu, planet2.cs.huji.ac.il,planet.cc.gt.atl.ga.us, planetlab-1.cmcl.cs.cmu.edu, planetlab-1.cs.princeton.edu,planetlab1.cs.purdue.edu, planetlab1.csres.utexas.edu, planetlab1.inria.fr, planetlab-1.it.uu.se, planetlab1.lcs.mit.edu, and planetlab1.pop-mg.rnp.br.
0
0.25
0.5
0.75
1
0 25 50 75
Pre
cisi
on
Number of Returned Top Candidates (k)
NVGNP
Vivaldi
Figure 9: Precision of Netvigator, GNP, and Vivaldi in Planet-Lab.
the 15 landmark nodes, 3 landmarks had partially missing mea-surement data and this affected the GNP results adversely whileNetvigator was not affected. When we re-ran the experiment withonly L=12 landmarks which had more complete measurement data,the performance of GNP improved dramatically, although it wasstill comparatively poor to Netvigator especially when k is small.Our experiments show that a small number of bad measurementdata can cause the estimation quality of GNP to degrade more than300%. It is interesting to note that the performance of Netviga-tor with either number of landmarks was approximately the same.This demonstrates the strong robustness of Netvigator to bad mea-surements. Realistically on the Internet, it is difficult to get a goodand consistent set of measurement data at all times and hence prox-imity estimation algorithm needs to work well in spite of these mea-surement issues.
We expect Vivaldi and GNP to perform approximately the samewith respect to the proximity estimation metrics. Figure 8 com-pares the proximity estimation accuracy of Netvigator with GNP(with 7 dimensions) and Vivaldi. GNP and Vivaldi perform approx-imately the same, with GNP performing a little better than Vivaldi.
As reported in the results from the enterprise network, the routeraliasing information improves clustering accuracy. However, un-like the HP enterprise network where we were able to get accessto a complete router aliasing database, on the open Internet, thisinformation is hard to obtain. Using the scriptroute sr-ally [17], weattempted to get as much information as possible. Due to the largenumber of router interfaces encountered, the process was very slowand because of non-responsive routers, the resulting aliasing infor-mation was incomplete. Nevertheless, we used what aliasing infor-mation we had to run the Netvigator (denoted as ’NV-alias’). Fig-ure 8 shows that with the L=12 landmarks, using the router aliasinginformation does give a boost to the mean accuracy, having over90% accuracy with just 2 candidates.
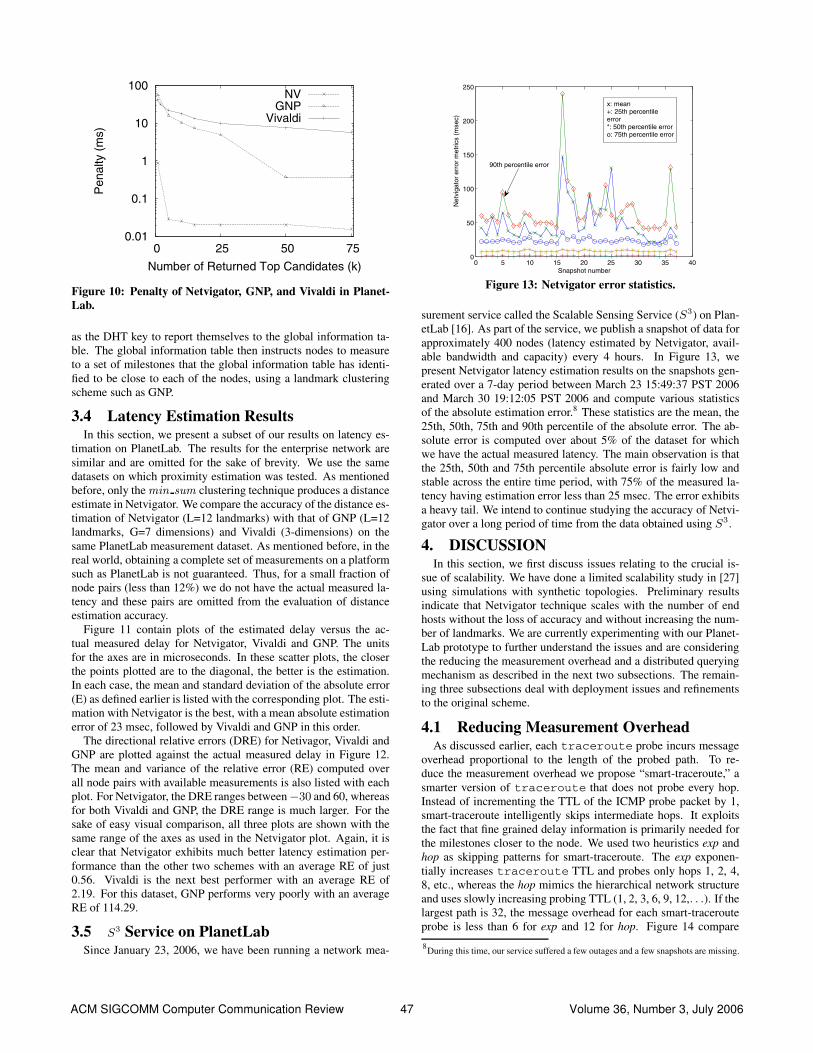
Figures 9 and 10 show the precision and relative penalty forNetvigator (m0 R), GNP (dimension 7), and Vivaldi. Netviga-tor outperforms GNP and Vivaldi in both metrics. It is interest-ing to compare Figure 10 with Figure 6. The penalty for Netviga-tor is very similar in both experiments. GNP however, shows muchhigher penalty in PlanetLab experiments.
Due to traceroute problems described above, we encounteredcases where no milestone was found on the paths to the landmarks.This problem can be addressed by active probing from the mile-stones, though this can cause a higher overhead. Each of the mile-stones also measures its distances to the landmarks to obtain itsown landmark vector. The milestones can use the landmark vector
ACM SIGCOMM Computer Communication Review 46 Volume 36, Number 3, July 2006
0.01
0.1
1
10
100
0 25 50 75
Pen
alty
(m
s)
Number of Returned Top Candidates (k)
NVGNP
Vivaldi
Figure 10: Penalty of Netvigator, GNP, and Vivaldi in Planet-Lab.
as the DHT key to report themselves to the global information ta-ble. The global information table then instructs nodes to measureto a set of milestones that the global information table has identi-fied to be close to each of the nodes, using a landmark clusteringscheme such as GNP.
3.4 Latency Estimation ResultsIn this section, we present a subset of our results on latency es-
timation on PlanetLab. The results for the enterprise network aresimilar and are omitted for the sake of brevity. We use the samedatasets on which proximity estimation was tested. As mentionedbefore, only the min sum clustering technique produces a distanceestimate in Netvigator. We compare the accuracy of the distance es-timation of Netvigator (L=12 landmarks) with that of GNP (L=12landmarks, G=7 dimensions) and Vivaldi (3-dimensions) on thesame PlanetLab measurement dataset. As mentioned before, in thereal world, obtaining a complete set of measurements on a platformsuch as PlanetLab is not guaranteed. Thus, for a small fraction ofnode pairs (less than 12%) we do not have the actual measured la-tency and these pairs are omitted from the evaluation of distanceestimation accuracy.
Figure 11 contain plots of the estimated delay versus the ac-tual measured delay for Netvigator, Vivaldi and GNP. The unitsfor the axes are in microseconds. In these scatter plots, the closerthe points plotted are to the diagonal, the better is the estimation.In each case, the mean and standard deviation of the absolute error(E) as defined earlier is listed with the corresponding plot. The esti-mation with Netvigator is the best, with a mean absolute estimationerror of 23 msec, followed by Vivaldi and GNP in this order.
The directional relative errors (DRE) for Netivagor, Vivaldi andGNP are plotted against the actual measured delay in Figure 12.The mean and variance of the relative error (RE) computed overall node pairs with available measurements is also listed with eachplot. For Netvigator, the DRE ranges between −30 and 60, whereasfor both Vivaldi and GNP, the DRE range is much larger. For thesake of easy visual comparison, all three plots are shown with thesame range of the axes as used in the Netvigator plot. Again, it isclear that Netvigator exhibits much better latency estimation per-formance than the other two schemes with an average RE of just0.56. Vivaldi is the next best performer with an average RE of2.19. For this dataset, GNP performs very poorly with an averageRE of 114.29.
3.5 S3 Service on PlanetLabSince January 23, 2006, we have been running a network mea-
0 5 10 15 20 25 30 35 400
50
100
150
200
250
Snapshot number
Net
viga
tor
erro
r m
etric
s (m
sec)
90th percentile error
x: mean+: 25th percentileerror*: 50th percentile erroro: 75th percentile error
Figure 13: Netvigator error statistics.
surement service called the Scalable Sensing Service (S3) on Plan-etLab [16]. As part of the service, we publish a snapshot of data forapproximately 400 nodes (latency estimated by Netvigator, avail-able bandwidth and capacity) every 4 hours. In Figure 13, wepresent Netvigator latency estimation results on the snapshots gen-erated over a 7-day period between March 23 15:49:37 PST 2006and March 30 19:12:05 PST 2006 and compute various statisticsof the absolute estimation error.8 These statistics are the mean, the25th, 50th, 75th and 90th percentile of the absolute error. The ab-solute error is computed over about 5% of the dataset for whichwe have the actual measured latency. The main observation is thatthe 25th, 50th and 75th percentile absolute error is fairly low andstable across the entire time period, with 75% of the measured la-tency having estimation error less than 25 msec. The error exhibitsa heavy tail. We intend to continue studying the accuracy of Netvi-gator over a long period of time from the data obtained using S3.
4. DISCUSSIONIn this section, we first discuss issues relating to the crucial is-
sue of scalability. We have done a limited scalability study in [27]using simulations with synthetic topologies. Preliminary resultsindicate that Netvigator technique scales with the number of endhosts without the loss of accuracy and without increasing the num-ber of landmarks. We are currently experimenting with our Planet-Lab prototype to further understand the issues and are consideringthe reducing the measurement overhead and a distributed queryingmechanism as described in the next two subsections. The remain-ing three subsections deal with deployment issues and refinementsto the original scheme.
4.1 Reducing Measurement OverheadAs discussed earlier, each traceroute probe incurs message
overhead proportional to the length of the probed path. To re-duce the measurement overhead we propose “smart-traceroute,” asmarter version of traceroute that does not probe every hop.Instead of incrementing the TTL of the ICMP probe packet by 1,smart-traceroute intelligently skips intermediate hops. It exploitsthe fact that fine grained delay information is primarily needed forthe milestones closer to the node. We used two heuristics exp andhop as skipping patterns for smart-traceroute. The exp exponen-tially increases traceroute TTL and probes only hops 1, 2, 4,8, etc., whereas the hop mimics the hierarchical network structureand uses slowly increasing probing TTL (1, 2, 3, 6, 9, 12,. . .). If thelargest path is 32, the message overhead for each smart-tracerouteprobe is less than 6 for exp and 12 for hop. Figure 14 compare
8During this time, our service suffered a few outages and a few snapshots are missing.
ACM SIGCOMM Computer Communication Review 47 Volume 36, Number 3, July 2006

(a) Netvigator (L=12). (b) Vivaldi. (c) GNP (L=12, G=7).
Figure 11: Estimated vs. actual delay on PlanetLab.
(a) Netvigator (L=12). (b) Vivaldi. (c) GNP (L=12, G=7).
Figure 12: Directional relative error on PlanetLab.
0
0.25
0.5
0.75
1
0 25 50 75
Acc
urac
y
Number of Returned Top Candidates
NVNV_expNV_hop
Figure 14: Accuracy of NV, NV exp, and NV hop.
these two smart hop skipping techniques, along with the baselineNetvigagor on PlanetLab with 12 landmarks.
We observe from the graph that with less measurement overhead,both exp and hop perform similarly and are only slightly less accu-rate than the baseline Netvigator. This implies that the informationnot used in exp and hop was not adding much value.
We plan to explore this further to find how the skipping patternsfor smart-traceroute can be adapted to given topologies. In addi-tion, we will enable smart-traceroute to probe multiple targets si-
multaneously. This smart version will have the following features:(i) Using heuristics, it avoids probing the common paths multipletimes. (ii) It reports data incrementally as it becomes available.(iii) It groups consecutive routers that are close to each other intosuper-routers to increase the probability of capturing common sub-path among different clients.
4.2 Distributed QueryingUsing a centralized server to store all information is not scalable
as it requires all nodes to report and query a central unit. This cancause a concentration of network traffic and single point of fail-ure. We are working on a distributed Internet distance informationservice to make Netvigator more robust and scalable. Our solutiontakes advantage of the locality of interest since nodes usually are in-terested in finding resources or services that are close by in networkproximity. We propose to distribute the position data among a set ofinfrastructure nodes, and have used a heuristics based approach forpartitioning and querying this data [6]. Simulation results show thatdistributed approach is not only accurate but also results in shorterresponse time and better network resource utilization.
4.3 Blocking of ICMP Probe MessagesThe widespread deployment and availability of traceroute made
it the measurement tool of choice for our experiments. At the sametime, we observed that traceroute is not a perfect path probing tool.Some network administrators disable the ICMP responses originat-
ACM SIGCOMM Computer Communication Review 48 Volume 36, Number 3, July 2006
0
0.25
0.5
0.75
1
0 5 10 15
Acc
urac
y &
Pre
cisi
on
Number of Returned Top Candidates (k)
AccuracyPrecision
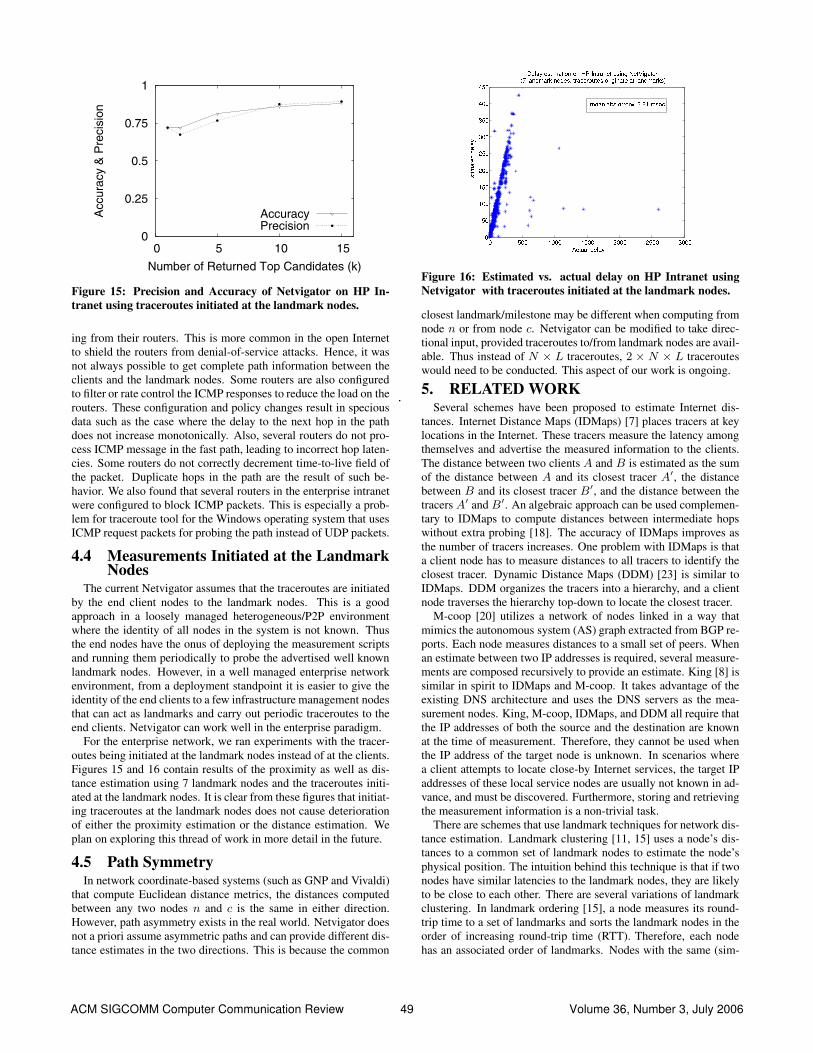
Figure 15: Precision and Accuracy of Netvigator on HP In-tranet using traceroutes initiated at the landmark nodes.
ing from their routers. This is more common in the open Internetto shield the routers from denial-of-service attacks. Hence, it wasnot always possible to get complete path information between theclients and the landmark nodes. Some routers are also configuredto filter or rate control the ICMP responses to reduce the load on therouters. These configuration and policy changes result in speciousdata such as the case where the delay to the next hop in the pathdoes not increase monotonically. Also, several routers do not pro-cess ICMP message in the fast path, leading to incorrect hop laten-cies. Some routers do not correctly decrement time-to-live field ofthe packet. Duplicate hops in the path are the result of such be-havior. We also found that several routers in the enterprise intranetwere configured to block ICMP packets. This is especially a prob-lem for traceroute tool for the Windows operating system that usesICMP request packets for probing the path instead of UDP packets.
4.4 Measurements Initiated at the LandmarkNodes
The current Netvigator assumes that the traceroutes are initiatedby the end client nodes to the landmark nodes. This is a goodapproach in a loosely managed heterogeneous/P2P environmentwhere the identity of all nodes in the system is not known. Thusthe end nodes have the onus of deploying the measurement scriptsand running them periodically to probe the advertised well knownlandmark nodes. However, in a well managed enterprise networkenvironment, from a deployment standpoint it is easier to give theidentity of the end clients to a few infrastructure management nodesthat can act as landmarks and carry out periodic traceroutes to theend clients. Netvigator can work well in the enterprise paradigm.
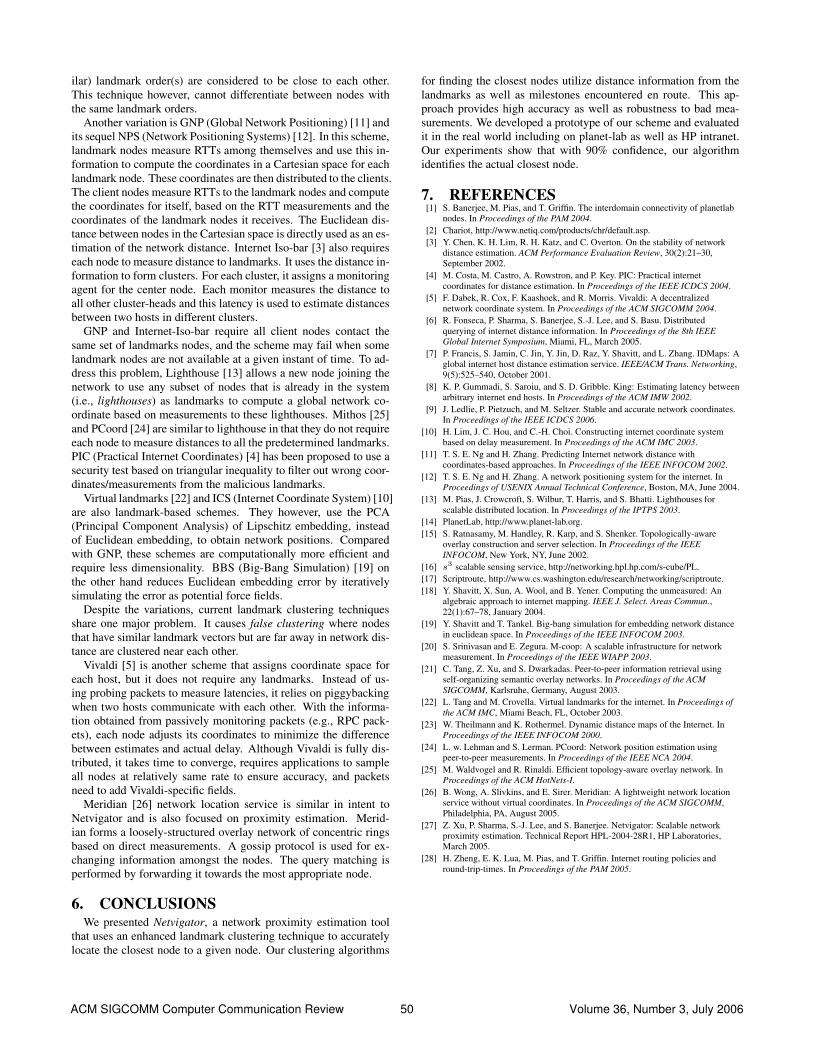
For the enterprise network, we ran experiments with the tracer-outes being initiated at the landmark nodes instead of at the clients.Figures 15 and 16 contain results of the proximity as well as dis-tance estimation using 7 landmark nodes and the traceroutes initi-ated at the landmark nodes. It is clear from these figures that initiat-ing traceroutes at the landmark nodes does not cause deteriorationof either the proximity estimation or the distance estimation. Weplan on exploring this thread of work in more detail in the future.
4.5 Path SymmetryIn network coordinate-based systems (such as GNP and Vivaldi)
that compute Euclidean distance metrics, the distances computedbetween any two nodes n and c is the same in either direction.However, path asymmetry exists in the real world. Netvigator doesnot a priori assume asymmetric paths and can provide different dis-tance estimates in the two directions. This is because the common
Figure 16: Estimated vs. actual delay on HP Intranet usingNetvigator with traceroutes initiated at the landmark nodes.
closest landmark/milestone may be different when computing fromnode n or from node c. Netvigator can be modified to take direc-tional input, provided traceroutes to/from landmark nodes are avail-able. Thus instead of N × L traceroutes, 2 × N × L tracerouteswould need to be conducted. This aspect of our work is ongoing.
5. RELATED WORKSeveral schemes have been proposed to estimate Internet dis-
tances. Internet Distance Maps (IDMaps) [7] places tracers at keylocations in the Internet. These tracers measure the latency amongthemselves and advertise the measured information to the clients.The distance between two clients A and B is estimated as the sumof the distance between A and its closest tracer A′, the distancebetween B and its closest tracer B′, and the distance between thetracers A′ and B′. An algebraic approach can be used complemen-tary to IDMaps to compute distances between intermediate hopswithout extra probing [18]. The accuracy of IDMaps improves asthe number of tracers increases. One problem with IDMaps is thata client node has to measure distances to all tracers to identify theclosest tracer. Dynamic Distance Maps (DDM) [23] is similar toIDMaps. DDM organizes the tracers into a hierarchy, and a clientnode traverses the hierarchy top-down to locate the closest tracer.
M-coop [20] utilizes a network of nodes linked in a way thatmimics the autonomous system (AS) graph extracted from BGP re-ports. Each node measures distances to a small set of peers. Whenan estimate between two IP addresses is required, several measure-ments are composed recursively to provide an estimate. King [8] issimilar in spirit to IDMaps and M-coop. It takes advantage of theexisting DNS architecture and uses the DNS servers as the mea-surement nodes. King, M-coop, IDMaps, and DDM all require thatthe IP addresses of both the source and the destination are knownat the time of measurement. Therefore, they cannot be used whenthe IP address of the target node is unknown. In scenarios wherea client attempts to locate close-by Internet services, the target IPaddresses of these local service nodes are usually not known in ad-vance, and must be discovered. Furthermore, storing and retrievingthe measurement information is a non-trivial task.
There are schemes that use landmark techniques for network dis-tance estimation. Landmark clustering [11, 15] uses a node’s dis-tances to a common set of landmark nodes to estimate the node’sphysical position. The intuition behind this technique is that if twonodes have similar latencies to the landmark nodes, they are likelyto be close to each other. There are several variations of landmarkclustering. In landmark ordering [15], a node measures its round-trip time to a set of landmarks and sorts the landmark nodes in theorder of increasing round-trip time (RTT). Therefore, each nodehas an associated order of landmarks. Nodes with the same (sim-
ACM SIGCOMM Computer Communication Review 49 Volume 36, Number 3, July 2006
ilar) landmark order(s) are considered to be close to each other.This technique however, cannot differentiate between nodes withthe same landmark orders.
Another variation is GNP (Global Network Positioning) [11] andits sequel NPS (Network Positioning Systems) [12]. In this scheme,landmark nodes measure RTTs among themselves and use this in-formation to compute the coordinates in a Cartesian space for eachlandmark node. These coordinates are then distributed to the clients.The client nodes measure RTTs to the landmark nodes and computethe coordinates for itself, based on the RTT measurements and thecoordinates of the landmark nodes it receives. The Euclidean dis-tance between nodes in the Cartesian space is directly used as an es-timation of the network distance. Internet Iso-bar [3] also requireseach node to measure distance to landmarks. It uses the distance in-formation to form clusters. For each cluster, it assigns a monitoringagent for the center node. Each monitor measures the distance toall other cluster-heads and this latency is used to estimate distancesbetween two hosts in different clusters.
GNP and Internet-Iso-bar require all client nodes contact thesame set of landmarks nodes, and the scheme may fail when somelandmark nodes are not available at a given instant of time. To ad-dress this problem, Lighthouse [13] allows a new node joining thenetwork to use any subset of nodes that is already in the system(i.e., lighthouses) as landmarks to compute a global network co-ordinate based on measurements to these lighthouses. Mithos [25]and PCoord [24] are similar to lighthouse in that they do not requireeach node to measure distances to all the predetermined landmarks.PIC (Practical Internet Coordinates) [4] has been proposed to use asecurity test based on triangular inequality to filter out wrong coor-dinates/measurements from the malicious landmarks.
Virtual landmarks [22] and ICS (Internet Coordinate System) [10]are also landmark-based schemes. They however, use the PCA(Principal Component Analysis) of Lipschitz embedding, insteadof Euclidean embedding, to obtain network positions. Comparedwith GNP, these schemes are computationally more efficient andrequire less dimensionality. BBS (Big-Bang Simulation) [19] onthe other hand reduces Euclidean embedding error by iterativelysimulating the error as potential force fields.
Despite the variations, current landmark clustering techniquesshare one major problem. It causes false clustering where nodesthat have similar landmark vectors but are far away in network dis-tance are clustered near each other.
Vivaldi [5] is another scheme that assigns coordinate space foreach host, but it does not require any landmarks. Instead of us-ing probing packets to measure latencies, it relies on piggybackingwhen two hosts communicate with each other. With the informa-tion obtained from passively monitoring packets (e.g., RPC pack-ets), each node adjusts its coordinates to minimize the differencebetween estimates and actual delay. Although Vivaldi is fully dis-tributed, it takes time to converge, requires applications to sampleall nodes at relatively same rate to ensure accuracy, and packetsneed to add Vivaldi-specific fields.
Meridian [26] network location service is similar in intent toNetvigator and is also focused on proximity estimation. Merid-ian forms a loosely-structured overlay network of concentric ringsbased on direct measurements. A gossip protocol is used for ex-changing information amongst the nodes. The query matching isperformed by forwarding it towards the most appropriate node.
6. CONCLUSIONSWe presented Netvigator, a network proximity estimation tool
that uses an enhanced landmark clustering technique to accuratelylocate the closest node to a given node. Our clustering algorithms
for finding the closest nodes utilize distance information from thelandmarks as well as milestones encountered en route. This ap-proach provides high accuracy as well as robustness to bad mea-surements. We developed a prototype of our scheme and evaluatedit in the real world including on planet-lab as well as HP intranet.Our experiments show that with 90% confidence, our algorithmidentifies the actual closest node.
7. REFERENCES[1] S. Banerjee, M. Pias, and T. Griffin. The interdomain connectivity of planetlab
nodes. In Proceedings of the PAM 2004.[2] Chariot, http://www.netiq.com/products/chr/default.asp.[3] Y. Chen, K. H. Lim, R. H. Katz, and C. Overton. On the stability of network
distance estimation. ACM Performance Evaluation Review, 30(2):21–30,September 2002.
[4] M. Costa, M. Castro, A. Rowstron, and P. Key. PIC: Practical internetcoordinates for distance estimation. In Proceedings of the IEEE ICDCS 2004.
[5] F. Dabek, R. Cox, F. Kaashoek, and R. Morris. Vivaldi: A decentralizednetwork coordinate system. In Proceedings of the ACM SIGCOMM 2004.
[6] R. Fonseca, P. Sharma, S. Banerjee, S.-J. Lee, and S. Basu. Distributedquerying of internet distance information. In Proceedings of the 8th IEEEGlobal Internet Symposium, Miami, FL, March 2005.
[7] P. Francis, S. Jamin, C. Jin, Y. Jin, D. Raz, Y. Shavitt, and L. Zhang. IDMaps: Aglobal internet host distance estimation service. IEEE/ACM Trans. Networking,9(5):525–540, October 2001.
[8] K. P. Gummadi, S. Saroiu, and S. D. Gribble. King: Estimating latency betweenarbitrary internet end hosts. In Proceedings of the ACM IMW 2002.
[9] J. Ledlie, P. Pietzuch, and M. Seltzer. Stable and accurate network coordinates.In Proceedings of the IEEE ICDCS 2006.
[10] H. Lim, J. C. Hou, and C.-H. Choi. Constructing internet coordinate systembased on delay measurement. In Proceedings of the ACM IMC 2003.
[11] T. S. E. Ng and H. Zhang. Predicting Internet network distance withcoordinates-based approaches. In Proceedings of the IEEE INFOCOM 2002.
[12] T. S. E. Ng and H. Zhang. A network positioning system for the internet. InProceedings of USENIX Annual Technical Conference, Boston, MA, June 2004.
[13] M. Pias, J. Crowcroft, S. Wilbur, T. Harris, and S. Bhatti. Lighthouses forscalable distributed location. In Proceedings of the IPTPS 2003.
[14] PlanetLab, http://www.planet-lab.org.[15] S. Ratnasamy, M. Handley, R. Karp, and S. Shenker. Topologically-aware
overlay construction and server selection. In Proceedings of the IEEEINFOCOM, New York, NY, June 2002.
[16] s3 scalable sensing service, http://networking.hpl.hp.com/s-cube/PL.[17] Scriptroute, http://www.cs.washington.edu/research/networking/scriptroute.[18] Y. Shavitt, X. Sun, A. Wool, and B. Yener. Computing the unmeasured: An
algebraic approach to internet mapping. IEEE J. Select. Areas Commun.,22(1):67–78, January 2004.
[19] Y. Shavitt and T. Tankel. Big-bang simulation for embedding network distancein euclidean space. In Proceedings of the IEEE INFOCOM 2003.
[20] S. Srinivasan and E. Zegura. M-coop: A scalable infrastructure for networkmeasurement. In Proceedings of the IEEE WIAPP 2003.
[21] C. Tang, Z. Xu, and S. Dwarkadas. Peer-to-peer information retrieval usingself-organizing semantic overlay networks. In Proceedings of the ACMSIGCOMM, Karlsruhe, Germany, August 2003.
[22] L. Tang and M. Crovella. Virtual landmarks for the internet. In Proceedings ofthe ACM IMC, Miami Beach, FL, October 2003.
[23] W. Theilmann and K. Rothermel. Dynamic distance maps of the Internet. InProceedings of the IEEE INFOCOM 2000.
[24] L. w. Lehman and S. Lerman. PCoord: Network position estimation usingpeer-to-peer measurements. In Proceedings of the IEEE NCA 2004.
[25] M. Waldvogel and R. Rinaldi. Efficient topology-aware overlay network. InProceedings of the ACM HotNets-I.
[26] B. Wong, A. Slivkins, and E. Sirer. Meridian: A lightweight network locationservice without virtual coordinates. In Proceedings of the ACM SIGCOMM,Philadelphia, PA, August 2005.
[27] Z. Xu, P. Sharma, S.-J. Lee, and S. Banerjee. Netvigator: Scalable networkproximity estimation. Technical Report HPL-2004-28R1, HP Laboratories,March 2005.
[28] H. Zheng, E. K. Lua, M. Pias, and T. Griffin. Internet routing policies andround-trip-times. In Proceedings of the PAM 2005.
ACM SIGCOMM Computer Communication Review 50 Volume 36, Number 3, July 2006