FOUR DEGREES OF PROXIMITY: - CiteSeerX
269
FOUR DEGREES OF PROXIMITY: KEY FACTORS THAT INFLUENCE PRIVATE SECTOR PREPAREDNESS AND CONTINUITY PLANNING by W. Michael Dunaway B.S., 1973, United States Naval Academy M.A, 1990, Fletcher School of Law and Diplomacy, Tufts University A Dissertation submitted to The School of Engineering and Applied Science of The George Washington University in partial fulfillment of the requirements for the degree of Doctor of Science 31 January 2010 Dissertation directed by Gregory L. Shaw Director, Institute for Crisis, Disaster and Risk Management Department of Engineering Management and Systems Engineering
-
Upload
khangminh22 -
Category
Documents
-
view
0 -
download
0
Transcript of FOUR DEGREES OF PROXIMITY: - CiteSeerX
FOUR DEGREES OF PROXIMITY:
KEY FACTORS THAT INFLUENCE PRIVATE SECTOR PREPAREDNESS AND CONTINUITY PLANNING
by W. Michael Dunaway
B.S., 1973, United States Naval Academy M.A, 1990, Fletcher School of Law and Diplomacy, Tufts University
A Dissertation submitted to
The School of Engineering and Applied Science of The George Washington University
in partial fulfillment of the requirements for the degree of Doctor of Science
31 January 2010
Dissertation directed by
Gregory L. Shaw Director, Institute for Crisis, Disaster and Risk Management
Department of Engineering Management and Systems Engineering
UMI Number: 3386954
All rights reserved
INFORMATION TO ALL USERS The quality of this reproduction is dependent upon the quality of the copy submitted.
In the unlikely event that the author did not send a complete manuscript
and there are missing pages, these will be noted. Also, if material had to be removed, a note will indicate the deletion.
UMI 3386954
Copyright 2010 by ProQuest LLC. All rights reserved. This edition of the work is protected against
unauthorized copying under Title 17, United States Code.
ProQuest LLC 789 East Eisenhower Parkway
P.O. Box 1346 Ann Arbor, MI 48106-1346
ii
The School of Engineering and Applied Sciences of the George Washington University
certifies that W. Michael Dunaway has passed the Final Examination for the degree of
Doctor of Science as of 02 December 2009. This is the final and approved form of the
dissertation.
FOUR DEGREES OF PROXIMITY:
KEY FACTORS THAT INFLUENCE PRIVATE SECTOR PREPAREDNESS AND CONTINUITY PLANNING
W. Michael Dunaway
Dissertation Research Committee: Gregory L. Shaw, Associate Professor, Engineering Management and Systems Engineering, Director, Institute for Crisis, Disaster and Risk Management Dissertation Director Thomas A. Mazzuchi, Professor of Engineering Management and Systems Engineering, Chair, Department of Engineering Management and Systems Engineering Committee Chairman John R. Harrald, Professor Emeritus of Engineering Management and Systems Engineering, Committee Member Julie C. Ryan, Associate Professor of Engineering Management and Systems Engineering, Committee Member Kathleen Smarick, Executive Director, National Consortium for the Study of Terrorism and Responses to Terrorism (START), University of Maryland Committee Member
iii
© Copyright 2009 by W. Michael Dunaway All rights reserved

iv
DEDICATION
This work is dedicated to the first responders and public and private sector leaders
who have worked tirelessly to keep America safe since September 11th 2001.
v
ACKNOWLEDGMENTS The list of people who have advised, encouraged and inspired this study is, of course, a
long one. The author is particularly indebted to the following individuals:
For academic guidance, counseling and support: Marvine Hamner, Jack Harrald, Greg
Shaw, and Julie Ryan, the George Washington University; Monica Schoch-Spana, Center
for Bio-Security, University of Pittsburgh; Gary LaFree and Kathleen Smarick,
University of Maryland; Kathleen Tierney and Dennis Mileti, University of Colorado,
Boulder; Susan Cutter, University of South Carolina; Fran Norris, Dartmouth College;
and Andy Felts, the College of Charleston.
For professional advice and a First Responder’s perspective: Chief Ed Sherlock, Captain
Tom Wilson, Barbara Fay and Cathy Welker in Annapolis; John Simsen in Galveston;
and David Maack in Racine. For insight into public/private partnerships: Brit Weber,
Michigan State University; Ann Patton, Tulsa Partners; Tom Moran, All Hazards
Consortium; Len Pagano, SafeAmerica Foundation, and Warren Edwards, Community
and Regional Resilience Institute.
For patience and understanding: Jane, Sarah and Missy.
This material is based upon work supported by the Science and Technology directorate of the U.S. Department of Homeland Security under Grant Award Numbers N00140510629 and 2008-ST-061-ST0004, made to the National Consortium for the Study of Terrorism and Responses to Terrorism (START, www.start.umd.edu). The views and conclusions contained in this document are those of the authors and should not be interpreted as necessarily representing the official policies, either expressed or implied, of the U.S. Department of Homeland Security or START.
vi
ABSTRACT
FOUR DEGREES OF PROXIMITY: KEY FACTORS THAT INFLUENCE PRIVATE SECTOR
PREPAREDNESS AND CONTINUITY PLANNING
Numerous federal documents issued since September 11, 2001 have emphasized
that private sector business and industry share equal responsibility with government for
the security of the nation’s critical infrastructure and key assets. The National Response
Framework (2008) further states that private sector entities have a role in the safety,
security and resilience of their communities. Yet, eight years after 9/11, only a fraction of
U.S. businesses and non-profits have taken adequate measures to protect their assets,
property and employees from the threat of harm from natural disasters or human-caused
incidents. To understand this disparity, this dissertation examined four factors that
influence the adoption of business continuity planning and emergency preparedness
measures within the private sector. The study conducted an online survey of 145
businesses, industries and non-profit organizations to assess the adoption of 12 specific
preparedness measures. From this data, the study developed a cognitive model
highlighting four “degrees of proximity” that could influence the commitment of a
business or organization to adopt continuity planning and emergency preparedness
programs:
(1) Geographic proximity (exposure): the physical proximity or exposure of a private sector entity to hazards or threats that affect the organization and its environment.
(2) Temporal proximity (experience): whether—and if so, how recently—a private
sector entity had experience with a disaster or emergency that affected the organization.
(3) Proximity of capability (capability): whether the private sector entity has at hand
the capability to manage a threat to its viability assessed as a function of the entity’s size.
vii
(4) Organizational proximity (collaboration): whether or not the private sector entity participates in a collaborative organization for regional emergency planning and preparedness.
The results confirm earlier research—and much of the experiential and anecdotal
information in the disaster and risk literature—that two key factors affect decisions of
private sector entities to adopt continuity planning measures: previous experience in a
disaster and the size of the organization. Owing to the varied level of survey participation
and the intervention of two natural disasters during the survey, the direct influence of
geographic exposure to hazards was less clear. However, the data did reveal that
participation in an organization dedicated to collaborative planning and mutual support
can have a motivating effect on preparedness equivalent to past experience in a disaster
or an increase in capability equal to the difference between a small and a medium-size
business. The data further identified a consistent hierarchy among the 12 preparedness
measures, indicating a strong prevalence or preference among private sector businesses
and non-profits for certain types of preparedness measures over others. Lastly, the
research identified a strong concern among business owners regarding hazards and
threats to organization viability that originate from natural disasters or that threaten
physical or intellectual property. There was relatively little concern exhibited for the
threat posed by terrorism.
The results of this study shed light on perceptions of risk and priorities for
preparedness measures within the private sector. The study further provides information
relevant to government policies and programs aimed at increasing continuity planning
within the private sector and specifically identifies the value of public-private

viii
partnerships for encouraging participation in efforts that protect business interests while
building community resilience against hazards and disasters.
KEYWORDS: Business continuity planning Emergency management Continuity of operations Private Sector Disaster preparedness Resilience

ix
TABLE OF CONTENTS
DEDICATION............................................................................................................... iv ACKNOWLEDGMENTS ...............................................................................................v ABSTRACT...................................................................................................................vi TABLE OF CONTENTS ............................................................................................... ix LIST OF FIGURES........................................................................................................xi LIST OF TABLES .......................................................................................................xiv LIST OF ACRONYMS................................................................................................. xv GLOSSARY OF TERMS............................................................................................xvii CHAPTER 1: INTRODUCTION ...................................................................................1 1.0 Background ..............................................................................................................1 1.1 Statement of the problem and research hypothesis ....................................................5 1.2 Significance of this study..........................................................................................8 1.3 Dissertation structure................................................................................................9 CHAPTER 2: LITERATURE REVIEW....................................................................... 12 2.0 Overview................................................................................................................ 12 2.1 Disaster, hazards and risk research.......................................................................... 14 2.1.1 Disaster as history, sociology and anthropology 20 2.1.2 Disaster research 26 2.1.3 Hazards and risk research 42 2.1.4 Heuristics 48 2.2 Business continuity management ............................................................................ 55 2.3 Federal agency documents...................................................................................... 61 2.4 Regional approaches and best practices................................................................... 78 2.5 The internet ............................................................................................................ 82 CHAPTER 3: CONCEPTUAL MODELS AND FRAMEWORKS............................... 88 3.0 Overview................................................................................................................ 88 3.1 Modeling risk ......................................................................................................... 92 3.2 Modeling resilience ................................................................................................ 99 3.3 Modeling distance and proximity.......................................................................... 103 3.4 Reasoned action and technology acceptance ......................................................... 107 3.5 Decision-making for planning and operations ....................................................... 113 CHAPTER 4: METHOD, APPROACH AND RESULTS.......................................... 122 4.0 Overview.............................................................................................................. 122 4.1 Research method .................................................................................................. 125 4.2 Analytic approach................................................................................................. 127 4.3 Survey method...................................................................................................... 132 4.4 Survey structure........................................................................................... 136 4.5 Summary of results ........................................................................................... 141 4.5.1 Characteristics of participants 142

x
4.5.2 Perceptions of risk and threat 145 4.5.3 Perceptions of federal, state and local responsibilities 147 CHAPTER 5: HYPOTHESES, TESTING AND ANALYSIS..................................... 150 5.0 Overview.............................................................................................................. 150 5.1 Descriptive statistics, tests of significance, and box plots........................................157 5.3 Skewness and tests of normality: Anderson-Darling test 171 5.4 Non-Parametric tests: Kruskal-Wallis test 175 5.5 Pareto charts of preparedness measures 177 5.6 Correlation of proximities among private sector entities 181 5.7 Influences on participation in a collaborative partnership 186 CHAPTER 6: SUMMARY OF RESULTS................................................................. 190 6.0 Overview.............................................................................................................. 190 6.1 Analysis of research results................................................................................... 190 6.2 Limitations and agenda for further research .......................................................... 196 6.3 The question of motivation .................................................................................. 199 6.4 Conclusion: A framework for private sector preparedness..................................... 203 REFERENCES............................................................................................................ 214 APPENDIX A: SAMPLE SURVEY .......................................................................... 238
xi
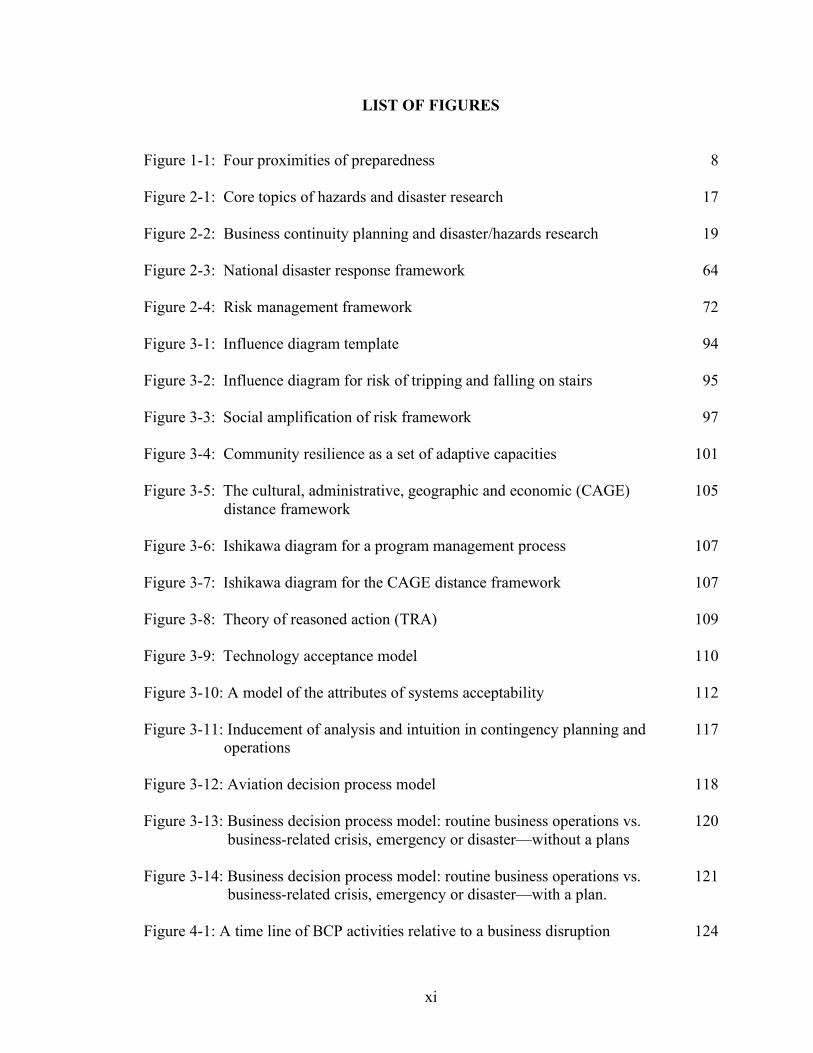
LIST OF FIGURES
Figure 1-1: Four proximities of preparedness 8 Figure 2-1: Core topics of hazards and disaster research 17 Figure 2-2: Business continuity planning and disaster/hazards research 19 Figure 2-3: National disaster response framework 64 Figure 2-4: Risk management framework 72 Figure 3-1: Influence diagram template 94 Figure 3-2: Influence diagram for risk of tripping and falling on stairs 95 Figure 3-3: Social amplification of risk framework 97 Figure 3-4: Community resilience as a set of adaptive capacities 101 Figure 3-5: The cultural, administrative, geographic and economic (CAGE) 105 distance framework Figure 3-6: Ishikawa diagram for a program management process 107 Figure 3-7: Ishikawa diagram for the CAGE distance framework 107 Figure 3-8: Theory of reasoned action (TRA) 109 Figure 3-9: Technology acceptance model 110 Figure 3-10: A model of the attributes of systems acceptability 112 Figure 3-11: Inducement of analysis and intuition in contingency planning and 117 operations Figure 3-12: Aviation decision process model 118 Figure 3-13: Business decision process model: routine business operations vs. 120 business-related crisis, emergency or disaster—without a plans Figure 3-14: Business decision process model: routine business operations vs. 121 business-related crisis, emergency or disaster—with a plan. Figure 4-1: A time line of BCP activities relative to a business disruption 124
xii
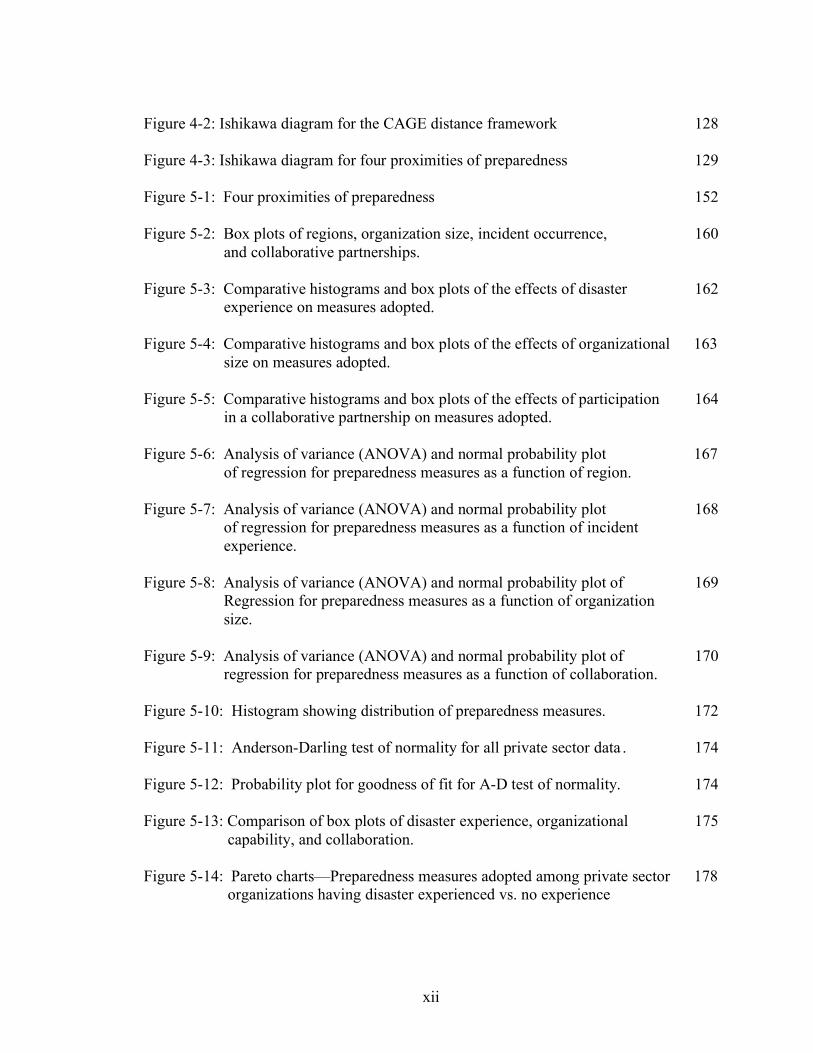
Figure 4-2: Ishikawa diagram for the CAGE distance framework 128 Figure 4-3: Ishikawa diagram for four proximities of preparedness 129 Figure 5-1: Four proximities of preparedness 152 Figure 5-2: Box plots of regions, organization size, incident occurrence, 160 and collaborative partnerships. Figure 5-3: Comparative histograms and box plots of the effects of disaster 162 experience on measures adopted. Figure 5-4: Comparative histograms and box plots of the effects of organizational 163 size on measures adopted. Figure 5-5: Comparative histograms and box plots of the effects of participation 164 in a collaborative partnership on measures adopted. Figure 5-6: Analysis of variance (ANOVA) and normal probability plot 167 of regression for preparedness measures as a function of region. Figure 5-7: Analysis of variance (ANOVA) and normal probability plot 168 of regression for preparedness measures as a function of incident experience. Figure 5-8: Analysis of variance (ANOVA) and normal probability plot of 169 Regression for preparedness measures as a function of organization size. Figure 5-9: Analysis of variance (ANOVA) and normal probability plot of 170 regression for preparedness measures as a function of collaboration. Figure 5-10: Histogram showing distribution of preparedness measures. 172 Figure 5-11: Anderson-Darling test of normality for all private sector data . 174 Figure 5-12: Probability plot for goodness of fit for A-D test of normality. 174 Figure 5-13: Comparison of box plots of disaster experience, organizational 175 capability, and collaboration. Figure 5-14: Pareto charts—Preparedness measures adopted among private sector 178 organizations having disaster experienced vs. no experience
xiii
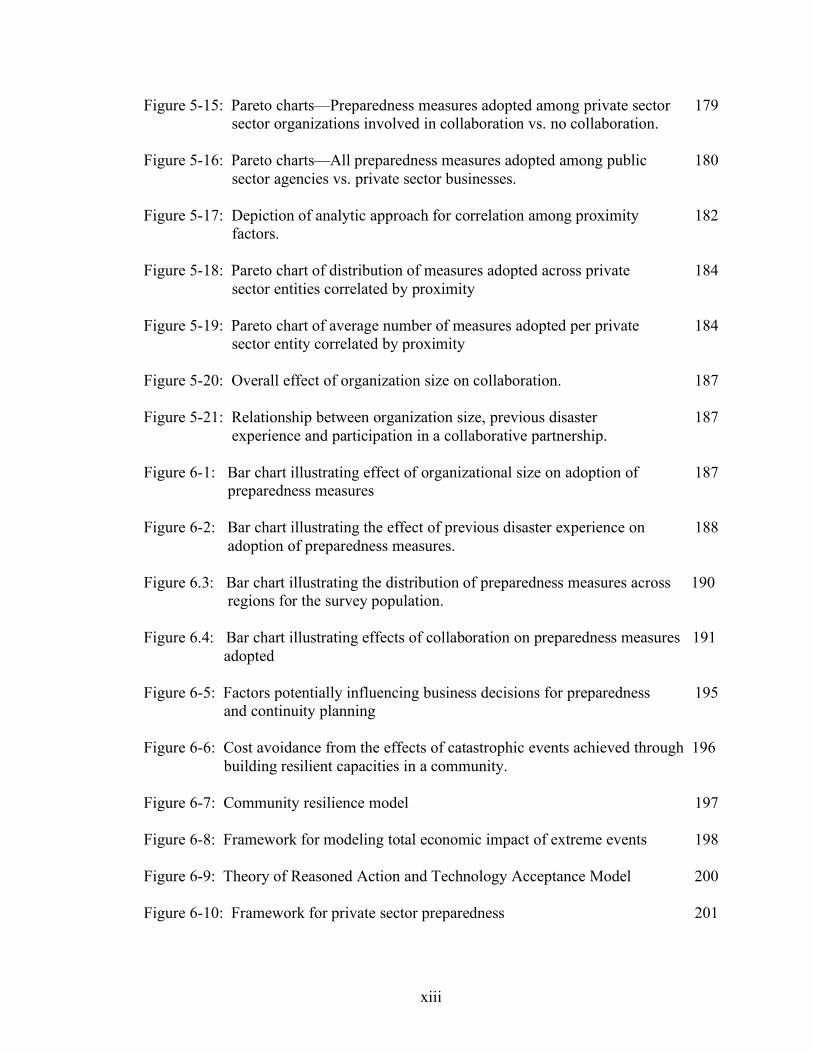
Figure 5-15: Pareto charts—Preparedness measures adopted among private sector 179 sector organizations involved in collaboration vs. no collaboration. Figure 5-16: Pareto charts—All preparedness measures adopted among public 180 sector agencies vs. private sector businesses. Figure 5-17: Depiction of analytic approach for correlation among proximity 182 factors. Figure 5-18: Pareto chart of distribution of measures adopted across private 184 sector entities correlated by proximity Figure 5-19: Pareto chart of average number of measures adopted per private 184 sector entity correlated by proximity Figure 5-20: Overall effect of organization size on collaboration. 187 Figure 5-21: Relationship between organization size, previous disaster 187 experience and participation in a collaborative partnership. Figure 6-1: Bar chart illustrating effect of organizational size on adoption of 187 preparedness measures Figure 6-2: Bar chart illustrating the effect of previous disaster experience on 188 adoption of preparedness measures. Figure 6.3: Bar chart illustrating the distribution of preparedness measures across 190 regions for the survey population. Figure 6.4: Bar chart illustrating effects of collaboration on preparedness measures 191 adopted Figure 6-5: Factors potentially influencing business decisions for preparedness 195 and continuity planning Figure 6-6: Cost avoidance from the effects of catastrophic events achieved through 196 building resilient capacities in a community. Figure 6-7: Community resilience model 197 Figure 6-8: Framework for modeling total economic impact of extreme events 198 Figure 6-9: Theory of Reasoned Action and Technology Acceptance Model 200 Figure 6-10: Framework for private sector preparedness 201
xiv
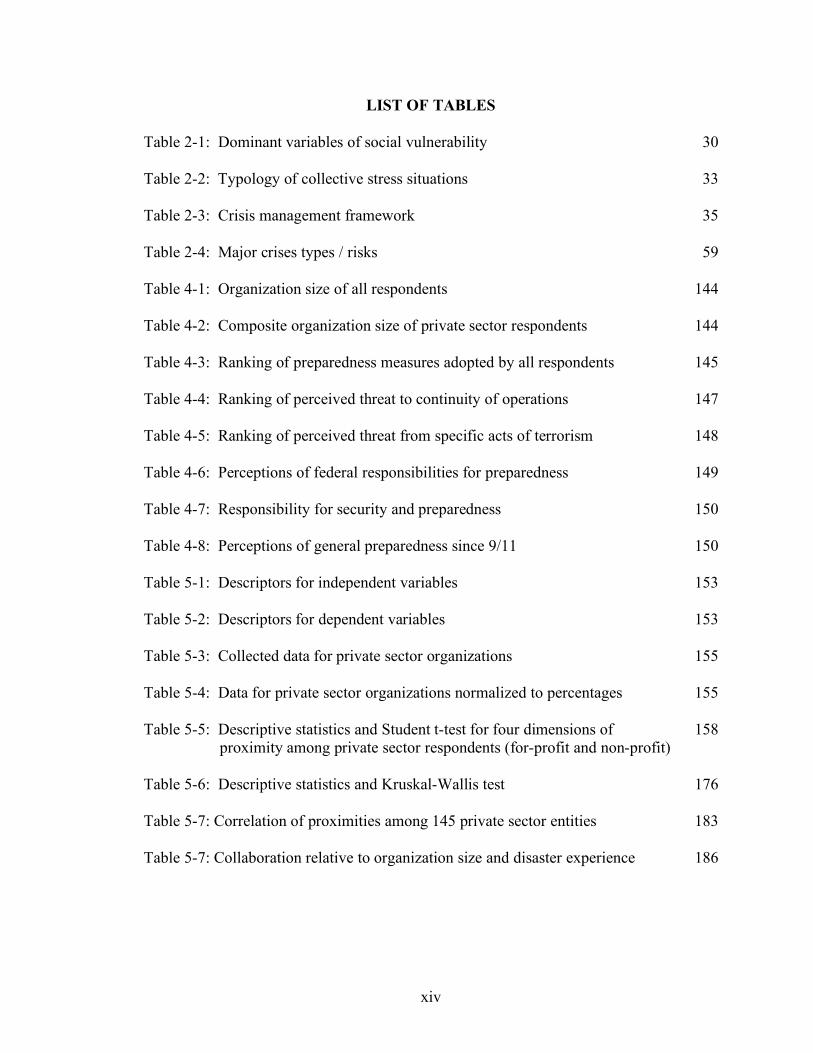
LIST OF TABLES
Table 2-1: Dominant variables of social vulnerability 30 Table 2-2: Typology of collective stress situations 33 Table 2-3: Crisis management framework 35 Table 2-4: Major crises types / risks 59 Table 4-1: Organization size of all respondents 144 Table 4-2: Composite organization size of private sector respondents 144 Table 4-3: Ranking of preparedness measures adopted by all respondents 145 Table 4-4: Ranking of perceived threat to continuity of operations 147 Table 4-5: Ranking of perceived threat from specific acts of terrorism 148 Table 4-6: Perceptions of federal responsibilities for preparedness 149 Table 4-7: Responsibility for security and preparedness 150 Table 4-8: Perceptions of general preparedness since 9/11 150 Table 5-1: Descriptors for independent variables 153 Table 5-2: Descriptors for dependent variables 153 Table 5-3: Collected data for private sector organizations 155 Table 5-4: Data for private sector organizations normalized to percentages 155 Table 5-5: Descriptive statistics and Student t-test for four dimensions of 158 proximity among private sector respondents (for-profit and non-profit) Table 5-6: Descriptive statistics and Kruskal-Wallis test 176 Table 5-7: Correlation of proximities among 145 private sector entities 183 Table 5-7: Collaboration relative to organization size and disaster experience 186
xv
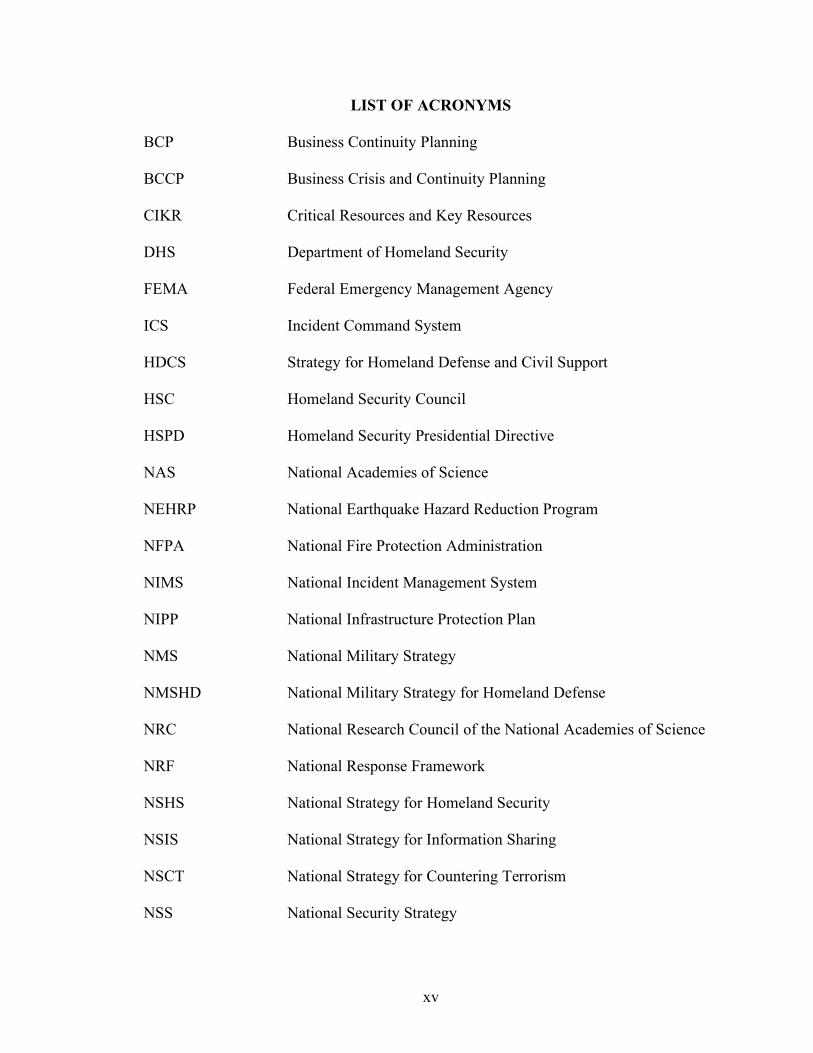
LIST OF ACRONYMS
BCP Business Continuity Planning
BCCP Business Crisis and Continuity Planning
CIKR Critical Resources and Key Resources
DHS Department of Homeland Security
FEMA Federal Emergency Management Agency
ICS Incident Command System
HDCS Strategy for Homeland Defense and Civil Support
HSC Homeland Security Council
HSPD Homeland Security Presidential Directive
NAS National Academies of Science
NEHRP National Earthquake Hazard Reduction Program
NFPA National Fire Protection Administration
NIMS National Incident Management System
NIPP National Infrastructure Protection Plan
NMS National Military Strategy
NMSHD National Military Strategy for Homeland Defense
NRC National Research Council of the National Academies of Science
NRF National Response Framework
NSHS National Strategy for Homeland Security
NSIS National Strategy for Information Sharing
NSCT National Strategy for Countering Terrorism
NSS National Security Strategy

xvi
PS PREP Private Sector Voluntary Preparedness Certification Program
Y2K Year 2000 (refers to the world-wide change in computer clock time
that occurred at midnight on 31 December 1999)
xvii
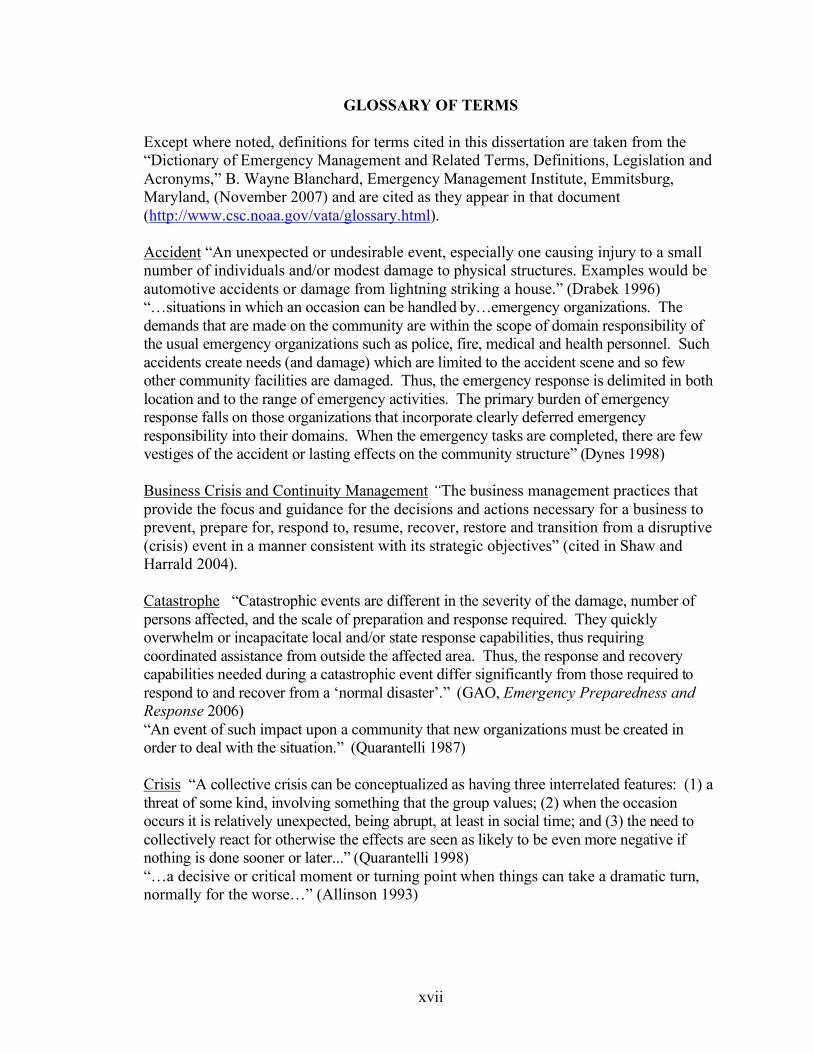
GLOSSARY OF TERMS Except where noted, definitions for terms cited in this dissertation are taken from the “Dictionary of Emergency Management and Related Terms, Definitions, Legislation and Acronyms,” B. Wayne Blanchard, Emergency Management Institute, Emmitsburg, Maryland, (November 2007) and are cited as they appear in that document (http://www.csc.noaa.gov/vata/glossary.html). Accident “An unexpected or undesirable event, especially one causing injury to a small number of individuals and/or modest damage to physical structures. Examples would be automotive accidents or damage from lightning striking a house.” (Drabek 1996) “…situations in which an occasion can be handled by…emergency organizations. The demands that are made on the community are within the scope of domain responsibility of the usual emergency organizations such as police, fire, medical and health personnel. Such accidents create needs (and damage) which are limited to the accident scene and so few other community facilities are damaged. Thus, the emergency response is delimited in both location and to the range of emergency activities. The primary burden of emergency response falls on those organizations that incorporate clearly deferred emergency responsibility into their domains. When the emergency tasks are completed, there are few vestiges of the accident or lasting effects on the community structure” (Dynes 1998) Business Crisis and Continuity Management “The business management practices that provide the focus and guidance for the decisions and actions necessary for a business to prevent, prepare for, respond to, resume, recover, restore and transition from a disruptive (crisis) event in a manner consistent with its strategic objectives” (cited in Shaw and Harrald 2004). Catastrophe “Catastrophic events are different in the severity of the damage, number of persons affected, and the scale of preparation and response required. They quickly overwhelm or incapacitate local and/or state response capabilities, thus requiring coordinated assistance from outside the affected area. Thus, the response and recovery capabilities needed during a catastrophic event differ significantly from those required to respond to and recover from a ‘normal disaster’.” (GAO, Emergency Preparedness and Response 2006) “An event of such impact upon a community that new organizations must be created in order to deal with the situation.” (Quarantelli 1987) Crisis “A collective crisis can be conceptualized as having three interrelated features: (1) a threat of some kind, involving something that the group values; (2) when the occasion occurs it is relatively unexpected, being abrupt, at least in social time; and (3) the need to collectively react for otherwise the effects are seen as likely to be even more negative if nothing is done sooner or later...” (Quarantelli 1998) “…a decisive or critical moment or turning point when things can take a dramatic turn, normally for the worse…” (Allinson 1993)
xviii
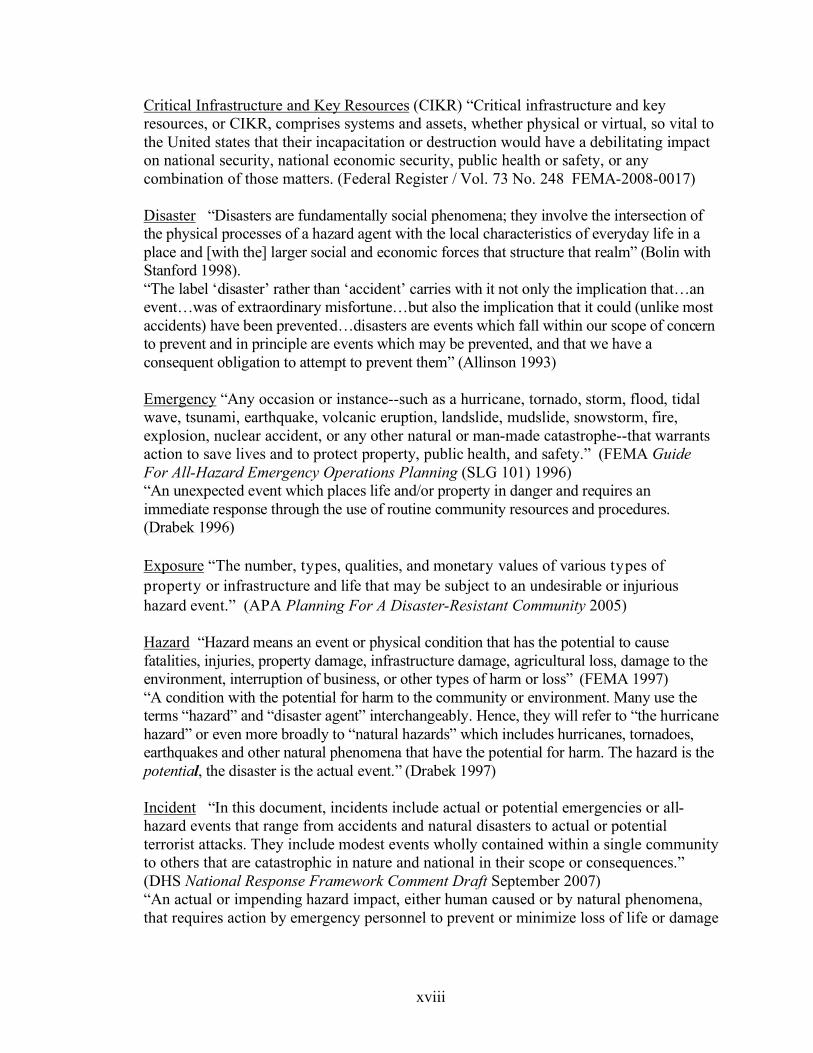
Critical Infrastructure and Key Resources (CIKR) “Critical infrastructure and key resources, or CIKR, comprises systems and assets, whether physical or virtual, so vital to the United states that their incapacitation or destruction would have a debilitating impact on national security, national economic security, public health or safety, or any combination of those matters. (Federal Register / Vol. 73 No. 248 FEMA-2008-0017) Disaster “Disasters are fundamentally social phenomena; they involve the intersection of the physical processes of a hazard agent with the local characteristics of everyday life in a place and [with the] larger social and economic forces that structure that realm” (Bolin with Stanford 1998). “The label ‘disaster’ rather than ‘accident’ carries with it not only the implication that…an event…was of extraordinary misfortune…but also the implication that it could (unlike most accidents) have been prevented…disasters are events which fall within our scope of concern to prevent and in principle are events which may be prevented, and that we have a consequent obligation to attempt to prevent them” (Allinson 1993) Emergency “Any occasion or instance--such as a hurricane, tornado, storm, flood, tidal wave, tsunami, earthquake, volcanic eruption, landslide, mudslide, snowstorm, fire, explosion, nuclear accident, or any other natural or man-made catastrophe--that warrants action to save lives and to protect property, public health, and safety.” (FEMA Guide For All-Hazard Emergency Operations Planning (SLG 101) 1996) “An unexpected event which places life and/or property in danger and requires an immediate response through the use of routine community resources and procedures. (Drabek 1996) Exposure “The number, types, qualities, and monetary values of various types of property or infrastructure and life that may be subject to an undesirable or injurious hazard event.” (APA Planning For A Disaster-Resistant Community 2005) Hazard “Hazard means an event or physical condition that has the potential to cause fatalities, injuries, property damage, infrastructure damage, agricultural loss, damage to the environment, interruption of business, or other types of harm or loss” (FEMA 1997) “A condition with the potential for harm to the community or environment. Many use the terms “hazard” and “disaster agent” interchangeably. Hence, they will refer to “the hurricane hazard” or even more broadly to “natural hazards” which includes hurricanes, tornadoes, earthquakes and other natural phenomena that have the potential for harm. The hazard is the potential, the disaster is the actual event.” (Drabek 1997) Incident “In this document, incidents include actual or potential emergencies or all-hazard events that range from accidents and natural disasters to actual or potential terrorist attacks. They include modest events wholly contained within a single community to others that are catastrophic in nature and national in their scope or consequences.” (DHS National Response Framework Comment Draft September 2007) “An actual or impending hazard impact, either human caused or by natural phenomena, that requires action by emergency personnel to prevent or minimize loss of life or damage
xix
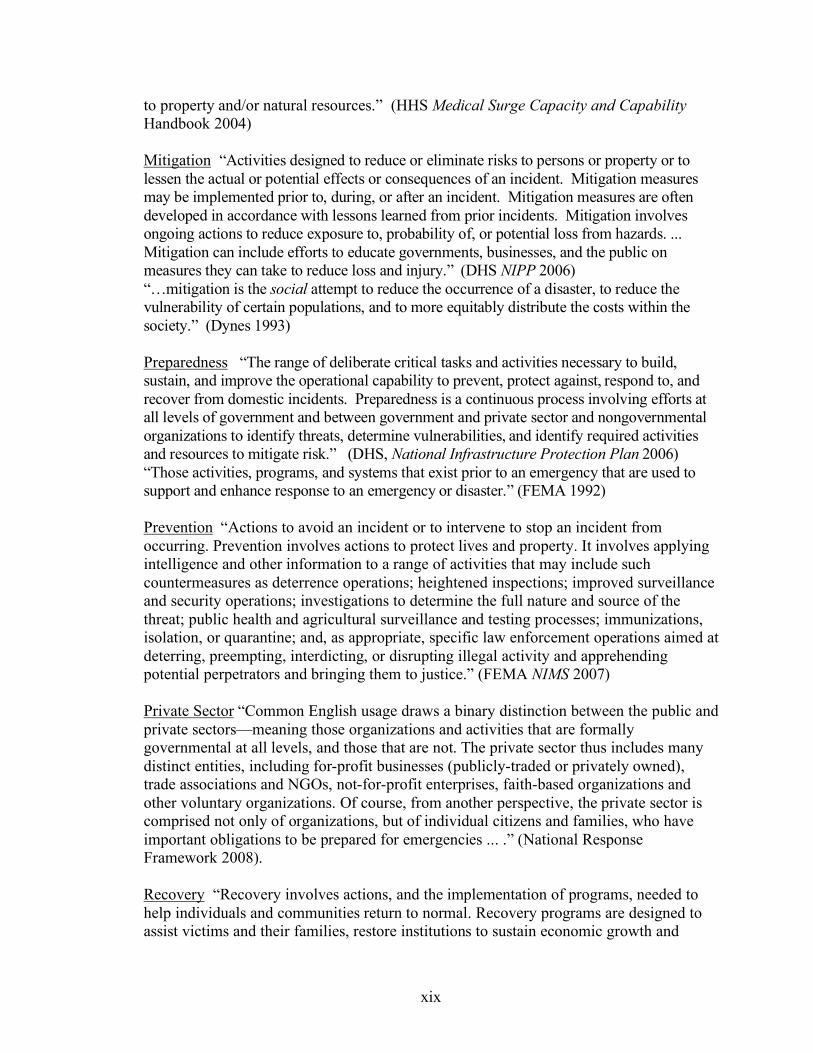
to property and/or natural resources.” (HHS Medical Surge Capacity and Capability Handbook 2004) Mitigation “Activities designed to reduce or eliminate risks to persons or property or to lessen the actual or potential effects or consequences of an incident. Mitigation measures may be implemented prior to, during, or after an incident. Mitigation measures are often developed in accordance with lessons learned from prior incidents. Mitigation involves ongoing actions to reduce exposure to, probability of, or potential loss from hazards. ... Mitigation can include efforts to educate governments, businesses, and the public on measures they can take to reduce loss and injury.” (DHS NIPP 2006) “…mitigation is the social attempt to reduce the occurrence of a disaster, to reduce the vulnerability of certain populations, and to more equitably distribute the costs within the society.” (Dynes 1993) Preparedness “The range of deliberate critical tasks and activities necessary to build, sustain, and improve the operational capability to prevent, protect against, respond to, and recover from domestic incidents. Preparedness is a continuous process involving efforts at all levels of government and between government and private sector and nongovernmental organizations to identify threats, determine vulnerabilities, and identify required activities and resources to mitigate risk.” (DHS, National Infrastructure Protection Plan 2006) “Those activities, programs, and systems that exist prior to an emergency that are used to support and enhance response to an emergency or disaster.” (FEMA 1992) Prevention “Actions to avoid an incident or to intervene to stop an incident from occurring. Prevention involves actions to protect lives and property. It involves applying intelligence and other information to a range of activities that may include such countermeasures as deterrence operations; heightened inspections; improved surveillance and security operations; investigations to determine the full nature and source of the threat; public health and agricultural surveillance and testing processes; immunizations, isolation, or quarantine; and, as appropriate, specific law enforcement operations aimed at deterring, preempting, interdicting, or disrupting illegal activity and apprehending potential perpetrators and bringing them to justice.” (FEMA NIMS 2007) Private Sector “Common English usage draws a binary distinction between the public and private sectors—meaning those organizations and activities that are formally governmental at all levels, and those that are not. The private sector thus includes many distinct entities, including for-profit businesses (publicly-traded or privately owned), trade associations and NGOs, not-for-profit enterprises, faith-based organizations and other voluntary organizations. Of course, from another perspective, the private sector is comprised not only of organizations, but of individual citizens and families, who have important obligations to be prepared for emergencies ... .” (National Response Framework 2008). Recovery “Recovery involves actions, and the implementation of programs, needed to help individuals and communities return to normal. Recovery programs are designed to assist victims and their families, restore institutions to sustain economic growth and
xx
confidence, rebuild destroyed property, and reconstitute government operations and services. Recovery actions often extend long after the incident itself. Recovery programs include mitigation components designed to avoid damage from future incidents. (DHS, National Response Plan (Draft) 2004). “Activities and programs designed to return conditions to a level that is acceptable to the entity.” (NFPA 1600, 2007) Resilience “In the context of the NIPP, resiliency is the capability of an asset, system, or network to maintain its function during or to recover from a terrorist attack or other incident.” (DHS NIPP 2006) “The capacity of a system, community or society to resist or to change in order that it may obtain an acceptable level in functioning and structure. This is determined by the degree to which the social system is capable of organizing itself, and the ability to increase its capacity for learning and adaptation, including the capacity to recover from a disaster.” (UN/ISDR 2002) Response “Those activities and programs designed to address the immediate and short-term effects of the onset of an emergency or disaster.” (FEMA 1992) “The term ‘response’ as used in this Framework includes immediate actions to save lives, protect property and meet basic human needs. Response also includes the execution of emergency plans and actions to support short-term recovery. (DHS National Response Framework 2008) Risk “A measure of potential harm that encompasses threat, vulnerability, and consequence. In the context of the NIPP, risk is the expected magnitude of loss due to a terrorist attack, natural disaster, or other incident, along with the likelihood of such an event occurring and causing that loss.” (DHS NIPP 2006) “The estimated impact that a hazard would have on people, services, facilities, and structures in a community; the likelihood of a hazard event resulting in an adverse condition that causes injury or damage. Risk is often expressed in relative terms such as a high, moderate, or low likelihood of sustaining damage above a particular threshold due to a specific type of hazard event. (FEMA 2001) Threat “The likelihood of a hazard occurring.” (HHS Medical Surge Capacity and Capability Handbook 2004) “An indication of possible violence, harm, or danger.” (FEMA NIMS Draft 2007) Vulnerability “A measure of the extent to which a potential event is likely to deplete or damage available resources such that the reestablishment of usual living conditions cannot be achieved within a reasonable period. In this sense vulnerability may be measured as a ratio of damaged to undamaged resources.” (Buckle 1995) “Vulnerability to disasters is a status resulting from human action. It describes the degree to which a society is either threatened by or protected from the impact of natural hazards. This depends on the condition of human settlements and their infrastructure, the way in which public policy and administration are engaged in disaster management, the level of information and education about hazards and how to deal with them.” (UN ISDR 2001)

xxi
“A weakness in the design, implementation, or operation of an asset, system, or network that can be exploited by an adversary, or disrupted by a natural hazard or technological failure.” (DHS NIPP 2006)
1
CHAPTER 1: INTRODUCTION 1.0 Background
1.1 Statement of the problem and research hypothesis
1.2 Significance of this study
1.3 Dissertation structure
1.0 Background More than eight years have passed since the terrorist attacks on the World Trade
Center and the Pentagon, and over four since Hurricanes Katrina and Rita devastated the
Gulf Coast. During that period it has become an article of faith that private sector
business and industry share equal responsibility with public sector government and
agencies for the protection of America’s assets, resources, critical infrastructures, and the
lives and livelihood of the nation’s citizens. National strategies issued by the federal
government since 9/11 have increasingly emphasized the shared responsibility for
homeland security between the public and private sectors (for example, the National
Strategy for Homeland Security [2002]; the National Strategy for Countering Terrorism
[2003]; the National Response Plan [2004]; the National Strategy for Pandemic Influenza
(2005); National Infrastructure Protection Plan [2006]; and the National Response
Framework [2008]).
Implicit in this charge is an assumption that the degree of security and resilience
attained in a community is a function of the level of coordination and involvement
between local government, local response agencies and the private sector—to include
businesses, non-profit associations, faith-based groups, and private voluntary
organizations. Indeed, the National Response Framework states that “During an incident,

2
key private sector business partners should be involved in the local crisis decision-
making process or at least have a direct link to key local emergency managers.
Communities cannot effectively respond to, or recover from, incidents without strong
cooperative relations with the private sector.” [NRF, 2008], (emphasis added).
Business and industry have long recognized the need to protect assets and core
organizational functions from threats posed by natural disasters and technological or
man-made incidents. Indeed, business functions directed toward ensuring continuity of
operations and disaster recovery have in recent years become professional competencies
and corporate line responsibilities in their own right, especially in larger organizations
where institutional complexity and sheer size require formal training in continuity
planning and the dedication of corporate assets and personnel to that purpose [Amato-
McCoy, 2006; Black, 2005; Rose 2009]. Recently, the term Business Crisis and
Continuity Management (BCCM) has been proposed as a more accurate name for the
business process that consolidates the traditional—and often separable—functions of
crisis management, risk assessment, emergency management and disaster recovery, and
business continuity planning [Shaw and Harrald, 2004]. There has also been recent
recognition that some measure of standardization and measurable competence among
private sector entities would be desirable.
As an indication of the growing momentum in this direction, Title IX of House
Resolution 1, Implementing Recommendations of the 9/11 Commission Act of 2007
establishes a Voluntary Private Sector Preparedness Accreditation and Certification
Program intended to certify private sector businesses in a “common set of criteria for
preparedness, disaster management, emergency management, and business continuity
3
programs.”1 The Department of Homeland Security has since begun crafting guidelines
for a voluntary private sector certification program in all-hazards business preparedness
that would implement this legislation. Title IX (section 524) cites the American National
Standards Institute’s Standard for Disaster/ Emergency Management and Business
Continuity Programs (ANSI/NFPA 1600) as the model for program envisioned, and
provides for third-party entities to manage the certification process, and not the
government itself.
The adoption of NFPA 1600 by private sector businesses or non-profits is itself a
voluntary program, and NFPA 1600 adds a caveat regarding the challenge of
implementing common standards across multiple agencies or organizations, noting that
“plans for business continuity, continuity of government and continuity of operations are
generally more similar in intent and less similar in content” [NFPA 1600, 14].
Therein lies a problem with the current state of continuity of operations planning
generally, and with business continuity planning specifically. With the exception of
certain federally regulated industries (e.g., nuclear power; transportation; aviation;
chemical production), business continuity programs are directed almost universally
toward survival of the corporate entity and its profitability; little regard is paid to the
condition of the social or economic environment that the corporation inhabits. The
National Response Framework effectively acknowledges this, providing that, “private
sector organizations and NGOs (non-governmental organizations) are encouraged to
develop contingency plans and to work with State and local planners to ensure that their
1 USC Title IX (Private Sector Preparedness) Sec. 524 Voluntary Private Sector Preparedness Accreditation and Certification Program (110th Congress, H.R.1, Implementing Recommendations of the 9/11 Commission Act of 2007), August 3, 2007 (Public Law No. 110-53) at http://thomas.loc.gov/cgi-bin/query/F?c110:5:./temp/~c110fnUs5s:e317311.
4
plans are consistent with pertinent plans, the NIMS (National Incident Management
System) and this Framework” [NRF, 6] (emphasis added). They are not, however,
required to do so.
In short, business continuity planning as currently practiced is essentially an
internally-focused enterprise with formalized processes directed toward the preservation
of corporate operations, capital and profitability with little regard for the benefits that
might be gained or economies that could be achieved through coordinated effort with
local agencies or organizations. [Flynn and Prieto, 2006]. NFPA 1600 does make
reference to the need for “mutual support,” though stipulating only that “the need for
mutual aid/assistance shall be determined” [NFPA 1600, p. 6]. What NFPA 1600 does
not do is to identify a relationship or establish the requirement for coordination between
private and public sector entities in disaster planning, response and recovery that would
begin to address the deficiency highlighted by the National Response Framework that
“communities cannot effectively respond to, or recover from, emergencies or disasters
without strong cooperative relations with private sector businesses” [NRF, p. 8].
In spite of the emphasis placed on business continuity programs in recent years, and
the current attempts to standardize procedures, there remains a less than enthusiastic
adoption of voluntary standards or willingness on the part of business to commit
resources to continuity and preparedness programs. For example, a recent analysis by
Mitroff and Alpaslan found that less than 25 % of Fortune 500 companies could be
considered capable of successfully managing a corporate crisis. [Mitroff and Alpaslan,
2003].
5
A fundamental question of business continuity and preparedness programs, then, is
whether private sector entities are truly prepared to protect their own interests and
welfare, much less participate effectively in planning initiatives or programs intended to
address the broader aspects of community resilience, security and cohesiveness called for
in the National Response Framework. And yet, with the stakes so clearly defined by the
well-known scale of loss experienced in the World Trade Center attacks in New York
City, and again along the Gulf Coast following Hurricanes Katrina, (and more recently
Hurricanes Gustav and Ike) one must ask, why would private sector businesses, industries
and organizations not participate in these initiatives? Are their any factors that would
reliably motivate the private sector to embrace emergency preparedness and continuity
planning initiatives?
1.1 Statement of the problem and research hypothesis These fundamental questions are the genesis of this research project. In succeeding
chapters, this dissertation will conduct a review of relevant literature, describe a survey of
private sector organizations, construct and test a statistical model of the data collected
from that survey, and develop a cognitive framework as an approach to understanding
motivation among private sector business, industry, and non-profit organizations toward
the adoption of emergency preparedness and continuity planning measures.
In a recent historical review of emergency management practices entitled, Emergency
Management: The American Experience 1900-2005, Claire Rubin articulates a hypothesis
about the broad evolution of emergency management practice in the United States:
“The hypothesis of this book is that changes in emergency management policies, authorities, and processes are event-driven, and major focusing events have provided an
6
opportunity to explore the effect of disasters on emergency management principles and practices.” [Rubin, 2007 (4)]
In a corollary fashion, this study asserts that focusing events occur not just at the
regional level with professional, cultural or national-level implications, but at the local
level with implications for decisions made by individual businesses, organizations and
communities regarding the adoption of policies and measures to prepare for, respond to
and mitigate the effects of local disasters and emergencies. The broad objective of this
research project is to make an attempt at identifying the degree to which focusing events
affecting an organization’s welfare might motivate its adoption of emergency
preparedness and business continuity measures within that organization.
To accomplish this objective, the study examines the influence of four factors on the
motivation of private sector businesses and non-profit organizations to adopt emergency
preparedness and continuity planning measures. The study analyzes the rate or extent of
adoption of twelve specific preparedness measures across a survey population of
businesses, industries and non-profit organizations in four regions of the country. It
develops a cognitive model highlighting the four key “degrees of proximity” that can
influence the commitment of a business or organization to adopt continuity planning and
emergency preparedness programs. It analyzes data gathered from the online survey and
develops a statistical model of the relationships between private sector business and non-
profit organizations and the range of preparedness measures that the private sector
entities adopted. Finally, it suggests a framework for conceptualizing the private sector
role in improving community preparedness and resilience against natural, man-made and
technological disasters, as envisioned in the National Response Framework.
7
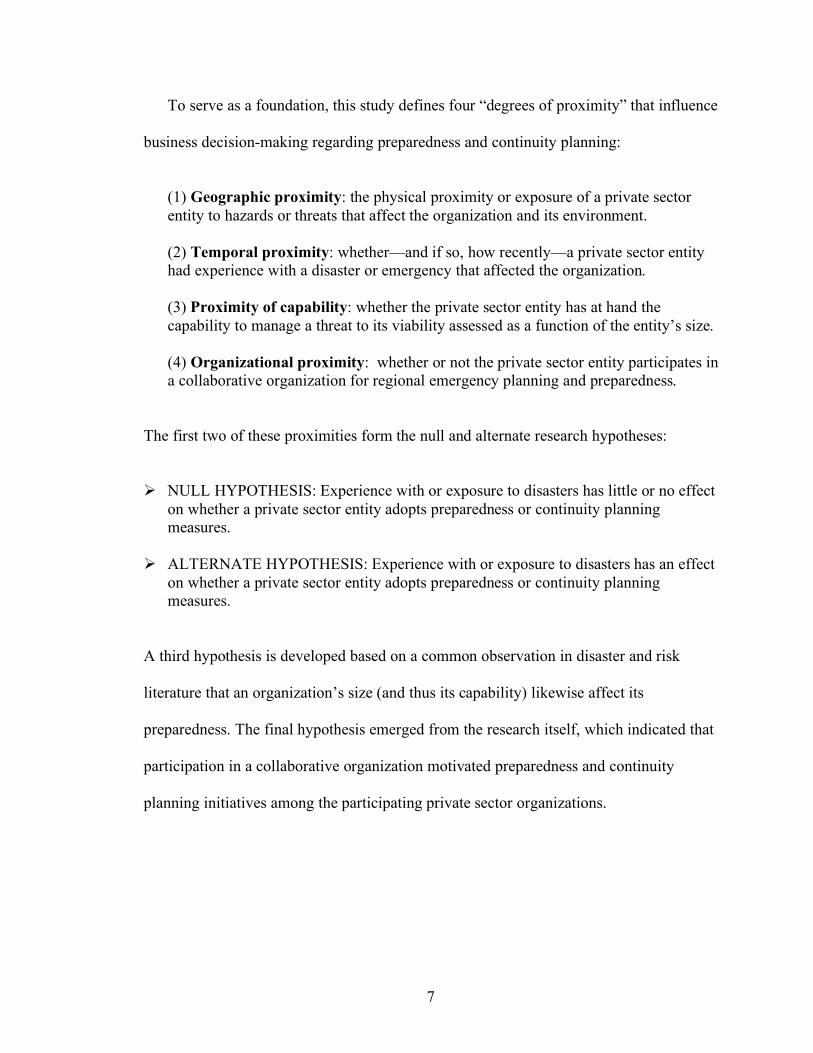
To serve as a foundation, this study defines four “degrees of proximity” that influence
business decision-making regarding preparedness and continuity planning:
(1) Geographic proximity: the physical proximity or exposure of a private sector entity to hazards or threats that affect the organization and its environment. (2) Temporal proximity: whether—and if so, how recently—a private sector entity had experience with a disaster or emergency that affected the organization. (3) Proximity of capability: whether the private sector entity has at hand the capability to manage a threat to its viability assessed as a function of the entity’s size. (4) Organizational proximity: whether or not the private sector entity participates in a collaborative organization for regional emergency planning and preparedness.
The first two of these proximities form the null and alternate research hypotheses:
NULL HYPOTHESIS: Experience with or exposure to disasters has little or no effect
on whether a private sector entity adopts preparedness or continuity planning measures.
ALTERNATE HYPOTHESIS: Experience with or exposure to disasters has an effect
on whether a private sector entity adopts preparedness or continuity planning measures.
A third hypothesis is developed based on a common observation in disaster and risk
literature that an organization’s size (and thus its capability) likewise affect its
preparedness. The final hypothesis emerged from the research itself, which indicated that
participation in a collaborative organization motivated preparedness and continuity
planning initiatives among the participating private sector organizations.

8
A graphical representation of the research hypotheses (Figure 1-1) is developed in
Chapter 3 of the study illustrating the four proximities that affect motivation toward
business preparedness and continuity planning:
Figure 1-1: Four proximities of preparedness
1.2 Significance of this study While limited in its scope, this study nevertheless sheds some light on perceptions of
risk and priorities for preparedness measures within the private sector. It empirically
validates the observations—both research-based and anecdotal—that past experience in a
disaster and the size of the organization have significant impact on the motivation of
private sector entities to devote resources to preparedness and continuity of operations
planning. It further identifies the potential value of public-private partnerships for
encouraging participation in efforts that protect business interests while building
community resilience against hazards and disasters. It establishes the prevalence (or
preference) among private sector entities for the adoption of certain preparedness
measures over others that is consistent across private sector businesses and non-profits, as
9
well as across public sector agencies. Finally, the study provides information that is
relevant to government policies and programs aimed at increasing continuity planning
within the private sector.
1.3 Dissertation structure The dissertation is organized in accordance with the February 2008 memorandum of
the George Washington University School of Engineering and Applied Science entitled
“SEAS Dissertation Format Guidelines,”2 and conforms with the George Washington
University’s standards for Electronic Theses and Dissertations.3 The dissertation will
follow a traditional organizational structure.
Chapter 2 provides an overview of the literature that bears on the research problem
and, specifically, on defining the motivations and obstacles faced by businesses and non-
profit organizations in responding to and preparing for large-scale disasters and civil
emergencies. The chapter will examine relevant literature in the disaster, hazards and risk
analysis fields; in the business continuity literature, business journals and trade
publications; in federal agency documents; and through current examples of literature and
best practices as they are emerging in the internet, through regional research centers, and
through university centers of excellence.
Chapter 3 reviews cognitive models of decision-making among individuals and
organizations relevant to the decision-making process for preparedness and continuity
planning within the private sector. Models examined include those used in modeling risk
2 GWU/SEAS website at: (http://www.seas.gwu.edu/shared/dissertation_guidelines_2008.pdf. 3 GWU ProQuest Guide to Electronic Theses and Dissertations: http://www.gwu.edu/~etds/

10
and resilience; in identifying cultural or economic distance (or proximity, as it is
employed in this study); reasoned action and technology acceptance models; and models
that highlight the distinction between operational decision-making and operational
planning as applied to business decision-making. This review serves as the foundation for
the development of a conceptual framework for analyzing private sector decisions or
commitment to business continuity planning and preparedness in the final chapter. The
review will also provide background and structure to the analysis of the Private Sector
Survey and the statistical models for hypothesis testing in Chapter 5.
Chapter 4 details the research method and analytic approach that is the focus of the
dissertation. The chapter presents the research approach and describes the methodology
of a Private Sector Survey of Preparedness and Continuity Practices that was conducted
among 171 businesses, industries, non-profit organizations, and local government
agencies in four geographic regions of the country to determine the factors that motivate
continuity planning and emergency preparedness. After describing the goals and
implementation of the survey, the chapter summarizes results and provides observations
on responses to questions that were not directly relevant to the statistical analysis that is
conducted in the next chapter.
Chapter 5 describes the analysis of results from the private sector survey and tests the
two principal and two secondary research hypotheses. It builds statistical models and
examines outcomes of the analysis across all sample populations. The analysis compares
frequency of selection of 12 measures of preparedness—the dependent variables of this
experiment—with results from response populations within each of the four proximities,
which serve as the independent variables of the analysis. It then separates out three
11
sample populations for comparative analysis using sample populations that were of
equivalent size. From this latter analysis, the results highlight the effects of organizational
capability, past experience in disaster, and participation in a collaborative organization as
having a significant affect on motivation within the private sector. Owing to events that
occurred during the course of the survey, and inconsistencies in response rates within
specific communities, the effects of geographic proximity to a hazard as a motivating
factor is inconclusive based on results of this study. The chapter then examines a series of
Pareto Charts generated from the responses that identify discernible patterns—if not
actual preferences or priorities—from among respondents as regards the selection of the
twelve preparedness measures evaluated in the survey.
Finally, Chapter 6 will offer an interpretation of the survey results, based on the
theoretical foundation provided from the Literature Review. It describes limitations to the
survey and the analytic methodology as revealed during the course of the study. The
chapter also offers an analysis of the survey process and its potential utility as a template
for future research in other geographic or professional communities. Lastly, the chapter
develops a cognitive Framework for Private Sector Preparedness based on an application
of reasoned action theory and the technology acceptance model.
Concluding appendices include additional graphics of the results of statistical
analyses and a copy of the Private Sector Survey of Preparedness and Continuity
Practices as it appeared on the internet.

12
CHAPTER 2: LITERATURE REVIEW 2.0 Overview 2.1 Disaster, hazards and risk research 2.1.1 Disaster as history, sociology and anthropology 2.1.2 Disaster research 2.1.3 Hazards and risk research
2.1.4 Heuristics
2.2 Business continuity management 2.3 Federal agency documents 2.4 Regional approaches and best practices 2.5 The internet
2.0 Overview This chapter reviews literature relevant to the involvement of private sector business,
industry and non-profit organizations in continuity planning, disaster and emergency
preparedness and risk management. By way of organization, it divides the literature into
five groups based on focus and source:
• Hazard, Risk and Disaster Management: This group includes theoretic and
academic literature largely from professional and scientific journals and books
written from a technical perspective by practitioners within those fields (for
example, Birch and Wachter 2006; Haddow and Bullock 2006; Lindell, Prater
and Perry 2007; Perrow 1999 and 2007). This genre also includes literature
dealing with particular disasters and the effects on organizations and
13
communities, often historic and sociological in nature and based on case
studies of specific disasters and the aftermath (Barry 1997; Bolin and Stanford
1998; Erikson 1976; Hoffman and Oliver-Smith 2002; Ripley 2008; Rubin
2006).
• Business Continuity Management: Literature from and for the business
sector—predominantly found in trade publications and a few textbooks—that
focuses on continuity of operations planning (COOP) within specific
professions and industries or teaches fundamental principles applicable across
the business enterprise. This material has been traditionally subdivided among
crisis management, business risk assessment and contingency planning, and
business continuity planning (for example, Dorn 2006; Henry 2006; Kuzyk
2007; Morganti 2002; Sheffi 2007).
• Federal Agency Documents: Government documents issued at the federal
level that establish policy or have been issued as guides for federal state and
local agencies, private sector business or for the use of private citizens and
non-profit organizations. Many of these have either been issued or revised
since the terrorist attacks of 9/11 and the formation of the Department of
Homeland Security (DHS NIPP 2006; DHS NRF 2008; FEMA 2004; HSC
NSPI 2006; NFPA 1600). Virtually all are accessible (and now largely
distributed) through federal agency websites, and many are accessed directly
through links from state and local agency websites. State offices of emergency
management and/or homeland security (and many local jurisdictions at the
county and city level) often issue similar documents crafted for regional

14
geography or local conditions and hazards. Owing to the diversity among
these, this study will not explore documents below the federal level.
• Resources for Best Practices: Documents that develop, collect or adapt “best
practices” literature from professional guides, emergency management or
government documents, and other sources, for use by local organizations,
individual corporations or regional or multi-agency constituencies (Business
Executives for National Security 2007; Magnusson, Thornton, Brady and
Ante 2004; National Congress for Secure Communities
[www.nationalcongress.org]; Citizen Corps [http://www.citizencorps.gov]).
• The internet: The internet provides ready access to documents that span all
four of the categories defined above, and thus has become an extraordinarily
versatile source for acquiring knowledge, recommended methods and best
practices, and regulations and standards pertaining to business continuity
planning, emergency management and disaster preparedness. Most of the
relevant professional journals are also accessible, either through a university
library or commercial library service. As representative examples, this section
presents websites from a federal agency, several consulting firms, a national
non-profit organization, a disaster research center, and a university-based
homeland security institute.
2.1 Disaster, hazards and risk research Two recent publications offer perspectives on the current state of professional and
academic research into emergency preparedness and continuity of operations practice
within the private sector, and the broader relationship between private sector
15
preparedness and community resilience. A 2006 study of the National Research Council,
Facing Hazards and Disasters: Understanding Human Dimensions, observed that prior
to the 1990s, little research had been conducted on private sector disaster preparedness
and most attention focused on research into regional impacts of disasters on communities,
families and society as a whole [Kreps 2006]. Consequently, little had been determined
about impacts on private sector business and industry beyond generalities such as that
“larger businesses are significantly more likely to engage in preparedness activities than
smaller ones” [p. 109]. This began to change in the late 1980s and early1990s with
studies sponsored by the National Earthquake Hazard Reduction Program (NEHRP),
founded in 1977. In particular, studies conducted on the economic impacts of Hurricane
Andrew and the Loma Prieta and Northridge earthquakes focused attention on the effects
that disasters have on individual businesses and also on the economic units that make up
a region’s economic equilibrium, and that make restoration of local communities possible
[Kreps 2006, p. 109].
More recently, the Handbook of Disaster Research [Rodriguez, Quarantelli, and
Dynes 2007] offers a number of perspectives on the current state of disaster and hazards
research, and on continuity of operations planning and risk management. Representative
among those perspectives (and fundamental to the intent of this research project) is the
observation of Kathleen Tierney of the Natural Hazards Center, University of Colorado
(Boulder), that very little substantive research has been done using businesses as a “unit
of analysis” or on the relationships between the economic resilience of individual
businesses—either before or after significant disasters—and whether there is any
correlation to business decisions or planning that was done in advance of those disasters.
16
(Similar observations had been made by Mileti [1999, p. 224] and by Perry and
Quarantelli [2005, p. 387], both cited below). Tierney reaffirms the observation in the
NRC study that “overall larger businesses do more to prepare for disasters than smaller
ones [Tierney 2007, p. 281], but later observes that “in the aggregate and controlling for
other factors, standard recommended preparedness measures have little impact on short-
and long-term business recovery outcomes,” (italics in the original) [p. 291]. This
assertion supports the general conclusion that much research remains to be done in
business preparedness decisions and the potential impact that those decisions have on
local communities. This is particularly so if, as Tierney states, there is little correlation to
be found between the normal efforts of businesses to prepare for crises or disasters, and
the actual outcomes after an event.
As highlighted by these two volumes, prior to the 1990s, little dedicated research had
been conducted on the impact of disasters on private sector enterprise, or on the roles
played by the private sector in disaster mitigation or recovery. The National Research
Council study presents a diagram in its introduction (adapted from an earlier work by
Tierney) that illustrates the traditional approach in hazards and disaster research.
17
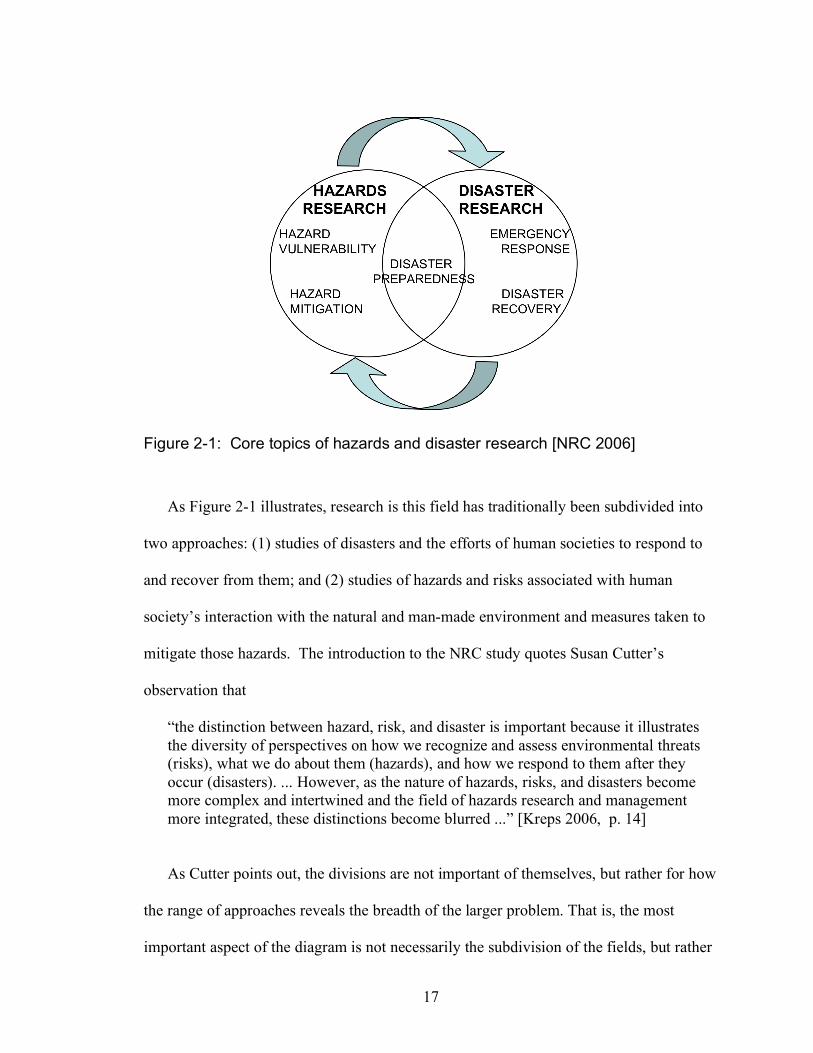
Figure 2-1: Core topics of hazards and disaster research [NRC 2006]
As Figure 2-1 illustrates, research is this field has traditionally been subdivided into
two approaches: (1) studies of disasters and the efforts of human societies to respond to
and recover from them; and (2) studies of hazards and risks associated with human
society’s interaction with the natural and man-made environment and measures taken to
mitigate those hazards. The introduction to the NRC study quotes Susan Cutter’s
observation that
“the distinction between hazard, risk, and disaster is important because it illustrates the diversity of perspectives on how we recognize and assess environmental threats (risks), what we do about them (hazards), and how we respond to them after they occur (disasters). ... However, as the nature of hazards, risks, and disasters become more complex and intertwined and the field of hazards research and management more integrated, these distinctions become blurred ...” [Kreps 2006, p. 14]
As Cutter points out, the divisions are not important of themselves, but rather for how
the range of approaches reveals the breadth of the larger problem. That is, the most
important aspect of the diagram is not necessarily the subdivision of the fields, but rather
18
the arrows that describe the interactive and mutually supportive nature of research within
the fields.
While these two fields of hazards and disaster research may be mutually supportive,
neither had focused to any great extent on the specific consequences that accrue to
individual businesses or industries, business sectors, or on the broader impact on the
economic foundations of affected communities that results from the economic loss and
recovery costs from disasters. This had begun to change with the approach of the Y2K
time change in 1999 [MacGregor 2003; Tierney 2007] and has gained momentum since
the 9/11 attacks on the World Trade Center, and most certainly since Hurricanes Katrina
and Rita. At the same time, however, the literature of the business community has rarely
delved into the long-term effects of natural and technological disasters on private sector
enterprise or on the surrounding community.
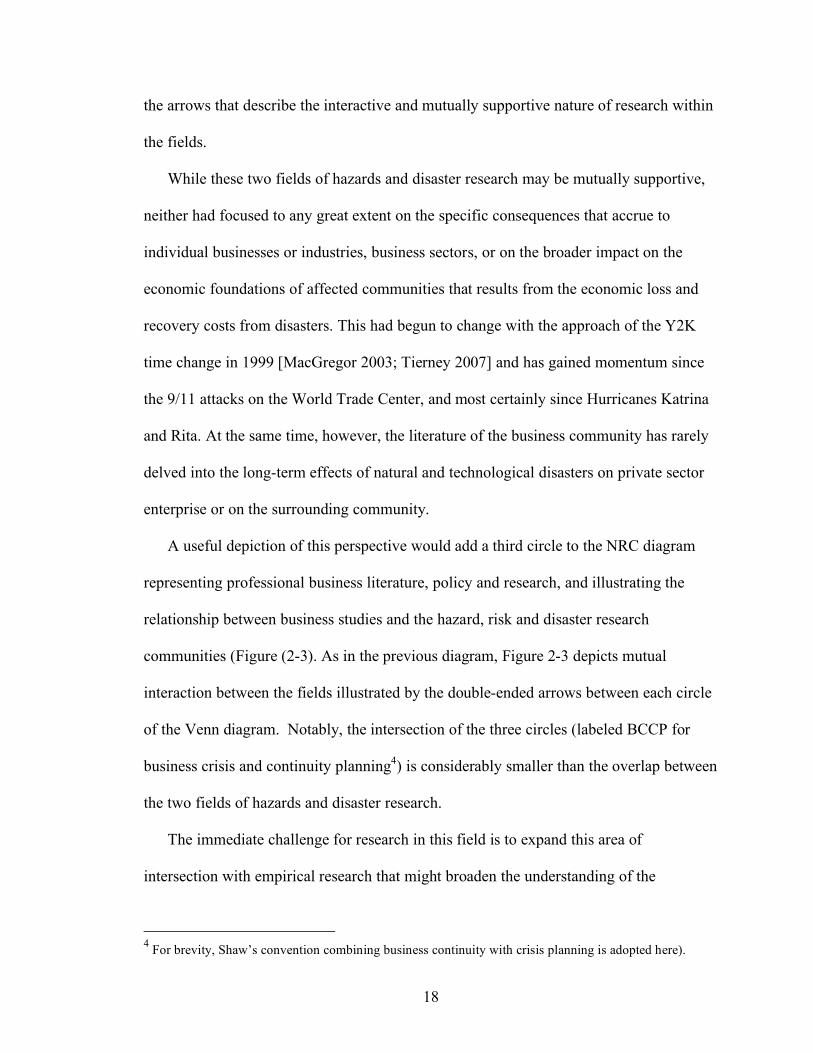
A useful depiction of this perspective would add a third circle to the NRC diagram
representing professional business literature, policy and research, and illustrating the
relationship between business studies and the hazard, risk and disaster research
communities (Figure (2-3). As in the previous diagram, Figure 2-3 depicts mutual
interaction between the fields illustrated by the double-ended arrows between each circle
of the Venn diagram. Notably, the intersection of the three circles (labeled BCCP for
business crisis and continuity planning4) is considerably smaller than the overlap between
the two fields of hazards and disaster research.
The immediate challenge for research in this field is to expand this area of
intersection with empirical research that might broaden the understanding of the
4 For brevity, Shaw’s convention combining business continuity with crisis planning is adopted here).
19
relationship between risk and hazard perceptions, the effects of disasters and extreme
events, and the role played by the private sector in local and regional resilience.
Ultimately, such research into economic impacts on local businesses and industries of
natural, technological and human-caused disasters might motivate participation in
corporate and community preparedness programs by individual businesses and non-profit
organizations. Much progress in this direction has, in fact, been seen in the professional
literature emerging from the business community since 9/11, as will be discussed in
Section 2.2. Only in recent years, however, has there begun to be much intersection of the
three fields.
Figure 2-2: Business continuity planning and disaster/hazards research
Hazards Research Disaster Research
HAZARD EMERGENCY VULNERABILITY RESPONSE HAZARD DISASTER MITIGATION RECOVERY BCCP
Professional Business Literature
SOCIAL & ECONOMIC CCNSEQUENCES
OF DISASTERS

20
2.1.1 Disaster as history, sociology and anthropology A reasonable starting point for this review is research that explores the economic and
communal impact of disasters from a historical or sociological perspective. Much of this
writing has emerged from field studies of the aftermath of specific disasters, and is
usually focused on effects at the organizational or societal levels, often informed by
personal anecdote and the lived experiences of disaster survivors. David Alexander
quotes Fischer’s observation that “what disaster sociologists actually study is (structural)
change under specialized circumstances” [Alexander 2005, 27]. In many respects, the
most significant of those “specialized circumstances” involves economic displacement, as
well as the geographic or communal displacement customarily noted in large-scale or
regional disasters.
Probably the most significant work in the historical and sociological genre is Kai
Erikson’s description of the 1972 Buffalo Creek incident, when a breached dam above a
West Virginia coal-mining town utterly destroyed a community of 5,000 persons
[Erickson 1976]. His study, aptly titled Everything in its Path, discusses at length the
economic structure of Appalachian coal towns, and the delicate balance between the
inhabitants, the mining industry, the harsh environment and the harsher way of life in that
impoverished region. While focusing primarily on the literal washing away of the
community of Buffalo Creek, Erickson’s observations nevertheless make it clear that a
culture on the margins of survival during routine times does not have the economic
wherewithal to recover from a catastrophe—a point Erickson emphasizes in the prologue
of the second edition regarding the aftermath of Hurricane Katrina [Erickson 1976,
21
reissued in 2006; see also Mileti 1999, 122]. This observation has since been developed
by Cutter, et al, into a Social Vulnerability Index that establishes some 42 dimensions of
vulnerability to natural hazards, many of which can be shown to have an economic basis
[Cutter, Boruff and Shirley 2003; Schmidtklein, Deutsch, Peigorsch and Cutter 2008].
A similar analysis of the broad interplay between disasters and the economics of
human life is to be found in John Barry’s Rising Tide, the story of the development of the
U.S. levee system in the wake of the 1927 Mississippi flood [Barry 1997]. This book
deals with the impact of natural disasters on both local and regional economies, but also
with the competing interests and priorities that arose out of the national campaign to re-
channel one of the largest river systems in the world to control flooding, and the
economic and social consequences that that campaign generated.
In a recent historical review of U.S. emergency management practices entitled
Emergency Management: The American Experience 1900-2005, Claire Rubin offers the
hypothesis that “changes in emergency management policies, authorities, and processes
are event-driven, and major focusing events have provided an opportunity to explore the
effect of disasters on emergency management principles and practices.” [Rubin 2007, 4].
This hypothesis is borne out in the changes in the U.S. levee system described by Barry,
and even by the changes in the coal mining industry’s relationship to its Appalachian
workforce, largely as a result of the notoriety (and a $13.5 million class-action law suit)
arising from the Buffalo Creek disaster.
However, the historical analysis of disasters as social and economic phenomena
points to a paradox in their value for motivating everyday decision-making of the sort
that might shape economic or social policy at the local level or for individual
22
organizations. First, in the same way that risks and hazards are ignored because a disaster
“can’t happen here,” historical disasters—even those of recent history—when analyzed at
the macro-level are all too easily observed as springing from grand causes far removed
from individual lives and affairs. It has been observed that hazards and disasters “reveal
the conceptions, alliances, relationships, social order and disorder, structure, and
organization of a certain community, region, or society,” in a way that constructs a
critical social theory about that society. [Garcia-Acosta (p. 58) in Hoffman and Oliver-
Smith 2002].
This point is echoed by Steinberg in Acts of God: The Unnatural History of Natural
Disaster in America, which analyzes the recurrent image in American history of disasters
as beyond prediction and control, even in the face of considerable scientific and historical
evidence to the contrary [Steinberg 2006]. He notes that what tends to happen is that
historical events of catastrophic proportions enter the collective memory as “archetypes,”
which transcend the efforts of normal political and social processes to resolve. [Steinberg
2006, 25] The destruction of New Orleans from Hurricane Katrina—which had been
predicted with eerie accuracy in a New Orleans Times Picayune article in 2002
[Steinberg 2006, 198]—is a case in point. More recently, the devastation of Galveston,
Texas from Hurricane Gustav—echoing the great hurricane of 1900—reinforces the
relative ineffectiveness of history in mitigating human social behavior, particularly the
urge or commitment to rebuild and endure, despite the challenges that nature imposes.
Given this perspective, it may be unrealistic to expect that individual commitment—such
as a small business owner’s decision to develop a detailed evacuation plan, or to site his
offices outside a flood plain—would be tempered through the study of disaster history.
23
On the other hand, the sort of immediacy required for motivating private sector
engagement may be found from personal accounts of disaster survivors such as those that
have emerged from the terrorist attacks of September 11, 2001. An example is Amanda
Ripley’s The Unthinkable: Who Survives When Disaster Strikes and Why. This book
includes an array of anecdotal information and interviews with survivors of disasters, and
explores personal experience in disaster survival that is more in line with the case-based
approach that typifies much of the genre in business and professional literature. Of
particular merit are the stories of individuals, offices and entire floors that escaped
destruction in New York City during the attacks on the World Trade Centers on
September 11th, 2001. Three particular points emerge from this book that have merit for
business preparedness for the unexpected and unpredictable: (1) the need for clear
instructions and authoritative leadership during crisis situations; (2) the value of planning
reinforced by rehearsals and drills, particularly for challenging situations such as rapid
evacuation from skyscrapers and building complexes; and (3) the importance of trust as
the critical element in an effective warning system [Ripley 2008].
Further insight into the relationship of disaster to economic effects at the individual
and societal levels is provided by cultural anthropology. In Catastrophe and Culture,
Hoffman and Oliver-Smith observe that
“Disasters, no matter how large, are experienced first at the local level. Even an enormous disaster affecting great areas and legions of people, while it may result from a single climatological, geological, or technological phenomenon, ultimately comes down to a compendium of local but related disasters experienced throughout the region. Not all communities experience a disaster in the same way or to the same degree; each undergoes a catastrophe in the context of its own profile of vulnerability. The same disaster agent will show great variation in patterns of destruction as well as interpretation of cause, effect, and responsibility. Such variation challenges more global, macro approaches.” [Hoffman and Oliver-Smith 2002, 13].
24
The view that “all disasters are local” is hardly unique to cultural anthropology. And yet,
this perspective highlights a common theme among most analyses of disasters and their
effects: the relationships among individuals, social classes, communities, regions and
nations, and how a disaster resonates in the public mind owing to differing perspectives.
This “framing” of disasters often illuminates, but can as easily obscure, important
dimensions of an event, particularly given the focus that is often provided by the media
[Button 2002, 146]. This is one cause of what is often a tension between policies adopted
at the national, state or local levels, and the pursuit by private citizens or groups of efforts
that are incompatible with those policies. A relevant example—and the specific subject of
this study—is the frequent statement in recent federal homeland security documents that
the private sector needs to become more involved in coordinated preparedness and
planning efforts, at the same time that the private sector has been largely resistant to
becoming involved in centrally coordinated homeland security initiatives.
This problem has particular resonance when differing perspectives on disaster
preparedness or response capability are driven by what cultural theorists have described
as a society’s or community’s active selection of risks to be accorded attention. The work
of anthropologists Mary Douglas and Aaron Wildavsky was the first to formulate a
theory and structure for how and why societies select the risks they do [Douglas and
Wildavsky 1982; also Thompson, Ellis and Wildavsky 1990; and Ellis and Thompson
1997]. Their formulation is more than a method for understanding priorities within a
bureaucracy. Rather, it represents four competing world-views—often depicted as a
quadrant of four groups— which organize priorities according to fears and threats to
power relationships. Mileti has observed more directly that risk and vulnerability are part
25
of the “shared culture” of a society and often reflect the interplay among political, social
and economic priorities within that society [Mileti 1999, 121]. An anthropologic or
cultural theory of this sort seems “academic” until one applies it to a problem such as the
U.S. response to Hurricane Katrina and the clear preferences established by the
Department of Homeland Security for focusing preparedness and response investments
(representing significant federal funding allocations) on “low-probability, high
consequence” terrorist events, rather than on the known threats of flooding and hurricane
preparedness in historically vulnerable regions [Cooper and Block 2006].
Another relevant insight into the cultural dimensions of organizational decision-
making and prioritization of resources comes from the work of Hofstede. His five-year
study of 72 international offices of IBM (which at the time of the study in the late 60s,
was as homogenous a corporate culture as was likely to be found) identified five
fundamental relationships that defined the values with an organization, and which can
vary among divisions of an otherwise cohesive organization. These included
• Power distance – the extent to which less powerful members of an organization accept and expect that power is distributed unequally;
• Uncertainty avoidance – the extent to which a culture programs its members to
feel either uncomfortable or comfortable in unstructured situations;
• Individualism versus Collectivism – the degree to which individuals are expected to look after themselves or to remain integrated into groups;
• Masculinity versus Femininity – the distribution of emotional roles between the
genders, i.e., “tough” masculine to “tender” feminine groups;
• Long-term versus Short-term orientation – the extent to which a culture programs its members to accept delayed gratification of material, social and emotional needs. [Hofstede 2001]

26
These relationships are particularly pertinent to collaborative decisions made by members
of a community when faced with an imminent or evolving disaster, and also contain
lessons for the balance that must be struck between central control, regional identity and
local autonomy—particularly in a federalist state system such as the United States.
2.1.2 Disaster research One of the earliest comprehensive assessments of the field of disaster research was a
study funded by the National Academies of Science in the mid-1990s and published in
1999 under the title Disasters by Design. That work was the progeny of an earlier (1975)
National Academies study by G. F. White and J. E. Haas that attempted to assess the state
of research into U.S. disasters at that time. Dennis Mileti, chairman of the 1999 study,
points out that it was difficult to directly attribute the 1975 study with any general
improvements in preparedness, recovery or mitigation policy. However, he emphasizes
that the impact on the disaster research field was profound insofar as it sparked
development of a “hazards community” growing out of the cadre of academic researchers
and graduate students that were involved in the initial study [Mileti 1999, p. 316].
Disasters by Design did not specifically address the role of the private sector in
providing an economic foundation for recovery, or define the need for coordination
between public and private sector entities in regional or community preparedness. It did
cite the general role of sound local economies in community resilience and recovery, and
devoted a chapter to aggregate national costs of various types of disasters. However,
specific focus on the private sector is limited to mention of the insurance industry’s role
in recovery and the responsibility of the private sector for mitigating the effects of
technological hazards [Mileti 1999, p. 213]. In the only two paragraphs devoted
27
specifically to private sector preparedness, Mileti notes that ‘the strongest predictor of
preparedness among businesses is size, followed by previous disaster experience, and
owning rather than leasing business property” [p. 218]. He states, however, that “studies
of the response of private sector organizations to disaster situations were virtually non-
existent” and that “little is known about how private organizations actually respond when
faced with disaster related demands” [p. 225].
As noted in the introduction to this section, Mileti’s 1999 finding was reaffirmed in
2007 by Kathleen Tierney in the Handbook of Disaster Research. In a relatively short
(21 page) article, Tierney provides an assessment within the disaster research field of the
state of research on business preparedness and the effects of disasters on private sector
enterprise. Perhaps the most significant aspect of this article is Tierney’s emphasis on the
relationship between the effect of disaster on individual businesses and on the community
as a whole. In particular, she emphasizes that the ability of the business community to
withstand stress and recover gracefully is often a function of decisions made and policies
adopted by the larger community.
The fates of businesses following disasters are influenced by such community-level factors as whether their communities had been effectively managing hazards through prudent land-use strategies; whether they had adopted up-to-date codes for new construction; whether they required retrofitting for structures that do not meet codes; and whether steps had been taken to reduce disaster-induced lifeline service disruption. ... [T]he fates of individual businesses also depend on local capacity to manage the recovery process, which includes the ability of the community to under-take pre-disaster recovery planning; gain access to, package, and leverage different sources of aid for businesses; and take advantage of knowledgeable experts both from within and outside the community during the recovery process. [Tierney 2007, p. 278-9].
Part of the disadvantage that both communities and their businesses suffer is that “the
consequences of local infrastructure failures for larger infrastructure systems, as well as
28
for businesses and business sectors, may become apparent only when disaster strikes.”
[Tierney 2007, p. 279]. These effects include damage resulting in direct impact of
disaster events, such as physical property damage and loss of inventory and business
records, as well as indirect effects including disruption or interruption of supply and
delivery chains and utility failures that affect regional economies. [p. 282]. Other
significant effects on business continuity include the loss of customer base due to
evacuations or local community degradation; time required for business restoration and
reclamation processes; and divided attention and priorities among employees when their
families and own homes require attention. Any or all of these may adversely affect
business operations, even if a business entity suffers no physical damage to its own assets
or properties [p. 283].
On the broader scale, business recovery at the individual business and community
level is dependent on a number of factors including government support to local recovery
efforts; recovery of local infrastructure and utilities; loss of customer base and revenue
stream; and ability of businesses to adapt successfully to the new, post-disaster operating
environment [Tierney 2007; also Alesch 2001]. Of particular value is the distinction
Tierney draws between “inherent resilience” and “adaptive resilience” in determining
business vulnerability and potential for recovery. Inherent resilience is a function of a
business’s characteristics that make it inherently less vulnerability relative to other
businesses in the affected region. These factors include relative size and financial
condition prior to the disaster; diversified market base and a more robust market niche;
mitigation steps and continuity measures adopted and practiced. Adaptive resilience, on
the other hand, is more reflective of an attitude and an ability to adapt to the changed
29
circumstances. This includes not simply shifting market focus or business plan, but
potentially abandoning operations in the affected region and moving, changing service
sectors, or even abandoning a failing enterprise and beginning anew [Tierney 2007;
Alesch 2001]. Lastly, Tierney cites the work of Miles and Chang in modeling factors
that affect the recovery process based on research into earthquake recovery. Their studies
indicate that a significant factor in successful business recovery is the recovery of
transportation, infrastructure and support services in the affected region [Tierney 2007;
Miles and Chang 2003]. The significant contribution of this perspective—and of
Tierney’s article more broadly—is to highlight the linkage that exists between the
vulnerability and resilience of individual businesses, the larger business and economic
environment of the affected region, and the vulnerability and resilience of the entire
region or community, to include the resilience of its human population.
A more comprehensive view of this relationship has been pursued by Susan Cutter
and other researchers in the development of a Social Vulnerability Index (SoVI). Social
vulnerability is an approach to identifying factors among populations, regions and
communities that account for variations in the sensitivity to hazards and the ability to
respond and recover from the affects of disasters [Cutter and Finch 2008]. It is based on
work over several decades within the social science community that has identified a
range of factors as determinants of vulnerability among populations. Among those are
“lack of access to resources (including information, knowledge, technology; limited
access to political power and representation; social capital, including social networks and
connections; beliefs and customs; building stock and age; frail and physically limited
individuals; and type and density of infrastructures and lifelines” [Cutter, Boruff and
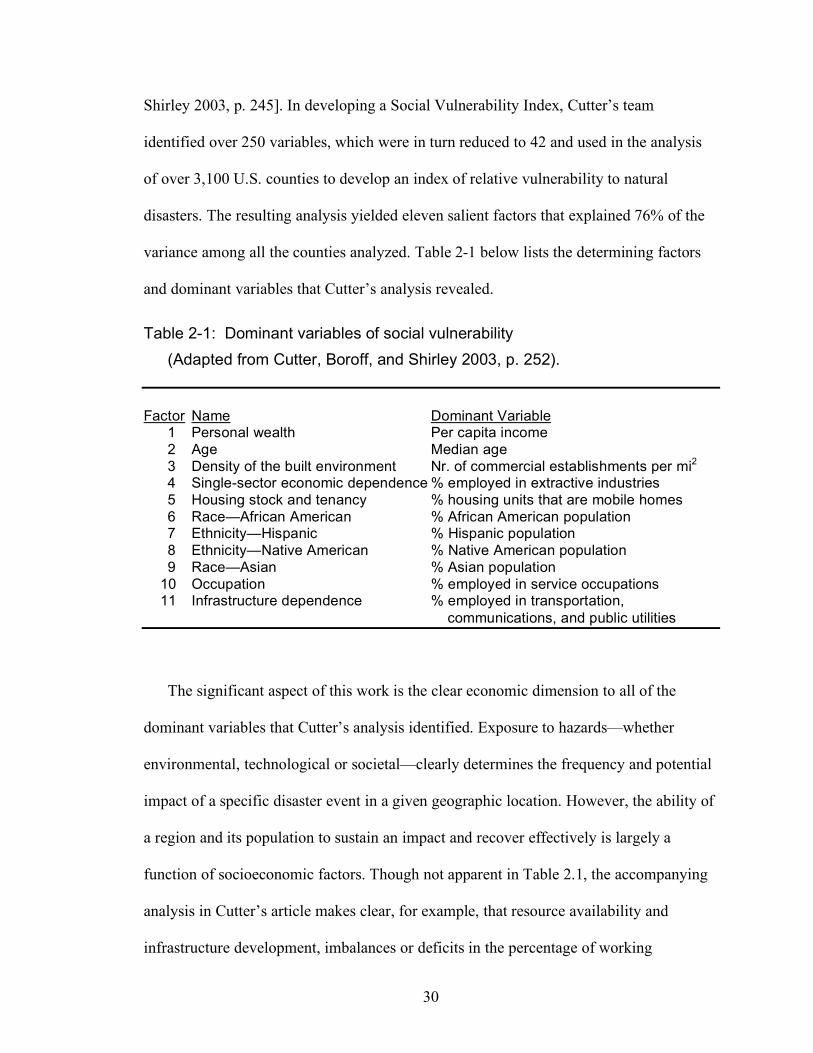
30
Shirley 2003, p. 245]. In developing a Social Vulnerability Index, Cutter’s team
identified over 250 variables, which were in turn reduced to 42 and used in the analysis
of over 3,100 U.S. counties to develop an index of relative vulnerability to natural
disasters. The resulting analysis yielded eleven salient factors that explained 76% of the
variance among all the counties analyzed. Table 2-1 below lists the determining factors
and dominant variables that Cutter’s analysis revealed.
Table 2-1: Dominant variables of social vulnerability (Adapted from Cutter, Boroff, and Shirley 2003, p. 252).
Factor Name Dominant Variable 1 Personal wealth Per capita income 2 Age Median age 3 Density of the built environment Nr. of commercial establishments per mi2 4 Single-sector economic dependence % employed in extractive industries 5 Housing stock and tenancy % housing units that are mobile homes 6 Race—African American % African American population 7 Ethnicity—Hispanic % Hispanic population 8 Ethnicity—Native American % Native American population 9 Race—Asian % Asian population 10 Occupation % employed in service occupations 11 Infrastructure dependence % employed in transportation, communications, and public utilities
The significant aspect of this work is the clear economic dimension to all of the
dominant variables that Cutter’s analysis identified. Exposure to hazards—whether
environmental, technological or societal—clearly determines the frequency and potential
impact of a specific disaster event in a given geographic location. However, the ability of
a region and its population to sustain an impact and recover effectively is largely a
function of socioeconomic factors. Though not apparent in Table 2.1, the accompanying
analysis in Cutter’s article makes clear, for example, that resource availability and
infrastructure development, imbalances or deficits in the percentage of working
31
population, and education and type of employment all contribute to socioeconomic status
and thus to the general vulnerability of a region to the potential effects of a disaster. As
Cutter summarizes,
Social vulnerability is born from inequality and its social and political consequences. In many ways, it mirrors the geography of inequality and poverty. Within the context of natural hazards, the SoVI helps determine which places may need specialized attention during immediate response and long-term recovery after a natural hazard event, given the sensitivity of the populations and the lowered capacity to respond. [Cutter and Finch 2008, p. 2305].
Based on this foundation, a more detailed investigation into preparedness and continuity
planning among private sector employers may enhance understanding of the relationship
between the viability of local economies and general civic preparedness and resilience.
Another foundational work in the field of disaster research was the 2005 study of
Perry and Quarantelli, What is a Disaster? [Perry and Quarantelli 2005]5. This book
directs attention to the problem of defining the term “disaster” and the varying
perspectives that have shed light on the subject. Of particular note is Quarantelli’s
assertion that disasters should be forcefully decoupled from hazards because a “focus on
disasters calls attention to the social nature of such happenings; a focus on hazards tends
to emphasize physical and natural phenomena. With rare exceptions little can be done
about the latter; much can be done about the former” [Quarantelli in Perry and
Quarantelli 2006, 342]. This statement originates from two fundamental distinctions
between hazards and disasters: (1) disasters are “social occasions” that can be largely
attributed to human decisions and human actions, and not environmental or ecological
phenomena; and (2) hazards, while possibly contributing to disasters, are merely one in
5 The study is a reassessment and expansion of a prior work, Quarantelli, E.L. (1998) What is a Disaster—Perspectives on the Question. London: Routledge.
32
usually a series or sequence of decisions, policies or action that lead to the failure of
human systems in avoiding or preventing a disaster. [Quarantelli, 2006 pp. 342-343].
This understanding of disasters as social events reinforces the broad concept of social
vulnerability as originating in often long-term policy and economic decisions such as
where to site cities, neighborhoods and industries; whom to empower and whom to
exclude from political and social decisions; and how to structure a local economic base
and distribute its benefits.
The subject of disasters is never far removed from the expense of disaster outcomes
and the costs of mitigation and preparedness. Mileti devoted an entire chapter of
Disasters by Design to the losses, costs and impacts of disaster. The National Research
Council similarly included an extensive section in the 2006 study on the direct and
indirect losses associated with disasters, including a discussion on the operational
vulnerability of businesses [Kreps 2006, p. 80]. And though it was not a central focus of
the work—the book concludes with Quarantelli’s observation that the “what, why and
who [of private sector involvement in disaster response] are totally unknown territories”
[p. 387])—What is a Disaster? contains observations about the economic dimensions of
disasters that could be applied directly to regional or local economies, and which are
potentially applicable to individual businesses.
For example, the essay by Neil Britton cites a “growing realization that what humans
do in the normal course of their lives can magnify the vulnerability of their community.
Steps taken to manage risks of extreme events can be justified to the extent that they
deliver a net benefit to society” [Britton 2005, p. 67]. Britton cautions that attempts to
manage risks will impose costs as well as benefits, but observes that emergency
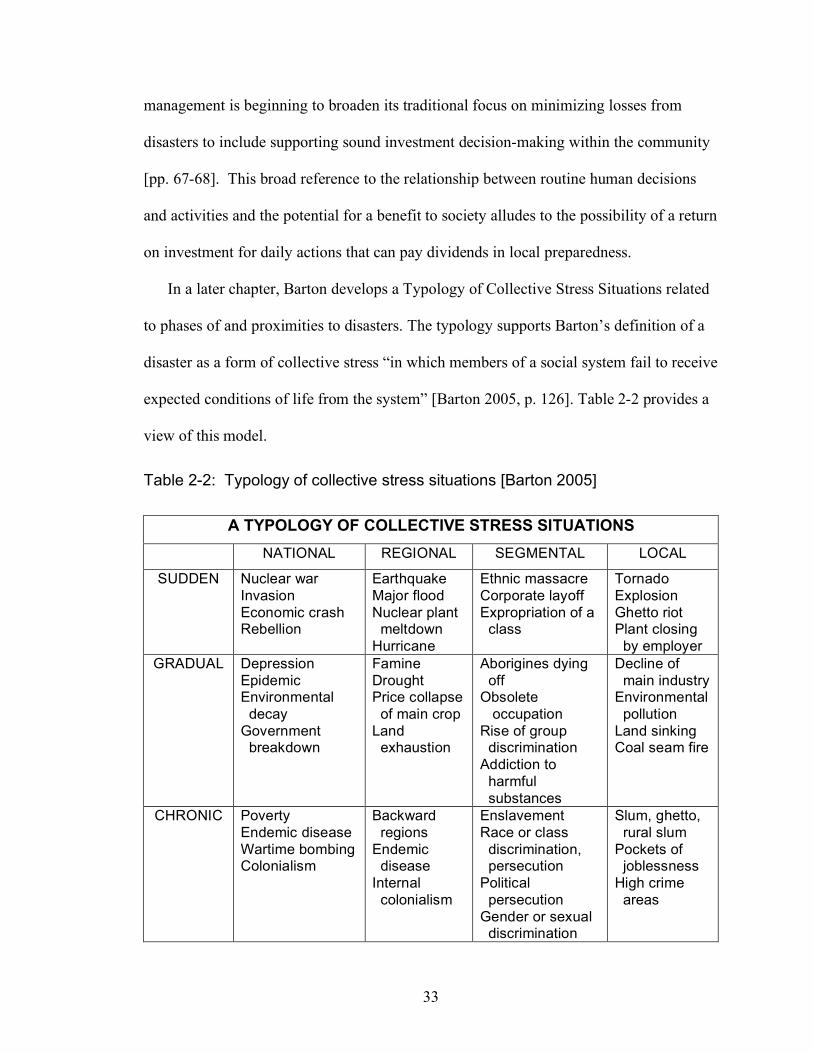
33
management is beginning to broaden its traditional focus on minimizing losses from
disasters to include supporting sound investment decision-making within the community
[pp. 67-68]. This broad reference to the relationship between routine human decisions
and activities and the potential for a benefit to society alludes to the possibility of a return
on investment for daily actions that can pay dividends in local preparedness.
In a later chapter, Barton develops a Typology of Collective Stress Situations related
to phases of and proximities to disasters. The typology supports Barton’s definition of a
disaster as a form of collective stress “in which members of a social system fail to receive
expected conditions of life from the system” [Barton 2005, p. 126]. Table 2-2 provides a
view of this model.
Table 2-2: Typology of collective stress situations [Barton 2005]
A TYPOLOGY OF COLLECTIVE STRESS SITUATIONS
NATIONAL REGIONAL SEGMENTAL LOCAL
SUDDEN Nuclear war Invasion Economic crash Rebellion
Earthquake Major flood Nuclear plant meltdown Hurricane
Ethnic massacre Corporate layoff Expropriation of a class
Tornado Explosion Ghetto riot Plant closing by employer
GRADUAL Depression Epidemic Environmental decay Government breakdown
Famine Drought Price collapse of main crop Land exhaustion
Aborigines dying off Obsolete occupation Rise of group discrimination Addiction to harmful substances
Decline of main industry Environmental pollution Land sinking Coal seam fire
CHRONIC Poverty Endemic disease Wartime bombing Colonialism
Backward regions Endemic disease Internal colonialism
Enslavement Race or class discrimination, persecution Political persecution Gender or sexual discrimination
Slum, ghetto, rural slum Pockets of joblessness High crime areas
34
Significantly, Barton’s typology includes a number of economic and business-related
stressors (economic crash; corporate layoff; decline of industry), emphasizing that there
is a broad range of events that have psychological impact similar to that of natural
disasters, but may be solely economic or business-related in cause. Barton’s typology is
also instructive for economic or business-related preparedness because it distinguishes
between disasters viewed from the national, regional or local levels, and also with regard
to whether they emerge suddenly, gradually, or from chronic social conditions.
A question for private sector entities is whether a localized disaster involving a single
business requires the same disaster preparedness measures as a disaster stretching across
an entire region. That is, is the definition or meaning of “disaster” for private sector
businesses more or less variable than the definition of “disaster” for a community, region
or nation? If so, does the difference have any meaning for how private sector entities or
non-profit organizations should think about preparedness, response and mitigation?
Barton’s typology could serve as a useful framework for assessing business continuity
plans in that respect. By dividing the question into both temporal and geographic
perspectives—in the manner of Barton’s typology—plans could be organized and
evaluated to cover the entire scope of both foreseeable and unforeseeable risks presented
to an organization or a business enterprise.
A second useful model or heuristic is provided by Smith, who illustrates phases of a
disaster event according to the actions available to the management team dealing with the
situation, and the outcomes or processes that result [Smith 2005, p. 218]. Table 2-3
provides a condensed version of Smith’s model.

35
Table 2-3: Crisis management framework [Smith 2005] (modified)6 Phase of the event
Characteristics and Processes
The crisis of management
- Role of assumptions and beliefs in shaping decision-making for disaster prevention (group think) - Reluctance to consider and plan for worst case scenarios due to perceived low probability of occurrence (and high cost of intervention) - Distraction of decision-making bodies by other issues which are given priority - Trade-offs made between “risk” and benefit—risk minimization - Failures in “management” to identify and prevent erosion of defenses - Excessive power given to technocratic elites in decision-making - Difficulties around communication inhibit early warnings of potential disaster - Emergent properties in complex systems generate conditions beyond the tolerance of control systems - Creation of pathways of vulnerability and fractures within control systems - Erosion of resilience
The operational crisis
- Trigger events expose weaknesses in the crisis management system - Release of “energy” or emergent properties cause damage and disruption - Emergent properties exceed capabilities of contingency plans - Need to utilize additional resources to deal with demands of the event - Need for containment and control; mobilization of rescue and recovery teams - Additional demands placed on other organizations to deal with damage - High task demands from vulnerable populations generates “political” problems - “Crisis management teams” mobilized to deal with task demands of the event - Constrained communications and control may compound initial problems - Prior failure to train rescue and crisis teams may lead to escalation of the event - Involvement of media increases the profile of the event and heightens stress levels for those charged with “management” of the problem - Mobilization of aid and resources from outside of the “region of damage”
The crisis of legitimation
- Need for rehabilitation, stabilization and recovery - Investigation of causal factors and lessons to be learnt–high level of government involvement - Re-evaluation of control mechanisms and contingency plans - Heightened possibility of scape-goating through a search for culpability - Organizational learning constrained due to assumptions of those “managing” the process - Media investigations into the cause of the event and the attempts at dealing with its demands - Impact on financial performance of organization or state through rehabilitation and recovery demands - Failure to address the core problems or assumptions and beliefs leading to single-loop learning
6 Smith’s original model provides a more elaborate listing of Characteristics and Processes involved in crisis development. For brevity’s sake some of the text has been condensed here.
36
Smith’s model would support examination of “what went wrong and why,” and thus
would be a valuable tool for generating lessons learned following any crisis or disaster
(and, perhaps, anticipating future events). It also illustrates phases of an investigation into
a seriously flawed response—such as Hurricane Katrina or the Challenger launch
decision—with separate focus on operational decisions made to respond to the actual
crisis; how those decisions were affected by the organizational biases and assumptions of
the decision-makers; and how those decisions highlight flaws that call into question the
legitimacy of processes and methodologies used by the leadership to formulate those
decisions. Smith’s model defines a disaster by highlighting its phases and management
challenges, starting with planning and communications decisions (or lack thereof) that set
the stage for a potential crisis in operations and execution that then leads to a crisis of the
legitimacy of the organization and its leadership. If carefully analyzed, this template
could serve as a tutorial for business crisis and continuity planning that would not be far
off the mark.
To reiterate, the models provided by both Barton and Smith are intended to illustrate
aspects of a definitional problem within a text that only minimally addresses private
sector disaster preparedness or continuity planning. Nevertheless, both heuristic
approaches provide insights that could be applied to private sector preparedness and
continuity planning. Chapter 3 will discuss the use of heuristic devices in the
development of business crisis and continuity plans.
In the summary chapter of this book, Quarantelli highlights what is perhaps the
fundamental problem with attempting to draw consistent lessons from disaster research
and apply them to the unit or organizational level, as one would in applying those lessons
37
to individual private sector enterprises or organizations. While this lesson (like the book
itself) is not directed at the private sector, it resonates with the scope of the problem faced
by private sector entities—both internally for large organizations, and in cooperative
efforts with other organizations in a community affected by disaster:
This [model] argues that organizations (and in our view, societies) instead of having clear and consistent goals and values operate instead from a variety of inconsistent and ill-defined preferences. Different social entities at different social levels have different and incompatible views at different times; preferences may not be known until after choices are made. In addition, different parts of the system do not know what others are doing; what happened in the past and why it happened is not clear, and the connections between the actions taken and the consequences of such actions are obscure.” [Quarantelli 2005, 337].
The variability in the organizational objectives and intentions that Quarantelli notes is
equally evident in the methods and abilities of organizations to actually survive disasters.
In one of the few studies to examine business responses to specific disasters, Daniel
Alesch and a team of researchers surveyed responses and outcomes to a range of disasters
by over 100 small businesses and non-profit organizations from 1992 to 2000 [Alesch,
Holly, Mittler and Nagy 2001]. This also included longitudinal surveys from a previous
study of business responses to the Northridge Earthquake (cited in section 2.2 above).
Among their findings was that “organizational failure takes many forms,” and conversely
that “survival and recovery take many forms” [p. 18]. This is so because failure or
survival and recovery can be defined in a number of ways depending on changes in a
business’s earnings, decisions to continue functioning after suffering a disaster and the
consequences, whether or not recovery financing was attained, whether successful
relocation was managed, and a host of other results.
38
Of immediate value for businesses is the summary version of the study’s results, After
the Disaster, What Should I Do Now? [Alesh, Holly, Mittler and Nagy 2002], published
through the Public Entity Risk Institute (website noted in section 2.2.5 below). This 7-
page document amounts to a quick and dirty survival guide for business planning prior to
and immediately after a disaster. The document highlights four key findings:
• Disasters cause problems for businesses unrelated to the damage they sustain
during the event;
• Unless business owners make good decisions about recovery, the greatest losses
come in the years following the disaster and not from direct damage;
• Following a disaster, things never get back to normal; the goal is to adjust to the
new business environment that will exist in the affected community;
• If correct decisions are made, the owner of a business can survive and achieve
viability in the post-event environment [p. 2].
The remainder of the document summarizes empirically derived steps that resulted in
successful transitions of businesses in disaster-affected regions to operations in the new
post-disaster environment.
Two other recent publications contain sections addressing broader private sector roles
and contributions to homeland security and resilience. The first, Stephen Flynn’s The
Edge of Disaster, is a critical view of the current state of homeland security in the United
States, to include first responder preparedness and the integrity of the nation’s critical
infrastructures. The problem as Flynn sees it is that:
“the design, ownership, and day-to-day operational knowledge of many of the nation’s most essential systems rest almost exclusively with the private sector, both foreign and domestic. But safety and security are public goods whose provision is a core responsibility of government at all levels.” [Flynn 2007, p. 141].

39
Among the solutions Flynn offers is to “tap into the private sector” to mobilize
readily available technologies and expertise and to incentivize private sector investment
and collaboration with federal and local government to strengthen local resilience. The
objective is to develop a “business case” for private sector investment in security and
preparedness [p. 136]. Incentives to the private sector would include insurance protection
made affordable through government policies that reduce barriers to comprehensive
insurance; streamlined information sharing among public and private sector entities to
improve security; and regional partnerships between private sector business and non-
profit organizations to support more vigorous community efforts at problem solving. The
prerequisite for these initiatives, Flynn asserts, is to eliminate the “slavish adherence to
free-market and small-government orthodoxy” that has hamstrung federal leadership to
mobilize private sector initiative [p. 149].
The second recent book to directly address private sector involvement in homeland
security and regional resilience is On Risk and Disaster: Lessons from Hurricane Katrina
[Daniels, Kettl and Kunreuther 2006]. As the title implies, this volume is focused more
on addressing risks from natural (and technological) events—such as Hurricane
Katrina—than on the national and homeland security aspects as Flynn’s book does.
Nevertheless, the book arrives at many of the same conclusions. (Interestingly, this may
reflect an emerging consensus on basic principles and an all-hazard approach to
preparedness as a means of reinforcing national security). The basic premise of the book,
as stated in the introduction, grows out of the U.S experience witnessed during Hurricane
Katrina, and the failed social and governmental response:
“We must find a way to distribute risks equitably in order to push our democracy closer to its promise of liberty and justice, not only for the affluent but for all. Rising
40
to this challenge demands that the public and private sectors collaborate to develop effective prevention strategies and coordinated responses to natural disasters, industrial accidents, terrorist attacks and pandemics.” [Daniels, Kettl and Kunreuther 2006, p. viii].
In the chapter entitled, “Private Sector Strategies for Managing Risk,” Meyer
identifies three key biases that predispose private individuals and the private sector to
routinely fail to prepare adequately for risks:
• a tendency to focus on short-term feedback (i.e. recent experience);
• a tendency to imagine the future as an extrapolation of the present; and
• discounting the value of ambiguous future rewards compared to immediate costs
[Meyer 2006, p. 154].
On the societal and political scale, these cognitive biases explain why the levees in New
Orleans were inadequately designed and engineered, and why upgrades were habitually
deferred; on the personal level, they explain why the experience of successfully preparing
for smaller storms had more impact on New Orleans residents’ thinking than the rare
experience of having to rebuild after inadequate preparation for the exceptional storm.
Such biases explain why organizations and citizens routinely make incorrect calculations
of risk (as noted by Perrow, 1999) and act on false assumptions of expected outcomes
and costs.
One traditional means of remedying the inability of people to make correct judgments
about risk and take appropriate mitigating actions is to provide insurance to cover for
losses when judgment fails, or measures taken prove inadequate to the circumstances.
Kunreuther [p. 175] argues for establishment of a comprehensive disaster insurance
program that would provide common protection against all hazards. Insurance industry
41
efforts to accommodate this would need to be backstopped by multi-state insurance pools
to defray risks and costs, as well as federal support for catastrophic regional damage that
might exceed private sector capabilities. A three-tiered system of this sort would demand
a public-private sector cooperative effort to balance regional risks against individual costs
[p. 199]. An independent analysis has estimated that this strategy could result in as much
as $11 billion in insured savings per year [Chernick and Appel 2007].
In a third article, Harrington offers three suggestions for building incentives for the
private sector to become more actively engaged in mitigating local and regional risks:
• allowing private catastrophe insurance premiums and coverage availability to be
determined by competition among insurers, rather than through federal regulation;
• reducing corporate tax disincentives for supplying private insurance against large
losses from extreme events; and
• constraining federal disaster assistance after major disasters in order to develop
stronger incentives for mitigation measures and acceptance of private insurance.
Like the treatise by Flynn, the articles in On Risk and Disaster deal with developing
stronger policies and means for improving regional and local preparedness through
engaging private sector resources, and structuring incentives and disincentives to ensure
greater public adoption of private sector initiatives. These ideas are not directed at
protecting businesses or making them more resilient against disasters, except insofar as
they, like private citizens, would be “customers” or recipients of these initiatives.
However, according to these authors, the overall resilience of the nation could be
improved by permitting the private sector to engage more fully in mitigation,
preparedness and response.
42
2.1.3 Hazards and risk research If the distinctions between the disaster research field and that of hazards and risk
research are blurring, as Cutter observed, there is one aspect in which the distinction
seems more clear. In disaster research, the attention to a broad range of natural and man-
made hazards has inclined contemporary research toward identifying “all-hazards”
capacities for mitigation, preparedness, response and recovery—thus the emerging
emphasis in this field on “resilience” as a broad-spectrum approach to building capacity
for disaster survival and restoration of community regardless of the nature of the disaster
that befalls. One recent study has defined community resilience as a set of networked
adaptive capacities that enable the community to identify resources that can ensure
stability through disasters and environmental stress, and to mobilize those resources for
the protection and benefit of the community [Norris, Stevens, Pfefferbaum, Wyche and
Pferfferbaum, 2008].
Traditional hazards and risk research, on the other hand, might be characterized as
taking a more economic approach in its analysis. That is, fundamental to hazards and risk
analysis is a recognition that resources are finite and therefore decisions must be made—
typically without full knowledge about potential consequences—concerning which
hazards to emphasize, given that organizations will face competing demands. As a
consequence, attention has focused on identifying which hazards present the highest risks
and the most likely worst-case scenarios against which to plan, and then instituting
appropriate policies and programs based on the resources available. For example, the
purchase of insurance by private individuals or businesses has traditionally been
characterized as a calculation of expected utility when weighing the cost of insurance
43
versus the benefit of being insured against possible loss, while at the same time
recognizing that paying for one form of insurance (i.e., liability) may mean that some
other outlay may be deferred (such as flood insurance). Declining to insure against less
certain flood damage may free up assets for better personal liability coverage; however,
the risk of flood damage must then be assumed by the individual or corporation [Slovic
2000] (see the discussion below). At the national level, the federal government’s focus
since September 11th 2001 on protecting the passenger airline system against terrorist
attack—at the perceived detriment to other national security priorities—is an example.
Recently an “all-hazards” approach to risk assessment and contingency planning has
begun to emerge within the business sector, as well as within the Department of
Homeland Security similar to that in the emergency management community. However,
the emphasis has been on achieving economies of scale through a more comprehensive
plan for preparedness and continuity of operations. This will be addressed later in this
section.
A further distinction that Mileti makes in Disasters by Design is that social
responsibility for risk reduction is more focused on the private sector in the case of
technological disasters than for natural disasters [Mileti 1999, 213]. This is so because
technological hazards are often seen as the by-products of private sector technology
development (sometimes with government funding or sponsorship) where the risk is born
by an exposed public, often without their consent (i.e., transport of hazardous materials;
electro-magnetic fields from transmission lines; nuclear power generating stations). As a
consequence, the attention of private sector entities has often been on protection of the
products or functions for which an organization or corporation has public liability.
44
Prior to 9/11, literature in the hazard and risk community focused to a great degree on
public acceptance of technologies and the corporate and government role in insuring
public safety against the statistically rare, but catastrophic events that have so often
shaped public opinion about the hazardous nature of advanced technologies. The first
comprehensive study of this issue is Perrow’s 1984 book Normal Accidents [2nd
publication in 1999]. The book’s subtitle “Living with High-Risk Technologies,”
provides the basic premise of the study: given the complexity of modern technologies,
risk of catastrophic failure with a potential for disaster cannot be eliminated and must
therefore be accommodated because of the fundamental role those technologies play in
society. Perrow’s study evaluates a pantheon of high-technology systems that have met
with occasional catastrophe: nuclear powered generating stations; petrochemical plants;
aircraft and air traffic control; maritime navigation leading to ship collisions and
groundings; dam failures; space vehicle accidents; military weapons systems
malfunctions. Perrow’s postscript in the 2nd edition further cites the Bhopal and
Chernobyl accidents, the destruction of space shuttle Challenger, and the potential for
massive control system failures in the Y2K time changeover, which had transpired since
the publication of the first edition.
Perrow concludes that systemic risk is unavoidable in modern, complex societies. The
risks inherent in complex technologies must be understood to the best degree possible,
but ultimately those risks cannot be engineered out of society. Analysis, at best, can
inform decisions and recommend whether to tolerate and improve, to restrict, or to
abandon certain high technology systems. However, these considerations must be
weighed alongside other social, economic and political priorities. Doing so in a
45
transparent and understandable fashion would likely make societal risks more acceptable
to the public.
In a more recent analysis written after 9/11 and Hurricane Katrina (The Next
Catastrophe, 2007), Perrow describes three fundamental vulnerabilities that the nation
unavoidably faces:
• Concentrations of energy such as explosive and toxic substances (i.e. industrial storage and processes); flammable substances including brush and scrub forests; and dams; (this includes critical infrastructures on which whole regions depend for economic stability and public services);
• Concentrations of population particularly in risk-prone areas, such as in close
proximity to the aforementioned hazardous substance sites and industries, and developments in flood planes, earthquake zones, forested areas prone to wildfires, and coastal areas prone to hurricanes;
• Concentrations of economic and political power particularly in critical industries
such as electrical power generation, telecommunications and the internet, and agriculture production of critical food supplies. Aside from the raw industries and production, this concentration includes economic clout that ensures deregulation of industries, reduces market competition, and concentrates political influence. [Perrow 2007, p. 6].
The parallel between these vulnerabilities and the factors identified in the Social
Vulnerability Index of Cutter, et al, is striking, and indicates the degree to which—as
Cutter noted—the fields of analysis appear to be merging toward consensus on the
inherent risks, scope and distribution of hazards in American society.
The significance of Perrow’s study to the issue addressed in this thesis is that it
typifies the priority given prior to 9/11 to the development and management by private
sector industry and government agencies of high-technology systems that hold potential
for catastrophic failure affecting the public and social sphere. In the hazard and risk
analysis field, research was largely directed toward quantifying and analyzing risks and
reconciling them with research into public perceptions of those risks. This was done, as

46
Perrow points out, to aid policy-makers in analyzing courses of action for technology
development and often for “selling” those technologies to the public.
With the increase in risk and public concern today, a new field of risk assessment has grown up, giving advice and (usually) legitimating the decisions of elites in the private and public sectors. At the behest of Congress, regulatory agencies have appeared in large numbers, and another function of risk assessors is to second-guess these agencies’ awkward attempts to do a very difficult job. ... This is a very sophisticated field. Mathematical models predominate; extensive research is conducted; and the esoteric matters of Bayesian probabilities, ALARA principles (as low as reasonably achievable), “discounted future probabilities,” and so on are debated in courtrooms as well as academic conferences. Some of the best scientific and social science minds are a work on the problem of “how safe is safe enough?” [Perrow 1999, pp. 307-308]7.
Perrow highlights that much of the work in the hazard and risk analysis field has been
directed toward defining risk and attempting to clarify society’s understanding of risk-
based decisions so as to improve social policies and resource investments, particularly
with regard to advanced technologies and hazardous substances. The challenge is
described succinctly in Slovic’s The Perception of Risk as “the need to make the
decision-maker’s perceptions of the hazard more accurate and the need to make him
aware of a more complete set of alternative courses of action” [Slovic, Kunreuther and
White 1972, in Slovic 2000, p. 24]. This book is a compilation of 25 years of research by
leaders in the field of risk analysis and risk perception. The question for this study is how
that research has been directed toward enabling individual businesses and private sector
enterprise to make better risk-based decisions.
7 A similar observation is made by Slovic “The practice of risk assessment has steadily increased in prominence during the past several decades as risk managers in government and industry have sought to develop more effective ways to meet public demands for a safer and healthier environment. Dozens of scientific disciplines have been mobilized to provide technical information about risk, and billions of dollars have been expended to create this information and distill it in the context of risk assessments” [Slovic 2000 p. 391].
47
The most direct applicability of hazards and risk research to business and private
sector concerns is the development of principals or methodologies for making complex
business decisions less “risky.” One example has been the attempt by risk researchers to
clarify the seemingly basic concept of insurance. Kunreuther’s proposal to establish
comprehensive disaster insurance as a means of accounting for bad judgments in
insurance decisions, and to ensure equitable sharing of social and economic risks has
already been cited [Daniels, Kettl and Kunreuther 2006]. Slovic further describes a series
of studies conducted over several years to determine rationales for private insurance
decisions. One key finding is that people consistently countermand principles of expected
utility theory by purchasing low-deductible policies that cover minor incidents with a
perceived high rate of occurrence, while avoiding insurance covering low-probability but
high-consequence, or catastrophic events (specifically flood and earthquake insurance).
Slovic cites several hypotheses for this common observation, which is backed up by
controlled experiments dealing with expected gains under uncertainty in gambling
scenarios. The most reasonable explanation is that individuals have a “threshold
protecting a finite reservoir of concern” and are selective, if not parsimonious, in
applying it to their decisions. [Slovic 2000 p. 70]. Slovic cites the comments of Haas in
the findings of a 1971 study of people’s response to earthquake insurance:
What do people attend to most of the time? They pay attention to that which is most pressing, that which must be attended to, that which has deadlines, that which is generally considered most critical, that which one would be severely criticized for if he or she didn’t attend to. [Haas 1971, cited in Slovic 2000, p. 69).
The lessons from this series of studies led to a number of recommendations regarding
non-traditional methods for improving adoption of disaster insurance by the public,
48
including Kunreuther’s call for mandated comprehensive disaster insurance; the bundling
of high-probability, low-consequence hazards insurance with low-probability, high-
consequence coverage; and the shaping of statistical information about the probabilities
of loss over time to make insurance more appealing (for example, compounding hazard
over time so that the risk of damage from a 100-year flood over a thirty-year mortgage
term is presented as 30%, rather than 1 in 100 in any given year).
However, Slovic’s and Kunreuther’s study has other implications for private sector
and public preparedness, aside from the seemingly fundamental issue of purchasing flood
or disaster insurance. This study offers a caution regarding expectations for cooperation
by private citizens and private sector entities in even basic preparedness and continuity of
operations measures against local or regional disasters. Studies cited later in this thesis
rarely indicate better than a 50% commitment by the public or by private sector
businesses to preparedness measures prior to actually experiencing a disaster firsthand. In
the same way that the study cited above proposed non-traditional solutions to the problem
of motivating insurance usage, we will likely need equally imaginative and non-
traditional approaches to motivate broad spectrum involvement in preparedness programs
by the private sector and general public.
2.1.4 Heuristics An important contribution from hazard and risk research that has implications for
preparedness and planning in the private sector is the use of heuristics in risk-based
decision-making. Heuristics are judgmental rules based on experience or ready-at-hand
knowledge that often take the place of evidence when decisions must be made on
incomplete information. They are employed—consciously or unconsciously—to reduce
49
difficult mental tasks to simpler ones. [Slovic, Fischhoff and Lichtenstein 1979, in
Kahneman, Slovic and Tversky 1982]. For purposes of this study, four are of note: the
anchoring effect, and the representativeness, availability, and affect heuristics.
Anchoring is the experience of misapplying statistical estimates based on prior
knowledge that skews subsequent estimates in a particular direction. For example, Slovic,
et al, cite a 1978 study of risk perception in which people were asked to estimate the
number of deaths that occurred in the U.S. based on a list of 40 different causes. In one
phase of the study, subjects were told in advance that the average number of automobile
fatalities was on the order of 50,000 per year; in the second phase, subjects were told only
that the annual number of U.S. deaths by electrocution was about 1,000 (both estimates
were factually true). In the latter phase of the survey, people who were aware of the 1,000
deaths by electrocution gave lower estimates of fatalities for virtually every other
category than the people who were aware of the 50,000 automobile fatalities. [Slovic,
Fischhoff and Lichtenstein 1980]. Thus, prior knowledge of a related fact affected
intuitive estimates of a much larger body of information.
Representativeness is the tendency of people to extrapolate probabilities from
information gathered from a small number of instances, and assume that it resembles or
corresponds to a broader set of circumstances. Tversky and Kahneman offer as an
example the likelihood that a random sample of ten men will yield a mean height of 6
feet based on the similarity of this finding in a much larger population, discounting the
fact that the accuracy of a probability assessment increases with sample size [Tversky
and Kanheman 1974]. They explain that
Our thesis is that people have strong intuitions about random sampling; that these intuitions are wrong in fundamental respects; that these intuitions are shared by naïve
50
subjects and by trained scientists; and that they are applied with unfortunate consequences in the course of scientific inquiry. ... (P)eople view a sample randomly drawn from a population as highly representative, that is, similar to the population in all essential characteristics. Consequently, they expect any two samples drawn from a particular population to be more similar to one another and to the population than sampling theory predicts, at least for most samples. [Tversky and Kahneman 1971, p. 105].
An example of the effect of the representativeness heuristic on decision-making
regarding natural disasters would be the assumption that the appearance of the “100-year
flood” (or Category 4 hurricane or 6.4 Richter-scale earthquake) essentially “innoculates”
home-owners, developers or city administrators from experiencing two such events
within their lifetimes, because statistical inference implies a frequency of occurrence of
no more than once every 100 years (or some other large time span).
The availability heuristic is based on the common experience that strong recollections
of an event often make the prevalence or frequency of the event seem more common than
it actually is. In this case,
Life-long experience has taught us that instances of large classes are recalled better and faster than instances of less frequent classes; that likely occurrences are easier to imagine than unlikely ones; and that associative connections are strengthened when two events frequently co-occur. ... That associative bonds are strengthened by repetition is perhaps the oldest law of memory known to man. The availability heuristic exploits the inverse form of this law, that is, it uses strength of association as a basis for the judgment of frequency. [Tversky and Kahneman 1973, pp. 164].
The representativeness heuristic and the availability heuristic could therefore be
considered at the heart of the oft-cited truism that “militaries fight the last war” because
the future probability is that the next instance of combat will closely resemble the current
sample (i.e., it can be expected to be representative of the last instance of warfare) and
51
also that the available experience of the decision-making leadership biases their decisions
towards making certain strategic, logistical and tactical assumptions about the nature of
future conflict. The same could be said about human expectations with regard to natural
disasters—Hurricane Katrina, for example.
Affect is a subtle form of emotion that amounts to a fleeting evaluation of “like” or
“dislike” to some stimulus that can shade an individual’s response to perceptions of risk
[Slovic 2000]. The affect heuristic states that peoples’ decisions about the differences
between costs and benefits of a given situation may be shaped not by a cognitive or
rational decision-making process, but rather by preferences based on affect or emotional
value associated with either the costs or the benefits [Finucane, Alhakami, Slovic and
Johnson 2000]. In other words, a strong elicitation of negative emotional response to a
certain situation or choice can amplify perceptions of risk, while a positive emotional
response can amplify perceptions of the benefits and therefore shape a decision-maker’s
preferences either for avoiding risks or for seeking benefits. As Finucane, et al, state it:
“representations of objects in people’s minds are tagged to varying degrees with affect. People consult or refer to an ‘affective pool’ (containing all the positive and negative tags associated with the representations consciously or unconsciously) in the process of making judgments. ... Using an overall, readily available affective impression can be far easier—more efficient—than weighing the pros and cons or retrieving from memory many relevant examples, especially when the required judgment or decision is complex or mental resources are limited. This characterization of a mental short-cut leads us to label the use of affect a ‘heuristic.’ [Finucane, et al 2000, p. 3].
Experiments have shown that the affect heuristic exerts a stronger influence when
decisions must be made under time stress, presumably because the heuristic value is
maximized when there is no time available for gaining further information or conducting
a rational calculation of costs and benefits.
52
The degree to which these heuristics are employed by different individuals during
specific sets of circumstances, and the degree to which heuristics take precedent over
other cognitive decision-making processes (such as expected utility or bounded
rationality) is a subject of speculation. The significance, rather, is that they may be
working through or in conjunction with more cognitive and deliberative processes:
“To date the availability heuristic has been portrayed typically as a cognitive judgment strategy, in that it works by increasing deliberation about reasons that bias probability judgments. However, the reasons that come to mind may be analytic, or tinged with positive or negative affective tags, or both. Thus, the availability heuristic may be working through cognitive or affective processes.” [Finucane, et al 2000 p. 14]
Implications of heuristics for this study reside in the decision-making processes used
by business owners and leaders in determining priorities for preparedness and continuity
initiatives, and how those decisions might be affected by personal experience in previous
disasters (or not), by corporate history, or by hazard and risk warnings (particularly those
that prove to be false alarms), as well as other costs and benefits competing for attention.
A further implication may be for the effectiveness of government or agency-sponsored
public preparedness campaigns, and whether it would prove more effective to emphasize
the potential for damage from lack of preparedness (the risk) or the broader advantages to
be gained from preparedness and continuity measures (the benefits).
One final area in which traditional research into hazard and risk perception may have
positive utility for private sector business and industry is in the area of public relations
and perceptions of organizational or corporate responsibility. Slovic discusses this in his
1993 article “Perceived Risk, Trust and Democracy,” [Slovic 2000, pp. 316-327]. He
53
points out that the consistent differences found between expert opinions of technological
risk and public perceptions of those same risks do not stem from public ignorance or
irrationality, but rather indicate a different public calculus that is not easily modeled in
current risk-based analysis. That is, public perceptions are based on larger concerns borne
out of debated uncertainties which are a part of any risk analysis, and the tempering of
uncertainties by social concerns such as involuntary exposure to hazards; inequities in
sharing of risks and benefits by population segments; and dread of unknown
consequences, particularly as portrayed by the media [Slovic 2000, p. 316]. Of equal
significance, however, is the factor of public trust, which is a function of long-term
relationships and a perception of open and honest communications. Slovic writes, “The
limited effectiveness of risk-communications efforts can be attributed to the lack of trust.
If you trust the risk manager, communication is relatively easy. If trust is lacking, no
form of communication will be satisfactory. Thus trust is more fundamental to conflict
resolution than communication” [Slovic 2000, p. 319].
The most significant aspect of this piece is Slovic’s presentation of data from studies
of trust-building activities between authorities and the public, compared with
corresponding activities that tend to undermine public trust. In general, trust-undermining
actions have a stronger negative effect on perception than trust-building actions have a
positive effect. This indicates that public trust built through civic relations programs may
provide capital that helps mitigate a potentially negative public image during a crisis—
but that the accumulation of that capital might not be apparent until it is drawn on during
a crisis. In other words, competence and openness on the part of organizations in a
democracy—whether private sector enterprises or public agencies—is the status quo
54
expectation of the public. Its absence will compound a crisis, while a reputation for
openness and competence can go a long way toward mitigating negative consequences
during that crisis. This finding has implications for private sector entities—particularly
businesses that control hazardous processes or materials—for building positive corporate
relations with the public before an incident that puts the entity in the public spotlight.
Likewise, it has implications for public sector agencies (whether federal, state or local)
that attempt to gain private sector support for preparedness initiatives requiring private
sector collaboration or cooperation with government.
Finally, formal risk assessment and analysis processes must be kept in perspective as
means to an end, the end being good decisions in a world in which competing demands
make certainty—even for mundane decisions like selection of insurance coverage—a
trade-off against other priorities. Fischoff, Slovic and Lichtenstein offer perhaps the most
realistic assessment of the utility of analytic methods for real-world decision-making:
No approach to acceptable risk is clearly superior to the others. To exploit the contributions each of these methods can make, careful consideration must be given to the social and political world in which they are used and to the natural world in which we all live. Our social world is characterized by its lack of orderliness. Because hazards are not the only consideration in hazard management decisions, the best we can hope for is some intelligent muddling through. Recognizing this, we should develop and apply the various approaches to hazard management not as inviolate ends in themselves but as servants to that process. [Fischoff, Slovic and Lichtenstein in Slovic 2000, p. 134].
55
2.2 Business continuity management While the research field of hazard and risk analysis has traditionally focused on the
social perceptions of risk and the implications for policy, the private sector has made use
of risk analysis tools for determining options and developing best practices for several
years. The “case-based” approach that characterizes much of the sociological research in
disaster studies has had particular relevance for motivating and instructing business
owners and executives toward the adoption of crisis and continuity management
practices. For well over a decade, private sector business and industry have been
cautioned about the increasing complexity of the basic systems and processes of modern
society and the potential for serious impact on business in the event of their failure
[Silverstein, 1992; Perrow, 1999]. Moreover, published guidelines for business
preparedness have emphasized that the first line of defense against technological
accidents, natural disasters, civil emergencies—even acts of terrorism—resides with the
individual businesses and organizations themselves, and that businesses can take steps to
protect themselves [FEMA 141, 1993; Laye, 2002]. This is not merely a matter of
corporate security, but an essential condition for maintaining continuity of business
operations and profitability, whether against internally or externally generated crises.
Nevertheless, in spite of the emphasis in professional literature—to say nothing of the
well-known experiences of 9/11, Hurricane Katrina and numerous other weather-related
disasters since 2001—there remains a less than enthusiastic adoption of voluntary
standards or willingness on the part of business to commit resources to continuity and
preparedness programs. A 2003 analysis by Mitroff and Alpaslan, drawing on a 20-year
study by the University of Southern California’s Center for Crisis Management, found
56
that—at most—only 25 % of Fortune 500 companies could be considered prepared to
deal competently with a corporate crisis. Mitroff emphasizes that this means that at best
estimate, 75% of Fortune 500 companies cannot be expected to capably deal with a crisis
[Mitroff and Alpaslan, 2003].
Similarly, a two-year survey of 168 U.S. companies completed in 2006, indicated that
73% considered pandemic influenza a serious threat to the United States; 59% believed
that PI would adversely affect their companies; and 72% believed that planning could
protect their companies from the impact of a pandemic. And yet, only 52% of those
companies indicated that they had taken steps to actually plan for or mitigate the effects
of pandemic influenza [Deloitte 2006].
More recently, a 2008 survey of 100 financial executives representing U.S. and
Canadian corporations with at least $1billion in annual revenue, revealed that 96% had
operations that were exposed to natural disasters such as hurricanes, earthquakes or
floods, but only 52% considered their companies prepared against loss due to a hurricane;
only 37% considered themselves protected against flooding; and only 29% had taken
what they considered adequate measures against the risk of earthquake damage. Perhaps
most revealing was that fewer than 21% of the same executives stated that they were
concerned about the potential for a negative impact on corporate bottom line owing to a
natural disaster. [FM Global 2008].
Nevertheless, it is clear that 9/11 forms a dividing line within the business community
in terms of at least awareness of the need for preparedness and continuity planning—
witness the fact of the three studies cited above. A more substantial indication is that
business functions directed toward ensuring continuity of operations and disaster
57
recovery have in recent years become professional competencies and corporate line
responsibilities in their own right, especially in larger organizations where institutional
complexity and sheer size require formal training in continuity planning and the
dedication of corporate assets and personnel to that purpose [Amato-McCoy, 2006;
Black, 2005].
The literature within the business community has also reflected a reevaluation since
9/11. For example, three recent business guides on crisis management and decision-
making copyrighted in 2000 and 2001 collectively contain no indexed references to
“disasters,” “natural disasters,” “hurricanes,” “flooding” or “terrorism.” [Harvard
Business School 2000 and 2001; Hoch, Kunreuther and Gunther 2001]. This is not to say
that corporate disasters and crises are not discussed. One article cites earthquake
protection planning in an example dealing with insurance risk estimation [Kunreuther in
Hoch, Kunreuther and Gunther 2001, p. 262]. Another cites both Three Mile Island and
the Exxon Valdez incident in an article dealing with CEO statements to the press during a
crisis [Augustine in Harvard Business School 2000, p. 21]. The third references the 1965
Northeastern electric power failure, the thalidomide tragedies of the 1960s, and the
Cuban Missile Crisis as examples of unique events, in a discussion of framing situations
for effective decision-making [Drucker in Harvard Business Review 2001, pp. 5-6].
However, it is clear through the executive perspective and typical readership of these
books (all three are anthologies of articles from influential business journals) that the
focus is on crisis management as a means of maintaining corporate integrity against
threats to business viability and profitability and not necessarily to physical integrity.
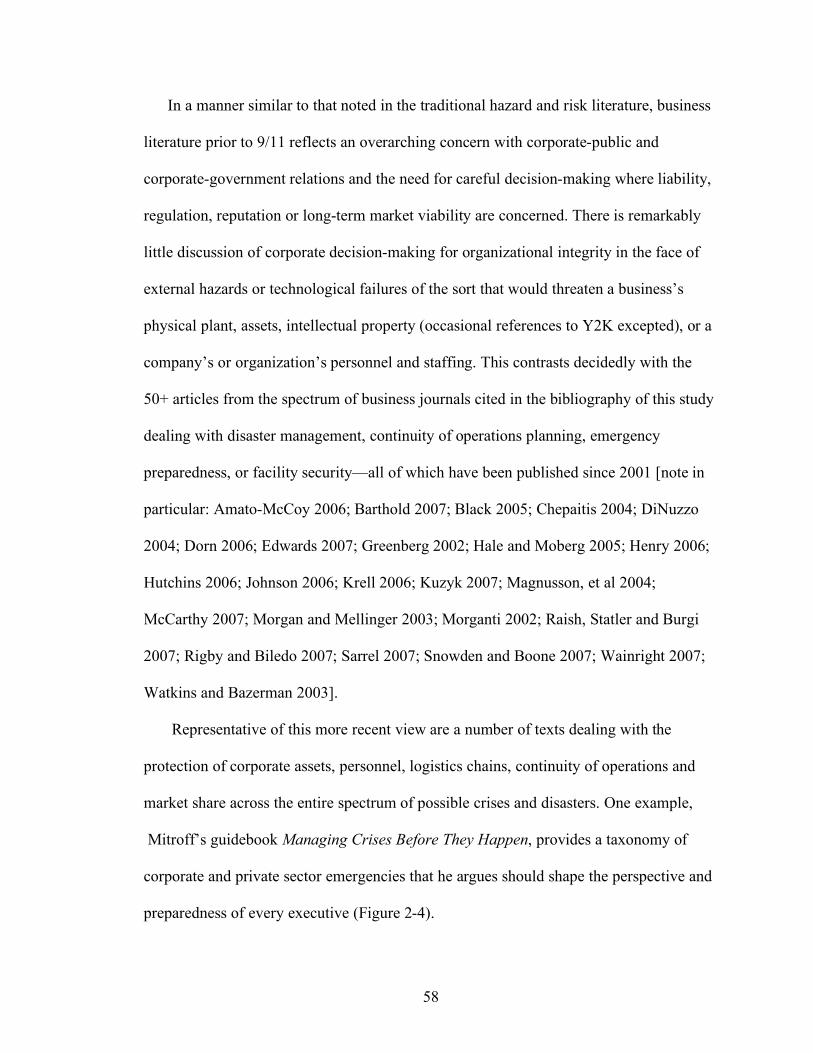
58
In a manner similar to that noted in the traditional hazard and risk literature, business
literature prior to 9/11 reflects an overarching concern with corporate-public and
corporate-government relations and the need for careful decision-making where liability,
regulation, reputation or long-term market viability are concerned. There is remarkably
little discussion of corporate decision-making for organizational integrity in the face of
external hazards or technological failures of the sort that would threaten a business’s
physical plant, assets, intellectual property (occasional references to Y2K excepted), or a
company’s or organization’s personnel and staffing. This contrasts decidedly with the
50+ articles from the spectrum of business journals cited in the bibliography of this study
dealing with disaster management, continuity of operations planning, emergency
preparedness, or facility security—all of which have been published since 2001 [note in
particular: Amato-McCoy 2006; Barthold 2007; Black 2005; Chepaitis 2004; DiNuzzo
2004; Dorn 2006; Edwards 2007; Greenberg 2002; Hale and Moberg 2005; Henry 2006;
Hutchins 2006; Johnson 2006; Krell 2006; Kuzyk 2007; Magnusson, et al 2004;
McCarthy 2007; Morgan and Mellinger 2003; Morganti 2002; Raish, Statler and Burgi
2007; Rigby and Biledo 2007; Sarrel 2007; Snowden and Boone 2007; Wainright 2007;
Watkins and Bazerman 2003].
Representative of this more recent view are a number of texts dealing with the
protection of corporate assets, personnel, logistics chains, continuity of operations and
market share across the entire spectrum of possible crises and disasters. One example,
Mitroff’s guidebook Managing Crises Before They Happen, provides a taxonomy of
corporate and private sector emergencies that he argues should shape the perspective and
preparedness of every executive (Figure 2-4).
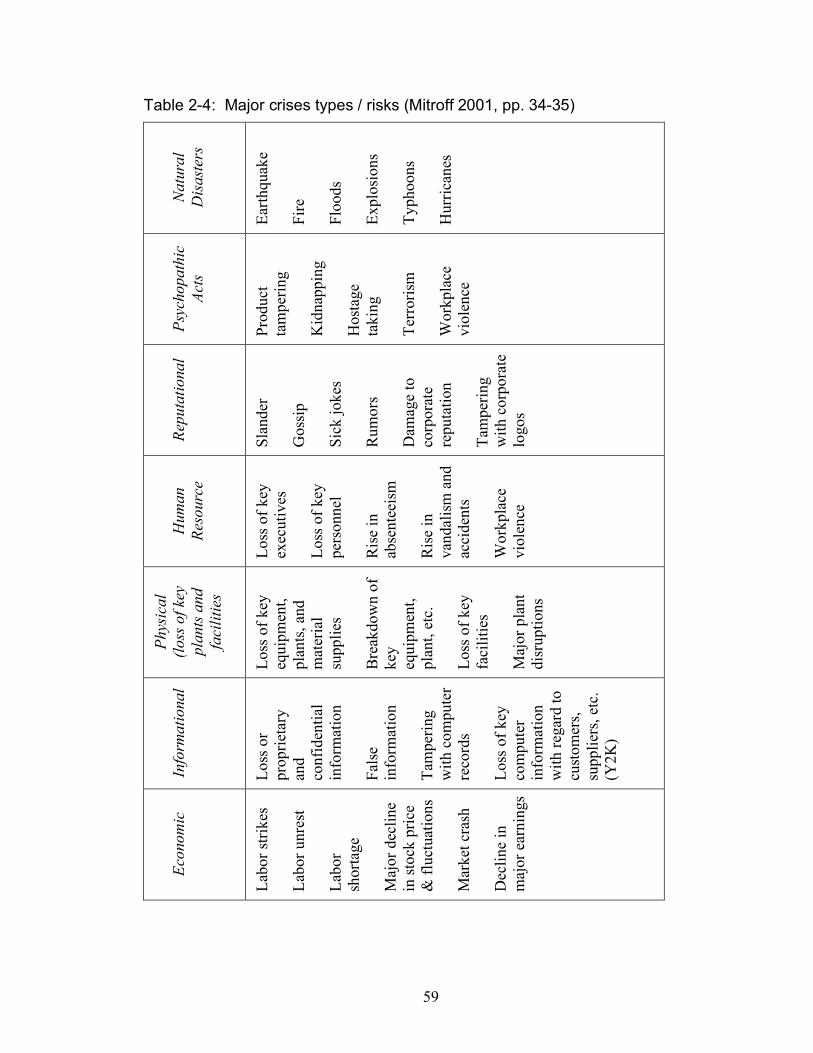
59
Table 2-4: Major crises types / risks (Mitroff 2001, pp. 34-35)
Na
tura
l D
isaste
rs
Earth
quak
e Fi
re
Floo
ds
Expl
osio
ns
Typh
oons
H
urric
anes
Ps
ycho
path
ic
Acts
Prod
uct
tam
perin
g K
idna
ppin
g H
osta
ge
taki
ng
Terr
oris
m
Wor
kpla
ce
viol
ence
Re
puta
tiona
l
Slan
der
Gos
sip
Sick
joke
s R
umor
s D
amag
e to
co
rpor
ate
repu
tatio
n Ta
mpe
ring
with
cor
pora
te
logo
s
H
uman
Re
sour
ce
Loss
of k
ey
exec
utiv
es
Loss
of k
ey
pers
onne
l R
ise
in
abse
ntee
ism
R
ise
in
vand
alis
m a
nd
acci
dent
s W
orkp
lace
vi
olen
ce
Phys
ical
(lo
ss o
f key
pl
ants
and
faci
litie
s
Loss
of k
ey
equi
pmen
t, pl
ants
, and
m
ater
ial
supp
lies
Bre
akdo
wn
of
key
equi
pmen
t, pl
ant,
etc.
Lo
ss o
f key
fa
cilit
ies
Maj
or p
lant
di
srup
tions
In
form
atio
nal
Loss
or
prop
rieta
ry
and
conf
iden
tial
info
rmat
ion
Fals
e in
form
atio
n Ta
mpe
ring
with
com
pute
r re
cord
s Lo
ss o
f key
co
mpu
ter
info
rmat
ion
with
rega
rd to
cu
stom
ers,
supp
liers
, etc
. (Y
2K)
Ec
onom
ic
Labo
r stri
kes
Labo
r unr
est
Labo
r sh
orta
ge
Maj
or d
eclin
e in
stoc
k pr
ice
& fl
uctu
atio
ns
Mar
ket c
rash
D
eclin
e in
m
ajor
ear
ning
s

60
Mitroff’s taxonomy is also the basis for the more recent Why Some Companies
Emerge Stronger and Better from a Crisis (2005), which provides a quick-and-dirty (11
pages) “Brief Primer on Crisis Management” that offers a conceptual framework for the
development of a Crisis Management plan.
A comprehensive approach to private sector preparedness is also reflected in an
article entitled “Identification of Core Competencies by Executive Level Business Crisis
and Continuity Managers” [Shaw and Harrald 2006], which proposes the term Business
Crisis and Continuity Management (BCCM) as a more accurate name for an
“organization wide strategic program” that consolidates the traditional functions of crisis
management, risk assessment, emergency management and disaster recovery, as well as
business continuity planning [Shaw and Harrald, 2004]. Shaw and Harrald offer the
following definition of a comprehensive view of this process:
The business management practices that provide the focus and guidance for the decisions and actions necessary for a business to prevent, prepare for, respond to, resume, recover, restore and transition from a disruptive (crisis) event in a manner consistent with its strategic objectives. [Shaw and Harrald 2004 p. 3].
A similarly practical guide to business preparedness is provided by Laye’s Avoiding
Disaster: How to Keep Your Business Going When Catastrophe Strikes. This book and
others of the sort [Childs and Dietrich 2002; Syed and Syed 2004] are more typical of the
“how to” approach to business crisis planning—often directed toward professionals in
continuity or risk management, or small business owners who lack specialized staff—
rather than a conceptual approach targeted for the executive leadership who need to
understand why business continuity planning and crisis management are important, but
not necessarily the details of how to implement it.
61
At the technical end of the spectrum are corporate guidelines or professional texts in
risk assessment and risk analysis (e.g., Koller 2005; Vose 2008), which are analytic
guidebooks for professional risk analysts for use either within consulting firms or
businesses that employ full-time or collateral-duty staff to conduct quantitative risk
assessments, or for classroom use in college-level or professional courses teaching these
skills. In any case, these guides provide a conceptual approach to risk assessment, but
then proceed to the quantitative assessment procedures required to support a detailed
analysis of cost-benefit based decision processes for risk management.
2.3 Federal agency documents In the opening page of Emergency Management: The American Experience 1900-
2005, Claire Rubin observes that “Prior to World War II, there was no overarching
legislation or policy at any level of government driving emergency and disaster
management in the United States.” [Rubin 2007, p. 11]. She quotes geographer
Rutherford Platt’s explanation that “Before 1950, disaster assistance was viewed as the
moral responsibility of neighbors, churches, charities and communities—not the federal
government” [Rubin, p. 12]. Until very recently, that general attitude had driven most
policy regarding private sector involvement in disaster preparedness and response,
whether that view was reflected by private businesses or industries, non-profit charitable
organizations, or by individual citizens. The first substantive piece of legislation devoted
to general disaster response—the 1950 Federal Disaster Relief Act—made provision for
federal assistance to regions affected by disaster, but focused on “making emergency
repairs to and temporary replacement of” public facilities (Rubin, p. 105]. It made no
mention of any specific role for private sector entities or for private citizens generally,

62
and local preparedness and recovery was understood to be the responsibility of the
citizens and the community themselves. State and local responsibility for preparedness
and recovery was also reflected in the 1950 Civil Defense Act, which covered civil
emergencies and physical damage inflicted through hostilities against the United States
[Rubin, p. 82]. This approach continued through a succession of legislation that defined
the boundaries of federal responsibility and provided mechanisms for state and local
support for disaster recovery via federal disaster assistance.8
The 1988 Stafford Act was the legislation that laid the foundation for what is today an
emerging recognition of the importance of the private sector in local disaster response,
recovery and mitigation. Section 307 of the Stafford Act, “Use of Local Firms and
Individuals,” states
In the expenditure of Federal funds for debris clearance, distribution of supplies, reconstruction, and other major disaster or emergency assistance activities which may be carried out by contract or agreement with private organizations, firms, or individuals, preference shall be given, to the extent feasible and practicable, to those organizations, firms, and individuals residing or doing business primarily in the area affected by such disaster or emergency. [Stafford Act 1988, §307].
While not explicitly stated, this provision recognizes several advantages that private
sector involvement provides for recovery operations. First, it supports the use of the most
readily available talent, material and equipment in the recovery operation, thus shortening
the logistics chain for recovery operations, and potentially the response time. Secondly, it
maintains emphasis on the fact that, while federal funding may be made available, the
responsibility for recovery remains with the affected community, including the resources
available from the for-profit sector. Third, it offers the opportunity to put disaster victims 8 This included the Small Business Act of 1953; the Southeast Hurricane Disaster Relief Act of 1965; the Disaster Relief Act of 1966; the National Flood Insurance Act of 1968; and the Disaster Relief Act of 1970, which was further expanded in 1974 [see Rubin, 2008, pp. 81-102].
63
and their businesses immediately to work with enough federal assistance to begin
restoration of the local economy, as well as that of the physical infrastructure and
community. Subsequent revisions to the Stafford Act (2000 § 5150; 2007 § 307)
preserved the original language.
The principles of the Stafford act were made operational by the Federal Response
Plan issued in 1992 under a provision of the Stafford Act itself. As later amended in
1998, the Stafford Act specified that
The combined emergency management authorities, policies, procedures, and resources of local, State, and Federal governments as well as voluntary disaster relief organizations, the private sector, and international sources constitute a national disaster response framework for providing assistance following a major disaster or emergency. [Federal Response Plan, 1998, p. 2]. Federal agencies are encouraged to take advantage of current partnership relations with the private sector. Businesses, both inside and outside the disaster-affected area can supply critical resources during response operations, and assist in restoring essential services and rebuilding the economic base during recovery operations. (As potential disaster victims, private-sector businesses are also urged to identify their risks, develop appropriate contingency plans, and take corrective actions prior to a disaster). [Federal Response Plan 1998, p. 9].
In particular, the Federal Response Plan specified in the Recovery Function Annex that
“the involvement of voluntary organizations and private sector at the national, State and
local levels is critical to the success of a disaster recovery mission [Federal Response
Plan, p. RF-3].” This was the first reference in a federal document to an expectation of
ongoing coordination between federal agencies and private sector business and voluntary
organizations, and the first mention of a need for risk assessments and development of
contingency plans among private sector entities as a key to disaster recovery within
affected areas. A diagram depicting the National Response Framework highlighted the
private sector as one of six partners in disaster response (Figure 2-3).

64
Figure 2-3: National disaster response framework [FRP 1998]
In conjunction with the issuing of the Federal Response Plan, the Clinton
Administration issued Presidential Decision Directive NSC-63 on Critical Infrastructure
Protection, which framed the risk to the nation’s infrastructure:
Because of our military strength, future enemies, whether nations, groups or individuals, may seek to harm us in non-traditional ways including attacks within the United States. Because our economy is increasingly reliant upon interdependent and cyber-supported infrastructures, non-traditional attacks on our infrastructure and information systems may be capable of significantly harming both our military power and our economy. [Clinton, 1998]
The document charged the private sector with the responsibility to “ensure the orderly
functioning of the economy and the delivery of essential telecommunications, energy,
financial and transportation services” so that “any interruptions or manipulations of these
critical functions [would be] brief, infrequent, manageable, geographically isolated and
minimally detrimental to the welfare of the United States.” [Clinton, 1998, para III.] The
document further established the concept of a shared responsibility and partnership
between “owners, operators, and the government,” in protecting the physical integrity and
65
operational viability of the nation’s critical infrastructures. It further established a
National Infrastructure Assurance Council (NIAC) to oversee coordination across
agencies and private sector concerns involved in maintaining and operating sectors of the
critical infrastructure, and placed directive control of this effort under a National
Coordinator for Infrastructure Protection and Counter-Terrorism.
Several themes were identified in PDD-63 that continue to pose challenges for current
efforts to identify a workable framework for public-private sector partnerships that would
enhance security of the economy and critical infrastructure, notably:
• Liability and legal impediments arising from participation by private sector companies in information sharing with federal agencies;
• Problems of classification of technical documents, threat analyses, risk and
vulnerability assessments;
• Information sharing and secure dissemination of proprietary information, trade secrets, business data, law enforcement information and evidentiary material;
• Impacts of information sharing between international trade partners and domestic
security and law enforcement agencies;
• Potential benefits and liabilities from mandates requiring insurance protection, particularly for foreign-owned elements of the critical infrastructure;
• Ways to encourage private sector participation in information sharing and risk
assessments;
• Means to foster public sensitivity to the need for critical infrastructure protection, to include the need for a national awareness campaign among the public.
At the same time that PDD-63 and the Federal Response Plan were being initiated,
two independent congressionally-chartered studies were underway that raised warnings
about the potential for domestic terrorism. The first was the report of The United States
Commission on National Security/21st Century—entitled New World Coming: American

66
Security in the 21st Century, commonly referred to as the Hart-Rudman Commission.
This study was chartered to examine the structure of the federal government (in particular
the Department of Defense) and make recommendations to address perceived gaps in the
nation’s strategic posture relative to current threats to national security. The second report
was the Advisory Panel to Assess Domestic Response Capabilities for Terrorism
Involving Weapons of Mass Destruction, commonly known as the Gilmore Commission.
The objective of this commission was to evaluate the vulnerabilities of the United States
against the potential for attack by a terrorist organization employing a weapon of mass
destruction.
In both of these studies, the focus on private sector preparedness and continuity
planning was founded on the concern that America’s critical infrastructures—which are
owned and operated predominantly by private corporations—were increasingly
vulnerable to terrorist attack. Phase III of the Hart-Rudman Commission report
emphasized that “homeland security is not peripheral to U.S. national security strategy,
but central to it” [Hart-Rudman 2001, p. 11]. It identified three measures that required
active public-private partnerships to achieve effective security:
• The development of transportation security measures to reduce the risk that importers, exporters, freight and transportation carriers serve as conduits for criminal or terrorist activity;
• Bolstering the intelligence gathering, data management and information sharing
capabilities of border control agencies to enhance inspection and identification of potential threats; and
• Strengthening the capabilities of border agencies to arrest terrorists and interdict
dangerous shipments before they arrive in the U.S. [Hart-Rudman 2001, p. 13].
67
The Hart-Rudman Commission cited progress made in implementing PDD-63, but
emphasized that the continuing integration of critical infrastructure systems such as
electrical utilities, water systems, transportation networks, telecommunications, and
banking and finance industries required coordination between federal agencies and
private sector enterprise to ensure security of these systems.
The concern for vulnerability to terrorism was highlighted, as well, by references in
the third annual report of the Gilmore Commission to the need for involvement by the
private sector in developing education in disaster awareness; maintaining security of
logistics and transportation systems; and participating in national efforts to ensure
security of cyber and communications systems [Gilmore 2001]. The Commission’s fourth
annual report made special mention of the concerns of private sector entities in emerging
requirements for protecting critical infrastructures—particularly the cyber infrastructure.
It recommended the establishment of an independent commission to address coordination
of federal requirements with private sector interests such as liability protection for
corporations, and the need to establish mechanisms for increasing market value
associated with compliance with government standards, and other mandated requirements
[Gilmore, 2002].
The final report of the Gilmore Commission called for “strong preparedness and
readiness across State and local government and the private sector with corresponding
processes that provide an enterprise-wide national capacity to plan, equip, train and
exercise against measurable standards” [Gilmore 2003, p. iv]. The report offered “a
prospective vision of the future for 2009” that emphasized “State, Local and Private
Sector Empowerment” as fundamental to domestic security [Gilmore 2003, p. 15]. This
68
report also included as an appendix a report of the Business Roundtable Security Task
Force (http://www.businessroundtable.org/) on initiatives that the Business Roundtable
had sponsored and coordinated to further preparedness in individual businesses and
among private-public partnerships within communities [Gilmore 2003, Appendix N].
It is significant that both the Hart-Rudman Commission and the Gilmore Commission
reports focused on preparedness against what the Gilmore Commission referred to as the
“new normalcy” of terrorism, with no specific reference to other hazards that could
jeopardize regional or national security. This outlook was reflected in the majority of
Federal documents from the late 1990s, through the post-9/11 period up until Hurricanes
Katrina and Rita in 2005. The focus of federal-level efforts to enjoin private sector
cooperation in homeland security was principally focused on maintaining security of the
nation’s critical infrastructures against terrorist attack.
Federal documents issued in the wake of 9/11 largely took this approach to
mobilizing and motivating the private sector. From the outset the private sector was
identified as a fundamental strategic resource and provider of equipment and services
essential to homeland security against the threat posed by terrorist acts involving
weapons of mass destruction. The Homeland Security Act of 2002 established that,
To the maximum extent practicable, the Secretary (of DHS) shall use national private sector networks and infrastructure for emergency response to chemical, biological, radiological, nuclear, or explosive disasters, and other major disasters. [§ 508]
and
The Secretary should, to the maximum extent possible, use off-the-shelf commercially developed technologies to ensure that the Department’s information technology systems allow the Department to collect, manage, share, analyze, and disseminate information securely over multiple channels of communication; and in order to further the policy of the United States to avoid competing commercially with

69
the private sector, the Secretary should rely on commercial sources to supply the goods and services needed by the Department [§ 509].
Moreover, noting that the private sector owns 85% of the nation’s infrastructure9, the
2002 National Strategy for Homeland Security identified five areas where partnerships
between federal agencies and private sector entities were essential:
• Border and transportation security for supply chains and overseas trade;
• Protection of critical infrastructure and key resources;
• Directing science and technology efforts to homeland security;
• Integrating information sharing among public and private sectors.
Homeland Security Presidential Directive (HSPD-7) on Critical Infrastructure
Identification, Prioritization, and Protection directed that the Department of Homeland
Security and sector-specific agencies collaborate with appropriate private sector entities
to encourage development of information sharing and analysis regarding threats,
vulnerabilities, incidents, potential protective measures and best practices [White House
2003]. The National Response Plan (2004) established an operational framework under
the National Incident Management System and the Incident Command System for
integrating private sector capabilities into local or regional response alongside local, state
and federal government agencies. Moreover, it established private sector responsibilities
9 The author has attempted (without success) to establish a source for the assertion that the private sector owns and operates 85% of the nation’s critical infrastructure. That statement does not appear in President Clinton’s PDD-63 nor in the reports of the Gilmore or Hart-Rudman Commissions. However, it is cited in numerous documents of the G. W. Bush administration, beginning with the National Strategy for Homeland Security (2002); and including the National Strategy for Physical Protection of Critical Infrastructure and Key Assets; the National Strategy for Pandemic Influenza; the 9/11 Commission Report, and the Government Accountability Office report “Critical Infrastructure Protection” [GAO 2006]. Of perhaps greater importance is the comment of one small business owner interviewed by the author who stated that, “the proportion of the private sector that owns that 85% of the nation’s infrastructure probably amounts to about 15% of the nation’s private sector.”

70
“(voluntarily or to comply with applicable laws and regulations)” [NRP 2004, p. 13] as
directed by local authorities or authorities in charge at the scene of an incident.
The successor to the National Response Plan, the National Response Framework,
expanded on the operational requirements for coordinating private sector support to
disaster response, and emphasized that “During an incident, key private sector business
partners should be involved in the local crisis decision-making process or at least have a
direct link to key local emergency managers. Communities cannot effectively respond to,
or recover from, incidents without strong cooperative relations with the private sector.”
[NRF, 2008]. The NRF then enumerated seven essential private-sector responsibilities,
which can be taken independent of involvement with the Federal government:
• Planning for protection of employees, infrastructure and facilities.
• Planning for the protection of information and the continuity of business operations.
• Planning for, responding to, and recovering from incidents that impact their own
infrastructure and facilities.
• Collaborating with emergency management personnel before an incident occurs to ascertain what assistance may be necessary and how they can help.
• Developing and exercising emergency plans before an incident occurs.
• Where appropriate, establishing mutual aid and assistance agreements to provide
specific response capabilities.
• Providing assistance (including volunteers) to support local emergency management and public awareness during response and throughout the recovery process.
However, it is the National Strategy to Secure Cyberspace that takes the most
expansive view of the relationship between public and private sector interdependencies
for security and mutual support:
71
The purpose of [the National Strategy to Secure Cyberspace] is to engage and empower Americans to secure the portions of cyberspace that they own, operate, control, or with which they interact. Securing cyberspace is a difficult strategic challenge that requires coordinated and focused effort from our entire society—the federal government, state and local governments, the private sector, and the American people. ... Our economy and national security are fully dependent upon information technology and the information infrastructure. At the core of the information infrastructure upon which we depend is the Internet, a system ... that connects millions of other computer networks making most of the nation’s essential services and infrastructures work. These computer networks also control physical objects such as electrical transformers, trains, pipeline pumps, chemical vats, radars, and stock markets, all of which exist beyond cyberspace. ... In general, the private sector is best equipped and structured to respond to the evolving cyber threat [White House, February 2003, p. viii-ix].
As can be seen, federal documents published at the strategic level, such as those
above, offer little by way of specific direction or guidance on how security, disaster
preparedness or continuity of operations could or should be achieved within the private
sector to support Homeland Security Department objectives. However, there are other
government sources that are intended to fill those needs. For example, detailed guidance
to private sector business and non-profits for all-hazards preparedness and continuity of
operations planning has been issued by the Federal Emergency Management Agency as
an Emergency Management Guide for Business and Industry
(http://www.fema.gov/business/guide/index.shtm) and through the Ready Business
program (http://www.ready.gov/business/); and in the Sector Specific Plans issued as
annexes to the Critical Infrastructure Protection Plan
(http://www.dhs.gov/xprevprot/programs/gc_1179866197607.shtm#2) for those
industries included in the eighteen critical infrastructure sectors. Similarly, a series of
guides for business and community planning against pandemic influenza was issued by
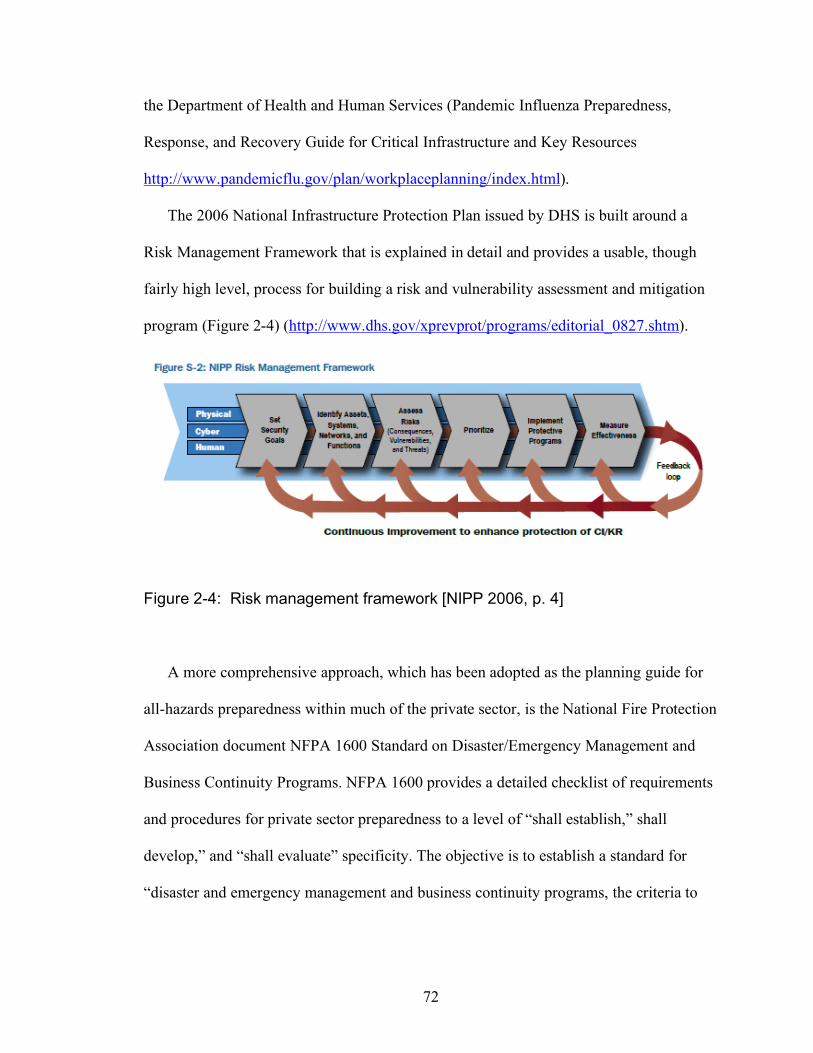
72
the Department of Health and Human Services (Pandemic Influenza Preparedness,
Response, and Recovery Guide for Critical Infrastructure and Key Resources
http://www.pandemicflu.gov/plan/workplaceplanning/index.html).
The 2006 National Infrastructure Protection Plan issued by DHS is built around a
Risk Management Framework that is explained in detail and provides a usable, though
fairly high level, process for building a risk and vulnerability assessment and mitigation
program (Figure 2-4) (http://www.dhs.gov/xprevprot/programs/editorial_0827.shtm).
Figure 2-4: Risk management framework [NIPP 2006, p. 4]
A more comprehensive approach, which has been adopted as the planning guide for
all-hazards preparedness within much of the private sector, is the National Fire Protection
Association document NFPA 1600 Standard on Disaster/Emergency Management and
Business Continuity Programs. NFPA 1600 provides a detailed checklist of requirements
and procedures for private sector preparedness to a level of “shall establish,” shall
develop,” and “shall evaluate” specificity. The objective is to establish a standard for
“disaster and emergency management and business continuity programs, the criteria to
73
assess current programs or to develop, implement, and maintain aspects for prevention,
mitigation, preparation, response, and recovery from emergencies” [NFPA 1600, p. 4].
While not strictly a federal document, NFPA 1600 has been acknowledged in the 9/11
Commission Report as the most authoritative standardized approach to business
preparedness and continuity planning. As a consequence, it was recommended in the
“Implementing Recommendations of the 9/11 Commission Act of 2007” [H.R. 1, 2007]
as a potential standard for the Voluntary Private Sector Accreditation and Certification
Program (explained below).
Harrald has noted that “Post 9/ll infrastructure protection investments have focused
on increasing the security of the infrastructure, not in increasing its resilience [Harrald
2005]. The truth of this is borne out in Bush Administration documents issued between
9/11 and the destruction of Hurricane Katrina. However, as the former incident served as
the “focusing event” (to use Rubin’s term) for U.S. anti-terrorism policies—many of
which necessarily involved private sector efforts in infrastructure protection—Hurricane
Katrina exposed the need for a more comprehensive, all-hazards approach that could
mobilize private sector resources when a catastrophic disaster exceeded the capacity of
even the federal government to respond (for example, witness the Wal-Mart
Corporation’s response to Hurricane Katrina [Cooper and Block 2006, pp.259-266]).
The fact that the Federal government ultimately recognized this deficiency can be
seen by comparing the focus of the 2002 National Strategy for Homeland Security with
the 2007 update to that document. Whereas the 2002 NSHS had focused exclusively on
the threat of terrorism to national assets—written as it was in the aftermath of 9/11—and
74
had directed its recommendations for private sector engagement toward terrorism
preparedness and prevention, the 2007 NSHS included specific references to Hurricane
Katrina, but more importantly to natural and man-made disasters in general. In this sense
the perspective of the National Strategy for Homeland Security had undergone an
important transformation from its original thrust. This broader scope was evident in the
initial section of the 2007 edition, entitled “Evolution of the Paradigm.” That introduction
emphasized that “homeland security is a shared responsibility built upon a foundation of
partnerships. Federal, State, local, and Tribal governments, the private and non-profit
sectors, communities, and individual citizens all share common goals and responsibilities
—as well as accountability—for protecting and defending the Homeland” [NSHS 2007,
p. 4]. This broadened scope included references to the concept of resilience as a key to
mitigating vulnerabilities of both government and private sector operations against man-
made or natural disasters [p. 29]. Moreover, the private and non-profit sectors were
identified as having a specific role in response alongside community, State and Federal
authorities:
Private and Non-Profit Sector. The private and non-profit sectors fulfill key roles and work closely with communities, States, and the Federal Government. The private sector plays an essential role implementing plans for the rapid restoration of commercial activities and critical infrastructure operations, which can help mitigate consequences, improve quality of life, and accelerate recovery for communities and the Nation. Non-profit organizations serve a vital role by performing essential services within communities in times of need, such as mass sheltering, emergency food supplies, counseling services, or other vital support services. [p. 33] (Emphasis in the original).
In addition to the roles identified for the private sector in the 2002 NSHS having to do
with protection of critical infrastructures, information sharing, science and technology
75
and supply chain security, the 2007 document identified five other areas requiring private
sector engagement for effective response, recovery and mitigation:
• Restoration of community services and the economy to include business and non-profit operations that underpin local economies;
• Engaging in planning and coordination of collective recovery efforts, particularly
in the form of public-private partnerships;
• Facilitating long-term assistance for displaced victims, including solutions for housing in affected areas;
• Rebuilding critical infrastructures to support the return of citizens and businesses
to affected communities; and
• Building a “Culture of Preparedness” by ensuring structural and operational resilience of critical infrastructures and contributing to collective initiatives to ensure the resilience of communities.
In essence, the experience of Hurricane Katrina demonstrated much more than the
need for preparedness and resilience among individual private sector enterprises or
sectors, as had been called for in the 9/11 Commission Report. The need identified by
Hurricane Katrina was for a strategic capability that could mobilize private sector
resources and talent, and employ it against regional disasters that crossed jurisdictions or
that destroyed an area’s infrastructure to such a degree that “normal” recovery and
restoration operations were impeded. The broader approach in the 2007 revision to the
National Strategy for Homeland Security did much to acknowledge that reality.
From the start, however, the Federal government has faced two significant challenges
in gaining private sector support for homeland security and preparedness initiatives. The
first challenge was simply motivating private sector participation in view of potential
costs and the uncertain return on investments from corporate or organizational
preparedness. The second challenge was identifying common standards or measures of

76
effectiveness that could ensure that the initiatives adopted actually achieved an
improvement in preparedness among private sector enterprise. This problem was
recognized by the members of the 9/11 Commission, who included in their report to
Congress an endorsement to recommendations of the American National Standards
Institute (ANSI) to establish a voluntary National Preparedness Standard for private
sector entities, based on NFPA 1600. [National Commission 2005, p. 399]. The
recommendation of the 9/11 Commission was later enacted in the “Implementing
Recommendations of the 9/11 Commission Act of 2007” (H.R. 1 of the 110th Congress)
as Title IX—Private Sector Preparedness, in an amendment to the Homeland Security
Act of 2002 [H.R.1 2007].
Title IX established the Voluntary Private Sector Accreditation, Certification and
Preparedness Program or “PS-Prep” (Private Sector Preparedness) as the Department of
Homeland Security program to institute a “common set of criteria for preparedness,
disaster management, emergency management, and business continuity programs” [H.R.
1, 2007, § 524]. The goals of the program are to develop guidance or recommendations
and identify best practices to foster commitment by the private sector in emergency
preparedness and continuity of operations planning. Specific objectives of the PS Prep
program are to motivate private sector businesses, industries and non-profit organizations
to:
(1) identify potential hazards and assess risks and impacts; (2) mitigate the impact of a wide variety of hazards, including weapons of mass destruction; (3) manage necessary emergency preparedness and response resources; (4) develop mutual aid agreements;
77
(5) develop and maintain emergency preparedness and response plans, and associated operational procedures; (6) develop and conduct training and exercises to support and evaluate emergency preparedness and response plans and operational procedures; and (7) develop procedures to respond to requests for information from the media or public.
Private sector entities that participate in the program would undergo a certification
process that will confirm they have met established standards of preparedness. The
voluntary certification criteria would be developed by DHS in consultation with private
sector entities and administered by third-party non-government agents (i.e., private
corporations or non-profits) that had been accredited by ANSI as competent to administer
the program and certify other private sector entities. The program would reside under the
executive authority of the Department of Homeland Security’s Assistant Secretary for
Infrastructure Protection. In view of the potential costs to achieving certification, the
legislation specifies that small business concerns be taken into consideration “to ensure
that such measures are not overly burdensome and are adequate to meet the voluntary
preparedness stand adopted” [H.R. 1 § 524].
At the time of this writing, the PS Prep program had been briefed during a series of
public meetings in early 2009 in order to solicit private sector response to the program,
which is to be implemented in 2009 under the incoming Obama administration. The
expectation on the part of DHS is that the PS Prep program would “raise the level of
private sector preparedness through a number of means, including (1) establishing a
system for DHS to adopt private sector preparedness standards; (2) encouraging creation
of those standards; (3) developing a method for a private sector entity to obtain a
78
certification of conformity with a particular DHS-adopted private sector standard, and
encouraging such certification; and (4) making preparedness standards adopted by DHS
more widely available.” [Federal Register 73(248) 2008].
However, a key concern expressed in the first of the public hearings held at the U.S.
Chamber of Commerce, Washington, D.C., on 15 January 2009, was that a standard and
certification process established by federal authority—even if voluntary—would have
immediate costs associated with compliance, and has the potential to become a tacit
mandate to the private sector which would generate long-term unavoidable costs to
achieve and maintain certification. [The author attended both of the public hearings on
this initiative]. There were also concerns expressed by industries that already comply
with existing standards that their previous efforts would have to be aligned with a new
system, at additional expense. Whether private sector businesses and non-profits would
participate in a voluntary program where standards are established by an agency acting
on behalf of the Federal government, remains to be seen.
2.4 Regional approaches and best practices10 Even without the impetus provided by the PS Prep initiative, or the National
Response Framework, there is a growing recognition among private sector business,
industry and non-profit organizations that they need to develop competencies in disaster
preparedness and continuity planning, and that there is a need to be able to coordinate
planning with other agencies and organizations in their regions. Yossi Sheffi’s book The
10 The footnotes in this section are internet links to the home pages of the non-profit and corporate initiatives cited. Inclusion in this section is in no way intended to imply an endorsement or recommendation by the author of practices espoused by the organizations listed. The author provides these only as examples and a partial listing of the many dedicated organizations engaged in civic and private sector preparedness at the time of publication of this study. The unavoidable omission of other equally capable and valuable organizations in other regions of the country is acknowledged and regretted.
79
Resilient Enterprise makes a business case for public-private sector partnerships that
provide benefits to a community and region by improving the resilience of companies
and this providing a competitive advantage for survival through adversity [Sheffi 2007].
Key to his approach is the building of security through collaboration to anticipate crises;
building flexibility through interchangeability to avoid crises; and building resilience
through redundancy to survive crises. Sheffi writes that the business case for investment
in preparedness and resilience among the private sector should be justified in two ways:
“Security investments should be justified both by their contribution to avoiding disruptions (even when not all the benefits can be quantified) and by the collateral benefits they provide. Resilience investments should be primarily justified by their contribution to flexibility—creating a competitive advantage for the company.” [Sheffi 2007 p. 279].
Since before 9/11, there have been numerous programs that have initiated and often
successfully institutionalized coordinated planning for disaster preparedness, response
and recovery between private and public sectors. Some of these have been federally
sponsored efforts with local chapters: for example, the FEMA-sponsored Project Impact
and Local Emergency Planning Committees,11 and the DHS-sponsored Citizens Corps12
established immediately after 9/11. Others have been organized within municipalities and
surrounding counties, such as the National Capital Region Emergency Preparedness
11 Local Emergency Planning Committees are mandated for communities to receive federal preparedness grants, and apply to regulated industries within a community that pose a risk to public safety from hazardous materials or toxic substances. The National Incident Management System Integration Center website states, “LEPCs are non-profit community organizations that must include in their membership, at a minimum, local officials including police, fire, civil defense, public health, transportation, and environmental professionals, as well as representatives of facilities subject to the emergency planning requirements, community groups, and the media. LEPCs must assist in the development of emergency response plans, conduct annual reviews at least annually, and provide information about chemicals in the community to citizens.” http://www.fema.gov/pdf/emergency/nims/lepc_fs.pdf. 12 Citizens Corps http://www.citizencorps.gov/.

80
Council (NCR-EPC) 13, San Diego’s The Security Network,14 the New Jersey Business
Force15 and cities that have transformed the Project Impact program after its termination
in 2001.16
Still others have taken a regional perspective across several state jurisdictions having
common security interests, such as the Community and Regional Resilience Institute
(CARRI),17 or the All Hazards Consortium.18 Yet others have undertaken efforts in cities
and towns across the entire nation, such as the or the Safe America Foundation,19 or the
Michigan State University initiative called the Critical Incident Protocol20 originally
sponsored by the Department of Justice Office of Domestic Preparedness, and now by
DHS.
While there has been sound support for programs of this sort at the national level
(enabled—so far—by relatively consistent funding from federal or private sector
sources), the programs have nonetheless met with varying degrees of success at the local
level, and are hardly universal in their adoption. Regardless of their scope, the
fundamental determinant for the success among these disparate organizations seems to be
the level of commitment shown by private sector businesses and non-profit organizations,
and by private citizens within the community.
13 National Capital Region Emergency Preparedness Council http://www.mwcog.org/committee/committee/default.asp?COMMITTEE_ID=40. 14 The Security Network http://www.thesecuritynetwork.org/. 15 New Jersey Business Force http://www.njbusinessforce.org/. 16 For example, the program in Tulsa, Oklahoma http://www.tulsapartners.org/, or Seattle, Washington http://www.seattle.gov/emergency/programs/projectimpact/ 17 Community and Regional Resilience Initiative: http://www.resilientus.org/. 18 All Hazards Consortium http://www.ahcusa.org. 19 Safe America Foundation http://www.safeamerica.org. 20 Critical Incident Protocol: http://www.cip.msu.edu/
81
Beyond an expanding number of regional public-private partnerships, several
private sector entities—non-profits and corporations alike—have begun providing
recommended best practices as a public service. For example, the Partnership for Critical
Infrastructure Security21 “coordinates cross-sector initiatives that promote public and
private efforts to help ensure secure, safe, and reliable critical infrastructure services.”
The Institute for Business and Home Safety22 provides an on-line guide and disaster
planning toolkit, “Open for Business,” for small businesses and homeowners that
includes worksheets for vulnerability and risk assessments and development of a
continuity plan. Other private initiatives, such as the National Congress for Secure
Communities23 and the Business Executives for National Security (BENS),24 have
advocated and actively supported public-private sector partnerships to enhance local and
regional security and emergency preparedness. Getting Down to Business: An Action
Plan for Public-Private Disaster Response Coordination is a guide published by the
BENS Business Response Task Force that provides recommendations on three priorities
for regional and community preparedness: (1) public-private sector collaboration; (2)
surge capacity and supply chain management; and (3) the legal and regulatory
environment [BENS 2007]. ProtectingAmerica.Org25 is a national coalition that supports
insurance industry efforts to “improve financial protection for consumers by establishing
special catastrophe backstops at the state and regional level to provide recovery and
rebuilding funds in case of a major national catastrophe.” The website also maintains a
21 Partnership for Critical Infrastructure Protection: http://www.pcis.org. 22 Institute for Business and Home Safety: http://www.ibhs.org/business_protection/ and http://www.disastersafety.org/. 23 National Congress for Secure Communities: http://nationalcongress.org/. 24 Business Executives for National Security: http://www.bens.org/home.html. 25 ProtectingAmerica.Org: http://www.protectingamerica.org/about-the-coalition.
82
page of web links to a wide range of research and planning resources to enhance
preparedness of both private sector entities and private citizens. One university resource,
the International Center for Enterprise Preparedness (Intercep) at New York University is
an “academic center dedicated to private sector crisis management and business
continuity.”26 Several other universities maintain provide similar resources through
research centers, business schools and graduate programs dedicated to homeland security,
risk management and continuity of operations, and disaster preparedness.
There are also numerous private sector corporations, business coalitions,
chambers of commerce and regional business planning commissions that offer similar
services, including published on-line (and some print) resources for other businesses and
regional entities. The importance of these services cannot be understated in terms of
disseminating and refining best practices for private sector entities interested in
improving their levels of preparedness and reducing vulnerability to predictable and
unforeseeable disasters and crises.
2.5 The internet As is clear from the preceding section, the internet provides ready access to
documents and resources that span all four of the literature categories defined in this
chapter, and thus has become an extraordinarily versatile source for acquiring knowledge,
recommended methods and best practices, and regulations and standards pertaining to
business continuity planning, emergency management and disaster preparedness. For
example, over 70% of the references listed in the bibliography of this dissertation—in
particular all of the government sources—are accessible online, either via open access
26 International Center for Enterprise Preparedness: http://www.nyu.edu/intercep/.
83
search engines, or through a university library journal index or commercial search
service. And this in no way reflects the available information that resides within private
sector business, regional planning organizations and state and local government agencies.
At the same time, however, a significant obstacle facing businesses, non-profit
organizations and the general public in preparing for disasters and planning for continuity
of operations is not the lack of available information and guidance, but the abundance of
it. Whereas a decade ago there was little information to guide the non-professional in
continuity of operations planning or emergency preparedness, there is now a virtually
limitless range of programs and best practices to choose from. This is compounded by the
overwhelming quantity of free and readily available information on the internet. This
wealth of information makes the problem of sorting out reliable sources and identifying
appropriate guidance a daunting problem for any business or organization that is
launching a new program in continuity planning or emergency preparedness—and the list
of on-line resources continues to grow over time.
As an example of the extent of the resources available, the websites described below
represent a federal agency, several business consulting firms, a national non-profit
organization, a disaster research center, a homeland security institute at a land-grant
university, and one private citizen. Each provides an extensive catalog of resources and
links to other websites, which are themselves connected to numerous other distinct—and
often overlapping—internet sources for homeland security, disaster and emergency
management, continuity of operations or business continuity planning.27 These websites,
while individually unique, are nevertheless representative of the breadth of information
27 Citation of these websites is not intended to constitute an endorsement of the content or methodology used by the authors or organizations hosting these sites.

84
available to researchers and customers seeking best practices, guidelines and templates
for developing business crisis and continuity management programs.
• Federal Emergency Management Agency (http://www.fema.gov). The FEMA
website is noteworthy for several reasons. First, as the emergency management
agency of the federal government, FEMA publishes information that is tacit
policy or government-sanctioned best practices in disaster preparedness,
emergency response and continuity of operations. Two sections are of special
significance for private sector entities. The first is the Business link that directs
customers to a collection of guidance documents for business, industry and
vendors in the private sector. The second important link, Regional Offices directs
visitors to the ten FEMA regions, and also to the emergency management
agencies of 59 states, territories and protectorates. From those, virtually every
state website links either directly or via subsidiary links to business-specific
planning guides, and often back to the FEMA business directory.
• Disaster Research Institute International and its associated Institute for Continuity
Management (http://www.drii.org). The website of the non-profit, DRII, is typical
of many firms and non-profit organizations that offer services for continuity
planning, risk analysis and security management. Many of those organizations
include “best practices” guidebooks as a primer in fundamental continuity
planning and an entrée to other courses and services offered by the organization.
DRII’s guidebook, “Professional Practices for Business Continuity Managers,”
85
appears under the link Professional Practices=>Introduction/ Overview. Several
other organizations maintain similar websites worthy of note: (1) the Business
Continuity Institute (http://www.thebci.org, which compiles a “Good Practices
Guide” for business continuity practices and also a reference of applicable
certification standards; and (2) the BCM Institute (http://www.bcm-institute.org),
an international certification organization in business continuity management.
• National Congress for Secure Communities (http://nationalcongress.org) is a non-
profit organization that sponsors partnerships between local communities and the
private sector as a means of increasing community resilience and preparedness. Its
partner organization, the Corporate Crisis Response Officers Association
maintains a website (http://www.ccroa.org) that contains a link to Resources for
business and industry partners, including an extensive listing of Best Practices
Abstracts and Public Private Partnership Abstracts. The abstracts provide
information and resources for businesses and industries involved in regional or
community preparedness initiatives, or for private sector vendors offering services
or material to support those initiatives.
• Institute for Business and Home Safety (IBHS) sponsors a website named
DisasterSafety.org (http://www.disastersafety.org/) that collects and manages best
practices and lessons learned for business and industry relevant to preparedness
against natural disasters, technological hazards, and everyday threats to the
viability, liability and profitability of business interests. Its program entitled
86
“Open for Business” (http://www.disastersafety.org/OFB_Training) offers an
online “disaster protection and recovery planning toolkit for the small to medium
sized business.”
• Natural Hazards Center at University of Colorado (Boulder).
(http://www.colorado.edu/hazards/) This site is hosted by one of the oldest
dedicated research centers for natural hazards in the country. It includes a link to
Resources that further directs customers to a dedicated link for Selected Web
Resources, and from there to a Business Continuity site that lists resources for the
private sector (http://www.colorado.edu/hazards/resources/web/business.html). In
addition, this site hosts a Natural Hazards Center Library with a hazards literature
database (HazLit Database) that accesses the entire library’s electronic holdings
for disaster, continuity and emergency/risk management related literature.
• Texas A&M University’s Integrative Center for Homeland Security
(http://homelandsecurity.tamu.edu/) maintains a site called TEX: Taxonomy for
Education and Exploration (http://homelandsecurity.tamu.edu/framework) which
is an extensive and highly organized online resource of homeland security and
disaster management internet sites and documents. Like other university and
research center websites, TEX contains links to other university libraries, but also
to private and national research laboratories, private industries, and non-
government organizations involved in terrorism studies, homeland security and
87
disaster preparedness. It also catalogs a wide range of available “best practices”
literature from those sources.
While unique in the organization and resources they list, these websites are more or
less representative of the enormous scope and ready availability through the internet of
information on risk management, continuity of operations planning, disaster and
emergency preparedness and homeland security. The challenge faced by any private
sector business or organization is to identify trusted sources and appropriate guidance for
their specific case from the universe of available information. This is by no means a
trivial task.
88
CHAPTER 3: CONCEPTUAL MODELS AND FRAMEWORKS
3.0 Overview
3.1 Modeling risk 3.2 Modeling resilience 3.3 Distance and proximity 3.4 Reasoned action and technology acceptance 3.5 Decision-making for planning and operations
3.0 Overview This chapter reviews several models relevant to decision-making among individuals
and organizations that will be applied to the decision-making process for preparedness
and continuity planning within the private sector. The review will provide background
and structure to the analysis of the Private Sector Survey and the development of a
Framework for Private Sector Preparedness to be presented in a later chapter.
There are several reasons for developing a model or framework for analyzing private
sector decisions or commitment to business continuity planning and preparedness. The
first and most basic reason is that a framework or model is a useful tool for simplifying
and depicting complex relationships [Senge 1990; Hoch 2001]28. Secondly, as will be
28A model in science is a physical, mathematical, or logical representation of a system of entities, phenomena, or processes. Basically a model is a simplified abstract view of the complex reality. Formally a model is a formalized interpretation that deals with empirical entities, phenomena, and physical processes in a mathematical, or logical way. A cognitive model is an approximation to animal cognitive processes (predominantly human) for the purposes of comprehension and prediction. Cognitive models tend to be focused on a single cognitive phenomenon or process (e.g., list learning), how two or more processes interact (e.g., visual search and decision making), or to make behavioral predictions for a specific task or tool. A conceptual schema or conceptual model is a map of concepts and their relationships. This describes the semantics of an organization and represents a series of assertions about its nature. Specifically, it describes the things of significance to an organization (entity classes), about which
89
seen in the following sections, practitioners in disaster research, risk analysis, mitigation
planning and preparedness have often resorted to models as a way of depicting the web of
relationships and variables, distinguishing sequences among causes and effects, and
exploring likely outcomes of decisions made under conditions of uncertainty. This
chapter builds on that tradition in the attempt to illustrate decision-making approaches
that are common to the disaster, hazard and risk research fields, but specific—even
unique—to private sector enterprise.
The third and most important reason is that business continuity planning and the
execution of those plans requires a balance between two types of business decision-
making: decision-making within the context of business operations where the risks and
potential consequences are immediate but relatively familiar; and decision-making of the
sort involved in planning against an uncertain future—such as a potential disaster
scenario and its consequences. Addressing this balance poses a dilemma insofar as the
commitment of business resources that may benefit preparedness for the unknown is
often considered a cost or diversion of resources away from core business functions
whose immediate consequences affect day-to-day success and profit-making. Moreover,
aside from the competing priorities for resources, these two types of business planning
also require two different cognitive processes, one involving execution and oversight of
routine operations and one involving planning against uncertainty. This dimension will be
explored more fully at the end of this chapter. As the statistician E. P. Box famously
it is inclined to collect information, and characteristics of (attributes) and associations between pairs of those things of significance (relationships). A framework is a basic conceptual structure used to solve or address complex issues. A conceptual framework is often used in research to outline possible courses of action or to present a preferred and reliable approach to an idea or thought. Souce: Wikipedia (http://en.wikipedia.org/wiki/Main_Page) [Definitions edited for brevity].

90
observed, “all models are wrong, and some models are useful” [Box 1979]. This is a
valuable caution for presenting models for explaining complex processes, particularly
decision processes that are as open-ended as whether or not to plan for and prepare
against unknown disasters. Following from that precept, Clemens developed a set of
criteria for assessing the usefulness of a model in conveying relevant information. In
order to be useful, a model must be:
Salient: Since no model can represent everything, it must selectively represent those things most relevant to the task at hand.
Accurate: The model should precisely encode the actual state of affairs and not an
erroneous or biased view. Complete yet parsimonious: The model should be as simple as possible, but no
simpler. It should concisely capture all the relevant dimensions of the problem without squeezing out the opportunity for serendipitous or creative insight.
Perceptible: Models should be appropriately displayed in high fidelity as they won't be
much use if we can't clearly see, hear, or feel them. Understandable: Once we perceive the model we must be able to make sense of it; it
shouldn't be too complicated or unfamiliar for us to understand. Predictive: The model should not only depict what is, but should also predict what will
happen; or at least give some insight into future possibilities. Falsifiable: The model should be formulated such that it is possible, through
experimentation, to both confirm and disconfirm the model's accuracy and predictive power.
Emotive: In addition, the model may convey a subjective feel for the emotional and
value-laden connotations of the situation being modeled. Inspiring: Because people are drawn to and inspired by thoughtful design, models
should be elegant, i.e. they should synergistically combine style and substance. Memorable: Models are not of much use if they pass quickly from the mind, or if they
cannot be used as a mnemonic device. Models should be easily accessible for future reference and to refresh our understanding.
Flexible: As all models are, to some degree, inaccurate, irrelevant, mistaken, time-
91
sensitive etc., they should be open to recursive revision to reflect new data, our growing understanding, or our evolving needs.
Coherent: Models do not exist in isolation but in interlocking systems, thus any
particular model should be coherent with other related models. Productive: Ultimately, the model has a purpose: the production of effective action. A
good model should help define our goals and then specify the actions necessary to reach them.
Useful: Usefulness is the sum of the above properties and the degree to which they
combine to promote understanding and effective action. It is important to note that the most accurate, or the most complete, or the most elegant model is not necessarily the most useful. [Clemens, 2007].
Gentner and Stevens assert that a major purpose of a model is to “enable a user to
predict the operation of a target system. As a result, the predictive power of such a model
is of considerable concern” [Gentner and Stevens 1983]. It would be presumptuous and
almost certainly inaccurate to propose that any model could capture all of the rationales
or rationalizations for a business decision to adopt preparedness or continuity measures—
or, conversely, to adopt none at all—sufficiently to be predictive of that decision process.
This is particularly true when one considers that business decisions related to prepared-
ness can change according to such factors as economic or corporate priorities;
compliance with regulation or code; insurance or tax incentives; corporate leadership;
and perceptions of vulnerability to prevailing or imminent hazards. The limitations of this
study in attempting to model preparedness among the private sector are admittedly
significant. Suffice it to say at this point that the effort is more descriptive than analytic.
To quote one critic, “muddling through at least has the merit of not imposing any
particular set of blinkers or filters on inquiry during the early stages of development”
[Rayner, 1988].

92
Having offered these caveats, this chapter reviews a number of conceptual models—
including several used in the disaster research field—that provide useful approaches for
depicting the relationships between disaster, risk, potential outcome, and the analytic
process leading to a decision to take preparedness measures. These include examples
from risk communications; the modeling of resilience in communities; a conceptual
framework for compatibility among potential business partners; and a technology
acceptance model based on reasoned action theory. The study then integrates aspects of
these models to produce a hybrid for depicting and understanding motivation among
private sector entities toward the adoption of preparedness and continuity planning.
3.1 Modeling risk A starting point for this discussion is the mental model of risk communication
developed by Morgan, Fischhoff, Bostrom and Atman. According to Fischhoff, the goal
of risk communications is to “provide laypeople with the information they need to make
informed, independent judgments about risks to health, safety, and the environment”
[Morgan, Fischhoff, Bostrom and Atman 2002, p. 4]. In the present case, “laypeople”
would refer to managers, presidents, CEOs, owners and leaders of private sector entities
who have responsibility for protecting the interests and viability of their organizations,
their employees and assets, but who lack a complete understanding of the situation
encountered during a disaster or crisis. As the authors explain, what people typically need
in order to make critical decisions in such cases can be categorized as follows:
• Advice and answers often in the form of explicit instructions, summarizing “the
conclusions they would reach if they had sufficient time and knowledge.”

93
• Numbers, i.e., quantitative summaries of expert knowledge to enable them to
“plug the values into their personal decision-making model and make the choice
that makes the most sense for their personal situations.”
• Processes and framing sufficient to allow individuals to “monitor their own
surroundings, identify risky situations, and devise appropriate responses.” Rather
than simply recommending correct action, this level of information provides a
basis for understanding and competent, independent decision-making.
[Morgan, Fischhoff, Bostrom and Atman 2002, pp. 5-6].
The mental models approach to risk communication is based on the development of
“influence diagrams” that enable the inclusion of various expert perspectives on a given
problem and the identification and inclusion of all the relevant factors that could
influence a specific problem or decision.
Figure 3-1 shows the authors’ template of a generic influence diagram that breaks the
risk calculus into separate management activities directed toward addressing: (1) risks
arising from exposure to the hazard and activities to mitigate it; and (2) risks arising from
the impact of an event and measures taken to limit its effects. Factors affecting outcomes
at a given stage in the analysis originate from environmental, physiological or behavioral
sources.

94
Figure 3-1: Influence diagram template [Morgan, Fishhoff, et al 2002, p. 42]
To illustrate an application of influence analysis, the template is directed to the specific
example of mitigating the risk of tripping and falling on stairs (Figure 3-2). In this
diagram, ovals represent conditions or states, and squares represent decisions or points of
intervention. The arrows indicate influences that affect subsequent nodes in the diagram.

95
Illustration of the construction of an influence diagram for the risk of tripping and falling on the stairs: (a) shows just those two elements; (b) adds factors that could cause a person to trip; (c) adds factors that might prevent a fall after a person trips; and (d) introduces decisions that residents could make that would influence the probabilities of tripping and falling.
Figure 3-2: Influence diagram for risk of tripping and falling on stairs [Morgan, Fischoff, et al 2002, p. 37]
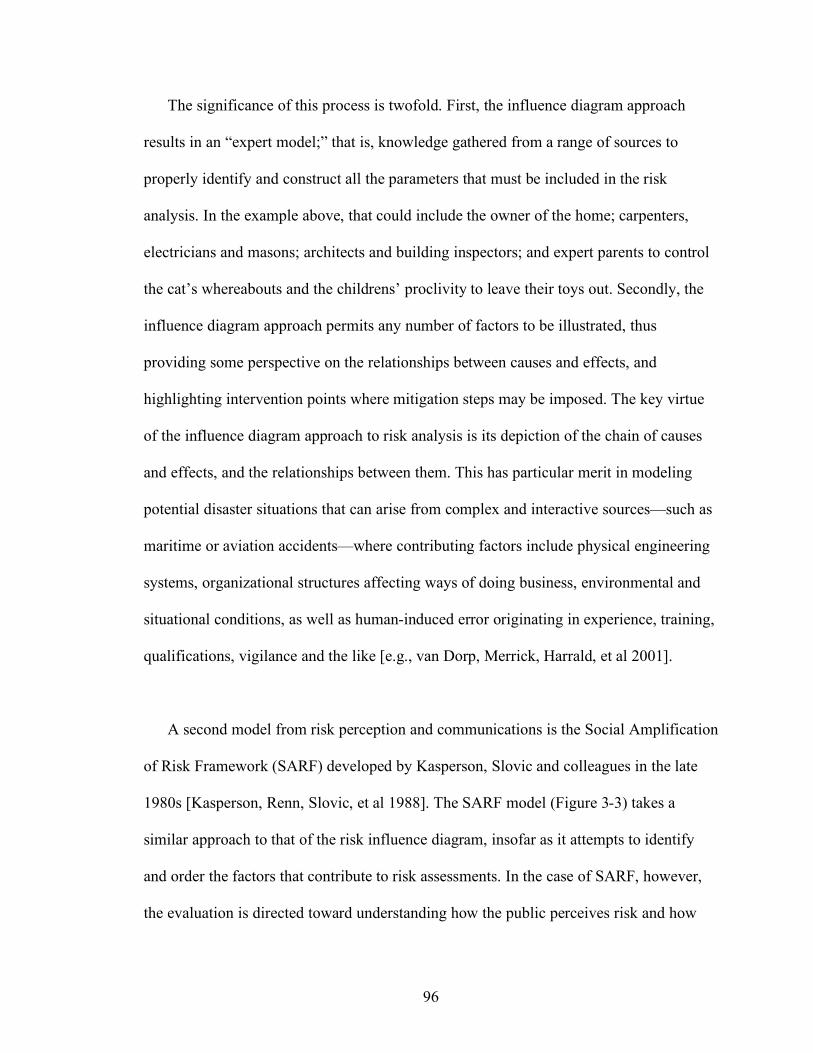
96
The significance of this process is twofold. First, the influence diagram approach
results in an “expert model;” that is, knowledge gathered from a range of sources to
properly identify and construct all the parameters that must be included in the risk
analysis. In the example above, that could include the owner of the home; carpenters,
electricians and masons; architects and building inspectors; and expert parents to control
the cat’s whereabouts and the childrens’ proclivity to leave their toys out. Secondly, the
influence diagram approach permits any number of factors to be illustrated, thus
providing some perspective on the relationships between causes and effects, and
highlighting intervention points where mitigation steps may be imposed. The key virtue
of the influence diagram approach to risk analysis is its depiction of the chain of causes
and effects, and the relationships between them. This has particular merit in modeling
potential disaster situations that can arise from complex and interactive sources—such as
maritime or aviation accidents—where contributing factors include physical engineering
systems, organizational structures affecting ways of doing business, environmental and
situational conditions, as well as human-induced error originating in experience, training,
qualifications, vigilance and the like [e.g., van Dorp, Merrick, Harrald, et al 2001].
A second model from risk perception and communications is the Social Amplification
of Risk Framework (SARF) developed by Kasperson, Slovic and colleagues in the late
1980s [Kasperson, Renn, Slovic, et al 1988]. The SARF model (Figure 3-3) takes a
similar approach to that of the risk influence diagram, insofar as it attempts to identify
and order the factors that contribute to risk assessments. In the case of SARF, however,
the evaluation is directed toward understanding how the public perceives risk and how
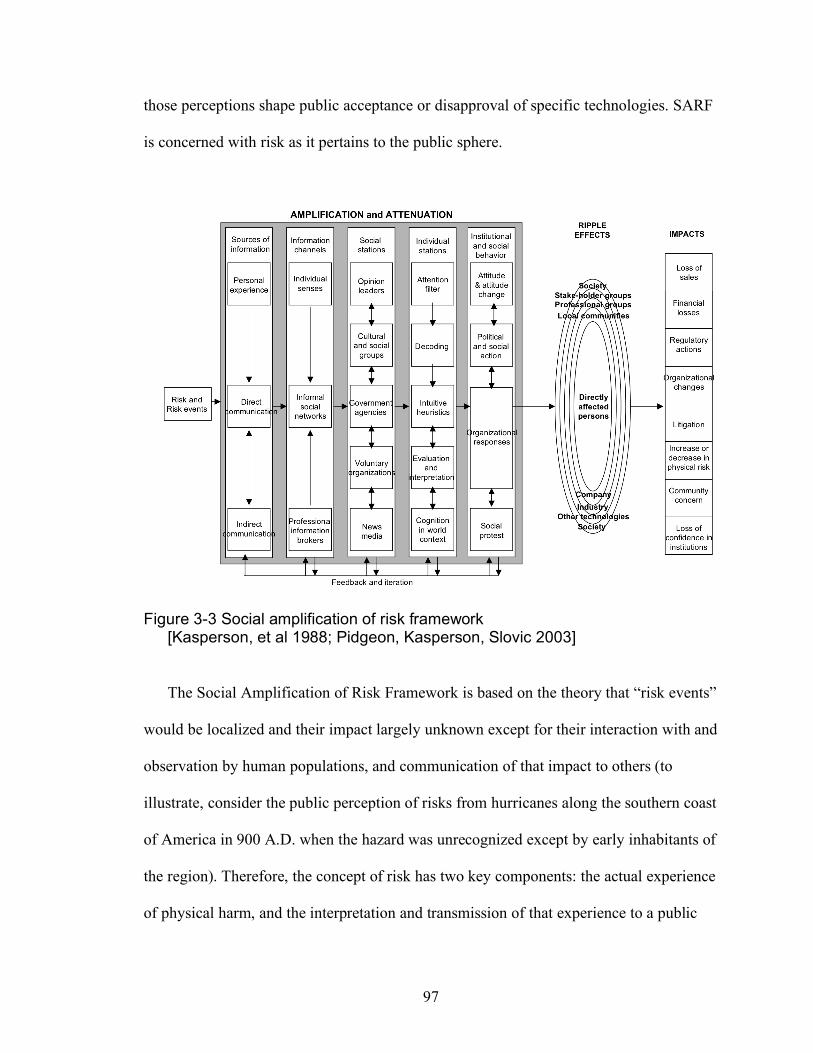
97
those perceptions shape public acceptance or disapproval of specific technologies. SARF
is concerned with risk as it pertains to the public sphere.
Figure 3-3 Social amplification of risk framework [Kasperson, et al 1988; Pidgeon, Kasperson, Slovic 2003]
The Social Amplification of Risk Framework is based on the theory that “risk events”
would be localized and their impact largely unknown except for their interaction with and
observation by human populations, and communication of that impact to others (to
illustrate, consider the public perception of risks from hurricanes along the southern coast
of America in 900 A.D. when the hazard was unrecognized except by early inhabitants of
the region). Therefore, the concept of risk has two key components: the actual experience
of physical harm, and the interpretation and transmission of that experience to a public
98
audience. Risk is then a product of an event and the social and cultural processes that
shape the interpretation of that event and the perceptions that result [Pidgeon, Kasperson,
and Slovic 2003, p. 15]. The initial article that presented the SARF methodology,
explains the core problem:
[T]he technical concept of risk is too narrow and ambiguous to serve as the crucial yardstick for policy making. Public perceptions, however, are the product of intuitive biases and economic interests and reflect cultural values more generally. The overriding dilemma for society is, therefore, the need to use risk analysis to design public policies on the one hand, and the inability of the current risk concepts to anticipate and explain the nature of public response to risk on the other. After a decade of research on the public experience of risk, no comprehensive theory exists to explain why apparently minor risk or risk events, as assessed by technical experts, sometimes produce massive public reactions, accompanied by substantial social and economic impacts and sometimes even by subsequently increased physical risks. [Kasperson, et al, 1988, p. 178].
In response to this dilemma, the SARF model presents an entire taxonomy of factors
that can attenuate or amplify risk perceptions, including informational, social, individual
and organizational factors (the grid and boxes on the left) and transmits the resulting risk
perceptions via a pool of public interactions (the concentric ovals on the right) that
generate ripple effects throughout a society. Those ripple effects result in impacts on
various levels and functions of that society. The authors hypothesize four response
mechanisms that contribute to public amplification (or attenuation) of risk, and that
account for the resulting reactions that emerge into the public dialogue about specific risk
issues:
• Heuristics and Values that provide simplifying mechanisms for individuals to evaluate risk and shape responses;
• Social Group Relationships that influence member responses and the types of
rationality brought to risk issues;
99
• Signal value which, as in the field of telecommunications, determines how high the volume and the quality of discrimination given to a particular public risk; and
• Stigmitization, a measure of the negative imagery or undesirable social impact
that is attributed to specific risks and technologies. [Kasperson, et al 1988, pp. 185-186]. The cumulative effect of these response mechanisms and the interactions among them are
what shape the amplitude of the ripple effects that impact public reaction and the
emergent policies.
The significance of the Social Amplification of Risk Framework for this study is that
it captures the interactive and reinforcing effects of public response and reaction at
varying social levels on the development of risk perception and illustrates that those
responses can have corresponding effects on public policy. The SARF structure allows
for the fact that risk perceptions are not simply the products of individual assessment or
analysis, but a reflection of a larger public perception that develops as a result of a wide
range of factors. This public aspect of risk perception and the potential for impact on
public acceptance of technologies and the shaping of public policies will be applied to the
Framework for Private Sector Preparedness to be presented later.
3.2 Modeling resilience Another research area relevant to the issue of private sector preparedness is directed
toward defining and understanding the resilience of communities and organizations
against threats posed by natural disasters, psychosocial traumas, and economic
disturbances. One recent study has devoted significant effort to defining community
resilience, identifying its “structural” components, and developing a model that would
serve to organize those components around a theoretical framework [Norris, Stevens,
100
Pfefferbaum, Wyche and Pfefferbaum 2008].29 This study approaches the concept of
resilience from four perspectives: as a metaphor taken from physics or engineering and
applied to organizations or social units; as a theory from public health about the ability of
individuals or populations to manage psychological stress; as a set of social, political and
economic capacities that enable adaptability to change; and as a strategy for disaster
preparedness [Norris, et al 2008].
Each of these four perspectives describes a basis for understanding resilience as it
applies to communities and to organizations. A virtue of this approach is the tacit
acknowledgement that more than one approach is needed to capture the range of qualities
and the dynamic nature of interactions that define the resilience of a community.
However, for the purposes of this study, the importance of the community resilience
study is that it attempts to identify the characteristics that would comprise a resilient
community and to relate them through a “network of adaptive capacities.” Figure 3-4 is
the model developed by the authors to illustrate the network of adaptive capacities that
collectively form the resilience within communities.
29 “Community resilience as a metaphor, theory, set of capacities, and strategy for disaster readiness.” American Journal of Community Psychology. 41(4) 127-150. The article will be referred to in this paper as the “Community Resilience study.”

101
Figure 3-4. Community resilience as a set of networked adaptive capacities [Norris, et al, 2008].
The four sets of adaptive capacities are depicted in the ovals with critical qualities
identified for each. The significance of this model is that it captures at one and the same
time the required adaptive capacities of a community, but also many of the equivalent
capacities of the individual social units—the organizations, agencies, neighborhoods and
businesses—that make up the community. As the authors highlight, “resilience rests on
both the resources themselves and the dynamic attributes of those resources” a view that
is consistent with “the property of an ecosystem that describes changes in stability
landscapes and resilience [Norris 2008, p. 135].” The concept of the community as an
ecosystem is the fundamental principle that this model captures. As such, the resilience of
the system rests on the resilience of individual components, on the interactions and
interdependencies with one another, and on the balance maintained within the system
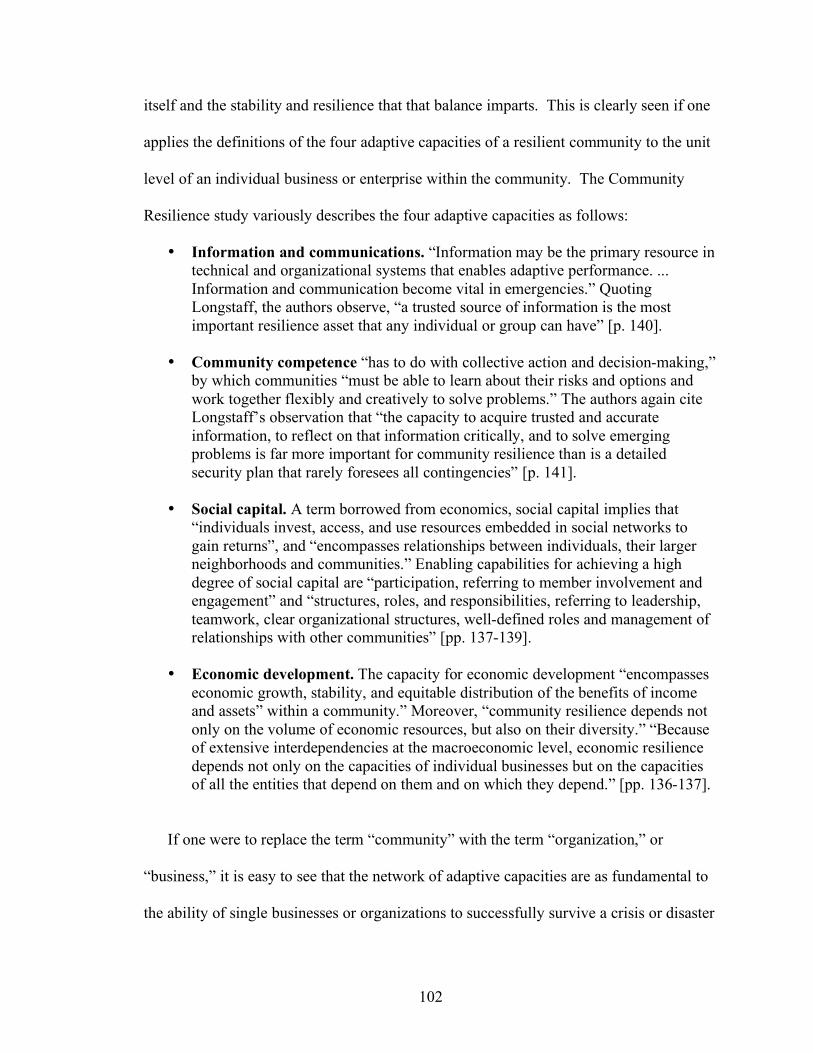
102
itself and the stability and resilience that that balance imparts. This is clearly seen if one
applies the definitions of the four adaptive capacities of a resilient community to the unit
level of an individual business or enterprise within the community. The Community
Resilience study variously describes the four adaptive capacities as follows:
• Information and communications. “Information may be the primary resource in technical and organizational systems that enables adaptive performance. ... Information and communication become vital in emergencies.” Quoting Longstaff, the authors observe, “a trusted source of information is the most important resilience asset that any individual or group can have” [p. 140].
• Community competence “has to do with collective action and decision-making,”
by which communities “must be able to learn about their risks and options and work together flexibly and creatively to solve problems.” The authors again cite Longstaff’s observation that “the capacity to acquire trusted and accurate information, to reflect on that information critically, and to solve emerging problems is far more important for community resilience than is a detailed security plan that rarely foresees all contingencies” [p. 141].
• Social capital. A term borrowed from economics, social capital implies that
“individuals invest, access, and use resources embedded in social networks to gain returns”, and “encompasses relationships between individuals, their larger neighborhoods and communities.” Enabling capabilities for achieving a high degree of social capital are “participation, referring to member involvement and engagement” and “structures, roles, and responsibilities, referring to leadership, teamwork, clear organizational structures, well-defined roles and management of relationships with other communities” [pp. 137-139].
• Economic development. The capacity for economic development “encompasses
economic growth, stability, and equitable distribution of the benefits of income and assets” within a community.” Moreover, “community resilience depends not only on the volume of economic resources, but also on their diversity.” “Because of extensive interdependencies at the macroeconomic level, economic resilience depends not only on the capacities of individual businesses but on the capacities of all the entities that depend on them and on which they depend.” [pp. 136-137].
If one were to replace the term “community” with the term “organization,” or
“business,” it is easy to see that the network of adaptive capacities are as fundamental to
the ability of single businesses or organizations to successfully survive a crisis or disaster
103
as they are for the entire community in which those businesses and organizations reside.
It is also clear that within the four sets of resources in the network of adaptive capacities,
many of those identified at the community level are equally critical for the resilience of
individual businesses and organizations. These include such qualities as
• Diversity of economic resources;
• Equity of resource distribution;
• Information skills and communication infrastructure;
• Problem solving skills
• Flexibility and creativity;
• Political partnerships;
• Leadership and role identification;
• Organizational linkages and cooperation;
• Formal and informal social ties; and
• A sense of community and attachment to place.
In this sense, the ecosystem of a resilient community is built on the resilience of its
constituent organizations and agencies and their active participation in maintaining
balance within the system. Displacement or trauma suffered by the ecosystem during a
disaster requires the collective involvement of all in order to restore the balance and adapt
to the changed environment.
3.3 Modeling distance and proximity In a 2001 Harvard Business Review article, economist Pankaj Ghemawat described
the concept of “distance” as it applies to the ability of companies to achieve penetration
in foreign markets. Based on a time-tested economic analysis process know as Country
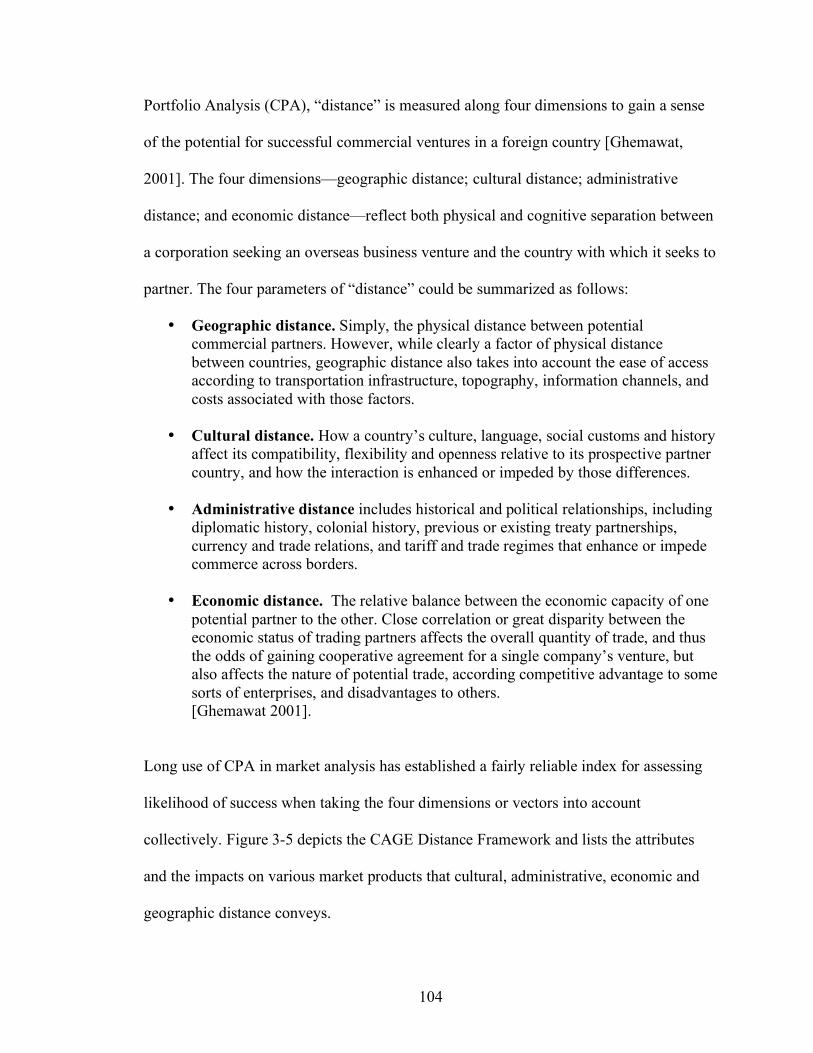
104
Portfolio Analysis (CPA), “distance” is measured along four dimensions to gain a sense
of the potential for successful commercial ventures in a foreign country [Ghemawat,
2001]. The four dimensions—geographic distance; cultural distance; administrative
distance; and economic distance—reflect both physical and cognitive separation between
a corporation seeking an overseas business venture and the country with which it seeks to
partner. The four parameters of “distance” could be summarized as follows:
• Geographic distance. Simply, the physical distance between potential commercial partners. However, while clearly a factor of physical distance between countries, geographic distance also takes into account the ease of access according to transportation infrastructure, topography, information channels, and costs associated with those factors.
• Cultural distance. How a country’s culture, language, social customs and history
affect its compatibility, flexibility and openness relative to its prospective partner country, and how the interaction is enhanced or impeded by those differences.
• Administrative distance includes historical and political relationships, including
diplomatic history, colonial history, previous or existing treaty partnerships, currency and trade relations, and tariff and trade regimes that enhance or impede commerce across borders.
• Economic distance. The relative balance between the economic capacity of one
potential partner to the other. Close correlation or great disparity between the economic status of trading partners affects the overall quantity of trade, and thus the odds of gaining cooperative agreement for a single company’s venture, but also affects the nature of potential trade, according competitive advantage to some sorts of enterprises, and disadvantages to others.
[Ghemawat 2001].
Long use of CPA in market analysis has established a fairly reliable index for assessing
likelihood of success when taking the four dimensions or vectors into account
collectively. Figure 3-5 depicts the CAGE Distance Framework and lists the attributes
and the impacts on various market products that cultural, administrative, economic and
geographic distance conveys.
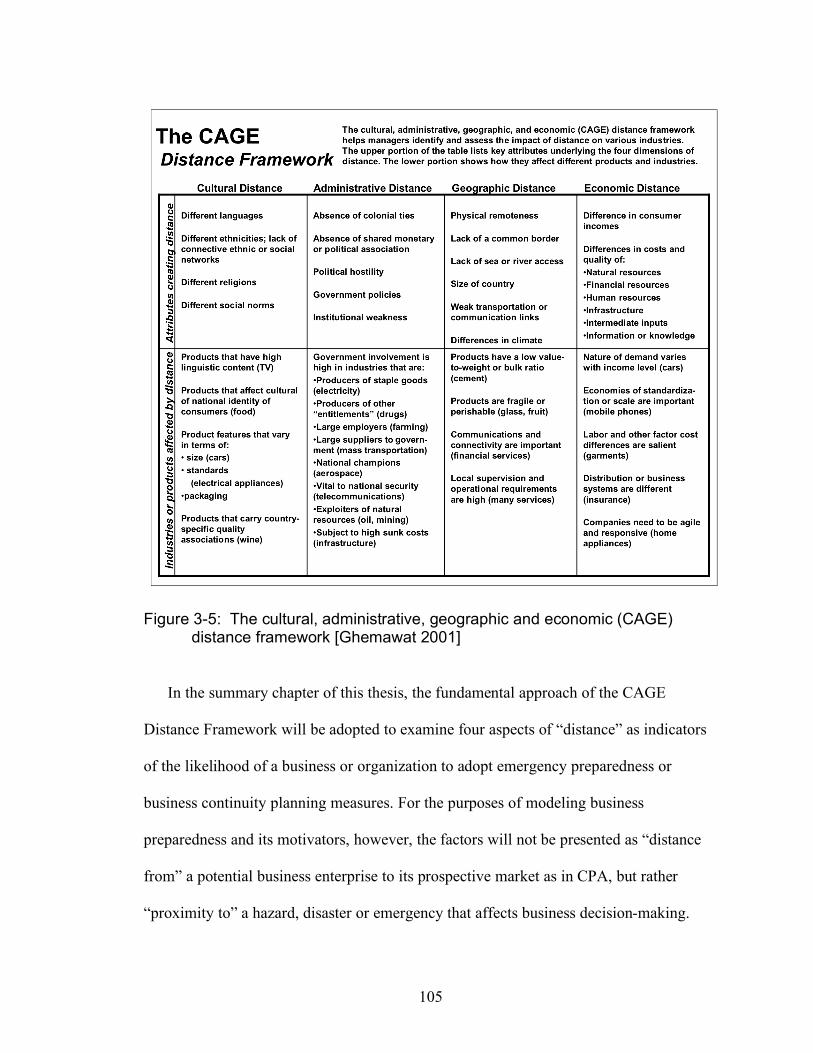
105
Figure 3-5: The cultural, administrative, geographic and economic (CAGE) distance framework [Ghemawat 2001]
In the summary chapter of this thesis, the fundamental approach of the CAGE
Distance Framework will be adopted to examine four aspects of “distance” as indicators
of the likelihood of a business or organization to adopt emergency preparedness or
business continuity planning measures. For the purposes of modeling business
preparedness and its motivators, however, the factors will not be presented as “distance
from” a potential business enterprise to its prospective market as in CPA, but rather
“proximity to” a hazard, disaster or emergency that affects business decision-making.

106
Relative degrees of proximity will be examined as indicators of motivation or de-
motivation for support or adoption of emergency preparedness or continuity planning
measures by a private sector entity.
A useful way to conceptualize the properties and relationships of an organization or
system is through the use of a “fishbone” or Ishikawa Diagram. This process was
developed by Kaoru Ishakawa in the 1960s as a way to understand cause and effect
relationships in quality control analysis. The diagram later became a fundamental tool of
Total Quality Management and other process analysis methods.30 Figure 3-6 is an
Ishikawa diagram for depicting a program management process. Arranging the four
dimensions of the CAGE Distance Framework as an Ishikawa diagram enables one to
visualize how the four elements of “distance” might relate to the ability of a company to
engage a foreign partner (Figure 3-7). The same technique will be adopted to illustrate
preparedness among private sector entities as a function of their proximity to specific
hazards and threats to organizational viability in the next chapter.
30 Source: Wikipedia, http://en.wikipedia.org/wiki/Ishikawa_diagram. Accessed 20 March 2009.
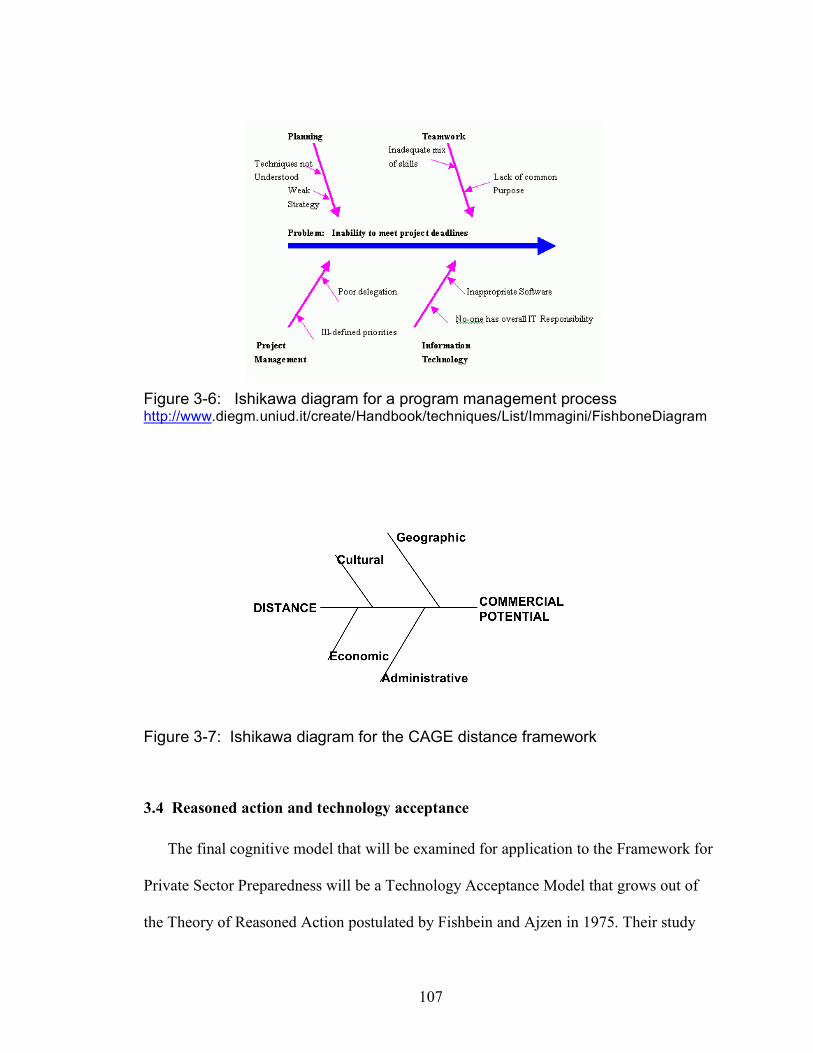
107
Figure 3-6: Ishikawa diagram for a program management process http://www.diegm.uniud.it/create/Handbook/techniques/List/Immagini/FishboneDiagram
Figure 3-7: Ishikawa diagram for the CAGE distance framework
3.4 Reasoned action and technology acceptance The final cognitive model that will be examined for application to the Framework for
Private Sector Preparedness will be a Technology Acceptance Model that grows out of
the Theory of Reasoned Action postulated by Fishbein and Ajzen in 1975. Their study
108
entitled Belief, Attitude, Intention and Behavior, established a framework for
understanding the distinctions between peoples’ beliefs, their formation of attitudes, their
intentions toward certain behaviors, and the adoption of those behaviors as evident
through their actions [Fishbein and Ajzen 1975]. Among the key aspects of their research
was the distinction between (1) an individual’s intentions toward certain behaviors and
how those intentions are shaped by the individual’s beliefs and attitudes toward that
behavior; and (2) normative standards that are culturally or socially formed regarding
actions that should or should not be taken, and how those normative beliefs form a
motivation to comply leading to pressures regarding that specific behavior. This pressure
Fishbein and Ajzen termed a “subjective norm.” According to their framework, an
individual’s behavioral intention is motivated by two factors: his attitude toward the
behavior itself, and the subjective norm that is the result of other, external social factors
[Fishbein and Ajzen 1977, p. 16].
A further set of distinctions was offered regarding the differences between beliefs,
attitudes, intentions and behavior. In brief, an attitude “refers to a person’s favorable or
unfavorable evaluation of an object” (evaluation being the critical word), and a belief
“represents the information he has about the object. Specifically a belief links an object to
some attribute” [Fishbein and Ajzen, p. 13]. The final distinction is drawn between
intention and behavior. In the former case, intentions “may be viewed as a special case of
beliefs, in which the object is always the person himself and the attribute is always a
behavior” [Fishbein and Ajzen, p. 12]. In other words, an intention is about a person’s
strength of attitude toward performing or not performing some behavior. As regards the

109
behavior itself, Fishbein and Ajzen consider it simply as “the observable acts of the
subject,” though behaviors can be used “to infer beliefs, attitudes, or intentions” [p. 14].
These distinctions are all critical to the Theory of Reasoned Action because the
attitude or intention toward a certain behavior is not necessarily an assurance of the actual
performance of that behavior. Much of the difference in actual attitude and belief and the
formation of intentions leading to actual performance of the behavior may be attributed to
the effects of subjective norms based on normative beliefs and a motivation to comply
with some external stimulus, as depicted in the schematic diagram of TRA (Figure 3-8).
Figure 3-8: Theory of reasoned action (TRA) [Fishbein and Ajzen 1975] An application of the Theory of Reasoned Action was developed by Malhotra and
Galletta to clarify the effects of social influence on the adoption of information systems
technologies [Malhotra and Galletta 1999]. Building on earlier work of Davis, Malhotra
and Galletta offer a model of technology acceptance that ties in two additional constructs,
the perceived usefulness and perceived ease of use of the technology (Figure 3-9).
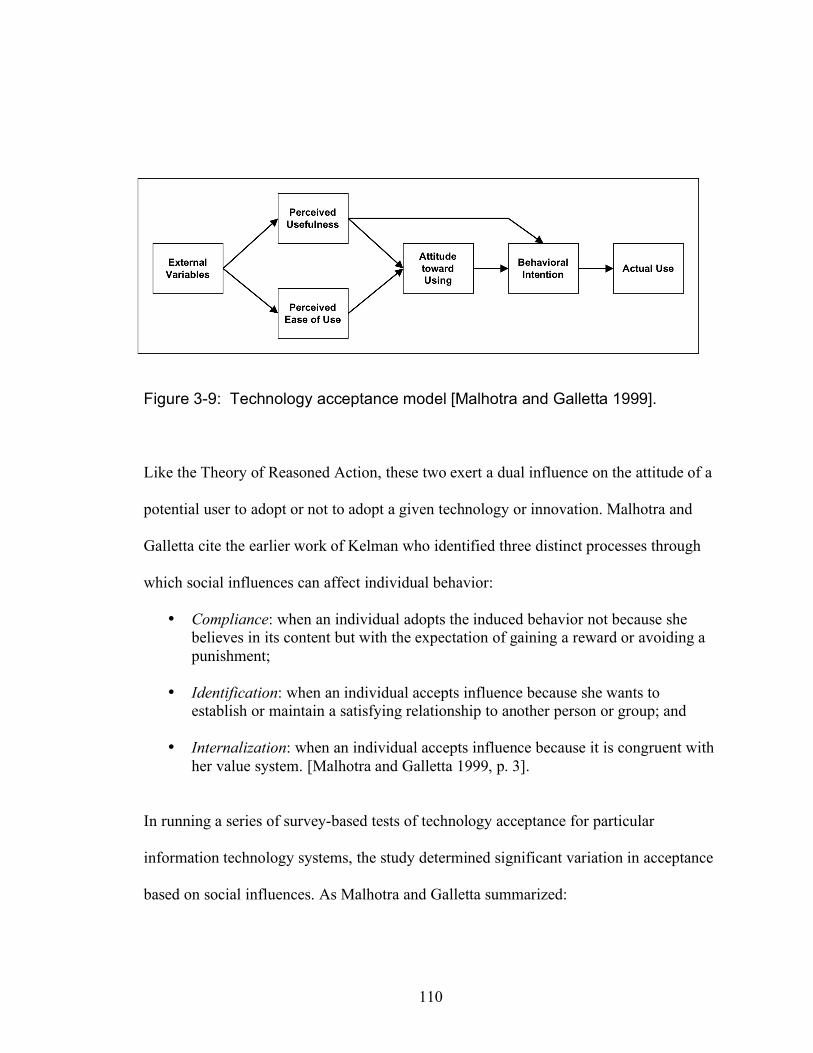
110
Figure 3-9: Technology acceptance model [Malhotra and Galletta 1999].
Like the Theory of Reasoned Action, these two exert a dual influence on the attitude of a
potential user to adopt or not to adopt a given technology or innovation. Malhotra and
Galletta cite the earlier work of Kelman who identified three distinct processes through
which social influences can affect individual behavior:
• Compliance: when an individual adopts the induced behavior not because she believes in its content but with the expectation of gaining a reward or avoiding a punishment;
• Identification: when an individual accepts influence because she wants to
establish or maintain a satisfying relationship to another person or group; and
• Internalization: when an individual accepts influence because it is congruent with her value system. [Malhotra and Galletta 1999, p. 3].
In running a series of survey-based tests of technology acceptance for particular
information technology systems, the study determined significant variation in acceptance
based on social influences. As Malhotra and Galletta summarized:

111
When social influences generate a feeling of compliance, they seem to have a negative influence on the users’ attitude toward use of the new information system. However, when social influences generate a feeling of internalization and identification on the part of the user, they have a positive influence on the attitude toward the acceptance and use of the new system. The findings also suggest that internalization of the induced behavior by the adopters of new information system plays a stronger role in shaping acceptance and usage behavior than perceived usefulness. Hence the consideration of social influences and how they affect the commitment of the user toward use of the information system seems important for understanding, explaining and predicting system usage and acceptance behavior. [Malhotra and Galletta 1999, p. 8]
Another researcher, Jakob Nielsen, developed the concept of “usability” and
“usability engineering” to describe the process of designing and assessing the quality of
the human-computer interface for computer software [Nielsen 1993]. He defines usability
by five characteristics:
• Learnability: The system should be easy to learn so that the user can rapidly start
getting some work done with the system.
• Efficiency: The system should be efficient to use, so that once the user has learned the system, a high level of productivity is possible.
• Memorability: The system should be easy to remember, so that the causal user is
able to return to the system after some period of not having used it, without having to learn everything all over again.
• Errors: The system should have a low error rate, so that users make few errors
during the use of the system, and so that if they do make errors they can easily recover from them. Further, catastrophic errors must not occur.
• Satisfaction: The system should be pleasant to use, so that users are subjectively
satisfied when using it; they like it. [Nielsen 1993, p. 26]. The parameters of Nielsen’ usability study are diagrammed in Figure 3-10. The
parameters are the end product of a refined engineering process that puts the human-
computer interface in the larger context of “system acceptability.” That is, “whether the
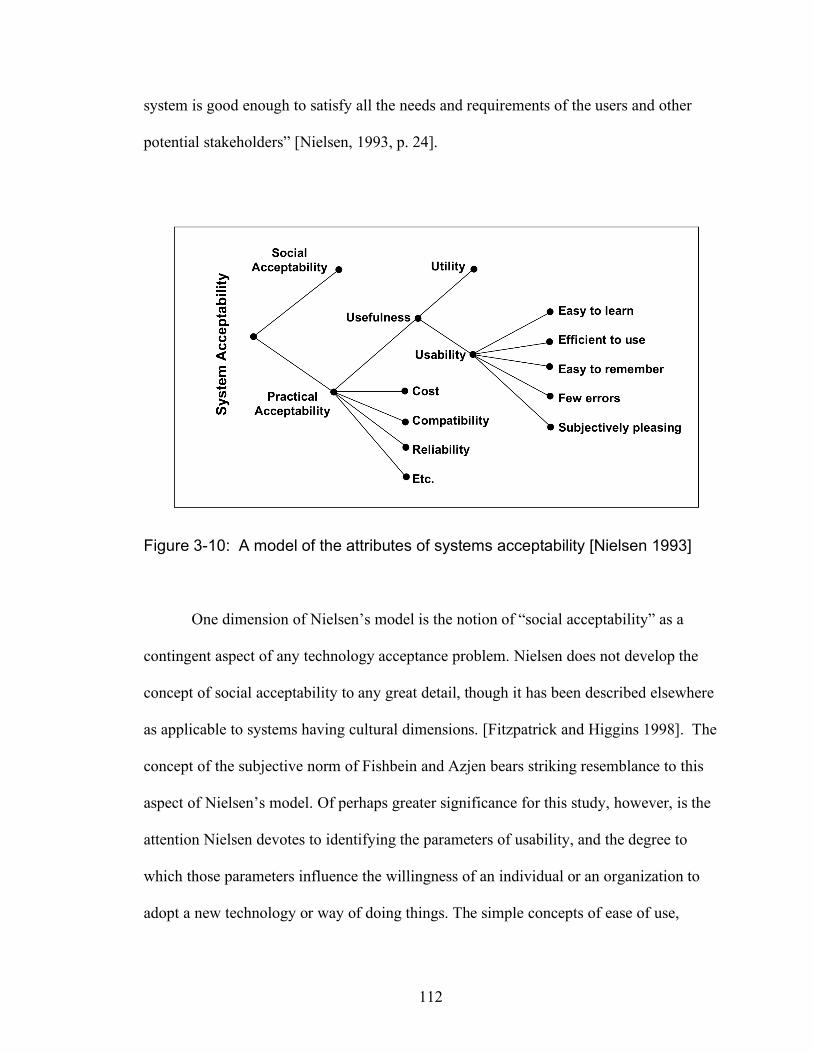
112
system is good enough to satisfy all the needs and requirements of the users and other
potential stakeholders” [Nielsen, 1993, p. 24].
Figure 3-10: A model of the attributes of systems acceptability [Nielsen 1993]
One dimension of Nielsen’s model is the notion of “social acceptability” as a
contingent aspect of any technology acceptance problem. Nielsen does not develop the
concept of social acceptability to any great detail, though it has been described elsewhere
as applicable to systems having cultural dimensions. [Fitzpatrick and Higgins 1998]. The
concept of the subjective norm of Fishbein and Azjen bears striking resemblance to this
aspect of Nielsen’s model. Of perhaps greater significance for this study, however, is the
attention Nielsen devotes to identifying the parameters of usability, and the degree to
which those parameters influence the willingness of an individual or an organization to
adopt a new technology or way of doing things. The simple concepts of ease of use,
113
compatibility, utility, and overall usefulness are worth keeping in mind when attempting
to introduce and motivate the adoption of new or unfamiliar concepts such as
preparedness and contingency planning within the private sector.
Collectively, the results of these studies have important implications for the
adoption by private sector entities of preparedness and continuity planning practices, and
indicate that some methods of inducing or influencing adoption will likely work better
than others. This is particularly relevant to issues affecting the usability of advanced or
new technologies and is particularly relevant to the adoption of preparedness and
continuity planning measures by the private sector. Moreover, there is an obvious social
dimension of private sector adoption of continuity planning and emergency preparedness,
that can affect the resilience and recovery of whole communities or regions. The social
aspect of individual business decisions will be explored in Chapter 6, but are clearly in
line with the models of the theory of reasoned action, as well as with acceptability and
usability engineering.
3.5 Decision-making for planning and operations An emerging school in the field of decision science research called Naturalistic
Decision-Making (NDM) examines cognitive processes involved in two different types or
modes of decision-making: one employed in operational settings where analytic strategies
are tempered by experience and where constraints in time, limited options, changing
circumstances and competing priorities all impact the decision-making process; and a
second mode dominated by analysis and hypothesizing about potential events or
consequences arising from imagined circumstances [Zsambok, Beach, Klein 1992; Flin,
Salas, Strub, Martin 1997]. These two types of decision-making illustrate the differences
114
between business decision-making for routine business operations (or even for crisis and
consequence management) and the mode of decision-making during business continuity
or contingency planning. On the one hand are decisions made in day-to-day operations—
an area where the domain is familiar and the costs, risks and outcomes known and
relatively predictable. NDM classifies expert decisions made in this domain as
Recognition-Primed Decision-Making (RPD), a form of decision-making based on the
use of analogy and heuristics to draw parallels between current situations and previous
experience. RPD contributes to analysis and understanding of such questions as
• how expertise and experience affect decision-making;
• how people use experience to adopt the first actions they consider;
• how people make decisions without analyzing strengths and weaknesses of alternate courses of action;
• how the use of heuristics aids in making situations recognizable as typical
[Klein, 1997]. The second mode of decision-making in NDM is termed Anticipatory Thinking—the
ability to prepare in current time for problems and opportunities in the indefinite future
that may not be clearly understood until they are encountered [Klein, Snowden and Pin
2007]. Anticipatory thinking is focused on examining potential events, including those
that have high consequences but a low probability of occurrence. This analytic approach
is differentiated from prediction because it involves active planning and functional
preparation, and not simply speculation about future possibilities. Moreover, whereas
prediction is externally directed toward predicting and understanding potential future
events, anticipatory thinking also involves identifying potential consequences relevant to
115
one’s own situation, and planning courses of action to mitigate, prepare for or avoid those
consequences [Klein 2007, p. 121]. Klein describes three modes of anticipatory thinking:
• Pattern matching, in which events that do not conform to patterns of previous experience are recognized for their dissimilarities as well as for their similarities. This is a common cognitive process among experts with large repertoires of patterns in their experience base.
• Trajectory matching, in which experience and understanding allow an expert
decision-maker to “get ahead of the curve” by recognizing where current actions or events are most likely to lead, and anticipating the next decision point. In military parlance, this is often referred to as the “OODA loop” for observe-orient-decide-act, that describes expert decision-making against an adversary.31
• Conditional recognition that allows one to see connections or interdependencies
between events and discern connections that indicate the likelihood of consequences and the sequence of cause and effect relationships. [Klein 2007, pp. 121-122].
Taken together, these two cognitive processes from Naturalistic Decision-Making
provide a way of characterizing the differences in methodology between decision-making
for routine or crisis business operations and those for business continuity or contingency
planning. This is not to say that there are no unknowns or unanticipated risks in business
decisions in such areas as marketing, competitive strategies, mergers or acquisitions, or
even day-to-day operational planning. But rather, for a seasoned business owner or CEO,
business decisions that affect the operation of a private sector enterprise is the familiar
terrain where experience and expertise can be brought to bear on the problems
encountered. It is in this arena that a CEO or business owner has chosen to play. Contrast
this with the decisions required for continuity of operations planning and emergency
preparedness, where threats and consequences are understood largely in the abstract,
through simulations and case studies, or through limited or unique experience which is 31 See http://oodacycle.com/OODA.aspx for a description of the origins of the OODA loop, devised by Colonel John Boyd to explain expert fighter pilot skills in dog-fights against opposing aircraft.

116
seldom replicated in later disasters or crises.32 This latter domain is where analytic
processes predominate, since experience may be limited, the decisions are not necessarily
immediate or operational, and where there is time to consider options. Cannon-Bowers,
Salas and Pruitt developed a framework for characterizing decision-making strategies
under these varying conditions according to categories of cognitive tasks. Their
framework offers an appropriate illustration of these two cognitive frames of reference as
they apply to business decision-making (Figure 3-11). As this diagram illustrates, there is
a greater reliance on analysis and option comparison in Anticipatory Thinking—during
planning when time is available and concepts are abstract, non-operational and
speculative (i.e., during threat and risk assessments, cost-benefit analysis, and
contingency planning). On the other hand, operational decisions made by experienced
decision-makers tend to be made by calling on past experience where learned patterns
compare with the problem at hand, heuristics gained through formal training and on-job-
experience, and an intimate understanding of the terrain and environment [Crego and
Spinks, 1997].
32 One area of research in NDM is the use of Recognition-Primed Decision-making among experienced operators such as Fire Chiefs, police officers and military personnel. While many of the domains these experts operate in is clearly that of emergency or crisis operations, they are arenas where seasoned professionals frequently draw on experience and expertise described in RPD, and at other times on analytic modes similar to Anticipatory Thinking. As opposed to these career professionals, business professionals are rarely challenged by emergency or crisis circumstances. For those business leaders who have been, their experiences frequently become the case studies used to train other business leaders in crisis or contingency management, as much of the literature in Chapter 2 illustrates. See the articles by Kerstholt; Fredholm; and Martin, Flin and Skriver in Flin, Salas, Strub and Martin 1997.
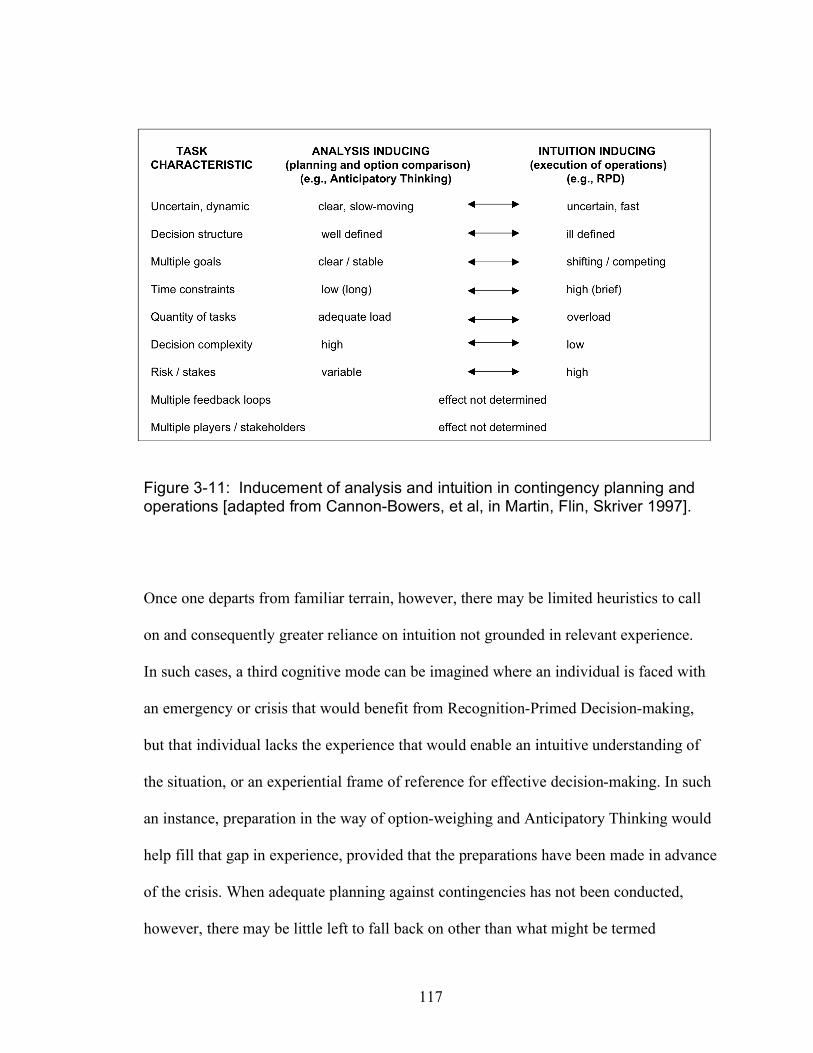
117
Figure 3-11: Inducement of analysis and intuition in contingency planning and operations [adapted from Cannon-Bowers, et al, in Martin, Flin, Skriver 1997].
Once one departs from familiar terrain, however, there may be limited heuristics to call
on and consequently greater reliance on intuition not grounded in relevant experience.
In such cases, a third cognitive mode can be imagined where an individual is faced with
an emergency or crisis that would benefit from Recognition-Primed Decision-making,
but that individual lacks the experience that would enable an intuitive understanding of
the situation, or an experiential frame of reference for effective decision-making. In such
an instance, preparation in the way of option-weighing and Anticipatory Thinking would
help fill that gap in experience, provided that the preparations have been made in advance
of the crisis. When adequate planning against contingencies has not been conducted,
however, there may be little left to fall back on other than what might be termed
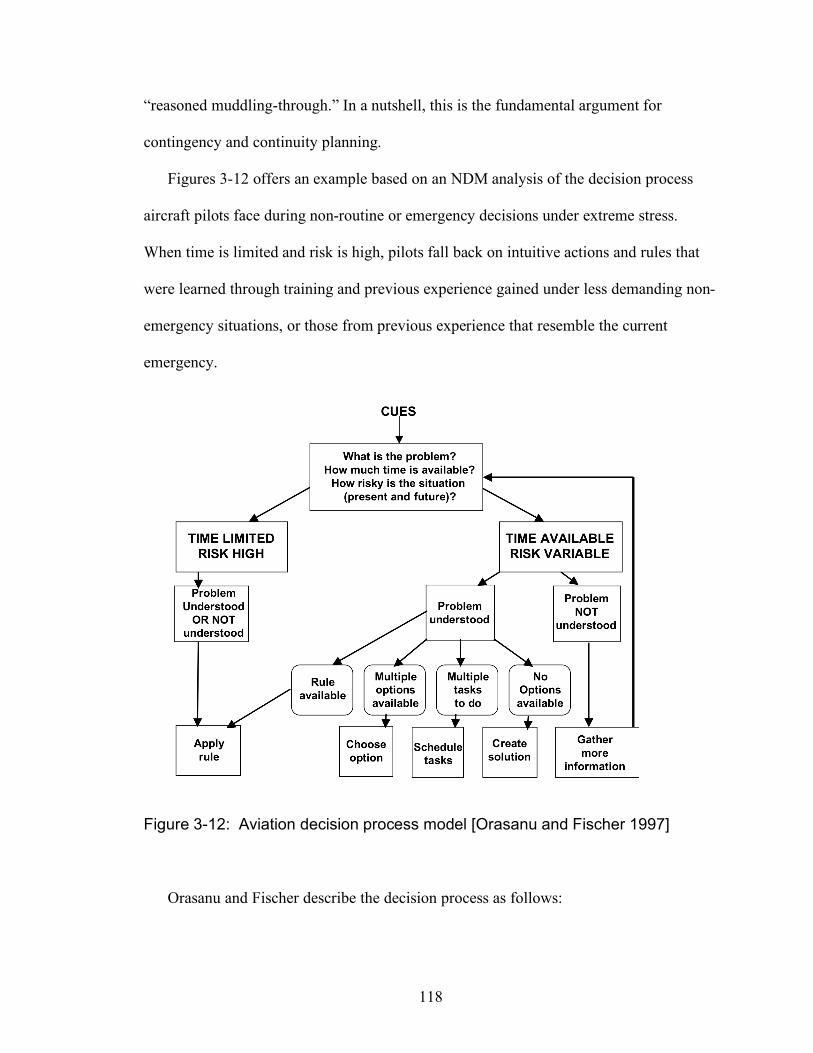
118
“reasoned muddling-through.” In a nutshell, this is the fundamental argument for
contingency and continuity planning.
Figures 3-12 offers an example based on an NDM analysis of the decision process
aircraft pilots face during non-routine or emergency decisions under extreme stress.
When time is limited and risk is high, pilots fall back on intuitive actions and rules that
were learned through training and previous experience gained under less demanding non-
emergency situations, or those from previous experience that resemble the current
emergency.
Figure 3-12: Aviation decision process model [Orasanu and Fischer 1997]
Orasanu and Fischer describe the decision process as follows:
119
Sometimes a single response is prescribed in company manuals or procedures. In other circumstances no rule is prescribed and multiple options may exist from which one must be selected. In these cases, options are evaluated on the basis of goals, situational constraints, and anticipated outcomes. On some rare occasions no response is available and the crew must invent a course of action. In order to deal appropriately with the situation, the decision maker must be aware of what response options are available and what constitutes a situationally appropriate process (retrieving and evaluating a single option, choosing, scheduling, inventing) in light of risk and time factors. Experience drives situation assessment and sensitivity response options. [Orasanu in Flin, Salas, Strub and Martin 1997, p. 48].
Interestingly, the explanation of the decision process that the authors provide
could be applied to business owners and CEOs as easily to aircraft pilots. Indeed, a
modification to this diagram—separating out the decision-making process under
uncertainty for the familiar terrain of business operations, from the decision-process
under the relatively unfamiliar terrain of a business crisis or disaster—illustrates the
critical difference between having cognitive rules that facilitate Recognition-Primed
Decision-Making from having nothing to draw on but a leader’s ability to “muddle
through” with a certain amount of authority supported by blind luck.
Figure 3-13 illustrates the decision process model the situation for a business leader
or executive faced with similarly stressful decisions during a crisis or disaster that
threatens his company’s survival. Under normal operating conditions, even stressful
problems are understood because they are part of “normal” competition and day-to-day
survival, as routine landings in bad weather and strong cross-winds are for experienced
pilots. In such cases, executives apply the rules, heuristics, and common sense built
through their years of experience and familiarity with the operating environment
(depicted on the left-hand column, “Problem understood: routine business operations”).
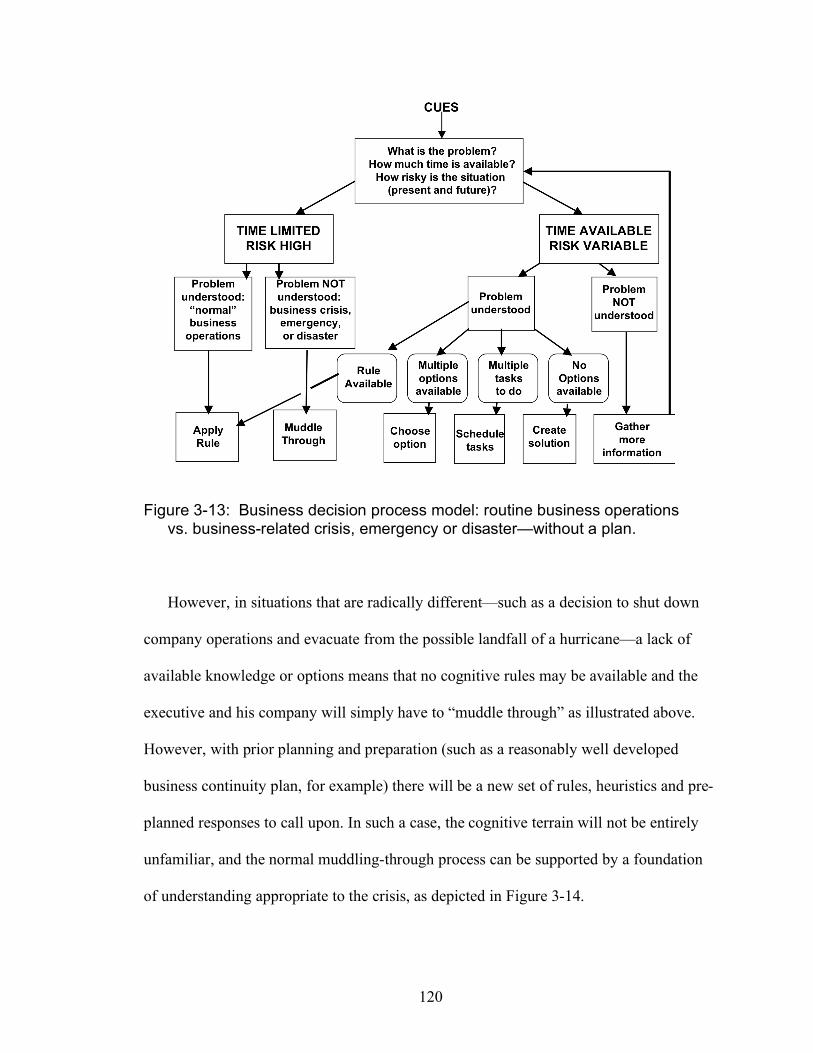
120
Figure 3-13: Business decision process model: routine business operations vs. business-related crisis, emergency or disaster—without a plan.
However, in situations that are radically different—such as a decision to shut down
company operations and evacuate from the possible landfall of a hurricane—a lack of
available knowledge or options means that no cognitive rules may be available and the
executive and his company will simply have to “muddle through” as illustrated above.
However, with prior planning and preparation (such as a reasonably well developed
business continuity plan, for example) there will be a new set of rules, heuristics and pre-
planned responses to call upon. In such a case, the cognitive terrain will not be entirely
unfamiliar, and the normal muddling-through process can be supported by a foundation
of understanding appropriate to the crisis, as depicted in Figure 3-14.
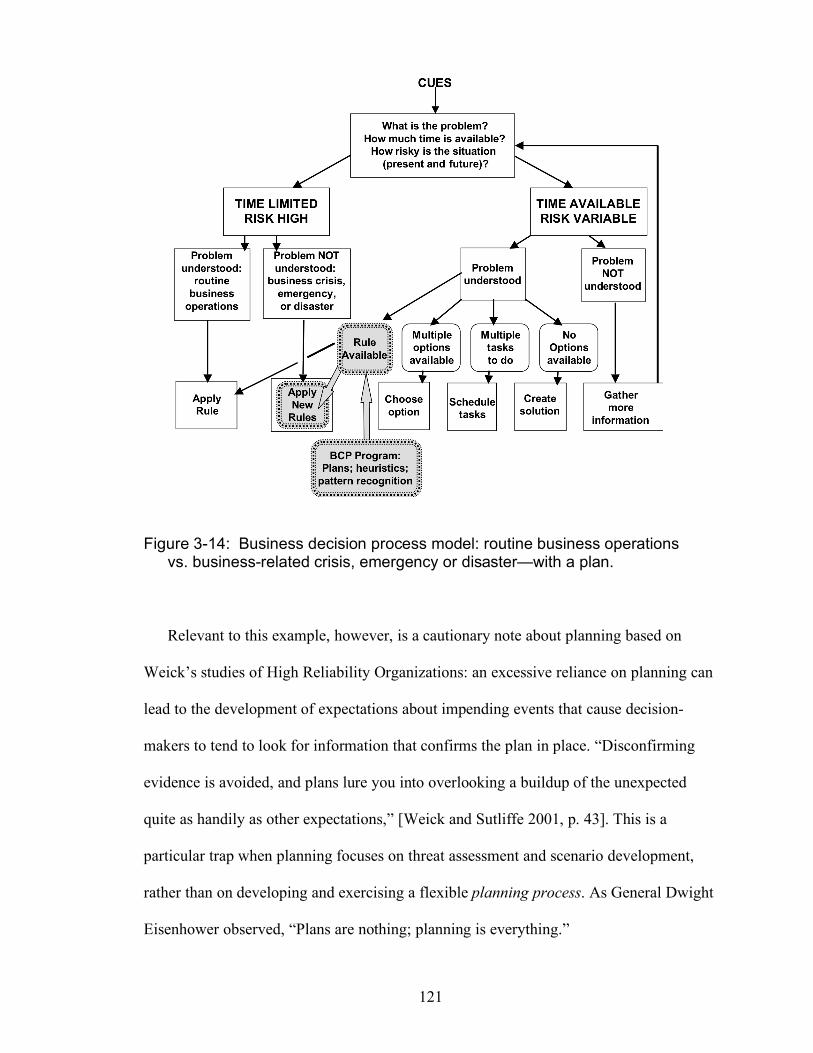
121
Figure 3-14: Business decision process model: routine business operations vs. business-related crisis, emergency or disaster—with a plan.
Relevant to this example, however, is a cautionary note about planning based on
Weick’s studies of High Reliability Organizations: an excessive reliance on planning can
lead to the development of expectations about impending events that cause decision-
makers to tend to look for information that confirms the plan in place. “Disconfirming
evidence is avoided, and plans lure you into overlooking a buildup of the unexpected
quite as handily as other expectations,” [Weick and Sutliffe 2001, p. 43]. This is a
particular trap when planning focuses on threat assessment and scenario development,
rather than on developing and exercising a flexible planning process. As General Dwight
Eisenhower observed, “Plans are nothing; planning is everything.”
122
CHAPTER 4: METHOD, APPROACH AND RESULTS
4.0 Overview
4.1 Research method
4.2 Analytic approach
4.3 Survey method
4.4 Survey structure
4.5 Summary of results
4.5.1 Characteristics of participants 4.5.2 Perceptions of risk and threat
4.5.3 Perceptions of federal, state and local responsibilities
4.0 Overview The Recognition-Primed Decision-Making and Anticipatory Thinking frameworks
presented in the previous chapter describe two different conceptual approaches to
decision-making that have relevance for private sector enterprise. The former method is
appropriate for managing risks in the familiar domain of day-to-day business operations,
while the latter is applicable to the less familiar realm of contingency and continuity
planning for emergencies or disasters that could affect business viability. To reiterate, this
framework does not distinguish between decision-making for normal operations and
decision-making during emergencies; certainly decisions under either situation must
often be made based on incomplete information, under the press of limited time, and
when the potential risks and penalties for error are high.
123
Rather, the distinction is between operational decisions made by an experienced
individual who has familiarity with the environment and with the general requirements of
the situation, as opposed to planning that is conducted against potential, but unknown
situations whose details and outcomes may not be known in advance: that is, the
distinction is between decision-making on the one hand, and planning in advance to
facilitate decision-making at some later time, on the other.
Experienced business leaders are, almost by definition, comfortable with making
decisions about the day-to-day operations of their companies and organizations, even
when those decisions will have heavy outcomes. For most, however, the same cannot be
said about decision-making during an emergency or crisis that threatens the company’s
viability, the safety or welfare of employees, or the integrity of facilities, physical capital
or the company’s reputation. Decision-making during a life-threatening emergency or a
disaster involving physical risk may be routine operations for some professionals, but it is
largely unknown territory for most CEOs and company owners.33
Given these facts, one should expect that Anticipatory Thinking about worst-case
scenarios, and planning for emergencies and interruptions to business operations would
be more widespread, if not common practice among experienced business leaders,
particularly after the 9/11 attacks on the World Trade Center and Hurricanes Katrina and
Rita. Current literature and experience indicate, however, that only a minority of
companies has incorporated business continuity planning and emergency preparedness
into their routine business functions, as noted in the studies cited in Chapter 2 [Mitroff
and Alpaslan 2003; Deloitte 2006; and FM Global 2008]. Add to this the fact that
33 See, for example, articles by Kerstholt; Fredholm; and Martin, Flin and Skriver in Flin, Salas, Strub and Martin 1997, and Mitroff 2001 and 2005.
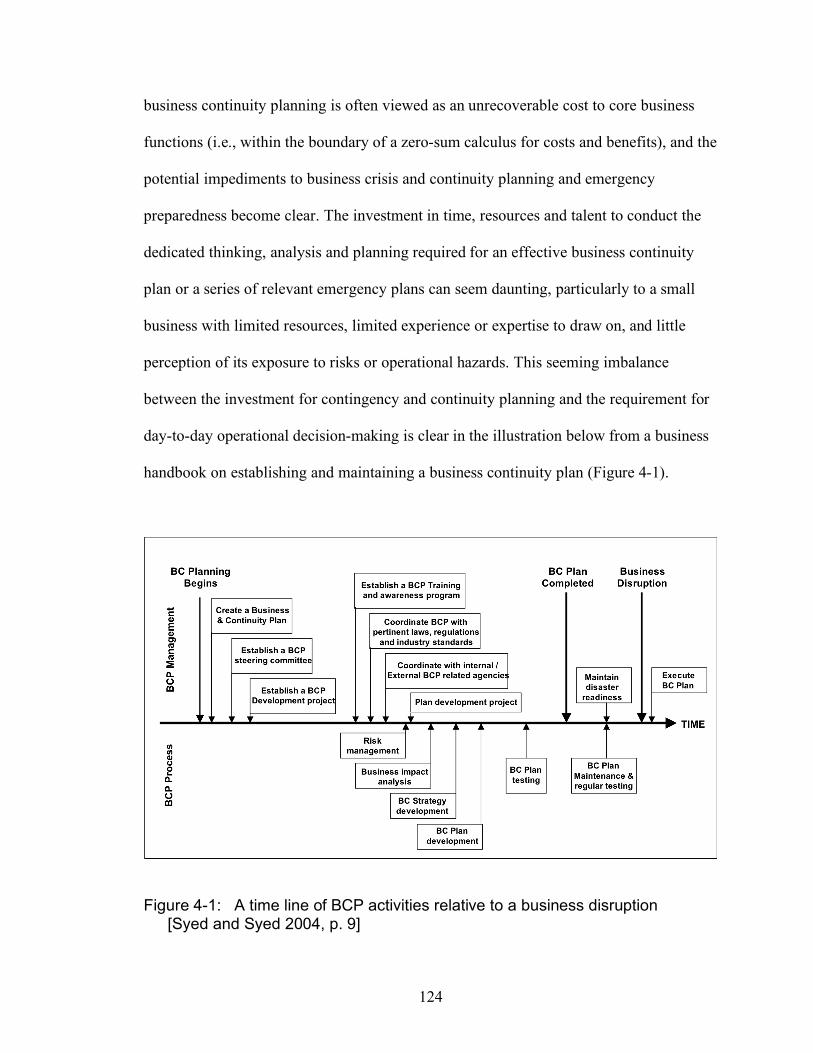
124
business continuity planning is often viewed as an unrecoverable cost to core business
functions (i.e., within the boundary of a zero-sum calculus for costs and benefits), and the
potential impediments to business crisis and continuity planning and emergency
preparedness become clear. The investment in time, resources and talent to conduct the
dedicated thinking, analysis and planning required for an effective business continuity
plan or a series of relevant emergency plans can seem daunting, particularly to a small
business with limited resources, limited experience or expertise to draw on, and little
perception of its exposure to risks or operational hazards. This seeming imbalance
between the investment for contingency and continuity planning and the requirement for
day-to-day operational decision-making is clear in the illustration below from a business
handbook on establishing and maintaining a business continuity plan (Figure 4-1).
Figure 4-1: A time line of BCP activities relative to a business disruption [Syed and Syed 2004, p. 9]
125
Recognizing the range of activities in this illustration that occur to the left of the business
disruption—all of which, of course, must take place concurrently with normal business
operations—it is not surprising that building and managing an effective Business
Continuity Plan can appear daunting, the investment for which might prove worthwhile—
with luck—only in the event of the 100-year flood or the rare Category 5 hurricane.
So the question arises: among those businesses that have adopted continuity planning
and emergency preparedness measures, what motivates the decision to do so? And
conversely, what are the inhibitors that deter other private sector enterprises from
committing the time, talent and resources necessary to develop their own plans? These
two questions are at the heart of the problem that motivated this study.
4.1 Research method This chapter will present the research method and highlight results of a project that
surveyed 145 businesses, industries, and non-profit organizations in four geographic
regions of the country to determine the factors that motivate private sector entities to
adopt business continuity planning or emergency preparedness measures. For purposes of
establishing a testable research question, the focus was on determining the effect of
recent experience in and geographic proximity to a disaster event on the adoption of
emergency preparedness measures or business continuity planning by a private sector
entity. As the research evolved, two additional factors were identified as relevant to
motivation among private sector entities. These factors are analyzed in the next chapter.
The introduction to this study cited a hypothesis that appears in Rubin’s Emergency
Management: The American Experience 1900-2005:
126
“The hypothesis of this book is that changes in emergency management policies, authorities, and processes are event-driven, and major focusing events have provided an opportunity to explore the effect of disasters on emergency management principles and practices.” [Rubin, 2007 (4)]
In a corollary fashion, this study proposes to examine whether focusing events occur not
just at the regional level with cultural or national-level implications, but at the level of
individual businesses, as well, with implications for the adoption of policies and
measures to prepare for, respond to and mitigate the effects of local disasters and
emergencies. The specific research objective is to identify the effects of disaster
experience and proximity to hazards in motivating the decision to adopt business
continuity planning and emergency preparedness measures within an organization. The
following research hypothesis was the basis for evaluation:
HYPOTHESIS: Experience with or exposure to disasters has an effect on whether a
private sector entity adopts preparedness or continuity planning measures.
NULL HYPOTHESIS: Experience with or exposure to disasters has little or no effect
on whether a private sector entity adopts preparedness or continuity planning
measures.
In addition to the factors of exposure and experience, two other motivations for
business decisions favoring preparedness were examined. According to Mileti and
Tierney, a second major factor besides past experience that influences preparedness
among private sector business is the size of the organization [Mileti 1999; Tierney 2007].
The significance of this factor is the relationship between organization size and the

127
availability of resources, technical and managerial capabilities, staffing capacity and the
like. Clearly, the administrative overhead required to establish, manage and operate a
full-blown, capital-letter Business Continuity Plan of the sort depicted in Figure 4.1 goes
a long way toward explaining why corporate size matters in formal business continuity
planning. But are organizational size and available resources the key discriminators? And
if so, what motivates small businesses to take similar measures? To explore this aspect of
the problem, the analysis also examined the effect of organizational size on the decision
by a private sector entity to adopt continuity and preparedness measures.
Lastly, during the course of the survey development and administration, it became
clear that a fourth factor had a significant effect on the business decision to adopt
continuity planning and emergency preparedness practices: that is, participation within a
community or regional planning structure or organization that aided collaborative
decision-making, coordinated planning or mutual support.
Thus the analytic approach for the data collection and analysis in this study is based
on four primary factors: (1) experience in a disaster that a business or organization may
have had, whether recent or historic; (2) exposure to a hazard or disaster by virtue of
geographic location; (3) the relative size of the business or organization as an indication
of capacity to prepare and availability of resources to respond; and (4) participation in a
local or regional organization for collaborative planning or mutual support. This structure
and the analytic process are described below.
4.2 Analytic approach

128
Chapter 3 presented Ghemawat’s concept of “distance” and the CAGE Framework as
a method to estimate the potential for a company to successfully expand its operations
into a foreign country. An Ishikawa Diagram was presented to visualize the CAGE
framework, where the four components of “distance” between the business and its
foreign market serve as indicators of commercial potential for the business (Figure 4-2).
Figure 4-2: Ishikawa diagram for the CAGE distance framework
A similar approach is presented here to analyze motivation within the private sector for
adopting continuity of operations planning and emergency preparedness measures.
Rather than “distance,” however, this framework is defined by the “proximity” of a
business or organization to the four factors described above that influence business
decisions for preparedness. The four “degrees of proximity” in this analysis are:
• Geographic proximity – geographic or physical distance from a hazard or
regional condition that exposes a business and its operations to the effects of a
disaster;
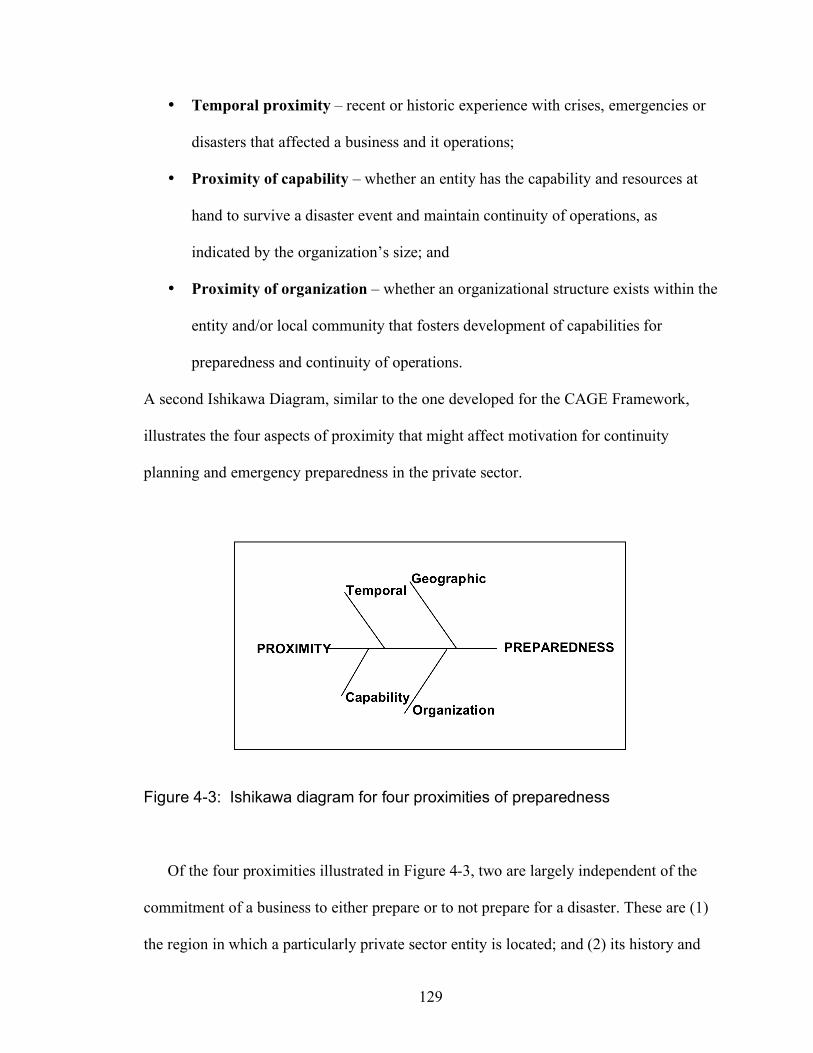
129
• Temporal proximity – recent or historic experience with crises, emergencies or
disasters that affected a business and it operations;
• Proximity of capability – whether an entity has the capability and resources at
hand to survive a disaster event and maintain continuity of operations, as
indicated by the organization’s size; and
• Proximity of organization – whether an organizational structure exists within the
entity and/or local community that fosters development of capabilities for
preparedness and continuity of operations.
A second Ishikawa Diagram, similar to the one developed for the CAGE Framework,
illustrates the four aspects of proximity that might affect motivation for continuity
planning and emergency preparedness in the private sector.
Figure 4-3: Ishikawa diagram for four proximities of preparedness
Of the four proximities illustrated in Figure 4-3, two are largely independent of the
commitment of a business to either prepare or to not prepare for a disaster. These are (1)
the region in which a particularly private sector entity is located; and (2) its history and

130
experience with disaster-related events.34 Conversely, the other two proximities are more
clearly reflections of decisions made within the entity itself: (3) the resources that a
company has available, by virtue of its size, to make itself more resilient and less
vulnerable to disaster; and (4) an entity’s decision to participate in an organization or
mutual aid association to enhance its preparedness through cooperation with other
entities. The survey did not attempt to directly assess the relationship between any
specific proximity and another is not intended to imply necessarily any sort of cause and
effect relationship among the four proximities. Direct cause-and-effect relationships
between proximities may, indeed, exist—for example, the more prepared companies are,
the more likely they are to participate in mutual aid agreements (or, conversely perhaps,
the less capable companies are the more likely they are to participate in mutual aid
agreements). However, this survey and analysis did not direct itself toward identifying
the degree to which those connections existed and how they would impact business
decisions. Nevertheless, some examination of the relationship among the four proximities
will be addressed in the next section.
Of equal importance—as explained in the next section—is that the dependent
variables used in the survey to determine levels of motivation toward preparedness are
represented by a number of preparedness measures (out of a total of twelve) that each
respondent claimed to have actually implemented. The measures that were assessed
through the survey included the following: 34 Tierney has observed that where a business locates is one of the key mitigation factors that are under an organization’s control, insofar as exposure can be avoided and vulnerability diminished by the choice of location that a business adopts (i.e., in a floodplain) [Tierney 2007]. It could likewise be claimed that a business’ experience during disaster is a function of its level of preparedness, though perhaps not a direct factor in whether or not a disaster occurs in the first place. This understanding would clearly distinguish between disasters that originate from sources external to the business or organization, and crises or emergencies that arise from conditions or situations internal to the organization—i.e., of its own making. However, organizational crises of this sort are not the subject of this analysis.
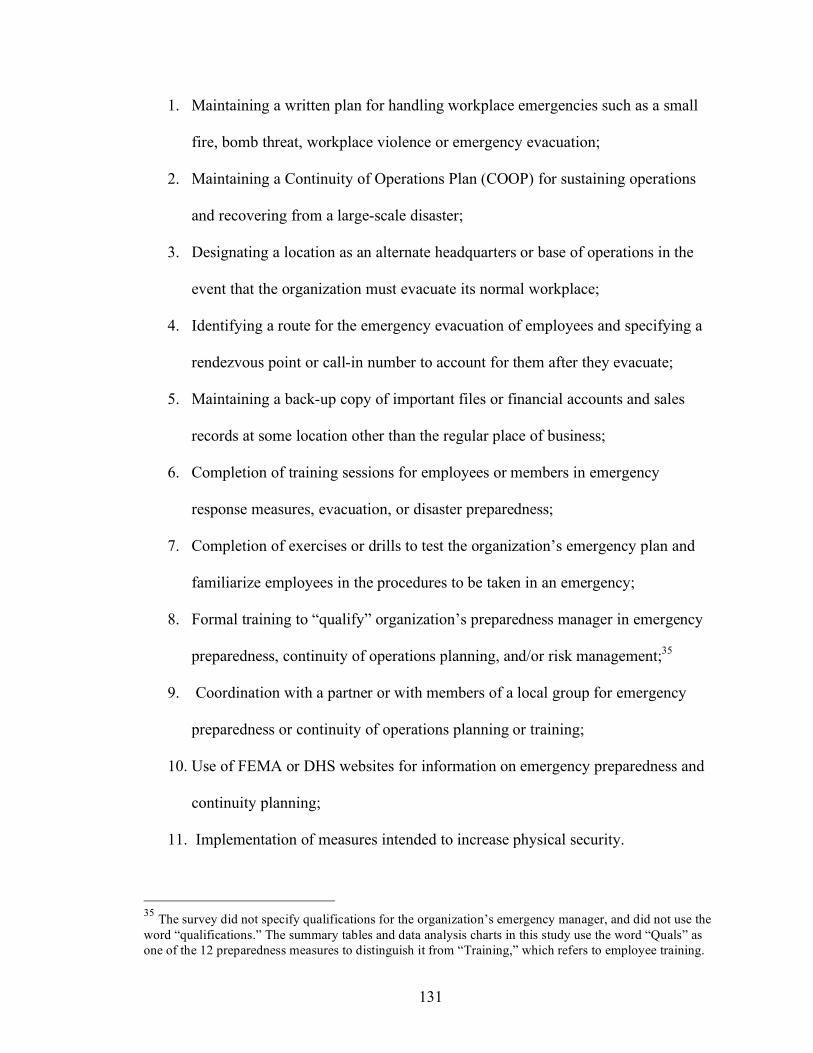
131
1. Maintaining a written plan for handling workplace emergencies such as a small
fire, bomb threat, workplace violence or emergency evacuation;
2. Maintaining a Continuity of Operations Plan (COOP) for sustaining operations
and recovering from a large-scale disaster;
3. Designating a location as an alternate headquarters or base of operations in the
event that the organization must evacuate its normal workplace;
4. Identifying a route for the emergency evacuation of employees and specifying a
rendezvous point or call-in number to account for them after they evacuate;
5. Maintaining a back-up copy of important files or financial accounts and sales
records at some location other than the regular place of business;
6. Completion of training sessions for employees or members in emergency
response measures, evacuation, or disaster preparedness;
7. Completion of exercises or drills to test the organization’s emergency plan and
familiarize employees in the procedures to be taken in an emergency;
8. Formal training to “qualify” organization’s preparedness manager in emergency
preparedness, continuity of operations planning, and/or risk management;35
9. Coordination with a partner or with members of a local group for emergency
preparedness or continuity of operations planning or training;
10. Use of FEMA or DHS websites for information on emergency preparedness and
continuity planning;
11. Implementation of measures intended to increase physical security.
35 The survey did not specify qualifications for the organization’s emergency manager, and did not use the word “qualifications.” The summary tables and data analysis charts in this study use the word “Quals” as one of the 12 preparedness measures to distinguish it from “Training,” which refers to employee training.
132
12. Registering or specifying a willingness to register corporate resources,
capabilities or services that could be donated to the local EMA during a disaster.
Each of these measures of preparedness represents a specific capability adopted by
the business or organization being surveyed. Responses to the questions in the survey
were simple yes/no responses; either an organization had put one of the measures into
practice, or it had not. There was no attempt made to determine the “degree” to which
adoption of the measure was adequate or feasible. In short, companies were asked to
“self-assess” based on a yes/no response to whether they had implemented any of twelve
measures of preparedness. For this reason—and for purposes of this study—adopting a
given measure of preparedness indicates merely that an organization is more motivated
toward getting prepared than if it had not adopted that measure. Thus, a company that
adopts or implements eight out of twelve measures was considered more motivated—for
whatever reason—than a company that adopts only three. The study did not solicit
reasons or rationales for why only certain measures were adopted; for why some were
selected over others; or how priorities or importance were assigned to the measures that
were adopted.
4.3 Survey method An internet-based survey was administered through an online commercial survey
company to four communities from separate geographic regions of the country.
Discussions were conducted with the directors of county emergency management
agencies of the counties or principal cities of the four regions, and all agreed to support
this research project. A survey link was posted on the websites of the county Emergency
133
Management Agencies, and/or on the websites of the local Chambers of Commerce or
Economic Development Councils and was accessible from June 2008 until February
2009. There was no identifying information from participants gathered in the survey
responses. A unique internet link was assigned to each participating region, so that
responses could be collected separately for comparison.
In addition to the four geographic regions targeted for participation, the survey was
also distributed through a university-based, federally-chartered program that facilitates
public and private sector partnerships to enhance community preparedness in cities,
counties and regions across the nation. Since 1999, the program has been initiated in over
45 communities across 23 states and maintains active liaison with its local organizations
through an online newsletter. Through its mailing list, the organization distributed a
separate link to the survey that enabled private sector members from within each of its
member organizations to participate in the survey. Those responses were compiled as a
separate “region” and constituted almost half of the responses to the survey. Those
responses were not identified for regional affiliation and, taken as a group, constitute a
basis for comparison against the responses collected from the four geographic regions.
The four geographic regions share some common traits relevant to this study:
• All regions contain coastal communities that are exposed to hazards from storms,
flooding, and damage caused by wind-driven tides and waves. Three of the
regions are vulnerable to hurricanes.
• All regions have a broad spectrum of industry, business, agriculture and urban
enterprises in their economic makeup; all contain port facilities with maritime
industries comprised of both commercial and recreational business enterprises;
134
• All have current public-private sector involvement in disaster planning and
preparedness, and several have local organizations dedicated to that purpose.
On the other hand, the regions differ in that each has unique historic and recent
experience with hurricanes and storms that generate flood conditions; each also has
significant hazards specific to the region.
• Region 1 lies on the upper Chesapeake Bay and last suffered the effects of a
hurricane in 2003 during Hurricane Isabel. Damage to the region was not
extensive, though it did include the failure of a number of small businesses and
damage to local agriculture and the recreational maritime industry. Since that
time, an ongoing campaign of hurricane preparedness has raised general
awareness, but has not been tested in a more recent event. Prior history that
generated a significant impact was Hurricane Agnes in 1972. This region is a
center for a number of large defense-related industries and two significant
military installations, and owing to its proximity to the nation’s capital, has had a
focus on terrorism awareness and counter-measures since 9/11 that is not typical
of the other regions.
• Region 2 is situated on the southern Atlantic seaboard and suffered extensive
damage during Hurricane Hugo in 1989, which resulted in declaration as a federal
disaster area. However, the region’s major city has since become a case study in
successful recovery that yielded a more economically vibrant community than had
existed before the storm. This region is also susceptible to earthquakes and has a
history of significant damage from them.
135
• Region 3 is on the western Gulf of Mexico and has historic and well-documented
experience in hurricanes and recent experience with both Hurricanes Katrina and
Rita. The number of survey responses from this region was the most robust of the
four regions surveyed, even though they terminated abruptly (and were not
resumed) halfway through the survey period when the region was evacuated and
subsequently heavily damaged during Hurricane Ike. This region is a center for
petroleum processing and transport and has a heavy industrial base and a long-
standing focus on industrial hazards and ecological protection.
• Region 4 is situated on western Lake Michigan and is not exposed to hurricane
damage. However, it is susceptible to severe winter storms, and springtime coastal
flooding. Weeks before the launching of the survey, this region was significantly
affected by the flooding of local rivers, which necessitated a partial evacuation of
nearby communities and did significant damage throughout the region.
• As noted above, Region 5 is not geographic in character, but is comprised of a
number of businesses and organizations from member communities who have
participated in a federally-sponsored, university-managed program to develop
public/private sector partnerships dedicated to collaborative planning and
emergency preparedness efforts. Member communities in this program are
distributed across the country and no geographic information was attained from
participants in this group.
136
4.4 Survey structure The survey was comprised of 34 questions clustered into six categories of interest to
support the research and analysis. In addition to data gathered to support hypothesis
testing, additional information was gathered from questions that assessed participants’
perceptions of risk; previous experience with disaster-related loss; and perceptions of
federal and local responsibility for public security and disaster preparedness.
Content validity of the survey instrument was determined through a number of
means. The survey was developed based on principles and techniques outlined in the
Sage Publications Applied Social Research Methods Series [Converse and Presser 1986;
Fowler 1995; Spector 1992]. In the process of development (over the course of more than
a year) the survey was reviewed by representatives from the following organizations:
• Regional director, wireless telecommunications carrier • Regional general manager of a national food and merchandise chain • Director of business continuity planning, regional gas & electric company • Regional manager, safety and environmental risk, of a national food chain • President, local commercial bank • President, regional medical center • Public information officer, regional medical center • Harbor master of a seaport city • Director of security, U.S. military installation • Director of homeland security programs, defense contracting company
The survey was further validated through administration via paper copy format to 15
businesses for review and usability testing under the sponsorship of the local chamber of
commerce. Blind results were delivered to the author and comments were incorporated
into the survey form. The survey was also reviewed and critical comments incorporated
from the following individuals with experience in survey-based research:
• Anthropologist in medical and public health research (PhD.) • Statistician at a university social science research institute (PhD.) • Cultural anthropologist at a social science research institute (PhD.)

137
• Cognitive psychologist, Department of Defense research agency (PhD.) • Statistician at a university-based school of criminal justice (PhD.) • Cultural anthropologist, U.S. Department of Homeland Security (PhD.) • Director of bio-security programs at a non-profit research institute (ScD.)
Lastly, in the process of gaining concurrence of the participating regions, the survey
was reviewed and critiqued by senior representatives of the following agencies:
• 7 directors of city and county offices of emergency management • 2 CEOs of city chambers of commerce • 1 director of a county office of economic development
In all, 234 participants visited the website and acknowledged a willingness to
participate in the survey. However, willingness (or ability) to answer the questions
varied, with overall response rates of typically 170-180 for “yes/no” questions, and 150-
160 for Likert Scale and multiple-choice questions. Of the 234 initial respondents, 27 did
little more than log onto the website and scan the survey. Another 36 had responses that
were evaluated as unreliable or incomplete. This was typically from two causes: (1) the
respondents did not provide enough identifying data (size or type of organization; sector;
or level of disaster experience) to enable a correlation with other responses; or (2)
because they answered less than 8 of the questions relevant to the 12 measures of
preparedness (typically answering only the “yes” questions, but leaving the “no”
responses blank. Consequently, a total of 63 responses were eliminated from the
database. In 88 other cases, answers to specific questions on preparedness measures were
left blank (i.e., answered neither “yes” nor “no”). In these 88 cases the answers were
considered to be “no” responses, and were counted as valid survey submissions primarily
because the omissions occurred in the three least commonly adopted measures (see
section 4.4), and the surveys were otherwise accurately completed. Assuming a “no”
138
response also resulted in a more conservative estimate of measures adopted. In all, the 88
questions where answers were assumed to be “no” and the data filled in by the author
represented less than 4.3% of the measures of preparedness that were validly answered in
the survey (that is, 88 out of a total 2052 measures (171 x 12)). Participation rates for
specific questions ranged from 64% to 77%, and the survey site calculated an overall
response rate of 66%. The survey site was set up to prevent a recurrent visit by any
computer that had previously completed the survey. (Internet Protocol (IP) Addresses
collected for this purpose were not recorded or accessible to the principal investigator or
any respondents).
In addition to the private sector respondents, 26 responses came from public agencies.
At the request of a number of respondents (notably, the hosting Emergency Management
Agencies), a category was added to question #2 to permit local government agencies to
participate in the survey. 26 public sector agencies subsequently responded. For the
analysis relevant to the research hypothesis (dealing specifically with private sector
entities analyzed in Chapter 5), these participants were removed from the database,
yielding a total of 145 private sector entities evaluated. However, for the results presented
in the remainder of this chapter, responses included public sector as well as private sector
entities.
Two caveats regarding potential biases in the survey process are in order. First,
because this was an online survey with an audience referred to it by local emergency
management and business organizations, the participants were largely self-selected and
motivated to complete the survey. Thus, it should not be inferred that the results are
139
necessarily reflective of the population in the regions surveyed, nor of the U.S. business
community at large. This aspect will be more fully discussed in Chapter 6.
Secondly, this survey and the research project itself is focused on identifying factors
that motivate private sector entities to adopt preparedness measures and continuity of
operations planning. The project makes no claim—and draws no conclusions—as to
whether the adoption of such measures actually improves business continuity planning or
emergency preparedness of specific entities. No attempt is made to correlate actual
preparedness of respondents with overall preparedness of a specific region, community or
business. This is a question—not addressed in this study—which is raised by Tierney’s
observation that it is not evident that “standard recommended preparedness measures
have little impact on short- and long-term business recovery outcomes” [Tierney 2007].
Appendix A provides a copy of the survey as it appeared on the website to
participants. As noted above, the questions fell into six general categories to support the
analysis, and can be broken down into the following sections. Numbers in brackets after
the group description indicate specific questions in the survey that were used to support
that aspect of the analysis.
• Group 1 General description and characteristics.
o Business type: publicly traded; privately owned; non-profit; government
agency [Q2].
o General business category according to an abbreviated North American
Industrial Classification System (NAICS) Code. [Q6].
o Business entity by size: employees [Q3]; total assets [Q4]; revenue [Q5].
140
• Group 2 Geographic proximity and exposure to hazards
o Covered by the geographic regions (Region 1 to Region 4, plus Region 5
(non-geographic)) to which the survey was distributed.
• Group 3 Recent disaster experience
o Within last 5 years (yes/no) [Q21].
o Type of disaster experienced (multiple choice) [Q23].
o Extent of damage: monetary cost; loss of operations; and when occurring
[Q22].
• Group 4 Preparedness and continuity measures adopted:
o Written emergency plan (yes/no) [Q7]
o Written Continuity of Operations Plan (yes/no) [Q8]
o Alternate headquarters designated (yes/no) [Q9]
o Emergency evacuation route designated (yes/no) [Q10]
o Back-up copy of records maintained (yes/no) [Q11]
o Emergency response training held (yes/no) [Q12]
o Exercises and drills conducted to test plans (yes/no) [Q13]
• Group 5 Organization structure and support
o Identity of individual responsible for emergency management plan
(multiple choice) [Q16]; level of training [Q17 and Q18].
o Collaboration in writing emergency or continuity plans (multiple choice)
[Q14]; from whom or by which agency resources [Q15].
o Coordination for mutual aid or support (yes/no) [Q19].
141
o Collaboration for joint planning and information sharing (multiple choice)
[Q34].
o Willingness to register resources with local EMA (multiple choice) [Q35].
• Group 6 General information and perceptions
o Identity of collaboration partner (multiple choice) [Q22].
o Perception of local threats [Q24]
o Perception of terrorist threat to region [Q25]
o Use of FEMA / DHS resources and planning templates [Q26]
o Perception of federal (DHS / FEMA) responsibilities [Q27]
o Perception of local government and private sector responsibilities [Q28]
o Perception of general level of preparedness since 9/11 [Q29]
o Inhibitors from preparing for emergencies and disasters [Q30]
o Implemented changes to security procedures since 9/11 (yes/no) [Q31]
o Types of changes to security procedures made (multiple choice) [Q32]
o Local costs to institute planning and preparedness measures [Q33]
4.5 Summary of results Chapter 5 provides analysis of the survey results relevant to the testing of the research
hypotheses. This section provides a brief summary of responses, as well as some results
of interest that emerged from the survey, and provides a snapshot of preparedness among
the participants. These results are based on percentage responses to the survey questions,
but not all were subjected to further statistical validation.
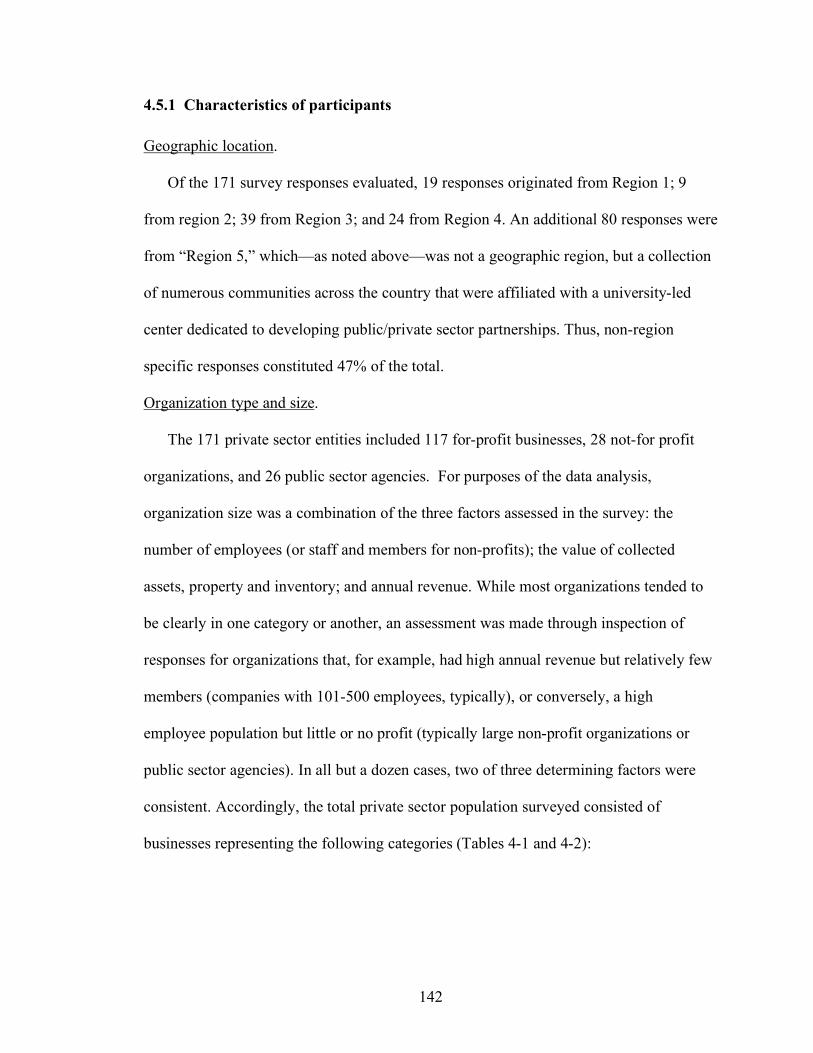
142
4.5.1 Characteristics of participants Geographic location.
Of the 171 survey responses evaluated, 19 responses originated from Region 1; 9
from region 2; 39 from Region 3; and 24 from Region 4. An additional 80 responses were
from “Region 5,” which—as noted above—was not a geographic region, but a collection
of numerous communities across the country that were affiliated with a university-led
center dedicated to developing public/private sector partnerships. Thus, non-region
specific responses constituted 47% of the total.
Organization type and size.
The 171 private sector entities included 117 for-profit businesses, 28 not-for profit
organizations, and 26 public sector agencies. For purposes of the data analysis,
organization size was a combination of the three factors assessed in the survey: the
number of employees (or staff and members for non-profits); the value of collected
assets, property and inventory; and annual revenue. While most organizations tended to
be clearly in one category or another, an assessment was made through inspection of
responses for organizations that, for example, had high annual revenue but relatively few
members (companies with 101-500 employees, typically), or conversely, a high
employee population but little or no profit (typically large non-profit organizations or
public sector agencies). In all but a dozen cases, two of three determining factors were
consistent. Accordingly, the total private sector population surveyed consisted of
businesses representing the following categories (Tables 4-1 and 4-2):
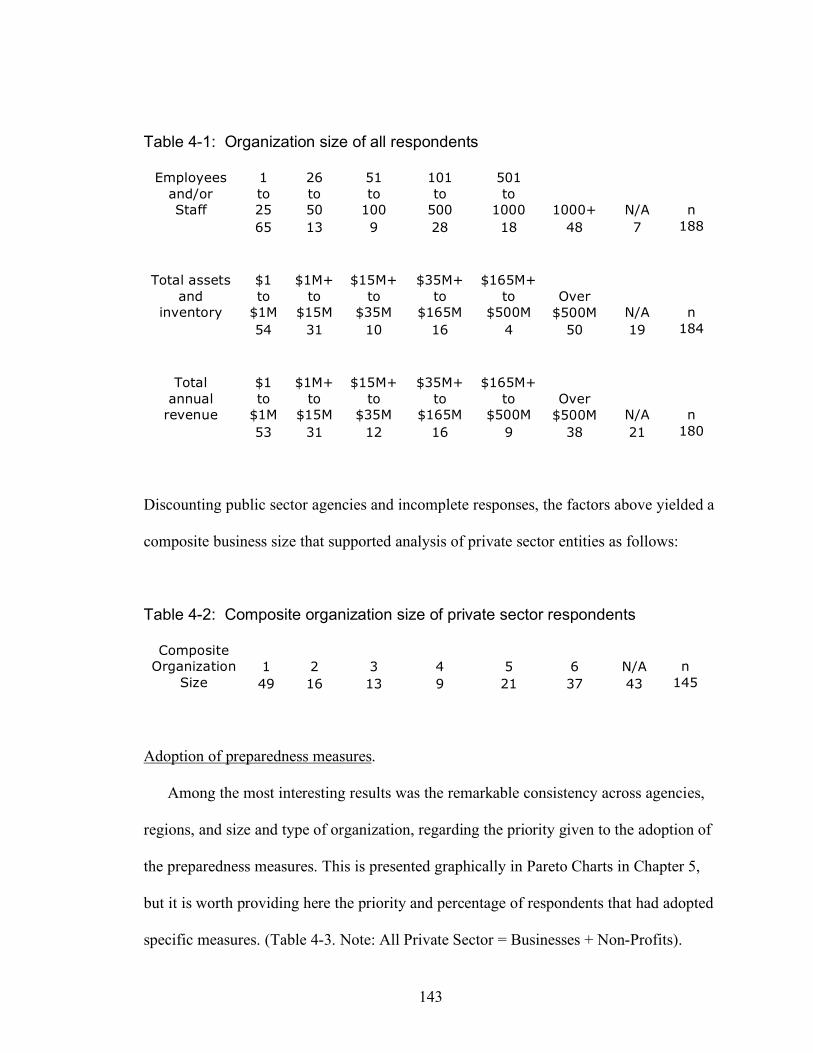
143
Table 4-1: Organization size of all respondents
1 to 25
26 to 50
51 to
100
101 to
500
501 to
1000 1000+ N/A
n
Employees and/or Staff
65 13 9 28 18 48 7 188
$1 to
$1M
$1M+ to
$15M
$15M+ to
$35M
$35M+ to
$165M
$165M+ to
$500M Over
$500M N/A
n
Total assets and
inventory 54 31 10 16 4 50 19 184
$1 to
$1M
$1M+ to
$15M
$15M+ to
$35M
$35M+ to
$165M
$165M+ to
$500M Over
$500M N/A
n
Total annual
revenue 53 31 12 16 9 38 21 180
Discounting public sector agencies and incomplete responses, the factors above yielded a
composite business size that supported analysis of private sector entities as follows:
Table 4-2: Composite organization size of private sector respondents
1 2 3 4 5 6 N/A n
Composite Organization
Size 49 16 13 9 21 37 43 145
Adoption of preparedness measures.
Among the most interesting results was the remarkable consistency across agencies,
regions, and size and type of organization, regarding the priority given to the adoption of
the preparedness measures. This is presented graphically in Pareto Charts in Chapter 5,
but it is worth providing here the priority and percentage of respondents that had adopted
specific measures. (Table 4-3. Note: All Private Sector = Businesses + Non-Profits).
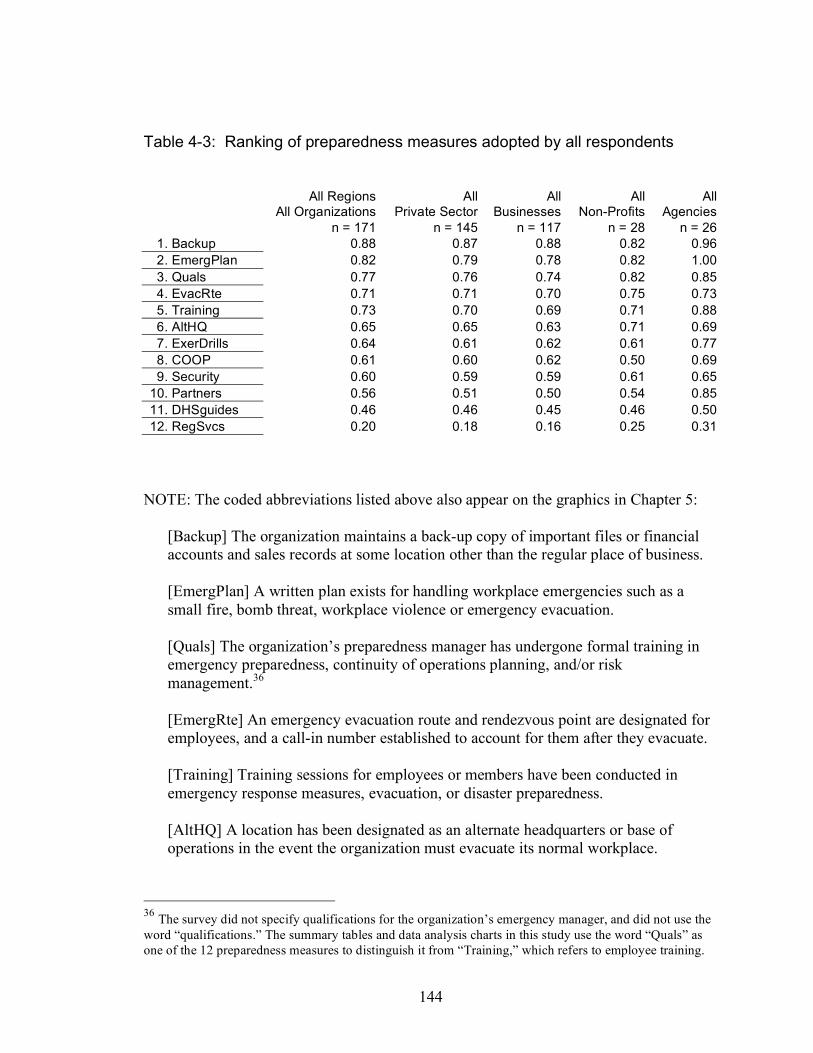
144
Table 4-3: Ranking of preparedness measures adopted by all respondents
All Regions
All Organizations All
Private Sector All
Businesses All
Non-Profits All
Agencies n = 171 n = 145 n = 117 n = 28 n = 26 1. Backup 0.88 0.87 0.88 0.82 0.96 2. EmergPlan 0.82 0.79 0.78 0.82 1.00 3. Quals 0.77 0.76 0.74 0.82 0.85 4. EvacRte 0.71 0.71 0.70 0.75 0.73 5. Training 0.73 0.70 0.69 0.71 0.88 6. AltHQ 0.65 0.65 0.63 0.71 0.69 7. ExerDrills 0.64 0.61 0.62 0.61 0.77 8. COOP 0.61 0.60 0.62 0.50 0.69 9. Security 0.60 0.59 0.59 0.61 0.65 10. Partners 0.56 0.51 0.50 0.54 0.85 11. DHSguides 0.46 0.46 0.45 0.46 0.50 12. RegSvcs 0.20 0.18 0.16 0.25 0.31
NOTE: The coded abbreviations listed above also appear on the graphics in Chapter 5:
[Backup] The organization maintains a back-up copy of important files or financial accounts and sales records at some location other than the regular place of business. [EmergPlan] A written plan exists for handling workplace emergencies such as a small fire, bomb threat, workplace violence or emergency evacuation. [Quals] The organization’s preparedness manager has undergone formal training in emergency preparedness, continuity of operations planning, and/or risk management.36 [EmergRte] An emergency evacuation route and rendezvous point are designated for employees, and a call-in number established to account for them after they evacuate. [Training] Training sessions for employees or members have been conducted in emergency response measures, evacuation, or disaster preparedness. [AltHQ] A location has been designated as an alternate headquarters or base of operations in the event the organization must evacuate its normal workplace.
36 The survey did not specify qualifications for the organization’s emergency manager, and did not use the word “qualifications.” The summary tables and data analysis charts in this study use the word “Quals” as one of the 12 preparedness measures to distinguish it from “Training,” which refers to employee training.
145
[ExerDrills] The organization has conducted exercises or drills to test the emergency plan and familiarize employees in the procedures to be taken in an emergency. [COOP] The organization has a written Continuity of Operations Plan (COOP) for sustaining operations and recovering from a large-scale disaster. [Security] The organization has implemented measures to increase physical security. [Partners] The organization coordinates with a partner or with members of a local group for emergency preparedness or continuity of operations planning or training. [DHSguides] The organization has accessed FEMA or DHS websites and downloaded information on emergency preparedness and continuity planning. [RegSvcs] The organization has registering or has specified a willingness to register corporate resources, capabilities or services with the local EMA for disaster planning.
While there tended to be some variation in the middle third of this ranking of
preparedness measures, the top and bottom third of the 12 assessed measures were
consistent across all sectors, with two exceptions—public sector agencies ranked training
and exercises higher in the adopted measures (3rd overall) than did any category of
private sector entities (typically 5th). Secondly, a similar variation was noted in
development of collaborative relationships and partnerships: public sector agencies
ranked this initiative as among the top five, whereas it ranked 10th out of 12 for private
sector entities. It was revealing—though not particularly reassuring—that the use of DHS
and FEMA websites as sources of information for private sector entities—as well as for
local public sector agencies—ranked 11th out of the 12 available measures.
4.5.2 Perceptions of risk and threat Perception of general risk for continuity of operations
Respondents were asked to rate the “threats” to continuity of operations, profitability
or survival of their organizations or businesses. Figures in Table 4-4 indicate average
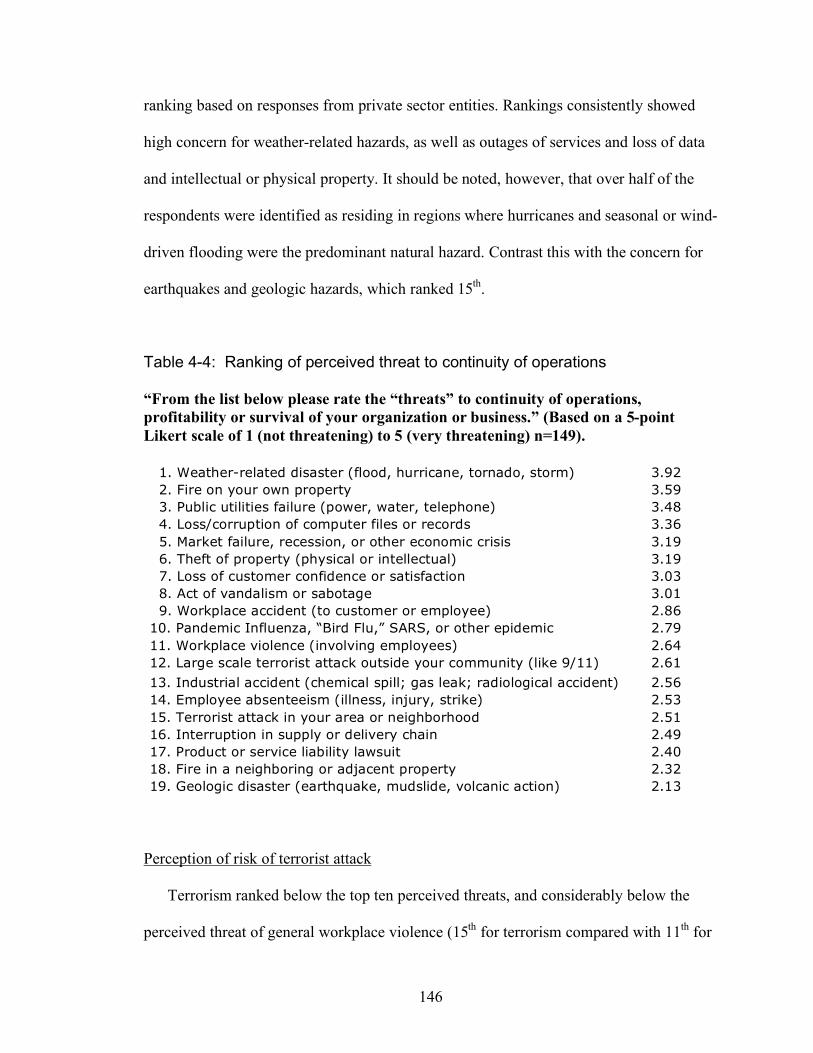
146
ranking based on responses from private sector entities. Rankings consistently showed
high concern for weather-related hazards, as well as outages of services and loss of data
and intellectual or physical property. It should be noted, however, that over half of the
respondents were identified as residing in regions where hurricanes and seasonal or wind-
driven flooding were the predominant natural hazard. Contrast this with the concern for
earthquakes and geologic hazards, which ranked 15th.
Table 4-4: Ranking of perceived threat to continuity of operations “From the list below please rate the “threats” to continuity of operations, profitability or survival of your organization or business.” (Based on a 5-point Likert scale of 1 (not threatening) to 5 (very threatening) n=149). 1. Weather-related disaster (flood, hurricane, tornado, storm) 3.92 2. Fire on your own property 3.59 3. Public utilities failure (power, water, telephone) 3.48 4. Loss/corruption of computer files or records 3.36 5. Market failure, recession, or other economic crisis 3.19 6. Theft of property (physical or intellectual) 3.19 7. Loss of customer confidence or satisfaction 3.03 8. Act of vandalism or sabotage 3.01 9. Workplace accident (to customer or employee) 2.86 10. Pandemic Influenza, “Bird Flu,” SARS, or other epidemic 2.79 11. Workplace violence (involving employees) 2.64 12. Large scale terrorist attack outside your community (like 9/11) 2.61
13. Industrial accident (chemical spill; gas leak; radiological accident) 2.56 14. Employee absenteeism (illness, injury, strike) 2.53 15. Terrorist attack in your area or neighborhood 2.51 16. Interruption in supply or delivery chain 2.49 17. Product or service liability lawsuit 2.40 18. Fire in a neighboring or adjacent property 2.32 19. Geologic disaster (earthquake, mudslide, volcanic action) 2.13
Perception of risk of terrorist attack
Terrorism ranked below the top ten perceived threats, and considerably below the
perceived threat of general workplace violence (15th for terrorism compared with 11th for
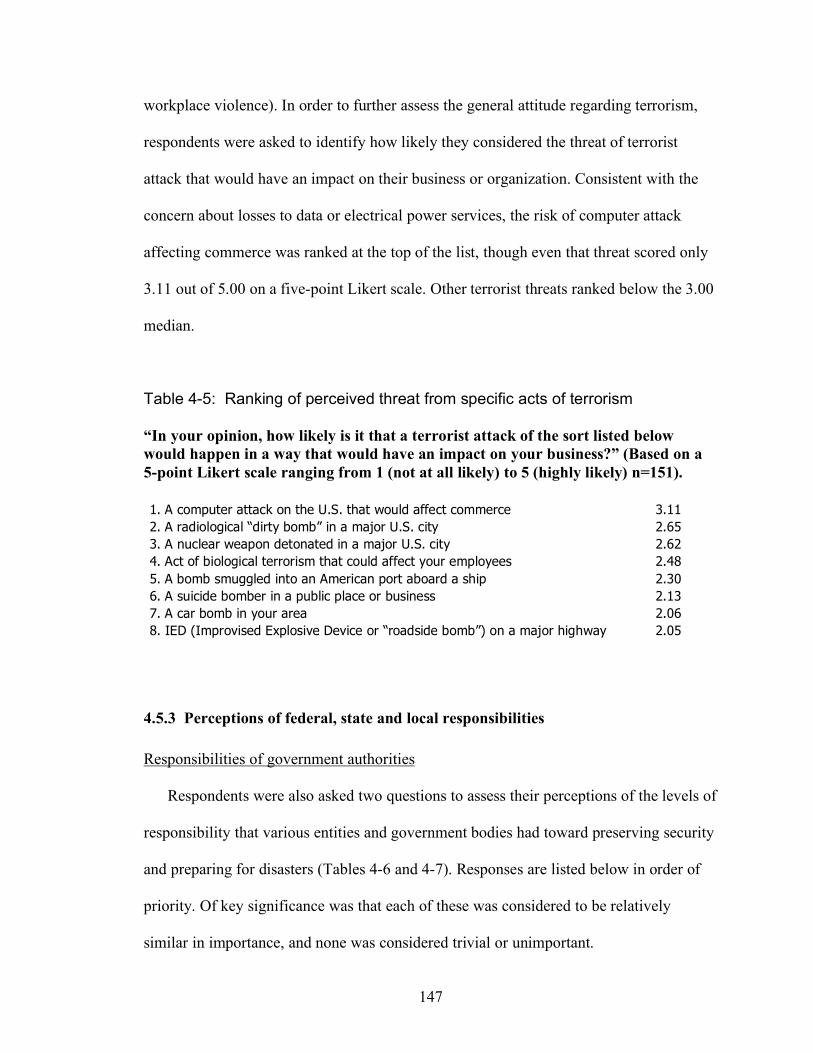
147
workplace violence). In order to further assess the general attitude regarding terrorism,
respondents were asked to identify how likely they considered the threat of terrorist
attack that would have an impact on their business or organization. Consistent with the
concern about losses to data or electrical power services, the risk of computer attack
affecting commerce was ranked at the top of the list, though even that threat scored only
3.11 out of 5.00 on a five-point Likert scale. Other terrorist threats ranked below the 3.00
median.
Table 4-5: Ranking of perceived threat from specific acts of terrorism
“In your opinion, how likely is it that a terrorist attack of the sort listed below would happen in a way that would have an impact on your business?” (Based on a 5-point Likert scale ranging from 1 (not at all likely) to 5 (highly likely) n=151). 1. A computer attack on the U.S. that would affect commerce 3.11 2. A radiological “dirty bomb” in a major U.S. city 2.65 3. A nuclear weapon detonated in a major U.S. city 2.62 4. Act of biological terrorism that could affect your employees 2.48 5. A bomb smuggled into an American port aboard a ship 2.30 6. A suicide bomber in a public place or business 2.13 7. A car bomb in your area 2.06 8. IED (Improvised Explosive Device or “roadside bomb”) on a major highway 2.05
4.5.3 Perceptions of federal, state and local responsibilities Responsibilities of government authorities
Respondents were also asked two questions to assess their perceptions of the levels of
responsibility that various entities and government bodies had toward preserving security
and preparing for disasters (Tables 4-6 and 4-7). Responses are listed below in order of
priority. Of key significance was that each of these was considered to be relatively
similar in importance, and none was considered trivial or unimportant.
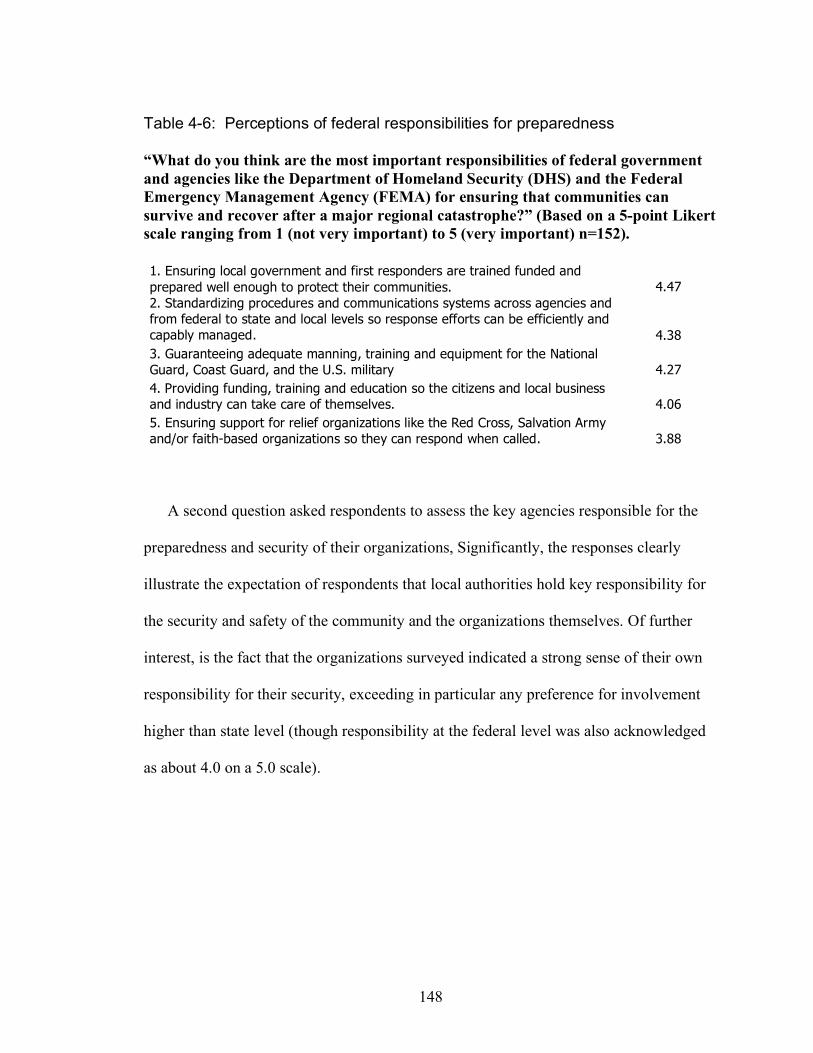
148
Table 4-6: Perceptions of federal responsibilities for preparedness “What do you think are the most important responsibilities of federal government and agencies like the Department of Homeland Security (DHS) and the Federal Emergency Management Agency (FEMA) for ensuring that communities can survive and recover after a major regional catastrophe?” (Based on a 5-point Likert scale ranging from 1 (not very important) to 5 (very important) n=152). 1. Ensuring local government and first responders are trained funded and prepared well enough to protect their communities. 4.47 2. Standardizing procedures and communications systems across agencies and from federal to state and local levels so response efforts can be efficiently and capably managed. 4.38 3. Guaranteeing adequate manning, training and equipment for the National Guard, Coast Guard, and the U.S. military 4.27 4. Providing funding, training and education so the citizens and local business and industry can take care of themselves. 4.06 5. Ensuring support for relief organizations like the Red Cross, Salvation Army and/or faith-based organizations so they can respond when called. 3.88
A second question asked respondents to assess the key agencies responsible for the
preparedness and security of their organizations, Significantly, the responses clearly
illustrate the expectation of respondents that local authorities hold key responsibility for
the security and safety of the community and the organizations themselves. Of further
interest, is the fact that the organizations surveyed indicated a strong sense of their own
responsibility for their security, exceeding in particular any preference for involvement
higher than state level (though responsibility at the federal level was also acknowledged
as about 4.0 on a 5.0 scale).
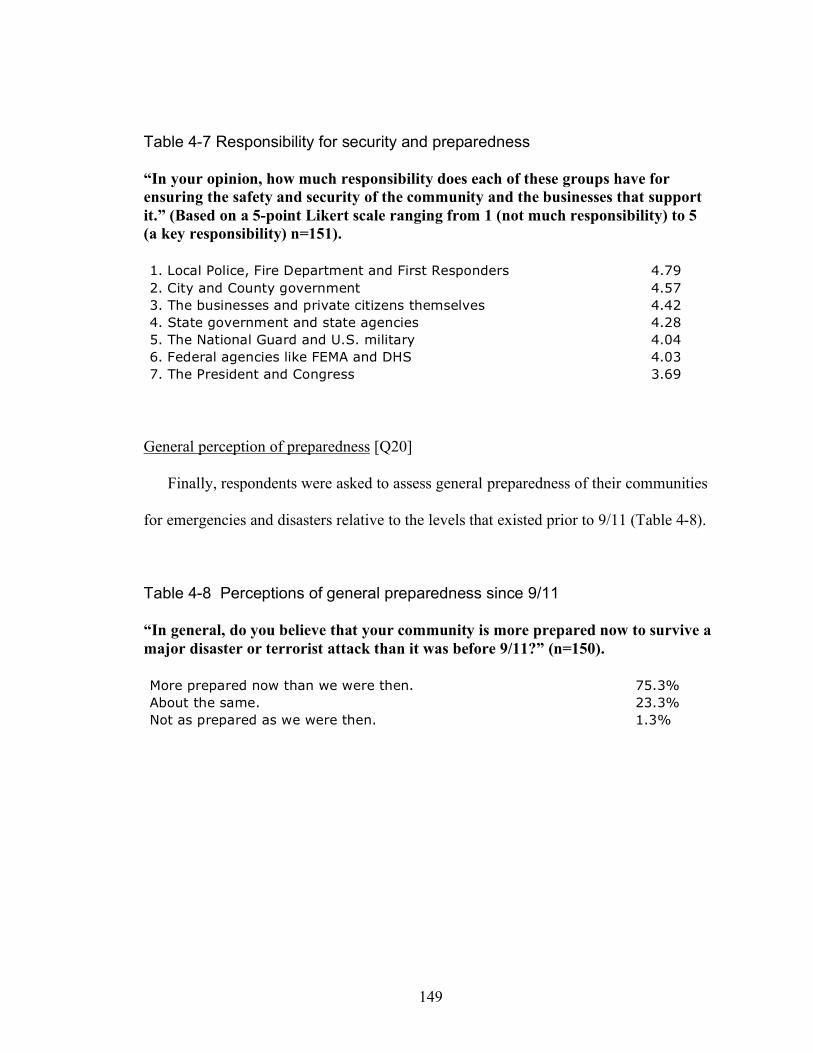
149
Table 4-7 Responsibility for security and preparedness
“In your opinion, how much responsibility does each of these groups have for ensuring the safety and security of the community and the businesses that support it.” (Based on a 5-point Likert scale ranging from 1 (not much responsibility) to 5 (a key responsibility) n=151). 1. Local Police, Fire Department and First Responders 4.79 2. City and County government 4.57 3. The businesses and private citizens themselves 4.42 4. State government and state agencies 4.28 5. The National Guard and U.S. military 4.04 6. Federal agencies like FEMA and DHS 4.03 7. The President and Congress 3.69
General perception of preparedness [Q20]
Finally, respondents were asked to assess general preparedness of their communities
for emergencies and disasters relative to the levels that existed prior to 9/11 (Table 4-8).
Table 4-8 Perceptions of general preparedness since 9/11 “In general, do you believe that your community is more prepared now to survive a major disaster or terrorist attack than it was before 9/11?” (n=150). More prepared now than we were then. 75.3% About the same. 23.3% Not as prepared as we were then. 1.3%
150
CHAPTER 5: HYPOTHESES, TESTING AND ANALYSIS
5.0 Overview
5.1 Descriptive statistics, tests of significance and box plots
5.2 Tests of significance, analysis of variance and regression
5.3 Skewness and tests of normality: Anderson-Darling test
5.4 Non-parametric tests: Kruskal-Wallis test
5.5 Pareto charts of preparedness measures
5.6 Correlation of proximities among private sector entities
5.7 Influences on participation in a collaborative partnership
5.0 Overview The goal of this research project is to assess the influence of various factors on the
decisions among private sector entities to adopt business continuity planning and
preparedness measures. This chapter presents analysis of the testing of four research
hypotheses. The original hypothesis (and basis for the dissertation) focused on assessing
the influence of past experience in disaster or geographic exposure to hazards as
motivating factors in an organization’s decision to adopt continuity and preparedness
measures. The two factors of experience and exposure form the principal null and
alternate hypotheses:
Ho: Experience with disasters (Ho1) or exposure to hazards (Ho2) has little or no effect on whether a private sector entity adopts preparedness or continuity planning measures.
Ha: Experience with disasters (Ha1) or exposure to hazards (Ha2) has an effect on
whether a private sector entity adopts preparedness or continuity planning measures.
151
As explained in the previous chapter, these two hypotheses were expanded based on a
common observation in the disaster research literature to include organizational size as a
third determining factor in private sector motivation toward preparedness. In this case,
organizational size is a reflection of available capacity or capability to plan for and
respond to a disaster. That factor establishes a third hypothesis:
Ho3: The size of the organization has little or no effect on whether a private sector entity adopts preparedness or continuity planning measures.
Ha3: The size of the organization has an effect on whether a private sector entity
adopts preparedness or continuity planning measures. Finally, results of the Private Sector Survey indicated the existence of a fourth
factor—participation in a collaborative organization or partnership—that was worth
examining and thus established a fourth hypothesis:
Ho4: Participation in a collaborative partnership has little or no effect on whether a
private sector entity adopts preparedness or continuity planning measures. Ha4: Participation in a collaborative partnership has an effect on whether a private
sector entity adopts preparedness or continuity planning measures. This section describes the analytic procedures and results of hypothesis testing using
quantitative methods to determine the relevance and validity of each of these influences
on private sector preparedness decisions. Data from the Private Sector Survey on
Preparedness and Continuity Planning were examined to determine connections between
the individual organizations and influences on motivation to adopt preparedness
measures. The analysis examined distributions of twelve preparedness measures relative
to four factors that established the independent variables of the analysis:
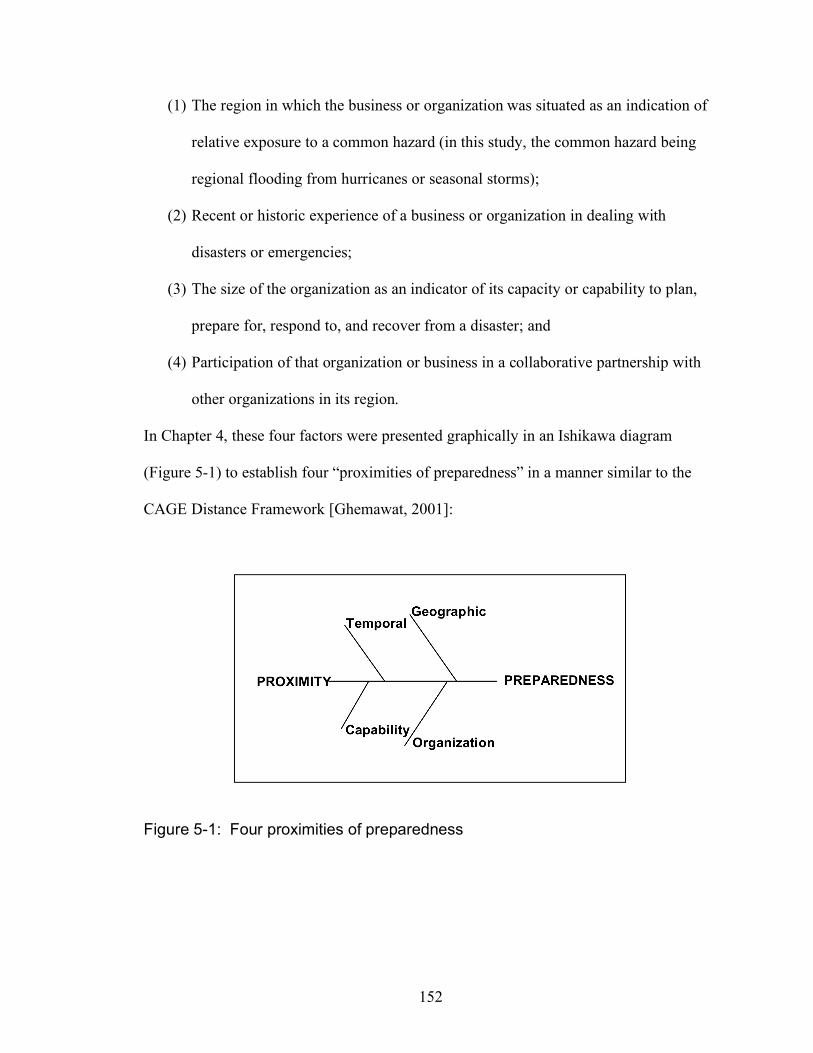
152
(1) The region in which the business or organization was situated as an indication of
relative exposure to a common hazard (in this study, the common hazard being
regional flooding from hurricanes or seasonal storms);
(2) Recent or historic experience of a business or organization in dealing with
disasters or emergencies;
(3) The size of the organization as an indicator of its capacity or capability to plan,
prepare for, respond to, and recover from a disaster; and
(4) Participation of that organization or business in a collaborative partnership with
other organizations in its region.
In Chapter 4, these four factors were presented graphically in an Ishikawa diagram
(Figure 5-1) to establish four “proximities of preparedness” in a manner similar to the
CAGE Distance Framework [Ghemawat, 2001]:
Figure 5-1: Four proximities of preparedness
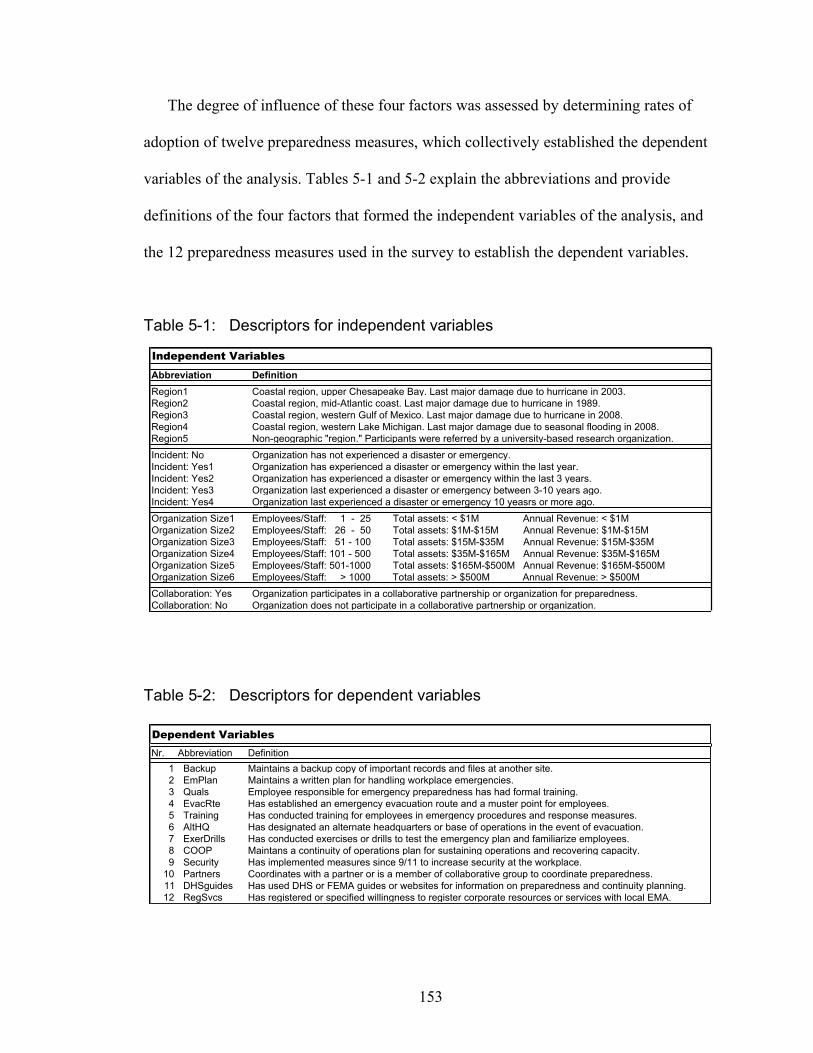
153
The degree of influence of these four factors was assessed by determining rates of
adoption of twelve preparedness measures, which collectively established the dependent
variables of the analysis. Tables 5-1 and 5-2 explain the abbreviations and provide
definitions of the four factors that formed the independent variables of the analysis, and
the 12 preparedness measures used in the survey to establish the dependent variables.
Table 5-1: Descriptors for independent variables
Table 5-2: Descriptors for dependent variables
Nr. Abbreviation Definition
1 Backup
2 EmPlan
3 Quals
4 EvacRte
5 Training
6 AltHQ
7 ExerDrills
8 COOP
9 Security
10 Partners
11 DHSguides
12 RegSvcs Has registered or specified willingness to register corporate resources or services with local EMA.
Dependent Variables
Has implemented measures since 9/11 to increase security at the workplace.
Has conducted exercises or drills to test the emergency plan and familiarize employees.
Coordinates with a partner or is a member of collaborative group to coordinate preparedness.
Has used DHS or FEMA guides or websites for information on preparedness and continuity planning.
Has established an emergency evacuation route and a muster point for employees.
Has conducted training for employees in emergency procedures and response measures.
Has designated an alternate headquarters or base of operations in the event of evacuation.
Maintans a continuity of operations plan for sustaining operations and recovering capacity.
Maintains a backup copy of important records and files at another site.
Maintains a written plan for handling workplace emergencies.
Employee responsible for emergency preparedness has had formal training.
Abbreviation Definition
Region1Region2Region3Region4Region5
Incident: NoIncident: Yes1Incident: Yes2Incident: Yes3Incident: Yes4
Organization Size1Organization Size2Organization Size3Organization Size4Organization Size5Organization Size6
Collaboration: YesCollaboration: No
Employees/Staff: 26 - 50 Total assets: $1M-$15M Annual Revenue: $1M-$15M
Organization last experienced a disaster or emergency 10 yeasrs or more ago.
Employees/Staff: 1 - 25 Total assets: < $1M Annual Revenue: < $1M
Organization last experienced a disaster or emergency between 3-10 years ago.
Coastal region, upper Chesapeake Bay. Last major damage due to hurricane in 2003.Coastal region, mid-Atlantic coast. Last major damage due to hurricane in 1989.Coastal region, western Gulf of Mexico. Last major damage due to hurricane in 2008.
Organization participates in a collaborative partnership or organization for preparedness.Organization does not participate in a collaborative partnership or organization.
Employees/Staff: 51 - 100 Total assets: $15M-$35M Annual Revenue: $15M-$35M Employees/Staff: 101 - 500 Total assets: $35M-$165M Annual Revenue: $35M-$165M
Employees/Staff: > 1000 Total assets: > $500M Annual Revenue: > $500M Employees/Staff: 501-1000 Total assets: $165M-$500M Annual Revenue: $165M-$500M
Organization has experienced a disaster or emergency within the last 3 years.
Independent Variables
Coastal region, western Lake Michigan. Last major damage due to seasonal flooding in 2008.Non-geographic "region." Participants were referred by a university-based research organization.
Organization has not experienced a disaster or emergency.Organization has experienced a disaster or emergency within the last year.
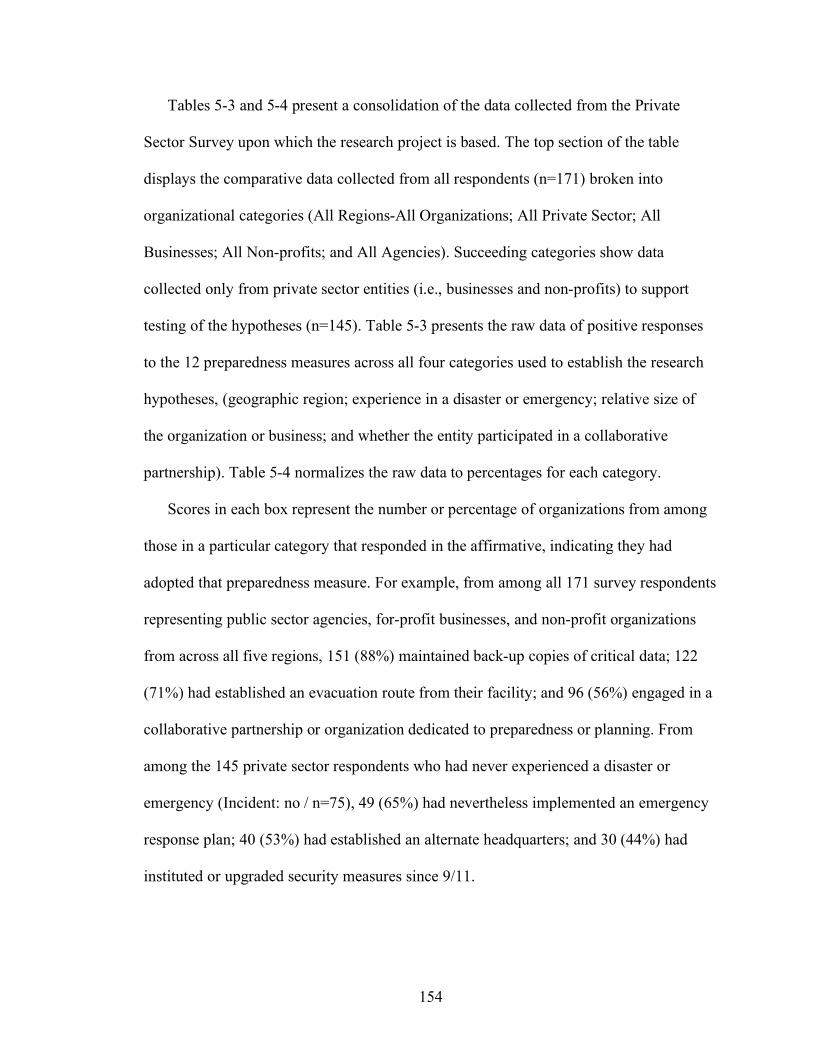
154
Tables 5-3 and 5-4 present a consolidation of the data collected from the Private
Sector Survey upon which the research project is based. The top section of the table
displays the comparative data collected from all respondents (n=171) broken into
organizational categories (All Regions-All Organizations; All Private Sector; All
Businesses; All Non-profits; and All Agencies). Succeeding categories show data
collected only from private sector entities (i.e., businesses and non-profits) to support
testing of the hypotheses (n=145). Table 5-3 presents the raw data of positive responses
to the 12 preparedness measures across all four categories used to establish the research
hypotheses, (geographic region; experience in a disaster or emergency; relative size of
the organization or business; and whether the entity participated in a collaborative
partnership). Table 5-4 normalizes the raw data to percentages for each category.
Scores in each box represent the number or percentage of organizations from among
those in a particular category that responded in the affirmative, indicating they had
adopted that preparedness measure. For example, from among all 171 survey respondents
representing public sector agencies, for-profit businesses, and non-profit organizations
from across all five regions, 151 (88%) maintained back-up copies of critical data; 122
(71%) had established an evacuation route from their facility; and 96 (56%) engaged in a
collaborative partnership or organization dedicated to preparedness or planning. From
among the 145 private sector respondents who had never experienced a disaster or
emergency (Incident: no / n=75), 49 (65%) had nevertheless implemented an emergency
response plan; 40 (53%) had established an alternate headquarters; and 30 (44%) had
instituted or upgraded security measures since 9/11.
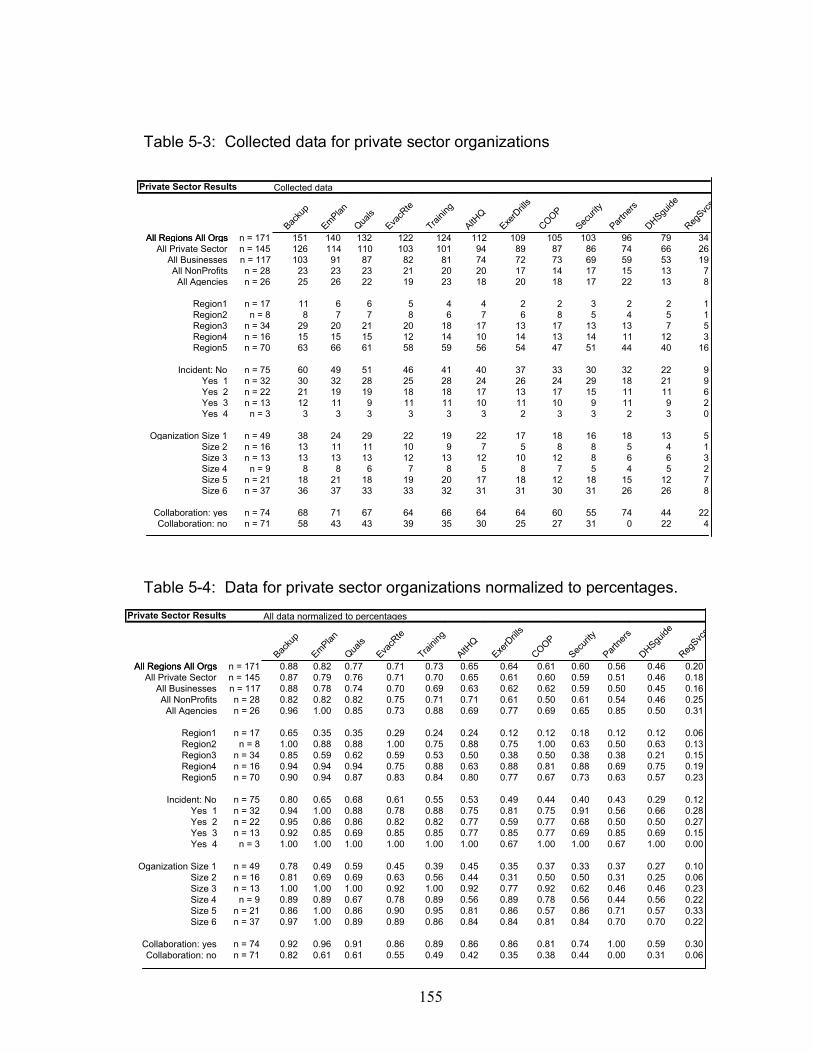
155
Table 5-3: Collected data for private sector organizations
Table 5-4: Data for private sector organizations normalized to percentages.
Private Sector Results Collected data
Bac
kup
Em
Plan
Qua
ls
Eva
cRte
Training
AltH
Q
Exe
rDrills
COOP
Sec
urity
Par
tner
s
DHSgu
ide
Reg
Svc
s
All Regions All Orgs n = 171 151 140 132 122 124 112 109 105 103 96 79 34
n = 145 126 114 110 103 101 94 89 87 86 74 66 26
n = 117 103 91 87 82 81 74 72 73 69 59 53 19
n = 28 23 23 23 21 20 20 17 14 17 15 13 7
n = 26 25 26 22 19 23 18 20 18 17 22 13 8
Region1 n = 17 11 6 6 5 4 4 2 2 3 2 2 1
Region2 n = 8 8 7 7 8 6 7 6 8 5 4 5 1
Region3 n = 34 29 20 21 20 18 17 13 17 13 13 7 5
Region4 n = 16 15 15 15 12 14 10 14 13 14 11 12 3
Region5 n = 70 63 66 61 58 59 56 54 47 51 44 40 16
n = 75 60 49 51 46 41 40 37 33 30 32 22 9
n = 32 30 32 28 25 28 24 26 24 29 18 21 9
n = 22 21 19 19 18 18 17 13 17 15 11 11 6
n = 13 12 11 9 11 11 10 11 10 9 11 9 2
n = 3 3 3 3 3 3 3 2 3 3 2 3 0
n = 49 38 24 29 22 19 22 17 18 16 18 13 5
n = 16 13 11 11 10 9 7 5 8 8 5 4 1
n = 13 13 13 13 12 13 12 10 12 8 6 6 3
n = 9 8 8 6 7 8 5 8 7 5 4 5 2
n = 21 18 21 18 19 20 17 18 12 18 15 12 7
n = 37 36 37 33 33 32 31 31 30 31 26 26 8
n = 74 68 71 67 64 66 64 64 60 55 74 44 22
n = 71 58 43 43 39 35 30 25 27 31 0 22 4
All Regions All Orgs
All Private Sector
All Businesses
All NonProfits
All Agencies
Incident: No
Yes 1
Yes 2
Yes 3
Yes 4
Oganization Size 1
Size 2
Size 3
Size 4
Size 5
Size 6
Collaboration: yes
Collaboration: no
All data normalized to percentagesPrivate Sector Results
Bac
kup
Em
Plan
Qua
ls
Eva
cRte
Training
AltH
Q
Exe
rDrills
COOP
Sec
urity
Par
tner
s
DHSgu
ide
Reg
Svc
s
All Regions All Orgs n = 171 0.88 0.82 0.77 0.71 0.73 0.65 0.64 0.61 0.60 0.56 0.46 0.20
n = 145 0.87 0.79 0.76 0.71 0.70 0.65 0.61 0.60 0.59 0.51 0.46 0.18
n = 117 0.88 0.78 0.74 0.70 0.69 0.63 0.62 0.62 0.59 0.50 0.45 0.16
n = 28 0.82 0.82 0.82 0.75 0.71 0.71 0.61 0.50 0.61 0.54 0.46 0.25
n = 26 0.96 1.00 0.85 0.73 0.88 0.69 0.77 0.69 0.65 0.85 0.50 0.31
Region1 n = 17 0.65 0.35 0.35 0.29 0.24 0.24 0.12 0.12 0.18 0.12 0.12 0.06
Region2 n = 8 1.00 0.88 0.88 1.00 0.75 0.88 0.75 1.00 0.63 0.50 0.63 0.13
Region3 n = 34 0.85 0.59 0.62 0.59 0.53 0.50 0.38 0.50 0.38 0.38 0.21 0.15
Region4 n = 16 0.94 0.94 0.94 0.75 0.88 0.63 0.88 0.81 0.88 0.69 0.75 0.19
Region5 n = 70 0.90 0.94 0.87 0.83 0.84 0.80 0.77 0.67 0.73 0.63 0.57 0.23
n = 75 0.80 0.65 0.68 0.61 0.55 0.53 0.49 0.44 0.40 0.43 0.29 0.12
n = 32 0.94 1.00 0.88 0.78 0.88 0.75 0.81 0.75 0.91 0.56 0.66 0.28
n = 22 0.95 0.86 0.86 0.82 0.82 0.77 0.59 0.77 0.68 0.50 0.50 0.27
n = 13 0.92 0.85 0.69 0.85 0.85 0.77 0.85 0.77 0.69 0.85 0.69 0.15
n = 3 1.00 1.00 1.00 1.00 1.00 1.00 0.67 1.00 1.00 0.67 1.00 0.00
n = 49 0.78 0.49 0.59 0.45 0.39 0.45 0.35 0.37 0.33 0.37 0.27 0.10
n = 16 0.81 0.69 0.69 0.63 0.56 0.44 0.31 0.50 0.50 0.31 0.25 0.06
n = 13 1.00 1.00 1.00 0.92 1.00 0.92 0.77 0.92 0.62 0.46 0.46 0.23
n = 9 0.89 0.89 0.67 0.78 0.89 0.56 0.89 0.78 0.56 0.44 0.56 0.22
n = 21 0.86 1.00 0.86 0.90 0.95 0.81 0.86 0.57 0.86 0.71 0.57 0.33
n = 37 0.97 1.00 0.89 0.89 0.86 0.84 0.84 0.81 0.84 0.70 0.70 0.22
n = 74 0.92 0.96 0.91 0.86 0.89 0.86 0.86 0.81 0.74 1.00 0.59 0.30
n = 71 0.82 0.61 0.61 0.55 0.49 0.42 0.35 0.38 0.44 0.00 0.31 0.06Collaboration: no
All NonProfits
All Businesses
All Agencies
Size 4
Size 5
Size 6
Oganization Size 1
Size 2
Size 3
All Regions All Orgs
All Private Sector
Collaboration: yes
Incident: No
Yes 1
Yes 2
Yes 3
Yes 4

156
As the data in Table 5-3 illustrate, there is significant variation among sample size
within populations across regions; among the sizes of organizations; and among
organizations with various levels of experience with disasters. This is a function of the
number and character of respondents to the survey and how the data broke out in terms of
classification. However, there is relative statistical parity in the survey populations when
data are consolidated and examined from different perspectives. Analysis later in this
chapter will examine comparative data collected among groups that
• have had no previous disaster experience and those that have (75:70);
• are regionally-affiliated versus those that were not selected from a specific
geographic region (75:70);
• occupy the lower two tiers of organization size (small businesses or organizations
with fewer than 50 employees and less than $15M in annual revenue) and those in
the upper three tiers (large businesses with more than 100 employees and greater
than $35M in annual revenue) (65:67); and those that
• do not participate in a collaborative organization versus those that do (71:74);
The following section describes the analysis of hypothesis testing for the four
independent variables examined in this study. For the remainder of this chapter, the
analysis will focus on private sector entities only—that is, for-profit businesses and non-
profit organizations across the five regions examined, totaling 145 respondents, where
local government agencies are not included. For this analysis, the statistical analysis
program SPSS was used to generate descriptive statistics, conduct tests of significance,
analysis of variance and regression. MiniTab was used to generate separate graphics of

157
histograms and to conduct tests of normality. Microsoft Excel was used to generate
Pareto Charts. Representative sections of the graphics will be included in the text of this
chapter for purposes of illustration; other graphics are collected in section 5.3 at the end
of the chapter.
5.1 Descriptive statistics, tests of significance, and box plots Table 5-5 presents a compilation of the descriptive statistics and tests of significance
that were run on the collected data. For purposes of this part of the analysis, the following
assumptions are made:
The four proximities that form the independent variables (exposure; experience;
capability and organization) are discrete and independent of each other; that is,
there is no necessary relationship between the size of an organization, its
geographic location, its experience with disaster, or its participation in a
collaborative organization;
The 12 preparedness measures that serve as the dependent variables are likewise
discrete and independent of each other; i.e., there is no precedence or relation
among them and the decision to adopt one or more measures has no necessary
relation to the decision to adopt or not to adopt any other;
Data reflecting observations within each category are independent and identically
distributed, and mutually exclusive (R1 is distinct from R4; S2 from S5; etc.).
Data within each category are normally distributed (this is the basic assumption of
the Central Limit Theorem, which states that any sufficiently large number of
independent random variables will be distributed approximately normally across a
population [Devore 2004; others].

158
The standard critical value of .05 is assumed for tests of significance.
Table 5-5: Descriptive statistics and Student t-test for four dimensions of proximity among private sector respondents (for-profit and non-profit)
The categories that form the independent variables reflected in Table 5-5 (region,
organization size, disaster experience, and collaboration with partner(s)) essentially
permit four different analytic views of the dataset. From the descriptive statistics the
following observations can be made:
(1) Differences of means. The mean of the number of measures adopted from among the
145 organizations in this population is 7.42; there is a notable deviation from this mean
across sample populations in the survey, most dramatically apparent in
Composite 145 7.4207 3.6068 0.2995 13.009 -0.753 -0.616 21.4358 144 1.18587E-46 6.4207 5.8286 7.0127
Region 1 17 2.8235 3.1272 0.7585 9.779 1.283 1.419 2.4043 16 2.8675E-02 1.8235 0.2157 3.4314
Region 2 8 9.0000 2.1381 0.7559 4.571 -2.222 5.666 10.5830 7 1.47079E-05 8.0000 6.2125 9.7875
Region 3 34 5.6765 4.0581 0.6960 16.468 0.004 -1.352 6.7195 33 1.17987E-07 4.6765 3.2605 6.0924
Region 4 16 9.2500 2.4358 0.6090 5.933 -1.755 4.628 13.5477 15 8.10008E-10 8.2500 6.9520 9.5480
Region 5 70 8.7857 2.3646 0.2826 5.591 -0.935 0.406 27.5486 69 5.87378E-39 7.7857 7.2219 8.3495
Size 1 49 4.9184 3.8451 0.5493 14.785 0.232 -1.206 7.1334 48 4.5935E-09 3.9184 2.8139 5.0228
Size 2 16 5.7500 3.4351 0.8588 11.800 -0.254 -1.338 5.5311 15 5.7599E-05 4.7500 2.9196 6.5804
Size 3 13 9.3077 1.7022 0.4721 2.897 -0.449 -0.252 17.5973 12 6.1808E-10 8.3077 7.2791 9.3363
Size 4 9 8.1111 3.0185 1.0062 9.111 -1.924 4.057 7.0676 8 1.0531E-04 7.1111 4.7909 9.4313
Size 5 21 9.2857 2.0036 0.4372 4.014 -0.600 -0.599 18.9511 20 3.0124E-14 8.2857 7.3737 9.1977
Size 6 37 9.5676 2.0621 0.3390 4.252 -1.247 0.789 25.2725 36 1.6652E-24 8.5676 7.8800 9.2551
No Incidents 75 6.0000 3.6093 0.4168 13.027 -0.356 -1.174 11.9971 74 4.9748E-19 5.0000 4.1696 5.8304
Incident <1 32 9.1875 2.2638 0.4002 5.125 -0.906 0.240 20.4588 31 1.4628E-19 8.1875 7.3713 9.0037
Incident 1-3 22 8.4091 3.4179 0.7287 11.682 -1.251 0.791 10.1677 21 1.4469E-09 7.4091 5.8937 8.9245
Incident 3-10 13 8.9231 3.8180 1.0589 14.577 -1.640 1.378 7.4823 12 7.4076E-06 7.9231 5.6159 10.2303
Incident >10 3 10.3333 1.1547 0.6667 1.333 -1.732 14.0000 2 5.0633E-03 9.3333 6.4649 12.2018
Collab'n: Yes 74 9.7162 1.8096 0.2104 3.275 -1.159 0.911 41.4352 73 1.8232E-52 8.7162 8.2970 9.1355
Collab'n: No 71 5.0282 3.4599 0.4106 11.971 -0.031 -1.262 9.8102 70 8.8086E-15 4.0282 3.2092 4.8471
Mean
Diff
95% Conf Inter
Lower UpperSE t df
Significance
(2-tailed)Variance Skewness KurtosisVariable n Mean SD

159
• Region 1 (historically, the region least affected by seasonal flooding or hurricane)
as compared to other regions with recurrent histories of disasters (2.8 : >9.0)37;
• Small businesses (Size1 <50 employees and $15M in annual revenue) and large
businesses (Size6 >1,000 employees and $500M in annual revenue) (4.9 : 9.5);
• Organizations with no experience in dealing with disasters compared to those that
have had some experience; (6.0 : >8.4).
• Organizations that do not collaborate with partners versus those that do (5.0 : 9.7).
Further exploratory analysis was done by constructing box plots of the survey data
divided into the sub-populations among the four factors shown in Table 5-5. This
information appears in Figure 5-2. In box plots the boxes represent the central quartiles
(50%) of the illustrated populations with the heavy black line in each box showing the
position of the mean. Whiskers at either end of the box mark the smallest and largest
values in the dataset that are not outliers. Outliers, where they exist, are shown as
numbered data points.
The box plots generated in this analysis show general trends among the data of each
independent variable. For example, there is little discernible pattern among data from
Regions 1-5. However, trends among the other three factors are much more evident, and
illustrate that the number (frequency) of preparedness measures adopted generally
increases with increasing organizational size; with previous disaster experience as
opposed to no experience; and with participation in a collaborative partnership.
37 Data from Region 3 ceased mid-way through the survey period when it was evacuated and subsequently devastated by Hurricane Ike.

160
Figure 5-2: Box plots of regions, organization size, incident occurrence, and collaborative partnerships.
Regions 1, 2, 3, 4, 5
Organization size (Size 1-6)
Incident occurrence (No / Yes1-4)
Collaboration partners (No / Yes)

161
Moreover, graphing the survey results in this fashion revealed one of the more
interesting dimensions among the factors examined in this study: that the clearest
difference in motivation for preparedness among the factors evaluated appeared to be
between organizations that had participated in a collaborative partnership and those that
had not (i.e., the bottom of the graphs in Figure 5-2). In order to further examine this
relationship, three sample populations were selected from the data of private sector
participants and compared using the Minitab histogram and box plot functions. The
populations represent mutually exclusive groups for three of the four factors—disaster
experience, organizational size, and participation in a collaborative partnership—and
have roughly equivalent population n’s. Figures 5-3 to 5-5 provide the histograms and
box plots from this analysis. Disaster experience and collaboration (5-3 and 5-5) divide
the survey population roughly in half. Organizations depicted in Figure 5-4 represent
those with less than 100 employees and under $35K annual revenue (Sizes 1-3) and those
with over 100 employees and $35K in annual revenue (Sizes 4-6), yielding comparative
populations of 78 and 67 respectively.
It should be noted that for this aspect of the analysis, one of the twelve dependent
variables—participation in a collaborative partnership—has been singled out for use as
an independent variable and then employed as a basis for comparison between disaster
experience, organizational capability, and collaboration as motivating factors for
preparedness. As will be noted in the summary in Chapter 6, there are any number of
ways by which to divide and analyze the data acquired in this study, and the selection
between dependent and independent variables is largely a matter of which facet of the
data is being examined and from which perspective.
162
Figure 5-3: Comparative histograms and box plots of the effects of disaster experience on measures adopted.
15129630
10
8
6
4
2
0
Data
Fre
qu
en
cy
6 3.609 75
8.943 2.938 70
Mean StDev N
No Disaster Experience
Previous Disaster Experience
Variable
Effect of Disaster Experience on Measures AdoptedNormal
Previous Disaster ExperienceNo Disaster Experience
12
10
8
6
4
2
0
Da
ta
Boxplot of No Disaster Experience, Previous Disaster Experience
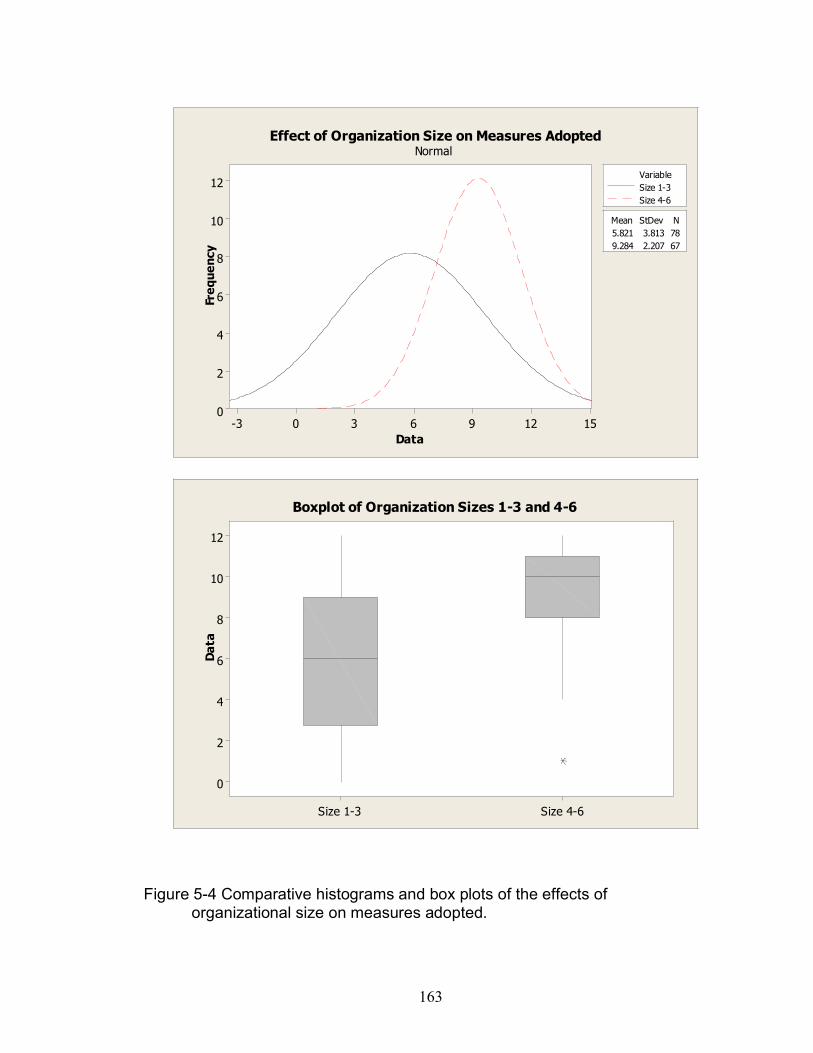
163
Figure 5-4 Comparative histograms and box plots of the effects of organizational size on measures adopted.
Size 4-6Size 1-3
12
10
8
6
4
2
0
Da
ta
Boxplot of Organization Sizes 1-3 and 4-6
15129630-3
12
10
8
6
4
2
0
Data
Fre
qu
en
cy
5.821 3.813 78
9.284 2.207 67
Mean StDev N
Size 1-3
Size 4-6
Variable
Effect of Organization Size on Measures AdoptedNormal
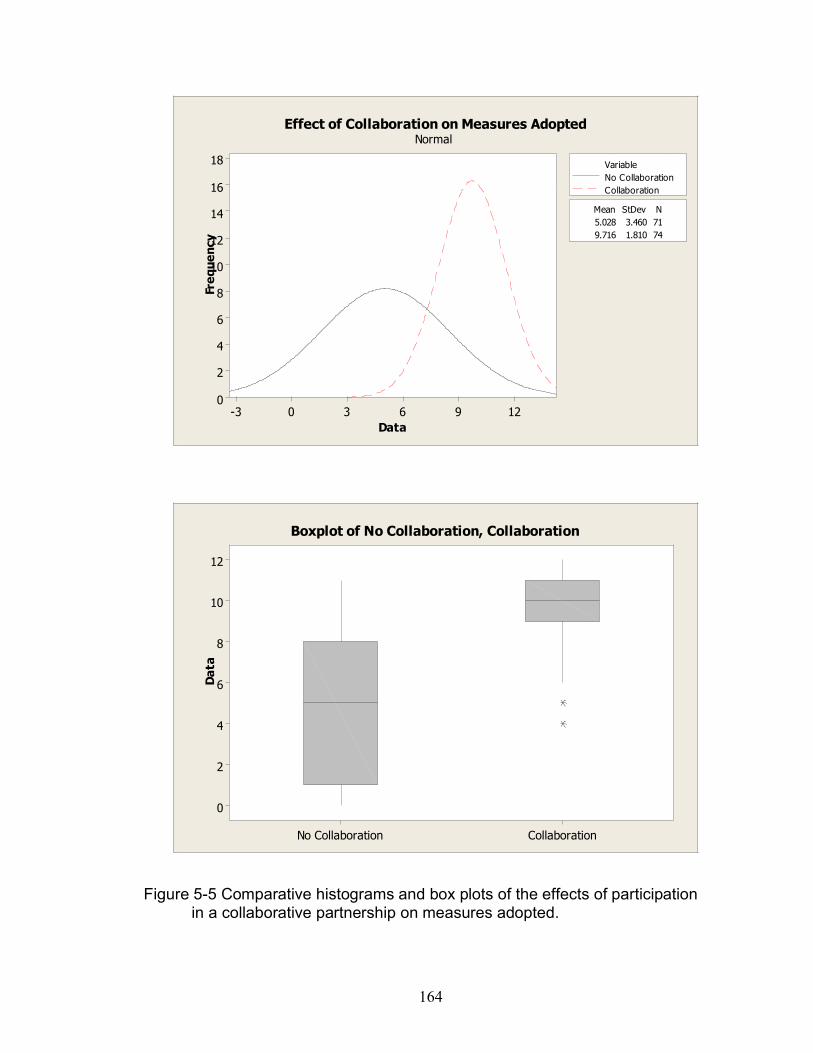
164
Figure 5-5 Comparative histograms and box plots of the effects of participation in a collaborative partnership on measures adopted.
129630-3
18
16
14
12
10
8
6
4
2
0
Data
Fre
qu
en
cy
5.028 3.460 71
9.716 1.810 74
Mean StDev N
No Collaboration
Collaboration
Variable
Effect of Collaboration on Measures AdoptedNormal
CollaborationNo Collaboration
12
10
8
6
4
2
0
Da
ta
Boxplot of No Collaboration, Collaboration
165
When the survey populations are examined in this fashion, the histograms and box
plots reveal one of the two significant findings of this research project: that among the
population sampled in this study, participation in a collaborative organization had a
stronger correlation with motivation to adopt preparedness measures and continuity
practices than past experience in a disaster, and at least an equivalent effect as the rough
doubling in size (on average) from a small to a medium-size (or larger) organization or
business. The implications of this finding will be examined in detail in Chapter 6.
5.2 Tests of significance, analysis of variance and regression Assuming that frequency distributions for all measures of preparedness reflect normal
distributions (a 2-tailed test), then the tests of significance (Student’s t-test) yield large
positive values in each case for t and a significance value less than the critical value of
.05, as was evident in Table 5-5. Thus, in all four cases the null hypotheses can be
rejected; that is, the data analysis does not show that the four proximities (geographic
exposure to hazard; past disaster experience; organizational size; and collaboration with
other organizations) have no effect on business decisions regarding adoption of
preparedness and continuity measures. Therefore, the failure to reject the null hypotheses
establishes that exposure to hazard, past experience with disaster, the size and capability
of the organization, and participation in a collaborative organization all have an impact
on the motivation of non-profit organizations to implement preparedness measures.
Further testing was conducted through a one-way Analysis of Variance (ANOVA) for
each of the four proximities. Figures 5-6 through 5-9 present the resulting tables of the
one-way ANOVA for independent variables of Regional Affiliation (exposure), Incident
Experience, Organization Size (capability) and Collaboration against the dependent
166
variable of preparedness measures adopted (maximum of 12). In each of the four cases,
the F-test of the distribution is large and the significance value is less than the critical
value of .05. Thus the ANOVA confirms that there are significant differences in the
means of each of the data sets.
Lastly, a regression analysis was performed on each of the four datasets, and a
Probability Plot was created to illustrate the relationship between the measures of
preparedness (dependent variable) and the independent variables within each sample
population. Scatter plots (lower half of Figures 5-6 to 5-9) show the relative dispersion of
data for each of the independent variables, with the Normal Probability Plot for each
independent variable illustrating the degree of linear conformance among residuals. In
each of the four cases, the P-P Plot for residuals shows that the regression conforms to
the linear model indicating moderately strong relationships between the independent and
dependent variables. However, the “bumpiness” and clustering in the probability plots
points to the need for a further level of analysis to examine the normality of the datasets.
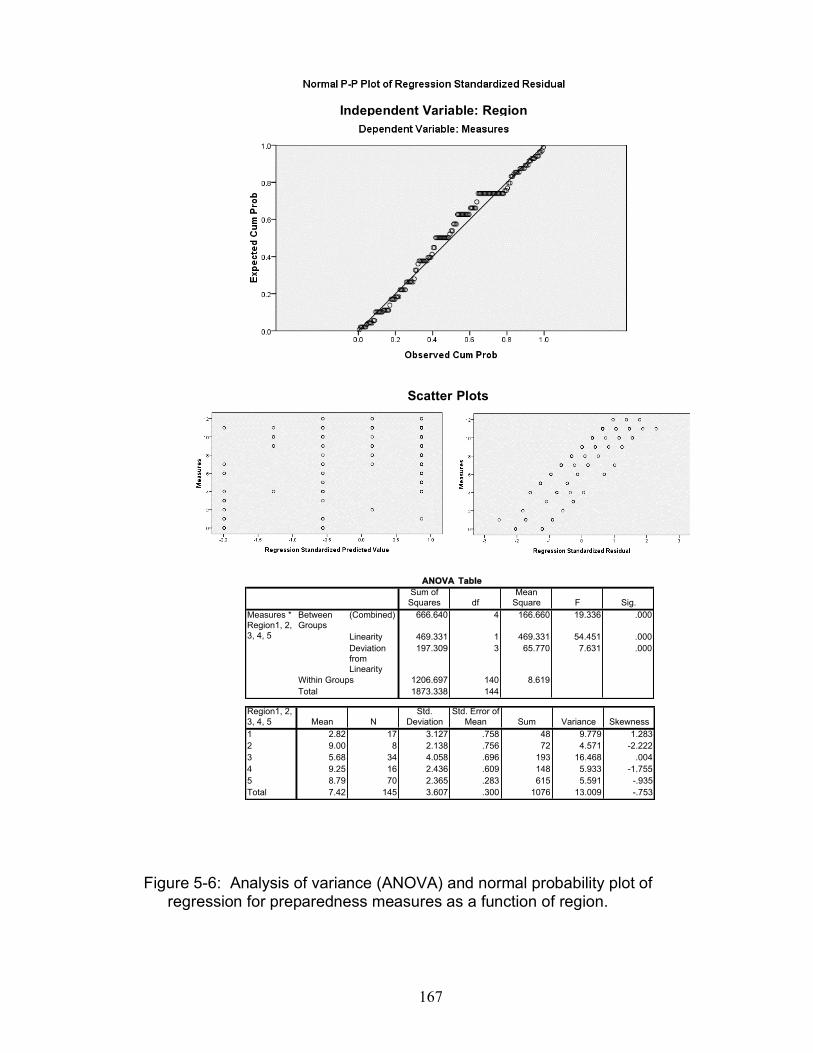
167
Figure 5-6: Analysis of variance (ANOVA) and normal probability plot of regression for preparedness measures as a function of region.
Independent Variable: Region
Scatter Plots
Sum of
Squares df
Mean
Square F Sig.
(Combined) 666.640 4 166.660 19.336 .000
Linearity 469.331 1 469.331 54.451 .000
Deviation
from
Linearity
197.309 3 65.770 7.631 .000
1206.697 140 8.619
1873.338 144
Measures *
Region1, 2,
3, 4, 5
Between
Groups
Within Groups
Total
ANOVA Table
Region1, 2,
3, 4, 5 Mean N
Std.
Deviation
Std. Error of
Mean Sum Variance Skewness
1 2.82 17 3.127 .758 48 9.779 1.283
2 9.00 8 2.138 .756 72 4.571 -2.222
3 5.68 34 4.058 .696 193 16.468 .004
4 9.25 16 2.436 .609 148 5.933 -1.755
5 8.79 70 2.365 .283 615 5.591 -.935
Total 7.42 145 3.607 .300 1076 13.009 -.753

168
Figure 5-7: Analysis of variance (ANOVA) and normal probability plot of regression for preparedness measures as a function of incident experience.
Independent Variable: Incident Experience
Scatter Plots
Sum of
Squares df
Mean
Square F Sig.
(Combined) 327.555 4 81.889 7.417 .000
Linearity 215.637 1 215.637 19.530 .000
Deviation
from
Linearity
111.918 3 37.306 3.379 .020
1545.783 140 11.041
1873.338 144
Measures *
When
Between
Groups
Within Groups
Total
ANOVA Table
When Mean N
Std.
Deviation
Std. Error of
Mean Sum Variance Skewness
0 6.00 75 3.609 .417 450 13.027 -.356
1 9.19 32 2.264 .400 294 5.125 -.906
2 8.41 22 3.418 .729 185 11.682 -1.251
3 8.92 13 3.818 1.059 116 14.577 -1.640
4 10.33 3 1.155 .667 31 1.333 -1.732
Total 7.42 145 3.607 .300 1076 13.009 -.753
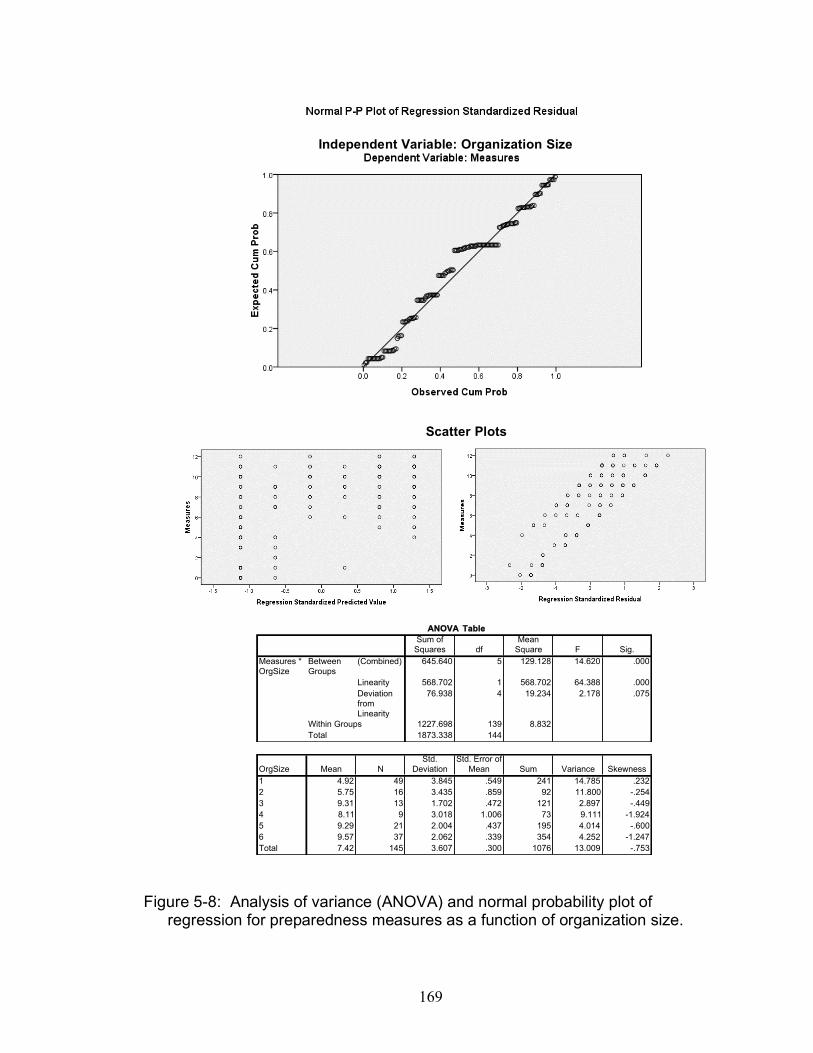
169
Figure 5-8: Analysis of variance (ANOVA) and normal probability plot of regression for preparedness measures as a function of organization size.
Scatter Plots
Independent Variable: Organization Size
Sum of
Squares df
Mean
Square F Sig.
(Combined) 645.640 5 129.128 14.620 .000
Linearity 568.702 1 568.702 64.388 .000
Deviation
from
Linearity
76.938 4 19.234 2.178 .075
1227.698 139 8.832
1873.338 144
Measures *
OrgSize
Between
Groups
Within Groups
Total
ANOVA Table
OrgSize Mean N
Std.
Deviation
Std. Error of
Mean Sum Variance Skewness
1 4.92 49 3.845 .549 241 14.785 .232
2 5.75 16 3.435 .859 92 11.800 -.254
3 9.31 13 1.702 .472 121 2.897 -.449
4 8.11 9 3.018 1.006 73 9.111 -1.924
5 9.29 21 2.004 .437 195 4.014 -.600
6 9.57 37 2.062 .339 354 4.252 -1.247
Total 7.42 145 3.607 .300 1076 13.009 -.753

170
Figure 5-9: Analysis of variance (ANOVA) and normal probability plot of regression for preparedness measures as a function of participation in a collaborative partnership.
Scatter Plots (all data)
Sum of
Squares df
Mean
Square F Sig.
Between
Groups
(Combined) 796.354 1 796.354 105.738 .000
1076.984 143 7.531
1873.338 144
Measures *
Partners
Within Groups
Total
ANOVA Tablea
Partners Mean N
Std.
Deviation
Std. Error of
Mean Sum Variance Skewness
0 5.03 71 3.460 .411 357 11.971 -.031
1 9.72 74 1.810 .210 719 3.275 -1.159
Total 7.42 145 3.607 .300 1076 13.009 -.753
Independent Variable: Collaboration
171
5.3 Skewness and tests of normality: Anderson-Darling test Among the assumptions upon which the descriptive statistics and tests of significance
are based is the assumption that the data follow a normal distribution. This is a reasonable
and valid assumption assuming a large population, as formulated in the Central Limit
Theorem. However, as was clear in Table 5.5, there is significant variability of n’s within
each test population of the independent variables, as well as wide disparity in variances.
There is likewise a high degree of variability in skewness and kurtosis indicating that the
actual data is not normally distributed. Skewness is an indicator of non-normality in a
distribution, such that negatively skewed distributions have longer left-hand tails, while
positive skewing indicates a longer right-hand tail. Kurtosis is an indicator of the
“fatness” of the tails relative to a normal distribution, and can be either negative (steep
sides to the curve with little tailing) to positive (showing a heavy or extended tail). In the
case of this dataset, individual data are skewed in either direction and kurtosis is positive
or negative depending on the population in question. This skewness is evident in the box
plots in Figure 5-2.
The deviation from normality is evident in the cumulative data across the entire
population of private sector survey responses. Figure 5-10 provides a histogram of the
total population of private sector respondents showing the frequency with which private
sector entities adopted the corresponding number of preparedness measures (1076
preparedness measures adopted by 145 private sector entities across the population).
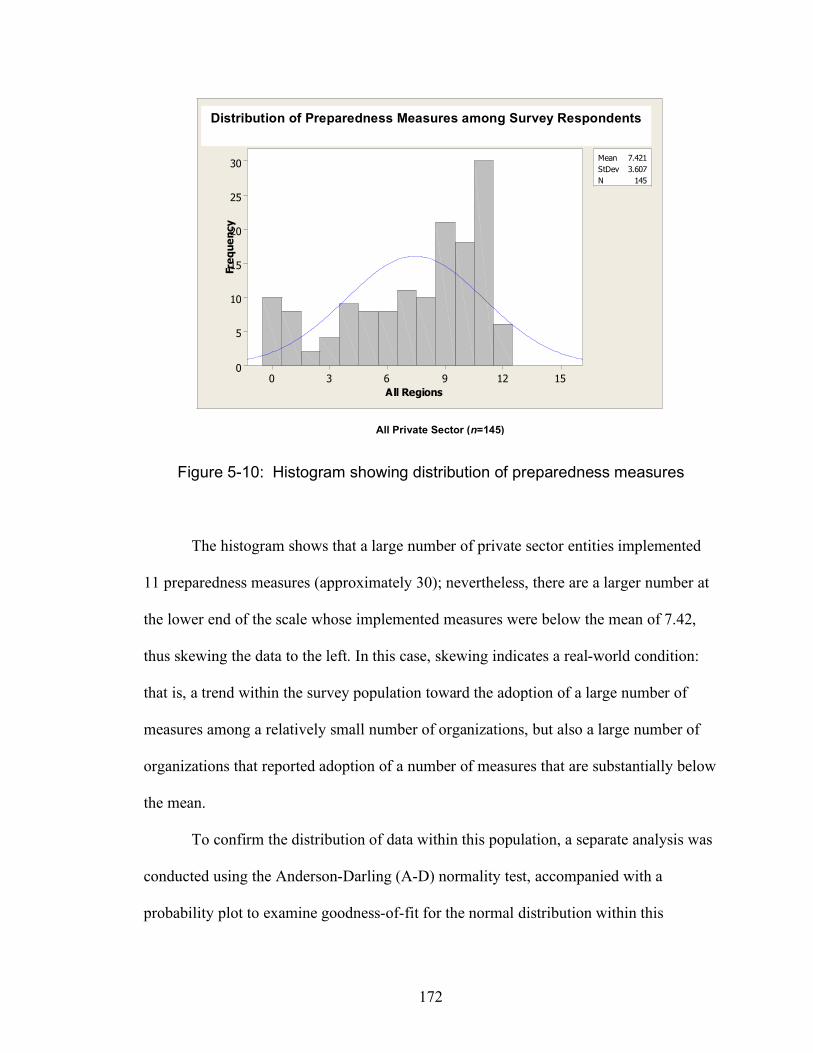
172
Figure 5-10: Histogram showing distribution of preparedness measures
The histogram shows that a large number of private sector entities implemented
11 preparedness measures (approximately 30); nevertheless, there are a larger number at
the lower end of the scale whose implemented measures were below the mean of 7.42,
thus skewing the data to the left. In this case, skewing indicates a real-world condition:
that is, a trend within the survey population toward the adoption of a large number of
measures among a relatively small number of organizations, but also a large number of
organizations that reported adoption of a number of measures that are substantially below
the mean.
To confirm the distribution of data within this population, a separate analysis was
conducted using the Anderson-Darling (A-D) normality test, accompanied with a
probability plot to examine goodness-of-fit for the normal distribution within this
15129630
30
25
20
15
10
5
0
All Regions
Fre
qu
en
cy
Mean 7.421
StDev 3.607
N 145
Effect of Geographic Proximity on Measures AdoptedNormal
All Private Sector (n=145)
Distribution of Preparedness Measures among Survey Respondents
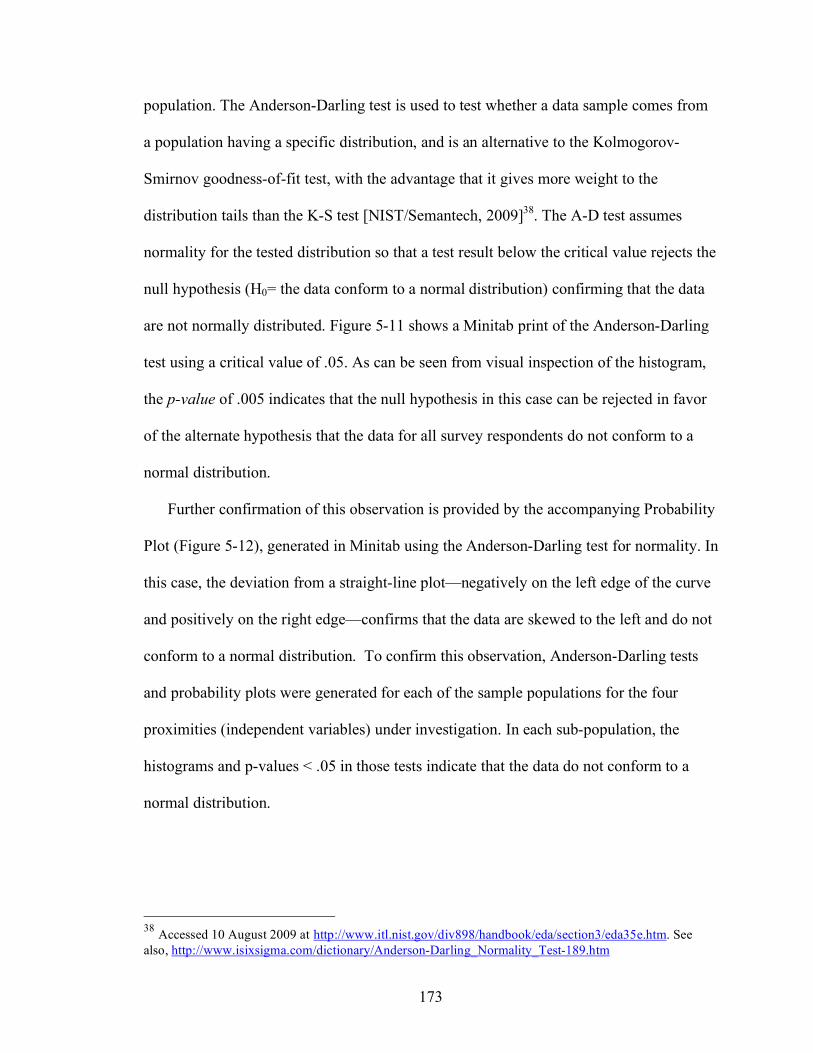
173
population. The Anderson-Darling test is used to test whether a data sample comes from
a population having a specific distribution, and is an alternative to the Kolmogorov-
Smirnov goodness-of-fit test, with the advantage that it gives more weight to the
distribution tails than the K-S test [NIST/Semantech, 2009]38. The A-D test assumes
normality for the tested distribution so that a test result below the critical value rejects the
null hypothesis (H0= the data conform to a normal distribution) confirming that the data
are not normally distributed. Figure 5-11 shows a Minitab print of the Anderson-Darling
test using a critical value of .05. As can be seen from visual inspection of the histogram,
the p-value of .005 indicates that the null hypothesis in this case can be rejected in favor
of the alternate hypothesis that the data for all survey respondents do not conform to a
normal distribution.
Further confirmation of this observation is provided by the accompanying Probability
Plot (Figure 5-12), generated in Minitab using the Anderson-Darling test for normality. In
this case, the deviation from a straight-line plot—negatively on the left edge of the curve
and positively on the right edge—confirms that the data are skewed to the left and do not
conform to a normal distribution. To confirm this observation, Anderson-Darling tests
and probability plots were generated for each of the sample populations for the four
proximities (independent variables) under investigation. In each sub-population, the
histograms and p-values < .05 in those tests indicate that the data do not conform to a
normal distribution.
38 Accessed 10 August 2009 at http://www.itl.nist.gov/div898/handbook/eda/section3/eda35e.htm. See also, http://www.isixsigma.com/dictionary/Anderson-Darling_Normality_Test-189.htm

174
Figure 5-11: Anderson-Darling test of normality for all private sector data
Figure 5-12: Probability plot for goodness of fit for A-D test of normality
121086420
Median
Mean
9.08.58.07.57.0
1st Q uartile 5.0000
Median 9.0000
3rd Q uartile 10.5000
Maximum 12.0000
6.8286 8.0127
8.0000 9.0000
3.2340 4.0776
A -Squared 5.52
P-V alue < 0.005
Mean 7.4207
StDev 3.6068
V ariance 13.0093
Skewness -0.753355
Kurtosis -0.616387
N 145
Minimum 0.0000
A nderson-Darling Normality Test
95% C onfidence Interv al for Mean
95% C onfidence Interv al for Median
95% C onfidence Interv al for StDev
95% Confidence Intervals
Summary for All RegionsDistribution of Preparedness Measures among Survey Respondents
20151050-5
99.9
99
95
90
80
70
60
50
40
30
20
10
5
1
0.1
All Regions
Pe
rce
nt
Mean 7.421
StDev 3.607
N 145
AD 5.515
P-Value <0.005
Probability Plot of All RegionsNormal
All Private Sector (n=145)
Probability Plot for Distribution of Preparedness Measures
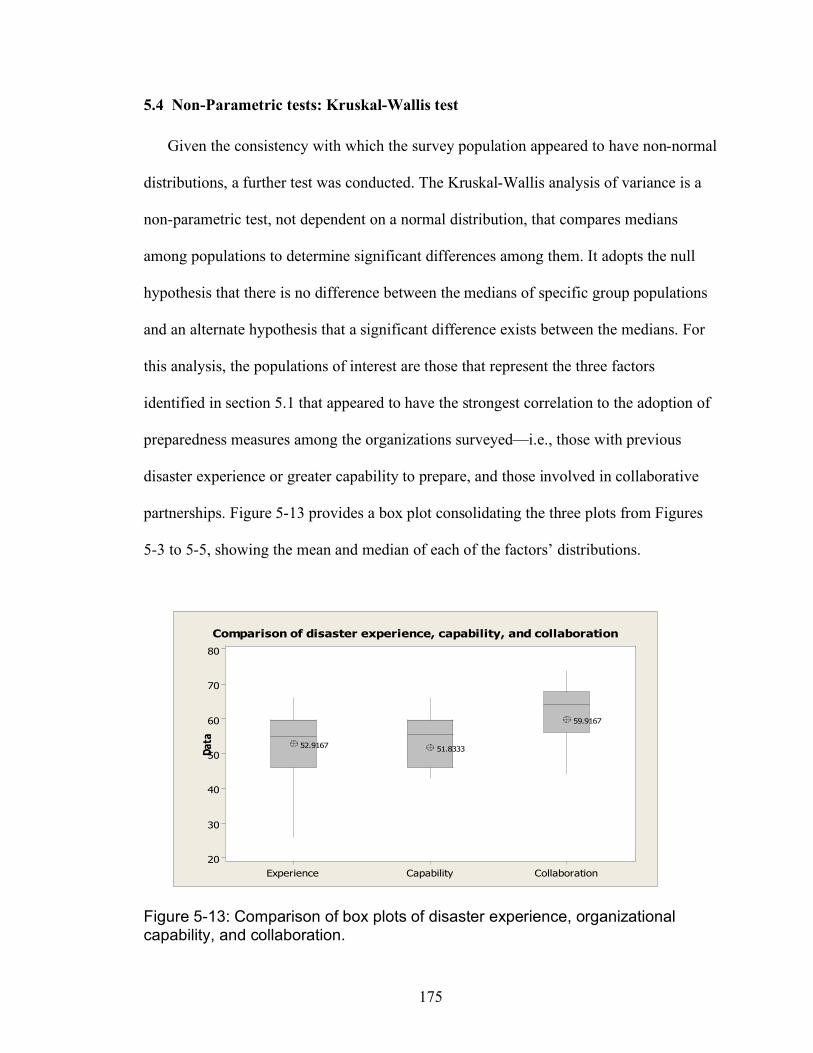
175
5.4 Non-Parametric tests: Kruskal-Wallis test Given the consistency with which the survey population appeared to have non-normal
distributions, a further test was conducted. The Kruskal-Wallis analysis of variance is a
non-parametric test, not dependent on a normal distribution, that compares medians
among populations to determine significant differences among them. It adopts the null
hypothesis that there is no difference between the medians of specific group populations
and an alternate hypothesis that a significant difference exists between the medians. For
this analysis, the populations of interest are those that represent the three factors
identified in section 5.1 that appeared to have the strongest correlation to the adoption of
preparedness measures among the organizations surveyed—i.e., those with previous
disaster experience or greater capability to prepare, and those involved in collaborative
partnerships. Figure 5-13 provides a box plot consolidating the three plots from Figures
5-3 to 5-5, showing the mean and median of each of the factors’ distributions.
Figure 5-13: Comparison of box plots of disaster experience, organizational capability, and collaboration.
CollaborationCapabilityExperience
80
70
60
50
40
30
20
Da
ta
52.916751.8333
59.9167
Comparison of disaster experience, capability, and collaboration
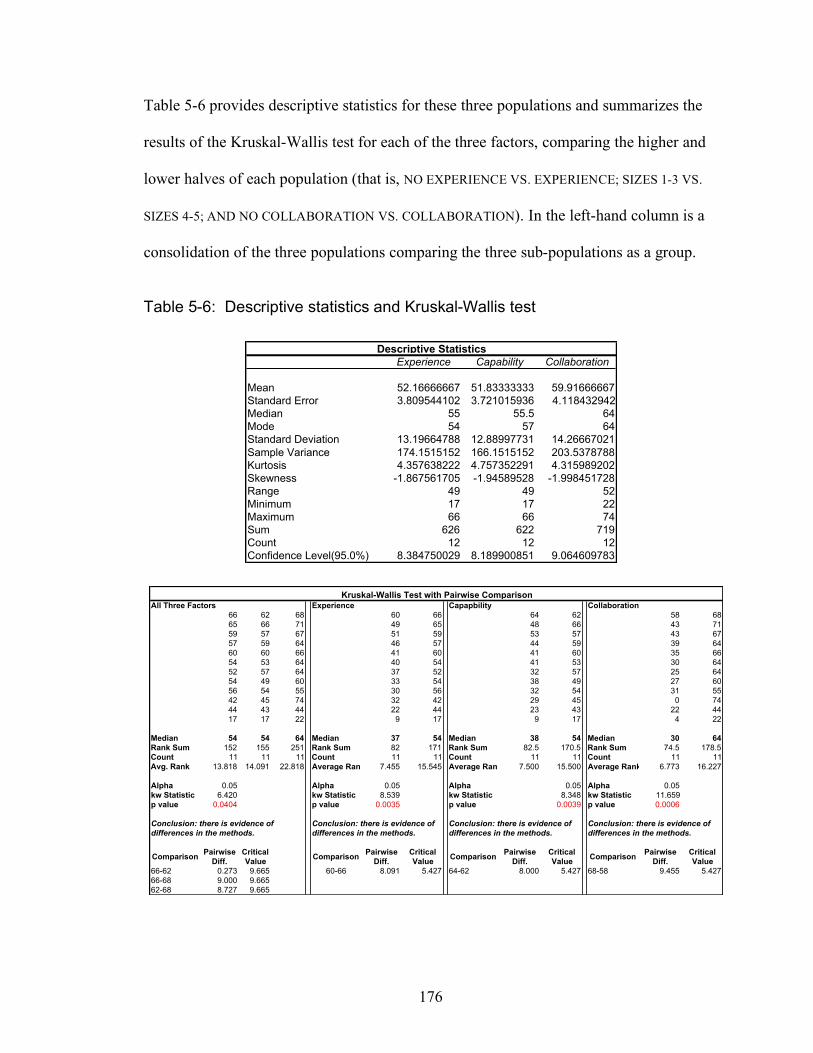
176
Table 5-6 provides descriptive statistics for these three populations and summarizes the
results of the Kruskal-Wallis test for each of the three factors, comparing the higher and
lower halves of each population (that is, NO EXPERIENCE VS. EXPERIENCE; SIZES 1-3 VS.
SIZES 4-5; AND NO COLLABORATION VS. COLLABORATION). In the left-hand column is a
consolidation of the three populations comparing the three sub-populations as a group.
Table 5-6: Descriptive statistics and Kruskal-Wallis test
Experience Capability Collaboration
Mean 52.16666667 51.83333333 59.91666667
Standard Error 3.809544102 3.721015936 4.118432942
Median 55 55.5 64
Mode 54 57 64
Standard Deviation 13.19664788 12.88997731 14.26667021
Sample Variance 174.1515152 166.1515152 203.5378788
Kurtosis 4.357638222 4.757352291 4.315989202
Skewness -1.867561705 -1.94589528 -1.998451728
Range 49 49 52
Minimum 17 17 22
Maximum 66 66 74
Sum 626 622 719
Count 12 12 12
Confidence Level(95.0%) 8.384750029 8.189900851 9.064609783
Descriptive Statistics
All Three Factors Experience Capapbility Collaboration
66 62 68 60 66 64 62 58 68
65 66 71 49 65 48 66 43 71
59 57 67 51 59 53 57 43 67
57 59 64 46 57 44 59 39 64
60 60 66 41 60 41 60 35 66
54 53 64 40 54 41 53 30 64
52 57 64 37 52 32 57 25 64
54 49 60 33 54 38 49 27 60
56 54 55 30 56 32 54 31 55
42 45 74 32 42 29 45 0 74
44 43 44 22 44 23 43 22 44
17 17 22 9 17 9 17 4 22
Median 54 54 64 Median 37 54 Median 38 54 Median 30 64
Rank Sum 152 155 251 Rank Sum 82 171 Rank Sum 82.5 170.5 Rank Sum 74.5 178.5
Count 11 11 11 Count 11 11 Count 11 11 Count 11 11
Avg. Rank 13.818 14.091 22.818 Average Rank 7.455 15.545 Average Rank 7.500 15.500 Average Rank 6.773 16.227
Alpha 0.05 Alpha 0.05 Alpha 0.05 Alpha 0.05
kw Statistic 6.420 kw Statistic 8.539 kw Statistic 8.348 kw Statistic 11.659
p value 0.0404 p value 0.0035 p value 0.0039 p value 0.0006
ComparisonPairwise
Diff.
Critical
ValueComparison
Pairwise
Diff.
Critical
ValueComparison
Pairwise
Diff.
Critical
ValueComparison
Pairwise
Diff.
Critical
Value
66-62 0.273 9.665 60-66 8.091 5.427 64-62 8.000 5.427 68-58 9.455 5.427
66-68 9.000 9.665
62-68 8.727 9.665
Conclusion: there is evidence of
differences in the methods.
Kruskal-Wallis Test with Pairwise Comparison
Conclusion: there is evidence of
differences in the methods.
Conclusion: there is evidence of
differences in the methods.
Conclusion: there is evidence of
differences in the methods.
177
For each of these three factors, as well as for the consolidated population, the Kruskal-
Wallis test indicates a p-value < .05, thus rejecting the null hypothesis and affirming that
there is a significant difference between the medians of each of these populations as well
as for the sup-populations within them. This confirms that the correlations seen between
the effect of collaboration, relative to that of organizational size and capability, and to
previous disaster experience is, indeed, significant.
5.5 Pareto charts of preparedness measures The second significant finding of this study emerged in examining Pareto charts
generated in Excel to determine the presence of patterns or general trends in the selection
of preparedness measures from among the survey populations (Figures 5-14 to 5-16). It
was noted in the introduction to this chapter that an assumption of the analysis is that
each of the dependent variables (the 12 measures of preparedness) are independent
among themselves; that is, there is no necessary connection or relationship between them
that would make any one measure a prerequisite for any other.
Nevertheless, there emerged a remarkably consistent pattern regarding the selection
and priority of the 12 preparedness measures. This can be detected in examining the
numerical scores in Table 5.3, in which the 12 measures have been arranged in generally
descending order of selection. The following Pareto charts make this trend more easily
recognizable.
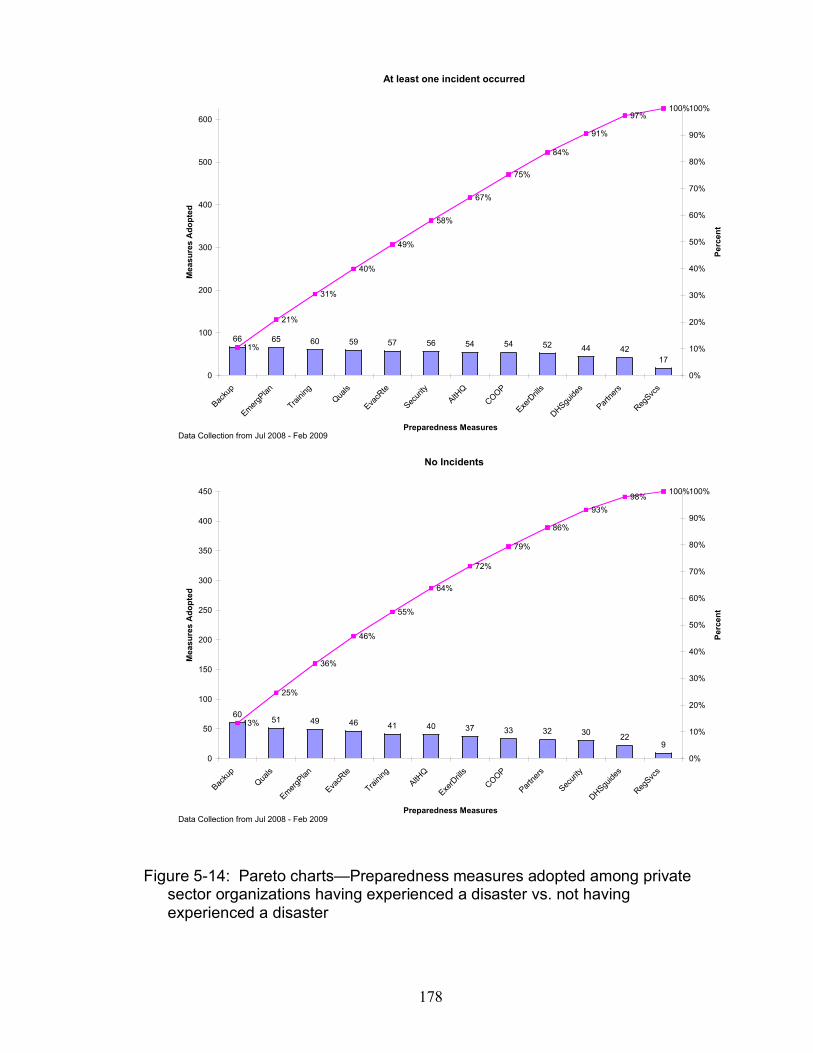
178
Figure 5-14: Pareto charts—Preparedness measures adopted among private sector organizations having experienced a disaster vs. not having experienced a disaster
At least one incident occurred
66 65 60 59 57 56 54 54 52 44 42
17
11%
21%
31%
40%
49%
58%
67%
75%
84%
91%
97%100%
0
100
200
300
400
500
600
Bac
kup
Em
ergP
lan
Training
Qua
ls
Eva
cRte
Sec
urity
AltH
Q
COOP
Exe
rDrills
DHSgu
ides
Par
tner
s
Reg
Svc
s
Preparedness Measures
Me
as
ure
s A
do
pte
d
0%
10%
20%
30%
40%
50%
60%
70%
80%
90%
100%
Pe
rce
nt
Data Collection from Jul 2008 - Feb 2009
No Incidents
6051 49 46 41 40 37 33 32 30
229
13%
25%
36%
46%
55%
64%
72%
79%
86%
93%
98%100%
0
50
100
150
200
250
300
350
400
450
Bac
kup
Qua
ls
Em
ergP
lan
Eva
cRte
Training
AltH
Q
Exe
rDrills
COOP
Par
tner
s
Sec
urity
DHSgu
ides
Reg
Svc
s
Preparedness Measures
Me
as
ure
s A
do
pte
d
0%
10%
20%
30%
40%
50%
60%
70%
80%
90%
100%
Pe
rce
nt
Data Collection from Jul 2008 - Feb 2009
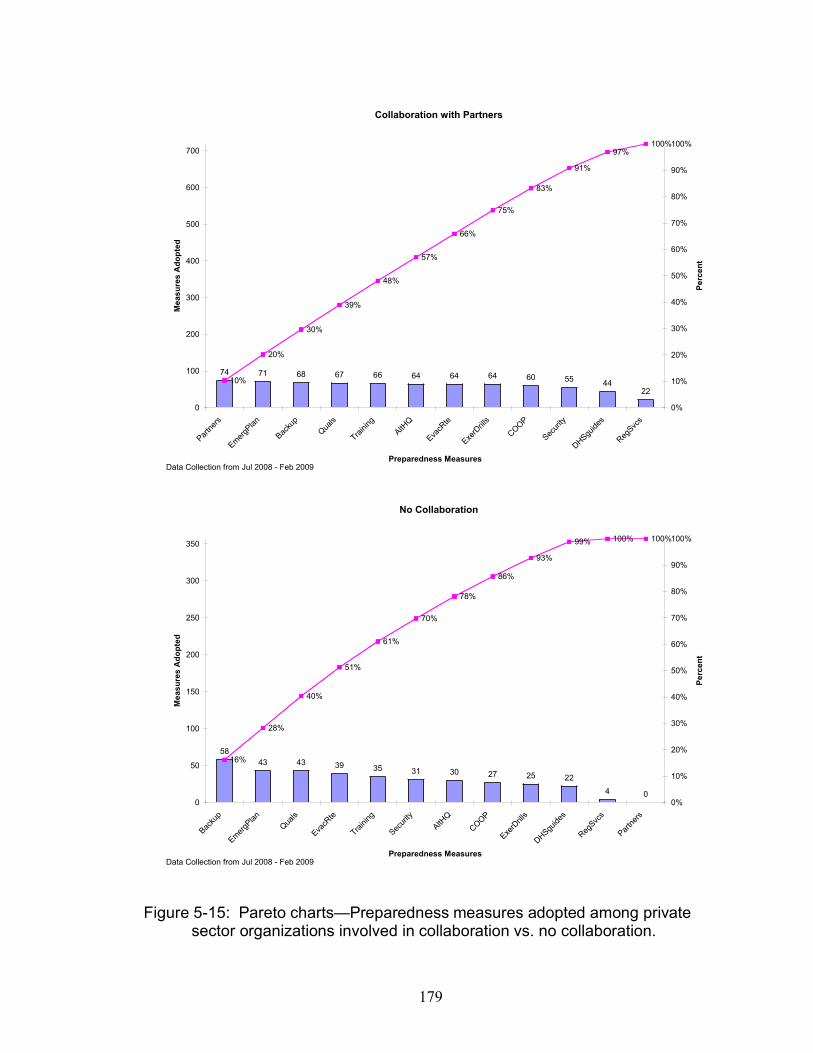
179
Figure 5-15: Pareto charts—Preparedness measures adopted among private sector organizations involved in collaboration vs. no collaboration.
Collaboration with Partners
74 71 68 67 66 64 64 64 60 5544
22
10%
20%
30%
39%
48%
57%
66%
75%
83%
91%
97%100%
0
100
200
300
400
500
600
700
Par
tner
s
Em
ergP
lan
Bac
kup
Qua
ls
Training
AltH
Q
Eva
cRte
Exe
rDrills
COOP
Secur
ity
DHSgu
ides
Reg
Svc
s
Preparedness Measures
Me
as
ure
s A
do
pte
d
0%
10%
20%
30%
40%
50%
60%
70%
80%
90%
100%
Pe
rce
nt
Data Collection from Jul 2008 - Feb 2009
No Collaboration
58
43 43 39 35 31 30 27 25 22
4 0
16%
28%
40%
51%
61%
70%
78%
86%
93%
99% 100% 100%
0
50
100
150
200
250
300
350
Bac
kup
Em
ergP
lan
Qua
ls
Eva
cRte
Training
Secur
ity
AltH
Q
COOP
Exe
rDrills
DHSgu
ides
Reg
Svc
s
Par
tner
s
Preparedness Measures
Me
as
ure
s A
do
pte
d
0%
10%
20%
30%
40%
50%
60%
70%
80%
90%
100%
Pe
rce
nt
Data Collection from Jul 2008 - Feb 2009

180
Figure 5-16: Pareto charts—All preparedness measures adopted among public sector agencies vs. private sector businesses (n= 26 and 117, respectively).
Government Agencies
26 25 23 22 22 20 19 18 18 1713
8
11%
22%
32%
42%
51%
60%
68%
76%
84%
91%
97%100%
0
50
100
150
200
Em
ergP
lan
Bac
kup
Training
Par
tner
s
Qua
ls
ExD
rills
Eva
cRte
AltH
Q
COOP
Sec
urity
DHSgu
ides
Reg
Svc
s
Preparedness Measures
Me
as
ure
s A
do
pte
d
0%
10%
20%
30%
40%
50%
60%
70%
80%
90%
100%
Pe
rce
nt
Data Collection from Jul 2008 - Feb 2009
All Businesses
103 91 87 82 81 74 73 72 69 59 53
19
12%
22%
33%
42%
51%
60%
68%
77%
85%
92%
98%100%
0
100
200
300
400
500
600
700
800
Bac
kup
Em
ergP
lan
Qua
ls
Eva
cRte
Training
AltH
Q
COOP
ExD
rills
Sec
urity
Par
tner
s
DHSgu
ides
Reg
Svc
s
Preparedness Measures
Me
as
ure
s A
do
pte
d
0%
10%
20%
30%
40%
50%
60%
70%
80%
90%
100%
Pe
rce
nt
Data Collection from Jul 2008 - Feb 2009
181
The Pareto charts of preparedness measures demonstrate that there is relative
consistency in the implementation of measures, regardless of whether the organization
has experienced a disaster or not; whether it engages in a collaborative partnership with
other organizations; or whether it is a government agency or private sector business. The
charts illustrate, as well, that both past experience and participation in a collaborative
partnership have a significant—and consistent—influence on the implementation of
preparedness measures across virtually the entire range of available measures assessed by
this study. The scales on the left hand column of those two charts further illustrate that
experience and collaboration have a significant effect on the total number of preparedness
measures adopted across an entire population.
5.6 Correlation of proximities among private sector entities
It was noted in the introduction to this dissertation that the study does not attempt to
determine cause-and-effect relationships regarding the influence of any specific
proximity on any other. In other words, the influence of exposure, experience, capability
and collaboration—as well as individual preparedness measures—were treated as
independent factors relative to one another. In the real world, however, this is not likely
the case. It should not be surprising, for example, if there were some relationship between
an organization’s past experience in a real disaster or its size and capabilities, and the
likelihood that it would adopt active measures to protect against disasters to include
participation in a collaborative planning partnership with other organizations in the same
community or region.
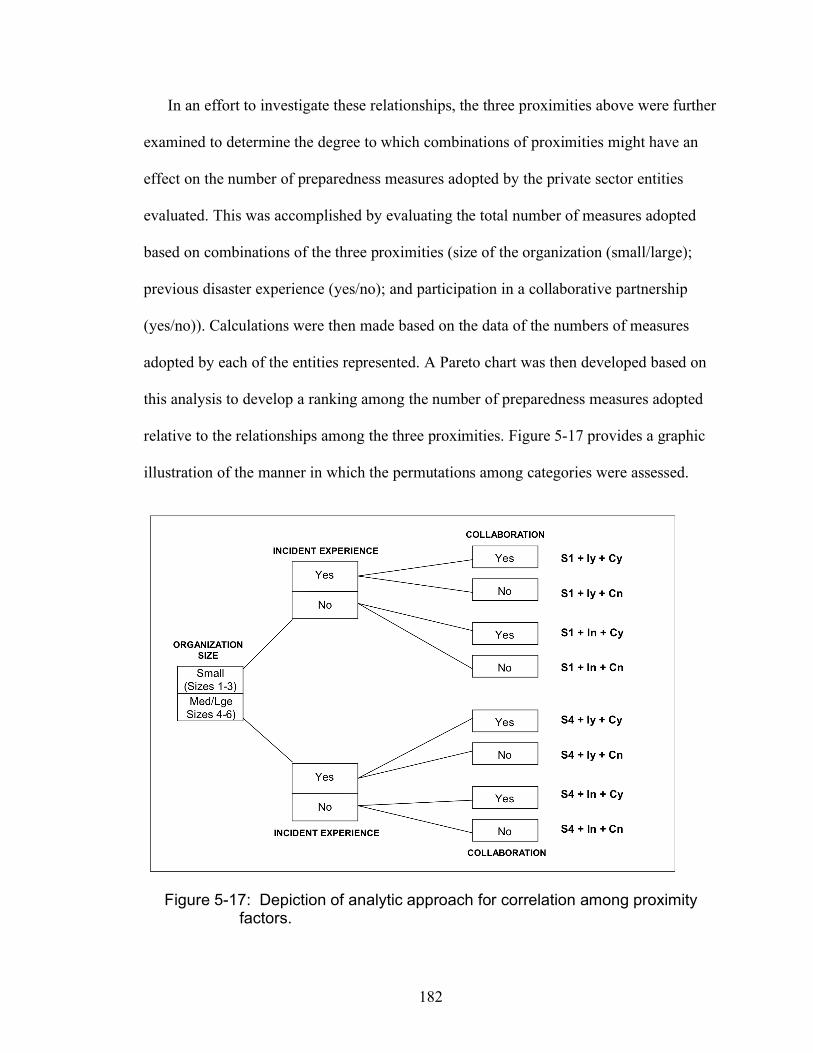
182
In an effort to investigate these relationships, the three proximities above were further
examined to determine the degree to which combinations of proximities might have an
effect on the number of preparedness measures adopted by the private sector entities
evaluated. This was accomplished by evaluating the total number of measures adopted
based on combinations of the three proximities (size of the organization (small/large);
previous disaster experience (yes/no); and participation in a collaborative partnership
(yes/no)). Calculations were then made based on the data of the numbers of measures
adopted by each of the entities represented. A Pareto chart was then developed based on
this analysis to develop a ranking among the number of preparedness measures adopted
relative to the relationships among the three proximities. Figure 5-17 provides a graphic
illustration of the manner in which the permutations among categories were assessed.
Figure 5-17: Depiction of analytic approach for correlation among proximity
factors.
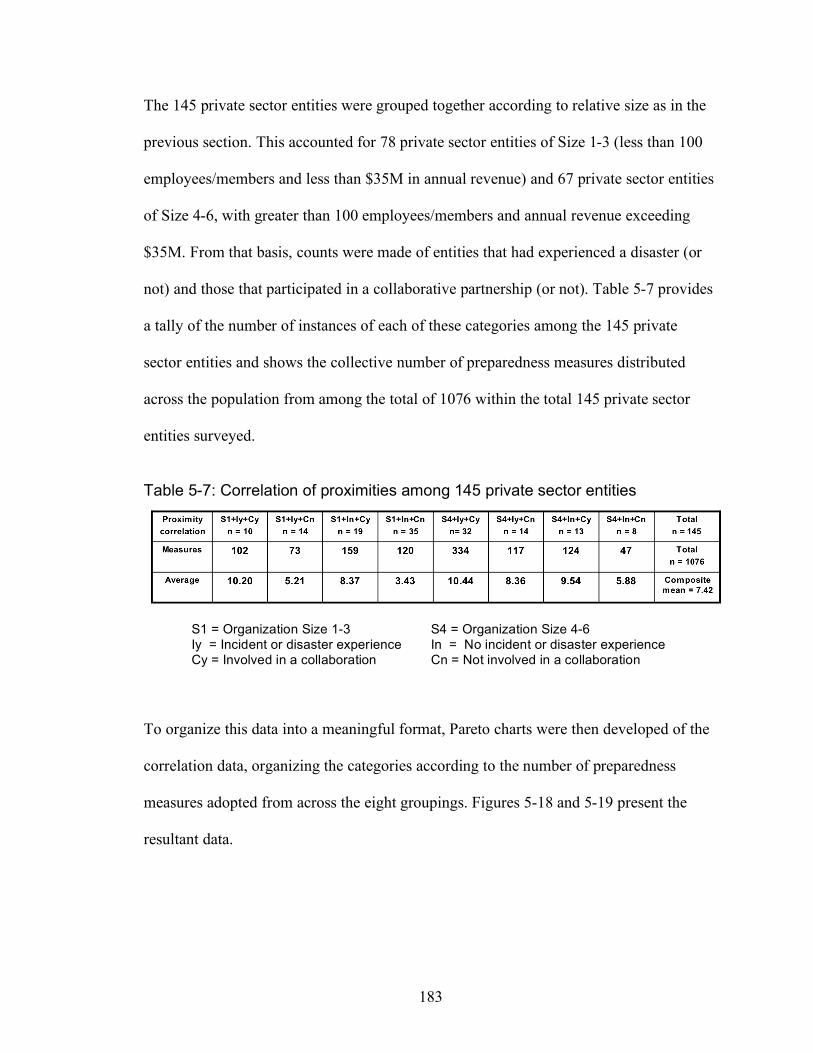
183
The 145 private sector entities were grouped together according to relative size as in the
previous section. This accounted for 78 private sector entities of Size 1-3 (less than 100
employees/members and less than $35M in annual revenue) and 67 private sector entities
of Size 4-6, with greater than 100 employees/members and annual revenue exceeding
$35M. From that basis, counts were made of entities that had experienced a disaster (or
not) and those that participated in a collaborative partnership (or not). Table 5-7 provides
a tally of the number of instances of each of these categories among the 145 private
sector entities and shows the collective number of preparedness measures distributed
across the population from among the total of 1076 within the total 145 private sector
entities surveyed.
Table 5-7: Correlation of proximities among 145 private sector entities
S1 = Organization Size 1-3 S4 = Organization Size 4-6 Iy = Incident or disaster experience In = No incident or disaster experience Cy = Involved in a collaboration Cn = Not involved in a collaboration
To organize this data into a meaningful format, Pareto charts were then developed of the
correlation data, organizing the categories according to the number of preparedness
measures adopted from across the eight groupings. Figures 5-18 and 5-19 present the
resultant data.

184
Figure 5-18: Pareto chart of distribution of measures adopted across private sector entities correlated by proximity
Figure 5-19: Pareto chart of average number of measures adopted per private sector entity correlated by proximity.
185
The degree of influence exerted by multiple proximities on private sector adoption of
preparedness measures as depicted in Figure 5-19 can be summarized as follows:
1. Large organizations with previous disaster experience and participation in a
collaborative partnership (10.44);
2. Small organizations with previous disaster experience and participation in a
collaborative partnership (10.22);
3. Large organizations that participate in collaborative partnership but have no
previous disaster experience (9.54);
4. Small organizations that participate in collaborative partnership but have no
previous disaster experience (8.37);
5. Large organizations with previous disaster experience but no participation in
collaborative partnerships (8.36);
6. Large organizations with neither previous disaster experience in disaster nor
participation in collaboration (5.88);
7. Small organizations with no previous disaster experience but membership in a
collaborative partnership (5.21);
8. Small organizations with neither previous disaster experience nor membership in
a collaborative partnership (3.43).
For the population surveyed in this research project, then, this analysis confirms that
there is a significant effect of multiple influences (i.e., proximities) on the decisions of
private sector entities to adopt preparedness measures. The data tend to confirm the
relative importance of organizational size—i.e., capability to prepare and respond—as the
key discriminator among private sector organizations toward adopting preparedness and
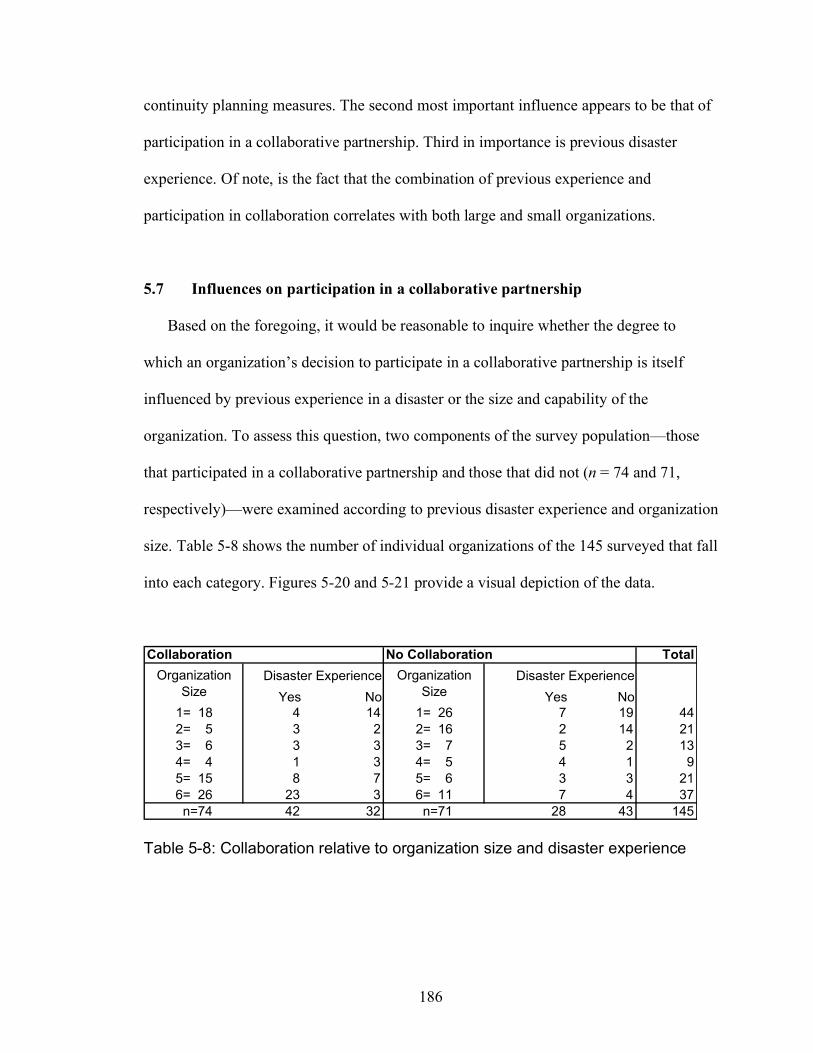
186
continuity planning measures. The second most important influence appears to be that of
participation in a collaborative partnership. Third in importance is previous disaster
experience. Of note, is the fact that the combination of previous experience and
participation in collaboration correlates with both large and small organizations.
5.7 Influences on participation in a collaborative partnership
Based on the foregoing, it would be reasonable to inquire whether the degree to
which an organization’s decision to participate in a collaborative partnership is itself
influenced by previous experience in a disaster or the size and capability of the
organization. To assess this question, two components of the survey population—those
that participated in a collaborative partnership and those that did not (n = 74 and 71,
respectively)—were examined according to previous disaster experience and organization
size. Table 5-8 shows the number of individual organizations of the 145 surveyed that fall
into each category. Figures 5-20 and 5-21 provide a visual depiction of the data.
Collaboration No Collaboration Total
Yes No Yes No
1= 18 4 14 1= 26 7 19 44
2= 5 3 2 2= 16 2 14 21
3= 6 3 3 3= 7 5 2 13
4= 4 1 3 4= 5 4 1 9
5= 15 8 7 5= 6 3 3 21
6= 26 23 3 6= 11 7 4 37
n=74 42 32 n=71 28 43 145
Organization
Size
Organization
Size
Disaster ExperienceDisaster Experience
Table 5-8: Collaboration relative to organization size and disaster experience

187
Figure 5-20: Overall effect of organization size on collaboration.
Figure 5-21: Relationship between organization size, previous disaster experience and participation in a collaborative partnership. Based on this analysis, it appears to be the case that participation in a collaborative
partnership is, indeed, influenced by the size of the organization. There is a significantly
higher percentage of partnerships (71% or 41/58) reported by the two largest organization
188
groups in the study (those with more than 500 employees and over $165 million in assets
and revenue). However, it also appears that the size of the organization exerts influence
at the other end of the spectrum, as well. Forty-one percent (18/44) of the smallest
organizations in this survey population—those with 25 employees or fewer and under $1
million in assets and revenue—also listed participation in a collaborative partnership as
one of the preparedness measures they had adopted. Results among the middle third of
the survey population revealed a lower but relatively consistent engagement in
collaboration across those three organization sizes.
With regard to the influence of multiple factors such as the combination of disaster
experience with organization size, the strongest influence appears to be among
organizations at the uppermost end of the scale. Figure 5-20 breaks down the previous
graph into four elements:
(1) Organizations that only participate in a collaborative partnership;
(2) Organizations that have disaster experience but are not members of a partnership;
(3) Organizations that have neither disaster experience nor membership in a
partnership; and
(4) Organizations that have experience and also participate in a collaborative
partnership.
The combination of disaster experience and membership in a collaborative partnership
clearly has the greatest prevalence among the largest organizations in the survey
population. However, as noted before, it is not feasible in this study to determine whether
any of these characteristics are directly linked to those conditions. For example, it is quite
likely that larger organizations—with the greatest longevity, most diversified assets and
189
multiple geographic locations—have the highest rate of experience with disasters and
organizational crises simply as a matter of course. That is, with size comes both
exposure and experience. This may motivate participation in collaborative planning as a
means of protecting assets from known hazards and to mitigate well-recognized
vulnerabilities. For the smaller business or organization, the motivation may be as high as
for the larger organization, but is not based so much on personal experience as on the
opportunity to participate with a larger corporation or organization and gain from their
experience.
Such questions as these are worth pursuing in follow-on studies, particularly in
attempting to identify and balance the interests and preparedness needs of a community
comprised of diverse businesses, industries and non-profits, all having a range of
interests, vulnerabilities and histories.
190
CHAPTER 6: SUMMARY OF RESULTS
6.0 Overview
6.1 Analysis of research results
6.2 Limitations and areas for further research
6.3 The question of motivation
6.4 Conclusion: A framework for private sector preparedness
6.0 Overview This final chapter summarizes significant results related to the research hypotheses
based on analysis developed in Chapter 5. Other results concerning perceptions of risk
and threat, agency responsibility, and general levels of preparedness were summarized in
Chapter 4. Limitations of this research project are discussed along with an analysis of
areas for future research. The chapter concludes by presenting a Framework for Private
Sector Preparedness as a conceptual model for the relationship between the preparedness
of individual private sector organizations and the overall resilience of the economic
environment they inhabit.
6.1 Analysis of research results The analysis of data collected from the Private Sector Survey of Preparedness and
Continuity Practices confirmed—for this survey population—the two key research
hypotheses that previous disaster experience and the size of the business or organization
have significant effects of private sector entities to adopt preparedness and continuity
planning measures. In particular, business or organizational size—as an indicator of
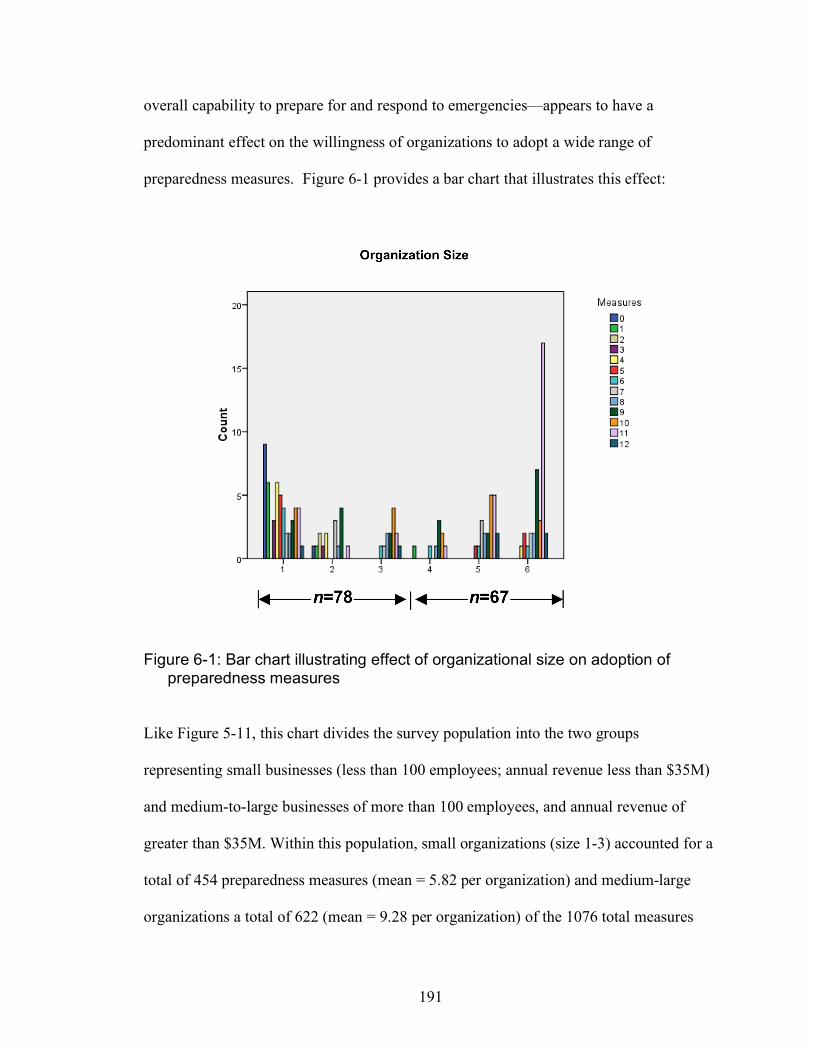
191
overall capability to prepare for and respond to emergencies—appears to have a
predominant effect on the willingness of organizations to adopt a wide range of
preparedness measures. Figure 6-1 provides a bar chart that illustrates this effect:
Figure 6-1: Bar chart illustrating effect of organizational size on adoption of preparedness measures
Like Figure 5-11, this chart divides the survey population into the two groups
representing small businesses (less than 100 employees; annual revenue less than $35M)
and medium-to-large businesses of more than 100 employees, and annual revenue of
greater than $35M. Within this population, small organizations (size 1-3) accounted for a
total of 454 preparedness measures (mean = 5.82 per organization) and medium-large
organizations a total of 622 (mean = 9.28 per organization) of the 1076 total measures
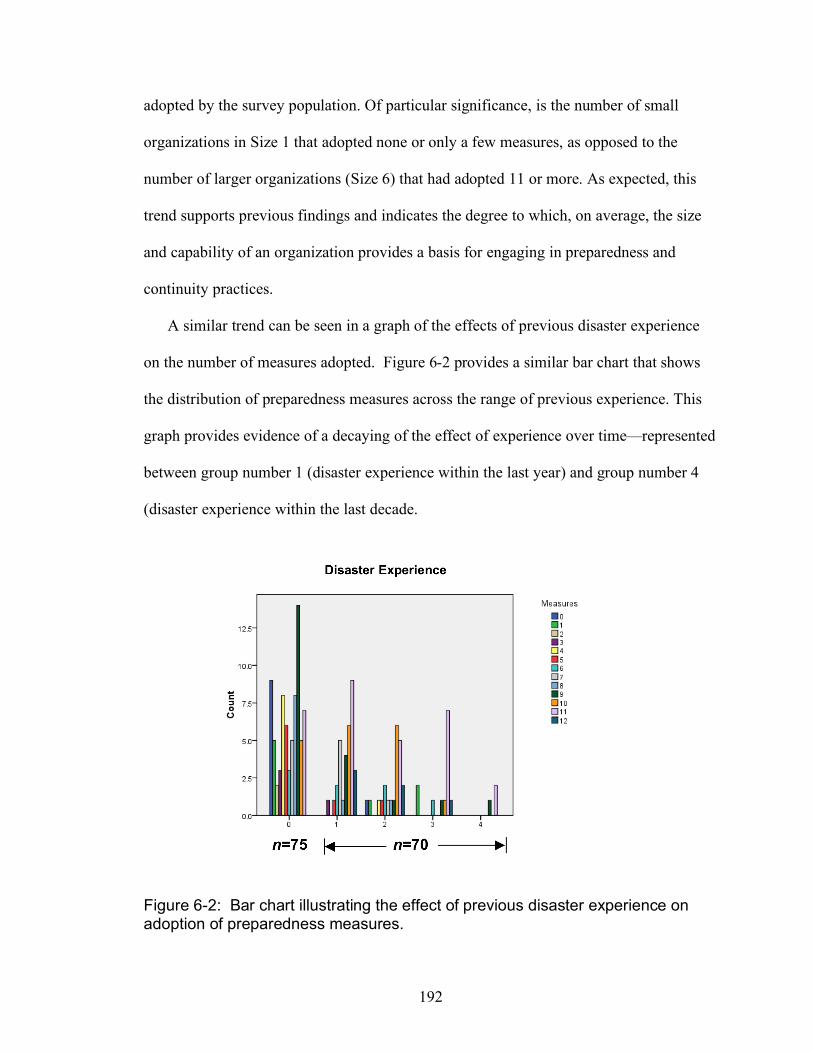
192
adopted by the survey population. Of particular significance, is the number of small
organizations in Size 1 that adopted none or only a few measures, as opposed to the
number of larger organizations (Size 6) that had adopted 11 or more. As expected, this
trend supports previous findings and indicates the degree to which, on average, the size
and capability of an organization provides a basis for engaging in preparedness and
continuity practices.
A similar trend can be seen in a graph of the effects of previous disaster experience
on the number of measures adopted. Figure 6-2 provides a similar bar chart that shows
the distribution of preparedness measures across the range of previous experience. This
graph provides evidence of a decaying of the effect of experience over time—represented
between group number 1 (disaster experience within the last year) and group number 4
(disaster experience within the last decade.
Figure 6-2: Bar chart illustrating the effect of previous disaster experience on adoption of preparedness measures.
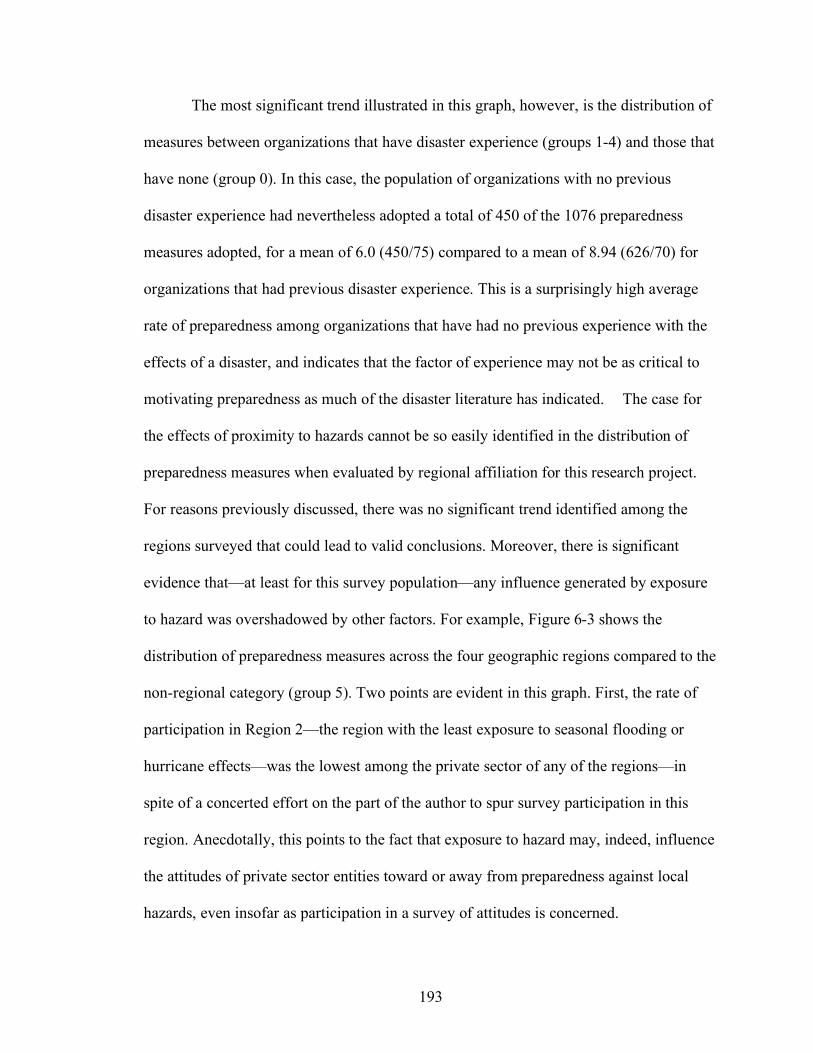
193
The most significant trend illustrated in this graph, however, is the distribution of
measures between organizations that have disaster experience (groups 1-4) and those that
have none (group 0). In this case, the population of organizations with no previous
disaster experience had nevertheless adopted a total of 450 of the 1076 preparedness
measures adopted, for a mean of 6.0 (450/75) compared to a mean of 8.94 (626/70) for
organizations that had previous disaster experience. This is a surprisingly high average
rate of preparedness among organizations that have had no previous experience with the
effects of a disaster, and indicates that the factor of experience may not be as critical to
motivating preparedness as much of the disaster literature has indicated. The case for
the effects of proximity to hazards cannot be so easily identified in the distribution of
preparedness measures when evaluated by regional affiliation for this research project.
For reasons previously discussed, there was no significant trend identified among the
regions surveyed that could lead to valid conclusions. Moreover, there is significant
evidence that—at least for this survey population—any influence generated by exposure
to hazard was overshadowed by other factors. For example, Figure 6-3 shows the
distribution of preparedness measures across the four geographic regions compared to the
non-regional category (group 5). Two points are evident in this graph. First, the rate of
participation in Region 2—the region with the least exposure to seasonal flooding or
hurricane effects—was the lowest among the private sector of any of the regions—in
spite of a concerted effort on the part of the author to spur survey participation in this
region. Anecdotally, this points to the fact that exposure to hazard may, indeed, influence
the attitudes of private sector entities toward or away from preparedness against local
hazards, even insofar as participation in a survey of attitudes is concerned.
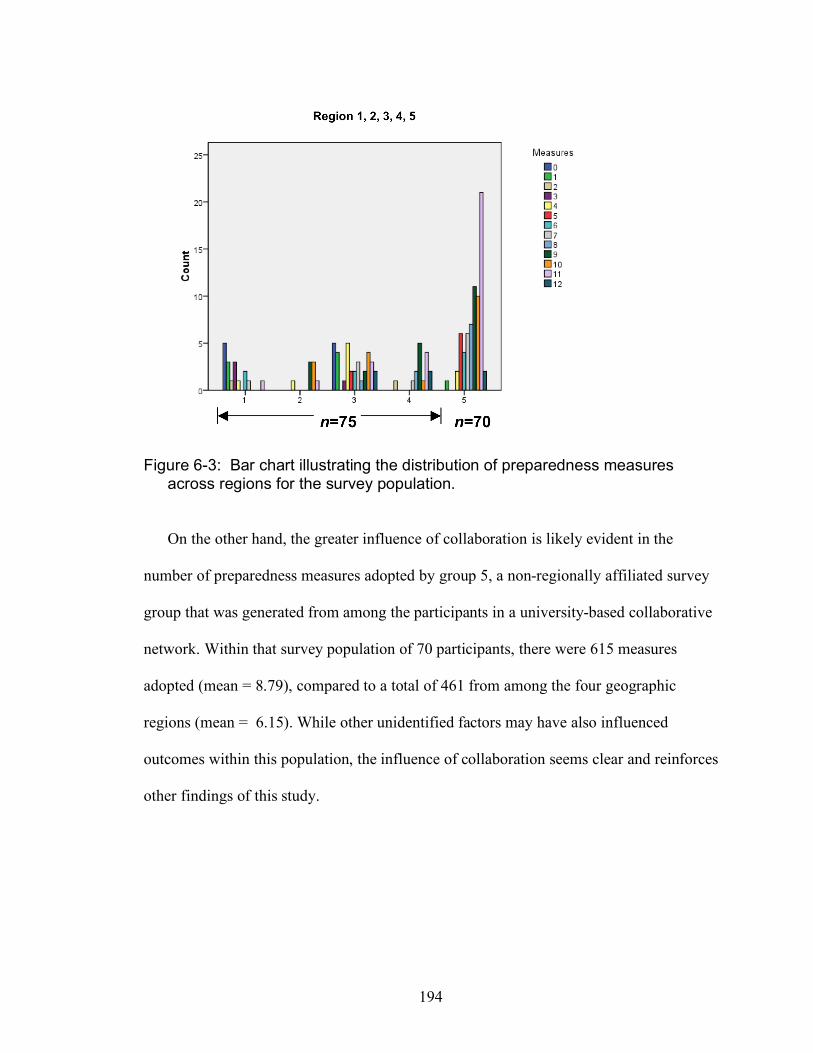
194
Figure 6-3: Bar chart illustrating the distribution of preparedness measures across regions for the survey population.
On the other hand, the greater influence of collaboration is likely evident in the
number of preparedness measures adopted by group 5, a non-regionally affiliated survey
group that was generated from among the participants in a university-based collaborative
network. Within that survey population of 70 participants, there were 615 measures
adopted (mean = 8.79), compared to a total of 461 from among the four geographic
regions (mean = 6.15). While other unidentified factors may have also influenced
outcomes within this population, the influence of collaboration seems clear and reinforces
other findings of this study.
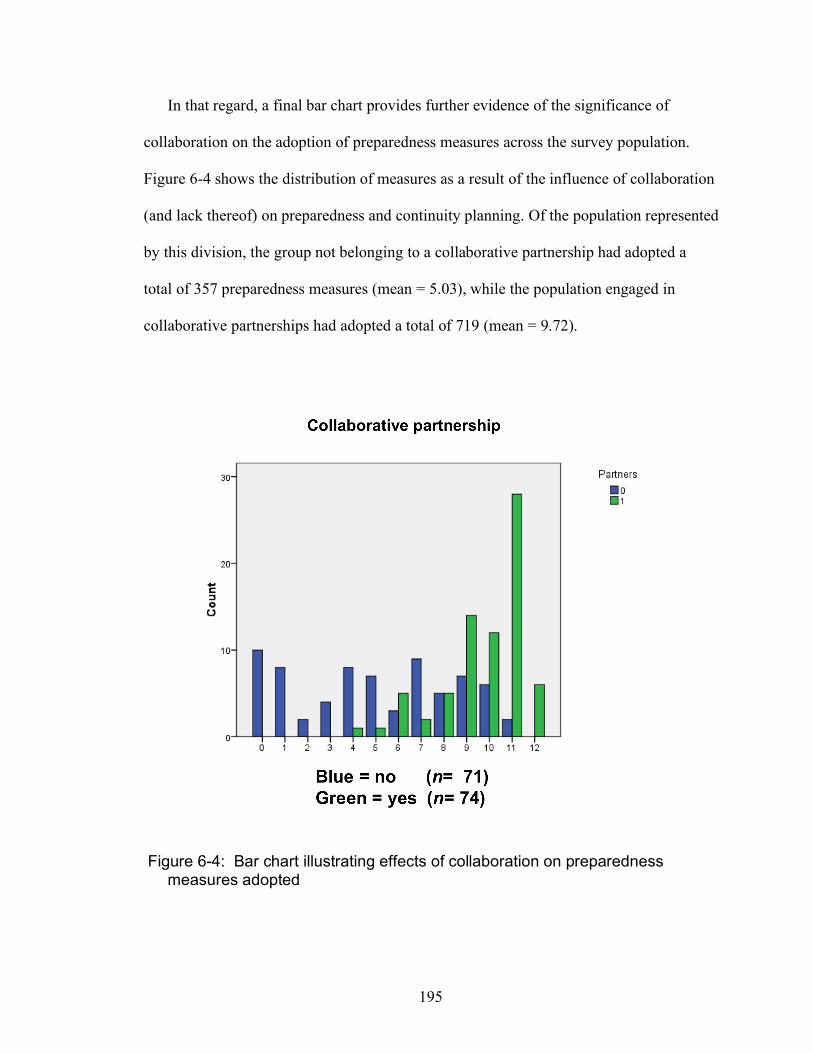
195
In that regard, a final bar chart provides further evidence of the significance of
collaboration on the adoption of preparedness measures across the survey population.
Figure 6-4 shows the distribution of measures as a result of the influence of collaboration
(and lack thereof) on preparedness and continuity planning. Of the population represented
by this division, the group not belonging to a collaborative partnership had adopted a
total of 357 preparedness measures (mean = 5.03), while the population engaged in
collaborative partnerships had adopted a total of 719 (mean = 9.72).
Figure 6-4: Bar chart illustrating effects of collaboration on preparedness measures adopted
196
This near doubling of the preparedness indicators from among the population involved in
a collaborative partnership—along with the significantly heavier trend of organizations in
this group to adopt a higher number of measures from within the population—is yet
further evidence of the apparent effect of collaboration on motivation to prepare.
6.2 Limitations and agenda for further research While this research project delivered results that validated three of the four research
hypotheses (for the specific population of private sector entities that participated in the
survey), there are nevertheless some limitations on the ability to draw broader
conclusions due to the structure of the research approach and several extenuating
circumstances. Specific limitations in the current effort include the following:
Limited survey population. While the data gathered in the Private Sector Survey
provided a basis for testing the hypotheses against this survey population, caution
must be exercised in claiming more validity for the results than is merited. A broader
survey population and diversity across regions or communities where exposure to
hazards can be more rigorously assessed would be a logical next step. In that regard, a
principal virtue of this current study may not be the results, per se, but rather the
development and “beta testing” of a survey instrument with the potential to explore
the relationships among motivating factors within private sector business, industry
and non-profit organizations.
A high degree of variation in survey participation between regions. The intervention
of two significant natural disasters during the course of the survey (Hurricane Ike
along the Gulf coast and the summer 2008 flooding in the northern Midwest)
undoubtedly affected the outcome of the survey, though the degree and direction of
197
that effect would not be easy to determine. Whether an ongoing natural disaster
would limit or enhance participation in a survey on preparedness could be debated.
Of greater significance is that the regional disparity among participants makes
conclusions regarding common perceptions of risk within specific communities
generally unreliable for this research study.
Establishing cause and effect relationships among proximities. It was observed in the
previous section that the relationships among the four proximities identified in this
study—experience, exposure, capability and collaboration—cannot be assessed as
cause and effect to any degree of fidelity. More research based on a larger population
of businesses and non-profit organizations and a different set of survey questions
would be necessary to draw firm conclusions in this direction (for example, “did
collaborative planning with other organizations provide you with knowledge or
capabilities for planning that you otherwise did not have?). That said, it does seem
clear that the development of private sector collaborative organizations at the regional
or local level may potentially be the most lucrative starting point for increasing the
general level of private sector preparedness and spreading capability across an entire
business sector of large and small businesses. On this issue, further research could
prove very worthwhile.
Establishing the parameters and characteristics of “collaboration” as it applies to
private sector and public sector efforts to jointly prepare for and respond to disasters.
This question has particular merit given the strong correlation among organizations
that belonged to collaborative partnerships with a higher than average rate of adoption
of preparedness measures as seen in this study. Within the business context, there has

198
been a great off effort and research invested in the art of negotiation, or of
salesmanship, leadership or corporate management. There is a good deal less research
into what constitutes effective collaboration—particularly in the context of forming
public/private sector partnerships for the purpose of preventing or dealing with
catastrophe. This is an area where further research could provide important insights.
The relationship between size of an organization and its actual capability to prepare
for a disaster. Without specific research in this area (which was not undertaken in this
study) it must be observed that the assertion that preparedness increases with the size
of the organization is itself a hypothesis, if not simply an assumption. While the data
in this project supports the conclusion that motivation to prepare seems to increase
with the size of the organization, this may not indicate actual preparedness within
specific organizations. Different organizations and businesses likely prepare in
different ways for the threats that are of most concern to them, and what constitutes
actual preparedness for one business or type of business might not be the whole
picture for another.
Finally, the connection between motivation to prepare and actual preparedness. The
assessment of capability or resilience against disasters or business crises cannot
necessarily be inferred from the number of measures of preparedness adopted, or
from programs in place or planning conducted, Establishing measures of
effectiveness for actual preparedness or resilience against disaster and the ability to
maintain continuity of operations is a field ripe for further investigation, as is seen in
the current efforts of the Department of Homeland Security to establish criteria for
preparedness to support a Voluntary Private Sector Preparedness Certification
199
Program (PS-PREP) under Title IX of the Implementing the Recommendations of the
911 Commission Act.
6.3 The question of motivation
More than any other issue, the question of motivation within the business sector is
of prime importance as an area for future research. As noted in the introduction of
Chapter 1, the establishment of standards or measures of effectiveness for preparedness—
as it currently being sought under the Title IX PS-PREP program—is not likely to be
nearly as important to the success of the program as the simple matter of motivating
businesses and non-profits to voluntarily participate. Previous surveys of the business
community have rarely indicated better than 50% adoption of any specific preparedness
measure, as noted in the literature cited in Chapter 2. But the larger issue is more
fundamental—that is, the question of what motivates businesses in regard to any specific
matter when considered as organizations acting in the presence of other organizations.
Motivation as a matter of organizational behavior has traditionally focused on the
behavior of members within an organization—that is, how workplace conditions,
incentives, perceptions, climate and leadership (among other factors) affect the
motivation of employees as members of the organization, and thus shape the culture and
character of the organization and its output and success. As an example, a foundational
text on organizational behavior describes expectancy theory—the expected relationship
between effort, outcome and reward—as a “framework for understanding how motivation
operates” [Bowditch and Buono 2001. This is one among about a dozen theories of
motivation discussed in the text, all of which examine motivation as it applies to
individual employees and employers in organizational contexts. Such questions as
200
these—fundamental though they are to the character, functions and goals of an
organization—do not address the behavior of organizations as entities that act on
decisions affecting the external environment. Edgar Schein addresses this question to
some degree in his discussion of the “Organization-Environment relationship” [Schein
1992]. Of particular relevance to the issue of disaster preparedness and collaboration is
his observation that “the more turbulent the environment, the more important it will be
for leaders to argue for and show that some level of control over the environment is
desirable and possible” [Schein, 1992, p. 364]. His discussion, however, is in a chapter on
Learning Culture, which is relevant for other reasons given the current state of private
sector preparedness already alluded to elsewhere in this study. About the specific
character of private sector motivation for preparedness, little appears to be known at this
stage, as we are all—individuals and organizations, alike--only embarking on a path to
learning how to do it effectively and institutionalize the concepts and objectives.
To elaborate, this research effort identified four factors that evidence indicates
may exert some measure of influence on the motivation of private sector organizations to
prepare for emergencies and conduct planning to ensure continuity of business
operations. However, these are far from the only—or perhaps—even the most important
of the factors. Given the growing recognition of the private sector role in protecting
critical infrastructure and contributing to the resilience of the nation’s communities, this
area merits further research to address the broader range of motivating factors, and to
determine the priorities and causal relationships among them.
For example, Figure 6-5 offers an illustration of some of the variables that could
influence those decisions on the part of a single business or the business sector of an
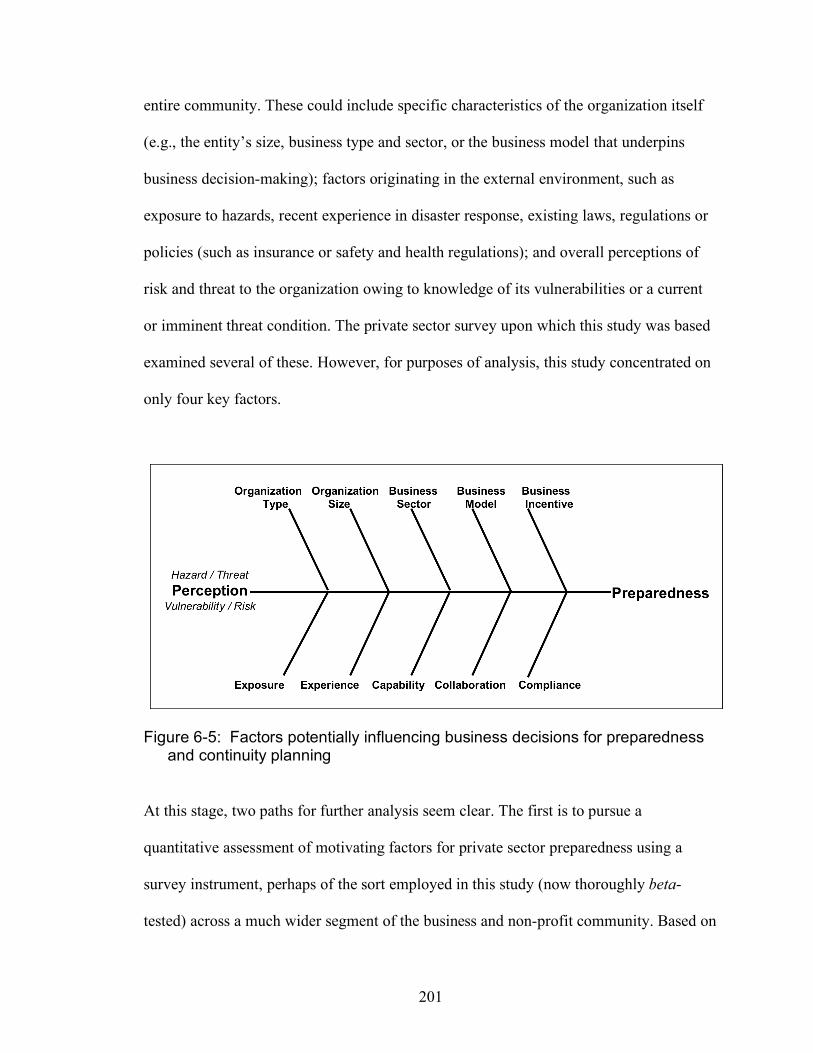
201
entire community. These could include specific characteristics of the organization itself
(e.g., the entity’s size, business type and sector, or the business model that underpins
business decision-making); factors originating in the external environment, such as
exposure to hazards, recent experience in disaster response, existing laws, regulations or
policies (such as insurance or safety and health regulations); and overall perceptions of
risk and threat to the organization owing to knowledge of its vulnerabilities or a current
or imminent threat condition. The private sector survey upon which this study was based
examined several of these. However, for purposes of analysis, this study concentrated on
only four key factors.
Figure 6-5: Factors potentially influencing business decisions for preparedness and continuity planning
At this stage, two paths for further analysis seem clear. The first is to pursue a
quantitative assessment of motivating factors for private sector preparedness using a
survey instrument, perhaps of the sort employed in this study (now thoroughly beta-
tested) across a much wider segment of the business and non-profit community. Based on
202
the experience of this study, a follow-on survey should certainly include a broader range
of regional perspectives and hazards, to include earthquakes, tornadoes, wildfires, as well
as technological and industrial hazards that are common in urban areas. This would be
essential to begin to understand the true effect of exposure to hazards as a motivating
factor, and which this study was not able to pursue with sufficient validity.
Secondly, and perhaps more importantly, a quantitative assessment should be
supplemented with qualitative work to understand motivation for preparedness from the
perspective of employees, shareholders and leaders in the business community. This
could be pursued through focus groups, targeted interviews, telephone discussion surveys
or other interview techniques. Fundamental, however, is the need to begin assessing the
why of business preparedness decisions. A more qualitative process may also begin
establishing some of the issues relevant to this study but inadequately addressed such as
the priorities for selecting and implementing some preparedness measures over others, or
the causal effects of factors such as organizational size or business sector on other factors
such as participation in collaborative partnerships.
The pursuit of this information may model efforts recently made to understand the
adoption of information security practices within the private sector. At this stage, ten
years after Y2K and with information technologies a growing aspect of modern life, there
may be valid lessons to be learned from the experiences of business attempts to protect
information technology systems, data, personal identifying information and digital
intellectual property that may inform further investigations into preparedness and
continuity planning, generally. One dissertation in the field arrived at conclusions similar
to this study: that more research was needed to understand and explain why businesses

203
adopt some IT management tools, rather than others [Ryan, 2001]. However, over the
course of a decade, information technology security practices have come a long way in
terms of universal adoption, and also in terms of the sophistication of systems that can be
used to aid the private sector in more easily protecting information systems. The National
Institute of Standards and Technology (NIST) guidebook, “Small Business Information
Security: The Fundamentals,” is a case in point [Kissel 2009]. The operable lesson that
information security practices may illustrate, is that it takes more than a couple of
decades of practice and technology development before increased security becomes
institutionalized within the private sector—and even then, there will always be holes in
the security systems, as there no doubt will be in preparedness regimes or continuity
planning.
6.3 Conclusion: A framework for private sector preparedness Tierney has observed that “individual businesses depend critically on robust local
business ecologies,” and that survival of individual businesses following a disaster is
determined not only on business continuity practices and the recovery of operations at the
individual or unit level, but on the return of residents, workers and consumers to the
region and on the restoration of the entire economic community [Tierney 2000, 287].
Businesses normally operate within a “natural environment” consisting of social, political
and economic forces; a population of consumers, citizens, residents and employees; and
among partners, competitors, customers and suppliers. The immediate challenge for any
business or non-profit following a disaster, local emergency or organizational crisis is to
limit the effects, recover gracefully and resume full business operations as expeditiously
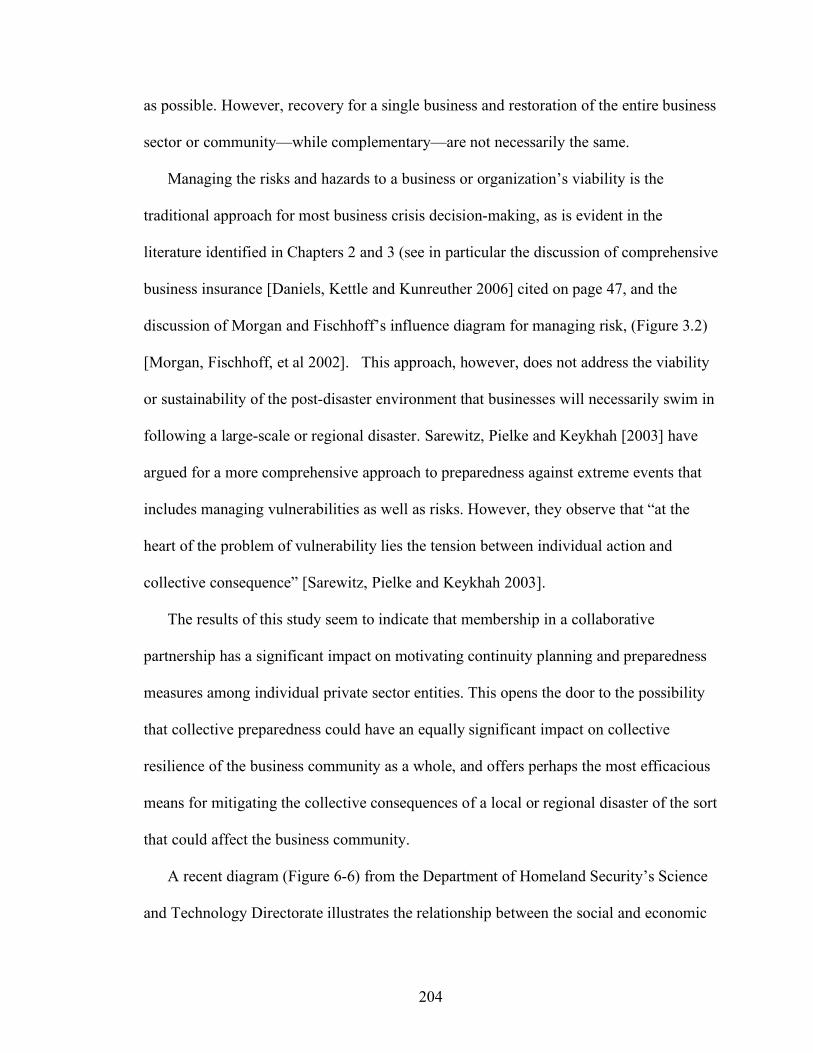
204
as possible. However, recovery for a single business and restoration of the entire business
sector or community—while complementary—are not necessarily the same.
Managing the risks and hazards to a business or organization’s viability is the
traditional approach for most business crisis decision-making, as is evident in the
literature identified in Chapters 2 and 3 (see in particular the discussion of comprehensive
business insurance [Daniels, Kettle and Kunreuther 2006] cited on page 47, and the
discussion of Morgan and Fischhoff’s influence diagram for managing risk, (Figure 3.2)
[Morgan, Fischhoff, et al 2002]. This approach, however, does not address the viability
or sustainability of the post-disaster environment that businesses will necessarily swim in
following a large-scale or regional disaster. Sarewitz, Pielke and Keykhah [2003] have
argued for a more comprehensive approach to preparedness against extreme events that
includes managing vulnerabilities as well as risks. However, they observe that “at the
heart of the problem of vulnerability lies the tension between individual action and
collective consequence” [Sarewitz, Pielke and Keykhah 2003].
The results of this study seem to indicate that membership in a collaborative
partnership has a significant impact on motivating continuity planning and preparedness
measures among individual private sector entities. This opens the door to the possibility
that collective preparedness could have an equally significant impact on collective
resilience of the business community as a whole, and offers perhaps the most efficacious
means for mitigating the collective consequences of a local or regional disaster of the sort
that could affect the business community.
A recent diagram (Figure 6-6) from the Department of Homeland Security’s Science
and Technology Directorate illustrates the relationship between the social and economic
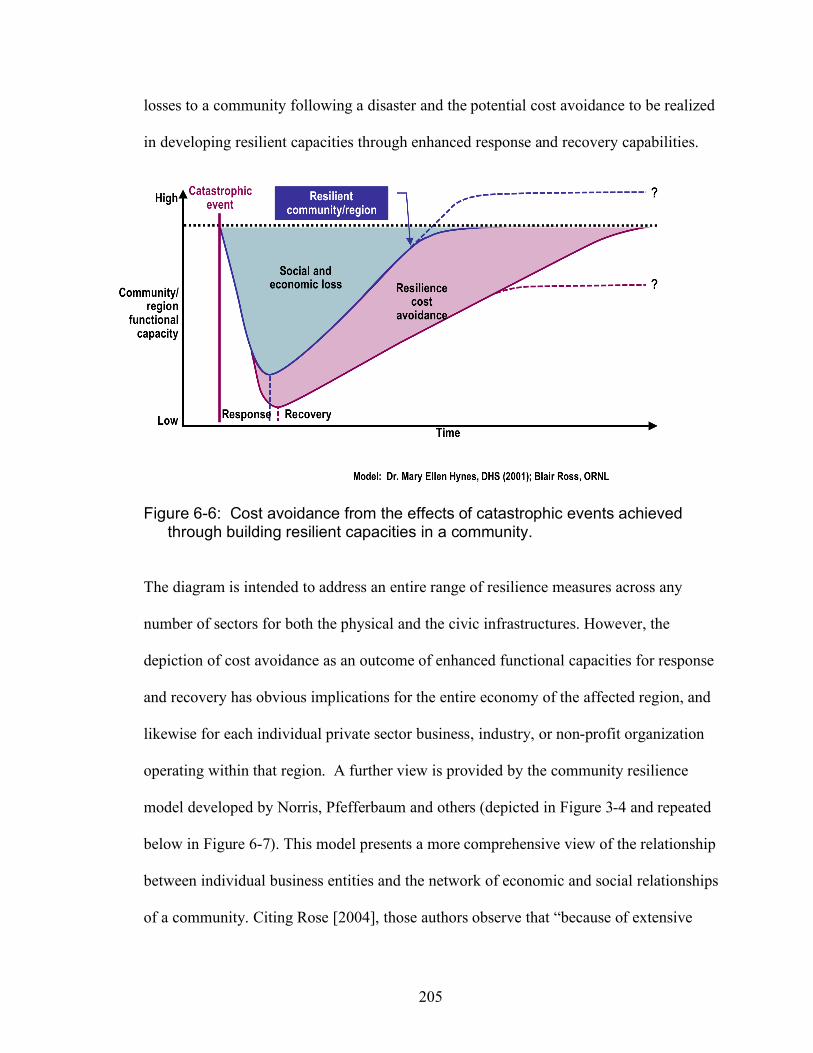
205
losses to a community following a disaster and the potential cost avoidance to be realized
in developing resilient capacities through enhanced response and recovery capabilities.
Figure 6-6: Cost avoidance from the effects of catastrophic events achieved through building resilient capacities in a community. The diagram is intended to address an entire range of resilience measures across any
number of sectors for both the physical and the civic infrastructures. However, the
depiction of cost avoidance as an outcome of enhanced functional capacities for response
and recovery has obvious implications for the entire economy of the affected region, and
likewise for each individual private sector business, industry, or non-profit organization
operating within that region. A further view is provided by the community resilience
model developed by Norris, Pfefferbaum and others (depicted in Figure 3-4 and repeated
below in Figure 6-7). This model presents a more comprehensive view of the relationship
between individual business entities and the network of economic and social relationships
of a community. Citing Rose [2004], those authors observe that “because of extensive
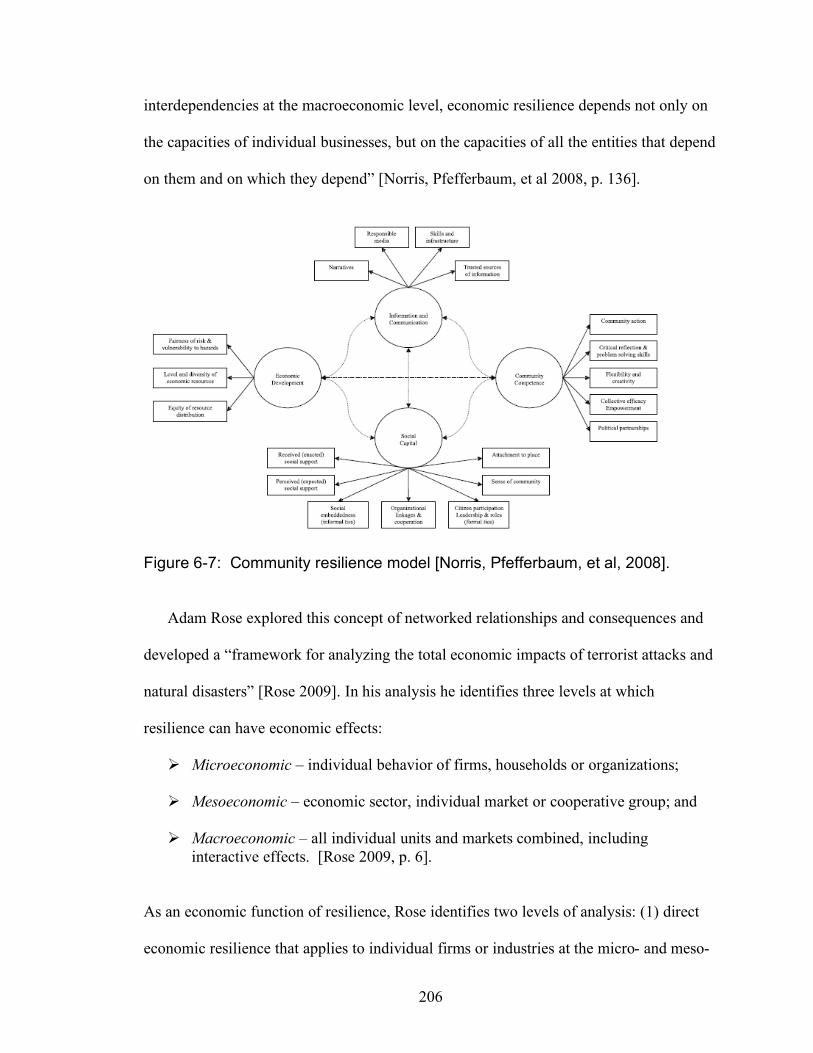
206
interdependencies at the macroeconomic level, economic resilience depends not only on
the capacities of individual businesses, but on the capacities of all the entities that depend
on them and on which they depend” [Norris, Pfefferbaum, et al 2008, p. 136].
Figure 6-7: Community resilience model [Norris, Pfefferbaum, et al, 2008].
Adam Rose explored this concept of networked relationships and consequences and
developed a “framework for analyzing the total economic impacts of terrorist attacks and
natural disasters” [Rose 2009]. In his analysis he identifies three levels at which
resilience can have economic effects:
Microeconomic – individual behavior of firms, households or organizations;
Mesoeconomic – economic sector, individual market or cooperative group; and
Macroeconomic – all individual units and markets combined, including interactive effects. [Rose 2009, p. 6].
As an economic function of resilience, Rose identifies two levels of analysis: (1) direct
economic resilience that applies to individual firms or industries at the micro- and meso-

207
levels, and which corresponds to economic equilibrium for the individual entity; and total
economic resilience that refers to the general equilibrium of the entire economy at the
macro-level, and which accounts for price and resource interactions in a given economy
following a disaster or other trauma. Figure 6-8 presents Rose’s framework.
Figure 6-8: Framework for modeling total economic impact of extreme events [Rose 2009, p. 15].
Of particular significance is Rose’s assertion that “the market is an excellent source of
resilience” [Rose 2009, p. 21]. By this, he means first, that resilience can provide a means
for conducting cost-benefit analyses of disaster-related strategies that account for both
pre-event mitigation measures and post-event recovery and restoration operations [p. 20].
Secondly, the normal “invisible hand” of market economies can provide indicators
following disaster or trauma of the effectiveness of mediation or mitigation efforts and
the overall strength and inadequacies in recovery and restoration schemes. This is not
without its unknowns, however, and Rose cautions that more research is needed on how
resilience functions as a system and on the behavioral linkages between risk perceptions
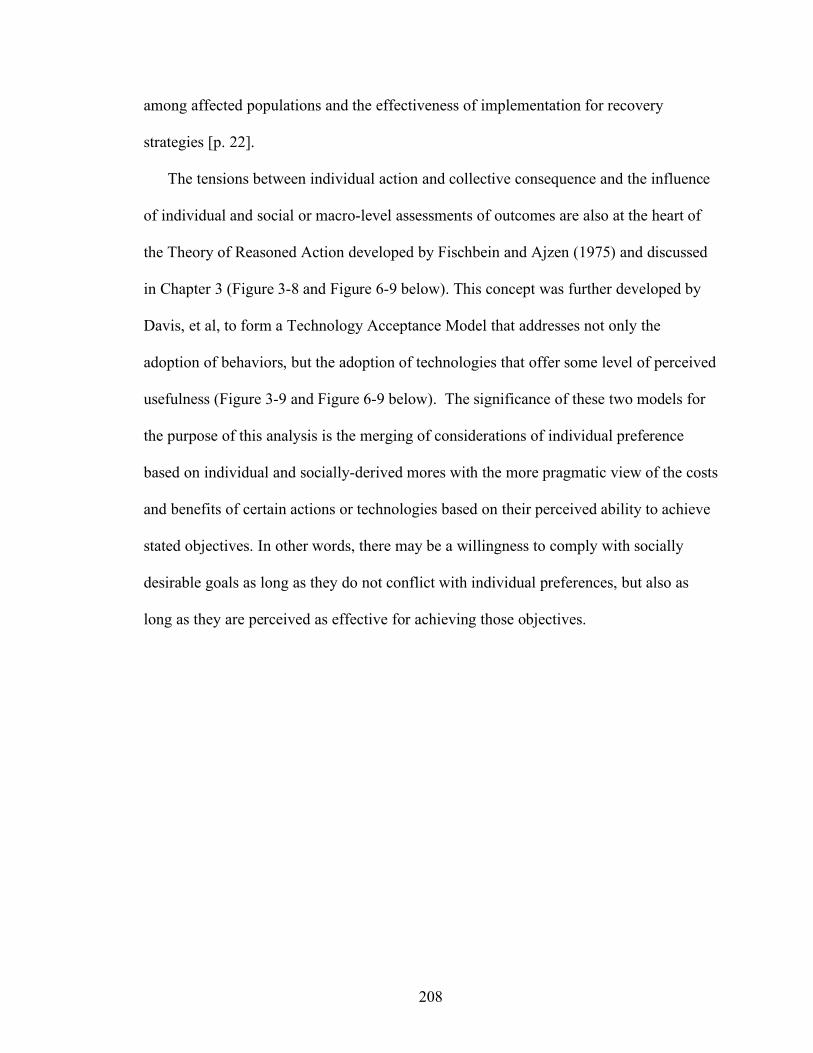
208
among affected populations and the effectiveness of implementation for recovery
strategies [p. 22].
The tensions between individual action and collective consequence and the influence
of individual and social or macro-level assessments of outcomes are also at the heart of
the Theory of Reasoned Action developed by Fischbein and Ajzen (1975) and discussed
in Chapter 3 (Figure 3-8 and Figure 6-9 below). This concept was further developed by
Davis, et al, to form a Technology Acceptance Model that addresses not only the
adoption of behaviors, but the adoption of technologies that offer some level of perceived
usefulness (Figure 3-9 and Figure 6-9 below). The significance of these two models for
the purpose of this analysis is the merging of considerations of individual preference
based on individual and socially-derived mores with the more pragmatic view of the costs
and benefits of certain actions or technologies based on their perceived ability to achieve
stated objectives. In other words, there may be a willingness to comply with socially
desirable goals as long as they do not conflict with individual preferences, but also as
long as they are perceived as effective for achieving those objectives.
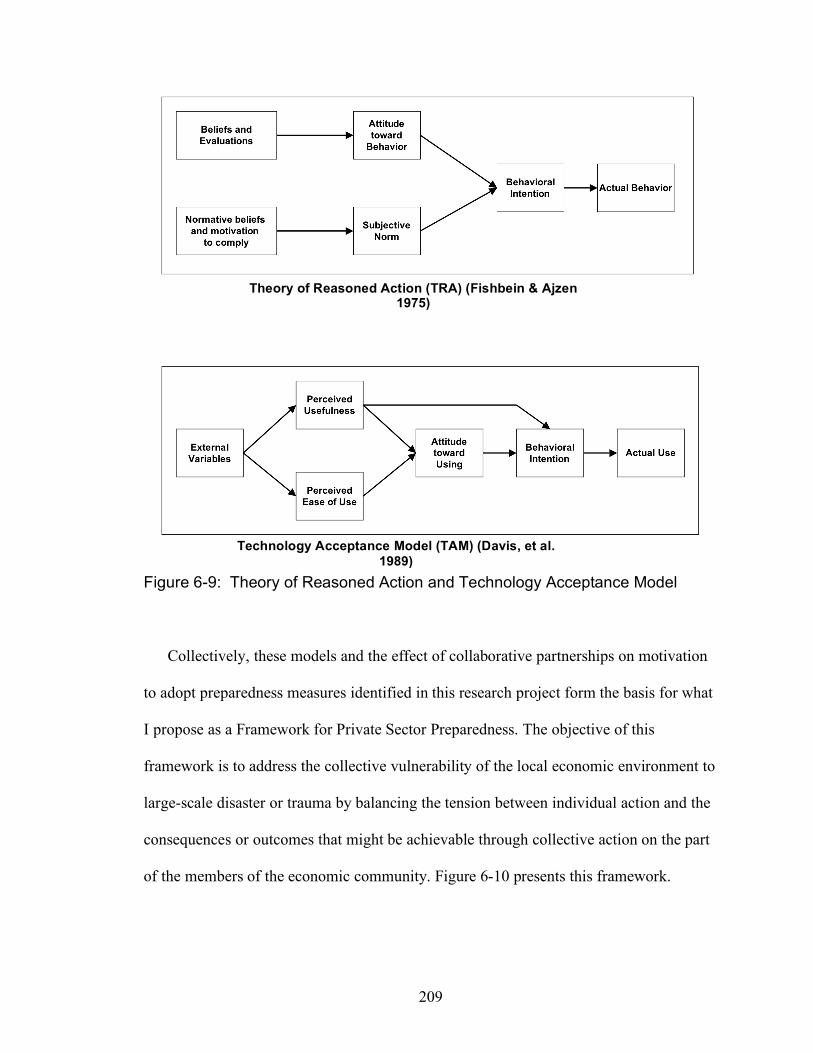
209
Figure 6-9: Theory of Reasoned Action and Technology Acceptance Model Collectively, these models and the effect of collaborative partnerships on motivation
to adopt preparedness measures identified in this research project form the basis for what
I propose as a Framework for Private Sector Preparedness. The objective of this
framework is to address the collective vulnerability of the local economic environment to
large-scale disaster or trauma by balancing the tension between individual action and the
consequences or outcomes that might be achievable through collective action on the part
of the members of the economic community. Figure 6-10 presents this framework.
Theory of Reasoned Action (TRA) (Fishbein & Ajzen 1975)
Technology Acceptance Model (TAM) (Davis, et al. 1989)

210
Figure 6-10: Framework for private sector preparedness Like all business decisions, those involving the direction of corporate resources and
talent toward preparedness and continuity planning are not made within a vacuum, but
are merely some among a range of business decisions made within the context of the
economic and social ecosystem which the business or corporation inhabits. The behaviors
that a company or organization adopts or avoids have consequences, both for the
organization itself and also for its competitors and local economy and the larger market
place—what Rose refers to as the micro-, meso-, and macro-economic scales. Likewise,
the resulting socio-economic behavior also has implications for an entire range of social
and political fields at the local, regional and sometimes national levels.
Like the Theory of Reasoned Action, business decisions to adopt certain behaviors
are based on a balance among competing interests that can be generally categorized as
211
springing either from intrinsic corporate values or objectives, or which may be subject to
socially-derived norms and standards. As in the case of individuals, the justification for
adopting these behaviors can spring from several sources and can overlap—such as, for
example, the case of maintaining a certain corporate image regarding fair-play or
compliance with regulations out of a self-interest to maintain public confidence in the
corporation and its products. Decisions based on corporate self-interest, however
grounded, could be considered as part of the corporation’s responsibility to itself and its
shareholders to maintain profitability; these decisions thus take place within a domain of
market competition.
In this sense, preparedness for emergencies or the adoption of continuity of
operations plans is merely one more among a number of corporate strategies for
achieving competitive advantage over other companies, assuming that the more prepared
company has a better chance of surviving a disaster, recovering its operations quickly,
and perhaps capturing market share that must be abandoned by less prepared competitors.
However, this sort of calculus growing solely out of self-interest does not account for
the health or viability of the larger economic system which itself must recover from a
regional or large-scale disaster. If this ecosystem is unable to recover from a
catastrophe—whether from a loss of public services or infrastructure; a loss of integrity
in the supply chain; the collapse of the customer base due to displacement of the local
population; or a complete shift to another commodity or service as a result of adaptation
to the post-disaster environment—then all members of the private sector are likely to
share equally in that outcome and suffer equally—or at least proportionately—in the
failure of the local economy. This is the case for a new approach among members of the
212
private sector within a community, based not on competition, but on collaboration against
common hazards and threats to the viability of the economic ecosystem. Within this
domain of cooperation, the immediate objective is not corporate viability but community
resilience against common threats. In this sense, preparedness and continuity planning
serve both the corporate interest directly by strengthening the resilience of the
organization, but also its interest in strengthening the resilience of the larger community,
local markets, the supply chain and customer base, and the economy as an ecosystem.
Such a sense of corporate responsibility toward the larger community does not need
to be the highest priority in order for it to have a significant effect on the overall
resilience of a community. Laye points out that there is clearly a tension—echoed in the
earlier observation of Sarewitz, Pielke and Keykhah—between individual or corporate
action and collective consequences:
[W]e are now discussing long-term recovery with many strategic issues, and it is difficult to stop thinking about short-term restoration issues. One of the things that changes during recovery is that companies that were not only willing but also eager to assist one another with mutual aid during the response phase and on into restoration will now move back to their more normal competitive postures and become less willing to share resources. The same is true for divisions within companies. [Laye 2002, p. 165. Italics in the original].
Nevertheless, what the results of this study indicated through the Private Sector
Survey of Preparedness and Continuity Practices is that many of the private sector
entities had already adopted a program of collaboration with other private sector entities
and had achieved a higher state of motivation toward preparedness as evidenced by a
higher average number of measures actually implemented. The Framework for Private
Sector Preparedness thus may be a worthwhile model for collaborative initiatives

213
elsewhere, and should be pursued in further research to validate and perhaps broaden the
applicability of the concept as a means for enhancing private sector preparedness.

214
REFERENCES Alesch, D. J. (undated). Complex urban systems and extreme events: Toward a
theory of disaster recovery. Public Entity Risk Institute. http://www.riskinstitute.org. Accessed 15 January 2008.
Alesch, D. J., Holly, J. N., Mittler, E., and Nagy, R. (2001). Organizations at risk:
What happens when small businesses and not-for-profits encounter natural disasters. Public Entity Risk Institute. http://www.riskinstitute.org. Accessed 15 January 2008.
Alesch, D. J., Holly, J. N. Mittler, E., and Nagy, R. (2002). After the disaster ...
What should I do now? Information to help small business owners' post-disaster business decisions. Public Entity Risk Institute. www.riskinstitute.org. Accessed 15 January 2008.
Alexander, D. (2005). An interpretation of disaster in terms of changes in culture,
society and international relations. In Perry, R. W., and Quarantelli, E.L., eds. What is a disaster?: New answers to old questions. (pp. 25-38). Philadelphia: XLibris.
Amato-McCoy, D. M. (2006). Planning for continuity. Bank Systems &
Technology. 43(3) 44-48. Anderson, M. J. and Whitcomb, P. J. (2007) DOE simplified: practical tools for
effective experimentation. New York: Productivity Press. Arvai, J. L. (2003). Using risk communication to disclose the outcome of a
participatory decision-making process: Effects on the perceived acceptability of risk-policy decisions. Risk Analysis. 23(2) 281-289.
Atkinson, W. (2005). Risk management: A new strategy with a historical
perspective. Purchasing. 134(12) 37-41. Aven, T., Nilsen, E. F., and Nilsen, T. (2004). Expressing economic risk-review
and presentation of a unifying approach. Risk Analysis. 24 (4) 989-1005. Bankoff, G., Frerks, G., and Hilhorst, D. (2004). Mapping vulnerability: Disasters,
development and people. London: Earthscan Publications, Ltd. Barabasi, A. L. (2002). Linked: How everything is connected to everything else.
New York: Plume Books. Barry, J. M. (1997). Rising tide: The great Mississippi flood of 1927 and how it
changed America. New York: Simon and Schuster.

215
Barthold, J. (2007). Disaster recovery is not enough. Telecommunications
Americas. 41(3) 18-23. Barton, A. H. (2005). Disaster and collective stress. In Perry, R. W., and
Quarantelli, E.L., eds. What is a disaster?: New answers to old questions. (pp. 125-152). Philadelphia: XLibris.
Baxter, J., Guibert, G., Kuligowski, E., Rabenold, C., and Stapleton, S. (2005).
Holistic disaster recovery: Ideas for building local sustainability after a natural disaster. Fairfax, VA: Public Entity Risk Institute.
Beichman, J. (2004). Ready for anything. Journal of Housing and Community
Development. 61(2) 18-20. Beierle, T. C. (2002). The quality of stakeholder-based decisions. Risk Analysis.
22(4) 739-749. Bennett, J. (2006). Planning for resiliency. Computer Technology Review. 26(3)
24. Berke, P. R. , and Campanella, T. J. (2006). Planning for post-disaster resiliency.
The Annals of the American Academy of Political and Social Science. 604(1) 192-207.
Bernard, H., Kilworth, P., Johnsen, E., Shelley, G. and McCarthy, G. (2001)
Estimating the ripple effect of a disaster. Connections. 24(2) 30-34. Bigley, G. A., and Roberts, K. H. (2001). The incident command system: high-
reliability for complex and volatile task environments. Academy of Management Journal. 44(6) 1281-1299.
Birch, E. L., and Wachter, S. M., eds. (2006). Rebuilding urban places after
disasters: Lessons from Hurricane Katrina. Philadelphia: University of Pennsylvania Press.
Black, P. (2005). Shelter from the storm: National disasters have underlined the
importance of business continuity planning-it's not just about compliance. Financial Planning. (Nov) 1-2.
Blaikie, P., Cannon, T., Davis, I., and Wisner, B. (2003). At risk: Natural hazards,
people's vulnerability and disasters. London: Routledge. Bolin, R., and L., Stanford. (1998). The northridge earthquake: Vulnerability and
216
disaster. New York: Routledge Publishers. Bowditch, J. L., and Buono, A. F. (2001). Primer on organizational behavior.
New York: John Wiley & Sons. Britnell, A. (2003). Crisis? What crisis? Profit. 22(5) 77. Box, G. E. P. (1979). Some problems of statistics and everyday life. Journal of
the American Statistical Association. 74(365) 1-4. Boyd, D., Dunn, L. A., Arnold, A., and Ullrich, M. (2008). Why have we not been
attacked again? Special Report. Washington: Defense Threat Reduction Agency.
Britton, N. R. (2005). Whatʼs a word: Opening up the debate. In Perry, R. W., and
Quarantelli, E.L., eds. What is a disaster?: New answers to old questions. (pp. 60-78). Philadelphia: XLibris.
Bryson, J. M. (1995). Strategic planning for public and nonprofit organizations.
San Francisco: Jossey-Bass. Buchanan, L., and O'Connell, A. (2006). A brief history of decison-making.
Harvard Business Review. (January) 33-41. Business Executives for National Security. (2007). Getting down to business: An
action plan for public-private disaster response coordination. Washington, D.C. http://www.bens.org/mis_support/Getting-Down-To-Business.pdf Accessed 25 September 2008.
Capra, F. (1982). The turning point: Science, society and the rising culture. New
York: Simon and Schuster. Cerullo, V., and Cerullo, M. J. (2004). Business continuity planning: A
comprehensive approach. Information Systems Management. 21(3) 70-78.
Checa, N., Maguire, J., and Barney, J. (2003). The new world disorder. Harvard
Business Review. (August) 70-79. Chepaitis, E. . (2004). The limited but invaluable legacy of the Y2K crisis for post-
911 crisis prevention, response and management. Journal of Information Technology Theory and Applcation. 6(3) 103-116.

217
Chernick, D. R. and Appel, D. (2007). Report on the impact on consumers from potential state & national legislation designed to prepare and protect citizens from natural catastrophes. Milliman, Inc. http://www.protectingamerica.org/pdf/Milliman_Report_FINAL.pdf. Accessed 20 January 2009.
Chesser, N. ed. (2007). Deterrence in the 21st century: An effects-based
approach in an interconnected world. US Strategic Command (USSTRATCOM).
Childs, D. R., and Dietrich, S. (2002). Contingency planning and disaster
recovery: A small business guide. Hoboken: John Wiley & Sons. Chiles, J. R. (2001). Inviting disaster: Lessons from the edge of technology. New
York: Harper Business. Choi, S. O., and Kim, B. T. (2007). Power and cognitive accuracy in local
emergency management networks. Public Administration Review. 67(December) 198-209.
Christensen, C. M., Baumann, H., Ruggles, R., and Sadtler, T. M. (2006).
Disruptive innovation for social change. Harvard Business Review. (December) 94-101.
Clarke, L. (2005). Worst cases: Terror and catastrophe in the popular
imagination. Chicago: University of Chicago Press. Clemens, M. (2007). A good model should be. Idiagram. Personal website.
http://www.idiagram.com/ideas/models.html. Accessed 25 November 2008.
Clinton, W. J. (1998). Presidential decision directive/NSC-63. Critical
infrastructure protection. Washington: White House. http://www.fas.org/irp/offdocs/pdd/pdd-63.htm. Accessed 10 January 2009.
Cohen, S., Eimicke, W. and Horan, J. (2002) Catastrophe and the public service:
A case study of the government response to the world trade center. Public Administration Review. 2002(62) 24-32.
Cone, C. L., Feldman, M. A., and DaSilva, A. T. (2007). Causes and effects.
Harvard Business Review. (July) 95-101. Converse, J. M. and Presser S. (1986). Survey Questions: Handcrafting the
218
Standardized Questionnaire. Sage University Series on Quantitative Applications in the Social Sciences 7(63). Thousand Oaks: Sage Publications.
Cooper, C. and Block, R. (2007). Disaster: Hurricane Katrina and the failure of
homeland security. New York: Henry Holt and Co. Coutu, D. L. (2002). How resilience works. Harvard Business Review. (March)
46-55. Crego, J. and Spinks, T. (1997) Critical incident management simulation. In Flinn,
R., Salas, E. Strub, M., and Martin, L., eds. (1997). Decision making under stress. Aldershot, UK: Ashgate Publishing Ltd. 85-94.
Creswell, J. W. (2003). Research design: Qualitative, quantitative, and mixed
methods approaches. Thousand Oaks: Sage Publications, Inc. Crowther, K. G., Haimes, Y. Y., and Taub, G. (2007). Systemic valuation of
strategic preparedness through application of the inoperability input-output model with lessons learned from Hurricane Katrina. Risk Analysis. 27(5) 1345-1364.
Cutter, S. L. (2003). The Vulnerability of Science and the Science of Vulnerability.
Annals of the Association of American Geographers. 93(1) 1-12. Cutter, S. L., Boruff, B. J. and Shirley, W. L. (2003). Social vulnerability to
environmental hazards. Social Science Quarterly. 84(2) 242-261. Cutter, S. L. (2005). Are we asking the right questions. In Perry, R. W., and
Quarantelli, E.L., eds. What is a disaster?: New answers to old questions. 39-48. Philadelphia: XLibris.
Cutter, S. L. and Finch, C. (2008). Temporal and spatial changes in social
vulnerability to natural hazards. Proceedings of the National Academies of Science. 105(7). 2301-2306.
Cvetkovich, G., Siegrist, M., Murray, R., and Tragesser, S. (2002). New
information and social trust: Assymetry and perseverance of attributions about hazard managers. Risk Analysis. 22(2) 359-367.
Daniels, R. J., Ketle, D. F., and Kunreuther, H., eds. (2006). On risk and disaster:
Lessons from Hurricane Katrina. Philadelphia: University of Pennsylvania Press.
219
Deisler, P. F. (2002). A perspective: Risk analysis as a tool for reducing the risks of terrorism. Risk Analysis. 22(3) 405-413.
Delich, M., Kelly, R., Dreibelbis, C. (2008). Building a resilient nation: Enhancing
security, ensuring a strong economy. Symposium Series. Arlington, VA: The Reform Institute.
Deloitte Center for Health Solutions. (2007). Year Two Pandemic Preparedness
Survey. Deloitte Development, LLC.. http://www.deloitte.com/ dtt/cda/doc/content/us _chs_ yeartwopandemicsurvey121806v1.pdf. Accessed 29 December 2008.
Department of Defense. (2005). Strategy for homeland defense and civil support.
Washington, D.C. Department of Defense. (2007). Homeland defense. Joint Pub 3-27. Washington,
D.C. Department of Homeland Security. (2004). Securing our homeland: U.S.
Department of homeland security strategic plan. Washington, D.C. Department of Homeland Security. (2004) National response plan. Washington,
D.C. Department of Homeland Security. (2006). A performance review of FEMA's
disaster management activities in response to Hurricane Katrina. OIC-06-32. Washington, D.C.
Department of Homeland Security. (2006). National infrastructure protection plan.
Washington, D.C. Department of Homeland Security and Department of Transportation. (2006).
Nationwide plan review, phase 2 report. Washington, D.C. Department of Homeland Security. (2007). Pandemic influenza: Best practices
and model protocols. Washington, D.C. Department of Homeland Security. (2006). Pandemic influenza: Preparedness,
response and recovery. Guide for critical infrastructure and key resources. Washington, D.C.
Department of Homeland Security. (2007). National preparedness guidelines.
Washington, D.C.
220
Department of Homeland Security. (2007). National incident management system
(draft). FEMA 501/Draft August 2007. Washington, D.C. Department of Homeland Security. Ready Business. Website. Washington, D.C.
http://www.ready.gov/business/index.html. Accessed 15 May 2008. Department of Homeland Security. (2008). The national response framework.
Washington, D.C. Department of Transportation, Department of Homeland Security. (2004). The
national plan for research and development in support of critical infrastructure protection. Washington, D.C.
Devore, J. L. (2004). Probability and Statistics for Engineering and the Sciences.
Belmont, CA: Brooks/Cole-Thomson Learning, Inc. DiNuzzo, J. (2004). Post 9-11 employee & business protection. Occupational
Health & Safety. 73(8) 66-89. Disaster Recovery Institute International. (2003). Professional practices for
business continuity planners. https://www.drii.org/professional_prac/index.php Accessed 15 February 2008.
Dorn, M. S. (2006). The "all hazards" way. School Planning & Management.
45(4) 10. Dorner, D. (1996). The logic of failure: Recognizing and avoiding error in complex
situations. Reading PA: Addison-Wesley. Douglas, M., and Wildavsky, A. (1982). Risk and culture. Berkeley: University of
California Press. Drucker, P. (1992). The new society of organizations. Harvard Business Review.
(September-October). 95-104. Early, P. C., and Mosakowski, E. (2004). Cultural intelligence. Harvard Business
Review. (October) 139-146. Edwards, F. L. (2007). Businesses prepare their employees for disaster recovery.
Public Manager. 35(4) 7-12. Eggers, W. D. (2004) Prospering in the secure economy. New York: Deloitte
221
Touche Tohmatsu. Ellis, R. J., and Thompson, M., eds. (1997). Culture matters: Essays in honor of
Aaron Wildavsky. Boulder: Westview Press. Erikson, K. T. (1976). Everything in its path: Destruction of community in the
Buffalo Creek flood. New York: Simon and Schuster. Farazmand, A., ed. (2001). Handbook of crisis and emergency management.
New York: Marcel Dekker, Inc. Federal Emergency Management Agency. (1993). Emergency management
guide for business and industry. FEMA 141. Washington, D.C. Federal Emergency Management Agency. (2004). Are you ready? An in-depth
guide to citizen preparedness. Washington, D.C. Federal Emergency Management Act. (2007). Robert T. Stafford disaster relief
and emergency assistance act as amended, and related authorities. FEMA 592. Washington, D.C.
Federal Register. (2008). Voluntary Private Sector Accreditation and Certification
Preparedness Program. FEMA. 73(248). 24 December 2008. Federal Response Plan. (1998). FEMA 9230.1-PL. Federal Emergency
Management Agency. Washington, D.C. Finucane, M. L., Alhakami, A., Slovic, P., Johnson, S. M. (2000) The affect
heuristic in judgments of risks and benefits. Journal of Behavioral Decision Making, 13(1), 1-17.
Fishbein, M. and Ajzen, I. (1975). Belief, attitude, intention and behavior: An
introduction to theory and research. MA: Addison-Wesley Publishers. Fischoff, B. and Furby, L. (1988). Measuring values: a conceptual framework for
interpreting transactions with special reference to contingent valuation of visibility. Journal of Risk and Uncertainty. 1. 147-188.
Fischoff, B., Gonzalez, B., Small, D., Lerner, J. (2003). Judged terror risk and
proximity to the world trade center. Journal of Risk and Uncertainty. 26(2/3)137-151.
Fitzpatrick, R. and Higgins, C. (1998) Usable software and its attributes.
222
Proceedings of Human Computer Interface on People and Computers XIII. http://www.comp.dit.ie/rfitzpatrick/papers/hci98_25.pdf. Accessed 28 April 2008.
Flinn, R., Salas, E. Strub, M., and Martin, L., eds. (1997). Decision making under
stress. Aldershot, UK: Ashgate Publishing Ltd. Flynn, S. (2007). The edge of disaster. New York: Random House. Flynn, S., and Prieto, D. B. (2006). Neglected defense: Mobilizing the private
sector to support homeland security. Council on Foreign Relations. New York.
FM Global. (2008). Study reveals most large companies exposed to natural
disasters but many unprepared. Press Release. Johnstown, R.I. Fowler, F.J. (1995). Improving survey questions: Design and evaluation.
Advanced Social Research Methods Series. Vol. 38. Thousand Oaks: Sage Publications.
Garcia-Acosta V. Historical disaster research, in Hoffman, S. and Oliver-Smith, A.
eds., (2001). Catastrophe & Culture. Sante Fe: School of American Research Press.
Gavetti, G., and Rivkin, J. W. (2005). How strategists really think: Tapping the
power of analogy. Harvard Business Review. (April) 54-63. Gentner, G. and Stevens, A. L., eds. (1983). Mental models. Hillsdale, NJ:
Lawrence Erlbaum Associates, Publishers. Ghemawat, P. (2001). Distance still matters: The hard reality of global expansion.
Harvard Business Review. (September) 137-147. Gilmore, J. S. III, Chairman. (1999). Annual report to the President and the
Congress of the advisory panel to assess domestic response capabilities for terrorism involving weapons of mass destruction. Assessing the Threat. Washington: RAND.
______ Second Annual Report (2000). Toward a National Strategy for Combating
Terrorism. ______ Third Annual Report (2001). For Ray Downey.
223
______ Fourth Annual Report (2002). Implementing the National Strategy. ______ Fifth Annual Report (2003). Forging Americaʼs New Normalcy. Gladwell, M. (2000). The tipping point: How little things can make a big
difference. New York: Little, Brown and Company. Granovetter, M. (1983). The strength of weak ties. Sociological Theory. 1. 201-
233 Greenberg, J. W. (2002). Sept 11, 2001: A CEO's story. Harvard Business
Review. (October) 58-64. Greenwald, B. and Kahn, J. (2005). All strategy is local. Harvard Business
Review. (September) 95-104. Government Accountability Office. (2006). Critical infrastructure protection:
Progress coordinating government and private sector efforts varies by sectorsʼ characteristics. GAO-07-30. Washington, D.C.
_____ (2008) Past experiences offer insights for recovering from hurricanes Ike
and Gustav and other recent natural disasters. Washington, D.C. GAO-08-1120.
Haddow, G. D., and Bullock, J. A. (2006). Introduction to emergency
management. Burlington: Elsevier Butterworth-Heinemann. Hale, E. (2006). Disaster plans: Beyond single-site events. American Banker.
171(154) 11-12. Hale, T., and Moberg, C. R. (2005). Improving supply chain disaster
preparedness. Journal of Physical Distribution and Logistics Management. 35(3/4) 195-207.
Hamel, G., and Valikangas, L. (2003). The quest for resilience. Harvard Business
Review. (September) 52-63. Harrald, J. R. (2005). Back to the drawing board: A first look at lessons learned
from Katrina. Testimony before the House committee on government reform hearings. 15 September 2005.
_____ (2006). National emergency management: Where does FEMA belong?
Testimony before the Senate homeland security and government affairs committee. 8 June 2006.
224
_____ (2006). Agility and discipline: Critical success factors for disaster
response. Annals of the American Academy of Political and Social Science. 604(1) 256-272.
Harrington, S. E. (2006). Rethinking disaster policy after Hurricane Katrina. In
Daniels, R. J., Ketle, D. F., and Kunreuther, H., eds. On risk and disaster: Lessons from Hurricane Katrina. (pp. 203-222). Philadelphia: University of Pennsylvania Press.
Hart, G. and Rudman, W. B. (1999). New world coming: American security in the
21st century. Phase 1 Report. United States commission on national security in the 21st century. Washington, D.C.
_____ (2000). Seeking a national strategy: A concert for preserving security and
promoting freedom. Phase II report of the United States commission on national security/21st century. Washington, D.C.
_____ (2001). Road map for national security: Imperative for change. Phase III
report of the United States. commission on national security/21st century. Washington, D.C.
Harvard Business School. (2000). Harvard business review on crisis
management. Boston: Harvard Business School Publishing. Harvard Business School. (2001) Harvard business review on decision-making.
Boston: Harvard Business School Publishing. Hayes-Roth, B. and F. Hayes-Roth (1980). A cognitive model of planning. Human
Planning Processes. Santa Monica: RAND Report R-2670-ONR. Henry, A. (2006). Preparing for the unknown: developing a business continuity
plan. Rural Telecommunications. 25(6)14-20. Heukelom, F. (2007). Kahneman and Tversky and the Origin of Behavioral
Economics. Tinbergen Institute Discussion Paper. 2007-003/1. http://papers.ssrn.com/ sol3/papers.cfm?abstract_id=956887. Accessed 10 Oct 2008.
Hiss, S. B. (2006). Does corporate social responsibility need social capital?
Journal of Corporate Citizenship. 2006(23) 81-91. Hoch, S. J. (2001). Combining mocels with intuition to improve decisions. In
Hoch, S. J., H.C. Kunreuther and R. E. Gunther. Wharton on making
225
decisions. Hoboken: John Wiley & Sons. 81-101. Hoch, S. J., H.C. Kunreuther and R. E. Gunther. (2001). Wharton on making
decisions. Hoboken: John Wiley & Sons. Hoffman, S. M., and Oliver-Smith, A. (2002). Catastrophe & culture: The
anthropology of disaster. Santa Fe: School of American Research Press. Hofstede, G. (1997). Cultures and organizations: Software of the mind. New
York: McGraw-Hill. Hofstede, G. (2001). Culture's consequences. Thousand Oaks: Sage
Publications, Inc. Hogan, L. J., Conference Moderator. 2001. Community response to the threat of
terrorism: An online symposium. Public Entity Risk Institute. http://www.riskinstitute.org. Accessed 15 January 2008.
Hogarth, R. M, Portell, M., and Cruxart, A. (2007). What risks do people perceive
in everyday life? A perspective gained from the experience sampling method (ESM). Risk Analysis. 27(6) 1427-1439.
Homeland Security Advisory Council. (2008). Top ten challenges facing the next
secretary of homeland security. Washington, D.C. Homeland Security Council. (2006). National strategy for pandemic influenza.
Washington, D.C. Homeland Security Council. (2007). National strategy for homeland security.
Washington, D.C. Homeland Security Institute. (2007). Homeland security strategic planning:
Mission area analysis. RP 05-05-03. Arlington. H.R. 1 (2007). Implementing recommendations of the 9/11 commission act of 2007. U.S. House of Representatives, 110th Congress. Washington, D.C. http://thomas.loc.gov/cgi-bin/query/F?c110:5:./temp/~c110fnUs5s:e317311. Accessed 20 December 2008. Hutchins, G. (2006). Your future in risk management. Quality Progress. 39(3) 54-
55.

226
Interrnational Risk Governance Council. (2008). Introduction to the IRGC Risk Governance Framework. http://www.irgc.org/IMG/pdf/An_Introduction_ to_the_IRGC_Risk_Governance_ Framework. Accessed 10 September 2008.
IBM Business Solutions. (2006) Panic slowly: Integrated disaster response and
built-in business continuity. White Paper. http://www-935.ibm.com/services/us/ bcrs/pdf/wp_integrated-disaster-response.pdf. Accessed 15 September 2007.
Johnson, R. M. (2006). Planning for emergencies. Associations Now. May. 24. Kahneman, D., Slovic, P. and Tversky, A., eds. (1982). Judgment under
uncertainty: Heuristics and biases. Cambridge: Cambridge University Press.
Kaplan, R. S., and Norton, D. P. (2000). Having trouble with your strategy? Then
map it. Harvard Business Review. (September) 167-176. Kaplan, R. S., and Norton, D. P. (2005). The office of strategy management.
Harvard Business Review. (October) 74-80. Kapucu, N. (2005). Interorganizational Coordination in Dynamic Context:
Networks in Emergency Management. Connections. 26(2) 33-48. Kasperson, R., Renn, O., Slovic, P., Brown, H., Emel, J., Goble, R., Kasperson
J., and Ratick, S. (1988). The social amplification of risk: a conceptual framework. Risk Analysis. 8(2). 178-187
Kayyem, J. N., and Pangi, R. L., eds. (2003). First to arrive: State and local
responses to terrorism. Cambridge: MIT Press. Kettl, D. F. (2006). Is the worst yet to come? Annals of the American Academy of
Political and Social Science. 604(1) 273-287. Kim, W. C., and Mauborgne, R. (2003). Tipping point leadership. Harvard
Business Review. (April) 60-69. Kissel, R. Small business information security: The fundamentals. National
Institute of Standards and Technology. NSTIR 7621 (Draft). (2009). Klein, G. (1997). The current status of the naturalistic decision-making
framework. In Flinn, R., Salas, E. Strub, M., and Martin, L., eds. (1997). Decision making under stress. Aldershot, UK: Ashgate Publishing Ltd. 12-

227
28. Klein, G., Snowden, D. and Pin, C. (2007). Anticipatory thinking. In Moiser, K.
and Fischer, U., eds. (2007). Proceedings of the eighth international conference on naturalistic decision-making. Pacific Grove, CA. http://bss.sfsu.edu/kmosier/NDM8_Proceedings.pdf. Accessed 20 March 2009.
Koller, G. (2005). Risk assessment and decision making in business and
industry. Boca Raton: Chapman & Hall/CRC. Krell, E. (2006). Worst-case scenario. Electric Perspectives. 31(6) 52-67. Kreps, G. ed. (2006). Facing hazards and disasters: Understanding human
dimensions. Washington, D.C.: National Research Council, National Academy of Sciences.
Kridel, M. S. (2006). Disaster recovery survival equation: Bc>dr+l. Infotech
Update. 15(6) 1-5. Kuhn, T.S. (1970). The Structure of Scientific Revolutions. 2nd ed. Chicago:
University of Chicago Press. Kunreuther, H., Movemsky, N. and Kahneman, D. (2001). Making Low Probabilities
Useful. Journal of Risk and Uncertainty. 23(2) 103-120. Kunreuther, H. (2002). Risk analysis and risk management in an uncertain world.
Risk Analysis. 22(4) 655-664. Kunreuther, H. (2002). Insurance in managing extreme event: Implications for
terrorism coverage. Risk Analysis. 22(3) 427-437. Kunreuther, H. (2006). Risk and reaction. Harvard International Review. 28 (3)
38-42. Kunreuther, H., Meyer, R. and Van den Bulte, C. (2004). Risk analysis for
extreme events: Economic incentives for reducing future losses. Gaithersburg, MD: National Institute of Standards and Technology. NIST GCR 04-871.
Kunreuther, H. (2006). Has the time come for comprehensive natural disaster
insurance? In Daniels, R. J., Ketle, D. F., and Kunreuther, H., eds. On risk and disaster: Lessons from Hurricane Katrina. (pp. 175-202).
228
Philadelphia: University of Pennsylvania Press. Kuzyk, R. (2007). Serving through disaster. Library Journal. 132(5) 26-29. Lattin, J., Carroll, D. J. and Green, P. E. (2003). Analyzing multivariate data.
Pacific Grove, CA: Brooks/Cole-Thomson Learning, Inc. Laye, J. (2002). Avoiding disaster: How to keep your business going when
catastrophe strikes. Hoboken: John Wiley & Sons. Leavitt, H. J. (2003). Why hierarchies thrive. Harvard Business Review. (March)
96-102. Lerbinger, O. (1997). Crisis manager. Mahwah NJ: Lawrence Erlbaum
Associates, Inc. Lindell, M. K., Prater, C., and Perry, R. W. (2007). Introduction to emergency
management. Hoboken: John Wiley & Sons. Lipsky, J. (2008). IMF says crisis marks tectonic shift in financial markets. IMF
Survey Magazine. 25 September 2008. http://www.imf.org/external/pubs/ ft/survey/so/2008/new092508a.htm. Accessed 23 October 2008.
MacGregor, D.G. (2003). Public response to Y2K: Social amplification and risk
adaptation: or, “how I learned to stop worrying and love Y2K. In Pidgeon, Kasperson and Slovic (eds.). The Social Amplification of Risk. (pp. 243-261). Cambridge: Cambridge University Press.
Mackey, W. F., Long, J., Crisp, H., Mayian, S., Cropley, D., and Raza, Shabaz.
(2002). The role of systems engineering in combating terrorism. Paper presented at the International Council on Systems Engineering 2002. Las Vegas.
Magnusson, P. Thornton, E., Brady, D., and Ante, S. (2004). What companies
need to do. Business Week. (3896) 26-27. Masuda, J. R., and Garvin, T. (2006). Place, culture, and the social amplification
of risk. Risk Analysis. 26(2) 437-454. McCarthy, E. (2007). Tech tools for disaster recovery. Journal of Financial
Planning. 20(2) 28-34.
229
McGill, W. L., Ayyub, B. M., and Kaminskiy, M. (2007). Risk analysis for critical asset protection. Risk Analysis. 27(5) 1265-1269. Meyer, R. J. Why we under-prepare for hazards. (2006). In Daniels, R. J., Ketle,
D. F., and Kunreuther, H., eds. On risk and disaster: Lessons from Hurricane Katrina. (pp. 153-174). Philadelphia: University of Pennsylvania Press.
Mileti, D. S. (1999). Disasters by design. Washington, D.C.: National Academy of Sciences. Moiser, K. and Fischer, U., eds. (2007). Proceedings of the eighth international
conference on naturalistic decision-making. Pacific Grove, CA. http://bss.sfsu.edu/kmosier/NDM8_Proceedings.pdf. Accessed 20 March 2009.
Molich, R. and Nielsen, J. (1990) Improving a human-computer dialogue.
Communications of the Association for Computing Machinery. 33(3) 338-348.
Mitroff, I. I., Pauchant, T. C. (1992). Transforming the crisis-prone organization.
San Francisco: Jossey-Bass, Inc. Mitroff, I, I., Pearson, C. M., and Harrington, L. K. (1996). The essential guide to
managing corporate crises. New York: Oxford University Press. Mitroff, I. and Anagnos, G. (2001). Managing crises before they happen: What
every manager needs to know about crisis management. New York: Amacon Publishing.
Mitroff, I. I., and Alpaslan, M. C. (2003). Preparing for evil. Harvard Business
Review. (April) 109-115. Mitroff, I. (2005). Why some companies emerge stronger and better from a crisis:
7 essential lessons for surviving disaster. New York: Amacon Publishing. Montgomery, D. C. (2005). Design and Analysis of Experiments. 6th Ed.
Hoboken: John Wiley and Sons. Moore, G. A. (2007). Focus on the middle term. Harvard Business Review. (July)
84-90. Morgan, J., and Mellinger, B. (2003). "Disaster doctrine." Association
230
Management. 55(9) 26-29. Morgan, M. G., Fischhoff, B., Bosatrom, A., and Atman, C. J. (2002). Risk
communication: A mental models approach. Cambridge: Cambridge University Press.
Morganti, M. (2002). A business continuity plan keeps you in business.
Professional Safety. 47(1) 19. Moss, M. L., and Shelhamer, C. (2007). The Stafford Act: Priorities for reform.
The Center for Catastrophe Preparedness and Response, New York: New York University.
Moteff, J. and Parfomak, P. (2004) Critical infrastructure and key assets:
Definition and identification. CRS Report for Congress. Congressional Research Service. Washington, D.C.
Moynihan, D. P. (2007). From forest fires to Hurricane Katrina: Case studies of
incident command systems. IBM Center for the Business of Government. Washington, D.C.
Murphy, C., and Gardoni, P. (2006). The role of society in engineering risk
analysis: A capabilities-based approach. Risk Analysis. 26(4) 1073-1083. National Commission on the Terrorist Attacks Upon the United States. (2005).
The 9/11 Commission Report. New York: W.W. Norton & Company. National Fire Protection Association. (2007). Standard on disaster/emergency
management and business continuity programs (NFPA 1600). Quincy, MA.
Nielsen, J. (1993). Usability engineering. San Francisco: Morgan Kaufmann. Nielsen, J. (1994). Conduct a heuristic evaluation. Online instruction guide.
http://www.useit.com/papers/heuristic/heuristic_evaluation.html . Accessed 13 September 2008.
Nielsen, J. and Levy, J. (1997). Measuring usability: preference vs. performance.
Communications of the Association for Computing Machinery. 37(4) 66-77.
Norris, F., Stevens, S. P., Pfefferbaum, B., and Wyche, K. F. (2008) Community
231
resilience as a metaphor, theory, set of capacities, and strategy for disaster readiness. American Journal of Community Psychology. 41(4) 127-150.
O'Hanlon, M., Orszag, P. R., and Daalder, I. H., et al. (2002). Protecting the
American homeland: A preliminary analysis. Washington, D.C: Brookings Institution Press.
Omand, D. (2004). Emergency planning, security and business continuity. RUSI
Journal. 149(4) 26-33. Orasanu, J. (1997) Stress and naturalistic decision making: Strengthening the
weak links. In Flinn, R., Salas, E. Strub, M., and Martin, L., eds. (1997). Decision making under stress. Aldershot, UK: Ashgate Publishing Ltd. 43-66.
Osborne, M. (2005). Crisis management. Telecommunications International.
39(12) 32-33. Pelling, Ma. (2003). The vulnerability of cities: Natural disaster and social
resilience. London: Earthscan Publications, Ltd. Perr, J. 2004. Cognitive dissonance, terrorism and 9/11. Perspectives.com.
March 30. http://www.perrspectives.com/articles/art_cogdis01.htm Accessed 04 January 2008.
Perrow, C. (1999). Normal accidents. Princeton: Princeton University Press. Perrow, C. (2007). The next catastrophe: Reducing our vulnerabilities to natural,
industrial, and terrorist disasters. Princeton: Princeton University Press. Perry, R. W., and Quarantelli, E.L., eds. (2005). What is a disaster?: New
answers to old questions. Philadelphia: XLibris. Perry, R. W. (2007) Introduction in Rodriguez, H., and Quarantelli, E. L., eds.
(2007). Handbook of disaster research. New York: Springer Publishing. Pidgeon, N., Kasperson, R. E., and Slovic, P., eds. (2003). The social
amplification of risk. Cambridge: Cambridge University Press. Pine, J. C. (2007). Technology in emergency management. Hoboken: John
Wiley & Sons. Plane, K. (2007). A very peculiar practice? Promulgating social partnerships with
232
small business. Australian Journal of Adult Learning. 47(1) 25-45. Porter, M. E. , and Kramer, M. R. (2006). Strategy & society: The link between
competitive advantage and corporate social responsibility. Harvard Business Review. (December) 78-92.
Putnam, R. D., and Feldstein, L. M. (2003). Better together: Restoring the
American community. New York: Simon & Schuster. Raish, W., Statler, M. and Burgi, P. (2007). Mobilizing corporate resources to
disasters: Toward a program for action. InterCEP White Paper. New York University. http://www.nyu.edu/intercep/events/20070125-218.html. Accessed 20 July 2007.
Rasmussen, J. (1997). Merging paradigms: Decision making, management, and
cognitive control. In Flinn, R., Salas, E. Strub, M., and Martin, L., eds. (1997). Decision making under stress. Aldershot, UK: Ashgate Publishing Ltd. 67-81.
Rayner, S. (1988). Muddling through metaphors to maturity: A commentary on
Kasperson, et al, The social amplification of risk. Risk Analysis. 8(2) 201-204.
Relyea, H. C. (2006). National emergency powers. CRS Report to Congress.
Washington, D.C. Renn, E. O. (2000). Cross-cultural risk perception - a survey of empirical studies.
Amsterdam: Kluwer Academic Publishers. Renn, E.O. (2006). Risk governance: Towards an integrative approach.
International Risk Governance Council. White Paper Nr. 1. Geneva. Richardson, H. W., Gordon, P., and Moore J. E., eds. (2007). The economic
consequences and costs of terrorism. Cheltenham: Edward Elgar Publishing, Inc.
Rigby, D., and Bilodeau, B. (2007). A growing focus on preparedness. Harvard
Business Review. (July) 21-22. Ripley, A. (2008). The Unthinkable: Who survives when disaster strikes and why.
New York: Crown Publishers. Roberts, J., and Ohlhorst, F. J. (2005). Disaster planning promises big channel

233
profits. CRN channel web research network. (January) 22. Rodriguez, H., and Quarantelli, E. L., eds. (2007). Handbook of disaster
research. New York: Springer Publishing. Rose, A. Z. (2004). Defining and measuring economic resilience to disasters.
Disaster prevention and management. 13. 307-314. _______ (2009). A framework for analyzing the total economic impacts of
terrorist attacks and natural disasters. Journal of Homeland Security and Emergency Management. 6(1) 1-27.
Rubin, C. ed. (2007). Emergency management: The American experience 1900-
2005. Fairfax, VA: Public Entity Risk Institute. Ruiz, G. (2005). Business continuity plans for an avian flu pandemic largely off
workforce radar. Workforce Management. 84(14) 34-37. Rutledge, A., and Boykin, K. (2006). After the fire. Circuits Assembly. 17(6) 26-
33. Ryan, J. J. C. H. (2001). Information security practices in small business.
Dissertation. The George Washington University, Washington, D.C. Sarewitz, D., Pielke, R. and Keykhah, M. (2003). Vulnerability and risk: Some
thoughts from a political and policy perspective. Risk Analysis. 23(4) 805-810.
Sarrel, M. D. (2007). Your disaster recovery plan: Building a business continuity
plan in case of disaster is vital to the survival of your company. PC Magazine. 26(2) 1.
Schein, E. H. (1992). Organizational culture and leadership. San Francisco:
Jossey-Bass. Schmidtklein, M. C., Deutsch, R. C., Piegorsch, W., and Cutter, S. L. (2008). A
sensitivity analysis of the social vulnerability index. Risk Analysis 28(4) 1099-1114.
Schwarzman, S. (2008). Some lessons of the financial crisis. Wall Street Journal.
4 November 2008. http://online.wsj.com/article/SB122576100620095567 .html. Accessed 15 December 2008.
Shaw, G. L., and Harrald, J. R., (2006) Identification of the core competencies of
234
executive level business crisis and continuity managers.” Journal of Homeland Security and Emergency Management. 1 (1) http://www.bepress.com/jhsem/vol1/iss1/1/. Accessed 14 November 2007.
Senate, U.S. (2006). Hurricane Katrina: A nation still unprepared. Special Report
of the Committee on Homeland Security and Governmental Affairs. S. Rept. 109-322. http://hsgac.senate.gov/_files/Katrina/FullReport.pdf. Accessed 15 Jan 2008.
Senge, P. (1990). The fifth discipline: The art & practice of the learning
organization. New York: Currency Doubleday. Sheffi, Y. (2007). The resilient enterprise: Overcoming vulnerability for
competitive advantage. Cambridge: MIT Press. Sheffi, Y., and Rice, J. B. (2005). A supply chain view of the resilient enterprise.
MIT Sloan Management Review. 47(1) 41-48. Silverstein, M. E. (1992). Disasters: Your right to survive. Washington, D.C:
Brassey's Publishing. Simpson, D. (2006). The metrics of hazards and the hazards of metrics:
Thoughts on the measurement of community preparedness. Briefing for the Disasters Roundtable. University of Louisville: Center for Hazards Research and Policy Development.
Slovic, P. (2000). The perception of risk. London: Earthscan Publications LTD. Slovic, P. (2002). Terrorism as hazard: A new species of trouble. Risk Analysis.
22(3) 425-426. Slovic, P., Fischhoff, B., and Lichtenstein, S. (1979). Rating the risks.
Environment. 21(3) 14-39. Slovic, P., Fischhoff, B., and Lichtenstein, S. (1980). Facts versus fears:
Understanding perceived risk. In Kahneman, D., Slovic, P. and Tversky, A., eds. (1982). Judgment under uncertainty: Heuristics and biases. (pp. 464-489). Cambridge: Cambridge University Press.
Slovic, P. Kunreuther, H. and White. G. (1974). Decision processes, rationality
and adjustment to natural hazards. In Slovic, P. (2000). The perception of
235
risk. (pp. 1-31). London: Earthscan Publications LTD. Smith, D. (2005). In the eye of the beholder? Making sense of the system(s) of
disaster(s). In Perry, R. W., and Quarantelli, E.L., eds. What is a disaster?: New answers to old questions. (pp. 201-236). Philadelphia: XLibris.
Snowden, D. J., and Boone, M. E. (2007). A leader's framework for decision
making. Harvard Business Review. (November) pp. 69-76. Solovoy, A. (2007). Business continuity planning. Hospitals and Health Networks.
6(2) 34-43. Spector, P. E. (1992). Summated Rating Scale Construction: An Introduction.
Sage University Series on Quantitative Applications in the Social Sciences 7(82). Thousand Oaks: Sage Publications.
Stallings, R. A., ed. (2003). Methods of disaster research. Philadelphia: Xlibris
Corp. Steinberg, J. (2002). The management of the human impact of a large-scale
community disaster: A perspective on the world trade center terrorist attack. Brief Treatment and Crisis Intervention. 2(2) 173-181.
Steinberg, T. (2006). Acts of god: The unnatural history of natural disaster in
America. 2nd edition. New York: Oxford University Press. Susman, T. (2003). Terrorism: Real threats. Real costs. Joint solutions.
Monograph. The Business Roundtable. Washington, D.C. Sutcliffe, K. M., and Weber, K. (2003). The high cost of accurate knowledge.
Harvard Business Review. (May) 74-82. Syed, A., and Syed, A. (2004). Business continuity planning methodology.
Mississauga, ON: Sentryx. Thomas, A., and Fritz, L. (2006). Disaster relief, inc. Harvard Business Review.
(November) 114-122. Thomas, W. M. (2007). Community resilience: Exploring the conceptual
framework. Bulletin of the American Meteorological Society. 88(3) 407-407.
Thompson, M., Ellis, R. J., and Wildavsky, A., eds. (1980). Cultural theory.
236
Boulder: Westview Press. Tierney, K. J. (2007). Businesses and disasters: Vulnerability, impact and
recovery. In Rodriguez, H., and Quarantelli, E. L., eds. Handbook of disaster research. (pp. 275-296). New York: Springer Publishing.
Turkle, S. (2003). Technology and human vulnerability. Harvard Business
Review. (September) 43-50. Tversky, A. and Kahneman, D. (1971). Belief in the law of small numbers.
Psychological Bulletin. 2. 105-110. Tversky, A. and Kahneman, D. (1973). Availability: A heuristic for judging
frequency and probability. In Kahneman, D., Slovic, P. and Tversky, A., eds. (1982). Judgment under uncertainty: Heuristics and biases. (pp. 164-178.) Cambridge: Cambridge University Press
Tversky, A. and Kahneman, D. (1974). Judgment under uncertainty. Science.
185(4157) 1124-1131. Tversky, A. and Khaneman, D. (1992). Advances in Prospect Theory: Cumulative
Representation of Uncertainty. Journal of Risk and Uncertainty. 5. 297-323. U.S. Congress (1988). Robert T. Stafford disaster relief and emergency
assistance act. Public Law 93-288. U.S. Code Title 42. Chap. 68. U.S. Congress (2002). Homeland Security Act of 2002. Public Law 107-296. H.R.
5005. 107th Congress. U.S. Congress. (2007). Implementing recommendations of the 9/11 commission
act of 2007. H.R. 1. 110th Congress. U.S. Northern Command. (2004). Civil support concept of employment. Colorado
Springs, CO. U.S. Northern Command. (2006). Defense support of civil authorities. CONPLAN
2501-05. Colorado Springs, CO. Vale, L. J., and Campanella, T. J., eds. (2005). The resilient city: How modern
cities recover from disaster. New York: Oxford University Press. Van Dorp, J., Merrick, R., Harrald, J., Mazzuchi, T., Grabowski, M. (2001). A risk
management procedure for the Washington state ferries. Risk Analysis. 21(1). 127-142
237
Vose, D. (2008). Risk analysis: a quantitative guide. West Sussex: John Wiley &
Sons Ltd. Wainwright, V. L. (2007). Business continuity by design. Health Management
Technology. 28(3) 20-21. Watkins, M. D., and Bazerman, M. H. (2003). Predictable surprises: The
disasters you should have seen coming. Harvard Business Review. (March) 73-80.
Weick, K. E., and Sutcliffe, K. M. (2001). Managing the unexpected: Assuring
high performance in an age of complexity. San Francisco: Jossey-Bass. White House. (2002). National strategy to combat weapons of mass destruction.
Washington, D.C. White House. (2003) National strategy for physical protection of critical
infrastructures and key assets. Washington, D.C. White House. (2003). National strategy for combating terrorism. Washington,
D.C. White House. (2003). National strategy to secure cyberspace. Washington, D.C. White House (2003). Critical infrastructure identification, prioritization, and
protection. Homeland security presidential directive 7. Washington, D.C. White House. (2006). National security strategy of the United States.
Washington, D.C. White House. (2007). National strategy for information sharing. Washington, D.C.
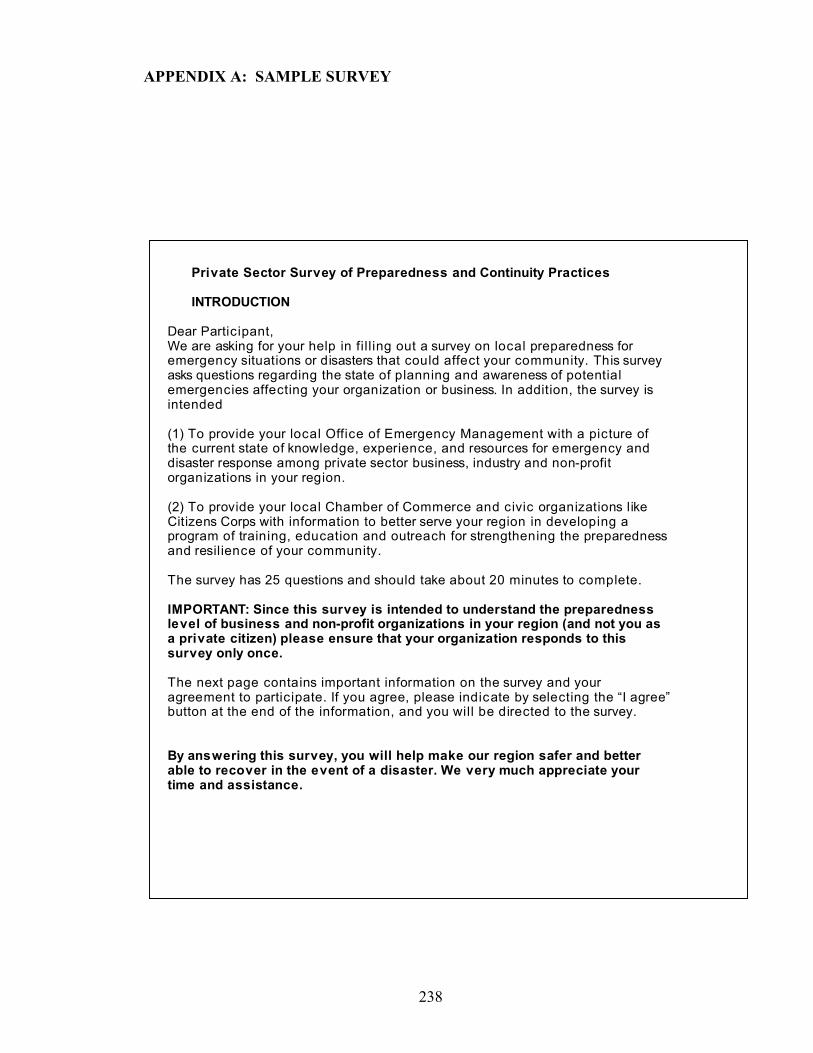
238
APPENDIX A: SAMPLE SURVEY
Private Sector Survey of Preparedness and Continuity Practices INTRODUCTION
Dear Participant, We are asking for your help in fil l ing out a survey on local preparedness for emergency situations or disasters that could affect your community. This survey asks questions regarding the state of planning and awareness of potential emergencies affecting your organization or business. In addition, the survey is intended (1) To provide your local Office of Emergency Management with a picture of the current state of knowledge, experience, and resources for emergency and disaster response among private sector business, industry and non-profit organizations in your region. (2) To provide your local Chamber of Commerce and civic organizations like Citizens Corps with information to better serve your region in developing a program of training, education and outreach for strengthening the preparedness and resilience of your community. The survey has 25 questions and should take about 20 minutes to complete. IMPORTANT: Since this survey is intended to understand the preparedness level of business and non-profit organizations in your region (and not you as a private citizen) please ensure that your organization responds to this survey only once. The next page contains important information on the survey and your agreement to participate. If you agree, please indicate by selecting the “I agree” button at the end of the information, and you will be directed to the survey. By answering this survey, you will help make our region safer and better able to recover in the event of a disaster. We very much appreciate your time and assistance.
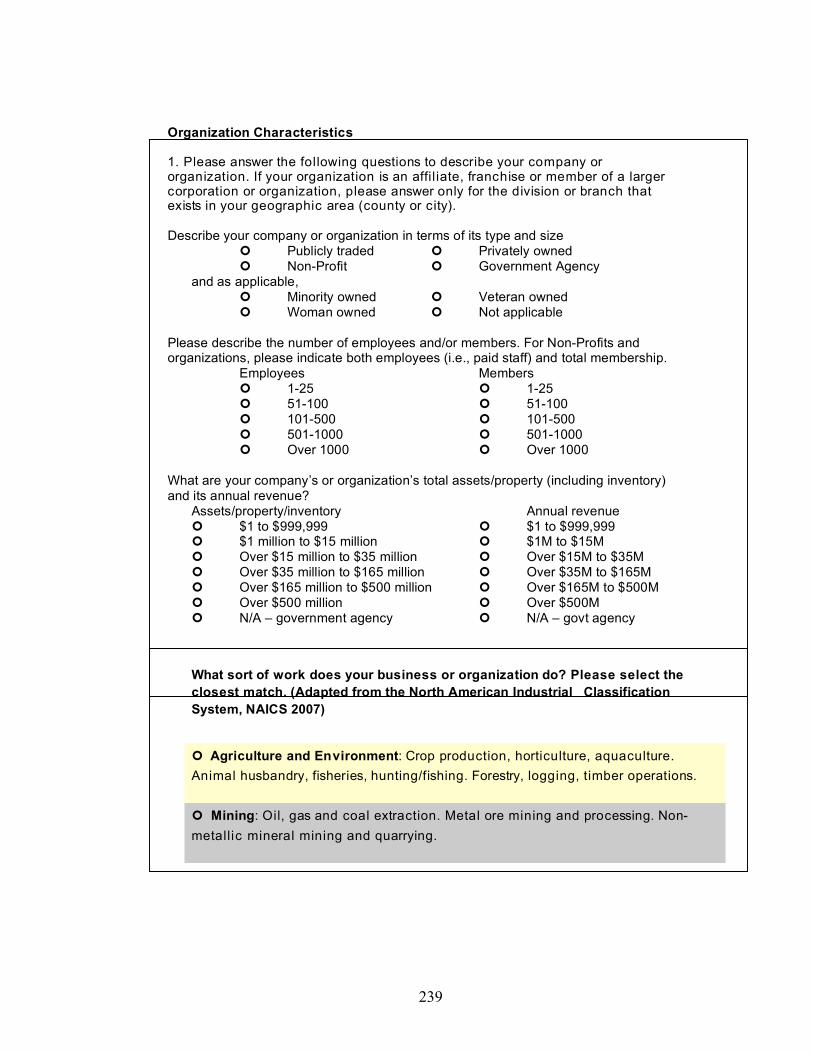
239
Organization Characteristics 1. Please answer the following questions to describe your company or organization. If your organization is an affil iate, franchise or member of a larger corporation or organization, please answer only for the division or branch that exists in your geographic area (county or city). Describe your company or organization in terms of its type and size Publicly traded Privately owned Non-Profit Government Agency and as applicable, Minority owned Veteran owned Woman owned Not applicable Please describe the number of employees and/or members. For Non-Profits and organizations, please indicate both employees (i.e., paid staff) and total membership. Employees Members 1-25 1-25 51-100 51-100 101-500 101-500 501-1000 501-1000 Over 1000 Over 1000 What are your company’s or organization’s total assets/property (including inventory) and its annual revenue? Assets/property/inventory Annual revenue $1 to $999,999 $1 to $999,999 $1 million to $15 million $1M to $15M Over $15 million to $35 million Over $15M to $35M Over $35 million to $165 million Over $35M to $165M Over $165 million to $500 million Over $165M to $500M Over $500 million Over $500M N/A – government agency N/A – govt agency
What sort of work does your business or organization do? Please select the closest match. (Adapted from the North American Industrial Classification System, NAICS 2007)
Agriculture and Environment: Crop production, horticulture, aquaculture. Animal husbandry, fisheries, hunting/fishing. Forestry, logging, timber operations.
Mining: Oil, gas and coal extraction. Metal ore mining and processing. Non-metallic mineral mining and quarrying.
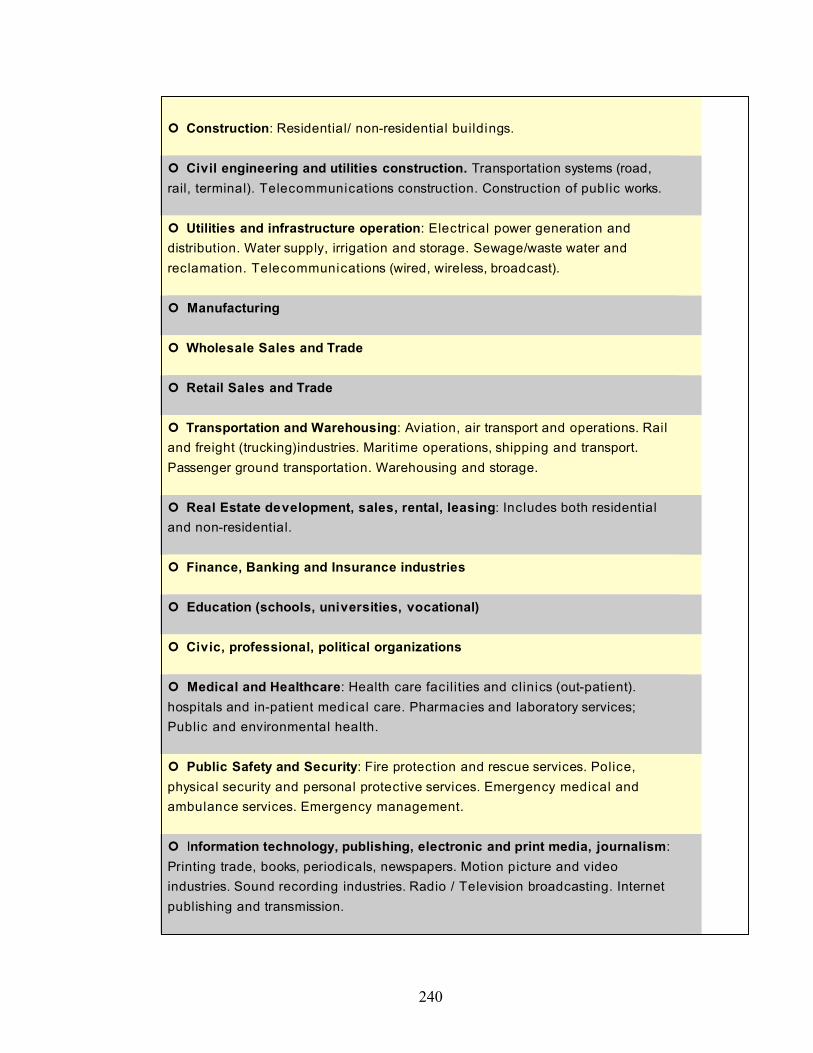
240
Construction: Residential/ non-residential buildings.
Civil engineering and utilities construction. Transportation systems (road, rail, terminal). Telecommunications construction. Construction of public works.
Utilities and infrastructure operation: Electrical power generation and distribution. Water supply, irrigation and storage. Sewage/waste water and reclamation. Telecommunications (wired, wireless, broadcast).
Manufacturing
Wholesale Sales and Trade
Retail Sales and Trade
Transportation and Warehousing: Aviation, air transport and operations. Rail and freight (trucking)industries. Maritime operations, shipping and transport. Passenger ground transportation. Warehousing and storage.
Real Estate development, sales, rental, leasing: Includes both residential and non-residential.
Finance, Banking and Insurance industries
Education (schools, universities, vocational)
Civic, professional, political organizations
Medical and Healthcare: Health care facilities and clinics (out-patient). hospitals and in-patient medical care. Pharmacies and laboratory services; Public and environmental health.
Public Safety and Security: Fire protection and rescue services. Police, physical security and personal protective services. Emergency medical and ambulance services. Emergency management.
Information technology, publishing, electronic and print media, journalism: Printing trade, books, periodicals, newspapers. Motion picture and video industries. Sound recording industries. Radio / Television broadcasting. Internet publishing and transmission.
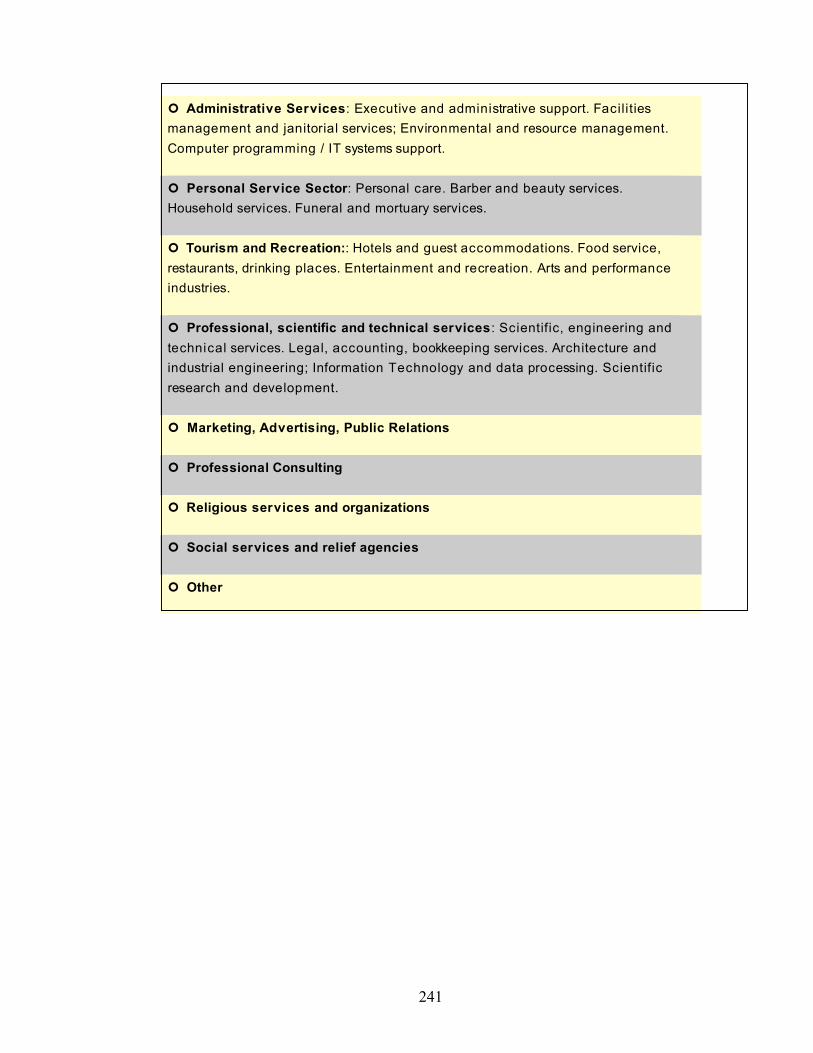
241
Administrative Services: Executive and administrative support. Facilities management and janitorial services; Environmental and resource management. Computer programming / IT systems support.
Personal Service Sector: Personal care. Barber and beauty services. Household services. Funeral and mortuary services.
Tourism and Recreation:: Hotels and guest accommodations. Food service, restaurants, drinking places. Entertainment and recreation. Arts and performance industries.
Professional, scientific and technical services: Scientific, engineering and technical services. Legal, accounting, bookkeeping services. Architecture and industrial engineering; Information Technology and data processing. Scientific research and development.
Marketing, Advertising, Public Relations
Professional Consulting
Religious services and organizations
Social services and relief agencies
Other
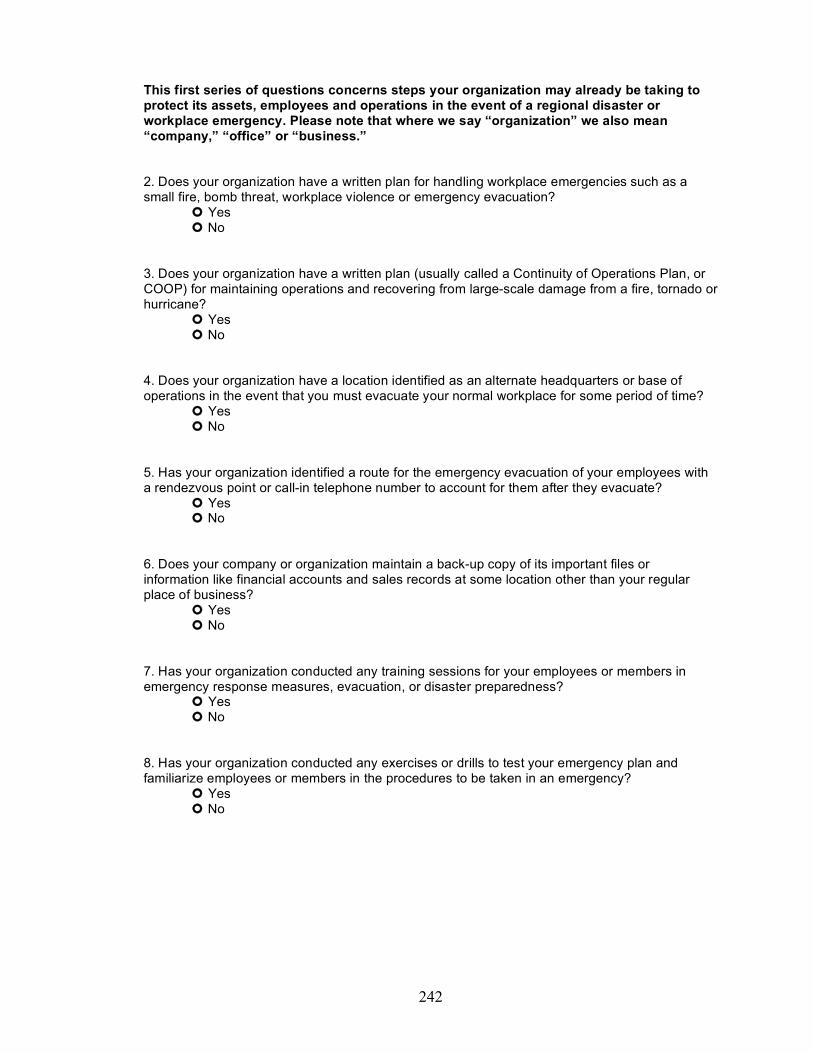
242
This first series of questions concerns steps your organization may already be taking to protect its assets, employees and operations in the event of a regional disaster or workplace emergency. Please note that where we say “organization” we also mean “company,” “office” or “business.” 2. Does your organization have a written plan for handling workplace emergencies such as a small fire, bomb threat, workplace violence or emergency evacuation? Yes No 3. Does your organization have a written plan (usually called a Continuity of Operations Plan, or COOP) for maintaining operations and recovering from large-scale damage from a fire, tornado or hurricane? Yes No 4. Does your organization have a location identified as an alternate headquarters or base of operations in the event that you must evacuate your normal workplace for some period of time? Yes No 5. Has your organization identified a route for the emergency evacuation of your employees with a rendezvous point or call-in telephone number to account for them after they evacuate? Yes
No 6. Does your company or organization maintain a back-up copy of its important files or information like financial accounts and sales records at some location other than your regular place of business? Yes
No 7. Has your organization conducted any training sessions for your employees or members in emergency response measures, evacuation, or disaster preparedness? Yes
No 8. Has your organization conducted any exercises or drills to test your emergency plan and familiarize employees or members in the procedures to be taken in an emergency? Yes
No

243
9. If your organization has a written plan for emergency response or business continuity planning, did you receive assistance from another organization or resource in writing it? If “yes” please indicate the source of that assistance.
We do not have a written plan. We have a written plan but no assistance was received in writing it. Yes we have a plan, and we received assistance from the following sources: (Select all that apply):
Parent corporation or headquarters staff Private consultant or firm we hired to develop the plan Corporate partner or partner in a mentor-protégé relationship Professional organization, association or club Guidelines adopted from a textbook or professional journal Guidelines utilized from another company’s critical incident plan Guidelines from a federal agency (FEMA, DHS, DOE, NIST) Guidelines from a state emergency management agency Guidelines from a local (county/city) office Other (please specify) __________________________________ 10. Who in your organization is responsible for the management of emergency preparedness or continuity of operations planning? President, Owner or CEO A professional emergency manager within the company An employee who serves as company emergency manager or security officer A professional emergency manager at our corporate headquarters A consultant or subject matter expert hired by the company Other (please specify) ________________________________________________ 11. Has the individual noted in the question above received formal training in emergency preparedness continuity of operations planning, risk management or a similar subject? Yes
No If yes, please indicate when the most recent training session or seminar was attended. Within the last year
Between 1 and 2 years ago. Between 2 and 3 years ago.
More than 3 years ago, but within the last 5 years. More than 5 years ago. 12. Does your organization coordinate with a partner or with members of a group for emergency preparedness or continuity of operations planning or training? Yes No If yes, please indicate the type of partner you coordinate with (select all that apply): Another business or organization similar to our own A professional organization or trade association A business organization or planning group in our neighborhood or area The local Chamber of Commerce The local Citizens Corps chapter A community service organization (Kiwanis, Rotary Club, Lions Club) A local First Responder (fire dept., police dept., emergency management, etc.) A high school, community college, vocational school or university A church or faith-based organization A local non-profit relief organization A national or federal organization or agency (i.e., American Red Cross). Other (please specify) __________________________________________________
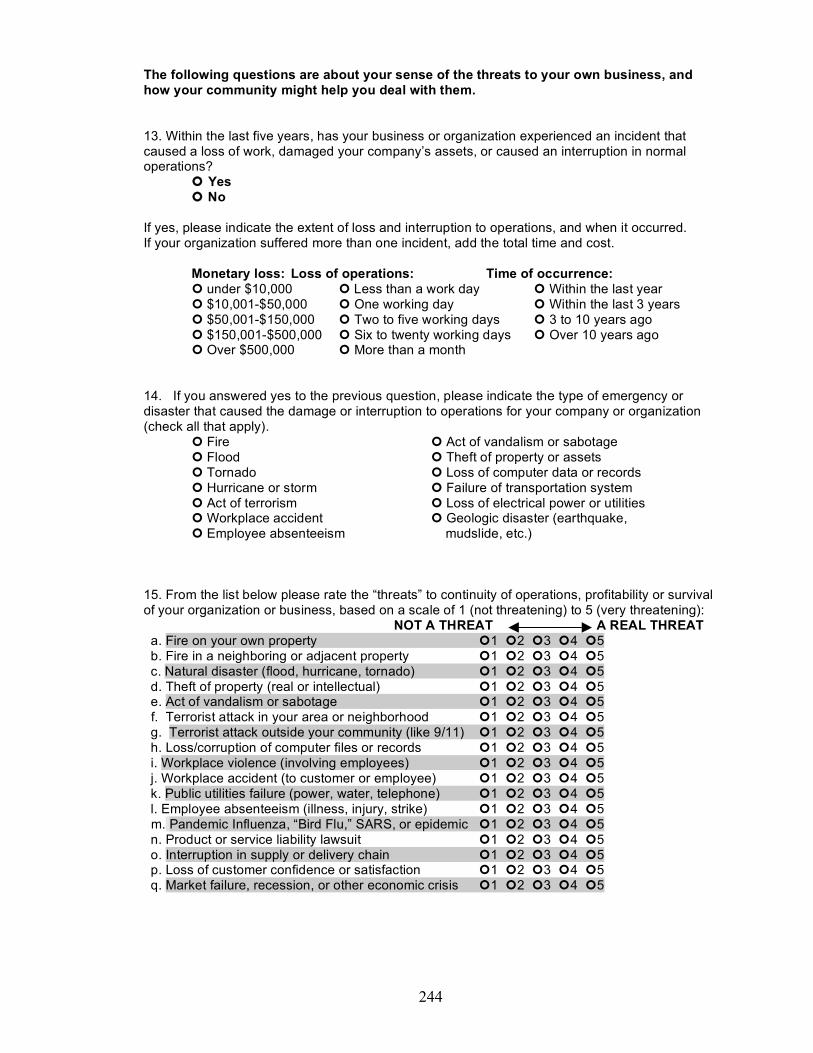
244
The following questions are about your sense of the threats to your own business, and how your community might help you deal with them. 13. Within the last five years, has your business or organization experienced an incident that caused a loss of work, damaged your company’s assets, or caused an interruption in normal operations? Yes No If yes, please indicate the extent of loss and interruption to operations, and when it occurred. If your organization suffered more than one incident, add the total time and cost. Monetary loss: Loss of operations: Time of occurrence: under $10,000 Less than a work day Within the last year $10,001-$50,000 One working day Within the last 3 years $50,001-$150,000 Two to five working days 3 to 10 years ago $150,001-$500,000 Six to twenty working days Over 10 years ago Over $500,000 More than a month 14. If you answered yes to the previous question, please indicate the type of emergency or disaster that caused the damage or interruption to operations for your company or organization (check all that apply). Fire Act of vandalism or sabotage Flood Theft of property or assets Tornado Loss of computer data or records Hurricane or storm Failure of transportation system Act of terrorism Loss of electrical power or utilities Workplace accident Geologic disaster (earthquake, Employee absenteeism mudslide, etc.) 15. From the list below please rate the “threats” to continuity of operations, profitability or survival of your organization or business, based on a scale of 1 (not threatening) to 5 (very threatening): NOT A THREAT A REAL THREAT a. Fire on your own property 1 2 3 4 5 b. Fire in a neighboring or adjacent property 1 2 3 4 5 c. Natural disaster (flood, hurricane, tornado) 1 2 3 4 5 d. Theft of property (real or intellectual) 1 2 3 4 5 e. Act of vandalism or sabotage 1 2 3 4 5 f. Terrorist attack in your area or neighborhood 1 2 3 4 5 g. Terrorist attack outside your community (like 9/11) 1 2 3 4 5 h. Loss/corruption of computer files or records 1 2 3 4 5 i. Workplace violence (involving employees) 1 2 3 4 5 j. Workplace accident (to customer or employee) 1 2 3 4 5 k. Public utilities failure (power, water, telephone) 1 2 3 4 5 l. Employee absenteeism (illness, injury, strike) 1 2 3 4 5 m. Pandemic Influenza, “Bird Flu,” SARS, or epidemic 1 2 3 4 5 n. Product or service liability lawsuit 1 2 3 4 5 o. Interruption in supply or delivery chain 1 2 3 4 5 p. Loss of customer confidence or satisfaction 1 2 3 4 5 q. Market failure, recession, or other economic crisis 1 2 3 4 5
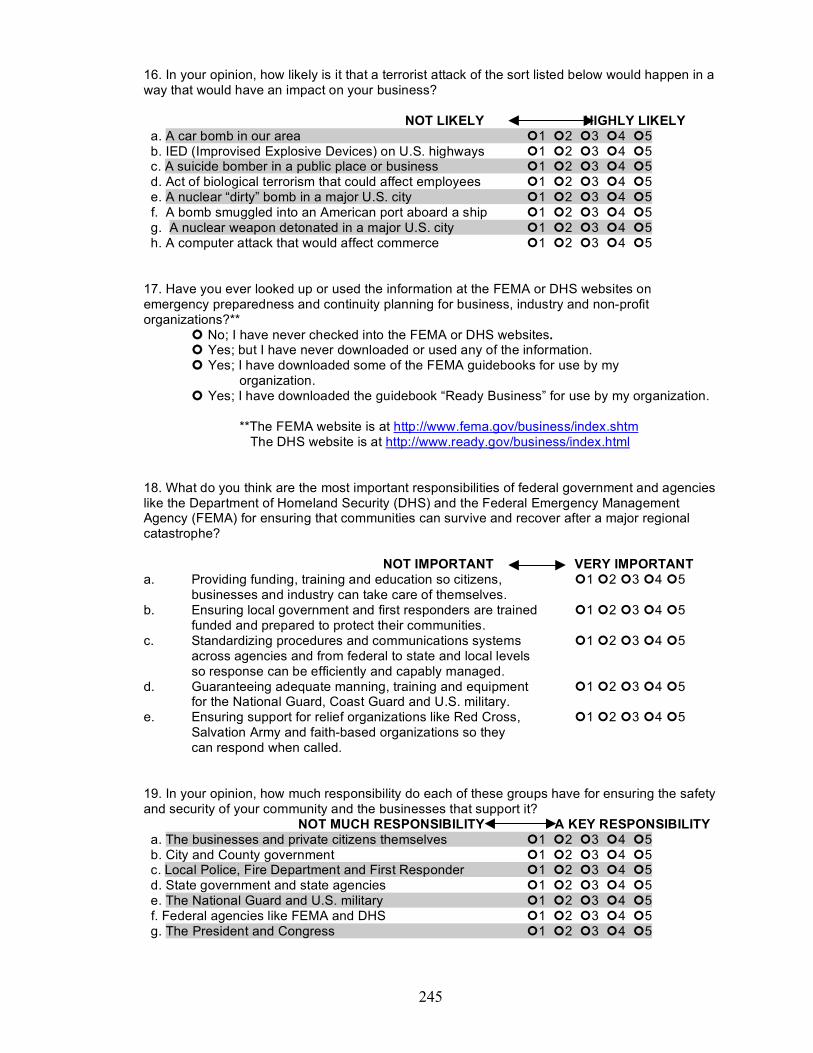
245
16. In your opinion, how likely is it that a terrorist attack of the sort listed below would happen in a way that would have an impact on your business? NOT LIKELY HIGHLY LIKELY a. A car bomb in our area 1 2 3 4 5 b. IED (Improvised Explosive Devices) on U.S. highways 1 2 3 4 5 c. A suicide bomber in a public place or business 1 2 3 4 5 d. Act of biological terrorism that could affect employees 1 2 3 4 5 e. A nuclear “dirty” bomb in a major U.S. city 1 2 3 4 5 f. A bomb smuggled into an American port aboard a ship 1 2 3 4 5 g. A nuclear weapon detonated in a major U.S. city 1 2 3 4 5 h. A computer attack that would affect commerce 1 2 3 4 5 17. Have you ever looked up or used the information at the FEMA or DHS websites on emergency preparedness and continuity planning for business, industry and non-profit organizations?**
No; I have never checked into the FEMA or DHS websites. Yes; but I have never downloaded or used any of the information. Yes; I have downloaded some of the FEMA guidebooks for use by my
organization. Yes; I have downloaded the guidebook “Ready Business” for use by my organization.
**The FEMA website is at http://www.fema.gov/business/index.shtm The DHS website is at http://www.ready.gov/business/index.html 18. What do you think are the most important responsibilities of federal government and agencies like the Department of Homeland Security (DHS) and the Federal Emergency Management Agency (FEMA) for ensuring that communities can survive and recover after a major regional catastrophe? NOT IMPORTANT VERY IMPORTANT a. Providing funding, training and education so citizens, 1 2 3 4 5 businesses and industry can take care of themselves. b. Ensuring local government and first responders are trained 1 2 3 4 5 funded and prepared to protect their communities. c. Standardizing procedures and communications systems 1 2 3 4 5 across agencies and from federal to state and local levels so response can be efficiently and capably managed. d. Guaranteeing adequate manning, training and equipment 1 2 3 4 5 for the National Guard, Coast Guard and U.S. military. e. Ensuring support for relief organizations like Red Cross, 1 2 3 4 5 Salvation Army and faith-based organizations so they can respond when called. 19. In your opinion, how much responsibility do each of these groups have for ensuring the safety and security of your community and the businesses that support it? NOT MUCH RESPONSIBILITY A KEY RESPONSIBILITY a. The businesses and private citizens themselves 1 2 3 4 5 b. City and County government 1 2 3 4 5 c. Local Police, Fire Department and First Responder 1 2 3 4 5 d. State government and state agencies 1 2 3 4 5 e. The National Guard and U.S. military 1 2 3 4 5 f. Federal agencies like FEMA and DHS 1 2 3 4 5 g. The President and Congress 1 2 3 4 5
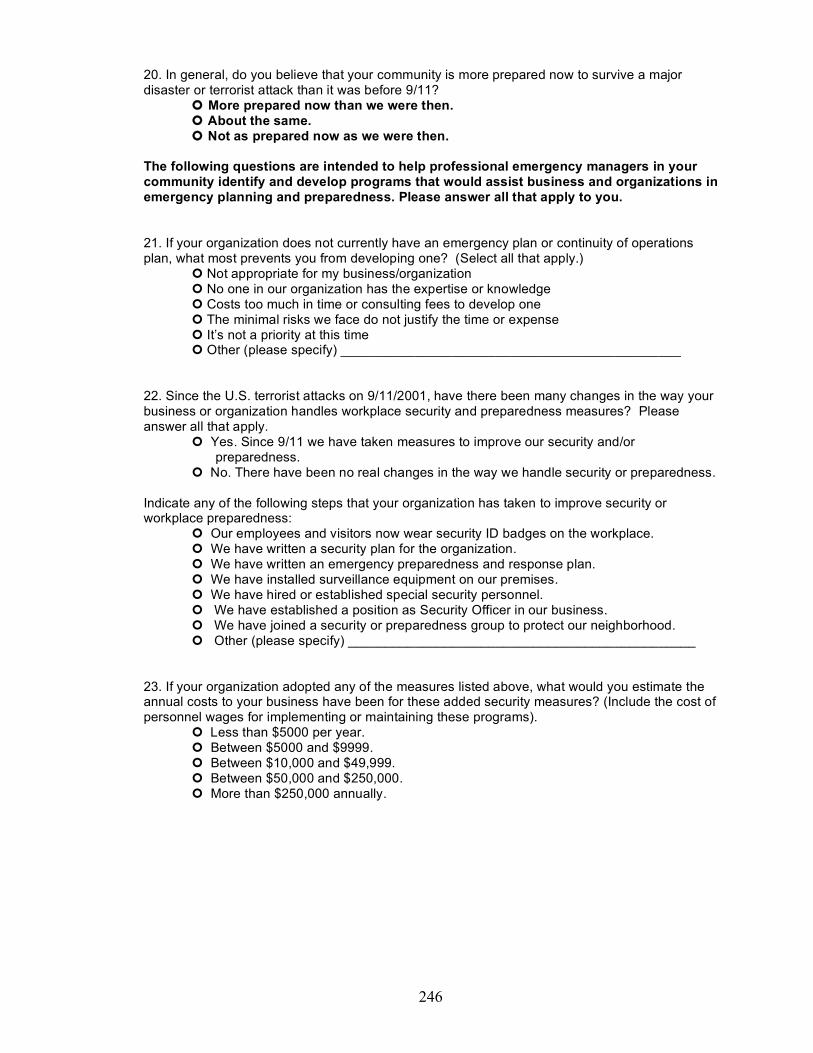
246
20. In general, do you believe that your community is more prepared now to survive a major disaster or terrorist attack than it was before 9/11?
More prepared now than we were then. About the same. Not as prepared now as we were then.
The following questions are intended to help professional emergency managers in your community identify and develop programs that would assist business and organizations in emergency planning and preparedness. Please answer all that apply to you. 21. If your organization does not currently have an emergency plan or continuity of operations plan, what most prevents you from developing one? (Select all that apply.) Not appropriate for my business/organization No one in our organization has the expertise or knowledge Costs too much in time or consulting fees to develop one The minimal risks we face do not justify the time or expense It’s not a priority at this time Other (please specify) ______________________________________________ 22. Since the U.S. terrorist attacks on 9/11/2001, have there been many changes in the way your business or organization handles workplace security and preparedness measures? Please answer all that apply.
Yes. Since 9/11 we have taken measures to improve our security and/or preparedness.
No. There have been no real changes in the way we handle security or preparedness. Indicate any of the following steps that your organization has taken to improve security or workplace preparedness:
Our employees and visitors now wear security ID badges on the workplace. We have written a security plan for the organization. We have written an emergency preparedness and response plan. We have installed surveillance equipment on our premises. We have hired or established special security personnel. We have established a position as Security Officer in our business. We have joined a security or preparedness group to protect our neighborhood. Other (please specify) _______________________________________________
23. If your organization adopted any of the measures listed above, what would you estimate the annual costs to your business have been for these added security measures? (Include the cost of personnel wages for implementing or maintaining these programs). Less than $5000 per year. Between $5000 and $9999. Between $10,000 and $49,999. Between $50,000 and $250,000. More than $250,000 annually.
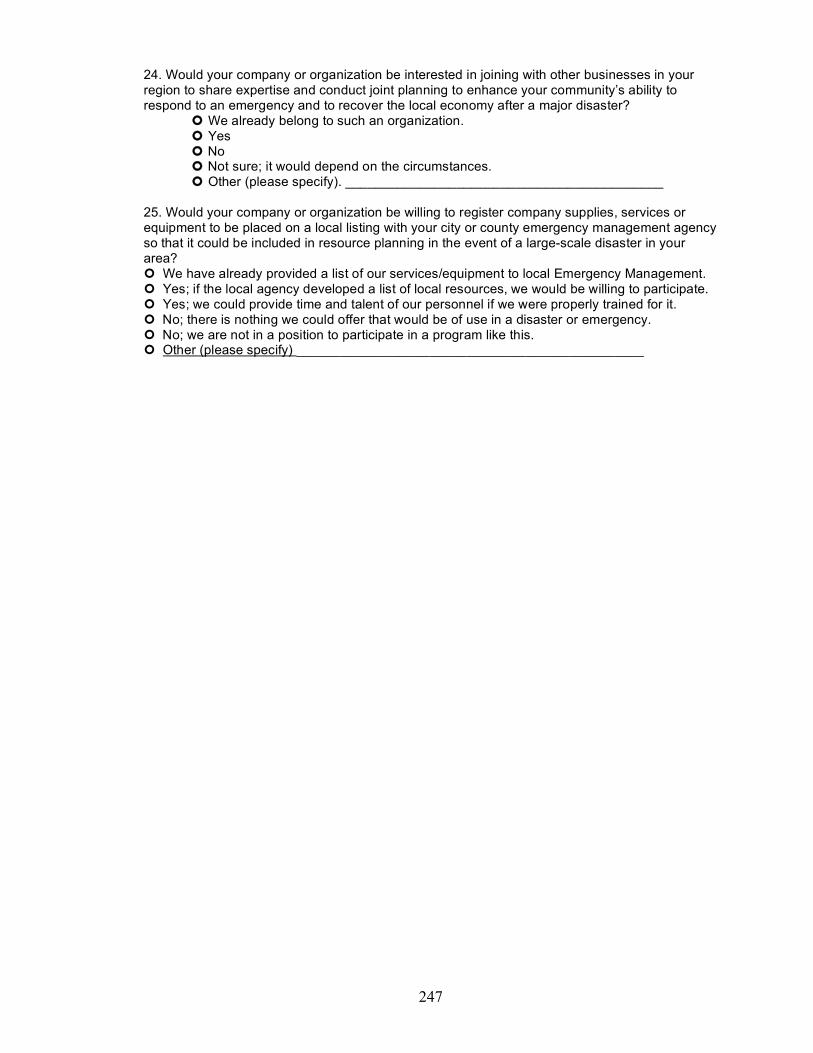
247
24. Would your company or organization be interested in joining with other businesses in your region to share expertise and conduct joint planning to enhance your community’s ability to respond to an emergency and to recover the local economy after a major disaster?
We already belong to such an organization. Yes No Not sure; it would depend on the circumstances. Other (please specify). ___________________________________________
25. Would your company or organization be willing to register company supplies, services or equipment to be placed on a local listing with your city or county emergency management agency so that it could be included in resource planning in the event of a large-scale disaster in your area? We have already provided a list of our services/equipment to local Emergency Management. Yes; if the local agency developed a list of local resources, we would be willing to participate. Yes; we could provide time and talent of our personnel if we were properly trained for it. No; there is nothing we could offer that would be of use in a disaster or emergency. No; we are not in a position to participate in a program like this. Other (please specify) _______________________________________________